A NEW FRAMEWORK FOR POST OCCUPANCY EVALUATION OF OFFICE BUILDING
Upload
khangminh22Category
view
0download
0
Master’s Thesis 2020 60 ECTS
Faculty of Environmental Sciences and Natural Resource Management
Temporal patterns in Macrotermes
mound occupancy in a savanna
ecosystem
Doreen Gakii Mugendi Master of Science in Ecology
i
Abstract
Macrotermes play a central role in the structure and functioning of many tropical ecosystems.
However, the patterns they display in occupying the mounds and important mechanisms that
support these patterns are not well documented. In this study, I investigated temporal patterns
in mound occupancy by Macrotermes Subhyalinus in Lake Mburo National Park, Uganda. The
status of 310 active and inactive mounds was investigated over a period of ten years. Collection
of data started at the beginning of the study in 2007 and was done twice in 2008 and at the end
of the ten-year period in 2016. Change in the number of active mounds was analyzed using
Generalized Linear Mixed Models (GLMM). Generalized Linear Model (GLM) is used to test
the effect of mound characteristics (size, vegetation cover, geophagy, elevation, proximity to
water) on active mounds. Factors (size, vegetation cover, geophagy) characterizing inactive and
re-occupied mounds were also compared. Relationships between local rainfall/temperature and
active mounds was investigated by correlation analyses. The rainfall/temperature was also
analyzed for temporal trends and variability. The present study established that active mounds
decreased from about 50% in 2007 and 2008 to only 2% in 2016 (P < 0.0001). However, the
surveys in early and late 2008 showed an increasing proportion of active mounds compared to
2007 suggesting a significant decrease occurred after 2008. From the GLM results, soil eating
by large herbivores (geophagy) occurred more on active mounds (P < 0.001). Additionally,
active mounds were generally less vegetated with about 33.26 ± 16.64 % of their surface
covered. The study also established that mounds that became re-occupied by Macrotermes did
not differ in size and vegetation cover within 2008 (P = 0.19). Neither, did the size of inactive
mounds change significantly after ten years (P = 0.61) suggesting that mounds were protected
from erosion and animal damage by the vegetation cover which increased from about 42 ± 19
% in 2007 to 66 ± 32 % in 2016 (P < 0.0001). No significant relationship was found between
active mounds and rainfall (r = 0.04, P = 0.16) or temperature (r = -0.038, P = 0.25). The drastic
decline of active mounds in the study area was potentially due to predation by aardvarks and/or
Doryline ants, which requires further investigation. This study did not find a single factor that
determines occupancy of the mounds by Macrotermes thereby suggesting a complex interaction
of factors that is likely not restricted by time. More studies on potential factors in the savanna
with regular assessments is therefore recommended.

ii
Acknowledgements
I wish to thank a few people who supported and helped me to successfully complete this thesis.
First, I’m sincerely grateful to my main supervisor, Prof. Stein Ragnar Moe for providing me
an interesting thesis topic, guidance and an opportunity to learn much more in the process. The
experience would have been daunting without his invaluable insights, discussions, advise and
timely responses to my queries. Thank you for kindly bearing with my prolonged absence from
school. I also wish to thank my co-supervisor Prof. Douglas Sheil for his contribution.
My sincere thanks to the Faculty of Environmental Sciences and Natural Resource Management
(MINA) for the study opportunity and financial support for this fieldwork. Special thanks to the
student advisors Espen Arestøl and Cathrine Glosli for their endless support. I also thank Dr.
Paul Okullo, the staff at Community Education Centre in Lake Mburo National Park, and my
research assistant Mr. Fredrick Matovu for facilitating a smooth data collection process.
I owe thanks to the Kenya Forestry Research Institute (KEFRI) for hosting me in their premises
while in Kenya, and mentorship from Dr. Mbae Muchiri, Dr. Eston Mutitu, Dr. Paul Ogungo
and staff from the Biometrics & GIS Department. Climate data acquisition would not have been
possible without support and guidance from IGAD Climate Prediction and Applications Centre
(ICPAC) and the Kenya Meteorological Department Headquarters in Nairobi. I especially learnt
how to maneuver the data by drawing from Mr. Ismael Lutta (ICPAC) and Mr. James Muhindi
(Kenya-MET) expertise.
To my friends, thank you for supporting me in countless ways, for showing interest in my work
and for teaching me new things. Hopefully, I inspired in you some enthusiasm for mound-
building termites in African savannas.
Finally, and most humbly, I’m grateful to my family for completing the journey with me. To
my mother, brother and late dad, you were my greatest source of strength and inspiration.
iii
Table of Contents
Abstract ................................................................................................................................................... i
Acknowledgements .................................................................................................................................ii
Table of Contents................................................................................................................................... iii
List of Figures ......................................................................................................................................... v
List of Tables .......................................................................................................................................... vi
1 Introduction ........................................................................................................................................ 7
2. Methodology..................................................................................................................................... 11
2.1 Study site .................................................................................................................................... 11
2.1.1 Ecological composition ....................................................................................................... 11
2.2 Study Design .............................................................................................................................. 13
2.2.1 Sampling of the additional mounds .................................................................................. 16
2.2.2 Mound distance geographic data acquisition and analysis ............................................. 18
2.3 Data acquisition of long-term local rainfall and temperature ............................................... 19
3 Analyses ............................................................................................................................................. 20
3.1 Change in proportion of active mounds over time ................................................................. 20
3.2 Effect of mound characteristics on mound activity status ..................................................... 20
4.3 Factors characterizing inactive and re-occupied mounds ..................................................... 21
4.4 Relationships between mound activity status and local rainfall/temperature ..................... 21
4.4.1 Correlation analyses and rainfall variability ................................................................... 21
4.4.2 The Standardized Precipitation Index (SPI) .................................................................... 21
4.4.3 Temporal trends and analyses in rainfall and temperature ........................................... 22
5. Results .............................................................................................................................................. 23
5.1 Change in proportion of active mounds over time ................................................................. 23
5.2 The effect of mound characteristics on mound activity status .............................................. 25
5.2.2 Factors (size and vegetation cover) characterizing the active and inactive mounds used
for geophagy ................................................................................................................................. 25
5.3 Factors (size, vegetation cover, geophagy) characterizing inactive and re-occupied mounds
over time ........................................................................................................................................... 26
5.3.1 Re-occupied mounds .......................................................................................................... 26
5.3.2 Consistently inactive mounds ............................................................................................ 27
5.5 Relationships between mound activity status and local rainfall/temperature ..................... 27
5.5.1 Correlation of active mounds and rainfall/temperature, and rainfall variability ........ 27
5.5.3. Temporal trends in rainfall and temperature ................................................................. 30
6 Discussion .......................................................................................................................................... 31
6.1. Change in proportion of active mounds ................................................................................. 31
6.2 The effect of mound characteristics on mound activity status .............................................. 32
iv
6.3 Factors characterizing inactive and re-occupied mounds ..................................................... 33
6.4 Relationship between mound activity status and rainfall ...................................................... 33
7. Conclusion ........................................................................................................................................ 34
8. References ........................................................................................................................................ 36
9 Appendices ........................................................................................................................................ 40
A.1 Multicollinearity analyses table ............................................................................................... 40
A.2 Most parsimonious model of 2016 ........................................................................................... 40
A.3 Image of the Standardized Precipitation Index from 2007-2016 ......................................... 41
A.4 Image of the Standardized Precipitation Index 1981-2016 ................................................... 42
A.5 Output of the standardized precipitation index values from 1981-2016 ............................. 42
A.6 Classical Additive Decomposition of Rainfall from 1981-2016 ............................................ 44
A.7 Classical Additive Decomposition of Temperature from 1981-2012.................................... 45
v
List of Figures
Figure. 1: The study area map of Lake Mburo National Park, Uganda. ................................................ 12
Figure 2: Image of a hole drilled drilled into a termite mounds, live termites of the Macrotermes
species and a repaired hole ................................................................................................................... 14
Figure. 3: Image showing ongoing height measurements and mound used for geophagy .................. 15
Figure. 4: Image of vegetated Macrotermes mound surface and tree density around........................ 16
Figure. 5: Sampling of additional mounds close to surface water features ......................................... 17
Figure. 6: Map illustrating the extensive surface water system of the park and spatial distribution of
the mounds ........................................................................................................................................... 18
Figure. 7: A schematic map illustrating how mound distances to surface water system were obtained
using geographic information system (GIS). ......................................................................................... 19
Figure. 8: Bar plot showing change in proportions of active and re-occupied mounds over time ...... 24
Figure. 9: Box plot of average size and vegetation cover of active and inactive mounds used for
geophagy ............................................................................................................................................... 26
Figure 10: Box plot of average size and vegetation cover of re-occupied mounds. ............................ 26
Figure 11: Box plot of average size and vegetation cover of inactive mounds . .................................. 27
Figure 12: Bar plot showing distribution of the standardized precipitation index (SPI) classes from
2007 to 2008 . ........................................................................................................................................ 29
Figure 13: Bar plot showing distribution of the standardized precipitation index (SPI) from 2009 to
2016 ...................................................................................................................................................... 29
Fig 14: Chart of classical additive decomposition of average monthly rainfall for Mbarara district
between 2007 and 2016 (mm). ............................................................................................................. 30

vi
List of Tables
Table 1: Change in proportion of active mounds over the ten-year period.. ....................................... 23
Table 2: Proportions of active and re-occupied mounds over time ..................................................... 24
Table 3: The effect of vegetation cover and geophagy on mound activity. ......................................... 25
Table 4: The Standardized Precipitation Index (SPI) of Mbarara district for 2007-2016.. .................... 28
7
1 Introduction
Termites (Isoptera) are an important group of soil macro-fauna in many tropical and subtropical
ecosystems (Erpenbach & Wittig, 2016; Jouquet et al., 2011). Particularly in savanna
environments, termites of the genus Macrotermes (family Termitidae) are widespread and
construct large epigeal mounds (Brandl et al., 2007; Davies et al., 2014; Erpenbach & Wittig,
2016). The mounds have special soil properties (Erens et al., 2015b), physical structure (Bignell
et al., 2010) and characteristic vegetation (Moe et al., 2009; Okullo & Moe, 2012b) which drive
heterogeneity of key ecological processes in the ecosystem (Dangerfield et al., 1998; Sileshi et
al., 2010). Macrotermes mounds are not always active (Blösch, 2002; Collins, 1981) and
undergo alternating periods of inactivity and re-occupation (Pomeroy, 2005b). A mound is
active if it is inhabited by termite colony and inactive if the colony dies or abandons the nest.
An inactive mound can nonetheless become active again through re-occupation by either the
builder or a different termite species (Erens et al., 2015a; Pomeroy, 2005a; Sands, 1965).
Therefore, the number of mounds cannot simply infer abundance of termite colonies at
landscape level because a mound may at any time be active or inactive (Acanakwo et al., 2019).
Macrotermes interact with each other, and with living and non-living components of their
environment (Ahmad et al., 2018) through processes such as competition, mutualism, predation
and ecosystem engineering (Erpenbach & Wittig, 2016; Jouquet et al., 2006; Jouquet et al.,
2011). These interactions result in complex patterns across space and time (Ahmad et al., 2018;
Theraulaz et al., 2003) that vary between the termite species, mound activity status, ecosystem,
age and size of the colony (Collins, 1981; Grohmann et al., 2010; Korb & Linsenmair, 2001;
Lepage, 1984; Muvengwi et al., 2018). However, variation in the activity status of mounds
plays a central role in the structure and functioning of the ecosystem. For example, regular
spatial patterning is common in large active mounds (Grohmann et al., 2010) and increases
productivity of dryland ecosystems such as African savannas (Pringle et al., 2010). Active
mounds also act as closed systems that accumulate and preserve nutrients within them
(Menichetti et al., 2014) thereby supporting unique, denser and more nutritive vegetation often
preferred for sustenance by large herbivores (Moe et al., 2009; Okullo & Moe, 2012b).
Conversely, abandoned mounds release nutrients into adjacent soils through leaching
(Menichetti et al., 2014) and progressive erosion thereby influencing the surrounding vegetation
(Gosling et al., 2012). Despite the renowned ecological importance of such patterning, there is
relatively little work on temporal patterns in mound activity.

8
Recognizing recurring patterns in activity status is central to understanding emergent mound
characteristics such as vegetation cover, size and consequent feedback loops (Blösch, 2008;
Dangerfield et al., 1998; Erpenbach & Wittig, 2016; Jouquet et al., 2006; Jouquet et al., 2011).
Active Macrotermes mounds for instance, continually increase in size as the colony grows to
its optimal size (Korb & Linsenmair, 1999) whereas inactive mounds continually erode due to
lack of repair and maintenance thereby decreasing in size (Korb & Linsenmair, 2001). Surface
erosion is however, reduced as a mound becomes vegetated (Pomeroy, 1976) and soil properties
of large mounds is maintained despite their activity status (Erens et al., 2015a). Both active
and inactive mounds may bear vegetation (Blösch, 2008; Pomeroy, 1976) but plant growth
commonly originates from at least a partially inactive mound following increased nutrients
release (Menichetti et al., 2014) and exposure to accelerated weathering which softens its
surface (Blösch, 2002; Glover et al., 1964). Where the mounds experience shading from
vegetation, large active mounds maintain higher internal daily temperatures than small inactive
ones (Korb & Linsenmair, 2000; Ndlovu & Pérez-Rodríguez, 2018). Such characteristics as
mound size and vegetation cover may therefore be explained by activity status of the mounds.
Mound densities vary across landscapes (e.g. Meyer et al., 1999; Mujinya et al., 2014; Pomeroy,
1977) but comparisons of colony abundance based on mound density should be done with
caution. For instance, the average proportion of all active mounds in northern Kruger National
Park was about 0.47, of which Macrotermes species consisted about 0.62 (Meyer et al., 1999),
and 0.58 for Macrotermes michaelseni mounds surveyed in a savanna ecosystem in Namibia
(Grohmann et al., 2010). Average proportion of inactive mounds in Uganda was 0.42 for
Macrotermes bellicosus and 0.21 for Macrotermes subhyalinus (Pomeroy, 1977). Some 0.66
mounds of various species were also active across multiple land-use types in central Nigeria
(Ahmed II & Pradhan, 2019). However, relatively low abundance of active mounds (Collins,
1981; Gosling et al., 2012; Lepage, 1984) and complete colony mortality (Sands, 1965) is also
reported and the decline can be gradual or drastic (Lepage, 1984; Pomeroy, 1977). Indications
of life in active mounds include fresh constructions evidenced by moist soil deposits,
preparations for alate flighting and steady flow of warm moist air from mounds that have
ventilation shafts. New termite colonies appear either as new mounds or re-occupation of old
ones, the latter being less common but having higher survival rates (Pomeroy, 2005b).
Nevertheless, mounds don’t always show these patterns of re-occupation (Darlington, 1985;
Pomeroy, 1976) or signs of activity and current statuses have to be inferred from previous and
subsequent visits (Pomeroy, 2005b).
9
Deliberate ingestion of soil from Macrotermes mounds by large herbivores (geophagy) is also
common in African savannas and is mainly attributed to nutrient supplementation (Baptista et
al., 2013; Kalumanga et al., 2017; Mahaney et al., 1999). Macrotermes accumulate essential
macro nutrients (Blösch, 2002; Watson, 1977) and mine scarce micro-nutrients such as Cobalt
(Co), Selenium (Se) and Iodine (I) Manganese (Mn) and Copper (Cu) in nutrient poor soils to
fertilize their fungus culture and benefit the colony (Gosling et al., 2012; Seymour et al., 2014).
The accumulation of minerals however also attracts large herbivores by acting as a critical
resource in nutrient poor ecosystems as the savannas (Seymour et al., 2014), thereby
highlighting the influence of termite activity on other functional groups.
Macrotermes are particularly vulnerable to inundation and hypoxic conditions (Coyle et al.,
2017; Schuurman & Dangerfield, 1997) and hence select nesting sites depending on
hydrogeomorphic and soil characteristics of the habitat. They predominantly build their nests
on well-drained soils in elevated hillslope positions (Levick et al., 2010a) and avoid places with
high risk of flooding. Such areas include concave floodplains (Meyer et al., 1999) and surface
water channels to which proximity influences mound activity and reportedly declines with
increasing stream order (Ahmed II & Pradhan, 2019). Macrotermes also avoid areas with too
much clay due to slow permeability and increased periods of inundation which preclude mound
and colony establishment (Levick et al., 2010a). Still, termite colonies can establish closer to
drainage lines in low rainfall regions (Muvengwi et al., 2018) emphasizing the influence of
hydrogeomorphic and climatic factors on colony survival.
Causes of colony death may be internal and include aging and/or hostile competition between
colonies (Muvengwi et al., 2018). The average life span of a queen among M.bellicosus, M.
Michaelson and M. subhyalinus species ranges from 11 to 20 years according to Keller, (1998),
although Pomeroy (1976) established longevity of M. bellicosus colonies in Uganda as 4 years
suggesting the influence of different mechanisms. Other local factors include flooding (Coyle
et al., 2017; Schuurman & Dangerfield, 1997), diseases, and predation especially by aardvarks
and Doryline ants (Grohmann et al., 2010; Lepage, 1984; Sands, 1965). Migration of the entire
Macrotermes colony is rare (Neoh et al., 2015).
Despite the critical role that occupancy status of the mounds by Macrotermes play in ecosystem
structure and functioning, focus on a temporal scale is still insufficient. Many studies downplay
the importance of regular/repeated monitoring of a species to detect change as a necessary
component of conservation. Therefore, the focus of this study was to investigate temporal
patterns in mound occupancy by termites of Macrotermes species in a savanna ecosystem.

10
Specific objectives guiding this investigation were; (i) to assess change in proportions of active
mounds over a ten-year period, (ii) to investigate the effect of mound characteristics (size,
vegetation cover, tree density around the mound, proximity of mounds to water, geophagy and
elevation) on mound activity status, (iii) to examine factors (size, vegetation cover, geophagy)
that characterize mounds that are inactive and re-occupied, and (iv) to investigate relationships
between mound activity status with long term local rainfall and temperature patterns.
11
2. Methodology
2.1 Study site
The study was conducted from June to August 2016 in Lake Mburo National Park located in
Kiruhura district, southwest of Uganda (00°30ˊS, 00°45ˊS and 45°00ˊE, 31°05Eˊ) (Fig. 1). The
park area is approximately 260 km2 and lies close to the equator at an altitude ranging from
1,220 to 1,450 m a.s.l. Lake Mburo National Park is part of the larger Kagera system which
covers about 30 000 km2 from the border area of Rwanda stretching to Tanzania and Uganda
(Blösch, 2002; Blösch, 2008). The park lies in a rain shadow between Lake Victoria basin to
the east and Ruwenzori mountains to the west forming a narrow semi-arid corridor in a high
rainfall area. Average annual rainfall is about 800mm and ranges from 650 mm to 1000 mm.
The rainfall follows a bimodal pattern which is typical near the equator with a major peak in
March to May and a second peak from (October) November to December. The driest period of
the year is mid-June to mid-August with June and July receiving no rainfall in most years
(Blösch, 2002). Daily temperatures range from 12 to 34 °C but seasonal fluctuations are
negligible. The low temperatures are due to relative high altitude of the region and regular
cloudiness (Blösch, 2002).
2.1.1 Ecological composition
Dominating landforms of the park include gentle slopes, smooth rounded hilltops, low flat
plains (broad flat valleys) and wetlands (Blösch, 2002). Seasonal floodplains drain through
swamp areas and Rwizi river which link together an extensive wetland system formed by five
lakes within the park boundary of which Lake Mburo is the largest (Maganyi & Mwolobi, 2009)
(Fig. 1). The complexity of landforms in Lake Mburo National Park gives rise to a high
biodiversity (Blösch, 2002; Tushabe et al., 2006). This study was conducted on the plains and
gentle slopes of the park where large vegetated termite mounds predominantly occur (Moe et
al., 2009). The prevalence of mound associated/restricted vegetation in seasonally waterlogged
flat areas can be ascribed to a combination of fire and drainage effects (Blösch, 2002). Mounds
are constructed primarily by Macrotermes subhyalinus (Rambur) which is the dominant termite
species in Lake Mburo National Park (Moe et al., 2017) and the south-western Uganda region
in general (Pomeroy, 1977).

12
Soils in Lake Mburo National Park are predominantly Ferralsol, Histosol, Vertisol and Leptisol
(Blösch, 2002). Ferralsols are strongly weathered soils (Klamt & Van Reeuwijk, 2000; Wrb,
2015) and dominate the gentle slopes of the park (Blösch, 2002). Recently deposited clays and
peats give rise to black cotton soils such as vertisol and histosols that underlie the seasonally
waterlogged valley bottoms of the park (Blösch, 2008; Spaargaren, 2001). The leptosols
commonly occur in hilly areas (NachtergaeleA, 2010).
Main vegetation types in the park are mound associated thickets, open and wooded savannas,
forest patches and extensive papyrus swamps (Blösch, 2002; Maganyi & Mwolobi, 2009). The
termite mound thickets differ in composition and are higher in tree density and diversity than
the savanna matrix (Acanakwo et al., 2018; Moe et al., 2009). Prevalent on-mound tree species
include Rhus natalensis Bernh. Ex C. Krauss, Grewia species, Allophylus africanus P. Beauv.,
Teclea nobilis Del, while the adjacent savanna areas are dominated by Acacia species such as
A. gerrardii Benth., A. hockii De Willd, A.sieberiana and Dichrostachsys cinerea (L.) Wight &
Figure. 1: The study area map showing road network (tracks) of the park along which mounds used for this study were located. The black and red dots represent spatial distribution of active and inactive mounds established at the beginning of the study in May-July 2007.

13
Arn (Acanakwo et al., 2018; Moe et al., 2009; Okullo & Moe, 2012b). The main grassland
vegetation comprise Sporobolus pyramidalis and Themeda triandara (Moe et al., 2009) while
Cyperus papyrus dominate the permanent swamp areas (Maganyi & Mwolobi, 2009).
Biomass density of wild ungulates in the park is about 87 kg ha -2 with the most numerous
species being impala Aepyceros melampus and zebra Equus burchelli. Other common ungulates
are the bushbuck Tragelaphus scriptus, water buck Kobus ellipsiprymnus defassa, warthog
Phacochoerus africanus, Eland Taurotragus oryx and African buffalo Syncerus caffer
(Rannestad et al., 2006). These large herbivores preferentially forage on vegetated Macrotermes
mounds (Mobæk et al., 2005). Lake Mburo National Park is also designated as an Important
Bird Area (BirdLifeInt., 2018; Tushabe et al., 2006) with more than 300 species having been
recorded (Averbeck, 2002; Nalwanga-Wabwire et al., 2009). Among them is the vulnerable
Shoebill (Balaeniceps rex) and near-threatened Papyrus Gonolek Laniarius mufumbiri
(BirdLifeInt., 2018). The most abundant species are the Grey-headed Sunbird Deleornis
axillaries, Blue-cheeked bee-eater Merops persicus, Red-billed firefinch Lagonosticta
senegala, Cardinal woodpecker Dendropicos fuscescens, Klaas’ Cuckoo Chrysococcyx klaas
and Yellow-fronted tinkerbird Pogoniulus chrysoconus (Nalwanga-Wabwire et al., 2009).
2.2 Study Design
The fieldwork comprised of checking active and inactive Macrotermes mounds and examining
their main characteristics, specifically; vegetation cover, height, basal diameter, signs of soil
eating by large herbivores (geophagy), distance to water, elevation and tree density around the
mound. The term ‘active’ refers to mounds inhabited by Macrotermes subhyalinus termites and
‘inactive’ to those mounds where termites were absent. Mounds used for this study were
selected between May and July 2007; first, using a table of random numbers to select a random
distance varying from 0.1 to 1 km along the road network of the park. Then, the road distance
was covered and a random compass bearing between 1 and 360 degrees was selected together
with another random distance away from the road. Macrotermes subyhalinus commonly
construct dome-shaped mounds (Aiki et al., 2019; Bignell et al., 2010) and those identified
nearest from the end point were included in the survey, whether active or inactive. In total, 310
mounds with a mean size of 984.77 ± 883.06 m2 ranging from 52 – 5210.5 m2 were sampled
and their geographic position recorded using a handheld Global Positioning System (GPS;
GARMIN GPS 12) device (accuracy of ̴ ± 3 m).
14
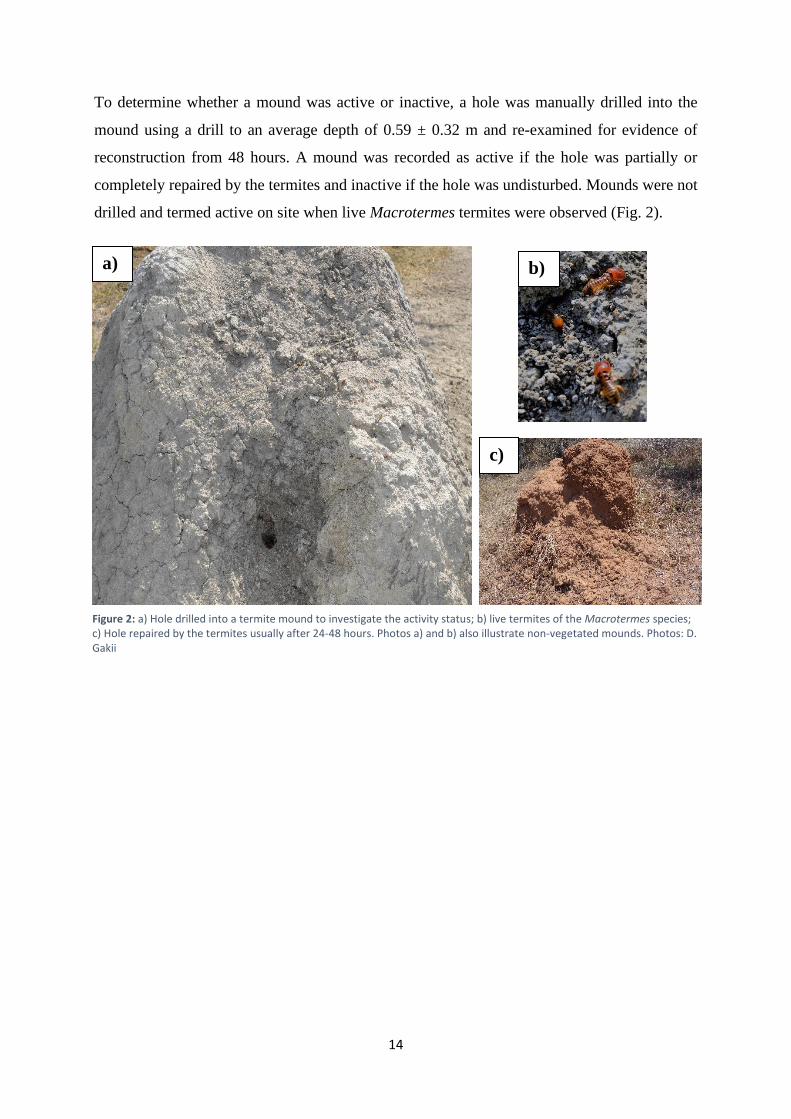
To determine whether a mound was active or inactive, a hole was manually drilled into the
mound using a drill to an average depth of 0.59 ± 0.32 m and re-examined for evidence of
reconstruction from 48 hours. A mound was recorded as active if the hole was partially or
completely repaired by the termites and inactive if the hole was undisturbed. Mounds were not
drilled and termed active on site when live Macrotermes termites were observed (Fig. 2).
b)
c)
a)
Figure 2: a) Hole drilled into a termite mound to investigate the activity status; b) live termites of the Macrotermes species; c) Hole repaired by the termites usually after 24-48 hours. Photos a) and b) also illustrate non-vegetated mounds. Photos: D. Gakii

15
Mound height was obtained using a calibrated rod by measuring distance from the tallest point
of the mound perpendicular to the base (Fig. 3a). The height was measured on opposite sides
of the mound at higher and lower elevations (height1 and height 2) to account for slope
variation. By use of a measuring tape, mound diameter was obtained from two measurements
along the longest axis (diameter 1) and the axis perpendicular to it (diameter 2) which usually
is the shortest (Darlington et al., 1992). Measurements of height and dimeter were used to
estimate above-ground size (volume) of mounds using the formula V= 0.2 + 0.9 dh; V, d and h
being volume, diameter and mound height respectively. According to previous studies by
Pomeroy (2005), this formula is well suited for estimation of volumes of Macrotermes
subhyalinus, which is the dominant species in the study area. To determine if the mounds were
used by animals for geophagy, mound surface was visually examined for presence of
characteristic marks such as licked surfaces and teeth marks (Fig. 3b).
Vegetation cover of the mound was estimated visually on a percentage scale based on how
much of the mound surface was visible. It was denoted as 0 % if the mound was bare and 100
% if the mound was fully covered with vegetation. Tree density around each mound was
obtained using a relascope at 3.5 meters from the edge of the mound and 1.37 diameter at breast
height (dhb) (Fig. 4).
a) b)
Figure. 3: a) Taking height measurements from the tallest point of the mound perpendicular to the base; b) A mound with licked surface indicating soil eating by animals (geophagy). Photos: D. Gakii
16
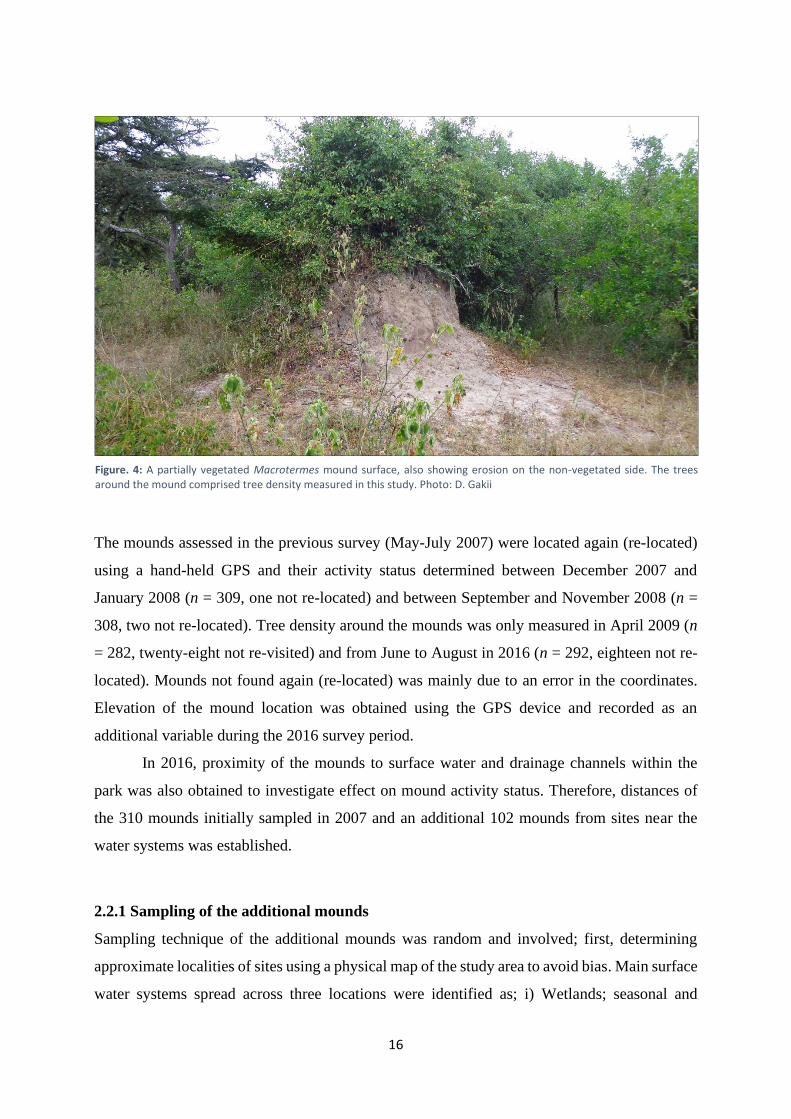
The mounds assessed in the previous survey (May-July 2007) were located again (re-located)
using a hand-held GPS and their activity status determined between December 2007 and
January 2008 (n = 309, one not re-located) and between September and November 2008 (n =
308, two not re-located). Tree density around the mounds was only measured in April 2009 (n
= 282, twenty-eight not re-visited) and from June to August in 2016 (n = 292, eighteen not re-
located). Mounds not found again (re-located) was mainly due to an error in the coordinates.
Elevation of the mound location was obtained using the GPS device and recorded as an
additional variable during the 2016 survey period.
In 2016, proximity of the mounds to surface water and drainage channels within the
park was also obtained to investigate effect on mound activity status. Therefore, distances of
the 310 mounds initially sampled in 2007 and an additional 102 mounds from sites near the
water systems was established.
2.2.1 Sampling of the additional mounds
Sampling technique of the additional mounds was random and involved; first, determining
approximate localities of sites using a physical map of the study area to avoid bias. Main surface
water systems spread across three locations were identified as; i) Wetlands; seasonal and
Figure. 4: A partially vegetated Macrotermes mound surface, also showing erosion on the non-vegetated side. The trees around the mound comprised tree density measured in this study. Photo: D. Gakii
17
permanently flooded, ii) Lake; Lake Mburo which is the largest within the park, and iii) River;
Rwizi which is a permanent river feeding into the extensive wetland system. In each of these
three locations, four sites were picked at random distances along the water systems. The study
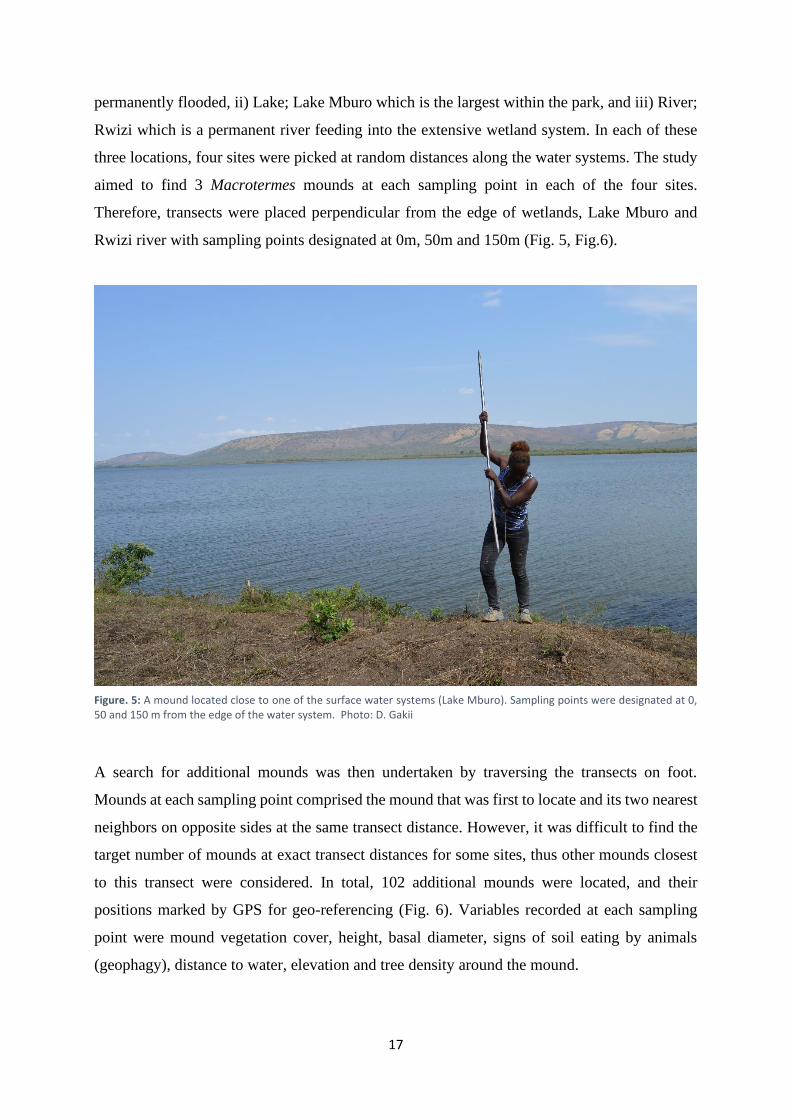
aimed to find 3 Macrotermes mounds at each sampling point in each of the four sites.
Therefore, transects were placed perpendicular from the edge of wetlands, Lake Mburo and
Rwizi river with sampling points designated at 0m, 50m and 150m (Fig. 5, Fig.6).
A search for additional mounds was then undertaken by traversing the transects on foot.
Mounds at each sampling point comprised the mound that was first to locate and its two nearest
neighbors on opposite sides at the same transect distance. However, it was difficult to find the
target number of mounds at exact transect distances for some sites, thus other mounds closest
to this transect were considered. In total, 102 additional mounds were located, and their
positions marked by GPS for geo-referencing (Fig. 6). Variables recorded at each sampling
point were mound vegetation cover, height, basal diameter, signs of soil eating by animals
(geophagy), distance to water, elevation and tree density around the mound.
Figure. 5: A mound located close to one of the surface water systems (Lake Mburo). Sampling points were designated at 0, 50 and 150 m from the edge of the water system. Photo: D. Gakii
18
2.2.2 Mound distance geographic data acquisition and analysis
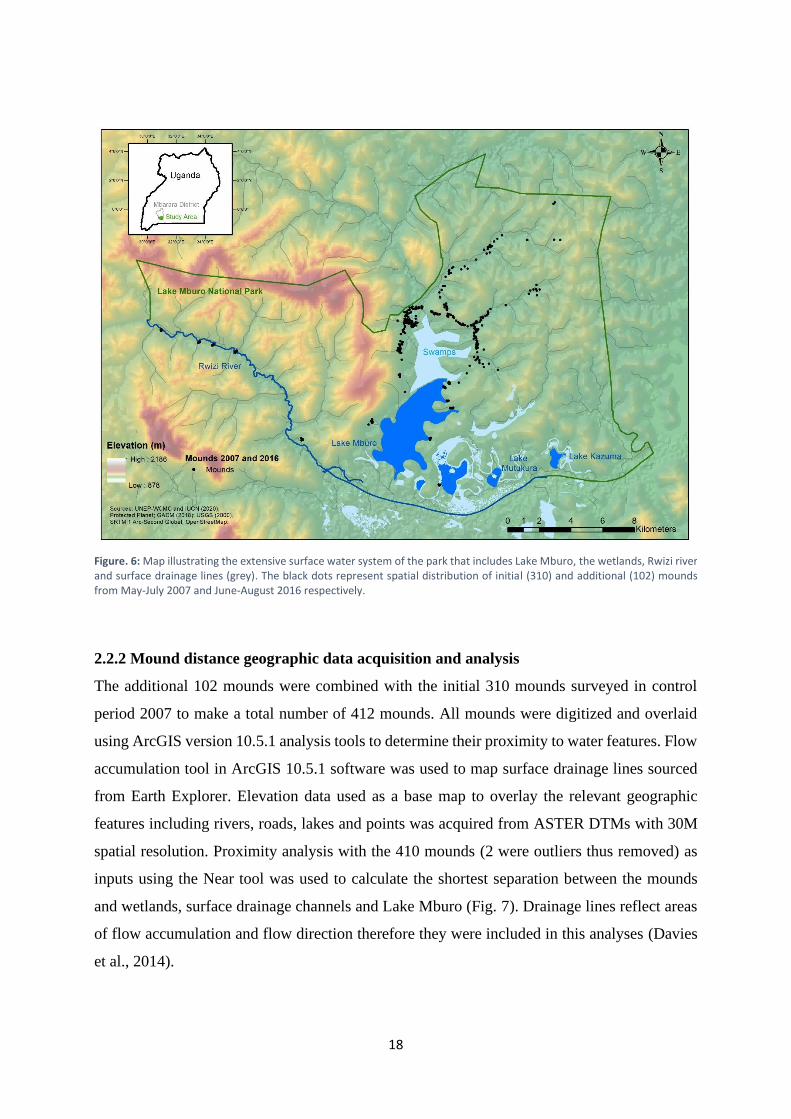
The additional 102 mounds were combined with the initial 310 mounds surveyed in control
period 2007 to make a total number of 412 mounds. All mounds were digitized and overlaid
using ArcGIS version 10.5.1 analysis tools to determine their proximity to water features. Flow
accumulation tool in ArcGIS 10.5.1 software was used to map surface drainage lines sourced
from Earth Explorer. Elevation data used as a base map to overlay the relevant geographic
features including rivers, roads, lakes and points was acquired from ASTER DTMs with 30M
spatial resolution. Proximity analysis with the 410 mounds (2 were outliers thus removed) as
inputs using the Near tool was used to calculate the shortest separation between the mounds
and wetlands, surface drainage channels and Lake Mburo (Fig. 7). Drainage lines reflect areas
of flow accumulation and flow direction therefore they were included in this analyses (Davies
et al., 2014).
Figure. 6: Map illustrating the extensive surface water system of the park that includes Lake Mburo, the wetlands, Rwizi river and surface drainage lines (grey). The black dots represent spatial distribution of initial (310) and additional (102) mounds from May-July 2007 and June-August 2016 respectively.

19
2.3 Data acquisition of long-term local rainfall and temperature
Local rainfall and temperature data for Mbarara district was obtained using the GeoCLIM
Climatology analysis software version 1.2.0. This is a spatial tool developed by the United
States Geological Survey (USGS)/Famine Early Warning Systems Network (FEWS NET) and
United States Agency for International Development (USAID) to analyze rainfall and
temperature climate data (https://earlywarning.usgs.gov/fews/software-tools/20). GeoCLIM was
preferred because it combines satellite and station data to create improved datasets and is useful
in East Africa where sparse rain gauge networks limit accurate rainfall estimation with
sufficient spatial distribution (Kimani et al., 2017). It applies high resolution (0.05° satellite
imagery), interpolation techniques, and long duration of record precipitation estimates based on
observations of infrared Cold Cloud Duration (CDC). GeoCLIM runs with Climate Hazards
Group Infra-Red Precipitation with Station (CHIRPS) data which comes with Background-
Assisted Station Interpolation for Improved Climate Surfaces i.e. BASIICS to grid the satellite
and station datasets (Funk et al., 2015). Thus, gridded monthly precipitation data from 1981-
2016 and maximum monthly temperature data from 1981-2012 were obtained for Mbarara
district. There were no missing variables recorded in any of the datasets.
Figure. 7: A schematic map illustrating how mound distances to surface water system were obtained using geographic information system (GIS).

20
3 Analyses
3.1 Change in proportion of active mounds over time
All statistical analyses were done using R analytical software version 3.5.3 for Windows (Team,
2017). Data comprised active and inactive Macrotermes subhyalinus mounds surveyed in four
periods made into three categorical variables for analysis; (i) 2007_Mid (May, June and July
2007), (ii) 2008_Early ( December to January 2007-08), (iii) 2008-Late (September, October
and November 2008) and (iv) 2016_Mid (June, July and August 2016). The categories were
obtained by dividing the year into three equal parts (early, mid and late) into which the survey
periods fit most suitably. A generalized linear mixed model (GLMM) was constructed using
the ‘glmer’ function within the lmer4 package (Kuznetsova et al., 2014) to test the effect of
survey period on mound activity status (active). A binomial distribution was followed. Since
the same mounds were repeatedly surveyed, mound identity was used as a random factor while
survey period was specified as fixed effects. The model excluded other predictor variables i.e.
mound size, vegetation cover, elevation, geophagy, proximity to water and tree density around
the mound because they were not measured in all four survey periods. The proportions of active
mounds in each survey period were also determined.
3.2 Effect of mound characteristics on mound activity status
A generalized linear model (GLM) was constructed following binomial distribution and logit
link function to determine the effect of mound characteristics on active mounds. Because nearly
all mounds were inactive in 2016 survey period, the model was split into 2007_Mid (n = 310),
2016_Mid (n = 292) and 2016_Mid (n =410) to resolve nonconvergence issues related to
scaling. Prior to the analyses, data was checked for multicollinearity using the Pearson
correlation coefficient (r), normality using Shapiro-wilk normality test and for outliers using
boxplots. The mound distance to lakes and wetlands was highly positively corelated (r = 0.83
– 0.89) in all three models (Appendix A1). Thus, lake distance was excluded based on its larger
p value and on the basis that most parts were adjacent to the wetland but farther from the
mounds (Fig. 6). A second order polynomial was included in the model to obtain a better fit,
although there was no change in the result.
In the 2007_Mid model, active mounds were specified as the response using the cbind function
while the mound size, vegetation cover, geophagy, elevation, distance to streams and wetlands
were fitted as explanatory variables. The 2016 models included tree density around the mounds
21
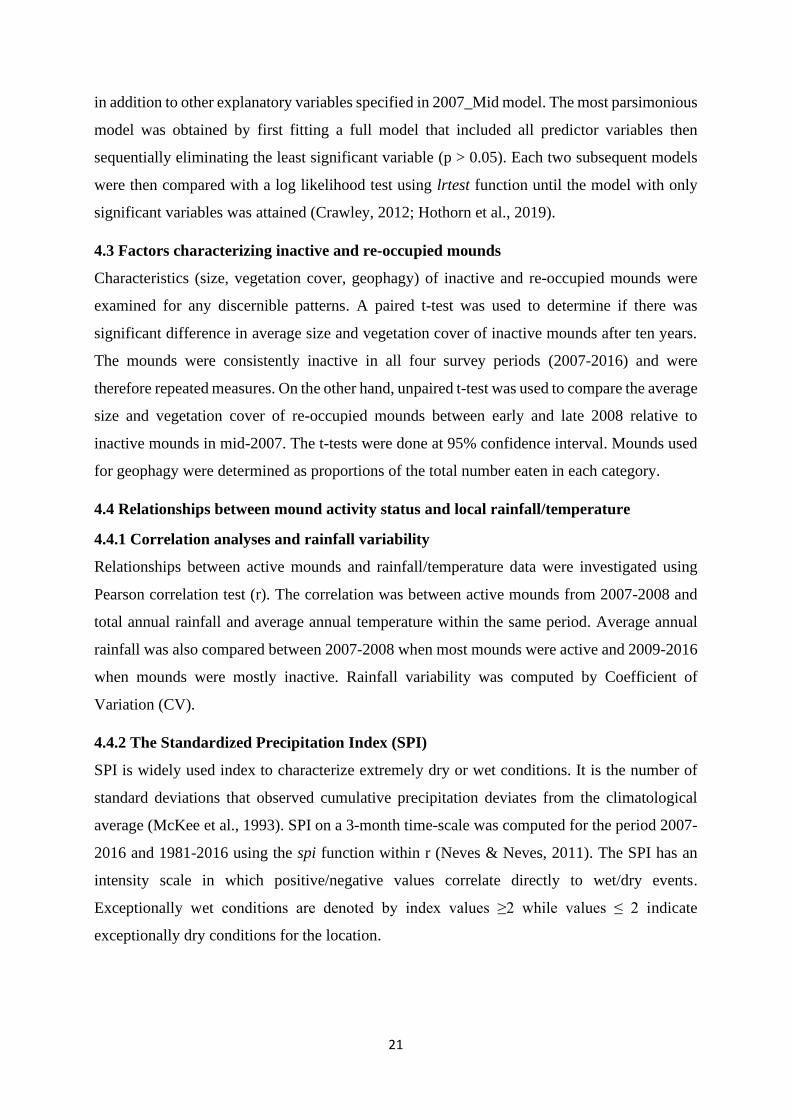
in addition to other explanatory variables specified in 2007_Mid model. The most parsimonious
model was obtained by first fitting a full model that included all predictor variables then
sequentially eliminating the least significant variable (p > 0.05). Each two subsequent models
were then compared with a log likelihood test using lrtest function until the model with only
significant variables was attained (Crawley, 2012; Hothorn et al., 2019).
4.3 Factors characterizing inactive and re-occupied mounds
Characteristics (size, vegetation cover, geophagy) of inactive and re-occupied mounds were
examined for any discernible patterns. A paired t-test was used to determine if there was
significant difference in average size and vegetation cover of inactive mounds after ten years.
The mounds were consistently inactive in all four survey periods (2007-2016) and were
therefore repeated measures. On the other hand, unpaired t-test was used to compare the average
size and vegetation cover of re-occupied mounds between early and late 2008 relative to
inactive mounds in mid-2007. The t-tests were done at 95% confidence interval. Mounds used
for geophagy were determined as proportions of the total number eaten in each category.
4.4 Relationships between mound activity status and local rainfall/temperature
4.4.1 Correlation analyses and rainfall variability
Relationships between active mounds and rainfall/temperature data were investigated using
Pearson correlation test (r). The correlation was between active mounds from 2007-2008 and
total annual rainfall and average annual temperature within the same period. Average annual
rainfall was also compared between 2007-2008 when most mounds were active and 2009-2016
when mounds were mostly inactive. Rainfall variability was computed by Coefficient of
Variation (CV).
4.4.2 The Standardized Precipitation Index (SPI)
SPI is widely used index to characterize extremely dry or wet conditions. It is the number of
standard deviations that observed cumulative precipitation deviates from the climatological
average (McKee et al., 1993). SPI on a 3-month time-scale was computed for the period 2007-
2016 and 1981-2016 using the spi function within r (Neves & Neves, 2011). The SPI has an
intensity scale in which positive/negative values correlate directly to wet/dry events.
Exceptionally wet conditions are denoted by index values ≥2 while values ≤ 2 indicate
exceptionally dry conditions for the location.
22
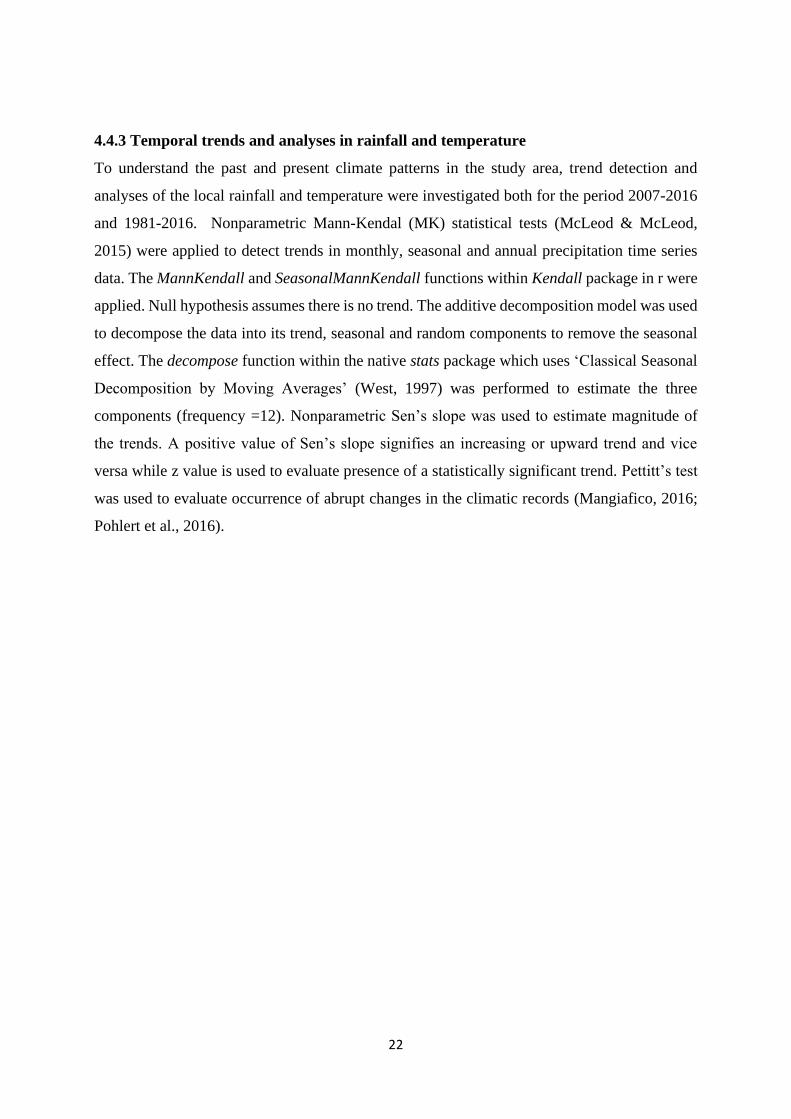
4.4.3 Temporal trends and analyses in rainfall and temperature
To understand the past and present climate patterns in the study area, trend detection and
analyses of the local rainfall and temperature were investigated both for the period 2007-2016
and 1981-2016. Nonparametric Mann-Kendal (MK) statistical tests (McLeod & McLeod,
2015) were applied to detect trends in monthly, seasonal and annual precipitation time series
data. The MannKendall and SeasonalMannKendall functions within Kendall package in r were
applied. Null hypothesis assumes there is no trend. The additive decomposition model was used
to decompose the data into its trend, seasonal and random components to remove the seasonal
effect. The decompose function within the native stats package which uses ‘Classical Seasonal
Decomposition by Moving Averages’ (West, 1997) was performed to estimate the three
components (frequency =12). Nonparametric Sen’s slope was used to estimate magnitude of
the trends. A positive value of Sen’s slope signifies an increasing or upward trend and vice
versa while z value is used to evaluate presence of a statistically significant trend. Pettitt’s test
was used to evaluate occurrence of abrupt changes in the climatic records (Mangiafico, 2016;
Pohlert et al., 2016).

23
5. Results
Overall, there were 7 active and 285 inactive mounds found in the present study (n = 292).
Average size of the mounds was 751.26 ± 595.81 m2 ranging from 25.31-4167.65 m2.
5.1 Change in proportion of active mounds over time
Proportions of active mounds increased significantly in early 2008 (prop. = 0.53, P = 0.03), but
the increase was not significant in late 2008 (prop. = 0.51, P = 0.15) compared to mid-2007
survey period (prop. 0.47, n = 310). However, the proportion of active mounds decreased
significantly in mid-2016 (prop. = 0.02, P < 0.0001) compared to mid-2007 (Table 1).
Therefore, there was an increasing proportion of active mounds within the first two years of the
study compared to mid-2007 after which a sharp decline is recorded at the end of the ten years.
Table 1: Change in proportion of active mounds over the ten-year period. The mounds were repeatedly checked four times
and effect of survey period (2008_Early, 2008_Late and 2016_Mid) on active mounds analyzed relative to 2007_Mid survey
period using a generalized linear mixed model (GLMM). The effect was positive in early and late 2008 having recorded an
increase in proportion of active mounds but significantly negative in mid-2016 as they declined to 0.02 from 0.47 in mid-2007.
Survey Period Estimate SE Z p
(Intercept) -0.26 0.23 -1.16 0.24
2008_Early 0.49 0.23 2.13 0.03
2008_Late 0.33 0.23 1.43 0.15
2016_Mid -5.58 0.51 -10.97 <0.0001
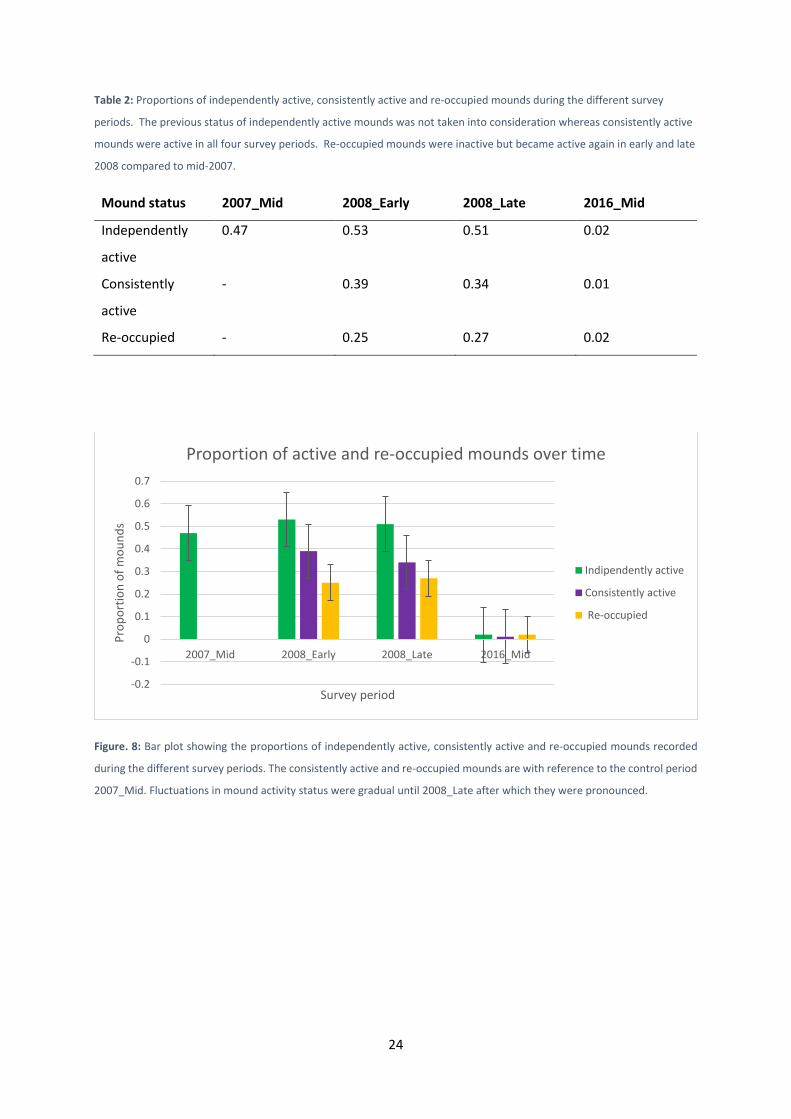
Overall, proportions of active and re-occupied mounds decreased over the ten-year period
(Table 2, Fig. 8). The proportion of independently active mounds in mid-2016 was 0.02 having
declined from 0.47 in mid-2007. The independently active comprised mounds whose activity
status was not compared to the previous survey period. Some mounds were active in all four
survey periods and are referred to here as ‘consistently’ active. Their proportions declined from
0.47 when the mounds were first surveyed in 2007_Mid to 0.39, 0.34 and 0.01 in the subsequent
surveys (n = 145). The inactive mounds in 2007_Mid that were re-occupied by Macrotermes in
the subsequent survey periods are termed here as ‘re-occupied’. Their proportion fluctuated
from 0.25 in early 2008 to 0.27 in late 2008 and 0.02 in mid-2016, n = 165 (Table 2, Fig. 8).
Thus, the independently active, consistently active and re-occupied mound categories followed
a similar pattern whereby, fluctuations were gradual between 2007 and 2008 after which the
declines were pronounced.
24
Table 2: Proportions of independently active, consistently active and re-occupied mounds during the different survey
periods. The previous status of independently active mounds was not taken into consideration whereas consistently active
mounds were active in all four survey periods. Re-occupied mounds were inactive but became active again in early and late
2008 compared to mid-2007.
Mound status 2007_Mid 2008_Early 2008_Late 2016_Mid
Independently
active
0.47 0.53 0.51 0.02
Consistently
active
- 0.39 0.34 0.01
Re-occupied - 0.25 0.27 0.02
Figure. 8: Bar plot showing the proportions of independently active, consistently active and re-occupied mounds recorded
during the different survey periods. The consistently active and re-occupied mounds are with reference to the control period
2007_Mid. Fluctuations in mound activity status were gradual until 2008_Late after which they were pronounced.
-0.2
-0.1
0
0.1
0.2
0.3
0.4
0.5
0.6
0.7
2007_Mid 2008_Early 2008_Late 2016_Mid
Pro
po
rtio
n o
f m
ou
nd
s
Survey period
Proportion of active and re-occupied mounds over time
Indipendently active
Consistently active
Re-occupied

25
5.2 The effect of mound characteristics on mound activity status
Active mounds were significantly more utilised for geophagy than inactive mounds (P < 0.001)
during the 2007-Mid survey period (prop. = 0.61: 0.39, n = 145). Additionally, active mounds
from the same survey period were less vegetated (P = 0.05), Table 3.
Table 3: The effect of vegetation cover and geophagy on mound activity. This is the most parsimonious model of the
2007_Mid survey period. The explanatory variables comprising the full model were mound size, vegetation cover, geophagy,
elevation, proximity to wetlands and streams. A generalized linear model following binomial distribution with logit link
function was used for the analysis.
Parameters Estimate SE Z P
Intercept -0.05 0.34 -0.15 0.88
Vegetation cover -0.01 0.01 -2.00 0.05
Geophagy (vs No) 0.95 0.25 3.77 < 0.001
A generalized linear model (GLM) fitted with the same variables using data from 2016_Mid
returned no significant results (Appendix A2).
5.2.2 Characteristics (size and vegetation cover) of the active and inactive mounds used
for geophagy
The average size of the active mounds used for geophagy was ±SE: 837.52 ± 71.14 m3 and ±SE:
1005.70 ± 112.17 m3 for inactive mounds, n = 145 (Fig. 9a). The average vegetation cover was
±SE: 28.62 ± 1.64% for active mounds and 32.10 ± 2.01% on inactive mounds (Fig. 9b).
Nevertheless, evaluation of the average size and vegetation cover did not indicate any
significant difference between the active and inactive mounds used for geophagy: size; t = -
1.33, df = 133, P = 0.19 and vegetation cover; t = -1. 33, df = 14, P = 0.17 (Fig. 9).
26
5.3 Factors (size, vegetation cover, geophagy) characterizing inactive and re-occupied
mounds over time
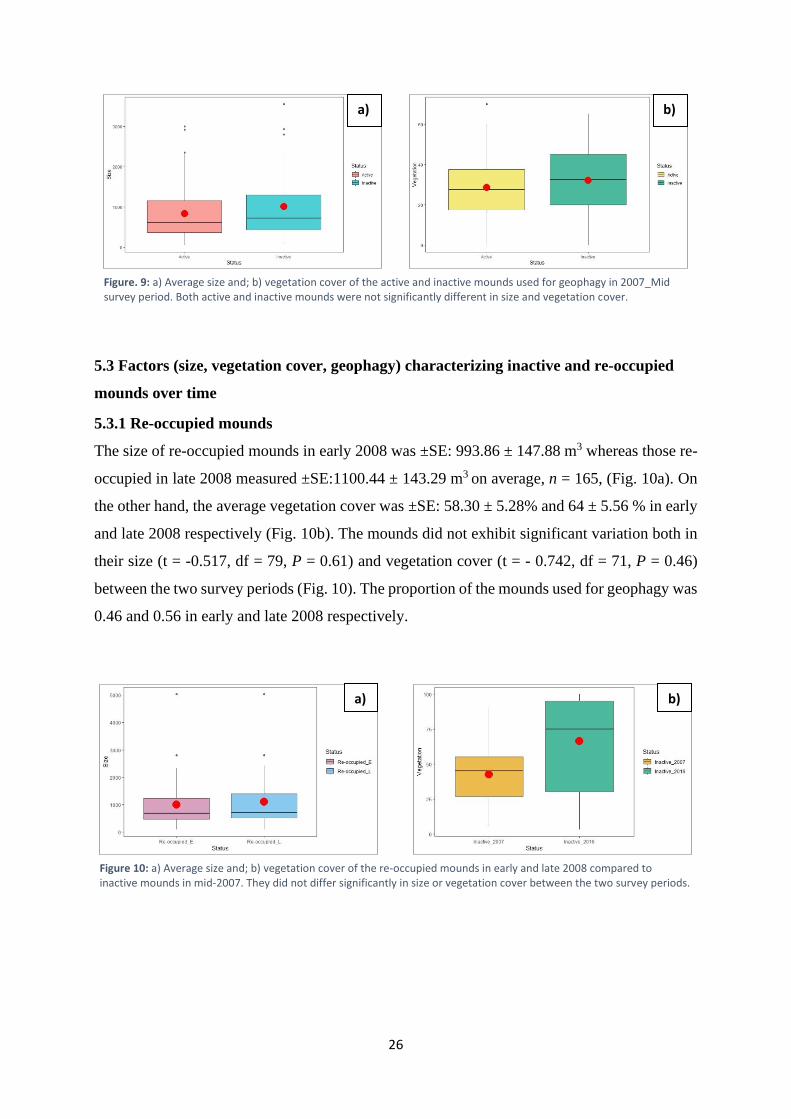
5.3.1 Re-occupied mounds
The size of re-occupied mounds in early 2008 was ±SE: 993.86 ± 147.88 m3 whereas those re-
occupied in late 2008 measured ±SE:1100.44 ± 143.29 m3 on average, n = 165, (Fig. 10a). On
the other hand, the average vegetation cover was ±SE: 58.30 ± 5.28% and 64 ± 5.56 % in early
and late 2008 respectively (Fig. 10b). The mounds did not exhibit significant variation both in
their size (t = -0.517, df = 79, P = 0.61) and vegetation cover (t = - 0.742, df = 71, P = 0.46)
between the two survey periods (Fig. 10). The proportion of the mounds used for geophagy was
0.46 and 0.56 in early and late 2008 respectively.
a) b)
Figure. 9: a) Average size and; b) vegetation cover of the active and inactive mounds used for geophagy in 2007_Mid survey period. Both active and inactive mounds were not significantly different in size and vegetation cover.
a) b)
Figure 10: a) Average size and; b) vegetation cover of the re-occupied mounds in early and late 2008 compared to inactive mounds in mid-2007. They did not differ significantly in size or vegetation cover between the two survey periods.

27
5.3.2 Consistently inactive mounds
The average size of the mounds was ±SE: 1027.84 ± 103.06 m3 at the beginning of the study in
mid-2007 and ±SE: 1023. 48 ± 103.24 m3 in mid-2016, n = 165. Nevertheless, there was no
significant variation in the sizes ten years later (t= 0.50975, df = 82, P = 0.61). Approximately
± SE: 42.50 ± 2.10 % of the mound surface was vegetated in 2007-mid which significantly
increased to ± SE: 66.15 ± 3.51 % after ten years (t = 6.8381, df = 84, P < 0.0001), Fig. 11. The
proportion of the mounds used for geophagy in mid-2016 decreased to 0.01 from 0.22 in mid-
2007, n = 92.
5.5 Relationships between mound activity status and local rainfall/temperature
5.5.1 Correlation of active mounds and rainfall/temperature, and rainfall variability
The relationship between active mounds and total annual rainfall in 2007-2008 period was not
significant at 95% confidence interval (r = 0.044, t = 1.42, df = 925, P = 0.16). Neither was the
negative correlation significant between the active mounds and average annual temperature for
the same period (r = -0.04, t = -1.16, df = 925, P = 0. 25).
Average monthly rainfall from 2007-2016 was 93.02 ± 60.46 mm with high variation (CV =
64%, range 1-294 mm). However, there was little variation in total annual rainfall among the
years (mean =1121.6 ±177.95 mm, CV = 15.87 %).
The total annual rainfall in 2007-2008 period when about 50% of the mounds were active was
1287.67 ± 95.27 with low variation, CV= 7.39%. The period 2009-2016 during which about
2% of mound were active was 1088.5 ± 177.59 mm, CV = 16.31%. Statistically, the total annual
rainfall did not differ significantly between the two periods (t = 1.39, df = 1.88, P = 0.31).
b) a)
Figure 11: a) Mean size and; b) vegetation cover of inactive mounds after ten years (mid-2007 to mid-2016). There was no significant variation in size, but vegetation cover increased substantially.

28
5.5.2 The Standardized Precipitation Index (SPI)
Mbarara district mostly experienced near normal precipitation for the period 2007-2016 (Table
4, Fig. 12, Fig 13, Appendix A3). Precipitation were near normal when the survey was
undertaken in May-July 2007 (SPI = 0 to 0.36). Although the survey period in early 2008 was
preceded by one month of extreme wetness (SPI = -2.2), a growing proportion of active mounds
(prop. = 0.53) was recorded compared to the previous mid-2007 survey period (prop. = 0.47).
The late 2008 survey period was preceded by two months of extreme wet conditions and
recorded a slight decrease in proportion of active mounds (prop. = 0.51) compared to early 2008
(prop. = 0.53). Precipitation conditions ranged from severely to extremely dry (SPI = -1.22 to
-2.2) in the survey period from June to August 2016 although it was moderately to very wet
(SPI = 0-1.38) prior to the survey (Table 4). Overall, precipitation conditions were mostly near
normal from 2007 to 2008, mode = 0 (Fig. 12) and from 2009 to 2016, mode = 1.38 (Fig. 13).
Precipitation conditions were also mostly near normal from 1981-2016 (Appendix A4, A5).
Table 4: The Standardized Precipitation Index (SPI) of Mbarara district for the study period 2007-2016. Areas highlighted in
green represent precipitation conditions during the different survey periods. Figures in bold red indicate extreme dry while
in bold blue indicate extremely wet conditions. In general, extremely wet and dry conditions were not common.
Period 2007 2008 2009 2010 2011 2012 2013 2014 2015 2016
January -0.13971 -0.21043 -0.35549 0.210428 -0.96742 -2.2 0.210428 -1.91451 -2.2 -1.22064
February -0.28222 0 0.35549 0.967422 -0.76471 -0.21043 -1.22064 -1.59322 -0.76471 0
March 0.430727 1.914506 0.069685 0.67449 1.382994 -0.13971 1.382994 1.085325 0.967422 0.967422
April 0.210428 -0.06968 0.069685 1.914506 1.22064 2.2 2.2 0.508488 1.914506 1.382994
May 0 0.13971 -0.06968 1.382994 0 0.76471 0 -0.50849 -0.58946 -1.22064
June 0.35549 0.069685 -0.96742 -1.59322 0.35549 -1.22064 -2.2 -0.96742 0.67449 -1.38299
July 0 -1.38299 -2.2 -2.2 -0.13971 -0.96742 -2.2 -1.22064 -2.2 -2.2
August -0.13971 2.2 -0.67449 -1.38299 2.2 1.22064 1.22064 0.76471 -1.59322 -0.96742
September 1.593219 2.2 0.67449 2.2 1.382994 1.382994 0.589456 0.069685 0.430727 0.76471
October 0.508488 1.382994 1.914506 1.382994 0.67449 1.593219 0.430727 0.67449 0.069685 -0.21043
November 2.2 -0.06968 0.67449 1.382994 1.593219 1.914506 1.382994 1.914506 1.382994 0.67449
December -0.06968 0 0.67449 0.35549 0.430727 0.589456 -0.21043 0.430727 -0.06968 0

29
Figure 12: Distribution of the standardized precipitation index (SPI) classes from 2007 to 2008 when about 50% of the mounds
were active. The bars represent total counts of the SPI values according to their classification. Conditions were mostly near
normal with 3 occurrences of extreme wetness, but no extreme dryness occurred within that period.
Figure 13: Distribution of the standardized precipitation index (SPI) from 2009 to 2016 when only 2% of the mounds were
active. The bars represent total counts of the SPI values according to their classification. Near normal conditions were the
most common and occurrences of extreme dryness or wetness were less than 5.
-5
0
5
10
15
20
25
Extremely wet Moderately dry moderately wet Near normal Very wet
Co
un
t o
f th
e SP
I val
ues
Classification of the SPI values
Distribution of the SPI values from 2007-2008
-10
0
10
20
30
40
50
60
70
Extremely dry Extremely wet Moderatelydry
Moderatelywet
Near normal Severely dry Very wet
Co
un
t o
f th
e SP
I val
ues
Classification of the SPI values
Distribution of the SPI values from 2009 to 2016

30
5.5.3. Temporal trends in rainfall and temperature
Rainfall showed a significantly declining seasonal trend from 2007 to 2016 (tau = -0.21, P <
0.05). The general annul trend was also declining but non-significant (Sen’s slope = -0.2; z = -
1.10, n = 120, P = 0.27, Fig. 14).
However, the seasonal and annual trends detected from the period 1981-2016 were non-
significant (Sen’s slope estimate = 0.03; z = 1.51, n= 432, P = 0.13). During this period, the
probable point of change was April 2013, but the change was not significant (U* = 786, P =
0.24), Appendix A6. Maximum temperature (1981-2012) only showed a significantly
increasing seasonal trend (tau = 0.124, P < 0.05) with a probable but non-significant point of
change detected in May 1995 (U* = 5414, P = 0.09) (Appendix A7).
Fig 14: Classical additive decomposition of average monthly rainfall for Mbarara district into trend, seasonal and random components between 2007 and 2016 (mm). Sum of the trend, seasonal and random component is equal to the observed series. Observed rainfall values from 2007 to 2016 ranged from 1-294 mm. The probable point of change was July 1999.

31
6 Discussion
This study assessed temporal patterns in mound occupancy by termites of Macrotermes species
in a savanna ecosystem. The main aim of the study was achieved by assessing change in
proportions of active mounds over the ten-year period, investigating the effect of mound
characteristics on mound activity status, examining factors characterizing the inactive and re-
occupied mounds over time and investigating relationships between mound activity status with
long-term local rainfall and temperature. The discussion structure is based on each of the
specific objectives and integrated in the conclusion section.
6.1. Change in proportion of active mounds
Data from this study shows that active mounds declined sharply in 2016 from about 50% in
2007 and 2008 to only 2.4 %. A comparable decline was reported by Lepage (1984), where
active mounds of Macrotermes bellicosus decreased from 14.3 to 0.8 per hectare within two
years. In a study by Sands (1965), no active Macrotermes natalensis mounds were found in two
out of three study locations within a five-month duration. These findings suggest that
considerable fluctuations in mound occupancy can occur within a relatively short or long period
of time as was inferred by Pomeroy (1976). It was however not possible to determine exactly
when a mound became inactive as there were no frequent assessments after 2008.
An increasing proportion of active mounds was recorded in early 2008 compared to 2007 (P =
0.03) but the increase was non-significant in late 2008 compared to 2007 (P = 0.15) indicating
gradual fluctuations in the mound occupancy. Pomeroy (2005), reported a similar trend
whereby few mounds of Macrotermes subhyalinus became inactive over a six and half year
period. Specifically, only 8 % of the mounds were inactive in one year and 39% during the
whole study period thereby representing an annual death rate of 6.1%. The approximate 50%
active mounds recorded from 2007 and 2008 surveys is also comparable to numbers reported
in other areas. For instance, the northern Kruger National Park where Macrotermes species
accounted for 62% of the 47 % active mounds including other species (Meyer et al., 1999) and
58% of Macrotermes michaelseni mounds in Namibia were active (Grohmann et al., 2010).
Mound re-occupation by Macrotermes was also apparent during the early and late 2008 survey
periods indicating alternating periods of activity and inactivity (Erens et al., 2015a; Pomeroy,
2005a).
Overall, the gradual fluctuations in active mounds apparent in 2007 and 2008 suggest that
Macrotermes mounds can maintain a relatively stable balance of active, inactive and re-
32
occupied mounds whereas the sharp decrease after 2008 suggest that this balance can be
disrupted within a relatively short or long period of time.
6.2 The effect of mound characteristics on mound activity status
The present study established that soil eating by large herbivores (geophagy) occurred more on
active than inactive mounds. This can be explained by the findings that active mounds act as
closed systems that accumulate and preserve nutrients within them (Menichetti et al., 2014)
thereby attracting soil eating by herbivores mainly for nutrient supplementation (Baptista et al.,
2013; Kalumanga et al., 2017; Mahaney et al., 1999). In particular, supplementation of Sodium
and Selenium has strongly been linked to geophagy among wildlife in Africa, Asia and North
America (Baptista et al., 2013; Flueck et al., 2012; Holdø et al., 2002; Kalumanga et al., 2017;
Mills & Milewski, 2007). This is probable because Selenium is fundamental at a physiological
level in all animals (Flueck et al., 2012) albeit scarce (Garousi, 2017) but it is several times
higher (0.33 mg kg-1) in Macrotermes mounds than worldwide averages and natural licks (Mills
et al., 2009). This is because Macrotermes preferentially mine materials such as Manganese
oxides which enhance specific suites of elements as Cobalt, Copper and Selenium in poor soils
(Mills et al., 2009; Seymour et al., 2014). On the other hand, deficiency of Sodium is
widespread in forage utilized by the herbivores (Holdø et al., 2002; Tracy & McNaughton,
1995) but significantly high amounts in Macrotermes mounds are reported (Baptista et al.,
2013). It is however, likely that Sodium was a more important driver of mound geophagy in the
seasonally waterlogged plains because high levels of Selenium occur in alkaline (calcareous)
soils such as Vertisols (Virmani et al., 1982) which are common on valleys of Lake Mburo
National Park (Blösch, 2002). Kalumanga et al., (2017) also linked Sodium to soil eating from
Macrotermes mounds that were exclusively situated in a floodplain further supporting this
view. Selenium supplementation may have been more important on the gentle slopes of the
park where leached ferralsol soils are dominant.
That soil was eaten less from inactive mounds in this study is supported by the findings that
nutrients are lost through leaching or erosion when the mound is inactive or destroyed (Gosling
et al., 2012; Menichetti et al., 2014). Macro-nutrients such as Sodium (Na), Calcium (Ca),
Magnesium (Mg) and Potassium (K) are highly soluble and readily lost even under moderate
leaching (Nanzyo, 2019; Sharpley & Kampath, 1988; Singh & Schulze, 2015). This may
explain why geophagy on inactive mounds in the present study decreased from 22% to only 1%
after ten years. Alternatively, the vegetation cover which considerably increased over the ten-
year period (P < 0.0001) deterred the herbivores by making the mound soil inaccessible for
33
eating. Even though, a study by Ruggiero & Fay (1994), established that elephants
preferentially exploited inactive mounds with a well-developed vegetation cover in a moist
African savanna. This was not the case in the present study, but the active and inactive mounds
where geophagy occurred in 2007 did not indicate significant variation in size or vegetation
cover. The similarity in the two aspects give grounds for speculating that the inactive mounds
were recently vacated given their little vegetation cover (32%) which is common among active
mounds (Glover et al., 1964). Alternatively, these mounds were already large enough to express
the full nutritional value of the mound (Seymour et al., 2014) and maintain in spite of the
activity status (Erens et al., 2015a) which requires further investigations.
6.3 Factors characterizing inactive and re-occupied mounds
Both inactive and re-occupied mounds were vegetated which is common among Macrotermes
mounds in the region (Blösch, 2002) and other areas (Aiki et al., 2019; Pomeroy, 1976).
However, vegetation cover of inactive mounds in the present study substantially increased from
about 42 to 66% after ten years (P < 0.0001). This was expected because inactive mounds are
generally easily weathered thereby providing a soft surface and releasing nutrients that favor
plant establishment and growth (Blösch, 2002; Glover et al., 1964; Menichetti et al., 2014). On
the flat seasonally flooded plains and gentle slope where this study took place, the mounds
safeguard vegetation due to good drainage and protection from the frequent savanna fires
(Blösch, 2002). Average size of the mounds did not differ after the ten-year period. Although
erosion acts faster when a nest is inactive (Lepage, 1984) colonization of the mound surface by
vegetation gradually protects the mound from erosion (Pomeroy, 1976) and damage from
animal activity (Lepage, 1984).
Mounds that were re-occupied by the termites were not significantly different in size and
vegetation cover between early and late 2008. This is possibly because active mounds are
regularly repaired (Korb & Linsenmair, 2000) and maintain a hard pan on the surface that
doesn’t favor plant growth (Glover et al., 1964).
6.4 Relationship between mound activity status and rainfall
Local rainfall and temperature did not influence activity status of the mounds as there were no
significant relationships or trends found. The annual rainfall in 2007 and 2008 when about 50%
of the mounds were active did not differ significantly from 2009-2016 during which time active
mounds decreased to 2% (P = 0.31). Despite the marked seasonality in mean monthly rainfall
recorded in the study area (CV = 64%), few inactive mounds were reported in an environment
with similar variability over a period of about six years (Pomeroy, 2005b). Further, precipitation
34
conditions were mostly near normal both in 2007-2016 (Fig. 12, Fig. 13) and from 1981-2016
suggesting no apparent threat such as flooding which can cause colony death (Coyle et al.,
2017; Schuurman & Dangerfield, 1997) (Appendix A4, A5). The lower and upper limits for
occurrence of M. subhyallinnus in Uganda was deduced as 300 to 2000 mm annual rainfall by
Pomeroy, (1978), suggesting that the 1189 mm between 2007-2016 in this study was near
optimal. Comparably, the upper and lower temperature limits for Uganda is about 9-37 ° C but
the mean maximum temperature from 1981-2012 recorded in this study ranged from 10-31 ° C
which is consistence with these findings (Pomeroy, 1978). Dry seasons are also rarely severe
and temperature lacks marked seasonality in Uganda’s climate (Pomeroy, 1978) which is
consistent with both long and short term results in the present study (Table, 4, Appendix A4,
A5).Overall, termites of Macrotermes subhyalinus species have been shown to thrive in drier
conditions with Pomeroy (2005), having reported fewer deaths following drier years in a
Kenyan savanna.
The cause of the sharp decline in active mounds in the study area is potentially predation by
aardvarks and Doryline ants. Even though this was not investigated in the present study, thee is
several reports that aardvarks and subterranean nomadic Dorylus species are major predators
among Macrotermes (Grohmann et al., 2010; Lepage, 1984; Pomeroy, 2005b; Sands, 1965).
The ants often exterminate whole termite populations (e.g. Sands, 1965, Lepage, 1984) and
although aardvark attacks are considered less damaging they may facilitate access of the
predatory ants into the mounds (Pomeroy, 2005b).
7. Conclusion
This study underscores the importance of regular monitoring of Macrotermes mounds in order
to detect change in occupancy when it occurs. The study established that active mounds
declined substantially over a period of ten years although the change was gradual within the
first two years. Regular re-occupation of the mounds followed a similar trend whereby the
decrease was substantial after the first two years. This study also established that geophagy
occurred more on active mounds and linked that to accumulation and preservation of essential
nutrients, particularly Sodium and Selenium deficiency among large herbivores in African
savannas. Nevertheless, the active and inactive mounds used for geophagy did not differ in size
or vegetation cover.
Re-occupied mounds did not differ in size or vegetation cover within two years. The inactive
mounds didn’t differ in size but were substantially more vegetated after ten years. This finding

35
highlights the role of vegetation cover in protecting mounds from erosion and animal damage
thereby stabilizing the mound size. Local rainfall and temperature did not appear to influence
activity status of the mounds either. Overall, proportions of active and re-occupied mounds
declined considerably having implications for geophagy, mound size and vegetation cover
which are central to ecosystem functioning and structure.

36
8. References
Acanakwo, E. F., Okullo, P., Sheil, D. & Moe, S. R. (2018). Termites confer resistance to changes in tree composition following reduced browsing in an African savanna. Journal of Vegetation Science, 29 (6): 989-998.
Acanakwo, E. F., Sheil, D. & Moe, S. R. (2019). Wood decomposition is more rapid on than off termite mounds in an African savanna. Ecosphere, 10 (1): e02554. doi: 10.1002/ecs2.2554.
Ahmad, S. K., Dawah, H. A. & Khan, M. A. (2018). Ecology of Termites. In Khan, M. A. & Ahmad, W. (eds) Termites and Sustainable Management: Volume 1 - Biology, Social Behaviour and Economic Importance, pp. 47-68. Cham: Springer International Publishing.
Ahmed II, J. B. & Pradhan, B. (2019). Spatial assessment of termites interaction with groundwater potential conditioning parameters in Keffi, Nigeria. Journal of Hydrology, 578: 124012.
Aiki, I., Pirk, C. W. W. & Yusuf, A. A. (2019). Thermal regulatory mechanisms of termites from two different savannah ecosystems. Journal of thermal biology, 85: 102418.
Averbeck, C. (2002). Population Ecology of Impala (Aepyceros melampus) and community-based wildlife conservation in Uganda: Technische Universität München.
Baptista, S. L., Pinto, P. V., Freitas, M. d. C., Cruz, C. & Palmeirim, J. M. (2013). Geophagy by A frican ungulates: the case of the critically endangered giant sable antelope of A ngola (H ippotragus niger variani). African Journal of Ecology, 51 (1): 139-146.
Bignell, D. E., Roisin, Y. & Lo, N. (2010). Biology of termites: a modern synthesis: Springer Science & Business Media.
BirdLifeInt. (2018). The IUCN Red List of Threatened Species 2018: e.T22697583A133840708. https://dx.doi.org/10.2305/IUCN.UK.2018-2.RLTS.T22697583A133840708.en. . Available at: https://www.iucnredlist.org/species/22697583/133840708.
Blösch, U. (2002). The dynamics of thicket clumps in the Kagera savanna landscape, East Africa: ETH Zurich.
Blösch, U. (2008). Thicket clumps: a characteristic feature of the Kagera savanna landscape, East Africa. Journal of vegetation science, 19 (1): 31-44.
Brandl, R., Hyodo, F., von Korff-Schmising, M., Maekawa, K., Miura, T., Takematsu, Y., Matsumoto, T., Abe, T., Bagine, R. & Kaib, M. (2007). Divergence times in the termite genus Macrotermes (Isoptera: Termitidae). Molecular phylogenetics and evolution, 45 (1): 239-250.
Collins, N. (1981). Populations, age structure and survivorship of colonies of Macrotermes bellicosus (Isoptera: Macrotermitinae). The Journal of Animal Ecology: 293-311.
Coyle, D. R., Nagendra, U. J., Taylor, M. K., Campbell, J. H., Cunard, C. E., Joslin, A. H., Mundepi, A., Phillips, C. A. & Callaham Jr, M. A. (2017). Soil fauna responses to natural disturbances, invasive species, and global climate change: Current state of the science and a call to action. Soil Biology and Biochemistry, 110: 116-133.
Crawley, M. J. (2012). The R book: John Wiley & Sons. Dangerfield, J., McCarthy, T. & Ellery, W. (1998). The mound-building termite Macrotermes
michaelseni as an ecosystem engineer. Journal of tropical Ecology, 14 (4): 507-520. Darlington, J., Zimmerman, P. & Wandiga, S. (1992). Populations in nests of the termite Macrotermes
jeanneli in Kenya. Journal of tropical ecology, 8 (01): 73-85. Darlington, J. P. (1985). The structure of mature mounds of the termite Macrotermes michaelseni in
Kenya. International Journal of Tropical Insect Science, 6 (2): 149-156. Davies, A. B., Levick, S. R., Asner, G. P., Robertson, M. P., van Rensburg, B. J. & Parr, C. L. (2014).
Spatial variability and abiotic determinants of termite mounds throughout a savanna catchment. Ecography, 37 (9): 852-862.
Erens, H., Boudin, M., Mees, F., Mujinya, B. B., Baert, G., Van Strydonck, M., Boeckx, P. & Van Ranst, E. (2015a). The age of large termite mounds—radiocarbon dating of Macrotermes falciger mounds of the Miombo woodland of Katanga, DR Congo. Palaeogeography, palaeoclimatology, palaeoecology, 435: 265-271.
37
Erens, H., Mujinya, B. B., Mees, F., Baert, G., Boeckx, P., Malaisse, F. & Van Ranst, E. (2015b). The origin and implications of variations in soil-related properties within Macrotermes falciger mounds. Geoderma, 249: 40-50.
Erpenbach, A. & Wittig, R. (2016). Termites and savannas–an overview on history and recent scientific progress with particular respect to West Africa and to the genus Macrotermes. Flora et Vegetatio Sudano-Sambesica, 19: 35-51.
Flueck, W. T., Smith-Flueck, J., Mionczynski, J. & Mincher, B. (2012). The implications of selenium deficiency for wild herbivore conservation: a review. European Journal of Wildlife Research, 58 (5): 761-780.
Funk, C., Peterson, P., Landsfeld, M., Pedreros, D., Verdin, J., Shukla, S., Husak, G., Rowland, J., Harrison, L. & Hoell, A. (2015). The climate hazards infrared precipitation with stations—a new environmental record for monitoring extremes. Scientific data, 2 (1): 1-21.
Garousi, F. (2017). Selenium in soil–plant–food systems. Acta Universitatis Sapientiae, Alimentaria, 10 (1): 91-106.
Glover, P., Trump, E. & Wateridge, L. (1964). Termitaria and vegetation patterns on the Loita Plains of Kenya. The Journal of Ecology: 367-377.
Gosling, C. M., Cromsigt, J. P., Mpanza, N. & Olff, H. (2012). Effects of erosion from mounds of different termite genera on distinct functional grassland types in an African savannah. Ecosystems, 15 (1): 128-139.
Grohmann, C., Oldeland, J., Stoyan, D. & Linsenmair, K. (2010). Multi-scale pattern analysis of a mound-building termite species. Insectes sociaux, 57 (4): 477-486.
Holdø, R. M., Dudley, J. P. & McDowell, L. R. (2002). Geophagy in the African elephant in relation to availability of dietary sodium. Journal of Mammalogy, 83 (3): 652-664.
Hothorn, T., Zeileis, A., Farebrother, R. W., Cummins, C., Millo, G., Mitchell, D. & Zeileis, M. A. (2019). Package ‘lmtest’.
Jouquet, P., Dauber, J., Lagerlöf, J., Lavelle, P. & Lepage, M. (2006). Soil invertebrates as ecosystem engineers: intended and accidental effects on soil and feedback loops. Applied soil ecology, 32 (2): 153-164.
Jouquet, P., Traoré, S., Choosai, C., Hartmann, C. & Bignell, D. (2011). Influence of termites on ecosystem functioning. Ecosystem services provided by termites. European Journal of Soil Biology, 47 (4): 215-222.
Kalumanga, E., Mpanduji, D. G. & Cousins, S. A. (2017). Geophagic termite mounds as one of the resources for African elephants in Ugalla Game Reserve, Western Tanzania. African journal of ecology, 55 (1): 91-100.
Kimani, M. W., Hoedjes, J. C. & Su, Z. (2017). An assessment of satellite-derived rainfall products relative to ground observations over East Africa. Remote sensing, 9 (5): 430.
Klamt, E. & Van Reeuwijk, L. (2000). Evaluation of morphological, physical and chemical characteristics of ferralsols and related soils. Revista Brasileira de Ciência do Solo, 24 (3): 573-587.
Korb, J. & Linsenmair, K. E. (1999). Reproductive success of Macrotermes bellicosus (Isoptera, Macrotermitinae) in two neighbouring habitats. Oecologia, 118 (2): 183-191.
Korb, J. & Linsenmair, K. (2000). Thermoregulation of termite mounds: what role does ambient temperature and metabolism of the colony play? Insectes sociaux, 47 (4): 357-363.
Korb, J. & Linsenmair, K. E. (2001). The causes of spatial patterning of mounds of a fungus-cultivating termite: results from nearest-neighbour analysis and ecological studies. Oecologia, 127 (3): 324-333.
Kuznetsova, A., Brockhoff, P. B. & Christensen, R. H. B. (2014). lmerTest: Tests for random and fixed effects for linear mixed effect models (lmer objects of lme4 package). R package version 2.0-6. Vienna, Austria: R Foundation for Statistical Computing http://www. inside-r. org/packages/cran/lmerTest.
Lepage, M. (1984). Distribution, density and evolution of Macrotermes bellicosus nests (Isoptera: Macrotermitinae) in the north-east of Ivory Coast. The Journal of Animal Ecology: 107-117.
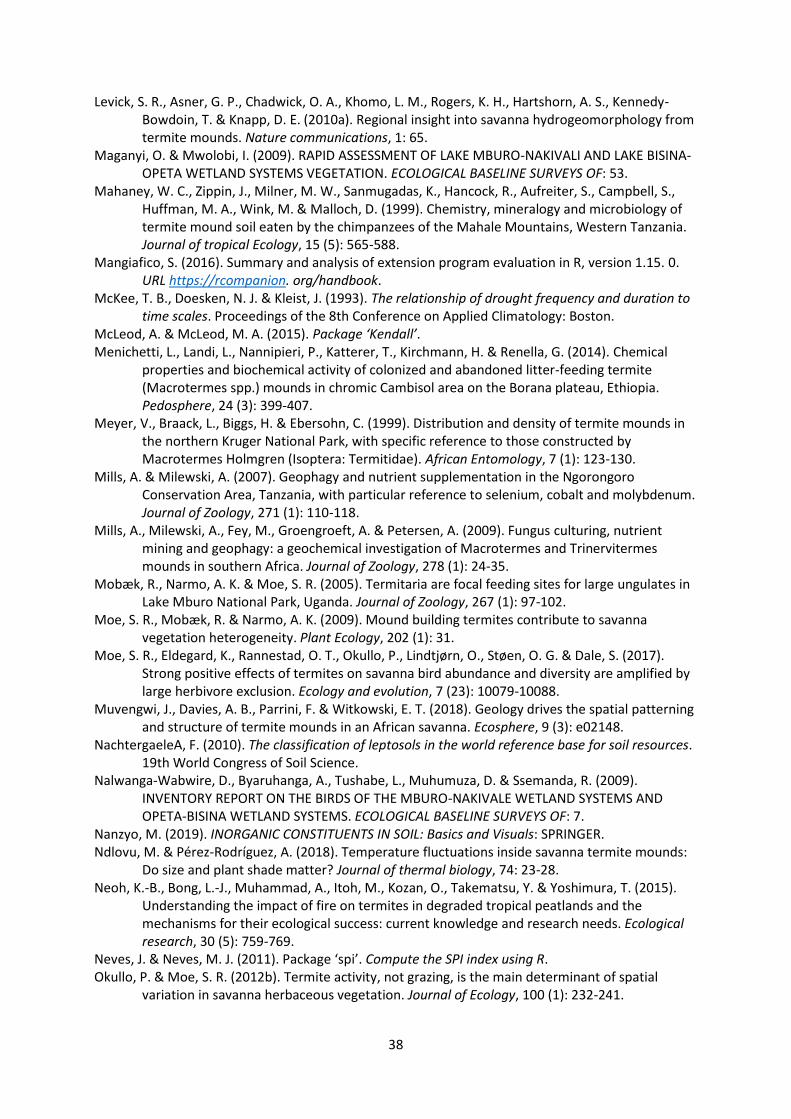
38
Levick, S. R., Asner, G. P., Chadwick, O. A., Khomo, L. M., Rogers, K. H., Hartshorn, A. S., Kennedy-Bowdoin, T. & Knapp, D. E. (2010a). Regional insight into savanna hydrogeomorphology from termite mounds. Nature communications, 1: 65.
Maganyi, O. & Mwolobi, I. (2009). RAPID ASSESSMENT OF LAKE MBURO-NAKIVALI AND LAKE BISINA-OPETA WETLAND SYSTEMS VEGETATION. ECOLOGICAL BASELINE SURVEYS OF: 53.
Mahaney, W. C., Zippin, J., Milner, M. W., Sanmugadas, K., Hancock, R., Aufreiter, S., Campbell, S., Huffman, M. A., Wink, M. & Malloch, D. (1999). Chemistry, mineralogy and microbiology of termite mound soil eaten by the chimpanzees of the Mahale Mountains, Western Tanzania. Journal of tropical Ecology, 15 (5): 565-588.
Mangiafico, S. (2016). Summary and analysis of extension program evaluation in R, version 1.15. 0. URL https://rcompanion. org/handbook.
McKee, T. B., Doesken, N. J. & Kleist, J. (1993). The relationship of drought frequency and duration to time scales. Proceedings of the 8th Conference on Applied Climatology: Boston.
McLeod, A. & McLeod, M. A. (2015). Package ‘Kendall’. Menichetti, L., Landi, L., Nannipieri, P., Katterer, T., Kirchmann, H. & Renella, G. (2014). Chemical
properties and biochemical activity of colonized and abandoned litter-feeding termite (Macrotermes spp.) mounds in chromic Cambisol area on the Borana plateau, Ethiopia. Pedosphere, 24 (3): 399-407.
Meyer, V., Braack, L., Biggs, H. & Ebersohn, C. (1999). Distribution and density of termite mounds in the northern Kruger National Park, with specific reference to those constructed by Macrotermes Holmgren (Isoptera: Termitidae). African Entomology, 7 (1): 123-130.
Mills, A. & Milewski, A. (2007). Geophagy and nutrient supplementation in the Ngorongoro Conservation Area, Tanzania, with particular reference to selenium, cobalt and molybdenum. Journal of Zoology, 271 (1): 110-118.
Mills, A., Milewski, A., Fey, M., Groengroeft, A. & Petersen, A. (2009). Fungus culturing, nutrient mining and geophagy: a geochemical investigation of Macrotermes and Trinervitermes mounds in southern Africa. Journal of Zoology, 278 (1): 24-35.
Mobæk, R., Narmo, A. K. & Moe, S. R. (2005). Termitaria are focal feeding sites for large ungulates in Lake Mburo National Park, Uganda. Journal of Zoology, 267 (1): 97-102.
Moe, S. R., Mobæk, R. & Narmo, A. K. (2009). Mound building termites contribute to savanna vegetation heterogeneity. Plant Ecology, 202 (1): 31.
Moe, S. R., Eldegard, K., Rannestad, O. T., Okullo, P., Lindtjørn, O., Støen, O. G. & Dale, S. (2017). Strong positive effects of termites on savanna bird abundance and diversity are amplified by large herbivore exclusion. Ecology and evolution, 7 (23): 10079-10088.
Muvengwi, J., Davies, A. B., Parrini, F. & Witkowski, E. T. (2018). Geology drives the spatial patterning and structure of termite mounds in an African savanna. Ecosphere, 9 (3): e02148.
NachtergaeleA, F. (2010). The classification of leptosols in the world reference base for soil resources. 19th World Congress of Soil Science.
Nalwanga-Wabwire, D., Byaruhanga, A., Tushabe, L., Muhumuza, D. & Ssemanda, R. (2009). INVENTORY REPORT ON THE BIRDS OF THE MBURO-NAKIVALE WETLAND SYSTEMS AND OPETA-BISINA WETLAND SYSTEMS. ECOLOGICAL BASELINE SURVEYS OF: 7.
Nanzyo, M. (2019). INORGANIC CONSTITUENTS IN SOIL: Basics and Visuals: SPRINGER. Ndlovu, M. & Pérez-Rodríguez, A. (2018). Temperature fluctuations inside savanna termite mounds:
Do size and plant shade matter? Journal of thermal biology, 74: 23-28. Neoh, K.-B., Bong, L.-J., Muhammad, A., Itoh, M., Kozan, O., Takematsu, Y. & Yoshimura, T. (2015).
Understanding the impact of fire on termites in degraded tropical peatlands and the mechanisms for their ecological success: current knowledge and research needs. Ecological research, 30 (5): 759-769.
Neves, J. & Neves, M. J. (2011). Package ‘spi’. Compute the SPI index using R. Okullo, P. & Moe, S. R. (2012b). Termite activity, not grazing, is the main determinant of spatial
variation in savanna herbaceous vegetation. Journal of Ecology, 100 (1): 232-241.
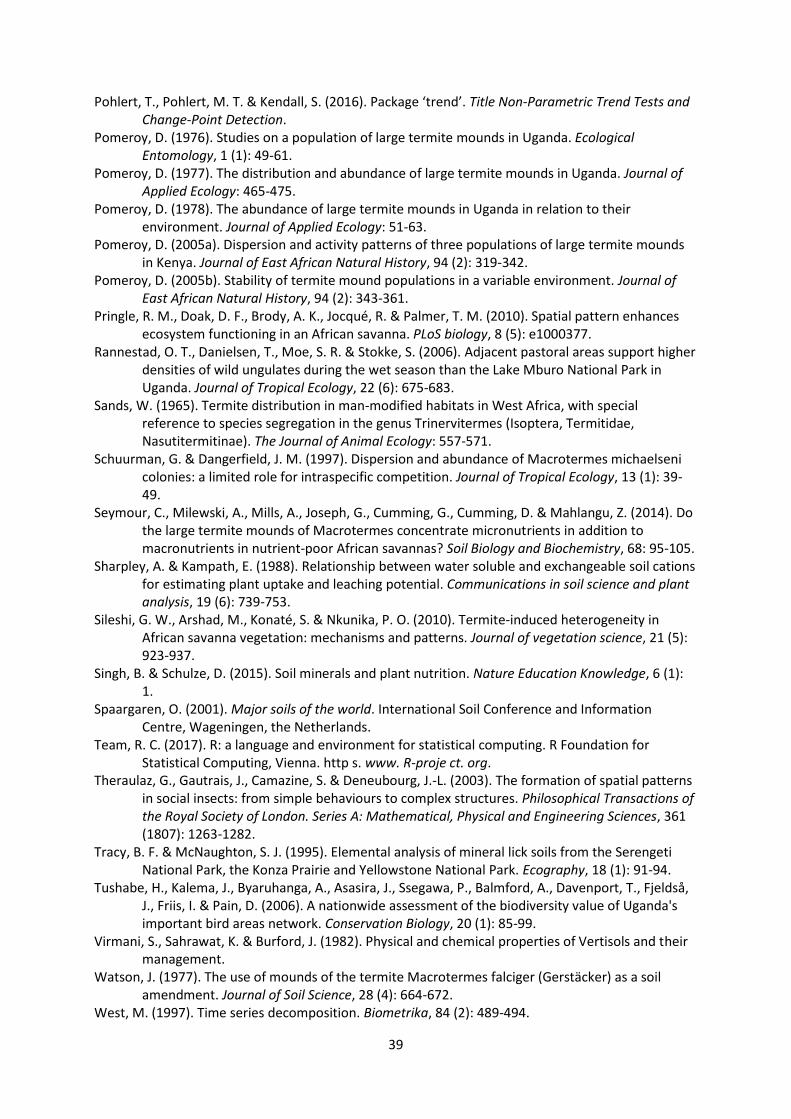
39
Pohlert, T., Pohlert, M. T. & Kendall, S. (2016). Package ‘trend’. Title Non-Parametric Trend Tests and Change-Point Detection.
Pomeroy, D. (1976). Studies on a population of large termite mounds in Uganda. Ecological Entomology, 1 (1): 49-61.
Pomeroy, D. (1977). The distribution and abundance of large termite mounds in Uganda. Journal of Applied Ecology: 465-475.
Pomeroy, D. (1978). The abundance of large termite mounds in Uganda in relation to their environment. Journal of Applied Ecology: 51-63.
Pomeroy, D. (2005a). Dispersion and activity patterns of three populations of large termite mounds in Kenya. Journal of East African Natural History, 94 (2): 319-342.
Pomeroy, D. (2005b). Stability of termite mound populations in a variable environment. Journal of East African Natural History, 94 (2): 343-361.
Pringle, R. M., Doak, D. F., Brody, A. K., Jocqué, R. & Palmer, T. M. (2010). Spatial pattern enhances ecosystem functioning in an African savanna. PLoS biology, 8 (5): e1000377.
Rannestad, O. T., Danielsen, T., Moe, S. R. & Stokke, S. (2006). Adjacent pastoral areas support higher densities of wild ungulates during the wet season than the Lake Mburo National Park in Uganda. Journal of Tropical Ecology, 22 (6): 675-683.
Sands, W. (1965). Termite distribution in man-modified habitats in West Africa, with special reference to species segregation in the genus Trinervitermes (Isoptera, Termitidae, Nasutitermitinae). The Journal of Animal Ecology: 557-571.
Schuurman, G. & Dangerfield, J. M. (1997). Dispersion and abundance of Macrotermes michaelseni colonies: a limited role for intraspecific competition. Journal of Tropical Ecology, 13 (1): 39-49.
Seymour, C., Milewski, A., Mills, A., Joseph, G., Cumming, G., Cumming, D. & Mahlangu, Z. (2014). Do the large termite mounds of Macrotermes concentrate micronutrients in addition to macronutrients in nutrient-poor African savannas? Soil Biology and Biochemistry, 68: 95-105.
Sharpley, A. & Kampath, E. (1988). Relationship between water soluble and exchangeable soil cations for estimating plant uptake and leaching potential. Communications in soil science and plant analysis, 19 (6): 739-753.
Sileshi, G. W., Arshad, M., Konaté, S. & Nkunika, P. O. (2010). Termite‐induced heterogeneity in African savanna vegetation: mechanisms and patterns. Journal of vegetation science, 21 (5): 923-937.
Singh, B. & Schulze, D. (2015). Soil minerals and plant nutrition. Nature Education Knowledge, 6 (1): 1.
Spaargaren, O. (2001). Major soils of the world. International Soil Conference and Information Centre, Wageningen, the Netherlands.
Team, R. C. (2017). R: a language and environment for statistical computing. R Foundation for Statistical Computing, Vienna. http s. www. R-proje ct. org.
Theraulaz, G., Gautrais, J., Camazine, S. & Deneubourg, J.-L. (2003). The formation of spatial patterns in social insects: from simple behaviours to complex structures. Philosophical Transactions of the Royal Society of London. Series A: Mathematical, Physical and Engineering Sciences, 361 (1807): 1263-1282.
Tracy, B. F. & McNaughton, S. J. (1995). Elemental analysis of mineral lick soils from the Serengeti National Park, the Konza Prairie and Yellowstone National Park. Ecography, 18 (1): 91-94.
Tushabe, H., Kalema, J., Byaruhanga, A., Asasira, J., Ssegawa, P., Balmford, A., Davenport, T., Fjeldså, J., Friis, I. & Pain, D. (2006). A nationwide assessment of the biodiversity value of Uganda's important bird areas network. Conservation Biology, 20 (1): 85-99.
Virmani, S., Sahrawat, K. & Burford, J. (1982). Physical and chemical properties of Vertisols and their management.
Watson, J. (1977). The use of mounds of the termite Macrotermes falciger (Gerstäcker) as a soil amendment. Journal of Soil Science, 28 (4): 664-672.
West, M. (1997). Time series decomposition. Biometrika, 84 (2): 489-494.
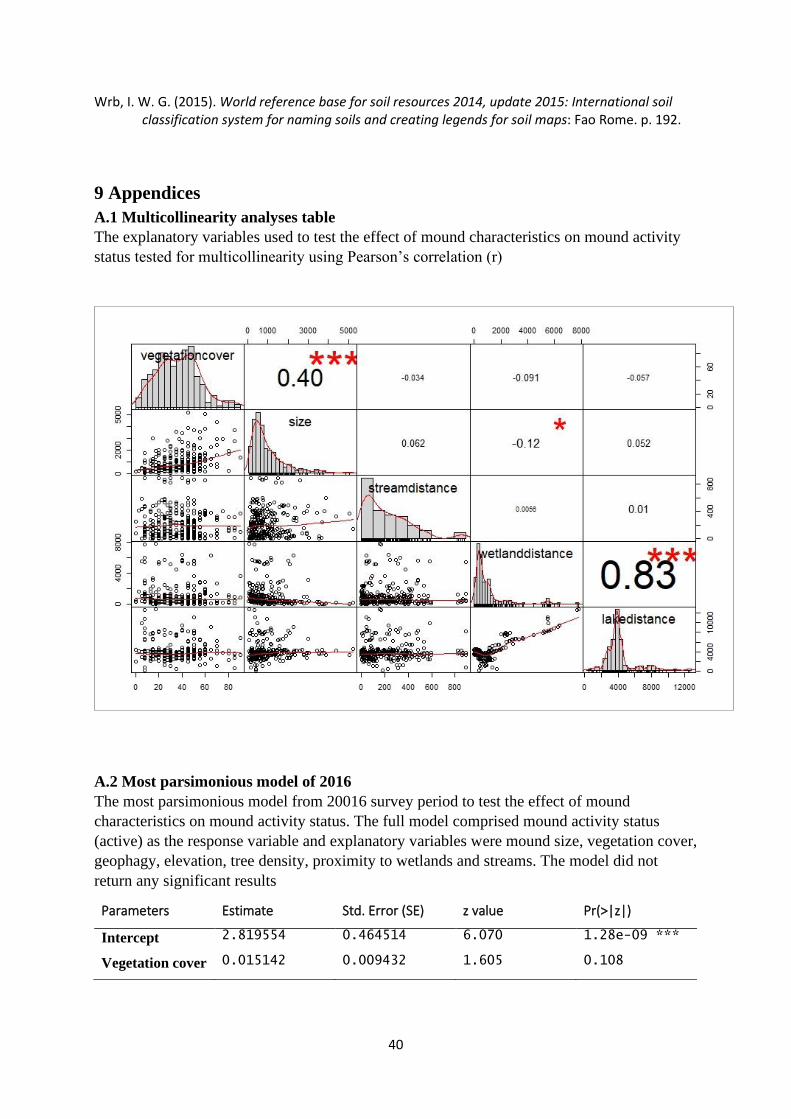
40
Wrb, I. W. G. (2015). World reference base for soil resources 2014, update 2015: International soil classification system for naming soils and creating legends for soil maps: Fao Rome. p. 192.
9 Appendices
A.1 Multicollinearity analyses table
The explanatory variables used to test the effect of mound characteristics on mound activity
status tested for multicollinearity using Pearson’s correlation (r)
A.2 Most parsimonious model of 2016
The most parsimonious model from 20016 survey period to test the effect of mound
characteristics on mound activity status. The full model comprised mound activity status
(active) as the response variable and explanatory variables were mound size, vegetation cover,
geophagy, elevation, tree density, proximity to wetlands and streams. The model did not
return any significant results
Parameters Estimate Std. Error (SE) z value Pr(>|z|)
Intercept 2.819554 0.464514 6.070 1.28e-09 ***
Vegetation cover 0.015142 0.009432 1.605 0.108

41
A.3 Image of the Standardized Precipitation Index from 2007-2016
The standardized precipitation index of the Mbarara district from 2007 to 20016.
An image showing computed standardized precipitation index (SPI) for Mbarara district in Uganda. The time series run from
January 2007 to December 2016 and the index was calculated for the time scale from 1 to 12 months. Precipitation
conditions were mostly near normal (white)

42
A.4 Image of the Standardized Precipitation Index 1981-2016
The Standardized precipitation index of the Mbarara district from 1981 to 2016
A.5 Output of the standardized precipitation index values from 1981-2016
Period January February March April May June July August September October November December
1981 -0.21043 -0.13971 0.13971 2.2 0.210428 -1.08532 -0.96742 1.593219 0.67449 0.967422 0.430727 -0.35549
1982 -0.76471 -0.50849 -0.06968 0.069685 1.085325 -1.91451 -1.22064 -0.67449 1.22064 0.35549 1.914506 0.282216
1983 -0.67449 -0.67449 0 0.967422 -0.21043 -1.22064 -1.38299 0.430727 1.593219 2.2 1.382994 -0.13971
1984 -0.96742 0 0.069685 0.589456 -2.2 -2.2 -0.06968 -0.13971 -0.13971 1.382994 1.593219 0.67449
1985 -0.13971 -2.2 -0.06968 0.67449 -1.08532 -2.2 -2.2 -2.2 0.67449 0.069685 1.382994 -0.06968
1986 -0.06968 -1.59322 -2.2 -1.59322 0.589456 1.22064 -0.06968 -0.67449 0.210428 1.593219 0.069685 0.069685
1987 0.430727 -0.50849 0.430727 0.76471 -0.76471 -0.96742 -0.96742 -1.59322 1.085325 -0.06968 0.67449 -0.35549
1988 -0.96742 -0.96742 0.76471 1.382994 0 -2.2 -0.13971 2.2 2.2 1.085325 -0.67449 -0.06968
1989 -1.59322 -2.2 0.67449 0.967422 0.589456 -1.91451 -1.38299 -0.50849 1.593219 1.22064 0.069685 0.35549
1990 -0.58946 0.35549 1.22064 1.382994 -1.22064 -2.2 -2.2 -0.50849 1.22064 0.67449 1.22064 0.67449
1991 0 -0.13971 -0.06968 1.382994 -0.06968 -0.06968 -0.67449 0 -0.13971 2.2 0.282216 0.76471
1992 -1.38299 -0.28222 0.76471 0.861634 -0.58946 -0.35549 -0.76471 -1.59322 0.508488 1.382994 0.589456 0
1993 -0.28222 -0.06968 0 1.382994 0.35549 -1.08532 -2.2 0.967422 -0.06968 0.430727 -0.13971 -0.06968
1994 -0.06968 -0.50849 0.67449 0.35549 0.967422 -2.2 -2.2 0 -0.67449 1.22064 1.914506 0.67449
1995 1.382994 -0.96742 0.67449 0.35549 -0.96742 0.069685 -2.2 -1.22064 0.67449 -0.13971 1.593219 0.069685
An image showing computed standardized precipitation index (SPI) for Mbarara district in Uganda. The time series run from January 1981 to December 2016 and the index was calculated for the time scale from 1 to 12 months.
43
Classification of the SPI values
SPI Drought category
2 ≤ Extremely wet
1.99 to 1.5 Very wet
1.49 to 1.0 Moderately wet
0.99 to (- 0.99) Near normal
(- 1.0) to (-1.49) Moderately dry
(- 1.5) to (- 1.99) Severely dry
-2≥ Extremely dry
1996 0.069685 0.210428 0 0.35549 -0.96742 -0.96742 -1.08532 1.593219 2.2 0.069685 0.508488 0.35549
1997 0.069685 -0.67449 0.069685 2.2 0.76471 -1.08532 0.35549 -0.21043 -1.22064 0.67449 0.35549 2.2
1998 0.67449 0.67449 0.069685 0.430727 0.35549 -2.2 -2.2 0.35549 0 1.593219 0.069685 -0.67449
1999 -0.96742 -2.2 0 -0.06968 -2.2 -2.2 -2.2 0.210428 1.382994 1.593219 1.22064 -0.50849
2000 -0.06968 0 1.382994 1.914506 0.069685 -2.2 -2.2 -0.06968 1.382994 2.2 2.2 0.67449
2001 -0.96742 -0.06968 1.914506 0.76471 0.069685 -2.2 -0.13971 -0.13971 1.22064 1.914506 1.382994 -0.06968
2002 0 0.069685 1.593219 0.589456 0.76471 -2.2 -2.2 -0.76471 -0.50849 1.914506 0.67449 0
2003 -0.21043 -0.96742 0.67449 0.210428 0.210428 -0.50849 -2.2 -0.50849 0.67449 0.35549 0.35549 0.210428
2004 0.210428 0 0.430727 0.430727 0.76471 -2.2 -2.2 -0.06968 1.382994 0.76471 0 -0.96742
2005 -0.13971 -1.38299 0.210428 0.35549 0.67449 -0.50849 -2.2 0.508488 0.67449 0.210428 0.430727 -2.2
2006 -0.58946 -0.06968 0.35549 0.069685 0.35549 -1.59322 0.069685 0 -0.13971 -0.21043 1.382994 -0.13971
2007 -0.13971 -0.28222 0.430727 0.210428 0 0.35549 0 -0.13971 1.593219 0.508488 2.2 -0.06968
2008 -0.21043 0 1.914506 -0.06968 0.13971 0.069685 -1.38299 2.2 2.2 1.382994 -0.06968 0
2009 -0.35549 0.35549 0.069685 0.069685 -0.06968 -0.96742 -2.2 -0.67449 0.67449 1.914506 0.67449 0.67449
2010 0.210428 0.967422 0.67449 1.914506 1.382994 -1.59322 -2.2 -1.38299 2.2 1.382994 1.382994 0.35549
2011 -0.96742 -0.76471 1.382994 1.22064 0 0.35549 -0.13971 2.2 1.382994 0.67449 1.593219 0.430727
2012 -2.2 -0.21043 -0.13971 2.2 0.76471 -1.22064 -0.96742 1.22064 1.382994 1.593219 1.914506 0.589456
2013 0.210428 -1.22064 1.382994 2.2 0 -2.2 -2.2 1.22064 0.589456 0.430727 1.382994 -0.21043
2014 -1.91451 -1.59322 1.085325 0.508488 -0.50849 -0.96742 -1.22064 0.76471 0.069685 0.67449 1.914506 0.430727
2015 -2.2 -0.76471 0.967422 1.914506 -0.58946 0.67449 -2.2 -1.59322 0.430727 0.069685 1.382994 -0.06968
2016 -1.22064 0 0.967422 1.382994 -1.22064 -1.38299 -2.2 -0.96742 0.76471 -0.21043 0.67449 0
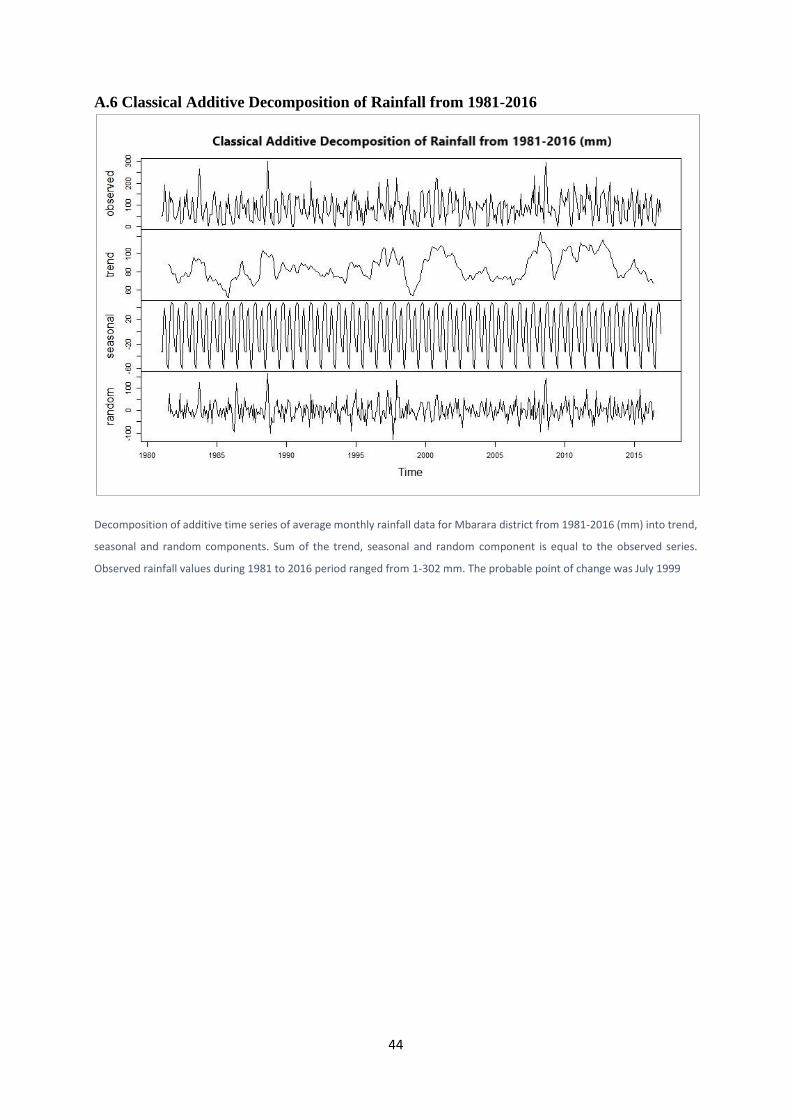
44
A.6 Classical Additive Decomposition of Rainfall from 1981-2016
Decomposition of additive time series of average monthly rainfall data for Mbarara district from 1981-2016 (mm) into trend,
seasonal and random components. Sum of the trend, seasonal and random component is equal to the observed series.
Observed rainfall values during 1981 to 2016 period ranged from 1-302 mm. The probable point of change was July 1999

45
A.7 Classical Additive Decomposition of Temperature from 1981-2012
Decomposition of additive time series of monthly average maximum temperature data for Mbarara district from 1981-2012
(°C) into trend, seasonal and random components. Sum of the trend, seasonal and random component is equal to the
observed series. Observed maximum temperature values during 1981 to 2012 period ranged from 10-31(°C). The probable
point of change was in May 1995 at temperature 25 (°C).

Copyright © 2022 FDOKUMEN