FLOW AND PRESSURE DISTRIBUTION AROUND RUBBLE MOUND PROTECTED PIPELINES
16
2 ND INTERNATIONAL CONFERENCE ON MARINE WASTE WATER DISCHARGES MWWD 2002 - ISTANBUL SEPT. 16 ÷20 Lomonaco-Flow and pressure distribution.doc - page 1 of 16 FLOW AND PRESSURE DISTRIBUTION AROUND RUBBLE MOUND PROTECTED PIPELINES Pedro Lomonaco ( 1 ), Cesar Vidal ( 2 ), Jose A. Revilla ( 3 ) and Inigo J. Losada ( 4 ) KEYWORDS outfalls, velocity, pressure, measurements, protections ABSTRACT A series of laboratory and prototype experiments have been performed to measure and model the flow around and inside rubble mounds for sea outfalls. In particular, the measured parameters in the laboratory experiments are velocity profiles (high resolution LDA) on the slopes and over the crest of a 1:20 physical model of the Santander rubble mound sea outfall. The dynamic pressure around the protected pipeline and the free surface evolution as the wave propagates over the structure was measured, as well. In the prototype experiments, velocity and pressure was measured on the crest of the aforementioned outfall. Two empirical models are presented to assess maximum pressure distributions around the pipeline and to evaluate peak velocity profiles over the structure. The data set is also a basis to study scale effects, and to calibrate and validate wave-structure interaction numerical models. INTRODUCTION Submarine pipelines and, more precisely, sea outfalls are commonly protected by rubble mounds, specifically if the pipeline is laid over hard bottoms or subject to high energy seas. The aims of the rubble mound protection are: 1) to guarantee the pipeline stability in case of a storm, 2) to protect the pipeline against crawling anchors or fishing nets, 3) to avoid sea bottom scouring yielding excessive pipeline bending, and 4) to reduce temperature gradients along the pipeline. In the case of sea outfalls, the stability and security of the pipeline is crucial due to the high investments involved and environmental issues. The Ocean & Coastal Research Group and the Marine Outfall & Environmental Hydraulics Group, at the University of Cantabria, have performed a series of research projects to improve our knowledge of stability and behavior of rubble mound protected submarine pipelines. Some of the results and experience gained has been published previously in [ 5 ] and [ 6 ], and more recent findings can also be found in [ 7 ] and [ 8 ]. The first attempt was, obviously, to assess the stability of the rubble mound protecting the pipeline. Two different approaches can be followed; first, to consider the rubble mound as a very low crested breakwater, hence the stability of each stone is directly related to the wave height and the freeboard, where the free surface profile is affected by the presence of the structure, yielding in some cases to wave breaking; second, to consider the rubble mound as large sediment which can be transported by the velocity field produced by the incoming waves. Hence, the stability of each individual stone can be characterized by a Shields-type parameter, known as the mobility parameter, which compares the drag forces with the stone weight. The mobility parameter requires a previous evaluation of the velocity profile over the structure, which is unknown in practice. So far, this velocity is computed using linear (Airy) wave theory, since no analytical 1 Senior Researcher, University of Cantabria, Santander, Spain. E-mail: [email protected] 2 Associate Professor, University of Cantabria, Santander, Spain. E-mail: [email protected] 3 Professor, University of Cantabria, Santander, Spain. E-mail: [email protected] 4 Professor, University of Cantabria, Santander, Spain. E-mail: [email protected] 5 References: P. Lomonaco and W.H.G. Klomp, 1997. Rock cover damage assessment. Proc. BOSS Conference. 6 C. Vidal, I.J. Losada and F.L. Martin, 1999. Stability of near-bed rubble-mound structures. Proc. 26 th ICCE. 7 C. Vidal, P. Lomonaco and F.L. Martin, 2002. Prototype analysis of stability of rubble mound protections for submarine outfalls. Proc. 28 th ICCE. 8 C. Vidal, P. Lomonaco, J.A. Revilla, F.L. Martin and R. Medina, 2002. Stability of rubble mound protections for submarine outfalls: Prototype and laboratory experiments. Proc. 2 nd MWWD Conference.
Transcript of FLOW AND PRESSURE DISTRIBUTION AROUND RUBBLE MOUND PROTECTED PIPELINES
2ND INTERNATIONAL CONFERENCE ON MARINE WASTE WATER DISCHARGES MWWD 2002 - ISTANBUL SEPT. 16÷20
Lomonaco-Flow and pressure distribution.doc - page 1 of 16
FLOW AND PRESSURE DISTRIBUTION AROUND RUBBLE MOUND PROTECTED PIPELINES
Pedro Lomonaco (1), Cesar Vidal (2), Jose A. Revilla (3) and Inigo J. Losada (4)
KEYWORDS
outfalls, velocity, pressure, measurements, protections
ABSTRACT A series of laboratory and prototype experiments have been performed to measure and model the flow around and inside rubble mounds for sea outfalls. In particular, the measured parameters in the laboratory experiments are velocity profiles (high resolution LDA) on the slopes and over the crest of a 1:20 physical model of the Santander rubble mound sea outfall. The dynamic pressure around the protected pipeline and the free surface evolution as the wave propagates over the structure was measured, as well. In the prototype experiments, velocity and pressure was measured on the crest of the aforementioned outfall. Two empirical models are presented to assess maximum pressure distributions around the pipeline and to evaluate peak velocity profiles over the structure. The data set is also a basis to study scale effects, and to calibrate and validate wave-structure interaction numerical models. INTRODUCTION Submarine pipelines and, more precisely, sea outfalls are commonly protected by rubble mounds, specifically if the pipeline is laid over hard bottoms or subject to high energy seas. The aims of the rubble mound protection are: 1) to guarantee the pipeline stability in case of a storm, 2) to protect the pipeline against crawling anchors or fishing nets, 3) to avoid sea bottom scouring yielding excessive pipeline bending, and 4) to reduce temperature gradients along the pipeline. In the case of sea outfalls, the stability and security of the pipeline is crucial due to the high investments involved and environmental issues. The Ocean & Coastal Research Group and the Marine Outfall & Environmental Hydraulics Group, at the University of Cantabria, have performed a series of research projects to improve our knowledge of stability and behavior of rubble mound protected submarine pipelines. Some of the results and experience gained has been published previously in [5] and [6], and more recent findings can also be found in [7] and [8]. The first attempt was, obviously, to assess the stability of the rubble mound protecting the pipeline. Two different approaches can be followed; first, to consider the rubble mound as a very low crested breakwater, hence the stability of each stone is directly related to the wave height and the freeboard, where the free surface profile is affected by the presence of the structure, yielding in some cases to wave breaking; second, to consider the rubble mound as large sediment which can be transported by the velocity field produced by the incoming waves. Hence, the stability of each individual stone can be characterized by a Shields-type parameter, known as the mobility parameter, which compares the drag forces with the stone weight. The mobility parameter requires a previous evaluation of the velocity profile over the structure, which is unknown in practice. So far, this velocity is computed using linear (Airy) wave theory, since no analytical 1 Senior Researcher, University of Cantabria, Santander, Spain. E-mail: [email protected] 2 Associate Professor, University of Cantabria, Santander, Spain. E-mail: [email protected] 3 Professor, University of Cantabria, Santander, Spain. E-mail: [email protected] 4 Professor, University of Cantabria, Santander, Spain. E-mail: [email protected] 5 References: P. Lomonaco and W.H.G. Klomp, 1997. Rock cover damage assessment. Proc. BOSS Conference. 6 C. Vidal, I.J. Losada and F.L. Martin, 1999. Stability of near-bed rubble-mound structures. Proc. 26th ICCE. 7 C. Vidal, P. Lomonaco and F.L. Martin, 2002. Prototype analysis of stability of rubble mound protections for submarine outfalls. Proc. 28th ICCE. 8 C. Vidal, P. Lomonaco, J.A. Revilla, F.L. Martin and R. Medina, 2002. Stability of rubble mound protections for submarine outfalls: Prototype and laboratory experiments. Proc. 2nd MWWD Conference.
MWWD 2002
Lomonaco - Flow and pressure distribution.doc - page 2 of 16
solutions have been developed to solve the problem. Moreover, empirical relationships of damage indicate that the linear velocity profile underestimates the velocity on the crest of the structure. Some formulations proposed introduce the freeboard effect by assuming the water depth over the crest to be the actual depth, thus the maximum velocity is computed accordingly, i.e., using local wave number at the crest [9]. Another approach might be the use of a 2DV numerical model, but it requires to be calibrated with measured real data, and do not fulfill the prerequisite of a simple model for engineering application, since requires huge computing effort. Currently, the damage assessment of a submarine rock protection under wave action is only linked with the stone stability. The pipeline strength is commonly analyzed to resist excessive bending during its installation, and to withstand the impact forces of the stones falling from the construction barges. Generally, the working pressure distribution inside and outside the pipeline is computed for the steady design condition, and the wave-induced dynamic pressure oscillation is assumed to be within the strain limits. Although, in rough seas and in near shore conditions (intermediate to shallow waters), the dynamic pressure can vary significantly. Moreover, the pressure wave traveling inside the pipeline (which enters through the outfall diffusers) has a different celerity compared with the free surface wave, hence the pressure difference may exceed buckling capacity. To overcome this lack of knowledge, a series of laboratory and prototype tests have been performed to measure and model the flow around and inside rubble mounds for sea outfall protections. In particular, the measured parameters in the laboratory experiments are velocity profiles (high resolution Laser Doppler Anemometry) on the slopes and over the crest of the structure, dynamic pressure around the protected pipeline and the free surface evolution as the wave propagates over. In the prototype experiments, velocity and pressure was measured on the crest of the Santander rubble mound sea outfall. The structure protects a 1.6 m diameter pipeline up to 43 m water depth. The instrument was deployed during the 1999/2000 and 2000/2001 winters at the crest of the 5 m high structure, located at 17 m water depth (LLW), 1000 m offshore. The structure tested in the laboratory is a geometrically similar 1:20 model of the Santander outfall; hence scale effects can be assessed. The aims of the study are four: first, to create an empirical model to assess pressure distributions around the pipeline for design purposes, including the stress along the pipeline, buckle, fatigue and water hammer/resonance conditions; second, to set up an empirical model to evaluate the velocity profiles over the structure for stone stability, turbulence generation, energy dissipation and wave breaking conditions; three, to calibrate and validate a VOF-type numerical model for pressure and velocity prediction, increasing the number of tested conditions for the empirical model, varying wave conditions, depth and structure geometry; and four, to analyze the scale effects during the laboratory tests. In this paper, the prototype and model tests are briefly described, presenting and discussing the measured parameters. Next, the flow and pressure characteristics around and inside the rubble mound are described, and an empirical model is presented to assess the peak pressure and velocities (positive and negative), meant for rubble mound stability and pipeline strain computations. PROTOTYPE TESTS The Santander sea outfall is a 1.6 m diameter high-density polyethylene (HDPE) pipeline, laid over a rocky bottom, 6 km north from the city. Santander is located on the northern coast of Spain, where mean tidal range is around 3,5 m (max. up to 5 m) and subject to very high wave energy. In deep water, a typical storm of Hs=5-6 m, Tp=15-18 s can be observed every year, and a storm of Hs=7 m, Tp=16 s occurs on average every 5 years. Longitudinally, the pipeline is placed from the shoreline on an excavated trench and covered by concrete along 580 m. From this point (10 m water depth), a rubble mound, formed by a core, a filter layer and a 3-ton main layer, protects the pipeline. The total length of the outfall is 2430 m, reaching up to 43 m water depth (LLW), it is designed for a maximum waste water discharge of 4.5 m3/s and to withstand a 200 year return period storm (at the outfall, Hs=9.44 m, Tp=18 s). The typical cross-section of the pipeline rubble mound protection is depicted in Figure 1.
9 References: P. Lomonaco, 1994. Design of rock cover for underwater pipelines. M.Sc. Thesis. IHE-Delft.
2ND INTERNATIONAL CONFERENCE ON MARINE WASTE WATER DISCHARGES MWWD 2002 - ISTANBUL SEPT. 16÷20
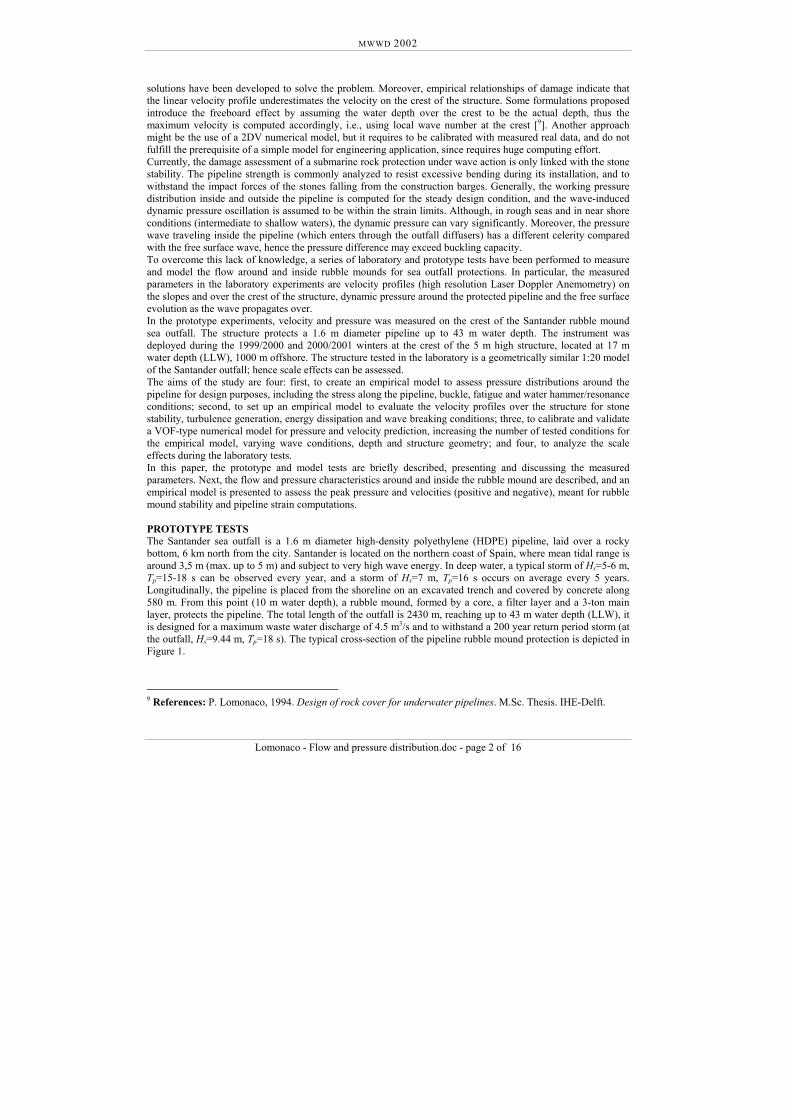
-14 -12 -10 -8 -6 -4 -2 0 2 4 6 8 10 12 14Cross-sectional axis [m]
-2
-1
0
1
2
3
4
5
6
7
8
Hei
ght [
m]
Main layer: 3 tonsFilter layer: 60-300 kg
Core:30-50 mm
HDPE pipeline, ∅=1.6 m
3.0 m
1.2 m0.8 m Main layer: 3 tons
Filter layer: 60-300 kg
Filter layer: 60-300 kg
Sea bottom (hard rock)
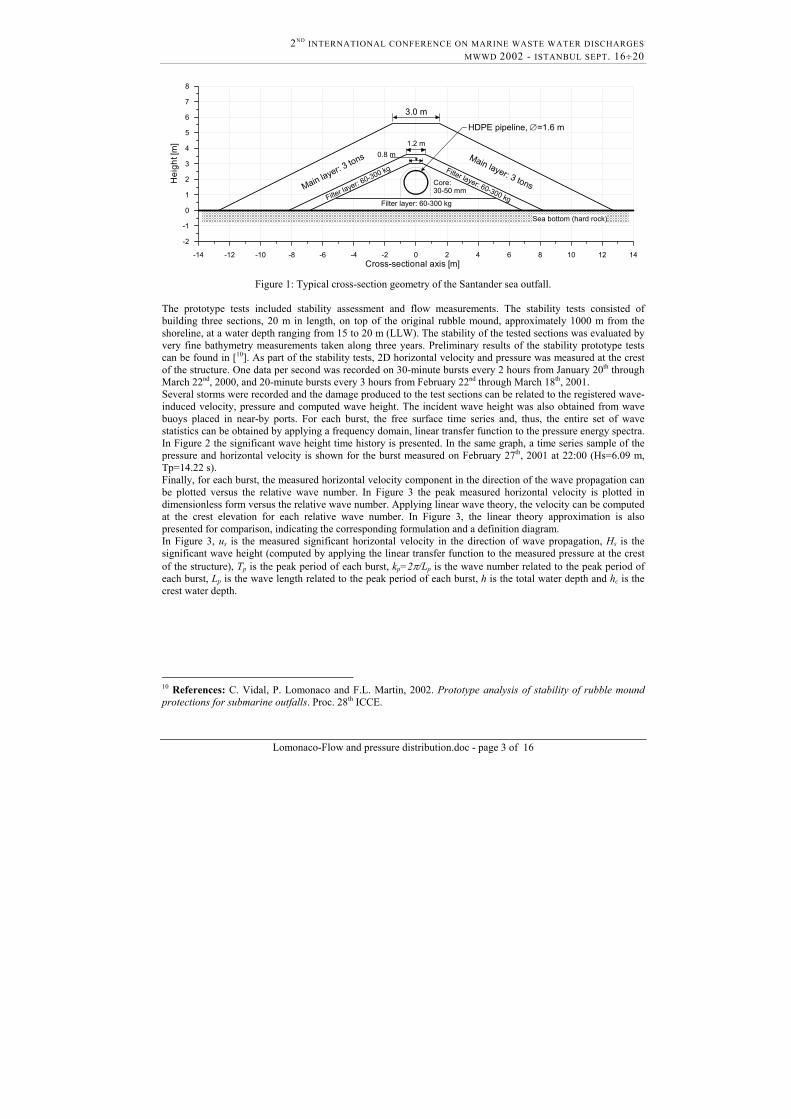
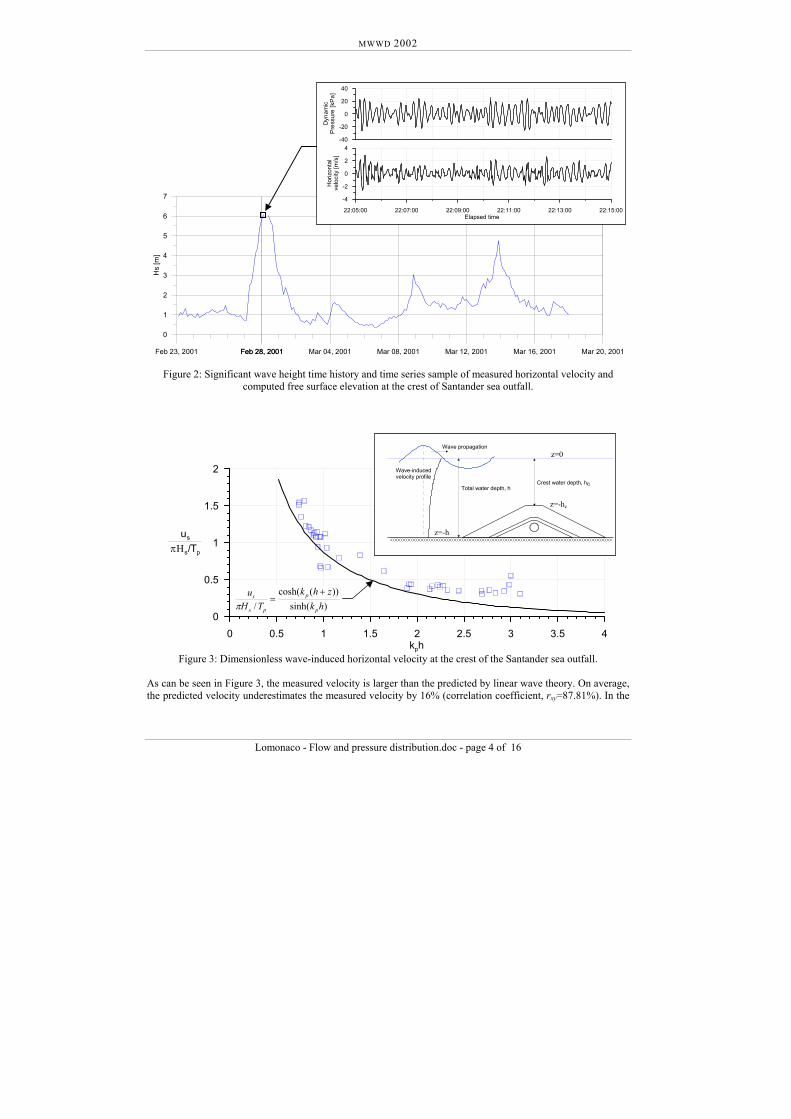
Figure 1: Typical cross-section geometry of the Santander sea outfall. The prototype tests included stability assessment and flow measurements. The stability tests consisted of building three sections, 20 m in length, on top of the original rubble mound, approximately 1000 m from the shoreline, at a water depth ranging from 15 to 20 m (LLW). The stability of the tested sections was evaluated by very fine bathymetry measurements taken along three years. Preliminary results of the stability prototype tests can be found in [10]. As part of the stability tests, 2D horizontal velocity and pressure was measured at the crest of the structure. One data per second was recorded on 30-minute bursts every 2 hours from January 20th through March 22nd, 2000, and 20-minute bursts every 3 hours from February 22nd through March 18th, 2001. Several storms were recorded and the damage produced to the test sections can be related to the registered wave-induced velocity, pressure and computed wave height. The incident wave height was also obtained from wave buoys placed in near-by ports. For each burst, the free surface time series and, thus, the entire set of wave statistics can be obtained by applying a frequency domain, linear transfer function to the pressure energy spectra. In Figure 2 the significant wave height time history is presented. In the same graph, a time series sample of the pressure and horizontal velocity is shown for the burst measured on February 27th, 2001 at 22:00 (Hs=6.09 m, Tp=14.22 s). Finally, for each burst, the measured horizontal velocity component in the direction of the wave propagation can be plotted versus the relative wave number. In Figure 3 the peak measured horizontal velocity is plotted in dimensionless form versus the relative wave number. Applying linear wave theory, the velocity can be computed at the crest elevation for each relative wave number. In Figure 3, the linear theory approximation is also presented for comparison, indicating the corresponding formulation and a definition diagram. In Figure 3, us is the measured significant horizontal velocity in the direction of wave propagation, Hs is the significant wave height (computed by applying the linear transfer function to the measured pressure at the crest of the structure), Tp is the peak period of each burst, kp=2π/Lp is the wave number related to the peak period of each burst, Lp is the wave length related to the peak period of each burst, h is the total water depth and hc is the crest water depth.
10 References: C. Vidal, P. Lomonaco and F.L. Martin, 2002. Prototype analysis of stability of rubble mound protections for submarine outfalls. Proc. 28th ICCE.
Lomonaco-Flow and pressure distribution.doc - page 3 of 16
MWWD 2002
Feb 23, 2001 Feb 28, 2001
0
1
2
3
4
5
6
7
Hs
[m]
Feb 28, 2001 Mar 04, 2001 Mar 08, 2001 Mar 12, 2001 Mar
-40
-20
0
20
40
Dyn
amic
Pre
ssur
e [k
Pa]
22:05:00 22:07:00 22:09:00 22:11:00Elapsed time
-4
-2
0
2
4
Hor
izon
tal
velo
city
[m/s
]
22:13:00 22:15:00
16, 2001 Mar 20, 2001
Figure 2: Significant wave height time history and time series sample of measured horizontal velocity and computed free surface elevation at the crest of Santander sea outfall.
Figure 3: Dimensionless wave-induced horizontal velocity at the crest of the Santander sea outfall.
0 0.5 1 1.5 2 2.5 3 3.5 4kph
0
0.5
1
1.5
2
us
πΗs/Tp
)sinh())(cosh(
/ hkzhk
THu
p
p
ps
s +=
π
Total water depth, hCrest water depth, hc
Wave-inducedvelocity profile
Wave propagation
z=-h
z=-hc
z=0
As can be seen in Figure 3, the measured velocity is larger than the predicted by linear wave theory. On average, the predicted velocity underestimates the measured velocity by 16% (correlation coefficient, rxy=87.81%). In the
Lomonaco - Flow and pressure distribution.doc - page 4 of 16

2ND INTERNATIONAL CONFERENCE ON MARINE WASTE WATER DISCHARGES MWWD 2002 - ISTANBUL SEPT. 16÷20
linear theory application, the structure geometry has no effect on the velocity profile, thus the freeboard effect is not yet introduced in the model. As a first approach, following previous findings related to the stability of submerged rubble mounds, the relative local wave number (kp,c) is applied to improve the empirical model correlation. As a result, the linear approximation presents a much better fit to the measured data, as shown in Figure 4, where the dimensionless measured velocity is again plotted, but now versus the relative local wave number. In this case, the predicted velocity is on average only 0.4% smaller than the measured one (rxy=88.78%). As shown in the definition sketch inserted in Figure 4, the velocity profile is enhanced by assuming the actual water depth as hc, i.e. at the crest of the rubble mound. The role of kp,c hc is to include in the measured data the water depth reduction and its effect on wave celerity.
0 0.5 1 1.5 2 2.5kp,c hc
0
0.5
1
1.5
2
us
πΗs/Tp
)sinh(1
/ , ccpps
s
hkTHu
=π
Wave-inducedvelocity profile
Wave propagation
Crest water depth, hc
3 3.5 4
Figure 4: Dimensionless wave-induced horizontal velocity at the crest of the Santander sea outfall. Correlation
improved by the effect of the relative local wave number on the velocity profile. Note that, whenever the individual wave height statistics is Rayleigh distributed, and so it is for the velocity distribution, then the dimensionless wave-induced velocity is independent of the statistical parameters (Hs, H1/10, Hrms, Hmax, etc.) being used, given the same parameter is employed for the velocity as well as for the wave height. In the next paragraphs, a series of laboratory tests are described where velocity profiles on top of the structure, as well as dynamic pressure around the protected pipeline, are measured on a 1:20 model of the Santander sea outfall. Both, the prototype tests and the laboratory test data are analyzed to present an empirical model to assess flow characteristics for design purposes. LABORATORY TESTS As mentioned above, a series of laboratory tests were performed in a wave flume at the University of Cantabria. Basically, the aims of the tests were to reproduce the flow conditions of the Santander sea outfall, in order to obtain a data set to develop an empirical model for velocity and pressure prediction. The data set also will be used to calibrate a 2DV-RANS, VOF-type numerical model, so the number of tested conditions can be increased, improving the empirical model applicability. Finally, the laboratory tests will be compared with the prototype tests to assess scale effects. Due to space and time constraints, in this paper only the results of the prototype and laboratory tests are presented, and a simple empirical model for pressure and velocity prediction is elucidated.
Lomonaco-Flow and pressure distribution.doc - page 5 of 16
MWWD 2002
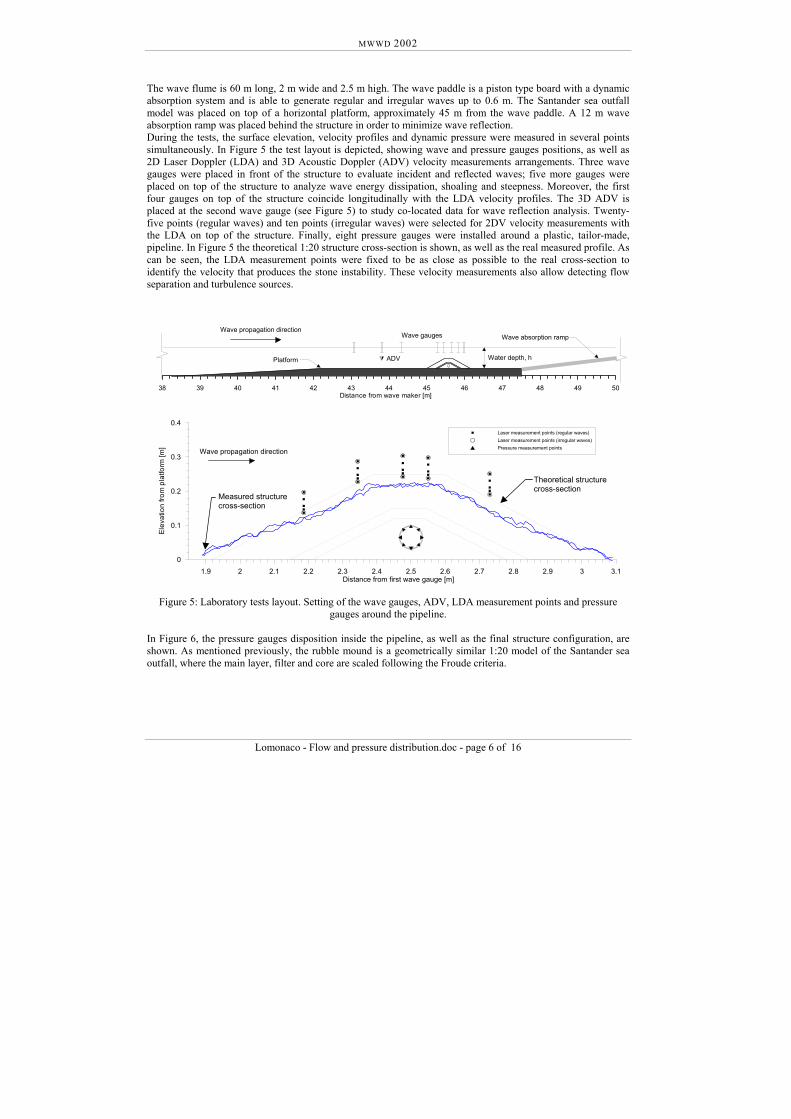
The wave flume is 60 m long, 2 m wide and 2.5 m high. The wave paddle is a piston type board with a dynamic absorption system and is able to generate regular and irregular waves up to 0.6 m. The Santander sea outfall model was placed on top of a horizontal platform, approximately 45 m from the wave paddle. A 12 m wave absorption ramp was placed behind the structure in order to minimize wave reflection. During the tests, the surface elevation, velocity profiles and dynamic pressure were measured in several points simultaneously. In Figure 5 the test layout is depicted, showing wave and pressure gauges positions, as well as 2D Laser Doppler (LDA) and 3D Acoustic Doppler (ADV) velocity measurements arrangements. Three wave gauges were placed in front of the structure to evaluate incident and reflected waves; five more gauges were placed on top of the structure to analyze wave energy dissipation, shoaling and steepness. Moreover, the first four gauges on top of the structure coincide longitudinally with the LDA velocity profiles. The 3D ADV is placed at the second wave gauge (see Figure 5) to study co-located data for wave reflection analysis. Twenty-five points (regular waves) and ten points (irregular waves) were selected for 2DV velocity measurements with the LDA on top of the structure. Finally, eight pressure gauges were installed around a plastic, tailor-made, pipeline. In Figure 5 the theoretical 1:20 structure cross-section is shown, as well as the real measured profile. As can be seen, the LDA measurement points were fixed to be as close as possible to the real cross-section to identify the velocity that produces the stone instability. These velocity measurements also allow detecting flow separation and turbulence sources.
38 39 40 41 42 43 44 45 46 47Distance from wave maker [m]
ADV
Wave propagation directionWave gauges
Platform
Wave abs
Water depth,
0
0.1
0.2
0.3
0.4
Elev
atio
n fro
m p
latfo
rm [m
]
1.9 2 2.1 2.2 2.3 2.4 2.5 2.6 2.7 2.8Distance from first wave gauge [m]
Laser measurLaser measurPressure measWave propagation direction
Measured structure cross-section
Theoretical structure cross-section
urement pointsement points (irregular waves)ement points (regular waves)
2.9 3 3.1
h
orption ramp
48 49 50
Figure 5: Laboratory tests layout. Setting of the wave gauges, ADV, LDA measurement points and pressure
gauges around the pipeline.
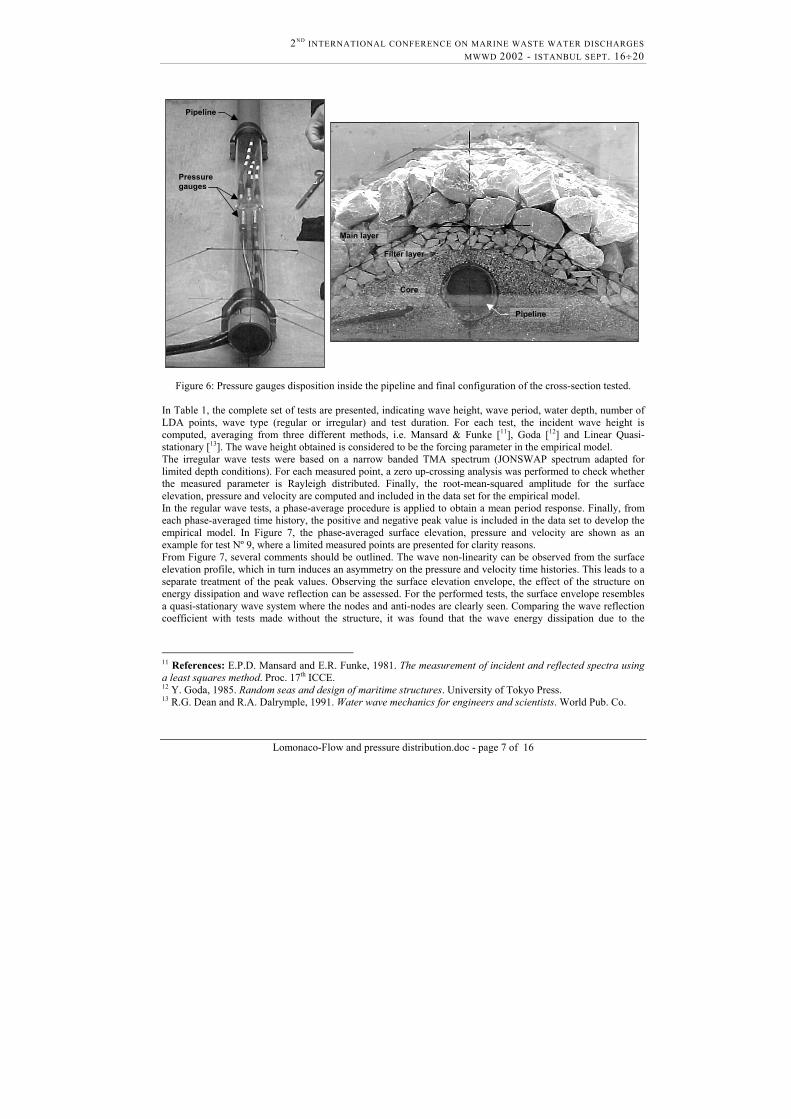
In Figure 6, the pressure gauges disposition inside the pipeline, as well as the final structure configuration, are shown. As mentioned previously, the rubble mound is a geometrically similar 1:20 model of the Santander sea outfall, where the main layer, filter and core are scaled following the Froude criteria.
Lomonaco - Flow and pressure distribution.doc - page 6 of 16
2ND INTERNATIONAL CONFERENCE ON MARINE WASTE WATER DISCHARGES MWWD 2002 - ISTANBUL SEPT. 16÷20
Main layer
Filter layer
Core
Pipeline
Pipeline
Pressure gauges
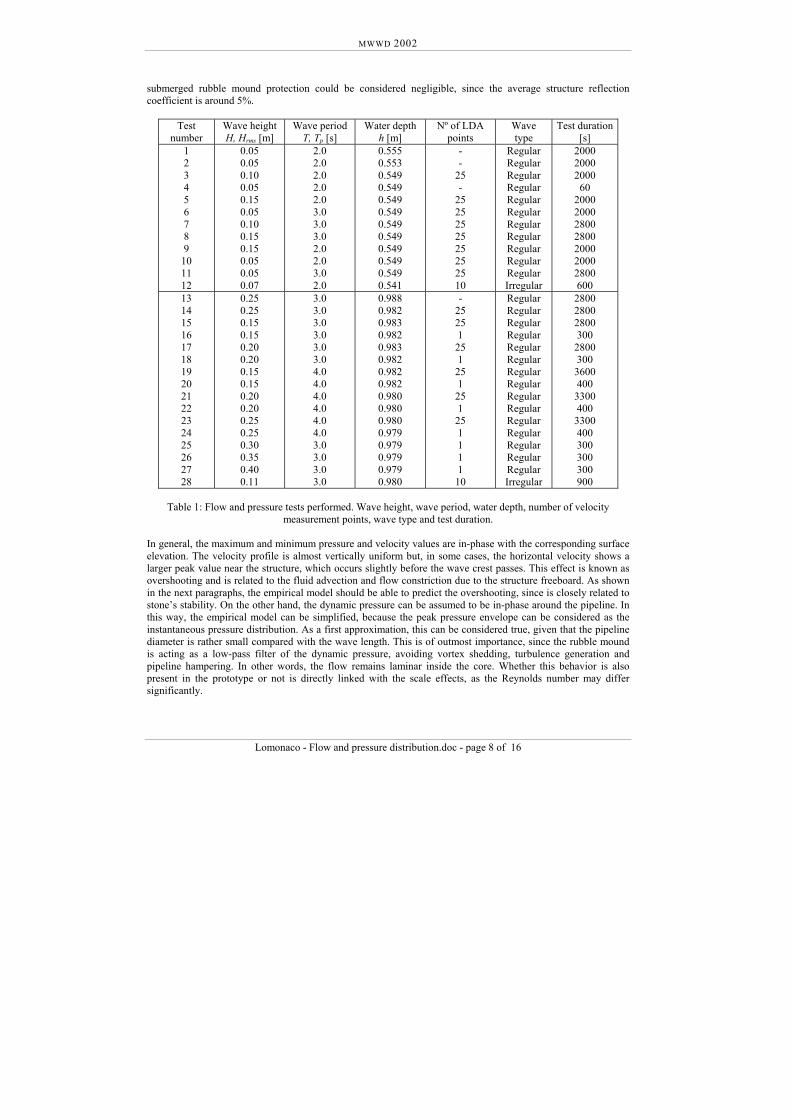
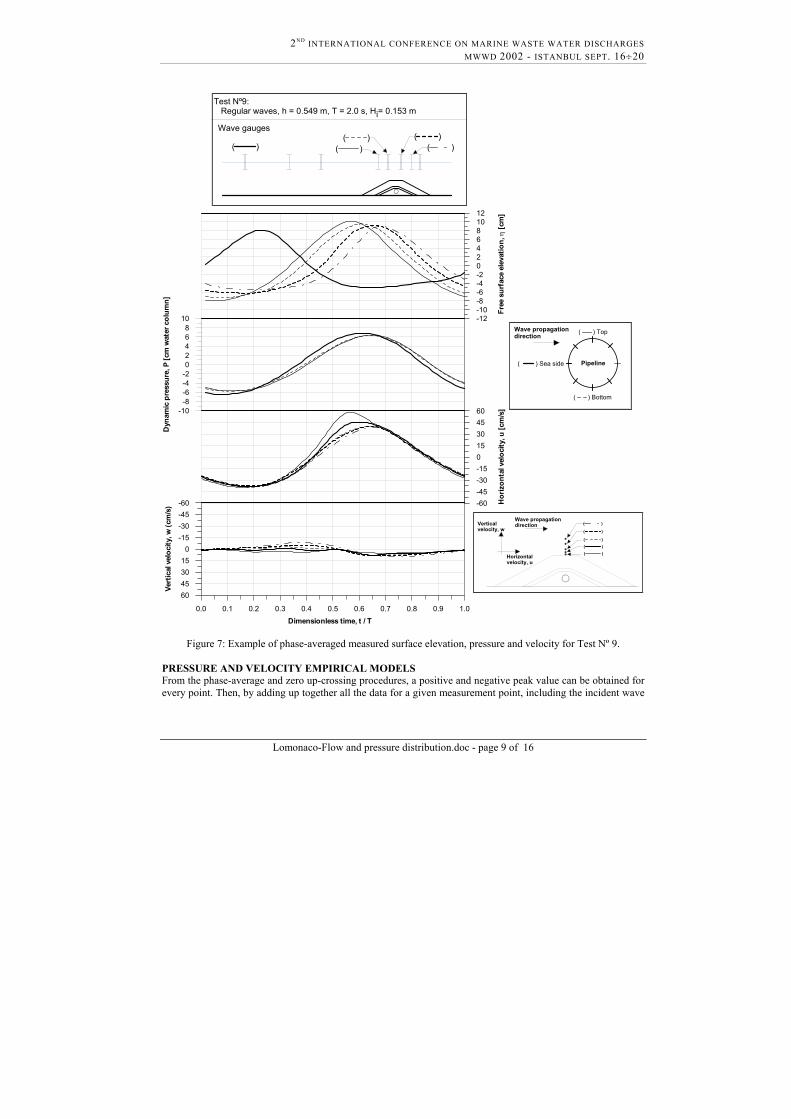
Figure 6: Pressure gauges disposition inside the pipeline and final configuration of the cross-section tested. In Table 1, the complete set of tests are presented, indicating wave height, wave period, water depth, number of LDA points, wave type (regular or irregular) and test duration. For each test, the incident wave height is computed, averaging from three different methods, i.e. Mansard & Funke [11], Goda [12] and Linear Quasi-stationary [13]. The wave height obtained is considered to be the forcing parameter in the empirical model. The irregular wave tests were based on a narrow banded TMA spectrum (JONSWAP spectrum adapted for limited depth conditions). For each measured point, a zero up-crossing analysis was performed to check whether the measured parameter is Rayleigh distributed. Finally, the root-mean-squared amplitude for the surface elevation, pressure and velocity are computed and included in the data set for the empirical model. In the regular wave tests, a phase-average procedure is applied to obtain a mean period response. Finally, from each phase-averaged time history, the positive and negative peak value is included in the data set to develop the empirical model. In Figure 7, the phase-averaged surface elevation, pressure and velocity are shown as an example for test Nº 9, where a limited measured points are presented for clarity reasons. From Figure 7, several comments should be outlined. The wave non-linearity can be observed from the surface elevation profile, which in turn induces an asymmetry on the pressure and velocity time histories. This leads to a separate treatment of the peak values. Observing the surface elevation envelope, the effect of the structure on energy dissipation and wave reflection can be assessed. For the performed tests, the surface envelope resembles a quasi-stationary wave system where the nodes and anti-nodes are clearly seen. Comparing the wave reflection coefficient with tests made without the structure, it was found that the wave energy dissipation due to the
11 References: E.P.D. Mansard and E.R. Funke, 1981. The measurement of incident and reflected spectra using a least squares method. Proc. 17th ICCE. 12 Y. Goda, 1985. Random seas and design of maritime structures. University of Tokyo Press. 13 R.G. Dean and R.A. Dalrymple, 1991. Water wave mechanics for engineers and scientists. World Pub. Co.
Lomonaco-Flow and pressure distribution.doc - page 7 of 16
MWWD 2002
Lomonaco - Flow and pressure distribution.doc - page 8 of 16
submerged rubble mound protection could be considered negligible, since the average structure reflection coefficient is around 5%.
Test number
Wave height H, Hrms [m]
Wave period T, Tp [s]
Water depth h [m]
Nº of LDA points
Wave type
Test duration [s]
1 2 3 4 5 6 7 8 9
10 11 12
0.05 0.05 0.10 0.05 0.15 0.05 0.10 0.15 0.15 0.05 0.05 0.07
2.0 2.0 2.0 2.0 2.0 3.0 3.0 3.0 2.0 2.0 3.0 2.0
0.555 0.553 0.549 0.549 0.549 0.549 0.549 0.549 0.549 0.549 0.549 0.541
- -
25 -
25 25 25 25 25 25 25 10
Regular Regular Regular Regular Regular Regular Regular Regular Regular Regular Regular Irregular
2000 2000 2000
60 2000 2000 2800 2800 2000 2000 2800 600
13 14 15 16 17 18 19 20 21 22 23 24 25 26 27 28
0.25 0.25 0.15 0.15 0.20 0.20 0.15 0.15 0.20 0.20 0.25 0.25 0.30 0.35 0.40 0.11
3.0 3.0 3.0 3.0 3.0 3.0 4.0 4.0 4.0 4.0 4.0 4.0 3.0 3.0 3.0 3.0
0.988 0.982 0.983 0.982 0.983 0.982 0.982 0.982 0.980 0.980 0.980 0.979 0.979 0.979 0.979 0.980
- 25 25 1 25 1 25 1 25 1 25 1 1 1 1 10
Regular Regular Regular Regular Regular Regular Regular Regular Regular Regular Regular Regular Regular Regular Regular Irregular
2800 2800 2800 300 2800 300 3600 400 3300 400 3300 400 300 300 300 900
Table 1: Flow and pressure tests performed. Wave height, wave period, water depth, number of velocity
measurement points, wave type and test duration. In general, the maximum and minimum pressure and velocity values are in-phase with the corresponding surface elevation. The velocity profile is almost vertically uniform but, in some cases, the horizontal velocity shows a larger peak value near the structure, which occurs slightly before the wave crest passes. This effect is known as overshooting and is related to the fluid advection and flow constriction due to the structure freeboard. As shown in the next paragraphs, the empirical model should be able to predict the overshooting, since is closely related to stone’s stability. On the other hand, the dynamic pressure can be assumed to be in-phase around the pipeline. In this way, the empirical model can be simplified, because the peak pressure envelope can be considered as the instantaneous pressure distribution. As a first approximation, this can be considered true, given that the pipeline diameter is rather small compared with the wave length. This is of outmost importance, since the rubble mound is acting as a low-pass filter of the dynamic pressure, avoiding vortex shedding, turbulence generation and pipeline hampering. In other words, the flow remains laminar inside the core. Whether this behavior is also present in the prototype or not is directly linked with the scale effects, as the Reynolds number may differ significantly.
2ND INTERNATIONAL CONFERENCE ON MARINE WASTE WATER DISCHARGES MWWD 2002 - ISTANBUL SEPT. 16÷20
Test Nº9: Regular waves, h = 0.549 m, T = 2.0 s, Hi= 0.153 m
Wave gauges
( ) ( )( ) ( )
( )
Wavedirect
(
Wave pdirect
Horizontavelocity,
Verticalvelocity, w
0.0 0.1 0.2 0.3 0.4 0.5 0.6 0.7 0.8 0.9 1.0Dimensionless time, t / T
-12-10-8-6-4-2024681012
Free
sur
face
ele
vatio
n, η
[cm
]
-10-8-6-4-202468
10
Dyn
amic
pre
ssur
e, P
[cm
wat
er c
olum
n]
60453015
0-15-30-45-60
Vert
ical
vel
ocity
, w (c
m/s
) -60-45-30-15015304560
Hor
izon
tal v
eloc
ity, u
[cm
/s]
l u
ropagationion ( )
( )
( )( )( )
Pipeline
propagationion ( ) Top
) Sea side
( ) Bottom
Figure 7: Example of phase-averaged measured surface elevation, pressure and velocity for Test Nº 9.
PRESSURE AND VELOCITY EMPIRICAL MODELS From the phase-average and zero up-crossing procedures, a positive and negative peak value can be obtained for every point. Then, by adding up together all the data for a given measurement point, including the incident wave
Lomonaco-Flow and pressure distribution.doc - page 9 of 16
MWWD 2002
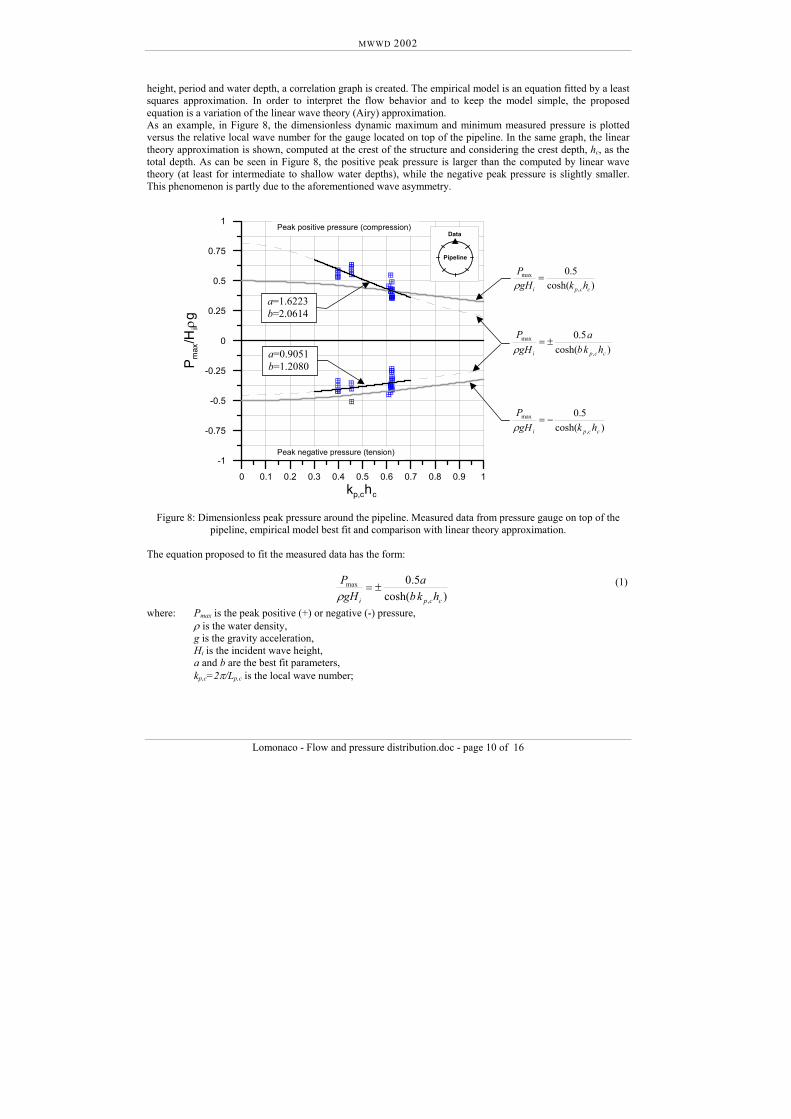
height, period and water depth, a correlation graph is created. The empirical model is an equation fitted by a least squares approximation. In order to interpret the flow behavior and to keep the model simple, the proposed equation is a variation of the linear wave theory (Airy) approximation. As an example, in Figure 8, the dimensionless dynamic maximum and minimum measured pressure is plotted versus the relative local wave number for the gauge located on top of the pipeline. In the same graph, the linear theory approximation is shown, computed at the crest of the structure and considering the crest depth, hc, as the total depth. As can be seen in Figure 8, the positive peak pressure is larger than the computed by linear wave theory (at least for intermediate to shallow water depths), while the negative peak pressure is slightly smaller. This phenomenon is partly due to the aforementioned wave asymmetry.
0 0.1 0.2 0.3 0.4 0.5 0.6 0.7 0.8 0.9 1kp,chc
-1
-0.75
-0.5
-0.25
0
0.25
0.5
0.75
1
P max
/Hiρ
g
Data
Pipeline
a=0.9051 b=1.2080
a=1.6223 b=2.0614
)cosh(5.0
,
max
ccpi hkgHP
=ρ
)cosh(5.0
,
max
ccpi hkgHP
−=ρ
)cosh(5.0
,
max
ccpi hkba
gHP
±=ρ
Peak negative pressure (tension)
Peak positive pressure (compression)
Figure 8: Dimensionless peak pressure around the pipeline. Measured data from pressure gauge on top of the
pipeline, empirical model best fit and comparison with linear theory approximation. The equation proposed to fit the measured data has the form: (1)
)cosh(5.0
,
max
ccpi hkba
gHP
±=ρ
where: Pmax is the peak positive (+) or negative (-) pressure, ρ is the water density, g is the gravity acceleration, Hi is the incident wave height,
a and b are the best fit parameters, kp,c=2π/Lp,c is the local wave number;
Lomonaco - Flow and pressure distribution.doc - page 10 of 16
2ND INTERNATIONAL CONFERENCE ON MARINE WASTE WATER DISCHARGES MWWD 2002 - ISTANBUL SEPT. 16÷20
Lomonaco-Flow and pressure distribution.doc - page 11 of 16
)tanh(2 ,
2
, ccpp
cp hkgT
Lπ
= is the local wave length, and
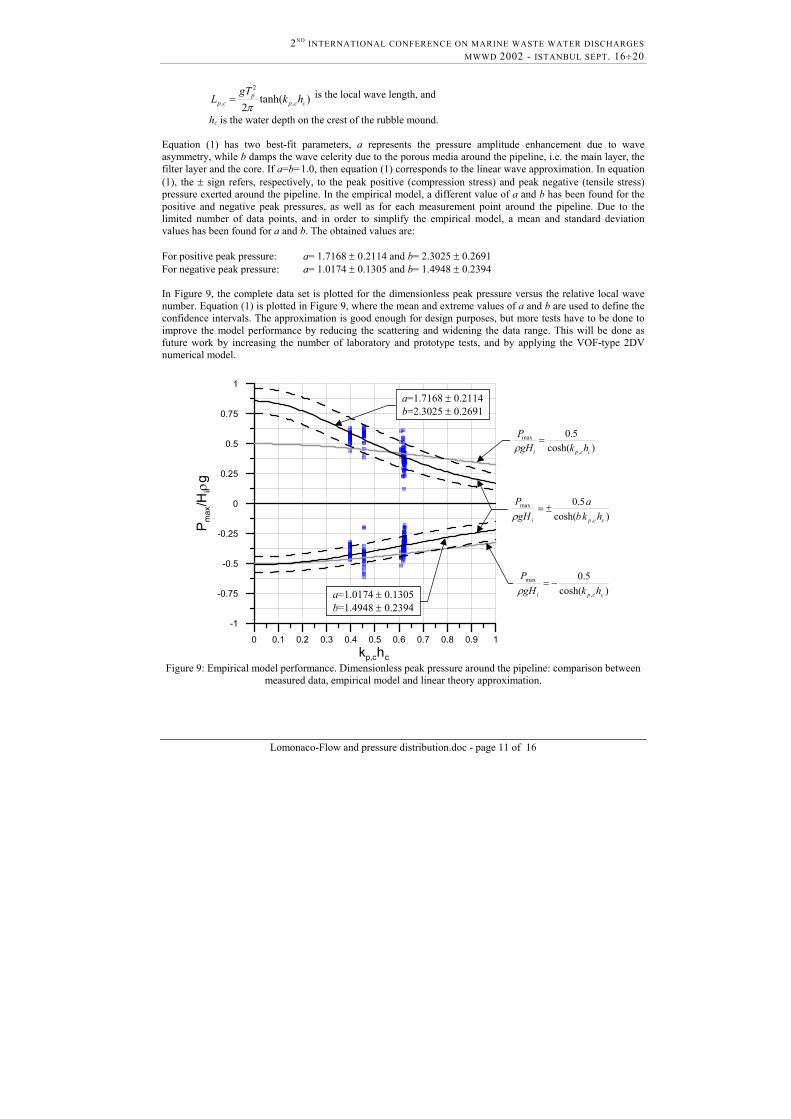
hc is the water depth on the crest of the rubble mound. Equation (1) has two best-fit parameters, a represents the pressure amplitude enhancement due to wave asymmetry, while b damps the wave celerity due to the porous media around the pipeline, i.e. the main layer, the filter layer and the core. If a=b=1.0, then equation (1) corresponds to the linear wave approximation. In equation (1), the ± sign refers, respectively, to the peak positive (compression stress) and peak negative (tensile stress) pressure exerted around the pipeline. In the empirical model, a different value of a and b has been found for the positive and negative peak pressures, as well as for each measurement point around the pipeline. Due to the limited number of data points, and in order to simplify the empirical model, a mean and standard deviation values has been found for a and b. The obtained values are: For positive peak pressure: a= 1.7168 ± 0.2114 and b= 2.3025 ± 0.2691 For negative peak pressure: a= 1.0174 ± 0.1305 and b= 1.4948 ± 0.2394 In Figure 9, the complete data set is plotted for the dimensionless peak pressure versus the relative local wave number. Equation (1) is plotted in Figure 9, where the mean and extreme values of a and b are used to define the confidence intervals. The approximation is good enough for design purposes, but more tests have to be done to improve the model performance by reducing the scattering and widening the data range. This will be done as future work by increasing the number of laboratory and prototype tests, and by applying the VOF-type 2DV numerical model.
0 0.1 0.2 0.3 0.4 0.5 0.6 0.7 0.8 0.9 1kp,chc
-1
-0.75
-0.5
-0.25
0
0.25
0.5
0.75
1
P max
/Hiρ
g
a=1.0174 ± 0.1305b=1.4948 ± 0.2394
a=1.7168 ± 0.2114b=2.3025 ± 0.2691
)cosh(5.0
,
max
ccpi hkgHP
=ρ
)cosh(5.0
,
max
ccpi hkgHP
−=ρ
)cosh(5.0
,
max
ccpi hkba
gHP
±=ρ
Figure 9: Empirical model performance. Dimensionless peak pressure around the pipeline: comparison between measured data, empirical model and linear theory approximation.
MWWD 2002
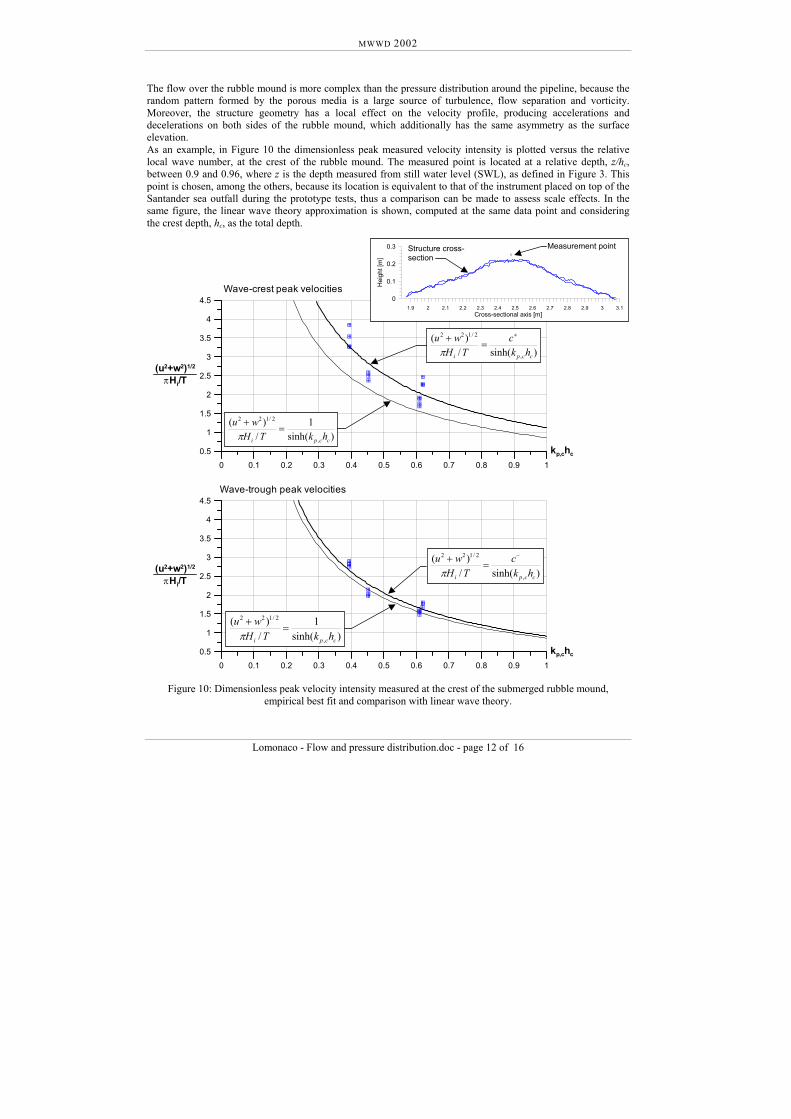
The flow over the rubble mound is more complex than the pressure distribution around the pipeline, because the random pattern formed by the porous media is a large source of turbulence, flow separation and vorticity. Moreover, the structure geometry has a local effect on the velocity profile, producing accelerations and decelerations on both sides of the rubble mound, which additionally has the same asymmetry as the surface elevation. As an example, in Figure 10 the dimensionless peak measured velocity intensity is plotted versus the relative local wave number, at the crest of the rubble mound. The measured point is located at a relative depth, z/hc, between 0.9 and 0.96, where z is the depth measured from still water level (SWL), as defined in Figure 3. This point is chosen, among the others, because its location is equivalent to that of the instrument placed on top of the Santander sea outfall during the prototype tests, thus a comparison can be made to assess scale effects. In the same figure, the linear wave theory approximation is shown, computed at the same data point and considering the crest depth, hc, as the total depth.
0 0.1 0.2 0.3 0.4 0.5 0.6 0.7 0.8 0.90.5
1
1.5
2
2.5
3
3.5
4
4.5
(u2+w2)1/2
πHi/T
Wave-crest peak velocities0
0.1
0.2
0.3
Hei
ght [
m]
1.9 2 2.1 2.2 2.3 2.4 2.5Cross-sectional ax
0 0.1 0.2 0.3 0.4 0.5 0.6 0.7 0.8 0.90.5
1
1.5
2
2.5
3
3.5
4
4.5
(u2+w2)1/2
πHi/T
Wave-trough peak velocities
sinh(/)(
,
2/122
cpi hkc
THwu +
=+
π
)sinh(1
/)(
,
2/122
ccpi hkTHwu
=+
π
sinh(/)(
,
2/122
cpi kc
THwu −
=+
π
)sinh(1
/)(
,
2/122
ccpi hkTHwu
=+
π
)ch
)c
Structure cross-section
Measurement point
1
kp,chc
2.6 2.7 2.8 2.9 3 3.1is [m]
1
kp,chc
Figure 10: Dimensionless peak velocity intensity measured at the crest of the submerged rubble mound,
empirical best fit and comparison with linear wave theory.
Lomonaco - Flow and pressure distribution.doc - page 12 of 16
2ND INTERNATIONAL CONFERENCE ON MARINE WASTE WATER DISCHARGES MWWD 2002 - ISTANBUL SEPT. 16÷20
In this case, the equation proposed to fit the measured data has the form:
)sinh(/)
,
2/1max
2
ccpi hkc
THw ±
=+π
( 2u (2)
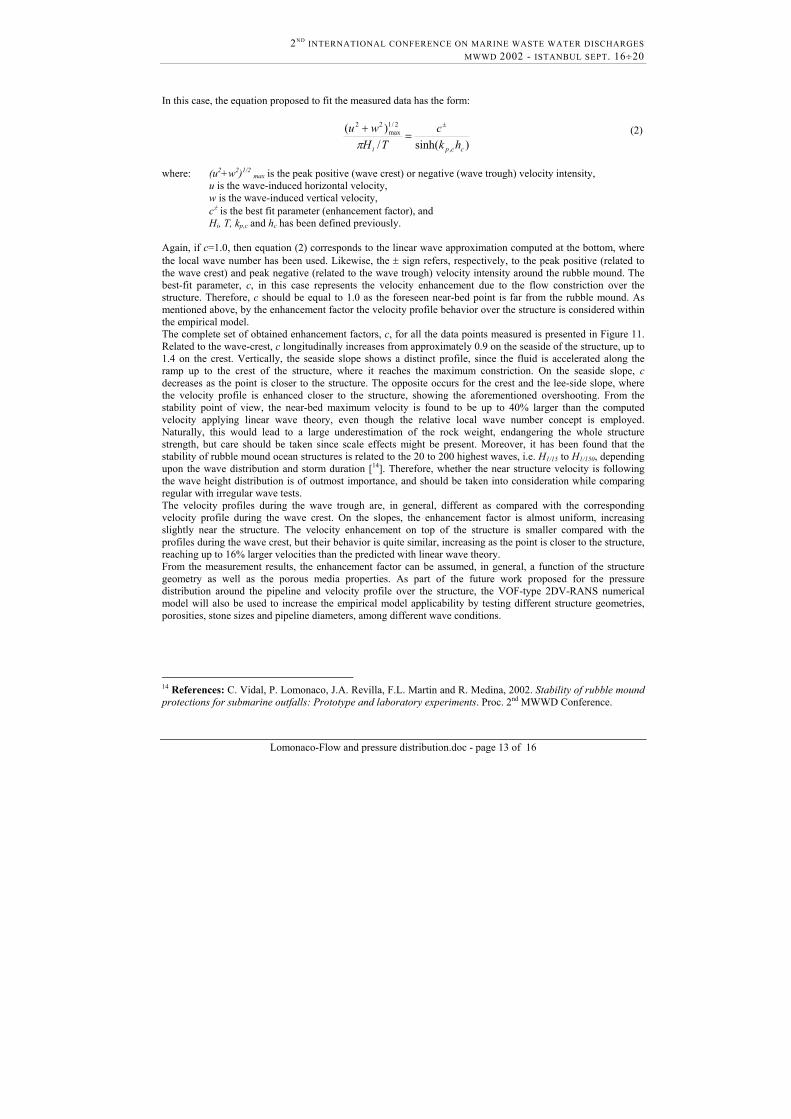
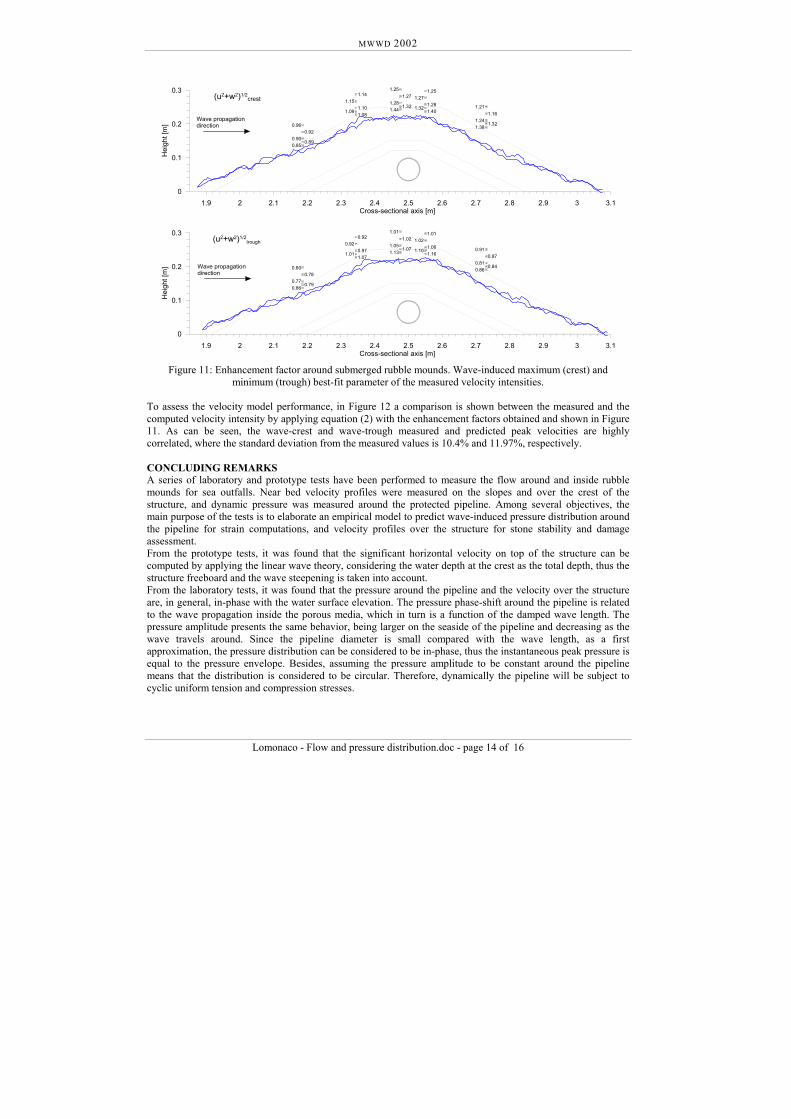
where: (u2+w2)1/2 max is the peak positive (wave crest) or negative (wave trough) velocity intensity, u is the wave-induced horizontal velocity, w is the wave-induced vertical velocity, c± is the best fit parameter (enhancement factor), and Hi, T, kp,c and hc has been defined previously. Again, if c=1.0, then equation (2) corresponds to the linear wave approximation computed at the bottom, where the local wave number has been used. Likewise, the ± sign refers, respectively, to the peak positive (related to the wave crest) and peak negative (related to the wave trough) velocity intensity around the rubble mound. The best-fit parameter, c, in this case represents the velocity enhancement due to the flow constriction over the structure. Therefore, c should be equal to 1.0 as the foreseen near-bed point is far from the rubble mound. As mentioned above, by the enhancement factor the velocity profile behavior over the structure is considered within the empirical model. The complete set of obtained enhancement factors, c, for all the data points measured is presented in Figure 11. Related to the wave-crest, c longitudinally increases from approximately 0.9 on the seaside of the structure, up to 1.4 on the crest. Vertically, the seaside slope shows a distinct profile, since the fluid is accelerated along the ramp up to the crest of the structure, where it reaches the maximum constriction. On the seaside slope, c decreases as the point is closer to the structure. The opposite occurs for the crest and the lee-side slope, where the velocity profile is enhanced closer to the structure, showing the aforementioned overshooting. From the stability point of view, the near-bed maximum velocity is found to be up to 40% larger than the computed velocity applying linear wave theory, even though the relative local wave number concept is employed. Naturally, this would lead to a large underestimation of the rock weight, endangering the whole structure strength, but care should be taken since scale effects might be present. Moreover, it has been found that the stability of rubble mound ocean structures is related to the 20 to 200 highest waves, i.e. H1/15 to H1/150, depending upon the wave distribution and storm duration [14]. Therefore, whether the near structure velocity is following the wave height distribution is of outmost importance, and should be taken into consideration while comparing regular with irregular wave tests. The velocity profiles during the wave trough are, in general, different as compared with the corresponding velocity profile during the wave crest. On the slopes, the enhancement factor is almost uniform, increasing slightly near the structure. The velocity enhancement on top of the structure is smaller compared with the profiles during the wave crest, but their behavior is quite similar, increasing as the point is closer to the structure, reaching up to 16% larger velocities than the predicted with linear wave theory. From the measurement results, the enhancement factor can be assumed, in general, a function of the structure geometry as well as the porous media properties. As part of the future work proposed for the pressure distribution around the pipeline and velocity profile over the structure, the VOF-type 2DV-RANS numerical model will also be used to increase the empirical model applicability by testing different structure geometries, porosities, stone sizes and pipeline diameters, among different wave conditions.
14 References: C. Vidal, P. Lomonaco, J.A. Revilla, F.L. Martin and R. Medina, 2002. Stability of rubble mound protections for submarine outfalls: Prototype and laboratory experiments. Proc. 2nd MWWD Conference.
Lomonaco-Flow and pressure distribution.doc - page 13 of 16
MWWD 2002
0
0.1
0.2
0.3
Hei
ght [
m]
1.9 2 2.1 2.2 2.3 2.4 2.5 2.6 2.7 2.8 2.9 3 3.1Cross-sectional axis [m]
1.381.32
1.241.16
1.211.40
1.321.28
1.271.25
1.441.32
1.281.27
1.25
1.081.09
1.101.15
1.14
0.850.89
0.900.92
0.96
(u2+w2)1/2crest
Wave propagationdirection
0
0.1
0.2
0.3
Hei
ght [
m]
1.9 2 2.1 2.2 2.3 2.4 2.5 2.6 2.7 2.8 2.9 3 3.1Cross-sectional axis [m]
0.860.84
0.810.87
0.911.16
1.101.06
1.021.01
1.131.07
1.051.02
1.01
1.071.01
0.970.92
0.92
0.860.79
0.770.78
0.80
(u2+w2)1/2trough
Wave propagationdirection
Figure 11: Enhancement factor around submerged rubble mounds. Wave-induced maximum (crest) and minimum (trough) best-fit parameter of the measured velocity intensities.
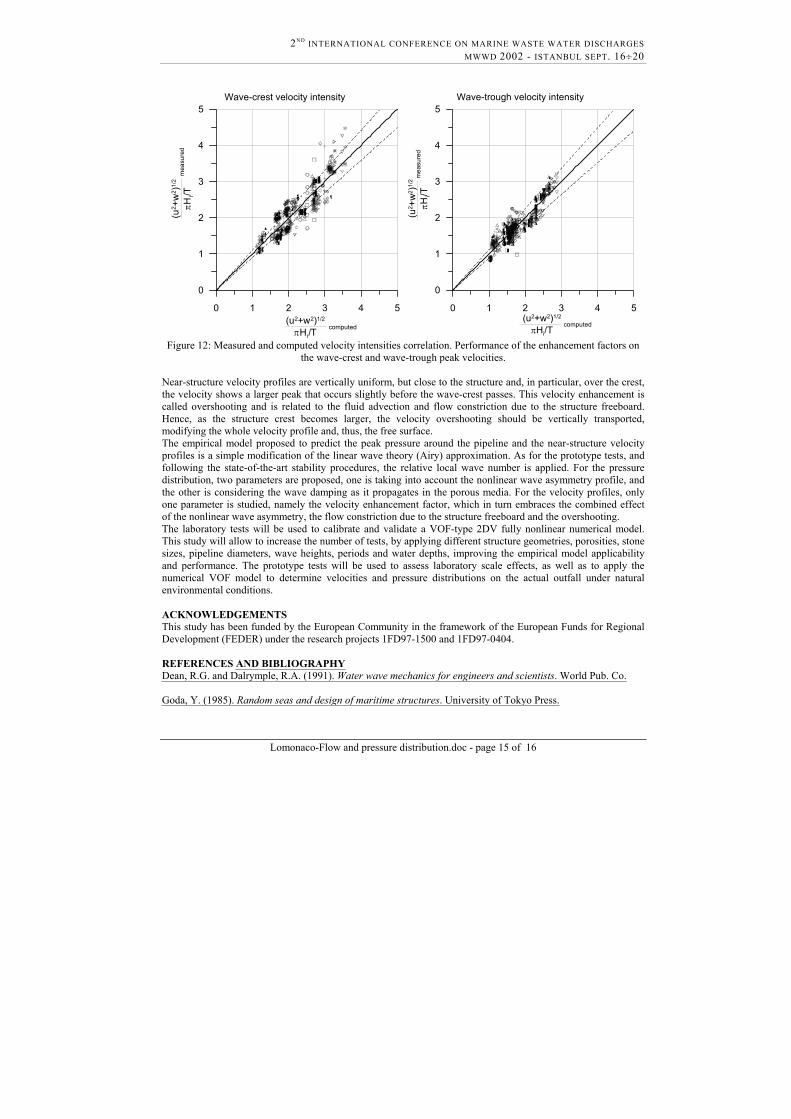
To assess the velocity model performance, in Figure 12 a comparison is shown between the measured and the computed velocity intensity by applying equation (2) with the enhancement factors obtained and shown in Figure 11. As can be seen, the wave-crest and wave-trough measured and predicted peak velocities are highly correlated, where the standard deviation from the measured values is 10.4% and 11.97%, respectively. CONCLUDING REMARKS A series of laboratory and prototype tests have been performed to measure the flow around and inside rubble mounds for sea outfalls. Near bed velocity profiles were measured on the slopes and over the crest of the structure, and dynamic pressure was measured around the protected pipeline. Among several objectives, the main purpose of the tests is to elaborate an empirical model to predict wave-induced pressure distribution around the pipeline for strain computations, and velocity profiles over the structure for stone stability and damage assessment. From the prototype tests, it was found that the significant horizontal velocity on top of the structure can be computed by applying the linear wave theory, considering the water depth at the crest as the total depth, thus the structure freeboard and the wave steepening is taken into account. From the laboratory tests, it was found that the pressure around the pipeline and the velocity over the structure are, in general, in-phase with the water surface elevation. The pressure phase-shift around the pipeline is related to the wave propagation inside the porous media, which in turn is a function of the damped wave length. The pressure amplitude presents the same behavior, being larger on the seaside of the pipeline and decreasing as the wave travels around. Since the pipeline diameter is small compared with the wave length, as a first approximation, the pressure distribution can be considered to be in-phase, thus the instantaneous peak pressure is equal to the pressure envelope. Besides, assuming the pressure amplitude to be constant around the pipeline means that the distribution is considered to be circular. Therefore, dynamically the pipeline will be subject to cyclic uniform tension and compression stresses.
Lomonaco - Flow and pressure distribution.doc - page 14 of 16
2ND INTERNATIONAL CONFERENCE ON MARINE WASTE WATER DISCHARGES MWWD 2002 - ISTANBUL SEPT. 16÷20
0 1 2 3 4 5(u2+w2)1/2
πHi/T
0
1
2
3
4
5
(u2 +
w2 )1/
2
πHi/T
Wave-crest velocity intensity
mea
sure
d
computed
0 1 2 3 4 5(u2+w2)1/2
πHi/T
0
1
2
3
4
5
(u2 +
w2 )1/
2
πHi/T
Wave-trough velocity intensity
mea
sure
d
computed
Figure 12: Measured and computed velocity intensities correlation. Performance of the enhancement factors on
the wave-crest and wave-trough peak velocities. Near-structure velocity profiles are vertically uniform, but close to the structure and, in particular, over the crest, the velocity shows a larger peak that occurs slightly before the wave-crest passes. This velocity enhancement is called overshooting and is related to the fluid advection and flow constriction due to the structure freeboard. Hence, as the structure crest becomes larger, the velocity overshooting should be vertically transported, modifying the whole velocity profile and, thus, the free surface. The empirical model proposed to predict the peak pressure around the pipeline and the near-structure velocity profiles is a simple modification of the linear wave theory (Airy) approximation. As for the prototype tests, and following the state-of-the-art stability procedures, the relative local wave number is applied. For the pressure distribution, two parameters are proposed, one is taking into account the nonlinear wave asymmetry profile, and the other is considering the wave damping as it propagates in the porous media. For the velocity profiles, only one parameter is studied, namely the velocity enhancement factor, which in turn embraces the combined effect of the nonlinear wave asymmetry, the flow constriction due to the structure freeboard and the overshooting. The laboratory tests will be used to calibrate and validate a VOF-type 2DV fully nonlinear numerical model. This study will allow to increase the number of tests, by applying different structure geometries, porosities, stone sizes, pipeline diameters, wave heights, periods and water depths, improving the empirical model applicability and performance. The prototype tests will be used to assess laboratory scale effects, as well as to apply the numerical VOF model to determine velocities and pressure distributions on the actual outfall under natural environmental conditions. ACKNOWLEDGEMENTS This study has been funded by the European Community in the framework of the European Funds for Regional Development (FEDER) under the research projects 1FD97-1500 and 1FD97-0404. REFERENCES AND BIBLIOGRAPHY Dean, R.G. and Dalrymple, R.A. (1991). Water wave mechanics for engineers and scientists. World Pub. Co. Goda, Y. (1985). Random seas and design of maritime structures. University of Tokyo Press.
Lomonaco-Flow and pressure distribution.doc - page 15 of 16
MWWD 2002
Lomonaco - Flow and pressure distribution.doc - page 16 of 16
Liu, P.L.-F., Hsu, T.J., Lin, P.-Z., Losada, I.J., Vidal, C. and Sakakiyama, T. (2000). The Cornell Breaking Wave
and Structure (COBRAS) model. Proc. Coastal Structures ’99. June 7 to 10, 1999. Santander, Spain. Lomonaco, P. (1994). Design of rock cover for underwater pipelines. M.Sc. Thesis. IHE-Delft, The Netherlands. Lomonaco, P. and Klomp, W.H.G. (1997). Rock cover damage assessment. Proc. BOSS Conference, July 7 to
10, 1997. Delft, The Netherlands. Mansard, E.P.D. and Funke, E.R. (1981). The measurement of incident and reflected spectra using a least
squares method. Proc. 17th ICCE, March 23 to 28, 1980. Sydney, Australia. Vidal, C., Lomonaco, P. and Martin, F.L. (2002). Prototype analysis of stability of rubble mound protections for
submarine outfalls. Proc. 28th ICCE. July 7 to 12, 2002. Cardiff, United Kindom. Vidal, C., Lomonaco, P., Revilla, J.A., Martin, F.L. and Medina, R. (2002). Stability of rubble mound
protections for submarine outfalls: Prototype and laboratory experiments. Proc. 2nd MWWD Conference, September 16 to 20, 2002. Istanbul, Turkey.
Vidal, C., Losada, I.J. and Martin, F.L. (1999). Stability of near-bed rubble-mound structures. Proc. 26th ICCE,
June 22 to 26, 1998. Copenhaguen, Denmark.