
EXPANDING OUR REACH - Amazon AWS
300
EXPANDING OUR REACH Annual Report 2013 Annual Report 2013 IOI CORPORATION BERHAD (9027-W) Two IOI Square, IOI Resort, 62502 Putrajaya, Malaysia www.ioigroup.com IOI CORPORATION BERHAD (9027-W)
-
Upload
khangminh22 -
Category
Documents
-
view
3 -
download
0
Transcript of EXPANDING OUR REACH - Amazon AWS
EXPANDING OUR REACHAnnual Report 2013
An
nu
al Re
po
rt 2013
IOI CORPORATION BERHAD (9027-W)
Two IOI Square, IOI Resort, 62502 Putrajaya, Malaysia
www.ioigroup.com
IOI C
OR
PO
RA
TIO
N B
ER
HA
D
(9027-W
)

OurVision
Cover Rationale
…is to be a leading corporation in our core businesses
by providing products and services of superior values
and by sustaining consistent long-term growth in
volume and profitability.
We shall strive to achieve responsible commercial
success by satisfying our customers’ needs, giving
superior performance to our shareholders, providing
rewarding careers to our people, cultivating mutually
beneficial relationship with our business associates,
caring for the society and the environment in which
we operate and contributing towards the progress of
our nation.
2013 marks a year of growth and expansion for IOI
Group as we set our sights on Expanding our Reach. By
continuously seizing new opportunities, enhancing our
product offerings and growing our business portfolio, we
have strengthened our competitive edge and delivered
added values to our customers and shareholders.
The cover design features IOI Group’s three core
operations. As we expand our reach in Malaysia and
abroad, we are committed to growing sustainably on our
journey to become a global leader in our integrated
plantation and property businesses.

In our pursuit of Vision IOI, we
expect our people to uphold, at
all times, the IOI Core Values
which are expressed as follows:
Integrity
which is essential and cannot
be compromised
Commitment
as we do what we say
we will do
Loyalty
is crucial because we are
one team sharing one vision
Excellence in Execution
as our commitments can
only be realised through
actions and results
Our Core ValuesSpeed or Timeliness
in response is important
in our ever changing
business environment
Innovativeness
to provide us additional
competitive edge
Cost Efficiency
is crucial as we need
to remain competitive
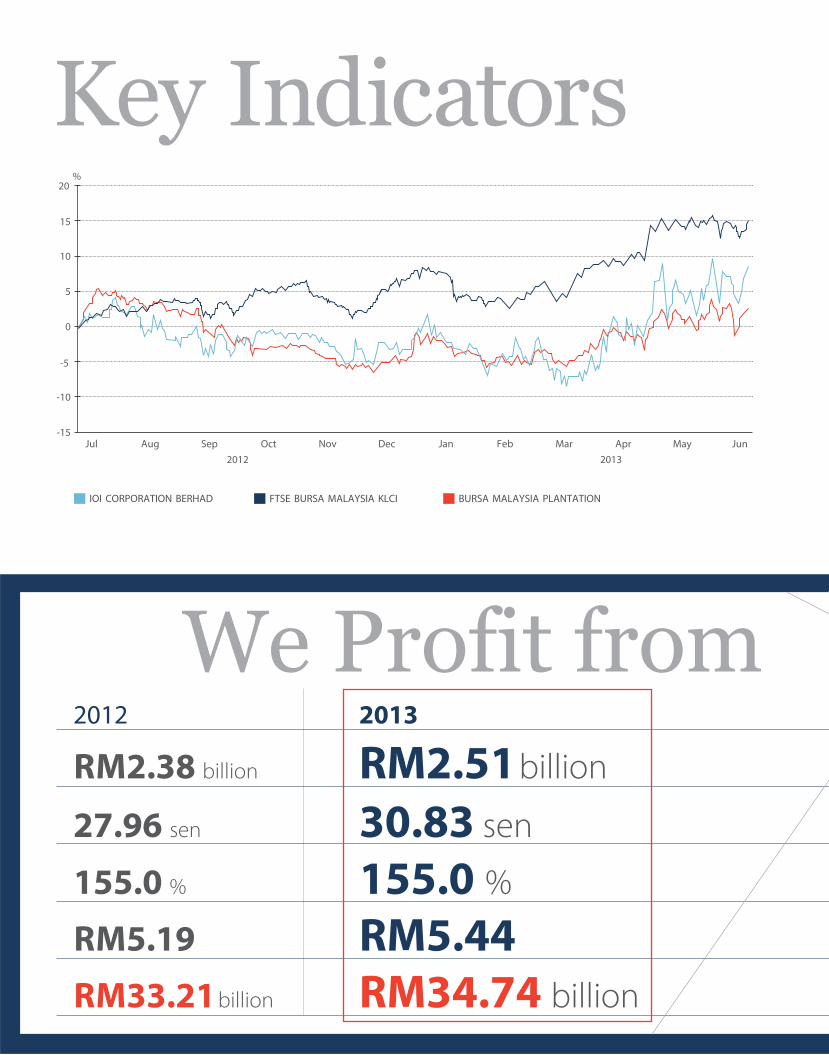
RM2.51 billionRM2.38 billion
27.96 sen
155.0 %
RM5.19
RM33.21billion RM34.74 billion
RM5.44
30.83 sen
155.0 %
We Profit from 2012 2013
Key Indicators20
%
15
10
0
5
-15
-10
-5
Jul
IOI CORPORATION BERHAD FTSE BURSA MALAYSIA KLCI BURSA MALAYSIA PLANTATION
Aug Sep
2012 2013
Oct Nov Dec Jan Feb Mar Apr May Jun
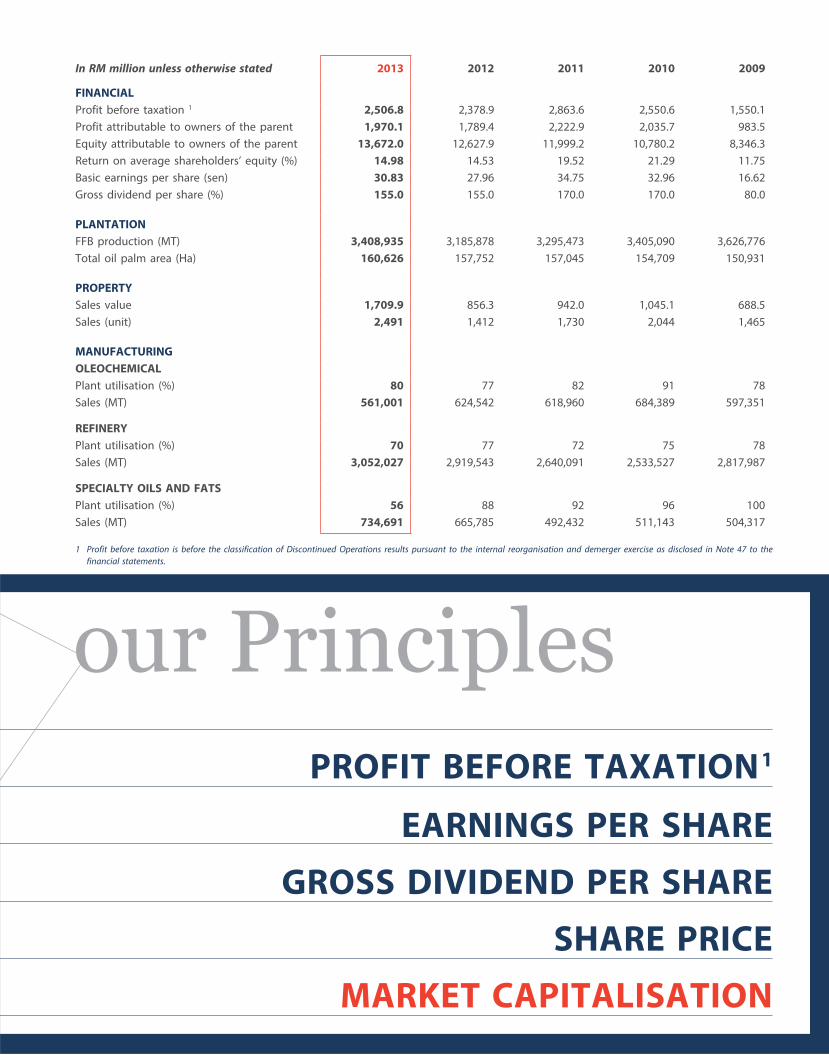
PROFIT BEFORE TAXATION1
EARNINGS PER SHARE
GROSS DIVIDEND PER SHARE
SHARE PRICE
MARKET CAPITALISATION
our Principles
In RM million unless otherwise stated 2013 2012 2011 2010 2009
FINANCIAL
Profit before taxation 1 2,506.8 2,378.9 2,863.6 2,550.6 1,550.1
Profit attributable to owners of the parent 1,970.1 1,789.4 2,222.9 2,035.7 983.5
Equity attributable to owners of the parent 13,672.0 12,627.9 11,999.2 10,780.2 8,346.3
Return on average shareholders’ equity (%) 14.98 14.53 19.52 21.29 11.75
Basic earnings per share (sen) 30.83 27.96 34.75 32.96 16.62
Gross dividend per share (%) 155.0 155.0 170.0 170.0 80.0
PLANTATION
FFB production (MT) 3,408,935 3,185,878 3,295,473 3,405,090 3,626,776
Total oil palm area (Ha) 160,626 157,752 157,045 154,709 150,931
PROPERTY
Sales value 1,709.9 856.3 942.0 1,045.1 688.5
Sales (unit) 2,491 1,412 1,730 2,044 1,465
MANUFACTURING
OLEOCHEMICAL
Plant utilisation (%) 80 77 82 91 78
Sales (MT) 561,001 624,542 618,960 684,389 597,351
REFINERY
Plant utilisation (%) 70 77 72 75 78
Sales (MT) 3,052,027 2,919,543 2,640,091 2,533,527 2,817,987
SPECIALTY OILS AND FATS
Plant utilisation (%) 56 88 92 96 100
Sales (MT) 734,691 665,785 492,432 511,143 504,317
1 Profit before taxation is before the classification of Discontinued Operations results pursuant to the internal reorganisation and demerger exercise as disclosed in Note 47 to the
financial statements.
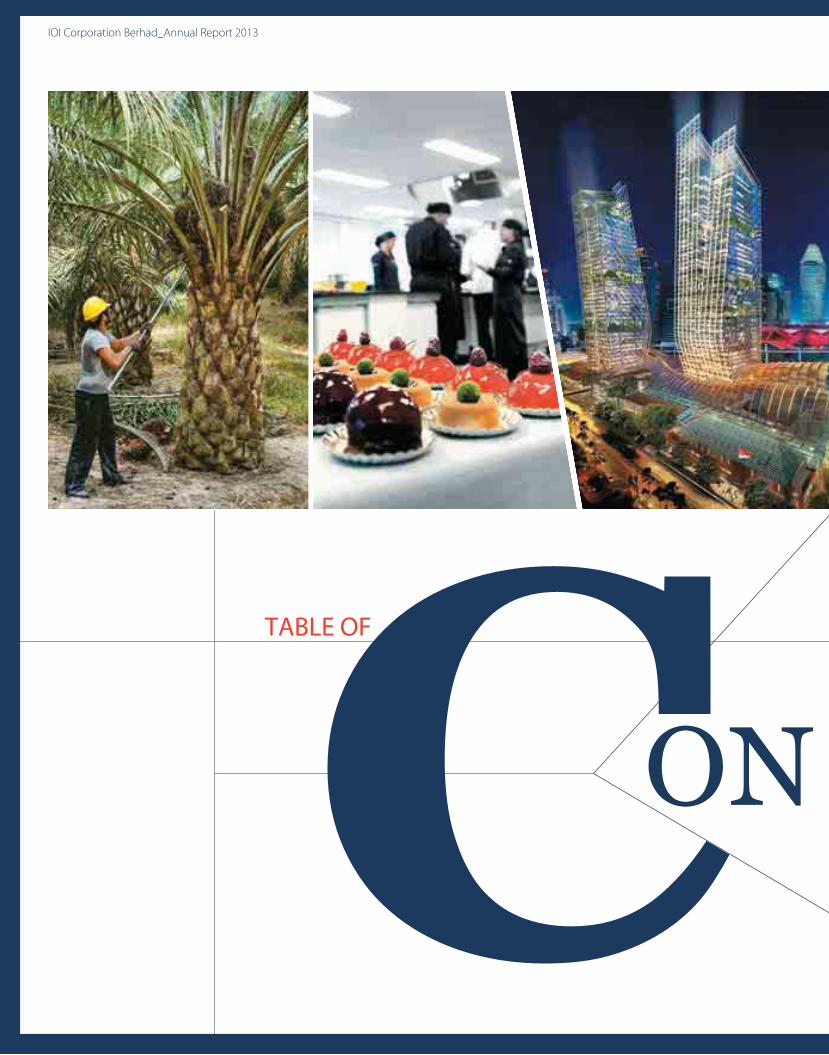
IOI Corporation Berhad_Annual Report 2013
TABLE OF
ON
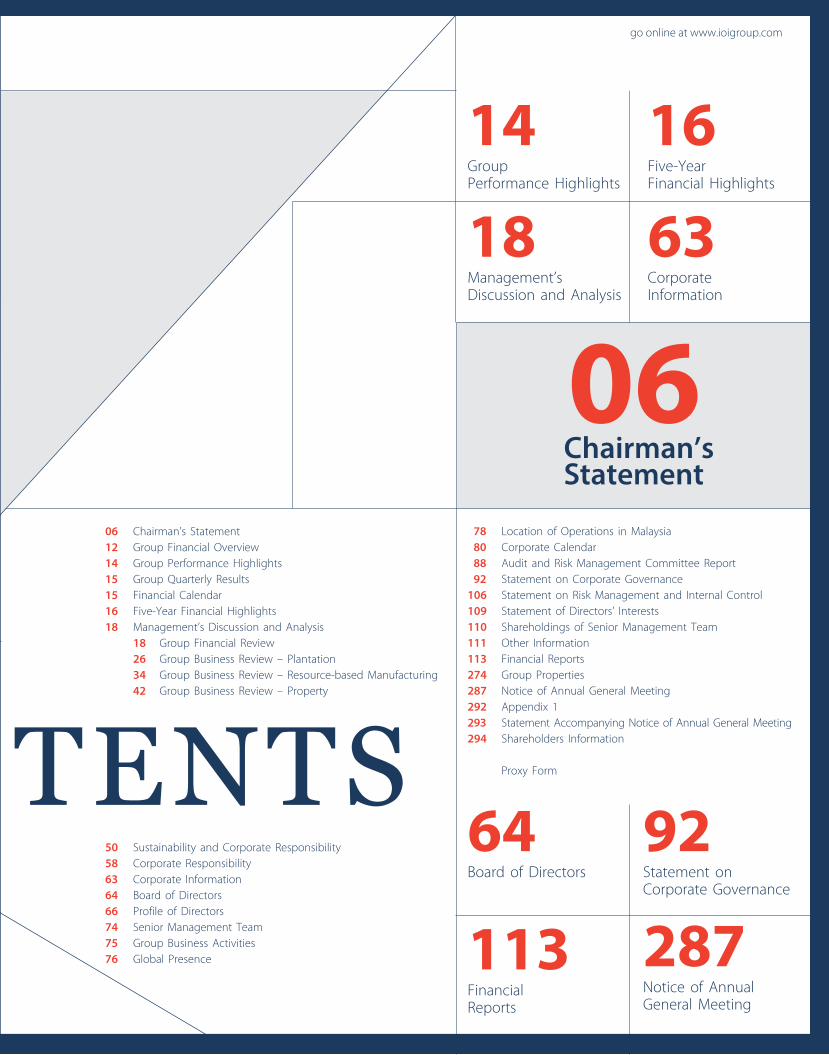
06Chairman’s Statement
14Group Performance Highlights
64Board of Directors
16Five-Year Financial Highlights
92Statement on Corporate Governance
18Management’s Discussion and Analysis
113Financial Reports
63Corporate Information
287Notice of Annual General Meeting
TENTS
go online at www.ioigroup.com
06 Chairman’s Statement
12 Group Financial Overview
14 Group Performance Highlights
15 Group Quarterly Results
15 Financial Calendar
16 Five-Year Financial Highlights
18 Management’s Discussion and Analysis
18 Group Financial Review
26 Group Business Review – Plantation
34 Group Business Review – Resource-based Manufacturing
42 Group Business Review – Property
50 Sustainability and Corporate Responsibility
58 Corporate Responsibility
63 Corporate Information
64 Board of Directors
66 Profile of Directors
74 Senior Management Team
75 Group Business Activities
76 Global Presence
78 Location of Operations in Malaysia
80 Corporate Calendar
88 Audit and Risk Management Committee Report
92 Statement on Corporate Governance
106 Statement on Risk Management and Internal Control
109 Statement of Directors’ Interests
110 Shareholdings of Senior Management Team
111 Other Information
113 Financial Reports
274 Group Properties
287 Notice of Annual General Meeting
292 Appendix 1
293 Statement Accompanying Notice of Annual General Meeting
294 Shareholders Information
Proxy Form
IOI
Cor
por
atio
n B
erh
ad
6
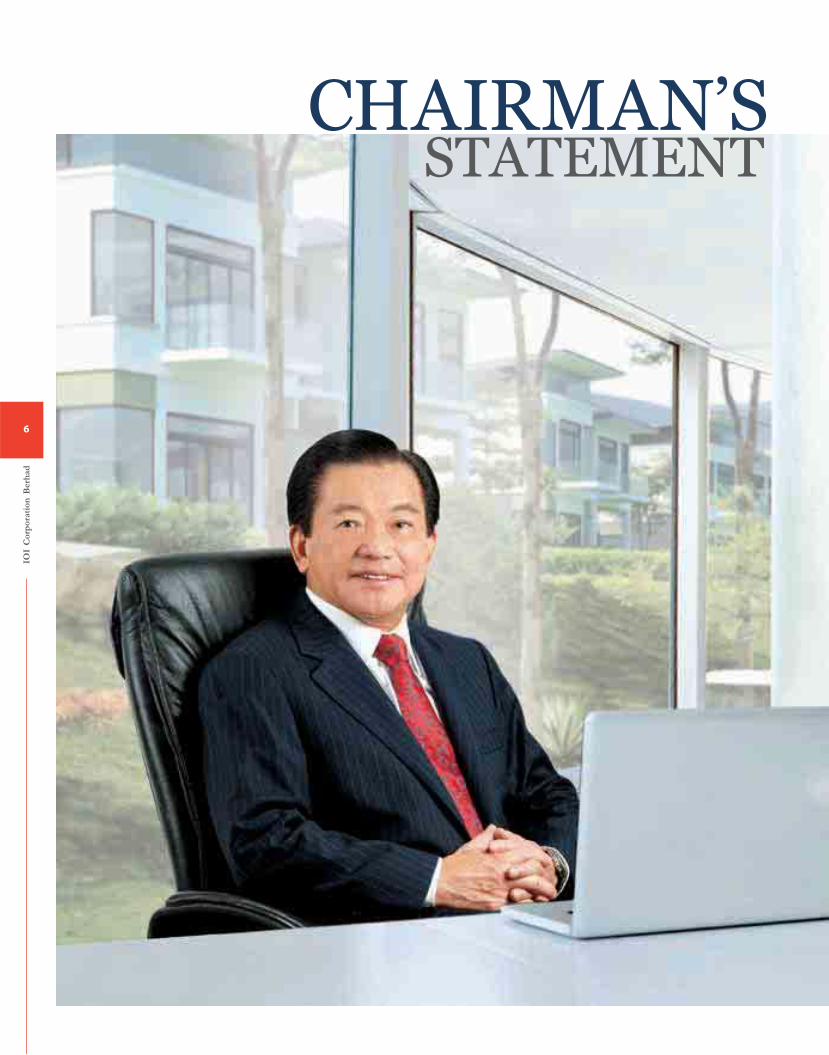
CHAIRMAN’SSTATEMENT
Dear Shareholders,
On behalf of the Board of Directors of IOI Corporation Berhad, I am pleased to present to you the Annual Report of the Company and the Group for the financial year ended 30 June 2013 (“FY2013”).
OPERATING ENVIRONMENT
The financial year under review continues to be yet another
challenging year. The global economy recovery was fairly sluggish
and sporadic. Conversely, the Malaysian economy has continued
to hold up well to achieve a consistent Gross Domestic Product
(“GDP”) growth rate of around 5% per annum. Market sentiments
were generally upbeat with low inflationary pressure and Bank
Negara Malaysia (“BNM”) holding interest rates steady.
In the palm oil sector, Crude Palm Oil (“CPO”) prices were relatively
low since the last quarter of 2012 but the earlier stock overhang
affecting the sector’s outlook had reduced substantially. The palm
oil downstream industries, on the other hand, have performed
relatively well due to lower feedstock prices.
In the domestic property scene, sales of properties at prime areas
remained encouraging despite a cautious property market
backdrop. Over at the Singapore’s property market, the high-end
properties segment continues to be affected by the additional
buyer’s stamp duty imposed as part of the Singapore government’s
property cooling measures.
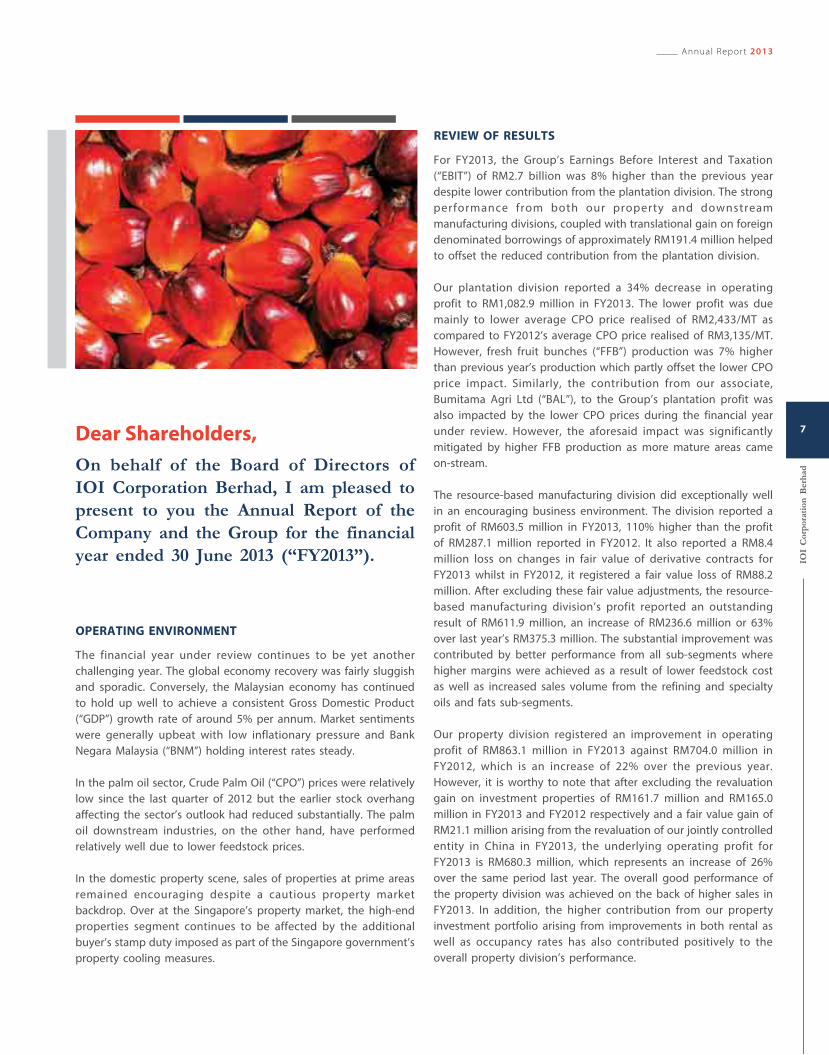
REVIEW OF RESULTS
For FY2013, the Group’s Earnings Before Interest and Taxation
(“EBIT”) of RM2.7 billion was 8% higher than the previous year
despite lower contribution from the plantation division. The strong
performance from both our property and downstream
manufacturing divisions, coupled with translational gain on foreign
denominated borrowings of approximately RM191.4 million helped
to offset the reduced contribution from the plantation division.
Our plantation division reported a 34% decrease in operating
profit to RM1,082.9 million in FY2013. The lower profit was due
mainly to lower average CPO price realised of RM2,433/MT as
compared to FY2012’s average CPO price realised of RM3,135/MT.
However, fresh fruit bunches (“FFB”) production was 7% higher
than previous year’s production which partly offset the lower CPO
price impact. Similarly, the contribution from our associate,
Bumitama Agri Ltd (“BAL”), to the Group’s plantation profit was
also impacted by the lower CPO prices during the financial year
under review. However, the aforesaid impact was significantly
mitigated by higher FFB production as more mature areas came
on-stream.
The resource-based manufacturing division did exceptionally well
in an encouraging business environment. The division reported a
profit of RM603.5 million in FY2013, 110% higher than the profit
of RM287.1 million reported in FY2012. It also reported a RM8.4
million loss on changes in fair value of derivative contracts for
FY2013 whilst in FY2012, it registered a fair value loss of RM88.2
million. After excluding these fair value adjustments, the resource-
based manufacturing division’s profit reported an outstanding
result of RM611.9 million, an increase of RM236.6 million or 63%
over last year’s RM375.3 million. The substantial improvement was
contributed by better performance from all sub-segments where
higher margins were achieved as a result of lower feedstock cost
as well as increased sales volume from the refining and specialty
oils and fats sub-segments.
Our property division registered an improvement in operating
profit of RM863.1 million in FY2013 against RM704.0 million in
FY2012, which is an increase of 22% over the previous year.
However, it is worthy to note that after excluding the revaluation
gain on investment properties of RM161.7 million and RM165.0
million in FY2013 and FY2012 respectively and a fair value gain of
RM21.1 million arising from the revaluation of our jointly controlled
entity in China in FY2013, the underlying operating profit for
FY2013 is RM680.3 million, which represents an increase of 26%
over the same period last year. The overall good performance of
the property division was achieved on the back of higher sales in
FY2013. In addition, the higher contribution from our property
investment portfolio arising from improvements in both rental as
well as occupancy rates has also contributed positively to the
overall property division’s performance.
Annual Report 2013
IOI
Cor
por
atio
n B
erh
ad
7
The panoramic view of Pukin Estate, Pahang.
At net earnings level, the Group posted a net earnings of RM1,970.1
million in FY2013 which is approximately 10% higher than the net
earnings of RM1,789.4 million in FY2012. The slightly higher
percentage increase at net earnings level as compared to EBIT
percentage increase of 8% is mainly due to lower tax expense and
minority interest charge.
A more detailed review of the Group’s performance is covered
under the section on “Management’s Discussion and Analysis” in
this Annual Report.
BUSINESS DEVELOPMENTS
On the plantation front, the Group is actively increasing its
holdings of planted land by new plantings targeted at around
22,000 hectares per annum (including that by its associate, BAL)
over the next three years in Indonesia. As a result of its substantial
new and replanting programme over the past several years, the
percentage of young plantings (aged seven years and below) has
increased to 32% of the Group’s total planted areas. As a
strategic move into the renewable energy sector, the Group is
leveraging on the plantation’s biomass by-products and waste by
constructing biogas capturing plants in two of its CPO mills, in
addition to the biomass power plant that the Group has completed
in Sandakan, Sabah.
As for our downstream manufacturing business, the Group will be
setting up an integrated palm oil processing plant costing
approximately RMB355 million (equivalent to approximately
RM182 million) in Xiamen, China. This is to cater to the growing
demands for specialty oils and fats and palm oil-related products
by the huge and increasingly affluent Chinese population.
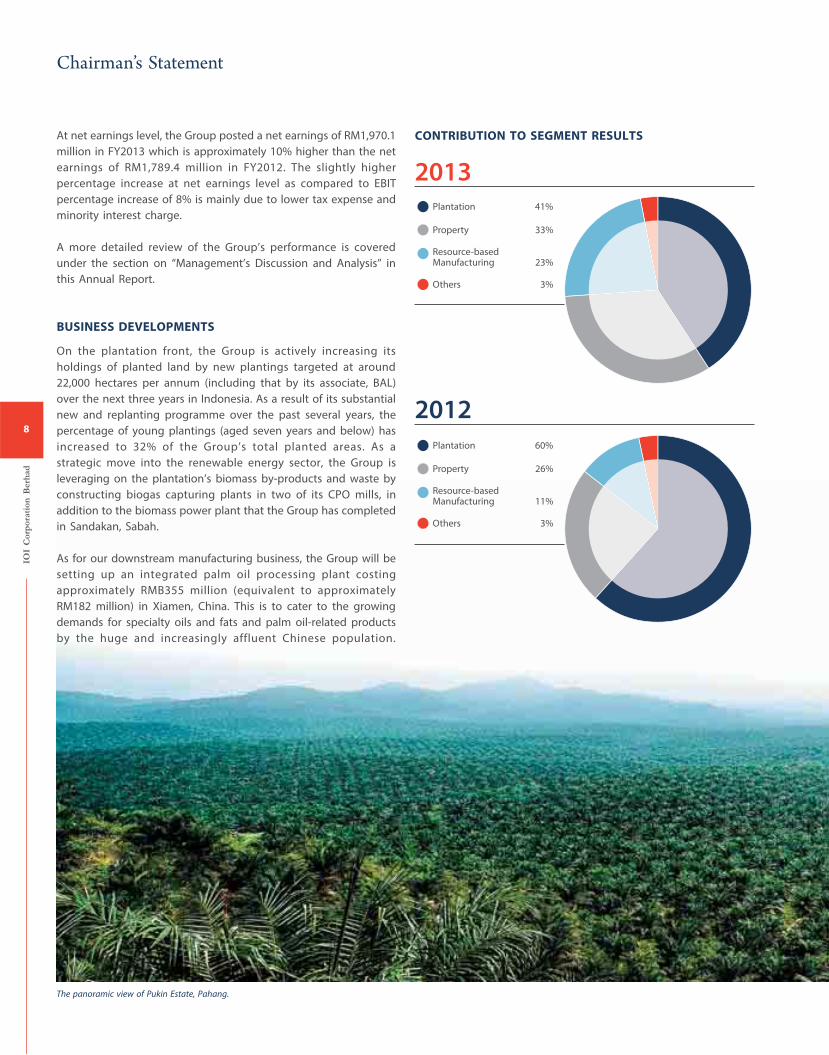
2013
2012
CONTRIBUTION TO SEGMENT RESULTS
Property 33%
Others 3%
Plantation 41%
Resource-based Manufacturing 23%
Property 26%
Others 3%
Plantation 60%
Resource-based Manufacturing 11%
IOI
Cor
por
atio
n B
erh
ad
8
Chairman’s Statement
We have also invested in a joint venture with Adeka Corporation
of Japan to manufacture premium grade margarine and filling fats
in Malaysia. In the oleochemical sub-segment, our state-of-the-art
fatty ester plant in Prai, Penang, catering to the cosmetics and
food additives industries is scheduled to be completed by the
second quarter of 2014.
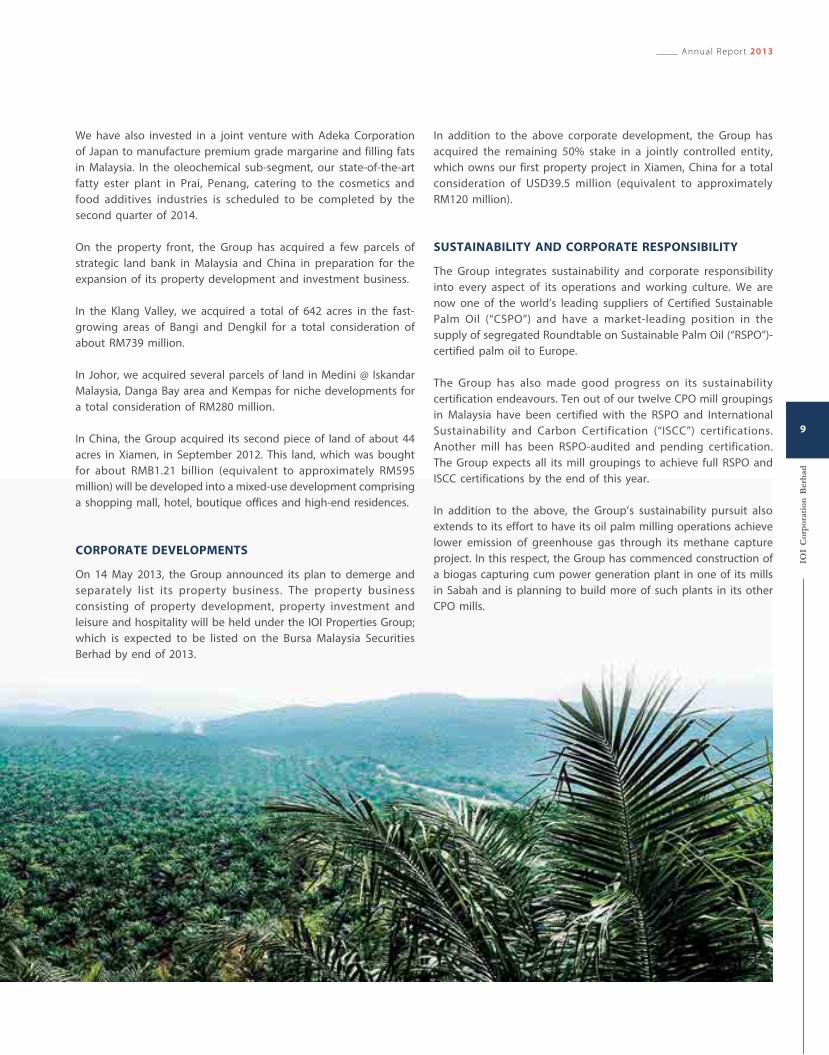
On the property front, the Group has acquired a few parcels of
strategic land bank in Malaysia and China in preparation for the
expansion of its property development and investment business.
In the Klang Valley, we acquired a total of 642 acres in the fast-
growing areas of Bangi and Dengkil for a total consideration of
about RM739 million.
In Johor, we acquired several parcels of land in Medini @ Iskandar
Malaysia, Danga Bay area and Kempas for niche developments for
a total consideration of RM280 million.
In China, the Group acquired its second piece of land of about 44
acres in Xiamen, in September 2012. This land, which was bought
for about RMB1.21 billion (equivalent to approximately RM595
million) will be developed into a mixed-use development comprising
a shopping mall, hotel, boutique offices and high-end residences.
CORPORATE DEVELOPMENTS
On 14 May 2013, the Group announced its plan to demerge and
separately list its property business. The property business
consisting of property development, property investment and
leisure and hospitality will be held under the IOI Properties Group;
which is expected to be listed on the Bursa Malaysia Securities
Berhad by end of 2013.
In addition to the above corporate development, the Group has
acquired the remaining 50% stake in a jointly controlled entity,
which owns our first property project in Xiamen, China for a total
consideration of USD39.5 million (equivalent to approximately
RM120 million).
SUSTAINABILITY AND CORPORATE RESPONSIBILITY
The Group integrates sustainability and corporate responsibility
into every aspect of its operations and working culture. We are
now one of the world’s leading suppliers of Certified Sustainable
Palm Oil (“CSPO”) and have a market-leading position in the
supply of segregated Roundtable on Sustainable Palm Oil (“RSPO”)-
certified palm oil to Europe.
The Group has also made good progress on its sustainability
certification endeavours. Ten out of our twelve CPO mill groupings
in Malaysia have been certified with the RSPO and International
Sustainability and Carbon Certification (“ISCC”) certifications.
Another mill has been RSPO-audited and pending certification.
The Group expects all its mill groupings to achieve full RSPO and
ISCC certifications by the end of this year.
In addition to the above, the Group’s sustainability pursuit also
extends to its effort to have its oil palm milling operations achieve
lower emission of greenhouse gas through its methane capture
project. In this respect, the Group has commenced construction of
a biogas capturing cum power generation plant in one of its mills
in Sabah and is planning to build more of such plants in its other
CPO mills.
Annual Report 2013
IOI
Cor
por
atio
n B
erh
ad
9

Cape Royale, another one of IOI Properties’ luxury condominium developments at Sentosa Cove, provides a unique integrated marina lifestyle for the residents.
Besides driving sustainable profit growth and returns for the
shareholders, the Group also undertakes many corporate
responsibility (“CR”) activities. This is done mainly through Yayasan
Tan Sri Lee Shin Cheng (“Yayasan TSLSC”), a charitable foundation
fully funded by the Group, which has been established since 1994.
During FY2013, Yayasan TSLSC committed about RM3.0 million in
funding its various projects and activities.
As the Group continues to expand its operations, it will strive to
further broaden and deepen its sustainability and CR endeavours.
Key highlights of the Group’s many sustainability measures
and CR initiatives are covered in the “Sustainability and Corporate
Responsibility” section.
DIVIDENDS AND CAPITAL MANAGEMENT
Two interim dividends totalling 15.5 sen per ordinary share
amounting to a total payout of approximately RM990.1 million
were declared for FY2013. The dividends represented an
approximately 50% distribution of the Group’s net profit
attributable to shareholders.
The company continues to manage its capital in a proactive
manner to enhance value to shareholders while optimising gearing
levels and providing for funding requirements.
During the year, the Company bought back 18,858,000 ordinary
shares of the Company from the open market at an average price
of RM5.10 per share, representing 0.3% of the issued and paid-up
share capital of the Company.
The Group also continues to maintain a healthy cash and cash
equivalents, which as at 30 June 2013 stood at RM3.41 billion, and
a net gearing ratio of 32%.
IOI
Cor
por
atio
n B
erh
ad
10
Chairman’s Statement
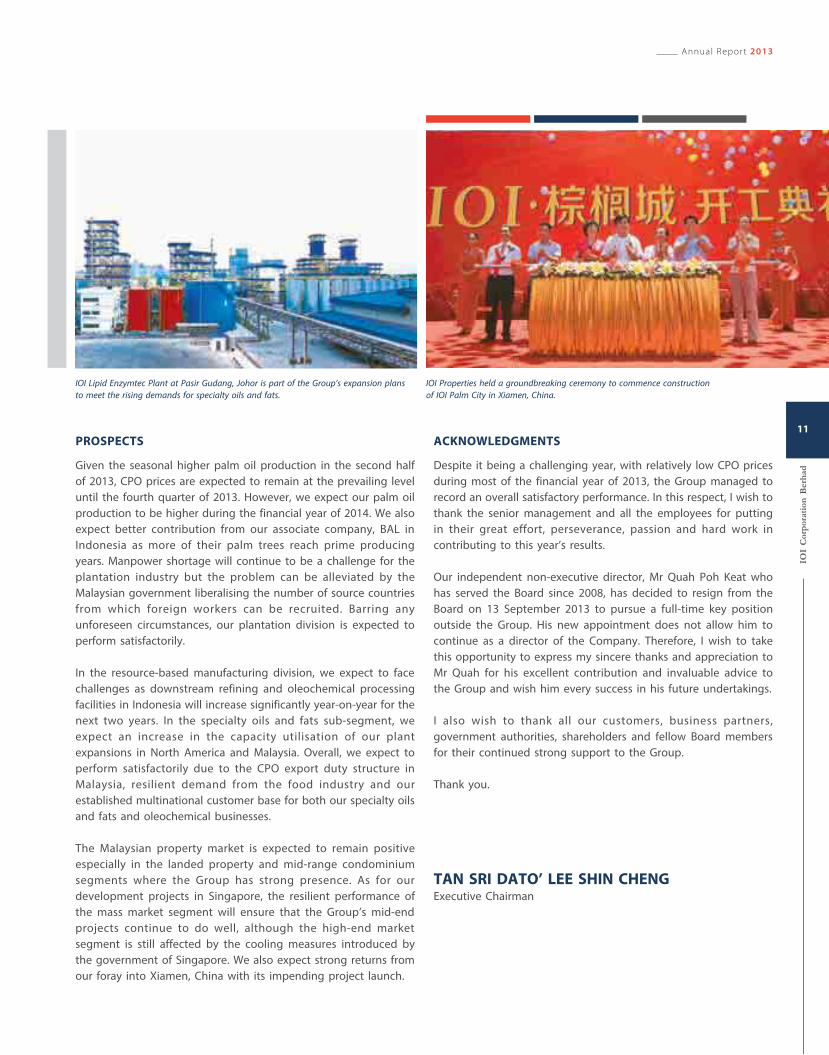
IOI Properties held a groundbreaking ceremony to commence construction
of IOI Palm City in Xiamen, China.
IOI Lipid Enzymtec Plant at Pasir Gudang, Johor is part of the Group’s expansion plans
to meet the rising demands for specialty oils and fats.
PROSPECTS
Given the seasonal higher palm oil production in the second half
of 2013, CPO prices are expected to remain at the prevailing level
until the fourth quarter of 2013. However, we expect our palm oil
production to be higher during the financial year of 2014. We also
expect better contribution from our associate company, BAL in
Indonesia as more of their palm trees reach prime producing
years. Manpower shortage will continue to be a challenge for the
plantation industry but the problem can be alleviated by the
Malaysian government liberalising the number of source countries
from which foreign workers can be recruited. Barring any
unforeseen circumstances, our plantation division is expected to
perform satisfactorily.
In the resource-based manufacturing division, we expect to face
challenges as downstream refining and oleochemical processing
facilities in Indonesia will increase significantly year-on-year for the
next two years. In the specialty oils and fats sub-segment, we
expect an increase in the capacity utilisation of our plant
expansions in North America and Malaysia. Overall, we expect to
perform satisfactorily due to the CPO export duty structure in
Malaysia, resilient demand from the food industry and our
established multinational customer base for both our specialty oils
and fats and oleochemical businesses.
The Malaysian property market is expected to remain positive
especially in the landed property and mid-range condominium
segments where the Group has strong presence. As for our
development projects in Singapore, the resilient performance of
the mass market segment will ensure that the Group’s mid-end
projects continue to do well, although the high-end market
segment is still affected by the cooling measures introduced by
the government of Singapore. We also expect strong returns from
our foray into Xiamen, China with its impending project launch.
ACKNOWLEDGMENTS
Despite it being a challenging year, with relatively low CPO prices
during most of the financial year of 2013, the Group managed to
record an overall satisfactory performance. In this respect, I wish to
thank the senior management and all the employees for putting
in their great effort, perseverance, passion and hard work in
contributing to this year’s results.
Our independent non-executive director, Mr Quah Poh Keat who
has served the Board since 2008, has decided to resign from the
Board on 13 September 2013 to pursue a full-time key position
outside the Group. His new appointment does not allow him to
continue as a director of the Company. Therefore, I wish to take
this opportunity to express my sincere thanks and appreciation to
Mr Quah for his excellent contribution and invaluable advice to
the Group and wish him every success in his future undertakings.
I also wish to thank all our customers, business partners,
government authorities, shareholders and fellow Board members
for their continued strong support to the Group.
Thank you.
TAN SRI DATO’ LEE SHIN CHENGExecutive Chairman
Annual Report 2013
IOI
Cor
por
atio
n B
erh
ad
11
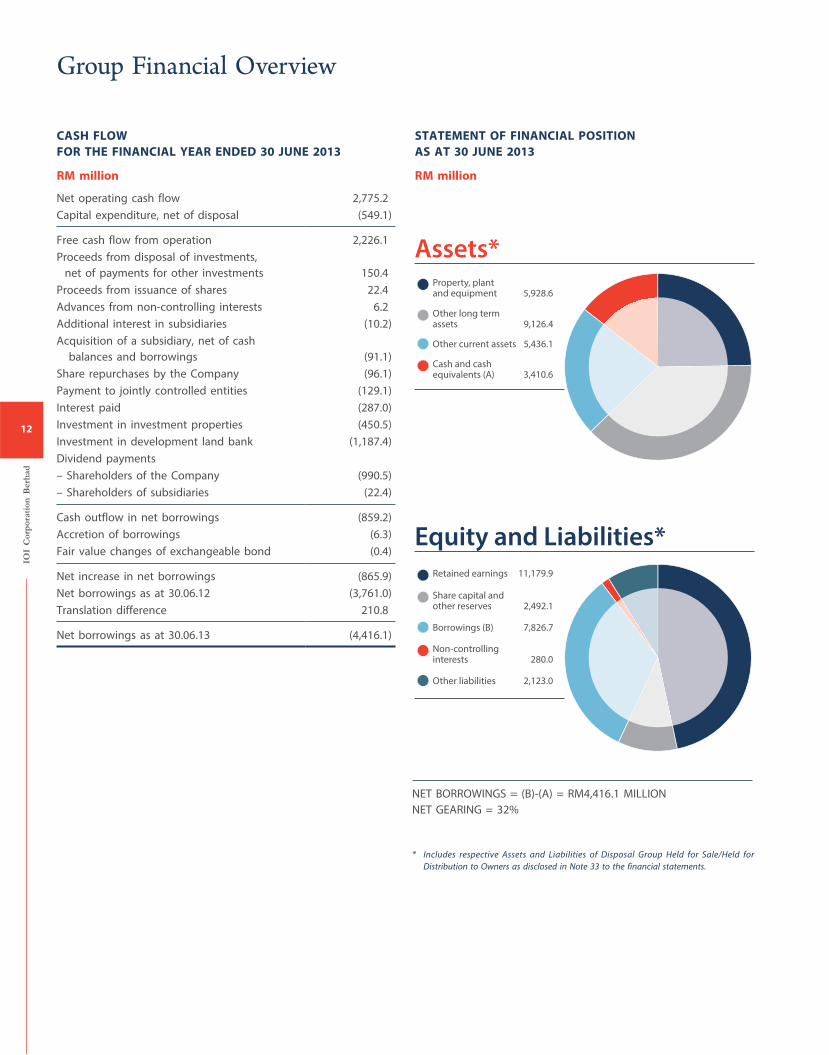
Assets*
Equity and Liabilities*
NET BORROWINGS = (B)-(A) = RM4,416.1 MILLION
NET GEARING = 32%
CASH FLOW
FOR THE FINANCIAL YEAR ENDED 30 JUNE 2013
RM million
Net operating cash flow 2,775.2
Capital expenditure, net of disposal (549.1)
Free cash flow from operation 2,226.1
Proceeds from disposal of investments,
net of payments for other investments 150.4
Proceeds from issuance of shares 22.4
Advances from non-controlling interests 6.2
Additional interest in subsidiaries (10.2)
Acquisition of a subsidiary, net of cash
balances and borrowings (91.1)
Share repurchases by the Company (96.1)
Payment to jointly controlled entities (129.1)
Interest paid (287.0)
Investment in investment properties (450.5)
Investment in development land bank (1,187.4)
Dividend payments
– Shareholders of the Company (990.5)
– Shareholders of subsidiaries (22.4)
Cash outflow in net borrowings (859.2)
Accretion of borrowings (6.3)
Fair value changes of exchangeable bond (0.4)
Net increase in net borrowings (865.9)
Net borrowings as at 30.06.12 (3,761.0)
Translation difference 210.8
Net borrowings as at 30.06.13 (4,416.1)
STATEMENT OF FINANCIAL POSITION
AS AT 30 JUNE 2013
RM million
Other long term assets 9,126.4
Property, plant and equipment 5,928.6
Cash and cash equivalents (A) 3,410.6
Other current assets 5,436.1
Share capital and other reserves 2,492.1
Retained earnings 11,179.9
Non-controlling interests 280.0
Other liabilities 2,123.0
Borrowings (B) 7,826.7
* Includes respective Assets and Liabilities of Disposal Group Held for Sale/Held for
Distribution to Owners as disclosed in Note 33 to the financial statements.
IOI
Cor
por
atio
n B
erh
ad
12
Group Financial Overview
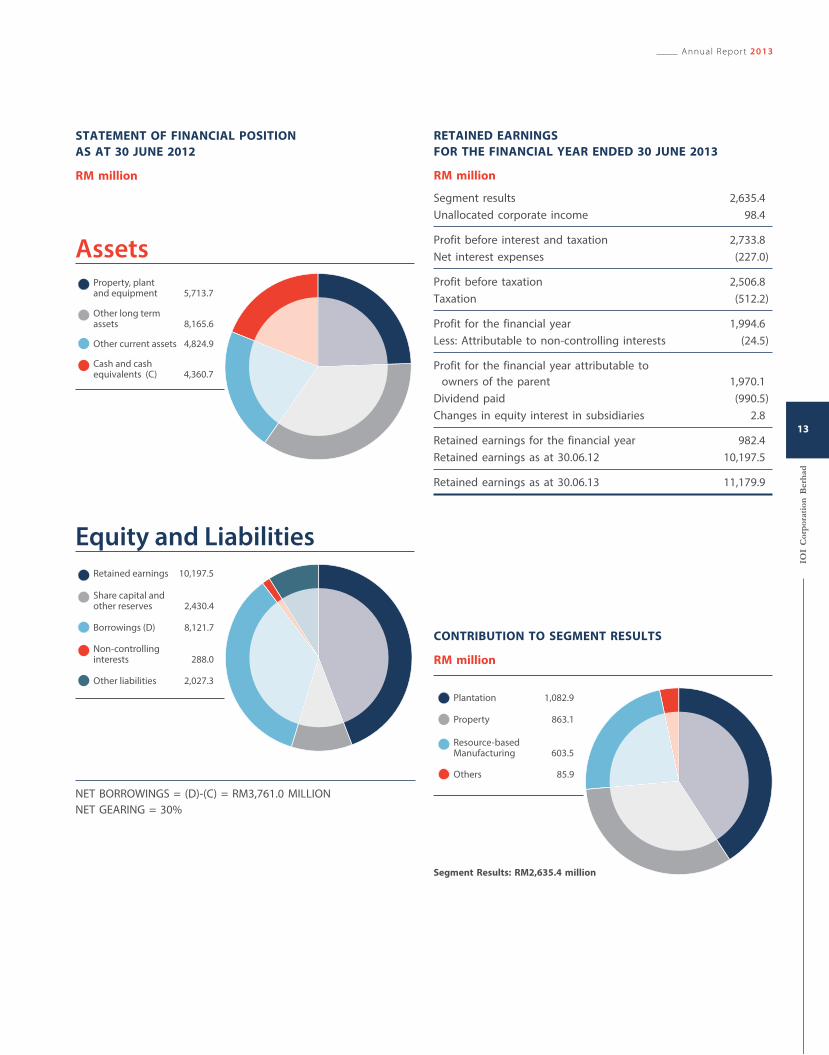
Assets
Equity and Liabilities
NET BORROWINGS = (D)-(C) = RM3,761.0 MILLION
NET GEARING = 30%
Segment Results: RM2,635.4 million
STATEMENT OF FINANCIAL POSITION
AS AT 30 JUNE 2012
RM million
CONTRIBUTION TO SEGMENT RESULTS
RM million
RETAINED EARNINGS
FOR THE FINANCIAL YEAR ENDED 30 JUNE 2013
RM million
Segment results 2,635.4
Unallocated corporate income 98.4
Profit before interest and taxation 2,733.8
Net interest expenses (227.0)
Profit before taxation 2,506.8
Taxation (512.2)
Profit for the financial year 1,994.6
Less: Attributable to non-controlling interests (24.5)
Profit for the financial year attributable to
owners of the parent 1,970.1
Dividend paid (990.5)
Changes in equity interest in subsidiaries 2.8
Retained earnings for the financial year 982.4
Retained earnings as at 30.06.12 10,197.5
Retained earnings as at 30.06.13 11,179.9
Other long term assets 8,165.6
Property, plant and equipment 5,713.7
Cash and cash equivalents (C) 4,360.7
Other current assets 4,824.9
Share capital and other reserves 2,430.4
Retained earnings 10,197.5
Non-controlling interests 288.0
Other liabilities 2,027.3
Borrowings (D) 8,121.7
Property 863.1
Plantation 1,082.9
Resource-based Manufacturing 603.5
Others 85.9
Annual Report 2013
IOI
Cor
por
atio
n B
erh
ad
13
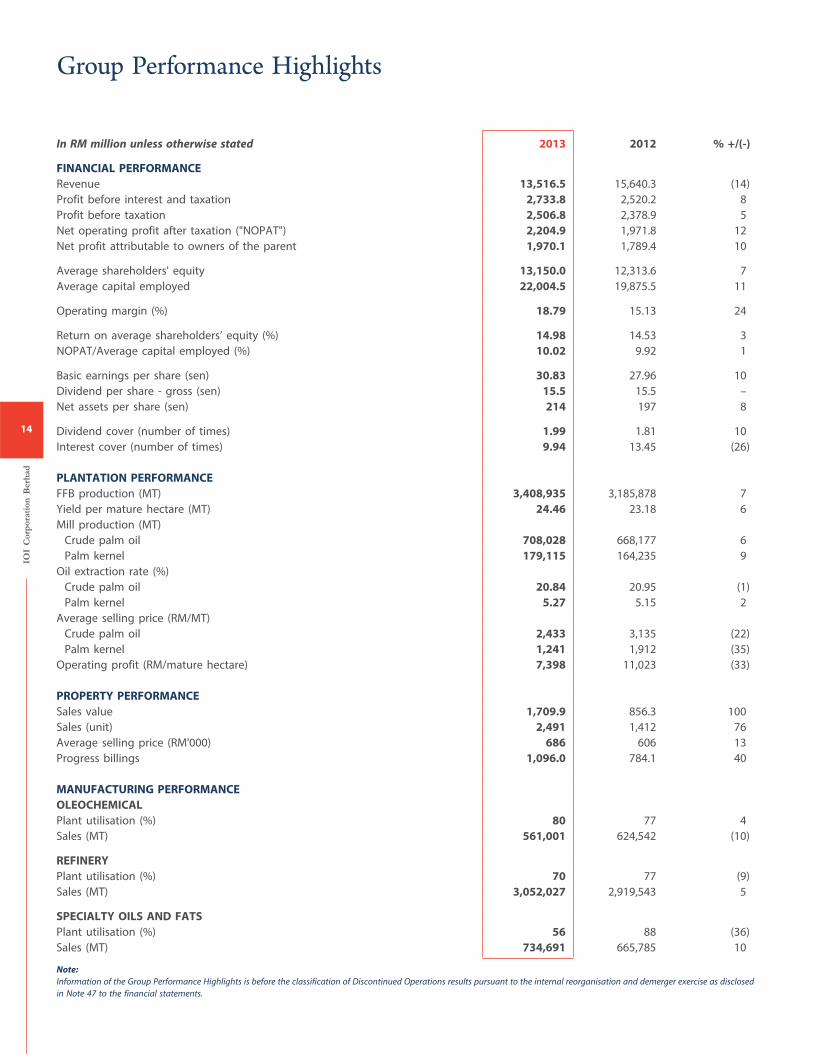
In RM million unless otherwise stated 2013 2012 % +/(-)
FINANCIAL PERFORMANCE
Revenue 13,516.5 15,640.3 (14)
Profit before interest and taxation 2,733.8 2,520.2 8
Profit before taxation 2,506.8 2,378.9 5
Net operating profit after taxation ("NOPAT") 2,204.9 1,971.8 12
Net profit attributable to owners of the parent 1,970.1 1,789.4 10
Average shareholders' equity 13,150.0 12,313.6 7
Average capital employed 22,004.5 19,875.5 11
Operating margin (%) 18.79 15.13 24
Return on average shareholders’ equity (%) 14.98 14.53 3
NOPAT/Average capital employed (%) 10.02 9.92 1
Basic earnings per share (sen) 30.83 27.96 10
Dividend per share - gross (sen) 15.5 15.5 –
Net assets per share (sen) 214 197 8
Dividend cover (number of times) 1.99 1.81 10
Interest cover (number of times) 9.94 13.45 (26)
PLANTATION PERFORMANCE
FFB production (MT) 3,408,935 3,185,878 7
Yield per mature hectare (MT) 24.46 23.18 6
Mill production (MT)
Crude palm oil 708,028 668,177 6
Palm kernel 179,115 164,235 9
Oil extraction rate (%)
Crude palm oil 20.84 20.95 (1)
Palm kernel 5.27 5.15 2
Average selling price (RM/MT)
Crude palm oil 2,433 3,135 (22)
Palm kernel 1,241 1,912 (35)
Operating profit (RM/mature hectare) 7,398 11,023 (33)
PROPERTY PERFORMANCE
Sales value 1,709.9 856.3 100
Sales (unit) 2,491 1,412 76
Average selling price (RM'000) 686 606 13
Progress billings 1,096.0 784.1 40
MANUFACTURING PERFORMANCE
OLEOCHEMICAL
Plant utilisation (%) 80 77 4
Sales (MT) 561,001 624,542 (10)
REFINERY
Plant utilisation (%) 70 77 (9)
Sales (MT) 3,052,027 2,919,543 5
SPECIALTY OILS AND FATS
Plant utilisation (%) 56 88 (36)
Sales (MT) 734,691 665,785 10
Note:Information of the Group Performance Highlights is before the classification of Discontinued Operations results pursuant to the internal reorganisation and demerger exercise as disclosed
in Note 47 to the financial statements.
IOI
Cor
por
atio
n B
erh
ad
14
Group Performance Highlights
Financial Calendar
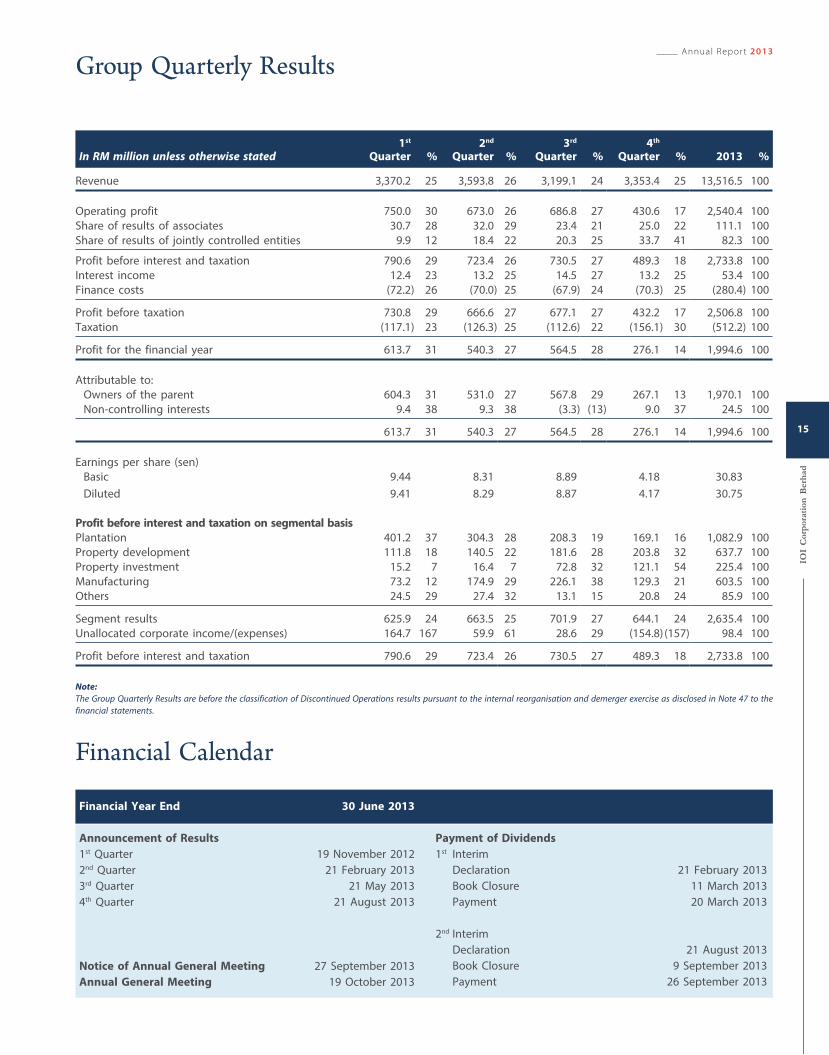
Financial Year End 30 June 2013
Announcement of Results
1st Quarter 19 November 2012
2nd Quarter 21 February 2013
3rd Quarter 21 May 2013
4th Quarter 21 August 2013
Payment of Dividends
1st Interim
Declaration 21 February 2013
Book Closure 11 March 2013
Payment 20 March 2013
2nd Interim
Declaration 21 August 2013
Book Closure 9 September 2013
Payment 26 September 2013
Notice of Annual General Meeting 27 September 2013
Annual General Meeting 19 October 2013
In RM million unless otherwise stated1st
Quarter %2nd
Quarter %3rd
Quarter %4th
Quarter % 2013 %
Revenue 3,370.2 25 3,593.8 26 3,199.1 24 3,353.4 25 13,516.5 100
Operating profit 750.0 30 673.0 26 686.8 27 430.6 17 2,540.4 100
Share of results of associates 30.7 28 32.0 29 23.4 21 25.0 22 111.1 100
Share of results of jointly controlled entities 9.9 12 18.4 22 20.3 25 33.7 41 82.3 100
Profit before interest and taxation 790.6 29 723.4 26 730.5 27 489.3 18 2,733.8 100
Interest income 12.4 23 13.2 25 14.5 27 13.2 25 53.4 100
Finance costs (72.2) 26 (70.0) 25 (67.9) 24 (70.3) 25 (280.4) 100
Profit before taxation 730.8 29 666.6 27 677.1 27 432.2 17 2,506.8 100
Taxation (117.1) 23 (126.3) 25 (112.6) 22 (156.1) 30 (512.2) 100
Profit for the financial year 613.7 31 540.3 27 564.5 28 276.1 14 1,994.6 100
Attributable to:
Owners of the parent 604.3 31 531.0 27 567.8 29 267.1 13 1,970.1 100
Non-controlling interests 9.4 38 9.3 38 (3.3) (13) 9.0 37 24.5 100
613.7 31 540.3 27 564.5 28 276.1 14 1,994.6 100
Earnings per share (sen)
Basic 9.44 8.31 8.89 4.18 30.83
Diluted 9.41 8.29 8.87 4.17 30.75
Profit before interest and taxation on segmental basis
Plantation 401.2 37 304.3 28 208.3 19 169.1 16 1,082.9 100
Property development 111.8 18 140.5 22 181.6 28 203.8 32 637.7 100
Property investment 15.2 7 16.4 7 72.8 32 121.1 54 225.4 100
Manufacturing 73.2 12 174.9 29 226.1 38 129.3 21 603.5 100
Others 24.5 29 27.4 32 13.1 15 20.8 24 85.9 100
Segment results 625.9 24 663.5 25 701.9 27 644.1 24 2,635.4 100
Unallocated corporate income/(expenses) 164.7 167 59.9 61 28.6 29 (154.8) (157) 98.4 100
Profit before interest and taxation 790.6 29 723.4 26 730.5 27 489.3 18 2,733.8 100
Note:The Group Quarterly Results are before the classification of Discontinued Operations results pursuant to the internal reorganisation and demerger exercise as disclosed in Note 47 to the
financial statements.
Annual Report 2013
IOI
Cor
por
atio
n B
erh
ad
15
Group Quarterly Results
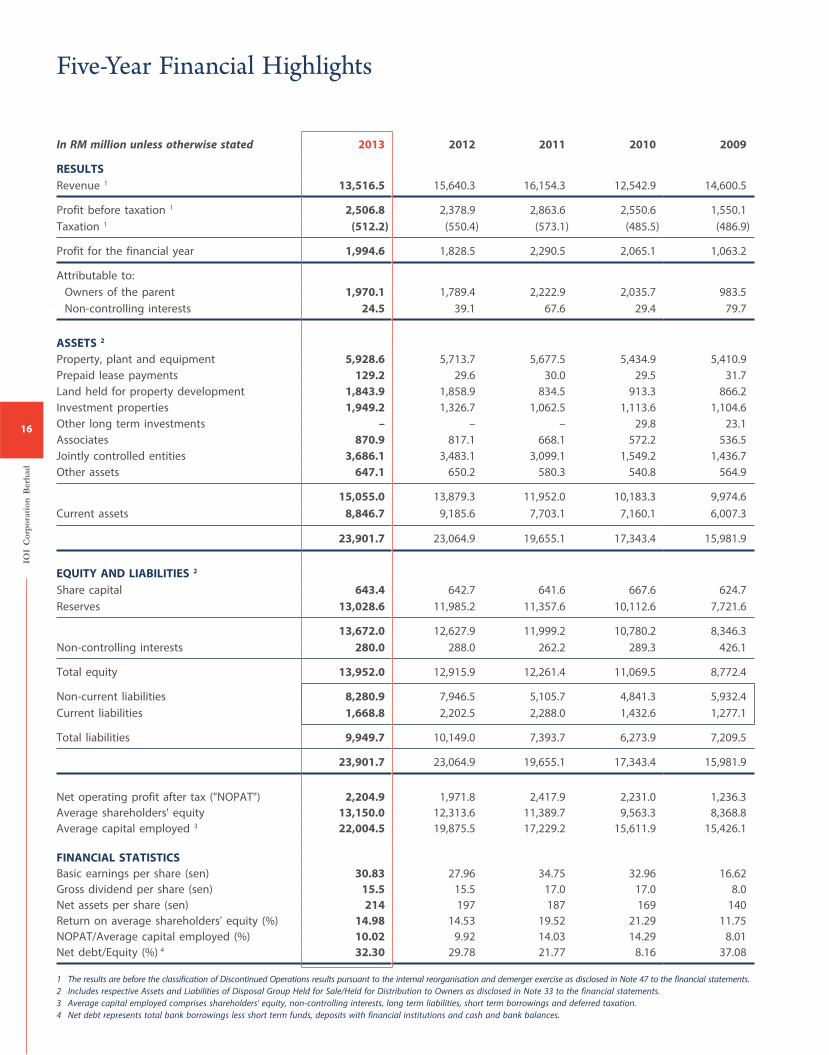
In RM million unless otherwise stated 2013 2012 2011 2010 2009
RESULTS
Revenue 1 13,516.5 15,640.3 16,154.3 12,542.9 14,600.5
Profit before taxation 1 2,506.8 2,378.9 2,863.6 2,550.6 1,550.1
Taxation 1 (512.2) (550.4) (573.1) (485.5) (486.9)
Profit for the financial year 1,994.6 1,828.5 2,290.5 2,065.1 1,063.2
Attributable to:
Owners of the parent 1,970.1 1,789.4 2,222.9 2,035.7 983.5
Non-controlling interests 24.5 39.1 67.6 29.4 79.7
ASSETS 2
Property, plant and equipment 5,928.6 5,713.7 5,677.5 5,434.9 5,410.9
Prepaid lease payments 129.2 29.6 30.0 29.5 31.7
Land held for property development 1,843.9 1,858.9 834.5 913.3 866.2
Investment properties 1,949.2 1,326.7 1,062.5 1,113.6 1,104.6
Other long term investments – – – 29.8 23.1
Associates 870.9 817.1 668.1 572.2 536.5
Jointly controlled entities 3,686.1 3,483.1 3,099.1 1,549.2 1,436.7
Other assets 647.1 650.2 580.3 540.8 564.9
15,055.0 13,879.3 11,952.0 10,183.3 9,974.6
Current assets 8,846.7 9,185.6 7,703.1 7,160.1 6,007.3
23,901.7 23,064.9 19,655.1 17,343.4 15,981.9
EQUITY AND LIABILITIES 2
Share capital 643.4 642.7 641.6 667.6 624.7
Reserves 13,028.6 11,985.2 11,357.6 10,112.6 7,721.6
13,672.0 12,627.9 11,999.2 10,780.2 8,346.3
Non-controlling interests 280.0 288.0 262.2 289.3 426.1
Total equity 13,952.0 12,915.9 12,261.4 11,069.5 8,772.4
Non-current liabilities 8,280.9 7,946.5 5,105.7 4,841.3 5,932.4
Current liabilities 1,668.8 2,202.5 2,288.0 1,432.6 1,277.1
Total liabilities 9,949.7 10,149.0 7,393.7 6,273.9 7,209.5
23,901.7 23,064.9 19,655.1 17,343.4 15,981.9
Net operating profit after tax ("NOPAT") 2,204.9 1,971.8 2,417.9 2,231.0 1,236.3
Average shareholders' equity 13,150.0 12,313.6 11,389.7 9,563.3 8,368.8
Average capital employed 3 22,004.5 19,875.5 17,229.2 15,611.9 15,426.1
FINANCIAL STATISTICS
Basic earnings per share (sen) 30.83 27.96 34.75 32.96 16.62
Gross dividend per share (sen) 15.5 15.5 17.0 17.0 8.0
Net assets per share (sen) 214 197 187 169 140
Return on average shareholders' equity (%) 14.98 14.53 19.52 21.29 11.75
NOPAT/Average capital employed (%) 10.02 9.92 14.03 14.29 8.01
Net debt/Equity (%) 4 32.30 29.78 21.77 8.16 37.08
1 The results are before the classification of Discontinued Operations results pursuant to the internal reorganisation and demerger exercise as disclosed in Note 47 to the financial statements.
2 Includes respective Assets and Liabilities of Disposal Group Held for Sale/Held for Distribution to Owners as disclosed in Note 33 to the financial statements.
3 Average capital employed comprises shareholders' equity, non-controlling interests, long term liabilities, short term borrowings and deferred taxation.
4 Net debt represents total bank borrowings less short term funds, deposits with financial institutions and cash and bank balances.
IOI
Cor
por
atio
n B
erh
ad
16
Five-Year Financial Highlights
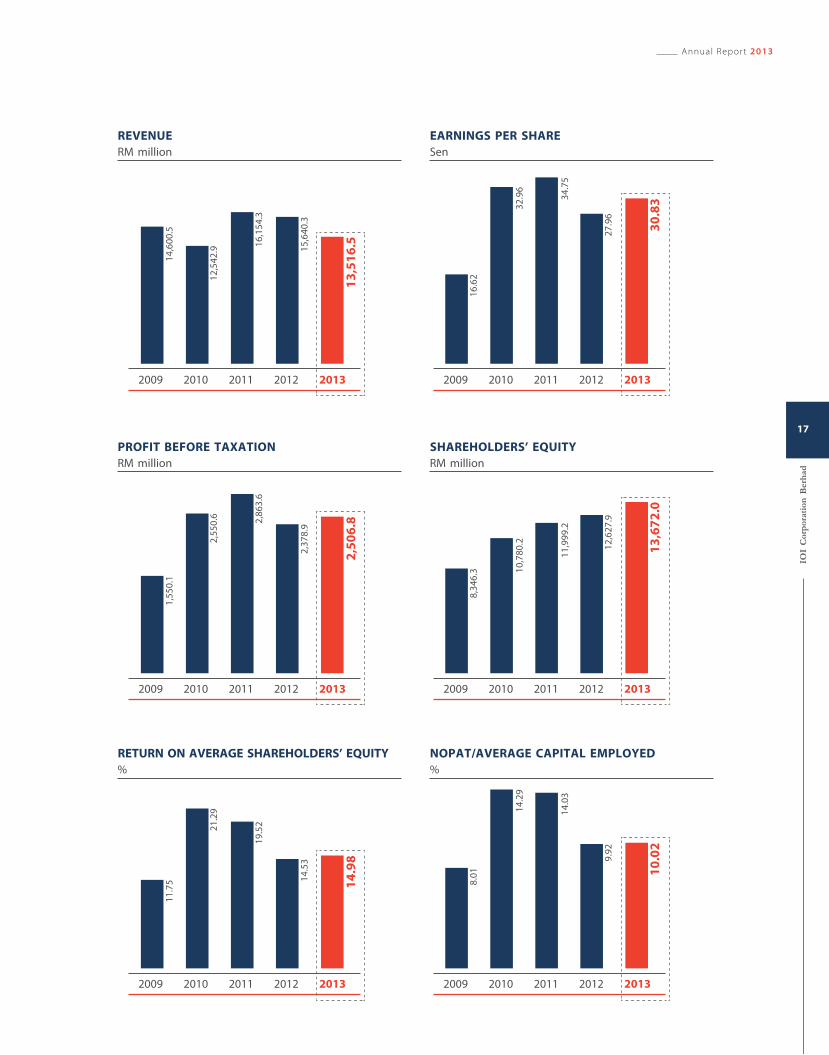
2013
30
.83
27
.96
34
.75
32
.96
16
.62
2012201120102009
2013
13
,67
2.0
12
,62
7.9
11
,99
9.2
10
,78
0.2
8,3
46
.3
2012201120102009
2013
10
.02
9.9
2
14
.03
14
.29
8.0
1
2012201120102009
2013
13
,51
6.515
,64
0.3
16
,15
4.3
12
,54
2.9
14
,60
0.5
2012201120102009
2013
2,5
06
.8
2,3
78
.9
2,8
63
.6
2,5
50
.6
1,5
50
.1
2012201120102009
2013
14
.98
14
.53
19
.5221
.29
11
.75
2012201120102009
REVENUE
RM million
PROFIT BEFORE TAXATION
RM million
RETURN ON AVERAGE SHAREHOLDERS’ EQUITY
%
EARNINGS PER SHARE
Sen
SHAREHOLDERS’ EQUITY
RM million
NOPAT/AVERAGE CAPITAL EMPLOYED
%
Annual Report 2013
IOI
Cor
por
atio
n B
erh
ad
17
0
500
1,000
1,500
2,000
2,500
3,000
3,500
4,000
RM/MT RM million
2013201220112010200920082007200620052004200320022001200019991998199719961995
Monthly average CPO price Group Operating Profit 1
199419930
500
1,000
1,500
2,000
2,500
3,000
3,500
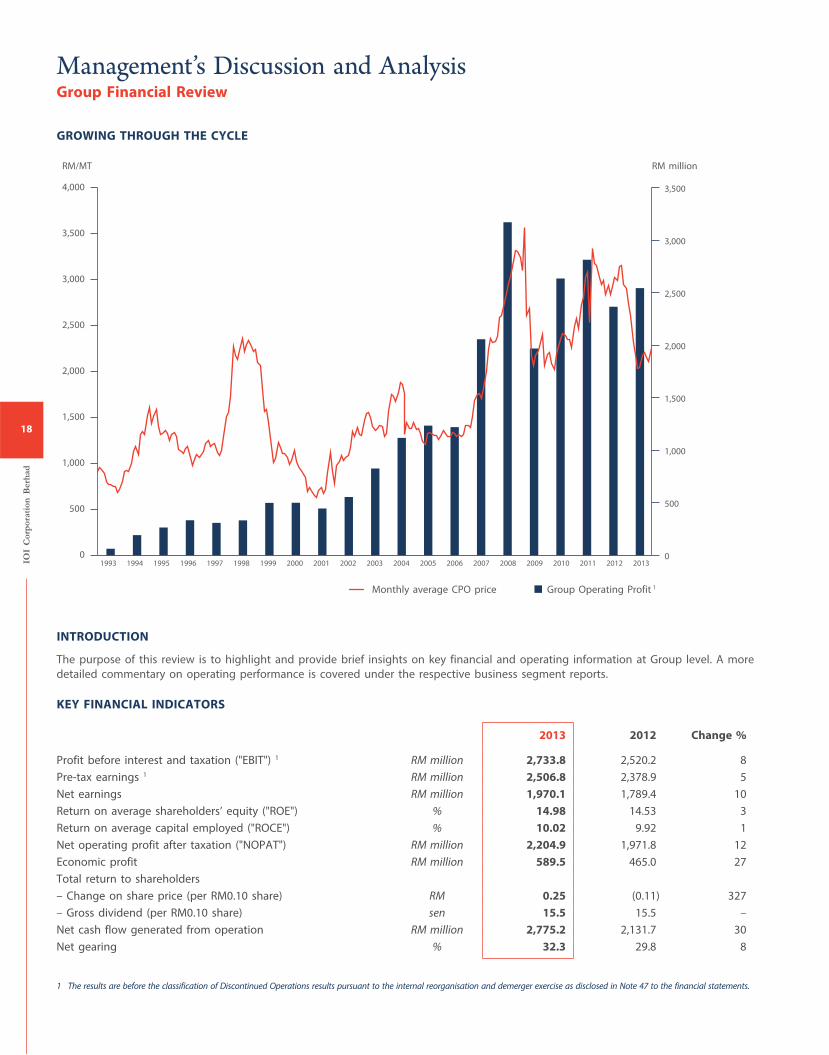
GROWING THROUGH THE CYCLE
INTRODUCTION
The purpose of this review is to highlight and provide brief insights on key financial and operating information at Group level. A more
detailed commentary on operating performance is covered under the respective business segment reports.
KEY FINANCIAL INDICATORS
2013 2012 Change %
Profit before interest and taxation ("EBIT") 1 RM million 2,733.8 2,520.2 8
Pre-tax earnings 1 RM million 2,506.8 2,378.9 5
Net earnings RM million 1,970.1 1,789.4 10
Return on average shareholders’ equity ("ROE") % 14.98 14.53 3
Return on average capital employed ("ROCE") % 10.02 9.92 1
Net operating profit after taxation ("NOPAT") RM million 2,204.9 1,971.8 12
Economic profit RM million 589.5 465.0 27
Total return to shareholders
– Change on share price (per RM0.10 share) RM 0.25 (0.11) 327
– Gross dividend (per RM0.10 share) sen 15.5 15.5 –
Net cash flow generated from operation RM million 2,775.2 2,131.7 30
Net gearing % 32.3 29.8 8
1 The results are before the classification of Discontinued Operations results pursuant to the internal reorganisation and demerger exercise as disclosed in Note 47 to the financial statements.
IOI
Cor
por
atio
n B
erh
ad
18
Management’s Discussion and AnalysisGroup Financial Review
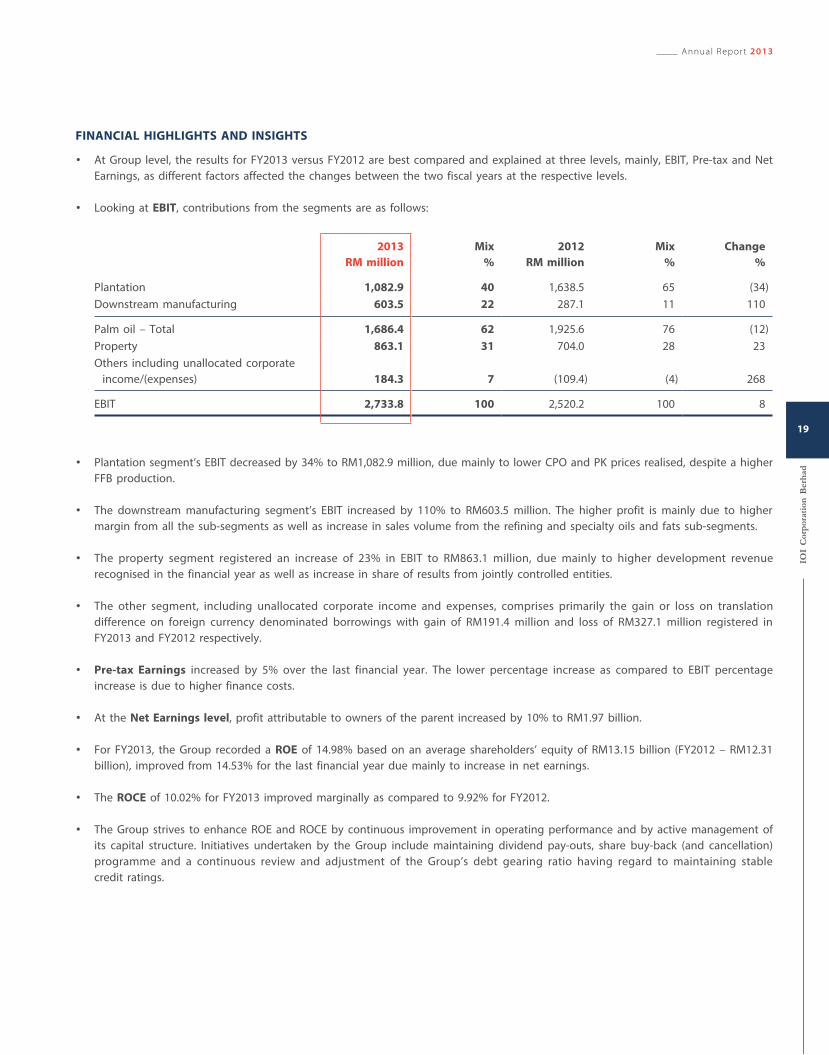
FINANCIAL HIGHLIGHTS AND INSIGHTS
• At Group level, the results for FY2013 versus FY2012 are best compared and explained at three levels, mainly, EBIT, Pre-tax and Net
Earnings, as different factors affected the changes between the two fiscal years at the respective levels.
• Looking at EBIT, contributions from the segments are as follows:
2013
RM million
Mix
%
2012
RM million
Mix
%
Change
%
Plantation 1,082.9 40 1,638.5 65 (34)
Downstream manufacturing 603.5 22 287.1 11 110
Palm oil – Total 1,686.4 62 1,925.6 76 (12)
Property 863.1 31 704.0 28 23
Others including unallocated corporate
income/(expenses) 184.3 7 (109.4) (4) 268
EBIT 2,733.8 100 2,520.2 100 8
• Plantation segment’s EBIT decreased by 34% to RM1,082.9 million, due mainly to lower CPO and PK prices realised, despite a higher
FFB production.
• The downstream manufacturing segment’s EBIT increased by 110% to RM603.5 million. The higher profit is mainly due to higher
margin from all the sub-segments as well as increase in sales volume from the refining and specialty oils and fats sub-segments.
• The property segment registered an increase of 23% in EBIT to RM863.1 million, due mainly to higher development revenue
recognised in the financial year as well as increase in share of results from jointly controlled entities.
• The other segment, including unallocated corporate income and expenses, comprises primarily the gain or loss on translation
difference on foreign currency denominated borrowings with gain of RM191.4 million and loss of RM327.1 million registered in
FY2013 and FY2012 respectively.
• Pre-tax Earnings increased by 5% over the last financial year. The lower percentage increase as compared to EBIT percentage
increase is due to higher finance costs.
• At the Net Earnings level, profit attributable to owners of the parent increased by 10% to RM1.97 billion.
• For FY2013, the Group recorded a ROE of 14.98% based on an average shareholders’ equity of RM13.15 billion (FY2012 – RM12.31
billion), improved from 14.53% for the last financial year due mainly to increase in net earnings.
• The ROCE of 10.02% for FY2013 improved marginally as compared to 9.92% for FY2012.
• The Group strives to enhance ROE and ROCE by continuous improvement in operating performance and by active management of
its capital structure. Initiatives undertaken by the Group include maintaining dividend pay-outs, share buy-back (and cancellation)
programme and a continuous review and adjustment of the Group’s debt gearing ratio having regard to maintaining stable
credit ratings.
Annual Report 2013
IOI
Cor
por
atio
n B
erh
ad
19
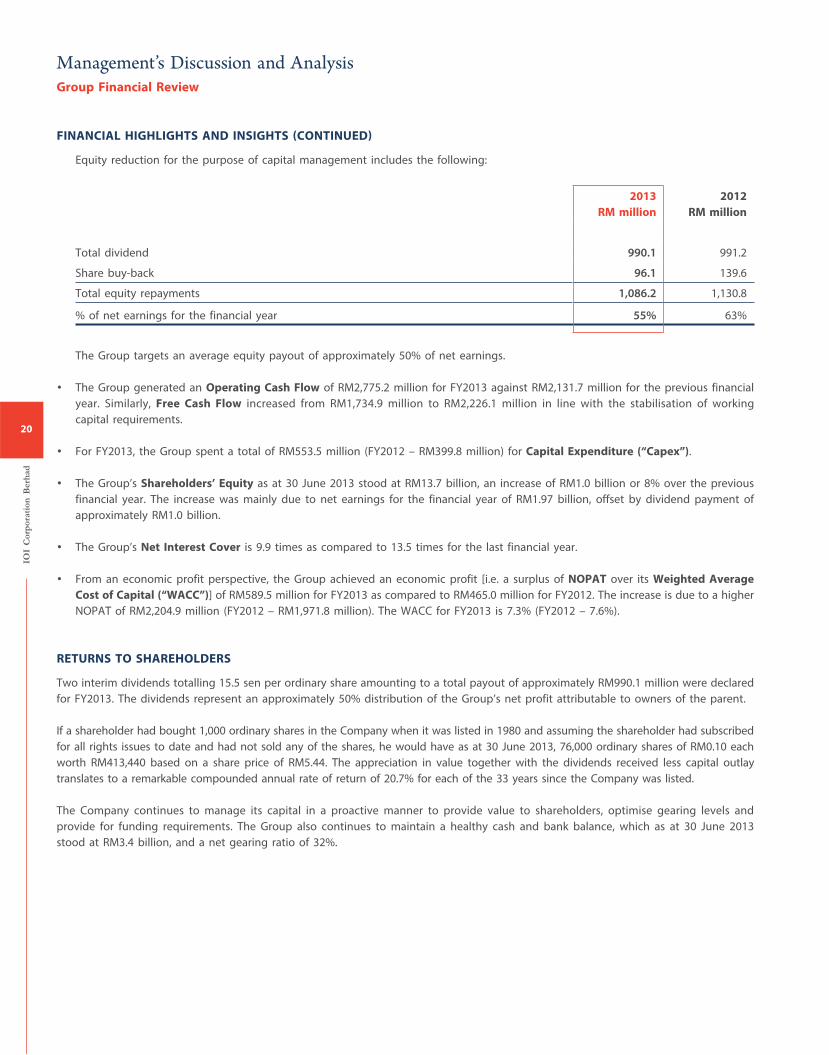
FINANCIAL HIGHLIGHTS AND INSIGHTS (CONTINUED)
Equity reduction for the purpose of capital management includes the following:
2013
RM million
2012
RM million
Total dividend 990.1 991.2
Share buy-back 96.1 139.6
Total equity repayments 1,086.2 1,130.8
% of net earnings for the financial year 55% 63%
The Group targets an average equity payout of approximately 50% of net earnings.
• The Group generated an Operating Cash Flow of RM2,775.2 million for FY2013 against RM2,131.7 million for the previous financial
year. Similarly, Free Cash Flow increased from RM1,734.9 million to RM2,226.1 million in line with the stabilisation of working
capital requirements.
• For FY2013, the Group spent a total of RM553.5 million (FY2012 – RM399.8 million) for Capital Expenditure (“Capex”).
• The Group’s Shareholders’ Equity as at 30 June 2013 stood at RM13.7 billion, an increase of RM1.0 billion or 8% over the previous
financial year. The increase was mainly due to net earnings for the financial year of RM1.97 billion, offset by dividend payment of
approximately RM1.0 billion.
• The Group’s Net Interest Cover is 9.9 times as compared to 13.5 times for the last financial year.
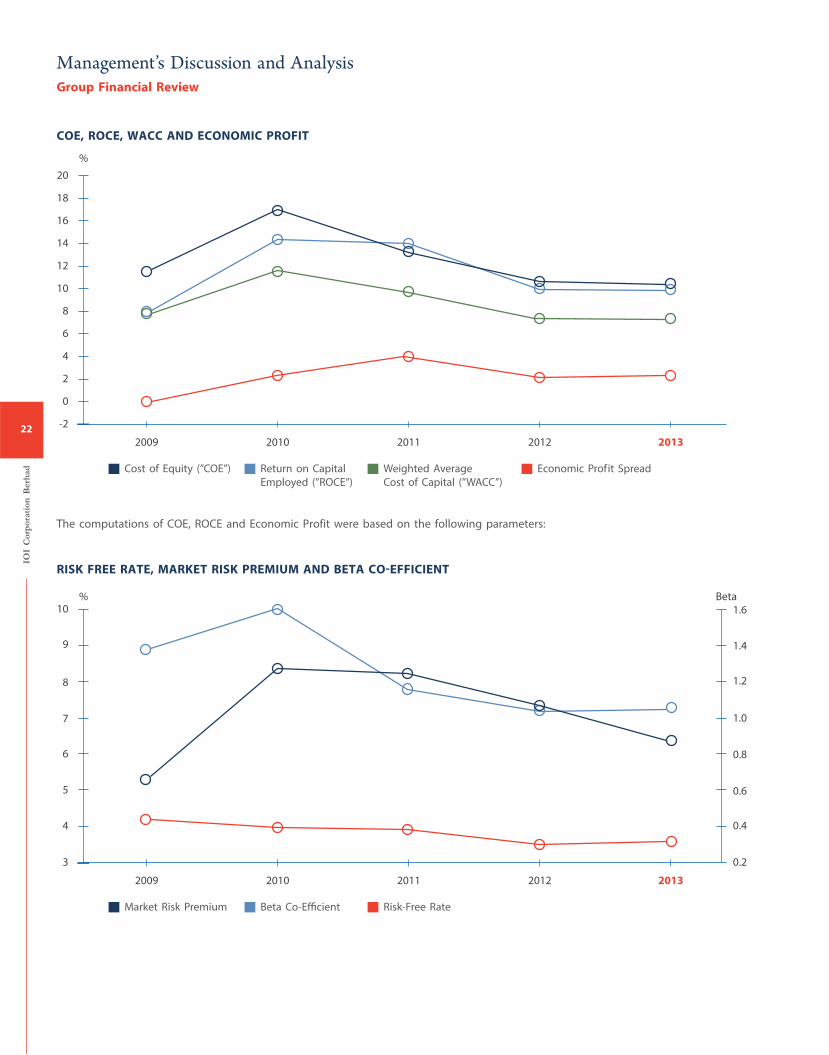
• From an economic profit perspective, the Group achieved an economic profit [i.e. a surplus of NOPAT over its Weighted Average
Cost of Capital (“WACC”)] of RM589.5 million for FY2013 as compared to RM465.0 million for FY2012. The increase is due to a higher
NOPAT of RM2,204.9 million (FY2012 – RM1,971.8 million). The WACC for FY2013 is 7.3% (FY2012 – 7.6%).
RETURNS TO SHAREHOLDERS
Two interim dividends totalling 15.5 sen per ordinary share amounting to a total payout of approximately RM990.1 million were declared
for FY2013. The dividends represent an approximately 50% distribution of the Group’s net profit attributable to owners of the parent.
If a shareholder had bought 1,000 ordinary shares in the Company when it was listed in 1980 and assuming the shareholder had subscribed
for all rights issues to date and had not sold any of the shares, he would have as at 30 June 2013, 76,000 ordinary shares of RM0.10 each
worth RM413,440 based on a share price of RM5.44. The appreciation in value together with the dividends received less capital outlay
translates to a remarkable compounded annual rate of return of 20.7% for each of the 33 years since the Company was listed.
The Company continues to manage its capital in a proactive manner to provide value to shareholders, optimise gearing levels and
provide for funding requirements. The Group also continues to maintain a healthy cash and bank balance, which as at 30 June 2013
stood at RM3.4 billion, and a net gearing ratio of 32%.
IOI
Cor
por
atio
n B
erh
ad
20
Management’s Discussion and AnalysisGroup Financial Review
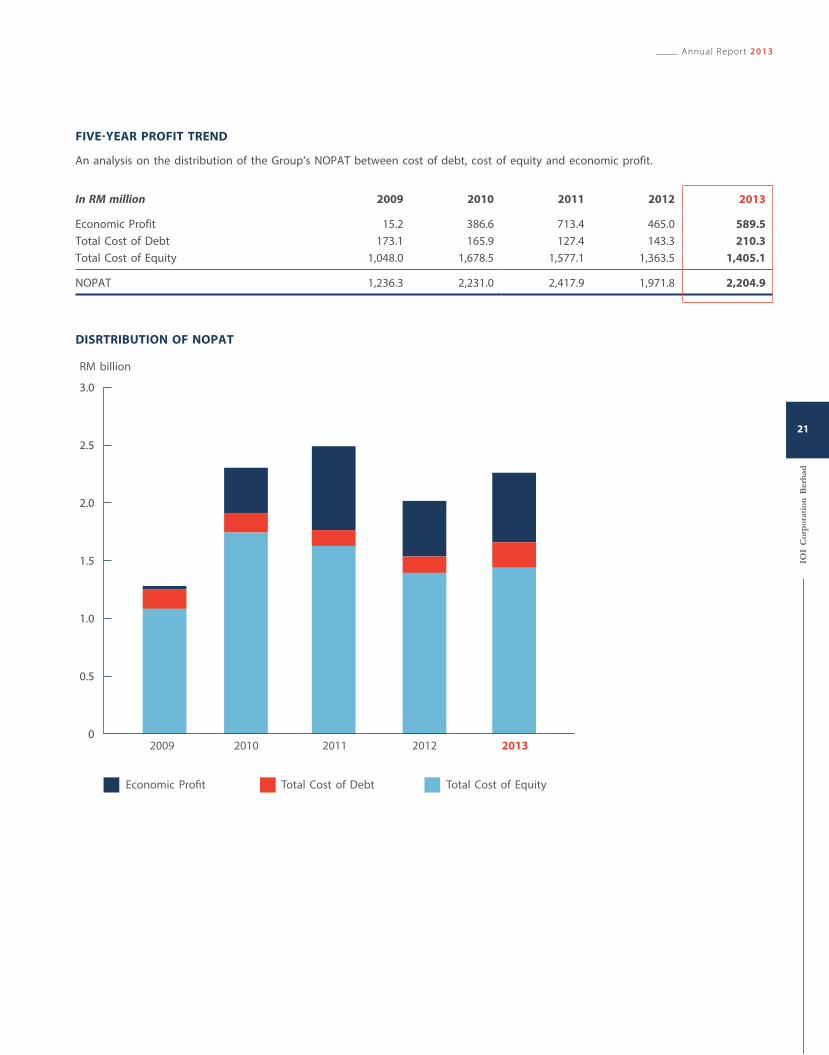
FIVE-YEAR PROFIT TREND
An analysis on the distribution of the Group’s NOPAT between cost of debt, cost of equity and economic profit.
In RM million 2009 2010 2011 2012 2013
Economic Profit 15.2 386.6 713.4 465.0 589.5
Total Cost of Debt 173.1 165.9 127.4 143.3 210.3
Total Cost of Equity 1,048.0 1,678.5 1,577.1 1,363.5 1,405.1
NOPAT 1,236.3 2,231.0 2,417.9 1,971.8 2,204.9
0
0.5
1.0
1.5
2.0
2.5
3.0
RM billion
Economic Profit Total Cost of Debt Total Cost of Equity
2009 2010 2011 2012 2013
DISRTRIBUTION OF NOPAT
Annual Report 2013
IOI
Cor
por
atio
n B
erh
ad
21
-2
0
2
4
6
8
10
12
14
16
18
20
%
Return on Capital
Employed (”ROCE”)
Cost of Equity (”COE”) Weighted Average
Cost of Capital (”WACC”)
Economic Prof it Spread
2009 2010 2011 2012 2013
2009 2010 2011 2012 2013
3
4
5
6
8
7
9
10
0.2
0.4
0.6
0.8
1.0
1.2
1.4
1.6% Beta
Risk-Free RateBeta Co-EfficientMarket Risk Premium
The computations of COE, ROCE and Economic Profit were based on the following parameters:
COE, ROCE, WACC AND ECONOMIC PROFIT
RISK FREE RATE, MARKET RISK PREMIUM AND BETA CO-EFFICIENT
IOI
Cor
por
atio
n B
erh
ad
22
Management’s Discussion and AnalysisGroup Financial Review
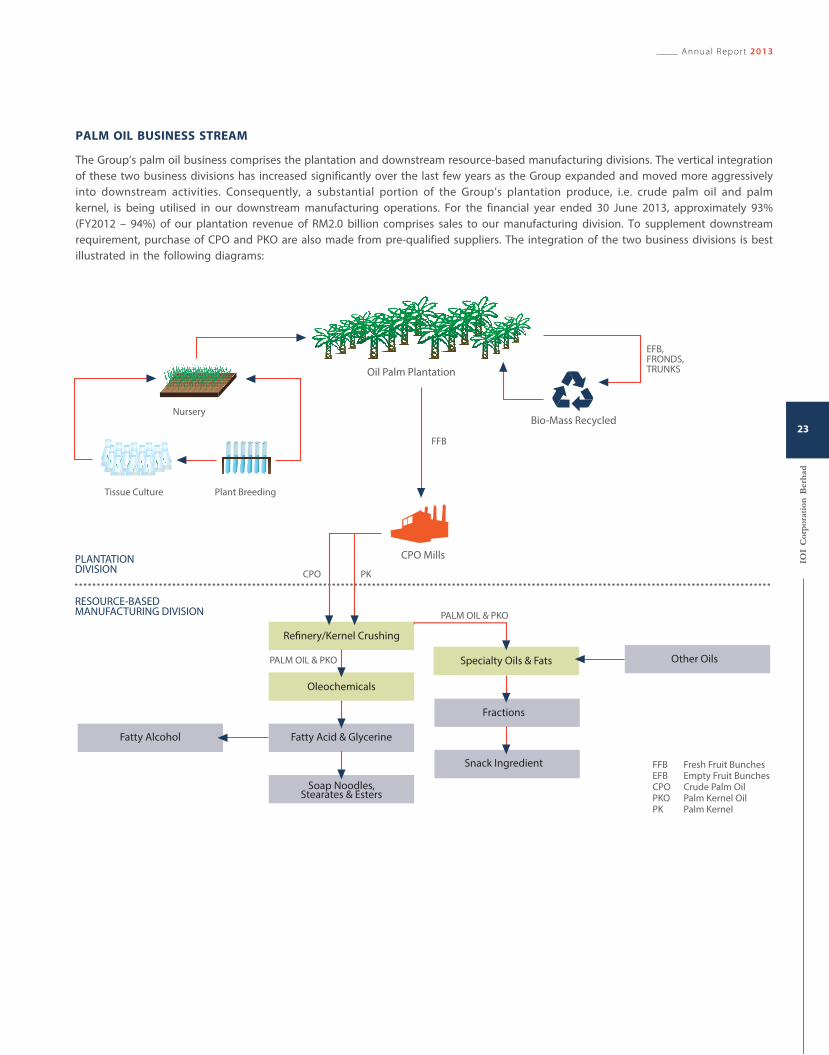
PALM OIL BUSINESS STREAM
The Group’s palm oil business comprises the plantation and downstream resource-based manufacturing divisions. The vertical integration
of these two business divisions has increased significantly over the last few years as the Group expanded and moved more aggressively
into downstream activities. Consequently, a substantial portion of the Group’s plantation produce, i.e. crude palm oil and palm
kernel, is being utilised in our downstream manufacturing operations. For the financial year ended 30 June 2013, approximately 93%
(FY2012 – 94%) of our plantation revenue of RM2.0 billion comprises sales to our manufacturing division. To supplement downstream
requirement, purchase of CPO and PKO are also made from pre-qualified suppliers. The integration of the two business divisions is best
illustrated in the following diagrams:
Oil Palm Plantation
EFB,FRONDS,TRUNKS
FFB
PK
PALM OIL & PKO
PALM OIL & PKO
RESOURCE-BASEDMANUFACTURING DIVISION
PLANTATIONDIVISION
CPO Mills
Specialty Oils & Fats
Fractions
Other Oils
Snack Ingredient
Fatty Alcohol
Plant BreedingTissue Culture
NurseryBio-Mass Recycled
CPO
FFBEFBCPOPKOPK
Fresh Fruit BunchesEmpty Fruit BunchesCrude Palm OilPalm Kernel OilPalm Kernel
Refinery/Kernel Crushing
Oleochemicals
Fatty Acid & Glycerine
Soap Noodles,Stearates & Esters
Annual Report 2013
IOI
Cor
por
atio
n B
erh
ad
23


IOI
Cor
por
atio
n B
erh
ad
26
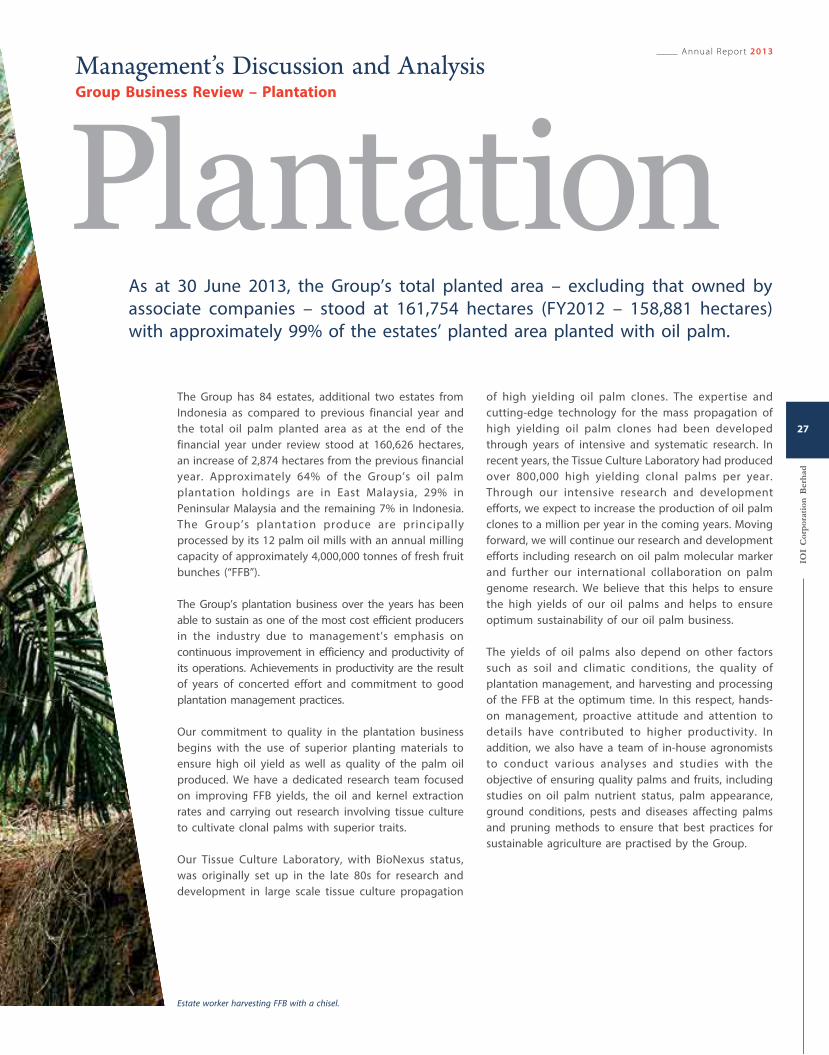
As at 30 June 2013, the Group’s total planted area – excluding that owned by
associate companies – stood at 161,754 hectares (FY2012 – 158,881 hectares)
with approximately 99% of the estates’ planted area planted with oil palm.
PlantationGroup Business Review – Plantation
Management’s Discussion and Analysis
The Group has 84 estates, additional two estates from
Indonesia as compared to previous financial year and
the total oil palm planted area as at the end of the
financial year under review stood at 160,626 hectares,
an increase of 2,874 hectares from the previous financial
year. Approximately 64% of the Group’s oil palm
plantation holdings are in East Malaysia, 29% in
Peninsular Malaysia and the remaining 7% in Indonesia.
The Group’s plantation produce are principally
processed by its 12 palm oil mills with an annual milling
capacity of approximately 4,000,000 tonnes of fresh fruit
bunches (“FFB”).
The Group’s plantation business over the years has been
able to sustain as one of the most cost efficient producers
in the industry due to management’s emphasis on
continuous improvement in efficiency and productivity of
its operations. Achievements in productivity are the result
of years of concerted effort and commitment to good
plantation management practices.
Our commitment to quality in the plantation business
begins with the use of superior planting materials to
ensure high oil yield as well as quality of the palm oil
produced. We have a dedicated research team focused
on improving FFB yields, the oil and kernel extraction
rates and carrying out research involving tissue culture
to cultivate clonal palms with superior traits.
Our Tissue Culture Laboratory, with BioNexus status,
was originally set up in the late 80s for research and
development in large scale tissue culture propagation
of high yielding oil palm clones. The expertise and
cutting-edge technology for the mass propagation of
high yielding oil palm clones had been developed
through years of intensive and systematic research. In
recent years, the Tissue Culture Laboratory had produced
over 800,000 high yielding clonal palms per year.
Through our intensive research and development
efforts, we expect to increase the production of oil palm
clones to a million per year in the coming years. Moving
forward, we will continue our research and development
efforts including research on oil palm molecular marker
and further our international collaboration on palm
genome research. We believe that this helps to ensure
the high yields of our oil palms and helps to ensure
optimum sustainability of our oil palm business.
The yields of oil palms also depend on other factors
such as soil and climatic conditions, the quality of
plantation management, and harvesting and processing
of the FFB at the optimum time. In this respect, hands-
on management, proactive attitude and attention to
details have contributed to higher productivity. In
addition, we also have a team of in-house agronomists
to conduct various analyses and studies with the
objective of ensuring quality palms and fruits, including
studies on oil palm nutrient status, palm appearance,
ground conditions, pests and diseases affecting palms
and pruning methods to ensure that best practices for
sustainable agriculture are practised by the Group.
Estate worker harvesting FFB with a chisel.
Annual Report 2013
IOI
Cor
por
atio
n B
erh
ad
27
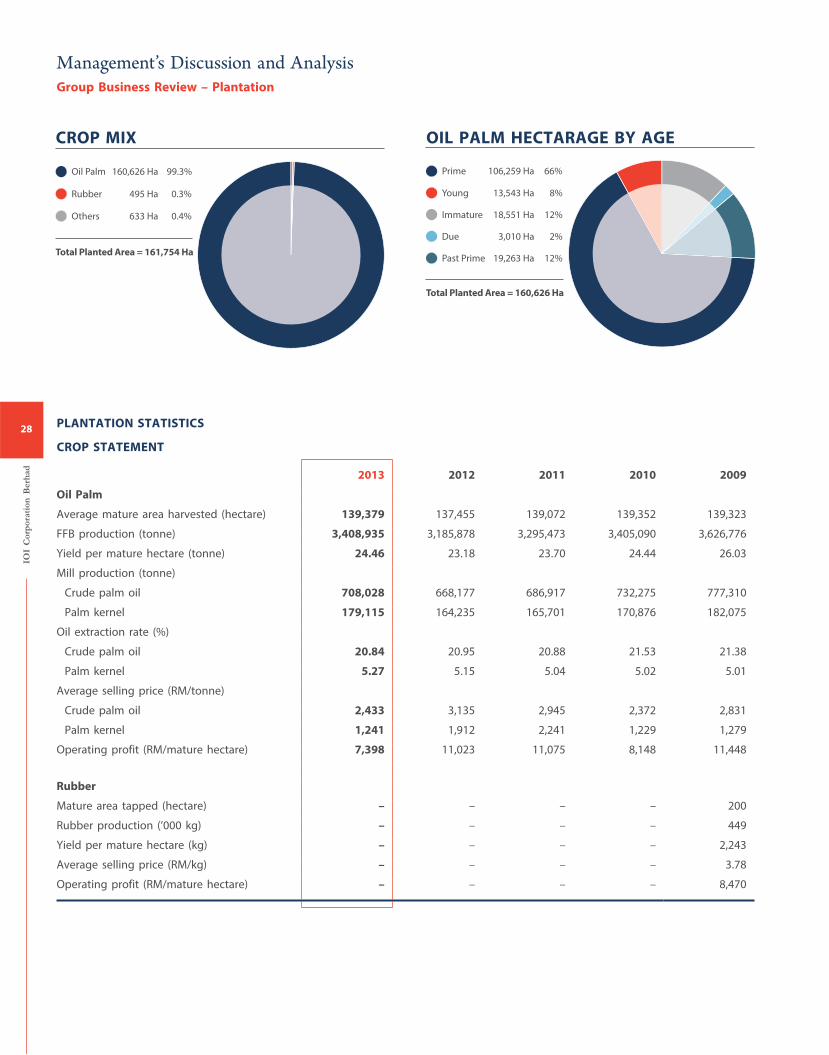
PLANTATION STATISTICS
CROP STATEMENT
2013 2012 2011 2010 2009
Oil Palm
Average mature area harvested (hectare) 139,379 137,455 139,072 139,352 139,323
FFB production (tonne) 3,408,935 3,185,878 3,295,473 3,405,090 3,626,776
Yield per mature hectare (tonne) 24.46 23.18 23.70 24.44 26.03
Mill production (tonne)
Crude palm oil 708,028 668,177 686,917 732,275 777,310
Palm kernel 179,115 164,235 165,701 170,876 182,075
Oil extraction rate (%)
Crude palm oil 20.84 20.95 20.88 21.53 21.38
Palm kernel 5.27 5.15 5.04 5.02 5.01
Average selling price (RM/tonne)
Crude palm oil 2,433 3,135 2,945 2,372 2,831
Palm kernel 1,241 1,912 2,241 1,229 1,279
Operating profit (RM/mature hectare) 7,398 11,023 11,075 8,148 11,448
Rubber
Mature area tapped (hectare) – – – – 200
Rubber production (’000 kg) – – – – 449
Yield per mature hectare (kg) – – – – 2,243
Average selling price (RM/kg) – – – – 3.78
Operating profit (RM/mature hectare) – – – – 8,470
Rubber 495 Ha 0.3%
Others 633 Ha 0.4%
Oil Palm 160,626 Ha 99.3%
Total Planted Area = 161,754 Ha
Young 13,543 Ha 8%
Immature 18,551 Ha 12%
Prime 106,259 Ha 66%
Due 3,010 Ha 2%
Past Prime 19,263 Ha 12%
Total Planted Area = 160,626 Ha
CROP MIX OIL PALM HECTARAGE BY AGE
IOI
Cor
por
atio
n B
erh
ad
28
Group Business Review – Plantation
Management’s Discussion and Analysis
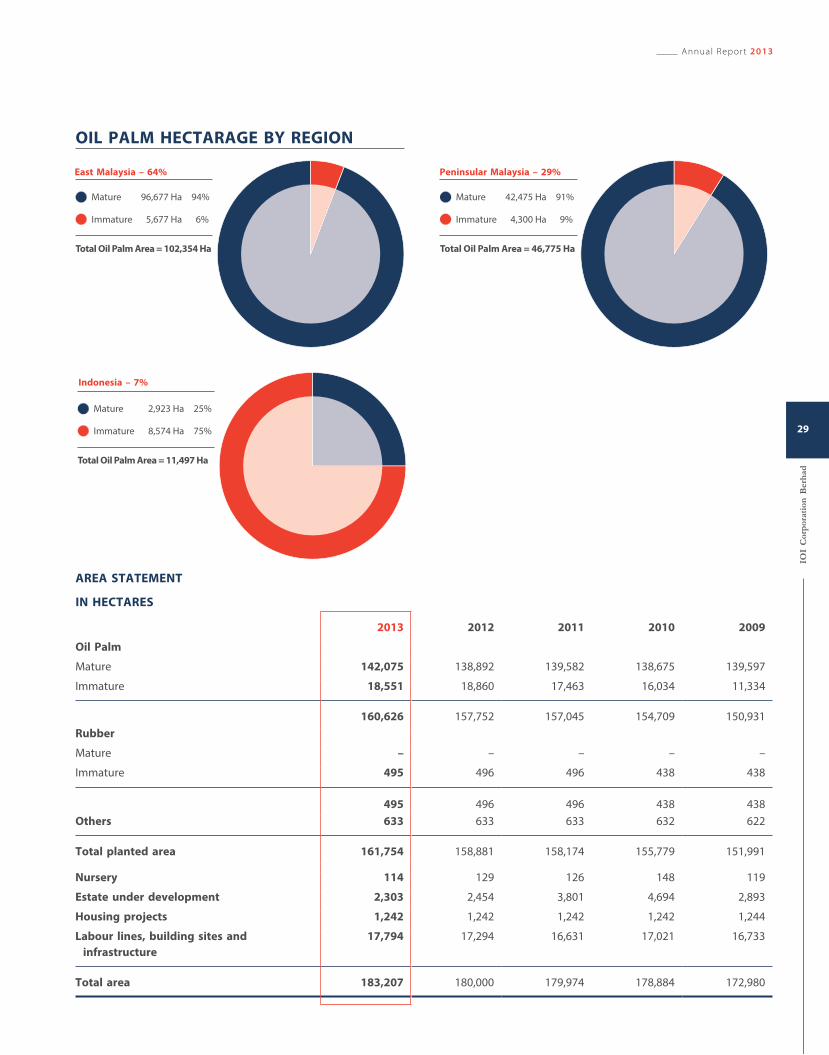
AREA STATEMENT
IN HECTARES
2013 2012 2011 2010 2009
Oil Palm
Mature 142,075 138,892 139,582 138,675 139,597
Immature 18,551 18,860 17,463 16,034 11,334
160,626 157,752 157,045 154,709 150,931
Rubber
Mature – – – – –
Immature 495 496 496 438 438
495 496 496 438 438
Others 633 633 633 632 622
Total planted area 161,754 158,881 158,174 155,779 151,991
Nursery 114 129 126 148 119
Estate under development 2,303 2,454 3,801 4,694 2,893
Housing projects 1,242 1,242 1,242 1,242 1,244
Labour lines, building sites and
infrastructure
17,794 17,294 16,631 17,021 16,733
Total area 183,207 180,000 179,974 178,884 172,980
Immature 5,677 Ha 6%
Mature 96,677 Ha 94%
Total Oil Palm Area = 102,354 Ha
Immature 4,300 Ha 9%
Mature 42,475 Ha 91%
Total Oil Palm Area = 46,775 Ha
Immature 8,574 Ha 75%
Mature 2,923 Ha 25%
Total Oil Palm Area = 11,497 Ha
East Malaysia – 64%
Indonesia – 7%
Peninsular Malaysia – 29%
OIL PALM HECTARAGE BY REGION
Annual Report 2013
IOI
Cor
por
atio
n B
erh
ad
29
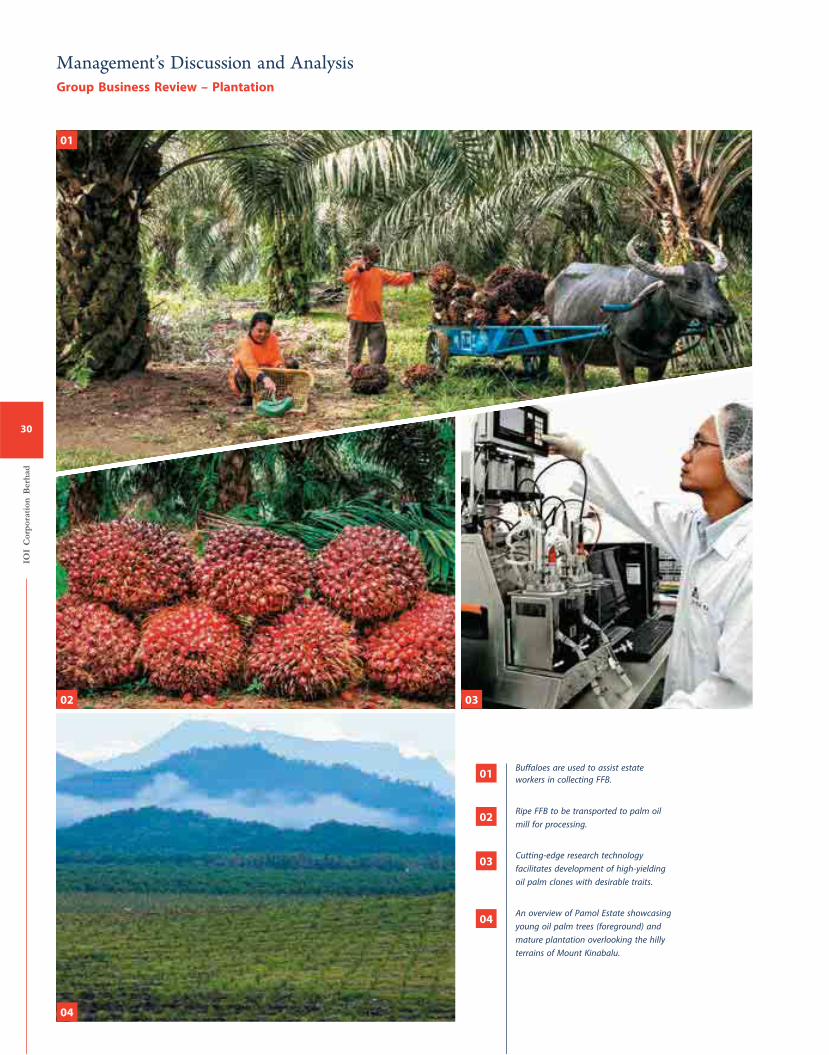
Buffaloes are used to assist estate
workers in collecting FFB.01
01
02
02
03
03
04
04
Ripe FFB to be transported to palm oil
mill for processing.
Cutting-edge research technology
facilitates development of high-yielding
oil palm clones with desirable traits.
An overview of Pamol Estate showcasing
young oil palm trees (foreground) and
mature plantation overlooking the hilly
terrains of Mount Kinabalu.
IOI
Cor
por
atio
n B
erh
ad
30
Group Business Review – Plantation
Management’s Discussion and Analysis
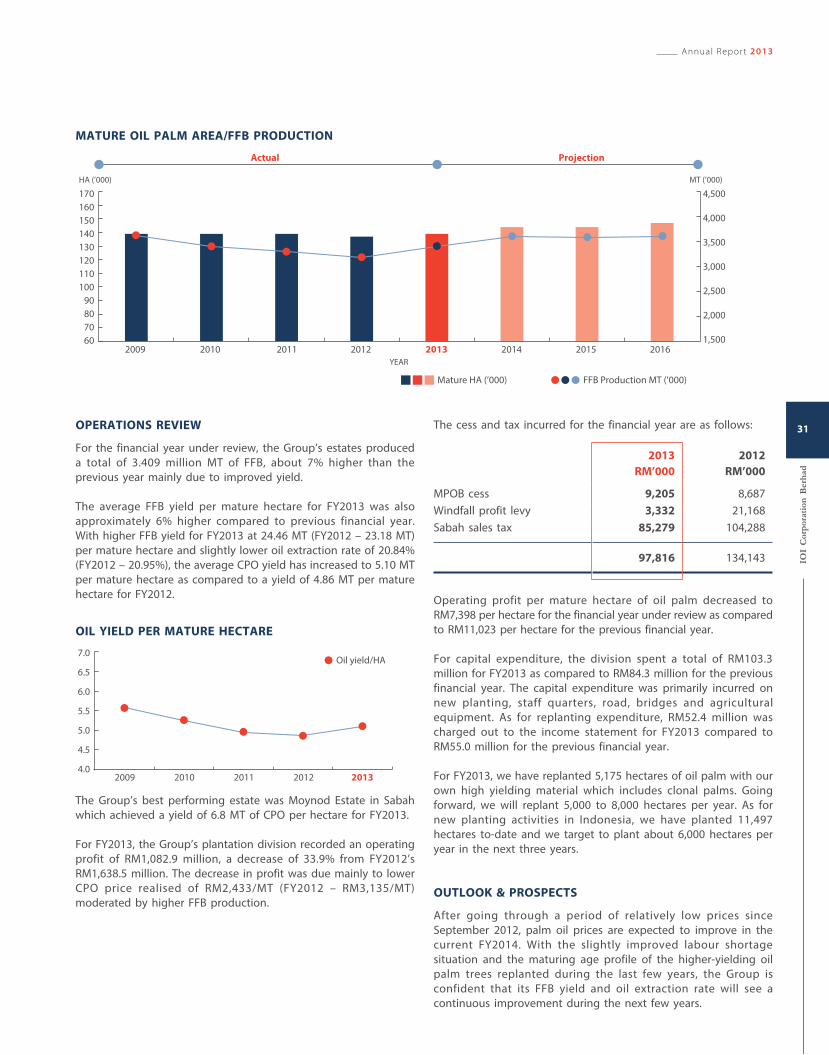
MATURE OIL PALM AREA/FFB PRODUCTION
OPERATIONS REVIEW
For the financial year under review, the Group’s estates produced
a total of 3.409 million MT of FFB, about 7% higher than the
previous year mainly due to improved yield.
The average FFB yield per mature hectare for FY2013 was also
approximately 6% higher compared to previous financial year.
With higher FFB yield for FY2013 at 24.46 MT (FY2012 – 23.18 MT)
per mature hectare and slightly lower oil extraction rate of 20.84%
(FY2012 – 20.95%), the average CPO yield has increased to 5.10 MT
per mature hectare as compared to a yield of 4.86 MT per mature
hectare for FY2012.
OIL YIELD PER MATURE HECTARE
2009 2010 2011 2012 20134.0
4.5
5.0
5.5
6.0
6.5
7.0Oil yield/HA
The Group’s best performing estate was Moynod Estate in Sabah
which achieved a yield of 6.8 MT of CPO per hectare for FY2013.
For FY2013, the Group’s plantation division recorded an operating
profit of RM1,082.9 million, a decrease of 33.9% from FY2012’s
RM1,638.5 million. The decrease in profit was due mainly to lower
CPO price realised of RM2,433/MT (FY2012 – RM3,135/MT)
moderated by higher FFB production.
The cess and tax incurred for the financial year are as follows:
2013
RM’000
2012
RM’000
MPOB cess 9,205 8,687
Windfall profit levy 3,332 21,168
Sabah sales tax 85,279 104,288
97,816 134,143
Operating profit per mature hectare of oil palm decreased to
RM7,398 per hectare for the financial year under review as compared
to RM11,023 per hectare for the previous financial year.
For capital expenditure, the division spent a total of RM103.3
million for FY2013 as compared to RM84.3 million for the previous
financial year. The capital expenditure was primarily incurred on
new planting, staff quarters, road, bridges and agricultural
equipment. As for replanting expenditure, RM52.4 million was
charged out to the income statement for FY2013 compared to
RM55.0 million for the previous financial year.
For FY2013, we have replanted 5,175 hectares of oil palm with our
own high yielding material which includes clonal palms. Going
forward, we will replant 5,000 to 8,000 hectares per year. As for
new planting activities in Indonesia, we have planted 11,497
hectares to-date and we target to plant about 6,000 hectares per
year in the next three years.
OUTLOOK & PROSPECTS
After going through a period of relatively low prices since
September 2012, palm oil prices are expected to improve in the
current FY2014. With the slightly improved labour shortage
situation and the maturing age profile of the higher-yielding oil
palm trees replanted during the last few years, the Group is
confident that its FFB yield and oil extraction rate will see a
continuous improvement during the next few years.
60
70
80
90
100
110
120
130
140
150
160
170
2009
HA (’000)
YEAR
MT (’000)
2010 2011 2012 2013 2014 2015 20161,500
2,000
2,500
3,000
3,500
4,000
4,500
Actual Projection
Mature HA (’000) FFB Production MT (’000)
Annual Report 2013
IOI
Cor
por
atio
n B
erh
ad
31


IOI
Cor
por
atio
n B
erh
ad
34
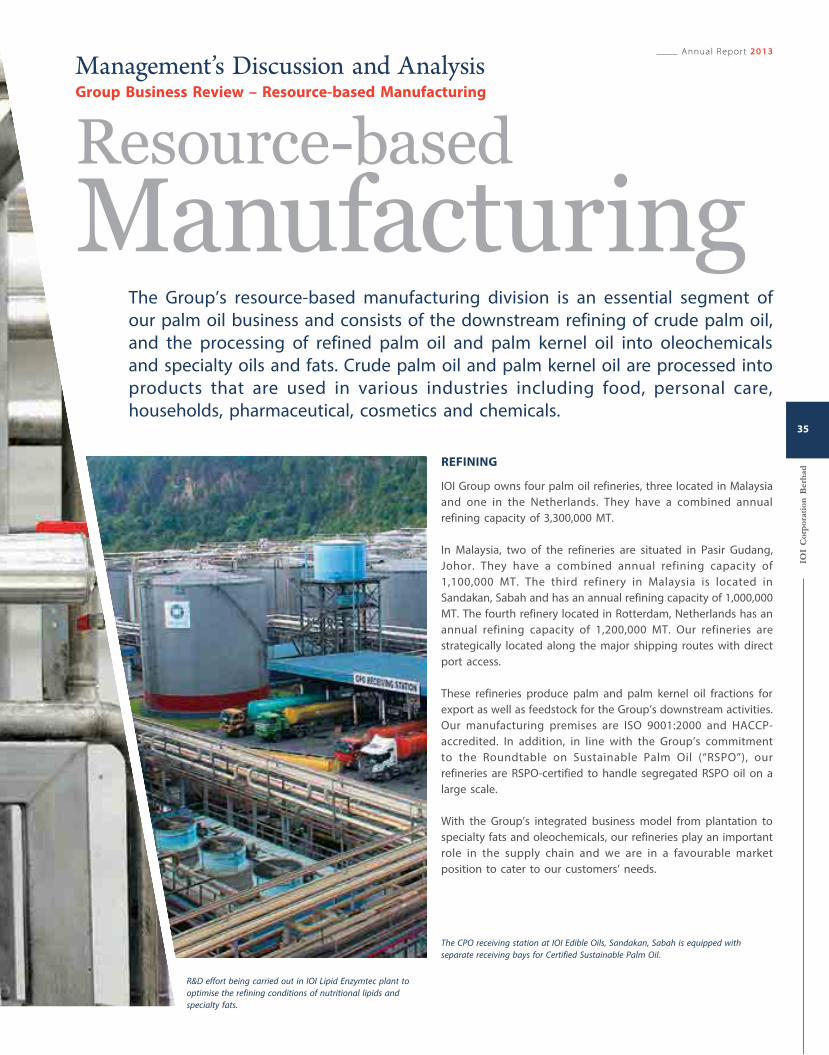
The Group’s resource-based manufacturing division is an essential segment of
our palm oil business and consists of the downstream refining of crude palm oil,
and the processing of refined palm oil and palm kernel oil into oleochemicals
and specialty oils and fats. Crude palm oil and palm kernel oil are processed into
products that are used in various industries including food, personal care,
households, pharmaceutical, cosmetics and chemicals.
ManufacturingResource-based
The CPO receiving station at IOI Edible Oils, Sandakan, Sabah is equipped with
separate receiving bays for Certified Sustainable Palm Oil.
R&D effort being carried out in IOI Lipid Enzymtec plant to
optimise the refining conditions of nutritional lipids and
specialty fats.
Group Business Review – Resource-based Manufacturing
REFINING
IOI Group owns four palm oil refineries, three located in Malaysia
and one in the Netherlands. They have a combined annual
refining capacity of 3,300,000 MT.
In Malaysia, two of the refineries are situated in Pasir Gudang,
Johor. They have a combined annual refining capacity of
1,100,000 MT. The third refinery in Malaysia is located in
Sandakan, Sabah and has an annual refining capacity of 1,000,000
MT. The fourth refinery located in Rotterdam, Netherlands has an
annual refining capacity of 1,200,000 MT. Our refineries are
strategically located along the major shipping routes with direct
port access.
These refineries produce palm and palm kernel oil fractions for
export as well as feedstock for the Group’s downstream activities.
Our manufacturing premises are ISO 9001:2000 and HACCP-
accredited. In addition, in line with the Group’s commitment
to the Roundtable on Sustainable Palm Oil (“RSPO”), our
refineries are RSPO-certified to handle segregated RSPO oil on a
large scale.
With the Group’s integrated business model from plantation to
specialty fats and oleochemicals, our refineries play an important
role in the supply chain and we are in a favourable market
position to cater to our customers’ needs.
Annual Report 2013
IOI
Cor
por
atio
n B
erh
ad
35
Management’s Discussion and Analysis
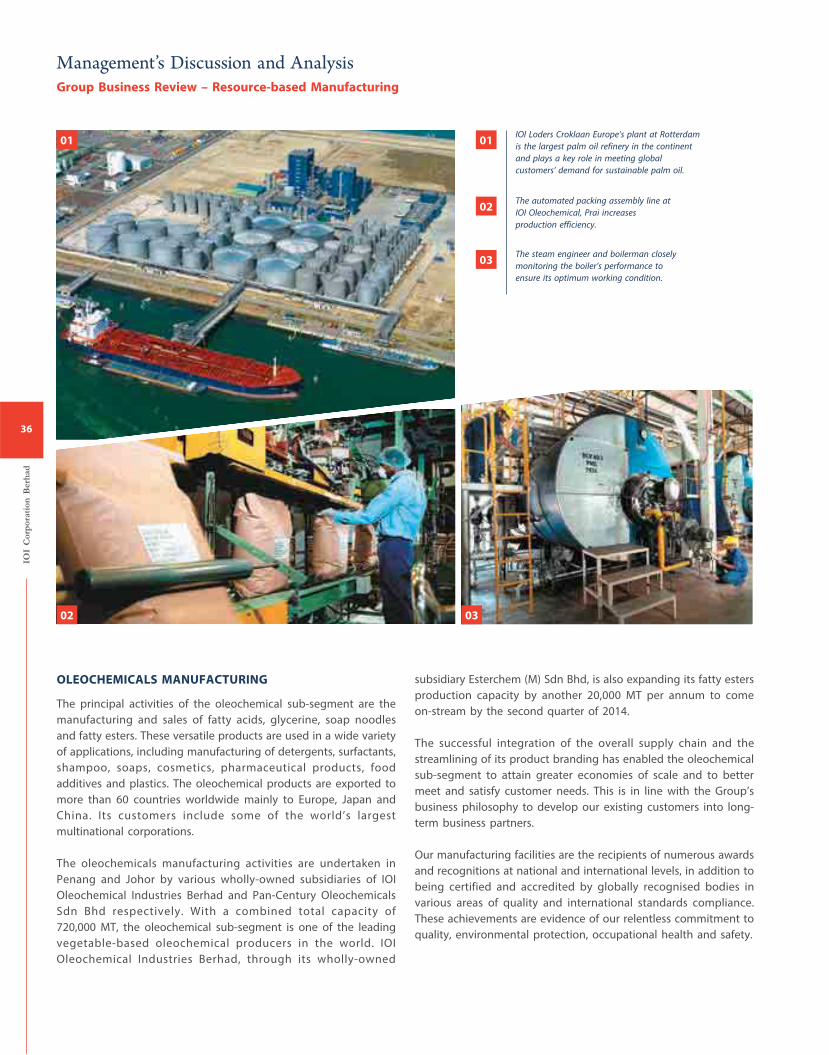
IOI Loders Croklaan Europe’s plant at Rotterdam
is the largest palm oil refinery in the continent
and plays a key role in meeting global
customers’ demand for sustainable palm oil.
01
02
03
The automated packing assembly line at
IOI Oleochemical, Prai increases
production efficiency.
The steam engineer and boilerman closely
monitoring the boiler’s performance to
ensure its optimum working condition.
01
02 03
Group Business Review – Resource-based Manufacturing
OLEOCHEMICALS MANUFACTURING
The principal activities of the oleochemical sub-segment are the
manufacturing and sales of fatty acids, glycerine, soap noodles
and fatty esters. These versatile products are used in a wide variety
of applications, including manufacturing of detergents, surfactants,
shampoo, soaps, cosmetics, pharmaceutical products, food
additives and plastics. The oleochemical products are exported to
more than 60 countries worldwide mainly to Europe, Japan and
China. Its customers include some of the world’s largest
multinational corporations.
The oleochemicals manufacturing activities are undertaken in
Penang and Johor by various wholly-owned subsidiaries of IOI
Oleochemical Industries Berhad and Pan-Century Oleochemicals
Sdn Bhd respectively. With a combined total capacity of
720,000 MT, the oleochemical sub-segment is one of the leading
vegetable-based oleochemical producers in the world. IOI
Oleochemical Industries Berhad, through its wholly-owned
subsidiary Esterchem (M) Sdn Bhd, is also expanding its fatty esters
production capacity by another 20,000 MT per annum to come
on-stream by the second quarter of 2014.
The successful integration of the overall supply chain and the
streamlining of its product branding has enabled the oleochemical
sub-segment to attain greater economies of scale and to better
meet and satisfy customer needs. This is in line with the Group’s
business philosophy to develop our existing customers into long-
term business partners.
Our manufacturing facilities are the recipients of numerous awards
and recognitions at national and international levels, in addition to
being certified and accredited by globally recognised bodies in
various areas of quality and international standards compliance.
These achievements are evidence of our relentless commitment to
quality, environmental protection, occupational health and safety.
IOI
Cor
por
atio
n B
erh
ad
36
Management’s Discussion and Analysis
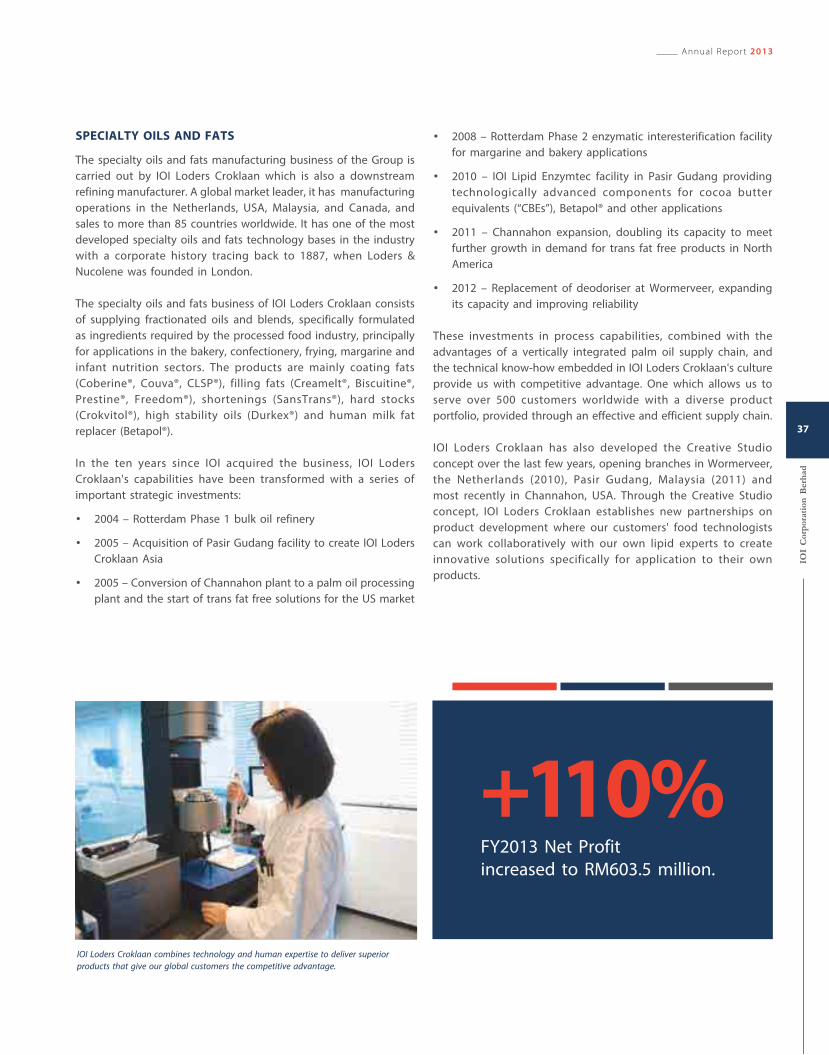
IOI Loders Croklaan combines technology and human expertise to deliver superior
products that give our global customers the competitive advantage.
FY2013 Net Profit
increased to RM603.5 million.
+110%
SPECIALTY OILS AND FATS
The specialty oils and fats manufacturing business of the Group is
carried out by IOI Loders Croklaan which is also a downstream
refining manufacturer. A global market leader, it has manufacturing
operations in the Netherlands, USA, Malaysia, and Canada, and
sales to more than 85 countries worldwide. It has one of the most
developed specialty oils and fats technology bases in the industry
with a corporate history tracing back to 1887, when Loders &
Nucolene was founded in London.
The specialty oils and fats business of IOI Loders Croklaan consists
of supplying fractionated oils and blends, specifically formulated
as ingredients required by the processed food industry, principally
for applications in the bakery, confectionery, frying, margarine and
infant nutrition sectors. The products are mainly coating fats
(Coberine®, Couva®, CLSP®), filling fats (Creamelt®, Biscuitine®,
Prestine®, Freedom®), shortenings (SansTrans®), hard stocks
(Crokvitol®), high stability oils (Durkex®) and human milk fat
replacer (Betapol®).
In the ten years since IOI acquired the business, IOI Loders
Croklaan's capabilities have been transformed with a series of
important strategic investments:
• 2004 – Rotterdam Phase 1 bulk oil refinery
• 2005 – Acquisition of Pasir Gudang facility to create IOI Loders
Croklaan Asia
• 2005 – Conversion of Channahon plant to a palm oil processing
plant and the start of trans fat free solutions for the US market
• 2008 – Rotterdam Phase 2 enzymatic interesterification facility
for margarine and bakery applications
• 2010 – IOI Lipid Enzymtec facility in Pasir Gudang providing
technologically advanced components for cocoa butter
equivalents (“CBEs”), Betapol® and other applications
• 2011 – Channahon expansion, doubling its capacity to meet
further growth in demand for trans fat free products in North
America
• 2012 – Replacement of deodoriser at Wormerveer, expanding
its capacity and improving reliability
These investments in process capabilities, combined with the
advantages of a vertically integrated palm oil supply chain, and
the technical know-how embedded in IOI Loders Croklaan's culture
provide us with competitive advantage. One which allows us to
serve over 500 customers worldwide with a diverse product
portfolio, provided through an effective and efficient supply chain.
IOI Loders Croklaan has also developed the Creative Studio
concept over the last few years, opening branches in Wormerveer,
the Netherlands (2010), Pasir Gudang, Malaysia (2011) and
most recently in Channahon, USA. Through the Creative Studio
concept, IOI Loders Croklaan establishes new partnerships on
product development where our customers' food technologists
can work collaboratively with our own lipid experts to create
innovative solutions specifically for application to their own
products.
Annual Report 2013
IOI
Cor
por
atio
n B
erh
ad
37
01
02
03
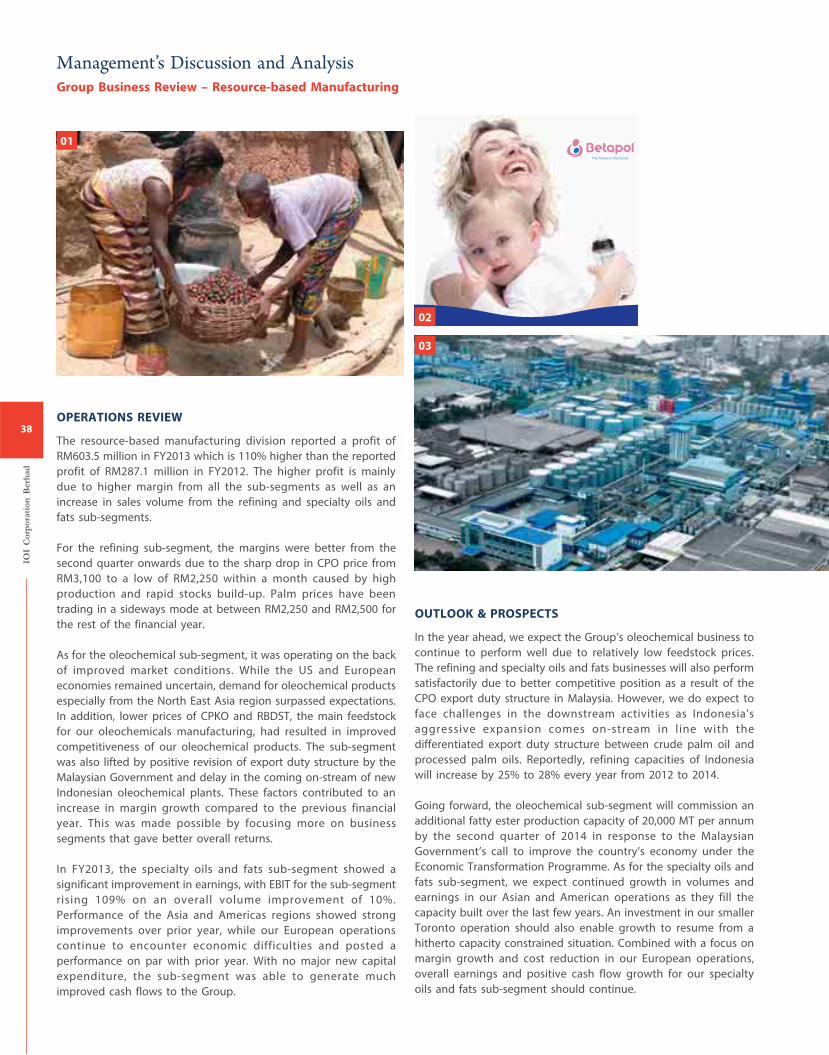
OPERATIONS REVIEW
The resource-based manufacturing division reported a profit of
RM603.5 million in FY2013 which is 110% higher than the reported
profit of RM287.1 million in FY2012. The higher profit is mainly
due to higher margin from all the sub-segments as well as an
increase in sales volume from the refining and specialty oils and
fats sub-segments.
For the refining sub-segment, the margins were better from the
second quarter onwards due to the sharp drop in CPO price from
RM3,100 to a low of RM2,250 within a month caused by high
production and rapid stocks build-up. Palm prices have been
trading in a sideways mode at between RM2,250 and RM2,500 for
the rest of the financial year.
As for the oleochemical sub-segment, it was operating on the back
of improved market conditions. While the US and European
economies remained uncertain, demand for oleochemical products
especially from the North East Asia region surpassed expectations.
In addition, lower prices of CPKO and RBDST, the main feedstock
for our oleochemicals manufacturing, had resulted in improved
competitiveness of our oleochemical products. The sub-segment
was also lifted by positive revision of export duty structure by the
Malaysian Government and delay in the coming on-stream of new
Indonesian oleochemical plants. These factors contributed to an
increase in margin growth compared to the previous financial
year. This was made possible by focusing more on business
segments that gave better overall returns.
In FY2013, the specialty oils and fats sub-segment showed a
significant improvement in earnings, with EBIT for the sub-segment
rising 109% on an overall volume improvement of 10%.
Performance of the Asia and Americas regions showed strong
improvements over prior year, while our European operations
continue to encounter economic difficulties and posted a
performance on par with prior year. With no major new capital
expenditure, the sub-segment was able to generate much
improved cash flows to the Group.
OUTLOOK & PROSPECTS
In the year ahead, we expect the Group’s oleochemical business to
continue to perform well due to relatively low feedstock prices.
The refining and specialty oils and fats businesses will also perform
satisfactorily due to better competitive position as a result of the
CPO export duty structure in Malaysia. However, we do expect to
face challenges in the downstream activities as Indonesia’s
aggressive expansion comes on-stream in line with the
differentiated export duty structure between crude palm oil and
processed palm oils. Reportedly, refining capacities of Indonesia
will increase by 25% to 28% every year from 2012 to 2014.
Going forward, the oleochemical sub-segment will commission an
additional fatty ester production capacity of 20,000 MT per annum
by the second quarter of 2014 in response to the Malaysian
Government’s call to improve the country’s economy under the
Economic Transformation Programme. As for the specialty oils and
fats sub-segment, we expect continued growth in volumes and
earnings in our Asian and American operations as they fill the
capacity built over the last few years. An investment in our smaller
Toronto operation should also enable growth to resume from a
hitherto capacity constrained situation. Combined with a focus on
margin growth and cost reduction in our European operations,
overall earnings and positive cash flow growth for our specialty
oils and fats sub-segment should continue.
IOI
Cor
por
atio
n B
erh
ad
38
Group Business Review – Resource-based Manufacturing
Management’s Discussion and Analysis
A view of IOI Loders Croklaan Asia plant in
Pasir Gudang, Johor.
01
02
04
04 05
03
05
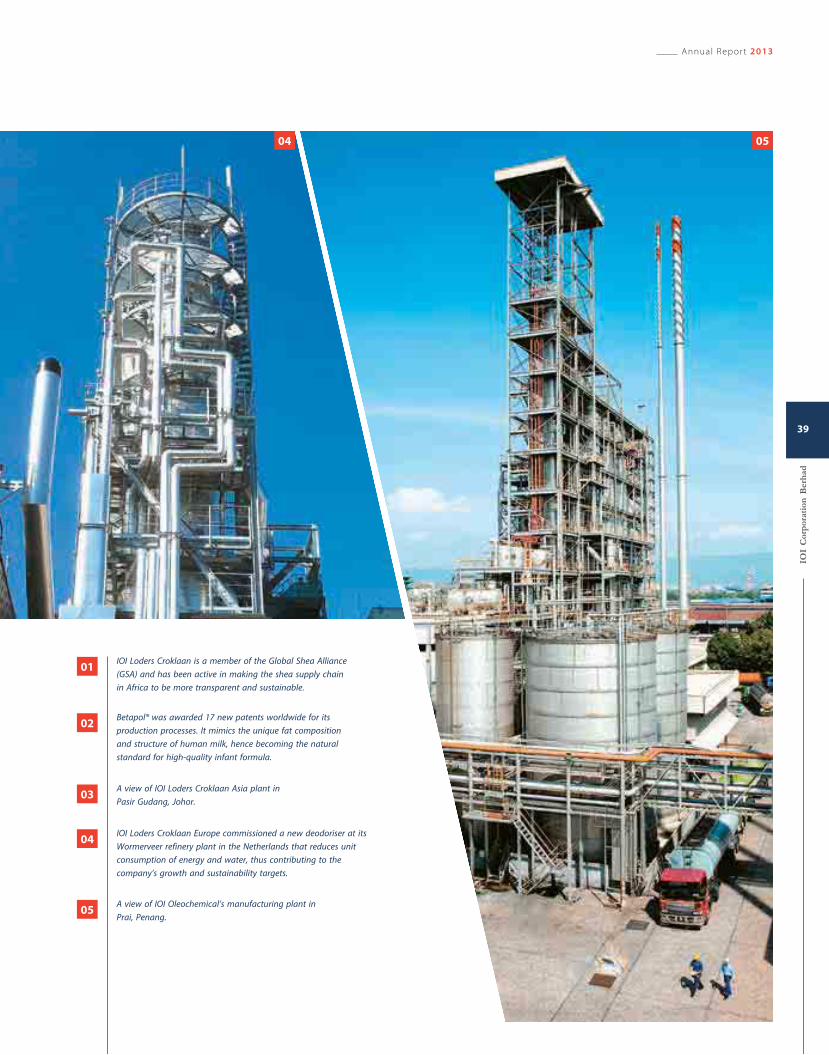
Betapol® was awarded 17 new patents worldwide for its
production processes. It mimics the unique fat composition
and structure of human milk, hence becoming the natural
standard for high-quality infant formula.
IOI Loders Croklaan Europe commissioned a new deodoriser at its
Wormerveer refinery plant in the Netherlands that reduces unit
consumption of energy and water, thus contributing to the
company’s growth and sustainability targets.
IOI Loders Croklaan is a member of the Global Shea Alliance
(GSA) and has been active in making the shea supply chain
in Africa to be more transparent and sustainable.
A view of IOI Oleochemical’s manufacturing plant in
Prai, Penang.
Annual Report 2013
IOI
Cor
por
atio
n B
erh
ad
39


IOI
Cor
por
atio
n B
erh
ad
42
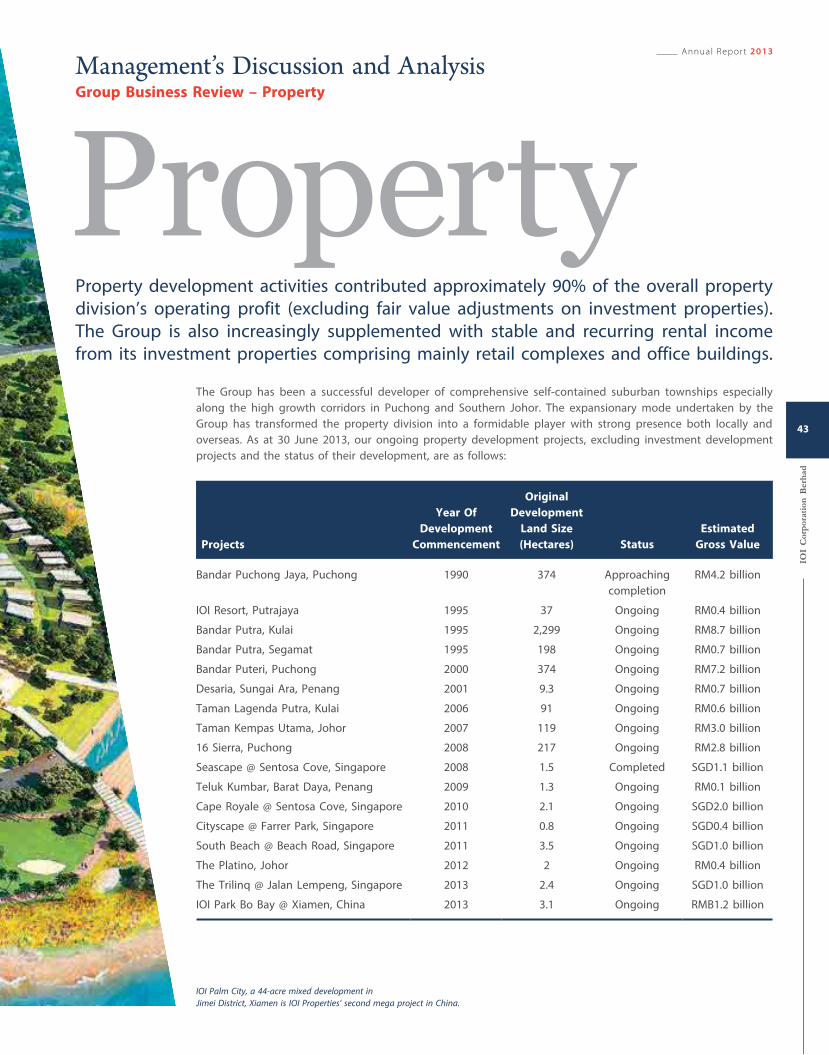
The Group has been a successful developer of comprehensive self-contained suburban townships especially
along the high growth corridors in Puchong and Southern Johor. The expansionary mode undertaken by the
Group has transformed the property division into a formidable player with strong presence both locally and
overseas. As at 30 June 2013, our ongoing property development projects, excluding investment development
projects and the status of their development, are as follows:
Projects
Year Of
Development
Commencement
Original
Development
Land Size
(Hectares) Status
Estimated
Gross Value
Bandar Puchong Jaya, Puchong 1990 374 Approaching
completion
RM4.2 billion
IOI Resort, Putrajaya 1995 37 Ongoing RM0.4 billion
Bandar Putra, Kulai 1995 2,299 Ongoing RM8.7 billion
Bandar Putra, Segamat 1995 198 Ongoing RM0.7 billion
Bandar Puteri, Puchong 2000 374 Ongoing RM7.2 billion
Desaria, Sungai Ara, Penang 2001 9.3 Ongoing RM0.7 billion
Taman Lagenda Putra, Kulai 2006 91 Ongoing RM0.6 billion
Taman Kempas Utama, Johor 2007 119 Ongoing RM3.0 billion
16 Sierra, Puchong 2008 217 Ongoing RM2.8 billion
Seascape @ Sentosa Cove, Singapore 2008 1.5 Completed SGD1.1 billion
Teluk Kumbar, Barat Daya, Penang 2009 1.3 Ongoing RM0.1 billion
Cape Royale @ Sentosa Cove, Singapore 2010 2.1 Ongoing SGD2.0 billion
Cityscape @ Farrer Park, Singapore 2011 0.8 Ongoing SGD0.4 billion
South Beach @ Beach Road, Singapore 2011 3.5 Ongoing SGD1.0 billion
The Platino, Johor 2012 2 Ongoing RM0.4 billion
The Trilinq @ Jalan Lempeng, Singapore 2013 2.4 Ongoing SGD1.0 billion
IOI Park Bo Bay @ Xiamen, China 2013 3.1 Ongoing RMB1.2 billion
PropertyProperty development activities contributed approximately 90% of the overall property
division’s operating profit (excluding fair value adjustments on investment properties).
The Group is also increasingly supplemented with stable and recurring rental income
from its investment properties comprising mainly retail complexes and office buildings.
IOI Palm City, a 44-acre mixed development in
Jimei District, Xiamen is IOI Properties’ second mega project in China.
Annual Report 2013
IOI
Cor
por
atio
n B
erh
ad
43
Group Business Review – Property
Management’s Discussion and Analysis
The table below sets forth key information with respect to the performance of our property development business excluding jointly
controlled entities:
2013 2012 2011 2010 2009
Units of property sold 2,491 1,412 1,730 2,044 1,465
Total sales (RM million) 1,709.9 856.3 942.0 1,045.1 688.5
Revenue (RM million) 1,098.8 843.0 971.6 945.5 660.2
EBIT (RM million) 555.2 451.2 509.9 532.1 309.6
EBIT margin (%) 50.53 53.52 52.48 56.27 46.89
The Group’s property investment portfolio comprises mainly retail and office space totalling approximately 242,000 sq. m. of net lettable
space. The Group’s principal investment properties as at 30 June 2013 are IOI Mall, One and Two IOI Square, Puchong Financial Corporate
Centre (“PFCC”) and IOI Boulevard. The performance of the property investment business is as follows:
2013 2012 2011 2010 2009
Revenue (RM million) 105.6 95.3 95.7 97.9 81.5
Operating profit excluding fair value gain
on investment properties (RM million) 63.7 55.1 116.1 49.8 46.6
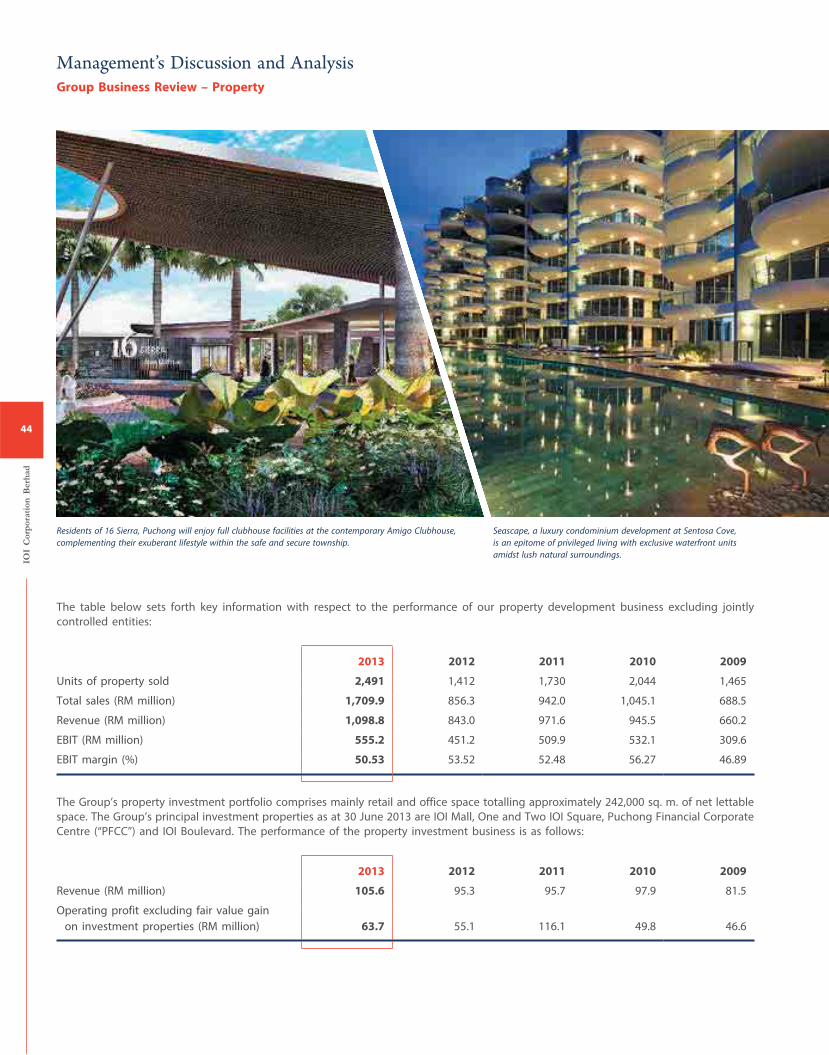
Residents of 16 Sierra, Puchong will enjoy full clubhouse facilities at the contemporary Amigo Clubhouse,
complementing their exuberant lifestyle within the safe and secure township.
Seascape, a luxury condominium development at Sentosa Cove,
is an epitome of privileged living with exclusive waterfront units
amidst lush natural surroundings.
IOI
Cor
por
atio
n B
erh
ad
44
Group Business Review – Property
Management’s Discussion and Analysis
OPERATIONS REVIEW
The Group sold a total of 2,491 units of properties with total sales value of RM1,709.9 million in FY2013, an increase of 1,079 units worth
RM853.6 million when compared to the previous financial year. In terms of revenue, the Group has achieved RM1.1 billion during the
financial year under review.
Property sales for the various projects are summarised as follows:
Sales Value (RM million) Units
Projects 2013 2012 2013 2012
The Trilinq @ Jalan Lempeng, Singapore 354.3 – 111 –
Bandar Puchong Jaya, Puchong 335.6 91.8 540 127
Bandar Putra, Kulai 230.7 160.6 573 412
Taman Kempas Utama, Johor 196.4 48.7 331 68
Bandar Puteri, Puchong 164.6 215.8 134 177
16 Sierra, Puchong 130.0 148.4 175 227
Taman Lagenda Putra, Kulai 79.2 36.7 179 141
IOI Resort, Putrajaya 76.4 77.6 117 121
The Platino, Johor 71.9 – 143 –
Bandar Putra, Segamat 32.7 23.6 131 111
Others 38.1 53.1 57 28
Total 1,709.9 856.3 2,491 1,412
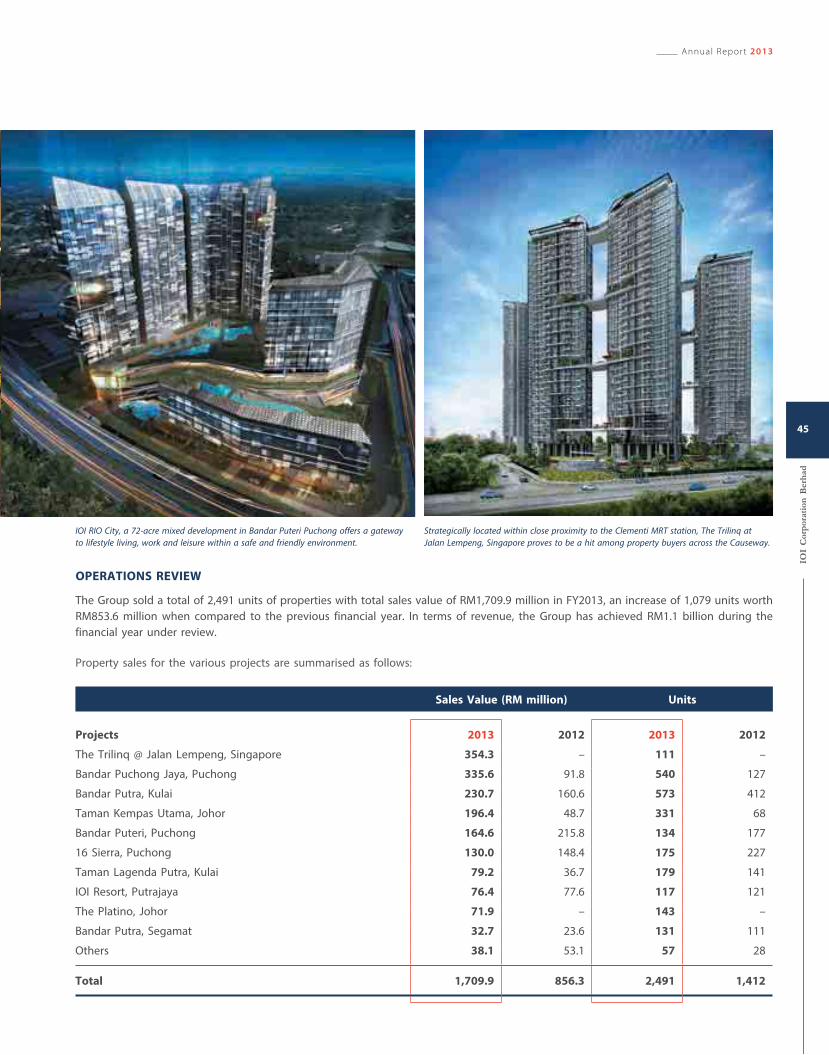
IOI RIO City, a 72-acre mixed development in Bandar Puteri Puchong offers a gateway
to lifestyle living, work and leisure within a safe and friendly environment.
Strategically located within close proximity to the Clementi MRT station, The Trilinq at
Jalan Lempeng, Singapore proves to be a hit among property buyers across the Causeway.
Annual Report 2013
IOI
Cor
por
atio
n B
erh
ad
45
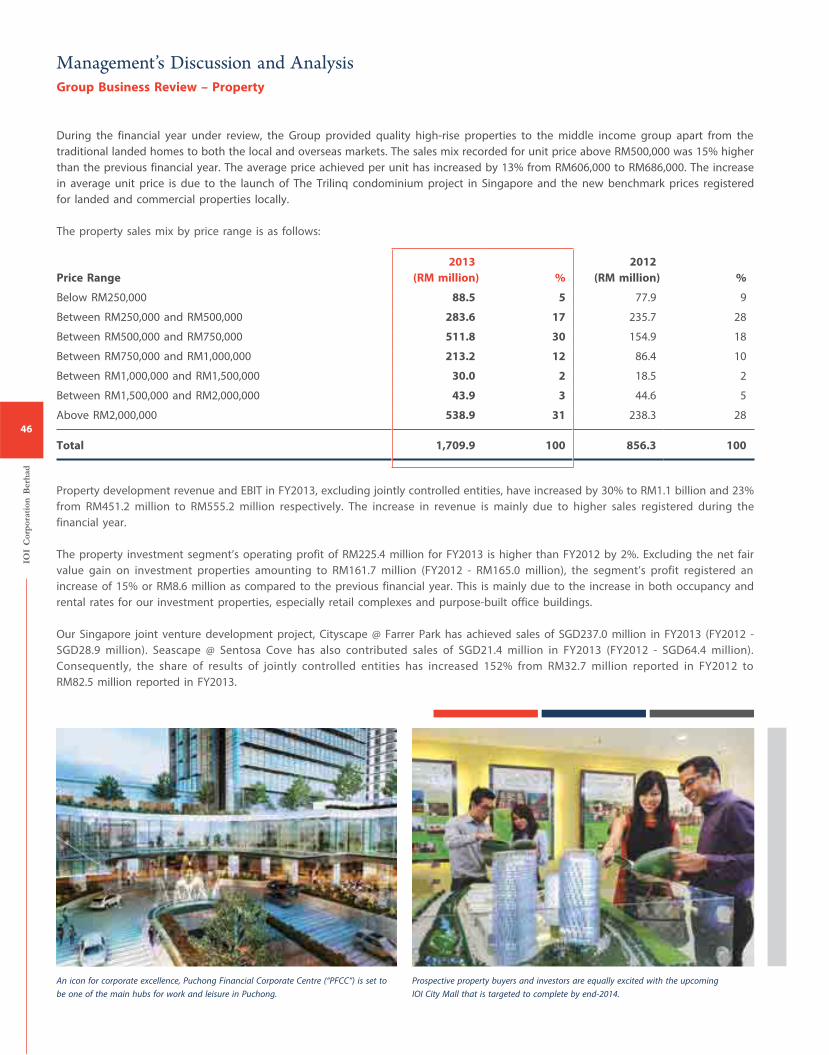
During the financial year under review, the Group provided quality high-rise properties to the middle income group apart from the
traditional landed homes to both the local and overseas markets. The sales mix recorded for unit price above RM500,000 was 15% higher
than the previous financial year. The average price achieved per unit has increased by 13% from RM606,000 to RM686,000. The increase
in average unit price is due to the launch of The Trilinq condominium project in Singapore and the new benchmark prices registered
for landed and commercial properties locally.
The property sales mix by price range is as follows:
Price Range
2013
(RM million) %
2012
(RM million) %
Below RM250,000 88.5 5 77.9 9
Between RM250,000 and RM500,000 283.6 17 235.7 28
Between RM500,000 and RM750,000 511.8 30 154.9 18
Between RM750,000 and RM1,000,000 213.2 12 86.4 10
Between RM1,000,000 and RM1,500,000 30.0 2 18.5 2
Between RM1,500,000 and RM2,000,000 43.9 3 44.6 5
Above RM2,000,000 538.9 31 238.3 28
Total 1,709.9 100 856.3 100
Property development revenue and EBIT in FY2013, excluding jointly controlled entities, have increased by 30% to RM1.1 billion and 23%
from RM451.2 million to RM555.2 million respectively. The increase in revenue is mainly due to higher sales registered during the
financial year.
The property investment segment’s operating profit of RM225.4 million for FY2013 is higher than FY2012 by 2%. Excluding the net fair
value gain on investment properties amounting to RM161.7 million (FY2012 - RM165.0 million), the segment’s profit registered an
increase of 15% or RM8.6 million as compared to the previous financial year. This is mainly due to the increase in both occupancy and
rental rates for our investment properties, especially retail complexes and purpose-built office buildings.
Our Singapore joint venture development project, Cityscape @ Farrer Park has achieved sales of SGD237.0 million in FY2013 (FY2012 -
SGD28.9 million). Seascape @ Sentosa Cove has also contributed sales of SGD21.4 million in FY2013 (FY2012 - SGD64.4 million).
Consequently, the share of results of jointly controlled entities has increased 152% from RM32.7 million reported in FY2012 to
RM82.5 million reported in FY2013.
An icon for corporate excellence, Puchong Financial Corporate Centre (“PFCC”) is set to
be one of the main hubs for work and leisure in Puchong.
Prospective property buyers and investors are equally excited with the upcoming
IOI City Mall that is targeted to complete by end-2014.
IOI
Cor
por
atio
n B
erh
ad
46
Group Business Review – Property
Management’s Discussion and Analysis

OUTLOOK & PROSPECTS
Overall, the housing sector continued to perform well in FY2013
and this momentum is expected to sustain in FY2014. The
prevailing low interest rate, relatively low unemployment rate and
the impetus provided by government infrastructure projects such
as the LRT and the MRT projects are some contributory factors for
this optimism.
In Johor, there was a record investment in excess of RM5 billion in
Iskandar Malaysia within the first three months of 2013 despite a
globally challenging investment climate. The increase of
Singapore’s small and medium enterprises in setting up operations
in Johor would also have a positive pull factor on the overall
Johor market. Other positive factors such as the MRT system
linking Johor and Singapore and the recently announced
KL-Singapore high-speed rail are expected to further enhance
Johor's prospect as a high growth area for property. All these
factors will bolster the Group's sales from its sizeable land bank in
Senai, Kulai and other pocket developments in the Iskandar
Malaysia region.
In 2013, the market outlook for the affordable housing segment and
developments with unique concepts at prime areas remains positive.
Hence, IOI Properties will focus more on providing quality high-rise
properties with good amenities and doorstep conveniences that will
appeal to the large middle income group. This will help to fill the
absolute price gap between terrace houses and high-rise homes.
FY2014 is expected to be a better year as more projects will be
approved and construction stages will be sufficiently advanced to
be ready for launch.
IOI's overseas development properties namely The Trilinq at Jalan
Lempeng, Singapore and IOI Park Bo Bay in Xiamen, China have
commenced active development and their respective revenues will
come on-stream from FY2014 onwards.
IOI has made further inroads into Xiamen, China where it successfully
bid for a 43.55-acre site in Jimei District in Xiamen for RMB1.2 billion
in September 2012. It is slated for a mixed development comprising
a shopping mall, boutique offices, a 5-star luxury hotel and luxury
high-rise residences. Upon completion, it will add sizable lettable
areas in both retail and office space to the Group's existing property
investment portfolio.
IOI Properties’ first foray into Xiamen, China, IOI Park Bo Bay is set to be the next preferred address with high-end residential duplex town villas, condominiums and commercial units.
Annual Report 2013
IOI
Cor
por
atio
n B
erh
ad
47
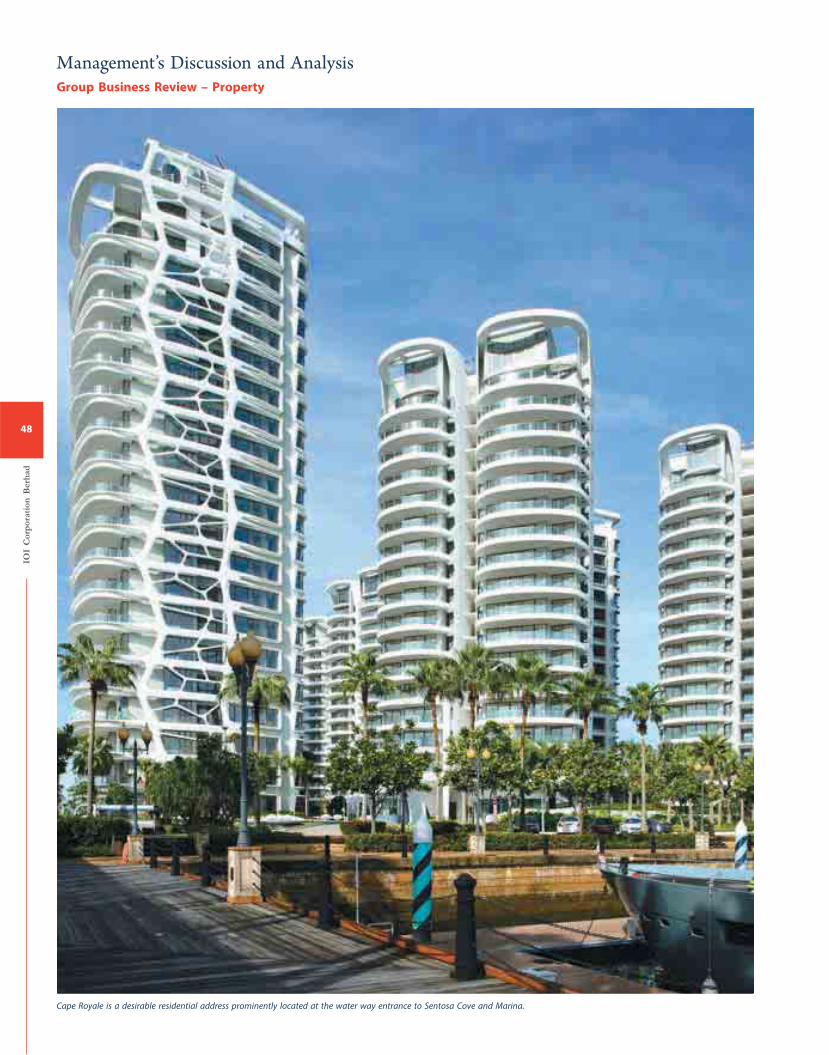
Group Business Review – Property
Cape Royale is a desirable residential address prominently located at the water way entrance to Sentosa Cove and Marina.
IOI
Cor
por
atio
n B
erh
ad
48
Management’s Discussion and Analysis
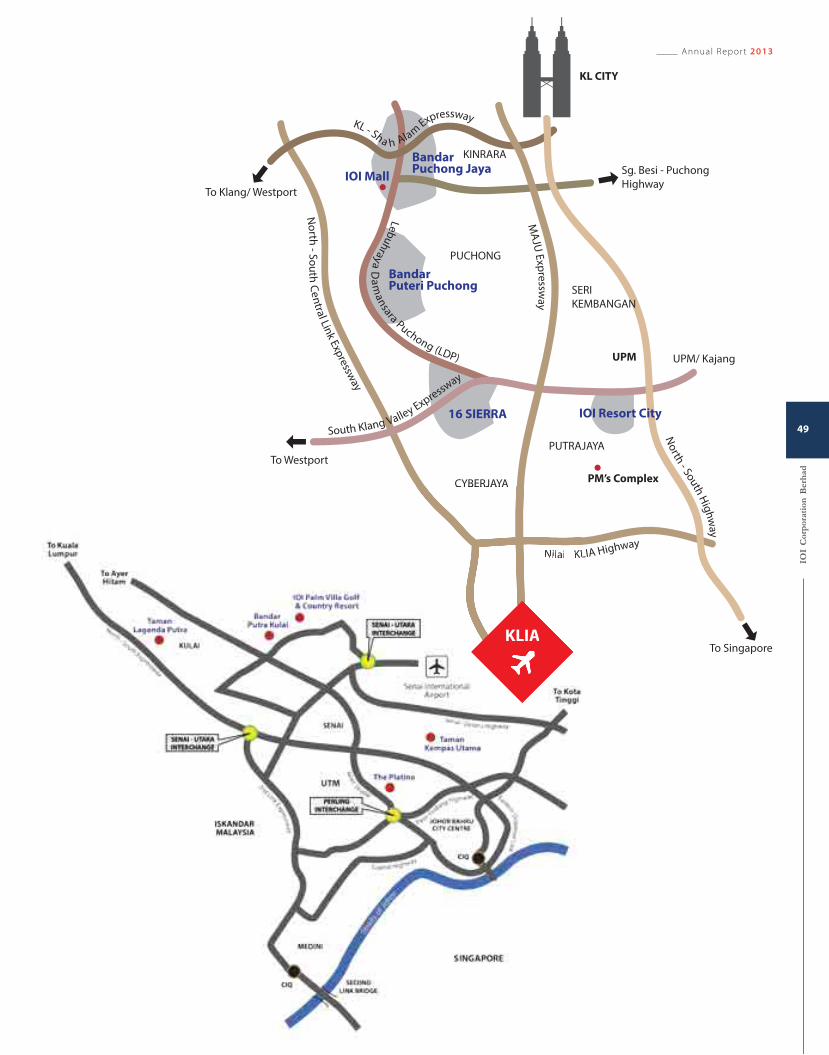
Lebu
hray
a D
am
ansara Puchong (LDP)
Nilai - KLIA Highway
No
rth - S
ou
th C
en
tral Link Exp
ressway
KL - Sha h Alam Expressway
South Klang Valley Expressway
MA
JU E
xpre
ssway
No
rth - South H
igh
way
To Klang/ Westport
To Westport
Sg. Besi - Puchong
Highway
PUTRAJAYA
KINRARA
PUCHONG
SERI
KEMBANGAN
CYBERJAYA PM’s Complex
UPM/ Kajang
To SingaporeKLIA
IOI Mall
KL CITY
UPM
IOI Resort City16 SIERRA
BandarPuteri Puchong
BandarPuchong Jaya
Nilai - KL
CYBERJAYA
KLIA
Annual Report 2013
IOI
Cor
por
atio
n B
erh
ad
49
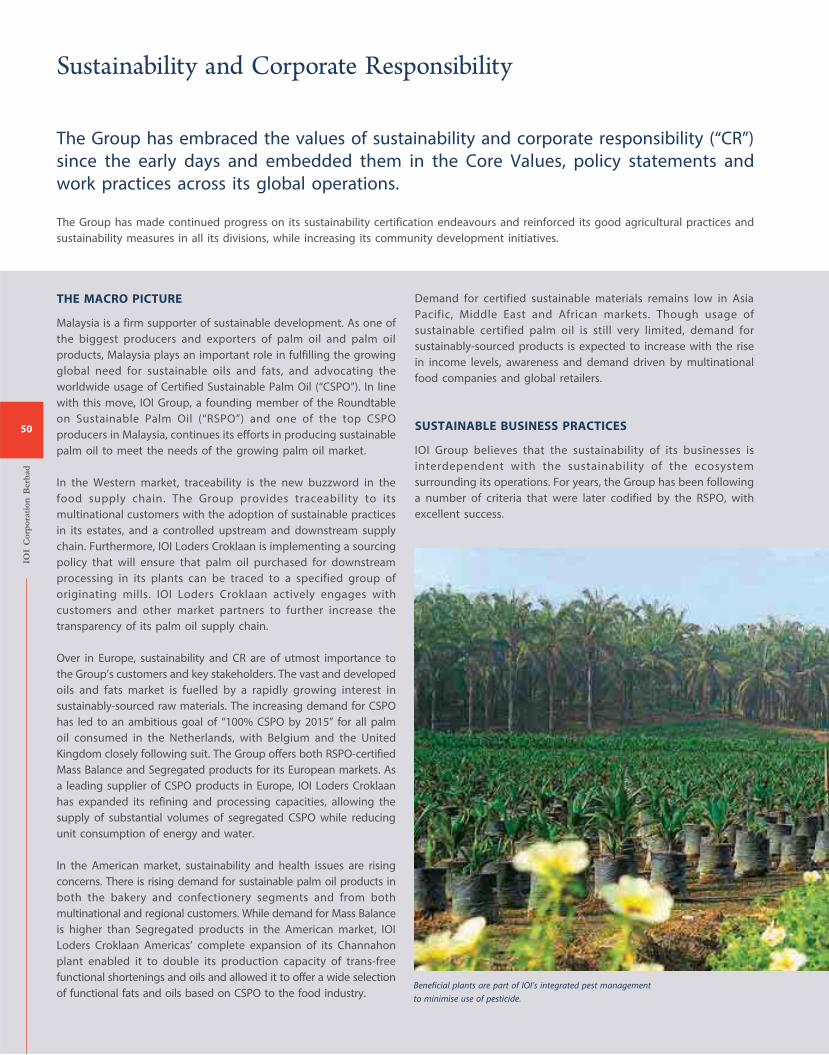
The Group has embraced the values of sustainability and corporate responsibility (“CR”)
since the early days and embedded them in the Core Values, policy statements and
work practices across its global operations.
The Group has made continued progress on its sustainability certification endeavours and reinforced its good agricultural practices and
sustainability measures in all its divisions, while increasing its community development initiatives.
Beneficial plants are part of IOI’s integrated pest management
to minimise use of pesticide.
THE MACRO PICTURE
Malaysia is a firm supporter of sustainable development. As one of
the biggest producers and exporters of palm oil and palm oil
products, Malaysia plays an important role in fulfilling the growing
global need for sustainable oils and fats, and advocating the
worldwide usage of Certified Sustainable Palm Oil (“CSPO”). In line
with this move, IOI Group, a founding member of the Roundtable
on Sustainable Palm Oil (“RSPO”) and one of the top CSPO
producers in Malaysia, continues its efforts in producing sustainable
palm oil to meet the needs of the growing palm oil market.
In the Western market, traceability is the new buzzword in the
food supply chain. The Group provides traceability to its
multinational customers with the adoption of sustainable practices
in its estates, and a controlled upstream and downstream supply
chain. Furthermore, IOI Loders Croklaan is implementing a sourcing
policy that will ensure that palm oil purchased for downstream
processing in its plants can be traced to a specified group of
originating mills. IOI Loders Croklaan actively engages with
customers and other market partners to further increase the
transparency of its palm oil supply chain.
Over in Europe, sustainability and CR are of utmost importance to
the Group’s customers and key stakeholders. The vast and developed
oils and fats market is fuelled by a rapidly growing interest in
sustainably-sourced raw materials. The increasing demand for CSPO
has led to an ambitious goal of “100% CSPO by 2015” for all palm
oil consumed in the Netherlands, with Belgium and the United
Kingdom closely following suit. The Group offers both RSPO-certified
Mass Balance and Segregated products for its European markets. As
a leading supplier of CSPO products in Europe, IOI Loders Croklaan
has expanded its refining and processing capacities, allowing the
supply of substantial volumes of segregated CSPO while reducing
unit consumption of energy and water.
In the American market, sustainability and health issues are rising
concerns. There is rising demand for sustainable palm oil products in
both the bakery and confectionery segments and from both
multinational and regional customers. While demand for Mass Balance
is higher than Segregated products in the American market, IOI
Loders Croklaan Americas’ complete expansion of its Channahon
plant enabled it to double its production capacity of trans-free
functional shortenings and oils and allowed it to offer a wide selection
of functional fats and oils based on CSPO to the food industry.
Demand for certified sustainable materials remains low in Asia
Pacific, Middle East and African markets. Though usage of
sustainable certified palm oil is still very limited, demand for
sustainably-sourced products is expected to increase with the rise
in income levels, awareness and demand driven by multinational
food companies and global retailers.
SUSTAINABLE BUSINESS PRACTICES
IOI Group believes that the sustainability of its businesses is
interdependent with the sustainability of the ecosystem
surrounding its operations. For years, the Group has been following
a number of criteria that were later codified by the RSPO, with
excellent success.
IOI
Cor
por
atio
n B
erh
ad
50
Sustainability and Corporate Responsibility
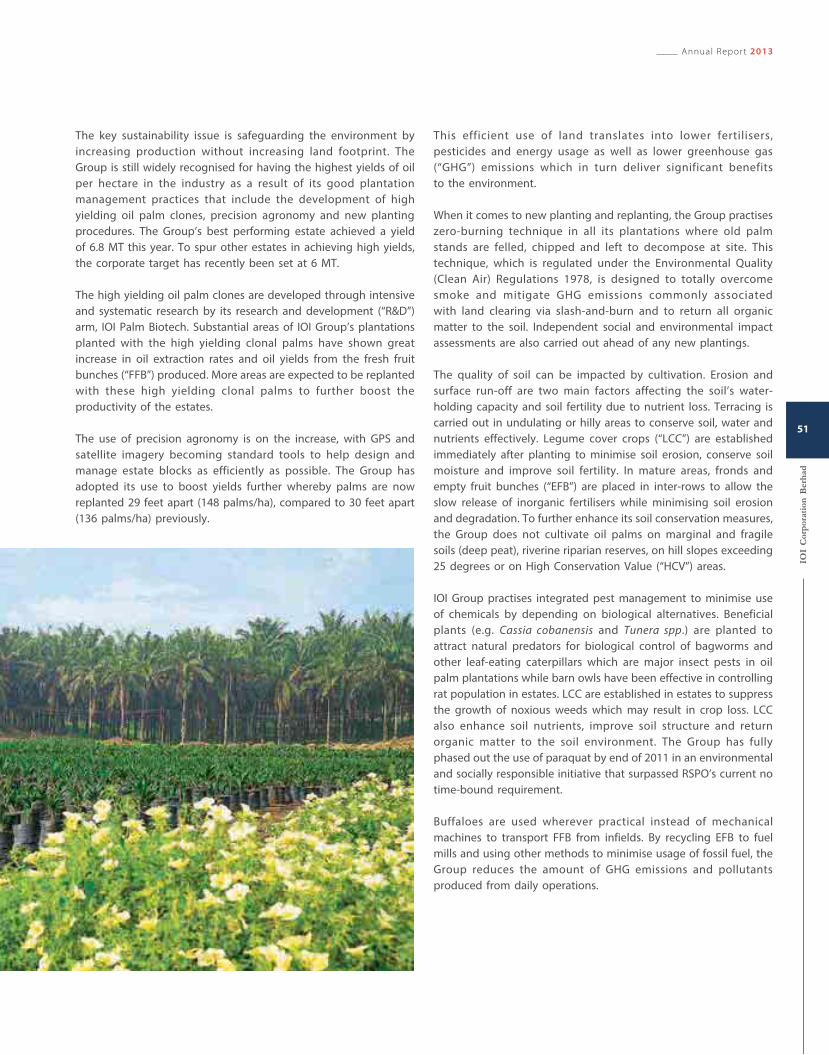
The key sustainability issue is safeguarding the environment by
increasing production without increasing land footprint. The
Group is still widely recognised for having the highest yields of oil
per hectare in the industry as a result of its good plantation
management practices that include the development of high
yielding oil palm clones, precision agronomy and new planting
procedures. The Group’s best performing estate achieved a yield
of 6.8 MT this year. To spur other estates in achieving high yields,
the corporate target has recently been set at 6 MT.
The high yielding oil palm clones are developed through intensive
and systematic research by its research and development (“R&D”)
arm, IOI Palm Biotech. Substantial areas of IOI Group’s plantations
planted with the high yielding clonal palms have shown great
increase in oil extraction rates and oil yields from the fresh fruit
bunches (“FFB”) produced. More areas are expected to be replanted
with these high yielding clonal palms to further boost the
productivity of the estates.
The use of precision agronomy is on the increase, with GPS and
satellite imagery becoming standard tools to help design and
manage estate blocks as efficiently as possible. The Group has
adopted its use to boost yields further whereby palms are now
replanted 29 feet apart (148 palms/ha), compared to 30 feet apart
(136 palms/ha) previously.
This efficient use of land translates into lower fertilisers,
pesticides and energy usage as well as lower greenhouse gas
(“GHG”) emissions which in turn deliver significant benefits
to the environment.
When it comes to new planting and replanting, the Group practises
zero-burning technique in all its plantations where old palm
stands are felled, chipped and left to decompose at site. This
technique, which is regulated under the Environmental Quality
(Clean Air) Regulations 1978, is designed to totally overcome
smoke and mitigate GHG emissions commonly associated
with land clearing via slash-and-burn and to return all organic
matter to the soil. Independent social and environmental impact
assessments are also carried out ahead of any new plantings.
The quality of soil can be impacted by cultivation. Erosion and
surface run-off are two main factors affecting the soil’s water-
holding capacity and soil fertility due to nutrient loss. Terracing is
carried out in undulating or hilly areas to conserve soil, water and
nutrients effectively. Legume cover crops (“LCC”) are established
immediately after planting to minimise soil erosion, conserve soil
moisture and improve soil fertility. In mature areas, fronds and
empty fruit bunches (“EFB”) are placed in inter-rows to allow the
slow release of inorganic fertilisers while minimising soil erosion
and degradation. To further enhance its soil conservation measures,
the Group does not cultivate oil palms on marginal and fragile
soils (deep peat), riverine riparian reserves, on hill slopes exceeding
25 degrees or on High Conservation Value (“HCV”) areas.
IOI Group practises integrated pest management to minimise use
of chemicals by depending on biological alternatives. Beneficial
plants (e.g. Cassia cobanensis and Tunera spp.) are planted to
attract natural predators for biological control of bagworms and
other leaf-eating caterpillars which are major insect pests in oil
palm plantations while barn owls have been effective in controlling
rat population in estates. LCC are established in estates to suppress
the growth of noxious weeds which may result in crop loss. LCC
also enhance soil nutrients, improve soil structure and return
organic matter to the soil environment. The Group has fully
phased out the use of paraquat by end of 2011 in an environmental
and socially responsible initiative that surpassed RSPO’s current no
time-bound requirement.
Buffaloes are used wherever practical instead of mechanical
machines to transport FFB from infields. By recycling EFB to fuel
mills and using other methods to minimise usage of fossil fuel, the
Group reduces the amount of GHG emissions and pollutants
produced from daily operations.
Annual Report 2013
IOI
Cor
por
atio
n B
erh
ad
51
INTERNATIONAL SUSTAINABILITY BENCHMARKS
RSPO Certification
As a founding member of the RSPO, IOI Group has played an
active role in promoting sustainable practices since its inception in
2004. The Group also advocates sustainable agricultural practices
in its estates to bring growth and use of CSPO to the world
market. As of 30 June 2013, ten out of twelve IOI Group’s mills and
their supply bases have been RSPO-certified. The Group is set to
achieve 100% certification by end of 2013.
In addition, all of IOI Group’s operating units and supply chain
units in Malaysia and overseas have successfully obtained the
RSPO Supply Chain Certification.
ISCC Certification
In addition to the RSPO certification, the Group is also diligently
pursuing the International Sustainability and Carbon Certification
(“ISCC”), which is the first international certification system that
can be used to prove sustainability and GHG savings for biomass
and bioenergy. It is recognised by the European Commission for
all member countries, specifically Germany and the Netherlands.
To date, nine of the Group’s palm oil mills and their supply bases
in Peninsular Malaysia and Sabah have been awarded the ISCC
certification. The achievement signifies that IOI Group’s products
comply with the strict sustainability criteria for the use of biomass
in renewable energy application set by the European Commission.
Challenges
Amid continuing challenges from a complex business environment,
the Group has made progress in the inherited land dispute case with
natives in Sarawak. RSPO has lifted the suspension on IOI’s certification
process in view of IOI Group’s commitment to resolve the ongoing
dispute. Following the affirmation of Federal Court, the highest
court in Malaysia, that the disputed land is without native rights
encumbrances, the Group is committed to improve the relationship
with the local communities through continuous dialogue.
SUSTAINABLE DEVELOPMENTS
The Group’s property business is undertaken by IOI Properties and
its subsidiaries (“IOIP Group”) which is committed to promote
sustainability in its developments and deliver value creation to its
customers by:
a) Incorporating design principles and adopting work practices
with due consideration for energy conservation and the
environment;
b) Promoting activities which contribute to the safety and
vibrancy of its communities.
In line with the policy, IOIP Group sources construction materials
and products locally which reduce transportation cost and air
pollution, adopts design features which harness natural light,
encourage cross and natural ventilation, reduces dependency
o n m e c h a n i c a l s y s t e m s w h i c h c o n s u m e e n e r g y a n d
incorporates energy management systems to help reduce overall
energy consumption and carbon footprints. The following
sustainability aims and features are incorporated within IOIP
Group’s developments:
Commercial High-Rise Buildings
• To obtain Green Building Index (“GBI”) or Green Mark
Certification.
• To orientate buildings towards North South direction to reduce
heat and sun glare.
• To incorporate energy management modules in its building
automation system.
Residential Buildings
• To adopt cross ventilation designs where applicable.
• To naturally ventilate all bathrooms without the use of exhaust
fans through strategically-placed windows.
• To adopt an open concept with high ceilings to enhance
natural lighting and ventilation.
• To orientate buildings towards North South direction to reduce
heat and sun glare.
• To incorporate vertical plantings to enhance beauty aesthetics
and reduce carbon footprints.
• To incorporate solar water heating systems.
• To install rainwater harvesting systems for irrigation purposes.
Other than incorporating environmentally-neutral design principles
and fittings in IOIP Group’s buildings, the same considerations are
given to projects which are mainly non-building based. For
example, in the course of refurbishing IOI’s Palm Garden Golf Club,
rigorous considerations were given to minimise impact to the
existing environment. More than 85% (or 2,191 trees) of the trees
at the old site were transplanted to the new site and the trees
achieved a remarkable survival rate of more than 95%. Besides
that, more than 80% of the planting material requirements for the
course was sourced, propagated and/or transplanted at site. The
onsite propagation helped to reduce fuel consumption and air
pollution which would otherwise have resulted from the need to
buy and transport these materials over long distances.
IOI
Cor
por
atio
n B
erh
ad
52
Sustainability and Corporate Responsibility
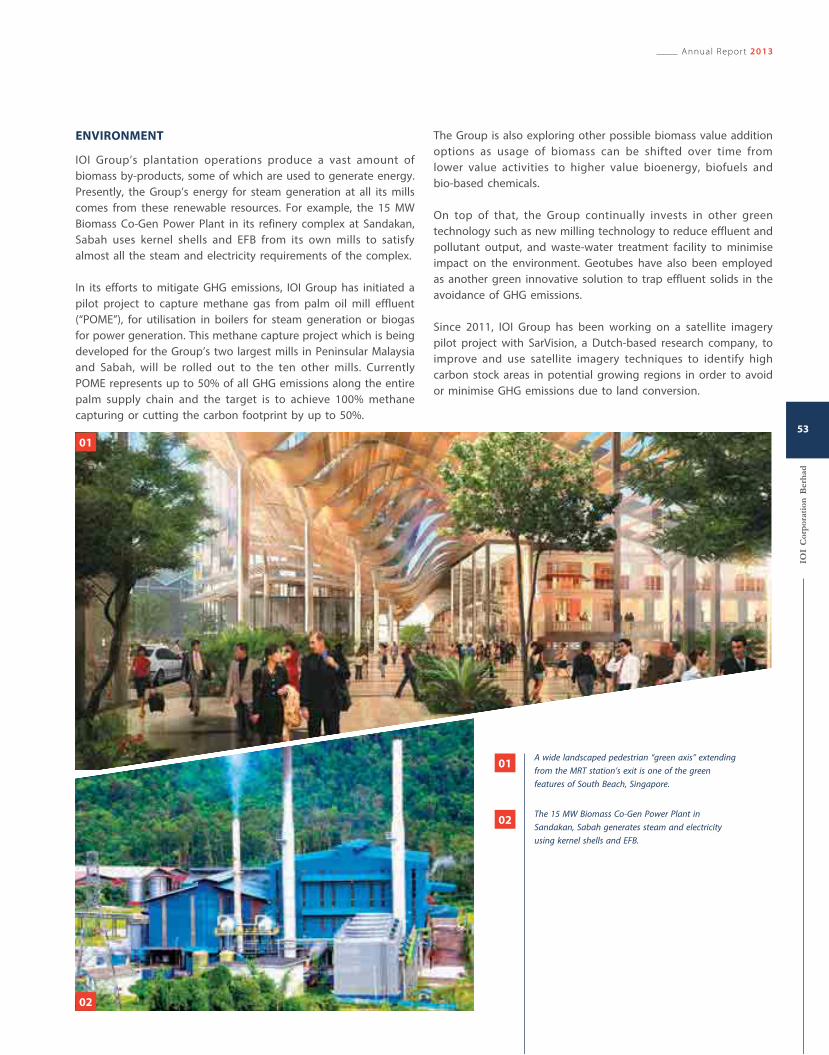
A wide landscaped pedestrian “green axis” extending
from the MRT station’s exit is one of the green
features of South Beach, Singapore.
01
01
02
02
The 15 MW Biomass Co-Gen Power Plant in
Sandakan, Sabah generates steam and electricity
using kernel shells and EFB.
ENVIRONMENT
IOI Group’s plantation operations produce a vast amount of
biomass by-products, some of which are used to generate energy.
Presently, the Group’s energy for steam generation at all its mills
comes from these renewable resources. For example, the 15 MW
Biomass Co-Gen Power Plant in its refinery complex at Sandakan,
Sabah uses kernel shells and EFB from its own mills to satisfy
almost all the steam and electricity requirements of the complex.
In its efforts to mitigate GHG emissions, IOI Group has initiated a
pilot project to capture methane gas from palm oil mill effluent
(“POME”), for utilisation in boilers for steam generation or biogas
for power generation. This methane capture project which is being
developed for the Group’s two largest mills in Peninsular Malaysia
and Sabah, will be rolled out to the ten other mills. Currently
POME represents up to 50% of all GHG emissions along the entire
palm supply chain and the target is to achieve 100% methane
capturing or cutting the carbon footprint by up to 50%.
The Group is also exploring other possible biomass value addition
options as usage of biomass can be shifted over time from
lower value activities to higher value bioenergy, biofuels and
bio-based chemicals.
On top of that, the Group continually invests in other green
technology such as new milling technology to reduce effluent and
pollutant output, and waste-water treatment facility to minimise
impact on the environment. Geotubes have also been employed
as another green innovative solution to trap effluent solids in the
avoidance of GHG emissions.
Since 2011, IOI Group has been working on a satellite imagery
pilot project with SarVision, a Dutch-based research company, to
improve and use satellite imagery techniques to identify high
carbon stock areas in potential growing regions in order to avoid
or minimise GHG emissions due to land conversion.
Annual Report 2013
IOI
Cor
por
atio
n B
erh
ad
53
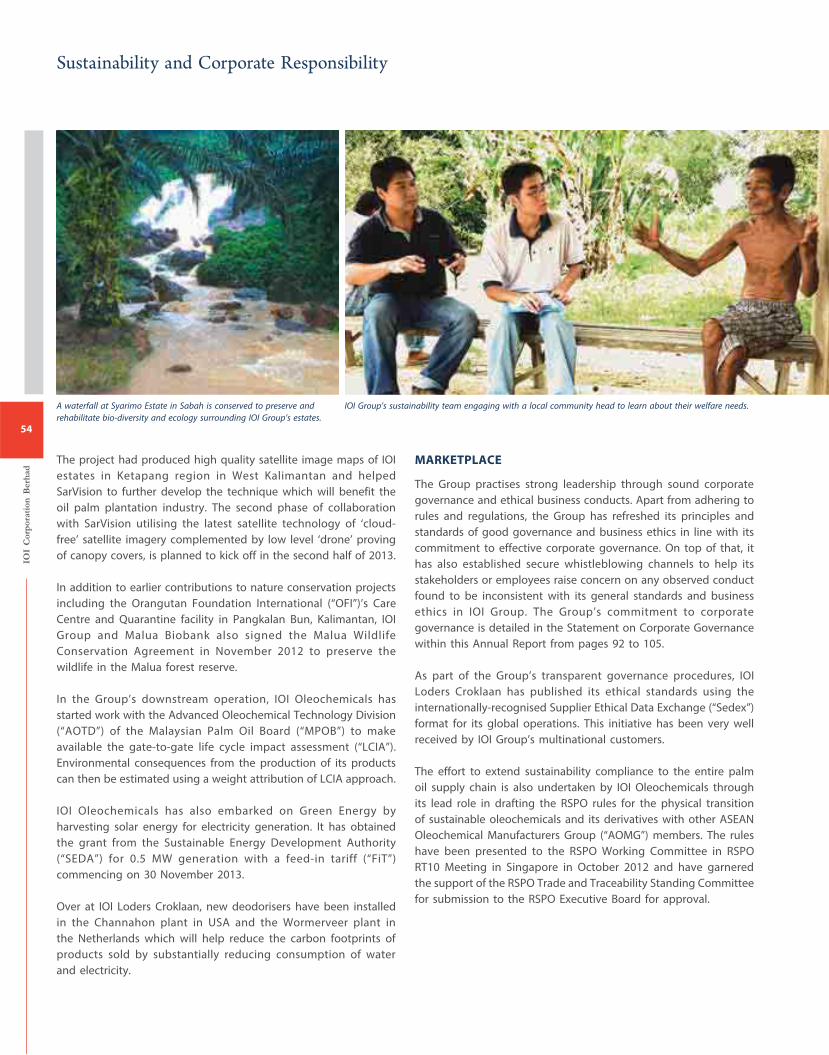
IOI Group’s sustainability team engaging with a local community head to learn about their welfare needs.A waterfall at Syarimo Estate in Sabah is conserved to preserve and
rehabilitate bio-diversity and ecology surrounding IOI Group’s estates.
The project had produced high quality satellite image maps of IOI
estates in Ketapang region in West Kalimantan and helped
SarVision to further develop the technique which will benefit the
oil palm plantation industry. The second phase of collaboration
with SarVision utilising the latest satellite technology of ‘cloud-
free’ satellite imagery complemented by low level ‘drone’ proving
of canopy covers, is planned to kick off in the second half of 2013.
In addition to earlier contributions to nature conservation projects
including the Orangutan Foundation International (“OFI”)’s Care
Centre and Quarantine facility in Pangkalan Bun, Kalimantan, IOI
Group and Malua Biobank also signed the Malua Wildlife
Conservation Agreement in November 2012 to preserve the
wildlife in the Malua forest reserve.
In the Group’s downstream operation, IOI Oleochemicals has
started work with the Advanced Oleochemical Technology Division
(“AOTD”) of the Malaysian Palm Oil Board (“MPOB”) to make
available the gate-to-gate life cycle impact assessment (“LCIA”).
Environmental consequences from the production of its products
can then be estimated using a weight attribution of LCIA approach.
IOI Oleochemicals has also embarked on Green Energy by
harvesting solar energy for electricity generation. It has obtained
the grant from the Sustainable Energy Development Authority
(“SEDA”) for 0.5 MW generation with a feed-in tariff (“FiT”)
commencing on 30 November 2013.
Over at IOI Loders Croklaan, new deodorisers have been installed
in the Channahon plant in USA and the Wormerveer plant in
the Netherlands which will help reduce the carbon footprints of
products sold by substantially reducing consumption of water
and electricity.
MARKETPLACE
The Group practises strong leadership through sound corporate
governance and ethical business conducts. Apart from adhering to
rules and regulations, the Group has refreshed its principles and
standards of good governance and business ethics in line with its
commitment to effective corporate governance. On top of that, it
has also established secure whistleblowing channels to help its
stakeholders or employees raise concern on any observed conduct
found to be inconsistent with its general standards and business
ethics in IOI Group. The Group’s commitment to corporate
governance is detailed in the Statement on Corporate Governance
within this Annual Report from pages 92 to 105.
As part of the Group’s transparent governance procedures, IOI
Loders Croklaan has published its ethical standards using the
internationally-recognised Supplier Ethical Data Exchange (“Sedex”)
format for its global operations. This initiative has been very well
received by IOI Group’s multinational customers.
The effort to extend sustainability compliance to the entire palm
oil supply chain is also undertaken by IOI Oleochemicals through
its lead role in drafting the RSPO rules for the physical transition
of sustainable oleochemicals and its derivatives with other ASEAN
Oleochemical Manufacturers Group (“AOMG”) members. The rules
have been presented to the RSPO Working Committee in RSPO
RT10 Meeting in Singapore in October 2012 and have garnered
the support of the RSPO Trade and Traceability Standing Committee
for submission to the RSPO Executive Board for approval.
IOI
Cor
por
atio
n B
erh
ad
54
Sustainability and Corporate Responsibility
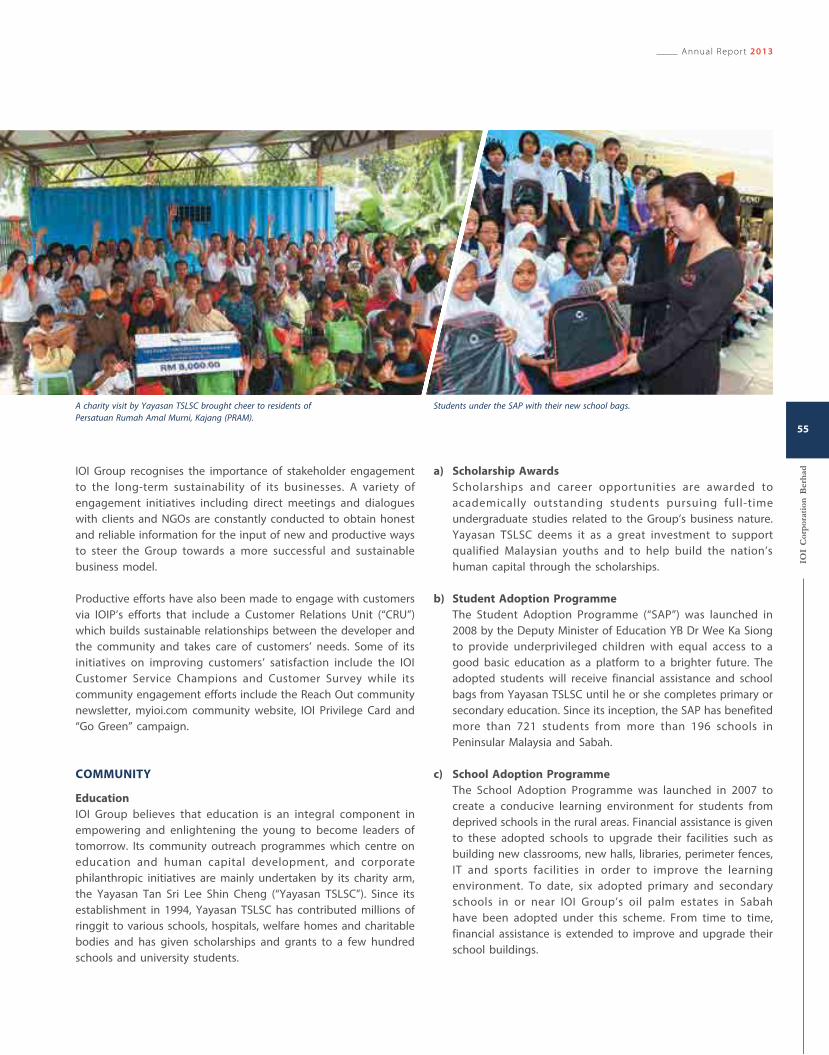
Students under the SAP with their new school bags.A charity visit by Yayasan TSLSC brought cheer to residents of
Persatuan Rumah Amal Murni, Kajang (PRAM).
IOI Group recognises the importance of stakeholder engagement
to the long-term sustainability of its businesses. A variety of
engagement initiatives including direct meetings and dialogues
with clients and NGOs are constantly conducted to obtain honest
and reliable information for the input of new and productive ways
to steer the Group towards a more successful and sustainable
business model.
Productive efforts have also been made to engage with customers
via IOIP’s efforts that include a Customer Relations Unit (“CRU”)
which builds sustainable relationships between the developer and
the community and takes care of customers’ needs. Some of its
initiatives on improving customers’ satisfaction include the IOI
Customer Service Champions and Customer Survey while its
community engagement efforts include the Reach Out community
newsletter, myioi.com community website, IOI Privilege Card and
“Go Green” campaign.
COMMUNITY
Education
IOI Group believes that education is an integral component in
empowering and enlightening the young to become leaders of
tomorrow. Its community outreach programmes which centre on
education and human capital development, and corporate
philanthropic initiatives are mainly undertaken by its charity arm,
the Yayasan Tan Sri Lee Shin Cheng (“Yayasan TSLSC”). Since its
establishment in 1994, Yayasan TSLSC has contributed millions of
ringgit to various schools, hospitals, welfare homes and charitable
bodies and has given scholarships and grants to a few hundred
schools and university students.
a) Scholarship Awards
Scholarships and career opportunities are awarded to
academically outstanding students pursuing full-time
undergraduate studies related to the Group’s business nature.
Yayasan TSLSC deems it as a great investment to support
qualified Malaysian youths and to help build the nation’s
human capital through the scholarships.
b) Student Adoption Programme
The Student Adoption Programme (“SAP”) was launched in
2008 by the Deputy Minister of Education YB Dr Wee Ka Siong
to provide underprivileged children with equal access to a
good basic education as a platform to a brighter future. The
adopted students will receive financial assistance and school
bags from Yayasan TSLSC until he or she completes primary or
secondary education. Since its inception, the SAP has benefited
more than 721 students from more than 196 schools in
Peninsular Malaysia and Sabah.
c) School Adoption Programme
The School Adoption Programme was launched in 2007 to
create a conducive learning environment for students from
deprived schools in the rural areas. Financial assistance is given
to these adopted schools to upgrade their facilities such as
building new classrooms, new halls, libraries, perimeter fences,
IT and sports facilities in order to improve the learning
environment. To date, six adopted primary and secondary
schools in or near IOI Group’s oil palm estates in Sabah
have been adopted under this scheme. From time to time,
financial assistance is extended to improve and upgrade their
school buildings.
Annual Report 2013
IOI
Cor
por
atio
n B
erh
ad
55
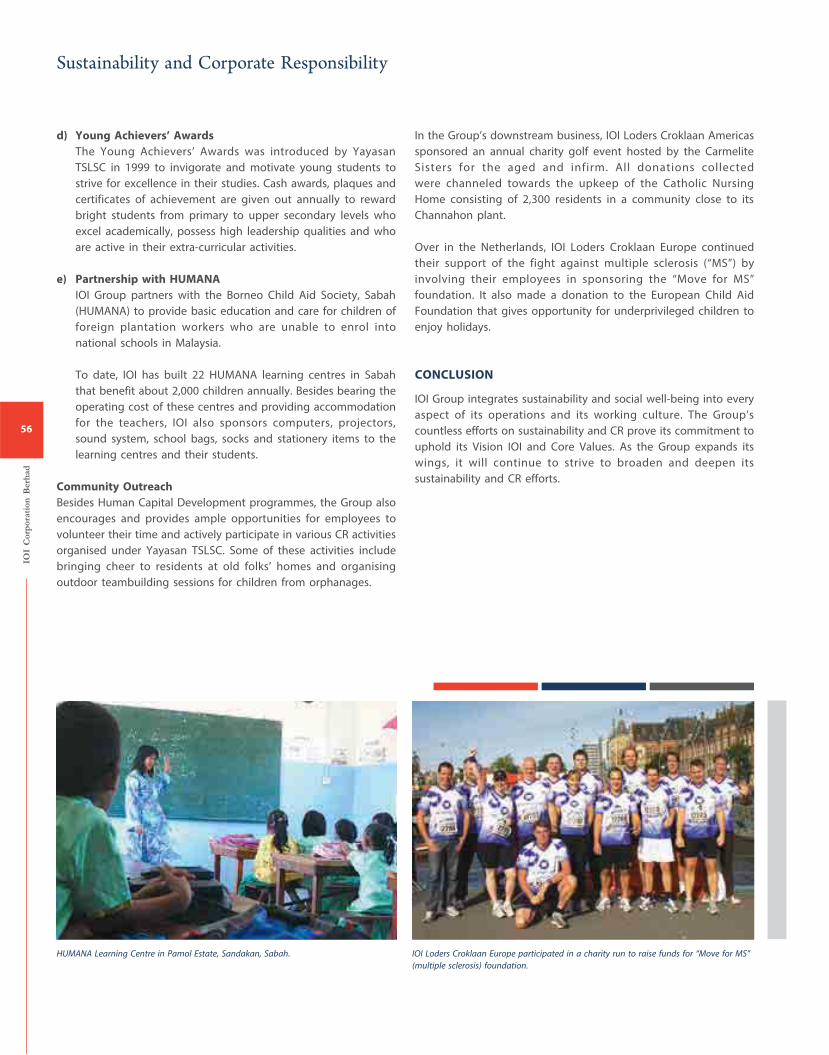
d) Young Achievers’ Awards
The Young Achievers’ Awards was introduced by Yayasan
TSLSC in 1999 to invigorate and motivate young students to
strive for excellence in their studies. Cash awards, plaques and
certificates of achievement are given out annually to reward
bright students from primary to upper secondary levels who
excel academically, possess high leadership qualities and who
are active in their extra-curricular activities.
e) Partnership with HUMANA
IOI Group partners with the Borneo Child Aid Society, Sabah
(HUMANA) to provide basic education and care for children of
foreign plantation workers who are unable to enrol into
national schools in Malaysia.
To date, IOI has built 22 HUMANA learning centres in Sabah
that benefit about 2,000 children annually. Besides bearing the
operating cost of these centres and providing accommodation
for the teachers, IOI also sponsors computers, projectors,
sound system, school bags, socks and stationery items to the
learning centres and their students.
Community Outreach
Besides Human Capital Development programmes, the Group also
encourages and provides ample opportunities for employees to
volunteer their time and actively participate in various CR activities
organised under Yayasan TSLSC. Some of these activities include
bringing cheer to residents at old folks’ homes and organising
outdoor teambuilding sessions for children from orphanages.
In the Group’s downstream business, IOI Loders Croklaan Americas
sponsored an annual charity golf event hosted by the Carmelite
Sisters for the aged and infirm. All donations collected
were channeled towards the upkeep of the Catholic Nursing
Home consisting of 2,300 residents in a community close to its
Channahon plant.
Over in the Netherlands, IOI Loders Croklaan Europe continued
their support of the fight against multiple sclerosis (“MS”) by
involving their employees in sponsoring the “Move for MS”
foundation. It also made a donation to the European Child Aid
Foundation that gives opportunity for underprivileged children to
enjoy holidays.
CONCLUSION
IOI Group integrates sustainability and social well-being into every
aspect of its operations and its working culture. The Group’s
countless efforts on sustainability and CR prove its commitment to
uphold its Vision IOI and Core Values. As the Group expands its
wings, it will continue to strive to broaden and deepen its
sustainability and CR efforts.
HUMANA Learning Centre in Pamol Estate, Sandakan, Sabah. IOI Loders Croklaan Europe participated in a charity run to raise funds for “Move for MS”
(multiple sclerosis) foundation.
IOI
Cor
por
atio
n B
erh
ad
56
Sustainability and Corporate Responsibility

Students of HUMANA Learning Centres,
located in IOI’s plantation estates in Sabah,
are provided with basic education and care.
Clinics and medical care facilities are set up
in all estates to ensure the welfare of estate
workers is taken care of.
Places of worships of different faiths are built
in every IOI Group’s estate to cater to the
needs of various communities.
Recreational activities are encouraged to
foster closer ties between the estate workers.
01
01
02
02
03
03
04
04
Annual Report 2013
IOI
Cor
por
atio
n B
erh
ad
57
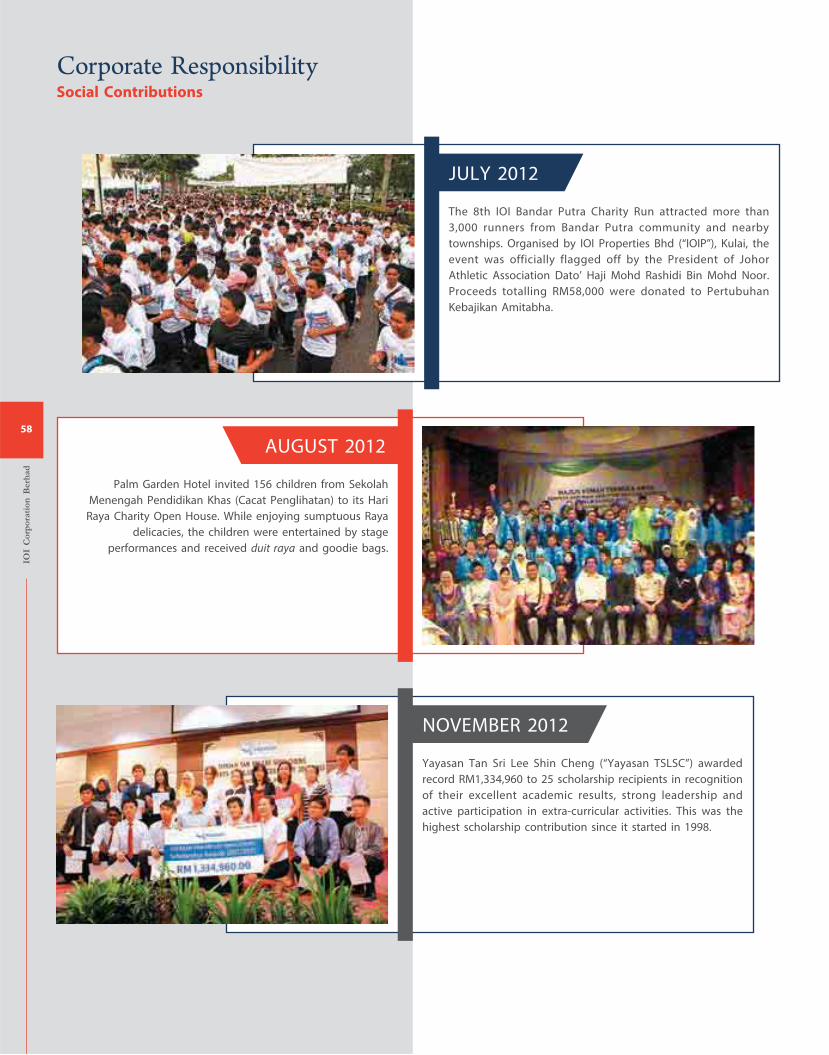
Palm Garden Hotel invited 156 children from Sekolah
Menengah Pendidikan Khas (Cacat Penglihatan) to its Hari
Raya Charity Open House. While enjoying sumptuous Raya
delicacies, the children were entertained by stage
performances and received duit raya and goodie bags.
AUGUST 2012
JULY 2012
The 8th IOI Bandar Putra Charity Run attracted more than
3,000 runners from Bandar Putra community and nearby
townships. Organised by IOI Properties Bhd (“IOIP”), Kulai, the
event was officially flagged off by the President of Johor
Athletic Association Dato’ Haji Mohd Rashidi Bin Mohd Noor.
Proceeds totalling RM58,000 were donated to Pertubuhan
Kebajikan Amitabha.
NOVEMBER 2012
Yayasan Tan Sri Lee Shin Cheng (“Yayasan TSLSC”) awarded
record RM1,334,960 to 25 scholarship recipients in recognition
of their excellent academic results, strong leadership and
active participation in extra-curricular activities. This was the
highest scholarship contribution since it started in 1998.
IOI
Cor
por
atio
n B
erh
ad
58
Corporate ResponsibilitySocial Contributions
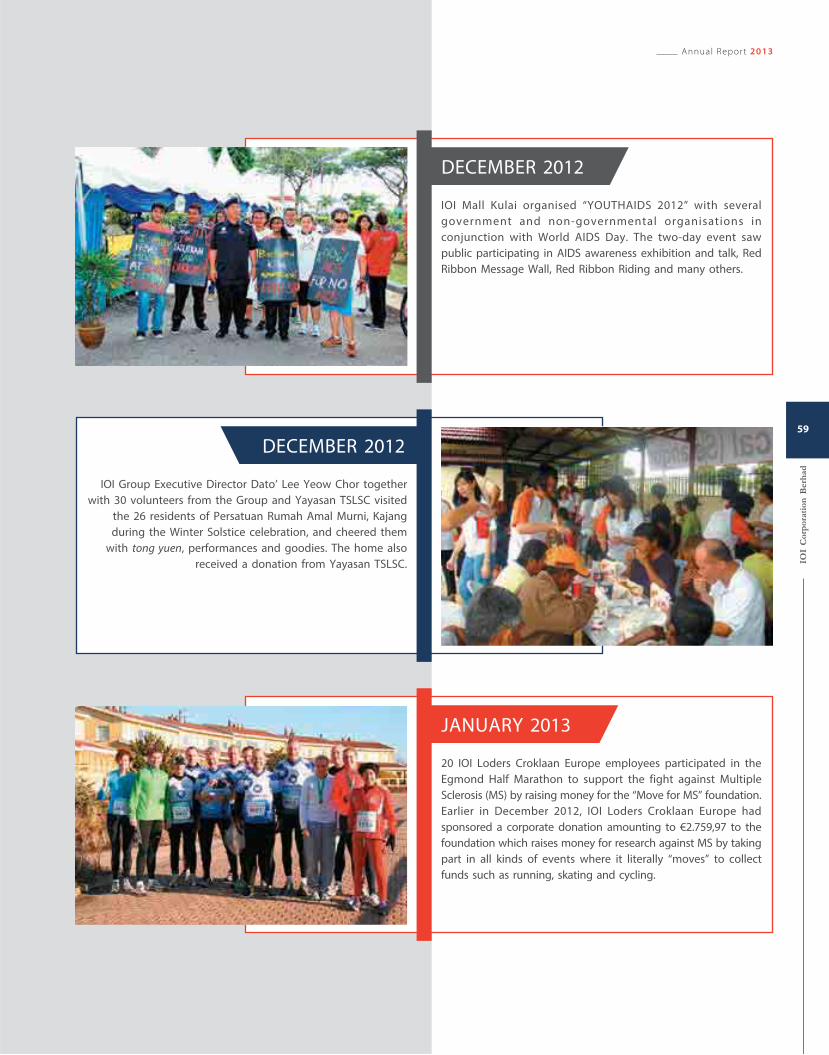
IOI Group Executive Director Dato’ Lee Yeow Chor together
with 30 volunteers from the Group and Yayasan TSLSC visited
the 26 residents of Persatuan Rumah Amal Murni, Kajang
during the Winter Solstice celebration, and cheered them
with tong yuen, performances and goodies. The home also
received a donation from Yayasan TSLSC.
DECEMBER 2012
DECEMBER 2012
IOI Mall Kulai organised “YOUTHAIDS 2012” with several
government and non-governmental organisations in
conjunction with World AIDS Day. The two-day event saw
public participating in AIDS awareness exhibition and talk, Red
Ribbon Message Wall, Red Ribbon Riding and many others.
JANUARY 2013
20 IOI Loders Croklaan Europe employees participated in the
Egmond Half Marathon to support the fight against Multiple
Sclerosis (MS) by raising money for the “Move for MS” foundation.
Earlier in December 2012, IOI Loders Croklaan Europe had
sponsored a corporate donation amounting to €2.759,97 to the
foundation which raises money for research against MS by taking
part in all kinds of events where it literally “moves” to collect
funds such as running, skating and cycling.
Annual Report 2013
IOI
Cor
por
atio
n B
erh
ad
59
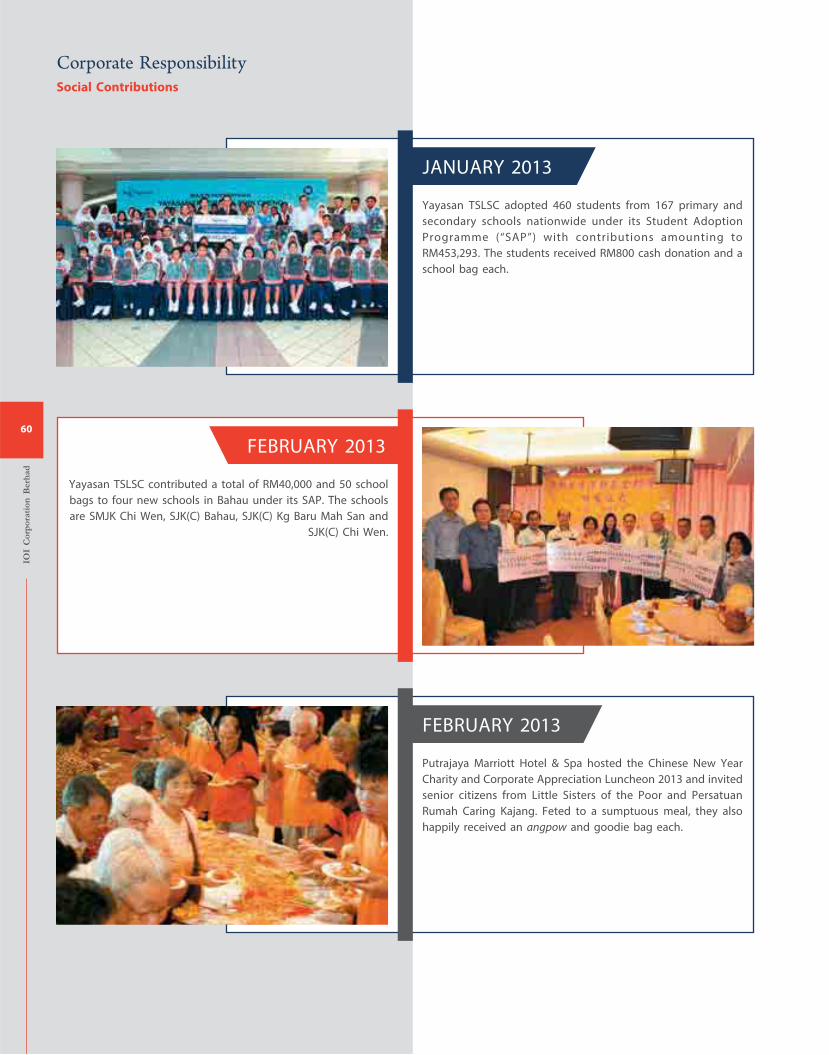
Yayasan TSLSC contributed a total of RM40,000 and 50 school
bags to four new schools in Bahau under its SAP. The schools
are SMJK Chi Wen, SJK(C) Bahau, SJK(C) Kg Baru Mah San and
SJK(C) Chi Wen.
FEBRUARY 2013
JANUARY 2013
Yayasan TSLSC adopted 460 students from 167 primary and
secondary schools nationwide under its Student Adoption
Programme (“SAP”) with contributions amounting to
RM453,293. The students received RM800 cash donation and a
school bag each.
FEBRUARY 2013
Putrajaya Marriott Hotel & Spa hosted the Chinese New Year
Charity and Corporate Appreciation Luncheon 2013 and invited
senior citizens from Little Sisters of the Poor and Persatuan
Rumah Caring Kajang. Feted to a sumptuous meal, they also
happily received an angpow and goodie bag each.
Social Contributions
IOI
Cor
por
atio
n B
erh
ad
60
Corporate Responsibility
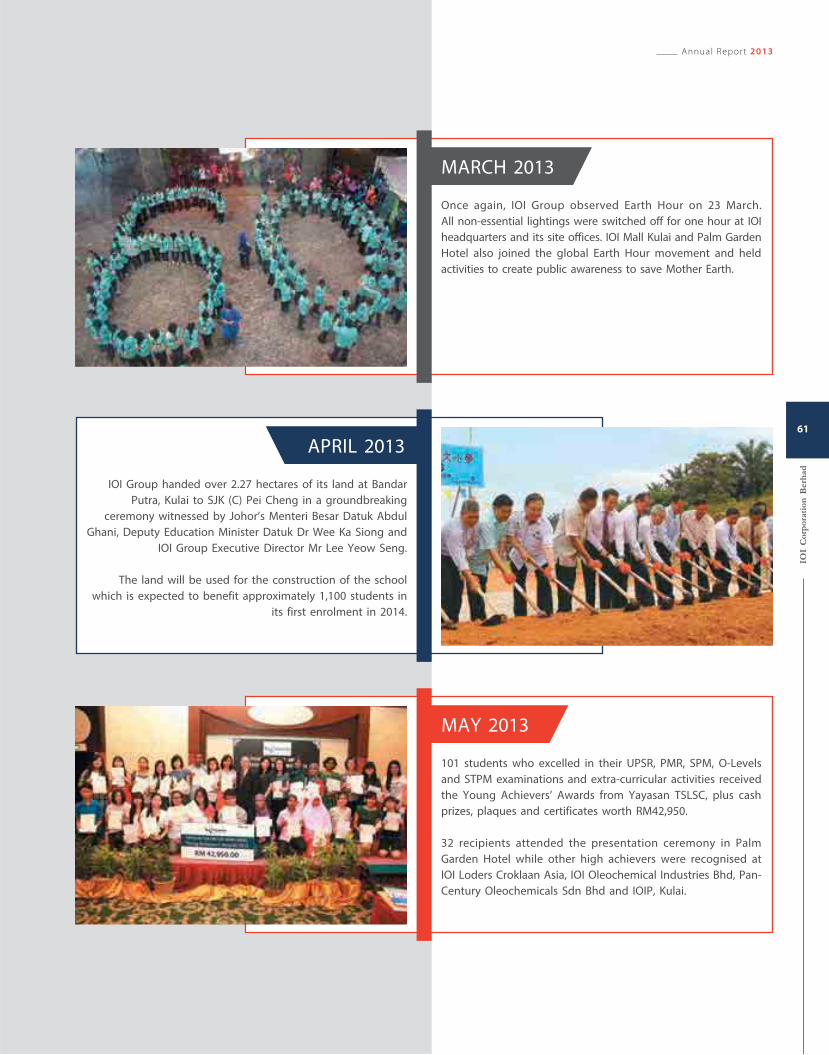
IOI Group handed over 2.27 hectares of its land at Bandar
Putra, Kulai to SJK (C) Pei Cheng in a groundbreaking
ceremony witnessed by Johor’s Menteri Besar Datuk Abdul
Ghani, Deputy Education Minister Datuk Dr Wee Ka Siong and
IOI Group Executive Director Mr Lee Yeow Seng.
The land will be used for the construction of the school
which is expected to benefit approximately 1,100 students in
its first enrolment in 2014.
APRIL 2013
MARCH 2013
Once again, IOI Group observed Earth Hour on 23 March.
All non-essential lightings were switched off for one hour at IOI
headquarters and its site offices. IOI Mall Kulai and Palm Garden
Hotel also joined the global Earth Hour movement and held
activities to create public awareness to save Mother Earth.
MAY 2013
101 students who excelled in their UPSR, PMR, SPM, O-Levels
and STPM examinations and extra-curricular activities received
the Young Achievers’ Awards from Yayasan TSLSC, plus cash
prizes, plaques and certificates worth RM42,950.
32 recipients attended the presentation ceremony in Palm
Garden Hotel while other high achievers were recognised at
IOI Loders Croklaan Asia, IOI Oleochemical Industries Bhd, Pan-
Century Oleochemicals Sdn Bhd and IOIP, Kulai.
Annual Report 2013
IOI
Cor
por
atio
n B
erh
ad
61
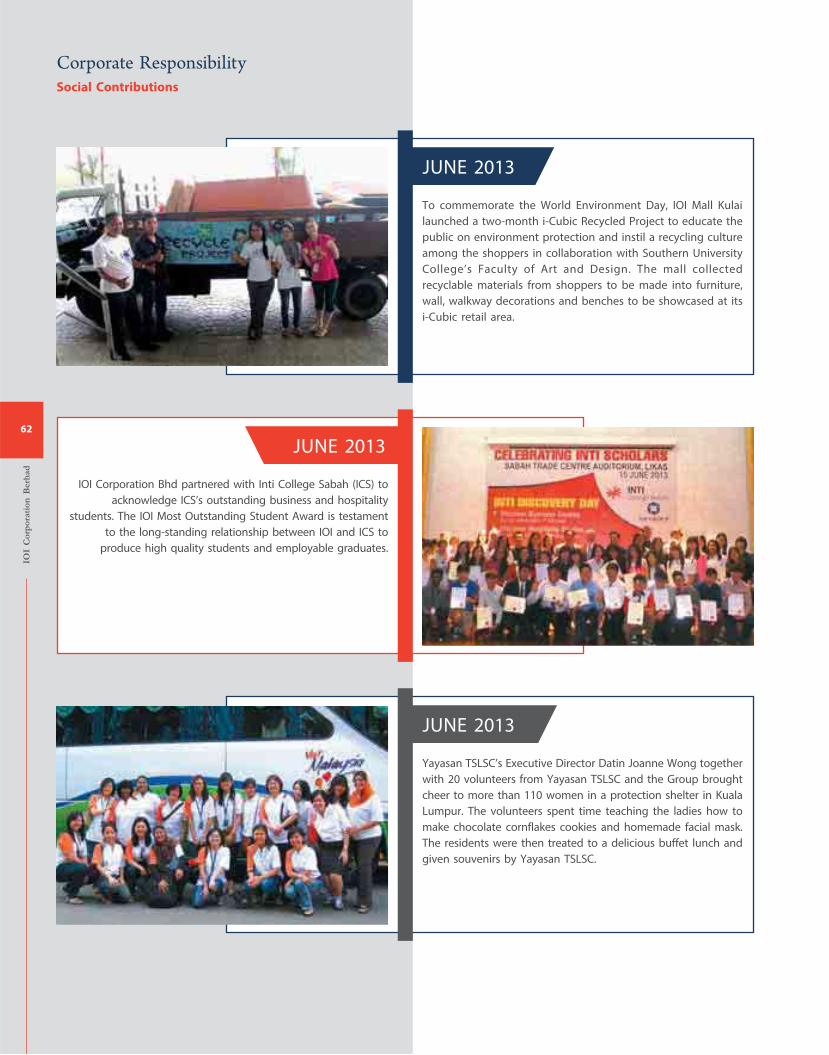
IOI Corporation Bhd partnered with Inti College Sabah (ICS) to
acknowledge ICS’s outstanding business and hospitality
students. The IOI Most Outstanding Student Award is testament
to the long-standing relationship between IOI and ICS to
produce high quality students and employable graduates.
JUNE 2013
JUNE 2013
To commemorate the World Environment Day, IOI Mall Kulai
launched a two-month i-Cubic Recycled Project to educate the
public on environment protection and instil a recycling culture
among the shoppers in collaboration with Southern University
College’s Faculty of Art and Design. The mall collected
recyclable materials from shoppers to be made into furniture,
wall, walkway decorations and benches to be showcased at its
i-Cubic retail area.
JUNE 2013
Yayasan TSLSC’s Executive Director Datin Joanne Wong together
with 20 volunteers from Yayasan TSLSC and the Group brought
cheer to more than 110 women in a protection shelter in Kuala
Lumpur. The volunteers spent time teaching the ladies how to
make chocolate cornflakes cookies and homemade facial mask.
The residents were then treated to a delicious buffet lunch and
given souvenirs by Yayasan TSLSC.
Social Contributions
IOI
Cor
por
atio
n B
erh
ad
62
Corporate Responsibility
BOARD OF DIRECTORS
Executive Chairman
TAN SRI DATO’ LEE SHIN CHENG
PSM, DPMS, JP
Executive Director
DATO’ LEE YEOW CHOR
DSAP
Executive Director
LEE YEOW SENG
Executive Director
LEE CHENG LEANG
Senior Independent Non-Executive
Director
DATUK HJ MOHD KHALIL B
DATO’ HJ MOHD NOOR
PJN, DSPN, JSM
Independent Non-Executive Director
DATUK KAROWNAKARAN @
KARUNAKARAN A/L RAMASAMY
DSDK, DMSM, KMN, AMN
Independent Non-Executive Director
QUAH POH KEAT
(Resigned on 13 September 2013)
Independent Non-Executive Director
CHEAH TEK KUANG
JP
Non-Independent Non-Executive Director
LIM TUANG OOI
AUDIT AND RISK MANAGEMENT
COMMITTEE
Chairman
DATUK HJ MOHD KHALIL B
DATO’ HJ MOHD NOOR*
PJN, DSPN, JSM
DATUK KAROWNAKARAN @
KARUNAKARAN A/L RAMASAMY*
DSDK, DMSM, KMN, AMN
CHEAH TEK KUANG*
JP
(Appointed on 13 September 2013)
QUAH POH KEAT*
(MIA 2022)
(Resigned on 13 September 2013)
* Independent Non-Executive Directors
CHARTERED SECRETARY
TAN CHOONG KHIANG
(MAICSA 7018448)
REGISTERED OFFICE AND
PRINCIPAL PLACE OF BUSINESS
Two IOI Square
IOI Resort
62502 Putrajaya
Tel +60 3 8947 8888
Fax +60 3 8947 8909
AUDITORS
BDO
Chartered Accountants
12th Floor, Menara Uni.Asia
1008, Jalan Sultan Ismail
50250 Kuala Lumpur
Tel +60 3 2616 2888
Fax +60 3 2616 3191
REGISTRAR
Tricor Investor Services Sdn Bhd
Level 17, The Gardens North Tower
Mid Valley City
Lingkaran Syed Putra
59200 Kuala Lumpur
Tel +60 3 2264 3883
Fax +60 3 2282 1886
LEGAL FORM AND DOMICILE
Public Limited Liability Company
Incorporated and Domiciled in Malaysia
STOCK EXCHANGE LISTING
Main Market of Bursa Malaysia Securities
Berhad
WEBSITES
www.ioigroup.com
www.ioiproperties.com.my
www.myioi.com
www.ioioleo.com
www.croklaan.com
EMAIL ADDRESS
CORPORATEINFORMATION
Annual Report 2013
IOI
Cor
por
atio
n B
erh
ad
63
BOARD OFDIRECTORS
IOI
Cor
por
atio
n B
erh
ad
64
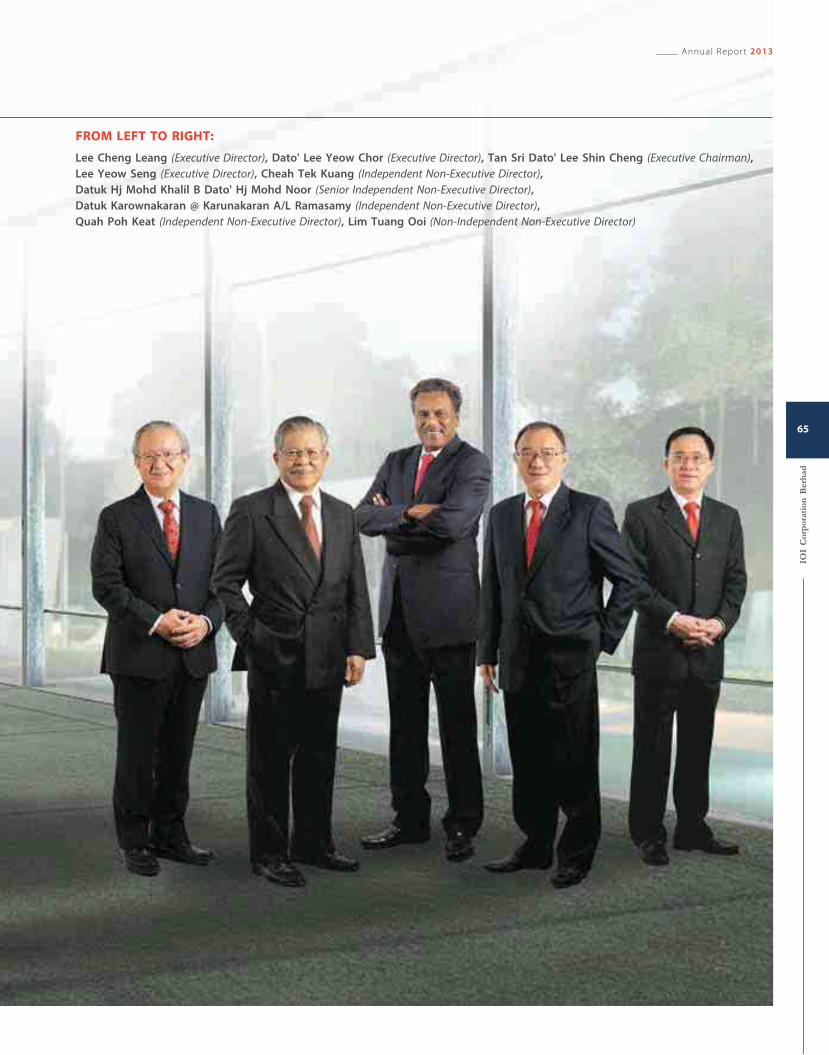
FROM LEFT TO RIGHT:
Lee Cheng Leang (Executive Director), Dato' Lee Yeow Chor (Executive Director), Tan Sri Dato' Lee Shin Cheng (Executive Chairman),
Lee Yeow Seng (Executive Director), Cheah Tek Kuang (Independent Non-Executive Director),
Datuk Hj Mohd Khalil B Dato' Hj Mohd Noor (Senior Independent Non-Executive Director),
Datuk Karownakaran @ Karunakaran A/L Ramasamy (Independent Non-Executive Director),
Quah Poh Keat (Independent Non-Executive Director), Lim Tuang Ooi (Non-Independent Non-Executive Director)
Annual Report 2013
IOI
Cor
por
atio
n B
erh
ad
65
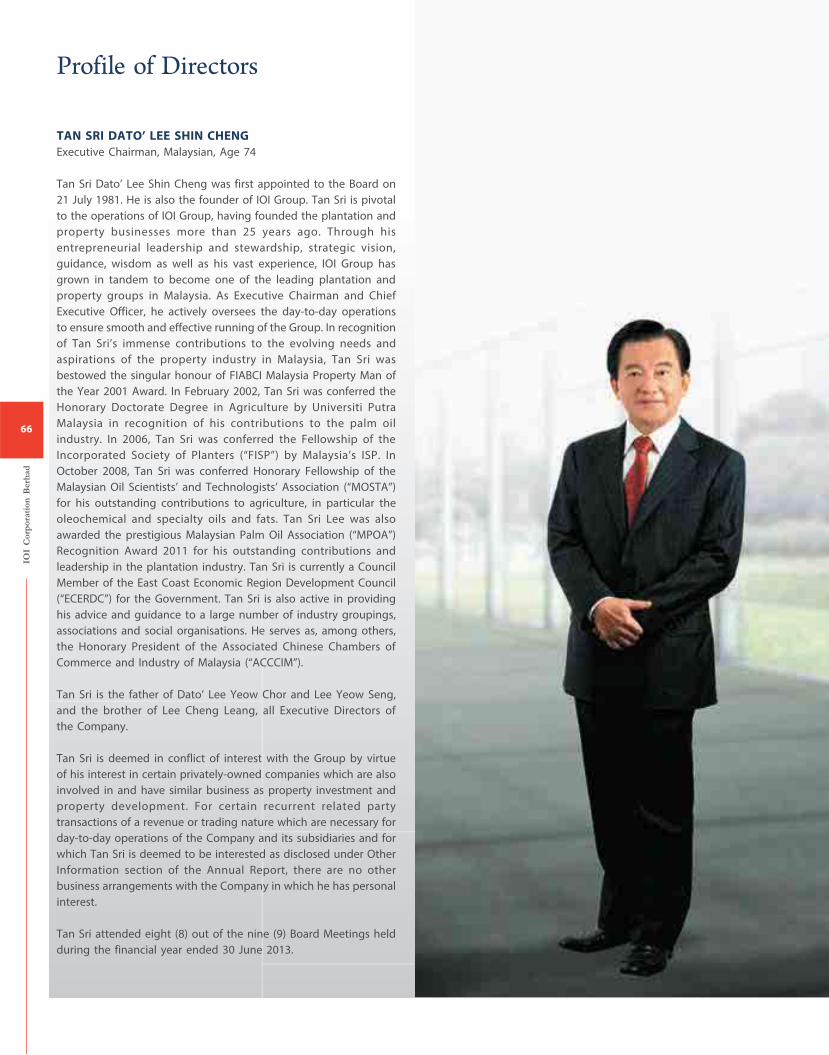
TAN SRI DATO’ LEE SHIN CHENG
Executive Chairman, Malaysian, Age 74
Tan Sri Dato’ Lee Shin Cheng was first appointed to the Board on
21 July 1981. He is also the founder of IOI Group. Tan Sri is pivotal
to the operations of IOI Group, having founded the plantation and
property businesses more than 25 years ago. Through his
entrepreneurial leadership and stewardship, strategic vision,
guidance, wisdom as well as his vast experience, IOI Group has
grown in tandem to become one of the leading plantation and
property groups in Malaysia. As Executive Chairman and Chief
Executive Officer, he actively oversees the day-to-day operations
to ensure smooth and effective running of the Group. In recognition
of Tan Sri’s immense contributions to the evolving needs and
aspirations of the property industry in Malaysia, Tan Sri was
bestowed the singular honour of FIABCI Malaysia Property Man of
the Year 2001 Award. In February 2002, Tan Sri was conferred the
Honorary Doctorate Degree in Agriculture by Universiti Putra
Malaysia in recognition of his contributions to the palm oil
industry. In 2006, Tan Sri was conferred the Fellowship of the
Incorporated Society of Planters (“FISP”) by Malaysia’s ISP. In
October 2008, Tan Sri was conferred Honorary Fellowship of the
Malaysian Oil Scientists’ and Technologists’ Association (“MOSTA”)
for his outstanding contributions to agriculture, in particular the
oleochemical and specialty oils and fats. Tan Sri Lee was also
awarded the prestigious Malaysian Palm Oil Association (“MPOA”)
Recognition Award 2011 for his outstanding contributions and
leadership in the plantation industry. Tan Sri is currently a Council
Member of the East Coast Economic Region Development Council
(“ECERDC”) for the Government. Tan Sri is also active in providing
his advice and guidance to a large number of industry groupings,
associations and social organisations. He serves as, among others,
the Honorary President of the Associated Chinese Chambers of
Commerce and Industry of Malaysia (“ACCCIM”).
Tan Sri is the father of Dato’ Lee Yeow Chor and Lee Yeow Seng,
and the brother of Lee Cheng Leang, all Executive Directors of
the Company.
Tan Sri is deemed in conflict of interest with the Group by virtue
of his interest in certain privately-owned companies which are also
involved in and have similar business as property investment and
property development. For certain recurrent related party
transactions of a revenue or trading nature which are necessary for
day-to-day operations of the Company and its subsidiaries and for
which Tan Sri is deemed to be interested as disclosed under Other
Information section of the Annual Report, there are no other
business arrangements with the Company in which he has personal
interest.
Tan Sri attended eight (8) out of the nine (9) Board Meetings held
during the financial year ended 30 June 2013.
IOI
Cor
por
atio
n B
erh
ad
66
Profile of Directors
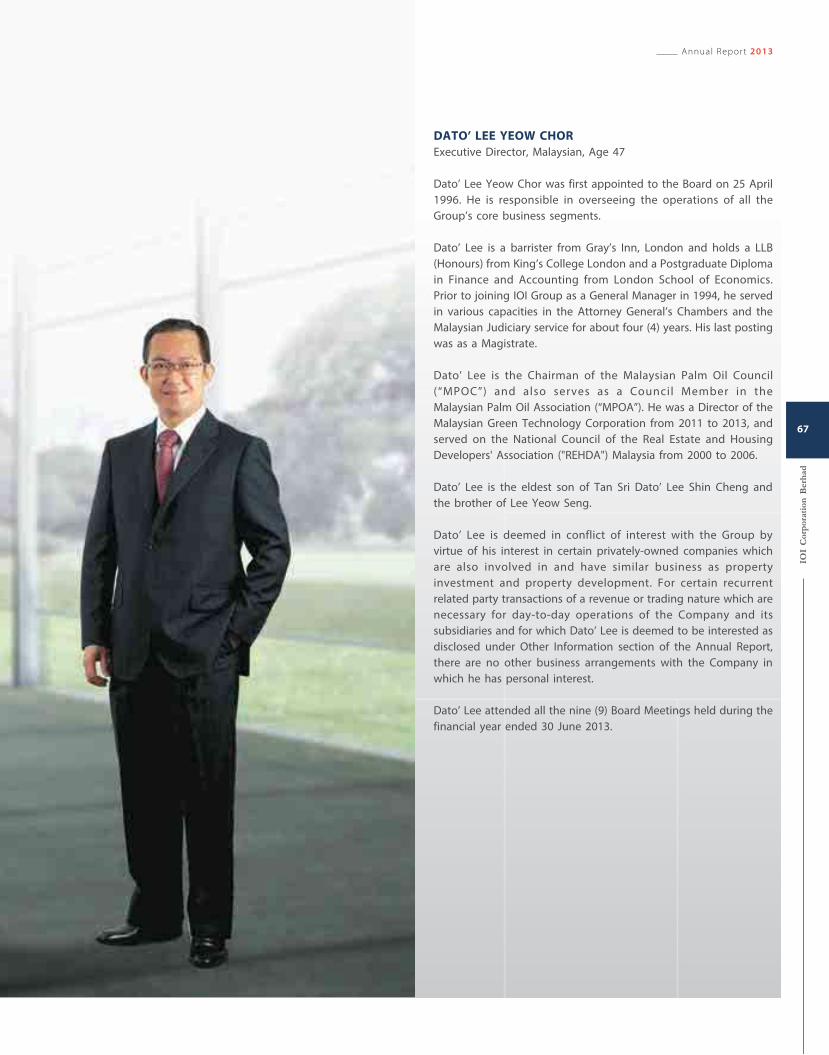
DATO’ LEE YEOW CHOR
Executive Director, Malaysian, Age 47
Dato’ Lee Yeow Chor was first appointed to the Board on 25 April
1996. He is responsible in overseeing the operations of all the
Group’s core business segments.
Dato’ Lee is a barrister from Gray’s Inn, London and holds a LLB
(Honours) from King’s College London and a Postgraduate Diploma
in Finance and Accounting from London School of Economics.
Prior to joining IOI Group as a General Manager in 1994, he served
in various capacities in the Attorney General’s Chambers and the
Malaysian Judiciary service for about four (4) years. His last posting
was as a Magistrate.
Dato’ Lee is the Chairman of the Malaysian Palm Oil Council
(“MPOC”) and also serves as a Council Member in the
Malaysian Palm Oil Association (“MPOA”). He was a Director of the
Malaysian Green Technology Corporation from 2011 to 2013, and
served on the National Council of the Real Estate and Housing
Developers' Association ("REHDA") Malaysia from 2000 to 2006.
Dato’ Lee is the eldest son of Tan Sri Dato’ Lee Shin Cheng and
the brother of Lee Yeow Seng.
Dato’ Lee is deemed in conflict of interest with the Group by
virtue of his interest in certain privately-owned companies which
are also involved in and have similar business as property
investment and property development. For certain recurrent
related party transactions of a revenue or trading nature which are
necessary for day-to-day operations of the Company and its
subsidiaries and for which Dato’ Lee is deemed to be interested as
disclosed under Other Information section of the Annual Report,
there are no other business arrangements with the Company in
which he has personal interest.
Dato’ Lee attended all the nine (9) Board Meetings held during the
financial year ended 30 June 2013.
Annual Report 2013
IOI
Cor
por
atio
n B
erh
ad
67
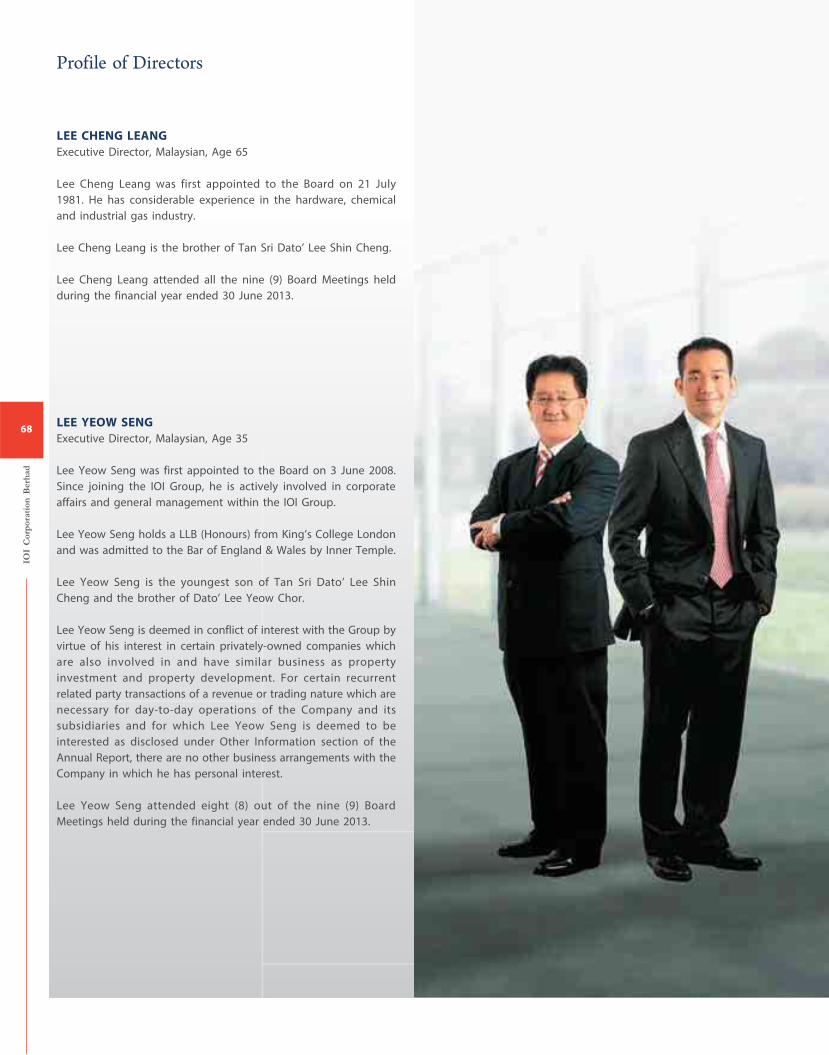
LEE CHENG LEANG
Executive Director, Malaysian, Age 65
Lee Cheng Leang was first appointed to the Board on 21 July
1981. He has considerable experience in the hardware, chemical
and industrial gas industry.
Lee Cheng Leang is the brother of Tan Sri Dato’ Lee Shin Cheng.
Lee Cheng Leang attended all the nine (9) Board Meetings held
during the financial year ended 30 June 2013.
LEE YEOW SENG
Executive Director, Malaysian, Age 35
Lee Yeow Seng was first appointed to the Board on 3 June 2008.
Since joining the IOI Group, he is actively involved in corporate
affairs and general management within the IOI Group.
Lee Yeow Seng holds a LLB (Honours) from King’s College London
and was admitted to the Bar of England & Wales by Inner Temple.
Lee Yeow Seng is the youngest son of Tan Sri Dato’ Lee Shin
Cheng and the brother of Dato’ Lee Yeow Chor.
Lee Yeow Seng is deemed in conflict of interest with the Group by
virtue of his interest in certain privately-owned companies which
are also involved in and have similar business as property
investment and property development. For certain recurrent
related party transactions of a revenue or trading nature which are
necessary for day-to-day operations of the Company and its
subsidiaries and for which Lee Yeow Seng is deemed to be
interested as disclosed under Other Information section of the
Annual Report, there are no other business arrangements with the
Company in which he has personal interest.
Lee Yeow Seng attended eight (8) out of the nine (9) Board
Meetings held during the financial year ended 30 June 2013.
IOI
Cor
por
atio
n B
erh
ad
68
Profile of Directors
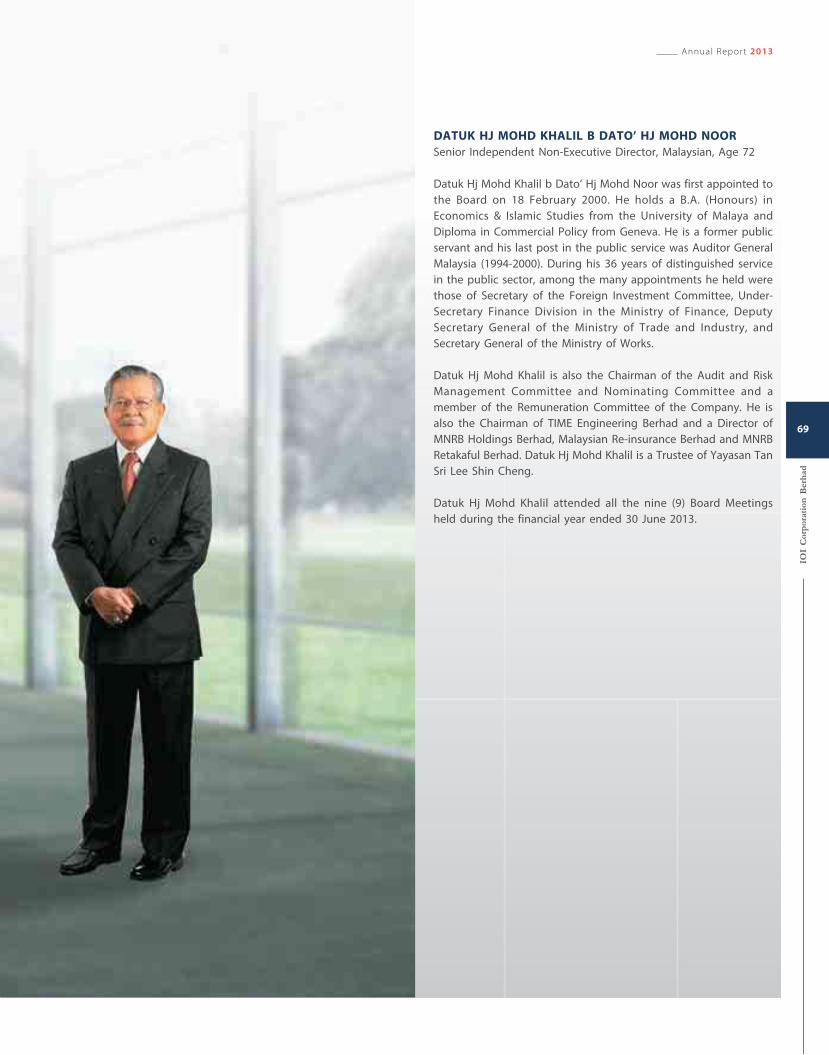
DATUK HJ MOHD KHALIL B DATO’ HJ MOHD NOOR
Senior Independent Non-Executive Director, Malaysian, Age 72
Datuk Hj Mohd Khalil b Dato’ Hj Mohd Noor was first appointed to
the Board on 18 February 2000. He holds a B.A. (Honours) in
Economics & Islamic Studies from the University of Malaya and
Diploma in Commercial Policy from Geneva. He is a former public
servant and his last post in the public service was Auditor General
Malaysia (1994-2000). During his 36 years of distinguished service
in the public sector, among the many appointments he held were
those of Secretary of the Foreign Investment Committee, Under-
Secretary Finance Division in the Ministry of Finance, Deputy
Secretary General of the Ministry of Trade and Industry, and
Secretary General of the Ministry of Works.
Datuk Hj Mohd Khalil is also the Chairman of the Audit and Risk
Management Committee and Nominating Committee and a
member of the Remuneration Committee of the Company. He is
also the Chairman of TIME Engineering Berhad and a Director of
MNRB Holdings Berhad, Malaysian Re-insurance Berhad and MNRB
Retakaful Berhad. Datuk Hj Mohd Khalil is a Trustee of Yayasan Tan
Sri Lee Shin Cheng.
Datuk Hj Mohd Khalil attended all the nine (9) Board Meetings
held during the financial year ended 30 June 2013.
Annual Report 2013
IOI
Cor
por
atio
n B
erh
ad
69
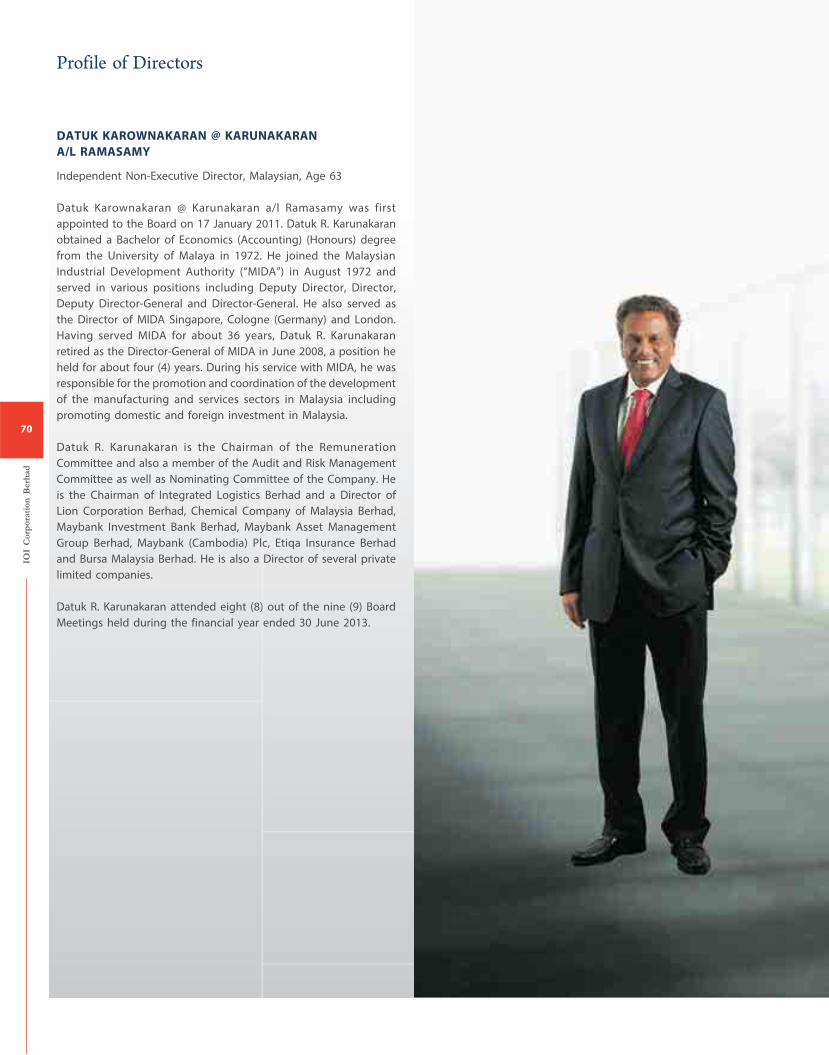
DATUK KAROWNAKARAN @ KARUNAKARAN
A/L RAMASAMY
Independent Non-Executive Director, Malaysian, Age 63
Datuk Karownakaran @ Karunakaran a/l Ramasamy was first
appointed to the Board on 17 January 2011. Datuk R. Karunakaran
obtained a Bachelor of Economics (Accounting) (Honours) degree
from the University of Malaya in 1972. He joined the Malaysian
Industrial Development Authority (“MIDA”) in August 1972 and
served in various positions including Deputy Director, Director,
Deputy Director-General and Director-General. He also served as
the Director of MIDA Singapore, Cologne (Germany) and London.
Having served MIDA for about 36 years, Datuk R. Karunakaran
retired as the Director-General of MIDA in June 2008, a position he
held for about four (4) years. During his service with MIDA, he was
responsible for the promotion and coordination of the development
of the manufacturing and services sectors in Malaysia including
promoting domestic and foreign investment in Malaysia.
Datuk R. Karunakaran is the Chairman of the Remuneration
Committee and also a member of the Audit and Risk Management
Committee as well as Nominating Committee of the Company. He
is the Chairman of Integrated Logistics Berhad and a Director of
Lion Corporation Berhad, Chemical Company of Malaysia Berhad,
Maybank Investment Bank Berhad, Maybank Asset Management
Group Berhad, Maybank (Cambodia) Plc, Etiqa Insurance Berhad
and Bursa Malaysia Berhad. He is also a Director of several private
limited companies.
Datuk R. Karunakaran attended eight (8) out of the nine (9) Board
Meetings held during the financial year ended 30 June 2013.
IOI
Cor
por
atio
n B
erh
ad
70
Profile of Directors
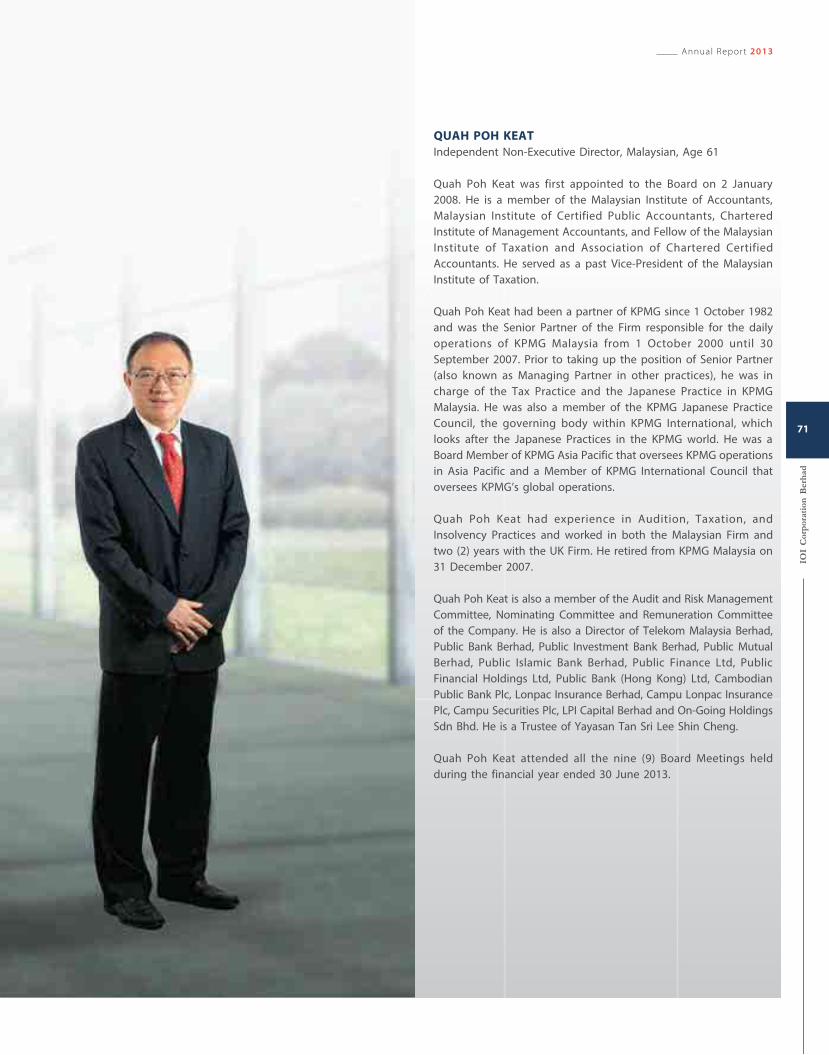
QUAH POH KEAT
Independent Non-Executive Director, Malaysian, Age 61
Quah Poh Keat was first appointed to the Board on 2 January
2008. He is a member of the Malaysian Institute of Accountants,
Malaysian Institute of Certified Public Accountants, Chartered
Institute of Management Accountants, and Fellow of the Malaysian
Institute of Taxation and Association of Chartered Certified
Accountants. He served as a past Vice-President of the Malaysian
Institute of Taxation.
Quah Poh Keat had been a partner of KPMG since 1 October 1982
and was the Senior Partner of the Firm responsible for the daily
operations of KPMG Malaysia from 1 October 2000 until 30
September 2007. Prior to taking up the position of Senior Partner
(also known as Managing Partner in other practices), he was in
charge of the Tax Practice and the Japanese Practice in KPMG
Malaysia. He was also a member of the KPMG Japanese Practice
Council, the governing body within KPMG International, which
looks after the Japanese Practices in the KPMG world. He was a
Board Member of KPMG Asia Pacific that oversees KPMG operations
in Asia Pacific and a Member of KPMG International Council that
oversees KPMG’s global operations.
Quah Poh Keat had experience in Audition, Taxation, and
Insolvency Practices and worked in both the Malaysian Firm and
two (2) years with the UK Firm. He retired from KPMG Malaysia on
31 December 2007.
Quah Poh Keat is also a member of the Audit and Risk Management
Committee, Nominating Committee and Remuneration Committee
of the Company. He is also a Director of Telekom Malaysia Berhad,
Public Bank Berhad, Public Investment Bank Berhad, Public Mutual
Berhad, Public Islamic Bank Berhad, Public Finance Ltd, Public
Financial Holdings Ltd, Public Bank (Hong Kong) Ltd, Cambodian
Public Bank Plc, Lonpac Insurance Berhad, Campu Lonpac Insurance
Plc, Campu Securities Plc, LPI Capital Berhad and On-Going Holdings
Sdn Bhd. He is a Trustee of Yayasan Tan Sri Lee Shin Cheng.
Quah Poh Keat attended all the nine (9) Board Meetings held
during the financial year ended 30 June 2013.
Annual Report 2013
IOI
Cor
por
atio
n B
erh
ad
71
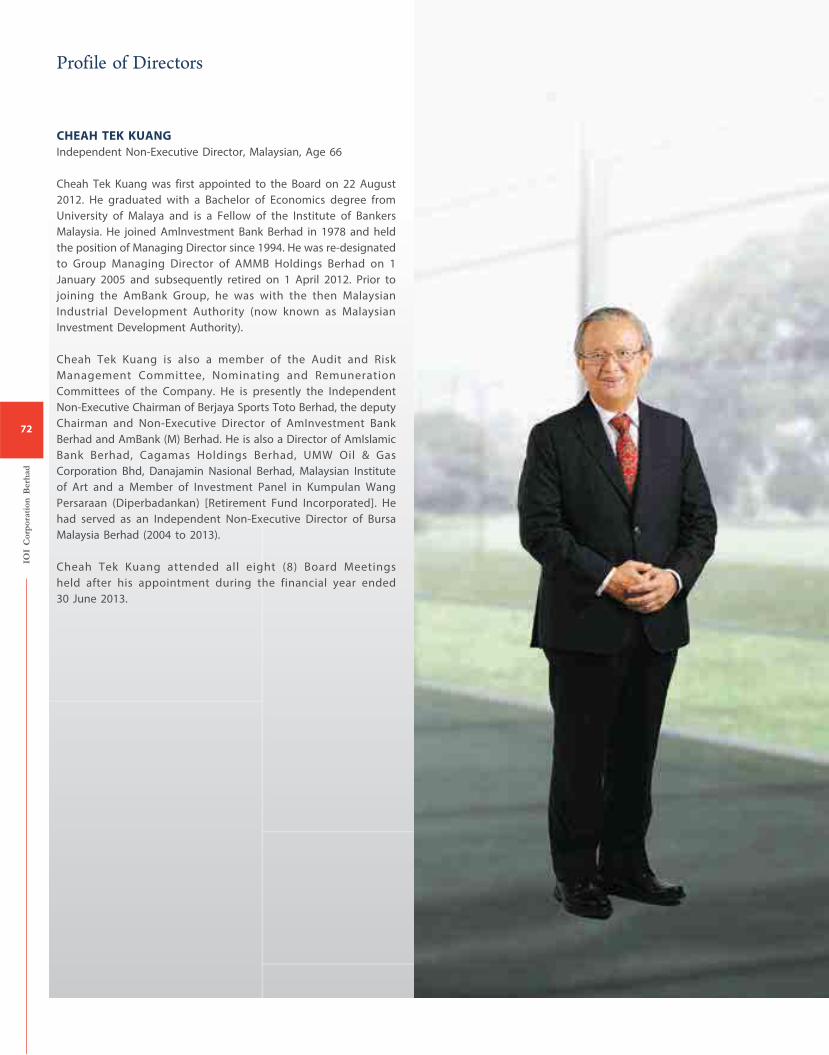
CHEAH TEK KUANG
Independent Non-Executive Director, Malaysian, Age 66
Cheah Tek Kuang was first appointed to the Board on 22 August
2012. He graduated with a Bachelor of Economics degree from
University of Malaya and is a Fellow of the Institute of Bankers
Malaysia. He joined Amlnvestment Bank Berhad in 1978 and held
the position of Managing Director since 1994. He was re-designated
to Group Managing Director of AMMB Holdings Berhad on 1
January 2005 and subsequently retired on 1 April 2012. Prior to
joining the AmBank Group, he was with the then Malaysian
Industrial Development Authority (now known as Malaysian
Investment Development Authority).
Cheah Tek Kuang is also a member of the Audit and Risk
Management Committee, Nominating and Remuneration
Committees of the Company. He is presently the Independent
Non-Executive Chairman of Berjaya Sports Toto Berhad, the deputy
Chairman and Non-Executive Director of AmInvestment Bank
Berhad and AmBank (M) Berhad. He is also a Director of AmIslamic
Bank Berhad, Cagamas Holdings Berhad, UMW Oil & Gas
Corporation Bhd, Danajamin Nasional Berhad, Malaysian Institute
of Art and a Member of Investment Panel in Kumpulan Wang
Persaraan (Diperbadankan) [Retirement Fund Incorporated]. He
had served as an Independent Non-Executive Director of Bursa
Malaysia Berhad (2004 to 2013).
Cheah Tek Kuang attended all eight (8) Board Meetings
held after his appointment during the financial year ended
30 June 2013.
IOI
Cor
por
atio
n B
erh
ad
72
Profile of Directors
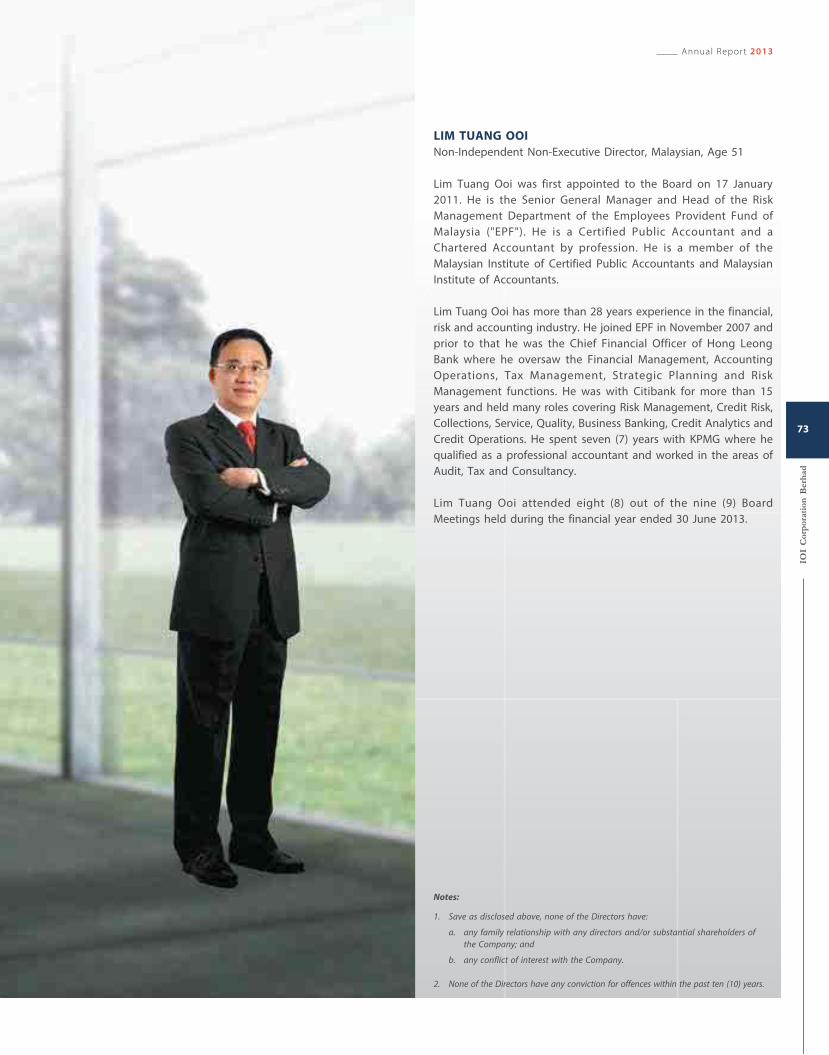
LIM TUANG OOI
Non-Independent Non-Executive Director, Malaysian, Age 51
Lim Tuang Ooi was first appointed to the Board on 17 January
2011. He is the Senior General Manager and Head of the Risk
Management Department of the Employees Provident Fund of
Malaysia ("EPF"). He is a Certified Public Accountant and a
Chartered Accountant by profession. He is a member of the
Malaysian Institute of Certified Public Accountants and Malaysian
Institute of Accountants.
Lim Tuang Ooi has more than 28 years experience in the financial,
risk and accounting industry. He joined EPF in November 2007 and
prior to that he was the Chief Financial Officer of Hong Leong
Bank where he oversaw the Financial Management, Accounting
Operations, Tax Management, Strategic Planning and Risk
Management functions. He was with Citibank for more than 15
years and held many roles covering Risk Management, Credit Risk,
Collections, Service, Quality, Business Banking, Credit Analytics and
Credit Operations. He spent seven (7) years with KPMG where he
qualified as a professional accountant and worked in the areas of
Audit, Tax and Consultancy.
Lim Tuang Ooi attended eight (8) out of the nine (9) Board
Meetings held during the financial year ended 30 June 2013.
Notes:
1. Save as disclosed above, none of the Directors have:
a. any family relationship with any directors and/or substantial shareholders of
the Company; and
b. any conflict of interest with the Company.
2. None of the Directors have any conviction for offences within the past ten (10) years.
Annual Report 2013
IOI
Cor
por
atio
n B
erh
ad
73
Group Chief Executive Officer
TAN SRI DATO’ LEE SHIN CHENG
Group Executive Directors
DATO’ LEE YEOW CHOR
LEE YEOW SENG
LEE CHENG LEANG
CORPORATE
Senior Group Financial Controller
KEVIN WONG TACK WEE
Group Financial Controller
LIM LAI SENG
Chartered Secretary
TAN CHOONG KHIANG
PLANTATION
Group Plantation Director
DATO’ FOONG LAI CHOONG
Senior General Manager,
Group Engineering
WONG CHEE KUAN
General Manager, Finance
LIM EIK HOY
General Manager, Peninsular
TAY CHING AN
General Manager, Keratong
TEE KE HOI
General Manager, Lahad Datu
RAGUPATHY A/L SELVARAJ
General Manager, Sandakan
SUDHAKARAN A/L
NOTTATH BHASKARAN
General Manager, Indonesia
GOH HOCK SIN
COMMODITY MARKETING
Head of Group Commodity Marketing
LEE YOKE HUI
OLEOCHEMICALS
Executive Director
TAN KEAN HUA
Chief Financial Officer
KHOO TIANG CHENG
Head of Operations, Johor
GURDEV SINGH A/L DARSHAN SINGH
SPECIALTY OILS AND FATS
Group Chief Executive Officer
JULIAN VEITCH
Chief Operating Officer, Americas
BILL TROY
Chief Operating Officer, Europe
DR LOEK FAVRE
Chief Operating Officer, Asia
MICHAEL VAN SALLANDT
Group Chief Financial Officer
VINCENT GEERTS
REFINERY
General Manager
SHYAM A/L M. K. LAKSHMANAN
PROPERTY
Property Director
TEH CHIN GUAN
Senior General Managers
LEE YOKE HAR
SIMON HENG
TAN KENG SENG
General Managers
LIM BENG YEANG
HO KWOK WING
IR CHOO KAY BOON
LOH CHIN YEAN
LEE MAN CHONG
LEE YEAN PIN (LI YANPING)
General Manager, IOI Mall
RONNIE ARTHUR FRANCIS
Acting General Manager, Johor
LOU FU LEONG
Assistant General Manager, Xiamen
OOI WOOI YAW
Financial Controller
BETTY LAU SUI HING
HOTELS AND GOLF CLUB
General Managers
SIMON YONG
BRANDON CHIN
74
IOI
Cor
por
atio
n B
erh
ad
SENIOR
TEAMMANAGEMENT
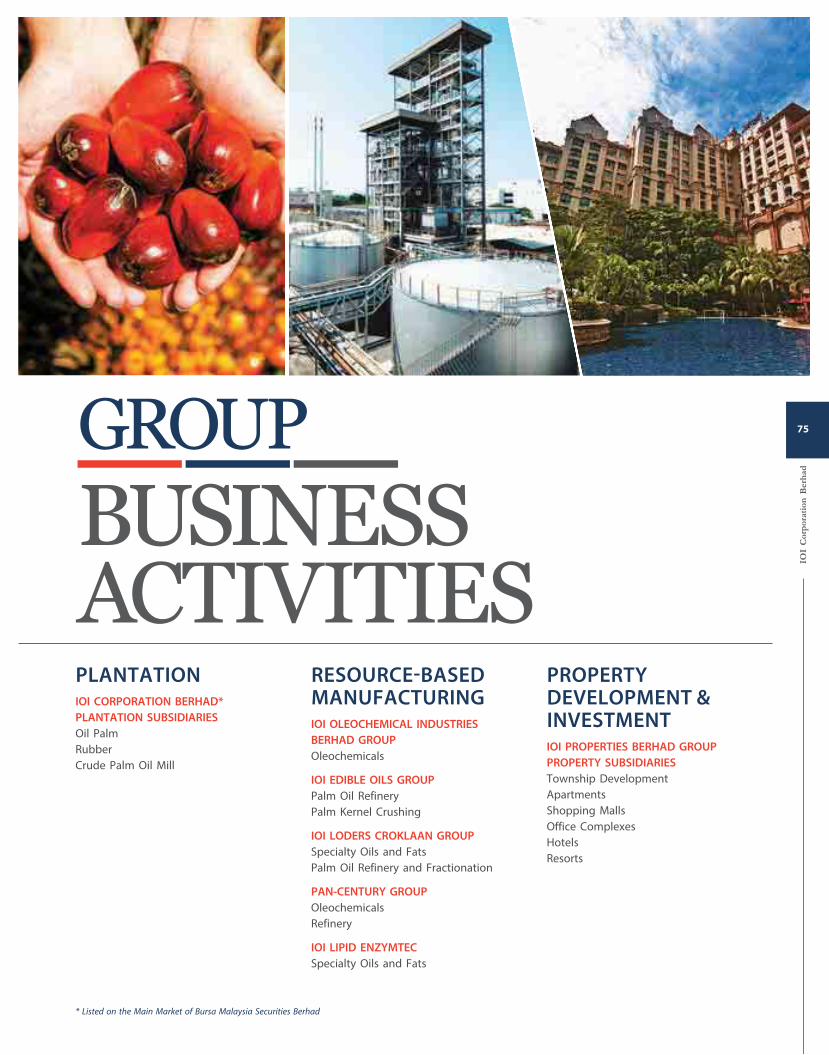
GROUPBUSINESSACTIVITIESPLANTATIONIOI CORPORATION BERHAD*
PLANTATION SUBSIDIARIES
Oil Palm
Rubber
Crude Palm Oil Mill
RESOURCE-BASED MANUFACTURINGIOI OLEOCHEMICAL INDUSTRIES
BERHAD GROUP
Oleochemicals
IOI EDIBLE OILS GROUP
Palm Oil Refinery
Palm Kernel Crushing
IOI LODERS CROKLAAN GROUP
Specialty Oils and Fats
Palm Oil Refinery and Fractionation
PAN-CENTURY GROUP
Oleochemicals
Refinery
IOI LIPID ENZYMTEC
Specialty Oils and Fats
PROPERTY DEVELOPMENT & INVESTMENTIOI PROPERTIES BERHAD GROUP
PROPERTY SUBSIDIARIES
Township Development
Apartments
Shopping Malls
Office Complexes
Hotels
Resorts
* Listed on the Main Market of Bursa Malaysia Securities Berhad
IOI
Cor
por
atio
n B
erh
ad
75
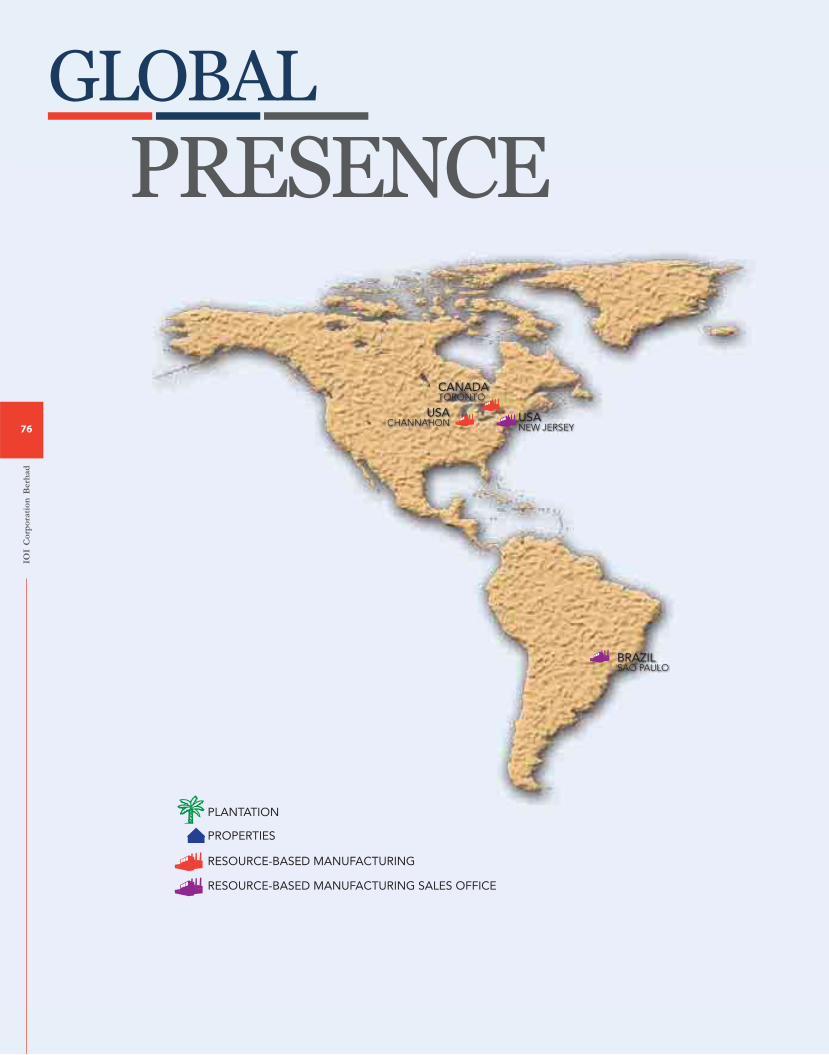
USACHANNAHON USA
NEW JERSEY
CANADATORONTO
PLANTATION
PROPERTIES
RESOURCE-BASED MANUFACTURING
RESOURCE-BASED MANUFACTURING SALES OFFICE
BRAZILSAO PAULO
GLOBALPRESENCE
IOI
Cor
por
atio
n B
erh
ad
76
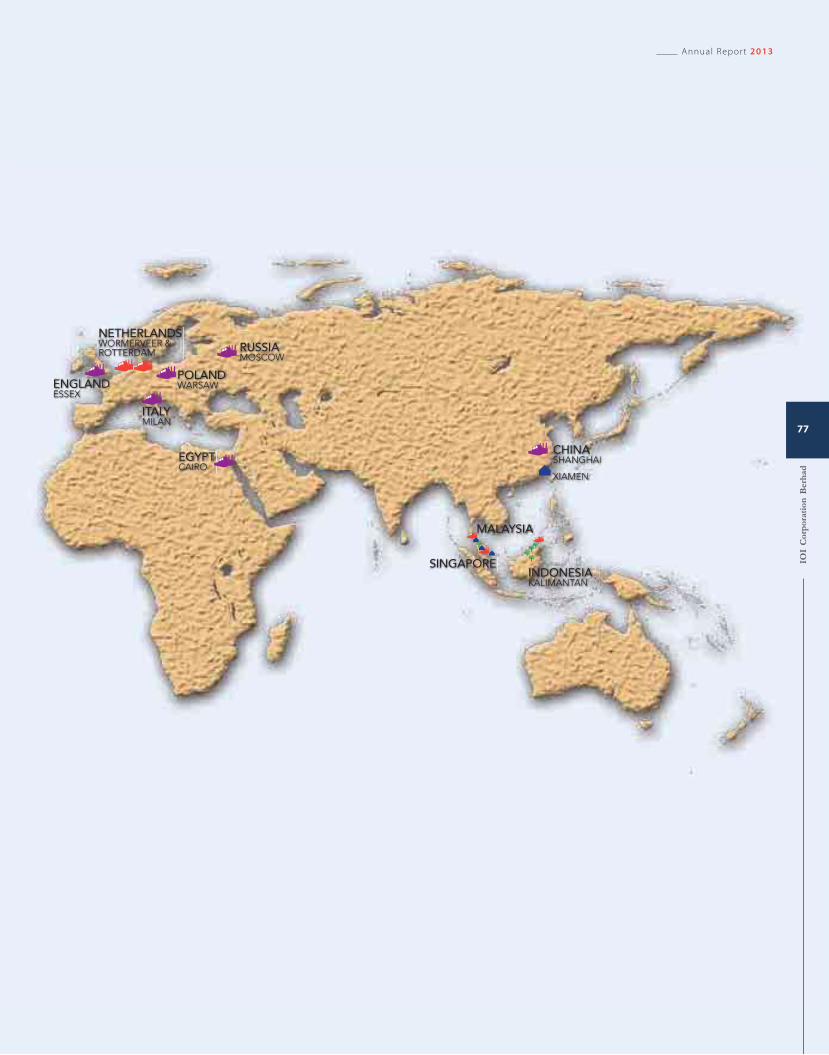
ENGLANDESSEX
ITALYMILAN
NETHERLANDSWORMERVEER & ROTTERDAM
POLANDWARSAW
RUSSIAMOSCOW
EGYPTCAIRO
CHINASHANGHAI
XIAMEN
MALAYSIA
SINGAPOREINDONESIA KALIMANTAN
Annual Report 2013
IOI
Cor
por
atio
n B
erh
ad
77
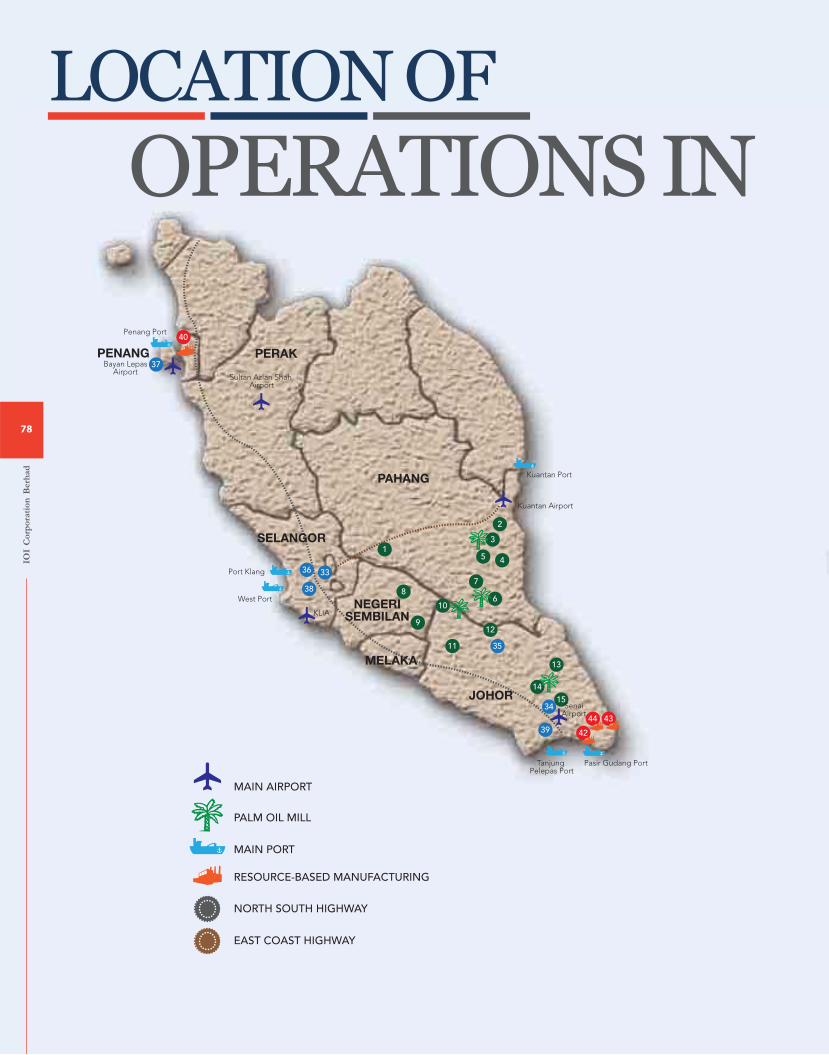
1
2
3
45
6
78
9
10
11
12
13
14
1534
35
42
4344
37
39
40
PENANG
Penang Port
Bayan LepasAirport
Sultan Azlan Shah Airport
Port Klang
West Port
Kuantan Port
Kuantan Airport
SenaiAirport
Pasir Gudang PortTanjung Pelepas Port
KLIA
PERAK
PAHANG
SELANGOR
MELAKA
JOHOR
NEGERISEMBILAN
33
38
36
PALM OIL MILL
MAIN AIRPORT
MAIN PORT
RESOURCE-BASED MANUFACTURING
NORTH SOUTH HIGHWAY
EAST COAST HIGHWAY
LOCATION OFOPERATIONS IN
IOI
Cor
por
atio
n B
erh
ad
78
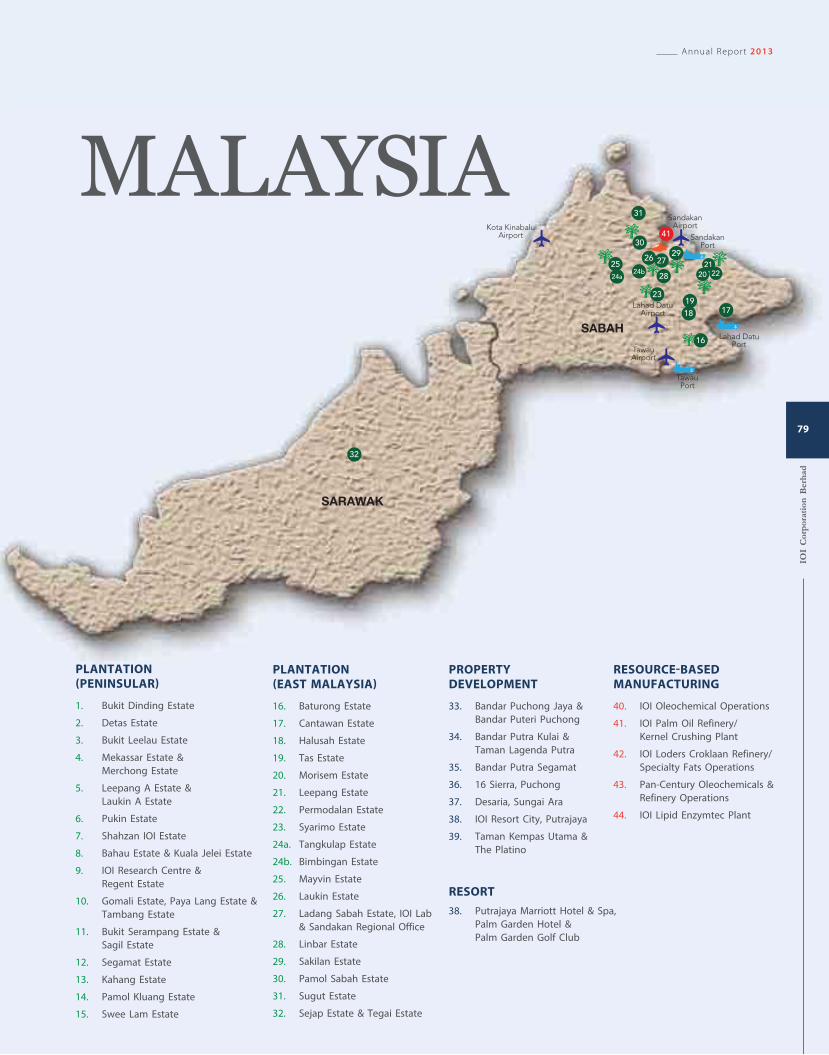
41
SARAWAK
SABAH
Kota KinabaluAirport
SandakanAirport
SandakanPort
Lahad DatuPort
Lahad DatuAirport
TawauPort
TawauAirport
17
16
1819
2021
23
24a24b
2526 27
30
31
29
22
32
28
PLANTATION (PENINSULAR)
1. Bukit Dinding Estate
2. Detas Estate
3. Bukit Leelau Estate
4. Mekassar Estate &
Merchong Estate
5. Leepang A Estate &
Laukin A Estate
6. Pukin Estate
7. Shahzan IOI Estate
8. Bahau Estate & Kuala Jelei Estate
9. IOI Research Centre &
Regent Estate
10. Gomali Estate, Paya Lang Estate &
Tambang Estate
11. Bukit Serampang Estate &
Sagil Estate
12. Segamat Estate
13. Kahang Estate
14. Pamol Kluang Estate
15. Swee Lam Estate
PLANTATION (EAST MALAYSIA)
16. Baturong Estate
17. Cantawan Estate
18. Halusah Estate
19. Tas Estate
20. Morisem Estate
21. Leepang Estate
22. Permodalan Estate
23. Syarimo Estate
24a. Tangkulap Estate
24b. Bimbingan Estate
25. Mayvin Estate
26. Laukin Estate
27. Ladang Sabah Estate, IOI Lab
& Sandakan Regional Office
28. Linbar Estate
29. Sakilan Estate
30. Pamol Sabah Estate
31. Sugut Estate
32. Sejap Estate & Tegai Estate
PROPERTY DEVELOPMENT
33. Bandar Puchong Jaya &
Bandar Puteri Puchong
34. Bandar Putra Kulai &
Taman Lagenda Putra
35. Bandar Putra Segamat
36. 16 Sierra, Puchong
37. Desaria, Sungai Ara
38. IOI Resort City, Putrajaya
39. Taman Kempas Utama &
The Platino
RESOURCE-BASED MANUFACTURING
40. IOI Oleochemical Operations
41. IOI Palm Oil Refinery/
Kernel Crushing Plant
42. IOI Loders Croklaan Refinery/
Specialty Fats Operations
43. Pan-Century Oleochemicals &
Refinery Operations
44. IOI Lipid Enzymtec Plant
MALAYSIA
RESORT
38. Putrajaya Marriott Hotel & Spa,
Palm Garden Hotel &
Palm Garden Golf Club
Annual Report 2013
IOI
Cor
por
atio
n B
erh
ad
79
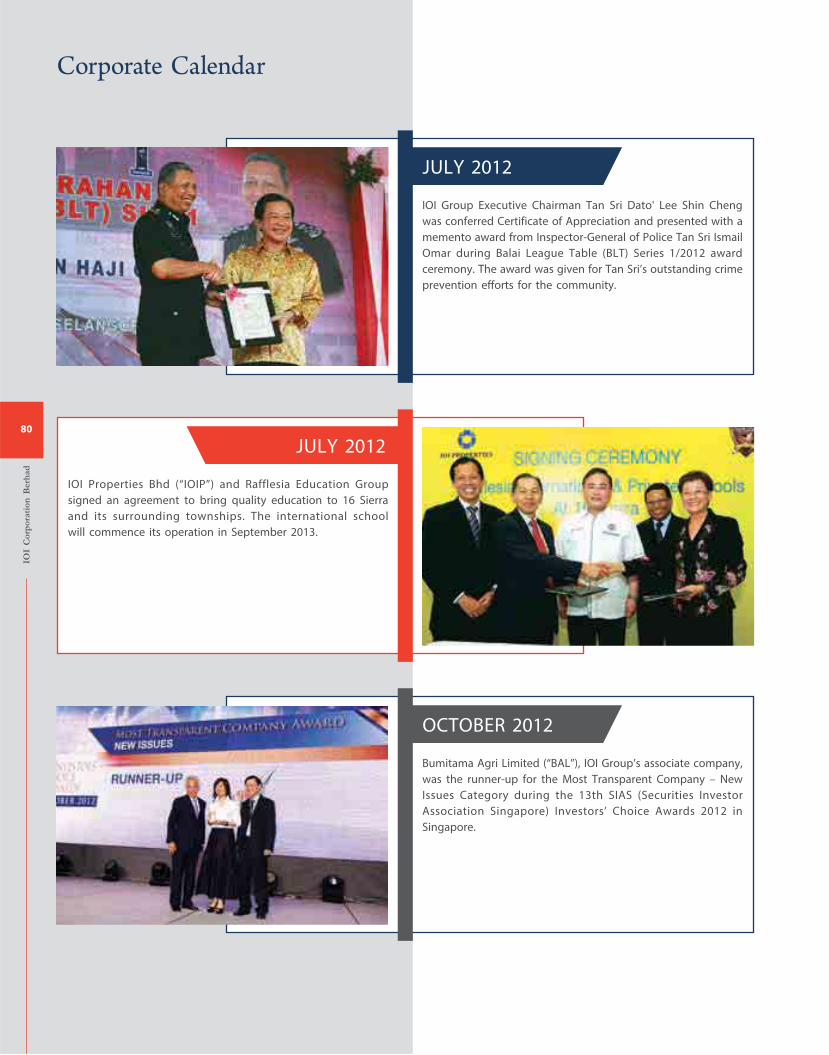
IOI Properties Bhd (“IOIP”) and Rafflesia Education Group
signed an agreement to bring quality education to 16 Sierra
and its surrounding townships. The international school
will commence its operation in September 2013.
JULY 2012
JULY 2012
IOI Group Executive Chairman Tan Sri Dato' Lee Shin Cheng
was conferred Certificate of Appreciation and presented with a
memento award from Inspector-General of Police Tan Sri Ismail
Omar during Balai League Table (BLT) Series 1/2012 award
ceremony. The award was given for Tan Sri’s outstanding crime
prevention efforts for the community.
OCTOBER 2012
Bumitama Agri Limited (“BAL”), IOI Group’s associate company,
was the runner-up for the Most Transparent Company – New
Issues Category during the 13th SIAS (Securities Investor
Association Singapore) Investors’ Choice Awards 2012 in
Singapore.
IOI
Cor
por
atio
n B
erh
ad
80
Corporate Calendar
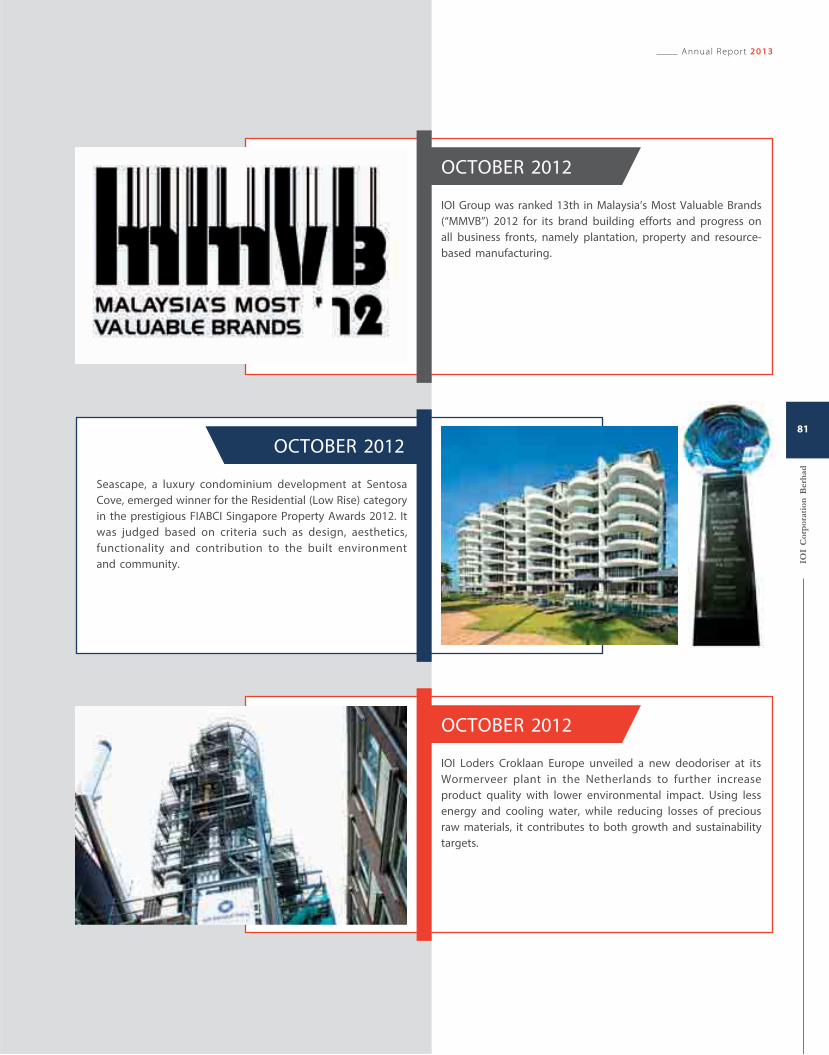
OCTOBER 2012
IOI Group was ranked 13th in Malaysia’s Most Valuable Brands
(“MMVB”) 2012 for its brand building efforts and progress on
all business fronts, namely plantation, property and resource-
based manufacturing.
OCTOBER 2012
IOI Loders Croklaan Europe unveiled a new deodoriser at its
Wormerveer plant in the Netherlands to further increase
product quality with lower environmental impact. Using less
energy and cooling water, while reducing losses of precious
raw materials, it contributes to both growth and sustainability
targets.
Seascape, a luxury condominium development at Sentosa
Cove, emerged winner for the Residential (Low Rise) category
in the prestigious FIABCI Singapore Property Awards 2012. It
was judged based on criteria such as design, aesthetics,
functionality and contribution to the built environment
and community.
OCTOBER 2012
Annual Report 2013
IOI
Cor
por
atio
n B
erh
ad
81
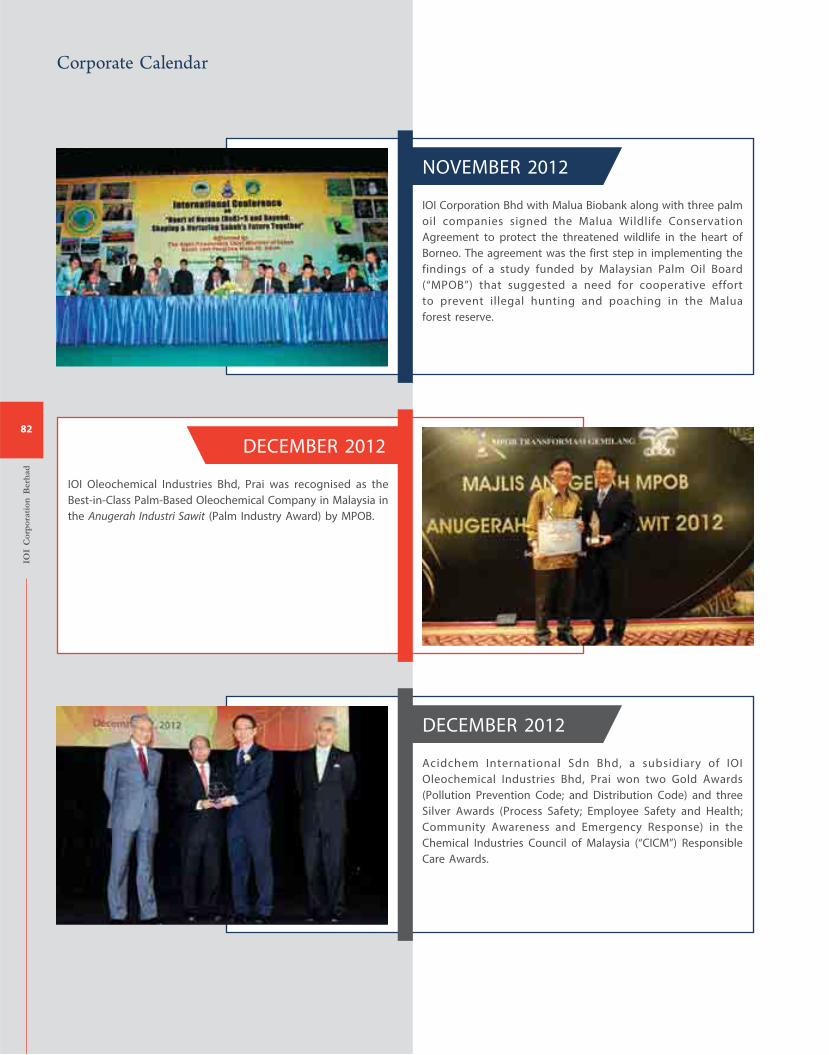
IOI Oleochemical Industries Bhd, Prai was recognised as the
Best-in-Class Palm-Based Oleochemical Company in Malaysia in
the Anugerah Industri Sawit (Palm Industry Award) by MPOB.
DECEMBER 2012
NOVEMBER 2012
IOI Corporation Bhd with Malua Biobank along with three palm
oil companies signed the Malua Wildlife Conservation
Agreement to protect the threatened wildlife in the heart of
Borneo. The agreement was the first step in implementing the
findings of a study funded by Malaysian Palm Oil Board
(“MPOB”) that suggested a need for cooperative effort
to prevent illegal hunting and poaching in the Malua
forest reserve.
DECEMBER 2012
Acidchem International Sdn Bhd, a subsidiary of IOI
Oleochemical Industries Bhd, Prai won two Gold Awards
(Pollution Prevention Code; and Distribution Code) and three
Silver Awards (Process Safety; Employee Safety and Health;
Community Awareness and Emergency Response) in the
Chemical Industries Council of Malaysia (“CICM”) Responsible
Care Awards.
IOI
Cor
por
atio
n B
erh
ad
82
Corporate Calendar
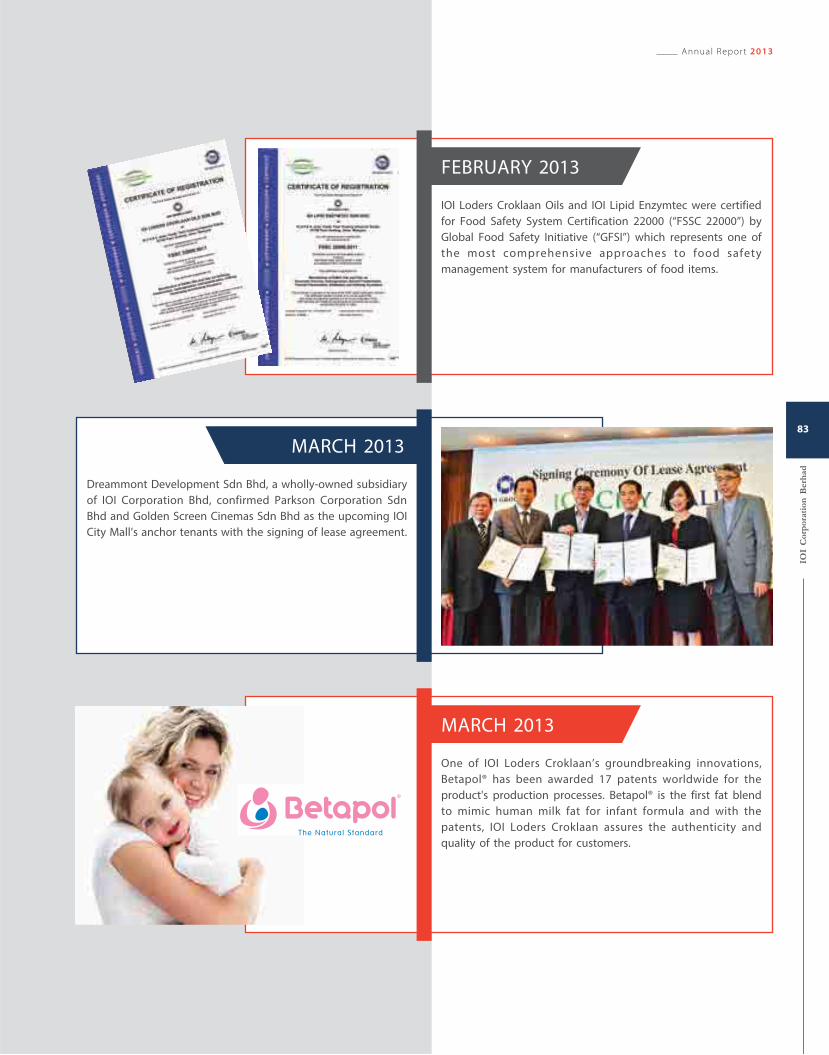
Dreammont Development Sdn Bhd, a wholly-owned subsidiary
of IOI Corporation Bhd, confirmed Parkson Corporation Sdn
Bhd and Golden Screen Cinemas Sdn Bhd as the upcoming IOI
City Mall’s anchor tenants with the signing of lease agreement.
MARCH 2013
FEBRUARY 2013
IOI Loders Croklaan Oils and IOI Lipid Enzymtec were certified
for Food Safety System Certification 22000 (“FSSC 22000”) by
Global Food Safety Initiative (“GFSI”) which represents one of
the most comprehensive approaches to food safety
management system for manufacturers of food items.
MARCH 2013
One of IOI Loders Croklaan’s groundbreaking innovations,
Betapol® has been awarded 17 patents worldwide for the
product's production processes. Betapol® is the first fat blend
to mimic human milk fat for infant formula and with the
patents, IOI Loders Croklaan assures the authenticity and
quality of the product for customers.
Annual Report 2013
IOI
Cor
por
atio
n B
erh
ad
83
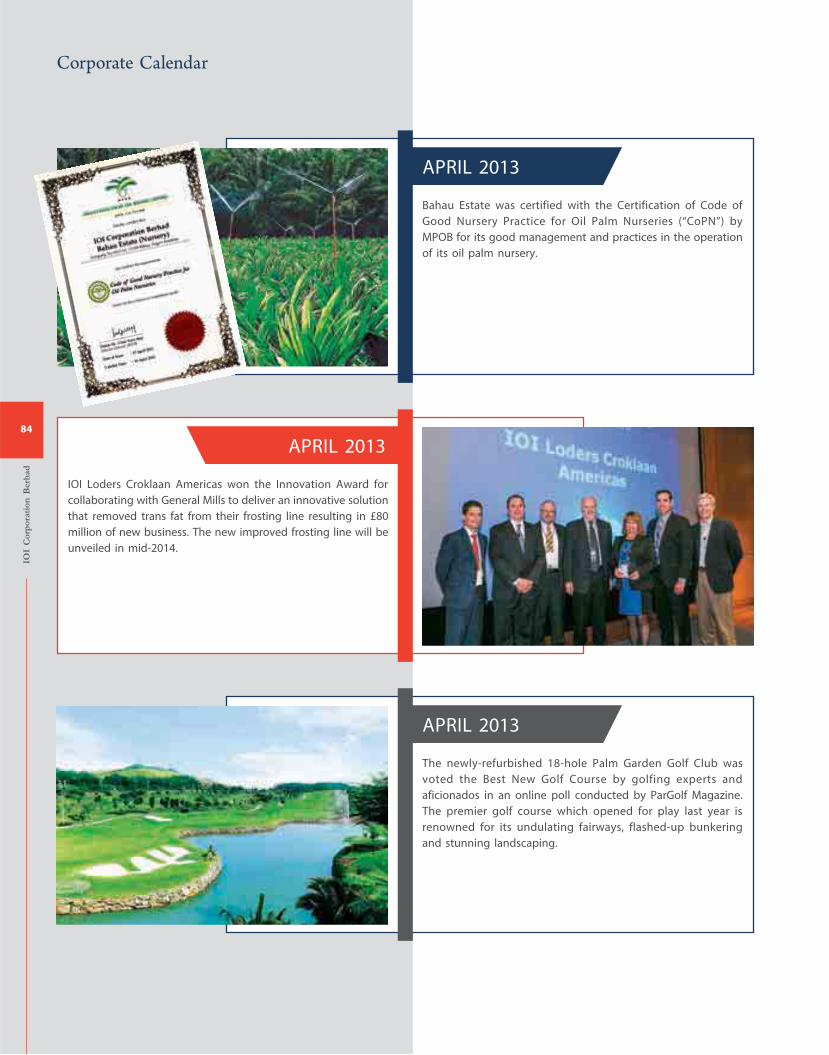
APRIL 2013
Bahau Estate was certified with the Certification of Code of
Good Nursery Practice for Oil Palm Nurseries (“CoPN”) by
MPOB for its good management and practices in the operation
of its oil palm nursery.
IOI Loders Croklaan Americas won the Innovation Award for
collaborating with General Mills to deliver an innovative solution
that removed trans fat from their frosting line resulting in £80
million of new business. The new improved frosting line will be
unveiled in mid-2014.
APRIL 2013
APRIL 2013
The newly-refurbished 18-hole Palm Garden Golf Club was
voted the Best New Golf Course by golfing experts and
aficionados in an online poll conducted by ParGolf Magazine.
The premier golf course which opened for play last year is
renowned for its undulating fairways, flashed-up bunkering
and stunning landscaping.
IOI
Cor
por
atio
n B
erh
ad
84
Corporate Calendar
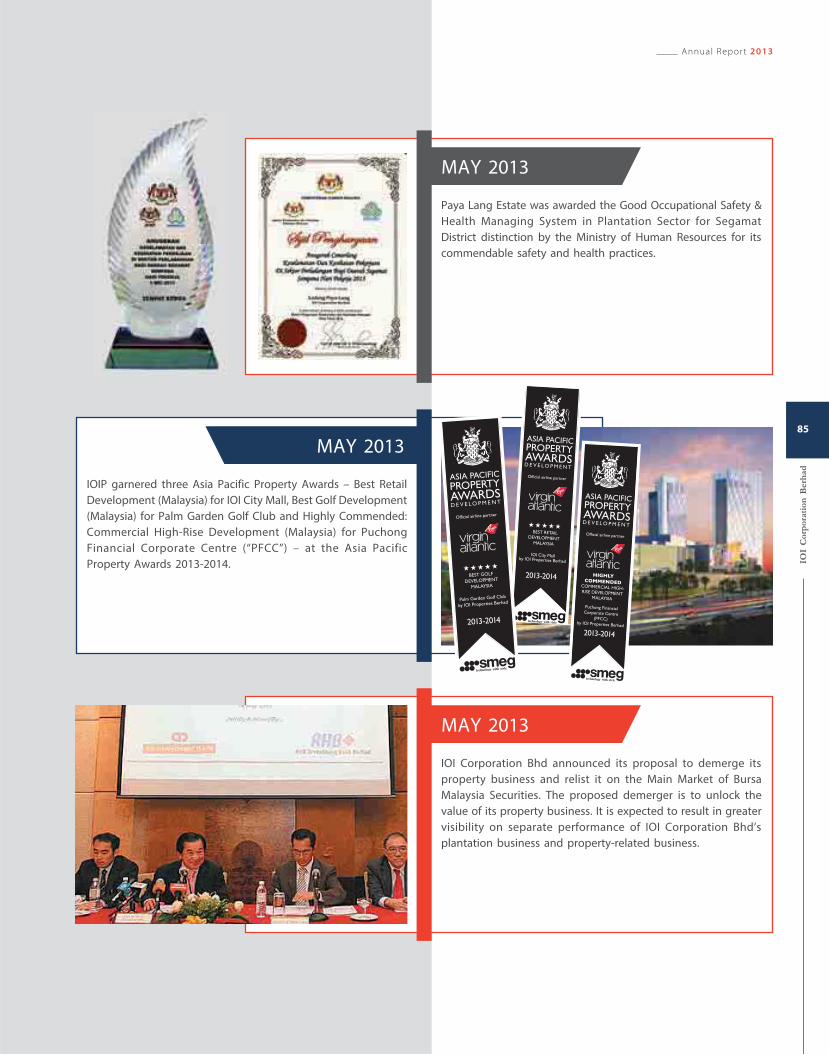
MAY 2013
Paya Lang Estate was awarded the Good Occupational Safety &
Health Managing System in Plantation Sector for Segamat
District distinction by the Ministry of Human Resources for its
commendable safety and health practices.
IOIP garnered three Asia Pacific Property Awards – Best Retail
Development (Malaysia) for IOI City Mall, Best Golf Development
(Malaysia) for Palm Garden Golf Club and Highly Commended:
Commercial High-Rise Development (Malaysia) for Puchong
Financial Corporate Centre (“PFCC”) – at the Asia Pacific
Property Awards 2013-2014.
MAY 2013
IOI City Mall
RETAIL
MAY 2013
IOI Corporation Bhd announced its proposal to demerge its
property business and relist it on the Main Market of Bursa
Malaysia Securities. The proposed demerger is to unlock the
value of its property business. It is expected to result in greater
visibility on separate performance of IOI Corporation Bhd’s
plantation business and property-related business.
Annual Report 2013
IOI
Cor
por
atio
n B
erh
ad
85
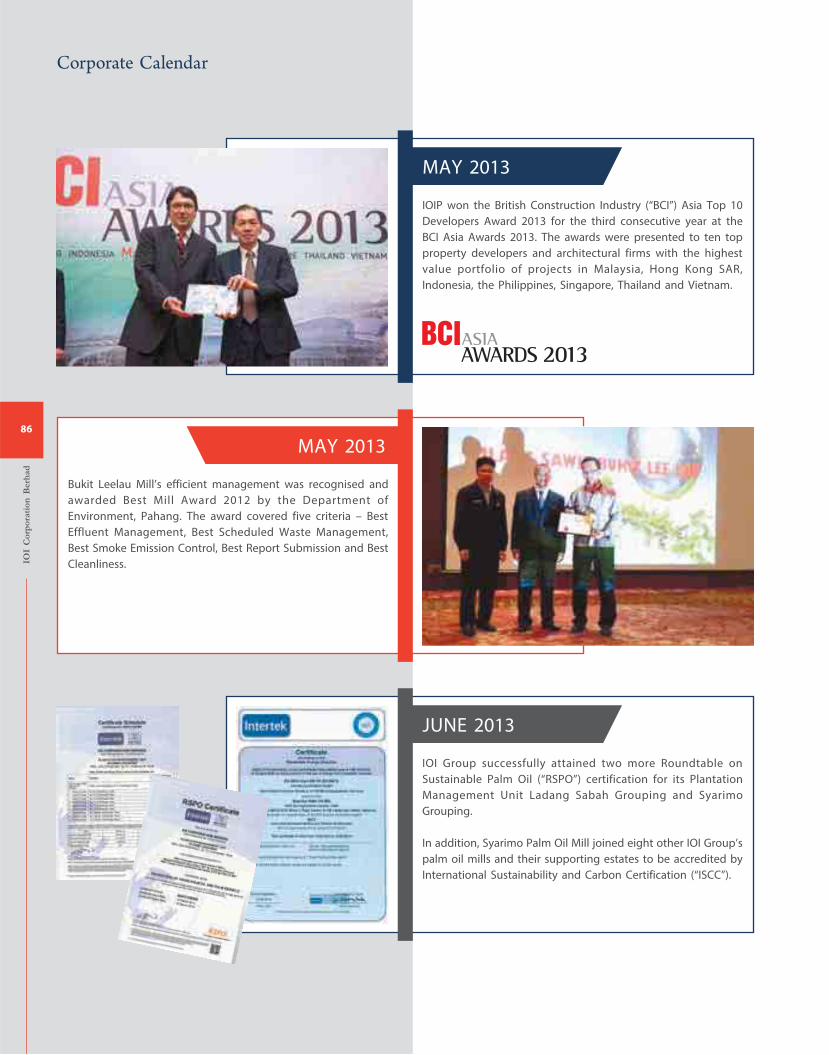
MAY 2013
IOIP won the British Construction Industry (“BCI”) Asia Top 10
Developers Award 2013 for the third consecutive year at the
BCI Asia Awards 2013. The awards were presented to ten top
property developers and architectural firms with the highest
value portfolio of projects in Malaysia, Hong Kong SAR,
Indonesia, the Philippines, Singapore, Thailand and Vietnam.
JUNE 2013
IOI Group successfully attained two more Roundtable on
Sustainable Palm Oil (“RSPO”) certification for its Plantation
Management Unit Ladang Sabah Grouping and Syarimo
Grouping.
In addition, Syarimo Palm Oil Mill joined eight other IOI Group’s
palm oil mills and their supporting estates to be accredited by
International Sustainability and Carbon Certification (“ISCC”).
Bukit Leelau Mill’s efficient management was recognised and
awarded Best Mill Award 2012 by the Department of
Environment, Pahang. The award covered five criteria – Best
Effluent Management, Best Scheduled Waste Management,
Best Smoke Emission Control, Best Report Submission and Best
Cleanliness.
MAY 2013
IOI
Cor
por
atio
n B
erh
ad
86
Corporate Calendar
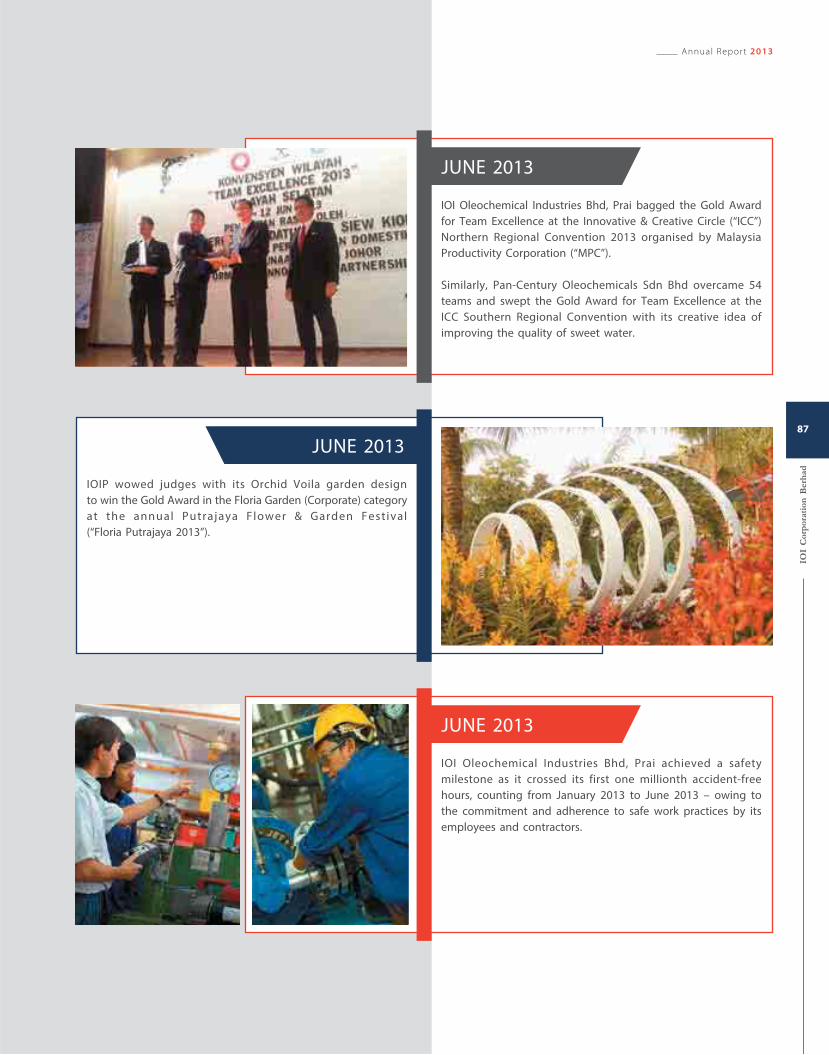
JUNE 2013
IOI Oleochemical Industries Bhd, Prai bagged the Gold Award
for Team Excellence at the Innovative & Creative Circle (“ICC”)
Northern Regional Convention 2013 organised by Malaysia
Productivity Corporation (“MPC”).
Similarly, Pan-Century Oleochemicals Sdn Bhd overcame 54
teams and swept the Gold Award for Team Excellence at the
ICC Southern Regional Convention with its creative idea of
improving the quality of sweet water.
IOIP wowed judges with its Orchid Voila garden design
to win the Gold Award in the Floria Garden (Corporate) category
at the annual Putrajaya Flower & Garden Fest ival
(“Floria Putrajaya 2013”).
JUNE 2013
JUNE 2013
IOI Oleochemical Industries Bhd, Prai achieved a safety
milestone as it crossed its first one millionth accident-free
hours, counting from January 2013 to June 2013 – owing to
the commitment and adherence to safe work practices by its
employees and contractors.
Annual Report 2013
IOI
Cor
por
atio
n B
erh
ad
87
The Board of Directors of IOI Corporation Berhad is pleased to present
the report on the Audit and Risk Management Committee (the
“Committee”) of the Board for the financial year ended 30 June 2013.
The Audit Committee was established on 24 March 1994 in line with
Bursa Malaysia Securities Berhad’s Main Market Listing Requirements.
With effect from 6 September 2012, the Audit Committee was
renamed as the Audit and Risk Management Committee.
A MEMBERS
Datuk Hj Mohd Khalil b Dato’ Hj Mohd Noor
Chairman
Senior Independent Non-Executive Director
Datuk Karownakaran @ Karunakaran a/l Ramasamy
Member/Independent Non-Executive Director
Cheah Tek Kuang
Member
Independent Non-Executive Director
(Appointed on 13 September 2013)
Quah Poh Keat
CPA (M), CA (M), FCCA, ACMA, MIT (M)
Member
Independent Non-Executive Director
(Resigned on 13 September 2013)
B COMPOSITION AND TERMS OF REFERENCE
1 Membership
The Committee shall be appointed by the Board of
Directors from amongst the Directors and shall consist of
no fewer than three (3) members. All the Committee
members must be Non-Executive Directors with a majority
of them being Independent Non-Executive Directors.
All the Committee members should be financially
literate with at least one (1) Director who is a member
of the Malaysian Institute of Accountants or alternatively
a person who must have the following qualifications are
also acceptable:-
(a) either one of the following qualifications and at
least three (3) years’ post-qualification experience
in accounting or finance:
(i) a degree/masters/doctorate in accounting or
finance; or
(ii) a member of any professional accountancy
organisation which has been admitted as a
full member of the International Federation of
Accountants; or
(b) at least seven (7) years’ experience being a chief
financial officer of a corporation or having the
function of being primarily responsible for the
management of the financial affairs of a corporation.
The Committee shall elect a Chairman from among its
members who is an Independent Non-Executive Director.
In the event that a member of the Committee resigns, dies
or for any other reason ceases to be a member with the
result that the number of members is reduced below three
(3), the Board of Directors shall, within three (3) months of
that event, appoint such number of new members as may
be required to make up the minimum of three (3) members.
The term of office and performance of the Committee and
each of its members shall be reviewed by the Board at
least once every three (3) years.
2 Objectives
The primary objectives of the Committee are to:
i Provide assistance to the Board in fulfilling its
fiduciary responsibilities, particularly in the areas
relating to the Company and its subsidiaries’
accounting and management controls, financial
reporting and business ethics policies.
ii Provide greater emphasis on the audit function
by serving as the focal point for communication
between Non-Committee Directors, the external
auditors, internal auditors and the management
and providing a forum for discussion that
is independent of the management. It is to be
the Board’s principal agent in assuring the
independence of the Company’s external auditors,
the integrity of the management and the adequacy
of disclosures to shareholders.
iii Undertake such additional duties as may be
appropriate and necessary to assist the Board.
3 Authority
The Committee is authorised by the Board to:
i Investigate any matter within its terms of reference
and have ful l and unrestr icted access to
any information pertaining to the Company and
the Group.
ii Have direct communication channels with both
the external auditors and internal auditors.
iii Full access to any employee or member of
the management.
iv Be able to convene meetings with the external
auditors, the internal auditors or both, without the
attendance of other Directors and employees,
whenever deemed necessary.
The Committee is also authorised by the Board to have the
necessary resources and to obtain outside legal or other
independent professional advice it considers necessary and
reasonable for the performance of its duties.
IOI
Cor
por
atio
n B
erh
ad
88
Audit and Risk Management Committee Report
4 Duties and Responsibilities
In fulfilling its primary objectives, the Committee will
need to undertake the fol lowing duties and
responsibilities summarised below:
i To review with management on a periodic basis,
the Company’s general policies, procedures and
controls especially in relation to management
accounting, financial reporting, risk management
and business ethics.
ii To consider the appointment of the external
auditors , the terms of reference of their
appointment, the audit fee and any questions of
resignation or dismissal.
iii To review with the external auditors their audit
plan, scope and nature of the audit for the
Company and the Group.
iv To review the external auditors’ management
letter and management’s response.
v To review with the external auditors with regard to
problems and reservations arising from their
interim and final audits.
vi To review with the external auditors the audit
report and their evaluation of the system of
internal controls.
vii To review the assistance given by employees of
the Company or Group to the external auditors.
viii To do the following, in relation to the internal
audit function:
• review the adequacy of the scope, functions,
competency and resources of the internal audit
function and that it has the necessary authority
to carry out its work.
• review the internal audit programme, processes,
the results of the internal audit programme,
processes or investigation undertaken and
whether or not appropriate action is taken
on the recommendations of the internal
audit function.
• review any appraisal or assessment of the
performance of members of the internal
audit function.
• approve any appointment or termination of
senior staff members of the internal audit
function.
• take cognisance of resignations of internal
audit staff members and provide the resigning
staff member an opportunity to submit his
reasons for resigning.
ix To review the Company and the Group's quarterly
f inancial statements and annual f inancial
statements before submission to the Board.
The review shall focus on:
• any changes in or implementation of major
accounting policies and practices.
• significant and unusual events.
• significant adjustments and issues arising from
the audit.
• the going concern assumption.
• compliance with the applicable approved
accounting standards and other legal
requirements.
x To review any related party transaction and conflict
of interest situations that may arise within the
Company or the Group including any transaction,
procedure or course of conduct that raises
questions of management integrity.
xi To undertake such other responsibilities as may be
agreed to by the Committee and the Board.
xii To consider the report, major findings and
m a n a g e m e n t ’ s r e s p o n s e o f a n y i n t e r n a l
investigations carried out by the internal auditors.
xiii To verify the allocation of options pursuant to
Executive Share Option Scheme (“ESOS”) in
compliance with the criteria of the ESOS at the end
of each financial year.
5 Conduct of Meetings
Number of Meetings
The Committee shall meet at least five (5) times a year.
The Chairman shall also convene a meeting of the
Committee if requested to do so by any member, the
management or the internal or external auditors to
consider any matter within the scope and responsibilities
of the Committee.
Attendance of Meetings
The head of finance and head of internal audit division
and representatives of the external auditors shall
normally be invited to attend meetings of the Committee.
However, the Committee shall meet with the external
auditors without executive board members present at
least twice a year. The Committee may also invite other
Directors and employees to attend any of its meeting to
assist in resolving and clarifying matters raised.
Quorum
A quorum shall consist of a majority of Independent Non-
Executive Directors and shall not be less than two (2).
6 Secretary to the Committee and Minutes
The Company Secretary shall be the secretary of the
Committee and as a reporting procedure, the minutes
shall be circulated to all members of the Board.
Annual Report 2013
IOI
Cor
por
atio
n B
erh
ad
89
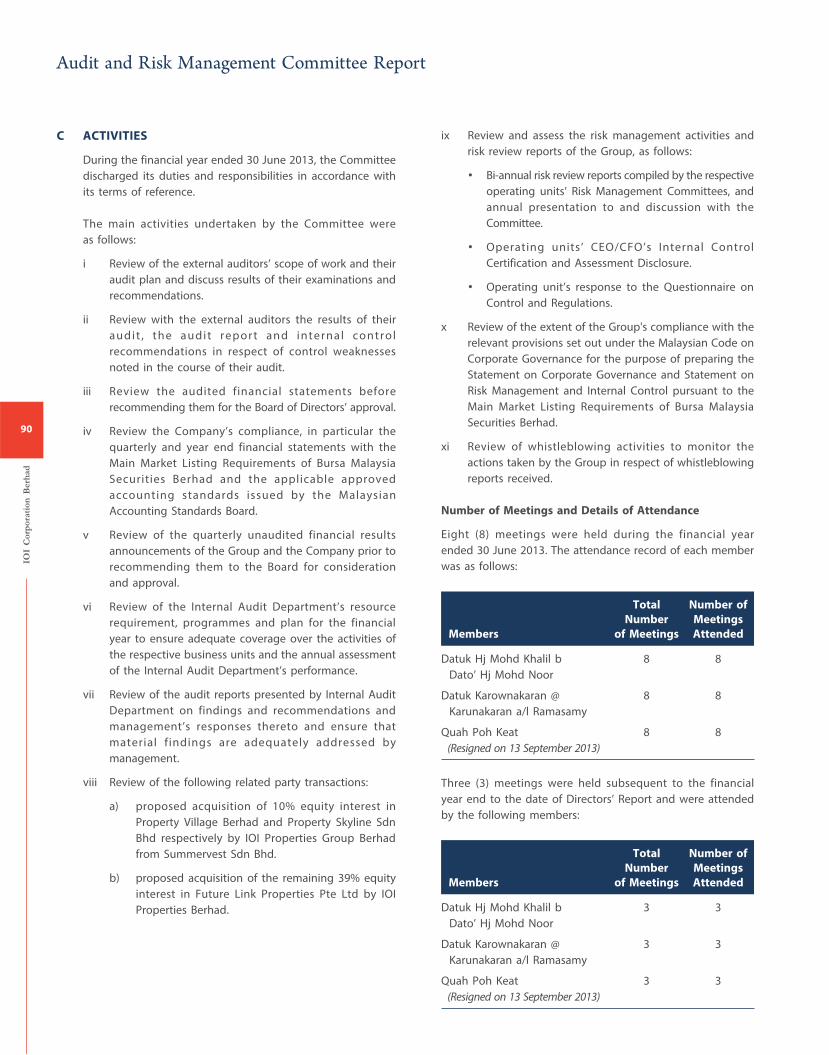
C ACTIVITIES
During the financial year ended 30 June 2013, the Committee
discharged its duties and responsibilities in accordance with
its terms of reference.
The main activities undertaken by the Committee were
as follows:
i Review of the external auditors’ scope of work and their
audit plan and discuss results of their examinations and
recommendations.
ii Review with the external auditors the results of their
audit , the audit report and internal control
recommendations in respect of control weaknesses
noted in the course of their audit.
iii Review the audited financial statements before
recommending them for the Board of Directors’ approval.
iv Review the Company’s compliance, in particular the
quarterly and year end financial statements with the
Main Market Listing Requirements of Bursa Malaysia
Securities Berhad and the applicable approved
accounting standards issued by the Malaysian
Accounting Standards Board.
v Review of the quarterly unaudited financial results
announcements of the Group and the Company prior to
recommending them to the Board for consideration
and approval.
vi Review of the Internal Audit Department’s resource
requirement, programmes and plan for the financial
year to ensure adequate coverage over the activities of
the respective business units and the annual assessment
of the Internal Audit Department’s performance.
vii Review of the audit reports presented by Internal Audit
Department on findings and recommendations and
management’s responses thereto and ensure that
material findings are adequately addressed by
management.
viii Review of the following related party transactions:
a) proposed acquisition of 10% equity interest in
Property Village Berhad and Property Skyline Sdn
Bhd respectively by IOI Properties Group Berhad
from Summervest Sdn Bhd.
b) proposed acquisition of the remaining 39% equity
interest in Future Link Properties Pte Ltd by IOI
Properties Berhad.
ix Review and assess the risk management activities and
risk review reports of the Group, as follows:
• Bi-annual risk review reports compiled by the respective
operating units’ Risk Management Committees, and
annual presentation to and discussion with the
Committee.
• Operating units’ CEO/CFO’s Internal Control
Certification and Assessment Disclosure.
• Operating unit’s response to the Questionnaire on
Control and Regulations.
x Review of the extent of the Group's compliance with the
relevant provisions set out under the Malaysian Code on
Corporate Governance for the purpose of preparing the
Statement on Corporate Governance and Statement on
Risk Management and Internal Control pursuant to the
Main Market Listing Requirements of Bursa Malaysia
Securities Berhad.
xi Review of whistleblowing activities to monitor the
actions taken by the Group in respect of whistleblowing
reports received.
Number of Meetings and Details of Attendance
Eight (8) meetings were held during the financial year
ended 30 June 2013. The attendance record of each member
was as follows:
Members
Total
Number
of Meetings
Number of
Meetings
Attended
Datuk Hj Mohd Khalil b
Dato’ Hj Mohd Noor
8 8
Datuk Karownakaran @
Karunakaran a/l Ramasamy
8 8
Quah Poh Keat
(Resigned on 13 September 2013)
8 8
Three (3) meetings were held subsequent to the financial
year end to the date of Directors’ Report and were attended
by the following members:
Members
Total
Number
of Meetings
Number of
Meetings
Attended
Datuk Hj Mohd Khalil b
Dato’ Hj Mohd Noor
3 3
Datuk Karownakaran @
Karunakaran a/l Ramasamy
3 3
Quah Poh Keat
(Resigned on 13 September 2013)
3 3
IOI
Cor
por
atio
n B
erh
ad
90
Audit and Risk Management Committee Report
D INTERNAL AUDIT FUNCTION
The annual Internal Audit plan is approved by the Committee
at the beginning of each financial year.
The Internal Audit Department performs routine audit on and
reviews all operating units within the Group, with emphasis
on principal risk areas. Internal Audit adopts a risk-based
approach towards planning and conduct of audits, which is
partly guided by an Enterprise Risk Management ("ERM")
framework. Impact on IOI’s vision is taken into consideration
in determining the risk level as a holistic approach in
contributing to the achievement of the Group’s objective and
in enhancing shareholders’ value.
140 audit assignments were completed during the financial
year on various operating units of the Group covering
plantation, properties, manufacturing, hotels and other
sectors. Audit reports were issued to the Committee and
Board incorporating findings, recommendations to improve
on the weaknesses noted in the course of the audits and
management's comments on the findings. An established
system has been put in place to ensure that all remedial
actions have been taken on the agreed audit issues and
recommendations highlighted in the audit reports. Significant
issues and matters unsatisfactorily resolved would be
highlighted to the Committee quarterly.
The total costs incurred for the internal audit function of the
Group for the financial year ended 30 June 2013 was
RM3,205,000 (2012: RM2,878,000).
E RISK MANAGEMENT
The Board and Management drive a proactive risk management
culture and ensure that the Group’s employees have a
good understanding and application of risk management
principles towards cultivating a sustainable risk management
culture through education. Regular risk awareness sessions
are conducted at the operational level to promote the
understanding of risk management principles and practices
across different functions within the Group. In addition, a risk-
based approach is embedded into existing key processes as
well as new key projects, and is compatible with the Group’s
internal control systems.
This is elaborated in details under a separate statement
called “Statement on Risk Management and Internal Control”
on pages 106 to 108.
Annual Report 2013
IOI
Cor
por
atio
n B
erh
ad
91
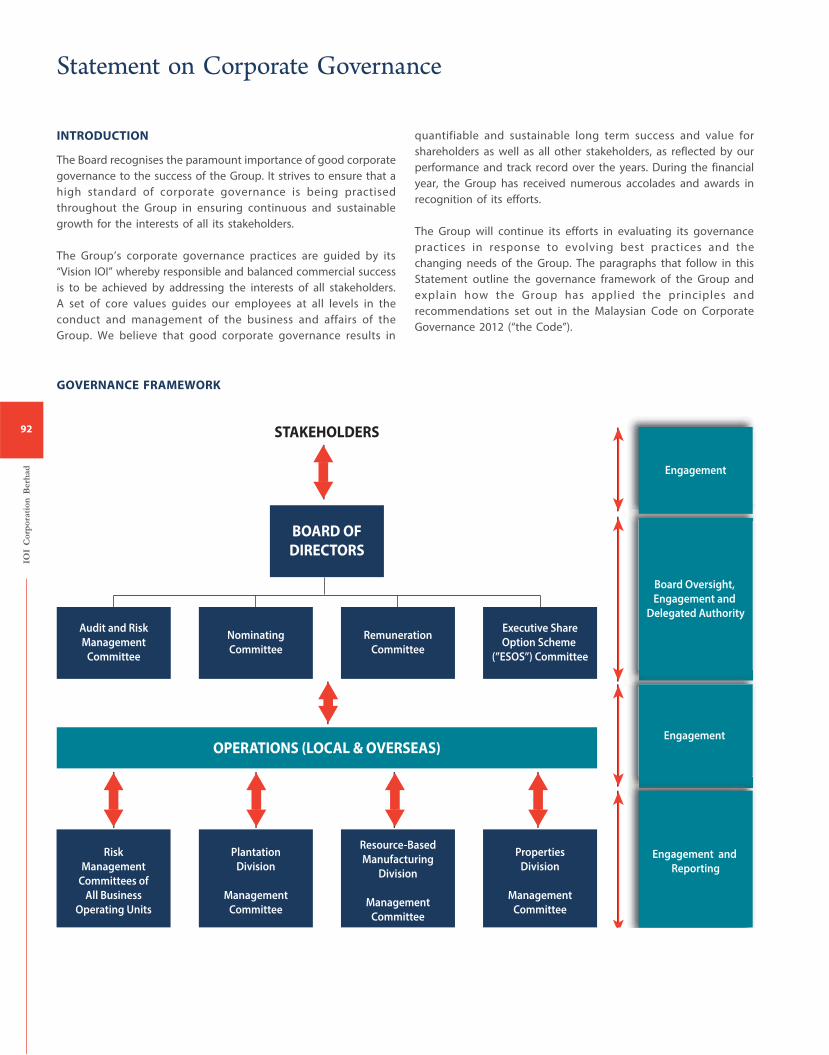
INTRODUCTION
The Board recognises the paramount importance of good corporate
governance to the success of the Group. It strives to ensure that a
high standard of corporate governance is being practised
throughout the Group in ensuring continuous and sustainable
growth for the interests of all its stakeholders.
The Group’s corporate governance practices are guided by its
“Vision IOI” whereby responsible and balanced commercial success
is to be achieved by addressing the interests of all stakeholders.
A set of core values guides our employees at all levels in the
conduct and management of the business and affairs of the
Group. We believe that good corporate governance results in
GOVERNANCE FRAMEWORK
quantifiable and sustainable long term success and value for
shareholders as well as all other stakeholders, as reflected by our
performance and track record over the years. During the financial
year, the Group has received numerous accolades and awards in
recognition of its efforts.
The Group will continue its efforts in evaluating its governance
practices in response to evolving best practices and the
changing needs of the Group. The paragraphs that follow in this
Statement outline the governance framework of the Group and
explain how the Group has applied the principles and
recommendations set out in the Malaysian Code on Corporate
Governance 2012 (“the Code”).
STAKEHOLDERS
OPERATIONS (LOCAL & OVERSEAS)
BOARD OF
DIRECTORS
Audit and Risk
Management
Committee
Nominating
Committee
Remuneration
Committee
Executive Share
Option Scheme
(”ESOS”) Committee
Board Oversight,
Engagement and
Delegated Authority
Engagement
Engagement and
Reporting
Engagement
Risk
Management
Committees of
All Business
Operating Units
Plantation
Division
Management
Committee
Resource-Based
Manufacturing
Division
Management
Committee
Properties
Division
Management
Committee
IOI
Cor
por
atio
n B
erh
ad
92
Statement on Corporate Governance
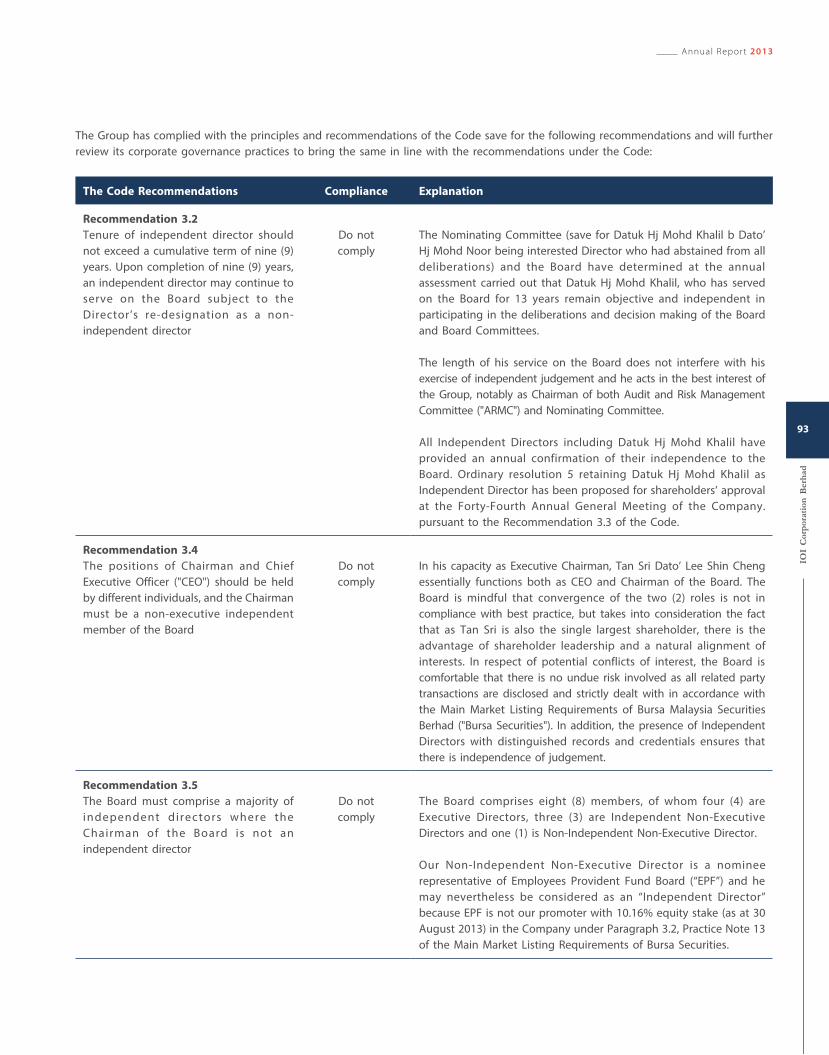
The Group has complied with the principles and recommendations of the Code save for the following recommendations and will further
review its corporate governance practices to bring the same in line with the recommendations under the Code:
The Code Recommendations Compliance Explanation
Recommendation 3.2
Tenure of independent director should
not exceed a cumulative term of nine (9)
years. Upon completion of nine (9) years,
an independent director may continue to
serve on the Board subject to the
Director’s re-designation as a non-
independent director
Do not
comply
The Nominating Committee (save for Datuk Hj Mohd Khalil b Dato’
Hj Mohd Noor being interested Director who had abstained from all
deliberations) and the Board have determined at the annual
assessment carried out that Datuk Hj Mohd Khalil, who has served
on the Board for 13 years remain objective and independent in
participating in the deliberations and decision making of the Board
and Board Committees.
The length of his service on the Board does not interfere with his
exercise of independent judgement and he acts in the best interest of
the Group, notably as Chairman of both Audit and Risk Management
Committee ("ARMC") and Nominating Committee.
All Independent Directors including Datuk Hj Mohd Khalil have
provided an annual confirmation of their independence to the
Board. Ordinary resolution 5 retaining Datuk Hj Mohd Khalil as
Independent Director has been proposed for shareholders’ approval
at the Forty-Fourth Annual General Meeting of the Company.
pursuant to the Recommendation 3.3 of the Code.
Recommendation 3.4
The positions of Chairman and Chief
Executive Officer ("CEO") should be held
by different individuals, and the Chairman
must be a non-executive independent
member of the Board
Do not
comply
In his capacity as Executive Chairman, Tan Sri Dato’ Lee Shin Cheng
essentially functions both as CEO and Chairman of the Board. The
Board is mindful that convergence of the two (2) roles is not in
compliance with best practice, but takes into consideration the fact
that as Tan Sri is also the single largest shareholder, there is the
advantage of shareholder leadership and a natural alignment of
interests. In respect of potential conflicts of interest, the Board is
comfortable that there is no undue risk involved as all related party
transactions are disclosed and strictly dealt with in accordance with
the Main Market Listing Requirements of Bursa Malaysia Securities
Berhad ("Bursa Securities"). In addition, the presence of Independent
Directors with distinguished records and credentials ensures that
there is independence of judgement.
Recommendation 3.5
The Board must comprise a majority of
independent directors where the
Chairman of the Board is not an
independent director
Do not
comply
The Board comprises eight (8) members, of whom four (4) are
Executive Directors, three (3) are Independent Non-Executive
Directors and one (1) is Non-Independent Non-Executive Director.
Our Non-Independent Non-Executive Director is a nominee
representative of Employees Provident Fund Board (“EPF”) and he
may nevertheless be considered as an “Independent Director”
because EPF is not our promoter with 10.16% equity stake (as at 30
August 2013) in the Company under Paragraph 3.2, Practice Note 13
of the Main Market Listing Requirements of Bursa Securities.
Annual Report 2013
IOI
Cor
por
atio
n B
erh
ad
93
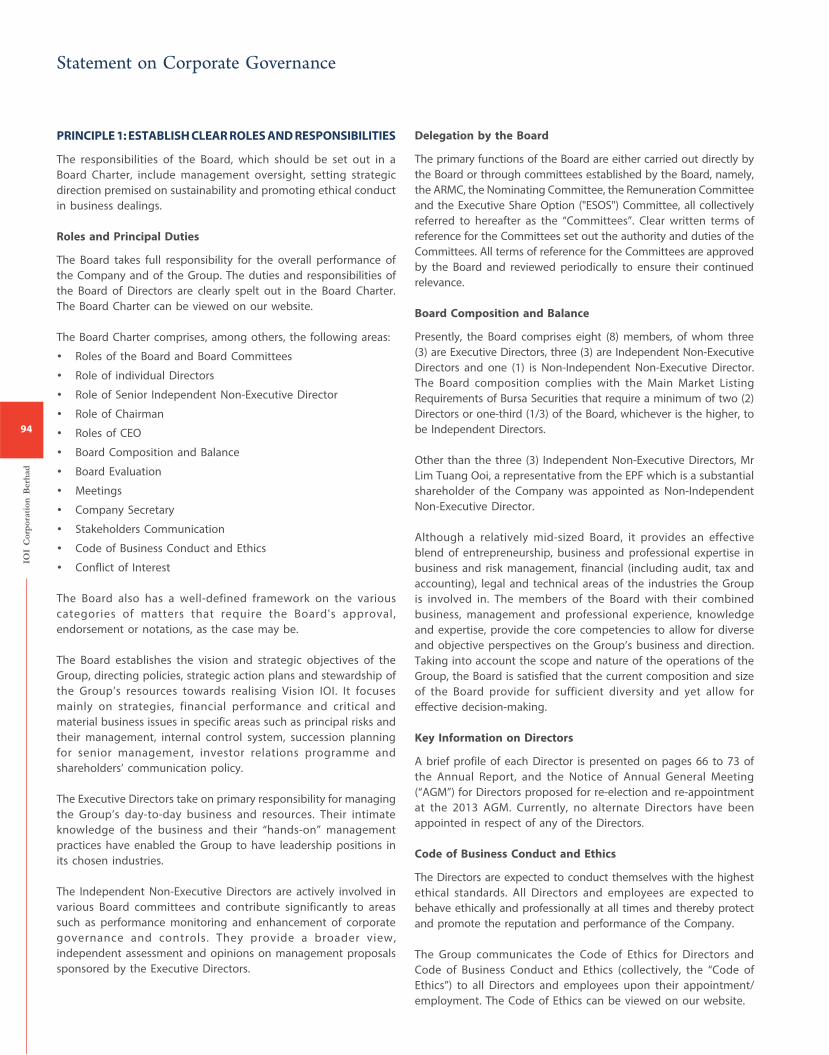
PRINCIPLE 1: ESTABLISH CLEAR ROLES AND RESPONSIBILITIES
The responsibilities of the Board, which should be set out in a
Board Charter, include management oversight, setting strategic
direction premised on sustainability and promoting ethical conduct
in business dealings.
Roles and Principal Duties
The Board takes full responsibility for the overall performance of
the Company and of the Group. The duties and responsibilities of
the Board of Directors are clearly spelt out in the Board Charter.
The Board Charter can be viewed on our website.
The Board Charter comprises, among others, the following areas:
• Roles of the Board and Board Committees
• Role of individual Directors
• Role of Senior Independent Non-Executive Director
• Role of Chairman
• Roles of CEO
• Board Composition and Balance
• Board Evaluation
• Meetings
• Company Secretary
• Stakeholders Communication
• Code of Business Conduct and Ethics
• Conflict of Interest
The Board also has a well-defined framework on the various
categories of matters that require the Board's approval,
endorsement or notations, as the case may be.
The Board establishes the vision and strategic objectives of the
Group, directing policies, strategic action plans and stewardship of
the Group’s resources towards realising Vision IOI. It focuses
mainly on strategies, financial performance and critical and
material business issues in specific areas such as principal risks and
their management, internal control system, succession planning
for senior management, investor relations programme and
shareholders’ communication policy.
The Executive Directors take on primary responsibility for managing
the Group’s day-to-day business and resources. Their intimate
knowledge of the business and their “hands-on” management
practices have enabled the Group to have leadership positions in
its chosen industries.
The Independent Non-Executive Directors are actively involved in
various Board committees and contribute significantly to areas
such as performance monitoring and enhancement of corporate
governance and controls. They provide a broader view,
independent assessment and opinions on management proposals
sponsored by the Executive Directors.
Delegation by the Board
The primary functions of the Board are either carried out directly by
the Board or through committees established by the Board, namely,
the ARMC, the Nominating Committee, the Remuneration Committee
and the Executive Share Option ("ESOS") Committee, all collectively
referred to hereafter as the “Committees”. Clear written terms of
reference for the Committees set out the authority and duties of the
Committees. All terms of reference for the Committees are approved
by the Board and reviewed periodically to ensure their continued
relevance.
Board Composition and Balance
Presently, the Board comprises eight (8) members, of whom three
(3) are Executive Directors, three (3) are Independent Non-Executive
Directors and one (1) is Non-Independent Non-Executive Director.
The Board composition complies with the Main Market Listing
Requirements of Bursa Securities that require a minimum of two (2)
Directors or one-third (1/3) of the Board, whichever is the higher, to
be Independent Directors.
Other than the three (3) Independent Non-Executive Directors, Mr
Lim Tuang Ooi, a representative from the EPF which is a substantial
shareholder of the Company was appointed as Non-Independent
Non-Executive Director.
Although a relatively mid-sized Board, it provides an effective
blend of entrepreneurship, business and professional expertise in
business and risk management, financial (including audit, tax and
accounting), legal and technical areas of the industries the Group
is involved in. The members of the Board with their combined
business, management and professional experience, knowledge
and expertise, provide the core competencies to allow for diverse
and objective perspectives on the Group’s business and direction.
Taking into account the scope and nature of the operations of the
Group, the Board is satisfied that the current composition and size
of the Board provide for sufficient diversity and yet allow for
effective decision-making.
Key Information on Directors
A brief profile of each Director is presented on pages 66 to 73 of
the Annual Report, and the Notice of Annual General Meeting
(“AGM”) for Directors proposed for re-election and re-appointment
at the 2013 AGM. Currently, no alternate Directors have been
appointed in respect of any of the Directors.
Code of Business Conduct and Ethics
The Directors are expected to conduct themselves with the highest
ethical standards. All Directors and employees are expected to
behave ethically and professionally at all times and thereby protect
and promote the reputation and performance of the Company.
The Group communicates the Code of Ethics for Directors and
Code of Business Conduct and Ethics (collectively, the “Code of
Ethics”) to all Directors and employees upon their appointment/
employment. The Code of Ethics can be viewed on our website.
IOI
Cor
por
atio
n B
erh
ad
94
Statement on Corporate Governance
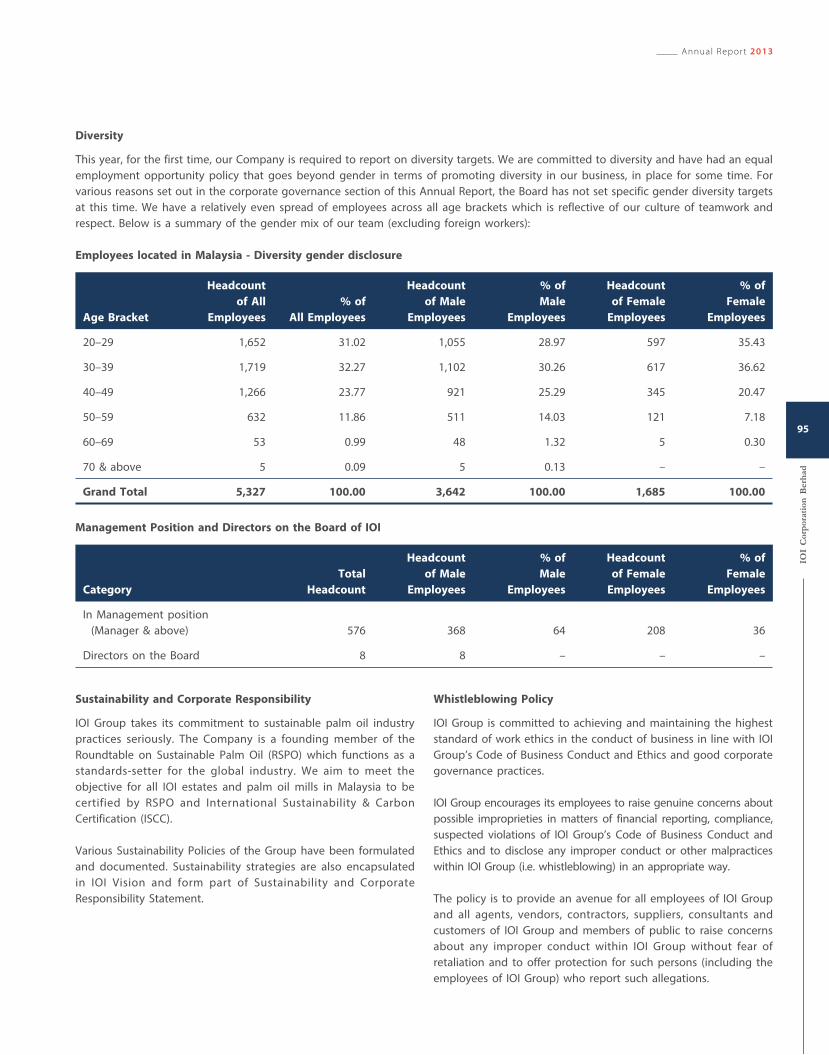
Diversity
This year, for the first time, our Company is required to report on diversity targets. We are committed to diversity and have had an equal
employment opportunity policy that goes beyond gender in terms of promoting diversity in our business, in place for some time. For
various reasons set out in the corporate governance section of this Annual Report, the Board has not set specific gender diversity targets
at this time. We have a relatively even spread of employees across all age brackets which is reflective of our culture of teamwork and
respect. Below is a summary of the gender mix of our team (excluding foreign workers):
Employees located in Malaysia - Diversity gender disclosure
Age Bracket
Headcount
of All
Employees
% of
All Employees
Headcount
of Male
Employees
% of
Male
Employees
Headcount
of Female
Employees
% of
Female
Employees
20–29 1,652 31.02 1,055 28.97 597 35.43
30–39 1,719 32.27 1,102 30.26 617 36.62
40–49 1,266 23.77 921 25.29 345 20.47
50–59 632 11.86 511 14.03 121 7.18
60–69 53 0.99 48 1.32 5 0.30
70 & above 5 0.09 5 0.13 – –
Grand Total 5,327 100.00 3,642 100.00 1,685 100.00
Management Position and Directors on the Board of IOI
Category
Total
Headcount
Headcount
of Male
Employees
% of
Male
Employees
Headcount
of Female
Employees
% of
Female
Employees
In Management position
(Manager & above) 576 368 64 208 36
Directors on the Board 8 8 – – –
Sustainability and Corporate Responsibility
IOI Group takes its commitment to sustainable palm oil industry
practices seriously. The Company is a founding member of the
Roundtable on Sustainable Palm Oil (RSPO) which functions as a
standards-setter for the global industry. We aim to meet the
objective for all IOI estates and palm oil mills in Malaysia to be
certified by RSPO and International Sustainability & Carbon
Certification (ISCC).
Various Sustainability Policies of the Group have been formulated
and documented. Sustainability strategies are also encapsulated
in IOI Vision and form part of Sustainability and Corporate
Responsibility Statement.
Whistleblowing Policy
IOI Group is committed to achieving and maintaining the highest
standard of work ethics in the conduct of business in line with IOI
Group’s Code of Business Conduct and Ethics and good corporate
governance practices.
IOI Group encourages its employees to raise genuine concerns about
possible improprieties in matters of financial reporting, compliance,
suspected violations of IOI Group’s Code of Business Conduct and
Ethics and to disclose any improper conduct or other malpractices
within IOI Group (i.e. whistleblowing) in an appropriate way.
The policy is to provide an avenue for all employees of IOI Group
and all agents, vendors, contractors, suppliers, consultants and
customers of IOI Group and members of public to raise concerns
about any improper conduct within IOI Group without fear of
retaliation and to offer protection for such persons (including the
employees of IOI Group) who report such allegations.
Annual Report 2013
IOI
Cor
por
atio
n B
erh
ad
95
Any employee or member of the public who has knowledge or is aware that any improper conduct has been, is being, or is likely to be
committed within IOI Group is encouraged to make disclosure by filling a prescribed Whistleblower Report Form and submit it through
any of the following reporting channels:
a) E-mail to [email protected]
b) Fax to +(603) 8948 8233. Whistleblowing Secretariat – Group Internal Audit, Tel: +(603) 8947 8888 (General line)
c) In person to the respective Head of Business/Operating Unit, or its Head of Human Resource
d) In writing to one or more of the following persons as appropriate at: IOI Group, Level 10, Two IOI Square, IOI Resort, 62502 Putrajaya,
Malaysia
POSITION NAME TEL NO.
Chairman of ARMC Dato’ Hj Mohd Khalil b Dato’ Hj Mohd Noor +(603) 8947 8953
Head of Group Internal Audit Frank Chin Suan Yong +(603) 8947 8949
Group Executive Chairman Tan Sri Dato’ Lee Shin Cheng
Group Executive Director Dato’ Lee Yeow Chor
Group Executive Director Lee Yeow Seng
Group Plantation Director Dato’ Foong Lai Choong
Property Director Teh Chin Guan
Executive Director, Oleochemicals Tan Kean Hua
Company Secretary
The Company Secretary, Vincent Tan Choong Khiang, assumed his
role in 2011, having 16 years experience in corporate secretarial
practice. He is a member of the Malaysian Institute of Chartered
Secretaries and Administrators (“MAICSA”). He is also a member of
Technical & Public Practice and Continuing Professional
Development Committees of MAICSA.
The Board has direct access to the advice and services of a
Company Secretary who is responsible to the Board for ensuring
that all governance matters and Board procedures are followed
and that applicable laws and regulations are complied with. These
include obligations on Directors relating to disclosure of interests
and disclosure of any conflicts of interest in transactions with the
Group. The Company Secretary is also charged with highlighting
all compliance and governance issues which they feel ought to be
brought to the Board’s attention.
The Company Secretary also facilitates the communication of key
decisions and policies between the Board, Board Committees and
Senior Management. In ensuring the uniformity of Board conduct
and effective boardroom practices throughout the Group, the
Company Secretary has oversight on overall corporate secretarial
functions of the Group, both in Malaysia and the region where the
Group operates.
Independent Professional Advice
The Directors, whether as a group or individually, are entitled to
take independent professional advice at the expense of the
Company, in furtherance of their duties and in the event that
circumstances warrant the same. The Company has in place
internal guidelines allowing the Directors to seek independent
professional advice.
PRINCIPLE 2: STRENGTHEN COMPOSITION
The Board should have transparent policies and procedures that
will assist in the selection of Board members. The Board should
comprise members who bring value to Board deliberations.
Appointment to the Board and the effectiveness of the Board
The Nominating Committee of the Board compose exclusively
three (3) Independent Non-Executive Directors. The Nominating
Committee is responsible to make independent recommendations
for appointments to the Board.
IOI
Cor
por
atio
n B
erh
ad
96
Statement on Corporate Governance
The Nominating Committee of the Board comprises of the
following Directors:
1. Datuk Hj Mohd Khalil b Dato’ Hj Mohd Noor (Chairman)
2. Datuk Karownakaran @ Karunakaran a/l Ramasamy
(appointed on 13 September 2013)
3. Cheah Tek Kuang (appointed on 13 September 2013)
4. Quah Poh Keat (resigned on 13 September 2013)
Selection of candidates to be considered for appointment as
Directors is facilitated through recommendations from the
Directors, Management or external parties including the Company’s
contacts in related industries, and finance, legal and accounting
professions. The Nominating Committee meets with the shortlisted
candidates to assess their suitability before formally considering
and recommending them for appointment to the Board and
where applicable, to the Committees.
In reviewing and recommending to the Board any new Director
appointments, the Nominating Committee considers: (a) the
candidate’s independence, in the case of the appointment of an
Independent Non-Executive Director; (b) the composition
requirements for the Board and Committees (if the candidate is
proposed to be appointed to any of the Committees); (c) the
candidate’s age, track record, skills, knowledge, expertise,
experience, professionalism, integrity, capabilities and such other
relevant factors as may be determined by the Nominating
Committee which would contribute to the Board’s collective skills;
and (d) any competing time commitments if the candidate has
multiple board representations.
The Board through the Nominating Committee also annually
reviews its required mix of skills and experience and other qualities,
including core competencies which the Directors should bring to
the Board. The Board has also implemented a process to be
carried out by the Nominating Committee annually for continuous
assessment and feedback to the Board on the effectiveness of the
Board as a whole, the Board committees and the contribution of
each individual Director.
When deliberating on the performance of a particular Director
who is also a member of the Nominating Committee, that member
abstains from the discussions in order to avoid any conflict of
interests. The results of the individual evaluation of the Directors
are also used by the Nominating Committee, in its consultation
with the Chairman of the Board, to review, where appropriate, the
composition of the Board and Committees, and to support its
proposals, if any, for appointment of new members and its
recommendations for the re-appointment and re-election of
retiring Directors. Comments from the Directors, if any, concerning
the Board as a whole and the general performance of the Directors,
are also presented to the Board.
Board Evaluation Criteria
The qualitative criteria is set out in a questionnaire covering four
(4) main areas relating to board structure, board operations, board
roles and responsibilities, board chairman’s role and responsibilities.
Individual Director Evaluation Criteria
Factors taken into account in the assessment of a Director’s
performance include his abilities and competencies, his objectivity
and the level of participation at Board and Committee meetings
including his contribution to Board processes and the business
strategies and performance of the Group.
Re-election and Re-appointment of Directors
In accordance with the Company’s Articles of Association
(“Articles”), all Directors who are appointed by the Board are
subject to election by shareholders at the first opportunity after
their appointment. The Articles also provide that at least one-third
(1/3) of the remaining Directors be subject to re-election by
rotation at each AGM provided always that all Directors including
the Managing Director shall retire from office at least once every
three (3) years but shall be eligible for re-election.
Pursuant to Section 129 of the Companies Act, 1965, Directors
who are over the age of seventy (70) years shall retire at every
AGM and may offer themselves for re-appointment to hold office
until the next AGM.
The Directors due for re-election by rotation pursuant to Article
101 of the Articles at the forthcoming Forty-Fourth AGM are
Datuk Karownakaran @ Karunakaran a/l Ramasamy and
Mr Lim Tuang Ooi. The profiles of the Directors who are due for
re-election are set out on pages 70 and 73.
The Directors who are due for retirement and re-appointment in
accordance to Section 129 of the Companies Act, 1965 at the
forthcoming Forty-Fourth AGM are Tan Sri Dato’ Lee Shin Cheng
and Datuk Hj Mohd Khalil b Dato’ Hj Mohd Noor. Their profiles are
set out on pages 66 and 69.
Annual Report 2013
IOI
Cor
por
atio
n B
erh
ad
97
Directors’ Remuneration
The Company’s remuneration scheme is linked to performance,
service seniority, experience and scope of responsibilities.
The Remuneration Committee of the Board comprises of the
following Directors:
1. Datuk Karownakaran @ Karunakaran a/l Ramasamy (Chairman)
(appointed on 13 September 2013)
2. Datuk Hj Mohd Khalil b Dato’ Hj Mohd Noor
3. Cheah Tek Kuang (appointed on 13 September 2013)
4. Tan Sri Dato' Lee Shin Cheng (resigned on 13 September 2013)
5. Quah Poh Keat (resigned on 13 September 2013)
1. Aggregate remuneration of Directors categorised into appropriate components:
Fees
RM’000
Salaries
RM’000
Bonus &
Incentives
RM’000
Benefits-in-
kind
RM’000
EPF
RM’000
Others
RM’000
Total
RM’000
Executive Directors 444 8,746 40,474 141 5,917 213 55,935
Non-executive Directors 454 – – 21 – 160 635
2. Number of Directors whose remuneration falls into the
following bands:
Number of Directors
Range of Remuneration Executive
Non-
executive
RM1 to RM50,000 – –
RM50,001 to RM100,000 – 1
RM100,001 to RM150,000 – 3
RM150,001 to RM200,000 – –
RM200,001 to RM250,000 – 1
RM250,001 to RM400,000 – –
RM400,001 to RM450,000 1 –
RM450,001 to RM1,250,000 – –
RM1,250,001 to RM1,300,000 1 –
RM1,300,001 to RM2,100,000 – –
RM2,100,001 to RM2,150,000 1 –
RM2,150,001 to RM52,100,000 – –
RM52,100,001 to RM52,150,000 1 –
T h e R e m u n e r a t i o n C o m m i t t e e r e v i e w s a n d s u b m i t s
recommendation to the Board on remuneration packages of
Directors in accordance with the Company’s policy guidelines
which sets a proportionately high variable pay component to the
remuneration package so as to strongly link remuneration to
performance, experience and the level of responsibilities. All
Directors are paid annual fees. The members of the ARMC receive
additional fees taking into consideration the nature of their
responsibilities. Members of other Board Committees do not
receive any additional fees. The fees for Directors are determined
by the full Board with the approval from shareholders at the AGM.
No Director is involved in deciding his own remuneration.
The details of the remuneration of Directors of the Company
comprising remuneration received/receivable from the Company
and subsidiary companies during the financial year ended 30 June
2013 are as follows:
For financial year ended 30 June 2013, none of the directors were
offered share options under the Company’s ESOS.
The Board is mindful of the requirement under the Code for the
disclosure of details of the remuneration of each Director. The
Company complies with the disclosure requirements under the
Main Market Listing Requirements of Bursa Securities i.e. disclosure
of Directors’ Remuneration by applicable bands of RM50,000. The
Board is of the view that the transparency and accountability
aspects of Corporate Governance as applicable to Directors’
Remuneration are appropriately served by the above band
disclosure.
IOI
Cor
por
atio
n B
erh
ad
98
Statement on Corporate Governance
PRINCIPLE 3: REINFORCE INDEPENDENCE
The Board should have policies and procedures to ensure
effectiveness of Independent Directors.
Annual Review of Directors’ Independence
The Nominating Committee reviews the independence of Directors
annually according to the criteria on independence set out in the
Main Market Listing Requirements and Practice Notes of Bursa
Securities on independence.
In addition to the annual review by the Nominating Committee of
the Directors’ independence, each Independent Non-Executive
Director also submits an annual declaration regarding his
independence.
All of the Independent Non-Executive Directors are also
independent from the substantial shareholders of the Company,
not being substantial shareholders themselves nor directly
associated with any substantial shareholder.
Taking cognisance of the non-separation of the roles of the
Chairman of the Board and the Chief Executive Officer, the
Board has identified Datuk Hj Mohd Khalil b Dato’ Hj Mohd Noor
as the Senior Independent Non-Executive Director of the
Board to whom concerns (of shareholders, management or
others) may be conveyed. The Senior Independent Non-Executive
Director may be contacted at tel: +(603) 8947 8953 and email:
PRINCIPLE 4: FOSTER COMMITMENT
Directors should devote sufficient time to carry out their
responsibilities, regularly update their knowledge and enhance
their skills.
Board Meeting
The Board is satisfied with the level of time commitment by each
of the Directors towards fulfilling their roles on the Board and
Board Committees.
The Board has at least five (5) regularly scheduled meetings
annually, with additional meetings for particular matters convened
as and when necessary. Board meetings bring an independent
judgement to bear on issues of strategies, risks, performance,
resources and standards of conduct.
Nine (9) Board meetings were held during the financial year ended
30 June 2013. The attendance record of each Director since the
last financial year was as follows:
Total Number
of Meetings
Number of
Meetings
Attended
Executive Directors
Tan Sri Dato’ Lee Shin Cheng 9 8
Dato’ Lee Yeow Chor 9 9
Lee Yeow Seng 9 8
Lee Cheng Leang 9 9
Non-Executive Directors
Datuk Hj Mohd Khalil b
Dato’ Hj Mohd Noor9 9
Datuk Karownakaran @
Karunakaran a/l Ramasamy9 8
Quah Poh Keat
(resigned on 13 September 2013)9 9
Lim Tuang Ooi 9 8
Cheah Tek Kuang
(appointed on 22 August 2012)8 8
Supply of Information
All Board members are supplied with information in a timely
manner. Board reports are circulated prior to the Board meetings
to enable the Directors to obtain further information and
explanation, where necessary, before the meetings.
The Board reports include, amongst others, periodical financial
and corporate information, significant operational, financial and
corporate issues, performance of the various business units and
management proposals that require Board’s approval.
Detailed periodic briefings on industry outlook, company
performance and forward previews (forecasts) are also conducted
for the Directors to ensure that the Board is well informed of the
latest market and industry trends and developments.
Annual Report 2013
IOI
Cor
por
atio
n B
erh
ad
99
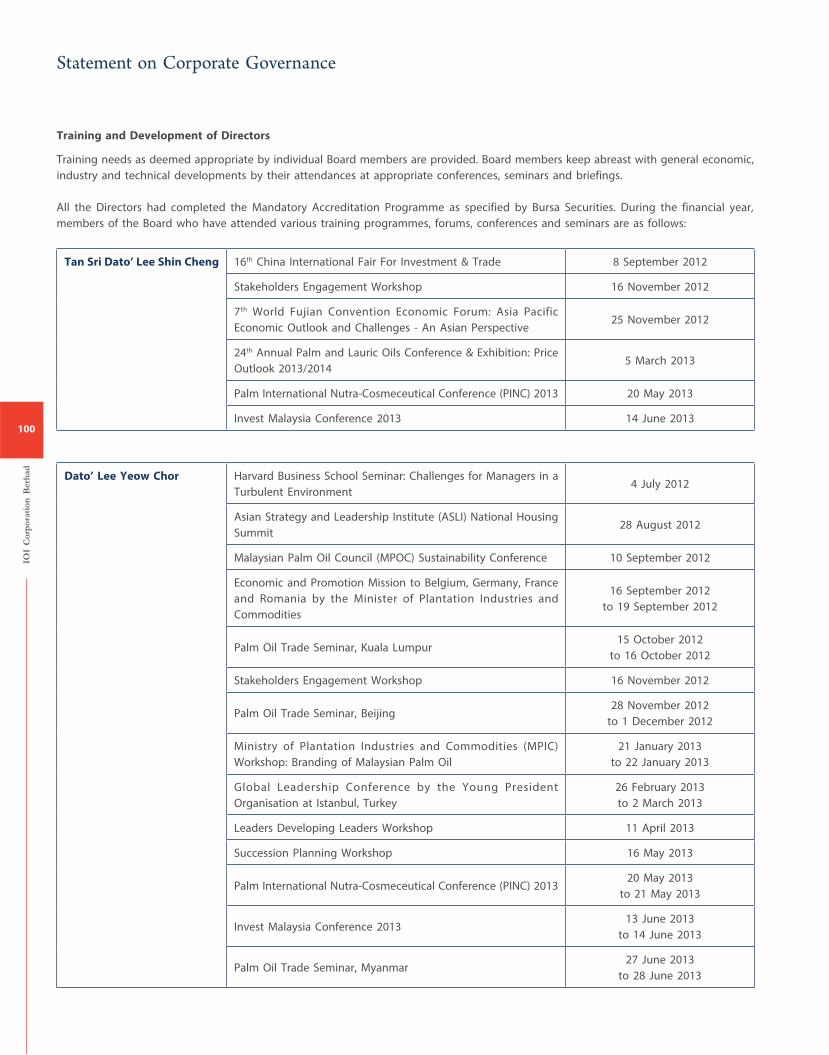
Training and Development of Directors
Training needs as deemed appropriate by individual Board members are provided. Board members keep abreast with general economic,
industry and technical developments by their attendances at appropriate conferences, seminars and briefings.
All the Directors had completed the Mandatory Accreditation Programme as specified by Bursa Securities. During the financial year,
members of the Board who have attended various training programmes, forums, conferences and seminars are as follows:
Tan Sri Dato’ Lee Shin Cheng 16th China International Fair For Investment & Trade 8 September 2012
Stakeholders Engagement Workshop 16 November 2012
7th World Fujian Convention Economic Forum: Asia Pacific
Economic Outlook and Challenges - An Asian Perspective25 November 2012
24th Annual Palm and Lauric Oils Conference & Exhibition: Price
Outlook 2013/20145 March 2013
Palm International Nutra-Cosmeceutical Conference (PINC) 2013 20 May 2013
Invest Malaysia Conference 2013 14 June 2013
Dato’ Lee Yeow Chor Harvard Business School Seminar: Challenges for Managers in a
Turbulent Environment4 July 2012
Asian Strategy and Leadership Institute (ASLI) National Housing
Summit28 August 2012
Malaysian Palm Oil Council (MPOC) Sustainability Conference 10 September 2012
Economic and Promotion Mission to Belgium, Germany, France
and Romania by the Minister of Plantation Industries and
Commodities
16 September 2012
to 19 September 2012
Palm Oil Trade Seminar, Kuala Lumpur15 October 2012
to 16 October 2012
Stakeholders Engagement Workshop 16 November 2012
Palm Oil Trade Seminar, Beijing28 November 2012
to 1 December 2012
Ministry of Plantation Industries and Commodities (MPIC)
Workshop: Branding of Malaysian Palm Oil
21 January 2013
to 22 January 2013
Global Leadership Conference by the Young President
Organisation at Istanbul, Turkey
26 February 2013
to 2 March 2013
Leaders Developing Leaders Workshop 11 April 2013
Succession Planning Workshop 16 May 2013
Palm International Nutra-Cosmeceutical Conference (PINC) 201320 May 2013
to 21 May 2013
Invest Malaysia Conference 201313 June 2013
to 14 June 2013
Palm Oil Trade Seminar, Myanmar27 June 2013
to 28 June 2013
IOI
Cor
por
atio
n B
erh
ad
100
Statement on Corporate Governance
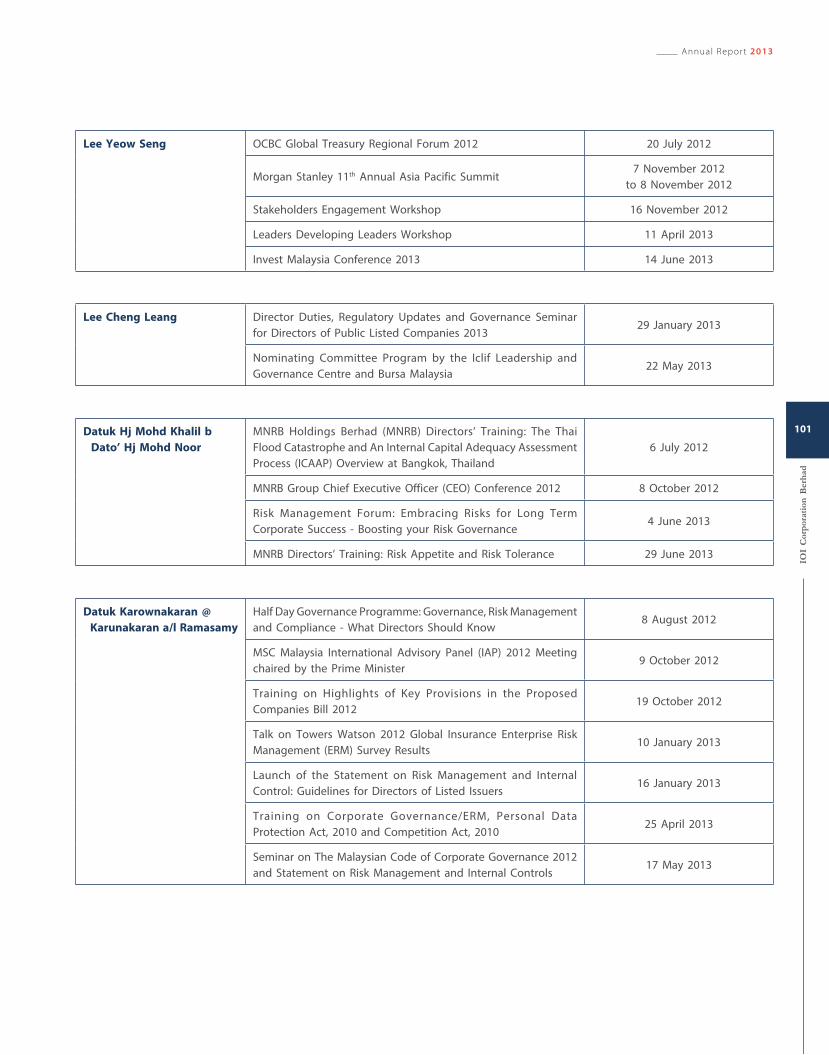
Lee Yeow Seng OCBC Global Treasury Regional Forum 2012 20 July 2012
Morgan Stanley 11th Annual Asia Pacific Summit 7 November 2012
to 8 November 2012
Stakeholders Engagement Workshop 16 November 2012
Leaders Developing Leaders Workshop 11 April 2013
Invest Malaysia Conference 2013 14 June 2013
Lee Cheng Leang Director Duties, Regulatory Updates and Governance Seminar
for Directors of Public Listed Companies 201329 January 2013
Nominating Committee Program by the Iclif Leadership and
Governance Centre and Bursa Malaysia 22 May 2013
Datuk Hj Mohd Khalil b
Dato’ Hj Mohd Noor
MNRB Holdings Berhad (MNRB) Directors’ Training: The Thai
Flood Catastrophe and An Internal Capital Adequacy Assessment
Process (ICAAP) Overview at Bangkok, Thailand
6 July 2012
MNRB Group Chief Executive Officer (CEO) Conference 2012 8 October 2012
Risk Management Forum: Embracing Risks for Long Term
Corporate Success - Boosting your Risk Governance4 June 2013
MNRB Directors’ Training: Risk Appetite and Risk Tolerance 29 June 2013
Datuk Karownakaran @
Karunakaran a/l Ramasamy
Half Day Governance Programme: Governance, Risk Management
and Compliance - What Directors Should Know8 August 2012
MSC Malaysia International Advisory Panel (IAP) 2012 Meeting
chaired by the Prime Minister9 October 2012
Training on Highlights of Key Provisions in the Proposed
Companies Bill 201219 October 2012
Talk on Towers Watson 2012 Global Insurance Enterprise Risk
Management (ERM) Survey Results10 January 2013
Launch of the Statement on Risk Management and Internal
Control: Guidelines for Directors of Listed Issuers16 January 2013
Training on Corporate Governance/ERM, Personal Data
Protection Act, 2010 and Competition Act, 201025 April 2013
Seminar on The Malaysian Code of Corporate Governance 2012
and Statement on Risk Management and Internal Controls17 May 2013
Annual Report 2013
IOI
Cor
por
atio
n B
erh
ad
101
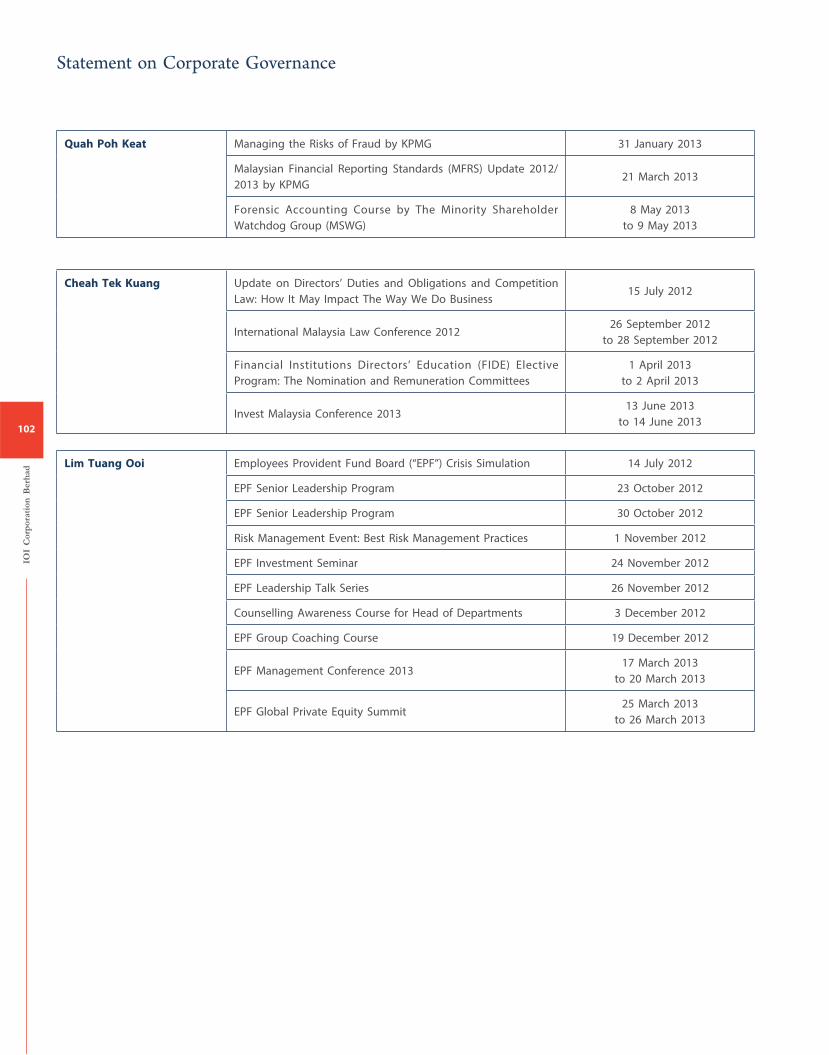
Quah Poh Keat Managing the Risks of Fraud by KPMG 31 January 2013
Malaysian Financial Reporting Standards (MFRS) Update 2012/
2013 by KPMG21 March 2013
Forensic Accounting Course by The Minority Shareholder
Watchdog Group (MSWG)
8 May 2013
to 9 May 2013
Cheah Tek Kuang Update on Directors’ Duties and Obligations and Competition
Law: How It May Impact The Way We Do Business15 July 2012
International Malaysia Law Conference 201226 September 2012
to 28 September 2012
Financial Institutions Directors’ Education (FIDE) Elective
Program: The Nomination and Remuneration Committees
1 April 2013
to 2 April 2013
Invest Malaysia Conference 201313 June 2013
to 14 June 2013
Lim Tuang Ooi Employees Provident Fund Board (“EPF”) Crisis Simulation 14 July 2012
EPF Senior Leadership Program 23 October 2012
EPF Senior Leadership Program 30 October 2012
Risk Management Event: Best Risk Management Practices 1 November 2012
EPF Investment Seminar 24 November 2012
EPF Leadership Talk Series 26 November 2012
Counselling Awareness Course for Head of Departments 3 December 2012
EPF Group Coaching Course 19 December 2012
EPF Management Conference 201317 March 2013
to 20 March 2013
EPF Global Private Equity Summit25 March 2013
to 26 March 2013
IOI
Cor
por
atio
n B
erh
ad
102
Statement on Corporate Governance
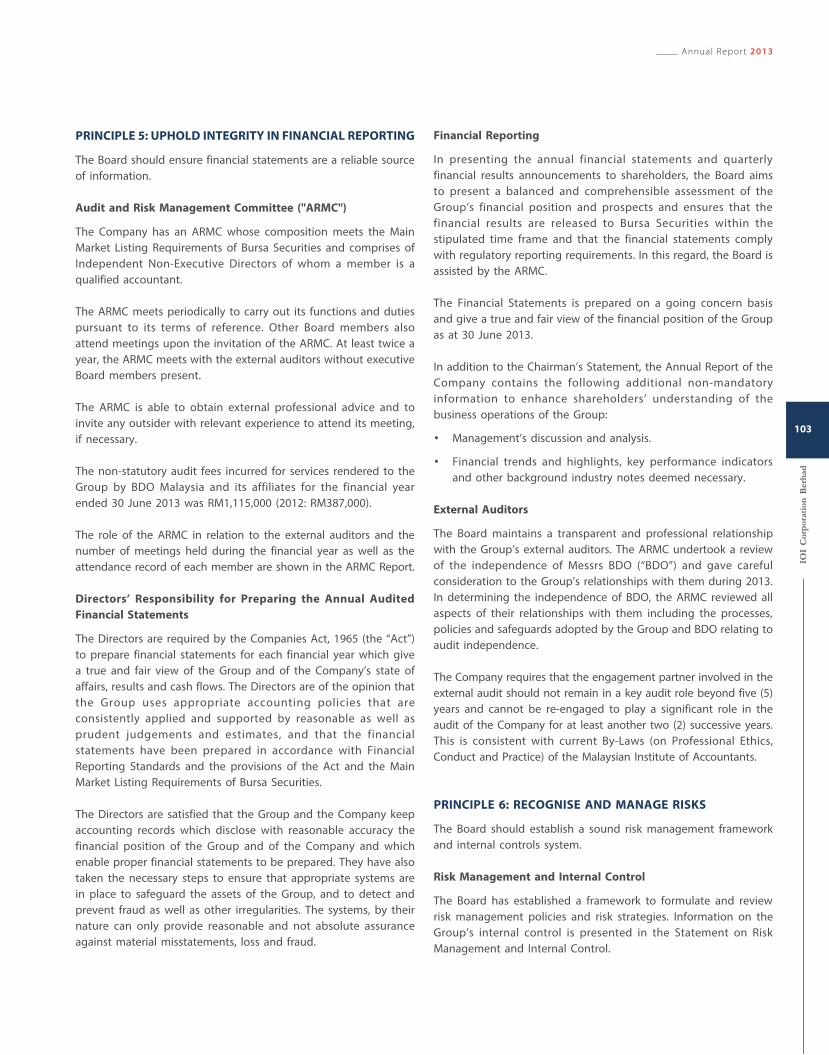
PRINCIPLE 5: UPHOLD INTEGRITY IN FINANCIAL REPORTING
The Board should ensure financial statements are a reliable source
of information.
Audit and Risk Management Committee ("ARMC")
The Company has an ARMC whose composition meets the Main
Market Listing Requirements of Bursa Securities and comprises of
Independent Non-Executive Directors of whom a member is a
qualified accountant.
The ARMC meets periodically to carry out its functions and duties
pursuant to its terms of reference. Other Board members also
attend meetings upon the invitation of the ARMC. At least twice a
year, the ARMC meets with the external auditors without executive
Board members present.
The ARMC is able to obtain external professional advice and to
invite any outsider with relevant experience to attend its meeting,
if necessary.
The non-statutory audit fees incurred for services rendered to the
Group by BDO Malaysia and its affiliates for the financial year
ended 30 June 2013 was RM1,115,000 (2012: RM387,000).
The role of the ARMC in relation to the external auditors and the
number of meetings held during the financial year as well as the
attendance record of each member are shown in the ARMC Report.
Directors’ Responsibility for Preparing the Annual Audited
Financial Statements
The Directors are required by the Companies Act, 1965 (the “Act”)
to prepare financial statements for each financial year which give
a true and fair view of the Group and of the Company’s state of
affairs, results and cash flows. The Directors are of the opinion that
the Group uses appropriate accounting policies that are
consistently applied and supported by reasonable as well as
prudent judgements and estimates, and that the financial
statements have been prepared in accordance with Financial
Reporting Standards and the provisions of the Act and the Main
Market Listing Requirements of Bursa Securities.
The Directors are satisfied that the Group and the Company keep
accounting records which disclose with reasonable accuracy the
financial position of the Group and of the Company and which
enable proper financial statements to be prepared. They have also
taken the necessary steps to ensure that appropriate systems are
in place to safeguard the assets of the Group, and to detect and
prevent fraud as well as other irregularities. The systems, by their
nature can only provide reasonable and not absolute assurance
against material misstatements, loss and fraud.
Financial Reporting
In presenting the annual financial statements and quarterly
financial results announcements to shareholders, the Board aims
to present a balanced and comprehensible assessment of the
Group’s financial position and prospects and ensures that the
financial results are released to Bursa Securities within the
stipulated time frame and that the financial statements comply
with regulatory reporting requirements. In this regard, the Board is
assisted by the ARMC.
The Financial Statements is prepared on a going concern basis
and give a true and fair view of the financial position of the Group
as at 30 June 2013.
In addition to the Chairman’s Statement, the Annual Report of the
Company contains the following additional non-mandatory
information to enhance shareholders’ understanding of the
business operations of the Group:
• Management’s discussion and analysis.
• Financial trends and highlights, key performance indicators
and other background industry notes deemed necessary.
External Auditors
The Board maintains a transparent and professional relationship
with the Group’s external auditors. The ARMC undertook a review
of the independence of Messrs BDO (“BDO”) and gave careful
consideration to the Group’s relationships with them during 2013.
In determining the independence of BDO, the ARMC reviewed all
aspects of their relationships with them including the processes,
policies and safeguards adopted by the Group and BDO relating to
audit independence.
The Company requires that the engagement partner involved in the
external audit should not remain in a key audit role beyond five (5)
years and cannot be re-engaged to play a significant role in the
audit of the Company for at least another two (2) successive years.
This is consistent with current By-Laws (on Professional Ethics,
Conduct and Practice) of the Malaysian Institute of Accountants.
PRINCIPLE 6: RECOGNISE AND MANAGE RISKS
The Board should establish a sound risk management framework
and internal controls system.
Risk Management and Internal Control
The Board has established a framework to formulate and review
risk management policies and risk strategies. Information on the
Group’s internal control is presented in the Statement on Risk
Management and Internal Control.
Annual Report 2013
IOI
Cor
por
atio
n B
erh
ad
103
Internal Audit Function
The Group’s internal audit function is carried out by the Internal
Audit (“IA”) Department, which reports directly to the ARMC on its
activities based on the approved annual Internal Audit Plan.
The appointment, resignation and dismissal of the Head of IA is
reviewed and approved by the ARMC. The ARMC also provides
input on the annual performance appraisal of the Head of IA. The
Head of IA has unfettered access to the ARMC, the Board and
Management. The Head of IA and a number of internal auditors of
the IA Department are members of The Institute of Internal
Auditors Malaysia.
PRINCIPLE 7: ENSURE TIMELY AND HIGH QUALITY
DISCLOSURE
Companies should establish corporate disclosure policies and
procedures to ensure comprehensive, accurate and timely
disclosure.
Timely and High Quality Disclosure
The Board reviews and approves all quarterly and other important
announcements. The Company announces its quarterly and full-
year results within the mandatory period. The financial statements
and, where necessary other presentation materials presented at
the Company’s general meetings, including material and price-
sensitive information, are disseminated and publicly released via
BURSA LINK on a timely basis to ensure effective dissemination of
information relating to the Group.
To ensure that communications to the public regarding IOI Group
are timely, factual, accurate, and complete, we have put in place a
Media Disclosure Policy which outlines the central principles and
practices in communicating with the media.
This Media Disclosure Policy is applicable to all Directors, those
authorised to speak on IOI Group’s behalf as well as all the employees
of IOI. It covers Media Guidelines comprising media protocols to
engage with the media in a responsible, productive, and positive
manner whilst keeping the integrity of IOI Group in mind.
PRINCIPLE 8: STRENGTHEN RELATIONSHIP BETWEEN
COMPANY AND SHAREHOLDERS
The Board should facilitate the exercise of ownership rights by
shareholders.
Annual General Meeting and Other Communications with
Shareholders
All shareholders of the Company receive the annual report of the
Company and the notice of AGM, which notice is also advertised
in the press and released via BURSA LINK. The chairmen of the
ARMC, Nominating Committee and Remuneration Committee and
the external auditors were present at the last AGM, and will
endeavour to be present at the 2013 AGM to assist the Directors
in addressing queries raised by the shareholders. Historically, the
Company’s AGMs have been well attended. It has always been the
practice for the Chairman to provide ample time for the Q&A
sessions in the AGMs and for suggestions and comments by
shareholders to be noted by management for consideration.
The Company provides for separate resolutions at general meetings
on each substantial issue. Pursuant to the Articles of Association of
the Company, all resolutions put to the vote at a general meeting
of the Company shall be decided on a show of hands unless before
or upon the declaration of the result, a poll is demanded as follows:
(i) by the Chairman of the meeting; or
(ii) by not less than two (2) members present in person or by
proxy and entitled to vote at the meeting; or
(iii) by a member or members present in person or by proxy and
representing not less than 10% of the total voting rights of
all members having the right to vote at the meeting; or
(iv) by a member or members present in person or by proxy and
representing not less that 10% of the total number of paid-
up shares of the Company (excluding treasury shares).
Pursuant to Paragraph 10.08(7A), Chapter 10 of the Main Market
Listing Requirements of Bursa Securities, the Chairman of the Meeting
will be exercising his rights under Article 55 of the Company’s
Articles of Association for resolution approving related party
transactions at the general meetings and at any adjournment thereof
to be put to the vote by way of poll.
IOI
Cor
por
atio
n B
erh
ad
104
Statement on Corporate Governance
Dialogue Between the Company and Investors
The Company strives to maintain an open and transparent channel
of communication with its stakeholders, institutional investors and
the investing public at large with the objective of providing as
clear and complete picture of the Group’s performance and
financial position as possible. The Company believes that a
constructive and effective investor relationship is an essential
factor in enhancing value for its shareholders. However, whilst the
Company endeavours to provide as much information as possible
to its shareholders and stakeholders, it is mindful of the legal and
regulatory framework governing the release of material and price-
sensitive information.
The Company uses the following key investor relation activities in
its interaction with investors:
• Meeting with analysts and institutional fund managers;
• Participating in roadshows and investors conferences, both
domestically and internationally; and
• Participating in teleconferences with investors and analysts.
The Group has also established several websites with the main
one being www.ioigroup.com for shareholders and the public to
access corporate information, financial statements, news and
events related to the Group on a timely basis. Material facts and
presentation materials given out at above functions are made
available on the Group’s website to provide equal opportunity of
access for other shareholders and the investing public and to
allow them to write in to the Group if they have questions.
During the financial year, the Group had approximately 40
meetings with analysts and investors. The Group enjoys a relatively
high level of coverage and exposure to the investment community.
Besides the above, management believes that the Company’s
Annual Report is a vital and convenient source of essential
information for existing and potential investors and other
stakeholders. Accordingly, the Company strives to provide a high
level of reporting and transparency that goes beyond mandatory
requirements in order to provide value for users.
Annual Report 2013
IOI
Cor
por
atio
n B
erh
ad
105
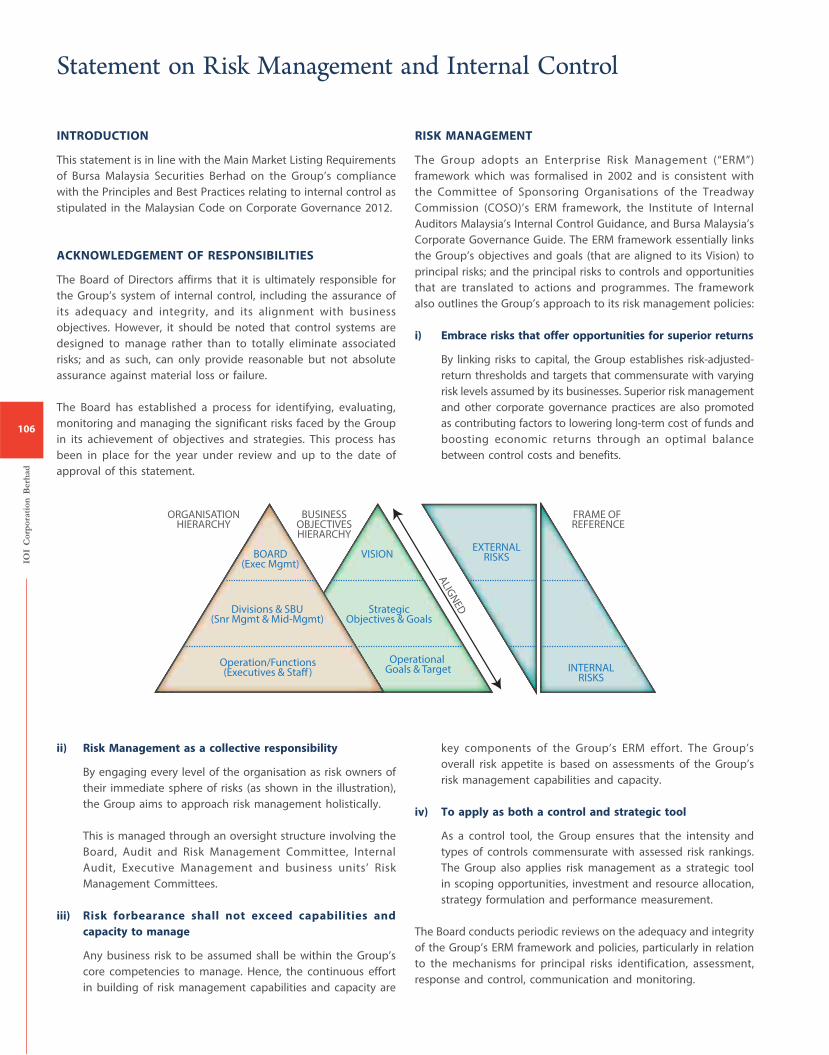
ORGANISATIONHIERARCHY
BOARD(Exec Mgmt)
VISION
ALIG
NED
EXTERNALRISKS
INTERNALRISKS
Divisions & SBU(Snr Mgmt & Mid-Mgmt)
StrategicObjectives & Goals
Operational Goals & Target
Operation/Functions(Executives & Staff)
BUSINESSOBJECTIVESHIERARCHY
ALIG
NED
FRAME OF REFERENCE
INTRODUCTION
This statement is in line with the Main Market Listing Requirements
of Bursa Malaysia Securities Berhad on the Group’s compliance
with the Principles and Best Practices relating to internal control as
stipulated in the Malaysian Code on Corporate Governance 2012.
ACKNOWLEDGEMENT OF RESPONSIBILITIES
The Board of Directors affirms that it is ultimately responsible for
the Group’s system of internal control, including the assurance of
its adequacy and integrity, and its alignment with business
objectives. However, it should be noted that control systems are
designed to manage rather than to totally eliminate associated
risks; and as such, can only provide reasonable but not absolute
assurance against material loss or failure.
The Board has established a process for identifying, evaluating,
monitoring and managing the significant risks faced by the Group
in its achievement of objectives and strategies. This process has
been in place for the year under review and up to the date of
approval of this statement.
RISK MANAGEMENT
The Group adopts an Enterprise Risk Management (“ERM”)
framework which was formalised in 2002 and is consistent with
the Committee of Sponsoring Organisations of the Treadway
Commission (COSO)’s ERM framework, the Institute of Internal
Auditors Malaysia’s Internal Control Guidance, and Bursa Malaysia’s
Corporate Governance Guide. The ERM framework essentially links
the Group’s objectives and goals (that are aligned to its Vision) to
principal risks; and the principal risks to controls and opportunities
that are translated to actions and programmes. The framework
also outlines the Group’s approach to its risk management policies:
i) Embrace risks that offer opportunities for superior returns
By linking risks to capital, the Group establishes risk-adjusted-
return thresholds and targets that commensurate with varying
risk levels assumed by its businesses. Superior risk management
and other corporate governance practices are also promoted
as contributing factors to lowering long-term cost of funds and
boosting economic returns through an optimal balance
between control costs and benefits.
ii) Risk Management as a collective responsibility
By engaging every level of the organisation as risk owners of
their immediate sphere of risks (as shown in the illustration),
the Group aims to approach risk management holistically.
This is managed through an oversight structure involving the
Board, Audit and Risk Management Committee, Internal
Audit, Executive Management and business units’ Risk
Management Committees.
iii) Risk forbearance shall not exceed capabilities and
capacity to manage
Any business risk to be assumed shall be within the Group’s
core competencies to manage. Hence, the continuous effort
in building of risk management capabilities and capacity are
key components of the Group’s ERM effort. The Group’s
overall risk appetite is based on assessments of the Group’s
risk management capabilities and capacity.
iv) To apply as both a control and strategic tool
As a control tool, the Group ensures that the intensity and
types of controls commensurate with assessed risk rankings.
The Group also applies risk management as a strategic tool
in scoping opportunities, investment and resource allocation,
strategy formulation and performance measurement.
The Board conducts periodic reviews on the adequacy and integrity
of the Group’s ERM framework and policies, particularly in relation
to the mechanisms for principal risks identification, assessment,
response and control, communication and monitoring.
IOI
Cor
por
atio
n B
erh
ad
106
Statement on Risk Management and Internal Control
The Group’s activities expose it to a variety of risks, including
operating and financial risks. The Group’s overall risk management
objective is to ensure that the Group creates value for its
shareholders whilst minimising potential adverse effects on its
performance and positions. The Group operates within an
established risk management framework and clearly defined
policies and guidelines that are approved by the Board.
Under the Group’s ERM framework, the Group has relevant policies
and guidelines on risk reporting and disclosure which cover the
following principal risks:
I) OPERATING RISK
• The Group’s policy is to assume operating risks that are
within its core businesses and competencies to manage.
Operating risk management ranges from managing
strategic operating risks to managing diverse day-to-day
operational risks.
• The management of the Group’s day-to-day operational
risks (such as those relating to health and safety, quality,
production, marketing and distribution, and statutory
compliance) is mainly decentralised at the business unit
level and guided by approved standard operating
procedures. Operational risks that cut across the
organisation (such as those relating to supply chain,
environmental sustainability, integrated systems, transfer
pricing and reputation) are coordinated centrally.
II) FINANCIAL RISK
• The Group is exposed to various financial risks relating to
credit, liquidity, interest rates, foreign currency exchange
rates, and commodity prices. The Group’s risk management
objectives and policies coupled with the required
quantitative and qualitative disclosures relating to its
financial risks are set out in Note 45 to the financial
statements on pages 219 to 248.
CONTROL ENVIRONMENT
• The Group’s corporate culture is embedded in its core values
of integrity, commitment, loyalty, excellence in execution,
speed or timeliness, innovativeness and cost efficiency – to
achieve the Group’s vision and support the business objectives,
risk management and internal control system.
• The Code of Business Conduct and Ethics reinforces the
Group’s core value on integrity by providing guidance on
moral and ethical behaviour that is expected from all employees
in following the laws, policies, standards and procedures.
• Board committees such as the Audit and Risk Management
Committee, Nominating Committee and Remuneration
Committee are established by the Board of Directors, and they
are governed by clearly defined terms of reference and
authority for areas within their scope.
• The Group has an organisational structure that is aligned with
its business and operational requirements, with clearly defined
lines of responsibility and authority levels.
CONTROL ACTIVITIES
• Policies and procedures have been established for key business
processes and support functions. The Group has in place a
system to ensure that there are adequate risk management,
financial and operational policies, procedures and rules relating
to the delegation and segregation of duties.
• Annual business plans and operating budgets are prepared by
business and operating units, and are approved by the Board.
Actual performance and significant variances against budget
are monitored on an ongoing basis.
INFORMATION AND COMMUNICATION PROCESSES
• Management and the Board receive timely, relevant and
reliable management and financial reports which are reviewed
on a regular basis.
• The Group has in place a Management Information System
that captures, compiles, analyses and reports relevant data,
which enables management to make business decisions in an
accurate and timely manner.
• A whistleblowing policy is established to provide appropriate
communication and feedback channels which facilitate
whistleblowing, in a transparent and confidential manner. It
outlines the Group’s commitment to encourage its employees
and stakeholders to raise genuine concerns about possible
improprieties in matters of financial reporting, compliance,
suspected violations of the Group’s Code of Business Conduct
and Ethics, and to disclose any improper conduct or other
malpractices within the Group (i.e. whistleblowing) in an
appropriate way.
Annual Report 2013
IOI
Cor
por
atio
n B
erh
ad
107
MONITORING
• The Group’s policies and procedures are reviewed and revised
periodically to meet changing business and operational needs
and regulatory requirements.
• Board meetings are held at least once in a quarter with a
formal agenda on matters for discussion. In addition, regular
management and operation meetings are conducted by senior
management which comprises Executive Directors and
divisional heads.
• The Group’s Internal Audit function reports to the Audit and
Risk Management Committee and is guided by an Internal
Audit Charter that is approved by the Board of Directors. The
Internal Audit function monitors compliance with the Group’s
policies and procedures and applicable laws and regulations,
and provides independent assurance on the adequacy and
effectiveness of risk management and internal control system
by conducting regular audits and continuous assessment.
Significant audit f indings and recommendations for
improvement are highlighted to senior management and the
Audit and Risk Management Committee, with periodic follow-
up reviews of the implementation of corrective action plans.
REVIEW FOR THE FINANCIAL YEAR
A review on the adequacy and effectiveness of the risk management
and internal control system has been undertaken for the financial
year under review. Each business unit, cutting across all geographic
areas, via its respective Risk Management Committees and
workgroups comprising personnel at all levels carried out the
following areas of work:
• Conducted reviews and updates of risk profiles including
emerging risks and re-rated principal risks.
• Evaluated the adequacy of key processes, systems, and
internal controls in relation to the rated principal risks, and
established strategic responses, actionable programmes and
tasks to manage the aforementioned and/or eliminate
performance gaps.
• Ensured internal audit programmes covered identified principal
risks. Audit findings throughout the financial period served as
key feedback to validate effectiveness of risk management
activities and embedded internal controls.
• Reviewed implementation progress of previously outlined
actionable programmes, and evaluated post-implementation
effectiveness.
• Reviewed the adequacy of all business resumption and
contingency plans, and their readiness for rapid deployment.
The review includes the following:
• Regular internal audit reports and periodic discussions with the
Audit and Risk Management Committee.
• Bi-annual risk reviews compiled by the respective units’ Risk
Management Committees, and annual presentation to and
discussion with the Audit and Risk Management Committee,
the Board, internal auditors, and external auditors.
• Operating units’ CEO/CFO’s Internal Control Certification and
Assessment disclosure.
• Operating units’ response to the Questionnaire on Control and
Regulations.
REVIEW OF THIS STATEMENT BY EXTERNAL AUDITORS
The external auditors (“BDO”) have reviewed this Statement on
Risk Management and Internal Control for inclusion in the Annual
Report of the Group for the financial year ended 30 June 2013.
Their review was conducted in accordance with Recommended
Practice Guide (“RPG”) 5, Guidance for Auditors on the Review of
Directors’ Statement on Internal Control, issued by the Malaysian
Institute of Accountants (“MIA”). RPG 5 does not require the
external auditors to, and they did not, consider whether this
Statement covers all risks and controls, or to form an opinion on
the effectiveness of the Group’s risk and control procedures. RPG
5 also does not require the external auditors to consider whether
the processes described to deal with material internal control
aspects of any significant problems disclosed in the annual report
will, in fact, remedy the problems.
Based on their review, the external auditors have reported to the
Board that nothing has come to their attention that causes them
to believe that the Statement on Risk Management and Internal
Control is inconsistent with their understanding of the process the
Board has adopted in the review of the adequacy and effectiveness
of the Group’s risk management and internal control system.
CONCLUSION
The Board is satisfied with the adequacy and effectiveness of the
Group’s risk management and internal control system. The Board
has received assurance from the Group Chief Executive Officer
and Senior Group Financial Controller that the Group’s risk
management and internal control system, in all material aspects, is
operating adequately and effectively. For the financial year under
review, there were no material control failures or adverse compliance
events that have directly resulted in any material loss to the Group.
This Statement on Risk Management and Internal Control is made
in accordance with the resolution of the Board of Directors dated
3 September 2013.
IOI
Cor
por
atio
n B
erh
ad
108
Statement on Risk Management and Internal Control
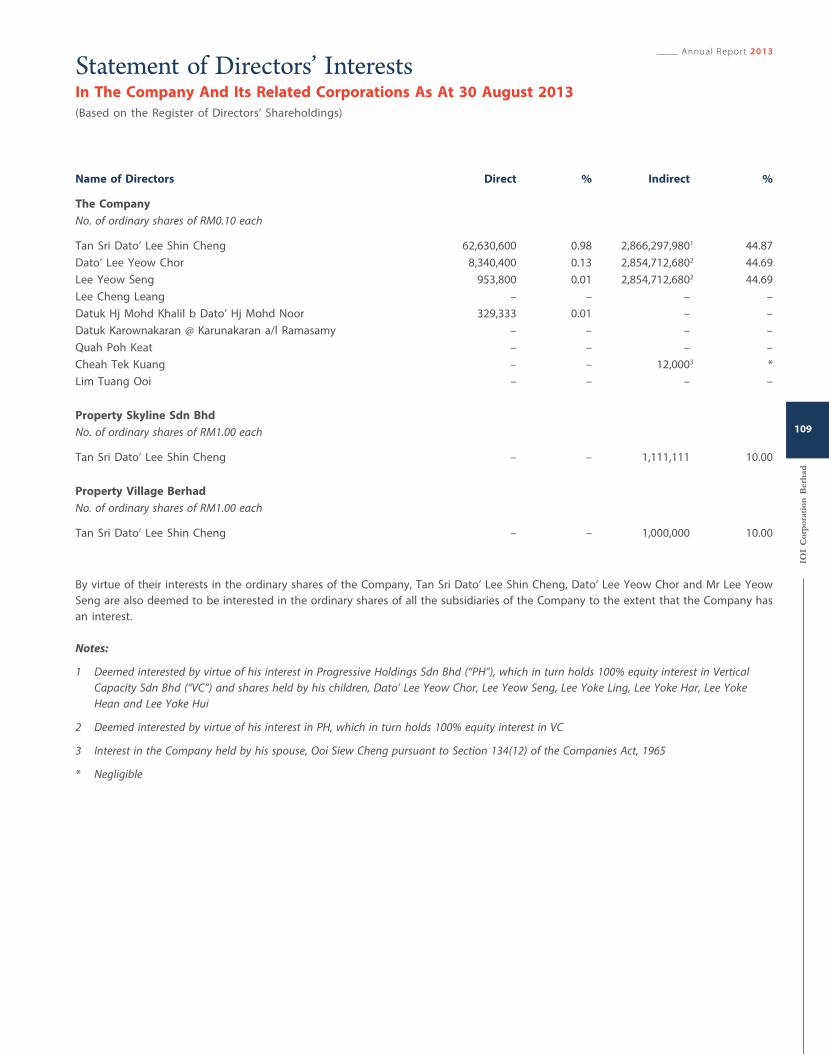
In The Company And Its Related Corporations As At 30 August 2013
(Based on the Register of Directors’ Shareholdings)
Name of Directors Direct % Indirect %
The Company
No. of ordinary shares of RM0.10 each
Tan Sri Dato’ Lee Shin Cheng 62,630,600 0.98 2,866,297,9801 44.87
Dato’ Lee Yeow Chor 8,340,400 0.13 2,854,712,6802 44.69
Lee Yeow Seng 953,800 0.01 2,854,712,6802 44.69
Lee Cheng Leang – – – –
Datuk Hj Mohd Khalil b Dato’ Hj Mohd Noor 329,333 0.01 – –
Datuk Karownakaran @ Karunakaran a/l Ramasamy – – – –
Quah Poh Keat – – – –
Cheah Tek Kuang – – 12,0003 *
Lim Tuang Ooi – – – –
Property Skyline Sdn Bhd
No. of ordinary shares of RM1.00 each
Tan Sri Dato’ Lee Shin Cheng – – 1,111,111 10.00
Property Village Berhad
No. of ordinary shares of RM1.00 each
Tan Sri Dato’ Lee Shin Cheng – – 1,000,000 10.00
By virtue of their interests in the ordinary shares of the Company, Tan Sri Dato’ Lee Shin Cheng, Dato’ Lee Yeow Chor and Mr Lee Yeow
Seng are also deemed to be interested in the ordinary shares of all the subsidiaries of the Company to the extent that the Company has
an interest.
Notes:
1 Deemed interested by virtue of his interest in Progressive Holdings Sdn Bhd (“PH”), which in turn holds 100% equity interest in Vertical
Capacity Sdn Bhd (“VC”) and shares held by his children, Dato’ Lee Yeow Chor, Lee Yeow Seng, Lee Yoke Ling, Lee Yoke Har, Lee Yoke
Hean and Lee Yoke Hui
2 Deemed interested by virtue of his interest in PH, which in turn holds 100% equity interest in VC
3 Interest in the Company held by his spouse, Ooi Siew Cheng pursuant to Section 134(12) of the Companies Act, 1965
* Negligible
Annual Report 2013
IOI
Cor
por
atio
n B
erh
ad
109
Statement of Directors’ Interests
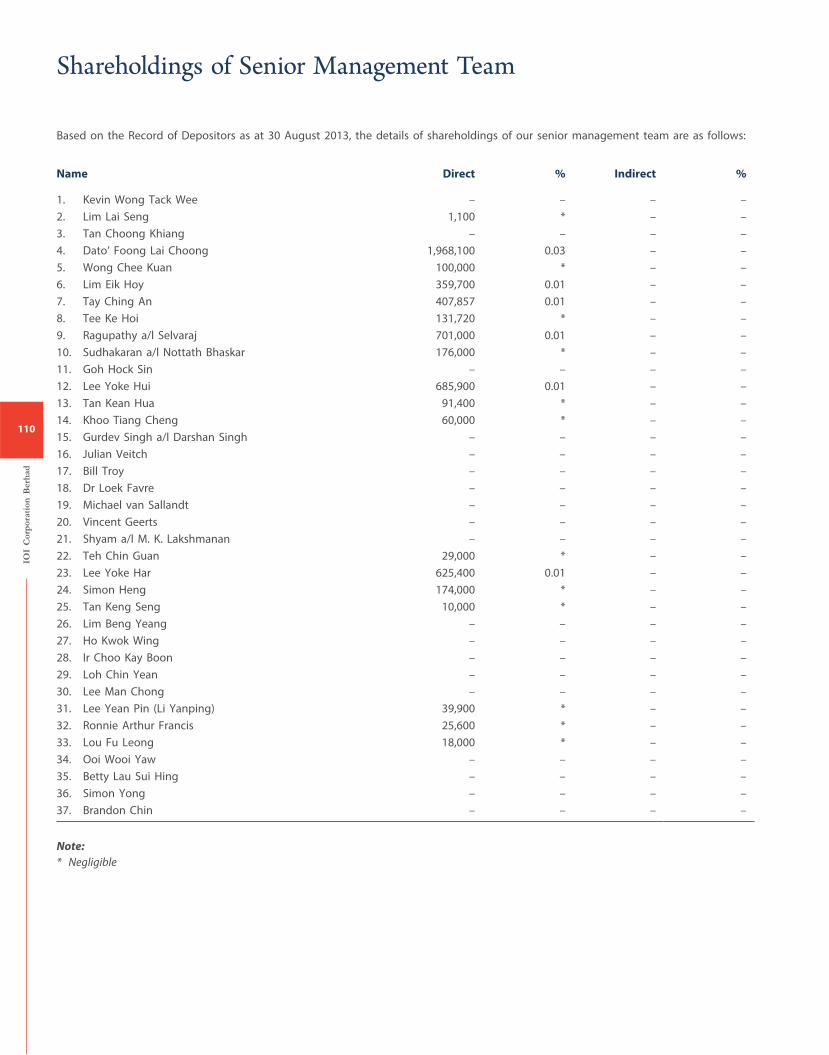
Based on the Record of Depositors as at 30 August 2013, the details of shareholdings of our senior management team are as follows:
Name Direct % Indirect %
1. Kevin Wong Tack Wee – – – –
2. Lim Lai Seng 1,100 * – –
3. Tan Choong Khiang – – – –
4. Dato’ Foong Lai Choong 1,968,100 0.03 – –
5. Wong Chee Kuan 100,000 * – –
6. Lim Eik Hoy 359,700 0.01 – –
7. Tay Ching An 407,857 0.01 – –
8. Tee Ke Hoi 131,720 * – –
9. Ragupathy a/l Selvaraj 701,000 0.01 – –
10. Sudhakaran a/l Nottath Bhaskar 176,000 * – –
11. Goh Hock Sin – – – –
12. Lee Yoke Hui 685,900 0.01 – –
13. Tan Kean Hua 91,400 * – –
14. Khoo Tiang Cheng 60,000 * – –
15. Gurdev Singh a/l Darshan Singh – – – –
16. Julian Veitch – – – –
17. Bill Troy – – – –
18. Dr Loek Favre – – – –
19. Michael van Sallandt – – – –
20. Vincent Geerts – – – –
21. Shyam a/l M. K. Lakshmanan – – – –
22. Teh Chin Guan 29,000 * – –
23. Lee Yoke Har 625,400 0.01 – –
24. Simon Heng 174,000 * – –
25. Tan Keng Seng 10,000 * – –
26. Lim Beng Yeang – – – –
27. Ho Kwok Wing – – – –
28. Ir Choo Kay Boon – – – –
29. Loh Chin Yean – – – –
30. Lee Man Chong – – – –
31. Lee Yean Pin (Li Yanping) 39,900 * – –
32. Ronnie Arthur Francis 25,600 * – –
33. Lou Fu Leong 18,000 * – –
34. Ooi Wooi Yaw – – – –
35. Betty Lau Sui Hing – – – –
36. Simon Yong – – – –
37. Brandon Chin – – – –
Note:* Negligible
IOI
Cor
por
atio
n B
erh
ad
110
Shareholdings of Senior Management Team
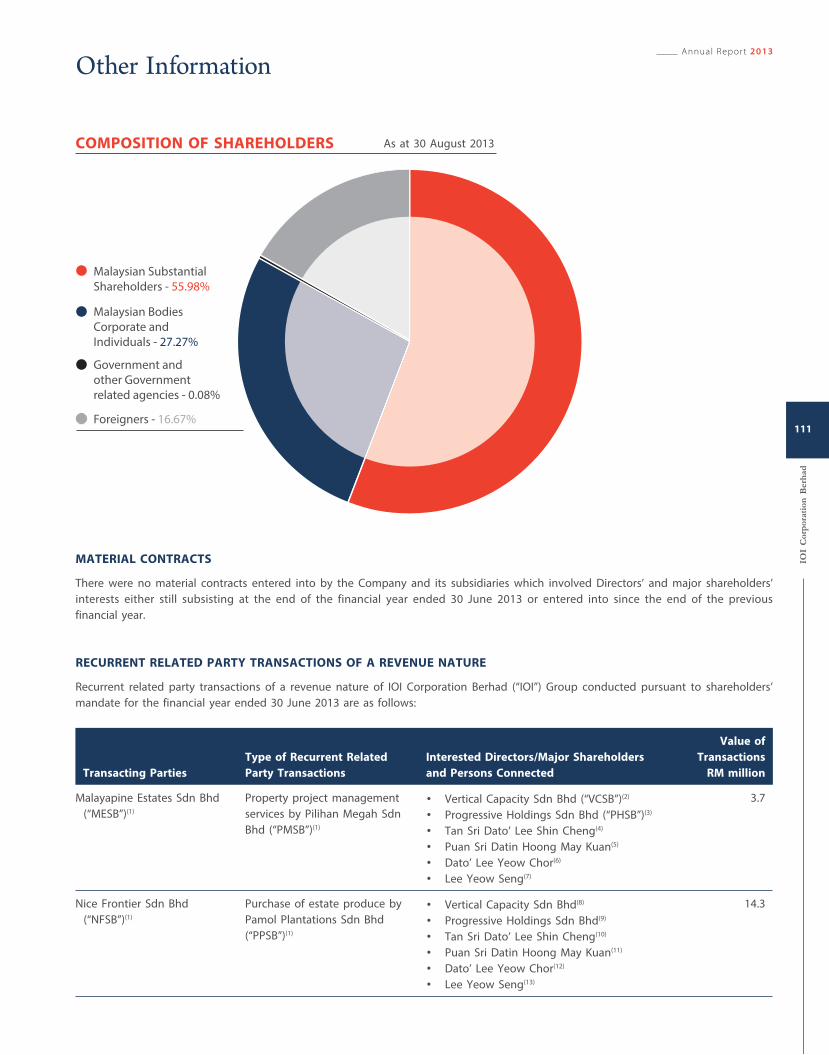
As at 30 August 2013COMPOSITION OF SHAREHOLDERS
MATERIAL CONTRACTS
There were no material contracts entered into by the Company and its subsidiaries which involved Directors’ and major shareholders’
interests either still subsisting at the end of the financial year ended 30 June 2013 or entered into since the end of the previous
financial year.
RECURRENT RELATED PARTY TRANSACTIONS OF A REVENUE NATURE
Recurrent related party transactions of a revenue nature of IOI Corporation Berhad (“IOI”) Group conducted pursuant to shareholders’
mandate for the financial year ended 30 June 2013 are as follows:
Transacting Parties
Type of Recurrent Related
Party Transactions
Interested Directors/Major Shareholders
and Persons Connected
Value of
Transactions
RM million
Malayapine Estates Sdn Bhd
(“MESB”)(1)
Property project management
services by Pilihan Megah Sdn
Bhd (“PMSB”)(1)
• Vertical Capacity Sdn Bhd (“VCSB”)(2)
• Progressive Holdings Sdn Bhd (“PHSB”)(3)
• Tan Sri Dato’ Lee Shin Cheng(4)
• Puan Sri Datin Hoong May Kuan(5)
• Dato’ Lee Yeow Chor(6)
• Lee Yeow Seng(7)
3.7
Nice Frontier Sdn Bhd
(“NFSB”)(1)
Purchase of estate produce by
Pamol Plantations Sdn Bhd
(“PPSB”)(1)
• Vertical Capacity Sdn Bhd(8)
• Progressive Holdings Sdn Bhd(9)
• Tan Sri Dato’ Lee Shin Cheng(10)
• Puan Sri Datin Hoong May Kuan(11)
• Dato’ Lee Yeow Chor(12)
• Lee Yeow Seng(13)
14.3
Other Information
Malaysian Substantial
Shareholders - 55.98%
Malaysian Bodies
Corporate and
Individuals - 27.27%
Government and
other Government
related agencies - 0.08%
Foreigners - 16.67%
Annual Report 2013
IOI
Cor
por
atio
n B
erh
ad
111
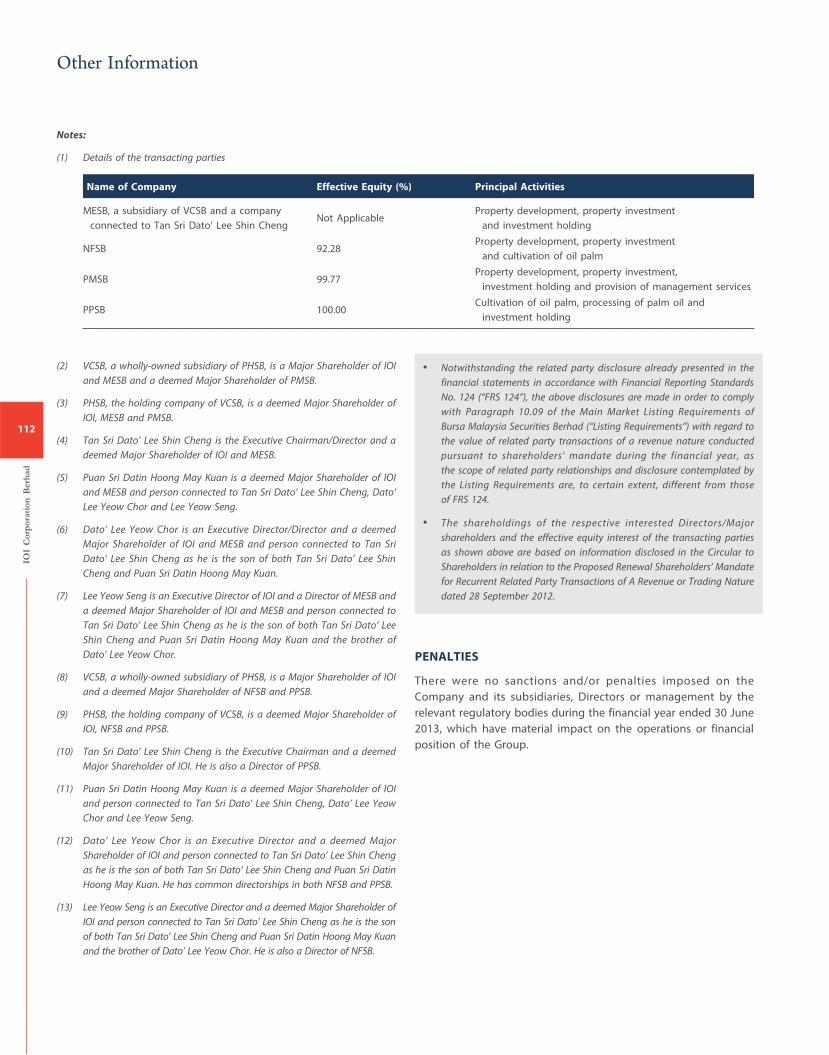
Notes:
(1) Details of the transacting parties
Name of Company Effective Equity (%) Principal Activities
MESB, a subsidiary of VCSB and a company
connected to Tan Sri Dato’ Lee Shin ChengNot Applicable
Property development, property investment
and investment holding
NFSB 92.28Property development, property investment
and cultivation of oil palm
PMSB 99.77Property development, property investment,
investment holding and provision of management services
PPSB 100.00Cultivation of oil palm, processing of palm oil and
investment holding
• Notwithstanding the related party disclosure already presented in the
financial statements in accordance with Financial Reporting Standards
No. 124 (“FRS 124”), the above disclosures are made in order to comply
with Paragraph 10.09 of the Main Market Listing Requirements of
Bursa Malaysia Securities Berhad (“Listing Requirements”) with regard to
the value of related party transactions of a revenue nature conducted
pursuant to shareholders’ mandate during the financial year, as
the scope of related party relationships and disclosure contemplated by
the Listing Requirements are, to certain extent, different from those
of FRS 124.
• The shareholdings of the respective interested Directors/Major
shareholders and the effective equity interest of the transacting parties
as shown above are based on information disclosed in the Circular to
Shareholders in relation to the Proposed Renewal Shareholders’ Mandate
for Recurrent Related Party Transactions of A Revenue or Trading Nature
dated 28 September 2012.
PENALTIES
There were no sanctions and/or penalties imposed on the
Company and its subsidiaries, Directors or management by the
relevant regulatory bodies during the financial year ended 30 June
2013, which have material impact on the operations or financial
position of the Group.
(2) VCSB, a wholly-owned subsidiary of PHSB, is a Major Shareholder of IOI
and MESB and a deemed Major Shareholder of PMSB.
(3) PHSB, the holding company of VCSB, is a deemed Major Shareholder of
IOI, MESB and PMSB.
(4) Tan Sri Dato’ Lee Shin Cheng is the Executive Chairman/Director and a
deemed Major Shareholder of IOI and MESB.
(5) Puan Sri Datin Hoong May Kuan is a deemed Major Shareholder of IOI
and MESB and person connected to Tan Sri Dato’ Lee Shin Cheng, Dato’
Lee Yeow Chor and Lee Yeow Seng.
(6) Dato’ Lee Yeow Chor is an Executive Director/Director and a deemed
Major Shareholder of IOI and MESB and person connected to Tan Sri
Dato’ Lee Shin Cheng as he is the son of both Tan Sri Dato’ Lee Shin
Cheng and Puan Sri Datin Hoong May Kuan.
(7) Lee Yeow Seng is an Executive Director of IOI and a Director of MESB and
a deemed Major Shareholder of IOI and MESB and person connected to
Tan Sri Dato’ Lee Shin Cheng as he is the son of both Tan Sri Dato’ Lee
Shin Cheng and Puan Sri Datin Hoong May Kuan and the brother of
Dato’ Lee Yeow Chor.
(8) VCSB, a wholly-owned subsidiary of PHSB, is a Major Shareholder of IOI
and a deemed Major Shareholder of NFSB and PPSB.
(9) PHSB, the holding company of VCSB, is a deemed Major Shareholder of
IOI, NFSB and PPSB.
(10) Tan Sri Dato’ Lee Shin Cheng is the Executive Chairman and a deemed
Major Shareholder of IOI. He is also a Director of PPSB.
(11) Puan Sri Datin Hoong May Kuan is a deemed Major Shareholder of IOI
and person connected to Tan Sri Dato’ Lee Shin Cheng, Dato’ Lee Yeow
Chor and Lee Yeow Seng.
(12) Dato’ Lee Yeow Chor is an Executive Director and a deemed Major
Shareholder of IOI and person connected to Tan Sri Dato’ Lee Shin Cheng
as he is the son of both Tan Sri Dato’ Lee Shin Cheng and Puan Sri Datin
Hoong May Kuan. He has common directorships in both NFSB and PPSB.
(13) Lee Yeow Seng is an Executive Director and a deemed Major Shareholder of
IOI and person connected to Tan Sri Dato’ Lee Shin Cheng as he is the son
of both Tan Sri Dato’ Lee Shin Cheng and Puan Sri Datin Hoong May Kuan
and the brother of Dato’ Lee Yeow Chor. He is also a Director of NFSB.
IOI
Cor
por
atio
n B
erh
ad
112
Other Information

114 Directors’ Report
financial statements124 Statements of Profit or Loss
126 Statements of Other Comprehensive Income
127 Statements of Financial Position
129 Statements of Changes in Equity
132 Statements of Cash Flows
135 Notes to the Financial Statements
271 Statement by Directors
271 Statutory Declaration
272 Independent Auditors’ Report
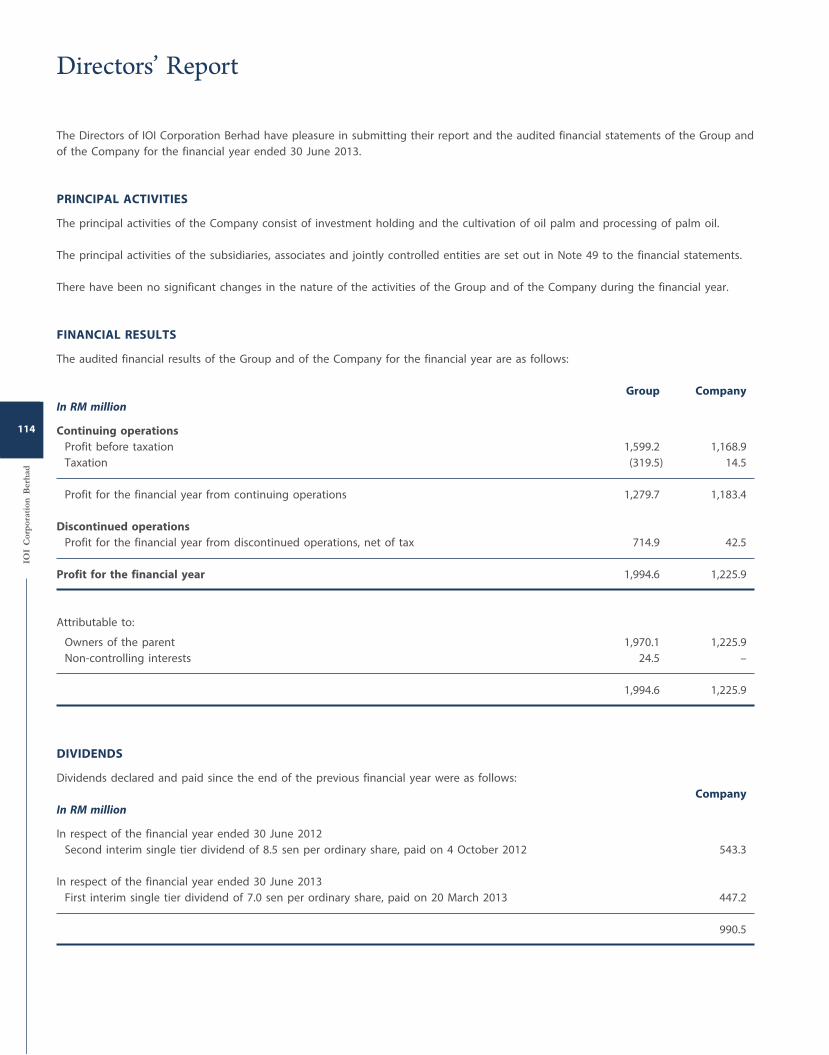
114
The Directors of IOI Corporation Berhad have pleasure in submitting their report and the audited financial statements of the Group and
of the Company for the financial year ended 30 June 2013.
PRINCIPAL ACTIVITIES
The principal activities of the Company consist of investment holding and the cultivation of oil palm and processing of palm oil.
The principal activities of the subsidiaries, associates and jointly controlled entities are set out in Note 49 to the financial statements.
There have been no significant changes in the nature of the activities of the Group and of the Company during the financial year.
FINANCIAL RESULTS
The audited financial results of the Group and of the Company for the financial year are as follows:
Group Company
In RM million
Continuing operations
Profit before taxation 1,599.2 1,168.9
Taxation (319.5) 14.5
Profit for the financial year from continuing operations 1,279.7 1,183.4
Discontinued operations
Profit for the financial year from discontinued operations, net of tax 714.9 42.5
Profit for the financial year 1,994.6 1,225.9
Attributable to:
Owners of the parent 1,970.1 1,225.9
Non-controlling interests 24.5 –
1,994.6 1,225.9
DIVIDENDS
Dividends declared and paid since the end of the previous financial year were as follows:
Company
In RM million
In respect of the financial year ended 30 June 2012
Second interim single tier dividend of 8.5 sen per ordinary share, paid on 4 October 2012 543.3
In respect of the financial year ended 30 June 2013
First interim single tier dividend of 7.0 sen per ordinary share, paid on 20 March 2013 447.2
990.5
IOI
Cor
por
atio
n B
erh
ad
114
Directors’ Report
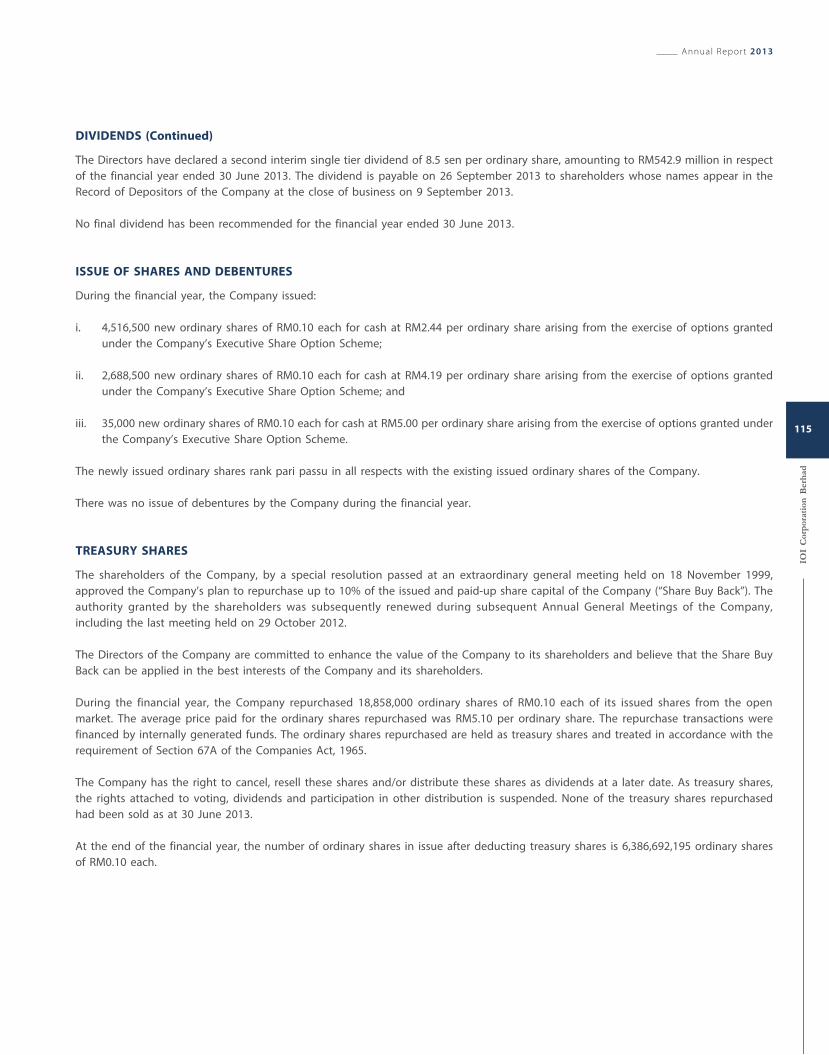
DIVIDENDS (Continued)
The Directors have declared a second interim single tier dividend of 8.5 sen per ordinary share, amounting to RM542.9 million in respect
of the financial year ended 30 June 2013. The dividend is payable on 26 September 2013 to shareholders whose names appear in the
Record of Depositors of the Company at the close of business on 9 September 2013.
No final dividend has been recommended for the financial year ended 30 June 2013.
ISSUE OF SHARES AND DEBENTURES
During the financial year, the Company issued:
i. 4,516,500 new ordinary shares of RM0.10 each for cash at RM2.44 per ordinary share arising from the exercise of options granted
under the Company’s Executive Share Option Scheme;
ii. 2,688,500 new ordinary shares of RM0.10 each for cash at RM4.19 per ordinary share arising from the exercise of options granted
under the Company’s Executive Share Option Scheme; and
iii. 35,000 new ordinary shares of RM0.10 each for cash at RM5.00 per ordinary share arising from the exercise of options granted under
the Company’s Executive Share Option Scheme.
The newly issued ordinary shares rank pari passu in all respects with the existing issued ordinary shares of the Company.
There was no issue of debentures by the Company during the financial year.
TREASURY SHARES
The shareholders of the Company, by a special resolution passed at an extraordinary general meeting held on 18 November 1999,
approved the Company’s plan to repurchase up to 10% of the issued and paid-up share capital of the Company (“Share Buy Back”). The
authority granted by the shareholders was subsequently renewed during subsequent Annual General Meetings of the Company,
including the last meeting held on 29 October 2012.
The Directors of the Company are committed to enhance the value of the Company to its shareholders and believe that the Share Buy
Back can be applied in the best interests of the Company and its shareholders.
During the financial year, the Company repurchased 18,858,000 ordinary shares of RM0.10 each of its issued shares from the open
market. The average price paid for the ordinary shares repurchased was RM5.10 per ordinary share. The repurchase transactions were
financed by internally generated funds. The ordinary shares repurchased are held as treasury shares and treated in accordance with the
requirement of Section 67A of the Companies Act, 1965.
The Company has the right to cancel, resell these shares and/or distribute these shares as dividends at a later date. As treasury shares,
the rights attached to voting, dividends and participation in other distribution is suspended. None of the treasury shares repurchased
had been sold as at 30 June 2013.
At the end of the financial year, the number of ordinary shares in issue after deducting treasury shares is 6,386,692,195 ordinary shares
of RM0.10 each.
Annual Report 2013
IOI
Cor
por
atio
n B
erh
ad
115
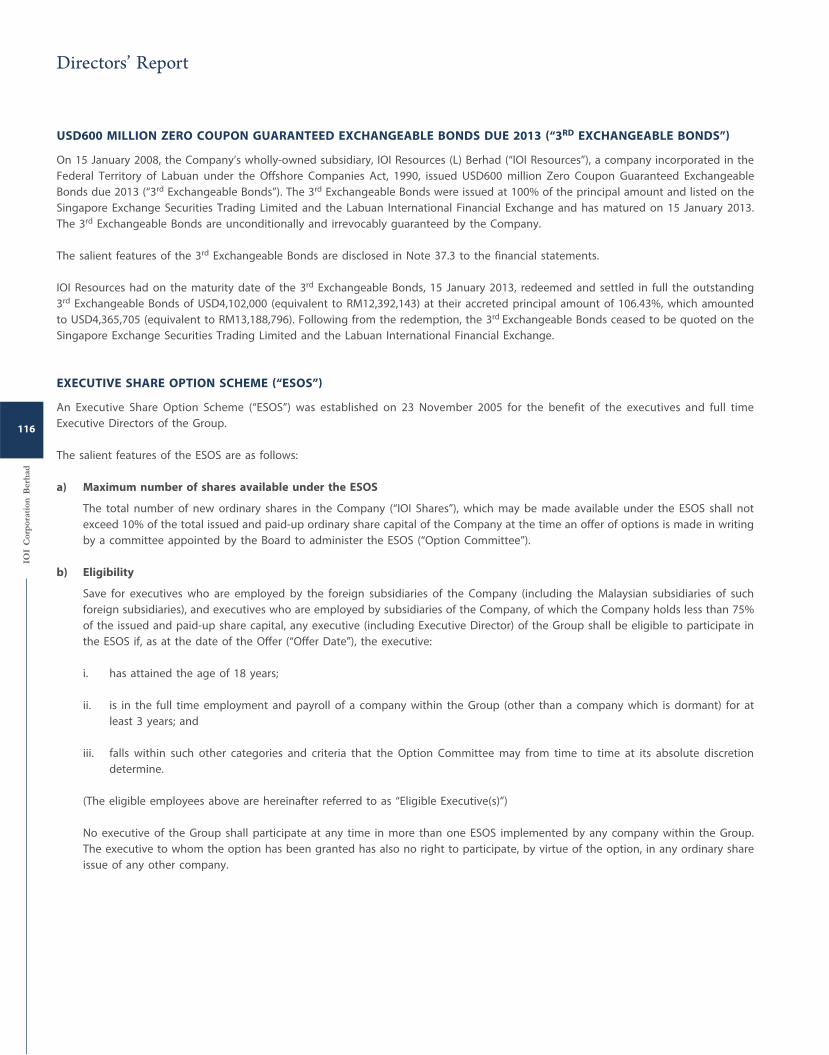
USD600 MILLION ZERO COUPON GUARANTEED EXCHANGEABLE BONDS DUE 2013 (“3RD EXCHANGEABLE BONDS”)
On 15 January 2008, the Company’s wholly-owned subsidiary, IOI Resources (L) Berhad (“IOI Resources”), a company incorporated in the
Federal Territory of Labuan under the Offshore Companies Act, 1990, issued USD600 million Zero Coupon Guaranteed Exchangeable
Bonds due 2013 (“3rd Exchangeable Bonds”). The 3rd Exchangeable Bonds were issued at 100% of the principal amount and listed on the
Singapore Exchange Securities Trading Limited and the Labuan International Financial Exchange and has matured on 15 January 2013.
The 3rd Exchangeable Bonds are unconditionally and irrevocably guaranteed by the Company.
The salient features of the 3rd Exchangeable Bonds are disclosed in Note 37.3 to the financial statements.
IOI Resources had on the maturity date of the 3rd Exchangeable Bonds, 15 January 2013, redeemed and settled in full the outstanding
3rd Exchangeable Bonds of USD4,102,000 (equivalent to RM12,392,143) at their accreted principal amount of 106.43%, which amounted
to USD4,365,705 (equivalent to RM13,188,796). Following from the redemption, the 3rd Exchangeable Bonds ceased to be quoted on the
Singapore Exchange Securities Trading Limited and the Labuan International Financial Exchange.
EXECUTIVE SHARE OPTION SCHEME (“ESOS”)
An Executive Share Option Scheme (“ESOS”) was established on 23 November 2005 for the benefit of the executives and full time
Executive Directors of the Group.
The salient features of the ESOS are as follows:
a) Maximum number of shares available under the ESOS
The total number of new ordinary shares in the Company (“IOI Shares”), which may be made available under the ESOS shall not
exceed 10% of the total issued and paid-up ordinary share capital of the Company at the time an offer of options is made in writing
by a committee appointed by the Board to administer the ESOS (“Option Committee”).
b) Eligibility
Save for executives who are employed by the foreign subsidiaries of the Company (including the Malaysian subsidiaries of such
foreign subsidiaries), and executives who are employed by subsidiaries of the Company, of which the Company holds less than 75%
of the issued and paid-up share capital, any executive (including Executive Director) of the Group shall be eligible to participate in
the ESOS if, as at the date of the Offer (“Offer Date”), the executive:
i. has attained the age of 18 years;
ii. is in the full time employment and payroll of a company within the Group (other than a company which is dormant) for at
least 3 years; and
iii. falls within such other categories and criteria that the Option Committee may from time to time at its absolute discretion
determine.
(The eligible employees above are hereinafter referred to as “Eligible Executive(s)”)
No executive of the Group shall participate at any time in more than one ESOS implemented by any company within the Group.
The executive to whom the option has been granted has also no right to participate, by virtue of the option, in any ordinary share
issue of any other company.
IOI
Cor
por
atio
n B
erh
ad
116
Directors’ Report
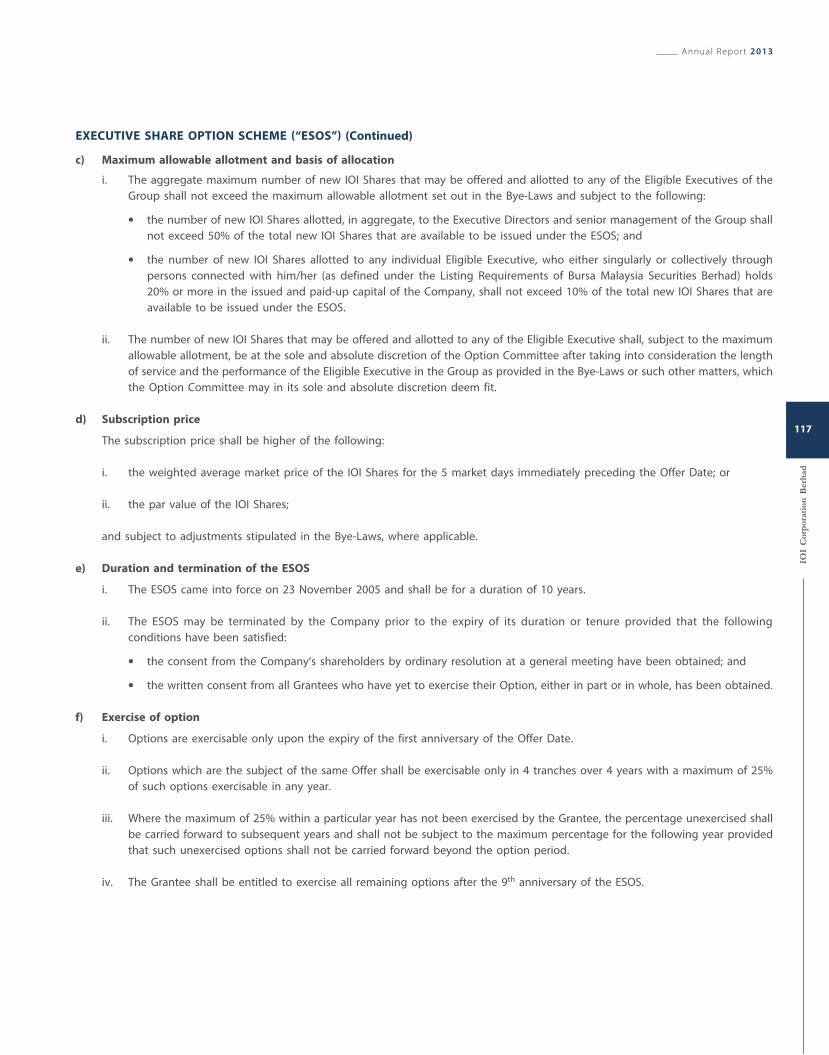
EXECUTIVE SHARE OPTION SCHEME (“ESOS”) (Continued)
c) Maximum allowable allotment and basis of allocation
i. The aggregate maximum number of new IOI Shares that may be offered and allotted to any of the Eligible Executives of the
Group shall not exceed the maximum allowable allotment set out in the Bye-Laws and subject to the following:
the number of new IOI Shares allotted, in aggregate, to the Executive Directors and senior management of the Group shall
not exceed 50% of the total new IOI Shares that are available to be issued under the ESOS; and
the number of new IOI Shares allotted to any individual Eligible Executive, who either singularly or collectively through
persons connected with him/her (as defined under the Listing Requirements of Bursa Malaysia Securities Berhad) holds
20% or more in the issued and paid-up capital of the Company, shall not exceed 10% of the total new IOI Shares that are
available to be issued under the ESOS.
ii. The number of new IOI Shares that may be offered and allotted to any of the Eligible Executive shall, subject to the maximum
allowable allotment, be at the sole and absolute discretion of the Option Committee after taking into consideration the length
of service and the performance of the Eligible Executive in the Group as provided in the Bye-Laws or such other matters, which
the Option Committee may in its sole and absolute discretion deem fit.
d) Subscription price
The subscription price shall be higher of the following:
i. the weighted average market price of the IOI Shares for the 5 market days immediately preceding the Offer Date; or
ii. the par value of the IOI Shares;
and subject to adjustments stipulated in the Bye-Laws, where applicable.
e) Duration and termination of the ESOS
i. The ESOS came into force on 23 November 2005 and shall be for a duration of 10 years.
ii. The ESOS may be terminated by the Company prior to the expiry of its duration or tenure provided that the following
conditions have been satisfied:
the consent from the Company’s shareholders by ordinary resolution at a general meeting have been obtained; and
the written consent from all Grantees who have yet to exercise their Option, either in part or in whole, has been obtained.
f) Exercise of option
i. Options are exercisable only upon the expiry of the first anniversary of the Offer Date.
ii. Options which are the subject of the same Offer shall be exercisable only in 4 tranches over 4 years with a maximum of 25%
of such options exercisable in any year.
iii. Where the maximum of 25% within a particular year has not been exercised by the Grantee, the percentage unexercised shall
be carried forward to subsequent years and shall not be subject to the maximum percentage for the following year provided
that such unexercised options shall not be carried forward beyond the option period.
iv. The Grantee shall be entitled to exercise all remaining options after the 9th anniversary of the ESOS.
Annual Report 2013
IOI
Cor
por
atio
n B
erh
ad
117
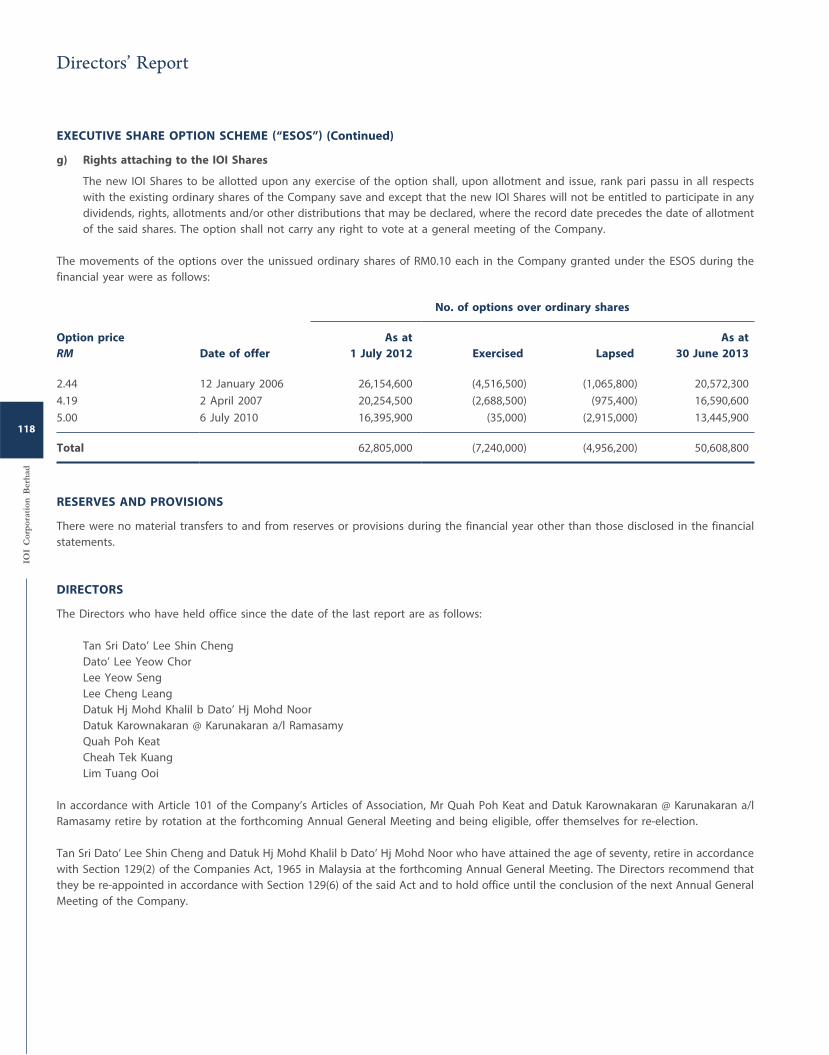
EXECUTIVE SHARE OPTION SCHEME (“ESOS”) (Continued)
g) Rights attaching to the IOI Shares
The new IOI Shares to be allotted upon any exercise of the option shall, upon allotment and issue, rank pari passu in all respects
with the existing ordinary shares of the Company save and except that the new IOI Shares will not be entitled to participate in any
dividends, rights, allotments and/or other distributions that may be declared, where the record date precedes the date of allotment
of the said shares. The option shall not carry any right to vote at a general meeting of the Company.
The movements of the options over the unissued ordinary shares of RM0.10 each in the Company granted under the ESOS during the
financial year were as follows:
No. of options over ordinary shares
Option price
RM Date of offer
As at
1 July 2012 Exercised Lapsed
As at
30 June 2013
2.44 12 January 2006 26,154,600 (4,516,500) (1,065,800) 20,572,300
4.19 2 April 2007 20,254,500 (2,688,500) (975,400) 16,590,600
5.00 6 July 2010 16,395,900 (35,000) (2,915,000) 13,445,900
Total 62,805,000 (7,240,000) (4,956,200) 50,608,800
RESERVES AND PROVISIONS
There were no material transfers to and from reserves or provisions during the financial year other than those disclosed in the financial
statements.
DIRECTORS
The Directors who have held office since the date of the last report are as follows:
Tan Sri Dato’ Lee Shin Cheng
Dato’ Lee Yeow Chor
Lee Yeow Seng
Lee Cheng Leang
Datuk Hj Mohd Khalil b Dato’ Hj Mohd Noor
Datuk Karownakaran @ Karunakaran a/l Ramasamy
Quah Poh Keat
Cheah Tek Kuang
Lim Tuang Ooi
In accordance with Article 101 of the Company’s Articles of Association, Mr Quah Poh Keat and Datuk Karownakaran @ Karunakaran a/l
Ramasamy retire by rotation at the forthcoming Annual General Meeting and being eligible, offer themselves for re-election.
Tan Sri Dato’ Lee Shin Cheng and Datuk Hj Mohd Khalil b Dato’ Hj Mohd Noor who have attained the age of seventy, retire in accordance
with Section 129(2) of the Companies Act, 1965 in Malaysia at the forthcoming Annual General Meeting. The Directors recommend that
they be re-appointed in accordance with Section 129(6) of the said Act and to hold office until the conclusion of the next Annual General
Meeting of the Company.
IOI
Cor
por
atio
n B
erh
ad
118
Directors’ Report
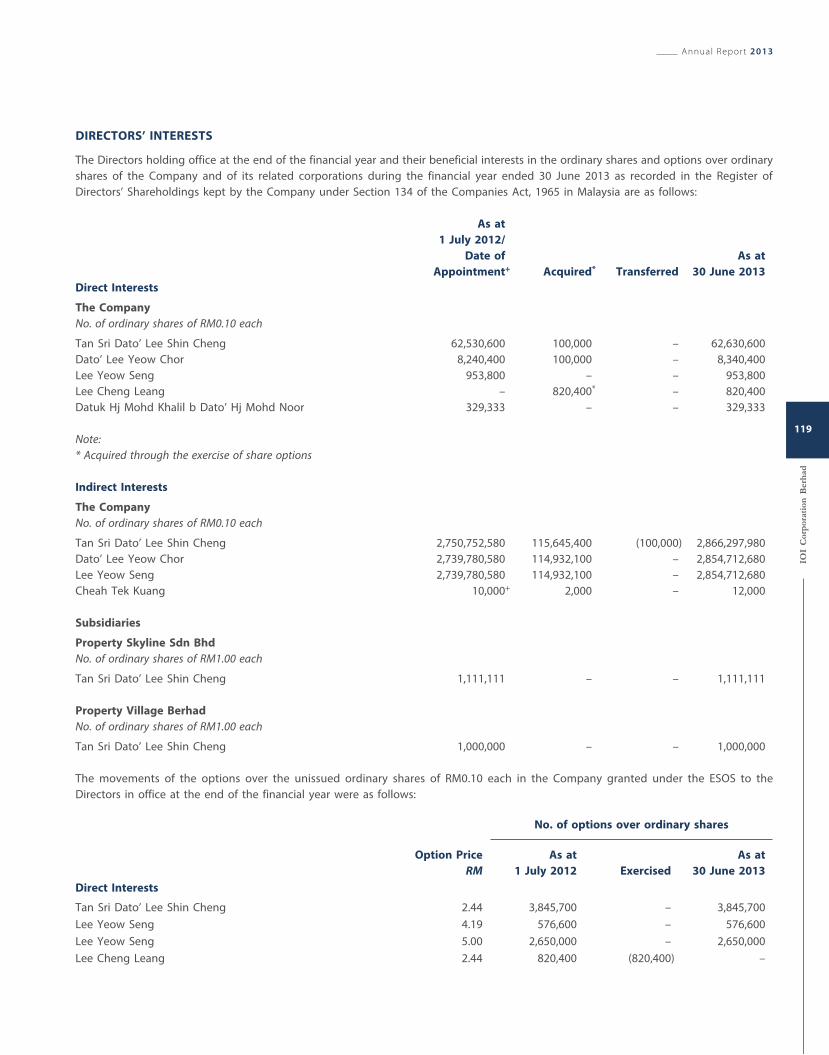
DIRECTORS’ INTERESTS
The Directors holding office at the end of the financial year and their beneficial interests in the ordinary shares and options over ordinary
shares of the Company and of its related corporations during the financial year ended 30 June 2013 as recorded in the Register of
Directors’ Shareholdings kept by the Company under Section 134 of the Companies Act, 1965 in Malaysia are as follows:
As at
1 July 2012/
Date of As at
Appointment+ Acquired* Transferred 30 June 2013
Direct Interests
The Company
No. of ordinary shares of RM0.10 each
Tan Sri Dato’ Lee Shin Cheng 62,530,600 100,000 – 62,630,600
Dato’ Lee Yeow Chor 8,240,400 100,000 – 8,340,400
Lee Yeow Seng 953,800 – – 953,800
Lee Cheng Leang – 820,400* – 820,400
Datuk Hj Mohd Khalil b Dato’ Hj Mohd Noor 329,333 – – 329,333
Note:
* Acquired through the exercise of share options
Indirect Interests
The Company
No. of ordinary shares of RM0.10 each
Tan Sri Dato’ Lee Shin Cheng 2,750,752,580 115,645,400 (100,000) 2,866,297,980
Dato’ Lee Yeow Chor 2,739,780,580 114,932,100 – 2,854,712,680
Lee Yeow Seng 2,739,780,580 114,932,100 – 2,854,712,680
Cheah Tek Kuang 10,000+ 2,000 – 12,000
Subsidiaries
Property Skyline Sdn Bhd
No. of ordinary shares of RM1.00 each
Tan Sri Dato’ Lee Shin Cheng 1,111,111 – – 1,111,111
Property Village Berhad
No. of ordinary shares of RM1.00 each
Tan Sri Dato’ Lee Shin Cheng 1,000,000 – – 1,000,000
The movements of the options over the unissued ordinary shares of RM0.10 each in the Company granted under the ESOS to the
Directors in office at the end of the financial year were as follows:
Option Price
RM
No. of options over ordinary shares
As at
1 July 2012 Exercised
As at
30 June 2013
Direct Interests
Tan Sri Dato’ Lee Shin Cheng 2.44 3,845,700 – 3,845,700
Lee Yeow Seng 4.19 576,600 – 576,600
Lee Yeow Seng 5.00 2,650,000 – 2,650,000
Lee Cheng Leang 2.44 820,400 (820,400) –
Annual Report 2013
IOI
Cor
por
atio
n B
erh
ad
119
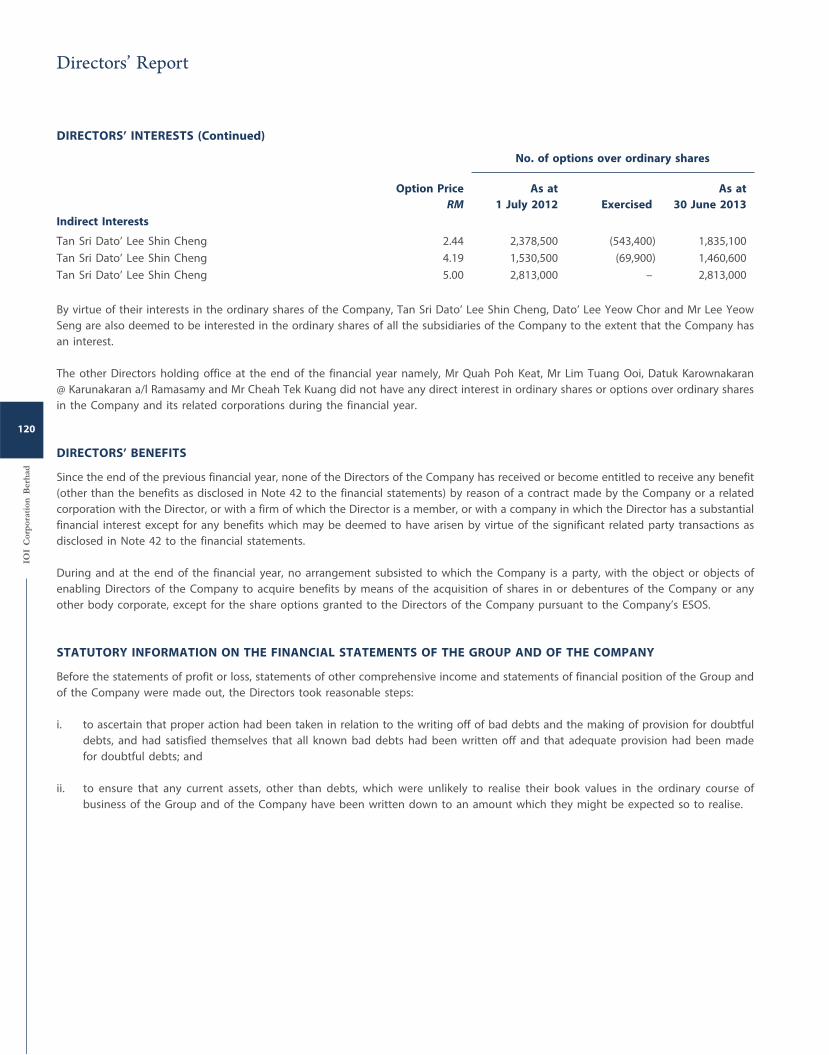
DIRECTORS’ INTERESTS (Continued)
Option Price
RM
No. of options over ordinary shares
As at
1 July 2012 Exercised
As at
30 June 2013
Indirect Interests
Tan Sri Dato’ Lee Shin Cheng 2.44 2,378,500 (543,400) 1,835,100
Tan Sri Dato’ Lee Shin Cheng 4.19 1,530,500 (69,900) 1,460,600
Tan Sri Dato’ Lee Shin Cheng 5.00 2,813,000 – 2,813,000
By virtue of their interests in the ordinary shares of the Company, Tan Sri Dato’ Lee Shin Cheng, Dato’ Lee Yeow Chor and Mr Lee Yeow
Seng are also deemed to be interested in the ordinary shares of all the subsidiaries of the Company to the extent that the Company has
an interest.
The other Directors holding office at the end of the financial year namely, Mr Quah Poh Keat, Mr Lim Tuang Ooi, Datuk Karownakaran
@ Karunakaran a/l Ramasamy and Mr Cheah Tek Kuang did not have any direct interest in ordinary shares or options over ordinary shares
in the Company and its related corporations during the financial year.
DIRECTORS’ BENEFITS
Since the end of the previous financial year, none of the Directors of the Company has received or become entitled to receive any benefit
(other than the benefits as disclosed in Note 42 to the financial statements) by reason of a contract made by the Company or a related
corporation with the Director, or with a firm of which the Director is a member, or with a company in which the Director has a substantial
financial interest except for any benefits which may be deemed to have arisen by virtue of the significant related party transactions as
disclosed in Note 42 to the financial statements.
During and at the end of the financial year, no arrangement subsisted to which the Company is a party, with the object or objects of
enabling Directors of the Company to acquire benefits by means of the acquisition of shares in or debentures of the Company or any
other body corporate, except for the share options granted to the Directors of the Company pursuant to the Company’s ESOS.
STATUTORY INFORMATION ON THE FINANCIAL STATEMENTS OF THE GROUP AND OF THE COMPANY
Before the statements of profit or loss, statements of other comprehensive income and statements of financial position of the Group and
of the Company were made out, the Directors took reasonable steps:
i. to ascertain that proper action had been taken in relation to the writing off of bad debts and the making of provision for doubtful
debts, and had satisfied themselves that all known bad debts had been written off and that adequate provision had been made
for doubtful debts; and
ii. to ensure that any current assets, other than debts, which were unlikely to realise their book values in the ordinary course of
business of the Group and of the Company have been written down to an amount which they might be expected so to realise.
IOI
Cor
por
atio
n B
erh
ad
120
Directors’ Report
STATUTORY INFORMATION ON THE FINANCIAL STATEMENTS OF THE GROUP AND OF THE COMPANY (Continued)
As at the date of this report, the Directors are not aware of any circumstances:
i. which would render the amounts written off for bad debts or the amount of the provision for doubtful debts in the financial
statements of the Group and of the Company inadequate to any substantial extent; or
ii. which would render the values attributed to current assets in the financial statements of the Group and of the Company misleading; or
iii. which have arisen which would render adherence to the existing method of valuation of assets or liabilities of the Group and of
the Company misleading or inappropriate.
As at the date of this report, there does not exist:
i. any charge on the assets of the Group or of the Company that has arisen since the end of the financial year which secures the
liabilities of any other person; or
ii. any contingent liability in respect of the Group or of the Company that has arisen since the end of the financial year.
No contingent or other liability has become enforceable, or is likely to become enforceable within the period of twelve (12) months after
the end of the financial year, which in the opinion of the Directors, will or may substantially affect the ability of the Group or of the
Company to meet their obligations as and when they fall due.
OTHER STATUTORY INFORMATION
As at the date of this report, the Directors are not aware of any circumstances not otherwise dealt with in this report or the financial
statements of the Group and of the Company that would render any amount stated in the financial statements misleading.
In the opinion of the Directors:
i. the results of the operations of the Group and of the Company for the financial year were not substantially affected by any item,
transaction or event of a material and unusual nature; and
ii. no item, transaction or event of a material and unusual nature has arisen in the interval between the end of the financial year and
the date of this report which is likely to affect substantially the results of the operations of the Group and of the Company for the
financial year in which this report is made.
DIFFERENT FINANCIAL YEAR END OF SUBSIDIARIES
Due to local requirements, seven (7) indirect subsidiaries of the Company, Loders Croklaan (Shanghai) Trading Co. Ltd, Tianjin Palmco Oil
And Fats Co. Ltd, Loders Croklaan Latin America Comercio De Gorduras e Oleos Vegetais Ltda, Loders Croklaan Burkina Faso
S. A. R. L, IOI (Xiamen) Edible Oils Co. Ltd, IOI (Xiamen) Properties Co. Ltd and Xiamen Double Prosperous Real Estate Development Co.
Ltd are adopting a 31 December financial year end, which does not coincide with that of the Company. The Directors of the Company
have been granted approvals under Section 168(3) of the Companies Act, 1965 in Malaysia by the Companies Commission of Malaysia for
the aforementioned subsidiaries to have different financial year end from that of the Company for the financial year ended 30 June 2013.
Annual Report 2013
IOI
Cor
por
atio
n B
erh
ad
121
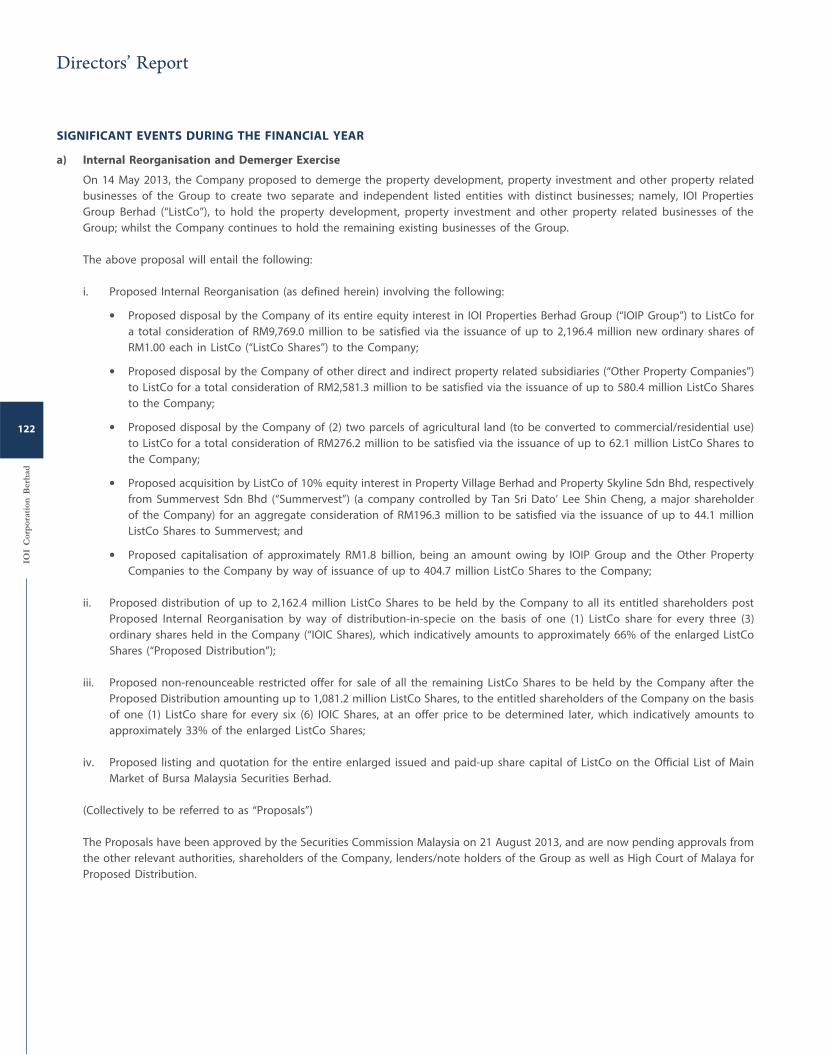
SIGNIFICANT EVENTS DURING THE FINANCIAL YEAR
a) Internal Reorganisation and Demerger Exercise
On 14 May 2013, the Company proposed to demerge the property development, property investment and other property related
businesses of the Group to create two separate and independent listed entities with distinct businesses; namely, IOI Properties
Group Berhad (“ListCo”), to hold the property development, property investment and other property related businesses of the
Group; whilst the Company continues to hold the remaining existing businesses of the Group.
The above proposal will entail the following:
i. Proposed Internal Reorganisation (as defined herein) involving the following:
Proposed disposal by the Company of its entire equity interest in IOI Properties Berhad Group (“IOIP Group”) to ListCo for
a total consideration of RM9,769.0 million to be satisfied via the issuance of up to 2,196.4 million new ordinary shares of
RM1.00 each in ListCo (“ListCo Shares”) to the Company;
Proposed disposal by the Company of other direct and indirect property related subsidiaries (“Other Property Companies”)
to ListCo for a total consideration of RM2,581.3 million to be satisfied via the issuance of up to 580.4 million ListCo Shares
to the Company;
Proposed disposal by the Company of (2) two parcels of agricultural land (to be converted to commercial/residential use)
to ListCo for a total consideration of RM276.2 million to be satisfied via the issuance of up to 62.1 million ListCo Shares to
the Company;
Proposed acquisition by ListCo of 10% equity interest in Property Village Berhad and Property Skyline Sdn Bhd, respectively
from Summervest Sdn Bhd (“Summervest”) (a company controlled by Tan Sri Dato’ Lee Shin Cheng, a major shareholder
of the Company) for an aggregate consideration of RM196.3 million to be satisfied via the issuance of up to 44.1 million
ListCo Shares to Summervest; and
Proposed capitalisation of approximately RM1.8 billion, being an amount owing by IOIP Group and the Other Property
Companies to the Company by way of issuance of up to 404.7 million ListCo Shares to the Company;
ii. Proposed distribution of up to 2,162.4 million ListCo Shares to be held by the Company to all its entitled shareholders post
Proposed Internal Reorganisation by way of distribution-in-specie on the basis of one (1) ListCo share for every three (3)
ordinary shares held in the Company (“IOIC Shares), which indicatively amounts to approximately 66% of the enlarged ListCo
Shares (“Proposed Distribution”);
iii. Proposed non-renounceable restricted offer for sale of all the remaining ListCo Shares to be held by the Company after the
Proposed Distribution amounting up to 1,081.2 million ListCo Shares, to the entitled shareholders of the Company on the basis
of one (1) ListCo share for every six (6) IOIC Shares, at an offer price to be determined later, which indicatively amounts to
approximately 33% of the enlarged ListCo Shares;
iv. Proposed listing and quotation for the entire enlarged issued and paid-up share capital of ListCo on the Official List of Main
Market of Bursa Malaysia Securities Berhad.
(Collectively to be referred to as “Proposals”)
The Proposals have been approved by the Securities Commission Malaysia on 21 August 2013, and are now pending approvals from
the other relevant authorities, shareholders of the Company, lenders/note holders of the Group as well as High Court of Malaya for
Proposed Distribution.
IOI
Cor
por
atio
n B
erh
ad
122
Directors’ Report
AUDIT AND RISK MANAGEMENT COMMITTEE
The Directors who served as members of the Audit and Risk Management Committee since the date of the last report are as follows:
Datuk Hj Mohd Khalil b Dato’ Hj Mohd Noor (Chairman)
Datuk Karownakaran @ Karunakaran a/l Ramasamy
Quah Poh Keat (MIA 2022)
NOMINATING COMMITTEE
The Directors who served as members of the Nominating Committee since the date of the last report are as follows:
Datuk Hj Mohd Khalil b Dato’ Hj Mohd Noor (Chairman)
Cheah Tek Kuang
Quah Poh Keat
REMUNERATION COMMITTEE
The Directors who served as members of the Remuneration Committee since the date of the last report are as follows:
Tan Sri Dato’ Lee Shin Cheng (Chairman)
Datuk Hj Mohd Khalil b Dato’ Hj Mohd Noor
Quah Poh Keat
AUDITORS
The auditors, BDO, have expressed their willingness to continue in office.
Signed on behalf of the Board in accordance with a resolution of the Directors:
Tan Sri Dato’ Lee Shin Cheng
Executive Chairman
Dato’ Lee Yeow Chor
Executive Director
Putrajaya
3 September 2013
Annual Report 2013
IOI
Cor
por
atio
n B
erh
ad
123
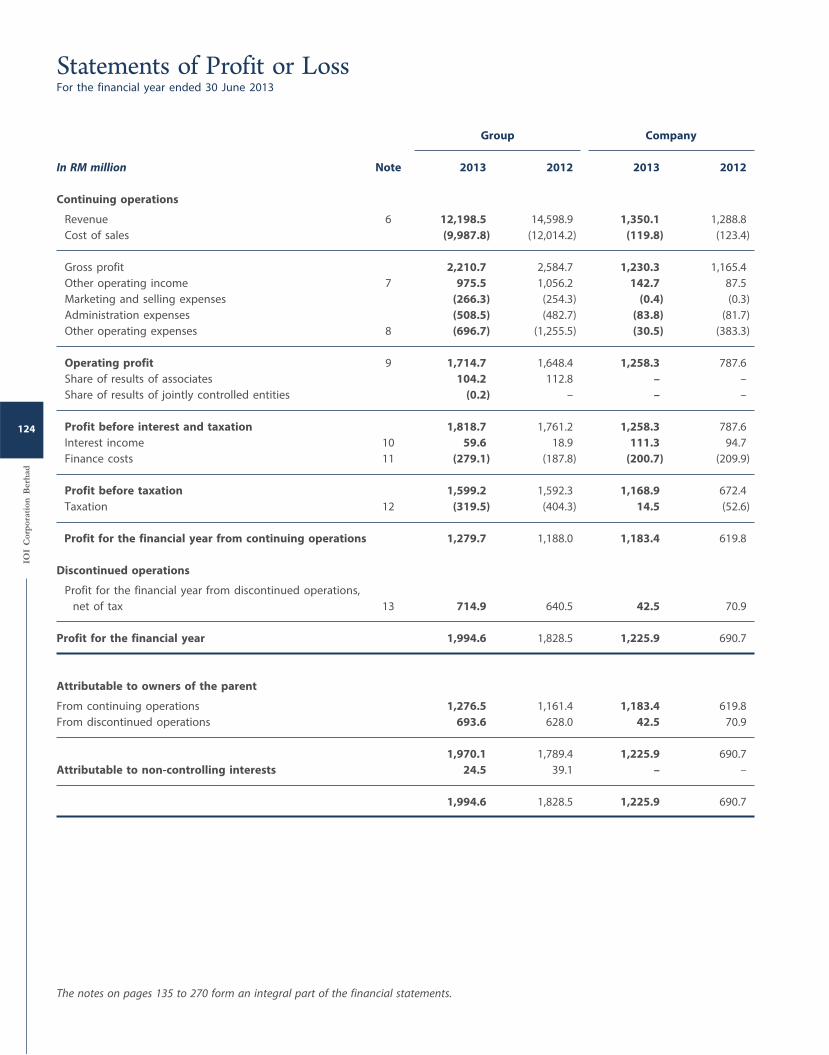
Group Company
In RM million Note 2013 2012 2013 2012
Continuing operations
Revenue 6 12,198.5 14,598.9 1,350.1 1,288.8
Cost of sales (9,987.8) (12,014.2) (119.8) (123.4)
Gross profit 2,210.7 2,584.7 1,230.3 1,165.4
Other operating income 7 975.5 1,056.2 142.7 87.5
Marketing and selling expenses (266.3) (254.3) (0.4) (0.3)
Administration expenses (508.5) (482.7) (83.8) (81.7)
Other operating expenses 8 (696.7) (1,255.5) (30.5) (383.3)
Operating profit 9 1,714.7 1,648.4 1,258.3 787.6
Share of results of associates 104.2 112.8 – –
Share of results of jointly controlled entities (0.2) – – –
Profit before interest and taxation 1,818.7 1,761.2 1,258.3 787.6
Interest income 10 59.6 18.9 111.3 94.7
Finance costs 11 (279.1) (187.8) (200.7) (209.9)
Profit before taxation 1,599.2 1,592.3 1,168.9 672.4
Taxation 12 (319.5) (404.3) 14.5 (52.6)
Profit for the financial year from continuing operations 1,279.7 1,188.0 1,183.4 619.8
Discontinued operations
Profit for the financial year from discontinued operations,
net of tax 13 714.9 640.5 42.5 70.9
Profit for the financial year 1,994.6 1,828.5 1,225.9 690.7
Attributable to owners of the parent
From continuing operations 1,276.5 1,161.4 1,183.4 619.8
From discontinued operations 693.6 628.0 42.5 70.9
1,970.1 1,789.4 1,225.9 690.7
Attributable to non-controlling interests 24.5 39.1 – –
1,994.6 1,828.5 1,225.9 690.7
The notes on pages 135 to 270 form an integral part of the financial statements.
IOI
Cor
por
atio
n B
erh
ad
124
Statements of Profit or LossFor the financial year ended 30 June 2013
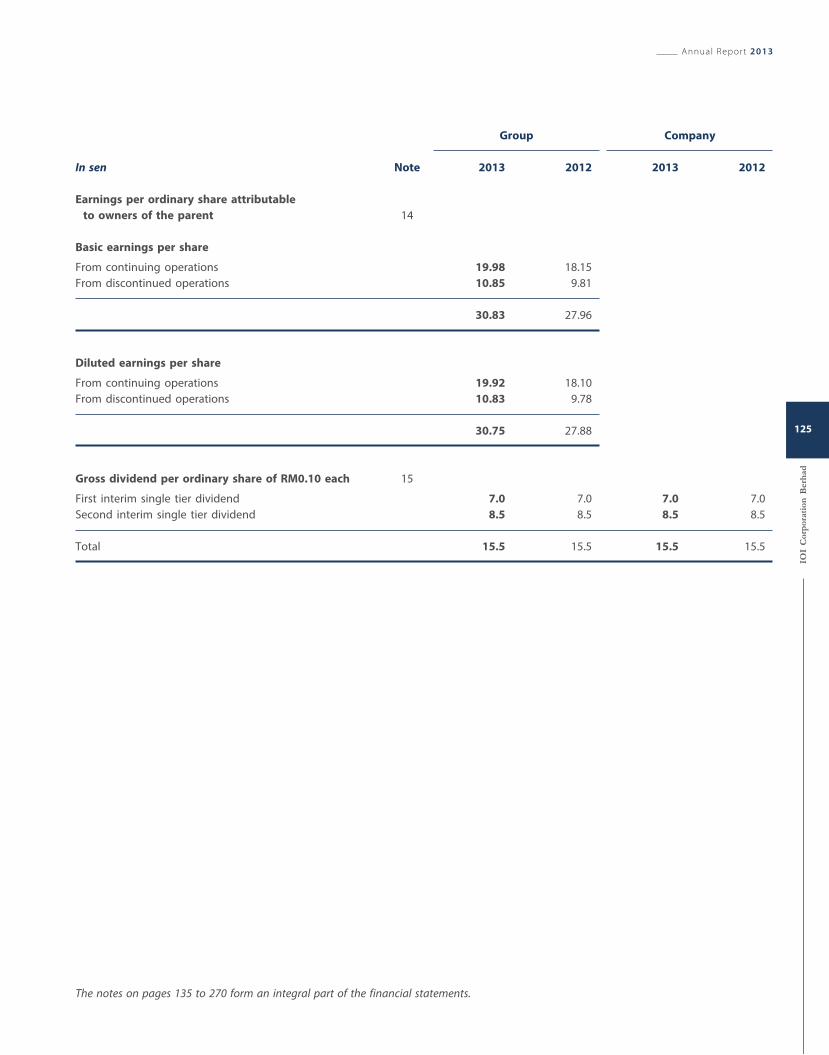
Group Company
In sen Note 2013 2012 2013 2012
Earnings per ordinary share attributable
to owners of the parent 14
Basic earnings per share
From continuing operations 19.98 18.15
From discontinued operations 10.85 9.81
30.83 27.96
Diluted earnings per share
From continuing operations 19.92 18.10
From discontinued operations 10.83 9.78
30.75 27.88
Gross dividend per ordinary share of RM0.10 each 15
First interim single tier dividend 7.0 7.0 7.0 7.0
Second interim single tier dividend 8.5 8.5 8.5 8.5
Total 15.5 15.5 15.5 15.5
The notes on pages 135 to 270 form an integral part of the financial statements.
Annual Report 2013
IOI
Cor
por
atio
n B
erh
ad
125
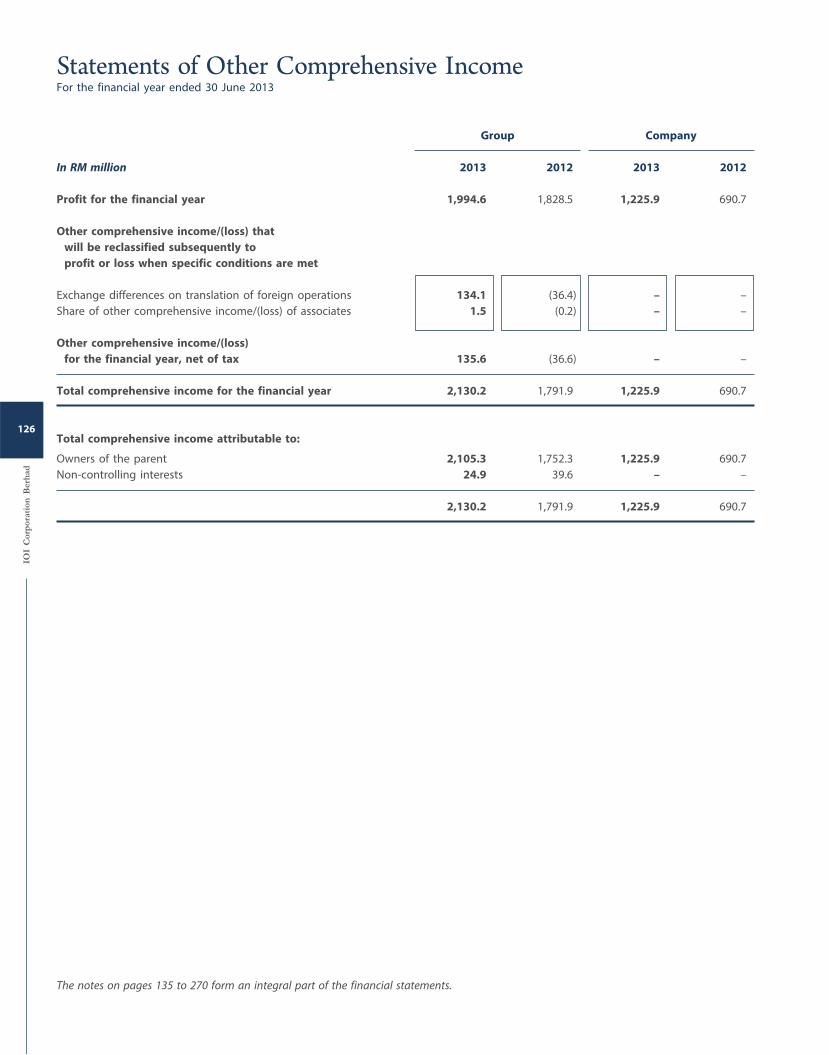
Group Company
In RM million 2013 2012 2013 2012
Profit for the financial year 1,994.6 1,828.5 1,225.9 690.7
Other comprehensive income/(loss) that
will be reclassified subsequently to
profit or loss when specific conditions are met
Exchange differences on translation of foreign operations 134.1 (36.4) – –
Share of other comprehensive income/(loss) of associates 1.5 (0.2) – –
Other comprehensive income/(loss)
for the financial year, net of tax 135.6 (36.6) – –
Total comprehensive income for the financial year 2,130.2 1,791.9 1,225.9 690.7
Total comprehensive income attributable to:
Owners of the parent 2,105.3 1,752.3 1,225.9 690.7
Non-controlling interests 24.9 39.6 – –
2,130.2 1,791.9 1,225.9 690.7
The notes on pages 135 to 270 form an integral part of the financial statements.
IOI
Cor
por
atio
n B
erh
ad
126
Statements of Other Comprehensive IncomeFor the financial year ended 30 June 2013
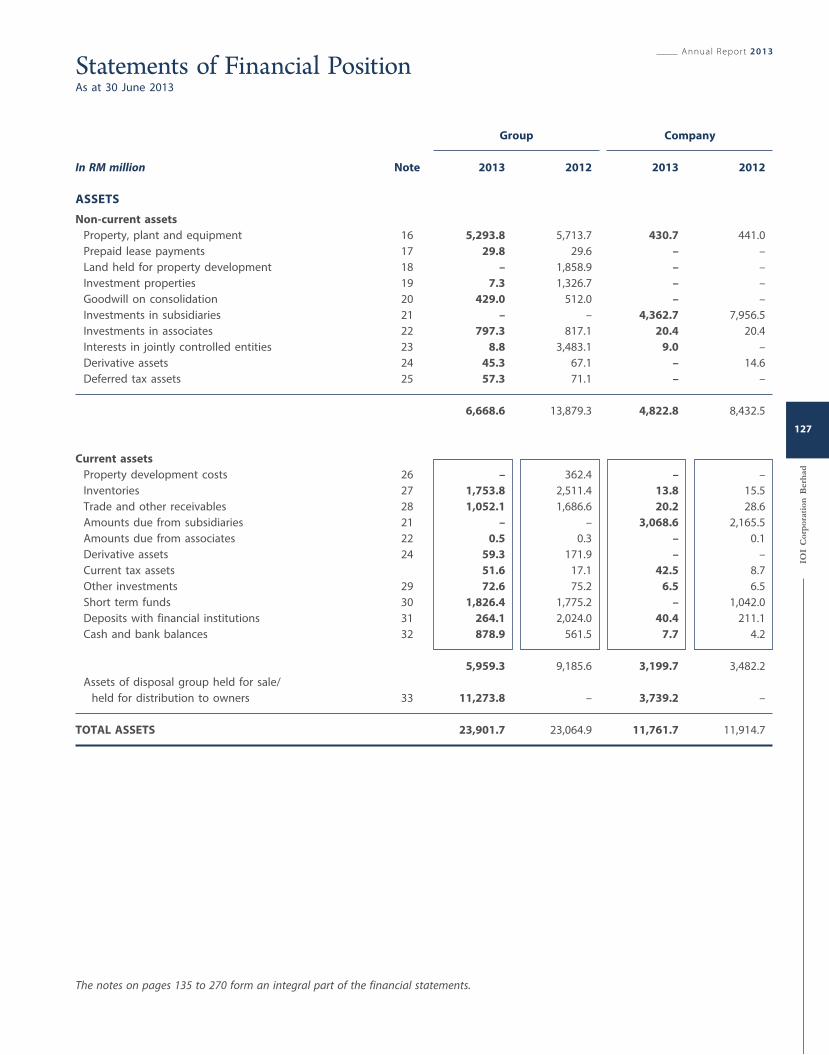
Group Company
In RM million Note 2013 2012 2013 2012
ASSETS
Non-current assets
Property, plant and equipment 16 5,293.8 5,713.7 430.7 441.0
Prepaid lease payments 17 29.8 29.6 – –
Land held for property development 18 – 1,858.9 – –
Investment properties 19 7.3 1,326.7 – –
Goodwill on consolidation 20 429.0 512.0 – –
Investments in subsidiaries 21 – – 4,362.7 7,956.5
Investments in associates 22 797.3 817.1 20.4 20.4
Interests in jointly controlled entities 23 8.8 3,483.1 9.0 –
Derivative assets 24 45.3 67.1 – 14.6
Deferred tax assets 25 57.3 71.1 – –
6,668.6 13,879.3 4,822.8 8,432.5
Current assets
Property development costs 26 – 362.4 – –
Inventories 27 1,753.8 2,511.4 13.8 15.5
Trade and other receivables 28 1,052.1 1,686.6 20.2 28.6
Amounts due from subsidiaries 21 – – 3,068.6 2,165.5
Amounts due from associates 22 0.5 0.3 – 0.1
Derivative assets 24 59.3 171.9 – –
Current tax assets 51.6 17.1 42.5 8.7
Other investments 29 72.6 75.2 6.5 6.5
Short term funds 30 1,826.4 1,775.2 – 1,042.0
Deposits with financial institutions 31 264.1 2,024.0 40.4 211.1
Cash and bank balances 32 878.9 561.5 7.7 4.2
5,959.3 9,185.6 3,199.7 3,482.2
Assets of disposal group held for sale/
held for distribution to owners 33 11,273.8 – 3,739.2 –
TOTAL ASSETS 23,901.7 23,064.9 11,761.7 11,914.7
The notes on pages 135 to 270 form an integral part of the financial statements.
Annual Report 2013
IOI
Cor
por
atio
n B
erh
ad
127
Statements of Financial PositionAs at 30 June 2013
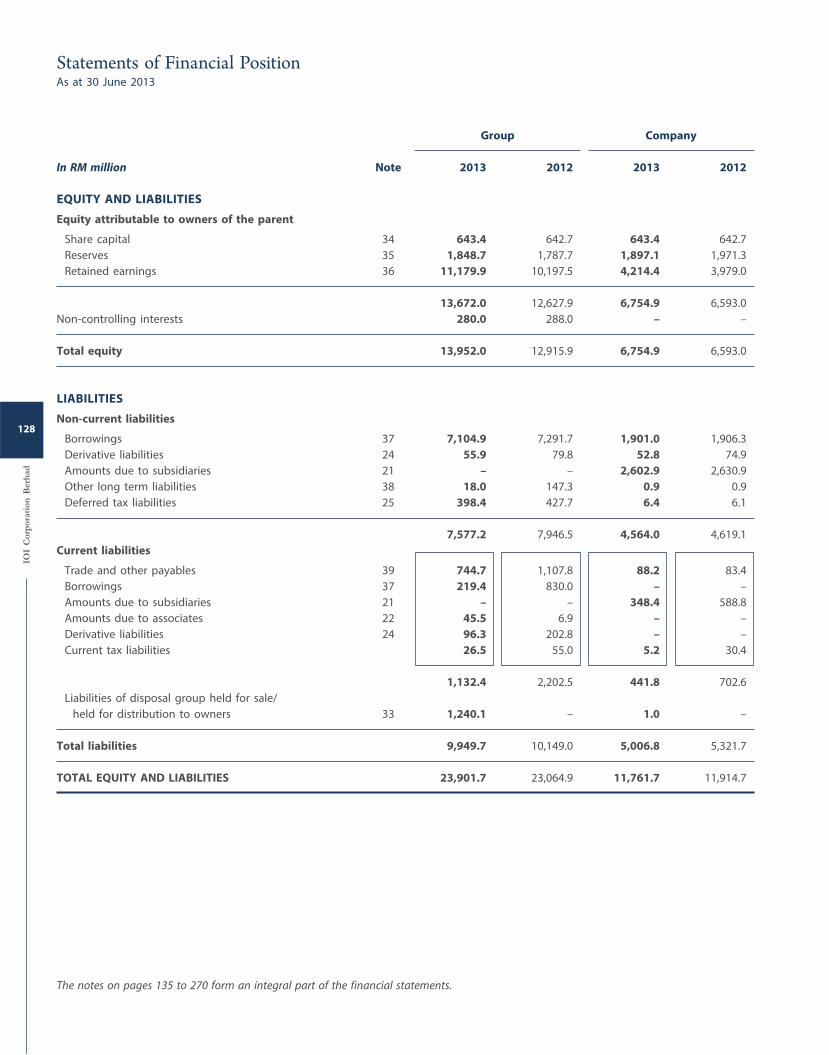
Group Company
In RM million Note 2013 2012 2013 2012
EQUITY AND LIABILITIES
Equity attributable to owners of the parent
Share capital 34 643.4 642.7 643.4 642.7
Reserves 35 1,848.7 1,787.7 1,897.1 1,971.3
Retained earnings 36 11,179.9 10,197.5 4,214.4 3,979.0
13,672.0 12,627.9 6,754.9 6,593.0
Non-controlling interests 280.0 288.0 – –
Total equity 13,952.0 12,915.9 6,754.9 6,593.0
LIABILITIES
Non-current liabilities
Borrowings 37 7,104.9 7,291.7 1,901.0 1,906.3
Derivative liabilities 24 55.9 79.8 52.8 74.9
Amounts due to subsidiaries 21 – – 2,602.9 2,630.9
Other long term liabilities 38 18.0 147.3 0.9 0.9
Deferred tax liabilities 25 398.4 427.7 6.4 6.1
7,577.2 7,946.5 4,564.0 4,619.1
Current liabilities
Trade and other payables 39 744.7 1,107.8 88.2 83.4
Borrowings 37 219.4 830.0 – –
Amounts due to subsidiaries 21 – – 348.4 588.8
Amounts due to associates 22 45.5 6.9 – –
Derivative liabilities 24 96.3 202.8 – –
Current tax liabilities 26.5 55.0 5.2 30.4
1,132.4 2,202.5 441.8 702.6
Liabilities of disposal group held for sale/
held for distribution to owners 33 1,240.1 – 1.0 –
Total liabilities 9,949.7 10,149.0 5,006.8 5,321.7
TOTAL EQUITY AND LIABILITIES 23,901.7 23,064.9 11,761.7 11,914.7
The notes on pages 135 to 270 form an integral part of the financial statements.
IOI
Cor
por
atio
n B
erh
ad
128
Statements of Financial PositionAs at 30 June 2013
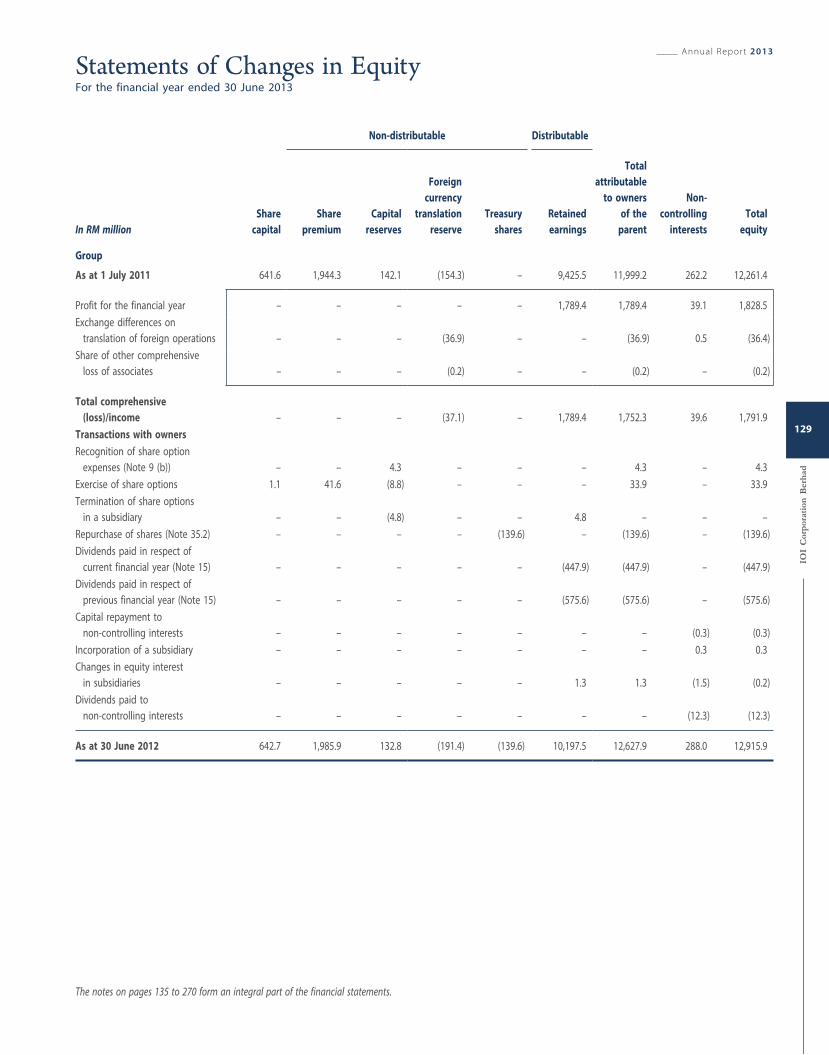
Non-distributable Distributable
In RM millionShare
capital
Share
premium
Capital
reserves
Foreign
currency
translation
reserve
Treasury
shares
Retained
earnings
Total
attributable
to owners
of the
parent
Non-
controlling
interests
Total
equity
Group
As at 1 July 2011 641.6 1,944.3 142.1 (154.3) – 9,425.5 11,999.2 262.2 12,261.4
Profit for the financial year – – – – – 1,789.4 1,789.4 39.1 1,828.5
Exchange differences on
translation of foreign operations – – – (36.9) – – (36.9) 0.5 (36.4)
Share of other comprehensive
loss of associates – – – (0.2) – – (0.2) – (0.2)
Total comprehensive
(loss)/income – – – (37.1) – 1,789.4 1,752.3 39.6 1,791.9
Transactions with owners
Recognition of share option
expenses (Note 9 (b)) – – 4.3 – – – 4.3 – 4.3
Exercise of share options 1.1 41.6 (8.8) – – – 33.9 – 33.9
Termination of share options
in a subsidiary – – (4.8) – – 4.8 – – –
Repurchase of shares (Note 35.2) – – – – (139.6) – (139.6) – (139.6)
Dividends paid in respect of
current financial year (Note 15) – – – – – (447.9) (447.9) – (447.9)
Dividends paid in respect of
previous financial year (Note 15) – – – – – (575.6) (575.6) – (575.6)
Capital repayment to
non-controlling interests – – – – – – – (0.3) (0.3)
Incorporation of a subsidiary – – – – – – – 0.3 0.3
Changes in equity interest
in subsidiaries – – – – – 1.3 1.3 (1.5) (0.2)
Dividends paid to
non-controlling interests – – – – – – – (12.3) (12.3)
As at 30 June 2012 642.7 1,985.9 132.8 (191.4) (139.6) 10,197.5 12,627.9 288.0 12,915.9
The notes on pages 135 to 270 form an integral part of the financial statements.
Annual Report 2013
IOI
Cor
por
atio
n B
erh
ad
129
Statements of Changes in EquityFor the financial year ended 30 June 2013
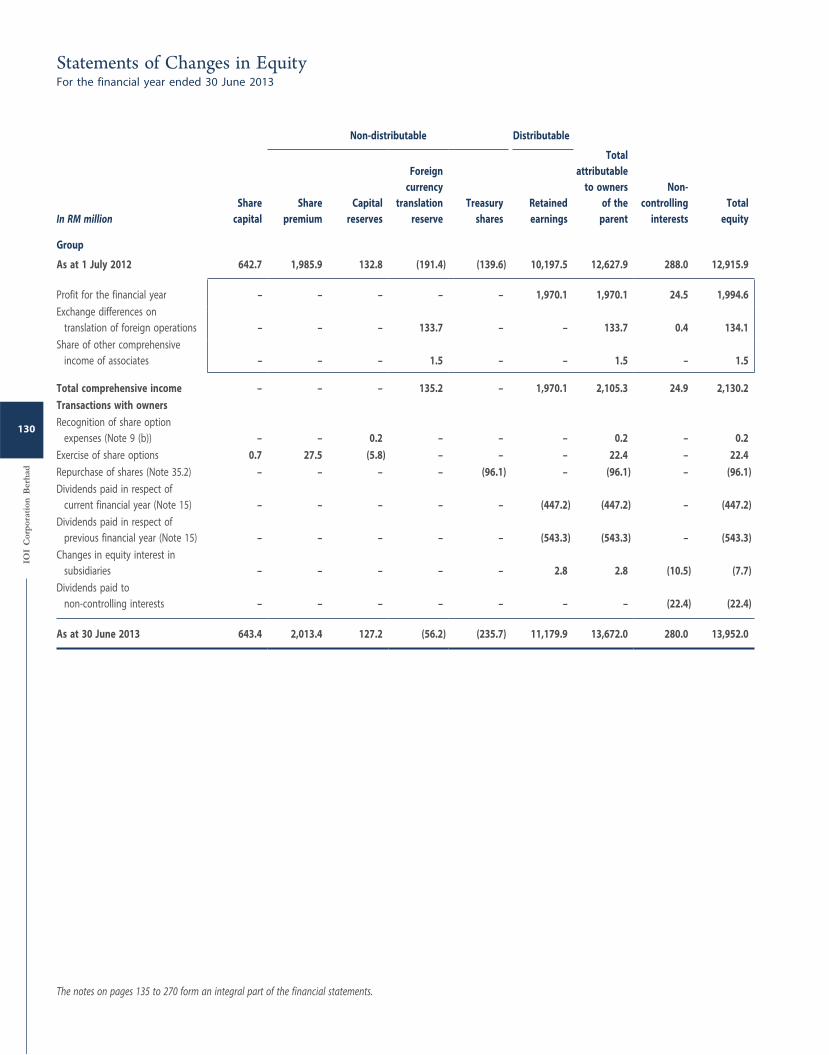
Non-distributable Distributable
In RM millionShare
capital
Share
premium
Capital
reserves
Foreign
currency
translation
reserve
Treasury
shares
Retained
earnings
Total
attributable
to owners
of the
parent
Non-
controlling
interests
Total
equity
Group
As at 1 July 2012 642.7 1,985.9 132.8 (191.4) (139.6) 10,197.5 12,627.9 288.0 12,915.9
Profit for the financial year – – – – – 1,970.1 1,970.1 24.5 1,994.6
Exchange differences on
translation of foreign operations – – – 133.7 – – 133.7 0.4 134.1
Share of other comprehensive
income of associates – – – 1.5 – – 1.5 – 1.5
Total comprehensive income – – – 135.2 – 1,970.1 2,105.3 24.9 2,130.2
Transactions with owners
Recognition of share option
expenses (Note 9 (b)) – – 0.2 – – – 0.2 – 0.2
Exercise of share options 0.7 27.5 (5.8) – – – 22.4 – 22.4
Repurchase of shares (Note 35.2) – – – – (96.1) – (96.1) – (96.1)
Dividends paid in respect of
current financial year (Note 15) – – – – – (447.2) (447.2) – (447.2)
Dividends paid in respect of
previous financial year (Note 15) – – – – – (543.3) (543.3) – (543.3)
Changes in equity interest in
subsidiaries – – – – – 2.8 2.8 (10.5) (7.7)
Dividends paid to
non-controlling interests – – – – – – – (22.4) (22.4)
As at 30 June 2013 643.4 2,013.4 127.2 (56.2) (235.7) 11,179.9 13,672.0 280.0 13,952.0
The notes on pages 135 to 270 form an integral part of the financial statements.
IOI
Cor
por
atio
n B
erh
ad
130
Statements of Changes in EquityFor the financial year ended 30 June 2013
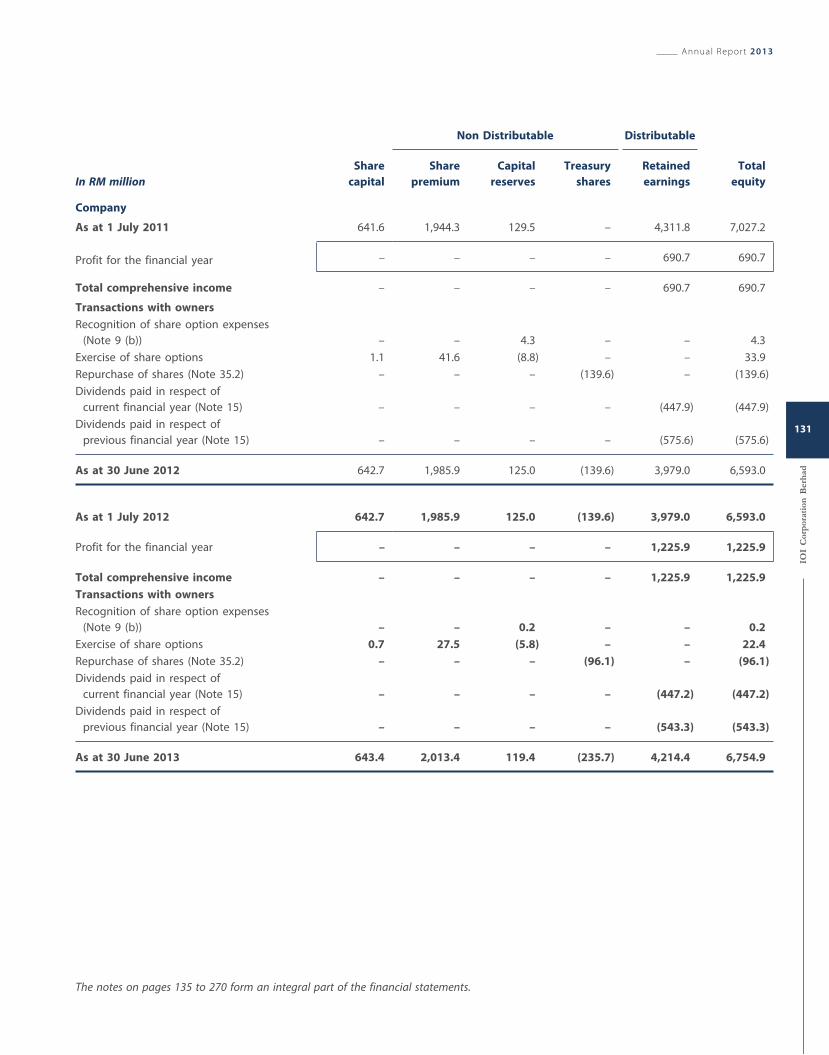
Non Distributable Distributable
In RM millionShare
capital
Share
premium
Capital
reserves
Treasury
shares
Retained
earnings
Total
equity
Company
As at 1 July 2011 641.6 1,944.3 129.5 – 4,311.8 7,027.2
Profit for the financial year – – – – 690.7 690.7
Total comprehensive income – – – – 690.7 690.7
Transactions with owners
Recognition of share option expenses
(Note 9 (b)) – – 4.3 – – 4.3
Exercise of share options 1.1 41.6 (8.8) – – 33.9
Repurchase of shares (Note 35.2) – – – (139.6) – (139.6)
Dividends paid in respect of
current financial year (Note 15) – – – – (447.9) (447.9)
Dividends paid in respect of
previous financial year (Note 15) – – – – (575.6) (575.6)
As at 30 June 2012 642.7 1,985.9 125.0 (139.6) 3,979.0 6,593.0
As at 1 July 2012 642.7 1,985.9 125.0 (139.6) 3,979.0 6,593.0
Profit for the financial year – – – – 1,225.9 1,225.9
Total comprehensive income – – – – 1,225.9 1,225.9
Transactions with owners
Recognition of share option expenses
(Note 9 (b)) – – 0.2 – – 0.2
Exercise of share options 0.7 27.5 (5.8) – – 22.4
Repurchase of shares (Note 35.2) – – – (96.1) – (96.1)
Dividends paid in respect of
current financial year (Note 15) – – – – (447.2) (447.2)
Dividends paid in respect of
previous financial year (Note 15) – – – – (543.3) (543.3)
As at 30 June 2013 643.4 2,013.4 119.4 (235.7) 4,214.4 6,754.9
The notes on pages 135 to 270 form an integral part of the financial statements.
Annual Report 2013
IOI
Cor
por
atio
n B
erh
ad
131
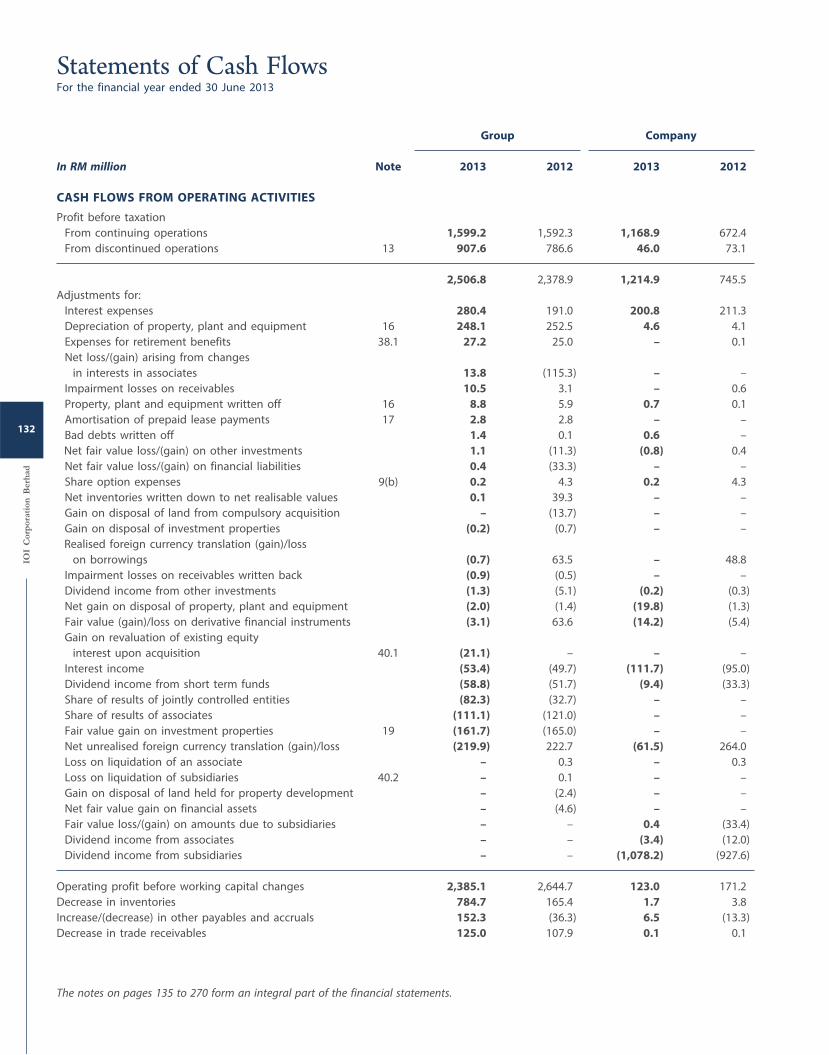
Group Company
In RM million Note 2013 2012 2013 2012
CASH FLOWS FROM OPERATING ACTIVITIES
Profit before taxation
From continuing operations 1,599.2 1,592.3 1,168.9 672.4
From discontinued operations 13 907.6 786.6 46.0 73.1
2,506.8 2,378.9 1,214.9 745.5
Adjustments for:
Interest expenses 280.4 191.0 200.8 211.3
Depreciation of property, plant and equipment 16 248.1 252.5 4.6 4.1
Expenses for retirement benefits 38.1 27.2 25.0 – 0.1
Net loss/(gain) arising from changes
in interests in associates 13.8 (115.3) – –
Impairment losses on receivables 10.5 3.1 – 0.6
Property, plant and equipment written off 16 8.8 5.9 0.7 0.1
Amortisation of prepaid lease payments 17 2.8 2.8 – –
Bad debts written off 1.4 0.1 0.6 –
Net fair value loss/(gain) on other investments 1.1 (11.3) (0.8) 0.4
Net fair value loss/(gain) on financial liabilities 0.4 (33.3) – –
Share option expenses 9(b) 0.2 4.3 0.2 4.3
Net inventories written down to net realisable values 0.1 39.3 – –
Gain on disposal of land from compulsory acquisition – (13.7) – –
Gain on disposal of investment properties (0.2) (0.7) – –
Realised foreign currency translation (gain)/loss
on borrowings (0.7) 63.5 – 48.8
Impairment losses on receivables written back (0.9) (0.5) – –
Dividend income from other investments (1.3) (5.1) (0.2) (0.3)
Net gain on disposal of property, plant and equipment (2.0) (1.4) (19.8) (1.3)
Fair value (gain)/loss on derivative financial instruments (3.1) 63.6 (14.2) (5.4)
Gain on revaluation of existing equity
interest upon acquisition 40.1 (21.1) – – –
Interest income (53.4) (49.7) (111.7) (95.0)
Dividend income from short term funds (58.8) (51.7) (9.4) (33.3)
Share of results of jointly controlled entities (82.3) (32.7) – –
Share of results of associates (111.1) (121.0) – –
Fair value gain on investment properties 19 (161.7) (165.0) – –
Net unrealised foreign currency translation (gain)/loss (219.9) 222.7 (61.5) 264.0
Loss on liquidation of an associate – 0.3 – 0.3
Loss on liquidation of subsidiaries 40.2 – 0.1 – –
Gain on disposal of land held for property development – (2.4) – –
Net fair value gain on financial assets – (4.6) – –
Fair value loss/(gain) on amounts due to subsidiaries – – 0.4 (33.4)
Dividend income from associates – – (3.4) (12.0)
Dividend income from subsidiaries – – (1,078.2) (927.6)
Operating profit before working capital changes 2,385.1 2,644.7 123.0 171.2
Decrease in inventories 784.7 165.4 1.7 3.8
Increase/(decrease) in other payables and accruals 152.3 (36.3) 6.5 (13.3)
Decrease in trade receivables 125.0 107.9 0.1 0.1
The notes on pages 135 to 270 form an integral part of the financial statements.
IOI
Cor
por
atio
n B
erh
ad
132
Statements of Cash FlowsFor the financial year ended 30 June 2013
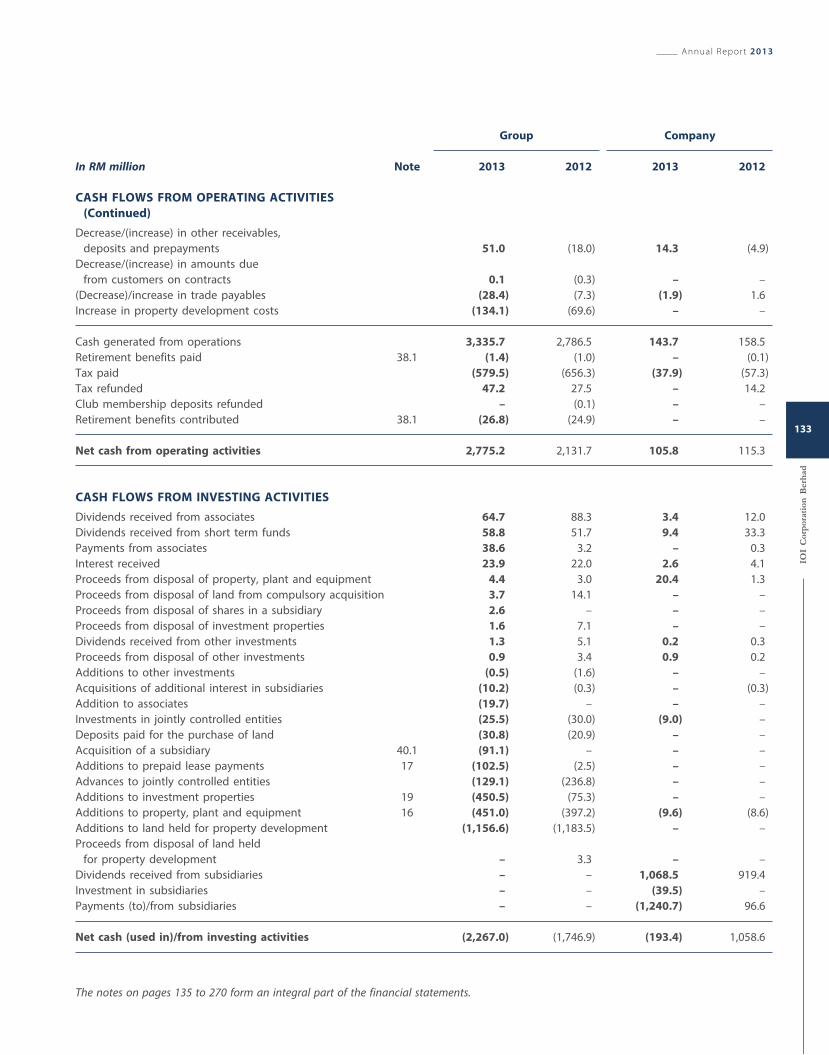
Group Company
In RM million Note 2013 2012 2013 2012
CASH FLOWS FROM OPERATING ACTIVITIES
(Continued)
Decrease/(increase) in other receivables,
deposits and prepayments 51.0 (18.0) 14.3 (4.9)
Decrease/(increase) in amounts due
from customers on contracts 0.1 (0.3) – –
(Decrease)/increase in trade payables (28.4) (7.3) (1.9) 1.6
Increase in property development costs (134.1) (69.6) – –
Cash generated from operations 3,335.7 2,786.5 143.7 158.5
Retirement benefits paid 38.1 (1.4) (1.0) – (0.1)
Tax paid (579.5) (656.3) (37.9) (57.3)
Tax refunded 47.2 27.5 – 14.2
Club membership deposits refunded – (0.1) – –
Retirement benefits contributed 38.1 (26.8) (24.9) – –
Net cash from operating activities 2,775.2 2,131.7 105.8 115.3
CASH FLOWS FROM INVESTING ACTIVITIES
Dividends received from associates 64.7 88.3 3.4 12.0
Dividends received from short term funds 58.8 51.7 9.4 33.3
Payments from associates 38.6 3.2 – 0.3
Interest received 23.9 22.0 2.6 4.1
Proceeds from disposal of property, plant and equipment 4.4 3.0 20.4 1.3
Proceeds from disposal of land from compulsory acquisition 3.7 14.1 – –
Proceeds from disposal of shares in a subsidiary 2.6 – – –
Proceeds from disposal of investment properties 1.6 7.1 – –
Dividends received from other investments 1.3 5.1 0.2 0.3
Proceeds from disposal of other investments 0.9 3.4 0.9 0.2
Additions to other investments (0.5) (1.6) – –
Acquisitions of additional interest in subsidiaries (10.2) (0.3) – (0.3)
Addition to associates (19.7) – – –
Investments in jointly controlled entities (25.5) (30.0) (9.0) –
Deposits paid for the purchase of land (30.8) (20.9) – –
Acquisition of a subsidiary 40.1 (91.1) – – –
Additions to prepaid lease payments 17 (102.5) (2.5) – –
Advances to jointly controlled entities (129.1) (236.8) – –
Additions to investment properties 19 (450.5) (75.3) – –
Additions to property, plant and equipment 16 (451.0) (397.2) (9.6) (8.6)
Additions to land held for property development (1,156.6) (1,183.5) – –
Proceeds from disposal of land held
for property development – 3.3 – –
Dividends received from subsidiaries – – 1,068.5 919.4
Investment in subsidiaries – – (39.5) –
Payments (to)/from subsidiaries – – (1,240.7) 96.6
Net cash (used in)/from investing activities (2,267.0) (1,746.9) (193.4) 1,058.6
The notes on pages 135 to 270 form an integral part of the financial statements.
Annual Report 2013
IOI
Cor
por
atio
n B
erh
ad
133
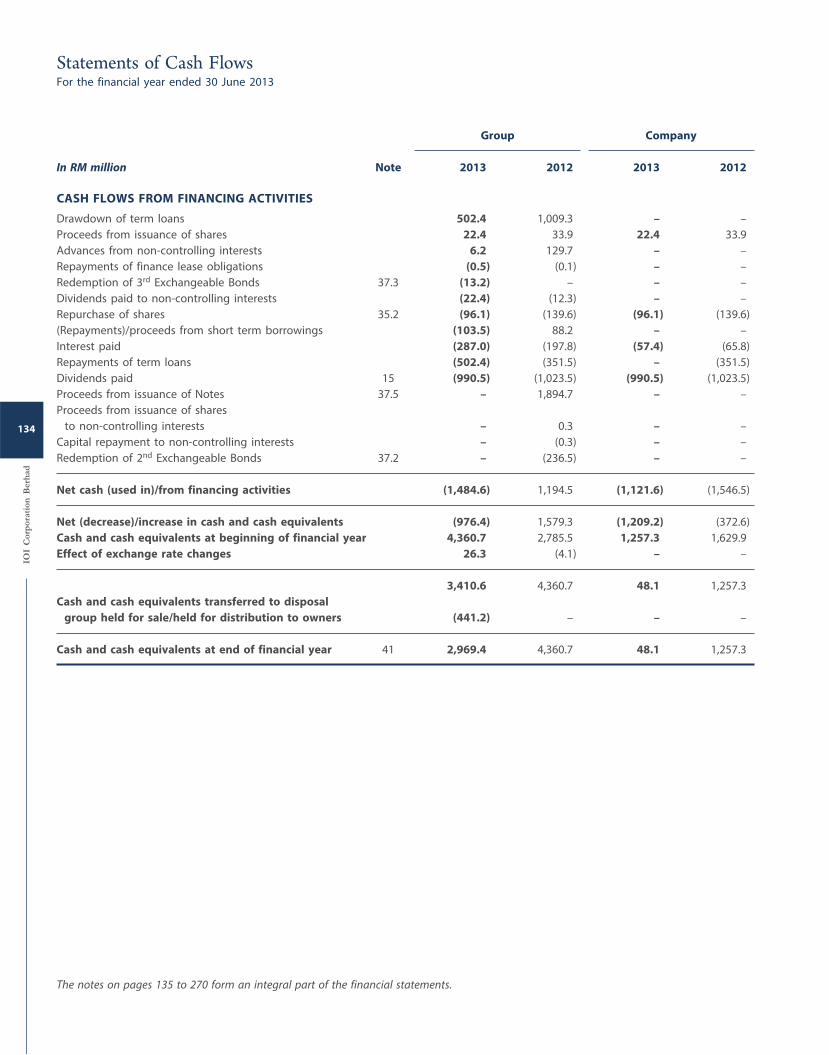
Group Company
In RM million Note 2013 2012 2013 2012
CASH FLOWS FROM FINANCING ACTIVITIES
Drawdown of term loans 502.4 1,009.3 – –
Proceeds from issuance of shares 22.4 33.9 22.4 33.9
Advances from non-controlling interests 6.2 129.7 – –
Repayments of finance lease obligations (0.5) (0.1) – –
Redemption of 3rd Exchangeable Bonds 37.3 (13.2) – – –
Dividends paid to non-controlling interests (22.4) (12.3) – –
Repurchase of shares 35.2 (96.1) (139.6) (96.1) (139.6)
(Repayments)/proceeds from short term borrowings (103.5) 88.2 – –
Interest paid (287.0) (197.8) (57.4) (65.8)
Repayments of term loans (502.4) (351.5) – (351.5)
Dividends paid 15 (990.5) (1,023.5) (990.5) (1,023.5)
Proceeds from issuance of Notes 37.5 – 1,894.7 – –
Proceeds from issuance of shares
to non-controlling interests – 0.3 – –
Capital repayment to non-controlling interests – (0.3) – –
Redemption of 2nd Exchangeable Bonds 37.2 – (236.5) – –
Net cash (used in)/from financing activities (1,484.6) 1,194.5 (1,121.6) (1,546.5)
Net (decrease)/increase in cash and cash equivalents (976.4) 1,579.3 (1,209.2) (372.6)
Cash and cash equivalents at beginning of financial year 4,360.7 2,785.5 1,257.3 1,629.9
Effect of exchange rate changes 26.3 (4.1) – –
3,410.6 4,360.7 48.1 1,257.3
Cash and cash equivalents transferred to disposal
group held for sale/held for distribution to owners (441.2) – – –
Cash and cash equivalents at end of financial year 41 2,969.4 4,360.7 48.1 1,257.3
The notes on pages 135 to 270 form an integral part of the financial statements.
IOI
Cor
por
atio
n B
erh
ad
134
Statements of Cash FlowsFor the financial year ended 30 June 2013
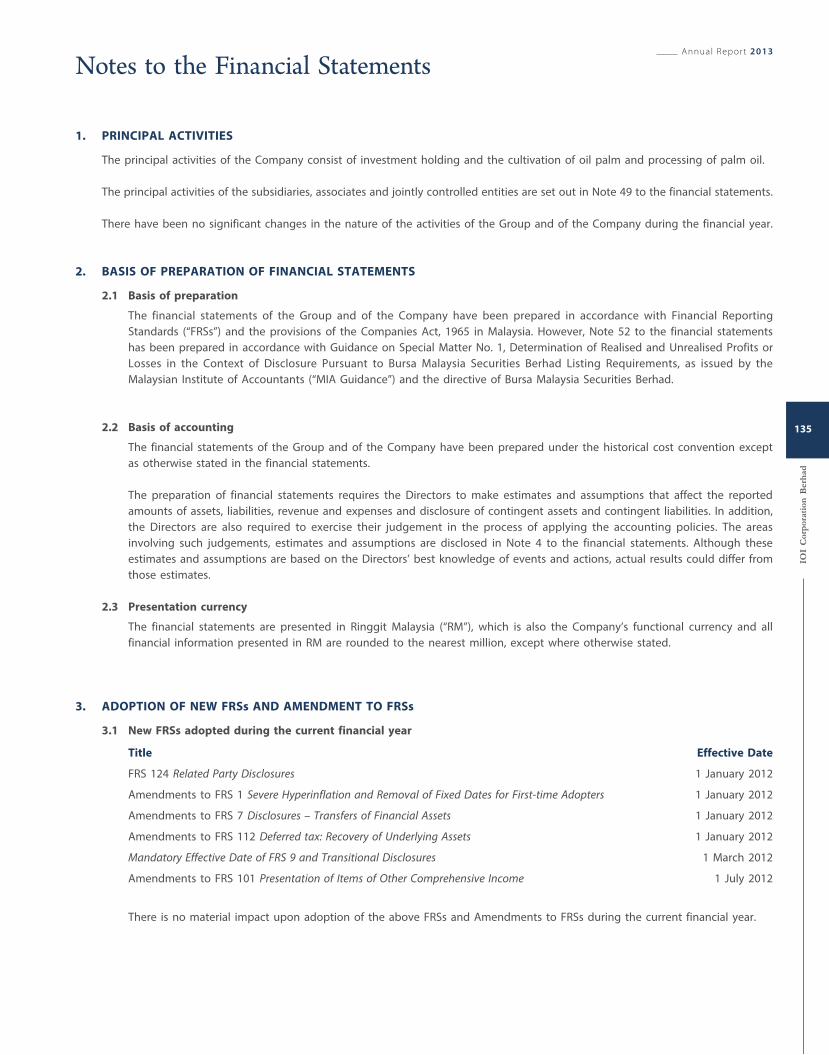
1. PRINCIPAL ACTIVITIES
The principal activities of the Company consist of investment holding and the cultivation of oil palm and processing of palm oil.
The principal activities of the subsidiaries, associates and jointly controlled entities are set out in Note 49 to the financial statements.
There have been no significant changes in the nature of the activities of the Group and of the Company during the financial year.
2. BASIS OF PREPARATION OF FINANCIAL STATEMENTS
2.1 Basis of preparation
The financial statements of the Group and of the Company have been prepared in accordance with Financial Reporting
Standards (“FRSs”) and the provisions of the Companies Act, 1965 in Malaysia. However, Note 52 to the financial statements
has been prepared in accordance with Guidance on Special Matter No. 1, Determination of Realised and Unrealised Profits or
Losses in the Context of Disclosure Pursuant to Bursa Malaysia Securities Berhad Listing Requirements, as issued by the
Malaysian Institute of Accountants (“MIA Guidance”) and the directive of Bursa Malaysia Securities Berhad.
2.2 Basis of accounting
The financial statements of the Group and of the Company have been prepared under the historical cost convention except
as otherwise stated in the financial statements.
The preparation of financial statements requires the Directors to make estimates and assumptions that affect the reported
amounts of assets, liabilities, revenue and expenses and disclosure of contingent assets and contingent liabilities. In addition,
the Directors are also required to exercise their judgement in the process of applying the accounting policies. The areas
involving such judgements, estimates and assumptions are disclosed in Note 4 to the financial statements. Although these
estimates and assumptions are based on the Directors’ best knowledge of events and actions, actual results could differ from
those estimates.
2.3 Presentation currency
The financial statements are presented in Ringgit Malaysia (“RM”), which is also the Company’s functional currency and all
financial information presented in RM are rounded to the nearest million, except where otherwise stated.
3. ADOPTION OF NEW FRSs AND AMENDMENT TO FRSs
3.1 New FRSs adopted during the current financial year
Title Effective Date
FRS 124 Related Party Disclosures 1 January 2012
Amendments to FRS 1 Severe Hyperinflation and Removal of Fixed Dates for First-time Adopters 1 January 2012
Amendments to FRS 7 Disclosures – Transfers of Financial Assets 1 January 2012
Amendments to FRS 112 Deferred tax: Recovery of Underlying Assets 1 January 2012
Mandatory Effective Date of FRS 9 and Transitional Disclosures 1 March 2012
Amendments to FRS 101 Presentation of Items of Other Comprehensive Income 1 July 2012
There is no material impact upon adoption of the above FRSs and Amendments to FRSs during the current financial year.
Annual Report 2013
IOI
Cor
por
atio
n B
erh
ad
135
Notes to the Financial Statements
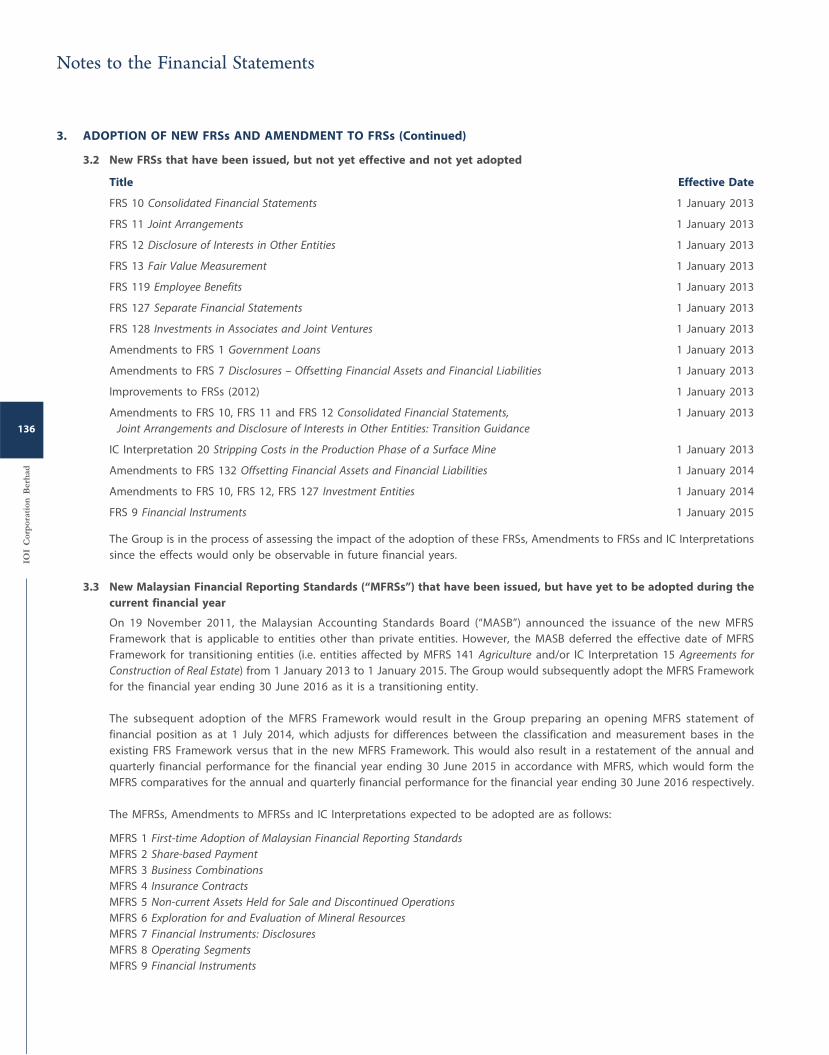
3. ADOPTION OF NEW FRSs AND AMENDMENT TO FRSs (Continued)
3.2 New FRSs that have been issued, but not yet effective and not yet adopted
Title Effective Date
FRS 10 Consolidated Financial Statements 1 January 2013
FRS 11 Joint Arrangements 1 January 2013
FRS 12 Disclosure of Interests in Other Entities 1 January 2013
FRS 13 Fair Value Measurement 1 January 2013
FRS 119 Employee Benefits 1 January 2013
FRS 127 Separate Financial Statements 1 January 2013
FRS 128 Investments in Associates and Joint Ventures 1 January 2013
Amendments to FRS 1 Government Loans 1 January 2013
Amendments to FRS 7 Disclosures – Offsetting Financial Assets and Financial Liabilities 1 January 2013
Improvements to FRSs (2012) 1 January 2013
Amendments to FRS 10, FRS 11 and FRS 12 Consolidated Financial Statements,
Joint Arrangements and Disclosure of Interests in Other Entities: Transition Guidance
1 January 2013
IC Interpretation 20 Stripping Costs in the Production Phase of a Surface Mine 1 January 2013
Amendments to FRS 132 Offsetting Financial Assets and Financial Liabilities 1 January 2014
Amendments to FRS 10, FRS 12, FRS 127 Investment Entities 1 January 2014
FRS 9 Financial Instruments 1 January 2015
The Group is in the process of assessing the impact of the adoption of these FRSs, Amendments to FRSs and IC Interpretations
since the effects would only be observable in future financial years.
3.3 New Malaysian Financial Reporting Standards (“MFRSs”) that have been issued, but have yet to be adopted during the
current financial year
On 19 November 2011, the Malaysian Accounting Standards Board (“MASB”) announced the issuance of the new MFRS
Framework that is applicable to entities other than private entities. However, the MASB deferred the effective date of MFRS
Framework for transitioning entities (i.e. entities affected by MFRS 141 Agriculture and/or IC Interpretation 15 Agreements for
Construction of Real Estate) from 1 January 2013 to 1 January 2015. The Group would subsequently adopt the MFRS Framework
for the financial year ending 30 June 2016 as it is a transitioning entity.
The subsequent adoption of the MFRS Framework would result in the Group preparing an opening MFRS statement of
financial position as at 1 July 2014, which adjusts for differences between the classification and measurement bases in the
existing FRS Framework versus that in the new MFRS Framework. This would also result in a restatement of the annual and
quarterly financial performance for the financial year ending 30 June 2015 in accordance with MFRS, which would form the
MFRS comparatives for the annual and quarterly financial performance for the financial year ending 30 June 2016 respectively.
The MFRSs, Amendments to MFRSs and IC Interpretations expected to be adopted are as follows:
MFRS 1 First-time Adoption of Malaysian Financial Reporting Standards
MFRS 2 Share-based Payment
MFRS 3 Business Combinations
MFRS 4 Insurance Contracts
MFRS 5 Non-current Assets Held for Sale and Discontinued Operations
MFRS 6 Exploration for and Evaluation of Mineral Resources
MFRS 7 Financial Instruments: Disclosures
MFRS 8 Operating Segments
MFRS 9 Financial Instruments
IOI
Cor
por
atio
n B
erh
ad
136
Notes to the Financial Statements
3. ADOPTION OF NEW FRSs AND AMENDMENT TO FRSs (Continued)
3.3 New Malaysian Financial Reporting Standards (“MFRSs”) that have been issued, but have yet to be adopted during the
current financial year (Continued)
The MFRSs, Amendments to MFRSs and IC Interpretations expected to be adopted are as follows (Continued):
MFRS 10 Consolidated Financial Statements
MFRS 11 Joint Arrangements
MFRS 12 Disclosure of Interests in Other Entities
MFRS 13 Fair Value Measurement
MFRS 101 Presentation of Financial Statements
MFRS 102 Inventories
MFRS 107 Statement of Cash Flows
MFRS 108 Accounting Policies, Changes in Accounting Estimates and Errors
MFRS 110 Events After the Reporting Period
MFRS 111 Construction Contracts
MFRS 112 Income Taxes
MFRS 116 Property, Plant and Equipment
MFRS 117 Leases
MFRS 118 Revenue
MFRS 119 Employee Benefits
MFRS 119 Employee Benefits (revised)
MFRS 120 Accounting for Government Grants and Disclosure of Government Assistance
MFRS 121 The Effects of Changes in Foreign Exchange Rates
MFRS 123 Borrowing Costs
MFRS 124 Related Party Disclosures
MFRS 126 Accounting and Reporting by Retirement Benefit Plans
MFRS 127 Separate Financial Statements
MFRS 128 Investments in Associates and Joint Ventures
MFRS 129 Financial Reporting in Hyperinflationary Economies
MFRS 132 Financial Instruments: Presentation
MFRS 133 Earnings Per Share
MFRS 134 Interim Financial Reporting
MFRS 136 Impairment of Assets
MFRS 137 Provisions, Contingent Liabilities and Contingent Assets
MFRS 138 Intangible Assets
MFRS 139 Financial Instruments: Recognition and Measurement
MFRS 140 Investment Property
MFRS 141 Agriculture
Mandatory Effective Date of MFRS 9 and Transition Disclosures
Amendments to MFRS 1 Government Loans
Amendments to MFRS 7 Disclosures – Offsetting Financial Assets and Financial Liabilities
Amendments to MFRS 10, MFRS 11 and MFRS 12 Consolidated Financial Statements, Joint Arrangements and Disclosure of
Interests in Other Entities: Transition Guidance
Amendments to MFRS 10, MFRS 12 and MFRS 127 Investment Entities
Amendments to MFRS 101 Presentation of Items of Other Comprehensive Income
Amendments to MFRS 132 Offsetting Financial Assets and Financial Liabilities
Amendments to MFRSs Annual Improvements 2009 – 2011 Cycle
Improvements to MFRSs (2008)
Improvements to MFRSs (2009)
Improvements to MFRSs (2010)
IC Interpretation 1 Changes in Existing Decommissioning, Restoration and Similar Liabilities
IC Interpretation 2 Members’ Shares in Co-operative Entities and Similar Instruments
IC Interpretation 4 Determining whether an Arrangement Contains a Lease
IC Interpretation 5 Rights to Interests Arising from Decommissioning, Restoration and Environmental Rehabilitation Funds
Annual Report 2013
IOI
Cor
por
atio
n B
erh
ad
137
3. ADOPTION OF NEW FRSs AND AMENDMENT TO FRSs (Continued)
3.3 New Malaysian Financial Reporting Standards (“MFRSs”) that have been issued, but have yet to be adopted during the
current financial year (Continued)
The MFRSs, Amendments to MFRSs and IC Interpretations expected to be adopted are as follows (Continued):
IC Interpretation 6 Liabilities Arising from Participating in a Specific Market – Waste Electrical and Electronic Equipment
IC Interpretation 7 Applying the Restatement Approach under MFRS 129 Financial Reporting in Hyperinflationary Economies
IC Interpretation 9 Reassessment of Embedded Derivatives
IC Interpretation 10 Interim Financial Reporting and Impairment
IC Interpretation 12 Service Concession Arrangements
IC Interpretation 13 Customer Loyalty Programmes
IC Interpretation 14 MFRS 119 Employee Benefits – The Limit on a Defined Benefit Asset, Minimum Funding Requirements and their
Interaction
IC Interpretation 15 Agreements for the Construction of Real Estate
IC Interpretation 16 Hedges of a Net Investment in a Foreign Operation
IC Interpretation 17 Distributions of Non-cash Assets to Owners
IC Interpretation 18 Transfers of Assets from Customers
IC Interpretation 19 Extinguishing Financial Liabilities with Equity Instruments
IC Interpretation 20 Stripping Costs in the Production Phase of a Surface Mine
IC Interpretation 107 Introduction of the Euro
IC Interpretation 110 Government Assistance – No Specific Relation to Operating Activities
IC Interpretation 112 Consolidation – Special Purpose Entities
IC Interpretation 113 Jointly Controlled Entities – Non-Monetary Contributions by Venturers
IC Interpretation 115 Operating Leases – Incentives
IC Interpretation 125 Income Taxes – Changes in the Tax Status of an Entity or its Shareholders
IC Interpretation 127 Evaluating the Substance of Transactions Involving the Legal Form of a Lease
IC Interpretation 129 Service Concession Arrangements: Disclosures
IC Interpretation 131 Revenue – Barter Transactions Involving Advertising Services
IC Interpretation 132 Intangible Assets – Web Site Costs
The Group is in the process of assessing the impact on the financial statements arising from the transition from FRSs to MFRSs.
However, some of the known effects are described as follows:
MFRS 1 First-time Adoption of Malaysian Financial Reporting Standards
This Standard requires an opening MFRS statement of financial position at the date of transition to reflect the retrospective
effects of implementing the MFRS Framework for the first time. However, it also provides some exceptions and exemptions to
an entity from full retrospective application of MFRSs.
The Group is in the process of assessing the impact of implementing the MFRS Framework since the effects would only be
observable for the financial year ending 30 June 2016.
MFRS 141 Agriculture
This Standard prescribes the accounting treatment, financial statements presentation, and disclosures related to agricultural
activity. It requires measurement at fair value less costs to sell from initial recognition of biological assets up to the point of
harvest, other than when fair value cannot be measured realiably on initial recognition. This Standard requires that subsequent
change in fair value less costs to sell of a biological asset be included in profit or loss for the period in which it arises.
The Group is in the process of assessing the impact of implementing this Standard since the effects would only be observable
for the financial year ending 30 June 2016.
Notes to the Financial Statements
IOI
Cor
por
atio
n B
erh
ad
138
3. ADOPTION OF NEW FRSs AND AMENDMENT TO FRSs (Continued)
3.3 New Malaysian Financial Reporting Standards (“MFRSs”) that have been issued, but have yet to be adopted during the
current financial year (Continued)
IC Interpretation 15 Agreements for the Construction of Real Estate
This Interpretation applies to the accounting for revenue and associated expenses by entities undertaking construction or real
estate directly or via subcontractors. Within a single agreement, the entity may contract to deliver goods or services in addition
to the construction of real estate. Such an agreement shall therefore, be splited into separately identifiable components.
An agreement for the construction of real estate shall be accounted for in accordance with MFRS 111 Construction Contracts
if the buyer is able to specify the major structural elements of the design of the real estate before construction begins and/
or specify major structural changes once construction is in progress. Accordingly, revenue shall be recognised by reference to
the stage of completion of the contract.
An agreement for the construction of real estate in which buyers only have limited ability to influence the design of the real
estate or to specify only minor variations to the basic designs is an agreement for the sale of goods in accordance with MFRS
118 Revenue. Accordingly, revenue shall be recognised by reference to the criteria in paragraph 14 of MFRS 118 (e.g. transfer
of significant risks and rewards, no continuing managerial involvement nor effective control, reliable measurement, etc.).
At the end of the financial year, the Group recognised revenue and associated costs from the construction of real estate by
reference to the stage of completion of the construction works.
4. SIGNIFICANT ACCOUNTING ESTIMATES AND JUDGEMENTS
4.1 Changes in estimates
Estimates are continually evaluated and are based on historical experience and other factors, including expectations of future
events that are believed to be reasonable under the circumstances. The Directors are of the opinion that there are no material
changes in estimates during the financial year.
4.2 Critical judgements made in applying accounting policies
The following are the judgements made by management in the process of applying the Group’s accounting policies that have
the most significant effect on the amounts recognised in the financial statements.
4.2.1 Classification between investment properties and property, plant and equipment
The Group has developed certain criteria based on FRS 140 in making judgement whether a property qualifies as an
investment property. Investment property is a property held for capital appreciation or to earn rental or for both.
Some properties comprise a portion that is held to earn rental or for capital appreciation and another portion that is
held for use in the production or supply of goods or services or for administrative purposes. If these portions could be
sold separately (or leased out separately under a finance lease), the Group would account for the portions separately.
If the portions could not be sold separately, the property is an investment property only if an insignificant portion is
held for use in the production or supply of goods or services or for administrative purposes. Judgement is made on an
individual property basis to determine whether ancillary services are so significant that a property does not qualify as
investment property.
4.2.2 Contingent liabilities
The determination and treatment of contingent liabilities are based on management’s view of the expected outcome
of the contingencies for matters in the ordinary course of business.
Annual Report 2013
IOI
Cor
por
atio
n B
erh
ad
139
4. SIGNIFICANT ACCOUNTING ESTIMATES AND JUDGEMENTS (Continued)
4.3 Key sources of estimation uncertainty
The key assumptions concerning the future and other key sources of estimation uncertainty at the end of the financial year
that have a significant risk of causing a material adjustment to the carrying amounts of assets and liabilities within the next
financial year are discussed below:
4.3.1 Impairment of goodwill on consolidation
The Group determines whether goodwill is impaired at least on an annual basis. This requires an estimation of the
value-in-use of the Cash-generating Units (“CGU”) to which goodwill is allocated. Estimating a value-in-use amount
requires management to make an estimate of the expected future cash flows from the CGU and also to choose a
suitable discount rate in order to calculate the present value of those cash flows. Further details are disclosed in Note
20 to the financial statements.
4.3.2 Deferred tax assets
Deferred tax assets are recognised for all deductible temporary differences, unutilised tax losses and unabsorbed capital
allowances to the extent that it is probable that taxable profit will be available against which the unutilised tax losses
and unabsorbed capital allowances can be utilised. Significant management judgement is required to determine the
amount of deferred tax assets that can be recognised, based upon the likely timing and level of future taxable profits
together with future tax planning strategies.
4.3.3 Fair values of borrowings
The fair values of borrowings are estimated by discounting future contractual cash flows at the current market interest
rates available to the Group for similar financial instruments.
4.3.4 Write down for obsolete or slow moving inventories
The Group writes down its obsolete or slow moving inventories based on an assessment of their estimated net selling
price. Inventories are written down when events or changes in circumstances indicate that the carrying amounts may
not be recoverable. The management specifically analyses sales trend and current economic trends when making a
judgement to evaluate the adequacy of the write down for obsolete or slow moving inventories. Where expectations
differ from the original estimates, the differences will impact the carrying amounts of inventories.
4.3.5 Valuation of investment properties
The fair value of investment property is arrived at by reference to market evidence of transaction prices for similar
property and is performed by registered independent valuers having an appropriate recognised professional qualification
and recent experience in the location and category of the property being valued.
Notes to the Financial Statements
IOI
Cor
por
atio
n B
erh
ad
140
5. SIGNIFICANT ACCOUNTING POLICIES
The accounting policies set out below have been applied consistently to all periods presented in these financial statements, and
have been applied consistently by Group entities, unless otherwise stated.
5.1 Basis of Consolidation
5.1.1 Business Combinations
Business combinations from 1 July 2010 onwards
Business combinations are accounted for by applying the acquisition method of accounting.
Identifiable assets acquired, liabilities and contingent liabilities assumed in a business combination are measured at their
fair value at the acquisition date, except that:
i. deferred tax assets or liabilities and liabilities or assets related to employee benefit arrangements are recognised
and measured in accordance with FRS 112 Income Taxes and FRS 119 Employee Benefits respectively;
ii. liabilities or equity instruments related to share-based payment transactions of the acquiree or the replacement by
the Group of an acquiree’s share-based payment transactions are measured in accordance with FRS 2 Share-based
Payment at the acquisition date; and
iii. assets (or disposal groups) that are classified as held for sale in accordance with FRS 5 Non-current Assets Held for
Sale and Discontinued Operations are measured in accordance with that Standard.
Acquisition-related costs are recognised as expenses in the periods in which the costs are incurred and the services are
received.
Any contingent consideration payable is recognised at fair value at the acquisition date. Measurement period
adjustments to contingent consideration are dealt with as follows:
i. if the contingent consideration is classified as equity, it is not remeasured and settlement is accounted for within
equity; and
ii. subsequent changes to contingent consideration classified as an asset or liability that is a financial instrument
within the scope of FRS 139 are recognised either in profit or loss or in other comprehensive income in accordance
with FRS 139. All other subsequent changes are recognised in profit or loss.
In a business combination achieved in stages, previously held equity interests in the acquiree are re-measured to fair
value at the acquisition date and any corresponding gain or loss is recognised in profit or loss.
The Group elects for each individual business combination, whether non-controlling interest in the acquiree (if any) is
recognised on the acquisition date at fair value, or at the non-controlling interest’s proportionate share of the acquiree
net identifiable assets.
Any excess of the sum of the fair value of the consideration transferred in the business combination, the amount of non-
controlling interest in the acquiree (if any), and the fair value of the Group’s previously held equity interest in the acquiree
(if any), over the net fair value of the acquiree’s identifiable assets and liabilities is recorded as goodwill in the statement
of financial position. The accounting policy for goodwill is set out in Note 5.12. In instances where the latter amount
exceeds the former, the excess is recognised as a gain on bargain purchase in profit or loss on the acquisition date.
Annual Report 2013
IOI
Cor
por
atio
n B
erh
ad
141
5. SIGNIFICANT ACCOUNTING POLICIES (Continued)
5.1 Basis of Consolidation (Continued)
5.1.1 Business Combinations (Continued)
Business combinations before 1 July 2010
Under the purchase method of accounting, the cost of a business combination is measured at the aggregate of fair
values at the date of exchange, of assets given, liabilities incurred or assumed, and equity instruments issued plus any
costs directly attributable to the business combination.
At the acquisition date, the cost of a business combination is allocated to identifiable assets acquired, liabilities assumed
and contingent liabilities in the business combination which are measured initially at their fair values at the acquisition
date. The excess of the cost of a business combination over the Group’s interest in the net fair value of the identifiable
assets, liabilities and contingent liabilities is recognised as goodwill (see Note 5.12 to the financial statements on
goodwill). If the cost of a business combination is less than the interest in the net fair value of the identifiable assets,
liabilities and contingent liabilities, the Group will:
i. reassess the identification and measurement of the acquiree’s identifiable assets, liabilities and contingent liabilities
and the measurement of the cost of the business combination; and
ii. recognise immediately in profit or loss any excess remaining after that reassessment.
When a business combination includes more than one exchange transaction, any adjustment to the fair values of the
subsidiary’s identifiable assets, liabilities and contingent liabilities relating to previously held interests of the Group is
accounted for as a revaluation.
5.1.2 Subsidiaries
Subsidiaries are entities (including special purpose entities) in which the Group and the Company have the ability to
control the financial and operating policies so as to obtain benefits from their activities. Control exists when the Group
has the power to govern the financial and operating policies of an entity. The existence and effect of potential voting
rights that are currently exercisable or convertible are considered when assessing the existence of control.
In the Company’s separate financial statements, investments in subsidiaries are stated at cost less impairment losses, if
any. Investments accounted for at cost shall be accounted for in accordance with FRS 5 Non-current Assets Held for Sale
and Discontinued Operations when they are classified as held for sale (or included in a disposal group that is classified
as held for sale) in accordance with FRS 5.
When control of a subsidiary is lost as a result of a transaction, event or other circumstance, the Group would
derecognise all assets, liabilities and non-controlling interests at their carrying amount and to recognise the fair value
of the consideration received. Any retained interest in the former subsidiary is recognised at its fair value at the date
control is lost. The resulting difference is recognised as a gain or loss in profit or loss.
The consolidated financial statements incorporate the financial statements of the Company and all its subsidiaries made
up to the end of the reporting period, using consistent accounting policies.
Subsidiaries are consolidated from the date of acquisition, being the date on which the Group obtains control, and
continue to consolidate until the date that such control ceases.
If a subsidiary uses accounting policies other than those adopted in the consolidated financial statements for like
transactions and events in similar circumstance, appropriate adjustments are made to its financial statements in
preparing the consolidated financial statements.
Notes to the Financial Statements
IOI
Cor
por
atio
n B
erh
ad
142
5. SIGNIFICANT ACCOUNTING POLICIES (Continued)
5.1 Basis of Consolidation (Continued)
5.1.2 Subsidiaries (Continued)
Non-controlling interests represent the equity in subsidiaries that are not attributable, directly or indirectly, to owners
of the Company, and is presented separately in the profit or loss and other comprehensive income and within equity
in the consolidated statement of financial position, separately from equity attributable to owners of the Company. Profit
or loss and each component of other comprehensive income are attributed to the owners of the parent and to the
non-controlling interests. Total comprehensive income is attributed to non-controlling interests even if this results in
the non-controlling interests having a deficit balance.
Components of non-controlling interests in the acquiree that are present ownership interests and entitle their holders
to a proportionate share of the entity’s net assets in the event of liquidation are initially measured at either fair value
or at the present ownership instruments’ proportionate share in the recognised amounts of the acquiree’s identifiable
net assets. All other components of non-controlling interests shall be measured at their acquisition date fair values,
unless another measurement basis is required by FRSs. The choice of measurement basis is made on a combination-by-
combination basis. Subsequent to initial recognition, the carrying amount of non-controlling interests is the amount of
those interests at initial recognition plus the non-controlling interests’ share of subsequent changes in equity.
The Group has applied the revised FRS 3 Business Combinations in accounting for business combinations from 1 July
2010 onwards. The change in accounting policy has been applied prospectively in accordance with the transitional
provisions provided by the Standard.
Changes in the Company owners’ ownership interest in a subsidiary that do not result in a loss of control are accounted
for as equity transactions. In such circumstances, the carrying amounts of the controlling and non-controlling interests
are adjusted to reflect the changes in their relative interests in the subsidiary. Any difference between the amount by
which the non-controlling interests is adjusted and the fair value of consideration paid or received is recognised directly
in equity and attributed to owners of the parent.
When the Group loses control of a subsidiary as a result of a transaction, event or other circumstance, profit or loss on
disposal is calculated as the difference between:
i. the aggregate of the fair value of the consideration received and the fair value of any retained interest; and
ii. the previous carrying amounts of the assets (including goodwill), and liabilities of the subsidiary and any non-
controlling interests.
Amounts previously recognised in other comprehensive income in relation to the subsidiary are accounted for (i.e.
reclassified to profit or loss or transferred directly to retained earnings) in the same manner as would be required if the
relevant assets or liabilities were disposed of. The fair value of any investments retained in the former subsidiary at the
date when control is lost is regarded as the fair value on initial recognition for subsequent accounting under FRS 139
Financial Instruments: Recognition and Measurement or, where applicable, the cost on initial recognition of an investment
in an associate or a jointly controlled entity.
Annual Report 2013
IOI
Cor
por
atio
n B
erh
ad
143
5. SIGNIFICANT ACCOUNTING POLICIES (Continued)
5.1 Basis of Consolidation (Continued)
5.1.3 Associates
Associates are entities in which the Group and the Company have significant influence and that are neither subsidiaries
nor interest in jointly controlled entities. Significant influence is the power to participate in the financial and operating
policy decisions of the investees but is not control or joint control over those policies.
In the Company’s separate financial statements, investments in associates are stated at cost less impairment losses, if
any. On disposal of such investments, the difference between net disposal proceeds and their carrying amounts is
included in profit or loss.
Investments in associates are accounted for in the consolidated financial statements using the equity method of
accounting based on the latest financial statements of the associates concerned, from the date significant influence
commences until the date the Group ceases to have significant influence over the associates. The investments in
associates in the consolidated statement of financial position are initially recognised at cost and adjusted thereafter for
the post acquisition changes in the Group’s share of net assets of the investments.
The interest in associates is the carrying amount of the investments in associates under the equity method together
with any long-term interest that, in substance, form part of the Group’s net interest in the associates.
The excess of the cost of investment over the Group’s share of the net fair value of net assets of the associates’
identifiable assets, liabilities and contingent liabilities at the date of acquisition represents goodwill. Goodwill relating
to the associate is included in the carrying amount of the investment and is not amortised. The excess of the Group’s
share of the net fair value of the net assets of the associates’ identifiable assets, liabilities and contingent liabilities over
the cost of investment at the date of acquisition is recognised in consolidated profit or loss.
The Group’s share of results of the associates during the financial year is recognised in consolidated profit or loss, after
adjustments to align the accounting policies with those of the Group, from the date that significant influence
commences until the date that significant influence ceases. Distributions received from the associates reduce the
carrying amount of the investments. Adjustments to the carrying amount may also be necessary for changes in the
Group’s proportionate interest in the associate arising from changes in the associate’s equity that have not been
recognised in the associate’s profit or loss. Such changes include those arising from the revaluation of property, plant
and equipment and from foreign currency translation differences. The Group’s share of those changes is recognised
directly in equity of the Group.
When the Group’s share of losses exceeds its interest in the associate, the carrying amount of that interest is reduced
to nil and the Group does not recognise further losses unless it has incurred legal or constructive obligations or made
payments on its behalf.
The most recent available financial statements of the associates are used by the Group in applying the equity method.
Where the reporting period of the financial statements are not coterminous, the share of results is arrived at using the
latest financial statements for which the difference in reporting period is no more than three (3) months. Adjustments
are made for the effects of any significant transactions or events that occur between the intervening periods.
Upon disposal of an investment in associate, the difference between the net disposal proceeds and its carrying amount
is included in profit or loss.
Notes to the Financial Statements
IOI
Cor
por
atio
n B
erh
ad
144
5. SIGNIFICANT ACCOUNTING POLICIES (Continued)
5.1 Basis of Consolidation (Continued)
5.1.4 Jointly controlled entities
Jointly controlled entities are joint ventures that involve the establishment of a corporation, partnership or other entity
over which there is a contractually agreed sharing or joint control over the economic activities of the entities. Joint
control exists when strategic financial and operational decisions relating to the activities require the unanimous consent
of all the parties sharing control.
In the Company’s separate financial statements, investments in jointly controlled entities are stated at cost less
impairment losses, if any.
Jointly controlled entities are accounted for in the consolidated financial statements using the equity method of
accounting. The consolidated financial statements include the Group’s share of the income and expenses of the equity
accounted jointly controlled entities, after adjustments to align the accounting policies with those of the Group, from
the date that joint control commences until the date that joint control ceases.
The Group recognises the portion of gains or losses on the sale of assets by the Group to the joint venture that is
attributable to the other venturers. The Group does not recognise its share of profits or losses from the joint venture
that result from the purchase of assets by the Group from the joint venture until it resells the assets to an independent
party. However, a loss on the transaction is recognised immediately if the loss provides evidence of a reduction in the
net realisable value of current assets or an impairment loss. When necessary, in applying the equity method, adjustments
are made to the financial statements of the jointly controlled entity to ensure consistency of accounting policies with
those of the Group.
Adjustments to the carrying amount may also be necessary for changes in the Group’s proportionate interest in the
jointly controlled entity arising from changes in the jointly controlled entity’s equity that have not been recognised in
the jointly controlled entity’s profit or loss. Such changes include those arising from the revaluation of property, plant
and equipment and from foreign exchange translation differences. The Group’s share of those changes is recognised
directly in equity of the Group.
Upon disposal of such investment, the difference between the net disposal proceeds and its carrying amount is
included in profit or loss.
5.1.5 Transactions eliminated on consolidation
Intragroup transactions and balances and the resulting unrealised gains are eliminated on consolidation. Unrealised
losses resulting from intragroup transactions are also eliminated unless cost cannot be recovered.
Unrealised profits arising on transactions between the Group and its associates and jointly controlled entities, which are
included in the carrying amount of the related assets and liabilities are eliminated partially to the extent of the Group’s
interests in the associates and jointly controlled entities. Unrealised losses on such transactions are also eliminated
partially unless cost cannot be recovered.
Annual Report 2013
IOI
Cor
por
atio
n B
erh
ad
145
5. SIGNIFICANT ACCOUNTING POLICIES (Continued)
5.2 Foreign Currency
5.2.1 Functional and presentation currency
The separate financial statements of each entity of the Group are measured using the currency of the primary economic
environment in which the entity operates (“the functional currency”). The consolidated financial statements are
presented in Ringgit Malaysia (“RM”), which is also the Company’s functional currency.
5.2.2 Foreign currency translation and balances
Transactions in foreign currencies are converted into the relevant functional currency at rates of exchange ruling at the
transaction dates. Monetary assets and liabilities in foreign currencies at the end of the reporting period are translated
into the relevant functional currency at rates of exchange ruling at that date. All exchange differences arising from the
settlement of foreign currency transactions and from the translation of foreign currency monetary assets and liabilities
are included in profit or loss in the period in which they arise. Non-monetary items initially denominated in foreign
currencies, which are carried at historical cost, are translated using the historical rate as of the date of acquisition, and
non-monetary items which are carried at fair value are translated using the exchange rate that existed when the values
were determined for presentation currency purposes.
5.2.3 Foreign operations
Financial statements of foreign operations are translated at the end of the reporting period exchange rates with respect
to their assets and liabilities, and at exchange rates at the dates of the transactions with respect to the statement of
profit or loss and other comprehensive income. All resulting translation differences are recognised as a separate
component of equity.
Exchange differences arising on a monetary item that forms part of the net investment of the Company in a foreign
operation shall be recognised in profit or loss in the separate financial statements of the Company or the foreign
operation, as appropriate. In the consolidated financial statements, such exchange differences shall be recognised
initially as a separate component of equity and recognised in profit or loss upon disposal of the net investment. When
a foreign operation is partially disposed of or sold, exchange differences that were recorded in equity are recognised in
profit or loss as part of the gain or loss on disposal.
Goodwill and fair value adjustments to the assets and liabilities arising from the acquisition of a foreign operation are
treated as assets and liabilities of the acquired entity and translated at the exchange rate ruling at the end of the
reporting period.
5.3 Property, Plant and Equipment and Depreciation
All items of property, plant and equipment are initially measured at cost. Cost includes expenditure that is directly attributable
to the acquisition of the items. The cost of self-constructed assets includes the cost of materials and direct labour, any other
costs directly attributable to bringing the assets to working condition for its intended use, and the costs of dismantling and
removing the items and restoring the site on which they are located.
Subsequent costs are included in the asset’s carrying amount or recognised as a separate asset, as appropriate, only when the
cost is incurred and it is probable that future economic benefits associated with the cost will flow to the Group and the cost
of the item can be measured reliably. The carrying amount of parts that are replaced is derecognised. The cost of the day-to-
day servicing of property, plant and equipment are charged to profit or loss during the financial year in which they are
incurred.
Each part of an item of property, plant and equipment with a cost that is significant in relation to the total cost of the item
and which have different useful lives, is depreciated separately.
After initial recognition, property, plant and equipment are stated at cost less accumulated depreciation and any accumulated
impairment losses.
Notes to the Financial Statements
IOI
Cor
por
atio
n B
erh
ad
146
5. SIGNIFICANT ACCOUNTING POLICIES (Continued)
5.3 Property, Plant and Equipment and Depreciation (Continued)
Freehold land has an unlimited useful life and therefore is not depreciated.
Construction in progress is also not depreciated until such time when the asset is available for use.
Other property, plant and equipment are depreciated on the straight-line method so as to write off the cost of the assets over
their estimated useful lives. The principal depreciation periods and annual rates are as follows:
Long term leasehold land over the lease period up to 99 years
Golf course development expenditure 2% – 2.5%
Buildings and improvements 2% – 10%
Plant and machinery 4% – 20%
Motor vehicles 10% – 20%
Furniture, fittings and equipment 5% – 33%
At the end of each reporting period, the carrying amount of an item of property, plant and equipment is assessed for
impairment when events or changes in circumstances indicate that its carrying amount may not be recoverable. A write-down
is made if the carrying amount exceeds the recoverable amount.
The residual values, useful lives and depreciation method are reviewed at the end of each reporting period to ensure that the
amount, method and period of depreciation are consistent with previous estimates and the expected pattern of consumption
of the future economic benefits embodied in the items of property, plant and equipment. The estimates of the residual values,
useful lives and related depreciation charges for the property, plant and equipment are based on commercial and production
factors. The Group anticipates that the residual values of its property, plant and equipment will be insignificant.
The carrying amount of an item of property, plant and equipment is derecognised on disposal or when no future economic
benefits are expected from its use or disposal. The difference between the net disposal proceeds, if any, and the carrying
amount is recognised in profit or loss.
When the use of a property changes from owner-occupied to investment property, the property is remeasured to fair value
and reclassified as investment property. Any gain arising on remeasurement is recognised directly in equity. Any loss is
recognised immediately in profit or loss.
The fair value of property, plant and equipment recognised as a result of a business combination is based on market values.
The market value of plant and equipment is the estimated amount for which a plant and equipment could be exchanged
between a willing buyer and a willing seller in an arm’s length transaction after proper marketing wherein the parties had
each acted knowledgeably, prudently and without compulsion. The market value of property is the estimated amount for
which a property could be exchanged on the date of valuation between a willing buyer and a willing seller in an arm’s length
transaction after proper marketing wherein the parties had each acted knowledgeably, prudently and without compulsion.
5.4 New Planting and Replanting Expenditure
New planting expenditure, which represents the total cost incurred from land clearing to the point of harvesting, is capitalised
under plantation development expenditure and is not amortised. Replanting expenditure, which represents cost incurred in
replanting old planted areas, is charged to profit or loss in the financial year it is incurred.
Annual Report 2013
IOI
Cor
por
atio
n B
erh
ad
147
5. SIGNIFICANT ACCOUNTING POLICIES (Continued)
5.5 Borrowing Costs
Borrowing costs that are directly attributable to the acquisition, construction or production of a qualifying asset is capitalised
as part of the cost of the asset until when substantially all the activities necessary to prepare the asset for its intended use or
sale are complete, after which such expense is charged to profit or loss. A qualifying asset is an asset that necessarily takes a
substantial period of time to get ready for its intended use or sale. Capitalisation of borrowing cost is suspended during
extended periods in which active development is interrupted.
The amount of borrowing costs eligible for capitalisation is the actual borrowing costs incurred on the borrowing during the
period less any investment income on the temporary investment of the borrowing.
All other borrowing costs are recognised in profit or loss in the period in which they are incurred.
5.6 Leases
5.6.1 Finance leases
A lease is recognised as a finance lease if it transfers substantially to the Group all the risks and rewards incidental to
ownership. Assets acquired under finance leases are recognised initially at amounts equal to the fair value of the leased
assets or, if lower, the present value of the minimum lease payments, each determined at the inception of the lease.
Any initial direct costs incurred by the Group are added to the amount recognised as an asset. The assets are capitalised
as property, plant and equipment and the corresponding obligations, net of finance charges, are included in borrowings.
The property, plant and equipment capitalised are depreciated on the same basis as owned assets as disclosed in Note
5.3 to the financial statements.
The minimum lease payments are allocated between finance charges and the reduction of the outstanding liability. The
finance charges are recognised in profit or loss over the period of the lease term so as to produce a constant periodic
rate of interest on the remaining finance lease obligations.
Leases of land and buildings are classified as operating or finance leases in the same way as leases of other assets. The
land and buildings elements of a lease are considered separately for the purpose of lease classification. All leases that
do not transfer substantially all the risks and the rewards are classified as operating leases other than the following:
property held under operating leases that would otherwise meet the definition of an investment property is
classified as an investment property on a property-by-property basis and, if classified as investment property, is
accounted for as if held under a finance lease; and
land held for own use under an operating lease, the fair value of which cannot be measured separately from the
fair value of a building situated thereon at the inception of the lease, is accounted for as being held under a finance
lease, unless the building is also clearly held under an operating lease.
5.6.2 Operating lease – the Group as lessee
Leases of assets under which all the risks and rewards incidental to ownership are retained by the lessor are classified
as operating leases. Payments made under operating leases are charged to profit or loss on a straight-line basis over
the period of the lease.
5.6.3 Lease of land and building
The minimum lease payments including lump-sum upfront payments made to acquire the interest in the land and
building are allocated between the land and building elements in proportion to the relative fair values of the leasehold
interests in the land element and the buildings element at the inception of the lease.
The lump-sum upfront lease payments made represent prepaid lease payments and are amortised over the lease term
on a straight-line basis, except for leasehold land that is classified as an investment property or an asset held under
property development.
Notes to the Financial Statements
IOI
Cor
por
atio
n B
erh
ad
148
5. SIGNIFICANT ACCOUNTING POLICIES (Continued)
5.6 Leases (Continued)
5.6.3 Lease of land and building (Continued)
For leases of land and buildings in which the amount that would initially be recognised for the land element is
immaterial, the land and buildings are treated as a single unit for the purpose of lease classification and is accordingly
classified as a finance or operating lease. In such a case, the economic life of the building is regarded as the economic
life of the entire leased asset.
Leasehold land which in substance is a finance lease is classified as property, plant and equipment.
5.7 Property Development Activities
5.7.1 Land held for property development
Land held for property development consists of land where no significant development activity have been carried out
or where development activities are not expected to be completed within the normal operating cycle. Such land is
classified within non-current assets and is stated at cost less any accumulated impairment losses.
Cost associated with the acquisition of land includes the purchase price of the land, professional fees, stamp duty,
commission, conversion fees and other relevant levies.
Land held for property development is reclassified as property development costs at the point when development
activities have commenced and where it can be demonstrated that the development activities can be completed within
the normal operating cycle.
5.7.2 Property development costs
Property development costs comprise costs associated with the acquisition of land and all costs that are directly
attributable to development activities or that can be allocated on a reasonable basis to such activities. They comprise
the cost of land under development, construction costs and other related development costs common to the whole
project.
Property development costs not recognised as an expense is recognised as an asset and is measured at the lower of
cost and net realisable value.
The excess of revenue recognised in profit or loss over billings to purchasers is shown as accrued billings under trade
and other receivables and the excess of billings to purchasers over revenue recognised in profit or loss is shown as
progress billings under trade and other payables.
5.8 Investment Properties
Investment properties are properties, which are held either to earn rental yields or for capital appreciation or for both and are
not occupied by the Group. Investment properties also include properties that are being constructed or developed for future
use as investment properties. Such properties are initially measured at cost, including transaction costs. Subsequent to initial
recognition, investment properties are stated at fair value. Fair value is arrived at by reference to market evidence of
transaction prices for similar properties and is performed by registered independent valuers having appropriate recognised
professional qualifications and recent experience in the location and category of the properties being valued and where
appropriate, on the investment method.
If the Group determines that the fair value of an investment property under construction is not reliably determinable but
expects the fair value of the property to be reliably determinable when construction is complete, the Group shall measure that
investment property under construction at cost until either its fair value becomes reliably determinable or construction is
completed (whichever is earlier). Once the Group is able to measure reliably the fair value of an investment property under
construction that has previously been measured at cost, the Group shall measure that property at its fair value.
Annual Report 2013
IOI
Cor
por
atio
n B
erh
ad
149

5. SIGNIFICANT ACCOUNTING POLICIES (Continued)
5.8 Investment Properties (Continued)
Properties that are occupied by companies in the Group are accounted for as owner-occupied rather than as investment
properties in the consolidated financial statements.
Gains or losses arising from changes in the fair values of investment properties are recognised in profit or loss in the financial
year in which they arise.
A property interest under an operating lease is classified and accounted for as an investment property on a property-by-
property basis when the Group holds it to earn rentals or for capital appreciation or both. Any such property interest under
an operating lease classified as an investment property is carried at fair value.
Investment properties are derecognised when either they have been disposed off or when the investment property is
permanently withdrawn from use and no future economic benefit is expected from its disposal. The gain or loss arising from
the retirement or disposal of investment property is determined as the difference between the net disposal proceeds, if any,
and the carrying amount of the asset and is recognised in profit or loss in the period of the retirement or disposal.
When the use of a property changes from investment property to owner-occupied, the property is remeasured to fair value
and reclassified as property, plant and equipment. Any gain or loss arising on remeasurement is recognised directly in profit
or loss.
5.9 Construction Contracts
Contract cost comprises cost related directly to the specific contract and those that are attributable to the contract activity in
general and can be allocated to the contract and such other costs that are specifically chargeable to the customer under the
terms of the contract. Contract cost includes direct materials, expenses, labour and an appropriate proportion of construction
overheads.
The aggregate costs incurred and profit or loss recognised on each contract is compared against the progress billings up to
the financial year end. Where costs incurred and recognised profits (less recognised losses) exceed progress billings, the
balance is shown as amounts due from customers on contracts. Where progress billings exceed costs incurred plus recognised
profits (less recognised losses), the balance is shown as amounts due to customers on contracts.
5.10 Inventories
Inventories are stated at the lower of cost and net realisable value.
Cost is determined on a weighted average basis. Cost comprises the original cost of purchase plus the cost of bringing the
inventories to their intended location and condition. The cost of produce and finished goods includes the cost of raw
materials, direct labour and a proportion of production overheads.
Inventories of completed development properties are stated at the lower of cost and net realisable value. Cost is determined
on a specific identification basis and includes land, all direct building costs and other related development costs.
Net realisable value is the estimated selling price in the ordinary course of business, less the estimated costs of completion
and selling expenses.
5.11 Cash and Cash Equivalents
Cash and cash equivalents include cash and bank balances, bank overdrafts, deposits and other short term, highly liquid
investments and short term funds with original maturities of three (3) months or less, which are readily convertible to cash
and are subject to insignificant risk of changes in value.
Notes to the Financial Statements
IOI
Cor
por
atio
n B
erh
ad
150
5. SIGNIFICANT ACCOUNTING POLICIES (Continued)
5.12 Goodwill
Goodwill recognised in a business combination is an asset at the acquisition date and is initially measured at cost, being the
excess of the sum of the consideration transferred, the amount of any non-controlling interest in the acquiree and the fair
value of the acquirer’s previously held equity interest (if any) in the entity over net of the acquisition-date amounts of the
identifiable assets acquired and the liabilities assumed. If, after reassessment, the Group’s interest in the fair value of the
acquiree’s identifiable net assets exceeds the sum of the consideration transferred, the amount of any non-controlling
interest in the acquiree and the fair value of the acquirer’s previously held equity interest in the acquiree (if any), the excess
is recognised immediately in profit or loss as a bargain purchase gain.
After initial recognition, goodwill is measured at cost less accumulated impairment losses, if any. Goodwill is not amortised
but instead tested for impairment annually or more frequently if events or changes in circumstances indicate that the
carrying amount may be impaired. Gains and losses on the disposal of an entity include the carrying amount of goodwill
relating to the entity sold.
Goodwill arising on acquisition of an associate is the excess of cost of investment over the Group’s share of the net fair value
of net assets of the associates’ identifiable assets and liabilities at the date of acquisition.
Goodwill relating to the associate is included in the carrying amount of the investment and is not amortised. The excess of
the Group’s share of the net fair value of the associate’s identifiable assets and liabilities over the cost of investment is
included as income in the determination of the Group’s share of the associate’s profit or loss in the period in which the
investment is acquired.
5.13 Impairment of Non-financial Assets
The carrying amounts of assets, other than inventories, deferred tax assets, assets arising from construction contracts, assets
arising from employee benefits, investment properties, property development costs, non-current assets (or disposal groups)
held for sale/held for distribution to owners and financial assets (other than investments in subsidiaries, associates and jointly
controlled entities) are reviewed at the end of each reporting period to determine whether there is any indication of
impairment. If such indication exists, impairment is measured by comparing the carrying value of the assets with their
recoverable amounts.
For goodwill, the recoverable amount is estimated at the end of each reporting period or more frequently when indicators
of impairment are identified.
For the purpose of impairment testing of these assets, recoverable amount is determined on an individual asset basis unless
the asset does not generate cash flows that are largely independent of those from other assets. If this is the case, recoverable
amount is determined for the Cash-generating Unit (“CGU”) to which the asset belongs. Goodwill acquired in a business
combination is, from the acquisition date, allocated to each of the Group’s CGUs, or groups of CGUs, that are expected to
benefit from the synergies of the combination, irrespective of whether other assets or liabilities of the Group are assigned to
those units or groups of units.
Goodwill acquired in a business combination shall be tested for impairment as part of the impairment testing of the CGU to
which it relates. The CGU to which goodwill is allocated shall represent the lowest level within the Group at which the
goodwill is monitored for internal management purposes and not larger than an operating segment determined in
accordance with FRS 8 Operating Segments.
Recoverable amount is the higher of net selling price and value-in-use, which is measured by reference to discounted future
cash flows. In estimating value-in-use, the estimated future cash inflows and outflows to be derived from continuing use of
the asset and from its ultimate disposal are discounted to their present value using a pre-tax discount rate that reflects
current market assessments of the time value of money and the risks specific to the asset for which the future cash flow
estimates have not been adjusted.
Annual Report 2013
IOI
Cor
por
atio
n B
erh
ad
151
5. SIGNIFICANT ACCOUNTING POLICIES (Continued)
5.13 Impairment of Non-financial Assets (Continued)
An impairment loss is recognised whenever the carrying amount of an asset exceeds its recoverable amount. The impairment
loss is charged to profit or loss unless it reverses a previous revaluation in which case it will be charged to equity.
Impairment loss on goodwill is not reversed in subsequent periods. An impairment loss for an asset other than goodwill is
reversed if, and only if, there has been a change in the estimates used to determine the asset’s recoverable amount since
the last impairment loss was recognised.
The carrying amount of an asset other than goodwill is increased to its revised recoverable amount, provided that this
amount does not exceed the carrying amount that would have been determined (net of amortisation or depreciation) had
no impairment loss been recognised for the asset in prior years. A reversal of impairment loss for an asset other than
goodwill is recognised in profit or loss, unless the asset is carried at revalued amount, in which case, such reversal is treated
as a revaluation increase.
5.14 Financial Instruments
A financial instrument is any contract that gives rise to a financial asset of one enterprise and a financial liability or equity
instrument of another enterprise.
A financial asset is any asset that is cash, an equity instrument of another enterprise, a contractual right to receive cash or
another financial asset from another enterprise, or a contractual right to exchange financial assets or financial liabilities with
another enterprise under conditions that are potentially favourable to the Group.
A financial liability is any liability that is a contractual obligation to deliver cash or another financial asset to another
enterprise, or a contractual obligation to exchange financial assets or financial liabilities with another enterprise under
conditions that are potentially unfavourable to the Group.
Financial instruments are classified as assets, liabilities or equity in accordance with the substance of the contractual
arrangement. At initial recognition, a financial instrument is recognised at fair value plus, in the case of a financial instrument
not at fair value through profit or loss, transaction costs that are directly attributable to the acquisition or issuance of the
financial instrument. Interest, dividends and losses and gains relating to a financial instrument or a component that is a
financial liability shall be recognised as income or expense in profit or loss. Distributions to holders of an equity instrument
are debited directly to equity, net of any related tax effect. Financial instruments are offset when the Group has a legally
enforceable right to offset and intends to settle on a net basis or to realise the asset and settle the liability simultaneously.
An embedded derivative is separated from the host contract and accounted for as a derivative if, and only if the economic
characteristics and risks of the embedded derivative is not closely related to the economic characteristics and risks of the
host contract, a separate instrument with the same terms as the embedded derivative meets the definition of a derivative,
and the hybrid instrument is not measured at fair value through profit or loss.
5.14.1 Financial assets
A financial asset is classified into the following four categories after initial recognition for the purpose of subsequent
measurement:
i. Financial assets at fair value through profit or loss
Financial assets at fair value through profit or loss comprise financial assets that are held for trading
(i.e. financial assets acquired principally for the purpose of resale in the near term), derivatives (both,
freestanding and embedded) and financial assets that were specifically designated into this classification upon
initial recognition.
Subsequent to initial recognition, financial assets classified as at fair value through profit or loss are measured
at fair value. Any gains or losses arising from changes in the fair value of financial assets classified as at fair value
through profit or loss are recognised in profit or loss. Net gains or losses on financial assets classified as at fair
value through profit or loss exclude foreign exchange gains and losses, interest and dividend income. Such
income is recognised separately in profit or loss as components of other income or other operating losses.
Notes to the Financial Statements
IOI
Cor
por
atio
n B
erh
ad
152
5. SIGNIFICANT ACCOUNTING POLICIES (Continued)
5.14 Financial Instruments (Continued)
5.14.1 Financial assets (Continued)
i. Financial assets at fair value through profit or loss (Continued)
However, derivatives that are linked to and must be settled by delivery of unquoted equity instruments that
do not have a quoted market price in an active market are recognised at cost.
Financial assets classified as financial assets at fair value through profit or loss include short term investment
and short term funds.
ii. Held-to-maturity investments
Financial assets classified as held-to-maturity comprise non-derivative financial assets with fixed or determinable
payments and fixed maturity that the Group has the positive intention and ability to hold to maturity.
Subsequent to initial recognition, financial assets classified as held-to-maturity are measured at amortised cost
using the effective interest method. Gains or losses on financial assets classified as held-to-maturity are
recognised in profit or loss when the financial assets are derecognised or impaired, and through the
amortisation process.
iii. Loans and receivables
Financial assets classified as loans and receivables comprise non-derivative financial assets with fixed or
determinable payments that are not quoted in an active market.
Subsequent to initial recognition, financial assets classified as loans and receivables are measured at amortised
cost using the effective interest method. Gains or losses on financial assets classified as loans and receivables
are recognised in profit or loss when the financial assets are derecognised or impaired, and through the
amortisation process.
iv. Available-for-sale financial assets
Financial assets classified as available-for-sale comprise non-derivative financial assets that are designated as
available-for-sale or are not classified as loans and receivables, held-to-maturity investments or financial assets
at fair value through profit or loss.
Subsequent to initial recognition, financial assets classified as available-for-sale are measured at fair value. Any
gains or losses arising from changes in the fair value of financial assets classified as available-for-sale are
recognised directly in other comprehensive income, except for impairment losses and foreign exchange gains
and losses, until the financial asset is derecognised, at which time the cumulative gains or losses previously
recognised in other comprehensive income are recognised in profit or loss. However, interest calculated using
the effective interest method is recognised in profit or loss whilst dividends on available-for-sale equity
instruments are recognised in profit or loss when the Group’s right to receive payment is established.
A financial asset is derecognised when the contractual right to receive cash flows from the financial asset has
expired. On derecognition of a financial asset in its entirety, the difference between the carrying amount and the
sum of consideration received (including any new asset obtained less any new liability assumed) and any cumulative
gain or loss that had been recognised directly in other comprehensive income shall be recognised in profit or loss.
A regular way purchase or sale is a purchase or sale of a financial asset under a contract whose terms require
delivery of the asset within the time frame established generally by regulation or marketplace convention. A regular
way purchase or sale of financial assets shall be recognised and derecognised, as applicable, using trade date
accounting.
Annual Report 2013
IOI
Cor
por
atio
n B
erh
ad
153
5. SIGNIFICANT ACCOUNTING POLICIES (Continued)
5.14 Financial Instruments (Continued)
5.14.2 Financial liabilities
Financial instruments are classified as liabilities or equity in accordance with the substance of the contractual
arrangement. A financial liability is classified into the following two categories after initial recognition for the
purpose of subsequent measurement:
i. Financial liabilities at fair value through profit or loss
Financial liabilities at fair value through profit or loss comprise financial liabilities that are held for trading,
derivatives (both, freestanding and embedded) and financial liabilities that were specifically designated into this
classification upon initial recognition.
Subsequent to initial recognition, financial liabilities classified as at fair value through profit or loss are measured
at fair value. Any gains or losses arising from changes in the fair value of financial liabilities classified as at fair
value through profit or loss are recognised in profit or loss. Net gains or losses on financial liabilities classified
as at fair value through profit or loss exclude foreign exchange gains and losses, interest and dividend income.
Such income is recognised separately in profit or loss as components of other income or other operating losses.
ii. Other financial liabilities
Financial liabilities classified as other financial liabilities comprise non-derivative financial liabilities that are
neither held for trading nor initially designated as at fair value through profit or loss.
Subsequent to initial recognition, other financial liabilities are measured at amortised cost using the effective
interest method. Gains or losses on other financial liabilities are recognised in profit or loss when the financial
liabilities are derecognised and through the amortisation process.
A financial liability is derecognised when, and only when, it is extinguished, i.e. when the obligation specified in the
contract is discharged or cancelled or expires. An exchange between an existing borrower and lender of debt
instruments with substantially different terms are accounted for as an extinguishment of the original financial
liability and the recognition of a new financial liability. Similarly, a substantial modification of the terms of an
existing financial liability is accounted for as an extinguishment of the original financial liability and the recognition
of a new financial liability.
Any difference between the carrying amount of a financial liability extinguished or transferred to another party and
the consideration paid, including any non-cash assets transferred or liabilities assumed, is recognised in profit or loss.
All financial liabilities of the Group are measured at amortised cost except for financial liabilities at fair value through
profit or loss, which are held for trading (including derivatives) or designated at fair value through profit or loss upon
initial recognition. Financial liabilities designated at fair value through profit or loss include exchangeable bonds.
A financial guarantee contract is a contract that requires the issuer to make specified payments to reimburse the
holder for a loss it incurs because a specified debtor fails to make payment when due in accordance with the
original or modified terms of a debt instrument.
The Group designates corporate guarantees given to banks for credit facilities granted to subsidiaries as insurance
contracts as defined in FRS 4 Insurance Contracts. The Group recognises these insurance contracts as recognised
insurance liabilities when there is a present obligation, legal or constructive, as a result of a past event, when it is
probable that an outflow of resources embodying economic benefits will be required to settle the obligation and a
reliable estimate can be made of the amount of the obligation.
At the end of every reporting period, the Group shall assess whether its recognised insurance liabilities are adequate,
using current estimates of future cash flows under its insurance contracts. If this assessment shows that the carrying
amount of the insurance liabilities is inadequate, the entire deficiency shall be recognised in profit or loss.
Recognised insurance liabilities are only removed from the statement of financial position when, and only when, it
is extinguished via a discharge, cancellation or expiration.
Notes to the Financial Statements
IOI
Cor
por
atio
n B
erh
ad
154
5. SIGNIFICANT ACCOUNTING POLICIES (Continued)
5.14 Financial Instruments (Continued)
5.14.3 Equity instruments
An equity instrument is any contract that evidences a residual interest in the assets of the Group and the Company
after deducting all of its liabilities. Ordinary shares are classified as equity instruments.
Ordinary shares are classified as equity and are recorded at their nominal value and proceeds in excess of the
nominal value of shares issued, if any, are accounted for as share premium. Both ordinary shares and share premium
are classified as equity. Interim dividends to shareholders are recognised in equity in the period in which they are
declared. Final dividends are recognised upon approval by shareholders in a general meeting.
The transaction costs of an equity transaction are accounted for as a deduction from equity, net of tax. Equity
transaction costs comprise only those incremental external costs directly attributable to the equity transaction,
which would otherwise have been avoided.
The Group measures a liability to distribute non-cash assets as a dividend to the owners of the Company at the fair
value of the assets to be distributed. The carrying amount of the dividend is remeasured at the end of each
reporting period and at the settlement date, with any changes recognised directly in equity as adjustments to the
amount of the distribution. On settlement of the transaction, the Group recognises the difference, if any, between
the carrying amount of the assets distributed and the carrying amount of the liability in profit or loss.
When issued shares of the Company are repurchased, the consideration paid, including any attributable transaction
costs, is presented as a change in equity. Repurchased shares that have not been cancelled are classified as treasury
shares and presented as a deduction from equity. No gain or loss is recognised in profit or loss on the sale, re-
issuance or cancellation of treasury shares. When treasury shares are reissued by resale, the difference between the
sales consideration and the carrying amount of the treasury shares is shown as a movement in equity.
5.14.4 Derivative financial instruments
Derivative financial instruments are initially recognised at fair value on the date a derivative contract is entered into
and subsequently remeasured at their fair value. Any gains or losses arising from changes in the fair value of these
contracts are recognised in profit or loss.
However, derivatives that are linked to and must be settled by delivery of unquoted equity instruments that do not
have a quoted market price in an active market are recognised at cost.
5.15 Impairment of Financial Assets
The Group assesses whether there is any objective evidence that a financial asset is impaired at the end of each reporting
period.
i. Held-to-maturity investments and loans and receivables
The Group collectively considers factors such as the probability of bankruptcy or significant financial difficulties of the
receivable, and default or significant delay in payments to determine whether there is objective evidence that an
impairment loss on held-to-maturity investments and loans and receivables has occurred. Other objective evidence of
impairment include historical collection rates determined on an individual basis and observable changes in national or
local economic conditions that are directly correlated with the historical default rates of receivables.
If any such objective evidence exists, the amount of impairment loss is measured as the difference between the financial
asset’s carrying amount and the present value of estimated future cash flows discounted at the financial asset’s original
effective interest rate. The impairment loss is recognised in profit or loss.
The carrying amount of held-to-maturity investments is directly reduced by the impairment loss whilst the carrying
amount of loans and receivables are reduced through the use of an allowance account.
If in a subsequent period, the amount of the impairment loss decreases and it objectively relates to an event occurring
after the impairment was recognised, the previously recognised impairment loss is reversed to the extent that the
carrying amount of the asset does not exceed its amortised cost at the reversal date. The amount of impairment
reversed is recognised in profit or loss.
Annual Report 2013
IOI
Cor
por
atio
n B
erh
ad
155
5. SIGNIFICANT ACCOUNTING POLICIES (Continued)
5.15 Impairment of Financial Assets (Continued)
ii. Available-for-sale financial assets
The Group collectively considers factors such as significant or prolonged decline in fair value below cost, significant
financial difficulties of the issuer or obligor, and the disappearance of an active trading market as objective evidence
that available-for-sale financial assets are impaired.
If any such objective evidence exists, an amount comprising the difference between the financial asset’s cost (net of
any principal payment and amortisation) and current fair value, less any impairment loss previously recognised in profit
or loss, is transferred from equity to profit or loss.
Impairment losses on available-for-sale equity investments are not reversed in profit or loss in subsequent periods.
Instead, any increase in fair value subsequent to the impairment loss is recognised in other comprehensive income.
Impairment losses on available-for-sale debt investments are subsequently reversed in profit or loss if the increase in
the fair value of the investment can be objectively related to an event occurring after the recognition of the impairment
loss in profit or loss.
5.16 Provisions
Provisions are recognised when there is a present obligation, legal or constructive, as a result of a past event, when it is
probable that an outflow of resources embodying economic benefits would be required to settle the obligation and a
reliable estimate can be made of the amount of the obligation.
If the effect of the time value of money is material, the amount of a provision will be discounted to its present value at a
pre-tax rate that reflects current market assessments of the time value of money and the risks specific to the liability.
Provisions are reviewed at the end of each reporting period and adjusted to reflect current best estimates. If it is no longer
probable that an outflow of resources embodying economic benefits would be required to settle the obligation, the
provision would be reversed.
Provisions for restructuring are recognised when the Group has approved a detailed formal restructuring plan, and the
restructuring either has commenced or has been announced publicly.
Provisions are not recognised for future operating losses. If the Group has a contract that is onerous, the present obligation
under the contract shall be recognised and measured as a provision.
5.17 Contingent Liabilities and Contingent Assets
A contingent liability is a possible obligation that arises from past events whose existence will be confirmed by the
occurrence or non-occurrence of one or more uncertain future events beyond the control of the Group or a present
obligation that is not recognised because it is not probable that an outflow of resources will be required to settle the
obligation. A contingent liability also arises in extremely rare cases where there is a liability that cannot be recognised
because it cannot be measured reliably. The Group does not recognise a contingent liability but discloses its existence in
the financial statements.
A contingent asset is a possible asset that arises from past events whose existence will be confirmed by the occurrence or
non-occurrence of one or more uncertain future events beyond the control of the Group. The Group does not recognise
contingent assets but disclosed its existence where inflows of economic benefits are probable, but not virtually certain.
In the acquisition of subsidiaries by the Group under business combinations, contingent liabilities assumed are measured
initially at their fair values at the acquisition dates.
Notes to the Financial Statements
IOI
Cor
por
atio
n B
erh
ad
156
5. SIGNIFICANT ACCOUNTING POLICIES (Continued)
5.18 Revenue Recognition
Revenue is measured at the fair value of the consideration received or receivable and is recognised when it is probable that
the economic benefits associated with the transaction will flow to the entities and the amount of the revenue can be
measured reliably.
5.18.1 Commodities, other products and services
Revenue is recognised upon delivery of products and customer acceptance, if any, or performance of services, net
of sales taxes and discounts.
5.18.2 Property development
Revenue from property development is recognised based on the “percentage of completion” method in respect of
all units that have been sold. The percentage of completion is determined based on the proportion of property
development costs incurred for work performed up to the end of the reporting period over the estimated total
property development costs.
When the outcome of a development activity cannot be reliably estimated, the property development revenue shall
be recognised only to the extent of property development costs incurred that is probable to be recoverable and
property development costs on the development units sold are recognised as an expense in the period in which
they are incurred.
Any expected loss on a development project, including costs to be incurred over the defects liability period, is
recognised immediately in profit or loss.
5.18.3 Construction contracts
Revenue from work done on construction contracts is recognised based on the “percentage of completion” method.
The percentage of completion is determined based on the proportion of contract costs incurred for work performed
up to the reporting period over the estimated total contract costs.
When the outcome of a construction contract cannot be estimated reliably, contract revenue shall be recognised
only to the extent of contract costs incurred that is probable to be recoverable and contract costs are recognised
as an expense in the period in which they are incurred.
When it is probable that total contract costs will exceed total contract revenue, the foreseeable loss is recognised
as an expense immediately.
5.18.4 Dividend income
Dividend income is recognised when shareholder’s right to receive payment is established.
5.18.5 Rental income
Rental income from investment properties is recognised based on the accruals basis.
5.18.6 Interest income
Interest income is recognised in profit or loss as it accrues.
5.18.7 Management fees
Management fees are recognised when services are rendered.
Annual Report 2013
IOI
Cor
por
atio
n B
erh
ad
157
5. SIGNIFICANT ACCOUNTING POLICIES (Continued)
5.19 Employee Benefits
5.19.1 Short term employee benefits
Wages, salaries, other monetary and non-monetary benefits are accrued in the period in which the associated
services are rendered by employees of the Group.
Short term accumulating compensated absences such as paid annual leave are recognised as an expense when
employees render services that increase their entitlement to future compensated absences. Short term non-
accumulating compensated absences such as sick leave are recognised when absences occur and they lapse if the
current period’s entitlement is not used in full and do not entitle employees to a cash payment for unused
entitlement on leaving the Group.
Bonuses are recognised as an expense when there is a present, legal or constructive, obligation to make such
payments, as a result of past events and when a reliable estimate can be made of the amount of the obligation.
5.19.2 Retirement benefits
The Group has various retirement benefit plans in accordance with local conditions and practices in the countries
in which it operates. These benefit plans are either defined contribution or defined benefit plans.
A defined contribution plan is a pension plan under which the Group pays fixed contributions into a separate entity
(a fund) and will have no legal or constructive obligations to pay further contributions if the fund does not hold
sufficient assets to pay all employee benefits relating to employee service in the current and prior periods. A defined
benefit plan is a pension plan that defines the amount of pension benefit to be provided, usually as a function of
one or more factors such as age and years of service.
5.19.2.1 Defined contribution plans
The Company and its subsidiaries incorporated in Malaysia make contributions to a statutory provident
fund. Contributions to defined contribution plans are recognised as an expense in the period in which the
employees render their services. Once the contributions have been paid, the Group has no further
payment obligations.
5.19.2.2 Defined benefit plans
The Group operates various defined benefit plans for eligible employees of the Group. The amount
recognised as a liability in respect of the defined benefit plan is the present value of the defined benefit
obligations at the end of the reporting period less the fair value of plan assets, together with adjustments
for unrecognised actuarial gains and losses and unrecognised past service cost.
If the amount calculated results in an asset, the Group measures the resulting asset at the lower of the
amount calculated and the net total of any cumulative unrecognised actuarial losses and past service cost
and the present value of any economic benefits available in the form of refunds from the plan or
reductions in future contributions to the plan.
The Group determines the present value of the defined benefit obligations and the fair value of the plan
assets with sufficient regularity such that the amounts recognised in the financial statements do not differ
materially from the amounts that would be determined at the end of the reporting period.
The present value of the defined benefit obligations and the related current service cost and past service
cost are determined using the projected unit credit method by an actuary. The rate used to discount the
obligations is based on market yields at the end of the reporting period for high quality corporate bonds
or government bonds.
Notes to the Financial Statements
IOI
Cor
por
atio
n B
erh
ad
158
5. SIGNIFICANT ACCOUNTING POLICIES (Continued)
5.19 Employee Benefits (Continued)
5.19.2 Retirement benefits (Continued)
5.19.2.2 Defined benefit plans (Continued)
Actuarial gains and losses resulting from changes in the present value of the plan assets are recognised
as income or expense over the expected average remaining working lives of the employees participating
in that plan when the net cumulative unrecognised actuarial gains and losses at the end of the previous
reporting period exceed the higher of:
i. 10% of the present value of the defined benefit obligations at that date (before deducting plan
assets); and
ii. 10% of the fair value of any plan assets at that date.
In measuring its defined benefit liability, the Group recognises past service cost as an expense on a
straight-line basis over the average period until the benefits become vested. To the extent that the
benefits are already vested immediately following the introduction of, or changes to, the defined benefit
plan, the Group recognises past service cost immediately in profit or loss.
The Group recognises gain or losses in the curtailment or settlement of a defined benefit plan when the
curtailment or settlement occurs. The gain or loss on curtailment comprises any resulting change in the
fair value of plan assets, change in the present value of defined benefit obligation and any related
actuarial gains and losses and past service cost that had not previously been recognised.
Where the calculation results in a benefit to the Group, the recognised asset is limited to the net total of
any unrecognised actuarial losses and past service costs and the present value of any future refunds from
the plan or reduction in future contributions to the plan.
If the Group has an unconditional right to a refund during the life of the plan, it would recognise an asset
measured as the amount of the surplus at the reporting date that it has a right to receive a refund which
would be the fair value of the plan assets less the present value of the defined benefits obligation, less
any associated costs, such as taxes. If the amount of a refund is determined as the full amount or a
proportion of the surplus, rather than a fixed amount, the Group would make no adjustment for the time
value of money, even if the refund is realisable only at a future date.
If there is no minimum funding requirement for contributions relating to future service, the economic
benefit available as a reduction in future contributions is the present value of future service cost to the
entity for each period over the shorter of the expected life of the plan and the expected life of the entity.
The Group would assume that there would be no change to the benefits provided by a plan in the future
until the plan is amended and a stable workforce unless it is demonstrably committed at the reporting
dates to make a reduction in the number of employees covered by the plan.
5.19.3 Equity compensation benefits
The Group operates equity-settled share-based compensation plans, allowing certain employees of the Group to
acquire ordinary share of the Company at pre-determined prices. The compensation expense relating to share
options is now recognised within staff costs in profit or loss over the vesting periods of the grants with a
corresponding increase in equity.
The total amount to be recognised as compensation expense is determined by reference to the fair value of the
share options at the date of the grant and the number of share options to be vested by the vesting date. The fair
value of the share options is computed using a binomial options pricing model performed by an actuary.
Annual Report 2013
IOI
Cor
por
atio
n B
erh
ad
159
5. SIGNIFICANT ACCOUNTING POLICIES (Continued)
5.19 Employee Benefits (Continued)
5.19.3 Equity compensation benefits (Continued)
At the end of each reporting period, the Group revises its estimates of the number of options that are expected to
become exercisable on vesting date. It recognises the impact of the revision of original estimates, if any, in profit or
loss, and a corresponding adjustment to equity over the remaining vesting period. The equity amount is recognised
in capital reserve until the option is exercised, upon which it will be transferred to share premium, or until the
option expires, upon which it will be transferred directly to retained earnings.
The proceeds received net of any directly attributable transaction costs are credited to equity when the options are
exercised.
In the event that modification increases the fair value of the equity instruments granted, measured immediately
before and after the modification, the Group includes the incremental fair value granted in the measurement of the
amount recognised for services received as consideration for the equity instruments granted. The incremental fair
value granted is the difference between the fair value of the modified equity instrument and that of the original
equity instrument, both estimated as at the date of the modification.
If the modification occurs during the vesting period, the incremental fair value granted is included in the
measurement of the amount recognised for services received over the period from the modification date until the
date when the modified equity instruments vest, in addition to the amount based on the grant date fair value of
the original equity instruments, which is recognised over the remainder of the original vesting period. If the
modification occurs after vesting date, the incremental fair value granted is recognised immediately.
If the Group modifies the terms and conditions of the equity instruments granted in a manner that reduces the total
fair value of the share-based payment arrangement, or is not otherwise beneficial to the employees, the Group
continues to account for the revised services received as consideration for the equity instruments granted as if that
modification had not occurred, other than a cancellation of some or all of the equity instruments granted.
5.20 Income Taxes
Income taxes include all domestic and foreign taxes on taxable profit. Income taxes also include other taxes, such as
withholding taxes, which are payable by foreign subsidiaries, associates or jointly controlled entities on distributions to the
Group and Company, and real property gains taxes, if any.
Taxation in profit or loss comprises current and deferred tax.
5.20.1 Current tax
Current tax expenses are determined according to the tax laws of each jurisdiction in which the Group operates and
include all taxes based upon the taxable profits (including withholding taxes payable by foreign subsidiaries on
distribution of retained earnings to companies in the Group), and real property gains taxes payable on disposal of
properties.
5.20.2 Deferred tax
Deferred tax is recognised in full using the liability method on temporary differences arising between the carrying
amount of an asset or liability in the statement of financial position and its tax base.
Deferred tax is recognised for all temporary differences, unless the deferred tax arises from goodwill or the initial
recognition of an asset or liability in a transaction which is not a business combination and at the time of the
transaction, affects neither accounting profit nor taxable profit.
Notes to the Financial Statements
IOI
Cor
por
atio
n B
erh
ad
160
5. SIGNIFICANT ACCOUNTING POLICIES (Continued)
5.20 Income Taxes (Continued)
5.20.2 Deferred tax (Continued)
A deferred tax asset is recognised only to the extent that it is probable that taxable profit will be available against
which the deductible temporary differences, unused tax losses and unused tax credits can be utilised. The carrying
amount of a deferred tax asset is reviewed at the end of each reporting period. If it is no longer probable that
sufficient taxable profit will be available to allow the benefit of part or all of that deferred tax asset to be utilised,
the carrying amount of the deferred tax asset will be reduced accordingly. When it becomes probable that sufficient
taxable profit will be available, such reductions will be reversed to the extent of the taxable profit.
Deferred tax assets and liabilities are offset when there is a legally enforceable right to set off current tax assets
against current tax liabilities and when the deferred income taxes relate to the same taxation authority on either:
i. the same taxable entity; or
ii. different taxable entities which intend either to settle current tax liabilities and assets on a net basis, or to
realise the assets and settle the liabilities simultaneously, in each future period in which significant amounts of
deferred tax liabilities or assets are expected to be settled or recovered.
Deferred tax will be recognised as income or expense and included in profit or loss for the period unless the tax
relates to items that are credited or charged, in the same or a different period, directly to equity, in which case the
deferred tax will be charged or credited directly to equity.
Deferred tax assets and liabilities are measured at the tax rates that are expected to apply to the year when the
asset is realised or the liability is settled, based on the announcement of tax rates and tax laws by the Government
which have the substantial effect of actual enactment by the end of the reporting period.
5.21 Non-current Assets (or Disposal Groups) Held For Sale/Held For Distribution to owners and discontinued operations
5.21.1 Non-current Assets (or Disposal Groups) Held For Sale/Held For Distribution to owners
Non-current assets (or disposal groups) are classified as held for sale if their carrying amounts will be recovered
principally through a sale transaction rather than through continuing use. This condition is regarded as met only
when the sale is highly probable and the asset is available for immediate sale in its present condition subject only
to terms that are usual and customary. Management must be committed to a plan to sell the assets which are
expected to qualify for recognition as a completed sale within one year from the date of classification. However, an
extension of the period required to complete the sale does not preclude the assets (or disposal groups) from being
classified as held for sale if the delay is caused by events or circumstances beyond the control of the Group and
there is sufficient evidence that the Group remains committed to its plan to sell the assets (or disposal groups).
When the Group is committed to a sale plan involving loss of control of a subsidiary, all of the assets and liabilities
of that subsidiary are classified as held for sale when the criteria described above are met, regardless of whether
the Group retains a non-controlling interest in its former subsidiary after the sale or otherwise.
Immediately before classification as held for sale, the measurement of the non-current assets (or all the assets and
liabilities in a disposal group) is brought up-to-date in accordance with applicable FRSs. Then, on initial classification
as held for sale, non-current assets or disposal groups (other than investment properties, deferred tax assets,
employee benefits assets, financial assets and inventories) are measured in accordance with FRS 5 that is at the
lower of carrying amount and fair value less costs to sell. Any differences are included in profit or loss as an
impairment loss.
The Group measures a non-current asset (or disposal group) classified as held for distribution to owners at the lower
of its carrying amount and fair value less costs to distribute.
Annual Report 2013
IOI
Cor
por
atio
n B
erh
ad
161
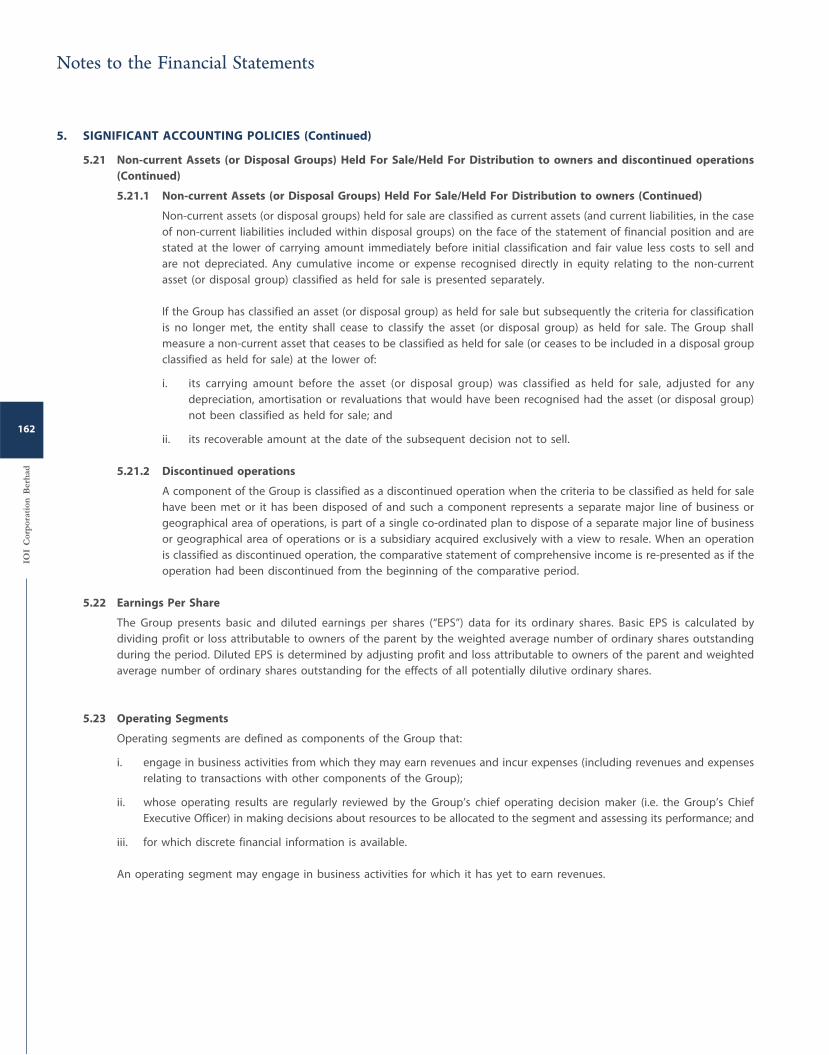
5. SIGNIFICANT ACCOUNTING POLICIES (Continued)
5.21 Non-current Assets (or Disposal Groups) Held For Sale/Held For Distribution to owners and discontinued operations
(Continued)
5.21.1 Non-current Assets (or Disposal Groups) Held For Sale/Held For Distribution to owners (Continued)
Non-current assets (or disposal groups) held for sale are classified as current assets (and current liabilities, in the case
of non-current liabilities included within disposal groups) on the face of the statement of financial position and are
stated at the lower of carrying amount immediately before initial classification and fair value less costs to sell and
are not depreciated. Any cumulative income or expense recognised directly in equity relating to the non-current
asset (or disposal group) classified as held for sale is presented separately.
If the Group has classified an asset (or disposal group) as held for sale but subsequently the criteria for classification
is no longer met, the entity shall cease to classify the asset (or disposal group) as held for sale. The Group shall
measure a non-current asset that ceases to be classified as held for sale (or ceases to be included in a disposal group
classified as held for sale) at the lower of:
i. its carrying amount before the asset (or disposal group) was classified as held for sale, adjusted for any
depreciation, amortisation or revaluations that would have been recognised had the asset (or disposal group)
not been classified as held for sale; and
ii. its recoverable amount at the date of the subsequent decision not to sell.
5.21.2 Discontinued operations
A component of the Group is classified as a discontinued operation when the criteria to be classified as held for sale
have been met or it has been disposed of and such a component represents a separate major line of business or
geographical area of operations, is part of a single co-ordinated plan to dispose of a separate major line of business
or geographical area of operations or is a subsidiary acquired exclusively with a view to resale. When an operation
is classified as discontinued operation, the comparative statement of comprehensive income is re-presented as if the
operation had been discontinued from the beginning of the comparative period.
5.22 Earnings Per Share
The Group presents basic and diluted earnings per shares (“EPS”) data for its ordinary shares. Basic EPS is calculated by
dividing profit or loss attributable to owners of the parent by the weighted average number of ordinary shares outstanding
during the period. Diluted EPS is determined by adjusting profit and loss attributable to owners of the parent and weighted
average number of ordinary shares outstanding for the effects of all potentially dilutive ordinary shares.
5.23 Operating Segments
Operating segments are defined as components of the Group that:
i. engage in business activities from which they may earn revenues and incur expenses (including revenues and expenses
relating to transactions with other components of the Group);
ii. whose operating results are regularly reviewed by the Group’s chief operating decision maker (i.e. the Group’s Chief
Executive Officer) in making decisions about resources to be allocated to the segment and assessing its performance; and
iii. for which discrete financial information is available.
An operating segment may engage in business activities for which it has yet to earn revenues.
Notes to the Financial Statements
IOI
Cor
por
atio
n B
erh
ad
162
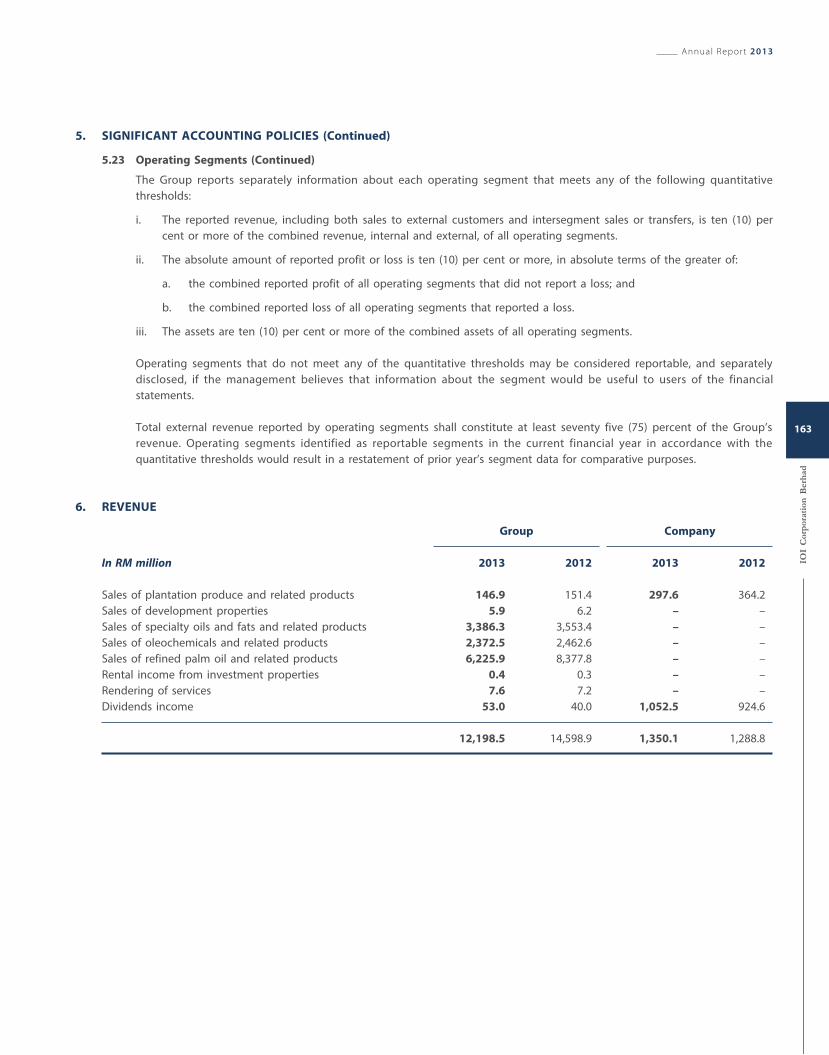
5. SIGNIFICANT ACCOUNTING POLICIES (Continued)
5.23 Operating Segments (Continued)
The Group reports separately information about each operating segment that meets any of the following quantitative
thresholds:
i. The reported revenue, including both sales to external customers and intersegment sales or transfers, is ten (10) per
cent or more of the combined revenue, internal and external, of all operating segments.
ii. The absolute amount of reported profit or loss is ten (10) per cent or more, in absolute terms of the greater of:
a. the combined reported profit of all operating segments that did not report a loss; and
b. the combined reported loss of all operating segments that reported a loss.
iii. The assets are ten (10) per cent or more of the combined assets of all operating segments.
Operating segments that do not meet any of the quantitative thresholds may be considered reportable, and separately
disclosed, if the management believes that information about the segment would be useful to users of the financial
statements.
Total external revenue reported by operating segments shall constitute at least seventy five (75) percent of the Group’s
revenue. Operating segments identified as reportable segments in the current financial year in accordance with the
quantitative thresholds would result in a restatement of prior year’s segment data for comparative purposes.
6. REVENUE
Group Company
In RM million 2013 2012 2013 2012
Sales of plantation produce and related products 146.9 151.4 297.6 364.2
Sales of development properties 5.9 6.2 – –
Sales of specialty oils and fats and related products 3,386.3 3,553.4 – –
Sales of oleochemicals and related products 2,372.5 2,462.6 – –
Sales of refined palm oil and related products 6,225.9 8,377.8 – –
Rental income from investment properties 0.4 0.3 – –
Rendering of services 7.6 7.2 – –
Dividends income 53.0 40.0 1,052.5 924.6
12,198.5 14,598.9 1,350.1 1,288.8
Annual Report 2013
IOI
Cor
por
atio
n B
erh
ad
163
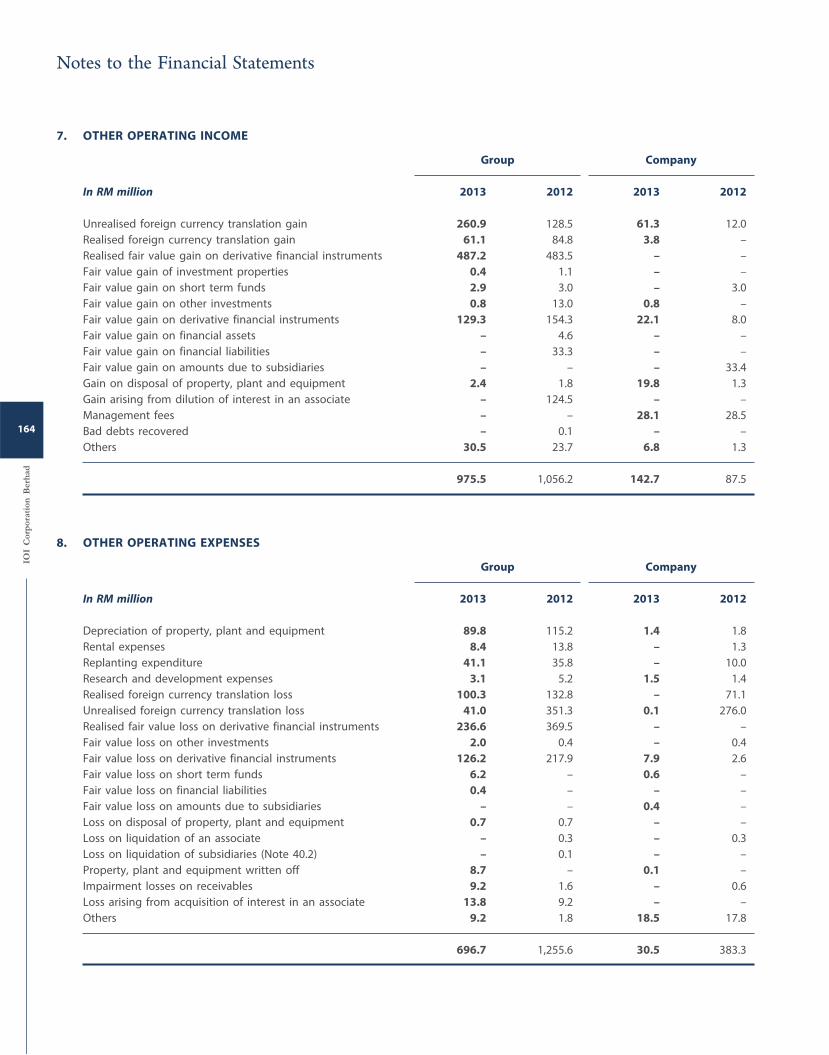
7. OTHER OPERATING INCOME
Group Company
In RM million 2013 2012 2013 2012
Unrealised foreign currency translation gain 260.9 128.5 61.3 12.0
Realised foreign currency translation gain 61.1 84.8 3.8 –
Realised fair value gain on derivative financial instruments 487.2 483.5 – –
Fair value gain of investment properties 0.4 1.1 – –
Fair value gain on short term funds 2.9 3.0 – 3.0
Fair value gain on other investments 0.8 13.0 0.8 –
Fair value gain on derivative financial instruments 129.3 154.3 22.1 8.0
Fair value gain on financial assets – 4.6 – –
Fair value gain on financial liabilities – 33.3 – –
Fair value gain on amounts due to subsidiaries – – – 33.4
Gain on disposal of property, plant and equipment 2.4 1.8 19.8 1.3
Gain arising from dilution of interest in an associate – 124.5 – –
Management fees – – 28.1 28.5
Bad debts recovered – 0.1 – –
Others 30.5 23.7 6.8 1.3
975.5 1,056.2 142.7 87.5
8. OTHER OPERATING EXPENSES
Group Company
In RM million 2013 2012 2013 2012
Depreciation of property, plant and equipment 89.8 115.2 1.4 1.8
Rental expenses 8.4 13.8 – 1.3
Replanting expenditure 41.1 35.8 – 10.0
Research and development expenses 3.1 5.2 1.5 1.4
Realised foreign currency translation loss 100.3 132.8 – 71.1
Unrealised foreign currency translation loss 41.0 351.3 0.1 276.0
Realised fair value loss on derivative financial instruments 236.6 369.5 – –
Fair value loss on other investments 2.0 0.4 – 0.4
Fair value loss on derivative financial instruments 126.2 217.9 7.9 2.6
Fair value loss on short term funds 6.2 – 0.6 –
Fair value loss on financial liabilities 0.4 – – –
Fair value loss on amounts due to subsidiaries – – 0.4 –
Loss on disposal of property, plant and equipment 0.7 0.7 – –
Loss on liquidation of an associate – 0.3 – 0.3
Loss on liquidation of subsidiaries (Note 40.2) – 0.1 – –
Property, plant and equipment written off 8.7 – 0.1 –
Impairment losses on receivables 9.2 1.6 – 0.6
Loss arising from acquisition of interest in an associate 13.8 9.2 – –
Others 9.2 1.8 18.5 17.8
696.7 1,255.6 30.5 383.3
Notes to the Financial Statements
IOI
Cor
por
atio
n B
erh
ad
164
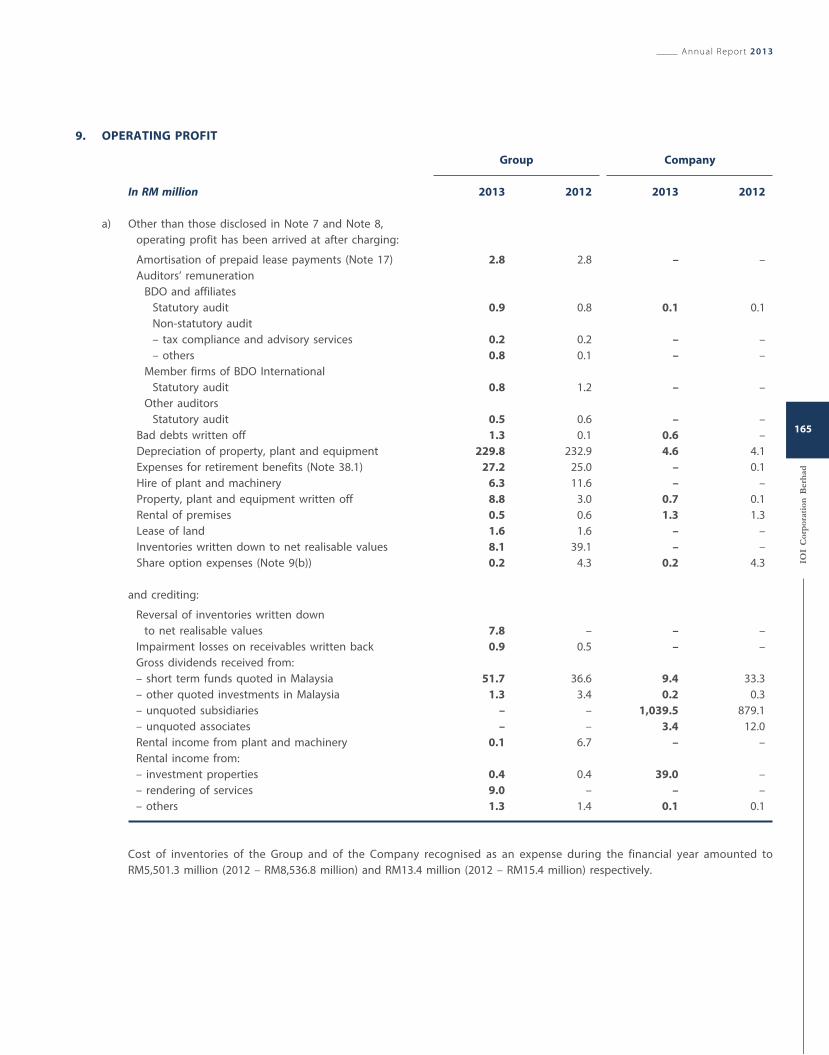
9. OPERATING PROFIT
Group Company
In RM million 2013 2012 2013 2012
a) Other than those disclosed in Note 7 and Note 8,
operating profit has been arrived at after charging:
Amortisation of prepaid lease payments (Note 17) 2.8 2.8 – –
Auditors’ remuneration
BDO and affiliates
Statutory audit 0.9 0.8 0.1 0.1
Non-statutory audit
– tax compliance and advisory services 0.2 0.2 – –
– others 0.8 0.1 – –
Member firms of BDO International
Statutory audit 0.8 1.2 – –
Other auditors
Statutory audit 0.5 0.6 – –
Bad debts written off 1.3 0.1 0.6 –
Depreciation of property, plant and equipment 229.8 232.9 4.6 4.1
Expenses for retirement benefits (Note 38.1) 27.2 25.0 – 0.1
Hire of plant and machinery 6.3 11.6 – –
Property, plant and equipment written off 8.8 3.0 0.7 0.1
Rental of premises 0.5 0.6 1.3 1.3
Lease of land 1.6 1.6 – –
Inventories written down to net realisable values 8.1 39.1 – –
Share option expenses (Note 9(b)) 0.2 4.3 0.2 4.3
and crediting:
Reversal of inventories written down
to net realisable values 7.8 – – –
Impairment losses on receivables written back 0.9 0.5 – –
Gross dividends received from:
– short term funds quoted in Malaysia 51.7 36.6 9.4 33.3
– other quoted investments in Malaysia 1.3 3.4 0.2 0.3
– unquoted subsidiaries – – 1,039.5 879.1
– unquoted associates – – 3.4 12.0
Rental income from plant and machinery 0.1 6.7 – –
Rental income from:
– investment properties 0.4 0.4 39.0 –
– rendering of services 9.0 – – –
– others 1.3 1.4 0.1 0.1
Cost of inventories of the Group and of the Company recognised as an expense during the financial year amounted to
RM5,501.3 million (2012 – RM8,536.8 million) and RM13.4 million (2012 – RM15.4 million) respectively.
Annual Report 2013
IOI
Cor
por
atio
n B
erh
ad
165
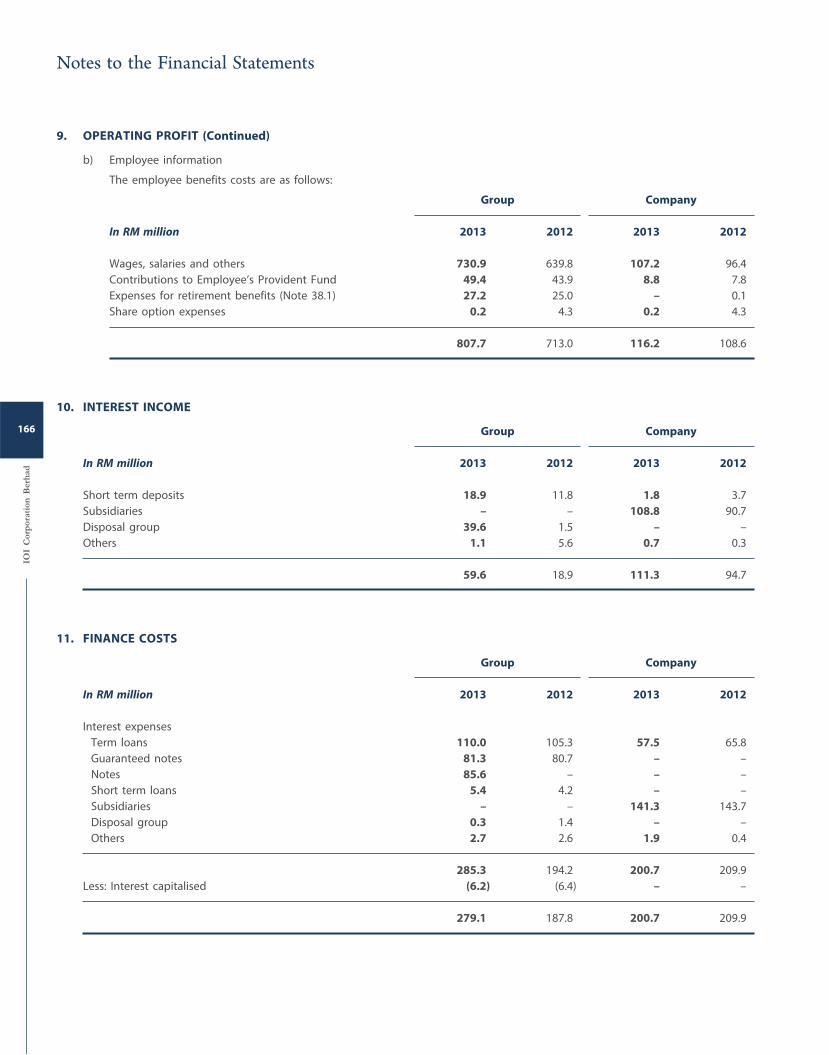
9. OPERATING PROFIT (Continued)
b) Employee information
The employee benefits costs are as follows:
Group Company
In RM million 2013 2012 2013 2012
Wages, salaries and others 730.9 639.8 107.2 96.4
Contributions to Employee’s Provident Fund 49.4 43.9 8.8 7.8
Expenses for retirement benefits (Note 38.1) 27.2 25.0 – 0.1
Share option expenses 0.2 4.3 0.2 4.3
807.7 713.0 116.2 108.6
10. INTEREST INCOME
Group Company
In RM million 2013 2012 2013 2012
Short term deposits 18.9 11.8 1.8 3.7
Subsidiaries – – 108.8 90.7
Disposal group 39.6 1.5 – –
Others 1.1 5.6 0.7 0.3
59.6 18.9 111.3 94.7
11. FINANCE COSTS
Group Company
In RM million 2013 2012 2013 2012
Interest expenses
Term loans 110.0 105.3 57.5 65.8
Guaranteed notes 81.3 80.7 – –
Notes 85.6 – – –
Short term loans 5.4 4.2 – –
Subsidiaries – – 141.3 143.7
Disposal group 0.3 1.4 – –
Others 2.7 2.6 1.9 0.4
285.3 194.2 200.7 209.9
Less: Interest capitalised (6.2) (6.4) – –
279.1 187.8 200.7 209.9
Notes to the Financial Statements
IOI
Cor
por
atio
n B
erh
ad
166
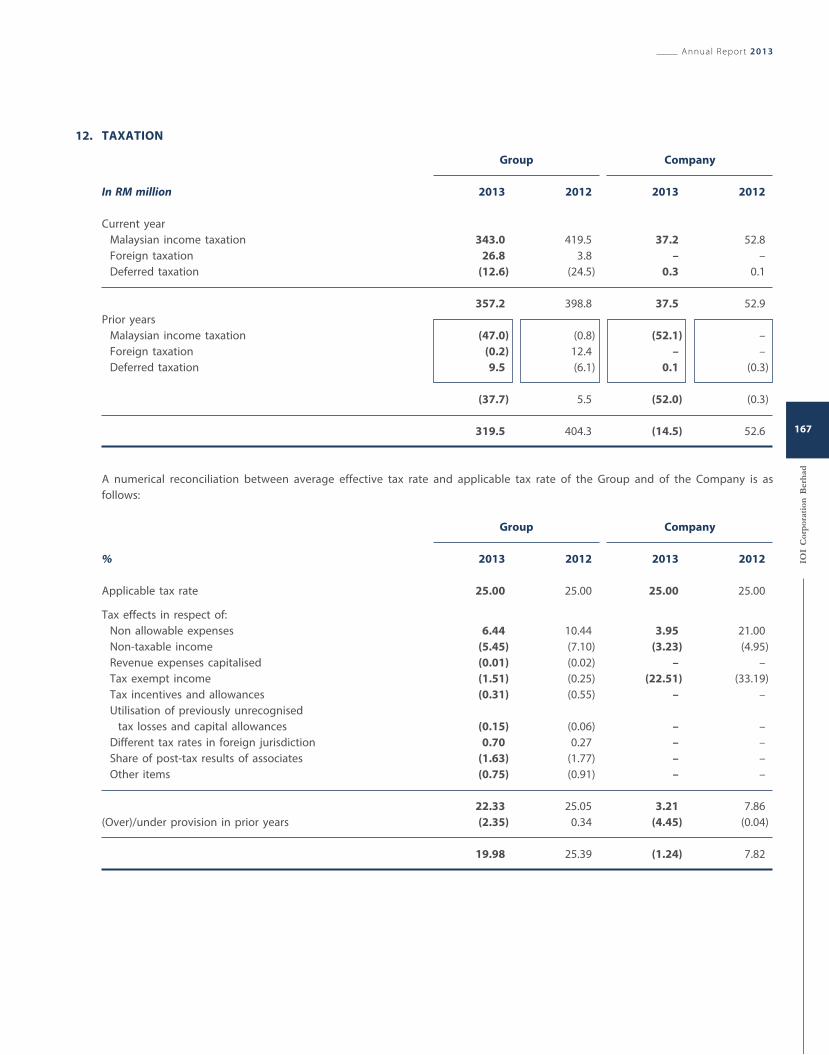
12. TAXATION
Group Company
In RM million 2013 2012 2013 2012
Current year
Malaysian income taxation 343.0 419.5 37.2 52.8
Foreign taxation 26.8 3.8 – –
Deferred taxation (12.6) (24.5) 0.3 0.1
357.2 398.8 37.5 52.9
Prior years
Malaysian income taxation (47.0) (0.8) (52.1) –
Foreign taxation (0.2) 12.4 – –
Deferred taxation 9.5 (6.1) 0.1 (0.3)
(37.7) 5.5 (52.0) (0.3)
319.5 404.3 (14.5) 52.6
A numerical reconciliation between average effective tax rate and applicable tax rate of the Group and of the Company is as
follows:
Group Company
% 2013 2012 2013 2012
Applicable tax rate 25.00 25.00 25.00 25.00
Tax effects in respect of:
Non allowable expenses 6.44 10.44 3.95 21.00
Non-taxable income (5.45) (7.10) (3.23) (4.95)
Revenue expenses capitalised (0.01) (0.02) – –
Tax exempt income (1.51) (0.25) (22.51) (33.19)
Tax incentives and allowances (0.31) (0.55) – –
Utilisation of previously unrecognised
tax losses and capital allowances (0.15) (0.06) – –
Different tax rates in foreign jurisdiction 0.70 0.27 – –
Share of post-tax results of associates (1.63) (1.77) – –
Other items (0.75) (0.91) – –
22.33 25.05 3.21 7.86
(Over)/under provision in prior years (2.35) 0.34 (4.45) (0.04)
19.98 25.39 (1.24) 7.82
Annual Report 2013
IOI
Cor
por
atio
n B
erh
ad
167
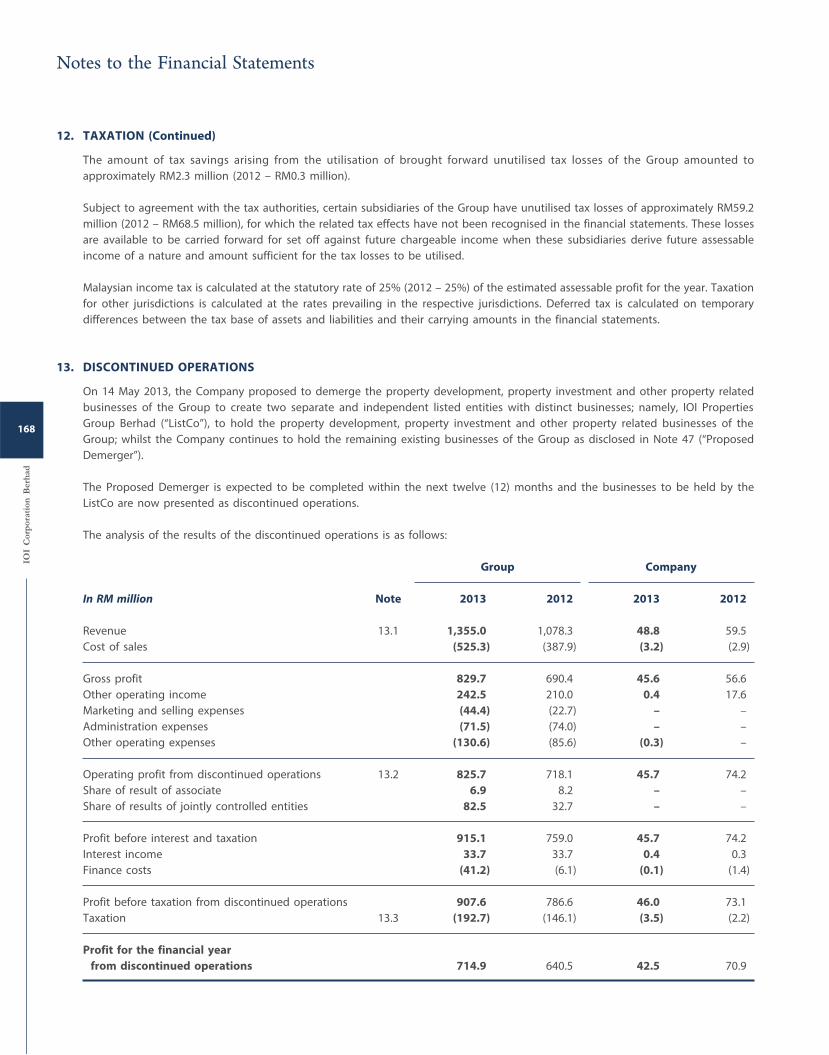
12. TAXATION (Continued)
The amount of tax savings arising from the utilisation of brought forward unutilised tax losses of the Group amounted to
approximately RM2.3 million (2012 – RM0.3 million).
Subject to agreement with the tax authorities, certain subsidiaries of the Group have unutilised tax losses of approximately RM59.2
million (2012 – RM68.5 million), for which the related tax effects have not been recognised in the financial statements. These losses
are available to be carried forward for set off against future chargeable income when these subsidiaries derive future assessable
income of a nature and amount sufficient for the tax losses to be utilised.
Malaysian income tax is calculated at the statutory rate of 25% (2012 – 25%) of the estimated assessable profit for the year. Taxation
for other jurisdictions is calculated at the rates prevailing in the respective jurisdictions. Deferred tax is calculated on temporary
differences between the tax base of assets and liabilities and their carrying amounts in the financial statements.
13. DISCONTINUED OPERATIONS
On 14 May 2013, the Company proposed to demerge the property development, property investment and other property related
businesses of the Group to create two separate and independent listed entities with distinct businesses; namely, IOI Properties
Group Berhad (“ListCo”), to hold the property development, property investment and other property related businesses of the
Group; whilst the Company continues to hold the remaining existing businesses of the Group as disclosed in Note 47 (“Proposed
Demerger”).
The Proposed Demerger is expected to be completed within the next twelve (12) months and the businesses to be held by the
ListCo are now presented as discontinued operations.
The analysis of the results of the discontinued operations is as follows:
Group Company
In RM million Note 2013 2012 2013 2012
Revenue 13.1 1,355.0 1,078.3 48.8 59.5
Cost of sales (525.3) (387.9) (3.2) (2.9)
Gross profit 829.7 690.4 45.6 56.6
Other operating income 242.5 210.0 0.4 17.6
Marketing and selling expenses (44.4) (22.7) – –
Administration expenses (71.5) (74.0) – –
Other operating expenses (130.6) (85.6) (0.3) –
Operating profit from discontinued operations 13.2 825.7 718.1 45.7 74.2
Share of result of associate 6.9 8.2 – –
Share of results of jointly controlled entities 82.5 32.7 – –
Profit before interest and taxation 915.1 759.0 45.7 74.2
Interest income 33.7 33.7 0.4 0.3
Finance costs (41.2) (6.1) (0.1) (1.4)
Profit before taxation from discontinued operations 907.6 786.6 46.0 73.1
Taxation 13.3 (192.7) (146.1) (3.5) (2.2)
Profit for the financial year
from discontinued operations 714.9 640.5 42.5 70.9
Notes to the Financial Statements
IOI
Cor
por
atio
n B
erh
ad
168
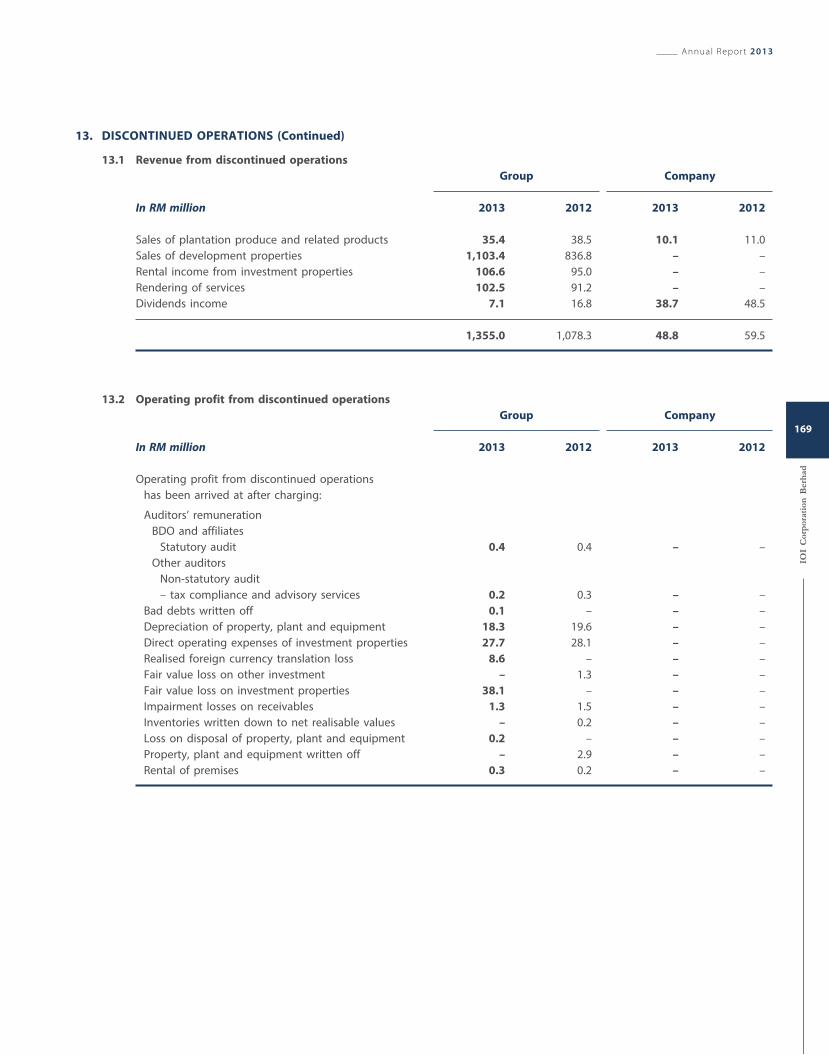
13. DISCONTINUED OPERATIONS (Continued)
13.1 Revenue from discontinued operations
Group Company
In RM million 2013 2012 2013 2012
Sales of plantation produce and related products 35.4 38.5 10.1 11.0
Sales of development properties 1,103.4 836.8 – –
Rental income from investment properties 106.6 95.0 – –
Rendering of services 102.5 91.2 – –
Dividends income 7.1 16.8 38.7 48.5
1,355.0 1,078.3 48.8 59.5
13.2 Operating profit from discontinued operations
Group Company
In RM million 2013 2012 2013 2012
Operating profit from discontinued operations
has been arrived at after charging:
Auditors’ remuneration
BDO and affiliates
Statutory audit 0.4 0.4 – –
Other auditors
Non-statutory audit
– tax compliance and advisory services 0.2 0.3 – –
Bad debts written off 0.1 – – –
Depreciation of property, plant and equipment 18.3 19.6 – –
Direct operating expenses of investment properties 27.7 28.1 – –
Realised foreign currency translation loss 8.6 – – –
Fair value loss on other investment – 1.3 – –
Fair value loss on investment properties 38.1 – – –
Impairment losses on receivables 1.3 1.5 – –
Inventories written down to net realisable values – 0.2 – –
Loss on disposal of property, plant and equipment 0.2 – – –
Property, plant and equipment written off – 2.9 – –
Rental of premises 0.3 0.2 – –
Annual Report 2013
IOI
Cor
por
atio
n B
erh
ad
169
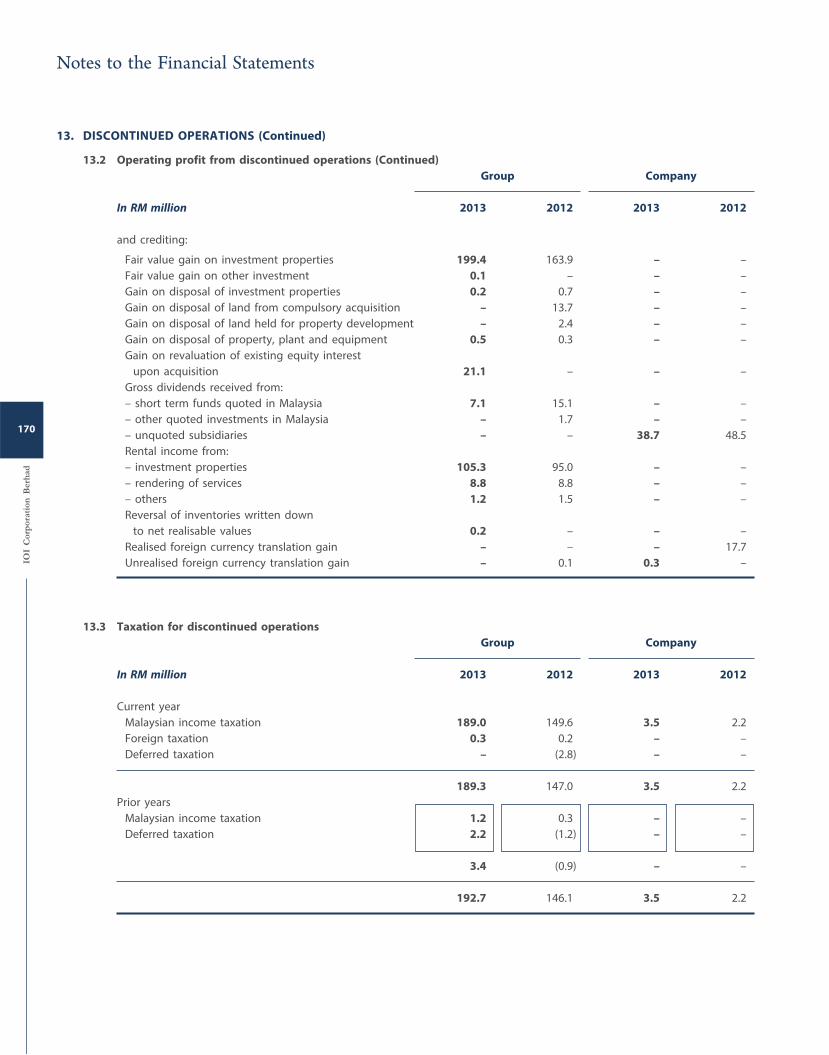
13. DISCONTINUED OPERATIONS (Continued)
13.2 Operating profit from discontinued operations (Continued)
Group Company
In RM million 2013 2012 2013 2012
and crediting:
Fair value gain on investment properties 199.4 163.9 – –
Fair value gain on other investment 0.1 – – –
Gain on disposal of investment properties 0.2 0.7 – –
Gain on disposal of land from compulsory acquisition – 13.7 – –
Gain on disposal of land held for property development – 2.4 – –
Gain on disposal of property, plant and equipment 0.5 0.3 – –
Gain on revaluation of existing equity interest
upon acquisition 21.1 – – –
Gross dividends received from:
– short term funds quoted in Malaysia 7.1 15.1 – –
– other quoted investments in Malaysia – 1.7 – –
– unquoted subsidiaries – – 38.7 48.5
Rental income from:
– investment properties 105.3 95.0 – –
– rendering of services 8.8 8.8 – –
– others 1.2 1.5 – –
Reversal of inventories written down
to net realisable values 0.2 – – –
Realised foreign currency translation gain – – – 17.7
Unrealised foreign currency translation gain – 0.1 0.3 –
13.3 Taxation for discontinued operations
Group Company
In RM million 2013 2012 2013 2012
Current year
Malaysian income taxation 189.0 149.6 3.5 2.2
Foreign taxation 0.3 0.2 – –
Deferred taxation – (2.8) – –
189.3 147.0 3.5 2.2
Prior years
Malaysian income taxation 1.2 0.3 – –
Deferred taxation 2.2 (1.2) – –
3.4 (0.9) – –
192.7 146.1 3.5 2.2
Notes to the Financial Statements
IOI
Cor
por
atio
n B
erh
ad
170
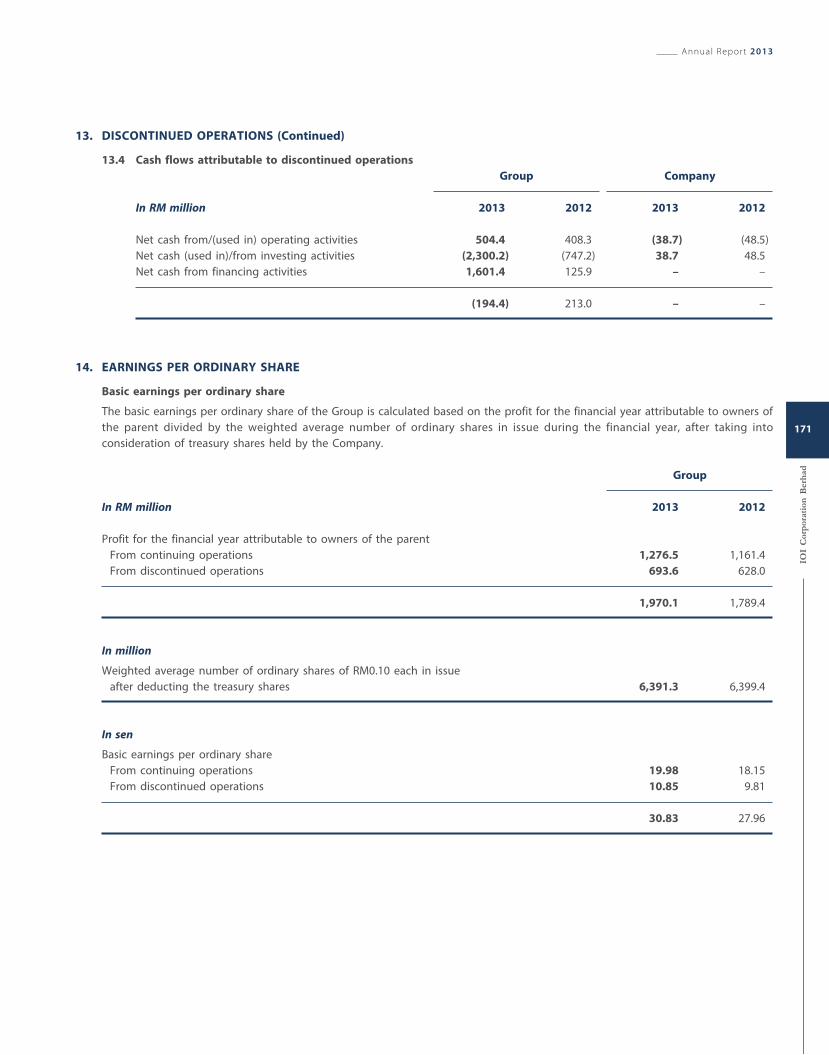
13. DISCONTINUED OPERATIONS (Continued)
13.4 Cash flows attributable to discontinued operations
Group Company
In RM million 2013 2012 2013 2012
Net cash from/(used in) operating activities 504.4 408.3 (38.7) (48.5)
Net cash (used in)/from investing activities (2,300.2) (747.2) 38.7 48.5
Net cash from financing activities 1,601.4 125.9 – –
(194.4) 213.0 – –
14. EARNINGS PER ORDINARY SHARE
Basic earnings per ordinary share
The basic earnings per ordinary share of the Group is calculated based on the profit for the financial year attributable to owners of
the parent divided by the weighted average number of ordinary shares in issue during the financial year, after taking into
consideration of treasury shares held by the Company.
Group
In RM million 2013 2012
Profit for the financial year attributable to owners of the parent
From continuing operations 1,276.5 1,161.4
From discontinued operations 693.6 628.0
1,970.1 1,789.4
In million
Weighted average number of ordinary shares of RM0.10 each in issue
after deducting the treasury shares 6,391.3 6,399.4
In sen
Basic earnings per ordinary share
From continuing operations 19.98 18.15
From discontinued operations 10.85 9.81
30.83 27.96
Annual Report 2013
IOI
Cor
por
atio
n B
erh
ad
171
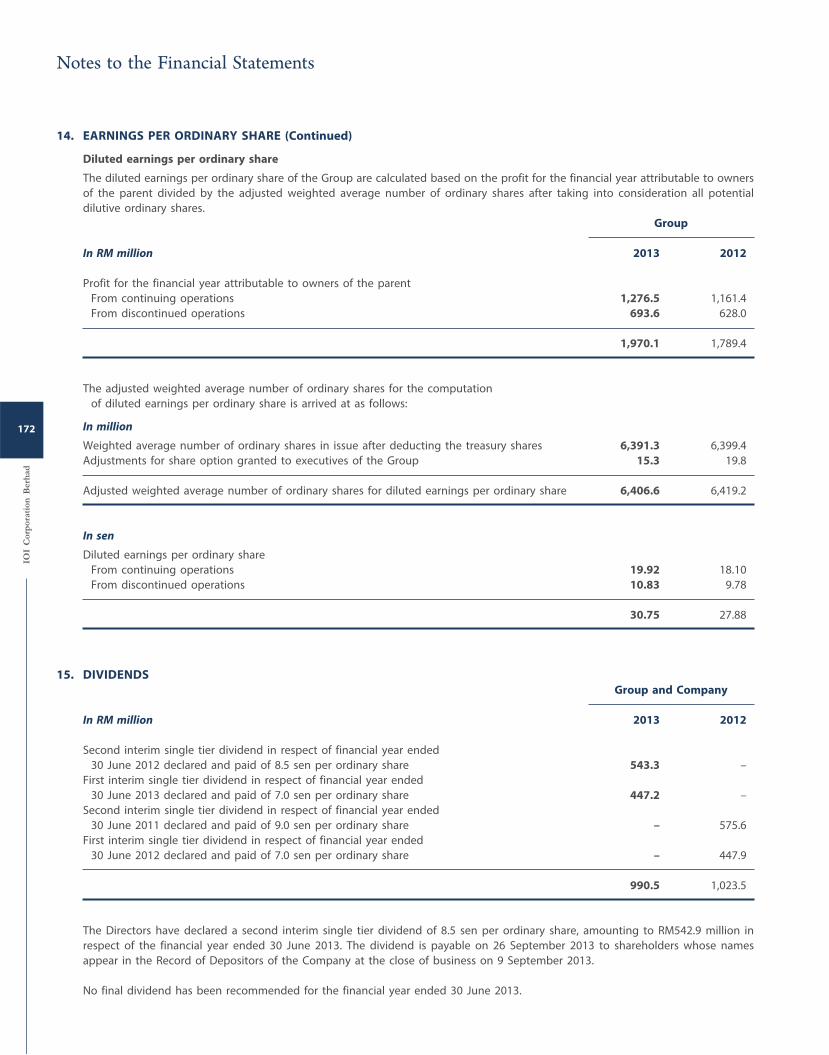
14. EARNINGS PER ORDINARY SHARE (Continued)
Diluted earnings per ordinary share
The diluted earnings per ordinary share of the Group are calculated based on the profit for the financial year attributable to owners
of the parent divided by the adjusted weighted average number of ordinary shares after taking into consideration all potential
dilutive ordinary shares.
Group
In RM million 2013 2012
Profit for the financial year attributable to owners of the parent
From continuing operations 1,276.5 1,161.4
From discontinued operations 693.6 628.0
1,970.1 1,789.4
The adjusted weighted average number of ordinary shares for the computation
of diluted earnings per ordinary share is arrived at as follows:
In million
Weighted average number of ordinary shares in issue after deducting the treasury shares 6,391.3 6,399.4
Adjustments for share option granted to executives of the Group 15.3 19.8
Adjusted weighted average number of ordinary shares for diluted earnings per ordinary share 6,406.6 6,419.2
In sen
Diluted earnings per ordinary share
From continuing operations 19.92 18.10
From discontinued operations 10.83 9.78
30.75 27.88
15. DIVIDENDS
Group and Company
In RM million 2013 2012
Second interim single tier dividend in respect of financial year ended
30 June 2012 declared and paid of 8.5 sen per ordinary share 543.3 –
First interim single tier dividend in respect of financial year ended
30 June 2013 declared and paid of 7.0 sen per ordinary share 447.2 –
Second interim single tier dividend in respect of financial year ended
30 June 2011 declared and paid of 9.0 sen per ordinary share – 575.6
First interim single tier dividend in respect of financial year ended
30 June 2012 declared and paid of 7.0 sen per ordinary share – 447.9
990.5 1,023.5
The Directors have declared a second interim single tier dividend of 8.5 sen per ordinary share, amounting to RM542.9 million in
respect of the financial year ended 30 June 2013. The dividend is payable on 26 September 2013 to shareholders whose names
appear in the Record of Depositors of the Company at the close of business on 9 September 2013.
No final dividend has been recommended for the financial year ended 30 June 2013.
Notes to the Financial Statements
IOI
Cor
por
atio
n B
erh
ad
172
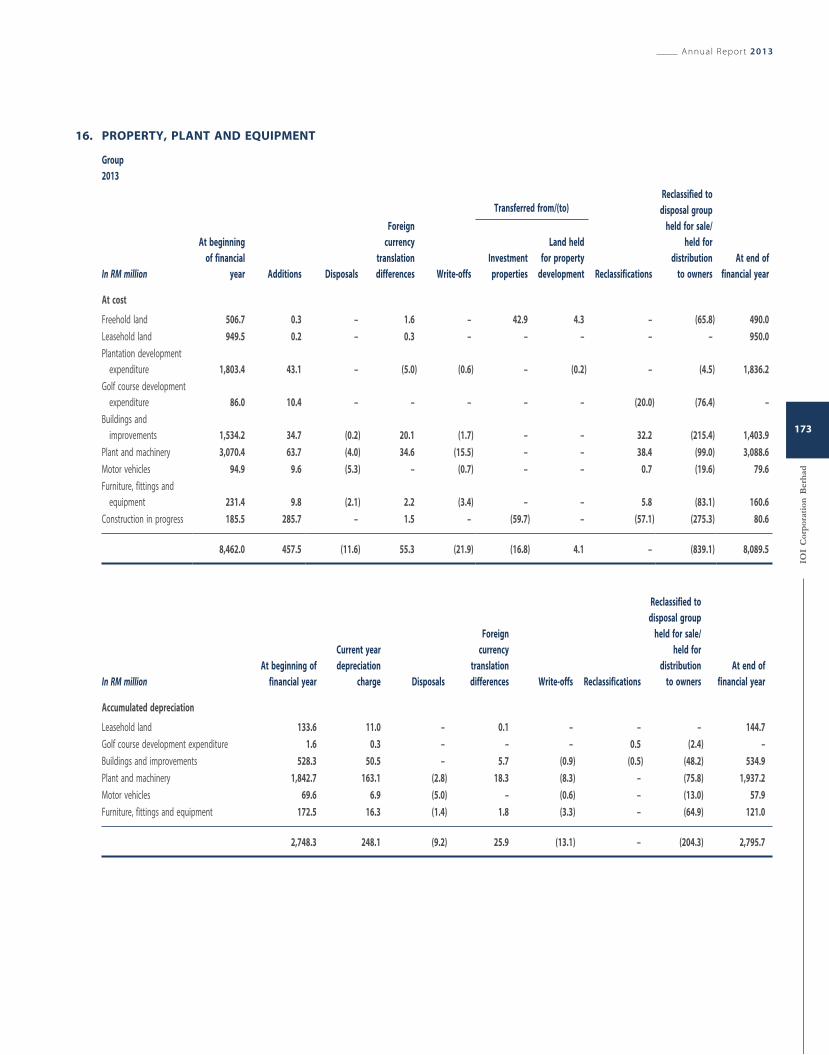
16. PROPERTY, PLANT AND EQUIPMENT
Group
2013
In RM million
At beginning
of financial
year Additions Disposals
Foreign
currency
translation
differences Write-offs
Transferred from/(to)
Reclassifications
Reclassified to
disposal group
held for sale/
held for
distribution
to owners
At end of
financial year
Investment
properties
Land held
for property
development
At cost
Freehold land 506.7 0.3 – 1.6 – 42.9 4.3 – (65.8) 490.0
Leasehold land 949.5 0.2 – 0.3 – – – – – 950.0
Plantation development
expenditure 1,803.4 43.1 – (5.0) (0.6) – (0.2) – (4.5) 1,836.2
Golf course development
expenditure 86.0 10.4 – – – – – (20.0) (76.4) –
Buildings and
improvements 1,534.2 34.7 (0.2) 20.1 (1.7) – – 32.2 (215.4) 1,403.9
Plant and machinery 3,070.4 63.7 (4.0) 34.6 (15.5) – – 38.4 (99.0) 3,088.6
Motor vehicles 94.9 9.6 (5.3) – (0.7) – – 0.7 (19.6) 79.6
Furniture, fittings and
equipment 231.4 9.8 (2.1) 2.2 (3.4) – – 5.8 (83.1) 160.6
Construction in progress 185.5 285.7 – 1.5 – (59.7) – (57.1) (275.3) 80.6
8,462.0 457.5 (11.6) 55.3 (21.9) (16.8) 4.1 – (839.1) 8,089.5
In RM millionAt beginning of
financial year
Current year
depreciation
charge Disposals
Foreign
currency
translation
differences Write-offs Reclassifications
Reclassified to
disposal group
held for sale/
held for
distribution
to owners
At end of
financial year
Accumulated depreciation
Leasehold land 133.6 11.0 – 0.1 – – – 144.7
Golf course development expenditure 1.6 0.3 – – – 0.5 (2.4) –
Buildings and improvements 528.3 50.5 – 5.7 (0.9) (0.5) (48.2) 534.9
Plant and machinery 1,842.7 163.1 (2.8) 18.3 (8.3) – (75.8) 1,937.2
Motor vehicles 69.6 6.9 (5.0) – (0.6) – (13.0) 57.9
Furniture, fittings and equipment 172.5 16.3 (1.4) 1.8 (3.3) – (64.9) 121.0
2,748.3 248.1 (9.2) 25.9 (13.1) – (204.3) 2,795.7
Annual Report 2013
IOI
Cor
por
atio
n B
erh
ad
173
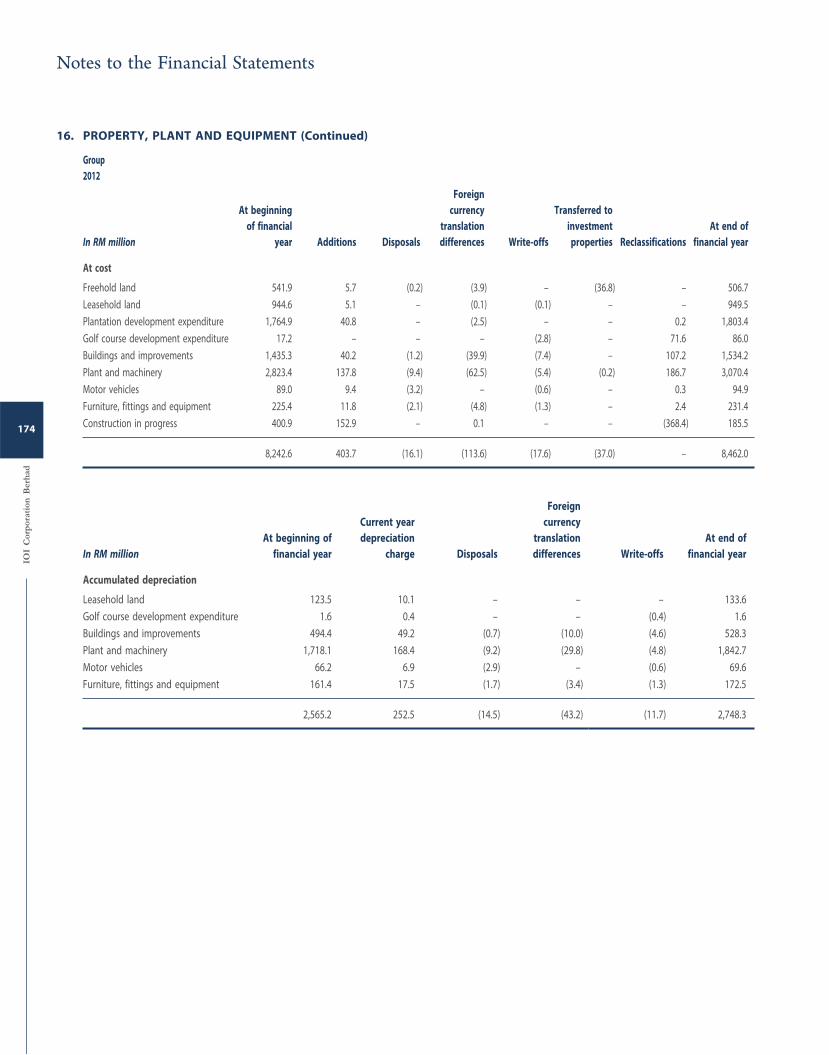
16. PROPERTY, PLANT AND EQUIPMENT (Continued)
Group
2012
In RM million
At beginning
of financial
year Additions Disposals
Foreign
currency
translation
differences Write-offs
Transferred to
investment
properties Reclassifications
At end of
financial year
At cost
Freehold land 541.9 5.7 (0.2) (3.9) – (36.8) – 506.7
Leasehold land 944.6 5.1 – (0.1) (0.1) – – 949.5
Plantation development expenditure 1,764.9 40.8 – (2.5) – – 0.2 1,803.4
Golf course development expenditure 17.2 – – – (2.8) – 71.6 86.0
Buildings and improvements 1,435.3 40.2 (1.2) (39.9) (7.4) – 107.2 1,534.2
Plant and machinery 2,823.4 137.8 (9.4) (62.5) (5.4) (0.2) 186.7 3,070.4
Motor vehicles 89.0 9.4 (3.2) – (0.6) – 0.3 94.9
Furniture, fittings and equipment 225.4 11.8 (2.1) (4.8) (1.3) – 2.4 231.4
Construction in progress 400.9 152.9 – 0.1 – – (368.4) 185.5
8,242.6 403.7 (16.1) (113.6) (17.6) (37.0) – 8,462.0
In RM millionAt beginning of
financial year
Current year
depreciation
charge Disposals
Foreign
currency
translation
differences Write-offs
At end of
financial year
Accumulated depreciation
Leasehold land 123.5 10.1 – – – 133.6
Golf course development expenditure 1.6 0.4 – – (0.4) 1.6
Buildings and improvements 494.4 49.2 (0.7) (10.0) (4.6) 528.3
Plant and machinery 1,718.1 168.4 (9.2) (29.8) (4.8) 1,842.7
Motor vehicles 66.2 6.9 (2.9) – (0.6) 69.6
Furniture, fittings and equipment 161.4 17.5 (1.7) (3.4) (1.3) 172.5
2,565.2 252.5 (14.5) (43.2) (11.7) 2,748.3
Notes to the Financial Statements
IOI
Cor
por
atio
n B
erh
ad
174
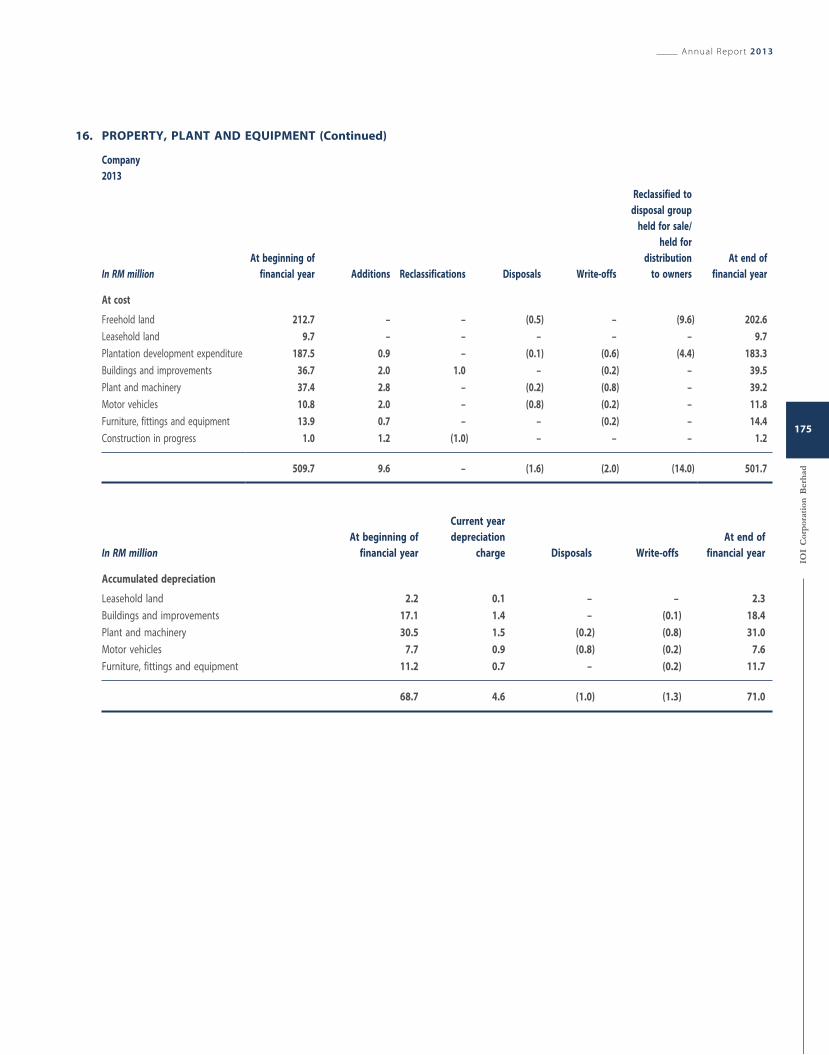
16. PROPERTY, PLANT AND EQUIPMENT (Continued)
Company
2013
In RM millionAt beginning of
financial year Additions Reclassifications Disposals Write-offs
Reclassified to
disposal group
held for sale/
held for
distribution
to owners
At end of
financial year
At cost
Freehold land 212.7 – – (0.5) – (9.6) 202.6
Leasehold land 9.7 – – – – – 9.7
Plantation development expenditure 187.5 0.9 – (0.1) (0.6) (4.4) 183.3
Buildings and improvements 36.7 2.0 1.0 – (0.2) – 39.5
Plant and machinery 37.4 2.8 – (0.2) (0.8) – 39.2
Motor vehicles 10.8 2.0 – (0.8) (0.2) – 11.8
Furniture, fittings and equipment 13.9 0.7 – – (0.2) – 14.4
Construction in progress 1.0 1.2 (1.0) – – – 1.2
509.7 9.6 – (1.6) (2.0) (14.0) 501.7
In RM millionAt beginning of
financial year
Current year
depreciation
charge Disposals Write-offs
At end of
financial year
Accumulated depreciation
Leasehold land 2.2 0.1 – – 2.3
Buildings and improvements 17.1 1.4 – (0.1) 18.4
Plant and machinery 30.5 1.5 (0.2) (0.8) 31.0
Motor vehicles 7.7 0.9 (0.8) (0.2) 7.6
Furniture, fittings and equipment 11.2 0.7 – (0.2) 11.7
68.7 4.6 (1.0) (1.3) 71.0
Annual Report 2013
IOI
Cor
por
atio
n B
erh
ad
175
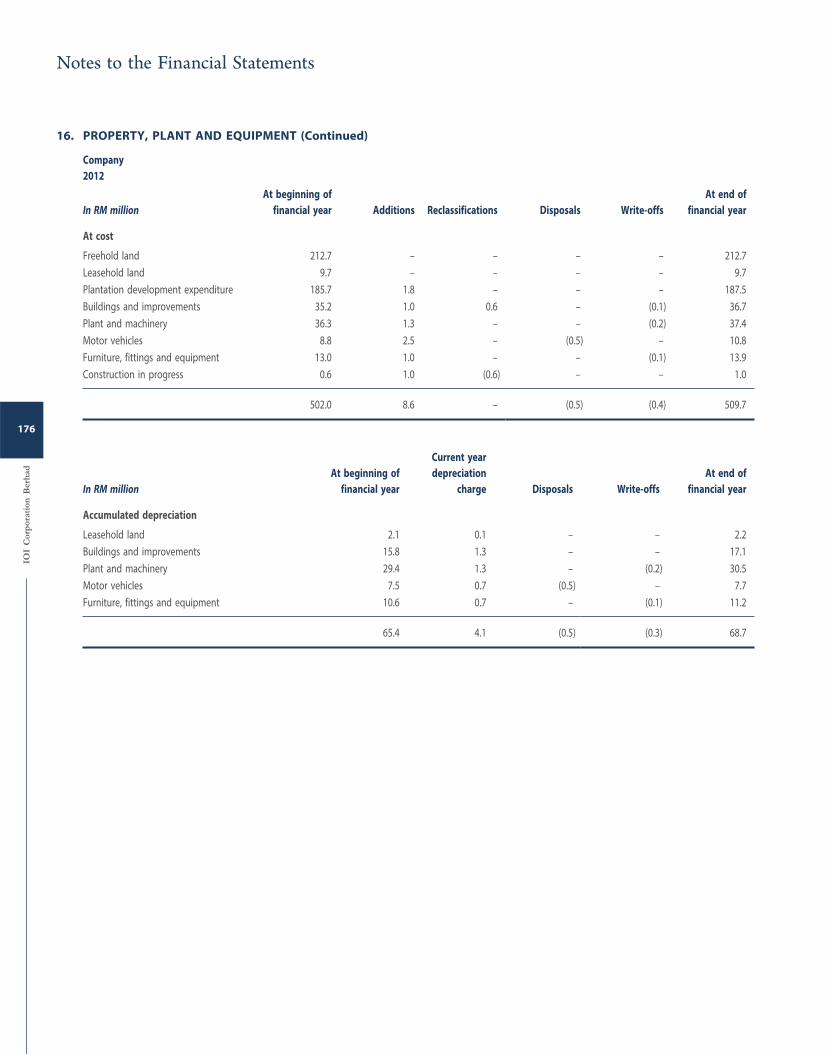
16. PROPERTY, PLANT AND EQUIPMENT (Continued)
Company
2012
In RM million At beginning of
financial year Additions Reclassifications Disposals Write-offs
At end of
financial year
At cost
Freehold land 212.7 – – – – 212.7
Leasehold land 9.7 – – – – 9.7
Plantation development expenditure 185.7 1.8 – – – 187.5
Buildings and improvements 35.2 1.0 0.6 – (0.1) 36.7
Plant and machinery 36.3 1.3 – – (0.2) 37.4
Motor vehicles 8.8 2.5 – (0.5) – 10.8
Furniture, fittings and equipment 13.0 1.0 – – (0.1) 13.9
Construction in progress 0.6 1.0 (0.6) – – 1.0
502.0 8.6 – (0.5) (0.4) 509.7
In RM millionAt beginning of
financial year
Current year
depreciation
charge Disposals Write-offs
At end of
financial year
Accumulated depreciation
Leasehold land 2.1 0.1 – – 2.2
Buildings and improvements 15.8 1.3 – – 17.1
Plant and machinery 29.4 1.3 – (0.2) 30.5
Motor vehicles 7.5 0.7 (0.5) – 7.7
Furniture, fittings and equipment 10.6 0.7 – (0.1) 11.2
65.4 4.1 (0.5) (0.3) 68.7
Notes to the Financial Statements
IOI
Cor
por
atio
n B
erh
ad
176
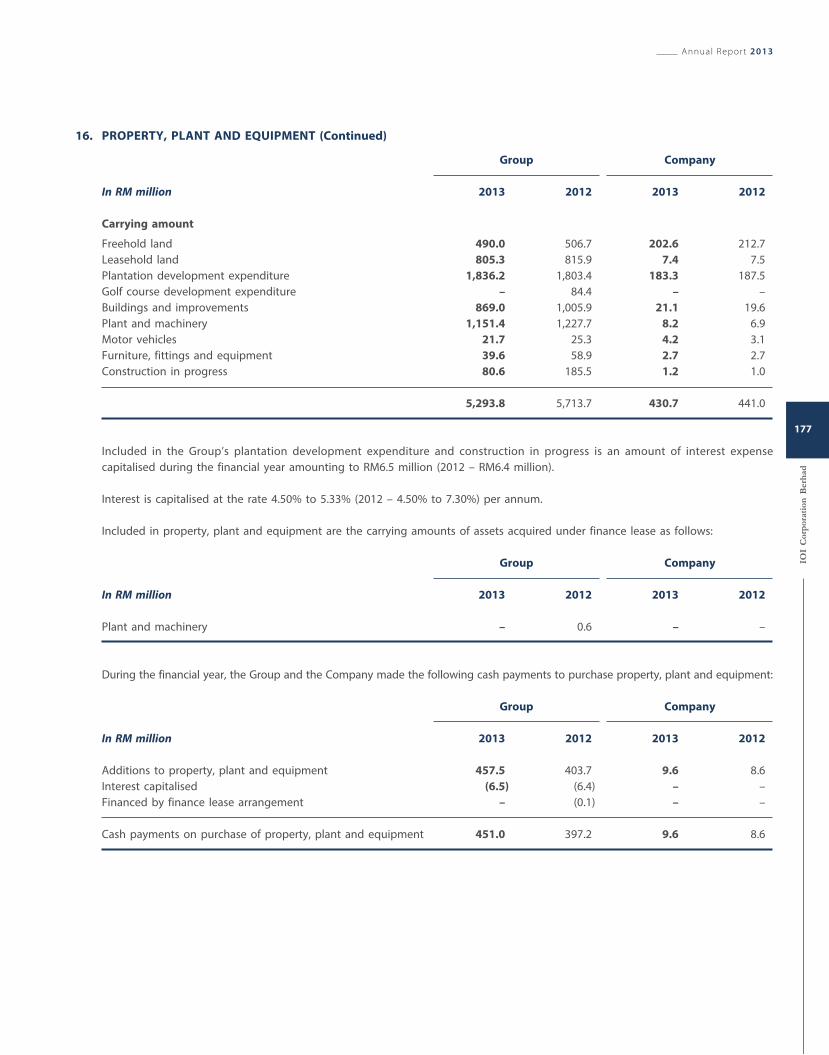
16. PROPERTY, PLANT AND EQUIPMENT (Continued)
Group Company
In RM million 2013 2012 2013 2012
Carrying amount
Freehold land 490.0 506.7 202.6 212.7
Leasehold land 805.3 815.9 7.4 7.5
Plantation development expenditure 1,836.2 1,803.4 183.3 187.5
Golf course development expenditure – 84.4 – –
Buildings and improvements 869.0 1,005.9 21.1 19.6
Plant and machinery 1,151.4 1,227.7 8.2 6.9
Motor vehicles 21.7 25.3 4.2 3.1
Furniture, fittings and equipment 39.6 58.9 2.7 2.7
Construction in progress 80.6 185.5 1.2 1.0
5,293.8 5,713.7 430.7 441.0
Included in the Group’s plantation development expenditure and construction in progress is an amount of interest expense
capitalised during the financial year amounting to RM6.5 million (2012 – RM6.4 million).
Interest is capitalised at the rate 4.50% to 5.33% (2012 – 4.50% to 7.30%) per annum.
Included in property, plant and equipment are the carrying amounts of assets acquired under finance lease as follows:
Group Company
In RM million 2013 2012 2013 2012
Plant and machinery – 0.6 – –
During the financial year, the Group and the Company made the following cash payments to purchase property, plant and equipment:
Group Company
In RM million 2013 2012 2013 2012
Additions to property, plant and equipment 457.5 403.7 9.6 8.6
Interest capitalised (6.5) (6.4) – –
Financed by finance lease arrangement – (0.1) – –
Cash payments on purchase of property, plant and equipment 451.0 397.2 9.6 8.6
Annual Report 2013
IOI
Cor
por
atio
n B
erh
ad
177
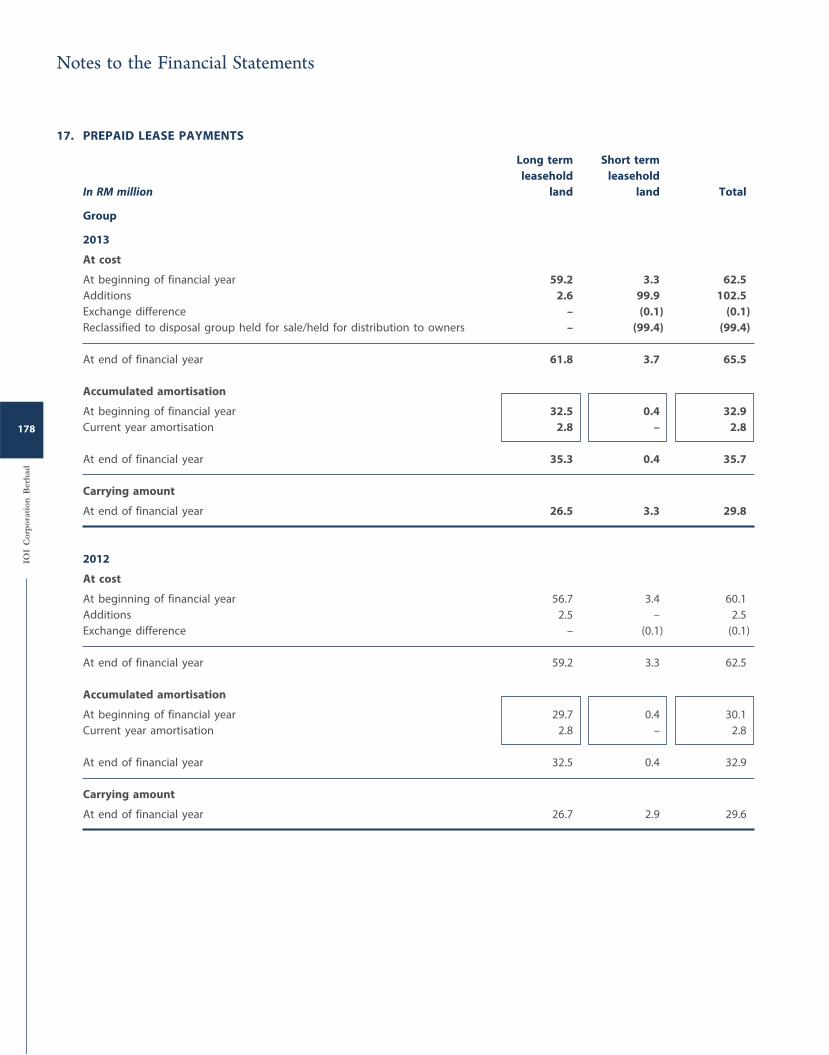
17. PREPAID LEASE PAYMENTS
Long term Short term
leasehold leasehold
In RM million land land Total
Group
2013
At cost
At beginning of financial year 59.2 3.3 62.5
Additions 2.6 99.9 102.5
Exchange difference – (0.1) (0.1)
Reclassified to disposal group held for sale/held for distribution to owners – (99.4) (99.4)
At end of financial year 61.8 3.7 65.5
Accumulated amortisation
At beginning of financial year 32.5 0.4 32.9
Current year amortisation 2.8 – 2.8
At end of financial year 35.3 0.4 35.7
Carrying amount
At end of financial year 26.5 3.3 29.8
2012
At cost
At beginning of financial year 56.7 3.4 60.1
Additions 2.5 – 2.5
Exchange difference – (0.1) (0.1)
At end of financial year 59.2 3.3 62.5
Accumulated amortisation
At beginning of financial year 29.7 0.4 30.1
Current year amortisation 2.8 – 2.8
At end of financial year 32.5 0.4 32.9
Carrying amount
At end of financial year 26.7 2.9 29.6
Notes to the Financial Statements
IOI
Cor
por
atio
n B
erh
ad
178
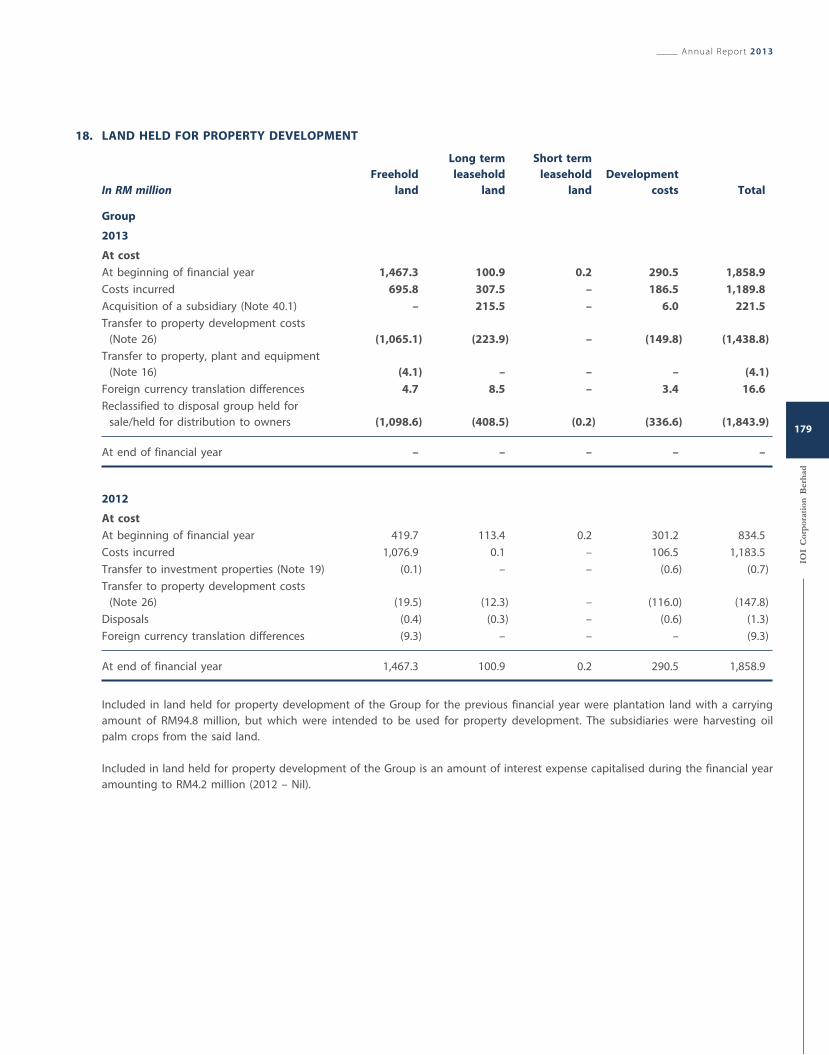
18. LAND HELD FOR PROPERTY DEVELOPMENT
In RM million Freehold
land
Long term
leasehold
land
Short term
leasehold
land
Development
costs Total
Group
2013
At cost
At beginning of financial year 1,467.3 100.9 0.2 290.5 1,858.9
Costs incurred 695.8 307.5 – 186.5 1,189.8
Acquisition of a subsidiary (Note 40.1) – 215.5 – 6.0 221.5
Transfer to property development costs
(Note 26) (1,065.1) (223.9) – (149.8) (1,438.8)
Transfer to property, plant and equipment
(Note 16) (4.1) – – – (4.1)
Foreign currency translation differences 4.7 8.5 – 3.4 16.6
Reclassified to disposal group held for
sale/held for distribution to owners (1,098.6) (408.5) (0.2) (336.6) (1,843.9)
At end of financial year – – – – –
2012
At cost
At beginning of financial year 419.7 113.4 0.2 301.2 834.5
Costs incurred 1,076.9 0.1 – 106.5 1,183.5
Transfer to investment properties (Note 19) (0.1) – – (0.6) (0.7)
Transfer to property development costs
(Note 26) (19.5) (12.3) – (116.0) (147.8)
Disposals (0.4) (0.3) – (0.6) (1.3)
Foreign currency translation differences (9.3) – – – (9.3)
At end of financial year 1,467.3 100.9 0.2 290.5 1,858.9
Included in land held for property development of the Group for the previous financial year were plantation land with a carrying
amount of RM94.8 million, but which were intended to be used for property development. The subsidiaries were harvesting oil
palm crops from the said land.
Included in land held for property development of the Group is an amount of interest expense capitalised during the financial year
amounting to RM4.2 million (2012 – Nil).
Annual Report 2013
IOI
Cor
por
atio
n B
erh
ad
179
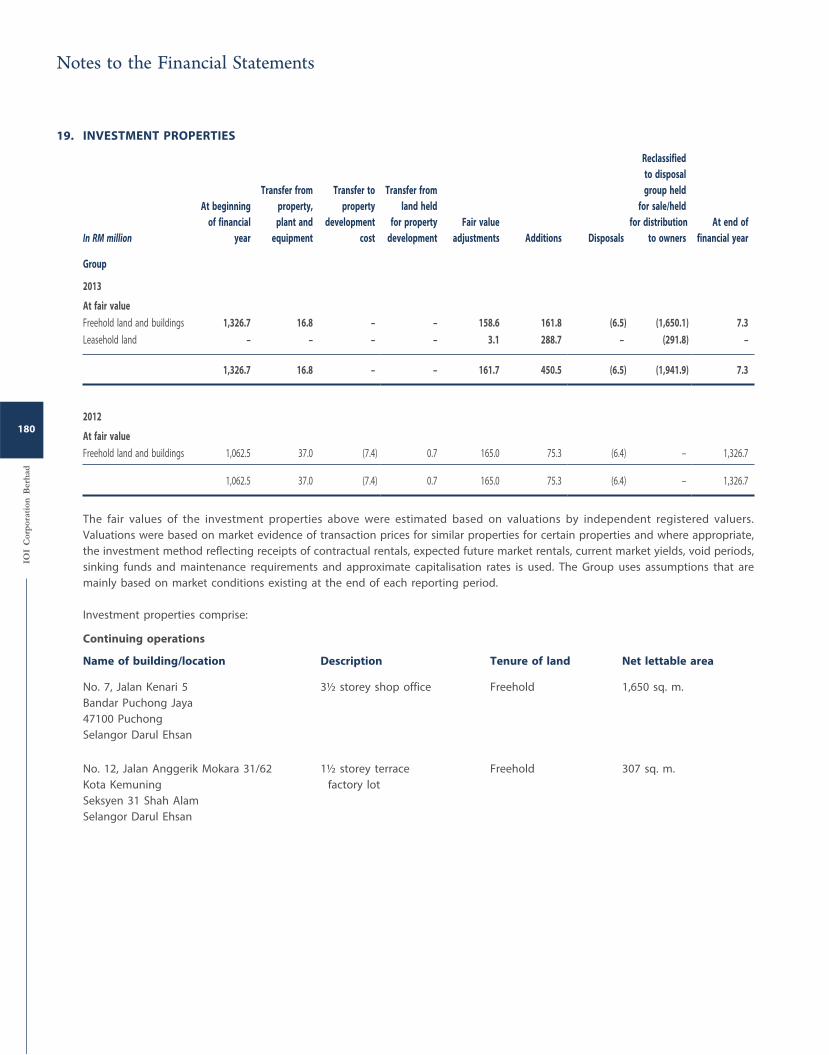
19. INVESTMENT PROPERTIES
In RM million
At beginning
of financial
year
Transfer from
property,
plant and
equipment
Transfer to
property
development
cost
Transfer from
land held
for property
development
Fair value
adjustments Additions Disposals
Reclassified
to disposal
group held
for sale/held
for distribution
to owners
At end of
financial year
Group
2013
At fair value
Freehold land and buildings 1,326.7 16.8 – – 158.6 161.8 (6.5) (1,650.1) 7.3
Leasehold land – – – – 3.1 288.7 – (291.8) –
1,326.7 16.8 – – 161.7 450.5 (6.5) (1,941.9) 7.3
2012
At fair value
Freehold land and buildings 1,062.5 37.0 (7.4) 0.7 165.0 75.3 (6.4) – 1,326.7
1,062.5 37.0 (7.4) 0.7 165.0 75.3 (6.4) – 1,326.7
The fair values of the investment properties above were estimated based on valuations by independent registered valuers.
Valuations were based on market evidence of transaction prices for similar properties for certain properties and where appropriate,
the investment method reflecting receipts of contractual rentals, expected future market rentals, current market yields, void periods,
sinking funds and maintenance requirements and approximate capitalisation rates is used. The Group uses assumptions that are
mainly based on market conditions existing at the end of each reporting period.
Investment properties comprise:
Continuing operations
Name of building/location Description Tenure of land Net lettable area
No. 7, Jalan Kenari 5
Bandar Puchong Jaya
47100 Puchong
Selangor Darul Ehsan
3½ storey shop office Freehold 1,650 sq. m.
No. 12, Jalan Anggerik Mokara 31/62
Kota Kemuning
Seksyen 31 Shah Alam
Selangor Darul Ehsan
1½ storey terrace
factory lot
Freehold 307 sq. m.
Notes to the Financial Statements
IOI
Cor
por
atio
n B
erh
ad
180
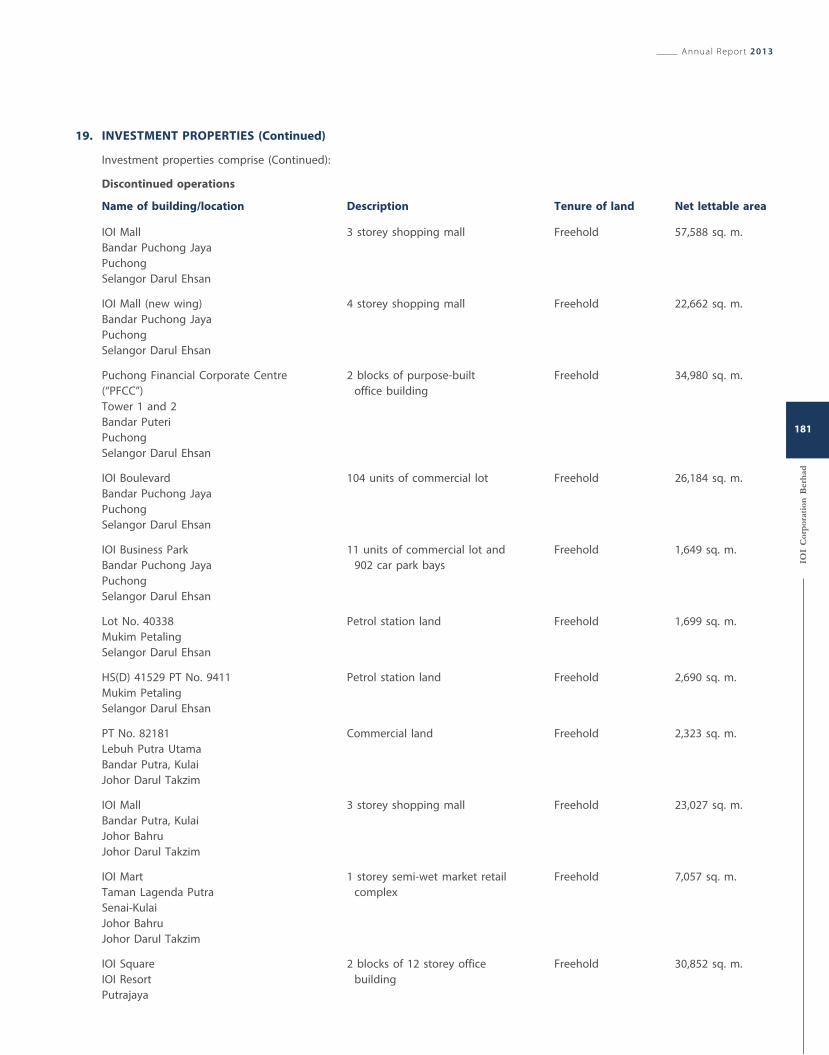
19. INVESTMENT PROPERTIES (Continued)
Investment properties comprise (Continued):
Discontinued operations
Name of building/location Description Tenure of land Net lettable area
IOI Mall
Bandar Puchong Jaya
Puchong
Selangor Darul Ehsan
3 storey shopping mall Freehold 57,588 sq. m.
IOI Mall (new wing)
Bandar Puchong Jaya
Puchong
Selangor Darul Ehsan
4 storey shopping mall Freehold 22,662 sq. m.
Puchong Financial Corporate Centre
(“PFCC”)
Tower 1 and 2
Bandar Puteri
Puchong
Selangor Darul Ehsan
2 blocks of purpose-built
office building
Freehold 34,980 sq. m.
IOI Boulevard
Bandar Puchong Jaya
Puchong
Selangor Darul Ehsan
104 units of commercial lot Freehold 26,184 sq. m.
IOI Business Park
Bandar Puchong Jaya
Puchong
Selangor Darul Ehsan
11 units of commercial lot and
902 car park bays
Freehold 1,649 sq. m.
Lot No. 40338
Mukim Petaling
Selangor Darul Ehsan
Petrol station land Freehold 1,699 sq. m.
HS(D) 41529 PT No. 9411
Mukim Petaling
Selangor Darul Ehsan
Petrol station land Freehold 2,690 sq. m.
PT No. 82181
Lebuh Putra Utama
Bandar Putra, Kulai
Johor Darul Takzim
Commercial land Freehold 2,323 sq. m.
IOI Mall
Bandar Putra, Kulai
Johor Bahru
Johor Darul Takzim
3 storey shopping mall Freehold 23,027 sq. m.
IOI Mart
Taman Lagenda Putra
Senai-Kulai
Johor Bahru
Johor Darul Takzim
1 storey semi-wet market retail
complex
Freehold 7,057 sq. m.
IOI Square
IOI Resort
Putrajaya
2 blocks of 12 storey office
building
Freehold 30,852 sq. m.
Annual Report 2013
IOI
Cor
por
atio
n B
erh
ad
181
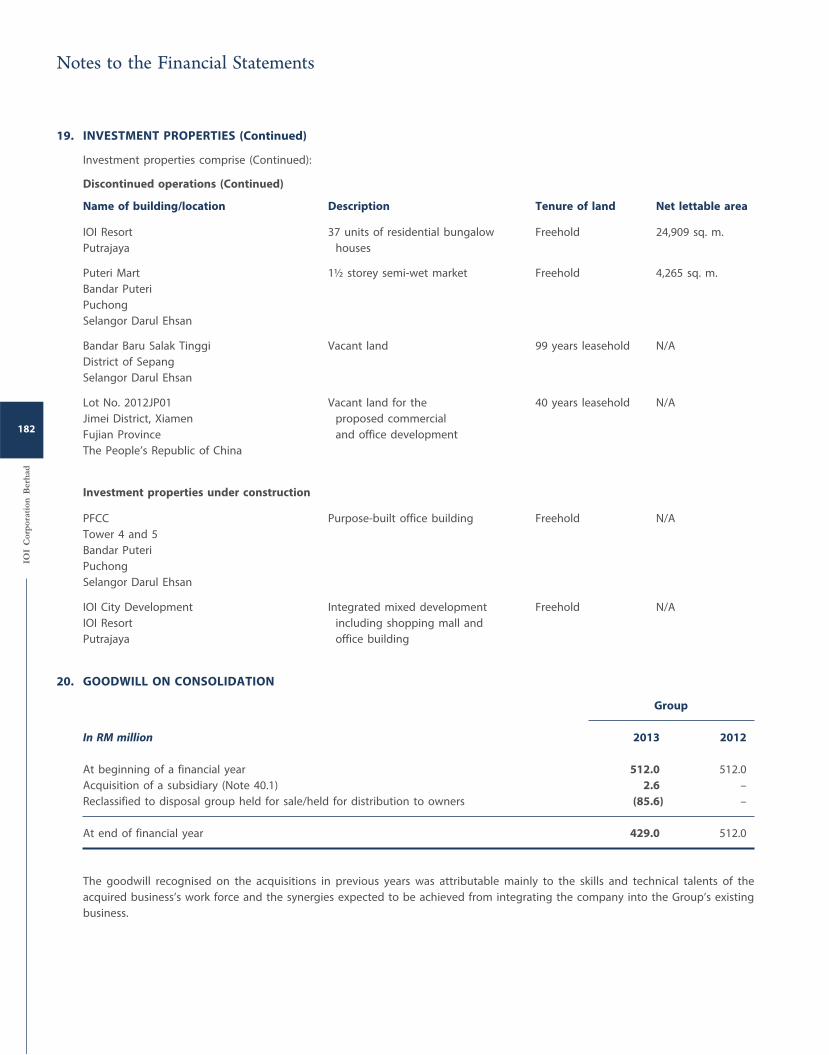
19. INVESTMENT PROPERTIES (Continued)
Investment properties comprise (Continued):
Discontinued operations (Continued)
Name of building/location Description Tenure of land Net lettable area
IOI Resort
Putrajaya
37 units of residential bungalow
houses
Freehold 24,909 sq. m.
Puteri Mart
Bandar Puteri
Puchong
Selangor Darul Ehsan
1½ storey semi-wet market Freehold 4,265 sq. m.
Bandar Baru Salak Tinggi
District of Sepang
Selangor Darul Ehsan
Vacant land 99 years leasehold N/A
Lot No. 2012JP01
Jimei District, Xiamen
Fujian Province
The People’s Republic of China
Vacant land for the
proposed commercial
and office development
40 years leasehold N/A
Investment properties under construction
PFCC
Tower 4 and 5
Bandar Puteri
Puchong
Selangor Darul Ehsan
Purpose-built office building Freehold N/A
IOI City Development
IOI Resort
Putrajaya
Integrated mixed development
including shopping mall and
office building
Freehold N/A
20. GOODWILL ON CONSOLIDATION
Group
In RM million 2013 2012
At beginning of a financial year 512.0 512.0
Acquisition of a subsidiary (Note 40.1) 2.6 –
Reclassified to disposal group held for sale/held for distribution to owners (85.6) –
At end of financial year 429.0 512.0
The goodwill recognised on the acquisitions in previous years was attributable mainly to the skills and technical talents of the
acquired business’s work force and the synergies expected to be achieved from integrating the company into the Group’s existing
business.
Notes to the Financial Statements
IOI
Cor
por
atio
n B
erh
ad
182
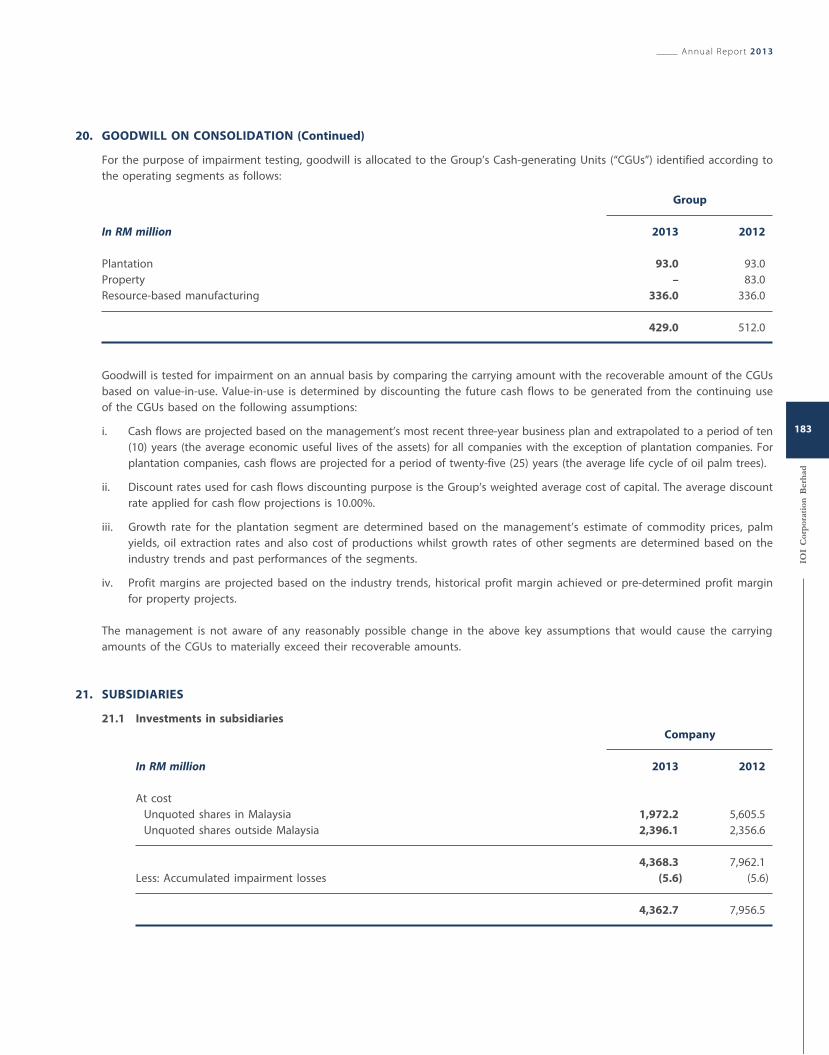
20. GOODWILL ON CONSOLIDATION (Continued)
For the purpose of impairment testing, goodwill is allocated to the Group’s Cash-generating Units (“CGUs”) identified according to
the operating segments as follows:
Group
In RM million 2013 2012
Plantation 93.0 93.0
Property – 83.0
Resource-based manufacturing 336.0 336.0
429.0 512.0
Goodwill is tested for impairment on an annual basis by comparing the carrying amount with the recoverable amount of the CGUs
based on value-in-use. Value-in-use is determined by discounting the future cash flows to be generated from the continuing use
of the CGUs based on the following assumptions:
i. Cash flows are projected based on the management’s most recent three-year business plan and extrapolated to a period of ten
(10) years (the average economic useful lives of the assets) for all companies with the exception of plantation companies. For
plantation companies, cash flows are projected for a period of twenty-five (25) years (the average life cycle of oil palm trees).
ii. Discount rates used for cash flows discounting purpose is the Group’s weighted average cost of capital. The average discount
rate applied for cash flow projections is 10.00%.
iii. Growth rate for the plantation segment are determined based on the management’s estimate of commodity prices, palm
yields, oil extraction rates and also cost of productions whilst growth rates of other segments are determined based on the
industry trends and past performances of the segments.
iv. Profit margins are projected based on the industry trends, historical profit margin achieved or pre-determined profit margin
for property projects.
The management is not aware of any reasonably possible change in the above key assumptions that would cause the carrying
amounts of the CGUs to materially exceed their recoverable amounts.
21. SUBSIDIARIES
21.1 Investments in subsidiaries
Company
In RM million 2013 2012
At cost
Unquoted shares in Malaysia 1,972.2 5,605.5
Unquoted shares outside Malaysia 2,396.1 2,356.6
4,368.3 7,962.1
Less: Accumulated impairment losses (5.6) (5.6)
4,362.7 7,956.5
Annual Report 2013
IOI
Cor
por
atio
n B
erh
ad
183
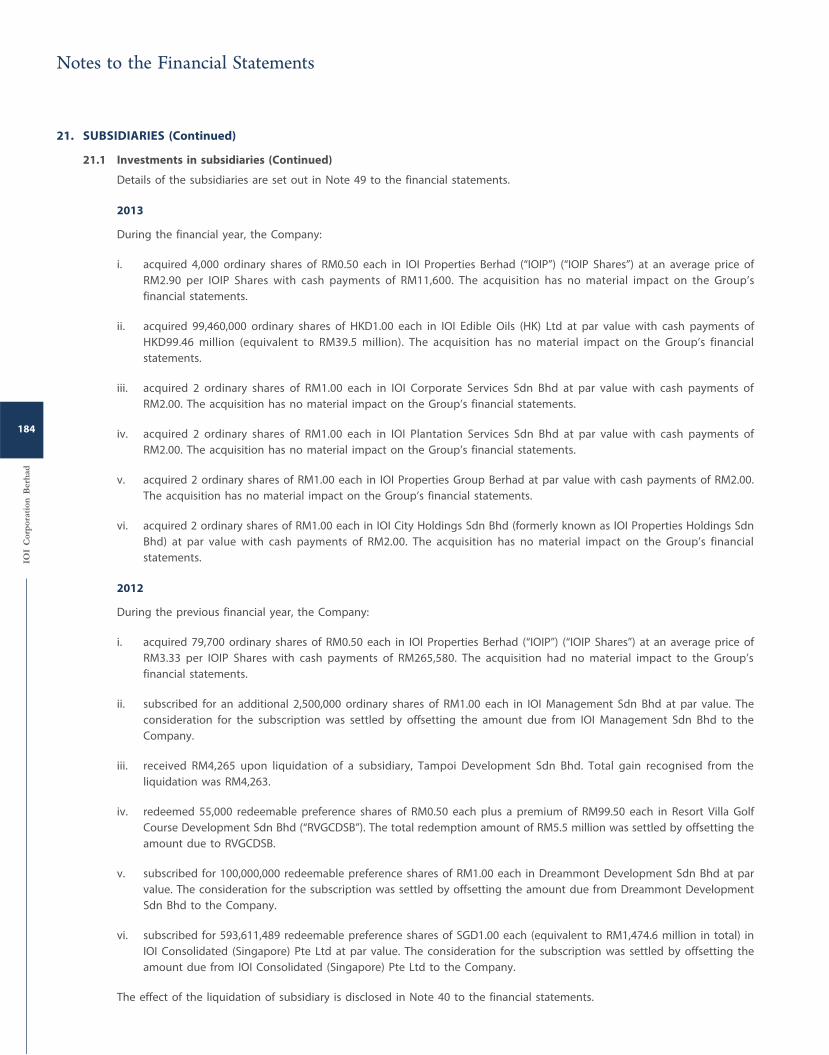
21. SUBSIDIARIES (Continued)
21.1 Investments in subsidiaries (Continued)
Details of the subsidiaries are set out in Note 49 to the financial statements.
2013
During the financial year, the Company:
i. acquired 4,000 ordinary shares of RM0.50 each in IOI Properties Berhad (“IOIP”) (“IOIP Shares”) at an average price of
RM2.90 per IOIP Shares with cash payments of RM11,600. The acquisition has no material impact on the Group’s
financial statements.
ii. acquired 99,460,000 ordinary shares of HKD1.00 each in IOI Edible Oils (HK) Ltd at par value with cash payments of
HKD99.46 million (equivalent to RM39.5 million). The acquisition has no material impact on the Group’s financial
statements.
iii. acquired 2 ordinary shares of RM1.00 each in IOI Corporate Services Sdn Bhd at par value with cash payments of
RM2.00. The acquisition has no material impact on the Group’s financial statements.
iv. acquired 2 ordinary shares of RM1.00 each in IOI Plantation Services Sdn Bhd at par value with cash payments of
RM2.00. The acquisition has no material impact on the Group’s financial statements.
v. acquired 2 ordinary shares of RM1.00 each in IOI Properties Group Berhad at par value with cash payments of RM2.00.
The acquisition has no material impact on the Group’s financial statements.
vi. acquired 2 ordinary shares of RM1.00 each in IOI City Holdings Sdn Bhd (formerly known as IOI Properties Holdings Sdn
Bhd) at par value with cash payments of RM2.00. The acquisition has no material impact on the Group’s financial
statements.
2012
During the previous financial year, the Company:
i. acquired 79,700 ordinary shares of RM0.50 each in IOI Properties Berhad (“IOIP”) (“IOIP Shares”) at an average price of
RM3.33 per IOIP Shares with cash payments of RM265,580. The acquisition had no material impact to the Group’s
financial statements.
ii. subscribed for an additional 2,500,000 ordinary shares of RM1.00 each in IOI Management Sdn Bhd at par value. The
consideration for the subscription was settled by offsetting the amount due from IOI Management Sdn Bhd to the
Company.
iii. received RM4,265 upon liquidation of a subsidiary, Tampoi Development Sdn Bhd. Total gain recognised from the
liquidation was RM4,263.
iv. redeemed 55,000 redeemable preference shares of RM0.50 each plus a premium of RM99.50 each in Resort Villa Golf
Course Development Sdn Bhd (“RVGCDSB”). The total redemption amount of RM5.5 million was settled by offsetting the
amount due to RVGCDSB.
v. subscribed for 100,000,000 redeemable preference shares of RM1.00 each in Dreammont Development Sdn Bhd at par
value. The consideration for the subscription was settled by offsetting the amount due from Dreammont Development
Sdn Bhd to the Company.
vi. subscribed for 593,611,489 redeemable preference shares of SGD1.00 each (equivalent to RM1,474.6 million in total) in
IOI Consolidated (Singapore) Pte Ltd at par value. The consideration for the subscription was settled by offsetting the
amount due from IOI Consolidated (Singapore) Pte Ltd to the Company.
The effect of the liquidation of subsidiary is disclosed in Note 40 to the financial statements.
Notes to the Financial Statements
IOI
Cor
por
atio
n B
erh
ad
184
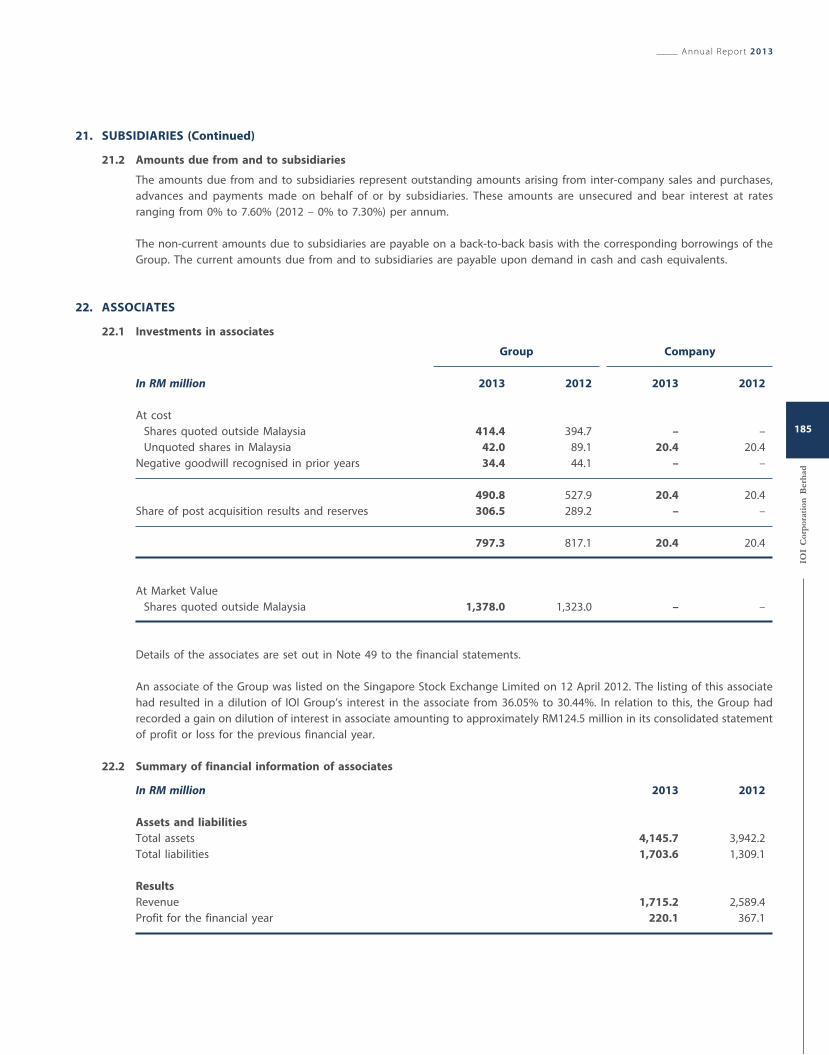
21. SUBSIDIARIES (Continued)
21.2 Amounts due from and to subsidiaries
The amounts due from and to subsidiaries represent outstanding amounts arising from inter-company sales and purchases,
advances and payments made on behalf of or by subsidiaries. These amounts are unsecured and bear interest at rates
ranging from 0% to 7.60% (2012 – 0% to 7.30%) per annum.
The non-current amounts due to subsidiaries are payable on a back-to-back basis with the corresponding borrowings of the
Group. The current amounts due from and to subsidiaries are payable upon demand in cash and cash equivalents.
22. ASSOCIATES
22.1 Investments in associates
Group Company
In RM million 2013 2012 2013 2012
At cost
Shares quoted outside Malaysia 414.4 394.7 – –
Unquoted shares in Malaysia 42.0 89.1 20.4 20.4
Negative goodwill recognised in prior years 34.4 44.1 – –
490.8 527.9 20.4 20.4
Share of post acquisition results and reserves 306.5 289.2 – –
797.3 817.1 20.4 20.4
At Market Value
Shares quoted outside Malaysia 1,378.0 1,323.0 – –
Details of the associates are set out in Note 49 to the financial statements.
An associate of the Group was listed on the Singapore Stock Exchange Limited on 12 April 2012. The listing of this associate
had resulted in a dilution of IOI Group’s interest in the associate from 36.05% to 30.44%. In relation to this, the Group had
recorded a gain on dilution of interest in associate amounting to approximately RM124.5 million in its consolidated statement
of profit or loss for the previous financial year.
22.2 Summary of financial information of associates
In RM million 2013 2012
Assets and liabilities
Total assets 4,145.7 3,942.2
Total liabilities 1,703.6 1,309.1
Results
Revenue 1,715.2 2,589.4
Profit for the financial year 220.1 367.1
Annual Report 2013
IOI
Cor
por
atio
n B
erh
ad
185
22. ASSOCIATES (Continued)
22.3 Amounts due from and to associates
Amounts due from and to associates represent outstanding amounts arising from agency income, purchases and payments
made on behalf of or by associates, which are unsecured, interest-free and payable upon demand in cash and cash
equivalents.
23. JOINTLY CONTROLLED ENTITIES
On 14 May 2013, the Company proposed to demerge the property development, property investment and other property related
businesses of the Group as disclosed in Note 47. The jointly controlled entities formed part of the assets to be demerged and is
now classified as a disposal group held for sale/held for distribution to owners in Note 33.
23.1 Interests in jointly controlled entities
Group Company
In RM million 2013 2012 2013 2012
Unquoted shares, at cost 9.0 942.6 9.0 –
Share of post acquisition results and reserves (0.2) (98.4) – –
8.8 844.2 9.0 –
Amounts due from jointly controlled entities – 2,638.9 – –
8.8 3,483.1 9.0 –
Details of the jointly controlled entities are set out in Note 49 to the financial statements.
During the previous financial year, amounts due from jointly controlled entities represented outstanding amounts arising
from the proportionate advances for the acquisitions and development of land in Singapore and China and for development
expenses and working capital, which were unsecured, bore interest at rates ranging from 0.90% to 2.05% per annum and
were not repayable within the next twelve (12) months.
During the previous financial year, guarantees given proportionally by the Group and the Company for credit facilities of
jointly controlled entities amounted to RM1,044.1 million and RM907.7 million respectively.
Notes to the Financial Statements
IOI
Cor
por
atio
n B
erh
ad
186
23. JOINTLY CONTROLLED ENTITIES (Continued)
23.1 Interests in jointly controlled entities (Continued)
The Group’s share of assets, liabilities, income and expenses of the jointly controlled entities were as follows:
Group
In RM million 2013 2012
Assets and liabilities
Non-current assets – 1.1
Current assets 8.8 5,777.5
Total assets 8.8 5,778.6
Current liabilities – 2,157.3
Non-current liabilities – 2,777.1
Total liabilities – 4,934.4
Results
Revenue – –
Expenses, including finance costs and taxation (0.2) –
23.2 Capital commitment of jointly controlled entities
Group
In RM million 2013 2012
Authorised capital expenditure of jointly controlled entities
Contracted
– Property, plant and equipment 85.3 –
– Construction in progress – 1,234.4
Annual Report 2013
IOI
Cor
por
atio
n B
erh
ad
187
24. DERIVATIVE FINANCIAL INSTRUMENTS
In RM million
Contract/
Notional amount
Net long/(short)
Fair value
Financial
Assets
Financial
Liabilities
Group
2013
Forward foreign exchange contracts (1,542.3) 13.0 66.6
Commodity forward contracts 41.0 43.4 26.1
Commodity futures 112.8 2.9 3.6
Cross currency swap contracts 1,492.4 45.3 –
Interest rate swap contracts 2,145.3 – 55.9
Total derivative financial instruments 2,249.2 104.6 152.2
Less: Current portion (59.3) (96.3)
Non-current portion 45.3 55.9
2012
Forward foreign exchange contracts (2,106.9) 38.4 110.2
Commodity forward contracts 441.3 119.9 86.5
Commodity futures (122.2) 13.6 6.1
Cross currency swap contracts 1,982.5 67.1 –
Interest rate swap contracts 2,153.4 – 79.8
Total derivative financial instruments 2,348.1 239.0 282.6
Less: Current portion (171.9) (202.8)
Non-current portion 67.1 79.8
Notes to the Financial Statements
IOI
Cor
por
atio
n B
erh
ad
188
24. DERIVATIVE FINANCIAL INSTRUMENTS (Continued)
In RM million
Contract/
Notional amount
Net long
Fair value
Financial
Assets
Financial
Liabilities
Company
2013
Interest rate swap contracts 1,909.8 – 52.8
Total derivative financial instruments 1,909.8 – 52.8
Less: Current portion – –
Non-current portion – 52.8
2012
Cross currency swap contracts 318.2 14.6 –
Interest rate swap contracts 1,917.0 – 74.9
Total derivative financial instruments 2,235.2 14.6 74.9
Less: Current portion – –
Non-current portion 14.6 74.9
i. Forward foreign exchange contracts
Forward foreign exchange contracts were entered into as hedges for sales and purchases denominated in foreign currencies
and to limit the exposure to potential changes in foreign exchange rates with respect to the Group’s foreign currencies
denominated financial assets and financial liabilities.
ii. Commodity forward contracts, swap contracts and futures
The commodities forward contracts, swap contracts and futures were entered into with the objective of managing and
hedging the respective exposure of the Group’s plantation segment and resource-based manufacturing segment to adverse
price movements in vegetable oil commodities. The fair values of these components have been determined based on
published market prices or quoted prices from reputable financial institutions.
iii. Cross currency swap contracts
Currency swap contracts are used to hedge foreign currency exposures of borrowings.
iv. Interest rate swap contracts
Interest rate swap contracts are used to hedge the Group’s exposures to movements in interest rates.
All the above derivatives are initially recognised at fair value on the date the derivative contract is entered into and are subsequently
re-measured at fair value through profit or loss. The resulting gain or loss from the re-measurement is recognised in profit or loss.
During the financial year, the Group and the Company recognised total fair value gains of RM130.4 million (2012 – loss of RM73.7
million) and RM22.1 million (2012 – loss of RM2.8 million) respectively arising from fair value changes of derivative liabilities. The
methods and assumptions applied in determining the fair values of derivatives are disclosed in Note 45.6.
Annual Report 2013
IOI
Cor
por
atio
n B
erh
ad
189
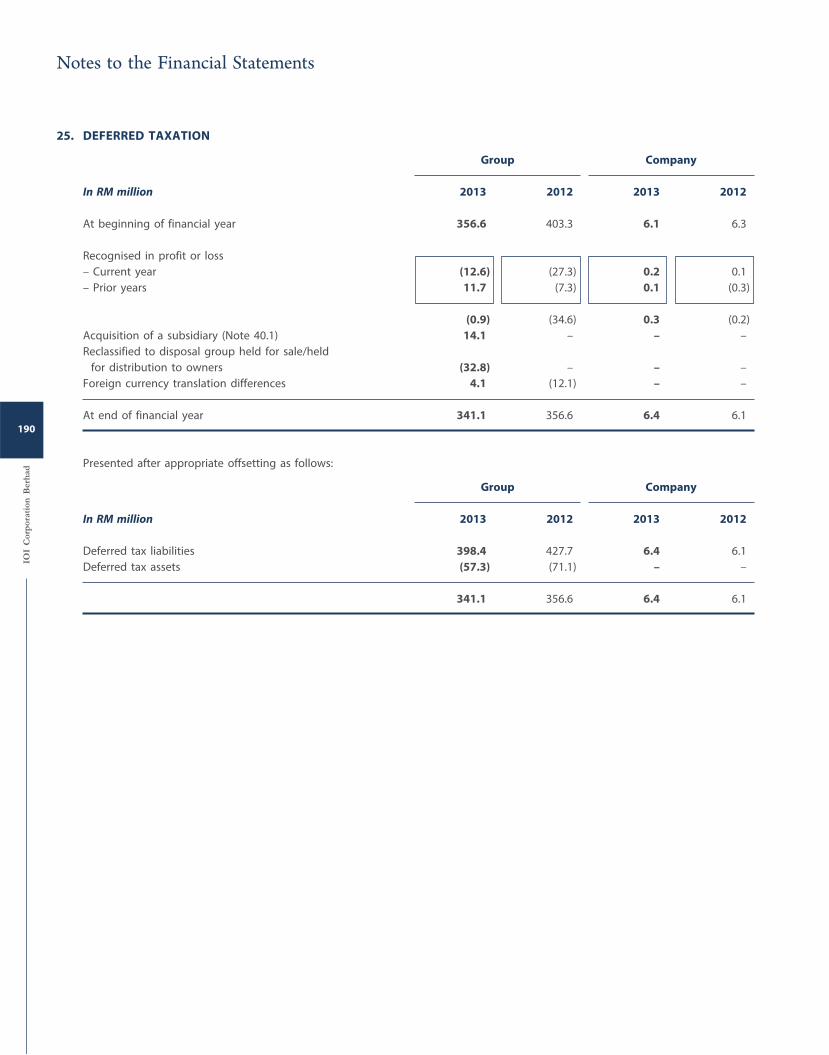
25. DEFERRED TAXATION
Group Company
In RM million 2013 2012 2013 2012
At beginning of financial year 356.6 403.3 6.1 6.3
Recognised in profit or loss
– Current year (12.6) (27.3) 0.2 0.1
– Prior years 11.7 (7.3) 0.1 (0.3)
(0.9) (34.6) 0.3 (0.2)
Acquisition of a subsidiary (Note 40.1) 14.1 – – –
Reclassified to disposal group held for sale/held
for distribution to owners (32.8) – – –
Foreign currency translation differences 4.1 (12.1) – –
At end of financial year 341.1 356.6 6.4 6.1
Presented after appropriate offsetting as follows:
Group Company
In RM million 2013 2012 2013 2012
Deferred tax liabilities 398.4 427.7 6.4 6.1
Deferred tax assets (57.3) (71.1) – –
341.1 356.6 6.4 6.1
Notes to the Financial Statements
IOI
Cor
por
atio
n B
erh
ad
190
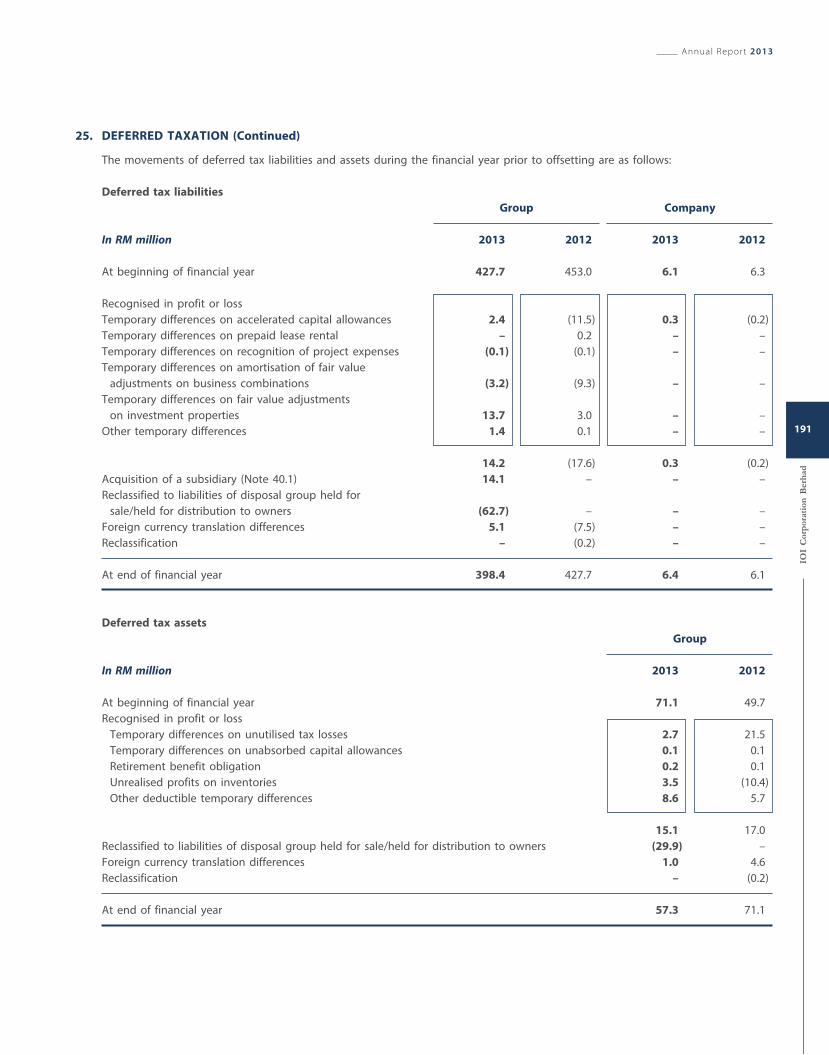
25. DEFERRED TAXATION (Continued)
The movements of deferred tax liabilities and assets during the financial year prior to offsetting are as follows:
Deferred tax liabilities
Group Company
In RM million 2013 2012 2013 2012
At beginning of financial year 427.7 453.0 6.1 6.3
Recognised in profit or loss
Temporary differences on accelerated capital allowances 2.4 (11.5) 0.3 (0.2)
Temporary differences on prepaid lease rental – 0.2 – –
Temporary differences on recognition of project expenses (0.1) (0.1) – –
Temporary differences on amortisation of fair value
adjustments on business combinations (3.2) (9.3) – –
Temporary differences on fair value adjustments
on investment properties 13.7 3.0 – –
Other temporary differences 1.4 0.1 – –
14.2 (17.6) 0.3 (0.2)
Acquisition of a subsidiary (Note 40.1) 14.1 – – –
Reclassified to liabilities of disposal group held for
sale/held for distribution to owners (62.7) – – –
Foreign currency translation differences 5.1 (7.5) – –
Reclassification – (0.2) – –
At end of financial year 398.4 427.7 6.4 6.1
Deferred tax assets
Group
In RM million 2013 2012
At beginning of financial year 71.1 49.7
Recognised in profit or loss
Temporary differences on unutilised tax losses 2.7 21.5
Temporary differences on unabsorbed capital allowances 0.1 0.1
Retirement benefit obligation 0.2 0.1
Unrealised profits on inventories 3.5 (10.4)
Other deductible temporary differences 8.6 5.7
15.1 17.0
Reclassified to liabilities of disposal group held for sale/held for distribution to owners (29.9) –
Foreign currency translation differences 1.0 4.6
Reclassification – (0.2)
At end of financial year 57.3 71.1
Annual Report 2013
IOI
Cor
por
atio
n B
erh
ad
191
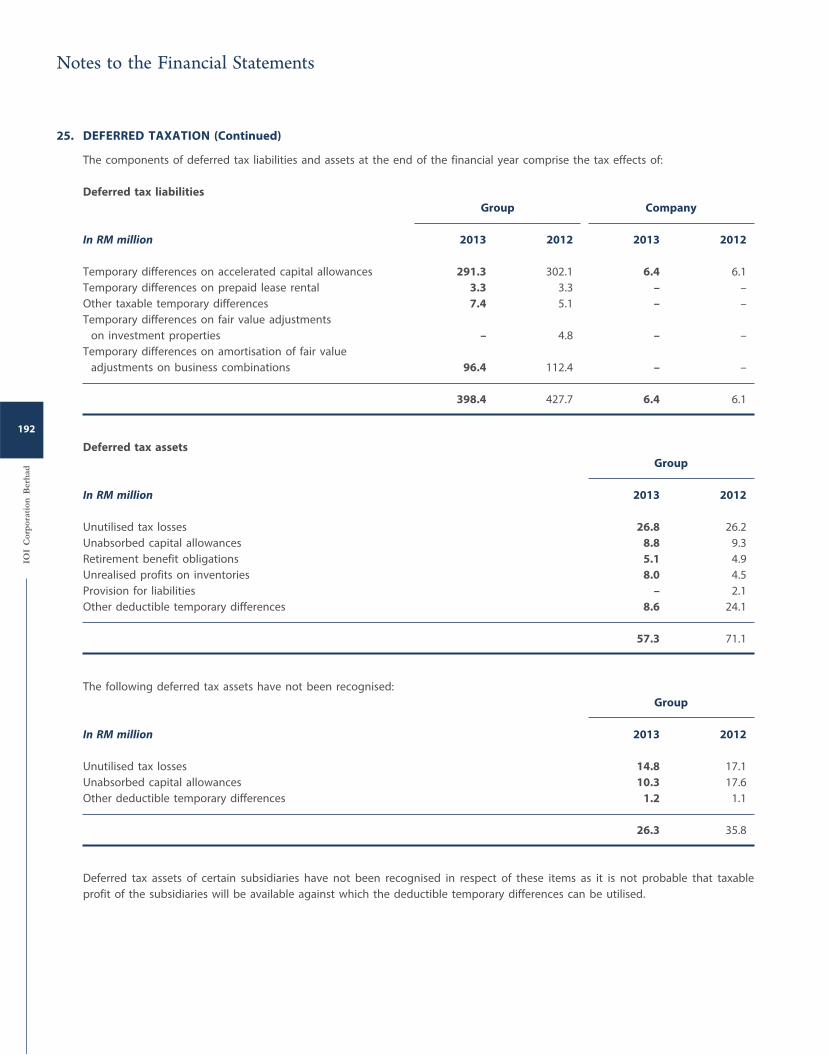
25. DEFERRED TAXATION (Continued)
The components of deferred tax liabilities and assets at the end of the financial year comprise the tax effects of:
Deferred tax liabilities
Group Company
In RM million 2013 2012 2013 2012
Temporary differences on accelerated capital allowances 291.3 302.1 6.4 6.1
Temporary differences on prepaid lease rental 3.3 3.3 – –
Other taxable temporary differences 7.4 5.1 – –
Temporary differences on fair value adjustments
on investment properties – 4.8 – –
Temporary differences on amortisation of fair value
adjustments on business combinations 96.4 112.4 – –
398.4 427.7 6.4 6.1
Deferred tax assets
Group
In RM million 2013 2012
Unutilised tax losses 26.8 26.2
Unabsorbed capital allowances 8.8 9.3
Retirement benefit obligations 5.1 4.9
Unrealised profits on inventories 8.0 4.5
Provision for liabilities – 2.1
Other deductible temporary differences 8.6 24.1
57.3 71.1
The following deferred tax assets have not been recognised:
Group
In RM million 2013 2012
Unutilised tax losses 14.8 17.1
Unabsorbed capital allowances 10.3 17.6
Other deductible temporary differences 1.2 1.1
26.3 35.8
Deferred tax assets of certain subsidiaries have not been recognised in respect of these items as it is not probable that taxable
profit of the subsidiaries will be available against which the deductible temporary differences can be utilised.
Notes to the Financial Statements
IOI
Cor
por
atio
n B
erh
ad
192
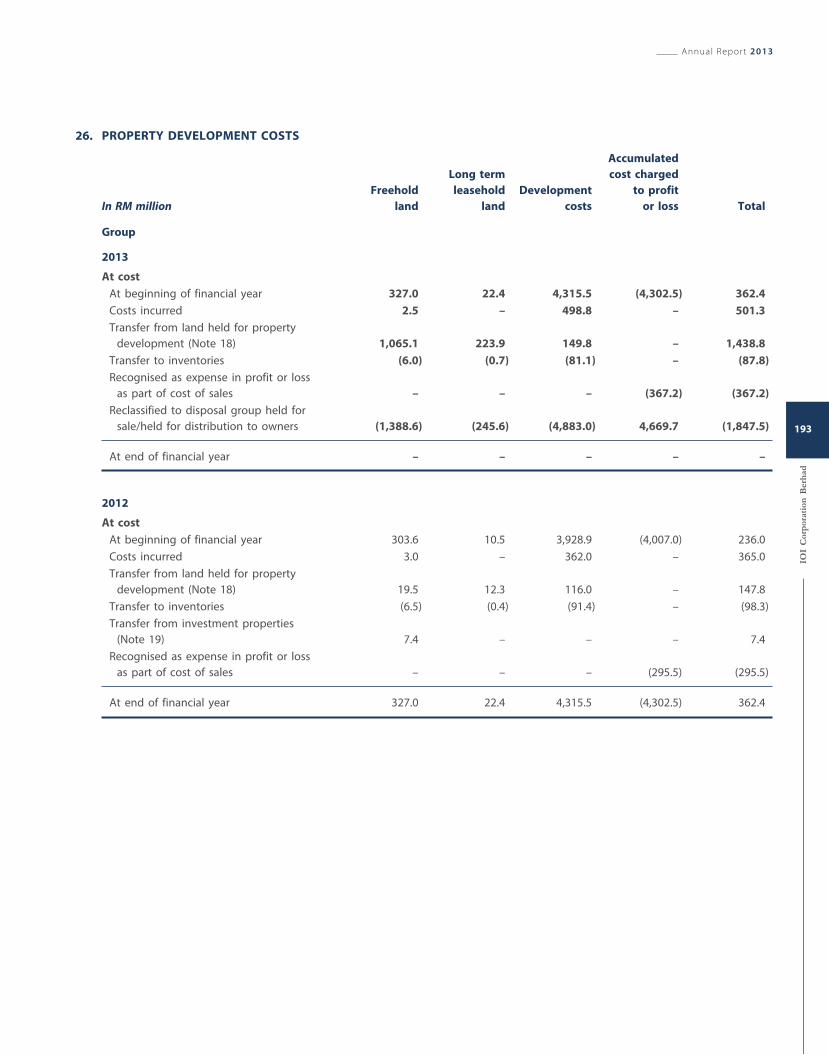
26. PROPERTY DEVELOPMENT COSTS
In RM million Freehold
land
Long term
leasehold
land
Development
costs
Accumulated
cost charged
to profit
or loss Total
Group
2013
At cost
At beginning of financial year 327.0 22.4 4,315.5 (4,302.5) 362.4
Costs incurred 2.5 – 498.8 – 501.3
Transfer from land held for property
development (Note 18) 1,065.1 223.9 149.8 – 1,438.8
Transfer to inventories (6.0) (0.7) (81.1) – (87.8)
Recognised as expense in profit or loss
as part of cost of sales – – – (367.2) (367.2)
Reclassified to disposal group held for
sale/held for distribution to owners (1,388.6) (245.6) (4,883.0) 4,669.7 (1,847.5)
At end of financial year – – – – –
2012
At cost
At beginning of financial year 303.6 10.5 3,928.9 (4,007.0) 236.0
Costs incurred 3.0 – 362.0 – 365.0
Transfer from land held for property
development (Note 18) 19.5 12.3 116.0 – 147.8
Transfer to inventories (6.5) (0.4) (91.4) – (98.3)
Transfer from investment properties
(Note 19) 7.4 – – – 7.4
Recognised as expense in profit or loss
as part of cost of sales – – – (295.5) (295.5)
At end of financial year 327.0 22.4 4,315.5 (4,302.5) 362.4
Annual Report 2013
IOI
Cor
por
atio
n B
erh
ad
193
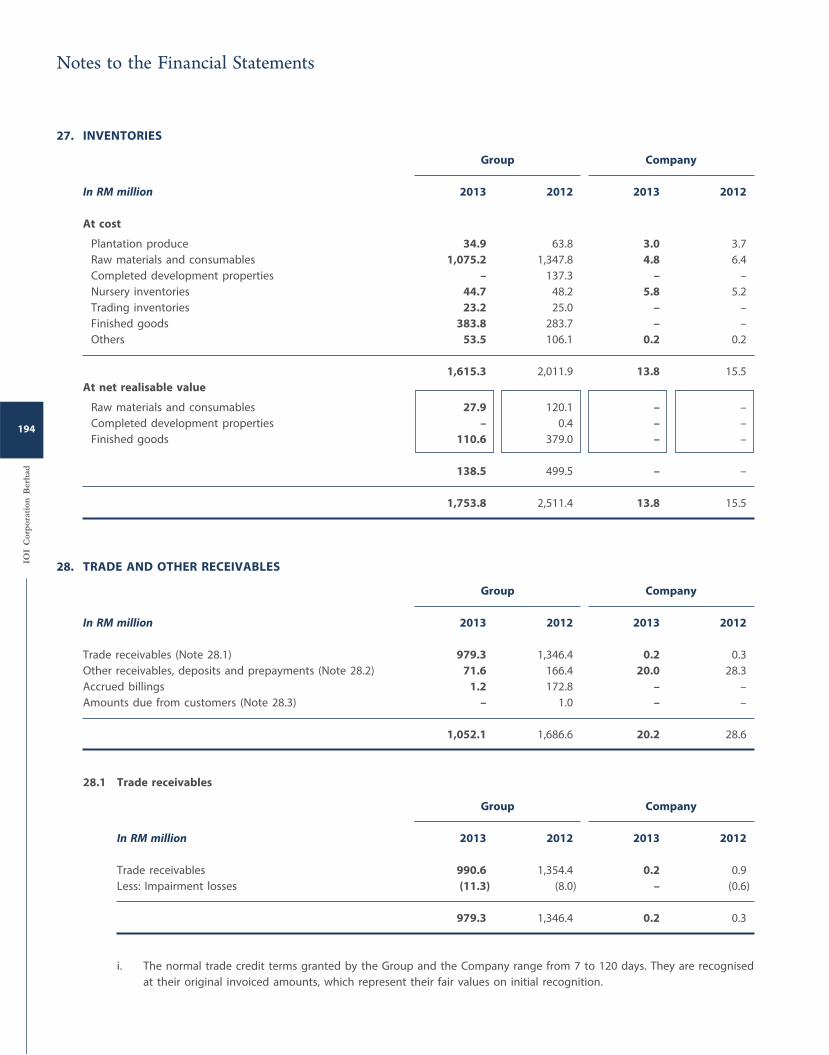
27. INVENTORIES
Group Company
In RM million 2013 2012 2013 2012
At cost
Plantation produce 34.9 63.8 3.0 3.7
Raw materials and consumables 1,075.2 1,347.8 4.8 6.4
Completed development properties – 137.3 – –
Nursery inventories 44.7 48.2 5.8 5.2
Trading inventories 23.2 25.0 – –
Finished goods 383.8 283.7 – –
Others 53.5 106.1 0.2 0.2
1,615.3 2,011.9 13.8 15.5
At net realisable value
Raw materials and consumables 27.9 120.1 – –
Completed development properties – 0.4 – –
Finished goods 110.6 379.0 – –
138.5 499.5 – –
1,753.8 2,511.4 13.8 15.5
28. TRADE AND OTHER RECEIVABLES
Group Company
In RM million 2013 2012 2013 2012
Trade receivables (Note 28.1) 979.3 1,346.4 0.2 0.3
Other receivables, deposits and prepayments (Note 28.2) 71.6 166.4 20.0 28.3
Accrued billings 1.2 172.8 – –
Amounts due from customers (Note 28.3) – 1.0 – –
1,052.1 1,686.6 20.2 28.6
28.1 Trade receivables
Group Company
In RM million 2013 2012 2013 2012
Trade receivables 990.6 1,354.4 0.2 0.9
Less: Impairment losses (11.3) (8.0) – (0.6)
979.3 1,346.4 0.2 0.3
i. The normal trade credit terms granted by the Group and the Company range from 7 to 120 days. They are recognised
at their original invoiced amounts, which represent their fair values on initial recognition.
Notes to the Financial Statements
IOI
Cor
por
atio
n B
erh
ad
194
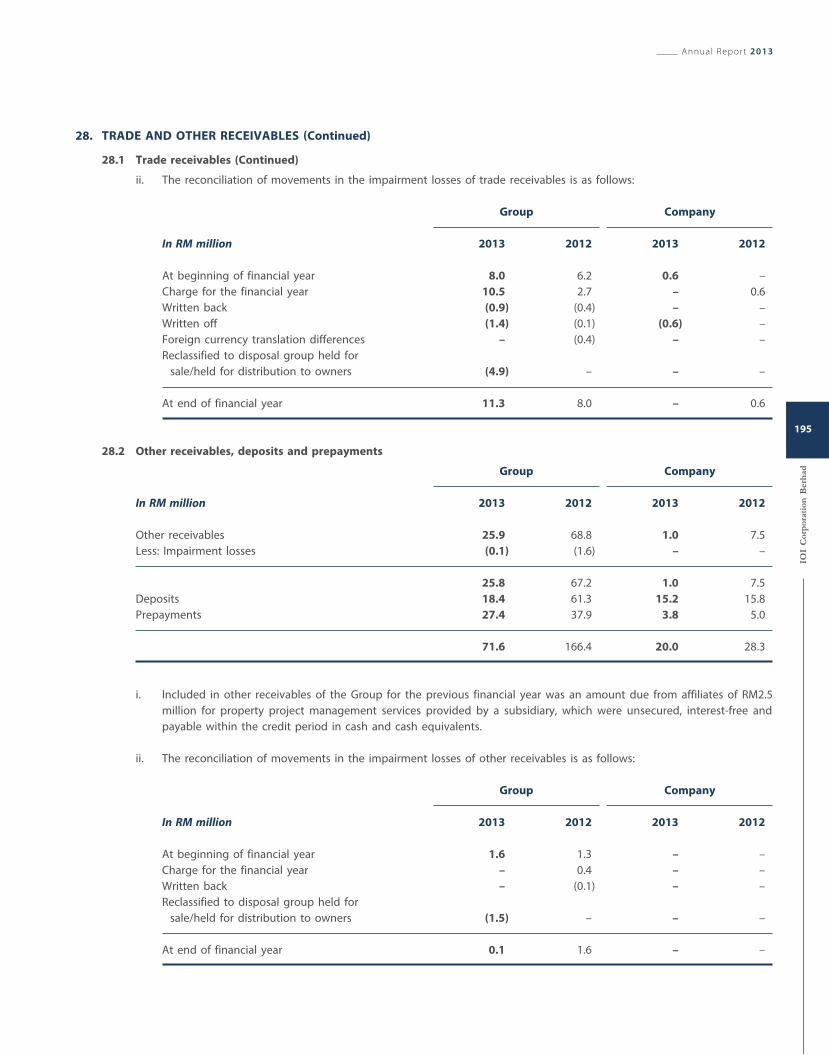
28. TRADE AND OTHER RECEIVABLES (Continued)
28.1 Trade receivables (Continued)
ii. The reconciliation of movements in the impairment losses of trade receivables is as follows:
Group Company
In RM million 2013 2012 2013 2012
At beginning of financial year 8.0 6.2 0.6 –
Charge for the financial year 10.5 2.7 – 0.6
Written back (0.9) (0.4) – –
Written off (1.4) (0.1) (0.6) –
Foreign currency translation differences – (0.4) – –
Reclassified to disposal group held for
sale/held for distribution to owners (4.9) – – –
At end of financial year 11.3 8.0 – 0.6
28.2 Other receivables, deposits and prepayments
Group Company
In RM million 2013 2012 2013 2012
Other receivables 25.9 68.8 1.0 7.5
Less: Impairment losses (0.1) (1.6) – –
25.8 67.2 1.0 7.5
Deposits 18.4 61.3 15.2 15.8
Prepayments 27.4 37.9 3.8 5.0
71.6 166.4 20.0 28.3
i. Included in other receivables of the Group for the previous financial year was an amount due from affiliates of RM2.5
million for property project management services provided by a subsidiary, which were unsecured, interest-free and
payable within the credit period in cash and cash equivalents.
ii. The reconciliation of movements in the impairment losses of other receivables is as follows:
Group Company
In RM million 2013 2012 2013 2012
At beginning of financial year 1.6 1.3 – –
Charge for the financial year – 0.4 – –
Written back – (0.1) – –
Reclassified to disposal group held for
sale/held for distribution to owners (1.5) – – –
At end of financial year 0.1 1.6 – –
Annual Report 2013
IOI
Cor
por
atio
n B
erh
ad
195
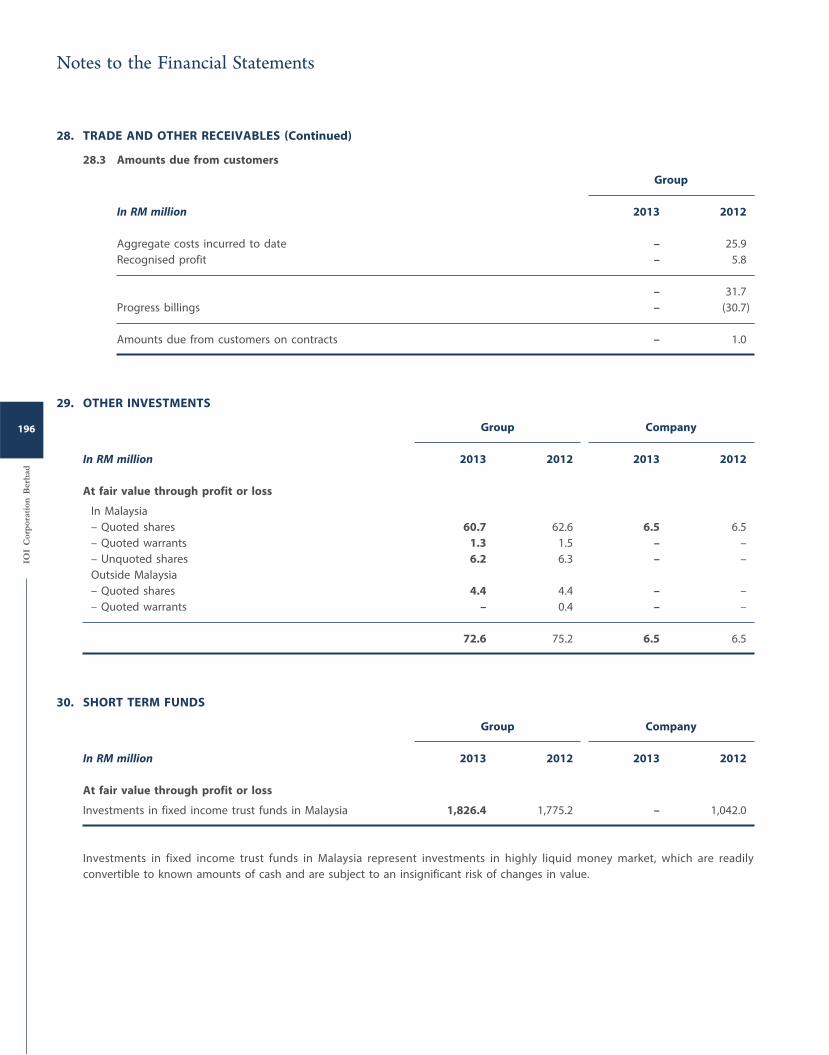
28. TRADE AND OTHER RECEIVABLES (Continued)
28.3 Amounts due from customers
Group
In RM million 2013 2012
Aggregate costs incurred to date – 25.9
Recognised profit – 5.8
– 31.7
Progress billings – (30.7)
Amounts due from customers on contracts – 1.0
29. OTHER INVESTMENTS
Group Company
In RM million 2013 2012 2013 2012
At fair value through profit or loss
In Malaysia
– Quoted shares 60.7 62.6 6.5 6.5
– Quoted warrants 1.3 1.5 – –
– Unquoted shares 6.2 6.3 – –
Outside Malaysia
– Quoted shares 4.4 4.4 – –
– Quoted warrants – 0.4 – –
72.6 75.2 6.5 6.5
30. SHORT TERM FUNDS
Group Company
In RM million 2013 2012 2013 2012
At fair value through profit or loss
Investments in fixed income trust funds in Malaysia 1,826.4 1,775.2 – 1,042.0
Investments in fixed income trust funds in Malaysia represent investments in highly liquid money market, which are readily
convertible to known amounts of cash and are subject to an insignificant risk of changes in value.
Notes to the Financial Statements
IOI
Cor
por
atio
n B
erh
ad
196
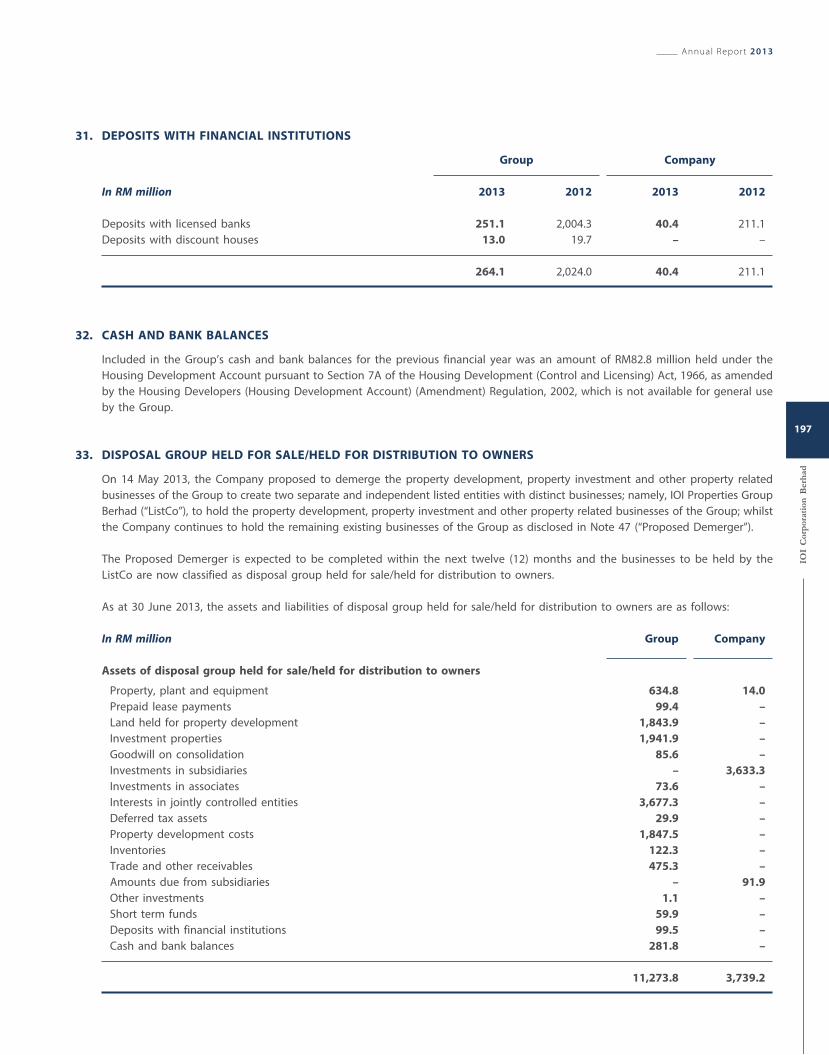
31. DEPOSITS WITH FINANCIAL INSTITUTIONS
Group Company
In RM million 2013 2012 2013 2012
Deposits with licensed banks 251.1 2,004.3 40.4 211.1
Deposits with discount houses 13.0 19.7 – –
264.1 2,024.0 40.4 211.1
32. CASH AND BANK BALANCES
Included in the Group’s cash and bank balances for the previous financial year was an amount of RM82.8 million held under the
Housing Development Account pursuant to Section 7A of the Housing Development (Control and Licensing) Act, 1966, as amended
by the Housing Developers (Housing Development Account) (Amendment) Regulation, 2002, which is not available for general use
by the Group.
33. DISPOSAL GROUP HELD FOR SALE/HELD FOR DISTRIBUTION TO OWNERS
On 14 May 2013, the Company proposed to demerge the property development, property investment and other property related
businesses of the Group to create two separate and independent listed entities with distinct businesses; namely, IOI Properties Group
Berhad (“ListCo”), to hold the property development, property investment and other property related businesses of the Group; whilst
the Company continues to hold the remaining existing businesses of the Group as disclosed in Note 47 (“Proposed Demerger”).
The Proposed Demerger is expected to be completed within the next twelve (12) months and the businesses to be held by the
ListCo are now classified as disposal group held for sale/held for distribution to owners.
As at 30 June 2013, the assets and liabilities of disposal group held for sale/held for distribution to owners are as follows:
In RM million Group Company
Assets of disposal group held for sale/held for distribution to owners
Property, plant and equipment 634.8 14.0
Prepaid lease payments 99.4 –
Land held for property development 1,843.9 –
Investment properties 1,941.9 –
Goodwill on consolidation 85.6 –
Investments in subsidiaries – 3,633.3
Investments in associates 73.6 –
Interests in jointly controlled entities 3,677.3 –
Deferred tax assets 29.9 –
Property development costs 1,847.5 –
Inventories 122.3 –
Trade and other receivables 475.3 –
Amounts due from subsidiaries – 91.9
Other investments 1.1 –
Short term funds 59.9 –
Deposits with financial institutions 99.5 –
Cash and bank balances 281.8 –
11,273.8 3,739.2
Annual Report 2013
IOI
Cor
por
atio
n B
erh
ad
197
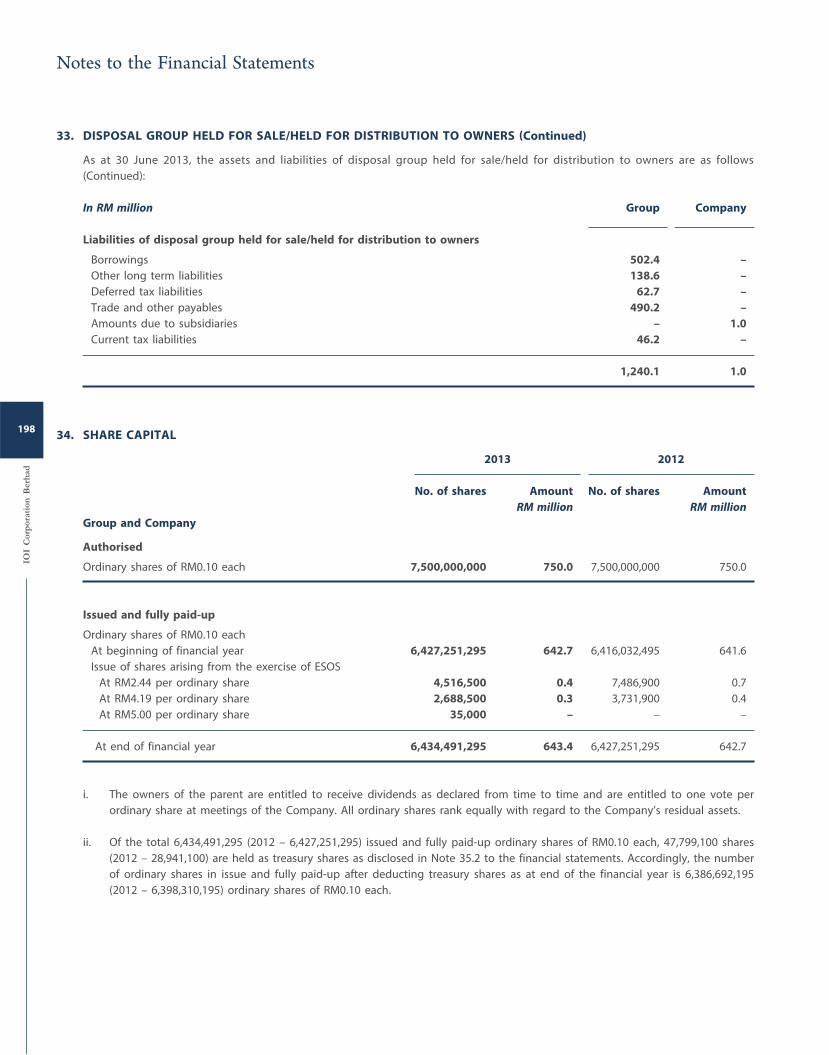
33. DISPOSAL GROUP HELD FOR SALE/HELD FOR DISTRIBUTION TO OWNERS (Continued)
As at 30 June 2013, the assets and liabilities of disposal group held for sale/held for distribution to owners are as follows
(Continued):
In RM million Group Company
Liabilities of disposal group held for sale/held for distribution to owners
Borrowings 502.4 –
Other long term liabilities 138.6 –
Deferred tax liabilities 62.7 –
Trade and other payables 490.2 –
Amounts due to subsidiaries – 1.0
Current tax liabilities 46.2 –
1,240.1 1.0
34. SHARE CAPITAL
2013 2012
No. of shares Amount No. of shares Amount
RM million RM millionGroup and Company
Authorised
Ordinary shares of RM0.10 each 7,500,000,000 750.0 7,500,000,000 750.0
Issued and fully paid-up
Ordinary shares of RM0.10 each
At beginning of financial year 6,427,251,295 642.7 6,416,032,495 641.6
Issue of shares arising from the exercise of ESOS
At RM2.44 per ordinary share 4,516,500 0.4 7,486,900 0.7
At RM4.19 per ordinary share 2,688,500 0.3 3,731,900 0.4
At RM5.00 per ordinary share 35,000 – – –
At end of financial year 6,434,491,295 643.4 6,427,251,295 642.7
i. The owners of the parent are entitled to receive dividends as declared from time to time and are entitled to one vote per
ordinary share at meetings of the Company. All ordinary shares rank equally with regard to the Company’s residual assets.
ii. Of the total 6,434,491,295 (2012 – 6,427,251,295) issued and fully paid-up ordinary shares of RM0.10 each, 47,799,100 shares
(2012 – 28,941,100) are held as treasury shares as disclosed in Note 35.2 to the financial statements. Accordingly, the number
of ordinary shares in issue and fully paid-up after deducting treasury shares as at end of the financial year is 6,386,692,195
(2012 – 6,398,310,195) ordinary shares of RM0.10 each.
Notes to the Financial Statements
IOI
Cor
por
atio
n B
erh
ad
198
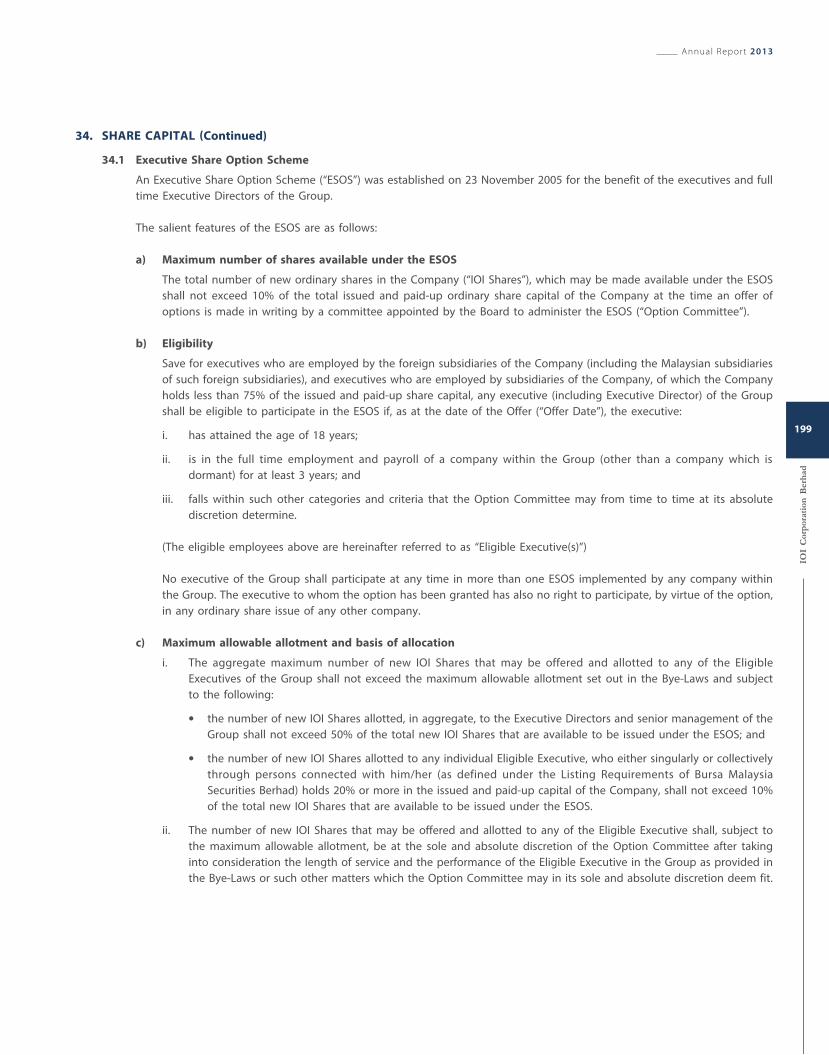
34. SHARE CAPITAL (Continued)
34.1 Executive Share Option Scheme
An Executive Share Option Scheme (“ESOS”) was established on 23 November 2005 for the benefit of the executives and full
time Executive Directors of the Group.
The salient features of the ESOS are as follows:
a) Maximum number of shares available under the ESOS
The total number of new ordinary shares in the Company (“IOI Shares”), which may be made available under the ESOS
shall not exceed 10% of the total issued and paid-up ordinary share capital of the Company at the time an offer of
options is made in writing by a committee appointed by the Board to administer the ESOS (“Option Committee”).
b) Eligibility
Save for executives who are employed by the foreign subsidiaries of the Company (including the Malaysian subsidiaries
of such foreign subsidiaries), and executives who are employed by subsidiaries of the Company, of which the Company
holds less than 75% of the issued and paid-up share capital, any executive (including Executive Director) of the Group
shall be eligible to participate in the ESOS if, as at the date of the Offer (“Offer Date”), the executive:
i. has attained the age of 18 years;
ii. is in the full time employment and payroll of a company within the Group (other than a company which is
dormant) for at least 3 years; and
iii. falls within such other categories and criteria that the Option Committee may from time to time at its absolute
discretion determine.
(The eligible employees above are hereinafter referred to as “Eligible Executive(s)”)
No executive of the Group shall participate at any time in more than one ESOS implemented by any company within
the Group. The executive to whom the option has been granted has also no right to participate, by virtue of the option,
in any ordinary share issue of any other company.
c) Maximum allowable allotment and basis of allocation
i. The aggregate maximum number of new IOI Shares that may be offered and allotted to any of the Eligible
Executives of the Group shall not exceed the maximum allowable allotment set out in the Bye-Laws and subject
to the following:
the number of new IOI Shares allotted, in aggregate, to the Executive Directors and senior management of the
Group shall not exceed 50% of the total new IOI Shares that are available to be issued under the ESOS; and
the number of new IOI Shares allotted to any individual Eligible Executive, who either singularly or collectively
through persons connected with him/her (as defined under the Listing Requirements of Bursa Malaysia
Securities Berhad) holds 20% or more in the issued and paid-up capital of the Company, shall not exceed 10%
of the total new IOI Shares that are available to be issued under the ESOS.
ii. The number of new IOI Shares that may be offered and allotted to any of the Eligible Executive shall, subject to
the maximum allowable allotment, be at the sole and absolute discretion of the Option Committee after taking
into consideration the length of service and the performance of the Eligible Executive in the Group as provided in
the Bye-Laws or such other matters which the Option Committee may in its sole and absolute discretion deem fit.
Annual Report 2013
IOI
Cor
por
atio
n B
erh
ad
199
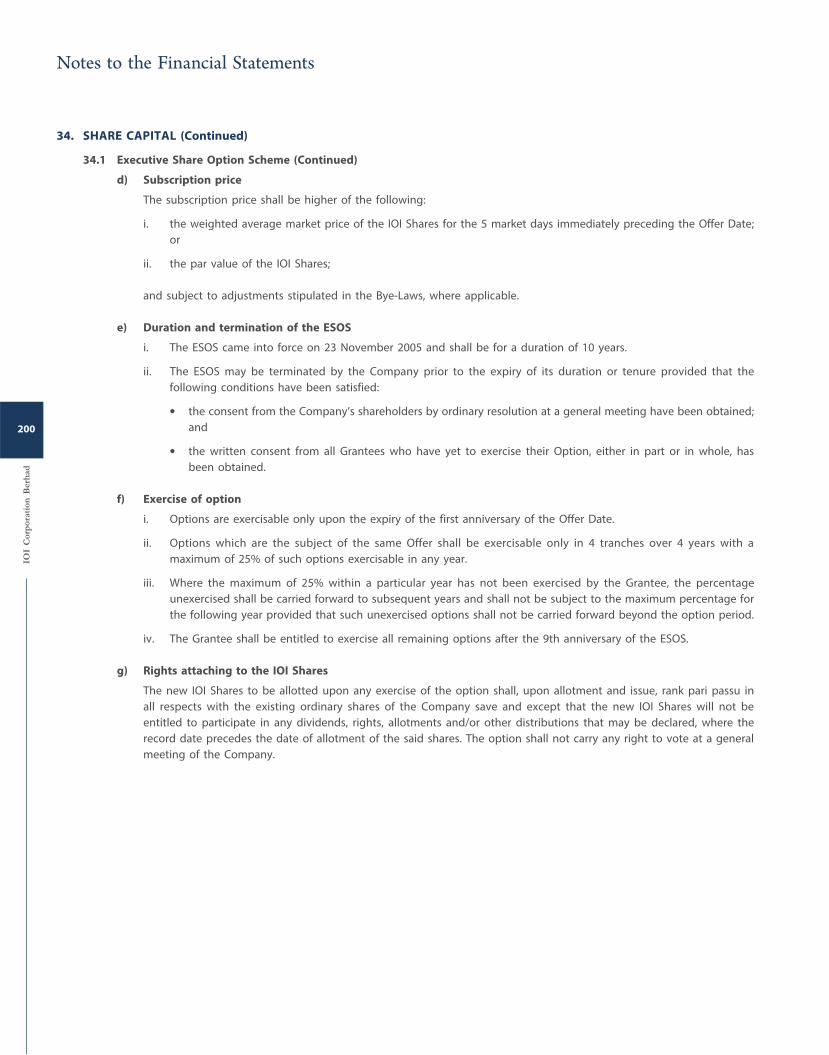
34. SHARE CAPITAL (Continued)
34.1 Executive Share Option Scheme (Continued)
d) Subscription price
The subscription price shall be higher of the following:
i. the weighted average market price of the IOI Shares for the 5 market days immediately preceding the Offer Date;
or
ii. the par value of the IOI Shares;
and subject to adjustments stipulated in the Bye-Laws, where applicable.
e) Duration and termination of the ESOS
i. The ESOS came into force on 23 November 2005 and shall be for a duration of 10 years.
ii. The ESOS may be terminated by the Company prior to the expiry of its duration or tenure provided that the
following conditions have been satisfied:
the consent from the Company’s shareholders by ordinary resolution at a general meeting have been obtained;
and
the written consent from all Grantees who have yet to exercise their Option, either in part or in whole, has
been obtained.
f) Exercise of option
i. Options are exercisable only upon the expiry of the first anniversary of the Offer Date.
ii. Options which are the subject of the same Offer shall be exercisable only in 4 tranches over 4 years with a
maximum of 25% of such options exercisable in any year.
iii. Where the maximum of 25% within a particular year has not been exercised by the Grantee, the percentage
unexercised shall be carried forward to subsequent years and shall not be subject to the maximum percentage for
the following year provided that such unexercised options shall not be carried forward beyond the option period.
iv. The Grantee shall be entitled to exercise all remaining options after the 9th anniversary of the ESOS.
g) Rights attaching to the IOI Shares
The new IOI Shares to be allotted upon any exercise of the option shall, upon allotment and issue, rank pari passu in
all respects with the existing ordinary shares of the Company save and except that the new IOI Shares will not be
entitled to participate in any dividends, rights, allotments and/or other distributions that may be declared, where the
record date precedes the date of allotment of the said shares. The option shall not carry any right to vote at a general
meeting of the Company.
Notes to the Financial Statements
IOI
Cor
por
atio
n B
erh
ad
200
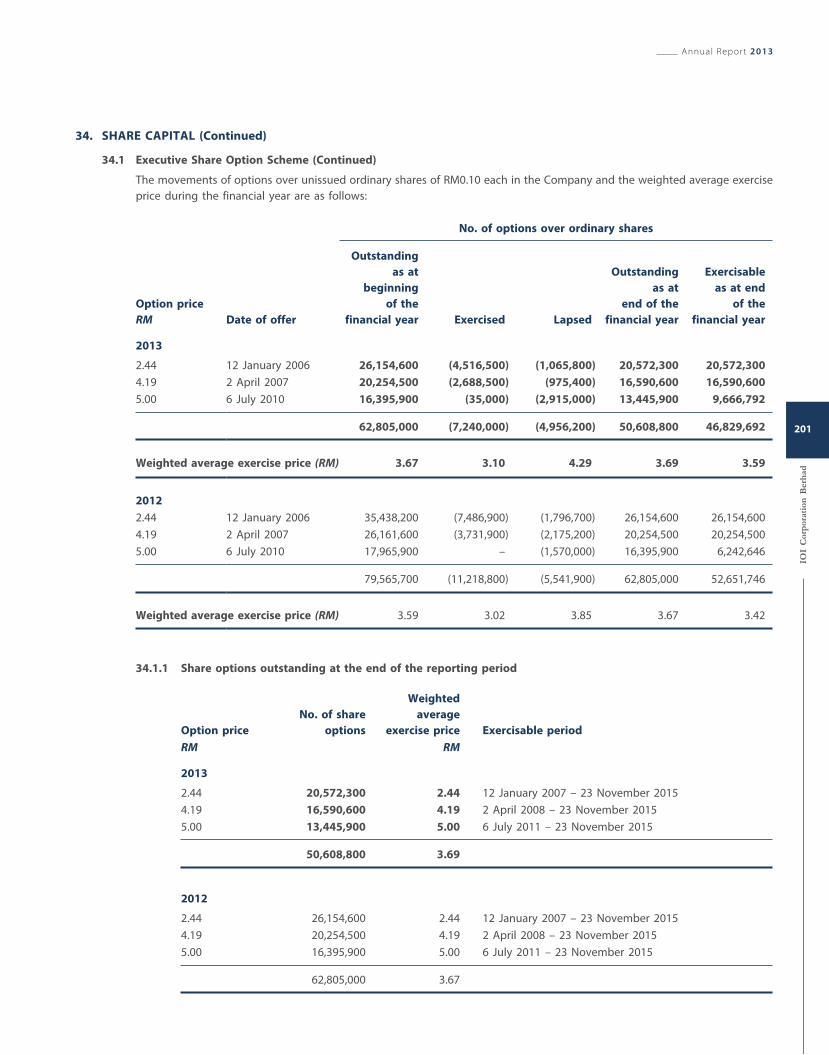
34. SHARE CAPITAL (Continued)
34.1 Executive Share Option Scheme (Continued)
The movements of options over unissued ordinary shares of RM0.10 each in the Company and the weighted average exercise
price during the financial year are as follows:
Option price
RM Date of offer
No. of options over ordinary shares
Outstanding
as at
beginning
of the
financial year Exercised Lapsed
Outstanding
as at
end of the
financial year
Exercisable
as at end
of the
financial year
2013
2.44 12 January 2006 26,154,600 (4,516,500) (1,065,800) 20,572,300 20,572,300
4.19 2 April 2007 20,254,500 (2,688,500) (975,400) 16,590,600 16,590,600
5.00 6 July 2010 16,395,900 (35,000) (2,915,000) 13,445,900 9,666,792
62,805,000 (7,240,000) (4,956,200) 50,608,800 46,829,692
Weighted average exercise price (RM) 3.67 3.10 4.29 3.69 3.59
2012
2.44 12 January 2006 35,438,200 (7,486,900) (1,796,700) 26,154,600 26,154,600
4.19 2 April 2007 26,161,600 (3,731,900) (2,175,200) 20,254,500 20,254,500
5.00 6 July 2010 17,965,900 – (1,570,000) 16,395,900 6,242,646
79,565,700 (11,218,800) (5,541,900) 62,805,000 52,651,746
Weighted average exercise price (RM) 3.59 3.02 3.85 3.67 3.42
34.1.1 Share options outstanding at the end of the reporting period
Option price
No. of share
options
Weighted
average
exercise price Exercisable period
RM RM
2013
2.44 20,572,300 2.44 12 January 2007 – 23 November 2015
4.19 16,590,600 4.19 2 April 2008 – 23 November 2015
5.00 13,445,900 5.00 6 July 2011 – 23 November 2015
50,608,800 3.69
2012
2.44 26,154,600 2.44 12 January 2007 – 23 November 2015
4.19 20,254,500 4.19 2 April 2008 – 23 November 2015
5.00 16,395,900 5.00 6 July 2011 – 23 November 2015
62,805,000 3.67
Annual Report 2013
IOI
Cor
por
atio
n B
erh
ad
201
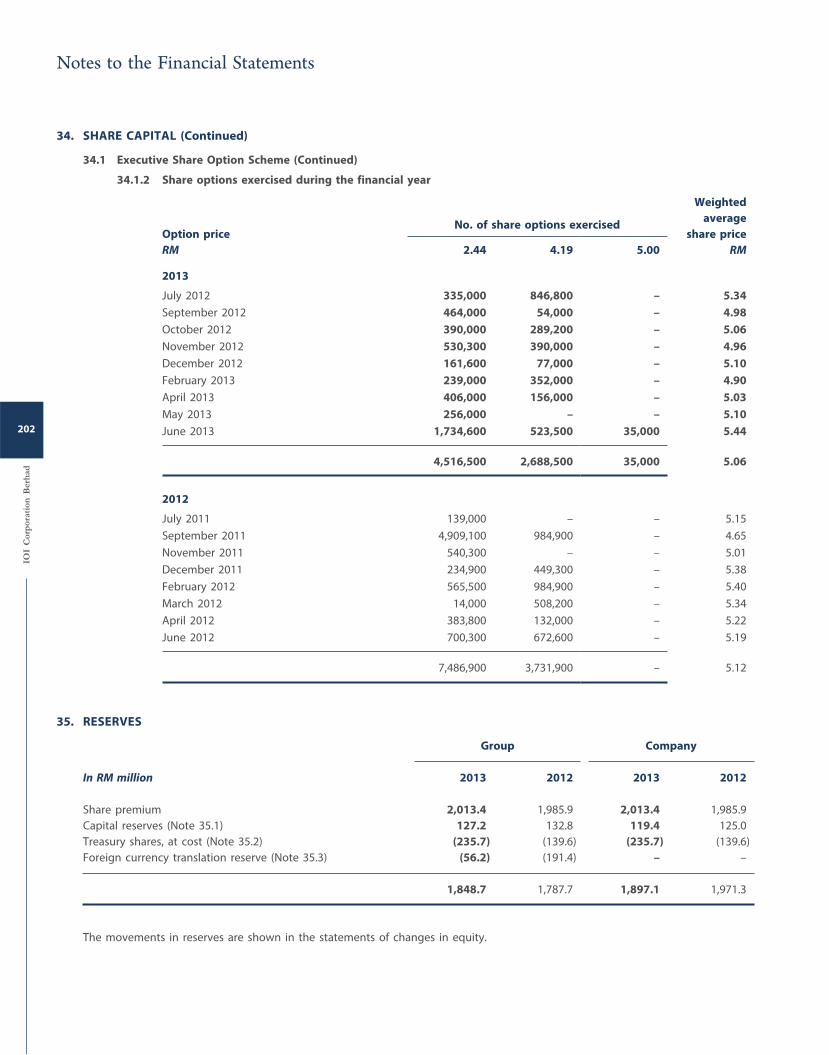
34. SHARE CAPITAL (Continued)
34.1 Executive Share Option Scheme (Continued)
34.1.2 Share options exercised during the financial year
Weighted
average
share price
RMOption price
RM
No. of share options exercised
2.44 4.19 5.00
2013
July 2012 335,000 846,800 – 5.34
September 2012 464,000 54,000 – 4.98
October 2012 390,000 289,200 – 5.06
November 2012 530,300 390,000 – 4.96
December 2012 161,600 77,000 – 5.10
February 2013 239,000 352,000 – 4.90
April 2013 406,000 156,000 – 5.03
May 2013 256,000 – – 5.10
June 2013 1,734,600 523,500 35,000 5.44
4,516,500 2,688,500 35,000 5.06
2012
July 2011 139,000 – – 5.15
September 2011 4,909,100 984,900 – 4.65
November 2011 540,300 – – 5.01
December 2011 234,900 449,300 – 5.38
February 2012 565,500 984,900 – 5.40
March 2012 14,000 508,200 – 5.34
April 2012 383,800 132,000 – 5.22
June 2012 700,300 672,600 – 5.19
7,486,900 3,731,900 – 5.12
35. RESERVES
Group Company
In RM million 2013 2012 2013 2012
Share premium 2,013.4 1,985.9 2,013.4 1,985.9
Capital reserves (Note 35.1) 127.2 132.8 119.4 125.0
Treasury shares, at cost (Note 35.2) (235.7) (139.6) (235.7) (139.6)
Foreign currency translation reserve (Note 35.3) (56.2) (191.4) – –
1,848.7 1,787.7 1,897.1 1,971.3
The movements in reserves are shown in the statements of changes in equity.
Notes to the Financial Statements
IOI
Cor
por
atio
n B
erh
ad
202
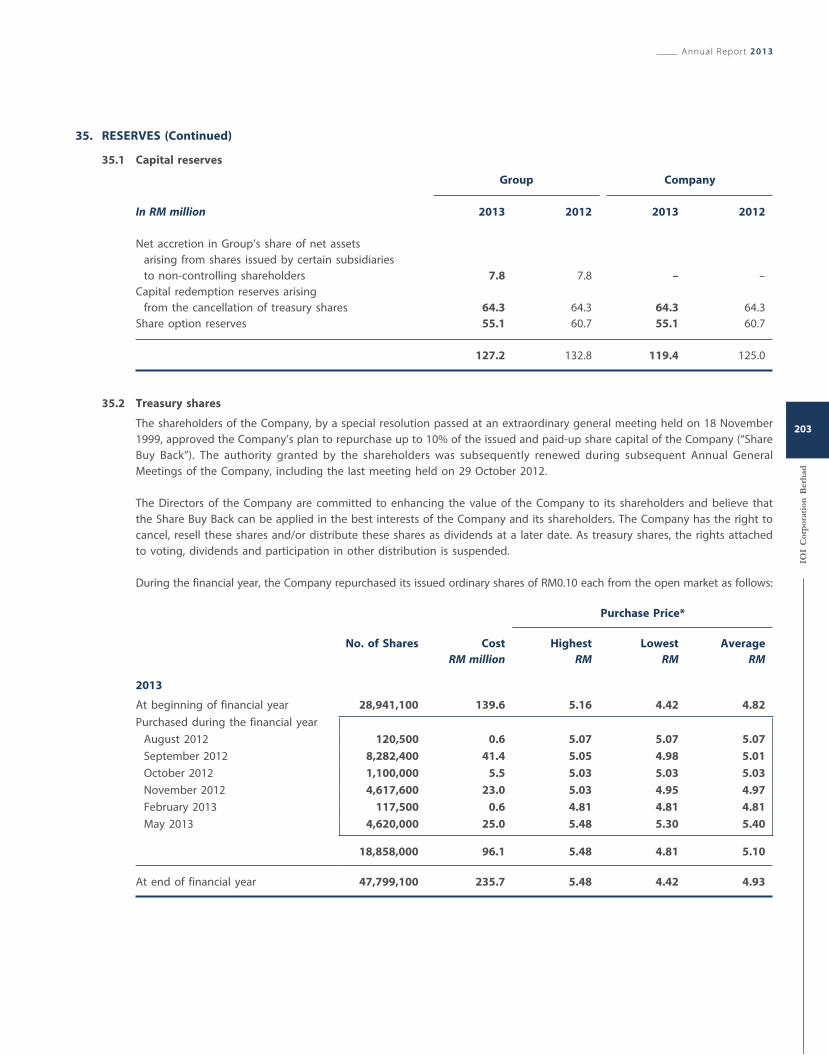
35. RESERVES (Continued)
35.1 Capital reserves
Group Company
In RM million 2013 2012 2013 2012
Net accretion in Group’s share of net assets
arising from shares issued by certain subsidiaries
to non-controlling shareholders 7.8 7.8 – –
Capital redemption reserves arising
from the cancellation of treasury shares 64.3 64.3 64.3 64.3
Share option reserves 55.1 60.7 55.1 60.7
127.2 132.8 119.4 125.0
35.2 Treasury shares
The shareholders of the Company, by a special resolution passed at an extraordinary general meeting held on 18 November
1999, approved the Company’s plan to repurchase up to 10% of the issued and paid-up share capital of the Company (“Share
Buy Back”). The authority granted by the shareholders was subsequently renewed during subsequent Annual General
Meetings of the Company, including the last meeting held on 29 October 2012.
The Directors of the Company are committed to enhancing the value of the Company to its shareholders and believe that
the Share Buy Back can be applied in the best interests of the Company and its shareholders. The Company has the right to
cancel, resell these shares and/or distribute these shares as dividends at a later date. As treasury shares, the rights attached
to voting, dividends and participation in other distribution is suspended.
During the financial year, the Company repurchased its issued ordinary shares of RM0.10 each from the open market as follows:
No. of Shares Cost
RM million
Purchase Price*
Highest
RMLowest
RMAverage
RM
2013
At beginning of financial year 28,941,100 139.6 5.16 4.42 4.82
Purchased during the financial year
August 2012 120,500 0.6 5.07 5.07 5.07
September 2012 8,282,400 41.4 5.05 4.98 5.01
October 2012 1,100,000 5.5 5.03 5.03 5.03
November 2012 4,617,600 23.0 5.03 4.95 4.97
February 2013 117,500 0.6 4.81 4.81 4.81
May 2013 4,620,000 25.0 5.48 5.30 5.40
18,858,000 96.1 5.48 4.81 5.10
At end of financial year 47,799,100 235.7 5.48 4.42 4.93
Annual Report 2013
IOI
Cor
por
atio
n B
erh
ad
203
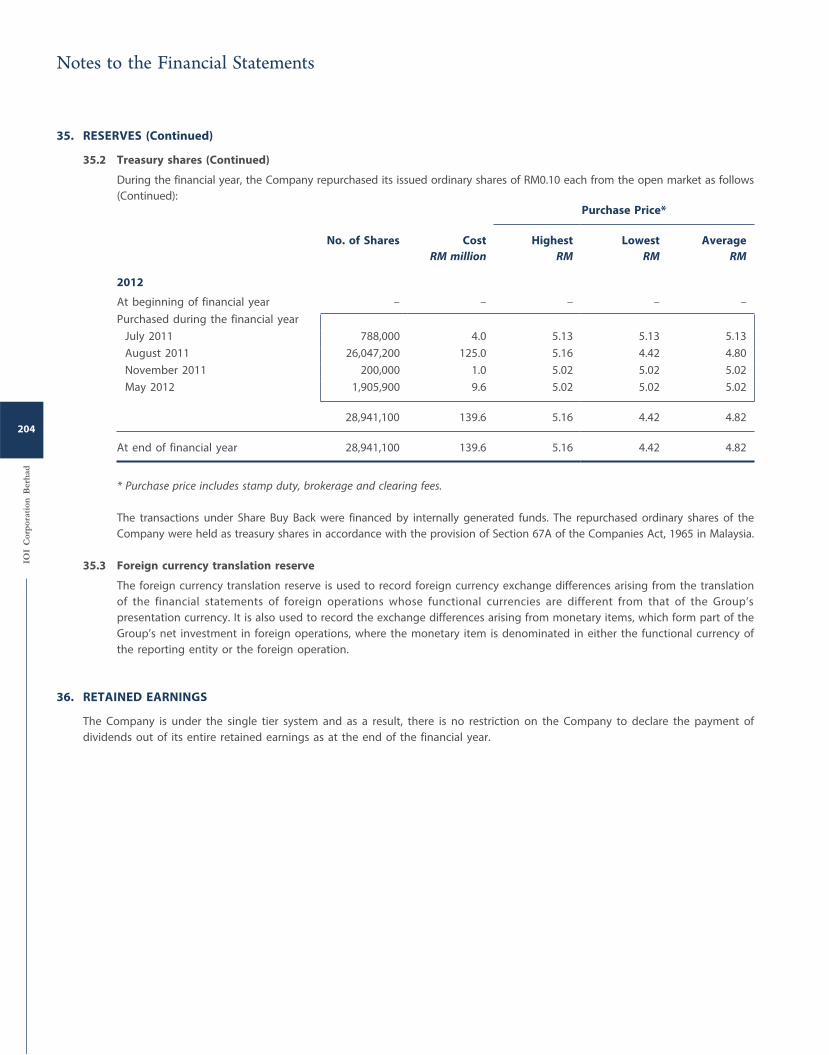
35. RESERVES (Continued)
35.2 Treasury shares (Continued)
During the financial year, the Company repurchased its issued ordinary shares of RM0.10 each from the open market as follows
(Continued):
No. of Shares Cost
RM million
Purchase Price*
Highest
RMLowest
RMAverage
RM
2012
At beginning of financial year – – – – –
Purchased during the financial year
July 2011 788,000 4.0 5.13 5.13 5.13
August 2011 26,047,200 125.0 5.16 4.42 4.80
November 2011 200,000 1.0 5.02 5.02 5.02
May 2012 1,905,900 9.6 5.02 5.02 5.02
28,941,100 139.6 5.16 4.42 4.82
At end of financial year 28,941,100 139.6 5.16 4.42 4.82
* Purchase price includes stamp duty, brokerage and clearing fees.
The transactions under Share Buy Back were financed by internally generated funds. The repurchased ordinary shares of the
Company were held as treasury shares in accordance with the provision of Section 67A of the Companies Act, 1965 in Malaysia.
35.3 Foreign currency translation reserve
The foreign currency translation reserve is used to record foreign currency exchange differences arising from the translation
of the financial statements of foreign operations whose functional currencies are different from that of the Group’s
presentation currency. It is also used to record the exchange differences arising from monetary items, which form part of the
Group’s net investment in foreign operations, where the monetary item is denominated in either the functional currency of
the reporting entity or the foreign operation.
36. RETAINED EARNINGS
The Company is under the single tier system and as a result, there is no restriction on the Company to declare the payment of
dividends out of its entire retained earnings as at the end of the financial year.
Notes to the Financial Statements
IOI
Cor
por
atio
n B
erh
ad
204
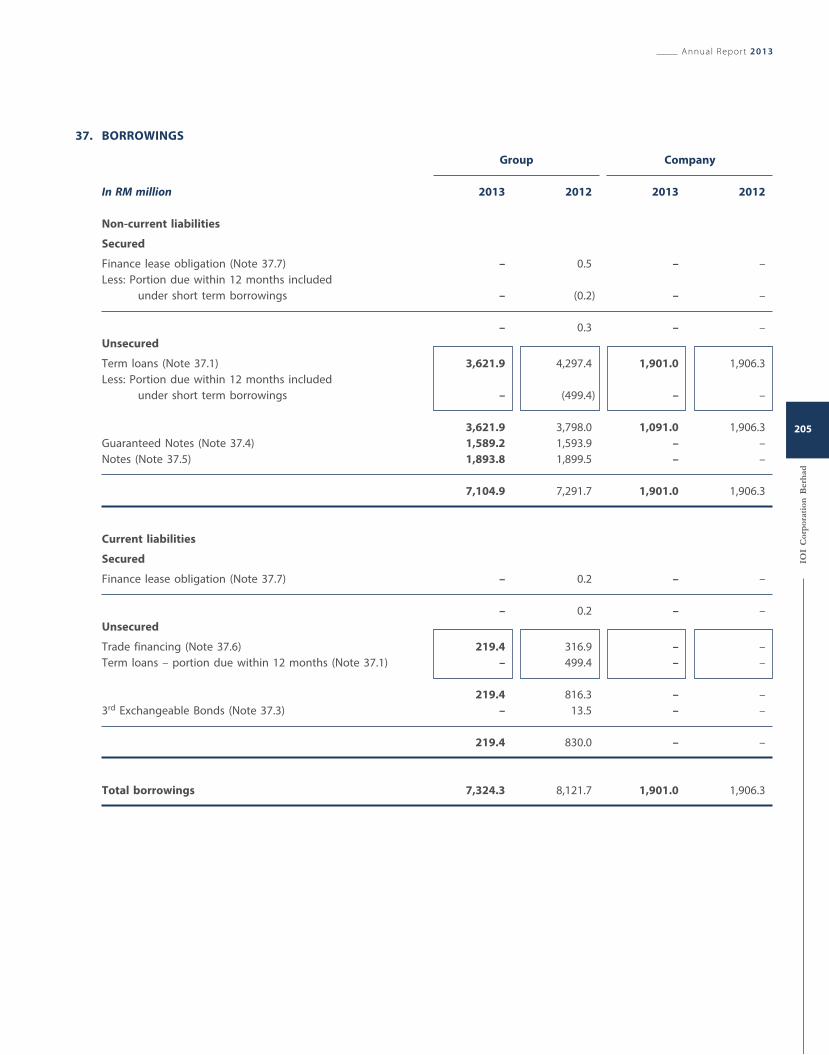
37. BORROWINGS
Group Company
In RM million 2013 2012 2013 2012
Non-current liabilities
Secured
Finance lease obligation (Note 37.7) – 0.5 – –
Less: Portion due within 12 months included
under short term borrowings – (0.2) – –
– 0.3 – –
Unsecured
Term loans (Note 37.1) 3,621.9 4,297.4 1,901.0 1,906.3
Less: Portion due within 12 months included
under short term borrowings – (499.4) – –
3,621.9 3,798.0 1,091.0 1,906.3
Guaranteed Notes (Note 37.4) 1,589.2 1,593.9 – –
Notes (Note 37.5) 1,893.8 1,899.5 – –
7,104.9 7,291.7 1,901.0 1,906.3
Current liabilities
Secured
Finance lease obligation (Note 37.7) – 0.2 – –
– 0.2 – –
Unsecured
Trade financing (Note 37.6) 219.4 316.9 – –
Term loans – portion due within 12 months (Note 37.1) – 499.4 – –
219.4 816.3 – –
3rd Exchangeable Bonds (Note 37.3) – 13.5 – –
219.4 830.0 – –
Total borrowings 7,324.3 8,121.7 1,901.0 1,906.3
Annual Report 2013
IOI
Cor
por
atio
n B
erh
ad
205
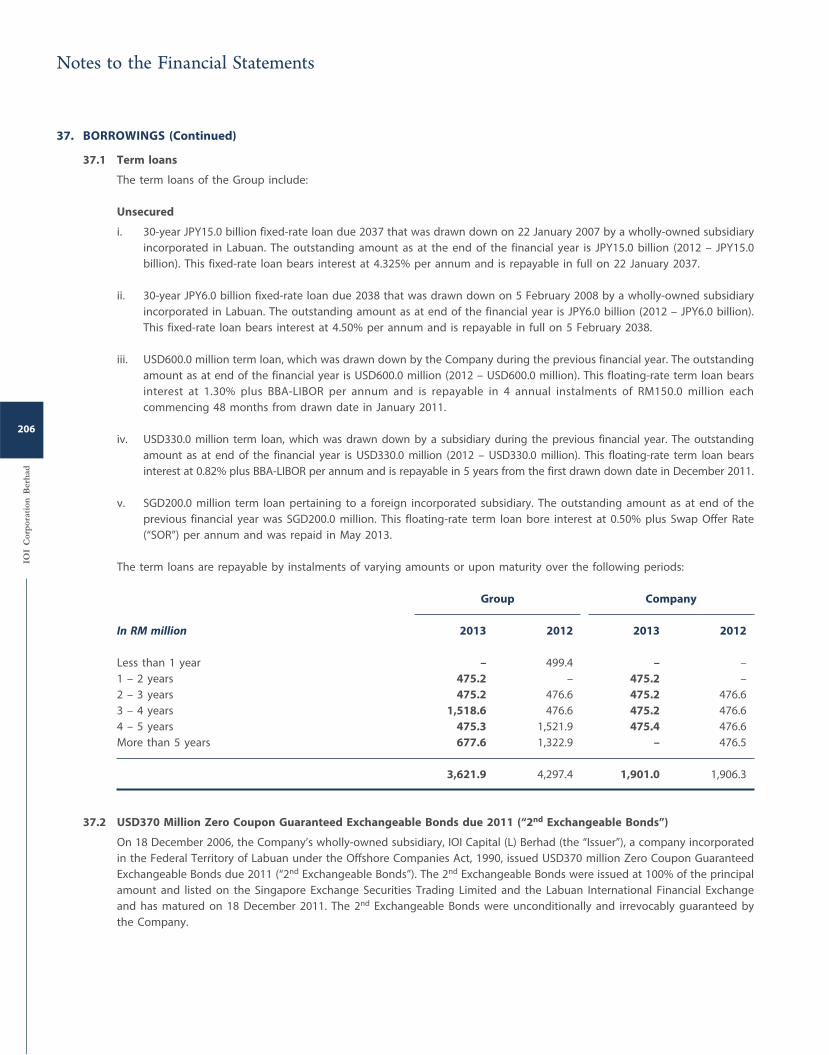
37. BORROWINGS (Continued)
37.1 Term loans
The term loans of the Group include:
Unsecured
i. 30-year JPY15.0 billion fixed-rate loan due 2037 that was drawn down on 22 January 2007 by a wholly-owned subsidiary
incorporated in Labuan. The outstanding amount as at the end of the financial year is JPY15.0 billion (2012 – JPY15.0
billion). This fixed-rate loan bears interest at 4.325% per annum and is repayable in full on 22 January 2037.
ii. 30-year JPY6.0 billion fixed-rate loan due 2038 that was drawn down on 5 February 2008 by a wholly-owned subsidiary
incorporated in Labuan. The outstanding amount as at end of the financial year is JPY6.0 billion (2012 – JPY6.0 billion).
This fixed-rate loan bears interest at 4.50% per annum and is repayable in full on 5 February 2038.
iii. USD600.0 million term loan, which was drawn down by the Company during the previous financial year. The outstanding
amount as at end of the financial year is USD600.0 million (2012 – USD600.0 million). This floating-rate term loan bears
interest at 1.30% plus BBA-LIBOR per annum and is repayable in 4 annual instalments of RM150.0 million each
commencing 48 months from drawn date in January 2011.
iv. USD330.0 million term loan, which was drawn down by a subsidiary during the previous financial year. The outstanding
amount as at end of the financial year is USD330.0 million (2012 – USD330.0 million). This floating-rate term loan bears
interest at 0.82% plus BBA-LIBOR per annum and is repayable in 5 years from the first drawn down date in December 2011.
v. SGD200.0 million term loan pertaining to a foreign incorporated subsidiary. The outstanding amount as at end of the
previous financial year was SGD200.0 million. This floating-rate term loan bore interest at 0.50% plus Swap Offer Rate
(“SOR”) per annum and was repaid in May 2013.
The term loans are repayable by instalments of varying amounts or upon maturity over the following periods:
Group Company
In RM million 2013 2012 2013 2012
Less than 1 year – 499.4 – –
1 – 2 years 475.2 – 475.2 –
2 – 3 years 475.2 476.6 475.2 476.6
3 – 4 years 1,518.6 476.6 475.2 476.6
4 – 5 years 475.3 1,521.9 475.4 476.6
More than 5 years 677.6 1,322.9 – 476.5
3,621.9 4,297.4 1,901.0 1,906.3
37.2 USD370 Million Zero Coupon Guaranteed Exchangeable Bonds due 2011 (“2nd Exchangeable Bonds”)
On 18 December 2006, the Company’s wholly-owned subsidiary, IOI Capital (L) Berhad (the “Issuer”), a company incorporated
in the Federal Territory of Labuan under the Offshore Companies Act, 1990, issued USD370 million Zero Coupon Guaranteed
Exchangeable Bonds due 2011 (“2nd Exchangeable Bonds”). The 2nd Exchangeable Bonds were issued at 100% of the principal
amount and listed on the Singapore Exchange Securities Trading Limited and the Labuan International Financial Exchange
and has matured on 18 December 2011. The 2nd Exchangeable Bonds were unconditionally and irrevocably guaranteed by
the Company.
Notes to the Financial Statements
IOI
Cor
por
atio
n B
erh
ad
206
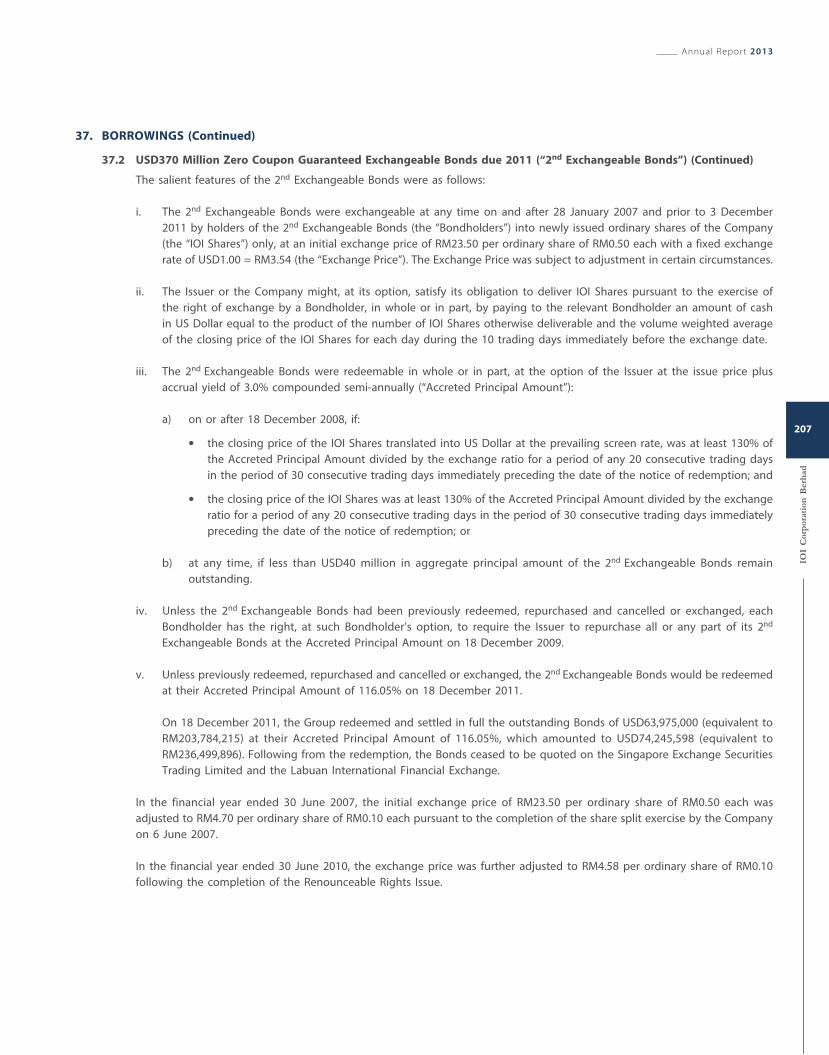
37. BORROWINGS (Continued)
37.2 USD370 Million Zero Coupon Guaranteed Exchangeable Bonds due 2011 (“2nd Exchangeable Bonds”) (Continued)
The salient features of the 2nd Exchangeable Bonds were as follows:
i. The 2nd Exchangeable Bonds were exchangeable at any time on and after 28 January 2007 and prior to 3 December
2011 by holders of the 2nd Exchangeable Bonds (the “Bondholders”) into newly issued ordinary shares of the Company
(the “IOI Shares”) only, at an initial exchange price of RM23.50 per ordinary share of RM0.50 each with a fixed exchange
rate of USD1.00 = RM3.54 (the “Exchange Price”). The Exchange Price was subject to adjustment in certain circumstances.
ii. The Issuer or the Company might, at its option, satisfy its obligation to deliver IOI Shares pursuant to the exercise of
the right of exchange by a Bondholder, in whole or in part, by paying to the relevant Bondholder an amount of cash
in US Dollar equal to the product of the number of IOI Shares otherwise deliverable and the volume weighted average
of the closing price of the IOI Shares for each day during the 10 trading days immediately before the exchange date.
iii. The 2nd Exchangeable Bonds were redeemable in whole or in part, at the option of the Issuer at the issue price plus
accrual yield of 3.0% compounded semi-annually (“Accreted Principal Amount”):
a) on or after 18 December 2008, if:
the closing price of the IOI Shares translated into US Dollar at the prevailing screen rate, was at least 130% of
the Accreted Principal Amount divided by the exchange ratio for a period of any 20 consecutive trading days
in the period of 30 consecutive trading days immediately preceding the date of the notice of redemption; and
the closing price of the IOI Shares was at least 130% of the Accreted Principal Amount divided by the exchange
ratio for a period of any 20 consecutive trading days in the period of 30 consecutive trading days immediately
preceding the date of the notice of redemption; or
b) at any time, if less than USD40 million in aggregate principal amount of the 2nd Exchangeable Bonds remain
outstanding.
iv. Unless the 2nd Exchangeable Bonds had been previously redeemed, repurchased and cancelled or exchanged, each
Bondholder has the right, at such Bondholder’s option, to require the Issuer to repurchase all or any part of its 2nd
Exchangeable Bonds at the Accreted Principal Amount on 18 December 2009.
v. Unless previously redeemed, repurchased and cancelled or exchanged, the 2nd Exchangeable Bonds would be redeemed
at their Accreted Principal Amount of 116.05% on 18 December 2011.
On 18 December 2011, the Group redeemed and settled in full the outstanding Bonds of USD63,975,000 (equivalent to
RM203,784,215) at their Accreted Principal Amount of 116.05%, which amounted to USD74,245,598 (equivalent to
RM236,499,896). Following from the redemption, the Bonds ceased to be quoted on the Singapore Exchange Securities
Trading Limited and the Labuan International Financial Exchange.
In the financial year ended 30 June 2007, the initial exchange price of RM23.50 per ordinary share of RM0.50 each was
adjusted to RM4.70 per ordinary share of RM0.10 each pursuant to the completion of the share split exercise by the Company
on 6 June 2007.
In the financial year ended 30 June 2010, the exchange price was further adjusted to RM4.58 per ordinary share of RM0.10
following the completion of the Renounceable Rights Issue.
Annual Report 2013
IOI
Cor
por
atio
n B
erh
ad
207
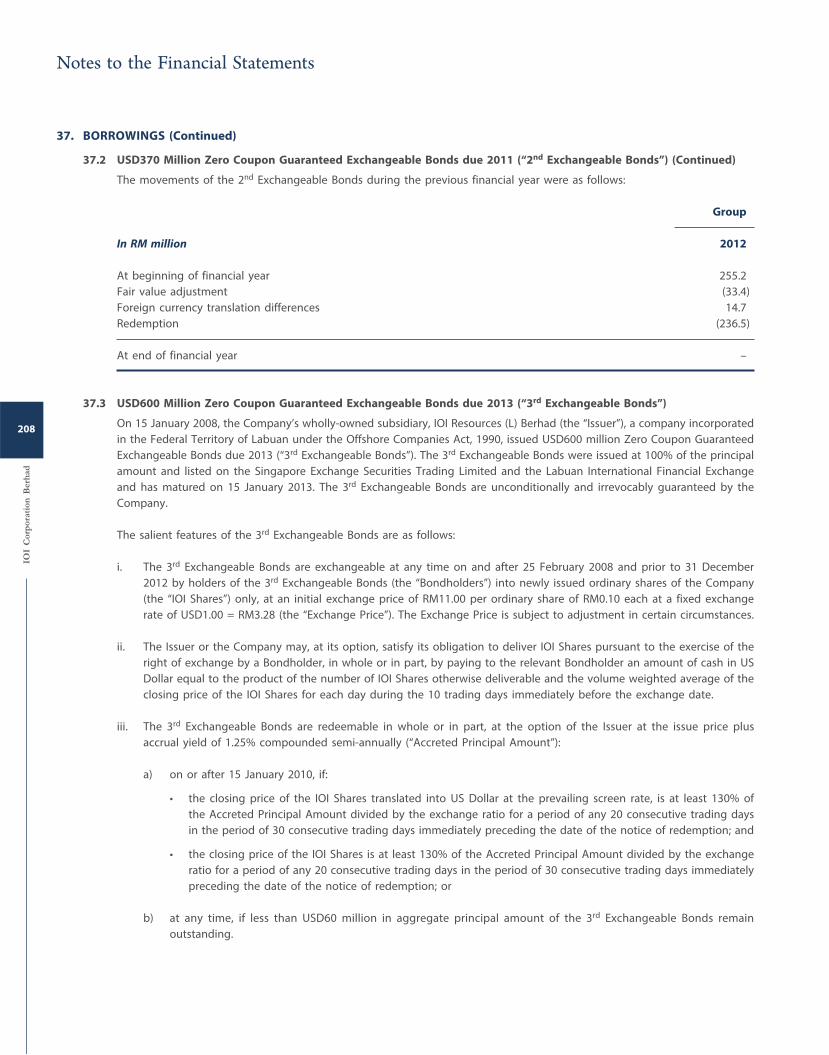
37. BORROWINGS (Continued)
37.2 USD370 Million Zero Coupon Guaranteed Exchangeable Bonds due 2011 (“2nd Exchangeable Bonds”) (Continued)
The movements of the 2nd Exchangeable Bonds during the previous financial year were as follows:
Group
In RM million 2012
At beginning of financial year 255.2
Fair value adjustment (33.4)
Foreign currency translation differences 14.7
Redemption (236.5)
At end of financial year –
37.3 USD600 Million Zero Coupon Guaranteed Exchangeable Bonds due 2013 (“3rd Exchangeable Bonds”)
On 15 January 2008, the Company’s wholly-owned subsidiary, IOI Resources (L) Berhad (the “Issuer”), a company incorporated
in the Federal Territory of Labuan under the Offshore Companies Act, 1990, issued USD600 million Zero Coupon Guaranteed
Exchangeable Bonds due 2013 (“3rd Exchangeable Bonds”). The 3rd Exchangeable Bonds were issued at 100% of the principal
amount and listed on the Singapore Exchange Securities Trading Limited and the Labuan International Financial Exchange
and has matured on 15 January 2013. The 3rd Exchangeable Bonds are unconditionally and irrevocably guaranteed by the
Company.
The salient features of the 3rd Exchangeable Bonds are as follows:
i. The 3rd Exchangeable Bonds are exchangeable at any time on and after 25 February 2008 and prior to 31 December
2012 by holders of the 3rd Exchangeable Bonds (the “Bondholders”) into newly issued ordinary shares of the Company
(the “IOI Shares”) only, at an initial exchange price of RM11.00 per ordinary share of RM0.10 each at a fixed exchange
rate of USD1.00 = RM3.28 (the “Exchange Price”). The Exchange Price is subject to adjustment in certain circumstances.
ii. The Issuer or the Company may, at its option, satisfy its obligation to deliver IOI Shares pursuant to the exercise of the
right of exchange by a Bondholder, in whole or in part, by paying to the relevant Bondholder an amount of cash in US
Dollar equal to the product of the number of IOI Shares otherwise deliverable and the volume weighted average of the
closing price of the IOI Shares for each day during the 10 trading days immediately before the exchange date.
iii. The 3rd Exchangeable Bonds are redeemable in whole or in part, at the option of the Issuer at the issue price plus
accrual yield of 1.25% compounded semi-annually (“Accreted Principal Amount”):
a) on or after 15 January 2010, if:
• the closing price of the IOI Shares translated into US Dollar at the prevailing screen rate, is at least 130% of
the Accreted Principal Amount divided by the exchange ratio for a period of any 20 consecutive trading days
in the period of 30 consecutive trading days immediately preceding the date of the notice of redemption; and
• the closing price of the IOI Shares is at least 130% of the Accreted Principal Amount divided by the exchange
ratio for a period of any 20 consecutive trading days in the period of 30 consecutive trading days immediately
preceding the date of the notice of redemption; or
b) at any time, if less than USD60 million in aggregate principal amount of the 3rd Exchangeable Bonds remain
outstanding.
Notes to the Financial Statements
IOI
Cor
por
atio
n B
erh
ad
208
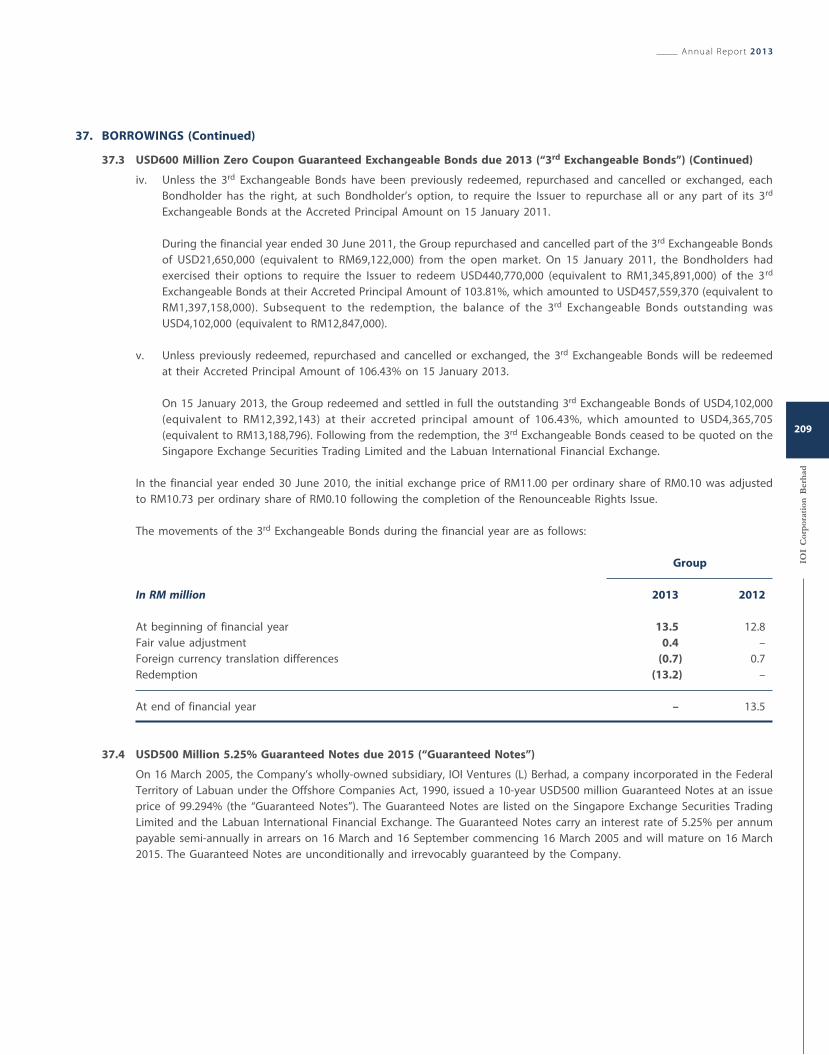
37. BORROWINGS (Continued)
37.3 USD600 Million Zero Coupon Guaranteed Exchangeable Bonds due 2013 (“3rd Exchangeable Bonds”) (Continued)
iv. Unless the 3rd Exchangeable Bonds have been previously redeemed, repurchased and cancelled or exchanged, each
Bondholder has the right, at such Bondholder’s option, to require the Issuer to repurchase all or any part of its 3rd
Exchangeable Bonds at the Accreted Principal Amount on 15 January 2011.
During the financial year ended 30 June 2011, the Group repurchased and cancelled part of the 3rd Exchangeable Bonds
of USD21,650,000 (equivalent to RM69,122,000) from the open market. On 15 January 2011, the Bondholders had
exercised their options to require the Issuer to redeem USD440,770,000 (equivalent to RM1,345,891,000) of the 3rd
Exchangeable Bonds at their Accreted Principal Amount of 103.81%, which amounted to USD457,559,370 (equivalent to
RM1,397,158,000). Subsequent to the redemption, the balance of the 3rd Exchangeable Bonds outstanding was
USD4,102,000 (equivalent to RM12,847,000).
v. Unless previously redeemed, repurchased and cancelled or exchanged, the 3rd Exchangeable Bonds will be redeemed
at their Accreted Principal Amount of 106.43% on 15 January 2013.
On 15 January 2013, the Group redeemed and settled in full the outstanding 3rd Exchangeable Bonds of USD4,102,000
(equivalent to RM12,392,143) at their accreted principal amount of 106.43%, which amounted to USD4,365,705
(equivalent to RM13,188,796). Following from the redemption, the 3rd Exchangeable Bonds ceased to be quoted on the
Singapore Exchange Securities Trading Limited and the Labuan International Financial Exchange.
In the financial year ended 30 June 2010, the initial exchange price of RM11.00 per ordinary share of RM0.10 was adjusted
to RM10.73 per ordinary share of RM0.10 following the completion of the Renounceable Rights Issue.
The movements of the 3rd Exchangeable Bonds during the financial year are as follows:
Group
In RM million 2013 2012
At beginning of financial year 13.5 12.8
Fair value adjustment 0.4 –
Foreign currency translation differences (0.7) 0.7
Redemption (13.2) –
At end of financial year – 13.5
37.4 USD500 Million 5.25% Guaranteed Notes due 2015 (“Guaranteed Notes”)
On 16 March 2005, the Company’s wholly-owned subsidiary, IOI Ventures (L) Berhad, a company incorporated in the Federal
Territory of Labuan under the Offshore Companies Act, 1990, issued a 10-year USD500 million Guaranteed Notes at an issue
price of 99.294% (the “Guaranteed Notes”). The Guaranteed Notes are listed on the Singapore Exchange Securities Trading
Limited and the Labuan International Financial Exchange. The Guaranteed Notes carry an interest rate of 5.25% per annum
payable semi-annually in arrears on 16 March and 16 September commencing 16 March 2005 and will mature on 16 March
2015. The Guaranteed Notes are unconditionally and irrevocably guaranteed by the Company.
Annual Report 2013
IOI
Cor
por
atio
n B
erh
ad
209
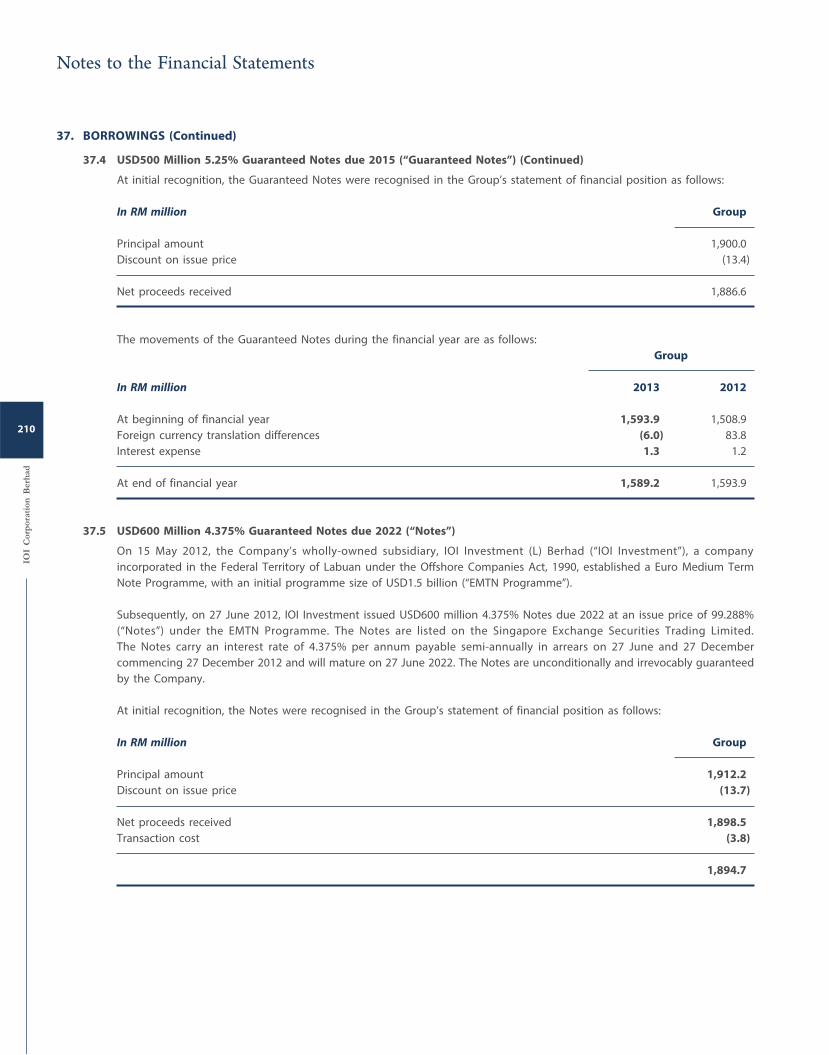
37. BORROWINGS (Continued)
37.4 USD500 Million 5.25% Guaranteed Notes due 2015 (“Guaranteed Notes”) (Continued)
At initial recognition, the Guaranteed Notes were recognised in the Group’s statement of financial position as follows:
In RM million Group
Principal amount 1,900.0
Discount on issue price (13.4)
Net proceeds received 1,886.6
The movements of the Guaranteed Notes during the financial year are as follows:
Group
In RM million 2013 2012
At beginning of financial year 1,593.9 1,508.9
Foreign currency translation differences (6.0) 83.8
Interest expense 1.3 1.2
At end of financial year 1,589.2 1,593.9
37.5 USD600 Million 4.375% Guaranteed Notes due 2022 (“Notes”)
On 15 May 2012, the Company’s wholly-owned subsidiary, IOI Investment (L) Berhad (“IOI Investment”), a company
incorporated in the Federal Territory of Labuan under the Offshore Companies Act, 1990, established a Euro Medium Term
Note Programme, with an initial programme size of USD1.5 billion (“EMTN Programme”).
Subsequently, on 27 June 2012, IOI Investment issued USD600 million 4.375% Notes due 2022 at an issue price of 99.288%
(“Notes”) under the EMTN Programme. The Notes are listed on the Singapore Exchange Securities Trading Limited.
The Notes carry an interest rate of 4.375% per annum payable semi-annually in arrears on 27 June and 27 December
commencing 27 December 2012 and will mature on 27 June 2022. The Notes are unconditionally and irrevocably guaranteed
by the Company.
At initial recognition, the Notes were recognised in the Group’s statement of financial position as follows:
In RM million Group
Principal amount 1,912.2
Discount on issue price (13.7)
Net proceeds received 1,898.5
Transaction cost (3.8)
1,894.7
Notes to the Financial Statements
IOI
Cor
por
atio
n B
erh
ad
210
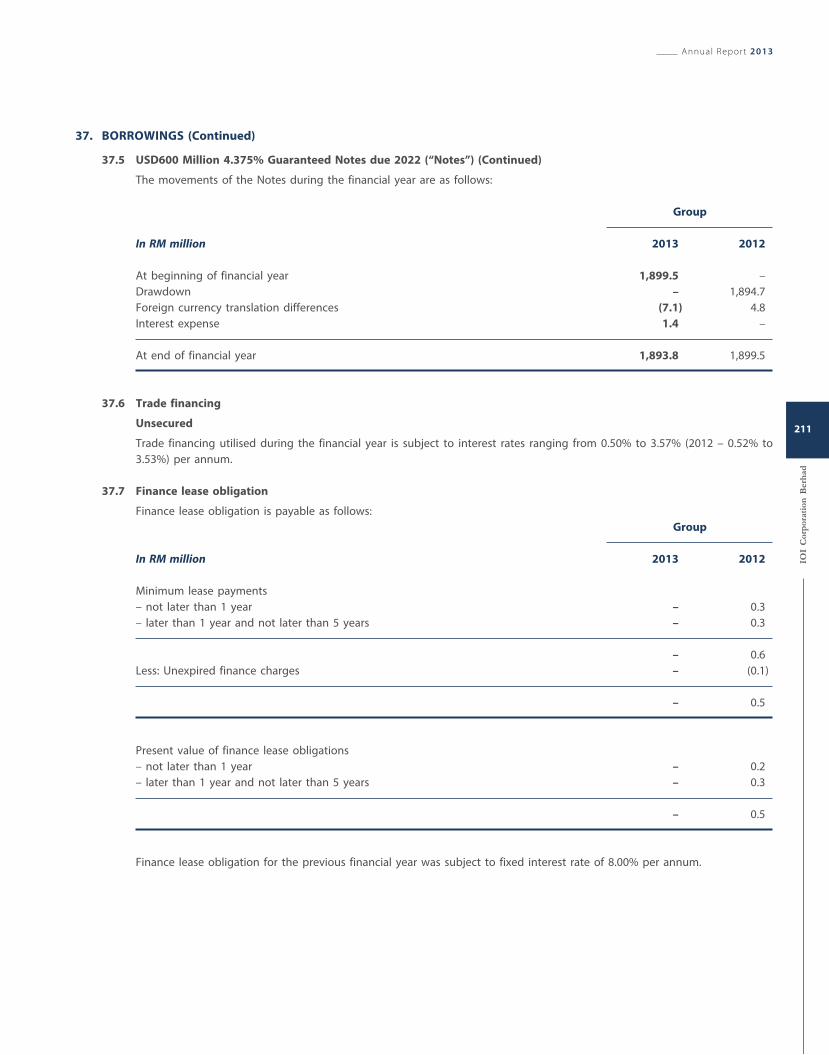
37. BORROWINGS (Continued)
37.5 USD600 Million 4.375% Guaranteed Notes due 2022 (“Notes”) (Continued)
The movements of the Notes during the financial year are as follows:
Group
In RM million 2013 2012
At beginning of financial year 1,899.5 –
Drawdown – 1,894.7
Foreign currency translation differences (7.1) 4.8
Interest expense 1.4 –
At end of financial year 1,893.8 1,899.5
37.6 Trade financing
Unsecured
Trade financing utilised during the financial year is subject to interest rates ranging from 0.50% to 3.57% (2012 – 0.52% to
3.53%) per annum.
37.7 Finance lease obligation
Finance lease obligation is payable as follows:
Group
In RM million 2013 2012
Minimum lease payments
– not later than 1 year – 0.3
– later than 1 year and not later than 5 years – 0.3
– 0.6
Less: Unexpired finance charges – (0.1)
– 0.5
Present value of finance lease obligations
– not later than 1 year – 0.2
– later than 1 year and not later than 5 years – 0.3
– 0.5
Finance lease obligation for the previous financial year was subject to fixed interest rate of 8.00% per annum.
Annual Report 2013
IOI
Cor
por
atio
n B
erh
ad
211
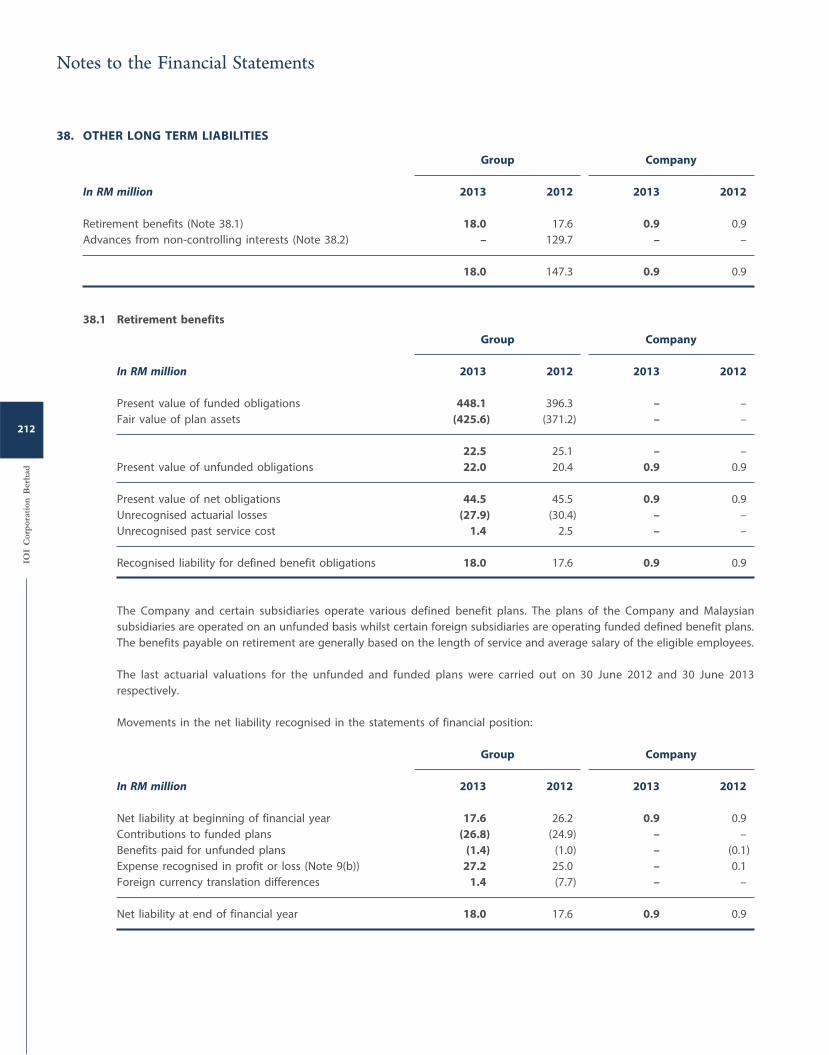
38. OTHER LONG TERM LIABILITIES
Group Company
In RM million 2013 2012 2013 2012
Retirement benefits (Note 38.1) 18.0 17.6 0.9 0.9
Advances from non-controlling interests (Note 38.2) – 129.7 – –
18.0 147.3 0.9 0.9
38.1 Retirement benefits
Group Company
In RM million 2013 2012 2013 2012
Present value of funded obligations 448.1 396.3 – –
Fair value of plan assets (425.6) (371.2) – –
22.5 25.1 – –
Present value of unfunded obligations 22.0 20.4 0.9 0.9
Present value of net obligations 44.5 45.5 0.9 0.9
Unrecognised actuarial losses (27.9) (30.4) – –
Unrecognised past service cost 1.4 2.5 – –
Recognised liability for defined benefit obligations 18.0 17.6 0.9 0.9
The Company and certain subsidiaries operate various defined benefit plans. The plans of the Company and Malaysian
subsidiaries are operated on an unfunded basis whilst certain foreign subsidiaries are operating funded defined benefit plans.
The benefits payable on retirement are generally based on the length of service and average salary of the eligible employees.
The last actuarial valuations for the unfunded and funded plans were carried out on 30 June 2012 and 30 June 2013
respectively.
Movements in the net liability recognised in the statements of financial position:
Group Company
In RM million 2013 2012 2013 2012
Net liability at beginning of financial year 17.6 26.2 0.9 0.9
Contributions to funded plans (26.8) (24.9) – –
Benefits paid for unfunded plans (1.4) (1.0) – (0.1)
Expense recognised in profit or loss (Note 9(b)) 27.2 25.0 – 0.1
Foreign currency translation differences 1.4 (7.7) – –
Net liability at end of financial year 18.0 17.6 0.9 0.9
Notes to the Financial Statements
IOI
Cor
por
atio
n B
erh
ad
212
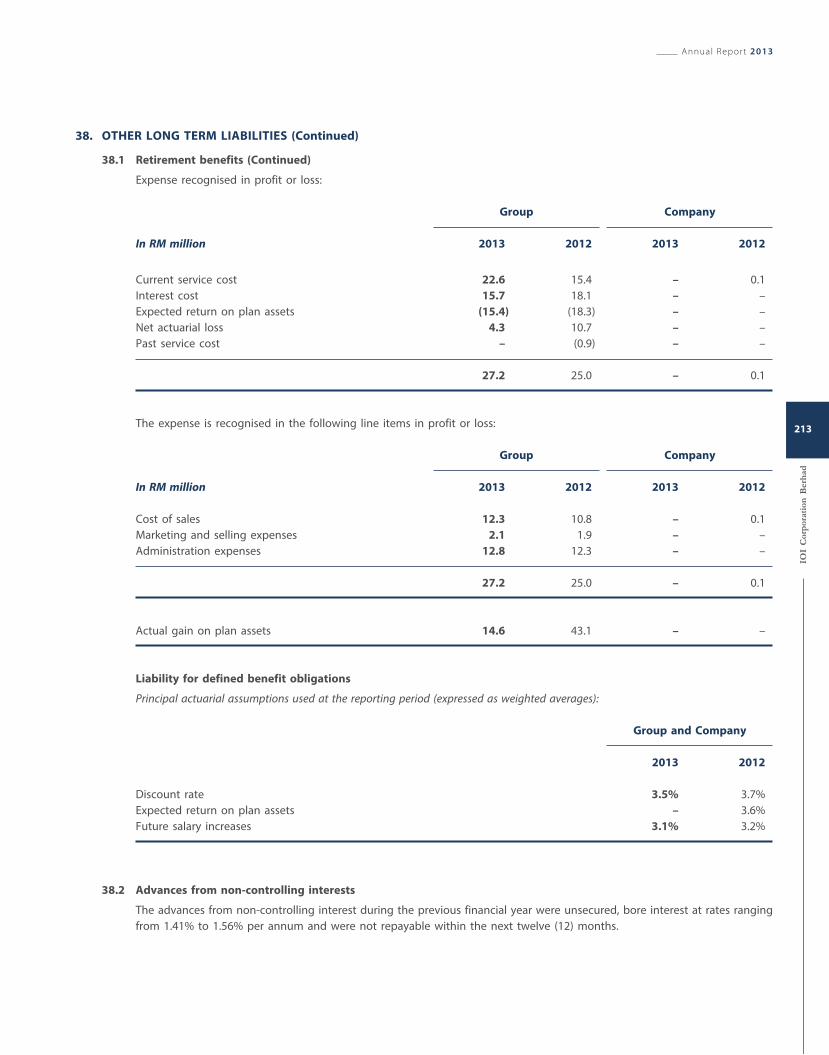
38. OTHER LONG TERM LIABILITIES (Continued)
38.1 Retirement benefits (Continued)
Expense recognised in profit or loss:
Group Company
In RM million 2013 2012 2013 2012
Current service cost 22.6 15.4 – 0.1
Interest cost 15.7 18.1 – –
Expected return on plan assets (15.4) (18.3) – –
Net actuarial loss 4.3 10.7 – –
Past service cost – (0.9) – –
27.2 25.0 – 0.1
The expense is recognised in the following line items in profit or loss:
Group Company
In RM million 2013 2012 2013 2012
Cost of sales 12.3 10.8 – 0.1
Marketing and selling expenses 2.1 1.9 – –
Administration expenses 12.8 12.3 – –
27.2 25.0 – 0.1
Actual gain on plan assets 14.6 43.1 – –
Liability for defined benefit obligations
Principal actuarial assumptions used at the reporting period (expressed as weighted averages):
Group and Company
2013 2012
Discount rate 3.5% 3.7%
Expected return on plan assets – 3.6%
Future salary increases 3.1% 3.2%
38.2 Advances from non-controlling interests
The advances from non-controlling interest during the previous financial year were unsecured, bore interest at rates ranging
from 1.41% to 1.56% per annum and were not repayable within the next twelve (12) months.
Annual Report 2013
IOI
Cor
por
atio
n B
erh
ad
213
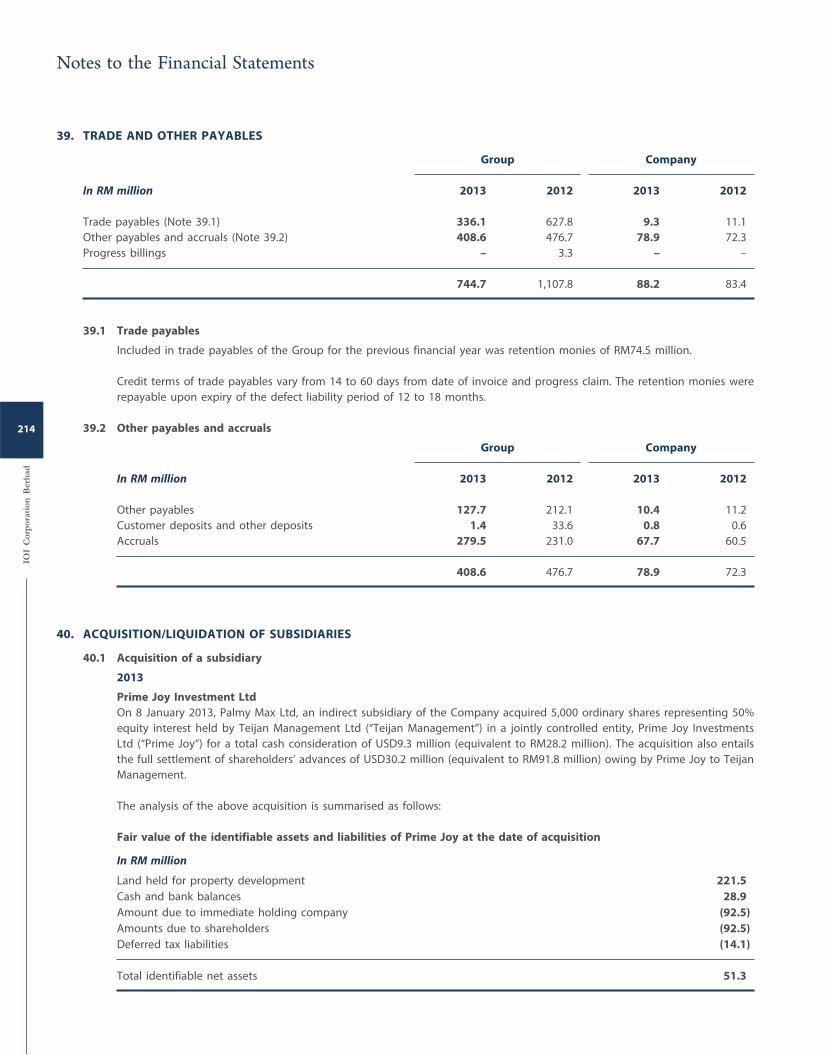
39. TRADE AND OTHER PAYABLES
Group Company
In RM million 2013 2012 2013 2012
Trade payables (Note 39.1) 336.1 627.8 9.3 11.1
Other payables and accruals (Note 39.2) 408.6 476.7 78.9 72.3
Progress billings – 3.3 – –
744.7 1,107.8 88.2 83.4
39.1 Trade payables
Included in trade payables of the Group for the previous financial year was retention monies of RM74.5 million.
Credit terms of trade payables vary from 14 to 60 days from date of invoice and progress claim. The retention monies were
repayable upon expiry of the defect liability period of 12 to 18 months.
39.2 Other payables and accruals
Group Company
In RM million 2013 2012 2013 2012
Other payables 127.7 212.1 10.4 11.2
Customer deposits and other deposits 1.4 33.6 0.8 0.6
Accruals 279.5 231.0 67.7 60.5
408.6 476.7 78.9 72.3
40. ACQUISITION/LIQUIDATION OF SUBSIDIARIES
40.1 Acquisition of a subsidiary
2013
Prime Joy Investment Ltd
On 8 January 2013, Palmy Max Ltd, an indirect subsidiary of the Company acquired 5,000 ordinary shares representing 50%
equity interest held by Teijan Management Ltd (“Teijan Management”) in a jointly controlled entity, Prime Joy Investments
Ltd (“Prime Joy”) for a total cash consideration of USD9.3 million (equivalent to RM28.2 million). The acquisition also entails
the full settlement of shareholders’ advances of USD30.2 million (equivalent to RM91.8 million) owing by Prime Joy to Teijan
Management.
The analysis of the above acquisition is summarised as follows:
Fair value of the identifiable assets and liabilities of Prime Joy at the date of acquisition
In RM million
Land held for property development 221.5
Cash and bank balances 28.9
Amount due to immediate holding company (92.5)
Amounts due to shareholders (92.5)
Deferred tax liabilities (14.1)
Total identifiable net assets 51.3
Notes to the Financial Statements
IOI
Cor
por
atio
n B
erh
ad
214
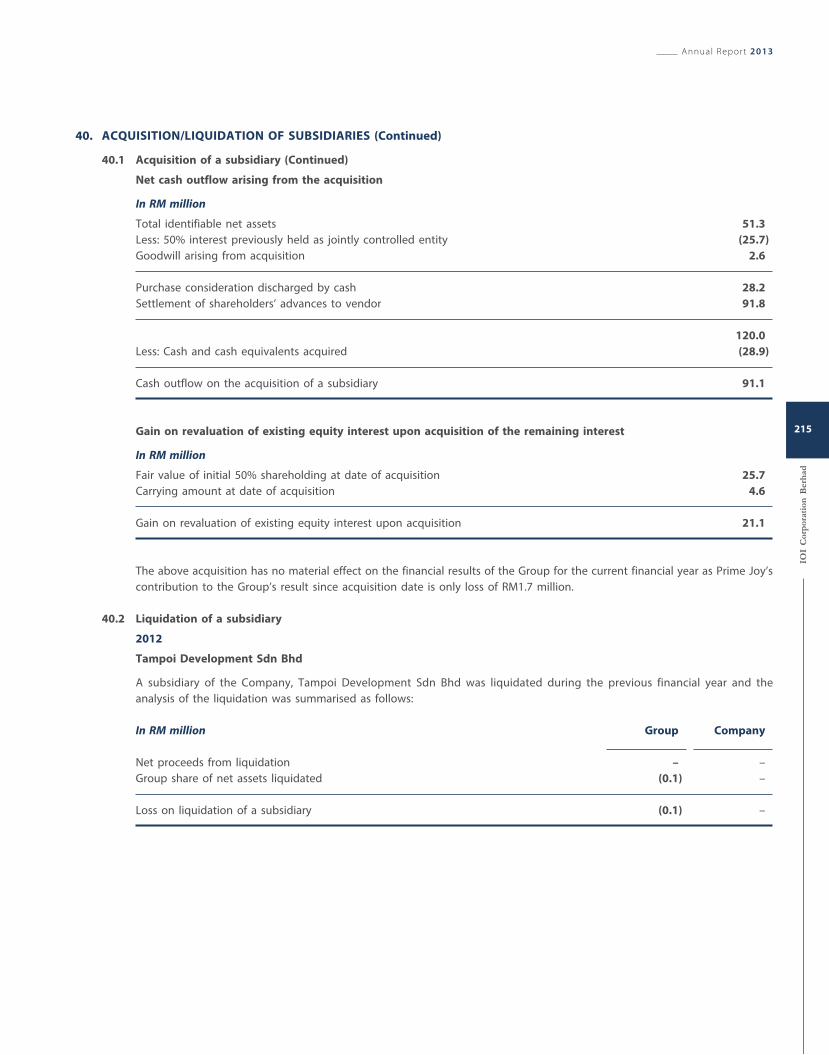
40. ACQUISITION/LIQUIDATION OF SUBSIDIARIES (Continued)
40.1 Acquisition of a subsidiary (Continued)
Net cash outflow arising from the acquisition
In RM million
Total identifiable net assets 51.3
Less: 50% interest previously held as jointly controlled entity (25.7)
Goodwill arising from acquisition 2.6
Purchase consideration discharged by cash 28.2
Settlement of shareholders’ advances to vendor 91.8
120.0
Less: Cash and cash equivalents acquired (28.9)
Cash outflow on the acquisition of a subsidiary 91.1
Gain on revaluation of existing equity interest upon acquisition of the remaining interest
In RM million
Fair value of initial 50% shareholding at date of acquisition 25.7
Carrying amount at date of acquisition 4.6
Gain on revaluation of existing equity interest upon acquisition 21.1
The above acquisition has no material effect on the financial results of the Group for the current financial year as Prime Joy’s
contribution to the Group’s result since acquisition date is only loss of RM1.7 million.
40.2 Liquidation of a subsidiary
2012
Tampoi Development Sdn Bhd
A subsidiary of the Company, Tampoi Development Sdn Bhd was liquidated during the previous financial year and the
analysis of the liquidation was summarised as follows:
In RM million Group Company
Net proceeds from liquidation – –
Group share of net assets liquidated (0.1) –
Loss on liquidation of a subsidiary (0.1) –
Annual Report 2013
IOI
Cor
por
atio
n B
erh
ad
215
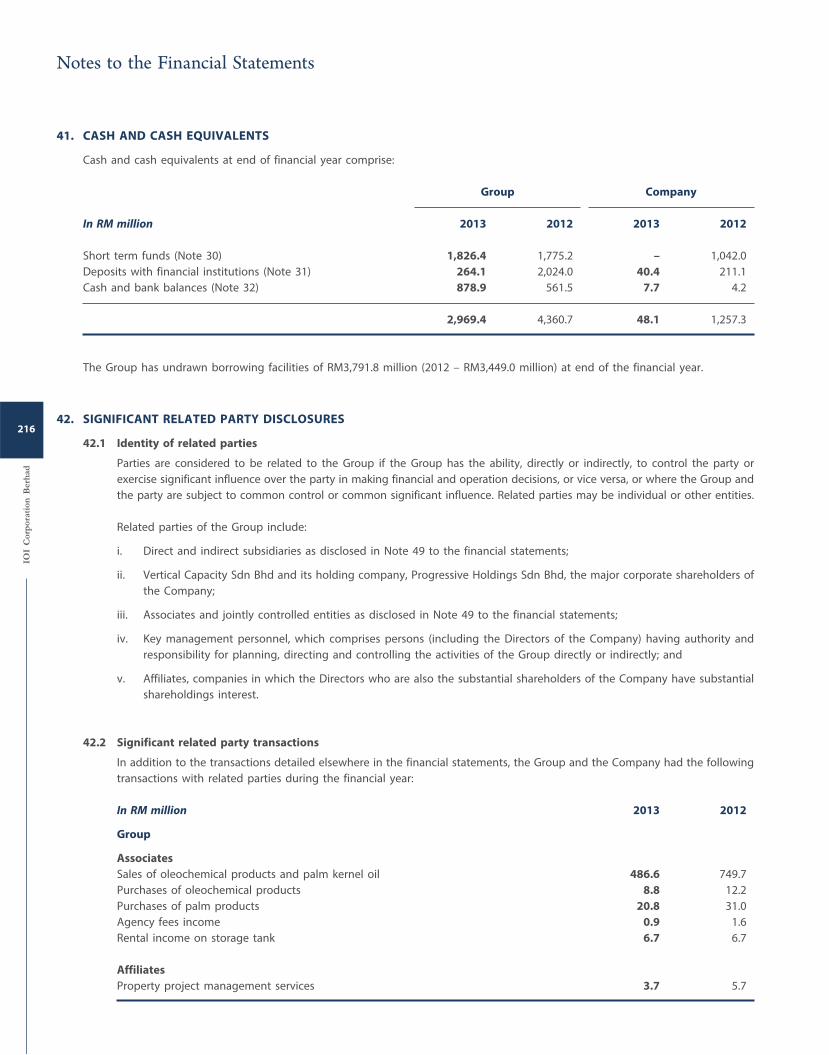
41. CASH AND CASH EQUIVALENTS
Cash and cash equivalents at end of financial year comprise:
Group Company
In RM million 2013 2012 2013 2012
Short term funds (Note 30) 1,826.4 1,775.2 – 1,042.0
Deposits with financial institutions (Note 31) 264.1 2,024.0 40.4 211.1
Cash and bank balances (Note 32) 878.9 561.5 7.7 4.2
2,969.4 4,360.7 48.1 1,257.3
The Group has undrawn borrowing facilities of RM3,791.8 million (2012 – RM3,449.0 million) at end of the financial year.
42. SIGNIFICANT RELATED PARTY DISCLOSURES
42.1 Identity of related parties
Parties are considered to be related to the Group if the Group has the ability, directly or indirectly, to control the party or
exercise significant influence over the party in making financial and operation decisions, or vice versa, or where the Group and
the party are subject to common control or common significant influence. Related parties may be individual or other entities.
Related parties of the Group include:
i. Direct and indirect subsidiaries as disclosed in Note 49 to the financial statements;
ii. Vertical Capacity Sdn Bhd and its holding company, Progressive Holdings Sdn Bhd, the major corporate shareholders of
the Company;
iii. Associates and jointly controlled entities as disclosed in Note 49 to the financial statements;
iv. Key management personnel, which comprises persons (including the Directors of the Company) having authority and
responsibility for planning, directing and controlling the activities of the Group directly or indirectly; and
v. Affiliates, companies in which the Directors who are also the substantial shareholders of the Company have substantial
shareholdings interest.
42.2 Significant related party transactions
In addition to the transactions detailed elsewhere in the financial statements, the Group and the Company had the following
transactions with related parties during the financial year:
In RM million 2013 2012
Group
Associates
Sales of oleochemical products and palm kernel oil 486.6 749.7
Purchases of oleochemical products 8.8 12.2
Purchases of palm products 20.8 31.0
Agency fees income 0.9 1.6
Rental income on storage tank 6.7 6.7
Affiliates
Property project management services 3.7 5.7
Notes to the Financial Statements
IOI
Cor
por
atio
n B
erh
ad
216
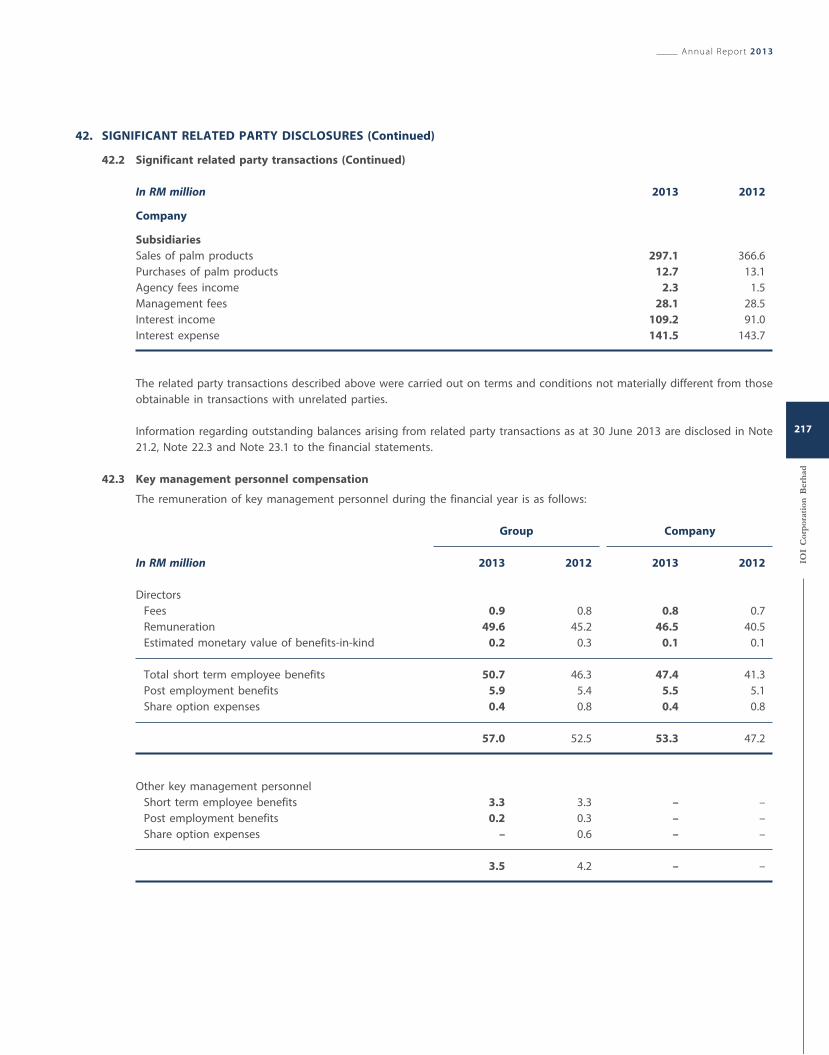
42. SIGNIFICANT RELATED PARTY DISCLOSURES (Continued)
42.2 Significant related party transactions (Continued)
In RM million 2013 2012
Company
Subsidiaries
Sales of palm products 297.1 366.6
Purchases of palm products 12.7 13.1
Agency fees income 2.3 1.5
Management fees 28.1 28.5
Interest income 109.2 91.0
Interest expense 141.5 143.7
The related party transactions described above were carried out on terms and conditions not materially different from those
obtainable in transactions with unrelated parties.
Information regarding outstanding balances arising from related party transactions as at 30 June 2013 are disclosed in Note
21.2, Note 22.3 and Note 23.1 to the financial statements.
42.3 Key management personnel compensation
The remuneration of key management personnel during the financial year is as follows:
Group Company
In RM million 2013 2012 2013 2012
Directors
Fees 0.9 0.8 0.8 0.7
Remuneration 49.6 45.2 46.5 40.5
Estimated monetary value of benefits-in-kind 0.2 0.3 0.1 0.1
Total short term employee benefits 50.7 46.3 47.4 41.3
Post employment benefits 5.9 5.4 5.5 5.1
Share option expenses 0.4 0.8 0.4 0.8
57.0 52.5 53.3 47.2
Other key management personnel
Short term employee benefits 3.3 3.3 – –
Post employment benefits 0.2 0.3 – –
Share option expenses – 0.6 – –
3.5 4.2 – –
Annual Report 2013
IOI
Cor
por
atio
n B
erh
ad
217
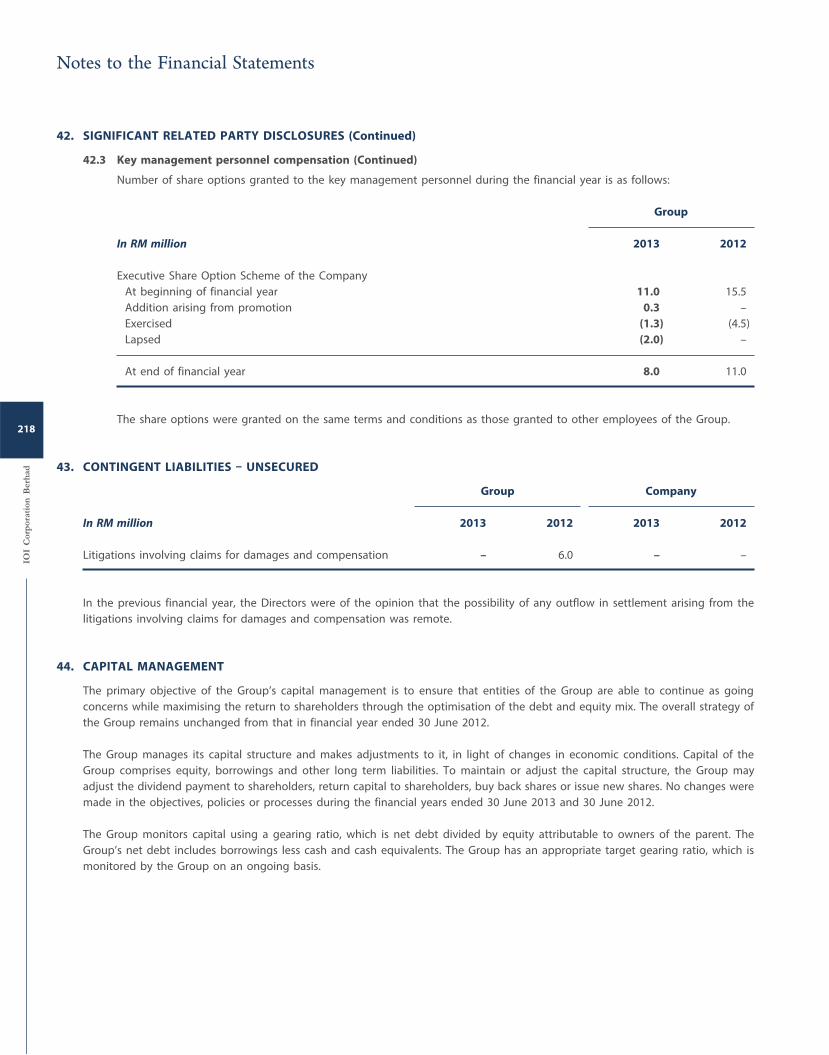
42. SIGNIFICANT RELATED PARTY DISCLOSURES (Continued)
42.3 Key management personnel compensation (Continued)
Number of share options granted to the key management personnel during the financial year is as follows:
Group
In RM million 2013 2012
Executive Share Option Scheme of the Company
At beginning of financial year 11.0 15.5
Addition arising from promotion 0.3 –
Exercised (1.3) (4.5)
Lapsed (2.0) –
At end of financial year 8.0 11.0
The share options were granted on the same terms and conditions as those granted to other employees of the Group.
43. CONTINGENT LIABILITIES – UNSECURED
Group Company
In RM million 2013 2012 2013 2012
Litigations involving claims for damages and compensation – 6.0 – –
In the previous financial year, the Directors were of the opinion that the possibility of any outflow in settlement arising from the
litigations involving claims for damages and compensation was remote.
44. CAPITAL MANAGEMENT
The primary objective of the Group’s capital management is to ensure that entities of the Group are able to continue as going
concerns while maximising the return to shareholders through the optimisation of the debt and equity mix. The overall strategy of
the Group remains unchanged from that in financial year ended 30 June 2012.
The Group manages its capital structure and makes adjustments to it, in light of changes in economic conditions. Capital of the
Group comprises equity, borrowings and other long term liabilities. To maintain or adjust the capital structure, the Group may
adjust the dividend payment to shareholders, return capital to shareholders, buy back shares or issue new shares. No changes were
made in the objectives, policies or processes during the financial years ended 30 June 2013 and 30 June 2012.
The Group monitors capital using a gearing ratio, which is net debt divided by equity attributable to owners of the parent. The
Group’s net debt includes borrowings less cash and cash equivalents. The Group has an appropriate target gearing ratio, which is
monitored by the Group on an ongoing basis.
Notes to the Financial Statements
IOI
Cor
por
atio
n B
erh
ad
218
44. CAPITAL MANAGEMENT (Continued)
Group Company
In RM million 2013 2012 2013 2012
Borrowings 7,324.3 8,121.7 1,901.0 1,906.3
Less: Cash and cash equivalents (2,969.4) (4,360.7) (48.1) (1,257.3)
Net debt 4,354.9 3,761.0 1,852.9 649.0
Equity 13,672.0 12,627.9 6,754.9 6,593.0
Gearing ratio (%) 31.85 29.78 27.43 9.84
45. FINANCIAL INSTRUMENTS
Financial risk management objectives and policies
The Group’s activities expose it to a variety of financial risks, including foreign currency risk, interest rate risk, price fluctuation risk,
credit risk, liquidity and cash flow risk. The Group’s overall financial risk management objective is to ensure that the Group creates
value for its shareholders whilst minimising potential adverse effects on its financial performance and positions. The Group operates
within an established risk management framework and clearly defined guidelines that are approved by the Board of Directors.
The Group operates within an established Enterprise Risk Management framework with clearly defined policies and guidelines, which
are administered via divisional Risk Management Committees. Divisional Risk Management Committees report regularly to the Audit
and Risk Management Committee which oversees the management of risk in the Group on behalf of the Board of Directors.
45.1 Foreign currency risk
The Group operates internationally and is exposed to various currencies, mainly US Dollar (“USD”), Euro (“EUR”), Singapore
Dollar (“SGD”) and Japanese Yen (“JPY”). Foreign currency denominated assets and liabilities together with expected cash
flows from committed purchases and sales give rise to foreign currency exposures.
The Group’s foreign currency risk management objective is to minimise foreign currency exposure that gives rise to economic
impact, both at transaction and reporting period translation levels.
45.1.1 Risk management approach
The Group maintains a natural hedge, whenever possible, by borrowing in the currency of the country, in which the
property or investment is located or by borrowing in currencies that match the future revenue stream to be
generated from its investments.
Foreign currency exposures in transactional currencies other than the functional currencies of the operating entities
are kept to an acceptable level. Material foreign currency transaction exposures are hedged with derivative financial
instruments such as forward foreign exchange contracts and options on a back-to-back basis.
The downstream segment’s forward contractual commitments intended to be physically settled are fully hedged
with respect to its currency risk on a back-to-back basis with currency forward contracts. Where the netting of
forward sales against forward purchases with matching currency risk characteristics is possible, these would first be
netted before hedging the net currency exposure with forward contracts. Currency risk on forward contractual
commitments with clear intention for net-cash settlement (i.e. paper trading) are not considered for hedging until
the exercising of the net settlement.
Annual Report 2013
IOI
Cor
por
atio
n B
erh
ad
219
45. FINANCIAL INSTRUMENTS (Continued)
45.1 Foreign currency risk (Continued)
45.1.1 Risk management approach (Continued)
The hedging methods that the Group adopts in managing its currency risk depend on the principal forms of foreign
currency exposure, as discussed below:
i. Structural foreign currency exposure from its net investment in foreign operations (subsidiaries,
associates, and joint ventures)
Background
The Group’s foreign operations of various functional currencies when translated into its parent’s reporting
currency based on closing rates (for assets and liabilities) and average transaction rates (for income and
expenses) at each consolidation, gives rise to foreign currency translation gain or loss that will be recognised
in other comprehensive income. Intragroup transactions with foreign operations involving monetary financial
instruments will also result in foreign currency translation gain or loss that cannot be eliminated on
consolidation, but has to be recognised either in profit or loss or in other comprehensive income. However,
non-monetary financial items translated at historical exchange rates will not give rise to foreign currency risk.
Resulting from its net investment in foreign operations, the Group’s current and future profit stream in various
foreign currencies will also be exposed to foreign currency risk.
Hedging method
Where feasible the Group would match its foreign currency borrowing with the functional currency of its
foreign operations. Nevertheless, the Group considers such foreign currencies’ overall fiscal position and
borrowing costs before deciding on the currency major to be carried as debt in its book. In this regard, the
Group has major foreign currency borrowings denominated in USD, EUR, SGD and JPY, which do not necessarily
match all the functional currencies of its foreign operations. Where appropriate, exposures from mismatch in
foreign currency borrowings are hedged with Cross Currency Swap.
ii. Transactional obligations or rights denominated in foreign currency
Background
The majority of the Group’s transactional currency risk arises from its foreign currency based forward sales and
purchases of commodity items, contracted by its subsidiaries along the palm value chain. These forward
commodity contracts for “own use” purposes are non-financial instruments and are generally not recognised
in the Statements of Financial Position. However, these non-financial forward contracts denominated in foreign
currency are exposed to economic risk due to currency fluctuations. Certain product-streams underlying the
forward contracts are net-cash settled or have contract provisions for net-cash settlement, and these are
accounted by the Group as financial instruments with fair valuation impact to its financial statements.
Regardless of “own use” or fair value through profit or loss, these forward contracts on fulfilment at maturity
will result in book receivables or payables in foreign currency.
Hedging method
Intra-day transactions or forward contracts in foreign currencies are first netted based on matching
characteristics. The net exposure is then hedged off with vanilla foreign exchange forwards.
In general, currency exposure from foreign investments and borrowings is managed centrally at the Group HQ level,
whilst currency exposure arising from transactions or contractual obligations is managed at the respective entity or
business unit’s level. The Group adopts a uniform Foreign Currency Risk Management Policy and Guide, which sets
out the authority and limits for inception of foreign currency derivatives; types of approved foreign currency
derivatives; acceptable hedging practices and methods; and over-sight structure and controls. Below are extracts of
key policies:
Notes to the Financial Statements
IOI
Cor
por
atio
n B
erh
ad
220
45. FINANCIAL INSTRUMENTS (Continued)
45.1 Foreign currency risk (Continued)
45.1.1 Risk management approach (Continued)
a) Speculative positioning on foreign currency is prohibited;
b) Net currency exposure on trade transactions and forward contracts are to be hedged in full on back-to-back
basis. Hedging on portfolio basis (or macro-hedging) comprising of unmatched mixed maturity and amount is
disallowed;
c) Inception of foreign currency derivatives as hedging instrument against forecast trade transactions in foreign
currency is disallowed;
d) Hedging with foreign currency futures on traded exchanges is generally disallowed;
e) Inception of over-the-counter structures derivatives for hedging purposes are confined to HQ and each
contract is subject to executive management’s approval; and
f) Subsidiaries inception of foreign currency derivative for hedging purposes are confined to vanilla foreign
currency forwards and plain European style foreign currency options.
The Group’s entire currency exposure (as hedge items) and corresponding foreign currency derivative hedging
instruments are mark-to-market and fair valued once a month primarily for operational hedge effectiveness testing
and for executive management reporting and oversight. Weekly long-short positions on foreign currencies and
foreign currency derivatives are also produced for timely control and intervention.
45.1.2 Foreign currency risk exposure
The analysis of the Group’s foreign currencies long-short positions for each class of financial instruments with
separate lines on currency derivative is as follows:
Group
Contract based currency USD EUR SGD JPY Others
Maturity <1 year > 1 year <1 year > 1 year <1 year > 1 year <1 year > 1 year <1 year > 1 year
In RM milion
2013
Financial assets in foreign
currencies
Cash and bank balances 639.0 – 14.1 – 16.6 – – – 5.1 –
Trade and other receivables 586.2 – 321.2 – – – 5.6 – 30.2 –
Derivative assets 322.9 – – – – – – – – –
Financial liabilities in
foreign currencies
Trade and other payables (121.9) – (153.9) – (0.5) – – – (20.1) –
Amounts due to associates – – – – – – – – (45.5) –
Borrowings (173.0) (6,461.5) – – – – – (677.6) – –
Derivative liabilities (333.8) – – – – – – – – –
Currency derivatives
Foreign currency forwards (1,425.1) – (72.3) – 1.9 – (19.1) – (55.5) –
Structured and hybrids – 233.1 – – – (494.1) – 677.6 – –
Net exposure (505.7) (6,228.4) 109.1 – 18.0 (494.1) (13.5) – (85.8) –
Annual Report 2013
IOI
Cor
por
atio
n B
erh
ad
221
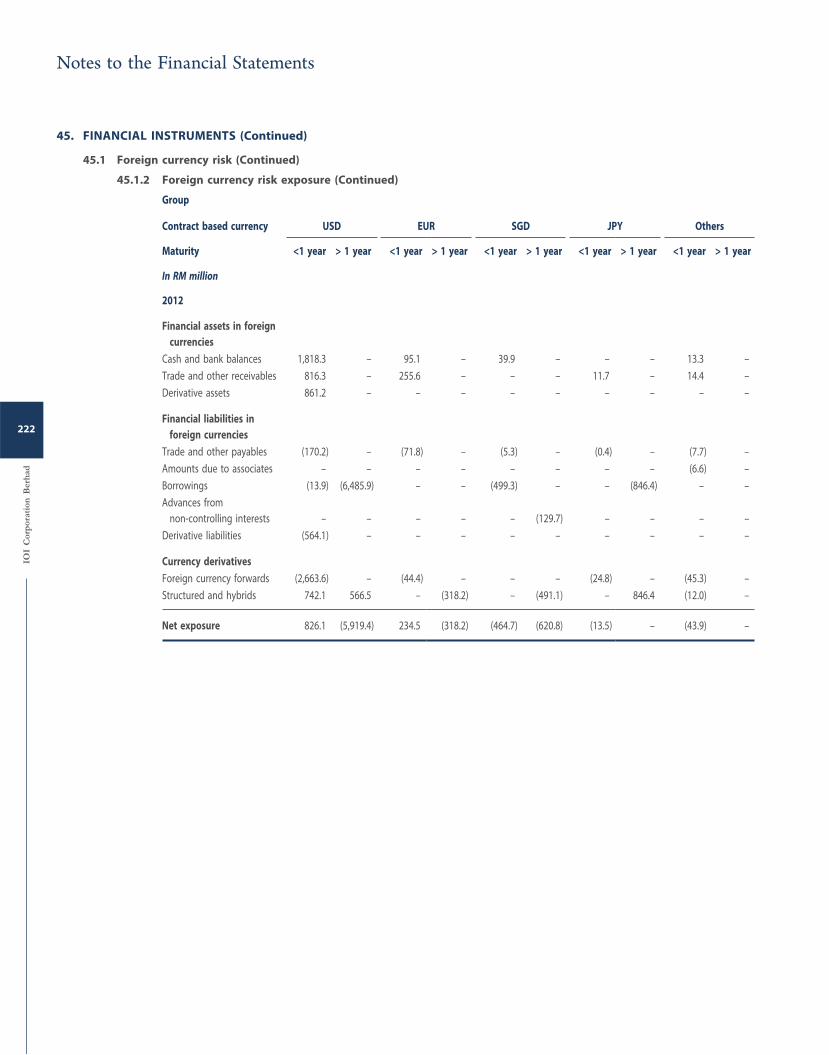
45. FINANCIAL INSTRUMENTS (Continued)
45.1 Foreign currency risk (Continued)
45.1.2 Foreign currency risk exposure (Continued)
Group
Contract based currency USD EUR SGD JPY Others
Maturity <1 year > 1 year <1 year > 1 year <1 year > 1 year <1 year > 1 year <1 year > 1 year
In RM million
2012
Financial assets in foreign
currencies
Cash and bank balances 1,818.3 – 95.1 – 39.9 – – – 13.3 –
Trade and other receivables 816.3 – 255.6 – – – 11.7 – 14.4 –
Derivative assets 861.2 – – – – – – – – –
Financial liabilities in
foreign currencies
Trade and other payables (170.2) – (71.8) – (5.3) – (0.4) – (7.7) –
Amounts due to associates – – – – – – – – (6.6) –
Borrowings (13.9) (6,485.9) – – (499.3) – – (846.4) – –
Advances from
non-controlling interests – – – – – (129.7) – – – –
Derivative liabilities (564.1) – – – – – – – – –
Currency derivatives
Foreign currency forwards (2,663.6) – (44.4) – – – (24.8) – (45.3) –
Structured and hybrids 742.1 566.5 – (318.2) – (491.1) – 846.4 (12.0) –
Net exposure 826.1 (5,919.4) 234.5 (318.2) (464.7) (620.8) (13.5) – (43.9) –
Notes to the Financial Statements
IOI
Cor
por
atio
n B
erh
ad
222
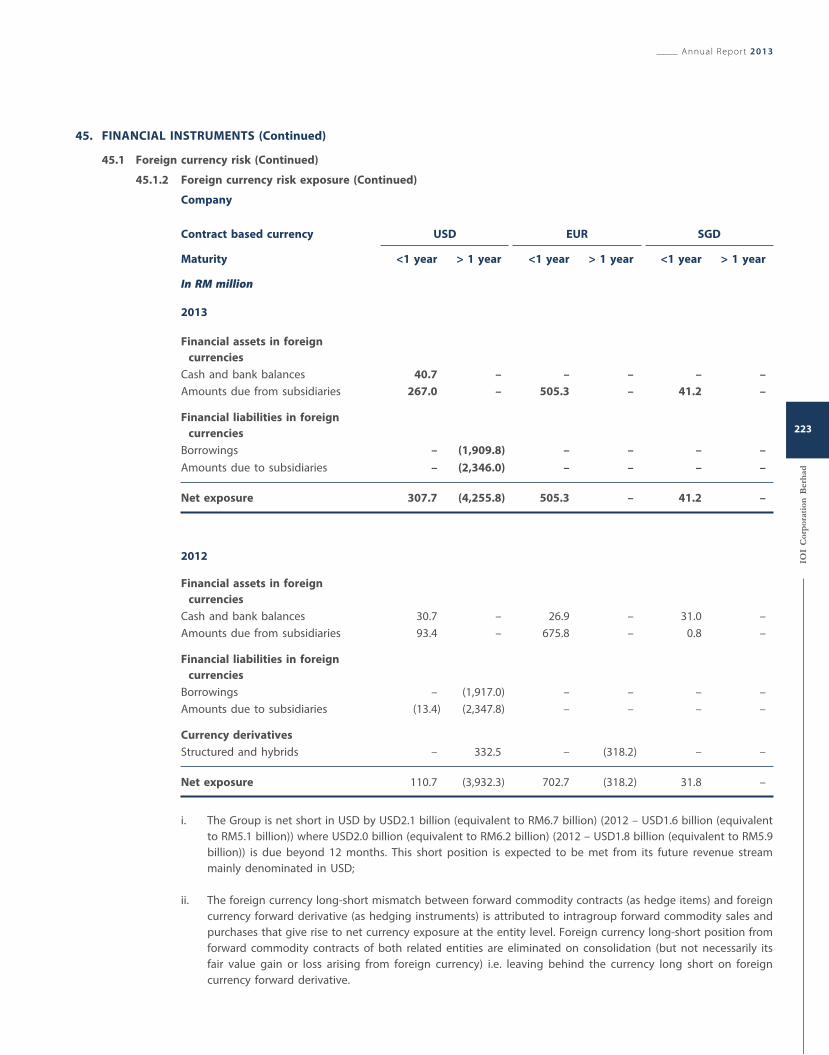
45. FINANCIAL INSTRUMENTS (Continued)
45.1 Foreign currency risk (Continued)
45.1.2 Foreign currency risk exposure (Continued)
Company
Contract based currency USD EUR SGD
Maturity <1 year > 1 year <1 year > 1 year <1 year > 1 year
In RM million
2013
Financial assets in foreign
currencies
Cash and bank balances 40.7 – – – – –
Amounts due from subsidiaries 267.0 – 505.3 – 41.2 –
Financial liabilities in foreign
currencies
Borrowings – (1,909.8) – – – –
Amounts due to subsidiaries – (2,346.0) – – – –
Net exposure 307.7 (4,255.8) 505.3 – 41.2 –
2012
Financial assets in foreign
currencies
Cash and bank balances 30.7 – 26.9 – 31.0 –
Amounts due from subsidiaries 93.4 – 675.8 – 0.8 –
Financial liabilities in foreign
currencies
Borrowings – (1,917.0) – – – –
Amounts due to subsidiaries (13.4) (2,347.8) – – – –
Currency derivatives
Structured and hybrids – 332.5 – (318.2) – –
Net exposure 110.7 (3,932.3) 702.7 (318.2) 31.8 –
i. The Group is net short in USD by USD2.1 billion (equivalent to RM6.7 billion) (2012 – USD1.6 billion (equivalent
to RM5.1 billion)) where USD2.0 billion (equivalent to RM6.2 billion) (2012 – USD1.8 billion (equivalent to RM5.9
billion)) is due beyond 12 months. This short position is expected to be met from its future revenue stream
mainly denominated in USD;
ii. The foreign currency long-short mismatch between forward commodity contracts (as hedge items) and foreign
currency forward derivative (as hedging instruments) is attributed to intragroup forward commodity sales and
purchases that give rise to net currency exposure at the entity level. Foreign currency long-short position from
forward commodity contracts of both related entities are eliminated on consolidation (but not necessarily its
fair value gain or loss arising from foreign currency) i.e. leaving behind the currency long short on foreign
currency forward derivative.
Annual Report 2013
IOI
Cor
por
atio
n B
erh
ad
223
45. FINANCIAL INSTRUMENTS (Continued)
45.1 Foreign currency risk (Continued)
45.1.2 Foreign currency risk exposure (Continued)
As at the end of the financial year, the Group and the Company have also entered into the following currency swap
contracts:
Group
2013
i. Cross currency swap to swap fixed rate USD liability of USD104.1 million to fixed rate EUR liability of EUR80.0
million. The contract effectively swapped part of the Group’s fixed rate Guaranteed Notes into fixed rate EUR
liability. This was done to maintain the appropriate amount of liability in EUR as a natural hedge against
existing EUR denominated investment in subsidiaries. The effective period for this cross currency swap is from
February 2005 to February 2015.
The Group has received USD2.2 million (equivalent to RM6.7 million) upon successfully unwinding the contract
during the financial year.
ii. Cross currency swaps to swap JPY liability of JPY21.0 billion to USD liability of USD182.7 million. These were
entered into as a cashflow hedge for the Group’s principal repayment for the loan obtained. The effective
period for these cross currency swaps is from January 2007 to February 2038.
iii. Cross currency swaps to swap floating rate USD liability of USD100.0 million to fixed rate RM liability of
RM302.0 million. These were entered into as a cashflow hedge for the Group’s principal repayment for the loan
obtained. The effective period for these cross currency swaps is from March 2012 to December 2016.
iv. Cross currency swap to swap floating rate USD liability of USD156.0 million to floating rate SGD liability of
SGD196.7 million. This was entered into to maintain the appropriate amount of liability in SGD as a natural
hedge against existing SGD denominated investment. The effective period for this cross currency swap is from
April 2012 to December 2016.
2012
i. Cross currency swap to swap fixed rate USD liability of USD104.1 million to fixed rate EUR liability of EUR80.0
million. The contract effectively swapped part of the Group’s fixed rate Guaranteed Notes into fixed rate EUR
liability. This was done to maintain the appropriate amount of liability in EUR as a natural hedge against
existing EUR denominated investment in subsidiaries. The effective period for this cross currency swap is from
February 2005 to February 2015.
ii. Cross currency swaps to swap JPY liability of JPY21.0 billion to USD liability of USD182.7 million. These were
entered into as a cashflow hedge for the Group’s principal repayment for the loan obtained. The effective
period for these cross currency swaps is from January 2007 to February 2038.
iii. Cross currency swaps to swap floating rate USD liability of USD100.0 million to fixed rate RM liability of
RM302.0 million. These were entered into as a cashflow hedge for the Group’s principal repayment for the loan
obtained. The effective period for these cross currency swaps is from March 2012 to December 2016.
iv. Cross currency swap to swap floating rate USD liability of USD156.0 million to floating rate SGD liability of
SGD196.7 million. This was entered into to maintain the appropriate amount of liability in SGD as a natural
hedge against existing SGD denominated investment. The effective period for this cross currency swap is from
April 2012 to December 2016.
Notes to the Financial Statements
IOI
Cor
por
atio
n B
erh
ad
224
45. FINANCIAL INSTRUMENTS (Continued)
45.1 Foreign currency risk (Continued)
45.1.2 Foreign currency risk exposure (Continued)
Company
2013
i. Cross currency swap to swap fixed rate USD liability of USD104.1 million to fixed rate EUR liability of EUR80.0
million. The contract effectively swapped part of the Group’s fixed rate Guaranteed Notes into fixed rate EUR
liability. This was done to maintain the appropriate amount of liability in EUR as a natural hedge against
existing EUR denominated investment in subsidiaries. The effective period for this cross currency swap is from
February 2005 to February 2015.
The Company has received USD2.2 million (equivalent to RM6.7 million) upon successfully unwinding the
contract during the financial year.
2012
i. Cross currency swap to swap fixed rate USD liability of USD104.1 million to fixed rate EUR liability of EUR80.0
million. The contract effectively swapped part of the Group’s fixed rate Guaranteed Notes into fixed rate EUR
liability. This was done to maintain the appropriate amount of liability in EUR as a natural hedge against
existing EUR denominated investment in subsidiaries. The effective period for this cross currency swap is from
February 2005 to February 2015.
45.1.3 Sensitivity analysis
The Group’s exposure to foreign currency risk primarily from foreign currency denominated borrowings. A 1,000 pips
increase or decrease in foreign currency rate of foreign currency denominated borrowings would have equally
decreased or increased the profit for the Group and the Company by approximately RM200 million (2012 – RM232
million) and RM60 million (2012 – RM60 million) respectively.
45.2 Interest rate risk
The Group’s interest rate risk arises from its interest bearing financial instruments that could impact fair value and future cash
flows due to fluctuation in market interest rates.
The Group’s objective on interest rate risk management is to achieve a balance in re-pricing risks and the optimisation of its
cost of funds whilst ensuring sufficient liquidity to meet funding needs.
45.2.1 Risk management approach
The Group actively reviews its debt portfolio, taking into account the nature and requirements of its businesses as
well as the current business and economic environment. This strategy allows it to achieve an optimum cost of
capital whilst locking in long term funding rates for long term investments.
Funds held for liquidity purposes and temporary surpluses are placed in short term interest bearing financial
instruments. Changes in market interest rates will be re-priced immediately into these floating interest bearing
financial instruments.
Annual Report 2013
IOI
Cor
por
atio
n B
erh
ad
225
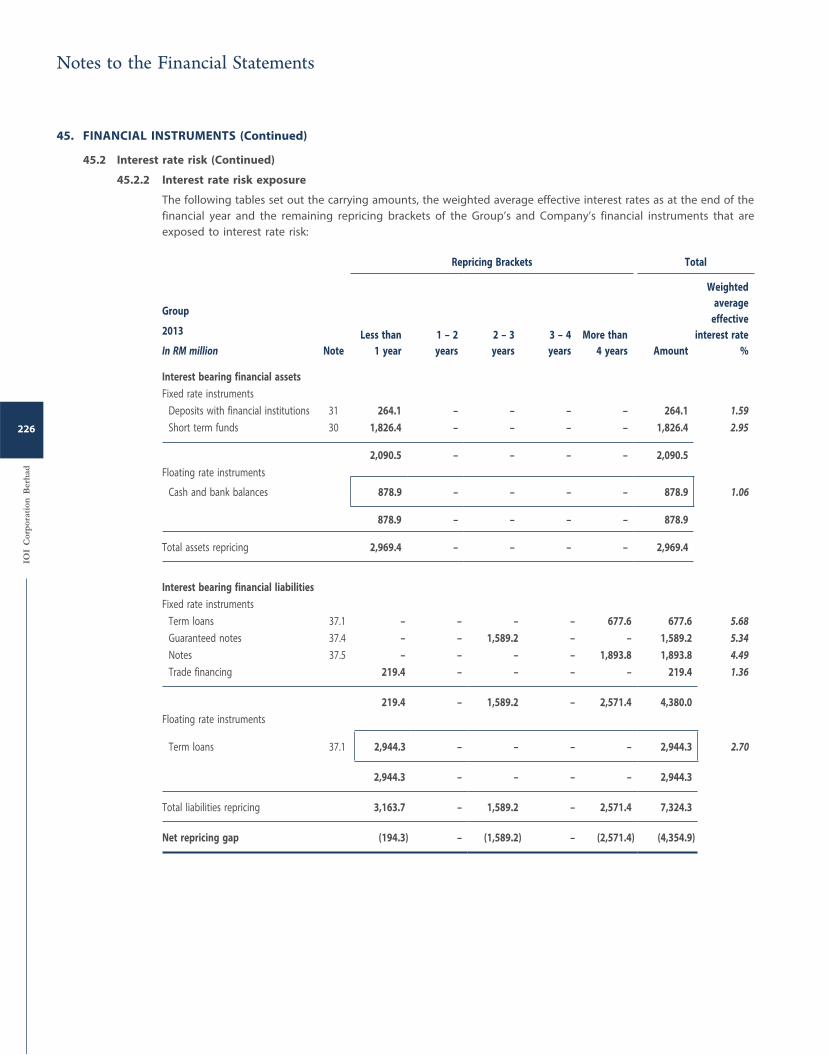
45. FINANCIAL INSTRUMENTS (Continued)
45.2 Interest rate risk (Continued)
45.2.2 Interest rate risk exposure
The following tables set out the carrying amounts, the weighted average effective interest rates as at the end of the
financial year and the remaining repricing brackets of the Group’s and Company’s financial instruments that are
exposed to interest rate risk:
Repricing Brackets Total
Group
2013
In RM million Note
Less than
1 year
1 – 2
years
2 – 3
years
3 – 4
years
More than
4 years Amount
Weighted
average
effective
interest rate
%
Interest bearing financial assets
Fixed rate instruments
Deposits with financial institutions 31 264.1 – – – – 264.1 1.59 Short term funds 30 1,826.4 – – – – 1,826.4 2.95
2,090.5 – – – – 2,090.5
Floating rate instruments
Cash and bank balances 878.9 – – – – 878.9 1.06
878.9 – – – – 878.9
Total assets repricing 2,969.4 – – – – 2,969.4
Interest bearing financial liabilities
Fixed rate instruments
Term loans 37.1 – – – – 677.6 677.6 5.68 Guaranteed notes 37.4 – – 1,589.2 – – 1,589.2 5.34 Notes 37.5 – – – – 1,893.8 1,893.8 4.49 Trade financing 219.4 – – – – 219.4 1.36
219.4 – 1,589.2 – 2,571.4 4,380.0
Floating rate instruments
Term loans 37.1 2,944.3 – – – – 2,944.3 2.70
2,944.3 – – – – 2,944.3
Total liabilities repricing 3,163.7 – 1,589.2 – 2,571.4 7,324.3
Net repricing gap (194.3) – (1,589.2) – (2,571.4) (4,354.9)
Notes to the Financial Statements
IOI
Cor
por
atio
n B
erh
ad
226
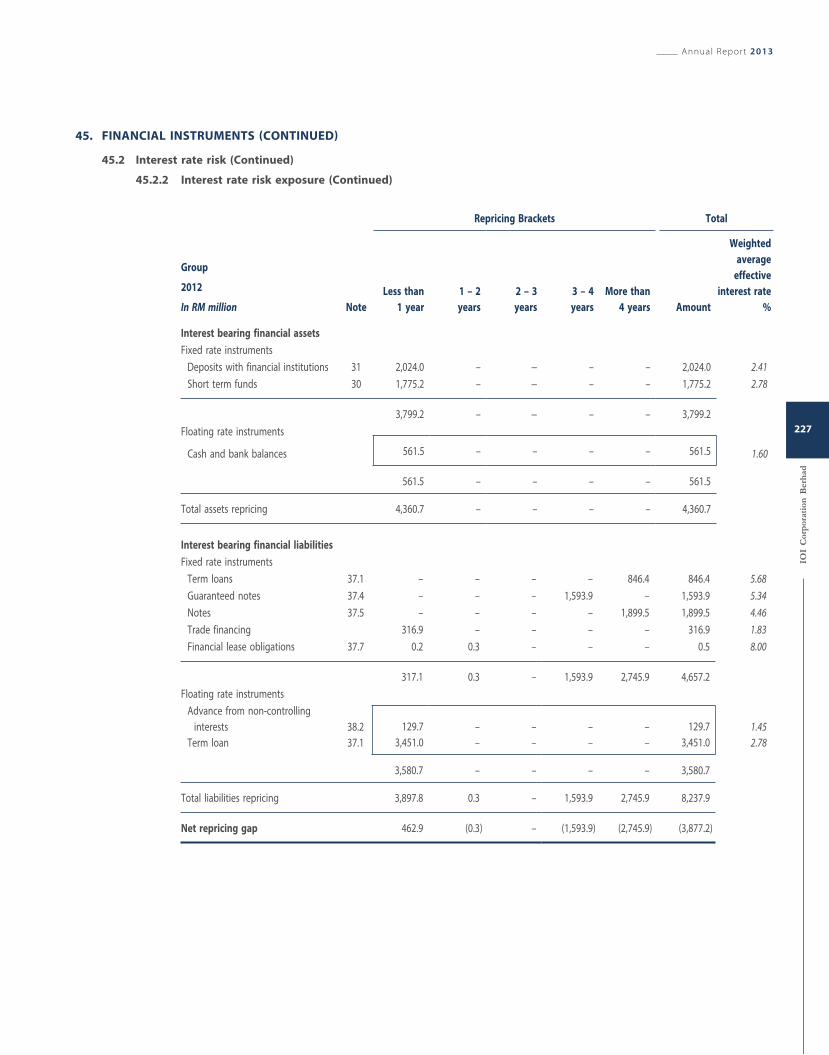
45. FINANCIAL INSTRUMENTS (CONTINUED)
45.2 Interest rate risk (Continued)
45.2.2 Interest rate risk exposure (Continued)
Repricing Brackets Total
Group
2012
In RM million Note
Less than
1 year
1 – 2
years
2 – 3
years
3 – 4
years
More than
4 years Amount
Weighted
average
effective
interest rate
%
Interest bearing financial assets
Fixed rate instruments
Deposits with financial institutions 31 2,024.0 – – – – 2,024.0 2.41
Short term funds 30 1,775.2 – – – – 1,775.2 2.78
3,799.2 – – – – 3,799.2
Floating rate instruments
Cash and bank balances 561.5 – – – – 561.5 1.60
561.5 – – – – 561.5
Total assets repricing 4,360.7 – – – – 4,360.7
Interest bearing financial liabilities
Fixed rate instruments
Term loans 37.1 – – – – 846.4 846.4 5.68
Guaranteed notes 37.4 – – – 1,593.9 – 1,593.9 5.34
Notes 37.5 – – – – 1,899.5 1,899.5 4.46
Trade financing 316.9 – – – – 316.9 1.83
Financial lease obligations 37.7 0.2 0.3 – – – 0.5 8.00
317.1 0.3 – 1,593.9 2,745.9 4,657.2
Floating rate instruments
Advance from non-controlling
interests
Term loan
38.2
37.1
129.7
3,451.0
–
–
–
–
–
–
–
–
129.7
3,451.0
1.45
2.78
3,580.7 – – – – 3,580.7
Total liabilities repricing 3,897.8 0.3 – 1,593.9 2,745.9 8,237.9
Net repricing gap 462.9 (0.3) – (1,593.9) (2,745.9) (3,877.2)
Annual Report 2013
IOI
Cor
por
atio
n B
erh
ad
227
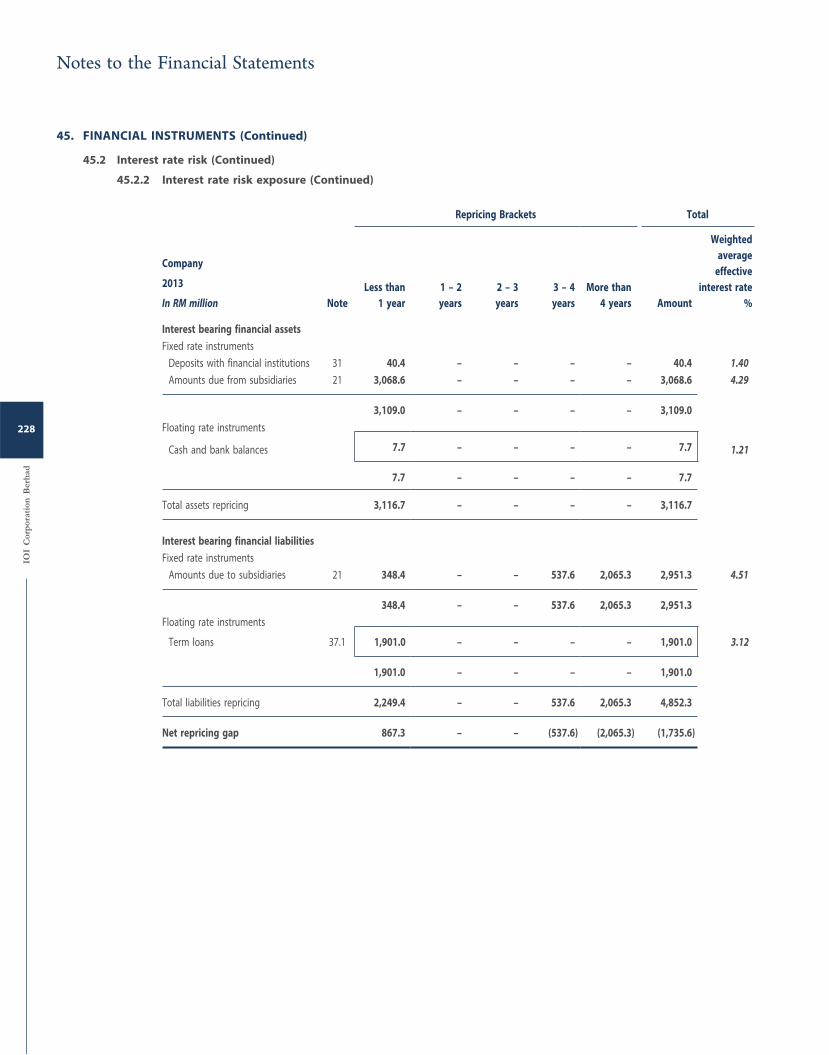
45. FINANCIAL INSTRUMENTS (Continued)
45.2 Interest rate risk (Continued)
45.2.2 Interest rate risk exposure (Continued)
Repricing Brackets Total
Company
2013
In RM million Note
Less than
1 year
1 – 2
years
2 – 3
years
3 – 4
years
More than
4 years Amount
Weighted
average
effective
interest rate
%
Interest bearing financial assets
Fixed rate instruments
Deposits with financial institutions 31 40.4 – – – – 40.4 1.40 Amounts due from subsidiaries 21 3,068.6 – – – – 3,068.6 4.29
3,109.0 – – – – 3,109.0
Floating rate instruments
Cash and bank balances 7.7 – – – – 7.7 1.21
7.7 – – – – 7.7
Total assets repricing 3,116.7 – – – – 3,116.7
Interest bearing financial liabilities
Fixed rate instruments
Amounts due to subsidiaries 21 348.4 – – 537.6 2,065.3 2,951.3 4.51
348.4 – – 537.6 2,065.3 2,951.3
Floating rate instruments
Term loans 37.1 1,901.0 – – – – 1,901.0 3.12
1,901.0 – – – – 1,901.0
Total liabilities repricing 2,249.4 – – 537.6 2,065.3 4,852.3
Net repricing gap 867.3 – – (537.6) (2,065.3) (1,735.6)
Notes to the Financial Statements
IOI
Cor
por
atio
n B
erh
ad
228
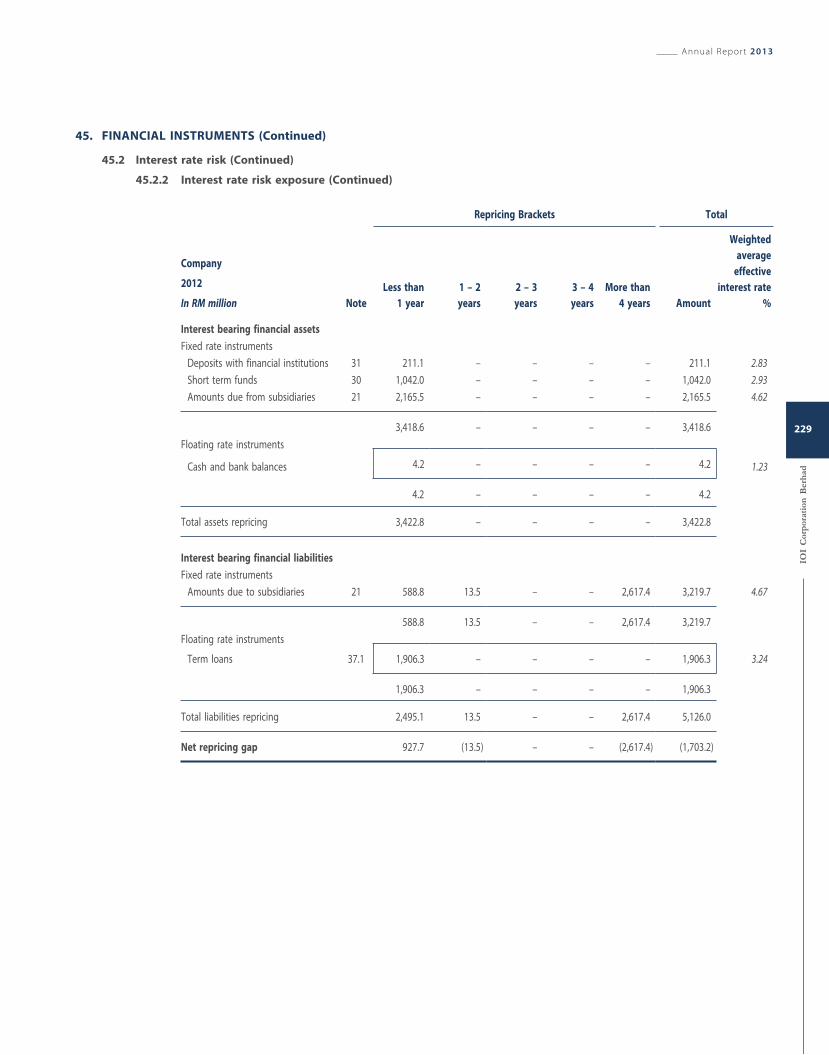
45. FINANCIAL INSTRUMENTS (Continued)
45.2 Interest rate risk (Continued)
45.2.2 Interest rate risk exposure (Continued)
Repricing Brackets Total
Company
2012
In RM million Note
Less than
1 year
1 – 2
years
2 – 3
years
3 – 4
years
More than
4 years Amount
Weighted
average
effective
interest rate
%
Interest bearing financial assets
Fixed rate instruments
Deposits with financial institutions 31 211.1 – – – – 211.1 2.83
Short term funds 30 1,042.0 – – – – 1,042.0 2.93
Amounts due from subsidiaries 21 2,165.5 – – – – 2,165.5 4.62
3,418.6 – – – – 3,418.6
Floating rate instruments
Cash and bank balances 4.2 – – – – 4.2 1.23
4.2 – – – – 4.2
Total assets repricing 3,422.8 – – – – 3,422.8
Interest bearing financial liabilities
Fixed rate instruments
Amounts due to subsidiaries 21 588.8 13.5 – – 2,617.4 3,219.7 4.67
588.8 13.5 – – 2,617.4 3,219.7
Floating rate instruments
Term loans 37.1 1,906.3 – – – – 1,906.3 3.24
1,906.3 – – – – 1,906.3
Total liabilities repricing 2,495.1 13.5 – – 2,617.4 5,126.0
Net repricing gap 927.7 (13.5) – – (2,617.4) (1,703.2)
Annual Report 2013
IOI
Cor
por
atio
n B
erh
ad
229
45. FINANCIAL INSTRUMENTS (Continued)
45.2 Interest rate risk (Continued)
45.2.2 Interest rate risk exposure (Continued)
As at the end of the financial year, the Group and the Company have also entered into the following interest rate
swap contracts:
Group
2013
i. Interest rate swaps to swap notional principal amount of USD600 million from floating interest rate to fixed
interest rate to hedge against interest rate fluctuations. The effective period for these interest rate swaps is
from October 2010 to October 2017.
ii. Interest rate swap to swap notional principal amount of USD74 million from floating interest rate to fixed
interest rate to hedge against interest rate fluctuations. The effective period for this interest rate swap is from
December 2011 to December 2016.
2012
i. Interest rate swaps to swap notional principal amount of USD600 million from floating interest rate to fixed
interest rate to hedge against interest rate fluctuations. The effective period for these interest rate swaps is
from October 2010 to October 2017.
ii. Interest rate swap to swap notional principal amount of USD74 million from floating interest rate to fixed
interest rate to hedge against interest rate fluctuations. The effective period for this interest rate swap is from
December 2011 to December 2016.
Company
2013
i. Interest rate swaps to swap notional principal amount of USD600 million from floating interest rate to fixed
interest rate to hedge against interest rate fluctuations. The effective period for these interest rate swaps is
from October 2010 to October 2017.
2012
i. Interest rate swaps to swap notional principal amount of USD600 million from floating interest rate to fixed
interest rate to hedge against interest rate fluctuations. The effective period for these interest rate swaps is
from October 2010 to October 2017.
45.2.3 Sensitivity analysis
Sensitivity analysis on interest rate is applied on floating rate financial instruments only, as the carrying amount of
fixed rate financial instruments are measured at amortised cost.
A 50 basis points increase or decrease in interest rates would have equally increased or decreased profits for the
Group and the Company by approximately RM1.9 million (2012 – RM2.3 million) and RM0.6 million (2012 – RM0.7
million) respectively.
Notes to the Financial Statements
IOI
Cor
por
atio
n B
erh
ad
230
45. FINANCIAL INSTRUMENTS (Continued)
45.3 Price fluctuation risk
The Group’s plantation and resource-based manufacturing segments are inversely exposed to price fluctuation risk on sales
and purchases of vegetable oil commodities. These two (2) operating segments enter into commodity future contracts with
the objective of managing and hedging their respective exposures to price volatility in the commodity markets.
The Group’s objective on price risk management is to limit the Group’s exposure to fluctuations in market prices and to
achieve expected margins on revenue.
45.3.1 Risk management approach
The Group manages its price fluctuation risk by having strict policies and procedures governing forward and futures
positions with dynamic limits on volume and tenure, mark-to-market losses, and on approvals. The Group’s
marketing and trading operations are centralised, and the long-short and mark-to-market positions are monitored
daily and reported to Senior Management weekly.
The Group’s commodity price risk management activities are integrated with its commodity sales and marketing
activities, which is centralised at the corporate level. The operation is governed by formalised policies and
procedures of which an outline is extracted below:
i. Forward sales commitment is limited to certain forward periods (generally 2– 5 months, depending on product
type);
ii. Volume that can be committed to forward sales is limited to a certain percentage of forecast production
(generally not exceeding 70% of monthly production, depending on product type);
iii. Forward contracts can only be incepted with pre-approved counter-parties. (Limits on volume and forward
period are further established for each counter-party);
iv. Commodity futures can only be traded by authorised officers with established volume limits; and
v. Each portfolio (by product category and legal entity) is subject to further limits on net volume exposure and
net mark-to-market fair value (“MTM FV”) loss limit (that serves as trigger for intervention).
Trade positions are compiled daily, and mark-to-market fair value is reviewed weekly. An exposure report on the
Group’s total long-short position (of all physical contracts, futures contracts and uncommitted inventory) with mark-
to-market fair value is produced monthly for executive oversight.
Annual Report 2013
IOI
Cor
por
atio
n B
erh
ad
231
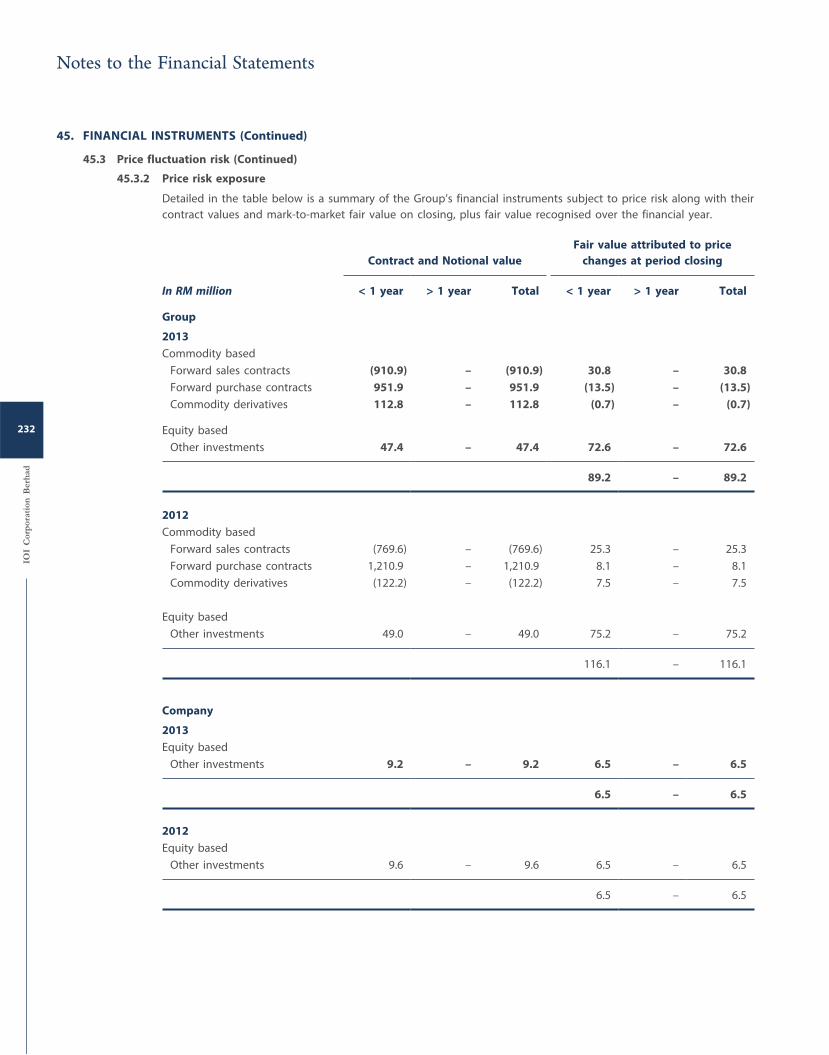
45. FINANCIAL INSTRUMENTS (Continued)
45.3 Price fluctuation risk (Continued)
45.3.2 Price risk exposure
Detailed in the table below is a summary of the Group’s financial instruments subject to price risk along with their
contract values and mark-to-market fair value on closing, plus fair value recognised over the financial year.
Contract and Notional value
Fair value attributed to price
changes at period closing
In RM million < 1 year > 1 year Total < 1 year > 1 year Total
Group
2013
Commodity based
Forward sales contracts (910.9) – (910.9) 30.8 – 30.8
Forward purchase contracts 951.9 – 951.9 (13.5) – (13.5)
Commodity derivatives 112.8 – 112.8 (0.7) – (0.7)
Equity based
Other investments 47.4 – 47.4 72.6 – 72.6
89.2 – 89.2
2012
Commodity based
Forward sales contracts (769.6) – (769.6) 25.3 – 25.3
Forward purchase contracts 1,210.9 – 1,210.9 8.1 – 8.1
Commodity derivatives (122.2) – (122.2) 7.5 – 7.5
Equity based
Other investments 49.0 – 49.0 75.2 – 75.2
116.1 – 116.1
Company
2013
Equity based
Other investments 9.2 – 9.2 6.5 – 6.5
6.5 – 6.5
2012
Equity based
Other investments 9.6 – 9.6 6.5 – 6.5
6.5 – 6.5
Notes to the Financial Statements
IOI
Cor
por
atio
n B
erh
ad
232
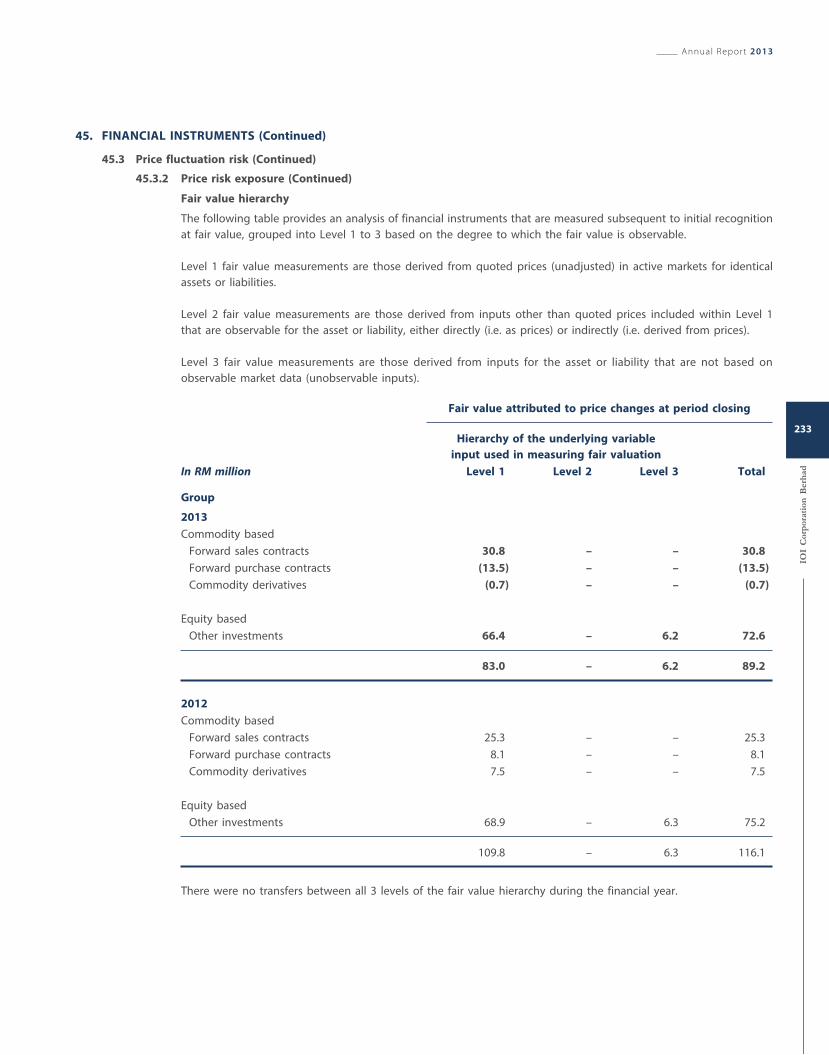
45. FINANCIAL INSTRUMENTS (Continued)
45.3 Price fluctuation risk (Continued)
45.3.2 Price risk exposure (Continued)
Fair value hierarchy
The following table provides an analysis of financial instruments that are measured subsequent to initial recognition
at fair value, grouped into Level 1 to 3 based on the degree to which the fair value is observable.
Level 1 fair value measurements are those derived from quoted prices (unadjusted) in active markets for identical
assets or liabilities.
Level 2 fair value measurements are those derived from inputs other than quoted prices included within Level 1
that are observable for the asset or liability, either directly (i.e. as prices) or indirectly (i.e. derived from prices).
Level 3 fair value measurements are those derived from inputs for the asset or liability that are not based on
observable market data (unobservable inputs).
In RM million
Fair value attributed to price changes at period closing
Hierarchy of the underlying variable
input used in measuring fair valuation
Level 1 Level 2 Level 3 Total
Group
2013
Commodity based
Forward sales contracts 30.8 – – 30.8
Forward purchase contracts (13.5) – – (13.5)
Commodity derivatives (0.7) – – (0.7)
Equity based
Other investments 66.4 – 6.2 72.6
83.0 – 6.2 89.2
2012
Commodity based
Forward sales contracts 25.3 – – 25.3
Forward purchase contracts 8.1 – – 8.1
Commodity derivatives 7.5 – – 7.5
Equity based
Other investments 68.9 – 6.3 75.2
109.8 – 6.3 116.1
There were no transfers between all 3 levels of the fair value hierarchy during the financial year.
Annual Report 2013
IOI
Cor
por
atio
n B
erh
ad
233
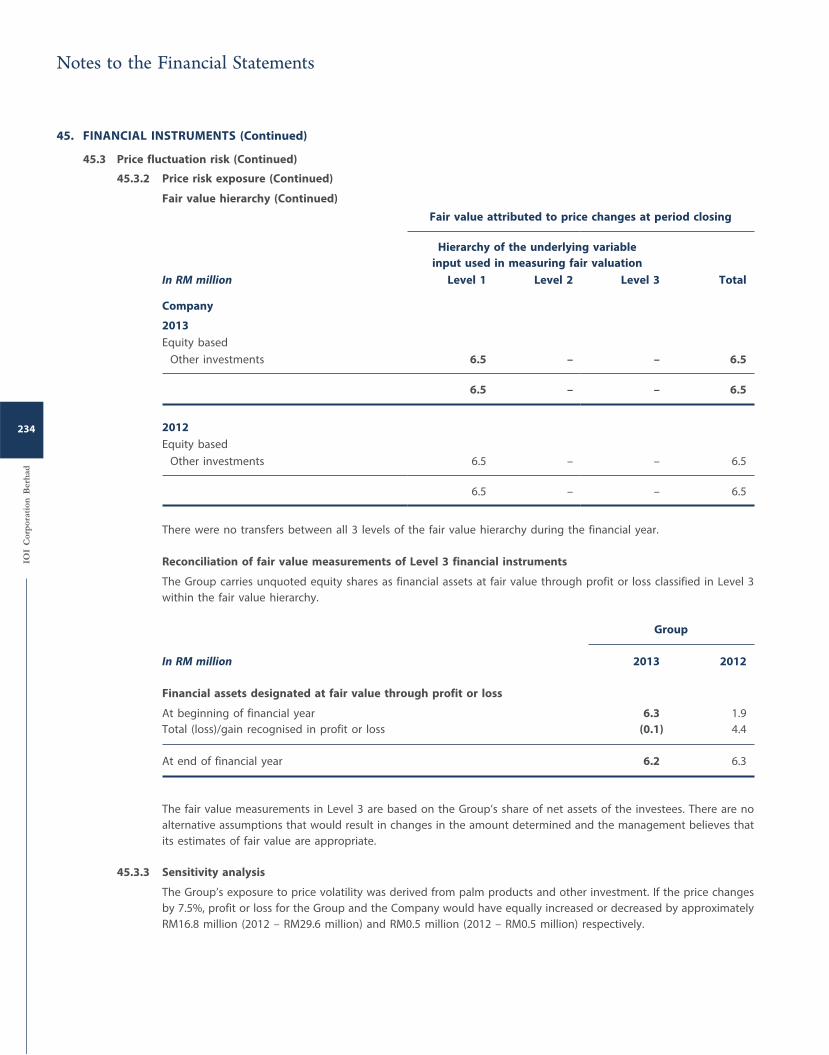
45. FINANCIAL INSTRUMENTS (Continued)
45.3 Price fluctuation risk (Continued)
45.3.2 Price risk exposure (Continued)
Fair value hierarchy (Continued)
In RM million
Fair value attributed to price changes at period closing
Hierarchy of the underlying variable
input used in measuring fair valuation
Level 1 Level 2 Level 3 Total
Company
2013
Equity based
Other investments 6.5 – – 6.5
6.5 – – 6.5
2012
Equity based
Other investments 6.5 – – 6.5
6.5 – – 6.5
There were no transfers between all 3 levels of the fair value hierarchy during the financial year.
Reconciliation of fair value measurements of Level 3 financial instruments
The Group carries unquoted equity shares as financial assets at fair value through profit or loss classified in Level 3
within the fair value hierarchy.
Group
In RM million 2013 2012
Financial assets designated at fair value through profit or loss
At beginning of financial year 6.3 1.9
Total (loss)/gain recognised in profit or loss (0.1) 4.4
At end of financial year 6.2 6.3
The fair value measurements in Level 3 are based on the Group’s share of net assets of the investees. There are no
alternative assumptions that would result in changes in the amount determined and the management believes that
its estimates of fair value are appropriate.
45.3.3 Sensitivity analysis
The Group’s exposure to price volatility was derived from palm products and other investment. If the price changes
by 7.5%, profit or loss for the Group and the Company would have equally increased or decreased by approximately
RM16.8 million (2012 – RM29.6 million) and RM0.5 million (2012 – RM0.5 million) respectively.
Notes to the Financial Statements
IOI
Cor
por
atio
n B
erh
ad
234
45. FINANCIAL INSTRUMENTS (Continued)
45.4 Credit risk
The Group’s credit risk exposure is mainly related to external counter-party credit risk on monetary financial assets and trade
credits. Credit risk is managed at the business unit level, but macro Group-wide policies on the granting of credit and credit
control are issued and monitored centrally, such as those relating to credit risk concentration, adequacy of formal credit
rating and evaluation of counter parties, credit impairment and unit level credit control performance.
Credit risk from monetary financial assets is generally low as the counter-parties involved are strongly rated financial
institutions or authorised exchanges. The Group does not extend any loans or financial guarantees to third parties except for
its own subsidiaries and jointly-controlled entities.
The Group’s objective on credit risk management is to avoid significant exposure to any individual customer or counter party
and to minimise concentration of credit risk.
45.4.1 Risk management approach
Credit risk or financial loss from the failure of customers or counter parties to discharge their financial and
contractual obligations from trade credits is managed through the application of credit approvals, credit limits,
insurance programmes and monitoring procedures on an on-going basis. If necessary, the Group may obtain
collateral from counter parties as a means of mitigating losses in the event of default.
The Group’s credit risk varies with the different classes of counter-parties as outlined below:
i. Plantation and resource-based manufacturing
Most of the upstream sales are intragroup to downstream “resource-based manufacturing”. Upstream sales
to external parties are mainly payment on delivery and/or secured with trade financing documentation.
Resource-based manufacturing sales are mostly to external parties with credit terms ranging from 30 to 90
days – and across global markets of varying sovereign risk. The Group also engages in forward sales (and
forward procurement of feedstock). Such forward contracts may have positive fair valuation giving rise to
counter-party default risk.
Policies and procedures
a) Customers are assessed for credit and sovereign nation risks (where applicable) on both quantitative and
qualitative elements prior to the approval of credit exposure and limits. In this regard, external credit
rating services such as Standard & Poor or Dun & Bradstreet are used. Where customers are approved for
forward physical contracts, limits on contractual forward periods and value are established. Regular
reviews are made;
b) Credit risk authority is decentralised to the respective entities’ credit committee – but supervised centrally
at the corporate level; and
c) Credit exposure is monitored on limits and ageing, managed and reviewed periodically. Customers with
emerging credit problems are identified early and remedial actions are taken promptly to minimise
further exposure and to restore past due status.
Collateral and credit enhancement
In general, a combination of:
a) Corporate guarantee may be required for globe-wide credit facilities for multinational corporations;
b) Cash deposits/advance may be required for certain customers or orders;
c) Transactional documentation (i.e. Letter of Credit or Cash against Document) for export sales; and
d) Credit insurance coverage (up to certain established limits) for downstream Oleochemical and Specialty
Fats’ credit sales – leaving some credit exposure on declined coverage and those beyond approved limits.
Annual Report 2013
IOI
Cor
por
atio
n B
erh
ad
235
45. FINANCIAL INSTRUMENTS (Continued)
45.4 Credit risk (Continued)
45.4.1 Risk management approach (Continued)
ii. Property
Generally, property units sold are progressively invoiced and settled by end-buyers’ financiers posing minimal
credit risk. Property investment entails the hospitality sub-segment for which sales are generally cash settled;
and the rental property sub-segment which poses a certain degree of collection risk in correlation with the
macroeconomic environment.
Policies and procedures
a) Tail-end progress billings on property units sold that serve as retention sum are closely monitored and
claimed upon expiry of retention period;
b) Credit where granted for corporate clients in the hospitality sub-segment are duly assessed and selectively
approved with established limits;
c) All tenants are subjected to deposits requirement averaging 3 months rental; and
d) Credit exposure is monitored on limits and ageing, managed and reviewed periodically. Debtors with
emerging credit problems are identified early and remedial actions are taken promptly to minimise
further exposure and to restore past due status.
Collateral and credit enhancement
In general, a combination of:
a) Title retention and conveyance on clearance for property development;
b) Cash deposits/advance for hospitality sub-segment; and
c) Deposits for rental sub-segment.
iii. Financial institutions and Exchanges
The Group places its working capital and surplus funds in current account, money market, and time-deposits
with banks; and in security papers and investment trusts managed by licensed institutions. The Group also
enters into financial derivative contracts with licensed financial institutions, and in commodity futures contracts
with licensed Exchanges for hedging purposes. Beyond the minimal deposit guarantee offered by certain
sovereign nation’s deposit insurance schemes, the Group is exposed to a degree of counter-parties’ credit risk
in times of severe economic or financial crisis.
Policies and procedures
a) Funds are placed only with licensed financial institutions with credit rating of “A– and above”. Similar
requirement is enforced on counter-parties for financial derivatives in addition to the mandatory
International Swaps and Derivatives Association master agreements;
b) Funds placements are centrally monitored, and where applicable are spread out based on location needs;
and
c) Commodity futures are incepted only with main licensed Exchanges.
Collateral and credit enhancement
In general, a combination of:
a) National deposit insurance; and
b) Fidelity guarantee.
In general, all business units in the Group have a comprehensive policy that governs the need for formal credit
rating system and evaluation on counter parties prior to any contractual arrangement that would result in credit risk
exposure. Besides exposure amount, credit risk is also measured and monitored by way of credit quality segregation,
past due ageing analysis, and limits breach alerts. Reviews on credit impairment needs are made quarterly based on
objective evidence of loss events.
Notes to the Financial Statements
IOI
Cor
por
atio
n B
erh
ad
236
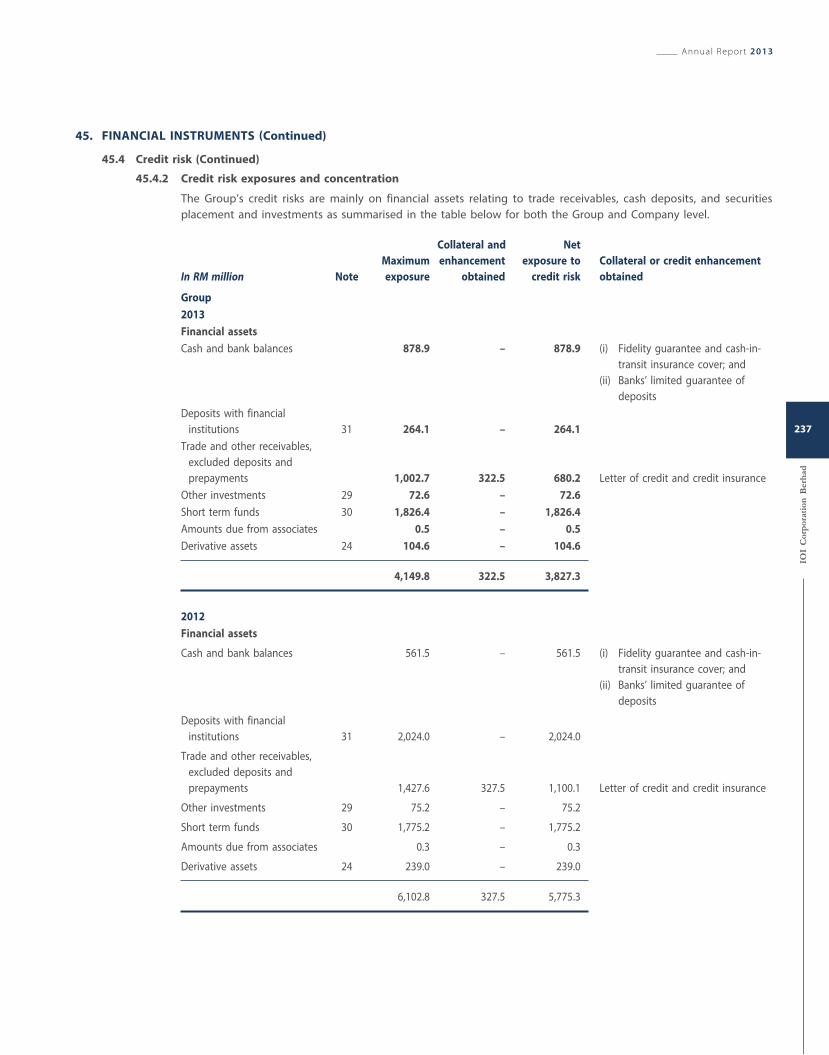
45. FINANCIAL INSTRUMENTS (Continued)
45.4 Credit risk (Continued)
45.4.2 Credit risk exposures and concentration
The Group’s credit risks are mainly on financial assets relating to trade receivables, cash deposits, and securities
placement and investments as summarised in the table below for both the Group and Company level.
In RM million Note
Maximum
exposure
Collateral and
enhancement
obtained
Net
exposure to
credit risk
Collateral or credit enhancement
obtained
Group
2013
Financial assets
Cash and bank balances 878.9 – 878.9 (i) Fidelity guarantee and cash-in-
transit insurance cover; and
(ii) Banks’ limited guarantee of
deposits
Deposits with financial
institutions 31 264.1 – 264.1
Trade and other receivables,
excluded deposits and
prepayments 1,002.7 322.5 680.2 Letter of credit and credit insurance
Other investments 29 72.6 – 72.6
Short term funds 30 1,826.4 – 1,826.4
Amounts due from associates 0.5 – 0.5
Derivative assets 24 104.6 – 104.6
4,149.8 322.5 3,827.3
2012
Financial assets
Cash and bank balances 561.5 – 561.5 (i) Fidelity guarantee and cash-in-
transit insurance cover; and
(ii) Banks’ limited guarantee of
deposits
Deposits with financial
institutions 31 2,024.0 – 2,024.0
Trade and other receivables,
excluded deposits and
prepayments 1,427.6 327.5 1,100.1 Letter of credit and credit insurance
Other investments 29 75.2 – 75.2
Short term funds 30 1,775.2 – 1,775.2
Amounts due from associates 0.3 – 0.3
Derivative assets 24 239.0 – 239.0
6,102.8 327.5 5,775.3
Annual Report 2013
IOI
Cor
por
atio
n B
erh
ad
237
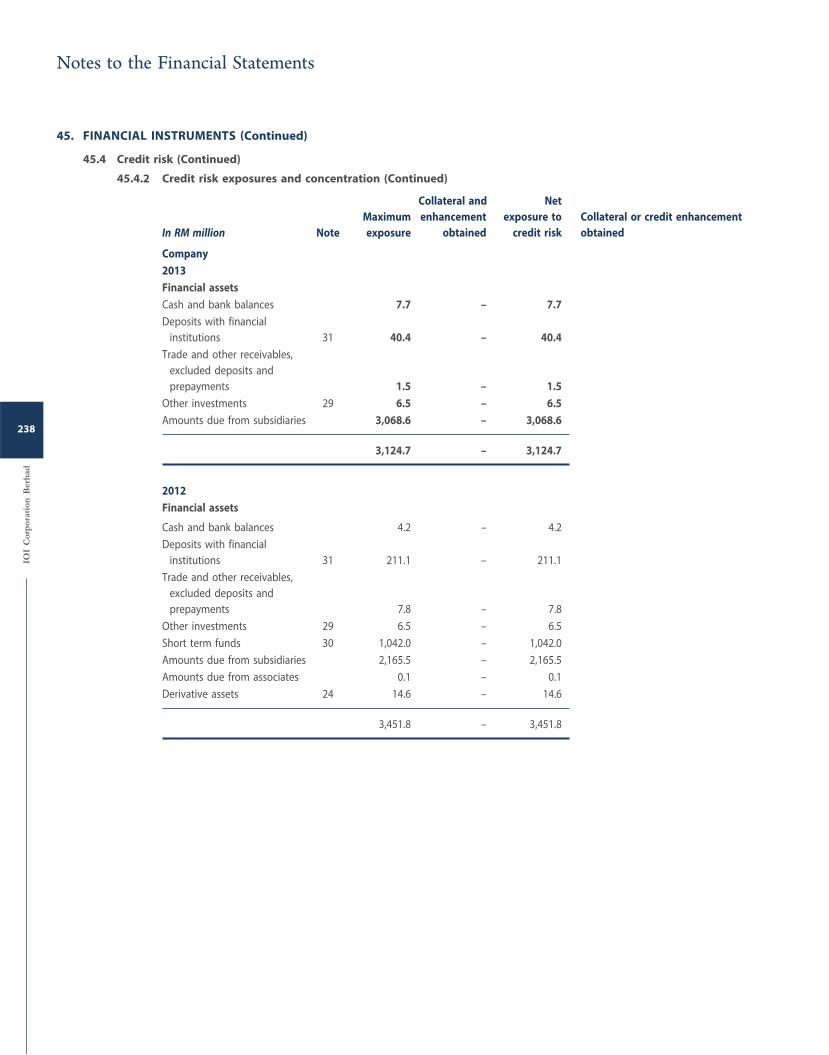
45. FINANCIAL INSTRUMENTS (Continued)
45.4 Credit risk (Continued)
45.4.2 Credit risk exposures and concentration (Continued)
In RM million Note
Maximum
exposure
Collateral and
enhancement
obtained
Net
exposure to
credit risk
Collateral or credit enhancement
obtained
Company
2013
Financial assets
Cash and bank balances 7.7 – 7.7
Deposits with financial
institutions 31 40.4 – 40.4
Trade and other receivables,
excluded deposits and
prepayments 1.5 – 1.5
Other investments 29 6.5 – 6.5
Amounts due from subsidiaries 3,068.6 – 3,068.6
3,124.7 – 3,124.7
2012
Financial assets
Cash and bank balances 4.2 – 4.2
Deposits with financial
institutions 31 211.1 – 211.1
Trade and other receivables,
excluded deposits and
prepayments 7.8 – 7.8
Other investments 29 6.5 – 6.5
Short term funds 30 1,042.0 – 1,042.0
Amounts due from subsidiaries 2,165.5 – 2,165.5
Amounts due from associates 0.1 – 0.1
Derivative assets 24 14.6 – 14.6
3,451.8 – 3,451.8
Notes to the Financial Statements
IOI
Cor
por
atio
n B
erh
ad
238
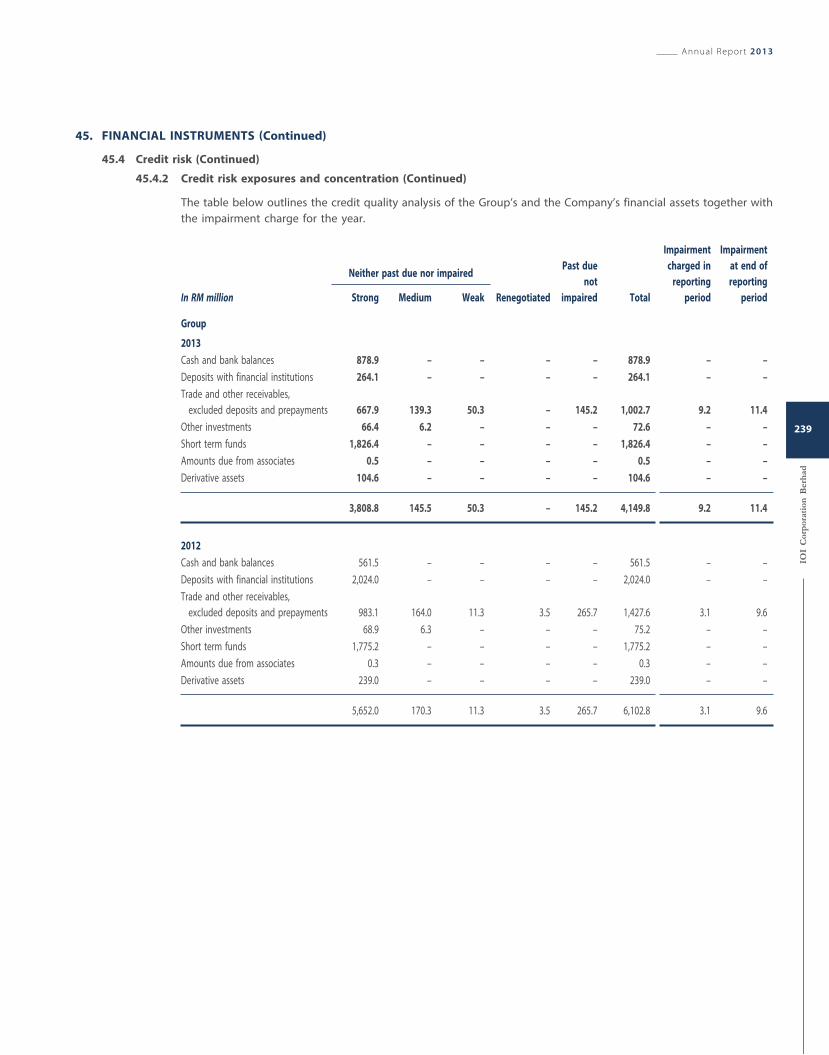
45. FINANCIAL INSTRUMENTS (Continued)
45.4 Credit risk (Continued)
45.4.2 Credit risk exposures and concentration (Continued)
The table below outlines the credit quality analysis of the Group’s and the Company’s financial assets together with
the impairment charge for the year.
In RM million Renegotiated
Past due
not
impaired Total
Impairment
charged in
reporting
period
Impairment
at end of
reporting
period
Neither past due nor impaired
Strong Medium Weak
Group
2013
Cash and bank balances 878.9 – – – – 878.9 – –
Deposits with financial institutions 264.1 – – – – 264.1 – –
Trade and other receivables,
excluded deposits and prepayments 667.9 139.3 50.3 – 145.2 1,002.7 9.2 11.4
Other investments 66.4 6.2 – – – 72.6 – –
Short term funds 1,826.4 – – – – 1,826.4 – –
Amounts due from associates 0.5 – – – – 0.5 – –
Derivative assets 104.6 – – – – 104.6 – –
3,808.8 145.5 50.3 – 145.2 4,149.8 9.2 11.4
2012
Cash and bank balances 561.5 – – – – 561.5 – –
Deposits with financial institutions 2,024.0 – – – – 2,024.0 – –
Trade and other receivables,
excluded deposits and prepayments 983.1 164.0 11.3 3.5 265.7 1,427.6 3.1 9.6
Other investments 68.9 6.3 – – – 75.2 – –
Short term funds 1,775.2 – – – – 1,775.2 – –
Amounts due from associates 0.3 – – – – 0.3 – –
Derivative assets 239.0 – – – – 239.0 – –
5,652.0 170.3 11.3 3.5 265.7 6,102.8 3.1 9.6
Annual Report 2013
IOI
Cor
por
atio
n B
erh
ad
239
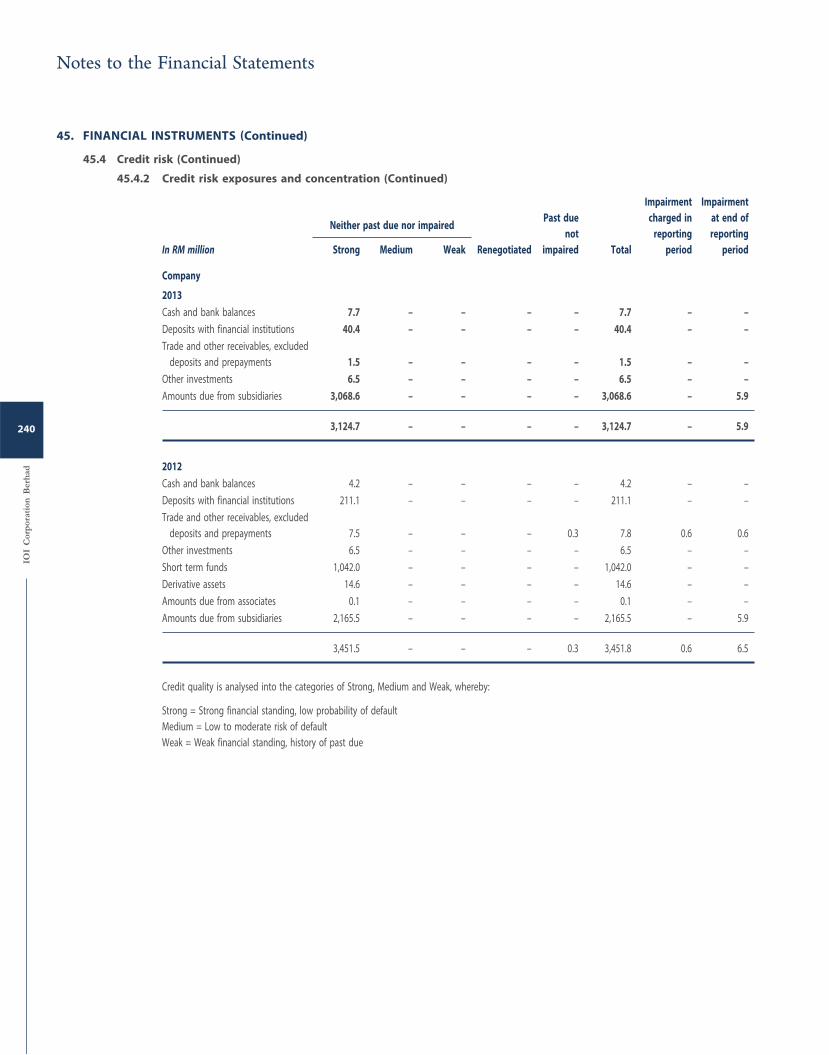
45. FINANCIAL INSTRUMENTS (Continued)
45.4 Credit risk (Continued)
45.4.2 Credit risk exposures and concentration (Continued)
In RM million Renegotiated
Past due
not
impaired Total
Impairment
charged in
reporting
period
Impairment
at end of
reporting
period
Neither past due nor impaired
Strong Medium Weak
Company
2013
Cash and bank balances 7.7 – – – – 7.7 – –
Deposits with financial institutions 40.4 – – – – 40.4 – –
Trade and other receivables, excluded
deposits and prepayments 1.5 – – – – 1.5 – –
Other investments 6.5 – – – – 6.5 – –
Amounts due from subsidiaries 3,068.6 – – – – 3,068.6 – 5.9
3,124.7 – – – – 3,124.7 – 5.9
2012
Cash and bank balances 4.2 – – – – 4.2 – –
Deposits with financial institutions 211.1 – – – – 211.1 – –
Trade and other receivables, excluded
deposits and prepayments 7.5 – – – 0.3 7.8 0.6 0.6
Other investments 6.5 – – – – 6.5 – –
Short term funds 1,042.0 – – – – 1,042.0 – –
Derivative assets 14.6 – – – – 14.6 – –
Amounts due from associates 0.1 – – – – 0.1 – –
Amounts due from subsidiaries 2,165.5 – – – – 2,165.5 – 5.9
3,451.5 – – – 0.3 3,451.8 0.6 6.5
Credit quality is analysed into the categories of Strong, Medium and Weak, whereby:
Strong = Strong financial standing, low probability of default
Medium = Low to moderate risk of default
Weak = Weak financial standing, history of past due
Notes to the Financial Statements
IOI
Cor
por
atio
n B
erh
ad
240
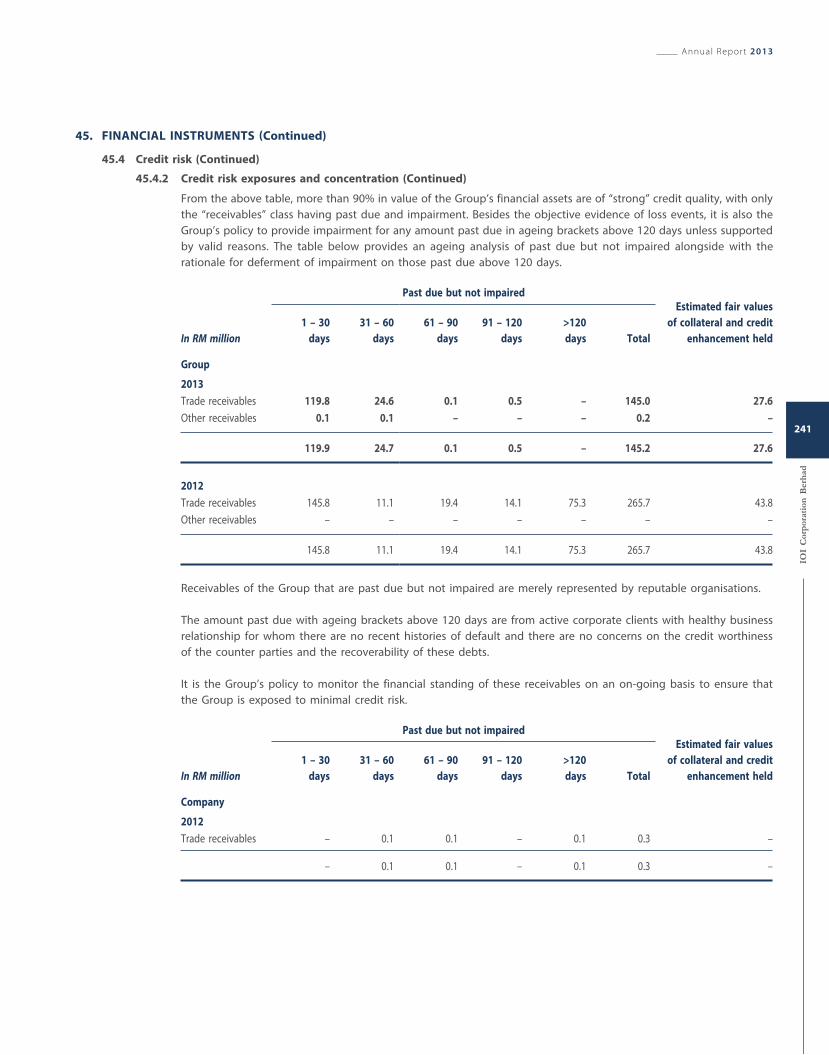
45. FINANCIAL INSTRUMENTS (Continued)
45.4 Credit risk (Continued)
45.4.2 Credit risk exposures and concentration (Continued)
From the above table, more than 90% in value of the Group’s financial assets are of “strong” credit quality, with only
the “receivables” class having past due and impairment. Besides the objective evidence of loss events, it is also the
Group’s policy to provide impairment for any amount past due in ageing brackets above 120 days unless supported
by valid reasons. The table below provides an ageing analysis of past due but not impaired alongside with the
rationale for deferment of impairment on those past due above 120 days.
In RM million
Past due but not impairedEstimated fair values
of collateral and credit
enhancement held
1 – 30
days
31 – 60
days
61 – 90
days
91 – 120
days
>120
days Total
Group
2013
Trade receivables 119.8 24.6 0.1 0.5 – 145.0 27.6
Other receivables 0.1 0.1 – – – 0.2 –
119.9 24.7 0.1 0.5 – 145.2 27.6
2012
Trade receivables 145.8 11.1 19.4 14.1 75.3 265.7 43.8
Other receivables – – – – – – –
145.8 11.1 19.4 14.1 75.3 265.7 43.8
Receivables of the Group that are past due but not impaired are merely represented by reputable organisations.
The amount past due with ageing brackets above 120 days are from active corporate clients with healthy business
relationship for whom there are no recent histories of default and there are no concerns on the credit worthiness
of the counter parties and the recoverability of these debts.
It is the Group’s policy to monitor the financial standing of these receivables on an on-going basis to ensure that
the Group is exposed to minimal credit risk.
In RM million
Past due but not impairedEstimated fair values
of collateral and credit
enhancement held
1 – 30
days
31 – 60
days
61 – 90
days
91 – 120
days
>120
days Total
Company
2012
Trade receivables – 0.1 0.1 – 0.1 0.3 –
– 0.1 0.1 – 0.1 0.3 –
Annual Report 2013
IOI
Cor
por
atio
n B
erh
ad
241
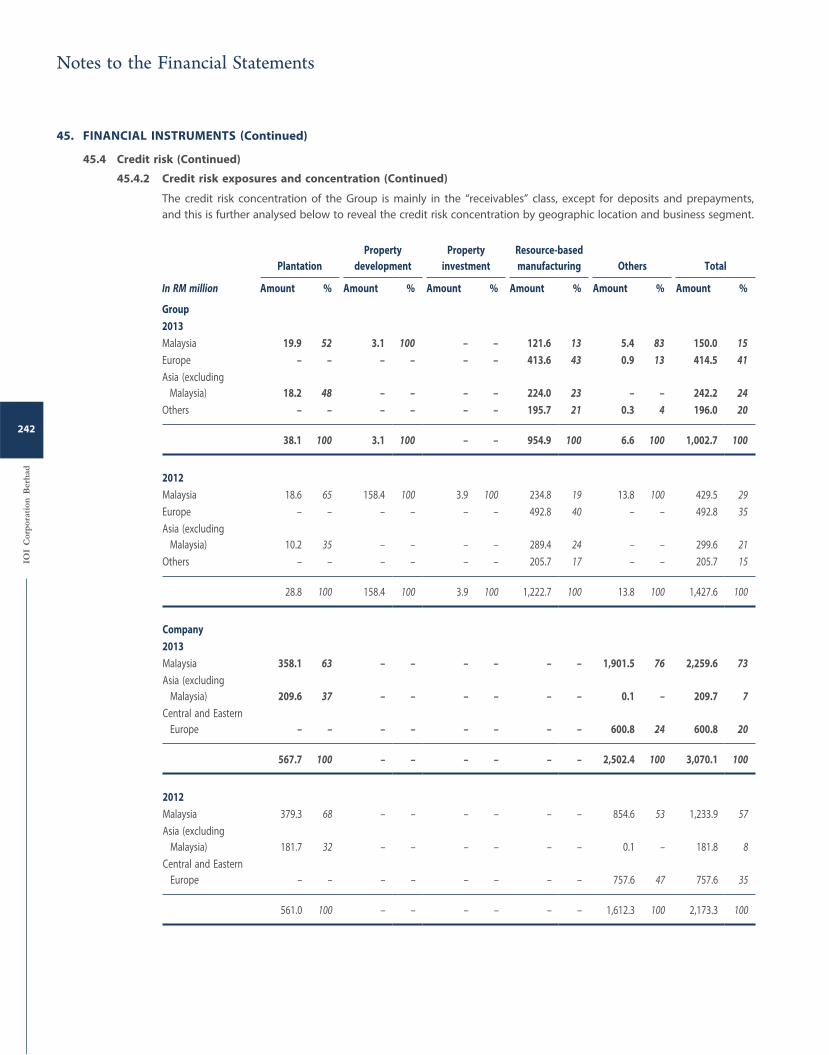
45. FINANCIAL INSTRUMENTS (Continued)
45.4 Credit risk (Continued)
45.4.2 Credit risk exposures and concentration (Continued)
The credit risk concentration of the Group is mainly in the “receivables” class, except for deposits and prepayments,
and this is further analysed below to reveal the credit risk concentration by geographic location and business segment.
In RM million
Plantation
Property
development
Property
investment
Resource-based
manufacturing Others Total
Amount % Amount % Amount % Amount % Amount % Amount %
Group
2013
Malaysia 19.9 52 3.1 100 – – 121.6 13 5.4 83 150.0 15Europe – – – – – – 413.6 43 0.9 13 414.5 41Asia (excluding
Malaysia) 18.2 48 – – – – 224.0 23 – – 242.2 24Others – – – – – – 195.7 21 0.3 4 196.0 20
38.1 100 3.1 100 – – 954.9 100 6.6 100 1,002.7 100
2012
Malaysia 18.6 65 158.4 100 3.9 100 234.8 19 13.8 100 429.5 29
Europe – – – – – – 492.8 40 – – 492.8 35
Asia (excluding
Malaysia) 10.2 35 – – – – 289.4 24 – – 299.6 21
Others – – – – – – 205.7 17 – – 205.7 15
28.8 100 158.4 100 3.9 100 1,222.7 100 13.8 100 1,427.6 100
Company
2013
Malaysia 358.1 63 – – – – – – 1,901.5 76 2,259.6 73Asia (excluding
Malaysia) 209.6 37 – – – – – – 0.1 – 209.7 7Central and Eastern
Europe – – – – – – – – 600.8 24 600.8 20
567.7 100 – – – – – – 2,502.4 100 3,070.1 100
2012
Malaysia 379.3 68 – – – – – – 854.6 53 1,233.9 57
Asia (excluding
Malaysia) 181.7 32 – – – – – – 0.1 – 181.8 8
Central and Eastern
Europe – – – – – – – – 757.6 47 757.6 35
561.0 100 – – – – – – 1,612.3 100 2,173.3 100
Notes to the Financial Statements
IOI
Cor
por
atio
n B
erh
ad
242
45. FINANCIAL INSTRUMENTS (Continued)
45.5 Liquidity and cash flow risk
Liquidity or cash flow risk arises when financial resources are insufficient to meet financial obligations as and when they fall
due, or have to be met at excessive cost. The Group’s liquidity risk includes non-financial instruments and forward contract
obligations.
The Group’s liquidity risk management objective is to ensure that all foreseeable funding commitments can be met as and
when due and in a cost-effective manner.
45.5.1 Risk management approach
The Group leverages on IOI Corporation Berhad as the public listed parent company whereby treasury related
activities are centralised and where the optimal weighted-average-costs-of funds is managed. The parent company
plays a central liquidity management role where the Group’s longer term funding requirements are managed based
on business and liquidity needs, whilst the day-to-day operational liquidity needs are decentralised at the business
unit level. The Group practises an arm’s-length market based policy with regard to funding costs and encourages
its business units to seek localised trade financing facilities where appropriate.
The Group actively manages its debt maturity profile, operating cash flows and the availability of funding so as to
ensure all operating, investing and financing needs are met. To mitigate liquidity risk, management measures and
forecasts its cash commitments, monitors and maintains a level of cash and cash equivalents deemed adequate to
finance the Group’s operations and investment activities. In addition, the Group strives to maintain available banking
facilities at a reasonable level against its overall debt position.
The Group manages its liquidity risk with a combination of the following methods:
i. Maintain a balanced contractual maturity profile of financial assets to meet financial liabilities (particularly on
near and immediate term maturity);
ii. Maintain a diversified range of funding sources with adequate back-up facilities;
iii. Maintain debt financing and servicing plan; and
iv. Maintain medium to long term cash flow planning incorporating funding positions and requirements of all its
subsidiaries.
As the Group’s policy, all business units conform to the following processes in ensuring its liquidity profiles are
balanced and that all its obligations can be met when due:
i. Perform annual cash flow budgeting and medium-term cash flow planning, in which the timing of operational
cash flows and its resulting surplus or deficit is reasonably determined. (Such aggregation allows for an
overview of the Group’s forecasted cash flow and liquidity position, which in-turn facilitates further consolidated
cash flow planning);
ii. Manage contingent liquidity commitment and exposures;
iii. Monitor liquidity ratios against internal thresholds;
iv. Manage working capital for efficient use of tied-in funds and optimise cash conversion cycle; and
v. Manage concentration and maturity profile of both financial and non-financial liabilities.
Annual Report 2013
IOI
Cor
por
atio
n B
erh
ad
243
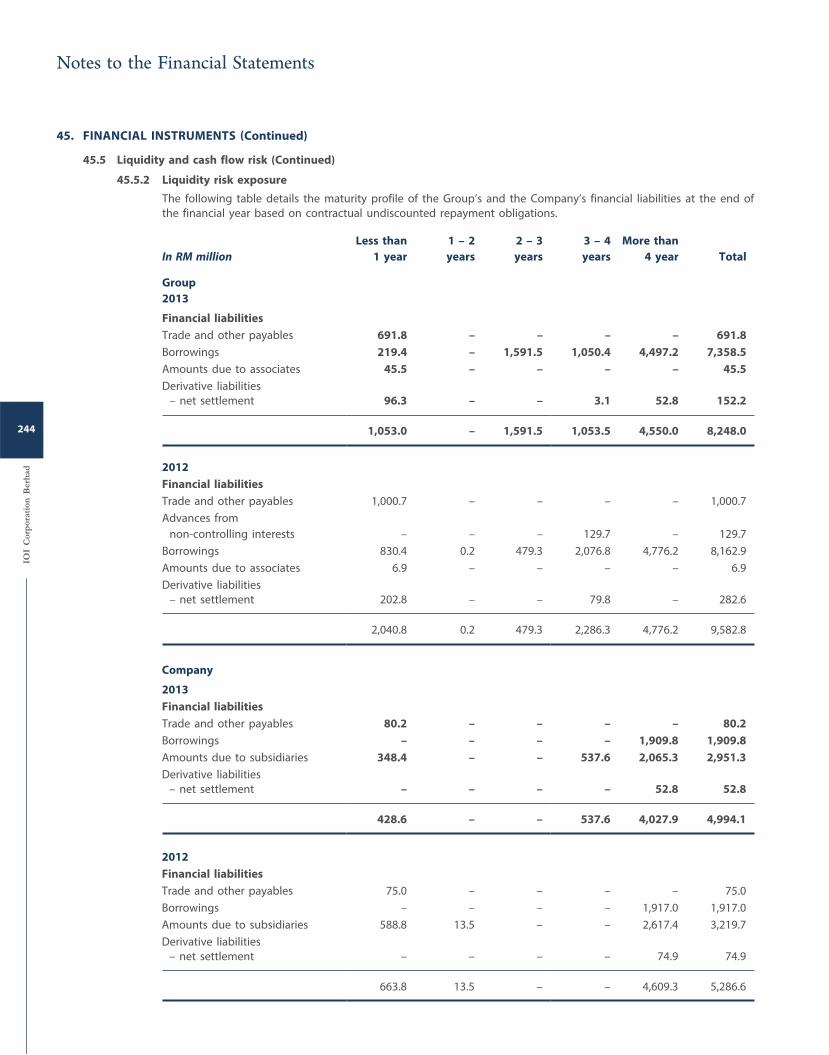
45. FINANCIAL INSTRUMENTS (Continued)
45.5 Liquidity and cash flow risk (Continued)
45.5.2 Liquidity risk exposure
The following table details the maturity profile of the Group’s and the Company’s financial liabilities at the end of
the financial year based on contractual undiscounted repayment obligations.
In RM millionLess than
1 year
1 – 2
years
2 – 3
years
3 – 4
years
More than
4 year Total
Group
2013
Financial liabilities
Trade and other payables 691.8 – – – – 691.8
Borrowings 219.4 – 1,591.5 1,050.4 4,497.2 7,358.5
Amounts due to associates 45.5 – – – – 45.5
Derivative liabilities
– net settlement 96.3 – – 3.1 52.8 152.2
1,053.0 – 1,591.5 1,053.5 4,550.0 8,248.0
2012
Financial liabilities
Trade and other payables 1,000.7 – – – – 1,000.7
Advances from
non-controlling interests – – – 129.7 – 129.7
Borrowings 830.4 0.2 479.3 2,076.8 4,776.2 8,162.9
Amounts due to associates 6.9 – – – – 6.9
Derivative liabilities
– net settlement 202.8 – – 79.8 – 282.6
2,040.8 0.2 479.3 2,286.3 4,776.2 9,582.8
Company
2013
Financial liabilities
Trade and other payables 80.2 – – – – 80.2
Borrowings – – – – 1,909.8 1,909.8
Amounts due to subsidiaries 348.4 – – 537.6 2,065.3 2,951.3
Derivative liabilities
– net settlement – – – – 52.8 52.8
428.6 – – 537.6 4,027.9 4,994.1
2012
Financial liabilities
Trade and other payables 75.0 – – – – 75.0
Borrowings – – – – 1,917.0 1,917.0
Amounts due to subsidiaries 588.8 13.5 – – 2,617.4 3,219.7
Derivative liabilities
– net settlement – – – – 74.9 74.9
663.8 13.5 – – 4,609.3 5,286.6
Notes to the Financial Statements
IOI
Cor
por
atio
n B
erh
ad
244
45. FINANCIAL INSTRUMENTS (Continued)
45.5 Liquidity and cash flow risk (Continued)
45.5.2 Liquidity risk exposure (Continued)
i. The Group and the Company have ample liquidity to meet its financial liabilities and obligations maturing in
the next 12 months;
ii. Financial liabilities contractual maturity periods exceeding 12 months are within comfortable levels, and should
be well covered by its annual free-cash-flow to be generated from its operations; and
iii. Liquidity risk concentration is evident in maturity bucket financial year 2013 and financial year 2016 onwards,
where the Group and the Company’s borrowing commitments are due.
45.6 Fair values
The carrying amounts of financial assets and financial liabilities, which are not carried at fair values, would
approximate their fair values as at the end of the financial year. This is due to the relatively short term nature of the
financial instruments or there is no significant difference between the historical interest rate at the point when
liabilities were undertaken and the current prevailing market interest rate.
The following methods and assumptions were used to estimate the fair values of financial instruments:
i. The carrying amounts of financial assets and liabilities maturing within twelve (12) months approximate fair
values due to the relatively short term maturity of these financial instruments.
ii. The fair values of quoted investments are their quoted market prices at the end of the financial year. The fair
values of unquoted investments are estimated based on a valuation approach by reference to the Group’s
share of net assets of the investees based on the latest available financial statements of the investees.
iii. The fair values of the Group’s 2nd Exchangeable Bonds and 3rd Exchangeable Bonds are their quoted market
prices at the end of the financial year. The fair values of the Group’s other borrowings are estimated using
discounted cash flow analysis, based on current incremental lending rates for similar types of lending and
borrowing arrangements and of the same remaining maturities.
iv. The fair values of derivative financial instruments are the estimated amounts that the Group would expect to
pay or receive on the termination of the outstanding positions as at the end of the financial year arising from
such contracts. They are determined by reference to the difference between the contracted rate and the
forward rate as at the end of the financial year applied to a contract of similar amount and maturity profile.
Annual Report 2013
IOI
Cor
por
atio
n B
erh
ad
245
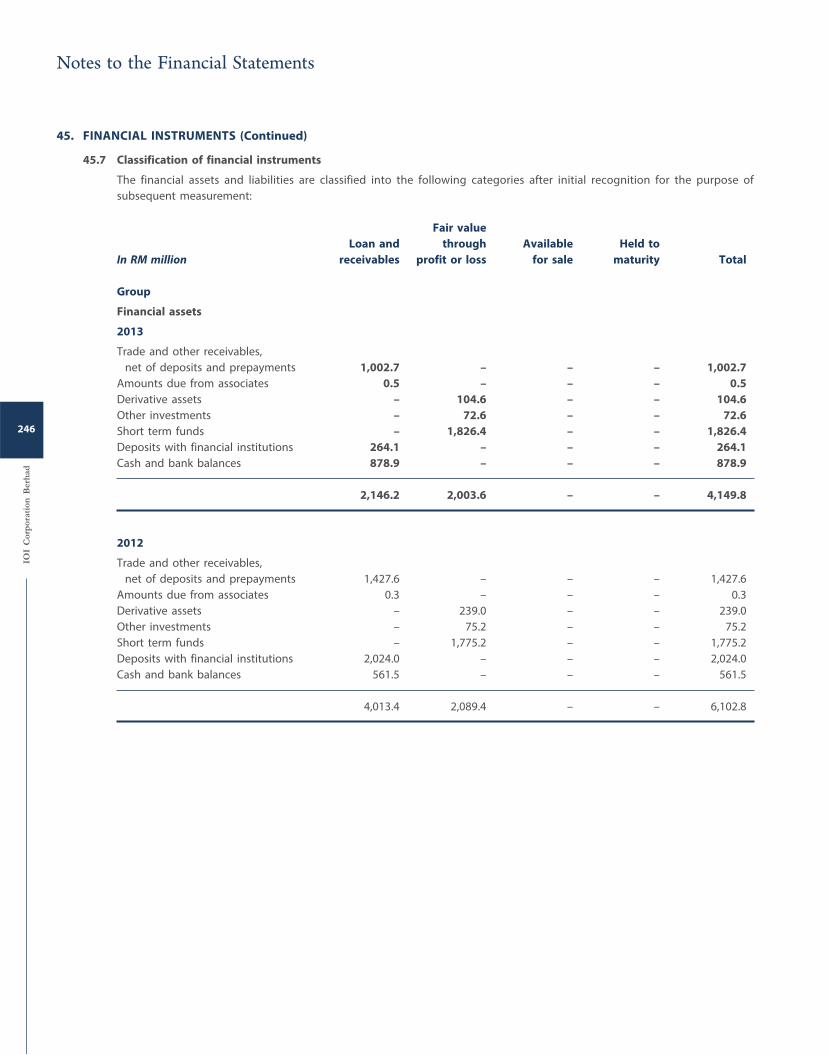
45. FINANCIAL INSTRUMENTS (Continued)
45.7 Classification of financial instruments
The financial assets and liabilities are classified into the following categories after initial recognition for the purpose of
subsequent measurement:
Fair value
Loan and through Available Held to
In RM million receivables profit or loss for sale maturity Total
Group
Financial assets
2013
Trade and other receivables,
net of deposits and prepayments 1,002.7 – – – 1,002.7
Amounts due from associates 0.5 – – – 0.5
Derivative assets – 104.6 – – 104.6
Other investments – 72.6 – – 72.6
Short term funds – 1,826.4 – – 1,826.4
Deposits with financial institutions 264.1 – – – 264.1
Cash and bank balances 878.9 – – – 878.9
2,146.2 2,003.6 – – 4,149.8
2012
Trade and other receivables,
net of deposits and prepayments 1,427.6 – – – 1,427.6
Amounts due from associates 0.3 – – – 0.3
Derivative assets – 239.0 – – 239.0
Other investments – 75.2 – – 75.2
Short term funds – 1,775.2 – – 1,775.2
Deposits with financial institutions 2,024.0 – – – 2,024.0
Cash and bank balances 561.5 – – – 561.5
4,013.4 2,089.4 – – 6,102.8
Notes to the Financial Statements
IOI
Cor
por
atio
n B
erh
ad
246
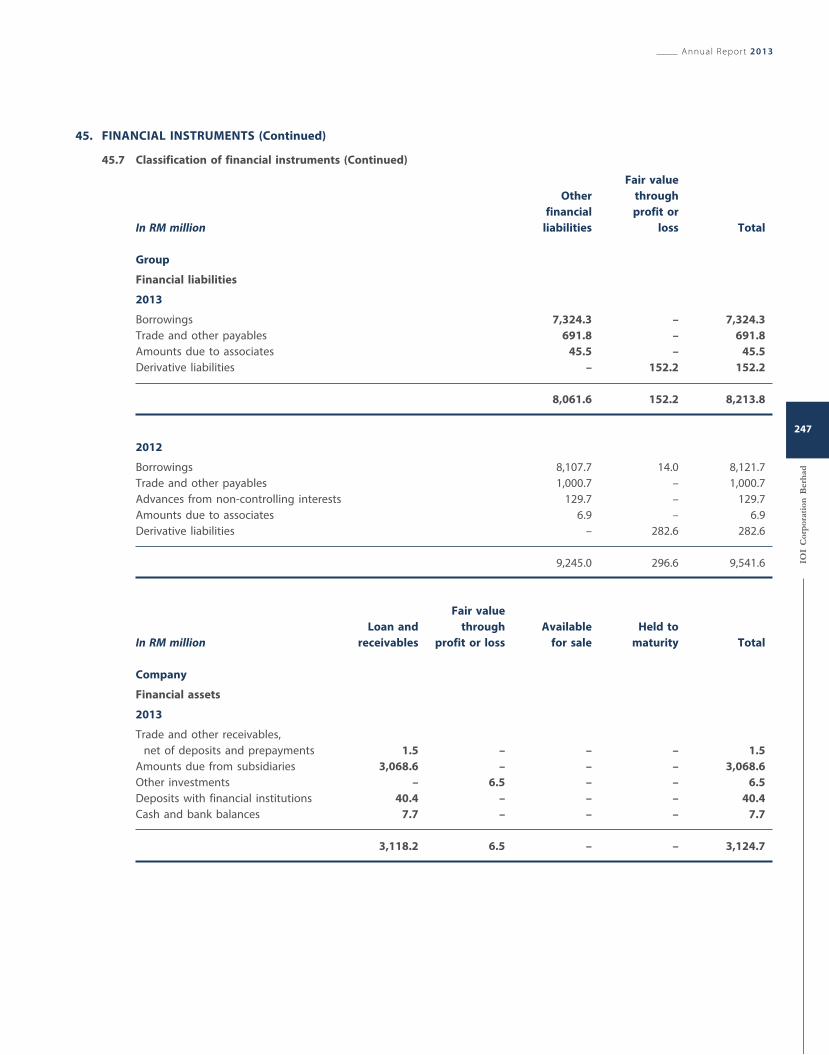
45. FINANCIAL INSTRUMENTS (Continued)
45.7 Classification of financial instruments (Continued)
Fair value
Other through
financial profit or
In RM million liabilities loss Total
Group
Financial liabilities
2013
Borrowings 7,324.3 – 7,324.3
Trade and other payables 691.8 – 691.8
Amounts due to associates 45.5 – 45.5
Derivative liabilities – 152.2 152.2
8,061.6 152.2 8,213.8
2012
Borrowings 8,107.7 14.0 8,121.7
Trade and other payables 1,000.7 – 1,000.7
Advances from non-controlling interests 129.7 – 129.7
Amounts due to associates 6.9 – 6.9
Derivative liabilities – 282.6 282.6
9,245.0 296.6 9,541.6
Fair value
Loan and through Available Held to
In RM million receivables profit or loss for sale maturity Total
Company
Financial assets
2013
Trade and other receivables,
net of deposits and prepayments 1.5 – – – 1.5
Amounts due from subsidiaries 3,068.6 – – – 3,068.6
Other investments – 6.5 – – 6.5
Deposits with financial institutions 40.4 – – – 40.4
Cash and bank balances 7.7 – – – 7.7
3,118.2 6.5 – – 3,124.7
Annual Report 2013
IOI
Cor
por
atio
n B
erh
ad
247
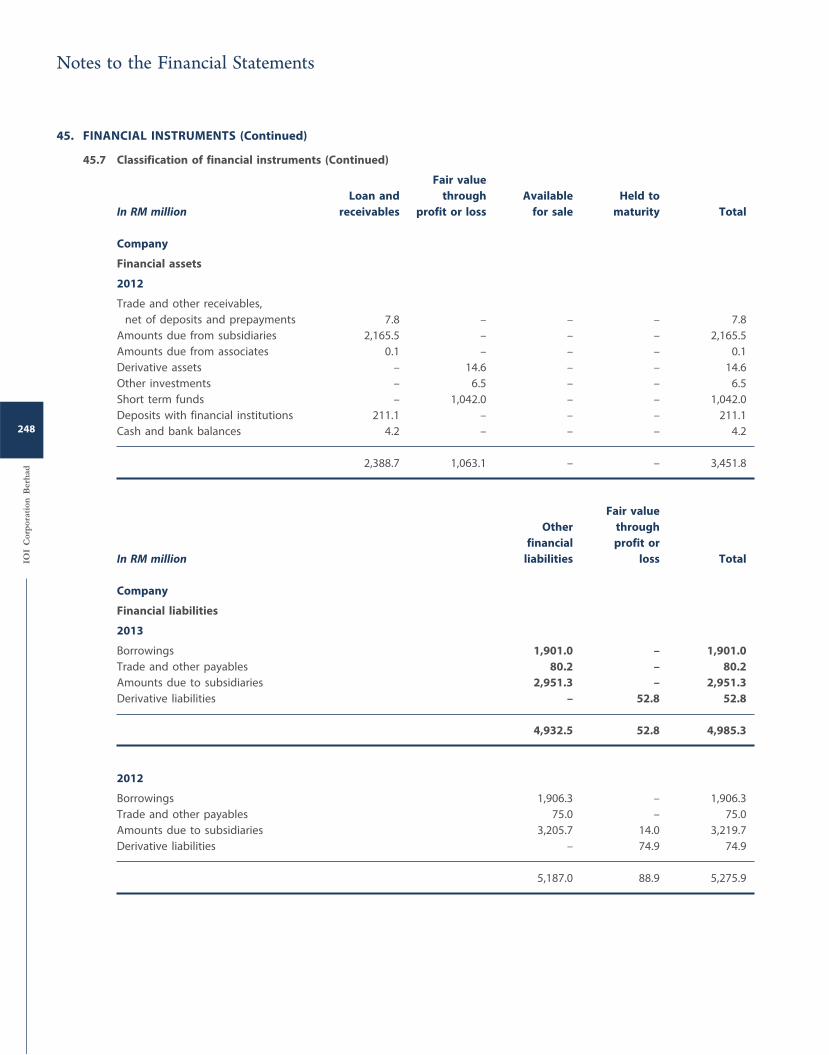
45. FINANCIAL INSTRUMENTS (Continued)
45.7 Classification of financial instruments (Continued)
Fair value
Loan and through Available Held to
In RM million receivables profit or loss for sale maturity Total
Company
Financial assets
2012
Trade and other receivables,
net of deposits and prepayments 7.8 – – – 7.8
Amounts due from subsidiaries 2,165.5 – – – 2,165.5
Amounts due from associates 0.1 – – – 0.1
Derivative assets – 14.6 – – 14.6
Other investments – 6.5 – – 6.5
Short term funds – 1,042.0 – – 1,042.0
Deposits with financial institutions 211.1 – – – 211.1
Cash and bank balances 4.2 – – – 4.2
2,388.7 1,063.1 – – 3,451.8
Fair value
Other through
financial profit or
In RM million liabilities loss Total
Company
Financial liabilities
2013
Borrowings 1,901.0 – 1,901.0
Trade and other payables 80.2 – 80.2
Amounts due to subsidiaries 2,951.3 – 2,951.3
Derivative liabilities – 52.8 52.8
4,932.5 52.8 4,985.3
2012
Borrowings 1,906.3 – 1,906.3
Trade and other payables 75.0 – 75.0
Amounts due to subsidiaries 3,205.7 14.0 3,219.7
Derivative liabilities – 74.9 74.9
5,187.0 88.9 5,275.9
Notes to the Financial Statements
IOI
Cor
por
atio
n B
erh
ad
248
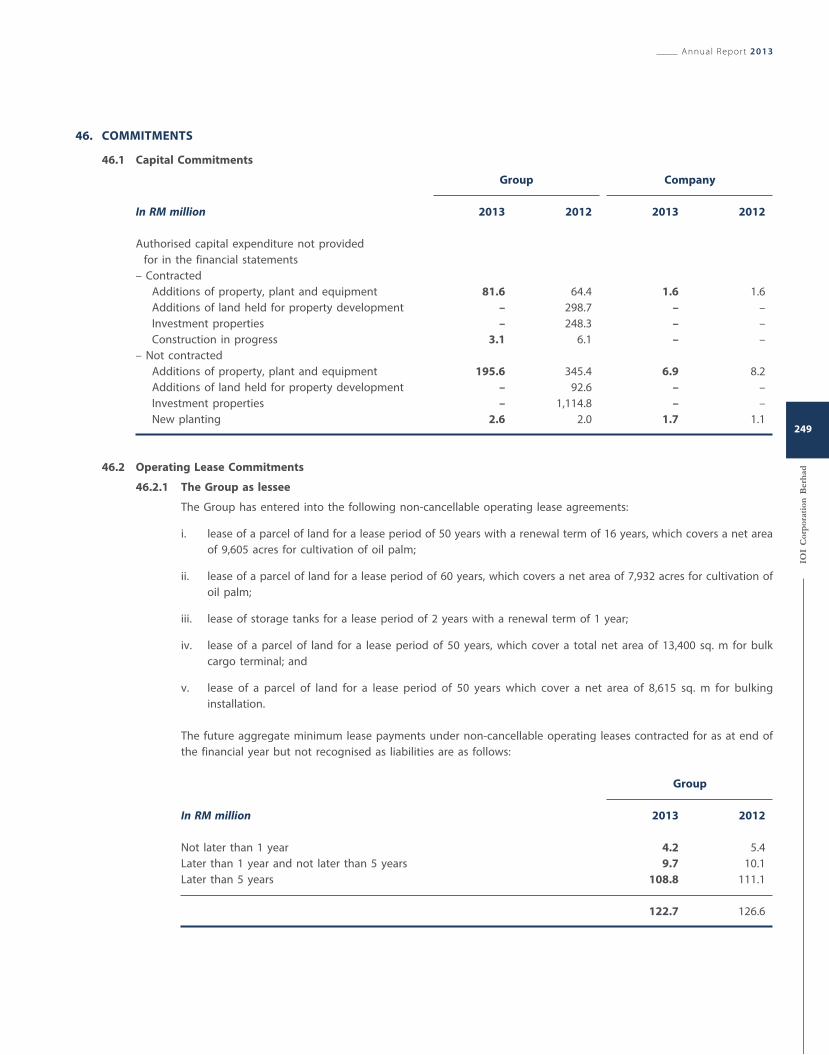
46. COMMITMENTS
46.1 Capital Commitments
Group Company
In RM million 2013 2012 2013 2012
Authorised capital expenditure not provided
for in the financial statements
– Contracted
Additions of property, plant and equipment 81.6 64.4 1.6 1.6
Additions of land held for property development – 298.7 – –
Investment properties – 248.3 – –
Construction in progress 3.1 6.1 – –
– Not contracted
Additions of property, plant and equipment 195.6 345.4 6.9 8.2
Additions of land held for property development – 92.6 – –
Investment properties – 1,114.8 – –
New planting 2.6 2.0 1.7 1.1
46.2 Operating Lease Commitments
46.2.1 The Group as lessee
The Group has entered into the following non-cancellable operating lease agreements:
i. lease of a parcel of land for a lease period of 50 years with a renewal term of 16 years, which covers a net area
of 9,605 acres for cultivation of oil palm;
ii. lease of a parcel of land for a lease period of 60 years, which covers a net area of 7,932 acres for cultivation of
oil palm;
iii. lease of storage tanks for a lease period of 2 years with a renewal term of 1 year;
iv. lease of a parcel of land for a lease period of 50 years, which cover a total net area of 13,400 sq. m for bulk
cargo terminal; and
v. lease of a parcel of land for a lease period of 50 years which cover a net area of 8,615 sq. m for bulking
installation.
The future aggregate minimum lease payments under non-cancellable operating leases contracted for as at end of
the financial year but not recognised as liabilities are as follows:
Group
In RM million 2013 2012
Not later than 1 year 4.2 5.4
Later than 1 year and not later than 5 years 9.7 10.1
Later than 5 years 108.8 111.1
122.7 126.6
Annual Report 2013
IOI
Cor
por
atio
n B
erh
ad
249
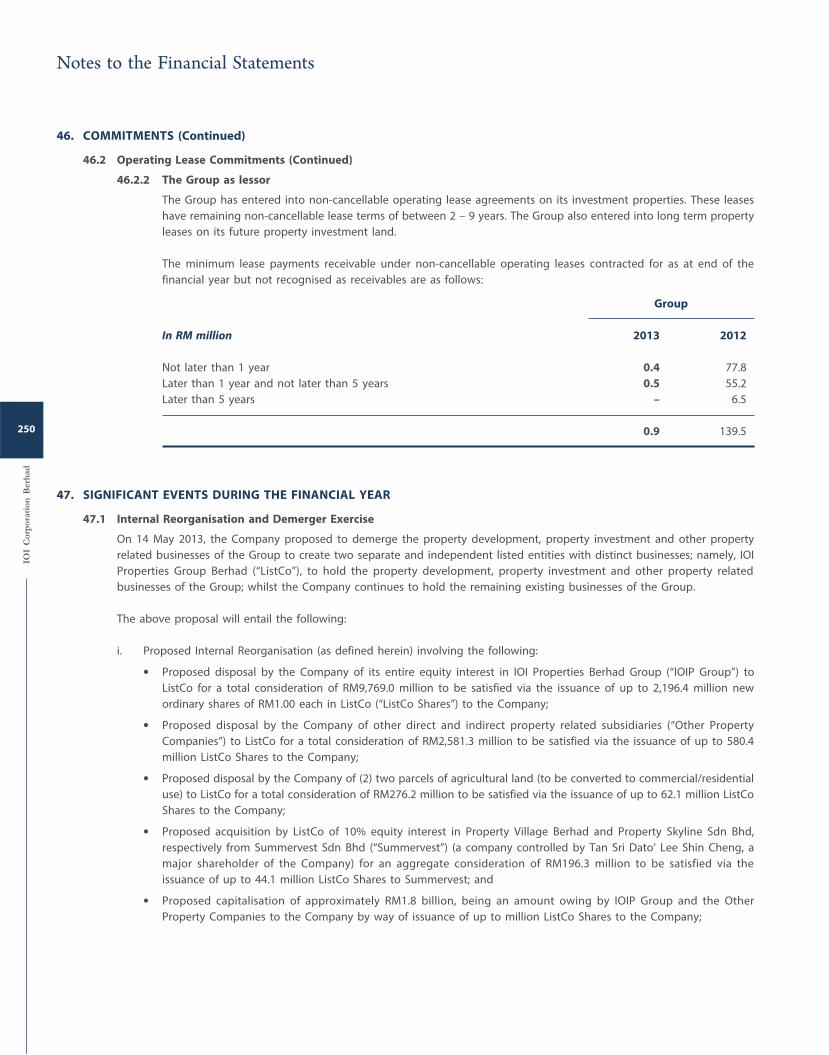
46. COMMITMENTS (Continued)
46.2 Operating Lease Commitments (Continued)
46.2.2 The Group as lessor
The Group has entered into non-cancellable operating lease agreements on its investment properties. These leases
have remaining non-cancellable lease terms of between 2 – 9 years. The Group also entered into long term property
leases on its future property investment land.
The minimum lease payments receivable under non-cancellable operating leases contracted for as at end of the
financial year but not recognised as receivables are as follows:
Group
In RM million 2013 2012
Not later than 1 year 0.4 77.8
Later than 1 year and not later than 5 years 0.5 55.2
Later than 5 years – 6.5
0.9 139.5
47. SIGNIFICANT EVENTS DURING THE FINANCIAL YEAR
47.1 Internal Reorganisation and Demerger Exercise
On 14 May 2013, the Company proposed to demerge the property development, property investment and other property
related businesses of the Group to create two separate and independent listed entities with distinct businesses; namely, IOI
Properties Group Berhad (“ListCo”), to hold the property development, property investment and other property related
businesses of the Group; whilst the Company continues to hold the remaining existing businesses of the Group.
The above proposal will entail the following:
i. Proposed Internal Reorganisation (as defined herein) involving the following:
Proposed disposal by the Company of its entire equity interest in IOI Properties Berhad Group (“IOIP Group”) to
ListCo for a total consideration of RM9,769.0 million to be satisfied via the issuance of up to 2,196.4 million new
ordinary shares of RM1.00 each in ListCo (“ListCo Shares”) to the Company;
Proposed disposal by the Company of other direct and indirect property related subsidiaries (“Other Property
Companies”) to ListCo for a total consideration of RM2,581.3 million to be satisfied via the issuance of up to 580.4
million ListCo Shares to the Company;
Proposed disposal by the Company of (2) two parcels of agricultural land (to be converted to commercial/residential
use) to ListCo for a total consideration of RM276.2 million to be satisfied via the issuance of up to 62.1 million ListCo
Shares to the Company;
Proposed acquisition by ListCo of 10% equity interest in Property Village Berhad and Property Skyline Sdn Bhd,
respectively from Summervest Sdn Bhd (“Summervest”) (a company controlled by Tan Sri Dato’ Lee Shin Cheng, a
major shareholder of the Company) for an aggregate consideration of RM196.3 million to be satisfied via the
issuance of up to 44.1 million ListCo Shares to Summervest; and
Proposed capitalisation of approximately RM1.8 billion, being an amount owing by IOIP Group and the Other
Property Companies to the Company by way of issuance of up to million ListCo Shares to the Company;
Notes to the Financial Statements
IOI
Cor
por
atio
n B
erh
ad
250
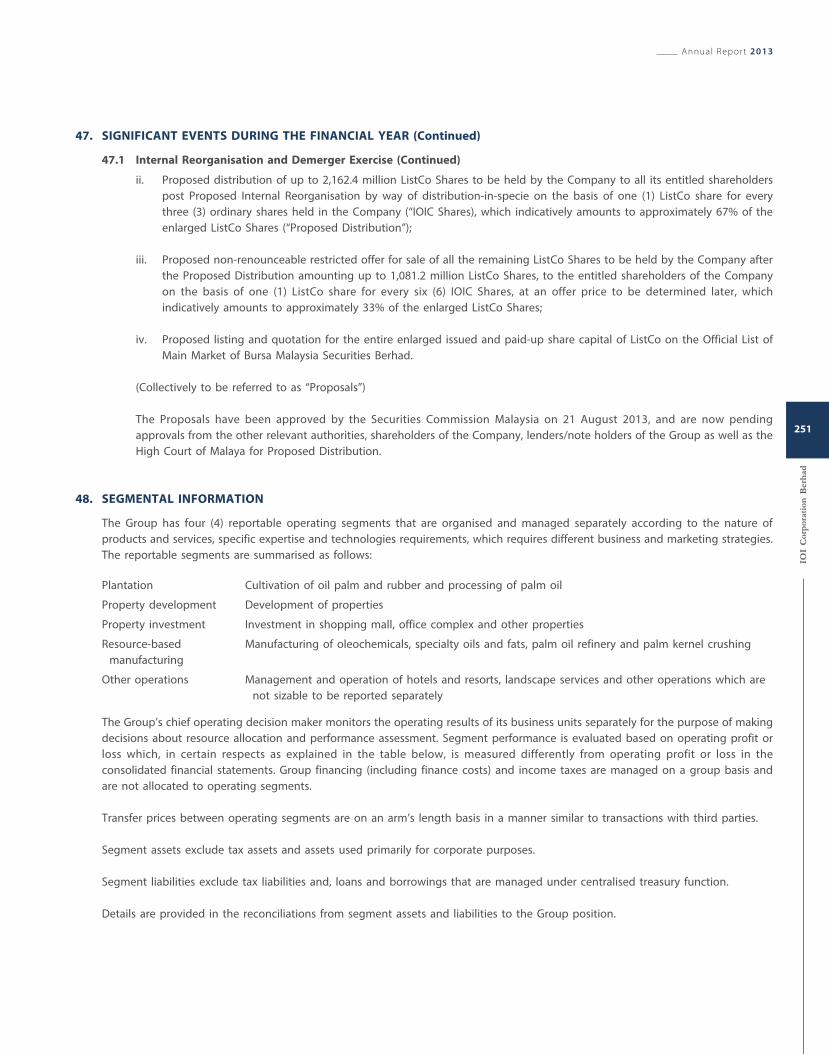
47. SIGNIFICANT EVENTS DURING THE FINANCIAL YEAR (Continued)
47.1 Internal Reorganisation and Demerger Exercise (Continued)
ii. Proposed distribution of up to 2,162.4 million ListCo Shares to be held by the Company to all its entitled shareholders
post Proposed Internal Reorganisation by way of distribution-in-specie on the basis of one (1) ListCo share for every
three (3) ordinary shares held in the Company (“IOIC Shares), which indicatively amounts to approximately 67% of the
enlarged ListCo Shares (“Proposed Distribution”);
iii. Proposed non-renounceable restricted offer for sale of all the remaining ListCo Shares to be held by the Company after
the Proposed Distribution amounting up to 1,081.2 million ListCo Shares, to the entitled shareholders of the Company
on the basis of one (1) ListCo share for every six (6) IOIC Shares, at an offer price to be determined later, which
indicatively amounts to approximately 33% of the enlarged ListCo Shares;
iv. Proposed listing and quotation for the entire enlarged issued and paid-up share capital of ListCo on the Official List of
Main Market of Bursa Malaysia Securities Berhad.
(Collectively to be referred to as “Proposals”)
The Proposals have been approved by the Securities Commission Malaysia on 21 August 2013, and are now pending
approvals from the other relevant authorities, shareholders of the Company, lenders/note holders of the Group as well as the
High Court of Malaya for Proposed Distribution.
48. SEGMENTAL INFORMATION
The Group has four (4) reportable operating segments that are organised and managed separately according to the nature of
products and services, specific expertise and technologies requirements, which requires different business and marketing strategies.
The reportable segments are summarised as follows:
Plantation Cultivation of oil palm and rubber and processing of palm oil
Property development Development of properties
Property investment Investment in shopping mall, office complex and other properties
Resource-based
manufacturing
Manufacturing of oleochemicals, specialty oils and fats, palm oil refinery and palm kernel crushing
Other operations Management and operation of hotels and resorts, landscape services and other operations which are
not sizable to be reported separately
The Group’s chief operating decision maker monitors the operating results of its business units separately for the purpose of making
decisions about resource allocation and performance assessment. Segment performance is evaluated based on operating profit or
loss which, in certain respects as explained in the table below, is measured differently from operating profit or loss in the
consolidated financial statements. Group financing (including finance costs) and income taxes are managed on a group basis and
are not allocated to operating segments.
Transfer prices between operating segments are on an arm’s length basis in a manner similar to transactions with third parties.
Segment assets exclude tax assets and assets used primarily for corporate purposes.
Segment liabilities exclude tax liabilities and, loans and borrowings that are managed under centralised treasury function.
Details are provided in the reconciliations from segment assets and liabilities to the Group position.
Annual Report 2013
IOI
Cor
por
atio
n B
erh
ad
251
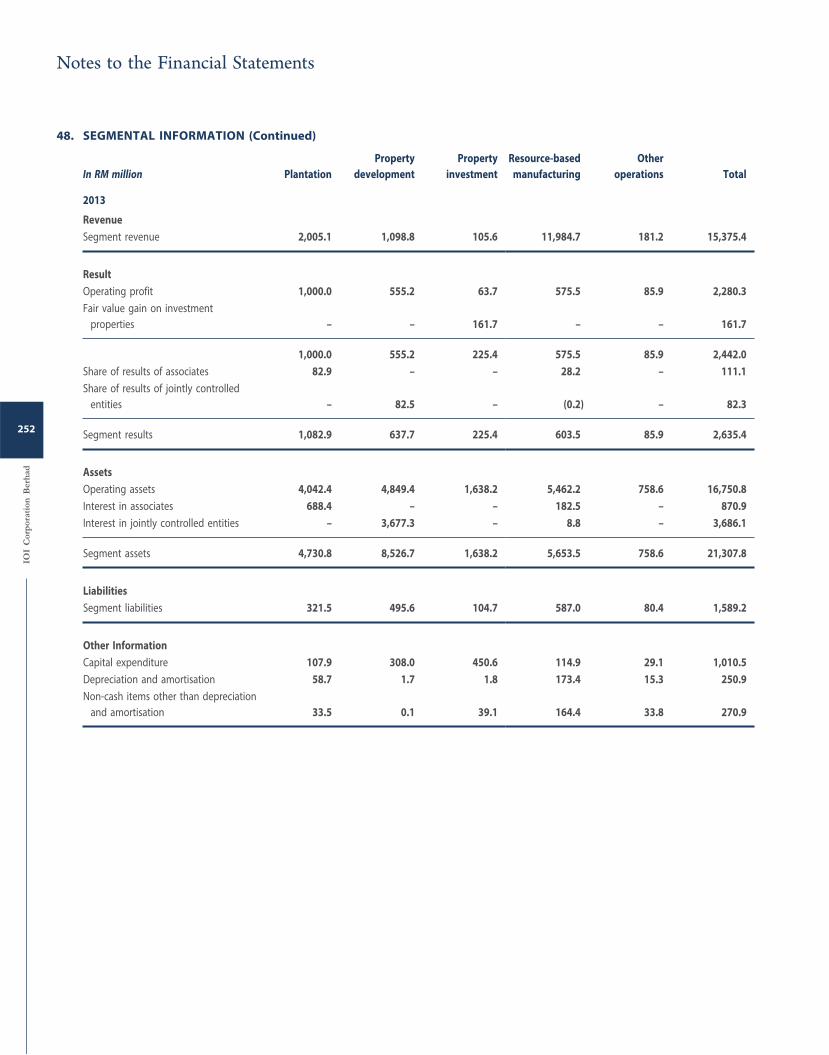
48. SEGMENTAL INFORMATION (Continued)
In RM million Plantation
Property
development
Property
investment
Resource-based
manufacturing
Other
operations Total
2013
Revenue
Segment revenue 2,005.1 1,098.8 105.6 11,984.7 181.2 15,375.4
Result
Operating profit 1,000.0 555.2 63.7 575.5 85.9 2,280.3
Fair value gain on investment
properties – – 161.7 – – 161.7
1,000.0 555.2 225.4 575.5 85.9 2,442.0
Share of results of associates 82.9 – – 28.2 – 111.1
Share of results of jointly controlled
entities – 82.5 – (0.2) – 82.3
Segment results 1,082.9 637.7 225.4 603.5 85.9 2,635.4
Assets
Operating assets 4,042.4 4,849.4 1,638.2 5,462.2 758.6 16,750.8
Interest in associates 688.4 – – 182.5 – 870.9
Interest in jointly controlled entities – 3,677.3 – 8.8 – 3,686.1
Segment assets 4,730.8 8,526.7 1,638.2 5,653.5 758.6 21,307.8
Liabilities
Segment liabilities 321.5 495.6 104.7 587.0 80.4 1,589.2
Other Information
Capital expenditure 107.9 308.0 450.6 114.9 29.1 1,010.5
Depreciation and amortisation 58.7 1.7 1.8 173.4 15.3 250.9
Non-cash items other than depreciation
and amortisation 33.5 0.1 39.1 164.4 33.8 270.9
Notes to the Financial Statements
IOI
Cor
por
atio
n B
erh
ad
252
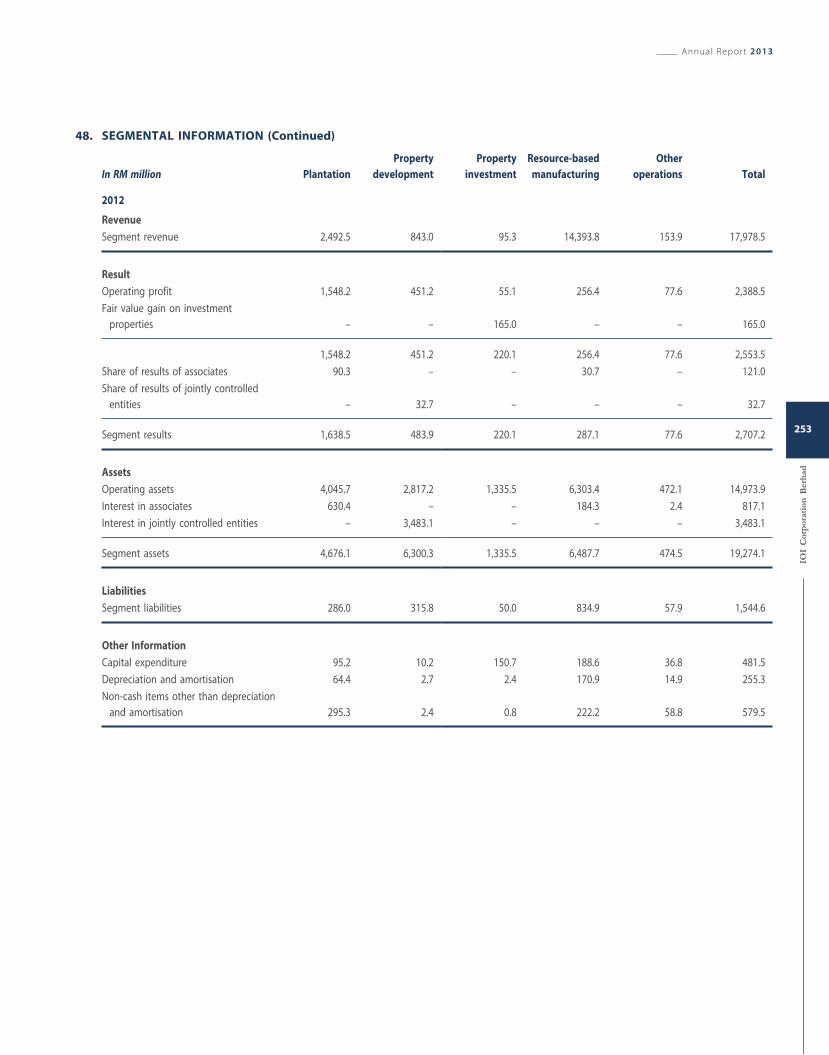
48. SEGMENTAL INFORMATION (Continued)
In RM million Plantation
Property
development
Property
investment
Resource-based
manufacturing
Other
operations Total
2012
Revenue
Segment revenue 2,492.5 843.0 95.3 14,393.8 153.9 17,978.5
Result
Operating profit 1,548.2 451.2 55.1 256.4 77.6 2,388.5
Fair value gain on investment
properties – – 165.0 – – 165.0
1,548.2 451.2 220.1 256.4 77.6 2,553.5
Share of results of associates 90.3 – – 30.7 – 121.0
Share of results of jointly controlled
entities – 32.7 – – – 32.7
Segment results 1,638.5 483.9 220.1 287.1 77.6 2,707.2
Assets
Operating assets 4,045.7 2,817.2 1,335.5 6,303.4 472.1 14,973.9
Interest in associates 630.4 – – 184.3 2.4 817.1
Interest in jointly controlled entities – 3,483.1 – – – 3,483.1
Segment assets 4,676.1 6,300.3 1,335.5 6,487.7 474.5 19,274.1
Liabilities
Segment liabilities 286.0 315.8 50.0 834.9 57.9 1,544.6
Other Information
Capital expenditure 95.2 10.2 150.7 188.6 36.8 481.5
Depreciation and amortisation 64.4 2.7 2.4 170.9 14.9 255.3
Non-cash items other than depreciation
and amortisation 295.3 2.4 0.8 222.2 58.8 579.5
Annual Report 2013
IOI
Cor
por
atio
n B
erh
ad
253
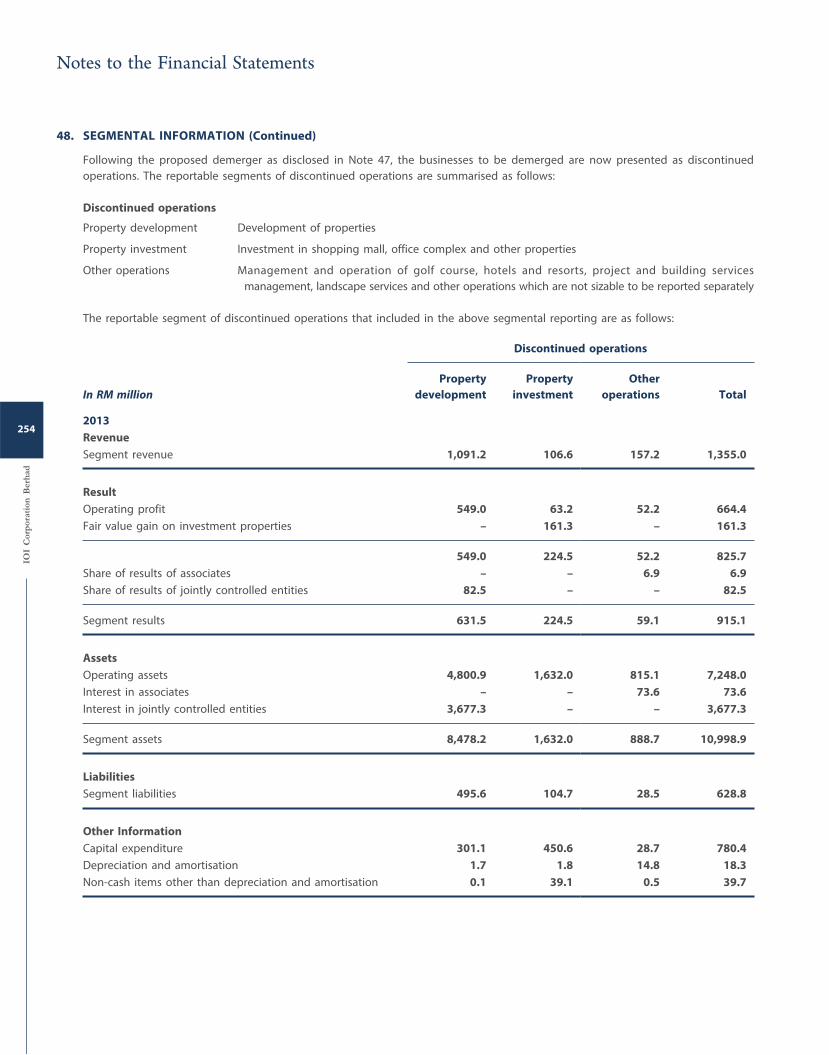
48. SEGMENTAL INFORMATION (Continued)
Following the proposed demerger as disclosed in Note 47, the businesses to be demerged are now presented as discontinued
operations. The reportable segments of discontinued operations are summarised as follows:
Discontinued operations
Property development Development of properties
Property investment Investment in shopping mall, office complex and other properties
Other operations Management and operation of golf course, hotels and resorts, project and building services
management, landscape services and other operations which are not sizable to be reported separately
The reportable segment of discontinued operations that included in the above segmental reporting are as follows:
Discontinued operations
In RM millionProperty
development
Property
investment
Other
operations Total
2013
Revenue
Segment revenue 1,091.2 106.6 157.2 1,355.0
Result
Operating profit 549.0 63.2 52.2 664.4
Fair value gain on investment properties – 161.3 – 161.3
549.0 224.5 52.2 825.7
Share of results of associates – – 6.9 6.9
Share of results of jointly controlled entities 82.5 – – 82.5
Segment results 631.5 224.5 59.1 915.1
Assets
Operating assets 4,800.9 1,632.0 815.1 7,248.0
Interest in associates – – 73.6 73.6
Interest in jointly controlled entities 3,677.3 – – 3,677.3
Segment assets 8,478.2 1,632.0 888.7 10,998.9
Liabilities
Segment liabilities 495.6 104.7 28.5 628.8
Other Information
Capital expenditure 301.1 450.6 28.7 780.4
Depreciation and amortisation 1.7 1.8 14.8 18.3
Non-cash items other than depreciation and amortisation 0.1 39.1 0.5 39.7
Notes to the Financial Statements
IOI
Cor
por
atio
n B
erh
ad
254
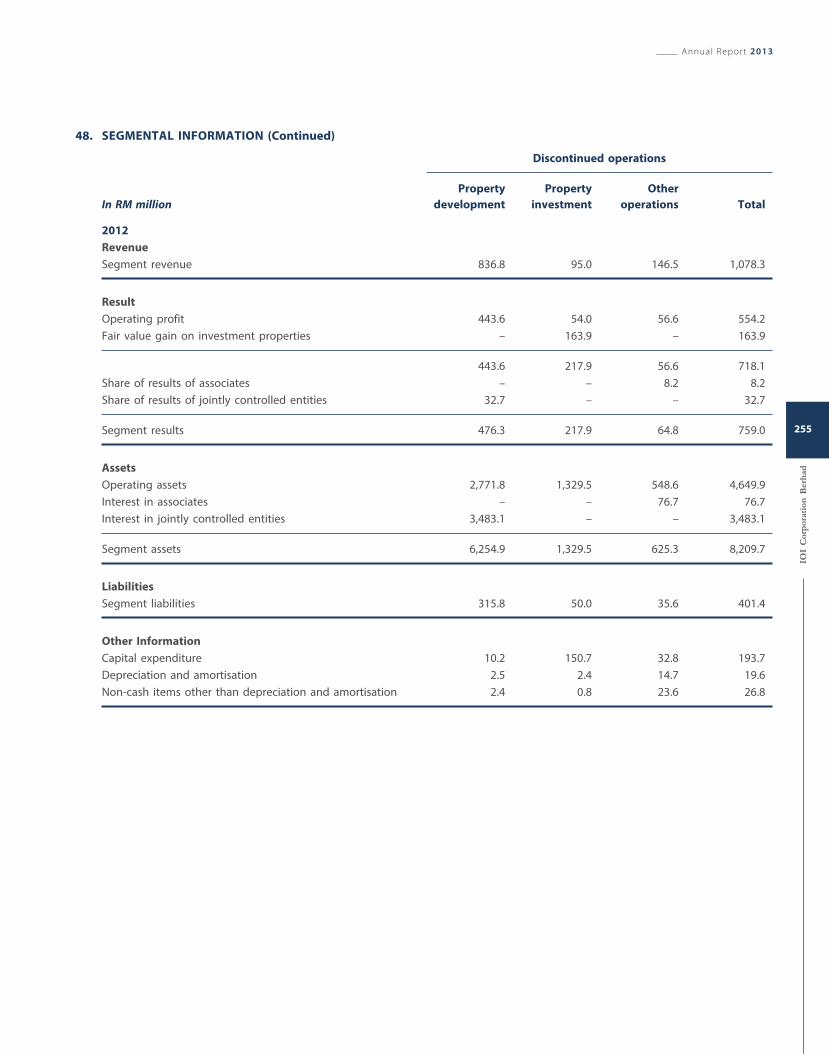
48. SEGMENTAL INFORMATION (Continued)
Discontinued operations
In RM millionProperty
development
Property
investment
Other
operations Total
2012
Revenue
Segment revenue 836.8 95.0 146.5 1,078.3
Result
Operating profit 443.6 54.0 56.6 554.2
Fair value gain on investment properties – 163.9 – 163.9
443.6 217.9 56.6 718.1
Share of results of associates – – 8.2 8.2
Share of results of jointly controlled entities 32.7 – – 32.7
Segment results 476.3 217.9 64.8 759.0
Assets
Operating assets 2,771.8 1,329.5 548.6 4,649.9
Interest in associates – – 76.7 76.7
Interest in jointly controlled entities 3,483.1 – – 3,483.1
Segment assets 6,254.9 1,329.5 625.3 8,209.7
Liabilities
Segment liabilities 315.8 50.0 35.6 401.4
Other Information
Capital expenditure 10.2 150.7 32.8 193.7
Depreciation and amortisation 2.5 2.4 14.7 19.6
Non-cash items other than depreciation and amortisation 2.4 0.8 23.6 26.8
Annual Report 2013
IOI
Cor
por
atio
n B
erh
ad
255
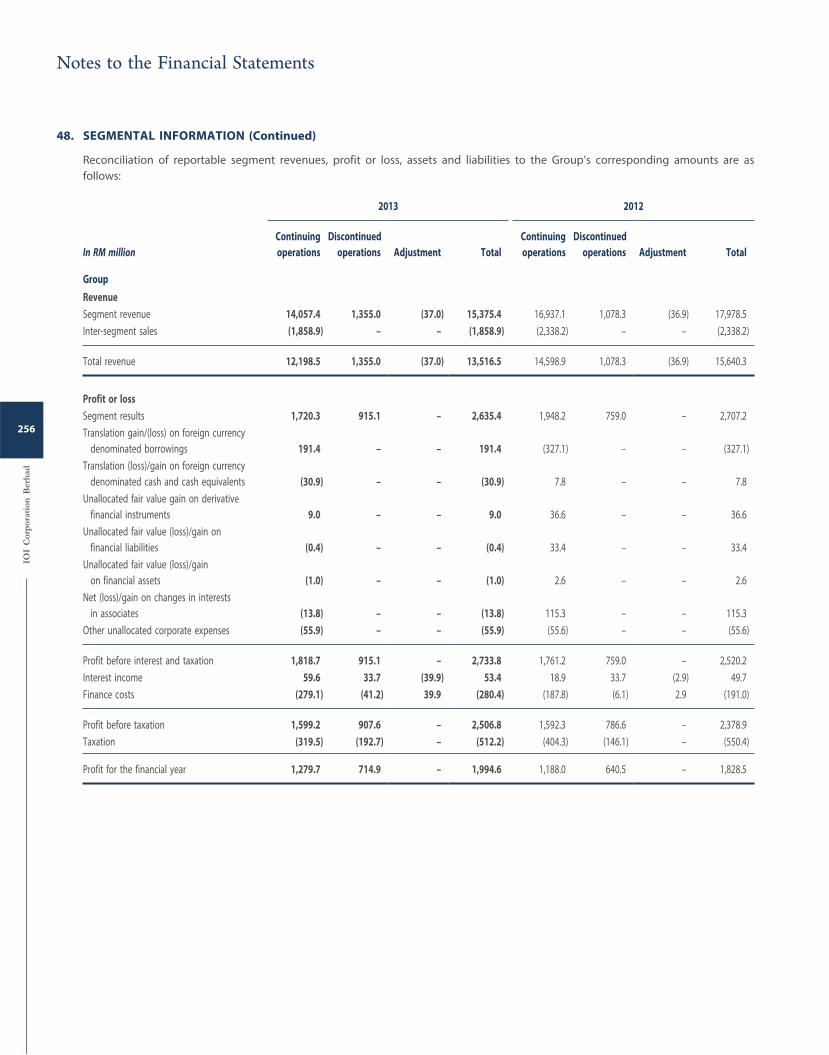
48. SEGMENTAL INFORMATION (Continued)
Reconciliation of reportable segment revenues, profit or loss, assets and liabilities to the Group’s corresponding amounts are as
follows:
2013 2012
In RM millionContinuing
operations
Discontinued
operations Adjustment Total
Continuing
operations
Discontinued
operations Adjustment Total
Group
Revenue
Segment revenue 14,057.4 1,355.0 (37.0) 15,375.4 16,937.1 1,078.3 (36.9) 17,978.5
Inter-segment sales (1,858.9) – – (1,858.9) (2,338.2) – – (2,338.2)
Total revenue 12,198.5 1,355.0 (37.0) 13,516.5 14,598.9 1,078.3 (36.9) 15,640.3
Profit or loss
Segment results 1,720.3 915.1 – 2,635.4 1,948.2 759.0 – 2,707.2
Translation gain/(loss) on foreign currency
denominated borrowings 191.4 – – 191.4 (327.1) – – (327.1)
Translation (loss)/gain on foreign currency
denominated cash and cash equivalents (30.9) – – (30.9) 7.8 – – 7.8
Unallocated fair value gain on derivative
financial instruments 9.0 – – 9.0 36.6 – – 36.6
Unallocated fair value (loss)/gain on
financial liabilities (0.4) – – (0.4) 33.4 – – 33.4
Unallocated fair value (loss)/gain
on financial assets (1.0) – – (1.0) 2.6 – – 2.6
Net (loss)/gain on changes in interests
in associates (13.8) – – (13.8) 115.3 – – 115.3
Other unallocated corporate expenses (55.9) – – (55.9) (55.6) – – (55.6)
Profit before interest and taxation 1,818.7 915.1 – 2,733.8 1,761.2 759.0 – 2,520.2
Interest income 59.6 33.7 (39.9) 53.4 18.9 33.7 (2.9) 49.7
Finance costs (279.1) (41.2) 39.9 (280.4) (187.8) (6.1) 2.9 (191.0)
Profit before taxation 1,599.2 907.6 – 2,506.8 1,592.3 786.6 – 2,378.9
Taxation (319.5) (192.7) – (512.2) (404.3) (146.1) – (550.4)
Profit for the financial year 1,279.7 714.9 – 1,994.6 1,188.0 640.5 – 1,828.5
Notes to the Financial Statements
IOI
Cor
por
atio
n B
erh
ad
256
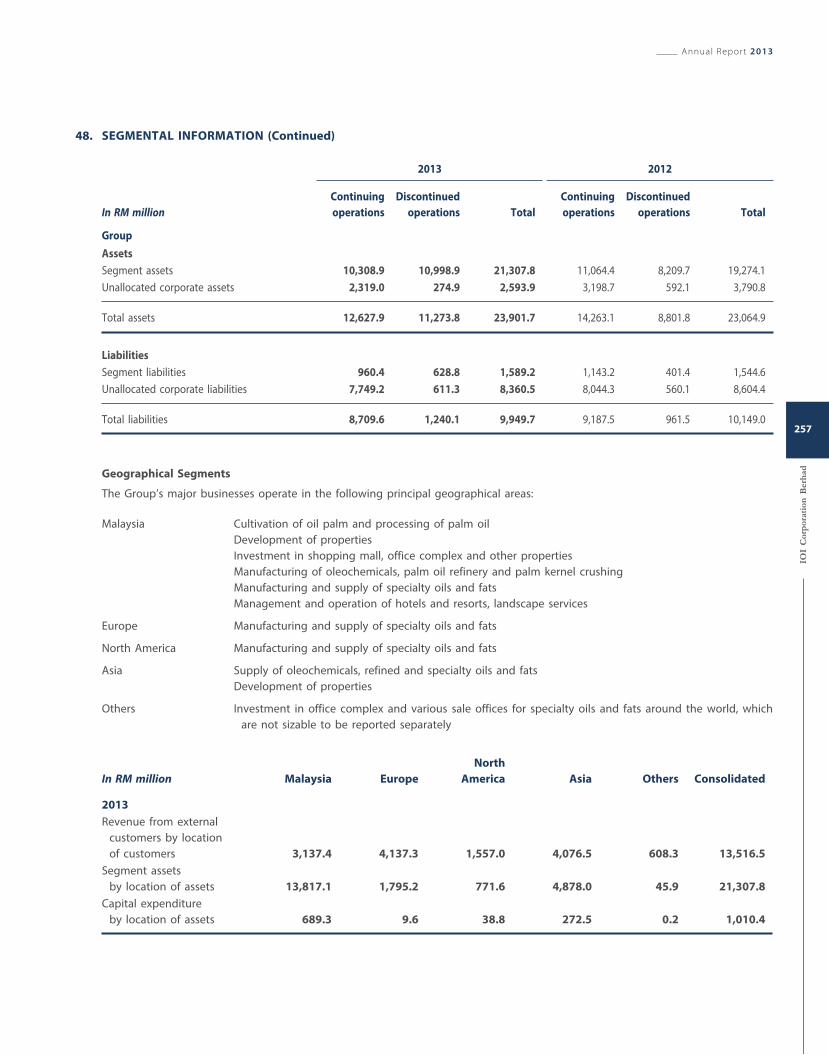
48. SEGMENTAL INFORMATION (Continued)
2013 2012
In RM millionContinuing
operations
Discontinued
operations Total
Continuing
operations
Discontinued
operations Total
Group
Assets
Segment assets 10,308.9 10,998.9 21,307.8 11,064.4 8,209.7 19,274.1
Unallocated corporate assets 2,319.0 274.9 2,593.9 3,198.7 592.1 3,790.8
Total assets 12,627.9 11,273.8 23,901.7 14,263.1 8,801.8 23,064.9
Liabilities
Segment liabilities 960.4 628.8 1,589.2 1,143.2 401.4 1,544.6
Unallocated corporate liabilities 7,749.2 611.3 8,360.5 8,044.3 560.1 8,604.4
Total liabilities 8,709.6 1,240.1 9,949.7 9,187.5 961.5 10,149.0
Geographical Segments
The Group’s major businesses operate in the following principal geographical areas:
Malaysia Cultivation of oil palm and processing of palm oil
Development of properties
Investment in shopping mall, office complex and other properties
Manufacturing of oleochemicals, palm oil refinery and palm kernel crushing
Manufacturing and supply of specialty oils and fats
Management and operation of hotels and resorts, landscape services
Europe Manufacturing and supply of specialty oils and fats
North America Manufacturing and supply of specialty oils and fats
Asia Supply of oleochemicals, refined and specialty oils and fats
Development of properties
Others Investment in office complex and various sale offices for specialty oils and fats around the world, which
are not sizable to be reported separately
In RM million Malaysia Europe
North
America Asia Others Consolidated
2013
Revenue from external
customers by location
of customers 3,137.4 4,137.3 1,557.0 4,076.5 608.3 13,516.5
Segment assets
by location of assets 13,817.1 1,795.2 771.6 4,878.0 45.9 21,307.8
Capital expenditure
by location of assets 689.3 9.6 38.8 272.5 0.2 1,010.4
Annual Report 2013
IOI
Cor
por
atio
n B
erh
ad
257
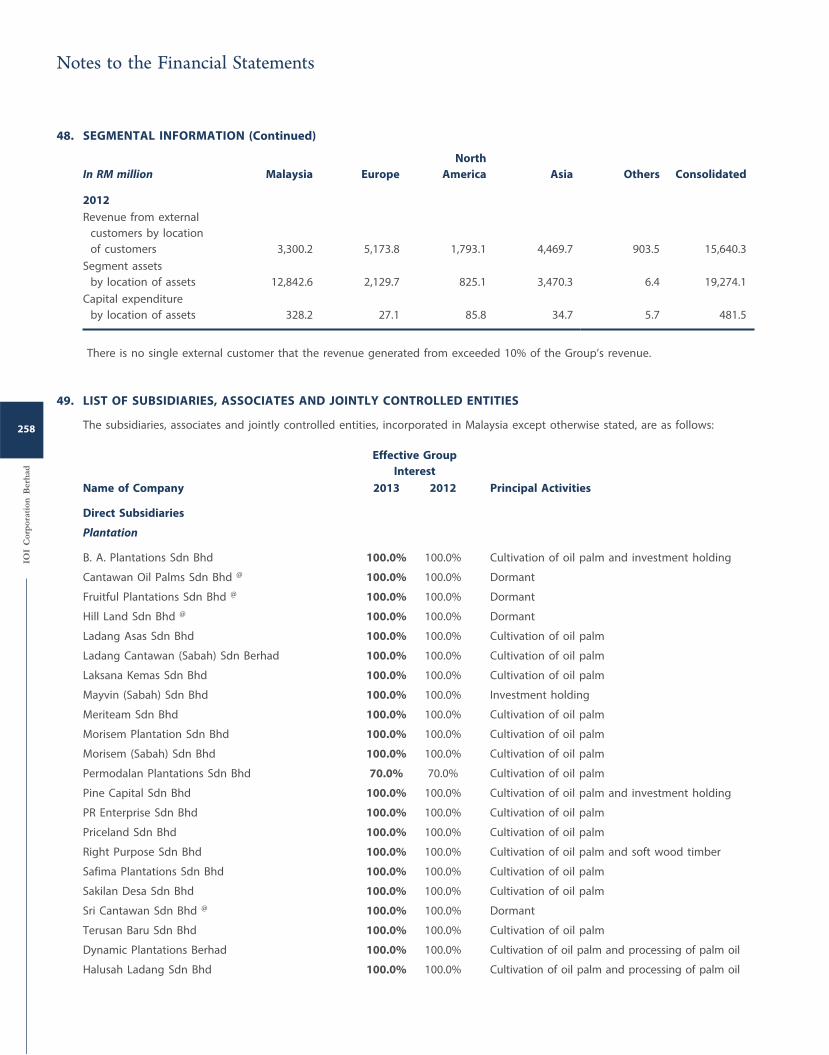
48. SEGMENTAL INFORMATION (Continued)
In RM million Malaysia Europe
North
America Asia Others Consolidated
2012
Revenue from external
customers by location
of customers 3,300.2 5,173.8 1,793.1 4,469.7 903.5 15,640.3
Segment assets
by location of assets 12,842.6 2,129.7 825.1 3,470.3 6.4 19,274.1
Capital expenditure
by location of assets 328.2 27.1 85.8 34.7 5.7 481.5
There is no single external customer that the revenue generated from exceeded 10% of the Group’s revenue.
49. LIST OF SUBSIDIARIES, ASSOCIATES AND JOINTLY CONTROLLED ENTITIES
The subsidiaries, associates and jointly controlled entities, incorporated in Malaysia except otherwise stated, are as follows:
Effective Group
Interest
Name of Company 2013 2012 Principal Activities
Direct Subsidiaries
Plantation
B. A. Plantations Sdn Bhd 100.0% 100.0% Cultivation of oil palm and investment holding
Cantawan Oil Palms Sdn Bhd @ 100.0% 100.0% Dormant
Fruitful Plantations Sdn Bhd @ 100.0% 100.0% Dormant
Hill Land Sdn Bhd @ 100.0% 100.0% Dormant
Ladang Asas Sdn Bhd 100.0% 100.0% Cultivation of oil palm
Ladang Cantawan (Sabah) Sdn Berhad 100.0% 100.0% Cultivation of oil palm
Laksana Kemas Sdn Bhd 100.0% 100.0% Cultivation of oil palm
Mayvin (Sabah) Sdn Bhd 100.0% 100.0% Investment holding
Meriteam Sdn Bhd 100.0% 100.0% Cultivation of oil palm
Morisem Plantation Sdn Bhd 100.0% 100.0% Cultivation of oil palm
Morisem (Sabah) Sdn Bhd 100.0% 100.0% Cultivation of oil palm
Permodalan Plantations Sdn Bhd 70.0% 70.0% Cultivation of oil palm
Pine Capital Sdn Bhd 100.0% 100.0% Cultivation of oil palm and investment holding
PR Enterprise Sdn Bhd 100.0% 100.0% Cultivation of oil palm
Priceland Sdn Bhd 100.0% 100.0% Cultivation of oil palm
Right Purpose Sdn Bhd 100.0% 100.0% Cultivation of oil palm and soft wood timber
Safima Plantations Sdn Bhd 100.0% 100.0% Cultivation of oil palm
Sakilan Desa Sdn Bhd 100.0% 100.0% Cultivation of oil palm
Sri Cantawan Sdn Bhd @ 100.0% 100.0% Dormant
Terusan Baru Sdn Bhd 100.0% 100.0% Cultivation of oil palm
Dynamic Plantations Berhad 100.0% 100.0% Cultivation of oil palm and processing of palm oil
Halusah Ladang Sdn Bhd 100.0% 100.0% Cultivation of oil palm and processing of palm oil
Notes to the Financial Statements
IOI
Cor
por
atio
n B
erh
ad
258
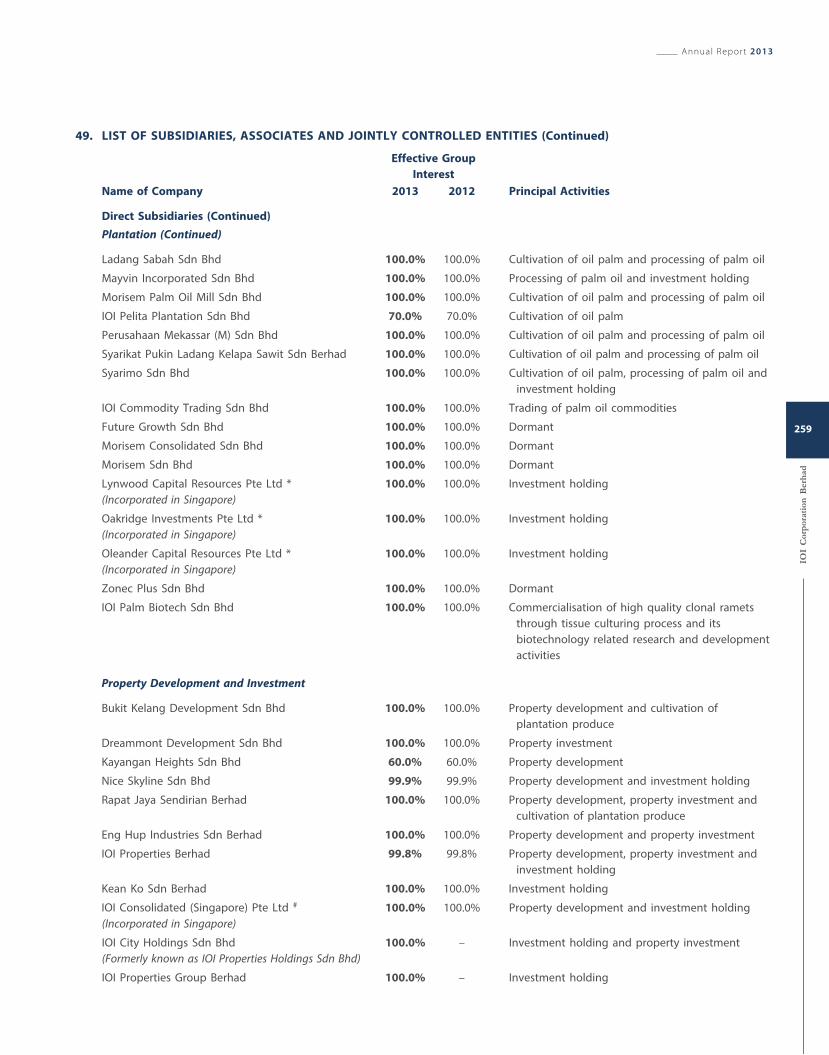
49. LIST OF SUBSIDIARIES, ASSOCIATES AND JOINTLY CONTROLLED ENTITIES (Continued)
Effective Group
Interest
Name of Company 2013 2012 Principal Activities
Direct Subsidiaries (Continued)
Plantation (Continued)
Ladang Sabah Sdn Bhd 100.0% 100.0% Cultivation of oil palm and processing of palm oil
Mayvin Incorporated Sdn Bhd 100.0% 100.0% Processing of palm oil and investment holding
Morisem Palm Oil Mill Sdn Bhd 100.0% 100.0% Cultivation of oil palm and processing of palm oil
IOI Pelita Plantation Sdn Bhd 70.0% 70.0% Cultivation of oil palm
Perusahaan Mekassar (M) Sdn Bhd 100.0% 100.0% Cultivation of oil palm and processing of palm oil
Syarikat Pukin Ladang Kelapa Sawit Sdn Berhad 100.0% 100.0% Cultivation of oil palm and processing of palm oil
Syarimo Sdn Bhd 100.0% 100.0% Cultivation of oil palm, processing of palm oil and
investment holding
IOI Commodity Trading Sdn Bhd 100.0% 100.0% Trading of palm oil commodities
Future Growth Sdn Bhd 100.0% 100.0% Dormant
Morisem Consolidated Sdn Bhd 100.0% 100.0% Dormant
Morisem Sdn Bhd 100.0% 100.0% Dormant
Lynwood Capital Resources Pte Ltd *
(Incorporated in Singapore)
100.0% 100.0% Investment holding
Oakridge Investments Pte Ltd *
(Incorporated in Singapore)
100.0% 100.0% Investment holding
Oleander Capital Resources Pte Ltd *
(Incorporated in Singapore)
100.0% 100.0% Investment holding
Zonec Plus Sdn Bhd 100.0% 100.0% Dormant
IOI Palm Biotech Sdn Bhd 100.0% 100.0% Commercialisation of high quality clonal ramets
through tissue culturing process and its
biotechnology related research and development
activities
Property Development and Investment
Bukit Kelang Development Sdn Bhd 100.0% 100.0% Property development and cultivation of
plantation produce
Dreammont Development Sdn Bhd 100.0% 100.0% Property investment
Kayangan Heights Sdn Bhd 60.0% 60.0% Property development
Nice Skyline Sdn Bhd 99.9% 99.9% Property development and investment holding
Rapat Jaya Sendirian Berhad 100.0% 100.0% Property development, property investment and
cultivation of plantation produce
Eng Hup Industries Sdn Berhad 100.0% 100.0% Property development and property investment
IOI Properties Berhad 99.8% 99.8% Property development, property investment and
investment holding
Kean Ko Sdn Berhad 100.0% 100.0% Investment holding
IOI Consolidated (Singapore) Pte Ltd #
(Incorporated in Singapore)
100.0% 100.0% Property development and investment holding
IOI City Holdings Sdn Bhd
(Formerly known as IOI Properties Holdings Sdn Bhd)
100.0% – Investment holding and property investment
IOI Properties Group Berhad 100.0% – Investment holding
Annual Report 2013
IOI
Cor
por
atio
n B
erh
ad
259
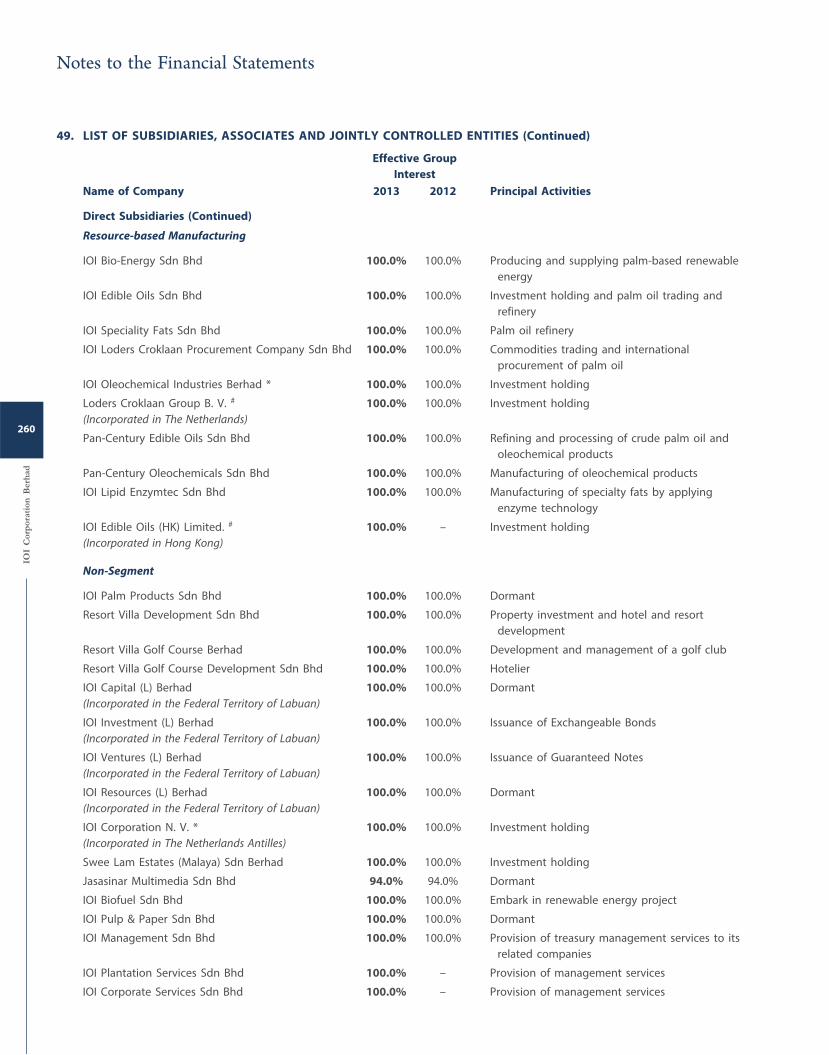
49. LIST OF SUBSIDIARIES, ASSOCIATES AND JOINTLY CONTROLLED ENTITIES (Continued)
Effective Group
Interest
Name of Company 2013 2012 Principal Activities
Direct Subsidiaries (Continued)
Resource-based Manufacturing
IOI Bio-Energy Sdn Bhd 100.0% 100.0% Producing and supplying palm-based renewable
energy
IOI Edible Oils Sdn Bhd 100.0% 100.0% Investment holding and palm oil trading and
refinery
IOI Speciality Fats Sdn Bhd 100.0% 100.0% Palm oil refinery
IOI Loders Croklaan Procurement Company Sdn Bhd 100.0% 100.0% Commodities trading and international
procurement of palm oil
IOI Oleochemical Industries Berhad * 100.0% 100.0% Investment holding
Loders Croklaan Group B. V. #
(Incorporated in The Netherlands)
100.0% 100.0% Investment holding
Pan-Century Edible Oils Sdn Bhd 100.0% 100.0% Refining and processing of crude palm oil and
oleochemical products
Pan-Century Oleochemicals Sdn Bhd 100.0% 100.0% Manufacturing of oleochemical products
IOI Lipid Enzymtec Sdn Bhd 100.0% 100.0% Manufacturing of specialty fats by applying
enzyme technology
IOI Edible Oils (HK) Limited. #
(Incorporated in Hong Kong)
100.0% – Investment holding
Non-Segment
IOI Palm Products Sdn Bhd 100.0% 100.0% Dormant
Resort Villa Development Sdn Bhd 100.0% 100.0% Property investment and hotel and resort
development
Resort Villa Golf Course Berhad 100.0% 100.0% Development and management of a golf club
Resort Villa Golf Course Development Sdn Bhd 100.0% 100.0% Hotelier
IOI Capital (L) Berhad
(Incorporated in the Federal Territory of Labuan)
100.0% 100.0% Dormant
IOI Investment (L) Berhad
(Incorporated in the Federal Territory of Labuan)
100.0% 100.0% Issuance of Exchangeable Bonds
IOI Ventures (L) Berhad
(Incorporated in the Federal Territory of Labuan)
100.0% 100.0% Issuance of Guaranteed Notes
IOI Resources (L) Berhad
(Incorporated in the Federal Territory of Labuan)
100.0% 100.0% Dormant
IOI Corporation N. V. *
(Incorporated in The Netherlands Antilles)
100.0% 100.0% Investment holding
Swee Lam Estates (Malaya) Sdn Berhad 100.0% 100.0% Investment holding
Jasasinar Multimedia Sdn Bhd 94.0% 94.0% Dormant
IOI Biofuel Sdn Bhd 100.0% 100.0% Embark in renewable energy project
IOI Pulp & Paper Sdn Bhd 100.0% 100.0% Dormant
IOI Management Sdn Bhd 100.0% 100.0% Provision of treasury management services to its
related companies
IOI Plantation Services Sdn Bhd 100.0% – Provision of management services
IOI Corporate Services Sdn Bhd 100.0% – Provision of management services
Notes to the Financial Statements
IOI
Cor
por
atio
n B
erh
ad
260
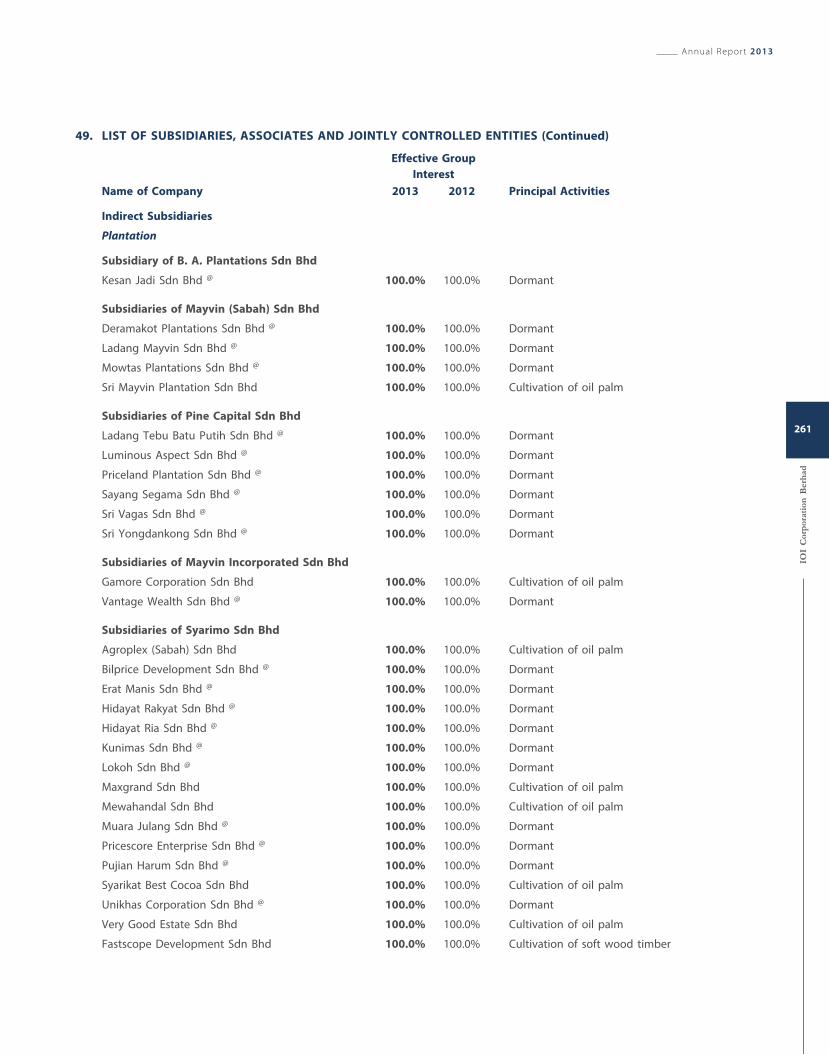
49. LIST OF SUBSIDIARIES, ASSOCIATES AND JOINTLY CONTROLLED ENTITIES (Continued)
Effective Group
Interest
Name of Company 2013 2012 Principal Activities
Indirect Subsidiaries
Plantation
Subsidiary of B. A. Plantations Sdn Bhd
Kesan Jadi Sdn Bhd @ 100.0% 100.0% Dormant
Subsidiaries of Mayvin (Sabah) Sdn Bhd
Deramakot Plantations Sdn Bhd @ 100.0% 100.0% Dormant
Ladang Mayvin Sdn Bhd @ 100.0% 100.0% Dormant
Mowtas Plantations Sdn Bhd @ 100.0% 100.0% Dormant
Sri Mayvin Plantation Sdn Bhd 100.0% 100.0% Cultivation of oil palm
Subsidiaries of Pine Capital Sdn Bhd
Ladang Tebu Batu Putih Sdn Bhd @ 100.0% 100.0% Dormant
Luminous Aspect Sdn Bhd @ 100.0% 100.0% Dormant
Priceland Plantation Sdn Bhd @ 100.0% 100.0% Dormant
Sayang Segama Sdn Bhd @ 100.0% 100.0% Dormant
Sri Vagas Sdn Bhd @ 100.0% 100.0% Dormant
Sri Yongdankong Sdn Bhd @ 100.0% 100.0% Dormant
Subsidiaries of Mayvin Incorporated Sdn Bhd
Gamore Corporation Sdn Bhd 100.0% 100.0% Cultivation of oil palm
Vantage Wealth Sdn Bhd @ 100.0% 100.0% Dormant
Subsidiaries of Syarimo Sdn Bhd
Agroplex (Sabah) Sdn Bhd 100.0% 100.0% Cultivation of oil palm
Bilprice Development Sdn Bhd @ 100.0% 100.0% Dormant
Erat Manis Sdn Bhd @ 100.0% 100.0% Dormant
Hidayat Rakyat Sdn Bhd @ 100.0% 100.0% Dormant
Hidayat Ria Sdn Bhd @ 100.0% 100.0% Dormant
Kunimas Sdn Bhd @ 100.0% 100.0% Dormant
Lokoh Sdn Bhd @ 100.0% 100.0% Dormant
Maxgrand Sdn Bhd 100.0% 100.0% Cultivation of oil palm
Mewahandal Sdn Bhd 100.0% 100.0% Cultivation of oil palm
Muara Julang Sdn Bhd @ 100.0% 100.0% Dormant
Pricescore Enterprise Sdn Bhd @ 100.0% 100.0% Dormant
Pujian Harum Sdn Bhd @ 100.0% 100.0% Dormant
Syarikat Best Cocoa Sdn Bhd 100.0% 100.0% Cultivation of oil palm
Unikhas Corporation Sdn Bhd @ 100.0% 100.0% Dormant
Very Good Estate Sdn Bhd 100.0% 100.0% Cultivation of oil palm
Fastscope Development Sdn Bhd 100.0% 100.0% Cultivation of soft wood timber
Annual Report 2013
IOI
Cor
por
atio
n B
erh
ad
261
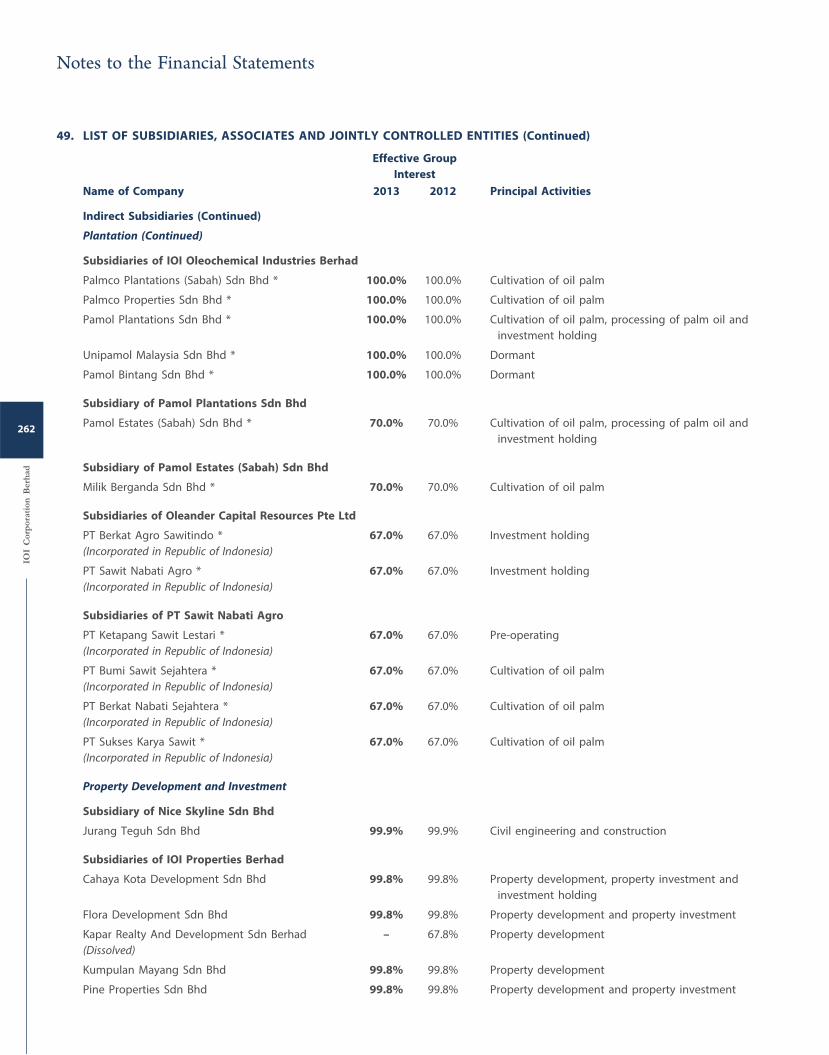
49. LIST OF SUBSIDIARIES, ASSOCIATES AND JOINTLY CONTROLLED ENTITIES (Continued)
Effective Group
Interest
Name of Company 2013 2012 Principal Activities
Indirect Subsidiaries (Continued)
Plantation (Continued)
Subsidiaries of IOI Oleochemical Industries Berhad
Palmco Plantations (Sabah) Sdn Bhd * 100.0% 100.0% Cultivation of oil palm
Palmco Properties Sdn Bhd * 100.0% 100.0% Cultivation of oil palm
Pamol Plantations Sdn Bhd * 100.0% 100.0% Cultivation of oil palm, processing of palm oil and
investment holding
Unipamol Malaysia Sdn Bhd * 100.0% 100.0% Dormant
Pamol Bintang Sdn Bhd * 100.0% 100.0% Dormant
Subsidiary of Pamol Plantations Sdn Bhd
Pamol Estates (Sabah) Sdn Bhd * 70.0% 70.0% Cultivation of oil palm, processing of palm oil and
investment holding
Subsidiary of Pamol Estates (Sabah) Sdn Bhd
Milik Berganda Sdn Bhd * 70.0% 70.0% Cultivation of oil palm
Subsidiaries of Oleander Capital Resources Pte Ltd
PT Berkat Agro Sawitindo *
(Incorporated in Republic of Indonesia)
67.0% 67.0% Investment holding
PT Sawit Nabati Agro *
(Incorporated in Republic of Indonesia)
67.0% 67.0% Investment holding
Subsidiaries of PT Sawit Nabati Agro
PT Ketapang Sawit Lestari *
(Incorporated in Republic of Indonesia)
67.0% 67.0% Pre-operating
PT Bumi Sawit Sejahtera *
(Incorporated in Republic of Indonesia)
67.0% 67.0% Cultivation of oil palm
PT Berkat Nabati Sejahtera *
(Incorporated in Republic of Indonesia)
67.0% 67.0% Cultivation of oil palm
PT Sukses Karya Sawit *
(Incorporated in Republic of Indonesia)
67.0% 67.0% Cultivation of oil palm
Property Development and Investment
Subsidiary of Nice Skyline Sdn Bhd
Jurang Teguh Sdn Bhd 99.9% 99.9% Civil engineering and construction
Subsidiaries of IOI Properties Berhad
Cahaya Kota Development Sdn Bhd 99.8% 99.8% Property development, property investment and
investment holding
Flora Development Sdn Bhd 99.8% 99.8% Property development and property investment
Kapar Realty And Development Sdn Berhad
(Dissolved)
– 67.8% Property development
Kumpulan Mayang Sdn Bhd 99.8% 99.8% Property development
Pine Properties Sdn Bhd 99.8% 99.8% Property development and property investment
Notes to the Financial Statements
IOI
Cor
por
atio
n B
erh
ad
262
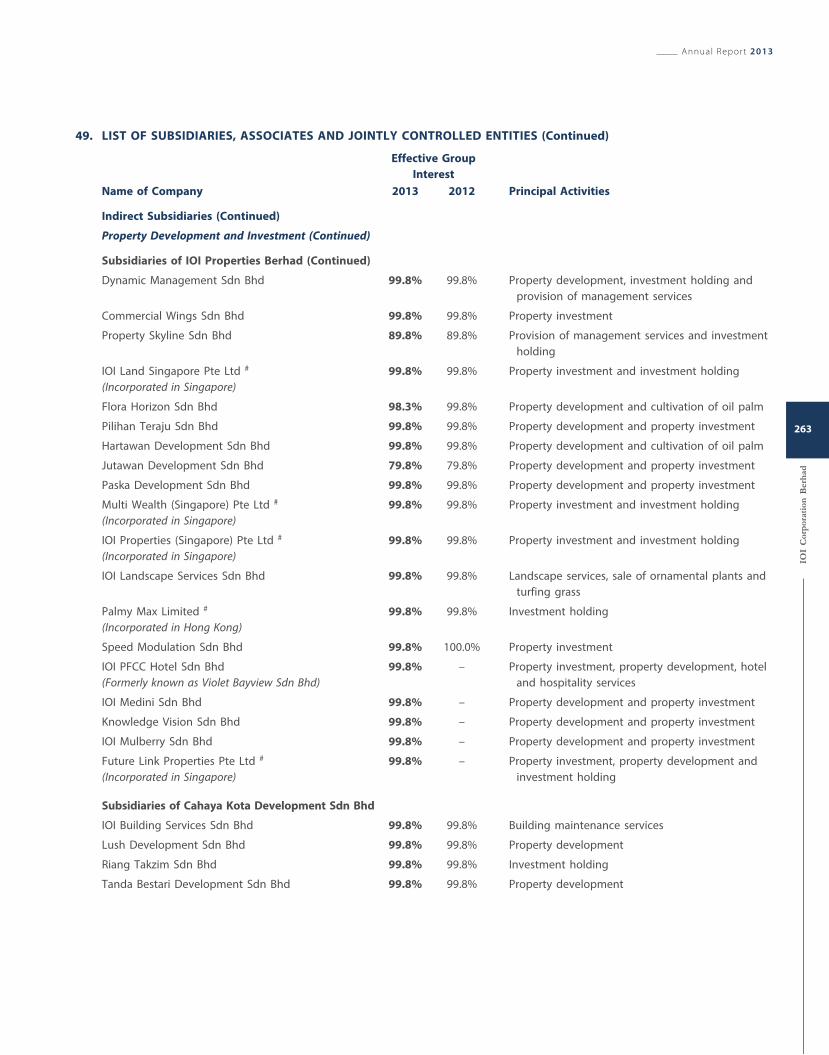
49. LIST OF SUBSIDIARIES, ASSOCIATES AND JOINTLY CONTROLLED ENTITIES (Continued)
Effective Group
Interest
Name of Company 2013 2012 Principal Activities
Indirect Subsidiaries (Continued)
Property Development and Investment (Continued)
Subsidiaries of IOI Properties Berhad (Continued)
Dynamic Management Sdn Bhd 99.8% 99.8% Property development, investment holding and
provision of management services
Commercial Wings Sdn Bhd 99.8% 99.8% Property investment
Property Skyline Sdn Bhd 89.8% 89.8% Provision of management services and investment
holding
IOI Land Singapore Pte Ltd #
(Incorporated in Singapore)
99.8% 99.8% Property investment and investment holding
Flora Horizon Sdn Bhd 98.3% 99.8% Property development and cultivation of oil palm
Pilihan Teraju Sdn Bhd 99.8% 99.8% Property development and property investment
Hartawan Development Sdn Bhd 99.8% 99.8% Property development and cultivation of oil palm
Jutawan Development Sdn Bhd 79.8% 79.8% Property development and property investment
Paska Development Sdn Bhd 99.8% 99.8% Property development and property investment
Multi Wealth (Singapore) Pte Ltd #
(Incorporated in Singapore)
99.8% 99.8% Property investment and investment holding
IOI Properties (Singapore) Pte Ltd #
(Incorporated in Singapore)
99.8% 99.8% Property investment and investment holding
IOI Landscape Services Sdn Bhd 99.8% 99.8% Landscape services, sale of ornamental plants and
turfing grass
Palmy Max Limited #
(Incorporated in Hong Kong)
99.8% 99.8% Investment holding
Speed Modulation Sdn Bhd 99.8% 100.0% Property investment
IOI PFCC Hotel Sdn Bhd
(Formerly known as Violet Bayview Sdn Bhd)
99.8% – Property investment, property development, hotel
and hospitality services
IOI Medini Sdn Bhd 99.8% – Property development and property investment
Knowledge Vision Sdn Bhd 99.8% – Property development and property investment
IOI Mulberry Sdn Bhd 99.8% – Property development and property investment
Future Link Properties Pte Ltd #
(Incorporated in Singapore)
99.8% – Property investment, property development and
investment holding
Subsidiaries of Cahaya Kota Development Sdn Bhd
IOI Building Services Sdn Bhd 99.8% 99.8% Building maintenance services
Lush Development Sdn Bhd 99.8% 99.8% Property development
Riang Takzim Sdn Bhd 99.8% 99.8% Investment holding
Tanda Bestari Development Sdn Bhd 99.8% 99.8% Property development
Annual Report 2013
IOI
Cor
por
atio
n B
erh
ad
263
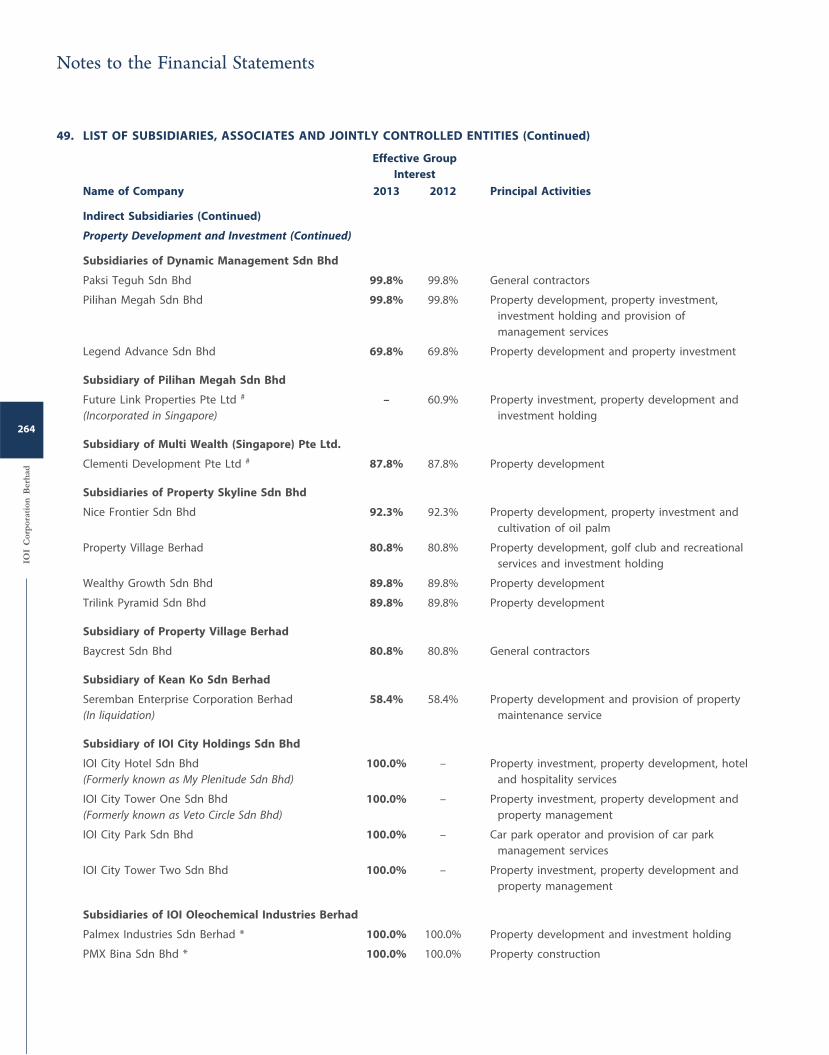
49. LIST OF SUBSIDIARIES, ASSOCIATES AND JOINTLY CONTROLLED ENTITIES (Continued)
Effective Group
Interest
Name of Company 2013 2012 Principal Activities
Indirect Subsidiaries (Continued)
Property Development and Investment (Continued)
Subsidiaries of Dynamic Management Sdn Bhd
Paksi Teguh Sdn Bhd 99.8% 99.8% General contractors
Pilihan Megah Sdn Bhd 99.8% 99.8% Property development, property investment,
investment holding and provision of
management services
Legend Advance Sdn Bhd 69.8% 69.8% Property development and property investment
Subsidiary of Pilihan Megah Sdn Bhd
Future Link Properties Pte Ltd #
(Incorporated in Singapore)
– 60.9% Property investment, property development and
investment holding
Subsidiary of Multi Wealth (Singapore) Pte Ltd.
Clementi Development Pte Ltd # 87.8% 87.8% Property development
Subsidiaries of Property Skyline Sdn Bhd
Nice Frontier Sdn Bhd 92.3% 92.3% Property development, property investment and
cultivation of oil palm
Property Village Berhad 80.8% 80.8% Property development, golf club and recreational
services and investment holding
Wealthy Growth Sdn Bhd 89.8% 89.8% Property development
Trilink Pyramid Sdn Bhd 89.8% 89.8% Property development
Subsidiary of Property Village Berhad
Baycrest Sdn Bhd 80.8% 80.8% General contractors
Subsidiary of Kean Ko Sdn Berhad
Seremban Enterprise Corporation Berhad
(In liquidation)
58.4% 58.4% Property development and provision of property
maintenance service
Subsidiary of IOI City Holdings Sdn Bhd
IOI City Hotel Sdn Bhd
(Formerly known as My Plenitude Sdn Bhd)
100.0% – Property investment, property development, hotel
and hospitality services
IOI City Tower One Sdn Bhd
(Formerly known as Veto Circle Sdn Bhd)
100.0% – Property investment, property development and
property management
IOI City Park Sdn Bhd 100.0% – Car park operator and provision of car park
management services
IOI City Tower Two Sdn Bhd 100.0% – Property investment, property development and
property management
Subsidiaries of IOI Oleochemical Industries Berhad
Palmex Industries Sdn Berhad * 100.0% 100.0% Property development and investment holding
PMX Bina Sdn Bhd * 100.0% 100.0% Property construction
Notes to the Financial Statements
IOI
Cor
por
atio
n B
erh
ad
264

49. LIST OF SUBSIDIARIES, ASSOCIATES AND JOINTLY CONTROLLED ENTITIES (Continued)
Effective Group
Interest
Name of Company 2013 2012 Principal Activities
Indirect Subsidiaries (Continued)
Property Development and Investment (Continued)
Subsidiaries of Palmy Max Limited
IOI (Xiamen) Properties Co. Ltd
(Incorporated in the People’s Republic of China)
99.8% – Property development, management of hotel,
shopping mall and commercial properties
Prime Joy Investments Limited
(Incorporated in Hong Kong)
99.8% – Investment holding
Subsidiary of Prime Joy Investments Limited
Xiamen Double Prosperous Real Estate
Development Co. Ltd
(Incorporated in the People’s Republic of China)
99.8% – Property development and property management
services
Resource-based Manufacturing
Subsidiary of IOI Edible Oils Sdn Bhd
IOI Jeti Sdn Bhd 100.0% 100.0% Dormant
Subsidiaries of IOI Oleochemical Industries Berhad
Acidchem International Sdn Bhd * 100.0% 100.0% Manufacture and sale of fatty acids and glycerine
and other related products
Derichem (M) Sdn Bhd * 100.0% 100.0% Manufacture and sale of soap noodles
Esterchem (M) Sdn Bhd * 100.0% 100.0% Dormant
Stabilchem (M) Sdn Bhd * 100.0% 100.0% Dormant
Palmco Oil Mill Sendirian Berhad * 100.0% 100.0% Sales of palm kernel oil and trading in
commodities
Subsidiary of Acidchem International Sdn Bhd
Acidchem (USA) Inc *
(Incorporated in United States of America)
100.0% 100.0% Trading in fatty acids and glycerine
IOI Oleo (Europe) ApS *
(Incorporated in Denmark)
100.0% 100.0% Carrying out registration of oleochemical products
of European Union registration, trading and
distribution of oleochemical products
Subsidiary of IOI Edible Oils (HK) Limited
IOI (Xiamen) Edible Oils Co. Ltd
(Incorporated in the People’s Republic of China)
100.0% – Palm oil refinery, manufacturing and trading of
speciality oils and fats and oleochemical products
Subsidiaries of Loders Croklaan Group B. V.
Loders Croklaan B. V. #
(Incorporated in The Netherlands)
100.0% 100.0% Manufacturing of specialty oils and fats
Loders Croklaan Canada Inc. #
(Incorporated in Canada)
100.0% 100.0% Manufacturing of specialty oils and fats
Loders Croklaan USA B. V. #
(Incorporated in The Netherlands)
100.0% 100.0% Investment holding
Annual Report 2013
IOI
Cor
por
atio
n B
erh
ad
265
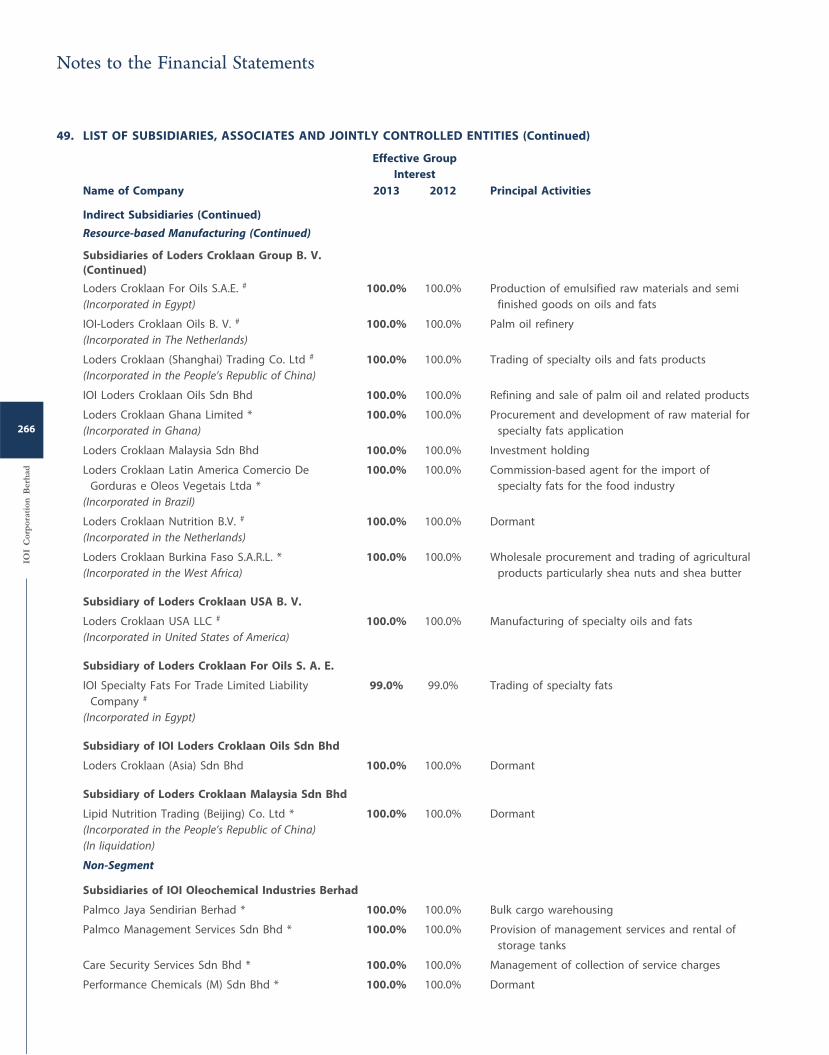
49. LIST OF SUBSIDIARIES, ASSOCIATES AND JOINTLY CONTROLLED ENTITIES (Continued)
Effective Group
Interest
Name of Company 2013 2012 Principal Activities
Indirect Subsidiaries (Continued)
Resource-based Manufacturing (Continued)
Subsidiaries of Loders Croklaan Group B. V.
(Continued)
Loders Croklaan For Oils S.A.E. #
(Incorporated in Egypt)
100.0% 100.0% Production of emulsified raw materials and semi
finished goods on oils and fats
IOI-Loders Croklaan Oils B. V. #
(Incorporated in The Netherlands)
100.0% 100.0% Palm oil refinery
Loders Croklaan (Shanghai) Trading Co. Ltd #
(Incorporated in the People’s Republic of China)
100.0% 100.0% Trading of specialty oils and fats products
IOI Loders Croklaan Oils Sdn Bhd 100.0% 100.0% Refining and sale of palm oil and related products
Loders Croklaan Ghana Limited *
(Incorporated in Ghana)
100.0% 100.0% Procurement and development of raw material for
specialty fats application
Loders Croklaan Malaysia Sdn Bhd 100.0% 100.0% Investment holding
Loders Croklaan Latin America Comercio De
Gorduras e Oleos Vegetais Ltda *
(Incorporated in Brazil)
100.0% 100.0% Commission-based agent for the import of
specialty fats for the food industry
Loders Croklaan Nutrition B.V. #
(Incorporated in the Netherlands)
100.0% 100.0% Dormant
Loders Croklaan Burkina Faso S.A.R.L. *
(Incorporated in the West Africa)
100.0% 100.0% Wholesale procurement and trading of agricultural
products particularly shea nuts and shea butter
Subsidiary of Loders Croklaan USA B. V.
Loders Croklaan USA LLC #
(Incorporated in United States of America)
100.0% 100.0% Manufacturing of specialty oils and fats
Subsidiary of Loders Croklaan For Oils S. A. E.
IOI Specialty Fats For Trade Limited Liability
Company #
(Incorporated in Egypt)
99.0% 99.0% Trading of specialty fats
Subsidiary of IOI Loders Croklaan Oils Sdn Bhd
Loders Croklaan (Asia) Sdn Bhd 100.0% 100.0% Dormant
Subsidiary of Loders Croklaan Malaysia Sdn Bhd
Lipid Nutrition Trading (Beijing) Co. Ltd *
(Incorporated in the People’s Republic of China)
(In liquidation)
100.0% 100.0% Dormant
Non-Segment
Subsidiaries of IOI Oleochemical Industries Berhad
Palmco Jaya Sendirian Berhad * 100.0% 100.0% Bulk cargo warehousing
Palmco Management Services Sdn Bhd * 100.0% 100.0% Provision of management services and rental of
storage tanks
Care Security Services Sdn Bhd * 100.0% 100.0% Management of collection of service charges
Performance Chemicals (M) Sdn Bhd * 100.0% 100.0% Dormant
Notes to the Financial Statements
IOI
Cor
por
atio
n B
erh
ad
266
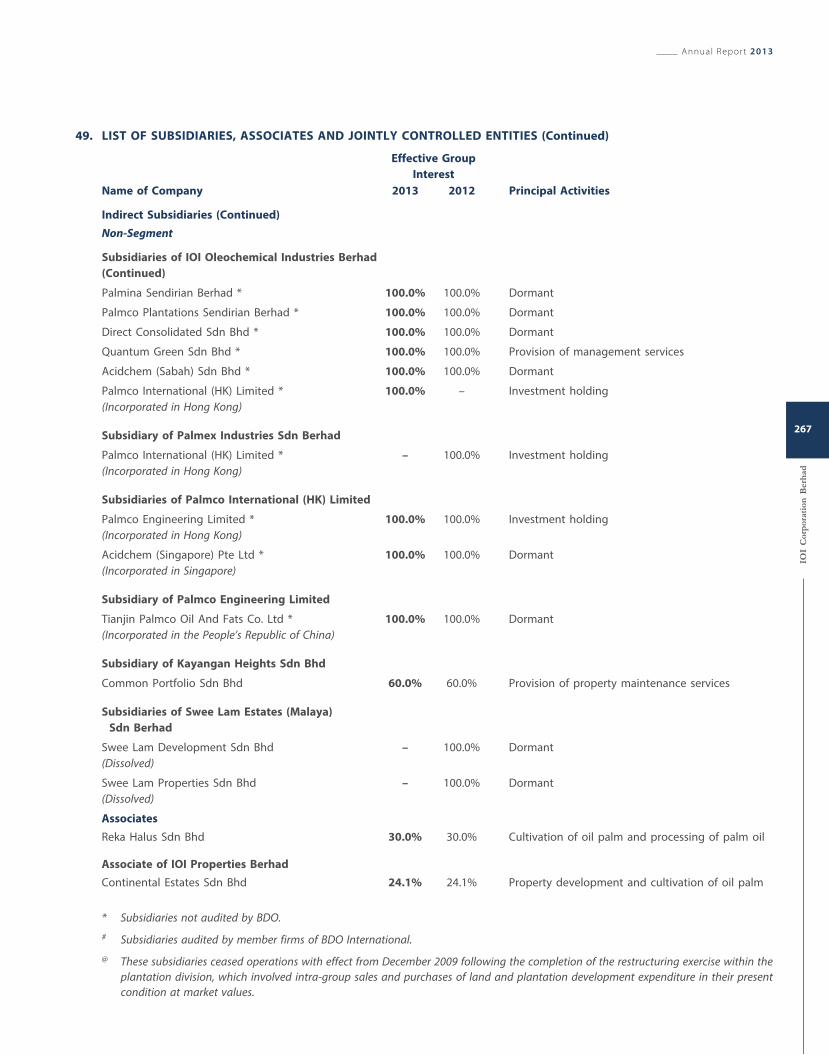
49. LIST OF SUBSIDIARIES, ASSOCIATES AND JOINTLY CONTROLLED ENTITIES (Continued)
Effective Group
Interest
Name of Company 2013 2012 Principal Activities
Indirect Subsidiaries (Continued)
Non-Segment
Subsidiaries of IOI Oleochemical Industries Berhad
(Continued)
Palmina Sendirian Berhad * 100.0% 100.0% Dormant
Palmco Plantations Sendirian Berhad * 100.0% 100.0% Dormant
Direct Consolidated Sdn Bhd * 100.0% 100.0% Dormant
Quantum Green Sdn Bhd * 100.0% 100.0% Provision of management services
Acidchem (Sabah) Sdn Bhd * 100.0% 100.0% Dormant
Palmco International (HK) Limited *
(Incorporated in Hong Kong)
100.0% – Investment holding
Subsidiary of Palmex Industries Sdn Berhad
Palmco International (HK) Limited *
(Incorporated in Hong Kong)
– 100.0% Investment holding
Subsidiaries of Palmco International (HK) Limited
Palmco Engineering Limited *
(Incorporated in Hong Kong)
100.0% 100.0% Investment holding
Acidchem (Singapore) Pte Ltd *
(Incorporated in Singapore)
100.0% 100.0% Dormant
Subsidiary of Palmco Engineering Limited
Tianjin Palmco Oil And Fats Co. Ltd *
(Incorporated in the People’s Republic of China)
100.0% 100.0% Dormant
Subsidiary of Kayangan Heights Sdn Bhd
Common Portfolio Sdn Bhd 60.0% 60.0% Provision of property maintenance services
Subsidiaries of Swee Lam Estates (Malaya)
Sdn Berhad
Swee Lam Development Sdn Bhd
(Dissolved)
– 100.0% Dormant
Swee Lam Properties Sdn Bhd
(Dissolved)
– 100.0% Dormant
Associates
Reka Halus Sdn Bhd 30.0% 30.0% Cultivation of oil palm and processing of palm oil
Associate of IOI Properties Berhad
Continental Estates Sdn Bhd 24.1% 24.1% Property development and cultivation of oil palm
* Subsidiaries not audited by BDO.
# Subsidiaries audited by member firms of BDO International.
@ These subsidiaries ceased operations with effect from December 2009 following the completion of the restructuring exercise within the
plantation division, which involved intra-group sales and purchases of land and plantation development expenditure in their present
condition at market values.
Annual Report 2013
IOI
Cor
por
atio
n B
erh
ad
267
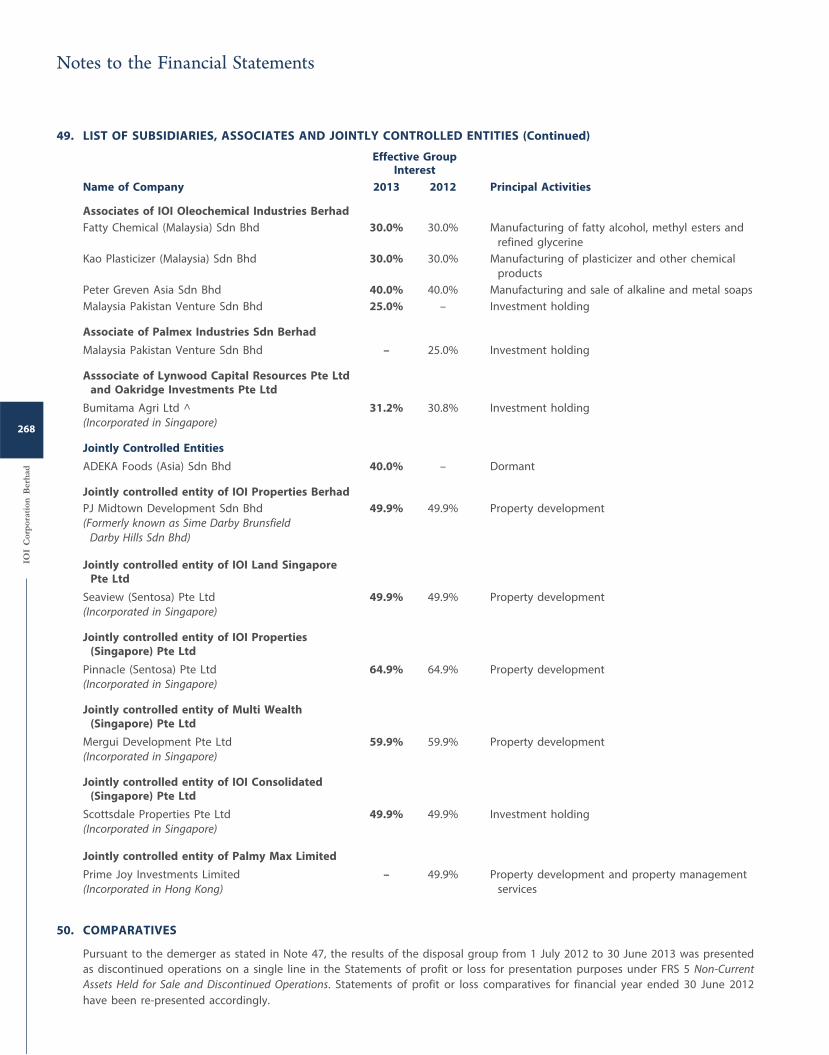
49. LIST OF SUBSIDIARIES, ASSOCIATES AND JOINTLY CONTROLLED ENTITIES (Continued)
Effective Group Interest
Name of Company 2013 2012 Principal Activities
Associates of IOI Oleochemical Industries Berhad
Fatty Chemical (Malaysia) Sdn Bhd 30.0% 30.0% Manufacturing of fatty alcohol, methyl esters and
refined glycerine
Kao Plasticizer (Malaysia) Sdn Bhd 30.0% 30.0% Manufacturing of plasticizer and other chemical
products
Peter Greven Asia Sdn Bhd 40.0% 40.0% Manufacturing and sale of alkaline and metal soaps
Malaysia Pakistan Venture Sdn Bhd 25.0% – Investment holding
Associate of Palmex Industries Sdn Berhad
Malaysia Pakistan Venture Sdn Bhd – 25.0% Investment holding
Asssociate of Lynwood Capital Resources Pte Ltd and Oakridge Investments Pte Ltd
Bumitama Agri Ltd ^
(Incorporated in Singapore)
31.2% 30.8% Investment holding
Jointly Controlled Entities
ADEKA Foods (Asia) Sdn Bhd 40.0% – Dormant
Jointly controlled entity of IOI Properties Berhad
PJ Midtown Development Sdn Bhd
(Formerly known as Sime Darby Brunsfield
Darby Hills Sdn Bhd)
49.9% 49.9% Property development
Jointly controlled entity of IOI Land Singapore Pte Ltd
Seaview (Sentosa) Pte Ltd
(Incorporated in Singapore)
49.9% 49.9% Property development
Jointly controlled entity of IOI Properties (Singapore) Pte Ltd
Pinnacle (Sentosa) Pte Ltd
(Incorporated in Singapore)
64.9% 64.9% Property development
Jointly controlled entity of Multi Wealth (Singapore) Pte Ltd
Mergui Development Pte Ltd
(Incorporated in Singapore)
59.9% 59.9% Property development
Jointly controlled entity of IOI Consolidated (Singapore) Pte Ltd
Scottsdale Properties Pte Ltd
(Incorporated in Singapore)
49.9% 49.9% Investment holding
Jointly controlled entity of Palmy Max Limited
Prime Joy Investments Limited
(Incorporated in Hong Kong)
– 49.9% Property development and property management
services
50. COMPARATIVES
Pursuant to the demerger as stated in Note 47, the results of the disposal group from 1 July 2012 to 30 June 2013 was presented
as discontinued operations on a single line in the Statements of profit or loss for presentation purposes under FRS 5 Non-Current
Assets Held for Sale and Discontinued Operations. Statements of profit or loss comparatives for financial year ended 30 June 2012
have been re-presented accordingly.
IOI
Cor
por
atio
n B
erh
ad
268
Notes to the Financial Statements
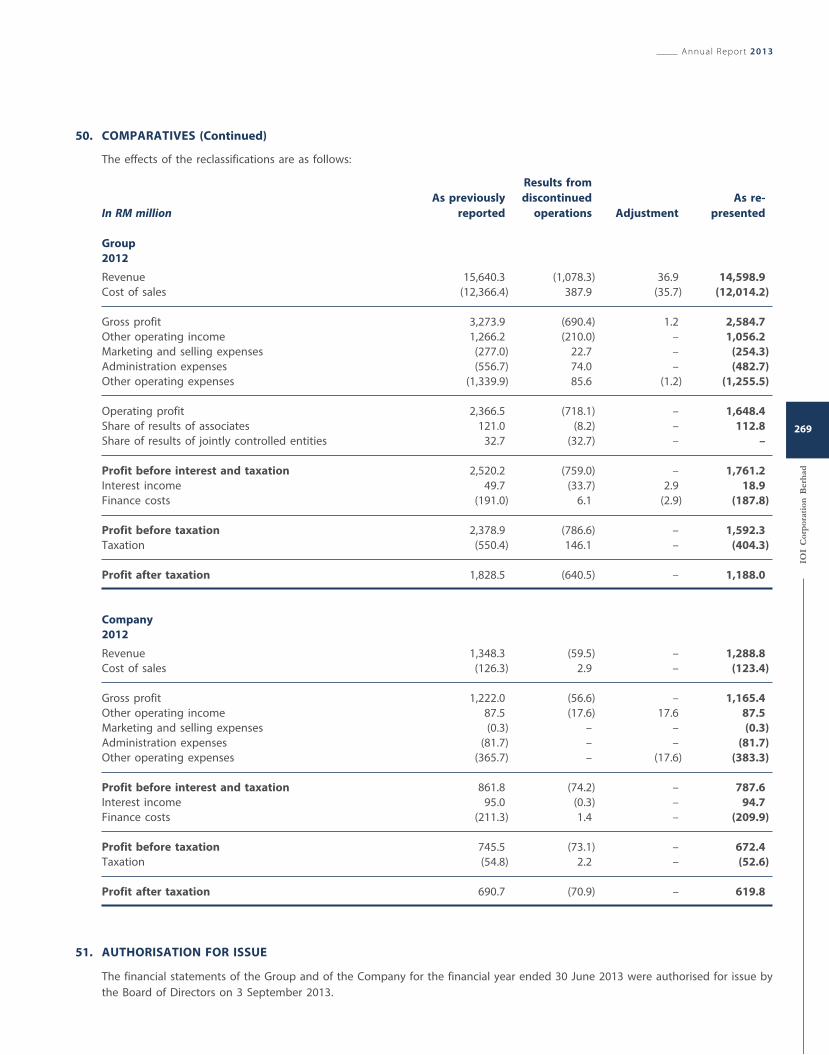
50. COMPARATIVES (Continued)
The effects of the reclassifications are as follows:
Results from
As previously discontinued As re-
In RM million reported operations Adjustment presented
Group
2012
Revenue 15,640.3 (1,078.3) 36.9 14,598.9
Cost of sales (12,366.4) 387.9 (35.7) (12,014.2)
Gross profit 3,273.9 (690.4) 1.2 2,584.7
Other operating income 1,266.2 (210.0) – 1,056.2
Marketing and selling expenses (277.0) 22.7 – (254.3)
Administration expenses (556.7) 74.0 – (482.7)
Other operating expenses (1,339.9) 85.6 (1.2) (1,255.5)
Operating profit 2,366.5 (718.1) – 1,648.4
Share of results of associates 121.0 (8.2) – 112.8
Share of results of jointly controlled entities 32.7 (32.7) – –
Profit before interest and taxation 2,520.2 (759.0) – 1,761.2
Interest income 49.7 (33.7) 2.9 18.9
Finance costs (191.0) 6.1 (2.9) (187.8)
Profit before taxation 2,378.9 (786.6) – 1,592.3
Taxation (550.4) 146.1 – (404.3)
Profit after taxation 1,828.5 (640.5) – 1,188.0
Company
2012
Revenue 1,348.3 (59.5) – 1,288.8
Cost of sales (126.3) 2.9 – (123.4)
Gross profit 1,222.0 (56.6) – 1,165.4
Other operating income 87.5 (17.6) 17.6 87.5
Marketing and selling expenses (0.3) – – (0.3)
Administration expenses (81.7) – – (81.7)
Other operating expenses (365.7) – (17.6) (383.3)
Profit before interest and taxation 861.8 (74.2) – 787.6
Interest income 95.0 (0.3) – 94.7
Finance costs (211.3) 1.4 – (209.9)
Profit before taxation 745.5 (73.1) – 672.4
Taxation (54.8) 2.2 – (52.6)
Profit after taxation 690.7 (70.9) – 619.8
51. AUTHORISATION FOR ISSUE
The financial statements of the Group and of the Company for the financial year ended 30 June 2013 were authorised for issue by
the Board of Directors on 3 September 2013.
Annual Report 2013
IOI
Cor
por
atio
n B
erh
ad
269
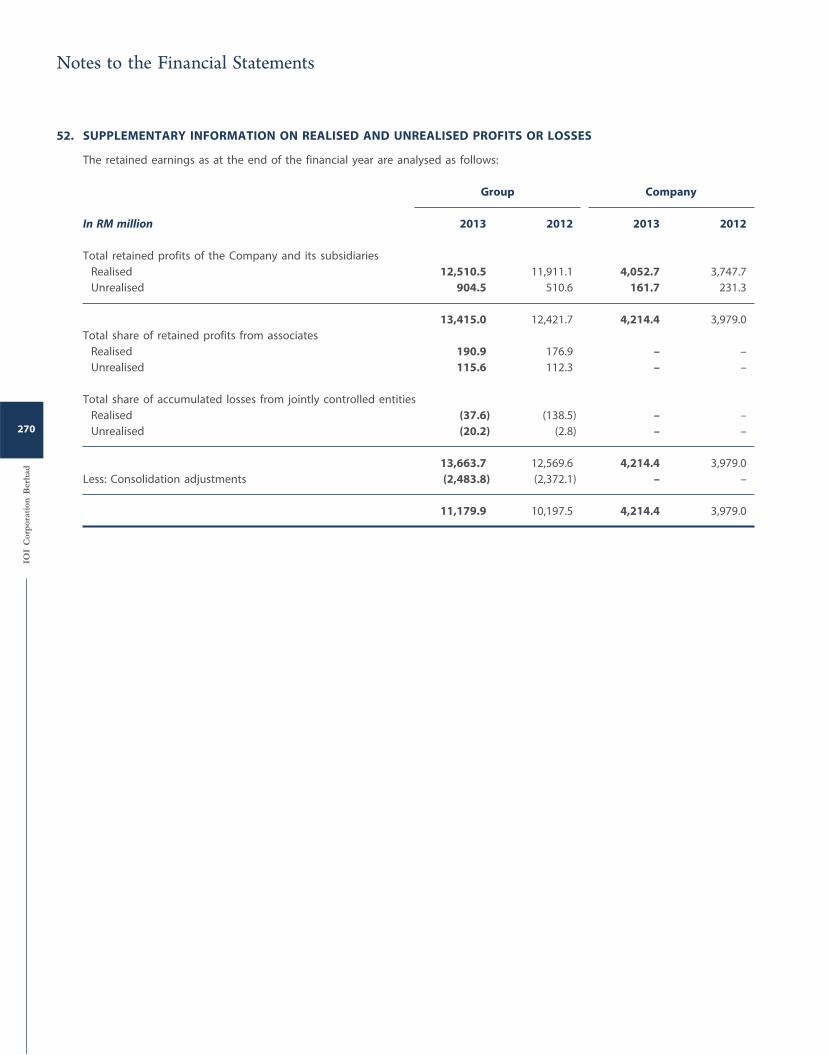
52. SUPPLEMENTARY INFORMATION ON REALISED AND UNREALISED PROFITS OR LOSSES
The retained earnings as at the end of the financial year are analysed as follows:
Group Company
In RM million 2013 2012 2013 2012
Total retained profits of the Company and its subsidiaries
Realised 12,510.5 11,911.1 4,052.7 3,747.7
Unrealised 904.5 510.6 161.7 231.3
13,415.0 12,421.7 4,214.4 3,979.0
Total share of retained profits from associates
Realised 190.9 176.9 – –
Unrealised 115.6 112.3 – –
Total share of accumulated losses from jointly controlled entities
Realised (37.6) (138.5) – –
Unrealised (20.2) (2.8) – –
13,663.7 12,569.6 4,214.4 3,979.0
Less: Consolidation adjustments (2,483.8) (2,372.1) – –
11,179.9 10,197.5 4,214.4 3,979.0
Notes to the Financial Statements
IOI
Cor
por
atio
n B
erh
ad
270
In the opinion of the Directors, the financial statements set out on pages 124 to 269 have been drawn up in accordance with Financial
Reporting Standards and the provisions of the Companies Act, 1965 in Malaysia so as to give a true and fair view of the financial position
of the Group and of the Company as at 30 June 2013 and of their financial performance and cash flows of the Group and of the
Company for the financial year then ended.
In the opinion of the Directors, the information set out in Note 52 to the financial statements on page 270 has been compiled in
accordance with the Guidance on Special Matter No.1, Determination of Realised and Unrealised Profits or Losses in the Context of
Disclosures Pursuant to Bursa Malaysia Securities Berhad Listing Requirements, issued by the Malaysian Institute of Accountants, and
presented based on the format prescribed by Bursa Malaysia Securities Berhad.
Signed on behalf of the Board in accordance with a resolution of the Directors:
Tan Sri Dato’ Lee Shin Cheng
Executive Chairman
Dato’ Lee Yeow Chor
Executive Director
Putrajaya
3 September 2013
I, Wong Tack Wee, being the officer primarily responsible for the financial management of IOI Corporation Berhad, do solemnly and sincerely
declare that the financial statements set out on pages 124 to 270 are, to the best of my knowledge and belief, correct and I make this
solemn declaration conscientiously believing the same to be true and by virtue of the provisions of the Statutory Declarations Act, 1960.
Subscribed and solemnly declared )
by the abovenamed ) Wong Tack Wee
at Puchong, Selangor Darul Ehsan )
this 3 September 2013 )
Before me
Ng Say Jin
Commissioner for Oaths
No. B195
Annual Report 2013
IOI
Cor
por
atio
n B
erh
ad
271
Statement by Directors
Statutory Declaration
REPORT ON THE FINANCIAL STATEMENTS
We have audited the financial statements of IOI Corporation Berhad, which comprise the statements of financial position as at 30 June
2013 of the Group and of the Company, and the statements of profit or loss, statements of other comprehensive income, statements of
changes in equity and statements of cash flows of the Group and of the Company for the financial year then ended, and a summary of
significant accounting policies and other explanatory information, as set out on pages 124 to 269.
Directors’ Responsibility for the Financial Statements
The Directors of the Company are responsible for the preparation of financial statements that give a true and fair view in accordance
with Financial Reporting Standards and the Companies Act, 1965 in Malaysia. The Directors are also responsible for such internal control
as the Directors determine is necessary to enable the preparation of financial statements that are free from material misstatement,
whether due to fraud or errors.
Auditors’ Responsibility
Our responsibility is to express an opinion on these financial statements based on our audit. We conducted our audit in accordance with
approved standards on auditing in Malaysia. Those standards require that we comply with ethical requirements and plan and perform
the audit to obtain reasonable assurance about whether the financial statements are free from material misstatement.
An audit involves performing procedures to obtain audit evidence about the amounts and disclosures in the financial statements. The
procedures selected depend on our judgement, including the assessment of risks of material misstatement of the financial statements,
whether due to fraud or error. In making those risk assessments, we consider internal control relevant to the entity’s preparation of the
financial statements that give a true and fair view in order to design audit procedures that are appropriate in the circumstances, but not
for the purpose of expressing an opinion on the effectiveness of the entity’s internal control. An audit also includes evaluating the
appropriateness of accounting policies used and the reasonableness of accounting estimates made by the Directors, as well as evaluating
the overall presentation of the financial statements.
We believe that the audit evidence we have obtained is sufficient and appropriate to provide a basis for our audit opinion.
Opinion
In our opinion, the financial statements give a true and fair view of the financial position of the Group and of the Company as of 30
June 2013 and of their financial performance and cash flows for the year then ended in accordance with Financial Reporting Standards
and the requirements of the Companies Act, 1965 in Malaysia.
REPORT ON OTHER LEGAL AND REGULATORY REQUIREMENTS
In accordance with the requirements of the Companies Act, 1965 in Malaysia, we also report the following:
(a) In our opinion, the accounting and other records and the registers required by the Act to be kept by the Company and its
subsidiaries of which we have acted as auditors have been properly kept in accordance with the provisions of the Act.
(b) We have considered the financial statements and the auditors’ reports of all the audited subsidiaries of which we have not acted
as auditors, which are indicated in Note 49 to the financial statements.
(c) We are satisfied that the financial statements of the subsidiaries that have been consolidated with the Company’s financial
statements are in form and content appropriate and proper for the purposes of the preparation of the financial statements of the
Group and we have received satisfactory information and explanations required by us for those purposes.
(d) The audit reports on the financial statements of the subsidiaries did not contain any qualification or any adverse comment made
under Section 174(3) of the Act.
IOI
Cor
por
atio
n B
erh
ad
272
Independent Auditors’ Reportto the members of IOI Corporation Berhad
OTHER REPORTING RESPONSIBILITIES
The supplementary information set out in Note 52 to the financial statements is disclosed to meet the requirement of Bursa Malaysia
Securities Berhad and is not part of the financial statements. The Directors are responsible for the preparation of the supplementary
information in accordance with Guidance on Special Matter No. 1, Determination of Realised and Unrealised Profits or Losses in the
Context of Disclosure Pursuant to Bursa Malaysia Securities Berhad Listing Requirements, as issued by the Malaysian Institute of
Accountants (“MIA Guidance”) and the directive of Bursa Malaysia Securities Berhad. In our opinion, the supplementary information is
prepared, in all material respects, in accordance with the MIA Guidance and the directive of Bursa Malaysia Securities Berhad.
OTHER MATTERS
This report is made solely to the members of the Company, as a body, in accordance with Section 174 of the Companies Act, 1965 in
Malaysia and for no other purpose. We do not assume responsibility to any other person for the content of this report.
BDO
AF: 0206
Chartered Accountants
Ooi Thiam Poh
2495/01/14 (J)
Chartered Accountant
Kuala Lumpur
3 September 2013
Annual Report 2013
IOI
Cor
por
atio
n B
erh
ad
273
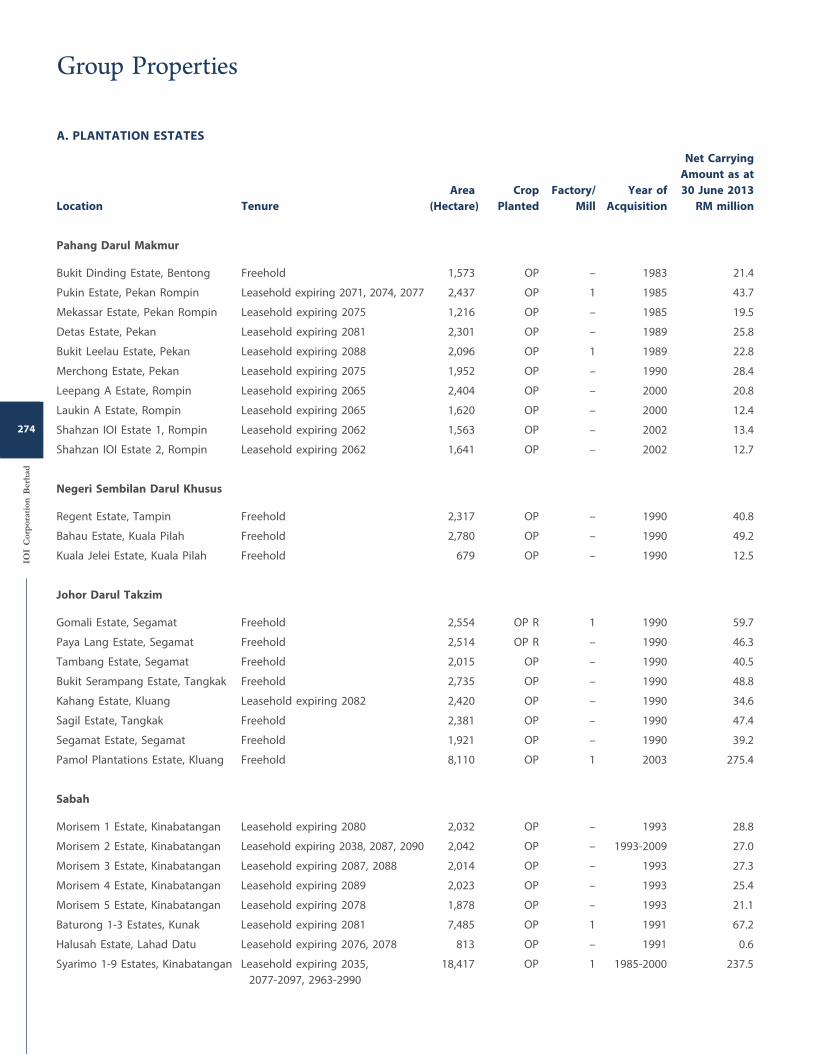
274
A. PLANTATION ESTATES
Location Tenure
Area
(Hectare)
Crop
Planted
Factory/
Mill
Year of
Acquisition
Net Carrying
Amount as at
30 June 2013
RM million
Pahang Darul Makmur
Bukit Dinding Estate, Bentong Freehold 1,573 OP – 1983 21.4
Pukin Estate, Pekan Rompin Leasehold expiring 2071, 2074, 2077 2,437 OP 1 1985 43.7
Mekassar Estate, Pekan Rompin Leasehold expiring 2075 1,216 OP – 1985 19.5
Detas Estate, Pekan Leasehold expiring 2081 2,301 OP – 1989 25.8
Bukit Leelau Estate, Pekan Leasehold expiring 2088 2,096 OP 1 1989 22.8
Merchong Estate, Pekan Leasehold expiring 2075 1,952 OP – 1990 28.4
Leepang A Estate, Rompin Leasehold expiring 2065 2,404 OP – 2000 20.8
Laukin A Estate, Rompin Leasehold expiring 2065 1,620 OP – 2000 12.4
Shahzan IOI Estate 1, Rompin Leasehold expiring 2062 1,563 OP – 2002 13.4
Shahzan IOI Estate 2, Rompin Leasehold expiring 2062 1,641 OP – 2002 12.7
Negeri Sembilan Darul Khusus
Regent Estate, Tampin Freehold 2,317 OP – 1990 40.8
Bahau Estate, Kuala Pilah Freehold 2,780 OP – 1990 49.2
Kuala Jelei Estate, Kuala Pilah Freehold 679 OP – 1990 12.5
Johor Darul Takzim
Gomali Estate, Segamat Freehold 2,554 OP R 1 1990 59.7
Paya Lang Estate, Segamat Freehold 2,514 OP R – 1990 46.3
Tambang Estate, Segamat Freehold 2,015 OP – 1990 40.5
Bukit Serampang Estate, Tangkak Freehold 2,735 OP – 1990 48.8
Kahang Estate, Kluang Leasehold expiring 2082 2,420 OP – 1990 34.6
Sagil Estate, Tangkak Freehold 2,381 OP – 1990 47.4
Segamat Estate, Segamat Freehold 1,921 OP – 1990 39.2
Pamol Plantations Estate, Kluang Freehold 8,110 OP 1 2003 275.4
Sabah
Morisem 1 Estate, Kinabatangan Leasehold expiring 2080 2,032 OP – 1993 28.8
Morisem 2 Estate, Kinabatangan Leasehold expiring 2038, 2087, 2090 2,042 OP – 1993-2009 27.0
Morisem 3 Estate, Kinabatangan Leasehold expiring 2087, 2088 2,014 OP – 1993 27.3
Morisem 4 Estate, Kinabatangan Leasehold expiring 2089 2,023 OP – 1993 25.4
Morisem 5 Estate, Kinabatangan Leasehold expiring 2078 1,878 OP – 1993 21.1
Baturong 1-3 Estates, Kunak Leasehold expiring 2081 7,485 OP 1 1991 67.2
Halusah Estate, Lahad Datu Leasehold expiring 2076, 2078 813 OP – 1991 0.6
Syarimo 1-9 Estates, Kinabatangan Leasehold expiring 2035,
2077-2097, 2963-2990
18,417 OP 1 1985-2000 237.5
IOI
Cor
por
atio
n B
erh
ad
274
Group Properties
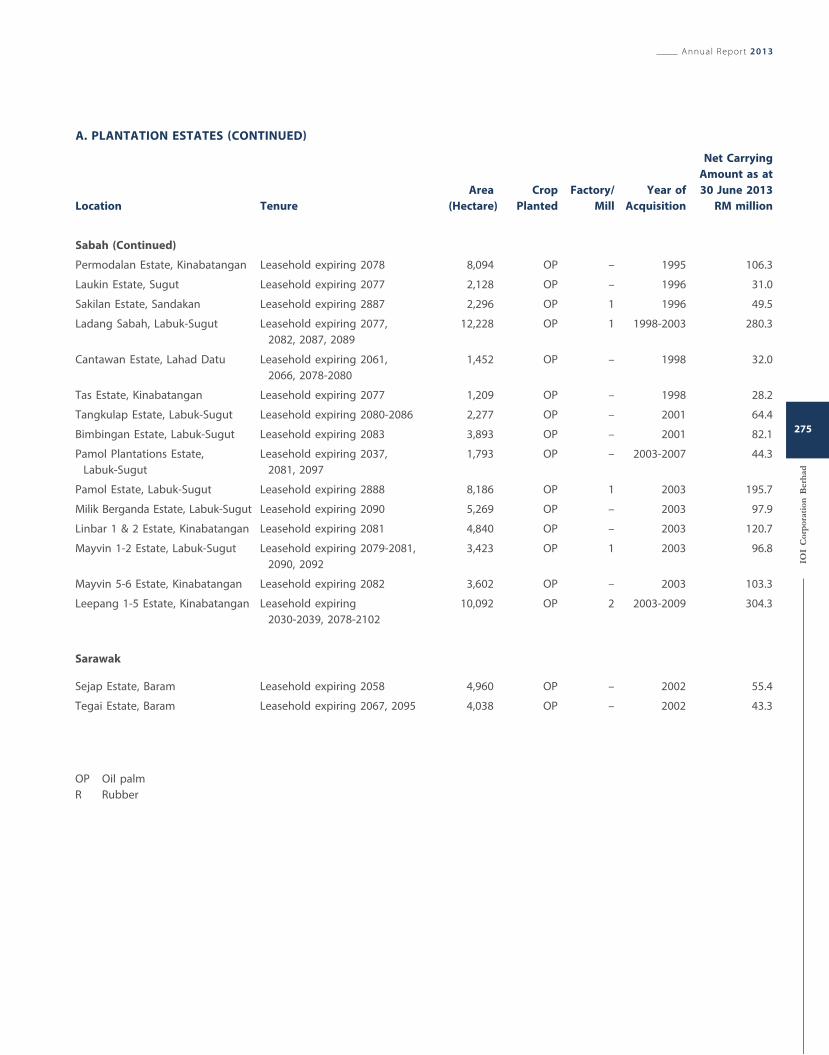
Location Tenure
Area
(Hectare)
Crop
Planted
Factory/
Mill
Year of
Acquisition
Net Carrying
Amount as at
30 June 2013
RM million
Sabah (Continued)
Permodalan Estate, Kinabatangan Leasehold expiring 2078 8,094 OP – 1995 106.3
Laukin Estate, Sugut Leasehold expiring 2077 2,128 OP – 1996 31.0
Sakilan Estate, Sandakan Leasehold expiring 2887 2,296 OP 1 1996 49.5
Ladang Sabah, Labuk-Sugut Leasehold expiring 2077,
2082, 2087, 2089
12,228 OP 1 1998-2003 280.3
Cantawan Estate, Lahad Datu Leasehold expiring 2061,
2066, 2078-2080
1,452 OP – 1998 32.0
Tas Estate, Kinabatangan Leasehold expiring 2077 1,209 OP – 1998 28.2
Tangkulap Estate, Labuk-Sugut Leasehold expiring 2080-2086 2,277 OP – 2001 64.4
Bimbingan Estate, Labuk-Sugut Leasehold expiring 2083 3,893 OP – 2001 82.1
Pamol Plantations Estate,
Labuk-Sugut
Leasehold expiring 2037,
2081, 2097
1,793 OP – 2003-2007 44.3
Pamol Estate, Labuk-Sugut Leasehold expiring 2888 8,186 OP 1 2003 195.7
Milik Berganda Estate, Labuk-Sugut Leasehold expiring 2090 5,269 OP – 2003 97.9
Linbar 1 & 2 Estate, Kinabatangan Leasehold expiring 2081 4,840 OP – 2003 120.7
Mayvin 1-2 Estate, Labuk-Sugut Leasehold expiring 2079-2081,
2090, 2092
3,423 OP 1 2003 96.8
Mayvin 5-6 Estate, Kinabatangan Leasehold expiring 2082 3,602 OP – 2003 103.3
Leepang 1-5 Estate, Kinabatangan Leasehold expiring
2030-2039, 2078-2102
10,092 OP 2 2003-2009 304.3
Sarawak
Sejap Estate, Baram Leasehold expiring 2058 4,960 OP – 2002 55.4
Tegai Estate, Baram Leasehold expiring 2067, 2095 4,038 OP – 2002 43.3
OP Oil palm
R Rubber
A. PLANTATION ESTATES (CONTINUED)
Annual Report 2013
IOI
Cor
por
atio
n B
erh
ad
275
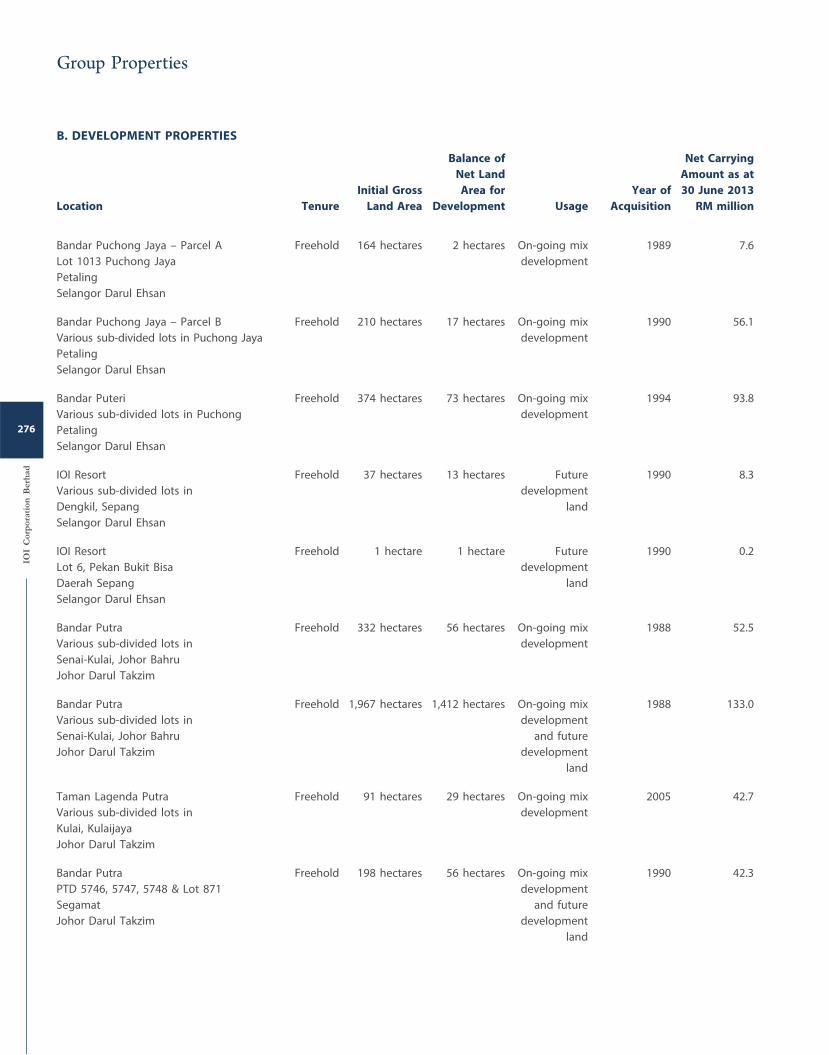
B. DEVELOPMENT PROPERTIES
Location Tenure
Initial Gross
Land Area
Balance of
Net Land
Area for
Development Usage
Year of
Acquisition
Net Carrying
Amount as at
30 June 2013
RM million
Bandar Puchong Jaya – Parcel A
Lot 1013 Puchong Jaya
Petaling
Selangor Darul Ehsan
Freehold 164 hectares 2 hectares On-going mix
development
1989 7.6
Bandar Puchong Jaya – Parcel B
Various sub-divided lots in Puchong Jaya
Petaling
Selangor Darul Ehsan
Freehold 210 hectares 17 hectares On-going mix
development
1990 56.1
Bandar Puteri
Various sub-divided lots in Puchong
Petaling
Selangor Darul Ehsan
Freehold 374 hectares 73 hectares On-going mix
development
1994 93.8
IOI Resort
Various sub-divided lots in
Dengkil, Sepang
Selangor Darul Ehsan
Freehold 37 hectares 13 hectares Future
development
land
1990 8.3
IOI Resort
Lot 6, Pekan Bukit Bisa
Daerah Sepang
Selangor Darul Ehsan
Freehold 1 hectare 1 hectare Future
development
land
1990 0.2
Bandar Putra
Various sub-divided lots in
Senai-Kulai, Johor Bahru
Johor Darul Takzim
Freehold 332 hectares 56 hectares On-going mix
development
1988 52.5
Bandar Putra
Various sub-divided lots in
Senai-Kulai, Johor Bahru
Johor Darul Takzim
Freehold 1,967 hectares 1,412 hectares On-going mix
development
and future
development
land
1988 133.0
Taman Lagenda Putra
Various sub-divided lots in
Kulai, Kulaijaya
Johor Darul Takzim
Freehold 91 hectares 29 hectares On-going mix
development
2005 42.7
Bandar Putra
PTD 5746, 5747, 5748 & Lot 871
Segamat
Johor Darul Takzim
Freehold 198 hectares 56 hectares On-going mix
development
and future
development
land
1990 42.3
IOI
Cor
por
atio
n B
erh
ad
276
Group Properties
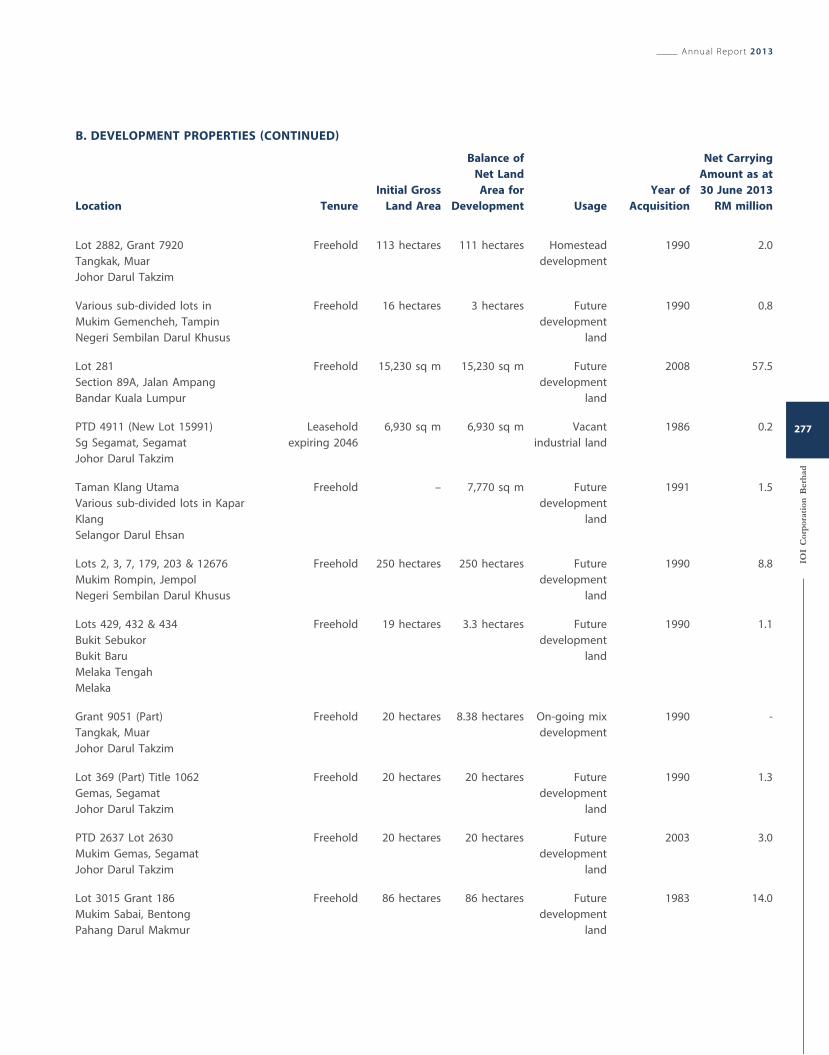
Location Tenure
Initial Gross
Land Area
Balance of
Net Land
Area for
Development Usage
Year of
Acquisition
Net Carrying
Amount as at
30 June 2013
RM million
Lot 2882, Grant 7920
Tangkak, Muar
Johor Darul Takzim
Freehold 113 hectares 111 hectares Homestead
development
1990 2.0
Various sub-divided lots in
Mukim Gemencheh, Tampin
Negeri Sembilan Darul Khusus
Freehold 16 hectares 3 hectares Future
development
land
1990 0.8
Lot 281
Section 89A, Jalan Ampang
Bandar Kuala Lumpur
Freehold 15,230 sq m 15,230 sq m Future
development
land
2008 57.5
PTD 4911 (New Lot 15991)
Sg Segamat, Segamat
Johor Darul Takzim
Leasehold
expiring 2046
6,930 sq m 6,930 sq m Vacant
industrial land
1986 0.2
Taman Klang Utama
Various sub-divided lots in Kapar
Klang
Selangor Darul Ehsan
Freehold – 7,770 sq m Future
development
land
1991 1.5
Lots 2, 3, 7, 179, 203 & 12676
Mukim Rompin, Jempol
Negeri Sembilan Darul Khusus
Freehold 250 hectares 250 hectares Future
development
land
1990 8.8
Lots 429, 432 & 434
Bukit Sebukor
Bukit Baru
Melaka Tengah
Melaka
Freehold 19 hectares 3.3 hectares Future
development
land
1990 1.1
Grant 9051 (Part)
Tangkak, Muar
Johor Darul Takzim
Freehold 20 hectares 8.38 hectares On-going mix
development
1990 -
Lot 369 (Part) Title 1062
Gemas, Segamat
Johor Darul Takzim
Freehold 20 hectares 20 hectares Future
development
land
1990 1.3
PTD 2637 Lot 2630
Mukim Gemas, Segamat
Johor Darul Takzim
Freehold 20 hectares 20 hectares Future
development
land
2003 3.0
Lot 3015 Grant 186
Mukim Sabai, Bentong
Pahang Darul Makmur
Freehold 86 hectares 86 hectares Future
development
land
1983 14.0
B. DEVELOPMENT PROPERTIES (CONTINUED)
Annual Report 2013
IOI
Cor
por
atio
n B
erh
ad
277
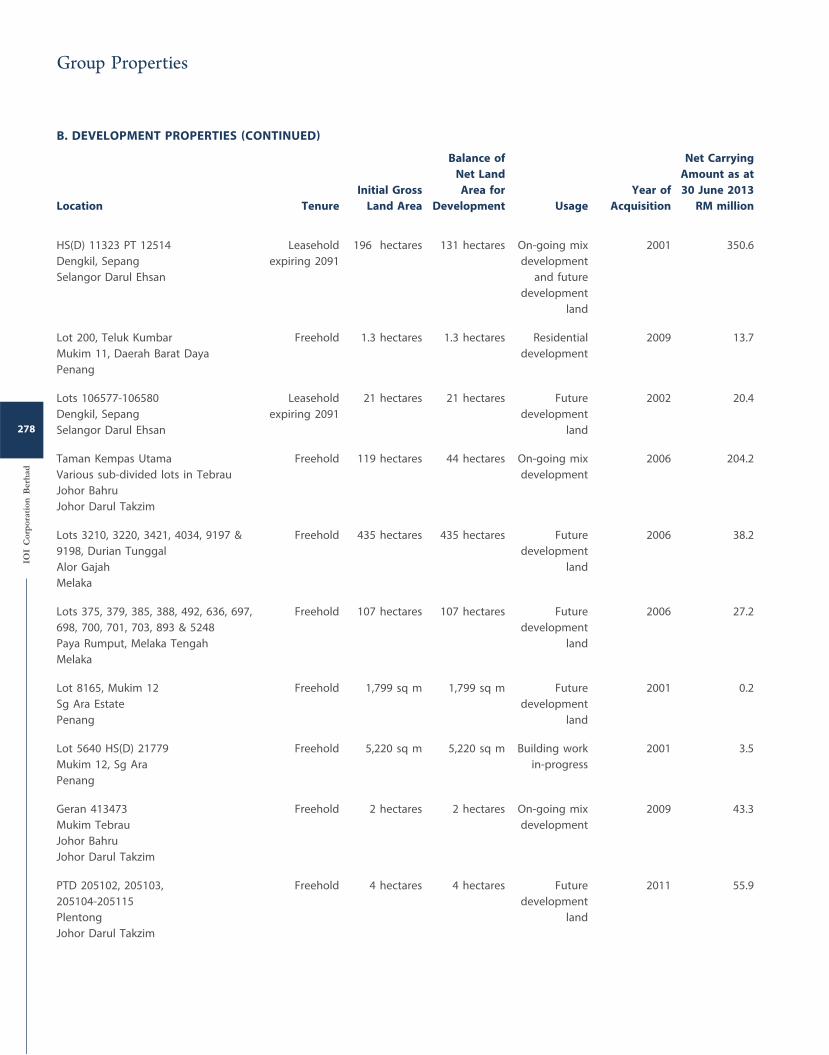
Location Tenure
Initial Gross
Land Area
Balance of
Net Land
Area for
Development Usage
Year of
Acquisition
Net Carrying
Amount as at
30 June 2013
RM million
HS(D) 11323 PT 12514
Dengkil, Sepang
Selangor Darul Ehsan
Leasehold
expiring 2091
196 hectares 131 hectares On-going mix
development
and future
development
land
2001 350.6
Lot 200, Teluk Kumbar
Mukim 11, Daerah Barat Daya
Penang
Freehold 1.3 hectares 1.3 hectares Residential
development
2009 13.7
Lots 106577-106580
Dengkil, Sepang
Selangor Darul Ehsan
Leasehold
expiring 2091
21 hectares 21 hectares Future
development
land
2002 20.4
Taman Kempas Utama
Various sub-divided lots in Tebrau
Johor Bahru
Johor Darul Takzim
Freehold 119 hectares 44 hectares On-going mix
development
2006 204.2
Lots 3210, 3220, 3421, 4034, 9197 &
9198, Durian Tunggal
Alor Gajah
Melaka
Freehold 435 hectares 435 hectares Future
development
land
2006 38.2
Lots 375, 379, 385, 388, 492, 636, 697,
698, 700, 701, 703, 893 & 5248
Paya Rumput, Melaka Tengah
Melaka
Freehold 107 hectares 107 hectares Future
development
land
2006 27.2
Lot 8165, Mukim 12
Sg Ara Estate
Penang
Freehold 1,799 sq m 1,799 sq m Future
development
land
2001 0.2
Lot 5640 HS(D) 21779
Mukim 12, Sg Ara
Penang
Freehold 5,220 sq m 5,220 sq m Building work
in-progress
2001 3.5
Geran 413473
Mukim Tebrau
Johor Bahru
Johor Darul Takzim
Freehold 2 hectares 2 hectares On-going mix
development
2009 43.3
PTD 205102, 205103,
205104-205115
Plentong
Johor Darul Takzim
Freehold 4 hectares 4 hectares Future
development
land
2011 55.9
B. DEVELOPMENT PROPERTIES (CONTINUED)
IOI
Cor
por
atio
n B
erh
ad
278
Group Properties
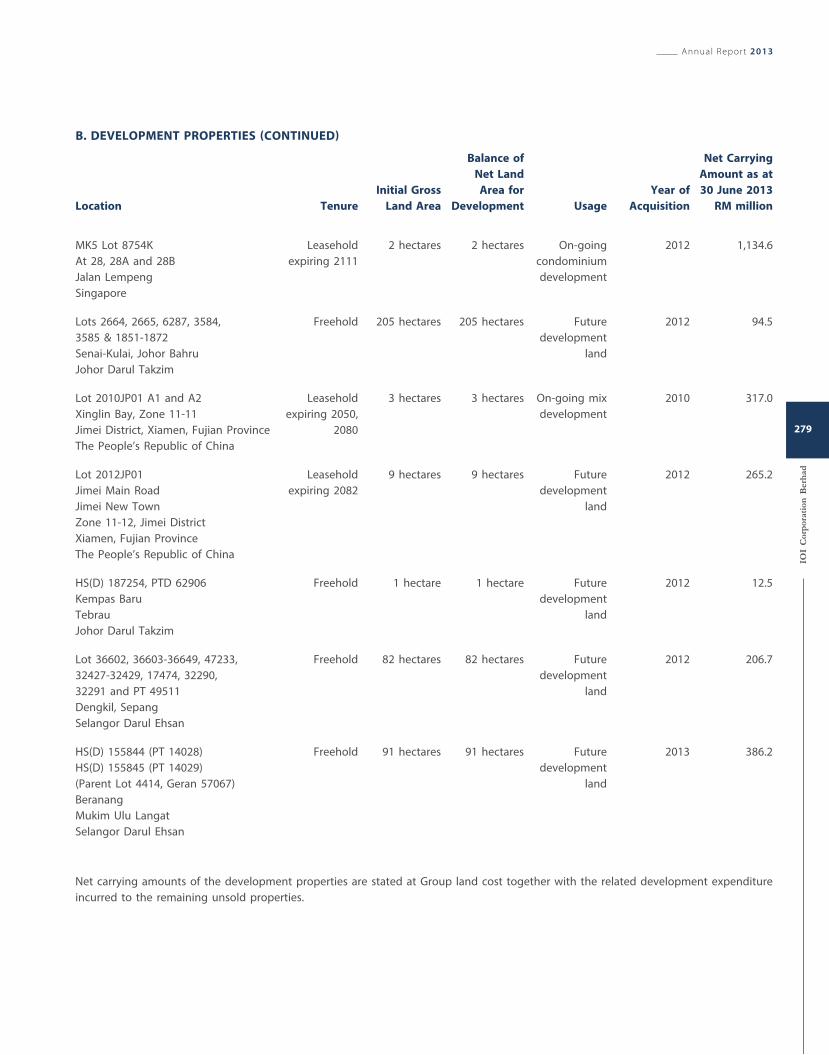
B. DEVELOPMENT PROPERTIES (CONTINUED)
Location Tenure
Initial Gross
Land Area
Balance of
Net Land
Area for
Development Usage
Year of
Acquisition
Net Carrying
Amount as at
30 June 2013
RM million
MK5 Lot 8754K
At 28, 28A and 28B
Jalan Lempeng
Singapore
Leasehold
expiring 2111
2 hectares 2 hectares On-going
condominium
development
2012 1,134.6
Lots 2664, 2665, 6287, 3584,
3585 & 1851-1872
Senai-Kulai, Johor Bahru
Johor Darul Takzim
Freehold 205 hectares 205 hectares Future
development
land
2012 94.5
Lot 2010JP01 A1 and A2
Xinglin Bay, Zone 11-11
Jimei District, Xiamen, Fujian Province
The People’s Republic of China
Leasehold
expiring 2050,
2080
3 hectares 3 hectares On-going mix
development
2010 317.0
Lot 2012JP01
Jimei Main Road
Jimei New Town
Zone 11-12, Jimei District
Xiamen, Fujian Province
The People’s Republic of China
Leasehold
expiring 2082
9 hectares 9 hectares Future
development
land
2012 265.2
HS(D) 187254, PTD 62906
Kempas Baru
Tebrau
Johor Darul Takzim
Freehold 1 hectare 1 hectare Future
development
land
2012 12.5
Lot 36602, 36603-36649, 47233,
32427-32429, 17474, 32290,
32291 and PT 49511
Dengkil, Sepang
Selangor Darul Ehsan
Freehold 82 hectares 82 hectares Future
development
land
2012 206.7
HS(D) 155844 (PT 14028)
HS(D) 155845 (PT 14029)
(Parent Lot 4414, Geran 57067)
Beranang
Mukim Ulu Langat
Selangor Darul Ehsan
Freehold 91 hectares 91 hectares Future
development
land
2013 386.2
Net carrying amounts of the development properties are stated at Group land cost together with the related development expenditure
incurred to the remaining unsold properties.
Annual Report 2013
IOI
Cor
por
atio
n B
erh
ad
279
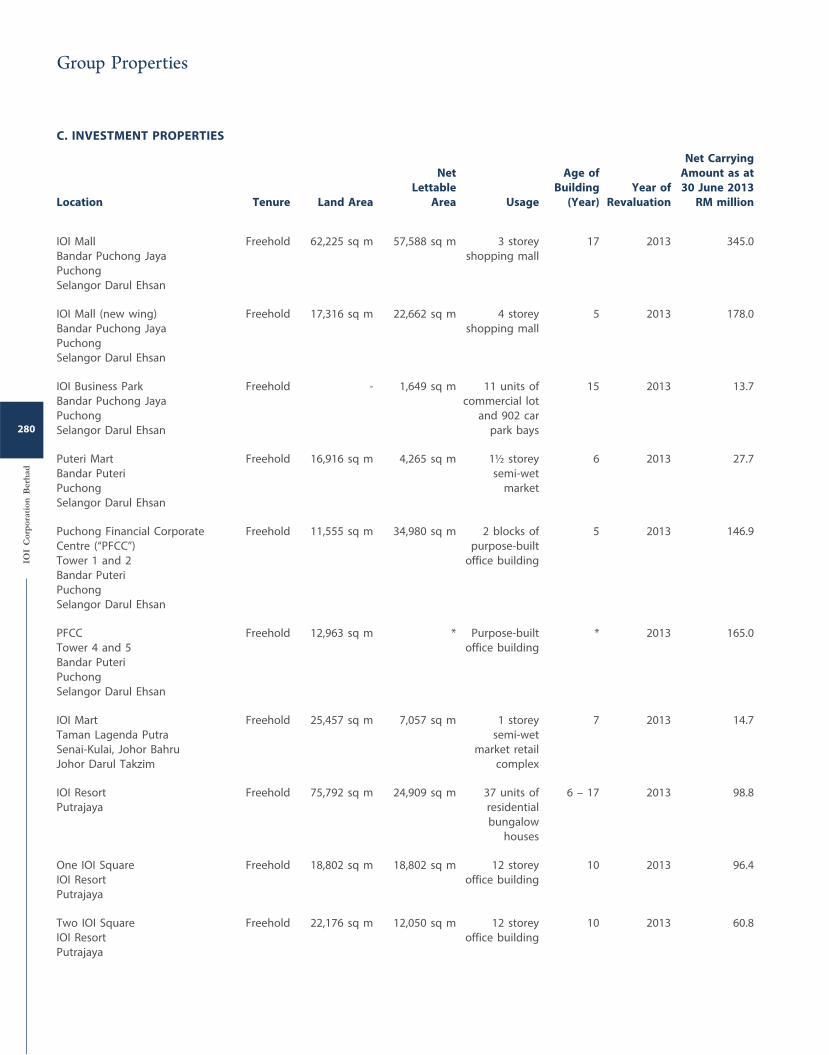
C. INVESTMENT PROPERTIES
Location Tenure Land Area
Net
Lettable
Area Usage
Age of
Building
(Year)
Year of
Revaluation
Net Carrying
Amount as at
30 June 2013
RM million
IOI Mall
Bandar Puchong Jaya
Puchong
Selangor Darul Ehsan
Freehold 62,225 sq m 57,588 sq m 3 storey
shopping mall
17 2013 345.0
IOI Mall (new wing)
Bandar Puchong Jaya
Puchong
Selangor Darul Ehsan
Freehold 17,316 sq m 22,662 sq m 4 storey
shopping mall
5 2013 178.0
IOI Business Park
Bandar Puchong Jaya
Puchong
Selangor Darul Ehsan
Freehold - 1,649 sq m 11 units of
commercial lot
and 902 car
park bays
15 2013 13.7
Puteri Mart
Bandar Puteri
Puchong
Selangor Darul Ehsan
Freehold 16,916 sq m 4,265 sq m 1½ storey
semi-wet
market
6 2013 27.7
Puchong Financial Corporate
Centre (“PFCC”)
Tower 1 and 2
Bandar Puteri
Puchong
Selangor Darul Ehsan
Freehold 11,555 sq m 34,980 sq m 2 blocks of
purpose-built
office building
5 2013 146.9
PFCC
Tower 4 and 5
Bandar Puteri
Puchong
Selangor Darul Ehsan
Freehold 12,963 sq m * Purpose-built
office building
* 2013 165.0
IOI Mart
Taman Lagenda Putra
Senai-Kulai, Johor Bahru
Johor Darul Takzim
Freehold 25,457 sq m 7,057 sq m 1 storey
semi-wet
market retail
complex
7 2013 14.7
IOI Resort
Putrajaya
Freehold 75,792 sq m 24,909 sq m 37 units of
residential
bungalow
houses
6 – 17 2013 98.8
One IOI Square
IOI Resort
Putrajaya
Freehold 18,802 sq m 18,802 sq m 12 storey
office building
10 2013 96.4
Two IOI Square
IOI Resort
Putrajaya
Freehold 22,176 sq m 12,050 sq m 12 storey
office building
10 2013 60.8
IOI
Cor
por
atio
n B
erh
ad
280
Group Properties
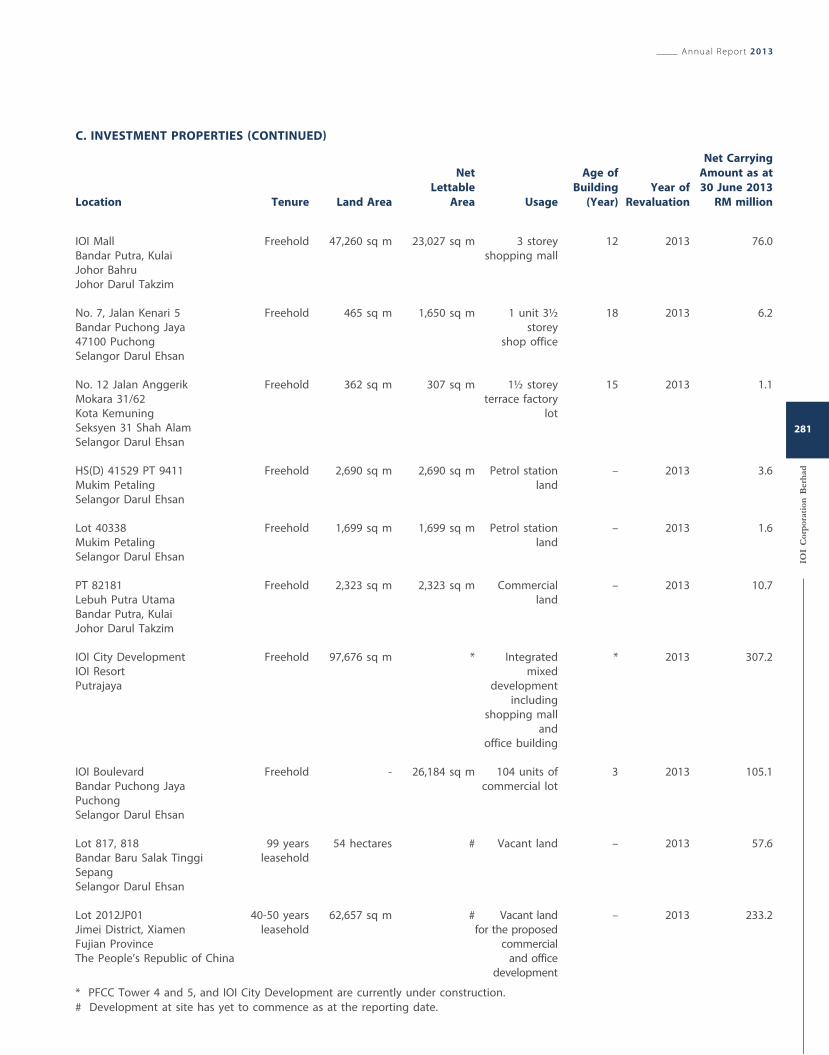
Location Tenure Land Area
Net
Lettable
Area Usage
Age of
Building
(Year)
Year of
Revaluation
Net Carrying
Amount as at
30 June 2013
RM million
IOI Mall
Bandar Putra, Kulai
Johor Bahru
Johor Darul Takzim
Freehold 47,260 sq m 23,027 sq m 3 storey
shopping mall
12 2013 76.0
No. 7, Jalan Kenari 5
Bandar Puchong Jaya
47100 Puchong
Selangor Darul Ehsan
Freehold 465 sq m 1,650 sq m 1 unit 3½
storey
shop office
18 2013 6.2
No. 12 Jalan Anggerik
Mokara 31/62
Kota Kemuning
Seksyen 31 Shah Alam
Selangor Darul Ehsan
Freehold 362 sq m 307 sq m 1½ storey
terrace factory
lot
15 2013 1.1
HS(D) 41529 PT 9411
Mukim Petaling
Selangor Darul Ehsan
Freehold 2,690 sq m 2,690 sq m Petrol station
land
– 2013 3.6
Lot 40338
Mukim Petaling
Selangor Darul Ehsan
Freehold 1,699 sq m 1,699 sq m Petrol station
land
– 2013 1.6
PT 82181
Lebuh Putra Utama
Bandar Putra, Kulai
Johor Darul Takzim
Freehold 2,323 sq m 2,323 sq m Commercial
land
– 2013 10.7
IOI City Development
IOI Resort
Putrajaya
Freehold 97,676 sq m * Integrated
mixed
development
including
shopping mall
and
office building
* 2013 307.2
IOI Boulevard
Bandar Puchong Jaya
Puchong
Selangor Darul Ehsan
Freehold - 26,184 sq m 104 units of
commercial lot
3 2013 105.1
Lot 817, 818
Bandar Baru Salak Tinggi
Sepang
Selangor Darul Ehsan
99 years
leasehold
54 hectares # Vacant land – 2013 57.6
Lot 2012JP01
Jimei District, Xiamen
Fujian Province
The People’s Republic of China
40-50 years
leasehold
62,657 sq m # Vacant land
for the proposed
commercial
and office
development
– 2013 233.2
* PFCC Tower 4 and 5, and IOI City Development are currently under construction.
# Development at site has yet to commence as at the reporting date.
C. INVESTMENT PROPERTIES (CONTINUED)
Annual Report 2013
IOI
Cor
por
atio
n B
erh
ad
281
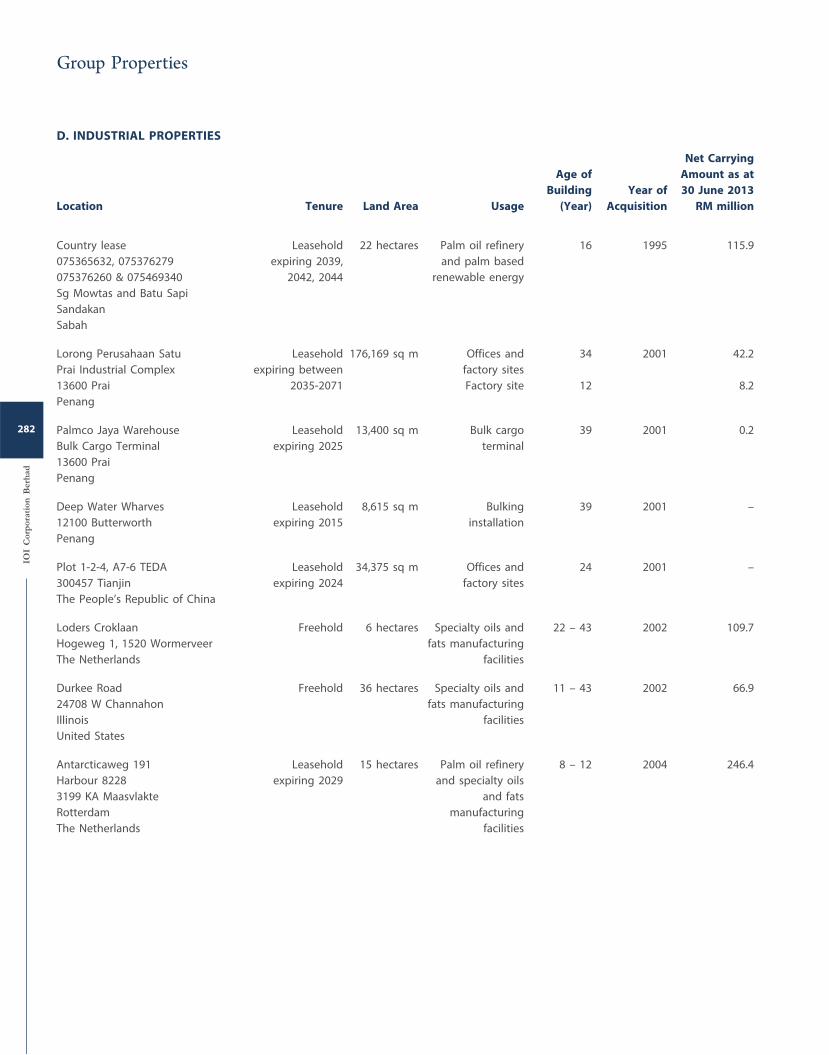
D. INDUSTRIAL PROPERTIES
Location Tenure Land Area Usage
Age of
Building
(Year)
Year of
Acquisition
Net Carrying
Amount as at
30 June 2013
RM million
Country lease
075365632, 075376279
075376260 & 075469340
Sg Mowtas and Batu Sapi
Sandakan
Sabah
Leasehold
expiring 2039,
2042, 2044
22 hectares Palm oil refinery
and palm based
renewable energy
16 1995 115.9
Lorong Perusahaan Satu
Prai Industrial Complex
13600 Prai
Penang
Leasehold
expiring between
2035-2071
176,169 sq m Offices and
factory sites
Factory site
34
12
2001 42.2
8.2
Palmco Jaya Warehouse
Bulk Cargo Terminal
13600 Prai
Penang
Leasehold
expiring 2025
13,400 sq m Bulk cargo
terminal
39 2001 0.2
Deep Water Wharves
12100 Butterworth
Penang
Leasehold
expiring 2015
8,615 sq m Bulking
installation
39 2001 –
Plot 1-2-4, A7-6 TEDA
300457 Tianjin
The People’s Republic of China
Leasehold
expiring 2024
34,375 sq m Offices and
factory sites
24 2001 –
Loders Croklaan
Hogeweg 1, 1520 Wormerveer
The Netherlands
Freehold 6 hectares Specialty oils and
fats manufacturing
facilities
22 – 43 2002 109.7
Durkee Road
24708 W Channahon
Illinois
United States
Freehold 36 hectares Specialty oils and
fats manufacturing
facilities
11 – 43 2002 66.9
Antarcticaweg 191
Harbour 8228
3199 KA Maasvlakte
Rotterdam
The Netherlands
Leasehold
expiring 2029
15 hectares Palm oil refinery
and specialty oils
and fats
manufacturing
facilities
8 – 12 2004 246.4
IOI
Cor
por
atio
n B
erh
ad
282
Group Properties
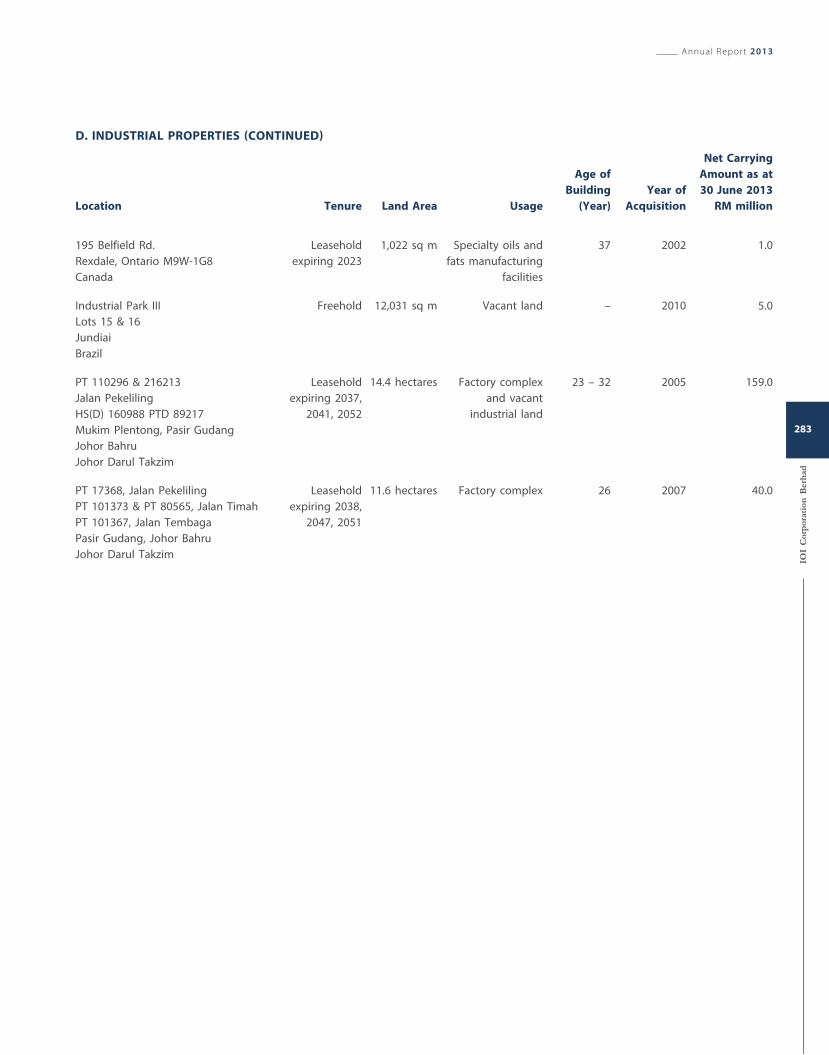
Location Tenure Land Area Usage
Age of
Building
(Year)
Year of
Acquisition
Net Carrying
Amount as at
30 June 2013
RM million
195 Belfield Rd.
Rexdale, Ontario M9W-1G8
Canada
Leasehold
expiring 2023
1,022 sq m Specialty oils and
fats manufacturing
facilities
37 2002 1.0
Industrial Park III
Lots 15 & 16
Jundiai
Brazil
Freehold 12,031 sq m Vacant land – 2010 5.0
PT 110296 & 216213
Jalan Pekeliling
HS(D) 160988 PTD 89217
Mukim Plentong, Pasir Gudang
Johor Bahru
Johor Darul Takzim
Leasehold
expiring 2037,
2041, 2052
14.4 hectares Factory complex
and vacant
industrial land
23 – 32 2005 159.0
PT 17368, Jalan Pekeliling
PT 101373 & PT 80565, Jalan Timah
PT 101367, Jalan Tembaga
Pasir Gudang, Johor Bahru
Johor Darul Takzim
Leasehold
expiring 2038,
2047, 2051
11.6 hectares Factory complex 26 2007 40.0
D. INDUSTRIAL PROPERTIES (CONTINUED)
Annual Report 2013
IOI
Cor
por
atio
n B
erh
ad
283
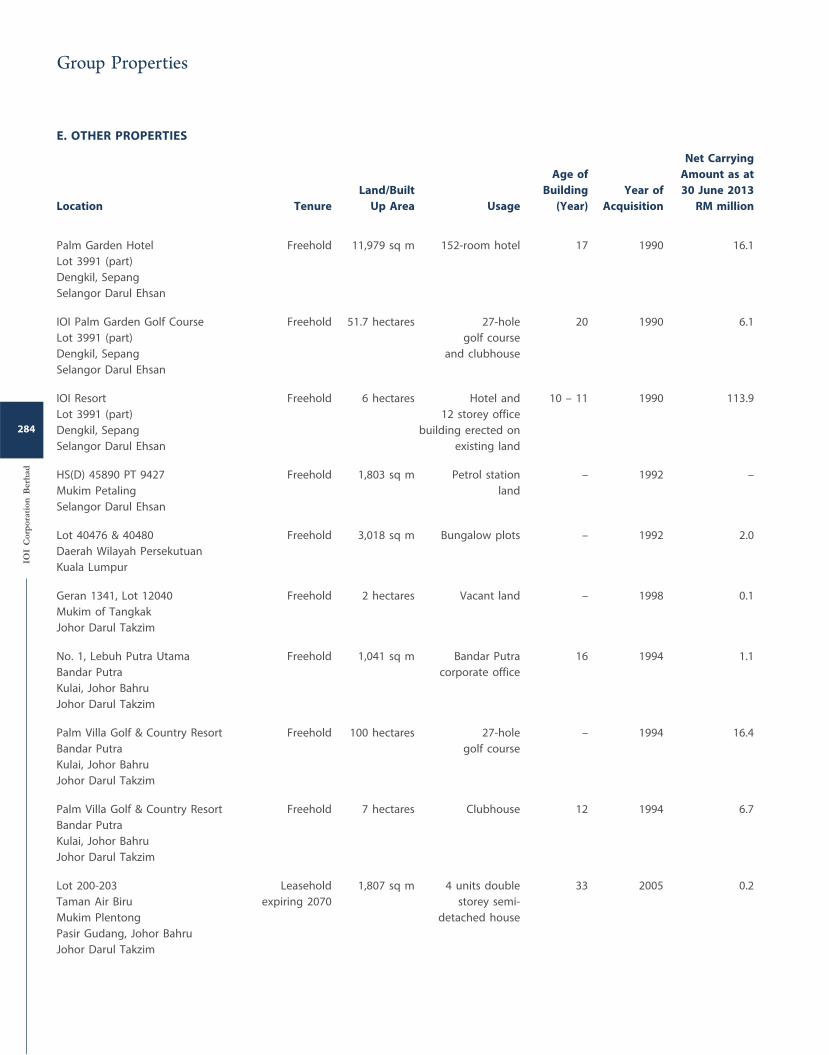
E. OTHER PROPERTIES
Location Tenure
Land/Built
Up Area Usage
Age of
Building
(Year)
Year of
Acquisition
Net Carrying
Amount as at
30 June 2013
RM million
Palm Garden Hotel
Lot 3991 (part)
Dengkil, Sepang
Selangor Darul Ehsan
Freehold 11,979 sq m 152-room hotel 17 1990 16.1
IOI Palm Garden Golf Course
Lot 3991 (part)
Dengkil, Sepang
Selangor Darul Ehsan
Freehold 51.7 hectares 27-hole
golf course
and clubhouse
20 1990 6.1
IOI Resort
Lot 3991 (part)
Dengkil, Sepang
Selangor Darul Ehsan
Freehold 6 hectares Hotel and
12 storey office
building erected on
existing land
10 – 11 1990 113.9
HS(D) 45890 PT 9427
Mukim Petaling
Selangor Darul Ehsan
Freehold 1,803 sq m Petrol station
land
– 1992 –
Lot 40476 & 40480
Daerah Wilayah Persekutuan
Kuala Lumpur
Freehold 3,018 sq m Bungalow plots – 1992 2.0
Geran 1341, Lot 12040
Mukim of Tangkak
Johor Darul Takzim
Freehold 2 hectares Vacant land – 1998 0.1
No. 1, Lebuh Putra Utama
Bandar Putra
Kulai, Johor Bahru
Johor Darul Takzim
Freehold 1,041 sq m Bandar Putra
corporate office
16 1994 1.1
Palm Villa Golf & Country Resort
Bandar Putra
Kulai, Johor Bahru
Johor Darul Takzim
Freehold 100 hectares 27-hole
golf course
– 1994 16.4
Palm Villa Golf & Country Resort
Bandar Putra
Kulai, Johor Bahru
Johor Darul Takzim
Freehold 7 hectares Clubhouse 12 1994 6.7
Lot 200-203
Taman Air Biru
Mukim Plentong
Pasir Gudang, Johor Bahru
Johor Darul Takzim
Leasehold
expiring 2070
1,807 sq m 4 units double
storey semi-
detached house
33 2005 0.2
IOI
Cor
por
atio
n B
erh
ad
284
Group Properties
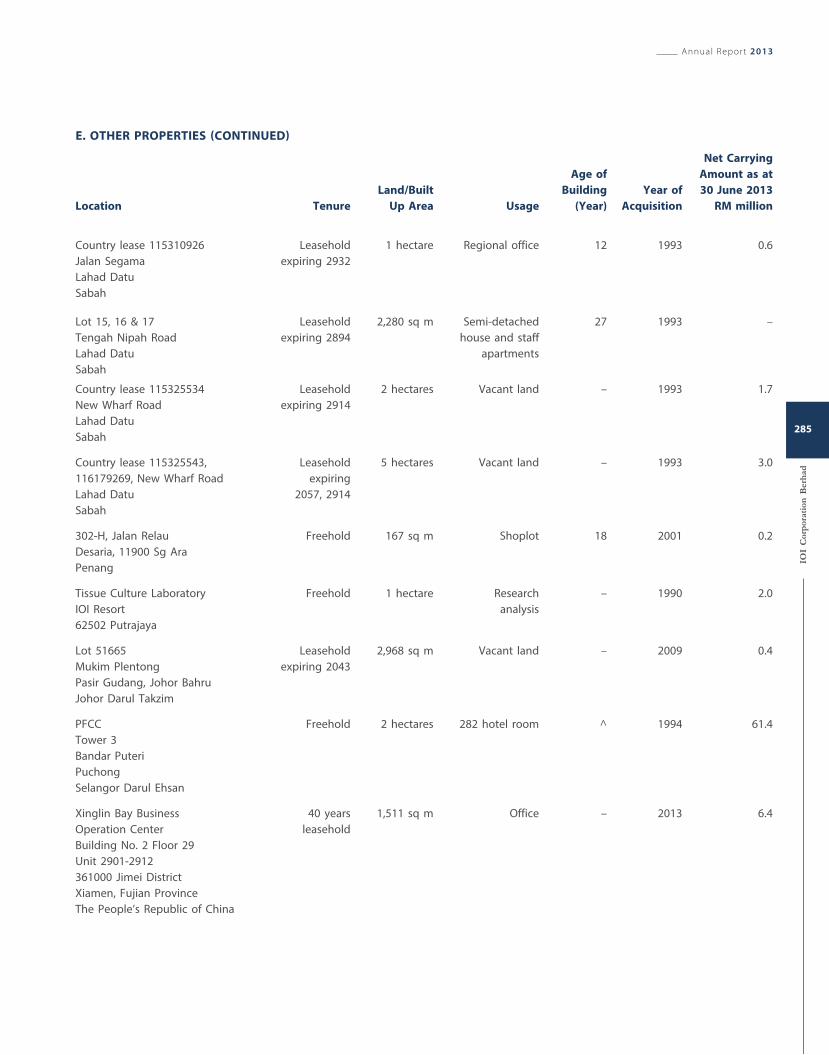
Location Tenure
Land/Built
Up Area Usage
Age of
Building
(Year)
Year of
Acquisition
Net Carrying
Amount as at
30 June 2013
RM million
Country lease 115310926
Jalan Segama
Lahad Datu
Sabah
Leasehold
expiring 2932
1 hectare Regional office 12 1993 0.6
Lot 15, 16 & 17
Tengah Nipah Road
Lahad Datu
Sabah
Leasehold
expiring 2894
2,280 sq m Semi-detached
house and staff
apartments
27 1993 –
Country lease 115325534
New Wharf Road
Lahad Datu
Sabah
Leasehold
expiring 2914
2 hectares Vacant land – 1993 1.7
Country lease 115325543,
116179269, New Wharf Road
Lahad Datu
Sabah
Leasehold
expiring
2057, 2914
5 hectares Vacant land – 1993 3.0
302-H, Jalan Relau
Desaria, 11900 Sg Ara
Penang
Freehold 167 sq m Shoplot 18 2001 0.2
Tissue Culture Laboratory
IOI Resort
62502 Putrajaya
Freehold 1 hectare Research
analysis
– 1990 2.0
Lot 51665
Mukim Plentong
Pasir Gudang, Johor Bahru
Johor Darul Takzim
Leasehold
expiring 2043
2,968 sq m Vacant land – 2009 0.4
PFCC
Tower 3
Bandar Puteri
Puchong
Selangor Darul Ehsan
Freehold 2 hectares 282 hotel room ^ 1994 61.4
Xinglin Bay Business
Operation Center
Building No. 2 Floor 29
Unit 2901-2912
361000 Jimei District
Xiamen, Fujian Province
The People’s Republic of China
40 years
leasehold
1,511 sq m Office – 2013 6.4
E. OTHER PROPERTIES (CONTINUED)
Annual Report 2013
IOI
Cor
por
atio
n B
erh
ad
285
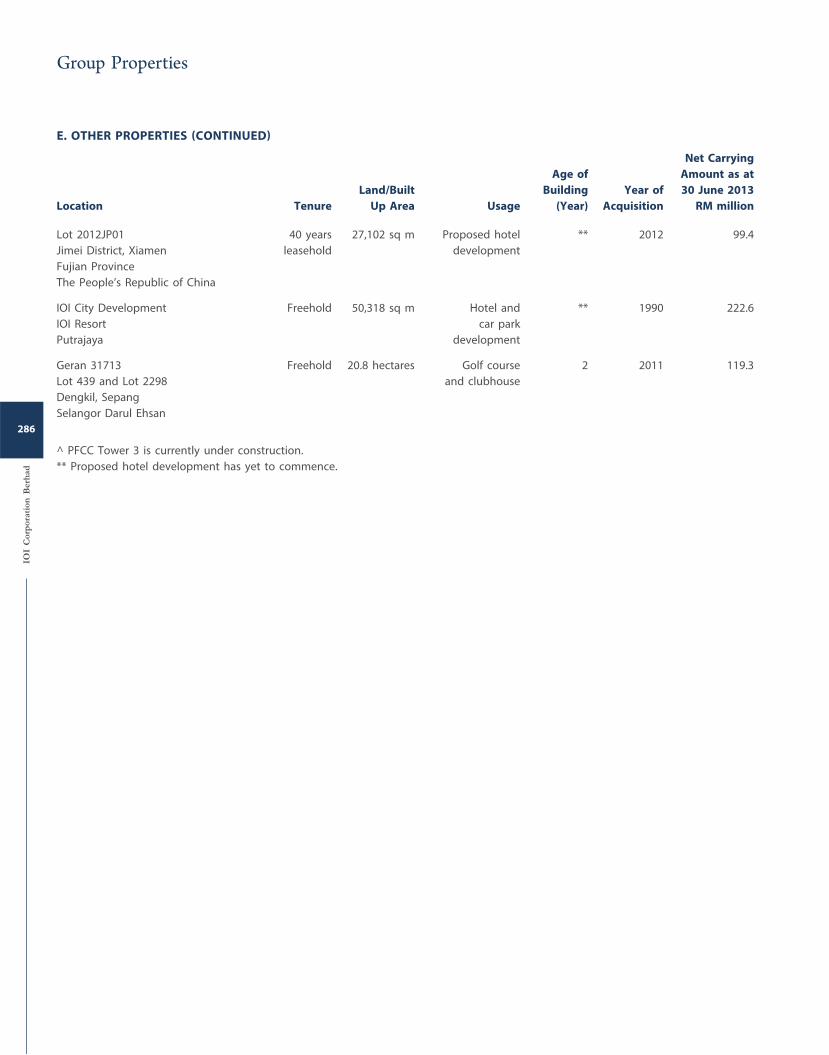
Location Tenure
Land/Built
Up Area Usage
Age of
Building
(Year)
Year of
Acquisition
Net Carrying
Amount as at
30 June 2013
RM million
Lot 2012JP01
Jimei District, Xiamen
Fujian Province
The People’s Republic of China
40 years
leasehold
27,102 sq m Proposed hotel
development
** 2012 99.4
IOI City Development
IOI Resort
Putrajaya
Freehold 50,318 sq m Hotel and
car park
development
** 1990 222.6
Geran 31713
Lot 439 and Lot 2298
Dengkil, Sepang
Selangor Darul Ehsan
Freehold 20.8 hectares Golf course
and clubhouse
2 2011 119.3
^ PFCC Tower 3 is currently under construction.
** Proposed hotel development has yet to commence.
E. OTHER PROPERTIES (CONTINUED)
IOI
Cor
por
atio
n B
erh
ad
286
Group Properties
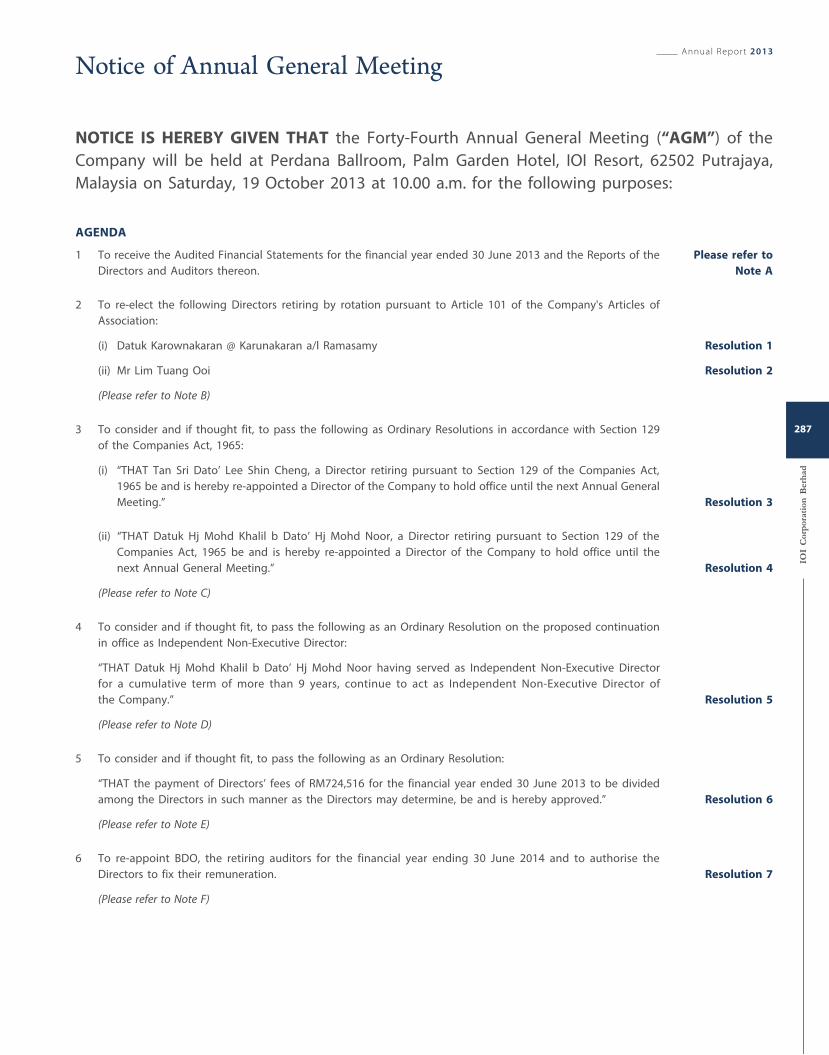
NOTICE IS HEREBY GIVEN THAT the Forty-Fourth Annual General Meeting (“AGM”) of the
Company will be held at Perdana Ballroom, Palm Garden Hotel, IOI Resort, 62502 Putrajaya,
Malaysia on Saturday, 19 October 2013 at 10.00 a.m. for the following purposes:
AGENDA
1 To receive the Audited Financial Statements for the financial year ended 30 June 2013 and the Reports of the
Directors and Auditors thereon.
Please refer to
Note A
2 To re-elect the following Directors retiring by rotation pursuant to Article 101 of the Company's Articles of
Association:
(i) Datuk Karownakaran @ Karunakaran a/l Ramasamy Resolution 1
(ii) Mr Lim Tuang Ooi Resolution 2
(Please refer to Note B)
3 To consider and if thought fit, to pass the following as Ordinary Resolutions in accordance with Section 129
of the Companies Act, 1965:
(i) “THAT Tan Sri Dato’ Lee Shin Cheng, a Director retiring pursuant to Section 129 of the Companies Act,
1965 be and is hereby re-appointed a Director of the Company to hold office until the next Annual General
Meeting.” Resolution 3
(ii) “THAT Datuk Hj Mohd Khalil b Dato’ Hj Mohd Noor, a Director retiring pursuant to Section 129 of the
Companies Act, 1965 be and is hereby re-appointed a Director of the Company to hold office until the
next Annual General Meeting.” Resolution 4
(Please refer to Note C)
4 To consider and if thought fit, to pass the following as an Ordinary Resolution on the proposed continuation
in office as Independent Non-Executive Director:
“THAT Datuk Hj Mohd Khalil b Dato’ Hj Mohd Noor having served as Independent Non-Executive Director
for a cumulative term of more than 9 years, continue to act as Independent Non-Executive Director of
the Company.” Resolution 5
(Please refer to Note D)
5 To consider and if thought fit, to pass the following as an Ordinary Resolution:
“THAT the payment of Directors’ fees of RM724,516 for the financial year ended 30 June 2013 to be divided
among the Directors in such manner as the Directors may determine, be and is hereby approved.” Resolution 6
(Please refer to Note E)
6 To re-appoint BDO, the retiring auditors for the financial year ending 30 June 2014 and to authorise the
Directors to fix their remuneration. Resolution 7
(Please refer to Note F)
Annual Report 2013
IOI
Cor
por
atio
n B
erh
ad
287
Notice of Annual General Meeting
AGENDA (CONTINUED)
7 As special business, to consider and if thought fit, to pass the following Ordinary Resolutions:
7.1 Authority to Directors to allot and issue shares pursuant to Section 132D of the Companies Act, 1965
“THAT pursuant to Section 132D of the Companies Act, 1965, the Directors be and are hereby authorised
with full powers to allot and issue shares in the Company from time to time and upon such terms and
conditions and for such purposes as they may deem fit subject always to the approval of the relevant
authorities being obtained for such issue and provided that the aggregate number of shares to be issued
pursuant to this resolution does not exceed ten percent (10%) of the issued share capital for the time
being of the Company and that such authority shall continue in force until the conclusion of the next
Annual General Meeting of the Company and that the Directors be and are also empowered to obtain
the approval from Bursa Malaysia Securities Berhad for the listing of and quotation for the additional
shares so issued.” Resolution 8
7.2 Proposed Renewal of Existing Share Buy-Back Authority
“THAT subject to compliance with applicable laws, regulations and the approval of all relevant authorities,
approval be and is hereby given to the Company to utilise up to the aggregate of the Company’s latest
audited retained earnings and share premium account, to purchase, from time to time during the validity
of the approval and authority under this resolution, such number of ordinary shares of nominal value
RM0.10 each in the Company as may be determined by the Directors of the Company from time to time
through Bursa Malaysia Securities Berhad (“Bursa Securities”) upon such terms and conditions as the
Directors may deem fit and expedient in the interest of the Company provided that the aggregate
number of shares to be purchased and/or held by the Company pursuant to this resolution does not
exceed ten percent (10%) of the issued and paid-up ordinary share capital of the Company at the time
of purchase (“Proposed Purchase”);
THAT at the discretion of the Directors of the Company, the shares of the Company to be purchased are
to be cancelled and/or retained as treasury shares and distributed as dividends or resold on Bursa
Securities and/or cancelled;
THAT the Directors of the Company be and are hereby empowered generally to do all acts and things
to give effect to the Proposed Purchase with full powers to assent to any condition, modification,
revaluation, variation and/or amendment (if any) as may be imposed by the relevant authorities and/or
do all such acts and things as the Directors may deem fit and expedient in the best interest of the
Company;
AND THAT such authority shall commence immediately upon passing of this resolution until:
(i) the conclusion of the next Annual General Meeting of the Company at which time the authority
shall lapse unless by ordinary resolution passed at a general meeting, the authority is renewed
either unconditionally or subject to conditions;
(ii) the expiration of the period within which the next Annual General Meeting after that date is
required by law to be held; or
(iii) revoked or varied by ordinary resolution of the shareholders of the Company in a general meeting,
whichever is the earlier but not so as to prejudice the completion of purchase(s) by the Company before
the aforesaid expiry date and, in any event, in accordance with the provisions of the Main Market Listing
Requirements of Bursa Securities or any other relevant authorities.” Resolution 9
IOI
Cor
por
atio
n B
erh
ad
288
Notice of Annual General Meeting
AGENDA (CONTINUED)
7.3 Proposed Renewal of Shareholders’ Mandate for Recurrent Related Party Transactions of a Revenue
or Trading Nature and Proposed New Shareholders’ Mandate for Additional Recurrent Related Party
Transaction of a Revenue or Trading Nature
“THAT subject always to the provisions of the Companies Act, 1965 (“the Act”), the Memorandum and
Articles of Association of the Company, Main Market Listing Requirements of Bursa Malaysia Securities
Berhad or other regulatory authorities, approval be and is hereby given to the Company and/or its
subsidiaries to enter into recurrent related party transactions of a revenue or trading nature which are
necessary for day-to-day operations involving the interests of Directors, Major Shareholders or persons
connected to the Directors and/or Major Shareholders of the Company and its subsidiaries (“Related
Parties”), as detailed in Part B, Section 4 of the Circular to Shareholders of the Company dated 27
September 2013 (“Shareholders’ Mandate”) subject to the following:
(a) the transactions are carried out in the ordinary course of business on normal commercial terms
which are not more favourable to the Related Parties than those generally available to the public
and are not to the detriment of the minority shareholders of the Company; and
(b) disclosure is made in the annual report of the aggregate value of transactions conducted pursuant
to the Shareholders’ Mandate during the financial year.
THAT authority conferred by this resolution will commence immediately upon the passing of this
Ordinary Resolution and shall continue to be in force until:
(i) the conclusion of the next Annual General Meeting of the Company, at which time it will lapse,
unless renewed by a resolution passed by the shareholders of the Company in a general meeting;
(ii) the expiration of the period within which the next Annual General Meeting of the Company after that
date it is required to be held pursuant to Section 143(1) of the Act, (but shall not extend to such
extension as may be allowed pursuant to Section 143(2) of the Act); or
(iii) revoked or varied by resolution passed by the shareholders of the Company in a general meeting,
whichever is the earlier,
AND THAT the Directors of the Company be and are hereby authorised to complete and do all such acts
and things as they may consider expedient or necessary to give effect to the Shareholders’ Mandate.” Resolution 10
8 As special business, to consider and if thought fit, to pass the following Special Resolution:
Proposed Amendments to the Articles of Association of the Company
“THAT the proposed amendments to the Articles of Association of the Company as contained in the Appendix
1 attached to the Annual Report 2013 be and are hereby approved.”
Special
Resolution 1
9 To transact any other business of which due notice shall have been given in accordance with the Companies
Act, 1965 and the Company’s Articles of Association.
By Order of the Board,
Tan Choong Khiang
Secretary (MAICSA 7018448)
Putrajaya
27 September 2013
Annual Report 2013
IOI
Cor
por
atio
n B
erh
ad
289
Notes
1 A member may appoint any person to be his proxy and there shall be no restriction as to the qualification of the proxy. The provision of Section 149(1)(b) of
the Companies Act, 1965 shall not apply to the Company.
2 An instrument appointing a proxy must be in writing under the hand of the appointor or of his attorney duly authorised in writing or, if the appointor is a
corporation, either under seal or under the hand of an officer or attorney duly authorised.
3 Subject to Note 4 below, a member shall not be entitled to appoint more than two (2) proxies to attend and vote at the same meeting. If a member appoints
two (2) proxies to attend at the same meeting, the instrument of proxy must specify the proportion of his shareholdings to be represented by each proxy.
4 Where a member of the company is an exempt authorised nominee which holds ordinary shares in the Company for multiple beneficial owners in one (1)
securities account, there is no limit to the number of proxies which the exempt authorised nominee may appoint in respect of each omnibus account it holds.
An exempt authorised nominee refers to an authorised nominee defined under the Securities Industry (Central Depositories) Act 1991 (“SICDA”) which is
exempted from compliance with the provisions of 25A(1) of the SICDA.
5 An instrument appointing a proxy may specify the manner in which the proxy is to vote in respect of a particular resolution and, where an instrument of proxy
so provides, the proxy is not entitled to vote on the resolution except as specified in the instrument.
6 An instrument appointing a proxy must be deposited at the Company's registered office at Two IOI Square, IOI Resort, 62502 Putrajaya, Malaysia not less than
48 hours before the time for holding the meeting or any adjournment thereof.
7 Only members whose names appear in the Record of Depositors as at 11 October 2013 shall be eligible to attend the AGM or appoint proxy to attend and
vote on his behalf.
8 Note A
This Agenda item is meant for discussion only as under the provision of Section 169(1) of the Companies Act, 1965, the audited financial statements do not
require a formal approval of the shareholders. Hence, this resolution will not put forward for voting.
9 Note B
Datuk Karownakaran @ Karunakaran a/l Ramasamy and Mr Lim Tuang Ooi are standing for re-election as Directors of the Company and being eligible, have
offered themselves for re-election at this AGM.
Datuk Karownakaran @ Karunakaran a/l Ramasamy has provided an annual confirmation of his independence to the Board. The Board has conducted an
assessment on the independence and performance of the Independent Director and Non-Independent Non-Executive Director, respectively, who are seeking
re-election at this AGM of the Company and is satisfied that the incumbents have complied with criteria applied by the Company.
10 Note C
The re-appointment of Tan Sri Dato’ Lee Shin Cheng and Datuk Hj Mohd Khalil b Dato’ Hj Mohd Noor who have attained the age of 70 years, as
Directors of the Company to hold office until the conclusion of the next AGM, shall take effect if the Ordinary Resolutions 3 and 4 are passed by a majority of
not less than three-fourths of such members as being entitled to vote in person or by proxy at this AGM of which not less than 21 days’ notice has been given.
11 Note D
The Nominating Committee and the Board have assessed the independence of Datuk Hj Mohd Khalil b Dato’ Hj Mohd Noor who has served as Independent
Non-Executive Director of the Company for a cumulative term of more than 9 years and recommended him to continue to act as Independent Non-Executive
Director of the Company.
12 Note E
The increase in Directors’ fees payout for the year ended 30 June 2013 (2012: RM660,000) is due to additional appointment of Mr Cheah Tek Kuang on
22 August 2012.
13 Note F
The Audit and Risk Management Committee and the Board have considered the re-appointment of BDO as Auditors of the Company and collectively agreed
that BDO has met the relevant criteria prescribed by Paragraph 15.21 of the Main Market Listing Requirements of Bursa Malaysia Securities Berhad.
IOI
Cor
por
atio
n B
erh
ad
290
Notice of Annual General Meeting
14 Explanatory Notes on Special Businesses
i Authority to Directors to allot and issue shares pursuant to Section 132D of the Companies Act, 1965
Ordinary resolution 8 is to seek a renewal of the general mandate which was approved at the 43rd Annual General Meeting of the Company held on 29
October 2012 and which will lapse at the conclusion of the forthcoming Annual General Meeting to be held on 19 October 2013.
The general mandate, if approved, will provide flexibility to the Company for any possible fund raising activities, including but not limited to placing of
shares for the purpose of funding future investment project(s) and acquisition(s) and for strategic reasons. In order to eliminate any delay and costs in
convening a general meeting to specifically approve such issuance of shares, it is considered appropriate that the Directors be empowered, as proposed
under ordinary resolution 8, to allot and issue shares in the Company up to an amount not exceeding in total ten percent (10%) of the issued share capital
of the Company for the time being. This authority, unless revoked or varied at a general meeting, will expire at the conclusion of the next Annual General
Meeting of the Company.
The Company did not issue any new shares pursuant to Section 132D of the Companies Act, 1965 under the general mandate which was approved at the
43rd Annual General Meeting of the Company.
ii Proposed Renewal of Existing Share Buy-Back Authority
Ordinary resolution 9, if passed, will empower the Company to purchase up to ten percent (10%) of the issued and paid-up ordinary share capital of the
Company through Bursa Malaysia Securities Berhad. This authority unless revoked or varied at a general meeting, will expire at the conclusion of the next
Annual General Meeting of the Company.
Please refer to explanatory information in the Circular to Shareholders dated 27 September 2013.
iii Proposed Renewal of Shareholders’ Mandate for Recurrent Related Party Transactions of a Revenue or Trading Nature and Proposed New
Shareholders’ Mandate for Additional Recurrent Related Party Transaction of a Revenue or Trading Nature (“Proposed Shareholders’ Mandate”)
Ordinary resolution 10 is to seek approval from the shareholders for renewal of the shareholders’ mandate granted by the shareholders of the Company
at the previous Annual General Meeting held on 29 October 2012 and new shareholders’ mandate for additional recurrent related party transaction of a
revenue or trading nature. The Proposed Shareholders’ Mandate will enable the Company and its subsidiaries to enter into any of the recurrent related
party transactions of a revenue or trading nature which are necessary for the day-to-day operations involving the interest of Directors, Major Shareholders
or persons connected to the Directors and/or Major Shareholders of the Company and its subsidiaries (“Related Parties”), subject to the transactions being
in the ordinary course of business on normal commercial terms which are not more favourable to the Related Parties than those generally available to the
public and are not to the detriment of the minority shareholders of the Company. This authority unless revoked or varied at a general meeting, will expire
at the conclusion of the next Annual General Meeting of the Company.
The details of the proposal are set out in the Circular to Shareholders dated 27 September 2013.
iv Proposed Amendments to the Articles of Association of the Company
Special resolution 1, if passed, will give authority to the Company to amend its Articles of Association to be aligned with the recent amendments to the
Main Market Listing Requirements of Bursa Malaysia Securities Berhad.
Annual Report 2013
IOI
Cor
por
atio
n B
erh
ad
291
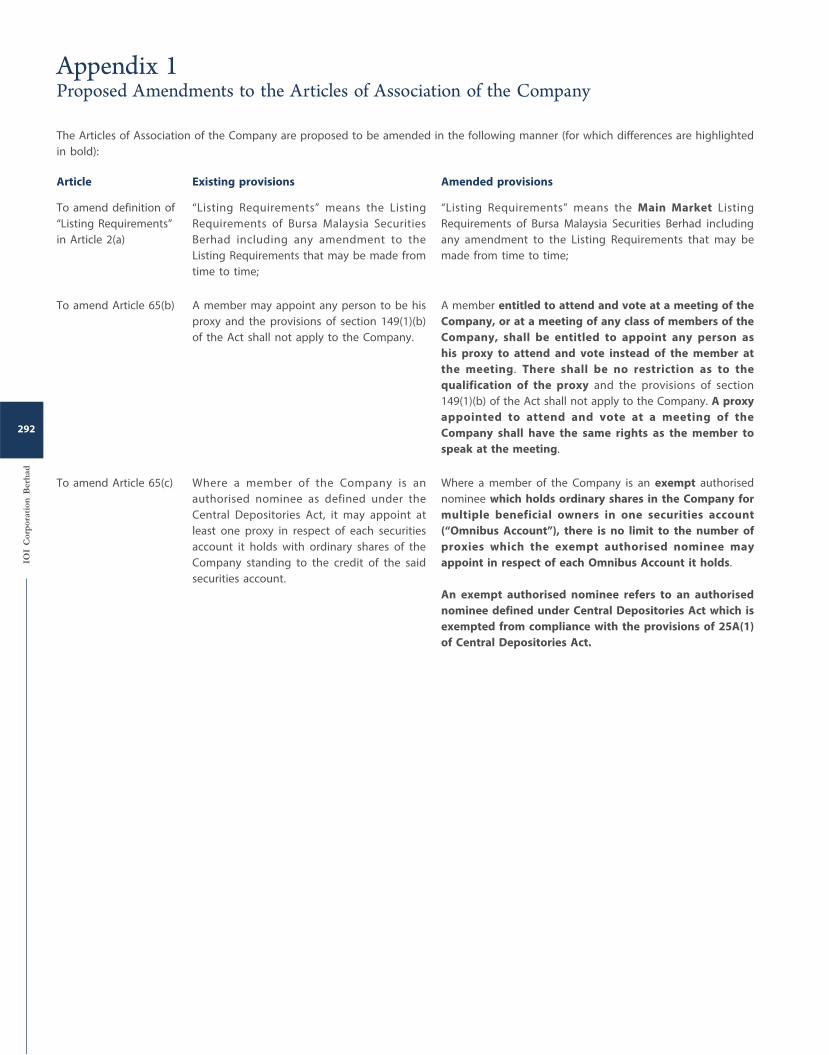
The Articles of Association of the Company are proposed to be amended in the following manner (for which differences are highlighted
in bold):
Article Existing provisions Amended provisions
To amend definition of
“Listing Requirements”
in Article 2(a)
“Listing Requirements” means the Listing
Requirements of Bursa Malaysia Securities
Berhad including any amendment to the
Listing Requirements that may be made from
time to time;
“Listing Requirements” means the Main Market Listing
Requirements of Bursa Malaysia Securities Berhad including
any amendment to the Listing Requirements that may be
made from time to time;
To amend Article 65(b) A member may appoint any person to be his
proxy and the provisions of section 149(1)(b)
of the Act shall not apply to the Company.
A member entitled to attend and vote at a meeting of the
Company, or at a meeting of any class of members of the
Company, shall be entitled to appoint any person as
his proxy to attend and vote instead of the member at
the meeting. There shall be no restriction as to the
qualification of the proxy and the provisions of section
149(1)(b) of the Act shall not apply to the Company. A proxy
appointed to attend and vote at a meeting of the
Company shall have the same rights as the member to
speak at the meeting.
To amend Article 65(c) Where a member of the Company is an
authorised nominee as defined under the
Central Depositories Act, it may appoint at
least one proxy in respect of each securities
account it holds with ordinary shares of the
Company standing to the credit of the said
securities account.
Where a member of the Company is an exempt authorised
nominee which holds ordinary shares in the Company for
multiple beneficial owners in one securities account
(“Omnibus Account”), there is no limit to the number of
proxies which the exempt authorised nominee may
appoint in respect of each Omnibus Account it holds.
An exempt authorised nominee refers to an authorised
nominee defined under Central Depositories Act which is
exempted from compliance with the provisions of 25A(1)
of Central Depositories Act.
IOI
Cor
por
atio
n B
erh
ad
292
Appendix 1Proposed Amendments to the Articles of Association of the Company
(i) Details of individuals who are standing for election as Directors (excluding directors standing for a re-election)
No individual is seeking election as a Director at the forthcoming Forty-Fourth Annual General Meeting of the Company.
(ii) Directors standing for re-election/re-appointment
(a) The Directors retiring by rotation and standing for re-election pursuant to Article 101 of the Articles of Association of the
Company are as follows:
• Datuk Karownakaran @ Karunakaran a/l Ramasamy
• Mr Lim Tuang Ooi
(b) The Directors seeking for re-appointment under Section 129 of the Companies Act, 1965 are as follows:
• Tan Sri Dato’ Lee Shin Cheng
• Datuk Hj Mohd Khalil b Dato’ Hj Mohd Noor
The profiles of the above-named Directors are set out in the section entitled “Profile of Directors” on pages 66 to 73 of the
Annual Report.
Their shareholdings in the Company and its related corporations are set out in the section entitled “Statement of Directors’ Interests” on
page 109 of the Annual Report.
Annual Report 2013
IOI
Cor
por
atio
n B
erh
ad
293
Statement Accompanying Notice of Annual General MeetingPursuant to Paragraph 8.27 (2) of the Main Market Listing Requirements of Bursa Malaysia Securities Berhad
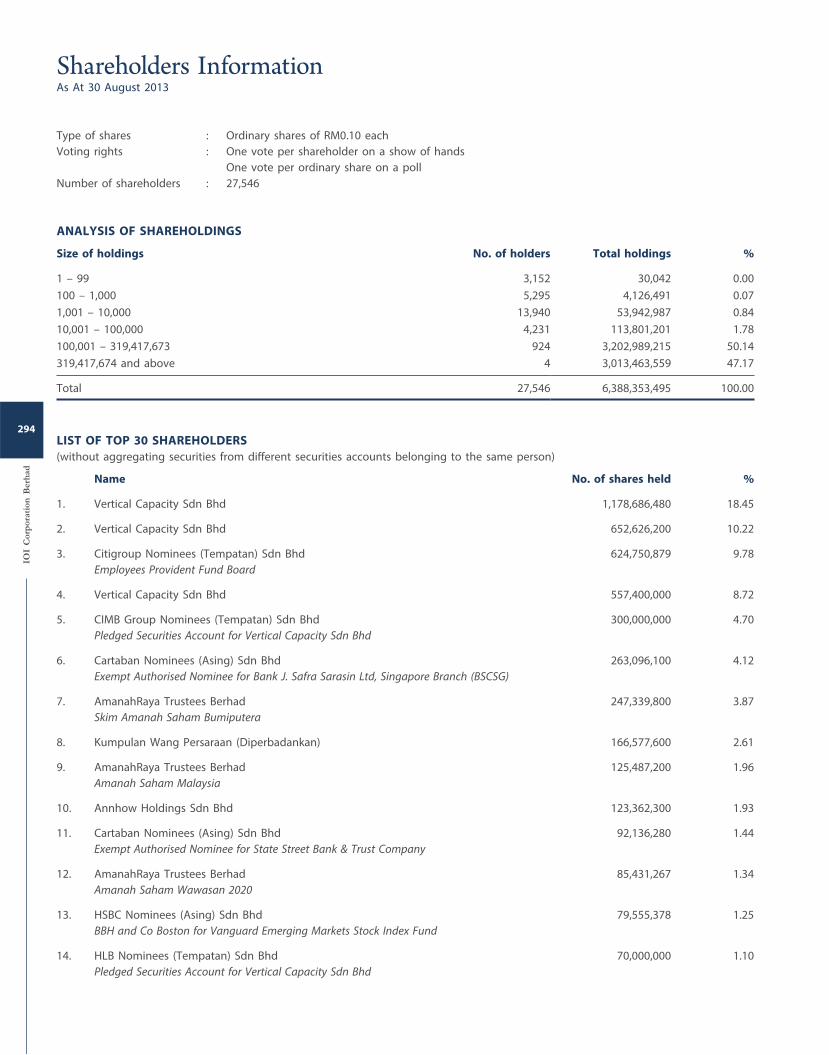
Type of shares : Ordinary shares of RM0.10 each
Voting rights : One vote per shareholder on a show of hands
One vote per ordinary share on a poll
Number of shareholders : 27,546
ANALYSIS OF SHAREHOLDINGS
Size of holdings No. of holders Total holdings %
1 – 99 3,152 30,042 0.00
100 – 1,000 5,295 4,126,491 0.07
1,001 – 10,000 13,940 53,942,987 0.84
10,001 – 100,000 4,231 113,801,201 1.78
100,001 – 319,417,673 924 3,202,989,215 50.14
319,417,674 and above 4 3,013,463,559 47.17
Total 27,546 6,388,353,495 100.00
LIST OF TOP 30 SHAREHOLDERS
(without aggregating securities from different securities accounts belonging to the same person)
Name No. of shares held %
1. Vertical Capacity Sdn Bhd 1,178,686,480 18.45
2. Vertical Capacity Sdn Bhd 652,626,200 10.22
3. Citigroup Nominees (Tempatan) Sdn Bhd
Employees Provident Fund Board
624,750,879 9.78
4. Vertical Capacity Sdn Bhd 557,400,000 8.72
5. CIMB Group Nominees (Tempatan) Sdn Bhd
Pledged Securities Account for Vertical Capacity Sdn Bhd
300,000,000 4.70
6. Cartaban Nominees (Asing) Sdn Bhd
Exempt Authorised Nominee for Bank J. Safra Sarasin Ltd, Singapore Branch (BSCSG)
263,096,100 4.12
7. AmanahRaya Trustees Berhad
Skim Amanah Saham Bumiputera
247,339,800 3.87
8. Kumpulan Wang Persaraan (Diperbadankan) 166,577,600 2.61
9. AmanahRaya Trustees Berhad
Amanah Saham Malaysia
125,487,200 1.96
10. Annhow Holdings Sdn Bhd 123,362,300 1.93
11. Cartaban Nominees (Asing) Sdn Bhd
Exempt Authorised Nominee for State Street Bank & Trust Company
92,136,280 1.44
12. AmanahRaya Trustees Berhad
Amanah Saham Wawasan 2020
85,431,267 1.34
13. HSBC Nominees (Asing) Sdn Bhd
BBH and Co Boston for Vanguard Emerging Markets Stock Index Fund
79,555,378 1.25
14. HLB Nominees (Tempatan) Sdn Bhd
Pledged Securities Account for Vertical Capacity Sdn Bhd
70,000,000 1.10
IOI
Cor
por
atio
n B
erh
ad
294
Shareholders InformationAs At 30 August 2013
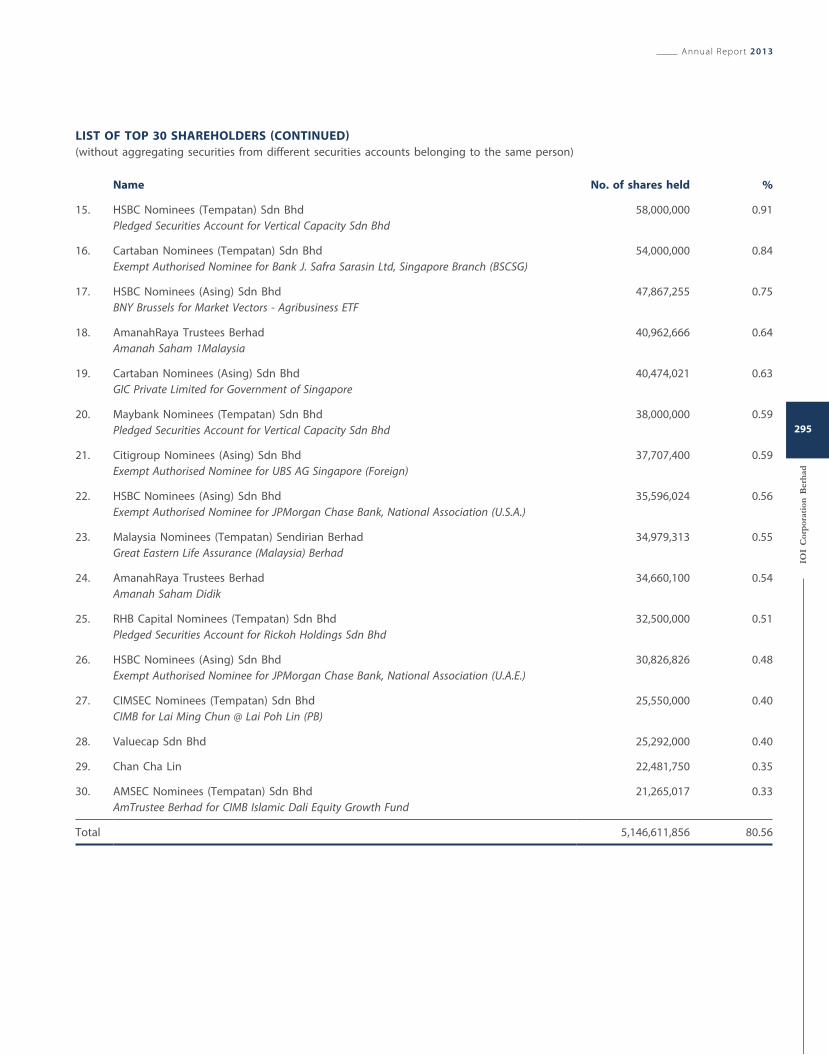
Name No. of shares held %
15. HSBC Nominees (Tempatan) Sdn Bhd
Pledged Securities Account for Vertical Capacity Sdn Bhd
58,000,000 0.91
16. Cartaban Nominees (Tempatan) Sdn Bhd
Exempt Authorised Nominee for Bank J. Safra Sarasin Ltd, Singapore Branch (BSCSG)
54,000,000 0.84
17. HSBC Nominees (Asing) Sdn Bhd
BNY Brussels for Market Vectors - Agribusiness ETF
47,867,255 0.75
18. AmanahRaya Trustees Berhad
Amanah Saham 1Malaysia
40,962,666 0.64
19. Cartaban Nominees (Asing) Sdn Bhd
GIC Private Limited for Government of Singapore
40,474,021 0.63
20. Maybank Nominees (Tempatan) Sdn Bhd
Pledged Securities Account for Vertical Capacity Sdn Bhd
38,000,000 0.59
21. Citigroup Nominees (Asing) Sdn Bhd
Exempt Authorised Nominee for UBS AG Singapore (Foreign)
37,707,400 0.59
22. HSBC Nominees (Asing) Sdn Bhd
Exempt Authorised Nominee for JPMorgan Chase Bank, National Association (U.S.A.)
35,596,024 0.56
23. Malaysia Nominees (Tempatan) Sendirian Berhad
Great Eastern Life Assurance (Malaysia) Berhad
34,979,313 0.55
24. AmanahRaya Trustees Berhad
Amanah Saham Didik
34,660,100 0.54
25. RHB Capital Nominees (Tempatan) Sdn Bhd
Pledged Securities Account for Rickoh Holdings Sdn Bhd
32,500,000 0.51
26. HSBC Nominees (Asing) Sdn Bhd
Exempt Authorised Nominee for JPMorgan Chase Bank, National Association (U.A.E.)
30,826,826 0.48
27. CIMSEC Nominees (Tempatan) Sdn Bhd
CIMB for Lai Ming Chun @ Lai Poh Lin (PB)
25,550,000 0.40
28. Valuecap Sdn Bhd 25,292,000 0.40
29. Chan Cha Lin 22,481,750 0.35
30. AMSEC Nominees (Tempatan) Sdn Bhd
AmTrustee Berhad for CIMB Islamic Dali Equity Growth Fund
21,265,017 0.33
Total 5,146,611,856 80.56
LIST OF TOP 30 SHAREHOLDERS (CONTINUED)
(without aggregating securities from different securities accounts belonging to the same person)
Annual Report 2013
IOI
Cor
por
atio
n B
erh
ad
295
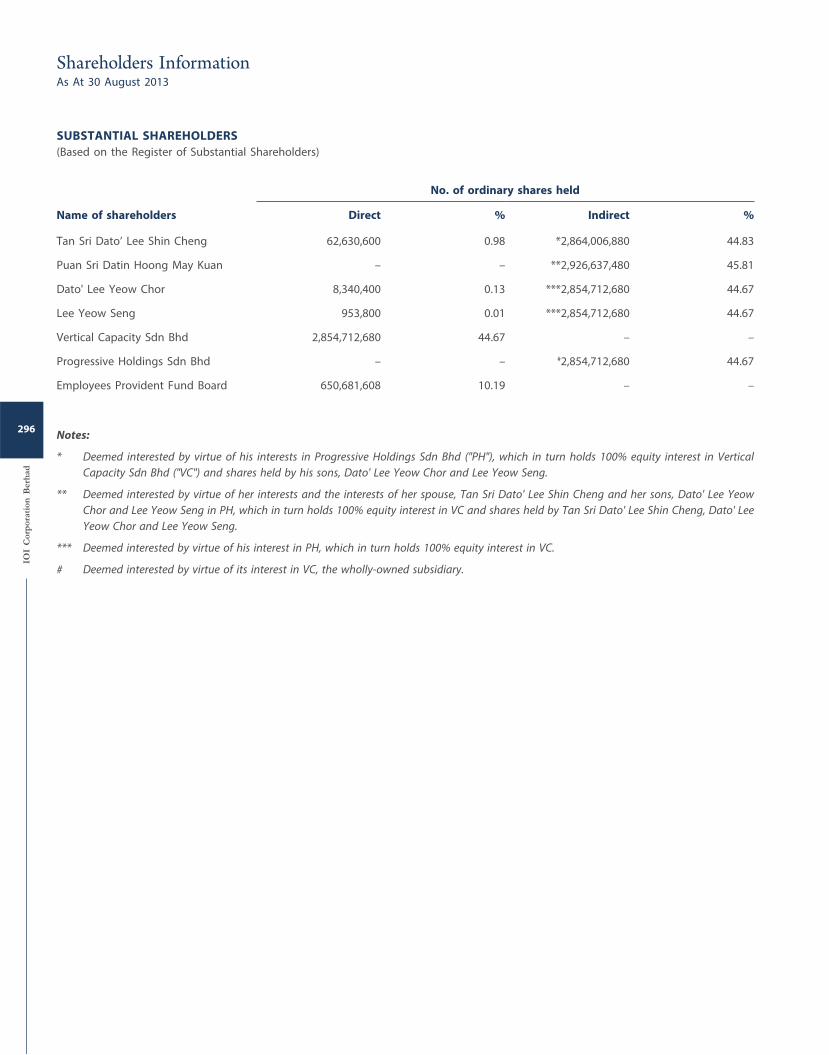
SUBSTANTIAL SHAREHOLDERS
(Based on the Register of Substantial Shareholders)
No. of ordinary shares held
Name of shareholders Direct % Indirect %
Tan Sri Dato’ Lee Shin Cheng 62,630,600 0.98 *2,864,006,880 44.83
Puan Sri Datin Hoong May Kuan – – **2,926,637,480 45.81
Dato' Lee Yeow Chor 8,340,400 0.13 ***2,854,712,680 44.67
Lee Yeow Seng 953,800 0.01 ***2,854,712,680 44.67
Vertical Capacity Sdn Bhd 2,854,712,680 44.67 – –
Progressive Holdings Sdn Bhd – – #2,854,712,680 44.67
Employees Provident Fund Board 650,681,608 10.19 – –
Notes:
* Deemed interested by virtue of his interests in Progressive Holdings Sdn Bhd ("PH"), which in turn holds 100% equity interest in Vertical
Capacity Sdn Bhd ("VC") and shares held by his sons, Dato' Lee Yeow Chor and Lee Yeow Seng.
** Deemed interested by virtue of her interests and the interests of her spouse, Tan Sri Dato' Lee Shin Cheng and her sons, Dato' Lee Yeow
Chor and Lee Yeow Seng in PH, which in turn holds 100% equity interest in VC and shares held by Tan Sri Dato' Lee Shin Cheng, Dato' Lee
Yeow Chor and Lee Yeow Seng.
*** Deemed interested by virtue of his interest in PH, which in turn holds 100% equity interest in VC.
# Deemed interested by virtue of its interest in VC, the wholly-owned subsidiary.
IOI
Cor
por
atio
n B
erh
ad
296
Shareholders InformationAs At 30 August 2013
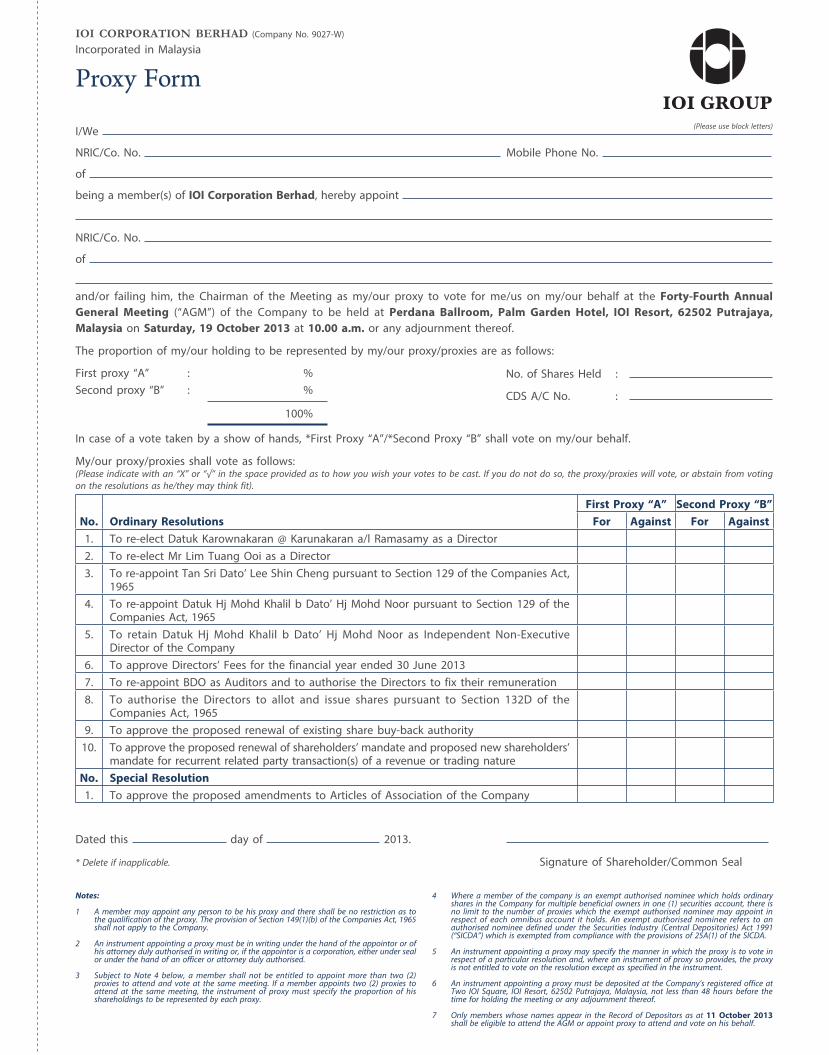
Proxy Form
IOI CORPORATION BERHAD (Company No. 9027-W)
Incorporated in Malaysia
I/We
NRIC/Co. No. Mobile Phone No.
of
being a member(s) of IOI Corporation Berhad, hereby appoint
NRIC/Co. No.
of
and/or failing him, the Chairman of the Meeting as my/our proxy to vote for me/us on my/our behalf at the Forty-Fourth Annual
General Meeting (“AGM”) of the Company to be held at Perdana Ballroom, Palm Garden Hotel, IOI Resort, 62502 Putrajaya,
Malaysia on Saturday, 19 October 2013 at 10.00 a.m. or any adjournment thereof.
The proportion of my/our holding to be represented by my/our proxy/proxies are as follows:
First proxy “A” : %
Second proxy “B” : %
100%
In case of a vote taken by a show of hands, *First Proxy “A”/*Second Proxy “B” shall vote on my/our behalf.
My/our proxy/proxies shall vote as follows:(Please indicate with an “X” or “√” in the space provided as to how you wish your votes to be cast. If you do not do so, the proxy/proxies will vote, or abstain from voting
on the resolutions as he/they may think fit).
First Proxy “A” Second Proxy “B”
No. Ordinary Resolutions For Against For Against
1. To re-elect Datuk Karownakaran @ Karunakaran a/l Ramasamy as a Director
2. To re-elect Mr Lim Tuang Ooi as a Director
3. To re-appoint Tan Sri Dato’ Lee Shin Cheng pursuant to Section 129 of the Companies Act, 1965
4. To re-appoint Datuk Hj Mohd Khalil b Dato’ Hj Mohd Noor pursuant to Section 129 of the Companies Act, 1965
5. To retain Datuk Hj Mohd Khalil b Dato’ Hj Mohd Noor as Independent Non-Executive Director of the Company
6. To approve Directors’ Fees for the financial year ended 30 June 2013
7. To re-appoint BDO as Auditors and to authorise the Directors to fix their remuneration
8. To authorise the Directors to allot and issue shares pursuant to Section 132D of the Companies Act, 1965
9. To approve the proposed renewal of existing share buy-back authority
10. To approve the proposed renewal of shareholders’ mandate and proposed new shareholders’ mandate for recurrent related party transaction(s) of a revenue or trading nature
No. Special Resolution
1. To approve the proposed amendments to Articles of Association of the Company
Dated this day of 2013.
* Delete if inapplicable. Signature of Shareholder/Common Seal
No. of Shares Held :
CDS A/C No. :
Notes:
1 A member may appoint any person to be his proxy and there shall be no restriction as to the qualification of the proxy. The provision of Section 149(1)(b) of the Companies Act, 1965 shall not apply to the Company.
2 An instrument appointing a proxy must be in writing under the hand of the appointor or of his attorney duly authorised in writing or, if the appointor is a corporation, either under seal or under the hand of an officer or attorney duly authorised.
3 Subject to Note 4 below, a member shall not be entitled to appoint more than two (2) proxies to attend and vote at the same meeting. If a member appoints two (2) proxies to attend at the same meeting, the instrument of proxy must specify the proportion of his shareholdings to be represented by each proxy.
4 Where a member of the company is an exempt authorised nominee which holds ordinary shares in the Company for multiple beneficial owners in one (1) securities account, there is no limit to the number of proxies which the exempt authorised nominee may appoint in respect of each omnibus account it holds. An exempt authorised nominee refers to an authorised nominee defined under the Securities Industry (Central Depositories) Act 1991 (“SICDA”) which is exempted from compliance with the provisions of 25A(1) of the SICDA.
5 An instrument appointing a proxy may specify the manner in which the proxy is to vote in respect of a particular resolution and, where an instrument of proxy so provides, the proxy is not entitled to vote on the resolution except as specified in the instrument.
6 An instrument appointing a proxy must be deposited at the Company’s registered office at Two IOI Square, IOI Resort, 62502 Putrajaya, Malaysia, not less than 48 hours before the time for holding the meeting or any adjournment thereof.
7 Only members whose names appear in the Record of Depositors as at 11 October 2013 shall be eligible to attend the AGM or appoint proxy to attend and vote on his behalf.
(Please use block letters)
STAMP
1st fold here
2nd fold here
The Company Secretary
IOI CORPORATION BERHADTwo IOI Square
IOI Resort
62502 Putrajaya
Malaysia