Our People, Our Resources - IUCN Portals
272
a Policy - -
-
Upload
khangminh22 -
Category
Documents
-
view
0 -
download
0
Transcript of Our People, Our Resources - IUCN Portals

a Policy -
-


OUR PEOPLE,
OUR RESOURCES
This One

IUCN – The World Conservation Union
Founded in 1948, The World Conservation Union brings together States, government agencies and a diverse
range of non-governmental organizations in a unique world partnership: 895 members in all spread across
some 137 countries. As a Union, IUCN seeks to influence, encourage and assist societies throughout the
world to conserve the integrity and diversity of nature and to ensure that any use of natural resources is equi
table and ecologically sustainable. A central secretariat coordinates the IUCN programme and serves the
Union membership, representing their views on the world stage and providing them with the strategies, ser
vices, scientific knowledge and technical support they need to achieve their goals. Through its six
Commissions, IUCN draws together over 6000 expert volunteers, project teams and action groups, focu
sing on species and biodiversity conservation and the management of habitats and natural resources. The
Union has helped many countries to prepare National Conservation Strategies, and demonstrates the appli
cation of its knowledge through the field projects it supervises. Operations are increasingly decentralized
and carried forward by an expanding network of regional and country offices, located principally in deve
loping countries.
IUCN Social Policy Group
Caring for the Earth, the IUCN basic policy statement, recognizes that people are most likely to care for
natural resources when they are enabled to assess their own initiatives, maintain a sound degree of control
over the natural resources and development process and when, by protecting the environment, they also
manage to satisfy their needs. Promoting the social conditions for this to happen, in full cooperation with
the IUCN membership and constituency at large, is the central task of the Social Policy Group.
IUCN Te]. ----41 22–999 02 74
Social Policy Group Fax. ++ 41 22-999 00 25
Rue Mauverney 28 e-mail: subQhq.iucn.org
CH-1196 Gland, Switzerland website: http://www.iucn.org/themes/spg/
United Nations Population Fund
UNFPA extends assistance to developing countries, countries with economies in transition and other coun
tries, at their request, to help them address reproductive health and population issues, and raises awareness
of these issues in all countries, as it has since its inception in 1969. UNFPA's three main areas of work are:
to help ensure universal access to reproductive health, including family planning and sexual health, to all
couples and individuals by the year 2015; to support population and development strategies that enable capa
city-building in population programming; to promote awareness of population and development issues and
to advocate for the mobilization of the resources and political will necessary to accomplish its areas of work.
UNFPA is guided by, and promotes, the principles of the Programme of Action of the International
Conference on Population and Development (Cairo, 1994). In particular, UNFPA affirms its commitment
to reproductive rights, gender equality and male responsibility, and to the autonomy and empowerment of
women everywhere. UNFPA believes that safeguarding and promoting these rights, and promoting the
well-being of children, especially girl children, are development goals in themselves. All couples and indi
viduals have the right to decide freely and responsibly on the number and spacing of their children, as well
as the right to the information and means to do so.
UNFPA is the lead United Nations organization for the follow-up and implementation of the Programme
of Action of the International Conference on Population and Development, and recognizes that all human
rights, including the right to development, are universal, indivisible, interdependent and interrelated.
Issues in Social Policy
OUR PEOPLE,
OUR RESOURCES
supporting rural communities in
participatory action research on
population dynamics and
the local environment
written by
Thomas Barton, Grazia Borrini-Feyerabend,
Alex de Sherbinin and Patrizio Warren
with contributions from IUCN staff,
members and partners
IUCN - The World Conservation Union
1997
The designation of geographical entities in this book, and the presentation of the material, do not imply the expression
of any opinion whatsoever on the part of IUCN or UNFPA concerning the legal status of any country, territory, or area,
or of its authorities, or concerning the definition of its frontiers or boundaries.
The views expressed in this publication do not necessarily reflect those of IUCN or UNFPA.
This publication has been made possible by special funding from UNFPA and funding of general social policy activities
in IUCN by DANIDA (Danish International Development Agency).
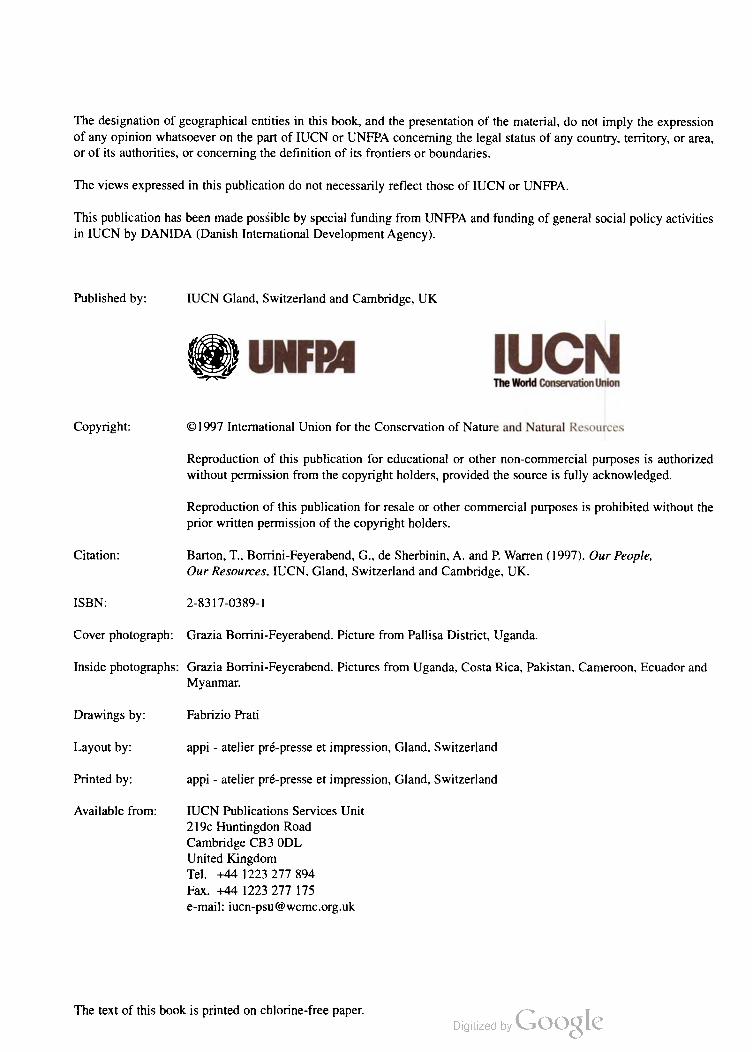
Published by:
Copyright:
Citation:
ISBN:
Cover photograph:
Inside photographs:
Drawings by:
Layout by:
Printed by:
Available from:
IUCN Gland, Switzerland and Cambridge, UK
£) UNFPA IUCNThe World Conservation Union
©1997 International Union for the Conservation of Nature and Natural Resources
Reproduction of this publication for educational or other non-commercial purposes is authorized
without permission from the copyright holders, provided the source is fully acknowledged.
Reproduction of this publication for resale or other commercial purposes is prohibited without the
prior written permission of the copyright holders.
Barton, T., Borrini-Feyerabend, G., de Sherbinin, A. and P. Warren (1997). Our People,
Our Resources, IUCN, Gland, Switzerland and Cambridge, UK.
2–8317–0389-1
Grazia Borrini-Feyerabend. Picture from Pallisa District, Uganda.
Grazia Borrini-Feyerabend. Pictures from Uganda, Costa Rica, Pakistan, Cameroon, Ecuador and
Myanmar.
Fabrizio Prati
appi- atelier pré-presse et impression, Gland, Switzerland
appi – atelier pré-presse et impression, Gland, Switzerland
IUCN Publications Services Unit
219.c Huntingdon Road
Cambridge CB30DL
United Kingdom
Tel. +44 1223 277 894
Fax. +44 1223 277 175
e-mail: iucn-psu Gwcmc.org.uk
The text of this book is printed on chlorine-free paper.
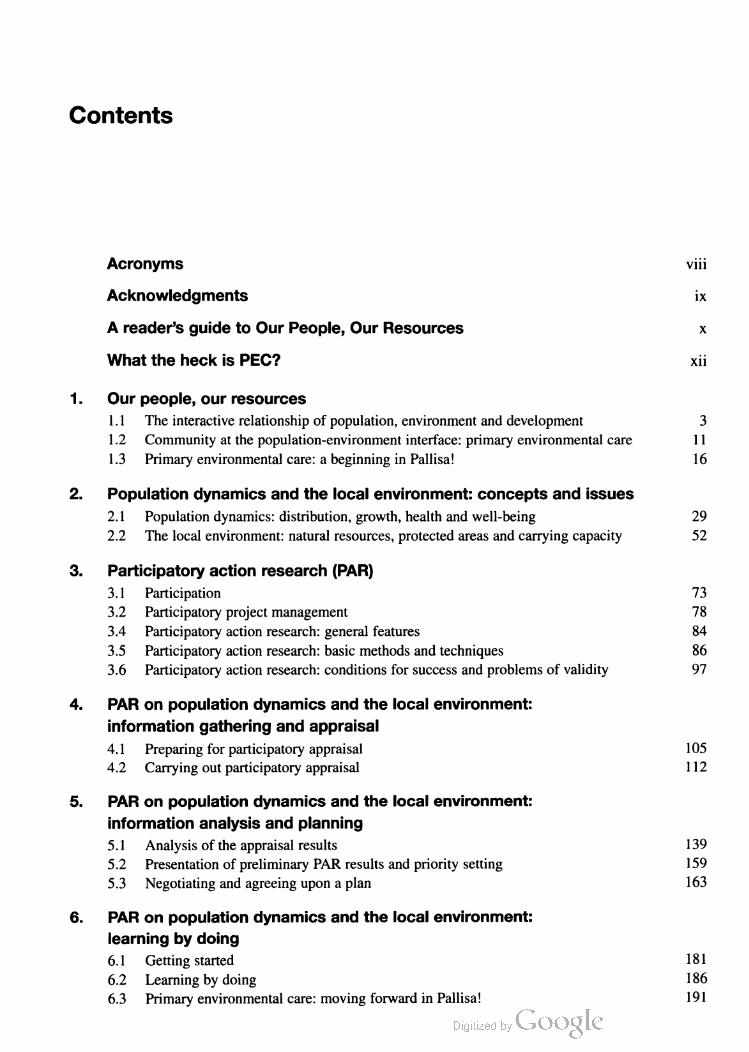
Contents
Acronyms viii
Acknowledgments ix
A reader’s guide to Our People, Our Resources x
What the heck is PEC? xii
1. Our people, our resources
1.1 The interactive relationship of population, environment and development 3
1.2 Community at the population-environment interface: primary environmental care 11
1.3 Primary environmental care: a beginning in Pallisa! 16
2. Population dynamics and the local environment: concepts and issues
2.1 Population dynamics: distribution, growth, health and well-being 29
2.2 The local environment: natural resources, protected areas and carrying capacity 52
3. Participatory action research (PAR)
3.1 Participation 73
3.2 Participatory project management 78
3.4 Participatory action research: general features 84
3.5 Participatory action research: basic methods and techniques 86
3.6 Participatory action research: conditions for success and problems of validity 97
4. PAR on population dynamics and the local environment:
information gathering and appraisal
4.1 Preparing for participatory appraisal 105
4.2 Carrying out participatory appraisal 112
5. PAR on population dynamics and the local environment:
information analysis and planning
5.1 Analysis of the appraisal results 139
5.2 Presentation of preliminary PAR results and priority setting 159
5.3 Negotiating and agreeing upon a plan 163
6. PAR on population dynamics and the local environment:
learning by doing
6.1 Getting started 181
6.2 Learning by doing 186
6.3 Primary environmental care: moving forward in Pallisa! 191

To our favorite teachers,
in particular
Sheldon Margen and Gayl Ness

What the heck is PEC7 (continued)
Annex A: Basic definitions and formulas to describe population dynamics
A.1
A.2
A.3
A.4
A.5
A.6
A.7
Annex B:
Population size and growth rate
Gender and age distribution
Births (natality) and fertility
Mortality
Natural population growth
Migration
Women's status
Basic methods and tools for PAR on population dynamics and the
local environment
B.1
B.2
B.3
B.4
B.5
B.6
B.7
B.8
B.9
B.10
B.11
B. 12
B. 13
B.14
Annex C:
C.1
C.2
Transect walks and diagrams
Participatory mapping
Historical mapping
Interviews with natural groups
Focus group discussions
Semi-structured interviews
Group brainstorming
Ranking exercises
Priority-setting exercises
Strengths, weaknesses, opportunities and limitations (SWOL) analysis
Role-playing
Slide language
Gender analysis
Some tips on good facilitation
Using a computer for demographic projections and map-making
Using a computer for demographic projections
Using a computer for map-making and GIS
References and suggestions for further reading
About the authors
201
205
206
208
209
211
212
213
217
218
219
220
221
222
223
224
225
226
227
228
229
231
237
241
245
259
Acronyms
BSP – Biodiversity Support Programme
CARE – Cooperative for Assistance and Relief Everwhere
FAO – Food and Agriculture Organization of the United Nations
ICHM – Instituto Superiore di Sanità
IIED – International Institute for Environment and Development
IRC – International Water and Sanitation Centre
IUCN – The World Conservation Union
NTFPs – Non-timber forest products
OECD - Organisation for Economic Cooperation and Development
PACODET – Pallisa Community Development Trust
PAR – Participatory action research
PEC – Primary environmental care
PRA – Participatory rural appraisal
PRB – Population Reference Bureau
UNEP – United Nations Environment Programme
UNFPA – United Nations Population Fund
UNICEF – United Nations Children’s Fund
USAID – United States Agency for International Development
WHO – World Health Organization
WWF–World Wide Fund FOr Nature

Acknowledgments
The publication of this handbook brings to fruition a three-year process that has seen contributions from
IUCN staff, members and partners in over twenty countries, as well as from rural people around the world
who have generously shared their experiences with the authors. The process began in 1994, when a manu
script produced by the Social Policy Group was sent to several field-based professionals with expertise in
participatory methods and ‘population and environment’ issues. The comments and contributions received
from these professionals were incorporated into a new manuscript, which was then translated into three lan
guages and sent out for comments to a much larger list of potential users all over the world. Their com
ments have also been incorporated in the present version.
The authors are particularly grateful to the following people for insightful, extensive contributions during
the earlier and later reviews: Tariq Banuri, Corinne Cécilia, A.B. Cunningham, Elijah Yaw Danso, Dulan
de Silva, Jenny Ericson, Lisa Garbus, Andrew Green, Alan Hamilton, Henk Hoefsloot, Serguey Ivanov,
Charity Kabutha, Patricia Larson, Ciro Martinez Gomez, Augusto Angel Maya, Gay] Ness, Krishna Oli,
Josephine Ouédraogo, Badri Pande, Mario Alejandro Perez, Adrian Phillips, M. Pudasaini, Mohammad
Rafiq, Marcos Reigota, Kath Shurcliff, Yacouba Yaro, and Nicholas Winer. In addition, the authors would
like to express their appreciation to Charlie Pye-Smith, who enlivened the Pallisa stories in the text, and to
IUCN staff members Susan Broomfield, Meghan Golay, Katharine Mann and Elaine Shaughnessy, who
assisted with graphic, publishing and secretarial skills.
The IUCN Social Policy Group sincerely acknowledges the UNFPA’s generous financial support for the
preparation of this handbook and its companion volume, Population and Strategies for National
Sustainable Development (Ness, 1997). Through the University of Michigan Population-Environment
Fellows Program, USAID supported the work of John Williams, a major contributor to the initial manu
script, and Alex de Sherbinin, one of the authors. UNFPA, USAID and the University of Michigan have
shown an exceptional readiness to further the integration of population variables into environmental plan
ning, management and action. An expanded print-run of this handbook was made possible through the sup
port of UNICEF’s Water, Environment and Sanitation Division and a USAID-funded sub-agreement with
the Population Reference Bureau. The IUCN Social Policy Group would also like to thank DANIDA, the
Danish International Development Agency, for its continued financial support to integrate social concerns
in IUCN initiatives.
The present handbook is the result of a long process and involves numerous contributions and insights.
It aims to stimulate thinking and questioning, rather than providing rigid guidelines, and it is offered as a tool
for ‘learning by doing’. In view of these characteristics, we hope that field-based population and conserva
tion professionals will actually use this document in their daily work. Ultimately, it is the authors’ sincere
hope that Our People, Our Resources will support decisions and actions on population and environment
matters in rural communities throughout the world — where those decisions and actions truly belong.
Thomas Barton, Grazia Borrini-Feyerabend, Alex de Sherbinin and Patrizio Warren
September 1997

A reader's guide to Our People, Our Resources
This handbook
focuses on the reciprocal influences of population dynamics and the local environment: i.e., on how
population size, structure, growth (or decline), and movement are related to the quality of the local envi
ronment, and to the local development process and quality of life;
illustrates concepts, methods and tools, for primary environmental care at the interface of population
dynamics and natural resource management;
emphasizes local knowledge and skills, local management of natural resources and participatory plan
ning as conditions that foster responsibility for both population and the environment;
describes a participatory action research (PAR) process in an imaginary village to illustrate PAR methods
and the three core concepts of primary environmental care: meeting needs, protecting the environment,
and empowering communities.
This handbook is for
natural resource managers and conservation professionals who seek to incorporate population dynamics
and participatory approaches in their work;
health and population professionals who seek to incorporate natural resource management and partici
patory approaches in their work;
facilitators of participatory action research exercises in rural communities in the developing world;
people, professionals and project staff concerned with primary environmental care and sustainable devel
opment in rural areas.
This handbook is not
a blueprint guide: the methods outlined provide useful ideas for those wishing to conduct PAR with a
community, but they will need to be adapted to fit the unique opportunities and constraints of the local
setting. Learning from experience, being sensitive to people's needs and expectations, and being inno
vative, creative and critical are much more important than following the exact methods prescribed in this
handbook.
comprehensive: this handbook presents some PAR methods that are particularly useful for dealing with
integrated issues of population and the environment, but the array of tools and methods for participa
tory action extends well beyond those discussed here. Further recommended reading in PAR and pri
mary environmental care is listed in the reference section of this handbook.

What you can find in the handbook
Chapter 1 describes the interactive nature of population, environment and development and the prima
ry environmental care (PEC) approach. The initial steps of a real PEC initiative in a rural context in
Uganda are illustrated.
Chapter 2 presents concepts related to population dynamics and the environment and introduces key
terms and indicators.
Chapter 3 discusses issues of participation in development and describes general features, methods
and techniques of PAR. It also presents some conditions for success, and addresses the validity of PAR
findings.
Chapter 4 describes the phases of information gathering and appraisal of a comprehensive PAR on
population dynamics and the environment, and introduces specific methods and tools.
Chapter 5 takes the reader from assessment and analysis of PAR findings to the planning of concrete
initiatives by community groups and relevant partners.
Chapter 6 examines issues related to the implementation of activities and describes methods for learn
ing by doing’. The same PEC initiative described in Chapter 1 is revisited, four years later.
Annex A provides definitions and formulas for key demographic indicators.
Annex B contains a series of files that elaborate on the participatory appraisal and planning techniques
presented in chapters 3-5, illustrate key steps to practise them, and list their relevant strengths and weak
neSSCS.
Annex C introduces techniques of population projection and geographic information systems and des
cribes two low-cost software packages useful for PAR in population dynamics and the local environ
ment: Demproj and Map Maker.
What you can skip or just skim through
Chapters 1 to 3, if you are not intrigued by theory and concepts and only wish to get a sense of what
can be done in a concrete setting.
Chapters 4 to 6 and Annex B, if you will never assist community-based initiatives and are just inter
ested in concepts and theory.
Annex A, if you do not need detailed demographic information.
Annex C, if you do not have a computer.

What the heck is PEC2
“Have you heard about that primary environmental care’ or, what do they call it.... PREC’”
“PEC, they call it PEC. Yes, I’ve heard about it; it is official policy of UNICEF and endorsed by IUCN,
IIED, Oxfam, other non-governmental organizations and even some aid agencies. Interesting stuff, isn’t it?”
“What do you mean, interesting – aren’t you sick of all this development jargon? And then, what's new
about it? I bet it is a way of shuffling some concepts around Primary Health Care and making it seem
like a new discovery...”
“Well, the term PEC is a sort of package, and it is easier to say than community-based sustainable
development’ or sustainable livelihood security’. The meaning is also richer than you think. It condenses
some key lessons from decades of field work – stuff that you and I have discussed for years. For instance,
one of the few things on which we always agreed is that caring for local environments is essential for
national environments and economies.”
“What a discovery! Local is the dimension of real meaning, it is the place where activities must be
carried out, where complexities, conflicts and knots come out to ruin all the nice dreams that the planners
concoct in air-conditioned offices. Besides, local environmental problems are the ones that people
understand.
They have immediate and often severe consequences for their health, well-being and daily income.”
“So, you agree that we should help communities to do what they can to conserve their environment
today, with simple means and immediate benefits?”
“Yes, but even an environmental utopian like you cannot deny that many communities do not care a bit
about conservation!”
“That is because they have more pressing needs; they can’t see how to link the satisfaction of those needs
with conservation. There must be ways to support them to find out, and that is what governmental
agencies and NGOs should be doing!”
“Wait a minute... There are innumerable local environments in the world, and for each of them
‘conservation’ means a different thing. In my home village we need to restore the pasture, which is
almost all gone. In the villages in the mountain district, they should make sure that some trees are left
standing to keep the soil in place, and that the paper mill does not pollute water so much that I’ll never
be able to catch a fish in the river again. But do you believe that people are willing to pay the price of
conservation, to invest labor and money, to stop getting a good income from timber and to give up their
jobs at the mill? I am not talking of a small price, nor of people who have a relatively sure pay-check at
the end of the month, like you and me...”

“Yes, some people are willing to pay the price, but only when conservation makes sense, when in return
they get something they need and value. If you think about what you have seen with your own eyes
working in this area I am sure you can find heaps of examples. That ‘something’ may be income, food,
health, jobs, cultural value, pride, recreation or whatever else they like. It should also last, not disappear
at the first gust of wind or change of administration. This is the real challenge of sustainable
development: finding those ingenious solutions — unique for every environment and society — that meet
the needs of the people while meeting the needs of the local environment. Some people call it PEC. But
9”
it could as well be called a ‘thriving human culture .
“What are you proposing? That someone like you or me is parachuted from outside to define the local
culture of this or that community?”
“Not at all, and this is another key point of PEC: a culture cannot be
defined by outsiders. The residents of your village, the people living
in the mountain district, the people of this community here —
they should get organized, look at their resources, figure out
their problems and decide what to do.
But ‘experts’ with a job and a salary in development
and conservation — people like you and me — should
help them out.”
“You’ll never change. You will remain a
dreamer all your life. What you say is obvious, but
clashes against reality. I am barely recovering from
my last trip to evaluate a multimillion-dollar program
that went completely astray. The supposed
‘beneficiaries’ didn’t co-operate - they knew how to get
the work going but didn’t lift a finger!”
“I bet your ‘beneficiaries’ were never involved in
deciding about the initiative. They were expected to
be grateful for something they didn’t request and in
exchange forego something they cared for. Why
should they have? I know of
initiatives of the beloved environmental
organizations we work for that put
‘participation’ as their first
objective. Look at this project
document, for example.
The term -‘community . ‘
participation’ appears at least-F
once on every page. But~
when you look at the
planned activities you
find that people
(actually only a
convenient sample
of them)

will be merely ‘consulted’. Not a word clarifies what methods will be used to consult them, not
a word describes what local groups and institutions will be taken as project partners. Most of the
budget goes for cars, uniforms and salary incentives for governmental staff and to get our expert advice'
in development and conservation. The willingness may be here, but there is still a long way to go to
meaningful practice...”
“One day you should clearly explain to me what you mean by participation’.”
“I mean something very close to participatory democracy, i.e., a sound measure of local control over
resources and the process of so-called development. The participation likely to be most effective for
environmental care is security of access to resources – security of tenure – the most powerful incentive to
invest for the long term. Control means both authority and responsibility, and we know that these are best
taken up by local institutions, in particular the ones that represent local residents and resource users.
Governments don’t need to let go of their rights. There are a plethora of regulations, leases, joint
management agreements, rights of resource extraction and so on that can maintain governmental
supervision but also create a sense of security and responsibility for the people.”
“I’ll be damned, you got me interested. So what is this PEC exactly then?”
“One definition is here, in this booklet dated 1990, look: “Primary environmental care is a process by
which local communities organize themselves and strengthen, enrich and apply their means and* -
capacities for the care of their environment while simultaneously satisfying their needs'.
“...What?”
“Imagine a little monster with three legs. One is protecting the environment’, the other is meeting
people's needs and the third is empowering the community’. This is what PEC is all about. Integrating
these three objectives, tapping the willingness and ingenuity of the people themselves. Of course, a
variety of obstacles need to be overcome, and some conditions need to be present. That is where external
support can be crucial. Political conditions include freedom to organize, capacity of influencing decisions
about development’, access to information, transparency about who controls what and so on. People like
you and me may not always be able to help about those, but we can support on the matter of technical
conditions, we can recognize that communities have valid claims of knowledge and skills, we can
provide our expert advice on the basis of a dialogue with them, building upon and integrating what
already exists. I am sure you have heard about participatory approaches to research, assessment, planning
and evaluation. We can encourage governments to adopt those approaches and to decentralize services, to
respond to felt needs rather than try to command and control from above, and...”
“Slow down, please! Perhaps I am a bit old-fashioned, but I still believe that what really counts is the
economy...”
“You are absolutely right. Some key economic conditions must be there for PEC to work. The costs and
benefits of conservation ought to be allocated fairly, and communities should have access to financial
means – such as loans they could obtain using as collateral the natural resources they have effectively
safeguarded. They should have access to regulated markets – markets that use incentives and
disincentives to value environmental care, public health and the local culture – and to reliable information
regarding the conditions of such markets...”
“Sure, wait for that! And then, would that be enough?”
“No, people should have time to discuss what they want and can do, to manage conflicts (which are
always there), to organize among themselves and to develop specific agreements and ‘contracts’ in part
nership with other social actors. No more quick and dirty projects!”
“You have not yet mentioned one of your favorite development subjects: women!”
“Yes, and I am at fault, because women are central to PEC. They are in practice the environmental mana
gers of most rural communities in the world, yet they are too often excluded from decisions about alloca
tion and use of resources, and deprived of the benefits of their own labor. If PEC will succeed it will be
because women will be fully empowered for themselves, their families and their communities. And a cru
cial component of that empowerment is their capacity to control their own fertility.”
“Fertility? What the heck has fertility to do with development and the environment?”
“Nobody can deny that fertility — stuff like the total number of children a woman has in her lifetime,
birth spacing and the like — has a tremendous influence on the health of women and children. And also,
when fertility can be controlled, families and communities are more in control of their own destiny.”
“Give me a break! This is the kind of rhetoric I would expect from a nurse at a health clinic...”
“Well, first of all there is not yet a good clinic around here, and people must walk for more than two
hours to reach the closest reproductive health services. You also know as well as I do that every plot of
land in this community that can be cultivated is already under the plough. The elders have been complai
ning for some years that the fallow is getting too short and the soil is losing fertility. Have you noticed
how many young men have already left for the capital? All this would not need to happen if the popula
tion here could remain stable — let us say, at the level that it was ten years ago. I bet if the people would
have a choice, they would choose not to migrate — they would stay on their land, have smaller and heal
thier families, remain where their forefathers lived for generations.”
“My dear friend, all this is lovely in theory. But you have not yet given me a hint on how we make it a
reality.”
“That is what practitioners in public health, conservation, development and the whole bag of good inten
tions in the world are discussing to the point of losing their voices. But, if there is one thing we need to
agree on, it is that the ‘beneficiaries’ should sit in the driver’s seat, and that the time of pre-cooked,
expert recipes is gone forever! The people who live with the resources, the women who hear the children,
the families who suffer the poverty — they should define the problems, the goals and the ways to reach
them. Professionals like us can only help and support, which is what I have decided to do. I know you
are skeptical about tools and bags of tricks, but there are some processes, some methods, some ideas that
I am beginning to use in my work. Some people call it ‘participatory action research’ but the name, as for
PEC, is not at all important. What counts is how you interact with people, and whether and how you
manage to be of some help. Have you seen this manual, what is it called...yes, Our People, Our
Resources. It contains some theory and some practical information on participatory action research for
population and the environment. Why don’t you give it a look? You might even discover some of those
hints you are looking for. .

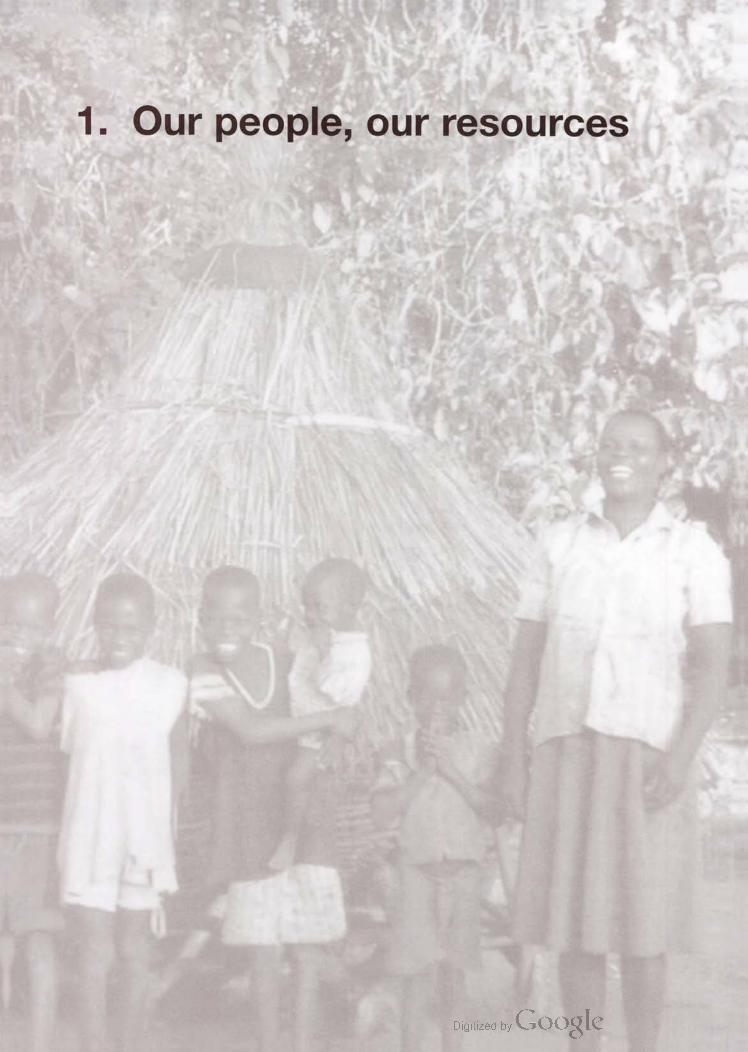
1. Our people, our resources
The dynamics of population and the management of environmental
resources are closely related concerns confronting our contemporary
world. Whether we live in rural or urban, developing or developed
regions, we need to understand and deal with the linkages between the sta
tus of society (e.g., population, socio-economic development, physical
health, quality of life) and the condition of the natural environment (e.g.,
status andfuture prospects of fresh water, soil, forests, wildlife, biodiver
sity). This chapter introduces these linkages and an integrated and partic
ipatory approach for addressing them: primary environmental care. The
approach is briefly described and illustrated by an example ofa real case
where it was put into practice.
1.1 The interactive relationship of population,
environment and development
Population dynamics, quality of life and the environment
1.2 Community at the population-environment
interface: primary environmental care
1.3 Primary environmental care: a beginning in Pallisa!
Organizing and adressing priority problems
Apparaising the local environment
Transects, priorities, and group work
Planning for action
Monitoring and assessing progress
1.1 The interactive relationship
of population, environment and
development
It is a paradox of our times that in the last decades of the twentieth
century, when the world is supporting a population larger than ever
before and, on average, healthier and wealthier than ever before, people
are increasingly concerned about the future of humankind. The media
show images of poverty, hunger, violence, and disease. Recurrent social
crises reveal that development efforts do not result in a more equitable
distribution of wealth, nor in an overall decrease in the numbers of poor
people. Where improvements in national economic indicators have been
obtained, it is often at the price of harsh environmental degradation. And
population growth – the ultimate sign of the success of the human
species – is seen by many as a major cause of environmental stress.
The argument for the latter view is rather straightforward. As population
enlarges, there are smaller amounts per person of the relatively stable
natural resources, such as water, arable land or timber. More people
means more environmental exploitation and/or more poverty. Yet, popu
lation growth cannot be separated from patterns of consumption, or from
the technology and social systems that people use to produce goods and
services. As an illustration of this point, a growing population in a given
area means, by definition, a decrease in the amount of water available
per person. But the impact of reductions in the per capita availability of
water on food production and human health depends very much on the
technology used locally for irrigation, water supply and waste disposal.
Under an unchanging technology for water and waste management, a
growing population will mean a smaller production of food per capita,
and the water available for drinking and hygiene may become less
and less healthy due to increasing contamination by human wastes. If,
however, the technology is improved to enable more efficient irrigation,
water supply and waste treatment, and if the local political, economic
and institutional context is such that these benefits can reach every inhab
itant of the area, the overall quality of life may actually improve as the
water per capita declines.
Some authors would even maintain that a certain concentration of peo
ple is necessary to provide the stimulus and economic conditions need
ed for technical improvement and development in general. An intriguing
argument presented by Esther Boserup (1981) sees population growth as
a main stimulus towards technological progress. According to this per
spective, early in human history the growing needs of numbers of people
population growth cannot
be separatedfrom patterns
of consumption, or from
the technology and social
systems that people use to
produce goods and
services

population growth
provided the
concentrations of labor
and the supply of
ingenuity to spur the
industrial revolution and
the develpment of modern
societies
problems of social
injustice and
environmental degradation
are the true Achilles’ heel
of the development’
enterprise
promoted the use of fire, the domestication of animals, the storage of
food and the development of agriculture, a productive system supporting
much larger populations than hunting and gathering. In the following
millennia, population growth stimulated improvements in agricultural
productivity via both technical innovations and reorganization of soci
eties. More recently, population growth provided the concentrations of
labor and the supply of ingenuity to spur the industrial revolution and the
development of modern societies, with their high levels of employment
in the production of services.
Although improved technologies may make it possible to support a
larger population, they must be constantly monitored. For example, an
improvement in the efficiency of fishing techniques, which makes it pos
sible to feed more people, can lead to overfishing, progressively result
ing in less food overall. Improved farming methods may produce more
food per acre, and therefore support more people, but the increased pop
ulation may be too large for the available water or fuel wood, thereby
overstraining another set of resources. It is not by chance that the pro
gressive exhaustion of renewable resources (e.g., water, soil, fisheries,
forested land) is a major concern of both the developing and developed
worlds.
What can be done to confront these issues? Over the last decades there has
been a flurry of activities. A variety of international agencies, govern
mental bodies and NGOs have been created for the purpose. Associations
of experts, consultants and development workers, each with their own
jargon and corporate rules, have been set up. Thousands of books, papers,
reports and manuals have been (and are still being) written. Development
and environment projects now operate even in the remotest areas of the
world. Globally, huge and yet insufficient sums of money are being spent
for development aid and environmental initiatives.
Have these development efforts been worthwhile? Yes, if we look at
improved agricultural yields, increased gross national products,
increased literacy and decreased childhood mortality. Not really, how
ever, if we take a closer look at issues of equity and environmental sus
tainability. In fact, problems of social injustice and environmental degra
dation are the true Achilles' heel of the development enterprise. How
did it happen? Some commonly acknowledged causes of problems
include the following:

• Little concern for the distribution of the costs and benefits of
development. Economic growth measured by increases in gross
national product has little to do with the distribution of wealth with
in a country. Many development initiatives end up enlarging the gap
between the rich and the poor.
• Inadequate attention to cultural differences. Development in Africa,
Asia, and Latin America is often assumed to be basically a repetition
of the socio-economic history of Europe and North America.
• Scarce consideration of environmental impact and demographic
changes. It is often assumed that natural resources are practically
unlimited and that population size will spontaneously stabilize with
increased income and improved education and health. Both assump
tions are often untenable.
• Top-down decision-making. Plans, programs and projects are
designed and implemented with little or no involvement of local insti
tutions or members of the local communities.
• Little concern for human resource development. Costly short-term
missions by international experts are often preferred to investing in
the long-term training of national professionals and promotion of
local expertise.
If large-scale development projects are often riddled with these kinds of
problems, even efforts at community-based development have been the
target of criticism. In part this is because – beyond the rhetoric of offi
cial documents – the commitment of governments and agencies to com
munity participation is often weak and self-serving (see Box 1.1).
Population dynamics, quality of life and the environment
How does population dynamics fit into the picture? How does it affect
not only the environment but also equity, quality of life, and respect for
cultural differences?
Currently, the human population is growing most rapidly in the poorest
regions of the world, where the resources for technological development
are most scarce and the institutional structure is weakest. Already today,
one person in five cannot get enough food to support an active working
life. One quarter of the world's people still are without safe drinking
water, and many more are without proper housing and sanitation.
Millions of children still die from malnutrition and preventable diseases,

Box 1.1
Some critical views on community-based development
• “by focusing on fatalism and lack of self-confidence in attempting to awaken people to their
potential for self-reliance, community development tends to ignore underlying causes of
poverty, such as limited access to land and the complexity of conflicting social, economic and
political interests.”
• “though the rhetoric of community development asserts a grassroots approach, it often erodes
into the mere promotion of government projects centrally planned by external bureaucracies.”
• “when projects genuinely emerge from the initiative of local efforts, they are generally neither
integrated into, nor coordinated with, larger macro-development plans and thus result in dupli
cation and waste.”
• “community development often assumes a simple homogeneity (uniformity) of interests
among village residents that is not a true reflection of the situation.”
Adapted from: Bergdall, 1993
and half a million women die each year from pregnancy-related prob
lems. Is it reasonable to expect that vast increases in human numbers
will be compatible with improvements in health and quality of life for
the multitudes in need? For some it is more reasonable to expect that the
weight of human population growth will end up as another burden on the
shoulders of the poor and their environment (Adedeji, 1985). Thus, a
world with many more people is likely to be even less equitable than it
is today.
The answer to this question can be controversial, especially for rural
areas. At times, increased survival rates due to improved health services
and people's behavioral change are even associated with a poorer quali
ty of life (see Case Example 1.1).
High rates of population growth, which are common in the developing
world, are largely the result of falling death rates in a context of persis
tently high fertility. Although infant and child mortality rates are still
higher than in the developed world, there has been an overall trend
toward a decrease in mortality in the early years of life and an increase
in life expectancy. Yet, one may ask: “To what extent is a decrease in
mortality associated with improvements in the quality of life for a
community as a whole?”
And there is more to quality of life’ than satisfying material needs.
Cultural and biological diversity, for instance, contribute to the resilience
of systems, but also make direct and indirect contributions to the quali
ty of life (both present and future). However, both are disappearing at
rapid rates due to population growth and the culture of mass consump
tion. Heyneman (1984) describes this process:
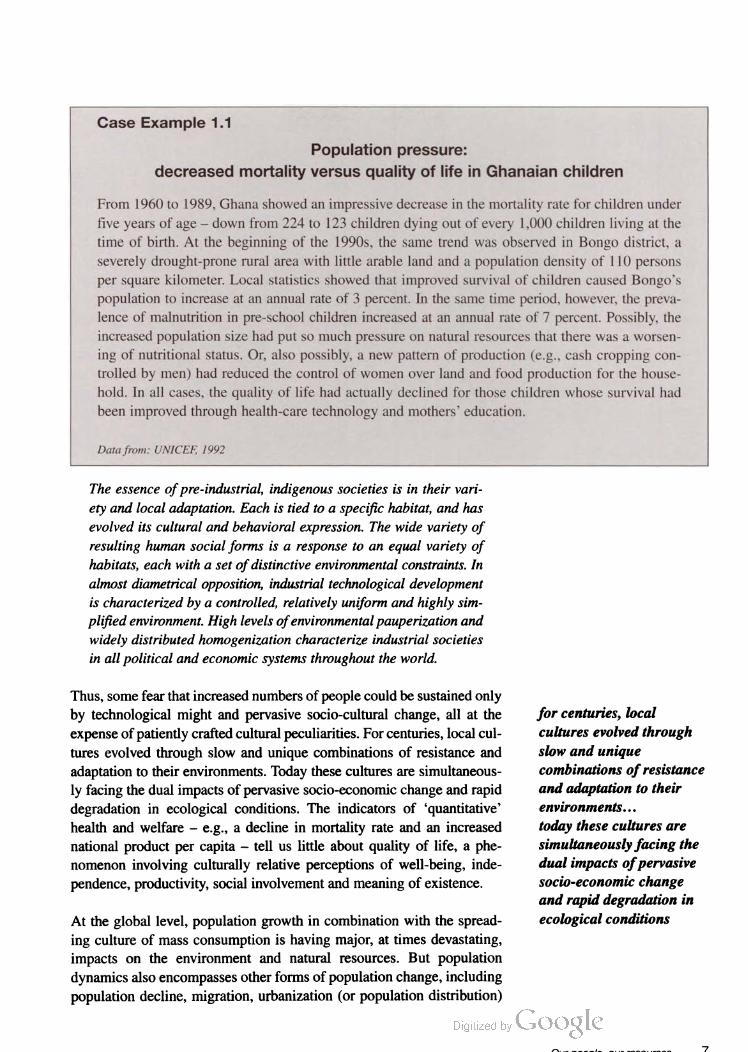
Case Example 1.1
Population pressure:
decreased mortality versus quality of life in Ghanaian children
From 1960 to 1989, Ghana showed an impressive decrease in the mortality rate for children under
five years of age — down from 224 to 123 children dying out of every 1,000 children living at the
time of birth. At the beginning of the 19905, the same trend was observed in Bongo district, a
severely drought-prone rural area with little arable land and a population density of 110 persons
per square kilometer. Local statistics showed that improved survival of children caused Bongo’s
population to increase at an annual rate of 3 percent. In the same time period, however, the preva
lence of malnutrition in pre-school children increased at an annual rate of 7 percent. Possibly, the
increased population size had put so much pressure on natural resources that there was a worsen
ing of nutritional status. Or, also possibly, a new pattern of production (e.g., cash cropping con
trolled by men) had reduced the control of women over land and food production for the house
hold. In all cases, the quality of life had actually declined for those children whose survival had
been improved through health-care technology and mothers’ education.
Data from: UNICEE 1992
The essence ofpre-industrial, indigenous societies is in their vari
ety and local adaptation. Each is tied to a specific habitat, and has
evolved its cultural and behavioral expression. The wide variety of
resulting human social forms is a response to an equal variety of
habitats, each with a set of distinctive environmental constraints. In
almost diametrical opposition, industrial technological development
is characterized by a controlled, relatively uniform and highly sim
plified environment. High levels ofenvironmental pauperization and
widely distributed homogenization characterize industrial societies
in all political and economic systems throughout the world.
Thus, some fear that increased numbers of people could be sustained only
by technological might and pervasive socio-cultural change, all at the
expense of patiently crafted cultural peculiarities. For centuries, local cul
tures evolved through slow and unique combinations of resistance and
adaptation to their environments. Today these cultures are simultaneous
ly facing the dual impacts of pervasive socio-economic change and rapid
degradation in ecological conditions. The indicators of ‘quantitative’
health and welfare — e.g., a decline in mortality rate and an increased
national product per capita — tell us little about quality of life, a phe
nomenon involving culturally relative perceptions of well-being, inde
pendence, productivity, social involvement and meaning of existence.
At the global level, population growth in combination with the spread
ing culture of mass consumption is having major, at times devastating,
impacts on the environment and natural resources. But population
dynamics also encompasses other forms of population change, including
population decline, migration, urbanization (or population distribution)
for centuries, local
cultures evolved through
slow and unique
combinations of resistance
and adaptation to their
environments. . .
today these cultures are
simultaneously facing the
dual impacts ofpervasive
socio-economic change
and rapid degradation in
ecological conditions

gender balance reflects
socio-economic processes,
such as male out
migration, which can have
significant indirect impacts
on the environment
and trends in aging and gender balance. Each of these, in turn, can have
significant implications for the environment as well as for equity and the
respect of cultural differences. For instance, migration from resource
poor areas to frontier regions has occurred throughout history. While
such migration can reduce the environmental pressure in the source
areas, the destination areas often suffer from the uncontrolled exploi
tation of resources, and may also experience cultural conflicts (see Case
Examples 2.2 and 2.3, pp. 35–36). Furthermore, in a world of six billion
people, there simply aren’t as many frontiers as in the past, and those
that remain are often quickly spoiled.
Migration to cities (urbanization) may be beneficial to the environment on
some levels, and harmful on others. On the benefits side, the concentra
tion of people means that it is more efficient to provide services such as
electricity, sanitation and public transportation. Furthermore, the housing
concentration of urban areas, particularly those in the developing world,
means that proportionally less land is taken away from agricultural activ
ities. On the problems side, we could count the concentrated production of
organic and human waste which, in the absence of modern sanitation
systems, is not easily absorbed by the environment. Urban areas are also
characterized by higher per capita levels of resource consumption.
At first glance, population aging and gender balance may seem to have
less dramatic consequences on the environment. And yet, these too are
important. Aging, especially in the developed world, is coming at a
tremendous cost to social support mechanisms and the health-care
system. As life expectancy climbs into the 70s in some developing coun
tries, available public sector financial resources may be stretched to meet
the growing demands on the health-care and social security systems.
This may mean that fewer resources are available to meet other needs,
such as environmental management and basic welfare. Gender balance
reflects socio-economic processes, such as male out-migration, which
can have significant indirect impacts on the environment. Where women
are the heads of household, and perhaps the sole providers for a family,
they may not have the time and resources available to manage the local
environment in a careful and sustainable way.
Affecting demographic phenomena is neither easy nor rapid. Let us
consider a reduction in natural increase (this is the portion of popula
tion growth that includes births minus deaths, but does not include
migration). Today, up to half the population in poor countries is under
14 years of age. Given this extremely young age distribution, even if
the present and next generation only have enough children to replace
themselves (approximately two births per woman), the total population
size of countries will still increase dramatically. This is because the
number of people of reproductive age, among whom fertility is highest,
greatly outweighs the population in older age groups, among whom
mortality is highest. The result is a significant excess of births over
deaths, leading to rapid population growth. For instance, it is estimated
that the African continent, which contains 12 percent of the world’s pop
ulation, will contribute about 34 percent of global population growth
between now and the year 2050 (United Nations, 1995).
Given the complex interplay of population, development and environ
ment mentioned above, is there any solution we can pursue? Is there
any way to improve the quality of human life while maintaining the
quality of the natural environment? Surely there is no one solution appli
cable to all contexts and societies. The complexity of the issues at stake
is such that even initiatives taken with the best intentions and adequate
resources can end up in abysmal failures. Yet, there are some lessons from
the past that can be brought to bear when searching for the specific solu
tion to fit a specific problem and context. Among these, we know that:
• People can take care of their environment when the conditions are in
place for them to meet their present needs by doing so, and to feel
secure about continuing to meet their needs in the future.
• People can take care of their environment when they agree on what
their problems and opportunities are, and organize to meet them
together (e.g., in local groups and institutions).
• People can take care of their environment when they manage to
obtain the support they need (e.g., information, technology, credit,
market outlets, health care) from various partners in society (e.g.,
government, NGO, business, research institutions).
• People can take care of their environment when their demographic
profile is not stressed beyond their capacity to cope (e.g., because of
massive inflow of migrants, outflow of local workforce, too rapid nat
ural growth, etc.).
As a way of synthesizing these lessons, some use an approach called
“primary environmental care’.
is there any way to
improve the quality of
human life while
maintaining the quality of
the natural environment?
people can take care of
their environment when
their demographic profile
is not stressed beyond their
capacity to cope
r", "--~~~1- - - --~~~. --~~~ O

Box 1.2
Population and “de-responsibilization’
Based on several case studies commissioned in rural parts of Pakistan, researchers at the Sustainable
Development Policy Institute came to the conclusion that, although the population of Pakistan is
reaching alarming levels and is still growing at about three percent a year, population growth is not
perceived as a major issue at the village level. In other words, population growth is seen as a prob
lem at the global or national levels, but not at the local level. This is not because of a lack of educa
tion about national priorities, but because of a conflict between national and local goals.
In some cases labor out-migration has become so important that the local environment is no
longer the central source of local income. In other cases, the village environment, with the com
mercialization of its products, has become part of the larger economy, to such an extent that the
way it is managed responds more to external constraints than to village-based requirements.
The consequence is that both resource management and fertility decisions are subject to the way
the community interacts with the larger politico-economic framework. But this interaction, instead
of leading to a nation-wide coherence in behavior, has been the source of even more conflicts
between local and national goals.
Although population growth is a problem largely at the global or national level, there are no insti
tutions at those levels that can influence behavior to respond to this problem. In Pakistan, the
authors found that the existing institutional structure has created a local-level indifference and
even hostility to national problems. At the local level, too, strategies available to individuals and
communities only operate at higher levels of aggregation that require co-operation. Local mecha
nisms for collective decision-making are either non-existent, or have been excluded from all but a
few narrow areas. This includes not only the growing erosion of local government systems, but
also of many institutions of civil society – the family, the neighborhood, and cultural and religious
associations.
In the end, development in Pakistan has led to a de-responsibilization of the people towards pub
lic matters. The question is not only of the power of the state, nor of the efficiency of the
market, but of the general ability of institutions to help people live together and co-operate with
each other. Simply put, it is a problem of governance. There needs to be a greater clarity of who
is responsible for what: what are the state, local bodies, communities and individuals responsible
for, and how can these different spheres of responsibility be kept mutually consistent during the
development process?
It follows, therefore, that the solutions to the problem of population growth lie mostly in respon
sibilization of local communities, and developing patterns of governance that support efforts
in local participation. One prescription is to re-create local social responsibility through the
strengthening and creation of local social and political institutions, at levels at which common
issues can become public matter.
Adapted from: Banuri and Amalric, 1992
1() Otte Goooo Otte Gooot trooo
1.2 Community at the population
environment interface:
primary environmental care
‘Primary environmental care’ is an approach to community-based
sustainable development matured on the basis of field experience. Many
people and organizations — from both developing and industrialized
countries — contributed to the development of this approach. Most of
them worked in participatory projects in poor urban and rural areas.
Others were involved in Primary Health Care, and water and sanitation
programs. Others were employed in large- and small-scale integrated
rural development schemes. Still others were simply concerned about
improving their own quality of life — and the quality of life of their
communities — by making optimal use of scarce resources. The knowl
edge and skills these people acquired from their practice with methods
and tools, their tribulations with conflicts and failures and their excite
ment as they solved problems and helped people, all contributed to a
consensus on goals to strive for, and ways to approach them. To give vis
ibility, legitimacy, incentive and impetus to such a consensus, a name
package was found: primary environmental care (PEC).
The objectives of PEC are not new, but the approach has the merit of
integrating them, affirming that the management of local environments
becomes effective and sustainable when linked with the satisfaction of
the needs (income, food, health, etc.) of local communities, and when all
the concerned people are involved and empowered to participate.
‘Meeting local needs’ means that people can maintain, produce or gain
access to the goods and services (food, shelter, income, health care, edu
cation, transportation, etc.) necessary for their life, health and well-being.
‘Protecting the local environment’ means different activities under dif
ferent conditions (e.g., eliminating a fire hazard, cleaning and protecting
a watershed, preventing flooding, halting an unsustainable extraction of
timber from a local forest, improving tilling practices to protect topsoil,
restoring a degraded communal building, leaving undisturbed the habi
tat of wildlife, etc.).
‘Empowering local communities’ means that communities, groups and
individuals obtain greater control over the factors influencing their lives.
This usually goes through several stages, in which people discuss and
identify their common problems and opportunities and then organize and
take action in partnership with others. Securing tenure to the natural
resources protected by the work of local people is a most important
with security oftenure,
the long-term economic
interests ofpeople tend to
merge with the long-term
‘interests ’ of the
environment
4 4
Box 1.3
Primary environmental care (PEC)
Primary environmental care is a process by which local communities – with varying degrees of
external support – organize themselves and strengthen, enrich and apply their means and capaci
ties (know-how, technologies and practices) for the care of their environment while simultane
ously satisfying their needs.
In synthesis, PEC integrates three objectives:
• meeting local needs;
• protecting the local environment; and
• empowering local communities.
The intelligence, experience, self-perceived interests and priorities of people and communities,
and their willingness to work together for the common good, are what PEC is all about.
major differences, con
trasts and power
imbalances are common
among community
members and subgroups
element of the empowerment process, and essential for sustainability.
With security of tenure, in fact, the long-term economic interests of peo
ple tend to merge with the long-term ‘interests of the environ
ment.
If a community engages in primary environmental care, many sensitive
issues are bound to be encountered, and many conflicts between local
and non-local interests and opinions are likely to emerge. Such conflicts
can arise in the planning stages (e.g., when trade-offs must be set among
environmental, economic and social goals, and priorities for action
must be agreed upon) or during implementation of activities, when some
can try to take advantage of others, or problems and mistakes become
apparent.
The community may also be united and well defined only in theory.
Community members may not feel a sense of common identity, may not
be equally aware or concerned about problems and ready to commit
resources or may not manage to achieve any suitable agreement about
what to do. A lengthy process of conflict management and negotiation
may be necessary before PEC activities can take off. In fact, major dif
ferences, contrasts and power imbalances are common among commu
nity members and subgroups. Women, ethnic minorities or religious
minorities may not be allowed to participate in decision-making or in
common endeavors on the same conditions as others. In such cases, PEC
requires a significant change in local habits and departure from cultural
11OrinS.
Local empowerment can only be based on the concerns of community
members and their willingness to be involved. Certainly, it cannot be
“brought in from outside. From outside, however, it can be impeded. In

this sense, PEC needs to be politically feasible, a condition too often
difficult to meet. Other constraints to PEC may be lack of capital, infor
mation, expertise, or the capacity of local people to organize, to manage
finances or to deal with government officials. Supporting institutions
(governmental and non-governmental, national and international, profit
oriented and solidarity-oriented) can help communities overcome these
constraints.
Thus, what are the challenges of PEC2
• The first challenge is political: assuring people a fair amount of self
determination and control over local resources.
• The second is institutional: developing local institutions capable of
gathering local knowledge and skills and delivering good ideas and
honest practice. people who organize and
• The third is socio-economic: assuring social appreciation and fair take initiatives for common
economic returns to sound environmental practice. interests develop a sense of
solidarity and common
identity, learn how to
establish and follow their
own rules, learn how to
pull together resources
and overcome problems
• Last but not least, there is a challenge of intelligence and ingenuity:
identifying the “win-win solutions by which both the environment
and people can profit.
If the process of PEC is complex and difficult, its rewards are certainly
worthwhile. People who organize and take initiatives for common
interests develop a sense of solidarity and common identity, learn how to
establish and follow their own rules, learn how to pull together resources
and overcome problems. In the process, they create new employment
opportunities, mobilize individuals and resources that were idle and
underexploited, and liberate their own energy to work, innovate and
diversify the basis of their livelihood. It is the experience of many com
munities that such initiatives can take off with capital investments that
are relatively low. When those initiatives benefit, at the same time, both
the environment and the people, the sense of community responsibility
for the environment grows and puts down strong roots.
Box 1.4 lists some conditions for the success of PEC, and the next
section gives a case example of the first steps of a real PEC initiative in
a rural context in Uganda.

Box 1.4
Conditions for success in primary environmental care
1. Capacity to organize and participate. All community members need to be able to play a role
in decision-making that affects livelihoods, in particular decisions over access, control and
management of common resources. This implies the right to set up community gatherings and
organizations. Women must be able to participate fully in these processes and capitalize on their
role as environmental managers for the benefit of themselves, their households and the whole
community.
2. Capacity to influence development priorities. Development programs need to be oriented
according to the priorities felt and expressed by communities, in full partnership with the nation
al authorities and the aid agency that may be assisting in the process. As a result, the entry point
for external assistance for environmental programs may not always be an environmental priority
but a community need, such as employment, housing or health care.
3. Integration of local knowledge and awareness of the environment. Communities need to be
involved in the assembly and analysis of environmental data. The provision of external environ
mental information and advice should be based on a dialogue with the community. Building on
and integrating traditional knowledge and skills is essential.
4. Access to natural resources. Communities need access, equitable internal distribution and
security of tenure for all the natural resources necessary to their livelihood. Security of land
tenure in urban and rural settings is particularly important, since only when tenure is safely
secured do motivations for long-term improvements emerge.
5. Access to financial resources. Communities need access to loan and credit facilities that rely
on record of payment rather than on collateral, which communities often lack.
6. Access to environmentally sound technologies. Communities need access to environmentally
sound technologies. These are best developed by way of participatory research, to assure that they
respond to felt needs and are adapted to local conditions, and are gender-appropriate, affordable,
efficient, usable and repairable by locals. In particular, there is a strong need for environmentally
sound alternatives to the unsound technologies presently in use.
7. Governmental support. Governments are the prime and indispensable partners of com
munities in PEC. They need not only to allow the process of community-based environmental
management to take place, but also to support it actively. To do so, a legislative framework for
environmental protection, including monitoring and enforcement, and an integrated set of sectoral
services that can address community needs are vital. Administrative decentralization is another
very important step towards the PEC process.
8. Access to information and public accountability. These need to be provided in governmental
policy and decision-making and in all aid-assisted activities. Community empowerment cannot be
achieved in an information vacuum or without a chance for the community to evaluate and discuss
responsibilities.
9. External support. Institutions (governmental and non-governmental) that can offer experience,
expertise and skills in support of the PEC process at the community level need to be developed
and strengthened. Also, a network of multi-disciplinary institutions capable of carrying out rele
vant research and training for PEC is needed
10. Appropriate time frame and adaptive planning. A longer-term time frame compared with
capital-intensive approaches is indicated. (Experience with other community-based approaches
suggests 10-year programs as realistic, although benefits should occur far earlier.) Also, great flex
ibility in project planning by an iterative approach ( ‘learning’ rather than ‘blueprint’) and adequate
monitoring are needed. Donors must be prepared for low initial levels of disbursement and for
changes in priorities.
11. Access to environmentally sound and socially responsive practices. Communities need
access to environmentally sound and socially responsive practices and tools, particularly in terms
of:
' participatory assessment of problems and resources;
' effective education, training and social communication;
~ local organization, planning and management of community-based initiatives;
' sustainable production (e.g., agroecology, agroforestry, integrated pest management, recycling
schemes, renewable sources of energy, biogas plants, fish ponds, etc.);
' participatory monitoring and evaluation.
From: Borrini-Feverabend. I995
1E
1.3 Primary environmental care: a
beginning in Pallisa!
Uganda's Pallisa district is located 120km to the north east of Kampala
in a lush, hilly area near the shores of Lake Kyoga. The district's resi
dents, mostly Iteso people, subsist almost entirely on small-scale agri
culture, livestock, and fishing. The district was badly affected by the
violence and civil war that tore the country apart and resulted in over a
million dead under the rule of Idi Amin and Milton Obote. In the 1980s
armed gangs of nomadic peoples from the north (the Karimojong) raid
ed the Iteso's cattle. After repeated attempts to get the government to
intercede on their behalf, some Iteso mounted an armed uprising that
lasted for several months. Peace returned to the area in 1989. It was time
for the people of Pallisa district to rebuild their lives and, by organizing
themselves in the Pallisa Community Development Trust (PACODET),
that is precisely what some of them have been doing.
Organizing and addressing priority problems
It was early morning in January 1993 and Stanley had gathered together
13 members of PACODET’s executive committee. Over the course of
the week, the same group would meet every day beneath a mango tree in
Kapuwai, a village in the Pallisa district. Stanley, a thoughtful man with
a quiet manner and bright eyes, was very much the leader of PACODET.
Another prominent member was Lawrence, the headmaster of the local
primary school, an upright, talkative man with an explosive laugh. James
and Amos were teachers too, James assuming the role of scribe and
Amos, with his broad smile, bringing a touch of levity to the meetings
(except when discussing his own subject, which was geography).
Several of those who attended the meetings came from other villages.
Vincent, a government agricultural extension agent who could discourse
freely on any matter related to farming, traveled an hour by bike each
way. Then there was Simeon Osire, a retired public health inspector from
Kagoli. The world he saw today was profoundly different from that
of his childhood, when food was plentiful, forests were large and
luxuriant, and lions, leopards and giraffes roamed the countryside.
There were many fewer women at these daily meetings than men,
and only two attended regularly. Stanley's wife Ann was a young and
exceedingly gentle woman, while Filder, who was married to
Lawrence, was more forceful and forthcoming. She had seven children,
the youngest of whom, a two-month-old boy, came along to the
meetings.

In addition to the local participants, the meeting included two health
experts from Makerere University. John Arube-Wani had almost 20
years’ experience in hospital social work; since 1985 he had spent much
of his time studying health issues in the countryside, where 90 percent
of the Ugandan population resides. Dr. Tom Barton, an American
physician-turned-anthropologist, arrived in Uganda in 1989; an expert
on sexually transmitted diseases – a tenth of Uganda's population is HIV
positive and destined to die of AIDS – he was a technical advisor to the
Child Health and Development Center at the University. Tom was a keen
supporter of PACODET's approach to primary health care and was also
helping Stanley and his colleagues think about the ways in which they
could tackle the district's environmental problems.
“When we first decided to do something,” recalled Stanley, who returned
to Pallisa district in 1989 having completed his studies in zoology at
Makerere University, “we saw that the most pressing problem was ill
health. Malaria was rampant and too many women died in childbirth.
Many of the children died too. Not a week passed without deaths in
every village. Then one day an elderly woman died just down there.” He
pointed towards the cart track which led to the primary school. “We
decided to count the number of deaths and look at the diseases which
were killing people. We knew the government wouldn’t do anything –
we had to act ourselves.” So PACODET set to work and in just three
years made great strides in promoting primary health care. “Now,” said
Stanley, after welcoming everyone under the mango tree, “it’s time to
look at other issues.”
PACODET’s history offers a good insight into the way in which a
dedicated group of people can shape their own destiny. In 1986 half a
dozen students born in the Kapuwai parish of Pallisa district decided
to work out ways of improving their community’s standard of living.
They founded the Kapuwai Students' Progressive Association (KSPA)
but, before they could start work, the armed rebellion had begun.
After the disruptions, KSPA reconvened in 1989 as the Pallisa
Community Development Trust (PACODET). Student associations
are common in Uganda, but this one was different. Rather than remain
ing a social organization dedicated to parties and festivities, the mem
bers of PACODET decided that they wanted to serve the community.
The students talked to the elders about the health problems in the
villages and the elders said: “You tell us that something can be
done. Show us that what you say is true, and we will give you our
support!”
The students called a meeting. Over a hundred people turned up and
together they discussed ways in which they might improve health. Funds
were obviously required, and each individual who wanted to join
PACODET contributed 100 shillings (approximately US$0.50 in those
days). Four hundred people attended the next meeting; before long,
PACODET had raised 40,000 shillings and its work could begin. Given
the high incidence of malaria in the district, one of the first things they
did was to purchase chloroquine to treat the sufferers. Another major
killer, especially of young children, was measles, and PACODET saw
that there was an urgent need for a vaccination program. The association
approached Pallisa's district medical officer and requested that the gov
ernment help train some of the villagers in basic health care. Since 1989,
40 community health workers and 15 traditional birth attendants have
been trained in and around Kapuwai. The vaccination program began,
and PACODET’s health workers were soon vaccinating more than 700
children a month against measles, TB, tetanus, polio, diphtheria and
whooping cough.
The program has been a resounding success. Child mortality has fallen
dramatically and the health of the adult population has also improved.
During the past year John Arube-Wani had carried out a qualitative sur
vey of five successful primary health projects around the country. “This
is the only one which was initiated by the community itself,” he said,
“and you really notice the difference. Here the villagers can discuss the
concepts thoroughly; they feel in control and they know that they will
continue to be successful. The other groups I’ve seen are much more fear
ful about their future as they're so dependent on outside help.” The
Ministry of Health has recognized PACODET's Health Care Project as
one of the best in Uganda. The Ministry, incidentally, supplied a refriger
ator, vaccine carriers and bicycles, and provided training when requested
to do so. However, most of the input, whether financial or technical, has
always come from PACODET, whose members now pay an annual sub
scription of 500 shillings per household and an enrollment fee of 3,500
shillings. At the time of the January 1993 meeting, PACODET was mid
way through its most ambitious project to date: the construction of a
health center that would eventually serve around 100,000 people.

Appraising the local environment
The human population was conspicuously healthier now to local eyes
than it had been in 1989, but the same could not be said of the environ
ment. Most of PACODET’s executive team were eager to tackle the
area’s environmental problems, yet they seemed unclear about their pre
cise nature. Tom suggested that they conduct a simple exercise which
would help to clarify their thoughts, and they spent the whole of one
afternoon drawing up two lists. One described all the features of the
environment and aspects of their lives that they appreciated and enjoyed;
the other concentrated on dislikes and grievances.
On the ‘appreciation’ list, a number of items came up quickly. The leafy
environment, good soils and adequate rainfall. The wide varieties of
birds and insects. The rocky hills, which provided a home for wild ani
mals and stone with which to build. The swamps, which provided fresh
water and a habitat for wildlife. Certain herbs for their medicinal quali
ties. Termites as a source of protein, and for the fine-particle clay useful
for brick building. The large variety of trees, including bread fruit,
mango, oil palm, pawpaw and flowering frangipani. Nature had been
kind to the people of Pallisa district, and they knew it. And the society
was friendly: in less abundant times everyone could be counted on to
come together and share resources.
When it came to discussing dislikes, nature was only occasionally
accused of making their lives difficult: monkeys raided crops, especial
ly around their granitoid hideaways; termites occasionally caused crop
damage; and mosaic disease had had a serious impact on cassava yields
in recent years. And, of course, there was the mosquito, vector of the
malaria parasite and scourge of the tropics. However, it was the human
condition, and the improprieties and weaknesses of the people them
selves, which dominated the group’s list of grievances. Education stan
dards were poor because parents didn’t value or couldn’t afford to give
their kids an education. Classrooms were in a bad state due to lack of
money, and many people felt schooling was unnecessary, despite the fact
that they themselves acknowledged that their problems often stemmed
from ‘lack of knowledge’. Alcoholism was a problem, and so was cont
amination of water sources and poor sanitation, even though half the
homes in the area now had pit latrines. Cooking stoves were inefficient
and filled the houses with smoke. Women spent too much time collecting
and transporting water. Domestic refuse left to rot in the open attracted
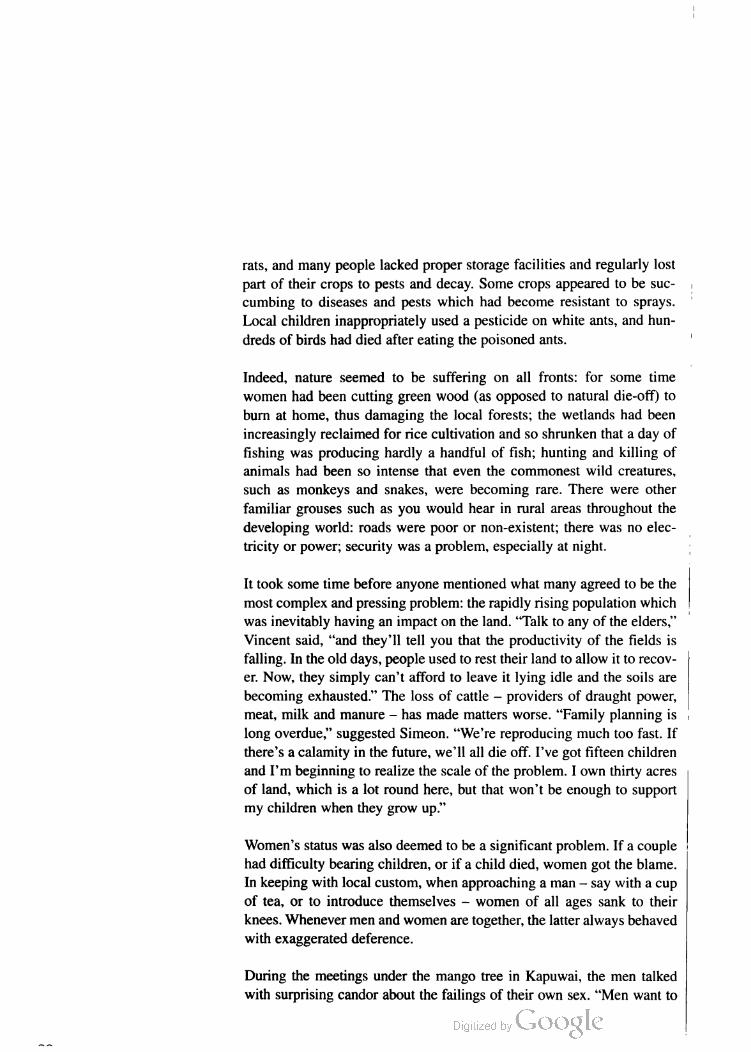
rats, and many people lacked proper storage facilities and regularly lost
part of their crops to pests and decay. Some crops appeared to be suc
cumbing to diseases and pests which had become resistant to sprays.
Local children inappropriately used a pesticide on white ants, and hun
dreds of birds had died after eating the poisoned ants.
Indeed, nature seemed to be suffering on all fronts: for some time
women had been cutting green wood (as opposed to natural die-off) to
burn at home, thus damaging the local forests; the wetlands had been
increasingly reclaimed for rice cultivation and so shrunken that a day of
fishing was producing hardly a handful of fish; hunting and killing of
animals had been so intense that even the commonest wild creatures,
such as monkeys and snakes, were becoming rare. There were other
familiar grouses such as you would hear in rural areas throughout the
developing world: roads were poor or non-existent; there was no elec
tricity or power; security was a problem, especially at night.
It took some time before anyone mentioned what many agreed to be the
most complex and pressing problem: the rapidly rising population which
was inevitably having an impact on the land. “Talk to any of the elders,”
Vincent said, “and they’ll tell you that the productivity of the fields is
falling. In the old days, people used to rest their land to allow it to recov
er. Now. they simply can’t afford to leave it lying idle and the soils are
becoming exhausted.” The loss of cattle — providers of draught power,
meat. milk and manure — has made matters worse. “Family planning is
long overdue,” suggested Simeon. “We’re reproducing much too fast. If
there’s a calamity in the future, we’ll all die off. I’ve got fifteen children
and I’m beginning to realize the scale of the problem. I own thirty acres
of land, which is a lot round here, but that won’t be enough to support
my children when they grow up.”
Women’s status was also deemed to be a significant problem. If a couple
had difficulty bearing children, or if a child died, women got the blame.
In keeping with local custom, when approaching a man — say with a cup
of tea. or to introduce themselves — women of all ages sank to their
knees. Whenever men and women are together, the latter always behaved
with exaggerated deference.
During the meetings under the mango tree in Kapuwai. the men talked
with surprising candor about the failings of their own sex. “Men want to
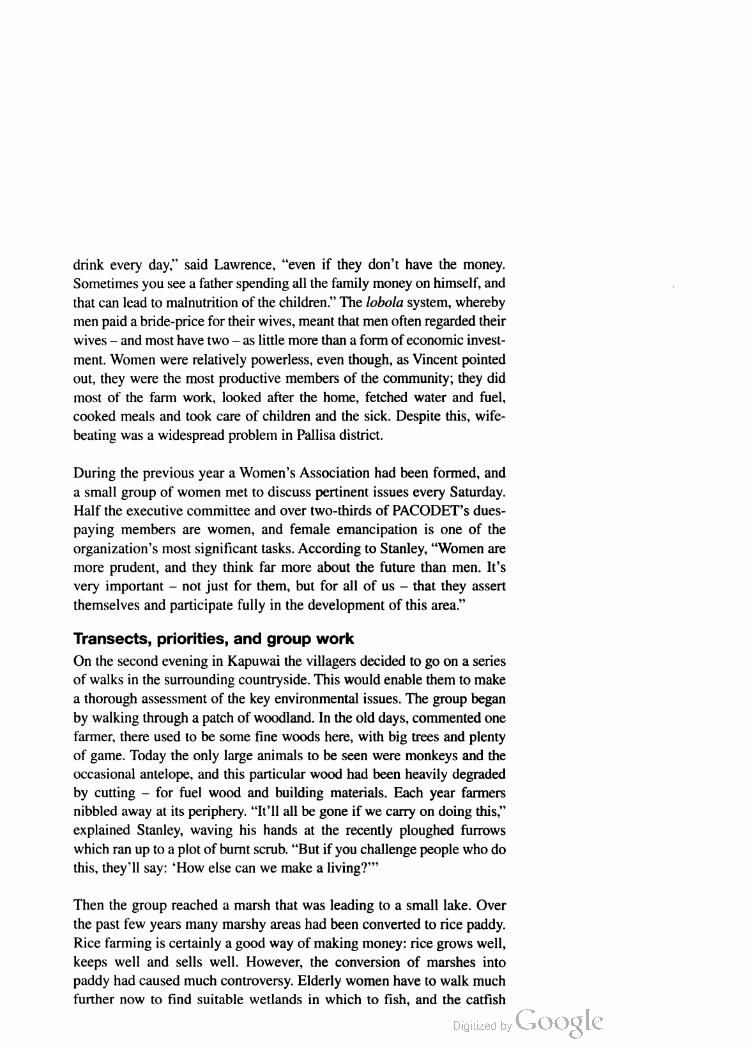
drink every day,” said Lawrence, “even if they don't have the money.
Sometimes you see a father spending all the family money on himself, and
that can lead to malnutrition of the children.” The lobola system, whereby
men paid a bride-price for their wives, meant that men often regarded their
wives – and most have two – as little more than a form of economic invest
ment. Women were relatively powerless, even though, as Vincent pointed
out, they were the most productive members of the community; they did
most of the farm work, looked after the home, fetched water and fuel,
cooked meals and took care of children and the sick. Despite this, wife
beating was a widespread problem in Pallisa district.
During the previous year a Women's Association had been formed, and
a small group of women met to discuss pertinent issues every Saturday.
Half the executive committee and over two-thirds of PACODET’s dues
paying members are women, and female emancipation is one of the
organization's most significant tasks. According to Stanley, “Women are
more prudent, and they think far more about the future than men. It's
very important – not just for them, but for all of us – that they assert
themselves and participate fully in the development of this area.”
Transects, priorities, and group work
On the second evening in Kapuwai the villagers decided to go on a series
of walks in the surrounding countryside. This would enable them to make
a thorough assessment of the key environmental issues. The group began
by walking through a patch of woodland. In the old days, commented one
farmer, there used to be some fine woods here, with big trees and plenty
of game. Today the only large animals to be seen were monkeys and the
occasional antelope, and this particular wood had been heavily degraded
by cutting – for fuel wood and building materials. Each year farmers
nibbled away at its periphery. “It’ll all be gone if we carry on doing this,”
explained Stanley, waving his hands at the recently ploughed furrows
which ran up to a plot of burnt scrub. “But if you challenge people who do
this, they’ll say: “How else can we make a living?”
Then the group reached a marsh that was leading to a small lake. Over
the past few years many marshy areas had been converted to rice paddy.
Rice farming is certainly a good way of making money: rice grows well,
keeps well and sells well. However, the conversion of marshes into
paddy had caused much controversy. Elderly women have to walk much
further now to find suitable wetlands in which to fish, and the catfish
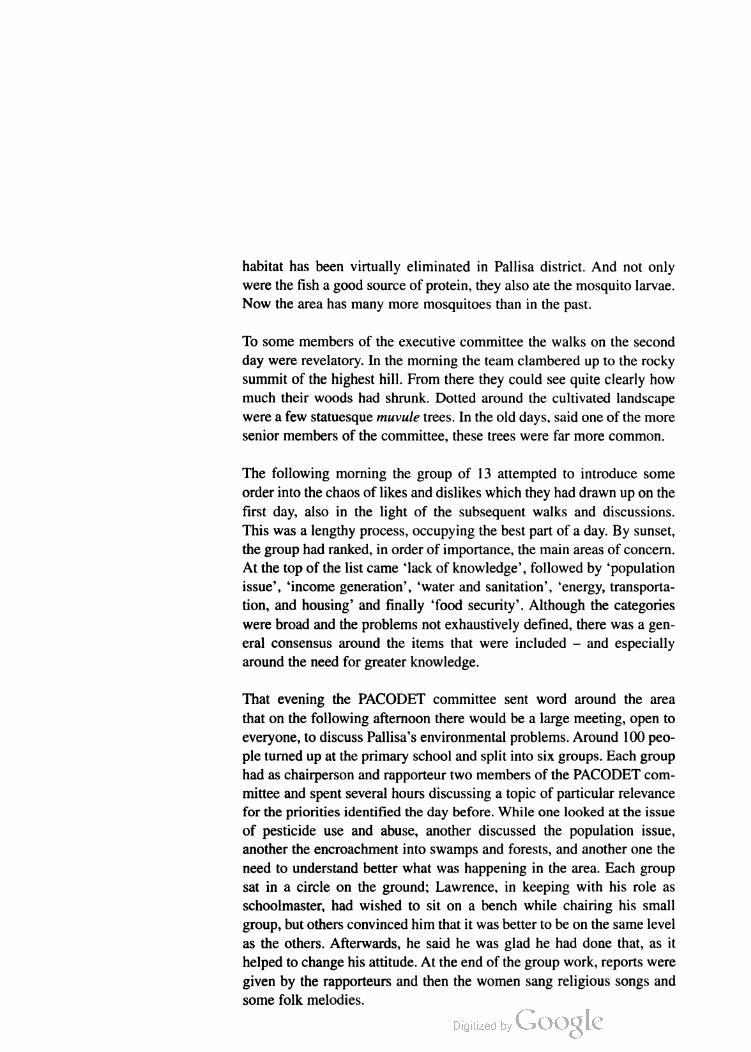
habitat has been virtually eliminated in Pallisa district. And not only
were the fish a good source of protein, they also ate the mosquito larvae.
Now the area has many more mosquitoes than in the past.
To some members of the executive committee the walks on the second
day were revelatory. In the morning the team clambered up to the rocky
summit of the highest hill. From there they could see quite clearly how
much their woods had shrunk. Dotted around the cultivated landscape
were a few statuesque muvule trees. In the old days, said one of the more
senior members of the committee, these trees were far more common.
The following morning the group of 13 attempted to introduce some
order into the chaos of likes and dislikes which they had drawn up on the
first day, also in the light of the subsequent walks and discussions.
This was a lengthy process, occupying the best part of a day. By sunset,
the group had ranked, in order of importance, the main areas of concern.
At the top of the list came “lack of knowledge’, followed by population
issue’, ‘income generation’, ‘water and sanitation’, ‘energy, transporta
tion, and housing and finally food security'. Although the categories
were broad and the problems not exhaustively defined, there was a gen
eral consensus around the items that were included – and especially
around the need for greater knowledge.
That evening the PACODET committee sent word around the area
that on the following afternoon there would be a large meeting, open to
everyone, to discuss Pallisa's environmental problems. Around 100 peo
ple turned up at the primary school and split into six groups. Each group
had as chairperson and rapporteur two members of the PACODET com
mittee and spent several hours discussing a topic of particular relevance
for the priorities identified the day before. While one looked at the issue
of pesticide use and abuse, another discussed the population issue,
another the encroachment into swamps and forests, and another one the
need to understand better what was happening in the area. Each group
sat in a circle on the ground; Lawrence, in keeping with his role as
schoolmaster, had wished to sit on a bench while chairing his small
group, but others convinced him that it was better to be on the same level
as the others. Afterwards, he said he was glad he had done that, as it
helped to change his attitude. At the end of the group work, reports were
given by the rapporteurs and then the women sang religious songs and
some folk melodies.

Planning for action
On their last day in Kapuwai, John Arube-Wani and Tom Barton met with
the executive team to discuss the results of the community-wide meeting
the day before. It was now time to draw up a plan of action. Although
there was a good deal of consensus on the problems to be addressed, the
same could not be said for the actions that the group felt PACODET could
or should take. There was still a good deal of confusion, not just about the
nature of Pallisa’s environmental problems, but about their severity and
significance. Stanley began by saying that the conservation of the
swamps was a priority, as was the protection of the woodlands from
further encroachment. At present, he didn’t think pesticide use was wide
spread enough to constitute a serious problem, though he acknowledged
the need to gain more information about the extent of their use.
Everyone agreed that ‘lack of knowledge’ contributed to poor land-use
practices, the mistreatment of women, the rapid population growth and
many other perceived ills. A variety of income-generating activities were
mooted. The idea of trying to gain an income while improving the envi
ronmental conditions was suggested; many found this appealing. Stanley
and others expressed interest in fish farming as a possible alternative to
growing rice in the swamps. Others mentioned setting up a grinding mill
— they already had a suitable building — and the women in the commit
tee discussed the local manufacture of mosquito nets and latrine slabs.
There were some ventures, such as tree planting, which the villagers
could undertake themselves at little or no cost. In fact, they had already
set up a small nursery. There was talk too of setting up a vegetable gar—
den at the primary school.
Yet again, ‘lack of knowledge’ was identified as a major problem. The
villagers had no idea how to make mosquito nets, or where to get the
materials; they had little experience in forestry matters, and none in fish
farming. PACODET’s Plan of Action was mostly devoted to gathering
information about training opportunities, funding sources and a variety
of technologies, as well as about themselves and their surroundings.
Over the next few months they intended to map their resources and carry
out a survey of agricultural practices; they hoped to find out who was
taking trees and who was encroaching the swamps. They also intended
to look at a range of concerns from family planning to household
hygiene, from dietary habits to the use of pesticides. It was an ambitious
program and the faces of those gathered beneath the mango tree
A..- __.__|.. a. .. -aa... ._...... 00
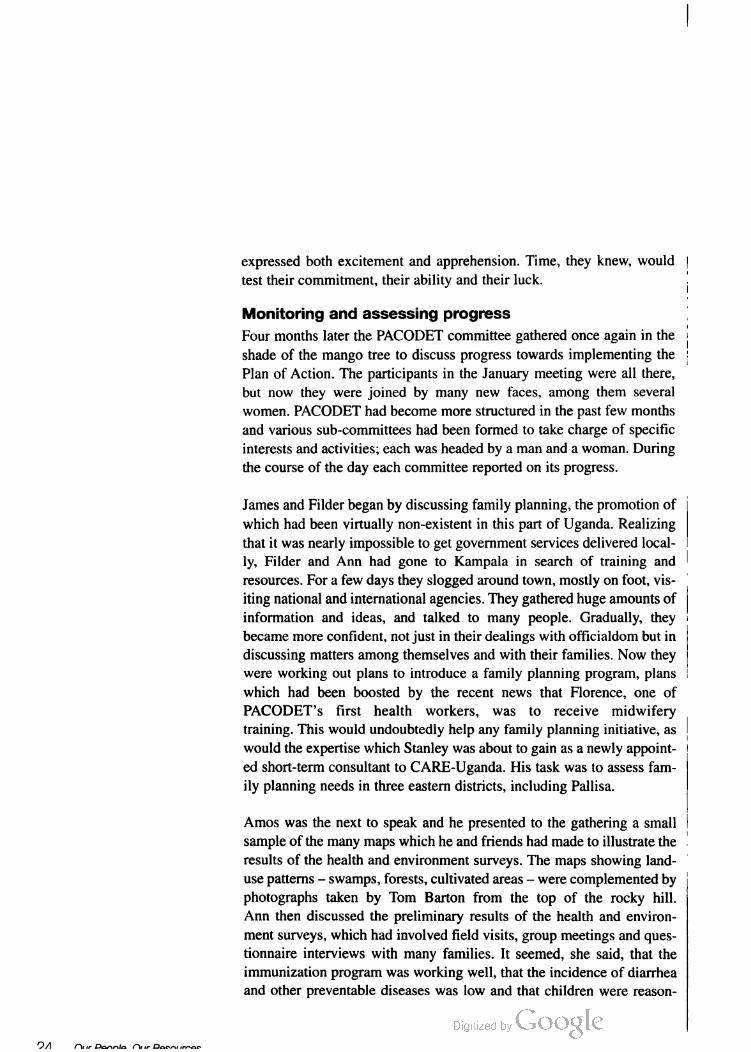
04 n. |r Dmnln fit If Dnoru irrvso
expressed both excitement and apprehension. Time, they knew, would
test their commitment, their ability and their luck.
Monitoring and assessing progress
Four months later the PACODET committee gathered once again in the
shade of the mango tree to discuss progress towards implementing the
Plan of Action. The participants in the January meeting were all there,
but now they were joined by many new faces, among them several
women. PACODET had become more structured in the past few months
and various sub-committees had been formed to take charge of specific
interests and activities; each was headed by a man and a woman. During
the course of the day each committee reported on its progress.
James and Filder began by discussing family planning, the promotion of
which had been virtually non-existent in this part of Uganda. Realizing
that it was nearly impossible to get government services delivered local
ly, Filder and Ann had gone to Kampala in search of training and
resources. For a few days they slogged around town, mostly on foot, vis
iting national and international agencies. They gathered huge amounts of
information and ideas, and talked to many people. Gradually, they
became more confident, not just in their dealings with officialdom but in
discussing matters among themselves and with their families. Now they
were working out plans to introduce a family planning program, plans
which had been boosted by the recent news that Florence, one of
PACODET’s first health workers, was to receive midwifery
training. This would undoubtedly help any family planning initiative, as
would the expertise which Stanley was about to gain as a newly appoint
ed short-term consultant to CARE-Uganda. His task was to assess fam
ily planning needs in three eastern districts, including Pallisa.
Amos was the next to speak and he presented to the gathering a small
sample of the many maps which he and friends had made to illustrate the
results of the health and environment surveys. The maps showing land
use patterns - swamps, forests, cultivated areas - were complemented by
photographs taken by Tom Barton from the top of the rocky hill.
Ann then discussed the preliminary results of the health and environ- .
ment surveys, which had involved field visits, group meetings and ques
tionnaire interviews with many families. It seemed, she said, that the
immunization program was working well, that the incidence of diarrhea
and other preventable diseases was low and that children were reason
ably well nourished. However, the sub-committee was particularly con
cerned about the dangerous use of pesticides and PACODET planned to
launch an education campaign to address this matter. The new regulation
would limit the use of Dimicron pesticide, which was used for the con
trol of insects and birds. Another measure to reduce pesticide use
involved the purchase of a truck-load of disease-resistant cassava, which
would be planted in a local plot and later distributed in the district.
Some people had begun to use animal manure to fertilize their fields
and to select seeds for their pest-resistant qualities. Finally, Vincent and
Lawrence had set up a tree nursery in the school garden, and here the
children would learn how to plant and tend trees.
Despite progress in these many areas, not everything was going well.
Someone mentioned that monkeys had begun to steal chickens; as there
was so little forest left for them to hunt in, no one was particularly sur
prised by this. One person complained about the increase in rats around
villagers’ homes, possibly due to the decrease in the number of herons
preying on them. Several committee members wondered whether the
widespread use of pesticides and the loss of wetlands habitat had led to
the decline in herons. “We’re learning basic ecology the hard way, said
Amos, but we are surely learning it! Recognizing the importance of
wetlands' ecology, Stanley had had contacts with the Ugandan office of
IUCN, which had proposed a pilot community project in wetlands man
agement as part of the new wetlands policy in Uganda. Everyone got
very excited learning about this.
Outsiders might find it odd that a poor rural community organization
should turn down an offer of money, yet this is precisely what PACODET
did. A couple of years before the PEC meetings in Kapuwai,
PACODET had sent in an application for the financing of a diesel grind
ing mill to the US Agency for International Development (USAID).
During their visit to Kampala, Filder and Ann had discussed the propos
al with USAID officials, who offered PACODET a considerable sum of
money. At first, the women were delighted, but after they had discussed
the matter with the PACODET committee, everyone began to have sec
ond thoughts. For one thing, they realized that there were now several
mills in the area which were operating at a loss. There were also the
environmental arguments against a diesel mill, which would emit nox
ious gases, fill the air with dust and introduce an unappealingly noisy
element into an otherwise peaceful and largely machineless setting.
The PACODET committee eventually decided to ask USAID to shift the
grant from the mill project to another one which would establish a
sewing and carpentry workshop. “So far we have no commitment from
USAID,” Filder told the committee, “but they’ve agreed to hold on to the
money until we present more detailed plans for the workshop. Perhaps
they’ll help us to get the tools we need to start working.” The women
were eager to produce quilts, mosquito nets and clothes, and they want
ed to use scraps of fabric, unwoven cotton and anything else they could
find. The workshop would also become a useful meeting place for their
association.
It was now late afternoon and an orange sun was sinking in the west.
A group of teenagers arrived to play music under the tree. It was a warm,
humid night; fireflies blinked in the darkness and the smell of wood
smoke drifted over the gathering crowd. People ate, chatted and laughed
a lot, still excited by the news of the day. As soon as the music started,
many began to dance. Others came close to the players and sang. They
sang religious songs, songs about AIDS, about past tragedies and future
hopes. The people of Kapuwai had come a long way since their region
was plundered by the Karimojong in the late 1980s. They had every
reason to celebrate.
The story ofPACODET is abridged from Pye-Smith and Borrini-Feyerabend, 1994.
2. Population dynamics and the
local environment: concepts
andissues

This chapter introduces some key terms, concepts and issues useful in
understanding local phenomena in population dynamics and environmen
tal management. Short case examples are used to illustrate some topics on
population and natural resources, and a list of indicators is provided for
those interested in measuring the status of populations and the environ
ment. The content of the chapter can be used to guide the preliminary
analysis of a community or region in which one expects to conduct partic
ipatory action research, and provides clues as to the kind of information to
look for in existing data sets and reports. Readers wishing to proceed
directly to participatory action research methodologies may skip ahead to
Chapter 3. Additional details on the formulas and indicators discussed in
this chapter may be found in Annex A.
2.1 Population dynamics: distribution, growth, health
and well-being
Population density
Settlement patterns
Migration
Gender roles and sex distribution
Population growth and decline
Population and culture: fertility and contraception
Health status and quality of life
2.2 The local environment: natural resources, protected
areas and carrying capacity for human populations
Water
Soil
Forests
Wildlife
Protected areas
Carrying capacity for human populations
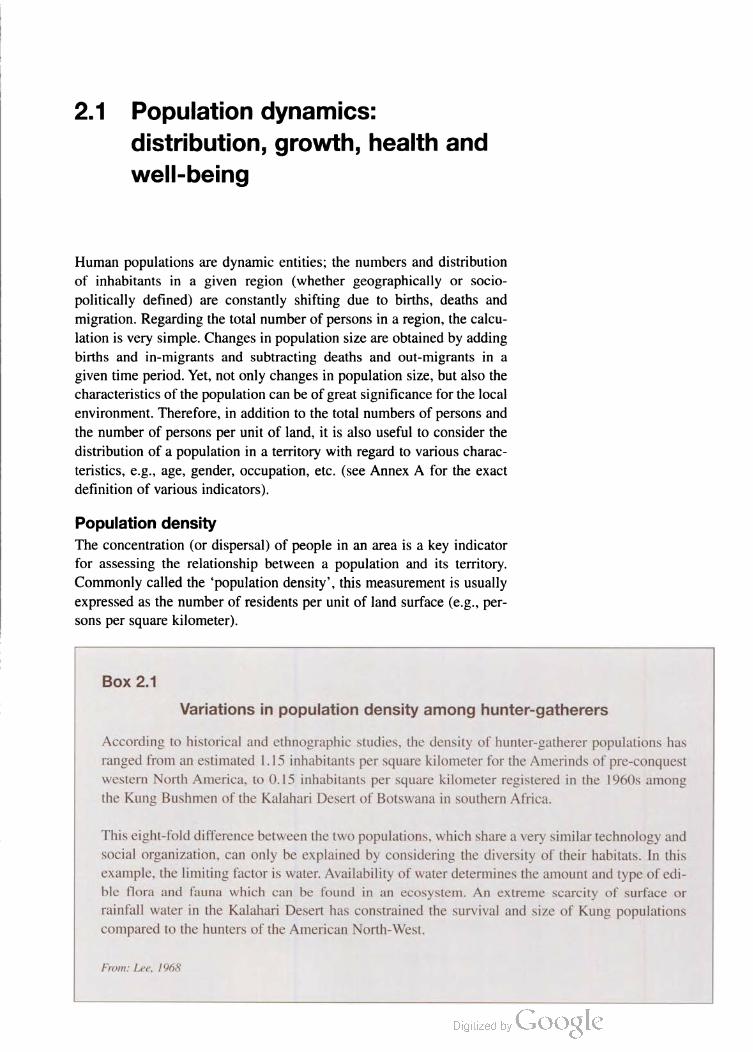
2.1 Population dynamics:
distribution, growth, health and
well-being
Human populations are dynamic entities; the numbers and distribution
of inhabitants in a given region (whether geographically or socio
politically defined) are constantly shifting due to births, deaths and
migration. Regarding the total number of persons in a region, the calcu
lation is very simple. Changes in population size are obtained by adding
births and in-migrants and subtracting deaths and out-migrants in a
given time period. Yet, not only changes in population size, but also the
characteristics of the population can be of great significance for the local
environment. Therefore, in addition to the total numbers of persons and
the number of persons per unit of land, it is also useful to consider the
distribution of a population in a territory with regard to various charac
teristics, e.g., age, gender, occupation, etc. (see Annex A for the exact
definition of various indicators).
Population density
The concentration (or dispersal) of people in an area is a key indicator
for assessing the relationship between a population and its territory.
Commonly called the population density’, this measurement is usually
expressed as the number of residents per unit of land surface (e.g., per
sons per square kilometer).
Box 2.1
compared to the hunters of the American North-West.
From: Lee, 1968
Variations in population density among hunter-gatherers
According to historical and ethnographic studies, the density of hunter-gatherer populations has
ranged from an estimated 1.15 inhabitants per square kilometer for the Amerinds of pre-conquest
western North America, to 0.15 inhabitants per square kilometer registered in the 1960s among
the Kung Bushmen of the Kalahari Desert of Botswana in southern Africa.
This eight-fold difference between the two populations, which share a very similar technology and
social organization, can only be explained by considering the diversity of their habitats. In this
example, the limiting factor is water. Availability of water determines the amount and type of edi
ble flora and fauna which can be found in an ecosystem. An extreme scarcity of surface or
rainfall water in the Kalahari Desert has constrained the survival and size of Kung populations

Box. 2.2
Nucleated and scattered settlement patterns among peasant farmers
Peasant households may be concentrated in large villages (nucleated settlement pattern), traveling
every day from their home to their plots, or they may be dispersed in order to live near their fields
(scattered settlement pattern).
As a rule of thumb, in areas where the land is fertile, where water is constantly available and where
agricultural production is almost completely based on cereals and beans (for example, in the val
leys of large rivers or where man-made irrigation systems have been built) a scattered settlement
pattern prevails, along with a high population density. In areas where fertility of soil and/or water
availability are major constraints and where small-scale agriculture is combined with cattle herd
ing, we may expect to find a low population density with a nucleated settlement pattern.
A third combination is typical of tropical rain forest societies: a very low population density com
bined with a scattered and semi-nomadic settlement pattern (i.e., people moving to a new place
every 5–10 years). This represents a two-fold strategy for procuring food, consisting of slash-and
burn horticulture of tubers and plantains for calories, combined with hunting, fishing and gather
ing for proteins and micro-nutrients.
At the local level, the density of human populations is affected by envi
ronmental constraints, as well as by technological, socio-economic and
political factors. For example, hunter-gatherer populations that rely on
wild food over relatively large territories are generally scattered and dis
persed (see Box 2.1). In contrast, technological improvement and effi
cient management of domesticated plants and animals allow agricultur
al and pastoral communities to support higher densities of population per
unit of land.
Taken by itself, however, the average density figure may be too rough an
estimate to be meaningful. The calculation of population density can be
refined by considering alternative denominators for the surface area that
are ecologically or politically significant. For example:
• In 1977, Egypt had an overall density of 39 persons per square
kilometer of its total land area; but due to the size of its deserts, this
was actually about 1,276 persons per square kilometer of arable
land.
• In 1992, the average density of the Shuar-Achuar population of the
Morona-Santiago Province in the Ecuadorian Amazon was approxi
mately 5.18 persons per square kilometer, but the actual density per
square kilometer of legally entitled land was 18.7.
Settlement patterns
The way in which a population exploits and manages natural resources
has major implications on its settlement pattern (i.e., the way in which

Box 2.3
Seasonal movements of nomads
Ecological variables such as water availability, climate, flora and the type of animals raised (i.e..
cows, horses, sheep, camels, etc.) contribute to shaping the size and density of nomadic groups
(which are smaller than those of most sedentary peasant farmers), as well as the way in which they
exploit their territory. Very often, herders’ movements are seasonal. For instance, in East Africa,
nomads congregate during the rainy season and disperse during the dry season, while on the Euro
Asian tundra, human and animal populations congregate during the summer months and disperse
in wintertime.
Anthropologists studying nomad groups have found that this annual cycle is also combined with
a pluri-annual one, which allows herders to exploit in a sustainable way different areas and eco
logical niches of their territory. Moreover, some scholars have discovered how indigenous knowl
edge of the habitat helps the nomads to choose their movements based on climatic contingencies
and variations (including droughts).
people live, work and, generally speaking, stay together). There are two
basic types of settlement patterns:
- sedentary — people live permanently in a given place and continu
ously exploit the surrounding territory;
' nomadic — people move continuously over a large territory, and
exploit its resources in a specific location only periodically.
A sedentary settlement pattern is typical of communities and societies
that depend on agriculture for their survival (see Box 2.2). Nomadism is
typical of herder populations who must constantly provide forage and
water for their animals (see Box 2.3).
Pure sedentarism and nomadism are two ways of interacting with the envi
ronment that lead to opposing geographical distributions of populations.
There are, however, many intermediate arrangements. For example, among
the Batswana (of Botswana) rural dwellers traditionally had a tripartite
arrangement. During the cold part of the year, they were at the ‘village’, in
the wet season at the ‘lands’ for planting and in the dry season at the
‘cattle post’ for herding. Many, if not most, rural communities combine a
certain degree of nomadism and sedentarism (see Box 2.4).
Density and settlement patterns of human populations are also deter
mined by economic and political factors. Not all the needs of a rural
community can be fulfilled locally. Tools for working the fields,
weapons for hunting animals, kitchen and housekeeping implements,
clothes and personal commodities, drugs and medicine, and magic and
religious salvation are almost always obtained through markets or
Box 2.4
Transhumance among Mediterranean peasant-pastoralists
Several Mediterranean and Middle Eastern rural communities combine small-scale agriculture
with breeding sheep (and, to a lesser extent, cows and horses). During the summertime at least
some of the men of each household leave their nucleated sedentary settlements in the lowlands to
bring the herds to the highland pastures.
Known in central and southern Italy as transumanza, this mix between sedentary and nomadic
lifestyle patterns often entails a double-residence situation, with a main house in a nucleated vil
lage and a second house (very often a hut) in the highland pastures.
trading centers that allow exchange with the external world.
Contemporary slash-and-burn horticulturists, hunter-gatherers, nomadic
herders and peasants with irrigated fields all depend, to a varying extent,
on urban populations (much as urban populations also depend on these
rural groups, e.g., for food, animal products, etc.).
Access to marketplaces for selling rural products and buying urban
made commodities is, in fact, a key element in determining geographical
location and distribution of rural settlements. In addition, denser urban
settlements attract people because they provide (or are supposed to pro
vide) political and military safety, as well as coordination of efforts for
building and maintaining infrastructures (e.g., roads, bridges, irrigation
systems, etc.).
Urban/rural interdependency has been a constant feature since the earli
esturban centers and states. Modern technology and services that pro
vide education, health, credit, and technical assistance have made towns
and central governments ever more important to rural life. Still, many
ecological, economic, political, and social problems affecting rural
communities are deeply rooted in past and current inequities in the rela
tionship between village and town, community and state, and peasants
and bureaucrats.
Migration
Migration can be a significant component of demographic change in
small communities and a key factor affecting the way in which human
populations relate to their environment. Immigration and emigration are
not, however, usually documented routinely at the local level. Moreover,
each local community is likely to have some unique migration charac
teristics (e.g., young men in rural southern Africa going to work in the
mines; young women in West Africa going to towns for trading). For
many communities, temporary or even semi-permanent migration is a
key survival strategy during periods of drought, natural disaster or civil
disturbance.
Based on the period of time involved, three main migration patterns
can be identified:
• permanent migration (e.g., young adults leaving with their children
to settle permanently in another location);
• temporary migration (e.g., men and/or women leaving for more
than one year to find work and remit money to their families); and
• seasonal migration (e.g., active population looking for gainful
employment for periods of less than one year).
In most developing countries, urbanization in the form of permanent
emigration from rural areas to large cities has become a major trend,
related to demographic, ecological, economic and socio-cultural
changes. Southern Africa has seen rates of urban population growth that
are double the overall growth of the national populations; because of
wars, refugee movements and the social upheavals of apartheid, more
than 40 percent of the region's population now live in urban areas.
Urbanization at these levels causes tremendous problems. Housing and
other services are often unable to keep up with demand, leading to squat
ter settlements and unsanitary conditions. Urban and peri-urban areas
strain the capacity of accessing water and fuel resources. Cities also pro
duce huge amounts of waste, polluting the water of rivers and lakes.
In the past 20 years, various agencies have attempted to control the trend
towards urbanization by launching large-scale agricultural development,
watershed management and colonization projects. The principal ration
ale behind these projects is the concept of integrating previously under
exploited regions into the national economic system. The surplus of
rural population generated by natural growth is supposed to be redis
tributed among these areas (see Case Example 2.1).
The socio-economic consequences of such ruralization initiatives are
controversial and politically very sensitive. Resettlement and coloniza
tion, for instance, can be carried out at the expense of the pre-existing
communities in the new settlement areas. These communities, which fre
quently consist of ethnic minorities, may be greatly affected by a large
inflow of immigrants, which they do not have the political power to con
trol or discourage. Immigration may affect the natural resource base of
these communities, bringing about resource scarcity and complex
problems affecting rural
communities are deeply
rooted in past and
current inequities in the
relationship between
willage and town,
community and state,
and peasants and
bureaucrats

Case Example 2.1
Migration and colonization in the Peruvian montaña
The Eastern Peruvian Andes are covered by tropical rainforest. The landscape of this region,
known as montaña, features abrupt mountains (reaching 2,500 meters) and deep valleys, dug out
over the millennia by large rivers (e.g., the Huallaga, the Urubamba, the Madre de Diós, and their
tributaries), draining towards the Amazon Basin. Until the beginning of this century, this region
(surface area of 270,000 square kilometers) was almost solely inhabited by a few thousand
Indians, belonging to groups such as the Aguaruna, the Machiguenga and others.
Opening roads across the highlands facilitated the migration of Highland peoples towards the
montaña. Large international agribusiness companies, such as the Peruvian Corporation, estab
lished enormous estates in this area and offered jobs. The population began to increase. In 1940,
the total population was already 245,645. By the 1981 census, 1,221,351 persons were settled in
the montaña, representing a five-fold increase in 40 years. Natural population growth rates for the
period ranged from 3.8 to 4.5 percent. Thus, the dramatic population growth was principally due
to immigration, rather than natural increase.
The magnitude of this phenomenon calls for an explanation. Why were the Highland peasants
moving towards the Upper Amazon Valley? Why did they choose to leave their community and to
settle in an environment which for most of them is harsh and unknown?
B. Lesevic, a Peruvian demographer, suggested that such a large migration flow should be ana
lyzed in terms of both attraction and expulsion factors. Among the former is a national policy
which supports extending the agricultural frontier and, consequently, colonization. This policy
provides for construction of roads and social infrastructures, facilitates land entitlement, assists
land-owners in making use of their property, and provides financial assistance (i.e., credit) to own
ers of middle-sized and small businesses. A side effect has been the development of a seasonal
labor-market, attracting thousands of landless Highland peasants towards the montaña for short
periods of time.
Among the expulsion factors, Lesevic includes: 1) unequal and unfair distribution of land in the
Andes and low productivity of Highlands agriculture; 2) a higher natural increase of the Andean
population than the actual chances of employment in the local agricultural labor-market; 3) inca
pacity of land reforms to change the patterns of Highlands agriculture; and 4) internal economic
crises leading to increased unemployment in urban areas of the country.
Colonization of the montaña has been a safety-valve for Andean agricultural land ownership and
productive structure. Supported by governments and international agencies, this process is, how
ever, having severe environmental and social consequences. Deforestation, soil erosion, riverpol
lution, conflicts with indigenous people, drug-trafficking, civil war, and urban poverty are
attributable to this attempt to provide for the landless by expanding the agricultural frontier, with
out resolving inequities and the inefficient mode of production still prevalent in the Andes.
Adapted from: CNP-CIPA, 1984
Case Example 2.2
History, conservation and human rights:
the case of the Yanomami in the Amazon of Brazil and Venezuela
The survival of the Yanomami people and their forest environment has been increasingly endan
gered in Brazil, with the encroachment of gold miners into their territory, and more recently also
into Venezuela. The invasion of 40,000 to 100,000 gold miners in the 1980s had serious negative
impacts on the Yanomami's health, socio-cultural fabric and natural environment. This has been
possible because of insufficient protection and regulation from the governments of both countries.
Road construction and mining operations caused significant deforestation, game population dis
placement, soil erosion, mercury contamination and other forms of pollution in Yanomami terri
tory. In addition, previously alien forms of social problems are becoming increasingly common,
including poverty, alcoholism and prostitution. Further, epidemic diseases such as influenza,
malaria and tuberculosis, introduced to the area by the miners, have had a devastating effect on the
population of villages. In 1993, a violent massacre of Yanomami villagers, mostly women and
children (at the hands of disgruntled miners), was reported around the world. In late November
1993, 16 more Yanomami were found dead in Venezuela, probably from mercury poisoning, a
slower but equally fatal consequence of gold extraction.
Adapted from: Sponsel, 1996
cultural changes, often with disruptive effects. Ethnocide or genocide of
indigenous peoples are among the potential negative outcomes of colo
nization and resettlement.
Gender roles and sex distribution
Women play an essential role in shaping the population outlook of a
community. In addition to bearing and rearing children, they frequently
take care of the sick and the elderly. Women are also the developers and
custodians of a wealth of unique knowledge and skills, often closely
related to the environment. Most cultures ascribe special responsibilities
and roles for environmental care to women. Gathering water and fuel for
household consumption is often exclusively done by women or girls.
World-wide, girls and women are responsible for an important percent
age of food production, and in some communities this contribution can
range up to 90 percent.
Nonetheless, women's economic contributions are too often underesti
mated. Development initiatives, and the attendant new technologies and
increased economic power, tend to be taken over by men and may there
by worsen the role of women in society. The breakdown of traditional
customs and rules (e.g., due to urbanization and shifts from an extend
ed to a nuclear family pattern) contributes to their disadvantages. For
instance, female-headed households, which generally depend on a sin
gle income-earner, are likely to be among the poorest households.
Case Example 2.3
The impact of rural migration on the environment in Burkina Faso
The Mossi Plateau, so named because it is the core area of Burkina Faso's largest ethnic group,
covers approximately half of the country's land surface. The plateau is in the Sahelian zone, which
is characterized by variable rainfall (600 to 900mm per year), poor soils and sparse vegetation.
Despite the environmental challenges of life on the plateau, it is home to the majority of Burkina
Faso's population, and densities are in excess of 45 to 75 persons per square kilometer. These den
sities, combined with rapidly growing populations, have led to extensification of agriculture, soil
exhaustion, and over-cutting of forests for firewood. By contrast, the southern and western parts
of Burkina Faso are relatively sparsely populated, and are characterized by more favorable cli
matic regimes. Population densities are on the order of 15-25 persons per square kilometer, rain
fall is in excess of 1,100mm, the vegetation is less degraded and soils are of higher quality.
The juxtaposition of these two zones has led in recent years to a large stream of migration from
the Mossi Plateau to the south and west of the country, parts of which were only recently opened
up for settlement since the eradication of river blindness in the 1980s. Many areas, however, were
already populated by local ethnic groups prior to the arrival of Mossi from the central plateau. The
scale of the migration was such that, in one village, the population quintupled from 1,402 to 7,955
inhabitants from 1975 to 1985, a 19 percent annual growth rate! In contrast to the largely male
seasonal labor migrations of the past, these new Mossi migrations involve entire households who
settle permanently in the new territory. In many receiving areas, Mossis are beginning to outnum
ber the local inhabitants.
This migration has had political and environmental repercussions. On the political side, the Mossi
often set up parallel structures of village governance, rather than subordinate themselves to the
local village head. This has created conflicts in some instances. Secondly, locals complain that the
Mossi bring with them cultivation practices that are ill-suited to the local environment, and that
deforestation has been exacerbated because the Mossi cut the forests for export to urban centers.
Although the Mossi have set up their own administrative structures, they have not challenged the
role of the local Chef des terres to assign lands for cultivation. In the migration-receiving areas,
villages practice a form of community land management in which the Chef des terres allocates
lands to peoples of his own ethnic group and to immigrants coming from outside. A newly arrived
migrant can only gain rights to cultivate a piece of land if he has been sponsored by a local res
ident or an immigrant who has been in the village over three years.
In the face of unprecedented migration levels, this traditional form of land management may be
contributing to problems of land degradation. First, because usufructuary rights represent rights to
cultivate but not to the land itself, there is no incentive to make improvements to one's land. On
the contrary, farmers are encouraged to harvest as much as possible from the land while it is in the
family's possession. Secondly, the significant increase in demographic pressure on the land has led
to over-exploitation and a decrease in the number of fallow years. Permitting farmers greater secu
rity of tenure may constitute an improvement. Whether or not a new form of land management
would be culturally acceptable is a question that might make an interesting subject for a partici
patory action research process.
Adapted from: Yaro, 1995

Environmental deterioration results in dramatic increases in the work
load of women, who must travel further to gather fuel wood and spend
more hours in carrying water.
Women are generally omitted or relegated to minor roles in most devel
opment activities. Although women supply the majority of the labor
when local projects require it, they have the least access to information,
educational opportunities or participation in decision-making. This is
particularly unfortunate because women, as the principal caretakers of
rural families, are extremely practical. If not excluded from the process,
women could contribute a degree of common sense which is too often
missing in development planning (Bergdall, 1993).
A gender analysis of population can be of great use in planning or
implementing programs involving the use of natural resources, since in
many societies access to and control over the resources are gender-based
(see Chapter 4). Basic demographic questions about population and
women can help to reveal the nature of the labor force, as well as gender
based roles in the household, in the community, and in various sectors.
A key indicator of women's status is education (see Annex A, section
A.7). In fact, a strong correlation has been seen in many studies around
the world between mothers’ formal education and decrease of infant and
child mortality, decrease of household size, and increased acceptance of
family planning and child spacing methods.
The sex ratio is an indicator of the sex distribution of the population, and it
is defined as the number of men per 100 women (see Annex A, section
A.2). If it is under 100, it means that there are more women than men in the
population; if it is over 100, there are more men than women. When the sex
ratio dips below 90, it is often an indication of very high male out-migration.
In such areas, it is common to see many female-headed households.
Population growth and decline
The difference between the number of births and deaths occurring in a
given period of time is the natural population growth. This natural
increase excludes changes in a population size due to migration. For the
sake of comparison, natural population growth is usually expressed as
a percentage increase with respect to the population existing at the
a strong correlation
has been seen between
mothers’ formal education
and decrease of infant and
child mortality, decrease of
household size, and
increased acceptance of
family planning and child
spacing methods

Table 2.1
Some indicators to assess women's status in the community
Indicators
• average size of family and household;
• sex and age distribution of the local population;Demographic • average frequency of pregnancies and deliveries;
:s of • average interval between pregnancies;
Status • maternal mortality rate;
• abortion rate (especially induced abortions);
• migration rate and gender-specific migration.
• average number of hours worked per day
(work-load of women);
• role in household decision-making:
Other • percentage of women involved in community development
indicators of activities: -
women's • gender differences in employment rate and types of work:
Status • percentage of women members of local political or development
committees:
• existence of gender-based segregation patterns;
• existence of female genital mutilation practices and percent of
women affected.
beginning of the time period considered (see Annex A). A three percent
rate of growth translates into a population doubling time (i.e., the time it
would take for a population to double assuming constant rates of growth)
of 23 years.
Examples of extreme population growth values currently affecting some
developing countries are reported in the last two columns of Table 2.2.
The table shows that for most of the selected countries, the crude birth
rate is stationary or decreasing. Meanwhile, from 1960 to 1994, the
crude death rates and especially the under-five mortality also decreased
markedly in all of these countries. This pattern suggests that natural pop
ulation growth in these regions has probably been related more to a
decrease of mortality (particularly in the early years of life) than to an
increase in natality and fertility. In the 1990s, this trend has reversed in
some countries due to HIV/AIDS, e.g., in Uganda, where the average
life expectancy from birth has now dropped into the mid-40s (PRB,
1996).
A negative rate of population growth, i.e., a natural decline in popula
tion size (sometimes called a “negative increase'), occurs when the num
ber of deaths exceeds that of births. This category of ‘natural population
decline is separate from changes in population numbers due to migration
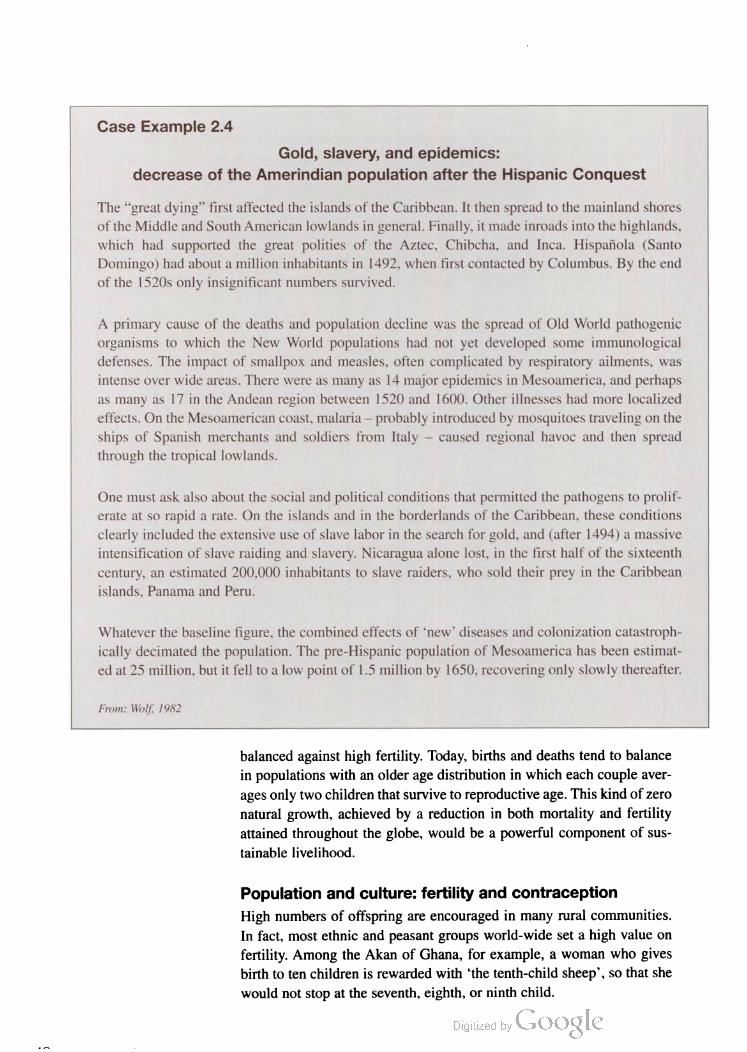
Case Example 2.4
Gold, slavery, and epidemics:
decrease of the Amerindian population after the Hispanic Conquest
The “great dying” first affected the islands of the Caribbean. It then spread to the mainland shores
of the Middle and South American lowlands in general. Finally, it made inroads into the highlands,
which had supported the great politics of the Aztec, Chibcha, and Inca. Hispafiola (Santo
Domingo) had about a million inhabitants in 1492, when first contacted by Columbus. By the end
of the 15205 only insignificant numbers survived.
A primary cause of the deaths and population decline was the spread of Old World pathogenic
organisms to which the New World populations had not yet developed some immunological
defenses. The impact of smallpox and measles, often complicated by respiratory ailments, was
intense over wide areas. There were as many as 14 major epidemics in Mesoamerica, and perhaps
as many as 17 in the Andean region between 1520 and 1600. Other illnesses had more localized
effects. On the Mesoamerican coast, malaria - probably introduced by mosquitoes traveling on the
ships of Spanish merchants and soldiers from Italy — caused regional havoc and then spread
through the tropical lowlands.
One must ask also about the social and political conditions that permitted the pathogens to prolif
erate at so rapid a rate. On the islands and in the borderlands of the Caribbean, these conditions
clearly included the extensive use of slave labor in the search for gold, and (after 1494) a massive
intensification of slave raiding and slavery. Nicaragua alone lost, in the first half of the sixteenth
century, an estimated 200,000 inhabitants to slave raiders, who sold their prey in the Caribbean
islands, Panama and Peru.
Whatever the baseline figure, the combined effects of ‘new’ diseases and colonization catastroph
ically decimated the population. The pre-Hispanic population of Mesoamerica has been estimat
ed at 25 million, but it fell to a low point of 1.5 million by 1650, recovering only slowly thereafter.
From: Wolf, I 982
balanced against high fertility. Today, births and deaths tend to balance
in populations with an older age distribution in which each couple aver
ages only two children that survive to reproductive age. This kind of zero
natural growth, achieved by a reduction in both mortality and fertility
attained throughout the globe, would be a powerful component of sus
tainable livelihood.
Population and culture: fertility and contraception
High numbers of offspring are encouraged in many rural communities.
In fact, most ethnic and peasant groups world-wide set a high value on
fertility. Among the Akan of Ghana, for example, a woman who gives
birth to ten children is rewarded with ‘the tenth-child sheep’, so that she
would not stop at the seventh, eighth, or ninth child.
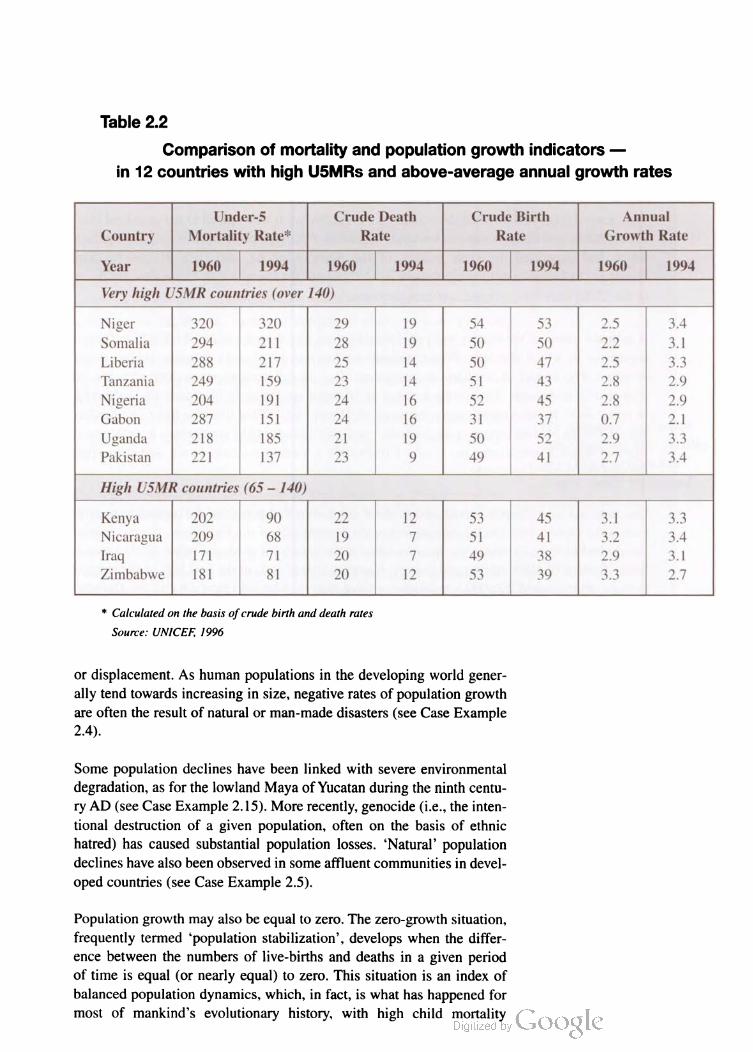
Table 2.2
Comparison of mortality and population growth indicators –
in 12 countries with high U5MRs and above-average annual growth rates
Under-5 Crude Death Crude Birth Annual
Country Mortality Rate" Rate Rate Growth Rate
Year 1960 1994 1960 1994 1960 1994 1960 1994
Very high U5MR countries (over 140)
Niger 320 320 29 19 54 53 2.5 3.4
Somalia 294 211 28 19 50 50 2.2 3.1
Liberia 288 217 25 14 50 47 2.5 3.3
Tanzania 249 159 23 14 51 43 2.8 2.9
Nigeria 204 191 24 16 52 45 2.8 2.9
Gabon 287 151 24 16 31 37 0.7 2.1
Uganda 218 185 21 19 50 52 2.9 3.3
Pakistan 221 137 23 9 49 41 2.7 3.4
High U5MR countries (65–140)
Kenya 202 90 22 12 53 45 3.1 3.3
Nicaragua 209 68 19 7 51 41 3.2 3.4
Iraq 171 71 20 7 49 38 2.9 3.1
Zimbabwe 181 81 20 12 53 39 3.3 2.7
*Calculated on the basis of crude birth and death rates
Source: UNICEF, 1996
or displacement. As human populations in the developing world gener
ally tend towards increasing in size, negative rates of population growth
are often the result of natural or man-made disasters (see Case Example
2.4).
Some population declines have been linked with severe environmental
degradation, as for the lowland Maya of Yucatan during the ninth centu
ry AD (see Case Example 2.15). More recently, genocide (i.e., the inten
tional destruction of a given population, often on the basis of ethnic
hatred) has caused substantial population losses. Natural population
declines have also been observed in some affluent communities in devel
oped countries (see Case Example 2.5).
Population growth may also be equal to zero. The zero-growth situation,
frequently termed population stabilization’, develops when the differ
ence between the numbers of live-births and deaths in a given period
of time is equal (or nearly equal) to zero. This situation is an index of
balanced population dynamics, which, in fact, is what has happened for
most of mankind's evolutionary history, with high child mortality

In settings where no social security system is available, sons and
daughters are the only security a parent has in his/her old age. Moreover,
beginning in childhood, sons and daughters often work to provide
additional income for the household. Once grown up, they play a major
role in strengthening, through marriage, the social links between
their parents’ household and other members of the community. This
often represents important economic and social advantages for the
families involved, in terms of capacity to mobilize extra labor, exchange
of goods and services, maintenance of property rights, social status,
etC.
The economic and social advantages of high fertility are often embedded
in deeply rooted social and religious values. With the exception of
Catholicism, no major religious tradition contains an unequivocal and
universally accepted prohibition against contraception. Even so, many
traditional communities still rely on religion for arguments opposing the
limitations on fertility and family size advocated by external develop
ment agents. For example, while religious scholars are divided on the
attitudes of Islam towards contraception, the widespread belief among
many practicing Muslims is that modern contraception is incompatible
with religious teachings.
\
Until recently, only Western Europe and societies with European ances
try in the New World looked negatively on fertility. These societies are
characterized by nuclear families, late marriages and parents contribut
ing to their children's economic well-being: all factors that would favor
smaller families and lower population growth (see below, Case Example
2.5).
In contrast, the predominant family pattern in much of rural Asia and
Africa is extended families, early marriages and adult children who
economically assist their parents. These factors tend to encourage high
fertility and high population growth rates.
In both cases, cultural attitudes toward fertility appear based on the pre
dominant social and economic conditions in a given community. In the
long run, both cultural systems are unsustainable, because growth in
either population or consumption cannot continue indefinitely into the
future.
the economic and social
advantages of high fertility
are often embedded in
deeply rooted social and
religious values
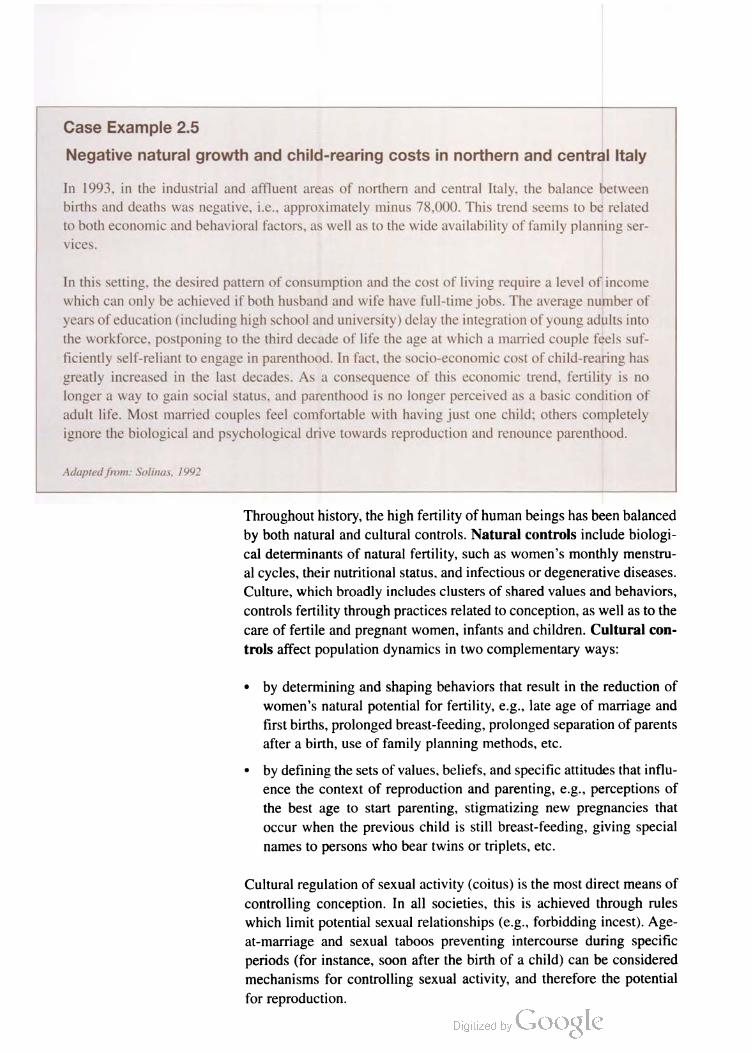
Case Example 2.5
Negative natural growth and child-rearing costs in northern and central Italy
In 1993, in the industrial and affluent areas of northern and central Italy, the balance between
births and deaths was negative, i.e., approximately minus 78,000. This trend seems to be related
to both economic and behavioral factors, as well as to the wide availability of family planning ser
vices.
In this setting, the desired pattern of consumption and the cost of living require a level ofincome
which can only be achieved if both husband and wife have full-time jobs. The average number of
years of education (including high school and university) delay the integration of young adults into
the workforce, postponing to the third decade of life the age at which a married couple feels suf
ficiently self-reliant to engage in parenthood. In fact, the socio-economic cost of child-rearing has
greatly increased in the last decades. As a consequence of this economic trend, fertility is no
longer a way to gain social status, and parenthood is no longer perceived as a basic condition of
adult life. Most married couples feel comfortable with having just one child; others completely
ignore the biological and psychological drive towards reproduction and renounce parenthood.
Adapted from: Solinas, 1992
Throughout history, the high fertility of human beings has been balanced
by both natural and cultural controls. Natural controls include biologi
cal determinants of natural fertility, such as women's monthly menstru
al cycles, their nutritional status, and infectious or degenerative diseases.
Culture, which broadly includes clusters of shared values and behaviors,
controls fertility through practices related to conception, as well as to the
care of fertile and pregnant women, infants and children. Cultural con
trols affect population dynamics in two complementary ways:
• by determining and shaping behaviors that result in the reduction of
women's natural potential for fertility, e.g., late age of marriage and
first births, prolonged breast-feeding, prolonged separation of parents
after a birth, use of family planning methods, etc.
• by defining the sets of values, beliefs, and specific attitudes that influ
ence the context of reproduction and parenting, e.g., perceptions of
the best age to start parenting, stigmatizing new pregnancies that
occur when the previous child is still breast-feeding, giving special
names to persons who bear twins or triplets, etc.
Cultural regulation of sexual activity (coitus) is the most direct means of
controlling conception. In all societies, this is achieved through rules
which limit potential sexual relationships (e.g., forbidding incest). Age
at-marriage and sexual taboos preventing intercourse during specific
periods (for instance, soon after the birth of a child) can be considered
mechanisms for controlling sexual activity, and therefore the potential
for reproduction.
A second way of controlling conception by cultural means is contracep
tion (i.e., practices which reduce the probability of a woman becoming
pregnant without necessarily preventing sexual intercourse). Contracep
tion also includes regulating sexual activity based on scientific or folk
knowledge of reproductive anatomy and variations in fertility during the
menstrual cycle, as well as contraceptive herbs and medications.
An important means of controlling conception, practiced by most pre
industrial societies, is prolonged breast-feeding. Folk wisdom in many
regions includes awareness of the relationship between breast-feeding
and length of post-partum amenorrhea (i.e., the time following delivery
during which a woman's menstrual cycle is interrupted). Research stud
ies have shown that under favorable conditions, prolonged breast-feed
ing can result in birth-spacing intervals of three or more years, with a
reliability comparable to modern medical and chemical contraceptives
(Short, 1984).
In addition, harsh living conditions tend to affect fertility. According to
Harris and Ross (1987), the way in which women are physically treated
can raise or lower the age of the first menstruation, lengthen or reduce
the period of adolescent sterility, increase or decrease the frequency of
amenorrhea, and hasten or retard the upper limits of the fertility age.
Variation in nutritional intake, physical workload and harsh living con
ditions may decrease fertility and increase the risks of natural abortion,
maternal mortality and infant mortality (Bongaarts, 1982; Hamilton et
al., 1984).
In many rural communities, various traditional (non-medical) forms of
planning and controlling births are far more prevalent than the modern
methods. In fact, most individuals or couples who utilize modern meth
ods are also likely to be using one or more of the traditional methods.
Thus, measurements of the impact of family planning interventions that
are only linked to levels of acceptance or use of specific modern meth
ods may be of little value in determining actual practices that are regu
lating population size in a community.
Over-emphasis on modern methods can also lead to discounting tradi
tional values in the community (Mamdani, 1972). A good method of
assessing the effects of any intentional change in population control
related behaviors in a community is to measure birth intervals, i.e., the
in many rural
communities, various
traditional (non-medical)
forms ofplanning and
controlling births are far
more prevalent than the
modern methods
...the assumption that a
decrease in infant and
child mortality would
automatically lead to a
reduction in the birth
rate proved to be
questionable...
average period of time between consecutive births among those women
who are having children in the community. This can be a very sensitive
measure at local levels, able to show changes rapidly and inexpensively.
Intra-uterine death and spontaneous abortion are high among human
females, i.e., up to 25 percent of pregnancies during the first month
(MacCormack, 1982). Although this pattern is partly due to natural
anatomical and physiological factors, such a high abortion rate cannot be
explained without taking into account the effects of harmful cultural
practices. Among such behaviors are not reducing the workload of
women during the early months of pregnancy or not providing them with
a high-quality diet. Additionally, intentional abortions (by mechanical
or chemical means) are practiced in many cultures as a child-spacing
device (Devereux, 1976). The impact of these practices may reach far
beyond the direct effects on the new life – unsafe abortions can cause
anatomical and physiological damage that reduces a woman's fertility.
More or less deliberate infanticide has also been widely reported in
historical and anthropological literature. In addition to direct killing, at
least five other forms of infanticidal behavior occur in several cultures:
placing an infant in dangerous situations; abandonment with little
chance of survival; negligence resulting in accidents; excessive physical
punishment; and lowered biological support (Scrimshaw, 1983). Not
only infants, but also children are the victims of direct or indirect forms
of homicide (Dickemann, 1984; see also Case Example 2.6).
Concern over population growth is not new to the domain of public
health. Since the late 1960s, when the assumption that a decrease in infant
and child mortality would automatically lead to a reduction in the birth
rate proved to be questionable (see Box 2.5), a family planning compo
nent has been added to most national health service delivery systems. In
1978, family planning was acknowledged by WHO as a basic element
of comprehensive Primary Health Care, and some years later it was
endorsed by UNICEF as a key component of its child survival strategy.
Nonetheless, in many countries – particularly those in Sub-Saharan
Africa – the short-term impact of family planning programs on ferti
lity rates has proven to be limited. Cultural acceptance, physical and
financial accessibility for users, and costs of service delivery have been
shown to be major constraints. Actual use of modern family planning

Case Example 2.6
Beliefs, parents’ attitudes and childhood deaths among the Achuar
The Achuar (a slash-and-burn horticultural society of the Pastaza watershed in the Ecuadorian and
Peruvian Amazon) consider the first year of life of a new-born baby as an extension of his or her
intra-uterine existence. Infants are thus perceived as being not only completely dependent on the
mother, but also as weak, incomplete and not yet full sons or daughters. Until they are given a per
sonal name, their social existence is not even acknowledged.
Achuar infants are assumed to be exposed to a vast amount of risks posed by the magic powers of
almost all objects, plus the behaviors of their parents. Most infant illnesses are believed to occur
after parents breach some of the infinite eating and behavioral taboos they must respect in order
to ensure an infant's health and survival. The death of a breast-fed child is most often attributed to
a ritual that has not been correctly followed by the parents. Even so, no blame is given to the moth
er or the father of the dead baby; everybody understands that the number of taboos is so great that
it would be impossible to live without breaking some of them. Thus, when infants die, limited
mourning rituals are carried out in a rapid fashion. Within days, nobody in the community seems
to be further interested in the issue.
This attitude is in strong contrast to the anxiety which surrounds illness in an already weaned, but
walking and talking child (i.e., a being who has a personal name and who is a real' son or daugh
ter). A sick child is a major event for a household: huge amounts of money and time are invested
in attempts to heal the child through modern medicine or expensive shamanistic rituals. The death
of such a child is often attributed to enemies witchcraft. Long mourning rituals are performed,
and the warriors of the community may discuss for weeks, or even months, the possibility of tak
ing revenge on the witch suspected of being responsible for the death.
However, as soon as the symptoms subside and the child recovers, the daily routine of child
rearing is resumed. Weaned children are left alone for the entire day with a sister who is only two
to three years older. During meals, they are not entitled to their own portion of food but must share
those of the parents, kinsmen and visitors. Customary rules are enforced by threats, physical pun
ishment and, in cases of severe infringement, administration of intoxicating datura roots.
Accidents both within and outside the home are quite common, as is retaliation against small chil
dren by elder brothers and sisters.
Considering infants as not fully human and accepting their death as destiny is perhaps a way of
culturally and psychologically managing the fragility and precariousness of the early months of
life and the high infant mortality affecting tropical rain forest societies (more than 150 deaths per
1,000 live births). Severe and somewhat inconsistent child training may, on the other hand, be
interpreted as a way of promoting acquisition of behaviors and skills which are adaptive with
respect not only to the harsh physical environment with which the Achuar must deal, but also to
the conflictive, violent and unsafe social arena in which adult social life unfolds. The Achuars' ver
sion of the Darwinian principle of survival of the fittest may indeed have contributed to limiting
population growth over the centuries.

Box 2.5
How can the birth rate be reduced?
There is a widespread assumption that the necessary and sufficient condition for reducing the birth
rate is to reduce the child death rate. The reasoning goes that if families see that their children no
longer die, they will have fewer of them.
Preston (1978) was among the first to question this notion. He called it a “hopeful policy declara
tion resting on a thin research base” and wondered how much mortality decline can be expected
to translate into fertility decline, and the strength of this relation in “setting levels of mortality con
trol.” An additional child death in a family leads, on average, to far less than one additional birth,
especially in high-fertility pre-transitional societies. He concluded: “The picture is not attractive
for those who look to mortality reduction as a means to reduce fertility through familial effects,
let alone those who advocate such measures as a means to reduce growth rates.”
A fall in the birthrate leading to a demographic transition seems to require the harnessing of
social and economic gains consequent to poverty reduction and socio-economic development.
Unfortunately, serious constraints prevent such development from happening and thus the birth
rate from falling. The factors include lack of agricultural land and its poor quality and irrigation
potential, poor supplies of energy and other raw materials, limited access to education and jobs,
and lack of political representation. There is also the economic stranglehold exerted by the rich
over the poor, and by the industrial over the developing world; the time needed for structural and
cultural change must also be taken into account. For many countries, these constraints appear to
be so great that a demographic transition is unlikely to occur before excessive pressure is exerted
on the ecological support system.
From: King, 1990
technologies is the result of complex socio-cultural changes that some
times unfold through generations.
Furthermore, important gender differences exist in many societies con
cerning the perceived advantages and disadvantages of having many
children. Because women disproportionately bear the costs of child
bearing and child-rearing, they are often more interested than men in
limiting and spacing births. Today, there are high levels of unmet need
for family planning among women in the developing world. Unmet need
is a measure that represents the percentage of women of reproductive
age who wish to space or limit births but who are not currently using a
contraceptive method.
The Program of Action that emerged from the 1994 International
Conference on Population and Development emphasized that organized
family planning programs are but one component of a broader strategy
to stabilize population growth rates and improve well-being. The other
ingredients include improving women's status, expanding reproductive
health services, poverty alleviation, improving infant and child health

Case Example 2.7
Linking population and environment in south-west Uganda
The Kigezi region of south-western Uganda is a beautiful area characterized by heavily terraced
hills that quilt the landscape. Once covered by forest that extended from Zaire to Burundi, most
of the trees have been cleared for timber, building poles and arable land. Only two major remnants
of the forest remain intact in Uganda, and both were designated as national parks by the govern
ment in 1992: Bwindi Impenetrable National Park (BINP) and Mgahinga Gorilla National Park
(MGNP). Together, the two parks are home to over half of the world’s population of mountain
gorillas (Gorilla gorilla berengei).
Beginning in 1986, NGOs have supported conservation and development activities through agro
forestry extension programs combined with conservation education and community outreach. In
1994, a more participatory, need-driven approach was adopted. The new activities include a ground
breaking multiple-use program in which certain resource users from a community are allowed
access to previously restricted forest products, such as weaving materials and medicinal herbs.
In 1992, in part as a response to a desire for family planning assistance expressed by community
members and relayed through project staff. one of such NGOs (CARE) initiated a region-wide
family planning program. The Community Reproductive Health Project (CREHP) works with the
district health teams to train clinic personnel in the delivery of family planning services in 74
regional health units. In 1994, CREHP began selecting and training community volunteers to pro
vide family planning counseling and referral in their communities and to distribute contraceptives.
From the initial impetus for CREHP, the linkages between the two regional projects were appar
ent. Population densities surrounding the parks are some of the highest in Africa, exceeding 250
persons per square kilometer. Land shortage due to overpopulation is one of the most pressing
problems for people of the area, as reported in numerous community surveys. Furthermore, there
are serious doubts that the conservation program will be sustainable if the local population con
tinues to grow at its current rate of about 3 percent. Finally, the desire for family planning among
local populations is high, due mostly to an inability to adequately provide for current children and
a pervasive lack of male support in the household.
From: Lindblade, 1994
services, education of the girl child, and increasing male responsibility.
Work on all of these fronts together is likely to have a greater impact on
fertility than would investment in family planning alone.
Health status and quality of life
Decreased mortality (especially among infants and children) and a relat
ed increase in life expectancy are evidence of a general improvement in
the health status of human populations. This phenomenon, which is in
contrast to the sometimes apocalyptic news and images of poverty, dis
ease, malnutrition and death spread by the media, has intrigued demog
raphers and epidemiologists and incited them to ask: “Why is mortality
decreasing?”
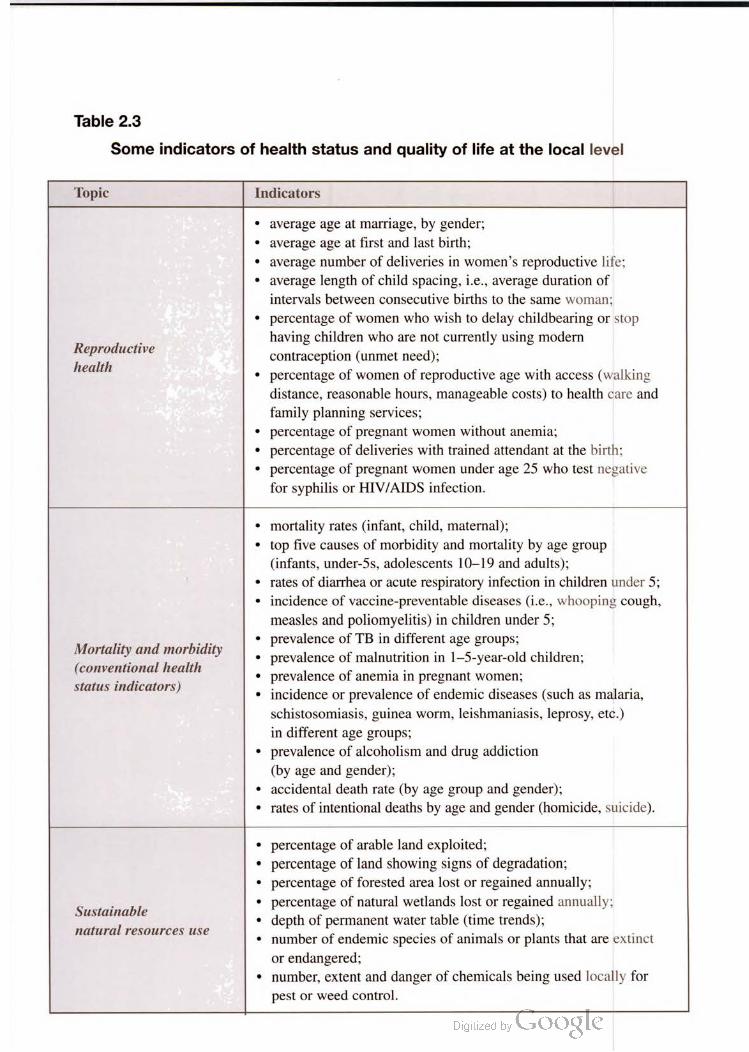
Table 2.3
Some indicators of health status and quality of life at the local level
Topic Indicators
Reproductive
health
average age at marriage, by gender;
average age at first and last birth;
average number of deliveries in women's reproductive life:
average length of child spacing, i.e., average duration of
intervals between consecutive births to the same woman;
percentage of women who wish to delay childbearing or stop
having children who are not currently using modern
contraception (unmet need);
percentage of women of reproductive age with access (walking
distance, reasonable hours, manageable costs) to health care and
family planning services;
percentage of pregnant women without anemia;
percentage of deliveries with trained attendant at the birth:
percentage of pregnant women under age 25 who test negative
for syphilis or HIV/AIDS infection.
Mortality and morbidity
(conventional health
status indicators)
mortality rates (infant, child, maternal);
top five causes of morbidity and mortality by age group
(infants, under-5s, adolescents 10–19 and adults);
rates of diarrhea or acute respiratory infection in children under 5;
incidence of vaccine-preventable diseases (i.e., whooping cough,
measles and poliomyelitis) in children under 5,
prevalence of TB in different age groups;
prevalence of malnutrition in 1–5-year-old children;
prevalence of anemia in pregnant women;
incidence or prevalence of endemic diseases (such as malaria,
schistosomiasis, guinea worm, leishmaniasis, leprosy, etc.)
in different age groups;
prevalence of alcoholism and drug addiction
(by age and gender);
accidental death rate (by age group and gender);
rates of intentional deaths by age and gender (homicide, suicide).
Sustainable
natural resources use
percentage of arable land exploited;
percentage of land showing signs of degradation;
percentage of forested area lost or regained annually;
percentage of natural wetlands lost or regained annually;
depth of permanent water table (time trends);
number of endemic species of animals or plants that are extinct
or endangered;
number, extent and danger of chemicals being used locally for
pest or weed control.
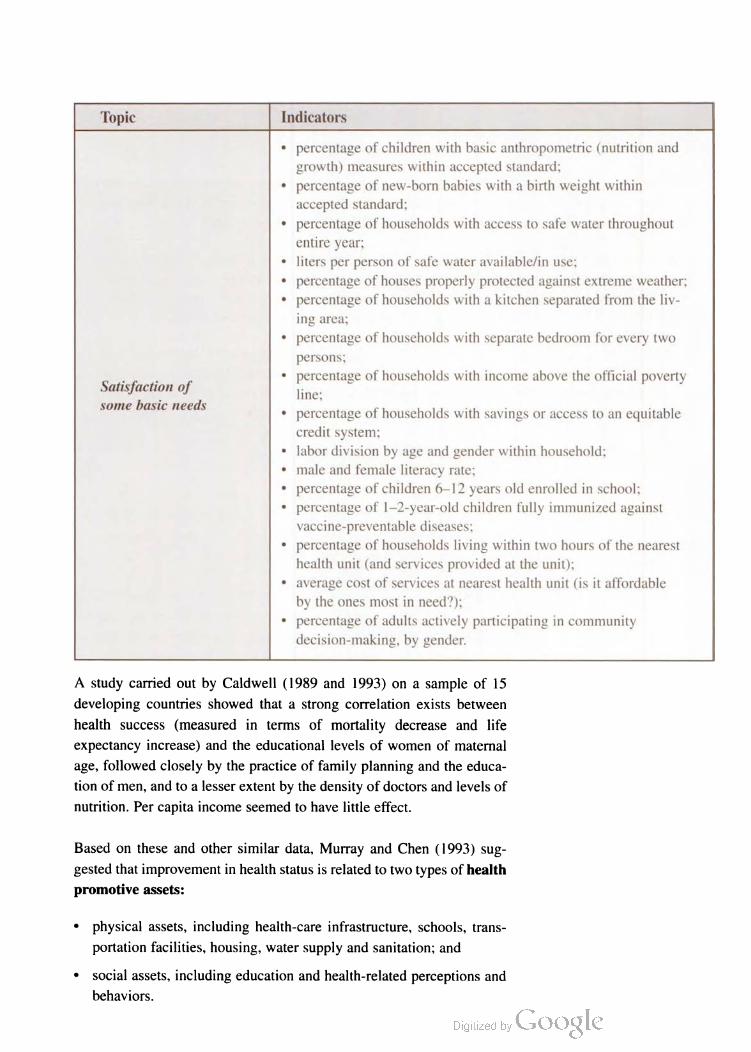
Topic Indicators
Satisfaction of
some basic needs
percentage of children with basic anthropometric (nutrition and
growth) measures within accepted standard;
percentage of new-born babies with a birth weight within
accepted standard;
percentage of households with access to safe water throughout
entire year;
liters per person of safe water available/in use;
percentage of houses properly protected against extreme weather;
percentage of households with a kitchen separated from the liv
ing area;
percentage of households with separate bedroom for every two
persons:
percentage of households with income above the official poverty
line;
percentage of households with savings or access to an equitable
credit system;
labor division by age and gender within household;
male and female literacy rate;
percentage of children 6–12 years old enrolled in school;
percentage of 1–2-year-old children fully immunized against
vaccine-preventable diseases;
percentage of households living within two hours of the nearest
health unit (and services provided at the unit);
average cost of services at nearest health unit (is it affordable
by the ones most in need?),
percentage of adults actively participating in community
decision-making, by gender.
A study carried out by Caldwell (1989 and 1993) on a sample of 15
developing countries showed that a strong correlation exists between
health success (measured in terms of mortality decrease and life
expectancy increase) and the educational levels of women of maternal
age, followed closely by the practice of family planning and the educa
tion of men, and to a lesser extent by the density of doctors and levels of
nutrition. Per capita income seemed to have little effect.
Based on these and other similar data, Murray and Chen (1993) sug
gested that improvement in health status is related to two types of health
promotive assets:
* physical assets, including health-care infrastructure, schools, trans
portation facilities, housing, water supply and sanitation; and
• social assets, including education and health-related perceptions and
behaviors.
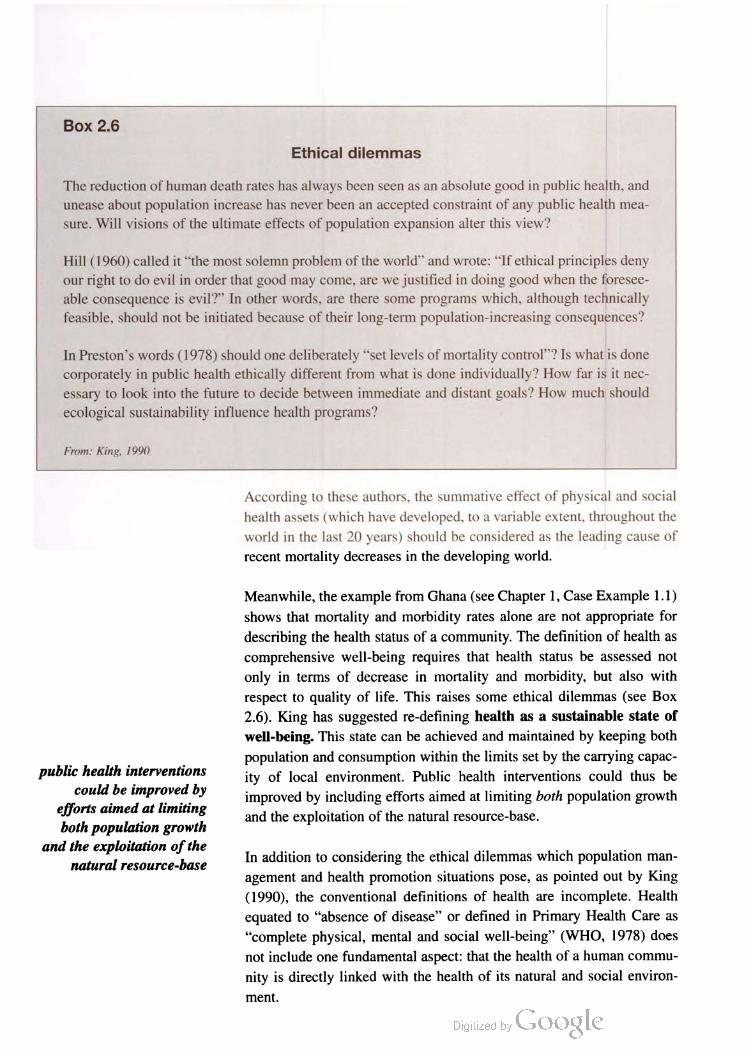
Box 2.6
The reduction of human death rates has always been seen as an absolute good in public health, and
unease about population increase has never been an accepted constraint of any public health mea
sure. Will visions of the ultimate effects of population expansion alter this view?
Hill (1960) called it “the most solemn problem of the world” and wrote: “If ethical principles deny
our right to do evil in order that good may come, are we justified in doing good when the foresee
able consequence is evil?” In other words, are there some programs which, although technically
feasible, should not be initiated because of their long-term population-increasing consequences?
In Preston's words (1978) should one deliberately “set levels of mortality control”? Is what is done
corporately in public health ethically different from what is done individually? How far is it nec
essary to look into the future to decide between immediate and distant goals? How much should
ecological sustainability influence health programs?
From: King, 1990
Ethical dilemmas
public health interventions
could be improved by
efforts aimed at limiting
both population growth
and the exploitation of the
natural resource-base
According to these authors, the summative effect of physical and social
health assets (which have developed, to a variable extent, throughout the
world in the last 20 years) should be considered as the leading cause of
recent mortality decreases in the developing world.
Meanwhile, the example from Ghana (see Chapter 1, Case Example 1.1)
shows that mortality and morbidity rates alone are not appropriate for
describing the health status of a community. The definition of health as
comprehensive well-being requires that health status be assessed not
only in terms of decrease in mortality and morbidity, but also with
respect to quality of life. This raises some ethical dilemmas (see Box
2.6). King has suggested re-defining health as a sustainable state of
well-being. This state can be achieved and maintained by keeping both
population and consumption within the limits set by the carrying capac
ity of local environment. Public health interventions could thus be
improved by including efforts aimed at limiting both population growth
and the exploitation of the natural resource-base.
In addition to considering the ethical dilemmas which population man
agement and health promotion situations pose, as pointed out by King
(1990), the conventional definitions of health are incomplete. Health
equated to “absence of disease” or defined in Primary Health Care as
“complete physical, mental and social well-being” (WHO, 1978) does
not include one fundamental aspect: that the health of a human commu
nity is directly linked with the health of its natural and social environ
ment.

Together with conventional “negative health status indicators such as
mortality and morbidity rates, positive indicators of health (i.e., of qual
ity of life) could thus be examined, focusing on issues such as repro
ductive health, sustainable use of natural resources and satisfaction of
basic needs.
A non-comprehensive example of a list of indicators for assessing
health status and quality of life at the local level is provided in Table 2.3.

2.2 The local environment:
natural resources, protected
areas and carrying capacity for
human populations
This section briefly illustrates the management status of some natural
resources of great importance for human populations. Ideally, sound
management incorporates both preservation and sustainable use, i.e., the
maintenance of viable ecosystems capable of sustaining biodiversity and
providing resources for future generations, coupled with uses of such
resources to satisfy today's needs (IUCN et al., 1991).
Water
The current world supply of renewable fresh water per capita is only 60
percent of what it was in 1970 (Engelman and LeRoy, 1993). Water is
becoming scarce due to growing populations, increasing demands for
agricultural and industrial use and inefficient water management. At the
local level, specific causes may include man-made changes in water
sheds (e.g., dams, irrigation systems), changes in vegetation coverage
(deforestation, erosion), increased pumping of underground water (low
ering the water table), and waste in water distribution systems (includ
ing losses due to leakage).
Decreased availability of water is coupled to worsening of water quali
ty. Excessive exploitation of surface and underground water for irriga
tion purposes may lead to salinization (i.e., abnormal concentration of
mineral salts in the topsoil) and water logging due to poor drainage.
Increased use of surface water by human and livestock populations
increases the risk of biological contamination of streams, ponds and
lakes (with consequences for human health). Uncontrolled industrial and
agricultural use may cause chemical pollution of both underground and
surface water (with potentially severe consequences on human health,
fisheries and aquatic animals and plants).
A set of indicators for assessing water availability, water quality, and
functioning of water supplies and distribution systems at the local level is
provided in Table 2.4. This information could be useful in working with
communities that are making decisions about the importance of water
management initiatives, as well as in evaluating the relevant results.
Community-based initiatives for improving local water management
may include:
• protection of water sources (e.g., building a cement cover and out
flow pipes for a spring so that animals and people do not contaminate
the source);

Table 2.4
Some indicators of water availability, water quality, and functioning of water
supplies and distribution systems at the local level
(human use only)
Topic Indicators
- percentage of households with safe domestic water sources
(wells, taps, etc.);
' average walking time from house to source of safe drinkable
water;
' average number of liters per capita available in the household in
different seasons;
' hourly capacity of springs in different seasons;
_ _ _ ' depth of the water table as measured in different seasons in a
Water availabtlttv' sample of wells;
' regularity of stream flow (overflow after rainfall?
dry in summer? etc.);
' average time spent daily for watering cattle in different seasons;
' percentage of productive units having access to irrigation
systems;
' surface of irrigated land plots;
~ length of irrigation systems.
' turbidity, chemical pollution, bacterial pollution;
~ number of fecal coliforrns per ml in different water sources and
seasons;
Water quality ' salt concentration per ml in different water sources and seasons;
' frequency and appropriateness of chlorinization of wells, tanks,
and piped-water systems;
' percentage of households satisfied with the taste and appearance
of water in different seasons.
Functioning of
water supply systems
- number of days per year in which household wells or taps are
not functioning;
- percentage of households relying on domestic water harvesting
systems;
' presence and function of local water committee controlling
maintenance and support for water supply;
' number and availability of local mechanics with training to
repair wells or taps;
' liters lost per minute due to major leakages in the supply
system;
- seasonal differences in depth of water table.
' construction of rain-water harvesting systems (e.g., a system of pipes or
channels to capture water from the roof of a house and store it in a cistern);
• improvement and maintenance of water distribution systems (e.g.,
providing ideas about the technology of a water system, labor for its
construction, and arranging for the training of local mechanics to
maintain the system):
• monitoring of the quality of water for human consumption;
• building appropriate human sanitation facilities (e.g., latrines, toi
lets);
• afforestation, building bunds, and contour plowing for increased soil
moisture and groundwater recharge.
Another important natural resource linked with water is wetlands, e.g.,
swamps, sloughs and shorelines. Many useful items are extracted from
wetlands, e.g., food (fruits, meat, fish), building materials (trees, reeds),
water (for irrigation, drinking, washing), traditional medicines, etc. In
addition, wetlands are important locations for cultivation and dry-season
grazing. For instance, the moist dambo lands along the upper valleys of
streams in Malawi are able to produce two crops per year compared to
the single growing season on the surrounding eroded and semi-arid hill
sides. Wetlands, and the plants and animals which are adapted to such
regions, are under tremendous pressure from expanding populations.
Drainage for agriculture is estimated to have resulted in the loss of 26
percent of wetlands worldwide (OECD/IUCN, 1996).
Soil
Between 1945 and 1990, over one-tenth of the world's vegetated land
(approximately 1.2 billion hectares) has suffered at least moderate soil
degradation as a result of human activity. Cultivation has reduced the
world's pre-agricultural supply of organic carbon by about 15 percent:
about 60 billion tons of soil carbon have risen from the soil to the atmo
sphere as climate-warming carbon dioxide (Engelman and LeRoy, 1995).
In recent times, the most widespread soil degradation has occurred in Asia
(450 million hectares) and Africa (320 million hectares), mostly because
of extending agricultural frontiers, overgrazing and deforestation.
At the local level, processes of soil degradation may include:
• decrease in depth of the humus stratum (the unconsolidated mineral
and organic material on the immediate surface of the earth, which
serves as a natural medium for the growth of plants);
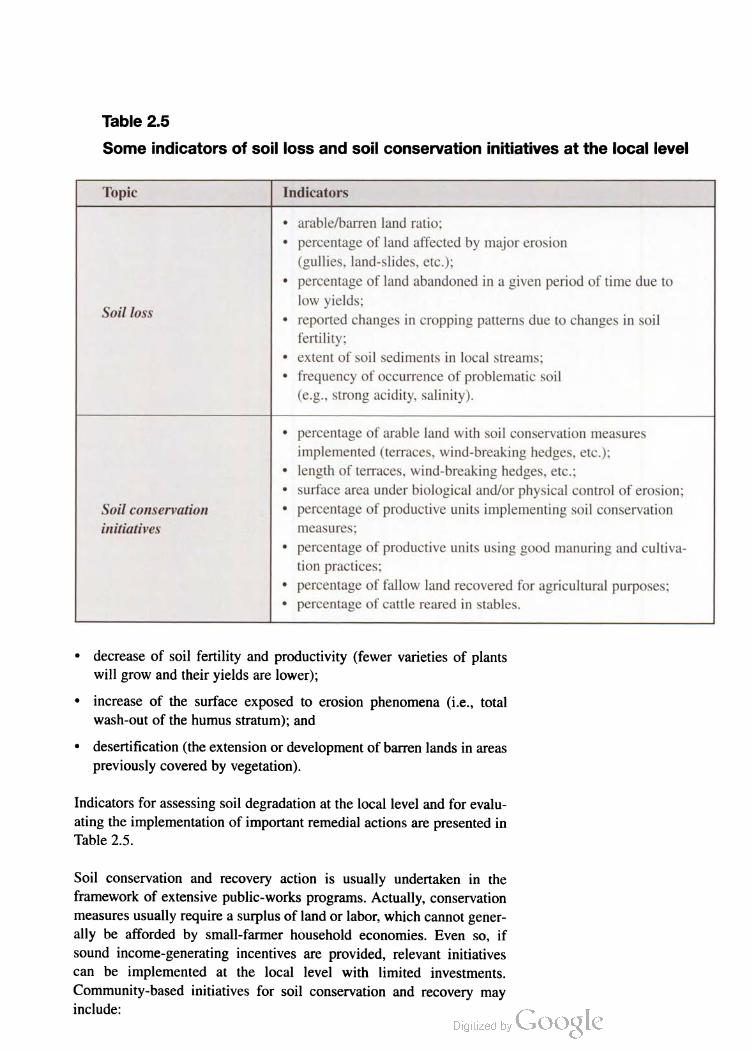
Table 2.5
Some indicators of soil loss and soil conservation initiatives at the local level
Topic Indicators
Soil loss
arable/barren land ratio;
percentage of land affected by major erosion
(gullies, land-slides, etc.);
percentage of land abandoned in a given period of time due to
low yields;
reported changes in cropping patterns due to changes in soil
fertility;
extent of soil sediments in local streams;
frequency of occurrence of problematic soil
(e.g., strong acidity, salinity).
Soil conservation
initiatives
percentage of arable land with soil conservation measures
implemented (terraces, wind-breaking hedges, etc.);
length of terraces, wind-breaking hedges, etc.;
surface area under biological and/or physical control of erosion;
percentage of productive units implementing soil conservation
measures:
percentage of productive units using good manuring and cultiva
tion practices;
percentage of fallow land recovered for agricultural purposes;
percentage of cattle reared in stables.
• decrease of soil fertility and productivity (fewer varieties of plants
will grow and their yields are lower);
* increase of the surface exposed to erosion phenomena (i.e., total
wash-out of the humus stratum); and
• desertification (the extension or development of barren lands in areas
previously covered by vegetation).
Indicators for assessing soil degradation at the local level and for evalu
ating the implementation of important remedial actions are presented in
Table 2.5.
Soil conservation and recovery action is usually undertaken in the
framework of extensive public-works programs. Actually, conservation
measures usually require a surplus of land or labor, which cannot gener
ally be afforded by small-farmer household economies. Even so, if
sound income-generating incentives are provided, relevant initiatives
can be implemented at the local level with limited investments.
Community-based initiatives for soil conservation and recovery may
include:

Case Example 2.8
Soil conservation in a dry climate
Since independence, the Tanzanian government has established a number of integrated land con
servation programs in the semi-arid interior of the country, where dry savannah prevails and peo
ple depend on pastoral and agro-pastoral economies. In most of these areas, land degradation is a
common consequence of excessive grazing and insufficient soil and water conservation measures
(all of which arose from the clearing of woodlands done in the first half of this century for tsetse
fly eradication).
In the 1970s and early 1980s such conservation measures ranged from machine-intensive works
to labor-intensive construction, from check-dams and woodlots to the relocation of people and out
right enclosure of severely degraded areas. Some ecological results were impressive, but local peo
ple rarely offered their genuine participation in these measures. At times, they even defied gov
ernment regulations openly, for instance, by keeping their herds where grazing was illegal, and
organizing among themselves to pay the fines collectively.
More recent soil conservation programs have learned from these experiences. First, local villagers
are now involved in negotiations from the beginning, resulting in enclosures that are generally
smaller and do not involve resettlement of many households or villages. Second, negotiations take
into account a variety of aspects of resource conservation and use, and thus proceed for a longer
time but end up in more complex and sophisticated regulations. Third, the Tanzanian Forest and
Bee-keeping Division is now taking full advantage of existing local associations and traditional
management practices.
For instance, among the Sukuma people in the region of Shinyanga, there exist traditional grazing
reserves (called ngitire), where herds are allowed to graze only during the dry season. Most of
these reserves are established on communal land, in hilltops or river valleys, and under the strict
control of village leaders. The Forest and Bee-keeping Division negotiates now with local leaders
and associations for the extension of these traditional reserves, as well as for de-stocking practices,
woodlot management and controlling the use of other resources. Local organizations like the
Sungusungu (originally groups of young warriors who protected the herds against theft) are fully
enlisted in resource management tasks and capacities, and special funds are created in each vil
lage to help them carry out various activities.
• building slow formation terraces on slopes;
• gully and land-slide control (e.g., by contour farming, small-scale
afforestation, planting soil-binding grasses in high-risk areas, etc.);
• improvement of cultivation practices (e.g., planting wind-breaking
hedges, introducing nitrogen-fixing crops);
• promotion of biological and/or proper chemical manuring;
• introduction of crop-rotation;
• improvement of irrigation and drainage systems;
• introduction of stable livestock-rearing technologies.
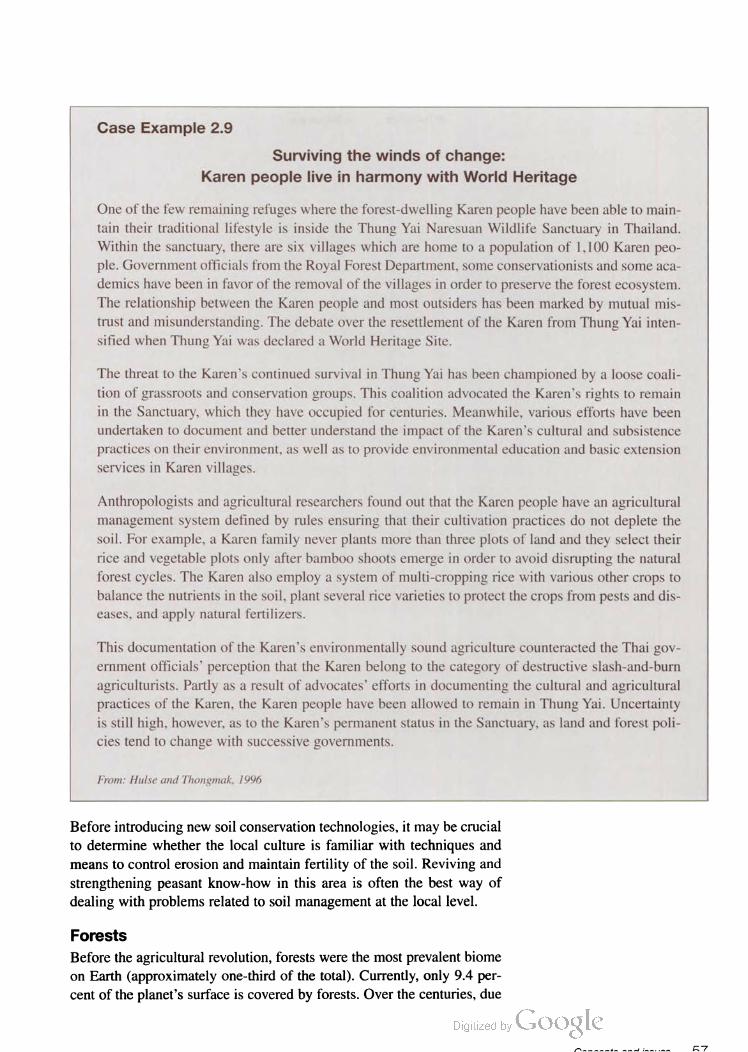
Case Example 2.9
Surviving the winds of change:
Karen people live in harmony with World Heritage
One of the few remaining refuges where the forest-dwelling Karen people have been able to main
tain their traditional lifestyle is inside the Thung Yai Naresuan Wildlife Sanctuary in Thailand.
Within the sanctuary, there are six villages which are home to a population of 1,100 Karen peo
ple. Government officials from the Royal Forest Department, some conservationists and some aca—
demics have been in favor of the removal of the villages in order to preserve the forest ecosystem.
The relationship between the Karen people and most outsiders has been marked by mutual mis
trust and misunderstanding. The debate over the resettlement of the Karen from Thung Yai inten
sified when Thung Yai was declared a World Heritage Site.
The threat to the Karen’s continued survival in Thung Yai has been championed by a loose coali—
tion of grassroots and conservation groups. This coalition advocated the Karen’s rights to remain
in the Sanctuary, which they have occupied for centuries. Meanwhile, various efforts have been
undertaken to document and better understand the impact of the Karen’s cultural and subsistence
practices on their environment, as well as to provide environmental education and basic extension
services in Karen villages.
Anthropologists and agricultural researchers found out that the Karen people have an agricultural
management system defined by rules ensuring that their cultivation practices do not deplete the
soil. For example, a Karen family never plants more than three plots of land and they select their
rice and vegetable plots only after bamboo shoots emerge in order to avoid disrupting the natural
forest cycles. The Karen also employ a system of multi-cropping rice with various other crops to
balance the nutrients in the soil, plant several rice varieties to protect the crops from pests and dis
eases, and apply natural fertilizers.
This documentation of the Karen’s environmentally sound agriculture counteracted the Thai gov—
ernment officials’ perception that the Karen belong to the category of destructive slash-and-bum
agriculturists. Partly as a result of advocates’ efforts in documenting the cultural and agricultural
practices of the Karen, the Karen people have been allowed to remain in Thung Yai. Uncertainty
is still high, however, as to the Karen’s permanent status in the Sanctuary, as land and forest poli
cies tend to change with successive governments.
From: Hulse and Thongmak. I996
Before introducing new soil conservation technologies, it may be crucial
to determine whether the local culture is familiar with techniques and
means to control erosion and maintain fertility of the soil. Reviving and
strengthening peasant know-how in this area is often the best way of
dealing with problems related to soil management at the local level.
Forests
Before the agricultural revolution, forests were the most prevalent biome
on Earth (approximately one-third of the total). Currently, only 9.4 per
cent of the planet’s surface is covered by forests. Over the centuries, due
R7
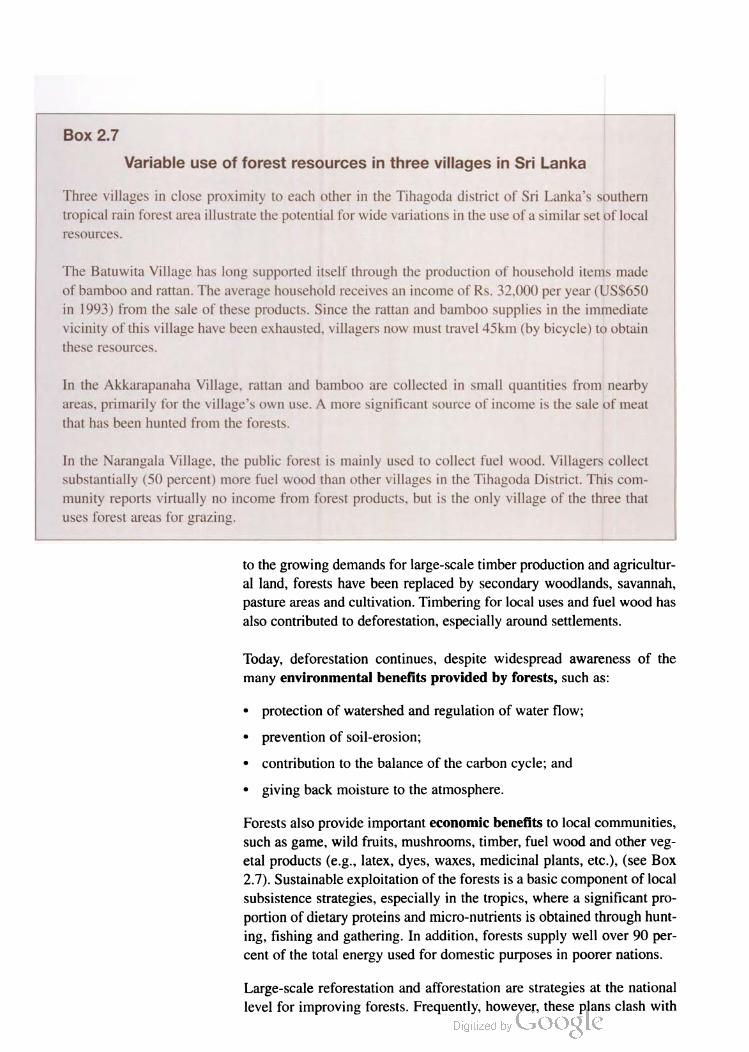
Box 2.7
Variable use of forest resources in three villages in Sri Lanka
Three villages in close proximity to each other in the Tihagoda district of Sri Lanka's southern
tropical rain forest area illustrate the potential for wide variations in the use of a similar set of local
TCSOUTCeS.
The Batuwita Village has long supported itself through the production of household items made
of bamboo and rattan. The average household receives an income of Rs. 32,000 per year (US$650
in 1993) from the sale of these products. Since the rattan and bamboo supplies in the immediate
vicinity of this village have been exhausted, villagers now must travel 45km (by bicycle) to obtain
these resources.
In the Akkarapanaha Village, rattan and bamboo are collected in small quantities from nearby
areas, primarily for the village's own use. A more significant source of income is the sale of meat
that has been hunted from the forests.
In the Narangala Village, the public forest is mainly used to collect fuel wood. Villagers collect
substantially (50 percent) more fuel wood than other villages in the Tihagoda District. This com
munity reports virtually no income from forest products, but is the only village of the three that
uses forest areas for grazing.
to the growing demands for large-scale timber production and agricultur
al land, forests have been replaced by secondary woodlands, savannah,
pasture areas and cultivation. Timbering for local uses and fuel wood has
also contributed to deforestation, especially around settlements.
Today, deforestation continues, despite widespread awareness of the
many environmental benefits provided by forests, such as:
• protection of watershed and regulation of water flow;
• prevention of soil-erosion;
• contribution to the balance of the carbon cycle; and
• giving back moisture to the atmosphere.
Forests also provide important economic benefits to local communities,
such as game, wild fruits, mushrooms, timber, fuel wood and other veg
etal products (e.g., latex, dyes, waxes, medicinal plants, etc.), (see Box
2.7). Sustainable exploitation of the forests is a basic component of local
subsistence strategies, especially in the tropics, where a significant pro
portion of dietary proteins and micro-nutrients is obtained through hunt
ing, fishing and gathering. In addition, forests supply well over 90 per
cent of the total energy used for domestic purposes in poorer nations.
Large-scale reforestation and afforestation are strategies at the national
level for improving forests. Frequently, however, these plans clash with
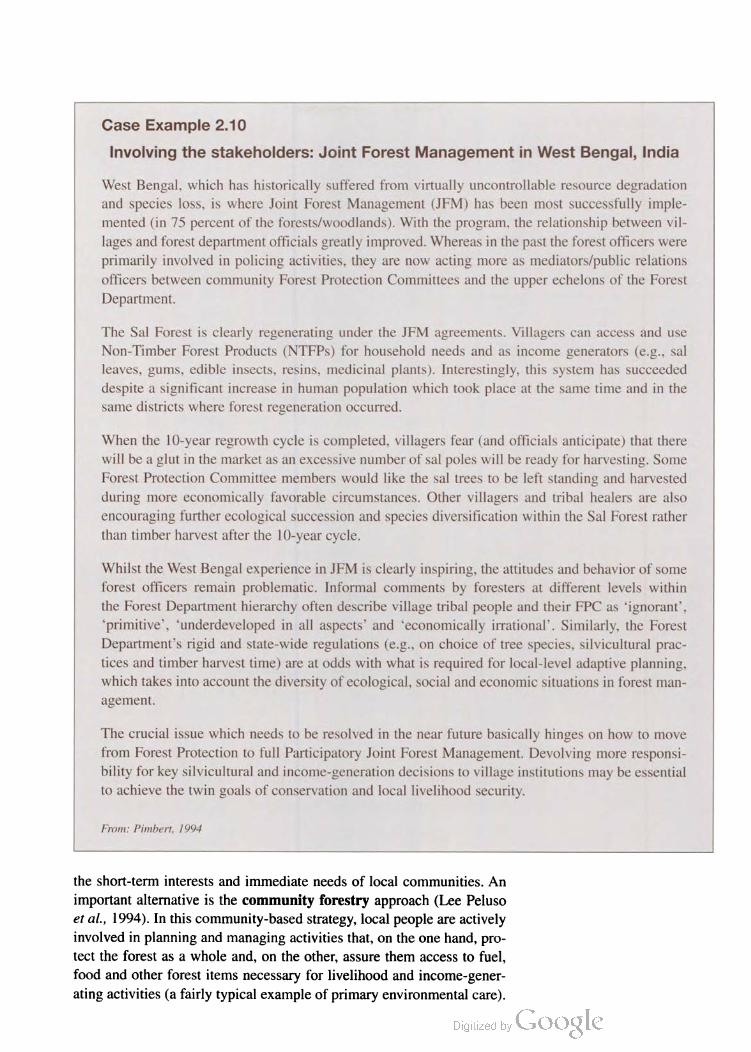
Case Example 2.10
Involving the stakeholders: Joint Forest Management in West Bengal, India
West Bengal, which has historically suffered from virtually uncontrollable resource degradation
and species loss, is where Joint Forest Management (JFM) has been most successfully imple
mented (in 75 percent of the forests/woodlands). With the program, the relationship between vil
lages and forest department officials greatly improved. Whereas in the past the forest officers were
primarily involved in policing activities, they are now acting more as mediators/public relations
officers between community Forest Protection Committees and the upper echelons of the Forest
Department.
The Sal Forest is clearly regenerating under the JFM agreements. Villagers can access and use
Non-Timber Forest Products (NTFPs) for household needs and as income generators (e.g., sal
leaves, gums, edible insects, resins, medicinal plants). Interestingly, this system has succeeded
despite a significant increase in human population which took place at the same time and in the
same districts where forest regeneration occurred.
When the 10-year regrowth cycle is completed, villagers fear (and officials anticipate) that there
will be a glut in the market as an excessive number of salpoles will be ready for harvesting. Some
Forest Protection Committee members would like the sal trees to be left standing and harvested
during more economically favorable circumstances. Other villagers and tribal healers are also
encouraging further ecological succession and species diversification within the Sal Forest rather
than timber harvest after the 10-year cycle.
Whilst the West Bengal experience in JFM is clearly inspiring, the attitudes and behavior of some
forest officers remain problematic. Informal comments by foresters at different levels within
the Forest Department hierarchy often describe village tribal people and their FPC as ignorant’,
primitive’, underdeveloped in all aspects and economically irrational’. Similarly, the Forest
Department's rigid and state-wide regulations (e.g., on choice of tree species, silvicultural prac
tices and timber harvest time) are at odds with what is required for local-level adaptive planning,
which takes into account the diversity of ecological, social and economic situations in forest man
agement.
The crucial issue which needs to be resolved in the near future basically hinges on how to move
from Forest Protection to full Participatory Joint Forest Management. Devolving more responsi
bility for key silvicultural and income-generation decisions to village institutions may be essential
to achieve the twin goals of conservation and local livelihood security.
From: Pimbert, 1994
the short-term interests and immediate needs of local communities. An
important alternative is the community forestry approach (Lee Peluso
et al., 1994). In this community-based strategy, local people are actively
involved in planning and managing activities that, on the one hand, pro
tect the forest as a whole and, on the other, assure them access to fuel,
food and other forest items necessary for livelihood and income-gener
ating activities (a fairly typical example of primary environmental care).

Case Example 2.11
Ethnic groups and firewood consumption
The customs of different ethnic groups can greatly influence the use of natural resources. For
example, in Nepal, some ethnic groups consume firewood at higher rates than others. Tradi
tionally, Brahmin and Chettri ethnic groups never drink alcohol and do not brew liquor in their
homes. In contrast, ethnic groups such as Tamang, Gurung, Kirati, and Sherpa in the highlands,
and Tharu and Rajbansi on the tropical plains practice home brewing. Interviews with alcohol
brewing and non-brewing ethnic groups in one village found that brewing households consume 20
percent more fuel wood than the others.
Contributed by Krishna Oli
Forestry management can be an opportunity for community develop
ment. Since a forest is better protected as a whole than in isolated patch
es, forestry activities offer the rationale for organizing (e.g., in a local
users' association) to distribute the benefits that come from the forest
(e.g., fodder or water) in an equitable way.
The objective of community forestry is to promote sustainable use of
forest areas by the local population. Conservation of the forest base thus
represents a means of:
• ensuring availability of fuel, building materials, and other goods (e.g.,
forest foods, traditional medicines, etc.);
• providing the environmental stability necessary for food production
(e.g., maintaining the water table, preventing erosion, etc.); and
• generating income and employment.
To achieve the above objectives, agro-forestry technologies have been
developed, often on the basis of local knowledge. These include:
• semi-cultivation of timber and other valuable species;
• management of animal and vegetal species important to the local diet;
• improvement in the efficiency of cooking-stoves;
• selective cutting of trees for timber and fuel wood;
• pest and fire control; and
• development of ecological tourism.
Indicators for assessing the forest situation at the local level and the
results of community-based agro-forestry activities are presented in
Table 2.6.

Table 2.6
Some indicators of forest conservation at local level and community-based
agro-forestry activities
Topic Indicators
ago, etc.);
arable land in one year);
communities or both;
Forest conservation ' frequency of small and large fires;
species);
exploitation in the area;
food, firewood, income, etc.
' percentage of territory covered by primary and secondary
forests at different points in time (e.g., current, one generation
' annual deforestation rate (hectares cleared per 100 hectares of
' percentage of forest effectively protected by the state, local
- biodiversity of different forest ecotypes (e.g., number and status
of different vegetal and animal species, presence of endangered
- existence of business interests involved in or aiming at timber
' existence of communities solely dependent on the forest for
regeneration;
' number of species planted:
' survival rate by species;
agro-forestry activities:
- surface area of new plantations, enrichment planting and natural
Agra-forestry activities ' percentage of households involved in agro-forestry activities;
- percentage of average household income generated from
~ diversity of forest products being used, appropriateness of
harvesting methods and amount of product harvested.
Wildlife
We understand as ‘wildlife’ all non-domesticated animals and plants
which are, or could be, used or valued in any way by people (IIED,
1994). Wild plants can include flowers, grasses, fruits, leaves, bark and
roots which provide medicines, fibers, fuel, building materials and food
for livestock. Wild animals can include both vertebrates and inverte
brates, providing meat, fur, bone, trophies and ivory, and cultural items.
Wildlife is inseparable from its habitat (forests, range lands, wetlands,
reefs, mountains), and it is typically through habitat destruction that
most species are lost.
The primary threat to wildlife comes from a combination of demo
graphic, economic and political factors. Expanding populations and
migration to frontier areas are increasing the pressure on wildlife and, in
most cases, leading to over-exploitation. The international economic
nnnnnnfo and incline R1
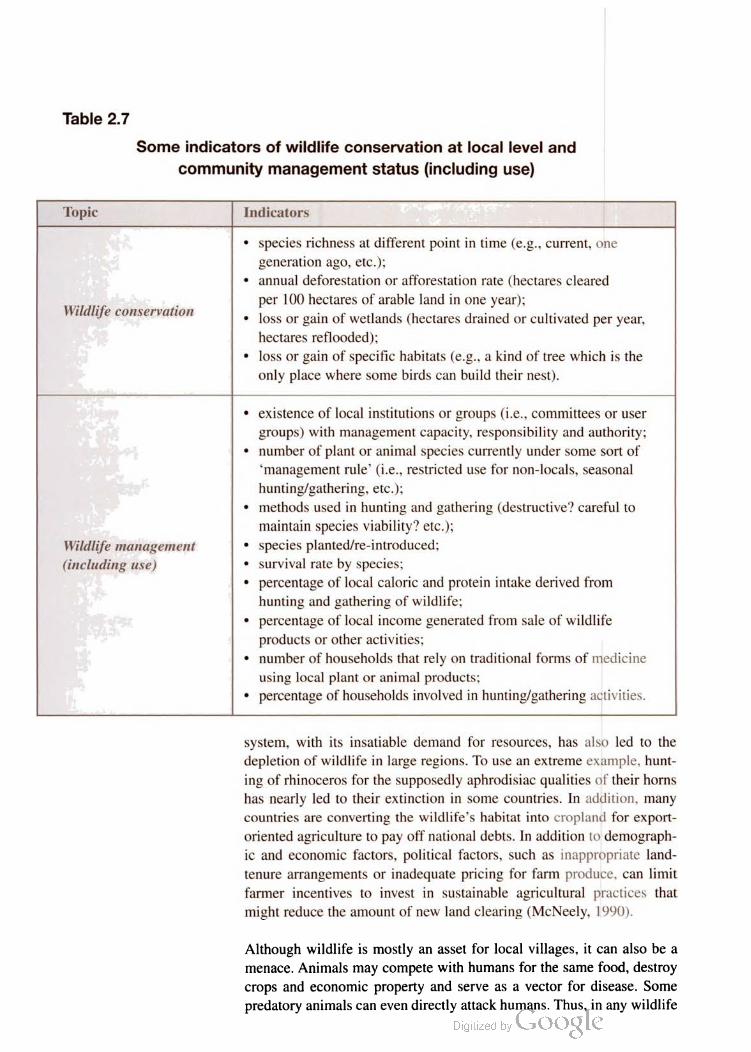
Table 2.7
Some indicators of wildlife conservation at local level and
community management status (including use)
Topic Indicators
Wildlife conservation
Wildlife management
(including use)
• species richness at different point in time (e.g., current, one
generation ago, etc.);
• annual deforestation or afforestation rate (hectares cleared
per 100 hectares of arable land in one year);
• loss or gain of wetlands (hectares drained or cultivated per year,
hectares reflooded);
• loss or gain of specific habitats (e.g., a kind of tree which is the
only place where some birds can build their nest).
• existence of local institutions or groups (i.e., committees or user
groups) with management capacity, responsibility and authority;
• number of plant or animal species currently under some sort of
‘management rule (i.e., restricted use for non-locals, seasonal
hunting/gathering, etc.);
• methods used in hunting and gathering (destructive? careful to
maintain species viability? etc.);
• species planted/re-introduced;
• survival rate by species;
• percentage of local caloric and protein intake derived from
hunting and gathering of wildlife;
• percentage of local income generated from sale of wildlife
products or other activities:
• number of households that rely on traditional forms of medicine
using local plant or animal products;
• percentage of households involved in hunting/gathering activities.
system, with its insatiable demand for resources, has also led to the
depletion of wildlife in large regions. To use an extreme example, hunt
ing of rhinoceros for the supposedly aphrodisiac qualities of their horns
has nearly led to their extinction in some countries. In addition, many
countries are converting the wildlife's habitat into cropland for export
oriented agriculture to pay off national debts. In addition to demograph
ic and economic factors, political factors, such as inappropriate land
tenure arrangements or inadequate pricing for farm produce, can limit
farmer incentives to invest in sustainable agricultural practices that
might reduce the amount of new land clearing (McNeely, 1990).
Although wildlife is mostly an asset for local villages, it can also be a
menace. Animals may compete with humans for the same food, destroy
crops and economic property and serve as a vector for disease. Some
predatory animals can even directly attack humans. Thus, in any wildlife
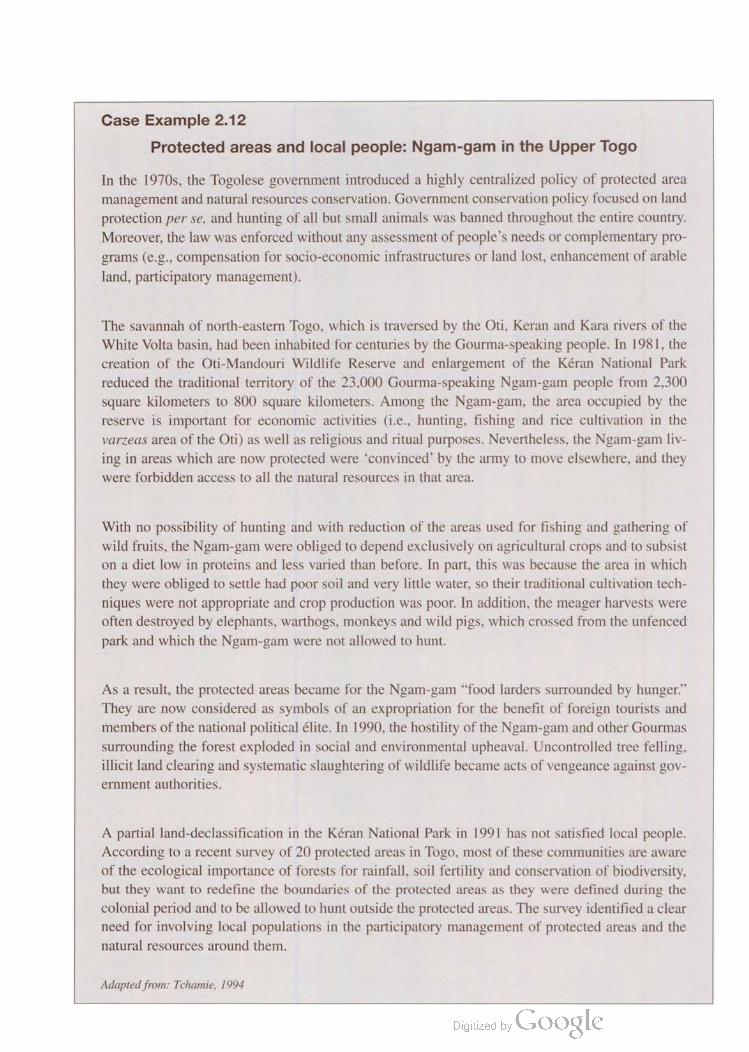
Case Example 2.12
Protected areas and local people: Ngam-gam in the Upper Togo
In the 1970s, the Togolese government introduced a highly centralized policy of protected area
management and natural resources conservation. Government conservation policy focused on land
protection perse, and hunting of all but small animals was banned throughout the entire country.
Moreover, the law was enforced without any assessment of people's needs or complementary pro
grams (e.g., compensation for socio-economic infrastructures or land lost, enhancement of arable
land, participatory management).
The savannah of north-eastern Togo, which is traversed by the Oti, Keran and Kara rivers of the
White Volta basin, had been inhabited for centuries by the Gourma-speaking people. In 1981, the
creation of the Oti-Mandouri Wildlife Reserve and enlargement of the Kéran National Park
reduced the traditional territory of the 23,000 Gourma-speaking Ngam-gam people from 2,300
square kilometers to 800 square kilometers. Among the Ngam-gam, the area occupied by the
reserve is important for economic activities (i.e., hunting, fishing and rice cultivation in the
varzeas area of the Oti) as well as religious and ritual purposes. Nevertheless, the Ngam-gam liv
ing in areas which are now protected were convinced by the army to move elsewhere, and they
were forbidden access to all the natural resources in that area.
With no possibility of hunting and with reduction of the areas used for fishing and gathering of
wild fruits, the Ngam-gam were obliged to depend exclusively on agricultural crops and to subsist
on a diet low in proteins and less varied than before. In part, this was because the area in which
they were obliged to settle had poor soil and very little water, so their traditional cultivation tech
niques were not appropriate and crop production was poor. In addition, the meager harvests were
often destroyed by elephants, warthogs, monkeys and wild pigs, which crossed from the unfenced
park and which the Ngam-gam were not allowed to hunt.
As a result, the protected areas became for the Ngam-gam “food larders surrounded by hunger.”
They are now considered as symbols of an expropriation for the benefit of foreign tourists and
members of the national political élite. In 1990, the hostility of the Ngam-gam and other Gourmas
surrounding the forest exploded in social and environmental upheaval. Uncontrolled tree felling,
illicit land clearing and systematic slaughtering of wildlife became acts of vengeance against gov
ernment authorities.
A partial land-declassification in the Kéran National Park in 1991 has not satisfied local people.
According to a recent survey of 20 protected areas in Togo, most of these communities are aware
of the ecological importance of forests for rainfall, soil fertility and conservation of biodiversity,
but they want to redefine the boundaries of the protected areas as they were defined during the
colonial period and to be allowed to hunt outside the protected areas. The survey identified a clear
need for involving local populations in the participatory management of protected areas and the
natural resources around them.
Adapted from: Tchamie, 1994

Case Example 2.13
African experiences in participatory management of protected areas
An innovative approach to participatory environmental protection was successfully developed in
the mid-1980s in Zimbabwe and Zambia. The Communal Areas Management Program for
Indigenous Resources (CAMPFIRE) was developed on the basis of two assumptions: a) that peo
ple living with wildlife pay the price for conservation through the threat of injury by dangerous
animals and damage to crops and, most of all, via foregoing other productive uses of local terri
tories – they should thus reap a good proportion of the benefits accruing from wildlife; and b) that
local people and local governments can effectively manage wildlife resources. Since the program
was launched, through the granting of appropriate management authority to districts, a substantial
flow of revenues has been directly employed for infrastructural development (to benefit both peo
ple and wildlife), invested in income-generating projects and shared among local households
(Makombe, 1994). The results of the approach are impressive. Local wildlife is thriving, as the
rural residents behave more as caretakers than enemies or competitors (e.g., during the severe
drought in the early 1990s, villagers dug deep holes for the elephants to drink from).
Recently, the West African Game Ranching Program (WAGREP), inspired by the CAMPFIRE
experience, has been developed for protected areas in Burkina Faso and the Ivory Coast. WAGREP
also plans to involve traditional hunting societies in the participatory management of wildlife
resources and to reinforce, through a local radio network, the capacity of the local people to con
trol land against poachers, fires, indiscriminate cutting of trees, etc. According to a survey con
ducted in 1992 by the IUCN among the Lobi of Burkina Faso (Kambou, 1992) and to an
FAO community forestry management program in Mali, traditional hunting societies are extreme
ly active all over West Africa, and they still play an important role in the decision-making
processes of the rural community. In the rapid development of rural societies in Africa, they would
be keenly interested in being involved in national park management, which would benefit from the
experience and knowledge of wildlife they have accumulated over centuries.
management strategy it is important to identify what are the most useful
plants and animals, what species should be preserved for their ecologi
cal, aesthetic or economic value, and which species need to be managed
so as to prevent their negative impacts on local villages. For instance,
rural parts of Zimbabwe have a serious problem with elephants tram
meling fields. The government is now espousing a form of controlled
culling of elephant herds (to replace strict controls that were instituted in
response to rampant poaching), while solar-powered electric fences have
been erected around farmers' fields (where practicable) to keep ele
phants out.
Protected areas
Protected areas are legally established sites dedicated to the protection
and maintenance of biological diversity and of natural and associated
cultural resources (IUCN, 1994). Unfortunately, in many developing
countries local residents are rarely involved in planning, managing and
benefiting from such protected areas and the resources they contain, and
conflicts between protected area authorities and local people are the rule

Box 2.8
Collaborative management of protected areas
The term ‘collaborative management’ (also referred to as co-management. participatory manage
ment, joint management, shared management, multi-stakeholder management or round-table
agreement) is used to describe a situation in which some or all of the relevant stakeholders in a
protected area are involved in a substantial way in management activities. Specifically. in a col
laborative management process, the agency with jurisdiction over the protected area (usually a
state agency) develops a partnership with other relevant stakeholders (primarily including local
residents and resource users) which specifies and guarantees their respective functions, rights and
responsibilities with regard to the protected area.
In general, the partnership identifies:
- a protected territory (or set of resources) and its boundaries;
' the range of functions and sustainable uses it can provide;
- the recognized stakeholders in the protected area;
' the functions and responsibilities assumed by each stakeholder;
' the specific benefits and rights granted to each stakeholder;
~ an agreed set of management priorities and a management plan;
- procedures for dealing with conflicts and negotiating collective decisions about all of the
above:
' procedures for enforcing such decisions; and
~ specific rules for monitoring, evaluating and receiving the partnership agreement, and the rel
ative management plan, as appropriate.
Collaborative management regimes and other similar arrangements can and do operate also in ter
ritories that do not have a protected area status, and can apply to virtually all types of natural
resources. Forests, fisheries and coastal resources, grazing lands, wildlife and even non-renewable
resources (e.g., oil and mineral deposits) are included in existing management agreements among
various parties.
From: Borrini-Feyerabend. I996
rather than the exception (see Case Example 2.12). This is particularly
unfortunate, as there is great potential for protected areas to benefit local
residents while protecting biodiversity (see Case Example 2.13).
In general, a situation in which local residents and the authorities in
charge of the protected area are in collaboration rather than conflict is
certain to assure the best conditions for long-tenn sustainability (see Box
2.8). This is particularly true when the access to the natural resources
included in the protected areas is essential for local livelihood security
and cultural survival. But it is also most important when commercial

Box 2.9
Critiques of the carrying capacity concept
At its heart, the concept of carrying capacity gives a privileged position to population density
among the factors that lead to land degradation. This has led to two principal criticisms. On the
one hand, the concept is overly deterministic and underestimates the human capacity for techno
logical innovation. On the other, it ignores the complexity of the real world', in which trade, pub
lic policy and land distribution all affect the relationship between human populations and land
degradation.
Boserup (1965) argued for the first criticism when she pointed out the inadequacies of the
Ricardian-Malthusian assumption of constant technology, and proposed an alternative theory that
as population grows, land becomes scarce and therefore is used more intensively. New agricultur
al technologies, including the use of fertilizer, irrigation and intercropping, can lead to higher
yields per unit area. If in certain parts of the world carrying capacity has been surpassed, critics of
the concept would point to areas that are both densely settled and highly productive due to the use
of appropriate technologies.
As for the second criticism, the concept of carrying capacity has been most frequently tested in
micro-level studies of islands, distinct regions or nation-states. According to Brookfield (1992),
the often unstated assumption of a subsistence economy with little or no trade, little government
intervention and free access to land, renders these studies effectively meaningless in a complex
and interdependent world.
From: de Sherbinin, 1993
forces (timber companies, mining and oil extraction industries, large
tourist entrepreneurs, etc.) are interested in the protected resources.
Generally, neither local communities nor the protected areas authorities
alone have the power to resist those forces, but together they can, as
together they can counteract the destructive tendencies of some of their
own members (Kothari et al., 1996).
Carrying capacity for human populations
Human ecologists define carrying capacity as the maximum size of a
human population that can be sustained by an ecosystem over a given
period without degrading environmental resources (McElroy and
Townsend, 1989). The capacity to sustain a human population may vary
greatly from one natural ecosystem to another. Obviously, we cannot
expect the Sahara Desert or the Polar tundra to have the same potential
for hosting humans as the fertile valleys of large rivers such as the Rhine,
the Nile, the Ganges and the Mississippi. Some key differences (though
not the only ones) between these extreme examples are rainfall and
water availability, chemical composition and physical texture of soil and
climate. These factors influence the flora and fauna and thus the poten
tial for food production.
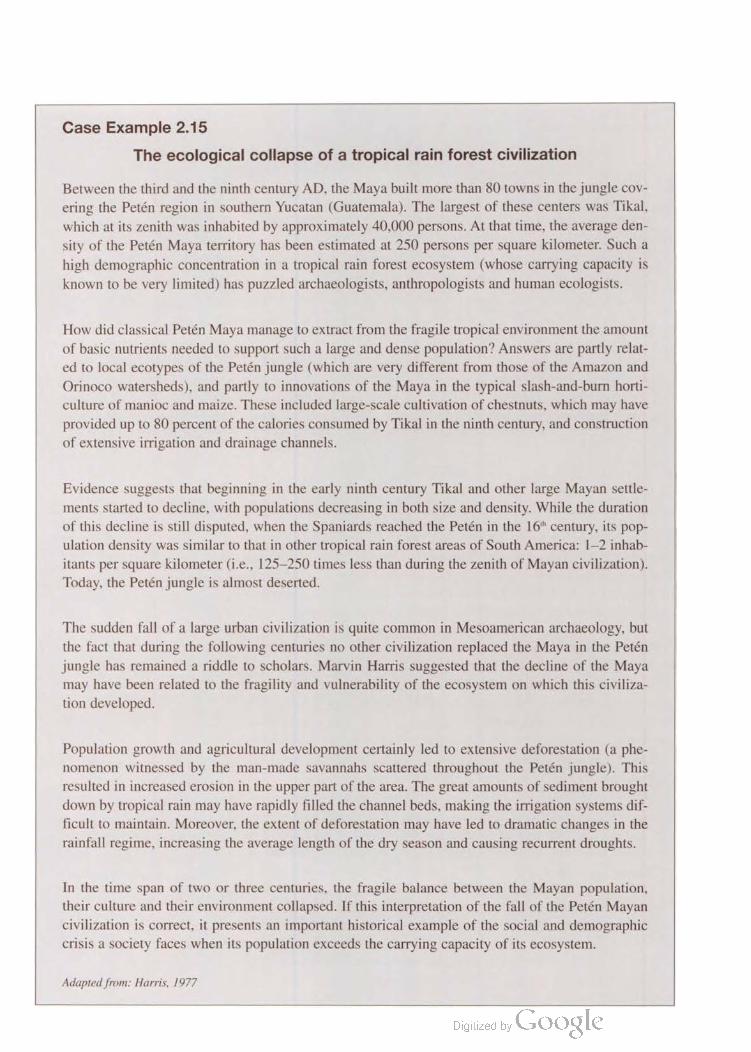
Case Example 2.15
The ecological collapse of a tropical rain forest civilization
Between the third and the ninth century AD, the Maya built more than 80 towns in the jungle cov
ering the Petén region in southern Yucatan (Guatemala). The largest of these centers was Tikal,
which at its zenith was inhabited by approximately 40,000 persons. At that time, the average den
sity of the Petén Maya territory has been estimated at 250 persons per square kilometer. Such a
high demographic concentration in a tropical rain forest ecosystem (whose carrying capacity is
known to be very limited) has puzzled archaeologists, anthropologists and human ecologists.
How did classical Petén Maya manage to extract from the fragile tropical environment the amount
of basic nutrients needed to support such a large and dense population? Answers are partly relat
ed to local ecotypes of the Petén jungle (which are very different from those of the Amazon and
Orinoco watersheds), and partly to innovations of the Maya in the typical slash-and-burn horti
culture of manioc and maize. These included large-scale cultivation of chestnuts, which may have
provided up to 80 percent of the calories consumed by Tikal in the ninth century, and construction
of extensive irrigation and drainage channels.
Evidence suggests that beginning in the early ninth century Tikal and other large Mayan settle
ments started to decline, with populations decreasing in both size and density. While the duration
of this decline is still disputed, when the Spaniards reached the Petén in the 16" century, its pop
ulation density was similar to that in other tropical rain forest areas of South America: 1–2 inhab
itants per square kilometer (i.e., 125–250 times less than during the zenith of Mayan civilization).
Today, the Petén jungle is almost deserted.
The sudden fall of a large urban civilization is quite common in Mesoamerican archaeology, but
the fact that during the following centuries no other civilization replaced the Maya in the Petén
jungle has remained a riddle to scholars. Marvin Harris suggested that the decline of the Maya
may have been related to the fragility and vulnerability of the ecosystem on which this civiliza
tion developed.
Population growth and agricultural development certainly led to extensive deforestation (a phe
nomenon witnessed by the man-made savannahs scattered throughout the Petén jungle). This
resulted in increased erosion in the upper part of the area. The great amounts of sediment brought
down by tropical rain may have rapidly filled the channel beds, making the irrigation systems dif
ficult to maintain. Moreover, the extent of deforestation may have led to dramatic changes in the
rainfall regime, increasing the average length of the dry season and causing recurrent droughts.
In the time span of two or three centuries, the fragile balance between the Mayan population,
their culture and their environment collapsed. If this interpretation of the fall of the Petén Mayan
civilization is correct, it presents an important historical example of the social and demographic
crisis a society faces when its population exceeds the carrying capacity of its ecosystem.
Adapted from: Harris, 1977
Case Example 2.14
Technology and carrying capacity in China
China provides an example of both the potential and the limitations of improved technology for
expanding food production. New management practices and technologies have resulted in more
productive agro-systems and substantially increased the carrying capacity in most areas. For
example, under pastoralist management, one hectare of grazing land in China could only support
1–2 persons. Traditional farming with careful recycling of organic fertilizers raised the carrying
capacity to 5–6 people per hectare. Today's cultivation, which increasingly relies on large inputs
of nitrogenous fertilizers, can sustain 10 people per hectare (the national average). In Sichuan,
China's most populous province, 17 people are able to be fed from each hectare.
Carrying capacity has thus been raised impressively over the past several thousand years in China.
However, although some constraints on food production were removed (for example, loss of herds
during cold winters or crippling damage of crops due to pests), new ones have emerged in their
place. Today, China's carrying capacity rests critically on the availability of fossil fuels and elec
tricity to provide synthetic fertilizers and pump the water needed for new, high-yielding crop vari
eties.
From: Mahar, 1985
Food availability (or more exactly, availability of calories, proteins and
micro-nutrients) is the most direct measure of human carrying capacity
of a given ecosystem. Around the world, the rural areas with the heavi
est population pressures are those in which the natural conditions (phys
ical, chemical and biological) for food production are the best.
Over the past 10,000 years, mankind has developed an increasing capac
ity to extract food value from the environment (see Case Example 2.14).
Hunting, fishing and gathering, which were practiced for nine-tenths of
the evolutionary history of humans, have been increasingly displaced by
more efficient ways of exploiting natural resources, such as agriculture
and animal breeding. Among the important customary or traditional
agricultural practices which are known to increase productivity in an
environmentally benign way are small-scale irrigation, animal traction,
biological manuring and crop rotation. More recently, large-scale
engine-powered agriculture, chemical control of soil fertility, pesticides
and genetic improvement of plants have dramatically increased these
techniques for squeezing out every possible calorie and protein from the
local resource bases.
Thus, within certain natural limits, the carrying capacity of a given envi
ronment can be increased by cultural (or, more specifically, agri-cultur
al’) means. On the other hand, history and archaeology provide us with
several examples of human populations that faced impressive crises
because of their failure to respect their local environmental limitations
(see Case Example 2.15).
within certain natural
limits, the carrying
capacity of a given
environment can be
increased by cultural
(or, more specifically,
‘agri-cultural’) means
It is therefore reasonable to ask how far a given community is from the
absolute ‘limits’ of the carrying capacity of its environment. A rough
estimate of carrying capacity can be obtained by comparing local food
production with population size. Although estimates based on food pro
duction and other proxy measures of effectiveness and efficiency in
resource-based exploitation are useful, full calculation of carrying
capacity is not completely answered by a single indicator. A more
detailed profile requires complex statistical models that combine natural
variables (latitude, altitude, climate, soil, water, fauna, flora, etc.) with
economic, social and political factors (such as available technology,
trading exchange network, presence of infrastructures, land ownership
and other aspects of the overall mode of production).
For the sake of local development and conservation activities, however,
these sophisticated and expensive studies are rarely necessary.
Participatory appraisal techniques focusing on key resources (such as
arable land, water, fuel wood, wildlife, etc.), seasonal food availability,
and nutritional status (see Chapter 4) can provide sufficiently valid infor
mation and practical advice from within the community about uses of
natural resources, risks of resource degradation and ways to cope with
those locally (see Case Example 3.2, p. 83, for an inspiring example of
primary environmental care which achieved better local management of
resources and, thus, an increased local ‘carrying capacity’).
fi“__AA‘ __A 2--..-

tory action researchICIOa3. Part

Involving people in the analysis of the problems that affect them and in the
design of potential solutions is the best way to achieve sustainable devel
opment in the truest sense of the term. Though more time-consuming, per
haps, than traditional conservation and development approaches that rely
on blueprint' plans and development experts', participatory approaches
generally lead to environmental conservation efforts that are sustained
over the long term – because the people themselves have an interest in
their success. This chapter provides some principles and methodological
considerations for carrying out participatory action research. Beginning
with a discussion of the term participation', we lay the ground for the
material which follows in Chapters 4, 5 and 6. In those chapters, readers
will be introduced to specific techniques for conducting participatory
action research on local population and the environment.
3.1 Participation
3.2 Participatory project management
Partnerships between local and non-local actors
3.3 Participatory action research: general features
3.4 Participatory action research: basic methods and
techniques
Participant observation
Interviewing – for qualitative and quantitative information
Facilitating group meetings and exercices
3.5 Participatory action research: conditions for
success and problems of validity
Community acceptance
Staff technical know-how and attitudes
Validity and reliability of participatory action research results

3.1 Participation
If we understand participation in the simplest of its meanings – taking
part, sharing, acting together – people's participation is nothing less than
the basic texture of social life. For millennia, people have participated’
in shaping their cultures and survival strategies in an immense variety of
ecological environments. For the greater part of the existence of Homo
sapiens, this sharing of tasks and responsibilities has taken place in self
regulated small groups – 50 to 60 individuals who interacted in a face
to-face way and shared the hunting, gathering, leisure and learning of
daily life.
With the advent of agriculture, and even more so with the advent of
industrial production, social units grew in size and became internally
diversified and specialized. Regulations and enterprises developed and
promoted by special groups had to face the consensus, the indifference
or the opposition of the rest of the people. Spontaneous participation
became an important test of confidence and trust.
In recent decades, large-scale planning, governmental services and reg
ulations, entrepreneurial projects and development schemes have
increasingly dominated socio-political life. In this context, people's par
ticipation is appreciated and sought by virtually all institutions, large
and small alike. Why is it so? What benefits can be expected from it and,
in particular, what benefits for activities related to population dynamics
and environmental conservation?
To begin with, participation is a condition by which local knowledge,
skills and resources can be mobilized and fully employed. Local people
may know very well the causes and possible remedies of deforestation
or soil erosion in their environment. They may know where to find and
how to use plants of unique properties or how to prevent animals from
damaging new seedlings. They may be able to offer labor, land, food,
shelter or tools for the running of a project. Contributions like these
increase the flexibility of an initiative and its responsiveness to local
conditions, they reduce the chances of mistakes with major environmen
tal consequences and often make up most of the difference between suc
cess and failure. In fact, the overriding benefit of people's participation
is the increased effectiveness of any initiative.
Another major benefit is a more efficient use of resources. In fact, local
knowledge and skills help minimize waste and obtain results with
the overriding benefit of
people's participation is
the increased effectiveness
of any initiative
Box 3.1
What to expect from people's participation in a conservation initiative
• local knowledge, skills and resources are used more fully
• the initiative becomes more effective and more efficient
• local people and outsiders share and enhance their awareness of problems, resources and
opportunities
• local people and outsiders share and diversify their relevant knowledge and skills
• local associations and institutions are created or become stronger and more capable
• local initiative and self-reliance are encouraged and cultivated
• the local society is likely to become more mature, non-paternalistic
• ‘development’, ‘democracy’ and equity are broadly promoted
... in all, the initiative becomes much more sustainable.
most local communities
possess greater stability
and continuity than
national governments;
their investments are made
for the next generations
rather than for the next
elections
limited investments; participation can bring to the project the full bene
fits of human and material resources that would otherwise remain idle or
poorly utilized; and local monitoring discourages the undue use of assets
and promotes accountability and the respect of rules.
Most of all, however, the participation of local people provides a unique
assurance of the sustainability of conservation initiatives. In fact, local
people are – at least potentially – the most directly interested in the pos
itive results of such initiatives. When they initiate them or participate in
setting them up, when they invest in them their own hopes and resources,
they are likely to remain motivated to sustain them in the long run. In
fact, most local communities possess greater stability and continuity
than national governments; their investments are made for the next gen
erations rather than for the next elections.
Agencies concerned with the effectiveness, efficiency and sustainability
of conservation and development initiatives can thus profit from people's
participation. But participation directly benefits local people as well.
When people take part in assessing population dynamics, environmental
problems, resources and opportunities, they acquire information and
enhance their awareness of factors playing a role in their lives. When
they act and contribute, they often acquire new skills and face the oppor
tunity of organizing themselves – with a variety of returns for local equi
ty, self-reliance and building of community or group identity.
In fact, the benefits of genuine people's participation in initiatives for the
common good are so many that for some authors the concept merges
with other concepts, like democracy and development, and makes the
whole difference between a mature and free society and a paternalistic
and possibly oppressive one.

Case Example 3.1
Participation in a population-environment project
The Orangi Pilot Project (OPP), located in a slum district north of Karachi, Pakistan, has success
fully blended both population and environmental activities into one integrated project using par
ticipatory approaches. Begun in 1980 as a sanitation project to introduce flush latrines, the OPP
staff organized the local population, and involved them in self-financing and building the project.
As a result of the collective efforts of community members, latrines were introduced in more than
50,000 homes.
OPP moved from sanitation into the health field (disease prevention) and ultimately, based on
women's expressed needs, into reproductive health and family planning. In Pakistan, women's
mobility is limited for cultural reasons. In order to reach them, it was thus necessary for project
workers to go into the homes or neighborhoods of potential clients. Because the service needed to
be delivered to the door, it was important that the outreach workers would be women who were
trusted by the clients.
The solution was to train local women as family planning suppliers and motivators. OPP devel
oped a three-month-long training course for community activists on subjects including family
planning, preventive health, nutrition, hygiene, and gardening. These activists organize by lanes
and have weekly meetings which are also used for service delivery at cost. Women are eager to
learn and pay a nominal fee to attend meetings.
An important innovation is that OPP relies on capacity building of local community members rather
than on social organizers from outside the specific community. The advantages are that the women
have confidence in the local activists and that through them OPP is able to reach a much larger audi
ence. While women are left to make their own decisions, based on full information, the activists
play a critical role as catalysts, providers of information and facilitators in service delivery.
Contributed by Tariq Banuri
Given all the benefits listed above, is participation universally desirable?
Could any problem arise? The management of a conservation initiative
may wish to take into consideration the following potential issues and
COnStra1ntS. the very concept of
‘stakeholder participation’
may be quite alien to some
cultures
• Full local participation and empowerment are best developed in a
democratic society. Yet, several communities affected by conserva
tion initiatives are highly hierarchical in nature and generally follow
the decisions of their leaders. In those communities, the participation
of certain disadvantaged groups may clash with local customs (e.g.,
the participation of women, the landless, ethnic minorities, etc.).
• The very concept of stakeholder participation may be quite alien
to some cultures and groups. For instance, it may be that the self
assertion required to express one's stake (which differs from the
‘stakes and interests of others) is considered unseemly and clashes
Box 3.2
The ambiguity of participation
The current widespread interest in people's participation in environmental and development pro
grams surely derives from the impressive benefits that participation is expected to bring. It also
derives, however, from a certain ambiguity of the concept itself. Its possible interpretations (which
also reflect alternative interpretations of the concepts of development and democracy) span from
participation as a means to facilitate and improve external interventions to participation as an
end in itself’.
If local people participate, they are willing to contribute local resources: this is the basic rationale
for promoting participation as a means’. For instance, people participate when they provide free
labor for a local construction, free or low-cost lodging and food for external workers, or needed
land, timber, building materials, animals, water, etc. From this point of view, participation regards
only the people who are involved in specific activities in a given period of time. The phenomenon
is relatively easy to monitor and evaluate.
The rationale of participation as an end in itself is more lofty, and its practice and evaluation are
more complex. People participate when they take an active role in planning, deciding, imple
menting and evaluating initiatives. In this process, people – and in particular the poor and disad
vantaged – end up organizing to overcome problems and to gain more control over their local envi
ronment and livelihood. Thus, seeking participation aims beyond the horizon of a specific initia
tive. A main indicator of success is the development and strengthening of local organizations,
which can represent people's interests and concerns long after a specific initiative (e.g., a project)
ceased to exist.
The above views can appear incompatible, but, as often happens in real life, specific people in spe
cific contexts end up being more influential than ideological approaches in determining results. At
times, participation promoted for the sake of savings and work efficiency has seeded a major
development of local awareness and concern. On other occasions, well-intentioned agencies never
managed to arouse the interest of local people for their own development and/or empowerment’.
with accepted behavioral norms. In fact, the participation of various
stakeholders presupposes that different interests exist within a com
munity, which is a concept largely derived from the economic and
cultural context of modern western society.
National governments may not support local participation or empow
erment, especially if they regard it as a threat to their own authority,
or as an encouragement to opposition groups. The participatory
approach also may not be viable because of local political opposition
or sheer lack of norms and institutional support.
Participatory processes require specific investments of time and
resources. In particular, the process of participation needs expert
facilitation and clear objectives, to avoid chaotic meetings and a gen
eral loss of direction for the initiative. The needed resources may not

be available or the relevant activities may not have been foreseen in
the original plan of the conservation initiative. In these cases, cre
ativity and managerial initiative are necessary.
' Participatory approaches require commitment over time and results
may take a while to appear. This can tax the patience of donors, man
agers, staff and local people alike. Threats against natural resources
may be escalating, and the urgency of taking action may discourage
people from undertaking lengthy participatory processes.
' Time and resource investments may be required to reach a good level
of communication between the local people and the national or expa
triate staff in the conservation initiative.
' Some compromises in conservation objectives may need to be made.
For instance, a conservation initiative designed by outsiders may pro
pose a total ban on local access to natural resources, which may be
simply unacceptable to the locals. Also, emphasis on the process of
participation may take attention and resources away from the ‘tech
nical content’ of the initiative.
In short, participation requires time and effort, not to mention addition
al resources and socio-political sensitivity. But the rewards, in terms of
the sustainability of project interventions, local empowerment and pro
motion of democratic processes, can more than make up for the costs
and potential frustrations encountered.
. . . national governments
may regard participation
as a threat to their own
authority, or as
encouragement to
opposition groups. ..
DA-ornrnfisnn , "Asian "..MVVAA 77

the rhetoric ofprogram
documents may talk about
the poorest of the poor',
but those who are
consulted are usually local
leaders andprominent
people
in the usual development
and conservation practice,
a written project document
is more important and
more ‘real’ to the funders
and supervisors than a
project in the field
3.2 Participatory project
management
In participatory project management two frequent practices are usually
called into question:
• the top-down decision-making process;
• the ‘blueprint approach to project planning and implementation.
Many, if not most, of the existing development and conservation initia
tives around the world are the result of top-down decision-making
processes. What is to be done, as well as how, where and when it will
be done, is decided by agencies from outside the local community.
Institutional desires and the wishes of ‘well-meaning outsiders carry
more weight than the felt needs and know-how of local actors. Even
when local participation is actually pursued, the rhetoric of program
documents may talk about the poorest of the poor', but those who are
consulted are usually local leaders and prominent people.
In addition, the administrative needs and bureaucratic rules of donors
and implementing agencies pressure development and conservation ini
tiatives into standard (conventional or normative) project documents.
These documents contain rigid sequences of outputs and activities (so
called ‘blueprint plans), based on forecasting which may have been
fixed even before a preliminary contact with the local community has
taken place. Despite their coherent and meaningful appearance, these
project documents do not usually survive the reality of implementation.
Delays, deviations, unforeseen constraints, incidental events, unexpect
ed outcomes and missed opportunities are the daily lot of many conser
vation or development initiatives. Unfortunately, in the usual develop
ment and conservation practice, a written project document is more
important and more real’ to the funders and supervisors than a project
in the field. Requirements for delivery of inputs and production of out
puts, as stated by the project document, are a straitjacket for project
managers and communities, preventing them from creatively exploring
alternative courses of action based on what they learn during project
implementation.
To overcome these limitations, some development and conservation
agencies have started to experiment with a new project management
style, which is based on the following:

• Flexible and relatively open-ended project documents. Lists of
objectives, outputs and activities are presented as an open set of alter
native courses of action. Their relevance to local needs and resources
is to be field-tested and validated, with the active involvement of local
actors, at the start-up of the project and during its lifetime. Selection
within this list, as well as reasonable shifts from the initial plan, is
foreseen at any time of the project. Consequently, timing, delivery of
inputs and achievement of results are left as open-ended as can be
acceptable for the donor and the implementing agency.
• Field-based participatory appraisal, feasibility analysis and
strategic planning. Whatever the general objectives of the initiative
are, time and resources are allocated for carrying out a preliminary
appraisal and feasibility analysis with the full involvement of local
actors, i.e., a participatory baseline assessment. This exercise usually
leads to lists of problems and possible solutions as perceived by dif
ferent groups of local persons. Planning decisions are eventually
made by collectively negotiating these lists against the mandate of the
external agency and the policy priorities of other local institutional
actors. It is only on this basis that a detailed short-term plan and
timetable is prepared.
• Participatory implementation and monitoring. The responsibility
of carrying out decisions negotiated through participatory planning is
shared by the different actors involved, such as community groups,
local authorities, NGOs and external donors. Each actor is supposed
to contribute its own resources (e.g., knowledge, skills, raw materials,
technical inputs, financing) to implement the common plan. Due to
the variety of actors involved and the flexibility of planning deci
sions, continuous monitoring by all the concerned parties becomes an
important component of implementation. The monitoring helps to
control the flow of inputs and the deployment of activities, as well as
to identify and settle conflicts and problems which may arise, and to
take advantage of opportunities as they come.
• Participatory evaluation and re-planning. The open-ended and iter
ative (i.e., repeating cycles) orientation of the participatory process
means that on-going evaluation is essential. In contrast to summative
evaluations that decide whether to continue a project or not, evalua
tions in participatory processes generally have a formative focus.
Their aim is to extract lessons learned during the implementation and
Box 3.3
The power of the center: a view on participation in Africa
A strong tradition of centralized planning and administrative control has taken hold in Africa. In
the post-independence era, forging a single national identity from different political, religious and
tribal backgrounds was an overriding priority for most young governments. The prospect of inde
pendent power centers was perceived as a threat to central authority and, by extension, to nation
al unity. As such it was aggressively discouraged.
Centralized authority has become an established way of life. Even most decentralization plans
have merely shifted authority to surrogate administrators located in provinces or regions. The
slightest sign of independence or autonomy is often dealt with quickly and harshly. It is not sur
prising that an attitude has emerged whereby rural people believe that the lead in development
activities should be taken by recognized authorities.
Correspondingly, an atmosphere of passivity and dependence prevails in rural communities. Local
initiative, when taken at all, has evolved into a dismal shadow of its true potential. People have
become accustomed to petitioning those in authority, or donors with outside resources, to do
something on their behalf. That reinforces a self-perception as submissive objects of development
rather than active players. The result is predictable: with a shrug of the shoulders, many villagers
spend a lot of time waiting for development to happen through the efforts of others and point
accusing fingers when it doesn’t take place.
Some political authorities, of course, do teach the need for self-reliance and thereby give at least
some rhetorical encouragement for local participation. This often takes the form of half measures,
of enlisting people to supply labor or make financial contributions to projects that have already
been decided elsewhere. When the recurring demands for labor or money are high and associated
with a low perception of personal benefits among the villagers, there will be little participation and
projects will fail.
Unfortunately, many attempts at locally initiated rural development projects do fail. Rural people
often have limited organizational and managerial skills. This not only makes them vulnerable to
intentional mismanagement and theft, but also contributes to inadequate planning. Self-help pro
jects are easily frustrated by inability to analyze problems and formulate simple solutions. When
such failures occur, the negative experience goes a long way to discouraging similar initiatives in
the future.
From: Bergdall, 1993
use them to guide the future evolution of the project. Re-planning of
each ensuing activity or phase is thus an expected part of such evalu
ations, in order to continuously learn from the previous experiences.
The new project management style entails several technical difficulties.
Repeating (cyclical or iterative), open-ended and comprehensive
processes are much more complex to manage than pre-defined one-time
Box 3.4
The power of the villages: another view on participation in Africa
Can the pattern of ‘local passivity’ be broken? Can traditional and new knowledge and skills he
harnessed for the good of local communities?
The Naam groups of Burkina Faso, West Africa, are illustrative of traditional participatory struc
tures that have been adapted and updated to fit current circumstances. Called Kombi-Naam in the
local Mooré tongue, they were, until a few years ago, traditional youth associations, composed of
girls aged 15 to 21 and young men of 20 to 35. with the purpose of both developing moral quali
ties such as solidarity, cooperation, friendship and loyalty in the young, and at the same time
accomplishing socially useful tasks for the village. Positions within the Naam were not at all based
on caste or social status, but rather on ability. The Kombi-Naam traditionally provided moral, civic
and technical training for the village youth.
Through the tireless work of Bernard Ouedraogo, a teacher turned agriculturist, Naams were
adapted for the purposes of modern development. The transition from the traditional to the mod
em Naam was gentle, enabling village groups to adapt little by little to their new roles. One impor
tant change was the opening up of the Naam to people of all ages, thereby involving the whole vil
lage rather than just one age group. The modern Naams also nominate counselors from among the
village elders, an innovation in line with the African tradition of respect for the wisdom of the
elders. The Naams are primarily involved in village agricultural development, but they also work
in income-generating activities.
In the late 19805 there were over 4,000 Naam and affiliated groups in the Yatenga area of Burkina
Faso, with well over 200,000 members - unquestionably one of the largest, most powerful
peasant organizations in Africa, and a formidable force for development. The Naams represent the
triumph of the idea of ‘developing without harming’.
The Naam is a form of development adapted to local needs, created by the people themselves,
which instead of destroying traditional structures from the outside, slowly, like leaven, transforms
them from the inside. It starts from where people are (based on a true appreciation of their African
identity). what they know (respect for traditional knowledge and values). their know-how (redis
covery of traditional techniques, some of which, for example in the field of water and soil con
servation, have proven invaluable) and what they wish to achieve (which implies meaningful
grassroots participation in defining the very objectives of the development process).
Adaptedfrom: Praden'and. 1989
interventions in a single sector. Engaging full participation calls for
effective means of communicating, building consensus among different
actors and, whenever needed, helping them to solve their conflicts.
Important goals in potential opposition, such as the exploitation of
natural resources for economic development and their conservation for
future gains and ecosystem functioning, need to be composed and har
monized. Working at the local level is possible only if the political and

local and non-local actors
have diverse comparative
advantages and skills,
which can complement
one another and at times
develop into true synergies
economic links with the national and international situation are acknowl
edged and strategically managed.
To meet these challenges, the professionals working with initiatives
aimed at participatory and sustainable development have looked for new
and appropriate technologies for project management. Various participa
tory methods for information gathering and assessment, planning,
implementation and evaluation have evolved in response to this demand.
In the following sections, we shall refer broadly to this growing family
of methods and tools as participatory action research’.
Partnerships between local and non-local actors
The process of responsible and informed decision-making at communi
ty level about environment and population issues can become more
effective by merging local knowledge and resources with external skills
and inputs. This is the justification for establishing a partnership
between local actors (community members and institutions) and non
local professionals with the aim of improving quality of life in the com
munity and optimal management of its natural resources.
Ideally, such partnerships are based on the following principles:
• Mutual respect. People from different backgrounds and social reali
ties seem to live in different worlds. Yet, if one is open minded, tol
erant and respectful, meetings of this kind can be among the most
rewarding events that life can offer.
• Complementarity of capacities. Most often, local and non-local
actors have diverse comparative advantages and skills, which can
complement one another and at times develop into true synergies.
• Working for a common goal. At best, collaboration develops on the
basis of a shared vision of what is appropriate and desirable in a given
context. When particular benefits and interests merge into a mutual
goal, all parties are more motivated to act. (This said, even a good
compromise, merging different goals of different partners, can be at
the basis of a successful partnership.)
• Process orientation. A collaboration is best considered as an organ
ic and evolving phenomenon, rather than a way to produce a project
plan that will stand forever. Partners should feel that agreements
can be changed, but they should respect them as they stand until all
interested parties agree to modification.
Case Example 3.2
When participation succeeds...
North of New Delhi, in the Indian state of Haryana, are the Shivalik hills, an ecosystem of luxu
riant broad-leaved and coniferous vegetation. Unfortunately, since the middle of the last century
these hills have suffered from wrong policies and unchecked resource exploitation, in particular of
timber and grass. Watershed erosion became so persistent and severe that the topography of the
region was profoundly affected. Deep gullies carved the denuded hills while the lakes and reser
voirs downstream slowly filled up with fertile silt and sediments.
The Haryana Forest Department attempted to stop this destructive process by constructing check
dams, palisades and silt detention structures. It even erected barbed-wire fences around the areas
to be protected and reforested: all attempts were frustrated. As soon as the stones and wooden
posts used to build the check dams and palisades were in place, local villagers removed them for
their own domestic use. Within days of setting a fence, passages were opened to allow access for
goats and cattle to what was left of the hillside pasture. It was a battle with no end and no win
ners. People and foresters fought one another while the environment worsened and the communi
ties got poorer and poorer.
The villagers of Sukhomajri were major contributors and victims in this state of affairs. In the late
seventies, after the latest baffled attempt at fencing a severely degraded area, a concerned forestry
officer pleaded with the people that they stop grazing and foraging the watershed. The villagers
replied they were ready to do so, but only if alternative means of survival could be found, since
they were hopelessly dependent on the hills for fodder and fuel.
The solution was found in capitalizing on a previously unused resource: rainwater. Until then,
rainwater had been simply left to run downstream with its load of fertile soil. With some outside
support, the people of Sukhomajri constructed a small earth dam above a gully head, thus collect
ing rainwater that could irrigate the village. Irrigation led to a dramatic increase in local crop
yields and provided a strong incentive to maintain the supply by protecting the watershed.
The impounded water was distributed equally, irrespective of land ownership, meaning that some
could use it directly, and others could sellit: everybody shared in the common interest. Slowly but
steadily, the number of goats raised locally decreased, and the number of stall-fed buffaloes and
the local milk production increased.
A village society was formed and soon assigned responsibility by the Forest Department for pro
tection of the forest. The society built contour trenches to improve the moisture regime in the hills,
planted local tree species and sowed bhabbar grass. The grass provided excellent fodder, which
was hand-collected and sold following the society's own rules to equally benefit all village house
holds. Soon, another check dam was built near Sukhomajri. By the early 1980s, the Haryana
Forest Department had become the leading agency in building dams, providing communities with
grass leases and helping to organize management societies in the villages of the Shivalik hills. The
barbed-wire fences could be completely removed: people's participation had successfully replaced
them with much more effective social fencing’.

3.3 Participatory action research:
general features
Growing from experiences in applied research in the social sciences,
community-based development and participatory project management,
participatory action research (PAR) (see Box 3.5) has been used widely
around the world. For instance, PAR has been applied to plan, imple
ment, monitor and evaluate many kinds of projects, such as community
organization and development, community health and nutrition, agricul
tural extension, community forestry, urban environmental improve
ments, education and training, etc.
Many variations on the theme exist. Some of the better known examples
include: rapid rural appraisal (RRA), participatory rural appraisal
(PRA), rapid assessment procedures (RAP), activist research and farmer
participatory research. While there are differences in emphasis, orienta
tion and sector of application for these methods, all of them share some
common features which allow us to group them under the label of par
ticipatory action research’. Such features include:
Local focus:
• An orientation towards the felt needs of local people and insti
tutions. PAR deals with issues directly experienced and explicitly
acknowledged as problems by local people and institutions.
• A strong link with locally generated initiatives. PAR aims at gen
erating information and supporting decision-making processes useful
for local aims and applicable to local initiatives.
• The involvement of non-local actors as partners in a learning pro
cess. When non-local actors are involved, they contribute to PAR via
discussions and negotiations with local actors.
Action focus:
• A minimal time-gap between data collection, analysis and feed
back. Timeliness of analysis and rapidity of feedback are sought, to
increase the cost-effectiveness of the research and promote the prac
tical use of its results.
• A direct feeding of research results into planning and action. PAR
goes beyond recommending changes based on the findings (as often
happens with conventional research). The action research process
incorporates methods for translating the knowledge gained directly
into practical decisions and/or feasible courses of action.

Box 3.5
A view on participatory action research
An important concern among the early developers of participatory action research was the need
for integrating understanding and practice. Here are some thoughts from Lewin, one of the pio
neers of action research.
. Action research is intended to contribute simultaneously to basic knowledge in social science
and to social action in everyday life. High standards for developing and testing theories are not
to be sacrificed, nor is the relation to practice to be lost.
. Action research, like social management more generally, involves iterative (repeated) cycles of
identifying a problem, planning, acting and evaluating.
. Action research typically involves change experiments on real problems. It focuses on a par
ticular problem and seeks to provide assistance to solve it.
. The social change desired by action research generally affects the patterns of thinking and act
ing that are presently well established in individuals and groups. The intended change is at the
level of norms and values, and it is expressed in action. Effective change, in this sense, depends
on participation by ‘clients’ in diagnosis and fact-finding as well as having free choice to
engage in new kinds of action.
Adaptedfrom: Argyris et al., 1990
Process focus:
An equal concern for process and results. PAR consists of collect
ing ‘fairly quick and fairly clean’ information, but it doesn’t stop
there. It also aims at making all participants aware of the implications
of the issue (problem, situation, etc.) being investigated and support
ing them in undertaking relevant action.
A built-in communication strategy. While final written reports are
useful for institutional or training purposes, meetings and workshops
are the most important means to provide feedback to local institutions
and the community at large.
The re-definition of the role of non-local professionals. Non-local
professionals are expected to leave behind their attitudes as ‘experts’
and to act more as providers of views and information that need to be
evaluated for appropriateness and usefulness by the local people. At
times, they may serve more as facilitators than experts. Precision and
accuracy of findings are balanced by the timeliness and user-friendli
ness of research and decision-making techniques.

3.4 Participatory action research:
basic methods and techniques
Participatory action research includes an increasing array of techniques
and tools designed for dealing with a variety of management issues and
problems. For simplicity of presentation, all of these techniques can be
brought back to three basic methods for generating information and
making decisions. These three methods, which have been widely used
and tested by applied social science, are: participant observation, indi
vidual interviewing, and facilitated group meetings and exercises.
Participant observation
Participant observation consists of taking part in social situations with
the aim of discovering issues, events and interactions which may be
obvious for the local actors but unknown to the external observer.
Extensively used by anthropologists, participant observation has proved
to be especially useful in the framework of participatory action research
for:
• understanding the way in which local people use natural resources
and manage their environment;
• understanding the local social environment, with special emphasis on
status, roles and behaviors related to gender, age, wealth, social sta
tus and ethnic differentials;
• understanding the daily relationships and communication flows exist
ing among non-local professionals (e.g., project staff) and different
groups of local people;
• analyzing daily, weekly, monthly or yearly patterns of activities and
the time allocated by local actors to perform them.
As used in conventional anthropology, the technique of participant
observation typically entails a regular routine of being there – taking
notes, reflecting, hypothesizing and making many repeated observations
for confirmation. Such a time-consuming procedure does not usually fit
well the practical needs of participatory action research. While failing to
provide the in-depth understanding of local society and culture which
comes after several months of full-time participant observation, a few
days spent walking around and visiting people and places with an open
mind are a good entry point for a professional new to a particular com
munity or project setting. The discussion of insider/outsider experiences
in the participant observation method is a key component of any action
research process (see Box 3.6).
Box 3.6
The insider/outsider experience
The ordinary participant in a social situation usually experiences it in an immediate, subjective
manner. We see some of what goes on around us; we experience our own movements; we move
through a sequence of activities as subjects, as the ones engaging in the activities. In short, we are
insiders. Our experience of participating in a social situation takes on meaning and coherence from
the fact that we are inside the situation, part of it. The participant observer, on the other hand, will
experience being both insider and outsider simultaneously.
From: Spradley, 1980
To get the most out of a rapid participant observation of a local setting,
PAR practitioners tend to focus this practice on situations directly rele
vant to specific issues of interest. For instance:
• transect observational walks (see Annex B, section B.1): walking
with one or more residents across the area surrounding a village can
be useful for obtaining information about patterns of natural
resources and their exploitation or use;
• visiting places where different community groups meet: people tend
to gather in places like markets, coffee shops, football grounds, reli
gious buildings, water source points (boreholes, springs), etc.
Observations can be made at such locations to identify patterns of
social interaction among different groups;
• attending official meetings and ceremonies (if possible and accept
able): observing at events, such as community meetings and cere
monies can generate insights about the political and social dynamics
in the community;
* observing service delivery and project activities: many kinds of ser
vices are provided in communities; observing the process can help in
assessing the reciprocal attitudes and behaviors of providers and
users. Traveling along during regular project activities, such as agri
cultural extension visits, natural reserve patrolling or family planning
outreaches is a very good way to understand the communication
flows between external agencies and local people. While it is desir
able to remain neutral relative to either the project or the community,
assisting with some simple tasks during the activity is generally
appreciated by staff and recipients. In this way, participant observa
tion can lead to closer rapport and good opportunities to engage in
discussions with local people, service providers and project staff.
In most observation sessions, note-taking is appropriate and necessary.
Jotting down what has been observed is not only an aid for memory but
also a way to focus the observer's attention on issues directly relevant to

PAR is principally for the
benefit of local people, any
observation collected by
outsiders needs to be
communicated to
the insiders and
discussed/evaluated
together with them
the problem(s) for which the action research is being done. Pre-set
observational check-lists can be used, but they are more controversial.
The advantages – standardization and systematization of observing spe
cific items – will need to be weighed against the risks of losing an open
ended, discovery-oriented and relaxed approach which is a basic
strength of participant observation.
As mentioned earlier, participant observation is usually combined in
action research with various individual interviewing and group discus
sion techniques. Indeed, verbal interaction on the spot, i.e., talking with
the people who happen to be there, can help to elicit insider interpreta
tions of an observed behavior, event or situation. Most importantly, as
PAR is principally for the benefit of local people, any observation col
lected by outsiders needs to be communicated to the insiders and dis
cussed/evaluated together with them.
Interviewing – for qualitative and quantitative
information
Interviewing is basically a process of inquiring into another person's
perceptions about a particular issue (or set of topics). It can include
exploring their knowledge, feelings, attitudes, opinions, past experiences
and expectations for the future.
Interviewing can be useful for a wide range of concerns, such as:
• local knowledge of the natural and social environment: natural
resources available and their traditional use; local technologies;
means to mobilize labor; social organization of the community; gen
der and age issues; etc.;
• felt problems and needs: related to household economy, conservation
of the resource base, education and health; access to reproductive
health, family planning, credit services, etc.;
• perception of existing initiatives in the area (e.g., conservation or
development projects): relationships among local actors and staff,
relevance of the initiative to local needs; functioning, acceptability
and appropriateness of the services provided; etc.;
• time trends in the life of the community: effects of seasonality on
social life; distribution of activities throughout the year; local histo
ry; life histories; expectations about the future; environmental and
population coping strategies in the past; etc.

Two main interview approaches are used by social researchers: open
ended and closed-ended interviewing. Open-ended interviews are
based on a more or less organized and standardized sequence of ques
tions whose answer are richer than a plain ‘yes’ or ‘no’ statement, a
numerical figure (e.g., 15 years) or a categorical judgment (e.g., ‘good’
or ‘bad’). As with participant observation, open-ended questions aim at
discovering elements of the insiders’ perceptions of the topic under
investigation, which are likely to be almost unknown to the interviewer.
Open-ended interviewing is thus a powerful means to catch ‘qualitative
information’. Widely used in anthropology, psychology and other tradi
tions of applied qualitative research, open-ended interviewing is a key
component of participatory action research (see Annex B, section B.6).
Choosing the proper respondents is an important element of open-ended
interviewing. Some respondents could be selected because they have
special knowledge about the topic of the action research — they are key
informants. It also helps if they are ready to talk and they are somewhat
reflective or analytical in their thinking. Other respondents might be
selected for their representativeness as members of different interest
groups, or on the basis of any special social status accorded to them,
either formally or informally. Open-ended questions can also be
addressed to a group of respondents. Groups may be spontaneously set
up (e.g., a natural group of peasant women encountered while they are
at a spring for water) or convened by the interviewer (e.g., a focused dis
cussion group or focus group).
Most often, the sampling of respondents for open-ended interviews is
based on judgmental (purposeful) criteria rather than random chance.
Such purposeful sampling is quite different from the random sampling
useful to draw statistical probabilities in quantitative research. Statis
tical sampling is based on randomness so that researchers can confi
dently generalize results from a small sample to a larger population. The
power of purposeful sampling lies in selecting information-rich cases for
in-depth analysis related to the central issues being studied. A list of dif
ferent sampling strategies that can be used in qualitative action research
(either for individuals or groups) is presented in Box 3.7.
The success of an open-ended interview depends very much on the
communication skills of the interviewer, which are needed to keep the dis
cussion as a relaxed dialogue. These skills include helping the interviewee
the power ofpurposeful
sampling lies in selecting
information-rich cases for
in-depth analysis related to
the central issues being
studied
Particinatorv action research 89

Box 3.7
Choosing a sample:
purposeful sampling in qualitative research and evaluation
There are several different strategies for purposefully selecting information-rich cases; the logic
of each strategy serves a particular research purpose.
2
Extreme case sampling: focuses on cases that are rich in information because they are unusu
al or special in some way (e.g., the only community in a district that has prohibited pesticides).
Maximum variation sampling: aims at capturing and describing the central themes or principal
outcomes that cut across participant or program variations (e.g., persons of different ages, gen
ders, religious groups and marital status in an area considering family planning interventions).
Homogeneous samples: picking a small sample with similar characteristics to describe some
particular sub-group in depth (e.g., firewood cutters or charcoal makers in a specific area).
Typical case sampling: using one or more typical cases to provide a local profile. These cases
(individuals, families/households, communities, etc.) are selected with the co-operation of key
informants, such as program staff or knowledgeable participants, who can help identify what
is typical.
Critical case sampling: looking for critical cases that can make a point quite dramatically or
that are, for some reason, particularly important in the scheme of things (e.g., the life history
of a poacher).
Snowball or chain sampling: begins by asking people in the program: ‘Who knows a lot
about...? Who should Italk to? By asking a number of people who else to talk with, the sam
ple gets bigger and bigger. Useful for identifying specific kinds of cases (e.g., critical, typical,
extreme, etc.).
Criterion sampling: reviewing and studying all cases that meet some pre-set criterion of
importance (e.g., the economic strategies of women-headed households).
Adapted from: Patton, 1987
(respondent, participant) feel at ease, phrasing questions in clear but not
leading ways (i.e., not suggesting the correct or expected answer, as in
the question “Do you believe conserving natural resources is good for your
community?”), and introducing probing questions appropriately (e.g., ask
ing for further details when respondents give general answers).
Confidentiality can be an issue for some participants. Although the
potential topics for interviews mentioned earlier in this section are not
generally very sensitive for most individuals, the nature of the interview
process, especially qualitative open-ended interviewing, can result in
respondents disclosing information which they would prefer to keep
confidential (i.e., they want the information revealed but not the source
of the information). It will be important for the interviewer to respect
such wishes if they arise.
Open-ended interviewing techniques are best carried out with detailed
note-taking aimed at catching the exact words and phrasing of respon
dents' answers (i.e., quotes, verbatim statements). Tape recording can be
of great assistance in this effort, but only where and when it is fully
acceptable to the respondent.
Once data are collected, good summarizing skills and insight capabili
ties are needed to extract meaningful content from the statements pro
vided by respondents, which at times can be long and wandering. The
latter task can be facilitated by the use of qualitative analysis matrices
(see Table 4.7, p. 136).
The qualitative information provided by open-ended interviews of
individuals or groups is often counterchecked and completed by other
methods and techniques, including participant observation and closed
ended interviewing. This is especially important when it is desirable to
assess the generalizability of the data for a larger group of people than
the small numbers directly interviewed.
Closed-ended interviews use carefully organized questions which
allow only a limited range of answers, e.g., a yes/no answer, a categori
cal answer (male or female, peasant or herder, etc.), a preference answer
(‘A is better than B', etc.) or an answer expressed by a number (age,
date, time, distance, land measurements, etc.). The series of questions in
this type of interview are usually presented with structured question
naires. These are pre-set formats in which the interviewer marks
responses against a given group of possible answers for each question.
To allow generalizing from these kinds of results, different statistically
random sampling procedures are at times used to select the respondents,
with the aim of interviewing a representative sample of the population
under study.
In applied social sciences, such as demography and epidemiology,
structured questionnaires are widely used for collecting quantitative data
(i.e., data which can be processed by means of arithmetic and statistical
formulas). Many research practitioners share a critical view of rural sur
veys which are solely dependent on questionnaires (see Box 3.8).
many research
practitioners share a
critical view of rural
surveys which are solely
dependent on
questionnaires

Box 3.8
A critical perspective on questionnaire surveys
In 1973-4, I collaborated in a large questionnaire survey in Tamil Nadu. Since I was responsible
neither for the training of the investigators who conducted the interviews, nor for the supervision
of the survey, it is not immodest to say that the survey was well supervised, and the investigators
were well trained and keen. There were eight investigators for 12 villages, each of which differed
sharply from the other 11. Four investigators had only one village each, but the other four each
had two villages.
On the basis of the survey data, I wrote an article on agricultural extension, and intended to sub
mit it for publication. But the more I looked at it, the more I sensed something was wrong.
Eventually I took the results from the eight shared villages and paired them by investigator. The
results from each village were more like those of its pair, shared by the same investigator, than like
any other village. It seemed likely that the main independent variable was the investigator, and the
basis for the article collapsed.
By occurring in a well-supervised survey, this experience throws into question the credibility of
other surveys which do not test for and report on individual interviewer bias. Few do. And the fact
that the literature about this kind of bias is so sparse may reflect that even those who do carry out
tests have sinned as I sinned in holding back from publishing the damning findings.
More generally, critical discussion of methodological problems so rarely accompanies publica
tions of survey results that the validity of the findings of much of the survey industry is open to
question. For our purposes here, the conclusion is that the quality of data from questionnaire sur
veys is often so poor that an improvement is not difficult to achieve.
From: Chambers, 1992
Two major complaints about questionnaires relate to the loss of human
touch and the extent of technical expertise required. Structured ques
tionnaires are often poorly understood by respondents and there are
problems with the reliability of the information collected. Moreover, car
rying out high-quality quantitative surveys requires specialized skills for
questionnaire design, as well as the capacity to cope with the sophisti
cation and abstractions of statistical analysis.
PAR, however, may also need quantitative information (such as the data
provided by a population census or a demographic survey). In other
words, it may require a blend of qualitative data about the nature of a
problem or a situation combined with quantitative data about the distri
bution or extent of the problem to ensure a full and reliable analysis of a
given situation.
To meet these needs, PAR can indeed combine qualitative and quanti
tative methods. This can be done sequentially, e.g., by doing open
ended interviews first to assess the range and nature of responses, fol
lowed by closed-ended questionnaires to check on the prevalence and
distribution of responses. Semi-quantitative and participatory methods
of ranking (see Annex B, section B.8) can then help individuals and
groups of respondents to express judgments and opinions about the
results of a questionnaire. Discussions of specific findings can also be
held with groups which are representative of specific social actors, inter
ests and/or the community at large. These discussions can focus on the
interpretation and validity of the findings derived from questionnaires.
Facilitating group meetings and exercises
Participant observation and individual interviewing are powerful ways to
elicit information about a local social setting. The action research
approach, however, does not stop at this point. As soon as possible, the
“research interaction needs to become a partnership among local and
non-local actors (community groups, local institutions, project staff,
etc.) aimed at taking action – if action is due – on the basis of the
research findings. The basic method which enables this to happen is
facilitated group work (see Annex B, section B.14).
Participants for action research group exercises can be recruited through
purposeful sampling strategies, such as those employed for open-ended
interviewing. Another strategy is to use spontaneous clusters of commu
nity members on the basis of a common interest, e.g., women farmers,
herd-boys, water vendors, traditional birth attendants, etc. Such natural
groups – which often coincide with, or can lead to identify, specific
interest groups – are actually the core actors of the PAR process.
Frequently, members of interest groups will already be participating in
the organized or informal indigenous social groups that are typically
found in most rural communities, e.g., farmers’ groups, burial societies,
self-help groups, mothers' unions, revolving credit clubs, etc. A core
concern of many of these social groups is mutual aid or assistance. At
times they constitute themselves as community-based organizations to
support the socio-economic and environmental interests of their individ
ual members or of the community as a whole, e.g., as a user group, a
local cooperative, a village council, a residents’ association, etc. Where
such groups exist, they are very important actors to involve in assessing
the local environmental and social situation and in planning some initia
tives to ameliorate it (see Box 3.9).
PAR may require a blend
of qualitative data about
the nature of a problem
combined with quantitative
data about the distribution
or extent of the problem
specific interest groups are
the core actors of the PAR
process

Box 3.9
Examples of community-based organizations
The engozi groups of south-western Uganda
Engozi societies are clusters of 10–20 or more families that collectively raise funds to purchase
and maintain an engozi, a traditional stretcher made of vines from the local forest and carried on
poles, used for transporting ill or pregnant persons to a health facility. All members of the society
participate in providing this effective health transport in a mountainous area poorly served with
roads, e.g., by carrying the stretcher, providing food to the carriers, etc. Paid-up members of the
society are carried for free; others may be charged a fee. In some societies, additional funds are
raised through various activities to support loans among their members, e.g., for health expenses
like drugs and doctors' fees.
The zanjeras in the Philippines
Traditional associations in the Philippines called zanjeras aim at assuring adequate and consistent
delivery of irrigation water to all their members. The zanjeras distribute water rights and labor
duties (e.g., for maintenance and repairs) proportionally to land ownership by way of the atar sys
tem (for instance: owning 1 hectare of land = 1 atar = receiving the water needed to irrigate 1
hectare + providing 1 day of labor per month). The zanjeras can earn income by selling water to
non-members, and usually this income goes to cover maintenance costs of the irrigation system
(cement, construction supplies, tools, food for the workers, lawyers' fees, etc.). Many zanjeras
have been in operation for more than two centuries. They allow for proportionality of costs and
benefits of communal work, and for remarkable ease and flexibility of accounting procedures
(e.g., when land is subdivided and the new owners share among themselves water and labor
duties).
Action research practitioners rely on a large selection of techniques and
tools to promote participatory appraisal, planning, monitoring, evalua
tion and re-planning among the members of interest groups. They
include group exercises that focus on:
• collection and organization of information owned by different local
and non-local actors;
• discussion and validation of information collected in the field or from
existing secondary sources (e.g., census, official statistics, technical
research);
• building consensus, resolving conflicts, setting priorities and making
decisions;
• learning by doing during the implementation of decided activities.
Experience has shown that group work with local actors is more likely
to be effective and efficient when a neutral and coherent facilitation is
provided by an experienced person who is not a member of the commu
nity. A good facilitator helps the participants to think and communicate
with one another, and avoids imposing his/her personal view or suggest
ing the ‘right answer or decision either explicitly or implicitly. He/she

takes care of helping the group achieve the results the group itself wish
es to achieve, managing interpersonal dynamics, ensuring that the dis
cussion is kept on a relevant track, and keeping the length of the exercise
within reasonable limits.
To carry out this role, the facilitator needs a good understanding of the
social and cultural reality of the participants. This awareness is essential
so that his/her personal style can be adapted to the rules of behavior, the
communication and analytical skills and the cultural attitudes of the par
ticipants. A good facilitator will be able to strike a balance between the
need to achieve some positive results in the group work and the need to
keep the interaction among participants as smooth and relaxed as possi
ble. Maximizing the contribution of each participant in the group exer
cise, settling conflicts and building consensus are the facilitator’s main
responsibilities (see additional details about facilitation in Annex B, sec
tion B.14, and in Chapter 5).
As part of skillful and non-intrusive facilitation, the creative use of visu
al aids is an important strategy for supporting group exercises in action
research. Some examples of visual techniques include the following:
' Maps and transect representations can be used very effectively in
groups to describe and analyze the community’s spatial distribution
of features of special interest (e.g., natural resources, types of soil,
vulnerable families, types of services, water points, land tenure pat
terns, etc.).
' Drawings, posters, pictures and slides as well as open-ended stories,
popular theater and community-directed videos can be an excellent
entry point for group discussions.
' Sorting, counting and ranking exercises may be done in written form
but, if literacy is low, they can equally be carried out with everyday
objects, such as seeds, stones or simple sketches on small slips of
paper.
' Graphic representations by means of pie charts or bar charts (or
better yet pictograms, i.e., graphs built of pictures) are suitable for
conveying quantitative information even to non-literate participants.
The pictograms (whose shape is often inspired by daily objects such
as trees, animals, pottery or food) can be used to describe and analyze
a goodfacilitator helps the
participants to think and
communicate with one
another, and avoids
imposing his/her personal
view or suggesting the
‘right’ answer or decision
either explicitly or
implicitly
the creative use of visual
aids is an important
strategy for supporting
group exercises in action
research

time trends, patterns of relationship among different actors, or
sequences of causes, problems and solutions.
Analytical tools (e.g., matrices, problem-cause-effect trees, Venn/
chapati diagrams – see Chapters 4 and 5) can be used to organize and
analyze findings, including qualitative statements. They can also be
used on flipcharts or chalkboards for assembling the ideas developed
in a brainstorming session with a group.

3.5 Participatory action research:
conditions for success and
problems of validity
Participatory action research can provide effective support to any conser
vation or development initiative. Though based principally on common
sense, PAR exercises have some pre-conditions, and entail several poten
tial technical and attitudinal difficulties that are addressed in this section.
Community acceptance
An underlying assumption of the PAR approach is that the people in the
community are willing and can afford to invest energy and time in the
process. Another assumption is that the non-local partners and facilita
tors in PAR have the trust and confidence of the local community. This
kind of trust is not developed overnight, and in some cultures it develops
only over months, and perhaps years, of working together.
It is unrealistic for people unfamiliar with a community or the local con
text to have the kind of understanding and local acceptance necessary to
become partners or facilitators in the PAR process. Therefore, it would
be advisable for at least one or two of the non-local support team to take
the time to get to know the community and build rapport with commu
nity members. Generally, this will mean either living within a commu
nity for a period of time, or maintaining contact with the community
through regular visits. This contact could be on the basis of regularly
scheduled meetings (e.g., those carried out by health workers or agricul
tural extension agents) or on the basis of a long-term conservation or
development initiative that require frequent visits to the community for
coordination. Once trust is established, it is far easier to collaborate with
community members in PAR or any other activity.
To enable those non-local partners who have not had extensive contact
with the community to get to know community members and vice versa,
it may be useful at the outset of a PAR to engage in some kind of ice
breaking activity. For example, the non-locals might participate in tradi
tional village tasks such as gardening, construction or clothes washing.
This can serve to build rapport while at the same time helping commu
nity members to see that they possess a unique body of knowledge and
skills not necessarily shared by outsiders. It may also help the non-local
partners to address their work with more humility.
Staff technical know-how and attitudes
After taking the initial decision to adopt participatory action research
(e.g., at the start of an initiative or to re-orient an existing project), some
...cultures and
communities are
dynamic entities: they
change, and often
rapidly...
specific know-how can be transferred to its staff via training by an expe
rienced practitioner. Regional and sectoral networks of concerned insti
tutions may provide technical assistance and open fora for discussion
and exchange of experiences. Learning materials in different languages
– this manual being but one example – are also available (see the
References section for recommended reading on PAR and PEC).
The availability of qualified support and literature alone, however, can
not ensure the deeper attitudinal change that the practice of action
research demands from project managers, conservation and development
professionals and field workers. While this change usually occurs spon
taneously in the process of field experience in participatory action
research, it can be facilitated by attention to a number of general cogni
tive and behavioral points:
* Knowledge is for the community, not for the non-local partners.
The most important objective of action research is to strengthen local
abilities to seek, organize and utilize relevant information to solve
problems. Participatory exercises are not the time or place for acade
mically oriented research. Collecting data in a participatory way may
be initially greeted with interest, but later resented by the communi
ty as a waste of time if the results are not returned promptly and
applied within their territory.
• Non-local partners in participatory action research need to have
something to offer. To be useful and justify their presence, the non
local partners and facilitators in an action research process need to
master their technical background as well as research and communi
cation skills. Unskilled facilitators are useless or even detrimental
and expose everyone to frustrating experiences. The best way to learn
how to facilitate action research exercises is by doing it with an expe
rienced colleague.
• Local culture deserves respect. An action research process which is
conducted and managed according to local customs is much more
likely to be successful in the eyes of all participants. Information
should be handled carefully. Whenever requested, anonymity and dis
cretion in sharing information with others should be assured.
Communities appreciate respect for local traditions, e.g., following
local protocols for introductions. At the same time, partners and facil
itators should be aware that cultures and communities are dynamic

entities: they change, and often rapidly. Attempts to restore customs
and practices which the community has already dismissed are un
likely to succeed and may cause resentment. People do not like to be
told what to maintain and what to change in their culture.
~ Communication is a major concern. Conducting action research
exercises in the local language (i.e., the variant of the national lan—
guage spoken in the area or the local ethnic vernacular language)
ensures full participation by the local community, regardless of edu
cation. Consecutive translation is tedious, boring to participants and
not appropriate. If the PAR partners are not comfortable with the
local language, bilingual facilitators can be recruited and trained.
- As already pointed out, simple written materials (such as flipcharts) are
often very useful, yet their value is limited in situations where literacy is
low. Visual aids, such as drawings, maps, photographs, slides and
videos, are always recommended, and they are essential when the major
ity of participants are non-literate. It is, however, a good strategy to test
the cultural acceptability of these tools beforehand. At times, specific
colors or images may be culturally sensitive or linked inappropriately
with local political, religious or ethnic divisiveness.
As crucial as it is to recognize the central role of the local actors through
these behavioral rules, participants and facilitators will need to avoid an
oversimplified conclusion that local perceptions, knowledge and experi
ence are the final or only truth. Just like academic institutions and devel
opment agencies, local communities are influenced by many forces that
can bias their capacity to analyze their situation and make effective deci
sions for improving it. Prejudices, conflicts, corruption, privileges, resis
tance to change, indifference and discrimination are widespread among
all types of societies, agencies, institutions and communities. Therefore,
a good action research process engenders among its participants an open
and possibly critical attitude towards both indi-genous and external
points of view.
In practice, this means that an action research process entails an
exchange and possibly a mediation between what local people think and
wish to do and what is suggested by other sources of knowledge, includ
ing development professionals and various kinds of research. Where
population dynamics and natural resource management are concerned.
local communities are
influenced by manyforces
that can bias their capacity
to analyze their situation
and make effective
decisions for improving it
a good action research
process engenders an open
and possibly critical
attitude towards both
indigenous and external
points of view
fin

... PAR results may be
considered valid and reli
able when their
application is environmen
tally beneficial and/or
brings about an actual
improvement of the living
conditions of the people...
... ‘valid’ and ‘reliable’ are
understoodfrom the
perspective of local people.
The results of the research
have to be first of all
meaningful and positive
for them...
the findings of biological, ecological, medical, demographic, economic,
social and cultural studies carried out by outsiders have an important
complementary role together with local knowledge of the environment
and society. Participatory action research methods can also be used in
facilitating the presentation of technical findings to non-specialized
audiences.
Validity and reliability of participatory action research
results
In conventional research, validity is taken to mean how close the find
ings are to reality; and reliability is equated with constancy of findings.
When it comes to participatory action research, the concepts are inter
preted somewhat differently. In striving for sustainable development,
PAR results may be considered valid and reliable when their application
is environmentally beneficial and/or brings about an actual improvement
of the living conditions of the people, which can be sustained over
time with minimal cost to the environment. In other words, ‘valid’ and
‘reliable are understood from the perspective of local people. The
results of the research have to be first of all meaningful and positive for
them.
By starting from local knowledge and wishing above all to empower
people to define what constitutes problems, opportunities and solutions
for them, participatory approaches challenge the conventional tenden
cies to rely on ‘scientific knowledge and external authorities. Yet, vali
dating findings is an important concern which, in PAR, is dealt with by
a method known as triangulation. In a strict sense, to triangulate means
to utilize at least three different points of view to analyze a given event
or situation. More generally, triangulation is based on the idea that using
multiple sources and methods is the best assurance of the validity, relia
bility and completeness of the collected information. Two basic modes
of triangulation are used in action research: external and internal trian
gulation.
‘External triangulation involves a comparison between the information
generated by participatory action research and data from external
sources, such as censuses, official statistics, aerial photographs, or local
independent research and technical studies. External triangulation is
often based on a review of secondary data, i.e., information already
existing and available from national and local agencies and academic

institutions or published in papers and books. Less frequently, addition
al studies, such as quantitative surveys, are used to validate qualitative
action research findings.
‘Internal triangulation refers to a set of techniques for strengthening
validity within the action research exercise itself. These techniques
include:
• Comparison of different perspectives. Different interest groups
may have views and perceptions of ‘reality’ that are different from
each other. One way to understand these co-existing views is for dif
ferent interest groups to go through the same exercises, e.g., to com
pile their own separate lists of concerns and then – possibly – com
pare and discuss them (see Chapter 5).
• Use of different methods and techniques for exploring the same
topic. For instance, a description of the way in which the communi
ty uses its territory may be developed through a combination of
observational walks, interviews with groups and a participatory map
ping exercise with community members.
• Involvement of non-local professionals with different disciplinary
backgrounds. Different disciplines will raise different questions
about the same issues, thereby stimulating deeper analysis by the par
ticipants. For instance, family planning needs among the women of a
community might be assessed through a combination of open-ended
interviews by an anthropologist, reproductive life histories collected
by a nurse and a group discussion with the local women's association,
where the first two types of information can be presented, reviewed
and additional ideas elicited.
This discussion of external and internal triangulation helps to show that
participatory action research describes and analyses problems or situa
tions through an overlapping variety of techniques, perspectives and
social interests. Therefore, multidisciplinary teamwork, capability to
combine local understanding with scientific explanation, and readiness
to shift from theoretical reasoning to concrete decision-making are key
elements for the successful application of participatory action research
in real-life settings.
participatory action
research describes and
analyses problems or
situations through an
overlapping variety of
techniques, perspectives
and social interests
Even when all these conditions are present, however, PAR practitioners
will continually be challenged by difficult questions, such as:
• Is the local classification of soils, as explained by one well-experi
enced village elder, compatible with the optimal use of this resource?
• Can we assume that the traditional means of contraception in the
region are safe and effective?
• To what extent do existing local institutions provide a structure for
equitable and effective decision-making concerning the local environ
ment and population dynamics?
• How genuine is the consensus achieved at the last participatory plan
ning or evaluation meeting?
It may be helpful to remember that the answers to such questions need
to make sense for both the PAR facilitators and the local people, and that
both questions and answers may be reframed and evolve with time.

4. PAR on population dynamics
and the local environment:
information gathering and
appraisal
Any participatory action research on population dynamics and the envi
ronment begins by appraising the current situation. In this chapter the
design of a comprehensive appraisal is outlined. Practical suggestions are
provided for environment and development professionals to:
• become familiar with the local setting and make preliminary con
tacts with the concerned community;
• identify suitable interest groups to be involved in the action research
process and help them to identify PAR topics;
• collect and review relevant information from secondary sources
(existing documents);
• assist local people to gather new information through various
appraisal exercises.
In a number of the example boxes, a fictitious village named Amada' is
used for illustrative purposes. The names and data are a composite based
on experiences in different countries. Additional information on specific
field methods can be found in Annex B.
4.1 Preparing for participatory appraisal
Building a support team for participatory action research
Making contact with influential community persons
Preliminary participant observation sessions and interviewing
Review of secondary information
Focusing the participatory appraisal
4.2 Carrying out participatory appraisal
Participatory environmental appraisal (environment profile)
Participatory censuses (population profile)
Participatory health appraisal (health profile)
Gender analysis focusing on reproductive issues

the team will also need
to remain sensitive to
excluded or minority
groups who may not be
represented among or
even mentioned by the
community leaders
format, with the external consultant acting more as a supporter than a
director of activities. In this learning process, special attention can be
given to the attitudes of the members of the support team, which should
be conducive to a genuine participatory approach.
Making contact with influential community persons
Once the team is set and oriented to the purposes and methods of action
research, exploratory field visits can be carried out in the concerned
communities. An important task in these visits is establishing contact
with the local leaders, authorities and other influential persons. These
initial contacts can be done in a relaxed and relatively informal way by
small sub-groups of 2–3 team members. The scheduling of such meet
ings is best arranged at the convenience of the local people – which, in
most rural communities, is usually late afternoon.
Meetings with local authorities and leaders will be an occasion to pre
sent the reason for the team's presence in the community. Permission
may need to be requested for team members to contact local people and
observe the community setting. The essential message could be:
We are here to learn about your community together with you. We
are especially interested in understanding what you perceive as
problems, resources and strategies for living in this area. We hope
to learn about your strengths, and we will look at factors or situa
tions that limit your capacity to improve your own quality of life. We
are especially interested in hearing from you what would be impor
tant to know, and what specific questions you yourselves would like
to be able to answer: And, if you have some unanswered questions
or problems that need resolving, we would be glad to support you in
addressing them through research, planning and action.
There is a risk of raising unrealistic expectations or creating distrustful
feelings during this first encounter and in subsequent interactions with
community members. It is important to be clear up front about the abil
ity of the support team to commit to long-term follow through, or to
bring funds into the community. Also, a good understanding of local eti
quette will be extremely useful to the successful introduction of the PAR
initiative. The team will also need to remain sensitive to excluded or
minority groups who may not be represented among or even mentioned
by the community leaders.
4.1 Preparing for participatory
appraisal
A participatory action research process begins with some steps that help
communication flow between the relevant community and the non-local
professionals and focus the exercise on topics of common interest. This
includes building a support team for PAR, making contacts with influ
ential community persons, carrying out preliminary participant observa
tion sessions and interviews, reviewing secondary (i.e., existing, already
compiled) information, and drafting the participatory appraisal design.
Building a support team for participatory action research
The best support for participatory action research is a professional team
that is sensitive (i.e., capable of working with local people in a consis
tent, friendly and relaxed way) and technically skilled (i.e., capable of
facilitating and applying relevant methods and tools and providing tech
nical information and support, as needed).
An ideal support team for a participatory appraisal exercise is comprised
of a balanced mix of people with theoretical and practical expertise. The
most appropriate members will be persons who are knowledgeable about
the local setting, language and culture and have a record of good rela
tionships with the local communities. As gender issues are critically
important in such a process, it will help to include both men and women
as active members of the team.
The team will be strongest if a variety of expertise is represented.
Depending on the scale of the project, the professionals for a participa
tory action research team focused on environment and population might
include persons with training in environmental sciences, public health
and social sciences. The size of the team should be proportional to the
size and accessibility of the territory and the community population to
be involved in the activities: 5–10 full-time persons may be sufficient to
manage a PAR initiative at district level within a reasonable number of
months. Smaller teams are more appropriate if the territory is limited to
a selection of pilot villages or settlements.
If none of the selected team members has solid experience in PAR meth
ods, it is recommended that a resource person (consultant) be recruited
for a start-up and training period. Terms of reference for the consultan
cy could stress the need for transferring sufficient skills and knowledge
to the team to enable them to facilitate a comprehensive PAR activity.
Training will be most effective when provided in a “learning by doing’
Box 4.1
Interest groups
Beyond the rather vague use of the word as a loose synonym for a group of people, the word ‘com
munity’ is of little use in implementing resource management activities which have a local orien
tation. It does not help us to think of the heterogeneous nature of the social groupings we are deal
ing with. As we need a concept that clearly acknowledges the diverse nature of many rural soci
eties and which can deal with this heterogeneity, the notion of an ‘interest group’ is far more help
ful. The concept refers to a group of people who have similar sets of interests in respect of a par
ticular situation. For example, people who own large numbers of livestock which are grazed on a
patch of common land have different interests from people who have only a few stall-fed animals.
A proposal to establish a plantation on common grazing land will affect those groups differently.
Identifying various interest groups is fundamental to any project activity and the number of sepa
rate interest groups will differ according to different situations. A minimum list of interest groups
would include women, the poor, lower castes (where applicable) and people specializing in dis
tinct economic activities. Examples of the latter category may be blacksmiths dependent on forests
for production of charcoal, tea shop owners with heavy demands for fuel wood, or livestock own
ers dependent on common grazing land. This is no more than an indicative list. Many other inter
est groups will be relevant in particular situations. It is also crucial to remember that broad cate
gories such as ‘women’ or ‘the poor’ are not always (in fact, not often) groups with homogeneous
interests. There are rich and poor women and there are different types of poor people. The inter
ests of the totally landless poor and poor people with at least some land may be different.
Adaptedfrom: Gilmour and Fisher; 1991
Conducting regular evening debriefing sessions among team members
will help to monitor the state of the relationship between the team and
the community.
Preliminary participant observation sessions and
interviewing
Once introductions are made and, if necessary, formal permission is
obtained, team members may spend some days in the community observ
ing what is going on and finding ways to talk with people. Opportunities
to meet natural groups (see Chapter 2) for an informal conversation
occur in many everyday activities, such as: queuing for the bus, drinking
tea at a public stall, taking a walk though the fields, sitting in the village
square and, in some cultures, visiting private homes. Natural groups
might include women waiting for their turn at a water source or washing
clothes, men engaged in community work or sitting together socializing,
youngsters playing football, etc.
opportunities to meet
natural groups for an
informal conversation
occur in many everyday
activities
In these preliminary observations and informal interviews the team can
identify existing interest groups in the community (see Box 4.1).
Such groups are more or less organized clusters of persons who share a
ruin. .-_;‘_...‘.-.._. .s_..r..._>___s --Ai _..____...-..._i ’1 N7
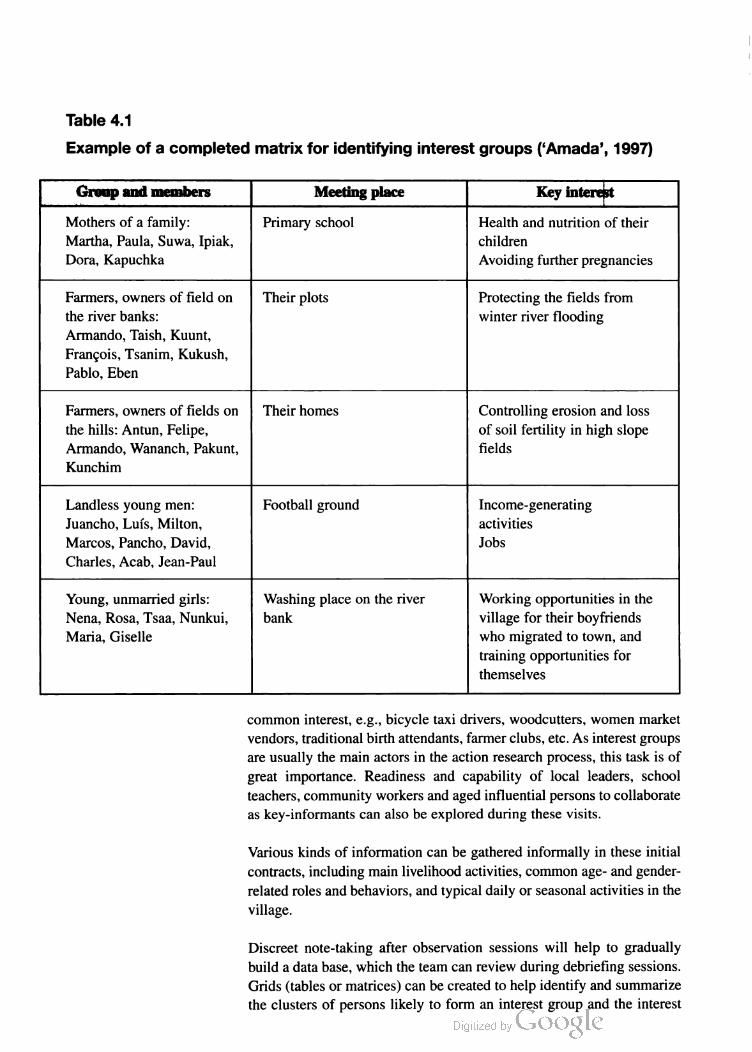
Table 4.1
Example of a completed matrix for identifying interest groups (“Amada’, 1997)
Group and members Meeting place Key interest
Mothers of a family:
Martha, Paula, Suwa, Ipiak,
Dora, Kapuchka
Health and nutrition of their
children
Avoiding further pregnancies
Primary school
Farmers, owners of field on
the river banks:
Armando, Taish, Kuunt,
François, Tsanim, Kukush,
Pablo, Eben
Their plots Protecting the fields from
winter river flooding
Farmers, owners of fields on
the hills: Antun, Felipe,
Armando, Wananch, Pakunt,
Kunchim
Their homes Controlling erosion and loss
of soil fertility in high slope
fields
Landless young men:
Juancho, Luís, Milton,
Marcos, Pancho, David,
Charles, Acab, Jean-Paul
Football ground Income-generating
activities
Jobs
Young, unmarried girls:
Nena, Rosa, Tsaa, Nunkui,
Maria, Giselle
Washing place on the river
bank
Working opportunities in the
village for their boyfriends
who migrated to town, and
training opportunities for
themselves
common interest, e.g., bicycle taxi drivers, woodcutters, women market
vendors, traditional birth attendants, farmer clubs, etc. As interest groups
are usually the main actors in the action research process, this task is of
great importance. Readiness and capability of local leaders, school
teachers, community workers and aged influential persons to collaborate
as key-informants can also be explored during these visits.
Various kinds of information can be gathered informally in these initial
contracts, including main livelihood activities, common age- and gender
related roles and behaviors, and typical daily or seasonal activities in the
village.
Discreet note-taking after observation sessions will help to gradually
build a data base, which the team can review during debriefing sessions.
Grids (tables or matrices) can be created to help identify and summarize
the clusters of persons likely to form an interest group and the interest

which is keeping them together (see Table 4.1). If needed or applicable,
a comparison between different sites (villages or settlements) may help
to identify patterns of interest groups in the region to be covered by the
action research initiative.
Review of secondary information
The preliminary interaction with the community can be complemented
by a review of existing compiled information (secondary information).
Types of data and documents likely to be available and useful include:
• local population figures from the last national census,
• local/regional statistics from education, agriculture and health sec
torS;
• geography and resource maps;
• documents on local economy, ecology and culture (e.g., ethnogra
phies, church records, records of market fees);
• project documents, annual reports, reviews, etc., from local organiza
tions, institutions and agencies involved with population or environ
ment issues.
Reviewing this information will help in compiling a baseline profile of
the community that includes demographic, environmental, economic
and socio-cultural aspects. It is worth remembering, however, that find
ing a figure in printed form does not necessarily mean that that figure is
accurate. Among the potential difficulties likely to be encountered are
contradictory statements in different sources, and information which is
outdated or no longer relevant for various reasons.
The secondary information can be compared (triangulated) against the
‘primary information collected during the initial observations and inter
views. Similarly, interviews with knowledgeable persons can be used to
check for the current validity of printed data. Calculation of quantitative
indicators (see Annex A) may help to summarize some scattered infor
mat1On.
Focusing the participatory appraisal
A possible next step is to generate a list of specific action research
questions concerning environment and population dynamics in the

Box 4.2
Example of a set of PAR questions on population dynamics and the local
environment (Amada’, 1997)
1. Are the seasonal flooding of the river banks and the decreasing productivity on the hillside
plots related to the way we manage our resources? Are they related to changes in the popula
tion of our village (e.g., migration of young people, growth of number of households)?
2. What can we do to reduce these problems?
3. Which natural resources (e.g., forestry products) can be exploited in a sustainable way for
income generation? How can access to these resources be granted to unemployed, land-less
youngsters?
4. Is there any chance to create job opportunities in the village and thus reduce the work-related
emigration of young men (and women)?
5. What training opportunities exist for young women? Can these be improved? Can these be
linked to existing environment and population issues?
6. Are the figures for population growth reported by the census valid for this village and the other
villages of the project area? Are reports of high levels of male emigration by villagers and by
government agencies accurate?
7. Is the health and nutritional status of children in this village as worrying as some mothers say
and several observations suggest?
8. Why, despite the complaints about the number of pregnancies, do women and men in this vil
lage not utilize the family planning services available at the district health center?
relevant communities. These have to be the community’s own questions,
although some of the members of the support team are likely to be pro
fessionally interested in the matter (e.g., because they are employed
locally in environment or development initiatives). Such team members
may contribute to phrasing the questions, making them more specific or
proposing to add some dimension of concern (e.g., sustainability, equi
ty). The questions can be elicited through individual interviews, group
discussions or even in an open community meeting. Once various ques
tions have been listed (see Box 4.2), they can be clustered by main topic
by the community and the support team.
Next is linking the topics to be investigated with the community persons
having the strongest concerns about each topic, i.e., their interest
groups’. A matrix can be generated by overlapping the research ques
tions list with the interest groups list (see Table 4.2). Based on this
matrix and on the direct knowledge of persons and place gained by inter
action with the community, the support team can invite some members
of relevant interest groups to participate in the action research process.
As a first step, it will be important to discuss issues affecting their capac
ity to participate, e.g., available time, willingness, literacy and any spe
cial skills. Literacy can be helpful, e.g., for taking notes, but should

Table 4.2
Example of a completed ‘what’ and ‘by whom’ action research matrix
(‘Amada’, 1997)
Who could participate in studying
What is to be investigated? (who has a particular interest)?
Causes of and remedial action for seasonal Owners of river bank plots
flooding at the village level
Causes of and remedial action for erosion on Owners of hill plots
the hills
Potential and constraints for sustainable agro- Landless residents
forestry activities
Population dynamics in the village, with a Young women and men
special emphasis on migration trends and their
causes
Training and job opportunities in environment Young women and men
and population
Health and nutrition of children Mothers
Use, acceptability and accessibility of family Married women and men
planning services
never be an essential requirement for participation. Also, interest groups
can be involved in a prominent way to explore questions of importance
to them, but should not be the only people involved in exploring such
questions. Ideally, a few members of each interest group will agree to
participate in all PAR exercises in an active way.
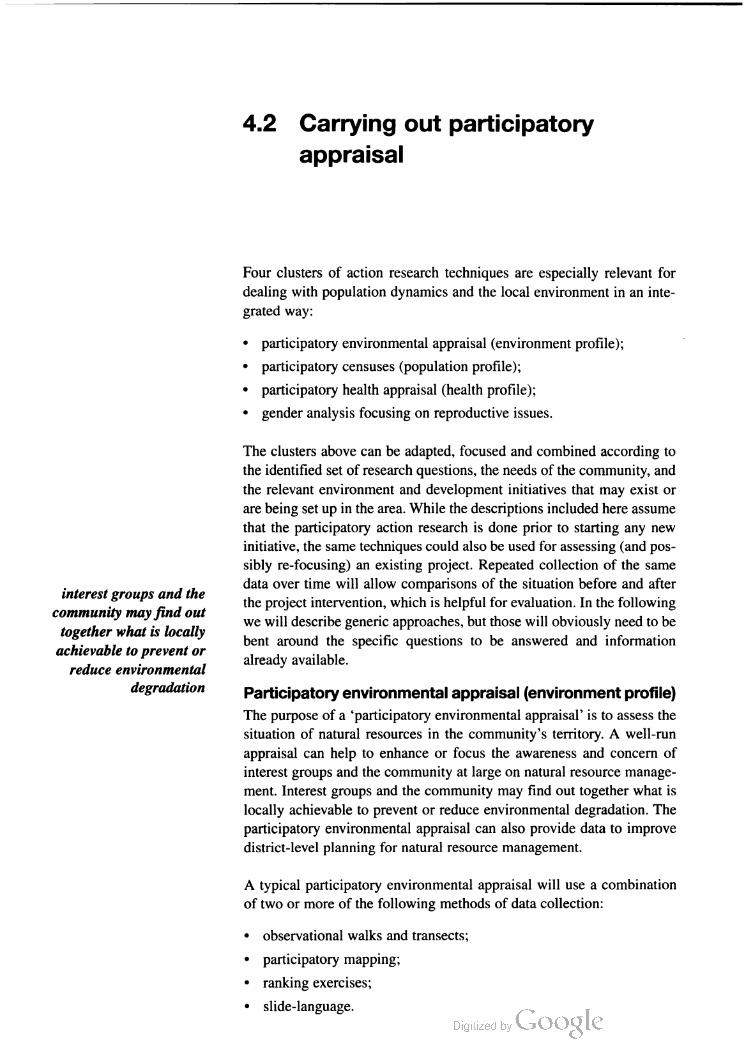
interest groups and the
community may find out
together what is locally
achievable to prevent or
reduce environmental
degradation
4.2 Carrying out participatory
appraisal
Four clusters of action research techniques are especially relevant for
dealing with population dynamics and the local environment in an inte
grated way:
• participatory environmental appraisal (environment profile);
• participatory censuses (population profile);
• participatory health appraisal (health profile);
• gender analysis focusing on reproductive issues.
The clusters above can be adapted, focused and combined according to
the identified set of research questions, the needs of the community, and
the relevant environment and development initiatives that may exist or
are being set up in the area. While the descriptions included here assume
that the participatory action research is done prior to starting any new
initiative, the same techniques could also be used for assessing (and pos
sibly re-focusing) an existing project. Repeated collection of the same
data over time will allow comparisons of the situation before and after
the project intervention, which is helpful for evaluation. In the following
we will describe generic approaches, but those will obviously need to be
bent around the specific questions to be answered and information
already available.
Participatory environmental appraisal (environment profile)
The purpose of a participatory environmental appraisal' is to assess the
situation of natural resources in the community’s territory. A well-run
appraisal can help to enhance or focus the awareness and concern of
interest groups and the community at large on natural resource manage
ment. Interest groups and the community may find out together what is
locally achievable to prevent or reduce environmental degradation. The
participatory environmental appraisal can also provide data to improve
district-level planning for natural resource management.
A typical participatory environmental appraisal will use a combination
of two or more of the following methods of data collection:
• observational walks and transects;
• participatory mapping;
• ranking exercises;
• slide-language.

T Box 4.3
Potential questions for dialogue during an exploratory walk
' What natural resources (e.g., forest products) are being used?
- Who uses them specifically?
- Who collects them?
' Who buys them?
' How dependent are the local persons on the use of such products?
' What is the relative value of these resources for the local communities, compared to other
sources of income?
~ What influence do wealth and other household characteristics have on resource use?
' What uses are the most important?
' Where are the resources used/gathered from?
' How much of each resource is being used?
~ What estimate can be made of the potential impacts of present rates of use on the future
quality or quantity of the resource?
From: Scott. I 996
Literacy is not necessary for participation in any of these exercises,
which can be carried out with elders, women, men, youngsters and even
children. For an environmental appraisal, the most desirable or appro
priate participants will be community members directly engaged in
exploiting (using) and/or managing (regulating the use of) key natural
resources (such as soil, fuel wood, timber, forestry products, fish, game,
irrigation water, etc.). Due to the typical patterns of labor division by
gender in most rural economies, participation of both men and women
representatives from the same households, in joint or separate settings,
is strongly recommended.
An observational walk across the territory with interest group members
is often a good starting point. As much as possible, it is desirable that the
walk follows a meaningful route, such as a straight line across a slope
valley or going downstream-upstream. Things to watch for include
changes in the landscape (e.g., forests, pasture, barren land, cultivated
plots, beaches, etc.), relevant environmental features (e.g., vegetation
coverage, types of crops, native plants and animals, water sources, types
of soil, erosion phenomena, etc.) and interaction of people and resources
(e.g., people collecting products, people using some areas for specific
purposes, settlements, field enclosures, etc.). These observations can be
discussed with participants and persons met on the way, and then jotted
down in a logbook. Ideally, the jotting will be a combination of sketch
es and words and will be jointly prepared by the support team and local
PAR participants.
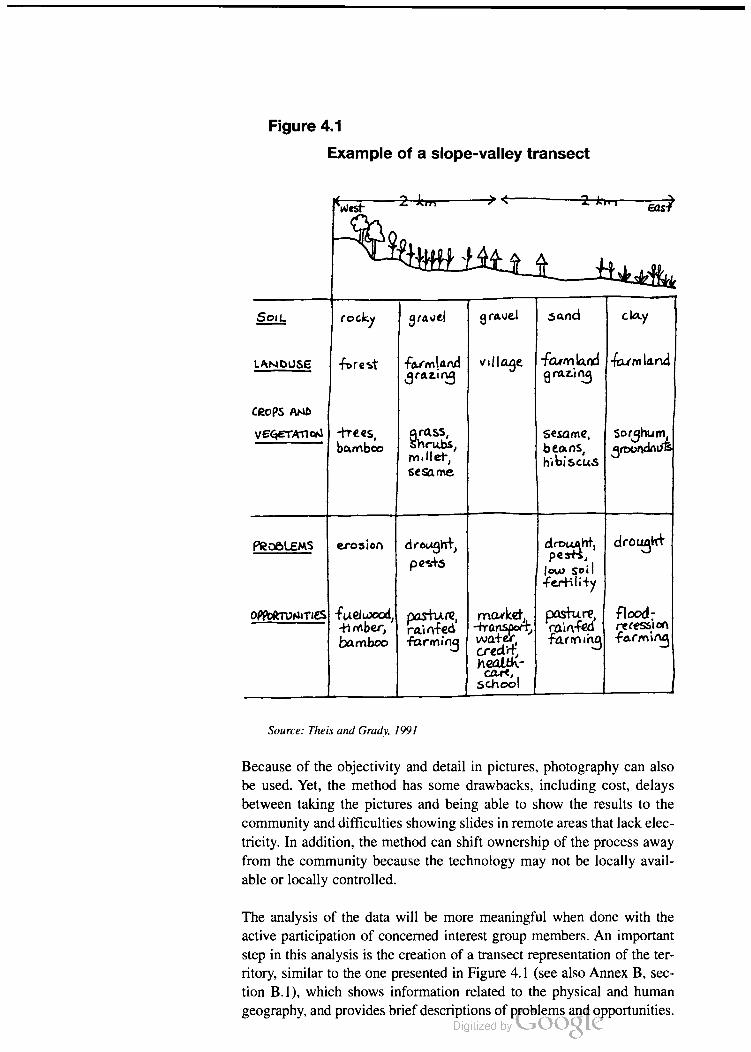
Figure 4.1
Example of a slope-valley transect
"WEE Eas'
SolL rocky 3ravel gravel sand clay
LAsseuse | ferest farmland village farmland |farmland
3razing graziad
CROQS AND
vegerAmos' trees, raSS, sesame, | Sorghum,
T bamboo £, beans, 3rcondavfs
millet, hibiscus
SéSAme.
froeueMs erosion drought, # ht, drought
pests low soil
fertility
opportunities fuelwood, pashare, market, Pasture, flood:£mber," £fed' |+ranspo'; 'rain fed recessionbamboo farming water, farming farmina
| scheál
Source: Theis and Grady, 1991
Because of the objectivity and detail in pictures, photography can also
be used. Yet, the method has some drawbacks, including cost, delays
between taking the pictures and being able to show the results to the
community and difficulties showing slides in remote areas that lack elec
tricity. In addition, the method can shift ownership of the process away
from the community because the technology may not be locally avail
able or locally controlled.
The analysis of the data will be more meaningful when done with the
active participation of concerned interest group members. An important
step in this analysis is the creation of a transect representation of the ter
ritory, similar to the one presented in Figure 4.1 (see also Annex B, sec
tion B.1), which shows information related to the physical and human
geography, and provides brief descriptions of problems and opportunities.
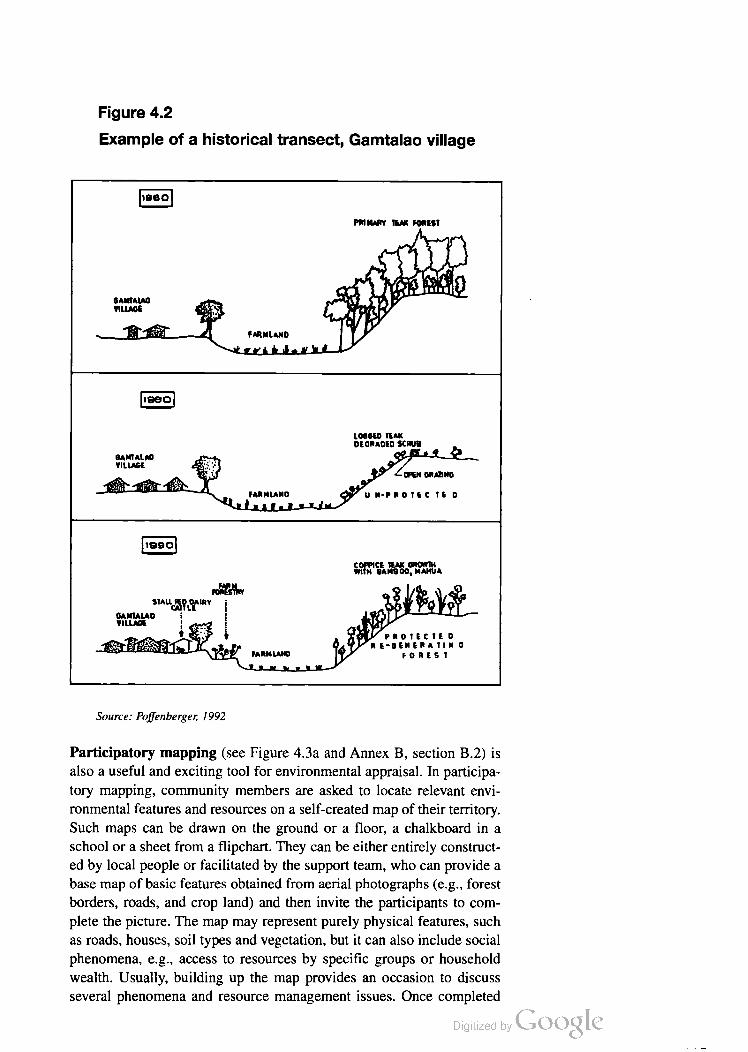
Figure 4.2
Example of a historical transect, Gamtalao village
PM MARY IEAK FOREST
GAMIMAO
VILLAGE
FARNLAND
LOGGED IEAK
DE GRADED SCRUB
m
GAMIALM'J
VILLAGE
0‘ .
nnnuno u N-PFOIEC it o
COPPICE TEAK GROWTH
mi‘l’siiiv
stands? II! V
omuuo i ;
mum 5
PROTECIE D
E'GENERA’IIN G
FARNLANO F 0 I E S I
Source: Poflenberger, 1992
Participatory mapping (see Figure 4.3a and Annex B, section 8.2) is
also a useful and exciting tool for environmental appraisal. In participa
tory mapping, community members are asked to locate relevant envi
ronmental features and resources on a self-created map of their territory.
Such maps can be drawn on the ground or a floor, a chalkboard in a
school or a sheet from a flipchart. They can be either entirely construct
ed by local people or facilitated by the support team, who can provide a
base map of basic features obtained from aerial photographs (e.g., forest
borders, roads, and crop land) and then invite the participants to com
plete the picture. The map may represent purely physical features, such
as roads, houses, soil types and vegetation, but it can also include social
phenomena, e.g., access to resources by specific groups or household
wealth. Usually, building up the map provides an occasion to discuss
several phenomena and resource management issues. Once completed

Figure 4.3a
Example of mapping exercise (present day)
CN- $4
## *** * W N* * ''# seemland w - --" ~ £). #
| > 6, 6
Qields
by the group, the map can be copied onto a flipchart, possibly by a local
artist.
importantly, the historical
perspective will help in
assessing how the local
environment has been
influenced by the
community's economic
or cultural needs, by
population dynamics and
by external phenomena
Information on the current environmental situation provided by the tran
sect walks or mapping become most enlightening and effective when
reviewed from a historical perspective. This can be done by discussing
the findings with some local elders who can recall details about the envi
ronmental situation and local interactions with the environment more
than one generation ago (at least 20–30 years previously). The historical
data produced in this way (see Figure 4.2, Figure 4.3b and Annex B, sec
tion B.3) will permit focusing on environmental changes that have
occurred during the last generation.
Importantly, the historical perspective will help in assessing how the
local environment has been influenced by the community’s economic or
cultural needs, by population dynamics and by external phenomena
(e.g., expanding or shrinking prices for certain crops or natural
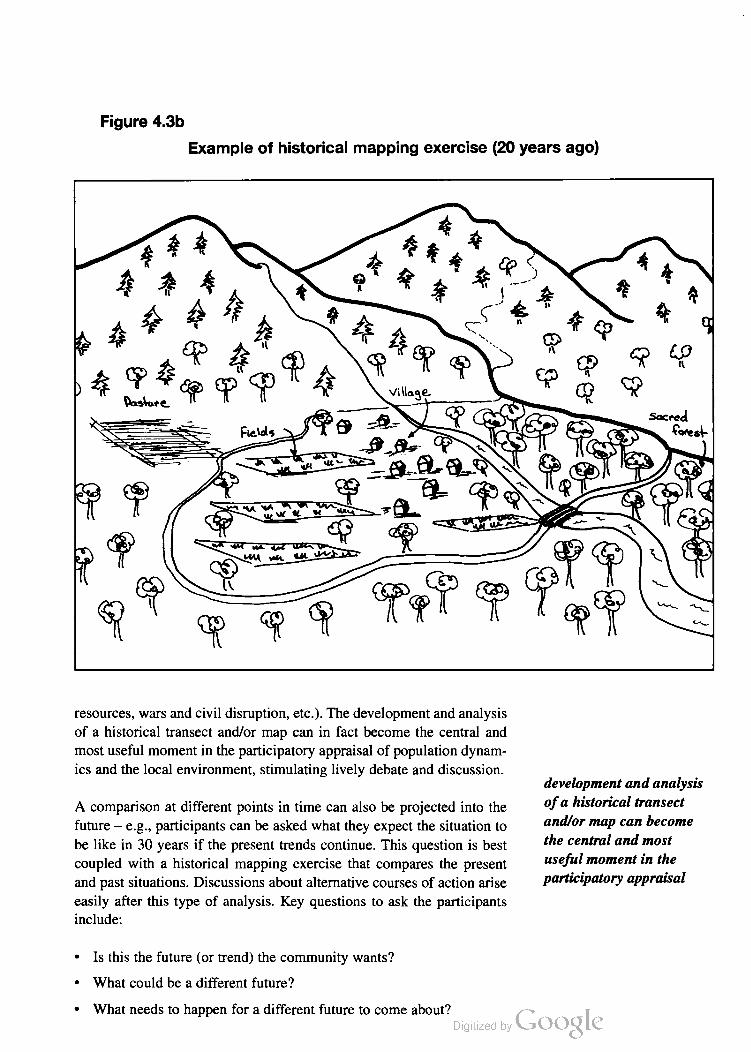
Figure 4.3b
Example of historical mapping exercise (20 years ago)
resources, wars and civil disruption, etc.). The development and analysis
of a historical transect and/or map can in fact become the central and
most useful moment in the participatory appraisal of population dynam
ics and the local environment, stimulating lively debate and discussion.
development and analysis
A comparison at different points in time can also be projected into the of a historical transect
future – e.g., participants can be asked what they expect the situation to and/or map can become
be like in 30 years if the present trends continue. This question is best the central and most
coupled with a historical mapping exercise that compares the present useful moment in the
and past situations. Discussions about alternative courses of action arise participatory appraisal
easily after this type of analysis. Key questions to ask the participants
include:
• Is this the future (or trend) the community wants?
• What could be a different future?
• What needs to happen for a different future to come about?

Alternative visions of the future will likely involve discussions sur
rounding the use of land and other natural resources in the next 20–30
years. Community members may wish to produce a third map, depicting
the ideal future, in which, for instance, common lands and resources are
well managed; water supply and sanitation are greatly improved; and
soil conservation practices, agro-forestry and other efforts are in place to
rehabilitate croplands and pasture.
When a mapping exercise is completed, the PAR support team and com
munity participants may wish to transfer the map of current environ
mental and social features to a computer mapping software such as Map
Maker (see Annex C, section C.2). This easy-to-use shareware package
allows one to create a basic geographic information system, in which
layers of information can be added together to create maps of varying
complexity, and specific variables (such as the size of land holdings) can
be stored in a simple data base. These locally created maps can also be
compared with professional maps to locate specific details.
Whether the map is transferred to a computer and printed out, or copied
on to a flipchart, it is important to remember that the map belongs to the
community. In other words, the support team may want to make a copy
for their own use, but the original copy should stay in the community.
Another way to build on the information generated by the environmen
tal appraisal is to use ranking exercises (see Annex B, section B.8).
Ranking exercises are a way for community interest groups to prioritize
their concerns or preferences about the situation of different natural
resources (see Table 4.3).
Ranking exercises carried out by gender-based groups (possibly also
sub-divided by age) (see Table 4.4) are a useful way to initiate a gender
analysis of the collected information (see Annex B, section B.13). When
combined with data on gender-related rights and responsibilities in
resource management, the gathered information offers a fairly complete
picture of gender-based interests and roles (actual and potential) in the
community.
The final method we will mention here is slide language, which is a way
of using photographed images (pictures or slides) to promote reflection

Table 4.4
Example of a gender-based matrix of environmental concerns
Rank
2
Married men Erosion Flooding Game
Young men Timber Erosion Game
Elderly men Game Erosion Fish
Married women Fuel wood Erosion Fish
Young women Fuel wood Drinking water Erosion
Elderly women Wild fruits Erosion Fish
a local participatory
census can arouse local
concern with respect to
existing patterns in
population dynamics
in all contexts. Where slide projectors are not available, or there is no
electricity, photo montages may be a suitable alternative.
Whatever the tool (or combination of tools) used for data collection and
analysis, a major aim of a participatory environmental assessment is the
creation and discussion of a detailed list of environmental concerns
(issues, problems) and key resources as perceived by the community.
These may be related solely to the research questions identified at the
beginning of the PAR, or expanded on these. This list and the findings
which support it can be communicated back to a broader community
audience and re-discussed for validation and further ideas. Brain
storming and group discussion can facilitate making amendments and
additions, so that a group consensus on the list can be reached.
Participatory censuses (population profile)
In many countries, fairly good data about the size and dynamic trends of
populations are available from national censuses and civil registers.
These data include measures of mortality, natality, fertility, natural
growth and migration (see Annex A for definitions and formulas).
Valuable as this information is, it normally has limitations. The census
data are generally analyzed at the national, provincial and district levels;
and a breakdown of census information for small municipalities or rural
villages is seldom available. Census data are usually collected only at
quite long intervals, e.g., once per decade, and thus may be out of date
for specific local needs. Moreover, civil registers in rural areas are gen
erally not reliable: births may be registered with a delay of several
months, infant deaths may not be recorded at all, and temporary and sea
sonal migration may not be considered.

Table 4.3
Example of a completed matrix ranking households’ concerns for different
natural resources (“Amada’, 1997)
Household Rank
1 2 3 4 5
Taish/Dora Fields on Fuel wood Fish Game Wild
river banks fruits
(flooding)
Armando/ Fuel wood Fish Timber Game Hill-fields
Nunkui for trade (erosion)
Kuunt/ Fields on Hill-fields Game Fish Building
Kapuchka river banks (erosion) materials
(flooding)
Pakunt/Suwa Hill-fields Timber Game Fish Fuel
(erosion) for trade wood
Kukush/Ipiak Fields on Fish Fuel Timber Building
river banks wood for trade materials
(flooding)
Milton/Paula Timber Hill-fields Fish Building Fields on
for trade (erosion) materials river banks
(flooding)
and awareness and/or collect specific information. Local people are
trained to use a simple (or disposable) camera to take pictures of signif
icant aspects and good and bad features of their lives and their environ
ment. It is important to recruit a variety of photographers (e.g., men and
women, farmers and traders, the wealthy and the poor) as each will have
a different perspective of what is relevant, and this can reveal important
differences in environmental perceptions. The pictures or slides are
exhibited and discussed in a group or community meeting. The basic
steps for using slide language are described in Annex B, section B.12.
Slide language is an attractive and fun way of identifying environmental
issues and the various perspectives on these in the community concerned.
Letting the community members identify the messages and the scenes to
be used encourages them to study and analyze their environment, and it
is an effective way of giving a voice to disadvantaged groups. However,
slides are a relatively expensive tool, they take time to develop (especial
ly if the film must be sent away) and slide projectors may not be available
Box 4.4
Social mapping for participatory village censuses
In participatory social mapping, villagers show the location of households. This has been extend
ed in India by Sheelu Francis and others into participatory censuses (household inhabitants are
estimated and indicated on the map). Another variant is health mapping, in which symbols are
used to indicate where people of different types and with different conditions (e.g., disabilities,
recent deaths, etc.) reside in a village. In a census, one common practice is for villagers to use
seeds of different sorts to represent people. Another, invented by Anusuda and Perumal Naicher of
Kethanayakanpatty village in Tamil Nadu, is to have a card for each household and mark details
with symbols on the card.
Triangulation of censuses took place in Ramasamypatti village, near Tiruchuli, in Tamil Nadu, in
May 1991. In a participatory rural appraisal training organized by SPEECH, a local NGO, four
groups of between 5 and 15 villagers used different methods of analysis and presentation: two did
social mapping directly on to paper; one made a ground model of the village with a card for each
household; and one did a seed census on to a map drawn on a floor. All four independently gen
erated a population figure of 355 for the same village.
Adaptedfrom: Chambers, 1992
To get an accurate and current profile of the population situation and
trends at the community or village level, a local participatory census
may be appropriate. This exercise has a two-fold purpose: to provide
valid, reliable and up-to-date demographic information based on the
local people’s knowledge of local vital events (i.e., births, deaths and
migrations); and to arouse local concern — if appropriate — with respect
to existing patterns in population dynamics.
Two main data collection methods can be used to conduct a participato
ry census:
' social mapping;
- semi-structured household interviewing.
Social mapping is an exciting and popular exercise in most communi
ties. It is carried out in a participatory fashion, similar to the natural
resource map discussed in the previous section of this chapter.
Community people collaborate in drawing a map of the territory and
locating households and compounds. The community members involved
in the exercise are then asked to recall the number of people living in
each household/compound, including all members by age and gender.
This participatory technique is extremely effective for performing a
rapid, low-cost census in small communities, even where literacy rates
are very low. The validity of participatory census figures generated by
the local people is usually quite high (see Box 4.4). Nevertheless, impor
nAn. :RKAWA‘M,‘ "Asian-4",. and Annanthnl ‘1’)‘1

Box 4.5
Example of participatory census interview guide
1. Household members:
• How many persons live in this household?
• How many babies (under one year of age)?
• How many small children (1–4 years old)?
• How many older children (5–14 years old)?
• How many young and adult men (15–59)?
• How many young and adult women (15–59)?
• How many elderly men (over 60)?
• How many elderly women (over 60)?
2. Are there any women currently expecting a baby?
3. Did you mourn the death of a member of the household in the last year? If yes, how old was
he/she?
4. When did your family settle in this place?
5. Did any member of this household leave the area for work this year?
• If yes, when did he/she leave?”
• When is he/she supposed to come back?”
* Time of occurrence is often best recalled if a reference to some important event in community life is made (such as har
west time, rainy season, etc.).
consider any local cultural
sensitivity about openly
discussing pregnancies,
births and deaths
tant information about vital events and migration might fail to be col
lected in this exercise.
If detailed and accurate information is needed about population dynam
ics (which depends on the concerns and issues identified by the partici
pants) and the population of the settlement is relatively large (for
instance, more than 100 households) a door-to-door household census is
recommended. This method relies on semi-structured interviews (see
Annex B, section B.6) with each household of the village or locality. As
some important questions in the interviews are related to pregnancies,
deliveries and children, the preferred respondents are generally women.
All adult and elderly women living in the household can be given the
opportunity to contribute. Examples of guides and summary forms for a
semi-structured interview for use in a participatory census exercise are
presented in Boxes 4.5 and 4.6m.
Ideally, the household interviews would be carried out in the local lan
guage by literate persons of the community, preferably female. Adult
women, however, are often busy with economic and/or domestic activi
ties and may have little time or interest in interviewing others. As an
alternative, teenage girls could be trained as interviewers. Male inter
viewers may be considered if female school enrollment and literacy are

Box 4.6
Example of participatory census interview summary form
Household number: 27 Location: Amada
Date of interview: 4 April 1997 Interviewer: Christine
Number of persons living in household (reference to Question 1)
Total number : 7
Babies (under one) 1
Small children (1–4) 2
Older children (5–14) 1
Adult men (15–59) 1
Adult women (15–59) 1
Elderly men (over 60) nOne
Elderly women (over 60) 1
Natality, fertility and mortality (reference to Questions 2 and 3)
Pregnant women 1
Children born in the last year 1
Deaths occurring in the last year 2 (1 small child, 1 elderly man)
Settlement and migration (reference to Questions 4 and 5)
Years living in the current location 2
Household members emigrated in the last year 1 (younger brother of the husband)
Departure December 1996
Return March 1997
especially low, but gender rules and interaction within the community
need to be carefully considered before making such a decision.
Questionnaire design and interviewer training will also need to consider
any local cultural sensitivity about openly discussing pregnancies, births
and deaths (for instance, if the death of a child is considered for any rea
son a stigma to the family, the local child mortality may end up being
underestimated).
Key elements to the success of the exercise include a relaxed but atten
tive attitude during the interview, good note-taking, and the quality and
promptness of systematically organizing the raw data collected. Role
playing among members of the participatory census team may help them
to acquire and develop these skills in a practical and active manner.
Analysis of the data from a census can be aimed at developing local
demographic indicators. Simplification of calculations and use of local
concepts and terms may render this component of the exercise more rel
evant and accessible for the participation of community members. Box

Box 4.7
Example of completed participatory census ‘Consolidated Information Form’
(‘Amada’, 1997)
Number of inhabitants 782
Number of infants (<1 year old) 36
Number of small children (1–4 yrs old) 105
Number of older children (5–14 yrs old) 211
Adult men (15–59 yrs old) 179
Adult women (15–59 yrs old) 212
Elderly men (>60 yrs old) 15
Elderly women (>60 yrs old) 24
Babies born in the last year 39
Deaths mourned in the last year 15
Babies who did not survive their 1st year 4 (1 baby for every 10 babies born in that yr)
Small children who died before age 5 6 (1 for every 23 children under age 5)
Number of women expected to deliver
before the end of the year 41
‘Normal’ household size 9
Number of households settled in the village
for at least 10 years 78
Number of adult men emigrated
in the last year 26 (1 for every 7 resident adults)
Number of adult men who did not return
during the last year 5 (1 for every 5 resident adults who left the
village)
Based on data presented in this box, Amada's population in 1997 had a crude birth rate of 50 per
1,000 (39 births/782 inhabitants x 1,000); a crude death rate of 19 per 1,000 (15 deaths/782 inhab
itants x 1,000); and a natural growth of 3.1% (50 – 19 = 31 per 1,000, or 3.1 per 100).
4.7 presents a hypothetical example of information tallied in a participa
tory analysis of census interview results.
The census exercise provides good occasions to discuss the local popu
lation situation and dynamics with various interest groups and the com
munity at large. Meetings can be arranged for this purpose with differ
ent community audiences. Pie charts, bar charts and pictograms can be
useful to illustrate the results of the census. Ideally, the community
would have gone through a historical mapping exercise and the maps

could be discussed again in the light of the data collected on population
dynamics. The PAR support team may also bring in the identified
research topics by asking questions such as:
• Why have so many infants and children died in the village?
• Why do most families have five or more children?
• Currently, is the village population increasing or decreasing?
• Within how many years will the village population reach (say) 1,000,
1,500 or 2,000 inhabitants?
• Do we have enough land and water to fulfill the needs of such a pop
ulation?
• Why are so many adult men looking for jobs outside the village?
• Why do some of them not return?
• Is there anything we can do to respond to the problems we have
discussed?
By answering these questions, the community and the support team
members will clarify issues, perceptions and priorities. The answers, and
associated discussions, should be recorded for future reference.
The measures of population size and dynamics obtained in the local cen
sus can also be used to calculate the more sophisticated demographic
indicators, such as life expectancy, presented elsewhere in this manual
(see Annex A). In this way, the participatory census can provide accurate
local data for a district or municipal demographic database and be used
for local demographic projections (see Annex C).
Participatory health appraisal (health profile)
The health status in a given locality affects and is affected by the com
munity's population profile and its patterns of using natural resources. A
comprehensive local environment and population appraisal will thus
elicit information also on the local health situation. In particular, the
nutritional status, the most common health problems and health risks
present in the community, and the available medical and public health
services will need to be investigated.
In the last 15 years, rapid, qualitative and participatory methods have
been tested and accepted in many countries as an important aid for
health services decision-making. Labeled “rapid epidemiological
appraisal' or qualitative health services research’, these methods can be
useful for dealing with the health-related aspects of participatory action
research. The following, in particular, are good as entry points for inter
est groups assessing their health needs and linking those to environmen
tal and population variables:
* health-risk mapping;
• child nutrition assessment;
• strengths, weaknesses, opportunities and limitations (SWOL) analy
sis of available health services.
Health-risk mapping is a variant of participatory mapping in which
community members:
• start with a brainstorming on the most common health problems felt
in the community in the last six months or a year, and draw up a list
of those problems;
• draw a map of the area or settlement, plot the distribution by house
hold of the identified health problems (e.g., malaria, tuberculosis,
child malnutrition, pregnancy-related deaths, accidents) and note if
there is any clustering of problems or noticeable distribution across
the village;
• use brainstorming again to identify some risk factors or conditions, in
the household or the community, which participants perceive as like
ly to have made households vulnerable or to have contributed to the
occurrence of the health problems; such factors may include poor
sanitation, poverty, crowded living conditions, recent migration, too
large or too small household, croplands affected by floods, etc.;
• insert in the map specific symbols to record the location and distri
bution of these risk factors (see Figure 4.4).
The best length of time for the recall period may take some discussion
with the group. In many regions of the world, six months is too short a
period of time to reflect seasonally related health patterns. For example,
diarrhea is often worst in rainy seasons when ground water contaminates
water sources, or meningitis is most common during the Sahelian dry
season when dust is blowing in the Saharan harmattan. At the same time,
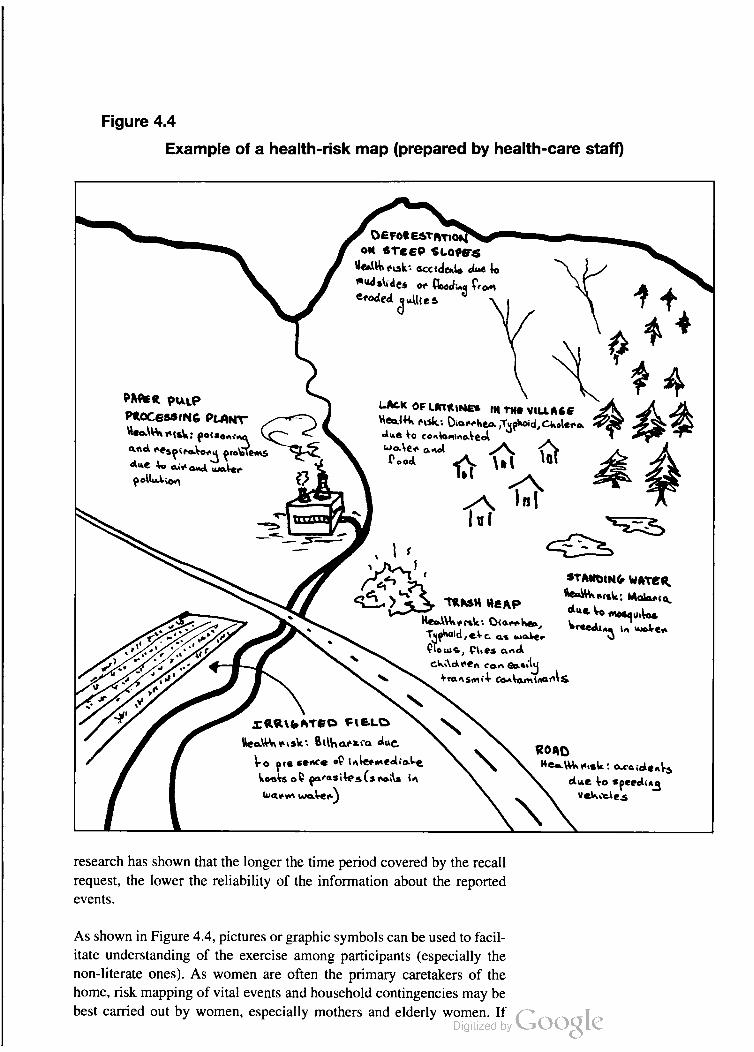
Figure 4.4
Example of a health-risk map (prepared by health-care staff)
OeForestation
on STeep SLoos's
"ee" cusk, accidents due to
"sudes or (kodas (rom
ecoded jue- $ 4 +
St. °, 4.LACK OF LATRifles IN TWG WULL AGG
Weal+A cusk: Derehea Tsenoid, ckolero.
*we to coatomina keel
*o-Wee awel A. *Peod [ \h ( ld #
D <^\
1. In
u I *::=>
, * <>
PMPE8 pulp
PROCessing planY
Wee" etsy.: foiseas." Q_2anc. ****** tree ewas s:
** axe ava water
eellation
\ f
Ż "I stANetNG waves.
t- isk."
3°, > TWASW WeAR : "tsk: Molaeta.
e Vo mosquitos
ReaWetsk, Otare hea,
TJehoid, etc. as woker
*leus, Pues and
cwV&*en car east.
transmit ceatamian's
breedu"3 ia wokew
3CQQV (, ATES E t e LC
WeaWawask: Bulwar-ca due
\-e are seace o' taleewaedial-e
WOAD
*e-W risk: accideals
due to *feedina
Vewccles
koeks o' earasites (s na's in
wawwa waker)
research has shown that the longer the time period covered by the recall
request, the lower the reliability of the information about the reported
eVentS.
As shown in Figure 4.4, pictures or graphic symbols can be used to facil
itate understanding of the exercise among participants (especially the
non-literate ones). As women are often the primary caretakers of the
home, risk mapping of vital events and household contingencies may be
best carried out by women, especially mothers and elderly women. If

the support team should
facilitate the drawing of
connections between the
identified health issues
and other phenomena and
features encountered
while assessing the
environmental and
population situation
in the area
time permits, complementary perspectives about health events and risks
can be obtained by conducting the same exercise with different gender,
age and status groups (e.g., male elders, adolescents, local men working
in migratory occupations such as mines or estate farms, etc.). This can
help in discovering differences in health beliefs and behaviors within the
community, as well as triangulating results to test their validity.
Risk mapping relies very much on local perceptions about the determi
nants of health and disease. It is thus a powerful entry point to identify
and discuss local (indigenous) medical beliefs and practices, and a
challenge to health professionals with limited acceptance of different
cultural understandings of health conditions. A medical anthropologist
may help the PAR support team to interpret the findings and understand
them within their (likely) bio-medical and ‘scientific system of reference.
The local point of view expressed by risk-mapping exercises can be
compared with conventional epidemiological and health services infor
mation from existing documents. This blending of viewpoints may yield
a new, integrated perspective on the community health profile and help
improve communication between various kinds of health service
providers and users.
The support team should facilitate the drawing of connections between
the identified health issues and other phenomena and features encoun
tered while assessing the environmental and population situation in the
area. In fact, many environmental and demographic features may be
health-risk factors in themselves. For instance small-size household
plots and poor productivity of the hillside land can be risk factors for
child malnutrition and high mortality. Large-size households or season
al male migration can be risk factors for tuberculosis.
A child nutrition assessment will enable the community to get a grasp
on the prevalence of child malnutrition. The standard means of assessing
malnutrition is to measure children's height and weight and compare
those among themselves and to average heights and weights of children
of the same age in a comparable group of reference (e.g., the country as
a whole). In communities where this kind of nutritional monitoring has
never taken place (for lack of equipment or trained personnel), the meth
ods presented below can be used to gain an approximate measure of
local malnutrition. They also accompany the community into the identi
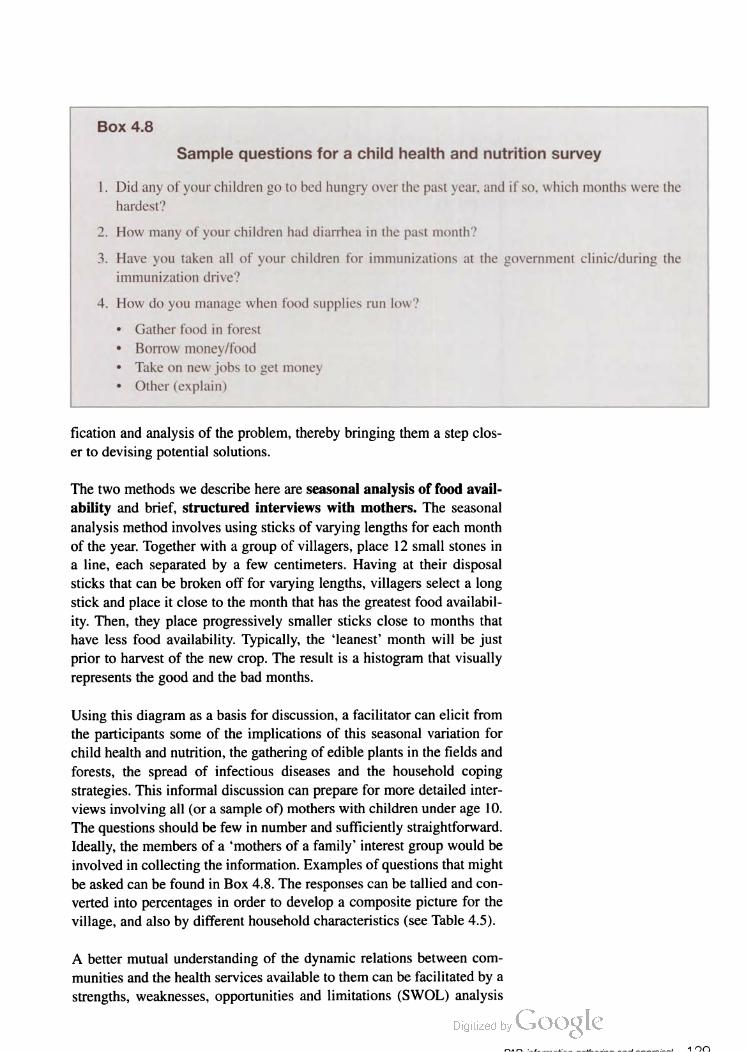
Box 4.8
Sample questions for a child health and nutrition survey
1. Did any of your children go to bed hungry over the past year. and if so, which months were the
hardest?
2. How many of your children had diarrhea in the past month?
3. Have you taken all of your children for immunizations at the government clinic/during the
immunization drive?
4. How do you manage when food supplies run low?
' Gather food in forest
' Borrow money/food
' Take on new jobs to get money
' Other (explain)
fication and analysis of the problem, thereby bringing them a step clos
er to devising potential solutions.
The two methods we describe here are seasonal analysis of food avail
ability and brief, structured interviews with mothers. The seasonal
analysis method involves using sticks of varying lengths for each month
of the year. Together with a group of villagers, place 12 small stones in
a line, each separated by a few centimeters. Having at their disposal
sticks that can be broken off for varying lengths, villagers select a long
stick and place it close to the month that has the greatest food availabil
ity. Then, they place progressively smaller sticks close to months that
have less food availability. Typically, the ‘leanest’ month will be just
prior to harvest of the new crop. The result is a histogram that visually
represents the good and the bad months.
Using this diagram as a basis for discussion, a facilitator can elicit from
the participants some of the implications of this seasonal variation for
child health and nutrition, the gathering of edible plants in the fields and
forests, the spread of infectious diseases and the household coping
strategies. This informal discussion can prepare for more detailed inter
views involving all (or a sample of) mothers with children under age 10.
The questions should be few in number and sufficiently straightforward.
Ideally, the members of a ‘mothers of a family’ interest group would be
involved in collecting the information. Examples of questions that might
be asked can be found in Box 4.8. The responses can be tallied and con
verted into percentages in order to develop a composite picture for the
village, and also by different household characteristics (see Table 4.5).
A better mutual understanding of the dynamic relations between com
munities and the health services available to them can be facilitated by a
strengths, weaknesses, opportunities and limitations (SWOL) analysis
n n 1“____‘__ _‘“a‘_-_~ ..__,.4 ._._____.-._Al
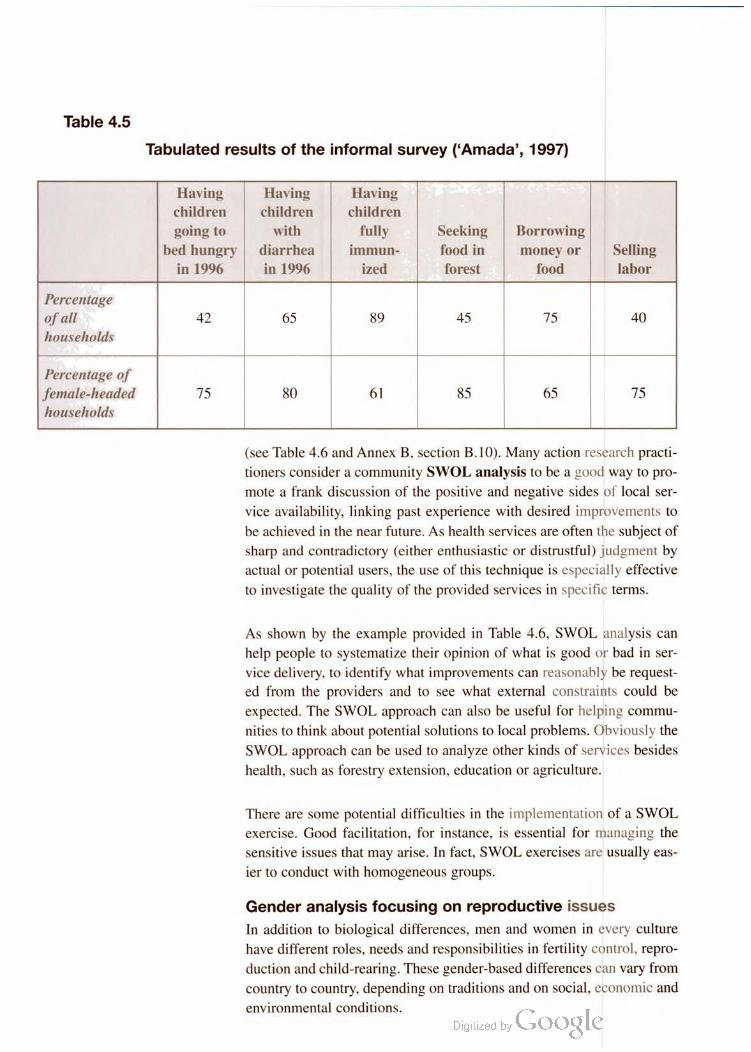
Table 4.5
Tabulated results of the informal survey (‘Amada’, 1997)
Having Having Having
children children children
going to with fully Seeking Borrowing
bed hungry diarrhea immun- food in money or Selling
in 1996 in 1996 ized forest food labor
Percentage
of all 42 65 89 45 75 40
households
Percentage of
female-headed 75 80 61 85 65 75
households
(see Table 4.6 and Annex B, section B.10). Many action research practi
tioners consider a community SWOL analysis to be a good way to pro
mote a frank discussion of the positive and negative sides of local ser
vice availability, linking past experience with desired improvements to
be achieved in the near future. As health services are often the subject of
sharp and contradictory (either enthusiastic or distrustful) judgment by
actual or potential users, the use of this technique is especially effective
to investigate the quality of the provided services in specific terms.
As shown by the example provided in Table 4.6, SWOL analysis can
help people to systematize their opinion of what is good or bad in ser
vice delivery, to identify what improvements can reasonably be request
ed from the providers and to see what external constraints could be
expected. The SWOL approach can also be useful for helping commu
nities to think about potential solutions to local problems. Obviously the
SWOL approach can be used to analyze other kinds of services besides
health, such as forestry extension, education or agriculture.
There are some potential difficulties in the implementation of a SWOL
exercise. Good facilitation, for instance, is essential for managing the
sensitive issues that may arise. In fact, SWOL exercises are usually eas
ier to conduct with homogeneous groups.
Gender analysis focusing on reproductive issues
In addition to biological differences, men and women in every culture
have different roles, needs and responsibilities in fertility control, repro
duction and child-rearing. These gender-based differences can vary from
country to country, depending on traditions and on social, economic and
environmental conditions.

Table 4.6
Example of SWOL matrix on health service provision (“Amada’, 1997)
What is
working well?
(strengths)
What is not
working well?
(weaknesses)
What can be
improved?
(opportunities)
What will prevent
the improvement?
(limitations)
The nurse comes
now twice a month
If somebody is sick
when the nurse is not
around, we have to
bring him to town
Some medicine can be
left with the teacher in
case of emergency
The nurse is not
willing (or cannot)
do that
Some medicines
are given for free
Often medicines are
not available
Strong medicines are
not given
Buy medicines in
town and stock them
in the village
We cannot afford to
buy expensive
medicines
We are not sure
how to use them
Vaccines for
children are
available
Nobody knows when
the vaccination team is
going to come
The community could
be informed by radio
Nothing
We have been
taught how to
prepare oral rehy
dration solution
(ORS) to treat
babies with
diarrhea
Giving ORS takes a
lot of time
Sugar is not always
available
Elders' daughters
should be taught
A machine to squeeze
sugarcane would help
The school teacher
does not want
somebody else to
teach her pupils
Who is going to
buy it?
We understand
why safe water
and latrines are
important
Boiling river water
requires a lot of fire
wood
Digging latrines is
hard work
We could ask the
District Administration
to build a piped water
Scheme as in Red Bank
Our men can do it
through communal
work
We don’t have
friends in the
District
Administration
Men are lazy and
do not understand
that this is
important
Gender analysis is a method used for identifying and discussing the most
important features of male and female roles within the local culture. This
method can be applied for assessing gender divisions of labor, gender
specific knowledge and practices related to natural resources manage
ment, and reproductive behavior. Its use is especially recommended, in
the framework of this manual, for all those mentioned aims, as well as
gender analysis is a
methodfor identifying
and discussing the most
importantfeatures of male
andfemale roles within
the local culture
for appraising existing knowledge, attitudes, needs and expectations
related to fertility, reproductive health and family planning. It is also rec
ommended that, wherever possible, a gender-based collection of infor
mation and analysis is carried out for the prior environmental, popula
tion and health profiles. Here we will focus on reproductive issues to
provide an example of how this can be done.
In most rural communities, relationships between men and women, sexu
al behaviors and beliefs, and practices related to conception, pregnancy
and delivery are extremely sensitive issues. Applying a gender analysis to
these topics requires a good understanding of local culture and well-devel
oped facilitation skills. A satisfactory outcome to this exercise is more
likely if it is not attempted until the participatory process is going well and
a smooth relationship has been established between insiders and outsiders.
Facilitators of gender analysis exercises will need to practice some cul
tural relativism, i.e., they will need to put aside their own ideas about
how men and women ought to relate to each other. Outsiders need to
be prepared to accept beliefs and behaviors which may be very different
from their own. For example, insistence on promoting equality in
women's conditions with respect to men's can be resented and disrupt
the process of community-based exercises, unless such a need is clearly
spelled out by the locals themselves.
On reproductive knowledge and behavior, the principal actors could be
small gender-based interest groups supported by a facilitator of the same
gender (e.g., five to six women with a female facilitator, a similar group
of men with a male facilitator). In many regions of the world, tradition
al culture, especially in rural areas, subordinates female involvement in
public settings, such as meetings. Dividing men and women into sepa
rate groups for discussion can be an effective way of coping with this
social norm. In a separate group, women can have the opportunity to
organize their thoughts, prepare their own presentations and refine their
opinions and wishes before meeting again with men. In this way, gender
separated groups can help ensure that women's insights are integrated
into the discussions of the entire community.
There are two basic methods, suggested for gathering and appraising
information, which are specifically relevant to a gender analysis of
reproductive behavior:
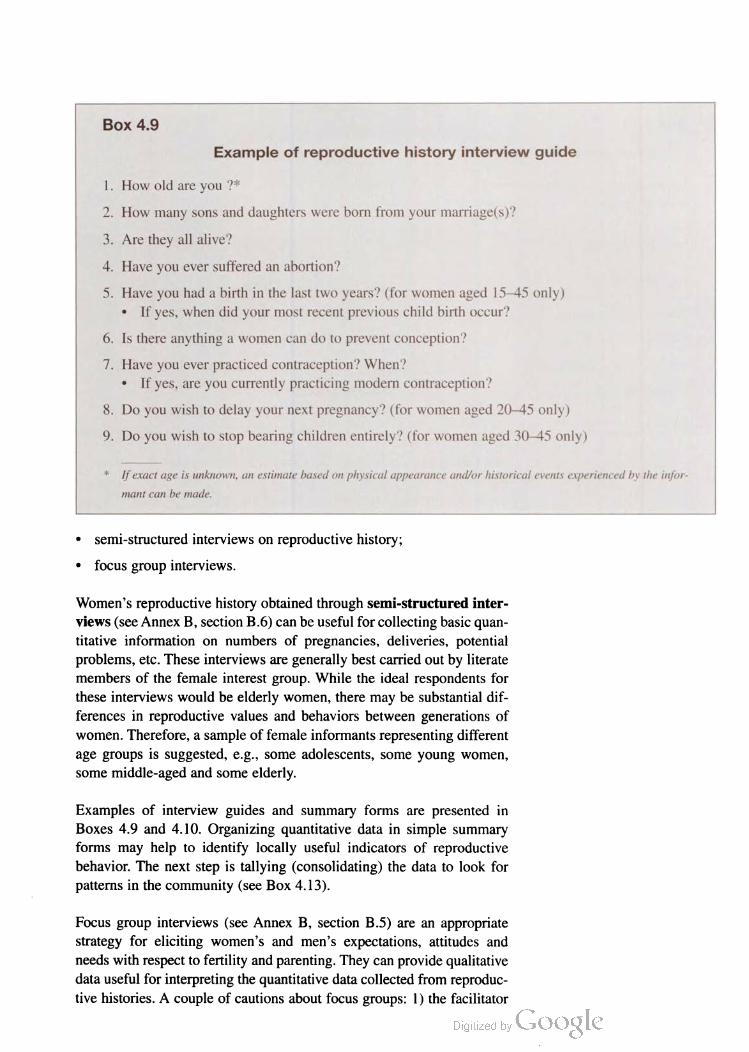
Box 4.9
Example of reproductive history interview guide
1. How old are you ?”
How many sons and daughters were born from your marriage(s)?
Are they all alive?
Have you ever suffered an abortion?
Have you had a birth in the last two years? (for women aged 15–45 only)
• If yes, when did your most recent previous childbirth occur?
6. Is there anything a women can do to prevent conception?
7. Have you ever practiced contraception? When?
• If yes, are you currently practicing modern contraception?
8. Do you wish to delay your next pregnancy? (for women aged 20–45 only)
9. Do you wish to stop bearing children entirely? (for women aged 30–45 only)
* If exact age is unknown, an estimate based on physical appearance and/or historical events experienced by the infor
mant can be made.
• semi-structured interviews on reproductive history;
• focus group interviews.
Women’s reproductive history obtained through semi-structured inter
views (see Annex B, section B.6) can be useful for collecting basic quan
titative information on numbers of pregnancies, deliveries, potential
problems, etc. These interviews are generally best carried out by literate
members of the female interest group. While the ideal respondents for
these interviews would be elderly women, there may be substantial dif
ferences in reproductive values and behaviors between generations of
women. Therefore, a sample of female informants representing different
age groups is suggested, e.g., some adolescents, some young women,
some middle-aged and some elderly.
Examples of interview guides and summary forms are presented in
Boxes 4.9 and 4.10. Organizing quantitative data in simple summary
forms may help to identify locally useful indicators of reproductive
behavior. The next step is tallying (consolidating) the data to look for
patterns in the community (see Box 4.13).
Focus group interviews (see Annex B, section B.5) are an appropriate
strategy for eliciting women's and men's expectations, attitudes and
needs with respect to fertility and parenting. They can provide qualitative
data useful for interpreting the quantitative data collected from reproduc
tive histories. A couple of cautions about focus groups: 1) the facilitator
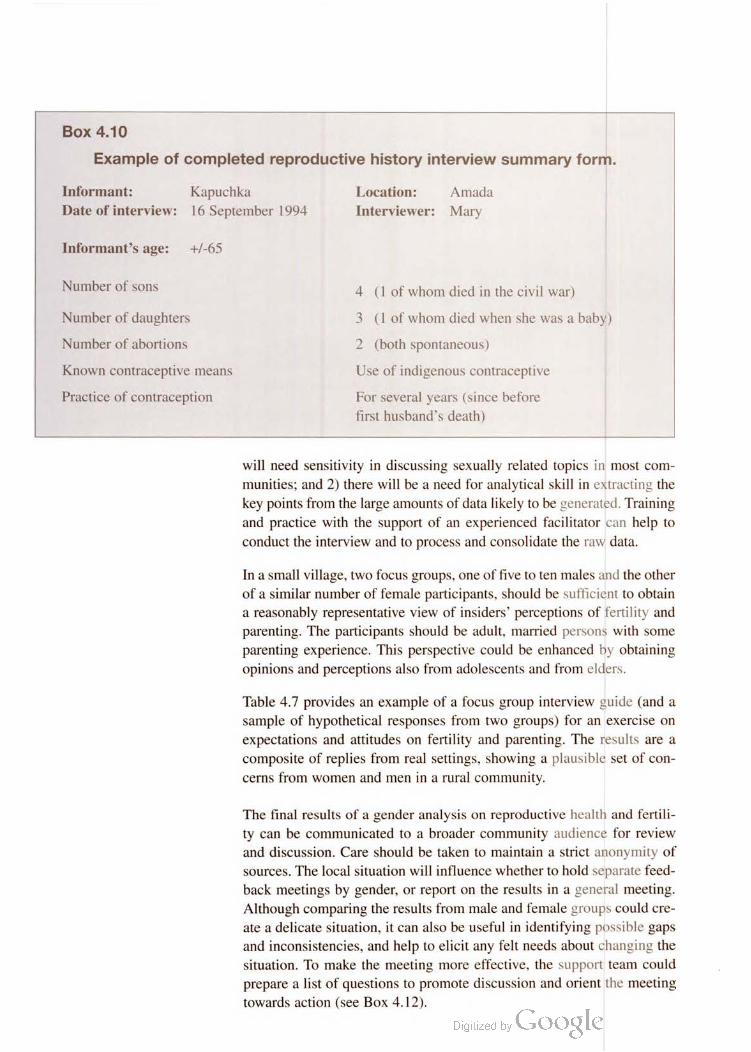
Box 4.10
Example of completed reproductive history interview summary form.
Informant: Kapuchka Location: Amada
Date of interview: 16 September 1994 Interviewer: Mary
Informant’s age; +/-65
Number of sons
Number of daughters
Number of abortions
Known contraceptive means
Practice of contraception
4 (1 of whom died in the civil war)
3 (1 of whom died when she was a baby)
2 (both spontaneous)
Use of indigenous contraceptive
For several years (since before
first husband's death)
will need sensitivity in discussing sexually related topics in most com
munities; and 2) there will be a need for analytical skill in extracting the
key points from the large amounts of data likely to be generated. Training
and practice with the support of an experienced facilitator can help to
conduct the interview and to process and consolidate the raw data.
In a small village, two focus groups, one of five to ten males and the other
of a similar number of female participants, should be sufficient to obtain
a reasonably representative view of insiders’ perceptions of fertility and
parenting. The participants should be adult, married persons with some
parenting experience. This perspective could be enhanced by obtaining
opinions and perceptions also from adolescents and from elders.
Table 4.7 provides an example of a focus group interview guide (and a
sample of hypothetical responses from two groups) for an exercise on
expectations and attitudes on fertility and parenting. The results are a
composite of replies from real settings, showing a plausible set of con
cerns from women and men in a rural community.
The final results of a gender analysis on reproductive health and fertili
ty can be communicated to a broader community audience for review
and discussion. Care should be taken to maintain a strict anonymity of
sources. The local situation will influence whether to hold separate feed
back meetings by gender, or report on the results in a general meeting.
Although comparing the results from male and female groups could cre
ate a delicate situation, it can also be useful in identifying possible gaps
and inconsistencies, and help to elicit any felt needs about changing the
situation. To make the meeting more effective, the support team could
prepare a list of questions to promote discussion and orient the meeting
towards action (see Box 4.12).

Box 4.11
Example of reproductive histories:
Consolidated Information Form (“Amada’, 1997)
Number of women interviewed 10 (five over 50 years of age;
five aged 20–45)
Average number of children born for each woman over 50 6
Average number of children born for each woman 20–45 3
Average number of children lost for each woman over 50 3
Average number of children lost for each woman 20–45 0.2 (1 for every 5 women)
Average number of abortions for each woman over 50 3
Average number of abortions for each woman 20–45 0.4 (2 for every 5 women)
Average birth interval for women 15–45 who have 30 months (with a range from
given birth in the past two years 12–80 months)
Proportion of women over 50 who have ever
used indigenous contraceptives 4 out of 5
Proportion of women 20–45
who wish to delay childbearing 3 out of 10
Proportion of women 20–45
who wish to stop childbearing 1 out of 10
Proportion of women 20–35 who have ever
used indigenous contraceptives 1 out of 5
Proportion of women 20–35 who have ever
received modern contraceptives from the clinic 1 out of 5
Proportion of women currently
using modern contraceptives 1 out of 20
Box 4.12
Gender analysis: comparing data from men and women
After the presentation of the gender analysis of reproductive issues, the following questions can
help the support team to guide a discussion that engages the voices of both genders for the good
of the community.
General: Were the ideas of the men and women different? In what way?
Men: What are the main problems of women regarding fertility and reproduction?
What do they think about these problems? What can be done about it?
Women: What are the main problems of men regarding fertility and reproduction?
What can be done about it?
General: What can be done by the whole community for the benefit of all?
Adapted from: Bergdall, 1993

1A0 rm... n___|_ A..- n‘_A..__x_
Two mothers stated that they felt the problem of high child mortality was
due to children being born too soon one after the other. The reproductive
history interviews revealed that over one-third of recent births occurred
two years or less after the birth of the previous child. It is not uncom
mon, according to the women of ‘Amada’, for a child to be weaned early
because the mother becomes pregnant again. Thus, closely spaced chil
dren compete with one another for adequate nutrition, and for their
mother’s attention. They also leave mothers increasingly tired and
unable to perform other household tasks. Some women blame the close
spacing of births on a breakdown in the rules governing postpartum
abstinence — the traditional l6-18-m0nth period following the birth of a
child during which couples abstained from sexual relations.
In the minds of the villagers the prevailing desire for large families is
partly related to the problems of infant and child mortality. A number of
parents commented during the gender analysis that “we have many sons
and daughters so that a few will survive and support us in our old age.”
The gender analysis also revealed that only 20 percent of women aged
20—45 have ever practiced modern family planning, and that, of the 40
percent of women of reproductive age who would like to limit or space
their births, only 5 percent were currently using a modern form of con
traception. This represents a significant level of unmet need for family
planning services. When probed, a number of women indicated that they
would like to practice modern family planning, but that they do not have
time to travel to the clinic in the closest town. which takes some hours,
only to wait there another hour or two for services. They also stressed
that some husbands objected to their wives being visited by a male doc
tor, and that others didn’t want to limit fertility because more children
meant more hands to help with household chores.
This hypothetical summary of findings shows how, through discussions
among different interest groups and joint analysis of the collected data,
the interrelations between the community’s environmental, health. and
population issues often become clear to the PAR participants. Although I
the focus of the analysis of the appraisal’s results may remain on prob
lems, some interest group members will undoubtedly start to think about
how the community might begin to address these problems. In the next
steps, interest groups can use a set of tools to more systematically iden
tify ‘solutions’ and potential actions.
Problem-cause-effect trees
Building a tree of problems, causes and effects is a simple and widely
comprehensible visual technique. It enables an interest group to summa
rize the findings of participatory appraisal exercises and orient itself
toward actions based on those findings.
The technique starts with a brainstorming aimed at reaching a consensus
within the group on what is the main ‘problem’ identified by the
appraisal exercise. A facilitator in this exercise (e.g., a member of the
PAR support team) will need to remember that definitions and linkages
of problems-causes-and-effects may be interpreted in several ways. The
‘problem’ for a development professional (e.g., soil erosion) could be a
‘cause’ for a community member (e.g., of the problem of declining
yields) and an ‘effect’ for a scientific researcher (e.g., of the problem of
deforestation and cultivation on steep slopes). A second reminder is that
lack of formal education does not mean lack of analytical thinking,
although special attention to visual methods may be needed for support
ing some community members to express their own views.
The exercise can be started off by posing a question such as:
What is showing up as your main concern/problem
based on our participatory research?
Such an entry is more appropriate than an attempt to define some ana
lytical categories (i.e., cause, problem, effect). If definitions become
necessary, they can be agreed upon at a later stage in the work.
Once the main problem is identified, the facilitator can create a large
outline sketch of a tree (e.g., on a blackboard or a flipchart) that shows
its trunk, roots and branches (see Figures 5.1 a—c). By writing the prob
lem on the trunk (graphic representation can be used if participants are
non-literate), he/she explains that, in this diagram, the roots represent the
causes of the problem and the branches its consequences. Further brain
storming (see Annex B, section B7) is then carried out among the par
ticipants in the exercise to list their perceptions about the ‘roots of the
problem’ and its consequences (branches) and plot them on the tree dia
gram:
lack offormal education
does not mean lack of
analytical thinking,
although special attention
to visual methods may be
neededfor supporting
some community members
to express their own views

Case Example 5.1
Participatory Research and Planning in St. Lucia
In 1981, a project entitled Conservation and Development of the South Coast of St. Lucia was ini
tiated by the Eastern Caribbean Natural Area Management Program (ECNAMP, now known as the
Caribbean Natural Resources Institute, CANARI). Up until that time there had been awareness of
the intrinsic value of natural resources in the area, including mangroves, coral reefs, sea grass beds
and xerophytic forests, but there had been no systematic inventory to support a unified effort at
conservation.
The project's new Advisory Committee began its work with the coordination and supervision of a
survey of conservation and development requirements for the south-east coast. The committee
comprised representatives of all relevant governmental and non-governmental institutions, as well
as several members of the community.
The survey represented a classical physical planning exercise, with data gathering; analysis of
issues, constraints and opportunities; definition of management alternatives; and formulation of
development and resource management plans. The exercise, however, included four characteris
tics that differentiated it from most undertakings of this nature:
1. The planning study was conceived and undertaken as an instrument of education and public
awareness. School groups were involved in data-gathering, analysis and decision-making exer
cises; information was disseminated to schools in the area; and field-based educational activi
ties were collectively designed and supported.
2. The study was also designed to facilitate community participation at all stages of planning by
involving resource users in data gathering, using local knowledge, redistributing research
results and encouraging participation in analyzing and formulating recommendations.
3. The involvement of agencies and institutions at the national and local levels was encouraged
through their participation in the project Advisory Committee, but also through more specific
consultations and reviews of individual project chapters and recommendations.
4. Whenever possible, the project encouraged implementing certain recommendations even
before the completion of the overall plan. This was seen as important to maintain the momen
tum that the participatory approach to the exercise had created.
One area of immense value to the project was the appreciation of popular and traditional man
agement techniques, which were demonstrated to be relevant to modern needs. In particular, this
knowledge proved essential for the management of mangroves and sea urchins. The project
adapted its management techniques to local conditions by seeking the guidance of residents and
resource users who participated in the decision-making.
Another major benefit of participatory planning was the recognition of community needs by gov
ernmental and non-governmental agencies. This recognition generated an understanding that con
servation efforts must include local development concerns if they are to receive community sup
port. As a result of the participatory process, decisions were easier to implement, because there
was strong commitment to the project and the community was willing to allocate human and
financial resources to make the plan work.
From: Renard, 1994

What are the main roots or causes of the problem?
What are its most important consequences?
Participants can also be asked to consider ‘perpetuating’ or ‘constrain
ing’ practices, i.e., problems brought about by some form of human
behavior or activity.
During the exercise, a renegotiation may take place within the group
about what is — really — the main problem at stake. If this happens,
amendments can be jotted on the diagram by the facilitator. Once a final
agreement has been reached by the group about the core problem and a
discussion about causes and effects has warmed up, external inputs (e.g.,
reminders based on the appraisal exercise data or ideas coming from
technical resource persons) may be introduced by the facilitator and dis
cussed with the group. In this activity, the facilitator should take care to
keep the discussion centered around concerns, topics and language that
are well understood by all the participants.
Identifying ‘solutions’ and potential actions
Once the diagram is completed, the discussion can move on to explore
possible ‘solutions’ to deal with the causes and consequences of the
problem. The purpose is to raise participant awareness that different lev
els of solutions can be forwarded for dealing with any single problem.
This can also help participants to understand that the final decision about
what to do will involve a trade-off between higher effectiveness (which
usually comes from attacking the very root causes of the problem) and
easier or faster generation of some specific results (which may alleviate
or control some effects and consequences of the problem on daily life,
even if they do not tackle the problem itself). Finally, a discussion of
possible ‘solutions’ may help sensitize participants to the fact that many,
if not most, of them are unlikely to be managed alone by a small
interest group — other actors within and outside the community will need
to collaborate for a proposed solution to succeed.
In contrast to ‘solutions’, which represent general objectives for address
ing the problems identified in the trees, ‘actions’ can be defined as spe
cific tasks that need to be carried out to reach those objectives. A support
team member could ask the members of the interest group what actions
they feel ready and able to put into practice within the next 12 months.
the final decision will
involve a trade-off between
higher effectiveness and
easier orfaster generation
of some specific results
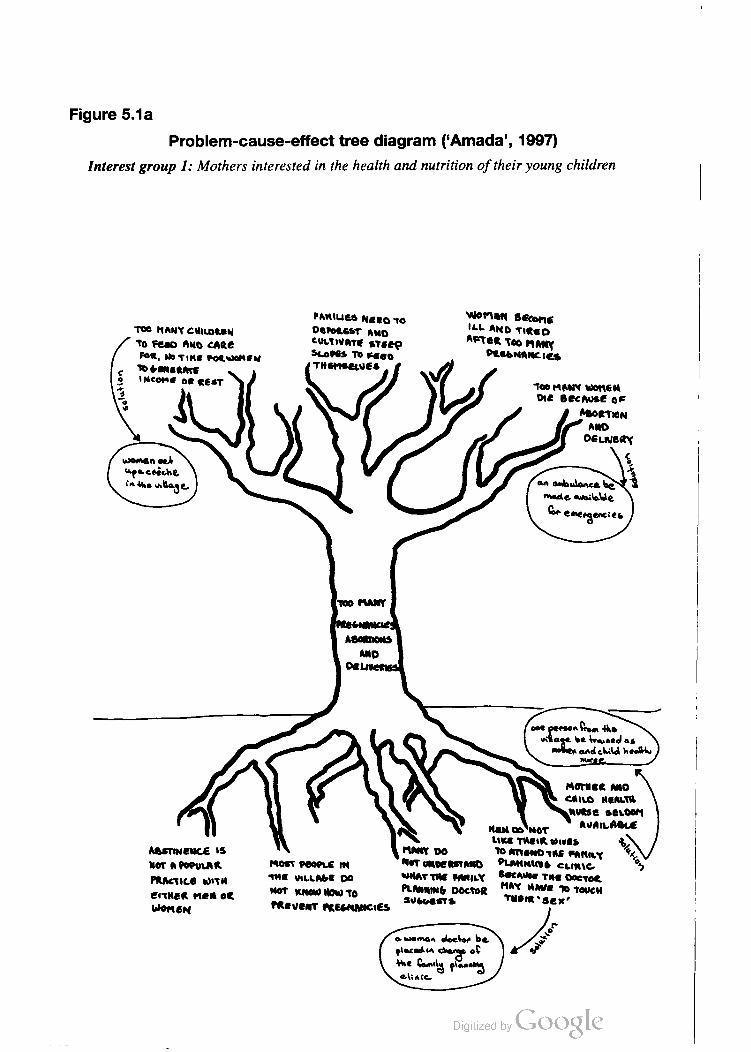
Figure 5.1a
Problem-cause-effect tree diagram (‘Amada’, 1997)
Interest group I: Mothers interested in the health and nutrition of their young children
Fmtues N520 ~10 Women B€t°n£
T00 HANYcHtLouu Derousr AND "L AM) 111220
To r-uo one cute “"3"”! "ice “I” I°° "ANY
'6‘. "on" me‘w 51.0955 To Face Pteanthes
106a".an \/Tumseutes
INCOME
°' ‘6“ too nmx wonen
Die Bienuse 0:
Reaction
MID
osmier
<d
5'.
M melt-an ha ‘3
made Mtlaldg
c": emergencies
C
.‘3a
3d
U!
women 0e):
“pmceiche,
3* like vtuorag,
one oson from 44“,
u\'\ a e be kf'A\f\QJ as
"it! andcklol hloluu
ML?
come NEGLT“
NW5: SELOOH
q\ "mm N“ Avnttaece
um: THUR times %,
Ass-mama ,5 me 00 To mamas mum: *5.
,m QNQW,‘ mm "on; m "of museums PLANMme cumc. °'>
PRMTILE will '1’"! \nLLAbE 00 “MT 1'“ PM!“ seem“ “’3 MT“,
nor kw now-m "Mama ooemk H“ M" 1° "W"
entree. not on $060,515 "lilt‘sex'
None" Fervent R£6Nhfl¢t€$
enema dock.“ be,
vocal“ elm of
“st ponds (flaming
clinic.

Figure 5.1b
Problem-cause-effect tree diagram (‘Amada’, 1997)
Interest group 2: Farmers interested in preventing hillside erosion andflooding
(bmflmcnl' #1,»,
ml wish.“ng SW,“
h "-‘l'ock pines
OMQ. a mop; N “up
Clot-015 n - Calm \tslted
C‘ommuni lo NARA q‘oér
dikes ~\s channel
tail-k akon er. “I ‘
6+"\Calc, \ozqh-(ong E
t 10950“. Lost Fist) stocks DEPLETSD <1
j, :mmLND time. oenioweoumg 3::1Rélze::bfig:l€s:eu-s a.
3's Losmr. cmemuo 1° CLHMIT some $213"; ’1“ 0 Y
HODSL|0€$ \/
NATE R $OPPL‘I
emetic a memebl-‘t
one TO sowtmt, + Hans
gusto" A1. N6 Rm‘mb
"‘8‘ M“ Mctureo BY okemz.
Nth-15R
.Q“
will a mil (deep
"4 Qtfleckel) or sin/d
Pi Qé Cram kph“ ‘Omue
tasldteel
lllLLSlOé
eeosrou
Female “19*
to most 1- common“:
"~— rnmenl- lo bred“
me rel-cake“ ~ (a Pinch-3 Ful
rbut'tn m #695
e Conflumlvn to (sh-AL
91nd coals-rd 9°“
with small
cunt" m
cud-(reds
Produhi
r-
j!
o
DEFORQsTM'ION
0N HILLSIDES
SO/u {fa )
'1
LACK OF
5011004
C
9
‘5Pi LHLK or bikes ere.
ups-I110“ '20 cMNNéL N
FLOOD (MOL UM OFF 650 'to (ten
Rfisde'tIRE "“""°’ 5°“ I-Ano rot AnnouncemF Korea-ton ¢° 0N “awn SLOPES
w" "ensues m 4:, it, swung Mt,
6°" matcumae 13 v ,0 MW,“
Smaller Quilt“ I lit‘QolQikté‘.
C \luhodg soupc‘s°n flit/15 Qtui
6 household taming, ’"les Cw
income,
lemma“
Cull tool Inuij
M slopeo 730 a,
91 $860094 &
uil
no“ amenl- comm-“Ge.
+° '2 “k9 "Ilia (In new
SQWQmenls “Ml Plot,
°" We kr\\scdes
generohofi

Figure 5.1c
Problem-cause-effect tree diagram (‘Amada’, 1997)
Interest group 3: Young men interested in income generation and employment opportuni
ties in the village
Jobs are armhoal m
we villaae, to 0' tracl' anal
9019‘s Tweet
Y‘
Min unto senaan ,b"
"1601“ 10 oQBMI
“AWK service
pro-rides
Sc teem-3 GAA
V“a rap
Dilirich eeguidgs
‘10 e
parent Pmdu\
from opporiumghes
:élotb I“ -§Hhc,.
Carr 1: <ATctt TB Your“ mum; versus-rem "°””‘"
"0 other, INFEfllUUS out or Men m vouelrr kr
l#50565, Skrklémé Seaman or:- aoBs "0"”"1'0 Lew"
NONE” “E 111855 TQTHQ‘“
Manama TO \/
tem: THE $217221 -
“Eaneo FeuBQQEOOLG
"005;m5 ME AURUSLE
Fol Lod’ll
the-sou Que
HMlAbeNEMT
u-hnA
3..LACK 6F
FISH time tnmwr.
Gamers
SCRRCLK
HILLsroc 15
neecnoe 0, nor
rtucu URLUAQLF
T|H$€Q LEFT
R“ EXPLOUA’TIM)
w, Mick or
g environ.
“akin Quad i3
emailed for “\
Or nailed Sloop}
oédouns lMpteneufs
Taflnrtlomat. INSTITUTIONS
FOG. Resoulcc “MM-EM
We wettmeflsb .ru Tile
LAs'r Oeegog
FAMILIES file
Lease - cmuoILEN
rut-\eP-H' snnu. PLOTS
eldeA: meal- with
goons Pavia and comic:
experience. all p
manaagmenl' asslcms
OMODrTres
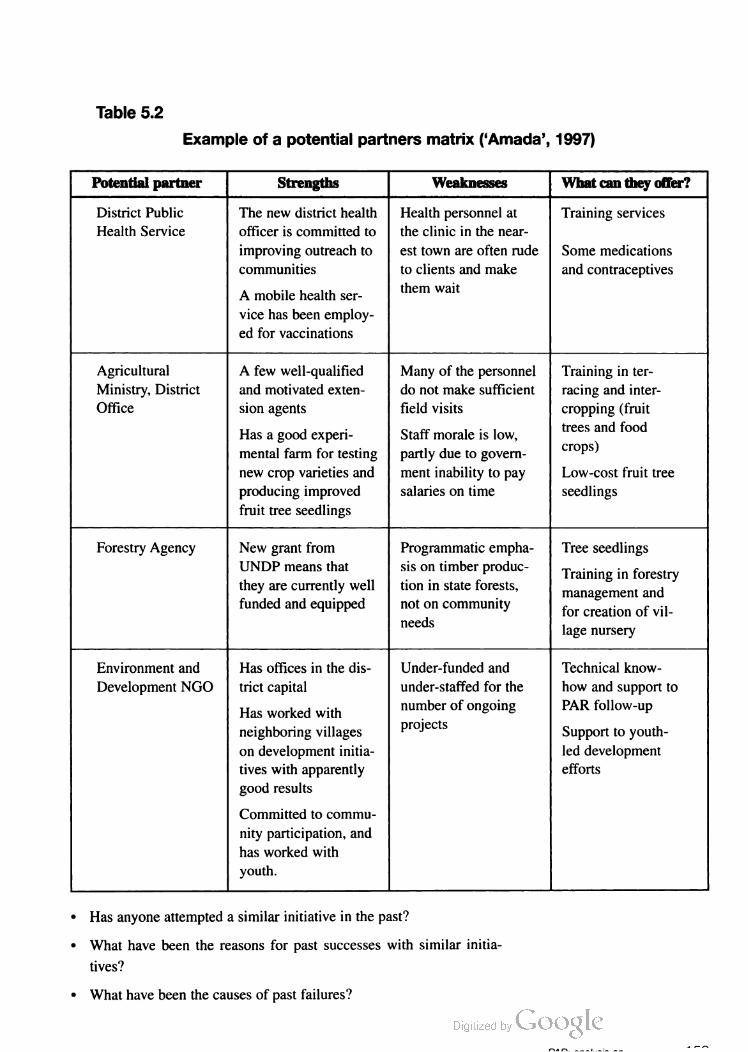
Table 5.2
Example of a potential partners matrix (‘Amada’, 1997)
Potential partner Strengths Weaknesses What can they offer?
District Public
Health Service
The new district health
officer is committed to
improving outreach to
communities
A mobile health ser
vice has been employ
ed for vaccinations
Health personnel at
the clinic in the near
est town are often rude
to clients and make
them wait
Training services
Some medications
and contraceptives
Agricultural
Ministry, District
Office
A few well-qualified
and motivated exten
sion agents
Has a good experi
mental farm for testing
new crop varieties and
producing improved
fruit tree seedlings
Many of the personnel
do not make sufficient
field visits
Staff morale is low,
partly due to govern
ment inability to pay
salaries on time
Training in ter
racing and inter
cropping (fruit
trees and food
crops)
Low-cost fruit tree
seedlings
Forestry Agency New grant from
UNDP means that
they are currently well
funded and equipped
Programmatic empha
sis on timber produc
tion in state forests,
not on community
needs
Tree seedlings
Training in forestry
management and
for creation of vil
lage nursery
Environment and
Development NGO
Has offices in the dis
trict capital
Has worked with
neighboring villages
on development initia
tives with apparently
good results
Committed to commu
nity participation, and
has worked with
youth.
Under-funded and
under-staffed for the
number of ongoing
projects
Technical know
how and support to
PAR follow-up
Support to youth
led development
efforts
Has anyone attempted a similar initiative in the past?
What have been the reasons for past successes with similar initia
tives?
What have been the causes of past failures?
n11 n. ___i. ._:_ a
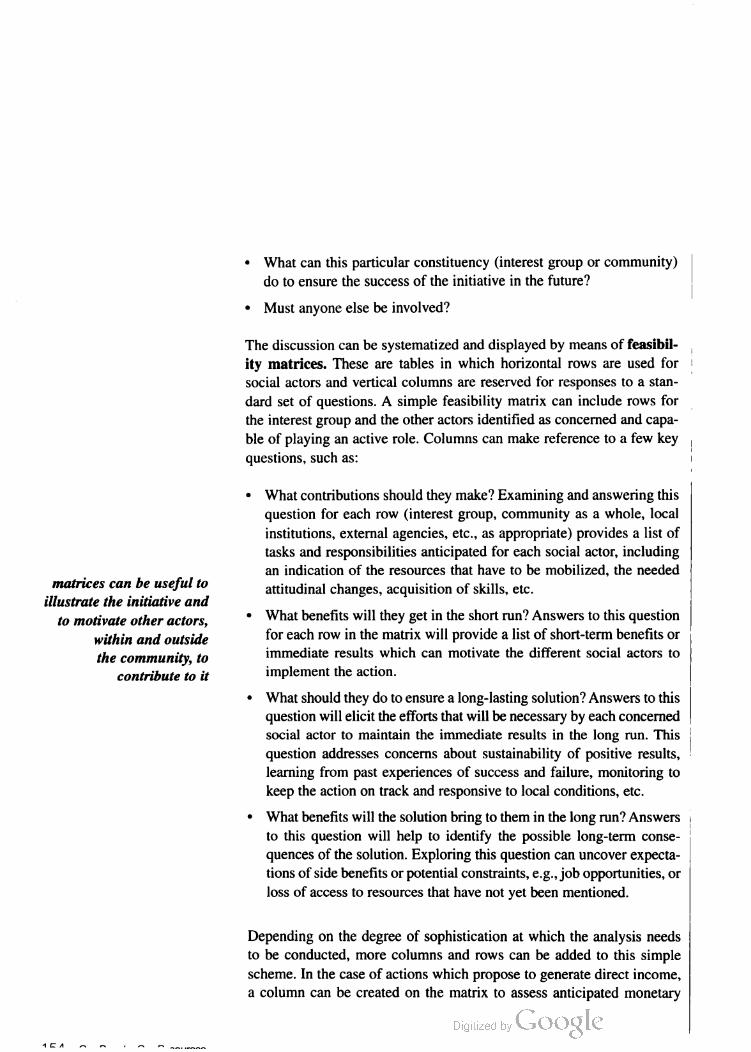
matrices can be useful to
illustrate the initiative and
to motivate other actors,
1CA
within and outside
the community, to
contribute to it
~ What can this particular constituency (interest group or community)
do to ensure the success of the initiative in the future?
' Must anyone else be involved?
The discussion can be systematized and displayed by means of feasibil
ity matrices. These are tables in which horizontal rows are used for
social actors and vertical columns are reserved for responses to a stan
dard set of questions. A simple feasibility matrix can include rows for
the interest group and the other actors identified as concerned and capa
ble of playing an active role. Columns can make reference to a few key
questions, such as:
' What contributions should they make? Examining and answering this
question for each row (interest group, community as a whole, local
institutions, external agencies, etc., as appropriate) provides a list of
tasks and responsibilities anticipated for each social actor, including
an indication of the resources that have to be mobilized, the needed
attitudinal changes, acquisition of skills, etc.
' What benefits will they get in the short run? Answers to this question
for each row in the matrix will provide a list of short-term benefits or
immediate results which can motivate the different social actors to
implement the action.
' What should they do to ensure a long-lasting solution? Answers to this
question will elicit the efforts that will be necessary by each concerned
social actor to maintain the immediate results in the long run. This
question addresses concerns about sustainability of positive results,
learning from past experiences of success and failure, monitoring to
keep the action on track and responsive to local conditions, etc.
' What benefits will the solution bring to them in the long run? Answers
to this question will help to identify the possible long-term conse
quences of the solution. Exploring this question can uncover expecta
tions of side benefits or potential constraints, e.g., job opportunities, or
loss of access to resources that have not yet been mentioned.
Depending on the degree of sophistication at which the analysis needs
to be conducted, more columns and rows can be added to this simple
scheme. In the case of actions which propose to generate direct income,
a column can be created on the matrix to assess anticipated monetary
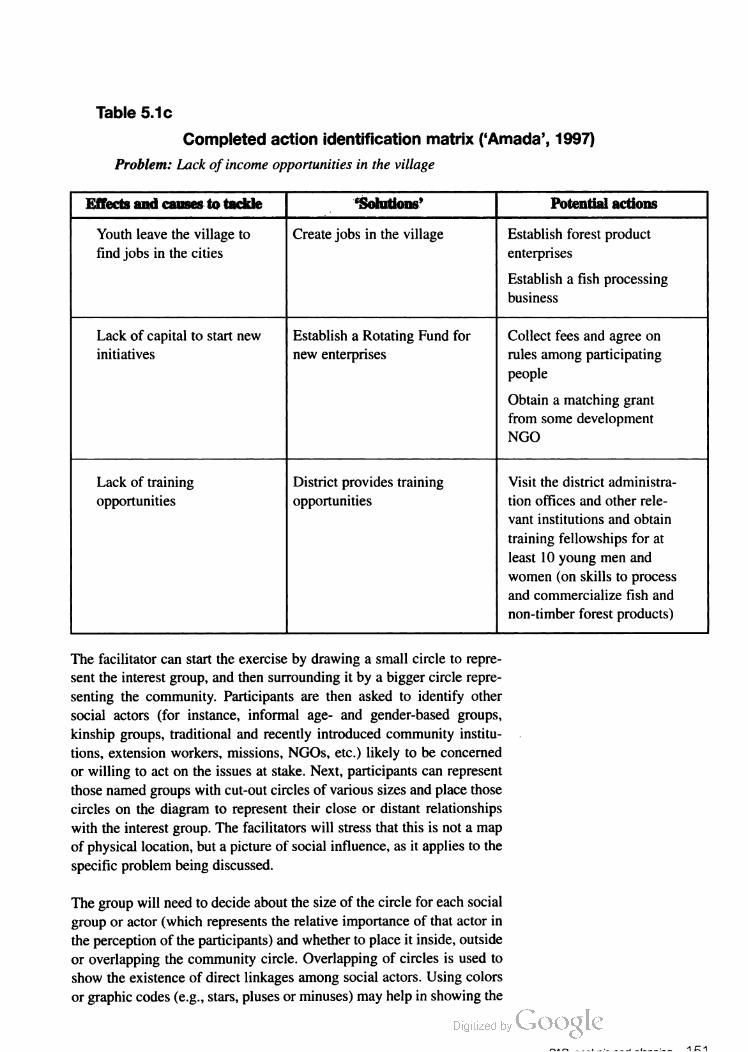
Table 5.1c
Completed action identification matrix (‘Amada’, 1997)
Problem: lack of income opportunities in the village
Effects and causes to tackle; , ‘_'§'Solutions’ Potential actions
Youth leave the village to
find jobs in the cities
Create jobs in the village Establish forest product
enterprises
Establish a fish processing
business
Lack of capital to start new
initiatives
Establish a Rotating Fund for
new enterprises
Collect fees and agree on
rules among participating
people
Obtain a matching grant
from some development
NGO
Lack of training
opportunities
District provides training
opportunities
Visit the district administra
tion offices and other rele
vant institutions and obtain
training fellowships for at
least 10 young men and
women (on skills to process
and commercialize fish and
non-timber forest products)
The facilitator can start the exercise by drawing a small circle to repre
sent the interest group, and then surrounding it by a bigger circle repre
senting the community. Participants are then asked to identify other
social actors (for instance, informal age- and gender-based groups,
kinship groups, traditional and recently introduced community institu
tions, extension workers, missions, NGOs, etc.) likely to be concerned
or willing to act on the issues at stake. Next, participants can represent
those named groups with cut-out circles of various sizes and place those
circles on the diagram to represent their close or distant relationships
with the interest group. The facilitators will stress that this is not a map
of physical location, but a picture of social influence, as it applies to the
specific problem being discussed.
The group will need to decide about the size of the circle for each social
group or actor (which represents the relative importance of that actor in
the perception of the participants) and whether to place it inside, outside
or overlapping the community circle. Overlapping of circles is used to
show the existence of direct linkages among social actors. Using colors
or graphic codes (e.g., stars, pluses or minuses) may help in showing the
1:11.‘| .A.-_ _Az| _|A__.-__

Figure 5.2
Example of a Venn diagram (‘Amada’, 1997)
Interest group 2: Farmers interested in preventing hillside erosion and flooding
toolture.
influence of each actor relative to the topic under consideration. As with
other participatory exercises, drawings (e.g., pictographs or symbols)
can substitute written words if the participants are non-literate.
The Venn diagram is helpful for visualizing a discussion of insider/out
sider relationships, but it may prove even more useful to go a step further
by conducting a candid assessment of the strengths and weaknesses of
potential partners in given actions (e.g., local government, line-agencies
of the central government, NGOs and development or conservation pro
jects existing in the area). Table 5.2 shows a matrix of potential partners
in which each one is assessed according to its strengths, weaknesses and
what it can offer. It is not necessary to develop a matrix, but matrices are
generally useful to record and discuss information.
Analyzing the feasibility of potential actions
Once a realistic assessment of the local partners has been completed, a
feasibility analysis of possible actions can be undertaken. The following
questions may be useful:
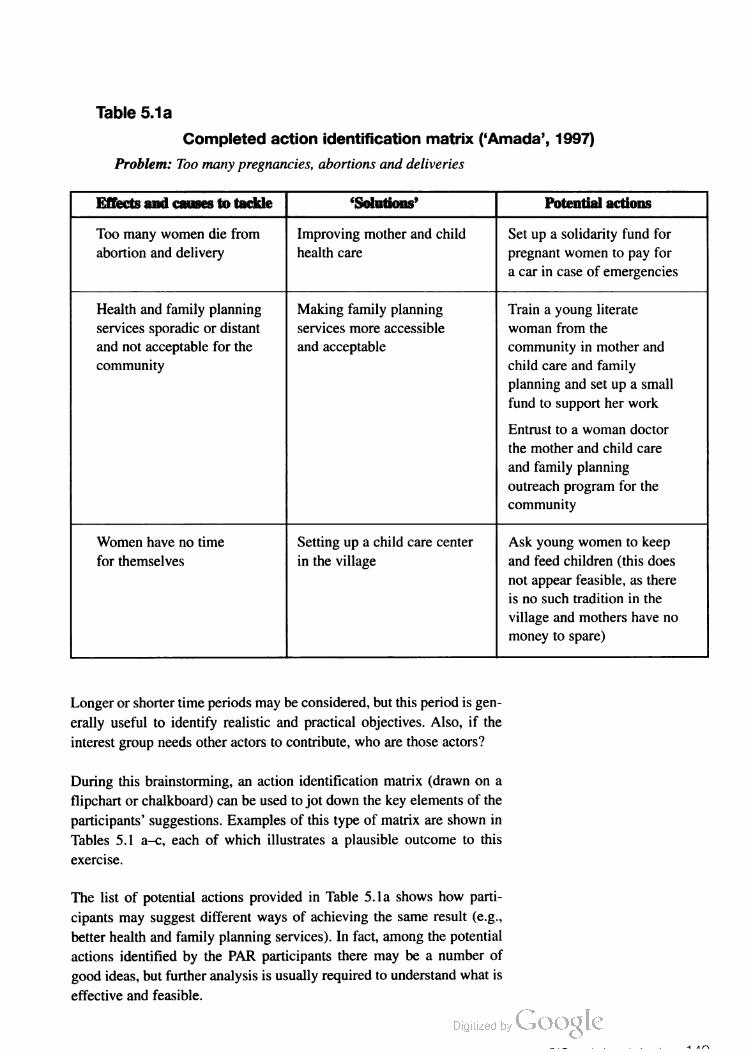
Table 5.1a
Completed action identification matrix (‘Amada’, 1997)
Problem: Too many pregnancies, abortions and deliveries
‘Solutions’ Potential actions
Too many women die from
abortion and delivery
Improving mother and child
health care
Set up a solidarity fund for
pregnant women to pay for
a car in case of emergencies
Health and family planning
services sporadic or distant
and not acceptable for the
community
Making family planning
services more accessible
and acceptable
Train a young literate
woman from the
community in mother and
child care and family
planning and set up a small
fund to support her work
Entrust to a woman doctor
the mother and child care
and family planning
outreach program for the
community
Women have no time
for themselves
Setting up a child care center
in the village
Ask young women to keep
and feed children (this does
not appear feasible, as there
is no such tradition in the
village and mothers have no
money to spare)
Longer or shorter time periods may be considered, but this period is gen
erally useful to identify realistic and practical objectives. Also, if the
interest group needs other actors to contribute, who are those actors?
During this brainstorming, an action identification matrix (drawn on a
flipchart or chalkboard) can be used to jot down the key elements of the
participants’ suggestions. Examples of this type of matrix are shown in
Tables 5.1 a—c, each of which illustrates a plausible outcome to this
exercise.
The list of potential actions provided in Table 5.1a shows how parti
cipants may suggest different ways of achieving the same result (e.g.,
better health and family planning services). In fact, among the potential
actions identified by the PAR participants there may be a number of
good ideas, but further analysis is usually required to understand what is
effective and feasible.

Table 5.1b
Completed action identification matrix (“Amada’, 1997)
Problem: Hillside erosion and irregular river flow
Effects and causes to tackle | | Solutions' Potential actions
Loss of crop land along Building dikes and de-silting Obtain technical assistance
river banks river bed on the construction of dikes
and other means for de-silt
ing river beds.
Organize village men to
work together
Deforestation on hillsides Reforestation of the hills Replant anti-erosion trees on
the sides of Blue, Black and
Yellow Hills
Revitalize forest manage
ment committee and forbid
tree cutting and grazing, so
that natural regeneration can
take place
Lack of soil protection Building terraces in household Get training and advice on
111CaSureS plots how low-cost terraces can
be built
Need to clear land for
agriculture on upland slopes
Increase yields in existing plots | Purchase collectively two
oxen and some high-quality
seeds (not feasible without a
well-functioning village
committee)
Stop land fragmentation Begin using family planning
because of large number of methods
children in a typical family
Analyzing the community organizational and institutional
COntext
Visual exercises can be used by interest groups to show their perceptions
of the various social actors who might present obstacles or contribute to
a given course of action. In particular, Venn diagrams (sometimes called
chapati or pancake diagrams) are used to elicit and portray sets of insid
er/outsider relationships for a community, including decision-making
power and external influences. As shown in Figure 5.2, Venn diagrams
can also focus on the linkages among the actors to be involved in carry
ing out a specific activity.

costs and benefits for the various involved persons or groups (at times
called stakeholders). Such a column could explore prospects for finding
markets or buyers, reasons to expect that sales would exceed expenses,
etc.
This exercise allows the interest group to assess the effort that will real
istically be required to achieve the ‘solution’ they would like to pursue,
as well as the potential conflicts of interest that could arise during the
implementation phase. Tables 5.3 a—c show examples of filled-out matri
ces for three interest groups in ‘Amada’. Besides summarizing the group
discussion, matrices such as these can be useful to illustrate the initiative
and to motivate other actors, within and outside the community, to con
tribute to it.
1ELI
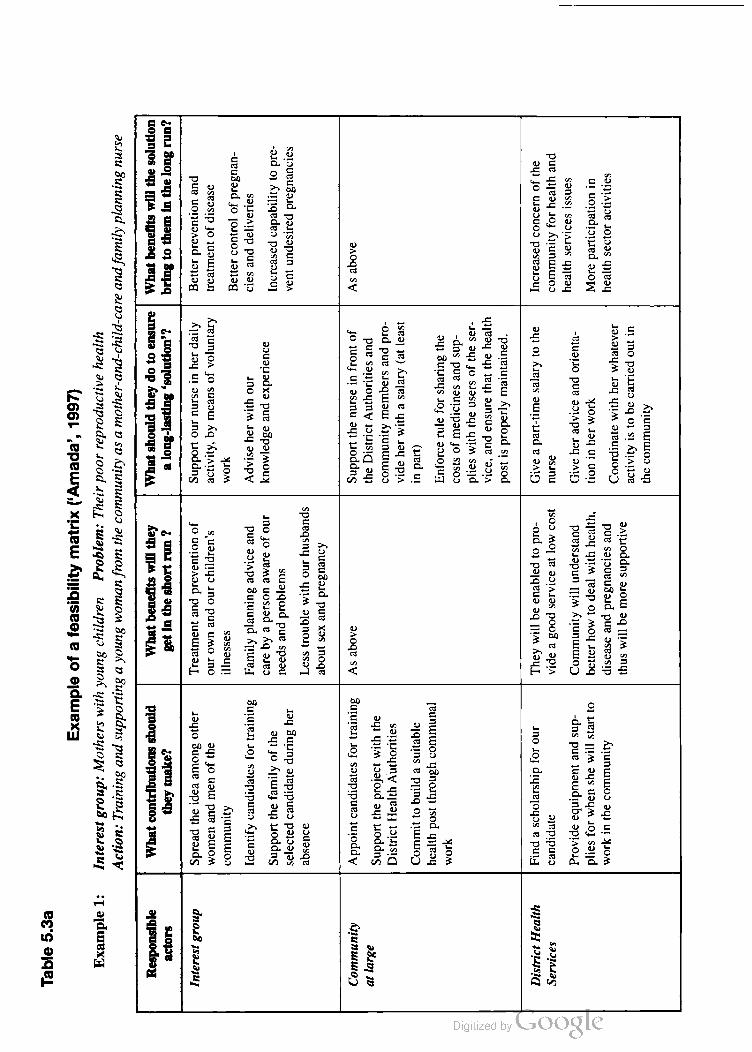
Table5.3a Example1:
Exampleofafeasibilitymatrix(Amada’,1997)
Interestgroup:Motherswithyoungchildren
Problem:Theirpoorreproductivehealth
Action:Trainingandsupportingayoungwomanfromthecommunityasamother-and-child-careandfamilyplanningnurse
Whatbenefitswillthey
.getintheshortrun?
Whatshouldtheydotoensure
along-lasting‘solution”?
Whatbenefitswillthesolution
bringtotheminthelongrun?
InterestgroupSpreadtheideaamongotherTreatmentandpreventionofSupportournurseinherdailyBetterpreventionandwomenandmenoftheourownandourchildren'sactivity,bymeansofvoluntarytreatmentofdisease
communityillnesseswork
Bettercontrolofpregnan
IdentifycandidatesfortrainingFamilyplanningadviceandAdviseherwithourciesanddeliveries
SupportthefamilyofthecarebyapersonawareofourknowledgeandexperienceIncreasedcapabilitytopre
--needsandproblems--
selectedcandidateduringherventundesiredpregnancies
absenceLesstroublewithourhusbands
aboutsexandpregnancy
CommunityAppointcandidatesfortraining|AsaboveSupportthenurseinfrontofAsabove
atlargeSupporttheprojectwiththetheDistrictAuthoritiesand
-------communitymembersandpro
DistrictHealthAuthorities--
videherwithasalary(atleast
Committobuildasuitableinpart)
heal|-
ealthpostthroughcommunaEnforceruleforsharingthe
work--
costsofmedicinesandsup
plieswiththeusersoftheservice,andensurethatthehealth
postisproperlymaintained.
DistrictHealthFindascholarshipforourTheywillbeenabledtopro-Giveapart-timesalarytotheIncreasedconcernoftheServicescandidatevideagoodserviceatlowcostnursecommunityforhealthand
Provideequipmentandsup
pliesforwhenshewillstartto
workinthecommunity
Communitywillunderstand
betterhowtodealwithhealth,
diseaseandpregnanciesand thuswillbemoresupportive
Giveheradviceandorienta
tioninherwork
Coordinatewithherwhateveractivityistobecarriedoutin
thecommunity
healthservicesissues Moreparticipationinhealthsectoractivities
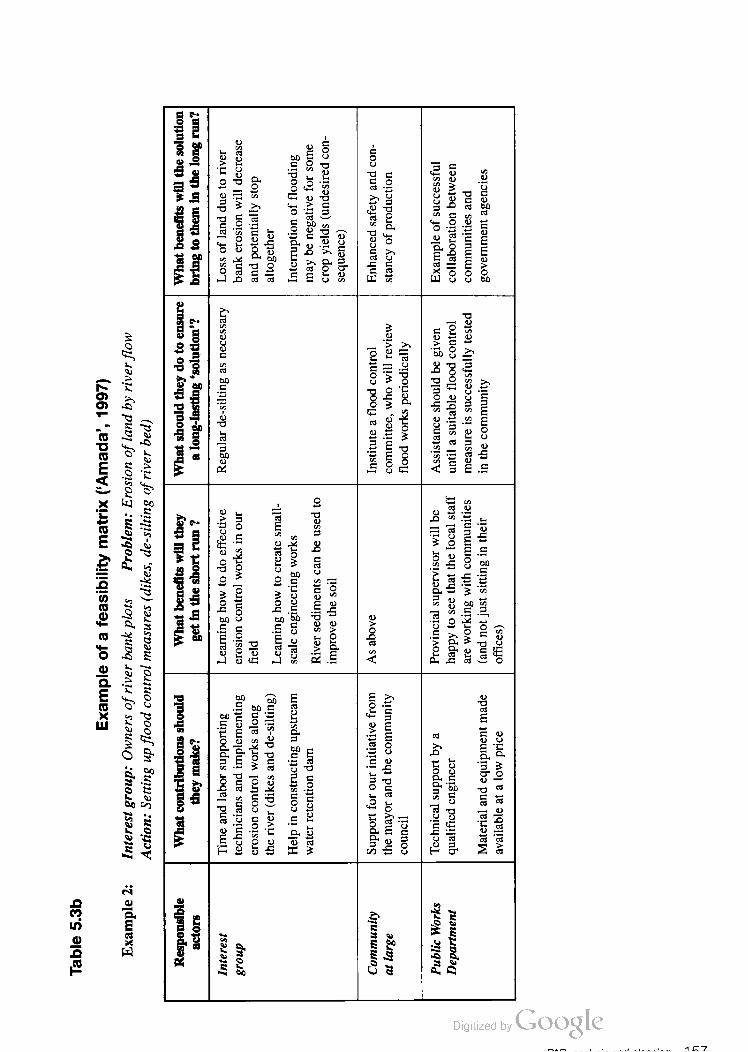
——:-—-r—t-v'r'.~1~'~uvulev
Table5.3b Example2:
Exampleofafeasibilitymatrix(‘Amada’,1997)
Interestgroup:Ownersofriverbankplots
Problem:Erosionoflandbyriverflow
Action:Settingupfloodcontrolmeasures(dikes,de-siltingofriverbed)
" - .’5benefitswilltrig.
_:LIPTA‘L._
intheshortrun‘I..':'
..-a-."E.
r“)
‘11..1.4v",
vwillthesolutionbringtotheminthelongrun?
InterestTimeandlaborsupportingLearninghowtodoeffectiveRegularde-siltingasnecessaryLossoflandduetoriver
grouptechniciansandimplementingerosioncontrolworksinourbankerosionwilldecrease
erosioncontrolworksalongfieldandpotentiallystop
''knde-ilin.
ther1ver(d1esadstg)Leammghowtocreatesmall_altogether
HelpinconstructingupstreamscaleengineeringworksInterruptionofflooding
waterretentiondamRiversedimentscanbeusedtomaybenegativeforsome--cropyields(undesrredcon
improvethesorl
sequence)
CommunitySupportforourinitiativefromAsaboveInstituteafloodcontrolEnhancedsafetyandcon
atlargethemayorandthecommunitycommittee,whowillreviewstancyofproduction
council
floodworksperiodically
PublicWorksDepartment
Technicalsupportbya
qualifiedengineer
Materialandequipmentmade
availableatalowprice
Provincialsupervisorwillbe
happytoseethatthelocalstaffareworkingwithcommunities
(andnotjustsittingintheir
offices)
Assistanceshouldbegiven
untilasuitablefloodcontrolmeasureissuccessfullytested
inthecommunity
Exampleofsuccessfulcollaborationbetween
communitiesand
governmentagencies
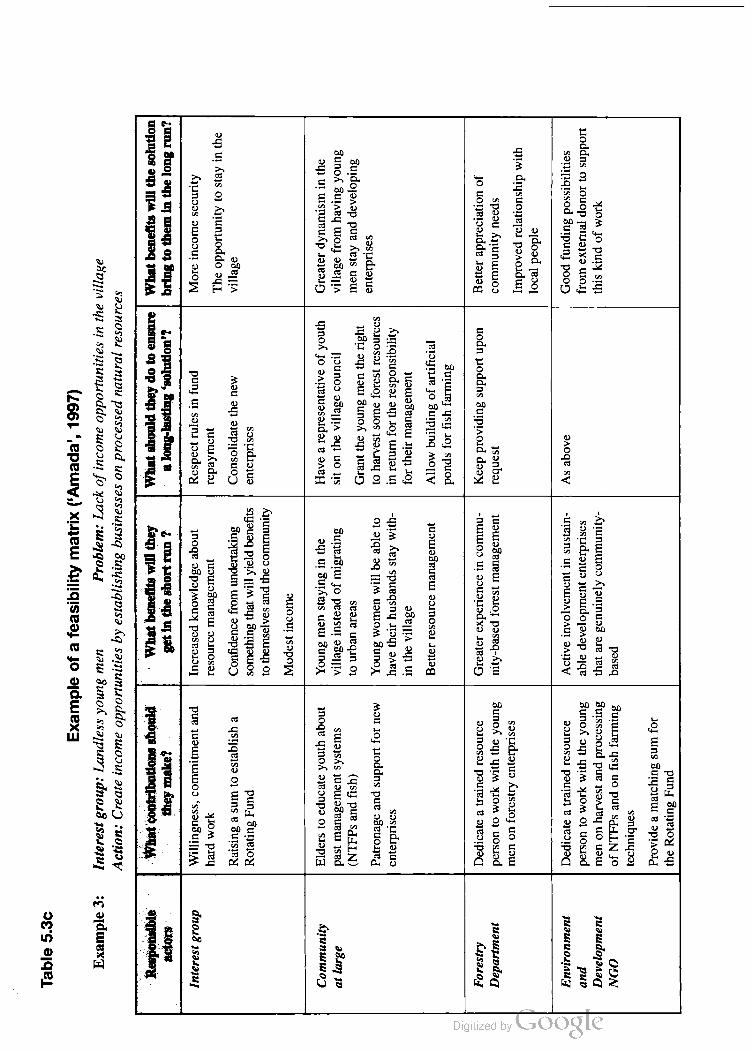
Table5.3C
Exampleofafeasibilitymatrix(“Amada’,1997)
Example3:Interestgroup:LandlessyoungmenProblem:Lackofincomeopportunitiesinthevillage
Action:Createincomeopportunitiesbyestablishingbusinessesonprocessednaturalresources
ResponsibleWhatcontributionsshouldWhatbenefitswilltheyWhatshouldtheydotoensure|Whatbenefitswillthesactorstheymake?getintheshortrun?along-lasting‘solution”?bringtotheminthelong1~
InterestgroupWillingness,commitmentandIncreasedknowledgeaboutRespectrulesinfundMoreincomesecurity
hardworkresourcemanagementrepaymentTheopportunitytostayinthe
RaisingasumtoestablishaConfidencefromundertakingConsolidatethenewvillage
RotatingFundsomethingthatwillyieldbenefitsenterprises
tothemselvesandthecommunity
Modestincome
CommunityElderstoeducateyouthaboutYoungmenstayingintheHavearepresentativeofyouthGreaterdynamismintheatlargepastmanagementsystemsvillageinsteadofmigratingsitonthevillagecouncilvillagefromhavingyoung
(NTFPsandfish)tourbanareasGranttheyoungmentheright'stayanddeveloping
PatronageandsupportfornewYoungwomenwillbeabletotoharvestsomeforestresources"
enterpriseshavetheirhusbandsstaywith-inreturnfortheresponsibility
inthevillagefortheirmanagement
BetterresourcemanagementAllowbuildingofartificial
pondsforfishfarming
ForestryDedicateatrainedresourceGreaterexperienceincommu-KeepprovidingsupportuponBetterappreciationof
Departmentpersontoworkwiththeyoungnity-basedforestmanagementrequestcommunityneeds
menonforestryenterprisesImprovedrelationshipwith
localpeople
EnvironmentDedicateatrainedresourceActiveinvolvementinsustain-AsaboveGoodfundingpossibilities
andpersontoworkwiththeyoungabledevelopmententerprisesfromexternaldonortosupport
Developmentmenonharvestandprocessingthataregenuinelycommunity-thiskindofwork
NGOofNTFPsandonfishfarmingbased
techniques
Provideamatchingsumfor
theRotatingFund
5.3 Negotiating and agreeing upon
a plan
At this stage the PAR process should have achieved several results:
' an assessment of the local environment, population dynamics and
health situation in the community at stake;
' the identification and consolidation of interest groups through
common work on participatory appraisal and analysis of specific
problems and ‘solutions’ to address them;
- the identification of key potential partners from inside and outside the
community and their potential roles in addressing the community’s
concerns; and
' communication and discussion about the appraisal and analysis with
all community members and interest groups, and prioritization of
actions to pursue.
It is now time to :
' contact the relevant potential partners and jointly negotiate a plan to
implement the priority actions agreed upon by the community.
Workshops are appropriate methods to carry out this last step. Indeed,
experience in participatory action research has shown that a structured
discussion on specific issues of common interest, supported by a sensi
tive and diplomatic preparation and a shared information base, is likely
to lead to mutually agreable ‘solutions’. Suggestions for organizing,
designing and implementing such a workshop are provided below.
Recruiting participants and organizing the workshop
In principle, it is desirable to involve in a participatory planning work
shop a variety of social actors, both internal and external to the commu
nity. Besides the interest groups that participated in the PAR process, this
may include the community leadership and various partner institutions
with a stake in the natural resources or economic development, educa
tion, health services, etc., as appropriate. For ensuring real participation
and keeping group dynamics under control, it is advisable that not more
than about 30 persons take active part in the event.
Keeping the planning workshop to a manageable size means that all the
potential partners should be encouraged to identify suitable representa
tives. Ideally, each would be represented by the same number of delegates
it is now time to contact
the relevant potential
partners andjointly
negotiate a plan to
implement the priority
actions agreed upon by
the community

reasonable approaches to
the identification of
representatives could be
designation (appointment),
election or volunteering
(two to four) so that a numerical balance is maintained. Depending on
the internal structure and dynamics of the various groups, reasonable
approaches to the identification of such people could be designation
(appointment), election or volunteering. In any case, groups and institu
tions need to be encouraged and allowed to make their own selections,
provided that the chosen delegates are entitled to a reasonable amount of
negotiating power and authority on behalf of the group. Otherwise, their
contributions could later be discounted or de-legitimized.
In some cases, it may be difficult to obtain the necessary support from
government agencies, which may need to be persuaded to send a repre
sentative to the planning workshop. The support team may play a useful
role in convincing local agencies of the importance of assisting commu
nities in participatory appraisal and planning exercises, and of the need
for their full support.
To ensure actual involvement of every participant and proper inter
change of ideas, the design of the workshop should be based on a bal
anced mix of small group activities and plenary discussions. A possible
list of activities to share information and elaborate a joint plan in the
workshop is presented in Box 5.1. Further general suggestions include
the following:
• The community is in charge of organization and logistics. Even if
an external budget is available, equitable cost-sharing by the commu
nity is recommended. Local residents might be able to assist with a
venue, contributions of food and cooking fuel, help with cooking, etc.
Most of all, the workshop should be owned by the community and
the PAR support team must make clear that they are present to assist,
but they are not in charge. One or more local persons should be des
ignated focal points for organization and logistics.
• Finalize in advance a ‘procedural’ understanding. This is an
understanding among all the expected participants and chairing per
sons covering the workshop objectives, agenda, duration, organiza
tion, logistics and criteria for the selection of participants.
• Plan the workshop’s timing and schedule carefully. The length of
the workshop might vary according to the number of topics to be dis
cussed, the number of participants and the methods to be employed.
As a rule of thumb, a participatory planning workshop should not last

Box 5.1
Possible program for a two-day participatory planning workshop
First day – morning
Opening ceremony:
Local authorities and/or or religious leaders as appropriate
Plenary session:
Explanation of the agenda by the chair and introduction of the facilitators and/or resource
persons, as appropriate (members of the PAR support team may play some of these roles)
Plenary session:
Presentations and discussions of the results of the participatory appraisal and analysis (prob
lems, opportunities) and of the remedial actions prioritized by the community.
First day – afternoon
Work in small groups:
Formation and organizing of work space for the small groups, each dedicated to one specific
action to be implemented. Each group is composed of the expected partners in the implemen
tation of the action.
Personal introductions and statements of desired results by all small group participants.
Illustration of proposed solutions and actions (discussion of action matrices, Tables 5.1 a-c)
Second day – morning
Work in small groups:
Discussion of actions in detail, in particular regarding feasibility, potential conflicts, timings
and divisions of tasks and responsibilities (possible discussion of feasibility matrices as in
Table 5.3a-c and planning matrices as in Table 5.4a-c)
Second day – afternoon
Plenary session:
Presentation of the results of the work in small groups by the group spokespersons, and dis
cussion by all participants.
Process comments by member of PAR support team
Summary of results by chair of workshop, with indication of expected next steps and accom
plishments in the future
Group evaluation of the workshop
Closing ceremony:
Authorities, refreshments, etc.
less than half a day nor more than three days. A weekend or any local
ly acknowledged rest day during the week can be appropriate for
maximizing attendance by various representatives. In some situa
tions, it works well to break the workshop program into two sessions,
interest group that
proposes a certain
‘solution’ will be
appropriately matched
with institutions that have
mandate and capacity to
deal with the subject
different environmental and population issues, as well as the need to
coordinate efforts among various government agencies, local interest
groups and other actors.
Negotiating a suitable course of action
Once a common information base is shared among all the participants,
Small working groups are the most appropriate way to discuss the pro
posed solutions and actions in more detail. It is desirable that these
groups consist of representatives from the concerned interest groups plus
representatives of the institutions that were identified as potential part
ners in the appraisal phases. Likely, the interest group that proposes a
certain solution (e.g., strengthening family planning services, support
ing community-based soil management, creating a rotating fund for
young people's enterprises, etc.) will be appropriately matched with
institutions that have mandate and capacity to deal with the subject (e.g.,
health departments of the central or local governments, agricultural
or environmental NGOs, international development agencies, etc.). If
needed, members of the support team can participate as facilitators.
Once a working group is formed, it is good if people introduce them
selves and state what they would like to achieve from the workshop. A
facilitator can then initiate the working session itself by asking the inter
est group representatives to summarize briefly what they are suggesting
to do and what kind of support they may need from the partners con
vened. After this beginning, the potential partners’ representatives will
comment, ask questions and present alternative options. The facilitator
can use open-ended questions to help elicit comments about how the
solution and required support fit with the institutional mandates, policies
and resource capabilities of the participants in the small group.
Answers and other key points can be recorded (on flipchart, chalkboard,
etc.) for the group to use in their discussion. In case the solution and
relative action are acceptable and feasible for the partners, the terms of
reference of the collaboration could be drafted by summarizing or high
lighting the main points of the discussion on the flipchart or chalkboard
(the participants should confirm whether the facilitator's phrasing really
catches the meaning of what has been said). Planning for action involves
deciding which specific activities should be carried out by whom, where,
when and with what means. In other words, the following questions
should be clearly answered:
pants’understandingoftheinter-linkagesexistingbetweendifferent
problems,solutionsand–ingeneral–factorsshapingtheenvironment,
healthandpopulationsituationofthecommunity.
Oralpresentationsbyinterestgroupmembersareperhapsthebestway
toconveythePARinformation.Conductingthesessionsinthiswaycar
riesthemessagethatwhateverispresentedistheresultofalearningpro
cesswhosemainactorsarecommunitymembers.Aswiththecommu
nityfeedbackmeetingdescribedinsection5.2,thesepresentationsneed
tobeadequatelypreparedbeforehand,aswellasbeingshort(about10
minutes)andtothepoint.Someposterdrawingssetupinthemeeting
roomorwrittenhandoutsmadeavailabletotheworkshopparticipants
canbeusefulinsupportingthepresentations.
Aftereachpresentation,areasonableamountoftimeforclarification
anddiscussionisnecessary.Membersoftheinterestgroupcantake
advantageofquestionsorcommentsraisedbytheaudiencetoprovide
furtherinformationwhich,duetotimeconstraints,theywerenotableto
includeinthepresentation.Thediscussioncanalsoleadtonewwaysof
lookingatissuesthroughthegeneralcontributions.
ThePARsupportteamhassomeimportantfacilitationfunctionsto
performinthesepresentationanddiscussionsessions.Theseinclude:
•assistingthechairinclarifyingthemodalitiesofgroupwork,presen
tations,etc.;
•assistingthechairincoordinatingpresentationsandthequestion
and-answerdiscussionstoensurethattheworkshopiskepton
schedule;
•assistinginvisuallyrecording(e.g.,onaflipchartorchalkboard)the
keypointsarisingfromtheplenarydiscussions(atbest,however,this
isdonebymembersoftheinterestgroups);
•keepingarecordoftheproceedingsthroughnote-taking.
Matricesandnotescanbeusedattheendoftheseriesofpresentations
anddiscussionsforconcludingthesession.Thistaskincludesavery
briefovervieworsummaryofwhathasoccurred.Insomecases,itis
appropriatefortheoverviewtobedonebyamemberofthesupport
team.Thisisagoodtimetostresstheinter-linkagesexistingamong
sharingtheinformation
generatedbytheappraisal
andfeasibilityanalysis...
facilitatetheparticipants’
understandingofthe
inter-linkagesexisting
betweendifferent
problems,solutionsand
factorsshapingthe
environment,healthand
populationsituationof
thecommunity
PARanalysisandplanning167

interestgroupthat
proposesacertain
‘solution’willbe
appropriatelymatched
withinstitutionsthathave
mandateandcapacityto
dealwiththesubject
168OurPeople,OurResources
differentenvironmentalandpopulationissues,aswellastheneedto
coordinateeffortsamongvariousgovernmentagencies,localinterest
groupsandotheractors.
Negotiatingasuitablecourseofaction
Onceacommoninformationbaseissharedamongalltheparticipants,
smallworkinggroupsarethemostappropriatewaytodiscussthepro
posedsolutionsandactionsinmoredetail.Itisdesirablethatthese
groupsconsistofrepresentativesfromtheconcernedinterestgroupsplus
representativesoftheinstitutionsthatwereidentifiedaspotentialpart
nersintheappraisalphases.Likely,theinterestgroupthatproposesa
certainsolution(e.g.,strengtheningfamilyplanningservices,support
ingcommunity-basedsoilmanagement,creatingarotatingfundfor
youngpeople'senterprises,etc.)willbeappropriatelymatchedwith
institutionsthathavemandateandcapacitytodealwiththesubject(e.g.,
healthdepartmentsofthecentralorlocalgovernments,agricultural
orenvironmentalNGOs,internationaldevelopmentagencies,etc.).If
needed,membersofthesupportteamcanparticipateasfacilitators.
Onceaworkinggroupisformed,itisgoodifpeopleintroducethem
selvesandstatewhattheywouldliketoachievefromtheworkshop.A
facilitatorcantheninitiatetheworkingsessionitselfbyaskingtheinter
estgrouprepresentativestosummarizebrieflywhattheyaresuggesting
todoandwhatkindofsupporttheymayneedfromthepartnerscon
vened.Afterthisbeginning,thepotentialpartners’representativeswill
comment,askquestionsandpresentalternativeoptions.Thefacilitator
canuseopen-endedquestionstohelpelicitcommentsabouthowthe
solutionandrequiredsupportfitwiththeinstitutionalmandates,policies
andresourcecapabilitiesoftheparticipantsinthesmallgroup.
Answersandotherkeypointscanberecorded(onflipchart,chalkboard,
etc.)forthegrouptouseintheirdiscussion.Incasethesolutionand
relativeactionareacceptableandfeasibleforthepartners,thetermsof
referenceofthecollaborationcouldbedraftedbysummarizingorhigh
lightingthemainpointsofthediscussionontheflipchartorchalkboard
(theparticipantsshouldconfirmwhetherthefacilitator'sphrasingreally
catchesthemeaningofwhathasbeensaid).Planningforactioninvolves
decidingwhichspecificactivitiesshouldbecarriedoutbywhom,where,
whenandwithwhatmeans.Inotherwords,thefollowingquestions
shouldbeclearlyanswered:

166OurPeople,OurResources
respectivelydevotedtoinformationsharinganddecision-making,
whicharecarriedoutontwoconsecutiveweeksontheappropriate
restdays.Thiscanhelpparticipantstodigesttheinformationand,if
needed,consulttheircolleaguesandleadersaboutacceptablecom
mitmentstobetaken.
•Havetheworkshopinanappropriatesetting.Theworkshopvenue
needstobecomfortable(accordingtolocalstandards)andreason
ablyprotectedfromexternalinterference,yetnottotallyisolated
fromtheplacesofdailylife.
•Payattentiontothecommunicationsupport.Participantsand
otherinterestedpersonswillappreciateshortsummariesofthemain
findingspreparedandmadeavailablepriortotheworkshop.During
theworkshop,presentationsshouldbeveryshort(i.e.,nolongerthan
10–15minuteseach)andsupportedbyvisualaids.Ifneeded,trans
latorsshouldbeavailable.
•Facilitateofficialacknowledgmentoftheworkshop.Conductinga
formalopeningandclosingofthemeetingaccordingtolocalproto
colhelpsallpartiestoaccepttheimportanceoftheinformationbeing
sharedandtheseriousnessofcommitmentsbeingmade.Ifpossible,
theopeningandclosingwillincludetheparticipationoflocalcivil
andreligiousauthorities.
•Takecareofdetails.Itisveryusefultomakealistofalltheequip
ment,supplies,materialsandtoolsthatmaybeneededandtocheck
thateverythingisavailablebeforestartingtheworkshop.Thesupport
teammayassisttoanticipateandmakeprovisionsaheadoftimefor
itemsandsuppliesnoteasilyfoundinruralareas,suchaslights,
audio-visualequipment(ifappropriate),stationeryandaphotocopier.
Sharingtheappraisalandfeasibilityanalysisinformation
Sharingtheinformationgeneratedbytheappraisalandfeasibility
analysisexercisesamonginterestgroupsandotherlocalactorsis
thefirsttasktobeaccomplishedduringtheworkshop.Forthis,each
interestgroupmaybrieflyrecounttheproblemtheywishtotackle,their
analysisofcausesandeffects,thesolutiontheyhaveidentified,the
actionsnecessarytoachievethesolutionandwhythecommunity
believesthattheactionisfeasibleandcanwork.Exchangeoftheseele
mentsinplenarywillhelptheexternalpartnersgetonboardwiththe
resultsofthePARprocesssofar.Moreover,itwillfacilitatethepartici

Box5.1
Possibleprogramforatwo-dayparticipatoryplanningworkshop
Firstday–morning
Openingceremony:
Localauthoritiesand/ororreligiousleadersasappropriate
Plenarysession:
Explanationoftheagendabythechairandintroductionofthefacilitatorsand/orresource
persons,asappropriate(membersofthePARsupportteammayplaysomeoftheseroles)
Plenarysession:
Presentationsanddiscussionsoftheresultsoftheparticipatoryappraisalandanalysis(prob
lems,opportunities)andoftheremedialactionsprioritizedbythecommunity.
Firstday–afternoon
Workinsmallgroups:
Formationandorganizingofworkspaceforthesmallgroups,eachdedicatedtoonespecific
actiontobeimplemented.Eachgroupiscomposedoftheexpectedpartnersintheimplemen
tationoftheaction.
Personalintroductionsandstatementsofdesiredresultsbyallsmallgroupparticipants.
Illustrationofproposedsolutionsandactions(discussionofactionmatrices,Tables5.1a-c)
Secondday–morning
Workinsmallgroups:
Discussionofactionsindetail,inparticularregardingfeasibility,potentialconflicts,timings
anddivisionsoftasksandresponsibilities(possiblediscussionoffeasibilitymatricesasin
Table5.3a-candplanningmatricesasinTable5.4a-c)
Secondday–afternoon
Plenarysession:
Presentationoftheresultsoftheworkinsmallgroupsbythegroupspokespersons,anddis
cussionbyallparticipants.
ProcesscommentsbymemberofPARsupportteam
Summaryofresultsbychairofworkshop,withindicationofexpectednextstepsandaccom
plishmentsinthefuture
Groupevaluationoftheworkshop
Closingceremony:
Authorities,refreshments,etc.
lessthanhalfadaynormorethanthreedays.Aweekendoranylocal
lyacknowledgedrestdayduringtheweekcanbeappropriatefor
maximizingattendancebyvariousrepresentatives.Insomesitua
tions,itworkswelltobreaktheworkshopprogramintotwosessions,
PARanalysisandplanning165
• What is to be achieved?
• What specific skills are needed?
• Who will be responsible?
• Who will actually do what?
• Where will activities take place?
• When will the activities occur (e.g., in relation to seasons and other
pre-set activities of the community), and for what duration will they
be happening?
• What material inputs will be needed (e.g., seeds, tools, family plan
ning supplies, etc.) and how will they be provided or gathered?
• How much money is required, and from what source(s) is it to be
provided?
In planning for specific activities in the community, it will be important
to establish the ownership of the project. In this context, ownership
relates to responsibility and control, especially for taking on-going deci
sions and distributing benefits. If this issue is not specifically clarified,
participants may simply assume that the ownership is commonly
understood only to run into conflict when multiple perceptions become
apparent (e.g., at the time of distributing benefits). Clear statements in
the planning phases will help avoid subsequent disputes.
In order to implement one or more portions of the plan, the interest
groups and/or pre-existing institutions in the community may wish to
become more formalized, with rules of membership and procedures.
Such groups will be stronger and more sustainable if they formulate a
simple set of by-laws. Facilitators can guide this process by asking some
basic questions like the ones in Box 5.2. Since many of these questions
need to be answered by all the members of the relevant groups, further
meetings may need to be scheduled to clarify all the points. These new
or strengthened pre-existing institutions may be a most important and
lasting benefit of the PAR process.
A good plan will include a monitoring component, i.e., a set of state
ments indicating how and by whom the implementation process will be
checked to ensure that activities are taking place as planned and that the
desired results are occurring (see Chapter 6 for more on monitoring and
evaluation). Members of the monitoring task group can assess inputs and
interest groups and/or
pre-existing institutions
in the community may
wish to become more
formalized, with rules of
membership and
procedures
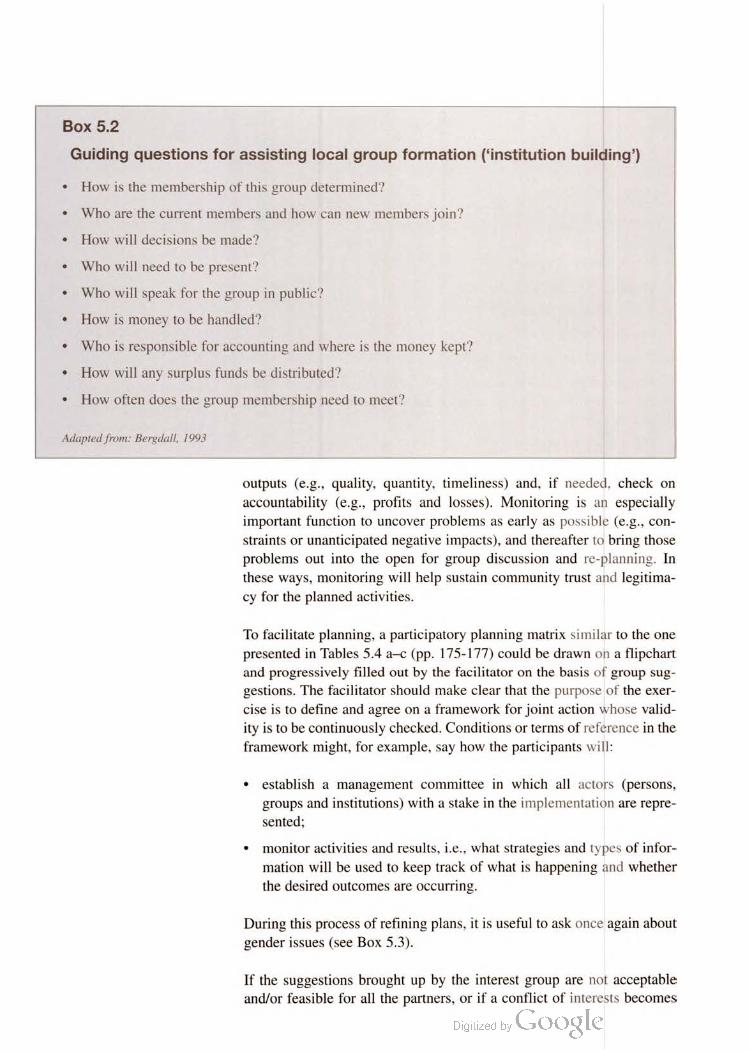
Box 5.2
Guiding questions for assisting local group formation (institution building')
• How is the membership of this group determined?
• Who are the current members and how can new members join?
• How will decisions be made?
• Who will need to be present?
• Who will speak for the group in public?
• How is money to be handled?
• Who is responsible for accounting and where is the money kept?
• How will any surplus funds be distributed?
• How often does the group membership need to meet?
Adapted from: Bergdall, 1993
outputs (e.g., quality, quantity, timeliness) and, if needed, check on
accountability (e.g., profits and losses). Monitoring is an especially
important function to uncover problems as early as possible (e.g., con
straints or unanticipated negative impacts), and thereafter to bring those
problems out into the open for group discussion and re-planning. In
these ways, monitoring will help sustain community trust and legitima
cy for the planned activities.
To facilitate planning, a participatory planning matrix similar to the one
presented in Tables 5.4 a-c (pp. 175-177) could be drawn on a flipchart
and progressively filled out by the facilitator on the basis of group sug
gestions. The facilitator should make clear that the purpose of the exer
cise is to define and agree on a framework for joint action whose valid
ity is to be continuously checked. Conditions or terms of reference in the
framework might, for example, say how the participants will:
• establish a management committee in which all actors (persons,
groups and institutions) with a stake in the implementation are repre
sented:
• monitor activities and results, i.e., what strategies and types of infor
mation will be used to keep track of what is happening and whether
the desired outcomes are occurring.
During this process of refining plans, it is useful to ask once again about
gender issues (see Box 5.3).
If the suggestions brought up by the interest group are not acceptable
and/or feasible for all the partners, or if a conflict of interests becomes

Box 5.3
A reality check for common initiatives: gender roles
Consider the initiative just planned, including the primary activities, their ongoing management
and monitoring and the distribution of benefits.
Which of the planned activities are traditionally done by women? Which are traditionally done
by men? Who has the best knowledge and skills to carry them out?
Will any gender group be disadvantaged by the planned activities? How, specifically? What can
be done to remedy or mitigate the disadvantage?
Will traditional gender roles cause any problems in successfully completing the tasks? If yes,
how might these problems be overcome?
Will there be any gender-differential in the distribution of benefits? What, specifically? What
can be done to remedy that?
apparent, further efforts will be needed to explore the nature of the dif
ficulties until the parties have reached an agreement.
Managing conflicts
The success of a participatory planning workshop depends on the willing
ness of participants to share information and make common decisions.
Involving local actors in such a process is a sensitive task, in which the
PAR support team can provide good human, diplomatic and organiza
tional support. There are many potential sources of conflict, including
contrasting economic and status interests, ethnic and cultural differ
ences, previous misunderstandings between the community and govem
ment or NGO representatives, bad records in personal relationships,
family grudges and individual rivalries. Any of these can act against the
efforts of the interest groups to establish agreements.
When there are strongly conflicting interests, it is generally wiser to
acknowledge the difficulty of solving most of these conflicts and con
centrate on suitable means of managing them. Experts in conflict man
agement have identified three basic strategies for addressing a conflict:
negotiation, mediation and conciliation (see Figure 5.4) The support
team can assist in the use of such strategies if and when needed in the
planning workshop. In all likelihood, conflicts that are serious and com
plex enough would surface and be dealt with before the workshop. If
they come out during the workshop, the postponement of decisions may
be needed.
Negotiation is a voluntary process in which parties meet face-to-face to
reach a mutually acceptable resolution of a conflict issue. Mediation is
the assistance of a neutral third party to bring about a negotiation pro
cess. Conciliation is an attempt by a neutral third party — such as the
471
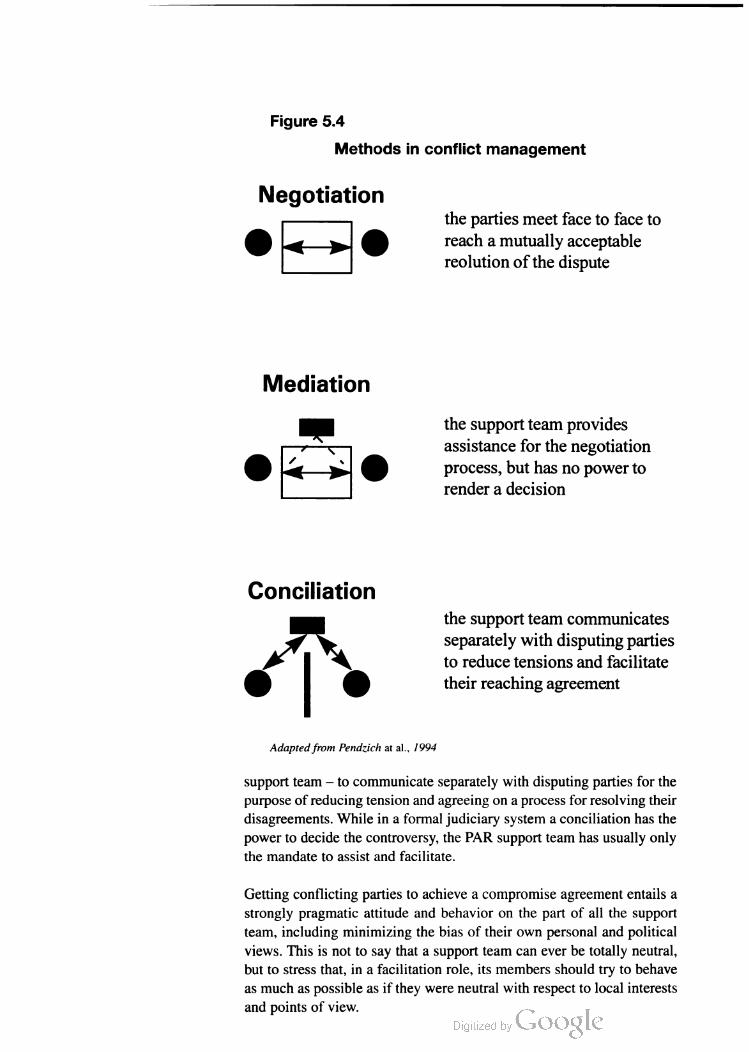
Figure 5.4
Methods in conflict management
Negotiation
the parties meet face to face to
reach a mutually acceptable
reolution of the dispute
Mediation
the support team provides
assistance for the negotiation
process, but has no power to
render a decision
Conciliation
the support team communicates
separately with disputing parties
to reduce tensions and facilitate
their reaching agreement
Adapted from Pendzich at al., 1994
support team – to communicate separately with disputing parties for the
purpose of reducing tension and agreeing on a process for resolving their
disagreements. While in a formal judiciary system a conciliation has the
power to decide the controversy, the PAR support team has usually only
the mandate to assist and facilitate.
Getting conflicting parties to achieve a compromise agreement entails a
strongly pragmatic attitude and behavior on the part of all the support
team, including minimizing the bias of their own personal and political
views. This is not to say that a support team can ever be totally neutral,
but to stress that, in a facilitation role, its members should try to behave
as much as possible as if they were neutral with respect to local interests
and points of view.
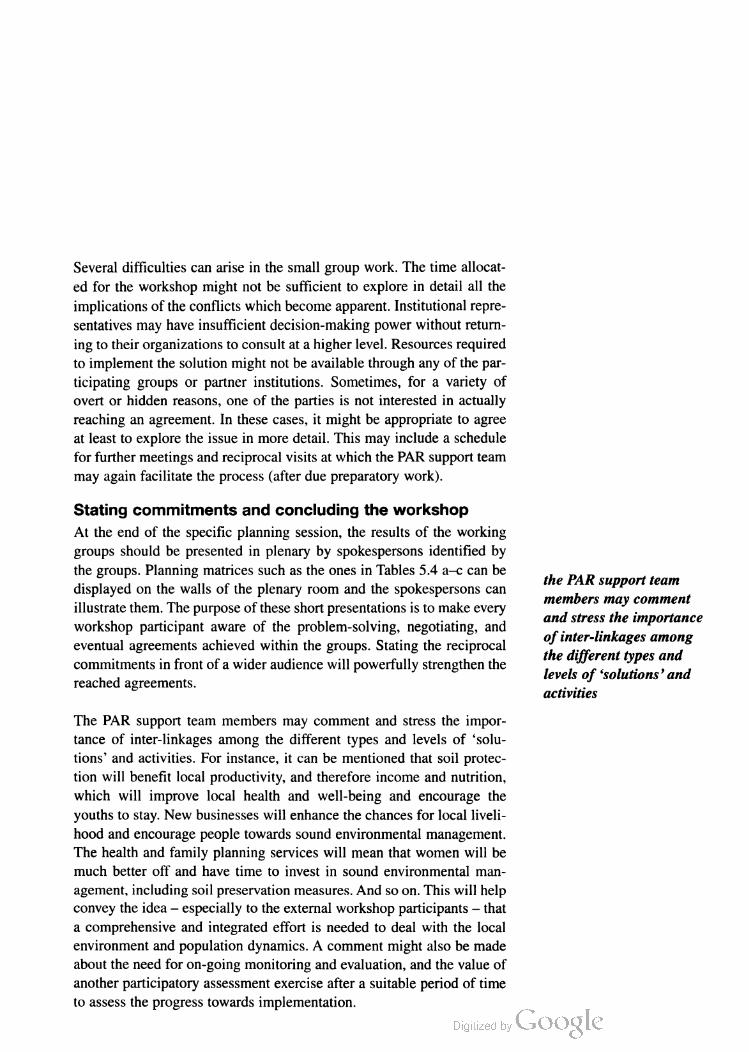
Several difficulties can arise in the small group work. The time allocat
ed for the workshop might not be sufficient to explore in detail all the
implications of the conflicts which become apparent. Institutional repre
sentatives may have insufficient decision-making power without return
ing to their organizations to consult at a higher level. Resources required
to implement the solution might not be available through any of the par
ticipating groups or partner institutions. Sometimes, for a variety of
overt or hidden reasons, one of the parties is not interested in actually
reaching an agreement. In these cases, it might be appropriate to agree
at least to explore the issue in more detail. This may include a schedule
for further meetings and reciprocal visits at which the PAR support team
may again facilitate the process (after due preparatory work).
Stating commitments and concluding the workshop
At the end of the specific planning session, the results of the working
groups should be presented in plenary by spokespersons identified by
the groups. Planning matrices such as the ones in Tables 5.4 a-c can be
displayed on the walls of the plenary room and the spokespersons can
illustrate them. The purpose of these short presentations is to make every
workshop participant aware of the problem-solving, negotiating, and
eventual agreements achieved within the groups. Stating the reciprocal
commitments in front of a wider audience will powerfully strengthen the
reached agreements.
The PAR support team members may comment and stress the impor
tance of inter-linkages among the different types and levels of solu
tions and activities. For instance, it can be mentioned that soil protec
tion will benefit local productivity, and therefore income and nutrition,
which will improve local health and well-being and encourage the
youths to stay. New businesses will enhance the chances for local liveli
hood and encourage people towards sound environmental management.
The health and family planning services will mean that women will be
much better off and have time to invest in sound environmental man
agement, including soil preservation measures. And so on. This will help
convey the idea – especially to the external workshop participants – that
a comprehensive and integrated effort is needed to deal with the local
environment and population dynamics. A comment might also be made
about the need for on-going monitoring and evaluation, and the value of
another participatory assessment exercise after a suitable period of time
to assess the progress towards implementation.
the PAR support team
members may comment
and stress the importance
of inter-linkages among
the different types and
levels of solutions’ and
activities
summaries of the
agreements can be posted
at one or more suitable
community locations as
large semi-permanent
displays
It is important that the process itself be evaluated by the participants. The
workshop participants should share their assessments of the procedures
used and the results of the exercise (be aware that a courtesy bias’ may
prevent participants from sharing negative assessments and thus encour
age them to do so, if appropriate).
Copies of the final plans of action can be circulated among the interest
ed people in the community and outside. In addition, summaries of the
agreements can be posted at one or more suitable community locations
as large semi-permanent displays, which may include graphics or pic
tograms to aid non-literate members of the community.
An official closing ceremony and a customary social event can be very
appropriate to acknowledge the work of the interest groups and other
participants in the planning workshop.

Exampleoffilledparticipatoryplanningmatrices;interestgroupofmothersofyoungchildren(“Amada’,1997)
Whatdowewanttoaccomplish?Tohaveinthecommunityahealthpostrunbyalocalwoman,capableofhelpingustoimprovefamilyhealthand
havethenumberofchildrenwedesire.
Whatdoweneed
Fromwhere
Howwillaccomplishment
Whatshouldwedo?Bywhen?fordoingit?dowegetit?WhoWilldoit?beassessed?
PreparealistofpossibleJune1997DiscussthematterintheChiefs,womenMembersoftheListprepared
candidatesfittingcommunity,heartheleaders,healthinterestgroup
requirements(includingopinionofthetraditionalworkers
familypermission)birthattendants
OfficialselectionofJuly1997LargeconsensusintheMembersoftheinterest|Decisionmadewiththe
community
group,communitycouncil,communityassembly
participationofallcommunityfamilies
Registrationtothecourse
August1997
Ticketandperdiemto
gettotheDistrict
Contributionof
communitymembers
Onememberofthe
interestgroupandthe
Candidateacceptedand
registered
Headquartersraisedduringmeetingappointedcandidate
ParticipationinthetrainingSept.-Dec.ScholarshipMinistryofHealthAppointedcandidateMother/childcareand
coursetobeheldinthe1997(assistedbythepersonfamilyplanningcertificate
DistrictHeadquartersresponsibleforhealthachievedbythe
onPARsupportteam)appointedcandidate
BuildingofhealthpostSept.-Dec.Localmaterials,labor,CommunitycouncilCommunitymen,women,Healthpostbuilt
accordingtoDistrictHealth1997cement,tin,nails,glass,DonorvialocalNGOyouthscoordinatedbytheaccordingtospecifications
Teamspecificationscorrugatedironcommunitycounciland
headoflocalNGO
EquippingthehealthpostJan.1998StandardhealthMinistryofHealthResponsiblestaffatHealthpostequipped
postequipmentDistrictHealthCenteraccordingtospecifications
Start-upofthepart-timeFeb1998SomebasiccapitalCollectionfromtheCommunityCouncilContractsigned,salary
contractforlocalhealth-carefortheyearcommunity,supportandheadofNGOdeliveredontime
personfromlocalNGO
DeliveryofsupplyandMarch1998||On-goingcommuni-DistrictHealthCenterMotherandchildcareFollow-upcarriedout
Table5.4a
candidate
post-trainingfollow-up
inthecommunity
cationwithDistrict
HealthCenter
andFPnursesuper visorinthedistrict
Supplyhandedin
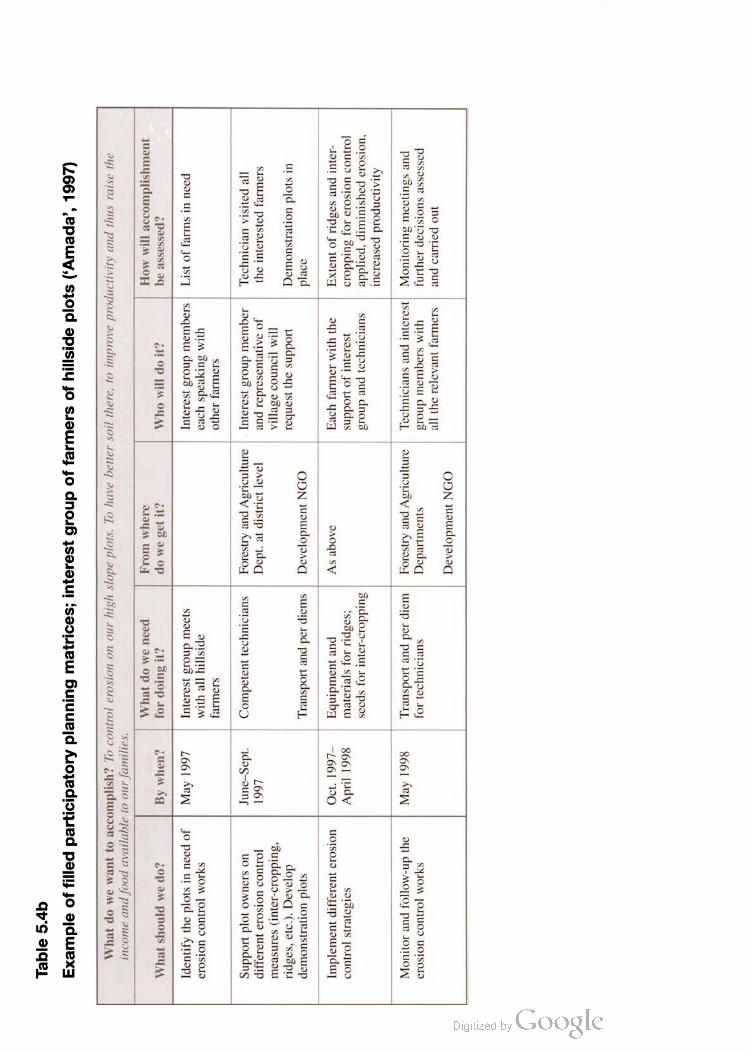
Table5.4b
Exampleoffilledparticipatoryplanningmatrices;interestgroupoffarmersofhillsideplots(‘Amada’,1997)
Whatdowewanttoaccomplish?Tocontrolerosiononourhighslopeplots.Tohavebettersoilthere,toimproveproductivityandthusraisethe
incomeandfoodavailabletoourfamilies.
Whatdoweneed
Fromwhere
Howwillaccomplishment
Whatshouldwedo?Bywhen?fordoingit?dowegetit?WhoWilldoit?beassessed?
IdentifytheplotsinneedofMay1997InterestgroupmeetsInterestgroupmembers|Listoffarmsinneed
erosioncontrolworkswithallhillsideeachspeakingwith
farmersotherfarmers
SupportplotownersonJune–Sept.Competenttechnicians|ForestryandAgriculture|Interestgroupmember|Technicianvisitedalldifferenterosioncontrol1997Dept.atdistrictlevelandrepresentativeoftheinterestedfarmers
measures(inter-cropping,villagecouncilwill
ridges,etc.).DeveloprequestthesupportDemonstrationplotsin
demonstrationplotsTransportandperdiemsDevelopmentNGOplace
Implementdifferenterosion|Oct.1997–EquipmentandAsaboveEachfarmerwiththeExtentofridgesandinter
controlstrategiesApril1998materialsforridges;supportofinterestcroppingforerosioncontrolseedsforinter-croppinggroupandtechniciansapplied,diminishederosion,
increasedproductivity
Monitorandfollow-uptheMay1998Transportandperdiem|ForestryandAgriculture|TechniciansandinterestMonitoringmeetingsand erosioncontrolworksfortechniciansDepartmentsgroupmemberswithfurtherdecisionsassessed
DevelopmentNGO
alltherelevantfarmers
andcarriedout
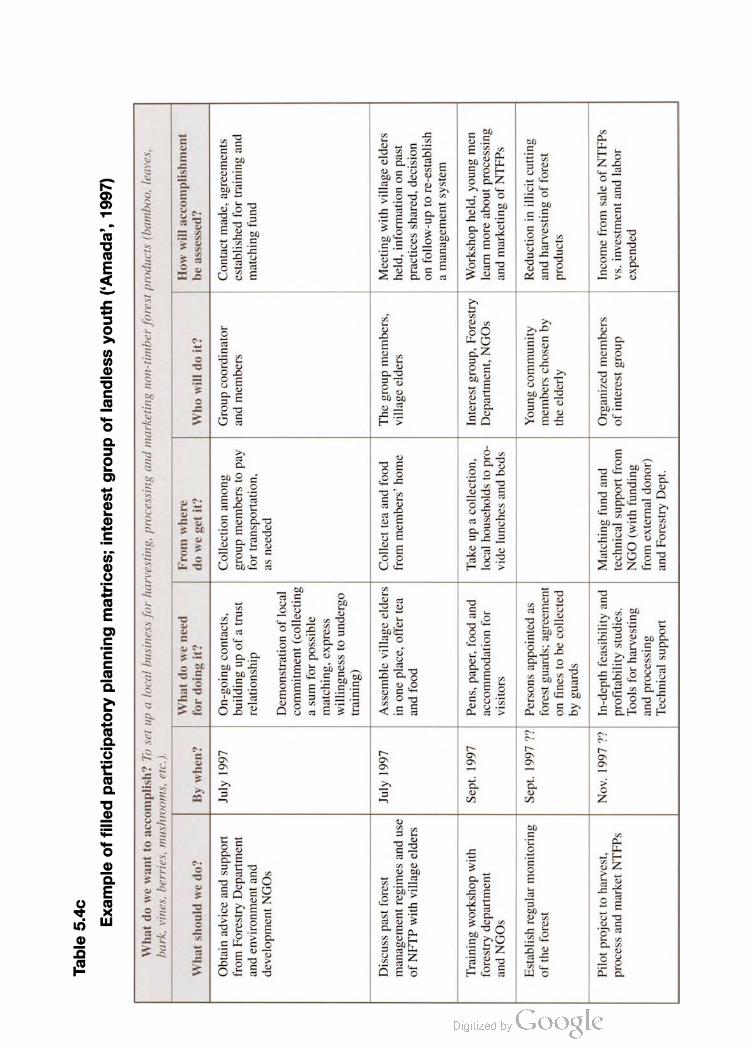
Exampleoffilledparticipatoryplanningmatrices;interestgroupoflandlessyouth(Amada’,1997)
Whatdowewanttoaccomplish?Tosetupalocalbusinessforharvesting,processingandmarketingnon-timberforestproducts(bamboo,leaves,
bark,vines,berries,mushrooms,etc.).
Whatdoweneed
Fromwhere
Howwillaccomplishment
Whatshouldwedo?Bywhen?fordoingit?dowegetit?Whowilldoit?beassessed?
ObtainadviceandsupportJuly1997On-goingcontacts,CollectionamongGroupcoordinatorContactmade,agreementsfromForestryDepartmentbuildingupofatrustgroupmemberstopayandmembersestablishedfortrainingand
andenvironmentandrelationshipfortransportation,matchingfund
developmentNGOsasneeded
Demonstrationoflocal commitment(collecting
asumforpossible matching,express
willingnesstoundergo
training)
DiscusspastforestJuly1997Assemblevillageelders|CollectteaandfoodThegroupmembers,Meetingwithvillageelders
managementregimesanduseinoneplace,offerteafrommembers’homevillageeldersheld,informationonpast ofNFTPwithvillageeldersandfoodpracticesshared,decision
onfollow-uptore-establish
amanagementsystem
TrainingworkshopwithSept.1997Pens,paper,foodandTakeupacollection,Interestgroup,Forestry|Workshopheld,youngmen
Table5.4c
forestrydepartment
andNGOs
accommodationfor
visitors
localhouseholdstopro videlunchesandbeds
Department,NGOs
learnmoreaboutprocessing
andmarketingofNTFPs
Establishregularmonitoring
oftheforest
Sept.1997??
Personsappointedas
forestguards;agreementonfinestobecollected
byguards
Youngcommunitymemberschosenby
theelderly
Reductioninillicitcutting
andharvestingofforest
products
Pilotprojecttoharvest,
processandmarketNTFPs
Nov.1997??
In-depthfeasibilityand
profitabilitystudies. Toolsforharvesting
andprocessing
Technicalsupport
Matchingfundand
technicalsupportfrom
NGO(withfundingfromexternaldonor)
andForestryDept.
Organizedmembers
ofinterestgroup
IncomefromsaleofNTFPs
vs.investmentandlabor
expended

6. PAR on population dynamics
and the local environment:
learning by doing

A peculiarity of participatory action research is that the phases of infor
mation gathering, appraisal, analysis and planning continue into the
implementation phase. The researchers, planners, implementers and ben
eficiaries are one and the same, working for themselves to improve their
livelihoods, their health and their environment. This chapter will describe
a process of learning by doing’ that is an integral part of project imple
mentation, and not a separate evaluation that comes only after the project
is completed. The example of Pallisa, first introduced in Chapter 1, is used
again to illustrate how plans and activities are refined as they are imple
mented.
6.1 Getting started
Organizing for action
Role of the PAR support team
6.2 Learning by doing
Participatory evaluation
Communicating findings and follow-up
External evaluation of the PAR process
6.3 Primary environmental care: moving forward in
Pallisa!
Community organizing
Meeting people's needs whilst caring for the local environment
A few practical matters
6.1 Getting started
Having successfully completed the planning phase of participatory
action research, the community can embark upon the difficult but
rewarding task of implementation. At this stage, interest group members,
external partners and other members of the community, as appropriate,
carry out the action plans developed during the planning workshop.
Though implementation may appear to be the long sought-after (and at
times elusive) goal which justifies the research and planning phases of
PAR, it is important to maintain a balanced perspective on the relative
value of each PAR component. In fact, the two early steps of PAR are as
important as the actual implementation, for they help to build the under
standing, commitment and sense of ‘ownership necessary to carry out
the initiatives. By the same token, unless there is an action component in
PAR, the whole process falls short of its potential, and people are likely
to become disheartened. Therefore, it is important that the momentum
built up during the research and planning phases is soon channeled into
concrete initiatives to solve specific problems.
A few key factors should be considered:
• implementation demands good coordination and an explicit attribu
tion of responsibilities;
• time lines are important for keeping initiatives on track;
• financial and material resources need to be procured sufficiently in
advance of project activities, so that they do not constitute bottle
necks to implementation.
The last two points are addressed in the participatory planning matrices
presented in Chapter 5 (Tables 5.4 a-c). In the following sections the roles
of the interest group coordinators and the PAR support team are addressed.
Organizing for action
It is important to the success of the initiative that one or a few people
assume responsibility for coordinating activities (see Box 6.1). The
coordinator role could be an elected position, or a position that rotates
among members of a group. The coordinator ensures that the priority
actions decided at the planning workshop do get implemented and
that meetings of the relevant partners are held on a regular basis. Such
meetings facilitate communication among the various actors and are
unless there is an action
component in PAR, the
whole process falls short
of its potential, and people
are likely to become
disheartened
Box 6.1
Managing for an “enabling environment
Under traditional, bureaucratic forms of organization, managers hold decision-making and planning
authority. Problem-solving is the domain of top managers, and problems are passed up the ladder
for solutions. Power is concentrated at the top, and those at lower levels fear making decisions or
taking initiative because they may be reprimanded for stepping out of line or making mistakes.
In an enabling environment, the manager becomes a coordinator. Coordination involves facilitat
ing relationships between people and events. A good coordinator helps to place people in such a
way that they can develop good relationships with each other and carry out work effectively.
A coordinator helps to support, build and challenge the actions of groups, and does not foster com
petition or dependency. A coordinator helps to build teams and groups so that they themselves
become self-directing, self-starting and self-managing. Creativity and taking initiative on the local
levels are encouraged.
Communication is based on dialogue. Those most affected and directly related to a task take
responsibility for that work. Orders are never given. Work is seen as a mutual task to be done and
a mutual learning process. The important principle is to have clear, transparent and open forms of
communication which everyone in the organization knows about.
Problem-solving and decision-making are done by the appropriate work group or the community.
Local work groups have guidelines and policies to help them, but the more responsibility taken by
the smallest unit, the more productive and the more self-managing the community can become.
The way the group works is decided by that group itself. They decide their own procedures based
on the goals and direction of the initiative, their particular area of work and their strengths and
weaknesses.
Adapted from: Hope and Timmel, 1984
crucial for monitoring process and outputs. In addition to the overall
coordinator of activities, the interest groups may wish to elect other
“responsible persons’. These individuals can follow up activities more
specifically related to one issue or problem, or to broad subjects of
importance to the interest group. A specific individual may also be
selected to monitor all the planned activities and report on those to the
village council or other relevant body.
The implementation phase may also benefit from an advisory council.
Ideally, the council would be composed of respected individuals with an
interest in community well-being, but without a direct vested interest in
the outcome of the specific actions. Male and female elders, school
teachers and even professionals residing outside the community may be
appropriate. The benefit of institutionalizing the PAR in this way is that
it broadens participation by community members (and non-members)

Case Example 6.1
Women and natural resource conservation in Pakistan
Conservation of water is a critical issue in the Kanak Valley of Balochistan Province in Pakistan.
The FAO Upland Conservation and Development Project has, since its inception phase in 1992,
promoted involving women as part of the overall strategy for participatory watershed manage
ment. Empowerment entails a lengthy process stressing women's increased participation in eco
nomic, social, political and environmental decision-making as active community members. The
project used the slide language technique among newly formed women's associations at the village
level in Kanak Valley. It is through this technique that women have come to own the issue of dimin
ishing water resources and to take action. A woman from each association was assigned a camera,
and was asked to take random photographs of environmental issues. The women, as it happened, pre
ferred to take photographs to accompany a story line with a definite message. Once all the associa
tions had taken a series of photographs, a convention was held to select the best set.
The winning slide show was narrated with the following story: “Thirty years ago our area was very
beautiful and prosperous. Most of the population depended on agriculture and livestock rearing.
The surrounding fields and mountains were green and sweet-smelling. People could gather fuel
wood and fodder for animals from one area for many months, and there were never shortages.
People used kareze water (underground water courses) for irrigation purposes. Everyone had
access to the water. With the arrival of the development era", electricity was installed in Noza sub
watershed. People gradually became aware that landowners were not satisfied with the income
they were receiving from crops and orchards irrigated by kareze water. They decided that if they
installed tubewells they could increase their income dramatically. Solandlords started digging and
putting in tubewells. When the tubewells were ready, landlords began increasing the number of
orchards. More and more land was cultivated and turned into orchards and vineyards. Landlords
started making lots and lots of money and became very wealthy. The groundwater level started
dropping and the karezes dried up. Vegetation cover started drying and disappearing. People are
having problems finding fuel and fodder for animals. Life is becoming more and more harsh and
difficult. Sometime women spend six hours a day going in search of drinking water. The green
fields have turned into desert. Beautiful villages have disappeared because we had to move as the
water sources dried up or became saline. Our future is nothing but ruins, unless we act together to
try to solve this problem.”
From this description of the problem of lowering water tables, and the accompanying slides, the
women's association developed the following proposed solutions:
• The FAO project should assist villagers in the area to organize a meeting of landlords, absen
tee tubewell owners, and owners of the upland. These people need to discuss this serious prob
lem and propose actions that they can implement themselves to use water in a better way. These
people own the resources and have the power to do something.
• People should work with the project to construct check dams whenever possible and they
should plant trees around these dams.
• Owners of wells are wasting large amounts of water. The project should have a policy enforced
that would require owners of tubewells to invest in trickle irrigation.
Adapted from: Kane, 1996
and draws on a wider body of expertise. It may also help to ensure that
the PAR process is carried forward, and that there is accountability on
the part of coordinators and others involved.
Role of the PAR support team
In keeping with the primary environmental care approach, PAR is aimed
at empowering communities to address problems that they have identi
fied and defined. By supporting the community in a systematic review of
their problems, opportunities and constraints, by working with them to
develop a plan of action and by supporting them to gather the resources
and agreements necessary to implement it, an effective support team
helps them to gain new confidence, new avenues and new alliances for
their own welfare.
Usually, the participatory appraisal and planning phases are the time of
maximum involvement of the support team. Yet, the members of the
team can still play an advisory role during the implementation phase,
and may be called upon for consultation when problems arise. Some
team members, particularly local field workers, will have regular inter
action with community members in the course of their work, and can
serve as valuable resources during the implementation phase.
In addition, the PAR support team can work with community members
to propose changes to government policies that are obstacles to commu
nity development, or meet with bankers in the capital to extend small
credit schemes in rural areas. It can also be called on by the community
to facilitate monitoring and evaluation activities. This can help to rein
force the tools and procedures the community has got acquainted with in
the original participatory appraisal and planning phases.
Care must be taken to critically evaluate assistance to the community.
For instance, team members need to avoid playing too big a role medi
ating between the community and outside agencies or authorities. Team
members may wish to introduce community members to potential
sources of technical or financial support, but the actual negotiating and
coordinating with those external agencies is best left to the community
itself. Too much help by a facilitator tends to undermine independence
and self-confidence in the same way that premature introduction of cap
ital inputs does: it can foster dependency rather than self-reliance and
sustainable development.
Too much help by a
facilitator tends to
undermine independence
and self-confidence in the
same way that premature
introduction of capital
inputs does: it can foster
dependency rather than
self-reliance
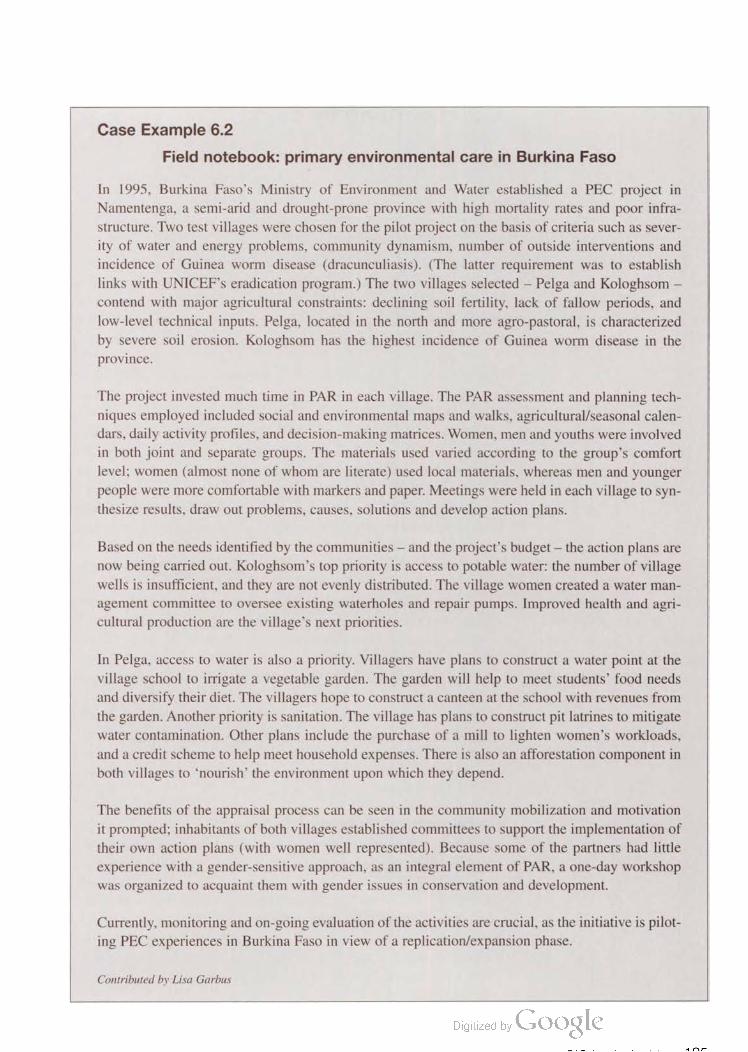
Case Example 6.2
Field notebook: primary environmental care in Burkina Faso
In 1995, Burkina Faso’s Ministry of Environment and Water established a PEC project in
Namentenga, a semi-arid and drought-prone province with high mortality rates and poor infra
structure. Two test villages were chosen for the pilot project on the basis of criteria such as sever
ity of water and energy problems. community dynamism. number of outside interventions and
incidence of Guinea worm disease (dracunculiasis). (The latter requirement was to establish
links with UNICEF’s eradication program.) The two villages selected — Pelga and Kologhsom —
contend with major agricultural constraints: declining soil fertility. lack of fallow periods, and
low-level technical inputs. Pelga, located in the north and more agro-pastoral, is characterized
by severe soil erosion. Kologhsom has the highest incidence of Guinea worm disease in the
province.
The project invested much time in PAR in each village. The PAR assessment and planning tech
niques employed included social and environmental maps and walks, agricultural/seasonal calen
dars, daily activity profiles, and decision-making matrices. Women. men and youths were involved
in both joint and separate groups. The materials used varied according to the group’s comfort
level: women (almost none of whom are literate) used local materials, whereas men and younger
people were more comfortable with markers and paper. Meetings were held in each village to syn
thesize results, draw out problems, causes. solutions and develop action plans.
Based on the needs identified by the communities — and the project’s budget — the action plans are
now being carried out. Kologhsom’s top priority is access to potable water: the number of village
wells is insufficient, and they are not evenly distributed. The village women created a water man
agement committee to oversee existing waterholes and repair pumps. Improved health and agri
cultural production are the village’s next priorities.
In Pelga, access to water is also a priority. Villagers have plans to construct a water point at the
village school to inigate a vegetable garden. The garden will help to meet students’ food needs
and diversify their diet. The villagers hope to construct a canteen at the school with revenues from
the garden. Another priority is sanitation. The village has plans to construct pit latrines to mitigate
water contamination. Other plans include the purchase of a mill to lighten women’s workloads,
and a credit scheme to help meet household expenses. There is also an afforestation component in
both villages to ‘nourish’ the environment upon which they depend.
The benefits of the appraisal process can be seen in the community mobilization and motivation
it prompted; inhabitants of both villages established committees to support the implementation of
their own action plans (with women well represented). Because some of the partners had little
experience with a gender-sensitive approach, as an integral element of PAR, a one-day workshop
was organized to acquaint them with gender issues in conservation and development.
Currently, monitoring and on-going evaluation of the activities are crucial, as the initiative is pilot
ing PEC experiences in Burkina Faso in view of a replication/expansion phase.
Contributed by Lisa Garbus
AnL
the reliance on external
evaluators can serve to
perpetuate a ‘conspiracy
of success’ in which
project achievements are
emphasized while mistakes
and problems are
downplayed or ignored
6.2 Learning by doing
In PAR, evaluation is not a one-time activity at the end of a project.
Rather, monitoring and evaluation are on-going throughout the PAR
process (see Figure 5.3, p. 162). Through a reflective approach, interest
groups learn from successes as well as mistakes along the way, building
their knowledge base and their capacity to respond to external change.
The two words – monitoring and evaluation – are used so frequently
together that they may appear to be different ways of saying the same
thing. However, it is important to distinguish between the two.
Monitoring involves checking to see if specific project tasks are being
accomplished in a timely and appropriate (i.e., transparent, honest, par
ticipatory) manner, and identifying external conditions that affect project
performance. Evaluation, on the other hand, refers to a periodic look at
project organization, approach and outputs. Evaluation can help to deter
mine if the project is properly designed to achieve longer-term objectives.
Put in another way, monitoring regularly checks if the project is on
track’, and evaluation questions whether the project is on the right track’.
Monitoring is integral to any activity, and most of us regularly monitor
our progress towards achieving various personal and professional goals,
even when we do not consciously call it by this name. Because of its iter
ative nature, most interest group members will probably be involved to
a greater or lesser extent in PAR monitoring. Still, it will most likely be
the responsibility of coordinators to ensure that regular monitoring of the
planned activities takes place, and that up-to-date records are kept of
finances and progress. Together with all the partners working together on
a specific activity, decisions can be made about how to redress deficien
cies in implementation. Evaluation takes place less frequently, and there
fore requires a more formalized mechanism.
Participatory evaluation
In traditional project management, evaluation is frequently left to out
side consultants who assess the results of a project, often with the inten
tion of determining whether or not a given activity will receive contin
ued funding. The reliance on external evaluators to obtain an objective’
view of the project too often results in alienation and fear on the part of
project implementers and beneficiaries, especially if the project's con
tinuation is tied to a favorable review. It can also serve to perpetuate a
‘conspiracy of success in which project achievements are emphasized
while mistakes and problems are downplayed or ignored.

Box 6.2
Why participatory evaluations?
Involving the community in developing an evaluation process ensures that all aspects of concern
to the community are covered. It also enables the skills and knowledge available within the com
munity to be identified and utilized for information collection and analysis. This reduces reliance
on outsiders (e.g., consultants), who may be much more expensive and less informed, to do this
work.
The results of the evaluation exercise should enable decisions to be reached on whether to change
the objectives of the initiative, change the strategy, change activities or continue all or some. In a
participatory evaluation both specific activities and the objectives of the initiative are considered.
with the objective of learning what worked (and why) and what was not successful (and the rea
sons for that). The process is intended to be forward looking and developmental in nature, and not
regulatory, judgmental, and controlling.
In PAR, evaluation is carried out with the participation of all stakehold—
ers in the project, and especially the community members. The goal is to
involve as many parties as possible in a frank and honest assessment of
what has been achieved, but also where and how the initiative needs to
be improved. The results of evaluation are then implemented as quickly
as possible (Gajanayake and Gajanayake, 1993). This ‘learning by
doing’ is characterized by a willingness to learn from mistakes and a
recognition that projects evolve in response to changing circumstances
and needs.
the goal is to involve as
a frank and honest
assessment of what has
been achieved, but also
where and how the
initiative needs to be
improved
The evaluation of initiatives provides an opportunity for both outsiders
and insiders to reflect on the past in order to make decisions about the
future. In a participatory process to design an evaluation, community
members are encouraged and supported by the PAR support team, local
institutions and external agencies to take responsibility for and control
of:
' planning what is to be evaluated;
' deciding how the evaluation will be done.
Much of the material acquired from the participatory information gath
ering, assessment and planning exercises can be used in participatory
evaluation.
In a preliminary evaluation meeting of a half day’s duration, the interest
group and/or the community at large might go through the following
steps to develop a plan for the evaluation:
Define the purpose. Review the goals and objectives of the initiative as
defined during the planning phase, and the reasons for the evaluation
many parties as possible in
indirect indicators provide
information on aspects
which cannot be easily or
accurately measured
(i.e., what do we want to know?). A useful exercise may be to write a
one-sentence statement of purpose that seeks to answer the following
questions:
• Who has a stake in the outcome of this evaluation?
• What would they like to come out of this?
• How will the results be used?
Define the priority areas. These can be written as questions on large
sheets of paper or a blackboard, and then rank-ordered. In addition to
results-oriented questions (Did we achieve our stated objectives? Were
the benefits achieved at a reasonable cost?), several process-oriented
questions might be included, such as:
• Was the process participatory?
• Was decision-making open and transparent?
• How did we handle contingencies (setbacks, constraints)?
• Was the budget well managed?
Identify responsible people. Decide who will do the evaluation (e.g.,
the whole community in an open meeting, the interest group, or the
interest group with the PAR support team), and which people will gath
er what information. If the community lacks the skills to conduct a thor
ough evaluation, an outside facilitator may be hired, with terms of refer
ence that include capacity-building of local evaluators'.
Identify indicators. These can be direct and indirect. Direct indicators
are pieces of information that directly relate to what is being measured
(e.g., the number of cattle owned by a family). Indirect indicators pro
vide information on aspects which cannot be easily or accurately mea
sured (e.g., whether a family possesses a radio or a bicycle can, in some
communities, be an appropriate indirect indicator of its total wealth').
Examples of indicators in the population, health and environmental sec
tors can be found in Chapter 2.
Identify the information sources for evaluation questions. If the
information is not currently available, decide what ways of gathering
information and what tools would be appropriate. If one tool has been
used before, it may be used again to update the information and show the
change that has occurred.

Once an evaluation plan has been agreed upon, the interest groups and
partners (if any) can develop a time line for carrying it out. Timing needs
to take into account factors such as seasonal constraints, labor demand,
religious holidays and field staff availability.
The tools for evaluation will depend largely on the activity being evalu
ated, and on whether quantitative or qualitative data are sought.
Quantitative approaches measure changes in numerical indicators (e.g.,
number of people served by the village health assistant, area of hillside
fields where erosion signs are still evident, or income from the sale of
non-forest timber products). Qualitative approaches, such as focus
groups and open-ended interviews, identify and describe people’s sub
jective perception about performance and results (e.g., people’s percep
tions of how the initiative has affected health, agriculture or income).
Many of the tools that are covered in Chapter 4 and in Annex B can be
adapted for evaluation purposes, and further tools can be found among
the documents in the bibliography.
Communicating findings and follow-up
When the evaluation is completed, it is important to schedule a meeting
to discuss results and decide on follow-up. The meeting should again
gather all relevant stakeholders, including the interest group, the PAR
support team, community members, external partners and donors (if
appropriate). The results of the evaluation can be presented in much the
same way the appraisal results were presented in a community feedback
meeting.
In order to incorporate the evaluation results quickly into the implemen
tation process, a follow-up plan can be linked directly to the participato
ry planning matrices described in Chapter 5 (Tables 5.4 a—c). A follow
up plan should include:
. an agreement on specific activities that must be taken by the interest
groups and their partners to meet the evaluation’s recommendations;
' the dates by which the activities should be completed;
' a list of materials/resources required, and their sources;
' a designation of responsibilities for each activity; and
' a description of the assessment/monitoring procedure.
the results of the
evaluation can be
presented in much the
same way the appraisal
results were presented in
a communityfeedback
meeting
4mm
By holding this meeting and modifying/adding to the original planning
matrix, the evaluation’s results are systematized into the normal imple
mentation procedures (Aaker and Shumaker, 1994).
External evaluation of the PAR process
On a final note, even if the implementation phase encounters setbacks,
or is not particularly successful in terms of quantitative indicators, there
may still be benefits of the PAR that should be recognized. For instance,
the PAR may have succeeded in raising questions that had never been
discussed within the community and, in the process, generated aware
ness of potential opportunities.
The answers to some of the following questions may not be of direct
interest to the community members, but may be of interest to the PAR
support team (or donors, if outside funding was used):
• Did the PAR raise awareness among community members about local
population dynamics, environmental issues and their linkages?
• Did it enhance communication on the subjects within the community?
• Has there been some form of organizing for action?
This kind of awareness, communication, and community empowerment
can leave lasting and tangible benefits for the community, long after the
implementation of the priority actions’ has officially ended.
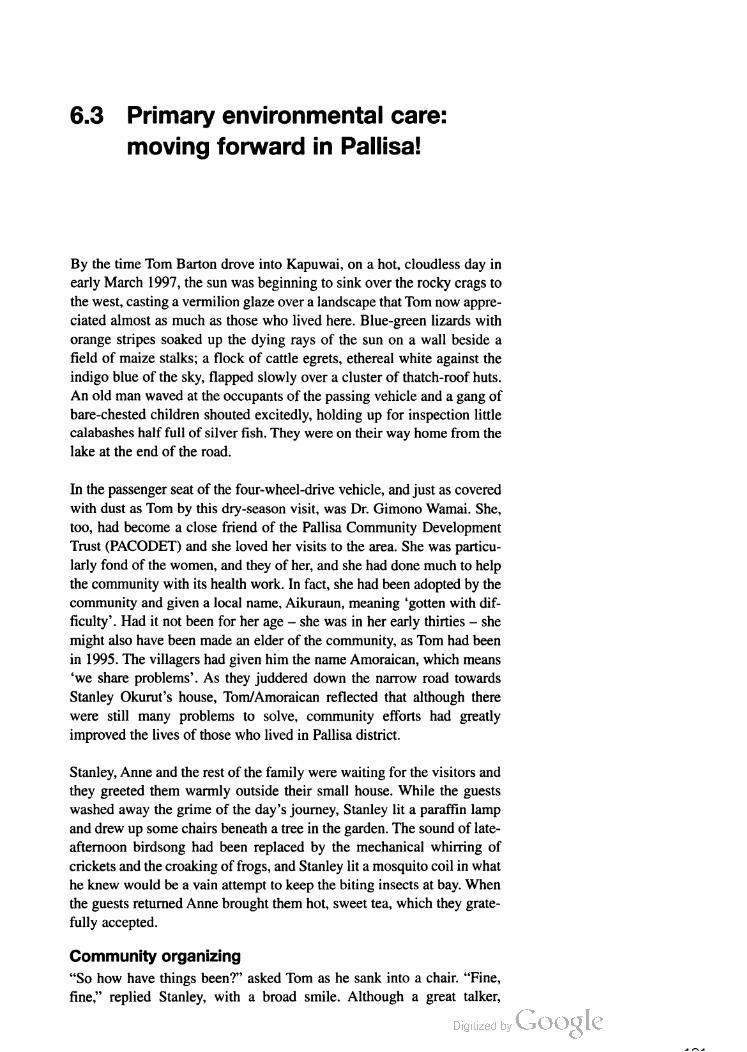
6.3 Primary environmental care:
moving forward in Pallisa!
By the time Tom Barton drove into Kapuwai, on a hot, cloudless day in
early March 1997, the sun was beginning to sink over the rocky crags to
the west, casting a vermilion glaze over a landscape that Tom now appre
ciated almost as much as those who lived here. Blue-green lizards with
orange stripes soaked up the dying rays of the sun on a wall beside a
field of maize stalks; a flock of cattle egrets, ethereal white against the
indigo blue of the sky, flapped slowly over a cluster of thatch-roof huts.
An old man waved at the occupants of the passing vehicle and a gang of
bare-chested children shouted excitedly, holding up for inspection little
calabashes half full of silver fish. They were on their way home from the
lake at the end of the road.
In the passenger seat of the four-wheel-drive vehicle, and just as covered
with dust as Tom by this dry-season visit, was Dr. Gimono Wamai. She,
too, had become a close friend of the Pallisa Community Development
Trust (PACODET) and she loved her visits to the area. She was particu—
larly fond of the women, and they of her, and she had done much to help
the community with its health work. In fact, she had been adopted by the
community and given a local name, Aikuraun, meaning ‘gotten with dif
ficulty’. Had it not been for her age — she was in her early thirties — she
might also have been made an elder of the community, as Tom had been
in 1995. The villagers had given him the name Amoraican, which means
‘we share problems’. As they juddered down the narrow road towards
Stanley Okurut’s house, Tom/Amoraican reflected that although there
were still many problems to solve, community efforts had greatly
improved the lives of those who lived in Pallisa district.
Stanley, Anne and the rest of the family were waiting for the visitors and
they greeted them warmly outside their small house. While the guests
washed away the grime of the day’s journey, Stanley lit a paraffin lamp
and drew up some chairs beneath a tree in the garden. The sound of late
aftemoon birdsong had been replaced by the mechanical whirring of
crickets and the croaking of frogs, and Stanley lit a mosquito coil in what
he knew would be a vain attempt to keep the biting insects at bay. When
the guests returned Anne brought them hot, sweet tea, which they grate
fully accepted.
Community organizing
“So how have things been?” asked Tom as he sank into a chair. “Fine,
fine,” replied Stanley, with a broad smile. Although a great talker,

4mm
Stanley was not much given to idle chit-chat and he immediately began
to tell Tom and Gimono about PACODET’s structure and progress.
“We’ve now got three main decision-making bodies,” he said. “You
probably remember, but I’ll tell you briefly again, so it’ll make more
sense of the conversations we will have over the next few days. First,
there’s a general assembly, and that consists of all the dues-paying mem
bers and voluntary members of PACODET, along with all the communi
ty groups. Second, we’ve got the senior advisory board, which is made
up of local elders, and then, third, there’s the executive committee.” The
latter, he explained, included 23 representatives — a man and a woman
from each of the participating community groups. The committee was
responsible for planning future projects, which were then reviewed by '
the general assembly and the advisory board — which included among its
members Tom and Gimono.
The mosquitoes eventually became too much to bear, and Stanley sug
gested they go inside for supper. As always Anne treated the guests
regally and in their honor a chicken had been killed. Boiled in its own
juices, it was accompanied by a heavy brown millet and cassava porridge
(atapa, the ‘real food’ of the region) and various vegetables from the
household gardens. Over the meal, Anne and Stanley told the visitors
what news there was to tell. Amos Odong was now sharing the post of
manager of the executive committee with Anne; V.V. was doing a fine
job training community agriculture assistants; a head of family had died
of AIDS and left school-age orphans, and a young man had been sent by
PACODET for technical training in Kampala. A few years ago the gos
sip would have been mostly about people; now it was also about com
munity projects. This was a measure of PACODET’s influence, which
now affected the lives of so many people in the area.
Tom and Gimono left soon after the meal was over, eager for rest at the
guest house after the long drive, and knowing that Stanley would be
ready to take them on a tour of the community as soon as the sun rose
the following day.
Sure enough, Stanley and Anne arrived soon after dawn, as Tom and
Gimono were finishing breakfast. Although the day had barely begun,
the surrounding countryside teemed with activity. In the field beside the
compound, a boy guided a plough behind a pair of oxen, and the dirt
track which led towards the town of Pallisa, which lay fifteen miles
away, was as busy as it ever was: men in crisp white shirts made their
way on bicycle towards their office jobs; colorfully uniformed children
headed towards the primary school; and strong young women with bas
kets and pots balanced on their heads or hoes over their shoulders set
about their early-moming chores.
Stanley suggested that they inspect the health dispensary, which was
soon to be officially inaugurated by the vice-chancellor of Makerere
University, and they made their way there by foot. When PACODET
began, its main concern was the lack of decent health-care facilities in
Pallisa district. Construction of a health dispensary in Kapuwai had
begun in 1991, and it was now fully operational with a skilled team of
community members who had been sponsored for nursing and mid
wifery training by PACODET. Gimono talked to two of the team and
they discussed the satellite sub-dispensaries, set up in each of the main
participating communities and staffed on a part-time basis by locally
trained community health workers.
“Of course there is still a problem with the satellite buildings,” said one
of the health workers, a slender young man with long, thin fingers.
“You’ve seen yourself. They’re mostly in semi-permanent shelters, or in
schools and churches.” He said that many of the communities had decid
ed to build small local dispensaries, and they had begun to make bricks
and gather the raw materials for their construction. “In my view that’s an
excellent thing,” he added, “especially when you consider that between
all of these groups and us here at the dispensary, we now serve over
60,000 people.”
When they left the health dispensary they were joined by V.V. Okurut,
who had bicycled over to Kapuwai from his village of Kobuin. There
was much to see, he explained, and he suggested that they spend the rest
of the day looking at PACODET’s projects on the land and talking to
farmers (which include men, women and youth in this area).
By 1993 PACODET had already begun to make a significant contribu
tion to the health care of the community, but its members were novices
when it came to tackling environmental problems. The will was there, as
we saw when Stanley and his colleagues met beneath the mango tree in
Kapuwai, but was the expertise?
Meeting people’s needs while caring for the local
environment
By midway through 1993, members of PACODET had begun to draw up
plans for the future. They considered a variety of agricultural and craft
related income-generating schemes; these, they hoped, might raise stan
dards of living and help reduce pressure on the woodlands and wetlands.
V.V., an agricultural extension officer by training, worked with others in
the group to develop sensitization sessions for community leaders and
farmers about pesticide safety and ways to reduce the amount of pesti
cides being used. Anne, Beatrice, Filder and other leading women in the
group immersed themselves in the family planning issue. Some of the
plans which the members mooted during those early meetings came to
nothing; but many others had come to fruition.
Most people in Pallisa make a living from the land, and farming had
been a focus of PACODET activity. “We recently set up our own depart
ment of sustainable agriculture,” explained V.V., “and I’ve just finished
training another batch of community agricultural assistants.” There was
now one in each of the ten communities covered by PACODET and they
were helping V.V. to tackle the pesticide problem. “You’ll recall,” he said
to Tom, “that one of the major concerns which came to light when we
first started looking at the environment was the way in which pesticides
were being misused. They were having a terrible effect on insects and
birds. We were also worried about the health hazards they posed.”
When the local government officers were sensitized about the pesticide ;
problem in 1993, they introduced by-laws to regulate pesticide use. ’
Among other things, these made the killing of birds with pesticides a ‘
criminal offense. “That certainly helped,” reflected V.V. “Soon after the
by-laws came in, several people were arrested and news spread round the 1
region like bush fire. Now we can see that people have changed their
ways.” Small boys still hunted birds with catapults, but V.V. reckoned
that there were far more birds in the area today than there were before 1
the by-laws were introduced.
PACODET was not opposed to the use of pesticides; rather, it wanted
farmers to use them only when necessary, and it now encouraged them
to practice what might by loosely termed integrated pest management, or
1PM. “If a farmer has a pest problem,” explained V.V., “he can contact
me or one of the community agricultural assistants and we’ll pay him a

visit.” They then help the farmer to assess the severity of the pest attack
and formulate ways to deal with it. Many farmers were proving recep
tive to the ideas promoted by PACODET. On their own they had noticed
that the prophylactic use of pesticides not only leads to a loss of flora
and fauna and a decline in fertility, but to the death of emukuny, the black
ants which play a vital role in controlling aphids and other pests. “A few
years ago,” explained V.V. when they reached the fields around Kobuin,
“the farmers here used lots of pesticide. Now they hardly use any
because they know how important the ants are.”
Indeed, some farmers were actually encouraging the ants. They had dis
covered that the ants liked sweet-tasting grasses, and they now scatter
these grasses around their fields. Gimono asked V.V. whether the pro
tection of the ants made a difference to crop yields. “A big difference,”
he replied simply. “That’s why the farmers are so keen to encourage
them now.” He took them through a field of cassava to a clump of
saplings. “You see these young trees?” he asked. “They have very hard
bark and a soft pith — the emukuny love them, and that’s why this farmer
has planted them around his field.”
When the PACODET conunittee went on their field walks with Tom
Barton in early 1993 they expressed particular concern about the loss of
wetlands. Over the years much of the swampy land had been drained to
make way for rice paddies. Economically, this had made sense to the
farmers: rice was a good money-earner. But the loss of wetlands had led
to a decline in the fish catch. The fish had hitherto been an important
source of protein, especially for the poorer families with little land. The
catfish also fed on mosquito larvae. Since the decline in their number.
malaria-transmitting mosquitoes had become more common.
“We’re tackling the wetland problem in two ways,” explained Stanley
when they reached a small area of papyrus and swampy land. “Directly,
by ensuring that there is no further drainage. And indirectly, by estab
lishing income-generating projects which provide an alternative to rice
cultivation.”
Two of the community projects were farm-based, involving poultry and
bees. A small-scale study by PACODET of poultry-keeping had led V.V.
to conclude that two factors led to a high death rate of chickens, ducks and
other birds. One was disease; the other was predation by wild animals.
AI‘
To tackle the first, PACODET was encouraging people to have their
poultry immunized against certain killer diseases. Many farmers were
now doing this. To reduce predation, farmers were advised to confine
their birds at night and keep them closer to home at all times, for exam
ple, by providing supplementary food near their pens. “Already,” said _
V.V., “farmers are noticing significant gains in their poultry production.”
Midway through the afternoon the small party came across a tree slung
with beehives. A farmer came out of his hut to join them. “In the old days,”
explained the farmer, “I used to keep bees in clay pots. But these are far
more efficient.” He pointed proudly to the wooden hives, locally designed
and locally built, which were suspended from the branches of the tree.
Tom asked what he did with his honey. Like most people who kept bees in
Kapuwai, he used all his honey in the home, although honey could fetch a
good price in the local markets. His family poured it on the millet porridge
they ate for breakfast, and his wife used it to cure the children’s coughs.
“Same with us,” said Stanley, who was also a keen bee-keeper.
It was late in the day when the party returned to Kapuwai and called in I
at the agricultural storage building. Stanley explained that most of the
people living in the area covered by PACODET still thought of them
selves as subsistence farmers, although many were rather more than that:
they grew food not only for themselves, but to sell in the marketplace. A
perennial problem faced by the farmers related to the fact that most grew
the same crops, and harvested them at a similar time. This tended to glut
the market, allowing buyers to purchase the farmers’ produce at low
prices, and also resulted in high prices when foods were scarce, for
example, in the dry season or before the new crops were ready to bar
vest. Naturally, far-sighted farmers who could store food during the
times of glut, in order to sell it later at a time of scarcity, would be at a
competitive advantage compared to those who did not do so. “And that’s
what this is all about,” concluded Stanley, waving at the storage depot
and calling for the store-keeper to come out.
PACODET was now operating as an agricultural cooperative. It pur
chased food during the harvest period, when prices were low, stored it
here, then sold the food in urban markets when the price was high. If the
community itself experienced shortages, such as a recurrence of the dras
tic famine of 1994, then PACODET was able to resell the produce at a
price lower than the one prevailing in the market. This system of protect

ing nutritional security in the community had already been taking place
in the very dry 1996 season — over eight tons of millet had been resold to
the community at a slight profit to the organization but at a major saving
for the community over the commercial rates in the open market.
So, who gained? “Well, PACODET gains for one thing,” explained the
man in charge of the store, “and the farmers do too.” PACODET gained
as the profits made through storage were channeled into its activities —
which, of course, were designed to help the local community. The farm
ers gained as they saved the considerable cost of transporting their food
to the urban markets — which was what they used to do — and they could
buy back food well below market price if and when they suffered from
shortages.
So far the system had worked to everyone’s satisfaction, although the
PACODET team were well aware of the problems which had beset agri
cultural cooperatives in Uganda in the past. “We know that this system
will only work if we are totally transparent and accountable for all our
activities,” admitted Stanley. So far they had been, with all decisions
about prices for buying and selling, as well as the use of funds, being
made collectively by the community committees.
All of these activities — ranging from bee-keeping to agricultural
storage — had helped people in Pallisa to increase their earnings.
Another income-generating project, established under the guidance of
PACODET, had involved carpentry. A workshop now functioned in the
PACODET compound and a manager taught skills and oversaw the pro
duction of furniture and fittings — which were used in community build
ings. A tailoring enterprise had also been established, and this was now
involved in the manufacture of school uniforms, with intentions to soon
begin making and marketing mosquito nets for malaria prevention.
The small group was joined at the compound by Amos Odong, who had
just returned from Pallisa. “In theory,” he explained once the greetings
were over, “any activity which raises the standard of living of people in
Pallisa should help take pressure off the wetlands and woodlands in the
area.” He said that since PACODET had begun to take an interest in envi
ronmental issues, wetland drainage had almost ceased. However, uncer
tainties about how to manage the wetlands remained, and experts who
came to advise had provided little in the way of helpful advice.

As far as the woodlands were concerned, he felt that people’s attitudes
were changing for the better. Felling of green trees was no longer com
mon practice, and he pointed out that Stanley had conducted experi
ments on his own land which had gone some way towards dispelling the
myth that crops and trees didn’t mix. He had found that certain crops,
like potatoes, grew better under big trees like eyerere (a Ficus species)
than they did out in the open. Empirical evidence such as this was
encouraging farmers to look after their trees, and in some cases plant
saplings.
“But what about the population growth in Pallisa?” inquired Gimono.
“The short answer,” replied Anne, “is that the population continues to
grow, but there is a far greater awareness now about the cumulative
effects that population growth has on the environment, health and
education than there was before PACODET became active.” In 1994
there was a period of rural famine in this part of Uganda, and its
impact was keenly felt by those with large families. The children of
large families, when compared to those of small families, were gener
ally less nourished, more prone to disease and received far less school
education. Indeed, in some large families the younger children received
no education at all. PACODET’s extensive team of health and develop
ment workers had done much to make people in Pallisa more aware of
the linkages between high fertility and poverty. A generation ago large
families were considered to be a source of wealth; now they are viewed
as a liability. Young couples are much more interested in having fewer
but well-educated children than many children without the prospect of a
prosperous life.
Returning to the verandah at the front of the dispensary, Tom and
Gimono were greeted by a burst of music. Jubilant voices and ringing
polyrhythms played on traditional instruments communicated the
strength and vitality of PACODET and the Kapuwai community. A
choral group of teenage women raised their voices to the accompani
ment of an equal number of young men plucking their adugus (bow
harps) in celebration of what had been accomplished by working togeth
er as a whole community. The catchy sounds brought even the oldest
women to their feet ululating and exclaiming, “PACODET, hallelujah!
Kapuwai!”
A few practical matters
Tom and Gimono stayed on till the end of the week, leaving soon after
the inauguration of the health center. It had been a day of great festivity,
with up to two thousand people attending the ceremony, but everyone
knew that PACODET would have to get back to the hard work of com
munity development as soon as the visitors had gone on their way.
Organizing, training, studying problems and testing solutions, as well as
providing services – these are the daily preoccupations of the men and
women who run PACODET.
PACODET began including environmental issues in early 1993. At that
time, it was quite apparent that they lacked information on many sub
jects, ranging from pesticide use to the amount of wetland in the area.
PACODET has since placed emphasis on research and documentation,
and staff have carried out a number of research studies in the area on top
ics ranging from health to alcoholism, sexual behavior to livestock hus
bandry. Information from these studies, as well as the routine informa
tion generated by the monitoring of their own community projects, has
helped to shape local plans and activities.
Efforts are currently underway to produce an annual report for circula
tion to committee members and interested organizations outside the pro
ject. There are also plans to produce a small monthly newsletter in the
vernacular. This will help PACODET keep the local community abreast
of developments.
There is no specific funding to sustain PACODET as an organization.
Some funds have been mobilized from various external sources for work
shops (e.g., UNICEF COOPIBO, CARE) and some equipment purchases
(e.g., US Embassy, EDF). Other funds have been generated by annual
house-hold contributions, charging fees for service in the health unit, and
by members of the executive committee participating as consultants in
research and evaluation activities for other agencies. More recently,
PACODET’s revolving fund and the millet cooperative are yielding some
income, which is both generated and managed locally. Key members of
the executive and essential staff are supported by PACODET so that they
can work full-time on essential activities. Rotation of the PACODET man
ager post followed advice from outside; rotation of other posts has also
been initiated in order to ensure accountability and sound management, as
well as to promote capacity-building of many people in the organization.

PACODET exists within an extensive web of linkages – local, national
and international. At the local level, the members participate in many
other local institutions, such as churches, parent-teacher associations,
local political organizations and so forth. The project regularly consults
and is consulted by various officials at the district level, both technical
(e.g., health, agriculture) and political/administrative. PACODET has
been approached by CARE to assist with their activities on reproductive
health in the whole of Pallisa district, and collaborative links are main
tained with the Child Health and Development Center at Makerere
University for capacity-building in research and computer skills. Some
international links have also been created through presentations and
participation in international meetings. Stanley Okurut, for example,
attended a workshop on participatory methods of health research at the
Liverpool School of Tropical Medicine.
In 1996, PACODET carried out a successful series of cross-visits for
agricultural improvement. They began with community discussions
about topics to investigate, places to visit and ways to observe.
Questions and ideas were recorded in words and symbols on slips of
paper and posted for ease of continuing the discussion. Farmers and staff
then got practical experience by visiting other communities in the
PACODET area followed by debriefing discussions. After this training
and pre-test, three groups were formed (25 farmers per group) and each
visited a different district and met with specific projects and farmer
groups in those settings. The result has been a big stimulus to agricul
tural planning and activities by individual farmers and for the organiza
tion as a whole.
The story of PACODET is an illustration of what a committed and
inspired community organization can achieve when given a moderate
level of support at the early stages of appraisal and planning. Today the
organization is self-sustaining, and has a tremendous pool of human
resources to draw on. Although not every participatory action research
process at the community level will result in a large, formalized organi
zation with links at national and international levels, PACODET's cur
rent situation is nevertheless illustrative of what can take place when
communities organize themselves to achieve what they care for: envi
ronmental protection and better health, income and improved living con
ditions for the local people.
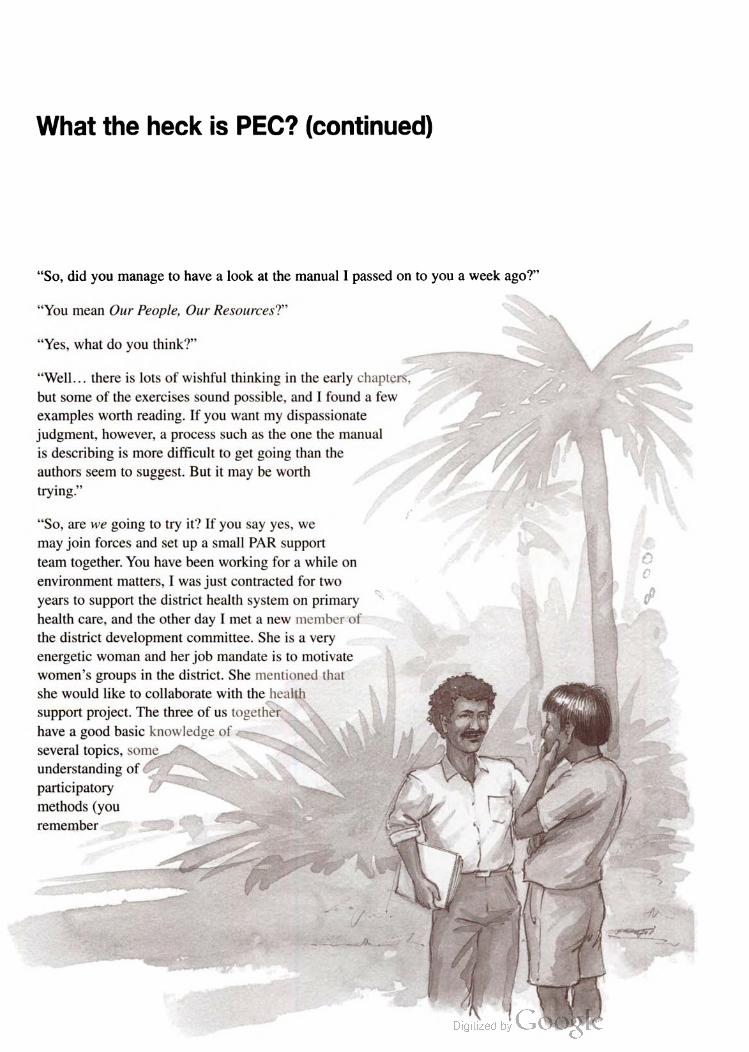
What the heck is PEC7 (continued)
“So, did you manage to have a look at the manual I passed on to you a week ago?”
“You mean Our People, Our Resources?” -
“Yes, what do you think?”
“Well... there is lots of wishful thinking in the early chapters,
but some of the exercises sound possible, and I found a few
examples worth reading. If you want my dispassionate
judgment, however, a process such as the one the manual
is describing is more difficult to get going than the -
authors seem to suggest. But it may be worth - -
trying.”
“So, are we going to try it? If you say yes, we
may join forces and set up a small PAR support
team together. You have been working for a while on £
environment matters, I was just contracted for two C
years to support the district health system on primary s: d"
health care, and the other day I met a new member of
the district development committee. She is a very
energetic woman and her job mandate is to motivate
women’s groups in the district. She mentioned that
she would like to collaborate with the health
support project. The three of us together
have a good basic knowledge of-
several topics, some- -~
understanding of 2 -- -
participatory
methods (you
remember

I worked with NGOs in other districts carrying out participatory assessment exercises) and lots of
contacts in the villages, among the district authorities and in the capital. If we prepare ourselves well, we
could help start a PAR process!”
“Hey, hey... slow down! All this will require a mountain of time and resources. Who is going to pay?
And are you sure that the people in the villages will be willing to participate? What would they get out of
it?”
“Someone has to start, do you not agree? You and I and the district lady have a salary, and if we get our
superiors to see the advantages of working with the local residents, they may let us take the time. Later
on, when we have some plans, we will find some appropriate financial backing. Butletus not worry too
much beforehand. There are plenty of resources in the district. Regarding the local residents, we will first
talk with them, and they will decide. I know the people in your village are fed up with the devastation of
the pasture, and I know the kids in many places I visit are not happy about moving to the capital in
search of jobs. We should be careful not to make promises we cannot maintain or raise grandiose
expectations, but we can work on the basis of their own willingness to get together and discuss. Some of
them will not see any benefit from this, but others will, I am convinced.”
“Well, first of all I need to meet the woman you mentioned, and discuss with her whether this has any
chance of really happening. Then, I want to discuss the idea with the forestry officers. I am supposed to
visit them tomorrow, and will mention your suggestion. Then, I will have to talk with our donor
representative in the capital, and get permission to spend more time in the communities. (In fact, now
that I recall, she had asked me to do exactly that the last time we met.) If all seems fine, we can go
together to discuss with the village people. But not before! Let us try not to put the cart in front of the
oxen, for a time!”
“Okay, okay. I just thought that the people in the villages where I am working would be happy to hear
about this, and that you would be convinced if you would meet them...”
“You know that there is no easy way to convince me. Only some hard facts would do. And, since we are
talking about this, you’ll never convince me to use those acronyms PAR, PEC or whatever else you call
these matters. As far as I am concerned, acronyms stink.”
“I don’t care about what we call it. Let the people find a name, whatever they like. For me, I would be
satisfied by going ahead with some concrete initiative, no matter the name.”
“I take your point. Let us forget about action research and primary environmental care, and let us get
working.”

Annex A: Basic definitions and
formulas to describe population
dynamics
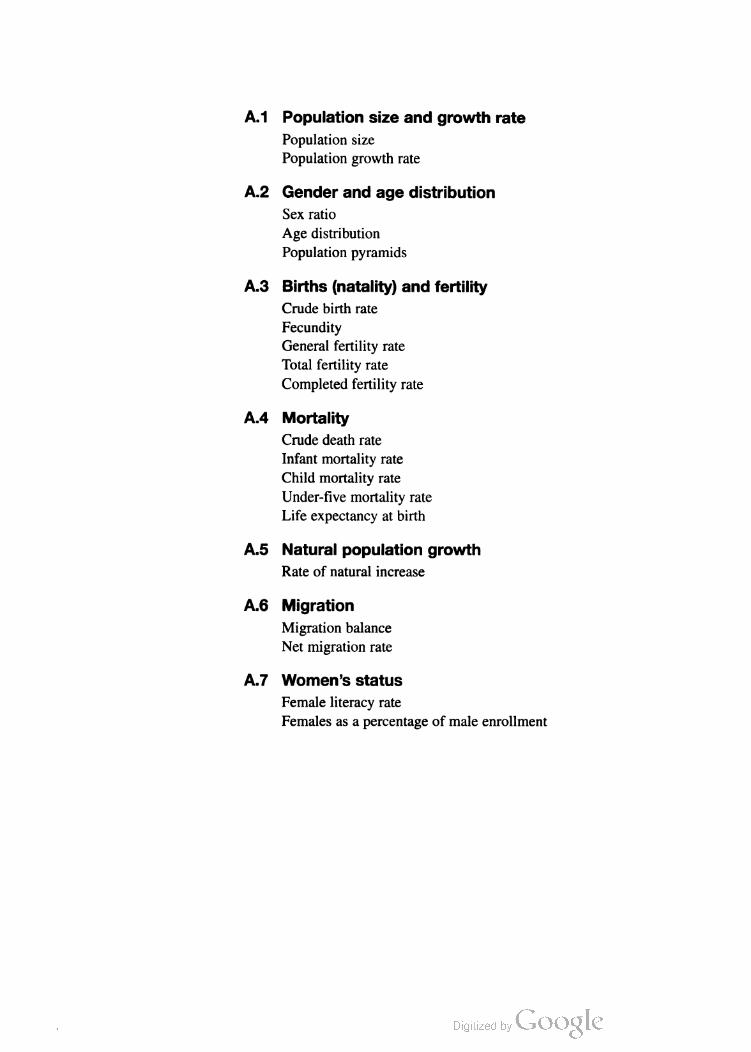
A.1
A.2
A.3
A.4
A.5
A.6
A.7
Population size and growth rate
Population size
Population growth rate
Gender and age distribution
Sex ratio
Age distribution
Population pyramids
Births (natality) and fertility
Crude birth rate
Fecundity
General fertility rate
Total fertility rate
Completed fertility rate
Mortality
Crude death rate
Infant mortality rate
Child mortality rate
Under-five mortality rate
Life expectancy at birth
Natural population growth
Rate of natural increase
Migration
Migration balance
Net migration rate
Women's Status
Female literacy rate
Females as a percentage of male enrollment
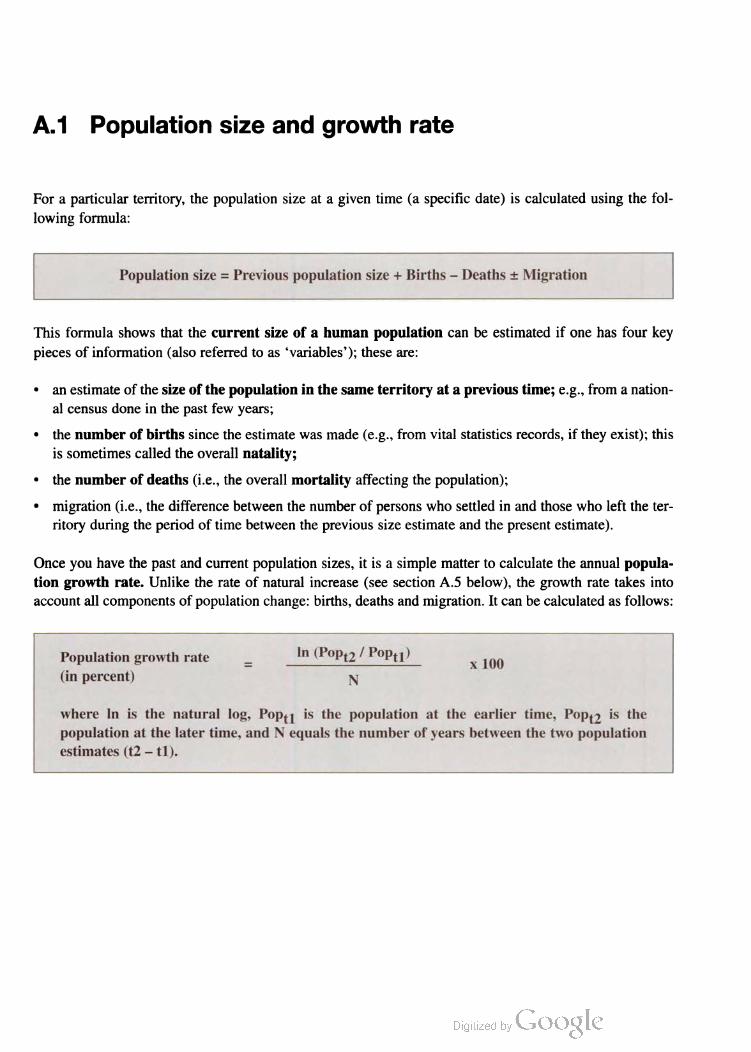
A.1 Population size and growth rate
For a particular territory, the population size at a given time (a specific date) is calculated using the fol
lowing formula:
Population size = Previous population size + Births – Deaths + Migration
This formula shows that the current size of a human population can be estimated if one has four key
pieces of information (also referred to as “variables'); these are:
• an estimate of the size of the population in the same territory at a previous time; e.g., from a nation
al census done in the past few years;
• the number of births since the estimate was made (e.g., from vital statistics records, if they exist); this
is sometimes called the overall natality;
• the number of deaths (i.e., the overall mortality affecting the population);
• migration (i.e., the difference between the number of persons who settled in and those who left the ter
ritory during the period of time between the previous size estimate and the present estimate).
Once you have the past and current population sizes, it is a simple matter to calculate the annual popula
tion growth rate. Unlike the rate of natural increase (see section A.5 below), the growth rate takes into
account all components of population change: births, deaths and migration. It can be calculated as follows:
Population growth rate - In (Popt2 / Popt1) x 100
(in percent) N
where in is the natural log, Popt1 is the population at the earlier time, Popt2 is the
population at the later time, and N equals the number of years between the two population
estimates (t2 – ti).
A.2 Gender and age distribution
The distribution by gender within a given population is generally expressed by the sex ratio, calculated as
follows:
- Total male population
Sex ratio - x 100
Total female population
Ratios lower than 100 indicate a higher proportion of females, and ratios higher than 100 mean a higher
proportion of males in a population. A sex ratio value between 90 and 110 is considered demographically
‘normal' or typical of an undisturbed population. Values lower than 90 or higher than 110 suggest that some
factor (such as gender-specific labor migration or war and the death of young males) is affecting the gen
der distribution of the population under consideration.
In order to portray the age pattern of a population, the age distribution is often portrayed in five basic
groupings: less than 1 year old (infancy), 1–4 years, 5–14, 15–44 (reproductive age) and 45+. However,
depending on the purpose, the breakdown into age groups can be quite different; for instance, 5–18 for
school-age children, or 65+ for the elderly. Because census data for small areas often break the population
up into five-year age groups (0–4, 5–9, 10–14, etc.), it may be difficult to obtain the precise breakdown
required for specific purposes (such as denominators for the calculation of certain age-specific rates or per
centages).
While data on age and gender can be presented in a simple table, a vivid visual representation of the gen
der and age distribution in a population is given by population pyramids. A demographic pyramid is
designed by plotting a horizontal bar graph of the estimated proportions of individuals in each gender
belonging to each five-year age group (0–4, 5–10, 10–15, 15–20, etc., up to those over 75°). By conven
tion, bars on the left are used for the proportions of males in each age group, and those on the right for
females (see Figure A.1).
On the basis of the shape of the demographic pyramid, three basic types of populations can be identified
(Livi Bacci, 1990):
• A wide-based pyramid (see Figures A.1, expansive pyramid) features a very high proportion of infants,
children and young people. This is typical of traditional, non-industrial communities (e.g., most of the
rural communities of developing countries). Populations of stable size described by an expansive pyra
mid are generally characterized by both high birth rates and high mortality, or high outward migration.
• A wide-waisted or ‘constrictive pyramid’ (see Figure A.1) represents a transitional population, with a
higher concentration of individuals in the age-groups between 15 and 40. This is typical of communi
ties undergoing rapid urbanization and/or industrialization (e.g., most urban communities of developing
countries). Many such transitional populations feature recently decreased birth rates, together with
inward migration (e.g., of job-seekers from other areas).
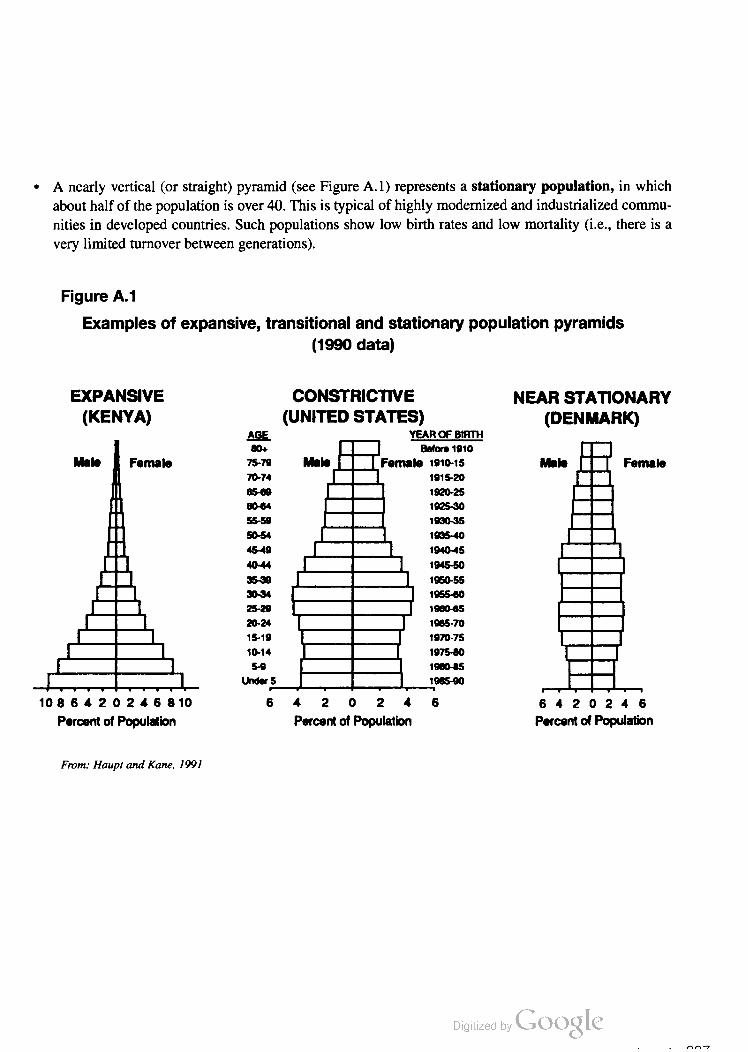
' A nearly vertical (or straight) pyramid (see Figure A.1) represents a stationary population, in which
about half of the population is over 40. This is typical of highly modernized and industrialized commu
nities in developed countries. Such populations show low birth rates and low mortality (i.e., there is a
very limited turnover between generations).
Figure A.1
Examples of expansive, transitional and stationary population pyramids
(1990 data)
EXPANSIVE CONSTRICTIVE NEAR STATIONARY
(KENYA) (UNITED STATES) (DENMARK)
AGE w
804 8010(01910
Male Female 75-79 Male Female 1910-15 Male Female
70-74 1915-20
05439 1920-25
50454 1925-30
5559 1900-35
50-54 190540
4549 194045
40-44 1945-50
3509 1950-55
3034 195550
25-29 195055
20-24 1995-70
1549 197015
10-14 1975410
5-9 195095
UndorS 1995-90
1086420246810 6 4 2 0 2 4 6 5420246
Percent of Population Percent of Population Percent of Population
From: Haupt and Kane, 1991
A.3 Births (natality) and fertility
The number of births occurring in a given population is affected by biological factors, psychological fac
tors (such as the desire to become parents) and economic, social and cultural factors. The basic indicator
for measuring natality is the crude birth rate (CBR), which is the annual number of births per 1,000 peo
ple in the population. The crude birth rate is calculated as follows:
- Total births in one year
Crude birth rate = x 1,000
Total mid-year population (all ages, same year)
The CBR in high-natality countries may be around 45 per 1,000 people; in areas with lower natality, it may
be less than 20 per 1,000 (Vaughan and Morrow, 1989).
Fecundity, or the biological capacity to reproduce, is the starting point from which to analyze fertility.
Humans have the potential for high fertility: most women over the course of their reproductive years have
the biological capacity to give birth to more than ten children (Henry, 1961). The potential fertility (or
fecundity) of women is moderated, however, by a number of factors, including cultural patterns (e.g., rules
or laws that regulate marriage and sexual intercourse), breast-feeding (which is a natural contraceptive),
poor health and nutrition, and other behaviors which prevent conception.
One indicator of fertility is the general fertility rate (GFR), representing the number of births in a given
period of time (usually one year) per 1,000 women of reproductive age.
Total births in one year
General fertility rate = x 1,000
Total women aged 15–44 at mid-year
GFR is related to the age-sex structure of the population, the marriage rate, the average age at marriage, the
availability and use of family planning methods, the educational and occupational status of women and the
overall pattern of socio-economic development. The GFR for Bangladesh in 1974 was 246.7, while in the
USA in 1985 it was only 57.8 (Newell, 1988).
A sophisticated statistical analysis of annual GFRs (also known as age-specific fertility rates) can provide
a snapshot of the average number of children born to women in a particular territory. This measure is called
the total fertility rate (TFR). A simpler (though less accurate) means of obtaining this estimate is to ask
a representative sample of women over 45 years about the total number of children they gave birth to in
their lifetime (including all except stillbirths). This information can be used to estimate the average num
ber of children in a woman's reproductive life, which is referred to as the completed fertility rate.
In populations with excellent health conditions, an average TFR of 2.1 children indicates (in the long term)
a stationary (non-growing or non-declining) population. A higher TFR indicates a growing (transitional or
expansive) population. In fact, TFR is a very useful indicator for population projections, as we shall see
later in this annex. Changes in fertility levels are a consequence of major changes in behavior, such as use
of contraception and specific customs and beliefs, as well as changes in nutritional, economic, epidemio
logical and other environmental factors.

The World Health Organization (WHO, 1981) states that child mortality reflects:
the main environmental factors ajfecting the health of a child, such as nutrition, sanitation, the com
municable diseases ofchildhood, and accidents occurring in and around the home. It reflects even more
than the infant mortality rate the level and amount ofpoverty, and is consequently a sensitive indicator
of socio-economic development in a community. Whereas the infant mortality rate may be more than 10
times higher in the least developed countries than in the developed countries, the child mortality rate
may be as much as 250 times higher This indicates the magnitude of the gap.
Under-five mortality rate (U5MR) is an aggregated and concise index of mortality during the early stages
of life. It has been officially adopted by UNICEF in order to show the magnitude of the phenomenon of
childhood deaths. This rate is calculated as follows:
Total deaths of children under 5 years in one year
Under-five mortality rate = x 1,000
Total number of live births (same year)
Note that the group measured in the numerator is different from that of the denominator; therefore, this
measurement is properly referred to as an index rather than an indicator. A comparison among 15 countries
with a ‘very high’ or ‘high’ under-five mortality (UNICEF classification) is provided in Table 2.2 (p. 39).
Another important indicator of mortality effect on population dynamics is life expectancy, which is the
average number of years a person would live if current mortality trends were to continue in the future. This
indicator is most commonly expressed in terms of life expectancy at birth, i.e., the average number of
years a new-born child is expected to survive under the current socio-economic and epidemiological con
ditions of the community. Life expectancy is a statistical aggregate based on the probabilities of death at
specific ages, and hence it is difficult to calculate in relatively small populations. At the local level it is more
appropriate to measure mortality by means of CDR, IMR and CMR.
A.4 Mortality
Mortality in a given population can be measured by several indicators, the most common of which are the
crude death rate (CDR), the infant mortality rate (IMR), the child mortality rate (CMR) and life expectan
cy at birth.
The crude death rate (CDR) is the number of deaths occurring in a given period of time (usually one year)
for every 1,000 persons in that population.
Total deaths in one year
Crude death rate - x 1,000
Total mid-year population (all ages, same year)
Although commonly used to describe populations, the CDR provides little information on people's health
status. Comparison of CDRs for populations with different age structures is relatively meaningless, and
therefore, where data are available, life expectancy is generally preferred (see below).
The infant mortality rate (IMR) is the number of deaths occurring among infants under one year in a given
period of time (usually one year) for every 1,000 live births (i.e., not counting stillbirths and abortions).
Total deaths among infants under 1 in one year
Infant mortality rate = x 1,000
Total number of live births (same year)
The World Health Organization (WHO, 1981) stresses that:
IMR is a useful indicator of the health status not only of the infants, but also of the whole population,
and of the socio-economic conditions under which they live. There are great differences in the infant
mortality rate between the least developed countries and the most developed countries. There are also
wide variations within countries –for example, between different geographical areas, between urban
and rural areas, and between populations at different socio-economic levels.
According to recent data, the country-specific IMR varies from as high as 163 in Afghanistan to as low as
4.3 in Japan (PRB, 1996).
The child mortality rate (CMR) is the number of deaths occurring among children from 1 to 4 years old
in a given period of time (usually one year) per 1,000 children of that age group.
Total deaths of 1–4 year-old-children in one year
Child mortality rate = x 1,000
Mid-year population of 1–4 year-olds (same year)
Note that a child is 1–4 years old between exact age 1 and exact age 5 (i.e., the date of his fifth birthday).
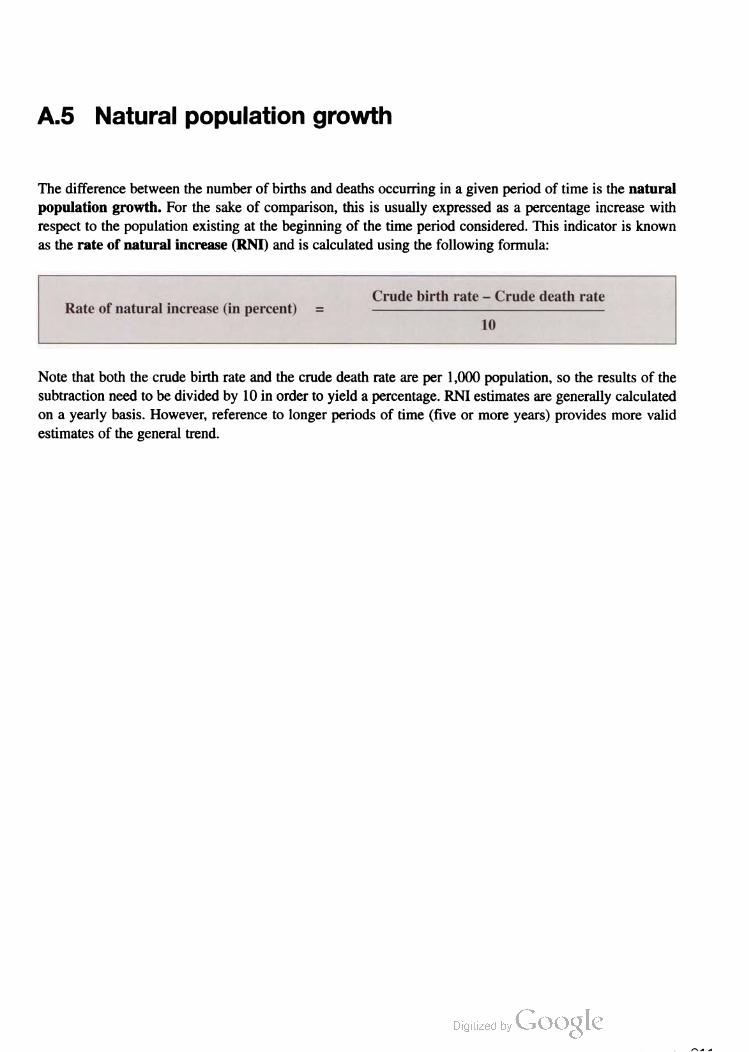
A.5 Natural population growth
The difference between the number of births and deaths occurring in a given period of time is the natural
population growth. For the sake of comparison, this is usually expressed as a percentage increase with
respect to the population existing at the beginning of the time period considered. This indicator is known
as the rate of natural increase (RNI) and is calculated using the following formula:
Crude birth rate - Crude death rate
Rate of natural increase (in percent) =
10
Note that both the crude birth rate and the crude death rate are per 1,000 population, so the results of the
subtraction need to be divided by 10 in order to yield a percentage. RNI estimates are generally calculated
on a yearly basis. However, reference to longer periods of time (five or more years) provides more valid
estimates of the general trend.

A.6 Migration
Migration is often a significant factor, not only in the demography of small communities, but also affect
ing the way in which human populations relate to their environment. Immigration and emigration are not,
however, usually documented routinely at the local level. If births and deaths are known for the period, this
limitation can be overcome by calculating the migration balance (MB), which is the number of ‘in or
"out migrants existing in a population at a given point in time (Livi Bacci, 1990). A positive result to the
equation indicates immigration flow towards the considered area; a negative value indicates emigration
to other areas.
Migration balance = (Popt2) - (Popt1) - (Birthst1-t2) + (Deathst1-t2)
where Popt1 is the population at the earlier time, Popt2 is the population at the later time,
and Birthst1-t2 and Deathst1-t2 are the births and deaths during the time period.
On the basis of this rough estimate, the net migration rate (NMR) can be calculated with the following
formula:
Total number of migrants in one year
Net migration rate - x 1,000
Total population at mid-year
NMR is the simplest means of assessing the quantitative effect of migration flow on local population
dynamics. More complete information, including age and gender distribution of the migrants, is usually dif
ficult to obtain. Moreover, each local community is likely to have some unique migration characteristics
(e.g., young men in rural southern Africa going to work in the mines; young women in west Africa going
to towns for trading). Thus, a household survey is recommended if the NMR is needed (e.g., for planning
a specific initiative).
It is important to clarify also what is meant by migration’. People move in and out of their territory of res
idence all the time, but these movements are considered migration only if the person establishes a per
manent or semi-permanent residence inside or outside the given territory. Seasonal migration is a variation
on permanent migration, which is found in many regions with seasonal agricultural employment with long
periods of slackened demand for labor. In this case, it may be possible to measure the number of individu
als engaged in this kind of migration, and calculate a seasonal net migration rate.
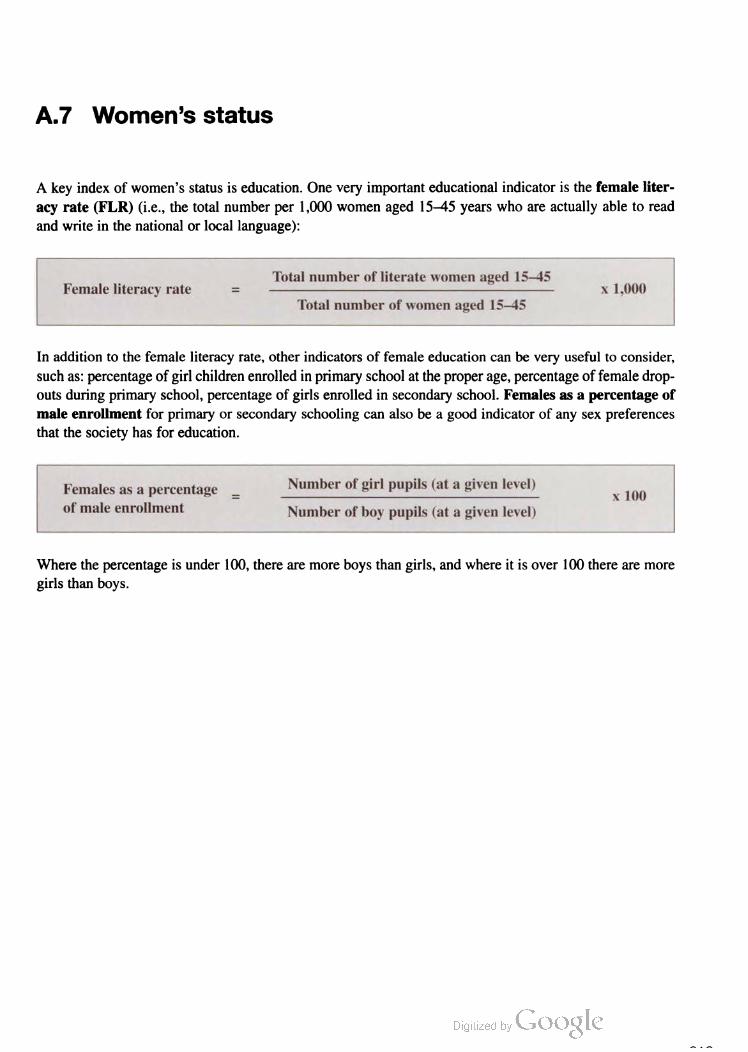
A.7 Women’s status
A key index of women‘s status is education. One very important educational indicator is the female liter
acy rate (FLR) (i.e., the total number per 1,000 women aged 15—45 years who are actually able to read
and write in the national or local language):
_ Total number of literate women aged 15—45
Female literacy rate = x 1,000
Total number of women aged 15-45
In addition to the female literacy rate, other indicators of female education can be very useful to consider,
such as: percentage of girl children enrolled in primary school at the proper age, percentage of female drop
outs during primary school, percentage of girls enrolled in secondary school. Females as a percentage of
male enrollment for primary or secondary schooling can also be a good indicator of any sex preferences
that the society has for education.
Number of irl u ils ata iven level)Females asapercentage = g P P ( g x100
0f male enmllment Number of boy pupils (at a given level)
Where the percentage is under 100. there are more boys than girls, and where it is over 100 there are more
girls than boys.

Annex B: Basic methods and
tools for PAR on population
dynamics and the local
environment

B.1 Transect walks and diagrams
B.2 Participatory mapping
B.3 Historical mapping
B.4 Interviews with natural groups
B.5 Focus group discussions
B.6 Semi-structured interviews
B.7 Group brainstorming
B.8 Ranking exercises
B.9 Priority-setting exercises
B.10 Strengths, weaknesses, opportunities and limita
tions (SWOL) analysis
B.11 Role-playing
B.12 Slide language
B.13 Gender analysis
B.14 Some tips on good facilitation
B.1 Transect walks and diagrams
One of the tools for gaining hands-on experience in a community is to take an observational walk, i.e., a
walk during which attention is specifically paid to people, activities, resources, environmental features, etc.
Observational walks may be taken in a meandering way, following a particular feature of the landscape or
the interests of the observer(s). The walks can also be structured as a transect, i.e., a straight line cutting
across the terrain in a specific way, such as a compass direction. Walks of these kinds help to verify the
information provided on maps, both through direct observation and in discussions with people met along
the way. Ideally the walk is organized for a small group, so as to maximize the opportunities for interac
tions.
Purposes
There are several types of transects, among which two broad categories are social and land-use transects.
The former concentrate on housing types, infrastructure and amenities, religious and cultural features and
behaviors, economic activities, skills and occupations. The land-use category focuses on environmental and
agricultural features (such as cultivated land, forests, ranges, barren land and erosion phenomena, streams,
bodies of water, types of soil and crops). A typical transect takes in a combination of social and land-use
information.
Steps in using the technique
• Decide what issues to focus on and the information that needs to be gathered.
• Agree with the relevant interest group who will take part in the transect walk and discuss with them the
purpose of the exercise.
• During the walk, take notes on relevant features observed; seek clarifications from local people; discuss
problems and opportunities.
• After the walk, meet with participants to discuss notes; involve participants in drafting a transect dia
gram to be used for further discussion and feedback to the community at large.
Strengths and weaknesses
+ Transect walks are a highly participatory and relaxed technique.
+ They enhance local knowledge and can also be used in low-literacy communities.
+ They may be extremely useful in validating findings of participatory mapping exercises.
– Transects may be time-consuming.
— Good transect diagrams require some graphic skills.

B.2 Participatory mapping
Participatory mapping starts with collective discussions among groups of community members and then
proceeds to drawing maps of their perceptions about the geographical distribution of environmental, demo
graphic, social and economic features in their territory. The participants are usually requested to draw their
own map, e.g., on a flipchart or on the ground, plotting features with symbols that are understood and
accepted by all members of the group, regardless of literacy. In certain cases, purchased maps, aerial pho
tographs or basic drawings on paper or on the ground can be used as a basis for the participatory exercise.
Purposes
Participatory mapping is useful for providing an overview (or 'snapshot') of the local situation. It can also
serve as a good starting point for environmental and social assessment. Periodically repeated participatory
mapping may help in monitoring and evaluating changes in the distribution of social resources (e.g., infra
structures like schools and health units) and in the use of natural resources. Historical and anticipated
future mapping (i.e., drawing a series of maps referring to different moments in time) are versions of par
ticipatory mapping that are helpful in describing and analyzing trends over time (see section B.3).
Steps in using the technique
• Explain the purpose of the exercise to the interest group.
• Agree on the subject of the mapping exercise and on the graphic symbols to be used; participants choose
their own symbols.
• Ask a participant to be responsible for drawing or plotting symbols according to the suggestions of the
group.
• Promote participation of all interest group members by posing questions to several individuals; allow
the group to discuss different opinions and perceptions.
• Once the map is finalized, ask participants to interpret the overall picture; if appropriate, suggest that
they identify the main problems revealed by the map and ask them about possible solutions within the
locally available resources (which are already drawn, or could now be drawn, on the map).
• Remember that the map is community property; leave the original in the community and make copies
of it if other uses are foreseen.
Strengths and weaknesses
+ Mapping and the associated discussions quickly provide a broad overview of the situation.
+ They encourage two-way communication.
+ They help people in seeing links, patterns and inter-relationships in their territory.
+ Individuals who are illiterate can also participate.
— Subjectivity and superficiality: mapping exercises must be complemented by information generated by
other participatory assessment tools.
– Some cultures may have difficulties in understanding graphic representations.

8.3 Historical mapping
Historical mapping uses a series of participatory mapping exercises to portray the demographic and natur
al resources situation of the community at different moments of its history. Usually, three maps are drawn,
showing the situation as it existed one generation ago, at the present time, and what is expected after one
generation’s time in the future. Demographic information can be plotted as household symbols or circles
to represent 10 or 100 people.
Purpose
Historical mapping can be extremely helpful to introduce the time dimension in participatory environmen
tal appraisal and/or participatory census exercises. It can provide visual evidence of changes that have
occurred and expected trends. In this way it can help identify determinants of environmental degradation
and population dynamics and enables participants to consider suitable means of moving towards a desired
future.
Steps in using the technique
' A map of the current demographic and environmental situation is drawn with participants.
' With the help of elderly community members, the same exercise is repeated to show the situation as it
was approximately twenty years ago.
' The current and past maps are then compared, often with a brainstorming, to collectively identify major
changes and their root causes.
' Based on the list of changes and causes, a prospective map can be drawn by the participants to show
their expectations of the situation which will exist in the community in 20—30 years from now, if the cur
rent trends are maintained.
' The future map can be reviewed to explore differences between what is projected and what a desirable
future status would be. The discussion can progress to identify potential means for addressing environ
mental degradation and population dynamics.
Strengths and weaknesses
+ The technique can be very appropriate to summarize the results of a comprehensive participatory
appraisal on environment and population dynamics.
+ It may increase participants’ understanding that most positive and negative changes in environments and
populations are shaped by historical, man-made actions.
+ It can help to identify mid- or long-term solutions to the population and environment problems affect
ing the community.
- The exercise is long and complex. Three sessions with the group may be needed to get through the whole
sequence of mapping and discussion.
- Sensitive issues from the past may be raised, including conflicts within the community and between the
community and outsiders.
- The analysis is likely to identify effects and causes which are beyond community control.
Discouragement and frustration may develop among participants.
B.4 Interviews with natural groups
Natural groups interviews are casual conversations with groups of people met during observational walks
and other forms of participant observation sessions. Typical natural groups might be peasants working in
their fields, mothers fetching their children from school, people queuing for a bus, traders and customers at
the market, patients waiting in a health unit, etc.
Purposes
Natural group interviews are a suitable means to get verbal comments about the situation in which the
actors are engaged. They help to discover problems and expectations related to the situation as perceived
by local actors, as well as common interests leading individuals to cluster in small groups.
Steps in using the tool
• Make a list of settings where natural groups can be observed in the community, and the types of groups
which seem to gather in those locations.
• Identify the groups likely to be most concerned with the topics of interest.
• Develop a set of open-ended questions you would like to address to the group.
• Find an opportunity to engage in conversation.
• Introduce into the conversation some of the key open-ended questions.
• Do not take notes during the conversation, but make a summary of the information obtained from the
natural group as soon as the interaction is finished.
Strengths and weaknesses
+ The technique helps to focus participant observation activities.
+ It provides important hints about local views on the issues of interest.
+ It helps to establish preliminary contacts and personal relationships with local people.
+ Group interaction enriches the quality of the information which can be elicited.
— Good communication skills are needed to get the most out of this technique.
– To avoid improper behaviors, some previous understanding of local etiquette is necessary.
– As people may not be willing to share all their ideas with an outsider, answers may be colored by what
they think the outsider expects to hear. A countercheck of the perceptions collected through this tech
nique is essential.
B.5 Focus group discussions
Focus groups are semi-structured discussions with a small group of persons sharing a common feature (e.g.,
women of reproductive age, shareholders in an irrigation system, users of a public service, etc.). A small
list of open-ended topics, posed as questions (see example in Table 4.7, p. 136), is used to focus the
discussion.
Purposes
Focus groups have been increasingly used in participatory research to identify and describe insider per
ceptions, attitudes, and felt needs. They are a crucial technique in participatory action research.
Steps in using the technique
Prepare a discussion topic guide (interview framework); decide on the number of focus groups; in a
small community, two groups of 6–12 persons each and representing key different categories (e.g., men
and women, peasants and herders, wealthy and poor, etc.) may be sufficient.
Select appropriate facilitators; this may involve matching by age, gender or language ability (focus
groups are best done in the local vernacular); the interviewer acts as a group facilitator, and a second
person acts as a rapporteur (note-taker); the rapporteur needs to write rapidly to capture people's expres
sions as exactly as possible; it may be useful to tape-record the session, but only if the community and
the group are comfortable with it and give explicit permission.
If possible, test your topics with members of a similar nearby community to improve formulation and
communication.
Before starting, explain the purpose of the session to the group; after posing topics, be sure each person
has at least one opportunity to provide ideas; if some participants dominate the discussion, it may be
necessary to pose questions directly to one or more of the less talkative participants.
As with semi-structured interviews (see section B.6), the facilitator is free to use a variety of probing
questions to help extract ideas and to keep the talk focused; limit the length of the session to about one
to two hours (including introduction).
Notes and recordings of interviews should be carefully reviewed immediately after the session (and
tape-recordings transcribed as soon as possible).
Analysis consists of extracting information, views and attitudes from the discussion; vivid and expres
sive statements should be recorded as phrased by the participants; local interpersonal dynamics should
also be recorded and assessed.
Strengths and weaknesses
+
+
Group interaction enriches the quality and quantity of information provided.
Focus group discussions are quite good at disclosing the range and nature of problems, as well as elic
iting preliminary ideas about solutions.
Practice and experience in qualitative research procedures is needed.
Large amounts of information are easily obtained, necessitating skills in extracting and summarizing for
the analysis.
B.6 Semi-structured interviews
Semi-structured interviews are lists of broad, open-ended questions to be addressed to knowledgeable indi
viduals in a conversational, relaxed and informal way. The interviewer is left free to rephrase these ques
tions and to ask probing questions for added detail (e.g., “Who?’, ‘Where?’, ‘When?’, and ‘How?") based
on respondents' answers and conversation flow. This form of interview is much more likely to yield in
depth opinions and perceptions than a closed-ended questionnaire.
Purposes
Semi-structured interviews can be used to obtain specific, quantitative and qualitative information.
Household features, gender-related issues, use of natural resources, household economics and many other
topics can be effectively explored by this technique.
Steps in using the tool
• Design an interview guide and a summary form; decide who is going to be interviewed (purposeful sam
pling procedures) and select appropriate interviewers (this may mean matching respondents and inter
viewers by age or gender, depending on topic and local cultural values).
• Pre-test the questionnaire guides with several individuals who are representative of the types of persons
to be interviewed in the actual study (make sure the questions are comprehensible, etc.).
• Conduct a training for all persons who will be doing the interviews (i.e., the interviewers); be sure the
training includes a number of practice interviews with other interviewers or community members and
subsequent reviews to improve performance.
• Teach the interviewers to make relatively brief notes during the interview, filling out the summary form
immediately after the interview; this will require practice to capture exact words and phrasing for quo
tations.
• Arrange for daily (or nightly) editing of all forms for completeness, errors, etc.; hold daily discussions
about problems encountered during the interviews, and to review the preliminary results with other
members of the team.
Strengths and weaknesses
+ Less intrusive than questionnaires; can be paced to fit the needs of the respondent.
+ Encourages two-way communication.
+ Administered in an atmosphere that makes respondents feel at ease, which may include privacy and con
fidentiality, depending on topic.
+ Can obtain very detailed information and rich quotations.
– Practice and experience are needed for appropriately using this tool, which requires sensitivity and the
ability to recognize and suppress one's own biases.
– Interviewers should have good literacy, communication, and summarizing skills.
– Interviewers will need some grasp of the general topics covered in the interview.
– Facilitator support is needed for analyzing data.
B.7 Group brainstorming
Brainstorming is a basic idea-gathering technique employed in many group exercises. It is based on a free
wheeling discussion started by an open-ended and somehow provocative question forwarded by the facili
tator. Opening statements should be general and non-leading, i.e., should not stress or overemphasize a par
ticular point of view that can bias the ideas of the participants. It should be clear that brainstorming is a free
and non-committal way of exploring ideas, i.e., no one commits themself to something by suggesting as a
potential solution an issue to explore.
Purpose
Brainstorming can elicit multiple ideas on a given topic, and the group discussion that usually follows it
can help group members explore and compare a variety of possible ‘solutions’.
Steps in using the technique
' The issue to be discussed is introduced by the facilitator; the key question is written on the blackboard
or on a flipchart.
- Participants are asked to provide short answers, comments or ideas, i.e., no speeches at this stage; at
times participants can provide ideas written on cards (only a few key words) which are then pinned to a
wall.
~ An important point to stress at the beginning is that ‘all ideas are good ideas’; if anyone does not agree
with someone else’s point, they should give what they think is a better idea; accept only additional con
tributions during the brainstorming, not disagreements or arguments; defer those to the discussion after
wards; encourage fresh ideas rather than repetitions of earlier items.
' Each participant is allowed to express his/her view; over-talkative participants will need to be quieted,
and silent participants can be explicitly asked for ideas.
' The facilitator picks the basic point out of participant statements and ensures that it is written (or por
trayed with a picture) on the blackboard or flipchart; appropriateness of the summary is checked with
the concerned participants.
' Keep the brainstorming relatively short: 15-30 minutes is usually sufficient to obtain most of the ideas
on a specific topic without tiring the participants.
' Review the results with the participant group; remove duplicated items and cluster groups of similar
ideas; highlight differences of opinion and discuss those until a list of clearly described ideas is
achieved; record (or summarize) the results of the brainstorming and keep them for future reference.
Strengths and weaknesses
+ A properly conducted brainstorming facilitates participation of all group members in the idea-building
process.
+ A large number of ideas and solutions can be generated quickly.
+ It is a good introduction for more structured and focused exercises.
- Experience in dealing with group dynamics — as well as good mediation and summarizing skills — is
needed by the facilitator to keep the discussion on track.
— Conflicts and uneasiness within the group may limit the brainstorming results.

B.8 Ranking exercises
Ranking exercises, which may be done with groups or individuals, are a way to enable people to express
their preferences and priorities about a given issue. When followed by a discussion of the ‘reasons for the
ranking, the technique may generate insights about the criteria through which different individuals, groups
or social actors make decisions on the kinds of issues of interest.
Purpose
Ranking exercises have been used for a variety of purposes, such as:
• identification of priorities and preferences;
• quantification of opinion and preferences elicited through interviewing or brainstorming;
• comparison of preferences and opinions as expressed by different social actors.
Steps in using the tool
• Make a list of items to be prioritized or obtain a list of items generated by other exercises and recruit
the participants to be involved in the exercise.
• Define a simple ranking mechanism. This may be based on a pair-wise comparison of items in the list
(“Is A better than B?’), on sorting cards representing items in order of preference, or on assigning a score
to the different items.
• Prepare a matrix on which preferences identified by participants could be jotted down (e.g., on the
ground, with a flipchart, on a chalkboard).
• Explain the ranking mechanism to each participant and ask them to carry out the exercise (e.g., give
them three stones to place on any categories they want in response to a specific guiding question – which
crop is the most difficult to raise, which problem to solve first, etc.).
• Ask participants to explain the criteria on which their choice has been made (“Why is A preferable to
B?").
• Synthesize the ranking results (e.g., count how many times an item has been preferred with respect to
others) and list the criteria of choice.
Strengths and weaknesses
+ Ranking is a flexible technique which can be used in a variety of situations and settings.
+ Whenever categorical judgments are needed, ranking is a suitable alternative to closed-ended inter
viewing.
+ Ranking exercises are generally found to be amusing and interesting by participants and are helpful in
increasing their commitment to action-research.
+ Information is provided on both the choices and reasons for the choices.
– Pre-testing is needed for the ranking mechanism and the tools to be used to facilitate it.
– Choices may be affected by highly subjective factors. In order to generalize results to the whole com
munity, a proper sampling strategy is needed.
B.9 Priority-setting exercises
Priority-setting exercises are used to reach a group decision on courses of action to be adopted. After a
brainstorming about the pros and cons of several possible alternative courses of action, each participant is
asked to evaluate them according to two or more criteria (e.g., effectiveness, feasibility, efficiency. visibil
ity, closeness to community concerns, etc.), and using a scoring system.
Purposes
Like other scoring and ranking techniques, these exercises may be used when individual opinions must be
consolidated into a group decision. They have proved useful for planning and, especially, for decision-mak
ing by a group.
Steps in using the tool
Draw a priority-setting matrix on a flipchart or blackboard, leaving spaces for possible actions on rows
and drawing columns for all chosen criteria; clearly explain the criteria to be used for ranking the cours
es of action.
Ask the group for possible actions to be evaluated and list them in the left column of the matrix; call for
a brief explanation of each action.
Distribute scoring cards; each member gets one set of cards for each of the scoring criteria (e. g., ‘effec
tiveness’, ‘feasibility’, etc.); the number of cards in each criteria set must be equal to the number of
actions being ranked, for example, if there are four actions, then each criteria set should contain a num
ber from 1 to 4; when asked to assess the ‘effectiveness’ of a specific action, the member must hand in
(or display) the appropriate card to the facilitator (i.e., if the participant feels that the action is the most
effective of the four, then he or she will hand over the card marked ‘4’ from the ‘effectiveness’ set); the
same procedure has to be repeated for each action and each criteria; scoring cards with labels and dif
ferent colors may help to avoid confusion.
Once a course of action has been evaluated, for all criteria, by all participants, jot down the scores in the
matrix and then return the cards to the participants; after all repetitions, total the individual scores by
criteria and report the totals in the right column of the matrix.
Ask participants to comment on the final results; clearly explain that the scores are meant to assist in
decision-making, but that they do not provide the final solution; support participants in making a final
decision by encouraging them to consider both the trends revealed by the total scores and the comments
and suggestions resulting from the discussion.
Strengths and weaknesses
+ Priority-setting exercises help groups to identify the main thrust of their collective opinions, instead of
just individual views.
They contribute to reaching a consensus on controversial issues.
The final decision may be too heavily influenced by the scoring mechanism (e.g., a criterion not listed
is forgotten, a criterion listed is taken as paramount).
Because of the complexity, a few trials may be needed at the beginning for the participants to learn the
system.
B.10 Strengths, weaknesses, opportunities
and limitations (SWOL) analysis
SWOL analysis is a powerful tool for group assessment of an issue of concern, in particular interventions
or services. It is based on a structured brainstorming aimed at eliciting group perceptions of the positive
factors (strengths), the negative factors (weaknesses), the possible improvements (opportunities) and the
constraints (limitations) related to the issue.
Purpose
SWOL analysis is especially useful for evaluating activities carried out in the community. It can be focused
on services provided by external agencies, as well as used for self-evaluation of the interest group's own
performance.
Steps in using the tool
• A four-column matrix is drafted on the blackboard or on a flipchart and the four judgment categories
are explained to participants; it helps to phrase the four categories as key questions, to which partici
pants can respond; the issue of concern is written on top of the matrix (if it is the only one to be con
sidered), or on the side, if several items will be SWOL-analyzed.
• The facilitator starts the brainstorming by asking the group a key question about strengths; responses
from the group are jotted down on the relevant column of the matrix.
• When all points of strength are represented, weaknesses, opportunities and limitations are also identi
fied by the group.
• Participants may have different opinions about an issue, and contradictory statements may be expressed;
in such cases, the facilitator can work towards a consensus, which may require a point to be discussed
at some length; each entry is left on the final matrix only after achieving a group agreement.
Strengths and weaknesses
+ The technique stresses consideration of different sides (positive and negative) of the issues. It therefore
helps to set the basis for negotiations and trade-offs and promotes understanding of the views of others.
+ SWOL is a good means to discuss an issue in detail within a group and to prepare the group to discuss
with outsiders.
+ SWOL can promote group creativeness. It helps to link perceptions of things as they are with realistic
expectations about how things could be.
+ Strengths and ‘weaknesses’ tend to be more discriptive and easier for respondents to identify.
– “Opportunities and limitations’ (i.e., threats, constraints or barriers) are more analytical concepts and
may be hard to elicit.
– Sensitive topics and differences of opinion may arise during the discussion.
– Some group members may attempt to dominate the discussion.
– Facilitator needs good synthesizing skills.
B.11 Role-playing
Role-playing consists of simulating events or interactions in a safe, make-believe setting with the aim of
identifying (and sometimes altering) attitudes and behaviors which enhance or hamper the flow of com
munication in real life.
Purpose
Role-playing is helpful in training members of action-research teams and/or interest groups in communi
cation skills. It may be used to develop simple theater sketches as entry points for involving a bigger audi
ence in a discussion of social roles and communication behaviors.
Steps in using the technique
Prepare a set of notes for the simulation exercise; the setting and roles to be played should be clearly
defined (i.e., village nurse and mothers of children to be immunized).
Prepare an observation checklist of features to be observed and assessed (i.e., Are the mothers made
comfortable? Is the nurse capable of passing on a clear message?).
Ask participants to form two sub-groups; make it clear that the exercise will be repeated and that each
participant will have the chance to act as a performer and as an observer.
Allow each sub-group to prepare a performance.
The first group makes its performance and is assessed by the second group; comments are jotted down
on the blackboard.
The same process is repeated with the second group acting as performers and the first as observer/eval
uatOrS.
The groups together discuss what can be done to improve communication in the setting that has been
acted.
Strengths and weaknesses
+
+
Role-playing is a powerful tool for identifying and acquiring communication skills.
Exchanging roles in the exercise allows participants to experiment and realize the interactive nature of
communication processes.
An experienced facilitator is needed to manage the group dynamics which may arise from the exercise.
A good performance in the simulated setting does not necessarily mean that the same level of commu
nication will be achieved in real life.

B.12 Slide language
Slide language (i.e., participatory picture-taking and slide shows) can be an effective tool for raising aware
ness about the local situation and promoting reflection. Insiders are trained to use a simple camera to take
pictures of relevant features and events in their own environment and community. These pictures are then
shown to interest groups and/or used at community meetings. Participants are asked to comment on the
images, to tell a story related to them or to identify positive and negative aspects of the object, situation or
event shown.
Purposes
Slide language can be used for a variety of interactive purposes such as participatory environmental assess
ment, gender analysis, evaluation of services or appraisal of traditional and new technologies. Slide lan
guage should not be confused with the use of pre-developed audio-visual materials for demonstration or
didactic purposes.
Steps in using the tool
• Train members of an interest group in using the camera and in composing and selecting significant
images (some practice may be needed).
• Decide the purpose of the session and collectively prepare a list of relevant scenes to be photographed;
try to clarify with the group what each image is meant to show; using this information, draft a written
text to accompany the slides.
• Assist the group in taking pictures; each image may be taken from three or four different angles, by dif
ferent group members and under different light conditions (this will increase the chances of producing
good-quality slides).
• After developing the slides, meet with the group and assist them in selecting the images they would like
to show; images should be relevant to the written text, meaningful, easily recognizable by the audience,
and of good technical quality; eight to twelve good slides are sufficient for a session.
• Start the session by explaining its purpose; prepare relevant key questions for each image to be used in
promoting discussion; project each slide for enough time so that details can be identified and discussed.
• Take notes on the main points of the discussion. Use them for wrapping up the session so that a list of
the problems elicited by the slides and possible solutions is agreed upon before its conclusion.
Strengths and weaknesses
+ Slide language is a creative and participatory way of visual portrayal.
+ It enhances local knowledge and can also be used in low-literacy communities.
– Slide language is a relatively expensive tool. Cameras, slide films, a good projector and often a portable
generator are required.
– It may take some time for the tool to be properly effective. During the first sessions participants may be
more attracted by the show’ than by its subject matter.

B.13 Gender analysis
Purpose
Gender analysis in an initiative dealing with population dynamics and the local environment helps to illus
trate the difference in the ways men and women contribute to population dynamics, perceive it and are
affected by it, and how they use natural resources, rely on them, and have access to alternatives. It also helps
to make explicit the constraints (financial, legal, cultural, etc.) that differentially affect the ability of men
and women to respond to, and participate in, common initiatives.
Steps in applying this process
Gender analysis can refer to any topic and be incorporated in all types of tools and processes, including:
natural group interviews, gender-based interviews (natural group, focus and key informant), seasonal cal
endars, trend analysis, mapping exercises, household interviews, informal discussions, and so on. First, it
is important to access and record data in ‘disaggregated’ and specific terms with respect to men and women.
In other words, questions should probe in detail, for instance:
~ Who migrates?
- Who wants large (small) families?
' Who is benefiting from large (small) families?
' Who is paying the price?
' Who has access to what resources - finance, equipment, land, natural products, etc.?
' Who uses which natural resources and for what?
' Who carries out which tasks?
' What role do women (men) play in decision-making about resource use?
- What is getting better for the women (men)?
- What is getting worse for the women (men)?
Second, both men and women should be allowed to provide their answers and their views, if necessary in
separate meetings. In some cultures, women are reluctant to attend meetings and to speak their minds. In
these cases, a woman facilitator may assist in rather informal gatherings and use great sensitivity to let the
women find out for themselves what they wish to discuss and how.
The information collected through the gender analysis will have explicit reference to women and men and
help with identifying — and possibly redressing — existing imbalances and inequities. In fact, gender analy
sis could be the basis of gender-based planning, in which women and men present their concerns as sepa
rate interest groups.
“An

Strengths and weaknesses
+Gender analysis ensures that the knowledge of both women and men is made available in the design and
management of community initiatives.
It explicitly acknowledges the importance of the role and contributions of women (not a given in many
communities).
It protects women from having to bear unforeseen and unacknowledged costs which may result from
community initiatives.
It enables constraints on women's participation to be addressed.
Patient and sensitive facilitation is required if women show reluctance to participate (due to shyness,
male opposition, etc.).
Addressing gender differences may be seen as a threat or criticism of the local culture and cause some
reSentment.
B.14 Some tips on good facilitation
There is an old saying about working together: We can accomplish anything, as long as we don’t worry
about who receives the credit.
Encouraging people
Facilitators guide a participatory process by asking questions and refraining from stating their own opin
ions or instructing participants in answers presumed by them to be correct or incorrect. Their job is to stim—
ulate the people to think and act in a self-reliant manner. It often means convincing people that they have
an important role to play in their communities. Facilitators enable people to get into the habit of trusting
their own ideas and organizing for action.
Many people, perhaps most, are shy in expressing themselves in public. In some cultures, this is especial
ly true of women and minorities. A lot of encouragement (not necessarily verbal) from facilitators is need
ed for such people to speak. Facilitators assure them that their ideas are important. Even the slightest hint
that their ideas might not be valuable discourages some folks from actively engaging in a discussion. A
facilitator, therefore, never rejects a response. There are no ‘wrong’ answers. Everyone has something to
contribute and every contribution has an insight at its core.
This does not mean that every contribution is easily understood when it is first presented. Many ideas may
be expressed in convoluted or unclear terms, especially by people who have too little (or too much) expe
rience in public speaking. The facilitator’s job is to make sure that the concerns someone is trying to con
vey are actually expressed and understood.
Facilitation is difficult because its style is contrary to much development work. Facilitators must break the
conventional mold of a teacher or extension officer. Educators in the developing world are often trapped by
the ‘anti-participatory orientation’ found in post-colonial schools, while extension officers tend to become
‘salesmen’, hawking predetermined plans from a central development office. Neither serves as a good
model for a facilitator.
Becoming a good facilitator is an on-going process that involves continual learning. No one is simply born
a natural facilitator. Facilitators work as a team and learn from one another. The most valuable training they
receive is ‘on-the-job’ training. Good facilitators are continually reflecting on their performance and on
how they might be able to improve their skills.
The major challenge of a participatory process is to discern the minimum level of facilitator support that
still allows it to be an effective catalyst for self-reliant initiative. A systematic pattern of monitoring visits
can accomplish this. Many facilitators, however, are tempted to skimp on follow-up work so that they can
conduct new seminars in additional communities. This tendency must be strongly resisted.
Probing for detail
A typical problem encountered in planning workshops is the one of abstraction. Hopes and dreams are stat
ed so vaguely that they become mere indicators of a broad, general direction — thereby losing the compelling
power of bold but concrete visions. Abstract statements can be transformed into specific vision statements
by asking, “What would we see if this was to happen?” Take, for example, a statement about ‘improved
health’. A facilitator might ask, “If we were to return in five years and take a picture of new developments
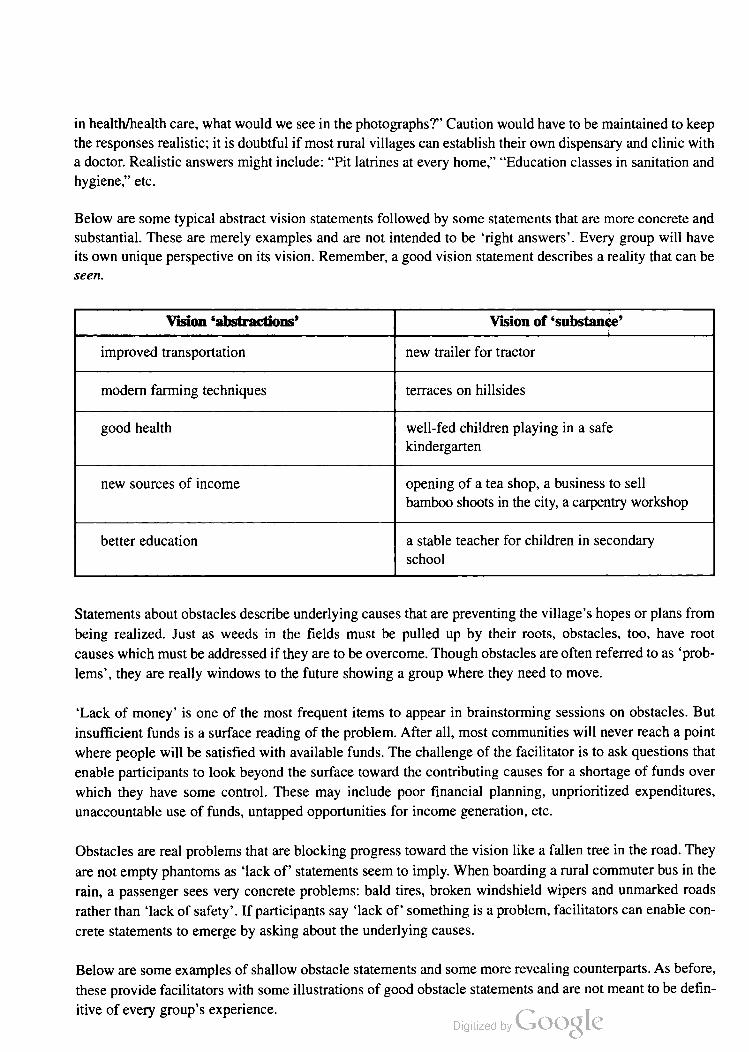
in health/health care, what would we see in the photographs?” Caution would have to be maintained to keep
the responses realistic; it is doubtful if most rural villages can establish their own dispensary and clinic with
a doctor. Realistic answers might include: “Pit latrines at every home,” “Education classes in sanitation and
hygiene,” etc.
Below are some typical abstract vision statements followed by some statements that are more concrete and
substantial. These are merely examples and are not intended to be ‘right answers’. Every group will have
its own unique perspective on its vision. Remember, a good vision statement describes a reality that can be
See/1.
* - Vision ‘abstractions' Vision of “substance’
improved transportation new trailer for tractor
modern farming techniques terraces on hillsides
good health well-fed children playing in a safe
kindergarten
new sources of income opening of a tea shop, a business to sell
bamboo shoots in the city, a carpentry workshop
better education a stable teacher for children in secondary
school
Statements about obstacles describe underlying causes that are preventing the village's hopes or plans from
being realized. Just as weeds in the fields must be pulled up by their roots, obstacles, too, have root
causes which must be addressed if they are to be overcome. Though obstacles are often referred to as prob
lems’, they are really windows to the future showing a group where they need to move.
‘Lack of money is one of the most frequent items to appear in brainstorming sessions on obstacles. But
insufficient funds is a surface reading of the problem. After all, most communities will never reach a point
where people will be satisfied with available funds. The challenge of the facilitator is to ask questions that
enable participants to look beyond the surface toward the contributing causes for a shortage of funds over
which they have some control. These may include poor financial planning, unprioritized expenditures,
unaccountable use of funds, untapped opportunities for income generation, etc.
Obstacles are real problems that are blocking progress toward the vision like a fallen tree in the road. They
are not empty phantoms as “lack of statements seem to imply. When boarding a rural commuter bus in the
rain, a passenger sees very concrete problems: bald tires, broken windshield wipers and unmarked roads
rather than lack of safety’. If participants say “lack of something is a problem, facilitators can enable con
crete statements to emerge by asking about the underlying causes.
Below are some examples of shallow obstacle statements and some more revealing counterparts. As before,
these provide facilitators with some illustrations of good obstacle statements and are not meant to be defin
itive of every group's experience.

'r ‘Underlying’ obstacles
lack of education poor attendance at literacy classes because
few people know about them
not enough money unaccountable use of funds
selfishness few benefits of co-op membership
floods deforestation and overgrazing
POOI' management late ordering of fertilizers
lack of cooperation
irregularly called meetings

Annex C: Using a computer for
demographic projections and
map-making

C.1
C.2
Using a computer for demographic projections:
wanting to know what lies ahead
Inputs and outputs
An illustration: the future implications of changing fertility
Resource: Demproj demographic projection software
Using a computer for map-making and GIS
Resource: Map Maker for Windows

C.1 Using a computer for demographic projections:
wanting to know what lies ahead
One of the things a community may wish to know is what the local population will be in 10, 20 or even 50
years. How many school-aged children will we have when our children are young parents? How many peo
ple will be of working age, or old age (over 65)? What will happen if the new migrants keep coming in?
These questions can be answered easily and precisely using demographic projection programs that have
been designed for use with small computers. With such a program, the user can obtain a projection of pop
ulation by age and sex for 5 to 50 years after the base or beginning year. The user decides on the base year
and the number of years for the projection, and can also make a few assumptions concerning future trends
for birth and death rates. It should be stated at the outset that a projection is only as good as the assump
tions upon which it is based. However, the advantage of using computers is that the assumptions can easi
ly be changed from one projection to the next to see the implications of different patterns of births or deaths
on future population size and age distribution.
Projections can be obtained on urban and rural populations separately, and on populations of specific areas
of interest, such as a local community. Migration can be taken into account, with the user deciding on either
current migration rates, or different assumptions of flows of migrants. Some of the programs can provide
information on the future impact of AIDS, if the user can provide basic information on current infection
rates and assumed future rates. In these ways, the computer programs can be a good tool for helping com
munities see the future implications of population interventions.
Inputs and outputs
The basic inputs for running computer projections are the key population indicators discussed in Annex A:
' population size, including the date of the information, and the distribution by age and gender, i.e.,
numbers of males and females for five-year age intervals: 0—4, 5—9,. .. 80+. Such data are usually avail
able from national population censuses down to province or district levels, and sometimes even for small
communities. The information could also come from a participatory community census.
' total fertility rate (TFR): one can use the UN-projected TFR, or choose a different one. If available,
one can use a full set of age-specific fertility rates.
- mortality data, either as age-specific death rates, or choosing a life table and entering simpler assump
tions of life expectancy at birth for men and women, again by five-year intervals.
' migration rates: best if age-specific migration rates, usually obtained from the participatory assessment
of the actual community. This is important for small communities, which can be overwhelmed by rela
tively small amounts of immigration, or badly weakened by even small amounts of out-migration.
The basic outputs are tables of numerical data or graphs showing total population, or numbers for specific
age groups for the selected time into the future. These programs can also show projected numbers of births
or deaths, or summary demographic statistics and age-sex pyramids.
By inputting different data or assumptions, it is possible to compare alternative future outcomes in the com
munity. This is especially useful because it shows clearly and dramatically what are the future implications
of different real conditions or interventions. For example, one can see the future implications of conditions
that might be controlled with specific programs, such as death, fertility and migration rates. With appro
nfi')

nnn
appropriate consideration given to local cultural sensitivities, one can generate tables and graphs of future
population scenarios, and use these to stimulate group discussion.
An illustration: the future implications of changing fertility
The following illustration shows how such a computer program could be used. For example, the isstte of
children, family size or family planning might come up in a participatory appraisal. One of the questions
that commonly arises is ‘What will the future hold if things continue as they are, if we continue to have the
same numbers of children or the same family size?’
The following is an example to illustrate both what a projection program can provide, and what are some
of the important lessons that can be learned from such an exercise (see Annex A for definitions of terms).
Take two hypothetical (make-believe) communities, with demographic characteristics that are quite com
mon for many developing countries. They both begin in 1970 with 2,100 people, and slightly more females
than males. They have age-sex distributions common among communities with high fertility and recent
rapid declines in mortality. They are both at relatively high total fertility rates (TFR 7.00). In mort ity,
Community 2 begins with slightly lower rates and a moderate advantage: crude death rates for Comm$i1ity
1 and 2 are respectively 26 vs. 16, and infant mortality rates are 167 vs. 127.
Then we assume that Community 1 shows very slow declines in both mortality and fertility. Infant mortal
ity declines slowly, remaining above 100 until after 2005, and life expectancy for males and females togeth
er increases only slowly from 38 to 58. The total fertility rate declines only gradually down to 5 by the year
2020. This is, in fact, a scenario close to that projected for a typical poor rural community without any spe
cific local interventions.
We assume that Community 2 shows the kind of rapid decline in mortality and fertility that Thailand
showed after 1965. Infant mortality goes down from 127 to 37 in 25 years, and life expectancy for males
and females together rises in that same period from 49 to 73. The total fertility rate declines from 7 to
replacement level in 25 years (1970—95). Not only Thailand, but South Korea, China and Taiwan had sim
ilar and even more rapid changes in mortality and fertility.
It may be an important lesson to note that these are not wild assumptions either for a small community or
for a very large nation. They reflect what can be done when a government (or a small community) is com
mitted to, and effective in, delivering primary health care and family planning services to its people. It also
shows what is happening in so many countries today, where primary health care does not reach most of the
people, especially the rural poor.
When we have made the basic assumptions of mortality and fertility declines, the computer program can
project numbers of people by age and sex, and numbers of births and deaths for every five-year period for
the 50 years 1970—2020. Table C.l shows just a portion of one of the total population tables. One 0 see
exactly where the decline of fertility overtakes the decline of mortality to bring smaller numbers. In 1 90,
20 years after the starting date, Community 2 has 1 person less than Community 1: 3,460 vs. 3,461. om
that point, however, the difference becomes very dramatic. By 2000, Community I already has 600 ore
(about 15 percent). By 2010, Community 1 has 1,685, or 38 percent more; and by 2020 Community‘l is1.7 times as large as Community 2. i
l
One of the basic things these tables can teach is that mortality and fertility are closely related, and lthat
changes in either take some time to have an effect on the total numbers of a population. They do haVe a
more immediate impact on specific age groups of the population. Here are some points worth making:

Table C.1
Projections for total population (five-year periods 1970–2020)
Year Community 1 Community 2
Total Male Female Total Male Female
1970 2,100 1,045 1,055 2,100 1,044 1,056
1975 2,360 1,177 1,183 2,431 1,212 1,219
1980 2,663 1,330 1,333 2,780 1,390 1,390
1985 3,024 1,513 1,512 3,127 1,567 1,560
1990 3,461 1,731 1,729 3,460 1,735 1,725
1995 3,996 1,998 1,998 3,756 1,883 1,872
2000 4,620 2,309 2,311 4,008 2,010 1,998
2005 5,338 2,668 2,669 4,256 2,134 2,122
2010 6, 184 3,093 3,091 4,499 2,255 2,244
2015 7,176 3,592 3,584 4,718 2,366 2,353
2020 8,277 4,146 4,131 4,899 2,456 2,443
Fertility and mortality are linked. High fertility also brings high mortality. High fertility implies that
women bear early, often and/or late in their reproductive lives, and all three are known to contribue to
high death rates among women and children. This is especially true for the poor. When we reduce fer
tility, especially by increasing the age at first birth (above 20) and the interval between births (more than
two years), we get lower levels of infant and maternal mortality.
Population has a momentum. The people who will give birth to the next generation, for the next 45
years, are already born. Thus even a rapid decline in fertility will not show up in reduced total popula
tion, in the case of our examples, for 25 years. Perhaps this is one of the most important lessons we can
learn. By the time population-induced environmental degradation is experienced, there is still a “built
in population growth for the next generation.
The impact on age groups differs. The numbers of small children and infants, ages 0 to 4, who are
dependent and need nurturing and good health care, will begin to decline within five years of fertility
decline. As the number of infants declines, the differences between the two communities grows very
rapidly. Within just 25 years (1995 in the chart) the community without the fertility decline will have
twice as many of these dependent infants and children as the community with rapid fertility decline. In
50 years they will have three times as many. For ages 15–19, the ages when children become adults, the
differences do not appear for 25 years after the beginning of the fertility decline. By 35 years, however,
there is a marked difference, and in 50 years, the larger community will have almost three times as many
young adults for whom it will have to find education, jobs or land.
Resource: Demproj demographic projection software
One very useful program for projecting populations is called Demproj, for Demographic Projection Model.
It is a full-featured population projection program developed by the Futures Group International with par
tial support from the US Agency for International Development. The program runs on DOS, and requires

only 770K of disk space and 640K RAM. This is well within the range of most computers today, even light
weight laptops.
The strongest feature of the program is its ease of use. It requires relatively little initial input of data, gives
clear choices in different types of assumptions and can produce output either in tables or in graphs. It does
this in part because it is linked to a number of basic life tables, from which it computes very quickly the
implications of the base population and whatever changes in assumptions (about death and birth rates,
migration or AIDS) the user makes.
Requests for copies of the program or more information should be sent to:
The Futures Group International
80 Glastonbury Boulevard
Glastonbury, CT06033
USA
Tel +1-203-633 .3501
Fax. +1-203-657 9701
E-mail: [email protected]
The cost is US$25.00 for manual and diskette (in 1997). The package is free to some users in developing countries.
C.2 Using a computer for map-making and GIS
Upon completion of the mapping exercise described in Chapter 4, it may be useful to transfer the paper
maps on to a computer mapping or geographic information system (GIS) software package. Both comput
er mapping and GIS packages allow the user to create digital maps that can easily be updated, changed or
manipulated. Another common feature of most mapping and GIS software packages is that point, line and
area features (e.g., water courses and wetlands, farmer’s fields, locations of wells, roads, houses and build
ings and other infrastructure) can be stored in separate layers or coverages for easy creation and updating.
The layers can then be added together to create a composite map that shows only the desired features, and
is not cluttered with irrelevant information. Figure C.l provides an example of a ‘manual’ GIS using acetate
sheets for overlays on a standard topographic sheet. Data from such a manual overlay exercise can easily
be digitized into ‘layers’ or ‘coverages’ for use in an automated mapping or GIS program.
GIS software packages perform many of the functions of a computer mapping program, but also allow the
user to create a database of geographic features and to perform spatial analyses of varying degrees of com
plexity (depending on the sophistication of the package). The database might contain information such as
the size of farmers’ fields, the number of residents in each household, the literacy level of different villages
or the straight line distance between points on the map. More detailed information on natural resources —
such as forest cover, soil erosion data, presence of specific habitats or species or risk of flooding — can also
be stored and shown. Even management data, such as the classification of forests by management regimes
or the presence in a village of a management committee, can be mapped, allowing interesting overlays
between socio-demographic, environmental and ‘action-oriented’ data.
An example of a sophisticated overlay analysis is presented in Figure C.2 (note: the map is reproduced here
in one color from a full-color original; the key is therefore illegible). The map, which presents the threats
to biological diversity in the Sierra Nevada de Santa Marta of Colombia, synthesizes an array of data on
population distribution (including types of settlements — indigenous, campesino or large land holders — and
the land uses associated with each type), roads and infrastructure, hydrology and the concentration and dis
tribution of biodiversity. Such a map offers an immediate guide to setting priorities and scheduling action.
Spatial analysis functions such as overlay analysis (identifying the area in which there is overlap between
two features), trend-surface analysis (displaying highs and lows of a particular variable as a ‘draped’ sur
face) or analyses of spatial variability (the degree to which there is clustering or dispersion of a map fea
ture) are common features of GIS. The most sophisticated GIS packages require the computing power of a
UNIX workstation and can perform hundreds of spatial and data analysis tasks. Simpler packages can run
on a basic laptop computer. Thus, GIS has become a valuable tool for natural resource management as well
as for a multiplicity of regional planning and location-analysis applications.
Although it may be beyond the financial means of most field-based PAR exercises, global positioning sys
tem (GPS) units can be used to produce highly accurate maps that show exact locations of specific features.
GPS units send signals up to satellites that orbit the earth and, through triangulation, are able to define with
in 50—100 meters (depending on the unit’s accuracy) the latitude and longitude of a point on the ground.
This can be particularly useful in work with local groups such as indigenous peoples who need, for politi
cal reasons, to accurately define their territory (see Poole, 1995).
4
Computer-generated maps may be particularly useful in communicating the results of a participatory
appraisal to decision-makers in government institutions, as they are clean and easy to read, and may be per
ceived (rightly or wrongly) as ‘more valid’ than hand-drawn maps.
Resource: Map Maker for Windows
Map Maker is a simple geographical information system (GIS) designed to allow non-expert users to cre
ate and manipulate maps. Using a variety of tools you can navigate around the map, measure distances and
areas, draw polygons, lines and symbols, and display and edit data. Graphic objects on the map may be
related to information in a data base, and data bases may be created directly from the map. You can print
maps directly on to any printer or plotter fully supported by Windows 3.1 or 95, and you can produce
images for inclusion in documents produced using Windows-based word processors.
The Map Maker project is designed to promote the wider use of maps as management tools, primarily in
developing countries. This IBM-compatible Windows-based software is available free to non-profit
making institutions, students, and academics. The software has largely been developed in the field in col
laboration with several institutions, in particular IUCN – The World Conservation Union, the Centro
Agronomico Tropical del Investigacion y Ensenanza (CATIE), and the Asia Desk of the United Nations
Center for Human Settlements (UNCHS). There are currently registered users in 110 countries.
For organizations or individuals in developing countries, Map Maker can be obtained free of charge. Those who have sufficient
resources are encouraged to make a contribution of $50. For more information, or to obtain the Map Maker program and documen
tation, send a request to:
Eric Dudley
64 Tenison Road
Cambridge, CBI 2DW
UK
Fax: +44 1223 350349
E-mail: [email protected]
For users with more advanced mapping needs there is an enhanced commercial version of the software available called Map Maker
Pro 2.0.
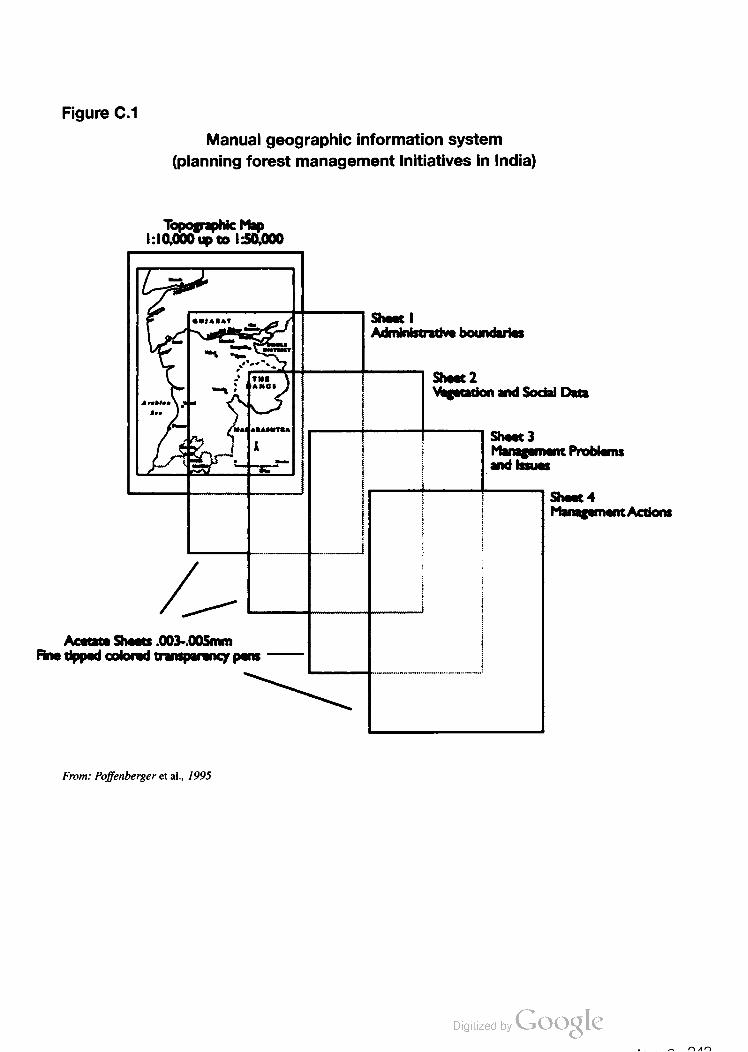
Figure C.1
Manual geographic information system
(planning forest management initiatives in India)
Topographic
l:l0.000 up to l:$0.000
ornaaa' _ I
_ '— ... Administrative boundaries
1:2: 2
Sea ‘
.— 4.“ ans-1n Sh“! 3
"J ‘ Management Problems
:— _ __ and Issues
Sheet 4
Management Actions
Acetate Sheets .003-.00$mm
Fine tipped colored transparency pens '—
\
From: Pojfenberger et al., I995
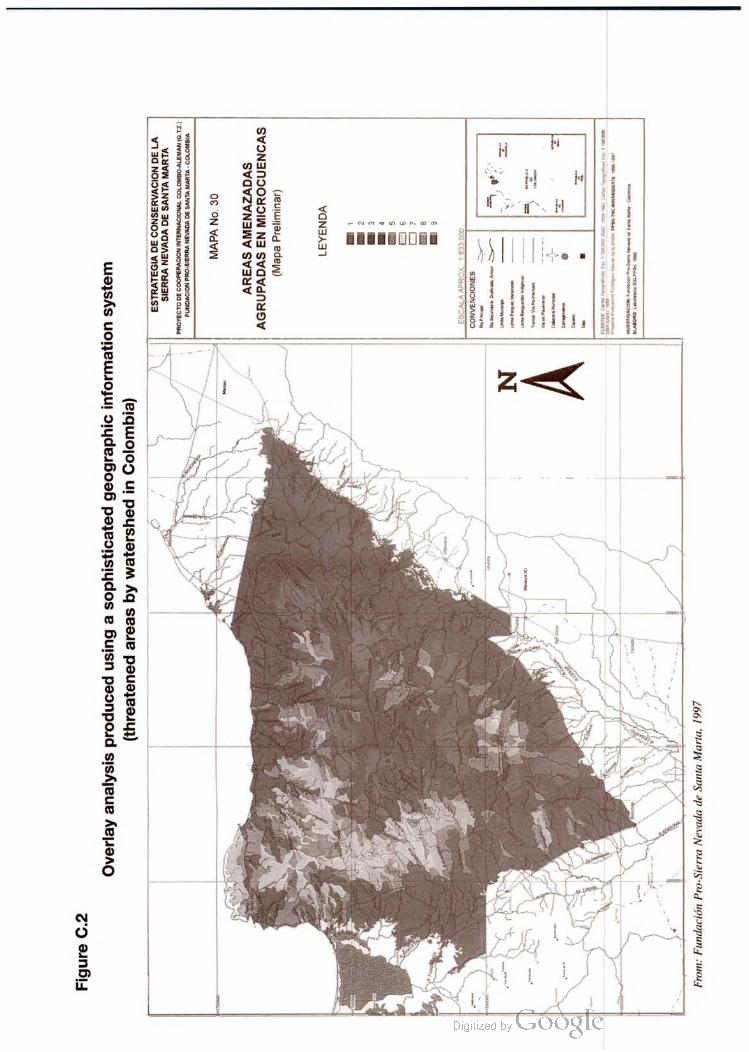
Figure
C.2
Overlay
analysis
produced
using
asophisticated
geographic
information
system
(threatened
areas
by
watershed
inColombia)
ESTRATEGIA
DE
CONSERVACION
DE
LA
SIERRANEVADA
DE
SANTA
MARTA PRoyecto
DEcoopERAcon
NTERNAcional
colomeo
Alemanarz.
1FUNDACION
PRO-SERRANEVADA
DE
SANTAMARIA.
colo
MAPA
NO,
30
AREASAMENAZADAS
AGRUPADAS
EN
MICROCUENCAS
|(Mapa
Preliminar)
LEYENDA
1 |2 _|
3 _|
4 5
-
7 8
L_I
3
SCALA
A.C.
13.000
CONVENCIONES
--
-
suoda
Ao,J--
*
p-
-
1-----
:-
re
ca
------
----
-
Co---
-
-_
-
psicamente
Acoccer
el
es
LAOC.
Los
From:
Fundación
Pro-Sierra
Nevada
deSanta
Marta,
1997
References and suggestions for further reading
The books, reports, manuals, articles and journals listed below were helpful in the writing
of this handbook. Documents with a three-letter key in the right column are particularly
valuable resources for the following:
methods and tools for participatory action research:
primary environmental care:
population and the environment:
Aaker, J. and J. Shumaker, Looking Back and Looking Forward: A Participatory Approach
to Evaluation, Heifer Project lntemational, Little Rock (Arkansas), 1994.
Adedeji, A., The African Development Proble'matique, UN Commission for Africa, Addis
Ababa, 1985.
Agarwal, A. and S. Narain, Towards Green Villages, a Strategyfor Environmentally-sound
and Participatory Development, Centre for Science and Environment, New Delhi, 1989.
Aguilar, L., Ayales, I. and G. Rodriguez, Género y Figura No Son Hasta La Sepultura:
Guia para la Construccion de Relaciones de Equidaa' en Iniciativas de Desarrollo
Sostenible, IUCN, Moravia (Costa Rica), 1995.
Argyris, C., Putnam, R. and D. McLain Smith, Action Science, Jossey-Bass Publishers,
San Francisco, 1990.
Ascher, W., Communities and Sustainable Forestry in Developing Countries, Institute for
Contemporary Studies, San Francisco, 1995.
Banuri, T. and F. Amalric, Population, Environment and De-responsibilisation: Case
Studies from the Rural Areas of Pakistan, Sustainable Development Policy Institute
Working Paper WP/POP/1992/ 1, Islamabad (Pakistan), 1992.
Bergdall, T.D., Methodsfor Active Participation: Experiences in Rural Developmentfrom
East and Central Africa, Oxford Press, Oxford (UK), 1993.
Binns, T. (ed.), People and Environment in Africa, John Wiley & Sons, Chichester (UK), 1995.
Bongaarts, J ., “Malnutrition and fertility. Reply to Rose Frisch”, Science, 215: 1273—74,
PAR
PEC
P&E
PAR
PEC
P&E
PAR
1982.

PEC
PEC
PEC
P&E
PAR
P&E
P&E
P&E
PAR
PAR
Bongaarts, J., Population Growth and the Food Supply: Conflicting Perspectives, Working
Papers n.53, The Population Council Research Division, New York, 1993.
Borrini, G. (ed.), Lessons Learned in Community Based Environmental Management:
Proceedings of the 1990 Primary Environmental Care Workshop, ICHM, Istituto
Superiore di Sanità, Rome, 1991.
Borrini, G., Environment and “Health as a Sustainable State”, International Course for
Primary Health Care Managers at District Level in Developing Countries (ICHM), Istituto
Superiore di Sanità, Rome, 1992.
Borrini-Feyerabend, G., “Promoting Health as a Sustainable State”, Medicine and Global
Survival, Part 1, Vol. 2, No. 3:162–75, and Part 2, Vol. 2, No. 4; 227–34, 1995.
Borrini-Feyerabend, G., Collaborative Management of Protected Areas: Tailoring the
Approach to the Context, IUCN, Gland (Switzerland), 1996.
Borrini-Feyerabend, G. with D. Buchan (eds.), Beyond Fences: Seeking Social
Sustainability in Conservation, IUCN, Gland (Switzerland), 1997.
Boserup, E., The Conditions ofAgricultural Growth: The Economics of Agrarian Change
under Population Pressure, Allen and Unwin, London, 1965.
Boserup, E., Population and Technological Change: A Study of Long Term Trends,
University of Chicago Press, Chicago, 1981.
Brookfield, H., “The Numbers Crunch”, The UNESCO Courier; January: 25–9, 1992.
Bruffee, K., Collaborative Learning: Higher Education, Interdependence, and the
Authority of Knowledge, Johns Hopkins University Press, Baltimore (MD), 1993.
Caldwell, J.C., Theory of Fertility Decline, Academy Press, New York, 1989.
Caldwell, J.C., “Health transition: the cultural, social and behavioral determinants of
health in the Third World”, Social Science and Medicine, 36, 2: 125–35, 1993.
Cernea, M. (ed.), Putting People First: Sociological Variables in Rural Development,
Oxford University Press, London and New York, 1991.
Cernea, M., The Building Blocs of Participation: Testing Bottom-up Planning, World Bank
Discussion Papers, The World Bank, Washington DC, 1992.
Chambers, R., Rural Development: Putting the Last First, Longman, London, 1983.
Chambers, R., Rural Appraisal: Rapid, Relaxed and Participatory, Discussion Paper 311,
Institute of Development Studies, Brighton (UK) and IIED, London, 1992.
P&E
P&E
PAR
PEC
PAR
PAR
PAR
PAR
PEC
Engelman, R. and P. LeRoy, Sustaining Water: Population and the Future of Renewable
Water Supplies, Population Action International, Washington DC, 1993.
Engelman, R. and P. LeRoy, Conserving Land: Population and Sustainable Food
Production, Population Action International, Washington DC, 1995.
Fals-Borda, O. and M.A. Rahman, Action and Knowledge: Breaking the Monopoly with
Participatory Action-Research, Intermediate Technology Publications, London and Apex
Press, New York, 1991.
FAO Forestry Department, Monitoring and Evaluation of Participatory Forestry Projects,
FAO Forestry Paper 60, FAO, Rome, 1985.
FAO, Population and Rural Resources, with Special Emphasis on Rural Renewable
Energy, FAO, Jamaica, 1986.
FAO, L'Approche Gestion de Terroirs, Documents de formation pour la Planification
Agricole 32, FAO, Service de Formation de la Division de l'analyse des politiques, Rome,
1993.
Fé d’Ostiani, L. and P. Warren (eds.), Steps Towards a Participatory and Integrated
Approach to Watershed Management, FAO, Tunis, 1996.
Feldstein, H., and J. Jiggins (eds.), Tools for the Field: Methodology Handbook for Gender
Analysis in Agriculture, Kumarian Press, West Hartford, 1994.
Foote-Whyte, W. (ed.), Participatory Action Research, Sage Publications, Newbury Park
London-New Delhi, 1991.
Fuglesang, A., About Understanding – Ideas and Observations on Cross-cultural
Communication, Dag Hammaskjold Foundation, Uppsala (Sweden), 1982.
Fundación Pro-Sierra Nevada de Santa Marta, Estrategia de Conservación de la Sierra
Nevada de Santa Marta, Bogota, Colombia, 1997
Gajanayake, S. and J. Gajanayake, Community Empowerment: A Participatory Training
Manual on Community Project Development, Northern Illinois University, Dekalb
(Illinois), 1993.
Gastil, J., Democracy in Small Groups: Participation, Decision Making and
Communication, New Society, Philadelphia, 1993.
Ghai, D. and J. Vivian (eds.), Grassroots Environmental Action: People's Participation in
Sustainable Development, Routledge, London and New York, 1992.
Gibson, C., The Aztecs Under Spanish Rule: A History of the Indians of the Valley of
Mexico 1519–1810, Stanford University Press, Stanford (California), 1964.

CNP–CIPA, Población y Colonización en la Alta Amazonia Peruana, Consejo Nacional de
Población – Centro de Investigación y Promoción Amazónica, Lima, 1984.
Daily, G.C. and P. Ehrlich, “Socioeconomic equity, sustainability, and earth's carrying
capacity” in Ecological Applications, 6:4, pp. 991–1001, Ecological Society of America,
1996.
Davidson, J. and D. Myers, No Time to Waste: Poverty and the Global Environment,
Oxfam, Oxford (UK), 1992.
Davis-Case, D., Community Forestry: Participatory Assessment, Monitoring and
Evaluation, Community Forestry Note 2, Forests, Trees and People Project, FAO, Rome,
1989.
Davis-Case, D., The Community's Toolbox. The Idea, Methods and Tools for Participatory
Assessment, Monitoring and Evaluation in Community Forestry, Community Forestry
Field Manual n.2, Forests, Trees and People Project, FAO, Rome, 1990.
de Colombani, P, Irshaid, M. and C.M. Meira de Melo, Integrating Primary Health Care
and Primary Environmental Care in the Health District of Pau da Lima (Salvador de
Bahia, Brazil), ICHM, Istituto Superiore di Sanità, Rome, 1990.
de Sherbinin, A., Population and Consumption Issues for Environmentalists, a literature
search and bibliography prepared by the Population Reference Bureau for the Pew
Charitable Trusts’ Global Stewardship Initiative, Washington DC, 1993.
Devereux, A., A Study of Abortion in Primitive Societies, (revised edition), New York,
International Universities Press, 1976.
Diamé, F., Diop, S., Ellsworth, L. and D. Thieba, Comment Mener un Atelier d'Initiation
en Diagnostic Participatif: Manuel de l'Animateur, Programme de Recherche-Appui des
Associations Paysannes, Innovation et Réseaux pour le Développement, Dakar, 1992.
Dickemann, M., “Concepts and classification in the study of human infanticide”, in
Hausfater, G. and S. Hardy (eds.), Infanticide: Comparative and Evolutionary
Perspectives, 427–37, Aldine, New York, 1984.
Dobyns, H.F., “An outline of Andean epidemic history to 1720°, Bulletin of the History of
Medicine, 37: 493–515, 1963.
Dompka, V. (ed.), Human Population, Biodiversity and Protected Areas: Science and
Policy Issues, American Association for the Advancement of Science, Washington DC,
1996.
Ehrlich, A., “Implications of population pressure on agriculture and ecosystems” in
Advances in Botanical Research, Vol. 21, pp 79–104, Academic Press Ltd, New York,
1995.
PAR
PAR
PEC
PAR
P&E
P&E

Gilmour, D.A. and R.J. Fisher, Villagers and Foresters – The Philosophy, Process and PAR
Practice of Community Forestry in Nepal, Sahayogi Press, Kathmandu, 1991.
Glade, W. and C. Reilly (eds.), Inquiry at the Grassroots, Inter-American Foundation, PAR
Arlington (Virginia), 1993.
Goethert, R. and N. Hamdi, Making Microplans. A Community-based Process in Design PAR
and Development, Intermediate Technology Publications, London, 1988.
Grandstaff, T. and A. Messerschmidt, A Manager's Guide to the Use of Rapid Rural PAR
Appraisal, FAO/UNDPFarm Program and Suranaree University of Technology, Bangkok,
1995.
Gueye, B. and K. Schoonmaker Freudenberger, Introduction à la Méthode Accélérée PAR
de Recherche Participative (MARP), Rapid Rural Appraisal, Quelques Notes pour
Appuyer une Formation Pratique, IIED Sustainable Agriculture Programme, London,
1991.
Hamilton, S., Popkin, B. and D. Spicer, Women and Nutrition in Third World Countries,
Begin and Garvey, South Hadley (Massachusetts), 1984.
Harris, M., Cannibal and Kings. The Origins of Culture, Random House Inc., New York,
1977.
Harris, M. and E.B. Ross, Death, Sex and Fertility. Population Regulation in Pre
industrial and Developing Societies, Columbia University Press, New York, 1987.
Harrison, P., The Third Revolution, I.B. Tauris & Co., London, 1992. P&E
Haupt, A. and T. Kane, The Population Reference Bureau's Population Handbook,
International Edition, PRB, Washington DC, 1991.
Hemming, J., Red Gold: The Conquest of the Brazilian Indians, Harvard University Press,
Cambridge (Massachusetts), 1978.
Henry, L., “Some data on natural fertility”, Eugenic Quarterly, 8: 81–91, 1961.
Hesperian Foundation News, The Hesperian Foundation, Albany (California).
Heyneman, D., “Presidential Address”, Journal of Parasitology, 70:3, 1984.
Hope, A. and S. Timmel, Training for Transformation: A Handbook for Community PAR
Workers, Mambo Press, Harare, 1984.
Hulse, D.L. and S. Thongmak, in Lewis, C. (ed.), Managing Conflicts in Protected Areas,
IUCN, Gland (Switzerland), 1996.

PEC
PAR
PEC
PEC
PAR
PEC
PAR
P&E
IASCP. The Common Property Resource Digest, Yale University, School of Forestry and
Environmental Studies, New Haven (Connecticut).
IIED, Whose Eden? An Overview of Community Approaches to Wildlife Management,
IIED, London, 1994.
ILEIA Newsletter, Centre for Research and Information Exchange in Ecologically Sound
Agriculture, Leusden (Netherlands).
Illich, I., Gender, Marion Boyars, New York, 1982.
International Development Program (Clark University), National Environment Program
(Government of Kenya), Egerton University and World Resources Institute, Participatory
Rural Appraisal Handbook, World Resources Institute, New York, 1992.
IRC, Community Self-Improvement in Water Supply and Sanitation, Training series: 5,
IRC, The Hague, 1988.
IRC, Working with Women and Men on Water and Sanitation: an African Field Guide,
IRC, The Hague (Netherlands), 1994.
IUCN/UNEP/WWF, Caring for the Earth: A Strategy for Sustainable Living,
IUCN/UNEP/WWF, Gland (Switzerland), 1991.
IUCN, Guidelines for Protected Areas Management Categories, IUCN, Cambridge (UK),
1994.
Jinapala, K., Brewer, J.D. and R. Sakthivadivel, Multi-Level Participatory Planning
for Water Resources Development in Sri Lanka, Gatekeeper Series No. 62, IIED, London,
1996.
Johnson, V., Hill, J and E. Ivan-Smith, Listening to Smaller Voices: Children in an
Environment of Change, Actionaid, Chard (Somerset, UK), 1995.
Kambou, C., Associations Traditionnelles et Modernes de Chasseurs: Forme de Gestion
de la Faune et Collaboration avec les Structures Technico-Administratives, IUCN,
Ouagadougou (Burkina Faso), 1992.
Kane, M., “Women’s Rule in Natural Resource Conservation: A Slide Show
Competition”, in Participatory Upland Conservation and Development (PUCD) Project
Bulletin, Special Issue No. 1., Tunis, FAO, 1996.
Kleymeyer, C.D., “Cultural Traditions and Community-Based Conservation: Is Culture
our Greatest Natural Resource?” in Grassroots Development, Vol. 20:1, Inter-American
Foundation, Arlington (Virginia), 1996.
King, M., “Health as a sustainable state”, The Lancet, 336: 664–7, 1990.

Klein, S., A Book for Midwives: A Manual for Traditional Birth Attendants and
Community Midwives, The Hesperian Foundation, Palo Alto (California), 1995.
Korten, D., “Community organization and rural development: a learning process
approach” in Public Administration Review, pp480–510, Sept-Oct, 1980.
Kothari, A., Singh, N. and S. Suri (eds.), People and Protected Areas: Towards
Participatory Conservation in India, Sage Publications, New Delhi, 1996.
Kropotkin, P., Mutual Aid, Extending Horizons, Boston, 1955 (first edition 1902).
Kubler, G., “The Quechua in the Colonial World” in Steward, J.H. (ed.), Handbook of
South American Indians, Vol. 2: The Andean Civilizations, 331–410, Bureau of American
Ethnology, Bulletin 143, Smithsonian Institution, Washington DC, 1946.
Lammerink, M.P. and I. Wolffers (eds.), Some Selected Examples of Participatory
Research, Special Programme on Research (DGIS/DST/SO), Ministry of Foreign Affairs,
The Hague (Netherlands), 1994.
Lammerink, M.P., Aprendiendo Juntos, Vivencias en Investigación Participativa,
Vanguardia, Managua (Nicaragua), 1995.
Lecomte Bernard, Project Aid – Limits and Alternatives, OECD, Paris, 1986.
Lee, R.B., “What hunters do for a living, or how to make out on scarce resources” in Lee,
R. and I. DeVore, Man the Hunter; A First Intensive Survey on a Single Crucial Stage of
Human Development, Aldine Publishing Company, Chicago (Illinois), 1968.
Lee Peluso, N., Turner, M. and L. Fortmann, Introducing Community Forestry: Annotated
Listing of Topics and Readings, Community Forestry Note 12, Forests, Trees and People
Project, FAO, Rome, 1994.
Lewis, C., Managing Conflicts in Protected Areas, IUCN, Gland (Switzerland), 1996.
Lindblade, K., “Program linking population and environment instituted to protect Ugandan
forest areas” in Population-Environment Fellows News, Vol. 2, No. 2., August 1994.
Livi Bacci, M., Introduzione alla Demografia, Loescher Editore, Torino, 1990.
Liz Claiborne and Art Ortenberg Foundation, A View from Airlie: Community Based
Conservation in Perspective, Liz Claiborne and Art Ortenberg Foundation, New York, 1993.
MacCormack, C.P. (ed.), Ethnography of Fertility and Birth, Academic Press, London,
1982.
MacLeod, M.J., Spanish Central America: A Socioeconomic History 1520–1720,
University of California Press, Berkeley, Los Angeles and London, 1973.
PAR
PAR
P&E
PEC
PAR
P&E
PAR
PAR
P&E
PAR
PAR
McCraken, J.A., Pretty J. and J.R. Conway, An Introduction to Rapid Rural Appraisal for
Agricultural Development, IIED, London, 1988.
McElroy, A. and P.K. Townsend, Medical Anthropology in Ecological Perspective,
Westview Press, Boulder (Colorado), 1989.
McKeown, T., The Role of Medicine, Basil Blackwell, Oxford, 1979.
McNeely, J., “Strategies for Conserving Biodiversity”, Environment, Vol. 32, No. 3., 1990.
Mahar, D.J. (ed.), Rapid Population Growth and Human Carrying Capacity, World Bank
Staff Working Papers, 690, Population and Development Series, 15, The World Bank,
Washington DC, 1985.
Makombe, K. (ed.), Sharing the Land: Wildlife, People and Development in Africa,
IUCN/ROSA, Environmental Issues Series, Harare, 1994.
Mamdani, M., The Myth of Population Control: Family, Caste, and Class in an Indian
Village, Monthly Review Press, New York, 1972.
Mezirow, J., Fostering Critical Reflection in Adulthood: A Guide to Transformative and
Emancipatory Learning, Jossey-Bass, San Francisco, 1990.
Minturn, L. and J. Stashak, “Infanticide as a terminal abortion procedure”, Behavior
Science Research, 17: 70–90, 1982.
Molnar, A., Community Forestry: Rapid Appraisal, Community Forestry Note 3, Forest,
Trees and People Project, FAO, Rome, 1989.
Mortimore, M., Tiffen, M. and F. Gichuki, “Sustainable growth in Machakos” in Ileia
Newsletter, 9:4.
Moser, C., Gender Planning and Development, Theory, Practice and Training, Routledge,
London, 1993.
Munasinghe, M. and W. Shearer (eds.), Defining and Measuring Sustainability: the
Biogeophysical Foundations, The World Bank, Washington DC, 1995.
Murray, C.J.L. and L.C. Chen, “In search for a contemporary theory for understanding
mortality change”, Social Science and Medicine, 36, 2: 143–55, 1993.
Myers, M., David, R., Akrat, S. and A.A. Hamid, The Effects of Male Out-migration on
Women's Management of Natural Resources in Sudan, Issues Paper 60, IIED, London,
1995.
Narayan, D., Participatory Evaluation: Tools for Managing Change in Water and
Sanitation, World Bank technical paper 207, The World Bank, Washington DC, 1993.
Ness, G. with M. Golay, Population and Strategiesfor National Sustainable Development,
Earthscan and IUCN, London, 1996.
Newell, C., Methods and Models in Demography, Belhaven Press, London, 1988.
Nichols, H, Social Survey Methods: A Fieldguidefor Development Workers, Development
Guidelines No. 6, Oxfam, Oxford (UK), 1991.
OAA/FAO, Le Diapo-langage. Nouveau Regard sur la Diapositive. La Communication
pour le Développement, Etude de Cas, OAA/FAO, Sous-division de la communication au
service du développement, Rome, 1989.
OECD/IUCN, Guidelinesfor Aid Agenciesfor Improved Conservation in Sustainable Use
of Tropical and Subtropical Wetlands, OECD, Paris, 1996.
Patton, M.Q., How to Use Qualitative Methods in Evaluation. Programme Evaluation Kit,
Center for the Study of Evaluation, University of California, Los Angeles, Sage
Publications, Newbury Park-London-New Delhi, 1987.
Pendzich, C., Thomas, G., and T. Wohlgemont, The Role of Alternative Conflict
Management in Community Forestry, Forest, Trees and People Programme, Working
Paper No. 1, FAO, Rome, 1994.
Pimbert, M., “Training workshop on joint forest management, West Bengal, India”,
manuscript, WWF, Gland (Switzerland), 1994.
Pimbert, M. and J. Pretty, Parks, People and Professionals: Putting ‘Participation’ into
Protected Area Management, UNRISD, IIED and WWF, Geneva (Switzerland), 1995.
PIA (Participatory Learning and Action) Notes, IIED, London.
Poffenberger, M., McGean, B., Khare, A. and J. Campbell, Community Forest Economy
and Use Patterns: Participatory Rural Appraisal (PRA) Methods in South Gujarat, India,
Field Methods Manual, Society for Promotion of Wastelands Development, New Delhi,
1992.
Poffenberger, M., McGean, B., Ravindranath, NH, and M. Gadgil (eds.), Diagnostic Tools
for Supporting Joint Forest Management Systems, Joint Forest Management Field
Methods Manual, Vol. 1, Society for the Promotion of Wastelands Development, New
Delhi, 1992.
Poffenberger, M., Josayma, C., Walpole, P. and K. Lawrence, Transitions in Forest
Management: Shifting Community Forestry from Project to Process, Proceedings of the
fourth Annual Meeting of the Asia Forest Network, 2-6 April 1995, Oriental Mindoro, The
Philippines. Research Network Report, August 1995.
P&E
PAR
PAR
PAR
PAR
PAR
PAR
PEC
PEC
PAR
PEC
PAR
PEC
PAR
PAR
Poole, P, Indigenous Peoples, Mapping and Biodiversity Conservation, Peoples and
Forest Program Discussion Paper, Biodiversity Support Program (BSP), World Wildlife
Fund, Washington DC, 1995.
Pradervand, P., Listening to Africa, Praeger, New York, 1989.
PRB, 1996 World Population Data Sheet, Population Reference Bureau, Washington DC,
1996.
Pye-Smith, C., Borrini-Feyerabend, G. with R. Sandbrook, The Wealth of Communities,
Earthscan, London, 1994.
Ramírez, M. and L. Aguilar, Con Calor de Amigos: Guía de Trabajo, Modulos
Audiovisuales de Reflexion sobre la Participación Comunitaria, Fundatec, Costa Rica,
1989.
Reader, J., Man on Earth, Penguin, London, 1988.
Renard, Y., Community Participation in St Lucia, Panos Institute and Caribbean Natural
Resources Institute, London, 1994.
Sadik, N. (ed.), Population Policies and Programmes: Lessons Learned from Two Decades
of Experience, New York University Press, New York, 1991.
Satterthwaite, D., Hart, R., Levy, C., Mitlin, D., Ross, D., Smit, J. and C. Stephens, The
Environment for Children, Earthscan, London, 1996.
Sauer, C.O., The Early Spanish Man, University of California Press, Berkeley and Los
Angeles, 1966.
Schoonmaker Freudenberger, K., “The historical matrix – breaking away from
static analysis” in Forest, Trees and People Newsletter, No. 26/27, FAO, FTP Program,
Rome.
Scoones, I. and J. Thompson (eds.), Beyond Farmer First, Intermediate Technology
Publications, London, 1994.
Scott, P., From Conflict to Collaboration: Mount Elgon Case Study, Issues in Forest
Conservation series, IUCN/WWF, Gland (Switzerland), 1996.
Scrimshaw, N.S. and G. Gleason (eds.), Rapid Assessment Procedures: Qualitative
Methodologies for Planning and Evaluation of Health Related Programmes, International
Nutrition Foundation for Developing Countries, Boston, 1992.
Scrimshaw, S., “Infanticide as deliberate fertility control”, in Bulatao, R. and R. Lee
(eds.), Determinants of Fertility in Developing Countries, 2: 245–66, Academic Press,
New York, 1983.

Scrimshaw, S.C.M. and E. Hurtado, Rapid Assessment Procedures for Nutrition and
Primary Health Care: Anthropological Approaches for Improving Programme
Effectiveness, United Nations University, Tokyo, 1987.
Short, R.V., “Breast-feeding”, Scientific American, 250, 4: 35–41, 1984.
Simmons, I.G., Changing the Face of the Earth: Culture, Environment, History, Basil
Blackwell, Cambridge (Massachusetts), 1989.
Simms Feldstein, H. and J. Jiggins (eds.), Tools for the Field, Kumarian Press, West
Hartford and Intermediate Technology Publications, London, 1994.
Slade, R.H. and J.G. Campbell, Monitoring and Evaluation of Social Forestry in India –
an Operational Guide, FAO Forestry Paper 75, FAO, Rome, 1986.
Slim, H. and P. Thompson, Listening for a Change, Oral Testimony and Development,
Panos Publications, London, 1993.
Slocum, R., Wichhart, L., Rocheleau, D. and B. Thomas-Slayter (eds.), Power, Process and
Participation — Tools for Change, Intermediate Technology Publications, London, 1995.
Solinas, P.G., Popolazioni e Sistemi Sociali. Linee di Ricerca in Etnodemografia, La
Nuova Italia Scientifica, Rome, 1992.
Sponsel, L.L., in Lewis, C., Managing Conflicts in Protected Areas, IUCN, Gland
(Switzerland), 1996.
Spradley, J., Participant Observation, Holt, Rinehart and Winston, New York, 1980.
Stringer, E.T., Action Research: A Handbook for Practitioners, Sage Publications,
Thousand Oaks (California), 1996.
Sungi Development Foundation, Participatory Village Planning, Report of a PRA in Banda
Munir Khan, Haripur (1994), Sungi Development Foundation, Haripur (Pakistan), 1994.
Tchamie, T.K., “Learning from local hostility to protected areas in Togo”, Unasylva,
176:45, 1994.
Theis, J. and H.M. Grady, Participatory Rapid Appraisal for Community Development: A
Training Manual Based on Experiences in the Middle East and North Africa, IIED and
Save the Children, London, 1991.
Toulmin, C., Cattle, Women and Wells: Managing Household Survival in the Sahel,
Oxford University Press, New York, 1992
UNFPA, The State ofWorld Population 1994, United Nations Population Fund, New York,
PAR
P&E
PAR
PAR
PAR
PAR
PAR
PAR
PAR
PAR
1994.
PAR
PAR
PAR
UNICEF. The State of the World Children 1992, Oxford University Press, Oxford, 1992.
UNICEF, The State of the World Children 1996, Oxford University Press, Oxford, 1996.
United Nations, World Population Prospects 1994, United Nations, New York, 1995.
United Nations, Reproductive Rights and Reproductive Health: A Concise Report, United
Nations, New York, 1996.
Uphoff, N. (quoted in Bergdall, 1993), “Debaters’ comments on Inquiry into Participation:
a research proposal”, UNRISD, Geneva, 1980.
USAID, Rapid, Low-Cost Data Collection Methods for A.I.D., USAID, Washington DC,
1987.
Vaughan, J.P. and R.H. Morrow (eds.), Manual of Epidemiology for District Health
Management, World Health Organization, Geneva, 1989.
Wayda, A.P. (ed.), Environment and Cultural Behavior. The Natural History Press, New
York, 1969.
Wade, R., Village Republics: Economic Conditions for Collective Action in South India,
Institute for Contemporary Studies, San Francisco, 1994.
West, P.C. and S.R. Brechin (eds.), Resident Peoples and National Parks: Social
Dilemmas and Strategies in International Conservation, University of Arizona Press,
Tucson (Arizona), 1991.
Whiteside, M., Diagnostico (Participativo) Rápido Rural: Manual de Técnicas, Comissão
Nacional do Meio Ambiente, Maputo (Mozambique), 1994.
WHO, Primary Health Care, Report of the International Conference on Primary Health
Care, Alma Ata, USSR, 6–12 September 1978, World Health Organization, Geneva, 1978.
WHO, Development of Indicators for Monitoring Progress Towards Health for All by the
Year 2000, “Health for All” Series, No. 4, World Health Organization, Geneva, 1981.
WHO, Our Planet, Our Health, Report of the WHO Commission on Health and
Environment, World Health Organization, Geneva, 1992.
Wolf, E.R., Europe and the People Without History, University of California Press,
Berkeley and Los Angeles, 1982.
Wolfson, M., Community Action for Family Planning, OECD, Paris, 1987.
World Bank, World Development Report 1992: Development and the Environment,
Oxford University Press, New York, 1992.

Yaro, Y., “Migrations internes et gestion traditionnelle des terroirs au Burkina”,
manuscript prepared at the request of the IUCN Social Policy Group, Gland (Switzerland),
1995.
Zumbrunnen, O., El Diapolenguaje: Un Instrumento de Comunicación Participativa PAR
Destinado a los Extensionistas de Campo, Primera parte: Gu’a Metodológica; Segunda
parte: Estudio de Caso, FAO, Honduras, 1994.


About the authors
Thomas Barton is a medical doctor and anthropologist who has been involved in community participation
and community organization for almost 30 years. He is an eclectic, problem-solver pragmatist, firmly com
mitted to a belief that people working together can make their lives more satisfying and their surroundings
a better place to be. Currently, he is a partner in the Creative Research and Evaluation Centre (CRC), a con
sulting firm in participatory methods based in Kampala, Uganda, and working widely in Africa.
Grazia Borrini-Feyerabend holds a doctorate in physics and a masters in public health. Her interests lie
mostly with processes of local organizing and partnership development in the areas of health, population
dynamics and natural resource management. She is currently the head of the IUCN Social Policy Group.
Her experience includes research, training, policy development and writing in public health and sustainable
development (primary environmental care). She has had the opportunity to work with people of many cul
tures.
Alex de Sherbinin holds a masters degree in geography with a specialization in population-environment
interactions. He is currently a University of Michigan Population-Environment Fellow with the IUCN
Social Policy Group. Previously he worked as a population geographer with the Population Reference
Bureau in Washington, DC, and as an agricultural extension agent with the Peace Corps in Mauritania, West
Africa.
Patrizio Warren is a development anthropologist. He carried out extensive field-research on the medical sys
tem and the human ecology of the Shuar-Achuar people of the Peruvian and Ecuadorian Amazon. He has
also collaborated in participatory action research and training projects in Latin America, Africa and Asia.
Currently, he works as a consultant on participatory methods for the Forestry Department of the United
Nation’s Food and Agriculture Organization (FAO).


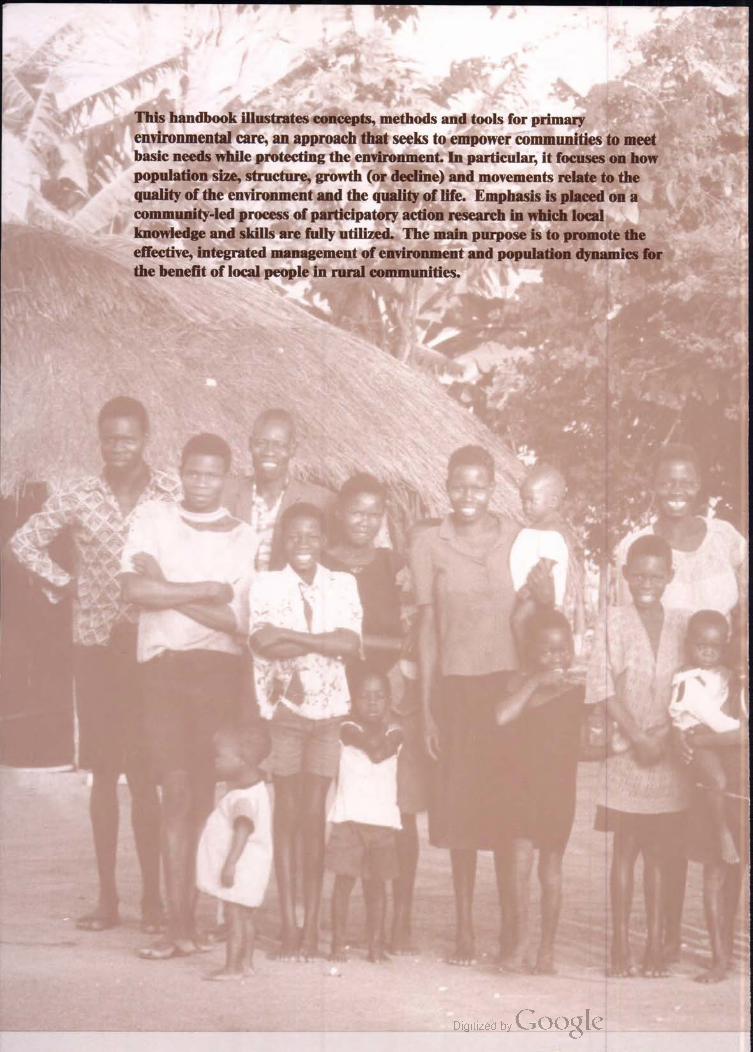
-
-
-
-
-: * .*-
This handbook illustrates concepts, methods andItools for primary
environmental care, an approach that seeks to empower communities to meet
basic needs while protecting the environment. In particular, it focuses on how
population size, structure, growth (or decline) and movements relate to the
quality of the environment and the quality of life. Emphasis is placed on a
community-led process of participatory action research in which local
knowledge and skills are fully utilized. The main purpose is to promote the
effective, integrated management of environment and population dynamics for
-
- - - - - - -