Retrofitting Steel Joist Supported Footbridges for Improved Vibration Response
11
Retrofitting Steel Joist Supported Footbridges for Improved Vibration Response Onur Avci, Ph.D., P.E., M.ASCE 1 1 Structural Project Engineer, AECOM, Specialty Practices Group, 20 Exchange Place, 12 th Floor, New York, NY, 10005, USA. Email: [email protected] ABSTRACT The main objective of this paper is to determine the possible increase in natural frequencies of the two joist supported laboratory footbridges when bottom chord extensions are installed in an attempt to reduce annoying floor vibrations. The results with bottom chord extensions installed after the concrete placement are compared to results when the bottom chord extensions are installed prior to concrete placement. Results from the static and dynamic tests on the single span footbridge indicate that installing the bottom chord extensions to the joists after concrete placement and with the center of the span jacked up increases the flexural stiffness and fundamental natural frequency considerably, but not as much as installing the bottom chord extensions before the concrete placement. For the three span footbridge, installing the bottom chord extensions also increases the flexural stiffness and fundamental natural frequency considerably, but there is no distinctive advantage of installing the bottom chord extensions before the concrete placement. For both of the footbridges, the magnitude of the increases in natural frequencies is sufficient to consider the installation of bottom chord extensions as a remedy to stiffen (and retrofit) a floor and reduce floor vibrations due to occupancy movements. INTRODUCTION Strength and deflections were the two common limit states being considered for the design of steel framed floor systems. With the use of high strength steel, lighter sections and low inherent damping, floor vibration serviceability has become a governing factor for the design of steel framed floor systems. In the presence of annoying floor vibrations in joist supported floor systems, sometimes bottom chord extensions are installed in an attempt to stiffen the floor system and correct the annoying vibrations problem by increasing the fundamental natural frequency. However, the effect of bottom chord extensions on the joist behavior is not very well known. There have been recommendations on strengthening the bottom chord elements (Fisher 2005, Broekemeier and Fisher 2007); however, the writer was unable to find any published document on extending joist bottom chords in an attempt to improve floor stiffness, which in turn will improve the vibration response. The study presented in this paper focuses on the effect of bottom chord extensions on the fundamental frequency of two laboratory footbridges. Experimental and analytical studies were conducted on single span and three span joist supported laboratory footbridges with different bottom chord extension (BCE) configurations. Three
Transcript of Retrofitting Steel Joist Supported Footbridges for Improved Vibration Response

Retrofitting Steel Joist Supported Footbridges for Improved
Vibration Response
Onur Avci, Ph.D., P.E., M.ASCE1
1Structural Project Engineer, AECOM, Specialty Practices Group, 20 Exchange
Place, 12th
Floor, New York, NY, 10005, USA. Email: [email protected]
ABSTRACT
The main objective of this paper is to determine the possible increase in natural
frequencies of the two joist supported laboratory footbridges when bottom chord
extensions are installed in an attempt to reduce annoying floor vibrations. The results
with bottom chord extensions installed after the concrete placement are compared to
results when the bottom chord extensions are installed prior to concrete placement.
Results from the static and dynamic tests on the single span footbridge indicate that
installing the bottom chord extensions to the joists after concrete placement and with
the center of the span jacked up increases the flexural stiffness and fundamental
natural frequency considerably, but not as much as installing the bottom chord
extensions before the concrete placement. For the three span footbridge, installing
the bottom chord extensions also increases the flexural stiffness and fundamental
natural frequency considerably, but there is no distinctive advantage of installing the
bottom chord extensions before the concrete placement. For both of the footbridges,
the magnitude of the increases in natural frequencies is sufficient to consider the
installation of bottom chord extensions as a remedy to stiffen (and retrofit) a floor and
reduce floor vibrations due to occupancy movements.
INTRODUCTION
Strength and deflections were the two common limit states being considered for the
design of steel framed floor systems. With the use of high strength steel, lighter
sections and low inherent damping, floor vibration serviceability has become a
governing factor for the design of steel framed floor systems. In the presence of
annoying floor vibrations in joist supported floor systems, sometimes bottom chord
extensions are installed in an attempt to stiffen the floor system and correct the
annoying vibrations problem by increasing the fundamental natural frequency.
However, the effect of bottom chord extensions on the joist behavior is not very well
known. There have been recommendations on strengthening the bottom chord
elements (Fisher 2005, Broekemeier and Fisher 2007); however, the writer was
unable to find any published document on extending joist bottom chords in an attempt
to improve floor stiffness, which in turn will improve the vibration response. The
study presented in this paper focuses on the effect of bottom chord extensions on the
fundamental frequency of two laboratory footbridges. Experimental and analytical
studies were conducted on single span and three span joist supported laboratory
footbridges with different bottom chord extension (BCE) configurations. Three

dimensional finite element computer models were created to simulate and compare
the results of stiffness and dynamic tests with the philosophy of testing the
footbridges and updating the finite element models, trying to minimize the
discrepancies between the test results and the FE model for better behavior prediction.
TEST SETUPS
A single span footbridge (Figure 1) and a three span footbridge (Figure 2) were
constructed at the Thomas M. Murray Structural Engineering Laboratory, Virginia
Tech, Blacksburg, Virginia. The single span footbridge of dimensions 2.13 m by 9.14
m (7 ft by 30 ft) was built inside the laboratory, while the three span footbridge 2.13
m by 27.43 m (7 ft by 90 ft) was built outside. Both of the footbridges were
constructed using 1.5VL Vulcraft deck with depth of 38 mm (1.5 in.) and a normal
weight concrete slab with a depth of 114 mm (4.5 in.); with a total slab depth of 152
mm (6.0 in.) supported on two parallel lines of 30K7 x 9.14 m (30 ft) span Vulcraft
joists at 1.22 m (4 ft) on center. Elco Grade 8 Stand-off screws with 102 mm (4 in.)
of stand-off and spaced at 305 mm (12 in.) on center were used to connect the cold-
formed steel decks to the joist top chords before the concrete was placed. The 28-day
concrete compressive strengths are 29.8 MPa (4320 psi) for the single span footbridge
and 34.2 MPa (4960 psi) for the three span footbridge.
Fig. 1. Single Span Footbridge, 2.13 m by 9.14 m (7 ft x 30 ft)
Fig. 2. Three Span Footbridge, 2.13 m by 3 @ 9.14 m (7 ft x 3 @ 30 ft)
Concrete walls were used as supports for the single span footbridge and exterior
supports for the three span footbridge. Built-up steel H-cross sections were used for
interior supports for the three span footbridge (Figure 3). The joist seats were welded
to the bearing plates located on the concrete walls at exterior supports. At the interior
supports, the two top chords were welded to each other using a steel bar to provide
top chord continuity. The joist seats at the interior supports were also welded to the
continuity plates located on the built-up sections. Bottom chord continuity was
provided by HSS 38 mm x 38 mm x 4.8 mm (1.5 in. x 1.5 in. x 3/16 in.) bottom chord
extensions. The BCE’s were instrumented as load cells so that the axial force in the

member could be monitored and recorded (Figure 4). Two of the four BCE’s of the
single span footbridge (S1 and S2 in Figure 5) and all twelve BCE’s of the three span
footbridge (Figure 6) were instrumented as load cells. For the three span footbridge,
the exterior BCE’s were connected to the concrete walls of the two exterior supports
(Extensions N1, S1, N6 and S6 in Figure 6). Interior BCE’s were connected to the
interior supports (Extensions N2, S2, N3, S3, N4, S4, N5 and S5 in Figure 6).
Exterior Support
Interior Support
Interior Support
Fig. 3. Three Span Footbridge Supports
(a) At Exterior Support (b) At Interior Support
Fig. 4. Bottom Chord Extensions
Note: 1 ft = 0.305 m
Fig. 5. Bottom Chord Extension Locations- Single Span Footbridge

Note: 1 ft = 0.305 m
Fig. 6 Bottom Chord Extension Locations- Three Span Footbridge
In the experimental program, static flexural stiffness tests were conducted first to
understand the flexural stiffness behavior of the footbridges. Both single span and
three span footbridges were tested with different BCE configurations (Figures 7 and
8). The three stages of the single span footbridge and the five stages of the three span
footbridge construction are the BCE configurations needed to determine the relative
effect of installing BCE’s after the concrete is placed.
a) Stage 1: Bottom Chord Extensions In Place
b) Stage 2: Bottom Chord Extensions Removed
c) Stage 3: Bottom Chord Extensions Re-installed
Fig. 7. Bottom Chord Extension Configurations for Single Span Footbridge
a) Stage 1: All Bottom Chord Extensions In Place
b) Stage 2: Exterior Bottom Chord Extensions Removed
c) Stage 3: All Bottom Chord Extensions Removed
d) Stage 4: Interior Bottom Chord Extensions Re-installed
e) Stage 5: All Bottom Chord Extensions Re-installed
Fig. 8. Bottom Chord Extension Configurations for Three Span Footbridge

Static flexural stiffness test protocol, finite element modeling technique and stiffness
test results are shown in detail by Avci (2005) and Avci and Murray (2011); therefore
will not be repeated here in this paper.
MODAL TESTING
The objective of vibration testing conducted in this study was to experimentally
determine the natural frequencies, modal damping ratios, and the corresponding mode
shapes of the laboratory footbridges and to determine the effect of BCE’s for each
configuration. For that purpose, chirp, sinusoidal, heel drop and walking excitations
were applied on the footbridges, while the acceleration response of the footbridges
was measured. A shaker placed on a force plate was used to generate and measure
the chirp and sinusoidal excitations. Heel drops were conducted on a force plate as
well. For all excitations, frequency response functions (FRF) were measured and
recorded. The collected FRF data was input and curve fitted in the ME’ScopeVES
software (Vibrant Technology, Inc. 2003) and natural frequencies, modal damping
ratios, and the corresponding mode shapes were approximated per the input data.
Single Span Laboratory Footbridge
The shaker and force plate assembly was placed at the inside and outside quarter
points on the single span footbridge, and chirp signals were used to sweep a
frequency range of 4-20 Hz for the three BCE configurations. The first bending
frequency was the main interest since it is in the range of human sensitivity for the
single span footbridge. Acceleration response data was collected at the points shown
in Figure 9. The first bending mode shape of the SAP2000 FE model and curve fitted
ME’ScopeVES model are shown in Figure 10. The FRF plots at the drive point are
shown in Figure 11(a) while the results of the accelerometer placed at the footbridge
center are displayed in Figure 11(b).
Fig. 9. Accelerometer Locations – Single span Footbridge
a) SAP2000 b) ME’ScopeVES
Fig. 10. First Bending Mode Shape – Single span Footbridge
Stage 1
Stage 3
Stage 2Stage 1
Stage 3
Stage 2
a) Accelerometer at Outside Quarter Point b) Accelerometer at Center Point
Fig. 11. Chirp FRF’s for Quarter Point Excitation - Single Span Footbridge
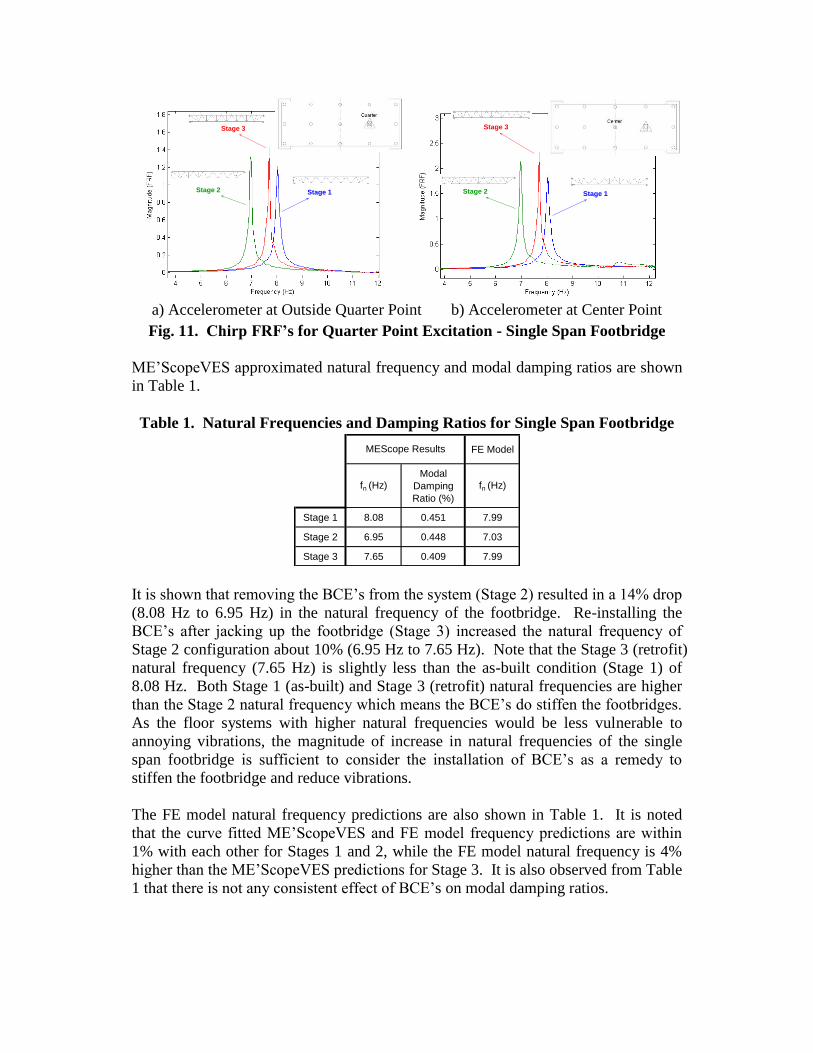
ME’ScopeVES approximated natural frequency and modal damping ratios are shown
in Table 1.
Table 1. Natural Frequencies and Damping Ratios for Single Span Footbridge
FE Model
fn (Hz)
Modal
Damping
Ratio (%)
fn (Hz)
Stage 1 8.08 0.451 7.99
Stage 2 6.95 0.448 7.03
Stage 3 7.65 0.409 7.99
MEScope Results
It is shown that removing the BCE’s from the system (Stage 2) resulted in a 14% drop
(8.08 Hz to 6.95 Hz) in the natural frequency of the footbridge. Re-installing the
BCE’s after jacking up the footbridge (Stage 3) increased the natural frequency of
Stage 2 configuration about 10% (6.95 Hz to 7.65 Hz). Note that the Stage 3 (retrofit)
natural frequency (7.65 Hz) is slightly less than the as-built condition (Stage 1) of
8.08 Hz. Both Stage 1 (as-built) and Stage 3 (retrofit) natural frequencies are higher
than the Stage 2 natural frequency which means the BCE’s do stiffen the footbridges.
As the floor systems with higher natural frequencies would be less vulnerable to
annoying vibrations, the magnitude of increase in natural frequencies of the single
span footbridge is sufficient to consider the installation of BCE’s as a remedy to
stiffen the footbridge and reduce vibrations.
The FE model natural frequency predictions are also shown in Table 1. It is noted
that the curve fitted ME’ScopeVES and FE model frequency predictions are within
1% with each other for Stages 1 and 2, while the FE model natural frequency is 4%
higher than the ME’ScopeVES predictions for Stage 3. It is also observed from Table
1 that there is not any consistent effect of BCE’s on modal damping ratios.

Three Span Laboratory Footbridge
The excitation forces applied to the single span footbridge were repeated for the three
span footbridge. The shaker and force plate assembly were placed at several
locations in the three spans. Acceleration response data was collected at the 75 points
shown in Figure 12. The first three bending modes were the main concern since they
were in the range of human sensitivity for the three span footbridge. The torsional
modes did not play an important role in the acceleration response. The first three
bending modes were determined using the SAP2000 FE model and curve fitted
ME’ScopeVES model as shown in Figure 13 (SAP2000 mode shapes on the first row
and ME’ScopeVES mode shapes on the second row).
Fig. 12. Accelerometer Locations- Three Span Footbridge
a) Mode 1 b) Mode 2 c) Mode 3
Fig. 13. Bending Modes - Three Span Footbridge
The chirp FRF results for central Bay 2 and central Bay 3 excitation points are shown
in Figures 14, 15 and 16. In each figure, the FRF magnitudes are at the drive points
since they have the best coherence values consistently for all measurements.
The results of the central Bay 2 chirp excitations are shown in Figure 14. For this
excitation location it was not possible to excite the second bending mode since the
shaker location is at the node point. Thus, the peaks in Figure 14 are the peaks of
bending modes 1 and 3. The results of the central Bay 3 chirp excitations are shown
in Figures 15 and 16. At this excitation location it was possible to excite all the first
three bending modes. Results of the first two modes are shown in Figure 15 with
third mode results shown in Figure 16.

Stage 1
Stage 5
Stage 3
Stage 3
Stage 2Stage 2 Stage 1
Stage 4
Stage 5
Stage 4
Figure 14 Chirp FRF’s for Bay 2 Central Point Excitation- First and Third
Bending Modes- Three Span Footbridge
Stage 1
Stage 5
Stage 3
Stage 3
Stage 2
Stage 2Stage 1
Stage 4
Stage 5
Stage 4
Figure 15 Chirp FRF’s for Bay3 Central Point Excitation- First and Second
Bending Modes- Three Span Footbridge

Stage 3
Stage 2
Stage 1
Stage 4
Stage 5
Figure 16 Chirp FRF’s for Bay3 Central Point Excitation- Third Bending
Mode- Three Span Footbridge
The collected FRF data for the three span footbridge was also input and curve fitted
in the ME’ScopeVES software. The approximated natural frequency and modal
damping ratios are shown in Table 2.
Table 2. Bending Mode Natural Frequencies and Damping Ratios for Three
Span Footbridge
FE Model FE Model FE Model
fn (Hz)
Modal
Damping
Ratio (%)
fn (Hz) fn (Hz)
Modal
Damping
Ratio (%)
fn (Hz) fn (Hz)
Modal
Damping
Ratio (%)
fn (Hz)
Stage 1 7.76 0.265 7.76 8.11 0.255 7.88 8.93 0.332 9.76
Stage 2 7.51 0.272 7.49 7.90 0.361 8.10 8.81 0.539 9.63
Stage 3 7.49 0.281 7.49 7.81 0.402 7.78 8.37 0.213 8.70
Stage 4 7.60 0.273 7.49 8.14 1.440 8.10 8.78 0.203 9.63
Stage 5 7.80 0.178 7.76 8.13 0.235 7.88 8.89 0.571 9.76
First Bending Mode Second Bending Mode Third Bending Mode
MEScope Results MEScope Results MEScope Results
It is shown in Table 2 that the first bending natural frequency of Stage 1 (7.76 Hz)
decreased to 7.51 Hz (3% drop) when the exterior BCE’s were removed from the
system (Stage 2). The second bending natural frequency of Stage 1 (8.11 Hz)
decreased to 7.90 Hz (again about a 3% drop) when the exterior BCE’s were removed
from the system (Stage 2). Also, the third bending natural frequency of Stage 1 (8.93
Hz) decreased to 8.81 Hz (a drop of less than 2%) when the exterior BCE’s were
removed from the system (Stage 2). Removing the interior BCE’s (Stage 3) did not
affect the first bending mode frequency (a slight change from 7.51 Hz to 7.49 Hz);
however, it decreased the second bending mode frequency from 7.90 Hz to 7.81 Hz
(about 1% drop), it also decreased the third bending mode frequency from 8.81 Hz to
8.37 Hz (5% drop). Re-installing the interior BCE’s (Stage 4) increased the first
bending mode natural frequency from 7.49 Hz to 7.60 Hz (about 1.5% increase), the
second bending mode frequency from 7.81 Hz to 8.14 Hz (4% increase) and the third
bending mode natural frequency from 8.37 Hz to 8.78 Hz (5% increase). Re-
installing the exterior BCE’s (Stage 5) increased the first bending mode natural
frequency from 7.60 Hz to 7.80 Hz (about 3 % increase) and the third bending mode
natural frequency from 8.78 Hz to 8.89 Hz (1% increase). The second bending mode
remained almost the same (a slight change from 8.14 Hz to 8.13 Hz).
The trend in Table 2 is very similar to the one in Table 1. The presence of BCE’s is
stiffening both of the footbridges. Like the single span footbridge, the magnitude of
increase in natural frequencies of the three span footbridge bending modes is
sufficient to consider the installation of BCE’s as a remedy to stiffen the footbridge
and reduce vibrations.
The FE model natural frequency predictions are also shown in Table 2. The curve
fitted ME’ScopeVES and FE model frequency predictions are within 1% of each
other for the first bending mode and 3% for the second bending mode for all stages.
For the third bending mode, the FE model predictions are 4-to-10% higher than the
ME’ScopeVES natural frequencies. It is also observed from Table 2 that there is not
any consistent effect of BCE’s on modal damping ratios.
CONCLUSIONS
The goal of this paper was to determine the possible increase in natural frequencies of
the joist supported footbridges when bottom chord extensions are installed in an
attempt to reduce annoying floor vibrations. Extensive analytical and experimental
studies are performed on two laboratory footbridges with different bottom chord
extension configurations. Results from static stiffness testing and modal testing on
both of the footbridges indicate that installing the bottom chord extensions to the
joists increases the flexural joist stiffness and fundamental natural frequency
considerably. The magnitude of the increases in natural frequencies is sufficient to
consider the installation of bottom chord extensions as a remedy to stiffen (and
retrofit) the footbridges and reduce annoying vibrations.
REFERENCES
Avci, O. (2005). “Effects of Bottom Chord Extensions on the Static and Dynamic
Performance of Steel Joist Supported Floors", Ph.D. Dissertation, Virginia
Polytechnic Institute and State University, Blacksburg, Virginia.

Avci, O. and Murray, T. M. (2011), "Effect of Bottom Chord Extensions on the Static
Flexural Stiffness of Open-Web Steel Joists", Journal of Performance of Constructed
Facilities, ASCE , doi:10.1061/(ASCE) CF.1943-5509.0000262
Broekemeier, M. W. and Fisher, J.M. (2007). Evaluation and Modification of Open-
Web Steel Joists and Joist Girders, North American Steel Construction Conference,
NASCC 2007 Proceedings, New Orleans, LA.
Computers and Structures, Inc. (2003). "SAP2000 - Linear and Nonlinear Static and
Dynamic Analysis and Design of Three-Dimensional Structures", Berkeley,
California.
Fisher, J.M. (2005). Strengthening Open-Web Steel Joists, Engineering Journal,
Fourth Quarter, pp 247-259.
Vibrant Technology, Inc. (2003). "ME’ScopeVES 4.0", Scotts Valley, California.