Three-dimensional joist member studies using equivalent beam theory
19
Proceedings of the Annual Stability Conference Structural Stability Research Council St. Louis, Missouri, April 16-20, 2013 Three-dimensional joist member studies using equivalent beam theory S.J. Kilber 1 , A.E. Surovek 2 Abstract When selecting steel joists for a structure, design engineers have traditionally relied on standard load tables, but this is limiting when commercial software is used. Additionally, because joists and joist girders are proprietary members, design engineers can benefit from an automated approach to obtain accurate estimates of member weights and section properties in the software analysis. Changes during the design process such as variations in loading cases can make the design of joists and joist girders tedious for the joist designers. Current structural design software packages lack the necessary capacities to estimate joist and joist girder weights and section properties accurately; however they do enable the implementation of user- defined cross-sectional property tables. For joist designers, custom tables for joists and joist girders can be used with the application of equivalent beam theory which allows joist and joist girder limit states to be analyzed by strength checks built into the design software. The custom tables for joist and joist girders are developed to represent approximate prismatic members based on the properties of typical chord sizes readily used in industry. This study presents the development and validation of 1 Graduate Research Assistant, Civil and Environmental Engineering, South Dakota School of Mines and Technology, Rapid City, SD, [email protected] 2 Associate Professor, Civil and Environmental Engineering, South Dakota School of Mines and Technology, Rapid City, SD, [email protected]
Transcript of Three-dimensional joist member studies using equivalent beam theory

Proceedings of theAnnual Stability Conference
Structural Stability Research CouncilSt. Louis, Missouri, April 16-20, 2013
Three-dimensional joist member studies using equivalentbeam theory
S.J. Kilber1, A.E. Surovek2
AbstractWhen selecting steel joists for a structure, design engineershave traditionally relied on standard load tables, but this islimiting when commercial software is used. Additionally, becausejoists and joist girders are proprietary members, designengineers can benefit from an automated approach to obtainaccurate estimates of member weights and section properties inthe software analysis. Changes during the design process such asvariations in loading cases can make the design of joists andjoist girders tedious for the joist designers. Current structuraldesign software packages lack the necessary capacities toestimate joist and joist girder weights and section propertiesaccurately; however they do enable the implementation of user-defined cross-sectional property tables. For joist designers,custom tables for joists and joist girders can be used with theapplication of equivalent beam theory which allows joist andjoist girder limit states to be analyzed by strength checks builtinto the design software. The custom tables for joist and joistgirders are developed to represent approximate prismatic membersbased on the properties of typical chord sizes readily used inindustry. This study presents the development and validation of1 Graduate Research Assistant, Civil and Environmental Engineering, South Dakota School of Mines and Technology, Rapid City, SD, [email protected] 2 Associate Professor, Civil and Environmental Engineering, South Dakota School of Mines and Technology, Rapid City, SD, [email protected]
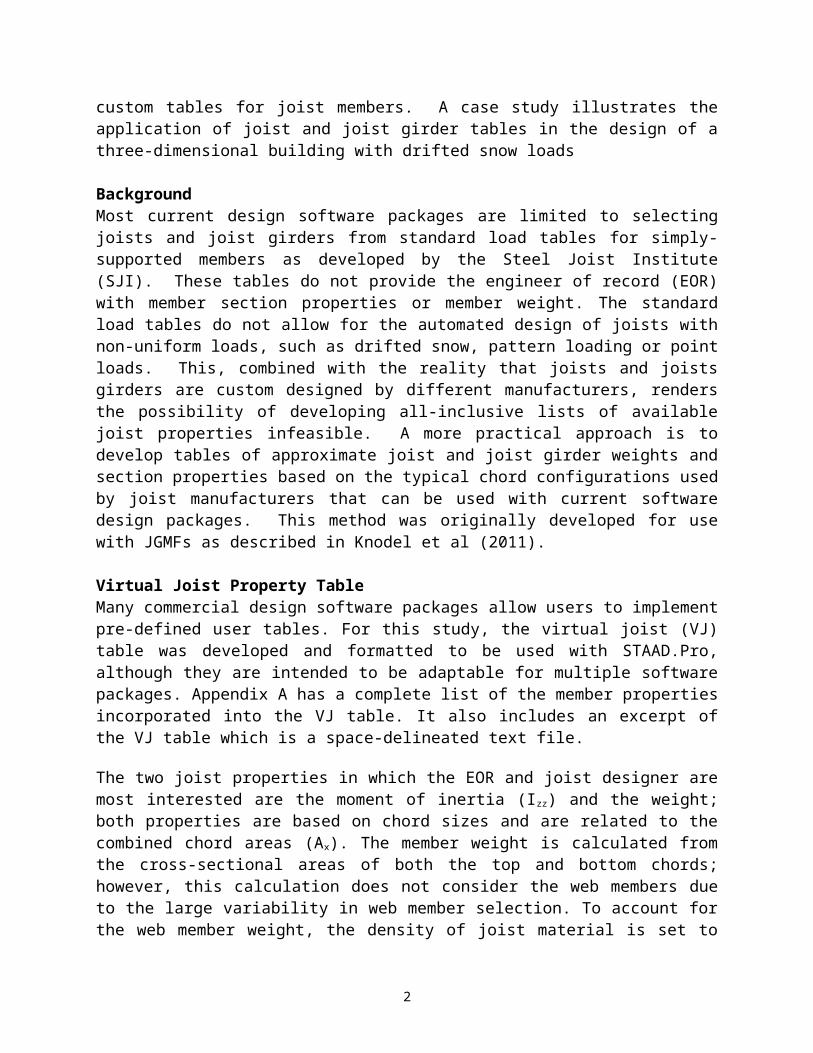
custom tables for joist members. A case study illustrates theapplication of joist and joist girder tables in the design of athree-dimensional building with drifted snow loads
BackgroundMost current design software packages are limited to selectingjoists and joist girders from standard load tables for simply-supported members as developed by the Steel Joist Institute(SJI). These tables do not provide the engineer of record (EOR)with member section properties or member weight. The standardload tables do not allow for the automated design of joists withnon-uniform loads, such as drifted snow, pattern loading or pointloads. This, combined with the reality that joists and joistsgirders are custom designed by different manufacturers, rendersthe possibility of developing all-inclusive lists of availablejoist properties infeasible. A more practical approach is todevelop tables of approximate joist and joist girder weights andsection properties based on the typical chord configurations usedby joist manufacturers that can be used with current softwaredesign packages. This method was originally developed for usewith JGMFs as described in Knodel et al (2011).
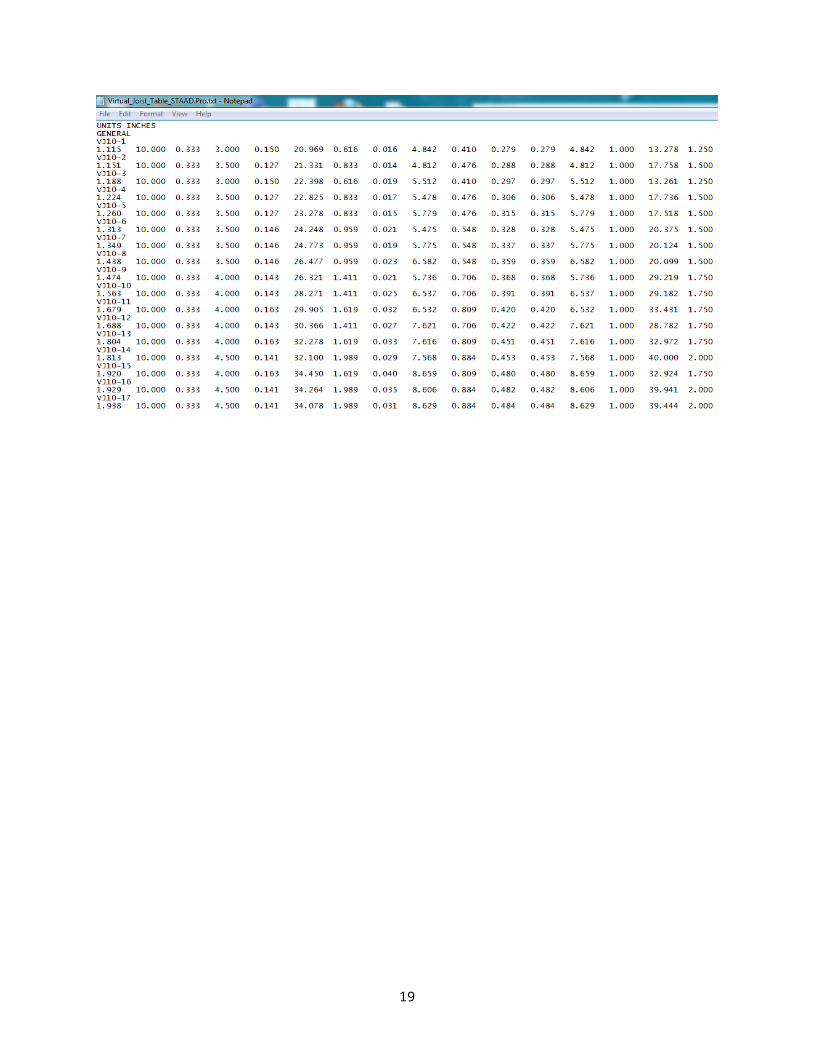
Virtual Joist Property TableMany commercial design software packages allow users to implementpre-defined user tables. For this study, the virtual joist (VJ)table was developed and formatted to be used with STAAD.Pro,although they are intended to be adaptable for multiple softwarepackages. Appendix A has a complete list of the member propertiesincorporated into the VJ table. It also includes an excerpt ofthe VJ table which is a space-delineated text file.
The two joist properties in which the EOR and joist designer aremost interested are the moment of inertia (Izz) and the weight;both properties are based on chord sizes and are related to thecombined chord areas (Ax). The member weight is calculated fromthe cross-sectional areas of both the top and bottom chords;however, this calculation does not consider the web members dueto the large variability in web member selection. To account forthe web member weight, the density of joist material is set to
2
the density of steel divided by 0.85. This density increaseprovides a simple means to approximately account for web memberweight in the VJ table without affecting calculated values ofaxial capacity.
Because the tables represent complex geometry of a joist with asingle beam member, they do not adequately capture out-of-planejoist behavior, nor can they capture local buckling of the joistcomponents. SJI developed this VJ table based on industry bracingstandards that eliminate out-of-plane limit states as memberfailure modes. For these studies, the joists were considered tohave continuous lateral bracing.
Equivalent Beam Theory
The application of equivalent beam has been shown to adequatelycapture the behavior of complex flexural systems in a single beamelement. Giltner and Kassimali (2000) applied equivalent beamprinciples to modeling full truss systems. They evaluated twodifferent equivalent beam methods:
1. The equivalent beam’s stiffness is calculated from thedeflection of the load truss.
2. Parallel axis-theorem was used to develop the equivalentbeam moment of inertia based on the truss cross-sectionalarea. The vertical and diagonal web members were notconsidered in the calculation of the equivalent moment ofinertia.
In their studies, Giltner and Kassimali compared and evaluateddisplacement and reaction values taken from a real three-dimensional model and those from equivalent models. They foundthat both equivalent methods provided acceptable results and twoprimary advantages. Equivalent beam theory greatly reduces thecomputational time needed for structural design software toanalyze the given member. It also reduces the time required toinput the truss geometry into the software package (Knodel et al2011).
3

Using equivalent beam theory (EBT) within the VJ table allows amulti-element flexural system, such as a joist, to be modeled asa single beam element. This simplified element has approximatebeam properties equivalent to those of the more complex system.In addition, the application of EBT allows both EOR’s and joistdesigners to address common non-uniform loading conditions ontheir design members. If the section properties of the EBTaccurately capture the properties of the joist, use of EBT allowsthe designers to move past the restrictions of simply-supportedload tables when selecting an appropriate member. Panel-pointloads, drifted snow loads, non-continuous uniform loads, etc. canbe handled directly when selecting an appropriately sized member.
The objective of this study is to determine if the virtual joistmoment of inertia and weight selected by STAAD.Pro are within anacceptable variance from the joist moment of inertia and weightdesigned by a proprietary joist design software. For the purposeof this study, a value within the +/-10% variance is deemedacceptable; whereas anything outside a +/-20% is consideredunacceptable for design purposes. Parametric studies on simply-supported joists and fixed-end joists with uniformly distributedloads were used to determine the effectiveness of the joisttables. Tables 1 and 2 show the parameters used in the singlejoist studies; these parameters were established by the SJIResearch Committee to represent a range of practical joistconfigurations and loadings.
Table 1: K-Series Joists Testing ScheduleDepth
(in)
Span1
(ft)
ASD LoadSpan 1(plf)
Span2
(ft)
ASD LoadSpan 2(plf)
12 18 375 24 20014 21 375 28 20016 24 375 32 20018 27 550 36 40020 30 550 40 40022 33 550 44 40024 36 550 48 40026 39 550 52 40028 42 550 56 400
4

30 45 550 60 400
The following testing procedure was used in the first and secondstages to verify the VJ table:
1. A member depth and span were chosen. The design was inputinto STAAD.Pro and the program selected a virtual joist forthe given design input.
2. The virtual joist designation, moment of inertia, and memberweight were recorded.
3. The same design layout was then entered into the proprietaryjoist design software.
4. The proprietary joist software results were recorded and thevariations in program results were calculated.
Simply-Supported K-Series Joist StudiesTwenty simply-supported K-Series joists were analyzed to ensurethe VJ table functioned for the simplest design case. Table 3summarizes results. The moment of inertia and weight varianceswere calculated using Eq. 1(Knodel et al 2011):
(1)
where: = moment of inertia or weight of virtual joist selected
by STAAD.Pro = moment of inertia or weight of joist designed
by The proprietary joist software
Table 2: LH-Series Joist Testing ScheduleDepth
(in)
Span1
(ft)
ASD LoadSpan 1(plf)
Span2
(ft)
ASD LoadSpan 2(plf)
18 27 600 36 40020 30 600 40 400
5

24 36 600 48 40028 42 600 56 40032 48 600 64 40036 54 600 72 40040 60 600 80 40044 66 600 88 40048 72 600 96 40052 78 600 104 40056 84 600 112 40060 90 600 120 40064 96 600 128 40068 102 600 136 40072 108 600 144 40080 120 600 160 40088 132 600 176 40096 144 600 192 400104 156 600 208 400112 168 600 224 400120 180 600 240 400
Table 3: Simply Supported K-Series Studies Variance (+/-) 10% 15% 20%# Considered 20 20 20I Acceptable 100% 100% 100%Weight Acceptable 80% 90% 100%Both Acceptable 80% 90% 100%
All of moment of inertia approximations fell within the +/-10%variance. For the weight variances, 80% were within the +/-10%variance. All of the weight approximations fell within the +/-20%variance.
Figure 1 shows the relationship between the moment of inertiavariance and depth for the K-Series tests. Figure 2 shows theweight variance vs. depth.
6

Figure 1: Moment of Inertia Variance vs. Depth for Simply-Supported K-SeriesTests
Figure 2: Weight Variance vs. Depth for Simply-Supported K-Series Tests
Figure 1 illustrates that there is no correlation between themoment of inertia variances and the joist depths. However, Figure2 shows that all of the joists less than 20 inches in depth havenegative weight variances, that is STAAD.Pro calculated a lowerweight than the proprietary software. After furtherinvestigation, it was determined that for joists with depths lessthan 20 inches, joist manufacturers will typically use steel rodfor the joist web; whereas, for all other joists depths (20inches and greater), manufacturers will use angle. With repsectto proportion of total joist weight, the rod webbing contributesmore weight to the joists than the angle webbing. To improve theweight variances presented in Figure 2, the simply-supported K-
7

Series joists less than 20 inches in depth were re-analyzed withvarious incremental increases added to the joist materialdensity.
Following the re-analysis, it was determined that the density forK-Series joists with depths less than 20 inches should be set tothe density of steel divided by 0.782, which yields a densityapproximately 10% greater than the original joist density. Table4 summarizes the re-analysis results. Figure 3 shows the updatedweight variance vs. depth.
Table 4: Simply Supported K-Series Studies with New Density forJoists <20” in Depth
Variance (+/-) 10% 15% 20%# Considered 20 20 20I Acceptable 100% 100% 100%Weight Acceptable 90% 100% 100%Both Acceptable 90% 100% 100%
Figure 3. Weight Variance vs. Depth for Simply-Supported K-Series Studies withNew Density for Joists <20” in Depth
After applying the new density to joists less than 20 inches indepth, 100% of the moment of inertia approximations and 90% ofthe weight variances fell within +/-10% variance. All of theweight variances fell within the +/-15% range. Figure 3 shows apositive shift in the weight variances for joists with depths
8

less than 20 inches. The lowest weight variance shown in Figure2, before the density adjustment, was approximately -18%; now thesame variance is approximately -12% as shown in Figure 3.
Accounting for Higher Weights in the VJ TablesThe increased density for joist with depths less than 20 inchesbetter accounted for the increased rod web weight experienced inthese members; however, it is not practical from a designstandpoint to have two different densities that are based onmember depth. EOR’s and joist designers do not necessarily knowthe member depth requirements prior to initial member selection.Application of a methodology that does not require any parametersof the final design selections to implement is essential inmaking the approach both user-friendly and universallyapplicable.
Thus, instead of using the increased density, the cross-sectionalareas of joists with depths less than 20 inches were increased by10% to account for the rod web weight. This area adjustmentallows EOR’s and joist designers to only apply one specializeddensity for the joist members in their design project. This isonly accomplished by accepting that joists with small depths arenot typically used in situations where axial capacity of thejoist is a limiting factor in design. The increase in area shouldnot greatly influence the design stresses that are calculated forthese members by the structural design software.
Fixed-End K-Series Joist StudiesThe same K-Series joists tested in the simply-supported testswere also analyzed with fixed-end conditions. The results of thisstudy are shown in Table 5. Figures 4 and 5 show the moment ofinertia variance and the weight variance versus depth,respectively. The increased cross-sectional areas for joists withdepths less than 20” were included in these tests.
Table 5: Fixed End Supported K-Series Studies Variance (+/-) 10% 15% 20%# Considered 20 20 20
9

I Acceptable 100% 100% 100%Weight Acceptable 95% 100% 100%Both Acceptable 95% 100% 100%
Figure 4. Moment of Inertia Variance vs. Depth for Fixed-End K-Series Tests
Figure 5. Weight Variance vs. Depth for Fixed-End K-Series Tests
Similar to the simply supported study, all of the moment ofinertia approximations fell within a +/- 10% variance. For theweight approximations, only one virtual joist fell outside of a+/- 10% variance. Figure 4 shows almost zero correlation betweenthe moment of inertia variance and joist depth. Figure 5 alsoindicates a lack of significant correlation between weight andjoist depth, similar to that shown in Figure 3.The correlationsin Figures 4 and 5 are not sufficient to justify more adjustmentsto the VJ table.
10

Simply-Supported LH-Series Joists StudiesThe trials on the simply supported LH-Series joists used the sameVJ table as the simply-supported K-Series joists. Table 6summarizes these results.
Table 6: Simply-Supported LH-Series Studies Variance (+/-) 10% 15% 20%# Considered 42 42 42I Acceptable 86% 98% 100%Weight Acceptable 90% 100% 100%Both Acceptable 79% 98% 100%
The moment of inertia variance fell within the +/-10% variance86% of the time. All of the moment of inertia variances fellwithin +/-20% range. All of the weight approximations fell withinthe +/-15% variance.
Figure 6 shows the relationship between the moment of inertiavariance and depth for the LH-Series tests. Figure 7 shows theweight variance vs. depth.
Figure 6. Moment of Inertia Variance vs. Depth for Simply-Supported LH-SeriesTests
11

Figure 7. Weight Variance vs. Depth for Simply-Supported LH-Series Tests
Both Figures 6 and 7 show downward trends, but insignificantcorrelation, in the variances as the joist depth increases. Thecorrelations for the moment of inertia and weight variances tojoist depth are minimal. There is little evidence here to supportadjustment of the VJ table. Figure 6 does show that for amajority of the LH-Series joists tested, STAAD selected virtualjoist members with smaller moments of inertia than what theproprietary joist software calculated. Further investigation intothis difference yielded that the LH-Series joists have highinteraction check values for the top chord in the end panels.Therefore, even in the simply supported case, the top chordexperiences combined axial and bending forces that need to beaccounted for in the design.
Three-Dimensional Building Case StudyIn order to demonstrate the effectiveness of the VJ tables in amore realistic design situation, a three-dimensional buildingmodel was developed to implement the VJ table. One goal for thiscase study was to determine the VJ table functionality with non-uniform member loads; in this instance, triangular drifted snowloads were applied to selected joists. The building geometry isshown in Figure 6 (SJI 2007). Table 7 shows the design loads andthe sub-set of ASCE7-10 (2010) load combinations considered. Toaccount for drifted snow, a six foot high mechanical screen wasadded to the north face of the building. In addition, the windloads were only considered from the east and west directions,
12

which are resisted by the joist girder moment frames shown inSection A-A of Figure 8. A joist spacing of five feet was alsoused in the building model.
Figure 8. Building Model Dimensions and Layout
Table 7. Design Loads and Load Combinations
Load TypeLoad(psf)
LoadCombinations
Dead Load 20 D + SBalanced Snow Load 32 D + WDrifted Snow Load1 80
D + 0.75S +0.75W
Uniform Wind 25 0.6D + W
13
PRECAST SHEAR WALLS ON EAST AND WEST SIDES OF BUILDING PERIMETER
DRIFT
PERIMETER DRIFT
INTERIORDRIFTJOISTS
INTERIORJOISTS
INTERIORJOISTS
INTERIORJOISTS
INTERIORJOISTS
INTERIORJOISTS
PERIMETER JOISTS
PERIMETER JOISTS

Load1. Acts over 17' drift length in the north bays.
Case Study Results – Joist SelectionAs shown in Figure 8, there are four different types of joiststhat need to be designed in this case study: Perimeter DriftJoists, Interior Drift Joists, Perimeter Joists, and InteriorJoists. All of the joists were considered pinned-pinned assumingno joist extensions and standard joist support conditions. Theresults of the case study are shown in Table 8.
Table 8. Joist Type Selection Results
STAAD.ProThe proprietary joist
software Variances
Joist TypeMemberDesignat
ion
Momentof
Inertia (in4)
Weight
(lbs)
MemberDesignat
ion
Momentof
Inertia (in4)
Weight
(lbs)
Momentof
InertiaVariance (%)
WeightVariance
(%)
Perimeter Drift VJ20-6 115.0 230
20K130/80 114.8 258 0.2 -10.8
Interior Drift VJ20-28 209.3 430
20K260/160 221.7 441 -5.6 -2.5
Perimeter VJ20-2 98.5 19520K130/80 104.3 238 -5.6 -18.1
Interior VJ20-22 186.8 38520K260/160 183.5 374 1.8 2.9
Table 8 shows that for two of the designed joist types, both themoment of inertia and weight approximations fell well within +/-10% variance. For the perimeter joist type, the moment of inertiaapproximation also fell within the +/-10% variance and the weightvariance fell within the +/-20% variance. The perimeter driftjoist had a weight variance fall just outside of the +/-10%variance. Similar to the simply-supported joist cases, this casestudy provided reasonably accurate agreement between thecommercial selections using the commercial software and theproprietary joist manufacturer designs. These resultsdemonstrate the VJ table functionality with both drifted snow and
14

uniform loading conditions. Even though the weight variance forthe perimeter type joist is outside the +/-10% variance, theaggregate joist weight estimated by STAAD of 56.4 kips was within0.7% of the proprietary software estimate of 56.0 kips. It shouldbe noted that the developed joists were designed for strengthrequirements only.
Conclusions and Recommendations
Similar to previous verification of the use of EBT and VirtualJoist Girder Tables for use in JGMF design (Knodel et al 2011),the studies show that a similar approach, which minormodifications to account for higher webbing weight in lower depthjoists, provide a reasonable approximation for the EOR whenestimating stiffness and weight of steel joists. The case studyprovides a preliminary proof-of-concept and illustrates the useof these tables in a more practical problem.
Further study is necessary to validate the use of EBT on joists,however. As stated earlier, equivalent beam theory allowscomplex models to be simplified and modeled as a single element.However, by simplifying a complex model, there is a possibilitythat certain failure mechanisms such as combined flexure andaxial forces are not addressed in the simplified element. Thiscan be seen in the LH-Series studies. By using the VJ Table andEBT, STAAD picked LH-Series joists with smaller moments ofinertia than the same joists designed by the joist designsoftware. The STAAD.Pro analysis failed to address the combinedflexure and axial forces that these large joists experience whenuniformly loaded. Thus, the members selected by STAAD had smallertop chords; this results in lower moments of inertia and memberweights. This design phenomena did not occur in the previousstudy (Knodel et al 2011) because the joist girders were onlyloaded at panel points; there was no inter-panel point loading ofthe top chord. Further structural modeling will need to be doneto address this combined flexure and axial forces in the topchord. The next portion of this research will address methods toaccount for joist component interaction that cannot be capturedby the EBT.
15

Acknowledgements
This research project was sponsored by the Steel Joist Institute.Bentley Systems, Inc. provided the STAAD.Pro software used in theresearch, and Habco Erectors, Inc. provided proprietary joistdesign software.
The authors wish to acknowledge the input and assistance offeredby the SJI Research Committee especially Dave Samuelson of NucorResearch and Development for Downstream Products and WalterWorthley with Valley Joist, Inc. In addition, the authors want toacknowledge Joe Pote with New Millennium Building Systems forboth for developing the virtual joist and virtual joist girdertables and for his input on the project as well as Jim Fisher ofComputerized Structural Design for providing the buildingexample. Findings, conclusions and recommendations are those ofthe authors and do not necessarily reflect those of thesponsoring organizations.
References
Knodel, P.A., Surovek, A.E., Pote, J.J. (2011). “A simplified approach forjoist girder moment frame design using equivalent beam theory.” Proceedings ofStructural Stability Research Council Conference, Pittsburgh, PA.
Giltner, B., Kassimali, A. (2000). “Equivalent beam method for trusses.”Practice Periodical on Structural Design and Construction, ASCE, 5 (2) 70-77.
SJI (2007). “Technical digest 11 – Design of lateral load resisting framesusing steel joists and joist girders.” Steel Joist Institute, 49-50.
American Society of Civil Engineers (2010). “Minimum design loads forbuildings and other structures.” ASCE, 7.
16

17

Appendix A
Equivalent Beam Properties in Virtual Joist Table
AxTotal Area of Top and bottom Chords
D Girder DepthTD Web ThicknessB Flange WidthTB Flange Thickness
IzzJoist Girder Strong-Axis Momentof Inertia
IyyJoist Girder Weak-Axis Moment of Inertia
Ixx Torsional Constant
SzElastic Section Modulus About Strong-Axis
SyElastic Section Modulus About Weak-Axis
Ay Shear Area in Y DirectionAz Shear Area in Z Direction
PzPlastic Section Modulus About Strong-Axis
PyPlastic Section Modulus About Weak-Axis
HSS Warping ConstantDEE Depth of WebBSD Minimum Bearing Seat Depth
Virtual Joist Table Excerpt
18
19