TECHNICAL DIGEST 3 - Steel Joist Institute
118
TECHNICAL DIGEST 3 STRUCTURAL DESIGN OF STEEL JOIST ROOFS TO RESIST PONDING LOADS FEBRUARY 20 18
-
Upload
khangminh22 -
Category
Documents
-
view
1 -
download
0
Transcript of TECHNICAL DIGEST 3 - Steel Joist Institute

TECHNICAL DIGEST 3
STRUCTURAL DESIGNOF STEEL JOISTROOFS TO RESISTPONDING LOADS
FEBRUARY 2018

The information presented in this publication has been developed by James M. Fisher, Ph.D, P.E., Dist.M.ASCE, Consulting Engineer for the Steel Joist Institute and Mark D. Denavit, Ph.D., P.E. Assistant Professor, Department of Civil and Environmental Engineering, University of Tennessee, Knoxville in conjunction with the SJI’s Engineering Practice Committee and the SJI’s Research Committee, and is produced in accordance with recognized engineering principles and is for general information only. The SJI and its committees have made a concerted effort to present accurate, reliable, and useful information on the structural design of steel joist roofs to resist ponding loads. The information contained in this digest should not be used or relied upon for any specific project without competent professional assessment of its accuracy, suitability and applicability by a licensed professional engineer or architect. The publication of the material contained in this Technical Digest is not intended as a representation or warranty on the part of the Steel Joist Institute. Any person making use of this information does so at one’s own risk and assumes all liability arising from such use.
Federal Regulations Governing Erection of Joist ProductsSteel joists and Joist Girders must be erected in accordance with the Occupational Safety and Health Administration (OSHA), U.S. Department of Labor 29 CFR Part 1926 Safety Standards for Steel Erection. The erection of Open Web Steel Joists is governed by Section 1926.757 of this Federal Regulation.
Copyright © 2018
by
Steel Joist Institute
All rights reserved. This Technical Digest or any part thereof must not be reproducedin any form without the written permission of the Steel Joist Institute.
Printed in the United States of America
Third EditionFirst Printing – February 2018

STRUCTURAL DESIGNOF STEEL JOIST ROOFSTO RESIST PONDING LOADS
TECHNICAL DIGEST 3
James M. Fisher, Consulting Engineer to the Steel Joist Institute, Estero, FL
Mark D. Denavit, Assistant Professor, Department of Civil and Environmental Engineering, University of Tennessee, Knoxville, TN
Steel Joist Institute234 W. Cheves StreetFlorence, SC 29501www.steeljoist.org

i
FORWARD
ACKNOWLEDGEMENTThe authors would like to thank SJI’s Managing Director, Kenneth Charles, and the members of the Engineering Practice Committee and the Research Committee of the Steel Joist Institute for their review and contributions to the writing of the third edition of this digest. The authors would also like to thank Nathan Lubecke, consulting engineer, for his assistance in developing the Ponding Spreadsheet, and for his many helpful suggestions.
This Technical Digest is another addition to the series of Steel Joist Institute publications designed to give the reader information regarding the application and usage of steel joists and Joist Girders.
Technical Digest No. 3 concerns itself with the proper design of joist and Joist Girder roof systems to avoid or resist ponding instability and water accumulation. Much of the revised information in the third edition is a direct result of the changes that have been adopted by recent building codes and the development of the SJI Roof Bay Analysis Tool.
This and other SJI Technical Digests serve to highlight specific areas of design and/or application for the benefit of architects, building inspectors, building officials, designers, engineers, erectors, students and others.

ii
ii
TABLE OF CONTENTS
ACKNOWLEDGEMENT ……………………………………………………… i
FOREWORD …………………………………………………………………... i
TABLE OF CONTENTS ………………………………………………………. ii
BACKGROUND ……………………………………………………………….. iii
GLOSSARY ……………………………………………………………………. iv
Chapter 1 GENERAL NATURE OF PONDING ………………………… 101
Chapter 2 CODE PROVISIONS FOR PONDING ……………....…....... 104
Chapter 3 ROOF DESIGN FOR PONDING …..……………….….……. 109
Chapter 4 DESIGN EXAMPLES ………………………………….……… 135
Chapter 5 SUMMARY AND CONCLUSIONS …….……………….…… 194
REFERENCES ………………………………………………………………… 195
Appendix A NOMENCLATURE ………………………………………….… 197
Appendix B CALCULATING EFFECTIVE MOMENTS OF INERTIAFOR STEEL JOISTS AND JOIST GIRDERS ……….……... 100
Appendix C DERIVATION OF EQUATIONS FOR THE JOISTS ONSTIFF SUPPORTS METHOD ……………………………….. 105
TABLE OF CONTENTS

iii
This Technical Digest outlines procedures for the selection of steel joists and Joist Girders that are required to meet the strength and stability requirements resulting from the accumulation of water on a roof system, i.e., ponding. The digest provides a summary of code provisions relative to ponding and discusses the assumptions and use of the SJI Roof Bay Analysis Tool. Design examples are provided using the AISC ponding provisions and the SJI Roof Bay Analysis Tool. The calculation of effective moments of inertia for joists and Joist Girders is presented in Appendix B. The derivation of equations for the joist on stiff supports method is presented in Appendix C.
BACKGROUND

iv
GLOSSARYASD (Allowable Strength Design). Method of proportioning structural components such that the allowable strength equals or exceeds the required strength of the component under the action of the ASD load combinations.
Allowable Strength*. Nominal strength divided by the safety factor, Rn/Ω.
Available Strength*. Design strength or allowable strength as appropriate.
Camber. An upward curvature of the chords of a joist or Joist Girder induced during shop fabrication. Note, this is in addition to the pitch of the top chord.
Chords. The top and bottom members of a joist or Joist Girder. When a chord is comprised of two angles there is usually a gap between the members.
Clear Span. The actual clear distance or opening between supports for a joist, that is the distance between walls or the distance between the edges of flanges of beams.
Design Load. Applied load determined in accordance with either LRFD load combinations or ASD load combinations, whichever is applicable.
Design Strength*. Resistance factor multiplied by the nominal strength, fRn.
End Diagonal or Web. The first web member on either end of a joist or Joist Girder which begins at the top chord at the seat and ends at the first bottom chord panel point.
Instability. Limit state reached in the loading of a structural component, frame or structure in which a slight disturbance in the loads or geometry produces large displacements.
Joist. A structural load-carrying member with an open web system which supports floors and roofs utilizing hot-rolled or cold-formed steel and is designed as a simple span member. Currently, the SJI has the following joist designations: K-Series including KCS, LH-Series and DLH-Series.
Joist Girder. A primary structural load-carrying member with an open web system designed as a simple span supporting equally spaced concentrated loads of a floor or roof system acting at the panel points of the member and utilizing hot-rolled or cold-formed steel.
Load. Force or other action that results from the weight of building materials, occupants and their possessions, environmental effects, differential movement, or restrained dimensional changes.
LRFD (Load and Resistance Factor Design). Method of proportioning structural components such that the design strength equals or exceeds the required strength of the component under the action of the LRFD load combinations.
Nominal Strength*. Strength of a structure or component (without the resistance factor or safety factor applied) to resist the load effects, as determined in accordance with the Standard Specifications.
Ponding. A process where water, gravitating to low points in the deflected surface of a roof system, causes progressively increasing deflection and load.
Required Strength*. Forces, stresses, and deformations produced in a structural component, determined by either structural analysis, for the LRFD or ASD load combinations, as appropriate, or as specified by the Standard Specifications.

v
Resistance Factor, f. Factor that accounts for deviations of the actual strength from the nominal strength, deviations of the actual load from the nominal load, uncertainties in the analysis that transforms the load into a load effect and for the manner and consequences of failure.
Safety Factor, Ω. Factor that accounts for deviations of the actual strength from the nominal strength, deviations of the actual load from the nominal load, uncertainties in the analysis that transforms the load into a load effect and for the manner and consequences of failure.
Span. The centerline-to-centerline distance between structural steel supports such as a beam, column or Joist Girder or the clear span distance plus four inches onto a masonry or concrete wall.
Specified Minimum Yield Stress. Lower limit of yield stress specified for a material as defined by ASTM.
Specifying Professional. The licensed professional who is responsible for sealing the building Contract Documents, which indicates that he or she has performed or supervised the analysis, design and document preparation for the structure and has knowledge of the load-carrying structural system.
Stability. Condition reached in the loading of a structural component, frame or structure in which a slight disturbance in the loads or geometry does not produce large displacements.
Standard Specification. STANDARD SPECIFICATION FOR K-SERIES, LH-SERIES, AND DLH-SERIES OPEN WEB STEEL JOISTS AND FOR JOIST GIRDERS., American National Standard SJI 100 – 2015
Webs. The vertical or diagonal members joined at the top and bottom chords of a joist or Joist Girder to form triangular patterns.
Yield Point. First stress in a material at which an increase in strain occurs without an increase in stress as defined by ASTM.
Yield Strength. Stress at which a material exhibits a specified limiting deviation from the proportionality of stress to strain as defined by ASTM.
Yield Stress. Generic term to denote either yield point or yield strength, as appropriate for the material.
NOTES:
Terms in Bold and their definitions come from the AISC and AISI Standard Definitions for Use in the Design of Steel Structures, 2004 Edition, First Printing April 2005.
These terms are usually qualified by the type of load effect, e.g., nominal tensile strength, available compressive strength, design flexural strength.
**

11
CHAPTER 1GENERAL NATURE OF PONDING
Ponding is a process where water, gravitating to low points in the deflected surface of a roof system, causes progressively increasing deflection and load.When sufficient strength and stiffness are provided, the result of ponding is equilibrium (Figure 1.1), albeit with water remaining on the roof surface and loads greater and in a different distribution than would be expected based on the undeformed roof. In addition, when water remains on the roof there is a greater chance of water penetrating the roof membrane. When either the strength or stiffness is insufficient, the result of ponding is collapse (Figure 1.2).
Figure 1.1 Potential for Roof Ponding Instability due to Blocked Drains(with permission from DEP Montgomery County, MD)
Ponding is a potential problem in northern as well as southern climates. Water can come from rain, snowmelt, or both. Heat from within a building can thaw areas of snow on a roof to produce melt water. The effect can be exacerbated with repetitive freeze-thaw cycles. Furthermore, primary drains may become blocked and water may accumulate faster than it can be discharged by secondary drains.
Since impounded water conforms to the deflected surface of the roof, the load from the water is not uniform across the roof system, which may pose further challenges for systems that are designed for uniform dead, live, or snow loads as is common for steel joist roofs.
FIGURE 1.1Potential for Roof Ponding Instability due to Blocked Drains
(with permission from DEP Montgomery County, MD)
1
CHAPTER 1GENERAL NATURE OF PONDING
Ponding is a process where water, gravitating to low points in the deflected surface of a roof system, causes progressively increasing deflection and load.When sufficient strength and stiffness are provided, the result of ponding is equilibrium (Figure 1.1), albeit with water remaining on the roof surface and loads greater and in a different distribution than would be expected based on the undeformed roof. In addition, when water remains on the roof there is a greater chance of water penetrating the roof membrane. When either the strength or stiffness is insufficient, the result of ponding is collapse (Figure 1.2).
Figure 1.1 Potential for Roof Ponding Instability due to Blocked Drains(with permission from DEP Montgomery County, MD)
Ponding is a potential problem in northern as well as southern climates. Water can come from rain, snowmelt, or both. Heat from within a building can thaw areas of snow on a roof to produce melt water. The effect can be exacerbated with repetitive freeze-thaw cycles. Furthermore, primary drains may become blocked and water may accumulate faster than it can be discharged by secondary drains.
Since impounded water conforms to the deflected surface of the roof, the load from the water is not uniform across the roof system, which may pose further challenges for systems that are designed for uniform dead, live, or snow loads as is common for steel joist roofs.
CHAPTER 1
1
CHAPTER 1GENERAL NATURE OF PONDING
Ponding is a process where water, gravitating to low points in the deflected surface of a roof system, causes progressively increasing deflection and load.When sufficient strength and stiffness are provided, the result of ponding is equilibrium (Figure 1.1), albeit with water remaining on the roof surface and loads greater and in a different distribution than would be expected based on the undeformed roof. In addition, when water remains on the roof there is a greater chance of water penetrating the roof membrane. When either the strength or stiffness is insufficient, the result of ponding is collapse (Figure 1.2).
Figure 1.1 Potential for Roof Ponding Instability due to Blocked Drains(with permission from DEP Montgomery County, MD)
Ponding is a potential problem in northern as well as southern climates. Water can come from rain, snowmelt, or both. Heat from within a building can thaw areas of snow on a roof to produce melt water. The effect can be exacerbated with repetitive freeze-thaw cycles. Furthermore, primary drains may become blocked and water may accumulate faster than it can be discharged by secondary drains.
Since impounded water conforms to the deflected surface of the roof, the load from the water is not uniform across the roof system, which may pose further challenges for systems that are designed for uniform dead, live, or snow loads as is common for steel joist roofs.

2
FIGURE 1.2Partial Roof Collapses due to Ponding
2
Figure 1.2 Partial Roof Collapses due to Ponding
2
Figure 1.2 Partial Roof Collapses due to Ponding

33
The surest way to avoid a ponding collapse is to construct a roof with sufficient slope and free drainage, so that water never accumulates. What is sufficient slope and what constitutes enough drainage? Roof slopes varying from 1/8 in./ft. to 1/2 in./ft. have been used successfully in the past, but it cannot be stated that in all cases such slopes prevent ponding collapse. Rational analysis to answer these questions requires knowledge of both the structural and hydrological characteristics of the roof. Roof slope, stiffness and strength of the members supporting the roof membrane, as well as the location and size of drains are all important in avoiding ponding instability.
The selection of drain sizes is generally not the responsibility of the structural engineer; however, the structural engineer must either evaluate or be provided with the characteristics of the secondary drainage system in order to determine the initial loads on the structure for ponding evaluation.
Finally, it is the responsibility of the building owner to properly maintain the drainage system so that it will function properly.

44
CHAPTER 2CODE PROVISIONS FOR PONDING
Code provisions relevant to ponding on steel joist roofs exist in many references.Several of these are cited in this chapter with key points as follows:
• All roofs require a primary and secondary drainage system.
• All roofs must be designed for impounded water based on the primary drains being blocked.
• No specific method of analysis or design for ponding is prescribed.
• Impounded water heights are to include the hydraulic head above the secondary drainage system.
• Ponding instability checks are to be made using the larger of snow load or rain load (impounded water).
• For roofs in locations where the ground snow load is 20 psf or less, anadditional 5 psf of rain-on-snow must be used in design.
• All roofs must be designed with a minimum slope for drainage.
Requirements from 2015 International Building Code(ICC 2015a)1503.4 Roof Drainage. “Design and installation of roof drainage systems shall comply with Section 1503 of this code and Sections 1106 and 1108, as applicable, of and the International Plumbing Code.” (ICC 2015b).
1503.4.1 Secondary (emergency overflow) drains or scuppers. “Where roof drains are required, secondary (emergency overflow) roof drains or scuppers shall be provided where the roof perimeter construction extends above the roof in such a manner that water will be entrapped if the primary drains allow buildup for any reason. The installation and sizing of secondary emergency overflow drains, leaders and conductors shall comply with Sections 1106 and 1108, as applicable, of the International Plumbing Code.”
1503.4.2 Scuppers. “When scuppers are used for secondary (emergency overflow) roof drainage, the quantity, size, location and inlet elevation of the scuppers shall be sized to prevent the depth of ponding water from exceeding that for which the roof was designed as determined by Section 1611.1. Scuppers shall not have an opening dimension of less than 4 inches. The flow through the primary system shall not be considered when locating and sizing scuppers.”
CHAPTER 2

55
1507.10.1 Slope. “Built-up roofs shall have a design slope of not less than one-fourth unit vertical in 12 units horizontal (2-percent slope) for drainage, except forcoal-tar built-up roofs that shall have a design slope of not less than one-eighth unit vertical in 12 units horizontal (1-percent slope).”
1608.3 Ponding instability. “Susceptible bays of roofs shall be evaluated for ponding instability in accordance with Section 7.11 of ASCE 7.”
1611.1 Design rain loads. “Each portion of a roof shall be designed to sustain the load of rainwater that will accumulate on it if the primary drainage system for that portion is blocked plus the uniform load caused by water that rises above the inlet of the secondary drainage system at its design flow. The design rainfall shall be based on the 100-year hourly rate indicated in Figure 1611.1 or on other rainfall rates determined from approved local weather data.
R = 5.2(ds+dh) (IBC Eq. 16-36)
where:
dh = Additional depth of water on the undeflected roof above the inlet of secondary drainage system at its design flow (i.e., the hydraulic head), in inches.
ds = Depth of water on the undeflected roof up to the inlet of secondary drainage system when the primary drainage system is blocked (i.e., the static head), in inches.
R = Rain load on the undeflected roof, in psf. When the phrase “undeflected roof” is used, deflections from loads (including dead loads) shall not be considered when determining the amount of rain on the roof.”
1611.2 Ponding instability. “Susceptible bays of roofs shall be evaluated for ponding instability in accordance with Section 8.4 of ASCE 7.”
1611.3 Controlled drainage. “Roofs equipped with hardware to control the rate of drainage shall be equipped with a secondary drainage system at a higher elevation that limits accumulation of water on the roof above that elevation. Such roofs shall be designed to sustain the load of rainwater that will accumulate on them to the elevation of the secondary drainage system plus the uniform load caused by water that rises above the inlet of the secondary drainage system at its design flow determined from Section 1611.1. Such roofs shall also be checked for ponding instability in accordance with Section 1611.2.”

66
Requirements from 2015 International Plumbing Code(ICC 2015b)1101.7 Roof design. “Roofs shall be designed for the maximum possible depth of water that will pond thereon as determined by the relative levels of roof deck and overflow weirs, scuppers, edges or serviceable drains in combination with the deflected structural elements. In determining the maximum possible depth of water, all primary roof drainage means shall be assumed to be blocked. The maximum possible depth of water on the roof shall include the height of the water required above the inlet of the secondary roof drainage means to achieve the required flow rate of the secondary drainage means to accommodate the design rainfall as required by Section 1106.”
1108.1 Secondary (emergency overflow) drains or scuppers. “Where roof drains are required, secondary (emergency overflow) roof drains or scuppers shall be provided where the roof perimeter construction extends above the roof in such a manner that water will be entrapped if the primary drains allow buildup for any reason. Where primary and secondary roof drains are manufactured as a single assembly, the inlet and outlet from each drain shall be independent.”
Provisions from ASCE 7-16 (ASCE 2016)7.10 RAIN-ON-SNOW SURCHARGE LOAD. “For locations where pg is 20 lb/ft2or less, but not zero, all roofs with slopes (in degrees) less than W/50 with W in ft. shall include a 5 lb/ft2 rain-on-snow surcharge load. This additional load applies only to the sloped roof (balanced) load case and need not be used in combination with drift, sliding, unbalanced, minimum, or partial loads.
where:
pg = Ground snow load as determined from Fig. 7-1 and Table 7-1 (of ASCE 7-16); or a site-specific analysis, in lb/ft.2
W = Horizontal distance from eave to ridge, in ft.”
7.11 PONDING INSTABILITY. “Susceptible bays shall be designed to preclude ponding instability. Roof deflections caused by full snow loads shall be evaluatedwhen determining the likelihood of ponding instability (see Section 8.4).”
8.3 DESIGN RAIN LOADS. “Each portion of a roof shall be designed to sustain the load of all rainwater that will accumulate on it if the primary drainage system for that portion is blocked plus the uniform load caused by water that rises above the inlet of the secondary drainage system at its design flow.
R = 5.2(ds+dh) (ASCE 7-16 Eq. 8.3-1)

77
If the secondary drainage systems contain drain lines, such lines and their point of discharge shall be separate from the primary drain lines. Rain loads shall be based on the total head (static head [ds] plus hydraulic head [dh]) assocaited with the design flow rate for the specified secondary drains and drainage system. The total head correspoinfing to the design flow rate for the specified drains shall be based on hydraulic test data.”
Contained in the Commentary to Section 8.3 are various tables which can be usedto determine flow rates, Q, for standpipes and scuppers as well as several examples using the tables. One of the most useful tables is Table C8.3-3 Flow Rate, Q, in Gallons Per Minute for Scuppers at Various Hydraulic Heads (dh) in inches, reproduced in this Digest at Table 2-1.
Table 2-1 (Based on ASCE 7-16 Table C8.3-3)Flow Rate, Q, in Gallons Per Minute for Scuppers at Various Hydraulic Heads (dh), in Inches
Hydraulic Head, dh, in.Drainage System 1 2 2.5 3 3.5 4 4.5 5 7 86 in. wide, channel scuppera 18 50 b 90 b 140 b 194 321 39324 in. wide, channel scupper 72 200 b 360 b 560 b 776 1,284 1,5726 in. wide, 4 in. high, closed scuppera 18 50 b 90 b 140 b 177 231 25324 in. wide, 4 in. high, closed scupper 72 200 b 360 b 560 b 708 924 1,0126 in. wide, 6 in. high, closed scupper 18 50 b 90 b 140 b 194 303 34324 in. wide, 6 in. high, closed scupper 72 200 b 360 b 560 b 776 1,212 1,372a Channel scuppers are open-topped (i.e., three sided). Closed scuppers are four-sidedb Interpolation is appropriate, including, between widths of each scupper.Source: Adapted from FM Global (2012).
8.4 PONDING INSTABILITY. “Susceptible bays shall be investigated by structural analysis to ensure that they possess adequate stiffness to preclude progressive deflection (i.e., instability) and adequate strength to resist the additional ponding load. Any of the following conditions shall be deemed to create susceptible bays: (1) bays with a roof slope less than 1/4 in. per foot (1.19°) when the secondary members are perpendicular to the free draining edge, (2) bays with a roof slope less than 1 in. per foot (4.76°) when the secondary members are parallel to the free draining edge, (3) bays with a roof slope of 1 in. per foot (4.76°) and a span to spacing ratio for the secondary members greater than 16 when the secondary members are parallel to the free draining edge, or (4) bays on which wateraccumulates (in whole or in part) when the primary drain system is blocked but the secondary drain system is functional. The larger of the snow load or the rain load equal to the design condition for a blocked primary drain system shall be used in this analysis.”
Provisions from FM Global (FM 2016)The FM Global “Loss Prevention Data 1-54, Roof Loads for New Construction,” contains their requirements for ponding and drainage. Shown in Figures 8a and 8b of that document are typical requirements for the position of secondary drains and scuppers. As shown in the figures the minimum and maximum invert heights of the secondary drains are 2 to 4 in. above the primary drains. The minimum and
TABLE 2-1(Based on ASCE 7-16 Table C8.3-3)
7
If the secondary drainage systems contain drain lines, such lines and their point of discharge shall be separate from the primary drain lines. Rain loads shall be based on the total head (static head [ds] plus hydraulic head [dh]) assocaited with the design flow rate for the specified secondary drains and drainage system. The total head correspoinfing to the design flow rate for the specified drains shall be based on hydraulic test data.”
Contained in the Commentary to Section 8.3 are various tables which can be usedto determine flow rates, Q, for standpipes and scuppers as well as several examples using the tables. One of the most useful tables is Table C8.3-3 Flow Rate, Q, in Gallons Per Minute for Scuppers at Various Hydraulic Heads (dh) in inches, reproduced in this Digest at Table 2-1.
Table 2-1 (Based on ASCE 7-16 Table C8.3-3)Flow Rate, Q, in Gallons Per Minute for Scuppers at Various Hydraulic Heads (dh), in Inches
Hydraulic Head, dh, in.Drainage System 1 2 2.5 3 3.5 4 4.5 5 7 86 in. wide, channel scuppera 18 50 b 90 b 140 b 194 321 39324 in. wide, channel scupper 72 200 b 360 b 560 b 776 1,284 1,5726 in. wide, 4 in. high, closed scuppera 18 50 b 90 b 140 b 177 231 25324 in. wide, 4 in. high, closed scupper 72 200 b 360 b 560 b 708 924 1,0126 in. wide, 6 in. high, closed scupper 18 50 b 90 b 140 b 194 303 34324 in. wide, 6 in. high, closed scupper 72 200 b 360 b 560 b 776 1,212 1,372a Channel scuppers are open-topped (i.e., three sided). Closed scuppers are four-sidedb Interpolation is appropriate, including, between widths of each scupper.Source: Adapted from FM Global (2012).
8.4 PONDING INSTABILITY. “Susceptible bays shall be investigated by structural analysis to ensure that they possess adequate stiffness to preclude progressive deflection (i.e., instability) and adequate strength to resist the additional ponding load. Any of the following conditions shall be deemed to create susceptible bays: (1) bays with a roof slope less than 1/4 in. per foot (1.19°) when the secondary members are perpendicular to the free draining edge, (2) bays with a roof slope less than 1 in. per foot (4.76°) when the secondary members are parallel to the free draining edge, (3) bays with a roof slope of 1 in. per foot (4.76°) and a span to spacing ratio for the secondary members greater than 16 when the secondary members are parallel to the free draining edge, or (4) bays on which wateraccumulates (in whole or in part) when the primary drain system is blocked but the secondary drain system is functional. The larger of the snow load or the rain load equal to the design condition for a blocked primary drain system shall be used in this analysis.”
Provisions from FM Global (FM 2016)The FM Global “Loss Prevention Data 1-54, Roof Loads for New Construction,” contains their requirements for ponding and drainage. Shown in Figures 8a and 8b of that document are typical requirements for the position of secondary drains and scuppers. As shown in the figures the minimum and maximum invert heights of the secondary drains are 2 to 4 in. above the primary drains. The minimum and

88
maximum invert heights for scuppers are shown as 2 to 4 in. above the low point of the roof. The next edition of 1-54 will indicate the invert heights of the secondary drains are to be 2 to 3 in. above the primary drains. Figures 8a and 8b will then be in sync with Section 2.5.4.1.6.5. Item D.
2.5.4.1.6.5 Secondary Drainage
“A. Provide secondary drainage to prevent any possibility of rain water overload. The overflow relief provision establishes the maximum possible water level based on blockage of the primary drainage system. Ensure the provision is in the form of minimal height roof edges, slots in roof edges, overflow scuppers in parapets or overflow drains adjacent to primary drains.
B. Ensure the overflow relief protection provides positive and uniform drainage relief for each roof section.
C. When designing and sizing the secondary drainage system (overflow drains or scuppers), assume the primary drains are 100% blocked and cannot flow water.
D. Ensure the inlet elevation of overflow drains and the invert elevation of overflow scuppers are not less than 2 in. nor more than 3 in. above the low point of the (adjacent) roof surface unless a safer water depth loading, including the required hydraulic head to maintain flow, has been determined by the roof-framing designer.
E. For secondary (overflow) roof drains, use a dam or standpipe diameter at least 30% larger than the drain outlet diameter.”
ANSI/SJI 100-2015 (SJI 2015)5.11 PONDING. “The ponding investigation shall be performed by the specifying professional.”
ANSI/AISC 360-16 (AISC 2016)B3.10 Design for Ponding. “The roof system shall be investigated through structural analysis to ensure strength and stability under ponding conditions, unless the roof surface is configured to prevent the accumulation of water. Methods of evaluating stability and strength under ponding conditions are provided in Appendix 2.”
The commentary to Section B3.10 states: “Determination of ponding stability is typically done by structural analysis where the rain loads are increased by the incremental deflections of the framing system to the accumulated rain water, assuming the primary roof drains are blocked.”
Appendix 2 of the AISC Specification provides methods for determining whether a roof system has adequate strength and stiffness to resist ponding. These methods will be discussed further in Chapter 3 of this Digest.

99
CHAPTER 3ROOF DESIGN FOR PONDING
The recommended general procedure for roof design for ponding is as follows.First, select a joist system to carry the primary design loads with the use of the SJI Load Tables (SJI 2015). Then, check the adequacy of the design for ponding.If the joist system is determined to be adequate, no further ponding checks are required and the design can proceed. If the joist system is determined to be inadequate for ponding, either the stiffness, strength, or both, of the systemshould be increased. The most efficient method will vary based on the specific loading and roof configuration. This can be accomplished by any of the following or a combination of the following:
• Decreasing the joist spacing
• Increasing the joist size for the original spacing
• Increasing the joist depth
• Increasing the Joist Girder depth
• Increasing the Joist Girder panel point load
Three methods of assessing the adequacy of a roof system are described in this chapter. The first two, the AISC Appendix 2 method and the joist on stiff supports method, are traditional methods which have a long history of successful use in design practice, but, as will be noted, neglect some potentially important effects.The third method, the direct analysis method, can account for all relevant effectsand is based on a special analysis in which the load due to impounded water is computed directly. Such an analysis is implemented within the SJI Roof Bay Analysis Tool.
Both the initial design and ponding check require the calculation of loads on the roof system in accordance with ASCE 7-16 (ASCE 2016). In the determination of the rain load, the hydraulic head is extremely important for ponding stability and impounded water calculations since it can account for a major portion of the load on a roof, especially in low snow load areas. The hydraulic head can be calculated as described in the commentary to Chapter 8 of ASCE 7-16 or as given in FM1-54 (FM 2016). A 100-year rainfall is typically used which can be determined from Figure 1611.1 in the 2015 IBC (ICC 2015a).
Design examples using these methods are presented in Chapter 4.
CHAPTER 3

1010
AISC Appendix 2 MethodAppendix 2 of the AISC Specification (AISC 2016) provisions provide two separate checks for determining whether a roof system has adequate strength and stiffness to resist ponding. Based on the work of Marino (1966), the two checks were developed under the following conditions:
• The roof is perfectly flat (i.e., no slope, members are not cambered, and tapered insulation is not considered).
• The bay under consideration is rectangular.
• The adjacent bays are identical to that of the bay under consideration.
• The joists are uniformly spaced.
• The Joist Girders or steel beam supporting the joists are of equal stiffness.
• All members are simply supported.
• Axial loads are not present in any member.
• Water covers the entire bay.
The first of the two checks “simplified design for ponding” is based only on the stiffness of the roof bay. The second of the two checks “improved design forponding” also includes aspects of the strength of the roof bay. If either check passes, the roof system is considered adequate.
Both checks are applicable to two-way systems, defined here as a system where the flexibility of the members (beams or Joist Girders) supporting the joists must be taken into account.
Note that the improved design for ponding check is only applicable to ASD due to the assumed 0.8Fy allowable stress in bending.
Procedure1. Complete initial design of roof system for primary design loads and identify
susceptible bays in accordance with Section 8.4 of ASCE 7-16 (ASCE 2016). The remaining steps will need to be completed for each unique susceptible bay.
2. Compute the stiffness factors Cp and Cs using Equations A-2-3 and A-2-4of the AISC Specification (AISC 2016), respectively. The effective moment of inertia should be used when computing these factors and can be determined as described in Appendix B of this Digest.

1111
3. Evaluate the two conditions given in Equations A-2-1 and A-2-2 of the AISC Specification (AISC 2016). If both are satisfied, the bay is considered stable for ponding and no further investigation is necessary. Ifone or both are not satisfied, then continue with the “improved design for ponding” check.
4. Compute the stress due to impounded water due to either nominal rain or snow loads (exclusive of the ponding contribution), and other loads acting concurrently, fo, for both the primary member (Joist Girder) and the secondary member (joist).
For joists, fo can be determined using Equation 3-1. This equation presumes the stress varies linearly with the applied uniform load and is equal to 0.6Fy when the load is equal to the specified load capacity from the SJI Load Tables. The yield strength, Fy, for joists is typically 50 ksi.
( )( ) +=
D R So y
c
S w max w ,wf 0.6F
w(3-1)
where,
wD = the uniform dead load, psf
wR = the design rain load, psf
wS = the design snow load, psf
S = the joist spacing, ft.
wc = the specified load capacity in the SJI Load Tables (ASD), lbs/ft.
Fy = the specified minimum yield strength, psi
For Joist Girders, fo, can be determined using Equation 3-2. This equation presumes the stress varies linearly with the applied panel point load and is equal to 0.6Fy when the load is equal to the specified load capacity. The yield stress, Fy, for Joist Girders is typically 50 ksi.
( ) +=
D R So y
c
P max P ,Pf 0.6F
P(3-2)
where,
PD = the panel point dead load, kips
PR = the design panel point rain load, kips

1212
PS = the design panel point snow load, kips
Pc = the panel point load indicated by the girder designation, kips
5. Compute the stress indexes Up and Us using Equations A-2-5 and A-2-6 of the AISC Specification (AISC 2016), respectively.
6. Follow the procedure described in Section 2.2 of the AISC Specification (AISC 2016) to check the bay. If the bay is determined to be satisfactory, the bay is considered stable for ponding and no further investigation is necessary. If the bay is determined to be unsatisfactory, then the framing needs to be revised (increasing the strength, stiffness, or both) and checked for ponding again.
AdaptationsAs noted above, the AISC Appendix 2 method is based on assumptions of idealized conditions which seldom exist in real roof structures. Therefore, adjustments are often required.
• For low sloped roofs (those with slopes approximately 1/4 in. per ft. and less): Determine the stress due to impounded water, fo, based on dead load plus snow load or dead load plus the triangular rain load. The stress, fo, should be taken as the maximum along the length of any member.
• For continuous framing: Use the moment of inertia of a simply-supported beam, which provides an equivalent deflection as that of the continuous beam.
• When joists are supported by a masonry or concrete wall at both ends: Use Cp = 0 and Up need not be checked as described in the commentary to Appendix 2 the AISC Specification (AISC 2016). Alternatively, use the joist on stiff supports method described in this Digest.
• When joists are supported by a masonry or concrete wall at one end and bear on a beam or Joist Girder at the other end, and the roof slopes towards the beam or Joist Girder: Use the AISC procedure without modification.
• When joists are supported by a masonry or concrete wall at one end and bear on a beam or Joist Girder at the other end, and the roof slopes towards the wall: Double the calculated moment of inertia for the beam or Joist Girder for the calculation of Cp and Up need not be checked.Doubling the moment of inertia for the beam or Joist Girder approximates the reduced deflection for the secondary members due to the non-deflecting wall.

1313
Joist on Stiff Supports MethodThis method applies to a single joist or series of joists that bear on a concrete or masonry wall or other support that can be approximated as rigid. For these cases, the flexibility of the joists themselves is of primary importance. Aderivation of the equations used in this method is presented in Appendix C.
Accounting for CamberA key feature of the joist on stiff supports method in contrast to the AISC Appendix 2 method is the ability to account for the camber of the roof. A roof which is cambered (or pitched) upward has a greater resistance to ponding than an initially flat or deflected roof. A flexural member begins deflecting from its unstressed shape. If a flexural member is crowned upward after all dead and live load has been placed on it because of initial shape, its response to water loading will not be the same as that of an initially deflected member. This is apparent since water loading will concentrate near the ends of the upward crowned member producing small flexural stresses, while for the initially deflected member the water collects near the center of the member magnifying flexural stresses.This results in relatively larger center deflections for the initially deflected member, which further increases its potential to retain water load.
Camber is provided for all joists. The approximate camber is given in Section 4.6 of the SJI Specification (SJI 2015) and summarized in Table 3-1. For the joist on stiff supports method, manufacturing tolerances for camber should be considered, for example, by reducing the approximate camber by 0.5 in.
Table 3-1 Approximate camber for joists and Joist GirdersTop Chord Length Approximate Camber
20ʹ-0ʺ 1/4ʺ30ʹ-0ʺ 3/8ʺ40ʹ-0ʺ 5/8ʺ50ʹ-0ʺ 1ʺ60ʹ-0ʺ 1 1/2ʺ70ʹ-0ʺ 2ʺ80ʹ-0ʺ 2 3/4ʺ90ʹ-0ʺ 3 1/2ʺ100ʹ-0ʺ 4 1/4ʺ
Greater than 100ʹ-0ʺ span/300TABLE 3-1
Approximate camber for joists and Joists Girders
13
Joist on Stiff Supports MethodThis method applies to a single joist or series of joists that bear on a concrete or masonry wall or other support that can be approximated as rigid. For these cases, the flexibility of the joists themselves is of primary importance. Aderivation of the equations used in this method is presented in Appendix C.
Accounting for CamberA key feature of the joist on stiff supports method in contrast to the AISC Appendix 2 method is the ability to account for the camber of the roof. A roof which is cambered (or pitched) upward has a greater resistance to ponding than an initially flat or deflected roof. A flexural member begins deflecting from its unstressed shape. If a flexural member is crowned upward after all dead and live load has been placed on it because of initial shape, its response to water loading will not be the same as that of an initially deflected member. This is apparent since water loading will concentrate near the ends of the upward crowned member producing small flexural stresses, while for the initially deflected member the water collects near the center of the member magnifying flexural stresses.This results in relatively larger center deflections for the initially deflected member, which further increases its potential to retain water load.
Camber is provided for all joists. The approximate camber is given in Section 4.6 of the SJI Specification (SJI 2015) and summarized in Table 3-1. For the joist on stiff supports method, manufacturing tolerances for camber should be considered, for example, by reducing the approximate camber by 0.5 in.
Table 3-1 Approximate camber for joists and Joist GirdersTop Chord Length Approximate Camber
20ʹ-0ʺ 1/4ʺ30ʹ-0ʺ 3/8ʺ40ʹ-0ʺ 5/8ʺ50ʹ-0ʺ 1ʺ60ʹ-0ʺ 1 1/2ʺ70ʹ-0ʺ 2ʺ80ʹ-0ʺ 2 3/4ʺ90ʹ-0ʺ 3 1/2ʺ100ʹ-0ʺ 4 1/4ʺ
Greater than 100ʹ-0ʺ span/300

1414
Procedure1. Complete initial design of roof system for primary design loads, including
determination of the water level above the roof surface at the point of joist support, h. See Chapter 8 Commentary of ASCE 7-16 (ASCE 2016) for the calculation of h, a minimum of 1 in. is suggested.
2. Compute the joist stiffness factor, Cs:
=4
s 7e
32SLC10 I
(3-3)
where,
S = Joist spacing, ft.
L = Design length of the joist, ft.
Ie = Effective moment of inertia of joist, in.4 (see Appendix B)
3. Compute the total centerline deflection under ponding, Δ:
[ ]∆ = + − ∆−
sc
s
C 0.244 w 1.268h1 C
, in. (3-4)
where,
w = Uniform load acting concurrently with ponding condition, lbs/ft.2
h = Height above roof surface at point of support or joist to level of water, in.
Δc = Centerline top chord ordinate above a horizontal datum connecting the top chord ends (camber), in. Camber can be estimated from Table 3-1. Manufacturing tolerances for camber should be considered when selecting Δc.
4. Compute the end reaction in the ponding condition, R1, using Equation 3-5 and compare to the maximum reaction for the joist when calculated from the SJI Load Tables. The reaction, R1, must be less than or equal to 0.5wcL, where wc is the specified load capacity in the SJI Load Tables in lb/ft. If it is not, the joist design must be revised.
( ) = + + ∆ − ∆ 1 cR SL 0.375 w 1.95h 1.24 , lbs (3-5)

1515
5. Compute the equivalent uniform distributed load in the ponding condition, w1, using Equation 3-6 and compare to the specified load capacity in the SJI Load Tables. The equivalent distributed load, w1must be less than or equal to the specified load capacity. If it is not, the joist design must be revised.
( ) = + + ∆ − ∆ 1 cw S 0.750 w 3.90h 3.16 , lb/ft. (3-6)
Limitations of the Traditional MethodsThe two methods described above have a long history of successful use in design. However, these methods have limitations and potentially important aspects of design are neglected in their use.
Flat Roof ConstructionThe derivation of the AISC Appendix 2 method (Marino 1966) assumes that the undeformed shape of the roof is perfectly flat, even though a minimum slope is required by the IBC (ICC 2015) and steel joists and Joist Girders are typically constructed with camber. The method has been adapted to account for low sloped roofs (including as described in this Digest), but to the authors’ knowledge no comprehensive study has been performed to evaluate the safety or accuracy of these adaptations. The joist on stiff supports method can account for camber, but not sloped joists.
Moment and Shear EnvelopesThe AISC Appendix 2 method was originally developed for roof systems with solid web steel beams and girders where a check of the maximum moment issufficient to assess strength. Open web steel joists and Joist Girders are typically designed for uniform loads. Accordingly, their shear and moment capacity canvary along their length, requiring strength to be checked along the entire length. This is especially important since 1) the maximum moment experienced under ponding conditions may not occur at mid-span, where the moment capacity is at a maximum, and 2) shear reversals near mid-span can occur under ponding conditions causing web members that are designed for tension to be subjected to compression.
Furthermore, when joists and Joist Girders which have been designed for uniform loads are subjected to nonuniform loads, additional potential limit states arise. For joists, a region of high applied distributed load can cause bending failure between the panel points. For Joist Girders, high applied panel point loads can cause failure of web verticals.
The joist on stiff supports method similarly assesses strength with only a check of moment strength at mid-span and shear strength at the supports.

1616
Level of LoadingThe AISC Appendix 2 method, with the built-in stress limit of 0.8Fy, is only intended for use with ASD. However, for stability related limit states, it is common practice to assess the nonlinear effects at LRFD level loading. For example, Section C1 of the AISC Specification states: “All load-dependent effects shall be calculated at a level of loading corresponding to LRFD load combinations or 1.6 times ASD load combinations” (AISC 2016).
SummaryThe AISC Appendix 2 method and the joist on stiff supports method have been used for many years, and most likely will be used for years to come. However, the authors now recommend the use of the direct analysis procedure as implemented in the SJI Ponding Analysis Tool for framing with open web steel joists and Joist Girders. The procedure and tool are explained in the remainder of this Chapter.
Direct Analysis MethodNoting the limitations of the traditional procedures described above, a more general method of design for ponding is presented here. In this method, the load-effects due to impounded water are computed directly based on the deformedshape of the roof system. Such computations can be made through the use of closed form solutions (e.g., Silver 2010) in simple cases or, more generally, through an iterative analysis.
Required StrengthsIn this method, required strengths are determined from an elastic analysis which considers all relevant member and component deformations. For open web steel joists and Joist Girders it is customary to account for the effect of shear deformations by dividing the moment of inertia by a factor equal to 1.15.
Neither the International Building Code (ICC 2015) or ASCE 7 (ASCE 2016) prescribe load factors for the evaluation of ponding instability. The loading is acombination of dead load, snow load, and a quantity of water computed based upon a water level and the deflected shape of the roof. Noting that the density of water is a well-known property and volume of water is being calculated explicitly, SJI recommends that the following load combinations be used.
D + 0.75P + 0.75S (ASD)
1.2D + 1.2P + 1.2S (LRFD)

1717
where,
D = Dead Load
P = Impounded Water Load
S = Snow Load
It is important to note that these load combinations are for use in a ponding instability check, not a strength check. Strength of the roof still needs to be assessed using the load combinations given in the International Building Code (ICC 2015) shown here in a simplified form:
D + (Lr or S or R) (ASD)
1.2D + 1.6(Lr or S or R) (LRFD)
where,
Lr = Roof Live Load
R = Rain Load
The use of the load combinations above requires two separate analyses one for strength and one to check against ponding instability. Alternatively, it is conservative use D + P + S (ASD) or 1.2D + 1.6P + 1.6P (LRFD) and perform only one analysis.
The water level for the computation of the impounded water load, P, is taken as the same water level for the definition of rain load, R, (i.e., hydraulic head above the secondary drain system). The difference in hydraulic head between the rain condition and that in the presence of snow can be neglected.
Both the impounded water load and snow load represent a physical quantity of material above the roof surface. In situations where these physical quantities overlapas shown in Figure 3.1, the load can be reduced to account for the fact that the density of a mix of water and snow is less than the density of water plus the density of snow. It is recommended that the density of the region where water and snow overlap be taken as the density of water. The density of snow is defined by Equation 7.7-1 of ASCE 7-16 (ASCE 2016). It is conservative to neglect the overlap and consider the water and snow loads independently.
Note that, with the exception of accounting for the physical overlap of material, the analysis presumes full design snow and full design rain loads acting concurrently. This is in contrast to current requirements (Section 8.4 of ASCE 7-16) where only the larger of the two need to be considered. The recommendations in this Digest are based on a case where a roof bay is supporting the design level snow load and subsequent rainfall or snowmelt from adjacent bays increases the load. The Design Professional may consider less stringent cases.

18
18
Water LevelWater Only
(a) Undeformed
Water Level
Water Only
(b) DeformedFigure 3.1 Schematic of Water and Snow Loading
For design by ASD, the analysis is conducted under 1.6 times the ASD load combination, and the resulting internal forces are divided by 1.6 to obtain the required strengths of components. This requirement is made to be consistent with general stability requirements in the AISC Specification (AISC 2016) that all load-dependent effects be calculated at a level of loading corresponding to LRFD load combinations or 1.6 times ASD load combinations.
In the analysis, the water level and snow level are maintained at their physically defined positions. The load factors and applied load adjustment factor are essentially applied to the density of each material.
FIGURE 3.1Schematic of Water and Snow Loading
18
Water LevelWater Only
(a) Undeformed
Water Level
Water Only
(b) DeformedFigure 3.1 Schematic of Water and Snow Loading
For design by ASD, the analysis is conducted under 1.6 times the ASD load combination, and the resulting internal forces are divided by 1.6 to obtain the required strengths of components. This requirement is made to be consistent with general stability requirements in the AISC Specification (AISC 2016) that all load-dependent effects be calculated at a level of loading corresponding to LRFD load combinations or 1.6 times ASD load combinations.
In the analysis, the water level and snow level are maintained at their physically defined positions. The load factors and applied load adjustment factor are essentially applied to the density of each material.

1919
Available StrengthsThe required strengths determined from analysis are to be compared to available strengths determined using the SJI Load Tables. Moment and shear need to be checked along the entire length and the applied loads need to be checked to prevent local overstress. Note that the increased allowable stress (i.e., 0.8Fy vs 0.6Fy) used in the traditional methods is not applicable to the direct analysis method.
Moment and Shear Envelopes: Steel joists and Joist Girders are typically designed for uniform loads. Thus, generally, the available moment and shear vary along the length. KCS-Series joists are an exception where the available shear is constant along the length.
Typical moment and shear envelopes for joists are shown in Figure 3.2. The moment envelope is a parabolic shape with a maximum value of wL2/8, where w is the total uniformly distributed load-carrying capacity given in the SJI Load Tables.The shear envelope is a multi-linear shape with maximum value of wL/2. A minimum value of 25% of the maximum end reaction is given based on the requirements in Section 4.4.2 of the SJI Specification for shear in the design direction.
Depending on the slope and direction of the joists or Joist Girders, there may be conditions where ponding could create an unbalanced loading condition with a much heavier ponding load towards one end of the joist. When this occurs, there is potential for stress reversals in the joist webs near centerline. All web members inherently have some stress reversal capacity but for unbalanced ponding conditions such as this, to ensure the joist web members have adequate stress reversal capacity, it is recommended to specify the joists be designed for a minimum shear equal to 12.5% of the maximum end reaction. The SJI Ponding Spreadsheet assumes a minimum vertical shear reversal strength of 12.5% of the end reaction.
Typical moment and shear envelopes for a Joist Girder with 8 joist spaces areshown in Figure 3.3. The moment envelope is a multi-linear shape with a maximum value in the center based on the panel point loads. The shear envelope is a multi-linear stair-step shape with a minimum value of 25% of the maximum end reaction based on the requirements in Section 4.4.2 of the SJI Specification (SJI 2015). For shear reversals, the strength is 25% of the shear envelope in the opposite direction based on the requirements in Section 4.4.2.2 of the SJI Specification (SJI 2015).

20
20
0
wL2/8
(a) Moment Envelope
0
wL/2
-wL/2
wL/8 (25% of end reaction, per SJI Specification)
wL/16 (12.5% of end reaction,assumed)
Shear diagram for simply supported beam under uniformly
distributed load
(b) Shear EnvelopeFigure 3.2 Strength Envelopes for a Steel Joist
FIGURE 3.2Strength Envelopes for a Steel Joist

2121
0
Mmax
(a) Moment Envelope
0
R
R
R/4 (25% of end reaction, per SJI Specification)
Shear diagram for simply supported beam with equal point loads
25% of shear envelope in reverse direction per SJI Specification
(b) Shear EnvelopeFigure 3.3 Strength Envelopes for a Joist Girder (example with 8 joist spaces)
Applied Loads (Local Overstress): Due to the nonuniform nature of ponding loads, the applied load on a portion of the length of a joist or Joist Girder can occasionally exceed the allowable load even when the shear and bending moment diagrams fall within their respective design envelopes. In such instances, there is the potential for overstress due to top chord bending between the panel points for joists or compression failure of web verticals for Joist Girders.
In these cases, the specifying professional may select a larger joist, specify a larger Joist Girder panel point load, or take no action if the applied loads are determined by analysis or judgement to not cause overstress.21
0
Mmax
(a) Moment Envelope
0
R
R
R/4 (25% of end reaction, per SJI Specification)
Shear diagram for simply supported beam with equal point loads
25% of shear envelope in reverse direction per SJI Specification
(b) Shear EnvelopeFigure 3.3 Strength Envelopes for a Joist Girder (example with 8 joist spaces)
Applied Loads (Local Overstress): Due to the nonuniform nature of ponding loads, the applied load on a portion of the length of a joist or Joist Girder can occasionally exceed the allowable load even when the shear and bending moment diagrams fall within their respective design envelopes. In such instances, there is the potential for overstress due to top chord bending between the panel points for joists or compression failure of web verticals for Joist Girders.
In these cases, the specifying professional may select a larger joist, specify a larger Joist Girder panel point load, or take no action if the applied loads are determined by analysis or judgement to not cause overstress.
FIGURE 3.3Strength Envelopes for a Joist Girder (example with 8 joist spaces)

2222
SJI Roof Bay Analysis ToolThe direct analysis method for ponding requires the use of an analysis in which the applied loads are based on the deformed shape. Such capabilities are rare in structural analysis software. The method has been implemented in the SJI Roof Bay Analysis Tool, which is available on the SJI website.
The SJI Roof Bay Analysis Tool is an excel workbook that can be used as a design aid for estimating purposes and the selection of roof framing. It performs analysis and design of a rectangular bay consisting of four columns, two Joist Girders, and several joists. General bay design (not considering the effects of ponding) is performed in the “Roof Bay Analysis” sheet (see Figure 3.4). Ponding analyses are performed in the “Ponding Analysis” sheet. Notes and instructions regarding the ponding analysis are given in the “Ponding Instructions” sheet and analysis results formatted for printing are given in the “Ponding Load Results” sheet.
Figure 3.4 SJI Roof Bay Analysis ToolFIGURE 3.4SJI Roof Bay Analysis Tool

2323
InputThe “Ponding Analysis” sheet references the “Roof Bay Analysis” sheet for key general input data such as bay dimensions, selected joist and Joist Girder, and loads (Figure 3.5 – note this figure and others in this chapter that show the SJI Roof Bay Analysis Tool display input and results from an analysis based on Example 2 of Chapter 4 but with a different water level). Additional data, specific to the ponding analysis and thus not defined in the “Roof Bay Analysis” is defined in the “Ponding Analysis” sheet (Figure 3.6). This additional data includes:
• Water level relative to zero datum: the primary input defining the load from the impounded water is the water level. This level is calculated as the hydraulic head above the inlet of secondary drainage system. The spreadsheet does not distinguish between rainwater and snowmelt. The hydraulic head can be determined from ASCE 7-16, or, when scuppers are used for the secondary drainage, Table 2-1 of this Digest.
• Compute load on deformed roof: for a ponding instability analysis, the impounded water load, P, is required and is computed based on the deformed shape of the roof. For a strength analysis, the rain load, R, is required and is computed based on the undeformed shape of the roof.
• Snow density: the snow density can be determined using ASCE 7-16Equation 7.7-1. The snow density is used to compute the height of snow in the bay. When computing ponding loads, the spreadsheet accounts for the possibility of snow and water occupying the same physical space as shown in Figure 3.1 (in this case, the density of snow plus water is taken as that of just water). To override this behavior and conservatively allow snow and impounded water to overlap, input a value of zero for snow density.
• Force level adjustment factor (α): ponding is a nonlinear phenomenon. For ASD, the analysis is conducted using a force level adjustment factor (α) of 1.6, unless overridden by the user. The loads are amplified by this factor and the results (i.e., moments and shears) are reduced by this factor. The AISC Specification requires such a factor for all load-dependent effects. SJI recommends using the default value of 1.6, however, because of the long history of not using an iterative solution for ponding calculations the spreadsheet allows the user to use a reduced multiplier.

2424
• Load factors: the default load factors depend on the selected design methodology (i.e., ASD or LRFD) and whether the user has selected to compute load on the deformed roof or not. If loads are computed on the deformed roof, then a ponding instability analysis is assumed, and load factors are those recommended by SJI. If loads are not computed on the deformed roof, then a strength analysis is assumed, and load factors are those defined within the International Building Code (ICC 2015a) for the deadplus rain combination. The user may override the default load factors based on their need or judgement.
• Top of roof elevation: when defining the top of roof elevations, the datum is to be the same as that used for defining the water load. The elevations are used to define the roof slope. The spreadsheet does not check for minimum load required by IBC, nor does it account for crickets.
• Camber: the default camber based on the SJI Specification and the span of the joists and Joist Girders. Manufacturing tolerances for camber need not beconsidered when using the SJI Roof Bay Analysis Tool since other means of providing a margin of safety (e.g., load factors) are employed.
• Bay is mirrored: mirroring of the bay accounts additional loads from outside the bay on edge joist and Joist Girders. When selected as “yes”, the loads on the edge joist or Joist Girder are doubled in the analysis.
• Joist support is wall: when selected as “yes” the joists on that edge are assumed to be supported by an infinitely stiff wall.
• Joist is rigid: when selected as “yes” the identified joist is assumed to be infinitely stiff and without camber.
• Effective moment of inertia: the effective moment of inertia for the joists and Joist Girders is automatically calculated and the 1.15 factor for shear deformations automatically included.

25
25
General Input (Defined in Roof Bay Analysis Spreadsheet)
Design Methodology ASD40.00 ft40.00 ft24K 7253 lb/ft
36G8N6.2K6.2 k8
18.00 psf36.00 lb/ft12.00 psf
z = 0.000 in z = 0.000 in
z = -10.000 in z = -10.000 in
Dead Load on Joists
Snow Load
Joist Girder Size
Number of Joist Spaces
Joist Girder Self Weight
Joist Allowable Load
Joist Girder Allowable Load
Joist SpanJoist Girder SpanJoist Size
JOIST GIRDER
JOIST GIRDER
JOIS
T 1
JOIS
T 2
JOIS
T 3
JOIS
T 4
JOIS
T 5
JOIS
T 6
DECKSPAN
MIRRORED BAYS(OPTIONAL)
Figure 3.5 General InputFIGURE 3.5General Input
25
General Input (Defined in Roof Bay Analysis Spreadsheet)
Design Methodology ASD40.00 ft40.00 ft24K 7253 lb/ft
36G8N6.2K6.2 k8
18.00 psf36.00 lb/ft12.00 psf
z = 0.000 in z = 0.000 in
z = -10.000 in z = -10.000 in
Dead Load on Joists
Snow Load
Joist Girder Size
Number of Joist Spaces
Joist Girder Self Weight
Joist Allowable Load
Joist Girder Allowable Load
Joist SpanJoist Girder SpanJoist Size
JOIST GIRDER
JOIST GIRDER
JOIS
T 1
JOIS
T 2
JOIS
T 3
JOIS
T 4
JOIS
T 5
JOIS
T 6
DECKSPAN
MIRRORED BAYS(OPTIONAL)
Figure 3.5 General Input

2626
Ponding Specific Input
-3.00 inCompute load on deformed roof: Y (Y or N)
15.30 lb/ft3
Force level adjustment factor (α ): 1.60override:
Load factors:1.00
override:0.75
override:0.75
override:
0.000 in0.000 in
-10.000 in-10.000 in
Camber:0.625 in
override: in0.000 in
override: in0.625 in
override: inBay is mirrored:
Y (Y or N)Y (Y or N)N (Y or N)Y (Y or N)
Joist support is wall:Y (Y or N)N (Y or N)
N (Y or N)N (Y or N)
Effective moment of inertia:215.1 in4
(Values include override: in4
1.15 factor for 1,677 in4
shear deformations) override: in4
Joist is rigid:
Bottom Joist Girder
Top Joist Girder
Top
Joist Girder
Joist 1 (Leftmost)Joist 9 (Rightmost)
Snow
Dead
Top of roof elevation:
Bottom Right
Snow density:
BottomTop
Bottom
Right
Joist
Left
Bottom LeftTop RightTop Left
Water level relative to zero datum:
Joist
Ponded Water
Figure 3.6 Ponding Specific Input
Analysis ProcedureThe ponding analysis is performed when the user presses the button labeled “RUN ANALYSIS”. The analysis is iterative; the following loop is performed until convergence is obtained:
• Compute loads: Loads due to the combination of dead, snow, and impounded water are computed based on the current deflected shape of the roof. To compute the loads, the bay is broken into a grid of cells: 20cells are used along the length of the joists and a number of cells equal tothe number of joist spaces is used along the length of Joist Girders. For each cell, the height of snow and water are computed at each of the four corners of the cell and the physical volume of water and snow is converted to four point loads following the method described by Colombi (2006) and
FIGURE 3.6Ponding Specific Input
26
Ponding Specific Input
-3.00 inCompute load on deformed roof: Y (Y or N)
15.30 lb/ft3
Force level adjustment factor (α ): 1.60override:
Load factors:1.00
override:0.75
override:0.75
override:
0.000 in0.000 in
-10.000 in-10.000 in
Camber:0.625 in
override: in0.000 in
override: in0.625 in
override: inBay is mirrored:
Y (Y or N)Y (Y or N)N (Y or N)Y (Y or N)
Joist support is wall:Y (Y or N)N (Y or N)
N (Y or N)N (Y or N)
Effective moment of inertia:215.1 in4
(Values include override: in4
1.15 factor for 1,677 in4
shear deformations) override: in4
Joist is rigid:
Bottom Joist Girder
Top Joist Girder
Top
Joist Girder
Joist 1 (Leftmost)Joist 9 (Rightmost)
Snow
Dead
Top of roof elevation:
Bottom Right
Snow density:
BottomTop
Bottom
Right
Joist
Left
Bottom LeftTop RightTop Left
Water level relative to zero datum:
Joist
Ponded Water
Figure 3.6 Ponding Specific Input
Analysis ProcedureThe ponding analysis is performed when the user presses the button labeled “RUN ANALYSIS”. The analysis is iterative; the following loop is performed until convergence is obtained:
• Compute loads: Loads due to the combination of dead, snow, and impounded water are computed based on the current deflected shape of the roof. To compute the loads, the bay is broken into a grid of cells: 20cells are used along the length of the joists and a number of cells equal tothe number of joist spaces is used along the length of Joist Girders. For each cell, the height of snow and water are computed at each of the four corners of the cell and the physical volume of water and snow is converted to four point loads following the method described by Colombi (2006) and

27
27
illustrated in Figure 3.7. The total load from the impounded water from each iteration is displayed in the spreadsheet as an indication of the speed of convergence.
(a) Isolation of Single Cell
(b) Transformation to Point LoadsFigure 3.7 Calculation of Loads
FIGURE 3.7Calculation of Loads
27
illustrated in Figure 3.7. The total load from the impounded water from each iteration is displayed in the spreadsheet as an indication of the speed of convergence.
(a) Isolation of Single Cell
(b) Transformation to Point LoadsFigure 3.7 Calculation of Loads

2828
• Perform structural analysis: The joists and Joist Girders are analyzedseparately; each is analyzed as a simply supported beam. The joists aresubjected to the computed loads and Joist Girders are subjected to thereactions from the joists. While the applied loads are nonlinear, no othersources of nonlinearity are considered (i.e., a first-order elastic analysis isperformed). To account for adjacent bays, loads on the Joist Girders andedge joists are doubled, as applicable according to the input.
• Check for convergence: after the structural analysis is performed,convergence is checked by comparing the computed point loads to thosecomputed in the previous iteration.
Once convergence is obtained, the moments, shears, and equivalent loads are computed and displayed.
OutputResults from the analysis are presented in data tables. The first table (Figure3.8) displays the maximum shear and moment for each joist as well asa strength check. The total applied loads in the ponded configurationare nonuniform as height of water varies with the deflection of the bay.Equivalent uniform distributed loads are computed through comparisons ofthe computed moment and shears to the available moment and shear envelopes for the joist (Figure 3.2). They are determined through a point-by-point comparison as the minimum specified capacity that results in the available strength of the joist equaling or exceeding the required strength ateach point along the length of the joist. Equivalent loads are computedseparately for moment and shear to readily identify which controls. Thestrength ratio is the ratio between the larger equivalent load (either momentor shear) and the specified load capacity from the SJI Load Tables.
To better visualize the structural behavior of the bay and to perform checks against local overstressing of the joists, two tables of applied joist loads aregenerated. The first table (Figure 3.9) displays the total applied load on the joists. The second table (Figure 3.10) displays the total applied load on the joist in excess of the allowable load.

29
FIGURE 3.8Joist Output
29
Joist Output
Joist Max Shear Equiv. Load Max Moment Equiv. Load Strength StrengthNumber kips lb/ft kip-ft lb/ft Ratio Check
1 4.29 214.3 39.10 212.9 0.85 OKAY2 4.44 222.0 40.32 220.3 0.88 OKAY3 4.64 232.2 41.97 230.3 0.92 OKAY4 4.78 239.2 43.10 237.2 0.95 OKAY5 4.83 241.7 43.49 239.7 0.96 OKAY6 4.78 239.2 43.10 237.2 0.95 OKAY7 4.64 232.2 41.97 230.3 0.92 OKAY8 4.44 222.0 40.32 220.3 0.88 OKAY9 4.29 214.3 39.10 212.9 0.85 OKAY
NOTES: 1. Loads and load effects correspond to ASD load combinations.2. Strength ratio computed assuming shear capacity equal to 12.5% of the end reaction for shear reversals, see Note 14 on the Ponding Instructions spreadsheet.
RUN ANALYSIS
Figure 3.6 Joist Output
30 30
Figu
re 3
.9 D
etai
led
Jois
t Out
put
Jois
tNu
mbe
r0'
0"
2' 0
"4'
0"
6' 0
"8'
0"
10' 0
"12
' 0"
14' 0
"16
' 0"
18' 0
"20
' 0"
22' 0
"24
' 0"
26' 0
"28
' 0"
30' 0
"32
' 0"
34' 0
"36
' 0"
38' 0
"40
' 0"
124
324
123
923
623
322
922
522
021
420
820
019
218
317
316
315
214
113
513
513
513
52
253
251
248
245
242
238
233
228
222
215
207
198
188
178
167
155
143
136
135
135
135
326
726
526
125
825
424
924
423
823
122
421
520
619
518
417
216
014
713
713
513
513
54
277
274
270
266
262
257
252
245
238
230
221
211
200
188
176
163
149
137
135
135
135
528
127
827
326
926
526
025
424
824
123
222
321
320
219
017
716
415
013
813
513
513
56
277
274
270
266
262
257
252
245
238
230
221
211
200
188
176
163
149
137
135
135
135
726
726
526
125
825
424
924
423
823
122
421
520
619
518
417
216
014
713
713
513
513
58
253
251
248
245
242
238
233
228
222
215
207
198
188
178
167
155
143
136
135
135
135
924
324
123
923
623
322
922
522
021
420
820
019
218
317
316
315
214
113
513
513
513
5
NOTE
S:1.
Loa
ds c
orre
spon
d to
ASD
load
com
bina
tions
.2.
Hig
hlig
hted
dis
tribu
ted
load
s m
ay c
ause
a lo
cal o
vers
tress
, see
not
es o
n Po
ndin
g In
stru
ctio
ns s
prea
dshe
et.
Tota
l Dis
trib
uted
Loa
d on
Joi
st a
s a
Func
tion
of D
ista
nce
from
Bot
tom
Sup
port
(lb/
ft)
FIGURE 3.9Detailed Joist Output

31 31
Figu
re 3
.10
Det
aile
d Jo
ist O
utpu
t
Jois
tNu
mbe
r0'
0"
2' 0
"4'
0"
6' 0
"8'
0"
10' 0
"12
' 0"
14' 0
"16
' 0"
18' 0
"20
' 0"
22' 0
"24
' 0"
26' 0
"28
' 0"
30' 0
"32
' 0"
34' 0
"36
' 0"
38' 0
"40
' 0"
1 20
314
128
51
424
2117
139
45
2825
2016
127
16
2421
1713
94
714
128
51
80
9
Tota
l Dis
trib
uted
Loa
d in
Exc
ess
of A
llow
able
Loa
d on
Joi
st a
s a
Func
tion
of D
ista
nce
from
Bot
tom
Sup
port
(lb/
ft)
FIGURE 3.10Detailed Joist Output

3232
The fourth table (Figure 3.11) displays the joist reactions, panel point loads, and a strength check for each Joist Girder. Equivalent uniform panel point loadsare computed through comparisons of the computed moment and shearsto the available moment and shear envelopes for the Joist Girder (Figure 3.3).They are determined through a point-by-point comparison as the minimum specified capacity that results in the available strength of the Joist Girder equaling or exceeding the required strength at each point along the length of the Joist Girder. Equivalent loads are computed separately for moment and shear to readily identify which controls. The strength ratio is the ratio between the larger equivalent load (either moment or shear) and the loadcapacity of the Joist Girder as determined from its designation.
Joist Girder Output
Joist Joist React. Joist React.Number kips kips
2 3.48 4.443 3.58 4.644 3.65 4.785 3.68 4.836 3.65 4.787 3.58 4.648 3.48 4.44
N/A (WALL) 9.78N/A (WALL) 9.62N/A (WALL) 1.58N/A (WALL) NO GOOD
NOTES: 1. Loads and load effects correspond to ASD load combinations.2. Highlighted panel point loads may cause a local overstress, see notes in Ponding Instructions.
Joist Girder size can be revised by inputting larger loads in the ''optional increased load data'' section of the Roof Bay Analysis spreadsheet
Top Joist GirderPanel Point Load
kips
Strength Check:
Bottom Joist GirderPanel Point Load
kips9.069.479.75
Strength Ratio:Strength Check:
Equiv. Load for Shear (kips):
Strength Ratio:
Equiv. Load for Shear (kips):Equiv. Load for Moment (kips): Equiv. Load for Moment (kips):
9.859.759.479.06
Figure 3.11 Joist Girder Output
Procedure1. Complete initial design of roof system for primary design loads and identify
susceptible bays in accordance with Section 8.4 of ASCE 7-16 (ASCE2016). The remaining steps will need to be completed for each uniquesusceptible bay.
2. Determine the joist and Joist Girder preliminary design using the roof bayanalysis spreadsheet.
32
The fourth table (Figure 3.11) displays the joist reactions, panel point loads, and a strength check for each Joist Girder. Equivalent uniform panel point loadsare computed through comparisons of the computed moment and shearsto the available moment and shear envelopes for the Joist Girder (Figure 3.3).They are determined through a point-by-point comparison as the minimum specified capacity that results in the available strength of the Joist Girder equaling or exceeding the required strength at each point along the length of the Joist Girder. Equivalent loads are computed separately for moment and shear to readily identify which controls. The strength ratio is the ratio between the larger equivalent load (either moment or shear) and the loadcapacity of the Joist Girder as determined from its designation.
Joist Girder Output
Joist Joist React. Joist React.Number kips kips
2 3.48 4.443 3.58 4.644 3.65 4.785 3.68 4.836 3.65 4.787 3.58 4.648 3.48 4.44
N/A (WALL) 9.78N/A (WALL) 9.62N/A (WALL) 1.58N/A (WALL) NO GOOD
NOTES: 1. Loads and load effects correspond to ASD load combinations.2. Highlighted panel point loads may cause a local overstress, see notes in Ponding Instructions.
Joist Girder size can be revised by inputting larger loads in the ''optional increased load data'' section of the Roof Bay Analysis spreadsheet
Top Joist GirderPanel Point Load
kips
Strength Check:
Bottom Joist GirderPanel Point Load
kips9.069.479.75
Strength Ratio:Strength Check:
Equiv. Load for Shear (kips):
Strength Ratio:
Equiv. Load for Shear (kips):Equiv. Load for Moment (kips): Equiv. Load for Moment (kips):
9.859.759.479.06
Figure 3.11 Joist Girder Output
Procedure1. Complete initial design of roof system for primary design loads and identify
susceptible bays in accordance with Section 8.4 of ASCE 7-16 (ASCE2016). The remaining steps will need to be completed for each uniquesusceptible bay.
2. Determine the joist and Joist Girder preliminary design using the roof bayanalysis spreadsheet.
FIGURE 3.11Joist Girder Output
32
The fourth table (Figure 3.11) displays the joist reactions, panel point loads, and a strength check for each Joist Girder. Equivalent uniform panel point loadsare computed through comparisons of the computed moment and shearsto the available moment and shear envelopes for the Joist Girder (Figure 3.3).They are determined through a point-by-point comparison as the minimum specified capacity that results in the available strength of the Joist Girder equaling or exceeding the required strength at each point along the length of the Joist Girder. Equivalent loads are computed separately for moment and shear to readily identify which controls. The strength ratio is the ratio between the larger equivalent load (either moment or shear) and the loadcapacity of the Joist Girder as determined from its designation.
Joist Girder Output
Joist Joist React. Joist React.Number kips kips
2 3.48 4.443 3.58 4.644 3.65 4.785 3.68 4.836 3.65 4.787 3.58 4.648 3.48 4.44
N/A (WALL) 9.78N/A (WALL) 9.62N/A (WALL) 1.58N/A (WALL) NO GOOD
NOTES: 1. Loads and load effects correspond to ASD load combinations.2. Highlighted panel point loads may cause a local overstress, see notes in Ponding Instructions.
Joist Girder size can be revised by inputting larger loads in the ''optional increased load data'' section of the Roof Bay Analysis spreadsheet
Top Joist GirderPanel Point Load
kips
Strength Check:
Bottom Joist GirderPanel Point Load
kips9.069.479.75
Strength Ratio:Strength Check:
Equiv. Load for Shear (kips):
Strength Ratio:
Equiv. Load for Shear (kips):Equiv. Load for Moment (kips): Equiv. Load for Moment (kips):
9.859.759.479.06
Figure 3.11 Joist Girder Output
Procedure1. Complete initial design of roof system for primary design loads and identify
susceptible bays in accordance with Section 8.4 of ASCE 7-16 (ASCE2016). The remaining steps will need to be completed for each uniquesusceptible bay.
2. Determine the joist and Joist Girder preliminary design using the roof bayanalysis spreadsheet.

3333
3. Determine the hydraulic head based on the flow rate, Q, and the drainage system.
a. The flow rate can be determined using ASCE 7-16 Equation C8-1.
b. The hydraulic head can be determined based on ASCE 7-16 Table C8.3-1, or when scuppers are used Table 2-1 of this Digest.
4. Determine the water level above the primary drain (dh + ds).
a. Check the Building Code to see if a minimum height for secondary drains is provided. ASCE 7-16 provides no minimum height except that the height should be higher than the primary drain. A minimum of 2 inches above the primary drain is often used and is required by FM Global.
b. Some codes require that scuppers be a minimum of 2 inches above the roof level, but should not exceed 4 inches above the roof level.
5. Input the required data into the ponding analysis spreadsheet. The data from the roof bay analysis is automatically transferred to the ponding analysis.
6. Run the ponding analysis.
a. If stability is achieved, the analysis is complete. Ponding stability is achieved when the shear and moment envelopes for the joists and Joist Girders are not exceeded.
b. If stability is not achieved, return to the roof bay analysis and select a larger joist, Joist Girder, or both by inputting increased loads in the “optional increased load data” section (or decrease the joist spacing). Rerun the ponding analysis until stability is achieved.
c. If local load effects are indicated (loads highlighted with red font) determine based on analysis or judgement whether the indicated applied loads will cause a localized overstress. If the loads are determined to cause overstress, rerun the analysis with larger joists or Joist Girders.
7. Determine if loading on the joists is symmetric or could cause shear reversals. If there is potential for shear reversal in the joists and shear reversal is not addressed via other design loading criteria such as Net Uplift or Snow Drift, specify that joist manufacturer is required to “design joists and Joist Girder webs for a minimum vertical shear equal to 12.5% of the end reaction in compression.”

3434
Practical Notes for Roof Design• It is important to have a rational strategy for addressing ponding
regardless of the specific methodology employed.
• Sometimes the best strategy is to eliminate susceptible bays by sloping roof members, or using tapered insulation or sloping fill.
• Counteract the ponding mechanism by providing upward camber in the joists, provided that drains are installed near columns (see FM Global 1-54 FM (2016).
• When designing roofs with low slopes, parallel chord joists with end supports at different elevations are more economical than providing pitch into the joist top chords. The web system of a non-parallel chord joist and the joist as a whole is more expensive to manufacture.

3535
CHAPTER 4DESIGN EXAMPLES
Example 1: LH-Series Joists on a Flat Roof with Parallel Chords on Stiff Supports, Camber IncludedGiven: Select a joist spacing and LH-Series joist for simple span roof joistssupported on masonry walls. Use ASD.
Project Description and Loading:
• Inside of wall to inside of wall dimension = 84 ft.
• dh = 2 in. (calculated using the provisions in ASCE 7-16)
• Dead Load, wD = 15 psf (includes allowance for joist weight)
• Live Load, wL = 20 psf (reducible)
• Snow Load, wS = 20 psf (rain-on-snow surcharge load not necessary)
Hand Calculation Solution:
The roof framing consists of a series of equally spaced wall-bearing longspan joists. The joists are considered secondary members, supported on an infinitely stiff primary member. Both the AISC Appendix 2 method and the joist on stiff supports method are applicable; however, the AISC Appendix 2 method does not account for the camber and will not be shown.
The span of a joist is the clear span plus the standard clear bearing lengths. The standard clear bearing length for an LH-Series joist is 6 in. according to Table 5.4-1of the SJI Specification (SJI 2015), thus the span of this joist is calculated as:
span = 84 ft. + 2 × 0.5 ft. = 85 ft.
Try a 48LH10 (from the Standard ASD Load Table Longspan Steel Joists, LH-Series, the total safe uniformly distributed load-carrying capacity (i.e. available load) from the Load Tables is 231 lb/ft. for an 85 ft. span.
The snow load is greater than the reducible live load, thus the combination of dead plus snow controls and the required joist spacing is calculated as:
Sreqʹd = wc/(wD + wS) = (231 lb/ft.)/(15 psf + 20 psf) = 6.6 ft.
Try a joist spacing of 6′-6″.
CHAPTER 4

3636
Check the defection of the joist under snow loads:
wS = (6.5 ft.)(20 psf) = 130 lbs/ft.
The value of wL/360 is determined as the RED value from the ASD LH-Series Load Tables as 127 lbs/ft. This value is for a deflection limit of L/360, whereas snow load is usually checked against a deflection limit of L/240. Thus, the revised limit is as follows:
( ) = = =
L 240 L 360360 360w w 127 lbs ft. 190 lbs ft.240 240
= > =L 240 Sw 190 lbs ft. w 130 lbs ft. OK
The camber, Δc, is determined as approximately 2.75 in. from Table 3-1(rounding the span down to the nearest entry in the table) minus a potential adverse manufacturing tolerance of 0.5 in.
Δc = 2.75 in. – 0.5 in. = 2.25 in.
The design length of the joist is calculated as:
L = span – 0.33 ft. = 85 ft. – 0.33 ft. = 84.67 ft.
The effective moment of inertia, Ie, is calculated as shown in Appendix B as:
( )( )( )−= 3 6j L 360I 26.767 w L 10 , in.4 (B-1)
( )( ) −= =3 6 4
jI 26.767 127 lbs ft. 84.67 ft. 10 2060 in.
= = =4
j 4e
I 2060 in.I 1790 in.1.15 1.15
(B-2)
Compute the joist stiffness factor:
( )( )( )
= = =44
s 7 7 4e
32 6.5 ft. 84.67 ft.32SLC 0.6010 I 10 1790in.
(3-3)
The uniform load acting concurrently with ponding condition is the dead load plus the snow load:
w = wD + wS = 15 psf + 20 psf = 35 psf

3737
Compute the expected mid-span deflection:
[ ]∆ = + − ∆−
sc
s
C 0.244 w 1.268h1 C
, in. (3-4)
( ) ( ) ∆ = + − −0.60 0.244 35 psf 1.27 2 in. 2.25 in.
1 0.60
∆ = 13.2in.
Compute the expected end reaction under ponding conditions:
( ) = + + ∆ − ∆ 1 cR SL 0.375 w 1.95h 1.24 , lbs (3-5)
( )( ) ( ) ( ) ( ) = + + − 1R 6.5 ft. 84.67 ft. 0.375 35psf 1.95 2in. 1.24 13.2in. 2.25in.
=1R 16,800lbs
Compute the allowable Reaction
0.5 wc L = 0.5(231 lbs/ft.)(84.67 ft.) = 9,780 lbs
16,800 > 9,780 lbs NG
Reduce joist spacing to 4′-9″
( )( )( )
= =4
7 4
32 4.75 ft. 84.67 ft.C 0.44s 10 1790 in.
( ) ( ) ∆ = + − = −0.44 0.244 35psf 1.27 2in. 2.25in. 6.9in.
1 0.44
( )( ) ( ) ( ) ( ) = + + − 1R 4.75 ft. 84.67 ft. 0.375 35psf 1.95 2in. 1.24 6.9in. 2.25in.
=1R 9,170 lbs
9,170 < 9,780 lbs OK

38
38
Compute the equivalent distributed load under ponding conditions:
( ) = + + ∆ − ∆ 1 cw S 0.75 w 3.90h 3.16 , lbs/ft. (3-6)
( ) ( ) ( ) ( ) = + + − 1w 4.75 ft. 0.75 35psf 3.90 2in. 3.16 6.9in. 2.25in.
=1w 232 lbs ft.
232 lbs/ft. ≈ 231 lbs/ft. OK
Use 48LH10 joists @ 4′-9″ spacing
Spreadsheet Solution using the SJI Roof Bay Analysis Tool:
This example can be analyzed with the SJI Roof Bay Analysis Tool by defining a fictitious Joist Girder span and number of joist spaces that corresponds to the desired joist spacing. To match the initial joist selection (prior to the ponding check) in the hand calculations, a joist spacing of 6′-6″ is defined by selecting a Joist Girder span of 39 ft. and 6 joist spaces. With the default parameters, theRoof Bay Analysis sheet identifies a 44LH10 as the most efficient. To override this and match the 48LH10 joist selected in the hand calculation a minimum joist depth of 48 in. is entered on the Roof Bay Analysis sheet. The resulting general input to the ponding analysis is shown in Figure 4.1.1.
General Input (Defined in Roof Bay Analysis Spreadsheet)
Design Methodology ASD85.00 ft39.00 ft
48LH10231 lb/ft
44G6N19.4K19.4 k
615.00 psf55.00 lb/ft20.00 psf
Joist SpanJoist Girder SpanJoist Size
Dead Load on Joists
Snow Load
Joist Girder Size
Number of Joist Spaces
Joist Girder Self Weight
Joist Allowable Load
Joist Girder Allowable Load
Figure 4.1.1 Example 1 – General Input
The calculations on the Roof Bay Analysis sheet ensure that the selected joist is sufficient for the dead, live, and snow loads. Checks for strength under rain load and stability under ponding conditions are performed on the Ponding Analysis sheet.
FIGURE 4.1.1Example 1 - General Input
38
Compute the equivalent distributed load under ponding conditions:
( ) = + + ∆ − ∆ 1 cw S 0.75 w 3.90h 3.16 , lbs/ft. (3-6)
( ) ( ) ( ) ( ) = + + − 1w 4.75 ft. 0.75 35psf 3.90 2in. 3.16 6.9in. 2.25in.
=1w 232 lbs ft.
232 lbs/ft. ≈ 231 lbs/ft. OK
Use 48LH10 joists @ 4′-9″ spacing
Spreadsheet Solution using the SJI Roof Bay Analysis Tool:
This example can be analyzed with the SJI Roof Bay Analysis Tool by defining a fictitious Joist Girder span and number of joist spaces that corresponds to the desired joist spacing. To match the initial joist selection (prior to the ponding check) in the hand calculations, a joist spacing of 6′-6″ is defined by selecting a Joist Girder span of 39 ft. and 6 joist spaces. With the default parameters, theRoof Bay Analysis sheet identifies a 44LH10 as the most efficient. To override this and match the 48LH10 joist selected in the hand calculation a minimum joist depth of 48 in. is entered on the Roof Bay Analysis sheet. The resulting general input to the ponding analysis is shown in Figure 4.1.1.
General Input (Defined in Roof Bay Analysis Spreadsheet)
Design Methodology ASD85.00 ft39.00 ft
48LH10231 lb/ft
44G6N19.4K19.4 k
615.00 psf55.00 lb/ft20.00 psf
Joist SpanJoist Girder SpanJoist Size
Dead Load on Joists
Snow Load
Joist Girder Size
Number of Joist Spaces
Joist Girder Self Weight
Joist Allowable Load
Joist Girder Allowable Load
Figure 4.1.1 Example 1 – General Input
The calculations on the Roof Bay Analysis sheet ensure that the selected joist is sufficient for the dead, live, and snow loads. Checks for strength under rain load and stability under ponding conditions are performed on the Ponding Analysis sheet.

39
39
Strength of the selected joist under rain load is evaluated first. Ponding specific input is defined as shown in Figure 4.1.2. Note that the load is computed on the undeformed roof (i.e., rain load, R, as opposed to impounded water load, P) and the default load factors result in the D + R load combination. The joist supports are defined as walls to indicate that they are rigid. The snow density is taken as 17 lbs/ft.3, this parameter does not affect the current analysis since the load factor for snow is zero, but it will be used later in the stability check.
Ponding Specific Input
2.00 inCompute load on deformed roof: N (Y or N)
17.00 lb/ft3
Force level adjustment factor (α ): 1.60override:
Load factors:1.00
override:0.00
override:1.00
override:
0.000 in0.000 in0.000 in0.000 in
Camber:2.750 in
override: in0.000 in
override: in0.000 in
override: inBay is mirrored:
Y (Y or N)Y (Y or N)N (Y or N)N (Y or N)
Joist support is wall:Y (Y or N)Y (Y or N)
N (Y or N)N (Y or N)
Effective moment of inertia:1,794.3 in4
(Values include override: in4
1.15 factor for 4,690 in4
shear deformations) override: in4
Joist
Left
Bottom LeftTop RightTop Left
Water level relative to zero datum:
Joist
Ponded Water
Snow
Dead
Top of roof elevation:
Bottom Right
Snow density:
BottomTop
Bottom
Right
Joist Girder
Joist 1 (Leftmost)Joist 7 (Rightmost)
Joist is rigid:
Bottom Joist Girder
Top Joist Girder
Top
Figure 4.1.2 Example 1 – Ponding Specific Input (D+R)FIGURE 4.1.2Example 1 - Ponding Specific Input (D+R)
39
Strength of the selected joist under rain load is evaluated first. Ponding specific input is defined as shown in Figure 4.1.2. Note that the load is computed on the undeformed roof (i.e., rain load, R, as opposed to impounded water load, P) and the default load factors result in the D + R load combination. The joist supports are defined as walls to indicate that they are rigid. The snow density is taken as 17 lbs/ft.3, this parameter does not affect the current analysis since the load factor for snow is zero, but it will be used later in the stability check.
Ponding Specific Input
2.00 inCompute load on deformed roof: N (Y or N)
17.00 lb/ft3
Force level adjustment factor (α ): 1.60override:
Load factors:1.00
override:0.00
override:1.00
override:
0.000 in0.000 in0.000 in0.000 in
Camber:2.750 in
override: in0.000 in
override: in0.000 in
override: inBay is mirrored:
Y (Y or N)Y (Y or N)N (Y or N)N (Y or N)
Joist support is wall:Y (Y or N)Y (Y or N)
N (Y or N)N (Y or N)
Effective moment of inertia:1,794.3 in4
(Values include override: in4
1.15 factor for 4,690 in4
shear deformations) override: in4
Joist
Left
Bottom LeftTop RightTop Left
Water level relative to zero datum:
Joist
Ponded Water
Snow
Dead
Top of roof elevation:
Bottom Right
Snow density:
BottomTop
Bottom
Right
Joist Girder
Joist 1 (Leftmost)Joist 7 (Rightmost)
Joist is rigid:
Bottom Joist Girder
Top Joist Girder
Top
Figure 4.1.2 Example 1 – Ponding Specific Input (D+R)

4040
The analysis is performed by clicking the Run Analysis button. The resulting output, shown in Figure 4.1.3, indicates that the joist has sufficient strength for the D + R load combination.
Joist Output
Joist Max Shear Equiv. Load Max Moment Equiv. Load Strength StrengthNumber kips lb/ft kip-ft lb/ft Ratio Check
1 4.76 112.0 92.01 109.6 0.49 OKAY2 4.76 112.0 92.01 109.6 0.49 OKAY3 4.76 112.0 92.01 109.6 0.49 OKAY4 4.76 112.0 92.01 109.6 0.49 OKAY5 4.76 112.0 92.01 109.6 0.49 OKAY6 4.76 112.0 92.01 109.6 0.49 OKAY7 4.76 112.0 92.01 109.6 0.49 OKAY
NOTES: 1. Loads and load effects correspond to ASD load combinations.2. Strength ratio computed assuming shear capacity equal to 12.5% of the end reaction for shear reversals, see Note 14 on the Ponding Instructions spreadsheet.
RUN ANALYSIS
Figure 4.1.3 Example 1 – Joist Output (D+R)
40
The analysis is performed by clicking the Run Analysis button. The resulting output, shown in Figure 4.1.3, indicates that the joist has sufficient strength for the D + R load combination.
Joist Output
Joist Max Shear Equiv. Load Max Moment Equiv. Load Strength StrengthNumber kips lb/ft kip-ft lb/ft Ratio Check
1 4.76 112.0 92.01 109.6 0.49 OKAY2 4.76 112.0 92.01 109.6 0.49 OKAY3 4.76 112.0 92.01 109.6 0.49 OKAY4 4.76 112.0 92.01 109.6 0.49 OKAY5 4.76 112.0 92.01 109.6 0.49 OKAY6 4.76 112.0 92.01 109.6 0.49 OKAY7 4.76 112.0 92.01 109.6 0.49 OKAY
NOTES: 1. Loads and load effects correspond to ASD load combinations.2. Strength ratio computed assuming shear capacity equal to 12.5% of the end reaction for shear reversals, see Note 14 on the Ponding Instructions spreadsheet.
RUN ANALYSIS
Figure 4.1.3 Example 1 – Joist Output (D+R)FIGURE 4.1.3Example 1 - Joist Output (D+R)

4141
Next, a stability check under ponding conditions must be performed. To do this the input labeled “Compute load on deformed roof” is switched from “N” to “Y”. Note that when this change is made, the default load factors switch to the D + 0.75P + 0.75S load combination recommended by SJI for a ponding stability check. The updated ponding specific input is shown in Figure 4.1.4.
Ponding Specific Input
2.00 inCompute load on deformed roof: Y (Y or N)
17.00 lb/ft3
Force level adjustment factor (α ): 1.60override:
Load factors:1.00
override:0.75
override:0.75
override:
0.000 in0.000 in0.000 in0.000 in
Camber:2.750 in
override: in0.000 in
override: in0.000 in
override: inBay is mirrored:
Y (Y or N)Y (Y or N)N (Y or N)N (Y or N)
Joist support is wall:Y (Y or N)Y (Y or N)
N (Y or N)N (Y or N)
Effective moment of inertia:1,794.3 in4
(Values include override: in4
1.15 factor for 4,690 in4
shear deformations) override: in4
Joist is rigid:
Bottom Joist Girder
Top Joist Girder
Top
Joist Girder
Joist 1 (Leftmost)Joist 7 (Rightmost)
Snow
Dead
Top of roof elevation:
Bottom Right
Snow density:
BottomTop
Bottom
Right
Joist
Left
Bottom LeftTop RightTop Left
Water level relative to zero datum:
Joist
Ponded Water
Figure 4.1.4 Example 1 – Ponding Specific Input (D+0.75P+0.75S)FIGURE 4.1.4Example 1 - Ponding Specific Input (D+0.75P+0.75S)
41
Next, a stability check under ponding conditions must be performed. To do this the input labeled “Compute load on deformed roof” is switched from “N” to “Y”. Note that when this change is made, the default load factors switch to the D + 0.75P + 0.75S load combination recommended by SJI for a ponding stability check. The updated ponding specific input is shown in Figure 4.1.4.
Ponding Specific Input
2.00 inCompute load on deformed roof: Y (Y or N)
17.00 lb/ft3
Force level adjustment factor (α ): 1.60override:
Load factors:1.00
override:0.75
override:0.75
override:
0.000 in0.000 in0.000 in0.000 in
Camber:2.750 in
override: in0.000 in
override: in0.000 in
override: inBay is mirrored:
Y (Y or N)Y (Y or N)N (Y or N)N (Y or N)
Joist support is wall:Y (Y or N)Y (Y or N)
N (Y or N)N (Y or N)
Effective moment of inertia:1,794.3 in4
(Values include override: in4
1.15 factor for 4,690 in4
shear deformations) override: in4
Joist is rigid:
Bottom Joist Girder
Top Joist Girder
Top
Joist Girder
Joist 1 (Leftmost)Joist 7 (Rightmost)
Snow
Dead
Top of roof elevation:
Bottom Right
Snow density:
BottomTop
Bottom
Right
Joist
Left
Bottom LeftTop RightTop Left
Water level relative to zero datum:
Joist
Ponded Water
Figure 4.1.4 Example 1 – Ponding Specific Input (D+0.75P+0.75S)

42
42
Again, the analysis is performed by clicking the Run Analysis button. The resulting output, shown in Figure 4.1.5, indicates that the joist does not have sufficient capacity for this combination.
Joist Output
Joist Max Shear Equiv. Load Max Moment Equiv. Load Strength StrengthNumber kips lb/ft kip-ft lb/ft Ratio Check
1 15.64 441.3 366.34 405.6 1.91 NO GOOD2 15.64 441.3 366.34 405.6 1.91 NO GOOD3 15.64 441.3 366.34 405.6 1.91 NO GOOD4 15.64 441.3 366.34 405.6 1.91 NO GOOD5 15.64 441.3 366.34 405.6 1.91 NO GOOD6 15.64 441.3 366.34 405.6 1.91 NO GOOD7 15.64 441.3 366.34 405.6 1.91 NO GOOD
NOTES: 1. Loads and load effects correspond to ASD load combinations.2. Strength ratio computed assuming shear capacity equal to 12.5% of the end reaction for shear reversals, see Note 14 on the Ponding Instructions spreadsheet.
Joist size can be revised by inputting larger loads in the ''optional increased load data'' section of the Roof Bay Analysis spreadsheet
RUN ANALYSIS
Figure 4.1.5 Example 1 – Joist Output (D+0.75P+0.75S)
FIGURE 4.1.5Example 1 - Joist Output (D+0.75P+0.75S)

4343
Just as with the hand calculation solution, the joist spacing will be reduced (by reducing the fictitious Joist Girder span) to produce a satisfactory design. By trial and error, a joist spacing of 4′-6″ (achieved with a fictitious Joist Girder span of 27 ft.) is selected and produces joist output that is just satisfactory for the D+0.75P+0.75S load combination as shown in Figure 4.1.6. The resulting joist spacing using the direct analysis method within the SJI Roof Bay Analysis Tool is slightly less than that determined using the joist on stiff supports method by hand calculation.
Joist Output
Joist Max Shear Equiv. Load Max Moment Equiv. Load Strength StrengthNumber kips lb/ft kip-ft lb/ft Ratio Check
1 8.42 219.0 188.49 208.7 0.95 OKAY2 8.42 219.0 188.49 208.7 0.95 OKAY3 8.42 219.0 188.49 208.7 0.95 OKAY4 8.42 219.0 188.49 208.7 0.95 OKAY5 8.42 219.0 188.49 208.7 0.95 OKAY6 8.42 219.0 188.49 208.7 0.95 OKAY7 8.42 219.0 188.49 208.7 0.95 OKAY
NOTES: 1. Loads and load effects correspond to ASD load combinations.2. Strength ratio computed assuming shear capacity equal to 12.5% of the end reaction for shear reversals, see Note 14 on the Ponding Instructions spreadsheet.
RUN ANALYSIS
Figure 4.1.6 Example 1 – Joist Output (D+0.75P+0.75S, Revised Design)
In addition to overall strength results shown in Figure 4.1.6, the spreadsheet outputs the applied loading on the joists as shown in Figure 4.1.7. This data is used to perform further local load effect checks but also can provide useful insights into the structural behavior of the joists. For instance, as indicated Figure 4.1.7, under the ponding condition, the joists are subjected to a distributed load ranging from 163lbs/ft. at the supports to 220 lbs/ft. at mid-span where the deflection and depth of water is the greatest.
43
Just as with the hand calculation solution, the joist spacing will be reduced (by reducing the fictitious Joist Girder span) to produce a satisfactory design. By trial and error, a joist spacing of 4′-6″ (achieved with a fictitious Joist Girder span of 27 ft.) is selected and produces joist output that is just satisfactory for the D+0.75P+0.75S load combination as shown in Figure 4.1.6. The resulting joist spacing using the direct analysis method within the SJI Roof Bay Analysis Tool is slightly less than that determined using the joist on stiff supports method by hand calculation.
Joist Output
Joist Max Shear Equiv. Load Max Moment Equiv. Load Strength StrengthNumber kips lb/ft kip-ft lb/ft Ratio Check
1 8.42 219.0 188.49 208.7 0.95 OKAY2 8.42 219.0 188.49 208.7 0.95 OKAY3 8.42 219.0 188.49 208.7 0.95 OKAY4 8.42 219.0 188.49 208.7 0.95 OKAY5 8.42 219.0 188.49 208.7 0.95 OKAY6 8.42 219.0 188.49 208.7 0.95 OKAY7 8.42 219.0 188.49 208.7 0.95 OKAY
NOTES: 1. Loads and load effects correspond to ASD load combinations.2. Strength ratio computed assuming shear capacity equal to 12.5% of the end reaction for shear reversals, see Note 14 on the Ponding Instructions spreadsheet.
RUN ANALYSIS
Figure 4.1.6 Example 1 – Joist Output (D+0.75P+0.75S, Revised Design)
In addition to overall strength results shown in Figure 4.1.6, the spreadsheet outputs the applied loading on the joists as shown in Figure 4.1.7. This data is used to perform further local load effect checks but also can provide useful insights into the structural behavior of the joists. For instance, as indicated Figure 4.1.7, under the ponding condition, the joists are subjected to a distributed load ranging from 163lbs/ft. at the supports to 220 lbs/ft. at mid-span where the deflection and depth of water is the greatest.
FIGURE 4.1.6Example 1 - Joist Output (D+0.75P+0.75S, Revised Design)

44 44
Figu
re 4
.1.7
Exam
ple
1 –
Det
aile
d Jo
ist O
utpu
t (D
+0.7
5P+0
.75S
, Rev
ised
Des
ign)
Jois
tNu
mbe
r0'
0"
4' 3
"8'
6"
12' 9
"17
' 0"
21' 3
"25
' 6"
29' 9
"34
' 0"
38' 3
"42
' 6"
46' 9
"51
' 0"
55' 3
"59
' 6"
63' 9
"68
' 0"
72' 3
"76
' 6"
80' 9
"85
' 0"
116
316
917
818
619
420
220
821
421
722
022
122
021
721
420
820
219
418
617
816
916
32
163
169
178
186
194
202
208
214
217
220
221
220
217
214
208
202
194
186
178
169
163
316
316
917
818
619
420
220
821
421
722
022
122
021
721
420
820
219
418
617
816
916
34
163
169
178
186
194
202
208
214
217
220
221
220
217
214
208
202
194
186
178
169
163
516
316
917
818
619
420
220
821
421
722
022
122
021
721
420
820
219
418
617
816
916
36
163
169
178
186
194
202
208
214
217
220
221
220
217
214
208
202
194
186
178
169
163
716
316
917
818
619
420
220
821
421
722
022
122
021
721
420
820
219
418
617
816
916
3
NOTE
S:1.
Loa
ds c
orre
spon
d to
ASD
load
com
bina
tions
.
Tota
l Dis
trib
uted
Loa
d on
Joi
st a
s a
Func
tion
of D
ista
nce
from
Bot
tom
Sup
port
(lb/
ft)
FIGURE 4.1.7Example 1 - Detailed Joist Output (D+0.75P+0.75S, Revised Design)

45
45
Example 2: Two-way System, K-Series Joists Supported on Joist Girders
Figure 4.2.1 Framing Plan
45
Example 2: Two-way System, K-Series Joists Supported on Joist Girders
Figure 4.2.1 Framing PlanFIGURE 4.2.1Framing Plan
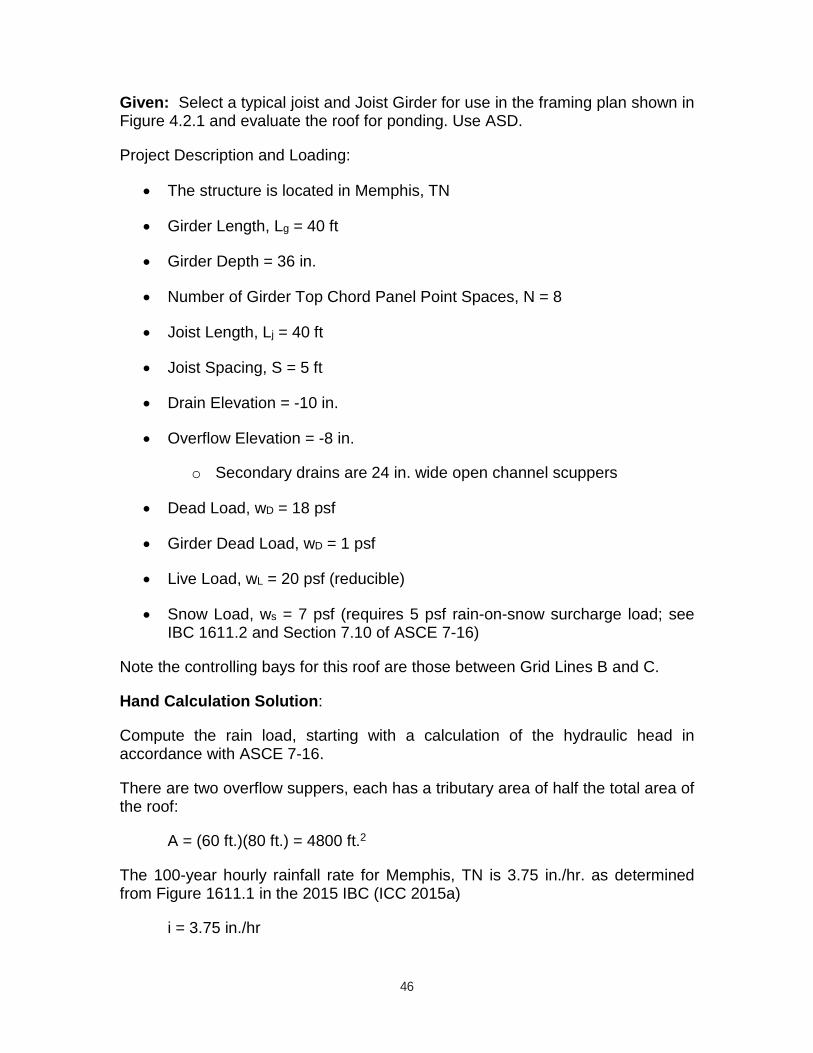
4646
Given: Select a typical joist and Joist Girder for use in the framing plan shown inFigure 4.2.1 and evaluate the roof for ponding. Use ASD.
Project Description and Loading:
• The structure is located in Memphis, TN
• Girder Length, Lg = 40 ft
• Girder Depth = 36 in.
• Number of Girder Top Chord Panel Point Spaces, N = 8
• Joist Length, Lj = 40 ft
• Joist Spacing, S = 5 ft
• Drain Elevation = -10 in.
• Overflow Elevation = -8 in.
o Secondary drains are 24 in. wide open channel scuppers
• Dead Load, wD = 18 psf
• Girder Dead Load, wD = 1 psf
• Live Load, wL = 20 psf (reducible)
• Snow Load, ws = 7 psf (requires 5 psf rain-on-snow surcharge load; see IBC 1611.2 and Section 7.10 of ASCE 7-16)
Note the controlling bays for this roof are those between Grid Lines B and C.
Hand Calculation Solution:
Compute the rain load, starting with a calculation of the hydraulic head in accordance with ASCE 7-16.
There are two overflow suppers, each has a tributary area of half the total area of the roof:
A = (60 ft.)(80 ft.) = 4800 ft.2
The 100-year hourly rainfall rate for Memphis, TN is 3.75 in./hr. as determined from Figure 1611.1 in the 2015 IBC (ICC 2015a)
i = 3.75 in./hr

4747
Determine the flow rate using Equation C8-1 in ASCE 7-16:
Q = 0.0104A i , gals/min. (ASCE 7-16 Eq. C8.3-1)
Q = (0.0104)(4800 ft.2)(3.75 in./hr) = 187.2 gals/min.
It can be seen from Table 2-1 of this Digest that the hydraulic head for a flow rate of 187.2 gals/min. is between 1 and 2 in. for the 24 in. wide scupper. Interpolating from Table 2-1, dh = 1.9 in. Therefore, use dh = 2 in.
Given the slope of the roof (neglecting crickets and camber), the rain load on the joists is triangular as shown in Figure 4.2.2 with a maximum magnitude, w1, and length, L1:
Figure 4.2.2 Loading Diagram (Rain Load Only)
( )= +R s hw 5.2 d d , psf (ASCE 7-16 Eq. 8.3-1)
( ) = − + = Rw 5.2 10.0in. 8.0in. 2.0in. 20.8psf
=1 Rw w S
( )( )= =1w 20.8psf 5 ft. 104lbs ft.
( )+= s h
1
d dL
roof slope
( )+= =1
2.0in. 2.0in.L 16 ft.
0.25in. ft.47
Determine the flow rate using Equation C8-1 in ASCE 7-16:
Q = 0.0104A i , gals/min. (ASCE 7-16 Eq. C8.3-1)
Q = (0.0104)(4800 ft.2)(3.75 in./hr) = 187.2 gals/min.
It can be seen from Table 2-1 of this Digest that the hydraulic head for a flow rate of 187.2 gals/min. is between 1 and 2 in. for the 24 in. wide scupper. Interpolating from Table 2-1, dh = 1.9 in. Therefore, use dh = 2 in.
Given the slope of the roof (neglecting crickets and camber), the rain load on the joists is triangular as shown in Figure 4.2.2 with a maximum magnitude, w1, and length, L1:
Figure 4.2.2 Loading Diagram (Rain Load Only)
( )= +R s hw 5.2 d d , psf (ASCE 7-16 Eq. 8.3-1)
( ) = − + = Rw 5.2 10.0in. 8.0in. 2.0in. 20.8psf
=1 Rw w S
( )( )= =1w 20.8psf 5 ft. 104lbs ft.
( )+= s h
1
d dL
roof slope
( )+= =1
2.0in. 2.0in.L 16 ft.
0.25in. ft.
FIGURE 4.2.2Loading Diagram (Rain Load Only)

4848
Determine the reactions due to the rain load:
=eq 1 1P 0.5 w L
( )( )= =eqP 0.5 104 lbs ft. 16 ft. 832 lbs
( )( )= = =2 1L 0.33L 0.33 16 ft. 5.33 ft.
( )−= J 2
L,J1 eqJ
L LR P
L
( ) ( )−= =L,J1
40.0 ft. 5.33 ft.R 832 lbs 721 lbs
40.0 ft.
= − = − =R,J1 eq L,J1R P R 832 lbs 721 lbs 111 lbs
Compute Joist Girder loads. In accordance with Section 4.8.2 of ASCE 7-16, the live load can be reduced to 12 psf based on the Joist Girder tributary area and slope:
( )( ) ( )( )= = = =R L,J1P 2 R 2 721lbs 1442 lbs 1.44kips
( )( )( ) ( )( )( )= + = = =D JP 18 psf 1psf S L 19 psf 5 ft. 40 ft. 3800 lbs 3.8kips
( )( )( ) ( )( )( )= = = =L JP 12 psf S L 12 psf 5 ft. 40 ft. 2400 lbs 2.4kips
( )( )( ) ( )( )( )= + = = =S JP 7 psf 5 psf S L 12 psf 5 ft. 40 ft. 2400 lbs 2.4kips
The dead plus live combination controls:
+ = + =D LP P 3.8 kips 2.4 kips 6.2 kips
Try a 36G8N6.2K Joist Girder.
Check deflection, first by computing the effective moment of inertia as shown inAppendix B:
( )( )( )( )( )= = = 4g c gI 0.027P L Nd 0.027 6.2 kips 40 ft. 8 36 in. 1928 in.
= = =4
g 4e
I 1928 in.I 1677 in.1.15 1.15

4949
Determine the minimum moment of inertia that satisfies a L/240 live load deflection limit. Calculations assume uniform loading of the Joist Girder.
( )( )∆ = = =g
max
L 40 ft 12 in. ft.2.0 in.
240 240
=∆
4L g
minmax
5 w LI
384E
( )( )( )( ) ( )( )
( )( )
=
4
min
40 ft. 12 psf5 40 ft. 12 in. ft.
1000 lbs kip 12 in. ft.I
384 29000 ksi 2.0 in.
= < =4 4min eI 477 in. I 1677 in. OK
Compute the load on the joist due to dead and live loads, noting that in accordance with Section 4.8.2 of ASCE 7-16, no live load reduction is permitted for the joist based on its tributary area and slope:
( ) ( )( )+ = + = + =D L D Lw w w S 18psf 20psf 5 ft. 190 lbs ft.
( ) ( )( )= = =L Lw w S 20psf 5 ft. 100 lbs ft.
The loading diagram for dead and rain loads is shown in Figure 4.2.3.
( )( )= = =2 Dw w S 18psf 5 ft. 90lbs ft.
= +JL,J2 2 L,J1
LR w R2
( )= + =L,J240 ft.R 90lbs ft. 721 lbs 2,521 lbs
2
= +JR,J2 2 R,J1
LR w R2
( )= + =L,J240 ft.R 90lbs ft. 111 lbs 1,911 lbs
2

5050
Figure 4.2.3 Loading Diagram (Dead and Rain Loads)
Locate the point of zero shear (based on the distance from the right reaction),
= = =R,J23
2
R 1,911lbsL 21.2 ft.w 90 lbs ft.
from right end.
Since the point of zero shear is less than 40 ft. – 16 ft. = 24 ft., it is located in the region of uniform loading and the equation used is valid.
Determine the maximum moment, Mmax
( )( )( )( )
= −2
2 3max R,J2 3
w LM R L
2
( )( ) ( )( )= − =
2
max
90lbs ft. 21.2 ft.M 1,911lbs 21.20 ft. 20,300 lb-ft.
2
However, this moment does not occur at midspan due to the non-uniformloading. The moment diagrams for D+L load combination and D+R load combination are shown in Figure 4.2.4. With the exception of a small shear reversal near the midspan of the joist, the D+L load combination controls over the D+R load combination.
50
Figure 4.2.3 Loading Diagram (Dead and Rain Loads)
Locate the point of zero shear (based on the distance from the right reaction),
= = =R,J23
2
R 1,911lbsL 21.2 ft.w 90 lbs ft.
from right end.
Since the point of zero shear is less than 40 ft. – 16 ft. = 24 ft., it is located in the region of uniform loading and the equation used is valid.
Determine the maximum moment, Mmax
( )( )( )( )
= −2
2 3max R,J2 3
w LM R L
2
( )( ) ( )( )= − =
2
max
90lbs ft. 21.2 ft.M 1,911lbs 21.20 ft. 20,300 lb-ft.
2
However, this moment does not occur at midspan due to the non-uniformloading. The moment diagrams for D+L load combination and D+R load combination are shown in Figure 4.2.4. With the exception of a small shear reversal near the midspan of the joist, the D+L load combination controls over the D+R load combination.
FIGURE 4.2.3Loading Diagram (Dead and Rain Loads)

5151
0 5 10 15 20 25 30 35 40
Position along length of joist (ft)
0
10
20
30
40
Mom
ent (
kip-
ft)D+LD+SD+R
(a)
0 5 10 15 20 25 30 35 40
Position along length of joist (ft)
-4
-2
0
2
4
Shea
r (ki
ps)
D+LD+SD+R
(b)Figure 4.2.4 Joist Moment and Shear Diagrams
Determine the joist size from the SJI Standard ASD Load Table for Open Web Steel Joists, K-Series, given a span of 40 ft., total load of 190 lbs/ft. (dead plus live load), and live load of 100 lbs/ft.
Try a 24K7 (no bolted bridging required).
wc = 253 lbs/ft. > wD+L = 190 lbs/ft. OK
wL/360 = 148 lbs/ft. > wL = 100 lbs/ft. OK
Check ponding per the AISC Appendix 2 method. Note that the method is not strictly applicable to this situation since the roof is sloped, but the adaptation for low sloped roofs described in Chapter 3 of this Digest will be used.
51
0 5 10 15 20 25 30 35 40
Position along length of joist (ft)
0
10
20
30
40
Mom
ent (
kip-
ft)
D+LD+SD+R
(a)
0 5 10 15 20 25 30 35 40
Position along length of joist (ft)
-4
-2
0
2
4
Shea
r (ki
ps)
D+LD+SD+R
(b)Figure 4.2.4 Joist Moment and Shear Diagrams
Determine the joist size from the SJI Standard ASD Load Table for Open Web Steel Joists, K-Series, given a span of 40 ft., total load of 190 lbs/ft. (dead plus live load), and live load of 100 lbs/ft.
Try a 24K7 (no bolted bridging required).
wc = 253 lbs/ft. > wD+L = 190 lbs/ft. OK
wL/360 = 148 lbs/ft. > wL = 100 lbs/ft. OK
Check ponding per the AISC Appendix 2 method. Note that the method is not strictly applicable to this situation since the roof is sloped, but the adaptation for low sloped roofs described in Chapter 3 of this Digest will be used.
FIGURE 4.2.4Joist Moment and Shear Diagrams

5252
Compute the stiffness factor for the Joist Girder (primary member):
( )( )( )
= = =44
s pp 7 7 4
p
32L L 32 40 ft. 40 ft.C 0.20
10 I 10 1677 in.
Compute the effective moment of inertia of the joist:
( )( ) ( )−=3 6
j L 360I 26.767 w L 10
( )( ) ( )−= − =3 6 4
jI 26.767 148 lbs ft. 40 ft. 0.33 ft. 10 247.3 in.
= = =4
j 4e
I 247.3 in.I 215.0 in.1.15 1.15
Compute the stiffness factor for the joist (secondary member):
( )( )( )
= = =44
ss 7 7 4
s
32 5 ft. 40 ft.32SLC 0.1910 I 10 215.0 in.
Check against the simplified method of design by evaluating Equation A-2-1 of the AISC Specification (AISC 2016). The details of the deck are omitted in this example; thus, the Equation A-2-2 will not be evaluated.
+ ≤p sC 0.9C 0.25 (AISC Eq. A-2-1)
( )+ = + = ≥p sC 0.9C 0.20 0.9 0.19 0.37 0.25 NG
Therefore, further analysis is required. The improved design provisions found in the AISC Specification Appendix 2 will be used.
For the Joist Girder (primary member) the stress index is calculated using Equation A-2-5 of the AISC Specification (AISC 2016).
− =
y op
o p
0.8F fU
f(AISC Eq. A-2-5)

5353
The parameter, fo, is the stress due to the load combination dead and rain load or dead and snow load, it is determined from Equation 3-2 of this Digest.
( ) +=
D R So y
c
P max P ,Pf 0.6F
P
( ) ( ) +
= =
o
3.8 kips max 1.44 kips,2.4 kipsf 0.6 50 ksi 30 ksi
6.2 kips
Note that the Joist Girder is stressed to the allowable limit under dead plus snow (excluding the ponding contribution). Compute the stress index:
( ) −= =
p
0.8 50 ksi 30 ksiU 0.33
30 ksi
For the joists (secondary members) the stress index is calculated using Equation A-2-6 of the AISC Specification (AISC 2016).
− =
y os
o s
0.8F fU
f(AISC Eq. A-2-6)
The parameter, fo, is the stress due to the load combination dead and rain load or dead and snow load, it is determined from Equation 3-1 of this Digest.
( )( ) +=
D R So y
c
S w max w ,wf 0.6F
w
The rain load is not uniform and thus this equation is not strictly applicable, however, as seen from the moment and shear diagrams (Figure 4.2.4) the dead plus snow load combination controls, thus it can be used anyway.
( ) ( )( ) ( ) + +
= =
o
5 ft. 18 psf 7 psf 5 psff 0.6 50 ksi 17.8 ksi
253 lbs ft.
Compute the stress index:
( ) −= =
s
0.8 50 ksi 17.8 ksiU 1.25
17.8 ksi

5454
The upper limit of Cp is determined from AISC Specification, Appendix 2, Fig. A-2.1, given Up = 0.33 and Cs = 0.19.
= < =p,lim pC 0.09 C 0.20 NG
The upper limit of Cs is determined from AISC Specification, Appendix 2, Fig. A-2.2, given Us = 1.25 and Cp = 0.20.
= > =s,lim sC 0.34 C 0.19 OK
Ponding instability exists.
In general, it is most effective to increase the stiffness and strength of the most highly stressed members to avoid ponding. In this case the Joist Girders should be made stiffer and stronger.
Try a 36G8N8.0K Joist Girder and repeat the calculations, note the calculations for the joist remain the same.
( )( )( )( )( )= = = 4g c gI 0.027P L Nd 0.027 8.0 kips 40 ft. 8 36 in. 2,488 in.
= = =4
g 4e
I 2,488 in.I 2,164 in.1.15 1.15
( )( )( )
= = =44
s pp 7 7 4
p
32L L 32 40 ft. 40 ft.C 0.15
10 I 10 2,164 in.
( ) ( ) +
= =
o
3.8 kips max 1.44 kips,2.4 kipsf 0.6 50 ksi 23.3 ksi
8.0 kips
( ) −= =
p
0.8 50 ksi 23.3 ksiU 0.72
23.3 ksi
The upper limit of Cp is determined from AISC Specification, Appendix 2, Fig. A-2.1, given Up = 0.72 and Cs = 0.19.
= > =p,lim pC 0.26 C 0.15 OK
The upper limit of Cs is determined from AISC Specification, Appendix 2, Fig. A-2.2, given Us = 1.25 and Cp = 0.15.
= > =s,lim sC 0.39 C 0.19 OK Thus, ponding stability is achieved.

55
55
Spreadsheet Solution using the SJI Roof Bay Analysis Tool:
Entering the relevant data into the Roof Bay Analysis sheet yields the same joist as selected in the hand calculations. However, the Roof Bay Analysis sheet identifies a deeper Joist Girder as the most efficient. To override this and match the 36G8N6.2K Joist Girder initially selected in the hand calculation a maximum joist depth of 36 in. is entered on the Roof Bay Analysis sheet. The resulting general input on the Ponding Analysis sheet is shown Figure 4.2.5.
General Input (Defined in Roof Bay Analysis Spreadsheet)
Design Methodology ASD40.00 ft40.00 ft24K 7253 lb/ft
36G8N6.2K6.2 k8
18.00 psf36.00 lb/ft12.00 psf
Dead Load on Joists
Snow Load
Joist Girder Size
Number of Joist Spaces
Joist Girder Self Weight
Joist Allowable Load
Joist Girder Allowable Load
Joist SpanJoist Girder SpanJoist Size
Figure 4.2.5 Example 2 – General Input
The calculations on the Roof Bay Analysis sheet ensure that the selected joist is sufficient for the dead, live, and snow loads. Checks for strength under rain load and stability under ponding conditions are performed on the Ponding Analysis sheet.
FIGURE 4.2.5Example 2 - General Input
55
Spreadsheet Solution using the SJI Roof Bay Analysis Tool:
Entering the relevant data into the Roof Bay Analysis sheet yields the same joist as selected in the hand calculations. However, the Roof Bay Analysis sheet identifies a deeper Joist Girder as the most efficient. To override this and match the 36G8N6.2K Joist Girder initially selected in the hand calculation a maximum joist depth of 36 in. is entered on the Roof Bay Analysis sheet. The resulting general input on the Ponding Analysis sheet is shown Figure 4.2.5.
General Input (Defined in Roof Bay Analysis Spreadsheet)
Design Methodology ASD40.00 ft40.00 ft24K 7253 lb/ft
36G8N6.2K6.2 k8
18.00 psf36.00 lb/ft12.00 psf
Dead Load on Joists
Snow Load
Joist Girder Size
Number of Joist Spaces
Joist Girder Self Weight
Joist Allowable Load
Joist Girder Allowable Load
Joist SpanJoist Girder SpanJoist Size
Figure 4.2.5 Example 2 – General Input
The calculations on the Roof Bay Analysis sheet ensure that the selected joist is sufficient for the dead, live, and snow loads. Checks for strength under rain load and stability under ponding conditions are performed on the Ponding Analysis sheet.

56
56
Strength of the selected joist and Joist Girder under rain load is evaluated first. Ponding specific input is defined as shown in Figure 4.2.6. Note that the load is computed on the undeformed roof (i.e., rain load, R, as opposed to impounded water load, P) and the default load factors result in the D + R load combination.The snow density determined is as 15.3 lbs/ft.3 in accordance with Equation 7.7-1 of ASCE 7-16 noting that the ground snow load for Memphis, TN is 10 psf. This parameter does not affect the current analysis since the load factor for snow is zero, but it will be used later in the stability check.
Ponding Specific Input
-6.00 inCompute load on deformed roof: N (Y or N)
15.30 lb/ft3
Force level adjustment factor (α ): 1.60override:
Load factors:1.00
override:0.00
override:1.00
override:
0.000 in0.000 in
-10.000 in-10.000 in
Camber:0.625 in
override: in0.000 in
override: in0.625 in
override: inBay is mirrored:
Y (Y or N)Y (Y or N)N (Y or N)Y (Y or N)
Joist support is wall:Y (Y or N)N (Y or N)
N (Y or N)N (Y or N)
Effective moment of inertia:215.1 in4
(Values include override: in4
1.15 factor for 1,677 in4
shear deformations) override: in4
Joist is rigid:
Bottom Joist Girder
Top Joist Girder
Top
Joist Girder
Joist 1 (Leftmost)Joist 9 (Rightmost)
Snow
Dead
Top of roof elevation:
Bottom Right
Snow density:
BottomTop
Bottom
Right
Joist
Left
Bottom LeftTop RightTop Left
Water level relative to zero datum:
Joist
Ponded Water
Figure 4.2.6 Example 2 – Ponding Specific Input (D+R)
FIGURE 4.2.6Example 2 - Ponding Specific Input (D+R)

57
57
The analysis is performed by clicking the Run Analysis button. The resulting output, shown in Figures 4.2.7 and 4.2.8, indicates that the joists and Joist Girders have sufficient strength for the D + R load combination.
Joist Output
Joist Max Shear Equiv. Load Max Moment Equiv. Load Strength StrengthNumber kips lb/ft kip-ft lb/ft Ratio Check
1 2.40 119.8 19.49 116.3 0.47 OKAY2 2.36 117.8 19.34 114.4 0.47 OKAY3 2.31 115.4 19.18 112.2 0.46 OKAY4 2.28 114.1 19.08 110.9 0.45 OKAY5 2.27 113.6 19.05 110.5 0.45 OKAY6 2.28 114.1 19.08 110.9 0.45 OKAY7 2.31 115.4 19.18 112.2 0.46 OKAY8 2.36 117.8 19.34 114.4 0.47 OKAY9 2.40 119.8 19.49 116.3 0.47 OKAY
NOTES: 1. Loads and load effects correspond to ASD load combinations.2. Strength ratio computed assuming shear capacity equal to 12.5% of the end reaction for shear reversals, see Note 14 on the Ponding Instructions spreadsheet.
RUN ANALYSIS
Figure 4.2.7 Example 2 – Joist Output (D+R)
FIGURE 4.2.7Example 2 - Joist Output (D+R)

58
58
Joist Girder Output
Joist Joist React. Joist React.Number kips kips
2 1.87 2.363 1.86 2.314 1.85 2.285 1.85 2.276 1.85 2.287 1.86 2.318 1.87 2.36
N/A (WALL) 4.80N/A (WALL) 4.80N/A (WALL) 0.77N/A (WALL) OKAY
NOTES: 1. Loads and load effects correspond to ASD load combinations.
Top Joist GirderPanel Point Load
kips
Strength Check:
Bottom Joist GirderPanel Point Load
kips4.894.804.74
Strength Ratio:Strength Check:
Equiv. Load for Shear (kips):
Strength Ratio:
Equiv. Load for Shear (kips):Equiv. Load for Moment (kips): Equiv. Load for Moment (kips):
4.724.744.804.89
Figure 4.2.8 Example 2 – Joist Girder Output (D+R)FIGURE 4.2.8Example 2 - Joist Girder Output (D+R)

59
59
Next, a stability check under ponding conditions must be performed. To do this the input labeled “Compute load on deformed roof” is switched from “N” to “Y”. Note that when this change is made, the default load factors switch to the D + 0.75P + 0.75S load combination recommended by SJI for a ponding stability check. The updated ponding specific input is shown in Figure 4.2.9.
Ponding Specific Input
-6.00 inCompute load on deformed roof: Y (Y or N)
15.30 lb/ft3
Force level adjustment factor (α ): 1.60override:
Load factors:1.00
override:0.75
override:0.75
override:
0.000 in0.000 in
-10.000 in-10.000 in
Camber:0.625 in
override: in0.000 in
override: in0.625 in
override: inBay is mirrored:
Y (Y or N)Y (Y or N)N (Y or N)Y (Y or N)
Joist support is wall:Y (Y or N)N (Y or N)
N (Y or N)N (Y or N)
Effective moment of inertia:215.1 in4
(Values include override: in4
1.15 factor for 1,677 in4
shear deformations) override: in4
Joist is rigid:
Bottom Joist Girder
Top Joist Girder
Top
Joist Girder
Joist 1 (Leftmost)Joist 9 (Rightmost)
Snow
Dead
Top of roof elevation:
Bottom Right
Snow density:
BottomTop
Bottom
Right
Joist
Left
Bottom LeftTop RightTop Left
Water level relative to zero datum:
Joist
Ponded Water
Figure 4.2.9 Example 2 – Ponding Specific Input (D+0.75P+0.75S)
FIGURE 4.2.9Example 2 - Ponding Specific Input (D+0.75P+0.75S)

60
60
Again, the analysis is performed by clicking the Run Analysis button. The resulting output is shown in Figures 4.2.10 and 4.2.11. Figure 4.2.10 indicates that the joists have sufficient capacity for this combination, but Figure 4.2.11 indicates that Joist Girder is overloaded with a stress ratio of 1.22.
Joist Output
Joist Max Shear Equiv. Load Max Moment Equiv. Load Strength StrengthNumber kips lb/ft kip-ft lb/ft Ratio Check
1 3.36 167.8 30.37 166.3 0.66 OKAY2 3.46 172.8 31.08 171.2 0.68 OKAY3 3.59 179.6 32.08 177.8 0.71 OKAY4 3.69 184.3 32.78 182.4 0.73 OKAY5 3.72 186.0 33.03 184.1 0.74 OKAY6 3.69 184.3 32.78 182.4 0.73 OKAY7 3.59 179.6 32.08 177.8 0.71 OKAY8 3.46 172.8 31.08 171.2 0.68 OKAY9 3.36 167.8 30.37 166.3 0.66 OKAY
NOTES: 1. Loads and load effects correspond to ASD load combinations.2. Strength ratio computed assuming shear capacity equal to 12.5% of the end reaction for shear reversals, see Note 14 on the Ponding Instructions spreadsheet.
RUN ANALYSIS
Figure 4.2.10 Example 2 – Joist Output (D+0.75P+0.75S)
FIGURE 4.2.10Example 2 - Joist Output (D+0.75P+0.75S)

6161
Joist Girder Output
Joist Joist React. Joist React.Number kips kips
2 2.90 3.463 2.95 3.594 2.99 3.695 3.00 3.726 2.99 3.697 2.95 3.598 2.90 3.46
N/A (WALL) 7.58N/A (WALL) 7.47N/A (WALL) 1.22N/A (WALL) NO GOOD
NOTES: 1. Loads and load effects correspond to ASD load combinations.2. Highlighted panel point loads may cause a local overstress, see notes in Ponding Instructions.
Joist Girder size can be revised by inputting larger loads in the ''optional increased load data'' section of the Roof Bay Analysis spreadsheet
Top Joist GirderPanel Point Load
kips
Strength Check:
Bottom Joist GirderPanel Point Load
kips7.097.377.55
Strength Ratio:Strength Check:
Equiv. Load for Shear (kips):
Strength Ratio:
Equiv. Load for Shear (kips):Equiv. Load for Moment (kips): Equiv. Load for Moment (kips):
7.627.557.377.09
Figure 4.2.11 Example 2 – Joist Girder Output (D+0.75P+0.75S)
Just as with the hand calculations, the most efficient method of rectifying the overstress is by stiffening and strengthening the Joist Girder. By trial and error, a panel point load of 7.5 kips was determined to produce a satisfactory design. The revised panel point load of 7.5 kips is entered into the optional increased load data table in the Roof Bay Analysis sheet as shown in Figure 4.2.12. With this increased load, the selected Joist Girder is a 36G8N7.5K, similar in size to that selected in the hand calculations.
OPTIONAL INCREASED LOAD DATA Member I Ieff = I/1.15Joist Load lb / ft 24K 7 247 215 in.4
JG Panel Point Load 7.5 kips 36G8N7.5K 2333 2029 in.4
Figure 4.2.12 Example 2 – Optional Increased Load Data (Revised Design)
61
Joist Girder Output
Joist Joist React. Joist React.Number kips kips
2 2.90 3.463 2.95 3.594 2.99 3.695 3.00 3.726 2.99 3.697 2.95 3.598 2.90 3.46
N/A (WALL) 7.58N/A (WALL) 7.47N/A (WALL) 1.22N/A (WALL) NO GOOD
NOTES: 1. Loads and load effects correspond to ASD load combinations.2. Highlighted panel point loads may cause a local overstress, see notes in Ponding Instructions.
Joist Girder size can be revised by inputting larger loads in the ''optional increased load data'' section of the Roof Bay Analysis spreadsheet
Top Joist GirderPanel Point Load
kips
Strength Check:
Bottom Joist GirderPanel Point Load
kips7.097.377.55
Strength Ratio:Strength Check:
Equiv. Load for Shear (kips):
Strength Ratio:
Equiv. Load for Shear (kips):Equiv. Load for Moment (kips): Equiv. Load for Moment (kips):
7.627.557.377.09
Figure 4.2.11 Example 2 – Joist Girder Output (D+0.75P+0.75S)
Just as with the hand calculations, the most efficient method of rectifying the overstress is by stiffening and strengthening the Joist Girder. By trial and error, a panel point load of 7.5 kips was determined to produce a satisfactory design. The revised panel point load of 7.5 kips is entered into the optional increased load data table in the Roof Bay Analysis sheet as shown in Figure 4.2.12. With this increased load, the selected Joist Girder is a 36G8N7.5K, similar in size to that selected in the hand calculations.
OPTIONAL INCREASED LOAD DATA Member I Ieff = I/1.15Joist Load lb / ft 24K 7 247 215 in.4
JG Panel Point Load 7.5 kips 36G8N7.5K 2333 2029 in.4
Figure 4.2.12 Example 2 – Optional Increased Load Data (Revised Design)
FIGURE 4.2.11Example 2 - Joist Girder Output (D+0.75P+0.75S)
61
Joist Girder Output
Joist Joist React. Joist React.Number kips kips
2 2.90 3.463 2.95 3.594 2.99 3.695 3.00 3.726 2.99 3.697 2.95 3.598 2.90 3.46
N/A (WALL) 7.58N/A (WALL) 7.47N/A (WALL) 1.22N/A (WALL) NO GOOD
NOTES: 1. Loads and load effects correspond to ASD load combinations.2. Highlighted panel point loads may cause a local overstress, see notes in Ponding Instructions.
Joist Girder size can be revised by inputting larger loads in the ''optional increased load data'' section of the Roof Bay Analysis spreadsheet
Top Joist GirderPanel Point Load
kips
Strength Check:
Bottom Joist GirderPanel Point Load
kips7.097.377.55
Strength Ratio:Strength Check:
Equiv. Load for Shear (kips):
Strength Ratio:
Equiv. Load for Shear (kips):Equiv. Load for Moment (kips): Equiv. Load for Moment (kips):
7.627.557.377.09
Figure 4.2.11 Example 2 – Joist Girder Output (D+0.75P+0.75S)
Just as with the hand calculations, the most efficient method of rectifying the overstress is by stiffening and strengthening the Joist Girder. By trial and error, a panel point load of 7.5 kips was determined to produce a satisfactory design. The revised panel point load of 7.5 kips is entered into the optional increased load data table in the Roof Bay Analysis sheet as shown in Figure 4.2.12. With this increased load, the selected Joist Girder is a 36G8N7.5K, similar in size to that selected in the hand calculations.
OPTIONAL INCREASED LOAD DATA Member I Ieff = I/1.15Joist Load lb / ft 24K 7 247 215 in.4
JG Panel Point Load 7.5 kips 36G8N7.5K 2333 2029 in.4
Figure 4.2.12 Example 2 – Optional Increased Load Data (Revised Design)FIGURE 4.2.12
Example 2 - Optional Increased Load Data (Revised Design)

62
62
Rerunning the ponding analysis with the revised Joist Girder shows that the strength of the Joist Girder is now sufficient (Figure 4.2.13). The overall strength of the joists is also sufficient. This is expected since increasing the panel point load of the Joist Girder increases the stiffness of the Joist Girder and of the system as a whole, resulting in less impounded water.
Joist Girder Output
Joist Joist React. Joist React.Number kips kips
2 2.89 3.423 2.93 3.524 2.95 3.595 2.96 3.616 2.95 3.597 2.93 3.528 2.89 3.42
N/A (WALL) 7.37N/A (WALL) 7.29N/A (WALL) 0.98N/A (WALL) OKAY
NOTES: 1. Loads and load effects correspond to ASD load combinations.
Top Joist GirderPanel Point Load
kips
Strength Check:
Bottom Joist GirderPanel Point Load
kips7.017.227.36
Strength Ratio:Strength Check:
Equiv. Load for Shear (kips):
Strength Ratio:
Equiv. Load for Shear (kips):Equiv. Load for Moment (kips): Equiv. Load for Moment (kips):
7.417.367.227.01
Figure 4.2.13 Example 2 – Joist Girder Output (D+0.75P+0.75S, Revised Design)
FIGURE 4.2.13Example 2 - Joist Girder Output (D+0.75P+0.75S, Revised Design)

6363
Example 3: Two-Way System, K-Series Joists Supported on Joist Girders
Figure 4.3.1 Roof Framing
63
Example 3: Two-Way System, K-Series Joists Supported on Joist Girders
Figure 4.3.1 Roof FramingFIGURE 4.3.1Roof Framing

6464
Given: Select a typical joist and Joist Girder for use in the framing plan shown inFigure 4.3.1 and evaluate the roof for ponding (note the Joist Girder size indicated in Figure 4.3.1 is the final selected size for the hand calculation solution). Use ASD. This example is the same as Example 2 except the framing is turned ninety degrees.
Project Description and Loading:
• The structure is located in Memphis, TN
• Girder Length, Lg = 40 ft
• Girder Depth = 36 in.
• Girder Top Chord Panel Point Spacing, N = 8
• Joist Length, Lj = 40 ft
• Joist Spacing, S = 5 ft
• Drain Elevation = -10 in.
• Overflow Elevation = -8 in.
o (secondary drains are 24 in. wide open channel scuppers)
• Hydraulic Head, dh = 2 in. from Example 2
• Dead Load, wD = 18 psf
• Girder Dead Load, wD = 1 psf
• Live Load, wL = 20 psf (reducible)
• Snow Load (roof), ws = 7 psf (requires 5 psf rain-on-snow surcharge load – see IBC 1611.2 and ASCE 7-16, SECTION 7.10)
Hand Calculation Solution:
The hydraulic head will be the same as in Example 2 (dh = 2 in.). The rain load on the controlling joist (neglecting crickets and camber), is uniform and calculated as:
( )= +R s hw 5.2 d d , psf (ASCE 7-16 Eq. 8-1)
( ) = − + = Rw 5.2 10.0in. 8.0in. 2.0in. 20.8psf

6565
Compute the total load on the joist for each of the possible load combinations:
( )( )+ = + =D Lw 18 psf 20 psf 5 ft. 190lbs ft.
( )( )+ = + =D Rw 18 psf 20.8 psf 5 ft. 194lbs ft.
( )( )( )+ = + + =D Sw 18 psf 7 psf 5 psf 5 ft. 150lbs ft.
The dead plus rain load combination controls.
Determine the joist size from the SJI Standard ASD Load Table for Open Web Steel Joists, K-Series, given a span of 40 ft., total load of 194 lbs/ft., and live load of 100 lbs/ft.
Try a 24K7 (no bolted bridging required).
wc = 253 lbs/ft. > wD+R = 194 lbs/ft. OK
wL/360 = 148 lbs/ft. > wL = 100 lbs/ft. OK
Compute the Joist Girder loads:
( )( )( ) ( )( )( )= + = = =D JP 18 psf 1psf S L 19 psf 5 ft. 40 ft. 3,800 lbs 3.8kips
( )( )( ) ( )( )( )= = = =L JP 12 psf S L 12 psf 5 ft. 40 ft. 2,400 lbs 2.4kips
( )( )( ) ( )( )( )= + = + =
=S JP 7 psf 5 psf S L 7 psf 5 psf 5 ft. 40 ft. 2,400 lbs
2.4kips
The rain load on the Joist Girder varies along the length. The joists framing into the Joist Girder directly adjacent to Grid Line 2 apply the greatest load. The load is calculated using the conservative assumption that the rain load from the joists framing in from either side are subjected to the same load.
( )( )( ) = − + = Rw 5.2 2.0in. 5 ft. 0.25in. ft. 2.0in. 14.3psf
( )( )( ) ( )( )( )= = = =R JP 14.3 psf S L 14.3 psf 5 ft. 40 ft. 2,860 lbs 2.86kips
The rain load from the second joist framing into the Joist Girder:
( )( )( ) = − + = Rw 5.2 2.0in. 2 5 ft. 0.25in. ft. 2.0in. 7.8psf
( )( )( ) ( )( )( )= = = =R JP 7.8 psf S L 7.8 psf 5 ft. 40 ft. 1,560 lbs 1.56kips

6666
The rain load from the third joist framing into the Joist Girder:
( )( )( ) = − + = Rw 5.2 2.0in. 3 5 ft. 0.25in. ft. 2.0in. 1.3psf
( )( )( ) ( )( )( )= = = =R JP 1.3 psf S L 1.3 psf 5 ft. 40 ft. 260 lbs 0.26kips
The rain load is zero on the fourth through seventh joists framing into the Joist Girder.
The moment diagrams for D+L, D+S, and D+R load combinations are shown in Figure 4.3.2. The D+L and D+S diagrams are identical control over the D+R load over the entire length of the Joist Girder.
The controlling total panel point load is:
( )+ = + =D S LP P or P 3.8 kips 2.4 kips 6.2 kips
A 36G8N6.2K would be sufficient for the loads excluding the ponding condition; however, considering the results of Example 2, try a 36G8N8.0K.
Check ponding.
Compute the effective moment of inertia and stiffness factor for the Joist Girders (primary members):
( )( )( )( )( )= = = 4g c gI 0.027P L Nd 0.027 8.0 kips 40 ft. 8 36 in. 2,488 in.
= = =4
g 4e
I 2,488 in.I 2,164 in.1.15 1.15
( )( )( )
= = =44
s pp 7 7 4
p
32L L 32 40 ft. 40 ft.C 0.15
10 I 10 2,164 in.
Compute the effective moment of inertia and stiffness factor for the joists (secondary members):
( )( ) ( )−=3 6
j L 360I 26.767 w L 10
( )( ) ( )−= − =3 6 4
jI 26.767 148 lbs ft. 40 ft. 0.33 ft. 10 247.3 in.
= = =4
j 4e
I 247.3 in.I 215.0 in.1.15 1.15
67
( )( )( )
= = =44
ss 7 7 4
s
32 5 ft. 40 ft.32SLC 0.1910 I 10 215.0 in.
0 5 10 15 20 25 30 35 40
Position along length of Joist Girder (ft)
0
50
100
150
200
250
300
Mom
ent (
kip-
ft)
D+L and D+SD+R
(a)
0 5 10 15 20 25 30 35 40
Position along length of Joist Girder (ft)
-30
-20
-10
0
10
20
30
Shea
r (ki
ps)
D+L and D+SD+R
(b)Figure 4.3.2 Joist Girder Moment and Shear Diagrams
66
The rain load from the third joist framing into the Joist Girder:
( )( )( ) = − + = Rw 5.2 2.0in. 3 5 ft. 0.25in. ft. 2.0in. 1.3psf
( )( )( ) ( )( )( )= = = =R JP 1.3 psf S L 1.3 psf 5 ft. 40 ft. 260 lbs 0.26kips
The rain load is zero on the fourth through seventh joists framing into the Joist Girder.
The moment diagrams for D+L, D+S, and D+R load combinations are shown in Figure 4.3.2. The D+L and D+S diagrams are identical control over the D+R load over the entire length of the Joist Girder.
The controlling total panel point load is:
( )+ = + =D S LP P or P 3.8 kips 2.4 kips 6.2 kips
A 36G8N6.2K would be sufficient for the loads excluding the ponding condition; however, considering the results of Example 2, try a 36G8N8.0K.
Check ponding.
Compute the effective moment of inertia and stiffness factor for the Joist Girders (primary members):
( )( )( )( )( )= = = 4g c gI 0.027P L Nd 0.027 8.0 kips 40 ft. 8 36 in. 2,488 in.
= = =4
g 4e
I 2,488 in.I 2,164 in.1.15 1.15
( )( )( )
= = =44
s pp 7 7 4
p
32L L 32 40 ft. 40 ft.C 0.15
10 I 10 2,164 in.
Compute the effective moment of inertia and stiffness factor for the joists (secondary members):
( )( ) ( )−=3 6
j L 360I 26.767 w L 10
( )( ) ( )−= − =3 6 4
jI 26.767 148 lbs ft. 40 ft. 0.33 ft. 10 247.3 in.
= = =4
j 4e
I 247.3 in.I 215.0 in.1.15 1.15

67
67
( )( )( )
= = =44
ss 7 7 4
s
32 5 ft. 40 ft.32SLC 0.1910 I 10 215.0 in.
0 5 10 15 20 25 30 35 40
Position along length of Joist Girder (ft)
0
50
100
150
200
250
300
Mom
ent (
kip-
ft)
D+L and D+SD+R
(a)
0 5 10 15 20 25 30 35 40
Position along length of Joist Girder (ft)
-30
-20
-10
0
10
20
30
Shea
r (ki
ps)
D+L and D+SD+R
(b)Figure 4.3.2 Joist Girder Moment and Shear Diagrams
FIGURE 4.3.2Joist Girder Moment and Shear Diagrams

6868
Check against the simplified method of design by evaluating Equation A-2-1 of the AISC Specification (AISC 2016). The details of the deck are omitted in this example; thus the Equation A-2-2 will not be evaluated.
+ ≤p sC 0.9C 0.25 (AISC Eq. A-2-1)
( )+ = + = ≥p sC 0.9C 0.15 0.9 0.19 0.32 0.25 NG
Therefore, further analysis is required. The improved design provisions found in the AISC Specification Appendix 2 will be used.
For the Joist Girder (primary member) the stress index is calculated using Equation A-2-5 of the AISC Specification (AISC 2016).
− =
y op
o p
0.8F fU
f(AISC Eq. A-2-5)
The parameter, fo, is the stress due to the load combination dead and rain load or dead and snow load, it is determined from Equation 3-2 of this Digest. However, as seen in Figure 4.3.2, snow load controls.
( ) + += = =
D S
o yc
P P 3.8 kips 2.4 kipsf 0.6F 0.6 50 ksi 23.3 ksiP 8.0 kips
Compute the stress index:
( ) −= =
p
0.8 50 ksi 23.3 ksiU 0.72
23.3 ksi
For the joists (secondary members) the stress index is calculated using Equation A-2-6 of the AISC Specification (AISC 2016).
− =
y os
o s
0.8F fU
f(AISC Eq. A-2-6)
The parameter, fo, is the stress due to the load combination dead and rain load or dead and snow load, it is determined from Equation 3-1 of this Digest. The worst case loading is due to rain load on the joist along Grid Line 2. Note that fo for the joist and Joist Girder need not be determined from the same load combination as it is conservative to take the greater value for each.
( ) ( )( ) ( ) + +
= = =
D Ro y
c
S w w 5 ft. 18 psf 20.8 psff 0.6F 0.6 50 ksi 23.0 ksi
w 253 lbs ft.

69
69
Compute the stress index:
( ) −= =
s
0.8 50 ksi 23.0 ksiU 0.74
23.0 ksi
The upper limit of Cp is determined from AISC Specification, Appendix 2, Fig. A-2.1, given Up = 0.72 and Cs = 0.19.
= > =p,lim pC 0.26 C 0.15 OK
The upper limit of Cs is determined from AISC Specification, Appendix 2, Fig. A-2.2, given Us = 0.74 and Cp = 0.15.
= > =s,lim sC 0.26 C 0.19 OK
Thus, ponding stability is achieved.
Spreadsheet Solution using the SJI Roof Bay Analysis Tool:
Entering the relevant data into the Roof Bay Analysis sheet yields the same joist as selected in the hand calculations. However, the Roof Bay Analysis sheet identifies a deeper Joist Girder as the most efficient. To override this and match the 36G8N6.2K Joist Girder initially selected in the hand calculation a maximum joist depth of 36 in. is entered on the Roof Bay Analysis sheet. The resulting general input on the Ponding Analysis sheet is shown Figure 4.3.3.
General Input (Defined in Roof Bay Analysis Spreadsheet)
Design Methodology ASD40.00 ft40.00 ft24K 7253 lb/ft
36G8N6.2K6.2 k8
18.00 psf36.00 lb/ft12.00 psf
Joist SpanJoist Girder SpanJoist Size
Dead Load on Joists
Snow Load
Joist Girder Size
Number of Joist Spaces
Joist Girder Self Weight
Joist Allowable Load
Joist Girder Allowable Load
Figure 4.3.3 Example 3 – General Input
The calculations on the Roof Bay Analysis sheet ensure that the selected joist is sufficient for the dead, live, and snow loads. Checks for strength under rain load and stability under ponding conditions are performed on the Ponding Analysis sheet. The evaluation of strength of the bay under rain load is similar that of Example 2 and is not shown here. The stability check under ponding conditions will be shown.
FIGURE 4.3.3Example 3 - General Input

7070
Ponding specific input is defined as shown in Figure 4.3.4. Note that the load is computed on the deformed roof (i.e., impounded water load, P, as opposed to rain load, R) and the default load factors result in the D + 0.75P + 0.75S load combination recommended by SJI for a ponding stability check. The snow density determined is as 15.3 lbs/ft.3 in accordance with Equation 7.7-1 of ASCE 7-16 noting that the ground snow load for Memphis, TN is 10 psf.
Ponding Specific Input
-6.00 inCompute load on deformed roof: N (Y or N)
15.30 lb/ft3
Force level adjustment factor (α ): 1.60override:
Load factors:1.00
override:0.00
override:1.00
override:
-10.000 in0.000 in
-10.000 in0.000 in
Camber:0.625 in
override: in0.625 in
override: in0.625 in
override: inBay is mirrored:
Y (Y or N)N (Y or N)Y (Y or N)Y (Y or N)
Joist support is wall:N (Y or N)N (Y or N)
N (Y or N)Y (Y or N)
Effective moment of inertia:215.1 in4
(Values include override: in4
1.15 factor for 1,677 in4
shear deformations) override: in4
Joist
Left
Bottom LeftTop RightTop Left
Water level relative to zero datum:
Joist
Ponded Water
Snow
Dead
Top of roof elevation:
Bottom Right
Snow density:
BottomTop
Bottom
Right
Joist Girder
Joist 1 (Leftmost)Joist 9 (Rightmost)
Joist is rigid:
Bottom Joist Girder
Top Joist Girder
Top
Figure 4.3.4 Example 3 – Ponding Specific Input (D+0.75P+0.75S)
70
Ponding specific input is defined as shown in Figure 4.3.4. Note that the load is computed on the deformed roof (i.e., impounded water load, P, as opposed to rain load, R) and the default load factors result in the D + 0.75P + 0.75S load combination recommended by SJI for a ponding stability check. The snow density determined is as 15.3 lbs/ft.3 in accordance with Equation 7.7-1 of ASCE 7-16 noting that the ground snow load for Memphis, TN is 10 psf.
Ponding Specific Input
-6.00 inCompute load on deformed roof: N (Y or N)
15.30 lb/ft3
Force level adjustment factor (α ): 1.60override:
Load factors:1.00
override:0.00
override:1.00
override:
-10.000 in0.000 in
-10.000 in0.000 in
Camber:0.625 in
override: in0.625 in
override: in0.625 in
override: inBay is mirrored:
Y (Y or N)N (Y or N)Y (Y or N)Y (Y or N)
Joist support is wall:N (Y or N)N (Y or N)
N (Y or N)Y (Y or N)
Effective moment of inertia:215.1 in4
(Values include override: in4
1.15 factor for 1,677 in4
shear deformations) override: in4
Joist
Left
Bottom LeftTop RightTop Left
Water level relative to zero datum:
Joist
Ponded Water
Snow
Dead
Top of roof elevation:
Bottom Right
Snow density:
BottomTop
Bottom
Right
Joist Girder
Joist 1 (Leftmost)Joist 9 (Rightmost)
Joist is rigid:
Bottom Joist Girder
Top Joist Girder
Top
Figure 4.3.4 Example 3 – Ponding Specific Input (D+0.75P+0.75S)FIGURE 4.3.4Example 3 - Ponding Specific Input (D+0.75P+0.75S)

71
71
The analysis is performed by clicking the Run Analysis button. The resulting output is shown in Figures 4.3.5 and 4.3.6. Figure 4.3.5 indicates that the joists have sufficient capacity for this combination, but Figure 4.3.6 indicates that Joist Girder is overloaded with a stress ratio of 1.20.
Joist Output
Joist Max Shear Equiv. Load Max Moment Equiv. Load Strength StrengthNumber kips lb/ft kip-ft lb/ft Ratio Check
1 4.31 228.7 44.47 222.4 0.90 OKAY2 4.19 222.4 43.25 216.3 0.88 OKAY3 3.98 210.9 41.02 205.1 0.83 OKAY4 3.69 195.3 38.01 190.1 0.77 OKAY5 3.31 174.7 34.03 170.1 0.69 OKAY6 2.88 150.1 29.40 147.0 0.59 OKAY7 2.71 135.8 27.10 135.5 0.54 OKAY8 2.70 135.0 27.00 135.0 0.53 OKAY
NOTES: 1. Loads and load effects correspond to ASD load combinations.2. Strength ratio computed assuming shear capacity equal to 12.5% of the end reaction for shear reversals, see Note 14 on the Ponding Instructions spreadsheet.
RUN ANALYSIS
Figure 4.3.5 Example 3 – Joist Output (D+0.75P+0.75S)
FIGURE 4.3.5Example 3 - Joist Output (D+0.75P+0.75S)

7272
Joist Girder Output
Joist Joist React. Joist React.Number kips kips
2 4.19 4.193 3.98 3.984 3.69 3.695 3.31 3.316 2.88 2.887 2.71 2.718 2.70 2.70
7.44 7.447.44 7.441.20 1.20
NO GOOD NO GOODNOTES: 1. Loads and load effects correspond to ASD load combinations.
2. Highlighted panel point loads may cause a local overstress, see notes in Ponding Instructions.
8.147.566.79
Joist Girder size can be revised by inputting larger loads in the ''optional increased load data'' section of the Roof Bay Analysis spreadsheet
Top Joist GirderPanel Point Load
kips
Strength Check:
Bottom Joist Girder
8.57
Panel Point Loadkips8.578.147.56
5.955.595.58
Strength Ratio:Strength Check:
Equiv. Load for Shear (kips):
Strength Ratio:
Equiv. Load for Shear (kips):Equiv. Load for Moment (kips): Equiv. Load for Moment (kips):
6.795.955.595.58
Figure 4.3.6 Example 3 – Joist Girder Output (D+0.75P+0.75S)
Just as with the hand calculations, the most efficient method of rectifying the overstress is by stiffening and strengthening the Joist Girder. This can be achieved in any one of several ways. One way would be to designate the Joist Girders as special and specify the panel point loads shown in Figure 4.3.6. The resulting special Joist Girder would be stiffer than that assumed in the analysis and thus, the loads would be conservative.
An alternative approach would be to continue using the SJI Roof Bay Analysis Tool to identify a standard Joist Girder with sufficient capacity. By trial and error, a panel point load of 7.5 kips was determined to produce a satisfactory design. The revised panel point load of 7.5 kips is entered into the optional increased load data table in the Roof Bay Analysis sheet as shown in Figure 4.3.7. With this increased load, the selected Joist Girder is a 36G8N7.5K, similar in size to that selected in the hand calculations.
OPTIONAL INCREASED LOAD DATA Member I Ieff = I/1.15Joist Load lb / ft 24K 7 247 215 in.4
JG Panel Point Load 7.5 kips 36G8N7.5K 2333 2029 in.4
Figure 4.3.7 Example 3 – Optional Increased Load Data (Revised Design)
FIGURE 4.3.6Example 3 - Joist Girder Output (D+0.75P+0.75S)
FIGURE 4.3.7Example 3 - Optional Increased Load Data (Revised Design)
72
Joist Girder Output
Joist Joist React. Joist React.Number kips kips
2 4.19 4.193 3.98 3.984 3.69 3.695 3.31 3.316 2.88 2.887 2.71 2.718 2.70 2.70
7.44 7.447.44 7.441.20 1.20
NO GOOD NO GOODNOTES: 1. Loads and load effects correspond to ASD load combinations.
2. Highlighted panel point loads may cause a local overstress, see notes in Ponding Instructions.
8.147.566.79
Joist Girder size can be revised by inputting larger loads in the ''optional increased load data'' section of the Roof Bay Analysis spreadsheet
Top Joist GirderPanel Point Load
kips
Strength Check:
Bottom Joist Girder
8.57
Panel Point Loadkips8.578.147.56
5.955.595.58
Strength Ratio:Strength Check:
Equiv. Load for Shear (kips):
Strength Ratio:
Equiv. Load for Shear (kips):Equiv. Load for Moment (kips): Equiv. Load for Moment (kips):
6.795.955.595.58
Figure 4.3.6 Example 3 – Joist Girder Output (D+0.75P+0.75S)
Just as with the hand calculations, the most efficient method of rectifying the overstress is by stiffening and strengthening the Joist Girder. This can be achieved in any one of several ways. One way would be to designate the Joist Girders as special and specify the panel point loads shown in Figure 4.3.6. The resulting special Joist Girder would be stiffer than that assumed in the analysis and thus, the loads would be conservative.
An alternative approach would be to continue using the SJI Roof Bay Analysis Tool to identify a standard Joist Girder with sufficient capacity. By trial and error, a panel point load of 7.5 kips was determined to produce a satisfactory design. The revised panel point load of 7.5 kips is entered into the optional increased load data table in the Roof Bay Analysis sheet as shown in Figure 4.3.7. With this increased load, the selected Joist Girder is a 36G8N7.5K, similar in size to that selected in the hand calculations.
OPTIONAL INCREASED LOAD DATA Member I Ieff = I/1.15Joist Load lb / ft 24K 7 247 215 in.4
JG Panel Point Load 7.5 kips 36G8N7.5K 2333 2029 in.4
Figure 4.3.7 Example 3 – Optional Increased Load Data (Revised Design)

73
73
Rerunning the ponding analysis with the revised Joist Girder shows that the overall strength of the joists (Figure 4.3.8) and Joist Girders (Figure 4.3.9) is now sufficient. However, the analysis also indicates that two of the applied panel point loads exceed the allowable panel point load (Figure 4.3.9). In general, these loads should be investigated for their potential to overstress localized areas of the Joist Girder (e.g., web verticals). If they are deemed a problem, then revised sizes can be selected.
Joist Output
Joist Max Shear Equiv. Load Max Moment Equiv. Load Strength StrengthNumber kips lb/ft kip-ft lb/ft Ratio Check
1 4.29 227.3 44.20 221.0 0.90 OKAY2 4.13 218.8 42.55 212.8 0.86 OKAY3 3.86 204.3 39.75 198.7 0.81 OKAY4 3.53 186.8 36.37 181.9 0.74 OKAY5 3.14 165.7 32.29 161.5 0.66 OKAY6 2.79 143.4 28.25 141.3 0.57 OKAY7 2.70 135.1 27.01 135.1 0.53 OKAY8 2.70 135.0 27.00 135.0 0.53 OKAY
NOTES: 1. Loads and load effects correspond to ASD load combinations.2. Strength ratio computed assuming shear capacity equal to 12.5% of the end reaction for shear reversals, see Note 14 on the Ponding Instructions spreadsheet.
RUN ANALYSIS
Figure 4.3.8 Example 3 – Joist Output (D+0.75P+0.75S, Revised Design)FIGURE 4.3.8Example 3 - Joist Output (D+0.75P+0.75S, Revised Design)
73
Rerunning the ponding analysis with the revised Joist Girder shows that the overall strength of the joists (Figure 4.3.8) and Joist Girders (Figure 4.3.9) is now sufficient. However, the analysis also indicates that two of the applied panel point loads exceed the allowable panel point load (Figure 4.3.9). In general, these loads should be investigated for their potential to overstress localized areas of the Joist Girder (e.g., web verticals). If they are deemed a problem, then revised sizes can be selected.
Joist Output
Joist Max Shear Equiv. Load Max Moment Equiv. Load Strength StrengthNumber kips lb/ft kip-ft lb/ft Ratio Check
1 4.29 227.3 44.20 221.0 0.90 OKAY2 4.13 218.8 42.55 212.8 0.86 OKAY3 3.86 204.3 39.75 198.7 0.81 OKAY4 3.53 186.8 36.37 181.9 0.74 OKAY5 3.14 165.7 32.29 161.5 0.66 OKAY6 2.79 143.4 28.25 141.3 0.57 OKAY7 2.70 135.1 27.01 135.1 0.53 OKAY8 2.70 135.0 27.00 135.0 0.53 OKAY
NOTES: 1. Loads and load effects correspond to ASD load combinations.2. Strength ratio computed assuming shear capacity equal to 12.5% of the end reaction for shear reversals, see Note 14 on the Ponding Instructions spreadsheet.
RUN ANALYSIS
Figure 4.3.8 Example 3 – Joist Output (D+0.75P+0.75S, Revised Design)

74
74
Joist Girder Output
Joist Joist React. Joist React.Number kips kips
2 4.13 4.133 3.86 3.864 3.53 3.535 3.14 3.146 2.79 2.797 2.70 2.708 2.70 2.70
7.23 7.237.23 7.230.96 0.96
OKAY OKAYNOTES: 1. Loads and load effects correspond to ASD load combinations.
2. Highlighted panel point loads may cause a local overstress, see notes in Ponding Instructions.
7.897.246.46
Top Joist GirderPanel Point Load
kips
Strength Check:
Bottom Joist Girder
8.43
Panel Point Loadkips8.437.897.24
5.765.585.58
Strength Ratio:Strength Check:
Equiv. Load for Shear (kips):
Strength Ratio:
Equiv. Load for Shear (kips):Equiv. Load for Moment (kips): Equiv. Load for Moment (kips):
6.465.765.585.58
Figure 4.3.9 Example 3 – Joist Girder Output (D+0.75P+0.75S, Revised Design)FIGURE 4.3.9Example 3 - Joist Girder Output (D+0.75P+0.75S, Revised Design)

7575
Example 4: Two-way System, K-Series Joists on Joist GirdersGiven: For the roof shown in Figure 4.4.1 select joist and Joist Girder sizes and determine if the roof is free draining under the total superimposed loads. Do not consider camber. Due to wall attachment assume the edge joist does not deflect.The roof has a slope of 1/4 in./ft. downward to the right. Use ASD.
Figure 4.4.1 Typical Framing
Project Description and Loading:
• Dead Load, wD = 14 psf
• Girder Dead Load, wD = 1 psf
• Snow Load, wS = 25 psf
Note that ensuring free drainage is typically a serviceability criterion to avoid anystanding water on the roof. Free drainage is not a necessary requirement for the structural integrity of the roof so long as the joists are designed to support the impounded water.
75
Example 4: Two-way System, K-Series Joists on Joist GirdersGiven: For the roof shown in Figure 4.4.1 select joist and Joist Girder sizes and determine if the roof is free draining under the total superimposed loads. Do not consider camber. Due to wall attachment assume the edge joist does not deflect.The roof has a slope of 1/4 in./ft. downward to the right. Use ASD.
Figure 4.4.1 Typical Framing
Project Description and Loading:
• Dead Load, wD = 14 psf
• Girder Dead Load, wD = 1 psf
• Snow Load, wS = 25 psf
Note that ensuring free drainage is typically a serviceability criterion to avoid anystanding water on the roof. Free drainage is not a necessary requirement for the structural integrity of the roof so long as the joists are designed to support the impounded water.
FIGURE 4.4.1Typical Framing
75
Example 4: Two-way System, K-Series Joists on Joist GirdersGiven: For the roof shown in Figure 4.4.1 select joist and Joist Girder sizes and determine if the roof is free draining under the total superimposed loads. Do not consider camber. Due to wall attachment assume the edge joist does not deflect.The roof has a slope of 1/4 in./ft. downward to the right. Use ASD.
Figure 4.4.1 Typical Framing
Project Description and Loading:
• Dead Load, wD = 14 psf
• Girder Dead Load, wD = 1 psf
• Snow Load, wS = 25 psf
Note that ensuring free drainage is typically a serviceability criterion to avoid anystanding water on the roof. Free drainage is not a necessary requirement for the structural integrity of the roof so long as the joists are designed to support the impounded water.
Example 4: Two-way System, K-Series Joists on Joist Girders

7676
Hand Calculation Solution:
Joist Selection:
wD+S = (14 psf + 25 psf)(6.25 ft.) = 244 lbs/ft.
Ls = 40 ft.; S = 6.25 ft.
Try 26K6 Joists
From Standard ASD Load Table for Open Web Steel Joists, K-Series
wc = 247 lbs/ft.
wL/360 = 157 lbs/ft.
Compute the load for a deflection limit of L/240:
( ) = = =
L 240 L 360360 360w w 157 lbs ft. 236 lbs ft.240 240
Compare to the snow load:
( ) ( )( )= = =s sw w S 25 psf 6.25 ft. 156 lbs ft.
= > =L 240 sw 236 lbs ft. w 156 lbs ft. OK
Determine the effective moment of inertia of the joist:
( )( ) ( )−=3 6
j L 360I 26.767 w L 10
( )( ) ( )−= − =3 6 4
jI 26.767 157 lbs ft. 40 ft. 0.33 ft. 10 262.4 in.
= = =4
j 4e
I 262.4 in.I 228.2 in.1.15 1.15
Joist Girder Selection:
Determine approximate girder depth = 1.1Lg = (1.1)(50 ft.) = 55 in.; use 56 in.
Panel point loading on Joist Girder
PD+S = (15 psf + 25 psf)(6.25 ft.)(40 ft) = 10,000 lbs = 10 kips
Try 56G8N10.0K Joist Girders

7777
Determine the effective moment of inertia of the Joist Girder:
( )( )( )( )= = = 4JG cI 0.027NP Ld 0.027 8 10.0 kips 50 ft. 56 in. 6,048 in.
= = =4
4JGe
I 6,048 in.I 5,259 in.1.15 1.15
Check snow load deflection against a limit of L/240:
( )( )= = =Sw 25 psf 40 ft. 1000 lbs ft. 0.0833 kips in.
( )( )( )( )
×∆ = = =
44S
S 4e
5 0.0833 kips in. 50 ft. 12 in. ft.5 w L 0.92 in.384EI 384 29,000 ksi 5,259 in.
L/240 = (50 ft.)(12 in./ft.)/240 = 2.50 in. > 0.92 in. OK
Free Drainage Check under full dead plus snow loading:
Determine the deflection at the midspan of the joists due to dead and snow load:
( )( )+ = + = =D Sw 14 psf 25 psf 6.25 ft. 244 lbs ft. 0.0203 kips in.
( ) ( )( )( )( )
++
− ∆ = = =4
4D S
D S 4e
5 0.0203 kips in. 40 ft. 0.33 ft. 12 in. ft.5 w L 2.05 in.384EI 384 29,000 ksi 228.2 in.
Based on the roof slope, the first upslope joist is higher than the edge joist by:
(6.25 ft.)(0.25 in./ft.) = 1.56 in.
Even without considering the deflection of the Joist Girders, it can be seen that the midspan of the first upslope joist will be lower than the edge, thus the joists must be stiffer to maintain free draining. The joist needs to be roughly 30% stiffer (≈ 2.05 in./1.56in. = 1.31).
Try a 30K12 joist,
wc = 438 lbs/ft.
wL/360 = 315 lbs/ft.

7878
Determine the effective moment of inertia of the joist:
( )( ) ( )−= − =3 6 4
jI 26.767 315 lbs ft. 40 ft. 0.33 ft. 10 526.4 in.
= = =4
j 4e
I 526.4 in.I 457.7 in.1.15 1.15
Determine the deflection at the midspan of the joist due to dead and snow load:
( ) ( )( )( )( )
++
− ∆ = = =4
4D S
D S 4e
5 0.0203 kips in. 40 ft. 0.33 ft. 12 in. ft.5 w L 1.02 in.384EI 384 29,000 ksi 457.7 in.
Determine the deflection of the Joist Girder at the first upslope joistapproximating the load on the Joist Girder as uniform.
( )( )+ = + = =D Sw 15 psf 25 psf 40 ft. 1,600 lbs ft. 0.133 kips in.
The deflection ∆x at any point, x, along the Joist Girder can be determined using the following equation:
( )∆ = − +3 2 3x JG JG
e
w x L 2L x x24EI
For the first upslope joist:
= =x 6.25 ft. 75 in.
= =JGL 50 ft. 600 in.
( )( )( )( )( ) ( ) ( )( ) ( )( )∆ = − +
3 2 3x 4
0.133 kips in. 75 in.600 in. 2 600 in. 75 in. 75 in.
24 29,000 ksi 5,259 in.
∆ =x 0.57 in.
The total deflection of the mid-span of the joist is determined as the sum of the deflection of the joist and of the Joist Girder.
1.02 in. + 0.57 in. = 1.59 in. ≈ 1.56 in. OK
Check if positive drainage exists between the 30K12 joist and the next upslope 26K6 joist.

7979
The Joist Girder deflection at the 26K6 joist located 12.5 ft. (150 in.). from the eave is:
( )( )( )( )( ) ( ) ( )( ) ( )( )∆ = − +
3 2 3x 4
0.133 kips in. 150 in.600 in. 2 600 in. 150 in. 150 in.
24 29,000 ksi 5,259 in.
∆ =x 1.05 in.
Total deflection of the 26K6 joist = 2.06 in. + 1.05 in. = 3.11 in.
The final elevation of the 26K6 joist = (12.5 ft.)(0.25 in./ft.) – 3.11 in. = 0.015 in.
The final elevation of the 30K12 joist = 1.56 – 1.59 in. = –0.030 in.
Positive drainage exists. Use the 30K12 joist at the first upslope location.
Spreadsheet Solution using the SJI Roof Bay Analysis Tool:
While not explicitly intended for this type of evaluation, the ponding analysis within the SJI Roof Bay Analysis Tool is capable of determining if the free drainage condition exists in this situation.
Entering the relevant data into the Roof Bay Analysis sheet yields the same joist as selected in the hand calculations (ensure that the option to minimize X-bridging for spans ≤ 60 ft. is selected as “N”). However, the Roof Bay Analysis sheet identifies a 52 in. deep Joist Girder as the most efficient. To override this and match the 56G8N10K Joist Girder selected in the hand calculation, amaximum and minimum Joist Girder depth of 56 in. are entered on the Roof Bay Analysis sheet. The resulting general input on the Ponding Analysis sheet is shown Figure 4.4.2.
General Input (Defined in Roof Bay Analysis Spreadsheet)
Design Methodology ASD40.00 ft50.00 ft26K 6247 lb/ft
56G8N10K10 k8
14.00 psf42.00 lb/ft25.00 psf
Dead Load on Joists
Snow Load
Joist Girder Size
Number of Joist Spaces
Joist Girder Self Weight
Joist Allowable Load
Joist Girder Allowable Load
Joist SpanJoist Girder SpanJoist Size
Figure 4.4.2 Example 4 – General Input
79
The Joist Girder deflection at the 26K6 joist located 12.5 ft. (150 in.). from the eave is:
( )( )( )( )( ) ( ) ( )( ) ( )( )∆ = − +
3 2 3x 4
0.133 kips in. 150 in.600 in. 2 600 in. 150 in. 150 in.
24 29,000 ksi 5,259 in.
∆ =x 1.05 in.
Total deflection of the 26K6 joist = 2.06 in. + 1.05 in. = 3.11 in.
The final elevation of the 26K6 joist = (12.5 ft.)(0.25 in./ft.) – 3.11 in. = 0.015 in.
The final elevation of the 30K12 joist = 1.56 – 1.59 in. = –0.030 in.
Positive drainage exists. Use the 30K12 joist at the first upslope location.
Spreadsheet Solution using the SJI Roof Bay Analysis Tool:
While not explicitly intended for this type of evaluation, the ponding analysis within the SJI Roof Bay Analysis Tool is capable of determining if the free drainage condition exists in this situation.
Entering the relevant data into the Roof Bay Analysis sheet yields the same joist as selected in the hand calculations (ensure that the option to minimize X-bridging for spans ≤ 60 ft. is selected as “N”). However, the Roof Bay Analysis sheet identifies a 52 in. deep Joist Girder as the most efficient. To override this and match the 56G8N10K Joist Girder selected in the hand calculation, amaximum and minimum Joist Girder depth of 56 in. are entered on the Roof Bay Analysis sheet. The resulting general input on the Ponding Analysis sheet is shown Figure 4.4.2.
General Input (Defined in Roof Bay Analysis Spreadsheet)
Design Methodology ASD40.00 ft50.00 ft26K 6247 lb/ft
56G8N10K10 k8
14.00 psf42.00 lb/ft25.00 psf
Dead Load on Joists
Snow Load
Joist Girder Size
Number of Joist Spaces
Joist Girder Self Weight
Joist Allowable Load
Joist Girder Allowable Load
Joist SpanJoist Girder SpanJoist Size
Figure 4.4.2 Example 4 – General InputFIGURE 4.4.2
Example 4 - General Input

80 80
Other ponding specific input is defined as shown in Figure 4.4.3. The elevation datum is set at the right end of the bay. The water level is set as zero as water above that will fall off the free edge. The load combination is selected as D + P + S and the force level adjustment factor is overridden as 1.0 for this simple evaluation. The snow density is taken as zero, so that reduction in load due to the physical overlap of water and snow is not considered. For consistency with the hand calculations, the joists and Joist Girders are assumed to be without camber (overridden to zero).
Ponding Specific Input
0.00 inCompute load on deformed roof: Y (Y or N)
0.00 lb/ft3
Force level adjustment factor (α ): 1.00override: 1.00
Load factors:1.00
override:1.00
override: 1.001.00
override: 1.00
12.500 in0.000 in12.500 in0.000 in
Camber:0.000 in
override: 0 in0.000 in
override: 0 in0.000 in
override: 0 inBay is mirrored:
Y (Y or N)N (Y or N)Y (Y or N)Y (Y or N)
Joist support is wall:N (Y or N)N (Y or N)
N (Y or N)Y (Y or N)
Effective moment of inertia:228.1 in4
(Values include override: in4
1.15 factor for 5,259 in4
shear deformations) override: in4
Joist is rigid:
Bottom Joist Girder
Top Joist Girder
Top
Joist Girder
Joist 1 (Leftmost)Joist 9 (Rightmost)
Snow
Dead
Top of roof elevation:
Bottom Right
Snow density:
BottomTop
Bottom
Right
Joist
Left
Bottom LeftTop RightTop Left
Water level relative to zero datum:
Joist
Ponded Water
Figure 4.4.3 Example 4 – Ponding Specific Input
80
Other ponding specific input is defined as shown in Figure 4.4.3. The elevation datum is set at the right end of the bay. The water level is set as zero as water above that will fall off the free edge. The load combination is selected as D + P + S and the force level adjustment factor is overridden as 1.0 for this simple evaluation. The snow density is taken as zero, so that reduction in load due to the physical overlap of water and snow is not considered. For consistency with the hand calculations, the joists and Joist Girders are assumed to be without camber (overridden to zero).
Ponding Specific Input
0.00 inCompute load on deformed roof: Y (Y or N)
0.00 lb/ft3
Force level adjustment factor (α ): 1.00override: 1.00
Load factors:1.00
override:1.00
override: 1.001.00
override: 1.00
12.500 in0.000 in12.500 in0.000 in
Camber:0.000 in
override: 0 in0.000 in
override: 0 in0.000 in
override: 0 inBay is mirrored:
Y (Y or N)N (Y or N)Y (Y or N)Y (Y or N)
Joist support is wall:N (Y or N)N (Y or N)
N (Y or N)Y (Y or N)
Effective moment of inertia:228.1 in4
(Values include override: in4
1.15 factor for 5,259 in4
shear deformations) override: in4
Joist is rigid:
Bottom Joist Girder
Top Joist Girder
Top
Joist Girder
Joist 1 (Leftmost)Joist 9 (Rightmost)
Snow
Dead
Top of roof elevation:
Bottom Right
Snow density:
BottomTop
Bottom
Right
Joist
Left
Bottom LeftTop RightTop Left
Water level relative to zero datum:
Joist
Ponded Water
Figure 4.4.3 Example 4 – Ponding Specific InputFIGURE 4.4.3
Example 4 - Ponding Specific Input
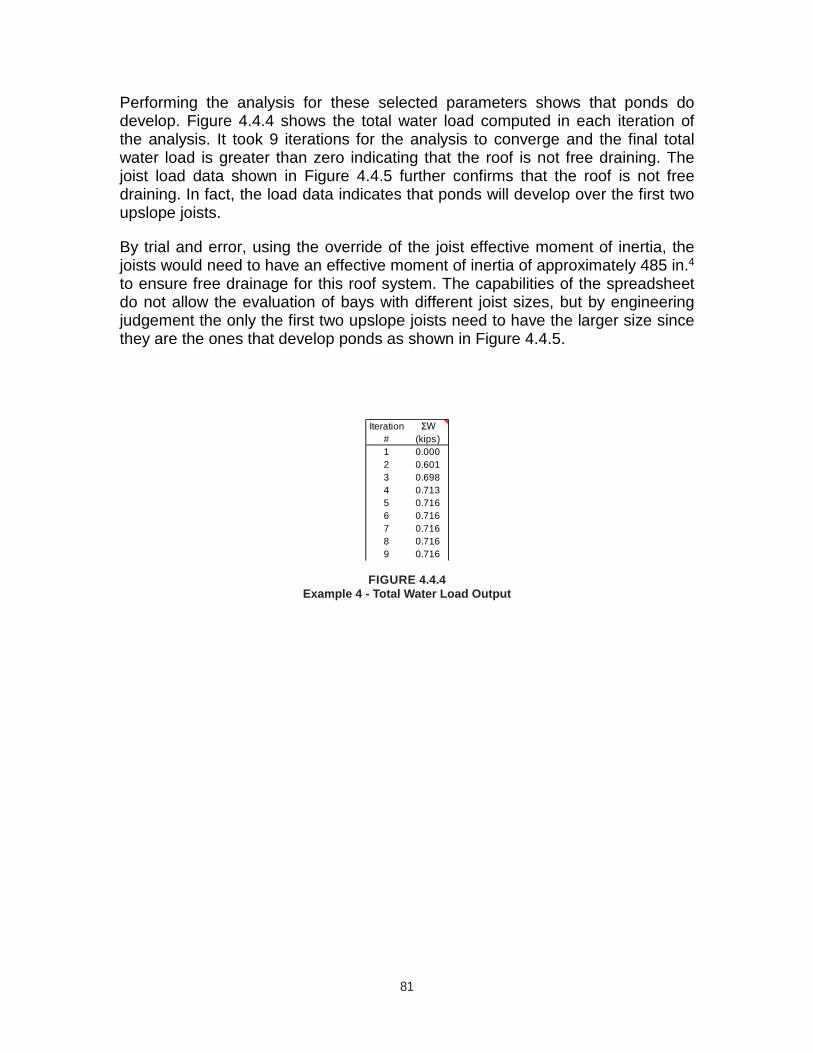
81
81
Performing the analysis for these selected parameters shows that ponds do develop. Figure 4.4.4 shows the total water load computed in each iteration of the analysis. It took 9 iterations for the analysis to converge and the final total water load is greater than zero indicating that the roof is not free draining. The joist load data shown in Figure 4.4.5 further confirms that the roof is not free draining. In fact, the load data indicates that ponds will develop over the first two upslope joists.
By trial and error, using the override of the joist effective moment of inertia, the joists would need to have an effective moment of inertia of approximately 485 in.4to ensure free drainage for this roof system. The capabilities of the spreadsheet do not allow the evaluation of bays with different joist sizes, but by engineering judgement the only the first two upslope joists need to have the larger size since they are the ones that develop ponds as shown in Figure 4.4.5.
Iteration ΣW# (kips)1 0.0002 0.6013 0.6984 0.7135 0.7166 0.7167 0.7168 0.7169 0.716
Figure 4.4.4 Example 4 – Total Water Load Output
FIGURE 4.4.4Example 4 - Total Water Load Output

82 82
Figu
re 4
.4.5
Exa
mpl
e 4
–D
etai
led
Jois
t Out
put
Jois
tNu
mbe
r0'
0"
2' 0
"4'
0"
6' 0
"8'
0"
10' 0
"12
' 0"
14' 0
"16
' 0"
18' 0
"20
' 0"
22' 0
"24
' 0"
26' 0
"28
' 0"
30' 0
"32
' 0"
34' 0
"36
' 0"
38' 0
"40
' 0"
124
424
424
424
424
424
424
424
424
424
424
424
424
424
424
424
424
424
424
424
424
42
244
244
244
244
244
244
244
244
244
244
244
244
244
244
244
244
244
244
244
244
244
324
424
424
424
424
424
424
424
424
424
424
424
424
424
424
424
424
424
424
424
424
44
244
244
244
244
244
244
244
244
244
244
244
244
244
244
244
244
244
244
244
244
244
524
424
424
424
424
424
424
424
424
424
424
424
424
424
424
424
424
424
424
424
424
46
244
244
244
244
244
244
244
244
244
244
244
244
244
244
244
244
244
244
244
244
244
724
424
424
424
424
424
524
624
825
025
125
125
125
024
824
624
524
424
424
424
424
48
244
244
244
245
249
255
260
265
269
271
271
271
269
265
260
255
249
245
244
244
244
912
212
212
212
212
412
512
612
712
812
912
912
912
812
712
612
512
412
212
212
212
2
NOTE
S:1.
Loa
ds c
orre
spon
d to
ASD
load
com
bina
tions
.2.
Hig
hlig
hted
dis
tribu
ted
load
s m
ay c
ause
a lo
cal o
vers
tress
, see
not
es o
n Po
ndin
g In
stru
ctio
ns s
prea
dshe
et.
Tota
l Dis
trib
uted
Loa
d on
Joi
st a
s a
Func
tion
of D
ista
nce
from
Bot
tom
Sup
port
(lb/
ft)
FIGURE 4.4.5Example 4 - Detailed Joist Output

83
83
Example 5: Two-way System, Impounded Water
Figure 4.5.1 Roof Framing
83
Example 5: Two-way System, Impounded Water
Figure 4.5.1 Roof FramingFIGURE 4.5.1Roof Framing

8484
Given: Select joists to use in the framing plan shown in Figure 4.5.1 and evaluate the roof for ponding. Allow the size of the joists to vary based on the supported height of impounded water. Use ASD.
Project Description and Loading:
• Dead Load, wD = 14 psf
• Girder Dead Load, wD = 1 psf
• Live Load, wL = 20 psf (reducible)
• The secondary drains consist of scuppers in the parapet walls.
• Assume a hydraulic head of 1 in. was calculated.
Hand Calculation Solution:
The water level at the blocked drain is equal to the difference in elevation between the drain the overflow scupper, ds, and the hydraulic head, dh, which is assumed to be calculated as 1 in.
( ) ( )= − − =sd 2 in. 10 in. 12 in.
Determine the rain load at the blocked drain:
( ) ( )= + = + =s hR 5.2 d d 5.2 12 in. 1in. 67.6 psf
Rain loads at other locations are computed similarly and shown in Figure 4.5.2.
Determine the loads on Joist J1:
( ) ( )( )= = =Dw 14 psf S 14 psf 5 ft. 70 lbs ft.
( ) ( )( )= = =Lw L S 20 psf 5 ft. 100 lbs ft.
( )( )+ = = =
R67.6 psf 61.1psfw S 64.35 psf 5 ft. 322 lbs ft.
2
+ = + =D Lw 70 lbs ft. 100 lbs ft. 170 lbs ft.
+ = + =D Rw 70 lbs ft. 322 lbs ft. 392 lbs ft.

8585
Figure 4.5.2 Impounded Water Loads
From the SJI Standard ASD Load Table for Open Web Steel Joists, K-Series try a 28K10
wc = 424 lbs/ft. > 392 lbs/ft. OK
Check deflection of the joist due to rain load against a limit of L/240:
wL/360 = 284 lbs/ft.
( ) = = =
L 240 L 360360 360w w 284 lbs ft. 426 lbs ft.240 240
= > =L 240 Rw 426 lbs ft. w 322 lbs ft. OK
Use a 28K10 joist.
The remaining joists sizes that were determined are shown on Figure 4.5.1.
85
Figure 4.5.2 Impounded Water Loads
From the SJI Standard ASD Load Table for Open Web Steel Joists, K-Series try a 28K10
wc = 424 lbs/ft. > 392 lbs/ft. OK
Check deflection of the joist due to rain load against a limit of L/240:
wL/360 = 284 lbs/ft.
( ) = = =
L 240 L 360360 360w w 284 lbs ft. 426 lbs ft.240 240
= > =L 240 Rw 426 lbs ft. w 322 lbs ft. OK
Use a 28K10 joist.
The remaining joists sizes that were determined are shown on Figure 4.5.1.
FIGURE 4.5.2Impounded Water Loads

8686
Determine the loads on Joist Girder G1:
( ) ( )( )( )= = = =D jP 15 psf SL 15 psf 5 ft. 40 ft. 3,000 lbs 3.0 kips
( ) ( )( )( )= = = =L jP 12 psf SL 12 psf 5 ft. 40 ft. 2,400 lbs 2.4 kips
( ) ( )( )( )= = = =R,max jP 61.1psf SL 61.1psf 5 ft. 40 ft. 12,220 lbs 12.22 kips
( ) ( )( )( )= = = =R,min jP 22.1psf SL 22.1psf 5 ft. 40 ft. 4,420 lbs 4.42 kips
The D+R load combination controls. Panel point loads range from 7.4 kips to 15.2 kips, therefore use a special Joist Girder.
Use a 36G8NSP with D+R loading diagram shown in Figure 4.5.2.
Check ponding:
Determine the effective moment of inertia of the Joist Girder. The equation for determination of the moment of inertia presented in Appendix B of this Digest is not applicable to this special Joist Girder, thus the gross moment of inertia will be estimated from the maximum moment. Given the loading shown in Figure 4.5.2, the maximum girder moment is 5424 kip-in. Assuming an effective depth of 34 in. (= 36 in. – 2 in.), the chord force is 159.5 kips (= 5424 kip-in./34 in.) and assuming a stress of 28 ksi, the cross-sectional area of each chord is 5.7 in.2 (= 159.5 kips/28 ksi). The gross moment of inertia can then be approximated using the parallel axis theorem:
( ) = = =
22 2 4
g34 in.I 2Ad 2 5.7 in. 3,295 in.
2
= = =4
g 4e
I 3,295 in.I 2,865 in.1.15 1.15
For the ponding check, conservatively use the 28K7 joist (wLL = 203 lbs/ft.).
( )−= 3 6j LLI 26.767 w L 10
( )( ) ( )−= − =3 6 4
jI 26.767 203 lbs ft. 40 ft. 0.33 ft. 10 339.2 in.
= = =4
j 4e
I 339.2 in.I 295.0 in.1.15 1.15

8787
Compute the stiffness factor for the Joist Girder (primary member):
( )( )( )
= = =44
s pp 7 7 4
p
32L L 32 40 ft. 40 ft.C 0.11
10 I 10 2,865 in.
Compute the stiffness factor for the joist (secondary member):
( )( )( )
= = =44
ss 7 7 4
s
32 5 ft. 40 ft.32SLC 0.1410 I 10 295.0 in.
Check against the simplified method of design by evaluating Equation A-2-1 of the AISC Specification (AISC 2016). The details of the deck are omitted in this example; thus the Equation A-2-2 will not be evaluated.
+ ≤p sC 0.9C 0.25 (AISC Eq. A-2-1)
( )+ = + = ≤p sC 0.9C 0.11 0.9 0.14 0.24 0.25 OK
Ponding instability does not occur.
Spreadsheet Solution using the SJI Roof Bay Analysis Tool:
The capabilities of the SJI Roof Bay Analysis spreadsheet do not allow the evaluation of bays with different sized joists. However, partial and conservative results can still be obtained.
Entering the relevant data into the Roof Bay Analysis sheet yields joist and Joist Girders that are sufficient for the dead and live loads but not the impounded water. Checks for strength under rain load and stability under ponding conditions are performed on the Ponding Analysis sheet. The resulting general input on the Ponding Analysis sheet is shown Figure 4.5.3.
General Input (Defined in Roof Bay Analysis Spreadsheet)
Design Methodology ASD40.00 ft40.00 ft24K 7253 lb/ft
40G8N5.4K5.4 k8
14.00 psf25.00 lb/ft0.00 psf
Dead Load on Joists
Snow Load
Joist Girder Size
Number of Joist Spaces
Joist Girder Self Weight
Joist Allowable Load
Joist Girder Allowable Load
Joist SpanJoist Girder SpanJoist Size
Figure 4.5.3 Example 5 – General InputFIGURE 4.5.3
Example 5 - General Input
87
Compute the stiffness factor for the Joist Girder (primary member):
( )( )( )
= = =44
s pp 7 7 4
p
32L L 32 40 ft. 40 ft.C 0.11
10 I 10 2,865 in.
Compute the stiffness factor for the joist (secondary member):
( )( )( )
= = =44
ss 7 7 4
s
32 5 ft. 40 ft.32SLC 0.1410 I 10 295.0 in.
Check against the simplified method of design by evaluating Equation A-2-1 of the AISC Specification (AISC 2016). The details of the deck are omitted in this example; thus the Equation A-2-2 will not be evaluated.
+ ≤p sC 0.9C 0.25 (AISC Eq. A-2-1)
( )+ = + = ≤p sC 0.9C 0.11 0.9 0.14 0.24 0.25 OK
Ponding instability does not occur.
Spreadsheet Solution using the SJI Roof Bay Analysis Tool:
The capabilities of the SJI Roof Bay Analysis spreadsheet do not allow the evaluation of bays with different sized joists. However, partial and conservative results can still be obtained.
Entering the relevant data into the Roof Bay Analysis sheet yields joist and Joist Girders that are sufficient for the dead and live loads but not the impounded water. Checks for strength under rain load and stability under ponding conditions are performed on the Ponding Analysis sheet. The resulting general input on the Ponding Analysis sheet is shown Figure 4.5.3.
General Input (Defined in Roof Bay Analysis Spreadsheet)
Design Methodology ASD40.00 ft40.00 ft24K 7253 lb/ft
40G8N5.4K5.4 k8
14.00 psf25.00 lb/ft0.00 psf
Dead Load on Joists
Snow Load
Joist Girder Size
Number of Joist Spaces
Joist Girder Self Weight
Joist Allowable Load
Joist Girder Allowable Load
Joist SpanJoist Girder SpanJoist Size
Figure 4.5.3 Example 5 – General Input

88
88
Given that strength of the bay is assessed using the D + R load combination for the building code and the rain load, R, is computed based on the undeformed roof, the required strengths from the SJI Roof Bay Analysis Tool for this case will be accurate despite not having input the final sizes. Ponding specific input isdefined as shown in Figure 4.5.4. Note that the load is computed on the undeformed roof (i.e., rain load, R, as opposed to impounded water load, P) and the default load factors result in the D + R load combination.
Ponding Specific Input
3.00 inCompute load on deformed roof: N (Y or N)
0.00 lb/ft3
Force level adjustment factor (α ): 1.60override:
Load factors:1.00
override:0.00
override:1.00
override:
-10.000 in0.000 in
-10.000 in0.000 in
Camber:0.625 in
override: in0.625 in
override: in0.625 in
override: inBay is mirrored:
Y (Y or N)N (Y or N)Y (Y or N)Y (Y or N)
Joist support is wall:N (Y or N)N (Y or N)
N (Y or N)Y (Y or N)
Effective moment of inertia:215.1 in4
(Values include override: in4
1.15 factor for 1,623 in4
shear deformations) override: in4
Joist is rigid:
Bottom Joist Girder
Top Joist Girder
Top
Joist Girder
Joist 1 (Leftmost)Joist 9 (Rightmost)
Snow
Dead
Top of roof elevation:
Bottom Right
Snow density:
BottomTop
Bottom
Right
Joist
Left
Bottom LeftTop RightTop Left
Water level relative to zero datum:
Joist
Ponded Water
Figure 4.5.4 Example 5 – Ponding Specific Input (D+R)
FIGURE 4.5.4Example 5 - Ponding Specific Input (D+R)

8989
The analysis is performed by clicking the Run Analysis button. The resulting output is shown in Figures 4.5.5 and 4.5.6. As expected, the sizes determined by the Roof Bay Analysis sheet for dead and live load only are insufficient for the case with impounded water. However, as noted above, the required strengths are accurate and can be used for design.
The joists can be selected based on the equivalent loads shown in Figure 4.5.5 and using the SJI Standard Load Tables. The resulting sizes range from 28K7 to 28K10, similar to as shown in Figure 4.5.1. The Joist Girder can be specified as special with panel point loads as shown in Figure 4.5.6 (these panel point loads differ from those shown in Figure 4.5.2 because the SJI Roof Bay Analysis Tool accounts for the camber in the joist and Joist Girder). However, the stability check still needs to be performed.
Joist Output
Joist Max Shear Equiv. Load Max Moment Equiv. Load Strength StrengthNumber kips lb/ft kip-ft lb/ft Ratio Check
1 7.68 384.0 76.26 383.5 1.52 NO GOOD2 7.16 357.9 71.04 357.4 1.41 NO GOOD3 6.41 320.3 63.53 319.8 1.27 NO GOOD4 5.70 284.8 56.42 284.3 1.13 NO GOOD5 5.03 251.3 49.71 250.8 0.99 OKAY6 4.40 219.8 43.42 219.3 0.87 OKAY7 3.81 190.3 37.53 189.8 0.75 OKAY8 3.29 164.7 32.49 164.3 0.65 OKAY
NOTES: 1. Loads and load effects correspond to ASD load combinations.2. Strength ratio computed assuming shear capacity equal to 12.5% of the end reaction for shear reversals, see Note 14 on the Ponding Instructions spreadsheet.
Joist size can be revised by inputting larger loads in the ''optional increased load data'' section of the Roof Bay Analysis spreadsheet
RUN ANALYSIS
Figure 4.5.5 Example 5 – Joist Output (D+R)
89
The analysis is performed by clicking the Run Analysis button. The resulting output is shown in Figures 4.5.5 and 4.5.6. As expected, the sizes determined by the Roof Bay Analysis sheet for dead and live load only are insufficient for the case with impounded water. However, as noted above, the required strengths are accurate and can be used for design.
The joists can be selected based on the equivalent loads shown in Figure 4.5.5 and using the SJI Standard Load Tables. The resulting sizes range from 28K7 to 28K10, similar to as shown in Figure 4.5.1. The Joist Girder can be specified as special with panel point loads as shown in Figure 4.5.6 (these panel point loads differ from those shown in Figure 4.5.2 because the SJI Roof Bay Analysis Tool accounts for the camber in the joist and Joist Girder). However, the stability check still needs to be performed.
Joist Output
Joist Max Shear Equiv. Load Max Moment Equiv. Load Strength StrengthNumber kips lb/ft kip-ft lb/ft Ratio Check
1 7.68 384.0 76.26 383.5 1.52 NO GOOD2 7.16 357.9 71.04 357.4 1.41 NO GOOD3 6.41 320.3 63.53 319.8 1.27 NO GOOD4 5.70 284.8 56.42 284.3 1.13 NO GOOD5 5.03 251.3 49.71 250.8 0.99 OKAY6 4.40 219.8 43.42 219.3 0.87 OKAY7 3.81 190.3 37.53 189.8 0.75 OKAY8 3.29 164.7 32.49 164.3 0.65 OKAY
NOTES: 1. Loads and load effects correspond to ASD load combinations.2. Strength ratio computed assuming shear capacity equal to 12.5% of the end reaction for shear reversals, see Note 14 on the Ponding Instructions spreadsheet.
Joist size can be revised by inputting larger loads in the ''optional increased load data'' section of the Roof Bay Analysis spreadsheet
RUN ANALYSIS
Figure 4.5.5 Example 5 – Joist Output (D+R)FIGURE 4.5.5Example 5 - Joist Output (D+R)

90
90
Joist Girder Output
Joist Joist React. Joist React.Number kips kips
2 7.16 7.163 6.41 6.414 5.70 5.705 5.03 5.036 4.40 4.407 3.81 3.818 3.29 3.29
11.64 11.6411.64 11.642.16 2.16
NO GOOD NO GOODNOTES: 1. Loads and load effects correspond to ASD load combinations.
2. Highlighted panel point loads may cause a local overstress, see notes in Ponding Instructions.
12.9411.5210.18
Joist Girder size can be revised by inputting larger loads in the ''optional increased load data'' section of the Roof Bay Analysis spreadsheet
Top Joist GirderPanel Point Load
kips
Strength Check:
Bottom Joist Girder
14.44
Panel Point Loadkips
14.4412.9411.52
8.927.746.71
Strength Ratio:Strength Check:
Equiv. Load for Shear (kips):
Strength Ratio:
Equiv. Load for Shear (kips):Equiv. Load for Moment (kips): Equiv. Load for Moment (kips):
10.188.927.746.71
Figure 4.5.6 Example 5 – Joist Girder Output (D+R)FIGURE 4.5.6Example 5 - Joist Girder Output (D+R)
91
An exact stability check under ponding conditions is not possible using the SJI Roof Bay Analysis Tool for bays with different size joists. However, the results will be conservative if the smallest joist is used. The smallest joist in the bay is a 28K7. To obtain this joist size, a joist load of 285 lbs/ft. is entered into the optional increased load data table in the Roof Bay Analysis sheet as shown in Figure 4.5.7. The Joist Girder is designated as special and will be entered in the Ponding Analysis sheet by overriding the effective moment of inertia of the Joist Girder to 2,865 in.4 as approximated in the hand calculations. The updated ponding specific input is shown in Figure 4.5.8.
OPTIONAL INCREASED LOAD DATA Member I Ieff = I/1.15Joist Load 285 lb / ft 28K 7 339 295 in.4
JG Panel Point Load kips 40G8N5.4K 1866 1623 in.4
Figure 4.5.7 Example 5 – Optional Increased Load Data (Revised Design)
Ponding Specific Input
3.00 inCompute load on deformed roof: N (Y or N)
0.00 lb/ft3
Force level adjustment factor (α ): 1.60override:
Load factors:1.00
override:0.00
override:1.00
override:
-10.000 in0.000 in
-10.000 in0.000 in
Camber:0.625 in
override: in0.625 in
override: in0.625 in
override: inBay is mirrored:
Y (Y or N)N (Y or N)Y (Y or N)Y (Y or N)
Joist support is wall:N (Y or N)N (Y or N)
N (Y or N)Y (Y or N)
Effective moment of inertia:295.0 in4
(Values include override: in4
1.15 factor for 2,865 in4
shear deformations) override: 2865 in4
Joist is rigid:
Bottom Joist Girder
Top Joist Girder
Top
Joist Girder
Joist 1 (Leftmost)Joist 9 (Rightmost)
Snow
Dead
Top of roof elevation:
Bottom Right
Snow density:
BottomTop
Bottom
Right
Joist
Left
Bottom LeftTop RightTop Left
Water level relative to zero datum:
Joist
Ponded Water
Figure 4.5.8 Example 5 – Ponding Specific Input (D+0.75P+0.75S)
FIGURE 4.5.7Example 5 - Optional Increased Load Data (Revised Design)
91
An exact stability check under ponding conditions is not possible using the SJI Roof Bay Analysis Tool for bays with different size joists. However, the results will be conservative if the smallest joist is used. The smallest joist in the bay is a 28K7. To obtain this joist size, a joist load of 285 lbs/ft. is entered into the optional increased load data table in the Roof Bay Analysis sheet as shown in Figure 4.5.7. The Joist Girder is designated as special and will be entered in the Ponding Analysis sheet by overriding the effective moment of inertia of the Joist Girder to 2,865 in.4 as approximated in the hand calculations. The updated ponding specific input is shown in Figure 4.5.8.
OPTIONAL INCREASED LOAD DATA Member I Ieff = I/1.15Joist Load 285 lb / ft 28K 7 339 295 in.4
JG Panel Point Load kips 40G8N5.4K 1866 1623 in.4
Figure 4.5.7 Example 5 – Optional Increased Load Data (Revised Design)
Ponding Specific Input
3.00 inCompute load on deformed roof: N (Y or N)
0.00 lb/ft3
Force level adjustment factor (α ): 1.60override:
Load factors:1.00
override:0.00
override:1.00
override:
-10.000 in0.000 in
-10.000 in0.000 in
Camber:0.625 in
override: in0.625 in
override: in0.625 in
override: inBay is mirrored:
Y (Y or N)N (Y or N)Y (Y or N)Y (Y or N)
Joist support is wall:N (Y or N)N (Y or N)
N (Y or N)Y (Y or N)
Effective moment of inertia:295.0 in4
(Values include override: in4
1.15 factor for 2,865 in4
shear deformations) override: 2865 in4
Joist is rigid:
Bottom Joist Girder
Top Joist Girder
Top
Joist Girder
Joist 1 (Leftmost)Joist 9 (Rightmost)
Snow
Dead
Top of roof elevation:
Bottom Right
Snow density:
BottomTop
Bottom
Right
Joist
Left
Bottom LeftTop RightTop Left
Water level relative to zero datum:
Joist
Ponded Water
Figure 4.5.8 Example 5 – Ponding Specific Input (D+0.75P+0.75S)

91
91
An exact stability check under ponding conditions is not possible using the SJI Roof Bay Analysis Tool for bays with different size joists. However, the results will be conservative if the smallest joist is used. The smallest joist in the bay is a 28K7. To obtain this joist size, a joist load of 285 lbs/ft. is entered into the optional increased load data table in the Roof Bay Analysis sheet as shown in Figure 4.5.7. The Joist Girder is designated as special and will be entered in the Ponding Analysis sheet by overriding the effective moment of inertia of the Joist Girder to 2,865 in.4 as approximated in the hand calculations. The updated ponding specific input is shown in Figure 4.5.8.
OPTIONAL INCREASED LOAD DATA Member I Ieff = I/1.15Joist Load 285 lb / ft 28K 7 339 295 in.4
JG Panel Point Load kips 40G8N5.4K 1866 1623 in.4
Figure 4.5.7 Example 5 – Optional Increased Load Data (Revised Design)
Ponding Specific Input
3.00 inCompute load on deformed roof: N (Y or N)
0.00 lb/ft3
Force level adjustment factor (α ): 1.60override:
Load factors:1.00
override:0.00
override:1.00
override:
-10.000 in0.000 in
-10.000 in0.000 in
Camber:0.625 in
override: in0.625 in
override: in0.625 in
override: inBay is mirrored:
Y (Y or N)N (Y or N)Y (Y or N)Y (Y or N)
Joist support is wall:N (Y or N)N (Y or N)
N (Y or N)Y (Y or N)
Effective moment of inertia:295.0 in4
(Values include override: in4
1.15 factor for 2,865 in4
shear deformations) override: 2865 in4
Joist is rigid:
Bottom Joist Girder
Top Joist Girder
Top
Joist Girder
Joist 1 (Leftmost)Joist 9 (Rightmost)
Snow
Dead
Top of roof elevation:
Bottom Right
Snow density:
BottomTop
Bottom
Right
Joist
Left
Bottom LeftTop RightTop Left
Water level relative to zero datum:
Joist
Ponded Water
Figure 4.5.8 Example 5 – Ponding Specific Input (D+0.75P+0.75S)FIGURE 4.5.8Example 5 - Ponding Specific Input (D+0.75P+0.75S)

9292
Again, the analysis is performed by clicking the Run Analysis button. The resulting output is shown in Figures 4.5.9 and 4.5.10. The results indicate that the joist along Grid Line 2, the two joists in the bay adjacent to Grid Line 2, as well as the Joist Girders are insufficient. However, the loads are shown in these tables are conservative as long as the stiffness of the members is not less than what was used in the analysis (Figure 4.5.8). Therefore, the overstressed joists can be safely designed for the loads shown in Figure 4.5.9 and the Joist Girder can be safely designed for the panel point loads shown in Figure 4.5.10. Note, that the loads shown in Figures 4.5.5 and 4.5.6 for the D+R load combination also need to be satisfied.
Joist Output
Joist Max Shear Equiv. Load Max Moment Equiv. Load Strength StrengthNumber kips lb/ft kip-ft lb/ft Ratio Check
1 7.68 384.0 76.26 383.5 1.29 NO GOOD2 7.16 357.9 71.04 357.4 1.21 NO GOOD3 6.41 320.3 63.53 319.8 1.08 NO GOOD4 5.70 284.8 56.42 284.3 0.96 OKAY5 5.03 251.3 49.71 250.8 0.85 OKAY6 4.40 219.8 43.42 219.3 0.74 OKAY7 3.81 190.3 37.53 189.8 0.64 OKAY8 3.29 164.7 32.49 164.3 0.55 OKAY
NOTES: 1. Loads and load effects correspond to ASD load combinations.2. Strength ratio computed assuming shear capacity equal to 12.5% of the end reaction for shear reversals, see Note 14 on the Ponding Instructions spreadsheet.
Joist size can be revised by inputting larger loads in the ''optional increased load data'' section of the Roof Bay Analysis spreadsheet
RUN ANALYSIS
Figure 4.5.9 Example 5 – Joist Output (D+0.75P+0.75S)
92
Again, the analysis is performed by clicking the Run Analysis button. The resulting output is shown in Figures 4.5.9 and 4.5.10. The results indicate that the joist along Grid Line 2, the two joists in the bay adjacent to Grid Line 2, as well as the Joist Girders are insufficient. However, the loads are shown in these tables are conservative as long as the stiffness of the members is not less than what was used in the analysis (Figure 4.5.8). Therefore, the overstressed joists can be safely designed for the loads shown in Figure 4.5.9 and the Joist Girder can be safely designed for the panel point loads shown in Figure 4.5.10. Note, that the loads shown in Figures 4.5.5 and 4.5.6 for the D+R load combination also need to be satisfied.
Joist Output
Joist Max Shear Equiv. Load Max Moment Equiv. Load Strength StrengthNumber kips lb/ft kip-ft lb/ft Ratio Check
1 7.68 384.0 76.26 383.5 1.29 NO GOOD2 7.16 357.9 71.04 357.4 1.21 NO GOOD3 6.41 320.3 63.53 319.8 1.08 NO GOOD4 5.70 284.8 56.42 284.3 0.96 OKAY5 5.03 251.3 49.71 250.8 0.85 OKAY6 4.40 219.8 43.42 219.3 0.74 OKAY7 3.81 190.3 37.53 189.8 0.64 OKAY8 3.29 164.7 32.49 164.3 0.55 OKAY
NOTES: 1. Loads and load effects correspond to ASD load combinations.2. Strength ratio computed assuming shear capacity equal to 12.5% of the end reaction for shear reversals, see Note 14 on the Ponding Instructions spreadsheet.
Joist size can be revised by inputting larger loads in the ''optional increased load data'' section of the Roof Bay Analysis spreadsheet
RUN ANALYSIS
Figure 4.5.9 Example 5 – Joist Output (D+0.75P+0.75S)FIGURE 4.5.9Example 5 - Joist Output (D+0.75P+0.75S)

93
93
Joist Girder Output
Joist Joist React. Joist React.Number kips kips
2 7.16 7.163 6.41 6.414 5.70 5.705 5.03 5.036 4.40 4.407 3.81 3.818 3.29 3.29
11.64 11.6411.64 11.642.16 2.16
NO GOOD NO GOODNOTES: 1. Loads and load effects correspond to ASD load combinations.
2. Highlighted panel point loads may cause a local overstress, see notes in Ponding Instructions.
12.9411.5210.18
Joist Girder size can be revised by inputting larger loads in the ''optional increased load data'' section of the Roof Bay Analysis spreadsheet
Top Joist GirderPanel Point Load
kips
Strength Check:
Bottom Joist Girder
14.44
Panel Point Loadkips
14.4412.9411.52
8.927.746.71
Strength Ratio:Strength Check:
Equiv. Load for Shear (kips):
Strength Ratio:
Equiv. Load for Shear (kips):Equiv. Load for Moment (kips): Equiv. Load for Moment (kips):
10.188.927.746.71
Figure 4.5.10 Example 5 – Joist Girder Output (D+0.75P+0.75S)FIGURE 4.5.10Example 5 - Joist Girder Output (D+0.75P+0.75S)
9494
CHAPTER 5SUMMARY AND CONCLUSIONS
Ponding is an important consideration in the design of steel joist roofs, one that poses unique challenges due to the nonlinear nature of the loading. This Technical Digest has presented relevant code provisions for the design of ponding, three separate methodologies to address ponding, and design examples illustrating the various methods. The following key observations have been made:
• Steel joists are economical and efficient for roof systems, but their use requires that Design Professionals give close attention to deflections.What appears to be a negligible secondary effect, in the case of ponding, can become a necessary strength design consideration.
• Three separate methodologies have been presented in this digest for designing steel joist roof systems to prevent ponding.
• One of the methods, the direct analysis method, is implemented within the SJI Roof Bay Analysis Tool. This is a state-of-the-art procedure which directly assesses loads in the ponding condition based on the deformed shape of the roof. In this methodology, the effect of roof slopes and camber are accounted for explicitly and a rational assessment of the strength of steel joists and Joist Girders is performed.
• Close attention by the Design Professional is critical to prevent collapse due to ponding. It is important to understand how water is displaced on the roof system and where potential ponding situations might occur. Outcrops of building lines along the low side of a sloped roof can lead to potential problems if water displacement is not controlled. Location and size of drains are important as well as properly designed overflow scuppers.Maintenance of these drains and scuppers to keep debris from accumulating should be routine.
CHAPTER 5

95
95
REFERENCES
ANSI/AISC 360-16 (AISC 2016), Specification for Structural Steel Buildings, July 7, 2016, American Institute of Steel Construction, Inc., Chicago, IL.
ANSI/SJI 100-2015 (SJI 2015), Standard Specification for K-Series, LH-Series, and DLH-Series Open Web Steel Joists and for Joist Girders, Effective January 1, 2015, Steel Joist Institute, Florence, SC.
ASCE 7-16 (ASCE 2016), Minimum Design Loads and Associated Criteria for Buildings and Other Structures, ASCE 7-16, American Society of Civil Engineers, Reston, VA.
Colombi, Pierluigi (2006). “The Ponding Problem on Flat Steel Roof Grids.” Journal of Constructional Steel Research, Vol. 62, No. 7, 647–655.
FM Global (FM 2016), “Loss Prevention Data 1-54, Roof Loads For New Construction,” FM Global, Norwood, MA.
ICC (2015a), 2015 International Building Code, International Code Council,Washington, DC
ICC (2015b), 2015 International Plumbing Code, International Code Council, Washington, DC.
Marino, Frank J. (1966) “Ponding of Two-Way Roof Systems” Engineering Journal, AISC, Vol. 3, No. 3, July.
Silver, Edward (2010) “A Strength Design Approach to Ponding” Engineering Journal, AISC, Vol. 47, No. 3, 175-187.
Additional references relevant to ponding, but not cited within this Digest include:
Burgett, Lewis B. (1973) “Fast Check for Ponding” Engineering Journal, AISC, Vol. 10, No. 1, January.
Carter, Charles J. and Zuo, Jiahong (1999), “Ponding Calculations in LRFD and ASD” Engineering Journal, AISC, Vol. 36, No. 3, Third Quarter.
Chinn, James (1965) “Failure of Simply-Supported Flat Roofs by Ponding of Rain” Engineering Journal, AISC, Vol. 2, No. 2, April.
REFERENCES

9696
Chinn, James, Mansouri, Abdulwahab H., and Adams, Stanley F. (1969) “Ponding of Liquids on Flat Roofs” Journal of Structural Division, ASCE, Vol. 95, No. ST5, May.
Chinn, James, Mansouri, Abdulwahab H., and Adams, Stanley F.(1970) Closure, “Ponding of Liquids on Flat Roofs” Journal of the Structural Division, ASCE, Vol. 96, No. ST9, September.
Fisher, James, West, Michael, and Van De Pas, Julius (1991) Designing with Steel Joists, Joist Girders, and Steel Deck, Nucor Corporation.
Fisher, James M. and Pugh, Carl W. (2007) Structural Design of Steel Joist Roofs to Resist Ponding Loads, Technical Digest No. 3, Steel Joist Institute, Myrtle Beach, SC.
Haussler, Robert W.(1962) “Roof Deflection Caused by Rainwater Pools” ASCE Civil Engineering magazine, Vol. 32, No. 10, October.
Heinzerling, John E. (1971) Structural Design of Steel Joist Roofs to ResistPonding Loads, Technical Digest No. 3, Steel Joist Institute, Myrtle Beach, SC.
Krenzi, Edward W. and Bohannan, Billy (1964) “Increases in Deflection andStresses caused by Ponding of Water on Roofs” Forest Products Journal, September.
Pandit, G.S. (1970) Discussion of “Ponding of Liquids on Flat Roofs” Journal of the Structural Division, ASCE, Vol. 96, No. ST1, January.
Patterson, Stephen and Mehta, Madan (2001) Roofing Design and Practice, Prentice-Hall, Inc., Upper Saddle River, NJ.
Salama, Ahmed E. and Moody, Martin F. (1967) “Analysis of Beams and Plates for Ponding Loads” Journal of the Structural Division, ASCE, Vol. 93, No. ST1, February.
Sawyer, Donald A.(1967) Discussion of “Ponding of Two-Way Roof Systems” Engineering Journal, AISC, Vol. 4, No. 1, January.
Sawyer, Donald A. (1967) “Ponding of Rainwater on Flexible Roof Systems” Journal of the Structural Division, ASCE, Vol. 93, No. ST1, February.
Sawyer, Donald A. (1968) “Roof-Structure Roof-Drainage Interaction” Journal of the Structural Division, ASCE, Vol. 94, No. ST1, January.

9797
APPENDIX ANOMENCLATURE
A = Roof area serviced by a single drainage system, ft.2
Cp = Stiffness factor for primary member in a flat roof
Cs = Stiffness factor for secondary member in a flat roof
D = Dead load
dh = Additional depth of water on the undeflected roof above the inlet of the secondary drainage system at its design flow (i.e. the hydraulic head), in.
ds = Depth of water on the undeflected roof up to the inlet of the secondary drainage system when the primary drainage system is blocked (i.e. static head), in.
E = Modulus of elasticity, ksi or lbs/in.2
fo = Stress due to impounded water due to either nominal rain or snow loads (exclusive of the ponding contribution), and other loads acting concurrently, ksi
F1 = Uniform load on the span due to dead load and a percentage of the live load acting at the onset of ponding, lbs
F2 = Uniform load on the span due to portion of the water load acting from the height above roof surface at the joist support to the level of water being contained, lbs
F3 = Sinusoidal load on the span due to the ponding of the water load, lbs
Fy = Specified minimum yield strength, ksi
h = Height above roof surface at point of support of joist to level of water, in.
I = Moment of inertia of flexural member, in.4
Ie = Effective moment of inertia, in.4
Ij = Moment of inertia of joist, in.4
IJG = Moment of inertia of Joist Girder, in.4
Ip = Moment of inertia of primary member, (e.g. Joist Girder, IJG), in.4
APPENDIX A

9898
Is = Moment of inertia of secondary member, (e.g. joist, Ij), in.4
i = Design rainfall intensity as specified by the code having jurisdiction, in./hr
L = Length, ft.
Lp = Length of primary member, ft.
Ls = Length of secondary member, ft.
MCL = Maximum joist moment under ponding conditions, lb-ft.
M1 = Maximum permissible joist moment under ponding conditions, lb-ft.
pg = Ground snow load, psf
P = Ponded water load
Pc = Specified panel point load capacity for a Joist Girder, kips
PD = Panel point dead load, kips
PR = Panel point rain load, kips
PS = Panel point snow load, kips
Q = Flow rate out of a single drainage system, gal/min.
R = Rain load on the undeflected roof
Rp = End reaction of joist under ponding conditions, lbs.
R1 = Maximum permissible joist end reaction under ponding conditions, lbs.
S = Snow load
S = Flexural member spacing; spacing of secondary members, ft.
W = Horizontal distance from eave to ridge, ft.
w = Uniform load, lbs/ft. or psf
wc = Specified uniform load capacity for a joist from the SJI Load Tables,lbs/ft.
wD = Uniform dead load, lbs/ft. or psf
wL = Uniform live load, lbs/ft. or psf

9999
wL/240 = Uniform load which will produce an approximate deflection of 1/240 of the span, lbs/ft.
wL/360 = Uniform load which will produce an approximate deflection of 1/360 of the span of a joist (red figure in the SJI Load Tables), lbs/ft.
wR = Uniform rain load, lbs/ft. or psf
wS = Uniform snow load, lbs/ft. or psf
w1 = Maximum permissible joist load under ponding conditions, lbs/ft.
α = Force level adjustment factor
Δ = Centerline deflection of flexural member, in.
Δc = Centerline top chord ordinate from horizontal datum connecting top chord ends, in. (Positive upward – Negative downward).
γ = Specific weight, lbs/ft.3 (γ = 62.4 lbs/ft.3 for water)

100
100
APPENDIX BCALCULATING EFFECTIVE MOMENTS OFINERTIA FOR STEEL JOISTS AND JOIST
GIRDERSFor K, LH and DLH-Series joists:The approximate gross moment of inertia of a K, LH or DLH-Series joist can be determined using Equation B-1 which can be found in the introduction to the Standard Load Tables (SJI 2015).
( )( ) ( )−=3 6
j L 360I 26.767 w L 10 in.4 (B-1)
where,
Ij = approximate gross moment of inertia (not adjusted for shear deformations), in.4
wL/360 = nominal live load which will produce an approximate deflection of 1/360 of the span (red figure in the Load Table), lbs/ft.
L = Design length of the joist (span - 0.33), ft.
Open web steel joists can be expected to have approximately 15 percent more deformation than a solid web member due to greater shear deformation.However, many of the equations and methods described in this Technical Digest were developed neglecting shear deformations (i.e., Bernoulli-Euler beam theory). In these situations, a reduced value, the effective moment of inertiacomputed using Equation B-2, is used in lieu of the gross moment of inertia.
= je
II
1.15, in.4 (B-2)
Example:Determine Ij and Ie for a 24K8 joist with inside of wall to inside of wall dimension = 35 ft.
The span of a joist is the clear span plus the standard clear bearing lengths. The standard clear bearing length for a 24K8 is 4 in. according to Table 5.4-1 of the SJI Specification (SJI 2015), thus the span of this joist is calculated as:
( )( )
= + =4 in.
span 35 ft. 2 35.66 ft.12 in. ft.
APPENDIX BCALCULATING EFFECTIVE MOMENTS OF INERTIA
FOR STEEL JOISTS AND JOIST GIRDERS

101
101
The value of wL/360 is determined as the red figure in the SJI Load Tables. For this joist, the value is found by linear interpolation between the values for spans of 35 ft and 36 ft.
( ) ( )( )
−= − − =
−L 360
35.66 ft. 35 ft.w 242 lbs ft. 242 lbs ft. 222 lbs ft. 228.7 lbs ft.
36 ft. 35 ft.
( )( ) ( )−= − =3 6 4
jI 26.767 228.7 lbs ft. 35.66 ft. 0.33 ft. 10 269.9 in.
= = =4
j 4e
I 269.9 in.I 234.7 in.1.15 1.15
For other joists:The effective moments of inertia for older joists may be required when checking an existing roof for ponding. The J- and H-Series joists had no published live load values so the equations given above cannot be used. Table B-1 is provided as a reference when the joist’s effective moment of inertia is needed. For LJ- andDLJ-Series joists, live load values can be found in the SJI publication "90 Years of Open-Web Steel Joist Construction".
When KCS joists are specified and a ponding check is required, effective moments of inertia are needed. Table B-2 gives a summary of the effective moments of inertia for all standard KCS joists.
For Joist Girders:The approximate gross moment of inertia of a Joist Girder can be determined using Equation B-3a for ASD or Equation B-3b for LRFD.
=JG cI 0.027NP Ld in.4 (B-3a)
=JG cI 0.018NP Ld in.4 (B-3b)
where,
IJG = approximate gross moment of inertia (not adjusted for shear deformations), in.4
N = number of joist spaces
Pc = specified panel point load capacity, kips

102102
L = Joist Girder length, ft.
d = effective depth of the Joist Girder, in.
Open web steel Joist Girders can be expected to have approximately 15 percent more deformation than a solid web member due to greater shear deformation.However, many of the equations and methods described in this Technical Digest were developed neglecting shear deformations (i.e., Bernoulli-Euler beam theory). In these situations, a reduced value, the effective moment of inertia computed using Equation B-4, is used in lieu of the gross moment of inertia.
= JGe
II1.15
, in.4 (B-4)
Example:Determine Ij and Ie for a 36G8N8.0K with length = 40 ft.
From the Joist Girder designation, it can be determined that the effective depth is 36 in., the number of joist spaces is 8, and the panel point load using ASD load combinations is 8 kips.
N = 8
Pc = 8.0 kips
L = 40 ft.
d = 36 in.
Therefore,
( )( )( )( )= = = 4JG cI 0.027NP Ld 0.027 8 8.0 kips 40 ft. 36 in. 2,488 in.
= = =4
4JGe
I 2,488 in.I 2,164 in.1.15 1.15

103
103
Table B-1 Effective Moments of Inertia for Standard J- and H-Series Joists
Standard J- and H-Series Joists
DesignationEffective Moment
of Inertia(in.4)
DesignationEffective Moment
of Inertia(in.4)
8J3 8H3 10.7 10J3 10H3 17.210J4 10H4 21.3
12J3 12H3 25.1 14J3 14H3 34.912J4 12H4 32.9 14J4 14H4 45.612J5 12H5 38.5 14J5 14H5 53.412J6 12H6 45.7 14J6 14H6 63.6
14J7 14H7 74.916J4 16H4 56.1 18J5 18H5 88.316J5 16H5 68.9 18J6 18H6 104.216J6 16H6 81.3 18J7 18H7 124.816J7 16H7 97.9 18J8 18H8 142.916J8 16H8 112.6 18J9 18H9 155.6
18J10 18H0 175.618J11 18H11 199.1
20J5 20H5 107.7 22J6 22H6 143.620J6 20H6 122.8 22J7 22H7 174.320J7 20H7 149.3 22J8 22H8 215.320J8 20H8 179.6 22J9 22H9 239.120J9 20H9 194.8 22J10 22H0 268.720J10 20H0 220.0 22J11 22H11 306.120J11 20H11 249.624J6 24H6 171.8 26J8 26H8 289.624J7 24H7 207.5 26J9 26H9 339.124J8 24H8 258.5 26J10 26H0 381.724J9 24H9 286.9 26J11 26H11 435.624J10 24H0 322.624J11 24H11 367.828J8 28H8 338.3 30J8 30H8 389.628J9 28H9 395.6 30J9 30H9 456.528J10 28H0 445.2 30J10 30H0 513.928J11 28H11 509.6 30J11 30H11 588.7
TABLE B-1Effective Moments of Inertia for Standard J- and H-Series Joists

104
104
Table B-2 Effective Moments of Inertia for Standard KCS Joists
Standard KCS Joists
DesignationMoment of
Inertia(in.4)
Effective Moment of
Inertia(in.4)
DesignationMoment of
Inertia(in.4)
Effective Moment of
Inertia(in.4)
10KCS1 29 25 22KCS2 194 16910KCS2 37 32 22KCS3 251 21810KCS3 47 41 22KCS4 377 328
22KCS5 485 42212KCS1 43 37 24KCS2 232 20212KCS2 55 48 24KCS3 301 26212KCS3 71 62 24KCS4 453 394
24KCS5 584 50814KCS1 59 51 26KCS2 274 23814KCS2 77 67 26KCS3 355 30914KCS3 99 86 26KCS4 536 466
26KCS5 691 60116KCS2 99 86 28KCS2 320 27816KCS3 128 111 28KCS3 414 36016KCS4 192 167 28KCS4 626 54416KCS5 245 213 28KCS5 808 70318KCS2 127 110 30KCS3 478 41618KCS3 164 143 30KCS4 722 62818KCS4 247 215 30KCS5 934 81218KCS5 316 27520KCS2 159 13820KCS3 205 17820KCS4 308 26820KCS5 396 344
TABLE B-2Effective Moments of Inertia for Standard KCS Joists

105105
APPENDIX CDERIVATION OF EQUATIONS FOR THE JOIST ON
STIFF SUPPORTS METHODThe equations developed in the following derivation are used in the joist on stiff supports method described in Chapter 3. The following assumptions are made in the derivation:
1. A joist behaves elastically like a beam of uniform section, with a reduced effective moment of inertia due to web strain.
2. The deflected shape of the joist is sinusoidal.
3. Superposition holds.
4. The ends of the joist are simply-supported, and they rest on rigid supports.
5. In the deformed configuration, the joist is loaded along its entire length by water (i.e., h ≥ Δc – Δ).
6. The stiffness factor for the joist is less than unity (i.e., Cs < 1).
Figure C.1 Reaction, moment, and deflection for horizontal joist cambered upward under dead load, live load, and water load
APPENDIX CDERIVATION OF EQUATIONS FOR
THE JOIST ON STIFF SUPPORTS METHOD

106106
End ReactionsThe reactions at either end of the joist are equal to the sum of the contributions from the superimposed load (F1), the water above the horizontal datum (F2), and the water below the horizontal datum (F3).
= + +p 1 2 3R F F F
( )( )( )( )
γγπ
∆ − ∆= + + c
p
SLwSL h SLR2 2 12 in. ft. 12 in. ft.
( ) = + + ∆ − ∆ p cR SL 0.5 w 2.6h 1.66 , lbs
where,
w = Uniform load acting concurrently with ponding condition, psf
S = Joist spacing, ft.
L = Design length of the joist, ft.
h = Height of water above datum, in.
γ = Density of water, 62.4 lbs/ft.3
∆ = Deflection of joist at midspan, in.
∆c = Camber of joist at midspan, in.
The method of design for ponding presented in Appendix 2 of the AISC Specification (AISC 2016) permits an allowable stress of 0.8Fy in lieu of the 0.6Fyused in the load SJI Load Tables. Thus, when comparing to the load tables, the reaction can be reduced by a factor equal to 0.6/0.8.
=1 p0.6R R0.8
( ) = + + ∆ − ∆ 1 cR SL 0.375 w 1.95h 1.24 , lbs.

107107
Bending MomentThe moment at the centerline of the joist is equal to the sum of the contributions from the superimposed load, the water above the horizontal datum, and the water below the horizontal datum.
π= + + 31 2
CLF LF L F LM
4 4
( )( )( )( )
γγπ π
∆ − ∆ = + +
cCL
SLwSL L h SL L LM2 4 2 12 in. ft. 4 12 in. ft.
( ) = + + ∆ − ∆ 2
CL cM SL 0.125w 0.650h 0.527 , lb-ft.
Again, when comparing to the load tables, the moment can be reduced by a factor equal to 0.6/0.8.
=1 CL0.6M M0.8
( ) = + + ∆ − ∆ 2
1 cM SL 0.094w 0.487h 0.395 , lb-ft.
For convenient comparisons to the SJI Standard Load Tables, the moment is converted to an equivalent uniform distributed load.
=2
11
w LM8
( ) = + + ∆ − ∆ 1 cw S 0.75 w 3.90h 3.16 , lb/ft.
DeflectionThe deflection is equal to the sum of the contributions from the superimposed load (Δ1), the water above the horizontal datum (Δ2), and the water below the horizontal datum (Δ3).
1 2 3∆ = ∆ + ∆ + ∆
( ) ( ) ( ) ( )44 4
3 2 2c4
e e e
SL5 wSL 5 hSL12 in. ft. 12 in. ft. 12 in. ft.384EI 384EI EI
γγπ
∆ − ∆∆ = + +

108108
where,
E = Modulus of elasticity of steel (29,000,000 lbs/in.2)
Ie = Effective moment of inertia, in.4
From Marino (1966) the stiffness factor for a joist is computed as:
( )4
2s 4
e
SLC 12 in. ftEI
γπ
=
thus,
( )
44s
2e
CSLEI 12 in. ft
πγ
=
Substituting this expression into the equation for deflection,
( ) ( )4 4
s s c s5w 5h12 in. ft C C C
384 384π π
γ∆ = + + ∆ − ∆
( )s s c s0.244wC 1.268hC C∆ = + + ∆ − ∆ , in.
Solving for Δ yields,
[ ]sc
s
C 0.244 w 1.268h1 C
∆ = + − ∆−
, in.