Business Conditions Digest June 1986
124
Digitized for FRASER http://fraser.stlouisfed.org/ Federal Reserve Bank of St. Louis
-
Upload
khangminh22 -
Category
Documents
-
view
0 -
download
0
Transcript of Business Conditions Digest June 1986

Digitized for FRASER http://fraser.stlouisfed.org/ Federal Reserve Bank of St. Louis
U.S. DEPARTMENT OF COMMERCEMalcolm Baldrige, Secretary
D. Bruce Merrifield, Acting Under Secretary for Economic Affairs
BUREAU OF ECONOMIC ANALYSISAllan H. Young, Director
Carol S. Carson, Deputy DirectorEdward K. Smith, Associate Director for
National Analysis and ProjectionsFeliksTamm, Editor
This report is prepared in the Statistical Indicators Division of the Bureau of EconomicAnalysis. Technical staff and their responsibilities for the publication are—
Barry A. Beckman—Technical supervision and reviewBrian D. Kajutti—Composite indexesMary D. Young—Data collection and compilation (Phone: 202-523-0541)
The cooperation of Government and private agencies that provide data is gratefullyacknowledged. Agencies furnishing data are indicated in the list of series titles andsources at the back of this report.
This publication is prepared under the general guidance of a technical committee consistingof the following persons:
Ronald E. Kutscher, Acting Chairman, Bureau of Labor Statistics, U.S. Department ofLabor
Ahmad Al-Samarrie, Office of Management and BudgetLincoln F. Anderson, Council of Economic AdvisersJohn H. Auten, U.S. Department of the TreasuryEdward K. Smith, Bureau of Economic Analysis, U.S. Department of CommerceCharles A. Waite, Bureau of the Census, U.S. Department of CommerceHelmut F. Wendel, Board of Governors of the Federal Reserve System
ABOUT THIS REPORT
BUSINESS CONDITIONS DIGEST (BCD) providesa monthly look at many of the economic timeseries found most useful by business analystsand forecasters.
The original BCD, which began publicationin 1961 under the title Business Cycle Develop-ments, emphasized the cyclical indicators ap-proach to the analysis of business conditionsand prospects. The report's contents were basedlargely on the list of leading, roughly coincident,and lagging indicators maintained by theNational Bureau of Economic Research, Inc.
In 1968, BCD was expanded to increase itsusefulness to analysts using other approaches tobusiness conditions analysis. Principal additionsto the report were series from the national in-come and product accounts and series based onsurveys of businessmen's and consumers' an-ticipations and intentions. The composite in-dexes were added at that time, and the report'spresent title was adopted.
The dominant feature of the current BCD isthe cyclical indicators section, in which eachbusiness cycle indicator is assigned a three-waytiming classification according to its behavior atpeaks, at troughs, and at all turns. This section issupplemented by a section containing other im-portant economic measures. The method ofpresentation is explained in the introductory textwhich begins on page 1.
Most of the data contained in this reportalso are published by their source agencies. Aseries finding guide and a complete list of seriestitles and sources can be found at the back of thereport.
Cyclical Indicators are economic time serieswhich have been singled out as leaders, coin-ciders, or laggers based on their general confor-mity to cyclical movements in aggregateeconomic activity. In this report, cyclical in-dicators are classified both by economic processand by their average timing at business cyclepeaks, at business cycle troughs, and at peaksand troughs combined. These indicators havebeen selected primarily on the basis of theircyclical behavior, but they also have provenuseful in forecasting, measuring, and in-terpreting short-term fluctuations in aggregateeconomic activity.
Other Economic Measures provide additional in-formation for the evaluation of current businessconditions and prospects. They include selectedcomponents of the national income and productaccounts; measures of prices, wages, andproductivity; measures of the labor force,employment, and unemployment; economicdata on Federal, State, and local government ac-tivities; measures of U.S. international transac-tions; and selected economic comparisons withmajor foreign countries.
Annual subscription price: $44.00 domestic,$55.00 foreign. Single copy price: $4.00 domes-tic, $5.00 foreign. Foreign airmail rates areavailable on request. Address correspondence
concerning subscriptions to Superintendent ofDocuments, U.S. Government Printing Office,Washington, D.C. 20402. Make checks payableto Superintendent of Documents.
Digitized for FRASER http://fraser.stlouisfed.org/ Federal Reserve Bank of St. Louis
BUSINESS CONDITIONS DIGEST
New Features and Changes for This Issue iii
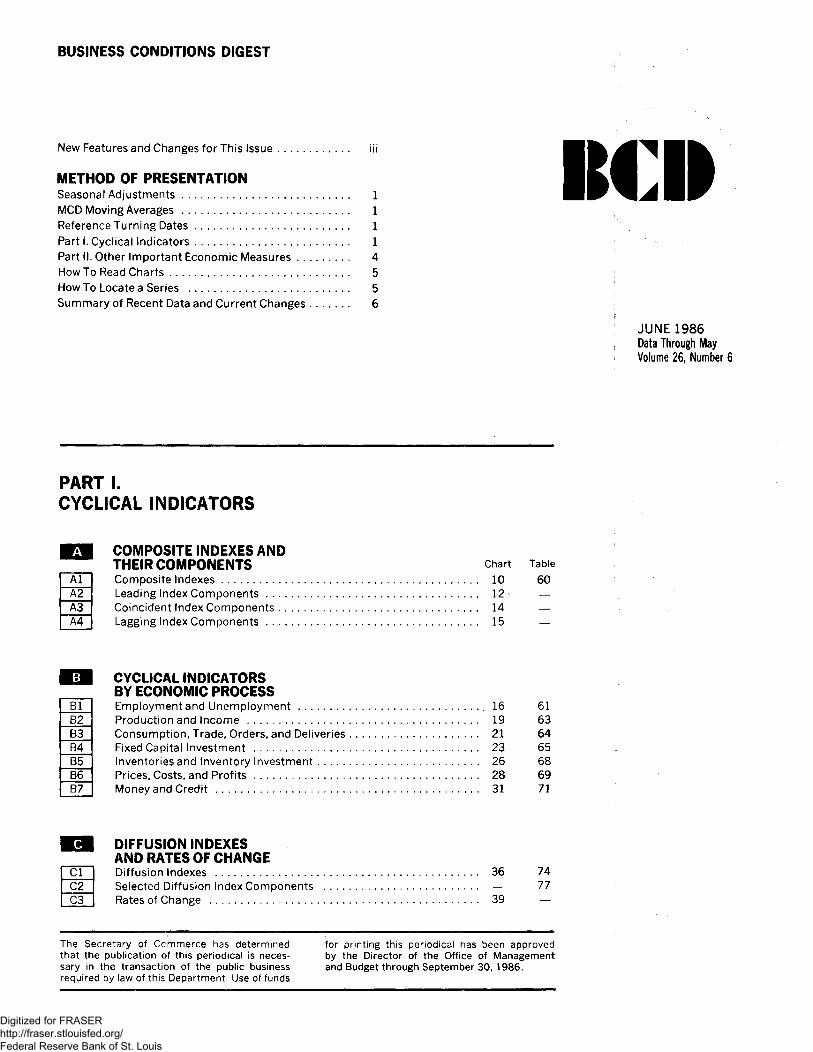
METHOD OF PRESENTATIONSeasonal Adjustments 1MCD Moving Averages 1Reference Turning Dates 1Part I. Cyclical Indicators 1Part II. Other Important Economic Measures 4How To Read Charts 5How To Locate a Series 5Summary of Recent Data and Current Changes 6
KCII
J U N E 1 9 8 6Data Through MayVolume 26f Number 6
A lA2A3A4
PART I.CYCLICAL INDICATORS
COMPOSITE INDEXES ANDTHEIR COMPONENTS Chart TableComposite Indexes 10 60Leading Index Components 12 * —Coincident Index Components 14 —Lagging Index Components 15 —
CYCLICAL INDICATORSBY ECONOMIC PROCESSEmploymentand Unemployment 16 61Production and Income 19 63Consumption, Trade, Orders, and Deliveries 21 64Fixed Capital Investment 23 65Inventories and Inventory Investment 26 68Prices, Costs, and Profits 28 69Money and Credit 31 71
DIFFUSION INDEXESAND RATES OF CHANGEDiffusion Indexes 36 74Selected Diffusion Index Components — 77Rates of Change 39 —
BlB2B3B4B5B6B7
ClC2C3
The Secretary of Commerce has determined for printing this periodical has been approvedthat the publication of this periodical is neces- by the Director of the Office of Managementsary in the transaction of the public business and Budget through September 30, 1986.required by law of this Department. Use of funds
Digitized for FRASER http://fraser.stlouisfed.org/ Federal Reserve Bank of St. Louis
BCII
A lA?
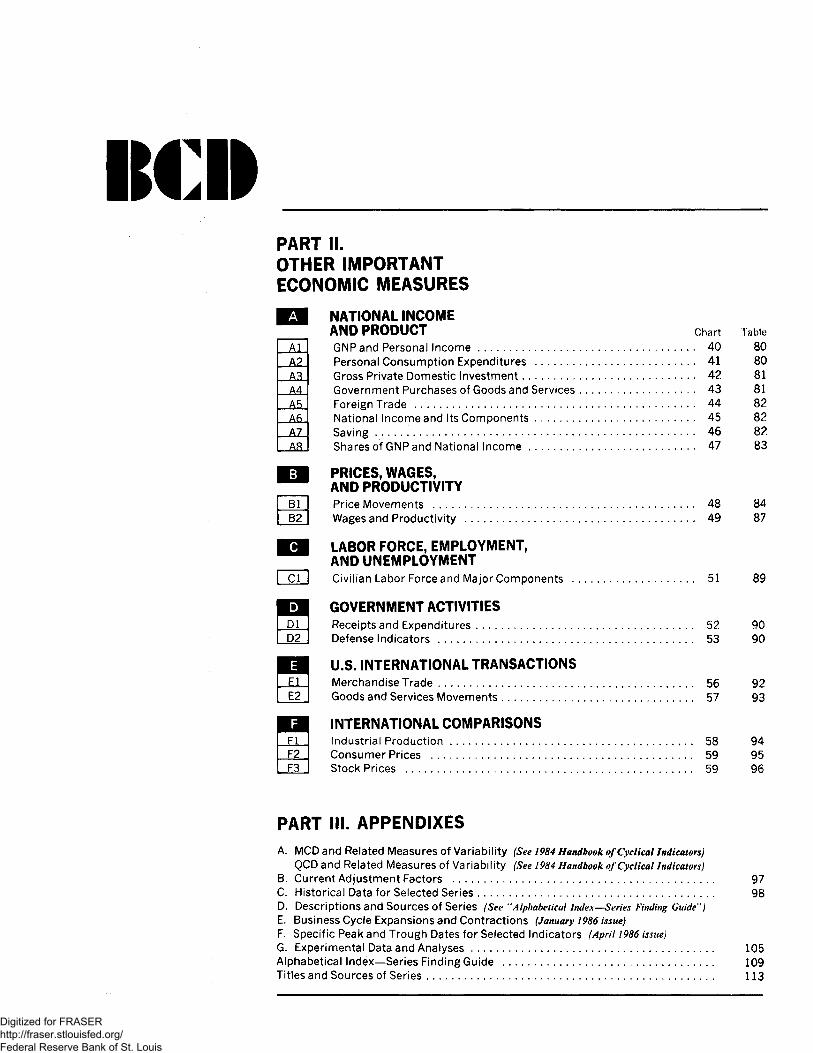
PART II.OTHER IMPORTANTECONOMIC MEASURES
NATIONAL INCOMEAND PRODUCT chartGNP and Personal Income 40Personal Consumption Expenditures 41Gross Private Domestic Investment 42Government Purchases of Goods and Services 43Foreign Trade 44National Income and Its Components 45Saving 46Shares of GNP and National Income 47
PRICES, WAGES,AND PRODUCTIVITYPrice Movements 48Wages and Productivity 49
A3A4A5A6A7Aft
BlB2
LABOR FORCE, EMPLOYMENT,AND UNEMPLOYMENTCivilian Labor Force and Major Components 51
GOVERNMENT ACTIVITIESReceipts and Expenditures 52Defense Indicators 53
U.S. INTERNATIONAL TRANSACTIONSMerchandise Trade 56Goods and Services Movements 57
INTERNATIONAL COMPARISONSIndustrial Production 58Consumer Prices 59Stock Prices 59
Table8080818182828283
8487
89
9090
9293
949596
PART III. APPENDIXES
A. MCDand Related Measures of Variability (See 1984 Handbook of Cyclical Indicators)QCD and Related Measures of Variability (See 1984 Handbook of Cyclical Indicators}
B. Current Adjustment Factors 97C. Historical Data for Selected Series 98D. Descriptions and Sources Of Series (See ''Alphabetical Index—Series Finding Guide")E. Business Cycle Expansions and Contractions (January 1986 issue)F. Specific Peak and Trough Dates for Selected Indicators (April 1986 issue)G. Experimental Data and Analyses 105Alphabetical Index—Series Finding Guide 109Titles and Sources of Series 113
Digitized for FRASER http://fraser.stlouisfed.org/ Federal Reserve Bank of St. Louis
Readers are invited to submit comments andsuggestions concerning this publication.Address them to Feliks Tamm, Chief, StatisticalIndicators Division, Bureau of Economic Analysis,U.S. Department of Commerce, Washington, DC 20230
NEW FEATURES
AND CHANGES
FOR THIS ISSUE
Changes in this issue are as follows:
1. Series 1, 21, 40, 41, 48, 340, 341, 570, 961, and963 on establishment employment have been revised for theperiod 1981 to date. These revisions reflect the sourceagency's adoption of a new benchmark (March 1985) for theperiod April 1984 to date and application of new seasonaladjustment factors for the period 1981 to date.
Revised data for other series affected by these revi-sions (series 26, 63, 345, 346, 358, and 370) will be shownin a future issue.
Further information concerning these revisions may beobtained from the U.S. Department of Labor, Bureau of LaborStatistics, Office of Employment Structure and Trends, Divi-sion of Monthly Industry Employment Statistics.
2. The series on U.S. international transactions havebeen revised to reflect the source agency's annual updatingof the basic statistics. The beginning dates for these re-visions are as follows:
1982—Series 651, 652, and 667-669;
1983--Series 618, 620, and 622.Further information concerning these revisions may be
obtained from the U.S. Department of Commerce, Bureau ofEconomic Analysis, Balance of Payments Division.
3. Appendix C contains historical data for series 12,13, 28, 29, 33, 66, 72, 85, 95, 98, 99, 101, 102, 104-106,108, and 111-113.
4. Appendix G contains cyclical comparisons for series1, 19, 32, and 47.
The July issue of BUSINESS CONDITIONS DIGEST is scheduled forrelease on August 5.
A limited number of
changes are made from
time to time to in-
corporate recent find-
ings of economic
research, newly avail-
able time series, and
revisions made by
source agencies in
concept, composition,
comparability, coverage,
seasonal adjustment
methods, benchmark
data, etc. Changes may
result in revisions of
data, additions or
deletions of series,
changes in placement of
series in relation to
other senes, changes
in composition of
indexes, etc.
ill
Digitized for FRASER http://fraser.stlouisfed.org/ Federal Reserve Bank of St. Louis
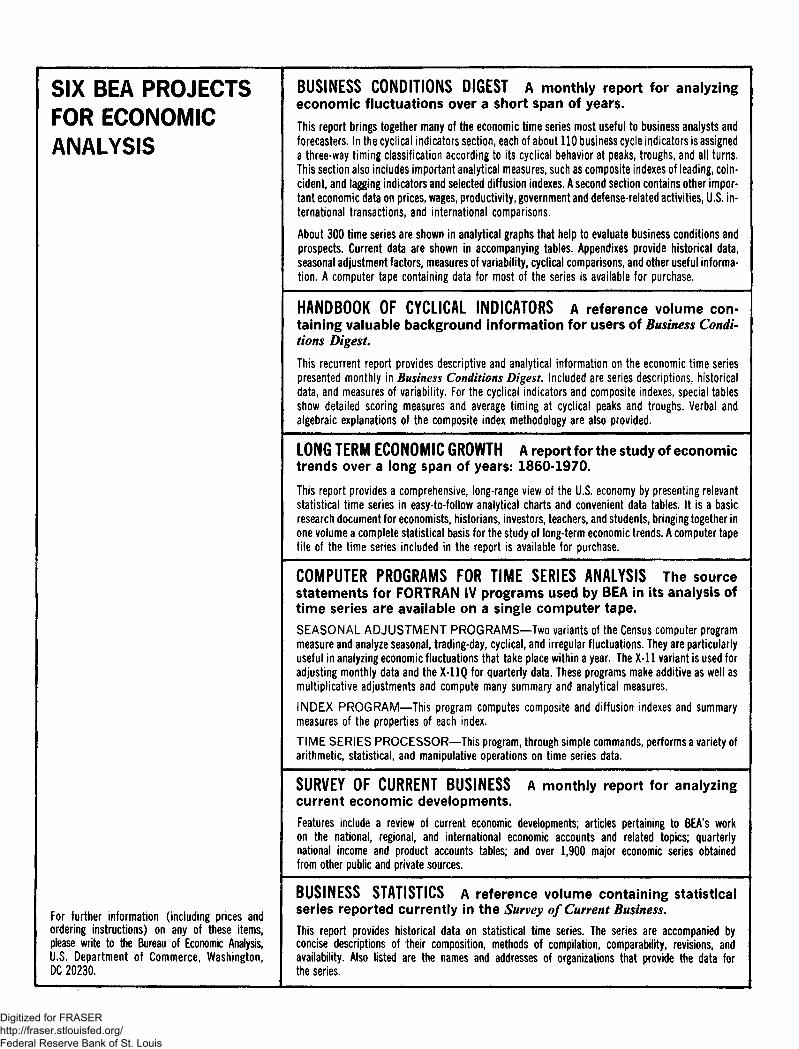
SIX BEA PROJECTSFOR ECONOMICANALYSIS
For further information (including prices andordering instructions) on any of these items,please write to the Bureau of Economic Analysis,U.S. Department of Commerce, Washington,DC 20230.
BUSINESS CONDITIONS DIGEST A monthly report for analyzingeconomic fluctuations over a short span of years.
This report brings together many of the economic time series most useful to business analysts andforecasters. In the cyclical indicators section, each of about 110 business cycle indicators is assigneda three-way timing classification according to its cyclical behavior at peaks, troughs, and all turns.This section also includes important analytical measures, such as composite indexes of leading, coin-cident, and lagging indicators and selected diffusion indexes. A second section contains other impor-tant economic data on prices, wages, productivity, government and defense-related activities, U.S. in-ternational transactions, and international comparisons.
About 300 time series are shown in analytical graphs that help to evaluate business conditions andprospects. Current data are shown in accompanying tables. Appendixes provide historical data,seasonal adjustment factors, measures of variability, cyclical comparisons, and other useful informa-tion. A computer tape containing data for most of the series is available for purchase.
HANDBOOK OF CYCLICAL INDICATORS A reference volume con-taining valuable background information for users of Business Condi-tions Digest,
This recurrent report provides descriptive and analytical information on the economic time seriespresented monthly in Business Conditions Digest Included are series descriptions, historicaldata, and measures of variability. For the cyclical indicators and composite indexes, special tablesshow detailed scoring measures and average timing at cyclical peaks and troughs. Verbal andalgebraic explanations of the composite index methodology are also provided.
LONG TERM ECONOMIC GROWTH A report for the study of economictrends over a long span of years: 1860-1970.
This report provides a comprehensive, long-range view of the U.S. economy by presenting relevantstatistical time series in easy-to-follow analytical charts and convenient data tables. It is a basicresearch document for economists, historians, investors, teachers, and students, bringing together inone volume a complete statistical basis for the study of long-term economic trends. A computer tapefile of the time series included in the report is available for purchase,
COMPUTER PROGRAMS FOR TIME SERIES ANALYSIS The sourcestatements for FORTRAN IV programs used by BEA in its analysis oftime series are available on a single computer tape.
SEASONAL A D J U S T M E N T PROGRAMS—Two variants of the Census computer programmeasure and analyze seasonal, trading-day, cyclical, and irregular fluctuations. They are particularlyuseful in analyzing economic fluctuations that take place within a year. The X- l l variant is used foradjusting monthly data and the X-11Q for quarterly data. These programs make additive as well asmultiplicative adjustments and compute many summary and analytical measures.
INDEX PROGRAM—This program computes composite and diffusion indexes and summarymeasures of the properties of each index.
T I M E SERIES PROCESSOR—This program, through simple commands, performs a variety ofarithmetic, statistical, and manipulative operations on time series data.
A monthly report for analyzingSURVEY OF CURRENT BUSINESScurrent economic developments.
Features include a review of current economic developments; articles pertaining to BEA's workon the national, regional, and international economic accounts and related topics; quarterlynational income and product accounts tables; and over 1,900 major economic series obtainedfrom other public and private sources.
BUSINESS STATISTICS A reference volume containing statisticalseries reported currently in the Survey of Current Business.
This report provides historical data on statistical time series. The series are accompanied byconcise descriptions of their composition, methods of compilation, comparability, revisions, andavailability. Also listed are the names and addresses of organizations that provide the data forthe series.
Digitized for FRASER http://fraser.stlouisfed.org/ Federal Reserve Bank of St. Louis
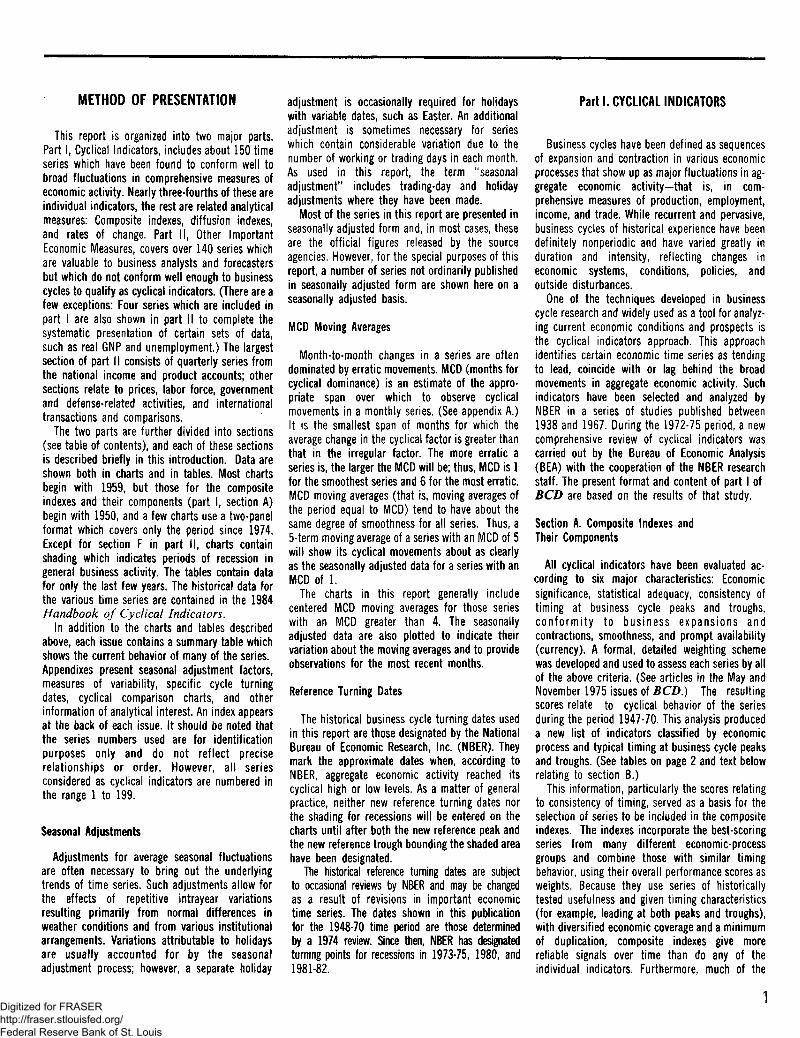
METHOD OF PRESENTATION
This report is organized into two major parts.Part I, Cyclical Indicators, includes about 150 timeseries which have been found to conform well tobroad fluctuations in comprehensive measures ofeconomic activity. Nearly three-fourths of these areindividual indicators, the rest are related analyticalmeasures: Composite indexes, diffusion indexes,and rates of change. Part II, Other ImportantEconomic Measures, covers over 140 series whichare valuable to business analysts and forecastersbut which do not conform well enough to businesscycles to qualify as cyclical indicators. (There are afew exceptions: Four series which are included inpart I are also shown in part II to complete thesystematic presentation of certain sets of data,such as real GNP and unemployment.) The largestsection of part II consists of quarterly series fromthe national income and product accounts; othersections relate to prices, labor force, governmentand defense-related activities, and internationaltransactions and comparisons.
The two parts are further divided into sections(see table of contents), and each of these sectionsis described briefly in this introduction. Data areshown both in charts and in tables. Most chartsbegin with 1959, but those for the compositeindexes and their components (part I, section A)begin with 1950, and a few charts use a two-panelformat which covers only the period since 1974.Except for section F in part II, charts containshading which indicates periods of recession ingeneral business activity. The tables contain datafor only the last few years. The historical data forthe various time series are contained in the 1984Handbook of Cyclical Indicators.
In addition to the charts and tables describedabove, each issue contains a summary table whichshows the current behavior of many of the series.Appendixes present seasonal adjustment factors,measures of variability, specific cycle turningdates, cyclical comparison charts, and otherinformation of analytical interest. An index appearsat the back of each issue. It should be noted thatthe series numbers used are for identificationpurposes only and do not reflect preciserelationships or order. However, all seriesconsidered as cyclical indicators are numbered inthe range 1 to 199.
Seasonal Adjustments
Adjustments for average seasonal fluctuationsare often necessary to bring out the underlyingtrends of time series. Such adjustments allow forthe effects of repetitive intrayear variationsresulting primarily from normal differences inweather conditions and from various institutionalarrangements. Variations attributable to holidaysare usually accounted for by the seasonaladjustment process; however, a separate holiday
adjustment is occasionally required for holidayswith variable dates, such as Easter. An additionaladjustment is sometimes necessary for serieswhich contain considerable variation due to thenumber of working or trading days in each month.As used in this report, the term "seasonaladjustment" includes trading-day and holidayadjustments where they have been made.
Most of the series in this report are presented inseasonally adjusted form and, in most cases, theseare the official figures released by the sourceagencies. However, for the special purposes of thisreport, a number of series not ordinarily publishedin seasonally adjusted form are shown here on aseasonally adjusted basts.
MCD Moving Averages
Month-to-month changes in a series are oftendominated by erratic movements. MCD (months forcyclical dominance) is an estimate of the appro-priate span over which to observe cyclicalmovements in a monthly series. (See appendix A.)It is the smallest span of months for which theaverage change in the cyclical factor is greater thanthat in the irregular factor. The more erratic aseries is, the larger the MCD will be; thus, MCD is 1for the smoothest series and 6 for the most erratic.MCD moving averages (that is, moving averages ofthe period equal to MCD) tend to have about thesame degree of smoothness for all series. Thus, a5-term moving average of a series with an MCD of 5will show its cyclical movements about as clearlyas the seasonally adjusted data for a series with anMCD of 1.
The charts in this report generally includecentered MCD moving averages for those serieswith an MCD greater than 4. The seasonallyadjusted data are also plotted to indicate theirvariation about the moving averages and to provideobservations for the most recent months.
Reference Turning Dates
The historical business cycle turning dates usedin this report are those designated by the NationalBureau of Economic Research, Inc. (NBER). Theymark the approximate dates when, according toNBER, aggregate economic activity reached itscyclical high or low levels. As a matter of generalpractice, neither new reference turning dates northe shading for recessions will be entered on thecharts until after both the new reference peak andthe new reference trough bounding the shaded areahave been designated.
The historical reference turning dates are subjectto occasional reviews by NBER and may be changedas a result of revisions in important economictime series. The dates shown in this publicationfor the 1948-70 time period are those determinedby a 1974 review. Since then, NBER has designatedturning points for recessions in 1973-75, 1980, and1981-82.
Part I. CYCLICAL INDICATORS
Business cycles have been defined as sequencesof expansion and contraction in various economicprocesses that show up as major fluctuations in ag-gregate economic activity—that is, in com-prehensive measures of production, employment,income, and trade. While recurrent and pervasive,business cycles of historical experience have beendefinitely nonperiodic and have varied greatly induration and intensity, reflecting changes ineconomic systems, conditions, policies, andoutside disturbances.
One of the techniques developed in businesscycle research and widely used as a tool for analyz-ing current economic conditions and prospects isthe cyclical indicators approach. This approachidentifies certain economic time series as tendingto lead, coincide with or lag behind the broadmovements in aggregate economic activity. Suchindicators have been selected and analyzed byNBER in a series of studies published between1938 and 1967. During the 1972-75 period, a newcomprehensive review of cyclical indicators wascarried out by the Bureau of Economic Analysis(BEA) with the cooperation of the NBER researchstaff. The present format and content of part I ofBCD are based on the results of that study.
Section A. Composite Indexes andTheir Components
All cyclical indicators have been evaluated ac-cording to six major characteristics: Economicsignificance, statistical adequacy, consistency oftiming at business cycle peaks and troughs,conformity to business expansions andcontractions, smoothness, and prompt availability(currency). A formal, detailed weighting schemewas developed and used to assess each series by allof the above criteria. (See articles in the May andNovember 1975 issues of BCD.) The resultingscores relate to cyclical behavior of the seriesduring the period 1947-70. This analysis produceda new list of indicators classified by economicprocess and typical timing at business cycle peaksand troughs. (See tables on page 2 and text belowrelating to section B.)
This information, particularly the scores relatingto consistency of timing, served as a basis for theselection of series to be included in the compositeindexes. The indexes incorporate the best-scoringseries from many different economic-processgroups and combine those with similar timingbehavior, using their overall performance scores asweights. Because they use series of historicallytested usefulness and given timing characteristics(for example, leading at both peaks and troughs),with diversified economic coverage and a minimumof duplication, composite indexes give morereliable signals over time than do any of theindividual indicators. Furthermore, much of the
Digitized for FRASER http://fraser.stlouisfed.org/ Federal Reserve Bank of St. Louis

Cross-Classification of Cyclical Indicators by Economic Process and Cyclical Timing
A. Timing at Business Cycle Peaks
^ v EconomicN . Process
CyclicalNvTiming \
LEADING (L) l
INDICATORS(61 series)
ROUGHLYCOINCIDENT (C)INDICATORS(24 series)
LAGGING (Lg)INDICATORS(19 series)
TIMINGUNCLASSIFIED (U)(8 series)
1.EMPLOYMENT ANDUNEMPLOYMENT(15 series)
Marginal employmentadjustments(3 series)
Job vacancies(2 series)
Comprehensiveemployment(1 series)
Comprehensiveunemployment(3 series)
Comprehensiveemployment(1 series)
Comprehensiveunemployment(2 series)
Comprehensiveemployment(3 series)
II.PRODUCTIONAND INCOME(10 series)
Capacity utilization(2 series)
Comprehensiveoutput and income(4 series)
Industrialproduction(4 series)
III.CONSUMPTION,TRADE, ORDERS,AND DELIVERIES(13 series)
Orders and deliveries(6 series)
i Consumption andtrade (2 series)
Consumption andtrade (4 series)
Consumption andtrade (1 series)
IV.FIXED CAPITALINVESTMENT(19 series)
Formation of businessenterprises(2 series)
Business investmentcommitments(5 series)
Residentialconstruction(3 series)
Business investmentcommitments(1 series)
Business investmentexpenditures(6 series)
Business investmentexpenditures(1 series)
Business investmentcommitments(1 series)
V.INVENTORIESAND INVENTORYINVESTMENT(9 series)
Inventoryinvestment(4 series)
Inventories onhand and onorder(1 series)
Inventories onhand and onorder(4 series)
VI.PRICES, COSTS,AND PROFITS(18 series)
Stock prices(1 series)
Sensitive commodityprices (2 series)
Profits and profitmargins (7 series)
Cash flows (2 series)
Unit labor costsand labor share(4 series)
Sensitive commodityprices (1 series)
Profits and profitmargins (1 series)
VII.MONEY ANDCREDIT(28 series)
Money (5 series)Credit flows
(5 series)Credit difficulties
(2 series)Bank reserves
(2 series)Interest rates
(1 series)
Velocity of money(2 series)
Interest rates{2 series)
Interest rates(4 series)
Outstanding debt(4 series)
Interest rates(1 series)
B. Timing at Business Cycle Troughs
^ v Economic\ . Process
Cycl ica( \vTiming ^ v
LEADING (L)INDICATORS(47 series)
ROUGHLYCOINCIDENT (C)INDICATORS(23 series)
LAGGING (Lg)INDICATORS(41 series)
TIMINGUNCLASSIFIED (U)(1 series)
1.EMPLOYMENT ANDUNEMPLOYMENT(15 series)
Marginal employmentadjustments(1 series)
Marginal employmentadjustments(2 series)
Comprehensiveemployment(4 series)
Job vacancies(2 series)
Comprehensiveemployment( I series)
Comprehensiveunemployment(5 series)
II.PRODUCTIONAND INCOME(10 series)
Industrialproduction(1 series)
Comprehensiveoutput and income(4 series)
Industrialproduction(3 series)
Capacity utilization(2 series)
III.CONSUMPTION,TRADE, ORDERS,AND DELIVERIES(13 series)
Orders and deliveries(5 series)
Consumption andtrade (4 series)
Consumption andtrade (3 series)
Orders and deliveries(1 series)
IV.FIXED CAPITALINVESTMENT(19 series)
Formation of businessenterprises(2 series)
Business investmentcommitments(4 series)
Residentialconstruction(3 series)
Business investmentcommitments(1 series)
Business investmentcommitments(2 series)
Business investmentexpenditures(7 series)
V.INVENTORIESAND INVENTORYINVESTMENT(9 series)
Inventoryinvestment(4 series)
Inventories onhand and onorder(5 series)
VI.PRICES, COSTS,AND PROFITS(18 series)
Stock prices(1 series)
Sensitive commodityprices (3 series)
Profits and profitmargins (6 series)
Cash flows (2 series)
Profits and profitmargins (2 series)
Unit labor costsand labor share(4 series)
VII.MONEY ANDCREDIT(28 series)
Money (4 series)Credit flows
(5 series)Credit difficulties
(2 series)
Money (1 series)Velocity of money
(1 series)
Velocity of money{1 series)
Bank reserves(1 series)
Interest rates(8 series)
Outstanding debt(4 series)
Bank reserves(1 series)
Digitized for FRASER http://fraser.stlouisfed.org/ Federal Reserve Bank of St. Louis
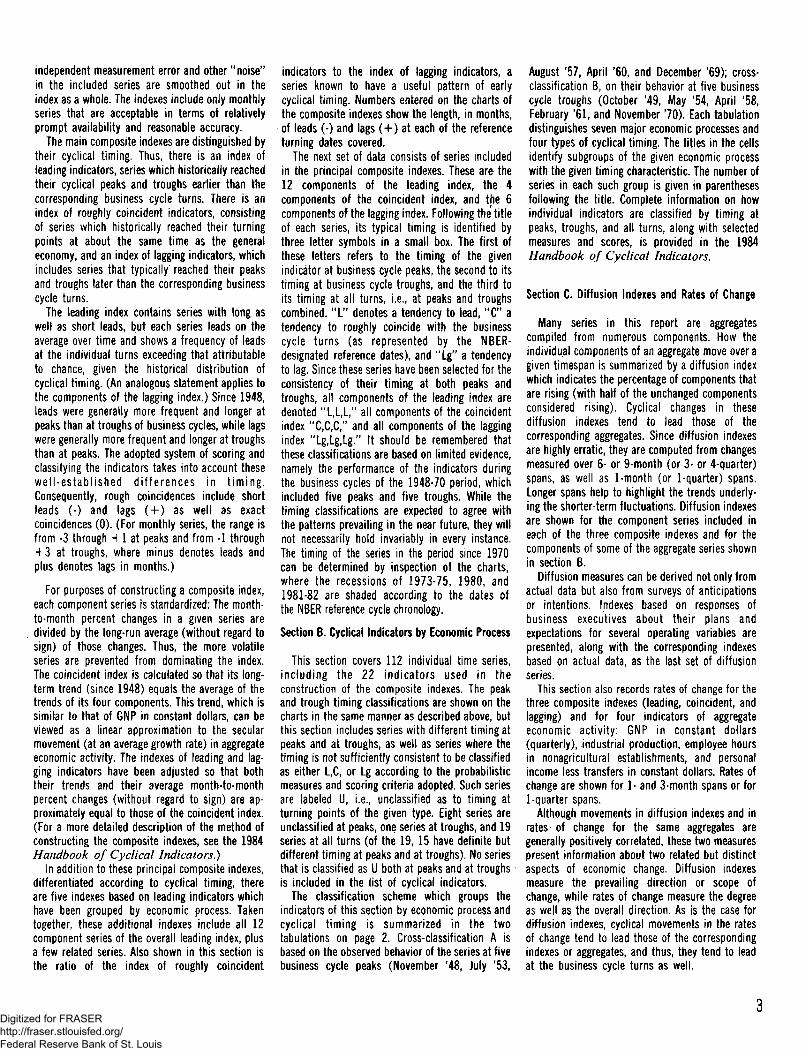
independent measurement error and other "noise"in the included series are smoothed out in theindex as a whole. The indexes include only monthlyseries that are acceptable in terms of relativelyprompt availability and reasonable accuracy.
The main composite indexes are distinguished bytheir cyclical timing. Thus, there is an index ofleading indicators, series which historically reachedtheir cyclical peaks and troughs earlier than thecorresponding business cycle turns. There is anindex of roughly coincident indicators, consistingof series which historically reached their turningpoints at about the same time as the generaleconomy, and an index of lagging indicators, whichincludes series that typically reached their peaksand troughs later than the corresponding businesscycle turns.
The leading index contains series with long aswell as short leads, but each series leads on theaverage over time and shows a frequency of leadsat the individual turns exceeding that attributableto chance, given the historical distribution ofcyclical timing. (An analogous statement applies tothe components of the lagging index.) Since 1948,leads were generally more frequent and longer atpeaks than at troughs of business cycles, while lagswere generally more frequent and longer at troughsthan at peaks. The adopted system of scoring andclassifying the indicators takes into account thesewell-established differences in t iming.Consequently, rough coincidences include shortleads (-) and lags ( + ) as well as exactcoincidences (0). (For monthly series, the range isfrom -3 through + 1 at peaks and from -1 through+3 at troughs, where minus denotes leads andplus denotes lags in months.)
For purposes of constructing a composite index,each component series is standardized; The month-to-month percent changes in a given series are
. divided by the long-run average (without regard tosign) of those changes. Thus, the more volatileseries are prevented from dominating the index.The coincident index is calculated so that its long-term trend (since 1948) equals the average of thetrends of its four components. This trend, which issimilar to that of GNP in constant dollars, can beviewed as a linear approximation to the secularmovement (at an average growth rate) in aggregateeconomic activity. The indexes of leading and lag-ging indicators have been adjusted so that boththeir trends and their average month-to-monthpercent changes (without regard to sign) are ap-proximately equal to those of the coincident index.(For a more detailed description of the method ofconstructing the composite indexes, see the 1984Handbook of Cyclical Indicators.)
In addition to these principal composite indexes,differentiated according to cyclical timing, thereare five indexes based on leading indicators whichhave been grouped by economic process. Takentogether, these additional indexes include all 12component series of the overall leading index, plusa few related series. Also shown in this section isthe ratio of the index of roughly coincident
indicators to the index of lagging indicators, aseries known to have a useful pattern of earlycyclical timing. Numbers entered on the charts ofthe composite indexes show the length, in months,of leads (-) and lags ( + ) at each of the referenceturning dates covered.
The next set of data consists of series includedin the principal composite indexes. These are the12 components of the leading index, the 4components of the coincident index, and the 6components of the lagging index. Following the titleof each series, its typical timing is identified bythree letter symbols in a small box. The first ofthese letters refers to the timing of the givenindicator at business cycle peaks, the second to itstiming at business cycle troughs, and the third toits timing at all turns, i.e., at peaks and troughscombined. "L" denotes a tendency to lead, "C" atendency to roughly coincide with the businesscycle turns (as represented by the NBER-designated reference dates), and "Lg" a tendencyto lag. Since these series have been selected for theconsistency of their timing at both peaks andtroughs, all components of the leading index aredenoted "L,L,L," all components of the coincidentindex "C,C,C," and all components of the laggingindex "Lg,Lg,Lg." It should be remembered thatthese classifications are based on limited evidence,namely the performance of the indicators duringthe business cycles of the 1948-70 period, whichincluded five peaks and five troughs. While thetiming classifications are expected to agree withthe patterns prevailing in the near future, they willnot necessarily hold invariably in every instance.The timing of the series in the period since 1970can be determined by inspection of the charts,where the recessions of 1973-75, 1980, and1981-82 are shaded according to the dates ofthe NBER reference cycle chronology.
Section B. Cyclical Indicators by Economic Process
This section covers 112 individual time series,including the 22 indicators used in theconstruction of the composite indexes. The peakand trough timing classifications are shown on thecharts in the same manner as described above, butthis section includes series with different timing atpeaks and at troughs, as well as series where thetiming is not sufficiently consistent to be classifiedas either L,C, or Lg according to the probabilisticmeasures and scoring criteria adopted. Such seriesare labeled U, i.e., unclassified as to timing atturning points of the given type. Eight series areunclassified at peaks, one series at troughs, and 19series at all turns (of the 19, 15 have definite butdifferent timing at peaks and at troughs). No seriesthat is classified as U both at peaks and at troughsis included in the list of cyclical indicators.
The classification scheme which groups theindicators of this section by economic process andcyclical timing is summarized in the twotabulations on page 2. Cross-classification A isbased on the observed behavior of the series at fivebusiness cycle peaks (November '48, July '53,
August '57, April '60, and December f69); cross-classification B, on their behavior at five businesscycle troughs (October '49, May '54, April '58,February '61, and November 70). Each tabulationdistinguishes seven major economic processes andfour types of cyclical timing. The titles in the cellsidentify subgroups of the given economic processwith the given timing characteristic. The number ofseries in each such group is given in parenthesesfollowing the title. Complete information on howindividual indicators are classified by timing atpeaks, troughs, and all turns, along with selectedmeasures and scores, is provided in the 1984Handbook of Cyclical Indicators.
Section C. Diffusion Indexes and Rates of Change
Many series in this report are aggregatescompiled from numerous components. How theindividual components of an aggregate move over agiven timespan is summarized by a diffusion indexwhich indicates the percentage of components thatare rising (with half of the unchanged componentsconsidered rising). Cyclical changes in thesediffusion indexes tend to lead those of thecorresponding aggregates. Since diffusion indexesare highly erratic, they are computed from changesmeasured over 6- or 9-month (or 3- or 4-quarter)spans, as well as 1-month (or 1-quarter) spans.Longer spans help to highlight the trends underly-ing the shorter-term fluctuations. Diffusion indexesare shown for the component series included ineach of the three composite indexes and for thecomponents of some of the aggregate series shownin section B.
Diffusion measures can be derived not only fromactual data but also from surveys of anticipationsor intentions. Indexes based on responses ofbusiness executives about their plans andexpectations for several operating variables arepresented, along with the corresponding indexesbased on actual data, as the last set of diffusionseries.
This section also records rates of change for thethree composite indexes (leading, coincident, andlagging) and for four indicators of aggregateeconomic activity: GNP in constant dollars(quarterly), industrial production, employee hoursin nonagricultural establishments, and personalincome less transfers in constant dollars. Rates ofchange are shown for 1- and 3-month spans or for1-quarter spans.
Although movements in diffusion indexes and inrates of change for the same aggregates aregenerally positively correlated, these two measurespresent information about two related but distinctaspects of economic change. Diffusion indexesmeasure the prevailing direction or scope ofchange, while rates of change measure the degreeas well as the overall direction. As is the case fordiffusion indexes, cyclical movements in the ratesof change tend to lead those of the correspondingindexes or aggregates, and thus, they tend to leadat the business cycle turns as well.
Digitized for FRASER http://fraser.stlouisfed.org/ Federal Reserve Bank of St. Louis
Part I I . OTHER IMPORTANT ECONOMICMEASURES
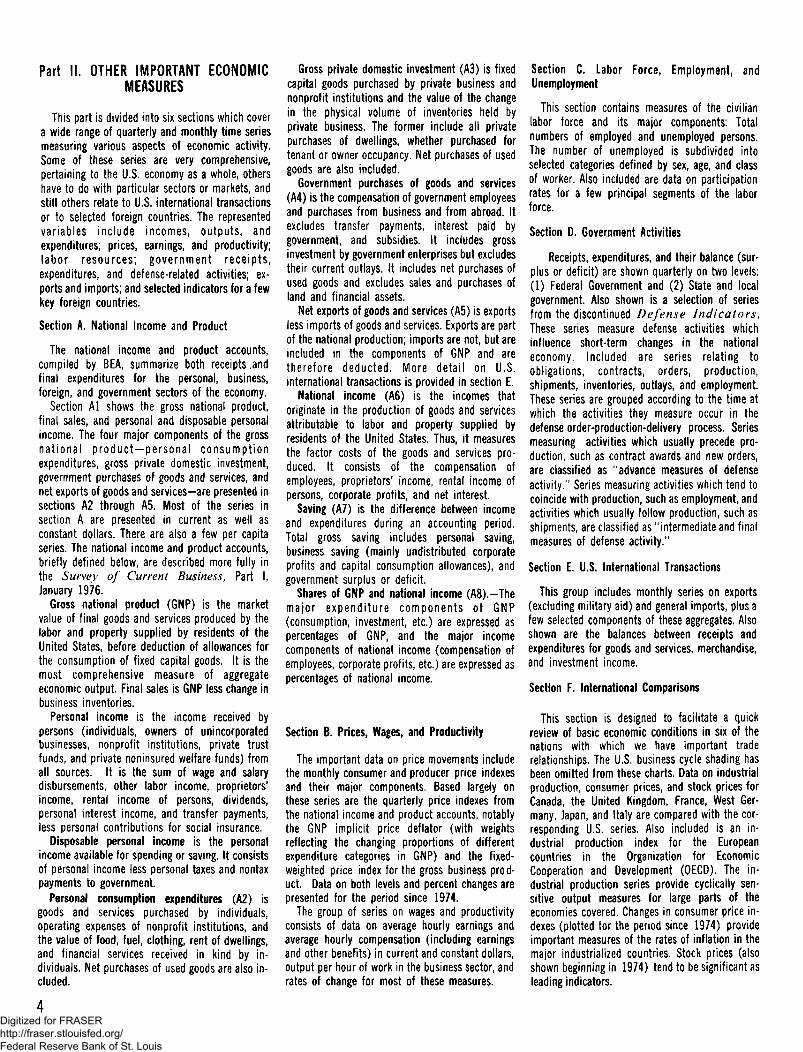
This part is divided into six sections which covera wide range of quarterly and monthly time seriesmeasuring various aspects of economic activity.Some of these series are very comprehensive,pertaining to the U.S. economy as a whole, othershave to do with particular sectors or markets, andstill others relate to U.S. international transactionsor to selected foreign countries. The representedvariables include incomes, outputs, andexpenditures; prices, earnings, and productivity;labor resources; government receipts,expenditures, and defense-related activities; ex-ports and imports; and selected indicators for a fewkey foreign countries.
Section A. National Income and Product
The national income and product accounts,compiled by BEA, summarize both receipts .andfinal expenditures for the personal, business,foreign, and government sectors of the economy.
Section Al shows the gross national product,final sales, and personal and disposable personalincome. The four major components of the grossnational product-personal consumptionexpenditures, gross private domestic investment,government purchases of goods and services, andnet exports of goods and services—are presented insections A2 through A5, Most of the series insection A are presented in current as well asconstant dollars. There are also a few per capitaseries. The national income and product accounts,briefly defined below, are described more fully inthe Survey of Current Business, Part I,January 1976.
Gross national product (GNP) is the marketvalue of final goods and services produced by thelabor and property supplied by residents of theUnited States, before deduction of allowances forthe consumption of fixed capital goods. It is themost comprehensive measure of aggregateeconomic output Final sales is GNP less change inbusiness inventories.
Personal income is the income received bypersons (individuals, owners of unincorporatedbusinesses, nonprofit institutions, private trustfunds, and private noninsured welfare funds) fromall sources. It is the sum of wage and salarydisbursements, other labor income, proprietors'income, rental income of persons, dividends,personal interest income, and transfer payments,less personal contributions for social insurance.
Disposable personal income is the personalincome available for spending or saving. It consistsof personal income less personal taxes and nontaxpayments to government.
Personal consumption expenditures (A2) isgoods and services purchased by individuals,operating expenses of nonprofit institutions, andthe value of food, fuel, clothing, rent of dwellings,and financial services received in kind by in-dividuals. Net purchases of used goods are also in-cluded.
Gross private domestic investment (A3) is fixedcapital goods purchased by private business andnonprofit institutions and the value of the changein the physical volume of inventories held byprivate business. The former include all privatepurchases of dwellings, whether purchased fortenant or owner occupancy. Net purchases of usedgoods are also included.
Government purchases of goods and services(A4) is the compensation of government employeesand purchases from business and from abroad. Itexcludes transfer payments, interest paid bygovernment, and subsidies. It includes grossinvestment by government enterprises but excludestheir current outlays. It includes net purchases ofused goods and excludes sales and purchases ofland and financial assets.
Net exports of goods and services (A5) is exportsless imports of goods and services. Exports are partof the national production; imports are not, but areincluded in the components of GNP and aretherefore deducted. More detail on U.S.international transactions is provided in section E.
National income (A6) is the incomes thatoriginate in the production of goods and servicesattributable to labor and property supplied byresidents of the United States, Thus, it measuresthe factor costs of the goods and services pro-duced. It consists of the compensation ofemployees, proprietors' income, rental income ofpersons, corporate profits, and net interest.
Saving (A7) is the difference between incomeand expenditures during an accounting period.Total gross saving includes personal saving,business saving (mainly undistributed corporateprofits and capital consumption allowances), andgovernment surplus or deficit.
Shares of GNP and national income (A8).—Themajor expenditure components of GNP(consumption, investment, etc.) are expressed aspercentages of GNP, and the major incomecomponents of national income (compensation ofemployees, corporate profits, etc.) are expressed aspercentages of national income.
Section B. Prices, Wages, and Productivity
The important data on price movements includethe monthly consumer and producer price indexesand their major components. Based largely onthese series are the quarterly price indexes fromthe national income and product accounts, notablythe GNP implicit price deflator (with weightsreflecting the changing proportions of differentexpenditure categories in GNP) and the fixed-weighted price index for the gross business prod-uct. Data on both levels and percent changes arepresented for the period since 1974.
The group of series on wages and productivityconsists of data on average hourly earnings andaverage hourly compensation (including earningsand other benefits) in current and constant dollars,output per hour of work in the business sector, andrates of change for most of these measures.
Section C. Labor Force, Employment, andUnemployment
This section contains measures of the civilianlabor force and its major components: Totalnumbers of employed and unemployed persons.The number of unemployed is subdivided intoselected categories defined by sex, age, and classof worker. Also included are data on participationrates for a few principal segments of the laborforce.
Section D. Government Activities
Receipts, expenditures, and their balance (sur-plus or deficit) are shown quarterly on two levels;(1) Federal Government and (2) State and localgovernment. Also shown is a selection of seriesfrom the discontinued Defense Indicators,These series measure defense activities whichinfluence short-term changes in the nationaleconomy. Included are series relating toobligations, contracts, orders, production,shipments, inventories, outlays, and employment.These series are grouped according to the time atwhich the activities they measure occur in thedefense order-production-delivery process. Seriesmeasuring activities which usually precede pro-duction, such as contract awards and new orders,are classified as "advance measures of defenseactivity." Series measuring activities which tend tocoincide with production, such as employment, andactivities which usually follow production, such asshipments, are classified as "intermediate and finalmeasures of defense activity."
Section E. U.S. International Transactions
This group includes monthly series on exports(excluding military aid) and general imports, plus afew selected components of these aggregates. Alsoshown are the balances between receipts andexpenditures for goods and services, merchandise,and investment income.
Section F. International Comparisons
This section is designed to facilitate a quickreview of basic economic conditions in six of thenations with which we have important traderelationships. The U.S. business cycle shading hasbeen omitted from these charts. Data on industrialproduction, consumer prices, and stock prices forCanada, the United Kingdom, France, West Ger-many, Japan, and Italy are compared with the cor-responding U.S. series. Also included is an in-dustrial production index for the Europeancountries in the Organization for EconomicCooperation and Development (OECD). The in-dustrial production series provide cyclically sen-sitive output measures for large parts of theeconomies covered. Changes in consumer price in-dexes (plotted for the period since 1974) provideimportant measures of the rates of inflation in themajor industrialized countries. Stock prices (alsoshown beginning in 1974) tend to be significant asleading indicators.
Digitized for FRASER http://fraser.stlouisfed.org/ Federal Reserve Bank of St. Louis
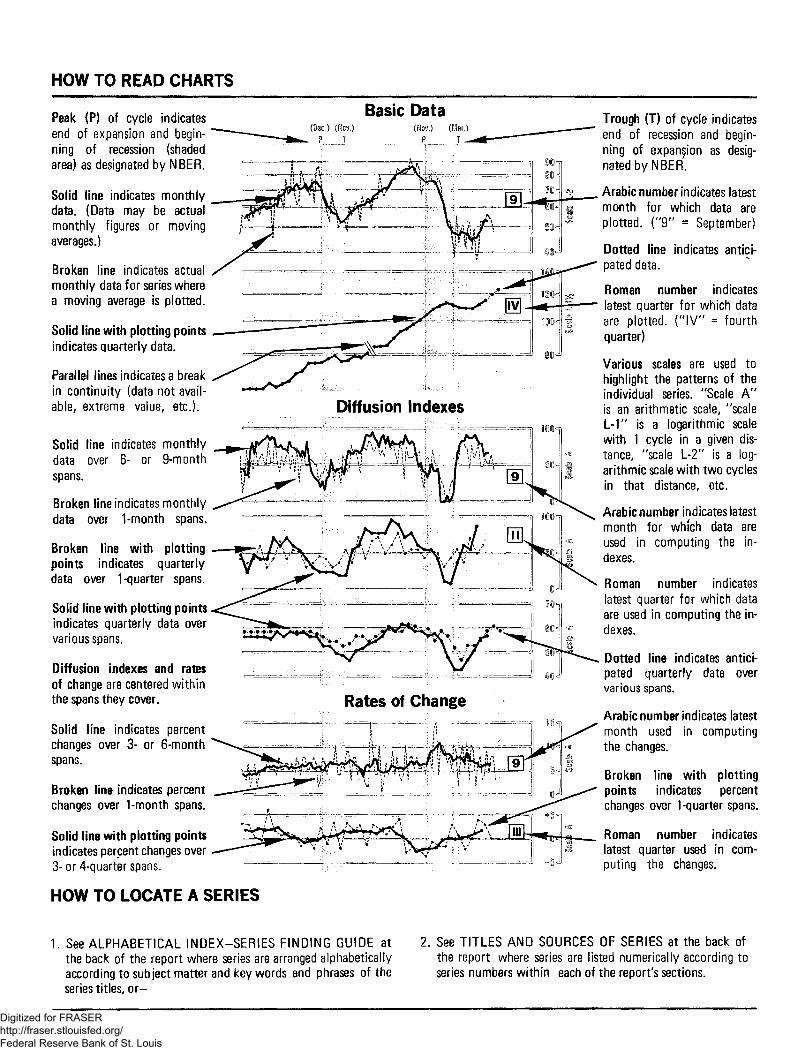
HOW TO READ CHARTS
Peak (P) of cycle indicatesend of expansion and begin-ning of recession (shadedarea) as designated by NBER.
Solid line indicates monthlydata. (Data may be actualmonthly figures or movingaverages.)
Broken line indicates actualmonthly data for series wherea moving average is plotted.
Solid line with plotting pointsindicates quarterly data.
Parallel lines indicates a breakin continuity (data not avail-able, extreme value, etc.).
Solid line indicates monthlydata over 6- or 9-monthspans.
Broken line indicates monthlydata over 1-month spans.
Broken line with plottingpoints indicates quarterlydata over 1-quarter spans.
Solid line with plotting pointsindicates quarterly data overvarious spans.
Diffusion indexes and ratesof change are centered withinthe spans they cover.
Solid line indicates percentchanges over 3- or 6-monthspans.
Broken line indicates percentchanges over 1-month spans.
Solid line with plotting pointsindicates percent changes over3-or4-quarter spans.
HOW TO LOCATE A SERIES
Basic Data
Diffusion Indexes
Rates of Change
Trough (T) of cycle indicatesend of recession and begin-ning of expansion as desig-nated by NBER.
Arabic number indicates latestmonth for which data areplotted. ("9" = September)
Dotted line indicates antici-pated data.
Roman number indicateslatest quarter for which dataare plotted. ("IV" = fourthquarter)
Various scales are used tohighlight the patterns of theindividual series. "Scale A"is an arithmetic scale, "scaleL-1" is a logarithmic scalewith 1 cycle in a given dis-tance, "scale L-2" is a log-arithmic scale with two cyclesin that distance, etc.
Arabic number indicates latestmonth for which data areused in computing the in-dexes.
Roman number indicateslatest quarter for which dataare used in computing the in-dexes.
Dotted line indicates antici-pated quarterly data overvarious spans.
Arabic number indicates latestmonth used in computingthe changes.
Broken line with plottingpoints indicates percentchanges over 1-quarter spans.
Roman number indicateslatest quarter used in com-puting the changes.
1. See ALPHABETICAL INDEX-SERIES FINDING GUIDE atthe back of the report where series are arranged alphabeticallyaccording to subject matter and key words and phrases of theseries titles, or -
2. See TITLES AND SOURCES OF SERIES at the back ofthe report where series are listed numerically according toseries numbers within each of the report's sections.
Digitized for FRASER http://fraser.stlouisfed.org/ Federal Reserve Bank of St. Louis
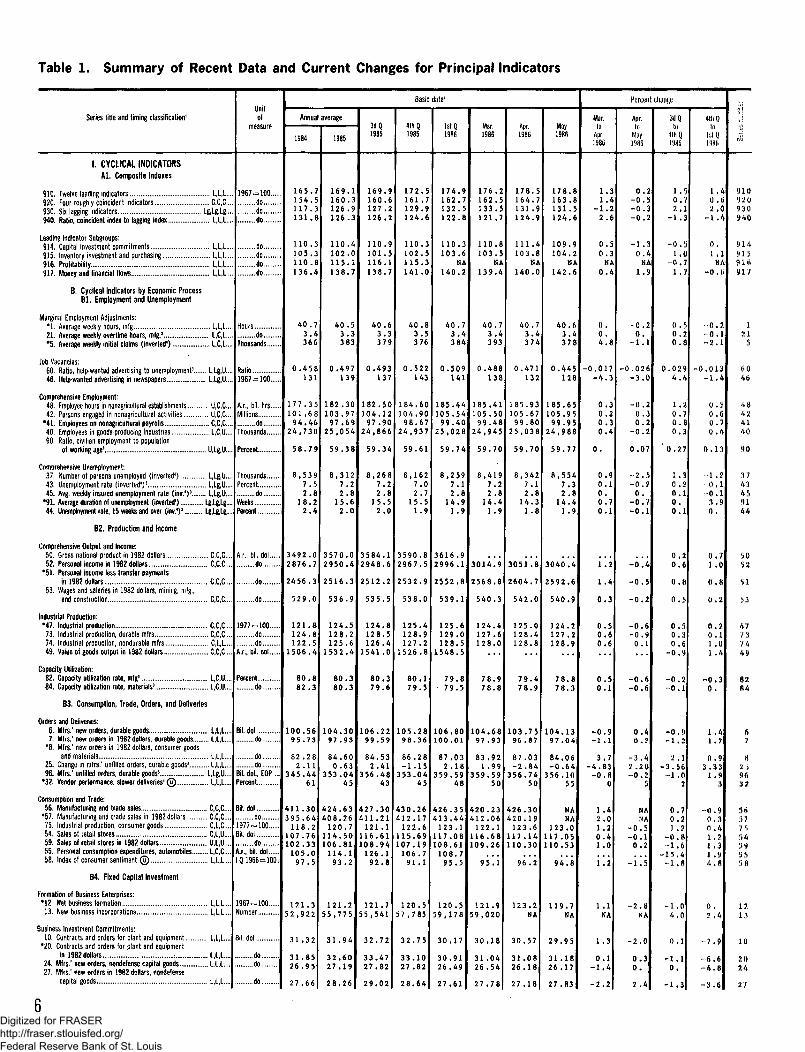
Table 1. Summary of Recent Data and Current Changes for Principal Indicators
Series title and timing classification1
1. CYCLICAL INDICATORSA l . Composite Indexes
910. Twelve leading indicators L.L.L...920 Four roughly coincident indicators C C C930 Six lafieine indicators Le,U LE...940. Ratio, coincident index to lagging index L,L,L...
Leading Indicator Subgroups:914. Capital investment commitments L,l,L..915 Inventory investment and purchasing L L L916 Profitability LL,L917 Money and financial flows , U ,L
B. Cyclical Indicators by Economic ProcessB l . Employment and Unemployment
Marginal Employment Adjustments:* 1 . Average weekly hours, mfg L(L,L..21. Average weekly overtime hours, mfg.3 L.C.L...*5. Average weekly initial claims (inverted1) L,C,L...
Job Vacancies:60 Ratio help'Wanted advertising to unemployment3 L Lg U46. Help-wanted advertising in newspapers L,Lg,U...
Comprehensive Employment:48. Employee hours in nonagricultural establishments U,C,C...42, Persons engaged in nonagricultural activities U.C.C...
• 4 1 , Employees on nonagricultural payrolls C(C,C...40. Employees in goods-producing industries L,C,U....90. Ratio, civilian employment to population
of working age' U,Lg,U....
Comprehensive Unemployment:37. Number of persons unemployed (inverted1) L,Lg,U....43. Unemployment rate (inverted')3 L.Lg.U....45. Avg. weekly insured unemployment rate (inv.4)3 Ug,U....
• 9 1 . Average duration of unemployment (inverted") lg,lg,Lg....44. Unemployment rate, 15 weeks and over (inv.T Lg.Lg.1*...
B2. Production and Income
Comprehensive Output and Income:50 Gross national product in 1982 dollars C C C52. Personal income in 1982 dollars C(C(C...
• 5 1 . Personal income less transfer paymentsin 1982 dollars C,C,C...,
53, Wages and salaries in 1982 dollars, mining, mfg,and construction C,C,C...
Industrial Production:*47, Industrial production C,C,C...
73. Industrial production, durable mfrs C,C,C...74. Industrial production, nondurable mfrs C,l,L...49. Value o1 goods output in 1982 dollars C,C,C...
Capacity Utilization:82 Capacity utilization rate mfg3 L C U84. Capacity utilization rate, materials3 L.C.U....
B3. Consumption, Trade, Orders, and Deliveries
Orders and Deliveries:6. Mfrs.' new orders, durable goods L.L.I7. Mfrs/new orders in 1982 dollars, durable goods L,L,L...
•8. Mfrs.' new orders in 1982 dollars, consumer goodsand materials L,L L
25. Change in mfrs.' unfilled orders, durable goods3 l , l ,L . . .96. Mfrs.' unfilled orders durable goods5 L.lg U
*32. Vendor performance, slower deliveries3 (u) L,L,L...
Consumption and Trade:56. Manufacturing and trade sales C,C,C...
•57. Manufacturing and trade sales in 1982 dollars C,C,C...75. Industrial production, consumer goods C,L,C...54. Sales of retail stores C.L.U....59. Sales of retail stores in 1982 dollars U,l,U,.~55, Personal consumption expenditures, automobiles L.C.C....58. Index of consumer sentiment © 1,1,1,...
B4. Fixed Capital Investment
Formation of Business Enterprises:•12. Net business formation L,L,L...
13. New business incorporations L,L,L...
business Investment Commitments:10. Contracts and orders for plant and equipment L,L,L...
•20. Contracts and orders for plant and equipmentin 1982 dollars • I I I
24. Mfrs.' new orders, nondefense capital goods 1,1,1.,..27. Mfrs.' new orders in 1982 dollars, nondefense
capital goods L,L,L...
ofmeasure
1967 = 100.do
. .dodo
do,do.do
. ..do
Hoursdo
Thousands
Ratio1967^100
A.r., bil. hrsMillions
doThousands
Percent
ThousandsPercent
doWeeksPercent
Ar bil. doldo
do
do
1977 = 100dodo
A.r., bil. dol
Percentdo
Bil. doldo
do .do
Bil. dol., EOP ...Percent
Bil. doldo
1977 = 100Bil. dol
doA.r., bil. dol
Q 1966-100.
1967 = 100dumber
Bil. dol
dodo
do
Basic data2
Annual
1984
1 6 5 . 71 5 4 . 5117.3131.8
110.3105.3110 .8136.4
40.73.4366
0.458131
177.35101.68
94.4624,730
58.79
8,5397.52.8
18.22.4
3492 .02876.7
2456.3
529.0
121.8124,8122.5
1506 .4
80.882.3
100.5695.73
82 .282 . 1 1
345 .4461
411.30395.64
118.2107 .76102.33
105.097.5
121,352,922
31 .32
31.8526.95
27.66
average
1985
169,1160.3126.9126.3
110.4102.0115.1138.7
40.53.33 83
0.497139
182 .30103.97
97 .6925,054
59.38
8,3127.22 .8
15.62 .0
3570.02950.4
2516,3
536.9
124.5128.2125.6
1532.4
80.380.3
104.3097.93
84.600.63
353.0445
424.63408.26
120.7114.50106.81
114.193.2
121.255,775
31 .94
32.6027.19
28.26
3dQ1985
169.9160.6127.2126.2
110.9101.5116.1138.7
40.63.3379
0.493137
182.50104.12
97.9024,866
59.34
8,2687.22.8
15.52 .0
3584.12948.6
2512.2
535.5
124.8128.5126.4
1541.0
80.379.6
106.2299.59
84.532 .41
356.4843
427.30411.21
121.1116.61108.94
126 .192.8
121.755,541
32.72
33.4727.82
29.02
4th Q1985
1 7 2 . 51 6 1 .71 2 9 . 91 2 4 . 6
110.3102.5115.3141.0
40 .83.5376
0.522143
184.60104.90
98.6724,937
59.61
8,1627.02 .7
15.51.9
3590 .82967.5
2532.9
538.0
125.4128.9127.2
1526 .8
80 .179.5
105.2898.36
86.28- 1 .15
353.0445
430.26412.17
122.6115.69107.19
106 .791 .1
120.557,785
32.75
33.1027 .82
28 .64
1st Q1986
174.9162.7132.5122.8
110.3103.6
NA140.2
40.73.43 84
0.509141
185.44105.54
99.4025,028
59.74
8,2597.12 .8
14.91 .9
3616 .92996.1
2552.8
539 .1
125.6129.0128.5
1548.5
79.879.5
106.80100.01
87 .032 .18
359.5948
426.35413 .44
123.1117.08108.61
108.795.5
120.559,178
30.17
30 .9126.49
27 .61
Mar.1986
176.2162.5133.5121.7
110.8103.5
NA139.4
40.73.4393
0.488138
185.41105.50
99.4824,945
59.70
8,4197.22.8
14 .41.9
3014.9
2568.8
540.3
124.4127.6128.0
78.978.8
104.6897 .93
83.921 .99
359.5950
420.23412.06
122.1116 .68109.26
95 .1
121 .959,020
30.18
31.0426.54
27 .78
Apr.1986
1 7 8 . 51 6 4 . 71 3 1 .91 2 4 . 9
1 1 1 . 41 0 3 . 8
NA140.0
40 .73 .4374
0 .471132
185.93105.67
99 .8025 ,038
59.70
8,3427.12 . 8
14.31.8
3051.8
2604.7
542 .0
125.0128.4128.8
7 9 . 478.9
103.7596 .87
87.03- 2 . 8 4
356 .7450
426.30420.19
123.6117 .14110.30
96.2
123.2NA
30.57
31 .0826 .18
27 .18
May1986
178,8163.8131 .5124.6
109.9104.2
NA142.6
40.63 .4378
0.445128
185.65105.95
99 .9524 ,988
59.77
8 ,5547.32 .8
14 .41.9
3040.4
2592.6
540.9
124.2127.2128.9
78 .878.3
104.1397 .04
84.06- 0 . 6 4
356.1055
NANA
123.0117 .05110.53
94 .8
119.7NA
29 .95
31 .1826 .17
27 .83
Percent change
Mar.to
Apr.1988
1 . 31 . 4
- 1 . 22 .6
0 . 50 . 3
HA0 .4
0 .0 .4 . 8
- 0 . 0 1 7- 4 . 3
0 . 30 . 20 . 30 4
0 .
0 . 90 . 10 .0 . 70 . 1
1 . 2
1 . 4
0 .3
0 . 50 . 60 .6
0.50 . 1
- 0 . 9- 1 .1
3.7- 4 . 8 3
- 0 . 80
1.42.01.20 .41.0
1 .2
1 .1NA
1.3
0 .1- 1 . 4
- 2 . 2
Apr.to
May1986
0 . 2- 0 . 5- 0 . 3- 0 . 2
- 1 . 30 . 4
NA1.9
- 0 . 20 .
- 1 . 1
- 0 . 0 2 6= 3 . 0
- 0 . 20 .30 . 2
0 . 0 7
- 2 . 5- 0 . 2
0 .- 0 . 7- 0 . 1
- 0 . 4
- 0 . 5
- 0 . 2
- 0 . 6- 0 . 9
0 . 1
- 0 . 6- 0 . 6
0 . 40 . 2
- 3 . 42 . 2 0» 0 . 2
5
NANA
- 0 . 5- 0 . 1
0 . 2
- 1 . 5
- 2 . 8NA
- 2 . 0
0 . 30 .
2 . 4
3d Qto
4th Q1985
1 .50 . 72 . 1
- 1 . 3
= 0 . 31 .0
- 0 . 71.7
0 .50 . 20 . 8
0 . 0 2 94 . 4
1 . 20 .70 . 80 3
* 0 . 2 7
1 . 30 .20 , 10 .0 . 1
0 .20 . 6
0 . 8
0.5
0 . 50 . 30 . 6
- 0 9
- 0 . 2= 0 . 1
- 0 . 9- 1 . 2
2 . 1- 3 . 5 6
- 1 . 02
0 . 70 . 21 . 2
» 0 . 8- 1 . 6
- 1 5 4- 1 . 8
- 1 . 04 . 0
0 . 1
- 1 . 10 .
- 1 . 3
4th Qto
istQ1986
1 . 40 . 62 .0
= 1 J
0 .1 . 1
NA- 0 . 6
- 0 . 2- 0 . 1- 2 . 1
- 0 . 0 1 3= 1 . 4
0 .50 . 60 . 7
0 . 1 3
- I .2- 0 . 1= 0 . 1
3.90 .
0 .71 .0
0 .8
0 .2
0 .20 . 11 .01 .4
= 0.30 .
1.41 .7
0 .93.33
1.93
- 0 . 90 ,30 .41 .21 .31 .94 .8
0 .2 . 4
- 7 . 9
- 6 . 6- 4 . 8
- 3 . 6
t •
1
91092093Q940
914913916917
121
3
6046
48424140
90
3743439144
3 2
51
33
47737449
82§4
7
82 39632
36377 33 43 93 338
1213
10
2024
27
Digitized for FRASER http://fraser.stlouisfed.org/ Federal Reserve Bank of St. Louis
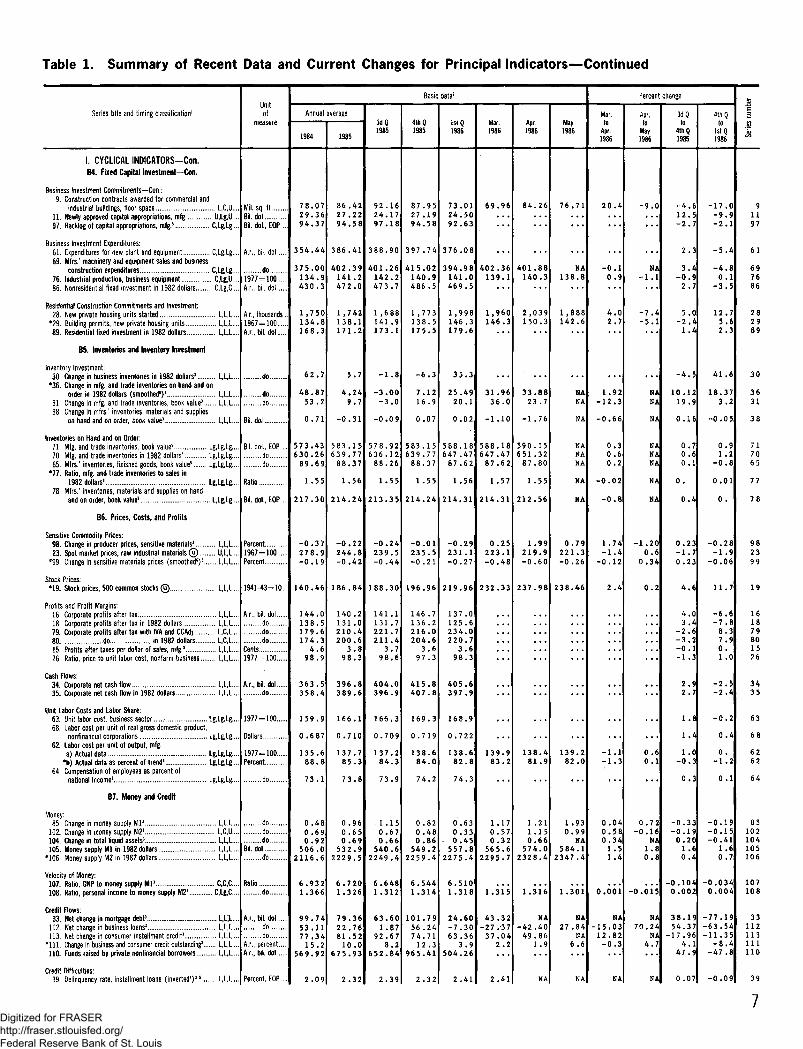
Table 1. Summary of Recent Data and Current Changes for Principal Indicators—Continued
Series title and timing classification1Unitof
measure
Basic data1
Annual average
1985
3dQ1985
4th Q1985
1st Q Mar.1986
Apr. May
Percent change
Mar.to
Apr.
Apr.to
May1986
3d Qto
4th Q1985
4th Qto
1st Q1986
I. CYCLICAL INDICATORS—Con.B4. Fixed Capital Investment-Con.
Business Investment Commitments—Con.:9. Construction contracts awarded for commercial and
industrial buildings, floor space L,C,U.11. Newly approved capital appropriations, mfg U,Lg,U....97. Backlog of capital appropriations, mfg.s C,Lg,Lg....
Business Investment Expenditures:61. Expenditures for new plant and equipment C.Lg.Lg....69. Mfrs.' machinery and equipment sales and business
construction expenditures C.Lg.Lg..76. Industrial production, business equipment C.Lg.U..86. Presidential fixed investment in 1982 dollars C,Lg,C...
Residential Construction Commitments and Investment:28. New private housing units started L,L,L,
*29. Building permits, new private housing units L,L,L...89. Residential fixed investment in 1982 dollars L,L,L...
B5. Inventories and Inventory Investment
Inventory Investment:30. Change in business inventories in 1982 dollars3 L,L,L.
*36, Change in mfg. and trade inventories on hand and onorder in 1982 dollars (smoothed6)3 L.L.L....
31. Change in mfg. and trade inventories, book value3 L,L,L...38. Change in mfrs.' inventories, materials and supplies
on hand and on order, book value3 L.L,!
Inventories on Hand and on Order:71. Mfg. and trade inventories, book value5 Lg,Lg,Lg....70. Mfg. and trade inventories in 1982 dollars5 Lg,Lg,Lg....65. Mfrs.' inventories, finished goods, book value5 Lg,Lg,Lg...,
*77. Ratio, mfg. and trade inventories to sales in1982 dollars3 Lg,Lg,Lg....
78. Mfrs.' inventories, materials and supplies on handand on order, book value5 L,Lg,Lg...,
B6. Prices, Costs, and Profits
Sensitive Commodity Prices:98. Change in producer prices, sensitive materials3 LfL,l23. Spot market prices, raw industrial mater ia ls© U,L,L...
*99. Change in sensitive materials prices (smoothed6)3 L,L,L...
Stock Prices:•19. Stock prices, 500 common stocks © L,L,L...
Profits and Profit Margins;16. Corporate profits after tax L,L,L...18. Corporate profits after tax in 1982 dollars L ,L ,L-79. Corporate profits after tax with IVA and CCAdj L,C,L...80 do in 1982 dollars L,C,L...15. Profits after taxes per dollar of sales, mfg.3 L,L,t26. Ratio, price to unit labor cost, nonfarm business L,L,L...
Mil. sq. f t . .Bil. dofBil. dol., EOP .
A.r., bil.dol..
1977 = 100..A.r., bil. dol..,
A.r., thousands.1967 = 100A.r., bil. dol
do
Bil. dol
Bil. dol., EOP .dodo
Ratio
Bil. dol., EOP .
Percent1967 = 100...Percent
1941-43=10.,
A.r,, bil.dol..
Cash Flows:34. Corporate net cash flow L.L.L...35. Corporate net cash flow in 1982 dollars L,L,L...
Unit Labor Costs and Labor Share:63. Unit labor cost, business sector -. Lg,Lg,Lg...,68. Labor cost per unit of real gross domestic product,
nonfinancial corporations Lg,Lg,Lg....62. Labor cost per unit of output, mfg.
a) Actual data Lg,Lg,Lg,...•b) Actual data as percent of trend3 Lg,Lg,Lg...
64. Compensation of employees as percent ofnational income3 Lg,Lg,Lg....
67. Money and Credit
Money:85. Change in money supply Ml 3 L,L,L...
102. Change in money supply M23 L,C,U....104. Change in total liquid assets3 L.L.L...105. Money supply Ml in 1982 dollars L.L.L...
•106. Money supply M2 in 1982 dollars L,L,L...
dododo
Cents1977 =-100...
A.r., bil.dol...do
1977=100...
Dollars
1977 = 100...Percent
..do..do..do..
Bil.doldo..
Velocity of Money:107. Ratio, GNP to money supply Ml 3 C,C,C...108. Ratio, personal income to money supply M23 C,Lg,C...
Credit Flows:33. Net change in mortgage debt3 L ,L ;L . . .
112. Net change in business loans3 L.L.I113- Net change in consumer installment credit3 L.L.L....
•111. Change in business and consumer credit outstanding3 L,L,L....110. Funds raised by private nonfinancial borrowers L.L.L...
Credit Difficulties:39. Delinquency rate, installment loans (inverted4)3 5 L,L,I—
Ratiodo...
A.r, bil. dol..dodo
A.r, percent..A.r, bil. dol...
Percent, EOP .
78.0729.3694.37
354 .44
375.00134,9430.3
1,750134.8168.3
62 .7
48.8753.2
573.43630.26
89.69
1 .55
217.30
- 0 . 3 7278.9-0 .19
160.46
144.0138.5179.6174.3
4.698.9
363.5358.4
159.9
0 .687
135.688.8
73.1
0 .480.6 90.92
506.02116.6
6.9321.366
99.7453.1177.34
15.2569.92
2.09
86 .4227 .2294 .58
386.41
402.39141 .2472.0
1,742138.1171.2
5.7
4.249.7
-0.31
583 .15639.7788.37
1.56
214.24
-0.2 2244.8-0.42
186.84
140 .2131.0210.4200.6
3.898.3
396.8389.6
166.1
0.710
137.785.3
73.8
0.960.650.69
532.92229.5
6.7201 .326
79.3622.7681 .5210 .0
675.93
92.1624.1797.18
388.90
401.26142.2473.7
1,688141 .9173.1
-1.8
-3.00-3.0
-0*09
578.92636.1288.26
1.55
213.35
-0.24239.5-0.44
188.30
141 .1131 .7221 .7211 .4
3.798.6
404.0396.9
166,3
0.709
137.284.3
73.9
1.150.670.66
540.62249 .4
6.648
63.601.87
92.678.2
652.84
87.9527 .1994.58
397.74
415.02140.9486 .5
1,773138.5175.5
-6.3
7.1216.9
583.15639.77
88.37
1.55
214.24
-0.01235.5-0.21
196.96
146 .7136 .2216.0204.63.6
97.3
415 .8407 .8
169.3
0.719
138.684.0
0.820.480.86549.2
2259.4
6.544
101.7956.2474.7112.3
965.41
73.0124.5092.63
376 .08
394.98141 .046 9.5
1,998146.3179.6
35.3
25.492 0 . 1
588.18647.47
87 .62
1.56
214.31
-0 .29231 .1-0 .27
219.96
137.0125.6234.0220.7
3.698 .3
405 .6397 .9
168.9
0 .722
138.682.8
0.630.33
• 0 .45557.8
2275.4
6.5101 .318
24.60-7 .3063.36
3.9504.26
69.96
402,36139.1
1,960146.3
31 .9636.0
588.18647.47
87.62
1.57
214.31
0.25223.1- 0 . 4 8
232.33
139.983.2
1.170.570.32
565.62295.7
1.315
43 .32-27 .'3 73 7 . 0 4
2 .2
84 .26 76.71 2 0 . 4
401.88140.3
NA138.8
- 0 . 10.9
2,039150.3
1 ,888142.6
4 .02.7
33 .8823 .7
590.15651 .32
87.80
1 .55
212.56
1 .99219.9-0 .60
2 3 7 . 9 8
NANA
0 . 7 92 2 1 . 3- 0 . 2 6
238.46
1.92- 1 2 . 3
-0 .66
0.30.60.2
- 0 . 0 2
- 0 . 8
1.74- 1 . 4
-0 .12
138.481.9
139,282.0
-1 .1-1 .3
1 .211 .150.66
574.02328.4
1.930.99
NA584.1
2347.4
0.040.580.34
1 .51 .4
- 9 . 0
NA
- 1 . 1
- 7 . 4- 5 . 1
-1 .200.6
0 .34
0 .2
0.60.1
0.72-0 .16
NA1.80 .8
1.316
NA- 4 2 . 4 0
4 9 . 8 61 . 9
1.301
NA2 7 . 8 4
NA6 . 6
0.001
NA- 1 5 . 0 31 2 . 8 2
- 0 . 3
- 0 . 0 1 5
NA7 0 . 2 4
NA4 . 7
2.41
- 4 . 612.5- 2 , 7
2.3
3.4- 0 . 9
2.7
5.0- 2 . 4
1 .4
- 4 . 5
10.1219,9
0.70.60.1
0 .
0.23- 1 . 70.23
4 .6
4,03.4
- 2 . 6- 3 . 2- 0 . 1- 1 . 3
2.92.7
1 .8
1 .4
1.0- 0 , 3
0.3
-0 .33-0 .19
0.201 .60.4
-0 .104
38.1954.37
-17.964,1
47.9
0,07
-17 .0- 9 . 9- 2 . 1
- 5 . 4
- 4 .0 .1
- 3 . 5
12.75.62 .3
18.373.2
- 0 . 0 5
0.91 .2
- 0 . 8
0.01
0 .
- 0 . 2 8- 1 . 9
-0 .06
- 6 . 6- 7 . 8
8.37,90 .1 .0
- 2 . 5- 2 . 4
- 0 . 2
0 . 4
0 .- 1 . 2
0 . 1
-0 .19-0 .15-0 .41
1.60 .7
- 0 . 0 3 40.004
-77.19-63.54-11.35
- 8 . 4- 4 7 . 8
- 0 . 0 9
Digitized for FRASER http://fraser.stlouisfed.org/ Federal Reserve Bank of St. Louis
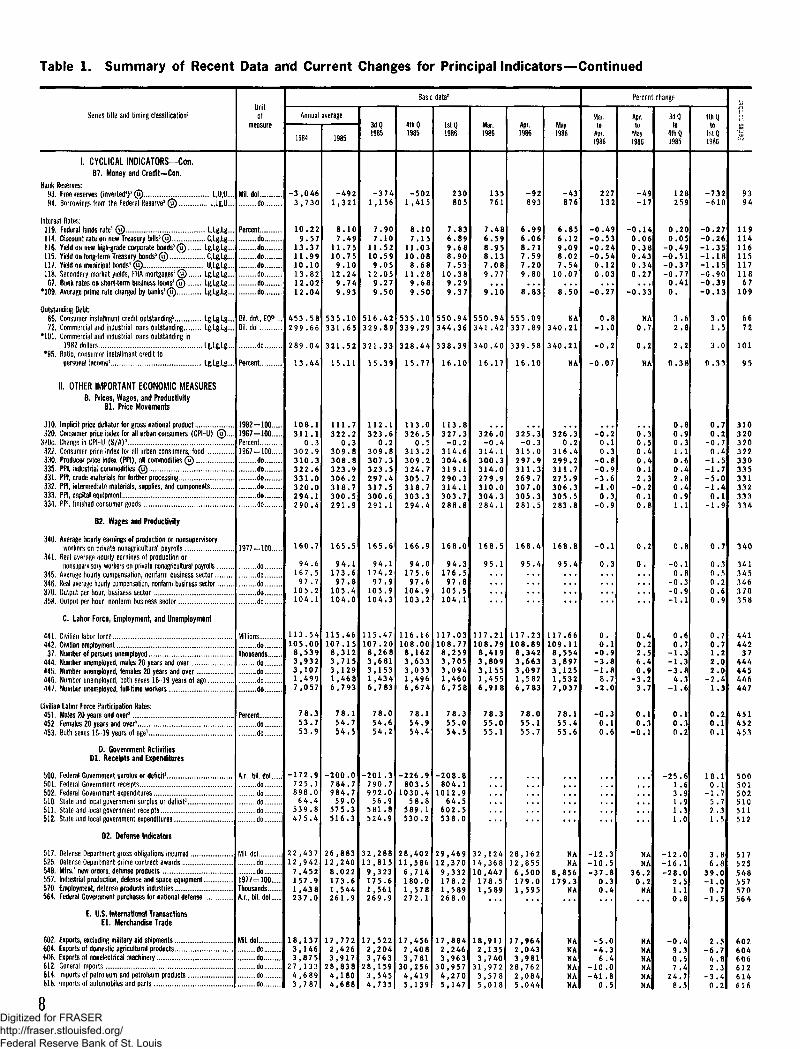
Table 1. Summary of Recent Data and Current Changes for Principal Indicators—Continued
Series title and timing classification1Unitof
measure
Basic data2
Annual average
1984 1985
3dQ1985
4th Q1985
1st Q Mar.1986
Apr.1986
May1986
Percent change
Mar.to
Apr.1986
Apr.to
May1986
3dQ
4th Q1985
4th Qto
lstQ1986
I. CYCLICAL INDICATORS—Con.B7. Money and Credit—Con.
Bank Reserves:93, Free reserves ( inverted4 )3® L.U.U....94, Borrowings from the Federal Reserve3 © L,Lg,U....
Interest Rates:119. Federal funds rate1 © L,Lg,Lg....114. Discount rate on new Treasury b i l l s 3 © C,lg,lg....116. Yield on new high-grade corporate bonds3 (u) Lg,Lg,Lg....115. Yield on long-term Treasury bonds3 @ C,Lg,Lg....117. Yield on municipal bonds3 © U.lg.lg....118. Secondary market yields, FHA mortgages3 ® Lg,lg,Lg....6?. Bank rates on short-term business l oans 3 © Lg,Lg,Lg....
*109. Average prime rate charged by banks 3 © Lg,Lg,Lg....
Outstanding Debt;66. Consumer installment credit outstanding5 Lg,lg,Lg....72, Commercial and industrial loans outstanding Lg,lgtLg...,
*101. Commercial and industrial loans outstanding in1982 dollars Lg.Lg.Lg....
*95. Ratio, consumer installment credit topersonal income1 Lg.Lg.Lg....
II. OTHER IMPORTANT ECONOMIC MEASURESB. Prices, Wages, and Productivity
B l . Price Movements
310. Implicit price deflator for gross national product320. Consumer price index for all urban consumers (CPI-U) © . . . .
320e. Change in CPI-U (S/A)3
322. Consumer price index for all urban consumers, food330. Producer price index (PPI), all commodities ©335. PPI, industrial commodities (u)331. PPI, crude materials for further processing332. PPI, intermediate materials, supplies, and components333. PPI, capital equipment334. PPI, finished consumer goods
B2. Wages and Productivity
340. Average hourly earnings of production or nonsupervisoryworkers on private nonagricultural payrolls
341. Real average dourly earnings of production ornonsupervisory workers on private nonagricultural payrolls
345. Average hourly compensation, nonfarm business sector346. Real average hourly compensation, nonfarm business sector . .370. Output per hour, business sector358. Output per hour, nonfarm business sector
0. Labor Force, Employment, and Unemployment
441. Civilian labor force442. Civilian employment
37. Number of persons unemployed444. Number unemployed, males 20 years and over445. Number unemployed, females 20 years and over446. Number unemployed, both sexes 16-19 years of age447. Number unemployed, full-time workers
Civilian Labor Force Participation Rates:451. Males 20 years and over3
452. Females 20 years and over3
453. Both sexes 16 19 years of age1.,..
Mil.doldo
Percent....do..,....do...
do.......do...
do..,do.,,do...
Bil. dot., EOP .dol
....do
Percent
1982 = 100...1967-100...Percent196/ 100
d o .... .do. .. .do.... . .do.
d o .. . do .,
1977-100...
do.do . , .do.
. .do. . ..do
Millions..do...
Thousands......do....do
do
Percent...
D. Government ActivitiesD l . Receipts and Expenditures
500. Federal Government surplus or deficit3
§01. Federal Government receipts502. Federal Government expenditures510. State and local government surplus or deficit3.511. State and local government receipts512. State and local government expenditures
- 3 , 0 4 63 , 7 3 0
10.229.57
13.3711.9910.1013.8212.0212.04
453.58299.66
289.04
13.44
108.1311.1
0 .3302.9310.3322.6331320.0294.1290.4
160.7
94.6167.597
105
A.r., bil. dol..
104.1
113.54105.008,5393,9323,1071 ,4997,057
78.353.753.9
-172.9
-4921,321
8.107.49
11.7510.75
9.1012.24
9.749.93
535.10331.65
321.52
15.11
111 .7322.2
0.3309.8308.8323.9306.2318.7300.5291.9
165.5
94.1173.6
97.8105.4104.0
115.46107.158,3123,7153,1291,46 86,793
78.154.754.5
-200.0
-3741,156
7.907.10
11.5210.599.05
12.059.279.50
516.42329.89
321.33
15.39
112.1323.6
0.2309.8307 .3323.5297 .4317.5300.6291 .1
165.6
94.1174.2
97.9105.9104.3
115.47107.208,2683,6813,1531,4346,783
78.054.654.2
-201 .3
-5021,415
8.107.15
11.0310.08
8.6811 .28
9 .689.50
535.10339.29
328.44
15.77
113.0
dododododo
D2. Defense Indicators
517. Defense Department gross obligations incurred525. Defense Department prime contract awards548. Nlfrs.1 new orders, defense products557. Industrial production, defense and space equipment..570. Employment, defense products industries564. Federal Government purchases for national defense .
E. U.S. International TransactionsEl . Merchandise Trade
692. Exports, excluding military aid shipments604. Exports of domestic agricultural products606, Exports of nonelectrical machinery612. General imports614. Imports of petroleum and petroleum products616. Imports of automobiles and parts
Mil.dol....do...do...
1977 = 100..,ThousandsA.r., bil. dol...
Mil.dol..
..do...
..do..
..do..
725.1898.0
64.4539.8475.4
22,43712,9427,452157.91 ,438237.0
18,1373,1463,875
27,1334,6893,787
7 84.7984.7
59.0575.3516.3
26,88312,2408,022173.61,544261.9
17,7722,4263,917
28,8384,1804,688
790.7992.056.9
581 .8524.9
32,28813,815
9,323175.61 ,561269.9
17,5222,2043,763
28,1593,5454,735
3260
313309324305318.7303.3294.4
166 .9
94.0175.697.6
104.9103.2
116.16108.008,1623,6333,0331 ,4966,674
78.154.954.4
-226.9
230805
7.836.899.688.907.53
10.389.299.37
550.94344.36
338.39
16.10
113.8327.3
- 0 . 2314.6304.6319.1290.3314.1303.7288.8
168.0
94.3176.5
97.8105.5104.1
117.03108.77
8,2593,7053,0941,4606,758
78.355.054.5
-208.8
135761
7.486.598.958.137 .089.77
9.10
550.94341.42
340.40
16.17
326.0- 0 . 4
314.1300.3314.0279.9310.0304.3284.1
168.5
95.1
117.21108.79
8,4193,8093,1551,4556,918
78.355.055.1
-92893
6.996.068.717.597.209.80
-43876
6.856.129.098.027.54
10.07
227132
-0.49-0.53-0.24-0.540.120.03
8.83
555.09337.89
339.58
16.10
8.50
NA340.21
340.21
-0.27
0.8-1.0
-0.2
-0.07
325.3-0.3
315.0297311269307.0305.3281 .5
168.4
95.4
326.30.2
316 .4299311275.9306305.
- 1
0.20.10.300.93.6
0
283.8
168.8
95.4
0.3- 0 . 9
- 0 . 1
0.3
117.23108.89
8,3423,6633,0971 ,5826,783
78.055.155.7
117 .66109.118,5543,8973,1251,5327,037
78.155.455.6
0.0.1
-0 .9- 3 . 8- 1 . 8
8.7- 2 . 0
- 0 . 30,10.6
80 3.51030.4
58.8589.1530.2
28,40211,586
6,714180.01,578272.1
17,4562,4083,781
30,2564,4195,139
80 4 . 11012.9
64.5602.5538 .0
29,46912,3709,332178.21,589268.0
17,8842,2463,963
30,9574,2705,147
32,12414,36810,447178.51,589
28,16212,8556,500179.01,595
NANA
8,856179.3
NA
-12.3-10.5-37.8
0.30.4
18,9112,1353,7 40
31 ,9723,5785,018
17,9642,0433,981
28,7622,0845,044
NANANANA
-5.0-4.36.4
-10.0-41.8
0.5
-49-17
-0.140.060.380.430.340.27
-0.33
NA0.7
0.2
NA
000.40.402.3
-0.20.10.8
0.2
0.
0.40.22.56.40.9
-3.23.7
0.10.3
-0.1
NANA
36.20.2NA
NANANANANANA
128259
0.200.05
-0.49-0.51-0.37-0.770.410.
3.62.8
2.2
0.38
0001.100.42.80 .40.91 .1
0.8
-0.3-0.9-1.1
0.60.7
-1.3-1.3-3.84.3
-1.6
0.10.30.2
-25.61.63.91 .91 .31.0
-12.0-16-28.0
2.510.8
-0.49.30.57.4
24.78.5
-732-610
-0.27-0.26-1.35-1.18-1.15-0.90-0.39-0.13
3.01
0.33
00.2
-0.70 .4
-1.5-1-5,
-1.9
0.7
00.50.20.60.9
0.70.71 .22.02.0
-2.41.3
0.20.10.1
18.10.1
-1.75.72.31.5
36
39.0-I .00.7
-1.5
2.5-6.742,3
-3.40.2
9394
11911411611511711867
109
6672
101
95
3103203 203 2233033533133233333 4
340
341345346370358
44144237
444445446447
451452453
500501§02510511512
51752554835757056 4
602604606612614616
Digitized for FRASER http://fraser.stlouisfed.org/ Federal Reserve Bank of St. Louis
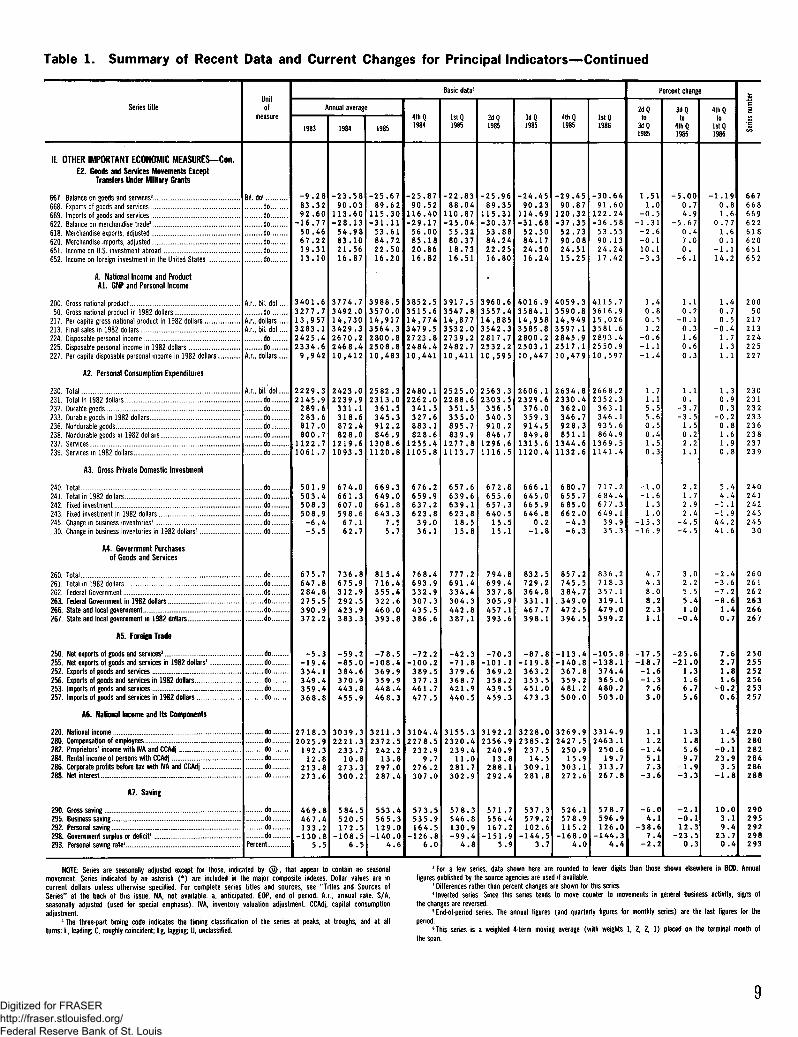
Table 1. Summary of Recent Data and Current Changes for Principal Indicators—Continued
Series titleUnitof
measure
Basic data'
Annual average
1983 1985
4th Q1984
1st Q1985
2dQ1985
3d Q1985
4th Q1985
1st Q
Percent change
2dQ
3dQ1985
3dQto
4th Q1985
4th Qto
1st Q1986
IE. OTHER IMPORTANT ECONOMIC M E A S U R E S - C o n .E2. Goods and Services Movements Except
Transfers Under Military Grants
667. Balance on goods and services3
668. Exports of goods and services669. Imports of goods and services622. Balance on merchandise trade3
618. Merchandise exports, adjusted620. Merchandise imports, adjusted651. Income on U.S. investment abroad652. Income on foreign investment in the United States .
A. National Income and ProductA l . GNP and Personal Income
200. Gross national product50. Gross national product in 1982 dollars
217, Per capita gross national product in 1982 dollars213. Final sales in 1982 dollars224. Disposable personal income225. Disposable personal income in 1982 dollars227. Per capita disposable personal income in 1982 dollars
A2. Personal Consumption Expenditures
230. Total231. Total in 1982 dollars. . . .232. Durable goods233. Durable goods in 1982 dollars.236. Nondurable goods238. Nondurable goods in 1982 dollars.237. Services239. Services in 1982 dollars. . .
A3. Gross Private Domestic Investment
240. Total241. Total in 1982 dollars242. Fixed investment243. Fixed investment in 1982 dollars245. Change in business inventories3
30. Change in business inventories in 1982 dollars3...
A4. Government Purchasesof Goods and Services
260. Total261. Total in 1982 dollars262. Federal Government263. Federal Government in 1982 dollars266. State and local government267. State and local government in 1982 dollars....
A5. Foreign Trade
250. Net exports of goods and services3,.. .255. Net exports of goods and services in 1982 dollars3.252. Exports of goods and services256. Exports of goods and services in 1982 dollars..253. Imports of goods and services257. Imports of goods and services in 1982 dollars ..
A6. National Income and Its Components
220. National income280. Compensation of employees282. Proprietors' income with IVA and CCAdj .. . .284. Rental income of persons with CCAdj . .286. Corporate profits before tax with IVA and CCAdj288. Net interest
A7. Saving
290. Gross saving295. Business saving292. Personal saving298. Government surplus or deficit3
293. Personal saving rate3
Bit. dol . .
..do...
..do...
..do..
..do...
..do..
..do..
A.r., bil.dol.....do
A.r., dollars..A.r., bil.dol..
...do
...doA.r., dollars..
A.r., bi l .dol..do. ..
. . .do .do.. .do. .
. . .do.... . . do .. .do. .
...do...
...do...
...do...
...do...
..do..
..do...
..do.....do.....do....do..
.do.. .do-
dodo
..do. .
...do.,.do...do...do...do.....do..
do..do..do..do..
Percent
- 9 . 2883.3292.60
•16.7750.4667,2219.3113.10
3401.63277.713,9573283.12425.42334.6
9,942
2229.32145.9289.6283.6817.0800.7
11221061.7
501.9503.4508.3508.9-6.4-5.5
675.7647 .8284.8275.5390.9372.2
-5 .3-19 .4354.1349.4359.4368.8
2718.32025.9192 .312.8
213.8273.6
469.8467.4133.2
-130.85 .5
- 2 3 . 5 890,
113,- 2 8 ,
54,83,21,16.
3774.73492.014,7303429.32670.22468.410,412
2423.02239.9
331 .1318.6872.4828.0
1219.61093.3
674.0661 .3607 .0598.6
67.162.7
736.8675.9312.9292.5423.9383.3
-59.2-85.0384.6370.9443455.9
3039.32221 .3233.710.8
273.3300.2
584.5520.5172.5
-108.56.5
-25.6789.62
115.30-31.11
5 3 . 6 184 .7222.5016.20
3988.53570.014,9173564.32800.82508.810,483
2582.32313.0
361.5345 .3912.2846.9
1308.61120.8
669.3649.0661.8643.3
7.55.7
815.4716.4355.4322.646 0.0393.8
-7 8.5-108.4369.9359.9448.446 8.3
3211.32372.5
242.213.8
297.0287 .4
553 .4565.3129.0
-140.04.6
- 2 5 . 8 790.52
116.40-29.17
56.0085.1820.8616.82
3852.53515.614,7743479.52723.82484.410,441
24802262341327883828
12551105
676.2659.9637.2623,839.036.1
768.4693.9332.9307.343 5.5386.6
- 7 2 . 2•100.2389.5377 .3461 .747 7.5
3104.42278.5
232.99.7
276.2307 .0
573.5535.9164.5
-126 .86.0
-22.8388.04
110.87-25.04
55.3280.3718.7316.51
3917.53547.814,8773532.02739.22482.710,411
2525.02288.6
351.5335.0895.7839.9
1277 .81113.7
657.6639.6639.1623.8
18.515.8
777 .2691 .4334.4304.3442.83 87.1
-42 .3-71 .8379.6368.7421.9440.5
3155.32320.4
239.411 .0
281.7302.9
578.3546 .8130.9- 9 9 . 4
4 . 8
-25.9689.35
115.31-30.37
53.8884.2422.2516.80
3960.63557.414,8853542.32817.72532.210,595
25632303356340910846
12961116
672.8655.6657 .3640.5
15.515.1
794.8699.4337.8305.9457 .1393.6
-70.3-10136935843 9.5459.3
3192.22356.9240.913 .8
288.1292.4
571.7556.4167.2
-151.95.9
-24.4590.23
114.69-31.68
52.5084.1724.5016.24
4016.93584.114,9583585.82800.22503.110,447
2606.12329.6376.0359.3914.5849.8
1315.61120.4
666.1645.0665.9646 .8
0.2-1 .8
832.5729.2364.8331.146 7.7398.1
-87 .8-119.8363.2353.5451.0473.3
3228.02385.2
237.514.5
3 0 9 . 1281,8
537.3579.2102
-144.53.7
- 2 9 . 4 590.87
120.32-37 .35
52.7390.0824.5115.25
4059.33590.814,9493597.12845.92517.110,479
2634.82330 .4
362.0346.7928.3851.1
1344.61132.6
6 80.7655 .7685.0662.0
-4 .3-6 .3
857.2745.5384.7349.047 2.5396.5
-113.4-140.8367.8359.2481.2500.0
3269.92427 .5250.915.9
303.1272.6
526.1578.9115.2
-168.04.0
-30.6491 .60
122. 24-36.5853.5590 .1324.2417.42
4115.73616.915,0263581.62893.42550.910,597
2668.22352.3
363.1346.1935.6864.9
1369.51141 .4
717.2684.4677.3649.1
39.935.3
836.2718.3357.1319.1479.0399.2
-105.8-138.1374.4365.0480 .2503.0
3314.92 4 6 3 . 1
250.619.7
313.7267.8
578.7596.9126.0
-144.34.4
1 .511.0
-0 .5-1 .31
-2 .6- 0 . 110.1-3 .3
1 .40 .80 .51 .2
-0 .6- 1 . 1-1 .4
1 .71 .15.55.60 .50.41.50.3
-1- 1
11
-15
4.74.38.08.22.31 .1
-17 .5-18.7
-1 .6-1 .3
2.63.0
1.11 .2
- 1 . 45.17.3
-3 .6
-6 .04.1
-38.67 .4
-2 .2
- 5 . 0 00.74.9
-5.670.47 .00.
- 6 . 1
1.10.2
- 0 . 10.31 .60.60 .3
1 .10.
-3- 3 . 7-3 .5
1 .50 .22.21 .1
2 .21 .72.92 .4
-4 .5-4 .5
3 .02.25.55.41 .0
- 0 . 4
-25.6-21.0
116 .75.6
1 .315.69.7
-1 .9-3 .3
- 2 . 1- 0 . 112.3
-23 .50.3
-1 .190 . 81 .6
0.771 . 60 .1
- 1 . 114.2
1 .400
- 0 . 41 .71 .31 .1
10 .90.3
-0 .201 .61 .90
54.4
-1 .1-1 .944.241 .6
- 2 . 4-3 .6= 7.2-8 .6
1 .40
7 . 62 . 711 .6
-0 .20 .6
1 .41 .5
-0.123.93.5
= 1 .8
10.03 .19.4
23 .70 .4
NOTE: Series are seasonally adjusted except for those, indicated by ® , that appear to contain no seasonalmovement. Series indicated by an asterisk (*) are included in the major composite indexes. Dollar values are incurrent dollars unless otherwise specified. For complete series titles and sources, see "Titles and Sources ofSeries" at the back of this issue. NA, not available, a, anticipated. EOP, end of period. A.r., annual rate. S/A,seasonally adjusted (used for special emphasis). IVA, inventory valuation adjustment. CCAdj, capital consumptionadjustment.
'The three-part timing code indicates the timing classification of the series at peaks, at troughs, and at allturns: L, leading; C, roughly coincident; Lg, lagging; U, unclassified.
1 For a few series, data shown here are rounded to fewer digits than those shown elsewhere in BCD. Annualfigures published by the source agencies are used if available.
1 Differences rather than percent changes are shown for this series.1 Inverted series. Since this series tends to move counter to movements in general business activity, signs of
the changes are reversed.5 End-of-period series. The annual figures (and quarterly figures for monthly series) are the last figures for the
period.s This series is a weighted 4-term moving average (with weights 1, 2, 2, 1) placed on the terminal month of
the span.
Digitized for FRASER http://fraser.stlouisfed.org/ Federal Reserve Bank of St. Louis
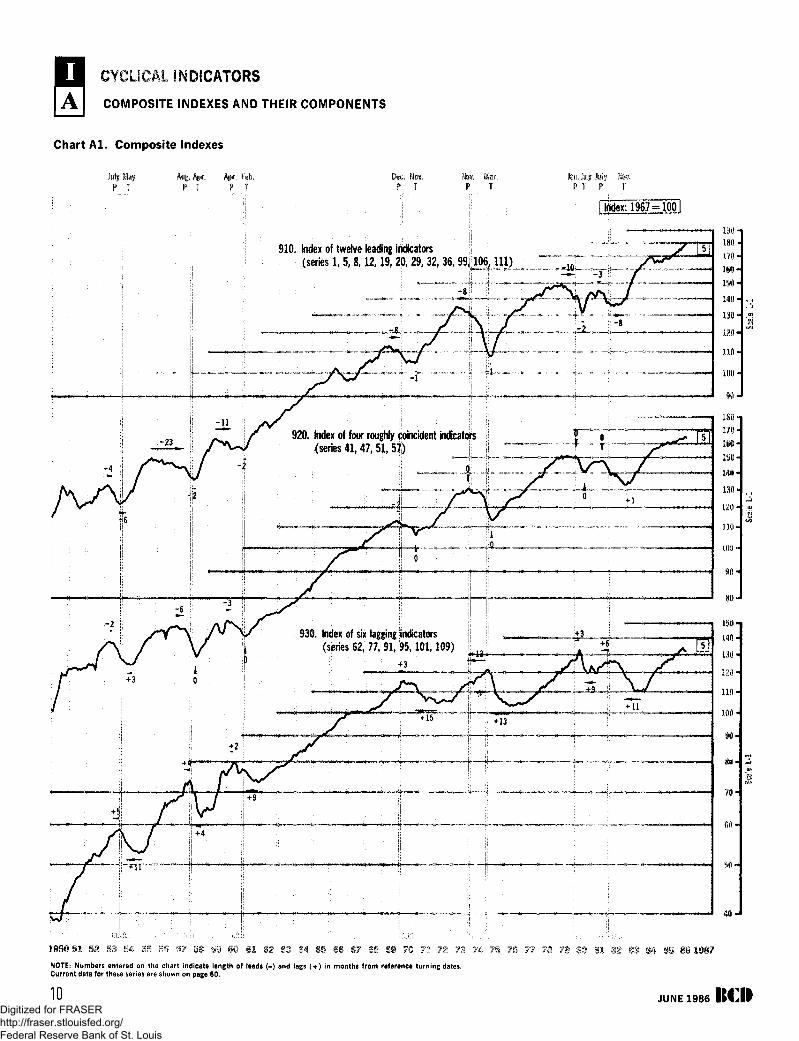
CYCLICAL INDICATORS
j A I COMPOSITE INDEXES AND THEIR COMPONENTS
Chart Al . Composite Indexes
July May Aug. Apr. Apr. Feb.P T P T P T
Dec. Nov. Now, Mar.P T P T
Jan. July Juiy Nov.P T ' P T
920. Index of four roughly Coincident indicators(series 41,47, 51, 57) |l
930. Index of six lagging indicators(series 62, 77, 91, fit 101,109) ^ J
X9gQSl 52 53
NOTE: Numbers entered on the chart indicate length of leads (-) and lags ( + ) in months from reference turning dates.Current data for these series are shown on page 60.
s as im?
10 JUNE 1986HOIDigitized for FRASER http://fraser.stlouisfed.org/ Federal Reserve Bank of St. Louis
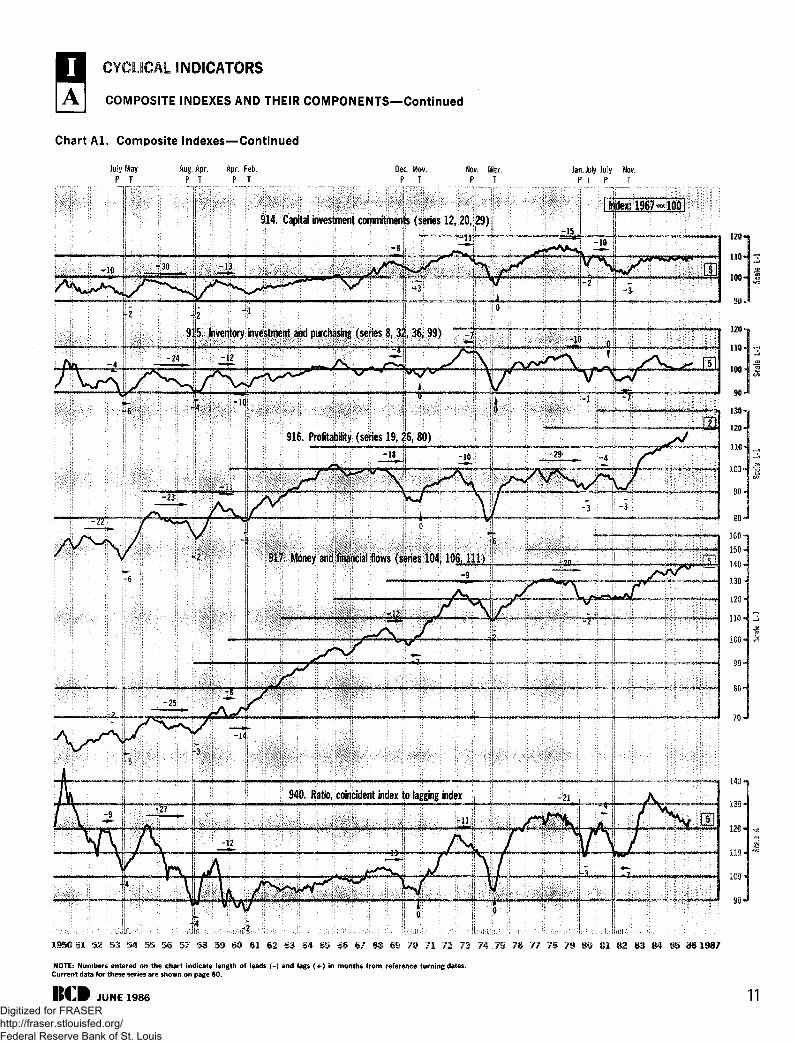
CYCLICAL INDICATORS
A I COMPOSITE INDEXES AND THEIR COMPONENTS—Continued
Chart Al . Composite Indexes—Continued
July MayP T
Aug. Apr. Apr. Feb.P T P T
Dec. Nov.P T
Nov. Mar.P T
ill|f 9 l i ijCapttal investment commitrnerife {slrieS 12, 20,i£9)
Jan. July July Nov.P T P T
916. Profitability (series 19, ?6r 80)
1950 51 52 53 54 57 58 59 60 61 62 §3 64 ©§ 68 67 68 89 70 71 72 73 74.75 J® 17 78 70 SO 81 82 83 84 85 86 1987
NOTE: Numbers entered on the chart indicate length of leads (-) and lags ( + ) in months from reference turning dates.Current data for these series are shown on page 60.
BCII JUNE 1986 11Digitized for FRASER http://fraser.stlouisfed.org/ Federal Reserve Bank of St. Louis
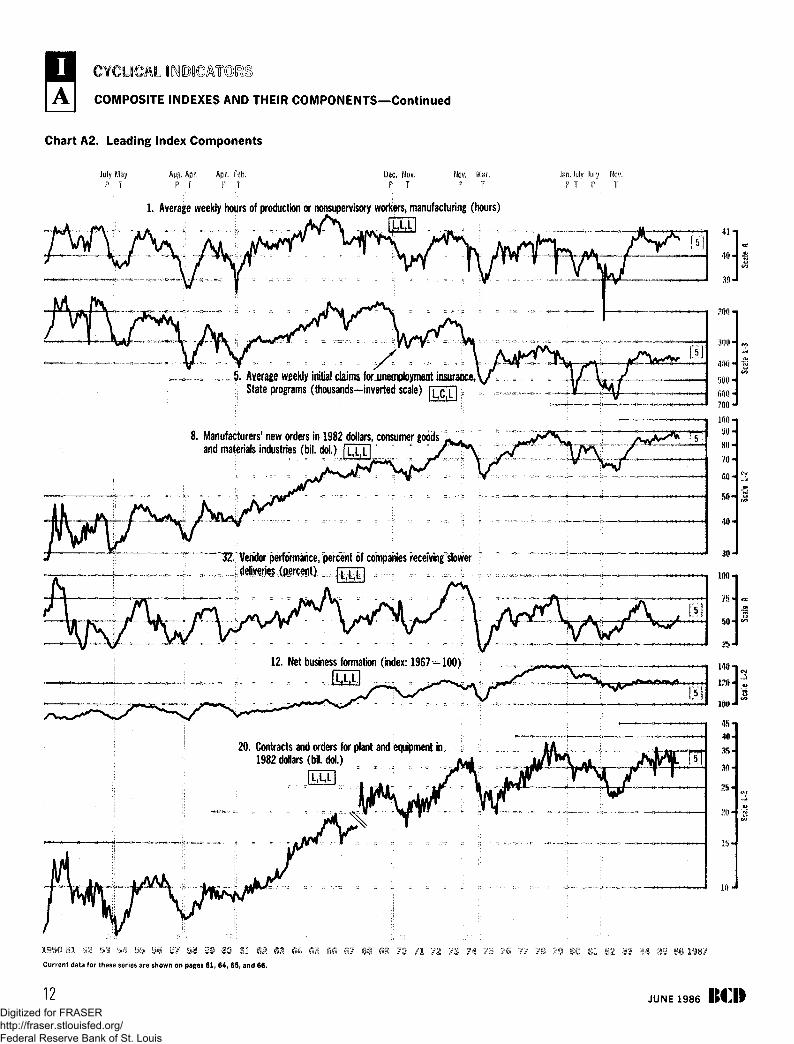
COMPOSITE INDEXES AND THEIR COMPONENTS—Continued
Chart A2. Leading Index Components
July MayP T
Auj*. Apr. Apr. Feb.P T P T
Dec, Nov.P T
New. Mar.P T
Jen. July July Nov.P T P T
h Average weekly hours of production or nonsupervisory workers, manufacturing (hours)
Jl
.„» , . 5. Average weekly initial.claims forjuqvloyineot insurance,\; State programs (thousands—inverted scale) h C H :
8. Manufacturers' new orders in 1982 dollars, consumer goodsand materials industries (bit. doi.) O J 1 1
Z.rVendor performance, percent Of companies receiving'slowerm (percent) ^ J
700 -
100 -
9 0 -
S 0 -
7 0 -
12. Net business formation (index: 1 9 6 7 - 1 0 0 )
. - ..-.inn L _
20. Contracts and orders for plant and equipment in1982 dollars (hi dol.)
140-
120-
100-
40-
1950 SI §2 53 S4 m S6 i ? SB 59 ©O 61 62
Current data for these series are shown on pages 6 1 , 64, 65, and 66.
71 12 73
12 JUNE 1986 KCIIDigitized for FRASER http://fraser.stlouisfed.org/ Federal Reserve Bank of St. Louis
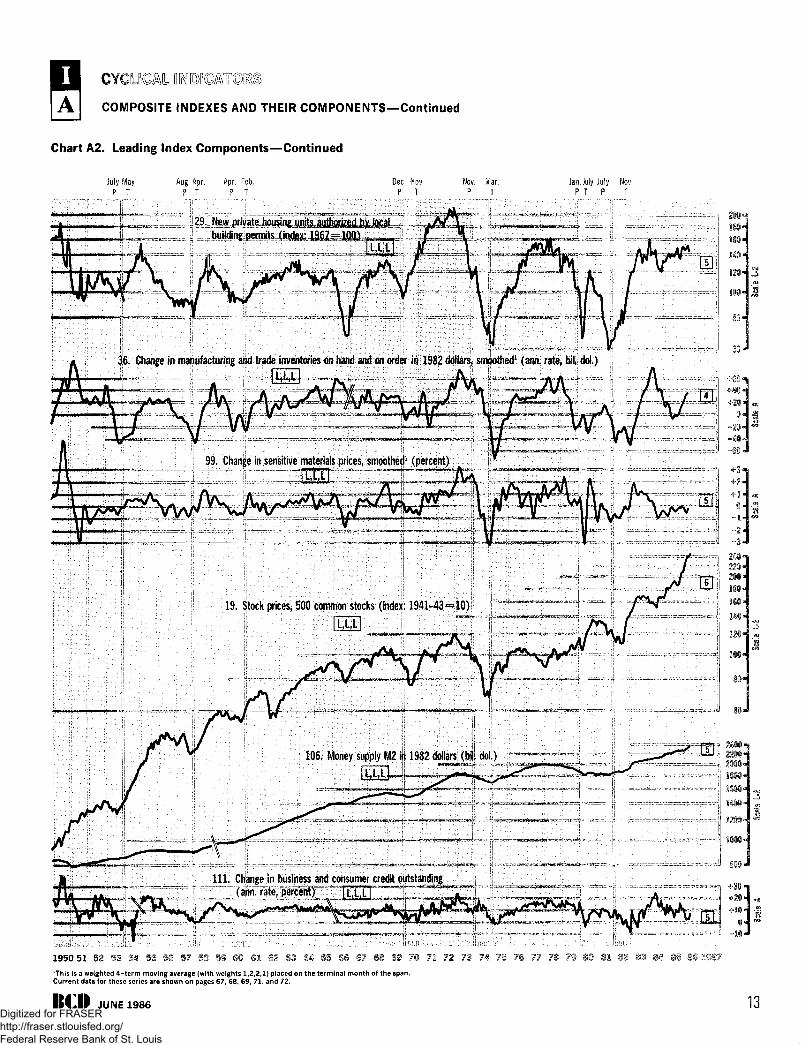
GY
COMPOSITE INDEXES AND THEIR COMPONENTS—Continued
Chart A2. Leading Index Components—Continued
July May Aug. Apr. Apr. Feb.P T P T P T
Dec.P P T
Jan. July July Nov.P T P T
3,6. Change in manufacturing and trade inventories on hand and on order In 1982 dollars; smoothed1 (ann. rate, bil. dol.)
99. Change in sensitive materials prices, smoothed1 (percent)
19. Stock prices, 500 common stocks (index: 1941-43=10).
IXX
106. Money supply M2 in 1932 dollars (bi!, dol.)
111. Change in business and consumer credit outstanding— nxo "
1950 51 52 53'This is a weighted 4-term moving average (with weights 1,2,2,1) placed on the terminal month of the span.Current data for these series are shown on pages 67, 68, 69, 71 , and 72.
ItCII JUNE 1986 13Digitized for FRASER http://fraser.stlouisfed.org/ Federal Reserve Bank of St. Louis
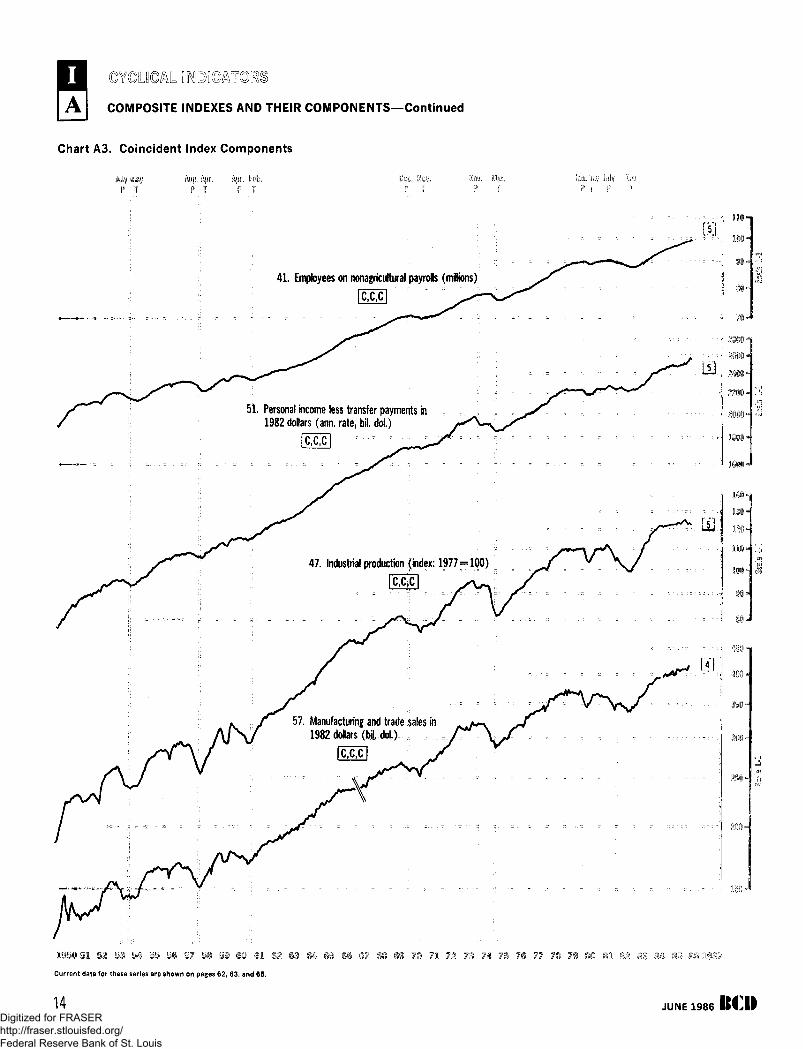
COMPOSITE INDEXES AND THEIR COMPONENTS—Continued
Chart A3. Coincident Index Components
July MayP T
Aug. Apr. Apr. Feb.PI ? 1
i>.c. Key. to. Mar.P T P T
Uly fey
41. Employees an nonagricultural payrolls (mlons)
51, Personal income less transfer payments in1982 dollars (ann. rate, bil. dol.)
(Tex
47. Industrial production (index: 1977-100)
CXX
57. Manufacturing and trade $ales in1982 dollars ( b i dol.)
Current data for these series are shown on pages 62, 63, and 65,
14 JUNE 1986 IUDigitized for FRASER http://fraser.stlouisfed.org/ Federal Reserve Bank of St. Louis

@Y@U©MJN[D>[
COMPOSITE INDEXES AND THEIR COMPONENTS—Continued
Chart A4. Lagging Index Components
July MayP T
Aug. Apr. Apr. Feb.P T P T
Dec. Nov.P T
Nov. Mar.P T
Jan. July July Nov.P T P T
91. Average duration of unemployment (weeks—inverted scale)
77. Ratio, manufacturing and trade inventories to sales in1982 dollars (ratio) I
in'10 =
12 H
IS-
20-
22-
- _
4 1
1.7 «
1.S-
1.5 «
62. Labor cost per unit of output, manufacturing—actual data~ ^asrpercentvhxend(pet tsnt) ' ' 'T'Q*I i r j i
109. Average prime rate charged by b^nks (percent)
101. Commercial and industrial bans outstanding in 1982 dollars (bil. doi.)
Lg,Lg,lg
95. Ratio, consumer installment credit outstanding to personal income
<Percent>
51 52 33 34 25 5S 57 58 59 (30 61 62 03 64 S5 6© 67 68 69 70
Current data for these series are shown on pages 62, 68, 70, and 73.
ItCII JUNE 1986 15Digitized for FRASER http://fraser.stlouisfed.org/ Federal Reserve Bank of St. Louis
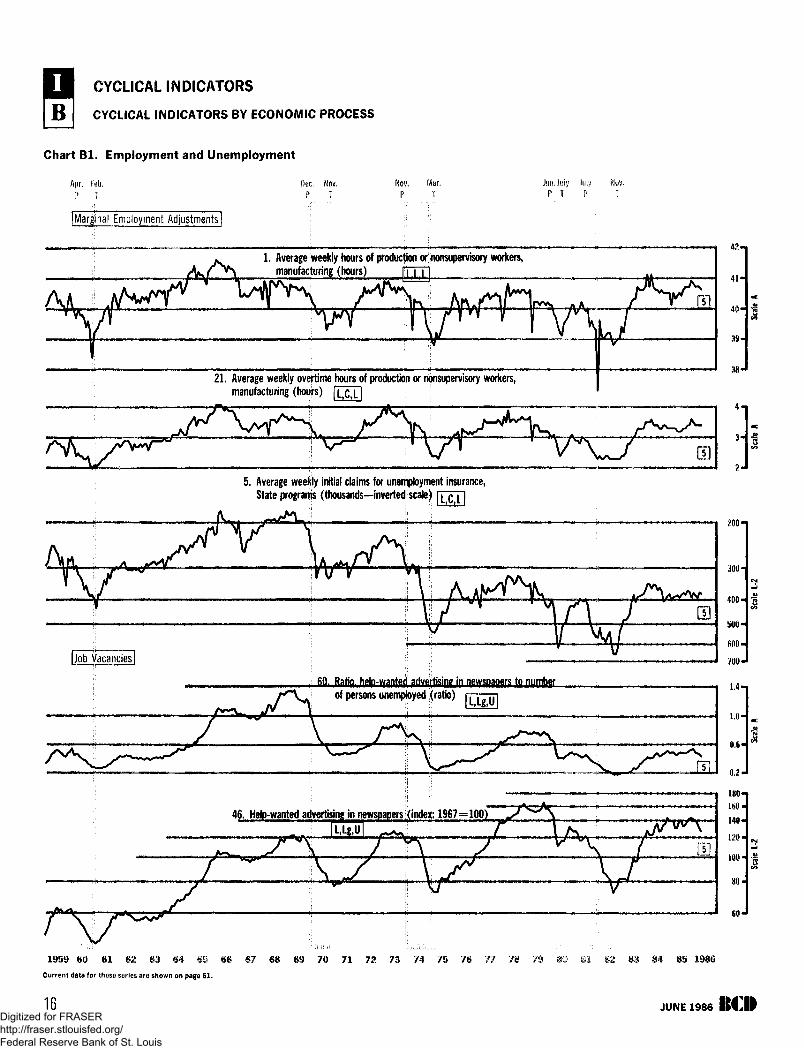
CYCLICAL INDICATORS
B I CYCLICAL INDICATORS BY ECONOMIC PROCESS
Chart B l . Employment and Unemployment
Apr. Feb.P I
Dec. Nov.P T
Nov.P
Jan. Juiy July Nov.p T ' P T
[Marginal Employment Adjustments]
1. Average weekly hours of production or nonsupervisory workers,manufacturing (hours)
21. Average weekly overtime hours of production or nonsupervisory workers,manufacturing (hours) [ L , C , L 1 ;
5. Average weekly initial claims for unemployment insurance,State programs (thousands—inverted scale) [ LTC,L I
1999 60 SICurrent data for those series are shown on page 61.
4 1 -
4 0 -
3 9 -
38-
fid. Ratio, heln-iuanterl arh/erfeinp in newsnaoers to number
46. Help-wanted advertising in newspapers :(inde)(: 1967=100 )
66 ©J 68 69 70 71 72 73 74 75 84 85 1986
16 JUNE1986Digitized for FRASER http://fraser.stlouisfed.org/ Federal Reserve Bank of St. Louis
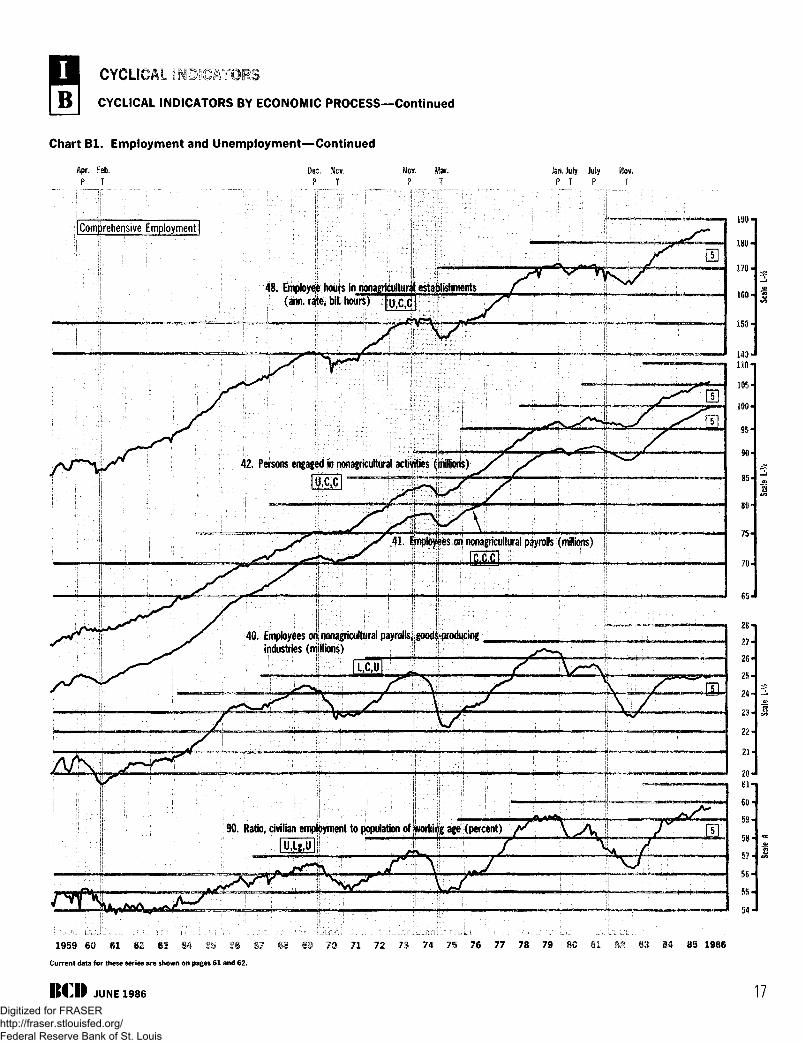
CYCLICAL
B I CYCLICAL INDICATORS BY ECONOMIC PROCESS—Continued
Chart Bl . Employment and Unemployment—Continued
Apr. Feb.P T
Dec. Nov.P T
Nov. Mar.P T
Jan. July July Wov.P T P T
[Comprehensive Employment|
48. Employee hours in nonagricultural establishments(ann. rate, bil. hours) [ y fC fp| If Z
ji . ;. .r&\r~\'i . ^****
T>i li
--JL
42. Persons engaged in nonagricultural activities (millions) / ^ ^s
fee] —~jbli| y s
z
"mployees on nonagricultural payrolls (millions)
190-
180-
170-
160-
150-
140-
110"
105-
100 ^
§ 5 -
85-
8 0 -
75 -
70*
65-
2S-
2 7 -
26-
2 5 -
24 -
2 3 -
22-
2 1 -
2 0 -6 1 -
0 0 -
5 S -
58 •
5 7 -
5 S -
5 4 -
40. Employees on nonagricultural payrolls, goods-producingindustries (millions) i \
\
90. Ratio, civilian employment to population of working age (percent) I
1959 60 61 ©2 63 64 Si SS
Current data for these series are shown on pages 61 and 62.
! XJ
7® 71 72 73 74 75 7© 77 78 79 84 8S 198©
KCII JUNE 1986 17Digitized for FRASER http://fraser.stlouisfed.org/ Federal Reserve Bank of St. Louis

CYCLICAL INDICATORS BY ECONOMIC PROCESS—Continued
Chart Bl . Employment and Unemployment—Continued
Apr. Feb.P T
Dec.P
Nov.T
Nov.P
Mar.T
Jan. JulyP T
JulyP I
[Comprehensive Unemployment |
37. Number of persons unemployed (millions—inverted scale)
43. Unemployment rate (percent—inverted scale)
n
n-
45. Average weekly insured unemployment rate, State programs (percent—inverted scale)
91. Average duration of unemployment (weeks—inverted scale)
3 -
4 -
44. Unemployment rate, persons unemployed 15 weeks and over (percent—inverted scale)
IS
18-
20 «
2 2 -
1*
2 -
3 -
4*
Current data for these series are shown on page 62.
18 JUNE 1986 IUIIDigitized for FRASER http://fraser.stlouisfed.org/ Federal Reserve Bank of St. Louis
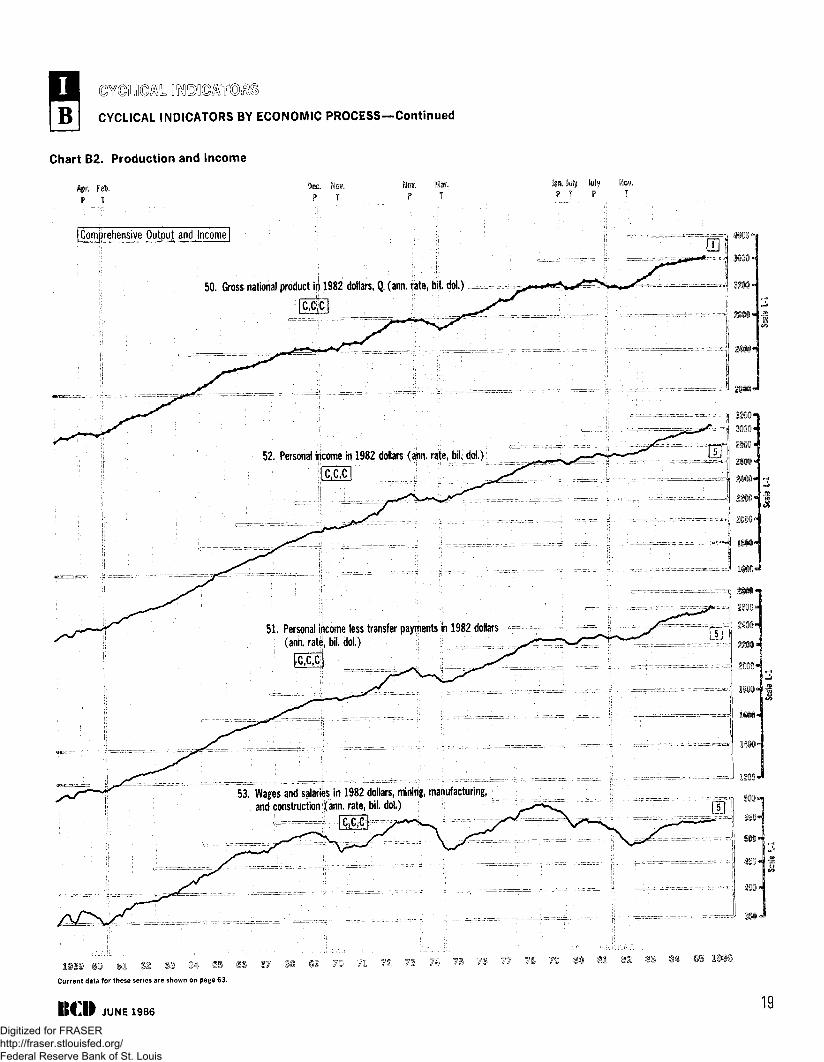
B I CYCLICAL INDICATORS BY ECONOMIC PROCESS—Continued
Chart B2. Production and Income
Apr. Feb.
P T
Dec. NovP T
Wov MarP T
Jan Jtly Ju'yp i p
|Comprehensive Output and Income]
50. Gross national product in 1982 dollars, Q (ann. rate, bii. dol.)
52. Personal income in 1982 dollars (ann. rate, bil. dot.)
C X X
51. Personal income less transfer payments in 1982 dollars(ann. rate, bit. dot.)
53. Wages and salaries in 1982 dollars, mining, manufacturing,and construction (ann. rate, bil. dol.)
11 73 B2 83
Current data for these series are shown on page 63.
BCII JUNE 198619
Digitized for FRASER http://fraser.stlouisfed.org/ Federal Reserve Bank of St. Louis
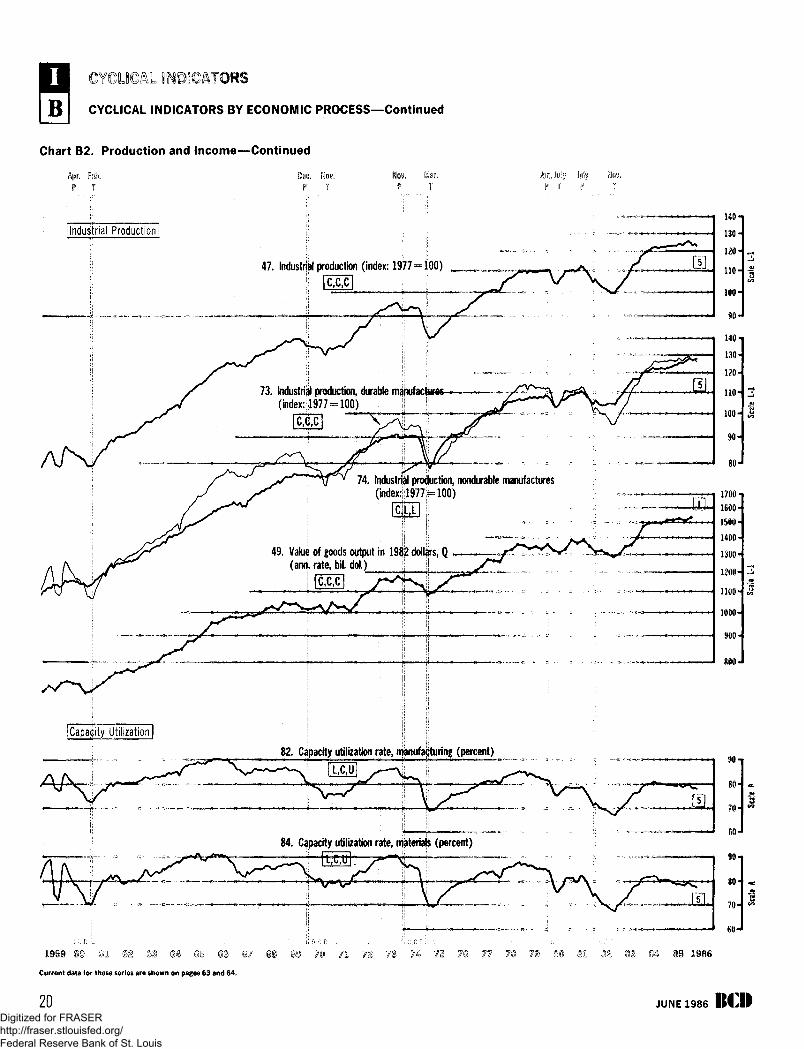
CYCLICAL INDICATORS BY ECONOMIC PROCESS—Continued
Chart B2. Production and Income—Continued
i. Ju:!y July [ ta .F T P I
[Industrial Production|
47. Industrie production (index: 1977-100)
73. Industrial production, durable manufactum(index: jj!977« 100)
clc
74. Industrial production, nondurable manufactures(index:j|1977M00)
cfcri ?!
49, Vakje of goods output in 1932 dollars, Q(ami; rate, bil, dol.) l! i!
[Capacity Utilization
82. Capacity utilization rate, manufacturing (percent)
84. Capacity utilization rate, materials (percent)
• B
1959
Current data for these series are shown on pages 63 and 64,
20 JUNE 1986 BCIIDigitized for FRASER http://fraser.stlouisfed.org/ Federal Reserve Bank of St. Louis
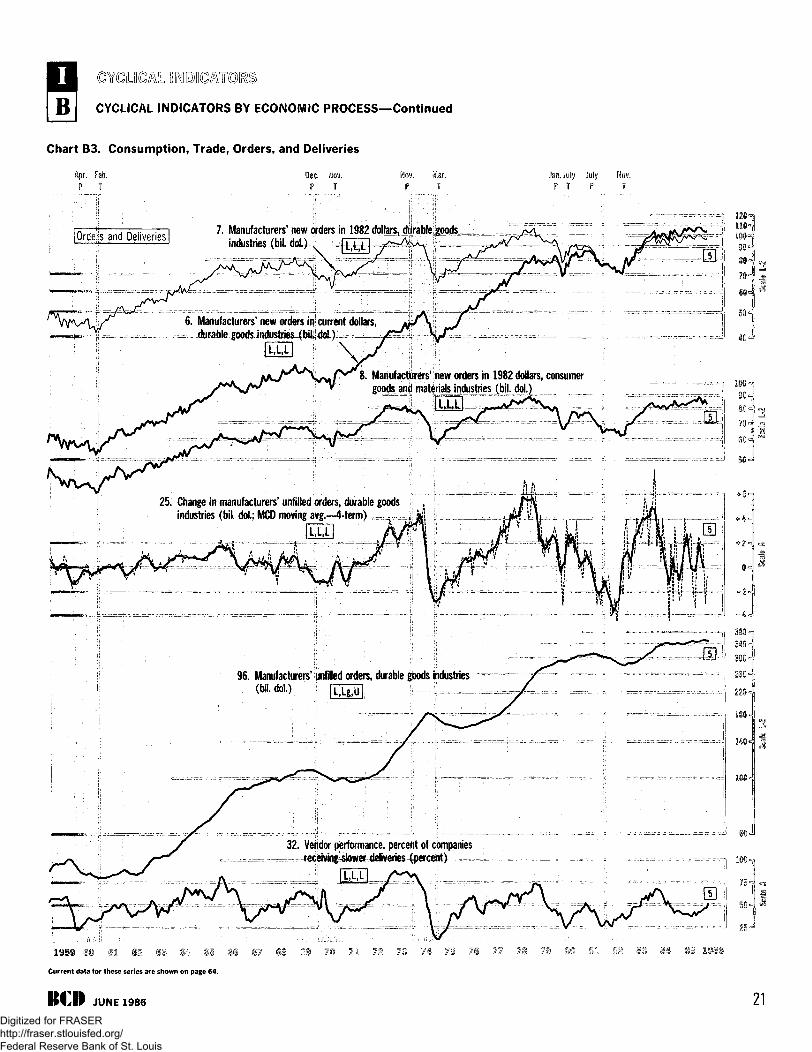
QYQUQIAL 0(MO0
CYCLICAL INDICATORS BY ECONOMIC PROCESS—Continued
Chart B3. Consumption, Trade, Orders, and Deliveries
Dec. Nov.P T
Nov. Mar.P T
Jan. July Jyly Wov.F T P T
[Orders and Deliveries 1 7. Manufacturers1 new orders in 1982 dollars, durable goodsindustries (bil. dol.) ^ [ L , l , t l
6. Manufacturers' new orders in current dollars,durable goods industries <b& dol.)
\
8. Manufacturers' new orders in 1982 dollars, consumergoods and materials industries (bil. dot.)
25. Change in manufacturers' unfilled orders, durable goodsindustries (bil. dol.; MCD moving avg.—4-term)
96. Manufacturers' unfilled orders, durable goods industries(bil. dol.)
32. Vendor performance, percent of companies.receiving-slower deliveries (percent)
19S©
Current data for these series are shown on page 64.
BCD JUNE 1986 21Digitized for FRASER http://fraser.stlouisfed.org/ Federal Reserve Bank of St. Louis
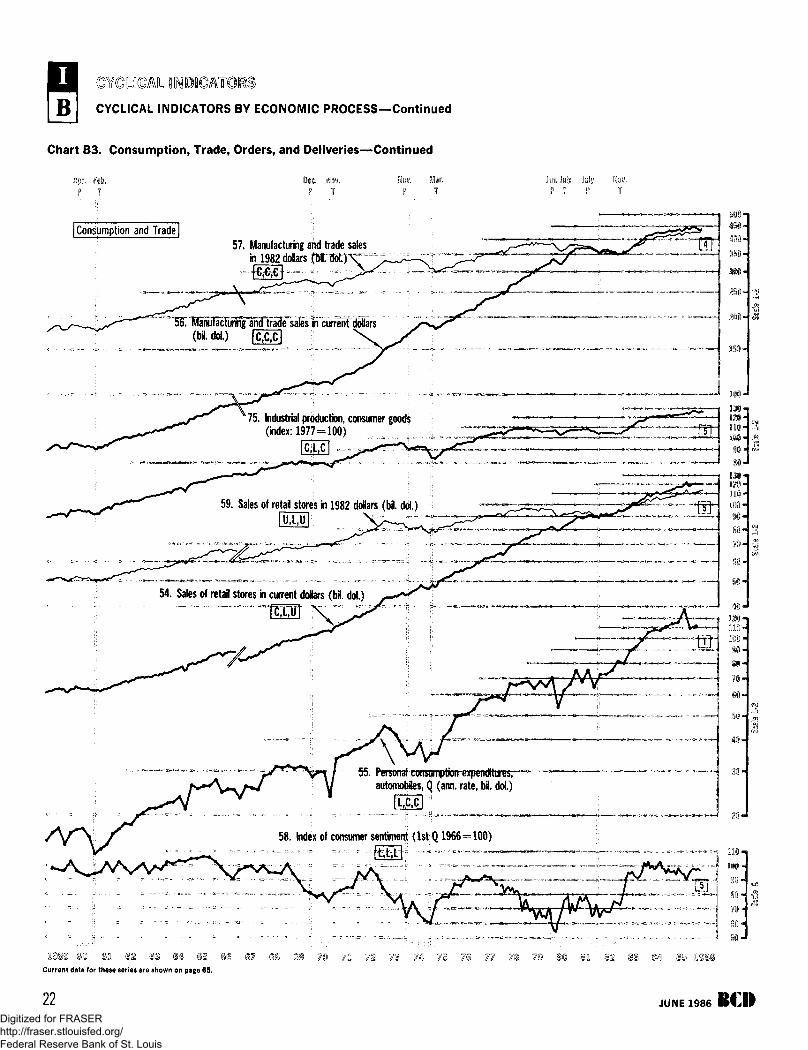
B CYCLICAL INDICATORS BY ECONOMIC PROCESS—Continued
Chart B3. Consumption, Trade, Orders, and Deliveries—Continued
Apr. Feb.
f Ikn.kly July Nov.
F T P T
[Consumption and Trade)57. Manufacturing and trade sates
in 1982 dollars
5C"TOntiTacFurig anHraHe sates in currenfd^(bildoJ.)
75. Industrial production, consumer goods(index: 1977-100)
cfccl ...
59. Sales of retail stores in 1982 dollars (bH. dpi.)
U.L.U
54. Sales of retail stores in current dollars (bH. dol.)
XUT N.
6ncfitutcs, ~*" ^^j
automoiles, Q (arm. rate, bi. dol.)
LXtC
58. Index of consumer sentiment (istlQ 1966=100)
WWB (B© §1 §2 §3 S^ ©iCurrent data for these series are shown on page 65.
22 JUNE 1986 RCIIDigitized for FRASER http://fraser.stlouisfed.org/ Federal Reserve Bank of St. Louis
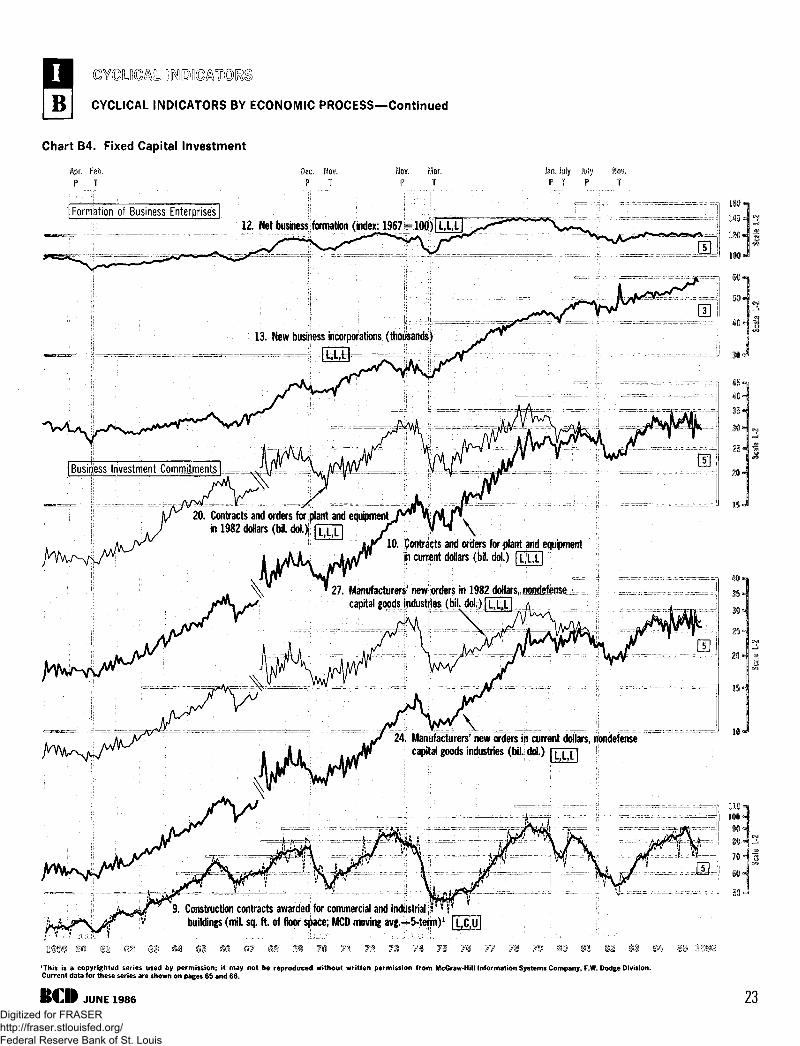
B CYCLICAL INDICATORS BY ECONOMIC PROCESS—Continued
Chart B4. Fixed Capital Investment
Apr. Feb.P T
Dec. Wov.P T
Nov. Mar.P T
Jan. July July Wow.F T P T
[ Formation of Business Enterprises [12. Net business formation (index: 1967=100)1 L,
13. New business incorporations (thousands)
cn
I Business Investment Comi&ilmejtsj- -
20. Contracts and orders for plant and equipment. . . „ . v
in 1982 dollars (bil. dol.) f i m / V W \10. Contracts and orders for plant and equipment
in current dollars (bil. dol.) | L L L
21. Manufacturers' new orders in 1982 dollars, qofldefensecapital goods industries (bil. d o l . ) I n L
24. Manufacturers' new orders in current dollars, nondefensecapital goods industries (bil. dol.) n ~ f [
Construction contracts awarded for commercial and industrialbuildings (mil. sq. ft. of floor space; MCD moving avg.-
1
i
1 1 0 1L0(l =
OH
lThis is a copyrighted series used by permission; it may not be reproduced without written permission from McGraw-Hill Information Systems Company, F.W. Dodge Division.Current data for these series are shown on pages 65 and 66.
ItCII JUNE 1986 23Digitized for FRASER http://fraser.stlouisfed.org/ Federal Reserve Bank of St. Louis
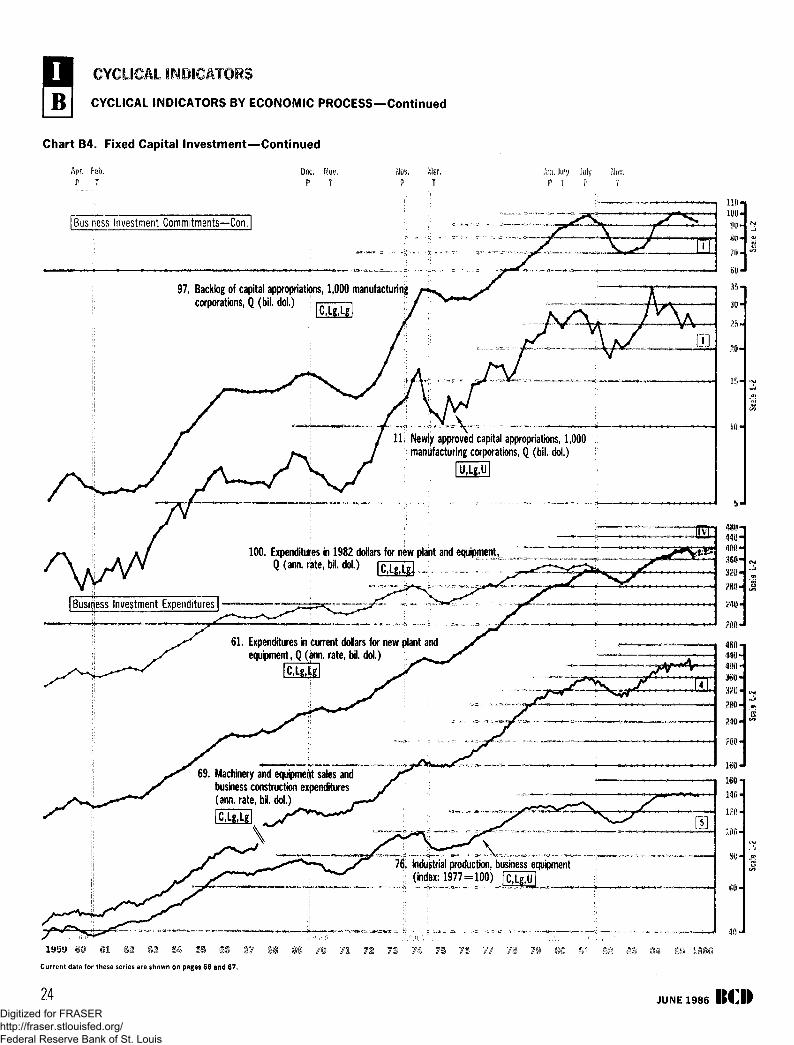
CYCLICAL INDICATORS
B I CYCLICAL INDICATORS BY ECONOMIC PROCESS—Continued
Chart B4. Fixed Capital Investment—Continued
Apr. Feb.
P TDee. Nov.
F T P T
iijifi. July July f t o ,
P T P T
[Business Investment Commitments—Con,
97. Backlog of capital appropriations, 1,000 manufacturingcorporations, Q (bil. dol.)
Newly approved capital appropriations, l t000manufacturing corporations, Q (bil. dol.
UJIU
100. Expenditures in 1982 dollars for new plant and equipment,Q (ann. riite, bil. dol.) 1 '"
| Business Investment Expenditures]
61. Expenditures in current dollars for new plant andequipments (arm. rate, bil. dol.)
69. Machinery and equipment sales andbusiness construction expenditures(anrt. rate, bil. dol.)
76. Industrial production, business equipment;; (index: 1977-100)
Current data for these series are shown on pages 66 and 67.
24 JUNE 1986Digitized for FRASER http://fraser.stlouisfed.org/ Federal Reserve Bank of St. Louis
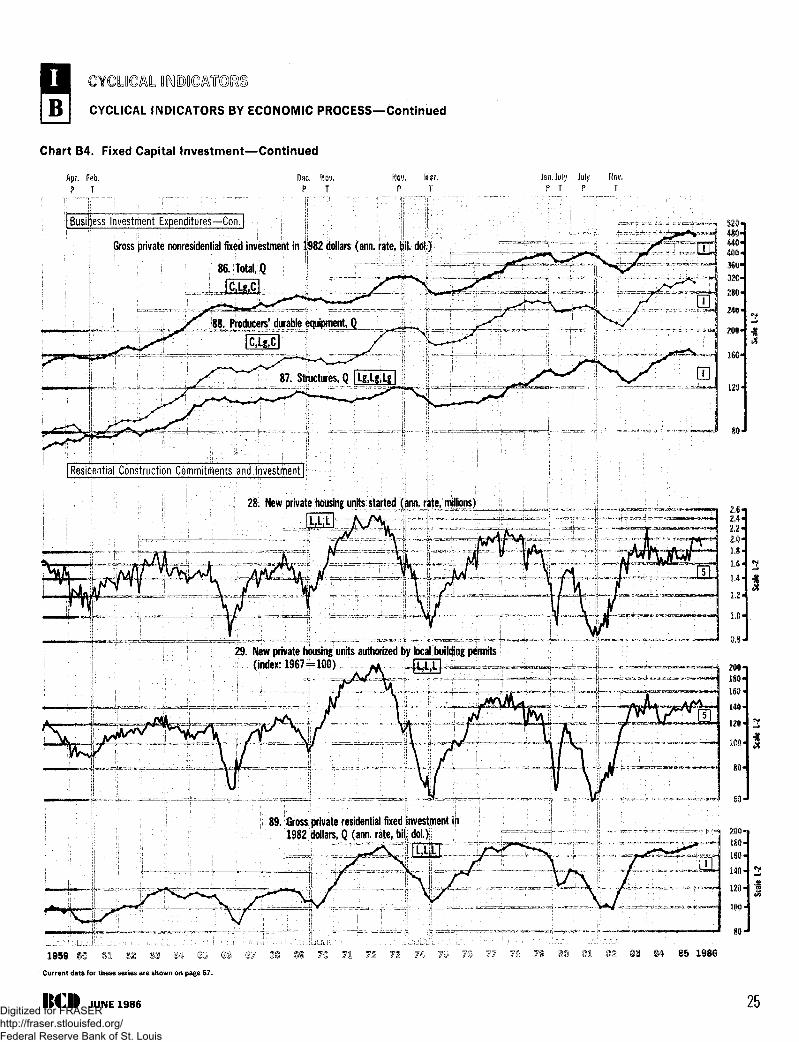
B CYCLICAL INDICATORS BY ECONOMIC PROCESS—Continued
Chart B4. Fixed Capital Investment—Continued
Apr. Hk
F T
Dec. Nov.P T
Nov. Jan. July July Mow.P T P T
[Business Investment Expenditures—Con,[
Gross private nonresidentiaj fixed investment in 1982 dollars (ann. rate, bil. dot.)
86. Total, Q
ClLgfC
. Producers' durable equipment, Q
[Residential Construction Commitments and Investment|
28. New private housing units started (ann. rate, millions)
29. New private housing units authorized by local building permits(index: 1967 = 100) - ~~~~
1.0-
0.8-
200 n
280-
160-
140-
120-
100-
80-
89. Gross private residential fixed investment in1982 dollars, Q (ann. rate, bil. dol.)
1959 m 32. at ®§ §a mCurrent data for these series are shown on page 67.
84 85 1986
ItCII JUNE 1986 25Digitized for FRASER http://fraser.stlouisfed.org/ Federal Reserve Bank of St. Louis
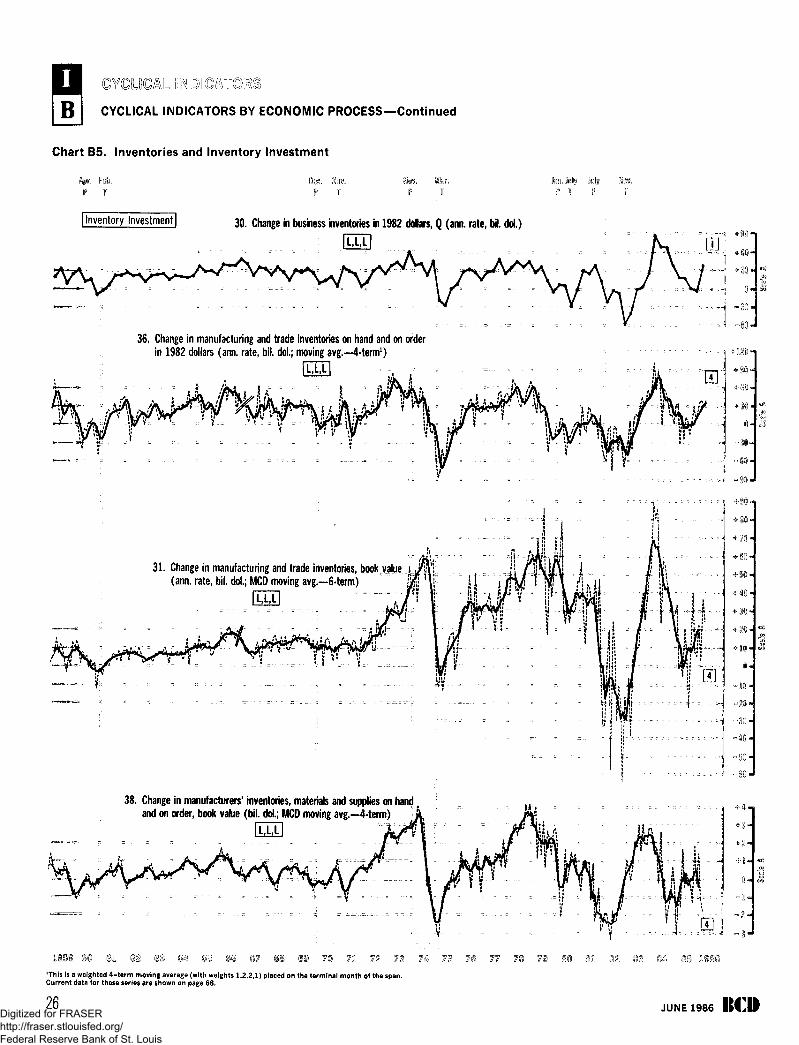
B CYCLICAL INDICATORS BY ECONOMIC PROCESS—Continued
Chart B5. Inventories and Inventory Investment
Apr. Fall.
P T
0ec. Nov.P T
Jan. July T IJ ;
P T
| inventory InvestmenT] 30. Change in business inventories in 1982 dollars, Q (ann. rate, bil. dol.)+ 90 T
36, Change in manufacturing and trade inventories on hand and on orderin 1982 dollars (ann. rate, bil. dol.; moving avg.—4-term1)
full^ v & -
31. Change in manufacturing and trade inventories, book value(ann. rate, bil. dol.; MCD moving avg— 6-term)
38. Change in manufacturers' inventories, materials and supplies on hand ,and on order, book value (bil. dol.; MCD moving avg.—4-term)
§1 S2 S3'This Is a weighted 4-term moving average (with weights 1,2,2,1) placed on the terminal month of the span.Current data for these series are shown on page 68.
26 JUNE 1986 ItCIIDigitized for FRASER http://fraser.stlouisfed.org/ Federal Reserve Bank of St. Louis
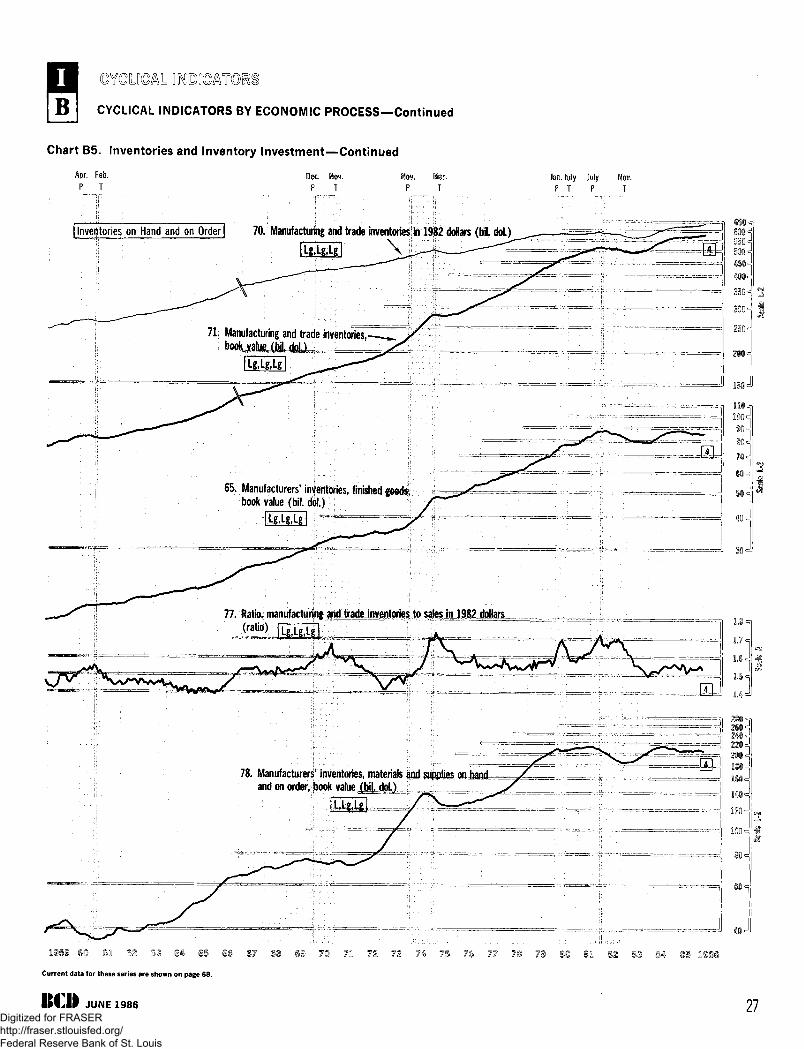
CYCUO^l
CYCLICAL INDICATORS BY ECONOMIC PROCESS—Continued
Chart B5. Inventories and Inventory Investment—Continued
Apr. Feb.
P TDec. Nov.
P TNov. Mar.
P TJan. July July Nov.
P T P T
[inventories on Hand and on Order] 70. Manufacturing and trade inventories in 1982 dollars (bil. dol.)
lLg,Lg,Lg| \ 5 0 0 -
= • - " - = 35®
71. Manufacturing and trade inventories
65. Manufacturers' inventories, finished geod&rbook value (bil. dol.)
77. Ratio, manufacturing and tradejnventories to sales in 1982 dollars_^
<rati0>= = j 1.7 <
78. Manufacturers' inventories, materials and supplies on handand on order, book value (biL dpi.)
220-
71
Current data for these series are shown on page 68.
BCD JUNE 1986 27Digitized for FRASER http://fraser.stlouisfed.org/ Federal Reserve Bank of St. Louis
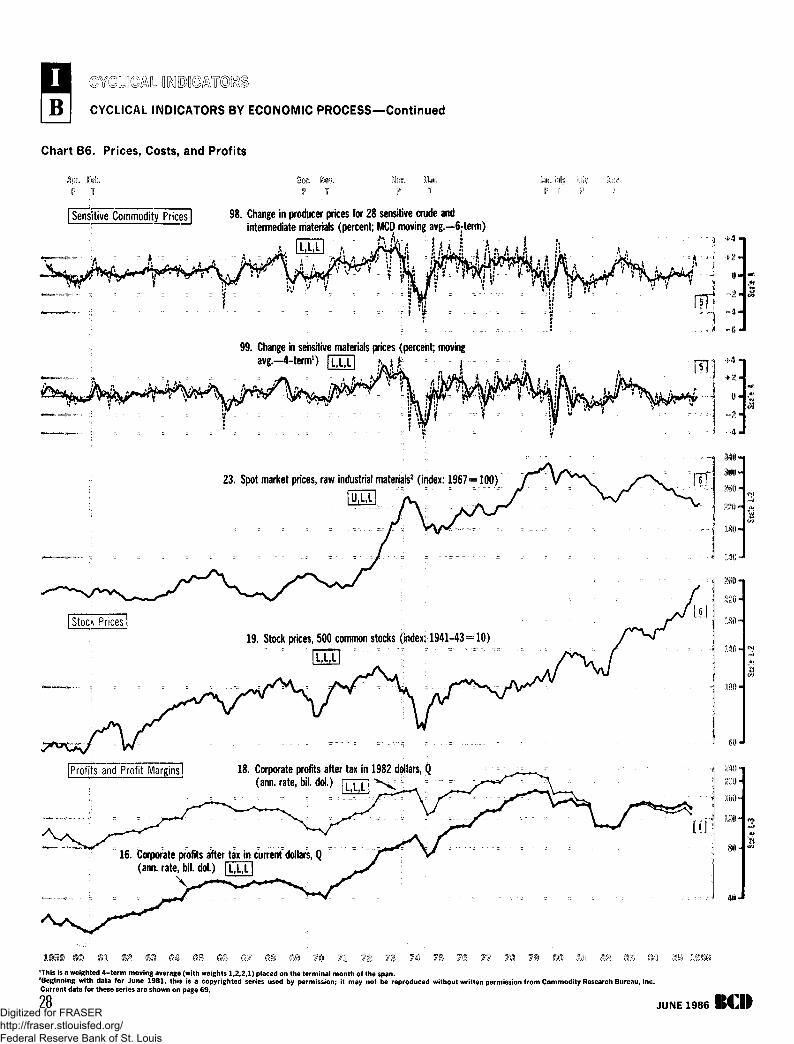
CYCLICAL INDICATORS BY ECONOMIC PROCESS—Continued
Chart B6. Prices, Costs, and Profits
}L Feb.
* T
Dec. Mac Jam, i ; %
F T '
I Sensitive Commodity Prices | 98. Change in producer prices for 28 sensitive crude andintermediate materials (percent; MCD moving avg.—6rterm)
99. Change in sensitive materials prices (percent; movingavg.-4-term1) Kxx\
+ 2-
23. Spot market prices, raw industrial materials2 (index: 1967 = 100)
19. Stock prices, 500 common stocks (index; 1941-43=10)
L L L
[Profits and Profit Margins| 18. Corporate profits after tax in 1982 dollars, Q(ann. rate, bi). d d ) 17771 ^*
L,L,L
16. Corporate profits after tax in current dollars, Q(ann. rate, bil. dol.)
\
ISO-
11 71 i© §1 §?, m m m^This is a weighted 4-term moving average (with weights 1,2,2,1) placed on the terminal month of the span.beginning with data for June 1981, this is a copyrighted series used by permission; it may not be reproduced without written permission from Commodity Research Bureau, Inc.Current data for these series are shown on page 69.
28 JUNE 1986 IMJIDigitized for FRASER http://fraser.stlouisfed.org/ Federal Reserve Bank of St. Louis
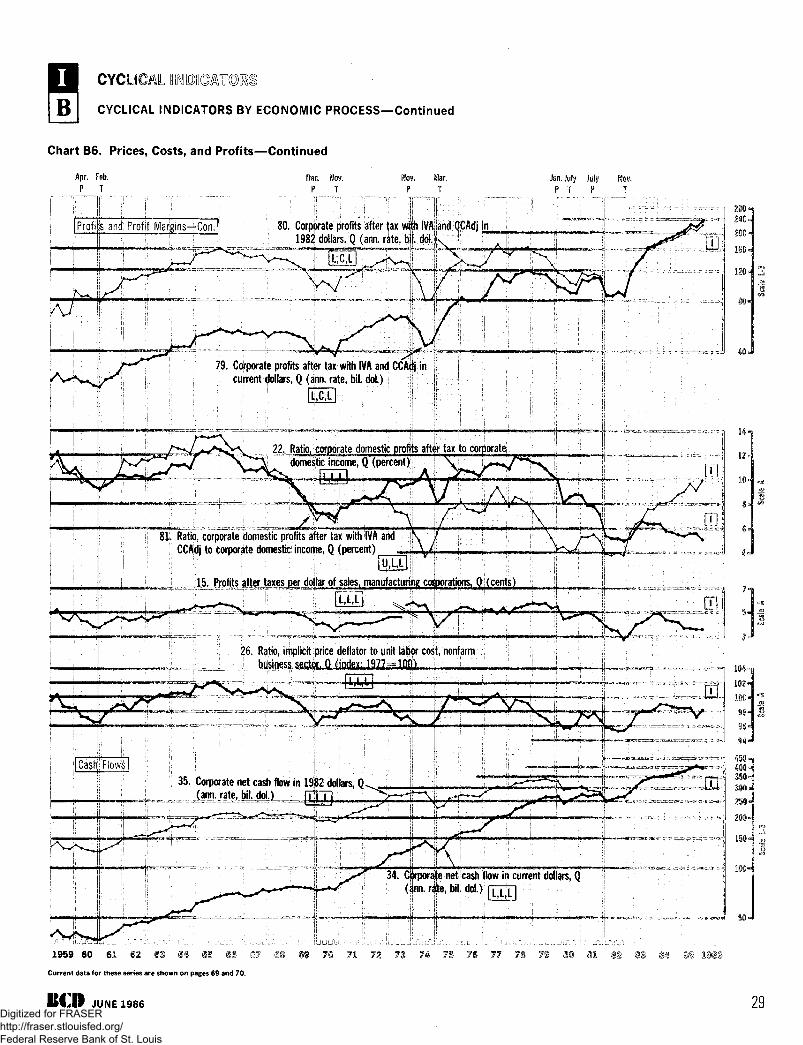
CYCLICAL
CYCLICAL INDICATORS BY ECONOMIC PROCESS—Continued
Chart B6. Prices, Costs, and Profits—Continued
80. Corporate profits after tax with (VAiand CCAdj in1982 dollars, Q (ana rate, bjf. dokk
Profits and Profit Margins—Con.
79. Corporate profits aftyr tax with IVA and CCAdj in {
current dollars, Q (Am. rate, bil. dol.) J !
_ 22. Ratio, corporate domestic profits after tag jo corporatedomestic income, Q (percent;
81. Ratio, corporate domestic profits after tax with IVA and \ /P.P.ftHi tn rnmnrate Hnmftctir inrnmp (I (nprcenW \ /CCAdj to corporate domestic income, Q (percent)
15. Profits after taxes ger dollar of salesf manufacturing corporations, Q (cents)
26. Ratio, implicit price deflator to unit labor co^t, nonfarm
35. Corporate net cash flow in 19$2 dollars, Q_ _ ^ _ (ann. r|te, I ^ Q L L ^ V
34. Corporate net cash flow in current dollars, Q(ann.raW, bil. dol.) n~[
1959 60 61
Current data for these series are shown on pages 69 and 70.
\\i\\ JUNE 1986 29Digitized for FRASER http://fraser.stlouisfed.org/ Federal Reserve Bank of St. Louis
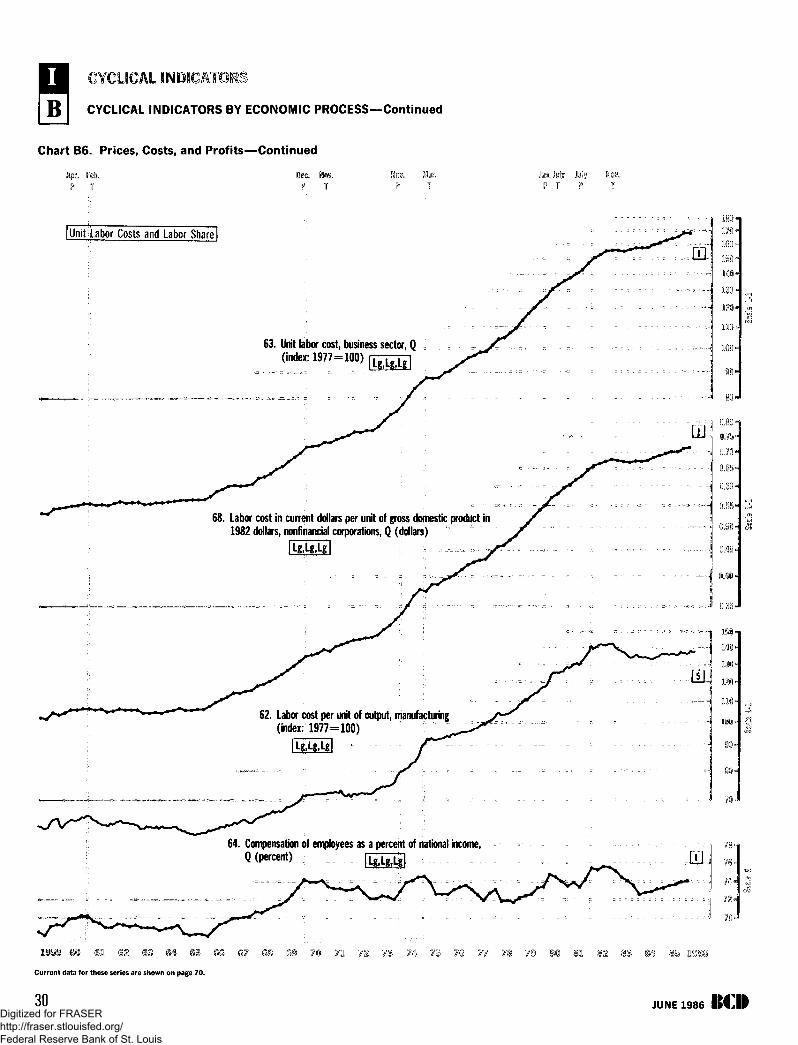
B CYCLICAL INDICATORS BY ECONOMIC PROCESS—Continued
Chart B6. Prices, Costs, and Profits—Continued
Apr. Feb.
P T
Dec. Nov.P T
Nov. feP T
k t July July taP T P I
[Unit Labor Costs andLabor Share 1 - -
in*I / O -
bO -
yo-
lay -63. Unit tabor cost, business sector, Q(index: 1977-100) [7
68. Labor cost in current dollars per unit of gross domestic product in1982 dollars, nonfinancial corporations, Q (dollars) " "
62. Labor cost per unit of output, manufacturing(index: 1977-100)
64. Compensation of employees as a percent of national income,Q (percent) _ _
Current data for those series are shown on page 70.
30 JUNE 1 9 8 6Digitized for FRASER http://fraser.stlouisfed.org/ Federal Reserve Bank of St. Louis
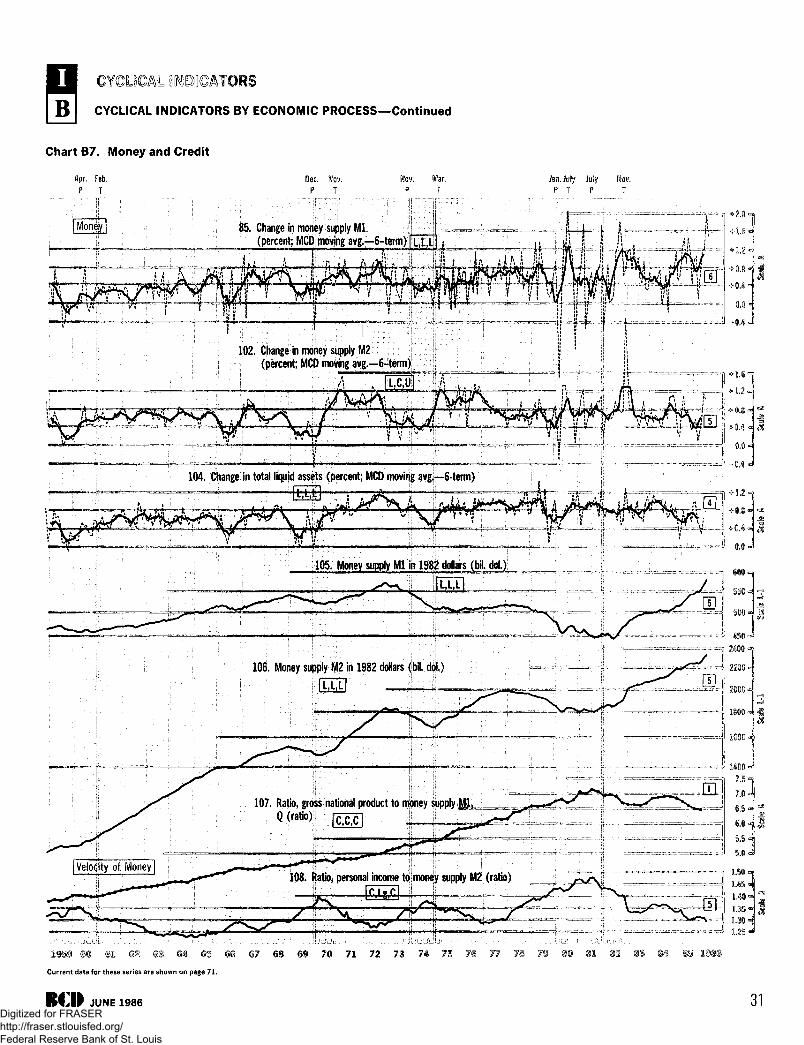
B CYCLICAL INDICATORS BY ECONOMIC PROCESS—Continued
Chart B7. Money and Credit
Apr Feb.
P TDec. Nov.
P TUw. Mar.
P TJan. July July
P T P
85. Change in money supply M l(percent; MCtij moving avg,—6-term)|LfLlj i
* irjf
O^C^^^^^^^^^^K102. Change in money supply M2
(percent; MCb moving avg.—6-term
104. Change in total liquid assets (percent; MCD moving avg,—6-term)
105. Money supply M l in 1982 dollars (fail, dol.)
106. Money supply M2 in 1982 dollars (fail, dpi.)
107. Ratio, gross national product to money supply M l ,Q (ratio);
[Velocity of Money|108. Ratio, personal income to money supply M2 (ratio)
67 68 69 70 71 72 73 74
Current data for these series are shown on page 71.
ItCI) JUNE 1986 31Digitized for FRASER http://fraser.stlouisfed.org/ Federal Reserve Bank of St. Louis
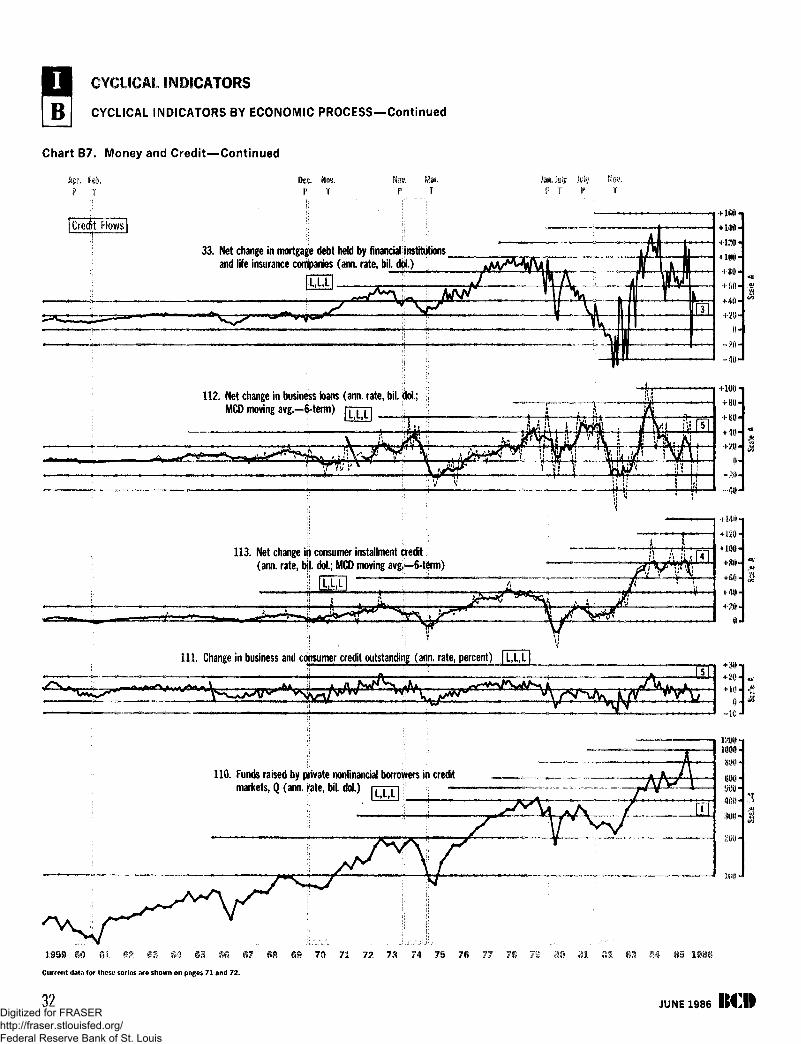
CYCLICAL INDICATORS
B I CYCLICAL INDICATORS BY ECONOMIC PROCESS—Continued
Chart B7. Money and Credit—Continued
Apr. Feb.
P T
Dec. Nov.P T
ten. July July Nov.P T P T
ICredp'lowsl
33. Net change in mortgage debt held by financial institutions m
and life insurance companies (ann. rate, bil. dol.)
112. Net change in business bans (ann. rate, bil. dol.; ;MCD moving avg.—6
.y^V ^
• " V
credit isdol,; MCD moving avg.—6-term)
Net change in consumer installment
111. Change in business and consumer credit outstanding (ann. rate, percent) | L,L,l
shf\«b • ^ VV +10-
•=• !©•*
r^^j^yr y v ^ YV7VT: Xr
110. Funds raised by private nonfinancia! borrovvers in creditmarkets, Q (ann. rate, bil. dol.)
69 70 71 72 73 74 7S 7S19BS
Current data for these series are shown on pages 71 and 72
32 JUNE 1986 KCIIDigitized for FRASER http://fraser.stlouisfed.org/ Federal Reserve Bank of St. Louis
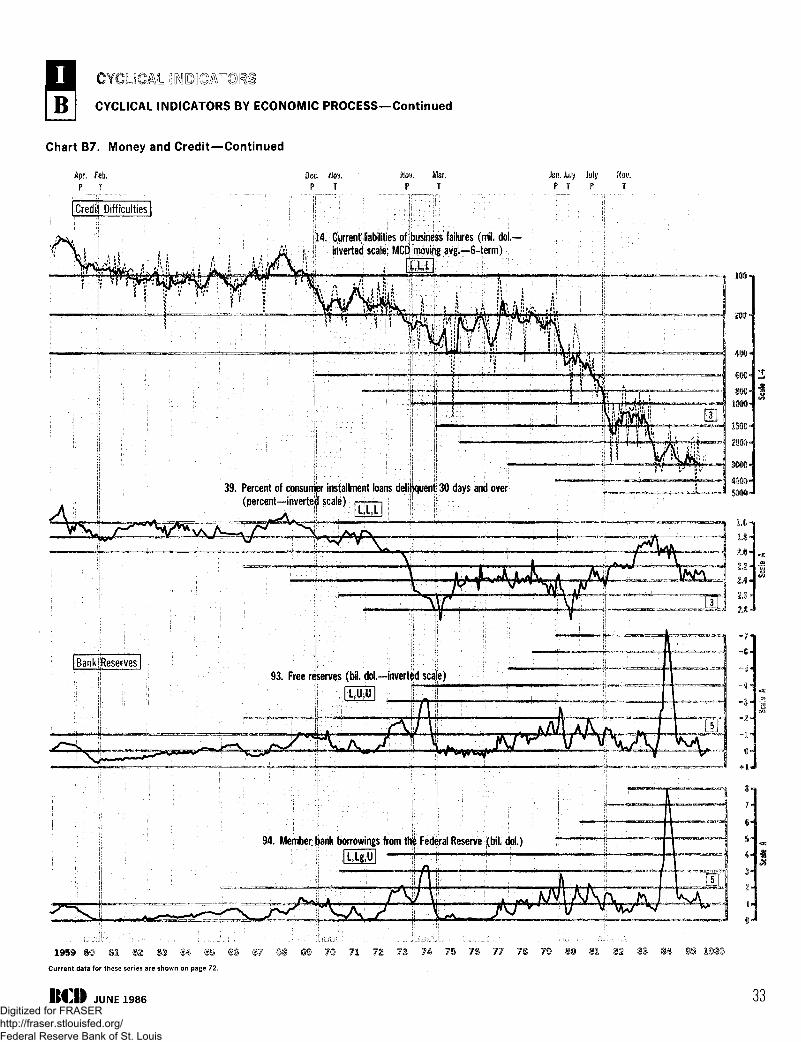
CYCLICAL INDICATORS BY ECONOMIC PROCESS—Continued
Chart B7. Money and Credit—Continued
Apr. Feb.P T
Dec. Nov.P T
Nov. M$r.P T
Jan. July July Wov.P T P T
[Credit Difficulties 1
14, Current liabilities of business failures (mil. dol.—J^ ji ( inverted scale; MC^movirjgavg.—6-term)
39. Percent of consumer installment loans delinquent 30 days and over(percent—inverted scale) [
93. Free reserves (bii. dol.—Inverted scale)
94. Member bank borrowings from the Federal Reserve (bil. dol.)
1959
Current data for these series are shown on page 72.
lt€l> JUNE 1986 33Digitized for FRASER http://fraser.stlouisfed.org/ Federal Reserve Bank of St. Louis

CYCLICAL INDICATORS BY ECONOMIC PROCESS—Continued
Chart B7. Money and Credit—Continued
Apr. Feb.
P TDec. NOT.
P TNOT. Mar.
P Ti. July July Nov.
T P T
119. Federal funds rate (percent)
114. Discount rate on new issues of 91-dayTreasury bills (percent) fcXg
116. Yield on new issues of high-grade corporate bonds
115. Yield on long-term Treasury; bonds (percent)C.LtL
118. Secondary market yields on FHA mortgages (percent)
117. Yield on municipal bonds, 20-bond average (percent)
S2 $
Current data for these series are shown on pages 72 and 73
34 JUNE 1936Digitized for FRASER http://fraser.stlouisfed.org/ Federal Reserve Bank of St. Louis
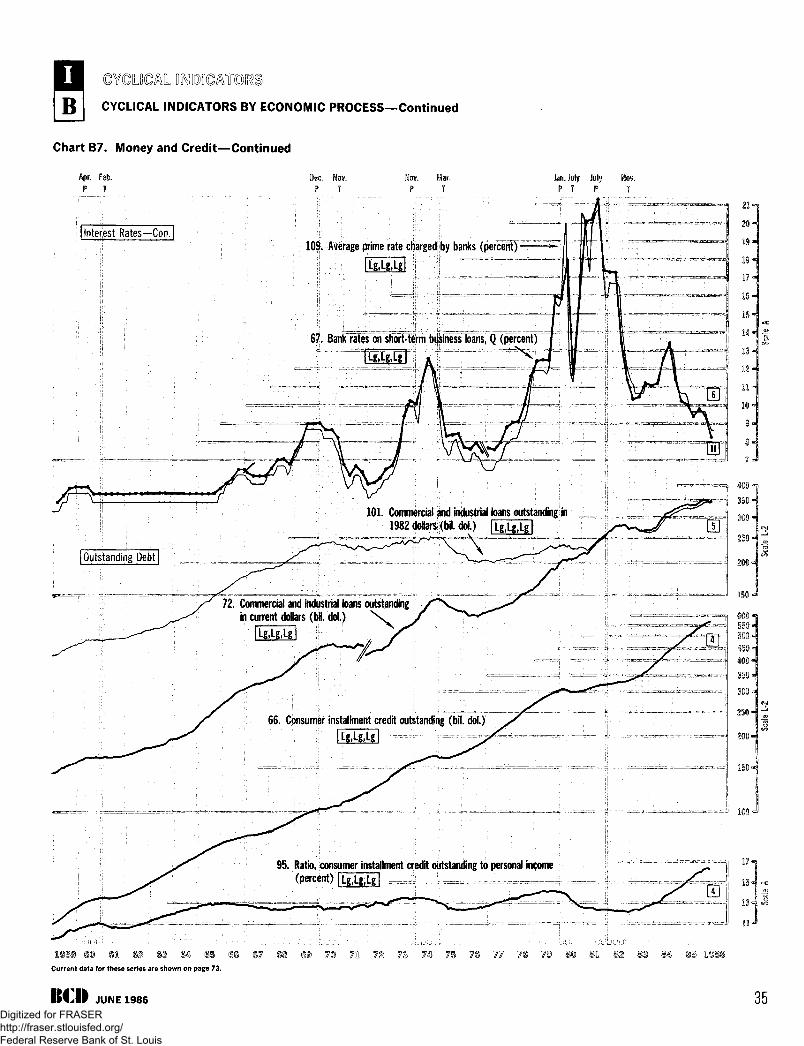
B CYCLICAL INDICATORS BY ECONOMIC PROCESS—Continued
Chart B7. Money and Credit—Continued
Jan. July k\y Nov.P T P T
} interjest Rates—Con.109. Average prime rate charged by banks (percent)
67. Bank rates on short-term business loans, Q (percent)
101. Commercial and industrial loans outstanding in1982 dollars (biL dol.) UJT
1 Outstanding Debt 1
72. Commercial and industrial loans outstandingin current dollars (oil. dol.) \
66. Consumer installment credit outstanding (bit. dol.)
95. Ratio, consumer installment credit outstanding to personal income(percent) [Lg,Lg,L
Current data for these series are shown on page 73.
ItCII JUNE 1986 35Digitized for FRASER http://fraser.stlouisfed.org/ Federal Reserve Bank of St. Louis
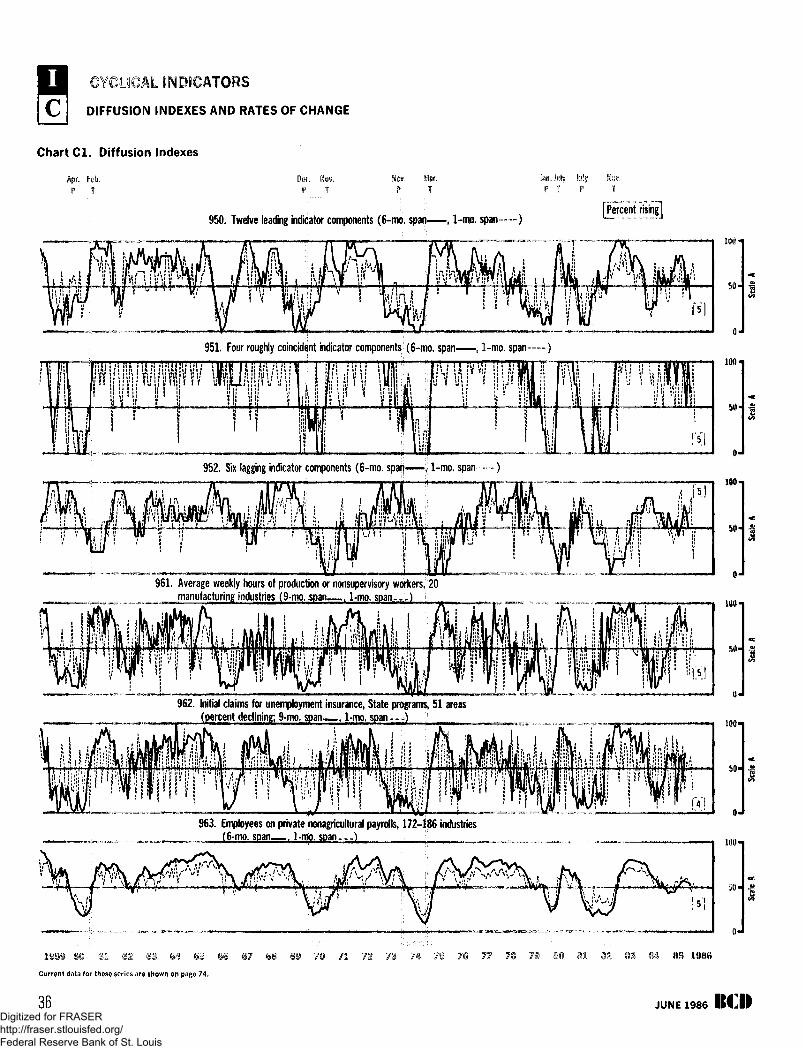
CYCLICAL INDICATORS
C I DIFFUSION INDEXES AND RATES OF CHANGE
Chart C l . Diffusion IndexesApr. Nb .
P IDec, Hm,
P TUrn. Mar.
P T
Jan. July July Nay.P ? ' P T
950. Twelve leading indicator components (6-mo. s p a n — , 1-mo. s p a n — - )[Percent rising]
50-
951. Four roughly coincident indicator components (6-mo. s p a n — , 1-mo. span——)
i • "I!
!A ii
t '
952. Six lagging indicator components (6-mo. spa i ]— \ 1-mo. s p a n — )
i i
ii ii ii5
100-1
961. Average weekly hours of production or nonsupervisory workers, 20manufacturing industriesJ9-mo. span—J*rno . j
100 -
50-
962. Initial claims for unemployment insurance, State programs, 51 areas(percent declining; 9»mo. s p a n — f i ' m o . span - . a ) \
\l
963. Employees on private nonagricultural payrolls, 172-186 industries(6-mo. span—», 1-mo. span,- -_Q.
50-
85 108S
Current data for these series are shown on page 74.
36 JUNE 1986 tunDigitized for FRASER http://fraser.stlouisfed.org/ Federal Reserve Bank of St. Louis

DIFFUSION INDEXES AND RATES OF CHANGE—Continued
Chart C l . Diffusion Indexes—Continued
Apr. Feb.
P TDec. Nov.
P T
Now. Mar.
P TJan. July July Nov.
P T P T
964. Manufacturers' nevy orders, 34-35 durable goods industries(9-mo. s p a n ^ 1-mo. span---)
percent rising]
965. Newly approved capital appropriations in 1972 dollars, 17
majiujacturing M a r i e s (4 -Q jM ing avg.«
i\ "iVf." ~i&\
\l . .».. . ' » ' .11 . . . . ;
_ | f „ ... ^ ^ _
966. Industrial production, 24 industries (6-mo. span , 1-mo, span---)
967. Spot market prices, 13 raw industrial materials(9-mo. span-*—, 1-mo. span---)
968. Stock prices, 500 common stocks, 42-82 industries(9-mo. span—, 1-mo. span---)
960. Net profits, manufacturing, about 600 companies1 (4-Q span)
I® SI §2 S3 §4 <3S (SS 87 §S §9 70 71 1% 73 7Q 1% 76 1
'This is a copyrighted series used by permission; it may not be reproduced without written permission from Dun & Bradstreet, Inc.Current data for these series are shown on page 75.
ItCII JUNE 1986 37Digitized for FRASER http://fraser.stlouisfed.org/ Federal Reserve Bank of St. Louis
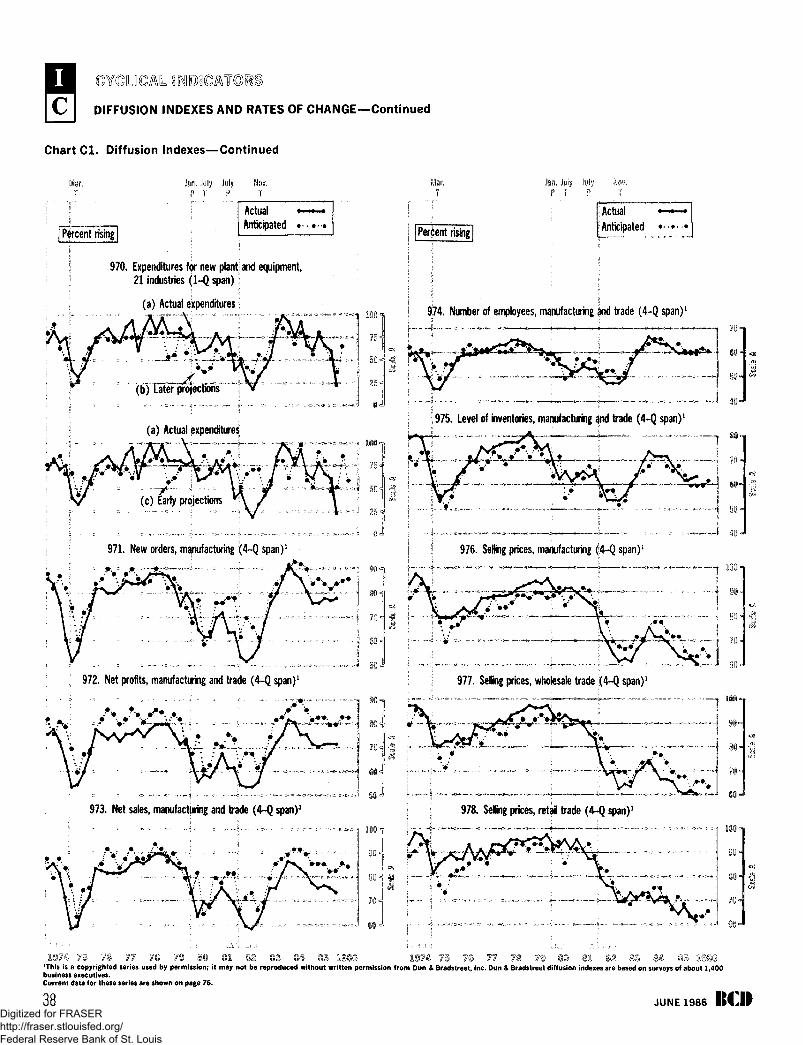
YfSUC&L
DIFFUSION INDEXES AND RATES OF CHANGE—Continued
Chart C l . Diffusion Indexes—Continued
Mar.
T
Jan. July
P 1
July
P
Nov.
T
Actual # * * - •Anticipated •• • ••••
Mar.T
! '!
| | Percent rising
Jan. JutyP T
JulyP
Nov.
Actual - ~ ~ *|i Anticipated • • • • • « •
970. Expenditures for new plant: and equipment21 industries (1-Q span);;
(a) Actual expenditures:
(6) later projections f
(a) Actual expenditures
:
i 974. Number of employees, manufacturing and trade (4-Q span)1
;975. Level of inventories, manufacturing and trade (4-Q span)1
' projections
971. New orders, manufacturing (4-Q span)1 976. Setting prices, manufacturing (4-Q span)1
80-
70 -
972. Net profits, manufacturing and trade (4-Q span)
SOS) -
9 0 *
977. Seffing prices, wholesale trade (4-Q span)1
70-
973. Net sales, manufacturing and trade (4-Q span)1 978. Selling prices, retail trade (4-Q span)1
100
'B 7d 11 1% 7B i© 81 B2 S3 84 S i 19)SS 1S74 7 i 7§ 11 7§ 1% W Bl B2 ©3 84 S'This is a copyrighted series used by permission; it may not be reproduced without written permission from Dun & Bradstreet, Inc. Dun & Bradstreet diffusion indexes are based on surveys of about 1,400business executives.Current data for these series are shown on page 76.
38 JUNE 1986 KCIIDigitized for FRASER http://fraser.stlouisfed.org/ Federal Reserve Bank of St. Louis
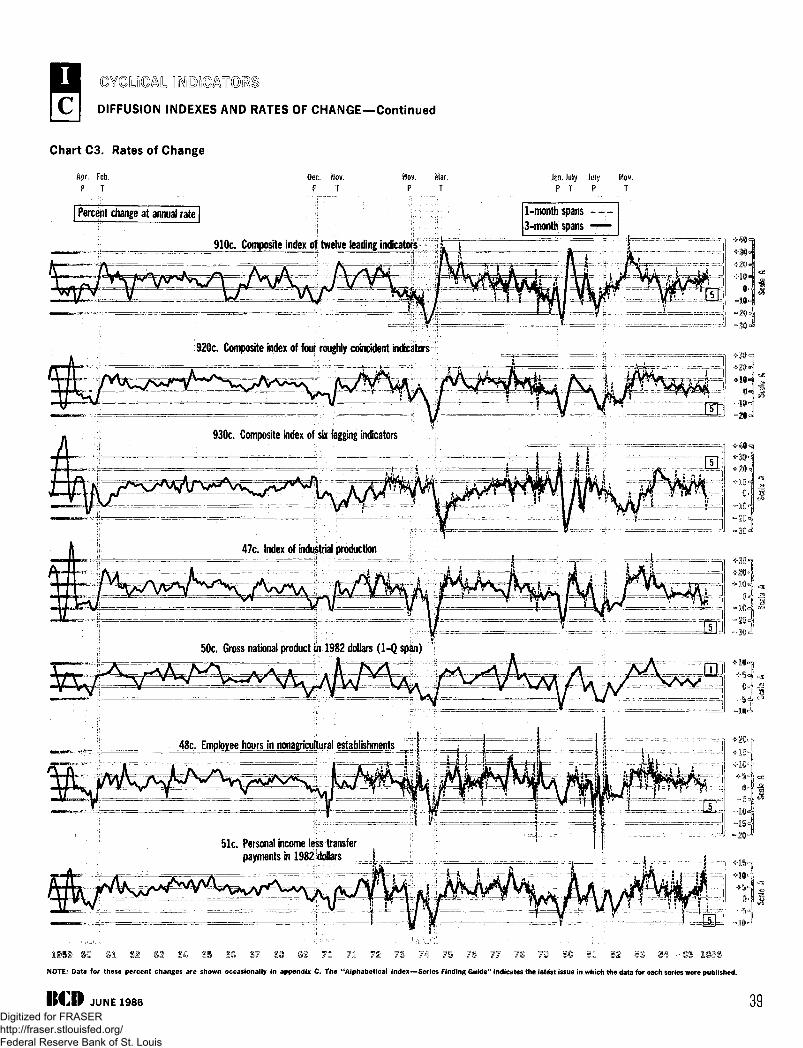
DIFFUSION INDEXES AND RATES OF CHANGE—Continued
Chart C3. Rates of Change
Apr. Feb.
P T
Dec. Nov.
P T
Nov. Mar.
P T
Jan. July July Nov.
F T P T
Percept change at annual rate I 1-month spans3-month spans —
910c. Composite index of twelve leading indicators
4-20
920c. Composite index of four roughly coincident indicators
930c. Composite index of six tagging indicators
47c. Index of industrial production
50c. Gross national product in 1982 dollars (1-Q span)
48c. Employee hours in nonagricuftural establishments
51c. Personal income less transferpayments in 1982 dollars _ ) __
NOTE: Data for these percent changes are shown occasionally in appendix C. The "Alphabetical Index—Series Finding Guide" indicates the latest issue in which the data for each series were published.
B C D JUNE 1986 39Digitized for FRASER http://fraser.stlouisfed.org/ Federal Reserve Bank of St. Louis
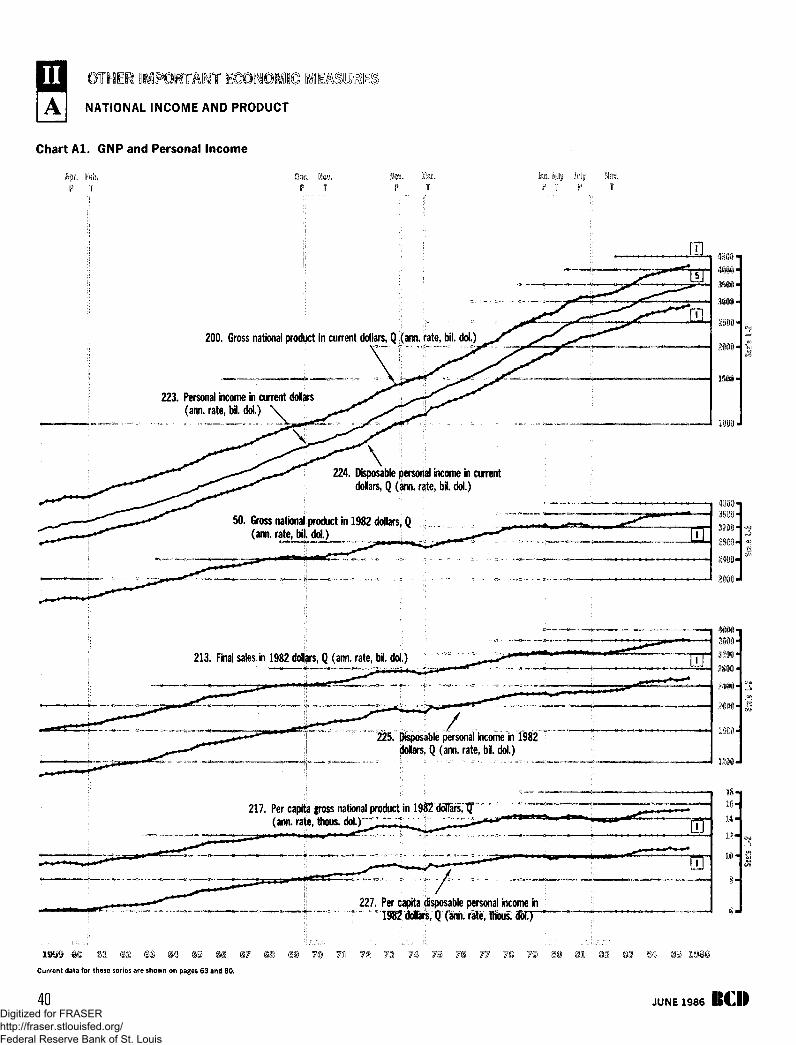
NATIONAL INCOME AND PRODUCT
Chart A l . GNP and Personal Income
it. Feb. Dee. Mav.
P T P T
Jan. khj k\\] Mov.
r T P T
200. Gross national product in current dollars, Q (am. rate, bil. doJ.)
223. Personal income in current dollars(ann. rate, bi. dot.)
224. Disposable personal income in currentdollars, Q (ana rate, bil. d d )
50. Gross national product in 1932 d o t e , Q(ann. rate, bil. dof.)
213. Final sales m 1982 dollars, Q (ann. rate, by. do!.)
225. Disposable personal income in 1982doflars, Q (ann. rate, bit. dol.)
217. Per capita gross national products 198?donarsTQ" ' " " '."!'"(ann. rate, thous. i
2800-
1600-
1 8 -
16-
1 4 -
1 2 -
1 0 -
227. Per capita isposable personal income inc ^ Q T a n n - rale, IRHIS. tfoTT^
Current data for these series are shown on pages 63 and 80.
40 JUNE 1986 BCDDigitized for FRASER http://fraser.stlouisfed.org/ Federal Reserve Bank of St. Louis
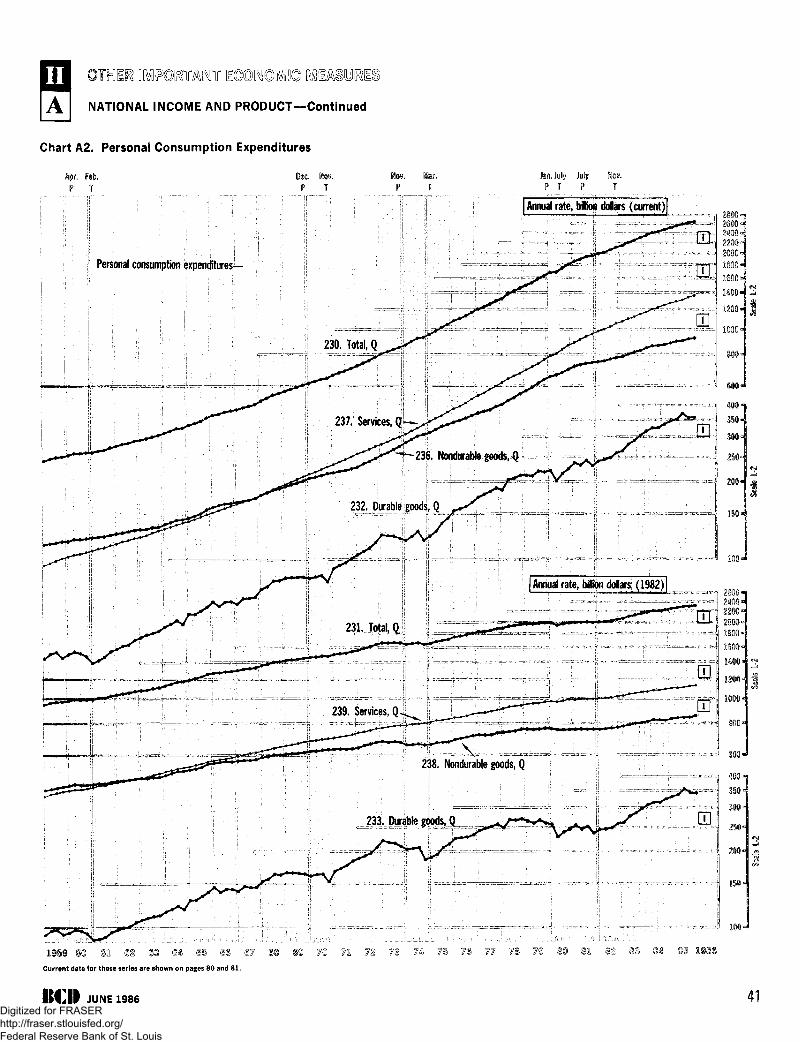
©@WI©1D©
NATIONAL INCOME AND PRODUCT—Continued
Chart A2. Personal Consumpt ion Expenditures
Annual rate, billion dollars (current))
!i Personal consumption expenditures
Annual rate, biion dollars (1982)[
220©'2000<1000'
1400
3I2OO*
1000'
n-
400-
350-
300°
250-^
200-
150 «
inn a
2800^2 W <2200'2000'
160©'
1200
T) '
-
ooo-350-
300-
250-
150-
100-
19S9
Current data for these series are shown on pages 80 and 81.
ItCII JUNE 1986 41Digitized for FRASER http://fraser.stlouisfed.org/ Federal Reserve Bank of St. Louis
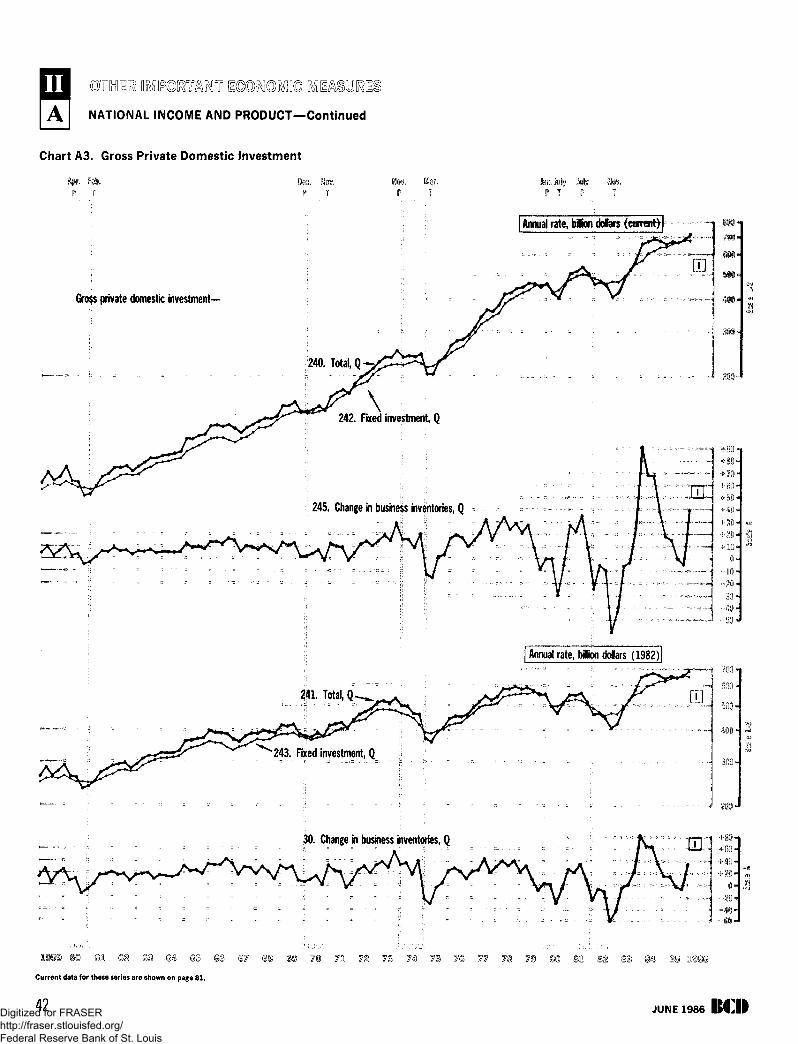
A I NATIONAL INCOME AND PRODUCT—Continued
Chart A3. Gross Private Domestic Investment
Apr. Feb.P T
Gross private domestic investment-
P TNov. fc
P TM\j
I Annual rate, bion Mm <ttnreitt)-|
240. Total, Q
\242. Fixed investment, Q
30. Change in business Inventories, Q
8110
245. Change in business inventories, QL w
L_—+ 30-
+20-
+ i®-
0*• - • 1 0 a
- 3 0 *
Annual rate, bfton dolars (1982)1
[ i fion-
400-
300*
100 -
+ 3® -|+ 60
Current data for these series fire shown on page 8 1 .
42 JUNE 1986 ICCIIDigitized for FRASER http://fraser.stlouisfed.org/ Federal Reserve Bank of St. Louis
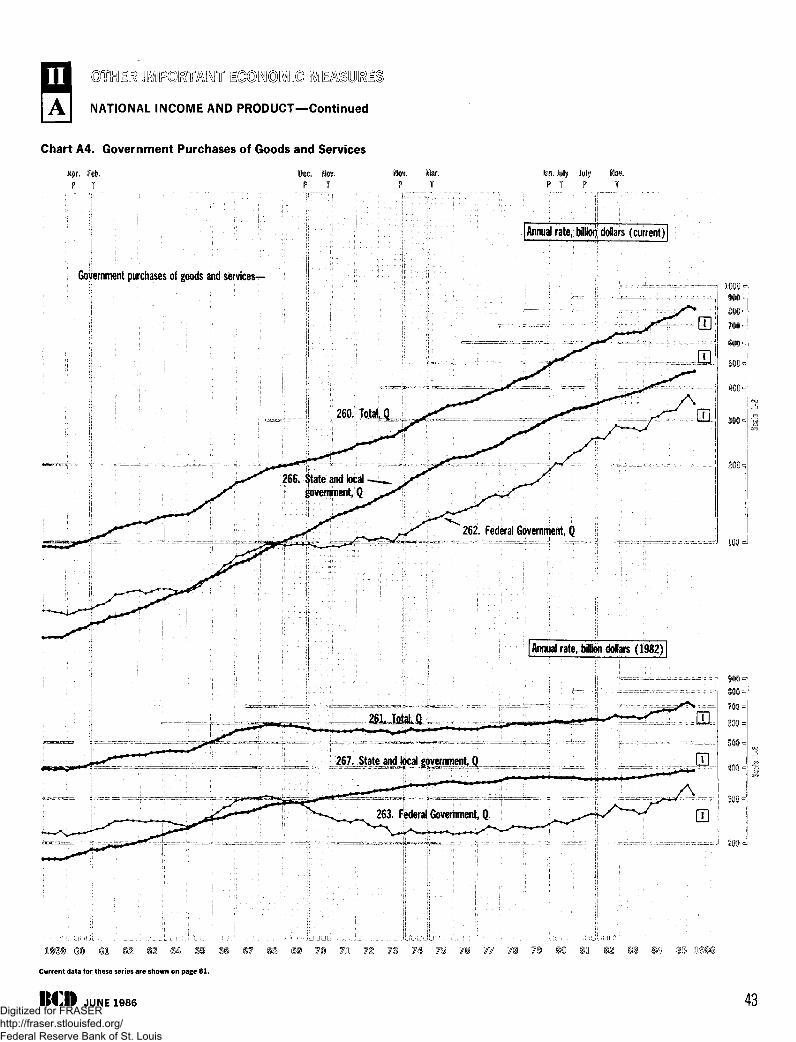
COMO
NATIONAL INCOME AND PRODUCT—Continued
Chart A4. Government Purchases of Goods and Services
Apr. Fab.P T
Dae. Wov.P T
Nov. Mar.P T
hn.bl; July Ncv.
Annual rate, billion dollars (current) |
Government purchases of goods and services—
266. State and localgovernment, Q
[Annual rate, billion dollars (1982)1
267. State_ and tocal government, Q
see
000 -
700-
600-
500 =
J 2 0 0 -
Current data for these series are shown on page 81 .
JUNE 1986
§9 70
43Digitized for FRASER http://fraser.stlouisfed.org/ Federal Reserve Bank of St. Louis
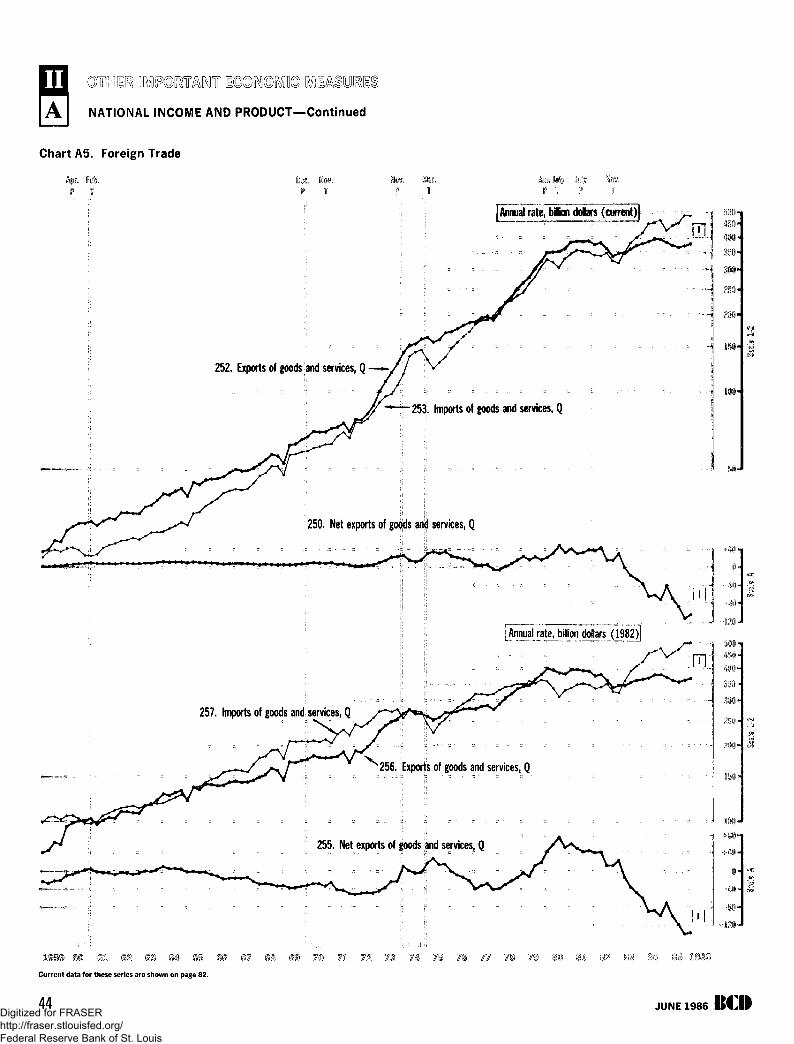
A NATIONAL INCOME AND PRODUCT—Continued
Chart A5. Foreign Trade
Apr. Feb. Dec. Nov. f t e . Maff,P T P T
Jsm. Judy Jnoty to.P I ? I
[Annual rate, bikm dollars (current)]
252. Exports of goods and services, Q ——
253. Imports of goods and services, Q
250. Net exports of goods and services, Q
Annual rate, billion dollars (1
257. Imports of goods and services,
256. Exports of goods and services, Q
255. Net exports of goods and services, Q
§© 851
Current data for these series are shown on page 82.
44 JUNE 1936Digitized for FRASER http://fraser.stlouisfed.org/ Federal Reserve Bank of St. Louis
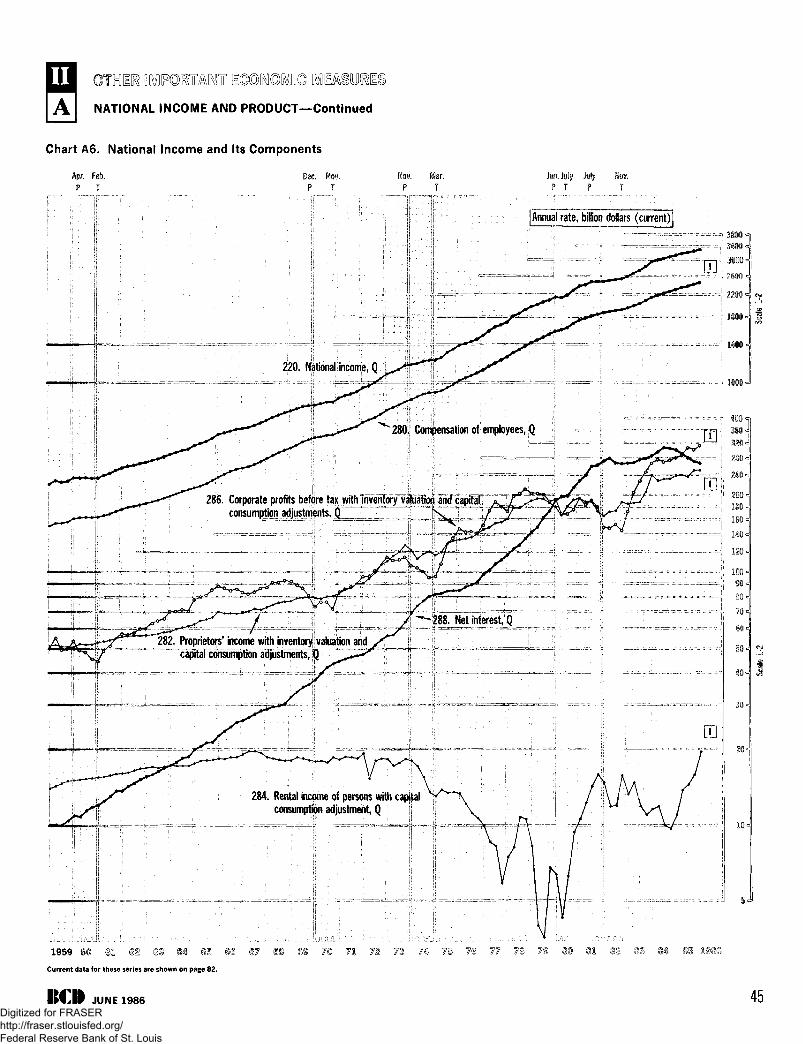
m mmmmi EOOMOKNATIONAL INCOME AND PRODUCT—Continued
Chart A6. National Income and Its Components
Apr. Feb.P T
Dec. Now.P T
Jan. July July Nov.P T P T
Annual rate, billion dollars (current)]
220. National income, Q
280. Compensation of employees, Q
286. Corporate profits before tax withmvenfery vaTuafiog ancTcapltaTconsumption adjustments, Q Z T „. ^ v 7" ~
288. Net interest, Q282. Proprietors' income with inventory valuation and
capital consumption adjustments, Q
284. Rental income of persons with capitalconsumption adjustment, Q
1959 m <S3L
Current data for these series are shown on page 82,
IN: JUNE 1986 45Digitized for FRASER http://fraser.stlouisfed.org/ Federal Reserve Bank of St. Louis
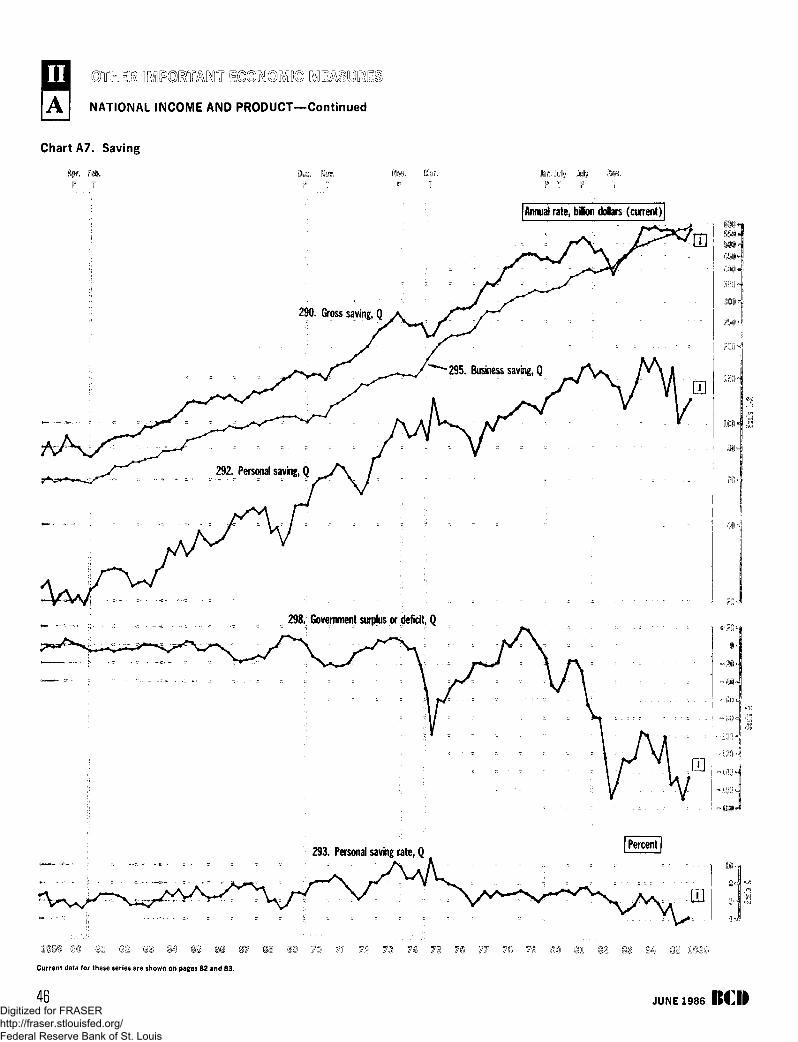
NATIONAL INCOME AND PRODUCT—Continued
Chart A7. Saving
Dgg. Mov. WOT. M M .
FT f 1
Annual rate, b ion doftars (current)
298, Government surplus or deficit, Q
293. Personal saving rate, Q
Current data for these series are shown on pages 82 and 83.
46 JUNE 1986 BCIIDigitized for FRASER http://fraser.stlouisfed.org/ Federal Reserve Bank of St. Louis

NATIONAL INCOME AND PRODUCT—Continued
Chart A8. Shares of GNP and National Income
sr. Feh. cc.p
Nov.r
Nov.P
MarT
hv M y. T
Ah
PNov.T
| Percent of GNP |
268. State and local government purchasesof goods and services, Q
265. Federal Government purchases of goods and services, Q
92 4 7 . Change in business inventories, Q
251, Net exports of goods and services, Q
20-
248. Nonresidential fixed investment, Q
249. Residential fixed investment, Q
| Percent of National Income [
64, Compensation of employees, Q
287. Corporate profits before tax with inventory valuationand capita! consumption adjustments, Q
is-
283. Proprietors' income with inventory valuationand capital consumption adjustments, Q
^7
285. Rental income of persons with capital consumption adjustment, Q
Current data for these series are shown on page 83.
KCII JUNE 1986 47Digitized for FRASER http://fraser.stlouisfed.org/ Federal Reserve Bank of St. Louis
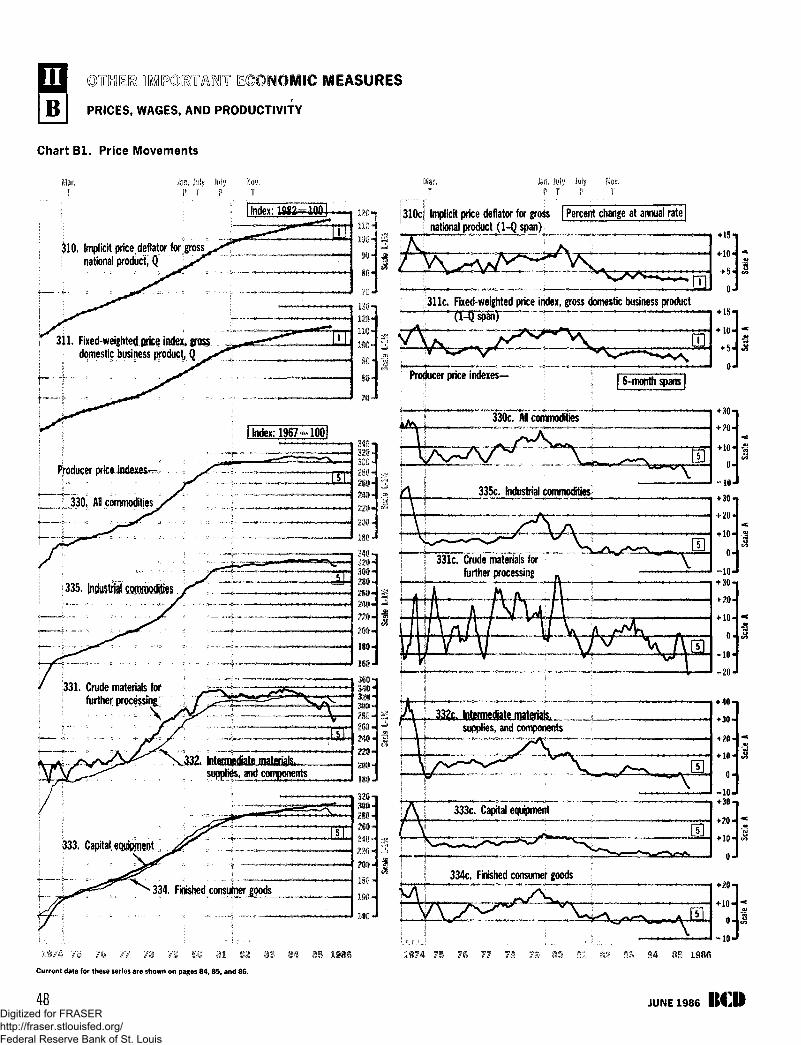
T ECONOMIC MEASURES
PRICES, WAGES, AND PRODUCTIVITY
Chart B l . Price Movements
an. July July Nov.P T P T
Implicit price deflator for grate | Percent change at armua) rate]national product (1-Q span)
310. Implicit price deflator forI national product, Q
311. Fixed-weighted price index, gross.I domestic business product,
Producer price indexes—
330c. AN commodities1 Index: 1967^=1001
Producer price indexes—
^ 330. AH commodities335c. Industrial commodities
331c. Crude materials forfurther processing
331. Crude materials forfurther; processing;
332q. Intermediate materials,supplies, and components
Intermediate materialssupplies, and components
333c. Capital equipment
333. Capital equipment
334c. Finished consumer goods334. Finished consumerj^oods
Current data for those series are shown on pages 84, 85, and 86.
48 JUNE 1986 ItClftDigitized for FRASER http://fraser.stlouisfed.org/ Federal Reserve Bank of St. Louis
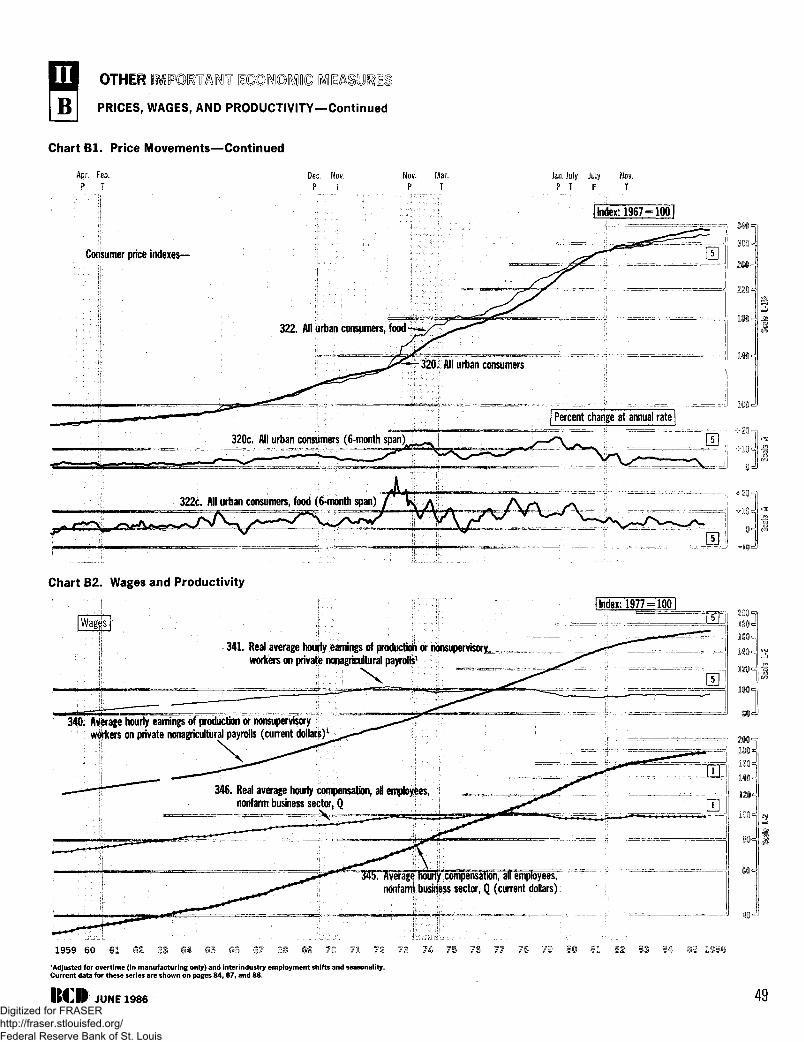
OTHER T
PRICES, WAGES, AND PRODUCTIVITY—Continued
Chart B l . Price Movements—Continued
Apr. Feb.p
Dec. Nov.P T
Nov. Mar.P T
Jan. hily July Nov.P T P T
[Index: 1967^100]
Consumer price indexes—
320c. All urban consumers (6-month span)
322c. All urban consumers, food (6-month span)
C h a r t B 2 . W a g e s a n d P r o d u c t i v i t y
1 Index: 1977^1001
341. Real average hourly earnings of production or nonsupervisorjL.workers on private nonagricultural payrolls1
X
340. Average hourly eamings^Tproduction or nonsupervisory "workers on private nonagricultural payrolls (current dollars)1
346. Real average hourly compensation, all employees,nonfarm business sector, Q
1 ? O v e r a g e hourtfcompensSBh, aff employees;nonfarm business sector, Q (current dollars)
1959 60 61 62 6® 7 2 7 3 7 4 7S 7 7
'Adjusted for overtime (in manufacturing only) and interindustry employment shifts and seasonality.Current data for these series are shown on pages 84, 87, and 88.
JUNE 1986 49Digitized for FRASER http://fraser.stlouisfed.org/ Federal Reserve Bank of St. Louis
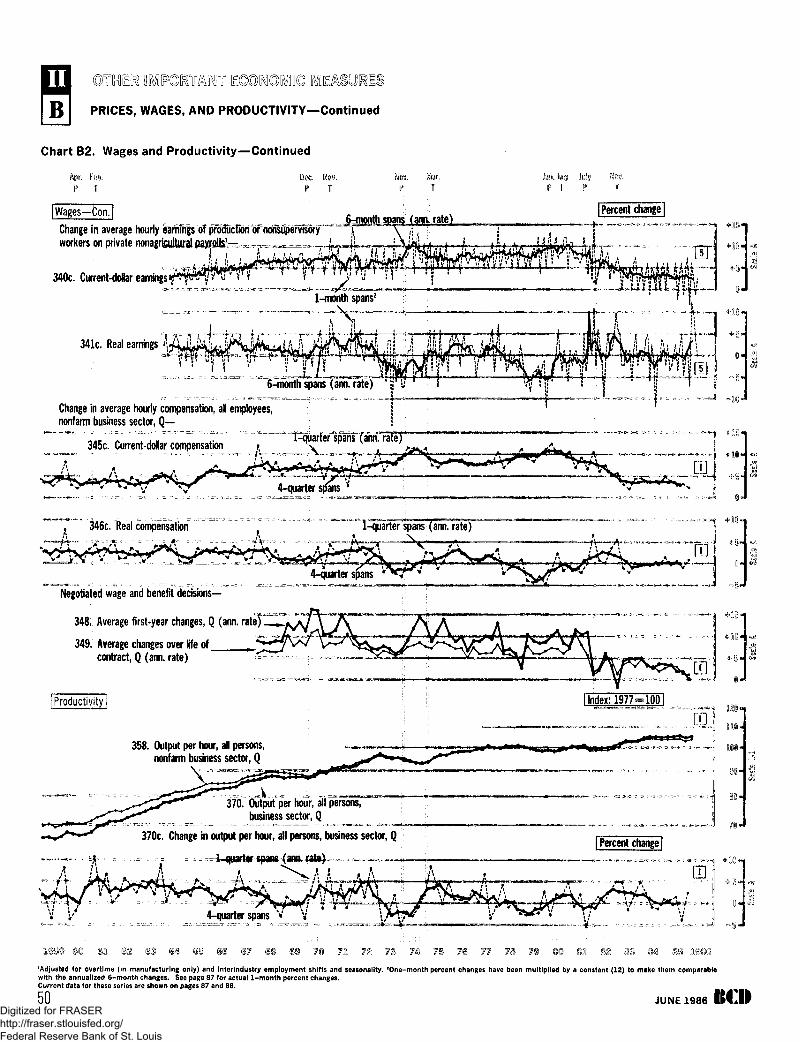
©JUEU mmmmi ECONOMO© MEASURES
PRICES, WAGES, AND PRODUCTIVITY—Continued
Chart B2. Wages and Productivity—Continued
Apr. Fab.P T
Dec. Wov.P T
NOT. Mar.P T
Jan. July JulyP T P
|W3ges—Con| _ 6-month soans ( m rate^Change in average hourly eariiuifs of prciucfjori ofncHisujperviswy \workers on private nonagricultiiral payrolls1—
[Percent change |
340c. Current-dollar earnings^
1y earningsof productionor nonsupervisory 1 \ :M : l \ I
3 4 1 c . R e a l e a r n i n g s I A r r V "
(5-month spans (arm. rate^ " ' j ; I;
Change in average hourly compensation, aH employees,nonfarm business sector, Q—
345c. Current-dollar compensation >, \
4-quarter stfans
, 346c. Real compensation 1-quarter ipans ^(ann. ra ter
Negotiated wage and benefit decisions—
348. Average first-year changes, Q (arm. rate)
349. Average changes over life ofcontract, Q (ann. rate)
[Productivity]
tti"!I Index: 1977=1001
358. Output per hour, aH persons,nonfarm business sector, Q
V....370. Output per hour, all persons,
business sector, Q
370c. Change in output per hour, all persons, business sector, Q
IZO-
| Percent change |
4-quarterspans x ^ V
73 7? IS'Adjusted for overtime (in manufacturing only) and Interindustry employment shifts and seasonally. 'One-month percent changes have been multiplied by a constant (12) to make them comparablewith the annuallzed 6-month changes. See page 87 for actual 1-month percent changes.Current data for these series are shown on pages 87 and 88.
50 JUNE 1986 K C I IDigitized for FRASER http://fraser.stlouisfed.org/ Federal Reserve Bank of St. Louis
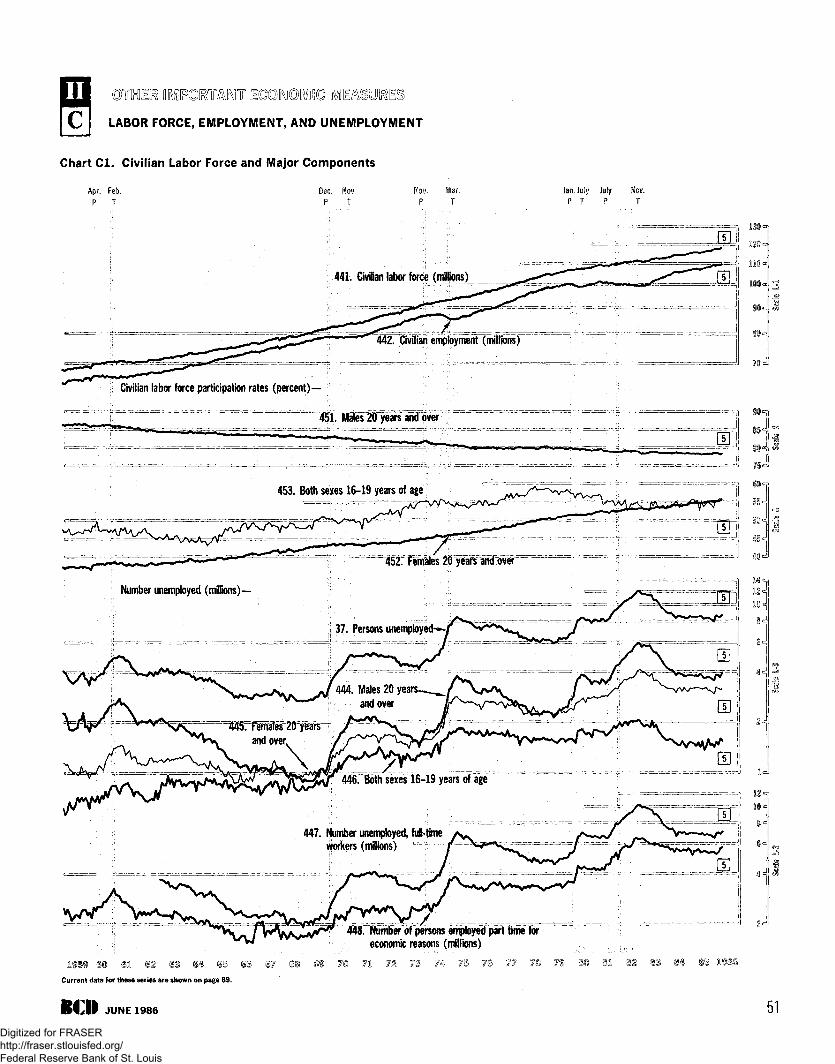
C I LABOR FORCE, EMPLOYMENT, AND UNEMPLOYMENT
Chart C l . Civilian Labor Force and Major Components
Apr. Feb.
P TDec. Nov.
P TNov. Mar.
P TJan. July July Nov.
441. Civilian labor force (millions)
442. Civilian employment (millions)
Civilian labor force participation rates (percent)
451. Males 20 years and over JL
75-
453. Both sexes 16-19 years of age
45£ Females 20 years aiid over
Number unemployed (millions)—
37. Persons unemploy
444. Males 20 y e a r s - ^ ^and over
446. Both sexes 16-19 years of age
447. Number unemployed, full-timeworkers (millions) c r f
448. Number of persons employed part time foreconomic reasons (millions)
Current data for these series are shown on page 89.
BCD JUNE 1986 51Digitized for FRASER http://fraser.stlouisfed.org/ Federal Reserve Bank of St. Louis
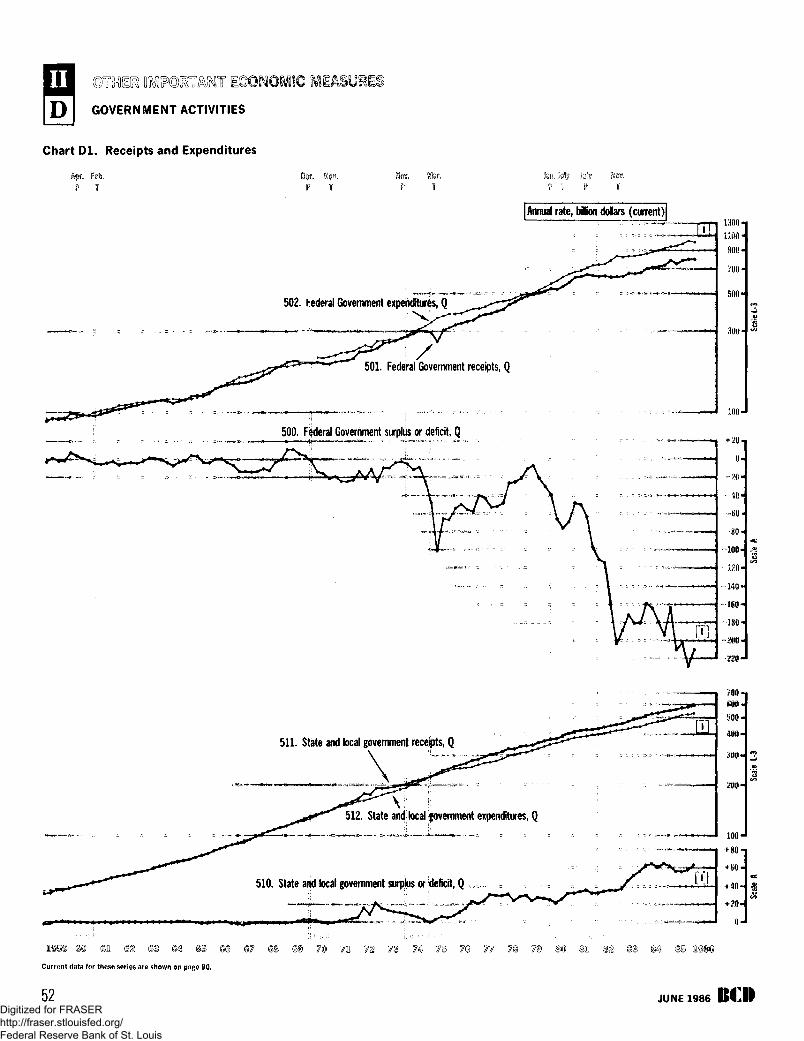
GOVERNMENT ACTIVITIES
Chart D l . Receipts and Expenditures
Apr, Feb.
P T
Dec. WOT.
P T
Kov. Mar.
P T
Jan i i % July
? T P
[Annual rate, biondolars (current)]
502. federal Government expenditures, Q
A501. Federal Government receipts, Q
500. Federal Government surplus or deficit, Q
511. State and local government receipts, Q
512. State and local government expenditures, Q
510. State and local government surplus or deficit, Q
s© ©n
Current data for these series are shown en page 90.
52
100 J
700-1
600-
800-
400-
300 -
100 J
+ S0-
+S0-
+ 40-
JUNE 1986 KCIIDigitized for FRASER http://fraser.stlouisfed.org/ Federal Reserve Bank of St. Louis
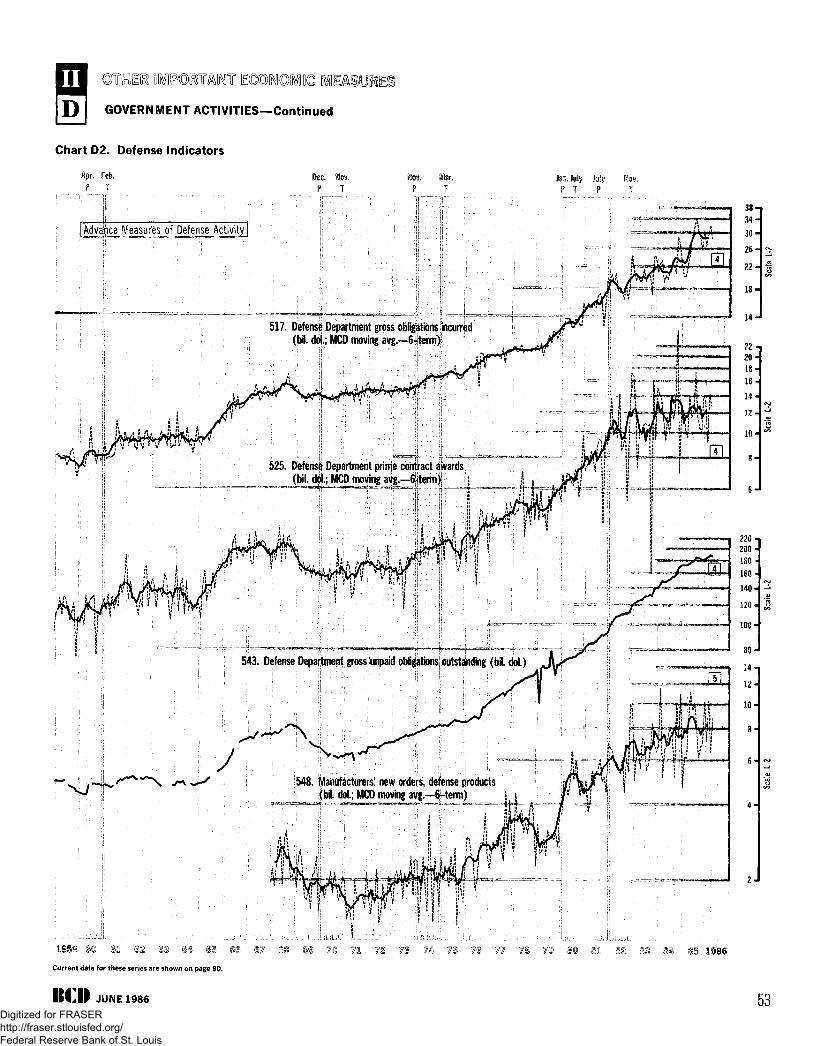
GOVERNMENT ACTIVITIES—Continued
Chart D2. Defense Indicators
Jan. July Jyly MOT.P T P T
Advance Measures of Defense Activity!
517. Defense Department gross obligations incurred(bil. dot.; MCD moving avg.—6-termY
Defense Department prime contract awards(bil, doL; MCD moving avg.—ftterm)
543. Defense Department gross unpaid obligations outstanding (bil. dol.)
Hfh
548. Manufacturers' new orders, defense products( U . dol.; MCD moving avg.—6-term)
19S6
Current data for these series are shown on page 90.
JUNE 1986 53Digitized for FRASER http://fraser.stlouisfed.org/ Federal Reserve Bank of St. Louis
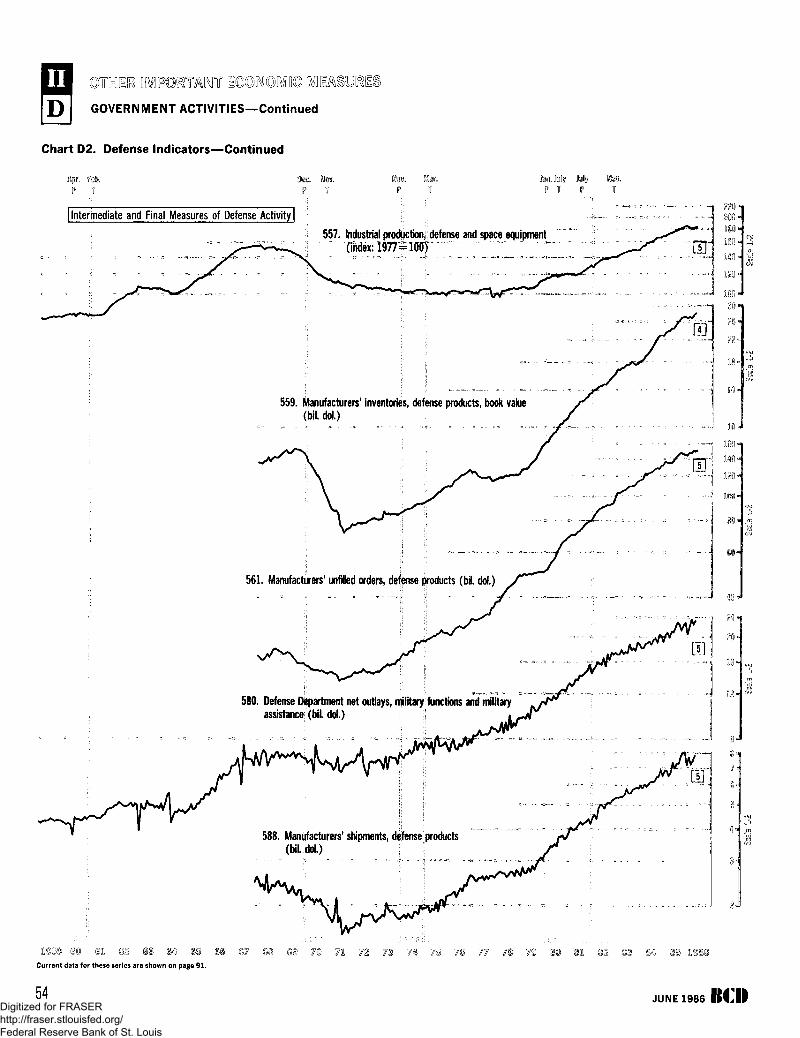
GOVERNMENT ACTIVITIES—Continued
Chart D2. Defense Indicators—Continued
Apr, Feb.
P T
MOT. %W.
P Tkn July Jyly Mgy.
F T P T
| Intermediate and Final Measures of Defense Activity |
557. Industrial production,
559. Manufacturers' inventories, defense products, book value(bit. dol.)
561. Manufacturers' unfilled orders, defense products ( b i dol.)
580. Defense Department net outlays, military functions and militaryassistance (bil. dol.) ! ;;
588. Manufacturers' shipments, defense products(bil. do).) ; !
§ usCurrent data for these series are shown on page 9 1 .
54 JUNE 1986 KillDigitized for FRASER http://fraser.stlouisfed.org/ Federal Reserve Bank of St. Louis
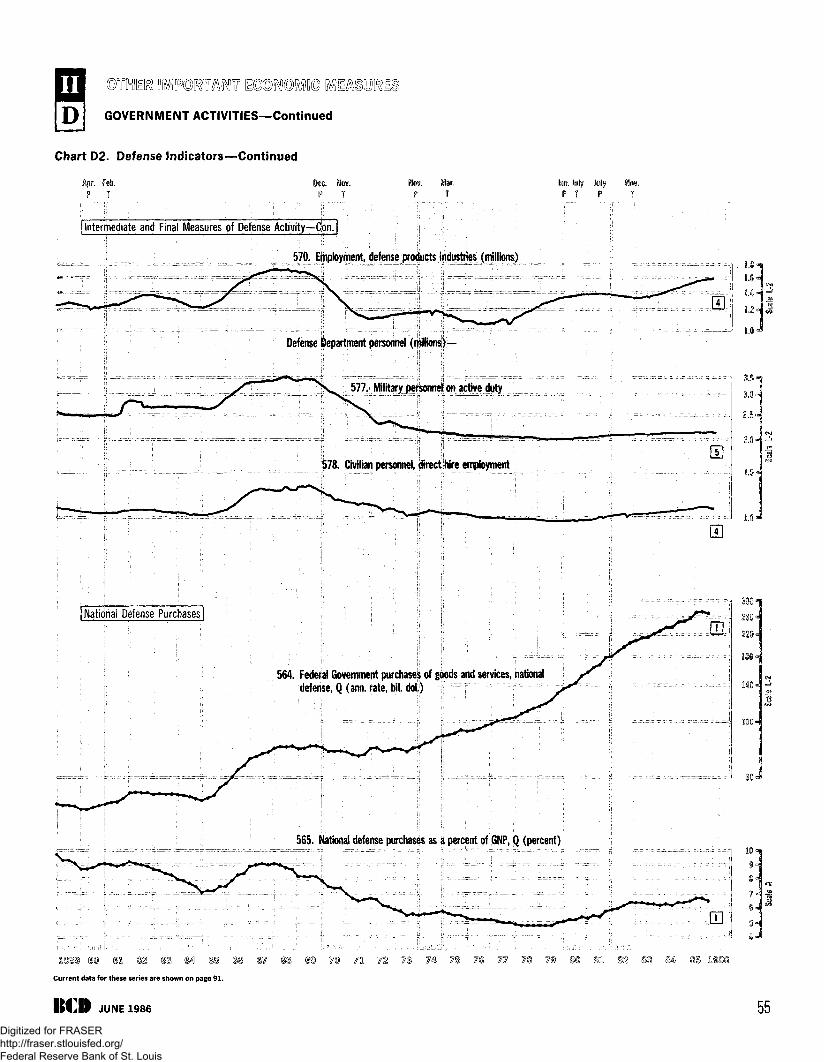
GOVERNMENT ACTIVITIES—Continued
Chart D2. Defense Indicators—Continued
r r[re. Uov.
V T
[Joy. IMiP T P T P T
|intermediate and Final Measures of Defense Activity—Con.]
570. Employment, defense products industries (millions)
Defense Department personnel (millions)—
577. Military personnel on active duty
578. Civilian personnel, direct hire employment
1 Natidfiai Defense Purchases?]
564. Federal Government purchases of goods and services, nationaldefense, Q (ann. rate, bil. dot)
220 «
565. National defense purchases as a percent of GNP, Q (percent)
© ©21 %t (S3 (S4 S i
Current data for these series are shown on page 91.
BCII JUNE 1986 55Digitized for FRASER http://fraser.stlouisfed.org/ Federal Reserve Bank of St. Louis
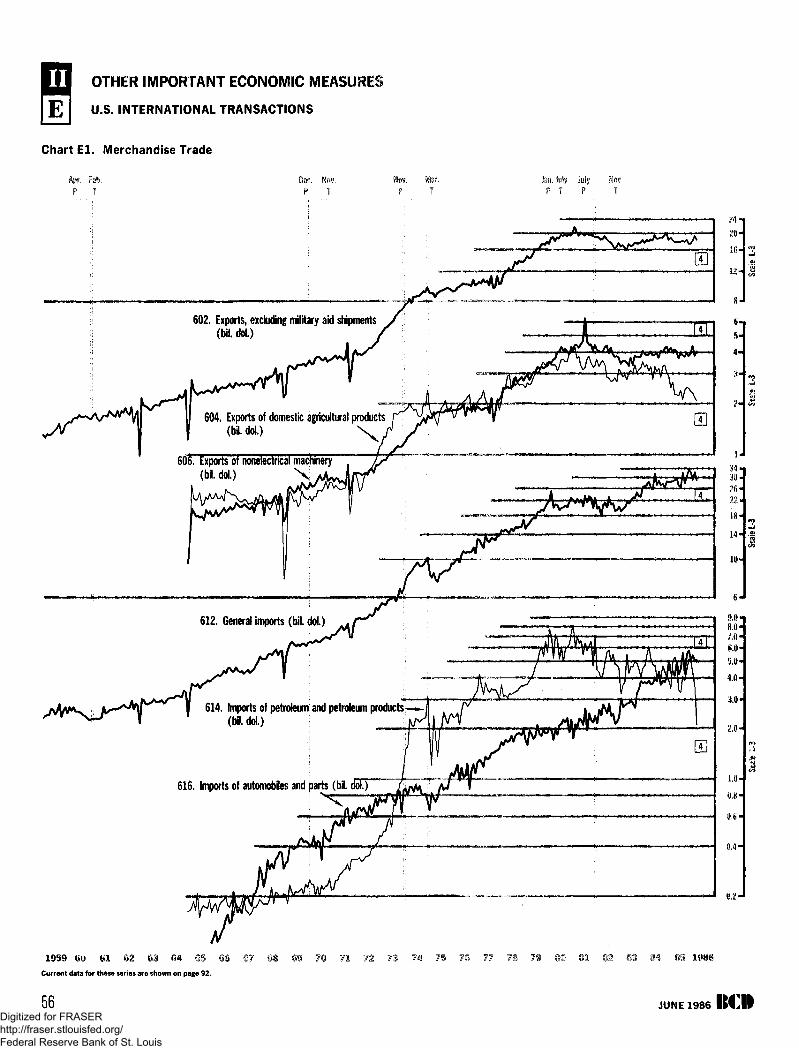
OTHER IMPORTANT ECONOMIC MEASURES
U.S. INTERNATIONAL TRANSACTIONS
Chart El . Merchandise Trade
Apr. Feb.
P T
Dec. Nov.
P T
Nov.P
Mar. Jan. July July NOT.
p r P T
602. Exports, excluding military aid shipments(bil. do).)
604. Exports of domestic agricultural products(bLdoL) : \
606. Exports of nonelectrical machinery(bidoL)
612. General imports (bil. doJ.)
614. Imports of petroleum and petroleum p r o d u c t s - ^(ML dol.) I
616. Imports of automobiles and parts (bil. dol.)
1959 6u 61 62 S3 64 65Current data for these series are shown on page 92.
67 68
20-
12-
3-
3 4 -
3 0 -
2 S -
2 2 -
18-
14-
10-
9.0-
7.0-
6.0-
5.0-
4.0-
3.0-
2.0-
1.0-
0.8-
0,4-
0.2 J
56 JUNE 1986 BCIIDigitized for FRASER http://fraser.stlouisfed.org/ Federal Reserve Bank of St. Louis
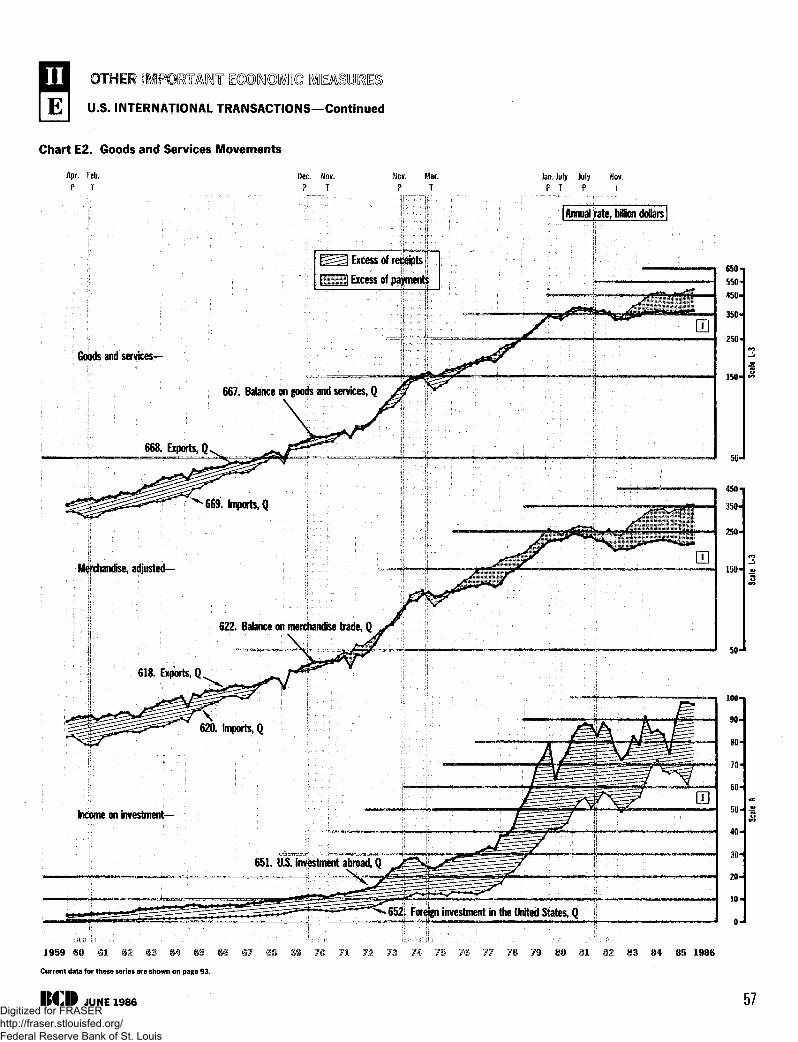
E U.S. INTERNATIONAL TRANSACTIONS—Continued
Chart E2. Goods and Services Movements
Jan. July July Nov.P I P T
[Annual rate, billion dollars
Excess of receipts
Excess of
Goods and services—
667. Balance on goods and services, Q
Merchandise, adjusted—
622. Balance on merchandise trade, Q
V620. Imports, Q
Income on investment—
651. U.S. investment abroad, Q
652. Foreign investment in the United States, Q
1959 6©
Current data for these series are shown on page 93.
1986
IECII JUNE 1986 57Digitized for FRASER http://fraser.stlouisfed.org/ Federal Reserve Bank of St. Louis

INTERNATIONAL COMPARISONS
Chart F l . Industrial Production
Apr. Feb.
P T
Industrial product ion-
721. OECD European countries
Die. rc©v.
p T P T
Im.hhj hhjP l ' ?
723. Canada
I© §1 <B2 <B$ m i S
Current data for these series are shown on page 94.
58 JUNE 1986 KCIIDigitized for FRASER http://fraser.stlouisfed.org/ Federal Reserve Bank of St. Louis
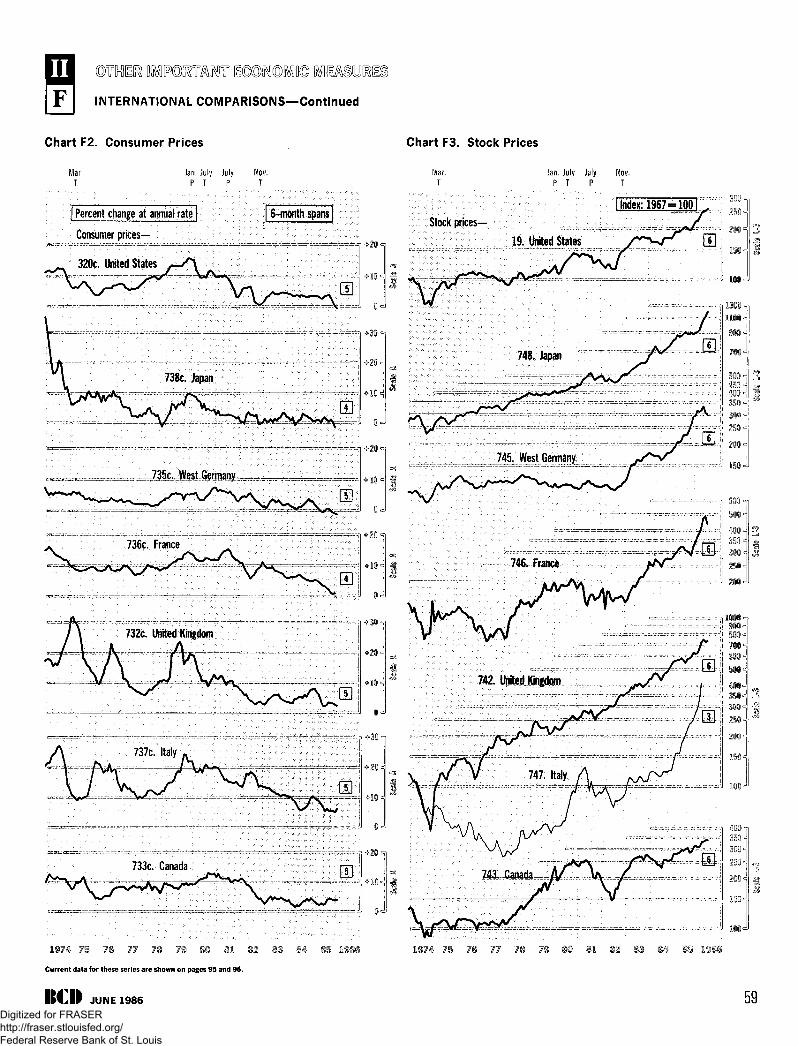
INTERNATIONAL COMPARISONS—Continued
Chart F2. Consumer Prices
Jan. July July Nov.P T P T
Chart F3. Stock Prices
Mar.T
Jan. July July Nov.P T P T
1 Percent change at annual rate [
Consumer prices—
| 6-month spans
?5 76 77 78 79 80 81
Current data for these series are shown on pages 95 and 96.
INJI JUNE 1986 59Digitized for FRASER http://fraser.stlouisfed.org/ Federal Reserve Bank of St. Louis
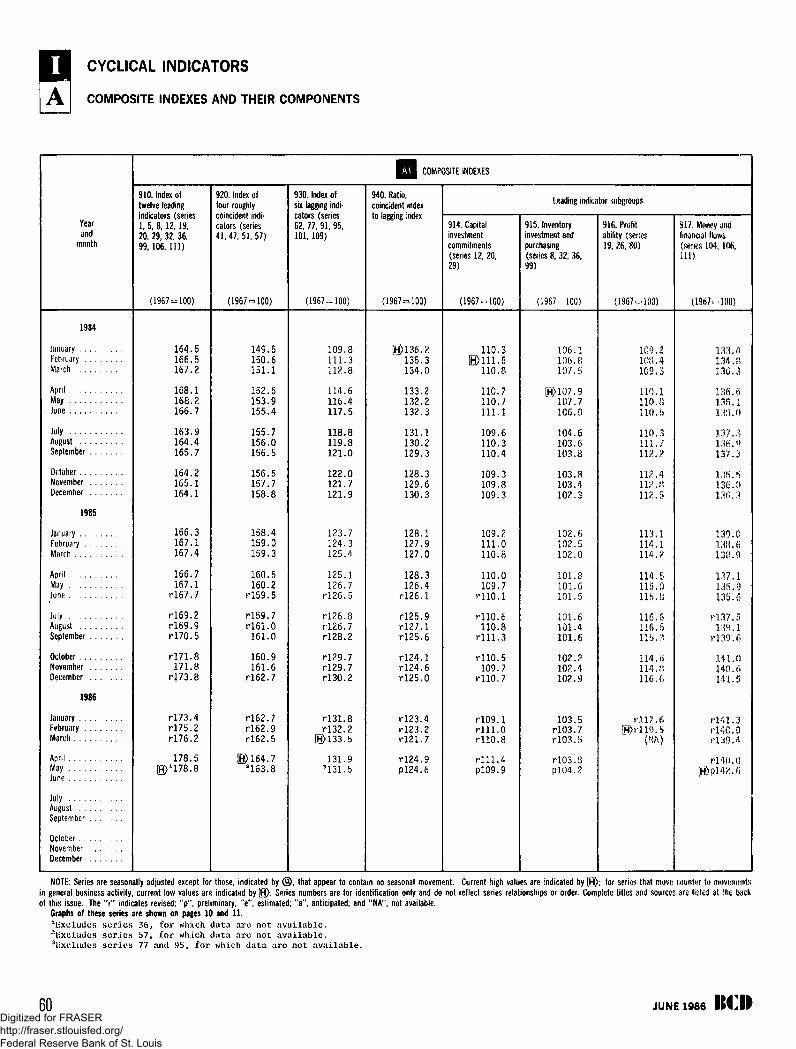
CYCLICAL INDICATORS
A I COMPOSITE INDEXES AND THEIR COMPONENTS
Yearand
month
COMPOSITE INDEXES
910. Index oftwelve leadingindicators (series1,5,8 ,12,19,20, 29, 32, 36,99, 106, 111)
(1967-100)
920. Index offour roughlycoincident indi-cators (series41,47,51,57)
(1967-100)
930. Index ofsix lagging indi-cators (series62, 77,91,95,101, 109)
(1967 = 100)
940. Ratio,coincident indexto lagging index
(1967 = 100)
Leading indicator subgroups
914. Capitalinvestmentcommitments(series 12, 20,29)
(1967-100)
915. Inventoryinvestment andpurchasing(series 8,32, 36,99)
(1967-100)
916. Profit-ability (series19, 26, 80)
(1967-100)
917, Money andfinancial flows(series 104, 108,111)
(1967-100)
1984
JanuaryFebruaryMarch . . . . . .
AprilMayJune
JulyAugustSeptember . . .
OctoberNovember . . .December . . .
1985
• JanuaryFebruaryMarch
AprilMayJune
JulyAugustSeptember . . .
OctoberNovember , . .December . . .
1986
JanuaryFebruaryMarch . . . . . .
AprilMay . . . . . . .June
July .AugustSeptember . . .
OctoberNovember . . .December . , .
164.5166.5167.2
168.168.166.7
163.9164.4165.7
164.2165.1164.1
166.3167.1167.4
149.5150.6151.1
152.6153.9155.4
155.7156.0156.5
156.157.
166.167.
rl67.
rl69.2rl69.9rl7O.5
rl71.8171.8
rl73.8
rl73.4rl75.2K76.2
178.5JV178.8
158.8
158.4159.0159.3
160.5160.2
rl59.5
rl59.7rl61.0161.0
160,161.
rl62.7
rl62.7rl62.9rl62.5
.7163.8
109.8111.3112.8
114.6116.4117.5
118.8119.8121.0
122.0121.7121.9
123.7124.3125.4
125.1126.7
rl26.5
rl26.8rl26.7rl28.2
rl29.7rl29.7rl30.2
rl31.8rl32.2
©133.5
131.93131.5
0)136.2135.3134.0
110.3
133.132.132.
131.130.129.
110.8
110.7110.7111.1
109.110.110.
128.3129.6130.3
128.1127.9127.0
128.3126.4
rl26.1
rl25.9rl27.1rl25.6
rl24.1rl24.6rl25.0
rl23.4rl23.2rl21.7
rl24.9P124.6
109.3109.8109.3
109.2111.0110.8
110.0109.7
rllO.l
rll0.6110.8rill.3
rllO.5109.7
rll0.7
rlO9.1rlll.Orll0.8
r i l l . 4P109.9
106.1106.8107.5
©107.9107.7106.0
104.6103.6103.8
103.8103.4102.3
102.6102.5102.0
101.8101.6101.5
101.6101.4101.6
102.2102.4102.9
103.5rlO3.7rlO3.5
rlO3.8P104.2
109.2108.4109.3
110.1110.8110.5
110.3111.7112.2
112.4112.8112.5
113.1114.1114.2
114.5115.0115.8
116.6116.5115.3
114.6114.8116.6
r l l7 .6l9.5(NA)
133.4134. B136.3
136.6138.1138.0
137.3136.9137.3
135.5136.0136.3
139.0138.6138.9
137.1135.9135.6
rl37.5139.1
rl39.6
141.0140.6141.5
fl41.3r140.0rl39.4
rl40.0IH>P142.6
NOTE: Series are seasonally adjusted except for those, indicated by ® , that appear to contain no seasonal movement. Current high values are indicated by |H); for series that move counter to movementsin general business activity, current low values are indicated by |H>. Series numbers are for identification only and do not reflect series relationships or order. Complete titles and sources are listed at the backof this issue. The "r" indicates revised; "p" , preliminary; "e" , estimated; "a" , anticipated; and "NA", not available.
Graphs of these series are shown on pages 10 and 11.1Excludes series 36, for which data are not available.sUxcludcs series 57, for which data are not available.Excludes series 77 and 95, for which data are not available.
60 JUNE 1986Digitized for FRASER http://fraser.stlouisfed.org/ Federal Reserve Bank of St. Louis
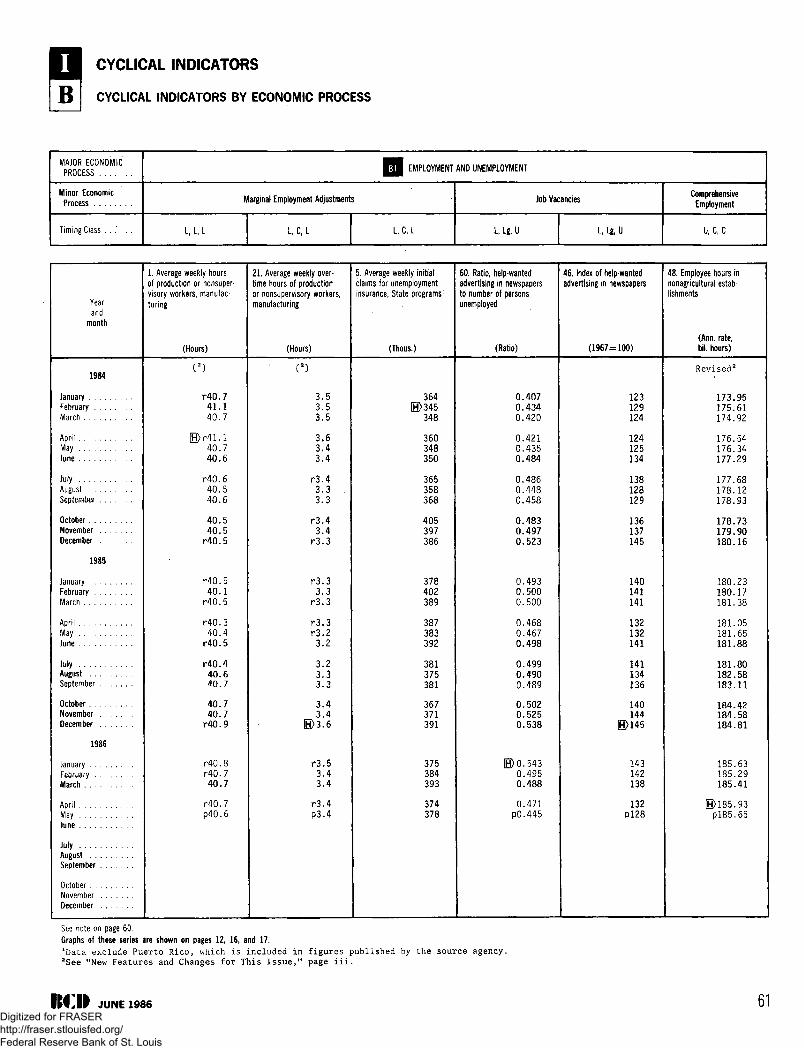
CYCLICAL INDICATORS
B I CYCLICAL INDICATORS BY ECONOMIC PROCESS
MAJOR ECONOMICPROCESS
Minor EconomicProcess
Timing Class . . . . . .
Q j EMPLOYMENT AND UNEMPLOYMENT
Marginal Employment Adjustments
L,L,L L,C,L L,C,L
Job Vacancies
I Lg, U L, Lg, U
ComprehensiveEmployment
u,c,c
Year
month
1984
JanuaryFebruaryMarch
AprilMayJune
JulyAugustSeptember
OctoberNovemberDecember
1985
JanuaryFebruaryMarch
AprilMayJune
JulyAugustSeptember
OctoberNovemberDecember
1986
JanuaryFebruaryMarch
AprilMayJune
JulyAugustSeptember
OctoberNovemberDecember
1. Average weekly hoursof production or nonsuper-visory workers, manufac-turing
(Hours)
(2)
r40.741.140.7
(H>r41.140.740.6
r40.640.540.6
40.540.5
r40.5
r40.540.1
r40.5
r40.340.4
r40.5
r40.440.640.7
40.740.7
r40.9
r40.8r40.740.7
r40.7p40.6
21. Average weekly over-time hours of productionor nonsupervisory workers,manufacturing
(Hours)
(2)
3.53 .53.5
3.63 .43.4
r3.43.33.3
r3.43.4
r3.3
r3.33.3
r3.3
r3.3r3.2
3.2
3.23.33.3
3.43.4
E>3.6
r3.53.43.4
r3.4p3.4
5. Average weekly m\tia\claims for unemploymentinsurance, State programs1
(Thous.)
364E>345
348
360348350
365358368
405397386
378402389
387383392
381375381
367371391
375384393
374378
60. Ratio, help-wantedadvertising in newspapersto number of personsunemployed
(Ratio)
0.4070.4340.420
0.4210.4350.484
0.4860.4480.458
0.4830.4970.523
0.4930.5000.500
0.4680.4670.498
0.4990.4900.489
0.5020.5250.538
E>0.5430.4950.488
0.471pO.445
46. Index of help-wantedadvertising in newspapers
(1967 = 100)
123129124
124125134
138128129
136137145
140141141
132132141
141134136
140144
E>145
143142138
132pl28
48. Employee hours innonagricultural estab-lishments
(Ann. rate,bil. hours)
Revised2
173.95175.61174.92
176.54176.34177.29
177.68178.12178.93
178.73179.90180.16
180.23180.17181.38
181.05181.65181.88
181.80182.58183.11
184.42184.58184.81
185.63185.29185.41
G>185.93P185.65
See note on page 60.Graphs of these series are shown on pages 12, 16, and 17.*Data exclude Puerto Rico, which is included in figures published by the source agency.2See "New Features and Changes for This Issue/' page iii.
JUNE 1986 61Digitized for FRASER http://fraser.stlouisfed.org/ Federal Reserve Bank of St. Louis
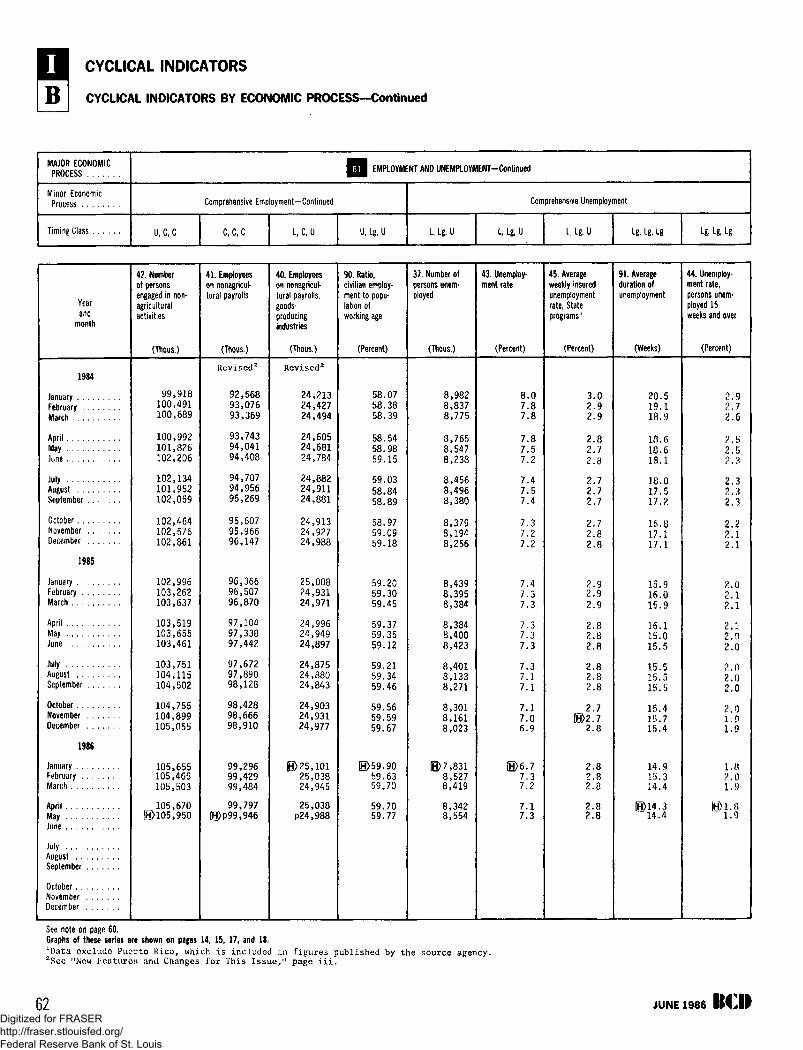
CYCLICAL INDICATORS
B I CYCLICAL INDICATORS BY ECONOMIC PROCESS—Continued
MAJOR ECONOMICPROCESS
Minor EconomicProcess
Timing Class
£ J EMPLOYMENT AND UNEMPLOYMENT-Continued
Comprehensive Employment—Continued
U.C.C C,C,C L, Cr U U, Lg, U
Comprehensive Unemployment
L. Lg, U L, Lg, U L, Lg, U Lg, Lg, Lg Lg, Lg, Lg
Yearand
month
42. Numberof personsengaged in non-agriculturalactivities
(Thous.)
41. Employeeson nonagricul-tural payrolls
(Thous.)
40. Employeeson nonagncultural payrolls,goods-producingindustries
(Thous.)
90. Ratio,civilian employ-ment to popu-lation ofworking age
(Percent)
37. Number ofpersons unem-ployed
(Thous.)
43. Unemploy-ment rate
(Percent)
45. Averageweekly insuredunemploymentrate, Stateprograms'
(Percent)
91. Averageduration ofunemployment
(Weeks)
44. Unemploy-ment rate,persons unem-ployed 15weeks and over
(Percent)
1984
JanuaryFebruaryMarch
April . . . . . . .MayJune
JulyAugustSeptember . . ,
OctoberNovember . ..December . . ,
1985
JanuaryFebruaryMarch
AprilMayJune
JulyAugustSeptember . , .
OctoberNovember , . .December . . .
1986
JanuaryFebruaryMarch
AprilMayJune
JulyAugustSeptember . , .
OctoberNovember . . .December . . .
99,918100,491100,689
100,992101,826102,206
102,134101,952102,059
102,464102,576102,861
102,996103,262103,637
103,519103,655103,461
103,751104,115104,502
104,755104,899105,055
105,655105,465105,503
105,6701)105,950
Revised
92,56893,07693,369
93,74394,04194,408
94,70794,95695,269
95,60795,96696,147
96,36696,50796,870
97,10497,33897,442
97,67297,89098,128
98,42898,66698,910
99,29699,42999,484
99,797[H)p99,946
Revised2
24,21324,42724,494
24,60524,68124,784
24,88224,91124,881
24,91324,92724,988
25,00824,93124,971
24,99624,94924,897
24,87524,88024,843
24,90324,93124,977
E>25,10125,03824,945
25,038p24,988
58.0758.3858.39
58.5458.9859.15
59.0358.8458.89
58.9759.0959.18
59.2059.3059.45
59.3759.3559.12
59.2159.3459.46
59.5659.5959.67
©59.9059.6359.70
59.7059.77
8,9828,8378,775
8,7658,5478,238
8,4568,4968,380
8,3798,1948,256
8,4398,3958,384
8,3848,4008,423
8,4018,1338,271
8,3018,1618,023
E>7,8318,5278,419
8,3428,554
8.07.87.8
7.87.57.2
7.47.57.4
7.37.27.2
7.47.37.3
7.37.37.3
7.37.17.1
7.17.06.9
)6.77.37.2
7.17.3
3.02.92.9
2.82.72.8
2.72.72.7
2.72.82.8
2.92.92.9
2.82.82.8
2.82.82.8
2.7©2.7
2.8
2.82.82.8
2.82.8
20.519.1IB.9
18.618.618.1
18.017.517.2
16.817.117.1
15.916.015.9
16.115.015.5
15.515.515.5
15.415.715.4
14.915.314.4
14.4
2.92.72.6
2.52.5
2.32.32.3
2.22.12.1
2.02.12 .1
2.12.02.0
2.02.02.0
2.01.91.9
1.82.01.9
See note on page 60.Graphs of these series are shown on pages 14, 15, 17, and 18.xData exclude Puerto Rico, which is included in figures published by the source agency.2Sec "New Features and Changes for This Issue/1 page iii.
62 JUNE 1986 ICODigitized for FRASER http://fraser.stlouisfed.org/ Federal Reserve Bank of St. Louis
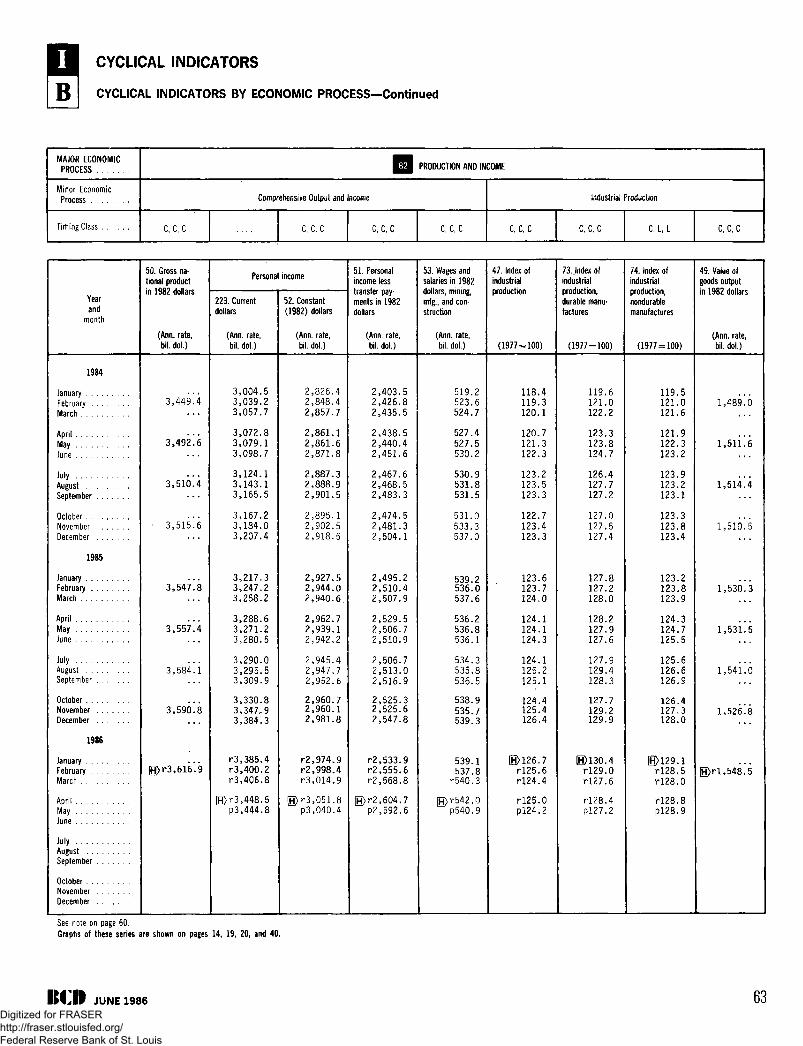
CYCLICAL INDICATORS
B I CYCLICAL INDICATORS BY ECONOMIC PROCESS—Continued
MAJOR ECONOMICPROCESS PRODUCTION AND INCOME
Minor EconomicProcess Comprehensive Output and Income Industrial Production
Timing Class CCC ccc CCC ccc ccc ccc CL, L C.C.C
Yearand
month
1984
JanuaryFebruaryMarch
AprilMayJune
JulyAugustSeptember
OctoberNovemberDecember
1985
JanuaryFebruaryMarch
AprilMayJune
JulyAugustSeptember
OctoberNovemberDecember
1986
JanuaryFebruaryMarch
AprilMayJune
JulyAugustSeptember
OctoberNovemberDecember
50. Gross na-tional productin 1982 dollars
(Ann. rate,bil. dol.)
3 , 4 4 9 . 4
3 , 4 9 2 ^ 6
3,510.4
3,515.6
3,547^8
3,557.4
3,584.1
3,59CL8
B>r3,616*.9
Personal income
223. Currentdollars
(Ann. rate,bil. dol.)
3,004.53,039.23,057.7
3,072.83,079.13,098.7
3,124.13,143.13,165.5
3,167.23,184.03,207.4
3,217.33,247.23,258.2
3,288.63,271.23,280.5
3,290.03,295.53,309.9
3,330.83,347,. 93,384.3
r3,385.4r3,400.2r3,406.8
[R)r3,448.5p3,444.8
52. Constant(1982) dollars
(Ann. rate,bil. dol.)
2,826.42,848.42,857.7
2,861.12,861.62,871.8
2,887.32,888.92,901.5
2,895.12,902.52,918.5
2,927.52,944.02,940.6
2,962.72,939.12,942.2
2,945.42,947,72,952.6
2,960.72,960.12,981.8
r2,974.9r2,998.4r3,014.9
H>r3,051.8p3,040.4
51. Personalincome lesstransfer pay-ments in 1982dollars
(Ann. rate,bil. dol.)
2,403.52,426.82,435.5
2,438.52,440.42,451.6
2,467.62,468.52,483.3
2,474.52,481.32,504.1
2,495.22,510.42,507.9
2,529.52,506.72,510.9
2,506.72,513.02,516.9
2,525.32,525.62,547.8
r2,533.9r2,555.6r2,568.8
[H>r2,604.7p2,592.6
53. Wages andsalaries in 1982dollars, mining,mfg., and con-struction
(Ann. rate,bil. dol.)
519.2523.6524.7
527.4527.5530.2
530.9531.8531.5
531.0533.3537.0
539.2536.0537.6
536.2536.8536.1
534.3535.8536.5
538.9535.7539.3
539.1537.8
r540.3
[H)r542.0P540.9
47. Index ofindustrialproduction
(1977-100)
118.4119.3120.1
120.7121.3122.3
123.2123.5123.3
122.7123.4123.3
123.6123.7124.0
124.1124.1124.3
124.1125.2125.1
124.4125.4126.4
E>126.7r l25.6r l24.4
r l25.0P124.2
73. Index ofindustrialproduction,durable manu-factures
(1977 = 100)
119.6121.0122.2
123.3123.8124.7
126.4127.7127.2
127.0127.5127.4
127.8127.2128.0
128.2127.9127.6
127.9129.4128.3
127.7129.2129.9
H>130.4rl29.0rl27.6
rl28.4P127.2
74. Index ofindustrialproduction,nondurablemanufactures
(1977-100)
119.5121.0121.6
121.9122.3123.2
123.9123.2123.1
123.3123.8123.4
123.2123.8123.9
124.3124.7125.5
125.6126.6126.9
126.4127.3128.0
B>129.1rl28.5rl28.0
rl28.8P128.9
49. Value ofgoods outputin 1982 dollars
(Ann. rate,bil. dol.)
1,489^6
1,511.6
1,514^4
1.5KK5
1,53CL3
l ,53 l !s
l,54l!6
l , 5 2 6 ; s
E>r l ,548."5
See note on page 60.Graphs of these series are shown on pages 14, 19, 20, and 40.
J U N E 1 9 8 6 63Digitized for FRASER http://fraser.stlouisfed.org/ Federal Reserve Bank of St. Louis
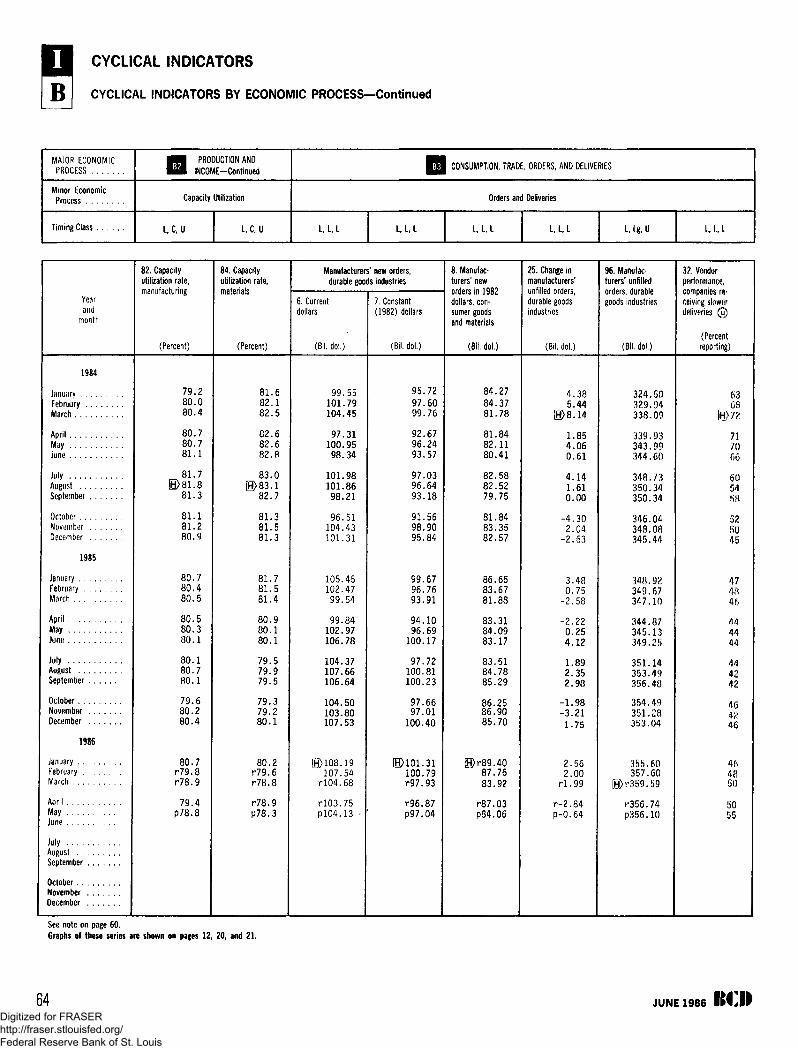
CYCLICAL INDICATORS
B I CYCLICAL INDICATORS BY ECONOMIC PROCESS—Continued
MAJOR ECONOMICPROCESS
Minor EconomicProcess
Timing Class
• • • PRODUCTION AND• i l l INCOME—Continued
Capacity Utilization
L,C,U L.C.U
Q CONSUMPTION, TRADE, ORDERS, AND DELIVERIES
Orders and Deliveries
L, L, L U, L L, L, I L.L.L 1, Lg, U L, I, I
Yearand
month
82. Capacityutilization rate,manufacturing
(Percent)
84. Capacityutilization rate,materials
(Percent)
Manufacturers' new orders,durable goods industries
6. Currentdollars
(Bil. dol.)
7. Constant(1982) dollars
(Bil. dol.)
8. Manufac-turers' neworders in 1982dollars, con-sumer goodsand materials
(Bil. dol.)
25. Change inmanufacturers'unfilled orders,durable goodsindustries
(Bil. dol.)
96. Manufac-turers' unfilledorders, durablegoods industries
lil. dol.)
32. Vendorperformance,companies re-ceiving slowerdeliveries @
(Percentreporting)
1984
JanuaryFebruaryMarch . . . . . .
AprilMayJune
JulyAugustSeptember . . .
OctoberNovember . , .December , . .
1985
JanuaryFebruaryMarch
AprilMayJune
JulyAugustSeptember . . .
OctoberNovember . . .December . . ,
1986
January .FebruaryMarch . .
AprilMayJune
JulyAugustSeptember , . ,
October . . .November .December ,
79.280.080.4
80.780.781.1
81.7
81.3
81.81,80.9
80.780.480.5
80.580.380.1
81.682.182.5
82.682.682.8
83.01
82.7
81.381.581.3
81.781.581.4
80.980.180.1
80.80.80.
79.680.280.4
80.7r79.8r78.9
79.4p?8.8
79.79,79.
79.79.80 ,1
80.2r79.6r78.8
r78.9P78.3
99.55101.79104.45
97.31100.9598.34
101.98101.8698.21
96.51104.43101.31
105.45102.4799.54
99.84102.97106.78
104.37107.66106.64
104.50103.80107.53
E>108.19107.54
rlO4.68
rlO3.75P104.13
95.7297.6099.76
92.6796.2493.57
97.0396.6493.18
91.5698.9095.84
99.6796.7693.91
94.1096.69100.17
97.72100.81100.23
97.6697.01100.40
H>101.31100.79r97.93
r96.87P97.04
84.2784.3781.78
81.8482.1180.41
82.5882.5279.75
81.8483.3582.57
86.6583.6781.88
83.3184.0983.17
83.5184.7885.29
86.2586.9085.70
E)r89.4087.7683.92
r87.03P84.06
4.385.44
H>8.14
1.854.060.61
4.141.610.00
-4.302.04-2.63
3.480.75-2.58
-2.220.254.12
1.893598
9821
1-75
2.562.00rl.99
r-2.84p-0.64
324.50329.94338.09
339.93343.99344.60
348.73350.34350.34
346.04348.08345.44
348.92349.67347.10
344.87345.13349.25
351.14353.49356.48
354.49351.28353.04
355.60357.60
[H>r359.59
r356.74P356.10
6368
717066
5458
526045
474846
444444
444242
464246
4648
5055
See note on page 60.Graphs of these series are shown on pages 12, 20, and 21.
64 JUNE 1986 ItCIIDigitized for FRASER http://fraser.stlouisfed.org/ Federal Reserve Bank of St. Louis
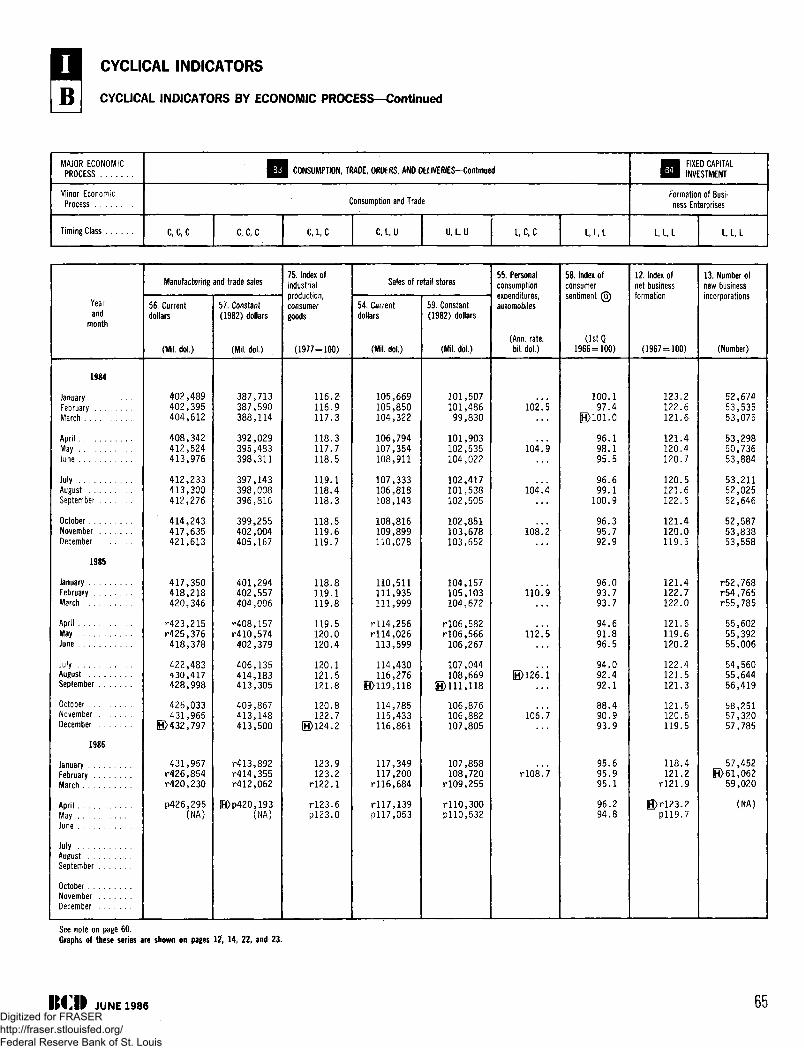
CYCLICAL INDICATORS
B I CYCLICAL INDICATORS BY ECONOMIC PROCESS—Continued
MAJOR ECONOMICPROCESS
Minor EconomicProcess
Timing Class
Q | CONSUMPTION, TRADE, ORDERS, AND DEMVERfES—Continued
Consumption and Trade
C, C, C C,C,C C, L,C C L , U U.L.U L,C,C L, L,L
• • FIXED CAPITALl i i l INVESTMENT
Formation of Busi-ness Enterprises
L.L.L L.L.L
Yearand
month
1984
JanuaryFebruaryMarch
AprilMay ,June
JulyAugustSeptember
OctoberNovemberDecember
1985
JanuaryFebruaryMarch
AprilMayJune
JulyAugustSeptember
OctoberNovemberDecember
1986
JanuaryFebruaryMarch
AprilMayJune
JulyAugustSeptember
OctoberNovemberDecember
Manufacturing and trade sales
56. Currentdollars
(Mil. dol.)
402,489402,395404,612
408,342412,524413,976
412,233413,300412,276
414,243417,635421,613
417,350418,218420,346
r423,215r425,376418,378
422,483430,417428,998
426,033431,965
0)432,797
431,957r426,854r420,230
p426,295(NA)
57. Constant(1982) dollars
(Mil. dol.)
387,713387,590388,114
392,029395,483398,311
397,143398,008396,816
399,255402,004405,167
401,294402,557404,006
r408,157r410,574
402,379
406,135414,183413,305
409,867413,148413,500
r4 l3 ,892r414,355r412,062
[H>p420,193(NA)
75. Index ofindustrialproduction,consumergoods
(1977 = 100)
116-2116.9117.3
118.3117.7118.5
119.1118.4118.3
118.5119.6119.7
118.8119.1119.8
119.5120.0120.4
120.1121.5121.8
120.8122.7
E>124.2
123.9123.2
rl22.1
rl23.6P123.0
Sales of retail stores
54. Currentdollars
(Mil. dol.)
105,669105,850104,322
106,794107,354108,911
107,333106,818108,143
108,816109,899110,078
110,511111,935111,999
rll4,256rll4,026
113,599
114,430116,276
E>119,118
114,785115,433116,861
117,349117,200
rll6,684
rll7,139pll7,053
59. Constant(1982) dollars
(Mil. dol.)
101,507101,48699,830
101,903102,535104,022
102,417101,538102,505
102,851103,678103,652
104,157105,103104,672
rlO6,582rlO6,566
106,267
107,044108,669
H>H1.118
106,876106,882107,805
107,858108,720
rlO9,255
rll0,300pllO,532
55. Personalconsumptionexpenditures,automobiles
(Ann. rate,bil. dol.)
102^5
104.9
104.4
108.2
110.9
112^5
E>i26!i
106\7
rlO&\7
58. Index ofconsumersentiment (u)
(1st Q1966 = 100)
100.197.4
B>101.0
96.198.195.5
96.699.1
100.9
96.395.792.9
96.093.793.7
94.691.896.5
94.092.492.1
88.490.993.9
95.695.995.1
96.294.8
12. Index ofnet businessformation
(1967-100)
123.2122.6121.6
121.4120.4120.7
120.5121.6122.5
121.4120.0119.5
121.4122.7122.0
121.6119.6120.2
122.4121.5121.3
121.5120.5119.5
118.4121.2
rl21.9
0>rl23.2P119.7
13. Number ofnew businessincorporations
(Number)
52,67453,53553,075
53,29850,73653,884
53,21152,02552,646
52,58753,83853,558
r52,768r54,765r55,785
55,60255,39255,006
54,56055,64456,419
58,25157,32057,785
57,452E)61,062
59,020
(NA)
See note on page 60.Graphs of these series are shown on pages 12, 14, 22, and 23.
JUNE 1986 65Digitized for FRASER http://fraser.stlouisfed.org/ Federal Reserve Bank of St. Louis
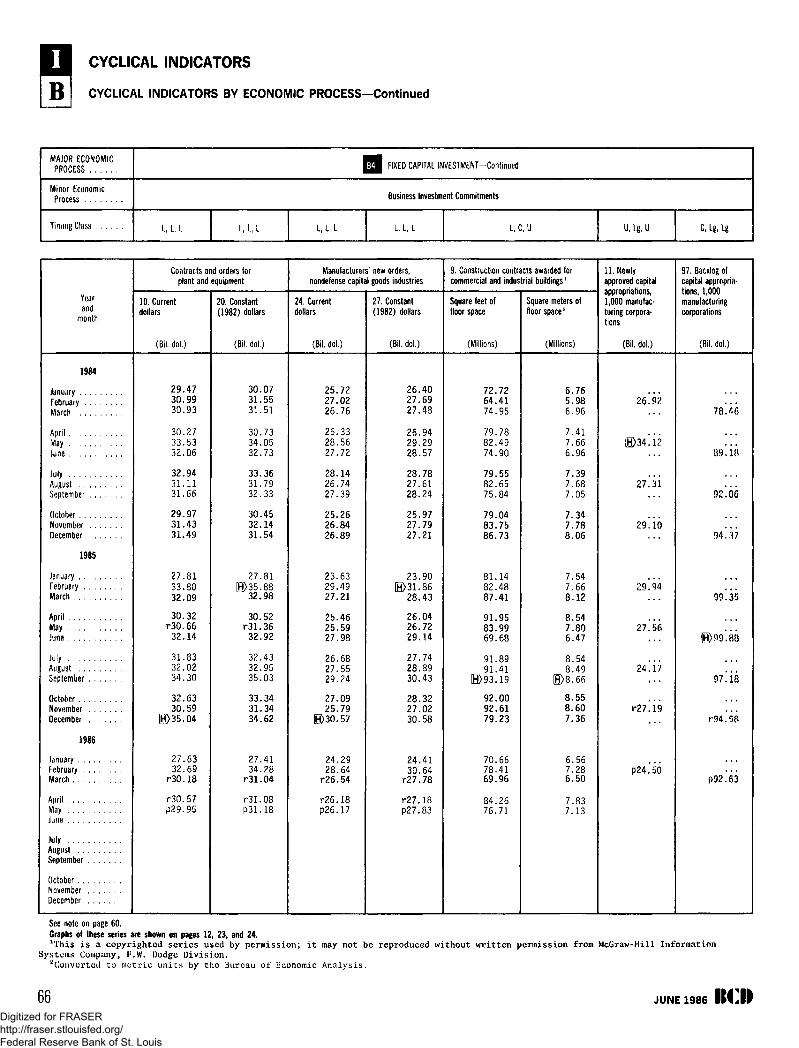
CYCLICAL INDICATORS
B I CYCLICAL INDICATORS BY ECONOMIC PROCESS—Continued
MAJOR ECONOMICPROCESS
Minor EconomicProcess
Timing Class
^ J FIXED CAPITAL INVESTMENT—Continued
Business Investment Commitments
1 ,1 ,1 L,L,L L,L, L Lr L, L L, C, U U, Lg, U C Lg, Lg
Yearand
month
Contracts and orders forplant and equipment
10. Currentdollars
(Bit. dol.)
20. Constant(1982) dollars
(Bil. dol.)
Manufacturers' new orders,nondefense capital goods industries
24. Currentdollars
(Bit. dol.)
27. Constant(1982) dollars
(Bil. dol.)
9. Construction contracts awarded forcommercial and industrial buildings1
Square feet offloor space
(Millions)
Square meters offloor space2
(Millions)
11. Newlyapproved capitalappropriations,1,000 manufac-turing corpora-tions
(Bil, dol.)
97. Backlog ofcapital appropria-tions, 1,000manufacturingcorporations
Sil. dol.)
1984
JanuaryFebruaryMarch
AprilMayJune . . . . . . .
July .AugustSeptember . . .
OctoberNovember , . .December . . .
1985
JanuaryFebruaryMarch
AprilMayJune
JulyAugustSeptember . . .
OctoberNovember . . .December , . .
1986
JanuaryFebruaryMarch
AprilMayJune
JulyAugustSeptember . . .
OctoberNovember . . .December . . .
29.4730.9930.93
30.2733.5332.06
32.9431.1131.66
29.9731.4331.49
27.8133.8032.09
30.32r30.66
32.14
31.8332.0234.30
32.6330.59
©35.04
27.6332.69
r30.18
r30.57p29.95
30.0731.5531.51
30.7334.0532.73
33.3631.7932.33
30.4532.1431.54
27.81©35.88
32.98
30.52r31.3632.92
32.4332.9535.03
33.3431.3434.62
27.4134.28r31.04
r31.08P31.18
25.7227.0226.76
26.3328.5627.72
28.1426.7427.39
25.2626.8426.89
23.6329.4927.21
25.4625.5927.98
26.6827.5529.24
27.0925.79
[©30.57
24.2928.64
r26.54
r26.18P26.17
26.4027.6927.48
26.9429.2928.57
28.7827.6128.24
25.9727.7927.21
23.90D31.86
28.43
26.0426.7229.14
27.7428.8930.43
28.3227.0230.58
24.4130.64
r27.78
r27.18P27.83
72.7264.4174.95
79.7882.4974.90
79.5582.6575.84
79.0483.7586.73
81.1482.4887.41
91.9583.9969.68
91.8991.41
©93.19
92.0092.6179.23
70.6678.4169.96
84.2676.71
6.765.986.96
7.417.666.96
7.397.687.05
7.347.788.06
7.547.668.12
8.547.806.47
8.548.49
©8.66
8.558.607.36
6.567.286.50
7.837.13
26.92
©34.12
27.31
29.10
29.94
27.56
24.17
r27.19
P24.50
78.46
89.18
92.06
94.37
99.35
©99.88
97.18
r94.58
P92.63
See note on page 60.Graphs of these series are shown on pages 12, 23, and 24.lrrhis is a copyrighted series used by permission; it may not be reproduced without written permission from McGraw-Hill Information
Systems Company, F.W. Dodge Division.Converted to metric units by the Bureau of Economic Analysis.
66 JUNE 1986
Digitized for FRASER http://fraser.stlouisfed.org/ Federal Reserve Bank of St. Louis
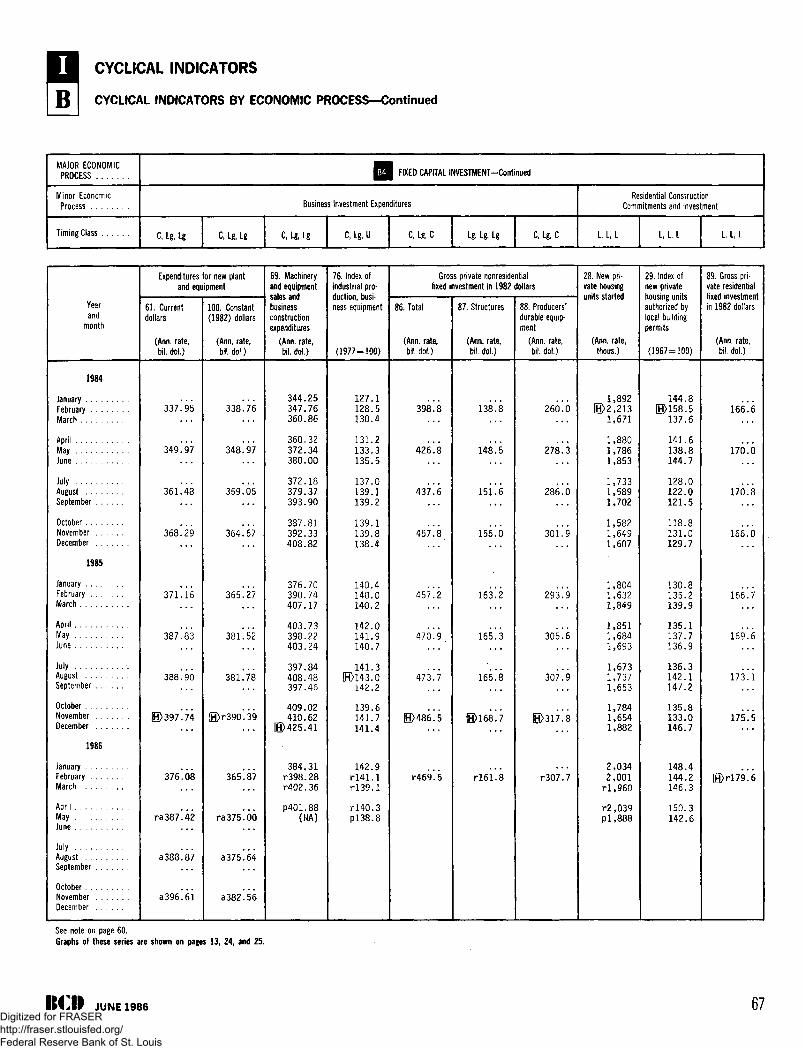
CYCLICAL INDICATORS
CYCLICAL INDICATORS BY ECONOMIC PROCESS—Continued
MAJOR ECONOMICPROCESS
Minor EconomicProcess
Timing Class
Q | FIXED CAPITAL tNVESTMENT—Continued
Business Investment Expenditures
C, Lg, Lg C Lg, Lg C Lg, Lg C, Lg, U C Lg, C Lg, Lg, Lg C, Lg, C
Residential ConstructionCommitments and Investment
L, L,L L, L, L L,L,L
Yearand
month
1984
JanuaryFebruaryMarch
AprilMayJune
JulyAugustSeptember
OctoberNovemberDecember
1985
JanuaryFebruaryMarch
April . . .MayJune
July . . .AugustSeptember
OctoberNovemberDecember
1986
JanuaryFebruaryMarch
AprilMayJune
JulyAugustSeptember
OctoberNovemberDecember
Expenditures for new plantand equipment
61. Currentdollars
(Ann. rate,bil. dol.)
3 3 7 . 9 5
3 4 9 . 9 7
36U43
368!29
371*16
387!83
388.90
jH>397.74
376.08
ra387*.42
a388!&7
a396!61
100. Constant(1982) dollars
(Ann, rate,bil. dol.)
338!76
348.97
359.05
364!67
365!27
381*52
381!78
0)r39O.39
365!87
ra375!66
a375.*64
a382 !%
69. Machineryand equipmentsales andbusinessconstructionexpenditures
(Ann. rate,bil. dol.)
344.25347.76360.86
360.32372.34380.00
372.18379.37393.90
387.81392.33408.82
376.70390.74407.17
403.73398.22403.24
397.84408.48397.46
409.02410.62
0 )425 .41
384,31r398.28r402.36
P401.88(NA)
76. Index ofindustrial pro-duction, busi-ness equipment
(1977 = 100)
127.1128.5130.4
131.2133.3135.5
137,0139.1139.2
139.1139.8138.4
140.4140.0140.2
142.0141.9140.7
141.3H>143.0
142.2
139.6141.7141.4
142.9rHl. lrl39.1
rl40.3P138.8
Gross private nonresidentialfixed investment in 1982 dollars
86. Total
(Ann. rate,bil. dol.)
39&\8
426*. 8
437.'f5
457.8
457*2
470.9
473.7
E)486 .5
r469*.5
87. Structures
(Ann, rate,bil. dol.)
138!8
148!5
151*6
156.0
163!2
165.3
165.8
0 )168 !7
rl61.8
88. Producers'durable equip-ment
(Ann. rate,bil. dol.)
260.6
278.3
286.0
301.9
293.9
305*6
307.9
0)317.8
r307.7
28. New pri-vate housingunits started
(Ann. rate,thous.)
1,892H)2,213
1,671
1,8801,7861,853
1,7331,5891,702
1,5821,6491,607
1,8041,6321,849
1,8511,6841,693
1,6731,7371,653
1,7841,6541,882
2,0342,001
r l ,960
r2,039pi,888
29. Index ofnew privatehousing unitsauthorized bylocal buildingpermits
(1967 = 100)
144.80)158.5
137.6
141.6138.8144.7
128.0122.0121.5
118.8131.0129.7
130.8135.2139.9
135.1137.7136.9
136.3142.1147.2
135.8133.0146.7
148.4144.2146.3
150.3142.6
89. Gross pri-vate residentialfixed investmentin 1982 dollars
(Ann. rate,bil. dol.)
166! 6
17O!6
176*3
166!o
166!?
169!<5
173.* i
175.5
H > r l 7 9 . 6
See note on page 60.Graphs of these series are shown on pages 13, 24, and 25.
JUNE 1986 67Digitized for FRASER http://fraser.stlouisfed.org/ Federal Reserve Bank of St. Louis
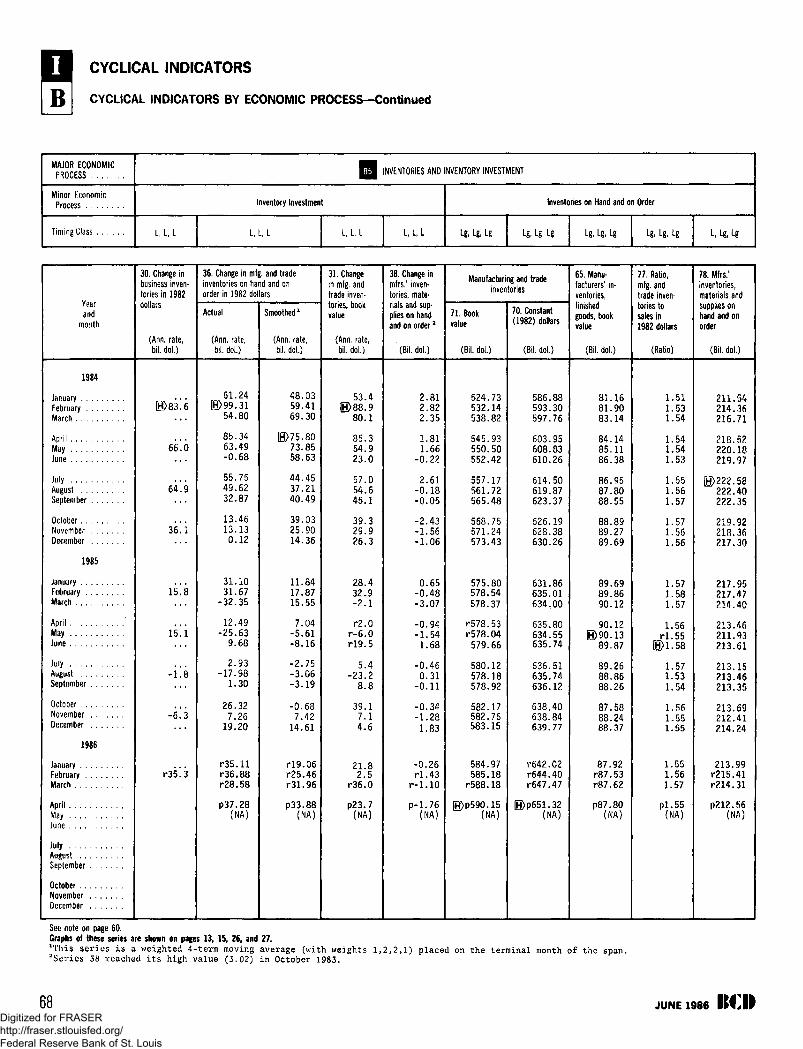
CYCLICAL INDICATORS
CYCLICAL INDICATORS BY ECONOMIC PROCESS—Continued
MAJOR ECONOMICPROCESS
Minor EconomicProcess
Timing Class
El INVENTORIES AND INVENTORY INVESTMENT
Inventory Investment
L. L, L L.L.L L.L.L L, L,L
Inventories on Hand and on Order
Lg, Lg. Lg Lg. Lg, Lg Lg, Lg, Lg Lg, Lg, Lg L, Lg, Lg
Yearand
month
30. Change inbusiness inven-tories in 1982dollars
(Ann. rate,bil. dot.)
36. Change in mfg. and tradeinventories on hand and onorder in 1982 dollars
Actual
(Ann. rate,bil. dot)
Smoothed l
(Ann, rate,bil. dol.)
31. Changein mfg. andtrade inven-tories, bookvalue
(Ann. rate,bil. dol.)
38. Change inmfrs.' inven-tories, mate-rials and sup-plies on handand on order2
(Bil. dol.)
Manufacturing and tradeinventories
71. Bookvalue
(Bil. dol.)
70. Constant(1982) dollars
(Bil. dol.)
65. Manu-facturers' in-ventories,finishedgoods, bookvalue
(Bil. dol.)
77. Ratio,mfg. andtrade inventories tosales in1982 dollars
(Ratio)
78. Mfrs.1
inventories,materials andsupplies onhand and onorder
(Bil. dol.)
1984
JanuaryFebruaryMarch
AprilMayJune
JulyAugustSeptember . . .
OctoberNovember . . ,December . . .
1985
JanuaryFebruaryMarch
AprilMayJune
JulyAugustSeptember . . .
OctoberNovember . . .December , . .
1986
JanuaryFebruaryMarch
AprilMayJune
JulyAugustSeptember . . .
OctoberNovember . . .December . . ,
66.0
36.1
15.8
15.1
-6.3
r35.3
61.24©99.31
54.80
85.3463.49-0.68
55.7549.6232.87
13.4613.130.12
31.1031.67
-32.35
12.49-25.63
9.68
2.93-17.98
1.30
26.327.26
19.20
r35.11r36.88r28.58
P37.28<NA)
48.0359.4169.30
©75.8073.8558.63
44.4537.2140.49
39.0325.9014.36
11.8417.8715.55
7.04-5.61-8.16
-2.75-3.06-3.19
-0.687.42
14.61
rl9.06r25.46r31.96
P33.88(NA)
53.4.9
80.1
85.354.923.0
57.054.645.1
39.329.926.3
28.432.9-2.1
r2.0r-6.0rl9.5
5.4-23.2
8.8
39.17.14.6
21.82.5
r36.0
P23.7(NA)
2.812.822.35
1.811.66
-0.22
2.61-0.18-0.05
-2.43-1.56-1.06
0.65-0.48-3.07
-0.94-1.54
1.68
-0.460.31
-0.11
-0.34-1.281.83
-0.26rl.43
r-1.10
p-1.76(NA)
524.73532.14538.82
545.93550.50552.42
557.17561.72565.48
568.75571.24573.43
575.80578,54578.37
r578.53r578.04579.66
580.12578.18578.92
582.17582.76583.15
584.97585.18r588.18
E>p590.15(NA)
586.88593.30597.76
603.95608.83610.26
614.50619.87623.37
626.19628.38630.26
631.86635.01634.00
635.80634.55635.74
636.51635.74636.12
638.40638.84639.77
r642.02r644.40r647.47
E>P651.32(NA)
81.1681.9083.14
84.1485.1186.38
86.9587.8088.55
88.8989.2789.69
89.6989.8690.12
90.12.13
89.87
89.2688.8688.26
87.5888.2488.37
87.92r87.53r87.62
P87.80(NA)
1.511.531.54
1.541.541.53
1.551.561.57
1.571.561.56
1.571.581.57
)1.58
1,54
1.561.551,55
1.551.561.57
pi. 55(NA)
211.54214.36216.71
218.52220.18219.97
©222,58222.40222.35
219.92218,36217.30
217.95217.47214.40
213.46211.93213.61
213.15213.46213.35
213.69212.41214.24
213.99r215.41rZ14.31
P212.56(NA)
See note on page 60,Graphs of these series are shown on pages 13, 15, 26, and 27.lThis series is a weighted 4-term moving average (with weights 1,2,2,1) placed on the terminal month of the span.aSeries 38 reached its high value (3.02) in October 1983.
JUNE 1986 RCIIDigitized for FRASER http://fraser.stlouisfed.org/ Federal Reserve Bank of St. Louis
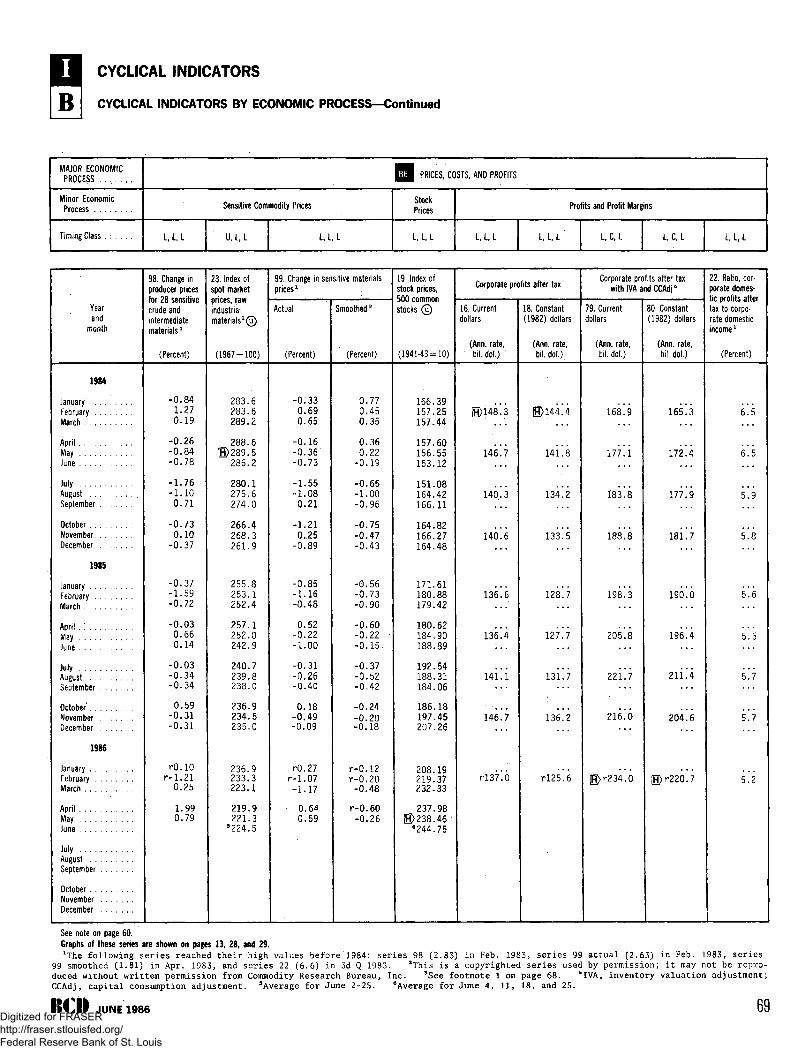
CYCLICAL INDICATORS
CYCLICAL INDICATORS BY ECONOMIC PROCESS—Continued
MAJOR ECONOMICPROCESS
Minor EconomicProcess
Timing Class . . . . . .
j Q PRICES, COSTS, AND PROFITS
Sensitive Commodity Prices
L .L .L U, L, L I L L
StockPrices
L .L .L
Profits and Profit Margins
L .L .L L, L, L L,C,L L,C,L L .L .L
Yearand
month
1984
JanuaryFebruary . . . . . . . .March
AprilMayJune
July . . .August . . .September
October . . . :NovemberDecember . . ; . . . .
1985
JanuaryFebruary . . . ; . . . .March
April . ',MayJune
JulyAugustSeptember
October .NovemberDecember
1986
JanuaryFebruaryMarch
AprilMayJune . .
JulyAugustSeptember
OctoberNovemberDecember
98. Change inproducer pricesfor 28 sensitivecrude andintermediatematerialsx
(Percent)
-0.84•1.270.19
-0.26-0.84-0.78
-1.76 j
-1.100.71
-0.730.10
-0.37
-0.37-1.59-0.72
-0.030.660.14
-0.03-0.34-0.34
0.59-0.31-0.31
rO.10r-1.21
0.25
1.990.79
23. Index ofspot marketprices, rawindustrial,materials2©
(1967 = 100)
283.6283.6289.2
288.61H>289.5
286.2
280.1275.6274.0
266.4268.3261.9
255.8253.1252.4
257.1252.0242.9
240.7239.8238.0
236.9234.5235.0
236.9233.3223.1
219.9221.3
5224.5
99. Change in sensitive materialspricesx
Actual
(Percent)
-0.330.690.65
-0.16-0.36-0.73
-1.55-1.080.21
-1.210.25
-0.89
-0.85-1.16-0.48
0.52-0.22-1.00
-0.31-0.26-0.40
0.18-0.49-0.09
rO.27r-1.07-1.17
0.640.59
Smoothed3
(Percent)
0.770.45 '0.35
0.360.22
-0.19
-0.65-1.00-0.96
-0.75-0.47-0.43
-0.56-0.73-0.90
-0.60-0.22-0.15
-0.37-0.52-0..42
-0.24-0.20-0.18
r-0.12r-0.20
-0.48
r-0.60-0.26
19. Index ofstock prices,500 commonstocks ©
(1941-43=10)
166.39157.25157.44
157.60156.55153.12
151.08164.42166.11
164.82166.27164.48
171.61180.88179.42
180.62184.90188.89
192.54188.31184.06
186.18197.45207.26
208.19219.37232.33
237.98E>238.46 '
6244 75
Corporate profits after tax
16. Currentdollars
(Ann. rate,bil. dol.)
(H>148".3
ue'.i
140! 3
140*. 6
136.6
136*4
141.1
146.7
rl37".6
18. Constant(1982) dollars
(Ann. rate,bil. dol.)
E>144!4
14l!s
134.2
133.5
12sl 7
127.7
131'.7
136.2
rl25.6
Corporate profits after taxwith IVA and CCAdp
79. Currentdollars
(Ann. rate,bil. dol.)
168*. 9
1771 i
183.8
188." 8
198^3
205^8
2 2 L 7
216.0
E>r234.0
80. Constant(1982) dollars
(Ann. rate,bil. dol.)
165^3
172li
177.9
181.7
190.0
196^4
2li.'i
204.6
E > r 2 2 0 . 7
22. Ratio, cor-porate domes-tic profits aftertax to corpo-rate domesticincome1
(Percent)
6\5
b\5
5.9
5.8
5.6
5.5
b\7
5.7
5.*2
See note on page 60.Graphs of these series are shown on pages 13, 28, and 29.lThe following series reached their high values before 1984: series 98 (2.83) in Feb. 1983, series 99 actual (2.63) in Feb. 1983, series
99 smoothed (1.81) in Apr. 1983, and series 22 (6.6) in 3d Q 1983. 2This is a copyrighted series used by permission; it may not be repro-duced without written permission from Commodity Research Bureau, Inc. 3See footnote 1 on page 68. *IVA, inventory valuation adjustment;CCAdj, capital consumption adjustment. 5Average for June 2-25. 6Average for June 4, 11, 18, and 25.
IMJ) JUNE 1986 69Digitized for FRASER http://fraser.stlouisfed.org/ Federal Reserve Bank of St. Louis

CYCLICAL INDICATORS
B I CYCLICAL INDICATORS BY ECONOMIC PROCESS—Continued
MAJOR ECONOMICPROCESS
Minor EconomicProcess
Timing Class
Q PRICES, COSTS, AND PROFITS—Continued
Profits and Profit Margins—Continued
U.L.L L.L.L L.L.L
Cash Flows
Lt L, L L, L, L
Unit Labor Costs and Labor Share
Lg, Lg, Lg Lg, Lg, Lg Lg, Lg, Lg Lg, Lg, Lg
Yearand
month
1984
JanuaryFebruary .March
AprilMayJune
July . . . .August . .September
October . . .NovemberDecember . . .
1985
JanuaryFebruary , ,March , . .
April . .May . .June .
July . . .August . . .September
October. . .NovemberDecember
1986
JanuaryFebruaryMarch , . .
AprilMayJune
July . .AugustSeptember
October .NovemberDecember . .
81. Ratio, cor-porate domes-tic profits aftertax with IVAand CCAdj tocorp. domesticincome l
(Percent)
i.'i
8*2
8*2
8*4
8*9
9.1
9*8
9.2
[H>I6.6
15. Profits after
taxes per dollar
of sales, manu-
facturing cor-
porations
(Cents)
4*9
E>4*9
4*4
4*3
4*2
3.* 7
3*.7
r3.*6
P3.6
26. Ratio, im-plicit price de-flator to unitlabor cost,nonfarm busi-ness sector
(1977-100)
98 .4
E>99.*2
99.1
98*8
98.6
98.6
98.6
97^3
98.3
Corporate net cash flow
34. Currentdollars
(Ann. rate,bil. dol.)
357*8
360.1
364*6
371*6
379*9
387*3
404.0
1>415.'8
r 4 0 5 . 6
35. Constant(1982) dollars
{Ann. rate,bit. dol.)
355*1
355.8
358*. 6
364*2
372*6
381'.6
396.9
(H) 407*8
r397.9
63. Index ofunit labor cost,business sector
(1977-100)
15s!4
158*7
160' 6
162*3
163*8
165.2
166.3
[R>169.3
168.9
68. Labor costper unit of realgross domesticproduct, non-financial cor-porations
(Dollars)
0.679
0.682
0.691
0.697
0.703
0.709
0.709
0.7W
(H)0.722
62. Index of labor cost per unitof output, manufacturing
Actual data
(1977-100)
135.7135.7135.4
135.7135.4135.1
134.4134.6135.2
135.9136.1137.4
137.8137.4137 8
137.2137.5137 6
137.4136.7137.4
139.3138.1138.5
137 6rl38.2
E>rl39.9
138.4P139.2
Actual dataas a percentof trend
(Percent)
91.290.890.1
89.989.388.7
87.887.587.5
87.687.387 7
87.586.9Rfi 7
35.985.785 4
84.984.084.1
84.883.783.6
00 f.
r 8 2 . 6r 8 3 . 2
81 .9P82.0
64. Compen-sation of em-ployees as apercent of na-tional income
(Percent)
72*8
73*6
7s!i
73*4
73*5
73*8
73*9
74*2
B74.3
See note on page 60.
Graphs of these series are shown on pages 15, 29, and 30.11VA, inventory valuation adjustment; CCAdj, capital consumption adjustment.
70 JUNE 1986Digitized for FRASER http://fraser.stlouisfed.org/ Federal Reserve Bank of St. Louis
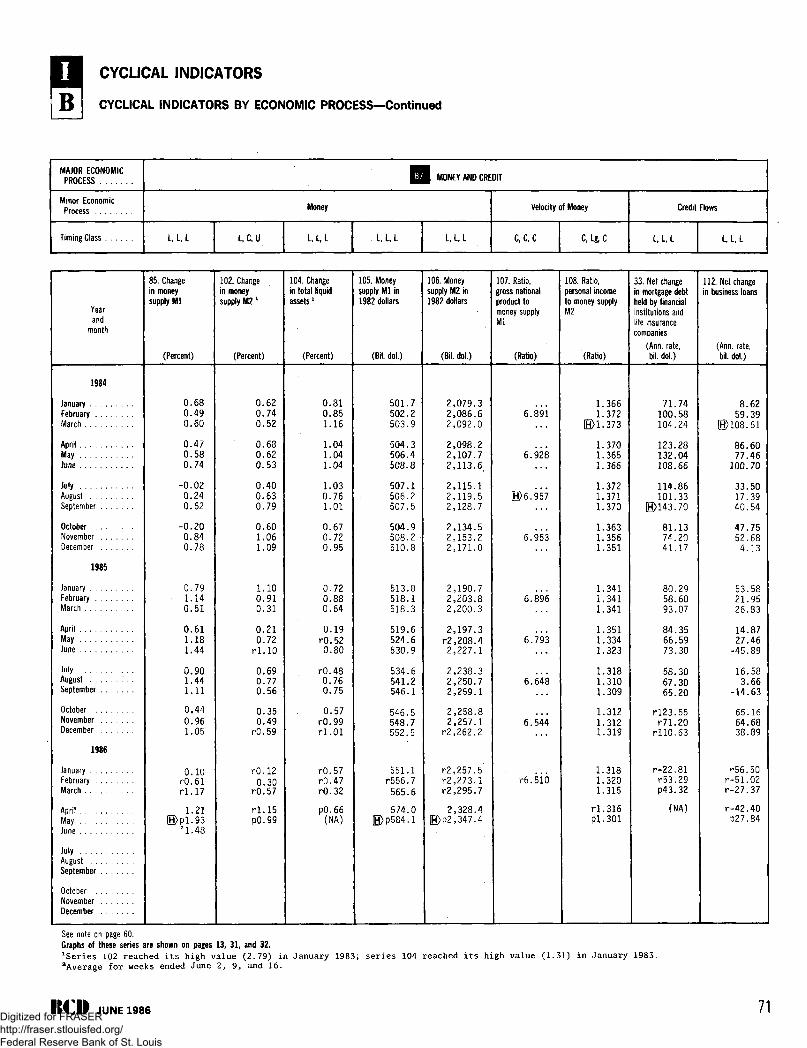
CYCLICAL INDICATORS
CYCLICAL INDICATORS BY ECONOMIC PROCESS—Continued
MAJOR ECONOMICPROCESS
Minor EconomicProcess
Timing Class
Q MONEY AND CREDIT
Money
L.L.L L.C.U U , l . L, L, L L, L, L
Velocity of Money
C,C,C C Lg, C
Credit Flows
L.L.L
Yearand
month
1984
JanuaryFebruaryMarch
AprilMayJune
JulyAugustSeptember
OctoberNovemberDecember
1985
JanuaryFebruaryMarch
AprilMayJune
JulyAugustSeptember , . .
OctoberNovemberDecember
1986
JanuaryFebruaryMarch
AprilMayJune
JulyAugustSeptember
OctoberNovemberDecember
85. Changein moneysupply Ml
(Percent)
0 .680.490.60
0.470.580.74
-0.020.240.62
-0.200.840.78
0.791.140.51
0.611.181.44
0.901.441.11
0,440.961.05
0.10r0.61r l .17
1.21K>P1.93
21.43
102. Changein moneysupply M2 x
(Percent)
0 .620.740.52
0.680.620.53
0.400.630.79
0.601.061.09
1.100.910.31
0.210.72
r l . 10
0.690.770.56
0.350.49
r0.59
r0.120.30
rO.57
rl .15pO.99
104. Changein total liquidassetsx
(Percent)
0.810.851.16
1.041.041.04
1.030.761.01
0.670.720.95
0.720.880.64
0.19r0.520.80
r0.480.760.75
0.57rO.99r l .O l
rO.57r0.47r0.32
pO.66(NA)
105. Moneysupply Ml in1982 dollars
(Bil. dot.)
501.7502.2503.9
504.3506.4508.8
507.1506.2507.5
504.9508.2510.8
513.8518.1518.3
519.6524.6530.9
534.6541.2546.1
546.5548.7552.5
551.1r556.7
565.6
574.00>p584.1
106. Moneysupply M2 in1982 dollars
(Bil. dol.)
2,079.32,086.62,092.0
2,098.22,107.72,113.6,
2,115.12,119.52,128.7
2,134.52,153.22,171.0
2,190.72,203.82,200.3
2,197.3r2,208.42,227.1
2,238.32,250.72,259.1
2,258.82,257.1
r2,262.2
r2,257.5r2,273.1r2,295.7
2,328.4[H>p2,347.4
107. Ratio,gross nationalproduct tomoney supplyMl
(Ratio)
6 .891
6.928
E>6.957
6.953
6.896
6.793
6.648
6.544
r6.5i6
108. Ratio,personal incometo money supplyM2
(Ratio)
1.3661.372
GB>1.373
1.3701.3651.366
1.3721.3711.370
1.3631.3561.351
1.3411.3411.341
1.3511.3341.323
1.3181.3101.309
1.3121.3121.319
1.3181.3201.315
r l .316pi.301
33. Net changein mortgage debtheld by financialinstitutions andlife insurancecompanies
(Ann. rate,bil. dol.)
71.74100.58104.24
123.28132.04108.66
114.86101.33
E>143.70
81.1374.2041.17
80.2958.6093.07
84.3566.5973.30
58.3067.3065.20
rl23.55r71.20
rllO.63
r-22.81r53.29P43.32
(NA)
112. Net changein business loans
(Ann, rate,bil. dol.)
8 .6259.39
ff i) lO8 filtn/ xuo• ui
86.6077.46
100.70
33.5017.3940.54
47.7552.684.13
53.5821.9526.83
14.8727.46
-45.89
16.583.66
-14.63
65.1664.6838.89
r56.50r-51.02r-27.37
r-42.40P27.84
See note on page 60.Graphs of these series are shown on pages 13, 31, and 32.xSeries 102 reached its high value (2.79) in January 1983; series 104 reached its high value (1.31) in January 1983.2Average for weeks ended June 2, 9, and 16.
JUNE 1986 71Digitized for FRASER http://fraser.stlouisfed.org/ Federal Reserve Bank of St. Louis

CYCLICAL INDICATORS
CYCLICAL INDICATORS BY ECONOMIC PROCESS—Continued
MAJOR ECONOMICPROCESS
Minor EconomicProcess
Timing Class
^ H MONEY AND CREDIT—Continued
Credit Flows-Continued
L.L.L L, l , L L.L.L
Credit Difficulties
L.L.L L.L.L
Bank Reserves
L.U.U L, Lg, U
Interest Rates
L, Lg, Lg C. Lg, Lg
Yearand
month
113. Net changein consumerinstallmentcredit
(Ann. rate,bil. dol.)
111. Change inbusiness andconsumer creditoutstanding
(Ann. rate,percent)
110. Fundsraised by privatenonfinancialborrowers incredit markets
(Ann. rate,mil. dol.)
14. Currentliabilities ofbusinessfailures1©
(Mil. dol.)
39. Percentof consumerinstallmentloans delin-quent 30 daysand over
(Percent)
93. Freereserves ©
(Mil. dol.)
94. Memberbank borrowings from theFederalReserve @
(Mil. dol.)
119. Federalfunds rate (u)
(Percent)
114. Discountrate on newissues of 91-dayTreasury bills ©
(Percent)
1984
JanuaryFebruaryMarch
April .MayJune
JulyAugustSeptember , . .
OctoberNovember . . ,December . . .
1985
JanuaryFebruaryMarch
AprilMayJune
JulyAugustSeptember , . .
OctoberNovember , . .December . , .
1986
JanuaryFebruaryMarch
AprilMayJune
JulyAugustSeptember . . .
OctoberNovember , . .December . . .
78.6669.4160.96
74.64114.1395.18
73.5880.6263.04
70.6171.9575.31
75.1682.1699.59
90.5275.9652.69
81.4372.61
B123.96
78.7067.7277.72
91.86r61.19r37.04
P49.86(NA)
12.215.019.3
19.40)24.0
21.9
13.112.517.2
11.011.65.7
14.17.512.9
11.08.93.4
7.99.17.7
rl5.210.910.9
r8.0rl.5r2.2
rl.9p6.6
492,968
635,480
476,812
674,436
r533,160
r552,300
r652,844
E>r965,412
p504,260
1,783.31,713.13,479.7
2,429.43,074.33,427.4
2,783.71,968.72,045.6
1,471.32,763.72,328.4
rl,815.6r2,409.8r3,485.8
p3,279.8p3,261.9p2,995.6
p2,150.5p3,162.4pi,925.3
pi,824.6p5,026.9pi,707.8
p3,442.3p3,263.4p2,607.9
(NA)
1.84(B>1.78
1.85
1.961.932.10
1.911.972.09
2.33
2.32
2.272.292.41
(NA)
-102376-241
-742-2,408-2,526
-5,311-7,328-6,614
-5,397-3,924-2,333
-650-386-827
-585-530-300
-252-246-623
-434-813-260
341213135
r-92p-43
715567952
1,2342,9883,300
5,924)8,0177,242
6,0174,6173,186
1,3951,2891,593
1,3231,3341,205
1,1071,0731,289
1,1871,7411,318
770884761
893p876
9.569.599.91
10.2910.3211.06
11.23E>11.64
11.30
9.999.438.38
8.358.508.58
8.27
7.998.058.27
8.147.867.48
26.89
8.939.039.44
9.699.909.34
10.13©10.49
10.41
9.978.79a.is
7.768.228.57
8.00
7.08
7.177.207.07
7.047.03
6.066.12
96.21
See note on page 60.Graphs of these series are shown on pages 13, 32, 33, and 34.Tories 14 reached its high value (829.2) in July 1983.2Average for weeks ended June 4, 11, 18, and 25.aAvcrago for weeks ended June 5, 12, 19, and 26.
72 JUNE 1986Digitized for FRASER http://fraser.stlouisfed.org/ Federal Reserve Bank of St. Louis
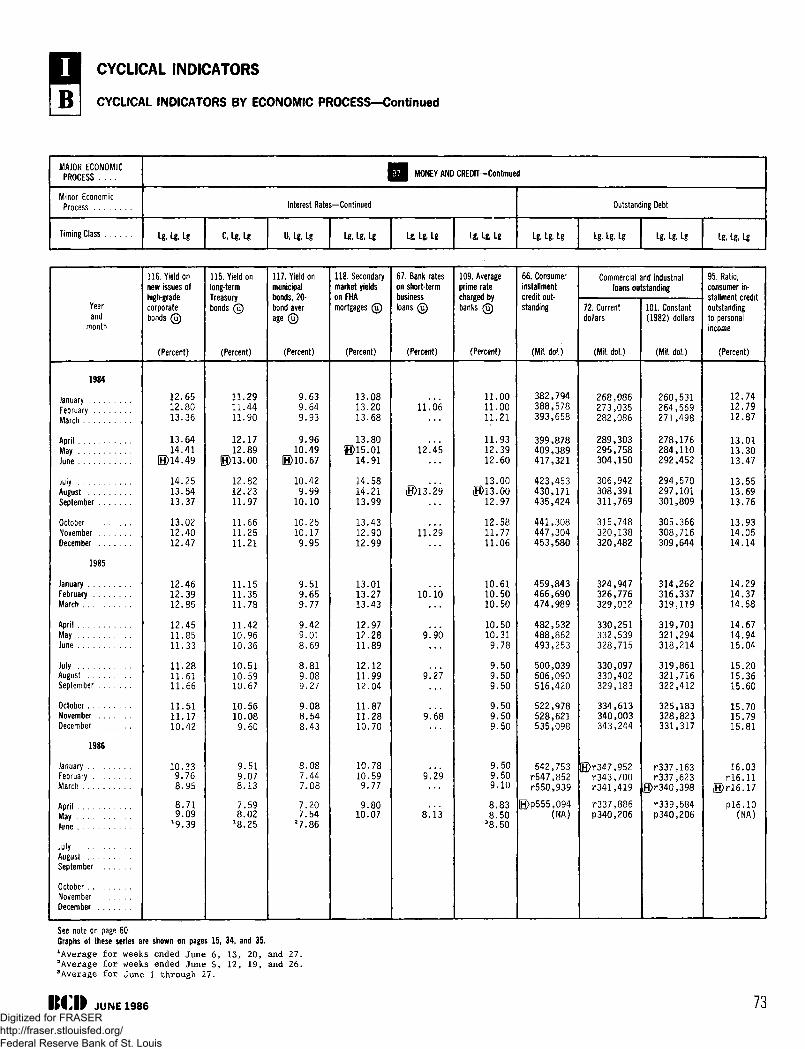
CYCLICAL INDICATORS
B I CYCLICAL INDICATORS BY ECONOMIC PROCESS—Continued
MAJOR ECONOMICPROCESS
Minor EconomicProcess
Timing Class
Q MONEY AND CREDIT—Contmued
Interest Rates—Continued
Lg, Lg, Lg C, Lg, Lg U. Lg, Lg Lg, Lg, Lg Lg, Lg, Lg Lg, Lg, Lg
Outstanding Debt
Lg, Lg, Lg Lg, Lg, Lg Lg, Lg, Lg Lg, Lg, Lg
Yearand
month
1984
JanuaryFebruaryMarch
AprilMayJune
JulyAugustSeptember
OctoberNovemberDecember
1985
JanuaryFebruaryMarch
AprilMayJune
JulyAugustSeptember
October .NovemberDecember
1986
JanuaryFebruaryMarch
AprilMayJune
JulyAugustSeptember
OctoberNovemberDecember
116. Yield onnew issues ofhigh-gradecorporatebonds @
(Percent)
12.6512.8013.36
13.6414.41
H)14.49
14.2513.5413.37
13.0212.4012.47
12.4612.3912.85
12.4511.8511.33
11.2811.6111.66
11.5111.1710.42
10.339.768.95
8.719.09
l 9 .39
115. Yield onlong-termTreasurybonds ©
(Percent)
11.2911.4411.90
12.1712.89
H>13.00
12.8212.2311.97
11.6611.2511.21
11.1511.3511.78
11.4210.9610.36
10.5110.5910.67
10.5610.08
9.60
9.519.078.13
7.598.02
X8.25
117. Yield onmunicipalbonds, 20-bond aver-age ©
(Percent)
9.639.649.93
9.9610.49
[H>10.67
10.429.99
10.10
10.2510.179.95
9.519.659.77
9.429.018.69
8.819.089.27
9.088.548.43
8.087.447.08
7.207.54
27.86
118. Secondarymarket yieldsonFHAmortgages (u)
(Percent)
13.0813.2013.68
13.80©15.01
14.91
14.5814.2113.99
13.4312.9012.99
13.0113.2713.43
12.9712.2811.89
12.1211.9912.04
11.8711.2810.70
10.7810.599.77
9.8010.07
67. Bank rateson short-termbusinessloans ©
(Percent)
l l ! 0 6
12.45
H>13*.29
11^29
io!io
9! 90
9.27
9.68
9 ^ 2 9
8 . 1 3
109. Averageprime ratecharged bybanks ©
(Percent)
11.0011.0011.21
11.9312.3912.60
13.000)13.00
12.97
12.5811.7711.06
10.6110.5010.50
10.5010.319.78
9.509.509.50
9.509.509.50
9.509.509.10
8.838.50
38.50
66. Consumerinstallmentcredit out-standing
(Mil. dol.)
382,794388,578393,658
399,878409,389417,321
423,453430,171435,424
441,308447,304453,580
459,843466,690474,989
482,532488,862493,253
500,039506,090516,420
522,978528,621535,098
542,753r547,852r550,939
(H>p555,094(NA)
Commercial and industrialloans outstanding
72. Currentdollars
(Mil. dol.)
268,086273,035282,086
289,303295,758304,150
306,942308,391311,769
315,748320,138320,482
324,947326,776329,012
330,251332,539328,715
330,097330,402329,183
334,613340,003343,244
E)r347,952r343,700r341,419
r337,886p340,206
101. Constant(1982) dollars
(Mil. do!.)
260,531264,569271,498
278,176284,110292,452
294,570297,101301,809
305,366308,716309,644
314,262316,337319,119
319,701321,294318,214
319,861321,716322,412
325,183328,823331,317
r337,163r337,623
0>r34O,398
r339,584p340,206
95. Ratio,consumer in-stallment creditoutstandingto personalincome
(Percent)
12.7412.7912.87
13.0113.3013.47
13.5513.6913.76
13.9314.0514.14
14.2914.3714.58
14.6714.9415.04
15.2015.3615.60
15.7015.7915.81
16.03rl6.11
E>rl6.17
P16.10(NA)
See note on page 60.Graphs of these series are shown on pages 15, 34, and 35.JAverage for weeks ended June 6, 13, 20, and 27.2Average for weeks ended June 5, 12, 19, and 26.3Average for June 1 through 27.
JUNE 1986 73Digitized for FRASER http://fraser.stlouisfed.org/ Federal Reserve Bank of St. Louis

CYCLICAL INDICATORS
C I DIFFUSION INDEXES AND RATES OF CHANGE
Yearand
month
DIFFUSION INDEXES
950. Twelve leadingindicator components(series 1, 5, 8, 12, 19,20, 29, 32, 36, 99, 106,111)
1-monthspan
6-monthspan
951. Four roughlycoincident indicatorcomponents (series41 ,47 ,51 ,57 )
1-monthspan
6-monthspan
952. Six laggingindicator components(series 62,77, 91, 95,101, 109)
1-monthspan
6-monthspan
961. Average weeklyhours of production ornonsupervisory workers,20 manufacturingindustries
1-monthspan
9-monthspan
962. Initial claims forunemployment insurance,State programs, 51areas l
1-monthspan
9°monthspan
963. Employees onprivate nonagrieulturalpayrolls, 136industries
1-monthspan
6-monthspan
1984
JanuaryFebruaryMarch
AprilMayJune
JulyAugustSeptember . . ,
OctoberNovember . . ,December , , ,
1985
January . .February .March . , ,
April . . . .May . . . .June . . . .
July . . . .August . .September
October . ,NovemberDecember
1986
JanuaryFebruaryMarch
AprilMay . . . . . . .June
JulyAugustSeptember . . .
OctoberNovember . . .December , , .
58.370.850.0
58.341.725.0
16.737.575.0
33.370.841.7
70.850.033.3
33.370.8r54.2
62.558.354.2
75,037.570.8
r54.250.0r62.5
75.0354.5
75.070.862.5
25.025.025.0
25.033.329.2
66.758.350.0
62.550.058.3
50,66,66.7
83.3r75.083.3
r83.3r75.045.8
62.5336.4
100.075.0100.0
100.0100.0100.0
75.087.550.0
62.5100.075.0
50.0100.075.0
100.062.575.0
50.0100.050.0
50.087.5100.0
75.075.050.0
100.0"33.3
100.0100.0100.0
100.0100.0100.0
100.0100.0100.0
100.0100.0100.0
100.0100.075.0
100.0100.0100.0
75.0100.0100.0
100.087.550.0
100.0"66.7
8.375,075.0
83.366.766.7
83.375.066.7
58.350.066.7
66.750.058.3
41.750.033.3
41.750.083.3
91.741.766.7
66.7r66.783.3
16.7550.0
66.766.775.0
83.383.83,
83.66.66.
66.66.58.3
50.050.066.7
58.350.050.0
58.3r41.750.0
58.375.066.7
50.0s50.0
Revised'
67.585.07.5
97.515.035.0
37.542.567.5
25.070.060.0
35.022.585.0
12.77.77.
27.87.65.0
75.052.595.0
22.522.572.5
47.5P42.5
Revised^
80.052.542.5
35.050.022.5
7.542.57.5
10.020.017.5
40.040.047.5
55.067.567.5
87.592.597.5
75.080.080.0
p70.0
36.372.570.6
41,31,92,
76.590.256.9
66.772.536.3
Revised'
67.872.767.6
19.652.976.5
5.972.571.6
11.872.584.3
19.645.186.3
9.882.459.8
23.574.527.5
56.952.9r62.7
P25.5(NA)
27.35,13,
33.3
17.6
r29.4
33.341.264.7
64.758.866.7
64.713.760.8
64.7r35.3P66.7
(NA)
62.255.950.5
63.053.557.0
5H.447.853.8
49.251.647.0
56.256.850.8
61.957.659.5
59.753.545.1
54.6
P48.9
Revised8
78.176.577.0
75.169.265.1
63.259.258.6
53.249.754.9
49.247.843.0
45.44.44,
48,50.54,
57.057.055.9
55.4
P53.0
NOTE: Figures are the percent of series components rising. (Half of the unchanged components are counted as rising.) Data are centered within the spans: 1-month indexes are placed on the 2d month, 6-month indexes on the 4th month, and 9-month indexes on the 6th month of the span; 1-quarter indexes are placed on the 1st month of the 2d quarter and 4-quarter indexes on the 2d month of the 3d quarter.Series are seasonally adjusted except for those, indicated by © , that appear to contain no seasonal movement. Series numbers are for identification only and do not reflect series relationships or order. Com-plete titles and sources are listed at the back of this issue. The " r " indicates revised; " p " , preliminary; " e " , estimated; " a " , anticipated; and "NA", not available.
Graphs of these series are shown on page 36.
^Figures arc the percent of components declining.2$QQ "Now Features and Changes for This Issue/' page iii.3LixcIudes series 36, for which data are not available,"lixcludcs series 57, for which data are not available.Excludes .series 77 and 95, for which data are not available.
74 JUNE 1986Digitized for FRASER http://fraser.stlouisfed.org/ Federal Reserve Bank of St. Louis
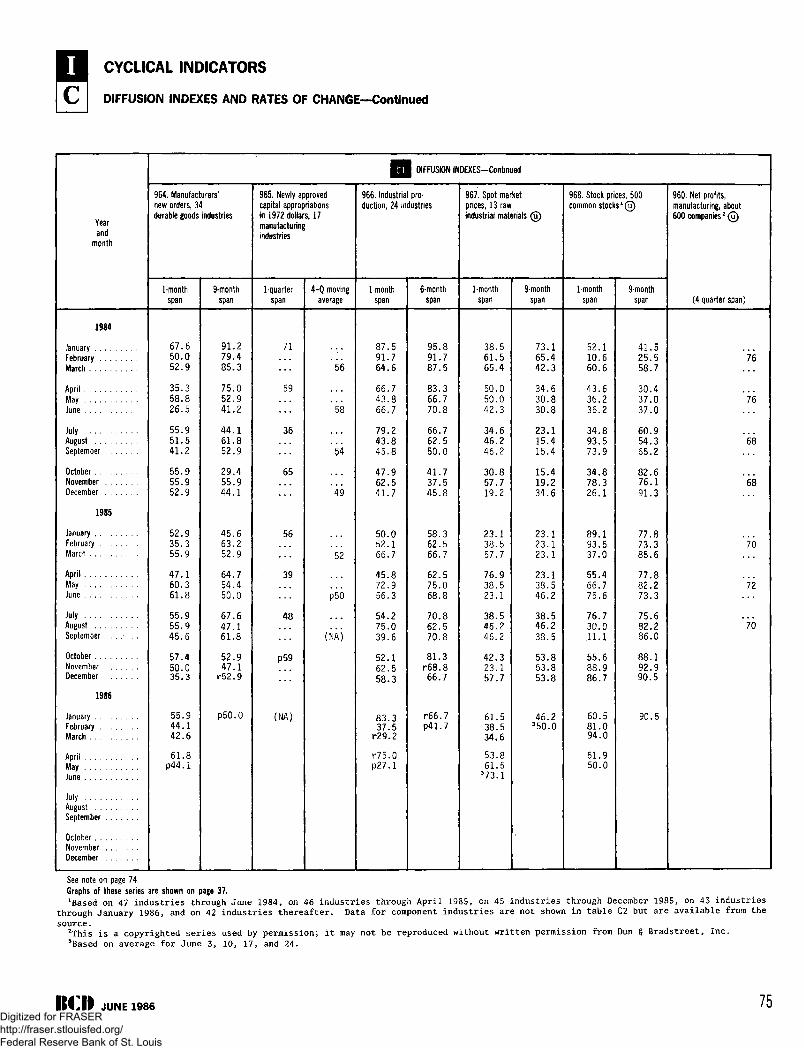
CYCLICAL INDICATORS
C DIFFUSION INDEXES AND RATES OF CHANGE—Continued
Yearand
month
1984
JanuaryFebruary . . .March
AprilMayJune
JulyAugustSeptember
OctoberNovemberDecember
1985
JanuaryFebruaryMarch
AprilMayJune
JulyAugustSeptember . . . . . . .
OctoberNovemberDecember
1986
JanuaryFebruaryMarch
AprilMayJune
JulyAugustSeptember
OctoberNovemberDecember
K B DIFFUSION INDEXES—Continued
964. Manufacturers'new orders, 34durable goods industries
1-monthspan
6 7 . 650.052.9
35.358.826.5
55.951.541.2
55.955.952.9
52.935.355.9
47.160.361.8
55.955.945.6
57.450.035.3
55.944.142.6
61.8p44.1
9-monthspan
91.279.485.3
75.052.941.2
44.161.852.9
29.455.944.1
45.663.252.9
64.754.450.0
67.647.161.8
52.947 .1
r52 .9
P50.0
965. Newly approvedcapital appropriationsin 1972 dollars, 17manufacturingindustries
1-quarterspan
71
59
36
65
56
39
48
p59
(NA)
4-Q movingaverage
56
*58
54
*49
52
p5O
(NA)
966. Industrial pro-duction, 24 industries
1-monthspan
87.591.764.6
66.743 .866.7
79.243.845.8
47.962.541.7
50.052.166.7
45.872.956.3
54.275.039.6
52.162.5CO "3
83.337.5
r29.2
r75.0p27.1
6-monthspan
95.891.787.5
83.366.770.8
66.762.550.0
41.737.545.8
58.362.566.7
62.575.068.8
70.862.570.8
81.3r 6 8 . 8
66 7
r66 .7P41.7
967. Spot marketprices, 13 rawindustrial materials (u)
1-monthspan
38.561.565.4
50.050.042.3
34.646.246.2
30.857.719.2
23.138.557.7
76.938.523.1
38.546.246.2
42.323.157 7
61.538.534 6
53.861.5
373.1
9-monthspan
73.165.442.3
34.630.830.8
23.115.415.4
15.419.234.6
23.123.123.1
23.138.546.2
38.546.238.5
53.853.853 8
46.2350.0
968. Stock prices, 500common stocks l(u)
1-monthspan
5 2 . 110.660.6
43.636.236.2
34.893.573.9
34.878.326.1
89.193.537.0
55.466.775.6
76.730.0.11.1
55.688.986 7
60.581.094.0
61.950.0
9-monthspan
41.525.558.7
30.437.037.0
60.954.365.2
82.676 .191.3
77.873.385.6
77.882.273.3
75.682.286.0
88 .192.990 5
90.5
960. Net profits,manufacturing, about600 companies2©
(4 quarter span)
*76
*76
68
68
*70
72
'70
See note on page 74.Graphs of these series are shown on page 37.lBased on 47 industries through June 1984, on 46 industries through April 1985, on 45 industries through December 1985, on 43 industries
through January 1986, and on 42 industries thereafter. Data for component industries are not shown in table C2 but are available from thesource.
2This is a copyrighted series used by permission; it may not be reproduced without written permission from Dun § Bradstreet, Inc.3Based on average for June 3, 10, 17, and 24.
ItO JUNE 1986 75Digitized for FRASER http://fraser.stlouisfed.org/ Federal Reserve Bank of St. Louis

CYCLICAL INDICATORS
C DIFFUSION INDEXES AND RATES OF CHANGE—Continued
Yearand
quarter
1983
First quarterSecond quarter . . . .Third quarterFourth quarter . . . .
1984
First quarterSecond quarter . . . .Third quarterFourth quarter . . . .
1985
First quarterSecond quarter . . . .Third quarterFourth quarter . . . .
1986
First quarterSecond quarter . . . .Third quarterFourth quarter . . . .
Yearand
quarter
1983
First quarterSecond quarterThi rd quarterFourth quarter . . . .
1984
First quarterSecond quarter . . . .Third quarterFourth quarter . . . .
1985
First quarterSecond quarter . . . .Third quarterFourth quarter . . . .
1986
First quarterSecond quarter . . . .Third quarterFourth quarter . . . .
{ I DIFFUSION INDEXES- Continued
970. Expenditures for new plant and equipment,21 industries
a. Actualexpenditures
(1-Q span)
38 .150.081.095.2
88 .171.488 .161.9
57.173.861.957 .1
19.0
b. Laterprojections
(1-Q span)
47.666.790.581.0
76.264.376.271.4
52.476.261.947.6
33.361.9
c. Earlyprojections
(1-Q span)
42.954.876.276.2
57.178.692.954.8
47.685.776.242.9
47.681.054.8
971. New orders, manufacturing1©
Actual
(4-Q span)
66747884
90868479
74747675
76
Anticipated
(4-Q span)
66778285
88919088
82848280
828384
972. Net profits, manufacturingand trade' @
Actual
(4-Q span)
62667174
80797474
70697070
70
Anticipated
(4-Q span)
64738081
84868884
80818178
788181
973. Net sales, manufacturingand t rade '©
Actual
(4-Q span)
66747480
85848280
76747574
72
Anticipated
(4-Q span)
6878f
88909088
84848481
818483
0 1 DIFFUSION INDEXES - Continued
974. Number of employees,manufacturing and trade1 ©
Actual
(4-Q span)
48545861
65636262
60585859
58
Anticipated
{4-Q span)
50565960
62646462
60625958
596059
975. Level of inventoriemanufacturing and trade
Actual
(4-Q span)
54596268
72707070
66636061
62
i,
Anticipated
(4-Q span)
52586264
66707066
64666258
585860
976, Selling prices, manu-facturing1 @
Actual
(4-Q span)
61606568
74707068
65626161
59
Anticipated
(4-Q span)
65667069
74767672
70706462
626562
977. Selling prices, wholesaletrade' ©
Actual
(4-Q span)
63626870
itt
t(i
t
^3593555
34505950
59
Anticipated
(4-Q span)
68646872
72767572
68666660
646462
973. Selling prices, retailt rade1®
Actual
(4-Q span)
681269It
It687070
66636662
60
Anticipated
(4-Q span)
69677071
70747468
65706762
62§264
NOTE: Figures are the percent of series components rising. (Half of the unchanged components are counted as rising.) Data are placed at the end of the span. Series are seasonally adjusted except for those,indicated b y ® , that appear to contain no seasonal movement. The V indicates revised; "p", preliminary; and "NA", not available.
Graphs of these series are shown on page 38.1This is a copyrighted series used by permission; it may not be reproduced without written permission from Dun 5 Bradstrcct, Inc. Dun ft
Bradstreot diffusion indexes are based on surveys of about 1,400 business executives.
76 JUNE 1986Digitized for FRASER http://fraser.stlouisfed.org/ Federal Reserve Bank of St. Louis
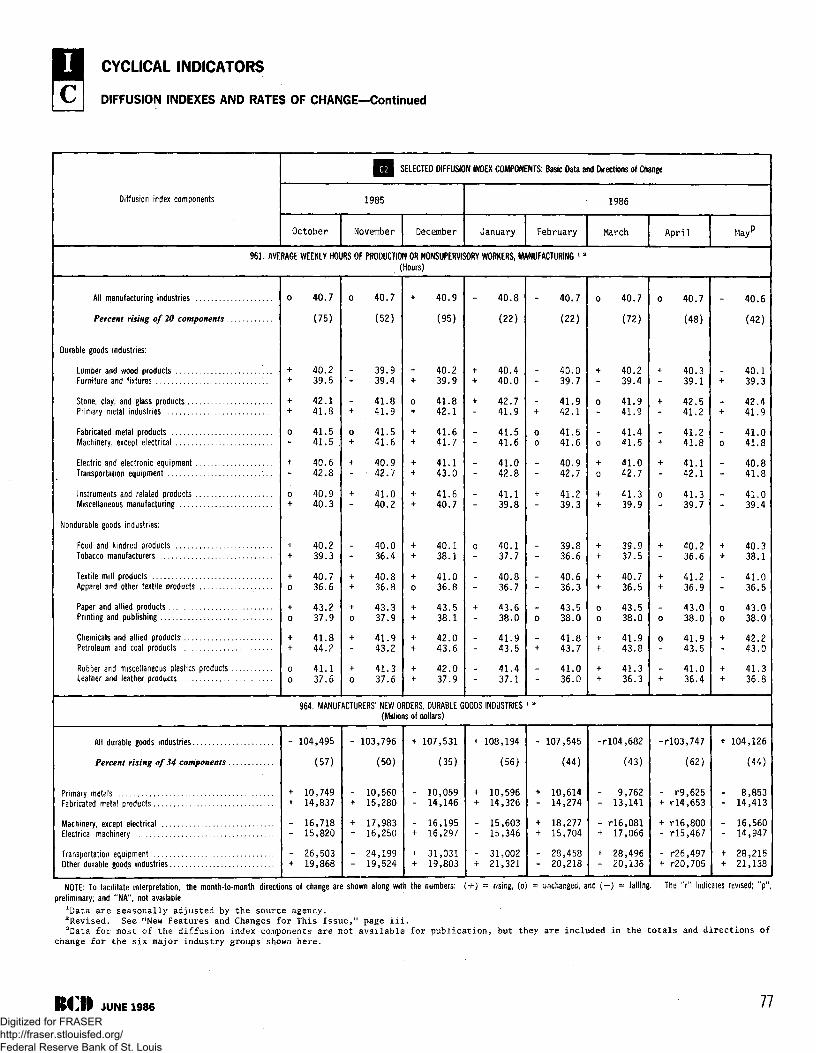
CYCLICAL INDICATORS
C I DIFFUSION INDEXES AND RATES OF CHANGE—Continued
Diffusion index components
SELECTED DIFFUSION INDEX COMPONENTS: Basic Data and Directions of Change
1985
October November December
1986
January February March April May"
961. AVERAGE WEEKLY HOURS OF PRODUCTION OR NONSUPERVISORY WORKERS, MANUFACTURING '(Hours)
All manufacturing industries
Percent rising of 20 components .
Durable goods industries:
Lumber and wood products ...Furniture and fixtures
Stone, clay, and glass products,Primary metal industries
Fabricated metal products .Machinery, except electrical
Electric and electronic equipmentTransportation equipment
Instruments and related products .Miscellaneous manufacturing
Nondurable goods industries:
Food and kindred productsTobacco manufacturers
Textile mill productsApparel and other textile products
Paper and allied products.Printing and publishing .,.
Chemicals and allied products .Petroleum and coal products ..
Rubber and miscellaneous plastics products .Leather and leather products
4 0 . 7
( 7 5 )
40.239.5
42.141.8
41.541.5
40.642.8
40.940.3
40.239.3
40.736.6
43.237.9
41.844.2
41.137.6
40.7
(52)
39.939.4
41.841.9
41.541.6
40.942.7
41.040.2
40.036.4
40.836.8
43.337.9
41.943.2
41.337.6
40.9
(95)
40.239.9
41.842.1
41.641.7
41.143.0
41.640.7
40.138.1
41.036.8
43.538.1
42.043.6
42.037.9
40,8
(22)
40.440.0
42.741.9
41.541.6
41.042.8
41.139.8
40.137.7
40.836.7
43.638.0
41.943.5
41.437.1
40.7
(22)
40.039.7
41.942.1
41.541.6
40.942,7
41.239.3
39.836.6
40.636.3
43.538.0
41.843.7
41.036.0
40.7
(72)
40.239.4
41.941.9
41.441.6
41.042.7
41.339.9
39.937.5
40.736.5
43.538.0
41.943.8
41.336.3
40.7
(48)
40.6
(42)
40.339.1
42.541.2
41.241.8
41.142.1
41.339.7
40.236.6
41.236.9
43.038.0
41.943.5
41.036.4
+
+
0
-
-
+
-
00
+
++
40.139.3
42.441.9
41.041.8
40.841.8
41.039.4
40.338.1
41.036.5
43.038.0
42.243.0
41.336.8
964. MANUFACTURERS' NEW ORDERS, DURABLE GOODS INDUSTRIES '(Millions of dollars)
All durable goods industries
Percent rising of 34 components .
Primary metalsFabricated metal products
Machinery, except electricalElectrical machinery
Transportation equipmentOther durable goods industries
- 104,495
(57)
+ 10,749+ 14,837
- 16,718- 15,820
- 26,503+ 19,868
- 103,796
(50)
- 10,560+ 15,280
+ 17,983+ 16,250
- 24,199- 19,524
+ 107,531
(35)
- 10,059- 14,146
- 16,195+ 16,297
+ 31,031+ 19,803
+ 108,194
(56)
+ 10,596+ 14,326
- 15,603- 15,346
- 31,002+ 21,321
- 107,545
(44)
+ 10,614- 14,274
+ 18,277+ 15,704
- 28,458- 20,218
-rlO4,682
(43)
- 9,762- 13,141
- rl6,081+ 17,066
+ 28,496- 20,136
-rlO3,747
(62)
- r9,625+ rl4,653
+ rl6,800- rl5,467
- r26,497+ r20,705
+ 104,126
(44)
- 8,853- 14,413
- 16,560- 14,947
+ 28,215+ 21,138
NOTE: To facilitate interpretation, the month-to-month directions of change are shown along with the numbers: ( + ) = rising, (o) - unchanged, and ( - ) = falling. The "r" indicates revised; "p",preliminary; and "NA", not available.*Data are seasonally adjusted by the source agency.2Revised. See "New Features and Changes for This Issue," page iii.3Data for most of the diffusion index components are not available for publication, but they are included in the totals and directions o£
change for the six major industry groups shown here.
JUNE 1986 77Digitized for FRASER http://fraser.stlouisfed.org/ Federal Reserve Bank of St. Louis
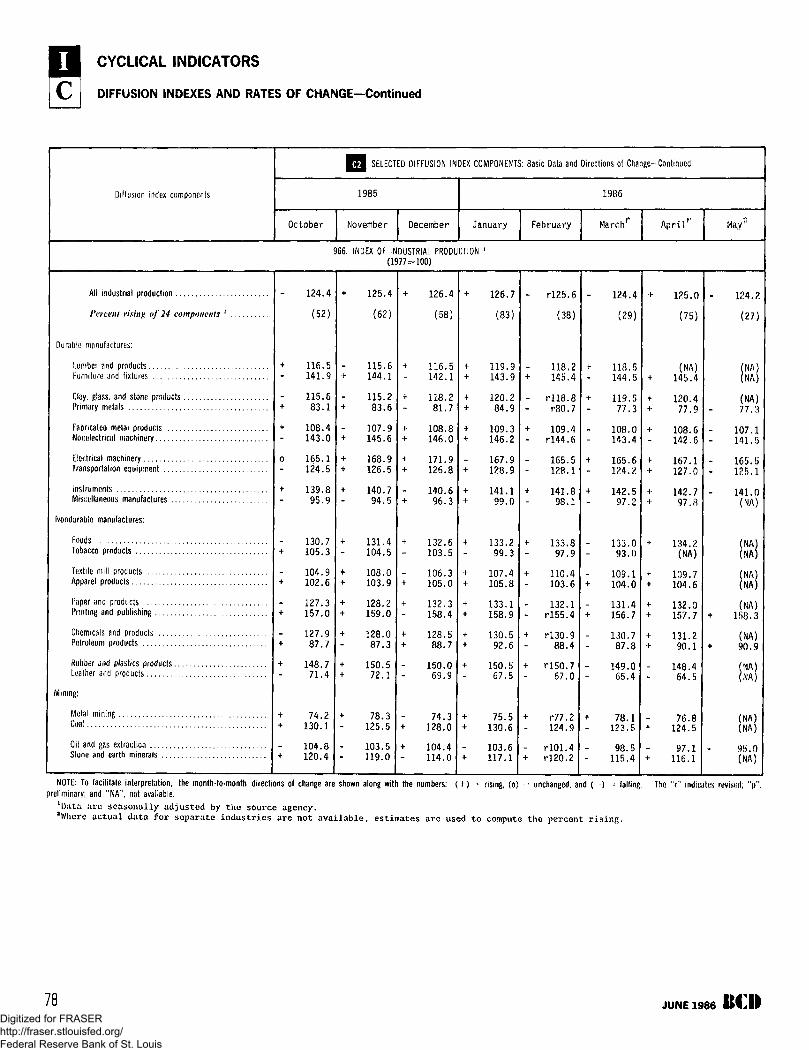
CYCLICAL INDICATORS
C I DIFFUSION INDEXES AND RATES OF CHANGE—Continued
Diffusion index components
SELECTED DIFFUSION INDEX COMPONENTS: Basic Data and Directions of Change-Continued
1985
October November December
1986
January February March April' Ma/
966. INDEX OF INDUSTRIAL PRODUCTION(1977-100)
All industrial production
Percent rising of 24 components * .,
Durable manufactures:
Lumber and productsFurniture and fixtures
Clay, glass, and stone products.Primary metals
Fabricated metal productsNonelectrical machinery...
Electrical machineryTransportation equipment
InstrumentsMiscellaneous manufactures .
Nondurable manufactures;
FoodsTobacco products .
Textile mill productsApparel products
Paper and productsPrinting and publishing ....
Chemicals and products .Petroleum products
Rubber and plastics products.Leather and products
Mimng:
Metal mining ,..Coal
Oil and gas extractionStone and earth minerals .,
124.4
(52)
116.5141.9
115.683.1
108.4143.0
165.1124.5
139.895.9
130.7105.3
104.9102.6
127.3157.0
127.987.7
148.771.4
74.2130.1
104.8120.4
125.4
(62)
115.6144.1
115.283.6
107.9145.6
168.9126.5
140.794.5
131.4104.5
108.0103.9
128.2159.0
128.087.3
150.572.1
78.3125.5
103.5119.0
+ 126.4
(58)
+ 116.5142.1
+ 118.281.7
+ 108.8+ 146.0
+ 171.9+ 126.8
140.6+ 96.3
132.6103.5
106.3105.0
132.3158.4
128.588.7
150.069.9
74.3128.0
104.4114.0
+ 126.7
(83)
+ 119.9+ 143.9+ 120.2+ 84.9
109.3146.2
167.9128.9
+ 141.1+ 99.0
+ 133.299.3
+ 107.4+ 105.8
+ 133.1+ 158.9
130.592.6
+ 150.567.5
75.5130.6
103.6+ 117.1
rl25.6
(38)
118.2145.4
rll8.8r80.7
109.4rl44.6
165.5128.1
141.898.1
133.897.9
110.4103.6
132.1rl55.4
+ rl30.988.4
+ rl50.767.0
Til .1124.9
rlO1.4rl20.2
124.4
(29)
+ 118.5144.5
+ 119.577.3
108.0143.4
+ 165.6124.2
+ 142.597.2
133.093.0
109.1104.0
131.4156.7
130.787.8
149.065.4
78.1123.5
98.5115.4
125.0
(75)
(NA)145.4
120.477.9
108.6142.6
167.1127.0
142.797.8
+ 134.2(NA)
+ 109.7+ 104.6
132.0157.7
131.290.1
148.464.5
76.8124.5
97.1116.1
124.2
(27)
(NA)(NA)
(NA)77.3
107.1141.5
165.6125.1
141.0(NA)
(NA)(NA)
(NA)(NA)
(NA)158.3
(NA)90.9
(NA)(NA)
(NA)(NA)
95.0(NA)
NOTE: To facilitate interpretation, the month-to-month directions of change are shown along with the numbers: ( V) - rising, (o) ^ unchanged, and (••-) - fall ing. The " r " indicates revised; " p " ,preliminary; and "NA" , not available.
'Data arc seasonally adjusted by the source agency.2Whcre actual data for separate industries are not available, estimates are used to compute the percent rising.
78 JUNE 1986Digitized for FRASER http://fraser.stlouisfed.org/ Federal Reserve Bank of St. Louis
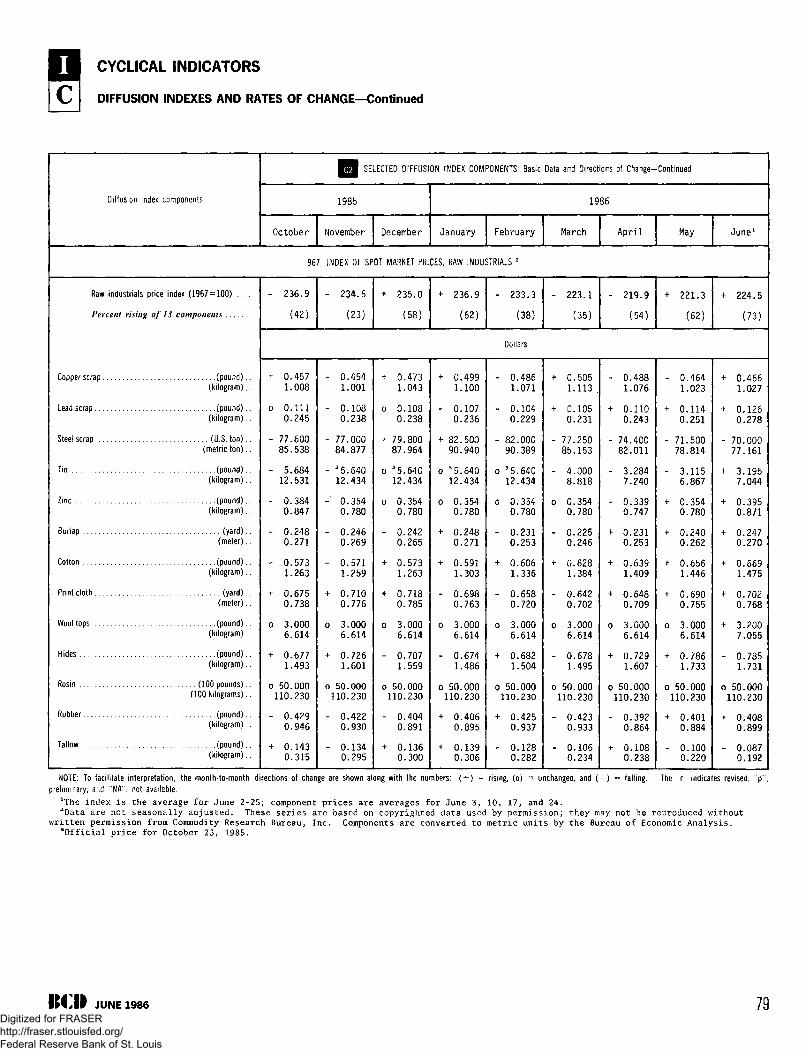
CYCLICAL INDICATORS
C I DIFFUSION INDEXES AND RATES OF CHANGE—Continued
Diffusion index components
Raw industr ials price index (1967 = 100) ....
Percent rising of 13 components
Copper scrap (pound)..(kilogram),.
Lead scrap (pound).,(kilogram)..
Steel scrap (U.S. ton).,(metric ton)..
Tin (pound)(kilogram)..
Zinc (pound).,(kilogram)..
Burlap (yard)..(meter)..
Cotton (pound).,(kilogram)..
Print cloth (yard).,(meter)..
Wool tops (pound)..(kilogram)..
Hides (pound)..(kilogram)..
Rosin (100 pounds)(100 kilograms)..
Rubber (pound)..(kilogram)..
Tallow (pound)..(kilogram)..
^ 9 SELECTED DIFFUSION INDEX COMPONENTS: Basic
1985
October
96
- 236.9
(42)
November December
Data and Directions of Change—Continued
1986
January February
/. INDEX OF SPOT MARKET PRICES, RAW INDUSTRIALS 2
- 234.5
(23)
+ 235.0
(58)
+ 236.9
(62)
- 233.3
(38)
March A p r i l
- 223.1
(35)
- 219.9
(54)
May
+ 221.3
(62)
June1
+ 224.5
(73)
Dollars
+ 0.4571.008
o 0.1110.245
- 77.60085.538
- 5.68412.531
- 0.3840.847
- 0.2480.271
- 0.5731.263
+ 0.6750.738
o 3.0006.614
+ 0.6771.493
o 50.000110.230
- 0.4290.946
+ 0.1430.315
- 0.4541.001
- 0.1080.238
- 77.00084.877
- 35.64012.434
-' 0.3540.780
- 0.2460.269
- 0.5711.259
+ 0.7100.776
o 3.0006.614
+ 0.7261.601
o 50.000110.230
- 0.4220.930
- 0.1340.295
+ 0.4731.043
o 0.1080.238
+ 79.80087.964
o 35.64012.434
o 0.3540.780
- 0.2420.265
+ 0.5731.263
+ 0.7180.785
o 3.0006.614
- 0.7071.559
o 50.000110.230
- 0.4040.891
+ 0.1360.300
+ 0.4991.100
- 0.1070.236
+ 82.50090.940
o 35.64012.434
o 0.3540.780
+ 0.2480.271
+ 0.5911.303
- 0.6980.763
o 3.0006.614
- 0.6741.486
o 50.000110.230
+ 0.4060.895
+ 0.1390.306
- 0.4861.071
- 0.1040.229
- 82.00090.389
o 35.64012.434
o 0.3540.780
- 0.2310.253
+ 0.6061.336
- 0.6580.720
o 3.0006.614
+ 0.6821.504
0 50.000110.230
+ 0.4250.937
- 0.1280.282
+ 0.5051.113 ,
+ 0.1050.231
- 77.25085.153
- 4.0008.818
o 0.3540.780
- 0.2250.246
+ 0.6281.384
- 0.6420.702
o 3.0006.614
- 0.6781.495
o 50.000110.230
- 0.4230.933
- 0.1060.234
- 0.4881.076
+ 0.1100.243
- 74.40082.011
- 3.2847.240
- 0.3390.747
+ 0.2310.253
+ 0.6391.409
+ 0.6480.709
o 3.0006.614
+ 0.7291.607
o 50.000110.230
- 0.3920.864
+ 0.1080.238
- 0.4641.023
+ 0.1140.251
- 71.50078.814
- 3.1156.867
+ 0.3540.780
+ 0.2400.262
+ 0.6561.446
+ 0.6900.755
o 3.0006.614
+ 0.7861.733
o 50.000110.230
+ 0.4010.884
- 0.1000.220
+ 0.4661.027
+ 0.1260.278
- 70.00077.161
+ 3.1957.044
+ 0.3950.871
+ 0.2470.270
+ 0.6691.475
+ 0.7020.768
+ 3.2007.055
- 0.7851.731
o 50.000110.230
+ 0.4080.899
- 0.0870.192
NOTE: To facilitate interpretation, the month-to-month directions of change are shown along with the numbers: ( + ) = rising, (o) ~ unchanged, and ( —) = falling. The "r" indicates revised; "p"preliminary; and "NA", not available.
lffhe index is the average for June 2-25; component prices are averages for June 3, 10, 17, and 24.2Data are not seasonally adjusted. These series are based on copyrighted data used by permission; they may not be reproduced without
written permission from Commodity Research Bureau, Inc. Components are converted to metric units by the Bureau of Economic Analysis.Official price for October 23, 19S5.
JUNE 1986 79Digitized for FRASER http://fraser.stlouisfed.org/ Federal Reserve Bank of St. Louis
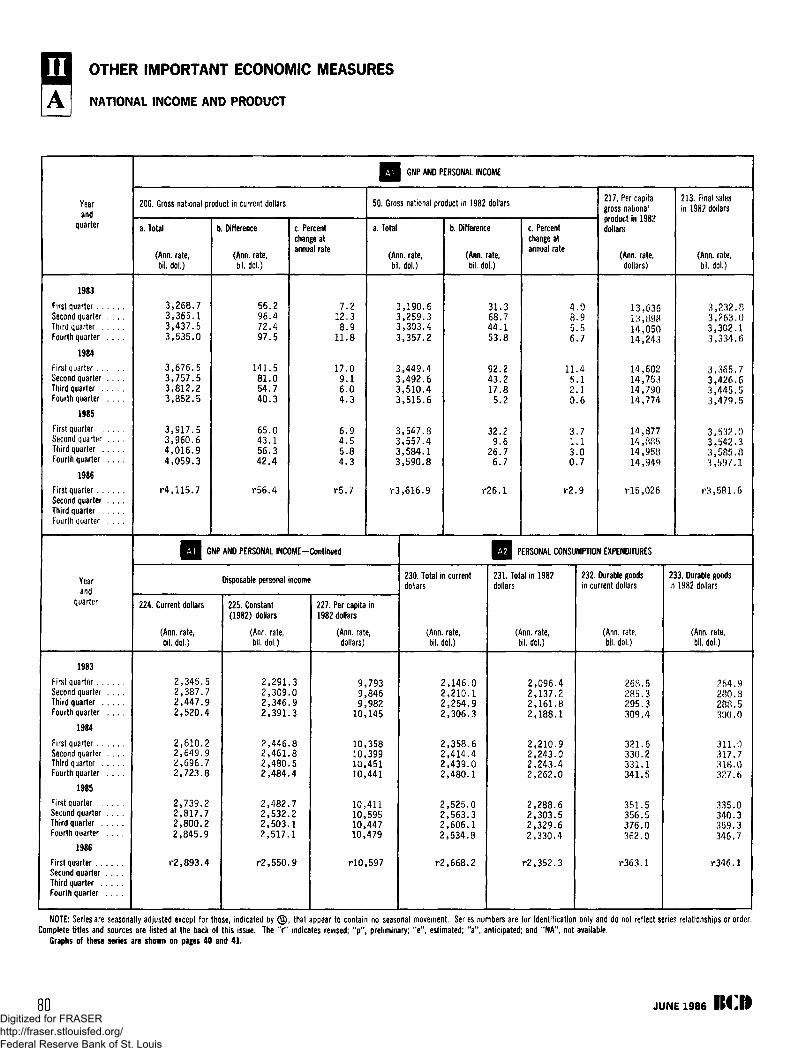
OTHER IMPORTANT ECONOMIC MEASURES
I A I NATIONAL INCOME AND PRODUCT
Year
and
quarter
1983
First quarterSecond quarter . . . .Third quarterFourth quarter . . . .
1984
First quarterSecond quarter . . . .Third quarterFourth quarter . . . .
1985
First quarterSecond quarter . . . .Third quarterFourth quarter . . . .
1986
First quarterSecond quarter . . . .Third quarterFourth quarter . . . .
Yearand
quarter
1983
First quarterSecond quarter . . . .Third quarterFourth quarter . . . .
1984
First quarterSecond quarter . . . .Third quarterFourth quarter . . . .
1985
First quarterSecond quarter . . . .Third quarterFour th quarter . . . .
1986
First quarterSecond quarter . . . .Third quarterFourth quarter . . . .
200. Gross national product in current dollars
a. Total
(Ann. rate,bil. dol.)
3,268.73,365.13,437.53,535.0
3,676.53,757.53,812.23,852.5
3,917.53,960.64,016.94,059.3
r4 ,115 .7
b. Difference
(Ann. rate,bil. dol.)
56.296.472.497.5
141.581.054.740.3
65.043.156.342.4
r56.4
c. Percentchange atannual rate
7128
11
179
2398
01
6.04
6454
r5.
m GNP AND PERSONAL INCOME—Continued
Disposable personal income
224. Current dollars
(Ann. rate,bil. dol.)
2,345.52,387.72,447.92,520.4
2,610.22,649.92,696.72,723.8
2,739.22,817.72,800.22,845.9
r2,893.4
225. Constant(1982) dollars
(Ann. rate,bil. dol.)
2,2912,3092,3462,391
2,4462,4612,4802,484
2,4822,5322,5032,517
r2,550
.30
.93
8854
7211
9
227.
3
9583
7
i50.
i GNP AND PERSONAL INCOME
Gross national product in 1982 dollars
a. Total
Per capita in
1982 dollars
(Ann. rate,
dollars)
9,9,9,
10,
10,10,10,10,
i ni.U ,10,10,10,
no,
793846982145
358399451441
41 1*T I 1
595447479
597
(Ann. rate,bil
33
3333
r3
dol.)
, 1 9 0 ., 2 5 9 ., 3 0 3 .
} , 3 5 7 .
, 4 4 9 ., 4 9 2 ., 5 1 0 ., 5 1 5 .
, 5 4 7 .
6342
4646
8,557.4,584.,590.
,616.
18
9
b. Difference
{Ann. rate,bil.
230. Total in currentdollars
(Ann. rate,bi . dol.)
2222
22I2
cI22
,146,,210',254,306
,358,414,439,480
, uco,563,606,634
,668
0193
6401
nu318
2
dol.)
31684453
9243175
329
266.
r26 .
i
3718
2282
2677
1
c. Percentchange atannual rate
4856
11520
3130
r2
.0
.5
.7
.4
.1
.1
.6
.7
.1
.0J
.9
217, Per capita
gross national
prouuci in ijoidollars
(Ann. rate,dollars)
13 63613,* 89814,05014,243
14,60214J5314,79014,774
14,87714,88514,15814,949
rl5,026
3 PERSONAL CONSUMPTION EXPENDITURES
231. Total indollars
(Ann.
1982
rate,bil. dol.)
2222
2222
o
222
r2
, 0 9 6,137, 1 6 1188
210243
4281
90
243.4262
OQQtoo303.329.330.
352.
0
c0564
3
232. Durable goods
in current dollars
(Ann. rate,bil. dol.)
268,5285.3295.3309.4
321.6330.2331.1341.5
•5E1 K031 . 3356.5376.0362.0
r363 .1
213. Final salesin 1982 dollars
(Ann. rate,bil. dol.)
3,232.83,S263!o3,302.13,334.6
1 3 f r 7
3I426 '.63,445.53,479.5
3,532.03,542.33,585.83397 .1
r 3 531 g
233, Durable goodsin 1982 dollars
(Ann, rate,bil. dol.)
264.9280.8288.5300.0
311.0317.7318.0327.6
340.' 3359.3346.7
r346.1
NOTE: Series are seasonally adjusted except for those, indicated by © r that appear to contain no seasonal movement. Series numbers are for identification only and do not reflect series relationships or order.
Complete titles and sources are listed at the back of this issue. The " r " indicates revised; " p " , preliminary; " e " , estimated; " a " , anticipated; and "NA", not available.
Graphs of these series are shown on pages 40 and 4 1 .
JUNE 1986Digitized for FRASER http://fraser.stlouisfed.org/ Federal Reserve Bank of St. Louis

OTHER IMPORTANT ECONOMIC MEASURES
A NATIONAL INCOME AND PRODUCT—Continued
Yearand
quarter
1983
First quarterSecond quarter . . . .Third quarterFourth quarter . . . .
1984
f i r s t quarterSecond quarter . . . .Third quarterFourth quarter . . . .
1985
First quarterSecond quarter . . . .Third quarterFourth quarter . . . .
1986
First quarterSecond quarter . . . .Third quarterFourth quarter . . . .
Yearand
quarter
1983
First quarterSecond quarter . . . .Third quarterFourth quarter . . . .
1984
First quarterSecond quarter . . . .Third quarterFourth quarter . . . .
1985
First quarterSecond quarter . . . .Third quar terFourth quarter . . . .
1986
First quarterSecond quarter . . . .Third quarterFourth quarter . . . .
236. Nondurablegoods in currentdollars
(Ann. rate,bil. do!.)
792 .4811 .7826 .5837 .2
856 .6873 .2876 .68 8 3 . 1
895 .7910 .2914.5928 .3
r 9 3 5 . 6
PERSONAL CONSUMPTION EXPENDITURES—Continued
238. Nondurablegoods in 1982dollars
(Ann. rate,bil. dol.)
787.0796.8806.8812.0
819.4832.8831.2828.6
839.9846.7849.8851.1
r864.9
• • GROSS PRIVATE• S I DOMESTIC INVEST,-Con,
245. Change inbusiness inven-tories in currentdollars
(Ann. rate,bil. dol.)
-42 .7- 5 . 5- 2 . 825.5
92.168.968.339.0
18.515.50.2
- 4 . 3
r39 .9
30. Change inbusiness inven-tories in 1982dollars
(Ann. rate,bil. dol.)
-42 .2- 3 . 7
1.422.6
83.666.0
' 64.936.1
15.815.1-1 .8-6 .3
r35.3
237. Services incurrent dollars
(Ann. rate,bil. dol.)
1,085.21,113.01,133.11,159.6
1,180.41,211.11,231.31,255.4
1,277.81,296.61,315.61,344.6
r l , 369 .5
260. Total incurrent dollars
(Ann. rate,bil. dol.)
669.3673.8681.1678.6
696.5735.1747.3768.4
777.2794.8832.5857.2
r836..2
239. Services in1982 dollars
(Ann. rate,bil. dol.)
1,044.51,059.71,066.51,076.1
1,080.51,092.61,094.31,105.8
1,113.71,116.51,120.41,132.6
rl,141.4
E9 (
261. Total in1982 dollars
(Ann. rate,bit. dol.)
649.1648.2651.5642.2
650.1677.1682.4693.9
691.4699.4729.2745.5
r718.3
240. Total incurrent dollars
(Ann, rate,bil. dol.)
425.0483.7521.2577.6
658.8673.3687.9676.2
657.6672.8666.1680.7
r717.2
J | GROSS PRIVATE DOMESTIC INVESTMENT
241. Total in1982 dollars
(Ann. rate,bil. dol.)
422.5489.0526.3575.9
649.0662.9673.3659.9
639.6655.6645.0655.7
r684.4
242. Fixed invest-ment in currentdollars
(Ann. rate,bil. dol.)
467.7489.2524.0552.1
566.7604.5619.5637.2
639.1657.3665.9685.0
r677.3
30VERNMENT PURCHASES OF GOODS AND SERVICES
262. FederalGovernment incurrent dollars
(Ann. rate,bil. dol.)
2 8 7 . 1287.0286.0279.2
285.6314.8318.5332,9
334.4337.8364.8384.7
r 3 5 7 . 1
263. FederalGovernment in1982 dollars
(Ann. rate,bil. dol.)
279.2277.6277.4267.9
271.4294.8296.7307.3
304.3305.9331.1349.0
r319.1
266. State andlocal governmentin current dollars
(Ann. rate,bil. dol.)
382.2386.9395.1399.4
410.9420.3428.8435.5
442.8457.1467.7472.5
r479.0
243. Fixed invest-ment in 1982dollars
(Ann. rate,bil. dol.)
464.7492.7524.9553.2
565.4596.8608.4623.8
623.8640.5646.8662.0
r649.1
267. State andlocal governmentin 1982 dollars
(Ann. rate,bil. dol.)
369.9370.6374.1374.3
378.6382.4385,7386.6
387.1393.6398.1396.5
r399.2
See note on page 80.Graphs of these series are shown on pages 41 , 42, and 43.
JUNE 1986 81Digitized for FRASER http://fraser.stlouisfed.org/ Federal Reserve Bank of St. Louis
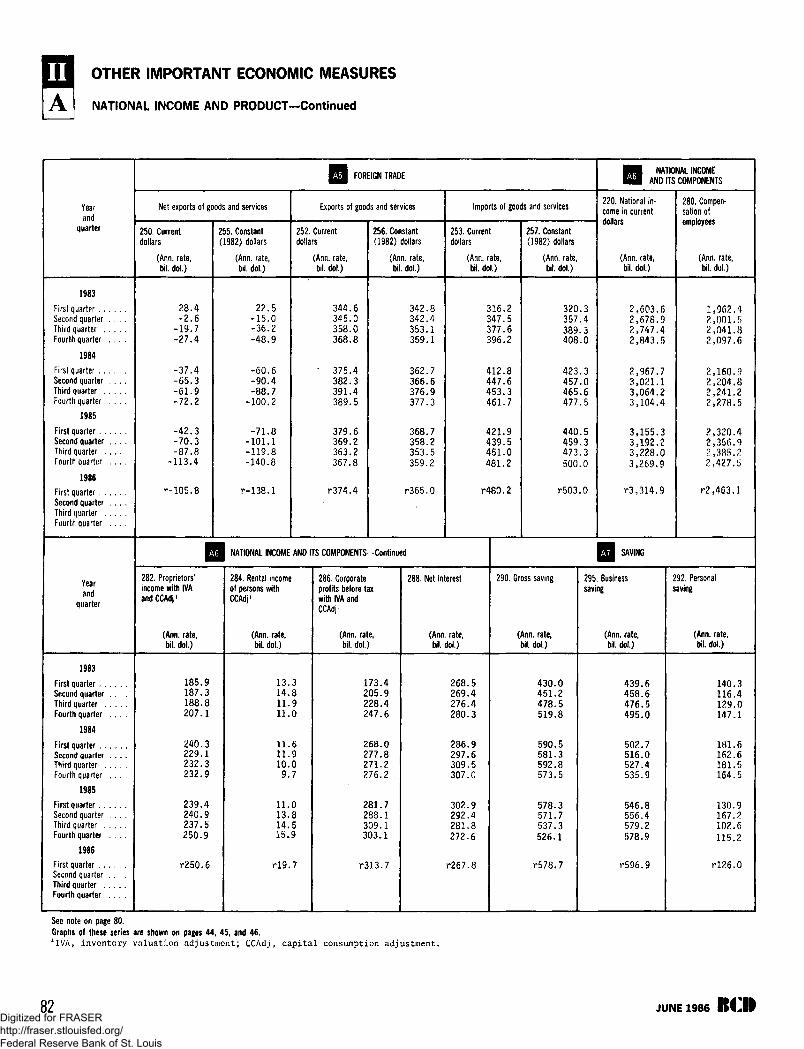
OTHER IMPORTANT ECONOMIC MEASURES
NATIONAL INCOME AND PRODUCT—Continued
Yearand
quarter
1983
First quarterSecond quarter . . . .Third quarterFourth quarter . . . .
1984
First quarterSecond quarter . . . .Third quarterFourth quarter . . . .
1985
First quarterSecond quarter . . . .Third quarterFourth quarter . . . .
1986
Fi rs t q u a r t e r . . . .Second q u a r t e r . . . .T h i r d q u a r t e rF o u r t h q u a r t e r . . . .
VearTear
andquarter
1983
F i r s t q u a r t e r . . . .Second q u a r t e r . . . .T h i r d q u a r t e rF o u r t h q u a r t e r . . . .
1 9 8 4
First quarterSecond quarter . . . .Third quarterFourth quarter . . . .
1985
First quarterSecond quarter . . . .Third quarterFour th quarter . . . .
1986
First quarterSecond quarter . . . .Third quarterFourth quarter . . . .
Net exports of goods and services
250. Currentdollars
(Ann. rate,bil. dol.)
2 8 . 4- 2 . 6
- 1 9 . 7- 2 7 . 4
- 3 7 . 4- 6 5 . 3- 6 1 . 9- 7 2 . 2
- 4 2 . 3- 7 0 . 3- 8 7 . 8
- 1 1 3 . 4
r-105.8
282. Proprietors'income with IVAand CCAdj1
(Ann. rate,bil. dol.)
185.187.188.207.
240.229.232.232.
239.240.237.250.
r250.
E
9381
3139
4959
6
255. Constant(1982) dollars
(Ann. rate,bil. dol.)
22,5-15.0-36.2-48.9
-60.6-90.4-88.7
-100,2
-71.8-101.1-119.8-140.8
r-138.1
252.
H FOREIGN TRADE
Exports of goods and services
Currentdollars
(Ann. rate,bil. dol.)
344345358
600
3 6 8 . 8
" 375382391389
379369363367
r 3 7 4
4345
6228
4
256. Constant(1982) dollars
(Ann. rate,bil. dol.)
342342353359
362366376377
368358353359
r365
1 NATIONAL INCOME AND ITS COMPONENTS—Continued
284. Rental incomeof persons withCCAdj'
(Ann. rate,bil. dol.)
13.14.11.11.
11.11.10.9.
11.13.14.15.
rl9.
3890
6907
0859
7
286. Corporateprofits before taxwith IVA andCCAdj1
(Ann.bil
rate,dol.)
173.4205228247
268277271276
281288
946
0822
71
309.1303.
r313
1
7
288.
.8
.4
.1
.1
.7
.6
.9
.3
.7
.2
.5
.2
.0
253.
Imports of goods and services
Currendollars
Net interest
(Ann. rate,bil. iol.)
268269276
(Ann. rate,bil. dol.)
316347
25
377.6396
412447453461
421439451481
r480
.5
.4
.4280.3
286297309307
302292281272
r267
.9
.6
.5
.0
.9
.4
.8
.6
.8
2
8637
9502
2
290.
257. Constant(1982) dollars
(Ann. rate,bil. dol.)
320357389408
423457465477
440459473500
r503
Gross saving
(Ann. rate,bil. dol.)
430.0451.2478.5519.8
590.5581.3592.8573.5
578.3571.7537.3526.1
r 5 7 8 . 7
.3
.4
.3
.0
.3
.0
.6
.5
.5'.3.3,0
.0
295
• H NATIONAL INCOME1 1 1 AND ITS COMPONENTS
220. National in-come in currentdollars
(Ann. rate,bil. dol.)
2,6032,6782,7472,843
2,9673,0213,0643,104
3,1553,1923,2283,269
r3,314
Q SAVING
Businesssaving
(Ann. rate,bil. dol.)
439.6458.6476.5495.0
502.7516.0527.4535.9
546.8556.4579.2578.9
r596 .9
.6
.9
.4
.5
.7
.1
.ZA
.3\z.0.9
.9
280. Compen-sation ofemployees
(Ann. rate,bil. dol.)
1 ,962.42,001.52,041.82,097.6
2,160.92,204.82,241.22,278.5
2,320.42S,356!92,385.22,427.5
r2 ,463.1
292. Personalsaving
(Ann. rate,bil. dol.)
140.3116.4129.0147.1
181.6162.6181.5164.5
130.9167.2102.6115.2
rl26.0
See note on page 80.Graphs of these series are shown on pages 44, 45, and 46.*IVA, inventory valuation adjustment; CCAdj, capital consumption adjustment.
82 JUNE 1986Digitized for FRASER http://fraser.stlouisfed.org/ Federal Reserve Bank of St. Louis
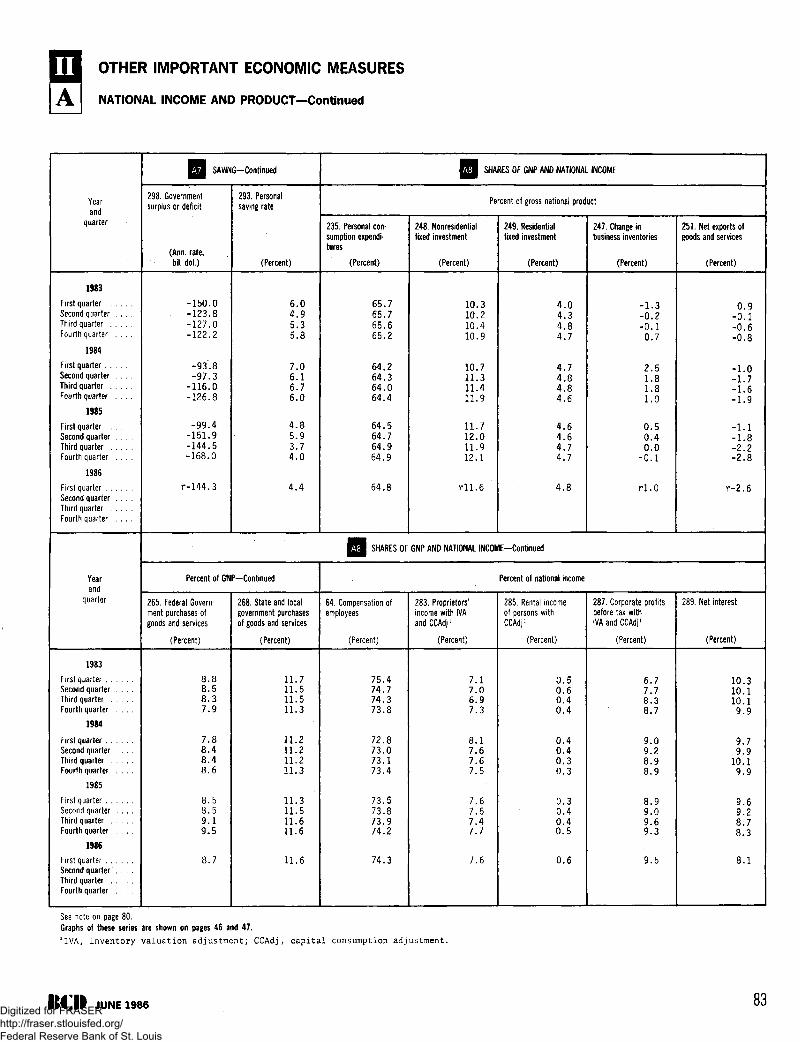
OTHER IMPORTANT ECONOMIC MEASURES
A I NATIONAL INCOME AND PRODUCT—Continued
Yearand
quarter
1983
First quarterSecond quarter . . . .Third quarterFourth quarter . . . .
1984
F i r s t q u a r t e r . . . . . .S e c o n d q u a r t e r . . . .T h i r d q u a r t e rF o u r t h q u a r t e r . . . .
1 9 8 5
First quarterSecond quar ter . . . .Third quarterFourth quarter . . . .
1986
First quarterSecond quarter . . . .Thi rd quarterFourth quarter . . . .
Yearand
quar ter
1983
First quar terSecond quarter . . . .Third quarterFour th quarter . . . .
1984
First quar terSecond quar ter . . . .Third quarterFourth quar ter . . . .
1985
First quarterSecond quarter . . . .Third quarterFour th quarter . . . .
1986
First quar terSecond quar ter . . . .Third quarterFour th quarter . . . .
Q j SAVING—Continued
298. Governmentsurplus or deficit
(Ann. rate,bil. dol.)
- 150 .0. -123 .8
-127 .0-122 .2
- 9 3 . 8- 9 7 . 3
-116.0-126.8
-99.4-151.9-144.5-168.0
r-144.3
293. Personalsaving rate
(Percent)
6.04.95.35.8
7.06.16.76.0
4.85.93.74.0
4.4
Percent of GNP—Continued
265. Federal Govern-ment purchases ofgoods and services
(Percent)
8.88.58.37.9
7.88.48.48.6
8.58.59.19.5
8.7
268. State and localgovernment purchasesof goods and services
(Percent)
1 1 . 71 1 . 51 1 . 51 1 . 3
1 1 . 21 1 . 21 1 . 21 1 . 3
1 1 . 31 1 . 51 1 . 61 1 . 6
1 1 . 6
Q j SHARES OF GNP AND NATIONAL INCOME
Percent of gross national product
235. Personal con-sumption expendi-tures
(Percent)
65.765.765.665.2
64.264.364.064.4
64.564.764.964.9
64.8
248. Nonresidentialfixed investment
(Percent)
10.310.210.410.9
10.711.311.411.9
11.712.011.912.1
HI .6
249. Residentialfixed investment
(Percent)
4.04.34.84.7
4.74.84.84.6
4.64.64.74.7
4.8
Q J SHARES OF GNP AND NATIONAL JNCOME—Continued
64. Compensation ofemployees
(Percent)
75 .474.774 .373 .8
7 2 . 873 .07 3 . 173 .4
73 .573 .873 .974.2
74 .3
283. Proprietors'income with IVAandCCAdj1
(Percent)
7.17.06.97.3
8.17.67.67.5
7.67.57.47.7
7.6
Percent of national income
285. Rental incomeof persons withCCAdj1
(Percent)
0.50.60.40.4
0.40.40.30.3
0.30.40.40.5
0.6
247. Change inbusiness inventories
(Percent)
- 1 . 3-0.2-0.10.7
2.51.81.81.0
0.50.40.0
-0.1
rl.O
287. Corporate profitsbefore tax withIVA and CCAdj1
(Percent)
6.77.78.38.7
9.09.28.98.9
8.99.09.69.3
9.5
251. Net exports ofgoods and services
(Percent)
0.9- 0 . 1-0.6-0.8
-1.0-1.7-1.6-1.9
-1 .1-1.8-2.2-2.8
r-2.6
289. Net interest
(Percent)
10.310 .11 0 . 19.9
9.79.9
1 0 . 19.9
9.69.28.78.3
8.1
See note on page 80.Graphs of these series are shown on pages 46 and 47.1IVA, inventory valuation adjustment; CCAdj, capital consumption adjustment.
JUNE 1986 83Digitized for FRASER http://fraser.stlouisfed.org/ Federal Reserve Bank of St. Louis
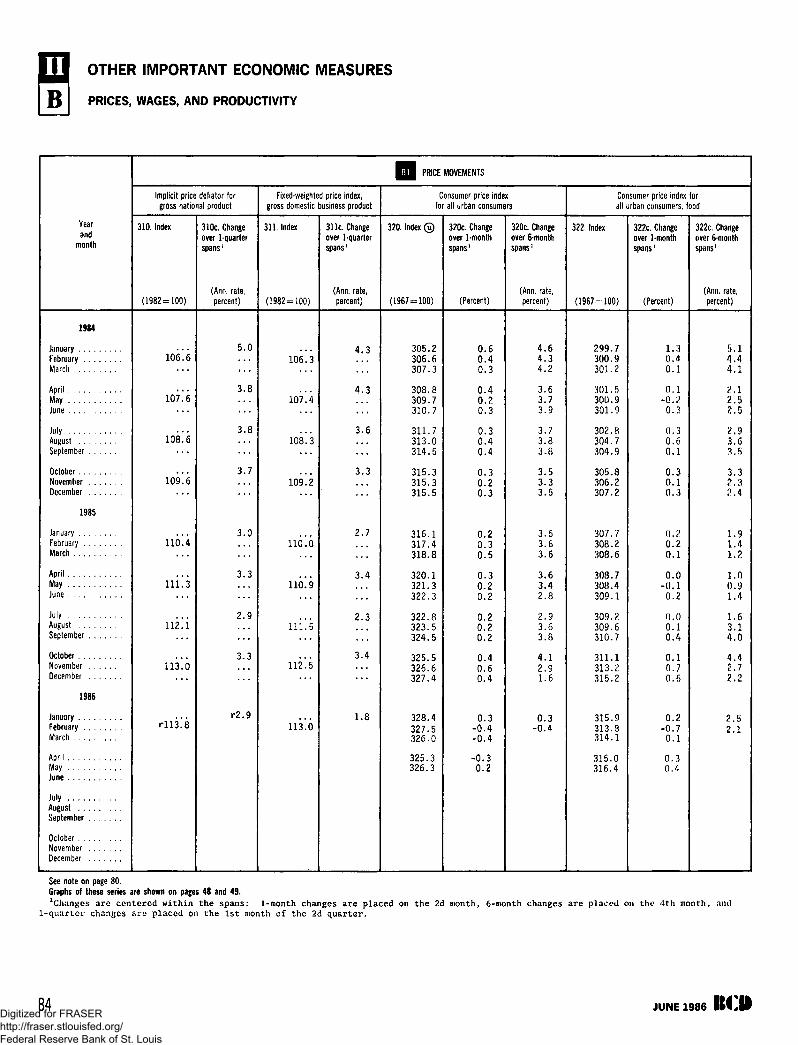
OTHER IMPORTANT ECONOMIC MEASURES
B I PRICES, WAGES, AND PRODUCTIVITY
Yearand
month
1984
JanuaryFebruaryMarch
AprilMayJune
July . . . .AugustSeptember
October . . . .November . . . .December . . .
1985
January , .February . , ,March
AprilMayJune
JulyAugustSeptember
OctoberNovemberDecember
1986
JanuaryFebruaryMarch
AprilMayJune . . .
JulyAugustSeptember
OctoberNovember . . .December . . . .
Q PRICE MOVEMENTS
Implicit price deflator forgross national product
310. Index
(1982 = 100)
106^6
107*6
lOs'o"
109.6
11CL4
111.3
112I i
113*0
rll3.*8
310c. Changeover 1-quarterspans'
(Ann. rate,percent)
5.0
3.8
3.8
3.7
3.0
3.3
2.9
3.3
r 2 . 9
Fixed-weighted price index,gross domestic business product
311. Index
(1982=100)
106.3
107^4
108! 3
109.2
110*6
110*9
111.5
112*5
113*.6
311c. Changeover 1-quarterspans'
(Ann. rate,percent)
4.3
4.3
3.6
3.3
2.7
3.4
2.3
3.4
1.8
Consumer price indexfor all urban consumers
320. Index ®
(1967-100)
305.2306.6307.3
308.8309.7310.7
311.7313.0314.5
315.3315.3315.5
316.1317.4318.8
320.1321.3322.3
322.8323.5324.5
325.5326.6327.4
328.4327.5326.0
325.3326.3
320c. Changeover 1-monthspans1
(Percent)
0.60.40.3
0.40.20.3
0.30.40.4
0.30.20.3
0.20.30.5
0.30.20.2
0.20.20.2
0.40.60.4
0.3-0.4-0.4
-0.30.2
320c. Changeover 6-monthspans1
(Ann. rate,percent)
4 . 64 . 34 .2
3.63.73.9
3.73.83.8
3.53.33.5
3.63.63.6
3.63.42.8
2.93.63.8
4 .12.91.6
0.3- 0 . 4
Consumer price index forall urban consumers, food
322. Index
(1967-100)
299.7300.9301.2
301.5300.9301.9
302.8304.7304.9
305.8306.2307.2
307.7308.2308.6
308.7308.4309.1
309.2309.6310.7
311.1313.2315.2
315.9313.8314.1
315.0316.4
322c. Changeover 1-monthspans!
(Percent)
1.30.40.1
0.1-0.20.3
0.30.60.1
0.3D.I0.3
0.20.20.1
0.0-0.1
0.2
0.00.10.4
0.10.70.6
0.2-0.70.1
0.30.4
322c. Changeover 6-monthspans1
(Ann. rate,percent)
5 .14 . 44 . 1
2 . 1
2 .5
2 .93.63.5
3.32 .3ZA
1.91.41.2
1.00 .91.4
1.63 . 14 . 0
4 .4l . l2 .2
2 .52 . 1
See note on page 80.Graphs of these series are shown on pages 48 and 49.xChanges are centered within the spans: 1-month changes are placed on the 2d month, 6-month changes are placed on the 4th month,
1-quarter changes are placed on the 1st month of the 2d quarter.and
JUNE 1986Digitized for FRASER http://fraser.stlouisfed.org/ Federal Reserve Bank of St. Louis
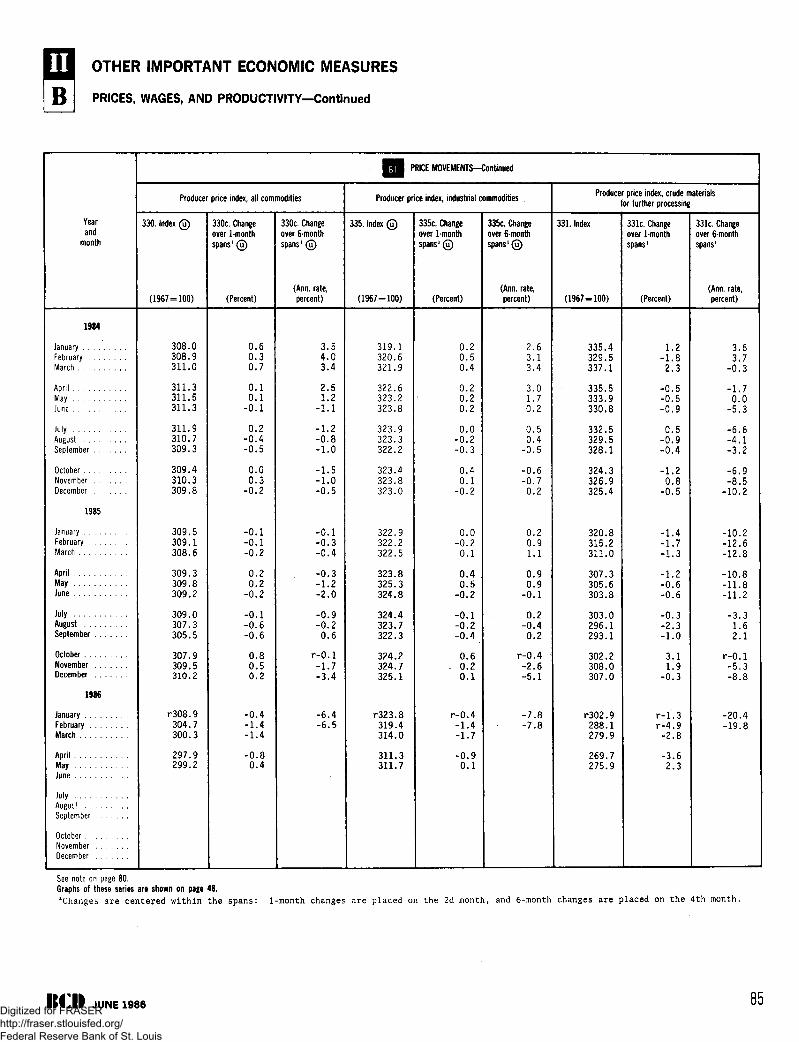
OTHER IMPORTANT ECONOMIC MEASURES
B I PRICES, WAGES, AND PRODUCTIVITY—Continued
Yearand
month
1984
JanuaryFebruaryMarch
AprilMayJune
JulyAugustSeptember
OctoberNovemberDecember
1985
JanuaryFebruaryMarch
AprilMayJune
JulyAugustSeptember
OctoberNovemberDecember
1986
JanuaryFebruaryMarch
AprilMayJune
JulyAugustSeptember
OctoberNovemberDecember
WjM PRICE MOVEMENTS—Continued
Producer price index, all commodities
330. Index ©
(1967 = 100)
308.0308.9311.0
311.3311.5311.3
311.9310.7309.3
309.4310.3309.8
309.5309.1308.6
309.3309.8309.2
309.0307.3305.5
307.9309.5310.2
r308.9304.7300.3
297.9299.2
330c. Changeover 1-monthspans1©
(Percent)
0.60.30.7
0.10.1
- 0 . 1
0.2-0 .4-0 .5
0.00.3
-0.2
- 0 . 1- 0 . 1-0.2
0.20.2
-0.2
- 0 . 1-0 .6-0.6
0.80.50.2
-0 .4-1 .4-1.4
-0 .80.4
330c. Changeover 6-monthspansl ®
(Ann. rate,percent)
3.54.03.4
2.51.2
-1 .1
-1.2-0 .8-1 .0
-1.5-1 .0-0.5
- 0 . 1-0 .3-0 .4
-0 .3-1.2-2 .0
-0.9-0.20.6
r-0.1-1.7-3.4
-6.4-6.5
Producer price index, industrial commodities
335. Index ©
(1967 = 100)
319.1320.6321.9
322.6323.2323.8
323.9323.3322.2
323.4323.8323.0
322.9322,2322.5
323.8325.3324.8
324.4323.7322,3
324.2324.7325.1
r323.8319.4314,0
311.3311.7
335c. Changeover 1-monthspans1 ©
(Percent)
0.20.50.4
0.20.20.2
0.0-0.2-0.3
0.40.1
-0.2
0.0-0.20.1
0.40.5
-0.2
- 0 , 1-0.2-0 .4
0.6. 0.2
0.1
r-0.4-1.4-1.7
-0.90.1
335c. Changeover 6-monthspans l©
(Ann. rate,percent)
2.63.13.4
3.01.70.2
0.50.4
-0.5
-0.6-0.70.2
0.20.91.1
0.90.9
-0 .1
0.2-0.40.2
r-0.4-2.6-5.1
-7.8-7.8
Producer price index, crude materialsfor further processing
331. Index
(1967 = 100)
335.4329.5337.1
335.5333.9330.8
332.5329.5328.1
324.3326.9325.4
320.8315.2311.0
307.3305.6303.8
303.0296.1293.1
302.2308.0307.0
r302.9288.1279.9
269.7275.9
331c. Changeover 1-monthspans1
(Percent)
1.2- 1 . 8
2 .3
- 0 . 5- 0 . 5- 0 . 9
0 .5-0.9-0.4
-1.20.8
-0.5
-1.4-1.7-1.3
-1.2-0.6-0.6
-0.3-2.3-1.0
3.11.9
-0.3
r-1.3r-4.9-2.8
-3.62.3
331c. Changeover 6-monthspans'
(Ann. rate,percent)
3 .63.7
- 0 . 3
- 1 . 70.0
-5.3
-6.6-4.1-3.2
-6.9-8.5
-10.2
-10.2-12.6-12.8
-10.8-11.8-11 ?
i. L , C
-3.31.62.1
r-0.1-5.3-8.8
-20,4-19.8
See note on page 80.Graphs of these series are shown on page 48.
Changes are centered within the spans: 1-month changes are placed on the 2d month, and 6-month changes are placed on the 4th month.
ItO JUNE 1986 85Digitized for FRASER http://fraser.stlouisfed.org/ Federal Reserve Bank of St. Louis
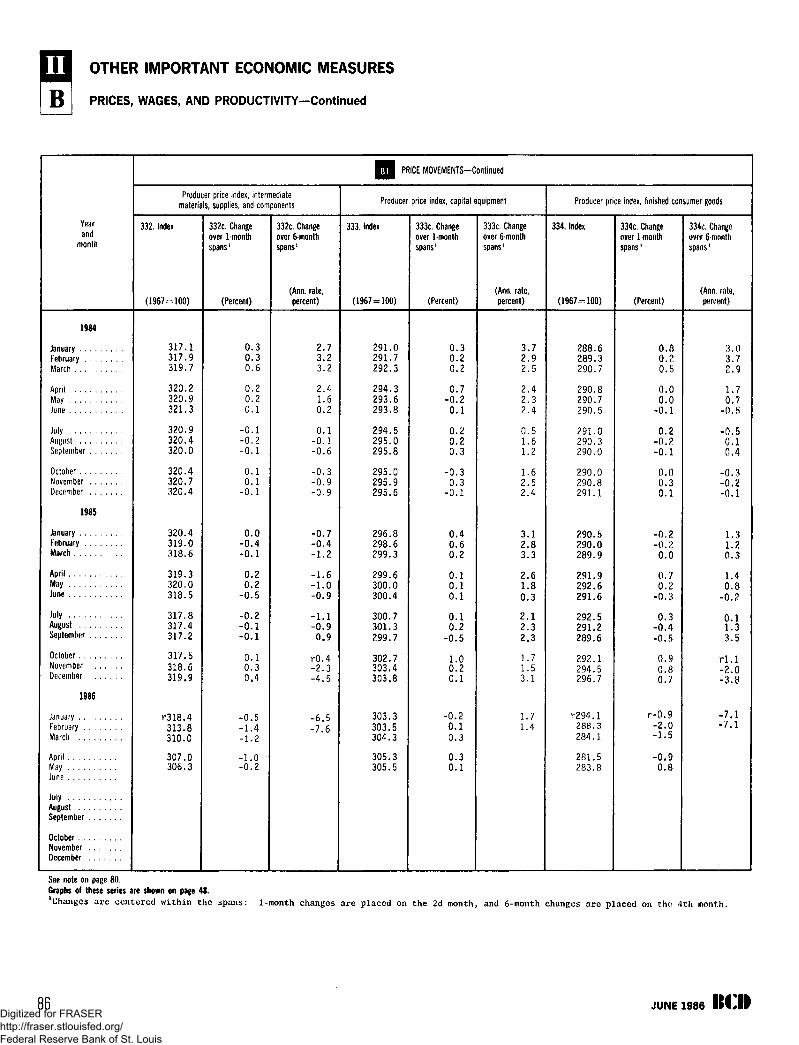
OTHER IMPORTANT ECONOMIC MEASURES
B I PRICES, WAGES, AND PRODUCTIVITY—Continued
Yearand
month
1984
JanuaryFebruaryMarch
April , . ,May . . . . .June
JulyAugustSeptember
OctoberNovemberDecember
1985
January . . . . . . . . .FebruaryMarch
Apri lMayJune
JulyAugustSeptember
OctoberNovemberDecember . . . . . . .
1986
JanuaryFebruaryMarch
AprilMayJune
JulyAugustSeptember .
OctoberNovemberDecember
Q PRICE MOVEMENTS—Continued
Producer price index, intermediatematerials, supplies, and components
332. Index
(1967-100)
317.1317.9319.7
320.2320.9321.3
320.9320.4320.0
320.4320.7320.4
320.4319.0318.6
319.3320.0318.5
317.8317.4317.2
317.5318.6319.9
r318.4313.8310 0
307.0306.3
332c. Changeover 1-monthspans1
(Percent)
0 .30 .30 .6
0.20.20.1
-0.1-0.2-0.1
0.10.1
-0.1
0.0-0.4-0.1
0.20.2
-0.5
-0.2-0.1-0.1
0.10.30.4
-0.5-1.4- 1 2
-1.0-0.2
332c. Changeover 6-monthspans1
(Ann. rate,percent)
2 .73 .23.2
2 .41.60.2
0.1-0.1-0 6
-0.3-0.9-0.9
-0.7-0.4-1.2
-1.6-1.0-0.9
-1.1-0.9
0.9
r0.4-2.3-4.5
-6.5-7.6
Producer price index, capital equipment
333. Index
(1967-100)
291.0291.7292.3
294.3293.6293.8
294.5295.0295 8
295.0295.9295.6
296.8298.6299.3
299.6300.0300.4
300.7301.3299.7
302.7303.4303.8
303.3303.5304.3
305.3305.5
333c. Changeover 1-monthspans1
(Percent)
0.30.20.2
0.7-0.2
0.1
0.20.20 3
-0.30.3
-0.1
0.40.60.2
0.10.10.1
0.10.2
-0.5
1.00.20.1
-0.20.10.3
0.30.1
333c. Changeover 6-monthspans1
(Ann. rate,percent)
3.72.92.5
2.42.32.4
0.51.61 2
1.62.52.4
3.12.83.3
2.61.80.3
2 . 12.32.3
1.71.53.1
1.71.4
Producer price index, finished consumer goods
334. Index
(1967-100)
288.6289.3290.7
290.8290.7290.5
291.0290.3290 0
290.0290.8291.1
290.5290.0289.9
291.9292.6291.6
292.5291.2289.6
292.1294.5296.7
r294 .1288.3284.1
281.5283.8
334c. Changsover lmonthspans5
(Percent)
0.80.20.5
0.00.0
-0 .1
0.2-0.2-0 1
0.00.30.1
-0.2-0.2
0.0
0.70.2
-0.3
0.3-0.4-0.5
0.90.80.7
r-0.9-2.0-1.5
-0.90.8
334c, Changeover 6-monthspans'
(Ann. rate,percent)
3 .03.72 .9
1.70.7
- 0 . 5
- 0 . 50 . 1n d
-0 .3-0 .2-0 .1
1.31.20.3
1.40.8
-0 .2
0.11.33.5
r l . l- 2 .0-3 .8
- 7 . 1- 7 . 1
See note on page 80.Graphs of these series are shown on page 48.
Changes are centered within the spans: 1-month changes are placed on the 2d month, and 6-month changes are placed on the 4th month.
86 JUNE 1986Digitized for FRASER http://fraser.stlouisfed.org/ Federal Reserve Bank of St. Louis

OTHER IMPORTANT ECONOMIC MEASURES
B I PRICES, WAGES, AND PRODUCTIVITY—Continued
Year
and
month
1984
January
February
March
April
May
June
July
August
September
October
November
December
1985
January
February
March
April
May
June
July
August
September
October
November
December
1986
January
February
March
April
May
June
JulyAugustSeptember
October
November
December
WAGES AND PRODUCTIVITY
Average hourly earnings of production or nonsupervisory
workers on private nonagncultural payrolls1
Current-dollar earning:
340. Index
(1977 = 100)
Revised3
158.4158.3158.9
159.6159.5160 0
160.6160.5161.4
161.4162.0162.7
162.7163.6163.8
164.2164.4165.2
165.0165.5166.4
166.2166.8167.7
167.3
168.2
168.5
168.4
P168.8
340c. Change
over 1-month
spans2
(Percent)
Revised3
0.4
0.0
0.3
0.5
-0 .1
0 4
0.3
0.0
0.5
0.0
0.4
0.5
0.0
0.5
0.2
0.2
0.2
0.5
-0.2
0.3
0.5
-0 .1
0.4
0.6
-0.3
0.5
0.2
-0 .1
p0.2
340c. Change
over 6-month
spans2
(Ann, rate,
percent)
Revised3
3.0
2.7
2.9
2.8
2.8
3 2
2.2
3.1
3.4
2.7
3.9
3.1
3.5
3.1
3.1
2.7
2.3
3.1
2.4
2.9
3.1
2.9
3.3
2.6
2.7
P2.3
Real earnings
341. Index
(1977 = 100)
Revised3
94.7
94.6
94.9
95.3
94.9
95 0
94.9
94.0
94.0
93.9
94.2
94.4
94.3
94.5
94.2
94.0
94.1
94.2
93.9
94.1
94.4
94.0
93.9
94.0
93.5
94.4
95.1
95.4
P95.4
341c. Change
over 1-month
spans2
(Percent)
Revised3
-0 .1
-0.1
0.3
0.4
-0.5
0 2
-0 .1
-1.0
0.0
-0 .1
0.3
0.2
-0.2
0.2
-0.3
-0.2
0.0
0.2
-0.3
0.1
0.4
-0.4
-0 .1
0.1
-0.6
1.0
0.8
0.3
pO.O
341c. Change
over 6-month
spans *
(Ann. rate,
percent)
Revised3
0.9
0.4
0.5
0.5
-1.4
-2 0
-2.8
-1.4
-1.2
-1.4
1.1
0.5
0.2
-0.3
-0.4
-0.7
-0.9
0.4
0.0
-0.3
-0.5
-1.0
0.7
1.5
3.0
p3.2
Average hourly compensation, all employees,
nonfarm business sector
Current-dollar compensation
345. Index
(1977 = 100)
16514
166.8
168i3
169^6
1 7 l ! 5
173 .1
. . .
174.2
175!6
176.5
345c. Change
over 1-quarter
spans2
(Ann. rate,
percent)
4.4
3.5
3.5
3.2
4.7
3.7
2.8
3.1
2.2
345c. Change
over 4-quarter
spans *
(Ann. rate,
percent)
3^9
3^6
3!7
3- 7
3^5
3l5
2^9
See note on page 80.
Graphs of these series are shown on pages 49 and 50.
Adjusted for overtime (in manufacturing only) and interindustry employment shifts.2Changes are centered within the spans: 1-month changes are placed on the 2d month, 6-month changes are placed on the 4th month, 1-quar-
ter changes are placed on the 1st month of the 2d quarter, and 4-quarter changes are placed on the middle month of the 3d quarter.3See "New Features and Changes for This Issue," page iii.
JUNE 1986 87Digitized for FRASER http://fraser.stlouisfed.org/ Federal Reserve Bank of St. Louis

OTHER IMPORTANT ECONOMIC MEASURES
B I PRICES, WAGES, AND PRODUCTIVITY—Continued
Yearand
month
WAGES AND PRODUCTIVITY-Continued
Average hourly compensation, all employees,nonfarm business sector—Continued
Real compensation
346. Index
(1977-100)
346c. Changeover 1-quarterspans1
(Ann. rate,percent)
346c. Changeover 4-quarterspans1
(Ann. rate,percent)
Negotiated wage andbenefit decisions
348. Averagefirst-yearchanges ©
(Ann. rate,percent)
349. Averagechanges overlife ofcontract ©
(Ann. rate,percent)
Output per hour, all persons, business sector
370. Index
(1977-100)
370c. Changeover 1-quarterspans1
(Ann. rate,percent)
370c. Changeover 4-quarterspans'
(Ann. rate,percent)
358. Index ofoutput per hour,all persons,nonfarm busi-ness sector
(1977-100)
1984
JanuaryFebruaryMarch
April . . . . . . .MayJune
JulyAugustSeptember . . ,
OctoberNovember . , .December . . .
1985
JanuaryFebruary . . ,March
April . .May , .June , .
July . . . .August . .September
OctoberNovember . . ,December . . ,
1986
January . .February .March . . .
AprilMay . . . .June
July . . . .August . .September
October. .NovemberDecember
97.£
97.8
97.7
97.6
97.9
97.8
97.9
9 7 . 6
9 7 . 8
- O . 7
-O. I
-0.4
-0.5
1.3
-0.5
0.4
-1.1
0.7
-0.3
-0.4
0.1
0.0
0.2
0.0
- 0 , 1
5.1
3.5
2.7
3.7
3.6
3.5
2.0
2.0
p0.3
4.7
3.2
3.1
2.0
2.7
3.4
3.0
1,4
Pl.2
104.9
105.5
105.3
105.0
105.3
105.5
105.9
104.9
105.5
5.1
2.5
-0.8
- 1 . 3
1.0
O.E
1.6
-3.9
2.5
2.2
1.3
0.3
-0.1
0.5
-0.1
0.2
104.0
104.5
104.2
103.8
104.1
104.2
104.3
103.2
104.1
See note on page 80.Graphs of these series are shown on pages 49 and SO.1Changcs are centered within the spans: 1-quarter changes are
placed on the middle month of the 3d quarter.placed on the 1st month of the 2d quarter, and 4-quarter changes arc
JUNE 1986Digitized for FRASER http://fraser.stlouisfed.org/ Federal Reserve Bank of St. Louis
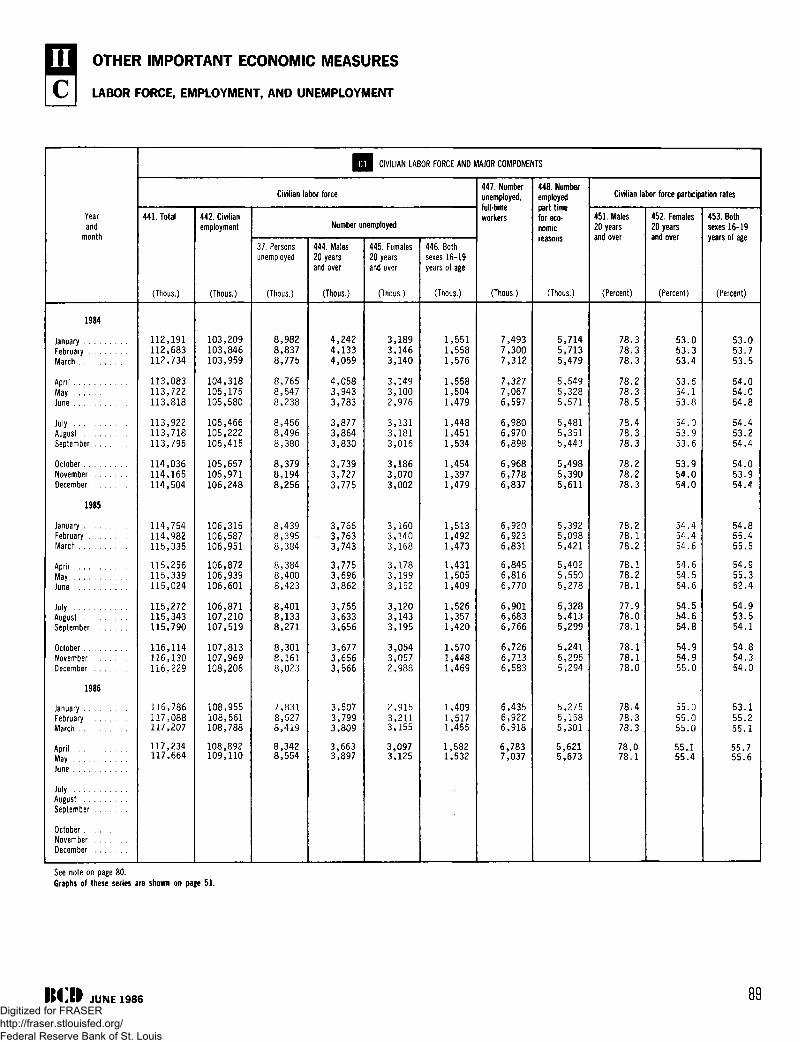
OTHER IMPORTANT ECONOMIC MEASURES
C I LABOR FORCE, EMPLOYMENT, AND UNEMPLOYMENT
Yearand
month
1984
JanuaryFebruaryMarch
AprilMayJune
JulyAugustSeptember
OctoberNovemberDecember
1985
JanuaryFebruaryMarch
AprilMayJune
JulyAugustSeptember
OctoberNovemberDecember
1986
JanuaryFebruaryMarch
AprilMayJune
JulyAugustSeptember
OctoberNovemberDecember
Q CIVILIAN LABOR FORCE AND MAJOR COMPONENTS
Civilian labor force
441. Total
(Thous.)
112,191112,683112,734
113,083113,722113,818
113,922113,718113,795
114,036114,165114,504
114,754114,982115,335
115,256115,339115,024
115,272115,343115,790
116,114116,130116,229
116,786117,088117,207
117,234117,664
442. Civilianemployment
(Thous.)
103,209103,846103,959
104,318105,175105,580
105,466105,222105,415
105,657105,971106,248
106,315106,587106,951
106,872106,939106,601
106,871107,210107,519
107,813107,969108,206
108,955108,561108,788
108,892109,110
Number unemployed
37. Personsunemployed
(Thous.)
8,9828,8378,775
8,7658,5478,238
8,4568,4968,380
8,3798,1948,256
8,4398,3958,384
8,3848,4008,423
8,4018,1338,271
8,3018,1618,023
7,8318,5278,419
8,3428,554
444. Males20 yearsand over
(Thous.)
4,2424,1334,059
4,0583,9433,783
3,8773,8643,830
3,7393,7273,775
3,7663,7633,743
3,7753,6963,862
3,7553,6333,656
3,6773,6563,566
3,5073,7993,809
3,6633,897
445. Females20 yearsand over
(Thous.)
3,1893,1463,140
3,1493,1002,976
3,1313,1813,016
3,1863,0703,002
3,1603,1403,168
3,1783,1993,152
3,1203,1433,195
3,0543,0572,988
2,9153,2113,155
3,0973,125
446. Bothsexes 16-19years of age
(Thous.)
1,5511,5581,576
1,5581,5041,479
1,4481,4511,534
1,4541,3971,479
1,5131,4921,473
1,4311,5051,409
1,5261,3571,420
1,5701,4481,469
1,4091,5171,455
1,5821,532
447. Numberunemployed,full-timeworkers
(Thous.)
7,4937,3007,312
7,3277,0676,597
6,9806,9706,898
6,9686,7786,837
6,9206,9236,831
6,8456,8166,770
6,9016,6836,766
6,7266,7136,583
6,4356,9226,918
6,7837,037
448. Numberemployedpart timefor eco-nomicreasons
(Thous.)
5,7145,7135,479
5,5495,3285,571
5,4815,3515,443
5,4985,3905,611
5,3925,0985,421
5,4025,5505,278
5,3285,4135,299
5,2415,2955,294
5,2755,1585,301
5,6215,673
Civilian labor force participation rates
451. Males20 yearsand over
(Percent)
78.378.378.3
78.278.378.5
78.478.378.3
78.278.278.3
78.278 .178.2
78 .178.278 .1
77.978.078 .1
78 .178 .178.0
78.478.378.3
78,078 .1
452. Females20 yearsand over
(Percent)
53.053.353.4
53.654 .153.8
54.053.953.6
53.954.054.0
54.454.454.6
54.654.554.6
54.554.654.8
54.954.955.0
55.055.055.0
55O155.4
453. Bothsexes 16-19years of age
(Percent)
53.053.753.5
54.054.054.8
54.453.254.4
54.053.954.4
54.855.455.5
54.955.352.4
54.953.554.1
54.854.354.0
53 .155.255 .1
55,755.6
See note on page 80.Graphs of these series are shown on page 51.
JUNE 1986Digitized for FRASER http://fraser.stlouisfed.org/ Federal Reserve Bank of St. Louis

OTHER IMPORTANT ECONOMIC MEASURES
GOVERNMENT ACTIVITIES
Yearand
month
1984
JanuaryFebruaryMarch . . . .
AprilMay . . .June
JulyAugustSeptember
OctoberNovember . .December . .
1985
January . .FebruaryMarch
AprilMayJune
JulyAugustSeptember
OctoberNovemberDecember
1986
JanuaryFebruaryMarch
AprilMayJune
JulyAugustSeptember
OctoberNovemberDecember
Q RECEIPTS AND EXPENDITURES
500. Surplusor deficit
(Ann. rate,bil. dol.)
-157.8
-163.0
-i7s!i
-192*7
-209.1
-20l!3
-226.9
r-2Q8*8
rederal Governmen
501. Receipts
(Ann. rate,bil. dol.)
709^4
72l!8
727! 1
742. i
789.7
754*9
790.7
803.5
rSok'.i
502. Expendi-tures
(Ann. rate,bil. dol.)
86?!2
884.9
905.2
934^7
952*4
964.0
992*0
1,030*4
r l , 012*9
State and local government'
510. Surplusor deficit
(Ann. rate,bil. dol.)
64*0
65*7
62! i
65*8
63.2
57*3
56.9
58*8
r64.*5
511. Receipts
(Ann. rate,bit. dol.)
525^5
537*4
542*2
554! i
560 is
570*0
sails
589.* i
r602.*5
512. Expendi-tures
(Ann. rate,bil. dol.)
46115
471*7
480 ! i
488! 3
497! 2
51217
52419
53012
r538.0
Q DEFENSE INDICATORS
Advance measures of defense activity
517. DefenseDepartmentgross obliga-tions incurred
(Mil. dol.)
21,14522,66723,445
19,18520,34219,781
20,98823,09822,191
20,82128,89226 686
22,49220,37720,346
22,65525,14029,513
31,64134,47030,753
28,62925,80930,768
26,79229,49232 124
p28,162(NA)
525. DefenseDepartmentprime con-tract awards
(Mil. dol.)
15,08914,27313,779
11,3989,459
11,644
10,10112,64711,441
12,90125,552
7 017
12,44912,43210,360
9,65814,14711,627
12,16317,57911,702
10,58410,08614,088
13,4249,318
14 368
pl2,855(NA)
543. DefenseDepartmentgross unpaidobligationsoutstanding
(Mil. dol.)
142,169145,648150,842
149,369149,452151,538
152,828156,271156,950
159,226168,32117? 010
174,180173,704174,338
174,867178,000179,337
182,074187,278186,401
185,059182,400183,504
185,82218B,008190 756
pl88,903(NA)
548. Manu-facturers1
new orders,defenseproducts
(Mil. dol.)
6,5036,884
11,713
5,1396,6486,834
7,6008,0907 301
5,16710,091
7 448
11,0614,7086,240
6,1308,773
11,238
9,59410,2708,106
6,1796,8107,152
10,3507,200
10 447
r6,§00p8,856
See note on page 80.Graphs of these series are shown on pages 52 and 53.1Based on national income and product accounts.
90 JUNE 1986 IN:Digitized for FRASER http://fraser.stlouisfed.org/ Federal Reserve Bank of St. Louis
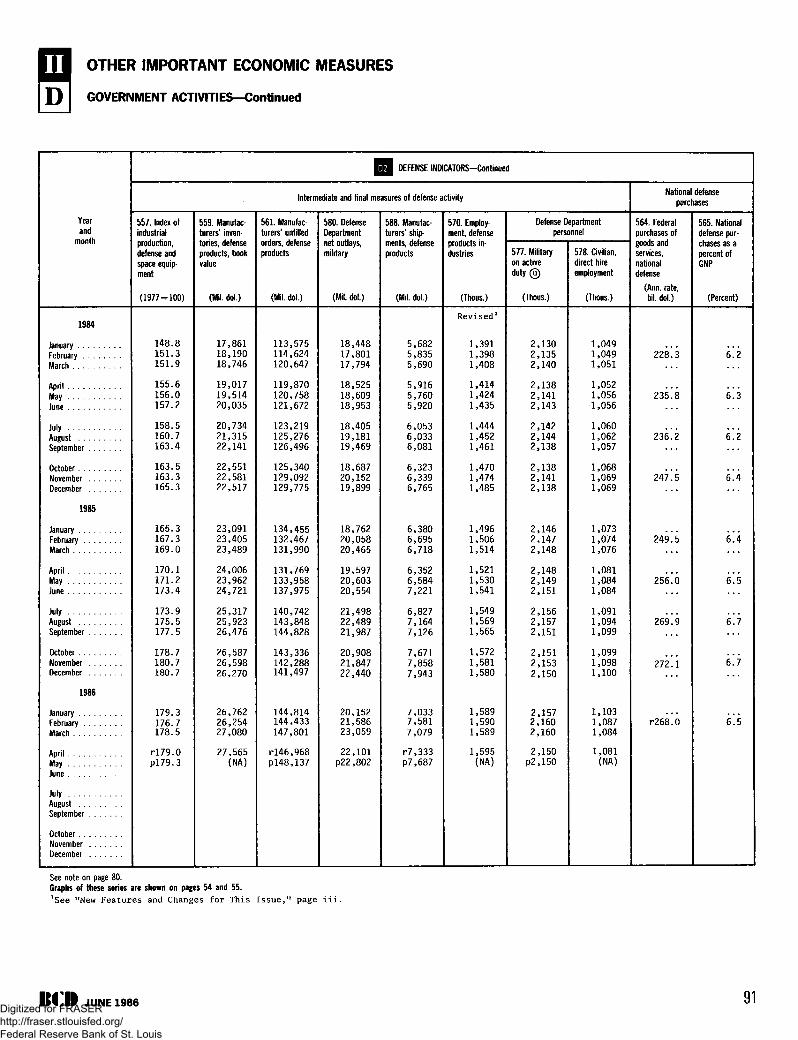
OTHER IMPORTANT ECONOMIC MEASURES
[ £ ) I GOVERNMENT ACTIVITIES—Continued
Yearand
month
1984
JanuaryFebruaryMarch
AprilMayJune
JulyAugustSeptember
OctoberNovemberDecember
1985
JanuaryFebruaryMarch
AprilMayJune
JulyAugustSeptember
OctoberNovemberDecember
1986
JanuaryFebruaryMarch
AprilMayJune
JulyAugustSeptember
OctoberNovemberDecember
Q | DEFENSE INDICATORS—Continued
Intermediate and final measures of defense activity
557. Index ofindustrialproduction,defense andspace equip-ment
(1977=100)
148.8151.3151.9
155.6156.0157.2
158.5160.7163.4
163.5163.3165.3
165.3167.3169.0
170.1171.2173.4
173.9175.5177.5
178.7180.7180.7
179.3176.7178.5
rl79.0P179.3
559. Manufac-turers' inven-tories, defenseproducts, bookvalue
(Mil. dol.)
17,86118,19018,746
19,01719,51420,035
20,73421,31522,141
22,55122,58122,517
23,09123,40523,489
24,00623,96224,721
25,31725,92326,476
26,58726,59826,270
26,76226,25427,080
27,565(NA)
561. Manufac-turers' unfilledorders, defenseproducts
(Mil. dol.)
113,575114,624120,647
119,870120,758121,672
123,219125,276126,496
125,340129,092129,775
134,455132,467131,990
131,769133,958137,975
140,742143,848144,828
143,336142,288141,497
144,814144,433147,801
rl46,968pl48,137
580. DefenseDepartmentnet outlays,military
(Mil. dol.)
18,44817,80117,794
18,52518,60918,953
18,40519,18119,469
18,68720,15219,899
18,76220,05820,465
19,59720,60320,554
21,49822,48921,987
20,90821,84722,440
20,15221,58623,059
22,101p22,802
588. Manufac-turers' ship-ments, defenseproducts
(Mil. dol.)
5,6825,8355,690
5,9165,7605,920
6,0536,0336,081
6,3236,3396,765
6,3806,6956,718
6,3526,5847,221
6,8277,1647,126
7,6717,8587,943
7,0337,5817,079
r7,333p7,687
570. Employ-ment, defenseproducts in-dustries
(Thous.)
Revised1
1,3911,3981,408
1,4141,4241,435
1,4441,4521,461
1,4701,4741,485
1,4961,5061,514
1,5211,5301,541
1,5491,5691,565
1,5721,5811,580
1,5891,5901,589
1,595(NA)
Defense Departmentpersonnel
577. Militaryon activedu ty©
(Thous.)
2,1302,1352,140
2,1382,1412,143
2,1422,1442,138
2,1382,1412,138
2,1462,1472,148
2,1482,1492,151
2,1562,1572,151
2,1512,1532,150
2,1572,1602,160
2,150p2,150
578. Civilian,direct hireemployment
(Thous.)
1,0491,0491,051
1,0521,0561,056
1,0601,0621,057
1,0681,0691,069
1,0731,0741,076
1,0811,0841,084
1,0911,0941,099
1,0991,0981,100
1,1031,0871,084
1,081(NA)
National defensepurchases
564. Federalpurchases ofgoods andservices,nationaldefense
(Ann. rate,bil. dol.)
228.3
235.8
236.2
247.5
249.5
256\0
269.9
Zll\
r 2 6 8 . 0
565. Nationaldefense pur-chases as apercent ofGNP
(Percent)
6.2
6.3
6.2
6.4
6.4
6 \5
6 .7
6\7
6.5
See note on page 80.Graphs of these series are shown on pages 54 and 55.lSee "New Features and Changes for This Issue," page iii.
JUNE 1986 91Digitized for FRASER http://fraser.stlouisfed.org/ Federal Reserve Bank of St. Louis
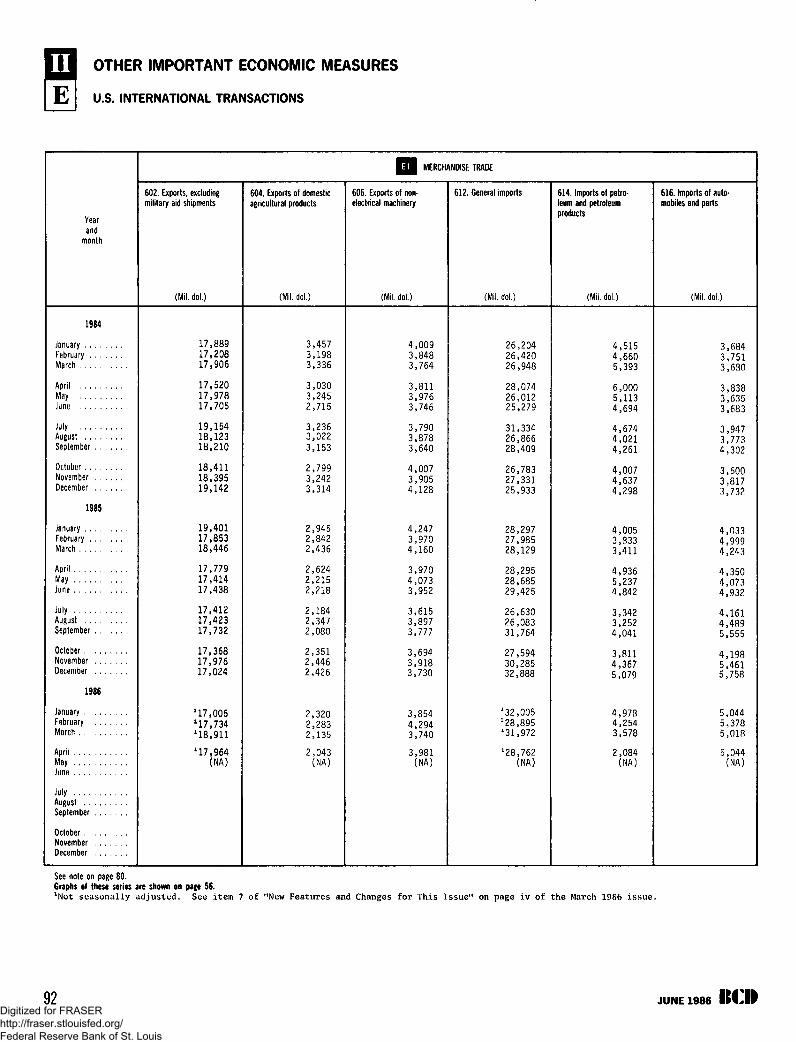
OTHER IMPORTANT ECONOMIC MEASURES
E U.S. INTERNATIONAL TRANSACTIONS
Yearand
month
MERCHANDISE TRADE
602. Exports, excludingmilitary aid shipments
(Mil. dol.)
604. Exports of domesticagricultural products
(Mil. dol.)
606. Exports of non-electrical machinery
(Mil. dol.)
612. General imports
(Mil. dol.)
614. Imports of petro-leum and petroleumproducts
(Mil. dol.)
616. Imports of auto-mobiles and parts
(Mil. dol.)
1984
JanuaryFebruaryMarch
AprilMayJune
July . . . . . . .AugustSeptember . . .
OctoberNovember , . .December . , .
1985
JanuaryFebruaryMarch
AprilMayJune
JulyAugustSeptember . , .
OctoberNovember . . .December . . .
1986
JanuaryFebruaryMarch
AprilMayJune
JulyAugustSeptember . . .
OctoberNovember . . .December . . .
17,88917,20817,906
17,52017,97817,705
19,15418,12318,210
18,41118,39519,142
19,40117,85318,446
17,77917,41417,438
17,41217,42317,732
17,36817,97617,024
'17,006'17,734118,911
'17,964(NA)
3,4573,1983,336
030245
2,715
3,2363,0223,153
2,7993,2423,314
2,9452,8422,436
2,6242,2152,218
2,1842,3472,080
2,3512,4462,426
2,3202,2832,135
2,043(NA)
4,0093,8483,764
3,811976746
790878640
007905
4,128
4,2473,9704,160
3,9704,0733,952
3,6153,8973,777
694918
3,730
3,8544,2943,740
3,981<NA)
26,20426,42026,948
28,07426,01225,279
31,33426,86628,409
26,78327,33125,933
28,29727,98528,129
28,29528,68529,425
26,63026,08331,764
27,59430,28532,888
'32,005X28.895"31,972
'28,762(NA)
4,5154,6605,393
6,0005,1134,694
4,6744,0214,261
4,0074,6374,298
4,0053,8333,411
4,9365,2374,842
3,3423,2524,041
3,8114,3675,079
4,9784,2543,578
2,084<NA)
3,6843,7513,680
3,8383,6353,683
3,9473,7734,302
3,6003,8173,732
4,0334,9994,243
4,3504,0734,932
161489
5,555
4,1985,4615,758
5,0445,3785,018
5,044(NA)
See note on page 80.Graphs of these series are shown on page 56.'Not seasonally adjusted. See item 7 of "New Features and Changes for This Issue" on page iv of the March 1986 issue.
92 JUNE 1986Digitized for FRASER http://fraser.stlouisfed.org/ Federal Reserve Bank of St. Louis

OTHER IMPORTANT ECONOMIC MEASURES
E U.S. INTERNATIONAL TRANSACTIONS—Continued .
Year
and
month
1984
January
February
March
April
May
June
July
August
September
October
November
December
1985
January
February
March
April
MayJune
July
August
September
October
November
December
1986
January
February
March
April
May
June
July
August
September
October
November
December . . .
Q j GOODS AND SERVICES MOVEMENTS (EXCLUDING TRANSFERS UNDER MILITARY GRANTS)
Goods and services
667. Balance
(Mil. dol.)
Revised2
-17,872
-25,394
-25,166
-25,874
-22,832
-25,959
-24,454
-29,451
p-3O,637
668. Exports
(Mil. dol.)
Revised2
89,907
89,053
90,631
90,522
88,040
89,350
90,234
90,873
p91,605
669. Imports
(Mil. dol.)
Revised2
107,779
114,447
115,797
116,396
110,872
115,309
114,688
120,324
pl22,242
Merchandise, adjusted1
622. Balance
(Mil. dol.)
Revised2
-25,801
-29,094
-28,453
-29,174
-25,045
-30,367
-31,675
-37,352
p-36,585
618. Exports
(Mil. dol.)
Revised2
53,614
54,590
55,691
56,005
55,324
53,875
52,498
52,727
p53,548
620. Imports
(Mil. dol.)
Revised2
79,415
83,684
84,144
85,179
80,369
84,242
84,173
90,079
p90,133
Income on investment
651. U.S. invest-ment abroad
(Mil. dol.)
Revised2
22,860
21,104
21,396
20,861
18,726
22,253
24,502
24,509
p24,241
652. Foreigninvestment inthe United States
(Mil. dol.)
Revised2
15,446
17,208
17,991
16,823
16,507
16,804
16,240
15,254
pl7,421
See note on page 80.
Graphs of these series are shown on page 571Balance of payments basis: EX1
of Defense purchases (imports).2See t;Nevv Features and Changes
:cludes transfers under military grants and Department of Defense sales contracts (exports) and Department
for This Issue," page iii.
JUNE 1986 93Digitized for FRASER http://fraser.stlouisfed.org/ Federal Reserve Bank of St. Louis

OTHER IMPORTANT ECONOMIC MEASURES
INTERNATIONAL COMPARISONS
Yearand
month
1984
JanuaryFebruaryMarch
AprilMayJune
July ,AugustSeptember . . .
OctoberNovemberDecember
1985
JanuaryFebruaryMarch
AprilMayJune
JulyAugustSeptember
OctoberNovemberDecember
1986
JanuaryFebruaryMarch
AprilMayJune
JulyAugustSeptember
OctoberNovemberDecember
Q INDUSTRIAL PRODUCTION
47. United States,index of industrial production
(1977-100)
118.4119.3120.1
120.7121.3122.3
123.2123.5123.3
122.7123.4123.3
123.6123.7124.0
124.1124.1124.3
124.1125.2125.1
124.4125.4126.4
126.7rl25.6rl24.4
rl25.0pl24.2
72LOECD1
European coun-tries, index ofindustrialproduction
(1977-100)
108108107
106107104
108109109
109109108
108110111
noinin112111112
112114110
112113
P113
(NA)
728. Japan,index of indus-trial production
(1977-100)
131.5135.4134.2
135.1137.9138.6
139.2140.2139.4
143.3143.4142.7
143.0rl43.4rl41.9
rl44.9rl47.4rl44.9
rl47.2rl45.5rl44.5
rl44.8rl44.2rl44.6
rl44.6rl45.2P144.5
(NA)
725. WestGermany, indexof industrialproduction
(1977 = 100)
106108105
105106
95
109108108
109110109
110109110
110111
r l l 2
116112112
116r l l6
110
113113
pll2
(NA)
726. France,index of indus-trial production
(1977-100)
105104105
102105103
107107105
107105103
101105107
r lO4105104
108108105
107109104
104105
P1O5
(NA)
722, UnitedKingdom, indexof industrialproduction
(1977-100)
105104103
103102103
102102103
103103104
106106108
109109108
108108109
108no
rlO7
108rlO9plO9
(NA)
727. Italy, indexof industrialproduction
(1977-100)
106.0104.0108.0
104.3108.0108.4
107.3108.0110.7
107.5107.0107.4
102.8111.5111.7
107.6108.5111.1
107.3105.8110.6
106.9110.9106.6
108.3rill.3P114.6
(NA)
723. Canada,index of indus-trial production
(1977 = 100)
111.0108,0110.0
109,9110.3111.3
115.1114.5112,2
112.2114.1115.0
113.9114.0114.2
115.0115.0116.4
118.1118.1118.0
119,1120.1
rl20.0
rl20.0rlZQ.BpllS.3
(NA)
See note on page 80.Graphs of these series are shown on page 58.Organization for Economic Cooperation and Development.
94 JUNE 1986Digitized for FRASER http://fraser.stlouisfed.org/ Federal Reserve Bank of St. Louis
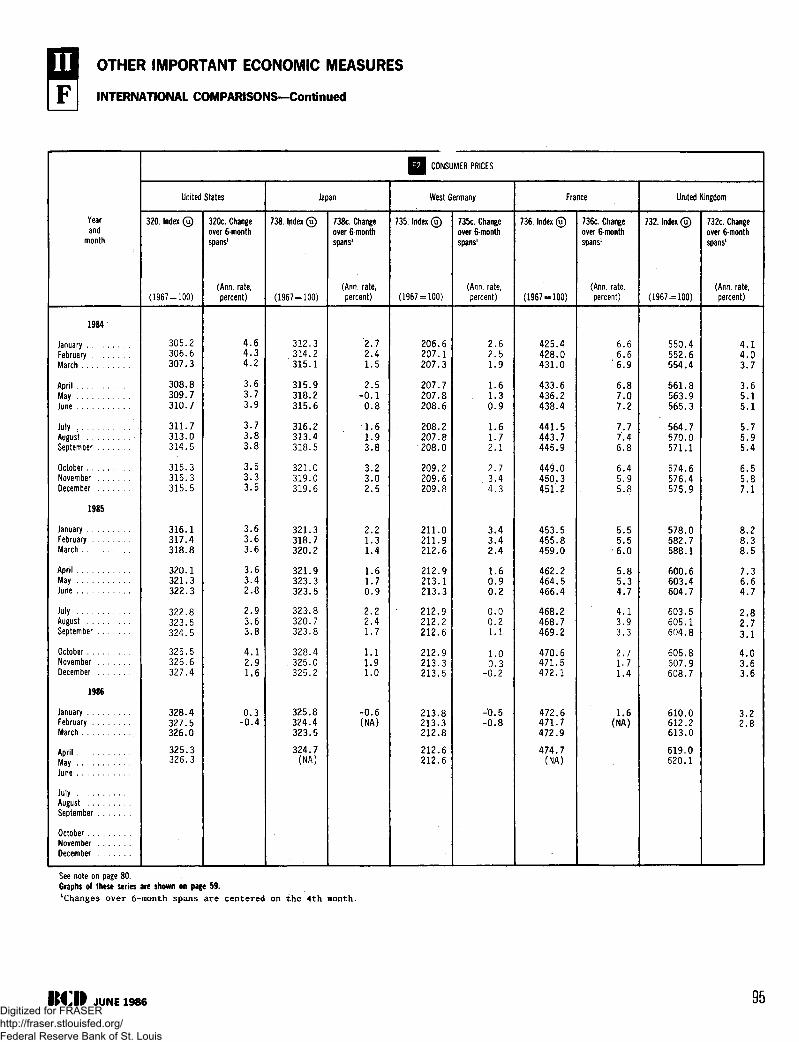
OTHER IMPORTANT ECONOMIC MEASURES
F I INTERNATIONAL COMPARISONS—Continued
Yearand
month
1984
JanuaryFebruaryMarch
AprilMayJune
JulyAugustSeptember
OctoberNovemberDecember
1985
JanuaryFebruaryMarch
AprilMayJune
JulyAugustSeptember
OctoberNovemberDecember
1986
JanuaryFebruaryMarch
AprilMayJune
JulyAugustSeptember
OctoberNovemberDecember
Q CONSUMER PRICES
United States
320. Index ©
(1967 = 100)
305.2306.6307.3
308.8309.7310.7
311.7313.0314.5
315.3315.3315.5
316.1317.4318.8
320.1321.3322.3
322.8323.5324.5
325.5326.6327.4
328.4327.5326.0
325.3326.3
320c. Changeover 6-monthspans1
(Ann. rate,percent)
4 .64 .34 .2
3.63.73.9
3.73.83.8
3.53.33.5
3.63.63.6
3.63.42.8
2.93.63.8
4.12.91.6
0.3-0.4
Japan
738. Index ©
(1967 = 100)
312.3314.2315.1
315.9318.2315.6
316.2313.4318.5
321.0319.0319.6
321.3318.7320.2
321.9323.3323.5
323.8320.7323.8
328.4325.0325.2
325.8324.4323.5
324.7(NA)
738c. Changeover 6-monthspans1
(Ann. rate,percent)
'2.72.41.5
2.5-0 .10.8
1.61.93.8
3.23.02.5
2.21.31.4
1.61.70.9
2.22.41.7
1.11.91.0
-0.6(NA)
West Germany
735. Index ©
(1967 = 100)
206.6207.1207.3
207.7207.8208.6
208.2207.8208.0
209.2209.6209.8
211.0211.9212.6
212.9213.1213.3
212.9212.2212.6
212.9213.3213.5
213.8213.3212.8
212.6212.6
735c. Changeover 6-monthspans1
(Ann. rate,percent)
2.62.51.9
1.61.30.9
1.61.72 .1
2.73.44.3
3.43.42.4
1.60.90.2
0.00.21.1
1.00.3
-0.2
-0.5-0.8
France
736. Index©
(1967 = 100)
425.4428.0431.0
433.6436.2438.4
441.5443.7445.9
449.0450.3451.2
453.5455.8459.0
462.2464.5466.4
468.2468.7469.2
470.6471.5472.1
472.6471.7472.9
474.7(NA)
736c. Changeover 6-monthspans1
(Ann. rate,percent)
6.66.6
' 6 . 9
6.87.07.2
7.77.46.8
6.45.95.8
5.55.56.0
5.85.34.7
4.13.93.3
2.71.71.4
1.6(NA)
United Kingdom
732. Index©
(1967 = 100)
550.4552.6554.4
561.8563.9565.3
564.7570.0571.1
574.6576.4575.9
578.0582.7588.1
600.6603.4604.7
603.5605.1604.8
605.8607.9608.7
610.0612.2613.0
619.0620.1
732c. Changeover 6-monthspans'
(Ann. rate,percent)
4 . 14 .03.7
3.65 .15 .1
5.75.95.4
6.55.87.1
8.28.38.5
7.36.64.7
2.82.73.1
4.03.63.6
3.22.8
See note on page 80.Graphs of these series are shown on page 59.1Changes over 6-month spans are centered on the 4th month.
JUNE 1986 95Digitized for FRASER http://fraser.stlouisfed.org/ Federal Reserve Bank of St. Louis
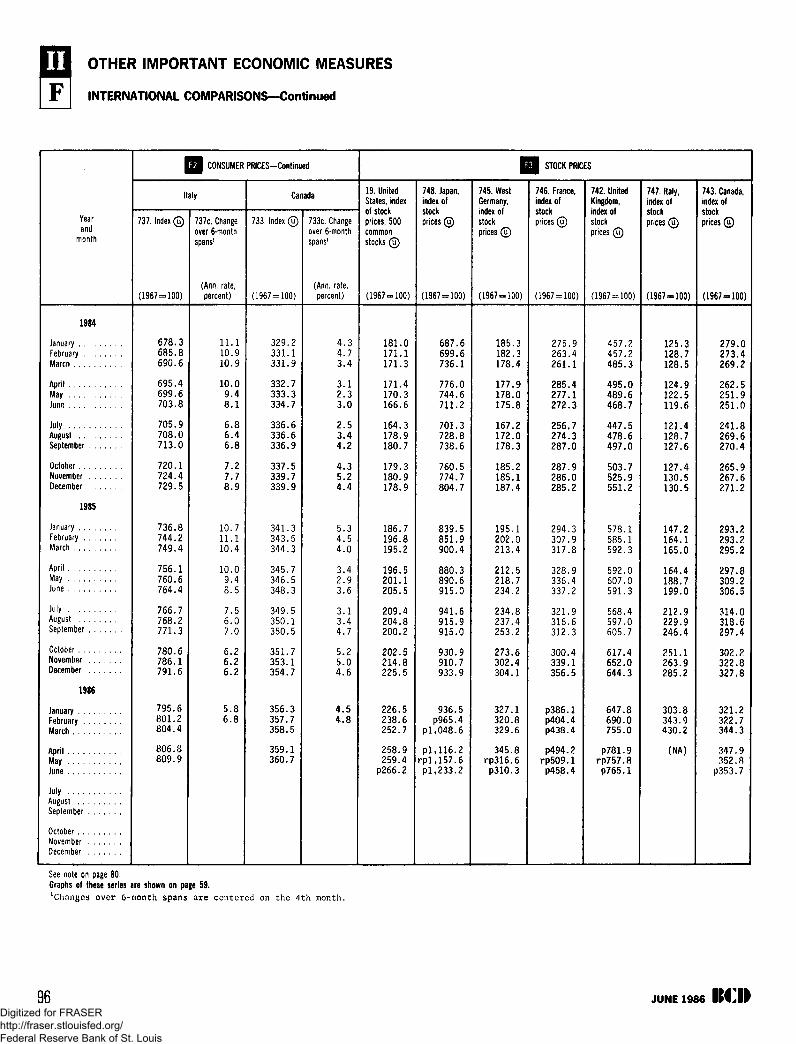
OTHER IMPORTANT ECONOMIC MEASURES
F I INTERNATIONAL COMPARISONS—Continued
Yearand
month
1984
JanuaryFebruary . .March
April . . . .May . . .June
JulyAugustSeptember
OctoberNovemberDecember
1985
January .FebruaryMarch
AprilMayJune
JulyAugustSeptember
October . .November . . .December . , .
1986
JanuaryFebruaryMarch
AprilMayJune
JulyAugustSeptember
OctoberNovemberDecember
Q CONSUMER PRICES—Continued
Italy
737. Index ©
(1967-100)
678.3685.8690.6
695.4699.6703.8
705.9708.0713.0
720.1724.4729.5
736.8744.2749.4
756.1760.6764.4
766.7768.2771.3
780.6786.1791.6
795.6801.2804.4
806.8809.9
737c. Changeover 6-monthspans1
(Ann. rate,percent)
11 .110.910.9
10.09.48.1
6.86.46.8
7.27.78.9
10.711.110.4
10.09.48.5
7.56.07.0
6.26.26.2
5.86.8
Canada
733. Index ©
(1967 = 100)
329.2331.1331.9
332.7333.3334.7
336.6336.6336.9
337.5339.7339.9
341.3343.5344.3
345.7346.5348.3
349,5350.1350.5
351.7353.1354.7
356.3357.7358.5
359.1360.7
733c. Changeover 6-monthspans'
(Ann. rate,percent)
4 .34.73.4
3.12.33.0
2.53.44.2
4.35.24.4
5.34.54.0
3.42.93.6
3.13.44.7
5.25.04.6
4.54.8
Q STOCK PRICES
19. UnitedStates, indexof stockprices, 500commonstocks ©
(1967 = 100)
181.0171.1171.3
171.4170.3166.6
164.3178.9180.7
179.3180.9178.9
186.7196.8195.2
196.5201.1205.5
209.4204.8200.2
202.5214.8225.5
226.5238.6252.7
258.9259.4
P266.2
748. Japan,index ofstockprices ©
(1967-100)
687.6699.6736.1
776.0744.6711.2
701.3728.8738.6
760.5774.7804.7
839.5851.9900.4
880.3890.6915.0
941.6915.9915.0
930.9910.7933.9
936.5P965.4
pi,048.6
pi,116.2rpl,157.6pi,233.2
745. WestGermany,index ofstockprices ©
(1967 = 100)
185.3182.3178.4
177.9178.0175.8
167.2172.0178 3
185.2185.1187.4
195.1202.0213.4
212.5218.7234.2
234.8237.4253.2
273.6302.4304.1
327.1320.8329.6
345.8rp316.6
P310.3
746. France,index ofstockprices ©
(1967 = 100)
275.9263.4261.1
285.4277.1272.3
256.7274.3287 0
287.9286.0285.2
294.3307.9317.8
328.9336.4337.2
321.9316.6312.3
300.4339.1356.5
P386.1P404.4P438.4
P494.2rp509.1
P458.4
742. UnitedKingdom,index ofstockprices ©
(1967-100)
457.2457.2485.3
495.0489.6468.7
447.5478.6497 0
503.7525.9551.2
578.1585.1592.3
592.0607.0591.3
568.4597.0605.7
617.4652.0644.3
647.8690.0755.0
P781.9rp757.8P765.1
747. Italy,index ofstockprices ©
(1967-100)
125.3128.7128.5
124.9122.5119.6
121.4128.7127 6
127.4130.5130.5
147.2164.1165.0
164.4188.7199.0
212.9229.9246.4
251.1263.9285.2
303.8343.9430.2
(NA)
743. Canada,index ofstockprices ©
(1967-100)
279.0273.4269.2
262.5251.9251.0
241.8269.6270 4
265.9267.6271.2
293.2293.2295.2
297.8309.2306.5
314.0318.6297.4
302.2322.8327.8
321.2322.7344.3
347.9352,8
P353.7
See note on page 80.Graphs of these series are shown on page 59.Changes over 6-month spans are centered on the 4th month.
96 JUNE 1986Digitized for FRASER http://fraser.stlouisfed.org/ Federal Reserve Bank of St. Louis

APPENDIXESB. Current Adjustment Factors
Series1985
July Aug. Sept. Oct. Nov. Dec
1986
Jan. Feb. Mar. Apr. May June
5. Average weekly initial claims, State-unemployment insurance . ... . v:.i
13. New business incorporations1.
15. Profits after taxes per dollar of sales,manufacturing corporations2
33. Net change in mortgage debt1 3. . . . . .
72. Commercial and'industrial loansoutstanding in current dollars4.
517. Defense Department gross obligationsincurred1. . . . . . .... . . . .
525. Defense Department prime contract awards
543. Defense Department gross unpaid :
obligations outstanding . . . . . . . .
570. Employment, defense products industries . .
580. Defense Department net outlays1 . . . ., . .
604. Exports of domestic agricultural products .
606'. Exports of nonelectrical machinery . . . .
614. Imports of petroleum and petroleumproducts1 . .-;. . . .
616. Imports of automobiles and parts1
105.7
102.1
636
100.1
88.5
73.2
97.0
100.1
9,9.9
82.5
102.7
114.9
98.4
86.3
98; 1,
100.0r
1956
99.9
86.9
78.7
93.8
99.3
100.4
84.5
95.5
113.3
87.8
81.4
93.3
575
99.9
117.7
186.4
97.0
100.0
95.6
90.6
99.5
107.0
87.9
95.9
104.3
-46
99.9
112.7
70.2
98,6
100.0
101.8
9,9.7
106.0
115.0
104.3
105.6
89.0
94.5
51
99.9
105.4
119.9
100.0
100.1
97.9
113.9
95.6
102.8
96.4
125.2
100.3
-512
100.0
108.8
92.0
101.4
100.5
103.4
108.9
98.3
95.3
94.3
144.1
105.3
-692
99.7
121.1
114.9
104.1
100.2
100.5
109.3
96.1
98.3
106.0
101.3
91.3
- 97.3
-3776
99.7
92.2
100.3
103.6
100.1
95.5
107.1
90.2
82.5
93.5
89.8
103.8
-1172
100.3
101.9
111.5
103.2
100.0
100.8
112.4
111.3
84.5
109.3
93.1
106.3
1053
100.3
95.1
84.3
103.6
99.8
100.6
103.8
100.0
93.7
107.9
82.8
102.8
108.6
446
100.5
86.8
88:8
101.3
99.8
100.8
94.9
104.1
92.0
112,0
87.4
104.1
1408
100.4
80.5
81.0
98.6
100.1
99.5
92.5
104.7
108.2
110.0
NOTE: These series are seasonally adjusted by the Bureau of Economic Analysis rather than by the source agency. Seasonally ad-justed data prepared by the source agency.will be used in BUSINESS CONDITIONS DIGEST whenever they are available. For a descriptionof the method used to compute these factors, see Bureau of the Census Technical Paper No. 15, THE X-ll VARIANT OF THE CENSUS METHOD' II SEASONAL ADJUSTMENT PROGRAM. '
factors are the products of seasonal and trading-day, factors.^Quarterly series; factors are placed in the middle month of the quarter.
, 3These quantities-, in millions of dollars, are subtracted from the month-to-month net change in the unadjusted monthly totals to'yield the seasonally adjusted net change. These factors are computed by the additive version of the X-ll variant of the Census Meth-od II seasonal adjustment program.
4These factors apply only to the loans portion of this series.
97Digitized for FRASER http://fraser.stlouisfed.org/ Federal Reserve Bank of St. Louis
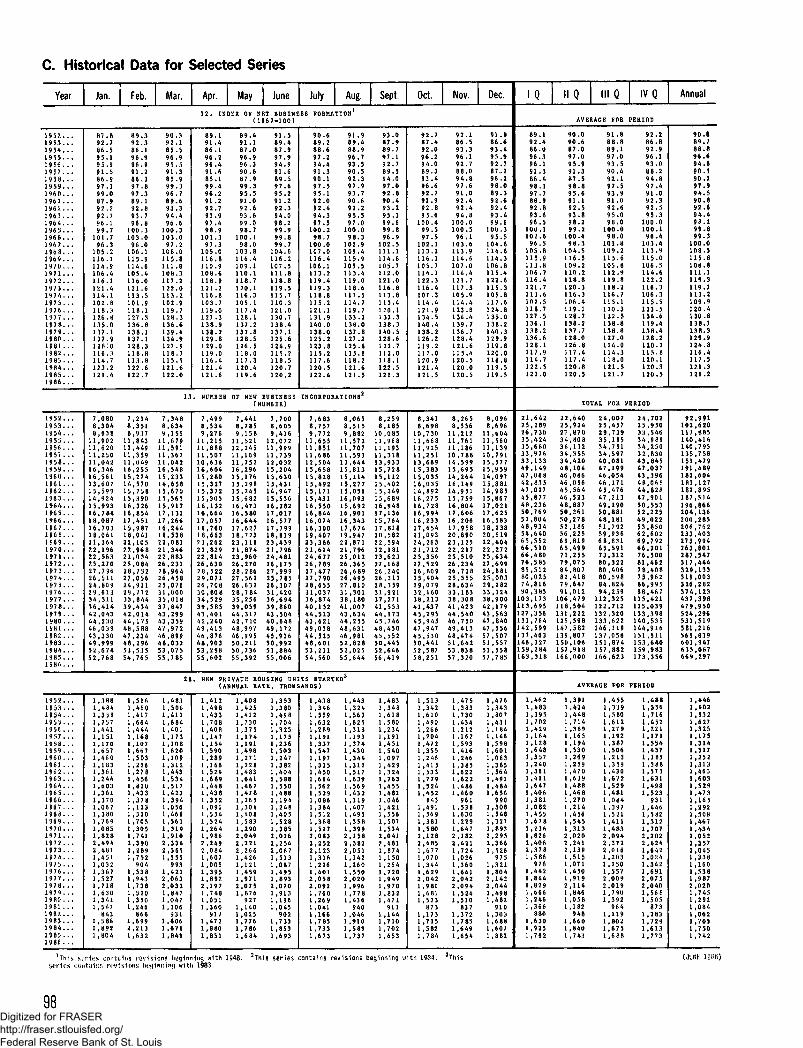
C. Historical Data for Selected Series
Year
1 9 5 2 . . .1 9 5 3 . . .1 9 5 4 . . .1 9 5 5 . . .1 9 5 6 . . .1 9 5 7 . . ,1 9 5 8 . , .1 9 5 9 . . .I 9 6 0 , . .1 9 6 1 . . .1 9 6 2 . . .1 9 6 3 . . .196 4 . . .1 9 6 5 . . .1 9 6 6 . . .1 9 6 7 . . .196 8 . . .1 9 6 9 . , .1 9 7 0 . . .1 9 7 1 . . .1 9 7 2 . . .1 9 7 3 . . .19 7 4 . . .1 9 7 5 . . .1 9 7 6 , . .1 9 7 ? . , .1 9 7 8 . . .1 9 7 9 . . .19 8 0 . . .1 9 8 1 . . .1 9 8 2 . , .1 9 8 3 . , .1 9 8 4 . . .1 9 8 5 . . ,1 9 8 6 . . .
1 9 5 2 . . .1 9 5 3 . . .1 9 5 4 . . .1 9 5 5 . . .1 9 5 6 . . .1 9 5 7 . . .1 9 5 8 . . .1 9 5 9 . . .1 9 6 0 . . .1 9 6 1 , . .1 9 6 2 . . .1 9 6 3 . . .1 9 6 4 . . .1 9 6 5 . . .1 9 6 6 , , .1 9 6 7 . , .1 9 6 8 . . .1 9 6 9 , . .1 9 7 0 . . .1 9 7 1 . . .1 9 7 2 . . .1 9 7 3 . . .1 9 7 4 . . .1 9 7 5 . . .1 9 7 6 . . .1 9 7 7 . . ,1 9 7 8 . . .1 9 7 9 . . .1 9 8 0 . . .1 9 8 1 . . .1 9 8 2 . . .1 9 8 3 . . .1 9 8 4 . . .1 9 8 5 , . .1 9 8 6 . . .
1 9 5 2 . . .
19 5 3 . . .1 9 5 4 . . .195 5 . , .1 9 5 6 . , ,1 9 5 7 . . .1 9 5 8 . . .1 9 5 9 . . .1 9 6 0 . . .1961 . . .1 9 6 2 , . .1 9 6 3 . . .1 9 6 4 . . .1 9 6 5 . . .1 9 6 6 . . .1 9 6 7 . . .1 9 6 8 . . .1 9 6 9 , . ,1 9 7 0 . . .1 9 7 1 . . .1 9 7 2 . . .1 9 7 3 . . .197 4 . . .1 9 7 5 . . .1 9 7 6 . . .1 9 7 7 . . .1 9 7 8 . . .1 9 7 9 . . .1 9 8 0 . . .1981 . . .1 9 8 2 . . .1 9 8 3 . . .1 9 8 4 . . .1 9 8 5 . , .1 9 8 6 . . ,
Jan.
87 .892.786.595 .195.991 .586.997 .199.087.992.292.796 .199.7
101.796 .3
105.2116.1114.9106.4116.1121.4114.1102.8118.3126.8135.0137.1137.9128:0116.3114.7123.2121,4
7,0 808,3048,638
11,90211,62011,25011,04216,34616,56113,60715,59914,92415,99316,78418,08?16,70318,06121,36422,19622,56325,27027,79626,5112 4,80 92 9,61334,31136 ,41442,04344,23046,03943,33049,99952,67452,768
1,388
1,4841,3581,7571,4411,1511,1701,6571,4601,1831,3611,2441 ,6031,3611,3701,0671,3 801 ,7691,0851,8282,4942,4811,4511 ,0321 ,3671,5271,7181,6301 ,3411,547
8431,5861,8921,80 4
Feb.
8 9 . 39 2 . 386 .196 .996.991.286 .397 .89 7 . 389 .192 .893.796 .8
100.3103,0
96.0106.1115.9114.6105.4116.0121.6113 .5101.9118.1127 .3136.8138.1137.1128.3118.8113.8122,6122.7
7,2148,3518,937
11,84312,44911,35911,04916,25515,27414,57015,75815,39016,32616,85417,45115,98718,04122,10522,96821,03425 ,08428,75227,05624,93129 ,77233,8 4439,43442 ,01444 ,17548,58847 ,23448,29653,53554 ,765
1,516
1,4601,4171,6641,4441,1681 ,1071 ,66?1,5031,2261 ,2781,4561,8201,43 31,3781.1231,5201,7051,3051,7412,3902,2891,752
9041,5381,9431.7381,5201,3501,246
8661,6992,2131,632
Mar.
90 .392 .185 .596 .995 .591 .385.99 9 . 396.789.693 .394 ,496.6
100.3103.0
97.2106.0115.8111 .8108.3117.2122.0113 .2102.9119.7128.3136.6139.4134.9127,9118.7115,5121.6122.0
13
7,3488,6349,155
11 ,67911.59111,36711,04216,54815,23314,65815,67015,56315,91717,13117,26616,24418,53822,08321,34622,88326,23128,96426,45825,07631,00035,01837,84743 ,29943,35947,97246,89948,03253,07555 ,785
28
1,483
1,5061,4111,6841,4011,1731 ,1081 ,6201,1091,3121,4431,5341,5171,4231,3941,0561,4661,5611,3191,9102,3342,3651,555
9931,4212,0632,0321,8471 ,0471,306
9311,6061,6711,849
Apr. May June12 . INDEX OF NET BUSINE
89 .191 .486 .196 .29 6 . 491 .685 .19 9 . 496 .291.292.793.997 .498.9
101.397 ,3
105.0116.8110.9108.6118.9121.2116.8103.7119.0127 ,3138.9138.2129.8129.0119,0116.4121 .4121.6
7,4998,5349,276
11,21511,88811,50710,63616,60415,2 8015,32715,37215,30516,13216,66417,05716,76018,66323,26221,82922 ,81426,63028 ,52229 ,07126,70830 ,80834,52939 ,58543 ,40142 ,24049 ,41346,87648 ,90353,29855,602
(1967-100)
89 .49 1 . 187.096 .996 .390.687.999 .395 .591.092.693.699.098,7
100.198.0
103.8116.4109.1110.1118.7120.1116.3105.1117.4128.1137.2137.8128.5126.5118.0117.3120.4119.6
91 .58 9 .8 7 .9 7 .9 4 .9 1 .8 9 .9 7 .95 .291.292 .394.098.29 9 .9 9 .9 9 .
104.116.107.5111.8118.8119.5115.7110.3121.0130.7138.4137.1125.6124.9115.2118.5120.7120.2
(NUMBER)
7,4418,7859,158
11.52112,24511,10911,75216,29615,17615,29815,24515,68216,47 316,5 6016,64417,62718,72323,11821 ,87423,96026 ,27028,28627,56226,63228 ,78435,25639,05944,31742,71048,99746,99550,21150,73655,392
7,7008.6059,436
12,07211,99911,73912,03215,20415,63015,43114,94715,53616,28217,01716,57717,79918,83923,43921,7 9624,48126 ,17527,99925,78526,30731,42036 ,69439,86043,50440 ,64849,17245,93650,99253,88455,006
July Aug.ss FORMATION'
90 .689.288.697 .294.49 1 . 39 0 . 197 ,59 5 . 192.092 .49 4 . 397 .5
100.298.7
100.0107 .0116.4106.1113.2119.4119.3118.8115.2121.1131.9140.0138.0125.2123.8115.2117.6120.5122.4
7,6 838,7579,772
11,65511,85111,68612,50415,65815,82815,49215,17115,43116,55016,84416,07416,30019,40 723,36621 ,61424,67726,78927,47727,79028,65531,03736 ,87440,15244 ,51343 ,62149 ,03844,52548 ,60153,21154,560
91 .989 .488.996 .793 .590 .592 .397.993.790.692.295 .597.0
100.098.3
102.9109.4115.9105.5113.4119.0118.6117.5114.7119.7133.2138,0137.8127.2125.6115.8118.2121.6121.5
8,0658,5159,882
11,57211,70711,59313,64415.81315,11415,27715,05616,09315.69216,90116,34317,67419,9 4722,87121,7 9625,01226 ,36526 ,68926 ,49527,81031 ,3013 8,18041,00743 ,63444,25548 ,63146,98152,82852,02555,644
. MEW PRIVATE HOUSING UNITS STARTED3
(ANNUAL RATE, THOUSANDS)
1 ,412
1 ,4981,4331,7081 ,4081,14?1,1541,5901,2891,1661 ,5241,6891,4481,43 81,3521 ,0911.5541,5241,2641,9 862,2492,0841 ,6071.0051 ,3951 ,8922,1971.7481,0511,360
9171,4721,8801,851
1,408
1,4251,4121,7301,3751,1741,1911,4981,2711,2281,4831,6411,46 71 ,4781,2651,3041,4081,5 831,2902,0492 ,2212,2661,4261,1211,4591.9712,0751,876
9271 ,1401.0251,7761,7 861,684
1,353
1,4981 ,7041,3251,1751,2361,5031,2471,3 821 ,4041 ,5881,5501,4881,1941 ,2481,4051,5281,3852,0262,2542,0671,5131 ,0871,4951,8932,0701 ,9131 ,1961,045
9021,7331,8531,693
1,438
1 ,5591,6321,2891,1911,3371,5471,1971,3351,4501,6141,5621,5291,0861,3641,5121 ,3681,5172,0832,2522,1231,3161,2261,4012 ,0582,0921 .7601,2691,0411,1661,7851,7331,673
1 ,443
1,5631,6251,3131 ,1931,3741,4301,3441,3121,5171,6391,5691,43 21.1191,4071.4951,3581,3992 ,1582,3822,0511,1421,2601,5502,0201.9961,7781,43 6
9401,0461,9101,5891,737
Sept.
93.087.989.797 ,192.789 .594 .097.09 2 , 89 0 . 493 .295 .399.699 .896.9
102 .5111 .1114.6105.7112.0121.0116.8113,8115.4120.1132 .3138 .3140.5128.6122.7112.0118.1122.5121.3
8,2598,185
10,08511,96811,19311,31813,93315,72815,11215,40215,24915,68916,94817,13615,76417,81820,58222,59422,18123,62327 ,16826,24026,31328,35931,92137 ,27141 ,55344 ,17345,74648,45045,55250,44552,64656,419
1,483
1,6181,5 801,2341,1911,4511,5401,0971,4291,3241,7631,4551,4821,0461,4211,5561,5071,5342,0412,4811,8741,1501 ,2641,7201,9491 ,9701,8321,471
9111,1441,7101,7021,653
Oct.
92.78 7 . 492 .096.294.089 .393 .496.692.791.992 .895.6
100.499 .597 .5
102.1113.2116.1105.7114.1122.3116.4107 .3114.4121,9134.5140.4138.2126.2119.2112,0120.9121.4121.5
8,3418,698
10,7 3011,66811,92511,25113,66915,38315,03516,03514,89216,27516,72816,99416,23317,65421,09324,26321,71225,35627,52926 ,80925 ,40429,07932,16038 ,21341,43 745 ,29545,94547,94745,53050 ,4415 2 ,5 8758,251
1,513
1,6101,4901 ,2661 ,2041,4721,3551,2 461,4151,5331,7791,5241,452
8431 ,4911,5691,3811,5 802 ,1282 ,4851,6771,0701,3441,6292 ,0421,9811,6811,523
8731,1731 ,7151,5 821,784
Nov.
92 .186 .593 .396 .192.788.09 4 . 897,691 .092 .49 2 . 494 .8
100.0100.5
96 .1103.6113.9114.6107.0114.4121.7117.3105.9114.4123.8134.4139.7136.7128,4121.6115.4120.5120.0120.5
8,2658,5 56
11,21211,76111,18610,78814,59915,69514,26416,14914,95115,75916,80417,60616,20617,95820,89023,12522,21725,51026,23426 ,71825,55528 ,63433,18338 ,30841 ,42344 ,54046,75049,41348 ,47451,64253,83857,320
1,475
1,3831,7301,4341,2121,1621,5931,4161 ,2461,3851,6221,6221,4861,460
9611,5381,6301,2291,6472,1822 ,4211 ,7241 ,0261.3601,6412 ,0422,0941,5241,510
83?1 ,3721,7851,6491,654
Dec.
91 .986.693.495,992.387.296.298.089.392.692.495.499.6
100.395.5
104.6114.6114.3106.8115.4122.6115,3105.8117.6124.8135.0138.2140.3129.9119.8120,0118.8119.5119.5
8,0968,696
11,60411,56011,13910,79115,57715,95914,09715,88114,98515,86717,02117,62516,58318,23820,61922,40422,27225,63427 ,69924,88125,00329,28233,12438.90042,17943,56347 ,84047,55657,50751,55753.55857,785
1,4?6
l i s o ?U 4 3 11,1841,1461,5981,6011 ,0631,3651.5641.4911.4841,656
9 901,3081.5481,3271,8932,2952,3661,526
9751,3211,80 42,1422 ,0441,49 81,482
9101,3031,6881,6071,882
IQ
89 .192 .486.096 .396 .191 .386 .498 .197.788.992 .893.696 .5
100.1102.6
96 .5105.8115.9113.8106.7116.4121.7113.6102.5118.7127 .5136,1138.2136.6128.1117.9114.7122.5122.0
II Q
AVE
90.090.687.097.095.991 .387 .598 .895.691 .192 .593 .898.299.2
100,498 .3
104.5116.5109.2110.2118.8120.3116.3106.4119 .1128.7138.2137.7128.0126.8117.4117.4120.8120.5
III Q IV Q
IAGK FOR PERIOD
9 1 . 8 92 .288 .8 86 .889 .1 92 .997.0 96 .193 .5 93 .09 0 . 4 88 .29 2 . 1 9 4 . 897.5 9 7 . 493 .9 91.091.0 92 .392.6 92 .595.0 9 5 . 398.0 100.0
100.0 100.198 .0 9 6 . 4
101.8 103.4109.2 113.9115,6 115.0105.8 106.5112.9 114,6119,8 122.2118.2 116.3116.7 106 .3115.1 115.5120.3 123.5132.5 134.6138.8 139.4138.8 138.4127.0 128.2124,0 120.2114.3 115 .8118.0 120.1121.5 120.3121.7 120.5
TOTAL POR PERIOD
21,64225,28926,73035,42435,66033,97633,13349,14947,06842 ,83547,02745,87748,23650,76952,80448 ,93454,64065,55266,51066,48076,58585,51280,02574,81690,385
103,173113,695127,356131,764142.599137,463146,327159,284163.318
1,462
W3951,7021 ,4291,1641,1281.6481.3571,2401,3611,4111,6471,4061,3811,0821,4551,6781,2361,8262,4062 ,3781,586
9761 ,4421,8441 ,8291,6661 ,2461,366
8801,6301,9251,762
22,64025,92427,87034 ,80836,13234,35534,42048 ,10446,08646,05645 ,56446,52348,88?50,26150,27852,18656,22569,81965,49971,25579,07584,80782 ,41879,64791,012
106,479118,504131,222125,598147,582139,807150,10615? ,918166,000
24,007 24,70225,457 25 ,95029 ,739 33,54635,195 34 ,98934 ,751 34 ,25034,597 32 ,83040,081 43 ,84547,199 47 ,03746,054 43,39646 ,171 48 ,06545,476 44 ,82847,213 47 ,90149,190 50 ,55350,881 52,22548,181 49 ,02251,792 53 ,85059,936 62 ,60268 ,831 69 ,79265,591 66 ,20173,312 76,50080,322 81 ,46280,406 78 ,40880,598 75,96284 ,824 86 ,99594,259 98,467
112,325 115,421122,712 125,039132,320 133,398133,622 140,535146,119 144,916137,058 151,511151,874 153,640157,882 159,983166,623 173,356
AVERAGE FOR PERIOD
1,391
1^448,714
I ,369L.16S1,1941,5301,269
,259,470
L.6391,488
,468,270,214,456
L.545L .313. , 0 2 0£,2411,139
,515,071,450,919
2,1141,8461,0581,182
9481,6601,8401,743
1,455 1,488
l !§80 l ! ? 1 61,612 1,4521,279 1,2211,192 1,1711,387 1,5541,506 1,4571,213 1,1851,359 1,3881,430 1,5731,672 1,6311,529 1,4981,481 1,5231,084 9311,397 1,4461,521 1,5821,411 1,3121,483 1,7072,094 2,2022,372 2 ,4242,016 1,6421,203 1,0241,250 1,3421,55? 1,6912,009 2 ,0752,019 2,0401,7 90 1,56 81,392 1,505
964 8731,119 1,2831,802 1,7291,675 1,6131,688 1,773
Annual
90 .889.788 .896 .694 .690 .390 .297 .994 .590 ,892.694 .498.299 .89 9 . 3
100.0108.3115.8108.8111.1119.3119,1113.2109.9120.4U 0 . 8138 .1138.3129.9124.8116.4117.5121.3121.2
92 ,991102,620117,885140,416140,7 93135,758151,479191,489182,604183,127182,895187,514196,866204,136200,285206,762233,403273,994263,801287,547317 ,444329,133319,003326,282374,123437,398479,950524,296531,519581,216565,839601,947635,067669,297
1,4461 4021^532L.627L ,325L.17S1,314L.S171,2521,313L,4631,6031,5291,473
,1651,292t , 5 0 8L ,467L.4342,0522,3572,0451,3381,1601,538L,9871,020
,745,292,084
I ,0621,703
,7501,742
'This series contains revisions beginning with 1948. 2Th1s series contains revisions beginning with 1984. Thisseries contains revisions beginning with 1983.
(JUNE 1986)
Digitized for FRASER http://fraser.stlouisfed.org/ Federal Reserve Bank of St. Louis
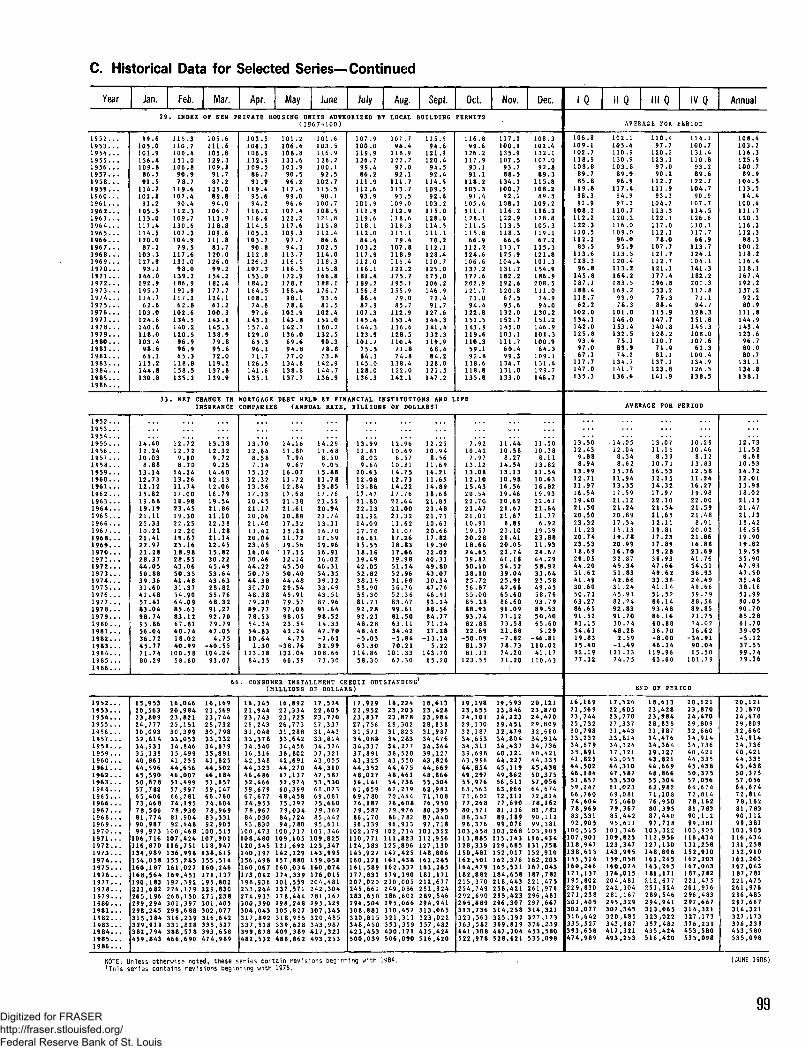
C. Historical Data for Selected Series—Continued
Year
1952 . . .1 9 5 3 . . .1 9 5 4 . . .1 9 5 5 . . .1 9 5 6 . . .1 9 5 7 . . .1 9 5 8 . . .1 9 5 9 . . .1 9 6 0 . . .1 9 6 1 . . .1 9 6 2 . . .1 9 6 3 . . ,1 9 6 4 . . .196 5 . . ,1 9 6 6 . . .1 9 6 7 . . .196 8 . . .1 9 6 9 . . .1 9 7 0 . . ,1 9 7 1 . . .1 9 7 2 . . .1 9 7 3 . . .1 9 7 4 . . .1 9 7 5 . . .1976 . . .1 9 7 7 . . .1 9 7 8 . . .1 9 7 9 . . .1 9 8 0 . . .1981 . . .1 9 8 2 . . .1 9 8 3 . . .1 9 8 4 . . .1 9 8 5 . . .1 9 8 6 . . .
1 9 5 2 . . .1 9 5 3 . . .1954 . . .1 9 5 5 . . .19 5 6 . . .1 9 5 7 . . .1 9 5 8 . . .1959. . .1 9 6 0 . . .1 9 6 1 . . .1 9 6 2 . . .1 9 6 3 . . .1 9 6 4 . . .196 5 . . .1 9 6 6 . . .1 9 6 7 . . .1 9 6 8 . . .1 9 6 9 . . .1 9 7 0 . . .1 9 7 1 . . .1 9 7 2 . . .
1 9 7 3 . . .1 9 7 4 . . .1 9 7 5 . . .1 9 7 6 . . .1 9 7 7 . . .1 9 7 8 . . .1 9 7 9 . . .1 9 8 0 . . .1 9 8 1 . . .1 9 8 2 . . .1 9 8 3 . . .1984. . .1 9 8 5 . . .1986. . .
1 9 5 2 . . .1 9 5 3 . . .1 9 5 4 . . .1 9 5 5 . . .1 9 5 6 . . .1 9 5 7 . . .1 9 5 8 . . .1959 . . .1960 . . .1 9 6 1 . . .1 9 6 2 . . .1 9 6 3 . . .196 4 . . .1 9 6 5 . . .1966 . . .1 9 6 7 . . .1 9 6 8 . . .1 9 6 9 . . .1 9 7 0 . . .1971 . . .1 9 7 2 . . .1973 . , .1 9 7 4 . . .1 9 7 5 . . .1 9 7 6 . . .1977 . . .1 9 7 8 . . .1979. . .1980 . . .1 9 8 1 . . .19 8 2 . . .1 9 S 3 . . .1 9 8 4 . . .1 9 8 5 . . .1 9 8 6 . . .
Jan.29
99.6105.0101.9136.4109.8
86.591.5
102.891.2
105.5113.0117.4114.5120.0
87.2103.3127.9
93.1144.0192.9195.7114.7
62.6103.0
140.6118.0103.498.664.1
115.2144.8130.8
33
14.4012.2410.03
8.8813.1412.7312.1215.8219.6819.1921.1125.3310.2221.4122.9721.2828.3744.0550.8839.3631.6041.4857.4183.0498.7495.8656.0436.7245.7771.7480.2 9
15,95320,56323,80924,77730,09332,81434,93335,13540,86344,59645,59050,87857,78265,40673,46878,50681 ,77490,98799,973
106,716116,870134,989154,058160 ,187168,564190,183223,682265,196299,294298,245315,384329,919382,794459,843
Feb.. INDEX
115.3110.7100.4151.0106,890.978.7
102.490.4
112.3109.7130.6107.3104.9
79.5117 .6131.0
98.0139.2186.9191 .9117.2
62.8102.6
140.2120.5
96.996.965.3
118.8158.5135.2
Mar. Apr. May June July Aug. Sept. Oct.OF NEW PRIVATE HOUSING UNITS AUTHORIZED BY LOCAL BUILDING PERMITS
1 0 5 . 61 1 1 . 61 0 5 . 8129.3109.8
91 .787.2
89.894.0
106.7113.9118.8109.6111.8
83.7120.0126.0
99.2154.2181 .4177.7124.1
61 .2100.3
145 .3138.9
7 9 .895 .672.0
119.2137.6139.9
. NET CHANGE IN
INSURANCE
12.7212.72
9.908 .70
14 .2413.2611 .7417.0018 .9823 .4519.3022 .2512.2019.6725 .1618.9828 .5543.06
50 .354 1 . 4 831.3754.906 4 . 0 985 .6383 .1267 .816 0 . 7 418.0240 .99
100 .5858 .60
16,04620 ,98423 ,82125 ,15130,39933,05334,84635,49941,25544,65646 ,00751,49957 ,99766,28174 ,19578,93081 ,90492,4480 0 , 4 6 807 ,424 ]16 ,75136,99855,245
L61.O27169,451192,392*26,179268,150301,397 .299,688316,239331,828388,578166,690
13 .3812.32
9.729.25
14 .6012.1312.0616.7919 ,5421,8621.1022 .3811 .2821 .1422 .4515.8230 .2245 .49
53 .6443 .6328 .8255.7668 .3291.2792 .7079.7947 .05
4 . 7 5- 4 0 . 5 5104.24
93.07
66
16,16921,56923 ,74425,73230 ,79833,23234,67935,89141,82544,50246 ,18451,85759,14766 ,76074,60478,96983 ,33192,90500 ,51507 ,90118,94738 ,61555,51460,246
171,13795,802
129,830171,238JO1.4O5J02.077316,642J35.527393,658+ 74,989
103.5106.3106.9132.9109.5
86.791.9
95.694.2
116.2116.6114.5105.2103.790.8
112.8126.3107 .3153.0184.3164.5108.1
74.697.6
157.4129.0
65.396.171.7
126.5141 .6135.1
MORTGAGE
COMPAKIE
13.7012.64
8.587.14
15.3212.3213 .3617.3320.4521.1720.0621 .4013.4220.0423.4516.0430 .4644.2250.7544.3830.7048.3879.20
78.5354.3454.8310 .64
1.30123,28
84.35
. CONSUK
(1967=100)
101.2106.4108.8133.6101.9
90.596.2
99.096.6
107.4122.2117.6109.3
97.794.3
113,7116.5116.5172.9178.1166.4
98.178.8
102.9
142.7136.0
69.694.877.0
134.8138.8137.7
101 .6103.5116.9126 .2100.192.5
102.7
90.1100.7108.5121 .8115.8112.4
86.6102.5114.0118.3115.8166.8188.1176 .7
93,681.5
102.4
160.2132.5
90.378.873.8
142 .9144. 7136.9
107 .9100.0119.9126.7
99.486.2
111 .9
93.9101.9111 .9119.6118.1112.084.4
103.2117.9112.0116.1181.4189.2156.886.487.9
107.3
144.3123.9101.7
75.584.3
145.0128.0136.3
107 .798.4
118.9122.2
97.092.1
111 .7
93.5109.0112.911 8.6118.3113.1
79.4107.8118.9115.4122 .2175.7195.1155,9
79.085.7
112.9
136.6128.5110.4
71.874.8
138.4122.0142.1
115.594.6
121 .9120.4
94.592.4
114.5109.592.6
103.2115.0128.0114.5111 .1
70.2112.1128.4110.7125.0175.0206.2146.9
72.491 .7
127.6
141 .4132.3119.968.484.2
128.0121.5147.2
116.899.6
126.2117.9
93.191.1
118.2105 .3
91 .4105.6111 .1128.1111 .5115.866 .9
112.2124.6106.6137.2177.6202.9121.7
71.094.4
122.8
143.9119.6110.3
59.192.8
138.6118.8135.8
DEBT HELD BY FINANCIAL INSTITUTIONS AND LIFE
1 (ANNUAL RATE,
14.1611.80
7.949.67
16.0711 .7212.8417 .6821 .3821 .6120 .8817.3215 .2821 .7219.5617 .1532 .1445 .50
50 .404 4 . 4 829 .5445 .9179.57
98 .0523 .5442 .24
4 .73- 3 8 . 7 6132.04
66.59
14.2911.688.509.05
15.8811 .7813.8517.7621.5220.9421.7413 .3116.7017.5919.9616.9136.0246 .31
54.3539.1233,4943.5187.96
98.5214 .3347.70-7 .6132.99
108.6673.30
B1LL1UW
13.9911.818.039.64
20.6312.0813 .8617.4721.8022.1321.9214.0917.7016.6115.5518.1639.4942.05
52.8238.1538.9055.3081.71
92.2148.2848.41-5.0363.30
114.8658.30
12 .9610.69
8.5710.8114.7512.7314.2217.7622 ,6 421.0021.3211.6221.0717.2618.8317.6639.9851.145 2.9631.6036 .7652.3683.47
81 .5063.1134.42-5 .8470 .21
101.3367 .30
ER INSTALLMENT CREDIT OUTSTANDING1
(MILLIONS
16,34521 ,94423 ,74326,24331 ,04833 ,37834 ,54036,31642 ,34844 ,32346,68652,46659,67967 ,67774 ,95378,96784,03093,830
100 ,473108,480120,345140,197156,498160,067173,042198,936233,244274,933300,390304 ,043317,892337 ,518399 ,878482,532
16,89222,33423 ,72526 ,77331 ,28833,64234,45636,80242 ,69144,27047 ,13752,97460,39968 ,45875 ,29279,03484,72494,780
100,717109,105121,692142 ,229157,880160,034174,339201 ,559237,571278,444298,248305,827318 ,955339,628409,389488,862
DF DOLLAR
17 , 5 2 42 2 , 6 0 52 3 , 7 7 027 , 3 3 7
3 3 * 8 1 434,'32437 ,32143 ,05544 ,31047,58753 ,53061 ,02369 ,08175,66079,36785 ,44295 ,611
101,346L09.825123,347143,995159,058160,074176,015204,481242,304281 ,167295,329307 ,345320 ,485343,987417,321493,253
S )
17,92922,95223,83727,75631,57134,08834,31737,89143,32544,35248,02754,14161,6596 9 ,7 8076,18779,58786,17096 ,339
102,179110,771124,383145,927160,221161,589177 ,831207,020245,661283,650294,504308,881320,815348,450423,453500,039
18,22423,20323 ,87828,302
34^28334,27738,52843,55044,47548,46154,73662 ,23970 ,44476,60879,97686 ,7 8296,913
102 ,714111 ,823125,896147,425161 ,43 8162,337179 ,190210,005249 ,086286 ,602295,066310,457321 ,311353,359430,171506 ,090
12.2510.94
8.5611 .6914.2111.6514.8918.6821.8521.4821.7110.6320.6617,8219.3022 .0240.3349.8043 .0730.3447.7646.9193.2488.5684.7771.2427.28
-13.145.22
143.7065.20
7.9210 .42
7.9713.1213.0812.1015.4320.5422.7021.4721 .0110.9119.5720.2818.6624.6539.8250 .10
25.7256 .8755.0085.2888.9393.7482.8822 .69
-50.0981 .3781 .13
123.55
18,61323,42823,98428,838
34,47634,36439,12743,82644,66948,86655,30462,98271,10876,95080,39587,44097,718
103,322112,956127,130148,806162,245163,265181,171212,677251,924289,546294,941313,065323,022357,482435 ,424516,420
19,19823,65524,10129,130
34,65334,31139,69843,99644,85449,29755,97663 ,56371 ,60277,26880,57188,34798,376
103,458113 ,885128,339150,481162,501
182,882215,370254,749292 ,690295,889313,736323,563363,582441,308522,978
Nov.
117.2100.1135.9107.593.788.5
134.1100.7
92.1108.3116.2122.9113.5118,366.6
113.7125,9104.4131 .7182,2192.6120.8
67.595.6
132.0152,7145.0103.1111.760.499.3
134.7131.0133.0
11.4410.58
8.2714.5413.1310.9816.5619.4620,6221.6721.67
8.8921.1021.4120.0521.7441.1854.52
25.9142.6665.6086.6091 .0971.1273.5821.88-7.8278.7374.2071.20
19,59323,84624,22329,4513 2 47 934,*80434,43740 ,12144,22745,11949,86256 ,51163,96672,21277,69081 ,13689,18999,076
103,268115,143129,685152,017162,376
184,658218,443258,421295 ,423296,307314,258325 ,392369,819447 ,30452 8,621
Dec.
108.3102.4132.1107.0
92.889.3
115.8108.2
89.3109.2116,2128.8105.3119.167 .2
115.3121 .8101 .3154.9186.9208.5111 .0
74.994.0
130.2151 .2146.9101.3100.9
64.3109.1131 .4129.7146 .7
11.5010.38
8.1113.8211.5410.6316.8219.9322.6721.6421.77
6.9219.3923.8811 .9324.6744.2958.92
21,5849.4558,7693.7989.5350.4065.60
5.29-46.81110.02
41 .17110.63
20.12123 ,87024,47029,80932 66034,91434,73640,42144,33545,43850,37557 ,05664,67472,81478,16281,7 8390,11299,381
103,905116,434131,258152,910162,203167,043187,782221,475261,976296,483297 ,667314,321327,173376,239453,580535,098
1 Q
106.8109.1102.7138.9108.8
89.785.8
119.898.391.9
108.2112.2122.3110.5112.2
83.5113,6128.3
96.8145.8187.1188.4118.762.2
102.0134,1142.0125.893.497.067.1
117.7147.0135.3
II Q
AVEB
1 0 2 . 11 0 5 . 4110.9130.9103.8
89.996.9
117.494.997.2
110.7120 .2116.0109.0
96.095.9
113.5120.4113 .2164.2183.5169.2
99 .978.3
101.0146.0153.4132.5
75.189.974.2
134.7141.7136.6
I I I Q IV Q
AGE FOR PERIOD
110.497 ,7
120.2123.1
97.090.2
112.7111.9
93 .3104.7113.3122.1117.0112.1
78.0107.7121 .7112.7121.1177.4196.8153.2
79 .388 .4
115.9147.7140 .8128.2110.7
71.981 .1
137.1123,8141.9
114.1100.7131 .4110 .8
93.289 .6
122.7104.7
90.9107 .7114 .5126 .6110,1117.7
66.9113.7124.1104.1141 .3182.2201 .3117.8
71 .194.7
128.3151,8145 .3108.0107.6
61 .3100 ,4134.9126 .5138 .5
Annual
108.4103.2116.3125.9100,7
89.9104.5113.5
94 .4100.4111 .7120.3116.3112.3
88 ,3100.2118,2116.4118.1167.4192,2157.2
92.280 .9
111.8144.9145.4123,6
96.780.080.7
131.1134.8138.1
13.5012.439.888.94
13.9912.7111.9716.5419,4021 .5020.5023.3211.2320.7423.5318.6929.0544.20
41.4930.6050.7163.2786.6 591.5281.1554.6119.8315.4092.1977.32
16,16921,56923 ,74425,73230,7 9833,23234,67935,89141 ,82544,50246 ,18451 ,85759 ,14766,76074,60478,96983,33192,905
100,515107,901118,947138,615155,514160 ,246171,137195,802229,830271,238301,405302,077316 ,642335,527393,658474,989
14.0512.04
8.348.62
15.7611.9413.3517.5921.1221.2420.8917.3415.1319.7820.9916.7032 .8745.34
42.6631 .2445.9382 .2492.8391.7030.7448.26
2.59-1.49
121 .3374.75
13.0711 .15
8.3910 .7116.5312 .1514.3217,9722 .1021 .5421 .6512.1119.8117.2317.8919 .2839 .9347 .66
33 .3641 .1451 .5286 .1493 .4886.166 0 . 8 836.70- 8 . 0 046 .24
119.9663 .60
10.2910.46
8.1213 .8312.5811 .2416 .2719.9822.0021 .5921 .48
8.9120,0221.8616 .8823 .6941 .7654.51
24.4049 .6659.7988.5689.8571 ,7574.0216.62
- 3 4 . 9 190 .0465.50
101.79
END OF PERIOD
17,52422 ,60523 ,77027,33731 ,44333 ,81434 ,32437 ,32143 ,05544 ,31047 ,58753 ,53061 ,02369 ,08175,66079,36785,44295,611
101,346109,825123,347143,995159,058160 ,074176,015204,481242 ,304281 ,167295 ,329307 ,345320 ,485343,987417 ,321493,253
18,61323 ,4282 3 , 9 8 428 ,83831 ,98734,47634 ,36439,12743,82644 ,66948 ,86655,30462 ,98271 ,10876,95080 ,39587,44097 ,718
103,322112,956127,130148,806162,245163,26 5181,171212,677251 ,924289,546294,941313,065323,022357,482435 ,424516,420
20 ,12123,87024,4702 9,80 932 ,6603 4 , 9 1 434,73640 ,42144 ,33545 ,43850 ,37557 ,05664 ,67472,81478,16281 ,78390,11299 ,381
103,905116,434131,258152,910162,203167 ,043187,7 82221 ,475261 ,976296,483297,667314 ,321327,173376,239453,580535,098
12,7311 .52
8.6310 .5314.7212 .0113.9818.022 1 . 1 521 .4721 .1315.4216,5519.9019.8219.5935.9047 .9347 .5035 .4838.1651.9980 .0590 .7085 .2861 .7039 .05- 5 . 1 237 .5599 .7479.36
20 ,12123,87024,47029,80932 ,66034 ,91434,73640 ,42144 ,3354 5 , 4 3 850 ,37557 ,05664 ,67472 ,81478,16281 ,7 8390,11299,381
103,905116,434131 ,258152,910162,203167 ,043187,782221,475261,976296,483297,667314 ,321327 ,173376,239453,580535,098
NOTE: Unless otherwise noted, these series contain revisions beginning with 1984.'This series contains revisions beginning with 1975.
(JUNE 1906)
99Digitized for FRASER http://fraser.stlouisfed.org/ Federal Reserve Bank of St. Louis

C. Historical Data for Selected Series—Continued
Year
1952...1953...1954. ..1955...1956...1957...1958...1959...I960...1961.,.1962...1963...1964...1965...1966...1967...1968...1969...1970...1971...1972...1973...1974. ..1975...1976...1977...1978...1979...1980...1981...1982...1983...1984...1985...1986.,.
1952...1953...1954...1955...1956...1957...1958. ..1959...1960...1961...1962.. .1963...1964...1965...1966...1967...1968...1969...1970,. .1971. ,,1972...1973...1974...1975...1976,. .1977. ..1978...1979.. .1980.. .1981 ...1982, ..1983...1984...1985, ..1986...
1952...1953...1914...1955...1956.. .1957..,19S8...1959., .1960...1961 ...1962.. .1963...196 4...1965...1966...1967.
1969!!!1970...1971...1972...1973...1974...19 7 5 ...1976!!!1977. ,.1978...1979...1980...1981...1982...1983...1984...1985...1986...
Jan.
19,21,21,20,242829,28,31,32,33,36,38,43,53,61,67,77,88,90,84,94,
113,140,125,124,135,155,193,213,254,268,268,324,
000000
-000
" 000000-00010000
=00010001000
67889999
10101010111212
ia1212121212131212121313131212121214
63222700052951569517156743 39995 820399315621958762540 48521944478279967652349450158975068016693553086947
.33
.00
.16
.54,23.00.30.79.00.28.07.34.39.25.77.06.70,65.17.55.78.99.45.07.45.93.04.06.62.56.72.77.68.79
Feb. Mar. Apr.7 2 . C O M M E R C I A L A N I
19,21,2 1 ,2 0 ,24,28,28,28,31,32,33,36,39,44,54,62,67,77,90,9 1 ,85,98,
1 1 6 ,1 3 9 ,1 2 5 ,1 2 5 ,1 3 5 ,158,197,213,259,268,273,326,
00000
-000-O000000000
-000000000000
-0101
6412770646926 867208355 83870966712126195618071404415843023625260034322605758824658341288391934582035776
.41
.00
.08
.61
.00
.07
.53
.36
.07
.42
.27
.40
.32
.12
.29
.69
.11
.35
.58
.87
.95
.20,45.29.75.70.15.33.92.55.58.14.49.14
95. RATIO
.05
.22
.19
.22
.20
.43
.72
.26
.11
.77
.35
.88
.70
.27
.70
17304338.4889207 507481970803213007429
6788
999
101010
.013217.30
417030207337
11.06111212
12121212121213
12121313131212121214
684370
05414340339627
05482073822809097937
19,21,21 ,20,25,29,28,28,32,33,33,36,39,45,54,63,67,79,91,91 ,86,
100,117,138,123.126,138,160,200,211,261,269,2 82,329,
000-00000
-000000O100000
-0000000
-010100
7614300369164141827288200931119072512015638051007320912439041951247381524901795363354066763284500 86012
.16
.48,08.23.15.07.22.29.07.21.20.20.13.37,53.03.43.35.34,64.85.24.56.72.41.60.44.77.13.03.09.19.60.51
, CONSUM
6788
99
10101011111212
12121212121313
12121313131212121214
.04
.45
.17
.42
.60
.32
.34
.663209.8546.69
1236373748002?
12572173742706148758
19,21,2021,25,29,28.29,32,33,34,36,39,46,55,63,68,81,91 ,90,87,
101,122,136,120,126,140,165,200,215,266,265,289,330,
85
00
-00000
-0-0000000
-00000000
-00011
-110000
KR IN
6788
99
1010101122
2222233
22
1313131212121314
MayINDUSTRIAL(MILLIONS
7426759670 49932503554092293079121458554203377598877132333891342768857564789925620793583581668604303251
19,80921,81620,81121,41626,44829,65028,16829,57332,59133,02034,26936,62639,88247 ,20956,13963,99869,06782,27791 ,86491 ,66287 ,906
103,074125,111133,750121,069127,740143,029168,229198,756221,279271 ,022261,465295,758332,539
. CHANGE IN
,25.24.47.23,22.00,37.07.14.14.34.40.19.31.75.34.64.35.48.54.55.43.11.14.68.82.03.33.62.73.85.75.47.61
(P
0.330.160.870.53
-0.150.070,370.710.070 .420.270 .400,38
-0.18-0.2 90.850,740.050.240.940.130.860.191.000.670.160.960.080.10
-0.560.021 .-2 80.581.18
STALLMENT CR
.11
.57
.20
.50
.59
.36
.37
.59
.3718.87.54.69
12380835540827
16671887713003140167
(P
6.257.678,178.60
9.539.42
10.4110.5010.4511.2311.9312.5712.69
12.1012.4012.1612.3312 .6013.1113.23
12.1712,7313,2813.9313.5612.3311,9912.0813.3014.94
June July Aug.LOANS OUTSTANDING INOF DOLLARS)
19,96921,74720,65021,7 9626,79930,03328,07930,04233,01132,95534,50936,74040,13747,71857,22864,68269,59883,50292,44490,70688,268
105,166126.537131 ,397122,018128,990145,547171,623202,454225,515272,899262,099304,150328,715
20,14121,77820,65122,24427,14530,24528,03930,02632,99333,01234,74036,87240,42648,07258,22365,08370.29483,90992,43389.95188,429
106,581130,706130,713121,328128,860146,937175,320200,910229,664273,160261,703306,942330,097
MONEY SUPPLY Ml 2
ERCENT)
0.410.000.16
-0.150.15
-0.070.670,350.000.21
-0.130.070.190.370.170.790.740.250,190.670.380,780.411.35
-0.030.500.691.341.37
-0.070.070,730.741.44
0.240.080.310.300.000.070.000.420.430.00
-0.070.660.760,49
-0.690.610.630.150.240.620.840.270.260.170.370.780.571.011.140.490.201.00
-0.020.90
EDIT OUTSTANDINGERCENT)
6.457.738.188.75
9.459.49
10.4910.4010.5111 .2611.9912.5812.65
12.1112.4112.2312.1312.8413.1413.22
12.2212.8113.4113.9613.3312.2912.0312.1713.4715.04
6.627.866.198.75
9.289.62
10.5410.3610 .5711.3712 .0512.6412.67
12.1112.3912.2312,3612.7413.2613.14
12 .2212.8113.4513.8513.0712.1411 .9712.2613.5515.20
20,21,19.22,2 7 ,30.27,30,32,33,35,37,40,49,59,64,71,85,93,9 1 ,88,
108,133,129,121,130,147,179,201,234,273,262,308,330,
0000-000000000000000000000000201001
Sept.CURRENT
1909348046644182859414568401310380478391393608623591410726278005053045790 83214792017732814540875391402
.32
.08
.31
.00,22.07.51.07.78.35.00.20.63.36.23.89.62.05.90.31.91.15.26.52.66.49.45.68.01,67.13.58.24.44
20,21,19,22,27,3028,30,32,33,35,37,4 1 ,50,59,65,7 2 ,86,93,93,88,
108,137,128,120 ,130,148,183,203,238,274,262,311,329,
0
OcDOLLARS'
3818197539777783741226469562143183414181419501553184044354375934564291467106467697904178478857 47769183
.57-0.08000
-00
-0-00
-00
.16
.15
.37
.22
.22
.56
.07
.28
.14
.130.560000000000000
0101001
TO PERSONAL
6788
9910101011121212
1212121212121313
1 212121313121211121315
.55
.96
.16
.91
.27
.85
.59
.38
.6344.07.72.62
2810362338732114
1 722875388950798426936
6889
.73
.70
.55
.46
.20
.90
.39
.94
.04
.37
.28
.23
.6?
.13
.63
.33
.09
.29
.45
.62
.11
20,21,19,23,27,29,28,30,32,33,35,37,41,50,60,65,73,87,91,92,90,109,138,126,121,132,150,184,204,241,274,261,315,334,
00000
-00
-0-0000
6506407184218589692159159962156358216 258125786441533586 8046 5502664352999770174501399727377856829748613
.24
.08
.47
.15
.07
.22
.44
.42
.21
.28
.27
.460.370
-00000
.72,46.55.72.39.51
0.31000
-010001010-00
INCOME3
.62
.03
.14
.01
9.24910
.98
.6410.401011121212
12121212121313
1 212121313121212121315
.67
.49
.15
.50,57
31.103922.467524U. 1 328925693801001467660
6889
910
.77
.42
.44
.14
.12
.94
.31
.23
.14
.30
.79
.92
.20
.44
.80
.05
.13
.05
.20
.1110 .64101011121212
1212121212121313
1 212121313121211121315
.35
.74
.55
.25
.65
.55
.30
.1439.23.52612100
• 0 932975294631395509370
Nov.
21;21 ,19,23,28,29,28,31,33,33,35,38,42,51,61,66,74,88,91,92,91 ,
110,139,126,123,133,152,183,209,244,270,263,320,340,
000
-00
-00O00O00000000000000000001000
6889
91010101011121212
1212121212121313
1 212131313121211121415
0314519557711995733420761182 80939579066650043161374070082301408877734131317272486394253824235187138003
.32
.00
.46
.23
.22
.15
.58
.00
.00
.41
.41
.65
.37
.42
.12
.33
.97
.29
.37
.30
.57
.76
.54
.94
.20
.51.
.50
.13
.55
.71
.30,32.84.96
.96
.16
.10
.08
.13
.10
.71
.31
.80
.62
.24
.64
.53
.281742.19.55551601
. 0 92 7045994491291610579
Dec.
21,13321,05820,31424,11028,39529,51728,49631,28833,01833,42935,98639,04542,73752,30061,33267,06875,15089,05991 ,06991,78892,111111,764139,873126,245124,225134,372152,870186,443211,014247,853264,699267,368320,482343,244
0.160.080.150.230,22
-0.300.14
-0.28-0.140.270.34
-0.260.250.650.350.490.71
• 0.100.370 .221.160.720.25
-0.100.940.630.690.28
-1.000.820.610.290.781.05
7.098.208.169.13
9.1710.0410.8010.3210.8611.6212.2312.6412.58
12.2512.2212 .3812.1712.5612.5913.1512.94
12.1212.3613.1313.6313.8712.3912.1211.9112.7114.1415.81
IQ
19,21,21 ,20,24,28,28,28,31.33,33,36,39,44,54,62,67,7 7 ,89,91,85,97,
1 1 6 ,1 3 9 ,124,125,136,158,196,212,258,268,274,326,
00000000-0000000000000000000
678311033712872866911657799025734139109581024460467994929491311479009470666484451217921694652862402912
.30
.16
.11
.31
.13
.00,15.48.05.30.18.31.28.25.53.55.41,45.31.69.86.32.49.31.54.74.54
0.39000100
6788
99
101010111112121212121212121213
12121313131212121214
.47
.71
.41
.03,59.81
.03
.33
.18
.31
.67
.29
.22
.72
.35
.01
.74
.39
.70
.113641.38.439525
08512072792909088041
II Q
19,21,20,21,26,29,28,29,32,33,34,36,39,47,56,64,69,82,91,91,87,
103,124,133,121,127,143,168,200,220,270,263,296,330,
00000000-00000000000000000000
-000001
6788
99
10101011111212
12121212
Ml
AVERAGE
8407468094203937292675696320183006088580432480931813048800868393368 3 5904292885065548598792203056404502
20,212022273028303233,35,3740,49,59,65,71,85,92,91,88,
107,133,129,121,129,147,179,202,234,273,262,309,329,
A V E R A G E
.33
.13
.19
.20
.07
.00
.47
.33
.02
.26
.16
.29
.25
.17
.21
.43
.71
.22
.30
.72
.35
.69
.24
.74
.44
.49
.89
.92
.05
.37
.31
.92
.60
.08
AVE
.27
.66
.18
.62
.52
.42
.42
.50
.44
.22
.93
.56
.68
.4111401627
12.661313
12121313131212121314
11.24
16742992533102132688
00000-00-000-0000000000000
Q
FOR
2378440696284473010343769301190320878951171780333 2415198067260784881347904097483337602044286 2442034894
FOR
.38
.03
.26
.15
.05
.03
.24
.02
.38
.21
.07,33.65.53.08.68.57,13.68.44.90.15.30
0.3200O0100001
RAGE
6788
991010101112L2L2
222L223L3
12121313121211121315
.42
.65
.72
.77
.49
.42
.87
.68
.28
.15
FOR
.60
.95
.16
.89
.26
.82
.59
.38
.62
.43
.09,62.62
.10
.38
.23
.40
.74
.24
.13
!24.87.51.89.941099386739
IVQ
PERIOD
20,2119232829283133,33,35,3842,51.60,66,74,88,91,92,91,
110,139,126,123,133,151,164,208,244,269,264,318,339,
9383839967671516 863510930443088534821435 87984291226162277165340768320458104273952745331685930128789287
PERIOD
00000-00
-0"00000000000000000000001000
.24
.05
.36
.05
.17
.22
.39
.23
.12
.32
.34
.28
.33
.60
.00
.46
.80
.26
.42
.28
.83
.63
.41
.23
.75
.69
.50
.21
.23
.61
.23
.51
.47
.82
PERIOD
68899
91010101011121212
12121212121312
12131313121211121415
.95
.14
.13
.09
.36
.17
.08
.72
.33
.80
.60
.24
.64
.55
.18
.40
.20
.54
.58
.17
.98
!os.5892.SO1292610477
Annual
20,21,20,22,26,29,28,29,32,33,34,37,40,48,57,64,70,83,91,91,88,
104,128,132,122,129,144,172 »201,228,268,264,299,331,
00000-00000000000000000000000000000
67889
173571477132716646391924601118730079501082608469549403517608274858494328576154825722967153162622657648
.31
.09
.23
.18
.10
.06
.31
.14
.05
.27,15.30.38.38.21.53.62.26.43.53.74.45.36.40.54.64.66.57.54.53.71.78.48.96
.46
.77
.16
.73
.3$9.529.41910101011121212
12121212121313
12121313131212121315
.65
.49
.48
.55
.32
.00
.55
.64
1338.25.406012.15
20794086192100304411
' T h i s s e r i e s c o n t a i n s r e v i s i o n s b e g i n n i n g w i t h 1 9 8 3 . 2 T h i s s e r i e s c o n t a i n s r e v i s i o n s b e g i n n i n g w i t h 1 9 7 4 . 3 T h i ss e r i e s c o n t a i n s r e v i s i o n s b e g i n n i n g w i t h 1 9 7 5 .
1 9 8 6 )
100Digitized for FRASER http://fraser.stlouisfed.org/ Federal Reserve Bank of St. Louis

C. Historical Data for Selected Series—Continued
Year Jan. Feb.9 8 . CHANGE IN
1 9 5 2 . . .1 9 5 3 . . .1 9 5 4 . . .1 9 5 5 . . .1 9 5 6 . . .1 9 5 7 . . .1 9 5 8 . . .1 9 5 9 . . .1 9 6 0 . . .1 9 6 1 . . .1 9 6 2 . . .1 9 6 3 . . .1 9 6 4 . . .196 5 . . .196 6 . . .196 7 . . .1 9 6 8 . . .196 9 . . .1 9 7 0 . . .1 9 7 1 . . .1 9 7 2 . . .1 9 7 3 . . .1 9 7 4 . . .1 9 7 5 . . .1 9 7 6 . . .1 9 7 7 . . .1 9 7 8 . . .1 9 7 9 . . .1 9 8 0 . . .1 9 8 1 . . .1 9 8 2 . . .1 9 8 3 . . .1 9 8 4 . . .1 9 8 5 . . .1 9 8 6 . . .
- 1 . 1 5 - 0 . 9 7- 0 . 6 1 0 . 5 1- 0 . 4 1 - O . 1 0
0 . 3 0 0 . 7 0- 0 . 1 0 0 . 5 7- 0 . 8 0 - 1 . 1 0
0 . 9 4 - 0 . 3 10 . 3 0 1 . 3 80 . 1 9 - 1 . 0 5
- 0 . 7 3 - 0 . 4 20 . 7 2 - 0 . 3 10 . 0 0 0 . 1 10 . 0 0 0 . 0 0
- 0 . 5 9 - 0 . 5 90 . 7 8 0 . 6 8
- 1 . 0 0 - 1 . 3 2- 0 . 4 8 0 . 1 0
2 . 1 1 1 . 8 2- 0 . 7 6 - 1 . 6 9
0 . 8 1 1 . 5 11 .81 0 . 4 61 . 5 1 4 . 0 6
- 0 . 9 9 - 0 . 3 5- 3 . 2 2 0 . 0 6
3 . 1 4 1 . 1 6- 0 . 5 9 0 . 0 9
2 . 5 8 1 . 4 00 . 8 9 1 . 3 00 . 9 4 1 . 9 2
- 2 . 6 8 - 2 . 5 6- 0 . 0 4 - 1 . 5 7
1 . 7 2 2 . 8 3- 0 . 8 4 1 .27- 0 . 3 7 - 1 . 5 9
99
1 9 5 2 . . .1 9 5 3 . .1 9 5 4 . .1 9 5 5 . .1 9 5 6 . .1 9 5 7 . .1 9 5 8 . .1 9 5 9 . .I 9 6 0 . .1 9 6 1 . .1 9 6 2 . .1 9 6 3 . .1 9 6 4 . .1 9 6 5 . .1 9 6 6 . .1 9 6 7 . .196 8 . .1 9 6 9 . .1 9 7 0 . .1 9 7 1 . .1 9 7 2 . .1 9 7 3 . .1 9 7 4 . .1 9 7 5 . .1 9 7 6 . .1 9 7 7 . .1 9 7 8 . .1 9 7 9 . .I 9 6 0 . .1 9 8 1 . .1 9 8 2 . .1 9 8 3 . .1 9 8 4 . .1 9 8 5 . .1 9 8 6 . .
- 1 . 2 6 - 2 . 0 9- 0 . 9 9 0 . 0 0- 0 . 5 2 - 0 . 3 1
0 . 9 1 0 . 8 0- 0 . 3 8 ^ 0 . 1 9- 1 . 1 6 - 1 . 5 6
0 . 1 0 - 0 . 1 0- 0 . 1 0 0 . 7 0
0 . 3 8 - 0 . 9 6- 0 . 3 1 0 . 4 1
0 . 9 1 - 0 . 8 0- 0 . 1 0 0 . 0 0
0 . 2 0 0 . 0 0- 0 . 7 7 - 0 . 2 9
1 . 2 2 0 . 9 3- 0 . 2 0 - 1 . 1 9- 0 . 3 9 0 . 0 0
1 . 9 2 1 . 7 90.17 -6 .780 . 2 8 1 . 2 01 . 9 9 0 . 8 51 .81 3 . 8 40 . 4 4 1 . 9 4
- 2 . 2 5 0 . 1 92 . 1 3 1 . 0 70 . 6 5 0 . 9 12 . 5 6 0 . 7 51 . 3 7 2 . 3 61 . 0 9 1 . 6 0
- 2 . 1 1 - 2 . 1 2- 0 . 1 3 - 1 . 0 5
1 . 5 5 2 . 6 3- 0 . 3 3 0 . 6 9- 0 . 8 5 - 1 . 1 6
99
1 9 5 2 . . .1 9 5 3 . .1 9 5 4 . .1 9 5 5 . .1 9 5 6 . .1 9 5 7 . .1 9 5 8 . .
1 9 5 9 . .I 9 6 0 . .1 9 6 1 . .196 2 . .1 9 6 3 . .1 9 6 4 . .1 9 6 5 . .1 9 6 6 . .1 9 6 7 . .1 9 6 8 . .1 9 6 9 . .1 9 7 0 . .1 9 7 1 . .1 9 7 2 . .1973 . .1 9 7 4 . .1 9 7 5 . .1976 . .1 9 7 7 . .1 9 7 8 . .1 9 7 9 . .1 9 8 0 . . .1 9 8 1 . .1 9 8 2 . .1 9 8 3 . .1 9 8 4 . .1 9 8 5 . .1 9 6 6 . .
- 0 . 3 1 - 0 . 9 8- 0 . 6 2 - 0 . 5 4- 0 . 1 9 - 0 . 1 7
0 . 3 9 0 . 4 90 . 4 6 0 . 3 5
- 0 . 0 3 - 0 . 5 0- 0 . 4 1 - 0 . 1 2
- 0 . 0 6 - 0 . 1 6- 0 . 5 8 - 0 . 2 8- 0 . 1 3 0 . 2 1
0 . 0 9 - 0 . 0 20 . 3 7 0 . 1 80 . 2 4 - 0 . 2 60 . 5 2 0 . 7 7
- 0 . 5 4 - 0 , 5 80 . 5 0 0 . 3 21 . 6 4 1 . 7 50 . 2 5 0 . 1 0
- 0 . 7 7 - 0 . 3 00 . 5 8 1 . 0 51 . 6 2 1 . 9 52 . 5 8 2 . 2 7
- 3 . 2 8 - 2 . 6 70 . 7 2 1 . 3 40 . 4 9 0 . 7 71 . 0 0 1 . 7 01 . 1 4 1 . 0 20 . 0 5 0 . 3 40 . 2 0 - 0 . 9 0
- 1 . 0 8 - 0 . 8 1- 0 . 0 7 0 . 8 4
0 .77 0 . 45- 0 . 5 6 - 0 . 7 3
Mar. Apr.PRODUCER PRICES
- 0 . 2 00 .40
- 0 . 1 0- 0 . 6 0
0 . 4 8- 0 . 4 1- 0 . 7 3
1.36- 1 . 5 4
1.26- 0 . 9 2- 0 . 1 0
0 . 7 2- 0 . 3 0
1 .44- 0 . 7 2
1.062.27
- 1 . 4 61 .750 .153.772 .60
- 1 . 4 82 .232.570.694 . 0 3
- 0 . 8 80.17
- 0 . 8 31.610 . 1 9
- 0 . 7 2
- 0 . 2 90 .00
- 0 . 6 20 .50
- 0 . 1 9- 0 . 6 1- 0 . 2 1
0.67- 0 . 4 9
1.56- 0 . 8 3- 0 . 1 1
0.910 .000 .47
- 0 . 4 10 .19
- 1 . 9 80 .000.950 .383 .823 . 2 21.151.93
- 0 . 3 11.130.17
- 6 . 2 41.04
- 0 . 5 90 . 0 4
- 0 . 2 6- 0 . 0 3
May JuneFOR 28 SBNSITIVE
(PERCENT)
- 0 . 6 90 .100.100 .70
- 0 . 5 7- 0 . 6 1-0 .10
0 .29- 0 . 3 9- 0 . 2 0- 0 . 3 1
0 .63- 0 . 1 0
0.700.471.140 .38
- 1 . 4 60.960.090 .922.96
- 4 . 6 33.870 .05
- 0 . 7 62 .120.27
- 2 . 7 7- 0 . 2 0- 0 . 2 9
1.54- 0 . 8 4
0 .66
- 0 . 2 0- 0 . 2 0
0 .210 .59
-0 .67- 0 . 1 0
0 . 8 40 .95
- 1 . 5 70 .62
- 0 . 6 30 .100 .30
- 0 . 1 0- 0 . 1 9
2 .051.52
- 2 . 1 40.171.281.740.76
- 0 . 3 0- 1 . 9 5
1.2 0- 1 . 7 6
2 .971.890 .22
- 0 . 4 0- 0 . 7 0
2.46- 0 . 7 8
0 . 1 4
. CHANGE IN SENSITIVE MATERIALS(PERCENT)
- 1 . 3 00 . 5 00 .42
- 0 . 7 90 . 2 8
- 0 . 3 0- 0 . 6 3
1.19- 1 . 3 6
1.75-0.51- 0 . 3 1
0 .510 .480 .92
- 1 . 1 00 .691.32
- 0 . 9 61.101.183 . 4 92 .01
- 0 . 5 82 .192 .220.353 . 7 1
- 0 . 9 80 .67
- 1 . 2 01.750 .65
- 0 . 4 8
- 1 . 0 3- 1 . 4 0
0 .730 . 7 00 .09
- 0 . 6 0- 0 . 8 4
0 . 6 80 .201.11
- 1 . 1 20 .001.520.87
- 0 . 1 8- 0 . 9 1- 0 . 3 9- 0 . 3 5- 0 . 0 9
1.080 .752 .541.811.292 .20
- 0 . 2 60 . 6 40 .70
- 4 . 6 90.87
- 1 . 1 20 .53
- 0 . 1 60 .52
- 0 . 7 6- 0 . 1 0
0.310 .00
- 1 . 4 1- 0 . 5 0
0.110 .29
- 0 . 2 00 .00
- 0 . 3 10 .52
- 0 . 5 00 .48
- 0 . 5 50.41
- 0 . 4 9- 0 . 5 2
0.27- 0 . 3 6
1.652.41
- 3 . 9 21.650 . 2 8
- 0 . 9 40 .780 .08
- 3 . 7 9- 0 . 4 9- 0 . 3 6
0.57- 0 . 3 6- 0 . 2 2
- 0 . 8 6- 0 . 3 0
0.310.69
- 1 . 1 50.100 . 8 40 . 6 8
- 1 . 1 8- 0 . 7 0- 1 . 0 3- 0 . 3 1
0.30- 0 . 4 8- 0 . 0 9
1.120.59
- 0 . 7 9- 0 . 5 3
0 . 0 00.811.700 .00
- 2 . 8 10.96
- 2 . 5 22 .140 .98
- 1 . 0 4- 0 . 8 2- 2 . 0 0
1.18- 0 . 7 3- 1 . 0 0
. CHANGE IN SENSITIVE MATERIALS(PERCENT)
- 1 . 3 9- 0 . 3 3- 0 . 2 2
0 . 4 40 .06
- 0 . 9 4- 0 . 1 0
- 0 . 4 70.270 .11
- 0 . 1 00.17
- 0 . 2 90 .93
- 0 . 7 60 .131.74
- 0 . 3 40 . 4 81.262 .681.81
- 1 . 5 81.661.041.571.770.65
- 1 . 3 5- 0 . 7 4
1.700 .35
-0.90
- 1 . 5 1- 0 . 2 3
0.070.27
- 0 . 0 2- 0 . 9 1- 0 . 3 7
- 0 . 6 80.85
- 0 . 4 7- 0 . 1 2
0.460.080 .79
- 0 . 9 50.101.30
- 0 . 5 70 .991.133 .171.69
- 0 . 2 91.811.110.902.37
- 0 . 3 9- 0 . 6 9- 0 . 9 6
1.810 .36
- 0 . 6 0
- 1 . 2 5- 0 . 3 2
0 .380.10
- 0 . 1 4- 0 . 6 4- 0 . 4 9
- 0 . 5 81.02
- 0 . 7 3- 0 . 0 2
0.590 .480.31
- 0 . 8 00 .020 . 5 4
- 0 . 4 40.871.063 ,p50 . 9 40 . 5 41 .690 . 6 50 . 5 81 . 8 8
- 2 . 2 60 . 0 8
- 1 . 0 11 .290 . 2 2
- 0 . 2 2
- 0 . 9 6- 0 . 4 7
0.470 .22
- 0 . 5 8- 0 . 4 0- 0 . 2 1
- 0 . 4 20 .54
- 0 . 7 30.070 .480 .45
- 0 . 1 0- 0 . 1 6- 0 . 0 8- 0 .20- 0 . 1 9
0 . 4 21.132 .52
-0 .370 .421.35
- 0 . 4 50 .891.04
- 3 . 1 60.10
- 1 . 0 30.86
- 0 . 1 9- 0 . 1 5
July
- 0 . 5 0- 0 . 1 0
1.980.49
- 0 . 5 8- 0 . 1 0
0 .62- 0 . 4 7- 0 . 6 0- 0 . 3 1
0.001.980 .500 .30
- 0 . 1 91.011.68
- 1 . 6 0- 0 . 6 6
2.861.49
- 0 . 7 00 .74
- 0 . 4 74 .582.070.46
- 1 . 3 73 . 7 0
- 0 . 7 40.300 .64
- 1 . 7 6- 0 . 0 3
Aug.D INTERM
0 . 4 0- 0 . 4 0- 0 . 1 0
1.08- 1 . 4 5- 0 . 3 1
2.07- 0 . 3 8- 1 . 7 1
0.100 .420 ,820 .801.18
- 3 . 8 50 .800.830 .43
- 0 . 0 92 .371,253.57
- 1 . 9 72 .23
- 0 . 6 13 . 6 01.21
- 0 . 4 03 .29
- 0 . 3 7- 1 . 2 6
1.51- 1 . 1 0- 0 . 3 4
Sept.
- 0 . 3 0- 0 . 4 1
0.610.87
- 0 . 5 9-0 .83
1.320 .00
- 0 . 3 10.41
- 0 . 2 1- 1 . 5 2- 0 . 4 0- 0 . 4 9-0 .68
1.481 .160 .25
- 0 . 0 90 . 2 40.074 .41
- 1 . 8 13 .391.562 .040 .780 .531,04
- 2 . 1 30 .08
- 0 . 4 30 .71
- 0 . 3 4
PRICES, ACTUAL DATA
- 0 . 6 8- 0 . 2 0
0 .721.28
- 0 . 1 0- 0 . 3 0
1.15- 0 . 2 9- 0 . 7 0
0 .10- 0 . 3 1
1,150 .600 .000 .000.100.59
- 0 . 6 2- 1 . 0 7
1.080 .720.970 .49
- 0 . 5 13 .690 .750.57
- 0 . 4 03.02
- 0 . 0 40 . 7 40 .99
- 1 . 5 5- 0 . 3 1
0 .10- 0 . 4 1- 0 . 2 0
0.970 . 0 0
- 0 . 3 01.66
- 0 . 1 0- 0 . 7 0
0.400.310.411.390.76
- 3 . 7 80 .400 .580 .80
- 0 . 3 61.690 .883.76
- 1 . 5 72 . 5 2
- 0 . 9 71.661 .66
- 0 . 1 23.270 .12
- 0 . 7 41.84
- 1 . 0 8- 0 . 2 6
PRICES, SMOOTHED
- 0 . 8 3- 0 , 4 0
0 . 4 50 . 5 6
- 0 . 8 6- 0 . 2 8
0 . 3 7
- 0 . 5 4- 0 . 0 3- 0 . 6 8
0 . 2 60 . 2 90 . 1 4
- 0 . 2 40 . 3 80 . 0 7
- 0 . 6 0- 0 . 2 8
0 . 2 41.071,96
- 0 . 9 2-0 .26
1.40-1.07
1.180.40
-1 .89-0.30-0.85
0.84-0.65-0.37
- 0 . 6 2- 0 . 2 5
0 .360 .82
- 0 . 6 5- 0 . 2 0
0.96
- 0 . 7 8- 0 . 1 3- 0 . 4 5
0 . 4 40 .450.05
- 0 . 7 50 .540.41
- 0 . 4 2- 0 . 5 5
0 .580 .931.92
- 0 . 7 5- 0 . 4 1
1.44-0 .47
1.310 .190.57
- 0 . 3 5- 0 . 6 0
1.13- 1 . 0 0- 0 . 5 2
- 0 . 1 0-0 .82
0 .820.870 .19
-1 .310 .610 . 4 8
- 0 . 4 00 .20
- 0 . 3 1- 0 . 8 2
0.49- 0 . 3 8- 1 . 1 5
0 .600.970 .79
- 0 . 2 70 . 4 40 .081 .72
- 2 . 2 02 . 5 20 .331.101.210 .201.15
- 1 . 7 80 .370 . 0 40.21
- 0 . 4 0
DATA'
- 0 . 3 5- 0 . 3 9
0 . 3 61 .01
- 0 . 1 9- 0 . 4 0
1 . 1 8
- 0 . 7 30 . 0 8
- 0 . 2 20 . 3 30 . 8 00 . 1 1
- 1 . 4 70 . 4 50 . 6 50 . 0 6
- 0 . 6 11 .000 . 6 82 . 1 5
- 0 . 7 30 . 6 21 .120 . 5 71 .300 . 0 22 . 12
- 0 . 4 1- 0 . 2 7
1 . 1 5- 0 . 9 6- 0 . 4 2
Oct.
- 0 . 7 0- 0 . 9 2
0 .71- 0 . 3 8- 0 . 7 9
0.101.600.09
- 0 . 9 2- 0 . 3 1- 0 . 1 0
0 .410 .900 .29
-0 .10- 0 . 3 9
2.070.000.17
- 0 . 1 62 .392.82
. - 4 . 0 5- 0 . 3 3- 0 . 0 5- 1 . 2 4
2.001.491.20
- 0 . 8 0- 0 . 0 8
1.03- 0 . 7 3
0.59
- 1 . 1 7- 1 . 4 4
0.81- 0 . 4 8- 0 . 5 8- 0 . 9 2
1.820.19
- 0 . 9 1- 0 . 3 0
0.210 .831.460.19
- 0 . 6 8- 0 . 2 0
1.53- 0 . 4 4- 0 . 1 8- 0 . 0 9
2.061.75
- 3 . 5 5- 0 . 5 5- 0 . 6 5- 0 . 3 6
2 .301.790 .89
- 1 . 0 1- 0 . 4 6
1.17- 1 . 2 1
0 .18
- 0 . 3 1- 0 . 6 8
0 .460 .75
- 0 . 0 5- 0 . 7 4
1.25
-0 .640.17
- 0 . 0 20 .190.970.16
- 1 . 7 60 .320.870 .35
- 0 . 4 20 . 8 60 .782 .28
- 1 . 7 71.500 .290 .981 .440.262 .13
- 0 . 7 3- 0 . 0 8
0 .99- 0 . 7 5- 0 . 2 4
Nov.
- 0 . 6 0- 0 . 4 1
0 . 3 00 . 2 9
- 0 . 1 0- 0 . 4 2
0 . 0 0- 0 . 3 8- 0 . 7 3- 1 . 0 2- 0 . 3 1
0 . 3 10 . 3 90 . 5 9
- 0 . 6 90 . 8 81 .411 . 4 4
- 1 . 9 20 . 4 81 . 6 23 . 6 4
- 1 . 9 70 . 6 71 .21
- 0 . 7 82 . 8 7
- 0 . 8 82 . 1 3
- 2 . 0 2- 0 . 3 4
0 . 9 90 . 1 0
- 0 . 3 1
- 0 . 3 00 . 5 20 . 3 00 . 5 70 . 6 8
- 0 . 8 30 . 7 0
- 0 . 1 9- 0 . 8 2- 1 . 6 1
0 . 3 10 . 5 10 . 4 80 .47
- 0 . 4 90 . 9 01 .510 . 7 0
- 1 . 1 80 . 0 91 .632 . 5 5
- 2 . 1 60 . 0 00 . 5 5
- 0 . 5 72 . 1 6
- 0 . 8 01 .49
- 1 . 7 9- 0 . 8 4
1 .160 . 2 5
- 0 . 4 9
- 0 . 4 6- 0 . 7 4
0 . 5 60 . 3 9
- 0 . 0 2- 0 . 9 3
1 . 2 0
-0^69- 0 . 2 4
0 .070 . 1 60 . 9 60 . 1 4
- 1 . 3 20 . 3 51 . 1 80 . 3 7
-0.410.411.132 .21
- 2 . 5 41.08
- 0 . 1 80.431.810 .511 .47
- 1 . 2 1- 0 . 2 9
0.90- 0 . 4 7- 0 . 2 0
Dec.
- 0 . 4 0- 0 . 2 1
0 . 1 00 . 6 70 .100 . 3 1
- 0 . 5 90 . 0 00 . 2 10 . 5 20 . 2 10 .000 . 2 00 . 0 0
- 1 . 1 91 .072 . 9 5
- 0 . 5 0- 0 . 9 8
1.271 .183 . 0 5
- 5 . 3 32 .271 .152 . 6 9
- 0 . 4 2- 1 . 9 4
0 . 6 1- 0 . 3 6
0 . 9 00 . 8 8
- 0 . 3 7- 0 . 3 1
- 0 . 4 9- 0 .10
0 .001 .2 40 . 1 00 . 0 0
- 0 . 6 9- 0 . 2 9- 0 . 3 1
0 . 9 2- 0 . 1 0
0 . 1 0- 0 .10
0 . 3 6- 0 . 6 9
0 . 8 91.670 . 1 7
- 1 . 1 90 . 7 01 .304 . 1 1
- 4 . 7 71 .360 . 9 22 . 4 6
- 0 . 5 7- 0 . 4 8- 0 . 2 8- 0 . 8 7
0 . 0 90 . 7 4
- 0 . 8 9- 0 . 0 9
- 0 . 5 9- 0 . 4 6
0 . 5 10 .380 . 0 8
- 0 . 8 00 . 8 3
- 0 . 7 0- 0 . 4 5
0 . 1 00 .330 . 7 10 .22
- 0 . 7 00 . 4 81.450 . 2 5
- 0 . 7 00 . 1 91 .462 . 4 0
- 3 . 0 70 . 4 60 . 1 80 . 2 81 .590 . 2 80 . 9 4
- 1 . 3 8- 0 . 3 6
0 . 9 1- 0 . 4 3- 0 . 1 8
I Q
- 0 . 7 70 . 1 0
- 0 .200 . 1 30 . 3 2
- 0 . 7 7- 0 . 0 3
1 . 0 1- 0 . 8 0
0 . 0 4- 0 . 1 7
0 . 0 00 . 2 4
- 0 .490 .97
- 1 . 0 10 .232 . 0 7
- 1 . 3 01 .360 . 8 13 . 1 10 .42
- 1 . 5 52 , 1 80 . 6 91.562 . 0 70 . 6 6
- 1 . 6 9- 0 .81
2 . 0 50 . 2 1
-0 .89
II Q III Q
AVERAGE FOR
- 0 . 3 9- 0 . 0 3- 0 . 1 0
0 . 6 0- 0 . 4 8- 0 . 4 4
0 . 1 80 . 6 4
- 0 . 8 20 . 6 6
- 0 . 5 90 . 2 10 . 3 70 . 2 00 . 2 50 . 9 30 . 7 0
- 1 . 8 60 . 3 80 . 7 71 .012 . 5 1
- 0 . 5 71 .021 .06
- 0 . 9 42 .070 . 7 8
- 2 . 9 30 . 1 5
- 0 . 5 31 .35
- 0 . 6 30 . 2 6
- 0 . 1 3- 0 .30
0 . 8 30 . 8 1
- 0 . 8 7- 0 . 4 1
1 . 3 4- 0 .28- 0 . 8 7
0 . 0 70 . 0 70 . 4 30 . 3 00 .33
- 1 . 5 71.101 .23
- 0 . 3 1- 0 . 3 5
1 .820 . 9 42 , 4 3
- 1 . 0 11 .721 . 8 42 . 5 70 . 8 2
- 0 . 4 12 . 6 8
- 1 .08- 0 . 2 9
0 . 5 7- 0 . 7 2- 0 . 2 4
IV Q
PERIOD
- 0 . 5 7- 0 . 5 1
0 . 3 70 . 1 9
- 0 . 2 60 . 0 00 . 3 4
- 0 . 1 0- 0 . 4 8- 0 . 2 7- 0 . 0 7
0 . 2 40 . 5 00 . 2 9
- 0 . 6 60 . 5 22 . 1 40 . 3 1
- 0 . 9 10 . 5 31 .733 . 1 7
- 3 . 7 80 . 8 70 . 7 70 . 2 21 .48
- 0 . 4 41.31
- 1 . 0 60 . 1 60 . 9 7
- 0 . 3 3- 0 . 0 1
Annual
- 0 . 4 7- 0 . 1 9
0 . 2 20 . 4 3
- 0 . 3 2- 0 . 4 1
0 . 4 50 . 3 2
- 0 . 7 40 . 1 2
- 0 . 1 90 . 2 20 . 3 50 . 0 8
- 0 . 2 50 . 3 81 .070 . 0 5
- 0 . 5 51 .121 .122 . 8 1
- 1 . 2 40 . 5 21.460 . 6 41 . 4 80 . 5 00 . 4 3
- 0 . 9 2- 0 . 3 7
1 . 2 4- 0 , 3 7- 0 . 2 2
- 1 . 5 5- 0 . 1 6- 0 . 1 4
0 .31-0 .10- 1 . 0 1- 0 .21
0 . 6 0- 0 . 6 5
0 . 6 2- 0 . 1 3- 0 . 1 4
0 .24- 0 . 1 9
1 .02-0 .83
0 . 1 01 . 6 8
- 0 . 5 20 .861 . 3 43 .051 .46
- 0 . 8 81 .801.261 .222 . 4 80 . 5 7
- 1 . 1 9- 0 . 7 9
1 . 9 80 . 3 4
- 0 . 8 3
- 0 . 8 8- 0 . 6 0
0 . 4 50 . 4 6
- 0 . 8 2- 0 . 3 3
0 . 0 40 . 5 5
- 0 . 3 90 . 1 4
- 0 . 8 20 . 0 70 . 4 40 . 2 9
- 0 . 2 70 . 2 1
- 0 . 1 0- 0 . 5 5- 0 . 1 2
0 . 2 41.072 . 2 2
- 0 . 7 00 . 0 41 .15
- 1 . 2 41 .190 . 5 9
- 3 . 1 7- 0 . 1 5- 1 . 1 6
0 . 7 6- 0 . 4 2- 0 . 2 3
- 0 . 2 3- 0 .48
0 . 4 51 . 0 40 . 0 3
- 0 . 6 41 . 1 40 . 0 3
- 0 , 6 00 . 2 3
- 0 . 1 00 . 2 50 .830 . 1 3
- 1 . 6 40 . 3 70 . 7 10 , 3 2
- 0 . 5 71 .070 . 5 62 . 1 5
- 1 . 0 91 .511 .021.171 .15
- 0 . 1 12 . 4 8
- 0 . 5 70 . 1 20 .96
- 0 . 8 1- 0 . 3 2
- 0 . 6 5- 0 . 3 4
0 . 3 70 . 4 40 . 0 7
- 0 . 5 80 . 6 1
- 0 . 1 0- 0 . 6 8- 0 . 3 3
0 . 1 40 . 4 80 . 6 10 . 3 5
- 0 . 6 20 . 5 31.570 . 1 4
- 0 . 8 50 . 2 31 .662 . 8 0
- 3 . 4 90 . 2 70 . 2 70 . 5 11.300 . 1 70 . 7 0
- 1 . 2 2- 0 . 4 0
1..02- 0 . 6 2- 0 . 1 3
- 0 . 8 3- 0 . 3 9
0 . 2 80 . 5 6
- 0 . 2 1- 0 . 6 4
0 . 3 90 . 2 7
- 0 . 5 80 . 1 6
- 0 . 2 30 . 1 60 . 5 30 . 1 4
- 0 . 3 80 . 0 70 . 5 70 . 4 0
- 0 . 5 10 . 6 01 .162 , 5 5
- 0 . 9 60 . 2 41.060 . 4 21 .210 . 7 80 . 1 4
- 0 . 7 8- 0 . 5 6
1 . 1 8- 0 , 3 8- 0 . 3 8
- 0 . 8 9- 0 . 5 0- 0 . 1 9
0 . 4 40 . 2 9
- 0 . 4 9- 0 . 2 1
0 . 1 8-0 .23-0 . 2 0
0 . 0 6- 0 . 0 1
0 . 2 4- 0 . 1 0
0 . 7 4- 0 . 6 3
0 . 3 21 .710 . 0 0
- 0 . 2 00 . 9 62 . 0 62 .22
- 2 . 5 11 .240 . 7 71 .421 .310 . 3 5
- 0 . 6 8- 0 . 8 8
0 . 8 20 . 5 2
- 0 . 7 3
- 1 .24- 0 . 3 4
0 . 3 10 . 2 0
- 0 . 2 5- 0 . 6 5- 0 . 3 6
0 . 7 2
0 .60- 0 . 6 4- 0 . 0 2
0 . 5 10 . 3 40 . 3 3
- 0 . 6 40 . 0 10 . 5 5
- 0 . 4 00.761.112.910 .750 .221.620 . 4 40.791 .76
- 1 . 9 4- 0 . 1 7- 1 . 0 0
1.320 .13
- 0 . 3 2
- 0 .60- 0 . 3 5
0 . 3 90 . 8 0
- 0 . 5 7- 0 . 2 9
0 . 8 4
- 0 . 6 8- 0 . 0 3- 0 . 4 5
0 . 3 40 . 5 10 .10
- 0 . 8 20 . 4 60 . 3 8
- (- I
- i
- i
_ ,
. 3 2
. 4 8) . 6 1> . 8 9I . 0 1) . 8 0) . O 2
. 3 2) . 3 2
. 260 . 2 00 . 2 7
- 0 . 3 5- 0 . 5 7
1 . 0 4- 0 . 8 7- 0 . h /•
- 0 . 4 5- 0 . 6 3
0 . 5 10 . 5 10 . 0 0
- 0 . 8 21 .090 . 1 1
- 0 . 6 8- 0 . 1 7
0 . 0 50 . 2 30 , 8 80 . 1 7
- 1 . 2 60 . 3 81.170 . 3 2
- 0 , 5 10 . 4 91 .122 . 3 0
- 2 . 4 61 .010 . 1 00 , 5 61 .610 . 3 51 .51
- 1 . 1 1- 0 . 2 4
0 . 9 3-C 55- 0 . 2 1
- 0 . 8 0- 0 . 4 5
0 . 2 50 . 4 8
- 0 . 1 3- 0 . 5 6
0 . 3 4
- 0 . 5 40 . 1 0
- 0 . 2 40 . 1 30 . 5 40 . 1 3
- 0 . 2 5- 0 . 1 1
0 . 4 70 . 5 6
- 0 . 3 50 .421 .022 . 3 3
- 0 . 0 7- 0 . 3 2
1.070 . 3 61.270 . 9 10 . 0 5
- 0 . 5 8- 0 . 6 7
1 .03- 0 . 1 9- 0 . 4 2
NOTE: These series contain revisions beginning with 1981.'This series is a weighted 4-term moving average (with weights 1,2,2,1) placed on the terminal month of the span.
(JUNE 1986)
101Digitized for FRASER http://fraser.stlouisfed.org/ Federal Reserve Bank of St. Louis
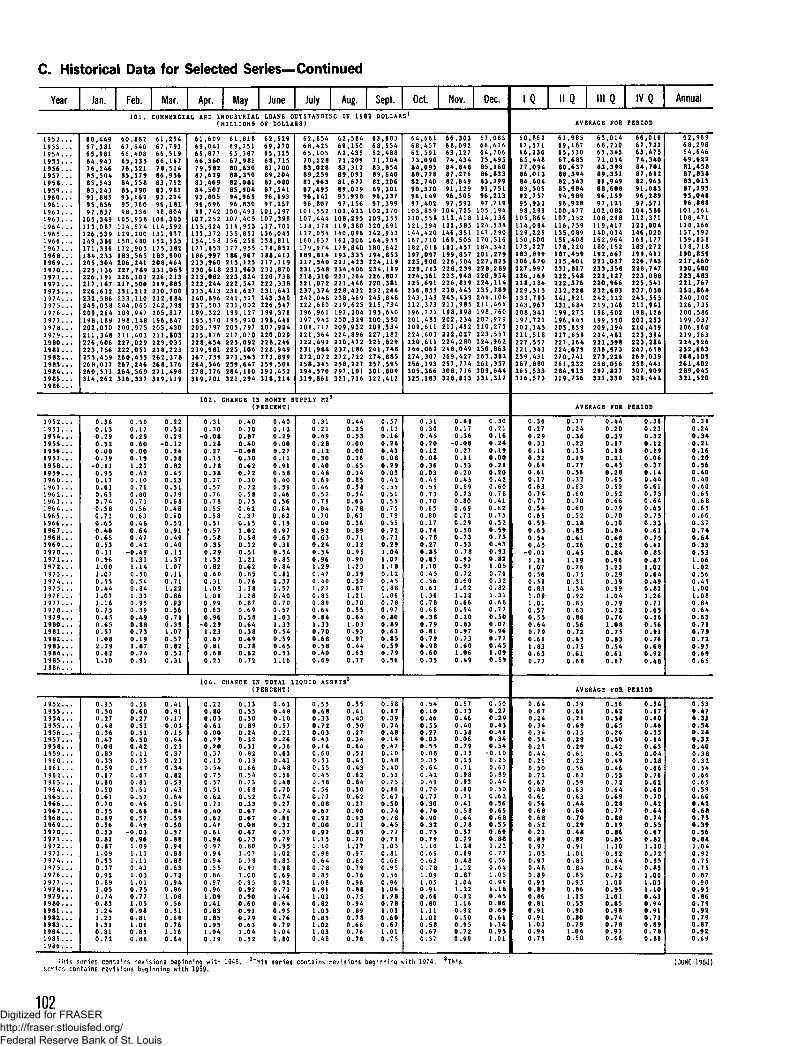
C. Historical Data for Selected Series—Continued
Year
1 9 5 2 . , .1 9 3 3 , . .1 9 5 4 . . .1 9 5 5 . , .1 9 5 6 . . .1 9 5 7 , . .1 9 5 8 . . .1 9 5 9 . , .1 9 6 0 . . .1 9 6 1 . . .1 9 6 2 , , .1 9 6 3 . . .1 9 6 4 . . .1 9 6 5 . . .1 9 6 6 . . .1 9 6 7 . . .1 9 6 8 . . .1 9 6 9 . . .1 9 7 0 . . .1 9 7 1 . . .1 9 7 2 . . .1 9 7 3 . , .1 9 7 4 . . .1 9 7 5 . . .1 9 7 6 . . .1 9 7 7 . . .1 9 7 8 . . .1 9 7 9 . . .1 9 8 0 . . .1 9 8 1 . . .1 9 8 2 . . .1 9 8 3 . . .1 9 8 4 . . .1 9 8 5 . . .1 9 8 6 . . .
1 9 5 2 . . .1 9 5 3 . . .1 9 5 4 . . .1 9 5 5 . . .1 9 5 6 . . .1 9 5 7 . . .1 9 5 8 . . .
1 9 5 9 . . .I 9 6 0 . . .1 9 6 1 . . .1 9 6 2 . . .1 9 6 3 . . .1 9 6 4 , . .1 9 6 5 . , .1 9 6 6 . . .1 9 6 7 . . .1 9 6 8 . . .1 9 6 9 . . .1 9 7 0 . .1 9 7 1 . ' ! .1 9 7 2 . . .1 9 7 3 . . .1 9 7 4 . . .1 9 7 5 , . .1 9 7 6 . . .1 9 7 7 . . .1 9 7 8 . . .1 9 7 9 . . .1 9 8 0 . . .1 9 8 1 . . .1 9 8 2 . . .1 9 8 3 . . .1 9 8 4 . . .1 9 8 5 . . .1 9 8 6 . . .
1 9 5 2 . . .
19 5 4 ! ' . !1 9 5 5 . . .1 9 5 6 . . .
1 9 5 7 . . .1 9 5 8 . . .1 9 5 9 . . .
I 9 6 0 . . .1 9 6 1 . . .1 9 6 2 . . .1 9 6 3 . . .1 9 6 4 . . .
1 96 5 . . .1 9 6 6 . . .1 9 6 7 . . .1 9 6 8 . . .1 9 6 9 . . .1 9 7 0 . . .1 9 7 1 . . .1 9 7 2 . . .1 9 7 3 . . .1 9 7 4 . , .1 9 7 5 . . .1 9 7 6 . , .1 9 7 7 . . .1 9 7 8 . . .1 9 7 9 . . .1 9 8 0 . . ,1 9 8 1 . . .1 9 8 2 . . .1 9 8 3 . . .1 9 8 4 . . .1 9 8 5 . . .1 9 8 6 . . ,
Jan.
6 0 , 4 4 96 7 , 3 8 165 ,9816 4 , 9 4 376 ,24685 , 5 0 48 5 , 5 4 38 3 , 2 4 391 , 8 8 59 5 , 8 5 697 ,857
1 0 5 , 3 4 91 1 3 , 0 8 71 2 6 , 5 3 91 4 9 , 3 861 7 1 , 3 9 61 8 4 , 2 3 32 0 5 , 3 0 4225 , 1 3 62 2 6 , 1 9 12 1 7 , 1 6 72 2 6 , 6 3 22 3 2 , 5 8 62 4 5 , 0 3 82 0 9 , 2 6 41 9 8 , 1 6 92 0 2 , 0 3 0211 , 3 4 82 2 6 , 6 0 62 2 3 , 7 5 62 5 5 , 4 5 92 6 8 , 0 1 72 6 0 , 5 3 13 1 4 , 2 6 2
0 . 3 60 . 1 30 . 2 90 . 5 20 . 0 80 . 3 9
" 0 . 1 10 . 9 50 . 1 70 . 6 10 . 6 30 . 7 40 . 5 80 . 7 10 . 6 50 . 4 00 . 6 50 . 5 30 31
i!oo1.070 . 5 30 . 4 41.071 .160 . 7 50 , 4 50 . 6 50 . 5 71 . 0 82 . 7 90 . 6 21.10
0 , 9 5
(K27o ! 4 80 . 3 6
0 . 0 80 . 8 3
0 . 3 30 . 5 90 . 6 70 . 6 00 . 5 0
0 . 6 10 , 7 00 . 5 50 . 8 90 . 5 60 . 3 30 . 6 20 . 8 71 . 0 90 . 9 30 . 3 70 . 9 20 . 8 91 .050 . 7 40 . 8 31 . 2 41.231 .310 , 8 10 . 7 2
Feb.1 0 1 .
6 0 , 6 8 267 , 5 4 066 , 4 0 86 5 , 2 3 57 6 , 5 2 18 5 , 5 7 98 4 , 5 5 883 , 2 9 09 3 , 1 6 29 5 , 7 6 09 8 , 2 3 6
1 0 5 , 9 3 81 1 4 , 5 7 41 2 9 , 2 0 01 5 0 , 4 8 01 7 2 , 9 0 31 8 3 , 5 6 52 0 6 , 2 4 1227 , 7 8 92 2 6 , 1 0 22 1 7 , 5 0 02 3 1 , 2 1 22 3 3 , 1 1 02 4 4 , 0 6 52 0 9 , 9 4 71 9 8 , 1 4 82 0 0 , 9 7 52 1 1 , 4 0 32 2 7 , 0 2 92 2 2 , 0 5 12 6 0 , 4 5 52 6 7 , 2 4 62 6 4 , 5 6 93 1 6 , 3 3 7
0 . 5 00 . 1 70 . 2 90 . 6 00 . 0 00 . 1 91 .21
0 . 4 20 . 1 00 . 7 60 . 8 00 . 7 10 .560 . 6 30 . 4 80 . 6 40 . 4 70 . 4 2
K 3 11 . 1 40 . 5 00 . 5 40 . 8 41 . 3 30 . 9 50 . 3 90 . 4 90 . 8 80 . 7 30 . 1 91 .870 . 7 40 . 9 1
0 . 5 6
0 | 2 7o!s i0 , 5 1
0 . 4 20 . 1 1
0 . 2 30 . 5 70 . 6 70 . 8 10 . 5 1
0 . 5 70 . 4 60 . 6 60 . 5 70 . 4 9
- 0 , 0 30 . 9 61 .091 .111 .110 , 4 31 . 0 31 .010 . 7 50 . 7 71 . 0 50 . 9 80 . 8 11 .010 . 8 50 . 8 8
Mar. Apr. MayCOMMERCIAL AND INDUSTRIAL
6 1 , 2 5 46 7 , 7 9 36 6 , 3 1 96 6 , 1 6 77 8 , 5 1 48 6 , 9 5 68 3 , 7 1 28 3 , 9 6 19 3 , 2 2 49 6 , 1 6 19 8 , 6 0 4
1 0 6 , 3 0 51 1 4 , 5 9 21 3 1 , 9 3 71 5 2 , 5 3 517 5 , 3 8 21 8 3 , 9 0 02 0 8 , 4 6 42 3 1 , 0 6 52 2 6 , 2 1 32 1 9 , 8 8 52 3 0 , 7 0 02 3 2 , 6 8 42 4 2 , 7 9 82 0 5 , 8 1 71 9 6 , 8 4 72 0 3 , 4 3 02 1 1 , 8 0 32 2 9 , 0 3 52 1 8 , 2 2 32 6 2 , 3 7 82 6 8 , 3 7 62 7 1 , 4 9 83 1 9 , 1 1 9
0 . 2 20 . 5 20 . 2 9
- 0 . 1 20 . 2 40 . 3 80 . 8 2
0 . 4 50 . 2 30 . 5 10 . 7 90 . 6 80 . 4 80 . 6 00 . 5 20 , 9 10 . 4 90 . 4 00 . 1 5K 3 71 .070 . 1 10 . 7 11 .220 . 8 60 . 9 30 . 5 60 , 7 10 . 3 91.070 . 5 70 . 8 20 . 5 20 . 3 1
0 . 4 1
0 . 9 10 . 1 70 . 0 30 . 1 5
0 . 2 50 . 3 7
0 , 2 30 . 3 40 . 8 20 . 5 90 . 4 3
0 . 6 40 . S 10 . 8 40 . 5 90 . 5 00 . 3 70 . 8 80 . 9 40 . 8 80 . 6 80 . 6 30 . 7 20 . 9 40 . 8 61 . 0 80 . 5 60 . 5 10 . 6 60 . 7 61 . 1 60 . 6 4
(MILLIONS
6 1 , 6 0 96 9 , 0 4 16 5 , 8 7 76 6 , 3 6 07 9 , 5 828 7 , 6 2 98 3 , 4 6 98 4 , 5 0 79 3 , 8 0 59 6 , 6 9 69 9 , 7 4 2
1 0 7 , 2 5 21 1 5 , 6 2 41 3 3 , 3 7 21 5 4 , 1 5 81 7 7 , 8 5 31 6 6 , 9 9 72 1 3 , 9 6 02 3 0 , 6 1 82 2 3 , 0 8 22 2 2 , 2 4 42 3 3 , 4 1 32 4 0 , 8 9 62 3 7 , 5 0 31 9 9 , 3 2 21 9 5 , 5 7 02 0 3 , 7 9 72 1 5 , 8 7 62 2 8 , 4 5 42 1 9 , 9 8 12 6 7 , 7 5 92 6 4 , 5 4 62 7 8 , 1 7 63 1 9 , 7 0 1
1 0 2 .
0 . 3 10 . 3 0
- 0 . 0 80 . 2 80 . 2 70 . 1 50 . 7 8
0 , 3 80 . 2 70 . 5 70 . 7 60 . 7 80 . 5 50 . 5 80 , 5 10 . 5 70 . 5 80 , 3 5
1 . 5 20 . 8 20 . 6 00 . 3 11 . 0 81 . 0 90 . 9 90 . 6 30 . 9 6
- 0 . 2 91 .230 . 6 70 . 8 10 . 6 80 . 2 1
1 0 4 .
0 . 2 2
o!o3o ! 6 10 . 0 0
0 . 2 00 . 3 7
0 . 1 50 . 5 40 . 7 50 . 5 70 . 5 1
0 . 6 20 . 7 10 . 4 00 . 6 20 . 4 70 . 6 10 . 9 40 . 9 70 . 9 40 . 9 40 . 5 80 .860 . 9 70 . 9 61 . 0 90 . 4 10 . 8 30 . 8 50 . 9 51 . 0 40 . 1 9
6 1 , 8 1 86 9 , 2 5 16 5 , 3 8 76 7 , 9 8 18 0 , 6 3 08 8 , 3 5 08 2 , 0 8 18 5 , 9 0 49 4 , 9 6 99 6 , 8 3 0
1 0 0 , 4 9 31 0 7 , 4 0 51 1 6 , 9 5 31 3 5 , 8 5 11 5 6 , 2 5 61 7 7 , 9 5 51 8 6 , 9 6 72 1 5 , 1 2 52 3 1 , 9 6 32 2 3 , 8 2 42 2 2 , 5 4 7231 ,6272 4 1 , 5 2 72 3 1 , 0 0 2199 ,1271 9 5 , 9 2 0205 ,797217 ,0702 2 5 , 0 9 22 2 5 , 1 0 62 7 1 , 5 6 52 5 9 , 6 4 72 8 4 , 1 1 03 2 1 , 2 9 4
:HANGE IN
June July Aug. Sept. Oct.LOANS OUTSTANDIHG IN 1982 DOLLARS1
OF DOLLARS)
6 2 , 5 2 96 9 , 2 7 06 5 , 3 2 56 8 , 7 1 581 ,7008 9 , 2 0 46 2 , 0 808 7 , 5 4 19 6 , 1 9 39 7 , 2 5 7
1 0 1 , 1 9 71 0 7 , 3 9 81 1 7 , 7 0 11 3 6 , 0 4 51 5 8 , 8 1 11 7 8 , 8 5 21 8 8 , 4 1 32 1 7 , 1 1 92 3 2 , 8 7 02 2 0 , 7 3 82 2 2 , 3 3 82 3 1 , 6 4 32 4 3 , 3 4 02 2 6 , 5 4 71 9 9 , 3 7 61 9 8 , 4 4 62 0 7 , 9 2 42 2 0 , 0 2 9
2 2 8 , 9 4 92 7 2 , 8 9 92 5 9 , 5 0 42 9 2 , 4 5 23 1 8 , 2 1 4
6 2 , 8 5 46 8 , 4 2 56 5 , 1 0 57 0 , 1 2 88 3 , 0 2 88 9 , 2 5 98 1 , 9 6 38 7 , 4 9 59 6 , 1 4 19 6 , 8 0 7
1 0 1 , 5 5 21 0 7 , 4 4 41 1 8 , 1 7 91 3 7 , 0 5 41 6 0 , 6 3 21 7 9 , 9 7 41 8 9 , 8 1 42 1 7 , 5 4 0231 , 5 4 82 1 8 , 3 1 02 2 1 , 0 7 22 3 7 , 3 7 42 4 2 , 0 4 82 2 2 , 6 8 01 9 6 , 9 6 11 9 7 , 9 4 22 0 8 , 7 1 72 2 1 , 3 6 4
2 3 1 , 9 8 42 7 2 , 0 7 22 5 8 , 3 4 52 9 4 , 5 7 03 1 9 , 8 6 1
MONEY SUPPLY M2(PERCENT)
0 . 4 00 . 3 00 . 8 70 . 4 0
- 0 . 0 80 . 3 00 . 6 2
0 . 7 20 . 3 00 . 7 20 . 5 80 . 7 50 . 6 20 . 3 70 . 1 51 . 020 . 5 80 . 1 2
1 .210 . 6 20 . 8 50 . 2 61 . 3 81 .260 . 8 70 . 6 90 . 5 80 . 6 40 . 3 80 . 6 90 . 7 80 . 6 20 . 7 2
2HANGE IN
0 . 4 00 . 1 30 . 2 90 . 0 00 .270 . 1 10 . 9 10 . 5 80 . 4 00 . 5 90 .460 . 5 60 . 6 40 . 6 20 . 1 90 . 9 70 . 6 70 . 3 1
0 . 8 50 . 8 40 . 6 10 . 3 71.570 . 4 00 . 7 00 .571 . 0 31 . 3 30 . 5 40 . 5 90 . 6 50 . 5 31 .10
0 , 3 10 .210 . 4 90 . 2 80 . 1 20 , 3 00 . 4 0
0 . 4 80 . 6 90 . 4 60 . 5 20 . 7 90 . 8 40 . 7 00 . 0 00 . 9 20 . 6 30 . 2 4
0 . 9 61 . 2 90 , 4 70 . 4 01 . 2 20 . 8 50 . 8 90 . 6 40 . 8 41 .330 . 7 00 . 6 80 . 5 8O.400 . 6 9
TOTAL LIQUID AS(PERCENT)
0 . 3 3
0^500 . 8 90 . 2 4
0 . 3 10 . 8 2
0 . 1 30 . 6 60 . 5 40 . 7 30 . 6 8
0 . 5 20 , 3 30 , 6 70 . 6 70 . 0 80 . 4 70 . 7 30 . 8 01 .070 . 7 80 . 9 71 . 0 00 . 9 50 . 9 20 . 9 00 . 6 00 . 9 10 . 7 90 . 6 31 . 0 40 . 5 2
0 . 6 3
0 . 1 00 . 5 70 , 2 1
0 . 3 60 . 6 3
0 . 4 80 . 5 60 . 4 80 . 7 0
0 . 2 70 . 7 40 . 6 10 . 3 20 . 3 70 . 7 90 . 9 51 . 0 20 . 8 30 . 9 80 . 6 90 . 9 20 . 7 11 .460 . 6 40 . 9 50 . 7 60 . 7 91 . 0 40 . 8 0
0 . 5 5
0 . 3 30 . 7 20 . 0 3
0 . 1 40 . 6 8
0 . 5 50 . 4 5J . 5 80 . 5 6
0 . 0 80 . 6 70 . 9 20 . 0 00 . 9 21 . 1 51 .100 . 9 80 . 6 40 . 7 80 .851 .060 . 9 11 .010 . 8 21 .030 . 8 51 . 0 21 , 0 30 . 4 8
6 2 , 5 8 46 9 , 1 5 06 2 , 4 3 57 1 , 2 0 98 3 , 3 1 28 9 , 0 9 38 1 , 6 7 78 9 , 0 2 99 5 , 9 9 89 7 , 1 5 6
1 0 2 , 4 2 31 0 8 , 2 9 51 1 9 , 3 801 4 0 , 0 9 61 6 3 , 3 0 61 7 9 , 8 4 01 9 3 , 3 3 52 2 1 , 4 2 32 3 4 , 4 0 62 2 1 , 2 6 42 2 1 , 4 4 62 2 8 , 4 3 22 3 8 , 4 6 92 1 9 , 6 2 51 9 7 , 2 0 42 0 0 , 3 2 92 0 9 , 9 3 22 2 4 , 8 9 6
2 3 7 , 1 8 62 7 2 , 7 2 22 5 8 , 2 2 72 9 7 , 1 0 13 2 1 , 7 1 6
;
0 . 4 40 . 2 50 . 5 30 . 0 00 . 0 00 . 2 60 . 6 5
0 , 3 40 . 8 50 . 5 80 . 5 40 . 6 30 . 7 80 . 6 10 . 3 60 . 8 90 . 7 10 . 1 20 , 9 50 . 9 01 . 2 30 . 2 90 . 3 20 . 8 71 .210 . 7 00 . 5 50 . 6 41 . 0 30 . 9 30 . 9 70 . 4 40 . 6 30 . 7 7
SETS3
0 . 5 5
0 . 4 30 . 5 00 .27
0 . 6 40 . 5 2
0 . 4 30 . 6 20 . 8 40 . 5 0
0 .270 . 9 00 . 9 30 . 1 10 . 8 90 . 7 01.170 . 9 70 . 6 20 . 7 90 . 7 60 . 9 60 . 8 80 . 7 50 . 9 40 . 8 90 . 7 80 . 6 60 . 7 60 . 7 6
6 3 , 6 0 36 8 , 5 5 46 2 , 4 8 87 1 , 7 0 48 3 , 8 5 48 9 , 6 4 08 2 , 2 0 68 9 , 3 0 19 6 , 3 3 79 7 , 3 9 9
1 0 2 , 2 7 01 0 9 , 1 5 51 2 0 , 6 9 11 4 2 , 9 5 31 6 4 , 9 5 51 8 0 , 6 4 21 9 4 , 8 5 32 2 4 , 1 1 92 3 4 , 1 1 92 2 6 , 8 0 72 2 0 , 3 8 12 3 2 , 2 4 42 4 5 , 8 4 62 1 5 , 7 3 41 9 5 , 6 4 02 0 0 , 3 8 02 0 9 , 5 3 42 2 7 , 1 8 22 2 1 , 8 2 9
2 7 4 , 8 8 52 5 7 , 5 9 53 0 1 , 8 0 93 2 2 , 4 1 2
0 . 5 70 . 1 30 . 1 60 . 2 40 . 4 30 . 0 80 . 2 9
0 . 0 30 . 4 20 . 5 50 . 5 10 . 5 50 , 7 50 . 7 90 . 5 50 . 7 20 . 7 10 . 2 91 , 0 41 . 0 21 . 1 80 . 1 20 . 4 50 . 8 81 .060 . 7 80 . 9 70 . 8 00 . 8 90 . 6 30 . 8 50 . 5 90 . 7 90 . 5 6
0 . 5 8
0 . 3 90 . 7 40 . 4 8
0^470 .10
0 . 4 00 . 5 30 . 7 50 . 8 6
0 . 5 00 . 7 40 . 7 60 . 4 50 . 7 70 . 7 11 . 0 30 . 8 10 . 6 60 . 9 50 . 5 60 . 9 61 . 0 61 . 2 80 . 7 81 .010 . 6 00 . 6 71 . 0 10 . 7 5
6 4 , 6 6 16 8 , 4 5 76 2 , 5 9 17 3 , 0 9 08 4 , 0 9 58 8 , 7 2 88 2 , 7 409 0 , 3 7 09 6 , 1 4 99 7 , 4 0 2
1 0 3 , 8 3 91 1 0 , 5 5 81 2 1 , 2 9 41 4 4 , 4 2 01 6 7 , 7 1 01 8 2 , 0 1 81 9 7 , 0 9 72 2 5 , 9 0 02 2 9 , 7 1 32 2 4 , 3 6 12 2 5 , 6 9 12 3 6 , 8 5 52 4 3 , 1 4 92 1 2 , 3 7 31 9 6 , 7 2 12 0 1 , 4 8 52 0 9 , 6 1 12 2 4 , 6 0 32 2 0 , 6 1 1
2 7 4 , 3 0 72 5 6 , 1 9 33 0 5 , 3 6 63 2 5 , 1 8 3
0 . 3 10 . 3 00 . 4 50 . 2 00 . 1 20 . 0 80 . 3 6
0 . 0 30 . 4 50 . 5 50 . 7 30 . 7 00 . 6 50 . 8 00 . 1 70 . 7 40 . 7 80 .270 . 8 50 . 8 51 .100 . 4 50 . 5 60 . 6 21 .360 . 7 80 . 6 80 . 3 80 . 7 90 . 8 10 . 7 90 . 9 80 . 6 00 . 3 5
0 . 5 4
0 . 4 60 . 5 50 .270 . 0 30 .550 .06
0 . 6 40 .420 .490 . 7 0
0 .300 . 7 00 . 9 00 . 3 20 . 7 50 . 7 91 .100 .690 . 6 20 . 7 81 .091 .050 . 9 10 . 6 60 . 8 01 .111 . 0 10 . 5 80 . 6 70 . 5 7
Nov.
6 6 , 3 0 36 8 , 0 9 26 3 , 1 2 77 4 , 4 3 48 4 , 8 4 88 7 , 2 7 68 2 , 8 4 99 1 , 1 2 99 6 , 5 0 59 7 , 5 9 3
1 0 4 , 7 2 51 1 2 , 4 1 81 2 2 , 5 8 51 4 6 , 3 5 11 6 9 , 5 0 51 8 3 , 4 5 71 9 9 , 8 5 72 2 6 , 5 0 42 2 8 , 2 3 92 2 3 , 9 4 82 2 6 , 8 1 92 3 8 , 4 4 52 4 3 , 4 3 92 1 1 , 9 8 51 9 8 , 8 9 82 0 2 , 2 3 42 1 1 , 4 9 22 2 2 , 0 2 72 2 4 , 2 8 0
2 6 9 , 4 2 72 5 7 , 7 7 43 0 8 , 7 1 63 2 8 , 8 2 3
0 . 4 80 . 1 70 . 3 6
- 0 . 0 80 .270 . 1 10 . 5 3
0 . 2 00 . 4 50 . 6 90 . 7 30 . 8 00 . 6 90 . 7 10 . 2 90 . 5 00 . 7 30 . 5 30 . 7 80^930 . 9 10 , 7 20 . 6 01 . 0 21 . 1 20 . 6 60 . 5 40 . 2 00 . 8 30 . 9 70 . 7 30 . 6 01 .060 . 4 9
0 . 5 7
0 . 4 60 . 4 00 . 3 80 .06
o ! l 5
0 , 2 50 . 7 10 . 9 80 . 9 30 . 6 0
0 . 4 10 . 5 80 . 6 40 . 7 80 .570 . 7 91 . 2 80 . 6 90 . 4 81 . 1 20 . 8 71 . 0 41 .220 . 1 21 .160 . 9 20 . 5 00 . 9 50 . 7 20 . 9 9
Dec.
6 7 , 0 8 36 6 , 6 1 66 4 , 7 0 67 5 , 4 9 56 5 , 1 6 08 6 , 8 3 38 3 , 2 9 991 ,7519 6 , 2 1 39 7 , 7 1 9
1 0 5 , 1 9 41 1 4 , 1 3 61 2 4 , 5 3 4147 , 2 9 01 7 0 , 3 1 61 8 4 , 3 4 22 0 1 , 2 7 92 2 7 , 8 2 52 2 8 , 2 8 92 2 0 , 9 5 42 2 4 , 1 1 42 3 5 , 7 8 92 4 4 , 1 0 62 1 1 , 4 6 61 9 8 , 7 6 02 0 2 , 9 7 92 1 0 , 2 7 52 2 3 , 5 5 32 2 4 , 9 6 22 5 0 , 8 6 32 6 3 , 3 8 22 6 1 , 3 5 73 0 9 , 6 4 43 3 1 , 3 1 7
0 . 3 00 . 2 10 . 1 60 . 2 40 . 1 90 . 0 00 . 2 1
0 . 4 20 . 6 00 . 7 80 . 4 10 .620 . 7 50 . 5 20 . 5 90 . 7 30 . 4 30 .930 . 8 21 . 0 50 . 7 60 . 3 20 . 8 21 .310 . 6 80 . 7 20 . 5 00 . 0 70 . 9 60 . 7 70 . 4 51 . 0 90 . 5 9
0 . 5 00 .27
0 . 4 30 . 4 10 . 3 40 . 5 4
- 0 . 1 0
0 . 6 30 . 8 90 . 4 40 .50
0 . 5 60 . 6 50 . 6 80 . 5 50 , 6 90 . 8 81 . 220 . 7 70 . 5 60 . 6 41 . 0 50 . 9 91 . 1 80 . 4 50 . 6 60 . 6 90 . 6 11 . 1 40 . 9 51 .01
IQ
6 0 , 8 6 26 7 , 5 7 16 6 , 2 3 66 5 , 4 4 67 7 , 0 9 48 6 , 0 1 38 4 , 6 0 48 3 , 5 0 59 2 , 7 5 79 5 , 9 3 29 8 , 2 9 9
1 0 5 , 8 6 41 1 4 , 0 8 41 2 9 , 2 2 51 5 0 , 8 0 01 7 3 , 2 2 71 8 3 . 8 9 92 0 6 , 6 7 02 2 7 , 9 9 72 2 6 , 1 6 92 1 8 , 1 8 42 2 9 , 5 1 52 3 2 , 7 9 32 4 3 , 9 6 72 0 8 , 3 4 31 9 7 , 7 2 12 0 2 , 1 4 52 1 1 , 5 1 82 2 7 , 5 5 72 2 1 , 3 4 32 5 9 , 4 3 12 6 7 , 8 8 02 6 5 , 5 3 33 1 6 , 5 7 3
0 . 3 60 . 2 70 , 2 90 . 3 30 . 1 10 . 3 20 . 6 4
0 . 1 70 . 6 30 . 7 40 . 7 10 . 5 40 . 6 50 . 5 50 . 6 50 . 5 40 . 4 5
1 .211 .070 . 5 60 . 5 90 . 8 31 . 0 91 .010 . 5 70 . 5 50 . 6 40 . 7 90 . 6 11.830 . 6 30 . 7 7
0 . 6 4
0 . 2 40 . 3 40 . 3 4
0 . 2 50 , 4 4
0 . 2 60 . 5 00 . 7 20 . 6 70 . 4 8
0 . 5 60 . 6 80 . 6 80 . 5 20 . 2 20 . 8 90 . 9 71 .030 . 9 70 . 4 80 . 8 90 . 9 50 . 8 90 . 8 60 . 8 10 . 9 10 . 9 11 .030 . 9 40 . 7 5
II Q III Q
AVERAGE FOR
6 1 , 9 8 56 9 , 1 8 76 5 , 5 3 06 7 , 6 8 58 0 , 6 3 78 8 , 3 9 48 2 , 5 4 38 5 , 9 8 49 4 , 9 8 99 6 , 9 2 6
1 0 0 , 4 7 71 0 7 , 3 5 21 1 6 , 7 5 91 3 5 , 0 8 91 5 6 , 4 0 61 7 8 , 2 2 01 8 7 , 4 5 92 1 5 , 4 0 12 3 1 , 8 1 72 2 2 , 5 4 82 2 2 , 3 7 62 3 2 , 2 2 82 4 1 , 9 2 12 3 1 , 6 8 41 9 9 , 2 7 51 9 6 , 6 4 52 0 5 , 8 3 92 1 7 , 6 5 82 2 7 , 2 6 42 2 4 , 6 7 92 7 0 , 7 4 12 6 1 , 2 3 22 8 4 , 9 1 33 1 9 , 7 3 6
6 3 , 0 1 46 8 , 7 1 06 3 , 3 4 37 1 , 0 1 48 3 , 3 9 86 9 , 3 3 16 1 , 9 4 98 8 , 6 0 89 6 , 1 5 99 7 , 1 2 1
1 0 2 , 0 8 21 0 6 , 2 9 81 1 9 , 4 1 71 4 0 , 0 3 41 6 2 , 9 6 41 8 0 , 1 5 21 9 2 , 6 6 72 2 1 , 0 2 72 3 3 , 3 5 82 2 2 , 1 2 72 2 0 , 9 6 62 3 2 , 6 8 32 4 2 , 1 2 22 1 9 , 3 4 61 9 6 , 6 0 21 9 9 , 5 5 02 0 9 , 3 9 42 2 4 , 4 8 12 2 1 , 5 9 82 3 6 , 9 7 32 7 3 , 2 2 62 5 8 , 0 5 62 9 7 , 8 2 73 2 1 , 3 3 0
AVERAGE FOR
0 . 3 70 . 2 40 . 3 60 , 2 30 . 1 50 . 1 90 . 7 7
0 . 3 20 . 6 30 . 6 00 . 7 00 . 6 00 . 5 20 . 2 80 . 8 50 . 6 10 . 2 6
0 . 4 51 . 1 90 . 7 60 . 7 50 . 3 11 . 3 40 . 9 20 . 8 50 . 6 30 . 8 60 . 5 60 . 7 20 . 6 50 . 7 50 . 6 10 . 6 8
0 . 4 40 . 2 00 . 3 90 . 1 70 . 1 80 . 2 10 . 4 5
0 . 6 50 . 5 30 . 5 20 . 6 60 . 7 90 . 7 00 . 3 00 . 6 40 . 6 80 . 2 2
0 . 8 40 . 9 61 . 2 30 . 2 90 . 3 90 . 9 91 . 0 40 . 7 90 . 7 20 . 7 61 . 0 80 . 7 50 . 8 30 . 5 40 . 6 10 . 6 7
AVERAGE FOR
0 . 3 9
O | 2 10 . 6 90 . 1 5
o!290 . 6 1
0 . 230 . 5 60 . 6 20 . 5 90 . 6 3
0 . 4 40 . 6 00 . 7 00 . 2 90 . 4 80 . 8 20 . 9 11 .010 . 8 50 . 8 40 . 8 50 . 9 50 . 8 61 . 1 50 . 5 50 . 9 00 . 8 00 . 7 91 . 0 40 . 5 0
0 . 5 6
(K380 . 6 50 . 2 6
(K420 . 4 3
0 .490 . 4 60 . 5 30 . 7 20 . 6 4
0 . 2 80 . 7 70 . 8 80 . 1 90 . 8 60 . 8 51 .100 . 9 20 . 6 40 . 8 40 . 7 21 .000 . 9 51 .010 . 8 50 . 9 80 , 7 40 . 7 80 . 9 30 . 6 6
IV Q
PERIOD
6 6 , 0 1 66 7 , 7 2 26 3 , 4 7 57 4 , 3 4 08 4 , 7 0 18 7 , 6 1 28 2 , 9 6 39 1 , 0 8 39 6 , 2 8 99 7 , 5 7 1
1 0 4 , 5 8 61 1 2 , 3 7 11 2 2 , 6 0 41 4 6 , 0 2 01 6 9 , 1 7 71 8 3 , 2 7 21 9 9 , 4 1 12 2 6 , 7 4 32 2 8 , 7 4 72 2 3 , 0 8 82 2 5 , 5 4 12 3 7 , 0 3 02 4 3 , 5 6 52 1 1 , 9 4 11 9 8 , 1 2 62 0 2 , 2 3 32 1 0 , 4 5 92 2 3 , 3 9 42 2 3 , 2 8 42 4 7 , 6 5 82 6 9 , 0 3 92 5 8 , 4 4 13 0 7 , 9 0 93 2 8 , 4 4 1
PERIOD
0 . 3 60 , 2 30 . 3 20 . 1 20 . 1 90 . 0 60 . 3 7
0 . 4 40 . 6 10 . 7 50 . 6 40 . 6 50 . 7 50 . 3 30 . 6 10 . 7 50 . 4 1
0 . 6 50 . 8 71 . 0 20 . 6 40 . 4 90 . 8 21 ,260 . 7 10 . 6 50 . 3 60 . 5 60 . 9 10 . 7 60 . 6 80 . 9 20 . 4 8
PERIOD
0 . 5 4
o!400 . 4 60 . 3 5
0^630 . 0 40 . 2 80 . 6 60 . 7 60 . 6 20 . 6 0
0 . 7 00 . 4 20 . 6 40 . 7 40 . 5 50 . 6 70 . 8 21 . 2 00 . 7 20 . 5 50 . 8 51 .001 . 0 31 . 1 00 . 4 10 . 9 40 . 9 10 .710 . 8 90 , 7 80 . 8 6
Annual
6 2 , 9 6 96 8 , 2 9 86 4 , 6 4 66 9 , 6 2 28 1 , 4 5 68 7 , 8 3 68 3 , 0 1 58 7 , 2 9 59 5 , 0 4 89 6 , 8 6 8
1 0 1 , 3 6 11 0 8 , 4 7 11 1 8 , 2 6 61 3 7 , 5 9 21 5 9 , 8 3 61 7 8 , 7 1 81 9 0 , 8 5 92 1 7 , 4 6 02 3 0 , 4 8 02 2 3 , 4 8 32 2 1 , 7 6 72 3 2 , 6 6 42 4 0 , 1 0 02 2 6 , 7 3 52 0 0 , 5 6 61 9 9 , 0 3 72 0 6 , 9 6 02 1 9 , 2 6 32 2 4 , 9 2 62 3 2 , 6 6 32 6 8 , 1 0 92 6 1 , 4 0 22 8 9 , 0 4 53 2 1 , 5 2 0
0 . 3 60 . 2 40 . 3 40 . 2 10 . 1 60 . 2 00 . 5 6
0 . 4 00 . 6 00 . 6 50 . 6 60 . 6 50 . 6 60 . 3 70 . 7 40 . 6 40 . 3 3
0 . 5 31 .061 . 0 20 . 5 60 . 4 51 . 0 01 . 0 80 . 8 40 . 6 40 . 6 30 . 7 10 . 7 90 . 7 20 . 9 50 . 6 90 . 6 5
0 . 5 30 .47o l s j0 . 5 40 . 2 80 . 3 2(K400 . 3 6
0 . 3 20 . S 40 . 6 60 . 6 50 . 5 9
o!42d'.bH0 . 7 50 . 3 90 . 5 60 . 8 41 . 0 40 . 9 20 . 7 50 . 7 50 . 8 70 . 9 80 . 9 50 . 8 60 . 7 90 . 9 20 . 7 90 . 8 70 . 9 20 . 6 9
This series contains revisions beginning with 1945. 2Th1s series contains revisions beginning with 1974. 3Thisseries contains revisions beginning with 19S9,
(JUNE 1986)
102Digitized for FRASER http://fraser.stlouisfed.org/ Federal Reserve Bank of St. Louis
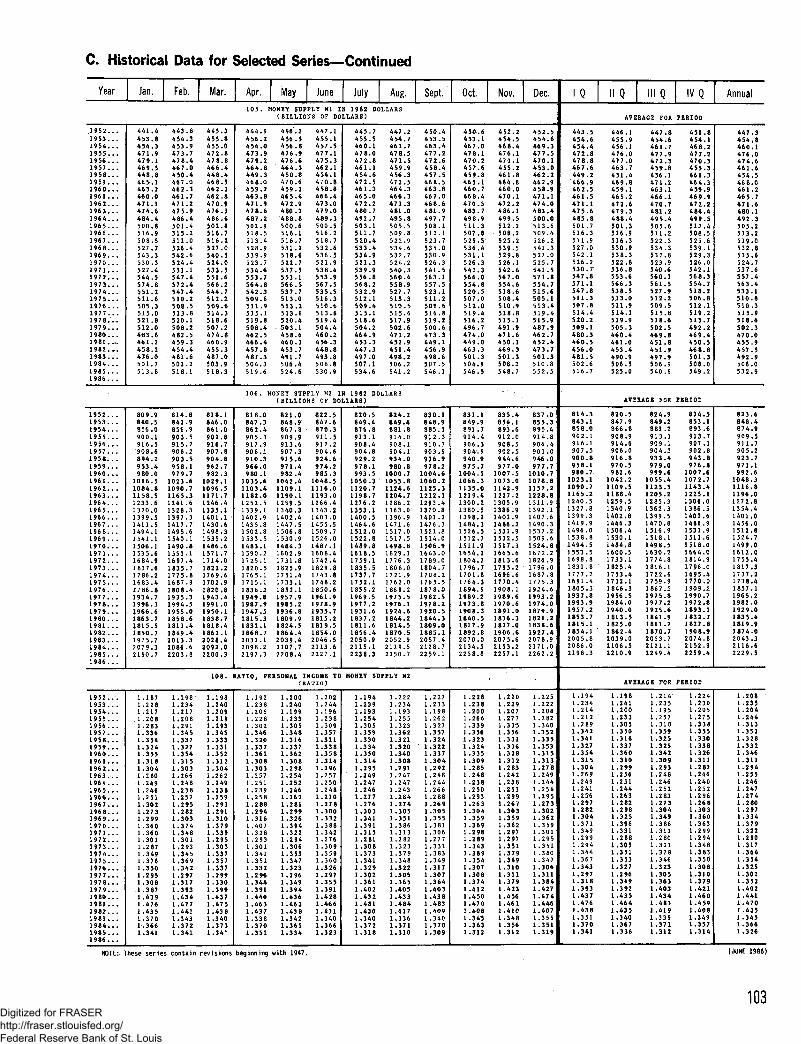
C. Historical Data for Selected Series—Continued
Year
. 1 9 5 2 . . .1 9 5 3 . . .1 9 5 4 . . .
1 9 5 5 . . .1 9 5 6 . . .1 9 5 7 . . .1 9 5 8 . . .1959 . . .1960 I I I1 9 6 1 , . .1 9 6 2 . . .196 3 . . .1 9 6 4 . . .1 9 6 5 . .1 9 6 6 I I I1 9 6 7 . . .1 9 6 8 . . .1 9 6 9 . . .1 9 7 0 . . .1 9 7 1 . . .1 9 7 2 . . .1 9 7 3 . . .1 9 7 4 . . .1 9 7 5 . . .1 9 7 6 . . .1 9 7 7 . . .1 9 7 8 . . . .1 9 7 9 . . .1 9 8 0 . . .1 9 8 1 . . . .1 9 8 2 . . . .
1984.1."1 9 8 5 . . .1 9 8 6 . . .
1 9 5 2 . . .1953 . . .1 9 5 4 . . .1 9 5 5 . . .1 9 5 6 . . .1 9 5 7 . . .1 9 5 8 . . .1 9 5 9 . . .1 9 6 0 . . .1 9 6 1 . . .1 9 6 2 . . .1 9 6 3 . . .196 4 . . .196 5 . . .1 9 6 6 . . .196 7 . . .1 9 6 8 . . .1 9 6 9 . . .1 9 7 0 . . .1 9 7 1 . . .1 9 7 2 . . .1 9 7 3 . . .1 9 7 4 . . .1 9 7 5 . . .1 9 7 6 . . .1 9 7 7 . . .
1 9 7 9 I I !1 9 8 0 . . .1 9 8 1 , . .
1982 . . .1 9 8 3 . . .1 9 8 4 . . .1 9 8 5 . . .1 9 8 6 . . .
19 5 2 . . .1 9 5 3 . . .1 9 5 4 . . .1 9 5 5 . . .1 9 5 6 . . .1 9 5 7 . . .1 9 5 8 . . .1 9 5 9 . . .1 9 6 0 . . .1 9 6 1 . . .1 9 6 2 . . .1 9 6 3 . . .1 9 6 4 . . .1 9 6 5 . . .1966 . . .1 9 6 7 . . .196 8 . . .1 9 6 9 . . .1 9 7 0 . . .1 9 7 1 . . .1 9 7 2 . . .1 9 7 3 . . .1 9 7 4 . . .1 9 7 5 . . .1 9 7 6 . . .1 9 7 7 . . .1 9 7 8 . . .1 9 7 9 . . .1 9 8 0 . . .1 9 8 1 . . .1 9 8 2 . . .1 9 8 3 . . .1 9 6 4 . . .1 9 8 5 . . .1 9 8 6 . . .
Jan.
4 5 3 . 84 5 4 . 3
4 7 9 . 146 9 . 54 4 8 . 8
463124 6 0 . 04 7 1 . 14 7 4 . 64 8 4 . 4
5 1 6 . 95 0 8 . 55 2 7 . 75 4 3 . 35 3 0 . 35 2 7 . 45 4 4 . 55 7 4 . 85 5 1 . 25 1 1 . 65 0 5 . 35 1 5 . 05 2 1 . 85 1 2 . 0483 .64 6 1 . 24 5 8 . 2
5 0 1 . 75 1 3 . 8
80 9 .9
8 5 6 . 09 0 0 . 19 1 6 . 59 0 8 . 68 9 4 . 29 5 3 . 49 8 0 . 0
1 0 1 6 . 51 0 8 4 . 81 1 5 8 . 51 2 3 3 . 61 3 2 0 . 01 3 9 9 . 51 4 1 1 . 51 4 9 4 . 11541 .11 5 0 6 . 11 5 3 5 . 61 6 8 4 . 91 8 3 7 . 617 8 6 . 21 6 8 3 . 417 8 6 . 81 9 3 4 . 7
1966 Ie1 8 6 3 . 71 8 1 5 . 5
1 8 5 0 . 71 9 7 5 . 72 0 7 9 . 32190 .7
1 . 1 8 71 . 2 2 8
.217L.208L.283L.336L.354L.324L.355L.318L.304
.2 80L.249
.246
. 2 5 1L.302L.2731 .299L.360L.360L.3011.287L.349L . 3 7 6L.35OL.295L.308L.387L.43 9L.476
. 4 3 5L.370L .3661 .341
Feb. Mar.
4 5 4 . 3 4 5 5 . 84 5 3 . 9 4 5 5 . 0
4 7 8 . 4 4 7 8 . 84 6 7 . 0 4 6 6 . 44 5 0 . 4 4 4 8 . 4
4 6 2 . 3 4 6 2 . 14 6 1 . 7 4 6 2 . 84 7 1 . 2 4 7 0 . 94 7 5 . 9 4 7 6 . 34 8 6 . 4 4 8 6 . 6
5 I 5 I 2 516175 1 1 . 0 5 1 6 , 25 2 6 . 4 5 2 7 . 05 4 2 . 6 5 4 0 . 55 2 4 . 4 5 2 4 . 05 3 1 . 1 5 3 3 . 55 4 7 . 4 5 5 1 . 65 7 2 . 4 5 6 6 . 25 4 7 . 4 5 4 4 . 75 1 0 . 2 5 1 2 . 25 0 8 . 5 5 0 9 . 65 1 3 . 8 5 1 4 . 35 2 0 . 1 5 1 8 . 65 0 8 . 2 5 0 7 . 24 8 2 . 5 4 7 4 . 84 5 9 . 3 4 6 0 . 94 5 4 . 4 4 5 5 . 3481 fi 487 0502 I 2 503 195 1 8 . 1 5 1 8 . 3
8 1 4 . 8 8 1 8 . 1842 > 9 846 • 08 5 6 . 9 8 6 1 . 09 0 3 . 5 9 0 2 , 89 1 5 . 2 9 1 6 . 79 0 6 . 2 9 0 7 . 89 0 3 . 5 9 0 4 . 89 5 8 . 1 9 6 2 . 79 7 9 . 7 9 8 2 . 3
1 0 2 3 . 6 1 0 2 9 . 11 0 9 0 . 7 1 0 9 6 . 51 1 6 5 . 3 1 1 7 1 . 71 2 4 1 . 6 1 2 4 6 . 41 3 2 8 . 3 1 3 3 5 . 11 3 9 7 . 3 1 4 0 1 . 11 4 1 7 . 7 1 4 3 0 . 61 4 9 5 . 6 1 4 9 8 . 31 5 4 0 .1 4 9 0 , f1 5 5 3 .1 6 9 7 . '1 8 3 5 .1 7 7 5 .1 6 8 7 .1808.<<1 9 3 5 . :
1955 I(1 8 5 8 . (1 8 1 1 . '
1 5 3 5 . 2} 1 4 8 6 . 6
1 5 7 1 . 7t 1 7 1 4 . 01 1 8 2 2 . 2) 1 7 6 9 . 6
1 7 0 2 . 9» 1 8 2 0 . 8
1 9 4 3 . 4
1 9 5 o ! l. 183 8 . 71 1 8 1 8 . 4
1849 . 4 1ooz . 12 0 1 3 . 3 2 0 2 8 . 42 0 8 6 . 6 2 0 9 2 . 02 2 0 3 . 8 2 2 0 0 . 3
1 0 8 .
1 . 1 9 8 1 . 1 9 81 . 2 3 4 1 . 2 4 01 . 2 1 7 1 . 2 0 91 . 2 0 8 1 . 2 1 91 . 2 9 1 1 . 2 9 31 . 3 4 5 1 . 3 4 51 . 3 3 7 1 . 3 3 31 .327 1 . 3 3 11 . 3 5 41 . 3 1 51 . 3 0 31 . 2 6 61 . 2 4 81 . 2 3 8
1 . 2 5 71 . 2 9 51 . 2 8 21 . 3 0 31 . 3 7 41 . 3 4 81 . 3 0 11 .2 931 . 3 4 51 . 3 6 91 . 3 4 21 . 2 9 71 . 3 1 71 . 3 9 31 . 4 3 41 . 4 7 71 . 4 4 11 . 3 4 31 . 3 7 21 . 3 4 1
L.352L.312L.304
. 2 6 2
.249
. 2 3 8
.2 59L.293L .291L.310L.379L.339L.295L.303L.337L .357L.337L.299L.330L.399L.437L.475
. 4 3 8
. 3 4 0L.373L.34.1
Apr. May June July Aug.1 0 5 . MONEY SUPPLY Ml IN 1982 DOLLARS
4 5 6 . 24 5 4 . 0
• 4 7 3 . 94 7 9 . 24 6 4 . 84 4 9 . 3
459124 6 3 . 84 7 1 . 94 7 8 . 64 8 7 . 2
5 1 8 . 55 1 3 . 45 2 8 . 95 3 9 . 95 2 3 . 75 3 4 . 65 5 3 . 75 6 4 . 85 4 2 . 35 0 9 . 65 1 1 . 95 1 5 . 15 1 9 . 85 0 8 . 446 2 . 54 6 6 . 44 5 7 . 8
5 0 4 . 35 1 9 . 6
(BILLIONS OF DOLLARS)
4 5 6 . 54 5 6 . 8
476 .94 7 6 . 64 6 4 . 34 5 0 . 847 0 64 5 9 . 246 5 . 44 7 2 . 94 8 0 . 24 8 8 . 8500 .65 1 6 . 15 1 6 . 75 3 1 . 25 3 8 . 65 2 2 . 75 3 7 . 55 5 3 . 15 6 6 . 55 3 7 . 75 1 3 . 05 1 3 . 25 1 3 . 65 2 0 . 45 0 3 . 14 5 8 . 646 0 . 34 5 3 . 7
5 0 6 . 45 2 4 . 6
4 5 5 . 14 5 7 . 5
4 7 7 . 14 7 5 . 346 2 . 14 5 4 . 1
45sla4 6 6 . 44 7 3 . 04 7 9 . 04 8 9 . 3500 .55 16 I25 1 8 . 75 3 2 . 65 3 6 . 55 2 1 . 95 3 8 . 45 5 3 . 95 6 7 . 55 3 5 . 55 1 6 . 35 1 0 . 65 1 3 . 65 1 9 . 45 0 4 . 44 6 0 . 24 5 6 . 34 4 8 . 8
493 .85 0 8 . 85 3 0 . 9
4 4 5 . 74 5 5 . 546 0 . 1
4 7 2 . 84 6 1 . 14 5 4 . 64 7 2 . 546 1134 6 5 . 04 7 2 . 24 8 0 . 74 9 2 . 75 0 3 . 1S i l l ?5 2 0 . 45 3 3 . 45 3 4 . 95 2 1 . 35 3 9 . 95 5 6 . 85 6 8 . 25 3 2 . 95 1 2 . 15 0 9 . 45 1 5 . 15 1 8 . 65 0 4 . 24 6 4 . 94 5 3 . 34 4 7 . 3
507 115 3 4 . 6
447 .24 5 4 . 74 6 1 . 7
4 7 8 . 54 7 1 . 54 5 9 . 94 5 6 . 3
4 6 4 . 34 6 6 . 34 7 1 . 3481 .04 9 5 . 85 0 5 . 55 0 9 . 8522. .95 3 4 . 65 3 2 . 75 2 4 . 25 40 .35 6 0 . 45 5 8 . 95 2 7 . 75 1 3 . 35 1 0 . 55 1 5 . 65 1 7 . 95 0 2 . 64 7 1 . 2452 .94 5 1 . 4
4 9 8 . 25 0 6 . 2541 . 2
1 0 6 . MONEY SUPPLY M2 IK 1982 DOLLARS
8 1 8 . 0
862 I49 0 5 . 39 1 7 . 99 0 6 . 1910 .39 6 6 . 09 8 0 . 1
1 0 3 5 . 61 1 0 3 . 41 1 8 2 . 01 2 5 2 . 51 3 3 9 . 11 4 0 2 . 9143 5 .81 5 0 2 . 81 5 3 3 . 51 4 8 3 . 11 5 9 0 . 21 7 2 5 . 11 8 2 0 . 51 7 6 5 . 11 7 1 5 . 11 8 3 6 . 21 9 4 9 . 8
1947 Is1 8 1 5 . 31 8 3 1 . 1
1 8 6 8 . 72 0 3 1 . 12 0 9 8 . 22 1 9 7 . 3
(BILLIONS OP DOLLARS)
8 2 1 . 0
867 I 89 0 9 . 99 1 3 . 69 0 7 . 39 1 5 . 69 7 1 . 49 8 2 . 4
1 0 4 2 . 41 1 0 9 . 11 1 9 0 . 11 2 5 9 . 513 40 .31 4 0 2 . 41 4 4 7 . 51 5 0 6 . 81 5 3 0 . 91 4 8 4 . 31 6 0 2 . 91 7 3 1 . 81 8 2 5 . 91 7 5 1 . 41 7 3 3 . 11 8 5 2 . 11 9 5 7 . 9
1936 Is1 8 0 9 . 91 8 2 4 . 5
1 8 6 4 . 42 0 3 9 . 42 1 0 7 . 72 2 0 8 . 4
8 2 2 . 5
8 7 0 . 39 1 1 . 59 1 2 . 29 0 4 . 69 2 4 . 69 7 4 . 29 8 5 . 3
1 0 4 8 . 51 1 1 6 . 01 1 9 3 . 01 2 6 6 . 413 4 3 . 21 4 0 3 . 01 4 5 5 . 51 5 0 9 . 71 5 2 6 . 01 4 8 7 . 11 6 0 8 . 41 7 4 2 . 41 8 2 9 . 81 7 4 3 . 81 7 4 8 . 21 8 5 0 . 61 9 6 1 . 9
1 9 3 5 . 71 8 1 5 . 21 8 1 9 . 5
1 8 5 4 . 02 0 4 6 . 52113 .62 2 2 7 . 1
RATIO, PERSONAL INCOME TO
1 . 1 9 2. 2 3 8.206.2 28. 3 0 2.346. 3 2 0.337. 3 6 1. 3 0 8.303.257. 2 5 1. 2 3 9
, 2 5 8. 2 8 8
L.294. 3 1 6.407. 3 2 8. 2 9 3. 3 0 1.341. 3 5 1. 3 3 2.2 96. 3 4 4.391.440.463.437. 3 3 8. 3 7 0. 3 5 1
(RAT
1 . 2 0 0. 2 4 0. 1 9 9
L.233L.3O5L.348L . 316L.337L.362L.308L.298
. 2 5 4
. 2 5 2
.246
.26 2L . 2 8 1L.299L.326L.394L.322L.294L.306L.353L .347L.323L.296L.349L.394L.436L.46 2
. 4 3 8
. 3 4 2L.365L.334
CO)
. 2 0 2
.2 44
.196
. 2 3 8
. 3 0 9
.357
.311
. 3 3 8
. 3 5 8
. 3 1 4
.296
.257
. 2 5 0
. 2 4 8
.27 0L.278L.300
. 3 3 2
. 3 8 8
.3 42
.276
. 3 0 9
. 3 5 9
. 360
.3 26
.297
. 3 5 5
.391
. 4 2 8
.466
. 4 3 1
. 3 4 0
.366
. 3 2 3
8 2 0 . 5
8 7 6 . i9 1 3 . 19 0 8 . 49 0 4 . 89 2 9 . 29 7 8 . 19 9 3 . 5
1 0 5 0 . 31 1 2 0 . 71 1 9 8 . 71 2 7 6 . 21 3 5 3 . 11 4 0 0 . 5146 4 . 61 5 1 2 . 01 5 2 2 . 81 4 8 9 . 81 6 1 8 . 51 7 5 9 . 1183 5 . 51 7 3 7 . 71 7 5 2 . 1185 5 . 21 9 6 9 . 5197 7 .21 9 3 1 . 6183 7 . 21 8 1 1 . 6
2 0 5 0 . 92 1 1 5 . 12 2 3 8 . 3
82 4 . 2
8 8 1 . 89 1 4 . 09 0 8 . 19 0 4 . 19 3 4 . 09 8 0 . 8
1 0 0 0 . 71 0 5 5 . 81 1 2 4 . 61 2 0 4 . 71 2 8 6 . 21363 ,01 3 9 6 . 91 4 7 1 . 61 5 1 7 . 01 5 1 7 . 51 4 9 8 . 81 6 2 9 . 11 7 7 6 . 31 8 0 8 . 01 7 2 1 . 91762 .0186 9 . 21 9 7 5 . 5
1 9 2 4 . 61 8 4 4 . 21 8 1 4 . 5
2 0 5 2 . 92 1 1 9 . 52 2 5 0 . 7
MONEY SUPPLY M2
1 . 1 9 41 . 2 3 91 . 1 9 31 , 2 5 41 . 3 0 51 . 3 5 9
.330L.334L.350L.314
.295. 2 4 9.2 47.246
L.276L.303
. 3 4 1
. 3 9 1
. 3 1 5
.281L.308L.373
. . 341L.329L.302L.361L.402L.43 2L . 4 8 1
. 4 3 0
. 3 4 0L.372L.318
1 . 2221 . 2 3 41 . 1 9 31 . 2 5 51 . 3 2 31 . 3 6 21 . 3 2 11 . 3 2 01 . 3 4 01 . 3 0 81 .2911 .2471 .2 471 . 243
1 . 2 7 41 . 3 0 51 . 3 5 11 . 3 8 61 . 3 1 31 .2 821 . 3 2 31 . 3 7 91 . 3481 . 3 2 21 . 3 0 51 . 3 6 51 . 4051 . 4331 . 4 8 41 . 4 1 71 . 3 3 61 . 3 7 11 . 3 1 0
Sept.
4 5 0 . 44 5 3 . 54 6 3 . 4
472164 5 8 . 44 5 7 . 5
4 6 3 . 846 7 . 046 8 . 6481 .94 9 7 . 75 0 8 . 15 1 2 . 15 2 3 . 75 3 5 . 05 3 0 . 95 2 6 . 35 4 1 . 55 6 3 . 15 5 7 . 55 2 3 . 15 1 1 . 25 0 8 . 65 1 6 . 85 1 9 . 2500 .64 7 3 . 34 4 9 . 14 5 6 . 9
5 0 7 . 55 46 .1
8 3 0 . 1
8 8 5 . 19 1 2 . 39 1 0 . 79 0 3 . 99 3 6 . 99 7 8 . 2
1 0 0 4 . 61 0 6 0 . 21 1 2 5 . 31 2 1 2 . 11 2 9 3 . 41 3 7 0 . 81401 . 21 4 7 6 . 31 5 2 1 . 81 5 1 4 . 01 5 0 6 . 91 6 4 3 . 01 7 8 9 . 01 8 0 4 . 71 7 0 8 . 21 7 6 5 . 51 8 7 8 . 01 9 8 2 . 5
1 9 2 0 . 51 8 4 4 . 31 8 0 9 . 0
2057lI2128172 2 5 9 . 1
1 .2271 . 2 3 31 . 1 9 81 . 2 6 21 .3271 .3571 . 3 2 41 . 3 2 21 . 3 3 71 . 3 0 41 . 2 9 21 . 2 4 81 . 2 4 41 . 2 6 6
1 . 2 6 91 . 3 0 51 . 3 5 51 . 3 8 11 . 3 0 61 . 2 7 71 . 3 3 11 . 3 8 3
1 . 3 4 91 . 3 1 71 , 3 0 71 . 3 6 41 . 4 0 31 . 4 3 81 . 4 8 31 . 4 0 91 . 3 4 01 . 3 7 01 . 3 0 9
Oct.
4 5 0 . 64 5 3 . 146 7 . 0
47 8 .14 7 0 . 24 5 7 . 64 5 9 . 8
4 6 0 . 74 6 8 . 44 7 0 . 5 '4 8 3 . 74 9 8 . 95 1 1 . 3507 Is5 2 5 . 55 3 6 . 45 3 1 . 15 2 6 . 35 4 2 . 35 6 6 . 05 5 4 . 85 2 0 . 55 0 7 . 05 1 2 . 05 1 9 . 45 1 6 . 24 9 6 . 74 7 4 . 04 4 9 . 04 6 3 . 3
5 0 4 . 95 4 6 . 5
8 3 1 . 1
891 .79 1 4 . 49 0 6 . 390 4 . 99 40 .99 7 5 . 7
1 0 0 4 . 51 0 6 6 . 31 1 3 5 . 01 2 1 9 . 41 3 0 0 . 21 3 8 0 . 51 3 9 8 . 21 4 8 4 . 31 5 2 6 . 51 5 1 2 . 71 5 1 1 . 91 6 5 4 . 21 8 0 4 . 21 7 9 6 . 71 7 0 1 . 81 7 6 4 . 31 8 9 4 . 91 9 8 9 . 2197 3 .81 9 0 8 . 31 8 4 0 . 51 8 1 7 . 9
2 0 7 0 . 02 1 3 4 . 52 2 5 8 . 8
. 2 2 8
. 2 3 8
. 2 0 0L.266
. 3 3 9
.356
. 3 2 3
. 3 2 4L.335L.309L.285
. 2 4 8
. 2 3 8
. 2 5 0
1263L.304L.359L.369L.298L.289L.343
. 3 8 9
. . 3 5 4L.307L.308L.374L.412L.450L.470L.408
. 3 4 5L . 3 6 31 .312
Nov.
4 5 2 . 24 5 4 . 54 6 8 . 4
47 6 .14 7 1 . 14 5 5 . 24 6 1 . 8
46 0 . 047 0 . 14 7 2 . 24 8 6 . 14 9 9 . 55 1 2 . 25 0 8 ^5 2 5 . 25 3 9 . 55 2 9 . 85 2 6 . 15 4 2 . 65 6 7 . 05 5 4 . 65 1 8 . 65 0 8 . 45 1 0 . 95 1 8 . 85 1 5 . 14 9 1 . 94 7 1 . 64 5 0 . 14 6 9 . 3
5O8.*25 4 8 . 7
8 3 5 . 48 5 4 . 18 9 3 . 69 1 2 . 09 0 8 . 59 0 2 . 59 4 4 . 69 7 7 . 0
1 0 0 7 . 51 0 7 3 . 01 1 4 2 . 91 2 2 7 . 21 3 0 5 . 91 3 8 6 . 91 4 0 1 . 91 4 8 6 . 21 5 3 1 . 91 5 1 2 . 51 5 1 7 . 31 6 6 5 . 61 8 1 3 . 61 7 9 5 . 21 6 9 6 . 61 7 7 0 . 41 9 0 8 . 11 9 8 9 . 61970 .61891 lo1 8 3 6 . 31 8 2 7 . 0
2 0 7 5 . 62 1 5 3 . 22 2 5 7 . 1
1 . 2 2 01 . 2 2 91 . 2 0 71 . 2 7 71 . 3 3 51 . 3 5 61 . 3 3 11 . 3 3 61 . 3 2 81 . 3 1 21 . 2 8 31 . 2 4 21 . 2 3 81 . 2 5 3
1 . 2 6 71 . 3 0 31 . 3 5 91 . 3 6 21 . 2 9 71 .2971 . 3 5 11 . 3 7 91 . 3 4 91 . 3 1 01 . 3 1 11 . 3 7 91 . 4 2 31 .4561 . 4 6 11 . 4 1 01 . 3 4 81 . 3 5 61 . 3 1 2
Dec.
4 5 2 . 54 5 4 . 646 9 . 3
47 7 , 54 7 0 . 14 5 3 . 046 2 . 2
4 5 8 . 94 7 1 . 14 7 4 . 04 8 3 , 45 0 0 . 05 1 3 . 65 0 9 . 45 2 6 . 25 41 .35 2 7 . 05 2 5 . 7541 .55 7 1 . 85 5 4 . 75 1 5 . 65 0 5 . 15 1 3 . 45 1 9 . 45 1 5 . 94 8 7 . 946 2 . 74 5 2 . 447 3 . 7
5 1 0 . 85 5 2 . 5
8 3 7 . 0
895 149 1 4 . 89 0 6 . 49 0 1 . 09 4 6 . 09 7 7 . 7
1 0 1 0 . 71 0 7 8 . 81 1 5 2 . 21 2 2 8 . 81311 .91 3 9 2 . 11 4 0 7 . 61490 .31537 .21509 .61 5 2 4 . 81 6 7 2 . 21 8 2 6 . 91 7 9 6 . 01687 .81 7 7 5 . 31 9 2 4 . 61 9 9 3 . 2197 4 . 01879 191821 ,21 8 3 8 . 6
2 0 7 8 . 92 1 7 1 . 02 2 6 2 . 2
.225
.222
. 2 0 8
.2 82
.340
. 3 5 2
. 3 3 5
.353L.315L.313L.278
. 2 4 9
. 2 4 4
. 2 5 4
1273L.302L.362L.359
. 3 0 1L.295L.351L .380
L.3061,311L.384L.427L.474L.446
. 4 0 7
. 3 5 51 . 3 5 11 . 3 1 9
Q
4 4 3 . 54 5 4 . 64 5 4 . 4
4 7 2 . 84 7 8 . 846 7 . 64 4 9 . 2
46 2 . 54 6 1 . 54 7 1 . 14 7 5 . 64 8 5 . 85 0 1 . 7516 135 1 1 . 95 2 7 . 05 4 2 . 15 2 6 . 25 3 0 . 75 4 7 . 85 7 1 . 15 4 7 . 85 1 1 . 3507 . 85 1 4 . 45 2 0 . 25 0 9 . 14 8 0 . 34 6 0 . 54 5 6 . 0
5 0 2 . 6516 .7
8 1 4 . 3843 .18 5 8 . 09 0 2 . 1916 .190 7 . 59 0 0 . 89 5 8 . 19 8 0 . 7 .
1 0 2 3 . 11 0 9 0 . 71 1 6 5 . 21240 .51 3 2 7 . 81 3 9 9 . 31 4 1 9 . 91 4 9 6 . 01 5 3 8 . 81 4 9 4 . 51 5 5 3 . 51 6 9 8 . 81 8 3 1 . 81777 . 21691 . 4180 5 . 31 9 3 7 . 81993 .91 9 5 7 . 21 8 5 3 . 71 8 1 5 . 11 8 5 4 . 12 0 0 5 . 82 0 8 6 . 02 1 9 8 . 3
1 . 1 9 41 . 2 3 4L.214L . 2 1 2L.289L.342L.341L.327L.354L.3151 . 3 0 4
. 2 6 9L .249L . 2 4 1
. 2 5 6L.2971 .2821 . 3 0 4L . 3 7 1L . 3 4 9L .2991 . 2 9 4L.344
L.343L.297L.318L.393L.437L.476L.43 8L.351L.3701 . 3 4 1
II Q III Q
AVERAGE FOG
4 4 6 . 14 5 5 . 94 5 6 . 14 7 6 . 04 7 7 . 04 6 3 . 74 5 1 . 4
459 1146 5 . 24 7 2 . 64 7 9 . 34 8 8 . 4501 .3516 195 1 6 . 35 3 0 . 95 3 8 . 35 2 2 . 85 3 6 . 85 5 3 . 65 6 6 . 35 3 8 . 55 1 3 . 05 1 1 . 95 1 4 . 15 1 9 . 95 0 5 . 34 6 0 . 44 6 1 . 04 5 3 . 4
5 0 6 . 55 2 5 . 0
4 4 7 . 84 5 4 . 64 6 1 . 7477 .<4 7 2 . 34 5 9 . 84 5 6 . 1
463 I ]4 6 6 . 14 7 0 . 7481 .24 9 5 . 4
5 1 K 2522 .35 3 4 . 35 3 2 . 85 2 3 . 95 4 0 . 65 6 0 . 15 6 1 . 55 2 7 . 95 1 2 . 25 0 9 . 55 1 5 . 85 1 8 . 65 0 2 . 546 9 . 84 5 1 . 84 5 1 . 9
5 0 6 . 95 4 0 . 6
AVERAGE FOR
8 2 0 . 58 4 7 . 98 6 6 . 89 0 8 . 99 1 4 . 69 0 6 . 09 1 6 . 89 7 0 . 59 8 2 . 6
1 0 4 2 . 21 1 0 9 . 51 1 8 8 . 41 2 5 9 . 51 3 4 0 . 91 4 0 2 . 81 4 4 6 . 31 5 0 6 . 41 5 3 0 . 11 4 8 4 . 81 6 0 0 . 51 7 3 3 . 11 8 2 5 . 41 7 5 3 . 41 7 3 2 . 11 8 4 6 . 31 9 5 6 . 51 9 8 4 . 01 9 4 0 . 01 8 1 3 . 51 8 2 5 . 01 8 6 2 . 42 0 3 9 . 02 1 0 6 . 52 2 1 0 . 9
8 2 4 . 9849 .2881 .29 1 3 . 19 0 9 . 19 0 4 . 39 3 3 . 49 7 9 . 09 9 9 . 6
1 0 5 5 . 41 1 2 3 . 51 2 0 5 . 21 2 8 5 . 31 3 6 2 . 31 3 9 9 . 51 4 7 0 . 81 5 1 6 . 91 5 1 8 . 11 4 9 8 . 51630 .21 7 7 4 . 81 8 1 6 . 11 7 2 2 . 61 7 5 9 . 91 8 6 7 . 51 9 7 5 . 81977 .21 9 2 5 . 61 8 4 1 . 91 8 1 1 . 71870 .72 0 5 3 . 72 1 2 1 . 12 2 4 9 . 4
AVERAGE FOR
1 . 1 9 81 . 2 4 11 . 2 0 0
. 2 3 3
.305
. 3 5 0
. 3 1 6
.337
.3601 . 3 1 01 . 2 9 91 .2561 . 2 5 11 . 2 4 41 . 2 6 31 . 2 8 21 . 2 9 81 . 3 2 5
.396
.331
. 2 8 8
.305
.351
.3 53
. 3 2 7
.2 961 . 3 4 91 . 3 9 21 . 4 3 51 . 4 6 41 . 4 3 51 . 3 4 01 .3671 . 3 3 6
1 . 2 1 41 . 2 3 51 . 1 9 51 . 2 5 71 . 3 1 81 . 3 5 91 . 3 2 51 . 3 2 51 . 3 4 21 . 3 0 91 . 2 9 31 . 2 4 81 .2461 . 2 5 21 .2 831 . 2 7 31 . 3 0 41 . 3 4 91 . 3 861 . 3 1 11 . 2 8 01 . 3 2 11 . 3 7 8
1 . 3 2 31 . 3 0 51 . 3 6 31 . 4 0 31 . 4 3 41 . 4 8 31 . 4 1 91 . 3 3 91 . 3 7 11 . 3 1 2
IV Q
PERIOD
451 .84 5 4 . 146 8 . 2477 .24 7 0 . 54 5 5 . 34 6 1 . 3
459194 6 9 . 94 7 2 . 24 8 4 . 44 9 9 . 5
5 0 8 . 55 2 5 . 65 3 9 . 15 2 9 . 35 2 6 . 05 4 2 . 15 6 8 . 35 5 4 . 75 1 8 . 25 0 6 . 85 1 2 . 15 1 9 , 25 1 5 . 74 9 2 . 246 9 . 44 5 0 . 546 8 . 8
5 0 1 . 35 0 8 . 05 4 9 . 2
PERIOD
8 3 4 . 5853 .18 9 3 . 69 1 3 . 79 0 7 . 19 0 2 . 89 4 3 . 89 7 6 . 8
1 0 0 7 . 61 0 7 2 . 71 1 4 3 . 41 2 2 5 . 11 3 0 6 . 01 3 8 6 . 51 4 0 2 . 61 4 8 6 . 91 5 3 1 . 91 5 1 1 . 61 5 1 8 . 01 6 6 4 . 01 8 1 4 . 91 7 9 6 . 01 6 9 5 . 41 7 7 0 . 01 9 0 9 . 21 9 9 0 . 71972 .81 8 9 3 . 11 8 3 2 . 71 8 2 7 . 8190 8 .92 0 7 4 . 82 1 5 2 . 92 2 5 9 . 4
PERIOD
1 . 2 2 41 . 2 3 01 . 2 0 51 . 2 7 51 . 3 3 81 . 3 5 51 . 3 3 01 . 3 3 81 .3 261 . 3 1 11 . 2 8 21 . 2 4 61 . 2401 . 2 5 21 . 2 9 61 . 2 6 81 . 3 0 31 . 3 6 01 . 3 6 31 . 2 9 91 . 2 9 41 . 3 4 81 . 3 8 31 .3 501 . 3 0 81 . 3 1 01 . 3 7 91 . 4 2 11 . 4 6 01 . 4 5 91 . 4 0 81 . 3 4 91 . 3 5 71 . 3 1 4
Annual
447 .34 5 4 . 8460 .1476 .0474 .64 6 1 .4 5 4 .
461146 5 .4 7 1 .4 8 0 . 14 9 2 . 3
5 1 3 . 25 1 9 . 05 3 2 . 85 3 5 . 65 2 4 . 75 3 7 . 65 5 7 . 45 6 3 . 45 3 3 . 15 l 0 . 85 1 0 . 35 1 5 . 95 1 6 . 65 0 2 . 34 7 0 . 04 5 5 . 94 5 7 . 5
492 .95 0 6 . 05 3 2 . 9
8 2 3 . f8 4 8 . '8 7 4 .9 0 9 .9 1 1 .90 5 . .9 2 3 .9 7 1 .9 9 2 . (
1 0 4 8 . 31 1 1 6 . 81 1 9 6 . 01 2 7 2 . 81 3 5 4 . 41 4 0 1 . 01 4 5 6 . 01 5 1 2 . 81 5 2 4 . 71 4 9 9 . 01 6 1 2 . 01 7 5 5 . 41 8 1 7 . 31 7 3 7 . 21 7 3 8 . 41 8 5 7 . 11 9 6 5 . 21982 .01 9 2 9 . 0183 5 . 41 8 1 9 . 91 8 7 4 . 02 0 4 3 . 32 1 1 6 . 62 2 2 9 . 5
1 . 2 0 81 . 2 3 51 . 2 0 41 . 2 4 41 . 3 1 31 . 3 5 21 . 3 2 61 . 3 3 21 . 3 4 61 . 3 1 11 . 2 9 41 . 2 5 51 .2461 . 2 4 71 . 2 7 41 . 2 8 01 .2971 . 3 3 41 . 3 7 91 . 3 2 21 . 2 9 01 . 3 1 71 . 3 6 41 . 3 5 41 . 3 2 51 . 3 0 21 . 3 5 21 . 4 0 21 . 4 4 11 . 4 7 01 . 4 2 51 . 3 4 51 . 3 6 61 .3 26
NOTE:- These series contain revisions beginning with 1947. (JUNE 1986)
103Digitized for FRASER http://fraser.stlouisfed.org/ Federal Reserve Bank of St. Louis
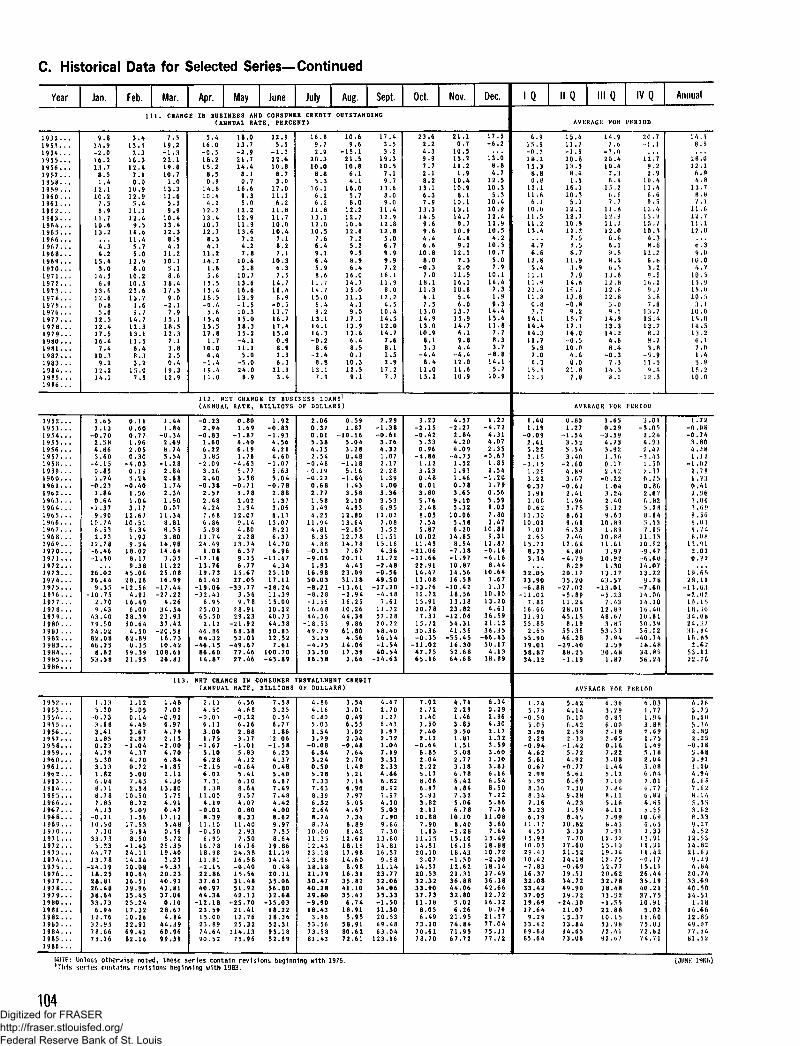
C. Historical Data for Selected Series—Continued
Year
1 9 5 2 . . .1953 . . .1 9 5 4 . . .1 9 5 3 , . ,1956 . . .1 9 5 7 . . .1 9 5 8 . . .1 9 5 9 . . .1 9 6 0 , . .1 9 6 1 . . .1 9 6 2 . . .1 9 6 3 . . .
196 5 . . .1 9 6 6 . . .196 7 . . .1 9 6 8 . . .1 9 6 9 . . .1 9 7 0 . , .1 9 7 1 . . .1 9 7 2 . . .1 9 7 3 . . .1 9 7 4 . . ,19 7 5 . . .1 976 . . .1 9 7 7 . . .1 9 7 8 , . .1 9 7 9 . . .1 9 8 0 . . .1 9 8 1 , . .1 9 8 2 . . .1 9 8 3 . . .1 9 8 4 . . ,
1985 . . .1 9 8 6 . . .
1 9 5 2 . . .1 9 5 3 . . .1 9 5 4 . . .1 9 5 5 . . .1 9 5 6 . . .1 9 5 7 . . .1 9 5 8 . . .1 9 5 9 . . .1 9 6 0 . . .1 9 6 1 . . .1 9 6 2 . . .1 9 6 3 . . .1 9 6 4 . . .1 9 6 5 . . .1 9 6 6 . . .1 9 6 ? , . .1 9 6 8 . . .1 9 6 9 . . .1 9 7 0 . . .1 9 7 1 . . .1 9 7 2 . . .1 9 7 3 . . .197 4 . . .1 9 7 5 . . .1 9 7 6 . , .1 9 7 7 . . .1 9 7 8 . . .1 9 7 9 , . ,1 9 8 0 . . .1981 . . .1 9 8 2 . . .1 9 8 3 . . .1 9 8 4 , . .1 9 8 5 , . .1 9 8 6 . . .
1 9 5 2 . . .1 9 5 3 . . .1 9 5 4 . , .1 9 5 5 . . .1 9 5 6 . . .1957 . . .1 9 5 8 . . .1 9 5 9 . . .1 9 6 0 . . .1961 . . .1 9 6 2 . . .1 9 6 3 . . .1 9 6 4 . . .1 9 6 5 . . .1 9 6 6 . . .1 9 6 7 , . .1 9 6 8 . . .1 9 6 9 . . .1 9 7 0 . . .1 9 7 1 , . .1 9 7 2 . . .1 9 7 3 . . .1 9 7 4 . . .1 9 7 5 . . .
1 9 7 6 . . .1 9 ? ? . . .1 9 ? 8 . . .1 9 7 9 . . .1 9 8 0 . . .1 9 8 1 . . .1 9 8 2 . . .1 9 8 3 . . .1 9 8 4 . . .1 9 8 5 . . .1 9 8 6 . . .
Jan.
9 . 814.9= 2.016.213.7
8 .51,4
12.110.2
7 . 38 .9
11.710.613.2
4.215.4
3,014.5
6 . 923,612.6
0 . 8
5 .612,512.417.516.4
10.3
12,2
14.1
2.651,13
-0 ,702.584.863.60
= 4.150.851.74
=0,231.840.64
-1 .379.90
10.746.532.23
22,78-6 .46= 1,50
26.0226.44
9,35-10 .75
2.709,43
43.4079.5024.0282.0846.25
8.6253.58
1.135.30
= 0.733.633.411.850.234,795.303.131.826.048.718.787.854,13
-0 .1110.50
7.1033.73
5.2344.7713.78
-24 .1918.2528.8126.4838.6433.73
6.9412.7632.9578.6675.16
Feb.i i
3 . 4
13.52.3
16.312.4
7 . 10 . 0
10.912,9
5 , 411.112,4
14.611.4
5.012.9
8.010.210,523.613.?
3 . 6
9 .714.712.313.111.5
8.3
15,0
7 .5
0,110,600.771.962.050.30
- 4 . 0 30.195.24
-0 .401.561.043.17
12.6710.51
6.341.939.54
18.028.179.38
45.0628.26
-12.564.91
16.496.00
28.3950.64
4.5062.89
0.3559.3921.95
1.125.050.144.493.672 .87
- 1 , 0 44.374.700,725.007.452.58
10.508.725.091.56
17,535.948.50
= 1.4324,1114.2410.08
10.6426.5129.9635.4525.2417.3210.2622.9169.4182.16
Mar.1 , CHANG
7 . 5
1 9 . 2- 1 . 32 2 . 119.810.7
1.013.311.6
5 . 59 . 9
10.413.412.3s:?
10.15.18 . 6
18,417.5
9 . 0- 2 . 1
7 .915.118.512,3
7.1
2,5
19.3
12,9
1.441 .84
-0 .342.698.745.54
- 1 . 2 82.842 .631.742.341,500.07
11,348.818.353,80
14.9814.64
3.3511 .2225.0816.99
-17 .44-27.22
4.2634.5423,9337,42
-20.5816.7310.42
103.6126.83
113
1.487.02
-0 .926.974.792.15
-2 .004.706.84
-1 .852.124.30
13.805.754.910.47
17.125.480.565.72
26.3519.40
3.23-9 .37
20.2340,9243.8137.06
0.1028.67
4.8444.3960.9699.59
Apr.
(A
5 . 4
16.0-0 .518.215,2
8 . 50 . 9
14.810 .4
4 . 212,213.410.7
8 . 3
14.71.65 . 6
15.515.418,5-0 .4
15.415.517,81.7
6.4
19.411.0
May
18.0
- 2 . 921.714.4
8 . 10 . 7
16.69 . 35 . 0
12.212.911,9
7 . 2
10.63.8
10.713.616.613,9- 1 . 5
15.018.31
2
5.24.1
5.0
4.0
1 1 2 , NET CHANG
- 0 . 2 32 . 9 4
- 0 , 8 31 . 606 . 2 23 . 8 5
- 2 . 0 93 . 2 62 . 4 0
- 0 , 3 82 . 5 72 . 4 84 . 2 47 . 6 86 . 8 65 . 9 8
1 3 . 7 42 4 . 4 9
1 .08- 1 2 . 1 6
1 3 , 7 61 9 . 7 36 1 . 4 3
- 1 9 . 0 6- 3 2 . 4 1
8 . 9 52 5 . 0 16 5 . 5 0
2 . 1 24 6 . 3 66 4 , 3 2
- 4 6 . 1 58 6 . 6 01 4 . 8 ?
_:
- i
_ (
13
It
.80, 6 9.87.40.19.76.63.77. 5 8. 7 1. 7 8,02. 9 4,07. 1 4.80. 2 8. 7 4. 3 7. 2 5
6.7715.6727.05
-33.773,369,78
28.9129.23
-21.9268.3852,01
-49.677 7.4627.46
June3 CONSUME
2 2 . 9
- 1 . 22 2 . 61 0 . 8
8 . 73 . 0
1 7 . 01 1 . 1
6 . 21 1 . 81 1 . 710.0
7 , 1
6 . 37 . 5
14.716.4
8 .9-0 .5
16.717.415.0
2.3
21.9
July
NT)
16.8
2 . 920.310.0
3 . 85 . 3
16.16 .26 .2
11.813.112 .0
7 , 6
5 , 98 .6
11.714.715.0
6 .4
13.114.114.3
- 2 . 4
13 .1
E IN BUSINESS LOA
1.92-0 .83-1 ,93
4.564.214.60
-1 .075.635.04
- 0 . 7 82.881.373.066.11
13.078.216.37
14.706.96
-11.474.34
25.1017.11
-28.2411,3915.0030.2240.7344.3850.8322.52
7.61100.70-45 .89
NET CHANGE IN CONSUMER
2 . 1 14 , 5 0
- 0 , 0 16 . 1 33 . 0 01 .75
- 1 . 6 75 . 1 06 . 2 8
- 2 , 1 56 . 0 27 . 3 16 . 3 8
11 . 0 04 . 1 9
- 0 . 0 28 . 3 9
11 .10= 0 . 5 0
6 . 9 51 6 , 7 818.9811.81- 2 . 1 5
22.8637.6140.9744.34
-12 .1823.5915,0023.8974.6490.52
6.564.68
-0 .226.362.883.17
- 1 . 0 15.834.12
-0 .645.416.103.649.374.070.808.33
11.402.937.50
16.1624.3816.58-0 .40
15.5631.4851.9242.13
-25 .7021,4112.7625.32
114.1375.96
7.583.250.546.771.862.06
- 1 . 5 86.234.370.485.406.677,497.484.424.008.629.977.558.64
19.8621.1914.14
0.48
2 0.1135.0656.8032.68
-35 .0318.2218.3652.3195.1852.69
2.060.370.015.384.152.54
- 0 . 4 8-0 .19-0 .22
0.682.771.583 .494 .25
11.944.818.354.88
-0 .13-9 .06
1.9316.9850 .03-8 .21- 8 . 2 8-1 .5616 .6844.36
-18 .5349.79
3.13-4 .7533.5016.58
Aug. Sept.
10.6 17.4
-15 .1 3.221.5 19.310.8 10.5
6.1 7.14 .1 9.7
16.0 13.65.7 8,08.0 9.0
12.2 11.412.7 12.910.4 12.8
7.2 5.0
6.4 7.216.0 16.114.7 11.915.0 8.011.3 12.2
4.1 4.5
17.1 14.513.9 12.013.6 14.7
12.5 17.2
NS1
RS)
0 , 5 9 2 . 2 91.87 - 1 . 3 8
- 1 0 . 1 6 - 0 . 6 15 . 0 4 3 .763 . 2 8 4 . 3 20 . 4 8 1.07
- 1 . 1 8 2 . 1 75 . 1 6 2 . 2 8
- 1 . 8 4 1 .391.43 1 .003 . 5 8 3 . 3 62 . 1 0 3 . 5 34 . 9 3 6 . 9 5
1 2 . 8 0 1 2 , 0 21 3 . 6 4 7 . 0 8- 2 . 6 5 3 . 5 21 2 , 7 8 1 1 , 5 11 4 . 7 8 1 5 . 1 6
7 . 6 7 4 . 3 62 0 , 1 1 2 1 , 7 2
4 . 4 5 - 2 . 4 82 3 , 0 9 - 0 . 5 63 1 . 1 8 4 9 . 5 0
- 1 3 . 6 1 - 1 7 . 2 0- 2 . 9 4 - 4 . 4 81 6 . 2 5 7 , 6 11 0 , 2 6 1 1 , 7 24 4 . 3 6 5 7 . 2 8
9 . 8 6 2 0 . 2 26 1 . 8 0 4 8 . 4 0
4 . 5 6 1 6 . 1 41 4 . 0 6 - 1 . 5 41 7 . 3 9 4 0 . 5 4
3 . 6 6 - 1 4 . 6 3
NSTALLMENT CREDIT
4 . 8 64 . 1 60 .805 . 0 31 .543 . 2 9
- 0 .086 . 8 43 . 2 40 . 5 05 . 2 87 , 3 37 . 6 38 . 3 96 . 3 22 . 6 48 , 7 48 . 7 4
1 0 . 0 01 1 . 3 51 2 . 4 32 3 , 1 81 3 . 9 618.18
21.7930.4740.2 829.80-9 .9018.43
3.9653.5673.5881.43
3 . 5 4 4 . 6 73 , 0 1 2 . 7 00 . 4 9 1.276 . 5 5 6 . 4 33 . 0 2 1 .972 . 3 4 2 . 3 2
- 0 . 4 8 1 .047 . 6 4 7 , 1 92 . 7 0 3 . 3 11 . 4 8 2 . 3 35 . 2 1 4 . 8 67 . 1 4 6 . 8 26 . 9 6 8 . 9 27 . 9 7 7 . 9 75 . 0 5 4 . 1 04 . 6 7 5 . 0 37 . 3 4 7 . 9 06 . 8 9 9 . 6 66 . 4 2 7 . 3 0
1 2 . 6 2 1 3 , 6 01 8 . 1 6 1 4 . 8 11 7 . 9 8 1 6 . 5 71 4 . 6 0 9 . 6 8
8 . 9 8 1 1 . 1 4
1 6 , 3 1 2 3 . 7 73 5 . 8 2 3 2 . 0 64 1 . 1 0 3 4 . 0 63 5 . 4 2 3 5 . 3 3
6 . 7 4 - 1 . 5 01 8 . 9 1 3 1 . 3 0
5 . 9 5 2 0 . 5 35 8 . 9 1 4 9 . 4 88 0 . 6 2 6 3 . 0 47 2 . 6 1 1 2 3 . 9 6
Oct.
23.6
4 . 39 . 97 . 72 . 18 .2
13.16 . 37 . 9
13.314.5
9 . 6
4 . 4
10 .i
- 0 . 37 . 0
18.111.3
4 . 17 . 5
14.913.010.9
11.0
3.23-2 ,15-0 .42
5.330.96
-4 .861.123.230.480.013.805.762.488.057.545.87
10,0211,45
-21.06-11.66
22.9114.4711.08
-13.7612,7215,9120.78
7.3115.7230.36-0 .35
-11.0247.7565.16
7.022.721.403.502.402 .12
-0 .646.852.042.225.178.066.975.933.822,11
10.887.901.63
11.1514.5120.10
3.0714.57
20.5.'32,3233.9037.7311.38
8.056.49
73.2C70.6178.70
Nov.
21.1
10.515.211.2
1.910.410.9
8 . 110.113.114.7
9 . 7
4 , 4
12.1
2.011.516.110.6
5 . 46 . 0
15.914.7
6 . 1
11.6
4.57-2 .27
2.844.204.09
-4 .751,521.931.460.783.659.105,32
10.065.586.20
14.658.54
- 7 . 1 8-1 .9710.8714.5616,58
-10.4218.5613,1823.82
-12 .0654.3141.36
-55.4516.3052.6864.63
4.742,291.463.853.SO1.811.515.082.773.186.786.424.847,325.066.78
10.108.40
- 2 . 2 815.1016.1518,43-1 .5012.62
21.3136.8844.0632.30
5.026.26
21.9574.8471.9567.72
Dec.
17.5-6 .2
13.08 . 84 . 7
12.510.3
5 . 310.410.912.412.910,5
4,210.5
10.7
7,910.114.4
7 . 31.99.3
14.415'.411.8
7 .7
5.710.9
1.22-4 .72
4.314.072.35
-0 .671.852.54
-1 .201.790.565.598.037.803.47
10.839.31
11.87-0 .16-6 .16
8.4410.64
1.671.37
10.9013.20
4,6136.5921.1336.35
-66.4350.17
4.1338.89
6.340.292.964.302.171.323.593.601.303.836.166.548.507.225.667,76
11.083,667.64
15.4918.3310.72-2 .0818.14
36'.3 842.6612.7216.32
0.7621.3777.0475.3177.72
IQ
6 . 9
15.9- 0 . 318.215.3
3 . 80 . 8
12.111.6
6 . 110.011.511 .2
4 . 7
6 .812.8
5.411 .111.921.611.8
0 . 3
14^114.414.3
7.0
15.5
11.5
1.401.19
-0 .092.415.223.15
- 3 . 1 51.293,220.371,911 .060.62
11.3010.02
7.072.65
15.778.733,34
32.0523.90-6 .88
-11.027.82
16.6631.9155.85
2.6553 .9019.0158.8?34.12
1 .245.79
-0 .505.053 .962.29
-0 .9 44.625.610.6?2.985.938.368.347.163.236,19
11.174.53
15.9810.0529.4310 .42-7 .83
32.0833,4237.0519.6917.64
9,2933.4269.6885.64
11 Q III Q
AVERAGE FOR
1 5 . 4 1 4 . 9
- 1 . 52 0 . 813.5
8 ,41,5
16.110,3
5 . 112.112.710.9
7^55,5
8.7a.9
3,97 .9
14.616.113.8= 0.8
15,'?17.116.0
10.04.60.0
21.8
1 .8
= 3.020.410.4
7 . 36 .4
15.26 . 6? . ?
11.812,911.7
6'.66.1
9 .58.46.S
13.612.812.612.8
5 . 0
14'.913.314.2
8.4- 0 . 3
7.314.3
8 .2
AVERAGE FOR
0 . 8 31.27
- 1 , 5 43 . 5 25 . 5 43 . 4 0
- 2 . 6 04 . 8 93 . 6 7
- 0 . 6 22 . 4 11 .963 . 7 58 . 6 29 . 6 96 . 3 37 . 4 6
1 7 . 6 44 . 8 0
- 4 . 7 98 , 2 9
2 0 , 1 73 5 . 2 0
- 2 7 . 0 2- 5 . 8 91 1 . 2 42 8 . 0 54 5 . 1 5
8 . 1 95 5 . 3 64 6 . 2 8
- 2 9 . 4 08 8 . 2 5- 1 , 1 9
1.630.29
= 3.594.733.9 21 .360.172.42
= 0.221 .043.242,405.129.69
10.891.89
10.8811 .61
3.9?10,92
1.3013.1?43.57
=13.01-5 .23
7,4312.3948.6?
3 .8553.33
7,942.59
30.481 .87
AVERAGE FOR
5 . 4 24 . 1 40 . 1 06 . 4 22 , 5 82 . 3 3
- 1 . 4 25 . 7 24 . 9 2
- 0 . 7 75.616.697.509.284.231 .598.45
10.823.337.70
17.6021.5214.18-0 .69
34.7249.9039.72
-24.3021.0715.3733.8494.6573.06
4,363.290.856,002.182.650.167.223.081.445.127.107.848.115.164.117.998.437.91
12.5215.1319.2412.7512.7?
32.7838.4333.52-1 .5522.8810,1553.9872.4192.67
IV Q
PMRXQ0
2 0 . 7
1 2 . 79 . 22 , 9
1 0 . 41 1 , 4
6 . 69 . 5
1 2 . 41 3 , 91 0 . ?10.34.38.8
6.83.29 . 5
16.29 . 73 . 87 . 6
i s ! 413.2
8,28.?3,8
= 5.911.5
9.4
12.3
PERIOB
3,01= 3.0 3
2.244. §32.4?
-3 .431.502.5?0,250.86
6 '.825.288.64S.S37.63
11.3310.62= 9.47-6 .6014.0?13.22
9.78= 7.6014.0614.1016.4010.6130.3936.02
=40.7 418.4834.8S56.24
PERIOD
6,031.771.943.882.691.731.495.182.043.086,047.016.7?6.B24,855.55
10.696.652.33
13.9116.SI16,42-O.I?15.11
35.1946.2127. 7510.91
5,0216.6075.0372.627 4.71
Annual
14.3
. ! .18.012.1
6 . 94 . 8
13.78 . 87 , 1
11.612.711.112.0
6 . 3
9 .010.0
4,710,313.913.010.3
3 . 1
i s !o14.S13.2
6.17.01.45.8
13. 2
10 ,0
1.7 2,= 0.08= 0.7 4
3.864.281.12
= 1.022.791 .730.412.563.063.699.569.035 . ? 48.08
13.912.010.7 2
1 9 ! 6 52 8 . 1 1
= 1 3 . 6 3= 2 . 0 21 0 . 1 51 8 . 3 03 4 . 0 82 4 . 5 ?3 6 . 8 4U.B5
2.6?33.112 2,76
4.263.730.6 05.3 42.8S2.2S
=0.185.683.911.104.946.687.6 28.14§.353.628.339,2?4.5 2
12.3314.8221.65
9.294.84
33.6940.5034.SI
1.1816.6612.8349,0?7 7.3481 .52
NOTE: Unless otherwise noted, these series contain revisions beginning with 1975.'This series eentaini revisions beginning with 1983.
{JUNK 1986)
104Digitized for FRASER http://fraser.stlouisfed.org/ Federal Reserve Bank of St. Louis
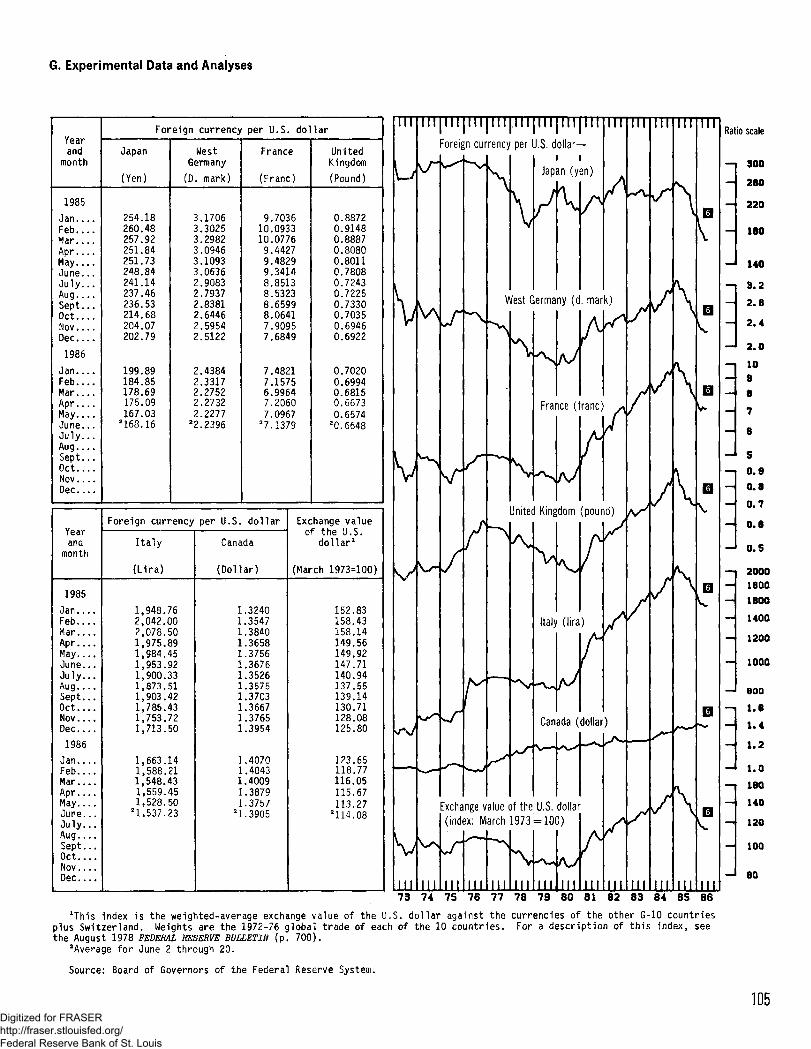
G. Experimental Data and Analyses
andmonth
1985
JanFeb...Mar...Apr..May...June.,Ju ly . .Aug..Sept.Oct..Nov..Dec...
1986
Jan. . ,Feb..Mar..Apr..May..June.July.Aug..Sept.Oct..Nov..Dec.
V Q av»Yearand
month
1985
Jan . . . ,Feb..Mar..Apr..May..June.July.Aug..Sept.Oct..Nov..Dec.
1986
Jan..Feb..Mar..Apr..May,.June.July.Aug..Sept.Oct..Nov..Dec.
Foreign currency
Japan
(Yen)
254.18260.48257.92251.84251.73248.84241.14237,46236.53214.68204.07202.79
199.89184.85178.69175.09167.03
2168.16
WestGermany
(D. mark)
3.17063.30253.29823.09463.10933.06362.90832.79372.83812.64462.59542.5122
2.43842.33172.27522.27322.2277
22.2396
Foreign currency per U.S.
Italy
(Lira)
1,948.762,042.002,078.501,975.891,984.451,953.921,900.331,873.511,903.421,785.431,753.721,713.50
1,663.141,588.211,548.431,559.451,528.50
21,537.23
per U.S. dol lar
France
(Franc)
9.703610.093310.07769.44279.48299.34148.85138.53238.65998.06417.90957.6849
7.48217.15756.99647.20607.0967
Z7.1379
dol lar
Canada
(Dollar)
111111]11111
1\1]1
21
.3240
.3547
.3840
.3658
.3756
.3676
.3526
.3575
.3703
.3667
.3765
.3954
,4070.4043,4009.3879,3757,3905
UnitedKingdom
(Pound)
0.88720.91480.88870.80800.80110.78080.72430.72250.73300.70350.69460.6922
0.70200.69940.68150.66730.6574
20.6648
Exchange valueot the u.o.
dollar1
(March 1973=100)
152.83158.43158.14149.56149.92147.71140.94137.55139.14130.71128.08125.80
123.65118.77116.05115.67113.27
H14.08
III
V
III
III II1 II1 II . II II 1 IIIForeign currency per U.S. dollar—
v/j
v\
III
\^
r
/J
r
rr
J\
Ixcha
(ind
*-T
I I !
L J
nge v
2x: M
•——
III
\
\V
i i
Japan (yen)
A\
"
r
West Germany (d. mark)
V
\
A
A rv
France (franc) ^
' SA
United Kingdom (pound)
>
alue (
arch
^ \
11
A,
Df the
1973
|
/fItaly (lira)
A
/
1
r
Canada (dollar)
v—
U.S.
|
dollar
KJ
1
A| i i
Ml
rJ
//
IS*
*
III
III
/V
JV
J
/
y
III
III
\\
\
V
\
III
III
0V
V
nI d
DVs*
B
D
_
B
III
Ratio scale
300
260
220
180
140
3.2
2.8
2.4
2.0
1098
7
8
S
0.9
0.8
0.7
0.6
0.5
2000
1800
1600
1400
1200
1000
800
1.6
1.4
1.2
1.0
160
140
120
100
80
73 74 75 76 77 78 79 80 81 82 83 84 85 86xThis index is the weighted-average exchange value of the U.S. dollar against the currencies of the other G-10 countries
plus Switzerland. Weights are the 1972-76 global trade of each of the 10 countries. For a description of this index, seethe August 1978 FEDERAL RESERVE BULLETIN (p. 700).
2Average for June 2 through 20.
Source: Board of Governors of the Federal Reserve System.
105Digitized for FRASER http://fraser.stlouisfed.org/ Federal Reserve Bank of St. Louis
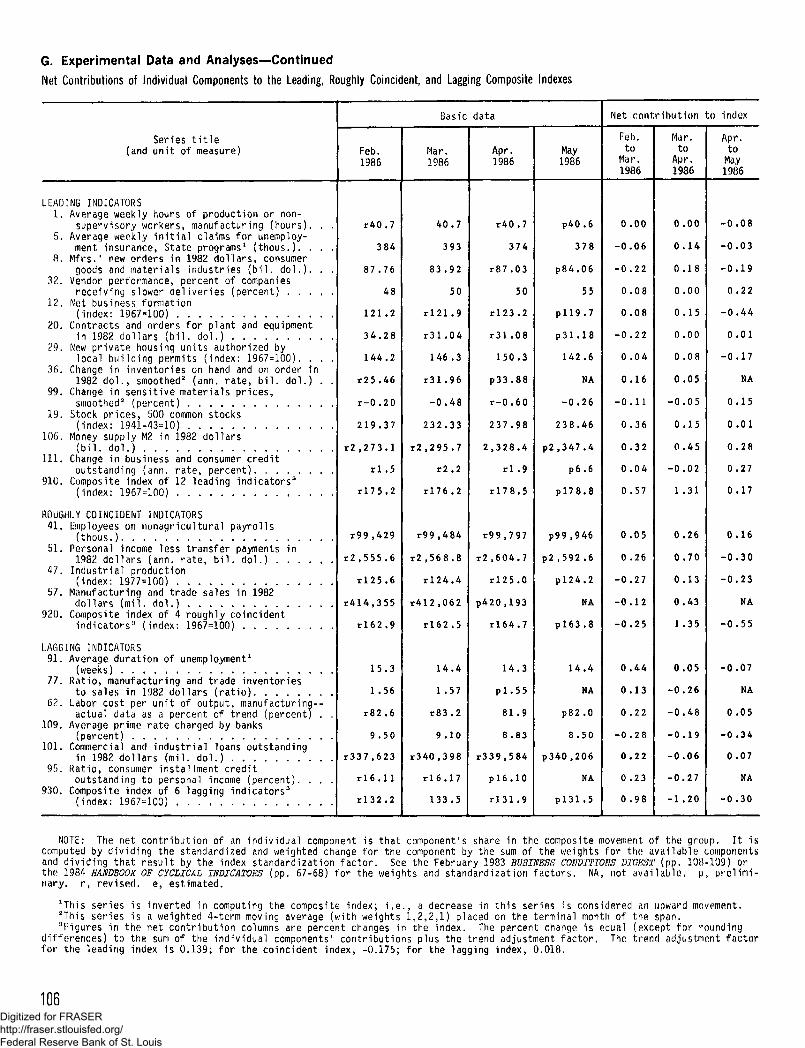
G. Experimental Data and Analyses—Continued
Net Contributions of Individual Components to the Leading, Roughly Coincident, and Lagging Composite Indexes
Series t i t l e(and uni t of measure)
LEADING INDICATORS1. Average weekly hours of production or non-
supervisory workers, manufacturing (hours). . .5. Average weekly i n i t i a l claims for unemploy-
ment insurance, State programs1 ( thous.) . . . .8. Mfrs.1 new orders in 1982 do l la rs , consumer
goods and materials industries ( b i l . d o l . ) . . .32. Vendor performance, percent of companies
receiving slower del iver ies (percent)12. Net business formation
(index: 1967^100)20. Contracts and orders for plant and equipment
in 1982 dol lars ( b i l . dol . )29. New pr ivate housing units authorized by
local bui lding permits (index: 1967=100). . . .36. Change in inventories on hand and on order in
1982 d o l . , smoothed2 (ann. ra te , b i l . dol . ) . .99. Change in sensit ive materials pr ices,
smoothed2 (percent)19. Stock pr ices, 500 common stocks
(index: 1941-43=10)106. Money supply M2 in 1982 dol lars
( b i l . do l . )111. Change in business and consumer credi t
outstanding (ann. ra te , percent)910. Composite index of 12 leading indicators3
(index: 1967=100)
ROUGHLY COINCIDENT INDICATORS41. Employees on nonagricultural payrol ls
(thous.)51. Personal income less transfer payments in
1982 dol lars (ann. ra te , b i l . dol . )47. Indust r ia l production
(index: 1977^100)57. Manufacturing and trade sales in 1982
dol lars (m i l . do l . )920. Composite index of 4 roughly coincident
indicators3 (index: 1967=100)
LAGGING INDICATORS91. Average duration of unemployment1
(weeks) . . . . . . .77. Ratio, manufacturing and trade inventories
to sales in 1982 dol lars ( r a t i o ) .62. Labor cost per uni t of output, manufacturing--
actual data as a percent of trend (percent) . .109. Average prime rate charged by banks
(percent) . . . .101. Commercial and i ndus t r i a l loans outstanding
in 1982 do l la rs (m i l . do l . ) . . . .95, Rat io, consumer instal lment c red i t
outstanding to personal income (percent) . . . .930. Composite index of 6 lagging ind ica tors 3
( index: 1967-100)
Feb.1986
r 4 0 . 7
384
87.76
48
121 .2
34 .28
144.2
r25 .46
r - 0 . 2 0
219.37
r2 , 2 7 3 . 1
r l .5
r l 7 5 . 2
r99 ,429
r 2 , 5 5 5 . 6
r l 2 5 , 6
r414 ,355
r l 6 2 . 9
15.3
1 .56
r 8 2 . 6
9 .50
r337 ,623
r l 6 . 1 1
r l 3 2 . 2
Basic
Mar.1986
40 .7
393
83 .92
50
r l 2 1 . 9
r31 .04
146 .3
r 3 1 . 9 6
- 0 . 4 8
232.33
r2 ,295 .7
r 2 . 2
r l 7 6 . 2
r99»484
r 2 , 5 6 8 . 8
r l 2 4 . 4
r412 ,062
r l 6 2 . 5
14 .4
1 .57
r 8 3 , 2
9 .10
r340 ,398
r l 6 . 1 7
133.5
data
Apr.1986
r 4 0 . 7
374
r87 .03
50
r l 2 3 . 2
r31 .08
150.3
p33,88
r - 0 . 6 0
237 .98
2 , 3 2 8 . 4
r l . 9
r l 7 8 . 5
r99 ,797
r 2 , 6 O 4 . 7
r l 2 5 . 0
p420,193
r l 6 4 . 7
14.3
p i . 5 5
81 .9
8.83
r 3 3 9 , 5 8 4
p l 6 . 1 0
r l 3 1 .9
May1986
P 4 0 . 6
378
p84.06
55
p!19 .7
p31 .18
142.6
NA
- 0 . 2 6
238.46
p2 , 3 4 7 . 4
P 6 . 6
p l 7 8 . 8
p99,946
p2,592 .6
p l 2 4 . 2
NA
p l 6 3 . 8
14 .4
NA
p82 .0
8 .50
p340 ,206
NA
pl31 .5
Net contribution to index
Feb.to
Mar.1986
0.00
- 0 . 0 6
- 0 . 2 2
0 .08
0 .08
-0 .22
0 .04
0.16
- 0 . 1 1
0 .36
0 .32
0 .04
0.57
0 .05
0.26
- 0 . 2 7
- 0 . 1 2
- 0 . 2 5
0 . 4 4
0 .13
0 .22
- 0 .28
0 .22
0 .23
0 .98
Mar.to
Apr.1986
0 .00
0 .14
0 .18
0.00
0.15
0.00
0 .08
0.05
- 0 . 0 5
0 .15
0,45
- 0 . 0 2
1 .31
0.26
0 .70
0.13
0.43
1 .35
0.05
- 0 . 2 6
- 0 . 4 8
- 0 . 1 9
- 0 . 0 6
- 0 . 2 7
- 1 .20
Apr.to
May1986
- 0 . 0 8
- 0 . 0 3
- 0 . 1 9
0.22
- 0 . 4 4
0 .01
- 0 . 1 7
NA
0.15
0 .01
0 .28
0 .27
0.17
0 .16
- 0 . 3 0
- 0 . 2 3
NA
- 0 . 5 5
- 0 . 0 7
NA
0 .05
-0 .34
0.07
NA
- 0 . 3 0
NOTE: The net contribution of an individual component is that component's share in the composite movement of the group. It iscomputed by dividing the standardized and weighted change for the component by the sum of the weights for the available componentsand dividing that result by the index standardization factor. See the February 1983 BUSINESS CONDITIONS DIGEST (pp. 108-109) orthe 1984 HANDBOOK OF CYCLICAL INDICATORS (pp. 67-68) for the weights and standardization factors. NA, not available, p, prelimi-nary, r, revised, e, estimated.
1This series is inverted in computing the composite index; i.e., a decrease in this series is considered an upward movement.2This series is a weighted 4-term moving average (with weights 1,2,2,1) placed on the terminal month of the span.3Figures in the net contribution columns are percent changes in the index. The percent change is equal (except for rounding
differences) to the sum of the individual components' contributions plus the trend adjustment factor. The trend adjustment factorfor the leading index is 0.139; for the coincident index, -0.175; for the lagging index, 0.018.
106Digitized for FRASER http://fraser.stlouisfed.org/ Federal Reserve Bank of St. Louis
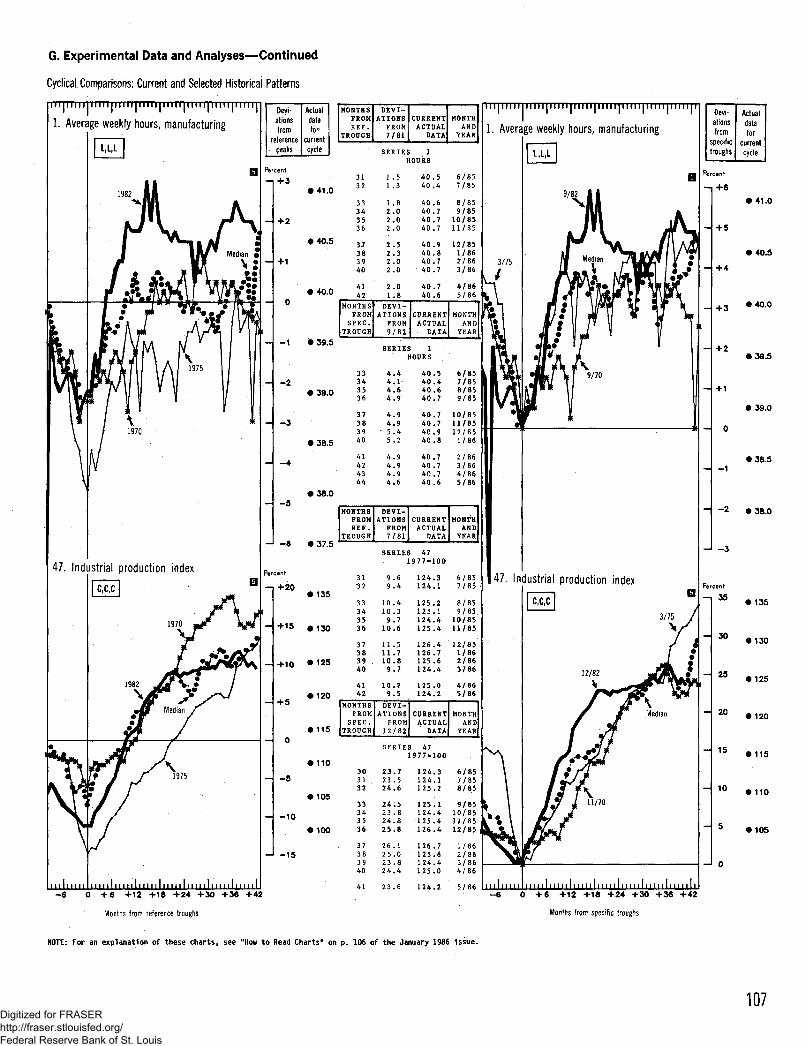
G. Experimental Data and Analyses—Continued
Cyclical Comparisons: Current and Selected Historical Patterns
I I M I j l l l TTTTT
1. Average weekly hours, manufacturing
47. Industrial production index
' c,c,c I
Devi-
ations
from
reference
peaks
Actual
data
for
current
cycle
REF.TROUGH 7/81
ANDYEAR
SERIES 1HOURS
Percent
—I +3
+ 2
+1
-2
-3
-5
Percent
+ 20
+15
+ 10
+ 5
-5
-10
-I -15
• 41.0
• 40.5
• 40.0
• 39.5
• 39.0
• 38.5
• 38.0
• 37.5
• 135
• 130
• 125
• 120
• 115
• 110
• 105
• 100
3132
33343536
37383940
1 .51.3
1 .82.02.02 .0
2.52.32 .02.0
40.540.4
6/85
7/85
40.6 8/8540.7 9/8540.7 10/8540.7 11/85
40.9 12/8540.8 1/8640.7 2/8640.7 3/86
4 14 2
MONTHSFROM
SPEC.TROUGH
2 . 01 . 8
D E V I -ATIOHS
FROM9 / 8 2
40.740.6
CURRENTACTUAL
DATA
4/865/86
MONTHAND
YEAR
SERIES 1HOURS
• " I 1 " " • " " I | U M . | . M U | . M . I | | U H I |
1. Average weekly hours, manufacturing
33343536
4.44.1-4.64.9
37 4.938 4.939 -5.440 5 .2
40.5 6/8540.4 7/8540.6 8/8540.7 9/85
40.7 10/8540.7 11/8540.9 12/8540.8 1/86
41424344
4.94.94.94,6
40.740.740.740-6
2/863/864/865/86
MONTHSFROMREF.
TROUGH
D E V I -ATIONS
FROM7 / 8 1
CURRENTACTUAL
DATA
MONTHAND
YEAR
SERIES 47
1977«1OO
3132
9.69.4
124.3124.1
6/857/85
3 3 10.4 12 5.2 8/8534 10.3 125.1 9/8535 9.7 124.4 10/8536 10.6 125.4 11/85
37 11.5 126.4 12/8538 11.7 126.7 1/8639 . 10.8 125.6 2/8640 9.7 124.4 3/86
414 2
MONTHSFROM
SPEC.TROUGH
10 . 29 .5
D E V I -ATIONS
FROM1 2 / 8 2
125 . 01 2 4 . 2
CURRENTACTUAL
DATA
4/865/86
MONTHAND
YEAR
SERIES 47
1977=100
303132
23.723.524.6
124.3124.1125.2
6/857/858/85
33 24.5 125.1 9/8534 23.8 124.4 10/8535 24.8 125.4 11/8536 25.8 126.4 12/85
37383940
26,25,23,24,
1 2 6 . 71 2 5 . 61 2 4 . 41 2 5 . 0
+18 +24 +30 +36 +422 3 . 6 1 2 4 . 2
1/862 / 8 63 / 8 64 / 8 6
5 /86
47. Industrial production index
Devi-
ationsfrom
specific
troughs
Actualdata
for
currentcycle
• 41.0
• 40.5
• 40.0
• 39.5
• 39.0
• 38.5
• 38.0
- 20
- 15
- 10
- 5
-I 0
• 135
• 130
• 125
• 120
• 115
l 110
• 105
+ 6 +12 +18 +24 +30 +36 +42
Months from reference troughs Months from specific troughs
NOTE: For an explanation of these charts, see "How to Read Charts" on p. 106 of the January 1986 Issue.
107Digitized for FRASER http://fraser.stlouisfed.org/ Federal Reserve Bank of St. Louis

G. Experimental Data and Analyses—Continued
Cyclical Comparisons: Current and Selected Historical Patterns—Continued
19. Index of stock prices
32. Vendor performance, percent ofcompanies receiving slower deliveries.
Devi-
ations
from
reference
peaks
Actual
for
current
cycle
REF.TROUGH
FROM7/81
ACTUALDATA
MONTH
Percent
- ) +100
SERIES 191941-43-10
4 9 . 1 1 9 2 . 5 4
+ 80
+ 60
• 240
• 220
• 200
33343536
37383940
414243
4 5 . 84 2 . 54 4 . 25 2 . 9
6 0 . 56 1 . 26 9 , 97 9 . 9
84.384.789.5
1 8 8 . 3 11 8 4 . 0 61 8 6 . 1 81 9 7 . 4 5
2 0 7 . 2 62 0 8 . 1 92 1 9 . 3 72 3 2 . 3 3
7/85
8/859/85
1 0 / 8 51 1 / 8 5
1 2 / 8 51 / 8 62 / 8 63 / 8 6
2 3 7 . 9 8 4 / 8 62 3 8 . 4 6 5 / 8 62 4 4 . 7 5 6 / 8 6
+40 • 180
MONTHSFROM
S P E C .TROUGH
D E V I -ATIONS
FROM7 / 8 2
CURRENTACTUAL
DATA
MONTHAND
YEAR
+ 20
- 2 0
- 4 0
• 160
• 140
• 120
• 100
• 80
SERIES 191 9 4 1 - 4 3 - 1 0
7 6 . 0 1 9 2 . 5 4
37383940
41424344
7 2 . 26 8 . 37 0 . 28 0 . 5
8 9 . 590.3
1 0 0 . 6112.4
188.31184.06186.18197.45
207.26208.19219.37232.33
7/85
8/859/8510/8511/85
12/851/862/863/86
45 117.6 237.98 4/8646 118.0 238.46 5/8647 123.8 244,75 6/86
MONTHSFROMREF.
TROUGH
CURRENTACTUAL
DATA
MONTHAND
YEAR
SERIES 32PERCENTREPORTING
31 44 6/85
32 44 7/85
-I 90
80
70
60
33343536
37383940
4142
42 8/8542 9/8546 10/8542 11/85
46 12/8546 1/8648 2/8650 3/86
5055
4/865/86
MONTHSFROM
SPEC.TROUGH
D E V I -ATIONS
FROM
5/82
CURRENTACTUAL
DATA
MONTHAND
YEAR
30
20
0 +6 +12 +18 +24 +30 +36 +42
Months from reference troughs
37383940
41424344
45464748
SERIES 32PERCENTREPORTING
14 44 6/8514 44 7/8512 42 8/8512 42 9/85
19. Index of stock prices
32. Vendor performance, percent ofcompanies receiving slower deliveries
16121616
18202025
46 10/8542 11/8546 12/8546 1/86
48 2/8650 3/8650 4/8655 5/86
Devi
ations
from
specific
troughs
Actual
data
for
current
cycle
140
120
100
60
60
40
20
-J 0
• 250
• 230
• 210
• 190
• 170
• 150
• 130
• 110
70 «100
60 9 90
50 #80
40
30 »60
20
10
-1 0
• 50
• 40
• 30
-6 0 +6 +12 +18 +24 +30 +36 +42 +48
Months from specific troughs
NOTE: For an explanation of these charts, see "How to Read Charts" on p. 106 of the January 1986 Issue.
108Digitized for FRASER http://fraser.stlouisfed.org/ Federal Reserve Bank of St. Louis
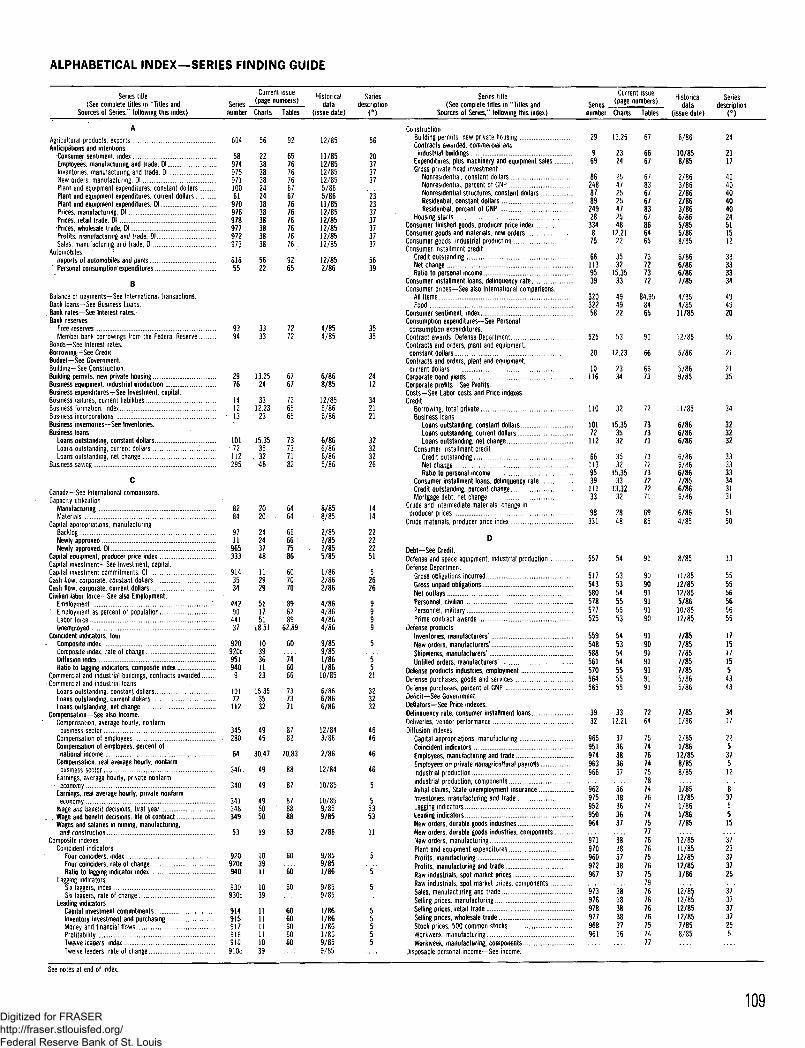
ALPHABETICAL INDEX—SERIES FINDING GUIDE
Series title C u r r e n t i s s u e
(See competeSties in "Titles and Series ( p a g e n u m b m )
Sources ol Series," following this index) number Charts Tables
A
Agricultural products, exports 604Anticipations and intentions
-Consumer sentiment, index 58Employees, manulaclunng and trade, Dl 974Inventories, manulacturing and trade, Dl 975New orders, manufacturing, Dl 971Plant and equipment expenditures, constant dollars 100Plant and equipment expenditures, current dollars 61Plant and equipment expenditures, Dl 970Prices, manufacturing, Dl 976Prices, retail trade, Dl 978Prices, wholesale trade, Dl 977Profits, manufacturing and trade, Dl 972Sales, manufacturing and trade, Dl .... 973
Automobiles' "Imports of automobiles and parts 616
* Personal consumption expenditures 55
B
Balance of payments—See International transactions.Bank loans-See Business Loans.
. Bank rates—See Interest rates.Bank reserves
Free reserves 93Member bank borrowings from the Federal Reserve 94
Bonds—See Interest rates.Borrowing—See Credit.Budget—See Government.Building—See Construction.Building permits, new private housing 29Business equipment, industrial production 76Business expenditures—See Investment, capital.Business failures, current liabilities 14
. Business formation, index 12Business incorporations 13Business inventories—See Inventories.Business loans
Loans outstanding, constant dollars 101Loans outstanding, current dollars 72Loans outstanding, net change 112
Business saving 295
C
Canada—See International comparisons.Capacity utilization
Manufacturing 82Materials . 84
Capital appropriations, manufacturingBacklog 97Newly approved ... 11Newly approved, Dl 965
Capital equipment, producer price index 333Capital investment- See Investment, capital.Capital investment commitments. Cl 914Cash flow, corporate, constant dollars 35Cash flow, corporate, current dollars 34Civilian labor force- See also Employment.
Employment . ... 442Employment as percent of population 90Labor force . .... 441Unemployed .... 37
Coincident indicators, lour• Composite index 920
Composite index, rate of change 920cDiffusion index 951Ratio to lagging indicators, composite index 940
Commercial and industrial buildings, contracts awarded 9Commercial and industrial loans
Loans outstanding, constant dollars 101Loans outstanding, current dollars 72Loans outstanding, net change 112
Compensation—See also Income.Compensation, average hourly, nonfarm
business sector 345Compensation ol employees •• 280Compensation of employees, percent of
national income.-. 64Compensation, real average hourly, nonfarm
business sector 346 .Earnings, average hourly, private nonfarm
••• economy 340Earnings, real average hourly, private nonfarm
economy 341Wage and benefit decisions, first year 348
. ', Wage and benefit decisions, life of contract 349Wages and salaries in mining, manufacturing,
and construction 53Composite indexes
Coincident indicatorsFour coinciders, index 920Four coincides, rate of change 920cRatio to lagging indicator index 940
Lagging indicatorsSix laggers, index 930Six laggers, rate of change 930c
Leading indicatorsCapital investment commitments 914Inventory investment and purchasing 915Money and financial flows 917Profitability 916Twelve leaders, index 910Twelve leaders, rate of change 910c
Historicaldata
(issue date)
Seriesdescription
(*)
Series title C u r r e n t i s s u e
(See complete titles in "Titles and Series ( p a g e n u m b e r s )Sources of Series," following this index) number Charts Tables
ConstructionBuilding permits, new private housing 29 13,25Contracts awarded, commercial and
industrial buildings 9Expenditures, plus machinery and equipment sales 69Gross private fixed investment
Nonresidential, constant dollars 86Nonresidential, percent of GNP 248Nonresidential structures, constant dollars 87Residential, constant dollars 89Residential, percent of GNP 249
Housing starts 28Consumer finished goods, producer price index . . . 334Consumer goods and materials, new orders 8Consumer goods, industrial production ... 75Consumer installment credit
Credit outstanding 66Net change 113Ratio to personal income 95
Consumer installment loans, delinquency rate 39Consumer prices—See also International comparisons.
All items 320Food 322
Consumer sentiment, index 58Consumption expenditures—See Personal
consumption expenditures.Contract awards, Defense Department 525Contracts and orders, plant and equipment,
constant dollars 20Contracts and orders, plant and equipment,
current dollars 10Corporate bond yields 116Corporate profits—See Profits.Costs—See Labor costs and Price indexes.Credit
Borrowing, total private 110Business loans
Loans outstanding, constant dollars 101Loans outstanding, current dollars 72Loans outstanding, net change 112
Consumer installment creditCredit outstanding 66Net change 113Ratio to personal income 95
Consumer installment loans, delinquency rate 39Credit outstanding, percent change I l lMortgage debt, net change 33
Crude and intermediate materials, change inproducer prices 98
Crude materials, producer price index 331
D
Debt-See Credit.Defense and space equipment, industrial production 557Defense Department
Gross obligations incurred 517Gross unpaid obligations 543Net outlays 580Personnel, civilian 578Personnel, military 577Prime contract awards 525
Defense productsInventories, manufacturers' 559New orders, manufacturers' 548Shipments, manufacturers' 588Unfilled orders, manufacturers' 561
Defense products industries, employment 570Defense purchases, goods and services 564Defense purchases, percent of GNP 565Deficit—See Government.Deflators—See Price indexes.Delinquency rate, consumer installment loans 39Deliveries, vendor performance 32Diffusion indexes
Capital appropriations, manufacturing .. , 965Coincident indicators 951Employees, manufacturing and trade 974Employees on private nonagrtcultoral payrolls 963Industrial production .. 966Industrial production, componentsInitial claims, State unemployment insurance 962Inventories, manufacturing and trade 975Lagging indicators 952Leading indicators 950New orders, durable goods industries 964New orders, durable goods industries, componentsNew orders, manufacturing 971Plant and equipment expenditures 970Profits, manufacturing 960Profits, manufacturing and trade 972Raw industrials, spot market prices 967Raw industrials, spot market prices, componentsSales, manufacturing and trade 973Selling prices, manufacturing 976Selling prices, retail trade 978Selling prices, wholesale trade 977Stock prices, 500 common stocks 968Workweek, manufacturing 961Workweek, manufacturing, components
Disposable personal income—See income.
Historicaldata
(issue date)
Seriesdescription
n
56
3333
19
92
n72
63
12/85
223838382424383838383838
5622
657676766767767676767676
9265
11/8512/8512/8512/855/865/8611/8512/8512/8512/8512/8512/85
12/852/86
20373737
23233737373737
5639
4/854/85
2/86
3535
13,25
24
3312,23
23
15,35
3532•46 .
6767
726565
73737182
6/868/85
12/856/866/86
6/866/866/865/86
2412
342121
32323226
2020
24243748
112929
511751
18,51
1039361123
15,35
3532
4945
30,47
49
49
495050
6464
66667586
607070
896289
62,89
60
74'6066
737371
8782
70,83
88
87
878888
8/85- 8/85
2/852/852/855/85
1/862/862/86
4/864/864/864/86
9/859/851/861/8610/85
6/866/866/86
12/843/86
2/86
12/84
10/85
10/859/859/85
1414
22222251
52626
9999
5
"5521
323232
4646
46
46
5
55353
103911
1039
111111111039
60
m60
6060606060
9/859/851/86
9/859/85
1/861/861/861/869/859/85
5
"5
5
55555
32
54
67
72
91
6/86
2324
25472525472548
12,21
22
3532
15,35
33
494922
53
12,23
2334
6667
678367678367866465
73727372
84,958465
90
66
6673
10/858/85
2/863/862/862/863/866/865/855/868/85
6/866/866/867/85
4/854/8511/85
12/85
5/86
5/869/85
2117
404040404024511512
33333334
494920
55
21
2135
11/85
15,35
3532
3532
15,35
3313,32
32
2848
737371
737273727271
6985
6/866/866/86
6/866/866/867/856/866/86
6/864/85
323232
333333343131
5150
8/85
535354555553
54535454555555
3312,21
3736383637
36'38363637
38'38373837
383838383736
909091919190
91909191919191
7264
75747674757874767474757776767576757976767676757477
11/8512/8512/855/8610/8512/85
7/857/857/857/857/855/865/86
7/851/86
2/851/8612/858/858/85
1/8512/851/861/867/85
12/8511/8512/8512/851/86
12/8512/8512/8512/857/858/85
555556565655
1715171554343
3417
22537512
"8375515
"3723373725
37373737255
See notes at end of index.
109Digitized for FRASER http://fraser.stlouisfed.org/ Federal Reserve Bank of St. Louis

ALPHABETICAL INDEX—SERIES FINDING GUIDE—Continued
Series title(See complete titles in "Titles and
Sources ol Series," following this index)
Current issueSeries tpage numbers)
number Charts Tables
Historicaldata
(issue date)
Seriesdescription
Series title(See complete titles in "Titles and
Sources of Series," following this index)Series
Current issue(page numbers)
number Charts Tables
Historical Seriesdata description
(issue date) (•)
Earnings - See Compensation.Employment and unemployment
Civilian labor forcePelense Department personnel, civilianDefense Department personnel, militaryEmployee hours in nonagroltural establishments
Rate ol change..............Total
Employees in goods producing industries.,Employees, manufacturing and trade, 01.....Employees on nonagneuitural payrolls....Employees on private nonagncultural payrolls. D l . .Employment, civilianEmployment, defense products industries..Employment, ratio to populationHelp-wanted advertising in newspapersHelp-wanted advertising, ratio to unemployment....Initial claims, State unemployment insuranceInitial claims, Stale unemployment insurance, DL...Overtime hours, manufacturingParticipation fate, both sexes 16-19 years of age..Participation rate, females 20 years and overParticipation rate, males 20 years and overPart-time workers lor economic reasonsPersons engaged in nonagncullural activitiesUnemployed, both sexes 16-19 years of ageUnemployed, females 20 years and overUnemployed, full-time workersUnemployed, males 20 years and overUnemployment, average duration,.,.,...Unemployment, civilianUnemployment rate. 15 weeks and overUnemployment rate, insuredUnemployment rate, totalWorkweek, manufacturingWorkweek, manufacturing, componentsWorkweek, manufacturing, Dl
Equipment See Investment, capital.Exports- See International transactions,
441578577
48c4840974419634425709046605962214534524514484244644544744491374445431
961
515555
39171738
14,17385155171616
12,163616515151511751515151
15,1818,51181818
12,16
36'
899191
"6i"62766274899162616161746189898989628989898962
62,89626262617774
4/865/8610/85
1/861/867/8512/857/858/854/867/854/864/864/861/851/857/854/864/864/864/864/864/864/864/864/864/864/864/864/864/867/85
8/85
Federal funds rate , ,Federal Government See Government.Federal Reserve, member bank borrowings from..Final sales in constant dollarsFinancial flows, Cl .,Fixed investment See Investment, capital.Fixed weighted price index, gross domesticbusiness product
Food See Consumer prices.Foreign trade See International transactions.France See International comparisons.Free reserves
119 34
311
Goods output in constant dollarsGovernment budget
Federal expenditures.. -federal receipts ,Federal surplus or deficit..,.,.,.,.,.....State and local expenditures.....State and local receipts ........State and local surplus or deficitSurplus or deficit, lotal .... ...,...„
Government purchases of goods and servicesFederal, constant dollarsFederal, current dollarsFederal, percent of GNP...National defense. ,,,,....„.National defense, percent of GNPState and local, constant dollarsState and local, current dollarsState and local, percent of GNPTotal, constant dollarsTotal, current dollars
Gross domestic business product, fixed weightedprice index ,., ....
Gross domestic product, labor cost per unitGioss national product
GNP, constant dollars.....GNP, constant dollats. differencesGNP, constant dollars, percent changesGNP, current dollarsGNP, current dollars, differencesGNP, current dollars, percent changesGNP. ratio to money supply M l . . 'Goods output in constant dollarsImplicit price deflatorPer capita GNP, constant dollars
Gross private domestic investment -See Investment, capital.
HHelp-wanted advertising in newspapersHelp wanted advertising, ratio to unemployment ,Hours, manufacturing
Average weekly hours ,..Average weekly hours, componentsAverage weekly hours, DlAverage weekly overtime
9/85
94213917
334011
728060
4/853/861/86
5/86
4/85
2/86
502501500512511510298
263262265564565267266268261260
31168
5050b50c200200b200c10749310217
4660
1
96121
52525252525246
43434755554343474343
4830
19,40
39'40
3i'204840
1616
12.16
3616
90909090909083
81818391918181838181
8470
63,80808080808071638480
6161
61777461
5/865/865/865/865/865/865/86
3/863/863/865/865/863/863/863/863/863/86
5/862/86
2/862/862/862/862/862/862/862/865/863/86
4/864/86
7/85
8/857/85
95656
55375595999
35385
535353535353
43434343434343434343
4928
38383838383830143838
HousingHousing starts 28 25 67Housing units authorized by local building permits 29 13,25 fi?Residential GPDI, constant dollars 89 25 67Residential GPDI, percent of GNP 249 47 83
I
Implicit price deflator, GNP 310 48 84Imports—See International transactions.Income
Compensation, average hourly, nonfarmbusiness sector 345 49 87
Compensation of employees 280 45 82Compensation of employees, percent si
national income 64 30,47 70,83Compensation, real average hourly, norfarn
business sector 346 49 88Consumer installment credit, ratio ts perscia' :nc:;Tu 95 15,35 73Corporate profits with IVA and CCAdi 286 45 82Corporate profits with IVA and CCAd1, percerl
of national income 287 47 83Disposable personal income, constant dol ars .. . . 225 40 80Disposable personal income, current dollars 224 40 80Disposable personal income, per capitaconstant dollars . 227 40 80
Earnings, average hourly, private norfameconomy 340 49 8?
Earnings, real average hourly, private ns t fameconomy 341 49 87
Income on foreign investment in the United States .. 652 57 93Income on U.S. investment abroad .. 651 57 93lnterest.net 288 45 82Interest, net, percent of national income , , 289 47 83National income.. . 220 45 82Personal income, constant dollars. 52 19 63Personal income, current dollars 223 40 63Personal income less transfer payments, constant dollars
Rate of change 51c 39Total 51 14,19 63
Personal income, ratio to money supply M2 .. . . 108 31 71Proprietors' income with IVA and CCAd| 282 45 82Proprietors' income with IVA and CCAd percentof national income 283 47 83
Rental income of persons with CCAdi 284 45 82Rental income of persons with CCAdi, percentof national income 285 4? 83
Wage and benefit decisions, first year 348 50 88Wage and benefit decisions, life of contract 349 50 88Wages and salaries m mining, manufacturing,
and construction §3 19 63Incorporations, new businesses 13 23 65Industrial commodities, producer price index . . . . 335 48 85Industrial production—See also International comparisons
Business equipmentConsumer goods ,Defense and space equipmentDurable manufacturesNondurable manufacturesTotalTotal, componentsTotal, DlTotal, rate of change
Industrials, raw, spot market pricesComponents . . . . . . ...Diffusion index „ ,. 967 3?Spot market index . . . . 23 28
Installment credit—See Credit,Insured unemployment
Average weekly initial claims 5 12,16 61Average weekly initial claims, 01... 962 36 74Average weekly insured unemployment rate...................... 45 18 62
lnterest.net 288 45 82Interest, net, percent of national income...... 289 47 83Interest rates
Bank rates on short-term business loans.... 67 35 73Corporate bond yields 116 34 73Federal funds rate 119 34 72Mortgage yields, secondary market 118 34 73Municipal bond yields 117 34 73Prime rate charged by banks 109 35 73Treasury bill rate 114 34 72Treasury bond yields............. 115 34 73
Intermediate materials, producer price index 332 48 86International comparisons
Consumer pricesCanada 733 59 96France 736 59 95Italy 737 59 96Japan . . 738 59 95United Kirgdcm 732 59 95United States . .. 320 49 84,95WestGe'irany 735 59 95
Industrial productionCanada 723 58 94France 726 58 94Itaiy W 58 94Japan . , 728 58 94OtCD, Fu'Spean {.ouches . . . . . . 721 58 94United Kingdom 722 58 94Un ted States 47 14.20,58 63,94West Germany 725 58 94
76 24 6775 22 65557 54 9173 20 6374 20 6347 14,20,58 63,94
78366 37 7547c 39
797569
6/8S6/862/863/86
12/843/86
12/846/863/86
3/863/863/86
10/85
10/859/859/853/863/863/862/862/86
11/852/866/863/86
3/863/86
9/85
6/865/85
8/858/858/858/858/858/85
8/8511/85
1/861/86
1/851/854/863/863/86
12/859/819/859/859/856/859/859/855/85
6/856/856/856/856/854/856/85
10/8510/8510/8510/8510/8510/858/8510/85
24244040
46
46
4633
55?574?474611U
ii3047
4747
4?5353
II2151
12
n13VIVI
n
2525
8884747
353535353535353550
60616161604961
5959595958581259
See notes at end of index
110Digitized for FRASER http://fraser.stlouisfed.org/ Federal Reserve Bank of St. Louis
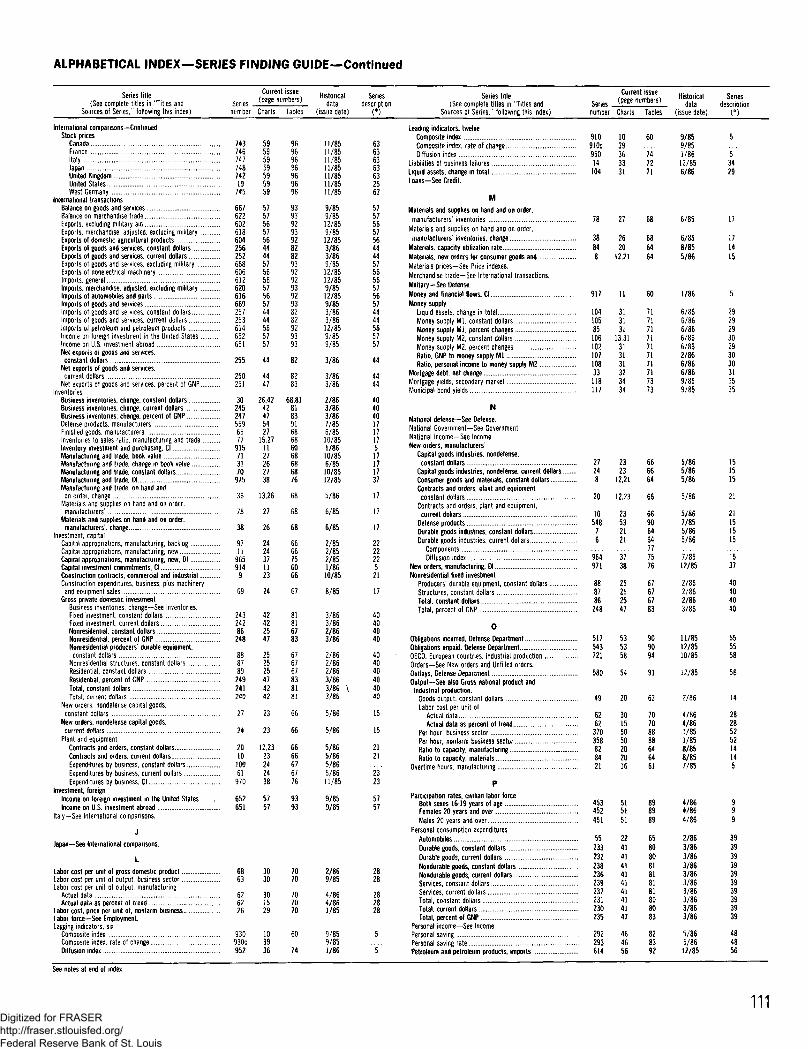
ALPHABETICAL INDEX—SERIES FINDING GUIDE—Continued
Series title Current issue
{See complete titles in "Titles and Series (page numbers)
Sources of Series," folfowing thts index) number Charts Tables
International comparisons—ContinuedStock prices
Canada 743 59France 746 59Italy 747 59Japan 748 59United Kingdom 742 59United States 19 59West Germany 745 59
International transactionsBalance on goods and services 667 57Balance on merchandise trade 622 57Exports, excluding military aid 602 56Exports, merchandise, adjusted, excluding military 618 57Exports of domestic agricultural products 604 56Exports oi goods and services, constant dollars 256 44Exports ot goods and services, current dollars 252 44Exports ot goods and services, excluding military 668 57Exports of nonelectrical machinery 606 56Imports, general 612 56Imports, merchandise, adjusted, excluding military 620 57Imports of automobiles and parts 616 56Imports of goods and services 669 57Imports of goods and services, constant dollars 257 44Imports of goods and services, current dollars 253 44Imports of petroleum and petroleum products 614 56Income on foreign investment in the United States 652 57Income on U.S. investment abroad 651 57Net exports ol goods and services,
constant dollars 255 44Net exports of goods and services.current dollars 250 44
Net exports of goods and services, percent of GNP 251 47Inventories
Business inventories, change, constant dollars 30 26,42Business inventories, change, current dollars 245 42Business inventories, change, percent of GNP 247 47Defense products, manufacturers' 559 54Finished goods, manufacturers' 65 27Inventories to sales ratio, manufacturing and trade 77 15,27Inventory investment and purchasing, Cl 915 11Manufacturing and trade, book value 71 27Manufacturing and trade, change in book value 31 26Manufacturing and trade, constant dollars 70 27Manufacturing and trade, 01 975 38Manufacturing and trade, on hand and
on order, change 36 13,26Materials and supplies on hand and on order,
manufacturers' 78 27Materials and supplies on hand and on order.
manufacturers', change 38 26Investment, capita)
Capital appropriations, manufacturing, backlog 97 24Capital appropriations, manufacturing, new 11 24Capital appropriations, manufacturing, new, D! 965 37Capital investment commitments, Cl 914 11Construction contracts, commercial and industrial 9 23Construction expenditures, business, plus machinery
and equipment sales 69 24Gross private domestic investment
Business inventories, change—See Inventories.Fixed investment, constant dollars 243 42Fixed investment, current dollars 242 42Nonresidential, constant dollars 86 25Nonresidential, percent of GNP 248 47Nonresidential producers' durable equipment,
constant dollars 88 25Nonresidential structures, constant dollars 87 25Residential, constant dollars 89 25Residential, percent of GNP 249 47Total, constant dollars 241 42Total, current dollars .... 240 42
New orders, nondeiense capital goods,constant dollars 27 23
New orders, nondefense capital goods,current dollars . 24 23
Plant and equipmentContracts and orders, constant dollars 20 12,23Contracts and orders, current dollars 10 23Expenditures by business, constant dollars 100 24Expenditures by business, current dollars 61 24Expenditures by business, 01 970 38
Investment, foreignIncome on (oreign investment in the United States 652 57Income on U.S. investment abroad 651 57
Italy—See International comparisons.
J
Japan—See International comparisons.
L
Labor cost per unit of gross domestic product 68 30Labor cost per unit of output, business sector 63 30Labor cost per unit of output, manufacturing
Actual data 62 30 70Actual data as percent of trend 62 15 70
Labor cost, price per unit ot, nonfarm business 26 29 70Labor lorce—See Employment.Lagging indicators, six
Composite index 930 10Composite index, rate of change 930c 39Diffusion index 952 36
Historicaldata
(issue date)
Seriesdescription
<*>
Series title / n a T n I h l l Historical Series{See complete titles in "Titles and Series ;page numDers' data description
Sources ot Series," following this index) number Charts Tables (issue date) (*)
Leading indicators, twelveComposite index 910Composite index, rate of change 910cDiffusion index 950
Liabilities of business failures 14Liquid assets, change in total 104Loans—See Credit.
96969696969696
939392939282829392929392938282929393
82
8283
68,8181839168686068686876
68
68
68
6666756066
11/8511/8511/8511/8511/8511/8511/85
9/859/8512/859/8512/853/863/869/8512/8512/859/8512/859/853/863/8612/859/859/85
3/86
3/863/86
2/863/863/867/856/8510/851/8610/856/8510/8512/85
5/86
6/85
6/85
2/852/852/851/8610/85
63636363632563
575756575644445756565756574444565757
44
4444
404040171717517171737
17
17
17
222222521
67
7070
60
"n
8/85
81816783
676767838181
66
66
6666676776
9393
3/863/862/863/86
2/862/862/863/863/86 \3/86
5/86
5/86
5/865/865/865/8611/85
9/859/85
40404040
404040404040
15
15
2121
2323
5757
2/869/85
4/864/861/85
9/859/851/86
2828
282828
1039363331
60 9/859/85
74 1/8672 12/8571 6/86
M
Materials and supplies on hand and on order,manufacturers' inventories 78 27 68
Materials and supplies on hand and on order,manufacturers'inventories, change 38 26 68
Materials, capacity utilization rate 84 20 64Materials, new orders for consumer goods and 8 12,21 64Materials prices—See Price indexes.Merchandise trade—See International transactions.Military—See Defense.Money and financial Hows, Cl 917 11 60Money supply
Liquid assets, change in total 104 31 71Money supply M l , constant dollars 105 31 71Money supply M l , percent changes 85 31 71Money supply M2. constant dollars 106 13.31 71Money supply M2, percent changes 102 31 71Ratio, GNP to money supply Ml 107 31 71Ratio, personal income to money supply M2 108 31 71
Mortgage debt, net change 33 32 71Mortgage yields, secondary market 118 34 73Municipal bond yields 117 34 73
N
National defense—See Defense.National Government—See Government.National income—See Income.New orders, manufacturers'
Capital goods industries, nondefense,constant dollars 27 23 66
Capital goods industries, nondefense, current dollars 24 23 66Consumer goods and materials, constant dollars 8 12,21 64Contracts and orders, plant and equipment,
constant dollars 20 12,23 66Contracts and orders, plant and equipment,
current dollars 10 23 66Defense products 548 53 90Durable goods industries, constant dollars 7 21 64Durable goods industries, current dollars 6 21 64
Components 77Diffusion index 964 37 75
New orders, manufacturing, Dl 971 38 76Nonresidential fixed investment
Producers' durable equipment, constant dollars 88 25 67Structures, constant dollars 87 25 67Total, constant dollars 86 25 67Total, percent of GNP 248 47 83
O
Obligations incurred, Defense Department 517 53 90Obligations unpaid, Defense Department 543 53 90OECD, European countries, industrial production 721 58 94Orders—See New orders and Unfilled orders.Outlays, Defense Department 580 54 91Output—See also Gross national product and
Industrial production.Goods output, constant dollars 49 20 63Labor cost per unit of
Actual data 62 30 70Actual data as percent of trend 62 15 70
Per hour, business sector 370 50 88Per hour, nonfarm business sector 358 50 88Ratio to capacity, manufacturing 82 20 64Ratio to capacity, materials 84 20 64
Overtime hours, manufacturing 21 16 61
P
Participation rates, civilian labor forceBoth sexes 16-19 years of age 453 51 89Females 20 years and over ... 452 51 89Males 20 years and over. . . . 451 51 89
Personal consumption expendituresAutomobiles 55 22 65Durable goods, constant dollars 233 41 80Durable goods, current dollars 232 41 80Nondurable goods, constant dollars 238 41 81Nondurable goods, current dollars 236 41 81Services, constant dollars 239 41 81Services, current dollars 237 41 81Total, constant dollars 231 41 80Total, current dollars 230 41 80Total, percent of GNP 235 47 83
Personal income—See Income.Personal saving 292 46 82Personal saving rate 293 46 83Petroleum and petroleum products, imports 614 56 92
6/85
1/86
12/85
2/86
53429
6/858/855/86
171415
6/866/866/866/866/862/866/866/869/859/85
29292930293030313535
5/865/865/86
5/86
5/867/855/865/86
7/8512/85
2/862/862/863/86
11/8512/8510/85
151515
21
21151515
is37
40404040
555558
4/864/861/851/858/858/857/85
4/864/864/86
2/863/863/863/863/863/863/863/863/863/86
5/865/8612/85
2828525214145
999
39393939393939393939
484856
See notes at end of index.
111Digitized for FRASER http://fraser.stlouisfed.org/ Federal Reserve Bank of St. Louis
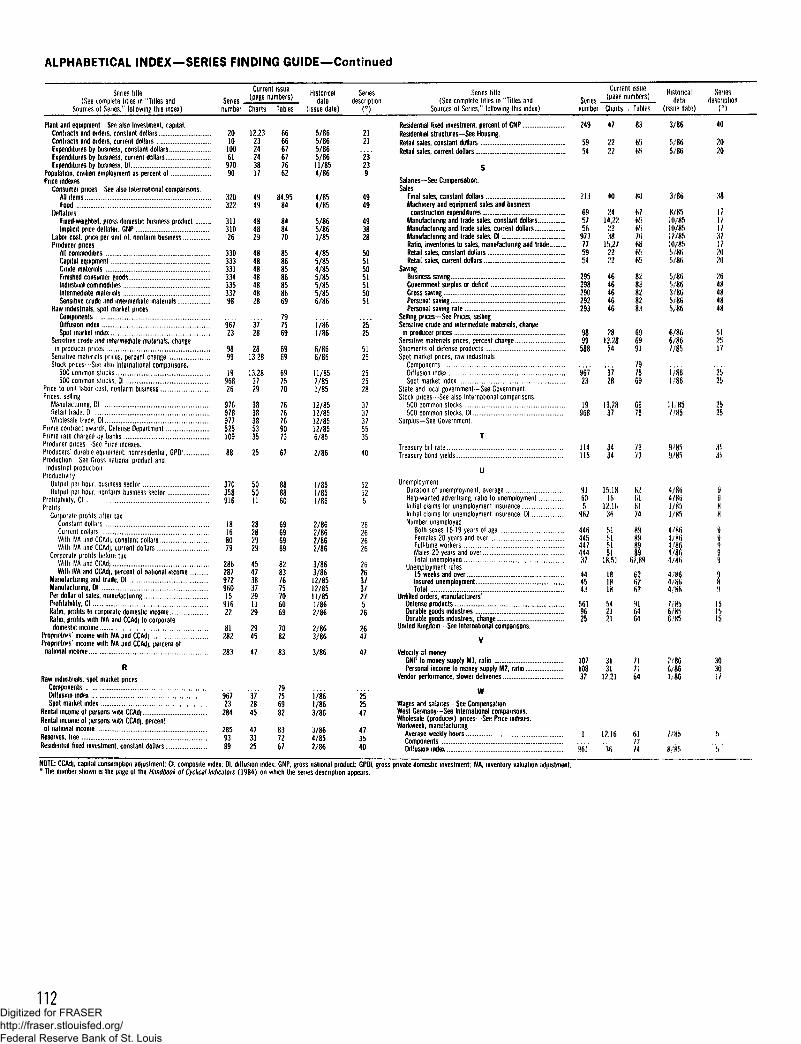
ALPHABETICAL INDEX—SERIES FINDING GUIDE—Continued
Series title(See complete titles in "Titles and
Sources of Series," following this index)
Current issueSeries (page numbers)
number Charts Tables
Historical Seriesdata description
(issue date) (*)
Series title{See complete titles in "Titles and
Sources of Series," following this index)
Current issue
Series (pagenumbers)
number Charts - Tables
Historicaldata
(issue date)
Serieslesenption
nPlant and equipment See also Investment, capital.
Contracts and orders, constant dollars....Contracts and orders, current dollarsExpenditures by business, constant dollars.Expenditures by business, current dollars .........Expenditures by business, Dl............. .......................:
Population, civilian employment as percent otPrice indexes
Consumer prices See also International comparisons.All itemsFood
DeflatorsFixed-weighted, gross domestic business product.....Implicit price dellator, GNP
Labor cost, price per unit of, nonlarm businessProducer prices
AH commoditiesCapital equipment ...,.,.........,.„„.„.,.,.,....„....,.....,.Crude materials.. .,.Finished consumer goods.Industrial commoditiesIntermediate materialsSensitive crude and intermediate materials
Raw industrials, spot market pricesComponentsDiffusion indexSpot market index
Sensitive crude and intermediate materials, changein producer prices
Sensitive materials prices, percent changeStock prices See also International comparisons,
500 common stocks500 common stocks, D l . . .
Price to unit labor cost, nontarm business..Prices, selling
Manufacturing, Dl ,Retail trade, DlWholesale trade, Dl .,.
Prime contract awards. Delense Department...Prime rale charged by banks ......................Producer prices See Price indexes.Producers' durable equipment, presidential. GPDIProduction See Gross national product and
Industrial productionProductivity
Output per hour, business sector, .Output per hour, ftortam biiMnes-* sector
Profitability, ClProfits
Corporate profits after taxConstant dollarsCurrent dollarsWith IVA and CCAd|, constant dollar* . . . .With IVA and CCAdj, u r re r t dol'drs
Corporate profits below taxWith IVA and CCAdi. ., ,With IVA and CCAd|, percent ol national ice o me . .
Manufacturing and fade. 131Ma nu I act u ring, DlPer dollar of sales, manufacturing . . . .Profitability, Cl 'Ratio, pro 11 Is to corporate domestic iru'omcRatio, profits with tVA and CCAdj to corporatedomestic income..
Proprietors' income wilt- :VA and CCAd; . . . .Proprietors' income with IVA and CCAdj. percent of
national income
Raw industrials, spot market pricesComponentsDilfusion indexSpot market index
Rental income ot persons with CCAd|.Rental income ol persons with CCAd|. percentof national income .....,.,,.
Reserves, freeResidential fixed investment, constant dollars,.,,
2010
10061
97090
320322
31131026
33033333133433533298
96723
9899
1996826
976978977525109
28628797296015
91622
282
283
12,232324243817
4949
484829
4848484848
3728
2813,28
13,283729
3838385335
370 50358 50916 U
28282929
45473837291129
2945
666667677662
84,95
848470
8586858669
797569
6969
697570
7676769073
69696969
82837675706069
7082
5/865/865/865/8611/854/86
4/854/85
5/865/861/85
4/855/854/855/855/855/856/86
1/861/86
6/866/86
11/857/851/85
12/8512/8512/8512/856/85
2/86
1/851/851/86
2/862/862/862/86
3/863/8612/8512/8511/851/862/86
2/863/86
3/86
96723284
2859389
372845
473325
79756982
837267
1/861/863/86
3/864/852/86
2121
' 2 3 '239
4949
493828
50515051515051
2525
5125
252528
3737375535
52525
26262626
2626373727526
2647
252547
473540
Residential fixed investment, percent of GNP..Residential structures—See Housing.Retail sales, constant dollarsRetail sales, current dollars..,.. ...
Salaries—See Compensation.Sales
Final sales, constant dollarsMachinery and equipment sales and business
construction expenditures...Manufacturing and trade sales, constant dollarsManufacturing and trade sales, current dollarsManufacturing and trade sales, DlRatio, inventories to sales, manufacturing and trade..Retail sales, constant dollars „Retail sales, current dollars .....................
SavingBusiness savingGovernment surplus or deficitGross savingPersonal saving...Personal saving rate ,
Selling prices—See Prices, sellingSensitive crude and intermediate materials, change
in producer pricesSensitive materials prices, percent change ...,,Shipments of defense productsSpot market prices, raw industrials
ComponentsDiffusion index .......,,...,„.Spot market index
State and local government—See Government.Stock prices—See also International comparisons,
500 common stocks500 common stocks, Dl
Surplus—See Government.
Treasury bill rateTreasury bond yields
UUnemployment
Duration of unemployment, average.Help-wanted advertising, ratio to unemployment...............Initial claims for unemployment insurance...Initial claims for unemployment insurance, DlNumber unemployed
Both sexes 16-19 years of ageFemales 20 years and over..,.,....Full-time workersMales 20 years and everTotal unemployed
Unemployment rates15 weeks and overInsured unemployment.....Total
Unfilled orders, manufacturers'Defense productsDurable goods industriesDurable goods industries, change............................
United Kingdom-See International comparisons.
Velocity ot moneyGNP to money supply M l . ratioPersonal income to money supply M2, ratio..
Vendor performance, slower deliveries
Wages and salaries—See Compensation.West Germany—See International comparisons.Wholesale (producer) prices- See Price indexes.Workweek, manufacturing
Average weekly hours. ,ComponentsDiffusion index
249
5954
213
695756973775954
295298290292293
96723
19968
114115
5962
44644544?44437
444543
5619625
107108
47
22It
40
2414,22tt3815.27nn
n13,2854
3?28
13,2837
3434
51515151
18,51
18
54212
6565
67656576686565
S2464646 8246 8246 83
6931
797569
69
n
nn
15,18 6216 01
12,16 6136 74
8262
916464
31 7131 71
12,21 64
12,16
3/86
5/865/86
3/86
10/8510/8512/8510/855/865/86
5/863/865/865/86
6/866/867/85
1/861/86
11/857/85
9/859/85
4/864/861/851/85
4/864/864/864/864/86
4/864/86
7/856/856-.'85
2/866/861/86
2020
17171737172020
1%4848
512517
2525
3535
303017
961
617774
7/85
8/85
h
" 5
NOTE: CCAdj. capital consumption adjustment: Cl. composite index: Dl, diffusion index: GNP. gross national product; GPDI, gross private domestic investment; IVA, inventory valuation ad|ustment.* The number shown is the page ot the Handbook o! Cyclical Indicators (1984) on which the series description appears.
112Digitized for FRASER http://fraser.stlouisfed.org/ Federal Reserve Bank of St. Louis
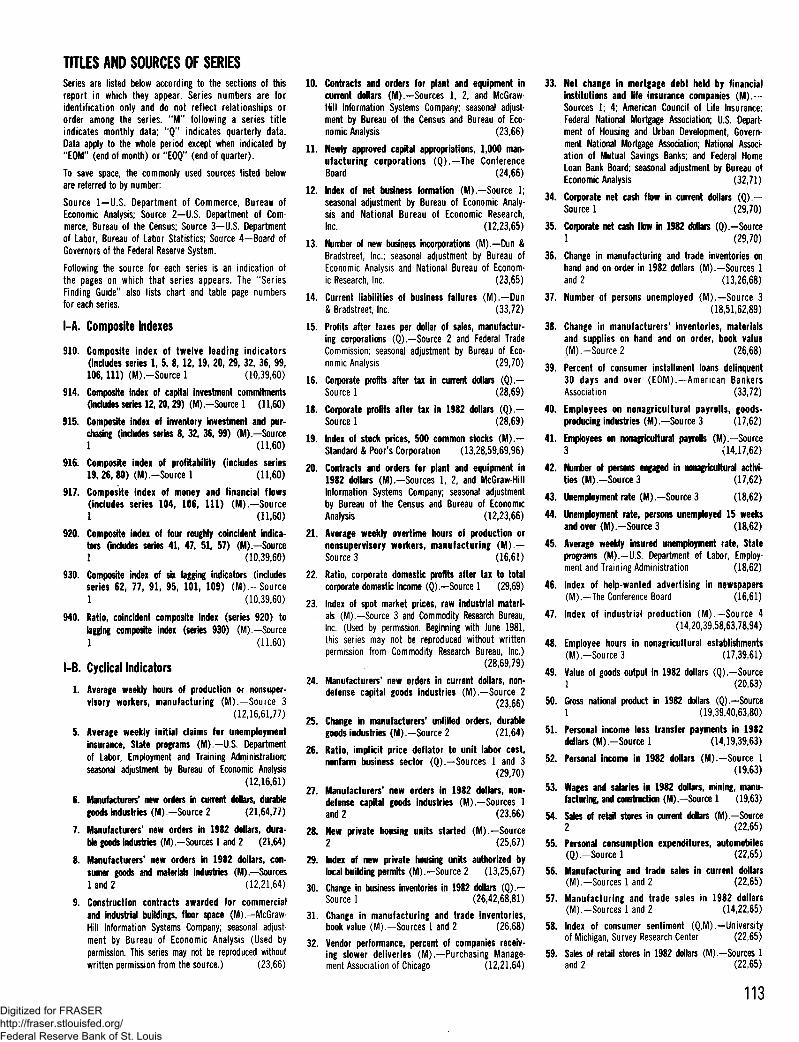
TITLES AND SOURCES OF SERIESSeries are listed below according to the sections of thisreport in which they appear. Series numbers are foridentification only and do not reflect relationships ororder among the series. " M " following a series titleindicates monthly data; " Q " indicates quarterly data.Data apply to the whole period except when indicated by"EOM" (end of month) or "EOQ" (end of quarter).
To save space, the commonly used sources listed beloware referred to by number:
Source 1—U.S. Department of Commerce, Bureau ofEconomic Analysis; Source 2—U.S. Department of Com-merce, Bureau of the Census; Source 3—U.S. Departmentof Labor, Bureau of Labor Statistics; Source 4—Board ofGovernors of the Federal Reserve System.
Following the source for each series is an indication ofthe pages on which that series appears. The "SeriesFinding Guide" also lists chart and table page numbersfor each series.
I-A. Composite Indexes
910. Composite index of twelve leading indicators(includes series 1, 5, 8, 12, 19, 20, 29, 32, 36, 99,106,111) (M) . -Source l (10,39,60)
914. Composite index of capital investment commitments(includes series 12, 20,29) (M).-Source 1 (11,60)
915. Composite index of inventory investment and pur-chasing (includes series 8, 32, 36, 99) (M).-Source1 (11,60)
916. Composite index of profitability (includes series19,26,80) ( M ) . - S o u r c e l (11,60)
917. Composite index of money and financial flows(includes series 104, 106, 111) (M) . -Sou rce1 (11,60)
920. Composite index of four roughly coincident indica-tors (includes series 41, 47, 51, 57) (M).-Source1 (10,39,60)
930. Composite index of six lagging indicators (includesseries 62, 77, 91 , 95, 101, 109) (M) . -Sou rce1 (10,39,60)
940. Ratio, coincident composite index (series 920) tolagging composite index (series 930) (M) — Source1 (11,60)
I-B. Cyclical Indicators
1. Average weekly hours of production or nonsuper-visory workers, manufacturing (M).—Source 3
(12,16,61,77)
5. Average weekly initial claims for unemploymentinsurance, State programs (M).—U.S. Departmentof Labor, Employment and Training Administration;seasonal adjustment by Bureau of Economic Analysis
(12,16,61)
6. Manufacturers' new orders in current dollars, durablegoods industries (M).-Source 2 (21,64,77)
7. Manufacturers' new orders in 1982 dollars, dura-ble goods industries (M).-Sources 1 and 2 (21,64)
8. Manufacturers' new orders in 1982 dollars, con-sumer goods and materials industries (M).—Sourcesl a n d 2 (12,21,64)
9. Construction contracts awarded for commercialand industrial buildings, floor space (M).—McGraw-Hill Information Systems Company; seasonal adjust-ment by Bureau of Economic Analysis (Used bypermission. This series may not be reproduced withoutwritten permission from the source.) (23,66)
10. Contracts and orders for plant and equipment incurrent dollars (M).—Sources 1, 2, and McGraw-Hill Information Systems Company; seasonal adjust-ment by Bureau of the Census and Bureau of Eco-nomic Analysis (23f66)
11. Newly approved capital appropriations, 1,000 man-ufacturing corporations (Q) .—The ConferenceBoard (24,66)
12. Index of net business formation (M).—Source 1;seasonal adjustment by Bureau of Economic Analy-sis and National Bureau of Economic Research,Inc. (12,23,65)
13. Number of new business incorporations (M).—Dun &Bradstreet, Inc.; seasonal adjustment by Bureau ofEconomic Analysis and National Bureau of Econom-ic Research, Inc. (23,65)
14. Current liabilities of business failures ( M ) . - D u n& Bradstreet, Inc. (33,72)
15. Profits after taxes per dollar of sales, manufactur-ing corporations (Q).—Source 2 and Federal TradeCommission; seasonal adjustment by Bureau of Eco-nomic Analysis (29,70)
16. Corporate profits after tax in current dollars ( Q ) -Source 1 (28,69)
18. Corporate profits after tax in 1982 dollars ( Q ) . -Sourcel (28,69)
19. Index of stock prices, 500 common stocks (M).—Standard & Poor's Corporation (13,28,59,69,96)
20. Contracts and orders for plant and equipment in1982 dollars (M).-Sources 1, 2, and McGraw-HillInformation Systems Company; seasonal adjustmentby Bureau of the Census and Bureau of EconomicAnalysis (12,23,66)
21. Average weekly overtime hours of production ornonsupervisory workers, manufacturing (M) .—Source 3 (16,61)
22. Ratio, corporate domestic profits after tax to totalcorporate domestic income (Q).-Source 1 (29,69)
23. Index of spot market prices, raw industrial materi-als (M).—Source 3 and Commodity Research Bureau,Inc. (Used by permission. Beginning with June 1981,this series may not be reproduced without writtenpermission from Commodity Research Bureau, Inc.)
(28,69,79)24. Manufacturers' new orders in current dollars, non-
defense capital goods industries (M).—Source 2(23,66)
25. Change in manufacturers' unfilled orders, durablegoods industries (M).-Source 2 (21,64)
26. Ratio, implicit price deflator to unit labor cost,nonfarm business sector (Q).—Sources 1 and 3
(29,70)27. Manufacturers' new orders in 1982 dollars, non-
defense capital goods industries (M).—Sources 1and 2 (23,66)
28. New private housing units started (M) . -Source2 (25,67)
29. Index of new private housing units authorized bylocal building permits (M).-Source 2 (13,25,67)
30. Change in business inventories in 1982 dollars ( Q ) . -Source 1 (26,42,68,81)
31. Change in manufacturing and trade inventories,book value (M).-Sources 1 and 2 (26,68)
32. Vendor performance, percent of companies receiv-ing slower deliveries (M).—Purchasing Manage-ment Association of Chicago (12,21,64)
33.
34.
35.
36.
37.
38.
39.
40.
41.
42.
43.
44.
45.
46.
47.
48.
49.
50.
51.
52.
53.
54.
55.
56.
57.
58.
59.
Net change in mortgage debt held by financialinstitutions and life insurance companies ( M ) . ~Sources 1; 4; American Council of Life Insurance;Federal National Mortgage Association; U.S. Depart-ment of Housing and Urban Development, Govern-ment National Mortgage Association; National Associ-ation of Mutual Savings Banks; and Federal HomeLoan Bank Board; seasonal adjustment by Bureau ofEconomic Analysis (32,71)
Corporate net cash flow in current dollars (Q).Source 1 (29,70)
Corporate net cash flow in 1982 dollars (Q).—Source1 (29,70)
Change in manufacturing and trade inventories onhand and on order in 1982 dollars (M).—Sources 1and 2 (13,26,68)
Number of persons unemployed (M).—Source 3(18,51,62,89)
Change in manufacturers' inventories, materialsand supplies on hand and on order, book value(M).-Source 2 (26,68)
Percent of consumer installment loans delinquent30 days and over (EOM).—American BankersAssociation (33,72)
Employees on nonagricultural payrolls, goods-producing industries (M).-Source 3 (17,62)
Employees on nonagricultural payrolls (M). Source3 (14,17,62)
Number of persons engaged in nonagricultural activi-ties (M).-Source3 (17,62)
Unemployment rate (M).-Source 3 (18,62)
iployed 15 weeks(18,62)
Unemployment rate, personsand over (M).-Source 3
Average weekly insured unemployment rate, Stateprograms (M).—U.S. Department of Labor, Employ-ment and Training Administration (18,62)
Index of help-wanted advertising in newspapers(M) . -The Conference Board (16,61)
Index of industrial production (M) . - Source 4(14,20,39,58,63,78,94)
Employee hours in nonagricultural establishments(M).-Source3 (17,39,61)
Value of goods output in 1982 dollars (Q),-Source1 (20,63)
Gross national product in 1982 dollars (Q),-Source1 (19,39,40,63,80)Personal income less transfer payments in 1982dollars (M).-Source 1 (14,19,39,63)
Personal income in 1982 dollars (M). -Source 1(19,63)
Wages and salaries in 1982 dollars, mining, manu-facturing, and construction (M).-Source 1 (19,63)
Sales of retail stores in current dollars (M). Source2 (22,65)Personal consumption expenditures, automobiles(Q).-Source 1 (22,65)
Manufacturing and trade sales in current dollars(M).-Sourcesland2 (22,65)
Manufacturing and trade sales in 1982 dollars(M).-Sourcesland2 (14,22,65)
Index of consumer sentiment (Q,M).—Universityof Michigan, Survey Research Center (22,65)
Sales of retail stores in 1982 dollars (M),-Sources 1and 2 (22,65)
113Digitized for FRASER http://fraser.stlouisfed.org/ Federal Reserve Bank of St. Louis
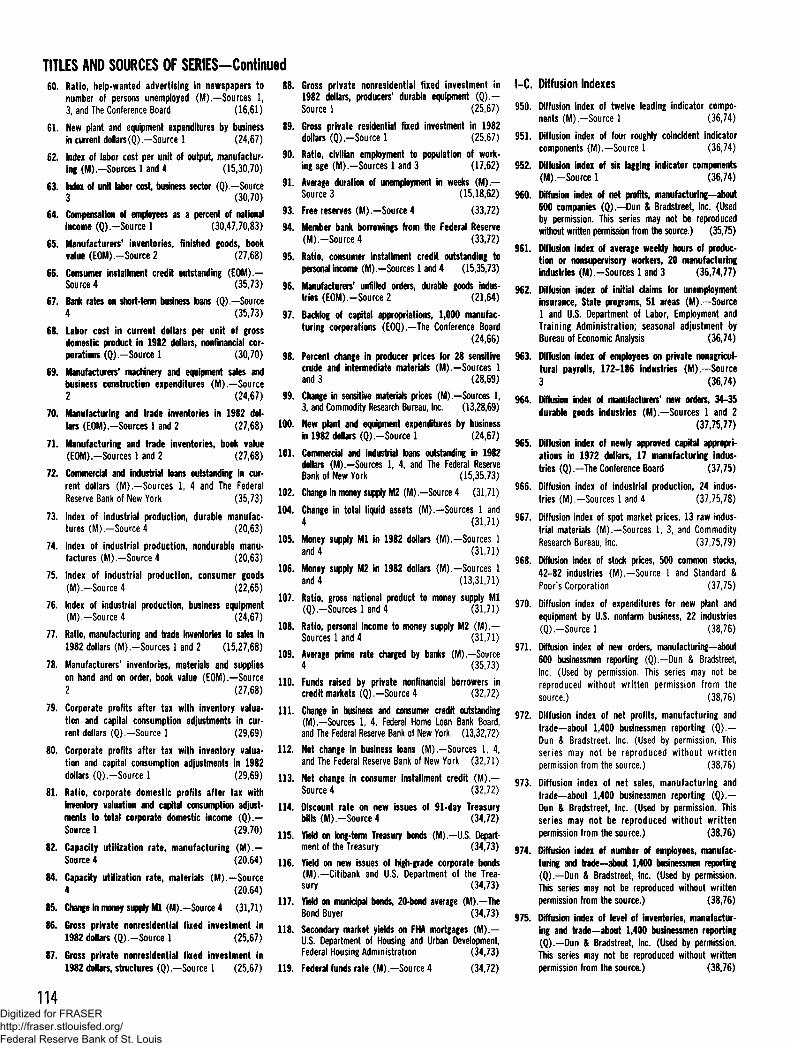
TITLES AND SOURCES OF SERIES-Continued60. Ratio, help-wanted advertising In newspapers to 88.
number of persons unemployed (M).—Sources 1,3, and The Conference Board (16,61)
61. New plant and equipment expenditures by business 89.in current dollars(Q).—Source 1 (24,67)
62. Index of labor cost per unit of output, manufactur- 90.ing (M).-Sources 1 and 4 (15,30,70)
63. Index of unit labor cost, business sector (Q).-Source 91*3 (30,70)
64. Compensation of employees as a percent of national 93>
income (Q).-Source 1 (30,47,70,83) 94.
65. Manufacturers' inventories, finished goods, bookvalue (EOM).—Source2 (27,68)
66. Consumer installment credit outstanding (EOM). -Source4 (35,73)
67. Bank rates on short-term business loans (Q).-Source4 (35,73)
Reserve Bank of New York (35,73)
73. Index of industrial production, durable manufac-tures (M).-Source 4 (20,63)
74. Index of industrial production, nondurable manu-factures (M).-Source 4 (20,63)
75. Index of industrial production, consumer goods(M) . -Source4 (22,65)
76. Index of industrial production, business equipment(M).-Source4 (24,67)
77. Ratio, manufacturing and trade inventories to sales in1982 dollars (M).-Sources 1 and 2 (15,27,68)
98.
68. Labor cost in current dollars per unit of grossdomestic product in 1982 dollars, nonfinancial cor-porations (Q).—Source 1 (30,70)
69. Manufacturers' machinery and equipment sales andbusiness construction expenditures (M).—Source2 (24,67) 99.
70. Manufacturing and trade inventories in 1982 dol-lars (EOM).-Sources 1 and 2 (27,68) 100-
71. Manufacturing and trade inventories, book value(EOM).—Sources 1 and 2 (27,68) 101-
72. Commercial and industrial loans outstanding in cur-rent dollars (M).—Sources 1, 4 and The Federal
Gross private nonresidential fixed investment in1982 dollars, producers' durable equipment (Q) .—Source 1 (25,67)
Gross private residential fixed investment in 1982dollars (Q ) . -Sou rce l (25,67)
Ratio, civilian employment to population of work-ing age (M).-Sources 1 and 3 (17,62)
Average duration of unemployment in weeks (M).—Source 3 (15,18,62)Free reserves (M) . -Source4 (33,72)
Member bank borrowings from the Federal Reserve(M).-Source4 (33,72)
Ratio, consumer installment credit outstanding topersonal income (M).-Sources 1 and 4 (15,35,73)
Manufacturers' unfilled orders, durable goods indus-tries (EOM).-Source 2 (21,64)
Backlog of capital appropriations, 1,000 manufac-turing corporations (EOQ).—The Conference Board
(24,66)
Percent change in producer prices for 28 sensitivecrude and intermediate materials (M).-Sources 1and 3 (28,69)
Change in sensitive materials prices (M) — Sources 1,3, and Commodity Research Bureau, Inc. (13,28,69)
New plant and equipment expenditures by businessin 1982 dollars (Q).-Source 1 (24,67)
Commercial and industrial loans outstanding in 1982dollars (M).-Sources 1, 4, and The Federal ReserveBank of New York (15,35,73)
102. Change in money supply M2 (M)-Source 4 (31,71)
95.
96.
97.
104.
105.
106.
107.
108.
109.78. Manufacturers' inventories, materials and supplies
on hand and on order, book value (EOM).—Source 110
2 (27,68)
79. Corporate profits after tax with inventory valua- \\\ttion and capital consumption adjustments in cur-rent dollars (Q).-Source 1 (29,69)
80. Corporate profits after tax with inventory valua- 112.tion and capital consumption adjustments in 1982dollars (Q).-Source 1 (29,69) 113,
81. Ratio, corporate domestic profits after tax withinventory valuation and capital consumption adjust- 114.ments to total corporate domestic income (Q).—Source 1 (29,70) n 5
82. Capacity utilization rate, manufacturing (M) .—Source 4 (20,64) u$
84. Capacity utilization rate, materials (M).—Source4 (20,64)
85. Change in money supply Ml (M).-Source 4 (31,71) 117<
86. Gross private nonresidential fixed investment in 118
1982 dollars (Q).-Source 1 (25,67)
87. Gross private nonresidential fixed investment in1982 dollars, structures (Q) . -Sou rce 1 (25,67) 119.
Change in total liquid assets (M).—Sources 1 and4 (31,71)
Money supply Ml in 1982 dollars (M).-Sources 1and 4 (31,71)
Money supply M2 in 1982 dollars (M).-Sources 1and 4 (13,31,71)
Ratio, gross national product to money supply Ml(Q).—Sources 1 and 4 (31,71)
Ratio, personal income to money supply M2 (M).—Sources l and 4 (31,71)
Average prime rate charged by banks (M).—Source4 (35,73)
Funds raised by private nonfinancial borrowers incredit markets (Q).-Source 4 (32,72)
Change in business and consumer credit outstanding(M).—Sources 1, 4, Federal Home Loan Bank Board,and The Federal Reserve Bank of New York (13,32,72)
Net change in business loans (M).—Sources 1, 4,and The Federal Reserve Bank of New York (32,71)
Net change in consumer installment credit (M).—Source 4 (32,72)
Discount rate on new issues of 91-day Treasurybills (M).-Source4 (34,72)
Yield on long-term Treasury bonds (M) -U .S . Depart-ment of the Treasury (34,73)
Yield on new issues of high-grade corporate bonds(M).—Citibank and U.S. Department of the Trea-sury (34,73)
Yield on municipal bonds, 20-bond average (M ) -TheBond Buyer (34,73)
Secondary market yields on FHA mortgages ( M ) -U.S. Department of Housing and Urban Development,Federal Housing Administration (34,73)
Federal funds rate (M) . -Sou rce 4 (34,72)
I-C. Diffusion Indexes
950. Diffusion index of twelve leading indicator compo-nents (M).-Source 1 (36,74)
951. Diffusion index of four roughly coincident indicatorcomponents (M).-Source 1 (36,74)
952. Diffusion index of six lagging indicator components(M).-Sourcel (36,74)
960. Diffusion index of net profits, manufacturing-abort600 companies (Q) . -Dun & Bradstreet, Inc. (Usedby permission. This series may not be reproducedwithout written permission from the source.) (35,75)
961. Diffusion index of average weekly hours of produc-tion or nonsupervisory workers, 20 manufacturingindustries (M).-Sources 1 and 3 (36,74,77)
962. Diffusion index of initial claims for unemploymentinsurance, State programs, 51 areas (M).-Source1 and U.S. Department of Labor, Employment andTraining Administration; seasonal adjustment byBureau of Economic Analysis (36,74)
963. Diffusion index of employees on private nonagricul-tural payrolls, 172-186 industries (M).—Source3 (36,74)
964. Diffusion index of manufacturers' new orders, 34-35durable goods industries (M).-Sources 1 and 2
(37,75,77)
965. Diffusion index of newly approved capital appropri-ations in 1972 dollars, 17 manufacturing indus-tries (Q).—The Conference Board (37,75)
966. Diffusion index of industrial production, 24 indus-tries (M).-Sources 1 and 4 (37,75,78)
967. Diffusion index of spot market prices, 13 raw indus-trial materials (M).—Sources 1, 3, and CommodityResearch Bureau, Inc. (37,75,79)
968. Diffusion index of stock prices, 500 common stocks,42-82 industries (M).—Source 1 and Standard &Poor's Corporation (37,75)
970. Diffusion index of expenditures for new plant andequipment by U.S. nonfarm business, 22 industries(Q) . -Source l (38,76)
971. Diffusion index of new orders, manufacturing—about600 businessmen reporting (Q).-Dun & Bradstreet,Inc. (Used by permission. This series may not bereproduced without written permission from thesource.) (38,76)
972. Diffusion index of net profits, manufacturing andtrade—about 1,400 businessmen reporting (Q).—Dun & Bradstreet, Inc. (Used by permission. Thisseries may not be reproduced without writtenpermission from the source.) (38,76)
973. Diffusion index of net sales, manufacturing andtrade—about 1,400 businessmen reporting (Q).—Dun & Bradstreet, Inc. (Used by permission. Thisseries may not be reproduced without writ tenpermission from the source.) (38,76)
974. Diffusion index of number of employees, manufac-turing and trade-about 1,400 businessmen reporting(Q) . -Dun & Bradstreet, Inc. (Used by permission.This series may not be reproduced without writtenpermission from the source.) (38,76)
975. Diffusion index of level of inventories, manufactur-ing and trade—about 1,400 businessmen reporting(Q).—Dun & Bradstreet, Inc. (Used by permission.This series may not be reproduced without writtenpermission from the source.) (38,76)
114Digitized for FRASER http://fraser.stlouisfed.org/ Federal Reserve Bank of St. Louis
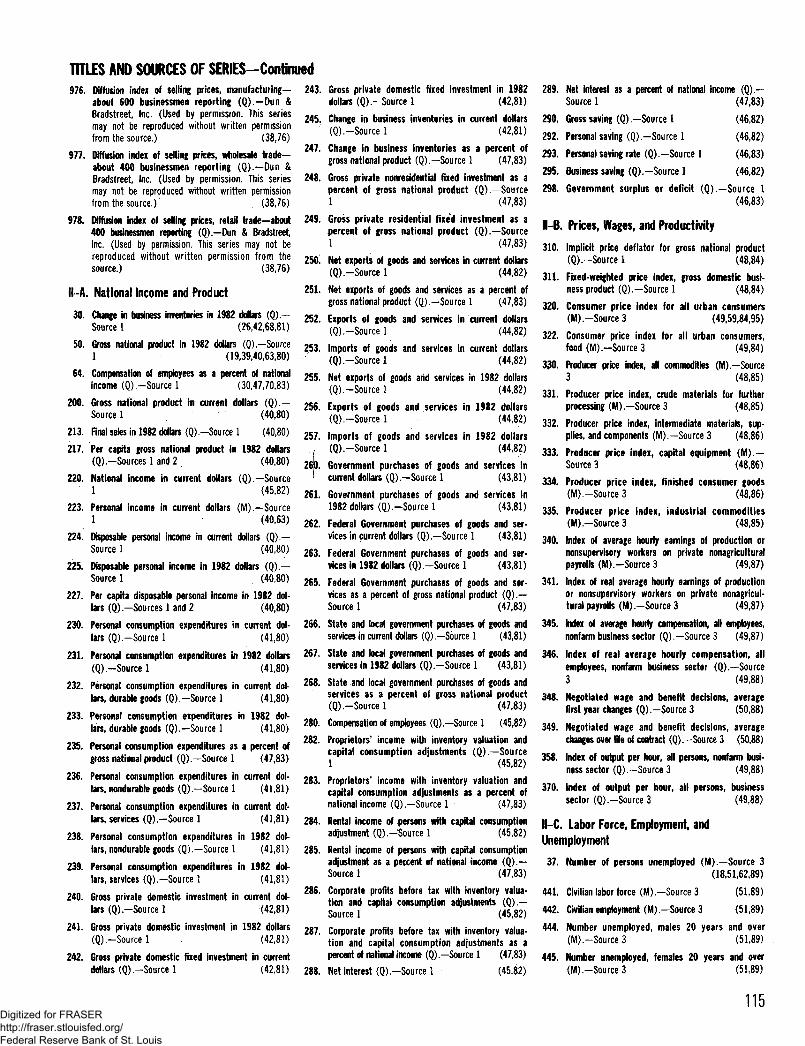
TITLES AND SOURCES OF SERIES—Continued976. Diffusion index of selling prices, manufacturing- 243.
about 600 businessmen reporting (Q).—Dun &Bradstreet, Inc. (Used by permission. This series 245may not be reproduced without written permissionfrom the source.) (38,76)
977. Diffusion index of selling prices, wholesale trade- 247>
about 400 businessmen reporting (Q).—Dun &Bradstreet, Inc. (Used by permission. This series 248.may not be reproduced without written permissionfrom the source.)' (38,76)
978. Diffusion index of selling prices, retail trade-about 249.400 businessmen reporting (Q).-Dun & Bradstreet,Inc. (Used by permission. This series may not bereproduced without written permission from the 050source.) (38,76)
II—A- National Income and Product
lars, durable goods (Q).—Source 1 (41,80)
251.
30. Change in business inventories in 1982 dollars (Q).- 252Source 1 (26,42,68,81)
50. Gross national product in 1982 dollars (Q).—Source 2531 (19,39,40,63,80)
64. Compensation of employees as a percent of national 255income (Q).-Source 1 (30,47,70,83)
200. Gross national product in current dollars (Q).— 056Source 1 (40,80)
213. Final sales in 1982 dollars (Q).-Source 1 (40,80) 257,
217. Per capita gross national product in 1982 dollars .
(Q).—Sources 1 and 2 (40,80) 2fl>.
220. National income in current dollars (Q).—Source
' l <45-82> 261.223. Personal income in current dollars (M).—Source
1 (40,63) m
224. Disposable personal income in current dollars (Q).—Source 1 (40,80) 263.
225. Disposable personal income in 1982 dollars (Q) . -Source 1 (40,80) 265.
227. Per capita disposable personal income in 1982 dol-lars (Q).—Sources 1 and 2 (40,80)
230. Personal consumption expenditures in current dot- 266.lars (Q).-Source 1 (41,80)
231. Personal consumption expenditures in 1982 dollars m-(Q). -Source 1 (41,80)
232. Personal consumption expenditures in current dol- 2*>8.lars, durable goods (Q).-Source 1 (41,80)
233. Personal consumption expenditures in 1982 dol-280.
282.235. Personal consumption expenditures as a percent ofgross national product (Q).-Source 1 (47,83)
236. Personal consumption expenditures in current dol- 283lars, nondurable goods (Q) .-Sou rce 1 (41,81)
237. Personal consumption expenditures in current dol-lars, services (Q).-Source 1 (41,81) 284.
238. Personal consumption expenditures in 1982 dol-lars, nondurable goods (Q).-Source 1 (41,81) 285.
239. Personal consumption expenditures in 1982 dol-lars, services (Q).—Source 1 (41,81)
240. Gross private domestic investment in current dol-lars (Q). -Sou rce 1 (42,81)
241. Gross private domestic investment in 1982 dollars 287(Q).—Source 1 (42,81)
242. Gross private domestic fixed investment in currentdollars (Q).-Source 1 (42,81) 288.
Gross private domestic fixed investment in 1982dollars (Q).-Source 1 (42,81)
Change in business inventories in current dollars(Q).—Source 1 (42,81)
Change in business inventories as a percent ofgross national product (Q).—Source 1 (47,83)
Gross private nonresidential fixed investment as apercent of gross national product (Q).—Source1 (47,83)
Gross private residential fixed investment as apercent of gross national product (Q).—Source1 (47,83)
Net exports of goods and services in current dollars(Q).-Sourcel (44,82)
Net exports of goods and services as a percent ofgross national product (Q).—Source 1 (47,83)
Exports of goods and services in current dollars(Q).-Sou reel (44,82)
Imports of goods and services in current dollars(Q). -Sou reel (44,82)
Net exports of goods arid services in 1982 dollars(Q).-Sourcel (44,82)
Exports of goods and services in 1982 dollars(Q).-Source 1 (44,82)
Imports of goods and services in 1982 dollars(Q).—Source 1 (44,82)
Government purchases of goods and services incurrent dollars (Q).-Source 1 (43,81)
Government purchases of goods and services in1982 dollars (Q).-Source 1 (43,81)
Federal Government purchases of goods and ser-vices in current dollars (Q).—Source 1 (43,81)
Federal Government purchases of goods and ser-vices in 1982 dollars (Q).-Source 1 (43,81)
Federal Government purchases of goods and ser-vices as a percent of gross national product (Q).—Source 1 (47,83)
State and local government purchases of goods andservices in current dollars (Q).—Source 1 (43,81)
State and local government purchases of goods andservices in 1982 dollars (Q).-Source 1 (43,81)
State and local government purchases of goods andservices as a percent of gross national product(Q).-Sourcel (47,83)
Compensation of employees (Q).—Source 1 (45,82)
Proprietors' income with inventory valuation andcapital consumption adjustments (Q).—Source1 (45,82)
Proprietors' income with inventory valuation andcapital consumption adjustments as a percent ofnational income (Q).—Source 1 (47,83)
Rental income of persons with capital consumptionadjustment (Q).-Source 1 (45,82)
Rental income of persons with capital consumptionadjustment as a percent of national income (Q).~Source 1 (47,83)
Corporate profits before tax with inventory valua-tion and capital consumption adjustments (Q).—Source 1 (45,82)
Corporate profits before tax with inventory valua-tion and capital consumption adjustments as apercent of national income (Q) .-Source 1 (47,83)
Net interest (Q).-Source 1 (45,82)
289. Net interest as a percent of national income (Q).—
Source 1 (47,83)
290. Gross saving (Q).-Source 1 (46,82)
292. Personal saving (Q).-Source 1 (46,82)
293. Personal saving rate (Q).-Source 1 (46,83)
295. Business saving (Q).-Source 1 (46,82)
298. Government surplus or deficit (Q).—Source 1
(46,83)
II—B. Prices, Wages, and Productivity
310. Implicit price deflator for gross national product(Q).-Source 1 (48,84)
311. Fixed-weighted price index, gross domestic busi-ness product (Q).-Source 1 (48,84)
320. Consumer price index for all urban consumers(M).-Source3 (49,59,84,95)
322. Consumer price index for all urban consumers,food (M).—Source 3 (49,84)
330. Producer price index, all commodities (M).—Source3 (48,85)
331. Producer price index, crude materials for furtherprocessing (M).-Source 3 (48,85)
332. Producer price index, intermediate materials, sup-plies, and components (M).—Source 3 (48,86)
333. Producer price index, capital equipment (M).—Source 3 (48,86)
334. Producer price index, finished consumer goods(M).-Source3 (48,86)
335. Producer price index, industrial commodities(M).-Source3 (48,85)
340. Index of average hourly earnings of production ornonsupervisory workers on private nonagriculturalpayrolls (M).-Source 3 (49,87)
341. Index of real average hourly earnings of productionor nonsupervisory workers on private nonagricul-tural payrolls (M).-Source 3 (49,87)
345. Index of average hourly compensation, all employees,nonfarm business sector (Q).—Source 3 (49,87)
346. Index of real average hourly compensation, allemployees, nonfarm business sector (Q). Source3 (49,88)
348. Negotiated wage and benefit decisions, averagefirst year changes (Q).-Sou rce 3 (50,88)
349. Negotiated wage and benefit decisions, averagechanges over life of contract (Q).-Source 3 (50,88)
358. Index of output per hour, all persons, nonfarm busi-ness sector (Q).—Source 3 (49,88)
370. Index of output per hour, all persons, businesssector (Q),—Source 3 (49,88)
II—C. Labor Force, Employment, andUnemployment
37. Number of persons unemployed (M).—Source 3
(18,51,62,89)
441. Civilian labor force (M).-Source 3 (51,89)
442. Civilian employment (M).-Source 3 (51,89)
444. Number unemployed, males 20 years and over(M).-Source 3 (51,89)
445. Number unemployed, females 20 years and over(M).-Source3 (51,89)
115Digitized for FRASER http://fraser.stlouisfed.org/ Federal Reserve Bank of St. Louis
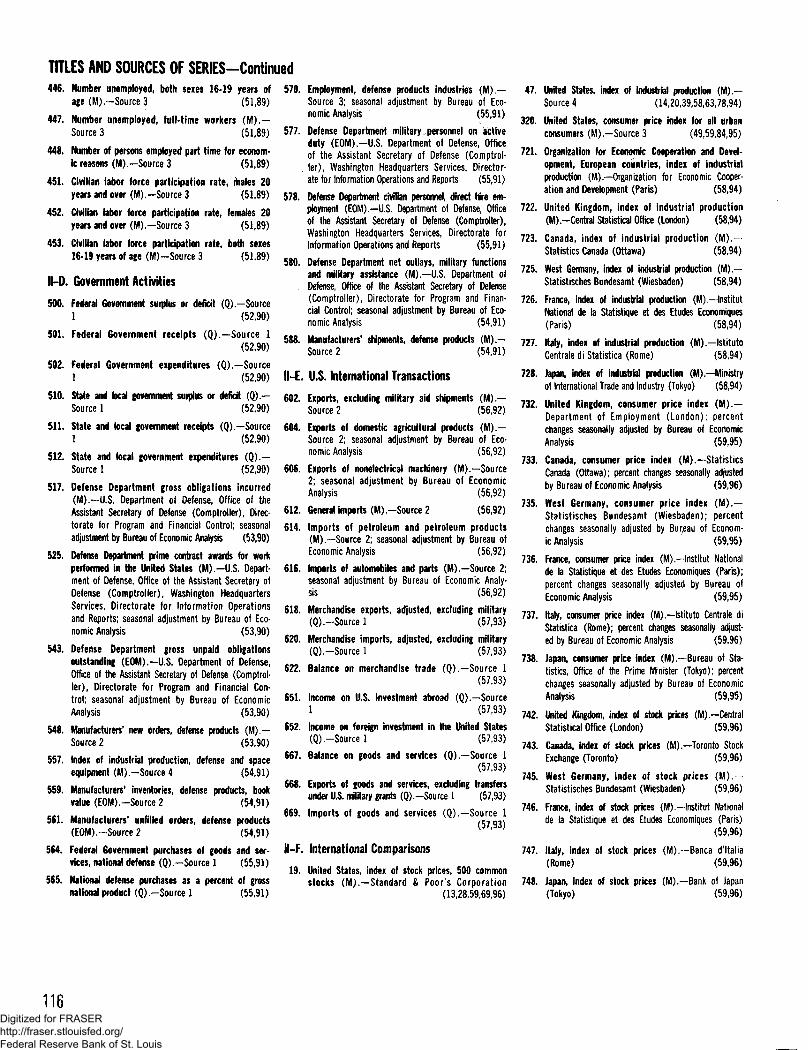
TITLES AND SOURCES OF SERIES-Continued446. Number unemployed, both sexes 16-19 years of
age (M).-Source 3 (51,89)
447. Number unemployed, full-time workers ( M ) . —Source 3 (51,89)
448. Number of persons employed part time for econom-ic reasons (M).-Source 3 (51,89)
451. Civilian labor force participation rate, rhales 20years and over (M).—Source 3 (51,89)
452. Civilian labor force participation rate, females 20years and over (M).—Source 3 (51,89)
453. Civilian labor force participation rate, both sexes16-19 years of age (M)-Source 3 (51,89)
Il-D. Government Activities
500. Federal Government surplus or deficit (Q). Source1 (52,90)
501. Federal Government receipts (Q).—Source 1(52,90)
502. Federal Government expenditures (Q).—Source1 (52,90)
510. State and local government surplus or deficit (Q).—Source 1 (52,90)
511. State and local government receipts (Q).-Source1 (52,90)
512. State and local government expenditures (Q).—Source 1 (52,90)
517. Defense Department gross obligations incurred(M).—U.S. Department of Defense, Office of theAssistant Secretary of Defense (Comptroller), Direc-torate for Program and Financial Control; seasonaladjustment by Bureau of Economic Analysis (53,90)
525. Defense Department prime contract awards for workperformed in the United States ( M ) - U . S . Depart-ment of Defense, Office of the Assistant Secretary ofDefense (Comptroller), Washington HeadquartersServices, Directorate for Information Operationsand Reports; seasonal adjustment by Bureau of Eco-nomic Analysis (53,90)
543. Defense Department gross unpaid obligationsoutstanding (EOM).-U.S. Department of Defense,Office of the Assistant Secretary of Defense (Comptrol-ler), Directorate for Program and Financial Con-trot; seasonal adjustment by Bureau of EconomicAnalysis (53,90)
548. Manufacturers' new orders, defense products (M) .—Source 2 (53,90)
557. Index of industrial production, defense and spaceequipment (M). -Source 4 (54,91)
559. Manufacturers' inventories, defense products, bookvalue (EOM).-Source 2 (54,91)
561. Manufacturers' unfilled orders, defense products(EOM).-Source 2 (54,91)
564. Federal Government purchases of goods and ser-vices, national defense (Q).-Source 1 (55,91)
565. National defense purchases as a percent of grossnational product (Q).-Source 1 (55,91)
570. Employment, defense products industries (M).—Source 3; seasonal adjustment by Bureau of Eco-nomic Analysis (55,91)
577. Defense Department military personnel on activeduty (EOM).-U.S. Department of Defense, Officeof the Assistant Secretary of Defense (Comptrol-
. ler), Washington Headquarters Services, Director-ate for Information Operations and Reports (55,91)
578. Defense Department civilian personnel, direct Nre em-ployment (E0M).—U.S. Department of Defense, Officeof the Assistant Secretary of Defense (Comptroller),Washington Headquarters Services, Directorate forInformation Operations and Reports (55,91)
580. Defense Department net outlays, military functionsand military assistance (M) . -U.S. Department ofDefense, Office of the Assistant Secretary of Defense(Comptroller), Directorate for Program and Finan-cial Control; seasonal adjustment by Bureau of Eco-nomic Analysis (54,91)
588. Manufacturers' shipments, defense products (M).—Source 2 (54,91)
II—E. U.S. International Transactions
602. Exports, excluding military aid shipments ( M ) . -Source 2 (56,92)
604. Exports of domestic agricultural products ( M ) . -Source 2; seasonal adjustment by Bureau of Eco-nomic Analysis (56,92)
606. Exports of nonelectrical machinery (M).—Source2; seasonal adjustment by Bureau of EconomicAnalysis (56,92)
612. General imports (M).-Source 2 (56,92)
614. Imports of petroleum and petroleum products(M).—Source 2; seasonal adjustment by Bureau ofEconomic Analysis (56,92)
616. Imports of automobiles and parts (M).-Source 2;seasonal adjustment by Bureau of Economic Analy-sis (56,92)
618. Merchandise exports, adjusted, excluding military(Q).-Source 1 (57,93)
620. Merchandise imports, adjusted, excluding military(Q).-Source 1 (57,93)
622. Balance on merchandise trade (Q).—Source 1(57,93)
651. Income on U.S. investment abroad (Q).—Source1 (57,93)
652. Income on foreign investment in the United States(Q). -Source 1 (57,93)
667. Balance on goods and services (Q).—Source 1(57,93)
668. Exports of goods and services, excluding transfersunder U.S. military grants (Q).-Source 1 (57,93)
669. Imports of goods and services (Q).—Source 1(57,93)
II—F. International Comparisons
19. United States, index of stock prices, 500 commonstocks (M).—Standard & Poor's Corporation
(13,28,59,69,96)
47. United States, index of industrial production ( M ) . -Source 4 (14,20,39,58,63,78,94)
320. United States, consumer price index for all urbanconsumers (M) . -Source 3 (49,59,84,95)
721. Organization for Economic Cooperation and Devel-opment, European countries, index of industrialproduction (M).—Organization for Economic Cooper-ation and Development (Paris) (58,94)
722. United Kingdom, index of industrial production(M) .-Central Statistical Office (London) (58,94)
723. Canada, index of industrial production (M) .Statistics Canada (Ottawa) (58,94)
725. West Germany, index of industrial production ( M ) . -Statistisches Bundesamt (Wiesbaden) (58,94)
726. France, index of industrial production (M). InstitutNational de la Statistique et des Etudes Economiques(Paris) (58,94)
727. Italy, index of industrial production (M).—IstitutoCentrale di Statistica (Rome) (58,94)
728. Japan, index of industrial production (M),-Ministryof International Trade and Industry (Tokyo) (58,94)
732. United Kingdom, consumer price index (M) .—Department of Employment (London); percentchanges seasonally adjusted by Bureau of EconomicAnalysis (59,95)
733. Canada, consumer price index (M).—StatisticsCanada (Ottawa); percent changes seasonally adjustedby Bureau of Economic Analysis (59,96)
735. West Germany, consumer price index (M) .Statistisches Bundesamt (Wiesbaden); percentchanges seasonally adjusted by Bureau of Econom-ic Analysis (59,95)
736. France, consumer price index (M).—Institut Nationalde la Statistique et des Etudes Economiques (Paris);percent changes seasonally adjusted by Bureau ofEconomic Analysis (59,95)
737. Italy, consumer price index (M).—Istituto Centrale diStatistica (Rome); percent changes seasonally adjust-ed by Bureau of Economic Analysis (59,96)
738. Japan, consumer price index (M).—Bureau of Sta-tistics, Office of the Prime Minister (Tokyo); percentchanges seasonally adjusted by Bureau of EconomicAnalysis (59,95)
742. Uhrted Kingdom, index of stock prices (M). CentralStatistical Office (London) (59,96)
743. Canada, index of stock prices (M).—Toronto StockExchange (Toronto) (59,96)
745. West Germany, index of stock prices ( M ) . -Statistisches Bundesamt (Wiesbaden) (59,96)
746. France, index of stock prices (M).—Institut Nationalde la Statistique et des Etudes Economiques (Paris)
(59,96)
747. Italy, index of stock prices (M). -Banca d'ltalia(Rome) (59,96)
748. Japan, index of stock prices (M).- Bank of Japan(Tokyo) (59,96)
116Digitized for FRASER http://fraser.stlouisfed.org/ Federal Reserve Bank of St. Louis
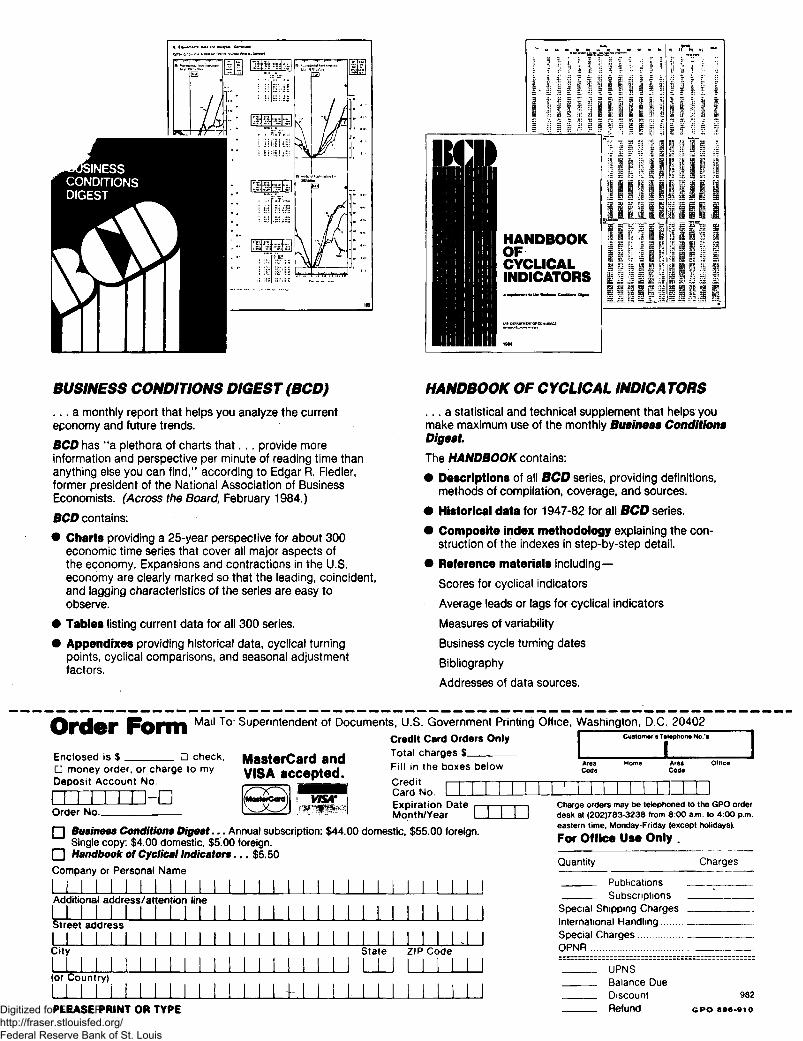
•ma
\
Am m
LU,.,.M^.,I. , .J
HANDBOOKOFCYCLICALINDICATORS
1. ( '• T '
;G & S fcffl S: 3 Si-
fi a * 4
K :j ^ HL •• !S i
5 : 1 ' IS
I s J ;• r us •«
B d ?,» IP its
iy p ^
s r!,' ;•? "ai {:2 ^ 3?
BUSINESS CONDITIONS DIGEST (BCD)
. . . a monthly report that helps you analyze the currenteponomy and future trends.
BCD has "a plethora of charts that. . . provide moreinformation and perspective per minute of reading time thananything else you can find," according to Edgar R. Fiedler,former president of the National Association of BusinessEconomists. (Across the Board, February 1984.)
BCD contains:
• Charts providing a 25-year perspective for about 300economic time series that cover all major aspects ofthe economy. Expansions and contractions in the U.S.economy are clearly marked so that the leading, coincident,and lagging characteristics of the series are easy toobserve.
• Tables listing current data for all 300 series.
• Appendixes providing historical data, cyclical turningpoints, cyclical comparisons, and seasonal adjustmentfactors.
HANDBOOK OF CYCLICAL INDICATORS
. . . a statistical and technical supplement that helps youmake maximum use of the monthly Business ConditionsDigest
The HANDBOOK contains:
• Descriptions of all BCD series, providing definitions,methods of compilation, coverage, and sources.
• Historical data for 1947-82 for all BCD series.
• Composite index methodology explaining the con-struction of the indexes in step-by-step detail.
• Reference materials including—
Scores for cyclical indicators
Average leads or lags for cyclical indicators
Measures of variability
Business cycle turning dates
Bibliography
Addresses of data sources.
Mail To: Superintendent of Documents, U.S. Government Printing Office, Washington, D.C. 20402Credit Card Orders Only
Total charges $Enclosed is $ D checkG money order, or charge to myDeposit Account No.
MasterCard andVISA accepted.
Customer's T»l«phone No.'s
I
Order No..
Fill in the boxes below.Credit rCard No. IExpiration Date ,— rMonth/Year I L
Q Business Conditions Digest... Annual subscription: $44.00 domestic, $55.00 foreign.Single copy: $4.00 domestic, $5.00 foreign.
G Handbook of Cyclical Indicators... $5.50
Company or Personal Name
Additional address/attentior
L II I IStreet address
LJCit)t
I I I I
(or Country)
i
1 1 II line
1 | I 1 1 1 1i i
111
I l I 1State
1 II 1ZIP Cc>de
*l 1
1 f 1
AreaCode
Area OfficeCode
PLEASE PRINT OR TYPE
Charge orders may be telephoned to the GPO orderdesk at (202)783-3238 from 8:00 a.m. to 4:00 p.m.eastern time, Monday-Friday (except holidays).
For Office Use Only
Quantity Charges
Publications _ _ _ _ _ = ^ _ _^ _ _ Subscriptions 'Special Shipping Charges _ ^ _ ^ _ _ =
International Handling , _Special Charges _ _ ^ ^ _ _ _OPNR _ _ _ _ _
UPNS^ ^ ^ ^ Balance Due^ ^ _ _ Discount 982_^ Refund GPO 8©«-»IODigitized for FRASER
http://fraser.stlouisfed.org/ Federal Reserve Bank of St. Louis
Superintendent of DocumentsU.S. Government Printing OfficeWashington, OX. 20402
OFFICIAL BUSINESS
Penalty for Private Use $300
FIRST-CLASS MAILPOSTAGE & FEES PAID
USGPOPERMIT No. G-26
Digitized for FRASER http://fraser.stlouisfed.org/ Federal Reserve Bank of St. Louis