Hong Kong Annual Digest of Statistics (1986 Edition)
273
這份刊物的 PDF 版本的文字是從印刷版掃描而成,再利用光學字符識別軟 件轉換成電子格式。由於原印刷版本已印製並保存多年,光學字符識別技 術未必能準確地識別某些文字或數字。因此,搜索或複製此 PDF 檔案內的 文字時應加以注意。 The text of this PDF publication was scanned from its printed version and then converted to electronic text using Optical Character Recognition (OCR) software. Because of the age and condition of the original printed copy, the OCR may not recognise certain characters or figures accurately. Caution should therefore be taken when searching or copying text from this PDF publication.
-
Upload
khangminh22 -
Category
Documents
-
view
3 -
download
0
Transcript of Hong Kong Annual Digest of Statistics (1986 Edition)
這份刊物的 PDF 版本的文字是從印刷版掃描而成,再利用光學字符識別軟
件轉換成電子格式。由於原印刷版本已印製並保存多年,光學字符識別技
術未必能準確地識別某些文字或數字。因此,搜索或複製此 PDF 檔案內的
文字時應加以注意。 The text of this PDF publication was scanned from its printed version and then converted to electronic text using Optical Character Recognition (OCR) software. Because of the age and condition of the original printed copy, the OCR may not recognise certain characters or figures accurately. Caution should therefore be taken when searching or copying text from this PDF publication.

Hong Kong Annual
Digest of Statistics
1986 Edition
Census and Statistics Department, Hong Kong
ymlo1
矩形
Hong
Di est
ong Annual
f tatis ~cs
1986 Edition
Census and Statistics Department, Hong Kong

PRINTED AND PUBLISHED BY THE GOVERNMENT PRINTER, HONG KONG

··~
Mong Kong
Annual Digest of Statistics
1986 Edition
CONTENTS
Foreword Conventions and symbols Official exchange rates of Hong Kong dollars
Section 1: CLIMATE AND GEOGRAPHY
1.1 1.2 1.3 1.4 1.5
Climatological normals (1951-1980) Climatological summary 1985 Summary of meteorological observations Area of Hong Kong in 1985 by census district Land utilization.in urban and rural areas
Section 2: POPULATION AND VITAL STATISTICS
2.1 *2.2 *2.3 2.4
*2.5 2.6 2.7 2.8 2.9 2.10 2.11 2.12 2.13 2.14 2.15 2.16
Census population 1911-1986 Whole population by broad area by sex Density of population by district board Population aged 15 and over by quinquennial age group by marital status by sex Domestic households by district board Domestic households by household size Domestic households by monthly household income Activity status of population Estimated mid-year population and growth rates Age structure of estimated mid-year population Total live births by age of mother Total live births by birth order Total deaths by age group by sex First marriages registered by sex by age group Total marriages by age group of bridegroom and bride .Divorce statistics
Section]: ; L~OUR
3.1 L;a:bol!l:r f~l'l~ and labour force participation rate by age by sex 3.2 UnemplOyment and unemployment rate by age by sex 3.3 Economically active population by occupation, 1985.General Household Surveys 3.4 Economically active population by industry, 1985 General Household Surveys 3.5 Economically active. population by activity status, 1985-0eneral Household Surveys 3.6 Working population by occupation by sex by educational attfilnment, 1981 Census 3.7 Working population by industry by sex by number of hours worked per week, 1981 Census 3.8 Working population by occupation by sex by activity status, 1981 Census · 3.9 Working population by industry by sex by activity status, 1981 Census 3.10 Establishments and persons engaged in the public and private sectors by major division 3.11 Employment in government service by purpose 3.12 Establishments in the private sector by industry group 3.13 Persons engaged in the private sector by industry group 3.14 Establishments and persons engaged in selected major divisions by employment size 3.15 Establishments in selected major divisions by census district 3.16 Persons engaged in selected major divisions by census district 3 .17 Reported vacancies in the public and private sectors by industry group 3.18 Nominal and real indexes of payroll per person engaged by industry group (June 1980:;::: 100) 3.19 Wage indexes
* New or revised table in this edition.
Page
ix x x
1
3 3 4 4 5
7
9 9
10 11 12 13 13 14 14 15 16 16 17 18 19 19
21
25 25 26 26 26 27 27 28 28 29 29 30 31 32 34 36 38 39 40

3.20 *3.21 *3.22
3.23 3.24
Average daily wages of workers engaged in government building and construction projects Salary index (A) for managerial and professional employees (June 1983=100) Salary index (B) for managerial and professional employees (June 1983=100) Reported occupational accidents by cause Stoppages of work by industry
Section 4: INDUSTRIAL PRODUCTION
*4.1
4.2
4.3
4.4
4.5
4.6
4.7 4.8
*4.9 4.10
Principal statistics for all establishments and government and non-profit institutions, 1984 Survey of Industrial Production Principal statistics for all manufacturing establishments analysed by industry group, 1984 Survey oflndustrial Production Principal statistics for all manufacturing establishments analysed by number of persons engaged, 1984 Survey of Industrial Production Principal statistics for all manufacturing establishments analysed by value of gross output, 1984 Survey of Industrial Production Principal statistics for all manufacturing establishments analysed by national accounts value added, 1984 Survey of Industrial Production Comparison of selected principal statistics for all manufacturing establishments, analysed by broad industry group for the years 1979, 1980, 1981, 1982, 1983 and 1984 Indexes of industrial production Textile production statistics Mining, cement and quarry production Electricity, gas and water consumption
Section 5: DISTRIBUTIVE TRADES, TRANSPORT AND SERVICES
5.1
5.2
5.3
5.4
5.5
5.6
5.7 5.8
5.9
5.10
5.11
5.12
5.13
*5.14 *5.15
Principal statistics for all establishments and government and non-profit institutions, 1984 Survey of Wholesale and Retail Trades, Restaurants and Hotels Principal statistics for all establishments classified by activity and analysed by number of persons engaged, 1984 Survey of Wholesale and Retail Trades, Restaurants and Hotels Principal statistics for all establishments classified by activity and analysed by sales and other receipts, 1984 Survey of Wholesale and Retail Trades, Restaurants and Hotels Comparison of principal statistics for all establishments in the wholesale and retail trades, restaurant and hotel sectors classified by activity and major group for the years 1982, 1983 and 1984 Principal statistics for all establishments classified by major group and analysed by number of persons engaged, 1984 Survey of Transport and Related Services Principal statistics for all establishments classified by major group and analysed by business receipts and other income, 1984 Survey of Transport and Related Services Comparison of principal statistics for all transport establishments for the years 1982, 1983 and 1984 Principal statisties for all establishments in the storage, communications, financing and business services sectors analysed by number of persons engaged, 1984 Survey of Storage, Communications, Financing, Insurance and Business Services Principal statistics for all establishments in the storage, communications, financing and business services sectors analysed by business receipts and other income, 1984 Survey of Storage, Communications, Financing, Insurance and Business Services Principal statistics for all establishments in the insurance sector analysed by number of persons engaged, 1984 Survey of Storage, Communications, Financing, Insurance and Business Services Principal statistics for all establishments in the insurance sector analysed by income and receipts, 1984 Survey of Storage, Communications, Financing, Insurance and Business Services Comparison of selected principal statistics for all establishments in the storage, communications, financing, insurance and business services sectors for the years 1982, 1983 and 1984 Summary statistics from the Annual Survey of Banks, Deposit-taking Companies and Representative Offices of Foreign Banks for 1980-1984 Value and volume indexes of retail sales Value and volume indexes of restaurant receipts
Section 6: EXTERNAL TRADE
6.1 6.2 6.3 6.4 6.5 6.6 6.7
ii
Overseas merchandise trade Trade by area Trade by main country Trade by Standard International Trade Classification Commodity Section Imports, re-exports and retained imports by end-use Imports by end-use by principal commodity Imports by end-use by main supplier
* New or revised table in this edition.
Page
41 42 42 43 43
45
47
47
48
48
48
49 51 52 53 53
55
57
58
59
60
62
64 66
67
68
69
69
70
71 72 72
73
75 75 76 76 77 77 78

6.8 Domestic exports by industrial origin 6. 9 Domestic exports of principal commodities by main market 6.10 Re-exports of principal commodities by main country of destination 6.11 Re-exports of principal commodities by main country of origin 6.12 Trade indexes 6.13 Unit value indexes and quantum indexes of domestic exports by principal commodity 6.14 Unit value indexes and quantum indexes of imports and re-exports by end-use 6.15 Unit value indexes and quantum indexes of imports by main supplier 6.16 Unit value indexes and quantum indexes of domestic exports by main market
Section 7: ESTIMATES OF GROSS DOMESTIC PRODUCT
7.1 7.2 7.3 7.4 7.5 7.6 7.7 7.8
Total expenditure on the gross domestic product Main components of expenditure on the gross domestic product Deflators of gross domestic product and its components (1980=100) Private consumption expenditure by type Composition of government consumption expenditure Gross domestic fixed capital formation analysed by institutional sector and type of assets Imports and exports of goods and services at current market prices Contribution of economic sectors to the gross domestic product at current prices
Section 8: PUBLIC FINANCE
8.1 8.2 8.3 8.4
Summary of actual revenue and expenditure (general revenue account) General revenue by main source-actual revenue General revenue account expenditure by main component Cost and size of the public service
Section 9: MONEY, BANKING AND FINANCE
9.1 Money supply 9.2 Deposits from customers 9.3 Balance sheets (old series): banks and deposit-taking companies 9.4 Balance sheets (new series): licensed banks 9.5 Balance sheets (new series): deposit-taking companies 9.6 Analysis ofloans and advances in Hong Kong (old series) 9.7 Analysis ofloans and advances for use in Hong Kong (new series) 9.8 Money market (old series) 9.9 Money market (new series) 9.10 Foreign currency position 9 .11 Interest rates charged and bank cheques cleared 9.12 Exchange rates and the effective exchange rate index 9 .13 Value of stock exchange turnover and index of share prices 9.14 Gold and silver exchange trading prices 9 .15 Commodity exchange turnover
Section 10: PRICES AND HOUSEHOLD EXPENDITURE
10.1 10.2 10.3 10.4
*10.5
Average retail prices of selected foodstuffs Average wholesale prices of selected foodstuffs Consumer price indexes (July 1973-June 1974= 100) Consumer price indexes (October 1979-September 1980 = 100) Household expenditure pattern by monthly expenditure group, Household Expenditure Survey 1984-85
Section 11: FOOD SUPPLIES
11.1 Food supplies 11.2 Estimated local production of foodstuffs 11.3 Imports of foodstuffs 11.4 Imported vegetables sold through Cheung Sha Wan Imported Vegetable Market 11.5 Poultry sold through Cheung Sha Wan Temporary Poultry Wholesale Market 11.6 Fresh marine fish sold through the fish marketing organization 11. 7 Salted/ dried marine fish sold through the fish marketing organization
* New or revised table in this edition.
Page
78 79 80 81 82 83 84 85 85
87
89 89 90 91 92 93 94 96
97
99 99
100 100
101
103 103 104 105 106 107 108 109 110 111 111 112 112 113 113
115
117 117 118 119 119
121
123 123 124 125 125 126 126
iii

Section 12: TRANSPORT, COMMUNICATIONS AND TOURISM
12.1 12.2 12.3 12.4 12.5 12.6
*12.7 *12.8 12.9
*12.10 12.11 12.12
*12.13 12.14 12.15
*12.16 12.17 12.18 12.19 12.20 12.21 12.22
Movement~ of aircrafts, ocean-going and other vessels International movements of commercial cargo Containers carried by ocean-going vessels Ocean-going vessel movements by ship type ·Public transport: estimated passenger-journeys by undertaking Public transport: estimated passenger-journeys by area Motor vehicles registered Motor vehicles licensed New registration of motor vehicles Length of roads Traffic accidents and casualties Telephone services International telephone and telegraph services Postal seivices Arrivals and departures of passengers by air, sea and land Hong Kong resident departures by destination " Visitor arrivals by country of residence Visitor arrivals by .mode of travel by country of residence Hotel statistics Seasonal pattern of average hotel room occupancy Receipts from visitors Per capita spending and length of stay of visitors
Section 13: BUILDING AND CONSTRUCTION
*13.l
13.2
13.3
13.4 13.5
13.6
13.7 13.8 13.9
*13.10 *13.11 13.12 13.13 13.14 13.15 13.16
*13.17 *13.18 13.19 13.20
Principal statistics for all establishments analysed by trade group, 1981, 1982, 1983 and 1984 Surveys of Building, Construction and Real Est~te Sectors Principal statistics for all building and civil engineering contractors analysed by gross value of construction work performed, 1984 Survey of Building, Construction and Real Estate Sectors Principal statistics for all building and civil engineering contractors analysed by national accounts value added, 1984 Survey of Building, Construction and Real Estate Sectors Construction site statistics, 1984 Survey of Building, Construction and Real Estate Sectors Real estate project statistics analysed by end-use of building, 1984 Survey of Building, Construction and Real Estate Sectors Gross value of construction work performed by all building and civil engineering contractors, analysed by broad trade group, contractor's role and type of construction location . Completed new buildings certified for occupation by type Usable floor area of completed new buildings by end-use by census area Completed new buildings by cost of construction Private domestic units with consent to commence work by geographic area Private domestic units with consent to commence work by floor area Private domestic units built by area by district Private domestic units built by area by type Stock, supply and vacancy position of non-residential premises Supply of new flatted factory space by area by district Sales and transfer of real property by area by district Price indexes by type of premises Rental indexes by type of premises Instruments registered in the Land Office Disposals of Government land
Sectionl4: HOUSING
14.1 *14.2 *14.3 *14.4
14.5 14.6 14.7 14.8 14.9
14.10
Land living quarters and land domestic households by type of living quarters, 1986 By-census Land living quarters and land domestic households by district board, 1986 By-census Land occupied living quarters by type by broad area, 1986 By-census Stock of living quarters by type of living quarters by broad area, 1986 Land living quarters by type by number of occupants, 1981 Census Distribution ofland domestic households by tenure, 1961-1986 Censuses Land domestic households by type of living quarters and accommodation by household size, 1981 Census Land domestic households by type of living quarters and accommodation by tenu,re, 1981 Census Land domestic households by type of living quarters and accommodation by monthly household rent, 1981 Census Housing Authority rental flats completed by geographic area
* New or revised table in this edition.
iv
Page
127
129 129 130 130 131 131 132 132 133 133 134 134 135 135 136 136 137 138 138 139 139 140
141
143
145
145 146
146
147 148 148 149 149 150 150 151 151 152 153 154 154 155 156
157
159 159 160 160 160 161 161 162
·-162 162

Page
14.11 Housing Authority rental flats completed by flat size 163 14.12 Distribution of stock of flats and authorized persons in Housing Authority rental estates by geographic area 163 14.13 Housing Authority rental flats allocated and persons rehoused by category 164 14.14 Average monthly rent of typical flats in Housing Authority estates 164 14.15 Distribution of population in Housing Authority cottage areas and temporary housing areas by census area 165 14.16 Housing Authority rental flats with consent to commence work by geographic area 165 14.17 Housing Authority rental flats with consent to commence work by flat size 165 14.18 Home Ownership Scheme residential units with consent to commence work by geographic area by saleable area 166 14.19 Home Ownership Scheme residential units completed by geographic area by saleable area 166 14.20 Non-residential/composite buildings with consent to commence work by Housing Authority by type 167 14.21 Non-residential/composite buildings completed by Housing Authority by type 167 14.22 Recurrent account of Housing Authority 167 14.23 Housing capital expenditure-Housing Authority 168 14.24 Housing capital expenditure-Hong Kong Government 168
Section 15: EDUCATION
15.1 15.2 15.3 15.4 15.5 15.6 15.7 15.8 15.9 15.10 15.11 15.12 15.13 15.14 15.15 15.16 15.17 15.18 15.19 15.20 15.21 15.22
*15.23 15.24 15.25 15.26 15.27 15.28
Whole population by educational attainment by sex, 1961-1981 Censuses Whole population by quinquennial age group by sex by educational attainment, 1981 Census Student/population ratios by age group by sex, 1971-1986 Censuses Summary of enrolment and operating educational institutions, 1985 Operating educational institutions by level of education by type of school Operating schools by level of education by type of school by area, 1985 Full-time enrolment by level of education by type of institution Enrolment in kindergarten, primary, secondary and matriculation course by age by sex, 1985 Enrolment in primary schools by type of school by grade Enrolment in secondary schools by type of school by grade Enrolment in matriculation course by type of school by grade Enrolment in technical institutes by type of course Enrolment in teachers' training colleges by type of course by sex Enrolment in polytechnics and Baptist College Full-time enrolment in universities by faculty by sex Enrolment in adult education by type of course by type of institution by sex Enrolment in private commercial/English tutorial classes Schools and enrolment in special education schools by sex Special classes in normal schools and enrolment in these classes Teachers in schools and colleges by qualification Teachers in schools and colleges by level by sex Pupil/teacher ratios in primary and secondary day schools by type of school Hong Kong Certificate of Education Examination 1985 grade analysis by subject Results of higher and advanced level examinations Polytechnic academic awards conferred (full-time courses) Baptist College academic awards conferred (full-time courses) University degrees and diplomas conferred Expenditure on education
Section 16: MEDICAL AND HEALTH
16.1 16.2 16.3 16.4 16.5 16.6 16.7 16.8 16.9 16.10 16.11 16.12 16.13 16.14 16.15
16.16 16.17
Hospital beds by classification of bed by census area by type of institution, 1985 Medical institutions and beds by census area by type Hospital beds by classification of bed Prophylactic immunizations Infectious diseases notified (cases and deaths) Notification and death rates of certain infectious diseases Causes of death Leading causes of death by sex by age, 1985 Deaths from heart disease by age by sex Major causes of death from cancer Causes of infant death Causes of maternal death Disease classification of in-patients treated in government, government assisted and private hospitals Out-patient attendances at government and government assisted institutions Analysis of attendances in accident and emergence departments of government and government assisted institutions Work of the ophthalmic, ear-nose-throat and dental services Work of para-medical services
* New or revised table in this edition.
169
171 171 172 172 173 173 174 174 175 176 177 177 178 179 180 180 181 181 181 182 182 182 183 184 184 185 185 186
187
189 190 191 191 192 193 193 194 195 195 196 197 197 198
198 199 199
v

16.18 Work of the pharmaceutical service 16.19 Work of institute of pathology and forensic pathology 16.20 Work of blood banks 16.21 Work of the family health services 16.22 Work of the district midwifery services (excluding hospitals) 16.23 Work of the psychiatric service 16.24 Work of the tuberculosis and chest service 16.25 Annual incidence and trend of venereal disease 16.26 Schools, pupils and doctors participating in school medical service by area 16.27 Registered medical personnel 16.28 Expenditure on the medical and health services
Section 17: SOCIAL WELFARE
17.1 17.2 17.3 17.4 17.5
*17.6 *17.7 *17.8
17.9 17.10 17.11 17.12
Applications for legal aid Type of applications for legal aid in civil cases Social security Type of public assistance cases Type of special needs allowance cases Disabled persons receiving rehabilitation services of Social Welfare Department New/re-activated cases offamily services centres of Social Welfare Department by nature of problems Admissions to children's, boys' and girls' homes by type of custody Child care places under the supervision of child care advisory inspectorate by type Child care centres under the supervision of child care advisory inspec;torate by type Cases referred to and waitlisted for elderly institutions by type of institution Expenditure on social welfare
Section 18: LAW AND ORDER
18.l 18.2 18.3 18.4 18.5 18.6 18.7 18.8 18.9 18.10
*18.11 18.12 18.13 18.14 18.15 18.16 18.17 18.18
*18.19 18.20 18.21
Cases of reported crime by type of offence by area Cases reported by type of offence Cases detected·by type of offence Persons prosecuted by type of offence by age group Age-specific prosecution rates Persons prosecuted by type of offence by age group, 1985 Minor narcotic offences dealt with by the police Miscellaneous offences dealt with by the police Value of property stolen and recovered for certain categories of crime Strength and annual cost of the police force Cases in the Supreme Court, District Court, Tenancy Tribunal and Labour Tribunal Work in the magistracies Prisoners and inmates Reception of convicted prisoners/inmates by sex by type of sentence by age on conviction Reception of convicted prisoners/inmates by type of offence by sex of offender Reception of prisoners under sentence of imprisonment by sex by length of sentence by age on conviction Reception of prisoners under sentence of imprisonment by sex by length of sentence by type of offence, 1985 Committal made to correctional institutions on remand by sex of offender Cases referred for social enquiry by type of offence by age group of offender Probation orders by type of offence by age group of offender Children and juveniles under protection of Women and Juveniles Ordinance
Section 19: CULTURE AND RECREATION
*19.l *19.2 *19.3 *19.4 *19.5 *19.6 *19.7 *19.8
Facilities and usage of public libraries Functions presented at selected venues Indoor cultural programmes Outdoor public entertainment programmes Sports and recreational activities Recreational facilities Parks and playgrounds by district Attendances at museums
* New or revised table in this edition.
vi
Page
200 200 201 201 202 202 203 203 203 204 204
205
207 207 208 209 209 210 210 210 211 211 212 212
213
215 215 216 216 217 217 218 218 218 219 219 220 220 221 222 223 224 224 225 226 226
227
229 230 231 232 233 234 235 235

Section 20: MISCELLANEOUS STATISTICS
20.1 20.2
*20.3 20.4 20.5 20.6 20.7
MAPS
Statistics on mass media Public markets and stalls in public markets by type of stall Licences and permits in force Petroleum products: releases from bond by type Fire, special service, ambulance calls and fatalities Local and foreign companies registered and dissolved Companies incorporated outside Hong Kong by origin
Map of Hong Kong classified by 1976 census area Map of Hong Kong Island, Kowloon and New Kowloon classified by 1976 census district Map of Hong Kong classified by 1981 census area Map of Hong Kong Island, Kowloon and New Kowloon classified by 1981 census district Map of Hong Kong Island classified by district board 1986 Map of Kowloon and New Kowloon classified by district board 1986 Map of New Territories and Islands classified by district board 1986
* New or revised table in this edition.
Page
237
239 239 240 242 242 243 243
245 247 249 251 253 255 257
vii

I

Foreword
The purpose of this annual publication is to bring together in one volume some of the most important and fundamental statistical series on Hong Kong, compiled by either the Census and Statistics Department or other government departments and organizations.
Wherever possible, data are presented for the ten-year period from 1976 to 1985. For this edition, certain new statistics, namely, salary indexes for managerial and professional employees, property price and rental indexes and Hong Kong resident departures by destination have been included. In addition, a new section on culture and recreation has been introduced and some basic data from the 1986 By..:census and the Household Expenditure Survey 1984-85 have been incorporated.
The Census and Statistics Department hopes that this publication will meet the needs of readers for up-to-date and comprehensive statistics on social and economic developments in Hong Kong. Any suggestions for improvement will be most welcome.
November 1986
R.BUTLER Commissioner for Census and Statistics
ix
Conventions and Symbols
Rounding of figures. In tables where figures have been rounded to the nearest final digit, there may be an apparent discrepancy between the sum of the constituent items and the total as shown.
Financial years. The symbol / represents financial years. Thus 1985/86 means the financial year starting on 1 April 1985 and ending on 31 March 1986.
Symbols. The following symbols have been used throughout the Annual Digest of Statistics - 1986 Edition. not available
- = nil or not applicable
Source. Unless otherwise specified, figures are compiled by the Census and Statistics Department.
Official Exchange Rates of Hong Kong Dollars
26 November 1974 to 16 October 1983 17 October 1983 onwards
x
Hong Kong dollars floating US$1 = HK$7 .8
Section!: CLIMATE AND GEOGRAPHY
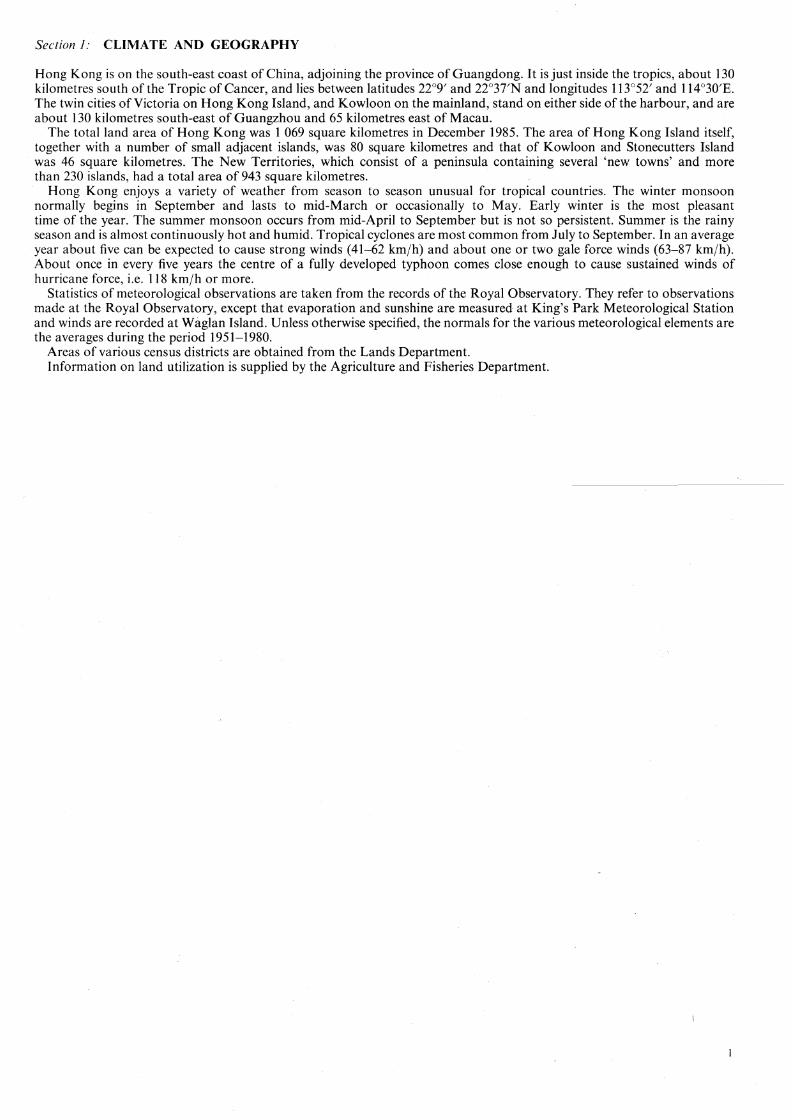
Hong Kong is on the south-east coast of China, adjoining the province of Guangdong. It is just inside the tropics, about 130 kilometres south of the Tropic of Cancer, and lies between latitudes 22°9' and 22°37'N and longitudes 113°52' and l l4°30'E. The twin cities of Victoria on Hong Kong Island, and Kowloon on the mainland, stand on either side of the harbour, and are about 130 kilometres south-east of Guangzhou and 65 kilometres east of Macau.
The total land area of Hong Kong was 1 069 square kilometres in December 1985. The area of Hong Kong Island itself, together with a number of small adjacent islands, was 80 square kilometres and that of Kowloon and Stonecutters Island was 46 square kilometres. The New Territories, which consist of a peninsula containing several 'new towns' and more than 230 islands, had a total area of 943 square kilometres.
Hong Kong enjoys a variety of weather from season to season unusual for tropical countries. The winter monsoon normally begins in September and lasts to mid-March or occasionally to May. Early winter is the most pleasant time of the year. The summer monsoon occurs from mid-April to September but is not so persistent. Summer is the rainy season and is almost continuously hot and humid. Tropical cyclones are most common from July to September. In an average year about five can be expected to cause strong winds (41-62 km/h) and about one or two gale force winds (63-87 km/h). About once in every five years the centre of a fully developed typhoon comes close enough to cause sustained winds of hurricane force, i.e. 118 km/h or more.
Statistics of meteorological observations are taken from the records of the Royal Observatory. They refer to observations made at the Royal Observatory, except that evaporation and sunshine are measured at King's Park Meteorological Station and winds are recorded at Waglan Island. Unless otherwise specified, the normals for the various meteorological elements are the averages during the period 1951-1980.
Areas of various census districts are obtained from the Lands Department. Information on land utilization is supplied by the Agriculture and Fisheries Department.

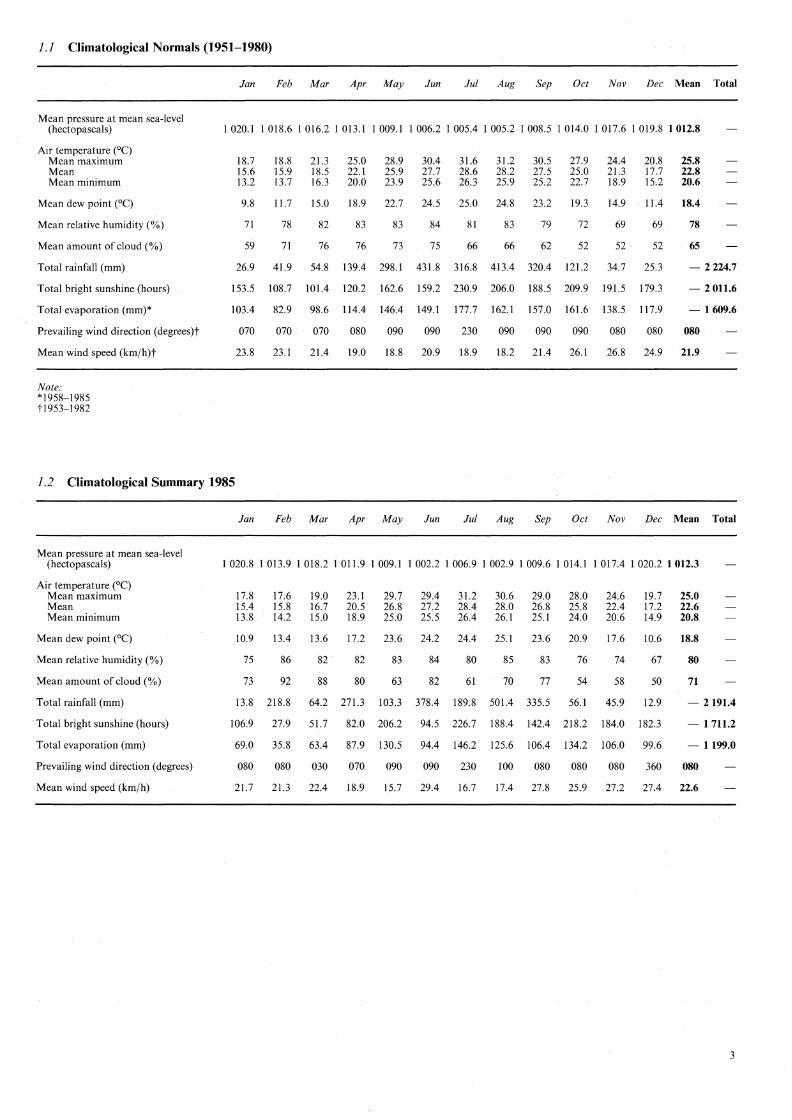
1.1 Climatological Normals (1951-1980)
Jan Feb Mar Apr May Jun Jui Aug Sep Oct Nov Dec Mean Total
Mean pressure at mean sea-level (hectopascals) 1 020.1 1 018.6 1 016.2 I 013.l 1 009.l I 006.2 I 005.4 1 005.2 1 008.5 1 014.0 1 017.6 I 019.8 1012.8
Air temperature (0 C) Mean maximum Mean Mean minimum
Mean dew point (0 C)
Mean relative humidity(%)
Mean amount of cloud(%)
Total rainfall (mm)
Total bright sunshine (hours)
Total evaporation (mm)*
Prevailing wind direction (degrees)t
Mean wind speed (km/h)t
Note: *1958-1985 tI953-1982
18.7 15.6 13.2
9.8
71
59
26.9
153.5
103.4
070
23.8
1.2 Climatological Summary 1985
Jan
18.8 15.9 13.7
11. 7
78
71
41.9
108.7
82.9
070
23.l
21.3 18.5 16.3
15.0
82
76
54.8
101.4
98.6
070
21.4
Feb Mar
25.0 28.9 30.4 22.1 25.9 27.7 20.0 23.9 25.6
18.9 22. 7 24.5
83 83 84
76 73 75
139.4 298.1 431.8
120.2 162.6 159.2
114.4 146.4 149.l
080 090 090
19.0 18.8 20.9
Apr May Jun
31.6 31.2 28.6 28.2 26.3 25.9
25.0 24.8
81 83
66 66
316.8 413.4
230.9 206.0
177.7 162.1
230 090
18.9 18.2
Jui Aug
30.5 27.9 27.5 25.0 25.2 22.7
23.2 19.3
79 72
62 52
320.4 121.2
188.5 209.9
157.0 161.6
090 090
21.4 26.1
24.4 21.3 18.9
14.9
69
52
34.7
191.5
138.5
080
26.8
Sep Oct Nov
20.8 17.7 15.2
11.4
69
52
25.3
179.3
117.9
080
24.9
25.8 22.8 20.6
18.4
78
65
- 2 224.7
- 2011.6
- 1609.6
080
21.9
Dec Mean Total
Mean pressure at mean sea-level (hectopascals) 1 020.8 1 013.9 1 018.2 1 011.9 1 009.1 1 002.2 I 006.9 1 002.9 1 009.6 I 014.l 1 017.4 I 020.2 1 012.3
Air temperature (0 C) Mean maximum Mean Mean minimum
Mean dew point (0 C)
Mean relative humidity(%)
Mean amount of cloud(%)
Total rainfall (mm)
Total bright sunshine (hours)
Total evaporation (mm)
Prevailing wind direction (degrees)
Mean wind speed (km/h)
17.8 17.6 15.4 15.8 13.8 14.2
10.9 13.4
75 86
73 92
13.8 218.8
106.9 27.9
69.0 35.8
080 080
21.7 21.3
19.0 23.l 29.7 16.7 20.5 26.8 15.0 18.9 25.0
13.6 17.2 23.6
82 82 83
88 80 63
64.2 271.3 103.3
51.7 82.0 206.2
63.4 87.9 130.5
030 070 090
22.4 18.9 15.7
29.4 31.2 27.2 28.4 25.5 26.4
24.2 24.4
84 80
82 61
378.4 189.8
94.5 226.7
94.4 146.2
090 230
29.4 16.7
30.6 29.0 28.0 28.0 26.8 25.8 26. l 25. l 24.0
25.1 23.6 20.9
85 83 76
70 77 54
501.4 335.5 56.1
188.4 142.4 218.2
125.6 106.4 134.2
100 080 080
17.4 27.8 25.9
24.6 22.4 20.6
17.6
74
58
45.9
184.0
106.0
080
27.2
19.7 17.2 14.9
10.6
67
50
12.9
182.3
99.6
360
27.4
25.0 22.6 20.8
18.8
80
71
- 2 191.4
- 1 711.2
- 1199.0
080
22.6
3

1.3 Summary of Meteorological Observations
1976 1977 1978
Mean pressure at mean sea-level (hectopascals) 1 013.1 1 013.5 I 012.7
Air temperature {°C) Mean maximum 25.4 26.4 25.6 Mean 22.5 23.3 22.8 Mean minimum 20.4 21.1 20.7
Mean dew point (0 C) 18. I 18.7 18.8
Mean relative humidity(%) 77 76 79
Mean amount of cloud (%) 65 61 71
Total rainfall (mm) 2 197.2 1680.0 2 593.0
Total bright sunshine (hours) I 883.5 2 201.3 I 755.2
Total evaporation (mm) 1 542.3 I 650.5 I 579.1
Prevailing wind direction (degrees) 080 080 080
Mean wind speed (km/h) 24.3 20.2 22.0
1.4 Area of Hong Kong in 1985 by Census District
Census area/ district Area (km 2 )
Hong Kong Island 79.44
Central 1.13
Sheung Wan 0.72
West J.71
Mid-levels 2.51
Pok Fu Lam 4.52
Peak 8.25
Wan Chai 1.27
Tai Hang 3.63
North Point & Quarry Bay 4.63
Shau Kei Wan & Chai Wan 5.84
Aberdeen 10.61
South 34.62
Kowloon 9.25
Tsim Sha Tsui 2.00
Yau Ma Tei I.OS
Mong Kok J.73
Hung Hom 2.17 -Ho Man Tin 2.30
Note: Figures are as at December 1985.
4
1979 1980
I 013.0 I 013.4
25.9 25.9 23.1 23.0 21.0 20.9
18.8 18.7
79 78
66 66
2 614.7 1 710.6
1 831.5 2012.0
I 489.1 I 567.0
080 080
21.9 23.0
1981 1982 1983
I 013.1 1 013.0 I 013.7
25.5 25.2 25.4 23.I 22.9 23.0 21.2 21.0 21.1
18.7 18.7 18.7
77 78 78
68 68 69
1 659.5 3 247.5 2 893.8
I 802.9 I 785.0 1 859.4
I 383.4 1429.1
080 080
23.7 22.8
Census area/district
New Kowloon
Lai Chi Kok
Cheung Sha Wan
Sham Shui Po
Shek Kip Mei
Kowloon Tong
1 365.3
070
25.0
Kowloon City & Wong Tai Sin
Tze Wan Shan & Ngau Chi Wan
Jordan Valley
Kwun Tong
Yau Tong
New Territories
Tsuen Wan New Town
Tsuen Wan Other Areas
Tuen Mun New Town
Tuen Mun Other. Areas
Yuen Long New Town
Yuen Long Other Areas
Sheung Shui/Fan Ling New Town
Fan Ling Other Areas
Tai Po New Town
Tai Po Other Areas
Sha Tin New Town
Sha Tin Other Areas
Sai Kung South and Hang Hau
Islands
Total
1984 1985
I 012.5 I 012.3
24.9 25.0 22.5 22.6 20.7 20.8
18.1 18.8
77 80
72 71
2 017.0 2 191.4
I 701.9 1 711.2
1 276.6 I 199.0
080 080
23.7 22.6
Area (km 2 )
36.89
1.00
3.70
0.75
3.03
2.52
4.78
7.79
5.24
5.41
2.67
943.30
26.07
48.35
13.92
68.78
1.63
140.16
5.59
133.10
4.30
138.79
26.52
43.29
127.38
165.42
1 068.88

1.5 Land Utilization in Urban and Rural Areas Percentage
Type of land use 1976 1977 1978 1979 1980 1981 1982 1983 1984 1985
Built-up land 12.4 13.6 14.8 15.7 15.7 16.0 16.1 16.2 16.3 16.5
Afforested areas and other woodland 11.8 11.9 11.8 11.8 11.8 11.7 11.7 11.7 11.7 11.7
Scrubland and grassland 58.9 58.6 58.4 58.0 58.8 58.7 58.6 58.6 58.6 58.5
Badland 4.1 4.1 4.1 4.1 4.3 4.3 4.3 4.3 4.3 4.2
Swamp 1.2 1.2 0.9 0.9 0.1 0.1 0.1 O.l 0.1
Paddy land I.I 0.3 0.1
Market gardening land 4.8 4.0 3.5 3.3 3.0 2.8 2.8 2.6 2.6 2.5
Other crop land 0.9 0.6 0.6 0.6 0.7 0.7 0.7 0.7 0.6 0.6
Fallow/abandoned land 3.1 3.9 3.9 3.9 4.0 4.0 3.9 3.8 3.8 3.9
Fish ponds 1.7 1.8 1.9 1.7 1.7 1.7 1.8 2.0 2.0 2.0
Total area of land (square kilometres) I 049 I 052 I 055 I 061 I 061 I 064 I 065 I 066 I 067 I 069
5

Section 2: POPULATION AND VITAL STATISTICS
Statistics on socio-economic characteristics of the population in Tables 2.1 to 2.8 have been obtained from the various population censuses.
Statistics relating to live births and deaths refer to known occurrences of such events. Statistics relating to marriages refer to such events as were registered with the Registrar of Marriages during the period
covered. The :figures include marriages performed at the official registries and at licensed places of public worship; they include also marriages other than first marriages.
A domestic household is a group of persons who live in the same living quarters and share a common provision of food, the expenditure of which is borne by one or more of its members. The group may consist of related family members and/ or unrelated persons. A one-person household responsible for his/her own expenses is also classified as domestic.
Monthly household income is defined as follows: a. for the 1971 Census The total monthly receipts of all members of the household from all sources, whether earned
(salaries, commissions and earnings from part-time work, but excluding annual bonuses), unearned payments (dividends, interest, rent, remittances, pensions, etc.) or profits from the household's own business. The income :figures for the marine census refer to December 1970 and for the land census to January 1971.
b. for the 1976 By-census Sum of personal income (consisting of earnings in cash from main employment and other cash income) of persons aged 12 or over who were found to be in the household during the reference night. For an employer or self-employed, earnings excluded expenses incurred in running the business. For an employee, the amount earned included salary or wages, commissions, bonuses, overtime, tips and other cash allowances except housing allowance. The income :figures for the marine census refer to May and for the land census to July 1976.
c. for the 1981 Census Sum of personal income (i.e. earnings in cash from employment and other cash income) of persons aged 12 and over who were found to be in the household at the census reference night.
d. for the 1986 By-census Sum of personal income (i.e. earnings in cash from employment and other cash income) of persons aged 13 and over who were found to be in the household at the census reference night.
Figures for the 1986 By-census incorporate an upward adjustment to allow for persons in non-contacted households. Similar adjustment was made for the 1976 By-census and 1981 Census :figures.
Divorce statistics are supplied by the Judiciary.
7

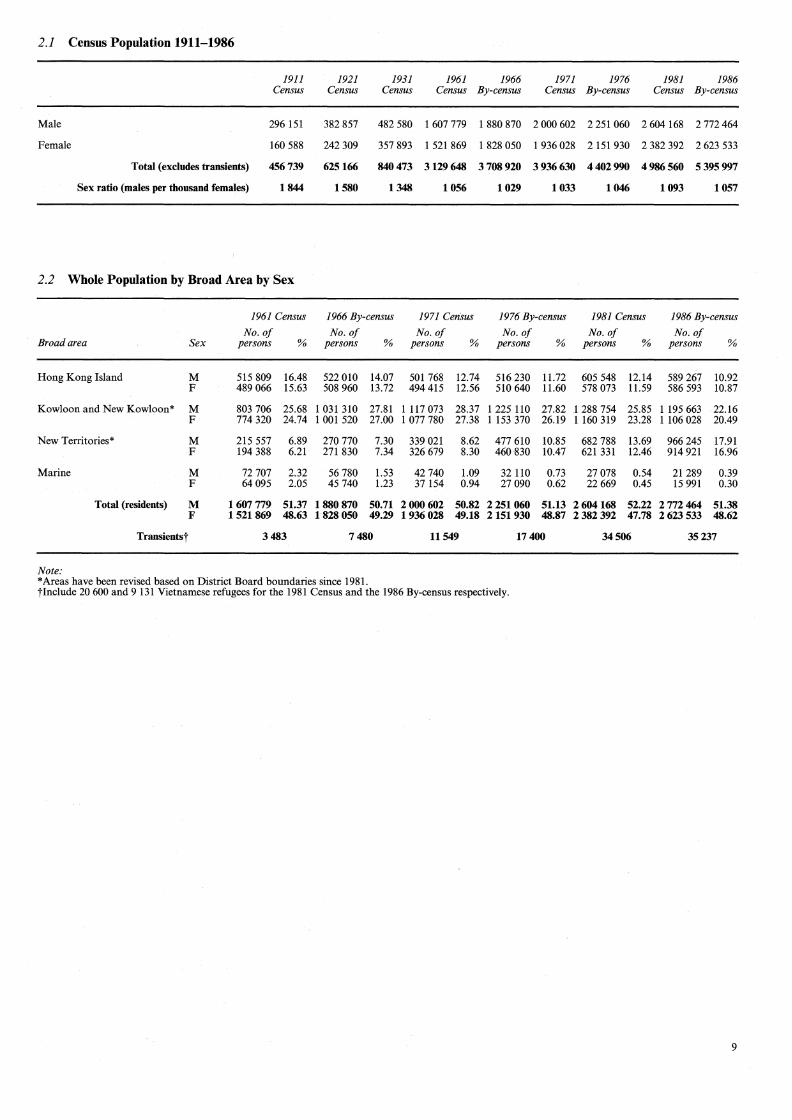
2.1 Census Population 1911-1986
1911 1921 1931 1961 1966 1971 1976 1981 1986 Census Census Census Census By-census Census By-census Census By-census
Male 296 151 382 857 482 580 1607779 1 880 870 2000 602 2 251 060 2 604 168 2 772464
Female 160 588 242 309 357 893 1 521 869 1 828 050 1936028 2 151 930 2 382 392 2 623 533
Total (excludes transients) 456739 625166 840473 3129648 3708920 3936630 4402990 4986560 5 395997
Sex ratio (males per thousand females) 1844 1580 1348 1056 1029 1033 1046 1093 1057
2.2 Whole Population by Broad Area by Sex
1961 Census 1966 By-census 1971 Census 1976 By-census 1981 Census 1986 By-census
No.of No. of No.of No.of No. of No.of Broad area Sex persons % persons % persons % persons % persons % persons %
Hong Kong Island M 515 809 16.48 522 010 14.07 501 768 12.74 516 230 11.72 605 548 12.14 589 267 10.92 F 489 066 15.63 508 960 13.72 494 415 12.56 510 640 11.60 578 073 11.59 586 593 10.87
Kowloon and New Kowloon* M 803 706 25.68 1 031 310 27.81 1 117 073 28.37 1 225 110 27.82 1 288 754 25.85 1 195 663 22.16 F 774 320 24.74 1 001 520 27.00 1077780 27.38 1 153 370 26.19 1 160 319 23.28 1106 028 20.49
New Territories* M 215 557 6.89 270 770 7.30 339 021 8.62 477 610 10.85 682 788 13.69 966 245 17.91 F 194 388 6.21 271 830 7.34 326 679 8.30 460 830 10.47 621 331 12.46 914 921 16.96
Marine M 72 707 2.32 56 780 1.53 42 740 1.09 32 110 0.73 27 078 0.54 21 289 0.39 F 64095 2.05 45 740 1.23 37 154 0.94 27 090 0.62 22 669 0.45 15 991 0.30
Total (residents) M 1607 779 51.37 1880870 50.71 2 OOO 602 50.82 2 251060 51.13 2 604168 52.22 2 772 464 51.38 F 1521869 48.63 1828050 49.29 1936 028 49.18 2151930 48.87 2 382392 47.78 2623 533 48.62
Transientst 3483 7480 11549 17400 34506 35237
Note: *Areas have been revised based on District Board boundaries since 1981. tinclude 20 600 and 9 131 Vietnamese refugees for the 1981 Census and the 1986 By-census respectively.
9

2.3 Density of Population* by District Board
1981 Census 1986 By-census
No.of No.of No.of persons No.of persons
District Board persons perkm2 persons per km2
Hong Kong Island
Central and Western 276 709 .. 22 853 251 846 20425 Wan Chai 229 209 23082 195 944 19 733 Eastern 460 766 26379 4901.82 26 825 Southern 216 937 5 716 237 888 6234
Sub-total 1183 621 15 281 1175 860 14942
Kowloon and New Kowloon
Kowloon City 479 648 52 704 423 976 46 185 KwunTong 610 368 53 918 678 265 59727 Mong Kok 240 822 170 590 202412 139 594 ShamShuiPo 455 430 61494 424 669 55 658 Wong Tai Sin 491 482 52 621 429499 45 985 Yau Ma Tei 171 323 53 041 142 870 44232
Sub-total 2449 073 58 578 2 301691 54561
New Territories
Islands 45 574 281 46907 288 North 113 753 832 144 879 1060 SaiKung 41 881 334 45276 359 Sha Tin 115 798 l 759 356 881 5 325 Tai Po 73 478 544 139 153 l 023 Tsuen Wan } 607 896 7784 240 842 4085 Kwai Chung and Tsing Yi 413 308 21119 TuenMun 119 128 1 510 284 529 3 573 Yuen Long 186 611 1 376 209 391 1 530
Sub-total 1304119 1421 1881166 2036
Total 4936813 4760 5 358 717 5130
Note: *Excludes marine population and transients.
10

2.4 Population Aged 15 and over by Quinquennial Age Group by Marital Status by Sex
1966 By-census* 1971 Census 1976 By-census 1981 Census
Age group Marital status M F M F M F M F
15--19 Never married 199 190 169 960 218 660 202 111 266030 245 530 288 843 262 108 Married 1200 8 350 988 6039 1 730 9960 3 685 9090 Widowed 100 5 28 44 69 Divorced/separated 100 4 9 60 32 54
20-24 Never married 94360 51 690 159 525 110 228 195 210 141 890 274992 196 963 Married 7 650 38 670 13 628 52 733 23 220 65 260 32 136 78 459 Widowed 100 200 17 95 20 50 103 256 Divorced/ separated 100 100 41 86 160 210 369 554
25-29 Never married 63 910 12 800 68 043 17 438 108 350 42 590 148 863 67 988 Married 44610 80200 38 856 68 807 80760 123 070 108 607 154 542 Widowed 600 82 209 50 230 289 563 Divorced/separated 100 500 140 149 480 470 1146 1 128
30-34 Never married 32470 7040 40343 5 350 32 520 6180 59962 19 817 Married 91 850 103 750 76068 89260 79 990 82260 157 323 157 350 Widowed 100 1140 251 689 160 480 373 1 210 Divorced/separated 600 300 404 260 600 310 1 595 1 439
35-39 Never married 16 060 4800 25 210 3 414 22440 2710 20096 4 509 Married 110 170 116 760 102 861 109 964 98450 93 460 110 506 93404 Widowed 1400 3200 713 1 805 430 1410 529 1 669 Divorced/separated 1100 600 706 448 1070 620 1176 989
40-44 Never married 7290 5040 15 054 3 584 14 830 2 510 16 736 2952 Married 106 760 102 540 116 283 113 203 110 840 108 560 121 037 102 069 Widowed I 370 6 140 1 493 4 533 990 3 250 1 233 3 625 Divorced/ separated 500 600 829 570 1 360 800 1 802 1 055
45--49 Never married 3 810 5470 8 131 3 984 10130 2990 13 037 2 707 Married 90630 75210 102 138 93 946 112 700 102 070 124 302 107 541 Widowed I 640 11 090 1 937 6930 1 590 6260 2182 7 736 Divorced/separated 500 800 740 564 1 510 1 050 1 704 1 339
50-54 Never married 2240 5 940 4785 5 121 6 650 3 880 10 103 3 078 Married 77150 58 310 92 916 77 574 103 700 98400 120 418 100 196 Widowed 1 800 17 490 2653 11 083 2650 10790 4129 15 153 Divorced/separated 400 400 614 517 1 320 1 050 1 657 1 384
55 and over Never married 2050 12 140 5 899 17 381 8 910 21260 15 405 22 308 Married 111 500 92 680 166 395 158 994 221 750 194 760 281 842 198 852 Widowed 10 350 96 890 13 062 80054 17 220 99400 32610 161 193 Divorced/separated 600 900 1 008 1084 2690 3 330 2 937 3 901
Total Never married 421380 274880 545650 368611 665070 469540 848037 582 430 Married 641520 676 470 710133 770520 833140 877800 1059856 1001503 Widowed 16760 136 850 20213 105426 23110 121870 41492 191474 Divorced/separated 3900 4300 4486 3687 9190 7900 12418 11843
Note: *Excludes persons living in institutions such as barracks, hospitals, asylums, prisons.
11

2.5 Domestic Households by District Board Number of domestic households
1981 1986 District board Census By-census
Hong Kong Island
Central and Western 73 391 75 341 Wan Chai 64 953 59 976 Eastern 115 740 133 OOO Southern 47959 57 582
Sub-total 302043 325 899
Kowloon and New Kowloon
Kowloon City 124 625 117 558 Kwun Tong 145 575 177 667 Mong Kok 73 556 67 431 ShamShuiPo 124 169 122 871 Wong Tai Sin 114 458 109 200 Yau Ma Tei 51920 46 788
Sub-total 634 303 641515
New Territories
Islands 10 988 13 104 North 27 290 39 025 SaiKung 9 572 11263 Sha Tin 26 081 89432 Tai Po 16 922 35 084 Tsuen Wan } 139 009 61 992 Kwai Chung and Tsing Yi 100 737 TuenMun 26930 69 853 Yuen Long 44505 57 785
Sub-total 301297 478 275
Marine 7095 6887
Total 1244738 1452576
12

2.6 Domestic Households by Household Size
1961* 1966 1971 1976 1981 1986 Household size (persons) Census By-census Census By-census Census By-census
104 139 105 280 126 247 147 440 189 087 214 921
2 100 951 92 540 110 497 140 720 191 841 237 177
3 97 356 92 300 103 994 134 660 191 995 251 507
4 92 502 94 760 109 342 146 590 213 908 299 050
5 82 542 90080 107 473 138 430 177618 217 838
6 71 203 90 840 99 758 115 610 126 247 125 021
7 53 684 73 520 79 169 79 360 74 971 59 869
8 34 859
} 54 662 48 850 39 996 26 277
9 21159 117 660 32 270 24 360 19 497 11 303
10 and over 28 814 33 596 23 370 19 578 9 613
Total 687 209 756980 857 008 999 390 1244 738 1452 576
Average household size (persons) 4.4 4.7 4.5 4.2 3.9 3.7
Note: *Includes domestic and non-domestic households.
2.7 Domestic Households by Monthly Household Income
1971 1976 1981 1986 Monthly household income (HK$) Census By-census Census By-census
Under 600 337 081 97 820 67 465 27 896
600-999 265 996 178 940 50 952 25 030
1,000-1,499 143 551 231 510 113 271 36 164
1,500-1,999 40384 154 080 123 749 52 199
2,000-2,499 28 333 98 810 157 256 81 067
2,500-2,999 55 920 120 449 78 610
3,000-3,999
} 200 290 209 207
,4,000-4,999 102 140 124 576 187 427
5,000-5,999 84705 153 444
6,000-6,999
} 54936 118 246
7,000-7,999 36 686 91 114 41 663 22 580
8,000-8,999 25 635 71 857
9,000-9,999 17 107 53 774
10,000-11,999 } } 79 490 6 390 39 375
12,000-14,999 66 709
15,000-19,999 1600 12 250 53 412
20,000 and over 2 790 16 036 66 930
Total 857008 952580 1244738 1452576
Note: Figures for 1976 By-census exclude 46 810 households whose wage-earners were not in the household at the census reference night, and whose other members had no 'other cash income'.
13

2.8 Activity Status of Population
Activity status
Economically activef
Self·employed and outworkers
Employers
Employees
Unpaid family workers*
Unemployed
Sub-total
Economically inactive
Home-makers
Students with no part-time work
Of independent means
Retired persons
Others (include inmates)
Sub-total
Total
Note:
1961 Census
4.3
1.8
30.2
1.7
0.7
38.7
15.1
21.2
1.8
1.4
21.8
61.3
100.0
1971 Census
3.4
1.0
34.8
1.0
1.8
42.0
14.7
31.0
0.6
2.0
9.7
58.0
100.0
1976 By-census
5.3
1.2
35.6
1.2
2.0
45.3
16.0
26.6
0.2
2.7
9.2
54.7
100.0
1981 Census
4.1
1.8
41.5
0.8
2.0
50.2
13.2
25.2
0.1
3.8
7.5
49.8
100.0
Percentage
1986 By-census
4.1
2.1
42.0
0.9
2.0
51.l
11.6
24.8
0.2
5.8
6.5
48.9
100.0
tThe economically active population figure of 1976 By-census includes all students taking up work during the school summer vacation and those job-seekers having just completed their education before the summer vacation. The definitions of employment and unemployment used in the 1986 By-census followed those recommended by The Thirteenth International Conference of Labour Statistics in October 1982, which are slightly different from those in previous censuses.
*Figures for 1961 to 1981 censuses .include other unpaid workers.
2.9 Estimated Mid-year Population and Growth Rates
1976t 1977t 1978t 1979t 1980t 1981 1982 1983 1984 1985
Estimated mid-year population 4 443 800 4 509 800 4 597 OOO 4 878 600 5 038 500 5 154 100 5 232 900 5 313 200 5 364 OOO 5 422 800
Growth rate(%) I.I 1.5 1.9 6.1 3.3 2.3 1.5 1.5 1.0 1.1
Birth rate§ per thousand population 17.7 17.7 17.6 17.0 17.1 16.9 16.5 15.7 14.4 14.1
Death rate§ per thousand population 5.1 5.2 5.2 5.2 5.0 4.8 4.9 5.0 4.8 4.7
Rate of natural increase§ per thousand population 12.6 12.6 12.4 11.8 12.1 12.1 11.6 10.7 9.7 9.4
Infant mortality rate§ per thousand live births 13.7 13.5 11.8 12.3 11.2 9.7 9.9 9.9 8.8 7.5
Note: tRevised estimates based on the 1976 By-census. tRevised estimates based on the 1981 Census. §The rates were calculated by using live births and deaths known to have occurred in a year but excluding those of Vietnamese refugees.
14

2.10 Age Structure of Estimated Mid-year Population
Age group Sex 1976t 1977t 1978t 1979t 1980t 1981 1982 1983 1984 1985
0-4 M 205 100 205 600 205 200 211100 211 1()() 214400 217 900 221 OOO 220 500 218 800 F 193 400 192 600 192 OOO 196 600 196 700 200 200 204200 207 100 206 300 204100
5-9 M 212 100 206 500 206 200 216 500 217 800 215 300 215 300 213 500 212 700 212 400 F 201 800 196 100 195 400 202 700 202400 199 OOO 198 300 197 600 196 900 197 OOO
10-14 M 273 400 262100 249 800 245 900 237 400 229 700 225 400 223 800 222200 221100 F 262 900 251 300 238 400 232 600 222 500 214 700 209 600 207 OOO 205 100 203 400
15-19 M 272 200 279 100 283 900 298 200 301 300 295 600 280 200 264900 248 500 236 300 F 259200 265 800 271 OOO 281 500 280 800 273 600 261400 246 900 232000 219 800
20-24 M 228 400 239 OOO 250 OOO 282 300 306 200 317 400 317 800 316 200 309 OOO 299 400 F 215 300 225 300 235 600 258 300 274 OOO 284 800 290 300 293 100 290 300 284 900
25-29 M 193 200 201 800 209 300 235 600 255 500 269 600 280 100 293 OOO 304600 314200 F 167 800 178 400 188 700 208 100 220 200 233 100 247 500 263 200 278 100 291 500
30-34 M 123 600 136 300 153 600 184000 210 300 230400 241100 249100 253 300 257 900 F 94000 107 900 125 500 149 700 169 900 188 600 202 300 213 300 222 OOO 231 900
35-39 M 126 800 121100 116 500 124 100 131 500 141 900 156 200 175 300 194 400 213 400 F 101 900 95 800 90 800 94400 98 300 107 400 121 600 140 300 160 500 180 400
40-44 M 135 100 134 700 134900 142400 144 900 145 200 141 OOO 136 200 131 800 132 200 F 117 600 116 400 115 100 115 900 114100 112000 108 700 105 400 103 100 104 200
45-49 M 131 300 132 OOO 133 700 141 800 144 700 146 500 147 OOO 147 800 146 900 145 800 F 121 300 121 700 121 400 123 300 123 200 122 200 121 400 120 500 118 700 117 100
50-54 M 117 300 119 700 122 200 129 900 137 OOO 140 900 142 600 143 300 142900 141 800 F 111 OOO 113 600 115 900 119 100 121 500 123 300 124400 124 700 123 700 122 200
55-59 M 93 900 97 800 102400 107 900 110 300 113 700 117 900 122 900 127 800 132 200 F 92 300 95 600 99000 102400 104 300 106 300 109 600 113 100 116 400 119 300
60-64 M 74900 77100 80 500 84900 90200 93 700 95600 97600 99200 102 300 F 77 800 80000 82600 86 800 89900 92400 94400 96100 97400 99400
65-69 M 42 500 47 600 52400 58 800 63 900 68 OOO 71300 74200 77200 79 900 F 56 600 59 900 64900 69900 72600 75 600 77900 80200 82100 84000
70-74 M 24200 26100 28 800 33000 36200 39900 43 OOO 46100 49000 52100 F 45100 45 700 47100 50600 53 500 56 500 58 800 60900 62900 64900
75 and over M 19 600 21 OOO 23 500 25 800 28 200 31 100 34300 38000 41900 46 300 F 52200 56200 60 700 64500 68 100 71100 75 800 80900 86600 92600
Total M 2273 600 2307 500 2352 900 2522200 2626500 2693300 2726700 2762900 2781900 2806100 F 2170200 2202300 2244100 2356400 2412000 2460800 2506200 2550300 2582100 2616700 T 4443800 4509800 4597000 4878600 5 038500 5154100 5232 900 5313200 5 364000 5422800
Note: tRevised estimates based on the 1976 By-census. tRevised estimates based on the 1981 Census.
15

2.11 Total Live Births* by Age of Mother
Age of mother 1976 1977 1978 1979 1980 1981 1982 1983 1984 1985
Under20 4537 4638 4 163 3 565 3 476 3 221 2627 2439 l 999 l 877
20-24 23 576 23 737 23 416 22940 24049 24560 23 179 21868 18 201 16 342
25--29 32199 33127 33 673 34041 35 188 35 881 36504 36039 34270 34246
30-34 11226 12434 14265 16 233 17 621 18 486 18 816 18 044 17743 18 223
35--39 4979 4 356 3 948 3 922 3 845 3 718 4194 4234 4 517 4 883
40-44 l 719 l 507 l 307 l 069 959 766 677 531 513 492
45--49 178 133 133 112 99 83 74 69 31 46
50 and over 1 3 4 5 2
Unknown 96 87 51 93 49 35 44 69 22 15
Total 78511 80022 80957 . 81975 85290 86751 86120 83293 77297 76126
Note: *Live births known to have occurred in a year but excluding those given by Vietnamese refugees.
2.12 Total Live Births* by Birth Order
Birth order 1976 1977 1978 1979 1980 1981 1982 1983 1984 1985
First 30 534 32 987 32652 33 789 36 739 37 916 36905 36 829 33 411 34340
Second 24029 23 920 25 839 26499 27696 29055 30 180 29294 27 840 26908
Third 11 816 12 301 12 747 12 811 12 769 12 710 12 545 11674 11 187 10 547
Fourth and higher 12 131 10810 - 9 718 8876 8 084 7069 6483 5488 4857 4324
Unknown 4 2 7 8 2 7
Total 78511 80022 80957 81975 85290 86751 86120 83293 77297 76126
Note: *Live births known to have occurred in a year but excluding those given by Vietnamese refugees.
16

2.13 Total Deaths* by Age Group by Sex
Age group
Less than 7 days
7-27 days
28 days-less than 1 year
I-4 years
5-9 years
10--14 years
15-19 years
20--24 years
25-29 years
30--34 years
35-39 years
40--44 years
45-49 years
50--54 years
55-59 years
60--64 years
65-69 years
70--74 years
75-79 years
80--84 years
85 years and over
Unknown
Sex
M F
M F
M F
M F
M F
M F
M F
M F
M F
M F
M F
M F
M F
M F
M F
M F
M F
M F
M F
M F
M F
M F
Total M F
Note:
1976 1977 1978 1979 1980 1981 1982 1983 1984 1985
354 320 321(3) 333 289 260(1) 270(4) 277(1) 203(4) 160(3) 210 241 221 230 217 206 218 195 171 129
71 81 59(1) 73 74 51 54 61(1) 63 48 51 58 61 46 55 55 58 43 47 32
209 206 159(1) 187 179 149 125 112 112 112 182 175 131 142 142 117 125 132 83 88
138 137 114 111 107 111 92 91 80 81 122 110 101 96 93 59 87 90 68 59
93 71 64 80 68 53 61 46 50 43 68 46 40 55 32 38 34 29 47 41
93 96 85 73 71 70 63 55 49 54 ~ ~ ~ ~ % ~ % " E E
156 152 144 172 154 161 134 117 100 91 102 92 91 93 84 65 73 75 54 47
221 233 254 237 227 217 232 204 196 157 113 97 110 129 106 119 100 143 88 92
223 239 262 248 244 254 258 199 222 205 118 133 126 116 100 131 121 134 126 130
223 202 255 245(1) 260 267 254 241 233 235 102 87 109 111 117 128 154 126 132 121
m m ~ ~ m w m ~ ~ ~ 130 119 101 97 108 111 119 106 121 116
463 471 406 472 392 409 416 392 353 317 231 228 188 205 200 177 164 136 117 132
762 729 716 793 741 682 681 626 603 575 374 346 351 338 318 330 321 280 264 254
1044 1041 1131 1120 1073 1077 1161 1117 1048 1050 m m ~ m ~ ~ rn m m ~
1321 1375 1434 1471 1517 1382 1441 1512 1451 1386 685 694 702 768 736 712 641 688 641 691
1 771 1 823 1 727 1 836 1 772 1 828 1 854 1 997 1 910 1 822 929 982 930 969 942 916 1 020 1 024 953 939
1684 1798 1911 2076 2161 2092 2080 2235 2133 2063 1 071 1 170 1 253 1 324 1 288 1 264 1 252 1 283 1 265 1 304
1 454 1 449 1 540 1 721 1 689 1 887 1 953 2 341 2 219 2 223 1 282 1 295 1 389 1 414 1 478 1 422 1 567 1 561 1 660 1 617
1 025 1 061 1 137 1 219 1 335 1 312 1 390 1 489 1 530 1 584 1 423 1 503 1 487 1 591 1 542 1 556 1 551 1 562 1 603 1 571
517 608 646 676 762 806 872 966 952 937 1 140 1 282 1 302 1 404 1 413 1 541 1 445 1 622 1 614 1 603
405 375 440 447 501 424 539 517 528 595 1173 1371 1467 1537 1618 1570 1617 1871 1665 1800
4(10) 17(15) 32(22) 31(24) 7(13) 15(11) 16(25) 18(22) 18(22) 11(16) 5 3 4 2 1 6 7 2 2 5
12 513(10) 12 762(15) 13 071(27) 13 877(25) 13 850(13) 13 750(12) 14 194(29) 14 871(24) 14 307(26) 14 029(19) 10 110 10 569 10 732 11223 11145 11070 11173 11627 11187 :n 210
Figures in brackets indicate the number of deaths of unknown sex excluded. *Deaths known to have occurred in a year but excluding those of Vietnamese refugees.
17

2.14 First Marriages Registered by Sex by Age Group
Sex/Age group 1976 1977 1978 1979 1980 1981 1982 1983 1984 1985
Bridegrooms
16-19 727 838 738 625 752 718 584 526 428 415
20--24 9 855 10 112 9 812 10 651 12 147 11904 11 199 9 364 10 117 8 457
25-29 16 287 15 746 15 670 17 600 18 807 18 361 19 386 17 312 21 924 17 873
30--34 4 881 5 319 5 819 6 666 8 036 7 944 8 425 7 481 9 107 7 886
35-39 1 907 1 723 1 791 1 974 2110 1 818 1 856 1 883 2 171 2 129
40--44 709 790 734 925 902 695 588 542 517 460
45-49 210 231 286 368 432 362 252 267 261 229
50 and over 116 118 151 238 290 238 190 225 205 209
Total 34692 34877 35001 39047 43476 42040 42480 37600 44730 37658
Brides
16-19 4 663 5 008 4290 4108 4269 4 017 3 261 2 774 2426 2135
20-24 18 912 18 503 18 479 20 915 23 742 22443 22067 18 545 21 701 17 021
25-29 9 740 9 797 10 257 11 487 12 535 12 564 13 909 12 907 16 620 14 533
30--34 1 096 1 298 1 642 2 070 2400 2478 2 672 2 728 3 222 3 092
35-39 285 278 300 403 416 396 413 475 610 628
40--44 107 116 134 149 183 142 115 109 110 132
45-49 67 47 54 83 105 82 82 66 73 69
50 and over 56 59 72 78 123 109 106 129 104 110
Total 34926 35106 35228 39293 43773 42231 42625 37733 44866 37720
18

2 .15 Total Marriages by Age Group of Bridegroom and Bride
Age of bridegroom
Below 20
20-24
25-29
30-34
35-39
40-44
45 and over
Age of bride
Below 20 20-24 25-29 30-34 35-39 40-44 45 and over
Below 20 20-24 25-29 30-34 35-39 40-44 45 and over
Below 20 20-24 25-29 30-34 35-39 40-44 45 and over
Below 20 20-24 25-29 30-34 35-39 40-44 45 and over
Below 20 20-24 25-29 30-34 35-39 40-44 45 and over
Below 20 20-24 25-29 30-34 35-39 40-44 45 and over
Below 20 20-24 25-29 30-34 35-39 40-44 45 and over
Total
2.16 Divorce Statistics
Petitions filed* during the year Defended casest
Divorce decrees
Note: *Include defended cases.
1976
532 192
7
2 398 6 468 1 050
42 2 2 2
1418 9 650 5474
266 19 5 1
276 2 214 2422
488 67
8 3
71 686
1 099 439 240
53 15
16 194 400 286 267 185 52
7 57
111 154 203 411
1 665 39617
1976
1 054 39
809
1977
623 202
16 1
2632 6 513 1 005
46 4 2 3
1 405 9 222 5 344
320 16 4 6
310 2 286 2 731
536 62
6 9
56 533
1 050 506 217
61 17
26 188 398 374 266 253 44
5 61
150 173 238 473
1 997 40390
1977
1 372 160 955
1978
526 199
13 1
2306 6 527 1 007
50 7 2 1
1170 9 OOO 5 591
378 25
3 4
260 2 415 3 010
679 55 10 5
48 548 974 604 202
43 8
11 182 360 365 258 186
58
4 61
148 209 248 501
2 138 40400
1978
1 728 59
1 420
1979
421 196
9
2226 7 381 1 096
57 3 2 2
1 191 10227 6201
454 37 2 3
227 2 700 3 399
940 68 16 6
50 574
1 059 689 246
37 12
18 206 391 489 327 221 82
4 75
207 287 309 520
2 635 45303
1979
2 018 66
1 520
1980
535 209
12 1
2 307 8 681 1276
75 3
4
1 195 10 974 6 682
573 42
4
213 3 382 4036 1 203
97 14 11
48 687
1 025 831 295
51 11
20 226 405 495 382 261
73
3 116 225 336 366 607
3 119 51111
1980
2 421 76
2 087
1981
530 182
7 1
2 190 8 447 1 314
63 7 1 6
1 022 10 561 6 723
622 45 7 2
267 3 053 4 162 1 359
110 13 6
26 532 995 878 338 47 12
8 112 343 550 431 280
72
3 77
194 376 383 734
3 665 50756
1981
2 811 80
2060
t Include district court cases starting from 1985 whereas figures before 1985 refer to high court cases only.
1982
405 169
10
1 778 8 033 1402
90 7 1 2
884 10 707 7 711
633 46 4 4
183 3 035 4482 1 559
149 21 12
28 446 984 946 356
39 18
6 89
272 500 450 277
77
2 52
143 299 463 704
3 988 51467
1982
3 120 79
2 673
1983
367 154
7 1
1 513 6 584 1 259
92 6
734 9 218 7 197
643 60 4
138 2441 4136 1 532
169 23
3
34 416 972
1 022 457
54 9
5 83
245 424 464 267
65
1 42
167 322 534 742
5 172
47778
1983
3 734 20
2 857
1984
310 107
10 2
1 307 7 294 1 488
85 5 1
694 11 311 9 507
776 71
6 1
100 2 820 5 164 1 675
197 14 4
21 422
1 088 1 066
442 43 11
58 214 369 458 214
57
2 49
119 281 480 643
4423 53409
1984
4764 9
4086
1985
305 102
6 1
1 158 5 958 1 307
90 2
2
553 8 564 8 335
792 70 12 2
102 2 237 4450 1 635
216 17 6
18 377
1138 1 011
432 38 12
4 62
189 318 417 172 48
2 36
131 273 425 539
3 491 45056
1985
5 047 115
4 313
19


Section 3: LABOUR
Figures on the labour force, labour force participation rate, unemployment and unemployment rate in Tables 3.1 to 3.5 are obtained from the Labour Force Surveys and General Household Surveys.
In the Labour Force Survey, economically active population is defined as persons aged 15 and over who were engaged in productive work for at least 15 hours during the seven days before enumeration (the hours criterion did not apply to employers, outworkers, self-employed, unpaid workers, farmers and fishermen), or who were on leave, and persons aged 15 to 64 who would have been engaged in productive work but were currently unemployed.
In the General Household Survey before 1985, economically active population is defined as persons aged 15 and over who performed some work for pay or profit; or who were on leave or on industrial dispute; or who were unpaid workers working for at least 15 hours during the seven days before enumeration; and persons aged 15 and over who would have been engaged in productive work but were currently unemployed.
In the General Household Survey in 1985, economically active population is defined as persons aged 15 and over who worked for at least one hour for pay or profit (including unpaid family workers) during the seven days before enumeration; or who had a job or enterprise but were temporarily not at work for reasons such as illness or injury, leave, strike, mechanical break-down, bad weather, etc. and were tested to have formal job attachment; and persons aged 15 and over who would have been engaged in productive work but were currently unemployed.
Figures in Tables 3.6 to 3.9 are obtained from 1981 Population Census. Prior to April 1980, statistics of employment and vacancies were compiled quarterly from separate employment surveys in
various sectors. Starting from April 1980, statistics of employment, vacancies and payroll are collected quarterly by an integrated Survey of
Employment, Vacancies and Payroll. In terms of the United Nations International Standard Industrial Classification (1968), the survey covers the following economic sectors:
J.S.I.C. M ajar Division
2 3 4 6 7 8 9
Economic Sector
Mining and Quarrying Manufacturing Electricity and Gas Wholesale, Retail and Import/Export Trades, Restaurants and Hotels Transport, Storage and Communication Financing, Insurance, Real Estate and Business Services Community, Social and Personal Services
For Major Divisions 7 and 9, the coverage is incomplete. Major expansions of industry coverage in these two major divisions took place in 1970, 1976 and 1977. As for Major Division 8, there was also a major expansion of industry coverage in 1973. Complete coverage of industry was attained in 1975. Economic activities not yet covered by the survey are:
I.S.I.C. Major Division
1 6 7 9
Economic Activities Not Covered
Agriculture, hunting, forestry and fishing (whole division) Hawkers, street vendors, retail pitches (other than market stalls) Taxis, public light buses, marine cargo handling services and tow boats Veterinary services, religious organizations, authors and other independent artists, domestic servants, and miscellaneous recreational and personal services
For the construction sector, employment statistics are collected for site workers only at building and construction sites which include: (a) sites in the private sector: all construction sites registered with the Buildings Ordinance Office, including those super
structures on sites above the Mass Transit Railway Stations or the Kowloon-Canton Railway Stations which were registered with the Buildings Ordinance Office, e.g. those real-estate development projects developed jointly with private developers.
(b) sites in the public sector: all sites under the charge of the Building Development Department, Engineering Development Department, New Territories Development Department, Water Supplies Department and the Housing Department; including Kowloon-Canton Railway Corporation sites not registered with the Buildings Ordinance Office, for which construction work was committed, contracted or started before 1.2.1983.
(c) railway construction sites: construction sites contracted out by the Mass Transit Railway Corporation and the Kowloon-Canton Railway Corporation that are not registered with the Buildings Ordinance Office. In the case of Kowloon-Canton Railway Corporation sites, only those contracted out after 1.2.1983 are included. Those contracted out before 1.2.1983 are included under (b).
Construction sites for village-type houses registered with the City and New Territories Administration are excluded. Statistics exclude minor alterations and additions, repairs, maintenance, partitioning and interior decoration work on existing buildings.
Following the re-organization of the Public Works Department into several departments in April 1982, the description of the statistical series on persons engaged at sites contracted by 'Public Works Department' given in Tables 3.12 and 3.13 is revised to read as sites contracted by 'other Government departments'.
As from the second quarter of 1985, employment figures in the public sector are compiled from the returns submitted by individual Government departments to the Civil Service Branch. Persons engaged include all direct employees paid under the
21
personal emolument vote on the reference date which, since this quarter, falls on the first of January, April, July, October of each year. This change in definition and reference date has negligible effect on the continuity of the employment series in the public sector. Classification of Government departments and sections by purpose is based on the System of National Accounts Classification for Government expenditure with some modifications. The former Kowloon-Canton Railway Department has been separated from the Government with effect from 1.2.1983 and accordingly its employment is excluded from Government employment.
An 'establishment' is defined as an economic unit which engages, under a single ownership or control, in one (or predominantly one) kind of economic activity at a single physical location.
'Persons engaged' refer to working proprietors, active business partners, unpaid family workers and all employees of the establishment who are either at work for pay or profit, or are temporarily absent from work, i.e. on short-term leave such as sick leave, casual leave or paid vacation. Excluded are outworkers, and persons on indefinite leave and on pension. Part-time and casual employees and unpaid family workers who worked for less than 3 hours of the normal working time on the reference date are also not included.
'Reported vacancies' refer to those unfilled, immediately available job openings for which the establishment is actively trying to recruit personnel.
'Payroll' refers to wages and salaries, bonuses and gratuities, commissions and allowances and cash payment in other forms paid directly to all employees. Profits earned by proprietors and business partners, pensions, and payment to outworkers are, however, excluded.
The 'nominal index of payroll per person engaged' is derived from the employment and total payroll figures. The 'real index of payroll per person engaged' is obtained by dividing the nominal index by the Consumer Price Index (A) to adjust changes in purchasing power.
'Payroll per person engaged' should not be interpreted as average income of employees. Firstly, the time period covered by employment figures is not the same as that covered by monthly payroll figures. Employment figures refer to a reference date, while monthly payroll is obtained by aggregating cash payments made over the whole month. Secondly, 'payroll' refers to payments to employees, whereas 'persons engaged' includes more than just employees. It also includes working proprietors, business partners and unpaid family members who normally are not on the payroll. Finally, as far as income is concerned, employees' income usually is not just limited to cash payments for work as reflected in payroll figures. Furthermore, because of the fact that 'persons engaged' includes some who are not on the payroll and the magnitude of such persons varies between sectors, comparison of absolute values of payroll per person engaged between sectors is not meaningful. However, movements in the nominal and real indexes of payroll per person engaged can be used as indicators of changes in average earnings of employees provided that the employment structure remains stable over time.
In 1978, an economic census was conducted for Major Division 6 for the year 1977. Upon analysis of returns, it was found that a number of establishments had changed their activities and/or commodity groups. As the changes were quite extensive and had accumulated over some time, activities of the affected establishments were reclassified with effect from June 1979. Similar reclassification was also made for Major Division 3 by utilizing the product information obtained in the 1978 Survey. of Industrial Production.
Concurrent with the September 1982 round of the Survey of Employment, Vacancies and Payroll, an industry updating survey was undertaken to collect up-to-date information on business activities of each and every establishment in l.S.l.C. Major Divisions 2, 3 & 4. Results of this survey have been used to compile statistics as from the third quarter of 1983. Statistics since this quarter analysed by industry are, therefore, not strictly comparable with those in previous quarters. To enable users to analyse the effect of this survey on the statistical series, statistics for the third quarter of 1983, both before and after incorporating the results of this survey, were given in the December 1983 issue of the Report of Employment, Vacancies and Payroll Statistics. On the other hand, indexes of payroll per person engaged (nominal and real) have been spliced as from the fourth quarter of 1983 in such a way that comparison can be directly made. A summary of the results of this survey was given in the Special Review Article contained in the May 1984 issue of the Hong Kong Monthly Digest of Statistics.
Concurrent with the June 1983 round of the survey, a similar survey was undertaken for l.S.l.C. Major Division 6. Results of this survey have been used to compile statistics as from the second quarter of 1984. To enable users to analyse the effect of this survey on the statistical series, statistics for the second quarter of 1984, both before and after incorporating the results of this survey, are given in the September 1984 issue of the Quarterly Report of Employment, Vacancies and Payroll Statistics. Similarly, indexes of payroll per person engaged (nominal and real) have been spliced as from the third quarter of 1984 in such a way that comparison can be directly made. A summary result of this survey was published in the Special Review Article contained in the July 1985 issue ofthe Hong Kong Monthly Digest of Statistics.
Concurrent with the March 1984 round of the survey, a similar survey was conducted for the services block (i.e. l.S.l.C. Major Divisions 7, 8 and 9). Results of this survey have been used to compile statistics in the March 1985 issue of the Report of Employment, Vacancies and Payroll Statistics. Based on the results of this survey, some establishments previously classified into this block, notably those in l.S.l.C. 9512 and 9519, were re-classified into appropriate industry sectors belonging to other I.S.l.C. major divisions in March 1985. In conjunction with this industry updating survey, some welfare organizations which used to provide a consolidated return covering the whole organization were asked to furnish detailed information in respect of individual branches operating at different locations. Appropriate industry codes were assigned to these branches and have been used to compile statistics as from March 1985. As a result, the figures since this quarter for some industry groups, notably 1.S.l.C. 934 and 939, are not strictly comparable with those in previous quarters. To enable users to analyse the effect of this survey on the statistical series, statistics for the first quarter of 1985, both before and after incorporating the results of this survey are given in the June 1985 issue of the Report of Employment, Vacancies and Payroll Statistics. An article entitled 'Shift in the Industrial Activities of Establishments in the Transport, Storage and Communication Sector, the Financing, Insurance, Real Estate and Business Services Sector; and the Community, Social and Personal Services Sector' was published in the January 1986 issue of the Hong Kong Monthly Digest of Statistics.
The second round of the industry updating survey for the industrial block was conducted concurrently with the September 1984 round of the survey. Based on the results, some establishments previously classified into this block were reclassified to
22

other I.S.I.C. major divisions in September 1985. As a result, the figures since this quarter for some industry groups, notably I.S.I.C. 833 are not strictly comparable with those in previous quarters. Statistics for the fourth quarter of 1985; both before and after incorporating the results ofthis survey are given in the December 1985 issue of the Report of Employment, Vacancies and Payroll Statistics. The indexes for the industrial block have been spliced as from the fourth quarter of 1985 so that comparison of changes over time can be directly made.
Except for construction sites and Government departments which are covered in full every quarter, surveys in the other economic sectors in the private sector are organised into annual cycles with a full count in one quarter and sample surveys in the other three quarters. In this publication, figures of establishments, employment and vacancies are derived from the full-scale surveys. For Major Divisions 2, 3, 4 and 5 the figures refer to December of the year before 1980 and September of the year from 1980 onwards. For Major Division 6, the figures refer to June of the year. As for Major Divisions 7, 8 and 9, the figures refer to November of the year before 1980, February of 1980 and March of the year from 1981 onwards. In the case of the public sector, the reference dates of employment and vacancies figures refer to October of the year before 1980 and September of the year from 1980 to 1984 and October of the year from 1985 onwards.
Wage indexes measuring the changes in wage rates of manual workers in selected industries mainly within the manufacturing sector had been compiled and published since 1964, based on the findings of the half-yearly Wage Survey.
In March 1982, a new quarterly Survey of Wages, Salaries and Employee Benefits was introduced to replace the half-yearly Wage Survey to measure changes in and levels of the 'price of labour'. A number of improvements were introduced in the new survey, including the collection of statistics on wage rates at more frequent intervals, the use of a larger sample (about 2 OOO establishments) to achieve a higher degree of precision in the estimates for each industry covered, and an extension in coverage to include the non-manufacturing sectors (the distributive trades, transport services, business services and personal services sector) and non-manual workers (up to supervisory level) so as to make the statistics more representative. Employees at the administrative and professional levels are however included in another annual Survey of Salaries and Employee Benefits (Managerial and Professional Employees - Excluding Top Management). Details of the scope and methodology of the new wage survey are given in the 'Quarterly Report of Wages, Salaries and Employee Benefits Statistics'.
The nominal and real wage indexes compiled from results of the new wage survey measure the 'pure' changes in wage rates by holding the structural pattern of the labour force with respect to industry, occupation, sex and mode of payment the same as that of March 1982, which is the base period of the wage indexes. Whilst the Nominal Wage Index measures the changes in wage rates in money terms, the Real Wage Index, which is obtained by deflating the Nominal Wage Index by the Consumer Price Index (A), measures the changes in the purchasing power of the amount of money earned.
Wage rates represent the amount of remuneration for fixed and normal time of work and are defined to include basic wages or salaries, cost of living allowance, meal benefits, commission and tips, good attendance bonus, night shift allowance, year-end bonus and other guaranteed and regular bonuses and allowances. When compiling wage indexes, year-end and other regular bonuses and allowances that are paid less frequently than monthly are averaged out to an equivalent monthly rate.
In reading the wage statistics, users are reminded to note that the change in the wage index for a particular industry between any two months may be different from the change derived by comparing the published wage rate figures for that industry over the corresponding months. As the wage index is designed to measure the 'pure' change in wage rates by holding constant the structure of the labour force with respect to industry, occupation, sex and mode of payment, the movement as indicated by the wage indexes should always be used to measure changes in wage rates.
Attention of users is also drawn to the difference between the wage indexes and the indexes of payroll per person engaged which are published by the department at quarterly intervals. While the former provides a measure in changes in the price of labour, the latter is a measure in changes in average earnings of workers. Total payroll is the amount of direct cash payments that employees receive from employers. Apart from cash receipts, it also includes overtime pay and other non-guaranteed and irregular bonuses and allowances. Hence, the indexes of payroll per person engaged tend to be sensitive to changes in the number of hours actually worked, the timing of the payment of bonuses, allowances and back-pay, and the composition of the labour force. As a result, movements in the wage indexes do not necessarily conform with those in the indexes of payroll per person engaged.
Based on the findings of a new annual Survey of Salaries and Employee Benefits (Managerial and Professional EmployeesExcluding Top Management) conducted since 1984, a Nominal Salary Index (A) and a Nominal Salary Index (B) are compiled. These salary indexes are designed to measure changes in salary rates using the occupational and industrial structures of June 1983, which is also taken as the base period of the indexes. Apart from basic salaries, the salary rate is defined to include also cost-of-living allowance, guaranteed year-end bonus, commission and tips and other guaranteed and regular bonuses and allowances. Other items which may contribute significantly to the total pay package of employees at this level such as profit-sharing bonus and housing allowance are not included in the definition of salary rate. However, statistics on these fringe benefits items are separately compiled and are expressed in terms of percentages of employees included in the survey entitled to such benefits.
The Salary Index (A) is compiled by comparing the average of the salary levels of managerial and professional employees in June of the reference year with that in June 1983. It is a comprehensive measure of change in salary levels and it takes into account changes in salary level resulting from movements across companies and in and out of occupations as well as changes in salaries for those who remain in the same occupation and the same company in both years. While the Nominal Salary Index (A) measures the changes in salary rates in money terms, the Real Salary Index (A), which is obtained by deflating the Nominal Salary Index (A) by the Hang Seng Consumer Price Index, measures the changes in salary rates in real terms.
On the other hand, the Salary Index (B) measures the changes in salary levels only for those who remain in the same occupation and in the same company in two consecutive years. It therefore accounts only for changes due to a general increment, meritorious increases and gains in seniority, and should be useful to personnel managers in making salary adjustments. A Real Salary Index (B) is also compiled using the method adopted in deriving the Real Salary Index (A).
23

Statistics on reported occupational accidents and industrial work stoppages are supplied by the Labour Department. Reported occupational accidents refer to all accidents reported to the Labour Department which have resulted in the death
of an employee or the total or partial incapacity of an employee for more than three days. Statistics on industrial work stoppages refer to number of work stoppages and the corresponding number of working days
(or man-days) classified by International Standard Industrial Classification major divisions. These figures cover stoppages of work arising from disputes connected with terms and conditions of employment. Stoppages involving fewer than ten workers or lasting less than one day are excluded, unless the aggregate of working days lost exceeds 100. The number of workers involved is the number who actually cease work at the establishments where the disputes occur.
24

3.1 Labour Force and Labour Force Participation Rate by Age by Sex
1976* 1977 1978 1979 1980 1981** 1982t 1983t 1984t 1985t
Number Number Number Number Number Number Number Number Number Number Age group/Sex ('OOO) % ('OOO) % ('OOO) % ('OOO) % ('OOO) % ('OOO) % ('OOO) % ('OOO) % ('OOO) % ('OOO) %
15-19 Male Female
20-24 Male Female
25-29 Male Female
30-34 Male Female
35-39 Male Female
40-44 Male Female
45-49 Male Female
50-54 Male Female
55-59 Male Female
60-64 Male Female
65 and over Male Female
Total (15 and over) Male
Female
Note:
234.3 45.1 114.0 42.3 120.3 48.0
348.4 82.1 194.3 89.1 154.1 74.7
273.3 77.1 186.3 97.9 87.0 53.0
153.9 74.5 115.9 98.9 38.1 42.5
162.9 74.7 120.4 98.7 42.S 44.3
183.1 74.0 128.7 98.6 54.4 46.5
168.7 71.6 120.9 97.4 47.8 42.9
150.3 66.8 106.5 93.8 43.8 39.4
103.3 60.4 75.l 84.S 28.3 34.4 72.1 47.6 49.9 67.2 22.2 28.8
44.9 18.9 27.7 32.0 17.2 11.3
1895.3 63.3 12YJ.7 80.7
655.7 45.0
222.7 42.0 108.0 39.5 114.7 44.6 366.3 82.7 200.2 88.7 166.1 76.5
283.3 77.7 189.8 98.1 93.5 54.7
171.9 72.6 127.7 98.9 44.2 41.0
149.6 74.2 111.8 98.9 37.9 42.8
178.0 72.1 127.2 98.3 50.9 43.3
170.6 69.6 123.1 96.6 47.6 40.4
152.7 66.4 112.3 93.4 40.S 36.9
106.2 60.2 75.8 83.7 30.4 35.4 76.5 46.9 54.0 66.1 22.6 27.7 49.5 19.0 31.7 32.5 17.8 11.0
1927.1 62.2 1261.2 79.7
665.9 43.9
217.9 40.0 107.2 38.8 110.7 41.3 377.0 83.2 200.2 87.8 176.9 78.6
309.4 78.0 201.7 97.7 107.7 56.6 199.7 73.3 146.9 99.0 52.8 42.6
152.3 75.5 112.1 98.6 40.3 45.6
177.9 73.7 127.5 98.2 50.S 45.2
176.8 71.7 126.6 97.0 50.2 43.3
163.0 67.2 116.3 92.8 46.8 39.8
107.6 58.5 77.0 82.3 30.6 33.9 83.0 48.0 56.S 65.8 26.5 30.4 57.0 20.5 36.4 33.8 20.6 12.1
2021.3 62.5 1308.1 79.5
713.3 44.9
217.6 38.6 109.5 37.8 108.1 39.5
415.9 82.8 225.9 87.4 189.9 78.0 330.7 79.2 213.2 98.5 117.5 58.4 230.0 73.0 171.1 98.7 58.9 41.6
161.2 74.1 120.0 99.1 41.3 42.8
179.8 73.8 129.6 98.4" SO.I 44.8
182.3 71.1 132.7 97.5 49.6 41.2
166.9 65.8 121.0 93.9 46.0 36.8
115.0 59.I 83.2 83.3 31.9 33.7 80.1 45.5 55.8 64.4 24.3 27.2 61.8 19.6 40.0 32.5 21.7 11.3
2141.0 62.0 1401.7 79.4
739.3 43.8
Figures are average of March and September Labour Force Surveys of the year. *Average of March 1976 Labour Force Survey and 1976 By-census. **Average of August-October 1981 General Household Survey and 1981 Census. tAverage of the quarterly General Household Surveys of the year.
226.6 39.3 118.9 39.6 107.7 39.0 475.5 84.5 258.1 89.0 217.4 79.7 361.9 80.3 234.7 97.9 127.3 60.3 272.6 74.8 200.0 99.1
72.7 44.7
169.0 74.8 122.4 98.9 46.6 45.6
185.3 75.2 130.5 98.6 54.9 48.0
188.5 72.3 134.1 97.4 54.4 44.2
174.1 65.5 127.7 93.6 46.4 36.0
121.1 58.5 89.4 84.0 31.7 31.5 84.6 45.7 60.1 64.1 24.S 26.8 64.5 19.8 41.1 32.1 23.4 11.9
2323.4 63.3 1516.8 80.2
806.6 45.3
3.2 Unemployment and Unemployment Rate by Age by Sex
1976* Number
1977 Number
1978 Number
1979 Number
Age group/Sex ('OOO) % ('OOO) % ('OOO) % ('OOO) %
15-19 Male Female
20-24 Male Female
25-29 Male Female
30-34 Male Female
35-39 Male Female
40-44 Male Female
45-49 Male Female
50-54 Male Female
55-59 Male Female
60-64 Male Female
65 and over Male Female
Total (15 and over) Male
Female
Note:
20.5 8.7 11.2 9.9 9.3 7.7
19.9 5.7 12.0 6.2 7.9 5.2
11.0 4.0 7.9 4.3 3.1 3.6
4.8 3.1 3.6 3.1 1.2 3.1 4.3 2.7 3.5 2.9 0.8 2.0 6.4 3.5 5.4 4.2 1.0 1.8 7.5 4.5 6.4 5.3 1.1 2.3 8.4 5.6 7.1 6.7 1.3 2.9 7.4 7.1 6.4 8.5 1.0 3.5 5.1 7.0 4.0 8.0 1.1 4.7
95.2 5.1 67.5 5.5 27.7 4.2
16.8 7.5 13.8 6.3 9.2 8.5 7.8 7.2 7.6 6.6 6.0 5.4
17.9 4.9 14.5 3.8 9.9 4.9 8.3 4.1 8.0 4.8 6.3 3.5
10.0 3.5 6.6 2.1 6.5 3.4 4.2 2.1 3.5 3.7 2.3 2.1
4.7 2.7 3.5 1.8 3.6 2.8 2.6 1.8 1.2 2.6 0.9 1.7
4.8 3.2 1.9 1.2 3.8 3.4 1.3 1.1 1.0 2.6 0.7 1.7
5.1 2.8 3.7 2.1 3.9 3.1 2.7 2.1 1.2 2.3 1.1 2.1 6.0 3.5 3.7 2.1 4.6 3.7 2.8 2.2 1.5 3.0 0.9 1.7
6.6 4.3 4.4 2.7 5.4 4.8 3.6 3.1 1.2 3.0 0.8 1.7 5.9 5.5 3.0 2.7 5.0 6.5 2.6 3.4 1.0 3.1 0.4 1.1
3.9 5.0 2.4 2.8 2.9 5.3 1.9 3.4 1.1 4.6 0.5 1.7
81.5 4.2 57.1 2.8 54.4 4.3 37.6 2.9 27.1 4.1 19.7 2.8
Figures are average of March and September Labour Force Surveys of the year. *Average of March 1976 Labour Force Survey and 1976 By-census. **Average of August-October 1981 General Household Survey and 1981 Census. tAverage of the quarterly General Household Surveys of the yea:r. o#Estirnate derived from August-October 1981 General Household Survey only.
15.5 7.1 9.8 8.9 5.8 5.3
16.3 3.9 9.8 4.3 6.5 3.4
7.7 2.3 5.4 2.5 2.3 2.0 3.4 1.5 2.9 1.7 0.5 0.8 2.0 1.2 1.6 1.3 0.4 0.8
2.7 1.5 2.4 1.8 0.4 0.7 3.7 2.0 3.4 2.5 0.4 0.8 4.6 2.8 4.2 3.4 0.5 1.0 3.6 3.1 3.1 3.7 0.5 1.6 1.8 2.2 1.3 2.3 0.5 1.9
61.1 2.9 43.6 3.1 17.5 2.4
1980 Number
('OOO) %
20.6 9.1 12.5 10.5 8.1 7.5
21.8 4.6 12.7 4.9 9.2 4.2
11.5 3.2 7.4 3.2 4.1 3.2
6.4 2.3 4.6 2.3 1.8 2.4
4.0 2.3 3.1 2.5 0.9 1.9
4.9 2.6 4.0 3.1 0.9 1.5
5.1 2.7 3.9 2.9 1.2 2.1
5.5 3.2 4.9 3.8 0.6 1.3 4.6 3.8 4.0 4.5 0.6 1.7 3.2 3.7 2.6 4.2 0.6 2.5
87.3 3.8 59.5 3.9 27.8 3.4
247.0 44.1 132.0 45.5 115.0 42.7
501.4 86.3 281.8 91.9 219.6 80.0
387.8 80.6 247.7 98.3 140.2 61.3 308.8 76.1 217.8 98.8 91.0 49.2
186.2 78.4 131.4 98.9
54.8_ 52.3
193.0 78.8 134.4 98.3 58.6 54.1
193.3 75.0 133.9 97.4 59.4 49.4
179.0 70.4 124.9 93.8 54.1 44.6 '
128.7 60.6 90.6 83.3 38.1 36.9 89.6 49.0 60.6 67.0 29.0 31.4
74.7 22.2 47.1 35.2 27.6 13.7
2489.5 66.3 1602.2 82.S
887.3 49.0
1981** Number
('OOO) %
19.5 7.9 11.8 8.9 7.7 6.7
20.4 4.1 12.3 4.4 8.2 3.7
11.0 2.8 6.8 2.7 4.2 3.1
7.7 2.5 5.1 2.4 2.6 2.9 5.4 2.9 3.8 2.9 1.6 2.8
5.0 2.6 3.7 2.8 1.3 2.2
6.5 3.4 4.9 3.7 1.6 2.7
7.9 4.4 6.1 4.9 1.8 3.4 7.1 5.5 5.4 6.0 1.6 4.3 5.3 5.9 4.0 6.6 1.3 4.4 0.8 0.6 0.3
2.3/f 2.3 If 2.1 If
96.4 3.9 64.4 4.1 32.1 3.6
203.1 38.4 107.1 39.4 95.9 37.3
486.0 86.0 256.0 90.5 230.0 81.6
411.5 81.6 260.5 98.7 151.0 62.8 322.9 75.7 225.7 99.1 97.2 48.9
207.4 76.6 143.7 99.l 63.8 50.6
194.5 78.3 137.1 98.8 57.4 52.3
194.9 74.8 136.4 97.7 58.5 48.4
180.4 68.J 128.9 93.5 51.S 40.S
131.1 59.2 94.2 82.9 36.8 34.2 88.4 45.0 61.2 62.1 27.1 27.8
77.9 20.8 49.4 33.0 28.5 12.7
2498.1 64.7 1600.3 81.3
897.8 47.5
1982t Number
('OOO) %
18.7 9.2 11.4 10.6 7.4 7.7
22.6 4.6 13.9 5.4 8.7 3.8
12.1 2.9 8.2 3.1 3.9 2.6
7.9 2.5 5.7 2.5 2.2 2.3 4.4 2.1 3.2 2.2 1.2 1.8
4.7 2.4 3.5 2.6 1.2 2.1 5.8 3.0 4.8 3.5 1.0 1.7 6.1 3.4 5.3 4.1 0.7 1.4 5.0 3.8 4.4 4.6 0.7 1.8 2.9 3.3 2.4 3.9 0.5 1.9 0.8 0.6 0.2
I.I 1.3 0.7
91.1 3.6 63.5 4.0 27.6 3.1
184.7 36.4 98.3 38.0 86.4 34.8
497.1 86.5 259.1 90.2 237.9 82.9
434.2 82.0 269.1 98.4 165.1 64.5 337.4 76.4 230.7 99.0 106.7 51.2 236.3 77.I 163.6 99.3 72.8 51.3
185.6 78.6 130.9 99.0 54.8 52.6
185.3 74.0 130.4 97.5 54.9 47.0
188.2 68.0 136.6 93.0 51.6 39.7
129.8 56.7 95.0 81.7 34.8 30.9 87.2 43.0 61.1 60.2 26.1 25.7
74.7 19.4 48.7 30.6 26.0 11.5
2540.5 64.S 1623.6 80.9
916.9 47.4
1983t Number
('OOO) %
20.5 II.I 11.5 11.7 9.0 10.4
27.2 5.5 17.4 6.7 9.9 4.2
16.3 3.8 12.2 4.5 4.1 2.5
JO.I 3.0 7.7 3.3 2.4 2.3 7.0 3.0 5.0 3.1 1.9 2.7
5.4 2.9 4.2 3.2 1.2 2.2
7.3 3.9 6.1 4.7 1.1 2.0
8.2 4.4 7.2 5.2 1.1 2.1 6.4 5.0 5.7 6.0 0.8 2.2 4.2 4.8 3.6 6.0 0.5 2.0 1.4 1.1 0.3
1.9 2.2 1.2
113.9 4.5 81.6 5.0 32.3 3.5
169.7 35.6 90.0 37.0 79.8 34.1
489.1 86.4 253.9 89.2 235.3 83.5
455.7 83.5 274.4 98.8 181.4 67.8 354.4 77.3 237.8 99.0 116.6 53.4
268.2 77.5 183.7 99.2 84.4 52.5
189.0 80.5 128.4 98.7 60.6 57.8
191.7 76.9 133.3 98.0 58.4 51.5
190.4 68.9 137.0 94.0 53.4 40.8
134.3 58.4 97.6 82.1 36.7 33.0 88.1 42.5 62.0 61.0 26.1 24.7 75.5 19.5 48.4 29.8 27.0 12.0
2606.2 65.S 1646.5 81.3
959.7 49.1
1984t Number
('OOO) %
19.5 11.5 10.7 11.9 8.8 11.0
25.5 5.2 14.9 5.9 10.6 4.5 13.6 3.0 8.9 3.2 4.7 2.6
8.2 2.3 6.0 2.5 2.2 1.9
6.2 2.3 4.8 2.6 1.5 1.7
4.4 2.4 3.4 2.7 1.0 1.7 6.6 3.4 5.2 3.9 1.3 2.3
6.9 3.6 6.1 4.4 0.8 1.5 5.6 4.2 5.2 5.3 0.5 1.3 3.1 3.5 2.6 4.2 0.5 2.0 1.4 1.1 0.3
1.9 2.2 1.2
101.0 3.9 68.8 4.2 32.2 3.4
15o.6 33.4 82.2 35.2 68.4 31.5
477.8 85.8 247.4 88.2 230.4 83.4
476.0 84.3 287.6 98.5 188.4 69.1
359.0 76.6 239.2 98.6 119.7 53.0
300.4 77.3 208.7 98.6 91.6 51.7
191.9 79.7 133.7 98.4 58.1 55.4
190.2 76.4 132.8 96.8 57.4 51.3
184.7 68.5 132.3 92.7 52.4 41.2
137.4 57.0 100.S 80.3 37.0 31.9 86.I 41.6 60.9 57.6 25.3 24.8
73.0 17.6 46.2 26.7 26.8 11.1
2626.9 64.8 1671.5 80.4
955.4 48.5
1985t Number
('OOO) %
16.4 10.9 8.7 10.6 7.7 11.2
21.I 4.4 13.0 5.2 8.1 3.5
12.3 2.6 8.7 3.0 3.6 1.9
6.9 1.9 5.3 2.2 1.5 1.3 5.3 1.8 4.2 2.0 1.0 1.1
3.8 2.0 2.9 2.1 0.9 1.6
5.0 2.6 4.3 3.2 0.7 1.2 4.9 2.7 4.3 3.3 0.6 I.I 4.4 3.2 3.9 3.9 0.5 1.4
2.5 2.9 2.2 3.5 0.3 1.2 1.2 1.0 0.2
1.6 2.3 0.6
83.6 3.2 58.6 3.5 25.1 2.6
25

3 .3 Economically Active Population by Occupation, 1985 General Household Surveys-
Occupation
Professional, technical and related workers
Administrative and managerial workers
Clerical and related workers
Sales workers
Service workers
Agriculture, animal husbandry and forestry workers and fishermen
Production and related workers, transport equipment operators and labourers
Unclassifiable
Unemployed without previous job
Note: Figures are averages of the 1985 quarterly General Household Surveys.
Number of persons
177 700
87 500
408 OOO
286 400
431 600
43 300
1 178 800
300
13 300
3.4 Economically Active Population by Industry, 1985 General Household Surveys
Industry
Agriculture, forestry, hunting and fishing
Mining and quarrying
Manufacturing (textiles and wearing apparel)
Manufacturing (others)
Electricity, gas and water
Construction
Wholesale and retail trade, restaurants and hotels
Transport, storage and communication
Financing, insurance, real estate and business services
Services
Unclassifiable
Unemployed without previous job
Note: Figures are averages of the 1985 quarterly General Household Surveys.
Number of persons
42000
800
396 JOO
548 700
17 JOO
202 OOO
591 400
213 300
149 900
452 200
100
13 300
3.5 Economically Active Population by Activity Status, 1985 General Household Surveys
Activity status
Self-employed and outworkers
Employers
Employees
Unpaid family workers
Student workers
Unemployed
Note: Figures are averages of the 1985 quarterly General Household Surveys.
26
Number of persons
213 100
105 400
2 160 400
48 700
15 700
83 600

3.6 Working Population by Occupation by Sex by Educational Attainment, 1981 Census
No Poly-schooling/ technic/
Kinder- Lower Upper* Matri- Post- Technical Occupation Sex garten Primary secondary secondary culation secondary institute University Total
Professional, technical and related workers M 131 2 698 4 580 22 540 7 230 10 719 10 601 30 916 89415
F 127 724 1 004 15 844 4710 18 771 1 758 11 347 54285
Administrative and managerial workers M 4 511 6 765 18 263 4 879 2 736 2 697 15 348 55199
F 588 763 3 679 1 015 474 363 2 025 8907
Clerical and related workers M 230 10 935 18 447 72482 18 805 4 375 4 675 8 749 138 698 F 46 4 905 11 800 105 554 18 103 3 821 6 765 4 213 155 207
Sales workers M 14 316 72 333 32 940 42 488 6 234 2 405 1 870 7 648 180 234 F 17 058 19 426 11 399 16 407 1 441 553 407 999 67690
Service workers M 21 076 117 553 55 670 41 692 5 226 1 350 1 027 2484 246 078 F 53 553 42 970 11 912 14 867 2 426 696 268 1 323 128 015
Agriculture, animal husbandry and forestry workers and fishermen M 11 820 17 042 2 915 1 754 281 135 61 278 34286
F 11 953 3 552 436 330 39 25 5 50 16390
Production and related workers, transport equipment operators and labourers M 53 769 377 592 208 491 124 969 9 846 3 765 8 474 7 922 794828
F 71 195 204 273 89 561 44 719 3 464 1 508 956 2 041 417 717
Unclassifiable and armed forces M 525 3 583 2 930 3 312 1 220 285 296 554 12 705 F 919 1 238 707 841 254 207 64 183 4413
Total M 101867 606 247 332738 327 500 53721 25770 29701 73899 1551443 F 154 851 277 676 127 582 202241 31452 26055 10586 22181 852 624 T 256718 883 923 460320 529741 85173 51825 40287 96080 2404 067
Note: *Figures include craft courses in technical institutes.
3.7 Working Population by Industry by Sex by Number of Hours Worked Per Week, 1981 Census
Number of hours worked per week On leave
75 and and not Industry Sex 15-24 25-34 35-44 45-54 55-64 65-74 over applicable Total
Agriculture, forestry, hunting and fishing M 19 5 72 215 94 93 25 30 534 31057
F 25 5 31 31 30 11 21 15 793 15947
Mining and quarrying M 27 21 169 508 347 211 84 45 1412 F 10 67 44 17 6 144
Manufacturing (textiles) M 3 214 3 329 16 455 83 427 25 979 9 525 4 843 12 976 159748 F 17 095 12 099 32454 145 883 23 933 3 117 1456 5 191 241228
Manufacturing (others) M 5 690 6 186 55 068 187 011 63 557 20760 9 032 30 703 378007 F 13 871 8 283 60242 99 725 19 433 3400 1 795 4 633 211382
Electricity, gas and water M 92 161 4464 5740 2002 370 139 255 13223 F 50 5 775 448 107 10 15 36 1446
Construction M 6 734 7 714 24 780 61 329 49 523 10 230 4 358 9 206 173 874 F 578 500 3 244 4008 2 522 405 244 624 12125
Wholesale and retail trade and restaurants and hotels M 3 138 3 089 35 609 59 123 43 524 38 388 40 923 96 984 320778
F 3 680 3 155 30 612 33 623 20405 12 007 10 757 26472 140 711
Transport, storage and communication M 3 860 3 717 28 600 53 057 31 022 11 897 6 778 20 806 159737
F 911 728 9 390 5 989 1 783 469 365 1996 21631
Financing, insurance, real estate and business services M 668 1298 37 138 16 732 5 881 1 501 780 5 161 69159
F 454 835 31 084 10 698 2403 192 82 963 46711
Services M 5 236 8 021 61 162 74 985 32 331 15 315 9 808 17 080 223 938 F 10 177 13 481 47 163 35 941 18 194 9 377 11 415 6 017 151 765
Unclassifiable M 385 445 3 331 6 503 2662 1 199 950 5 035 20510 F 730 496 2030 2 682 872 304 314 2106 9534
Total M 29063 33986 266848 548630 256922 109489 77720 228785 1551443 F 47581 39587 217092 339072 89699 29298 26464 63831 852624
27

3.8 Working Population by Occupation by Sex by Activity Status, 1981 Census
On leave Self- Unpaid or industrial
Occupation Sex employed Employers Outworkers Employees workers dispute Total
Professional, technical and related workers M 3 644 3 833 363 79494 547 1 534 89415
F 526 611 88 50 395 529 2136 54285
Administrative and managerial workers - M 21 508 33 208 76 407 55199
F 2048 6 471 267 121 8907
Clerical and related workers M 330 655 125 136 333 153 l 102 138 698 F 100 218 172 152 757 678 l 282 155 207
Sales workers M 57 005 28146 90 831 2884 l 368 180234 F 19 813 3 126 34163 9 531 l 057 67690
Service workers M 3 702 4732 159 233 395 643 3 447 246 078 F 968 886 153 121 463 l 852 2 693 128 015
Agriculture, animal husbandry and forestry workers and fishermen M 16 703 1 858 10 351 5 236 138 34286
F 5 432 184 2 918 7 791 65 16390
Production and related workers, transport equipment operators and labourers M 34 431 19 862 10 067 718 674 2 210 9 584 794828
F 3 306 l 496 43 649 357 680 4942 6 644 417717
Unclassifiable and armed forces M 709 537 297 10 818 67 277 12705 F 137 67 615 3 104 183 307 4413
Total M 116524 81131 11011 1313104 11816 17857 1551443 F 30282 8636 44677 728951 25773 14305 852 624 T 146806 89767 55688 2042 055 37589 32162 2404067
3.9 Working Population by Industry by Sex by Activity Status, 1981 Census
On leave Self- Unpaid or industrial
Industry Sex employed Employers Outworkers Employees workers dispute Total
Agriculture, forestry, hunting and fishing M 16 622 1 802 5 7 281 5 239 108 31057
F 5 413 179 11 2 543 7 767 34 15947
Mining and quarrying M 9 20 l 367 16 1412 F 144 144
Manufacturing (textiles) M 4 016 7 344 5047 141 327 449 1 565 159748 F l 086 967 24 567 209 662 l 845 3 101 241228
Manufacturing (others) M 9 836 17 468 4 678 341 710 1152 3 163 378007 F 762 1216 17 989 185 574 3 236 2 605 211382
Electricity, gas and water M 47 91 12 979 106 13223 F 20 1 410 16 1446
Construction M 3 459 3 760 116 164 377 185 1977 173 874 F 142 143 11 11 383 107 339 12125
Wholesale and retail trade and restaurants and hotels M 57 899 35 965 757 219 740 3449 2968 320 778
F 20 238 4265 l 119 102 687 10 506 l 896 140 711
Transport, storage and communication M 13 178 4204 138 605 351 3 399 159737
F 831 299 19 172 473 856 21631
Financing, insurance, real estate and business services M l 148 3448 43 63 887 78 555 69159
F 131 383 6 45 651 96 444 46711
Services M 8 391 5 135 53 206 599 643 3 117 223938 F 1 384 978 85 144 706 l 150 3462 151 765
Unclassifiable M 1 919 l 894 312 15 232 270 883 20510 F 295 186 889 6 019 593 l 552 9534
Total M 116524 81131 11011 1313104 11816 17857 1551443 F 30282 8636 44677 728951 25773 14305 852624 T 146806 89767 55688 2042 055 37589 32162 2404067
28

3.10 Establishments and Persons Engaged in the Public and Private Sectors by Major Division
Major division 1976 1977 1978 1979 1980 1981 1982 1983 1984 1985
Public sector Persons engaged 106 074 111 949 119 618 126 184 132 944 145 425 161 803 168 366 172 391 174 869
Private sector
Mining and quarrying Establishments 17 19 17 21 21 18 18 16 11 9 Persons engaged 459 657 617 814 902 872 921 852 655 642
Manufacturing Establishments 36 303 37 568 41240 42282 45409 46729 47089 46 817 48 992 48065 Persons engaged 773 746 755 108 816 683 870 898 892140 904646 856 137 865 073 904 709 848 900
Electricity and gas Establishments 4 4 4 4 4 4 4 4 3 3 Persons engaged 6485 6734 7204 7 912 9082 10269 11326 10760 10 516 11 032
Construction work sites Sites 1 093 1202 1261 1207 1212 1343 1 313 1117 1023 1 062 Persons engaged 48 761 63010 74734 85 959 89670 82 733 81243 71159 67 732 64427
Wholesale, retail and import/export trades, restaurants and hotels Establishments 59127 60739 61 573 65155 68 055 74068 82018 86743 92 347 101 854
Persons engaged 357 824 381 709 384 702 413 655 440913 455 752 498 723 520 352 548 594 588 678
Transport, storage and communication Establishments 1 735 1 989 2258 2450 2 578 2907 3 357 3 320 3 346 3 516
Persons engaged 51464 57 575 61460 68002 70429 76 876 85 846 88 702 89 594 93 612
Financing, insurance, real estate and business services Establishments 5962 6994 8482 9 638 10 171 11 563 13 421 14 161 14 651 15 532
Persons engaged 72465 83 085 98225 113 389 116000 134047 157 663 164453 165 032 171 631
Community, social and personal services Establishments 10415 12 387 13420 13 742 14 543 14907 16 360 17 747 18 304 18 922
Persons engaged 124 038 140 734 152 534 158 838 162 112 168 284 180383 189 214 192 656 199 438
3.11 Employment in Government Service by Purpose Nwnber of persons engaged
Purpose 1976 1977 1978 1979 1980 1981 1982 1983 1984 1985
General administration 9 918 10745 11827 13139 14404 17 309 18 525 19 639 19 870 19 867
Public order and safety Police 19 035 20476 21 778 22966 24113 25475 27 335 28 513 29 501 30413 Judiciary and correctional services 4168 4663 5344 5 513 5 525 5 835 6772 7 892 8 298 8 491 Fire protection 3 666 3 845 4234 4539 4949 5 316 5 772 6122 6292 6 577
Defence 207 207 215 212 214 216 218 224 220 227
Education 5 554 5 633 5 693 5 765 5 572 5 932 6 715 7037 7139 7 159
Health 14437 15 021 15 631 16127 17 118 18 254 19 781 21208 23 247 24656
Social security and welfare services 2124 2242 2435 2 517 2606 2 763 3 062 3 081 3 150 3 038
Housing and community amenities Housing 5 599 5 876 6 370 6710 7644 8 853 10 941 11 384 11 351 11 091 Community infrastructure 7 941 8412 9 012 9 614 9974 .11 065 13 329 13 809 14103 14156 Sanitary services 14152 14344 15 244 16144 16 541 17 581 18 812 19 414 18 809 18 294
Other community and social services 2213 2403 2620 3139 3 326 3 746 4869 5250 5 448 5 472
Economic services Agriculture, fisheries and forestry 1 520 1 760 2 327 2 151 2056 2265 2440 2 391 2 370 2 414 Mining, manufacturing 4759 4819 4767 4727 4813 4896 4970 5 027 4971 4924 Water 3 182 3496 3620 3 576 3 735 4018 4278 4 368 4 512 ,, 4782 Land transport 1 527 1 611 1 707 1 819 1 950 2 376 3 314 1 766 1694 1 659 Water transport 524 538 592 618 615 737 821 855 835 848 Air transport 399 398 416 449 458 485 521 561 581 583 Commerce and industry 2 706 2934 3200 3 618 3 975 4651 5 223 5 538 5 709 5 806 Postal services 2443 2 526 2 586 2 841 3 356 3 652 4105 4287 4 291 4412
Total 106074 111949 119618 126184 132944 145 425 161803 168366 172391 174869
29
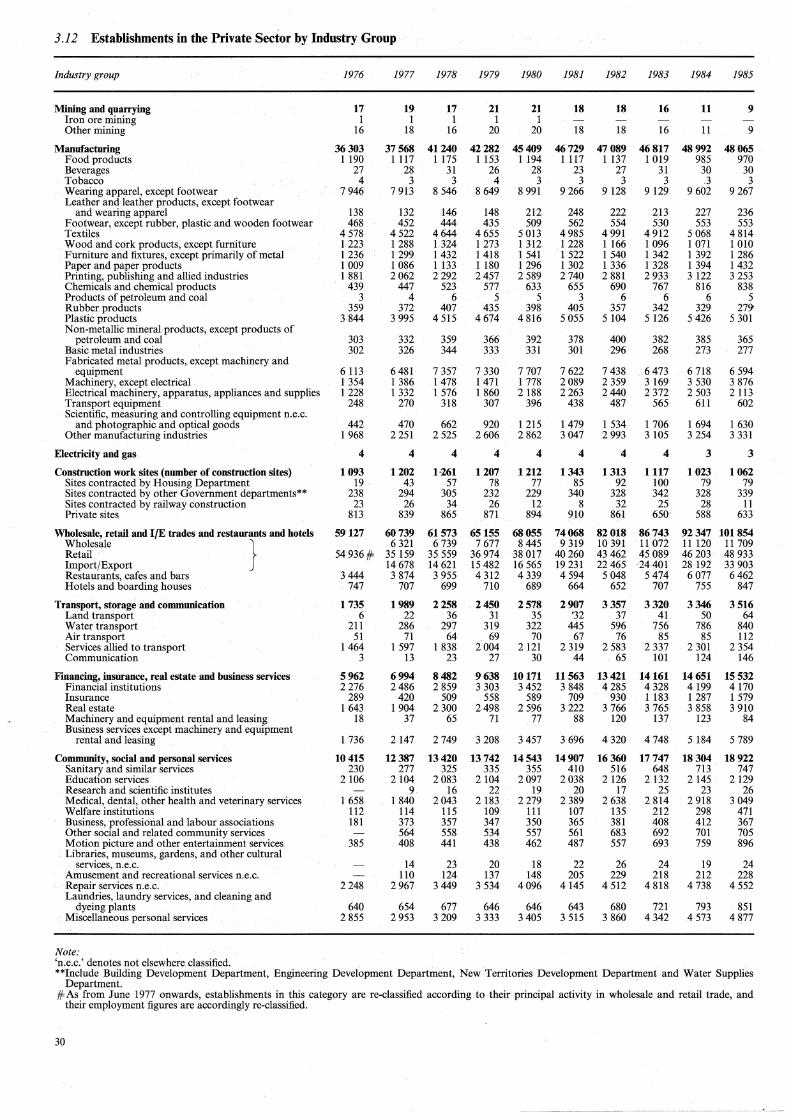
3.12 Establishments in the Private Sector by Industry Group
Industry group 1976 1977 1978 1979 1980 1981 1982 1983 1984 1985
Mining and quarrying 17 19 17 21 21 18 18 16 11 9 Iron ore mining 1 1 1 1 1 Other mining 16 18 16 20 20 18 18 16 11 9
Manufacturing 36303 37568 41240 42282 45409 46729 47089 46817 48992 48065 Food products 1190 1117 1175 1153 1194 1117 1137 1 019 985 970 Beverages 27 28 31 26 28 23 27 31 30 30 Tobacco 4 3 3 4 3 3 3 3 .3 3 Wearing apparel, except footwear 7946 7913 8 546 8 649 8 991 9266 9 128 9129 9602 9267 Leather and leather products, except footwear
and wearing apparel 138 132 146 148 212 248 222 213 227 236 Footwear, except rubber, plastic and.wooden footwear 468 452 444 435 509 562 554 530 553 553 Textiles 4578 4522 4644 4655 5013 4985 4991 4912 5 068 4 814 Wood and cork products, except furniture 1 223 1288 1324 1273 1 312 1228 1166 1096 1 071 1 010 Furniture and fixtiires, except primarily of metal 1 236 1299 1432 1418 1 541 1 522 1 540 1342 1 392 1 286 Paper and paper products l 009 1086 1133 1180 1296 1302 1 336 1 328 1 394 1432 Printing, publishing and allied industries 1 881 2062 2292 2457 2 589 2 740 2 881 2933 3122 3 253 Chemicals and chemical products 439 447 523 577 633 655 690 767 816 838 Products of petroleum and coal 3 4 6 5 5 3 6 6 6 5 Rubber products 359 372 407 435 398 405 357 342 329 27'} Plastic products 3 844 3 995 4 515 4674 4816 5 055 5104 5 126 5426 5 301 Non-metallic mineral products, except products of
petroleum and coal 303 332 359 366 392 378 400 382 385 365 Basic metal industries 302 326 344 333 331 301 296 268 273 277 Fabricated metal products, except machinery and
equipment 6113 6481 7 357 7 330 7707 7622 7 438 6473 6 718 6 594 Machinery, except electrical 1 354 1 386 1478 1471 1 778 2089 2 359 3 169 3 530 3 876 Electrical machinery, apparatus, appliances and supplies 1228 1 332 1 576 1 860 2188 2263 2440 2372 2 503 2 113 Transport equipment 248 270 318 307 396 438 487 565 611 602 Scientific, measuring and controlling equipment n.e.c.
and photographic and optical goods 442 470 662 920 1215 1479 1 534 1 706 1694 1 630 Other manufacturing industries 1968 2 251 2 525 2606 2862 3047 2993 3 105 3 254 3 331
Electricity and gas 4 4 4 4 4 4 4 4 3 3
Construction work sites (number of construction sites) 1093 1202 1-261 1207 1212 1343 1313 1117 1023 1062 Sites contracted by Housing Department 19 . 43 57 78 77 85 92 100 79 79 Sites contracted by other Government departments** 238 294 305 232 229 340 328 342 328 339 Sites contracted by railway construction 23 26 34 26 12 8 32 25 28 11 Private sites 813 839 865 871 894 910 861 650· 588 633
Wholesale, retail and .J{E trades and restaurants and hotels 59127 60739 61573 65155 68055 74068 82018 86743 92347 101854 Wholesale } 6 321 6739 7677 8445 9 319 10 391 11072 11120 11 709 Retail 54936# 35 159 35 559 36974 38 017 40260 43 462 45089 46203 48 933 Import/Export 14678 14 621 15 482 16 565 19 231 22465 24401 28 192 33 903 Restaurants, cafes and bars 3444 3 874 3 955 4 312 4 339 4594 5048 5474 6077 6462 Hotels and boarding houses 747 707 699 710 689 664 652 707 755 847
Transport, storage and communication 1735 1989 2258 2450 2578 2907 3357 3320 3346 3516 Land transport 6 22 36 31 35 '32 37 41 50 64 Water transport 211 286 297 319 322 445 596 756 786 840 Air transport 51 71 64 69 70 67 76 85 85 112 Services allied to transport 1464 1 597 1 838 2004 2121 2 319 2 583 2 337 2 301 2 354 Co=unication 3 13 23 27 30 44 65 101 124 146
Financing, insurance, real estate and business services 5962 6994 8482 9638 10171 11563 13421 14161 14651 15532 Financial institutions 2276 2486 2 859 3 303 3 452 3 848 4285 4 328 4199 4170 Insurance 289 420 509 558 589 709 930 1183 1 287 1 579 Real estate 1643 1904 2300 2498 2596 3222 3 766 3 765 3 858 3 910 Machinery and equipment rental and leasing 18 37 65 71 77 88 120 137 123 84 Business services except machinery and equipment
rental and leasing 1 736 2147 2749 3208 3 457 3 696 4320 4748 5 184 5 789
Community, social and personal services 10415 12387 13420 13742 14543 14907 16360 17747 18304 18922 Sanitary and similar services 230 277 325 335 355 410 516 648 713 747 Education services 2106 2104 2083 2104 2097 2038 2126 2132 2145 2129 Research and scientific institutes 9 16 22 19 20 17 25 23 26 Medical, dental, other health and veterinary services 1 658 1840 2043 2 183 2279 2 389 2 638 2 814 2 918 3 049 Welfare institutions 112 114 115 109 111 107 135 212 298 471 Business, professional and labour associations 181 373 357 347 350 365 381 408 412 367 Other social and related co=unity services 564 558 534 557 561 683 692 701 705 Motion picture and other entertainment services 385 408 441 438 462 487 557 693 759 896
: Libraries, museums, gardens, and other cultural services, n.e.c. 14 23 20 18 22 26 24 19 24
Amusement and recreational services n.e.c. 110 124 137 148 205 229 218 212 228 ·Repair services n.e.c. 2248 2967 3449 3 534 4096 4145 4 512 4 818 4 738 4552 Laundries, laundry services, and cleaning and
dyeing plants 640 654 677 646 646 643 680 721 793 851 · Miscellaneous personal services 2 855 2953 3209 3 333 3405 3 515 3 860 4342 4573 4877
Note: 'n.e.c.' denotes not elsewhere classified. **Include Building Development Department, Engineering DevelOpment Department, New Territories Development Department and Water Supplies
Department. #As from June 1977 onwards, establishments in this category are re-classified according to their principal activity in wholesale and retail trade, and
their employment figures are accordingly re-classified.
30

3.13 Persons Engaged in the Private Sector by Industry Group
Industry group 1976 1977 1978 1979 1980 1981 1982 1983 1984 1985
Mining and quarrying 459 657 617 814 902 872 921 852 655 642 Iron ore mining 38 40 42 40 2 Other mining 421 617 575 774 900 872 921 852 655 642
Manufacturing 773746 755108 816683 870898 892140 904646 856137 865 073 904709 848 900 Food products 15 209 15 274 16 454 16 567 18 241 17 127 18 559 17 196 16 996 17 168 Beverages 2 958 3 260 3 543 3444 4 394 4 291 4640 4 839 4648 4447 Tobacco 784 774 768 812 836 874 883 894 977 1 210 Wearing apparel, except footwear 244 510 229 757 246960 251 344 255 677 258 346 251 367 256 429 265 353 259 911 Leather and leather products, except footwear and
wearing apparel 2 359 2075 2 184 2 605 3 690 3 693 2 820 3 110 3 385 3 148 Footwear, except rubber, plastic and wooden footwear 4 976 5 001 5 106 6 115 6629 8 079 7 327 6 639 7 786 7 780 Textiles 137 315 123 977 122 965 126 751 124 573 123 365 111 588 lll 781 115 429 108 376 Wood and cork products, except furniture 7 691 7 868 8 128 8 310 7766 7 036 6 346 5 877 5 656 4992 Furniture and fixtures, except primarily of metal 8494 8 732 9 388 9 415 10 901 11 089 9 712 8 765 8 677 8 218 Paper and paper products 9002 9 619 10 049 11 177 11807 11979 12 284 11 909 13 006 13 466 Printing, publishing and allied industries 22 353 22091 23 936 25 129 26449 28 302 27 902 28 407 29 193 30 385 Chemicals and chemical products 5 534 5 822 6 354 6 874 7 646 8 003 7 919 8 318 8 216 8 731 Products of petroleum and coal 18 24 76 120 143 205 339 207 203 221 Rubber products 6 312 5 394 6 198 5 298 4 769 4458 3 482 2 953 3 090 2237 Plastic products 76 994 78449 86 512 87 853 86 314 89 147 83 043 82 730 92 355 84 686 Non-metallic mineral products, except products of
petroleum and coal 3 947 4056 4579 4 803 4 853 4 886 4 415 4 546 4223 4 107 Basic metal industries 3 807 4 100 4439 4196 4907 4684 4 544 3 539 3 538 3 798 Fabricated metal products, except machinery and
equipment 69 781 70 931 80 106 84 805 84 753 82 114 73 514 66 480 67 578 63 030 Machinery, except electrical 11 971 11 967 12 910 13 582 14 132 14 835 14 467 17 794 20049 21 995 Electrical machinery, apparatus, appliances and supplies 88 057 89 525 97 962 117 713 119 141 124 134 118 843 131 297 143 867 113 991 Transport equipment 11 810 12 205 13 482 14127 14 984 15 805 18 066 15 213 13 798 13 143 Scientific, measuring and controlling equipment n.e.c.
and photographic and optical goods 18 449 20 635 26 786 39 345 48479 48 287 44 804 46700 45 968 42 730 Other manufacturing industries 21 415 23 572 27798 30 513 31 056 33 906 29 273 29 450 30 718 31 130
Electricity and gas 6485 6734 7204 7912 9082 10269 11326 10760 10 516 11032
Construction work sites (number of construction sites) 48761 63010 74734 85959 89670 82733 81243 71159 67732 64427 Sites contracted by Housing Department 2 378 5 031 10 222 18 210 15 916 15 032 16 269 15 504 11 286 11 610 Sites contracted by other Government departments** 11 945 18 162 20 586 16 412 14449 16 523 18 106 19 038 17 999 15 671 Sites contracted by railway construction 4 791 7 526 7 396 5 380 4432 1 656 4 291 6 185 4 335 1 072 Private sites 29 647 32 291 36 530 45 957 54 873 49 522 42 577 30 432 34 112 36 074
Wholesale, retail and I/E trades and restaurants and hotels 357 824 381 709 384702 413655 440913 455 752 498723 520352 548 594 588 678 Wholesale } 37 646 39 887 44 351 48 062 51 161 55 783 58 034 56 535 58 655 Retail 254 535 #= 133 776 133 953 138 132 148 012 149 591 159 222 163 OOO 160 964 170 088 Import/Export 95 383 92 856 102 577 112 837 115 200 130 383 136 042 158 070 185 436 Restaurants, cafes and bars 86 806 97 887 99 937 109 605 113 081 119 808 131 727 140 981 150 464 150 880 Hotels and boarding houses 16 483 17 017 18 069 18 990 18 921 19 992 21 608 22 295 22 561 23 619
Transport, storage and communication 51464 57575 61460 68002 70429 76876 85846 88702 89594 93612 Land transport 10 989 11 352 11 518 13 549 14 325 16 315 17 210 20452 21 210 22 133 Water transport 7 633 11 255 11 475 11 816 11 968 13 184 14 871 16 244 15 653 16 661 Air transport 4 567 4774 4 863 5 454 6 016 6290 6 431 6496 6 671 7 354 Services allied to transport 18 852 19 523 21 391 23072 23 929 25 058 29 262 26 291 26 828 27 081 Communication 9 423 10 671 12 213 14111 14 191 16 029 18 072 19 219 19 232 20 383
Financing, insurance, real estate and business services 72465 83085 98225 113389 116000 134047 157 663 164453 165 032 171631 Financial institutions 37 999 40722 47 599 55 477 56 701 66475 76029 78 273 76 720 77 193 Insurance 4131 4 847 5 544 6 011 6 107 6972 7 973 8 116 8 419 8 929 Real estate 10 355 12 837 15 234 17 172 17 126 20 415 24 881 26 807 27 530 28 071 Machinery and equipment rental and leasing 99 527 515 592 618 583 755 765 732 714 Business services except machinery and equipment rental
and leasing 19 881 24152 29 333 34137 35 448 39602 48 025 50 492 51 631 56 724
Community, social and personal services 124038 140734 152534 158838 162112 168284 180 383 189 214 192 656 199 438 Sanitary and similar services 7 462 8 885 11479 11262 11 315 11 019 13 307 14 584 13 984 16 034 Education services 52 033 53 714 55 110 57 760 57 396 58 164 62 188 65 401 68 265 70 487 Research and scientific institutes 31 68 110 111 149 171 285 295 331 Medical, dental, other health and veterinary services 16 866 17 741 19 013 19 983 20 325 21 717 23 143 24 661 25 606 26 195 Welfare institutions 3 363 3 953 4 708 4 995 5 123 6 187 6 852 8 041 9473 8 562 Business, professional and labour associations 1 140 1 706 1 782 1 909 1924 2 059 2404 2 674 2 619 2408 Other social and related community services 3 511 3 623 3 721 3 876 4438 5 743 5 979 6 187 6 815 Motion picture and other entertainment services 7 759 7 847 8 269 8272 8 361 8 464 8 932 9 165 9 103 10 209 Libraries, museums, gardens, and other cultural
services n.e.c. 165 289 286 299 316 342 328 284 236 Amusement and recreational services n.e.c. 4 361 5 392 5 753 5 804 6747 6900 6 780 7 228 8 239 Repair services n.e.c. 14422 17 025 19 411 20 802 23 199 23 379 22 695 21 086 19 206 17 744 Laundries, laundry services, and cleaning and
dyeing plants 4 067 4284 4 307 4002 4029 4438 4 561 4 814 4 673 4 962 Miscellaneous personal services 16 926 17 511 19 083 19 983 20 350 21207 23 145 25 ~16 25 733 27 216
Note: 'n.e.c.' denotes not elsewhere classified. **Include Building Development Department, Engineering Development Department, New Territories Development Department and Water Supplies
Department. fl=As from June 1977 onwards, establishments in this category are re-classified according to their principal activity in wholesale and retail trade, and
their employment figures are accordingly re-classified.
31

3.14 Establishments and Persons Engaged in Selected Major Divisions by Employment Size
(a) Manufacturing
Number of persons engaged 1976 1977 1978 1979 1980 1981 1982 1983 1984 1985
1-9 Establishments 23 518 24846 27205 27 351 29747 30 541 31 741 31 368 33 022 32 827 Persons engaged 94478 97999 108 066 119969 117 124 120 129 120 410 118 192 124. 413 121 291
10--19 Establishments 5494 5600 6037 7 011 6970 7294 6 791 6 875 7028 6760 Persons engaged 73 388 74993 80958 97260 93 898 98 216 91 641 92 141 94303 90 156
20--49 Establishments 4174 4186 4714 4421 5119 5 198 5097 5 108 5 342 5040 Persons engaged 128 866 130 038 146 281 139 794 157 222 161 637 155 949 157 434 164 478 154 161
50--99 Establishments 1 745 l 650 1 918 2059 2111 2 181 2041 . 1 993 2095 2 016 Persons engaged 120 805 114 259. 131 733 141169 144974 146760 139 058 135 722 142 352 137 110
100--199 Establishments 838 777 863 901 895 958 897 938 942 904 Persons engaged 113 353 104 722 116 855 121 671 122 680 130 633 122043 127 159 128 684 122 734
200--499 Establishments 397 371 362 386 410 419 386 396 424 393 Persons engaged 114 723 106730 105 972 113 151 120 353 123 905 112 688 116 213 126 911 117 266
500--999 Establishments 92 98 104 109 117 105 108 107 104 99 Persons engaged 63496 67392 69303 72554 77 567 71 355 71378 70926 71 362 67257
1 000--1 999 Establishments 40 34 32 39 36 30 24 28 31 23 Persons engaged 52560 45 304 43.522 51625 46752 40115 31228 35 890 40828 29143
2 OOO and over Establishments 5 6 5 5 4 4 4 4 4 3 Persons engaged 12077 13 671 13993 13 705 11570 11 895 11 742 ll 396 11 378 9782
Total Establishments 36303 37568 41240 42282 45409 46729 47089 46817 48992 48065 Persons engaged 773746 755108 816683 870898 892140 904646 856137 865 073 904709 848900
32

3.14 Establishments and Persons Engaged in Selected Major Divisions by Employment Size (Continued)
(b) Wholesale, Retail and Import/Export Trades, Restaurants and Hotels
Number of persons engaged
Wholesale, retail and import/ export trades
1-4
5-9
10-19
20-49
50-99
100-199
200-499
500-999
1 OOO and over
Establishments Persons engaged
Establishments Persons engaged
Establishments Persons engaged
Establishments Persons engaged
Establishments Persons engaged
Establishments Persons engaged
Establishments Persons engaged
Establishments Persons engaged
Establishments Persons engaged
Sub-total Establishments
Restaurants and hotels
1-4
5-9
10-19
20-49
50-99
100-199
200-499
500-999
1 OOO and over
Sub-total
Total
Persons engaged
Establishments Persons engaged
Establishments Persons engaged
Establishments Persons engaged
Establishments Persons engaged
Establishments Persons engaged
Establishments Persons engaged
Establishments Persons engaged
Establishments Persons engaged
Establishments Persons engaged
Establishments Persons engaged
Establishments Persons engaged
1976 1977 1978 1979 1980 1981 1982 1983 1984 1985
39 965 40 616 41 791 44 029 45 278 51 098 57 237 61 165 65 600 72 837 91 824 93 354 94 451 99 624 101 792 112 429 123 219 129 498 136 802 150 606
10 660 10 918 10 543 11 135 12 079 12 288 13 020 13 280 13 434 14 584 66 663 68 438 66 124 69 737 75 755 77 150 82 064 83 576 84 470 92 016
3 065 3 246 3 194 3 461 3 915 3 765 4 194 4 247 4 428 4 868 39 487 41 996 41 265 44 400 50 809 48 860 54 174 55 025 57 145 62 986
971 1 083 1 089 1 171 1 388 1 297 1 462 1 452 1 597 1 751 27 457 30 494 30 863 33 298 38 700 36 869 41108 41 008 45 175 50 040
192 203 196 218 248 241 269 264 296 326 12 901 13 918 13 125 14 416 16 503 15 978 17 947 17 927 20 045 22 526
54 61 73 81 82 84 90 112 110 120 7 231 8 222 9 703 10 945 11 021 11 333 11 805 15 191 15 065 16 142
27 28 30 35 31 32 43 38 46 53 7 805 8 619 9 027 10 276 9 622 9 436 12 281 11 568 13 528 15 304
2 3 3 2 4 4 2 3 3 5 1 167 1 764 2 138 1 131 2 209 2 429 1 307 1 886 1 971 3 264
1 1 233
2 2 500
1 1468
1 1 483
1 1 397
1 1 368
I 1 295
~m %m %m ~m ~m ~~ mm ~~ ~m w~ 254 535 266 805 266 696 285 060 308 911 315 952 345 388 357 076 375 569 414 179
1 357 1 515 1 521 1 569 1 294 1 530 1 592 1 720 1 939 2 241 3 595 3 955 3 961 4 179 3 517 4 078 4 234 4 619 5 230 5 855
802 903 931 1 074 1 307 1 147 1 292 1 469 1 646 1 794 5 299 5 990 6 210 7 165 8 154 7 650 8 605 9 813 11 020 11 996
882 883 921 982 1 030 1 089 1 200 1 305 1 437 1 523 12143 12210 12832 13632 14412 14976 16427 17787 19616 20487
672 756 751 834 839 891 972 1 025 1 109 1 063 20 026 22 530 22 417 24 799 26 335 26 775 28 995 30 633 33 344 31 827
™ w w ~ ~ m m m ~ ~ 17 869 18 739 18 459 20 042 18 669 19 857 20 238 20 448 22 835 23 438
176 188 198 202 203 217 235 236 245 235 24015 25780 26980 27932 28176 30462 33244 32948 34642 33788
36 55 57 68 75 81 93 109 104 101 10 224 14 787 15 187 18 303 19 496 21 388 25 357 29 831 27 986 28 584
10 7 7 9 10 11 12 15 18 18 7 962 5 440 5 589 7 381 8 135 9 242 9 550 11 549 13 593 13 761
2 5 5 4 4 5 6 5 4 4 2156 5473 6371 5162 5108 5372 6685 5648 4759 4763
4m 4~ 4~ 5m 5m 5m 5~ 6m 6W 1m 103 289 114 904 118 006 128 595 132 002 139 800 153 335 163 276 173 025 174 499
~m @m film ~™ ~~ ~~ ~m ~m ~* m~ 357 824 381 709 384 702 413 655 440 913 455 752 498 723 520 352 548 594 588 678
33

3.14 Establishments and Persons Engaged in Selected Major Divisions by Employment Size· (Continued)
( c) Financing, Insurance, Real Estate and Business Services
Number of persons engaged 1976 1977 1978 1979 1980 1981 1982 1983 1984 1985
1-4 Establishments 2 958 3 698 4 507 5 232 5 565 6 307 7 518 8 094 8 621 9 354 Persons engaged 6 611 8 265 10 180 11 989 12 679 13 778 15 741 16 328 17 217 18 482
5-9 Establishments 1 445 1 557 1 965 2 091 2209 2 423 2 655 2 775 2 756 2 837 Persons engaged 9406 10 122 12 705 13 453 14 316 15 958 17 472 18 264 18 101 18 581
10--19 Establishments 874 959 1 095 1 257 1 322 1 613 1 777 1 791 1 813 1 853 Persons engaged 11684 12 926 14 680 17 012 17 950 21 879 24040 24270 24409 24 996
20--49 Establishments 456 516 616 707 725 829 l 005 1 023 969 991 Persons engaged 13 373 15 078 17 985 20 759 21 310 24 556 29 608 30 232 28 336 29 253
50-99 Establishments 152 171 192 218 216 226 275 283 280 274 Persons engaged 10427 11 787 13 319 14 997 14 839 15 553 18 860 19 522 19 559 19 OOO
100-199 Establishments 46 56 66 81 84 106 115 113 123 127 Persons engaged 6 358 7 921 9496 10 945 11 289 14 564 15 469 15 688 17 014 17 309
200-499 Establishments 27 32 34 43 40 50 61 63 67 74 Persons engaged 8 428 9 980 10 708 12 851 11 978 15 233 17 810 18 999 20659 22 627
500-999 Establishments 1 3 5 6 5 10 13 17 17 Persons engaged 527 1 776 3 138 3 569 3 134 6479 8444 11 105 11 986
1 OOO and over Establishments 4 4 4 4 4 4 5 6 5 5 Persons engaged 6178 6479 7 376 8 245 8070 9 392 12 184 12 706 8 632 9 397
Total Establishments 5962 6994 8482 9638 10171 11563 13421 14161 14651 15532 Persons engaged 72465 83085 98225 113 389 116000 134047 157663 164453 165 032 171631
3.15 Establishments in Selected Major Divisions by Census District
(a) Manufacturing
Census area/ district 1976 1977 1978 1979 1980 1981 1982 1983 1984 1985
Hong Kong Island 6625 7006 7592 7950 7853 7513 7682 7 403
Central 306 348 390 440 425 376 376 373 SheungWan 836 885 953 1 103 1 081 1 041 1 062 1 040 West 1 096 1145 1 127 1 212 1 250 1 175 1133 1 073 Mid-levels and Pokfulam 46 51 56 57 50 45 39 30 Peak 1 Wan Chai 1159 1 203 1 298 1 315 1 260 1 181 1156 1102 Tai Hang 290 301 319 334 318 283 286 246 North Point 1 077 1142 1 227 1192 1105 1 067 1114 1 062 Shau Kei Wan 1 083 1168 1 396 1 541 1 543 1 470 1 548 1 456 Aberdeen 716 746 809 730 785 845 941 991 South 16 17 17 26 35 30 27 30
Kowloon 9310 9295 9411 9311 8691 8091 8123 7574
Tsim Sha Tsui 894 956 1 044 989 1 027 1 001 1 130 1 063 Yau Ma Tei 1 713 1 694 1 725 1 778 1 613 1 380 1 378 1 290 Mong Kok 3 292 3 181 3 104 3 075 2 952 2 855 2 837 2 595 Hung Hom 3 327 3 389 3 461 3 388 3 003 2 768 2 704 2 560 Ho Man Tin 84 75 77 81 96 87 74 66
New Kowloon 14014 14134 15140 16358 16483 16258 16660 16299
Cheung Sha Wan 6 143 6 199 6274 6 301 5 817 5 857 5 929 5 951 Shek Kip Mei 406 419 530 536 460 454 434 390 Kowloon Tong 58 61 82 107 74 70 68 63 Kai Tak 4295 4298 4 538 4497 3 900 3 637 3 597 3 334 Ngau Tau Kok 2 731 2 721 3 145 4200 5 528 5 578 5 983 5 967 Lei Yue Mun 381 436 571 717 704 662 649 594
New Territories 6354 7133 9097 11790 14062 14955 16527 16789
Tsuen Wan area 3 987 4 321 5 707 7 665 9 534 10 161 10 985 11130 Yuen Long area 999 1210 1445 2 035 2 329 2 568 2 955 3 017 Tai Po area 967 1 143 1450 1 546 1 715 1 783 2 182 2 315 Islands and Sai Kung area 401 459 495 544 484 443 405 327
34

3.15 Establishments in Selected Major Divisions by Census District (Continued)
(b) Wholesale, Retail and Import/Export Trades, Restaurants and Hotels
Census area/ district 1976 1977 1978 1979 1980 1981 1982 1983 1984 1985
Hong Kong Island 21395 22019 21945 22963 25051 27 242 28332 29766 31943
Central 4 344 4449 4 375 4 417 4 221 4 211 4122 4 225 4 534 SheungWan 5 417 5 550 5 576 5 876 6498 6 995 6 940 7 317 7 569 West 2132 2 150 2043 2002 2 132 2 437 2 712 2 685 2 862 Mid-levels and Pokfulam 219 228 230 259 284 285 303 313 303 Peak 22 30 32 35 39 37 57 54 57 Wan Chai 2 701 2 867 2 993 3 062 3 676 3 935 4 192 4 515 5 107 Tai Hang 1 833 1 988 2025 2 170 2209 2 330 2 272 2416 2 649 North Point 2 263 2248 2 192 2 391 2 956 3 317 3 653 3 814 4 258 ShauKei Wan 1 361 1 380 1 355 1 580 1 699 1 902 1 916 2 169 2 298 Aberdeen 955 975 966 999 1132 1 584 1 938 2020 2 037 South 148 154 158 172 205 209 227 238 269
Kowloon 15803 16720 17107 18183 21067 22605 23819 25562 28332
Tsim Sha Tsui 5 104 5 579 5 803 6203 7 306 7 960 8 989 9 789 11 010 Yau Ma Tei 4 535 4772 4 833 5 367 5 968 6 320 6 287 6449 7 162 MongKqk 3 076 3 211 3 233 3 302 3 944 4 287 4 364 4 581 5 101 Hung Hom 2436 2 417 2467 2 513 2 899 3 049 3 195 3 751 4102 Ho Man Tin 652 741 771 798 950 989 984 992 957
New Kowloon 13192 13025 12709 13166 15400 17153 17602 18 213 20672
Cheung Sha Wan 3 816 3 844 3 857 4 205 4 875 5 440 5 825 6 317 6 788 ShekKip Mei 1 021 958 891 1 003 1 249 1272 1 270 1 247 1 161 Kowloon Tong l1l 125 127 157 181 204 226 234 240 Kai Tak 4 712 4 550 4 367 4284 4 867 5 191 5 166 5 148 5 867 Ngan Tau Kok · 1 481 1 516 1 518 1 651 2 255 3 153 3 257 3 424 4 504 Lei Yue Mun 2 051 2 032 1 949 1 866 1 973 1 893 1 858 1 843 2 112
New Territories 8737 8975 9812 10843 12 550 15 018 16990 18806 20907
Tsuen Wan area 3 569 3 706 4491 4 665 5 508 6 722 7 160 8 054 8 867 Yuen Long area 2 230 2 305 2 380 2 864 3 203 3 904 4471 4 830 5 263 Tai Po area 2 026 2 055 2033 2 251 2 755 3 277 4132 4 661 5 342 Islands and Sai Kung area 912 909 908 1 063 1 084 1115 1 227 1 261 1 435
(c) Financing, Insurance, Real Estate and Business Services
Census area/district 1976 1977 1978 1979 1980 1981 1982 1983 1984 1985
Hong Kong Island 4158 4748 5536 6291 7409 8327 8578 8846 9404
Central 2 380 2 526 2 743 2 948 3 126 3 370 3 246 3 241 3 472 SheungWan 724 833 1 045 1 275 1 617 1 728 1 732 1 695 1 716 West 83 105 114 141 153 203 228 225 248 Mid-levels and Pokfulam 85 97 111 125 136 167 194 221 211 Peak 5 8 7 7 10 15 19 27 27 Wan Chai 405 548 731 905 1 153 1 345 1 485 1 585 1 813 Tai Hang 231 319 401 424 572 696 740 755 818 North Point 159 206 247 287 409 521 594 687 704 ShauKei Wan 35 48 57 92 116 136 144 181 182 Aberdeen 39 45 55 63 87 113 168 196 182 South 12 13 25 24 30 33 28 33 31
Kowloon 1083 1398 1833 2124 2532 2942 3153 3223 3400
Tsim Sha Tsui 336 406 514 589 728 874 1 052 1 161 1 283 Yau Ma Tei 371 484 664 812 907 1 018 984 907 919 Mong Kok 184 268 347 379 477 545 546 574 593 Hung Hom 107 136 177 226 264 297 326 338 365 Ho Man Tin 85 104 131 118 156 208 245 243 240
New Kowloon 513 585 721 742 910 1206 1360 1458 1431
Cheung Sha Wan 221 248 289 297 360 473 534 620 586 Shek Kip Mei 21 27 23 30 33 48 53 58 58 Kowloon Tong 30 29 45 48 60 91 108 103 126 Kai Tak 134 155 205 179 199 240 269 268 269 Ngan Tau Kok 96 115 137 163 217 304 341 350 340 Lei Yue Mun II 11 22 25 41 50 55 59 52
New Territories 208 263 392 '481 712 946 1070 1124 1297
Tsuen Wan area 93 126 182 224 321 426 476 500 591 Yuen Long area 44 59 105 136 205 279 289 297 311 Tai Po area 50 55 74 85 139 190 240 252 319 Islands and Sai Kung area 21 23 31 36 47 51 65 75 76
35

3.16 Persons Engaged in Selected Major Divisions by Census District
(a) Manufacturing
Census area/ district 1976 1977 1978 1979 1980 1981 1982 1983 1984 1985
Hong Kong Island 115687 117877 125179 129300 120613 117 850 118 009 109114
Central 2 598 2 854 2 762 3 262 3 983 3 473 3 509 2 838 SheungWan 6 097 6 253 6 733 8 238 7 366 6 597 6 540 6 081 West 16 650 15 925 14494 14 927 14142 13 852 13 368 11 650 Mid-levels and Pokfulam 256 283 306 448 364 273 184 76 Peak 1 Wan Chai 8 092 8 078 9 030 8 830 7 960 7 016 6 688 5 830 Tai Hang 2007 1 894 2044 1 856 1 682 1 505 1 863 1 279 North Point 32 760 33 597 35 542 35 777 28 536 28 345 29 557 29 244 Shau Kei Wan 23 489 25000 28 724 30 969 31 071 31 544 30 944 27 689 Aberdeen 23 455 23 671 25 318 24707 25 246 25029 25 214 24 309 South 283 322 226 286 262 216 142 118
Kowloon 129083 123722 126795 132833 120202 111915 113617 107 696
Tsim Sha Tsui 7 917 7 508 8 214 7 571 8 513 8 019 8 124 7 601 Yau Ma Tei 9 869 9 080 9 372 9 625 8 359 7179 6 723 6084 Mong Kok 48 178 43 413 41 505 43 141 39 079 37 474 37 871 36 270 Hung Hom 62 635 63 318 67 336 71 915 63 819 58 853 60 558 57 479 Ho Man Tin 484 403 368 581 432 390 341 262
New Kowloon 345387 329 037 348665 373632 355183 357 862 371962 344463 Cheung Sha Wan 101 395 101 893 104 429 108 406 102 801 101 821 103 884 100 869 ShekKip Mei 1 990 2000 2 558 2499 2023 1 957 1 918 1 751 Kowloon Tong 339 421 633 736 429 419 373 303 Kai Tak 108 628 100 060 102 452 101 698 89 942 91 968 94170 85 476 Ngau Tau Kok 126 496 116 246 127 321 145 179 144 773 147 253 156 824 143 308 Lei Yue Mun 6 539 8 417 11272 15 114 15 215 14444 14 793 12 756
New Territories 183589 184472 216044 256375 260139 277 446 301121 287 627
Tsuen Wan area 143 534 139 796 161 606 188 565 191 875 203 804 216 721 200 991 Yuen Long area 19 227 21 821 26440 35 706 35 174 37 599 42 722 42 153 Tai Po area 14 854 16472 20748 24 339 26 598 30 123 36 289 40 144 Islands and Sai Kung area 5 974 6 383 7 250 7 765 6492 5 920 5 389 4 339
(b) Wholesale, Retail and Import/Export Trades, Restaurants and Hotels
Census area/ district 1976 1977 1978 1979 1980 1981 1982 1983 1984 1985
Hong Kong Island 151154 160079 158 617 168253 173329 184319 185 254 190 418 202 784 Central 43 184 42 943 41 836 42 575 36 935 36 717 34 803 35 219 37 556 SheungWan 34 552 35 439 35 164 37 880 39 865 41 271 41 011 41276 42468 West 11229 11 559 11 061 11294 11130 12 124 12 557 12 469 12 885 Mid-levels and Pokfulam 693 830 984 920 859 801 874 856 806 Peak 333 342 337 369 383 327 345 340 331 Wan Chai 20 271 22 203 23 561 24520 30002 32 329 33 687 36 413 39 391 Tai Hang 15 915 19 200 18 863 21228 21455 23 873 22 522 22 605 24 354 North Point 14 153 14 894 14 757 16 089 18 048 20 191 20 801 21 119 23 097 ShauKei Wan 5 485 5 870 5 763 6 556 6 717 7 332 7 635 8 070 8 313 Aberdeen 4 513 5 864 5 313 5 805 6 739 8 123 9 877 10 738 12 082 South 826 935 978 1 017 1196 1 231 1 142 1 313 1 501
Kowloon 111347 120 467 123670 132 822 149892 160 246 169598 179711 193457 Tsim Sha Tsui 42088 47048 49 372 54 031 63 602 69 155 77 679 85 564 95 055 Yau Ma Tei 32 186 33 522 34 335 37 458 39 083 40 505 40223 40 187 42 075 Mong Kok 19 184 20 758 20 138 20274 23 718 25135 25 269 25 834 26672 Hung Hom 14142 14 940 15 277 16449 18 093 19 861 21 127 22970 24485 Ho Man Tin 3 747 4 199 4 548 4610 5 396 5 590 5 300 5 156 5 170
New Kowloon 61229 64175 62281 66762 76392 86306 87968 92222 97623 Cheung Sha Wan 23 387 24 550 24 837 27 437 30 415 32 994 34970 38 378 39 379 ShekKipMei 3 040 2 956 2 968 3 070 3 563 3 834 3 983 3 770 4 106 Kowloon Tong 564 611 638 745 910 1 297 1 434 1 432 1 384 Kai Tak 19 502 20 582 19 005 19 314 20913 23 539 22 982 22 619 24102 Ngau Tau Kok 9104 9 663 9 285 10 651 13 322 17 426 17 920 19 490 21 912 Lei Yue Mun 5 632 5 813 5 548 5 545 7 269 7 216 6 679 6 533 6 740
New Territories 34094 36988 40134 45818 56139 67852 77532 86243 94814 Tsuen Wan area 14 945 16 370 19 060 21298 25 849 32 469 35 984 40 288 43 141 Yuen Long area 8 398 9 555 9945 11 690 14448 16 750 18 596 20169 20 798 Tai Po area 7977 8 165 8 315 9 516 12 338 14 769 18 518 21428 25 937 Islands and Sai Kung area 2 774 2 898 2 814 3 314 3 504 3 864 4434 4 358 4 938
36
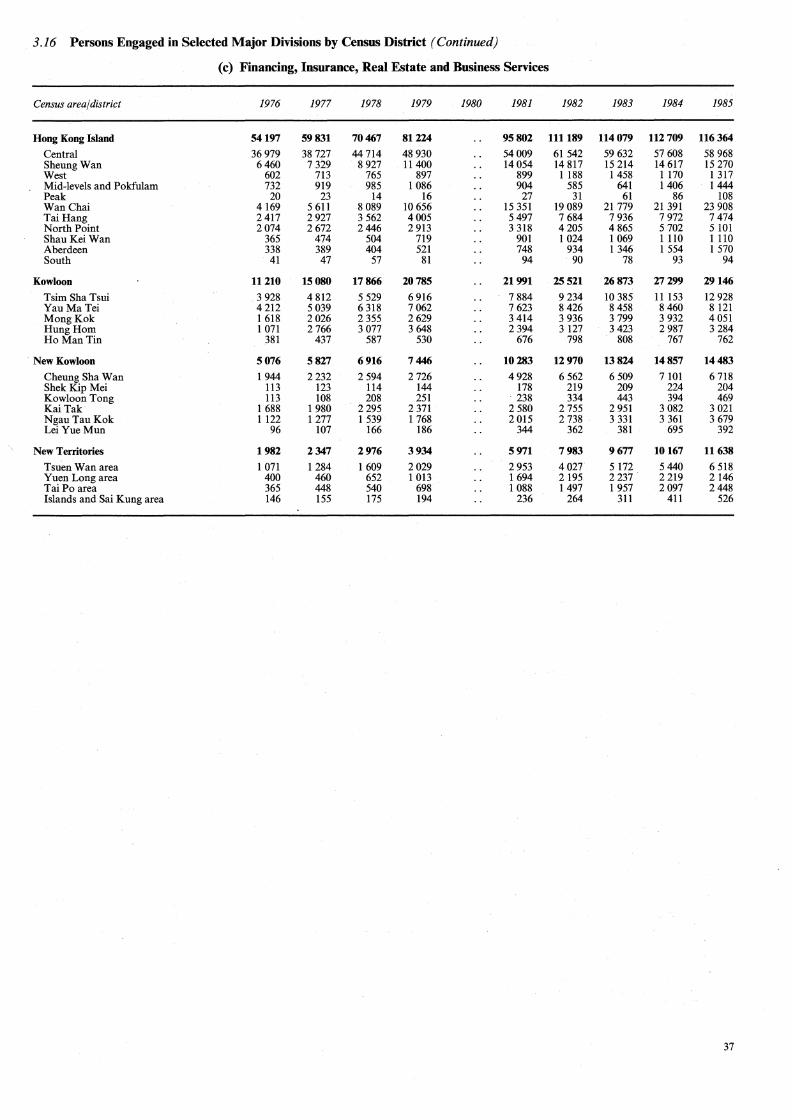
3.16 Persons Engaged in Selected Major Divisions by Census District (Continued)
(c) Financing, Insurance, Real Estate and Business Services
Census area/ district 1976 1977 1978 1979 1980 1981 1982 1983 1984 1985
Hong Kong Island 54197 59831 70467 81224 95802 111189 114079 112 709 116364
Central 36 979 38 727 44 714 48 930 54009 61 542 59 632 57 608 58 968 SheungWan 6460 7 329 8 927 11400 14 054 14 817 15 214 14 617 15 270 West 602 713 765 897 899 1 188 1 458 1 170 1 317 Mid-levels and Pokfulam 732 919 985 1 086 904 585 641 1406 1444 Peak 20 23 14 16 27 31 61 86 108 Wan Chai 4 169 5 611 8 089 10 656 15 351 19 089 21 779 21 391 23 908 Tai Hang 2417 2927 3 562 4005 5 497 7 684 7 936 7 972 7 474 North Point 2074 2672 2446 2 913 3 318 4205 4 865 5 702 5 101 Shau Kei Wan 365 474 504 719 901 1 024 1 069 1 110 1 110 Aberdeen 338 389 404 521 748 934 1 346 1 554 1 570 South 41 47 57 81 94 . 90 78 93 94
Kowloon 11210 15080 17866 20785 21991 25521 26873 27299 29146
Tsim Sha Tsui 3 928 4 812 5 529 6 916 7 884 9 234 10 385 11 153 12 928 Yau Ma Tei 4 212 5 039 6 318 7062 7 623 8 426 8 458 8460 8 121 Mong Kok 1 618 2026 2 355 2 629 3 414 3 936 3 799 3 932 4 051 Hung Hom 1 071 2 766 3 077 3 648 2394 3 127 3 423 2 987 3 284 Ho Man Tin 381 437 587 530 676 798 808 767 762
New Kowloon 5076 5827 6916 7446 10283 12970 13824 14857 14483
Cheung Sha Wan 1 944 2232 2 594 2 726 4928 6 562 6 509 7 101 6 718 ShekKip Mei 113 123 114 144 178 219 209 224 204 Kowloon Tong 113 108 208 251 238 334 443 394 469 Kai Tak 1 688 1 980 2295 2 371 2 580 2 755 2 951 3 082 3 021 Ngau Tau Kok 1 122 1 277 1 539 1 768 2 015 2 738 3 331 3 361 3 679 Lei Yue Mun 96 107 166 186 344 362 381 695 392
New Territories 1982 2347 2976 3934 5971 7983 9677 10167 11638
Tsuen Wan area 1 071 1284 1 609 2029 2 953 4027 5 172 5 440 6 518 Yuen Long area 400 460 652 1 013 1 694 2 195 2237 2 219 2 146 Tai Po area 365 448 540 698 1 088 1 497 1 957 2097 2448 Islands and Sai Kung area 146 155 175 194 236 264 311 411 526
37
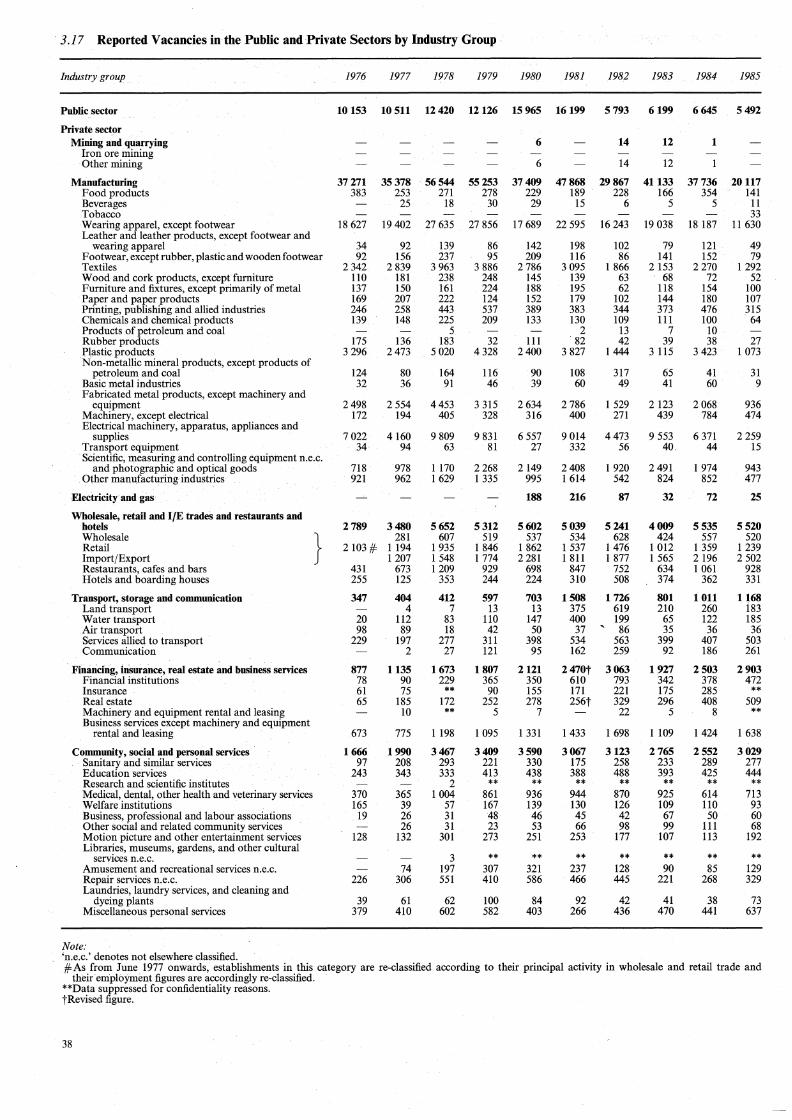
. 3.17 Reported Vacancies in the Public and Private Sectors by Industry Group
Industry group 1976 1977 1978 1979 1980 1981 1982 1983 1984 1985
Public sector 10153 10511 12420 12126 15965 16199 5793 6199 6645 5492
Private sector Mining and quarrying 6 14 12 1
Iron ore mining Other mining 6 14 12
Manufacturing 37271 35378 56544 55253 37409 47868 29867 41133 37736 20117 Food products 383 253 271 278 229 189 228 166 354 141 Beverages 25 18 30 29 15 6 5 5 11 Tobacco 33 Wearing apparel, except footwear 18 627 19 402 27 635 27 856 17 689 22 595 16 243 19 038 18 187 11 630 Leather and leather products, except footwear and
wearing apparel 34 92 139 86 142 198 102 79 121 49 Footwear, except rubber, plastic and wooden footwear 92 156 237 95 209 116 86 141 152 79 Textiles 2342 2 839 3 963 3 886 2 786 3 095 1 866 2 153 2270 1 292 Wood and cork products, exceptfurniture 110 181 238 248 145 139 63 68 72 52 Furniture and fixtures, except primarily of metal 137 150 161 224 188 195 62 118 154 100 Paper and paper products 169 207 222 124 152 179 102 144 180 107 Printing, publishing and allied industries 246 258 443 537 389 383 344 373 476 315 Chemicals and chemical products 139 148 225 209 133 130 109 111 100 64 Products of petroleum and coal 5 2 13 7 10 Rubber products 175 136 183 32 111 82 42 39 38 27 Plastic products 3 296 2473 5 020 4 328 2400 3 827 1444 3 115 3 423 1 073 Non-metallic mineral products, except products of
petroleum and coal 124 80 164 116 90 108 317 65 41 31 Basic metal industries 32 36 91 46 39 60 49 41 60 9 Fabricated metal products, except machinery and
equipment 2498 2 554 4453 3 315 2 634 2 786 1 529 2 123 2068 936 Machinery, except electrical 172 194 405 328 316 400 271 439 784 474 Electrical machinery, apparatus, appliances and
supplies 7 022 4160 9 809 9 831 6 557 9 014 4473 9 553 6 371 2 259 Transport equipment 34 94 63 81 27 332 56 40 44 15 Scientific, measuring and controlling equipment n.e.c.
and photographic and optical goods 718 978 1 170 2268 2 149 2408 1 920 2 491 1 974 943 Other manufacturing industries 921 962 1 629 1 335 995 1 614 542 824 852 477
Electricity and gas 188 216 87 32 72 25
Wholesale, retail and I/E trades and restaurants and hotels 2789 3480 5652 5312 5602 5039 5241 4009 5535 5520 Wholesale } 281 607 519 537 534 628 424 557 520 Retail 2 103 #= 1194 1 935 1 846 1 862 1 537 1 476 1 012 1 359 1 239 Import/Export 1 207 1 548 1 774 2 281 1 811 1 877 1 565 2 196 2 502 Restaurants, cafes and bars 431 673 1 209 929 698 847 752 634 1 061 928 Hotels and boarding houses 255 125 353 244 224 310 508 374 362 331
Transport, storage and communication 347 404 412 597 703 1508 1726 801 1011 1168 Land transport 4 7 13 13 375 619 210 260 i83 Water transport 20 112 83 110 147 400 199 65 122 185 Air transport 98 89 18 42 50 37 86 35 36 36 Services allied to transport 229 197 277 311 398 534 563 399 407 503 Communication 2 27 121 95 162 259 92 186 261
Financing, insurance, real estate and business services 877 1135 1673 1807 2121 2470t 3063 1927 2503 2903 Financial institutions 78 90 229 365 350 610 793 342 378 472 Insurance 61 75 ** 90 155 171 221 175 285 ** Real estate 65 185 172 252 278 256t 329 296 408 509 Machinery and equipment rental and leasing 10 ** 5 7 22 5 8 ** Business services except machinery and equipment
rental and leasing 673 775 1 198 1 095 1 331 1433 1 698 1109 1424 1 638
Community, social and personal services 1666 1990 3467 3409 3590 3067 3123 2765 2552 3029 Sanitary and similar services 97 208 293 221 330 175 258 233 289 277 Education services 243 343 333 413 438 388 488 393 425 444 Research and scientific institutes 2 ** ** ** ** ** ** ** Medical, dental, other health and veterinary services 370 365 1 004 861 936 944 870 925 614 713 Welfare institutions 165 39 57 167 139 130 126 109 110 93 Business, professional and labour associations 19 26 31 48 46 45 42 67 50 60 Other social and related community services 26 31 23 53 66 98 99 111 68 Motion picture and other entertainment services 128 132 301 273 251 253 177 107 113 192 Libraries, museums, gardens, and other cultural
services n.e.c. 3 ** ** ** ** ** ** ** Amusement and recreational services n.e.c. 74 197 307 321 237 128 90 85 129 Repair services n.e.c. 226 306 551 410 586 466 445 221 268 329 Laundries, laundry services, and cleaning and
dyeing plants 39 61 62 100 84 92 42 41 38 73 Miscellaneous personal services 379 410 602 582 403 266 436 470 441 637
Note: 'n.e.c.' denotes not elsewhere classified. #=As from June 1977 onwards, establishments in this category are re-classified according to their principal activity in wholesale and retail trade and
their employment figures are accordingly re-classified. **Data suppressed for confidentiality reasons. tRevised figure.
38

3 .18 Nominal and Real Indexes of Payroll Per Person Engaged by Industry Group (June 1980=100)
Industry group
Mining and quarrying Iron ore mining Other mining
Manufacturing Food products Beverages Tobacco Wearing apparel, except footwear Leather and leather products, except footwear and
wearing apparel Footwear, except rubber, plastic and wooden footwear Textiles Wood and cork products, except furniture Furniture and fixtures, except primarily of metal Paper and paper products Printing, publishing and allied industries Chemicals and chemical products including products
of petroleum and coal Rubber products Plastic products Non-metallic mineral products, except products of
petroleum and coal Basic metal industries Fabricated metal products, except machinery and
equipment Machinery, except electrical Electrical machinery, apparatus, appliances and
supplies Transport equipment Scientific, measuring and controlling equipment
n.e.c. and photographic and optical goods Other manufacturing industries
Electricity and gas
Wholesale, retail and I/E trades and restaurants and hotels Wholesale Retail Import/Export Restaurants, cafes and bars Hotels and boarding houses
Transport, storage and communication Land transport Water transport Air transport Services allied to transport Communication
Financing, insurance, real estate and business services Financial institutions Insurance Real estate Machinery and equipment rental and leasing Business services except machinery and equipment
rental and leasing
Community, social and personal services Sanitary and similar services Education services, including research and scientific
institutes Medical, dental, other health and veterinary services Welfare institutions Business, professional and labour associations Other social and related community services Motion picture, other entertainment and cultural
services n.e.c., including libraries, museums and gardens
Amusement and recreational services n.e.c. Repair services n.e.c. Laundries, laundry services, and cleaning and
dyeing plants Miscellaneous personal services
Note: Figures refer to December of the year. 'n.e.c.' denotes not elsewhere classified. **Data suppressed for confidentiality reasons.
1981
120.8
120.5
138.4 148.5 135.4 145.3 143.0
118.3 115.0 129.8 143.6 167.9 126.9 144.1
159.8 110.5 137.7
142.9 134.3
142.2 134.3
136.2 163.9
107.1 148.0
171.3
155.6 152.3 146.8 170.1 139.9 176.5
142.9 122.2 155.2
** 164.3
** 172.9 181.7 183.2 218.7 148.9
145.8
148.3 152.4
151.6 143.9 151.5
** 121.3
130.1 **
137.9
115.6 149.1
Nominal index 1982 1983 1984
151.4
150.9
150.7 154.8 141.2 197.1 161.0
135.6 146.0 143.8 141.7 141.4 141.2 148.5
194.7 122.3 142.5
177.2 155.0
153.9 136.3
147.1 130.3
129.2 154.3
197.6
168.7 169.1 164.3 186.3 142.5 195.7
175.4 149.0 195.5
** 198.6
**
194.9 230.2 182.9 196.9 203.5
149.1
168.6 156.9
178.0 172.5 174.l
** 170.5
170.7 **
137.3
127.9 140.7
163.5
162.9
171.9 174.9 171.6 247.7 191.3
145.4 173.0 167.7 153.4 177.0 151.5 184.1
196.5 128.3 162.9
209.8 158.2
164.3 136.1
168.7 156.4
133.3 165.7
212.4
190.0 177.7 166.9 222.4 159.1 217.3
191.3 164.2 188.6
** 207.6
** 231.2 281.6 241.9 224.3 336.8
169.1
185.8 150.7
195.5 183.0 175.0
** 174.1
186.6 **
143.2
125.0 172.7
165.4
164.9
190.3 184.9 163.5 256.3 209.7
162.7 186.1 180.4 183.5 197.1 161.2 203.0
196.7 164.4 181.9
198.3 177.2
185.8 159.1
193.9 179.7
151.7 195.8
238.1
215.9 207.4 196.5 238.2 176.6 258.2
220.4 179.2 221.2
** 258.8
** 253.8 313.0 247.7 254.3 303.2
184.9
199.3 153.2
210.4 202.6 210.2
** 204.1
194.8 **
155.9
158.2 167.7
1985
176.8
176.2
212.2 222.3 179.6 228.3 232.9
153.5 190.6 202.4 190.8 198.1 199.6 217.2
213.1 158.8 219.3
240.7 161.7
201.0 164.4
210.4 198.6
174.6 213.9
299.6
229.2 218.1 209.8 242.7 186.7 312.0
241.6 184.0 232.9
** 249.8
**
279.3 348.0 295.3 285.0 334.0
199.7
222.2 155.1
241.1 210.4 220.4
** 275.3
238.9 **
171.1
158.3 176.4
1981
99.5
99.3
114.0 122.3 111.5 119.7 117.8
97.4 94.7
106.9 118.3 138.3 104.5 118.7
131.6 91.0
113.4
117.7 110.6
117.1 110.6
112.2 135.0
88.2 121.9
141.1
128.2 125.5 120.9 140.l 115.2 145.4
117.7 100.7 127.8
** 135.3
**
142.4 149.7 150.9 180.1 122.7
120.l
122.2 125.5
124.9 118.5 124.8
** 99.9
107.2 **
113.6
95.2 122.8
Real index 1982 1983 1984
113.7
113.3
113.1 116.2 106.0 148.0 120.9
101.8 109.6 108.0 106.4 106.2 106.0 111.5
146.2 91.8
107.0
133.0 116.4
115.5 102.3
110.4 97.8
97.0 115.8
148.3
126.7 127.0 123.3 139.9 107.0 146.9
131.7 111.9 146.8
** 149.1
** 146.3 172.8 137.3 147.8 152.8
111.9
126.6 117.8
133.6 129.5 130.7
** 128.0
128.2 **
103.1
96.0 105.6
110.6
110.2
116.3 118.3 116.1 167.6 129.4
98.4 117.1 113.5 103.8 119.8 102.5 124.6
132.9 86.8
110.2
141.9 107.0
111.2 92.1
114.1 105.8
90.2 112.1
143.7
128.6 120.2 112.9 150.5 107.6 147.0
129.4 111.1 127.6
** 140.5
**
156.4 190.5 163.7 151.8 227.9
114.4
125.7 102.0
132.3 123.8 118.4
** 117.8
126.3 **
96.9
84.6 116.8
106.9
106.6
123.0 119.5 105.7 165.7 135.6
105.2 120.3 116.6 118.6 127.4 104.2 131.2
127.1 106.3 117.6
128.2 114.5
120.l 102.8
125.3 116.2
98.1 126.6
153.9
139.6 134.1 127.0 154.0 114.2 166.9
142.5 115.8 143.0
** 167.3
** 164.1 202.3 160.1 164.4 196.0
119.5
128.8 99.0
136.0 131.0 135.9
** 131.9
125.9 **
100.8
102.3 108.4
1985
111.3
111.0
133.6 140.0 113.1 143.8 146.7
96.7 120.0 127.5 120.2 124.7 125.7 136.8
134.2 100.0 138.1
151.6 101.8
126.6 103.5
132.5 125.l
109.9 134.7
188.7
144.3 137.3 132.1 152.8 117.6 196.5
152.1 115.9 146.7
** 157.3
**
175.9 219.1 186.0 179.5 210.3
125.8
139.9 97.7
151.8 132.5 138.8
** 173.4
150.4 **
107.7
99.7 111.1
39

3.19 Wage Indexes
Craftsmen and other operatives
Daily Wages
Supervisory, technical, clerical and misc.
non-productiOn workers
Monthly Salaries
All employees
July 73-Jurze 74=100 Mar. 82=100 in 1985 Mar. 82=100 in 1985 Mar. 82=100 1976 1977 1978 1979 1980 1981 1982 1983 1984 1985 (HK.$) 1982 1983 1984 1985 (HK.$) 1985
Nominal wage index
Overall
Manufacturing
Bakery products
Garments
Gloves
Handbags
Footwear
Cotton spinning and weaving
Knitting
Bleaching and dyeing
Wooden furniture and fixtures
Paper boxes
Printing
Plastic products
Metal products
Wrist watch bands
Electrical appliances
Electronics
Boatyards and shipyards
Photographic and optical goods
Watches and clocks
Jewellery
Wholesale/retail trades, restaurants and hotels
Wholesale
Retail
Import/export
Restaurants, exclusively Chinese
Restaurants, other than Chinese
Hotels
Transport services
Air freight forwarder/travel agency
Business services
Banks
Insurance
Technical consultancy firms
Personal services
Sanitary and similar services
Motor vehicles repairing
Real wage index
Overall
Note:
122 137 158 185 215 250 103.6110.S 120.1127.0
122 137 159 185 214 249 102.9109.6118.8 125.3
135 154 176 200 211 250 101.5111.7117.3 125.8
120 133 153 182 208 244 102.5 107.8113.5 117.5
116 135 153 166 188 197 103.5 106.6 131.1138.7
114 125 152 177 208 236 101.4104.9113.1120.7
- 103.0 102.3 106.0 105.6
- 101.9109.5117.8 126.4
- 104.7 112.l 121.6 125.3
124 141 168 189 224 264 103.2 111.6 120.9 131.7
109 122 128 139 149 167 103.2 96.8 103.6 112.8
111 125 155 180 217 249 102.9110.8121.1131.4
119 135 174 217 264 307 105.1113.5123.9 134.6
- 100.9 108.2 119.8 123.1
- 101.2111.3 117.4126.7
137 155 198 . 218 254 280 100.7 105.7 114.8 125.7
126 144 174 194 225 238 103.0 115.2 134.9 143.2
122 142 161 187 226 272 103.7 110.8 124:2 132.5
- 112.1121.8 130.4 142.2
-100.4117.8 136.4 155.5
- 103.5 113.2 121.4131.7
99.6 100.2 111.9 116.5
** ** ** **
- 102.0 100.1 108.7 124.7
125 143 153 183 230 ;; 280 102.0 100.l 108.7 124,7
109 116 127 132 134 136 99.0 95.5 96.9 98.8
101 102.6 110.9 120.6 128.5
98 102.5 113.1125.0 134.4
105 101.8 125.0 145.3 153.8
101 103.1 112.1123.3 133.8
80 103.4 112.8 124.0 135.5
88 100.6 112.5 123.6 130.5
118
92
99
116
144
122
128
87
97
96
82
87
l3l
94
91
170
99.l 107.3 114.7 120.7
100.8 114.7 125.7 134.l
102.1113.2 127.7 139.8
101.4 109.2 121.4 135.6
104.3 108.0 120.9 130.6
101.7 113.8 130.0 142.8
103.6 112.9 122.9 131.4
103.5 121.3 135.5 143.9
103.4 116.4.128.7 136.6
101.6 108.2 118.3 129.l
101.3 106.0 116.l 123.0
102.2 113.4 123.l 130.7
105.2 112.0 120.l 125.4
100.6 109.4118.2 129.l
102.0 112.l 132.8 142.0
103.2 112.9 132.l 145.3
101.7 108.1115.6120.8
103.2 115.9 126.5 136.6
101.1 108.0 121.2 132.8
105.2 117.8 140.0 151.9
101.4106.4 109.7 111.7
101.8 107.5 114.7 121.3
100.2 108.3 121.9 132.2
3,249
3,116
2,721
2,867
2,551
2,924
2,818
2,758
3,095
3,968
2,952
2,963
3,402
3,309
3,026
3,272
3,130
3,218
3,829
3,418
3,084
4,241
3,183
3,188
3,089
4,417
3,130
3,226
3,021
** 105.0 112.9124.4 136.4 3,738
103.1 112.7 123.l 135.9 2,935
102.6 110.4 120.4 130.3
101.7 109.9 120.5 129.6
102.3 113.3 125.6142.7
107.7 109.9 115.2 122.4
145 103.l 112.5 117.3 124.5
103.3 114. l 118.2 124.5
145 102.2 102.6 112.l 125.l
79* 98.1 9!'j.9 97.4 9!).9
4,199
4,151
3,890
4,890
1,856
1,702
3,381
2,526*
127.8
127.5
137.l
120.6
138.3
123.0
108.l
128.8
129.9
133.l
115.5
136.0
133.4
127.7
130.l
126.5
137.3
132.l
138.3
149.8
134.6
123.5
ilo.8 13i'i.6
132.8
151.9
111.7
121.3
132.2
145.4
135.9
130.3
129.6
142.7
122.4
124.6
124.5
125.0
99.4
Figures are as at September of the year. · · . ·. The set of wage indexes with March 1982 as the base period is compiled from a new quarterly wage survey conducted as from March 1982 to replace the old half-yearly wage survey. Due to the differences between the two surveys, the two sets of wage indexes are not directly comparable. For details of the differences between the two surveys, please refer to the 'Quarterly Report of Wages, Salaries and Employee Benefit Statistics for March, June & September 1982 Volume I'. **Data suppressed for confidentiality reasons. *Real wages are expressed in terms of March 1982 dollars.
40

3.20 Average Daily Wages of Workers Engaged in Government Building and Construction Projects HK$
Occupation 1976 1977 1978 1979 1980 1981 1982 1983 1984 1985
Male labourer 50.70 58.30 68.40 85.40 94.60 105.50 113.70 119.10 123.50 129.7
Female labourer 37.60 45.70 57.80 70.00 78.20 85.30 93.30 93.00 103.40 103.3
Concretor/Bricklayer 70.70 90.20 106.00 124.40 144.50 161.80 175.70 170.50 176.40 185.5
Mason 74.30 81.20 122.70 127.80 152.30 164.50 179.10 183.80 180.90 199.2
Steel bender 84.30 112.60 132.40 151.80 182.20 193.30 215.40 210.60 211.20 237.9
Blacksmith 62.50 76.10 93.90 118.80 138.40 164.20 182.60 177.30 182.30 186.1
Carpenter and joiner 71.20 90.70 . 115.90 134.70 154.50 166.10 180.00 180.10 186.50 192.l
Plumber 58.70 68.30 86.50 104.50 117.70 137.90 157.60 160.40 162.50 176.0
Fitter 57.20 62.60 79.80 96.50 113.00 127.20 139.50 149.30 153.20 162.0
Plasterer 67.60 87.00 102.40 132.10 147.80 167.20 185.40 181.00 186.70 198.2
Terrazzo and granolithic worker 72.20 93.30 107.10 132.90 145.20 185.90 204.60 169.60 205.50 217.l
Glazier 64.80 74.80 89.00 109.80 146.60 160.70 174.80 168.20 173.40 179.8
Painter 64.60 73.90 87.80 109.70 129.20 154.70 163.00 166.80 176.80 177.0
Electrician 55.40 64.80 80.50 95.70 104.80 122.90 141.30 142.00 160.40 171.5
Plant operator 58.90 67.00 81.90 99.20 112.50 126.80 154.70 159.80 164.00 167.7
Truck driver 53.70 59.70 74.20 87.20 99.70 115.80 127.60 138.20 146.50 151.7
Coolie 61.80 71.60 85.60 102.60 133.90 135.70 149.80 157.10 155.40 168.4
Pneumatic driller 64.00 81.40 98.00 123.00 133.90 151.50 175.50 160.60 179.30 179.5
Bamboo worker and scaffolder 84.00 103.70 127.10 166.30 203.50 199.10 214.10 207.20 208.60 223.2
Structural steel erector 71.20 88.50 105.90 119.00 124.60 136.10 201.30 173.40 189.10 219.7
Diver 147.10 154.50 195.30 181.80 215.90 317.40 252.80 288.00 294.90 332.9
Diver's linesman 42.40 51.60 65.20 82.50 80.00 109.50 127.10 133.30 122.50 148.7
Note: Figures are as at December of the year.
41

3.21 Salary Index (A) for Managerial and Professional Employees (June 1983=100)
Nominal salary index Sector/Company size (Number of persons engaged) 1984
Manufacturing/electricity, gas and steam Medium (200-1 999) 114.8 Large (2 OOO and over) 110.0 All companies ( 200 and over) 113.8
Building and construction and related trades Medium (50-499) 106.6 Large (500 and over) 98.l All companies ( 50 and over) 105.6
Wholesale/retail and import/export trades Medium (100-499) 114.3 Large (500 and over) 112.7 All companies ( 100 and over) 114.0
Transport, storage and communication Medium (100-499) 109.9 Large (500 and over) 112.0 All companies ( 100 and over) 110.9
Financial institutions and insurance Medium* (100-999) 114.9 Large#= (1 OOO and over) 111.6 All companies*# ( 100 and over) 114.1
Overall Medium 112.3 Large 110.0 All companies 111.8
Note: Figures are as at June of the year. *Investment and holding companies with 20-499 persons engaged are also included. #=Investment and holding companies with 500 and over persons engaged are also included.
1985
128.6 123.2 127.5
121.0 105.8 119.2
128.l 119.2 126.5
122.4 122.l 122.2
131.3 123.3 129.3
126.3 119.7 124.9
3.22 Salary Index (B)for Managerial and Professional Employees (June 1983=100)
Nominal salary index Sector/Company size (Number of persons engaged) 1984
Manufacturing/electricity, gas and steam Medium (200-1 999) 114.4 Large (2 OOO and over) 112.l All companies (200 and over) 113.9
Building and construction and related trades Medium (50-499) 110.6 Large (500 and over) 108.0 All companies ( 50 and over) 110.3
Wholesale/retail and import/export trades Medium (100-499) 115.9 Large (500 and over) 112.4 All companies ( 100 and over) 115.3
Transport, storage and communication Medium (100-499) 114.2 Large (500 and over) 112.5 All companies ( 100 and over) 113.3
Financial institutions and insurance Medium* (100-999) 114.7 Large#= (1 OOO and over) 112.3 All companies*# (I 00 and over) 114.1
Overall Medium 113.6 Large 111.8 All companies 113.2
Note: Figures are as at June of the year. *Investment and holding companies with 20-499 persons engaged are also included. #=Investment and holding companies with 500 and over persons engaged are also included.
42
1985
130.0 128.0 129.6
124.9 122.7 124.7
132.5 126.9 131.5
126.8 127.4 127.1
134.l 127.2 132.5
129.6 126.8 129.0
Real salary index
1984 1985
104.2 113.0 99.8 108.3
103.3 112.J
96.8 106.3 89.0 93.0 95.8 104.8
103.7 112.6 102.3 104.7 103.5 111.2
99.7 107.6 101.6 107.3 100.6 107.5
104.3 115.4 101.3 108.4 103.5 113.7
101.9 111.0 99.9 105.2
101.5 109.8
Real salary index
1984 1985
103.8 114.3 101.7 112.5 103.4 113.9
100.3 109.8 98.0 107.9
JOO.I 109.6
105.2 116.4 102.0 111.6 104.6 115.6
103.6 111.5 102.l 112.0 102.9 111.7
104.l 117.9 102.0 111.8 103.6 116.4
103.1 113.9 101.4 111.5 102.7 113.4

3 .23 Reported Occupational Accidents by Cause
Cause of accident
Machinery: power driven
Machinery: others
Transport
Explosions or fires
Hot or corrosive substances
Gassing, poisoning and other toxic substances
Electricity
Falls of persons
Stepping on or striking against objects
Falling objects
Falls of grounds
Handling without machinery
Hand tools
Miscellaneous
All causes
Fatal Non-fatal Fatal Non-fatal Fatal Non-fatal
Fatal Non-fatal Fatal Non-fatal
Fatal Non-fatal Fatal Non-fatal
Fatal Non-fatal
Fatal Non-fatal
Fatal Non-fatal Fatal Non-fatal Fatal Non-fatal
Fatal Non-fatal Fatal Non-fatal Fatal Non-fatal
3.24 Stoppages of Work by Industry
Number of work stoppages Agriculture, forestry, fishing Mining and quarrying Manufacturing Electricity; gas, water. Construction Wholesale and retail trades, restaurants
and hotels Transport, storage, communication Financing, insurance, real estate and
business services Community, social and personal services
Total
Working days lost Agriculture, forestry, fishing Mining and quarrying Manufacturing Electricity, gas, water Construction Wholesale and retail trades, restaurants
and hotels Transport, storage, communication Financing, ii;isurance, real estate ·and
business services Community, social and personal services
Total
1976
12 9 894
724 46
1 703 28
305
2080
7 35
3 99 45
4639
1 8 862
14 2 354
6 3
5 765
1977
8 9 368
1 638
53 1157
7 250
2 2 315
76 6
122
59 5 273
11 13 164
28 2 817
3 14 1
6743
1978
8 9 123
1 481
50 1 543
9 321
2 506
8 39 22
142
53 5 990
14 16 696
13 3 127
1 26
5 6292
2
1979
30 11 399
1 676
61 2 178
31 174
3 096
1 32 17
212
59 5 750
9 17 346
14 3 752
6 26
3 7 560
1980
18 13 663
1 665 44
2673 18
307 1
3 242
5 48 18
212 55
5 988
2 15 764
6 3 761
3 36 4
8079
1981
18 13 236
644 64
2687 20
393 2
3 161
4 19 14
170 68
5 900
14 147 13
3 410
35 2
8 423
1982
20 12 562
530 47
2 780 11
460 2
3444
1 18
12 190 70
7116
2 16 171
10 3 739
8 22
2 7 870
Number of accidents
1983
25 11 871
3 469 46
3 074 6
521 3
3 810
182 11
141 50
7 701
5 13 252
9 2644
4 22 7
10 285
1984
8 12 812
1 437
32 3 279
7 569
5 4179
1 38 8
131
47 7 874
1 17 667
12 3 659
2 26
1 11645
1985
10 9969
322 26
2 881 2
584 1
4 555
24"
13 88
39 7994
6 18 839
11 3 974
5 14 3
10 363
4 379 4 275 4 906 5 446 5 990 6 489 6 957 7 086 8 123 8 111 90 86 92 69 60 65 60 77 92 100
3 963 3 377 2 182 8 887 9 958 10 444 9 020 9 837 10 515 11 622 249 265 278 301 235 270 245 246. 217 216
44 808 49 589 53 374 66 534 70 386 69 158 70 879 70 895 80 954 79 340
1976 1977 1978
10 27 36
10 10
1979
21
11
3
1980
25
8
2 4 7 2
3 392 7 978 23 481 34 099 18 581
525 2 736 2 189 4 009 1 076
100 200 36 64 1 030 1 188 1 348
30 373 5 056 37
4 977 10 814 30 927 39 743 21 069
1981
28
11
3
1982
27
3
4 3
3
49 34
8 536 16 975
880 530
375 36 4 953 419
575
15319 17960
1983
4
3
2
11
1 300
66
780 220
164
2530
1984
4
2 4
11
2 185
102
54 780
3121
1985
2
3
1 080
80
1160
43


Section 4: INDUSTRIAL PRODUCTION
The 1984 Survey of lndustrialProduction covered the activities of mining and quarrying, manufacturing, and the supply of electricity, gas and water. The survey was conducted on a sample basis, with establishments selected from a comprehensive register maintained by the Census and Statistics Department and updated by reference to records of the Business Registration Office of the Inland Revenue Department and the factory registration system of the Labour Department. The list of mining and quarrying establishments was furnished by the Mines Division of the Labour Department.
The following explanatory notes apply to Tables 4.1-4.6: 1. The statistics cover all establishments that had operated during the reference year, including both the reporting and non-reporting establishments. Non-reporting establishments refer to those which operated during the whole or part of the reference year but became untraceable during the survey enumeration period owing to closure or removal. The economic contributions of non-reporting establishments are imputed on the basis of reporting establishments of the same trade and employment size. , 2. Government industries consist of 2 quarries, 1 printing house, 20 prison workshops (all included under one return), 2 abattoirs and I water works establishment. 3. Workshops in non-profit institutions are those run by the Social Welfare Department, Hong Kong Discharged Prisoners' Aid Society, Hong Kong Society for the Blind, New Life Psychiatric Rehabilitation Association, Po Leung Kuk, St. James' Settlement, Caritas Hong Kong, Christian Family Service Centre, Hong Kong Federation of Handicapped Youth, Spastics Association of Hong Kong, Mental Health Association of Hong Kong and Challenge Venture Workshop. 4. In the case of mining and quarrying, the figures include one sand dredging establishment which is permitted to work on the fringe territory of China. In the monthly trade statistics, the sand thus obtained is reckoned as a merchandise import.
The indexes of industrial production, which relate to net output at constant prices, are based on results of the Quarterly Survey of Industrial Production, conducted by the Census and Statistics Department, covering all manufacturing establishments engaging 500 or more persons and a sample of the smaller establishments. The production index for an industry is obtained by aggregating the production quantity relatives or deflated value indexes of the primary products or industrial services of the industry, using sales or work done values as weights. Deflated value indexes are adopted for those heterogeneous products that are not suitable for quantity measurement. National accounts value added is used as weights in aggregating the production indexes of different industries. The weights are derived from the 1981 Survey of Industrial Production.
The indexes of industrial production in Table 4. 7 cover the whole manufacturing sector, including the spinning and weaving industries. Statistics for the latter industries, obtained by enumerating all spinning and weaving establishments engaging 20 or more persons and a sample of the smaller establishments, are also shown separately in greater detail in Table 4.8.
In Table 4.8, the production indexes of the spinning and weaving industries for the years 1982 onwards are figures of a new series with 1981 taken as 100 and with results of the 1981 Survey oflndustrial Production taken as weights. The new series adopts 'national accounts value added' as weights for aggregation at the industry level, instead of 'Census value added' as in the old series. The indexes prior to 1981 shown in the table are obtained by imputation, using a technique known as 'splicing', based on the movements recorded in the old series.
Statistics of mining production are supplied by the Mines Division of the Labour Department and those of cement and quarry production by the cement manufacturing companies and the Geotechnical Control Office of the Engineering Development Department respectively.
Electricity and gas consumption are provided by the respective public utilities companies, and water supplies data by the Water Supplies Department.
45

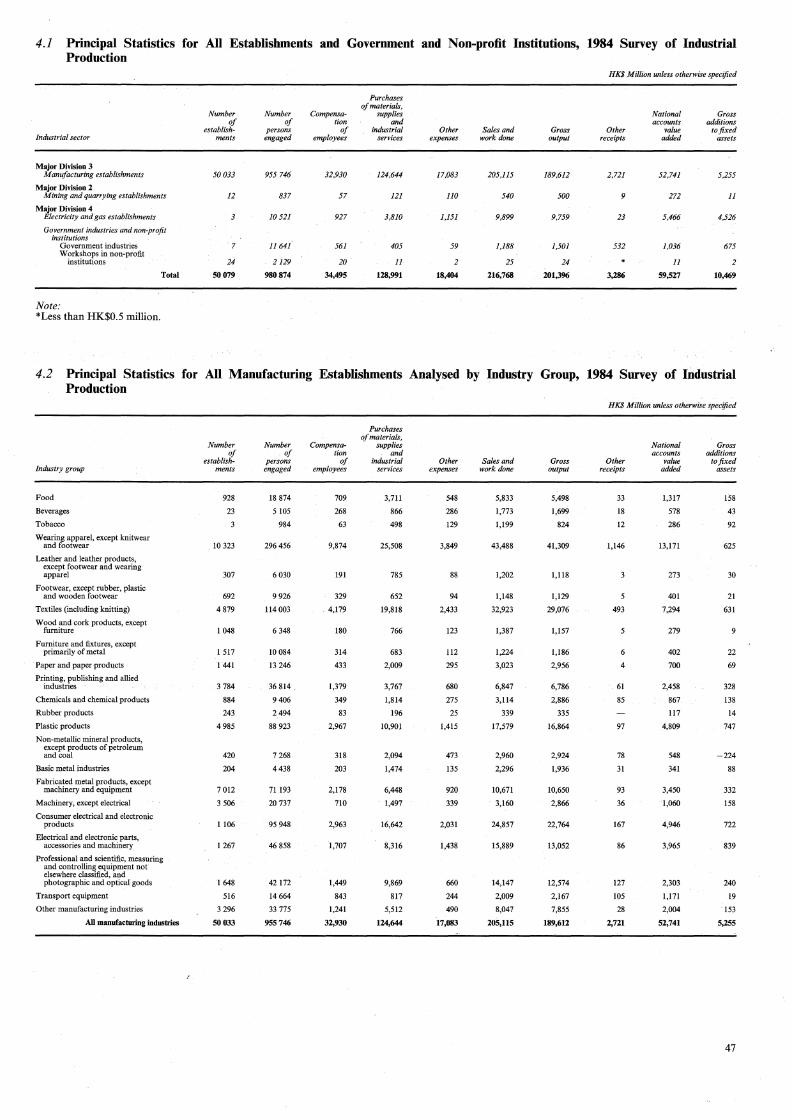
4.1 Principal Statistics for All Establishments and Government and Non-profit Institutions, 1984 Survey of Industrial Production
Industrial sector
Major Division 3 Manufacturing establishments
Major Division 2 Mining and quarrying establishments
Major Division 4 Electricity and gas establishments
Government industries and non-profit institutions
Government industries Workshops in non-profit
institutions
Note: *Less than HK$0.5 million.
Total
Number of
establishments
50033
12
3
7
24
50079
Number of
persons engaged
955 746
837
10521
II 64i
2 129
980874
Compensation
of employees
32,930
57
927
561
20
34,495
Purchases of materials,
supplies and
industrial services
124,644
121
3,810
405
II
128,991
Other expenses
17,083
110
1,151
59
2
18,404
Sales and work done
205,115
540
9,899
1,188
25
216,768
Gross output
189,612
500
9,759
1,501
24
201,396
HK$ Million unless otherwise specified
Other receipts
2,721
9
23
532
3,286
National accounts
value added
52,741
272
5,466
1,036
II
59,527
Gross additions
to fixed assets
5,255
II
4,526
675
2
10,469
4 .2 Principal Statistics for All Manufacturing Establishments Analysed by Industry Group, 1984 Survey of Industrial Production
Industry group
Food
Beverages
Tobacco
Wearing apparel, except knitwear and footwear
Leather and leather products, except footwear and wearing apparel
Footwear, except rubber, plastic and wooden footwear
Textiles (including knitting)
Wood and cork products, except furniture
Furniture and fixtures, except primarily of metal
Paper and paper·products
Printing, publishing and allied industries
Chemicals and chemical products
Rubber products
Plastic products
Non-metallic mineral products, except products of petroleum and coal
Basic metal industries
Fabricated metal products, except machinery and equipment
Machinery, except electrical
Consumer electrical and electronic products
Electrical and electronic parts, accessories and machinery
Professional and scientific, measuring and controlling equipment not elsewhere classified, and photographic and opticar goods
Transport equipment
Other manufacturing industries
All manufacturing industries
Number of
establishments
928
23
. 10 323
307
692
4 879
I 048
I 517
1441
3 784
884
243
4 985
420
204
7 012
3 506
1106
1267
1648
516
3 296
50033
Number of
persons engaged
18 874
5 105
984
296 456
6030
9 926
114 003
6 348
10 084
13 246
36 814
9406
2494
88 923
7 268
4438
71193
20737
95 948
46 858
42172
14 664
33 775
955746
Compensation
of employees
709
268
63
9,874
191
329
4,179
180
314
433
1,379
349
83
2,967
318
203
2,178
710
2,963
1,707
1,449
843
1,241
32,930
Purchases of materials,
supplies and
industrial services
3,711
866
498
25,508
785
652
19,818
766
683
2,009
3,767
1,814
196
10,901
2,094
1,474
6,448
1,497
16,642
8,316
9,869
817
5,512
124,644
Other expenses
548
286
129
3,849
88
94
2,433
123
112
295
680
275
25
1,415
473
135
920
339
2,031
1,438
660
244
490
17,083
Sales and work done
5,833
1,773
1,199
43,488
1,202
1,148
32,923
1,387
1,224
3,023
6,847
3,114
339
17,579
2,960
2,296
10,671
3,160
24,857
15,889
14,147
2,009
8,047
205,115
Gross output
5,498
1,699
824
41,309
1,118
1,129
29,076
1,157
1,186
2,956
6,786
2,886
335
16,864
2,924
1,936
10,650
2,866
22,764
13,052
12,574
2,167
7,855
189,612
HK$ Million unless otherwise specified
Other receipts
33
18
12
1,146
493
4
61
85
97
78
31
93
36
167
86
127
105
28
2,721
National accounts
value added
1,317
578
286
13,171
273
401
7,294
279
402
700
2,458
867
117
4,809
548
341
3,450
1,060
4,946
3,965
2,303
1,171
2,004
52,741
Gross additions
to fixed assets
158
43
92
625
30
21
631
22
69
328
138
14
747
-224
88
332
158
722
839
240
19
153
5,255
47

4.3 Principal Statistics for All Manufacturing Establishments Analysed by Number of Persons Engaged, 1984 Survey of Industrial Production
HK$ Million unless otherwise specified
Purchases of materials,
Number Number Compensa- supplies National Gross of of tion and accounts additions
Number of establish- persons of industrial Other Sales and Gross Other value to fixed persons -engaged ments engaged -employees services expenses work-done output receipts added assets
1-9 33 294 126 843 2,739 7,910 1,384 14,778 13,752 69 4,629 620
10-19 7177 93 300 3,005 9,530 1,160 14,977 14,726 27 4,262 471
20-49 5 657 171018 6,034 21,958 2,666 34;836 32,519 172 8,562 922
50-99 2271 148 857 5,434 20,684 2,474 33,276 30,733 344 8,180 970 100-199 1047 136 548 5,101 20,583 2,610 32,415 30,276 473 7,791 678
200-499 432 129 452 4,876 21,602 3,068 34,563 31,815 624 8,281 613
500-999 106 70 732 2,646 10,610 1,558 19,774 16,809 534 5,064 408
I OOO and over 48 78 996 3,095 11,767 2,162 20,496 18,982 479 5,972 573
Total 50033 955746 32,930 124,644 17,083 205,115 189,612 2,721 52,741 5,255
4.4 Principal Statistics for All Manufacturing Establishments Analysed by Value of Gross Output, 1984 Survey of Industrial Production
HK$ Million unless otherwise.specified
PW'. chases of materials,
Number Number Compensa- supplies National Gross Value of of of tion and accounts additions gross output establish- persons of industrial Other Sales and Gross Other value to fixed (HK$'000) ments engaged employees services expenses wo.rkdone output receipts added assets
Under 100 6 852 10 603 35 no 78 399 391 206 100
100-499 18 641 71379 1,353 2,031 629 4,776 4,756 7 2,140 298
500-999 7 324 56 302 1,456 2,532 495 5,105 4,996 2 2,040 182
1,000-1,999 5072 58 620 1,763 3,950 599 7,057 6,880 10 2,420 211
2,000-4,999 5 671 125 738 4,206 10,573 1,455 17,564 17,186 85 5,419 695 5,000-9,999 289i 118 592 4,189 12,596 1,634 20,886 19,512 162 5,585 647 10,000-19,999 1862 125 586 4,714 16,461 2,196 26,871 24,786 251 6,729 599
20,000-49,999 1 152 141673 5,414 23,629 2,883 36,434 33,972 578 8,391 790 50;000-99;999 319 83 706 3,071 15,073 1,908 24,640 21,506 397 5,172 500
100,000 and over 248 163 548 6,728 37,690 5,206 61,385 55,627 1,228 14,639 1,233
Total 50033 955746 32,930 124,644 17,083 205,115 189,612 2,721 52,741 5,255
4.5 Principal Statistics for All Manufacturing Establishments Analysed by National Accounts V aloe Added, 1984 Survey of Industrial Production
HK$ Million unless otherwise specified
Purchases of materials,
Number Number Compensa- supplies National Gtoss National accounts of of tion and accounts additions value added establish- persons of industrial Other Sa/es'and Gross Other value to fixed (HK$'000) ments engaged -employees services expenses work done output receipts added assets
Under 50 8 379 19 280 290 1,594 365 2,353 1,968 70 97 263 50-249 19996 77 727 1,463 3,681 745 6,991 6,907 2,557 310
250-499 7 900 72 349 1,961 5,119 702 8,696 8;433 11 2,711 247 500-999 5056 85840 2,705 7,785 950 12,396 12,067 16 3,469 326
1,000-2,499 4896 161424 5,607 19,804 2,246 30,462 28;894 178 7,376 966 2;500-4,999 2001 127 796 4,775 16,780 2,037 26,157 24,85'1 196 6,504 635 5,000-9 ,999 1056 121 338 4,581 18,882 2,358 30,383 27,7l0 428 7,092 623
10,000-24,999 498 116 961 4,432 18,147 2,558 30,334 27,123 507 7,344 622 25,000 and over 251 173 030 7,115 32,854 5,123 57,343 51,655 1,307 15,591 1,264
Total 50033 955746 32,930 124,644 17,083 205,HS 189,612 2,721 52,741 5,255
48

4.6 Comparison of Selected Principal Statistics for All Manufacturing Establishments, Analysed by Broad Industry Group for the Years 1979, 1980, 1981, 1982, 1983 and 1984
Broad industry group
Food, beverages and tobacco
Textiles (including knitting)
Wearing apparel, except knitwear and footwear
Leather, wood and cork products
Paper products, printing and publishing
Chemicals, rubber and non-metallic mineral products
Plastic products
1979
1980
1981
1982
1983
1984
1979
1980
1981
1982
1983
1984
1979
1980
1981
1982
1983
1984
1979
1980
1981
1982
1983
1984
1979
1980
1981
1982
1983
1984
1979
1980
1981
1982
1983
1984
1979
1980
1981
1982
1983
1984
Compensation of employees
452
578 (+28)
653 (+13)
804 (+23)
893 (+II)
1,039 (+16)
2,705
3,054 (+13)
3,211 (+5)
3,110 (-3)
3,775 (+21)
4,179 (+II)
5,167
6,223 (+20)
6,814 (+9)
7;214 (+6)
8,223 (+14)
9,874 (+20)
608
727 (+20)
842 (+16)
698 (-17)
798 (+14)
1,013 (+27)
871
1,118 (+28)
1,282 ( +15)
1,340 (+5)
1,515 (+13)
1,811 (+20)
378
412 (+9)
484 (+18)
540 (+II)
671 (+24)
751 (+12)
l,624
l,696 (+4)
1,991 (+17)
2,026 (+2)
2,213 (+9)
2,967 (+34)
Purchases of materials,
supplies and industrial
services
1,741
2,260 (+30)
2,880 (+27)
3,963 (+38)
4,293 (+8)
5,075 (+18)
11,660
12,567 (+8)
14,144 (+13)
13,274 (-6)
19,231 (+45)
19,818 (+3)
13,882
16,182 (+17)
18,497 (+14)
16,396 (-II)
21,001 (+28)
25,508 (+21)
1,928
1,883 (-2)
2,460 (+31)
1,807 (-27)
2,562 (+42)
2,885 (+13)
2,276
2,920 (+28)
3,643 (+25)
3,331 (-9)
4,506 ( +35)
5,776 (+28)
1,914
2,549 ( +33)
3,102 (+22)
3,013 (-3)
4,148 (+38)
4,105 (-1)
4,504
4,583 (+2)
5,515 (+20)
5,208 (-6)
7,170 (+38)
10,901 (+52)
Sales and work done
3,613
4,430 (+23)
5,017 /f (If)
6,606 (+32)
7,382 (+12)
8,806 (+19)
16,858
18,536 (+10)
21,196 (+14)
20,109 (-5)
28,173 (+40)
32,923 (+17)
22,470
26,782 (+19)
30,216 (+13)
29,347 (-3)
35,669 (+22)
43,488 (+22)
2,861
3,077 (+8)
3,971 (+29)
3,158 (-20)
4,430 (+40)
4,961 (+12)
3,937
5,054 (+28)
6,403 (+27)
6,124 (-4)
7,716 (+26)
9,871 (+28)
3,059
3,854 (+26)
4,550 (+18)
4,379 (-4)
6,038 (+38)
6,412 (+6)
7,255
7,765 (+ 7)
9,271 ( +19)
9,061 (-3)
Il,765 (+30)
17,579 (+49)
Gross output
3,170
3,990 (+26)
4,638 /f (#)
6,199 (+34)
6,817 (+10)
8,021 ( +18)
16,604
18,209 (+10)
20,087 (+10)
19,126 (-5)
26,610 (+39)
29,076 (+9)
21,742
25,795 (+19)
29,135 ( +13)
27,958 (-4)
34,026 (+22)
41,309 (+21)
2,835
3,037 (+7)
3,861 (+27)
2,996 (-22)
3,999 (+33)
4,590 ( +15)
3,924
5,072 (+29)
6,399 (+26)
6,109 (-5)
7,700 (+26)
9,742 (+27)
2,944
3,697 (+26)
4,467 (+21)
4,332 (-3)
5,942 (+37)
6,146 (+3)
7,208
7,663 (+6)
9,218 (+20)
8,888 (-4)
11,244 (+27)
16,864 (+50)
HK$ Million unless otherwise specified
National accounts.
value added
1,131
1,306 (+16)
1,254 /f (If)
1,582 (+26)
1,815 (+15)
2,181 (+20)
3,957
4,387 (+11)
4,594 (+5)
4,537 (-1)
6,409 (+41)
7,294 (+14)
6,553
7,880 (+20)
9,057 (+15)
9,600 (+6)
11,132 (+16)
13,171 ( +18)
764
920 (+20)
1,105 (+20)
914 (-17)
1,097 (+20)
1,356 (+24)
1,340
1,716 (+28)
2,210 (+29)
2,212 (*)
2,584 (+17)
3,158 (+22)
843
846 (*)
1,043 (+23)
1,005 (-4)
1,348 (+34)
1,532 (+14)
2,222
2,383 (+7)
2,923 (+23)
2,919 (*)
3,252 (+II)
4,809 (+48)
Gross additions to fixed assets
177
227 (+29)
215 (-6)
335 (+56)
434 (+30)
293 (-32)
748
840 (+12)
551 (-34)
312 (-44)
728 (+133)
631 (-13)
528
698 (+32)
987 (+41)
589 (-40)
611 (+4)
625 (+2)
57
86 (+51)
87 (+I)
41 (-53)
75 (+82)
82 (+9)
326
356 (+9)
447 (+25)
368 (-18)
233 (-37)
397 (+70)
204
280 (+37)
381 (+36)
353 (-7)
397 (+12)
-72 (-Il8)
419
460 (+10)
350 (-24)
410 (+17)
492 (+20)
747 (+52)
49
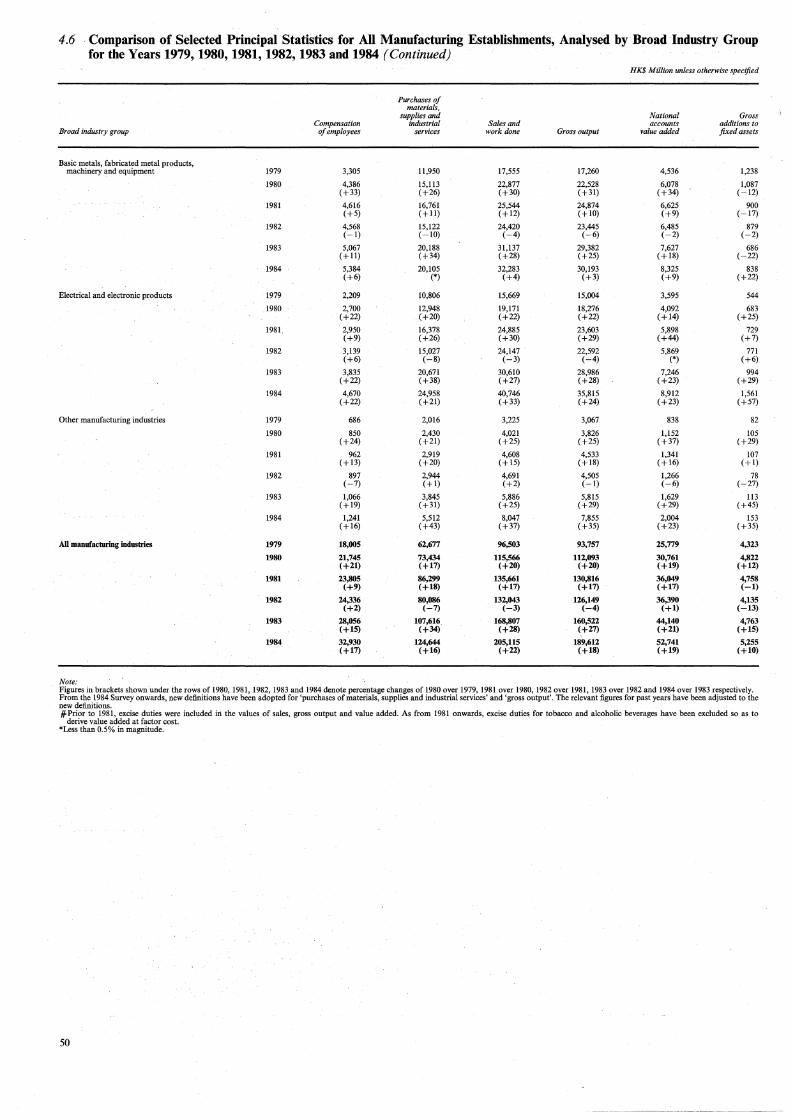
4.6 Comparison of Selected Principal Statistics for All Manufacturing Establishments, Analysed by Broad· Industry Group for the Years 1979, 1980, 1981, 1982, 1983 and 1984 (Continued)
HK.$ Million unless otherwise specified
Purchases of materials,
supplies and National Gross Compensation industrial Sales and accounts additions to
Broad industry group of employees services work done Gross output value added fixed assets
Basic metals, fabricated metal products, machinery and equipment 1979 3,305 11,950 17,555 17,260 4,536 1,238
1980 4,386 15,113 22,877 22,528 6,078 1,087 (+33) (+26) (+30) (+31) (+34) (-12)
1981 4,616 16,761 25,544 24,874 6,625 900 (+5) (+11) (+12) (+10) ( +9) (-17)
1982 4,568 15,122 24,420 23,445 6,485 879 (-1) (-10) (-4) (-6) (-2) (-2)
1983 5,067 20,188 31,137 29,382 7,627 686 (+11) (+34) (+28) (+25) (+18) (-22)
1984 5,384 20,105 32,283 30,193 8,325 838 (+6) (*) (+4) (+3) (+9) (+22)
Electrical and electronic products 1979 2,209 10,806 15,669 15,004 3,595 544
1980 2,700 12,948 19,171 18,276 4,092 683 (+22) (+20) (+22) (+22) (+14) ( +25)
1981 2,950 16,378 24,885 23,603 5,898 729 (+9) (+26) (+30) (+29) (+44) (+7)
1982 3,139 15,027 24,147 22,592 5,869 771 (+6) (-8) (-3) (-4) (*) (+6)
1983 3,835 20,671 30,610 28,986 7,246 994 (+22) ( +38) ( +27) (+28) (+23) (+29)
1984 4,670 24,958 40,746 35,815 8,912 1,561 (+22) (+21) ( +33) (+24) (+23) (+57)
Other manufacturing industries 1979 686 2,016 3,225 3,067 838 82
1980 850 2,430 4,021 3,826 1,152 105 (+24) (+21) (+25) (+25) ( +37) (+29)
1981 962 2,919 4,608 4,533 1,341 107 ( +13) (+20) (+15) (+18) ( +16) (+1)
1982 897 2,944 4,691 4,505 1,266 78 (-7) (+1) (+2) (-1) (-6) (-27)
1983 1,066 3,845 5,886 5,815 1,629 113 (+19) (+31) (+25) (+29) (+29) (+45)
1984 1,241 5,512 8,047 7,855 2,004 153 (+16) (+43) (+37) ( +35) ( +23) (+35)
All manufacturing industries 1979 18,005 62,677 96,503 93,757 25,779 4,323
1980 21,745 73,434 115,566 112,093 30,761 4,822 (+21) (+17) (+20) (+20) (+19) ( +12)
1981 23,805 86,299 135,661 130,816 36,049 4,758 (+9) (+18) (+17) (+17) (+17) (-1)
1982 24,336 80,086 132,043 126,149 36,390 4,135 (+2) (-7) (-3) (-4) (+1) (-13)
1983 28,056 107,616 168,807 160,522 44,140 4,763 (+15) (+34) (+28) (+27) (+21) (+15)
1984 32,930 124,644 205,115 189,612 52,741 5,255 (+17) (+16) (+22) (+18) (+19) (+10)
Note: Figures in brackets shown under the rows of 1980, 1981, 1982, 1983 and 1984 denote percentage changes of 1980 over 1979, 1981over1980, 1982 over 1981, 1983 over 1982 and 1984 over 1983 respectively. From the 1984 Survey onwards, new definitions have been adopted for 'purchases of materials, supplies and industrial services' and 'gross output'. The relevant figures for past years have been adjusted to the new definitions. #Prior to 1981, excise duties were included iii the values of sales, gross output and value added. As from 1981 onwards, excise duties for tobacco and alcoholic beverages have been excluded so as to
derive value added at factor cost. *Less than 0.5% in magnitude.
50

4.7 Indexes of Industrial Production 1981=100
Industry group Weights 1982 1983 1984 1985
Food 20.5 101.l 120.5 119.1 135.4
Beverages 9.6 106.5 98.0 109.5 107.6
Tobacco 4.7 86.8 95.3 137.9 215.1
Wearing apparel, except knitwear and footwear 251.3 99.6 106.0 113.8 105.0
Textiles (including knitting) 127.4 94.6 103.5 115.0 119.6
Paper and paper products 11.9 116.0 182.5 240.2 223.8
Newspaper printing, job printing and other printing 49.4 110.7 121.2 137.l 140.7
Chemicals and chemical products 15.l 97.8 125.3 133.2 160.5
Rubber products 3.2 119.3 134.6 150.4 122.4
Plastic products 81.l 107.0 121.l 174.0 169.7
Non-metallic mineral products 10.6 116.l 108.5 97.0 102.2
Basic metals 9.0 102.7 109.7 98.1 89.9
Fabricated metal products, except machinery and equipment 77.0 99.0 95.9 138.1 133.2
Machinery, except electrical 18. l 110.8 141.9 124.2 140.7
Consumer electrical and electronic products 103.2 96.0 113.l '150.0 134.9
Electrical and electronic parts, accessories and machinery 60.3 90.3 114.3 105.0 99.8
Professional and scientific equipment, photographic and optical goods, watches and clocks 52.7 117.5 153.2 133.8 150.6
Leather products and footwear (except rubber, plastic and wooden footwear) 12.2 69.0 72.8 67.9 66.4
Wood and cork products, and furniture and fixtures (except primarily of metal) 18.5 84.5 83.1 83.7 86.9
Transport equipment 27.0 107.3 98.5 133.2 113.0
Miscellaneous manufacturing industries n.e.c. 37.2 97.0 163.3 233.8 144.3
All manufacturing industries 1000.0 100.2 113.9 132.0 126.0
Note: 'n.e.c.' denotes not elsewhere classified.
51

4.8 Textile Production Statistics
Weights
Spinning and weaving industries
Spinning industry
Cotton yarn
Cotton/man-made fibre yarn #=
Woollen and worsted yarn
Weaving industry
Cotton piece-goods
Cotton/man-made fibre piece-goodst
Note: #=Includes pure man-made fibre yarn. tincludes pure man-made fibre piece goods.
1976
Stocks at end
1977
1 OOO
380 243 101 36
620
556 64
1976
134
132
152 87
155
136
139
100
(a) Production Indexes
1977
117
122
132
105 100
110
111
95
1978
118
126
131
125 92
106
104 139
1979
126
134
143 125 88
115
114
130
1980
115
121 126 117
98
107
107 103
(b) Production and Product Stocks
1978
Stocks at end
1979
Stocks at end
1980
Stocks at end
1981
1981
100
100
100 100 100
JOO
100 100
1982
Stocks at end
1982
90
90 100 71
76
89 92
66
1983
Stocks at end
1981 = 100
1983
99
93
106 71
64
103
107 68
1984
95
89
105 54 76
99 104 60
1984
Stocks at end
1985
1985
94
88 108 39
82
99
105 41
Production
of Produc-
Stocks at end
of year
Production
of Produc- of Produc- of Produc,.
Stocks at end
of year
Production
of Produc- of Produce of Produc-
Stocks at end
of year Unit year tion year tion year tion year tion year tion year tion year tion
Cotton yarn, grey Tonne 196 128 7 090 169 353 4 263 169 561 3 271 185 350 4 494. 163 992 6 941 129 360 2 913 126 379 2 652 140570 2 359 136 463 4 761 142 477 4 451
Cotton/man-made fibre yarn Tonne 25 756 1 657 31 015 1 291 39 913 1 407 38 973 1 508 36 620 2 175 31 945 1 123 21 914 1 858 21 560 1 023 16 849 1 494 I 1 572 I 300
Man-made (staple) ~-fibre yarn Tonne 6973 I 058 8 454 1 360 6 924 1 038 7 945 1 284 7 335 I 651 5 467 1 037 4 813 978 4 961 928 3 470 595 3 162 744
Woollen yarn Tonne
Worsted yarn Tonne
Wool/man-madefibre yarn Tonne
Cotton piece-
2 146 149
4 976 I 128
2120 377
2 464 68 2 455 160
2 378 694 2 062 440
2 034 496 1 547 591
2 424 158 2 299 271 1 926 301
I 908 331 2 382 486 2 815 289
I 995 459 1 425 338 734 173
goods 'OOO m 2 809 454 74 640 664 046 62 131 646 301 43 121 709 685 48 668 653 782 58 590 612 697 51 191 563 398 47 340 637 517 49 251 654 739 46 848 634 746 28 409
Cotton towelling 'OOO m 2 4146 354 12 887 I 123 12 OOO I 035 7 244 374 7 292 386 6 761 791 2 990 356 2 871 233 4463 209 4441 383
Cotton/manmade fibre piece-goods 'OOO m2 93 849 18 905 87844 16 146 133 469 14 530 124 974 13 841 98 289 12 806 95 654 10 124 62 992 10 445 65 030 6 431 58 003 9 312 39 285 3 554
Man-made fibre piece-goods '0oo m 2 3 642 465 4076 275 I 107 83 747 40 I 606 166 I 392 120 822 88 726 20 556 85
Cotton towels 'OOO 15 444 I 944 8 844 I 812 8 367 I 340 9 357 956 5 993 I 011 4 565 924 3 245 412 I 500 306
Labels 'OOO I 986 816 22 512 I 866 780 24 636 I 664 524 16 969 2 312 516 32 831 2 064 519 33 558 2 456 097 49 145 3 172 156 94 451 3 702 687 29 125 4 588 914 37 407 5 172 408 38 779
Note: *Figures suppressed for confidentiality reasons.
52

4.9 Mining, Cement and Quarry Production Tonne
1976 1977 1978 1979 1980 1981 1982 1983 1984 1985
Mining production
Feldspar 2299 3 378 3 157 742 2974 194 l 744 5 275 23 101 26777 Iron ore (50% Fe concentrate) 37058 Kaolin l 305 2466 89460§ 2 841 748 8 216 286 834 70 9602 Quartz 982 2063 665 2 12 34 116 Feldspar sandt 12964 3 325 31 114 51272 92293 82446
Cement production 764600 l 029 073 l 236 163 1278 669 1488 736 l 517 315 1435 596 l 716 577 1847 492 l 835 413
Quarry production* 10 448 988 13 655 605 13 865 424 21405957 13 338 409 15 597 621 14 196 646 12 441 706 11447968 10 912 848
Note: §Includes 63 805 tonnes of crude clay. tDerived from washing of kaolin. *Includes Government quarries, contract quarries, rock crushing sites and site crushers. Aggregate production figures for site crushers before 1980 were based. on explosive consumptions in development sites.
4.10 Electricity, Gas and Water Consumption
1976 1977 1978 1979 1980. 1981 1982 1983 1984 1985
Electricity (Million megajoules)
Domestic 5940 6944 7364 7 556 8 414 8 733 9227 10 685 10 817 11 519 Commercial 9607 11236 12533 13 763 15 647 17 340 19 953 22849 24609 26793 Industrial 10 535 11499 12 781 14124 15 125 15 406 15 436 16 820 18 543 18 819 Street lighting 109 112 117 120 132 141 153 171 196 208 Export to China 907 1109 851 979 l 323 2663 3 780
Total 26190 29792 32794 36470 40427 42471 45748 51849 56829 61120
. Gas (Million megajoules)
Domestic 930 994 1249 l 501 1 758 2024 2 500 3 021 3476 4036 Commercial 801 904 l 076 l 318 1 553 l 784 2138 2 670 3174 3 669 Industrial 160 180 179 202 212 225 220 233 257 273
Total 1891 2077 2503 3021 3524 4033 4858 5924 6907 7979
Water (Million cubic metres)
Domestic 151.18 150.43 156.07 170.14 184.39} Trade 118.63 112.85 118.08 126.83 143.58 507.41 519.46 592.03 627.11 636.98 Miscellaneous 135.23 123.66 138.22 170.04 180.04
Total 405;04 386.94 412.37 467.01 508.00 507.41 519.46 592.03 627.11 636.98
Note: Water restriction was imposed: a. from 1.6.77 to 4.7.77 on a 16-hour supply daily basis; b. from 5.7.77 to 18.4.78 on a 10-hour supply daily basis; c. from 8.10.81to25.10.81 on a 16-hour supply daily basis; d. from 26.10.81to4.5.82 on a 10-hour supply daily basis; e .. from 5.5.82 to 28.5.82 on a 16-hour supply daily basis.
53


Section 5: DISTRIBUTIVE TRADES, TRANSPORT AND SERVICES
The 1984 Survey of Wholesale and Retail Trades, Restaurants and Hotels was the sixth annual updating survey since the benchmark census carried out for this sector in respect of 1977. The survey was conducted on a sample basis, covering all wholesale, retail and import/export establishments, restaurants and hotels registered with the Business Registration Office of the Inland Revenue Department, and market stalls registered with the Urban Services Department and the Housing Department. Excluded from the survey were hawkers, street vendors, retail pitches (other than market stalls), cooked food stalls, and canteens in plants, offices, schools, and sports and recreation clubs not open to the general public. Tables 5.1 to 5.3 summarize the results of the 1984 Survey, while Table 5.4 compares the principal statistics by major group and activity for the years 1982 to 1984. Table 5.1 also presents information on Government and non-profit institutions including the Government Publications Centre, the Fish and Vegetable Marketing Organizations, welfare handicraft shops of the Hong Kong Council of Social Service, canteens and hostels of the Chinese Young Men's Christian Association, the Young Men's Christian Association of Hong Kong, Young Women's Christian Association and the Hong Kong Caritas.
The 1984 Survey of Transport and Related Services covered all transport establishments in Hong Kong, including local branches of companies incorporated overseas. It was also a sample survey with the sampling frame covering transport establishments registered with the Business Registration Office of the Inland Revenue Department, vehicle owners registered with the Transport Department and vessel owners registered with the Marine Department. As the vehicle owner records of the Transport Department were used for compiling the registers of urban taxis, New Territories taxis, public light buses and maxicabs, the survey included vehicle owners in these transport services irrespective of whether they operated their vehicles or rented them to others. Non-owner operators of taxis and public light buses were excluded because a sampling frame of such operators did not exist. Also excluded from the survey were minor transport activities such as those carried out by rickshaws, individual transport labourers, and temporary parking lots with no business registration. Summary results of the 1984 Transport Survey are presented in Tables 5.5 and 5.6 whereas Table 5.7 shows the comparisons of principal statistics in 1982 to 1984. Table 5.7 also gives information on Government transport services, which included the Transport Department for car parks and tunnel operation, the Civil Aviation Department for airport operation and the Marine Department for operation of lighthouses, moors, cargo handling areas and Macau ferry terminal service.
The 1984 Survey of Storage, Communications, Financing, Insurance and Business Services covered all establishments in these sectors registered with the Business Registration Office, except banks, representative offices of foreign banks and deposit-taking companies which were separately covered by the 1984 Survey of Banks, Deposit-taking Companies, and Representative Offices of Foreign Banks. Also excluded were private warehouses, cold storage services for fur offered by fur companies to their customers, overseas insurance companies without local branch/representative offices but operating entirely through general agents, agents and/ or management/ accounting/legal firms in Hong Kong, and self-employed insurance agents not registered with the Business Registration Office. Establishments were also enumerated on a sample basis. Summary results of the survey are at Tables 5.8 to 5.11. Comparisons of principal statistics for the years 1982 to 1984 are shown at Table 5.12. Table 5.12 also shows information on Government and semi-Government institutions, including those from the Post Office and the Export Credit Insurance Corporation.
Tables 5.1 to 5.12 relate to 'all establishments' and hence include the economic contributions of non-reporting establishments. 'Non-reporting establishments' refer to those establishments which operated during the whole or part of the reference year, but became untraceable during the survey enumeration period owing to closure or removal.
An Annual Survey of Banks, Deposit-taking Companies and Representative Offices of Foreign Banks has been implemented since the reference year 1980. In view of the number of establishments in the group, the nature of their business, and the distribution of business amongst them, it is not considered appropriate to collect and present statistics on these establishments in the same format, and in particular in the same degree of detail, as in the case of other groups of establishments covered in the Survey of Storage, Communications, Financing, Insurance and Business Services. Accordingly, a separate survey was organized, the main purpose of which was to obtain data for the compilation of estimates of gross domestic product. The survey covers all banks, deposit-taking companies and representative offices of foreign banks. Summary statistics of the survey results for the years 1980 to 1984 are presented in Table 5.13.
The retail sales indexes in Table 5.14 are compiled on the basis of data collected from a monthly survey of retail sales. The survey covers some 1 200 establishments drawn from all the retail establishments registered with the Business Registration Office of the Inland Revenue Department, and market stalls registered with the Urban Services Department and the Housing Department. Excluded from the survey are hawkers, street vendors and retail pitches.
The restaurant receipts indexes in Table 5.15 are compiled on the basis of data collected from a quarterly survey of restaurant receipts and purchases. The survey covers some 750 establishments drawn from all the catering establishments registered with the Business Registration Office of the Inland Revenue Department, the Urban Services Department and the Housing Department. Excluded from the survey are cooked food stalls operated outside the main structure of buildings, canteens attached to organizations and open to members only, and catering outlets operated by and situated within hotels.
The value indexes in Tables 5.14 and 5.15 measure the changes in value terms, while the volume indexes obtained by deflating the value indexes by specially constructed price indexes measure the change in real terms.
55

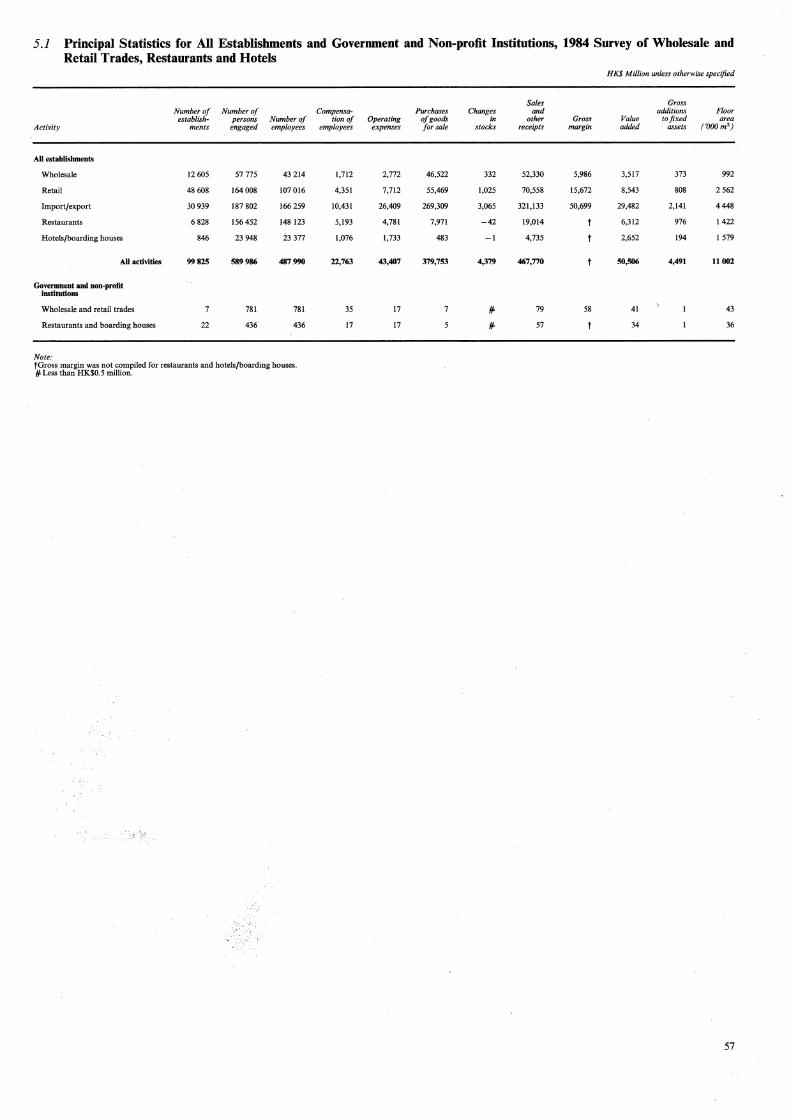
5.1 Principal Statistics for All Establishments and Government and Non-profit Institutions, 1984 Survey of Wholesale and Retail Trades, Restaurants and Hotels
HK$ Million unless otherwise specified
Sales Gross Number of Number of Compensa- Pilrchases Changes and odditions Floor
estoblish- persom Number of tionof Operating of goods in other Gross Value to fixed area Activity ments engaged employees employees expenses for sale stocks receipts margin added assets ('OOO m2 )
All establishments
Wholesale 12 605 57775 43214 1,712 2,772 46,522 332 52,330 5,986 3,517 373 992
Retail 48 608 164008 107 016 4,351 7,712 55,469 1,025 70,558 15,672 8,543 808 2562
Import/export 30 939 187 802 166 259 10,431 26,409 269,309 3,065 321,133 50,699 29,482 2,141 4448
Restaurants 6 828 156452 148123 5,193 4,781 7,971 -42 19,014 t 6,312 976 1422
Hotels/boarding houses 846 23 948 23 377 1,076 1,733 483 -1 4,735 t 2,652 194 1579
All activities 99825 589986 487990 22,763 43,407 379,753 4,379 467,770 t S0,506 4,491 11002
Govermnent and non-profit institutions
Wholesale and retail trades 7 781 781 35 17 * 79 58 41 43
Restaurants and boarding houses 22 436 436 17 17 * 57 t 34 36
Note: tGross margin was not compiled for restaurants and hotels/boarding houses. fl Less than HK$0.5 million .
. '.:t·. ~-.',
57

5.2 Principal Statistics for All Establishments Classified by Activity. and Analysed by Number of Persons Engaged, 1984 Survey of Wholesale and Retail Trades, Restaurants and Hotels
Activity/Number of persons engaged
Wholesale Below 5
5-9 10-19 20--49 50-99 100-199
200--499
Retail Below 5 5-9
10-19 20--49 50-99 100-199 200--499
500-999 1 OOO and over
Import/Export
Below 5
5-9 10-19 20--49 50-99 100-199 200--499 500-999
Restaurants
Below 5 5-9
10-19 20--49 50-99 100-199
200--499 500-999 1 OOO and over
Hotels/BOarding houses
Below 5 5-9 10-19
20--49 50-99 100-199
200--499 500-999
1 OOO and over
Note:
Sub-total
Sub-total
Sub-total
Sub-total
Sub-total
Total
Number of Number of establish- persons
ments engaged
8 936 18 445 2 332 14 625 1 016 13 099
272 7 409 31 1 864
15 1 905 2
12605
42 305
4708 1 070
347
82 53 30
9 4
48608
20 619 5 991 2 799 1169
239 91 28
30 939
1 774 1 937 1 236 1177
325 266
107
6828
666 86 33
18 11
4 16
846
99825
428
57 775
76172 29 004
13 167 10 363 5 650
7070 9 204
5 938 7 440
164 008
43 638
37070 35 296 33 863
15 769 11 889 8 255
2021
187 802
4462 12198
15 930 33 552 21 899
36 702 27 583 3 103,
1,023
156 452
1447
530 377 580 832
889 1 436
12021
5 836
23 948
589 986
*Statistics suppressed for confidentiality reasons. IF Less than HK$0.5 million.
Compensa-Number of tion of employees employees
8 319 248 11 540 405 12 191 529 6 992 312 1 839 81
1 905 428
43 214
26 670 22 549
12 342 10 176
5 633 7 065 9 204 5 938 7 440
107016
27 616
32 815 34 255 33 693
15 727 11 884
8 248 2021
166 259
1600 9418
14 551 32 478
21 724 36 644 27 583
3 103 1 023
148 123
941
473 369 580 832
889 1436
12021 5 836
23 377
487990
1,712
770 916
509 536 240
301 452
282 345
4,351
1,045
1,607 2,057 2,506 1,228 1,080
676 232
10,431
50 286
486 1,055
717 1,361
1,111
5,193
21
14 11 20 30 35
66 557 324
1,076
22,763
tGross margin was not compiled for restaurants and hotels/boarding houses.
58
Operating expenses
600
636 768
379 95
2,772
2,228 1,498
712 709 407 433 601 409
716
7,712
3,304 3,737 5,184 6,370
3,053 3,216 1,238
307
26,409
105 314 391
1,042
647 1,135
957
4,781
54 24 23 30 31
133
111 732 595
1,733
43,407
Purchases of goods for sale
10,631 10,018 12,886
9,573 1,733
46,522
14,616 10,128
7,100 5,820
2,955 2,751 5,117 2,225 4,757
55,469
35,752 46,361 54,369 51,490
25,808 40,020 13,178 2,331
269,309
339 612
716 1,878
1,017 1,777
1,456
7,971
25 276
162
483
379,753
Changes in stocks
130 JOO
2
93 -9
332
253 -84
117 90
164 123 63
75 225
1,025
-56
964 851 468
550 195
84
3,065
2 -26 -1 -1 -1
-14
-42
IF IF IF IF IF IF IF
-2
-1
4,379
Sales and other
receipts
11,805 11,331 14,578
10,374 1,962
52,330
19,181 13,065
8,410 7,332
3,584 3,509 6,635 2,963 5,878
70,558
42,040 52,613 64,021 64,277
32,352 46,418 16,298 3,114
321,133
652 1,362 1,653 4,136
2,508 4,442
3,730
19,014
93 49 39
67 92
149
258 2,511
1,477
4,735
467,770
Gross margin
1,298 1,396 1,632
873 204
5,986
4,775
2,825 1,410 1,549
781 861
1,435
798 1,238
15,672
5,988
6,965 9,962
12,523
6,273 5,241
2,992 755
50,699
HK$ Million unless otherwise specified
Value added
732 813 979 554 121
3,517
2,608 1,390
744 892 425
459 895 473 657
8,543
3,042
3,940 5,640 7,132
3,985 3,251
1,951 541
29,482
210 412
548 1,238
848 1,524
1,351
6,312
39 25 17 35 52 84
115 1,472
812
2,652
50,506
Gross additions
to fixed assets
167 43 86
57
373
184
61
72 60
60 74 38
108 151
808
253
235 423 549
188 223
237 32
2,141
14 -24
38 182
105 112 381
976
18
1 1
-3
-1 96
76
194
4,491
Floor area
('OOO m')
333 225 259
114 20
992
879 387
168 180 138 164 325
129 192
2562
750
583 754 841 343 668 471
37
4448
50 113 110 264 217 346
296
1422
73 17 20 37 38 42
77 990 285
1579
11002

5.3 Principal Statistics for All Establishments Classified by Activity and Analysed by Sales and Other Receipts, 1984 Survey of Wholesale and Retail Trades, Restaurants and Hotels
Activity/Sales and other receipts (HK$ 'OOO)
Wholesale Below 100 100--499 50(}...999 1,000--4,999 5,000-9,999 10,000:-19,999 20,000--49,999 50,000 and over
·Retail
Below 100 100--499 50(}...999
1,000--4,999 5,000-9,999 10,000:-19,999 20,000--49,999 50,000 and over
Import/Export Below 100 100--499 50(}...999 1,000--4,999 5,000-9,999 10,000-19,999 20,000--49,999 50,000 and over
Restaurants Below 100 100--499 50(}...999 1,000--4,999 5,000-9,999 10,00(}...19,999 20,000--49,999 50,000 and over
Hotels/Boarding houses Below 100 100--499 500-999 1,000--4,999 5,00(}...9,999 10,00(}...19,999
20,000--49,999 50,000 and over
Note:
Suh-total
Suh-total
Suh-total
Suh-total
Suh-total
Total
If Less than HK$ 0.5 million.
Number of Number of establish- persons
ments engaged
733 881 3 484 5 186 1846 5 005 4410 19 425 1071 8 650
610 7 626 311 6 805 138 4198
12605 57 775
5 278 5 526 22 953 33 633 10 402 28 704 8 364 40 946
806 8 080 342 7 606 337 10 126 126 29 387
48 608 164 008
2256 2913 5 876 8 939 5170 12253 8 239 34988 3817 23273 2448 23 910 2090 33 361 1044 48 165
30 939 187 802
494 1357 1 788 2239
504 265 164
17
6828
251 439
75 35 13 4 7
23
846
99825
679 5607
12 749 40 866 23494 31979 33 716 7 363
156452
418 1169
582 591 726 395
1 510 18 557
23948
589986
Compensa-Number of tion of employees employees
84 2 1458 32 2 783 78
14131 482 7 315 307 6 878 288 6478 303 4087 220
43 214 1,712
296 4 6 993 162
14 887 415 30 551 1,083 7 489 350 7472 329 9 974 587
29 354 1,421
107 016 4,351
1426 30 4 662 105 7 607 254
28 857 1,284 20 349 1,057 22 457 1,233 32 934 2,274 47968 4,194
166 259 10,431
171 3 082
10 531 37 990 23 349 31921 33 716 7 363
148123
209 847 545 589 726 395
1510 18 557
23 377
487990
60 313
1,199 844
1,110 1,374
291
5,193
4 20 15 20 26 15 55
921
1,076
22,763
tGross margin was not compiled for restaurants and hotels{boarding houses.
Operating expenses
11 72
112 669 380 470 565 494
2,772
38 633 800
2,010 609 515 837
2,270
7,712
45 228 418
2,248 2,642 2,814 5,002
13,014
26,409
6 85
287 1,098
795 968
1,121 421
4,781
48 26 35 33 15
152 1,416
1,733
43,407
Purchases of goods for sale
20 638
1,009 8,983 6,494 7,547 8,360
13,471
46,522
216 3,899 4,994
11,789 4,128 3,899 8,347
18,197
55,469
17 1,373 2,630
16,136 20,752 30,134 51,106
147,161
269,309
13 194 551
2,045 1,435 1,468 1,779
486
7,971
If If 2
2 18
452
483
Y79,753
Changes in stocks
If 19
-15 72 78
147
If 29
332
11 76 73
152 -37
54 156 540
1,025
77 9
-94 110 933 734
1,296
3,065
If 2 2
-25 -7 -5
-14 4
-42
If If If If If If
-1
-1
Sales and other
receipts
30 800
1,283 !0,514 7,388 8,355 9,478
14,482
52,330
305 5,359 6,761
15,456 5,347 4,798
10,021 22,512
70,558
67 1,634 3,560
20,708 25,381 34,922 60,811
174,050
321,133
28 432
1,264 4,516 3,217 3,692 4,556 1,309
19,014
17 82 51 65 91 47
218 4,164
4,735
467,770
Gross margin
10 180 257
1,589 945 943
1,090 972
5,986
99 1,527 1,820 3,775 1,172
945 1,770 4,563
15,672
50 326 902
4,249 4,593 5,543 9,976
25,060
50,699
t
t
HK$ Million unless otherwise specified
Value added
If 112 151 962 597 516 619 560
3,517
61 904
1,042 1,837
605 467 994
2,633
8,543
7 115 510
2,224 2,268 3,208 5,974
15,176
29,482
155 431
1,359 998
1,271 1,640
448
6,312
7 34 25 31 48
'30
127 2,348
2,652
50,506
Gross additions
to fixed asse~s
18 14 50 51
170 34 33
373
11 110 39
122 35 61 68
363
808
68 70
177 150 242 406
1,021
2,141
24 30
103 138 115 201 360
976
11
-5 4
167
194
4,491
Floor area
('OOO m2 )
12 81 96
325 174 110 119 74
992
51 365 328 506 145 135 214 818
2562
33 139 218 593 471 478 675
1 839
4448
6 52
103 334 217 303 325
81
1422
20 57 22 29 40 18 71
1322
1579
11002
59

5.4 Comparison of Principal Statistics for All Establishments in the Wholesale and Retail Trades, Restaurant and Hotel Sectors Classified by Activity and Major Group for the Years 1982, 1983 and 1984
HK$ M ii/ion unless otherwise specified
Gross Number of Number of Compensa- Purchases Sales and additions
establish- persons Number of tionof Operating of goods Changes other Gross Value to fixed Activity/Major group ments engaged employees employees expenses for sale in stocks receipts margin added assets
Wholesale
Foodstuffs. alcoholic drinks and tobacco 1982 3 444 22 677 17 556 542 495 18,072 52 19.456 1,408 973 176
1983 3 267 20 163 16031 544 515 19,641 103 21.057 1,500 973 54 (-5) (-11) (-9) (##) (+16) (+9) (+98) (+8) (+7) (##) (-69)
1984 3 678 22 811 17 753 699 728 18,464 -26 20,474 1,937 1,271 83 (+13) ( + 13) (+II) (+29) (+27) (-6) (-125) (-3) (+29) (+31) (+53)
Fuel 1982 175 2210 2067 67 65 2,108 10 2,280 172 113 8 1983 131 1957 1840 69 74 2,268 -1 2,452 176 109 26
(-25) (-JI) (-JI) (+2) (+15) (+8) (-107) (+8) (+2) (-3) ( +219) 1984 142 1772 1615 68 85 2,594 49 2,753 194 116 124
(+8) (-9) (-12) (-1) (+14) (+14) (-6812) (+12) (+11) (+6) ( +374)
Clothing, footwear and allied products 1982 1961 7 836 5 376 151 463 4,495 70 5,257 824 422 54 1983 2233 8 205 5 674 193 676 5,520 42 6,543 1,040 435 35
(+14) (+5) (+6) (+27) (+46) (+23) (-40) (+24) (+26) (+3) (-34) 1984 2 520 8 411 5 622 203 816 7,127 33 8,428 1,318 560 32
(+13) (+3) (-1) (+5) (+21) (+29) (-21) (+29) (+27) (+29) (-9)
Consumer durables and other consumer goods 1982 3 358 15 809 11 739 359 645 9,451 -73 10,814 1,238 710 112
1983 3 733 17 370 13 679 460 641 10,064 214 11,345 1,440 966 42 (+II) (+10) (+17) (+28) (-1) (+6) (-394) (+5) (+16) (+36) (-62)
1984 3 754 15 171 11 317 470 672 11,328 181 12,742 1,542 977 89 (+I) (-13) (-17) (+2) (+5) ( + 13) (-15) (+12) (+7) (+l) ( + 112)
Capital goods 1982 291 1646 1253 45 67 457 3 585 129 79 29 1983 330 1 380 968 33 45 484 31 545 90 50 8
(+13) (-16) (-23) (-28) (-32) (+6) (+I 090) (-7) (-30) (-37) (-72) 1984 307 1 094 814 28 47 485 23 551 89 47 10
(-7) (-21) (-16) (-14) (+4) (# #) (-26) (+2) (# #) (-6) (+28)
Raw materials and semi-manufactures 1982 1519 7055 5 508 175 333 4,286 151 4,812 638 372 66 1983 1673 7 576 5 666 209 365 6,418 113 7,188 872 543 26
(+JO) (+7) (+3) (+20) (+10) (+50) (-25) (+49) (+37) (+46) (~61) 1984 1654 6 823 5 087 207 374 6,096 66 6,837 787 477 25
(-1) (-10) (-JO) (-1) (+2) (-5) (-42) (-5) (-JO) (-12) (-5)
General commodities 1982 356 1192 599 18 26 287 3 351 67 42 5 1983 362 1248 155 25 33 271 2 352 82 50 6
(+2) (+5) (+26) (+42) (+24) (-6) (-46) (##) (+22) (+20) ( + 13) 1984 550 1693 1006 36 51 428 7 540 118 69 9
(+52) (+36) (+33) (+45) (+56) (+58) ( +338) (+54) (+44) (+38) (+45)
Sub-total 1982 11104 58426 44098 1,357 2,095 39,154 216 43,556 4,476 2,710 451 1983 11729 57899 44 613 1,532 2,409 44,667 504 49,482 5,200 3,127 198
(+6) (-1) (+1) (+13) (+15) (+14) ( +133) ( +14) ( +16) ( +15) (-56) 1984 12605 57 775 43 214 1,712 2,772 46,522 332 52,330 5,986 3,517 373
(+7) (# #) (-3) (+12) (+15) (+4} (-34) (+6) ( +15) ( +12) (+88)
Retail
Foodstuffs, alcoholic drinks and tobacco 1982 18 556 48 289 21987 635 1,038 10,604 97 13,256 2,730 1,720 160
1983 20 260 50976 24528 732 1,306 11,952 195 14,966 3,189 1,915 251 (+9) (+6) (+12) (+15) (+26) (+13) ( +102) (+13) (+17) (+II) (+56)
1984 21 813 53 649 25 633 877 1,669 13,631 211 17,063 3,606 1,994 295 (+8) (+5) ( +5) (+20) (+28) (+14) (+8) (+14) ( + 13) (+4) (+18)
Fuel 1982 484 4262 3 872 110 59 3,286 6 3,490 210 154 2 1983 497 4443 3 983 122 61 3,734 5 3,978 247 188 3
(+3) (+4) (+3) (+ll) (+5) (+14) (-27) (+14) (+18) (+21) (+29) 1984 480 4 387 3952 132 79 3,828 1 4,090 256 181 11
(-3) (-1) (-1) (+9) (+29) (+3) (-77) (+3) (+4) (-3) (+274)
Clothing, footwear and allied products 1982 6607 20120 13 865 427 1,087 3,225 153 4,898 l,8JO 769 143 1983 7 168 22009 14813 493 1,236 3,747 151 5,690 2,065 894 137
(+8) (+9) (+7) (+15) (+14) (+16) (-2) (+16) (+14) (+16) (-4) 1984 8 161 23 509 15 432 597 1,568 4,494 191 6,998 2,681 1,156 149
(+14) (+7) (+4) (+21) (+27) (+20) (+26) (+23) (+30) (+29) (+9)
Consumer durables and other consumer goods 1982 17 619 87 297 65 857 2,236 3,926 26,998 -208 34,799 7,218 4,079 918
1983 17 762 81839 62063 2,412 4,336 29,899 743 37,455 7,935 4,352 775 (+I) (-6) (-6) (+8) (+10) (+II) (-457) (+8) (+10) (+7) (-16)
1984 18 154 82463 61999 2,744 4,396 33,515 622 42,407 9,129 5,212 353 (+2) (+l) (##) (+14) (+I) (+12) (-16) (+13) (+15) (+20) (-54)
Sub-total 1982 43 265 159 968 105 582 3,407 6,IJO 44,114 48 56,443 11,968 6,722 1,223 1983 45688 159 267 105 387 3,758 6,939 49,332 1,093 62,089 13,435 7,348 1,165
(+6) (##) (##) (+JO) ( +14) ( +12) ( +2169) (+JO) ( +12) (+9) (-5) 1984 48608 164008 107016 4,351 7,712 55,469 1,025 70,558 15,672 8,543 808
(+6) ( +3) (+2) ( +16) (+II) ( +12) (-6) ( +14) ( +17) (+16) (-31)
60

5.4 Comparison of Principal Statistics for All Establishments in the Wholesale and Retail Trades, Restaurant and Hotel Sectors Classified by Activity and Major Group for the Years 1982, 1983 and 1984 (Continued)
HK$ Million unless otherwise specified
Gross Number of Number of Compensa- Purchases Sales and additions
establish- persons Number of lion of ·Operating of goods Changes other Gross Value to fixed Activity/Major group ments engaged employees employees expenses for sale in stocks receipts margin added asse~
Import/Export Foodstuffs, alcoholic drinks
and tobacco 1982 1235 9197 8 lll 346 1,337 16,173 80 18,661 2,382 1,286 82 1983 1479 10062 8 814 523 1,647 20,426 317 23,217. 2,927 1,575 132
(+20) (+9) (+9) (+51) (+23) (+26) (+294) (+24) (+23) (+22) (+61) 1984 2188 I3 861 11 827 642 2,014 27,017 153 30,823 3,687 1,960 93.
(+48) (+38) (+34) (+23) (+22) (+32) (-52) (+33) (+26) (+24) (-29) Fuel 1982 25 1582 1582 162 858 9,114 210 10,482 1,120 363 113
1983 36 I 707 1681 171 420 10,454 50 11,937 1,455 1,126 157 (+44) (+8) (+6) (+5) (-51) (+15) (-76) (+14) (+30) (+210) (+39)
1984 49 I 733 I 713 186 502 13,010 -167 14,447 1,189 794 199 (+36) (+2) (+2) (+9) (+19) (+24) (-436) (+21) (-18) (-29) (+27)
Clothing, footwear and allied products 1982 4405 25048 22463 1,100 3,237 30,337 189 36,107 5,417 2,818 290 1983 4729 28960 25 569 1,344 4,415 39,302 320 47,490 7,653 4,167 238
(+7) (+16) (+14) (+22) (+36) (+30) (+69) (+32) (+41) (+48) (-18) 1984 6008 37 797 33 802 2,296 6,548 56,005 488 68,220 11,771 6,430 382
(+27) (+31) (+32) (+71) (+48) (+42) (+52) (+44) (+54) (+54) (+60) Consumer durables and other
consumer goods 1982 6775 49072 44153 2,034 4,760 45,180 103 54,572 8,856 5,262 556 1983 8 244 53 282 47760 2,470 5,855 55,538 1,423 66,315 11,727 6,761 591
(+22) (+9) (+8) (+21) (+23) (+23) (+1287) (+22) (+32) (+28) (+6) 1984 10418 66 650 59 387 3,435 7,618 72,582 886 89,360 16,925 10,324 827
(+26) (+25) (+24) (+39) (+30) (+31) (-38) (+35) (+44) (+53) (+40) Capital goods 1982 603 5426 5148 313 450 2,910 63 3,817 909 551 95
1983 786 6 391 6053 402 610 4,520 171 5,939 1,527 999 53 (+30) (+18) (+18) (+28) (+36) (+55) (+171) (+56) (+68) (+81) (-44)
1984 I 074 8173 7649 531 813 5,614 143 7,333 1,816 1,106 71 (+37) (+28) (+26) (+32) (+33) (+24) (-17) (+23) (+19) (+11) (+33)
Raw materials and semi-manufactures 1982 2291 13 754 12403 723 1,946 18,674 280 22,115 3,495 2,039 182 1983 2928 15 808 14008 871 2,365 26,986 1,090 30,297 4,150 2,281 21.7
(+28) (+15) (+13) (+21) (+22) (+45) (+289) (+37) (+19) (+12) (+19)· 1984 4066 24256 21617 1,596 3,789 39,626 1,374 45,590 6,930 3,862 295
(+39) (+53) (+54) (+83) (+60) (+47) (+26) (+50) (+67) (+69) (+36) General commodities 1982 7118 41922 37 209 1,827 4,038 51,645 403 59,565 7,426 4,406 464
1983 8037 42 717 37 174 1,962 4,729 54,633 533 64,404 9,192 5,733 598 (+13) (+2) <IF IF> (+7) (+17) (+6) (+32) (+8) (+24) (+30) (+29)
1984 7 137 35 332 30266 1,743 5,126 55,454 188 65,360 8,381 5,006 274 . (-11) (-17) (-19) (-11) (+8) (+2) (-65) (+I) (-9) (-13) (-54)
Sub-total 1982 22452 146002 131070 6,505 16,626 174,032 1,328 205,319 29,605 16,724 1,783 1983 26240 158926 141059 7,744 20,042 211,860 3,905 249,599 38,632 22,642 1,986
(+17) ( +9) (+8) (+19) (+21) (+22) ( +194) (+22) (+30) (+35) (+II) 1984 30939 187 802 166259 10;431 26,409 269,309 3,()65 321,133 50,699 29,482 2,141
(+18) (+18) (+18) (+35) (+32) (+27) (-21) (+29) (+31) (+30) (+8)
Restaurants Chinese restaurants 1982 2812 roo 224 97 800 2,906 2,475 4,875 20 10,814 t 3,480 427
1983 3047 109 584 105 351 3,473 2,702 5,412 20 11,869 t 3,803 700 (+8) (+9) (+8) (+20) (+9) (+11) (+2) (+10) t (+9) (+64)
1984 3432 111 658 107 514 3,800 3,302 5,918 -46 13,689 t 4,479 637 (+13) (+2) (+2) (+9) (+22) (+9) (-327) (+15) t (+18) (-9)
Non-Chinese restaurants 1982 2436 31405 29 051 816 778 1,149 9 2,913 t 992 171 1983 2018 29974 27 754 886 844 1,254 12 3,181 t 1,102 177
(-17) (-5) (-4) (+9) (+8) (+9) (+38) (+9) t (+11) (+3) 1984 2 331 31185 28194 988 919 1,409 3 3,580 t 1,268 IOI
(+16) (+4) (+2) (+12) (+9) (+12) (-78) (+13) t (+15) (-43) Fast food shops 1982 576 6263 5 645 153 258 407 4 906 t 257 75
1983 630 7 748 7013 192 315 463 5 1,074 t 314 103 (+9) (+24) (+24) (+25) (+22) (+14) (+14) (+18) t (+22) (+37)
1984 657 8 670 7965 226 389 538 2 1,248 t 344 199 (+4) (+12) (+14) (+18) (+23) (+16) (-64) (+16) t (+10) (+93)
Bars 1982 108 4422 4266 163 110 52 2 356 t 198 28 1983 114 4036 4013 159 114 65 2 362 t 186 22
(+6) (-9) (-6) (-2) (+4) (+25) (-18) (+2) (-6) (-19) 1984 148 3 769 3644 155 124 60 -2 365 t 180 31
(+30) (-7) (-9) (-3) (+8) (-8) (-183) (+I) t (-3) (+37) Other eating and drinking plaoes 1982 285 I 018 765 19 38 50 2 123 t 38 11
1983 313 1121 749 19 37 50 (-9f)
129 t 44 4 (+10) c+to) (-2) (+I) (-3) (-2) (+4) t (+16) (-62)
1984 260 1169 806 24 47 46 I 133 t 41 8 ('--17) (+4) (+8) (+25) (+27) (-6) (+790) (+3) t (-'5) (+85)
Sub-total 1982 6217 143 332 137 526 4,057 3,661 6,533 37 15,113 t 4,964 712 1983 6122 152463 144880 4,729 4,013 7,243 39 16,614 t 5,448 1,007
(-2) (+6) (+5) (-!'17) (+10) (+II) (+6) (+10) t (+10) (+41) 1984 6828 156452 148123 5,193 4,781. 7,971 -42 19,014 t 6,312 976
(+12) (+3) (+2) (+10) (+19) (+10) (-208) (+14) t (+16) (-3)
Hotels/Boarding houses Hotels 1982 49· 20 975 20975 780 1,249 362 10 3,125 t 1,682 756
1983 50 20763 20763 866 1,415 424 6 3,589 t 1,953 248. (+2) (-1) {-!) (+11) (+13) (+17) (-38) (+15) t (+16) (-67)
1984 51 21307 21 307 1,020 1,616 480 -1 4,518 t 2,551 178 (+2) (+3) (+3) (+18) (+14) (+13) (-112) (+26) t (+31) (-28)
Boarding houses 1982 769 2422 1780 45 104 2 IF 204 t IOI 57 1983 726 2392 I 761 43 100 2 IF 185 t 86 . 16
(-6) (-1) (-1) (-6) (-4) (-6) (+38) ·(-9) t (-15) (-73) 1984 795 2642 2071 56 117 2 (-32fi 217 t 100 16
(+10) (+10) (+18) (+32) (+17) (+31) (+17) t (+17) (+4) Sub-total 1982 818 23397 22 755 825 1,353 364 10 3,329 t 1,783 814
1983 776 23155 22524 909 1,515 426 6 3,774 t 2,039 263 (-5) (-1) (-1) (+10) (+12) (+17) (-38) (+13) t (+14) (-68)
1984 846 23948 23 377 1/)76 1,733 483 -1 4,735 t 2,652 194 (+9) (+3) (+4) (+18) (+14) (+13) (-112) (+25) t (+30) (-26)
Total 1982 83856 531125 441031 16,152 29,845 264,196 1,639 323,760 t 32,903 4,983 1983 90554 551 711 458463 18,672 34,918 313,527 5,547 381,559 t 40,605 4,619
(+8) (+4) (+4) (+16) (+17) (+19) (+238) (+18) t (+23) (-7) 1984 99825 5119 986 487990 22,763 43,407 ·m,153 4,379 467770 t 50,506 4,491
(+10) (+7) (+6) (+22) (+24) (+21) (-21) (+23) t (+24) (-3) , .. ~
Note: Figures in brackets shown under the rows of 1983 and 1984 denote the percentage changes of the respective year over the preceding year derived from unrounded figures. IF Less than HK$0.5 million. IF IF Less than 0.5% in magnitude. tGross margin was not compiled for restaurants and hotels/boarding houses.
61

5 .5 Principal Statistics for All Establishments Classified by Major Group and Analysed by Number. of Pe..Sons Engaged, 1984 Survey of Transport and Related Services
Number of
Major group/Number of .establish- . persons engaged ments
Land passenger transport Below 5 19 599 5-9 164 10-19 57 20-49 50 50-99 21 100-199 6 500 and over 5
Sub-total 19 902
Land freight transport Below 5. 9 730 5-9 748 10-19 254 20-49 91 50-99 11 100--199 2
Sub-total JO 837
Supporting services to land transport Below 5 64
5-9 24 10-19 7 20-49 2 50-99 3 100--199 200-499
Sub-total
Ocean and coastal water trqnsport Below 5
5-9 10-19 20-49 50-99 100--199 200-499 500 and over
Sub-total
Inland water transport Below 5
5-9 10-19 20-49 50-99 100--199 200-499 500 and over
Sub-total
62
102
125 77 65 82 31 15 9 5
410
410 239
35 26
2
3 2
718
Number of
persons engaged
23 271 l 050 .742
1499 1492
864 20562
49481
12 159 4 581
3 178 2422
727 233
23.300
108 165 89 58
·197 118
284
I 019
206 487 927
2652 2407 2095 2'215 4221
15 210
952 l 322
446 756 162 394 660
l 763
6454
Number of
employees
3 472 851 712
1418 l 363
863 20 562
29241
2 829 3 424 2 812 2 198
725 229
12 217
64 160 88 58
197 118
284
969
184 474 919
2 651 2407 2095 2 215 4 221
15167
395 843 411
728 162 392 660
l 763
5354
Compensation of
employees
130 33 25 53 58 37
1,347
1,683
103 120 113
87
* *
466
2 4
* * 5
* *
43
14 28 49
269 198 209 215 349
1,332
17
33 18
37
* 22
* *
266
Operating expenses
889 39 35 72 74 56
2,062
3,227
582 346 166 125
* *
1,340
15 16
* .. 31
*
148
889 500
51
2,578 480 130
4,006 868
9,503
81
135
48 91
* 32
* *
638
Business receipts
and other income
1,953 89 70
144 176 99
3,364
5,894
1,156 551 324 244
* *
2,453
32 32
* *
50
* *
467
1,014 .524 121
2,810 861 474
4,454 2,088
12,347
137 191 75
150
* 65
* *
1,097
HK$ Million unless otherwise specified
Gross additions
to fixed assets
356 8 7
12 14 l
3,870
4,268
59 39
8 29
* *
146
-1 14
* * 3
* *
21
-162 22 24 4
11 7·
46 332
284
2 6
13
9
* # * *
140
Value added
1,256 54 38 72
106 45
2,237
3,808
680 319 191 149
* *
1,405
18
18
* *
19
* *
314
156 -50
64 347 359 268 502
1,277
2,923
60 66 44 83
* 34
* *
523
Floor area
('OOO m2 )
2 2 l
11 5 4
l 080
1106
9 14 11 22
* *
62
84 44
* *
173
* *
611
4
6 9
23 57 17
13 736
865
t l 1.
12
*
* *
JOI
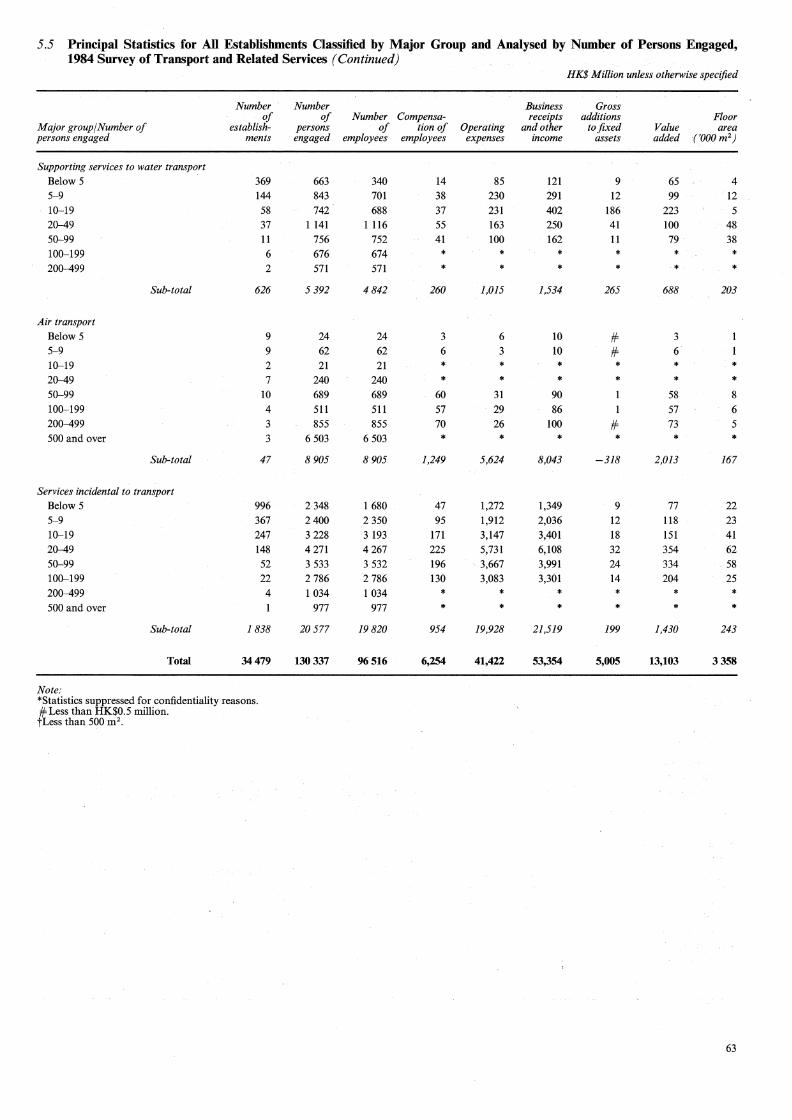
5.5 Principal Statistics for All Establishments Oassified by Major Group and Analysed by Number of Persons Engaged, 1984 Survey of Transport and Related Services (Continued) ·
HK$ Million unless otherwise specified
Number Number Business Gross of of Number Compensa- receipts additions Floor
Major group/Number of establish- persons of tion of Operating and other to.fixed Value area persons engaged ments engaged employees employees expenses income assets added ('OOO m 2 )
Supporting services to water transport
Below 5 369 663 340 14 85 121 9 65 4 5-9 144 843 701 38 230 291 12 99 12 10-19 58 742 688 37 231 402 186 223 5 20-49 37 1141 1116 55 163 250 41 100 48 50-99 11 756 752 41 100 162 11 79 38 100-199 6 676 674 * * * * * * 200-499 2 571 571 * * * * ·* *
Sub-total 626 5 392 4 842 260 1,015 1,534 265 688 203
Air transport
Below 5 9 24 24 3 6 10 # 3 5-9 9 62 62 6 3 10 # 6 10-19 2 21 21 * * * * * * 20-49 7 240 240 * * * * * * 50-99 10 689 689 60 31 90 1 58 8 100-199 4 511 511 57 29 86 l 57 6 200-499 3 855 855 70 26 100 # 73 5 500 and over 3 6 503 6 503 * * * * * *
Sub-total 47 8 905 8 905 1,249 5,624 8,043 -318 2,013 167
Services incidental to transport
Below 5 996 2 348 l 680 47 1,272 1,349 9 77 22 5-9 367 2400 2 350 95 1,912 2,036 12 118 23 10-19 247 3 228 3 193 171 3,147 3,401 18 151 41 20-49 148 4 271 4267 225 5,731 6,108 32 354 62 50-99 52 3 533 3 532 196 3,667 3,991 24 334 58 100-199 22 2 786 2 786 130 3,083 3,301 14 204 25 200-499 4 1 034 1034 * * * * * * 500 and over 977 977 * * * * * *
Sub-total 1838 20577 19820 954 19,928 21,519 199 1,430 243
Total 34479 130337 96516 6,254 41,422 53,354 5,005 13,103 3358
Note: *Statistics suppressed for confidentiality reasons. #Less than HK$0.5 million. tLess than 500 m 2 •
63

5.6 Principal Statistics for All Establishments Classified by Major Group and Analysed by Business Receipts and Other Income, 1984 Survey of Transport and Relat~d Services ··
Major group/Business receipts and other income (HK$'000)
Land passenger· transport
Below 100 100--499 500-999 1,000-4,999
5,000-9,999
10,000-19,999
20,000--49,~99
50,000 and over
Sub-total
Landfreight transport
Below 100
100--499
500-999 l ,000--4,999
5,000-9,999 10,000-19,999 20,000-49,999
Su/J..tota/
Supporting services to land transport
Below 100 100-499
500-999 1,000--4,999
5,000-9,999 10,000-19,999
20,000-49,999
50,000 and over
Su/J..total
Ocean and coastal water transport
Below 100
100-499
500-999 1,000--4,999
5,000-9,999 10,000-19,999
20,000-49,999 50,000 and over
Sub-total
Inland water transport
Below 100 100-499
500-999 l,000--4,999
5,000-9,999
10,000-19,999
20,000-49,999
50,000 and over
64
Sub-total
Number of
establishments
9695 9 951
118 105
17
7 3 5
19902
5703 4299
371 403
54
5 2
10837
36 26
11 21
3 2
2
102
39
72 50
102
41 36 44 26
410
165
363 89
70
11 12 5 3
718
Number of
persons engaged
9887 13 681
817
2247 1241
677 369
20562
49481
5 598 8756
2764 4758
852 454
117
23300
42 78 68
180
101 84
64 402
1019
48
275
393 1 500
1 576 l 504 3 572 6342
15 210
216 1 549
508
742 284
387 575
2 193
6454
.Number of
employees
376 3 326
685 2103 1 144
677 368
20562
29241
~69
4127
2 300 4055
800 449
117
12 217
11 64
67 176
101
84
64
402
969
30 264
393 1487
l 576 l 504 3 572 6342
15167
25 863
369
691 270 369 575
2 193
5 354
Compensation of
employees
6 132 26
78 46
30 17
1,347
1,683
5
141
87 166
38
* *
466
IF 1 2 6 2
* * *
43
1 8
21 87
154 135
349
576
1,332
36 15
27
15
20
* *
266
Operating expenses
269 624
31
102 54
56 28
2,062
3,227
136 376
132 372
217
* *
1,340
IF 4 5
23 8
* * *
148
9 17 93
113 390
607 8,273
9,503
3 28 33
113 45
124
* *
638
Business receipts
and other income
545 1,419
72 212 116 98 69
3,364
5,894
338 803
252 631 284
* *
2,453
7
8 53 23
* * *
467
2 19
33 206
288 524
1,315 9,959
12,347
8 95 55
159
75 155
* *
1,097
HK$ Million unless otherwise specified
Gross additions
to fixed assets
186
168 8
17 7
11
3,870
4,268
8 58 10 36
24
* *
146
IF IF IF 14
2
* * *
21
IF 1
# 20
-5 -149
19
399
284
-1 6 2
6 14
1
* *
140
Value added
334 928
44
115 65 43 42
2,237
3,808
213 492
154 355 146
* *
1,405
3 4
33 15
* * *
314
10
18 102
166 154
811 l,661
2,923
6 71 27 51
47
51
* *
523
Floor area
('000m2 )
t 1 4
10 3 7 2
1 080
1106
8 14 22 12
* *
62
3 23
28 98
112
* * *
611
4 4
13 18
20
58 747
865
t t
2 11 l
* *
101

5.6 Principal Statistics for All Establishments Classified by Major Group and Analysed by Business Receipts and Other Income, 1984 Survey of Transport and Related Services (Continued)
HK$ Million unless otherwise specified
Number Number Business Gross of of Number Compensa- receipts additions Floor
Major group/Business receipts establish- persons of tion of Operating and other to fixed Value area and other income (HK$'000) ments engaged employees employees expenses income assets added ('OOO m 2 )
Supporting services to water transport
Below 100 54 64 20 # 2 3 3 t 100-499 281 589 309 9 39 66 6 33 2
500-999 105 469 384 21 46 77 8 41 4
1,000--4,999 133 1452 I 347 68 190 290 24 142 16
5,000-9,999 24 657 639 37 112 168 28 71 21
10,000-19,999 12 752 750 35 105 155 9 66 57
20,000--49,999 14 819 802 51 363 454 9 132 75
50,000 and over 3 591 591 39 158 322 178 203 29
Sub-total 626 5 392 4 842 260 1,015 1,534 265 688 203
Air transport
100-499 4 10 10 # I # I t 500-999 8 35 35 4 2 6 # 4
1,000--4,999 12 220 220 17 16 31 16 2
5,000-9,999 11 527 527 53 31 84 2 52 6
10,000-19,999 4 361 361 34 16 51 1 35 4
20,000--49 ,999 5 950 950 81 33 117 # 84 7
50,000 and over 4 6 802 6 802 1,059 5,525 7,752 -322 1,822 148
Sub-total 47 8 905 8 905 1,249 5,624 8,043 -318 2,013 167
Services incidental to transport
Below 100 153 135 45 2 7 7 # # 100-499 350 876 690 13 73 89 16 9
500-999 186 837 645 19 103 128 26 5
1,000-4,999 555 2 817 2 570 97 1,198 1,326 20 130 35
5,000-9,999 194 1 915 1 891 98 1,214 1,343 14 119 19
10,000-19,999 146 2 170 2 170 103 1,894 2,020 9 121 19
20,000--49,999 147 3 636 3 617 204 4,316 4,686 25 289 51
50,000 and over 106 8 191 8 191 418 11,124 11,921 129 729 103
Sub-total 1838 20577 19820 954 19,928 21,519 199 1,430 243
Total 34479 130337 96516 6,254 41,422 53,354 5,005 13,103 3358
Note: *Statistics suppressed for confidentiality reasons. #Less than HK$0.5 million. tLess than 500 m2 .
65

5.7 Comparison of Principal Statistics for AU Transport Establishments for the Years 1982, 1983 and 1984 HK$ Million unless otherwise specified
Number Number Business Gross of of Number Compensa- receipts additions
establish- persons of tion of Operating and other to fixed Value Major group ments engaged employees employees expenses income assets added
Land passenger transport 1982 16 238 45 217 29498 1,446 2,170 4,265 4,114 2,819 1983 18 013 47 396 29 723 1,528 2,912 5,056 7,238 3,230
( + 11) (+5) ( + 1) ( +6) (+34) ( + 19) ( +76) ( + 15) 1984 19 902 49 481 29 241 1,683 3,227 5,894 4,268 3,808
( + 10) (+4) (-2) ( + 10) ( + 11) ( + 17) (-41) ( + 18)
Land freight transport 1982 12 897 25 950 12 827 416 1,186 2,298 209 1,330 1983 11948 26 689 14 985 497 1,413 2,592 152 1,494
(-7) ( +3) ( + 17) ( + 19) ( + 19) ( +13) (-28) ( + 12) 1984 10 837 23 300 12 217 466 1,340 2,453 146 1,405
(-9) (-13) (-18) (-6) (-5) (-5) (-4) (-6)
Supporting services to land transport 1982 37 578 566 26 46 354 4 302
1983 49 675 654 31 70 381 5 306 ( +32) ( +17) ( +16) (+20) (+53) ( +8) ( +22) ( +l)
1984 102 1 019 969 43 148 467 21 314 ( + 108) ( +51) (+48) (+37) ( + 112) ( +23) ( +317) ( +2)
Ocean and coastal water transport 1982 379 15 516 15 488 1,140 7,487 9,498 665 1,785
1983 421 15 655 15 626 1,236 8,239 10,494 146 2,304 ( + 11) ( + 1) ( +l) ( +8) ( + 10) ( + 10) (-78) ( +29)
1984 410 15 210 15 167 1,332 9,503 12,347 284 2,923 (-3) (-3) (-3) ( +8) ( + 15) ( + 18) ( +94) ( +27)
Inland water transport 1982 856 7 759 6 179 253 638 1,082 228 504 1983 789 7 093 5 617 248 536 967 104 470
(-8) (-9) (-9) (-2) (-16) (-11) (-54) (-7) 1984 718 6454 5 354 266 638 1,097 140 523
(-9) (-9) (-5) ( +7) ( + 19) (+13) ( +34) ( + 11)
Supporting services to water transport 1982 587 4 665 4147 188 672 1,078 76 572
1983 683 5 026 4498 222 797 1,273 156 652 ( + 16) (+8) (+8) ( + 18) ( + 19) ( + 18) ( + 105) ( + 14)
1984 626 5 392 4 842 260 1,015 1,534 265 688 (-8) ( +7) ( +8) ( + 17) (+27) ( +21) ( +70) ( +6)
Air transport 1982 46 8 210 8 210 914 3,600 4,929 216 1,330 1983 46 8 441 8 441 1, 051 4,231 6,227 -1,847 1,891
(----,-) ( +3) ( +3) ( + 15) ( + 18) ( +26) (-954) ( +42) 1984 47 8 905 8 905 1,249 . 5,624 8,043 -318 2,013
( +2) ( +5) ( +5) ( + 19) ( +33) ( +29) (-83) ( +6)
Services incidental to transport 1982 1 716 17 066 16 272 672 11,527 12,496 89 974 1983 1 787 18 703 17 934 807 14,897 16,207 160 1,288
( +4) ( +10) ( +10) (+20) ( +29) (+30) ( +79) ( +32) 1984 1 838 20 577 19 820 954 19,928 21,519 199 1,430
(+3) ( + 10) ( + 11) ( + 18) ( +34) ( +33) ( +24) ( + 11)
All transport groups 1982 32756 124 960 93 186 5,054 27,324 36,000 5,603 9,616 1983 33 736 129 678 97 478 5,620 33,095 43,198 6,114 11,634
( +3) ( +4) ( +5) ( + 11) ( +21) (+20) ( +9) ( +21) 1984 34479 130 337 96 516 6,254 41,422 53,354 5,005 13,103
( +2) ( +l) (-1) ( + 11) ( +25) (+24) (-18) ( +13)
Government transport services 1982 4 2 516 2 516 179 403 998 -591 733 1983 3 1 276 1 276 125 288 965 54 730
(-25) (-49) (-49) (-30) (-28) (-3) (-109) ( #=) 1984 3 1 156 1 156 148 243 1,021 78 735
(-) (-9) (-9) ( + 18) (-16) (+6) (+44) ( + 1)
Note: Figures in brackets shown under the rows of 1983 and 1984 denote the percentage changes of the respective year over the preceding year derived from unrounded figures. The Kowloon-Canton Railway Corporation was established in early 1983. Hence, its data relating to 1983 were included in the major group "Land passenger transport" instead of "Government transport services". #=Less than 0.5% in magnitude.
66

5.8 Principal Statistics for All Establishments in the Storage, Communications, Financing and Business Services Sectors Analysed by Number of Persons Engaged, 1984 Survey of Storage, Communications, Financing, Insurance and Business Services
Sector/Number of persons engaged
Storage
Below 5
5-9
10-19
W--49
50-99
100-199
Communications
Below 5
5-9
10-19
W--49
50-99
100-199
200--499
500 and over
Financing
Below 5
5-9
10-19
20--49
50-99
100-199
200--499
500 and over
Business services
Below 5
5-9
10-19
20--49
50-99
100-199
200--499
500 and over
Note:
Sub-total
Sub-total
Sub-total
Sub-total
Total
Number of
establishments
37
45
62
31
12
5
191
47
25
14
24
7
6
132
1 086
562
225
IOI
47
2
2036
2 915
698
425
240
75
26
16
10
4405
6764
Number of
persons engaged
118
324
788
911
764
572
3476
119
175
184
872
477
883
1 371
15 273
19355
1 827
3 663
2 855
2918
3 191
986
1208
1419
18 067
5 482
4216
5 543
7 155
5 080
3 367
4 747
10 301
45 891
86789
Number of
employees
118
320
782
910
764
572
3466
96
170
183
866
477
883
I 371
15 273
19319
1468
3 281
2 684
2 883
3 189
986
I 016
1419
16 926
3 395
3 674
5 224
6 861
4974
3 294
4649
10 234
42304
82016
Compensation of
employees
16
33
43
35
30
161
2
5
31
15
27
59
1,254
1,399
116
154
234
291
531
110
1,663
186
247
332
531
483
309
298
409
2 794
6,016
Operating expenses
19
43
148
139
94
104
547
II
6
85
25
18
60
2,343
2,552
824
754
1,268
1,333
872
583
6,222
700
505
653
1,078
746
502
179
158
4522
13,844
Total value of
purchases of goods for sale
6
II
21
27
105
179
19
32
37
51
20
185
364
Changes in
stocks
-0.2
-0.1
0.4 -0.1
-0.2
0.4
43.5
43.6
-0.8
-0.4
-0.4
1.5
4.1
2.5
12.8
4.1
23.5
67.1
Business receipts
and other income
20
72
231
238
192
161
915
5
18
18
134
66
77
188
5,719
6,226
2,295
2,149
2,278
3,909
3,147
948
16,956
1,105
872
1,181
2,097
1.535
1,125
759
839
9,513
33,610
HK$ Million unless otherwise specified
Gross additions
to.fixed assets
61
27
2
97
IF IF 12
4
20
926
965
54
1,384
225
95
83
11
2,039
42
26
28
89
36
39
34
IF 295
3,396
Value added
37
115
130
107
64
455
2
6
40
34
41
102
3,250
3,479
175
1,366
283
389
611
152
3,144
402
358
518
984
753
580
524
646
4,764
11,841
Floor area
('OOO m2 )
75
141
321
320
402
175
1434
2
2
4
6
351
374
27
40
29
38
37
12
221
77
46
62
79
55
37
30
33
420
2449
In the financing sector, value added was not compiled for investment and holding companies owing to the special features of their business operation. Hence, total value added for the sector did not include that of investment and holding companies. Caution should therefore be taken when interpreting value added figures throughout this sector. *Statistics suppressed for confidentiality reasons. IF Less than HK$0.5 million.
67

5.9 Principal Statistics for All Establishments in the Storage;· Communications, Financing and Business Services Sectors Analysed by Business Receipts and Other Income, 1984 Survey of Storage, Communications, Financing, Insurance and Business Services
Sector/Business receipts and other inco.me ( HK$'000)
Storage
Below 500
500-999
1,000-4,999
5,000-9,999
10,000-19,999
20,000-49,999
50,000 and over
Communications
Below 500
500-999
1,000-4,999
5,000-9,999
10,000-19,999
20,000-49,999
50,000 and over
Financing
Below 500
500-999
1,000-4,999
5,000-9,999
10,000-19,999
20,000-49,999
50,000 and over
Business services Below 500
500-999
1,000-4,999
5,000-9,999
10,000-19,999
20,000-49,999
50,000 and over
Note:
Sub-total
Sub-total
Sub-total
Sub-total
Total
Number of
establishments
20
22
93
35
15
6
191
63
13
36
3
4
132
1030
326
379
107
64
64
65
2036
2 565
528
965
207
63
47
30
4405
6764
Number of
persons engaged
56
93
1023
830
763
604
107
3476
239 176
1090
326
677
1281
15 565
19355
3 060
2078
3 371
1450
1179
2140
4789
18067
5 345
2473
10780
6169
4721
6877
9 526
45 891
86789
Number · of
employees
54
91
1016
830
763
604
107
3466
212
172
1086
326
677
1281
15 565
19319
2545
1870
3156
1251
1178
2138
4789
16926
3 321
2023
10169
5988
4639
6799
9 364
42304
82016
Compensa-tion of · Operating
employees expenses
42
42
38
161
4
27
9
21
60
1,273
1,399
95 82
188
121
133
247 795
1,663
98
86
617
423
291
444 836
2,794
6,016
3
17
132
141
133
547
2
42
7
18
98
2,380
2,552
170
119
407
433
436
672
3,985
6,222
224
162
1,002
637
428
832
1,237
4,522
13,844
Total value of
purchases of goods for sale
ff 2
18
5
23 27
105
179
1
22
17
7
59 78
185
364
Changes in
stocks
ff ff -0.2
0.2
-0.3
0.1
0.4
43.5
43.lj
ff ff -0.5
-0.7
0.6
0.8
5.6
17.6
23.5
61.l
Business receipts
and other income
5
18
205
243 219
915
89
27
72
228
5,794
6,226
104 226
756
710 896
2,048 12,216
16,956
393
364
1,996
1,337
911
1,596
2,916
9,513
33,610
HK$ Million wiless otherwise specified
Gross additions
to fixed assets
1
ff 64
22
97
4
22
932
965
19
-26
2 339
1,691
2,039
28
11
59 38
39
32
88
295
3,396
Value added
102
134
107
455
2 4
31
16
32
105
3,288
3,479
53
100
149 85
102
758
1,897
3,144
171
203
978
670
469
702
1,572
4,764
11,841
Floor area
('000m2 )
19
68 390
296
352
1434
2
7
7
353
374
31
23
33
17
17
23
78
221
58
30 120
54
39
40
79
420
2449
In the financing sector, value added was· not compiled for investment and hi>ldifig companies owing to the special features of their business operation. Hence, total value 'added for the sector did not incliide that of investment and holding companies. Caution should therefore be taken when interpreting value added figures throughout this sector. *Statistics suppressed for confidentiality reasons. ff Less than HK.$0.5 million. ff ff Less than HK$0.05 million.
68
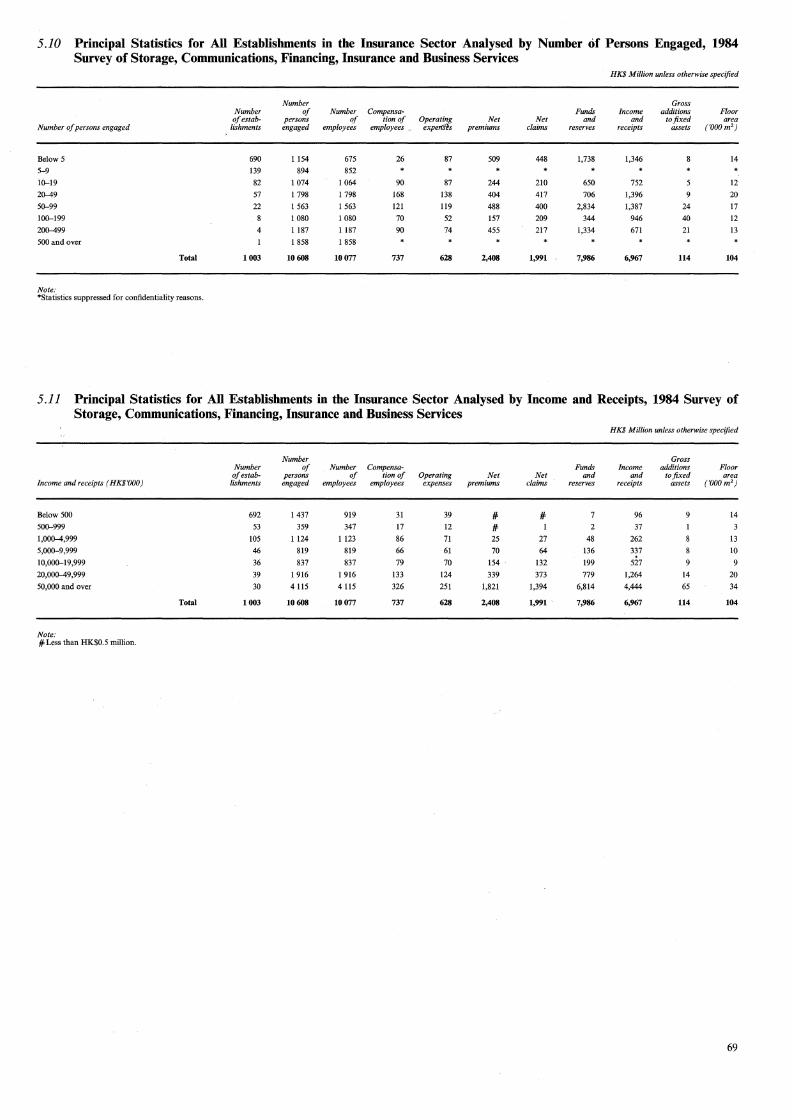
5.10 Principal Statistics for All Establishments in the Insurance Sector Analysed by Number of Persons Engaged, 1984 Survey of Storage, Communications, Financing, Insurance and Business Services
HK$ Million unless otherwise specified
Number Gross Number of Number Compensa- Funds Income additions Floor of estab- persons of tionof Operating Net Net and and to fixed area
Number of persons engaged lishments engaged employees employees _ expe~s premiums claims reserves receipts assets ('OOO m 2 }
Below 5 690 1154 675 26 87 509 448 1,738 1,346 14
5-9 139 894 852
10-19 82 1 074 1 064 90 87 244 210 650 752 12
20-49 57 I 798 I 798 168 138 404 417 706 1,396 20
50-99 22 I 563 1 563 121 119 488 400 2,834 1,387 24 17
100-199 1 080 1 080 70 52 157 209 344 946 40 12
200-499 1187 1 187 90 74 455 217 1,334 671 21 13
500 and over I 858 I 858
Total 1003 10608 10077 737 628 2,408 1,991 7,986 6,967 114 104
Note: *Statistics suppressed for confidentiality reasons.
5 .11 Principal Statistics for All Establishments in the Insurance Sector Analysed by Income and Receipts, 1984 Survey of Storage, Communications, Financing, Insurance and Business Services
HK$ Million unless otherwise specified
Number Gross Number of Number Compensa- Funds Income additions Floor of estab- persons of tion of Operating Net Net and and to fixed area
Income and receipts (HK$ 'OOO) lishments engaged employees employees expenses premiums claims reserves receipts assets ('OOO m 2 }
Below 500 692 1437 919 31 39 IF IF 96 14
500-999 53 359 347 17 12 IF I 2 37
1,000-4,999 105 1124 I 123 86 71 25 27 48 262 13
5,000-9,999 46 819 819 66 61 70 64 136 337 10
10,000-19,999 36 837 837 79 70 154 132 199 527 9
20,000-49,999 39 1916 1916 133 124 339 373 779 1,264 14 20
50,000 and over 30 4 115 4 115 326 251 1,821 1,394 6,814 4,444 65 34
Total 1003 10608 10077 737 628 2,408 1,991 7,986 6,967 114 104
Note: IF Less than HK$0.5 million.
69

5.12 Comparison of Selected Principal Statistics for All Establishments in the Storage, Communications, Financing, Insurance and Business Services Sectors for the Years 1982, 1983 and 1984
HK$ Million unless otherwise specified
Number Number Business of of Number Compensa- receipts
establish- persons of tion of Operating and other Value Sector ments engaged employees employees expenses income added
Storage 1982 196 4243 4 238 151 484 824 408 1983 201 3 840 3 827 167 530 995 445 1984 191 3 476 3 466 161 547 915 455
(-5) (-9) (-9) (-4) (+3) (-8) ( +2)
Communications 1982 93 19 450 19 436 1,118 1,727 4,514 2,770 1983 109 19 487 19 402 1,276 2,069 5,253 3,056 1984 132 19 355 19 319 1,399 2,552 6,226 3,479
( +21) (-1) ( #=) ( +10) ( +23) ( + 19) ( + 14)
Financing 1982 2 263 18 587 17 473 1,185 4,190 12,142 2,693 1983 2 117 18 535 17 123 1,368 5,084 13,982 2,269 1984 2 036 18 067 16 926 1,663 6,222 16,956 3,144
(-4) (-3) (-1) ( +22) ( +22) ( +21) ( +39)
Business services 1982 3 120 35 520 32 849 1,710 3,452 6,966 2,993 1983 3 867 40 438 37 023 2,199 3,789 7,856 3,912 1984 4405 45 891 42 304 2,794 4,522 9,513 4,764
( + 14) ( +13) ( + 14) ( +27) ( + 19) ( +21) ( +22)
Insurance 1982 859 8 735 8 441 484 472 5,247 t 1983 1 007 9 579 9084 659 641 6,199 t 1984 1 003 10 608 10 077 737 628 6,967 t
( #=) ( + 11) ( + 11) ( + 12) (-2) ( + 12)
Government/Semi-government institutions 1982 2 4 322 4322 276 296 676 t 1983 2 4 347 4 347 314 337 758 t 1984 2 4 431 4 431 366 333 877 t
(-) ( +2) ( +2) ( + 17) (-1) ( + 16)
Note: Figures in brackets denote percentage change of 1984 over 1983. In the financing sector, value added was not compiled for investment and holding companies owing to the special features of their business operation. Hence, total value added for the sector did not include that of investment and holding companies. Caution should therefore be taken when interpreting value added figures throughout this sector. #=Less than 0.5% in magnitude. tValue added was not compiled for the insurance sector and government/semi-government institutions.
70

5.13 Summary Statistics from the Annual Survey of Banks, Deposit-taking Companies and Representative Offices of Foreign Banks for 1980--1984
(a) Banks and Deposit-taking Companies
1980 1981 1982 Deposit- Deposit- Deposit-
taking taking taking Banks companies Banks companies Banks companies
Number of establishments 115 296 123 350 131 360
Number of persons engaged #= 43 314 4 647 49 039 6 540 51 991 6427
Receipts for the provision of services
Credit and bills 701,077 117,509 862,268 176,366 951,015 159,917
Current account operationst, executor and trustee services, guarantees, portfolio management, remittance, merchant banking advisory services 281,950 170,635 299,379 254,805 331,710 176,513
Syndication ofloans 88,683 169,469 90,513 281,637 105,851 297,906
Net interest receipts* 5,023,610 1,607,094 7,271,401 2,299,991 8,021,149 2,824,959
Profit from foreign exchange dealing 1,112,195 167,039 1,362,110 251,773 1,383,077 272,836
Dividends received and profit from trading in securities 1,186,060 120,934 1,440,800 979,449 1,426,471 748,435
Wages and salaries paid and other employees benefits offered 1,746,565 377,407 2,465,515 536,997 3,159,801 656,426
Rental payment 450,876 93,433 881,377 172,906 1,112,857 229,661
Office stationery and supplies 170,242 26,082 247,970 36,465 277,262 42,637
Advertising, promotion, communication, entertainment and staff travelling expenses 248,770 108,876 321,580 142,634 388,581 171,453
Expenses incurred outside Hong Kong, including expenses related to travelling, entertainment and business promotion and operating expenses of representative offices located outside Hong Kong 43,553 31,069 72,431 46,030 75,573 61,458
Other administrative expenses, including professional fees, insurance premiums, etc. 405,635 166,093 576,455 185,311 787,914 243,495
Note: #=Survey of Employment, Vacancies and Payroll conducted by the Census and Statistics Department. tFor banks only. *Interest received minus interest paid.
Number of establishments
Number of persons engaged#=
Wages and salaries paid to staff located in Hong Kong and other employees benefits offered to them
Other operating expenses
Note:
(b) Representative Offices of Foreign Banks
1980 1981 1982
107 121 118
859 453 466
31,953 43,365 36,964
41,500 54,228 58,514
#=Survey of Employment, Vacancies and Payroll conducted by the Census and Statistics Department.
HK$'000 unless otherwise specified
1983 1984 Deposit- Deposit-
taking taking Banks companies Banks companies
136 364 140 362
51 672 6 706 51 261 6 513
1,219,371 145,794 1,407,546 177,252
425,778 215,453 574,033 335,165
100,883 298,943 100,691 283,241
8,079,941 3,082,579 8,176,752 3,171,643
1,645,629 294,183 1,323,461 138,467
1,136,825 1,003,285 1,677,730 1,198,747
3,656,111 809,019 4,080,073 940,059
1,419,908 275,374 1,430,437 264,068
314,861 · 44,745 353,171 54,142
404,928 195,525 433,259 218,186
102,710 72,367 108,221 95,149
788,086 243,908 780,428 202,892
HK$'000 unless otherwise specified
1983 1984
129 132
383 425
53,704 58,852
64,215 70,874
71
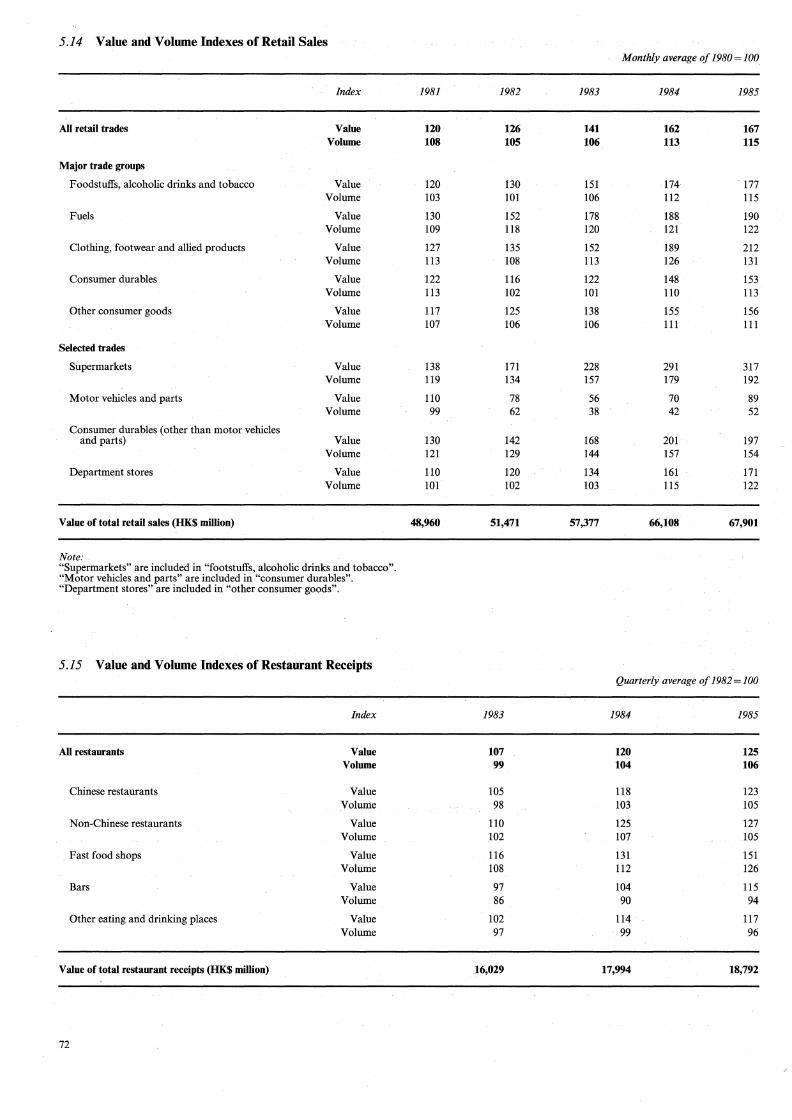
5.14 Value and Volume Indexes of Retail Sales Monthly average of 1980 = 100
Index 1981 1982 1983 1984 1985
All retail trades Value 120 126 141 162 167 Volume 108 105 106 113 115
Major trade groups
Foodstuffs, alcoholic drinks and tobacco Value 120 130 151 174 177 Volume 103 101 106 112 ll5
Fuels Value 130 152 178 188 190 Volume 109 ll8 120 121 122
Clothing, footwear and allied products Value 127 135 152 189 212 Volume ll3 108 113 126 131
Consumer durables Value 122 ll6 122 148 153 Volume 113 102 IOI llO 113
Other consumer goods Value ll7 125 138 155 156 Volume 107 106 106 l ll l ll
Selected trades
Supermarkets Value 138 171 228 291 317 Volume ll9 134 157 179 192
Motor vehicles and parts Value llO 78 56 70 89 Volume 99 62 38 42 52
Consumer durables (other than motor vehicles and parts) Value 130 142 168 201 197
Volume 121 129 144 157 154
Department stores Value llO 120 134 161 171 Volume 101 102 103 ll5 122
Value of total retail sales (HK$ million) 48,960 51,471 57,377 66,108 67,901
Note: "Supermarkets" are included in "footstuffs, alcoholic drinks and tobacco". "Motor vehicles and parts" are included in "consumer durables". "Department stores" are included in "other consumer goods".
5.15 Value and Volume Indexes of Restaurant Receipts Quarterly average of 1982=100
Index 1983 1984 1985
All restaurants Value 107 120 125 Volume 99 104 106
Chinese restaurants Value 105 118 123 Volume 98 103 105
Non-Chinese restaurants Value 110 125 127 Volume 102 107 105
Fast food shops Value ll6 131 151 Volume 108 112 126
Bars Value 97 104 115 Volume 86 90 94
Other eating and drinking places Value 102 114 117 Volume 97 99 96
V aloe of total restaurant receipts (HK$ million) 16,029 17,994 18,792
72

Section 6: EXTERNAL TRADE
External trade statistics comprise movements of merchandise between Hong Kong and her trading partners, by land, air and water and also by post, with the exception of the following classes of goods: I. Transhipment cargo under through bill of lading or through air way-bill; 2. Transit cargo; 3. Articles imported or exported by the armed forces of the Crown; 4. Ships' stores, including bunker fuel; aircraft stores, including aviation fuel; 5. Personal baggage and possessions of travellers, not including motor vehicles; 6. Advertising materials supplied free of charge and samples of no commercial value or valued at less than five hundred
dollars; 7. Marine fish arriving direct from fishing grounds on fishing craft registered or licensed in Hong Kong; 8. Gifts of a personal nature where no payment has been made by the receiver; 9. Articles temporarily imported and exported solely for exhibition and subsequent return; 10. Articles imported or exported under and in accordance with an A.T.A. carnet; 11. Circulatory used freight containers and the like; 12. Banknotes after issue into circulation, being legal tender in any country.
The external trade statistics relate to movements of merchandise only. Statistics on bullion and specie are not included but are separately available.
Imports are c.i.f. (cost, insurance and freight) values while exports and re-exports are f.o.b. (free-on-board) values. Imports are goods which have been produced or manufactured in places outside the jurisdiction of Hong Kong and
brought into Hong Kong by land, air or water for whatever purposes. Domestic exports are the natural produce of Hong Kong or the products of a manufacturing process in Hong Kong
which has changed permanently the shape, nature, form or utility of the basic materials used in manufacture. Domestic exports by industrial origin are obtained by re-grouping all 6-digit merchandise export items under the SITC
according to the industries in which these merchandise items are normally produced. The classification of industrial origin is structured upon the United Nations International Standard Industrial Classification of All Economic Activities (I.S.I.C.). Transactions in gold and specie are excluded.
Re-exports are products which have previously been imported into Hong Kong and which are re-exported without having undergone in Hong Kong a manufacturing process which has changed permanently the shape, nature, form or utility of the product.
Commodity items are classified and arranged in accordance with the Hong Kong Imports and Exports Classification List, Revised Edition, January 1982, which is based on the United Nations Standard International Trade Classification (SITC), Revision 2 with some modifications to suit Hong Kong's own requirements. Owing to the adoption of SITC (Revision 2) as from January 1978, figures for earlier years are not strictly comparable with those for 1978 onwards.
The trade index numbers are compiled from value and quantity data as published in the Hong Kong Trade Statistics. The unit values for domestic exports and re-exports are on an 'f.o.b.' basis while those for imports are on a 'c.i.f.' basis. Commencing from January 1982, the trade indexes are rebased to 1981 (i.e. 1981 = 100). Owing to the re-classification of commodity items, indexes as well as values of imports and re-exports of consumer goods, raw materials and semimanufactures and capital goods from 1981 onwards are not strictly comparable to those in the past.
The unit value for each commodity classification item is the quotient of the value over its corresponding quantity. As such, the unit value series (as opposed to market prices) are not free of the effect of change, especially improvements, in quality or of change in product mix included within a commodity classification.
As from March 1983, prices of selected imports (c.i.f.) and exports (f.o.b.) are collected and used to compile price indexes. These price indexes, which are based on product specifications, are used where appropriate to substitute the unit value indexes where problems of changes in quality, product mix, markets, sources, etc. exist.
Quantum index numbers are derived by dividing the value index numbers by the corresponding unit value index numbers; and as a result are derived as a residual and subject to the limitations mentioned above. The unit value index numbers are base-weighted while the quantum index numbers are current-weighted.
For the purpose of compiling trade index numbers, 737 items out of a total of I 874 items for domestic exports, 1 518 out of 3 162 for imports and 1 039 out of 2 638 for re-exports were selected. In terms of value, the selected items accounted for 69 per cent, 71 per cent and 71 per cent for domestic exports, imports and re-exports respectively in the base year 1981.
73


6.1 Overseas Merchandise Trade HK$ Million
1976 1977 1978 1979 1980 1981 1982 1983 1984 1985
Domestic exports
Value 32,629 35,004 40,711 55,912 68,171 80,423 83,032 104,405 137,936 129,882
Annual change(%) +43 +7 +16 +37 +22 +18 +3 +26 +32 -6
Imports
Value 43,293 48,701 63,056 85,837 l l l,651 138,375 142,893 175,442 223,370 231,420
Annual change(%) +29 +12 +29 +36 +30 +24 +3 +23 +27 +4
Re-exports
Value 8,928 9,829 13,197 20,022 30,072 41,739 44,353 56,294 83,504 105,270
Annual change(%) +28 +10 +34 +52 +50 +39 +6 +27 +48 +26
Total trade
Value 84,849 93,534 116,964 161,771 209,893 260,537 270,277 336,142 444,811 466,572
Annual change(%) +34 +10 +25 +38 +30 +24 +4 +24 +32 +5
Merchandise trade balance -1,736 -3,868 -9,147 -9,903 -13,408 -16,212 -15,508 -14,743 -1,929 +3,733
6.2 Trade by Area HK$ Million
Type of trade/Area 1976 1977 1978 1979 1980 1981 1982 1983 1984 1985
Imports 43,293 48,701 63,056 85,837 111,651 138,375 142,893 175,442 223,370 231,420
North America 5,567 6,425 7,955 10,944 13,993 15,337 16,579 20,446 25,708 23,473 Western Europe 6,779 7,973 l l,685 15,372 17,253 19,825 20,978 24,712 29,983 32,028 Soviet Union and Eastern Europe 272 302 285 317 326 435 395 752 930 889 Central and South America 536 470 496 601 648 887 931 l,465 l,863 l,836 Middle Eastt 802 907 l,510 1,246 1,320 1,394 1,748 l,322 1,390 1,780 Asiat 27,506 30,580 38,295 53,777 73,963 96,077 97,796 121,451 156,986 164,379 Africa 696 845 1, 181 1,413 1,582 l,468 l,102 l,646 2,096 2,524 Australasia and Oceania 1,127 1,191 1,543 1,966 2,176 2,524 2,939 3,349 4,093 4,132
Postal packages 7 7 106 200 390 428 425 300 321 379
Domestic exports 32,629 35,004 40,711 55,912 68,171 80,423 83,032 104,405 137,936 129,882
North America 12,632 14,723 16,396 20,435 24,374 31,555 33,860 47,573 65,935 62,133 Western Europe 11,510 10,864 12,804 19,498 23,199 23,702 23,704 27,113 33,021 28,416 Soviet Union and Eastern Europe 117 113 118 205 273 221 191 273 430 534 Central and South America 535 768 877 1,592 2,388 2,642 2,032 l,209 l,616 l,632 Middle Eastt 1,175 1,359 l,597 2,087 2,593 3,225 3,508 3,506 3,369 2,765 Asiat 3,618 4,101 5,310 7,819 9,821 11,970 13,397 18,271 26,191 27,884 Africa 1,291 1,491 1,608 l,708 2,747 3,709 2,548 2,440. 2,200 l,654 Australasia and Oceania 1,738 l,575 1,83 l 2,246 2,368 3,230 3,421 3,573 4,628 4,084
Postal packages 13 9 171 323 407 170 371 446 547 780
Re-exports 8,928 9,829 13,197 20,022 30,072 41,739 44,353 56,294 83,504 105,270
North America 942 948 1,303 2,135 3,266 5,079 5,971 8,737 13,068 15,892 Western Europe 820 905 1,170 2,311 3,286 3,257 3,152 3,674 4,692 6,388 Soviet Union and Eastern Europe 7 4 6 12 34 32 86 142 217 444 Central and South America 178 221 244 396 662 1,014 799 579 947 1,049 Middle Eastt 313 326 541 841 1,280 1,926 2,273 3,000 2,837 2,797 Asiat 5,923 6,654 9,004 12,878 19,344 27,453 29,221 36,965 57,799 74,941 Africa 373 430 543 939 1,566 2,087 l,842 l,900 l,991 l,900 Australasia and Oceania 371 341 387 510 634 891 1,010 l,299 l,952 l,859
Note: tiran was classified under the region of Asia with effect from 1979.
75
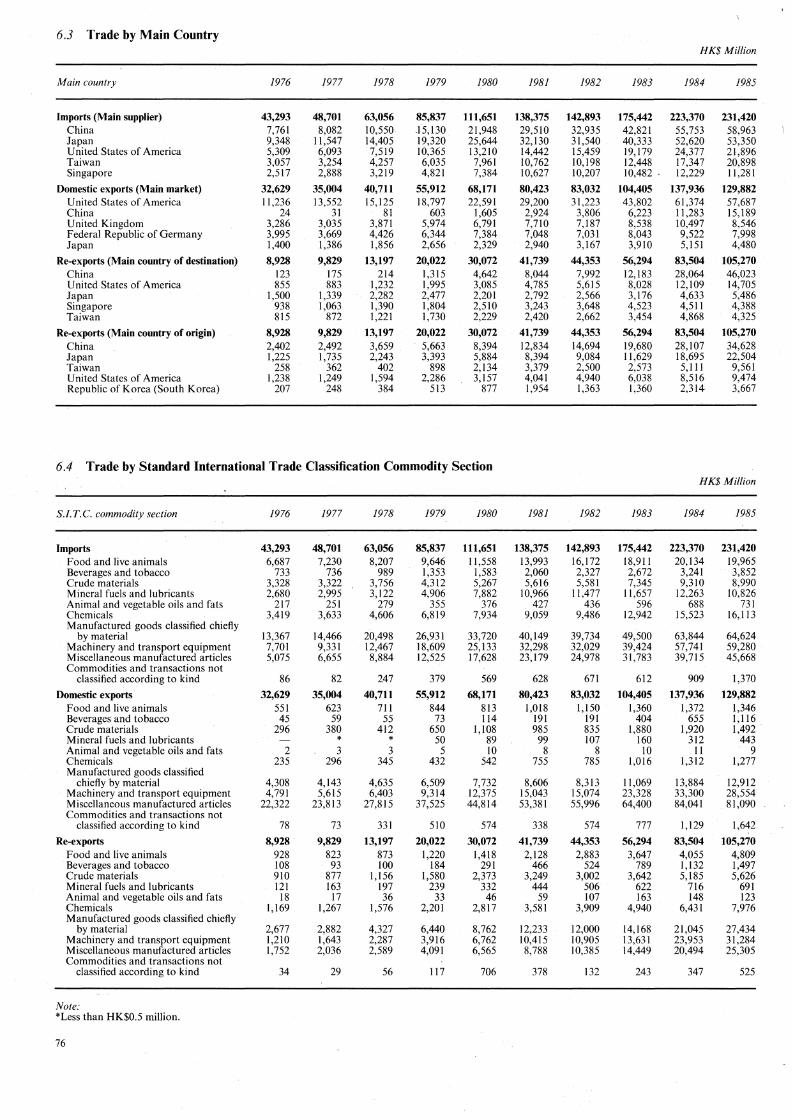
6.3 Trade by Main Country HK$ Million
Main country 1976 1977 1978 1979 1980 1981 1982 1983 1984 1985
Imports (Main supplier) 43,293 48,701 63,056 85,837 111,651 138,375 142,893 175,442 223,370 231,420 China 7,761 8,082 10,550 .15,130 21,948 29,510 32,935 42,821 55, 753 58,963 Japan 9,348 11,547 14,405 19,320 25,644 32,130 31,540 40,333 52,620 53,350 United States of America 5,309 6,093 7,519 10,365 13,210 14,442 15,459 19,179 24,377 21,896 Taiwan 3,057 3,254 4,257 6,035 7,961 10,762 10,198 12,448 17,347 20,898 Singapore 2,517 2,888 3,219 4,821 7,384 10,627 10,207 10,482 . 12,229 11,281
Domestic exports (Main market) 32,629 35,004 40,711 55,912 68,171 80,423 83,032 104,405 137,936 129,882 United States of America 11,236 13,552 15,125 18,797 22,591 29,200 31,223 43,802 61,374 57,687 China 24 31 81 603 1,605 2,924 3,806 6,223 11,283 15,189 United Kingdom 3,286 3,035 3,871 5,974 6,791 7,710 7,187 8,538 10,497 8,546 Federal Republic of Germany 3,995 3,669 4,426 6,344 7,384 7,048 7,031 8,043 9,522 7,998 Japan 1,400 1,386 1,856 2,656 2,329 2,940 3,167 3,910 5,151 4,480
Re-exports (Main country of destination) 8,928 9,829 13,197 20,022 30,072 41,739 44,353 56,294 83,504 105,270 China 123 175 214 1,315 4,642 8,044 7,992 12,183 28,064 46,023 United States of America 855 883 1,232 1,995 3,085 4,785 5,615 8,028 12,109 14,705 Japan 1,500 1,339 2,282 2,477 2,201 2,792 2,566 3,176 4,633 5,486 Singapore 938 1,063 1,390 1,804 2,510 3,243 3,648 4,523 4,511 4,388 Taiwan 815 872 1,221 1,730 2,229 2,420 2,662 3,454 4,868 4,325
Re-exports (Main country of origin) 8,928 9,829 13,197 20,022 30,072 41,739 44,353 56,294 83,504 105,270 China 2,402 2,492 3,659 5,663 8,394 12,834 14,694 19,680 28,107 34,628 Japan 1,225 1,735 2,243 3,393 5,884 8,394 9,084 11,629 18,695 22,504 Taiwan 258 362 402 898 2,134 3,379 2,500 2,573 5, 111 9,561 United States of America 1,238 1,249 1,594 2,286 3,157 4,041 4,940 6,038 8,516 9,474 Republic of Korea (South Korea) 207 248 384 513 877 1,954 1,363 1,360 2,314 3,667
6.4 Trade by Standard International Trade Classification Commodity Section HK$ Million
S.I. T.C. commodity section 1976 1977 1978 1979 1980 1981 1982 1983 1984 1985
Imports 43,293 48,701 63,056 85,837 111,651 138,375 142,893 175,442 223,370 231,420 Food and live animals 6,687 7,230 8,207 9,646 11,558 13,993 16,172 18,911 20,134 19,965 Beverages and tobacco 733 736 989 1,353 1,583 2,060 2,327 2,672 3,241 3,852 Crude materials 3,328 3,322 3,756 4,312 5,267 5,616 5,581 7,345 9,310 8,990 Mineral fuels and lubricants 2,680 2,995 3,122 4,906 7,882 10,966 11,477 11,657 12,263 10,826 Animal and vegetable oils and fats 217 251 279 355 376 427 436 596 688 731 Chemicals 3,419 3,633 4,606 6,819 7,934 9,059 9,486 12,942 15,523 16,113 Manufactured goods classified chiefly
by material 13,367 14,466 20,498 26,931 33,720 40,149 39,734 49,500 63,844 64,624 Machinery and transport equipment 7,701 9,331 12,467 18,609 25,133 32,298 32,029 39,424 57,741 59,280 Miscellaneous manufactured articles 5,075 6,655 8,884 12,525 17,628 23,179 24,978 31,783 39,715 45,668 Commodities and transactions not
classified according to kind 86 82 247 379 569 628 671 612 909 1,370
Domestic exports 32,629 35,004 40,711 55,912 68,171 80,423 83,032 104,405 137,936 129,882 Food and live animals 551 623 711 844 813 1,018 1,150 1,360 1,372 1,346 Beverages and tobacco 45 59 55 73 114 191 191 404 655 1,116 Crude materials 296 380 412 650 1,108 985 835 1,880 1,920 1,492 . Mineral fuels and lubricants * * 50 89 99 107 160 312 443 Animal and vegetable oils and fats 2 3 3 5 10 8 8 10 11 9 Chemicals 235 296 345 432 542 755 785 1,016 1,312 1,277 Manufactured goods classified
chiefly by material 4,308 4,143 4,635 6,509 7,732 8,606 8,313 11,069 13,884 12,912 Machinery and transport equipment 4,791 5,615 6,403 9,314 12,375 15,043 15,074 23,328 33,300 28,554 Miscellaneous manufactured articles 22,322 23,813 27,815 37,525 44,814 53,381 55,996 64,400 84,041 81,090 Commodities and transactions not
classified according to kind 78 73 331 510 574 338 574 777 1,129 1,642
Re-exports 8,928 9,829 13,197 20,022 30,072 41,739 44,353 56,294 83,504 105,270 Food and live animals 928 823 873 1,220 1,418 2,128 2,883 3,647 4,055 4,809 Beverages and tobacco 108 93 100 184 291 466 524 789 1,132 1,497 Crude materials 910 877 1,156 1,580 2,373 3,249 3,002 3,642 5,185 5,626 Mineral fuels and lubricants 121 163 197 239 332 444 506 622 716 691 Animal and vegetable oils and fats 18 17 36 33 46 59 107 163 148 123 Chemicals 1,169 1,267 1,576 2,201 2,817 3,581 3,909 4,940 6,431 7,976 Manufactured goods classified chiefly
by material 2,677 2,882 4,327 6,440 8,762 12,233 12,000 14,168 21,045 27,434 Machinery and transport equipment 1,210 1,643 2,287 3,916 6,762 10,415 10,905 13,631 23,953 31,284 Miscellaneous manufactured articles 1,752 2,036 2,589 4,091 6,565 8,788 10,385 14,449 20,494 25,305 Commodities and transactions not
classified according to kind 34 29 56 117 706 378 132 243 347 525
Note: *Less than HK$0.5 million.
76

6.5 Imports, Re-exports and Retained Imports by End-use HK$ Million
End-use 1976 1977 1978 1979 1980 1981 1982 1983 1984 1985
Raw materials and semi-manufactures Imports 19,103 20,391 26,624 37,507 46,489 57,235 56,444 75,258 99,740 97,385 Re-exports 2,904 3,404 4,855 7,583 11,600 16,748 16,796 21,411 34,683 42,793 Retained raw materials 16,198 16,986 21,769 29,924 34,889 40,487 39,648 53,847 65,058 54,592
Consumer goods
Imports 9,265 11,436 16,757 21,530 29,469 37,070 38,614 46,659 58,380 66,730 Re-exports 4,076 4,296 5,782 8,615 13,110 17,282 18,074 22,831 30,648 38,405 Retained consumer goods 5,188 7,140 10,975 12,915 16,359 19,788 20,540 23,828 27,732 28,325
Capital goods
Imports 5,450 6,500 8,165 12,156 16,055 18,822 19,943 22,540 32,781 36,228 Re-exports 887 1,140 1,468 2,374 3,567 4,862 5,904 7,596 13,420 18,573 Retained capital goods 4,563 5,359 6,697 9,782 12,488 13,960 14,038 14,945 19,360 17,655
Foodstuffs
Imports 6,925 7,541 8,547 9,968 12,065 14,660 16,785 19,732 20,681 20,752 Re-exports 1,000 900 978 1,319 1,602 2,575 3,241 4,022 4,255 5,077 Retained foodstuffs 5,925 6,641 7,569 8,649 10,463 12,084 13,543 15,710 16,426 15,676
Fuels
Imports 2,550 2,834 2,962 4,676 7,573 10,588 11,107 11,253 11,788 10,324 Re-exports 60 89 113 131 193 272 337 435 498 422 Retained fuels 2,490 2,745 2,849 4,546 7,380 10,316 10,770 10,818 11,290 9,902
Total imports 43,293 48,701 63,056 85,837 111,651 138,375 142,893 175,442 223,370 231,420
Total re-exports 8,928 9,829 13,197 20,022 30,072 41,739 44,353 56,294 83,504 105,270
Total retained imports 34,365 38,872 49,858 65,815 81,579 96,635 98,540 119,148 139,866 126,149
Note: Retained imports are derived by subtracting the re-export statistics from the corresponding import statistics. Since no account is taken of the trading margin and other charges involved in the re-exports, the resulting values of retained imports are understated to that extent. There also exists a time lag between importation and subsequent re-exportation.
6.6 Imports by End-use by Principal Commodity HK$ Million
End-use/ Principal commodity 1976 1977 1978 1979 1980 1981 1982 1983 1984 1985
Raw materials and semi-manufactures 19,103 20,391 26,624 37,507 46,489 57,235 56,444 75,258 99,740 97,385
Fabrics of man-made fibres 1,965 1,891 2,572 3,728 4,430 6,585 6,068 6,804 8,967 9,979 Thermionic, cold cathode and
photo-cathode valves and tubes, photocells, transistors, etc., and parts thereof 1,353 1,458 1,895 2,872 3,478 4,412 5,036 8,491 12,535 9,394
Iron and steel 1,143 1,369 2,018 2,884 3,426 3,842 4,035 4,334 5,604 6,072 Woven cotton fabrics 1,342 1,267 1,850 2,404 2,641 3,512 3,657 4,737 6,647 5,853 Watch and clock movements 923 1,286 1,739 2,572 3,688 4,187 3,437 4,259 4,725 5,379 Others 12,376 13,120 16,550 23,047 28,825 34,696 34,211 46,632 61,264 60,708
Consumer good~ 9,265 11,436 16,757 21,530 29,469 37,070 38,614 46,659 58,380 66,730
Clothing 709 952 1,297 1,976 3,461 5,219 6,464 8,537 11,613 13,216 Radios, television sets, gramophones,
records and tape recorders 573 685 981 1,719 2,744 3,829 2,984 3,900 6,588 7,619 Diamonds 1,630 2,060 3,824 3,624 4,178 3,625 3,660 3,844 3,959 4,028 Watches 654 886 1,380 1,667 2,137 3,069 2,724 3,678 3,631 3,749 Others 5,699 6,853 9,275 12,544 16,949 21,328 22,782 26,700 32,589 38, 11 ~
Capital goods 5,450 6,500 8,165 12,156 16,055 18,822 19,943 22,540 32,781 36,228
Electrical, textile and other industrial machinery and parts 1,188 1,305 1,768 2,615 3,222 4,215 #= 4,020 5,306 #= 7,401 #= 8,508
Others 4,262 5,195 6,397 9,541 12,833 14,607 #= 15,923 17,235 #= 25,380 #= 27,720
Foodstuff~ 6,925 7,541 8,547 9,968 12,065 14.,660 16,785 19,732 20,681 20,752
' Fuels 2,550 2,834 2,962 4,676 7,573 10,588 11,107 11,253 11,788 10,324
Total imports 43,293 48,701 63,056 85,837 111,651 138,375 142,893 175,442 223,370 231,420
Note: #= Revised figure.
77
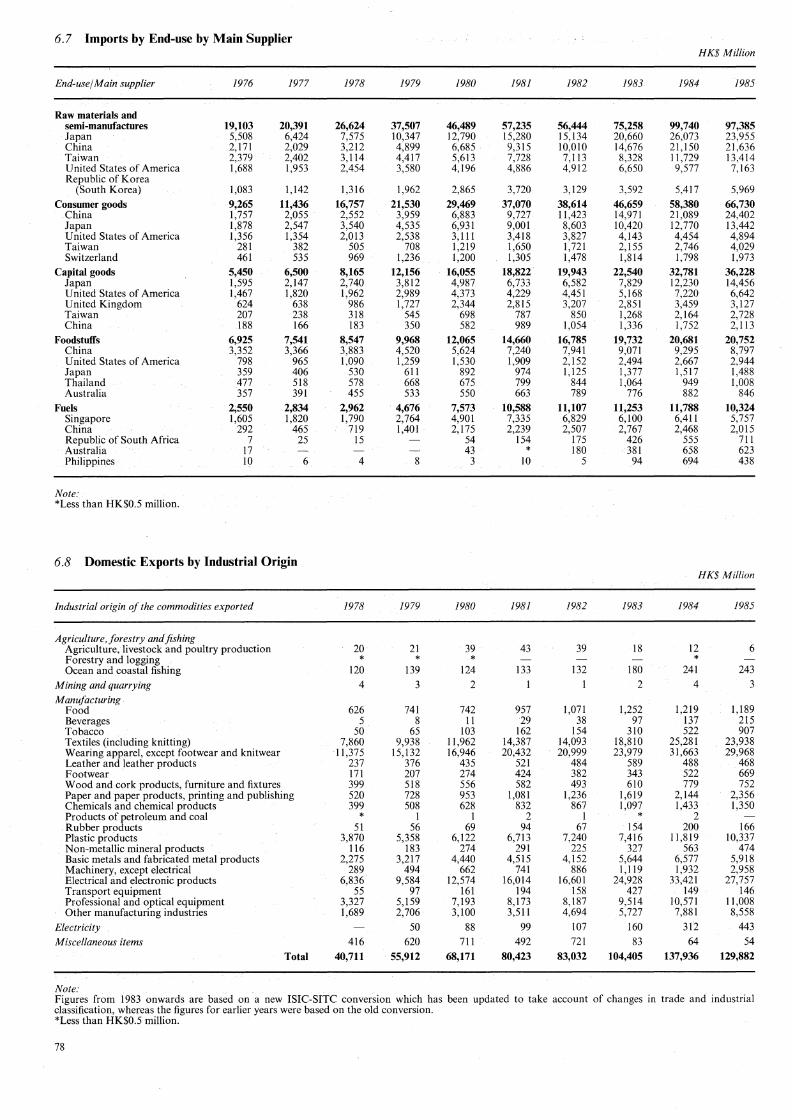
6.7 Imports by End-use by Main Supplier HK$ Million
End-use/Main supplier 1976 1977 1978 1979 1980 1981 1982 1983 1984 1985
Raw materials and semi-manufactures 19,103 20,391 26,624 37,507 46,489 57,235 56,444 75,258 99,740 97,385 Japan 5,508 6,424 7,575 10,347 12,790 15,280 15,134 20,660 26,073 23,955 China 2,171 2,029 3,212 4,899 6,685 9,315 10,010 14,676 21,150 21,636 Taiwan 2,379 2,402 3,114 4,417 5,613 7,728 7,113 8,328 11,729 13,414 United States of America 1,688 1,953 2,454 3,580 4,196 4,886 4,912 6,650 9,577 7,163 Republic of Korea
(South Korea) 1,083 1,142 1,316 1,962 2,865 3,720 3,129 3,592 5,417 5,969
Consumer goods 9,265 11,436 16,757 21,530 29,469 37,070 38,614 46,659 58,380 66,730 China 1,757 2,055 2,552 3,959 6,883 9,727 11,423 14,971 21,089 24,402 Japan 1,878 2,547 3,540 4,535 6,931 9,001 8,603 10,420 12,770 13,442 United States of America 1,356 1,354 2,013 2,538 3,111 3,418 3,827 4,143 4,454 4,894 Taiwan 281 382 505 708 1,219 1,650 1,721 2,155 2,746 4,029 Switzerland 461 535 969 1,236 1,200 1,305 1,478 1,814 1,798 1,973
Capital goods 5,450 6,500 8,165 12,156 16,055 18,822 19,943 22,540 32,781 36,228 Japan 1,595 2,147 2,740 3,812 4,987 6,733 6,582 7,829 12,230 14,456 United States of America 1,467 1,820 1,962 2,989 4,373 4,229 4,451 5,168 7,220 6,642 United Kingdom 624 638 986 1,727 2,344 2,815 3,207 2,851 3,459 3,127 Taiwan 207 238 318 545 698 787 850 1,268 2,164 2,728 China 188 166 183 350 582 989 1,054 1,336 1,752 2,113
Foodstuffs 6,925 7,541 8,547 9,968 12,065 14,660 16,785 19,732 20,681 20,752 China 3,352 3,366 3,883 4,520 5,624 7,240 7,941 9,071 9,295 8,797 United States of America 798 965 1,090 1,259 1,530 1,909 2,152 2,494 2,667 2,944 Japan 359 406 530 611 892 974 1,125 1,377 1,517 1,488 Thailand 477 518 578 668 675 799 844 1,064 949 1,008 Australia 357 391 455 533 550 663 789 776 882 846
Fuels 2,550 2,834 2,962 4,676 7,573 10,588 11,107 11,253 11,788 10,324 Singapore 1,605 1,820 1,790 2,764 4,901 7,335 6,829 6,100 6,411 5,757 China 292 465 719 1,401 2,175 2,239 2,507 2,767 2,468 2,015 Republic of South Africa 7 25 15 54 154 175 426 555 711 Australia 17 43 * 180 381 658 623 Philippines 10 6 4 8 3 10 5 94 694 438
Note: *Less than HK$0.5 million.
6.8 Domestic Exports by Industrial Origin HK$ Million
Industrial origin of the commodities exported 1978 1979 1980 1981 1982 1983 1984 1985
Agriculture, forestry and fishing Agriculture, livestock and poultry production 20 21 39 43 39 18 12 6 Forestry and logging * * * * Ocean and coastal fishing 120 139 124 133 132 180 241 243
Mining and quarrying 4 3 2 2 4 3
Manufacturing Food 626 741 742 957 1,071 1,252 1,219 1, 189 Beverages 5 8 11 29 38 97 137 215 Tobacco 50 65 103 162 154 310 522 907 Textiles (including knitting) 7,860 9,938 11,962 14,387 14,093 18,810 25,281 23,938 Wearing apparel, except footwear and knitwear 11,375 15,132 16,946 20,432 20,999 23,979 31,663 29,968 Leather and leather products 237 376 435 521 484 589 488 468 Footwear 171 207 274 424 382 343 522 669 Wood and cork products, furniture and fixtures 399 518 556 582 493 610 779 752 Paper and paper products, printing and publishing 520 728 953 1,081 1,236 1,619 2,144 2,356 Chemicals and chemical products 399 508 628 832 867 1,097 1,433 1,350 Products of petroleum and coal * 1 I 2 1 * 2 Rubber products 51 56 69 94 67 154 200 166 Plastic products 3,870 5,358 6,122 6,713 7,240 7,416 11,819 10,337 Non-metallic mineral products 116 183 274 291 225 327 563 474 Basic metals and fabricated metal products 2,275 3,217 4,440 4,515 4,152 5,644 6,577 5,918 Machinery, except electrical 289 494 662 741 886 1,119 1,932 2,958 Electrical and electronic products 6,836 9,584 12,574 16,014 16,601 24,928 33,421 27,757 Transport equipment 55 97 161 194 158 427 149 146 Professional and optical equipment 3,327 5,159 7,193 8,173 8,187 9,514 10,571 11,008 Other manufacturing industries 1,689 2,706 3,100 3,511 4,694 5,727 7,881 8,558
Electricity 50 88 99 107 160 312 443
Miscellaneous items 416 620 711 492 721 83 64 54
Total 40,711 55,912 68,171 80,423 83,032 104,405 137,936 129,882
Note: Figures from 1983 onwards are based on a new ISIC-SITC conversion which has been updated to take account of changes in trade and industrial classification, whereas the figures for earlier years were based on the old conversion. *Less than HK$0.5 million.
78

6.9 Domestic Exports of Principal Commodities by Main Market HK$ Million
Principal commodities/Main market 1976 1977 1978 1979 1980 1981 1982 1983 1984 1985
Articles of apparel and clothing accessories 14,288 13,908 15,709 20,131 23,258 28,288 28,824 34,365 46,714 44,912
United States of America 4,569 5,426 6,268 7,204 8,076 10,950 11,594 16,160 23,632 24,790 Federal Republic of Germany 2,669 2,191 2,608 3,599 4,262 4,324 4,333 4;585 5,553 4,561 United Kingdom 1,795 1,535 1,904 2,824 3,194 3,580 3,381 3,477 4,449 3,872
Watches and clocks 1,208 1,694 2,734 4,354 6,288 7,104 7,168 8,259 8,875 9,237
United States of America 359 539 796 1,074 1,620 1,947 2;509 3,079 3,469 3,736 China 1 44 149 372 275 335 387 824 Federal Republic of Germany 76 91 207 494 623 521 467 588 597 575
Textiles 3,086 2,696 2,869 4,065 4,535 5,302 5,052 7,084 8,631 7,823
China II 13 39 199 383 629 944 1,598 2,028· 2,123 United States of Amercia 586 516 476 519 602 744 591 1,047 1,269 1,110 United Kingdom 447 361 471 631 495 550 502 606 604 526
Plastic toys and dolls 1,866 2;432 2,5% 3,597 4,028 5,185 6,303 5,999 8,413 6,968 United States of America 954 1,215 1,192 1,589 1,633 2,338 3,146 2,934 5,109 4,123 United Kingdom 195 223 245 373 356 581 504 534 596 421 Canada 97 108 105 137 129 216 293 331 379 324
Telecommunications equipment, and parts, of and accessories for the apparatus and equipment falling within division 76 347 352 316 475 633 1,001 1,476 3,900 5,003 4,641
China * 32 121 301 499 705 1,813 1;995 United States of America 152 145 67 90 105 196 437 2,401 2,038 1,507 United Kingdom II 12 13 20 20 76 72 39 102 142
Electrical and non-electrical household equipment 400 611 782 1,202 1,972 2,997 2,728 3,673 5,218 4,551
United States of America 236 354 409 713 1,219 1,877 1,688 2,458 3,541 2,854 China * 4 12 16 20 87 250 386 Australia 19 58 91 76 95 169 169 172 255 255
Electronic components and parts for computers 467 683 678 787 1,465 2,126 1,694 3,833 6,147 4,427
United States of America 373 553 564 684 1,294 l,980 1,516 3,115 4,066 2,952 United Kingdom 22 28 16 18 44 37 39 212 l,020 496 Federal Republic of Germany 18 27 21 9 22 18 20 164 338 251
Radio-broadcast receivers (including receivers incorporating sound recorders or reproducers) 1,921 2,229 2,300 3,240 3,957 3,921 3,575 3,613 4,750 3,324
United States of America 849 998 872 868 1,178 1,320 1,458 1,606 2,534 1,635 Federal Republic of Germany 324 329 404 598 593 412 31'5 358 343 221 United Kingdom 96 99 191 437 417 436 253 223 278 171
Manufactures of metal 844 991 1,124 1,537 2,037 2,027 2,044 2,478 3,152 2,936
United States of America 195 263 278 346 440 454 505 700 1,014 888 China * * 2 24 73 93 156 249 392 489 United Kingdom 117 95 104 161 164 185 183 212 224 229
Jewellery, goldsmiths' and silversmiths' wares and other articles of precious or semi-precious metals, n.e.s. 687 711 802 %1 1,065 1,208 1,367 1,718 2,475 2,878
United States of America 327 333 377 402 366 464 498 755 1,246 1,483 Japan 33 30 40 60 57 74 122 196 264 276 Canada 10 14 16 18 17 17 17 30 51 141
Travel goods, handbags and similar containers 690 711 913 1,223 1,505 1,629 1,541 1,734 2,034 1,602
United States of America 253 256 334 384 465 502 497 657 893 720 Australia 66 53 63 83 95 140 152 157 191 144 Federal Republic of Germany 93 107 149 195 240 188 167 171 167 129
Note: 'n.e.s.' denotes not elsewhere specified. *Less than HK$0.5 million.
79

6.10 Re-exports of Principal Commodities by Main Country of Destination HK$ Miliion
Principal commodities/Main market 1976 1977 1978 1979 1980 1981 1982 1983 1984 1985
Textile yarn, fabrics, made-up articles, and related products 958 1,200 1,815 2,772 4,310 6,981 6,431 7,822 12,708 15,999
China 8 8 20 222 1,368 3,170 2,670 3,165 6,519 9,626 Republic of Korea (South Korea) 33 32 38 69 110 241 289 324 574 1,009 Japan 77 63 459 378 213 399 298 377 613 568
Electrical machinery, apparatus and appliances, and electrical parts thereof 386 510 664 1,195 1,%3 3,069 3,420 4,931 8,389 8,989
China * 1 27 259 359 339 745 2,046 4,176 Taiwan 98 126 173 305 496 596 625 1,002 1,726 1,161 United States of America 57 78 115 196 256 540 511 662 1,117 946
Articles of .apparel and clothing 289 309 464 935 1,554 2,197 3,021 4,495 6,184 7,652 accessones
United States of America 21 31 67 249 591 854 1,427 2,278 3,068 3,894 Japan 17 20 37 80 61 100 149 174 350 430 Saudi Arabia 3 8 24 19 46 75 167 328 340 373
Telecommunications and sound recording and reproducing apparatus and equipment 210 242 287 641 1,283 2,123 1,697 2,213 4,590 6,999
China I 7 4 116 444 1,035 404 719 2,896 4,924 Singapore 34 32 51 82 199 179 248 336 278 443 United States of America 19 II 13 17 37 95 98 200 479 406
Machinery specialized for particular industries 191 249 312 514 727 1,088 1,128 1,228 2,201 3,730
China I 6 9 91 206 326 481 541 1,343 2,909 Indonesia 49 70 72 96 159 273 169 154 172 139 Singapore 15 16 25 24 44 43 54 76 105 94
Office machines and automatic data processing equipment 115 131 214 415 580 706 947 1,442 3,019 3,730
China I I I 15 68 81 195 623 2,099 2,671 United States of America I I 2 23 38 89 156 179 143 212 Singapore 12 10 21 30 51 115 140 121 141 155
Road vehicles (including air cushion vehicles) 62 179 276 469 1,218 2,340 2,302 1,894 3,253 3,620
China I I 3 103 282 379 239 512 1,912 2,779 Indonesia 8 109 169 204 675 1,635 1,751 1,039 877 317 Macau 14 20 32 57 84 91 81 76 141 233
Watches and clocks 642 762 874 1;240 2,098 2,584 2,265 2,903 3,225 2,973
Singapore 205 243 292 341 587 600 563 687 629 581 China * * 2 21 144 221 180 222 404 468 Saudi Arabia 22 16 29 20 68 143 170 308 348 285
Baby carriageil, toys, games and sporting , ,goods 33 33 39 63 136 255 389 514 1,693 2,852
United States of America I 2 3 3 12 38 106 226 1,153 1,999 China * * * 2 7 13 19 24 116 156 Canada * * I * 3 8 12 76 137
Pearls, precious and semi-precious stones 1,244 1,146 1,739 2,184 2,120 2,342 2,075 2,035 2,003 2,093
United States of America 330 254 330 428 492 568 519 516 584 681 Japan 473 406 700 623 591 479 438 470 515 484 Belgium and Luxembourg 110 133 198 365 288 212 257 209 194 285
Note: *Less than HK$0.5 million.
80

6.11 Re-exports of Principal Commodities by Main Country of Origin HK$ Million
Principal commodities/ Main origin 1978 1979 1980 1981 1982 1983 1984 1985
Textile yarn, fabrics, made-up articles, and related products 1,815 2,772 4,310 6,981 6,431 7,822 12,708 15,999
China 1,247 1,666 1,967 2,732 2,811 3,728 5,785 6,915 Taiwan 143 359 957 1,782 1,313 1,161 2,430 3,934 Japan 171 250 452 647 648 943 1,348 1,371
Electrical machinery, apparatus and appliances, and electrical parts thereof 664 1,195 1,963 3,069 3,420 4,931 8,389 8,989
Japan 116 204 344 550 692 1,310 2,625 2,757 Taiwan 38 81 235 278 239 387 762 1,518 United States of America 209 337 558 829 1,060 1,299 2,116 1,373
Articles of apparel and clothing accessories 464 935 1,554 2,197 3,021 4,495 6,184 7,652
China 328 724 1,294 1,838 2,711 4,092 5,689 7,168 Macau 13 28 36 60 91 134 119 155 Taiwan 23 49 55 64 37 36 62 60
Telecommunications and sound recording and reproducing apparatus and equipment 287 641 1,283 2,123 1,697 2,213 4,590 6,999
Japan 185 420 717 1,046 1,094 1,446 2,748 4,066 Republic of Korea (South Korea) 3 10 73 396 133 59 143 666 Taiwan 34 79 225 285 114 81 263 449
Machinery specialized for particular industries 312 514 727 1,088 1,128 1,228 2,201 3,730
Japan 159 230 302 479 445 513 812 1,144 Taiwan 7 14 25 123 71 52 146 666 United States of America 37 48 74 112 117 191 419 480
Office machines and automatic data processing equipment 214 415 580 706 947 1,442 3,019 3,730
Japan 55 77 124 144 267 625 1,390 1,772 United States of America 123 198 275 399 542 588 1,048 1,211 Taiwan 14 61 72 64 38 53 202 237
Road vehicles (including air cushion vehicles) 276 469 1,218 2,340 2,302 1,894 3,253 3,620
Japan 219 365 1,038 2,080 2,092 1,611 2,893 3,112 Federal Republic of Germany 10 12 13 12 21 59 80 122 China 12 33 73 92 90 83 121 103
Watches and clocks 874 1,240 2,098 2,584 2,265 2,903 3,225 2,973
Japan 599 801 1,257 1,355 1,302 1,840 1,955 1,891 Switzerland 181 260 398 435 358 377 422 480 China 4 8 15 55 63 108 154 152
Baby carriages, toys, games and sporting goods 39 63 136 255 389 514 1,693 2,852
China 14 21 45 107 187 326 1,421 2,497 Taiwan 2 5 26 48 57 24 22 88 Japan 5 8 12 40 77 83 98 74
Pearls, precious and semi-precious stones 1,739 2,184 2,120 2,342 2,075 2,035 2,003 2,093
India 141 146 131 162 170 214 403 629 Belgium and Luxembourg 415 512 520 452 432 374 302 324 Israel 269 282 236 414 313 254 190 208
81

6.12 Trade Indexes 1981 =JOO
1976 1977 1978 1979 1980 1981 1982 1983 1984 1985
Total exports
Value 34 37 44 62 80 JOO 104 132 181 192 Unit value 65 67 72 84 92 JOO 107 118 133 134 Quantum 52 54 61 74 87 100 97 Ill 136 144
Domestic exports
Value 41 44 51 70 85 JOO 103 130 172 161 Unit value 67 69 72 84 92 JOO 106 117 131 131 Quantum 61 64 70 83 92 JOO 97 111 131 124
Imports
Value 31 35 46 62 81 JOO 103 127 161 167 Unit value 63 66 71 83 90 JOO J06 118 131 128 Quantum 50 53 65 75 90 JOO 98 107 123 131
Re-exports
Value 21 24 32 48 72 JOO 106 135 200 252 Unit value 60 64 71 85 93 100 1 JO 121 137 139 Quantum 36 37 45 57 78 100 97 112 146 182
Terms of trade 103 102 102 102 102 100 102 100 102 105
Note: The terms of trade index is derived from the ratio of the unit value index for total exports to that for imports.
82

6.13 Unit Value Indexes and Quantum Indexes of Domestic Exports by Principal Commodity 1981 =100
Commodity 1976 1977 1978 1979 1980 1981 1982 1983 1984 1985
Unit value index
All domestic exports 67 69 72 84 92 100 106 117 131 131 Clothing ff 63 64 67 81 91 100 110 123 146 148 Textile fabrics 72 72 72 88 93 100 105 114 133 127 Textile yarn and thread 73 70 71 85 92 100 94 100 112 115 Textile made-ups and related
articles 60 69 64 80 89 100 114 132 155 163 zadios of all kinds:j: 78 82 77 85 89 100 99 101 111 106
lectronic componentst 81 70 70 78 88 100 !03 112 114 114 /Footwear 75 74 80 86 94 100 108 115 128 122
Metal manufactures 60 62 68 80 94 100 108 115 133 137 I Metal ores and scrap ff 75 69 73 95 !05 100 93 113 109 91
Watches and clockst 106 107 116 120 111 100 92 95 94 86 Travel goods, handbags and
similar articles§ 100 !09 121 146 154 Domestic electrical appliances§ ff 100 101 107 116 107 Other exports ff 58 62 67 79 88 100 112 124 136 136
Quantum index
All domestic exports 61 64 70 83 92 100 97 111 131 124 Clothing ff 82 79 84 88 91 100 93 99 113 107 Textile fabrics 80 66 74 86 90 100 90 116 123 119 Textile yarn and thread 100 109 89 95 97 100 112 157 150 123 Textile made-ups and related
articles 92 80 82 99 102 100 79 89 98 87 Radios of all kinds:j: 86 93 70 87 107 100 92 92 110 82 Electronic componentst 42 60 63 74 94 100 84 133 205 154 Foo~ear 55 59 64 72 79 100 83 81 101 104 Mera! manufactures 68 79 79 95 108 100 94 108 119 109 Metal ores and scrap ff 29 36 45 63 118 JOO 82 198 196 184 Watches and clockst 16 22 33 51 80 100 110 123 133 151 Travel goods, handbags and
similar articles§ 100 87 88 85 64 Domestic electrical appliances§ ff 100 90 114 150 142 Other exports ff 54 61 72 88 95 100 102 119 146 142
Note: ff Indexes from 1984 onwards are not strictly comparable to those in the past due to re-classification of commodity items. tUnit value and quantum indexes from 1982 onwards have been revised using market price survey data. Hence they are not strictly comparable to those in
the past due to expansion in item coverage and change in method of pricing. :j:lndexes from 1982 onwards are not strictly comparable to those in the past due to re-classification of commodity items. §Grouped under 'other exports' before 1982.
83

6.14 Unit Value Indexes and Quantum Indexes oflmports and Re-exports by End-use 1981 =JOO
End-use 1976 1977 1978 1979 1980 1981 1982 1983 1984 1985
Unit value index
All imports 63 66 71 83 90 100 106 118 131 128 Foodstuffs 63 65 70 77 84 100 107 120 132 123 Consumer goods 67 72 80 93 95 100 105 119 131 131 Raw materials and semi-manufactures 64 67 69 83 91 100 105 117 134 128 Fuels 35 36 36 52 77 100 98 107 112 104 Capital goods 68 71 76 84 89 100 112 126 135 135
All re-exports 60 64 71 85 93 100 110 121 137 139 Foodstuffs 54 69 71 82 86 100 113 127 144 145 Consumer goods 62 66 77 93 99 100 108 119 134 135 Raw materials and semi-manufactures 59 62 66 79 90 100 110 119 137 137 Fuels 35 35 36 49 76 100 106 123 135 142 Capital goods 59 60 65 78 86 100 115 128 146 151
Quantum index
All imports 50 53 65 75 90 100 98 107 123 131 Foodstuffs 75 79 83 88 98 100 107 112 107 115 Consumer goods 37 43 56 63 84 100 100 106 120 137 Raw materials and semi-manufactures 53 55 69 81 91 100 94 112 131 133 Fuels 69 75 78 85 93 100 107 99 100 93 Capital goods 40 45 53 72 89 100 94 95 129 143
All re-ex ports 36 37 45 57 78 100 97 112 146 182 Foodstuffs 71 50 53 63 72 100 112 123 115 136 Consumer goods 38 38 43 54 77 100 97 111 133 165 Raw materials and semi-manufactures 30 34 45 58 79 100 92 108 151 186 Fuels 64 93 117 97 93 100 117 130 136 110 Capital goods 29 37 44 59 80 100 106 122 189 253
84

6.15 Unit Value Indexes and Quantum Indexes oflmports by Main Supplier 1981 =JOO
1976 1977 1978 1979 1980 1981 1982 1983 1984 1985
Unit value index
China 66 7J 73 83 91 JOO J06 I J2 128 J25
Japan 61 64 7J 83 87 100 99 J 14 125 120
United States of America 61 63 66 78 86 JOO 118 141 J56 156
Taiwan 65 63 65 81 88 100 107 I 13 127 126
United Kingdom 53 58 64 77 89 100 113 124 132 132
Quantum index
China 40 39 49 62 82 100 106 129 148 160
Japan 48 57 63 73 91 JOO 99 J 10 131 138 United States of America 60 67 79 92 107 100 91 94 108 97
Taiwan 44 48 6J 69 84 JOO 89 J02 127 154
United Kingdom 55 60 74 90 98 JOO 97 96 105 J02
85


Section 7: ESTIMATES OF GROSS DOMESTIC PRODUCT
Gross domestic product is an aggregate measure of the value of goods and services produced by residents within the domestic boundary of a country or a territory, net of their imported content, before provision for depreciation (or capital consumption). Gross domestic product at current market prices is valued at current period transaction prices, inclusive of indirect taxes less government subsidies. The constant price estimates are obtained by deflating the current price estimates of different categories of goods and services by the appropriate price indexes or by revaluing current period quantities at base year prices, whichever method is more appropriate for the category concerned. ,
Estimates of gross domestic product are compiled by the Census and Statistics Department using both the expenditure approach and the production approach.
The expenditure-based estimates measure the total value of goods and services produced for final use, net of their imported content, and comprise the following major components: (1) Private consumption expenditure: This covers all expenditure by the household sector, including private non-profit-making bodies, on goods and services for current use. It is the sum of the estimates of consumption expenditure on goods and services in the domestic market and the expenditure of Hong Kong residents abroad less the expenditure of non-residents in the domestic market.
Data sources for compiling the estimates include trade statistics, administrative statistics from government departments and various organizations, data collected from economic censuses/surveys, household expenditure surveys, surveys on expenditure of Hong Kong residents abroad and other expenditure surveys conducted by the Census and Statistics Department. (2) Government consumption expenditure: Government consumption expenditure refers to the current expenditure on goods and services by non-trading government departments. Trading departments are distinguished from non-trading departments in that the former are engaged mainly in the production of goods and services for sale to the public.
Current expenditure on goods and services by non-trading departments is the sum of compensation of employees and purchases of goods and services less receipts from sales of goods and services. The estimates are compiled based on an analysis of government .accounts and other supplementary information supplied by government departments. Disbursements which are transfer payments are not included. (3) Gross domestic fixed capital formation: This represents the gross value (i.e. no allowance being made for capital consumption) of investment expenditure in land, building and construction, real estate developers' margin, plant, machinery and equipment by the public and private sectors.
Transfer cost of land and buildings are the expenditure incurred in connection with transfer of ownership of land and buildings. Building and construction estimates for years from 1979 onwards were based on the results of the Survey of Building, Construction and Real Estate Sector. For the earlier years, estimates for the private sector were based on monthly reports of the Buildings Ordinance Office and information supplied by other construction companies concerned. Estimates for the public sector are derived from data obtained from the government accounts, the Mass Transit Railway Corporation and the Kowloon-Canton Railway Corporation. Real estate developers' margin is the difference between the selling price of the newly developed property and its land and construction cost which is taken as the measure of the economic activities of the real estate developers. Data are collected from the Survey of Building, Construction and Real Estate Sector.
Investment in plant and machinery is compiled from trade statistics, data from the government accounts and statistics on local production. ( 4) Increase in stocks: The estimates refer to the change in the value of work-in-progress and stocks of goods held by manufacturers and distributors. The information is based on the opening and closing book values of stocks reported by the establishments in censuses/surveys. Increase in stocks reflects changes in the physical quantities of stocks. Adjustments have been made for stock appreciation (i.e. the increase/decrease in value of stocks attributed to price changes) by revaluing the opening and closing stocks at the average current prices of the period. (5) Exports of goods less imports of goods: Exports of goods include domestic exports and re-exports of merchandise recorded on an f.o. b. basis, exclusive of monetary gold. Imports of goods are valued at c.i.f., covering all merchandise imports and a proportion of retained imports of gold which is considered as non-monetary. (6) Exports of services less imports of services: These comprise transactions in services between Hong Kong residents and the rest of the world. Data for compiling various items of imports and exports of services originate from the Hong Kong Tourist Association, various sources of administrative statistics, and the Survey of Imports and Exports of Services.
The production-based estimates measure the sum of 'value-added' or 'net output' of all productive units in the economy, for example factories, shops, service organizations. The value-added of a productive unit is equal to the value of total production by the unit (gross output) less the value of materials and services consumed in the process of production (intermediate input). Value-added can be equated with the sum of 'compensation of employees' and 'operating surplus'; the former includes wages and salaries, payments in kind·and employer's expenditure on social security and the latter refers basically to profits of the productive units subject to detailed definitional adjustments. Data sources for compiling the estimates are based on economic censuses and surveys conducted by the Census and Statistics Department, government accounts and other administrative records. A full set of production-based estimates for all economic sectors is available from 1980 onwards while for the earlier years, the estimates are available for selected sectors only.
Economic sectors covered by the production-based estimates are classified broadly into the following: agriculture and fishing; mining and quarrying; manufacturing; electricity, gas and water; construction; wholesale and retail, import/export trades, restaurants and hotels; transport, storage and communication; financing, insurance, real estate and business services; community, social and personal services; ownership of premises and the nominal sector. Ownership of premises is treated as an economic activity in the national accounts. This sector covers rental services which owners of premises like households,
87

government and private non-profit-making organizations provide to themselves and rental services provided to tenants by owners of premises in their individual capacity. An imputed estimate of rent is introduced into the national income calculations to reflect the value of services rendered by the former kind of properties. The nominal sector may be described as a provision for the adjustment for financial services. An imputed service charge, equal to net interest receipts (interest received minus interest paid) is included in valuing the output of the banking sector. It is necessary to charge other economic sectors for the use of this imputed service. However, there is virtually no basis to enable this allocation to be made, and the internationally accepted practice is to create a dummy or nominal account to which is debited the total imputed banking charge. The value-added of the nominal sector is negative and is of the same magnitude as the imputed banking charge.
Ideally, if complete and accurate data were available, the estimates ofG.D.P. using different approaches would be identical. However, in reality, data sources and methods of estimation suffer from many limitations and imperfections. In consequence, different approaches to estimation do not give identical results. If the sources and methods of compilation were reliable, close results would be expected from using the different approaches. In practice, a discrepancy within the range of ± 5% is considered quite satisfactory by international standards.
Further details on the methods and data sources for compiling the estimates of gross domestic product are contained in the publication 'Estimates of gross domestic product, 1966-1985'.
88

7.1 Total Expenditure on the Gross Domestic Product
Total expenditure at current market prices (HK$ Million)
Index (1980= 100)
Annual change(%)
Per capita expenditure (HK$}
Annual change(%)
Total expenditure at constant (1980) market prices (HK$ Million)
Index (1980= 100)
Annualchange(0/o)
Per capita expenditure (HK$)
Annual change(%)
Note: *Revised provisional estimates. tRevised preliminary estimates.
1976 1977 1978 1979 1980 1981 1982 1983 1984* 1985t
59,339 68,905 81,163 107,047 137,209 165,346 186,868 208,397 250,241 266,648
43.2 50.2 59.2 78.0 100 120.5 136.2 151.9 182.4 194.3
+27.7 +16.l +17.8 +31.9 +28.2 +20.5 +13.0 +ll.5 +20.l +6.6
13,134 15,033 17,389 21,715 27,100 31,899 35,496 38,988 46,359 48,871
+24.3 + 14.5 + 15.7 +24.9 +24.8 + 17.7 + 11.3 +9.8 + 18.9 +5.4
89,887 101,124 110,725 123,642 137,209 150,139 154,540 164,625 180,683 182,205
65.5 73. 7 80. 7 90. l 100 109.4 112.6 120.0 131. 7 132.8
+17.l +12.5 +9.5 +11.7 +ll.O +9.4 +2.9 +6.5 +9.8 +0.8
19,895 22,062 23,723 25,081 27,100 28,965 29,355 30,799 33,473 33,394
+ 13.9 + 10.9 + 7.5 +5.7 +8.0 +6.9 + 1.3 +4.9 +8.7 -0.2
7.2 Main Components of Expenditure on the Gross Domestic Product
G.D.P. components (at current market prices)
Private consumption expenditure
Government consumption expenditure
Gross domestic fixed capital formation
Increase in stocks
Exports of goods
Less imports of goods
Exports of services
Less imports of services
Total expenditure on gross domestic product at current market prices
Less indirect taxes less subsidies
Total expenditure on gross domestic product at current factor cost
Per capita G.D.P. at current market prices (HK$)
G.D.P. components (at constant (1980) market prices)
Private consumption expenditure
Government consumption expenditure
Gross domestic fixed capital formation
Increase in stocks
Exports of goods
Less imports of goods
Exports of services
Less imports of services
Total expenditure on gross domestic product at constant market prices
Per capita G.D.P. at constant market prices (HK$)
Note: *Revised provisional estimates. tRevised preliminary estimates.
HK$ Million
1976 1977 1978 1979 1980 1981 1982 1983 1984* 1985t
35,359 43,327 54,155 66,890 85,349 102,730 119,302 139,426 159,746 173,756
4,027
12,928
2,979
41,557
43,520
4,721
17,555
1,702
44,833
48,796
5,552
22,285
2,067
53,908
63,263
6,831
33,185
3,256
75,934
86,339
8,828 12,363 14,973
45,548 55,399 57,792
3,745 3,953 1,403
98,242 122,163 127,385
111,794 139,246 143,769
16,848 18,368 19,851
51,723 55,289 54,254
4,329 5,803 1,621
160,699 221,441 235,152
176,574 224,802 232,617
11,599 12,281 14,737 19,258 22,203 27,218 30,671 37,063 44,355 47,012
5,590
59,339
2,425
56,914
13,134
6,718
68,905
2,861
66,044
15,033
8,278 11,968
81,163 107,047
3,523 4,061
77,640 102,986
17,389 21,715
14,912 19,234 20,889 25,117
137,209 165,346 186,868 208,397
5,196 6,117 6,230 7,932
132,013 159,229 180,638 200,465
27,100 31,899 35,496 38,988
29,959
250,241
9,418
240,823
46,359
32,381
266,648
11,635
255,013
48,871
49,297 58,090 69,215 75,650 85,349 91,878 97,067 104,866 111,210 117,514
6,136 6,757 7,496 8,199 8,828 10,667 11,253 11,860 12,166 12,383
2_3,894 30,068 33,056 38,038 45,548 49,583 50,362 46,093 46,784 45,435
4,313 2,370 2,724 3,722 3,745 3,796 1,185 3,217 3,999 1,146
58,532 61,067 68,830 82,737 98,242 112,314 109,305 125,304 152,694 161,413
62,092
17,374
7,567
89,887
19,895
66,449 80,777 93,713 111,794 125,336 122,579 134,334 154,025
17,744 20,141 22,236 22,203 24,813 25,746 28,366 31,483
8,523 9,960 13,227 14,912 17,576 17,799 20,747 23,628
101,124 110,725 123,642 137,209 150,139 154,540 164,625 180,683
22,062 23,723 25,081 27,100 28,965 29,355 30,799 33,473
163,565
32,537
24,658
182,205
33,394
89

7.3 Deflators of Gross Domestic Product and Its Components (1980=100)
G.D.P. components 1976 1977 1978 1979 1980 1981 1982 1983 1984* 1985t
Private consumption expenditure 71.7 74.6 78.2 88.4 100 111.8 122.9 133.0 143.6 147.9
Government consumption expenditure 65.6 69.9 74.1 83.3 100 115.9 133.l 142.1 151.0 160.3
Gross domestic fixed capital formation 54.l 58.4 67.4 87.2 100 111.7 114.8 112.2 118.2 119.4
Changes in stocks 69.l 71.8 75.9 87.5 100 104.l 118.4 134.6 145.l 141.4
Exports of goods 71.0 73.4 78.3 91.8 100 108.8 116.5 128.2 145.0 145.7
Imports of goods 70.l 73.4 78.3 92.1 100 111.1 117.3 131.4 146.0 142.2
Exports of services 66.8 69.2 73.2 86.6 100 109.7 119.l 130.7 140.9 144.5
Imports of services 73.9 78.8 83.l 90.5 100 109.4 117.4 121.1 126.8 131.3
Gross domestic product 66.0 68.1 73.3 86.6 100 110.1 120.9 126.6 138.5 146.3
Note: *Revised provisional estimates. tRevised preliminary estimates.
90

7.4 Private Consumption Expenditure by Type
At current market prices
Food
Beverages
Tobacco
Clothing and other personal effects
Rent and water charges
Fuel and light
Furniture, furnishings and household equipment
Household operation
Personal care and health expenses
Personal care
Health expenses
Transport and communication
Recreation and entertainment
Miscellaneous services
Education and research
Financial and other services
Consumption expenditure of goods and services in the domestic market
Expenditure of residents abroad
Less expenditure of non-residents in the domestic market
Private consumption expenditure
At constant (1980) market prices
Food
Beverages
Tobacco
Clothing and other personal effects
Rent and water charges
Fuel and light
Furniture, furnishings and household equipment
Household operation
Personal care and health expenses
Personal care
Health expenses
Transport and communication
Recreation and entertainment
Miscellaneous services
Education and research
Financial and other services
Consumption expenditure of goods and services in the domestic market
Expenditure of residents abroad
Less expenditure of non-residents in the domestic market
Private consumption expenditure
Note: *Revised provisional estimates. t Revised preliminary estimates.
1976
9,771
672
512
5,356
4,815
746
2,715
629
777
1,110
2,585
2,295
548
4,496
37,027
2,399
4,067
35,359
13,502
819
788
7,177
7,064
1,381
3,302
1,060
1,157
1,674
4,074
3,453
675
6,823
52,949
3,217
6,869
49,297
1977
10,717
752
549
7,686
5,599
883
3,370
770
859
1,682
2,981
2,818
572
5,347
44,585
2,987
4,245
43,327
14,036
913
792
10,768
7,618
1,623
4,009
1,164
1,202
2,289
4,554
3,936
677
7,630
61,211
3,696
6,817
58,090
1978
12,804
891
613
11,488
6,562
919
4,383
941
1,059
1,948
3,757
3,422
627
6,521
55,935
3,533
5,313
54,155
15,829
1,053
819
15,640
8,412
1,668
5,012
1,292
1,393
2,388
5,435
4,468
717
8,706
72,832
4,156
7,773
69,215
1979
14,637
1,021
779
13,734
8,176
1,263
6,338
1,205
1,255
2,398
4,811
4,400
1980
17,520
1,040
907
16,776
10,044
2,031
7,863
1,504
1,495
3,005
6,568
5,707
1981
20,885
1,319
1,058
17,998
12,334
2,477
10,357
1,882
1,841
3,549
7,974
7,271
1982
23,673
1,470
1,262
21,217
15,127
2,500
10,643
2,253
1983
27,261
1,580
1,406
25,579
17,876
2,904
13,501
2,568
2,069 2,661
4,088 5,438
9,591 10,437
8,497 9,967
HK$ Million
1984*
29,916
1,569
1,571
29,226
20,125
3,358
16,976
2,939
1985t
30,165
1,832
1,801
32,939
22,598
3,212
17,515
3,291
3,030 3,130
6,134 7,068
12,091 13,289
12,045 13,721
741 891 1,077 1,229 1,418 1,648 1,935
7,856 10,314 13,404 16,115 18,159 21,287 23,426
68,614
4,888
6,612
66,890
16,455
1,074
902
15,779
9,078
1,856
6,629
1,379
1,451
2,728
5,737
5,096
833
9,402
78,399
5,423
8,172
75,650
85,665
6,483
103,426 . 119,734
7,757 8,681
6,799 8,453 9,113
85,349 102,730 119,302
17,520 18,292 19,071
1,040 1,190 1,280
907 952 1,021
16,776 17,092 18,528
10,044 11,084 12,208
2,031 1,955 1,927
7,863 9,596 9,666
1,504 1,617 1,679
1,495
3,005
6,568
5,707
891
10,314
85,665
6,483
6,799
85,349
1,630
3,115
6,929
6,536
941
11,483
92,412
7,154
7,688
91,878
1,647
3,196
7,121
6,903
924
11,984
97,155
7,585
7,673
97,067
140,755
10,424
11,753
139,426
20,138
1,117
718
20,266
13,294
2,071
11,581
1,745
1,953
3,711
7,102
7,701
901
12,547
104,845
8,763
8,742
104,866
161,915
12,268
14,437
159,746
20,531
964
682
20,965
13,939
2,398
13,301
1,805
2,041
3,558
7,473
8,566
912
13,793
110,928
9,832
9,550
111,210
175,922
13,056
15,222
173,756
21,096
1,070
707
22,933
14,740
2,301
13,792
1,884
2,011
3,843
7,817
9,328
928
14,574
117,024
10, 128
9,638
117,514
91
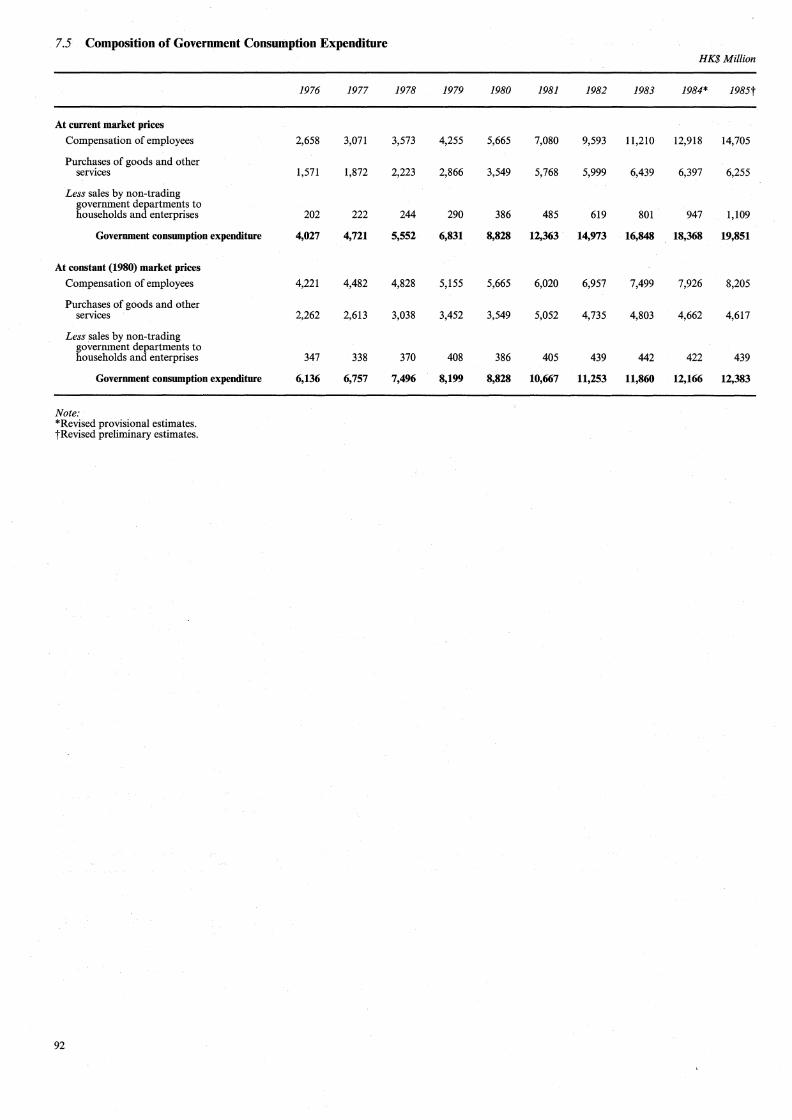
7.5 Composition of Government Consumption Expenditure HK$ Million
1976 1977 1978 1979 1980 1981 1982 1983 1984* 1985t
At current market prices
Compensation of employees 2,658 3,071 3,573 4,255 5,665 7,080 9,593 11,210 12,918 14,705
Purchases of goods and other services 1,571 1,872 2,223 2,866 3,549 5,768 5,999 6,439 6,397 6,255
Less sales by non-trading government departments to households and enterprises 202 222 244 290 386 485 619 801 947 1,109
Government consumption expenditure 4,027 4,721 5,552 6,831 8,828 12,363 14,973 16,848 18,368 19,851
At constant (1980) market prices
Compensation of employees 4,221 4,482 4,828 5,155 5,665 6,020 6,957 7,499 7,926 8,205
Purchases of goods and other services 2,262 2,613 3,038 3,452 3,549 5,052 4,735 4,803 4,662 4,617
Less sales by non-trading government departments to households and enterprises 347 338 370 408 386 405 439 442 422 439
Government consumption expenditure 6,136 6,757 7,496 8,199 8,828 10,667 11,253 11,860 12,166 12,383
Note: *Revised provisional estimates. tRevised preliminary estimates.
92

7.6 Gross Domestic Fixed Capital Formation Analysed by Institutional Sector and Type of Assets
At current market prices
Transfer costs of land and buildings
Building and construction
Residential, including combined residential and non-residential
Non-residential
Other construction and works
Real estate developers' margin.
Plant, machinery and equipment
Transport equipment
Machinery and other plant and equipment
Gross domestic fixed capital formation
At constant (1980) market prices
Transfer costs of land and buildings
Building and construction
Residential, including combined residential and non-residential
Non-residential
Other construction and works
Real estate developers' margin
Plant, machinery and equipment
Transport equipment
Machinery and other plant and equipment
Gross domestic fixed capital formation
Note: *Revised provisional estimates. t Revised preliminary estimates.
Institutional sector
Public Private Total
Public Private Total
Public Private Total
Public Private Total
Public Private Total
Public Private Total
Public Private Total
Public Private Total
Public Private Total
Public Private Total
Public Private Total
Public Private Total
Public Private Total
Public Private Total
Public Private Total
Public Private Total
Public Private Total
Public Private Total
Public Private Total
Public Private Total
1976
279 279
1,827 2,862 4,689
261 1,300 1,561
96 1,202 1,298
1,470 360
1.830
3,257 3,257
80 4,623 4,703
16 761 777
64 3,862 3.926
1,907 11,021 12,928
869 869
3,668 5,747 9,415
524 2,610 3,134
193 2,414 2,607
2,951 723
3,674
7.424 7,424
107 6,079 6,186
21 996
1,017
86 5,083 5,169
3,775 20,119 23,894
1977
372 372
2,841 4,035 6,876
429 1.112 2.201
llO 1,756 1.866
2,302 507
2,809
4,784 4,784
108 5,415 5,523
30 1,143 l.173
78 4,272 4,350
2,949 14,606 17,555
1,004 1,004
5,203 7,390
12,593
785 3.246 4.031
202 3,216 3,418
4,216 928
5.144
9,540 9,540
136 6,795 6,931
39 1,437 l.476
97 5,358 5.455
5,339 24,729 30,068
1978
563 563
4,015 4,621 8,636
839 2,266 3.105
242 1,787 2.029
2,934 568
3.502
5.683 5,683
292 7,111 7,403
162 1,013 1,175
130 6,098 6,228
4,307 17,978 22,285
1,221 1,221
6,433 7,405
13,838
1.344 3.631 4.975
387 2,864 3,251
4,702 910
5,612
9,407 9,407
340 8.250 8,590
187 l.190 l.377
153 7,060 7,213
6,773 26,283 33,056
1979
669 669
5,203 7,136
12,339
1,184 3,497 4,681
440 2,954 3.394
3.579 685
4,264
9,068 9,068
612 10,497 11,109
441 1.871 2.312
171 8,626 8,797
5,815 27,370 33,185
1,066 1,066
6,092 8,355
14,447
1,387 4,094 5.481
515 3,459 3,974
4,190 802
4.992
10,677 10,677
651 11,197 11,848
469 l,989 2.458
182 9.208 9.390
6,743 31,295 38,038
1980
1,110 1,110
6,097 10,526 16,623
l,880 4.553 6,433
529 4,533 5,062
3,688 1,440 5.128
13,270 13,270
626 13,919 14,545
469 3,178 3.647
157 10,741 10,898
6,723 38,825 45,548
1,110 1,110
6,097 10,526 16,623
1.880 4.553 6,433
529 4.533 5.062
3,688 1,440 5,128
13,270 13,270
626 13,919 14,545
469 3.178 3,647
157 10.741 10,898
6,723 38,825 45,548
1981
1,965 1,965
7,127 12,810 19,937
1,994 5.214 7.208
867 6,090 6,957
4,266 l.506 5,772
15,890 15,890
1,075 16,532 17,607
796 2,846 3,642
279 13.686 13,965
8,202 47,197 55,399
1,568 1,568
6,392 11,488 17,880
1,788 4,675 6,463
778 5.462 6.240
3,826 1,351 5,177
14,413 14,413
945 14,777 15,722
697 2.565 3.262
248 12.212 12,460
7,337 42,246 49,583
1982
1,601 1,601
10,340 14,447 24,787
2,476 5,946 8.422
1,316 7,113 8,429
6,548 l,388 7,936
14,482 14,482
1,166 15,756 16,922
823 2,748 3,571
343 13,008 13,351
11,506 46,286 57,792
1,517 1,517
8,511 11,906 20,417
2,038 4,901 6,939
1,084 5,862 6,946
5,389 1,143 6,532
14,958 14,958
928 12,542 13,470
656 2,189 2,845
272 10,353 10,625
9,439 40,923 50,362
1983
1,262 1,262
10,873 14,239 25,112
2,459 5.751 8,210
l,439 7,106 8,545
6,975 l,382 8,357
7,200 7,200
1,276 16,873 18,149
806 2,230 3,036
470 14.643 15,113
12,149 39,574 51,723
1,433 1,433
8,815 11,558 20,373
1,996 4,669 6,665
1,169 5,769 6,938
5,650 l,120 6.770
11.385 11,385
914 11.988 12,902
578 1,590 2,168
336 10,398 10,734
9,729 36,364 46,093
1984*
1,373 1,373
10,135 14,279 24,414
2,398 6,399 8,797
1,488 6,379 7,867
6.249 1.501 7,750
6,231 6,231
1,046 22,225 23,271
293 2,461 2,754
753 19,764 20.517
11,181 44,108 55,289
1,429 1,429
7,918 11,147 19,065
1.875 4,994 6,869
1,163 4.981 6.144
4,880 l,172 6,052
10,900 10,900
694 14,696 15,390
194 1,625 l.819
500 13,071 13.571
8,612 38,172 46,784
HK$Million
1985t
2,064 2,064
7,876 14,926 22,802
2,136 7.363 9,499
1.466 6.048 7.514
4,274 l,515 5,789
6,742 6,742
814 21,832 22,646
237 3,089 3.326
577 18,743 19,320
8,690 45,564 54,254
2,048 2,048
6,044 11,248 17,292
1,707 5.547 7.254
l.lll 4,558 5.669
3,226 l.143 4,369
11,095 11,095
540 14,460 15,000
157 2,045 2.202
383 12,415 12.798
6,584 38,851 45,435
93

7.7 Imports and Exports of Goods and Services at Current Market Prices HK$ Million
1976 1977 1978 1979 1980 1981 1982 1983 1984* 1985t
GOODS Exports of goods (f.o.b.) 41,557 44,833 53,908 75,934 98,242 122,163 127,385 160,699 221,441 235,152 Imports of goods ( c.i.f.) 43,520 48,796 63,263 86,339 111,794 139,246 143,769 176,574 224,802 232,617 Exports less imports of goods -1,963 -3,963 -9,355 -10,405 -13,552 -17,083 -16,384 -15,875 -3,361 2,535
SERVICES Exports of services
Transportation Shipping (a) cargo revenue (exports
and cross trade) 1,876 2,588 3,062 3,687 3,591 4,197 4,762 4,795 (b) passenger revenue 63 76 92 128 159 180 214 216 (c) chartering revenue 366 457 639 709 1,254 1,374 1,471 1,481 (d) management and agency fees 363 353 467 511 580 655 723 728 (e) foreign companies'
disbursements in HK excluding expenditure on fuel oils and port charges 2,129 2,622 2,803 3,304 3,756 3,787 4,204 4,233
Air transportation: cargo and passenger revenue and fees and commission received from foreign companies, disbursements of foreign companies in HK excluding expenditure on fuel oils and airport charges 1,732 2,628 2,968 3,864 4,531 5,828 7,210 7,585
Expenditure in HK of foreign airline and shipping companies on (a) fuel oils 731 707 727 l,162 1,916 2,377 2,486 2,682 2,781 2,563 (b) port and airport charges 161 167 196 226 258 324 397 577 764 946
Cargo forwarding 177 247 322 426 487 660 775 828 Sub-total 7,629 10,359 12,527 15,330 17,241 19,940 22,904 23,375
Travel Expenditure of civilian
visitors in HK 3,463 3,640 4,643 5,923 6,060 7,662 8,186 10,858 13,558 14,280 Expenditure of service
visitors in HK 76 64 74 68 118 237 304 245 189 201 Expenditure of transit
passengers in HK 144 164 174 142 133 73 117 109 109 123 Expenditure of foreign crews
inHK 204 187 215 248 218 171 163 164 176 200 Sub-total 3,887 4,055 5,106 6,381 6,529 8,143 8,770 11,376 14,03'2 14,804
Insurance Direct insurance to overseas 230 170 270 353 147 188 227 249 Re-insurance assumed from
overseas 59 45 127 22 268 327 464 509 Agents' commission 48 123 197 198 197 234 277 304
Sub-total 337 338 594 573 612 749 968 1,062
Cinema/ television film/ programme production and distribution 157 244 219 255 320 347 472 514
Hotel management 20 18 27 47 56 69 88 113 Advertising and marketing research 82 94 114 109 137 182 298 398
News transmission 100 115 173 216 232 312 392 421
Financial assets dealing and broking # # # # 450 677 844 1,070 Adjustment for import shipment 527 570 656 780 852 933 1,115 1,282
Banking services # # 500 751 806 1,088 1,507 2,034 Other services
Expenditure of foreign consuls and trade commissioners in HK (including their personnel) 12 12 20 22 29 32 36 41 44 45
Expenditure by UK troops stationed in HK 168 178 187 209 241 278 307 336 361 373
Postal services 8 7 13 18 14 18 29 34 47 27 Miscellaneous services n.e.s. 559 890 580 686 823 979 1,283 1,494
Sub-total 779 1,139 864 1,014 1,195 1,390 1,735 1,939 Total exports of services 11,599 12,281 14,737 19,258 22,203 27,218 30,671 37,063 44,355 47,012
Total exports of goods and services 53,156 57,114 68,645 95,192 120,445 149,381 158,056 197,762 265,796 282,164
94

7.7 Imports and Exports of Goods and Services at Current Market Prices (Continued) HK$Million
1976 1977 1978 1979 1980 1981 1982 1983 1984* 1985t
Imports of services
Transportation
Shipping: charter hire 487 780 800 977 902 1,086 1,268 1,281
Shipping and air transportation
(a) miscellaneous disbursements of HK companies abroad 2,093 3,138 3,941 5,064 5;670 6,732 7,564 7,356
(b) other revenue of foreign companies inHK 62 133 124 141 164 213 222 223
Passenger fares l,018 1,328 1,488 1,694 2,059 2,195 2,401 2,621 3,071 3,028
Sub-total 4,130 5,745 6,924 8,377 9,137 10,652 12,125 11,888
Travel
Expenditure of HK residents abroad 1,205 1,563 1,960 3,164 4,195 5,557 6,428 8,062 10,155 12,558
Expenditure of HK students abroad 653 722 797 976 1,184 1,297 1,401 1,510 1,607 1,594
Sub-total 1,858 2,285 2,757 4,140 5,379 6,854 7,829 9,572 11,762 14,152
Insurance
Direct insurance from overseas 161 261 277 333 303 326 501 470 Re-insurance ceded overseas 43 171 321 222 347 410 614 577 Expenses of local insurance
companies abroad 61 49 55 43 54 87 99 93
Sub-total 265 481 653 598 104 823 1,214 1,140
Cinema/television film/ programme production and distribution 118 125 125 159 180 219 184 219
Hotel management 25 55 78 87 87 107 136 166
Advertising and marketing research 84 101 86 83 57 74 87 108
News transmission 51 61 71 103 155 202 247 276
Financial assets dealing and broking # # # # 219 378 441 449
Banking services # # 232 340 406 454 655 786
Other services
Expenditure abroad of overseas offices of the HK Government 8 10 13 15 22 28 28 35 41 43
Miscellaneous expenditure abroad of the HK Government 138 221 311 394 528 1,615 907 1,216 1,183 1,189
Postal services 89 94 105 135 127 178 212 235 271 258 Miscellaneous services n.e.s. 419 716 687 812 968 1,150 1,613 1,707
Sub-total 848 1,260 1,364 2,633 2,115 2,636 3,108 3,197
Total imports of services 5,590 6,718 8,278 11,968 14,912 19,234 20,889 25,117 29,959 32,381
Total imports of goods and services 49,110 55,514 71,541 98,307 126,706 158,480 164,658 201,691 254,761 264,998 Exports less imports of services 6,009 5,563 6,459 7,290 7,291 7,984 9,782 11,946 14,396 14,631
Exports less imports of goods and services 4,046 1,600 -2,896 -3,115 -6,261 -9,099 -6,602 -3,929 11,035 17,166
Note: 'n.e.s.' denotes not elsewhere specified . . . Not available but token estimates were made and included in the grand totals. If Token estimates were made and included in 'miscellaneous services n.e.s.'. *Revised provisional estimates. tRevised preliminary estimates.
95

7.8 Contribution of Economic Sectors to the Gross Domestic Product at Current Prices
1980 1981 1982 1983 1984* HK$ HK$ HK$ HK$ HK$
Sector Million % Million % Million % Million % Million %
Agriculture and fishing 1,109 0.9 1,122 0.7 1,229 0.7 1,242 0.6 1,275 0.6
Mining and quarrying 213 0.2 253 0.2 308 0.2 316 0.2 299 OJ
Manufacturing 30,549 23.9 36,049 22.8 36,390 20.6 44,140 22.7 55,535 23.9
Electricity, gas and water 1,703 1.3 2,229 1.4 3,243 1.8 4,740 2.4 5,687 2.4
Construction &,570 6.7 11,922 7.5 12,904 7.3 12,269 6.3 12,218 5.3
Wholesale and retail, import/export trades, restaurants. and hotels 26,169 20.4 30,749 19.4 33,647 19.1 37,&93 19.5 51,117 22.0
Transport, storage and communication 9,645 7.5 11,853 7.5 13,632 7.7 15,9&0 &.2 17,95& 7.7
Financing, insurance, real estate and business services 29,292 22.9 37,6&& 23.8 39,746 22.5 34,614 17.& 36,466 15.7
Community, social and personal services 15,696 12.3 20,995 13.3 27,42& 15.6 31,&45 16.4 37,912 16.3
Ownership of premises 12,297 9.6 15,63& 9.9 19,317 11.0 23,351 12.0 25,660 11.0
Nominal sect~r (adjustment for financial services) -7,200 -5.7 -10,325 -6.5 -11,405 -6.5 -11,847 -6.1 -11,733 -5.0
Gross domes.tic product at factor cost (production-based estimate) 128,043 100.0 158,173 100.0 176,439 100.0 194,543 100.0 232,394 100.0
Indirect taxes less subsidies 5,196 6,117 6,230 7,932 9,41&
Gross domestic product at market prices (production-based estimate) 133,239 164,290 182,669 202,475 241,812
Gross domestic product at market prices (expenditure-based estimate) 137,209 165,346 186,868 208,397 250,241
Statistical discrepancy(%) -2.9 -0.6 -2.2 -2.8 -3.4
Note: *Revis.ed provisional estimates.
96
Section 8: PUBLIC FINANCE
Figures on public finance are supplied by the Finance Branch of Government Secretariat. As from 1973/74, revenue and expenditure for the Urban Council and the Housing Authority have been excluded, except
in respect of staff. Since 1975/76, payments for staff for the Urban Council and the Housing Authority have been transferred to a below-the-line account.
97

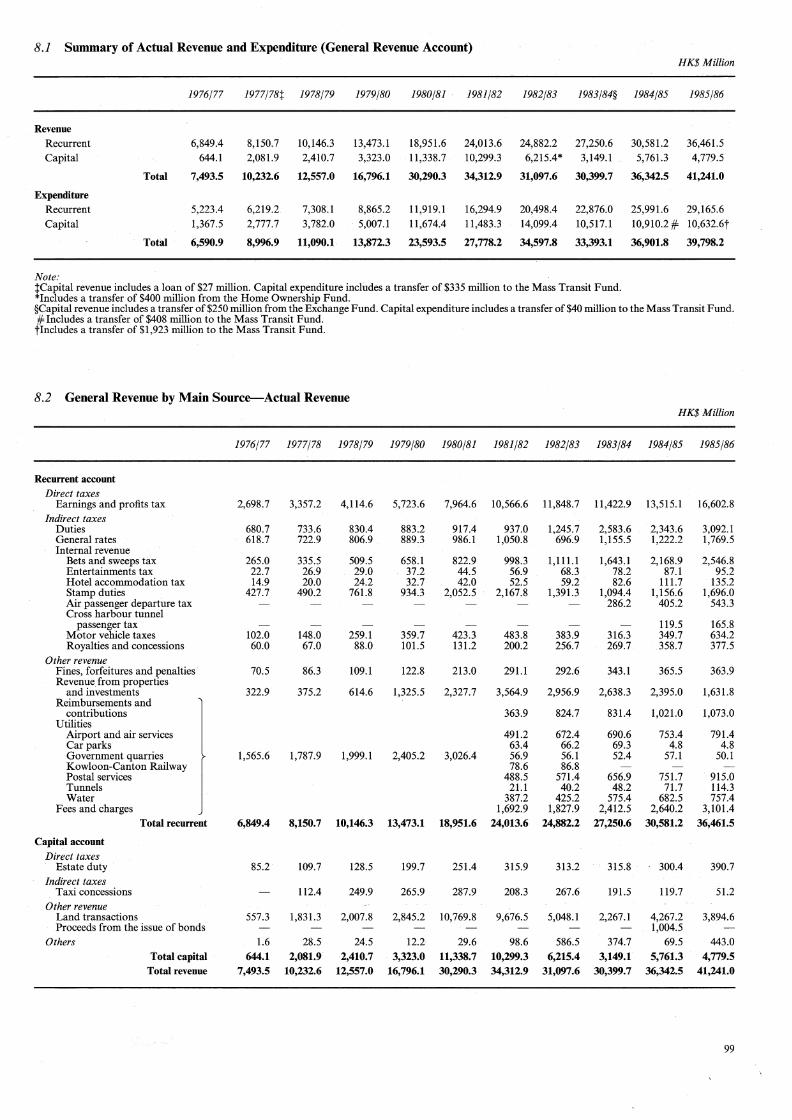
8.1 Summary of Actual Revenue and Expenditure (General Revenue Account) HK$ Million
1976/77 1977/78t 1978/79 1979/80 1980/81 1981/82 1982/83 1983/84§
Revenue Recurrent 6,849.4 8,150.7 10,146.3 13,473.l 18,951.6 24,013.6 24,882.2 27,250.6 Capital 644.l 2,081.9 2,410.7 3,323.0 11,338.7 10,299.3 6,215.4* 3,149.l
Total 7,493.5 10,232.6 12,557.0 16,796.1 30,290.3 34,312.9 31,097.6 30,399.7
Expenditure Recurrent 5,223.4 6,219.2. 7,308.l 8,865.2 11,919.l 16,294.9 20,498.4 22,876.0 Capital 1,367.5 2,777.7 3,782.0 5,007.l 11,674.4 11,483.3 14,099.4 10,517.l
Total 6,590.9 8,996.9 11,090.1 13,872.3 23,593.5 27,778.2 34,597.8 33,393.1
Note: tCapital revenue includes a loan of $27 million. Capital expenditure includes a transfer of $335 million to the Mass Transit Fund. *Includes a transfer of $400 million from the Home Ownership Fund.
1984/85 1985/86
30,581.2 36,461.5 5,761.3 4,779.5
36,342.5 41,241.0
25,991.6 29,165.6
10,910.2 # 10,632.6t
36,901.8 39,798.2
§Capital revenue includes a transfer of $250 million from the Exchange Fund. Capital expenditure includes a transfer of $40 million to the Mass Transit Fund. #Includes a transfer of $408 million to the Mass Transit Fund. tincludes a transfer of $1,923 million to the Mass Transit Fund.
8.2 General Revenue by Main Source-Actual Revenue HK$Million
1976/77 1977/78 1978/79 1979/80 1980/81 1981/82 1982/83 1983/84 1984/85 1985/86
Recurrent account Direct taxes
Earnings and profits tax 2,698.7 3,357.2 4,114.6 5,723.6 7,964.6 10,566.6 11,848.7 11,422.9 13,515.l 16,602.8 Indirect taxes
Duties 680.7 733.6 830.4 883.2 917.4 937.0 1,245.7 2,583.6 2,343.6 3,092.l General rates 618.7 722.9 806.9 889.3 986.l 1,050.8 696.9 1,155.5 1,222.2 1,769.5 Internal revenue
Bets and sweeps tax 265.0 335.5 509.5 658.1 822.9 998.3 1,111.l 1,643.l 2,168.9 2,546.8 Entertainments tax 22.7 26.9 29.0 37.2 44.5 56.9 68.3 78.2 87.l 95.2 Hotel accommodation tax 14.9 20.0 24.2 32.7 42.0 52.5 59.2 82.6 111.7 135.2 Stamp duties 427.7 490.2 761.8 934.3 2,052.5 2,167.8 1,391.3 1,094.4 1,156.6 1,696.0 Air passenger departiire tax 286.2 405.2 543.3 Cross harbour tunnel
passenger tax 119.5 165.8 Motor vehicle taxes 102.0 148.0 259.l 359.7 423.3 483.8 383.9 316.3 349.7 634.2 Royalties and concessions 60.0 67.0 88.0 101.5 131.2 200.2 256.7 269.7 358.7 377.5
Other revenue Fines, forfeitures and penalties 70.5 86.3 109.l 122.8 213.0 291.l 292.6 343.l 365.5 363.9 Revenuefrom properties
and investments 322.9 375.2 614.6 1,325.5 2,327.7 3,564.9 2,956.9 2,638.3 2,395.0 1,631.8 Reimbursements and
contributions 363.9 824.7 831.4 1,021.0 1,073.0 Utilities
Airport and air services 491.2 672.4 690.6 753.4 791.4 Car parks 63.4 66.2 69.3 4.8 4.8 Government quarries 1,565.6 1,787.9 1,999.l 2,405.2 3,026.4 56.9 56.1 52.4 57.l 50.l Kowloon-Canton Railway 78.6 86.8 Postal services 488.5 571.4 656.9 751.7 915.0 Tunnels 21.l 40.2 48.2 71.7 114.3 Water 387.2 425.2 575.4 682.5 757.4
Fees and charges 1,692.9 1,827.9 2,412.5 2,640.2 3,101.4 Total recurrent 6,849.4 8,150.7 10,146.3 13,473.1 18,951.6 24,013.6 24,882.2 27,250.6 30,581.2 36,461.5
Capital account Direct taxes
Estate duty 85.2 109.7 128.5 199.7 251.4 315.9 313.2 315.8 300.4 390.7 Indirect taxes
Taxi concessions 112.4 249.9 265.9 287.9 208.3 267.6 191.5 119.7 51.2 Other revenue
Land transactions 557.3 1,831.3 2,007.8 2,845.2 10,769.8 9,676.5 5,048.l 2,267.l 4,267.2 3,894.6 Proceeds from the issue of bonds 1,004.5
Others 1.6 28.5 24.5 12.2 29.6 98.6 586.5 374.7 69.5 443.0 Total capital 644.1 2,081.9 2,410.7 3,323.0 11,338.7 10,299.3 6,215.4 3,149.1 5,761.3 4,779.5
Total revenue 7,493.5 10,232.6 12,557.0 16,796.1 30,290.3 34,312.9 31,097.6 30,399.7 36,342.5 41,241.0
99

8.3 General Revenue Account Expenditure by Main Component HK$ Million
1976/77 1977/78 1978/79 1979/80 1980/81 1981/82 1982/83 1983/84 1984/85 1985/86
Recurrent account
Personal emoluments 2,118.0 2,455.2 2,868.0 3,488.0 4,632.9 5,977.0 7,479.l 8,334.7 9,602.6 10,963.3
Personnel related expenses 314.0 395.4 454.0 545.2 731.0 1,021.9 1,550.9 1,880.6 2,148.6 2,409.5
Departmental expenses } 1,414.4 1,735.4 2,056.4 2,476.9 3,341.6 5,313.4 2,564.2 2,742.3 2,829.3 2,906.4
Other charges 3,605.8 3,997.2 4,407.3 4,837.7
Subventions Education 813.l 943.3 1,125.5 1,391.5 1,872.5 2,254.4 2,989.2 3,270.3 3,762.l 4,227.8 Medical 185.6 226.3 272.6 319.6 446.7 583.8 724.8 813.7 941.3 1,060.3 Vocational training 125.3 180.9 150.2 260.0 University and Polytechnic
Grants Committee 255.4 306.8 348.l 410.6 580.5 724.0 898.0 1,009.3 1,401.3 1,561.5 Others 122.9 156.8 183.5 233.4 313.9 420.4 561.l 647.0 748.9 939.l
Total recurrent 5,223.4 6,219.2 7,308.1 8,865.2 11,919.l 16,294.9 20,498.4 22,876.0 25,991.6 29,165.6
Capital account
Plant, equipment and works } 549.0 663.0 627.l 518.l 405.4 167.7 241.4 370.2 501.4 1,635.5
Other non-recurrent 692.2 354.2 248.6 211.7 666.7
Subventions Education 30.l 38.5 36.4 70.5 90.3 126.3 100.8 114.9 161.8 173.0 Medical 1.6 13.5 11.l 21.8 29.6 45.5 68.2 98.6 62.8 43.5 Vocational training 9.0 70.7 168.9 113.2 University and Polytechnic
Grants Committee 40.l 24.5 65.2 135.3 237.1 148.9 132.9 150.1 201.0 157.0 Others 1.0 1.0 1.1 3.0 35.0 17.2 26.9 80.3 20.8
Transfers to funds Capital Works Reserve Fund*/
Public Works Non-Recurrent 1,128.0 1,436.9 2,273.9 3,092.4 3,791.8 6,938.2 10,800.0 7,700.0 7,757.5 5,800.0 Development Loan Fund 100.0 620.0 1,000.l 2,231.0 2,114.0 1,850.0 1,400.0 1,305.0 1,300.0 Home Ownership Fund 586.9 399.4 80.0 332.0 Mass Transit Fund 335.0 4.8 2.7 3,539.6 437.0 40.0 408.0 1,923.0 Others 181.8 36.5 65.2 104.l 40.2 35.l 30.0
Total capital 1,367.5 2,777.7 3,782.0 5,007.1 11,674.4 11,483.3 14,099.4 10,517.1 10,910.2 10,632.6
Total expenditure 6,590.9 8,996.9 11,090.1 13,872.3 23,593.5 27,778.2 34,597.8 33,393.1 36,901.8 39,798.2
Note: *The Capital Works Reserve Fund was established on 20 January 1982 by Resolution of the Legislative Council for the purpose of financing the Public Works Programme and acquisitions of land.
8.4 Cost and Size of the Public Service
1976/77 1977/78 1978/79 1979/80 1980/81 1981/82 1982/83 1983/84 1984/85 1985/86
Authorized establishment* 114 692 117 495 125 909 133 422 141 133 151 809 166 030 173 663 176 870 181 719
Annual change in establishment(%) +0.3 +2.4 +7.2 +6.0 +5.8 +7.6 +9.4 +4.6 +1.9 +2.7
Personal emoluments--excluding pensions (HK$ Million)t 2,118.0:j: 2,455.2 2,868.0 3,488.0 4,632.9 5,977.0 7,479.l 8,334.7 9,602.6 10,963.3
Annual change in personal emoluments(%) +19.9 +15.9 +16.8 +21.6 +32.8 +29.0 +25.1 + 11.4 +15.2 +14.2
Total recurrent expenditure (HK$ Million) 5,223.4 6,219.2 7,308.1 8,865.3 11,919.1 16,294.9 20,498.4 22,876.0 25,991.6 29,165.6
Personal emoluments (excluding pensions) as % of total recurrent expenditlµ"e 40.6 39.5 39.2 39.3 38.9 36.7 36.5 36.4 37.0 37.6
Note: *Excludes supernumerary posts held against permanent posts. tExclude those for posts in the Housing and Urban Services Departments which are paid by the Housing Authority and Urban Council respectively. :j:Excludes personal emoluments for the Independent Commission Against Corruption which up to 1979/80 were included in annually recurrent other charges.
100

Section 9: MONEY, BANKING AND FINANCE
The old series of statistics for the money supply and for banks and deposit-taking companies were supplied by the Commissioner of Banking/Commissioner of Deposit-taking Companies. The new series are supplied by the Secretary for Monetary Affairs. Statistics on spot and forward foreign currency transactions are provided by the Commissioner of Banking/Commissioner of Deposit-taking Companies.
The definitions of money supply in the old series are: Money supply definition 1 (Ml)-Legal tender notes and coins held by the non-bank and non-deposit-taking company
public; plus customers' demand deposits with licensed banks. Money supply definition 2 (M2)-Ml plus savings and time deposits (other than from banks and deposit-taking companies)
with licensed banks. Money supply definition 3 (M3)-M2 plus deposits from the non-bank and non-deposit-taking company public with
registered deposit-taking companies. The definitions of money supply in the new series are:
Money supply definition 1 (Ml)-Legal tender notes and coins held by the non-bank and non-deposit-taking company public; plus customers' demand deposits with licensed banks.
Money supply definition 2 (M2)-Ml plus customers' savings and time deposits with licensed banks and negotiable certificates of deposit (other than from banks and deposit-taking companies) issued by licensed banks.
Money supply definition 3 (M3)-M2 plus customers' deposits with licensed and registered deposit-taking companies and negotiable certificates of deposit (other than from banks and deposit-taking companies) issued by deposit-taking companies.
Other main differences between the old and new presentations are: (a) Hong Kong dollar components are now separately identified; (b) the consolidated balance sheet of banks now includes inter-bank balances and that of deposit-taking companies includes
inter-deposit-taking company balances, whereas both were excluded before; (c) Table 9.7 covers loans and advances where the funds are for use in Hong Kong, whereas the earlier classification (Table
9.6) covered those where the credit risk was in Hong Kong. Banks' note issues and their corresponding holdings of certificates of indebtedness are excluded from the balance sheets
of banks for both the old and the new series. (Tables 9.3 and 9.4) The average liquidity ratio is as defined in Section 18 of the Banking Ordinance and in Section 24A of the Deposit-taking
Companies Ordinance; figures are supplied by the Commissioner of Banking/Commissioner of Deposit-taking Companies. Short-term deposits with deposit-taking companies in Table 9.3 cover demand deposits, deposits repayable within 7 days or
at 7 days' notice or less, and time deposits where the depositors may obtain repayment before maturity. The inter-bank lending rates are obtained from Wah Kiu Yat Po; figures of bank cheques cleared are supplied by the
Clearing House of the Hong Kong Association of Banks. Statistics of exchange rates between the Hong Kong dollar and currencies of selected countries are compiled from
quotations supplied mainly by the Hang Seng Bank Limited. Figures are based on closing middle-market telegraphic transfer rates as at the last trading day of the year. The currencies are selected for those countries which are major trading partners of Hong Kong. The exchange rates of the SOR are derived by multiplying the U.S. dollar value of the SDR as published by the IMF by the appropriate exchange rates of Hong Kong dollar against U.S. dollar as published in the tables. The effective exchange rate index measures movements in the weighted average of nominal exchange rates of the Hong Kong dollar against the currencies of 15 principal trading partners. The principal trading partners are selected on the basis of their merchandise trade with Hong Kong and their relative importance in world trade. As from January 1983, a revised weighting system derived from the trade pattern in 1981 was used and indexes back to 1976 as shown in Table 9.12 are based on the revised weighting system. The base date is 18 December 1971 when the Smithsonian Agreement was reached.
Information on stock exchange turnover was supplied by the Hong Kong Stock Exchange Ltd., the Far East Exchange Ltd., the Kam Ngan Stock Exchange Ltd. and the Kowloon Stock Exchange Ltd. The indexes of share prices were compiled by the Hang Seng Bank Ltd., the Far East Exchange Ltd. and the Kam Ngan Stock Exchange Ltd. The Hang Seng Index referred to transactions in the Hong Kong Stock Exchange Ltd.; the Far East Index and the Kam Ngan Index referred to transactions in the Far East Exchange Ltd. and the Kam Ngan Stock Exchange Ltd. respectively.
Statistics on commodity trading and gold and silver exchange trading are supplied by the Hong Kong Futures Exchange Ltd. and the Chinese Gold and Silver Exchange Society respectively.
Cotton was first traded in the Futures Exchange on 9 May 1977, sugar on 15 November 1977, soybean on 1 November 1979 and gold on 19 August 1980. The lot unit for cotton was changed from 25 OOO lb to 50 OOO lb on 13 November 1979 and for soybean from I 5 OOO kg to 30 OOO kg on 18 August 1980; the lot unit for sugar is 112 OOO lb and for gold is 100 troy ounces.
101


9.1 Money Supply HK$ Million
Old series :j: New series
1978 1979 1980 1981 :j: 1980 1981 1982 1983 1984 1985
Legal tender notes and coins in circulation Commercial bank issues 6,986 7,920 9,374 11,066 :j: 9,374 11,066 12,646 13,930 14,246 17,966 Government issues 789 864 1,090 1,241 :j: 1,090 1,241 1,282 1,413 1,375 1,493
Total 7,775 8,784 10,464 12,307 :j: 10,464 12,307 13,928 15,343 15,621 19,458
Banks' and deposit-taking companies' holdings of legal tender notes and coins 1,232 1,499 2,092 2,473 :j: 2,097 2,480 2,486 2,629 2,347 2,601
Legal tender notes and coins in hands of public 6,543 7,285 8,372 9,834 :j: 8,367 9,827 II,442 12,714 13,273 16,857
Money supply (definition I) Hong Kong Dollar :j: 23,076 23,748 26,086 28,277 33,351 41,806 Foreign Currency :j: 1,122 1,446 1,399 2,619 3,440 3,460
Total 20,IIO 20,851 24,124 25,060 :j: 24,198 25,194 27,485 30,896 36,791 45,266
Money supply (definition 2) Hong Kong Dollar :j: 85,060 96,761 120,956 138,818 172,547 194,641 Foreign Currency :j: 11,180 19,995 85,732 118,867 141,533 195,597
Total 66,472 75,270 96,862 ll9,061 :j: 96,240 ll6,756 206,688 257,685 314,081 390,239
Money supply (definition 3) Hong Kong Dollar :j: 120,454 145,933 149,254 168,020 208,266 233,230 Foreign Currency :j: 18,319 30,885 102,293 143,125 180,035 242,730
Total 76,919 99,765 139,578 179,540 :j: 138,773 176,818 251,547 3ll,146 388,301 475,960
Note: Figures are as at end of the year.
9.2 Deposits from Customers HK$ Million
Old series :j: New series
1978 1979 1980 1981 :j: 1980 1981 1982 1983 1984 1985
Demand deposits with licensed banks Hong Kong Dollar :j: 14,709 13,921 14,644 15,564 20,078 24,949 Foreign Currency :j: 1,122 1,446 1,399 2,619 3,440 3,460
Total 13,567 13,566 15,752 15,226 :j: 15,831 15,367 16,043 18,182 23,518 28,409
Savings deposits with licensed banks Hong Kong Dollar + 40,031 48,073 61,907 58,704 66,241 81,216 + Foreign Currency + 2,777 4,779 7,683 12,452 14,909 17,549 +
Total 24,850 33,258 42,809 52,852 :j: 42,808 52,852 69,590 71,156 81,150 98,765
Time deposits with licensed banks Hong Kong Dollar :j: 21,391 23,876 31,324 50,406 71,686 67,955 Foreign Currency :j: 6,722 12,363 73,302 100,129 119,750 172,095
Total 21,512 21,161 29,929 41,149 :j: 28,ll4 36,239 104,626 150,535 191,436 240,050
Total deposits with licensed banks Hong Kong Dollar :j: 76, 132 85,870 107,876 124,674 158,005 174,121 Foreign Currency :j: 10,621 18,588 82,384 115,200 138,099 193,104
Total 59,929 67,985 88,490 109,227 :j: 86,753 104,457 190,259 239,874 296,103 367,224
Deposits with licensed deposit-taking companies Hong Kong Dollar :j: 3,455 5,264 7,734 6,948 Foreign Currency :j: 6,275 12,166 17,191 22,484
Total :j: 9,730 17,431 24,925 29,433
Deposits with registered deposit-taking companies Hong Kong Dollar :j: 34,993 48,489 24,053 23,463 27,450 31,063 Foreign Currency :j: 7,108 10,678 10,030 11,483 19,908 21,249
Total 10,447 24,495 42,716 60,479 :j: 42,101 59,167 34,083 34,946 47,359 52,3II
Deposits with all deposit-taking companies Hong Kong Dollar :j: 34,993 48,489 27,508 28,728 35,185 38,011 Foreign Currency :j: 7,108 10,678 16,304 23,649 37,099 43, 733
Total 10,447 24,495 42,716 60,479 :j: 42,101 59,167 43,813 52,377 72,283 81,744
Deposits with all deposit-taking institutions Hong Kong Dollar :j: 111,125 134,359 135,384 153,401 193,190 212,132 Foreign Currency :j: 17,729 29,266 98,688 138,849 175,198 236,837
Total 70,376 92,480 131,206 169,706 :j: 128,854 163,625 234,072 292,250 368,387 448,968
Note: Figures are as at end of the year.
103

9.3 Balance Sheets (Old Series): Banks and Deposit-taking Companies HK$ Million
Banks Deposit-taking companies
1978 1979 1980 1981 1978 1979 1980 1981
Number of licensed banks/registered deposit-taking companies 88 105 113 121 241 269 302 350
Liabilities
Deposits from the public 59,929 67,985 88,490 109,227 10,447 24,495 42,716 60,479
(of which: short-term) 7,649 12,907
Amount due to banks in Hong Kong 6,386 11,463 21,314 31,107
Amount due to deposit-taking companies 6,929 20,029 28,992 42,550
Amount due to banks abroad 51,385 73,685 117,704 169,815 27,398 31,160 49,929 87,679
Other liabilities 13,624 24,159 32,917 48,390 8,121 10,347 16,125 23,863
Total liabilities 131,867 185,858 268,103 369,982 52,352 77,465 130,084 203,128
Assets
Cash 1,227 1,495 2,087 2,466 5 4 5 7
Amount due from banks abroad: Demand and short-term claims 37,425 46,568 58,310 80,249 2,753 3,293 18,217 30,187 Time deposits 13,381 19,867 32,583 54,614 6,190 10,266 10,676 18,313
Amount due from banks in Hong Kong 6,929 20,029 29,217 43,790 Amount due from deposit-taking companies 6,386 11,463 20,790 30,732
Loans and advances Hong Kong 46,428 62,227 94,970 128,204 9,970 13,566 29,317 47,460 Abroad 16,411 20,778 29,433 33,586 21,165 24,778 30,232 48,038
Investments Hong Kong 4,294 5,462 7,276 8,525 1,062 1,157 2,505 2,046 Abroad 137 180 190 251 842 997 2,805 1,869
Other assets Hong Kong 5,980 9,581 13,126 20,775 1,644 1,459 3,622 5,635 Abroad 198 8,237 9,338 10,580 1,792 1,916 3,488 5,783
Total assets 131,867 185,858 268,103 369,982 52,352 77,465 130,084 203,128
Average liquidity during year (%) 45.4 48.0 49.7 49.9 45.8 45.4
Note: Figures are as at end of the year.
104
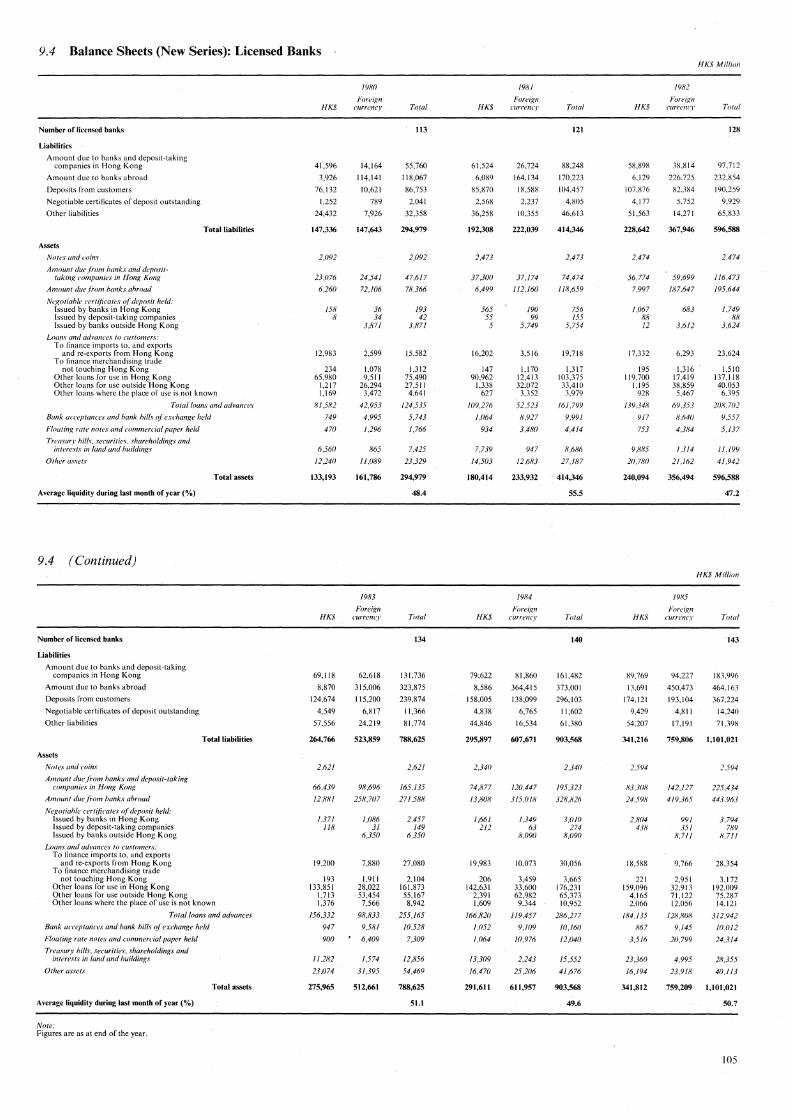
9.4 Balance Sheets (New Series): Licensed Banks
Number of licensed banks
Liabilities
Amount due to banks and deposit-taking companies in Hong Kong
Amount due to banks abroad
Deposits from customers
Negotiable certificates of deposit outstanding
Other liabilities
Assets
Notes and coins
Amount due f'rom hanks and deposittaking companies in Hong Kong
Amount due /Yom hanks ahroad
Negotiahle certfficates (d. deposit held: Issued by banks in Hong Kong Issued by deposit-taking companies Issued by banks outside Hong Kong
Loans and adwmcc'S to customers: To finance imports to, and exports
and re-exports from Hong Kong To !lnance merchandising trade
not touching Hong Kong Other loans for use in Hong Kong Other loans for use outside Hong Kong
Total liabilities
Other loans where the place of use is not known
Total loans and advances
Bank acceptances and hank hills <~f" exchange held
Floating rate notes and commercial paper held
Treasury hills, securities. shareholdings and interests in land and buildings
Other assets
Average liquidity during last month of year(%)
9.4 (Continued)
Number of licensed banks
Liabilities
Amount due to banks and deposit-taking companies in Hong Kong
Amount due to banks abroad
Deposits from customers
Negotiable certificates of deposit outstanding
Other liabilities
Assets
Notes and coins
Amount duef'rom hanks and deposit-taking companies in Hong Kong
Amount due.from hanks ahroad
Negotiahie certfftrntes r?fdeposit held: Issued by banks in Hong Kong Issued by deposit-taking companies Issued by banks outside Hong Kong
Loans and advances to customers.· To finance imports to, and exports
and re-exports from Hong Kong To finance merchandising trade
not touching Hong Kong Other loans for use in Hong Kong Other loans for use outside Hong Kong
Total assets
Total liabilities
Other loans where the place of use is not known
Total loans and advances
Bank aCl'eptances and hank hills <?f exchange held
Floating rate notes and commercial paper held
Treasury hills. securities, shareholdiflgs and interests in land and buildings
Other assets
Total assets
Average liquidity during last month of year(%)
Note: Figures are as at end of the year.
HK$
41,596
3,926
76,132
1,252
24,432
147,336
2,092
23,076
6.260
!SR R
12,983
234 65,980
1,217 1,169
81,5R2
749
470
6,560
12.240
133,193
HK$
69,118
8,870
124,674
4,549
57,556
264,766
2.621
66.439
12.8R1
1.371 118
19,200
193 133,851
1,713 1,376
156.332
947
900
ll.2R2
23.074
275,965
1980
Forei1-:n currency
14,164
I 14,141
10,621
789
7,926
147,643
24.541
72.106
36 34
3,871
2,599
1,078 9,511
26,294 3,472
42,953
4,995
1.296
R65
II.OM
161,786
19R3
Foreign currency
62.618
315,006
115,200
6,817
24.219
523,859
98.696
25R.707
1.llR6 31
6.350
7,880
1,911 28,022 53,454 7,566
98.R33
9,5Rl
6,409
1.574
31,395
512,661
Total
113
55,760
I 18,067
86,753
2,041
32,358
294,979
2,092
47,617
78.366
193 42
3,871
15,582
1,312 75,490 27,511
4,641
124.535
5.743
1,766
7,425
23.329
294,979
48.4
Total
134
131.736
323,875
239.874
11,366
81.774
7118,625
2.621
165.135
271.58R
2.457 149
6.350
27,080
2,104 161,873 55,167
8,942
255.165
I0.52R
7.309
12,856
54,469
788,625
51.1
HK$
61,524
6,089
85,870
2,568
36,258
192,308
2.473
37,300
6,499
565 55
5
16,202
147 90,962
1,338 627
109,276
1.064
934
7,739
14,503
180,414
HK$
79,622
8.586
158,005
4,838
44.846
295,897
2.340
74.877
13,811R
1,661 212
19,983
206 142,631
2,391 1,609
166.RJll
1.052
1,064
13,309
16.470
291,611
19R1
Foreign currencr
26,724
164,134
18,588
2,237
10,355
222,039
37.174
112.160
190 99
5.749
3,516
1,170 12,413 32,072
3,352
52.523
R,927
3.4RO
947
12.6R3
233,932
1984
Foreign currency
81,860
364.415
138,099
6,765
16.534
607,671
120.447
315,018
1.349 63
R,090
10,073
3,459 33,600 62.982
9,344
119.457
9,109
/0,976
2.243
25.206
611,957
Total
121
88,248
I 70,223
104,457
4,805
46,613
414,346
2.473
74.474
118,659
756 155
5.754
19,718
1,317 103,375 33,410
3,979
161.799
9,991
4,414
8.6R6
27.IR7
414,346
55,5
Total
140
161,482
373,001
296.103
11,602
61.380
903,568
2.340
195.323
32R.826
3,11/() 274
R.0911
30,056
3,665 176,231 65,373 10,952
286.277
111.160
12.040
15.552
41.676
903,568
49.6
HK$
58,898
6,129
107,876
4,177
51,563
228,642
2.474
56,774
7,997
1.()67 8R 12
17,332
195 I 19,700
1,195 928
139.34R
917
753
9.8R5
20.7811
240,094
HK$
89.769
13,691
174,121
9.429
54,207
341,216
2,594
R3.311R
24.598
2,8114 438
18.588
221 159,096
4,165 2,066
184.135
R67
3.516
23.360
16.194
341,812
19R2
Foreixn currenc.1·
38,814
226.725
82.384
5.752
14,271
367,946
59,699
1R7.647
683
3,612
6,293
1,316 17,419 38,859
5,467
69.353
R.6411
4.384
1.314
21.162
356,494
1985
Foreign currency
HK$ Million
Total
128
97,712
232,854
190.259
9,929
65,833
596,588
2.474
116.473
195,644
1.749 R8
3,624
23,624
1,510 137,l 18 40,053
6,395
2118.7112
9.557
5.137
11.199
41,942
596,588
47,2
HK$ Million
Total
143
94,227 183.996
450,473 464, 163
193.104 367,224
4,811 14,240
17.191 71.398
759,806 1,101,021
142.127
419.365
991 351
R.711
9.766
2,951 32,913 71,122 12,056
12R.ROR
9.145
20.799
4,995
23.91R
759,209
2.594
225.434
443.963
3.794 789
R.711
28,354
3,172 192,009 75.287 14,121
312.942
10,1112
24.314
JR,355
411,113
1,101,021
50.7
105

9.5 Balance Sheets (New Series): Deposit-taking Companies
Number of deposit-taking companies
Liabilities
Amount due to ban~s and deposit-taking companies in Hong Kong
Amount due to banks abroad
Deposits from customers
Negotiable certificates of deposit outstanding
Other liabilities
Assets
Notes and coins
Amount due from hanks and deposittaking companies in Hong Kong
Amount due from hanks abroad
Negotiable certificates (~(deposit held: Issued by banks in Hong Kong Issued by deposit-taking companies Issued by banks outside Hong Kong
Loans and advances to customers: To finance imports to, and exports
and re-exports from Hong Kong To finance merchandising trade
n.ot touching Hong Kong Other loans for use in Hong Kong Other loans for use outside Hong Kong
Total liabilities
Other loans where the place of use is not known
Total loans and adwtnces
Bank acceptances and hank hills <d. exchangt' held
Floating rate notes and commercial paper held
Treasury hills, securities, shareholdings and interests in land and buildings
Other assets
Average liquidity during last month of year(%)
9.5 (Continued)
Number of deposit-taking companies
Liabilities
Amount due to banks and deposit-taking companies in Hong Kong
Amount due to banks abroad
Deposits from customers
Negotiable certificates of deposit outstanding
Other liabilities
Assets
Notes and coins
Amount due from hanks and deposit-taking companies in Honr; Kong
Amount due from hanks ahroad
Negotiable cert{ficates <?(deposit held: Issued by banks in Hong Kong Issued by deposit-taking companies Issued by banks outside Hong Kong
Loans and advances to customers: To finance imports to, and exports
and re-exports from Hong Kong To finance merchandising trade
not touching Hong Kong Other loans for use in Hong Kong Other loans for use outside Hong Kong
Total assets
Total liabilities
Other loans where the place of use is not known
Total loans and advances
Bank acceptances and hank hills r?f exchange held
Floating rate notes and commercial paper held
Treasury hills, securities, shareholdings and interests in land and buildings
Other assets
Total assets
Average liquidity during last inonth of year(%)
Note: Figures are as at end of the year.
106
HK$
9,644
623
34,993
629
9,691
55,580
27,787
254
532 220
816
127 19,851
530 972
22,296
57
282
2,747
3,112
57,291
HK$
27,864
1,899
28,728
868
17,031
76,389
311,296
1,247
1,747 275
1,245
!03 37,972
811 713
40,843
71
270
1,631
3,255
79,643
1980
Foreign <'Urrency
21,753
49,338
7,108
103
6,477
84,779
10.849
23,997
196 37
2,663
877
468 3,669
28,107 3,976
37,096
394
1,779
1,680
4,375
83,068
1983
Foreif{n currency
67,061
139,809
23,649
1,060
18,869
250,447
29,459
76,992
2,064 420
13,942
1,157
680 9,087
75,519 8,901
95,344
1,073
11,554
6,014
10,331
247,194
Total
302
31,397
49,961
42,101
731
16,168
140,358
5
38,636
24.251
728 257
2,663
1,693
595 23,519 28,636
4,949
59,392
451
2,1161
4,427
7,487
140,358
44.2
Total
349
94,924
141.709
52,377
1,928
35,900
326,837
59,755
78,240
3,811 695
13,942
2,402
783 47,058 76,330
9,614
136,187
1,144
11,824•
7,645
13,586
326,837
60.1
HK$
14,842
700
48,489
975
14,208
79,215
8
39,609
944
939 237
1,380
150 32,360
781 1.633
36,305
87
89
2,337
2,944
83,499
HK$
34,654
1,586
35,185
1,124
16,279
88,826
39,626
1,035
1,908 378
1,214
95 36,716
1,098 988
40,110
76
777
1,581
2,965
88,463
1981
Foreign currency
31,219
87,030
10,678
454
9,840
139,221
17,986
38,000
640 143
5,825
788
741 7,673
44,444 5,792
59,438
696
4,376
1,724
6,111
134,937
1984
Foreign curremy
72,538
141,869
37,099
2,074
23,685
277,263
31,721
84,500
1,980 609
15,188
1,197
688 7,959
76,319 8,499
94,663
740
23,632
9,269
15,324
277,626
Total
350
46,062
87,730
59,167
1.430
24,048
218,436
57,596
38,944
1,578 380
5.825
2,167
891 40,034 45.225
7.425
95.742
783
4,465
4,061
9,055
218,436
46.0
Total
343
107,191
143,454
72,283
3,197
39,963
366,089
71.347
85,535
3,889 986
15,188
2,411
783 44,675 77.417
9.487
134,772
816
24,409
10,850
18,289
366,089
43.8
HK$
24,359
1,056
27,508
1,141
14,816
68,879
12
26.493
1,047
1.472 262
1.682
113 38.496
914 1.540
42.746
85
106
1,91!2
2,495
76,701
HK$
39,419
1,392
38,011
1,519
16,IOO
96,440
45,792
894
2,961 504
1,154
48 34,834
1,358 1.401
38,794
95
1,959
1,540
2,815
95,361
1982
Ford Kn currency
48,419
118,597
16,304
413
13,906
197,640
23,605
50,636
1,721 158
9,687
1,032
668 11,707 59,984
6,394
79,785
1,621
8,045
4,344
10.216
189,818
1985
Foreign currency
84.952
185,957
43,733
4,461
39,058
358,161
36.319
117,165
1.327 709
15,402
1,347
518 8,101
69,675 8,587
88.228
1,672
48,479
21.222
28.720
359,241
HK$ Million
Total
361
72,778
119,653
43,813
1,554
28,722
266,519
12
50,098
51,683
3,193 420
9,687
2,714
782 50.203 60,898
7,935
122.532
1.707
8,151
6,326
12,711
266,519
57.3
HK$ Million
Total
313
124.371
187,349
81,744
5,979
55,158
454,602
82,1/0
118,059
4.288 1,213
15,402
2,501
566 42,934 71,033
9,988
127.022
l,766
50.438
22,762
31,535
454,602
45.J

9.6 Analysis of Loans and Advances in Hong Kong (Old Series) HK$ Million
Banks Deposit-taking companies
1978 1979 1980 1981 1978 1979 1980 1981
Total loans and advances in Hong Kong 46,428 62,227 94,970 128,204 9,970 13,566 29,317 47,460
Manufacturing 6,642 8,540 11,905 15,632 654 932 1,418 2,308
Textiles 1.789 1,941 2,675 3,133 165 206 270 272 Cotton l,083 l,071 l,643 l,534 77 83 90 83 Others 706 870 l,032 l,599 88 123 180 189
Footwear and wearing apparel 1,083 1,393 1,786 2,216 45 52 80 104 Metal products and engineering 683 887 1,351 1,745 51 !02 110 150 Rubber, plastics and chemicals 575 742 963 1,102 32 48 90 132 Shipbuilding and repair 333 457 1,003 1,244 130 77 87 386 Electrical and electronic 769 1,134 1,581 2,169 84 204 328 362 Food 130 243 350 523 33 51 70 64 Beverages and tobacco 100 143 206 294 2 Printing and publishing 248 253 343 509 34 92 121 123 Miscellaneous 932 1,347 1,647 2,697 80 98 262 715
Agriculture and fisheries 45 58 92 114 5 14 12 4
Fisheries 16 30 37 42 3 14 12 3 Livestock and livestock products 19 15 30 37 2 Vegetables and horticultures JO 13 25 35
Transport and transport equipment 4,154 5,112 7,699 8,326 2,104 2,651 3,822 4,241
Electricity, gas and telephone 275 311 537 1,087 9 37 20 264
Building and construction 5,288 7,299 14,064 23,642 1,636 2,586 5,143 9,999
General commerce 15,539 19,695 27,308 33,199 1,675 2,334 4,904 6,381
Import, export and wholesale trade 14,502 18,583 25,701 31,180 1,574 2,185 4,758 6,080 Retail trade 1,037 1,112 1,607 2,019 IOI 149 146 301
Mining and quarrying 38 87 148 145 6 1 14 20
Miscellaneous 14,447 21,125 33,217 46,059 3,881 5,011 13,984 24,243
Hotels, boarding houses and catering 536 450 773 768 69 58 387 479 Financial concerns including banks 25 2,239 5,336 7,623 716 987 1,289 2,389 Stockbrokers 462 692 1,567 1,846 81 153 269 706 Professional and private individuals 9,631 12,872 16,125 21,527 1,502 2,283 8,391 14,690
To purchase residential property 4,940 7,524 7,173 9,167 782 l,128 4,530 6,347 For other business purposes 2,007 l,961 3,409 4,714 261 589 2,923 6,752 For other private purposes 2,684 3,387 5,543 7,646 459 566 938 l,591
All others 3,793 4,872 9,416 14,295 1,513 1,530 3,648 5,979
Note: Figures are as at end of the year.
107

9.7 Analysis of Loans and Advances for Use in Hong Kong (New Series) HK$ Million
Banks Deposit-taking companies
1981 1982 1983 1984 1985 1981 1982 1983 1984 1985
Loans and advances for use in Hong Kong 103,375 137,118 161,873 176,231 192,009 40,034 50,203 47,058 44,675 42,934
Manufacturing 12,430 14,439 16,210 16,940 17,962 1,761 2,497 2,457 1,853 1,764
Textiles 2,466 2,807 3,103 2,945 3,330 167 200 214 165 174 Cotton 1,26! l,317 l,554 1,367 1,652 38 55 70 58 68 Others l,205 1,490 1,549 1,578 1,678 129 144 143 106 106
Footwear and wearing apparel 1,558 1,930 1,990 1,937 2,015 99 113 124 I II 119 Metal products and engineering J,415 1,576 1,574 1,591 1,972 116 121 152 114 166 Ruhher, plastics and chemicals 912 1,051 1,301 1,245 1,080 124 123 157 156 97 Shipbuilding and repair 1,209 1,051 1,017 1,491 1,009 310 567 367 259 289 Electrical and electronic 1,456 1,717 2,186 2,698 3,167 220 295 269 179 171 Food 421 609 750 735 J,J21 58 61 34 19 36 Beverages and tobacco 267 304 450 381 638 I 75 87 13 25 Printing and publishing 451 516 538 540 688 /18 129 158 154 222 Miscellaneous 2,275 2,877 3,300 3,377 2,942 548 814 895 683 465
Agriculture and fisheries 97 119 138 215 189 8 3 12 JO 21
Fisheries 36 52 59 82 74 4 2 12 JO 20 Livestock and livestock products 37 43 54 116 89 3 * Vegetables and horticultures 24 24 25 17 25 I I I I *
Transport and transport equipment 6,680 10,509 13,811 13,985 13,818 3,830 5,135 6,967 6,613 5,927
Electricity, gas and telephone 1,075 2,242 2,684 4,135 4,407 235 259 595 654 536
Building, construction and property development 24,123 36,192 37,194 39,332 33,813 9,619 13,344 9,926 8,782 6,267
Wholesale and retail trade 14,982 17,711 23,165 26,024 28,221 2,799 2,645 3,099 2,220 1,319
Mining and quarrying 139 211 175 270 148 17 35 27 2 6
Miscellaneous 43,849 55,696 68,496 75,329 93,452 21,765 26,284 23,975 24,540 27,095
Hotels, hoarding houses and catering 704 1,19_8 1,562 2,312 3,359 446 513 575 515 337 Financial concerns (other than banks
and deposit-taking companies) 7,431 8,975 13,973 13,377 15,844 1,614 3,183 3,244 3,574 3,688 Stockbrokers 1,796 1,893 1,247 1,224 1,646 566 289 157 141 373 Professional and private individuals 20,918 25,754 30,286 33,039 41,625 14,366 17,403 15,862 16,389 18,594
To purchase flats in the Home Ownership Scheme and Private Sector Participation Scheme 989 1,258 2,002 2,370 3,296 592 1,-006 l,208 1,541 2,412
To purchase other residential property 7,983 10,128 12,569 14,631 18,984 5,788 6,714 9,315 10,821 12,538 For credit card advances 129 219 31 l 416 598 2 8 4 5 For other business purposes 4,469 4,915 5,413 4,85! 7,048 6,641 8,422 4,089 3,046 2,417 For other private purposes 7,348 9,235 9,99! 10,77! l l,698 l,345 l,259 l,242 978 1,223
All others 13,000 17,876 21,429 25,378 30,979 4,773 4,896 4,137 3,921 4,103
Note: Figures arc as at end of the year. *Less than HK$0.5 million.
108

9.8 Money Market (Old Series) HK$ Million
1978 1979 1980 1981
Inter-bank liabilities
Demand and call 4,035 5,447 6,085 7,138
Short notice 553 3,252 4,146 8,537
Time deposits 3,141 8,930 16,646 30,062
Total 7,729 17,629 26,877 45,737
Banks' liabilities to deposit-taking companies
Demand and call 2,969 10,773 10,008 12,505
Short notice 402 994 2,741 4,294
Time deposits 3,558 8,262 16,243 25,751
Total 6,929 20,029 28,992 42,550
Inter-deposit-taking company liabilities
Demand and call 189 458 326 684
Short notice 279 587 1,971 3,275
Time deposits 4,051 5,942 7,971 11,152
Total 4,519 6,987 10,268 l5,lll
Deposit-taking companies' liabilities to banks
Demand and call 922 451 1,122 1,310
Short notice 228 496 3,059 3,525
Time deposits 5,236 10,516 17, 133 26,272
Total 6,386 11,463 21,314 31,107
Note: Figures are as at end of the year.
109

9.9 Money Market (New Series)
Inter-bank liabilities
Demand and call
Short notice
Time deposits
Total
Banks' liabilities to deposit-taking companies
Demand and call
Short notice
Time deposits
Total
Inter-deposit-taking company liabilities
Demand and call
Short notice
Time deposits
Total
Deposit-taking companies' liabilities to banks
Demand and call
Short notice
Tfme deposits
9.9 (Continued)
Inter-bank liabilities
Demand and call
Short notice
Time deposits
Total
Total
Banks' liabilities to deposit-taking companies
Demand and call
Short notice
Time deposits
Total
Inter-deposit-taking company liabilities
Demand and call
Short notice
Time deposits
Total
Deposit-taking companies' liabilities to banks
Demand and call
Short notice
Time deposits
Total
Note: Figures are as at end of the year.
110
1980
Foreign HK$ currency Total
4,885
3,325
8,723
16,933
2,273
9,095
13,295
24,663
265
924
2,104
3,294
646 5,531
l,350 4,674
7,857 16,579
9,852 26,785
800 3,073
759 9,854
2, 753 16,048
4,312 28,975
75 340
1,021 1,945
5,719 7,823
6,815 10,109
710 425 l,135
1,702 1,842 3,543
3,939 12,672 16,610
6,350 14,938 21,288
1983
Foreign HK$ currency
4,060
9,829
27,654
2,055
10,676
30,559
Total
6,115
20,505
58,213
41,543 43,289 84,833
7,420
2,724
l,650
3,996
9,071
6,720
17,431 13,682 31,113
27,575 19,329 46,904
398 202 600
605 I, 790 2,395
1,693 8,485 10,178
2,696 10,477 13,173
987 396 1,383
2,152 5,413 7,565
22,028 50,774 72,803
25,168 56,584 81,751
1981
Foreign HK$ currency Total
5,622 1,000 6,622
5, 117 3,564 8,68 l
15,982 14,412 30,394
26,721 18,977 45,698
ll,009 l,474 12,483
2,328 2,007 4,335
21,466 4,266 25, 732
34,803 7,747 42,550
362 322 684
1,630 l ,622 3,253
2,728 8,276 l l,005
4,721 10,221 14,941
980 378 l,358
1,815 l,892 3,707
7,326 18,729 26,055
10,122 20,999 31,120
1984
Foreign HK$ currency
4,904
10,564
36,875
1,980
14,642
44,199
Total
6,884
25,206
81,074
52,343 60,820 113,164
7,408
2,473
1,017
5,025
8,425
7,498
17,398 14,998 32,396
27,279 21,040 48,318
326 348 674
600 2,380 2,980
11,292 8,144 19,436
12,218 10,871 23,090
615 813 1,428
2,169 5,259 7,428
19,651 55,594 75,246
22,435 61,666 84,102
HK$ Million
1982
Foreign HK$ currency Total
4,528 l, 156 5,684
8,793 4,614 13,408
23,090 20,299 43,389
36,411 26,069 62,481
6,123 l,590 7,713
2,717 4,121 6,837
13,647 7,034 20,681
22,486 12,745 35,231
852 1,229 2,081
948 1,875 2,823
2,442 8,938 11,379
4,242 12,042 16,284
l,341 562 l,903
2, 133 2,252 4,385
16,642 33,564 50,206
20,117 36,377 56,494
HK$ Million
1985
Foreign HK$ currency
4,635
13,349
39,697
2,109
14,367
53,863
Total
6,744
27,716
93,559
57,680 70,338 128,019
9,232
3,729
1,573 10,804
7,088 10,817
19, 129 15,228 34,357
32,089 23,889 55,978
443 613
635 1,870
12,876 9,619
13,954 12,102
668 3,349
3,134 11,171
21,662 58,331
25,465 72,850
l,057
2,505
22,495
26,057
4,017
14,305
79,993
98,315

9. JO Foreign Currency Position HK$ Million
1978 1979 1980 1981 1982 1983 1984 1985
Banks
Spot assets 69,694 110,114 164,184 233,175 359, 178 517,777 632,162 762,131
Forward purchases 31,431 44,149 96,805 113,775 185,950 258,965 292,543 426,126
Spot liabilities 58,167 93,443 150,911 224,453 374,738 533,515 630,880 767,163
Forward sales 32,729 46,087 94,845 104,494 154,107 223,367 274,283 402,828
Net spot position +11,527 + 16,671 + 13,273 +8,722 -15,560 -15,738 +1,282 -5,032
Net forward position -1,298 -1,938 +1,960 +9,281 +31,843 +35,598 + 18,260 +23,298
Open position 10,229 14,733 15,233 18,003 16,283 19,860 19,542 18,266
Deposit-taking companies
Spot assets 32,388 47,918 77,333 126,054 191,655 250,779 280,895 361,697
Forward purchases 18,963 23,853 32,110 46,267 55,651 50,758 57,929 105,228
Spot liabilities 31,653 46,658 78,025 128,973 195,592 252,033 278,873 359,065
Forward sales 18,460 23,536 30,013 41,747 49,902 44,597 55,673 103,748
Net spot position +735 + 1,260 -692 -2,919 -3,937 -1,254 +2,022 +2,632
Net forward position +503 +317 +2,097 +4,520 +5,749 +6,161 +2,256 + 1,480
Open position 1,238 1,577 1,405 1,601 1,812 4,907 4,278 4,112
All deposit-taking institutions
Spot assets 102,082 158,032 241,517 359,229 550,833 768,556 913,057 1,123,828
Forward purchases 50,394 68,002 128,915 160,042 241,601 309,723 350,472 531,354
Spot liabilities 89,820 140,101 228,936 353,426 570,330 785,548 909,753 1,126,228
Forward sales 51,189 69,623 124,858 146,241 204,009 267,964 329,956 506,576
Net spot position + 12,262 +17,931 +12,581 +5,803 -19,497 -16,992 +3,304 -2,400
Net forward position -795 -1,621 +4,057 +13,801 +37,592 +41,759 +20,516 +24,778
Open position 11,467 16,310 16,638 19,604 18,095 24,767 23,820 22,378
Note: Figures are as at end of the year. '+' denotes net assets and ' - ' denotes net liabilities.
9.// Interest Rates Charged 3nd Bank Cheques Cleared
1976 1977 1978 1979 1980 1981 1982 1983 1984 1985
The Hongkong and Shanghai Banking Corporation's quoted best lending rate ( 0/c) per annum) 6--6-l
' 4-J-6 4l-8l 81:-14! 10--17 16-20 IOj-15 IOl-16 8!-17 6-11
Inter-bank lending rate (24-hour call) (% per annum) 1-7! 1-6 4-121 7-19! 3!-19 9-22 5-151: 4--32 1-25 2-8
Bank cheques cleared ('OOO items) 39 067 41451 49 622 56 958 67 669 73 537 74 833 77 252 82 347 86 654
Value of bank cheques cleared (HK$ Million) 546,978 647,487 1.006,598 1.605,812 3,019,546 4,807,863 5,792,607 6,040,255 7.099,064 7,334,287
111
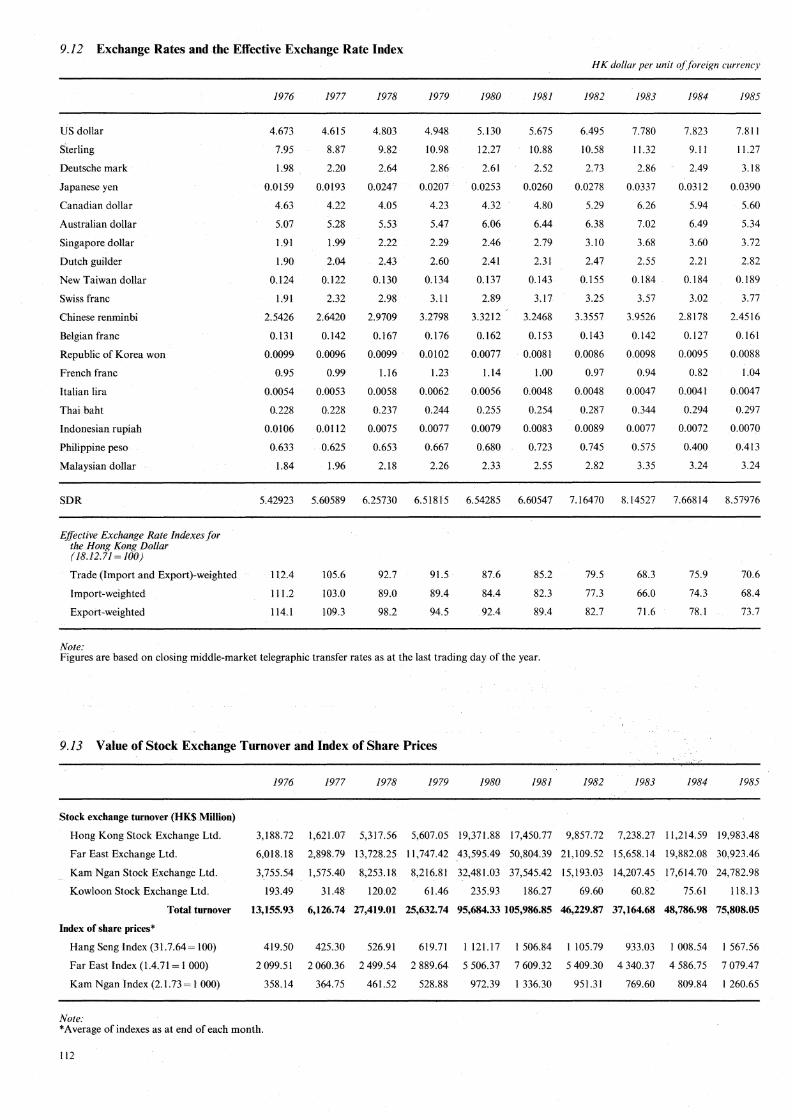
9.12 Exchange Rates and the Effective Exchange Rate Index
US dollar
Sterling
Deutsche mark
Japanese yen
Canadian dollar
Australian dollar
Singapore dollar
Dutch guilder
New Taiwan dollar
Swiss franc
Chinese rernninbi
Belgian franc
Republic of Korea won
French franc
Italian lira
Thai baht
Indonesian rupiah
Philippine peso
Malaysian dollar
SDR
Effective Exchange Rate Indexes for the Hong Kong Dollar (18.12.71=100)
Trade (Import and Export)-weighted
Import-weighted
Export-weighted
Note:
1976
4.673
7.95
1.98
0.0159
4.63
5.07
l.91
1.90
0.124
L91
2.5426
0.131
0.0099
0.95
0.0054
0.228
0.0106
0.633
1.84
5.42923
I 12.4
11 I .2
I 14.J
!977
4.615
8.87
2.20
0.0193
4.22
5.28
l.99
2.04
0.122
2.32
2.6420
0.142
0.0096
0.99
0.0053
0.228
0.0112
0.625
1.96
5.60589
105.6
103.0
109.3
1978
4.803
9.82
2.64
0.0247
4.05
5.53
2.22
2.43
0.130
2.98
2.9709
0.167
0.0099
1.16
0.0058
0.237
0.0075
0.653
2.18
6.25730
92.7
89.0
98.2
1979
4.948
10.98
2.86
0.0207
4.23
5.47
2.29
2.60
0.134
3.11
3.2798
0.176
0.0102
1.23
0.0062
0.244
0.0077
0.667
2.26
6.51815
91.5
89.4
94.5
1980
5.130
12.27
2.61
0.0253
4.32
6.06
2.46
2.41
0.137
2.89
3.3212
0.162
0.0077
1.14
0.0056
0.255
0.0079
0.680
2.33
6.54285
87.6
84.4
92.4
1981
5.675
10.88
2.52
0.0260
4.80
6.44
2.79
2.31
0.143
3.17
3.2468
0.153
0.0081
1.00
0.0048
0.254
0.0083
0.723
2.55
6.60547
85.2
82.3
89.4
Figures are based on closing middle-market telegraphic transfer rates as at the last trading day of the year.
9.13 Value of Stock Exchange Turnover and Index of Share Prices
1976 1977 1978 1979 1980 1981
HK dollar per unit offoreign currency
1982
6.495
10.58
2.73
0.0278
5.29
6.38
3.10
2.47
0.155
3.25
3.3557
0.143
0.0086
0.97
0.0048
0.287
0.0089
0.745
2.82
7.16470
79.5
77.3
82.7
1982
1983
7.780
11.32
2.86
0.0337
6.26
7.02
3.68
2.55
0.184
3.57
3.9526
0.142
0.0098
0.94
0.0047
0.344
0.0077
0.575
3.35
8.14527
68.3
66.0
71.6
1983
1984
7.823
9.11
2.49
0.0312
5.94
6.49
3.60
2.21
0.184
3.02
2.8178
0.127
0.0095
0.82
0.0041
0.294
0.0072
0.400
3.24
7.66814
75.9
74.3
78.l
1984
1985
7.81 l
I 1.27
3. 18
0.0390
5.60
5.34
3.72
2.82
0.189
3.77
2.4516
0.161
0.0088
1.04
0.0047
0.297
0.0070
0.413
3.24
8.57976
70.6
68.4
73.7
1985
Stock exchange turnover (HK$ Million)
Hong Kong Stock Exchange Ltd.
Far East Exchange Ltd.
Kam Ngan Stock Exchange Ltd.
Kowloon Stock Exchange Ltd.
3,188.72 1,621.07 5,317;56 5,607.05 19,371.88 17,450.77 9,857.72 7,238.27 l 1,214.59 19,983.48
6,018.18 2,898.79 13,728.25 I 1,747.42 43,595.49 50,804.39 21,109.52 15,658.14 19,882.08 30,923.46
3, 755.54 1,575.40 8,253.18. 8,216.81 32,481.03 37,545.42 15, 193.03 14,207A5 l 7,614. 70 24,782.98
193.49 31.48 120.02 61.46 235.93 186.27 69.60 60.82 75.61 118.H
Total turnover 13,155.93 6,126.74 27,419.01 25,632.74 95,684.33 105,986.85 46,229.87 37,164.68 48,786.98 75,808.05
Index of share prices*
Hang Seng Index (31.7.64= 100)
Far East Index (1.4.71 =I OOO)
Kam Ngan Index (2.1.73= l OOO)
Note:
419.50 425.30 526.91
2 099.51 2 060.36 2 499.54
358.14 364.75 461.52
*Average of indexes as at end of each month.
112
619.71
2 889.64
528.88
I 121.17
5 506.37
972.39
I 506.84
7 609.32
l 336.30
I 105.79 933.03
5 409.30 4 340.37
951.31 769.60
I 008.54
4 586.75
809.84
I 567.56
7 079.47
I 260.65

9.14 Gold and Silver Exchange Trading Prices
1976 1977 1978 1979 1980 1981 1982 1983 1984 1985
Gold ($/tael)
Opening* 847 751 919 1,308 3,135 3,611 2,702 3,500 3,565 2,869
Closingt 754 917 1,304 3,088 3,592 2,714 3,492 3,569 2,891 3,041
High ff 849 942 1,389 3,091 4,855 3,663 3,655 4,750 3,767 3,236
Low(a• 606 714 911 1,231 2,760 2,651 2,105 3,030 2,810 2,649
Silver ($/10 oz)
Opening* 251 286 1,680 780 470 710 695 500
Closingt 285 1,360 780 465 710 695 500 455
High ff 285 1,360 2,350 835 725 1,110 780 520
Low(d 244 286 550 450 295 660 495 430
Note: *As at first day of the year. t As at last day of the year. ff As at highest value during the year. (ii As at lowest value during the year.
9.15 Commodity Exchange Turnover
1977 1978 1979 1980 1981 1982 1983 1984 1985
Cotton
Lots 9 151 6 908 496 14 630 15 914
Value (U.S.$ 'OOO) 128,150 103,320 13,351 632,770 639,070
Sugar
Lots I 410 2 323 109 17 969 119 534 350 977 333 475 167 524 210 515
Value (U.S.$ 'OOO) 14,810 23,210 1,070 670,552 2,191,995 4,039,993 4,037,981 1,348,257 1,270,069
Soy bean
Lots 9 023 170 482 442 708. 747 993 734 936 372 352 340 545
Value (H.K.$ 'OOO) 240,923 10,046,486 27,247,275 40,680,779 50,837,680 26,206,012 19,855,703
Gold
Lots 26 674 32 740 10 910 6 106 5 845 5 977
Value (U.S.$ 'OOO) 1,770,747 1,628,510 430,891 268,165 220,266 197,115
113


Section 10: PRICES AND HOUSEHOLD EXPENDITURE
The average retail prices of the principal foodstuffs are obtained by price investigators from market stalls and shops throughout Hong Kong during the period specified.
The average wholesale prices of rice are supplied by the Trade Department, while those of live pigs, live cattle, fresh marine fish and fresh vegetables are supplied by the Agriculture and Fisheries Department.
The 1973/74-based Consumer Price Index (A) and Consumer Price Index (B) were based on the Household Expenditure Survey carried out during the period from July 1973 to June 1974. For Index (A) the weights were derived from the expenditure pattern of households with monthly expenditures between HK$400 and HK$1,499, and for Index (B) between HK$1,500 and HK$2,999 at the time of the survey in 1973/74.
The 1973/74-based Hang Seng Consumer Price Index was compiled by Hang Seng Bank Ltd. The weights of the Hang Seng Consumer Price Index were derived from the expenditure pattern of households with monthly expenditures between HK$3,000 and HK$9,999 during the period from July 1973 to June 1974.
The 1979/80-based Consumer Price Index (A), Consumer Price Index (B) and Hang Seng Consumer Price Index were based on the Household Expenditure Survey carried out between October 1979 and September 1980. For Index (A) the weights were derived from the expenditure pattern of 50% of the urban households with monthly expenditures between $1,000 and $3,499, for Index (B) the next 30% between $3,500 and $6,499, and for Hang Seng Consumer Price Index the next 10% between $6,500 and $19,999 at the time of the survey in 1979/80. The remaining 10% of households at the top and bottom of the expenditure scale are excluded from the coverage of the indexes.
Figures in Tables 10.1 to 10.4 are annual averages of the periods concerned. The latest Household Expenditure Survey was carried out between October 1984 and September 1985. Figures on
household expenditure patterns obtained from this survey are given in Table 10.5.
115


JO.I Average Retail Prices of Selected Foodstuffs HK$ per Kg unless otherwise specified
1976 1977 1978 1979 1980 1981 1982 1983 1984 1985
Rice
Top grade 2.55 2.50 2.68 2.83 3.31 4.04 4.20 4.42 4.70 4.65 Middle and low grade 2.25 2.15 2.38 2.51 2.96 3.79 3.95 4.09 4.36 4.31
Meat and poultry
Pork, best cut 12.90 14.22 13.21 14.10 15.41 17.20 19.94 22.12 23.52 21.75 Pork chop 16.44 18.22 16.96 18.39 20.33 22.75 26.06 28.51 30.14 27.99 Beef, best quality 16.50 16.30 16.29 19.36 23.13 25.13 27.23 28.03 30.92 30.34 Beef, belly flesh 9.84 9.54 9.59 11.00 12.63 13.40 14.10 14.45 16.22 15.84 Chicken, top grade 14.91 14.70 16.12 16.90 20.40 20.04 22.43 22.84 26.36 23.41 Duck, top grade 9.36 10.38 10.32 11.46 13.00 14.24 14.19 15.99 16.85 15.21
Marine fish, fresh
Golden thread 8.17 9.62 11.18 11.13 13.13 15.50 16.74 18.71 17.36 17.70 Mackerel 8.63 10.40 11.64 13.18 17.41 19.62 21.34 25.41 24.39 24.52 Garoupa 17.23 19.48 23.02 25.63 31.42 37.43 40.67 43.46 45.48 46.63
Fresh-water fish, fresh
Grass carp 15.20 18.40 19.79 20.73 23.30 25.55 26.80 25.80 26.45 23.39 Big head 11.59 13.81 14.47 16.06 18.44 19.82 21.41 21.05 21.71 19.17
Fresh vegetables
White cabbage 2.58 2.68 3.77 3.98 4.65 5.81 6.40 7.68 6.19 6.55 Flowering cabbage 3.77 4.05 5.21 5.72 6.60 7.93 8.75 10.53 8.52 8.86 Tomato 4.13 3.92 4.18 4.94 5.44 6.89 6.48 8.58 7.38 7.50
Fresh fruit
Apples (per piece) 0.91 0.97 1.22 1.17 1.28 1.47 1.78 1.97 2.18 2.21 Oranges (per piece) 0.46 0.52 0.59 0.84 0.80 1.17 1.67 1.72 1.97 2.03 Bananas 2.76 3.22 2.89 3.68 4.44 5.32 5.24 5.62 6.09 5.67
Fresh hen eggs (per piece) 0.35 0.35 0.33 0.36 0.36 0.47 0.50 0.52 0.59 0.56
Fresh milk (per bottle) 1.20 1.20 1.20 1.33 1.60 1.74 1.96 2.15 2.40 2.41
Flour, wheat 2.12 1.98 1.97 2.13 2.44 2.68 2.87 3.17 3.63 3.79
Sugar 3.79 3.09 2.87 3.13 5.28 6.76 5.79 5.67 5.79 5.30
10.2 Average Wholesale Prices of Selected Foodstuffs HK$ per Kg
1976 1977 1978 1979 1980 1981 1982 1983 1984 1985
Rice
See mew 2.03 2.10 2.13 2.17 2.59 3.19 3.03 3.15 3.09 2.84 South China jien 1.84 1.89 2.08 1.94 2.52 3.07 2.77 2.80 Thai 100% whole 2nd grade 1.81 1.73 2.09 2.16 2.64 3.34 3.15 3.20 3.14 3.00
Live pigs* 5.61 5.84 5.50 5.98 6.40 7.05 7.91 8.86 9.41 8.65
Live cattlet 7.56 7.18 7.39 9.26 10.22 10.10 10.84 11.22 12.58 12.40
Marine fish, fresh
Golden thread 4.86 6.12 6.20 6.33 7.60 8.02 8.02 8.55 7.84 7.04 Mackerel 4.12 5.09 5.88 6.40 8.03 9.82 9.27 10.90 10.38 10.25 Garoupa 10.70 12.14 13.08 14.54 17.92 20.31 22.98 25.68 23.46 24.51
Fresh vegetables, locally produced
Flowering cabbage ff 1.88 2.13 2.76 2.93 3.32 3.54 4.05 5.27 4.07 4.43 White cabbage ff 1.07 1.14 1.67 1.67 2.00 2.36 2.53 3.34 2.39 2.62 Tomato ff 1.93 1.64 1.83 2.38 2.48 2.21 1.71 4.30 3.69 3.43
Note: *Live weight. tDressed weight. ff Figures prior to 1983 refer to average weighted prices and as from 1983 onwards, they refer to simple average prices.
117

10.3 Consumer Price Indexes (July 1973-June 1974=100)
Weights attached 1976 1977 1978 1979 1980 1981
Consumer Price Index (A)
All items 100.00 111.2 117.7 124.7 139.2 160.8 185.5 Foodstuffs 56.60 106.3 113.5 121.3 134.3 154.1 178.5 Housing 14.08 115.8 124.3 130.3 142.6 152.6 171.9 Fuel and light 3.39 132.6 134.9 134.7 172.7 264.4 328.1 Alcoholic drinks and tobacco 2.65 129.l 133.4 141.7 160.0 181.8 200.0 Clothing and footwear 3.82 97.9 100.8 103.3 110.0 121.1 134.4 Durable goods 1.41 106.4 109.2 114.4 126.0 134.4 145.2 Miscellaneous goods 4.58 119.8 124.7 133.2 146.2 168.9 182.8 Transport and vehicles 4.36 111.9 115.3 121.7 152.3 196.7 239.3 Services 9.11 123.3 129.9 137.1 148.0 169.5 196.5
Consumer Price Index (B)
All items 100.00 111.8 117.9 124.9 139.3 160.3 184.0 Foodstuffs 47.82 107.0 114.3 121.9 136.0 156.3 180.6 Housing 16.79 115.0 123.l 129.4 142.0 152.3 170.6 Fuel and light 2.71 131.5 133.9 133.7 168.5 249.6 310.3 Alcoholic drinks and tobacco 2.04 125.7 130.1 137.5 154.9 175.3 193.0 Clothing and footwear 5.92 97.6 100.3 102.3 108.5 119.3 132.9 Durable goods 2.97 104.6 106.8 111.8 123.0 130.3 140.0 Miscellaneous goods 5.17 117.2 121.3 · 129.9 143.7 166.9 180.6 Transport and vehicles 5.11 116.3 119.9 125.3 158.0 198.0 238.0 Services 11.47 122.4 130.3 138.0 150.4 173.8 202.5
Hang Seng Consumer Price Index
All items 100.00 109.7 115.3 121.8 137.1 157.4 180.2 Foodstuffs 26.27 106.6 113.4 120.6 134.8 154.1 176.8 Housing 28.14 105.0 107.8 113.8 120.9 137.9 158.2 Fuel and light 2.53 128.5 130.3 130.3 165.8 222.3 284.5 Alcoholic drinks and tobacco 0.73 121.8 125.3 131.4 146.6 164.7 180.6 Clothing and footwear 6.11 98.2 101.5 104.8 111.8 122.8 139.9 Durable goods 3.88 101.4 102.9 106.6 113.2 118.8 127.4 Miscellaneous goods 4.36 113.5 117.3 123.7 136.5 159.2 173.5 Transport and vehicles 7.47 124.2 127.8 132.8 166.3 195.8 224.8 Services 20.51 116.2 127.0 137.3 159.3 183.3 209.3
118

10.4 Consumer Price Indexes (October 1979-September 1980= 100)
Weights 1980 attached (Oct.-Dec.) 1981 1982 1983 1984 1985
Consumer Price Index (A)
All items 100.00 106.9 117.9 130.3 143.2 154.9 159.8 Foodstuffs 46.39 107.2 119.9 134.l 145.6 155.4 156.0 Housing 15.05 104.7 114.0 125.2 136.4 145.7 155.2 Fuel and light 3.63 110.8 134.0 136.2 145.9 148.4 146.l Alcoholic drinks and tobacco 2.67 104.l 112.9 124.4 182.2 208.2 229.3 Clothing and footwear 5.02 107.5 114.7 129.7 140.3 155.9 169.0 Durable goods 6.71 101.9 107.l 108.2 113.8 124.8 123.5 Miscellaneous goods 5.68 105.9 110.4 122.5 134.0 149.7 151.2 Transport and vehicles 5.27 112.5 127.3 140.1 153.7 169.7 181.4 Services 9.58 108.7 118.l 134.3 152.2 170.2 184.6
Consumer Price Index (B)
All items 100.00 106.9 117.3 129.8 142.6 154.7 160.1 Foodstuffs 38.59 107.5 120.0 134.4 145.9 155.8 156.9 Housing 17.77 104.9 114.2 125. l 136. l 146.l 154.5 Fuel and light 2.71 110.5 134.8 136.6 146.4 148.2 146.2 Alcoholic drinks and tobacco 1.90 104.2 112.5 123.3 176.0 200.7 220.l Clothing and footwear 7.03 107.3 114.6 130.0 141.2 156.9 171.0 Durable goods 7.53 102.1 107.6 110.2 116.7 128.6 128.4 Miscellaneous goods 6.07 106.7 110.l 119.8 132.9 146.6 148.2 Transport and vehicles 6.09 111.5 125.l 139.4 156.1 172.0 182.3 Services 12.31 108.4 117.7 133.7 150.3 167.8 180.l
Hang Seng Consumer Price Index
All items 100.00 107.6 116.6 130.3 143.8 156.8 163.0 Foodstuffs 26.21 108.9 120.9 136.l 147.7 157.7 159.7 Housing 27.20 106.8 115.9 131.2 144.4 156.8 164.7 Fuel and light 1.85 109.7 139.4 141.9 151.8 152.8 151.3 Alcoholic drinks and tobacco 1.07 104.3 111.9 121.8 170.3 192.3 207.9 Clothing and footwear 7.50 107.4 108.7 116.9 120.7 137.0 146.7 Durable goods 6.88 102.4 107.0 110.0 117.6 130.5 132.l Miscellaneous goods 6.59 107.3 109.0 116.l 130.9 142.2 143.3 Transport and vehicles 9.13 109.2 118.8 137.8 162.7 179.4 187.9 Services 13.57 108.5 118.6 136.0 151.0 169.0 181.8
10.5 Household Expenditure Pattern by Monthly Expenditure Group, Household Expenditure Survey 1984-85 Percentage
Monthly expenditure group
$/,OOO $1,500 $2,000 $2.500 $3,500 $4,500 $5.500 $6,500 $7.5110 $8.500 $/0,000 $12.000 $15.000 $20.(J()() $25.00() Below he/ow he/ow he/ow helmr helmr he/ow he/ow he/ow hclmr he/ow he/mi· helmr he/mi· he/o1r and
Commodity/Service $/,OOO $1.500 $2,000 $2,500 $3,500 $4,500 $5.500 $6,500 $7.500 $8.500 $/0,()()() $12.000 $15,000 $20.000 $25,000 over All
FoodsturTs 59.1 57.7 55.4 55.8 52.6 49.5 46.5 44.0 41.5 40.3 38.7 36.5 32.7 31.8 27.5 20.1 38.3
Housing 15.1 15.1 15.8 12.9 13.4 14.9 17.9 18.7 20.2 21.6 20.6 22.7 22.0 23.0 21.0 27.7 20.7
Fuel and light 4.7 4.1 4.9 4.3 4.3 3.9 3.3 3.2 3.0 2.9 2.7 2.6 2.2 2.1 2.4 1.8 2.8
Alcoholic drinks and tobacco 6.3 5.1 5.7 4.5 3.4 3.1 2.3 2.2 1.9 1.5 1.7 1.7 1.5 1.0 0.9 0.6 1.8
Clothing and footwear 1.9 2.5 2.1 2.8 4.3 4.7 5.4 6.3 6.5 6.8 7.5 7.4 8.9 10.1 10.5 11.2 7.4
Durable goods 0.5 0.7 0.4 1.4 1.9 2.3 2.5 2.6 3.6 3.2 3.4 3.4 4.1 3.9 4.6 4.6 3.4
Miscellaneous goods 5.3 4.2 4.5 5.6 5.8 6.2 6.6 6.9 6.7 6.8 6.7 6.7 7.4 6.8 8.5 8.2 6.9
Transport and vehicles 2.4 5.3 5.0 5.9 6.3 6.6 6.5 6.7 6.6 7.0 6.9 6.9 7.5 6.9 7.0 11.0 7.2
Services 4.7 5.3 6.2 6.8 8.0 8.8 9.0 9.4 10.0 9.9 11.8 12.1 13.7 14.4 17.6 14.8 11.5
Total IOO.O IOO.O 100.0 IOO.O IOO.O IOO.O IOO.O I00.0 IOO.O IOO.O I00.0 IOO.O IOO.O IOO.O 100.0 IOO.O IOO.O
119


Section 11: FOOD SUPPLIES
Statistics of rice supplies are provided by the Trade Department. The intakes, off-takes and stock figures refer to the position at the godowns.
Statistics of live animals slaughtered and supplies of fresh vegetables and fresh fish are provided by the Agriculture and Fisheries Department. They refer to quantities available for sale, except in Table 11.1 where they refer to the net quantities available for consumption.
Figures on imports of foodstuffs are derived from Hong Kong Trade Statistics.
121


11.1 Food Supplies
1976 1977 1978 1979 1980 1981 1982 1983 1984 1985
Rice (tonne)
Intakes 347 724 327 021 334 752 346 266 357 047 347 792 353 231 354 442 349 532 355 627 Off-takes 342 678 337 259 328 118 354 219 351 919 345 IOI 352 739 358 490 351 548 352 952 Stock at end of period 73 275 63 037 69 671 61 718 66 846 69 537 70 029 65 981 63 965 66 640
Live animals slaughtered* (head)
Cattle 196 390 198 070 200 160 223 780 234 650 220 880 214 560 200 410 178 160 186 600 Pigs 3 196 450 3 254 510 3 457 790 3 414 800 3 436 950 3 419 550 3 485 OOO 3 470 840 3 548 620 3 597 460 Goats/sheep 16 200 17 250 16 620 16 110 18 450 17 980 16 020 14 020 16 310 17 160
Supplies of fresh vegetables ('OOO tonnes)
Locally grown vegetablest 186 194 175 192 195 176 155 153 159 151 Imported vegetables (net) 242 255 260 295 293 287 334 336 293 295
Supplies of live, chilled or frozen fish (tonne)
Fresh-water fish 35 810 33 560 35 880 41 730 44010 47 710 50 035 52 030 47 290 44 670 Marine fisht 98 910 97 090 96 730 104 730 96 280 92 780 94 OOO 97 400 102 540 92 780
Note: *In both urban and rural abattoirs. tinclude estimates for those not sold through the Vegetable Marketing Organization. tinclude estimates for those not sold through the Fish Marketing Organization.
11.2 Estimated Local Production of Foodstuffs
1976 1977 1978 1979 1980 1981 1982 1983 1984 1985
Crops (tonne)
Fruits 2 660 3 070 2 600 I 070 3 090 4 980 5 490 4 920 2 490 I 150 Vegetables 186 OOO 194 OOO 175 OOO 192 OOO 195 OOO 176 OOO 155 OOO 153 OOO 159 OOO 151 OOO Rice (paddy) 3 450 I 380 350 100 70 30 20 10 20 15 Field crops 7 520 3 510 2 670 2 760 2 350 2 500 2 100 I 800 I 710 I 460
Livestocks (head)
Pigst 367 470 403 150 499 670 528 630 453 290 432 030 388 420 392 290 560 810 593 160 Cattle 2 170 I 890 2 320 2 120 I 250 790 I 100 860 540 810
Poultry ('OOO heads)
Chickens 11 886 14 938 15 171 16 413 15 447 17 388 17 873 15 548 14 244 14 017 Ducks 2 634 2 131 3 424 2 670 3 248 4446 4 680 5 033 4 559 4 413 Geese 13 20 22 18 12 232 145 151 90 192 Quails 6 400 9072 8 419 13 011 13 412 12 019 12 431 8 694 14 630 12 435 Pigeons 947 727 I 258 I 288 1402 I 464 I 724 2 171 2 822 3 179
Dairy products and eggs ('OOO unless otherwise specified)
Milk (fresh) (tonne) 4 780 4 520 4 080 3 810 4 270 4 470 5 110 4210 3 080 2 930 Hen eggs 55 060 66 060 77 060 66 250 51 820 46 170 43 930 39 260 34 076 29 492 Duck eggs 5 200 6 300 6 640 5 080 2 760 I 270 700 520 288 I 619 Goose eggs 19 16 17 9 7 I 4 3 3 3 Quail eggs 80 OOO 93 180 100 224 154 900 146 360 126 040 130 100 133 430 140 089 149 188
Fish and fishery products (tonne)
Fish (live, chilled or frozen) Marine fish 111 310 116 060 120 920 137 440 145 920 133 080 133 290 144 030 151 640 146 400 Freshwater fish 5 180 4 180 5 790 6 540 7 020 6 780 7 780 7 100 6 500 5 800
Fish (dried, salted or smoked) Marine fish 4040 4160 4 050 4 870 4 260 3 960 3 460 3 230 3 160 3 020
Crustacean and molluscs (fresh, frozen, dried, salted, etc.) 25 720 23 560 22 OOO 30 730 25 400 26 650 23 860 24 I 10 25 750 29 130
Other marine products and preparations I 180 1 150 1 180 790 570 290 270 320 530 470
Note: tExclude local pigs not slaughtered in abattoirs.
123

11.3 Imports of Foodstuffs
Crops (tonne)
Rice (unhusked)
Wheat
Other cereals and cereal preparations
Other field crops
Vegetables (fresh, frozen or simply preserved)
Vegetables (preserved or prepared)
Fresh fruits and nuts
Dried fruits and fruit preparations
Sugar and honey
Coffee
Cocoa
Tea and mate
Livestock (head)
Cattle
Sheep, lambs and goats
Pigs ('OOO)
Poultry (tonne)
Chicken
Other poultry
Live animals
Meat and meat preparations
Dairy products and eggs (tonne unless otherwise
. specified)
Milk (fresh)
Cream (fresh)
Milk and cream (evaporated, condensed, powdered etc.)
Butter, cheese and curd
Eggs (fresh) (million)
Eggs (preserved) (million)
Fish and fish preparations (tonne)
Fish (fresh, chilled or frozen) Marine water fish Fresh water fish
Fish (dried,salted or smoked) Marine water fish Fresh water fish
Fish products and preparations
Crustacean and molluscs (fresh, frozen, dried, salted etc.)
Crustacean and molluscs products and preparations
Note: *Less than half unit.
124
1976 1977 1978 1979 1980 1981 1982 1983 1984 1985
361 916 340 924 343 638 361 078 360 049 362 102 365 394 370 547 365 809 378 336
132260 147164 124853 136596 116949 115625 124129 126194 123093 118766
322 642
52 709
297 825
76 305
340 536
374 517
47 655
314 977
73 904
353 205
32 496 40 905
102 787 113 488
17477 11212
278 212
9 765 11 351
202 661 203 031
16 739 17 097
2 826 2 857
13 273
12 890
899
120 338
4 633
629
33 204
4 625
896
105
9 253 30 842
6419 119
3 445
28 682
I 823
14 354
11 251
I 070
131 486
5 354
817
34 121
6 050
I 044
89
8 321 29 833
6 940 213
2 335
26 600
2 252
382 63 l
49 l l l
325 178
81 148
357 536
52 796
118 752
2466
322
10 101
205 992
16 974
2 940
12 766
12434
l 831
144 961
7 004
832
36 743
6 245
I 132
87
10 617 30 360
8 354 139
2 239
28 877
I 760
419 501
45 475
355 244
99 086
364 683
63 793
125 582
4 135
269
10 602
227 614
14 737
2 896
11 645
13 726
2 213
148 531
7 642
1 130
37 179
6 289
I 234
84
12 309 35 443
7 060 61
3 471
32 370
1 881
407 070 424 891
53 759 78 948
381 001 413 467
114 395 137 066
394 866 408 I 72
84 909 82 475
122 708 126 448
3 936 2 873
360 286
12 030 10 672
237 466
17 719
4 339
15 258
14201
2 084
171 732
10 195
I 316
40401
7 138
I 225
96
11454 37 437
7 655 361
5 589
33 330
2 235
219 531
16 877
2 984
19 268
20 932
2 587
172 359
13 656
I 453
40 088
7 079
I 206
Ill
12 211 41 621
8 716 *
4 451
29 836
I 885
479 915 520 997
107 042 92 628
454 533 440 114
148 707 147 186
411 044 426 977
85 483
134 252
2 646
224
11 043
216 395
16 170
3 102
18 115
22 869
2 903
196 433
16 040
675
44 006
6 268
I 202
138
14 445 42 671
9 448
4 308
44 515
1 861
71 824
161 947
12 237
170
11 875
198 450
14 157
3 053
15 951
21 700
3 422
217 246
14 803
722
48 843
5 909
I 196
118
14 706 45 475
8 674 JO
6 764
46 257
2 183
423 265
56 302
388 757
123 945
409 498
63 493
151 244
14 365
235
14190
178 141
18 311
2 997
20 237
17 808
3 289
212 528
21 977
587
43 384
6 518
I 306
150
15 003 41 281
10 824 2
3 865
49 257
2 258
472 514
64 689
405 273
142 274
455 220
68 124
162 916
18 109
278
15 642
185 830
16 859
2 978
34 125
23 381
3 425
223 202
27 375
520
48 077
7 286
I 245
142
19460 39 204
8 102 I
4 577
60 308
2 462
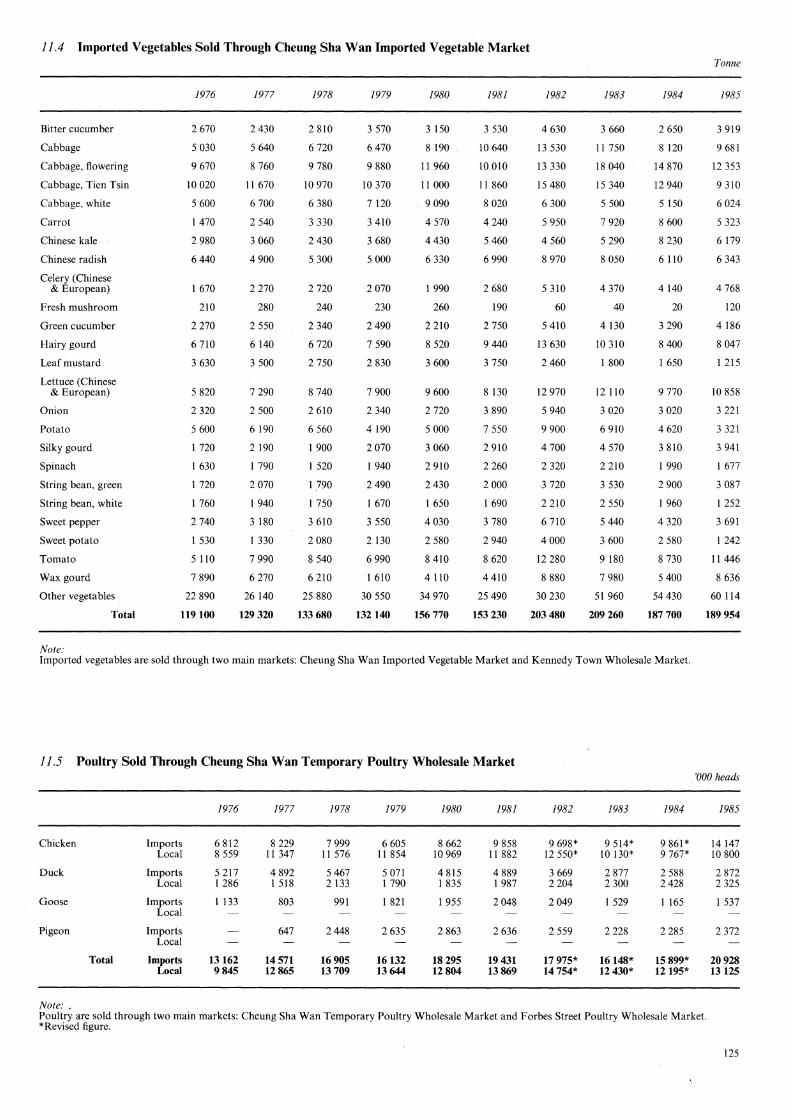
11.4 Imported Vegetables Sold Through Cheung Sha Wan Imported Vegetable Market
Bitter cucumber
Cabbage
Cabbage, flowering
Cabbage, Tien Tsin
Cabbage, white
Carrot
Chinese kale
Chinese radish
Celery (Chinese & European)
Fresh mushroom
Green cucumber
Hairy gourd
Leaf mustard
Lettuce (Chinese & European)
Onion
Potato
Silky gourd
Spinach
String bean, green
String bean, white
Sweet pepper
Sweet potato
Tomato
Wax gourd
Other vegetables
Total
Note:
1976
2 670
5 030
9 670
JO 020
5 600
1 470
2 980
6440
I 670
210
2 270
6 710
3 630
5 820
2 320
5 600
I 720
I 630
I 720
I 760
2 740
I 530
5 110
7 890
22 890
119 100
1977
2 430
5 640
8 760
11 670
6 700
2 540
3 060
4 900
2 270
280
2 550
6140
3 500
7 290
2 500
6 190
2 190
I 790
2 070
I 940
3 180
I 330
7 990
6 270
26 140
129 320
1978
2 8!0
6 720
9 780
JO 970
6 380
3 330
2 430
5 300
2 720
240
2 340
6 720
2 750
8 740
2 610
6 560
I 900
I 520
I 790
I 750
3 610
2 080
8 540
6 210
25 880
133 680
1979
3 570
6 470
9 880
JO 370
7 120
3 410
3 680
5 OOO
2 070
230
2490
7 590
2 830
7 900
2 340
4 190
2 070
1940
2 490
I 670
3 550
2 130
6 990
I 610
30 550
132 140
1980
3 150
8 190
II 960
II OOO
9 090
4 570
4 430
6 330
I 990
260
2 210
8 520
3600
9 600
2 720
5 OOO
3 060
2910
2 430
I 650
4 030
2 580
8 410
4110
34 970
156 770
1981
3 530
JO 640
JO 010
11 860
8 020
4 240
5 460
6 990
2 680
190
2 750
9 440
3 750
8 130
3 890
7 550
2 910
2 260
2 OOO
1 690
3 780
2 940
8 620
4410
25 490
153 230
1982
4 630
13 530
13 330
15 480
6 300
5 950
4 560
8 970
5 310
60
5 410
13 630
2 460
12 970
5 940
9 900
4 700
2 320
3 720
2 2!0
6 710
4000
12 280
8 880
30 230
203 480
1983
3 660
11 750
18 040
15 340
5 500
7 920
5 290
8 050
4 370
40
4 130
JO 310
I 800
12 110
3 020
6 910
4 570
2 210
3 530
2 550
5 440
3600
9 180
7 980
51 960
209 260
1984
2 650
8 120
14 870
12 940
5 150
8 600
8 230
6110
4140
20
3 290
8 400
I 650
9 770
3 020
4 620
3 810
I 990
2 900
I 960
4 320
2 580
8 730
5 400
54 430
187 700
Imported vegetables are sold through two main markets: Cheung Sha Wan Imported Vegetable Market and Kennedy Town Wholesale Market.
11.5 Poultry Sold Through Cheung Sha Wan Temporary Poultry Wholesale Market
Chicken
Duck
Goose
Pigeon
Note:.
Total
Imports Local
Imports Local
Imports Local
Imports Local
Imports Local
1976
6 812 8 559
5 217 I 286
I 133
13162 9845
1977
8 229 11 347
4892 I 518
803
647
14571 12865
1978
7 999 11 576
5 467 2 133
991
2 448
16905 13709
1979
6 605 11 854
5 071 I 790
I 821
2 635
16132 13644
1980
8 662 10969
4 815 I 835
I 955
2 863
18 295 12804
1981
9 858 11 882
4 889 I 987
2048
2 636
19 431 13 869
1982
9 698* 12 550*
3 669 2204
2049
2 559
17 975* 14 754*
1983
9 514* JO 130*
2 877 2300
I 529
2 228
16148* 12 430*
1984
9 861 * 9 767*
2 588 2 428
I 165
2 285
15 899* 12195*
Tonne
1985
3 919
9 681
12 353
9 310
6 024
5 323
6 179
6 343
4 768
120
4 186
8 047
I 215
JO 858
3 221
3 321
3 941
I 677
3 087
I 252
3 691
I 242
11446
8 636
60 114
189 954
'OOO heads
1985
14 147 JO 800
2 872 2 325
I 537
2 372
20928 13 125
Poultry are sold through two main markets: Cheung Sha Wan Temporary Poultry Wholesale Market and Forbes Street Poultry Wholesale Market. *Revised figure.
125

11.6 Fresh Marine Fish Sold Through the Fish Marketing Organization
Species
Fork-tail
Ginkgo
Golden Thread
Melon Coat
Melon Seed
Red Goatfish
Red Snapper
Yellow Belly
Genera
Big-eyes
Conger-pike Eels
Crevalles
Hair-tails
Horse-heads
Lizard fishes
Mackerels
Sardines
Scads
Soles
Tuna
Families
Anchovies
Breams
Croakers
Groupers
Pomfrets
Round Herrings
Snappers
Yell ow Croakers
Order
Sharks
Mixed
Others
Total
1976
1 498
618
5 890
2 658
1 698
1 773 489
1 924
7 164
3 666
I 074
4129
I 543
4 718
2 808
2 714
7 586
844
43
3 442
2 524
I 367
1 306
423
190
I 009
966
18 500
82564
1977
I 467
628
5 479
1 983
923
I 943
676
3 099
5 100
3 869
1 084
3 112
I 808
6 171
2 324
3 095
7 003
519
71
85
3 711
2 287
I 682
I 275
353
198
1471
881
18 775
81 072
1978
I 352
628
5 466
2 143
584
I 276
638
3 465
5 027
4400
714
2 415
2 270
5 236
2 366
I 833
7 331
603
73
99
2 340
2 218
1 782
2.028
426
173
2 117
812
20 780
80595
1979
I 060
I 044
5 955
1 979
501
1 952
1 093
4 823
8 007
3 343
794
1 808 I 995
5 865
2 084
1 670
5 622
464
13
56
1 752
2 421
I 965
2 470
255
285
1 860
I 035
17 161
79332
1980
I 433
835
5 530
1464
877 I 171
I 219
4 690
9 973
2 982
804
I 659
I 459
5 282
1 485
I 155
6 378 345
II
60
I 087
2 179
1 852
2 304
386
281
1 942
1 008
15 747
75598
11. 7 Salted/Dried Marine Fish Sold Through the Fish Marketing Organization
Anchovies
Croakers
Golden Thread
Ginkgo
Lizard fishes
Round Herrings
Sardines
Scads
Snappers
Others
126
Total
1976
495
446
16
25
103
27 29
60
12
352
1565
1977
428
339
16
26 124
42
26
47
10
437
1495
1978
502 313
65 14
137
34
31
43
5
438
1582
1979
209
254
63 21
142
43
48
27 3
679
1489
1980
101
190
53
24
108
44 60
86 3
645
1314
1981
1 309
691
5 448
1 309
578
1 388
1 059
3 357
10 232
3 191
752
1 969
1 108
5 348
1 716
987
5 206
209
5
66
749
2 003
I 789 2 100
289
283
1 888
1 208
17 486
73723
1981
205
246
36
27
129
65 54
45
4
696
1507
1982
1 289
628
4 821
1 165
480
I 233
813
2 732
10 123
2 739
657
2 271
969
4 771
1 788
467
4 815
207
6
45
821
1 940
1 596
2 231
124
315
1 818
1 127
17 705
69696
1982
179
335
56
25 125
22 29
101
5
602
1479
1983
1 019
489
4 224
673
1 056
1 001
733
2 730
8 179
2 573
495
1 993
912
4 318
I 706
542
5 436
205
10
60
I 062
I 892
1 521
I 858
117
356
2 308
817
17 300
65585
1983
168
215
45
14
91
36
42
98 4
495
1208
1984
I 008
456
5 815
1 165
1 442
734
697
2 024
6 OOO
3 008
461
2 610
1 309
5 601
I 945
371
4 733
188
8
30
1 558
2 180
1 661
2 005
135
344
3 345
621
17 419
68 873
1984
190
309
44
11
161
14
29
98
5
567
1428
Tonne
1985
786
348
5 328
1 394
1 510
593
488
1 577
5 216
2 482
328
2 596
801
5 145
1 737
179
3 123
175
7
33 1 147
2 212
1 490
2 113
101
356
2 586
498
15 158
59507
Tonne
1985
76
248
53 4
120
24
27
93
7
503
1155

Section 12: TRANSPORT, COMMUNICATIONS AND TOURISM
Statistics on aircraft movements are extracted from the reports of the Civil Aviation Department; on ocean-going and other vessels entered and cleared, seaborne cargoes and containers from the reports of the Marine Department; on cargoes transported by road from the Customs and Excise Department; and on cargoes carried by railway from the Kowloon-Canton Railway Corporation.
Statistics on ocean-going vessel movements by ship type are compiled based on reports obtained from the Marine Department.
Statistics about public transport are compiled by the Transport Department. Statistics on length of roads are supplied by the Engineering Development Department. Statistics on traffic accidents and casualties are provided by the Royal Hong Kong Police Force. The traffic accident figures
exclude accidents involving damages only. Statistics on postal services are obtained from the Post Office. Those on international telephone and telegraph services are
provided by the Cable and Wireless (Hong Kong) Ltd., while figures about local telephone services are supplied by the Hong Kong Telephone Company Ltd.
Statistics on arrivals and departures of passengers by air, sea and land as well as Hong Kong resident departures by destination are compiled by the Immigration Department. They refer exclusively to international movements of passengers or Hong Kong residents.
Particulars on visitors and hotels are supplied by the Hong Kong Tourist Association. For visitors, their countries of residence are used in the classification.
127

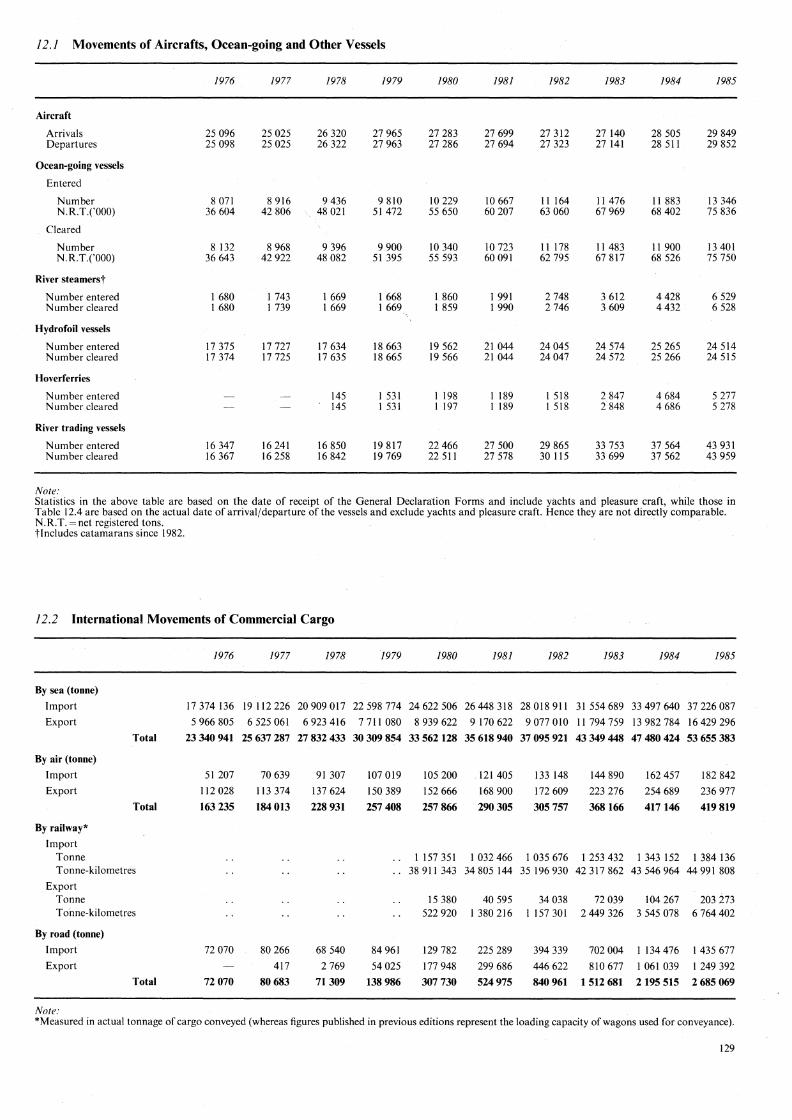
12./ Movements of Aircrafts, Ocean-going and Other Vessels
1976 1977 1978 1979 1980 1981 1982 1983 1984 1985
Aircraft
Arrivals 25 096 25 025 26 320 27 965 27 283 27 699 27 312 27 140 28 505 29 849 Departures 25 098 25 025 26 322 27 963 27 286 27 694 27 323 27 141 28 511 29 852
Ocean-going vessels
Entered
Number 8 071 8 916 9 436 9 810 10 229 10 667 11 164 11 476 11 883 13 346 N.R.T.('000) 36 604 42 806 48 021 51472 55 650 60 207 63 060 67 969 68 402 75 836
Cleared
Number 8 132 8 968 9 396 9 900 10 340 10 723 11 178 11 483 11 900 13 401 N.R.T.('000) 36 643 42 922 48 082 51 395 55 593 60 091 62 795 67 817 68 526 75 750
River steamerst
Number entered I 680 I 743 I 669 I 668 I 860 I 991 2 748 3 612 4 428 6 529 Number cleared I 680 I 739 I 669 I 669 I 859 I 990 2 746 3 609 4 432 6 528
Hydrofoil vessels
Number entered 17 375 17 727 17 634 18 663 19 562 21 044 24 045 24 574 25 265 24 514 Number cleared 17 374 17 725 17 635 18 665 19 566 21 044 24047 24 572 25 266 24 515
Hoverferries
Number entered 145 I 531 I 198 I 189 I 518 2 847 4 684 5 277 Number cleared 145 I 531 I 197 I 189 I 518 2 848 4 686 5 278
River trading vessels
Number entered 16 347 16 241 16 850 19 817 22466 27 500 29 865 33 753 37 564 43 931 Number cleared 16 367 16 258 16 842 19 769 22 511 27 578 30 115 33 699 37 562 43 959
Note: Statistics in the above table are based on the date of receipt of the General Declaration Forms and include yachts and pleasure craft, while those in Table 12.4 are based on the actual date of arrival/departure of the vessels and exclude yachts and pleasure craft. Hence they are not directly comparable. N.R.T. =net registered tons. tlncludes catamarans since 1982.
12.2 International Movements of Commercial Cargo
1976 1977 1978 1979 1980 1981 1982 1983 1984 1985
By sea (tonne)
Import 17374136 19112226 20 909 017 22 598 774 24 622 506 26 448 318 28 018 911 31554689 33 497 640 37 226 087
Export 5 966 805 6 525 061 6 923 416 7711080 8 939 622 9 170 622 9 077 010 11 794 759 13 982 784 16 429 296
Total 23 340 941 25 637 287 27 832 433 30 309 854 33 562 128 35 618 940 37 095 921 43 349 448 47 480 424 53 655 383
By air (tonne)
Import 51 207 70 639 91 307 107 019 105 200 121 405 133 148 144 890 162 457 182 842
Export 112 028 113 374 137 624 150 389 152 666 168 900 172 609 223 276 254 689 236 977
Total 163 235 184 013 228 931 257 408 257 866 290 305 305 757 368166 417 146 419 819
By railway*
Import Tonne I 157 351 I 032 466 I 035 676 I 253 432 I 343 152 I 384 136 Tonne-kilometres 38 911 343 34 805 144 35 196 930 42 317 862 43 546 964 44 991 808
Export Tonne 15 380 40 595 34 038 72 039 104 267 203 273 Tonne-kilometres 522 920 1380216 1 157 301 2 449 326 3 545 078 6 764 402
By road (tonne)
Import 72 070 80 266 68 540 84961 129 782 225 289 394 339 702 004 I 134 476 1 435 677
Export 417 2 769 54 025 177 948 299 686 446 622 810 677 I 061 039 I 249 392
Total 72070 80683 71309 138 986 307 730 524975 840 961 1512 681 2 195 515 2 685 069
Note: *Measured in actual tonnage of cargo conveyed (whereas figures published in previous editions represent the loading capacity of wagons used for conveyance).
129
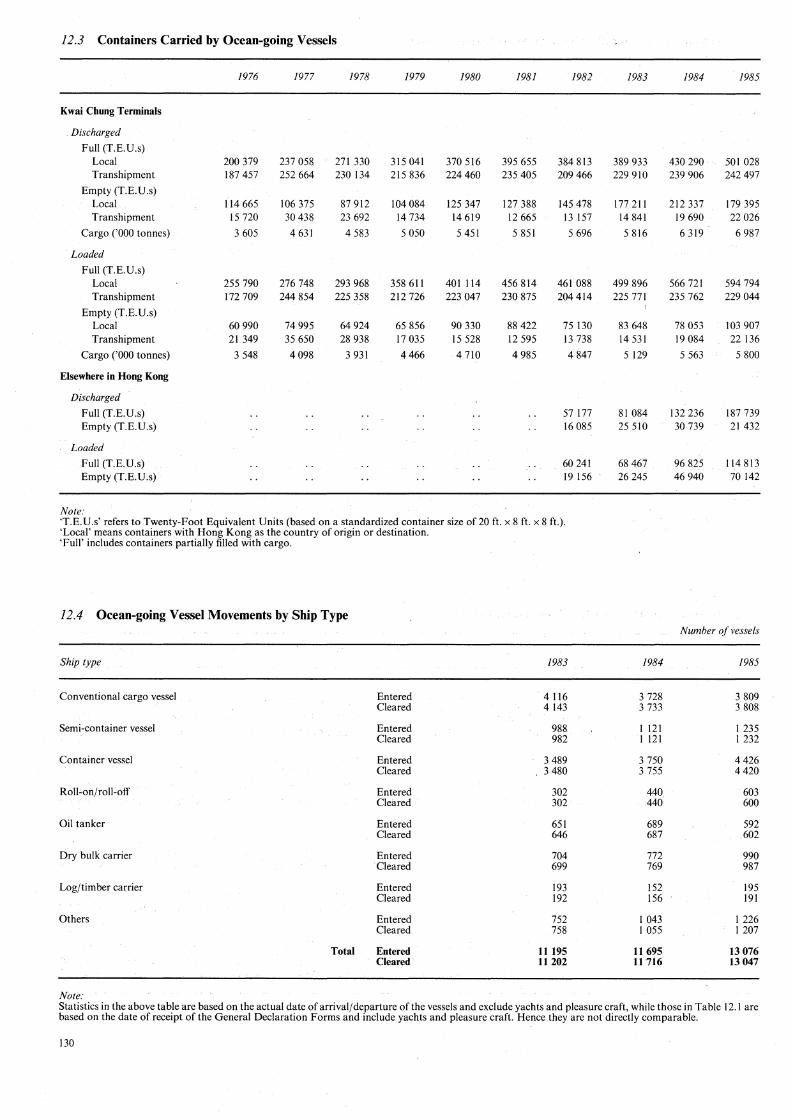
12.3 Containers Carried by Ocean-going Vessels
1976 1977 1978 1979 1980 1981 1982 1983 1984 1985
Kwai Chung Terminals
Discharged
Full (T.E.U.s) Local 200 379 237 058 271 330 315 041 370 516 395 655 384 813 389 933 430 290 501 028 Transhipment 187 457 252 664 230 134 215 836 224 460 235 405 209 466 229 910 239 906 242 497
Empty (T.E.U.s) Local 114 665 106 375 87 912 !04 084 125 347 127 388 145 478 177 21 l 212 337 l 79 395 Transhipment 15 720 30 438 23 692 14 734 14 619 12 665 13 157 14 841 19 690 22 026
Cargo ('OOO tonnes) 3 605 4 631 4 583 5 050 5 451 5 851 5 696 5 816 6 319 6 987
Loaded
Full (T.E.U.s) Local 255 790 276 748 293 968 358 61 l 401 114 456 814 461 088 499 896 566 721 594 794 Transhipment 172 709 244 854 225 358 212 726 223 047 230 875 204 414 225 771 235 762 229 044
Empty (T.E.U.s) Local 60 990 74 995 64 924 65 856 90 330 88 422 75 130 83 648 78 053 103 907 Transhipment 21349 35 650 28 938 17 035 15 528 12 595 13 738 14 531 19 084 22 136
Cargo ('OOO tonnes) 3 548 4 098 3 931 4466 4 710 4 985 4 847 5 129 5 563 5 800
Elsewhere in Hong Kong
Discharged
Full (T.E.U.s) 57 177 81 084 132 236 187 739 Empty (T.E.U.s) 16 085 25 510 30 739 21 432
Loaded
Full (T.E.U.s) 60 241 68 467 96 825 l 14 813 Empty (T.E.U.s) 19 156 26 245 46 940 70 142
Note: 'T.E.U.s' refers to Twenty-Foot Equivalent Units (based on a standardized container size of20 ft. x 8 ft. x 8 ft.). 'Local' means containers with Hong Kong as the country of origin or destination. 'Full' includes containers partially filled with cargo.
12.4 Ocean-going Vessel Movements by Ship Type Number of vessels
Ship type 1983 1984 1985
Conventional cargo vessel Entered 4 116 3 728 3 809 Cleared 4 143 3 733 3 808
Semi-container vessel Entered 988 I 121 I 235 Cleared 982 l 121 l 232
Container vessel Entered 3 489 3 750 4426 Cleared 3 480 3 755 4420
Roll-on/roll-off Entered 302 440 603 Cleared 302 440 600
Oil tanker Entered 651 689 592 Cleared 646 687 602
Dry bulk carrier Entered 704 772 990 Cleared 699 769 987
Log/timber carrier Entered 193 152 195 Cleared 192 156 191
Others Entered 752 I 043 I 226 Cleared 758 I 055 I 207
Total Entered 11 195 ll 695 13 076 Cleared· II 202 II 716 13 047
Note: Statistics in the above table are based on the actual date of arrival/ departure of the vessels and exclude yachts and pleasure craft, while those in Table 12. l are based on the date of receipt of the General Declaration Forms and include yachts and pleasure craft. Hence they are not directly comparable.
130
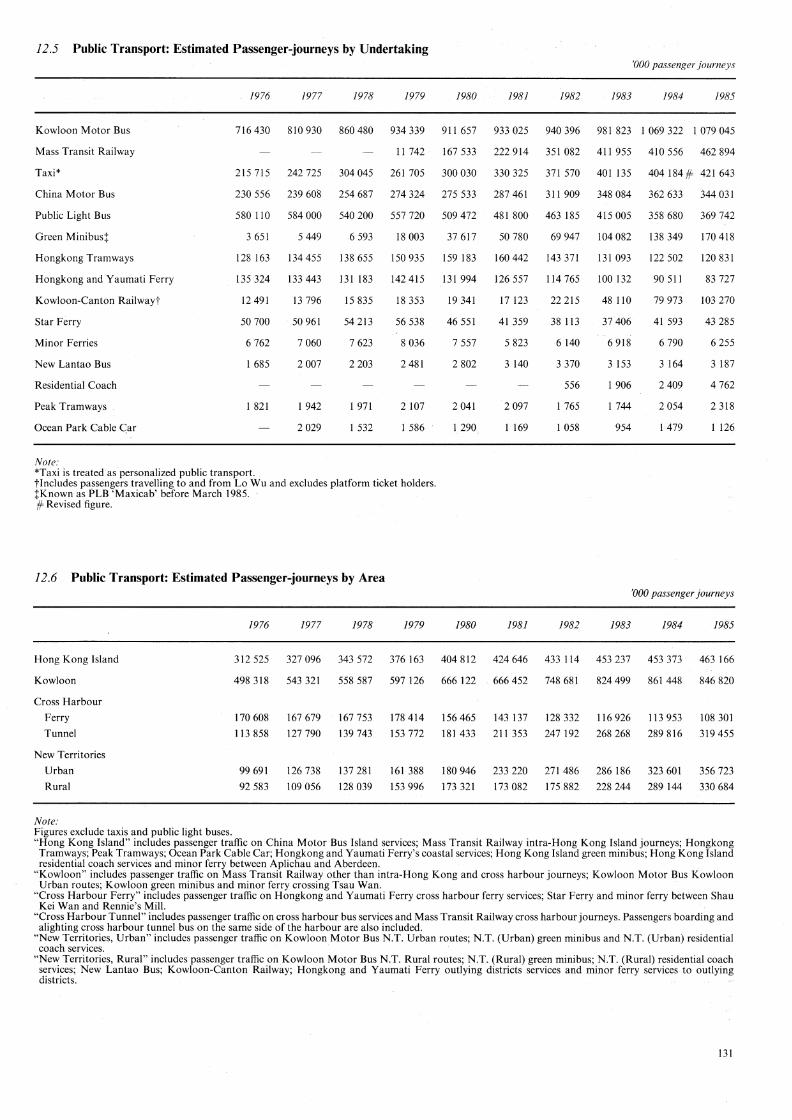
12.5 Public Transport: Estimated Passenger-journeys by Undertaking 'OOO passenger journeys
1976 1977 1978 1979 1980 1981 1982 1983 1984 1985
Kowloon Motor Bus 716 430 810 930 860 480 934 339 911 657 933 025 940 396 981 823 I 069 322 I 079 045
Mass Transit Railway 11 742 167 533 222 914 351 082 411 955 410 556 462 894
Taxi* 215 715 242 725 304 045 261 705 300 030 330 325 371 570 401 135 404 184 # 421 643
China Motor Bus 230 556 239 608 254 687 274 324 275 533 287 461 311 909 348 084 362 633 344 031
Public Light Bus 580 110 584 OOO 540 200 557 720 509 472 481 800 463 185 415 005 358 680 369 742
Green Minibus; 3 651 5 449 6 593 18 003 37 617 50 780 69 947 104 082 138 349 170 418
Hongkong Tramways 128 163 134455 138 655 150 935 159 183 160 442 143 371 131 093 122 502 120 831
Hongkong and Yaumati Ferry 135 324 133 443 131 183 142415 131 994 126 557 114 765 JOO 132 90 511 83 727
Kowloon-Canton Railwayt 12491 13 796 15 835 18 353 19 341 17 123 22 215 48 110 79 973 103 270
Star Ferry 50 700 50 961 54 213 56 538 46 551 41 359 38 113 37 406 41 593 43 285
Minor Ferries 6 762 7 060 7 623 8 036 7 557 5 823 6140 6 918 6 790 6 255
New Lantao Bus 1 685 2007 2203 2481 2 802 3140 3 370 3 153 3 164 3 187
Residential Coach 556 1906 2409 4 762
Peak Tramways I 821 I 942 I 971 2 107 2041 2 097 1 765 1 744 2 054 2 318
Ocean Park Cable <.:;ar 2029 1 532 I 586 I 290 1169 I 058 954 1479 1126
Note: *Taxi Is treated as personalized public transport. tlncludes passengers travelling to and from Lo Wu and excludes platform ticket holders. tKnown as PLB 'Maxicab' before March 1985. #= Revised figure.
12.6 Public Transport: Estimated Passenger-journeys by Area 'OOO passenger journeys
1976 1977 1978 1979 1980 1981 1982 1983 1984 1985
Hong Kong Island 312 525 327 096 343 572 376 163 404 812 424 646 433 114 453 237 453 373 463 166
Kowloon 498 318 543 321 558 587 597 126 666 122 666 452 748 681 824 499 861 448 846 820
Cross Harbour
Ferry 170 608 167 679 167 753 178 414 156 465 143 137 128 332 116 926 113 953 108 301
Tunnel I 13 858 127 790 139 743 153 772 181 433 211 353 247 192 268 268 289 816 319 455
New Territories
Urban 99 691 126 738 137 281 161 388 180 946 233 220 271 486 286 186 323 601 356 723
Rural 92 583 109 056 128 039 153 996 173 321 173 082 175 882 228 244 289 144 330 684
Note: Figures exclude taxis and public light buses. "Hong Kong Island" includes passenger traffic on China Motor Bus Island services; Mass Transit Railway intra-Hong Kong Island journeys; Hongkong Tramways; Peak Tramways; Ocean Park Cable Car; Hongkong and Yaumati Ferry's coastal services; Hong Kong Island green minibus; Hong Kong Island residential coach services and minor ferry between Aplichau and Aberdeen.
"Kowloon" includes passenger traffic on Mass Transit Railway other than intra-Hong Kong and cross harbour journeys; Kowloon Motor Bus Kowfoon Urban routes; Kowloon green minibus and minor ferry crossing Tsau Wan.
"Cross Harbour Ferry" includes passenger traffic on Hongkong and Yaumati Ferry cross harbour ferry services; Star Ferry and minor ferry between Shau Kei Wan and Rennie's Mill.
"Cross Harbour Tunnel" includes passenger traffic on cross harbour. bus services and Mass Transit Railway cross harbour journeys. Passengers boarding and alighting cross harbour tunnel bus on the same side of the harbour are also included.
"New Territories, Urban" includes passenger traffic on Kowloon Motor Bus N.T. Urban routes; N.T. (Urban) green minibus and N.T. (Urban) residential coach services.
"New Territories, Rural" includes passenger traffic on Kowloon Motor Bus N.T. Rural routes; N.T. (Rural) green minibus; N.T. (Rural) residential coach services; New Lantao Bus; Kowloon-Canton Railway; Hongkong and Yaumati Ferry outlying districts services arid minor ferry services to outlying districts.
131

12.7 Motor Vehicles Registered
1976 1977 1978 1979 1980 1981 1982 1983 1984 1985
Motor cycles 21 285 21 344 22093 23 289 25 536 27 438 27 434 25 685 22417 19 331
Motor tricycles 18 14 12 7 7 5 3 7
Private cars 113 665 122 858 142 049 162 762 190 146 211 556 214 849 200 923 182 985 168 200
Taxis 4994 6 203 7 663 8 762 9 856 11 061 12.756 14421 15 984 16481
Public buses 3 654 3 735 4093 4 382 4 928 5496 5 611 5 715 5 787 5 887
Private buses 265 263 242 222 226 224 248 231 186 158
Public light buses 4 346 4 350 4350 4 350 4350 4 350 4 350 4 350 4 350 4 350
Private light buses l 245 l 079 l 026 964 955 924, 1 330 1 724 l 886 2 107
Public c~rs l 322 916
Goods vehicles 37 108 42 798 47 405 51 780 58 801 64214 67 606 69 057 72469 77 918
Crown vehicles (excluding vehicles of HM Forces) 3 844 3 961 4 217 4410 4 590 5.041 5 380 5 697 5 786 6122
Total 191 746 207 521 233150 260928 299395 330309 339 567 327 803 311850 300 561
12.8 Motor Vehicles Licensed
1977 1978 1979 1980 1981 1982 1983 1984 1985
Motor cycles 16279 17 033 17 913 19 753 21 106 19 515 16 836 15 345 14060
Motor tricycles 8 6 5 3 7
Private cars 113 188 131 324 148 867 171642 190 307 184 585 159 488 147 616 144 723
Taxis Hong Kong and Kowloon 5449 6 892 7 997 9100 10 165 11 342 12 403 13 499 13 795 New Territories 737 735 732 734 880 l 376 l 887 2 260 2 388 Lantau 20 30 40
Public buses China Motor Bus Co. Ltd.
Single deck 5 5 8 8 .(j 4 4 2 Double deck 713 756 808 873 935 985 1 036 959 891
Kowloon Motor Bus Co. Ltd. Single deck 483 485 394 378 347 288 202 167 138 Double deck 1 190 1 318 1 436 1 689 2 028 2084 2144 2 245 2 373
New Lantao Bus Co. Ltd. Single deck 46 47 52 53 47 44 45 44 43 Double deck 2 6 8 9 9 n
Other public buses Single deck 1 154 1 336 l 545 l 708 1914 1971 1961 2001 2041 Double deck 7 10 26 32 56 72 82
Private buses Single deck 239 229 205 194 175 175 157 126 108 Double deck 12 28 53 47 33 26
Public light buses 4 337 4312 4 332 4 346 4 348 4 340 4327 4 332 4 344
Private light buses 966 915 857 806 796 1 213 l 600 l 782 2 025
Public cars 915
Goods vehicles Light } 48 610 54 648 Medium 40 882 44 897 48 400 50 343 54 785 59 511 59 399 13 342 14492 Heavy 188 182 Special purpose vehicles 351 351
Crown vehicles (excluding vehicles ofHM Forces) Motor cycles 943 997 915 936 1 067 1206 1184 1160 1 331 Other vehicles 3 018 3 220 3 495 3 654 3 974 4174 4 513 4626 4 791
Total 190552 214507 237968 266 244 292940 292906 267 318 258799 262890
132

12.9 New Registration of Motor Vehicles
1976 1977 1978 1979 1980 1981 1982 1983 1984 1985
Motor cycles I 687 2 250 2 945 3 364 4 438 4 391 2 683 I 533 I 010 I 028
Motor tricycles 7
Private cars 12 425 19 163 27 429 30 706 38 030 33 761 19 624 7108 6 569 I I I 19
Taxis Hong Kong and Kowloon 341 I 212 2 342 2 513 2 513 2 076 2 049 I 909 I 819 2 006 New Territories 240 541 72 93 80 238 596 585 503 260 Lan tau 20 10 11
Public buses China Motor Bus Co. Ltd.
Single deck 7 I I Double deck 92 81 97 66 179 I 15 81 88 28
Kowloon Motor Bus Co. Ltd. Single deck 50 4 I I 13 Double deck 98 89 107 151 297 413 160 105 179 188
New Lantao Bus Co. Ltd. Single deck 4 8 4 7 4 Double deck 2 4 2 2
Other public buses Single deck 82 64 215 256 218 246 134 78 94 126 Double deck 7 3 17 6 28 18 15
Private buses Single deck 7 25 29 19 34 23 17 23 8 3 Double deck 13 16 38 4 4
Public light buses 184 197 327 398 262 264 233 851 I 504 778
Private light buses 85 79 128 129 140 100 514 566 371 458
Public cars 97 201 126
Goods vehicles Light } 10 306 Medium 7 165 7 801 7 026 8 409 I I 794 10 194 10 109 8 199 9 494 2 251 Heavy 6 Special purpose vehicles 41
Crown vehicles (excluding vehicles of HM Forces) Motor cycles I 144 253 14 68 268 281 238 223 358 Other vehicles 52 100 258 296 299 388 556 652 323 472
Total 22 617 31955 41362 46429 58 371 52 515 37 083 21 988 22 158 29 452
12.10 Length of Roads Km
1976 1977 1978 1979 1980 1981 1982* 1983 1984 1985
Hong Kong Island
Flexible pavement } 257 260 262 263 266 268 342 343 344 345
Rigid pavement 92 92 96 102 I 10 III
Kowloon
Flexible pavement } 238 241 235 235 238 240 325 330 335 341
Rigid pavement 108 II I 109 Ill 111 III
New Territories
Flexible pavement } 420 429 464 483 503 538 418 419 431 461
Rigid pavement 47 49 51 50 51 55
Total 1 085 1 093 1 110 1 147 1162 1182 1 217 1244 1 279 1 323
Note: Figures are as at end of the year. *Figures adjusted to tie in with District Board.
133

12.11 Traffic Accidents and Casualties
1976 1977 1978 1979 1980 1981 1982 1983 1984 1985
Accidents
Hong Kong Islandt 3 806 4 201 4 431 4 182 4494 4901 4 725 4208 3 596 3 505
Kowloon 6076 6 890 8 052 7 708 8 186 9003 9102 8 580 7 792 7 921
New Territories 2 463 2 771 2 785 3 281 3 579 4130 4510 4050 3 732 3 492
Total 12345 13862 15268 15171 16259 18034 18337 16838 15120 14918
Casualties (number of persons)
Hong Kong Islandt Fatal 80 78 98 102 79 109 104 63 46 56 Serious l 435 l 514 l 554 l 499 1 459 l 575 2 016 l 579 l 185 l 144 Slight 3 199 3 541 3 672 3 638 4021 4407 3 889 3 712 3 299 3 206
Kowloon Fatal 163 159 200 201 161 177 182 127 130 126 Serious 2 578 2 845 3 241 2 825 2 925 3430 4070 2947 2279 2419 Slight 4 606 5 620 6 637 6434 7095 7 676 7 136 7 557 7 463 7 714
New Territories Fatal 108 135 139 157 162 192 171 150 146 127 Serious l 520 1 672 l 883 l 998 2060 2441 3 548 2 559 l 905 l 475 Slight 2060 2293 2 348 2 614 2 985 3 595 3 163 3 306 3 682 3 597
Total 15749 17857 19772 19468 20947 23602 24279 22000 20135 19864
Note: tincludes Marine and Lantau Island.
12.12 Telephone Services
1976 1977 1978 1979 1980 1981 1982 1983 1984 1985
Number of applications*
Received during period 155 979 168 312 174 199 175 649 222 582 240 639 245 491 244 776 248 119 279 921
Outstanding at end of period 6 340 4098 3 218 3 675 6 881 5 209 3 174 1 662 l 518 1 544
Number of exchange lines
Installed during period 140 823 156 080 162 788 167 486 208 684 227 419 238 475 234 350 234 920 264 595
Ceased during period 68 167 71 877 74262 77 364 102 348 122 618 145 177 157 209 148 304 163 732
Working at end of period 909 679 993 882 l 082 408 l 172 530 l 278 866 l 383 667 l 476 965 l 554 106 1640 722 1 741 585
Total equipped capacity of exchange lines at end of period l 114 980 l 174 020 l 223 650 l 298 824 1448 902 1 590 753 1749247 1870044 1 905 231 l 997 635
Note: *Refers to number of exchange lines requested for installation.
134

12.13 International Telephone and Telegraph Services
Number of telex subscribers (as at end of the year)
International telex traffic ('OOO minutes) Outward Inward Transit
Internal telex traffic ('OOO minutes)
Number of leased circuits (as at end of the year)
Outward international telephone traffic ('OOO minutes)
Public telegraph traffic ('OOO messages) Outward Inward
Inland telegrams Television programmes*
Number Minutes
Television programmes reception Number Minutes
Maritime radio telegrams (messages) Transmitted Received
Maritime radio telephone traffic · (minutes) Outward Incoming
Maritime radio telex (minutes) Outward Inward
Note:
1976
5 646
10 212 12 047 14 239
2 540
771
14 520
1192 1 533 7 937
53 1 343
424 9404
1977
7094
12 344 14 864 16 412
4099
920
17 408
1 128 1 415 8 666
51 2 303
365 5 339
39 008 41 572 106 744 110 994
3 186 33 909
3 867 42 991
1978
9 019
16 525 19426 16 262
6 318
1 054
23 026
1152 1 463 9 105
52 1 751
679 9 195
44987 116 338
5 500 60 608
1979
11108
19 044 22 543 13 749
8 742
1205
31 311
1 313 1 535
11 061
80 2 522
764 9623
53 151 119 853
5 153 70 238
3 616 16 513
1980
13 757
24440 30844 11 898
12 624
1 386
42 675
1981
16 635
30 663 37290 11 865
16 804
1 550
57 759
1 417 1 443 1 548 1 616
12 171 13 133
81 # 88 1 914 # 3 350
790# 792 10 324 # 11 335
54 528 124 824
3 836 69 820
7 531 19 800
54486 123 933
4463 72 736
25464 36222
1982
18 863
35 036 37 565 12 607
20495
1630
72 509
1 313 1426
12 190
62 3 157
963 22 364
53 434 129 382
1983
20868
36 395 40 542 16 516
23 769
1 621
89443
1984
23 657
41 160 45 482 18 013
27936
1 674
1985
26 993
43 993 50 545 19 491
31 521
1 734
110 681 # 144 761
1 242 1 286 1 165 1 233 1 172 1 135 9 115 9 569 7 256
85 # 291 # 214 4203# 16486# 4768
964 # 1 250 # 1 054 16 255 # 42 312 # 24 825
53 559 126 762
54 376 54 782 128 954 131 666
4 867 5 210 5 638 155 675
6466 168 686 91 414 133 617
41 800 44715
42019 64 618
47 370 69 702
53 867 54679
*Prior to 1984, figures refer to television programmes via satellite; from 1984 onwards, figures refer to television programmes via all media (i.e. both by satellite and by microwave link).
#= Revised figure.
12.14 Postal Services
Letter mail (million)
Local articles Articles posted to other countries Overseas articles for local delivery Articles in transit
Parcels ('000)
Local parcels
Total
Parcels posted to other countries Overseas parcels for local delivery Parcels in transit
Total
Note: *Revised figure.
1976
147.2 77.0
58.6 2.8
285.6
78 2 374
514 40
3006
1977
154.5
78.8 61.9 3.0
298.2
117 2 412
562 42
3133
1978
168.9 85.1 66.8 3.4
324.2
146 1 850
540 42
2578
1979
189.3 95.2 77.4 3.7
365.6
179 1 825
560 48
2612
1980
219.6 93.2 85.4 4.0
402.2
224 1 823
617 55
2719
1981
265.6 97.1 91.6 4.0
458.3
227
1 709 642
59
2637
1982
294.1 97.5 97.6 4.6
493.8
193 1 509
616 55
2373
1983
293.6
97.1 * 81.8*
3.8
476.3*
94 1 528*
568* 55*
2245*
1984
319.9* 108.0* 82.0 3.8*
513.7*
104 1491
572 48
2215
1985
358.4 115.3 85.0
3.8
562.5
203 1490
636 52
2381
135

12.15 Arrivals and Departures of Passengers by Air, Sea and Land Number of persons
1976 1977 1978 1979 1980 1981 1982 1983 1984 1985
Arrivals 5 282019 5 983185 6 793 372 9474427 10626699 11911165 12456867 13733320 16842 087 20460671 By air 2 068 725 2 285 450 2 629 383 2 836 120 3 036 939 3 509 028 3 661 883 3 767 160 4077 632 4 263 022 By sea 2 316 916 2 584 717 2 726 535 3 391 797 3 535 985 3 894 755 4458 823 4 745 831 5 098 648 5 571 509 Byland 896 378 1113 018 1437454 3 246 510 4053 775 4 507 382 4 336 161 5 220 329 7 665 807 10 626 140
Departures 5315 895 5980168 6770923 9470 893 10 558382 11 922 936* 12 513 233 13858142 16 882 140* 20 356 014
By air 2 115 562 2 308 974 2 664 575 2 909 541 3 164 026 3 619 688 3 777 485 3 917 235 4 206 576 4 373 496
By sea 2 316 729 2 589 069 2 735 207 3373177 3 631 865 4 019 388 4 610 701 4 910 653 5 389 878 5 913 220
Byland 883 604 1082125 1 371 141 3 188 175 3 762 491 4 283 860* 4125 047 5030254 7 285 686* 10 069 298
Note: Figures include servicemen but exclude refused landing passengers and cruise passengers. *Revised figure.
12.16 Hong Kong Resident Departures by Destination
Destination 1976 1977 1978 1979 1980 1981 1982 1983 1984 1985
People's Republic of China 844 910 1 038 147 1 285 707 3 204 329 3 916 944 4 537 463 4 615 784 5 724 418 8 036 452 10 960 747
Macao 1 775 796 1984498 2 088 164 2 576 OOO 2 716 584 3 015 910 3 355 578 3 341 945 3 519 115 3 716 413
Taiwan 170 405 167 726 199 172 216 089 260459 306 961 306 824 288 202 294 231 270 872
Japan 55 163 62 636 64113 71 328 99907 136 188 174 480 199 348 184 296 198 612
Thailand 50 915 41 656 69666 99 838 118 598 149 035 160 337 134 258 137 743 139 504
Philippines 57994 91 842 137 340 101 392 107 617 111 954 99 543 97245 96484 88 801
United Kingdom 34 637 42 111 46603 49 646 61415 70896 67 957 73 523 78 139 78 626
United States of America 26114 41466 45 315 59907 72000 68 756 76409 83 670 80737 77 369
Singapore 29491 29 897 33 244 40 840 53 172 59 071 63 784 70 817 81110 76 358
Canada 12 828 17 845 15 921 18 409 21 794 27 667 28 281 34092 34973 33 306
Australia and New Zealand 8 686 12 701 13 733 15 598 18 651 20 612 23 904 25 386 26 838 30469
West Germany 3 474 3 945 4847 4732 5 282 5 100 5 329 11 011 14 870
Others 115 602 81 459 89 966 88 201 99252 116 748 131 849 127 665 118 365 127 013
Total 3182 541 3615 458 4092 889 6546424 7551125 8626543 9109 830 10205 898 12699494 15 812960
Note: Hong Kong residents may travel to more than one country other than the destination claimed.
136

12.17 Visitor Arrivals by Country of Residence
Country of residence
Western Europe
France
Germany
Italy
Scandinavia
Switzerland
United Kingdom
Sub-total
Asia and Pacific
Japan
Australia
New Zealand
India
Indonesia
Korea, South
Malaysia
Philippines
Singapore
Taiwan
Thailand
Sub-total
America
United States of
1976
21 018
38 746
16 296
11 700
11 843
57 783
157 386
437 931
157 360
18 316
13 974
47186
24 748
63 395
38 761
55 141
77 794
88 240
1022 846
1977
27 686
41 356
17 691
13 294
14 274
71 097
185 398
485 495
154 849
22 138
16 857
56 664
45 672
73 316
52 844
62 946
87 488
80 775
1139 044
1978
33 955
51 851
28 385
16 206
16 862
84 324
231583
487 250
160 004
26022
24296
68 040
70 139
80491
86 381
66 920
128 924
99 764
1298231
1979
39 730
58 426
27 442
15 807
19 373
95 344
256122
508 Oil
139 236
28 547
29468
64008
61 563
86 307
89 549
77 191
206 344
132 551
1422 775
1980
42 335
61 869
30 165
18 202
20434
121 054
294 059
472 182
166 170
28 236
38 641
79400
45 187
99867
98 628
89 661
123 644
148 671
1390 287
1981
50 488
62926
33 369
19 768
21 893
167 117
355 561
507 960
201 793
26 809
44 915
96 731
44943
111 230
104 690
101 373
135 621
137 715
1513 780
1982
49162
58 170
31 919
20795
22 155
156 414
338615
515 697
216 486
22804
50 132
100 517
58 123
113 921
104 505
123 904
153 133
145 860
1605 082
1983
44050
62 941
32 330
22204
24 123
164 597
350 245
502 175
228 107
22 685
54238
89 685
51494
139 254
92 500
149 453
156 600
165 962
1652153
Number of persons
1984
49 906
71 411
34356
29 164
25 842
171 389
382068
584 013
278 071
26 544
65 575
105 709
45 289
135 310
97 887
168 672
166 762
151 222
1825 054
1985
60 731
79 687
42 856
36 421
30 963
187 906
438 564
635 767
275 494
23 219
72689
120 532
44728
129 469
112 147
200 977
176 617
136 697
1928 336
America 238 605 254 186 284 642 303 583 346 910 372 133 377 853 451 566 562 764 638 168
Canada 34087 40817 46489 50226 56352 64455 61413 73672 94177 113545
~~ mm m~ mm mw ~~ ~w m~ mm ~w mm Others 107 053 136 224 193 794 180 503 213 865 229 274 226 137 247 378 287 609 324 560
Total 1559977 1 755 669 2 054 739 2 213 209 2 301 473 2 535 203 2 609 100 2 775 014 3 151 672 3 443 173
137

12.18 Visitor Arrivals by Mode of Travel by Country of Residence Number of persons
Mode of travel/ Country of residence 1976 1977 1978 1979 1980 1981 1982 1983 1984 1985
By air
United Kingdom 54909 66 621 79423 88 966 108 165 151 404 144 116 150 836 152 870 164 462 West Europe excluding
United Kingdom 120 058 137 709 171 179 179 347 190 694 208 424 200 113 202 818 218 836 248 928 United States of America 233 032 244 818 258 996 261 243 279 696 305 051 322130 381 957 478 328 520 251 Canada 32442 38 919 42 889 45 143 48 704 55 830 53 866 63 637 79 118 91 619 Japan 426 962 471 709 465 609 484 812 442 361 462 036 472 973 455 133 504 203 523 666 Australia and New Zealand 168 691 165 396 169 430 151 830 162 338 192 886 208 295 221 388 268 603 260 946 South East Asiat 277 715 315 002 382 100 427 729 487 352 516 925 552 911 594 672 609 765 618 573 Others 181 284 235 632 332 918 412 435 346 589 372 406 402 815 409 878 434 663 444 395
Sub-total 1495 093 1675 806 1902 544 2 051 505 2065 899 2 264 962 '2 357 219 2 480 319 2 746 386 2872 840
By sea
United Kingdom 1467 2 680 2 068 2 541 2 720 2467 2 311 3 491 5 389 7600 West Europe excluding
United Kingdom 888 l 469 l 903 3 546 4 231 3 657 4653 7 644 12 111 16 255 United States of America 2445 4780 6 625 11 187 9 582 6487 9 720 18 218 21 898 27 430 Canada 306 310 249 718 862 881 l 116 2076 3 181 4 367 Japan 5 015 " 6 606 5 931 7686 6024 7 833 8030 11 688 17 720 23404 Australia and New Zealand 4 518 7 734 8 865 8449 8 207 8 014 8480 5 896 6 919 9 451 South East Asiat 4 577 5404 7770 6 051 8448 12 782 13 272 17 018 16 780 28 372 Others 499 796 844 1474 2 233 l 963 2964 5084 7 974 12 423
Sub-total 19 715 29 779 34 255 41652 42 307 44084 50546 71115 91972 129 302
By land
United Kingdom l 407 1 796 2 833 3 837 10 169 13 246 9 987 10270 13 130 15 844 West Europe excluding
United Kingdom 6 950 9 384 16 582 21 418 26408 29 380 27 933 27 831 34 216 47 870 United States of America 3 128 4 588 19 021 31 153 57 632 60 595 46003 51 391 62 538 90487 Canada l 339 l 588 3 351 4365 6 786 7 744 6 431 7 959 11 878 17 559 Japan 5 954 7 180 15 710 15 513 23 797 38 091 34694 35 354 62090 88 697 Australia and New Zealand 2467 3 857 7 731 7 504 23 861 27702 22 515 23 508 29093 '28 316 South East Asiat 15 820 12 850 21.647 21 532 25 943 27 867 28 486 30 873 38 235 59 235 Others 8 104 8 841 31 065 14 730 18 671 21 532 25 286 36 394 62134 93 023
Sub-total 45169 50084 117940 120 052 193 267 226157 201335 223 580 313 314 441031
Total 1559 977 1755669 2054739 2213 209 2 301473 2 535203 2609100 2 775014 3151672 3 443173
Note: tExcludes Taiwan.
12.19 Hotel Statistics
1976 1977 1978 1979 1980 1981 1982 1983 1984 1985
High tariff hotels
Number of hotels 18 20 21 21 22 25 26 27 28 28 Number of rooms 9 841 10 777 11279 11 546 12 178 13 837 14 935 14 999 15 377 15 311 Room occupancy rate(%) 80 85 89 90 88 88 83 83 89 88
Medium tariff hotels
Number of hotels 27 23 21 19 18 17 16 15 15 15 Number of rooms 2 752 2249 2 126 2080 2052 1 753 l 796 1 752 l 785 l 680 Room occupancy rate (%) 73 84 89 89 85 85 81 79 84 90
Hostels and guest houses
Number of hostels and guest houses 7 7 7 6 6 5 5 6 7 8 Number of rooms 754 774 763 737 759 733 684 819* 869* l 189 Room occupancy rate (%) 81 88 89 93 90 86 82 86 87 85
All categories
Number of hotels 52 50 49 46 46 47 47 48 50 51 Number of rooms 13347 13800 14168 14363 14989 16323 17415 17 570* 18031* 18180 Room occupancy rate(%) 79 85 89 91 87 87 82 83 89 88
Note: *Revised figure.
138

12.20 Seasonal Pattern of Average Hotel Room Occupancy
Month
January
February
March
April
May
June
July
August
September
October
November
December
Whole year
12 .21 Receipts from Visitors
Country of residence
Japan
South East Asiat
United States of America
West Europe
Australia and New Zealand
Canada
Others
1976
67
73
78
79
84
73
69
85
81
92
94
73
79
1977
80
82
87
90
86
80
76
85
84
96
94
79
85
1978
85
78
91
93
95
84
84
88
94
97
97
85
89
1979
84
93
96
95
94
87
84
89
89
95
98
82
91
1980
82
78
91
90
89
83
81
87
89
98
97
81
87
1981
83
79
91
90
89
86
85
87
88
97
95
78
87
1982
70
83
87
85
86
79
79
82
79
94
90
75
82
1983
74
72
83
82
83
79
79
79
87
98
95
83
83
1984
78
74
86
91
92
89
86
88
93
98
97
90
89
Percentage
1985
86
76
94
92
90
91
83
85
89
97
93
84
88
HK$ Million
1976 1977 1978 1979 1980 1981 1982 1983 1984 1985
851.43 1,063.36 1,197.79 1,548.44 1,284.05 1,553.50 1,428.30 1,624.06 2,060.51 2,511.09
620.32 562.58 797.17 969.66 1,168.67 1,482.27 1,743.88 2,292.71 2,561.61 2,457.58
585.82 608.06 611.58 837.19 938.18 1,138.35 1,291.12 2,154.15 2,996.38 3,416.12
388.89 417.05 616.37 795.87 923.44 1,192.80 1,199.32 1,348.80 1,597.45 1,729.02
419.78 376.90 445.59 506.59 610.39 908.15 966.92 1,317.20 1,772.77 1,561.95
73.37 72.17 82.72 108.85 128.79 206.22 163.89 298.51 425.59 445.21
524.01 539.90 892.54 1,157.00 1,006.85 1,180.52 1,392.39 1,822.23 2,143.62 2,159.13
Total 3,463.62 3,640.02 4,643.76 5,923.60 6,060.37 7,661.81 8,185.82 10,857.66 13,557.93 14,280.10
Note: tExcludes Taiwan.
139

12.22 Per Capita Spending and Length of Stay of Visitors
1976 1977 1978 1979 1980 1981 1982 1983 1984 1985
Average per capita expenditure (HK$)
Japan 1,944 2,190 2,458 3,048 2,719 3,058 2,770 3,234 3,528 3,950
South East Asiat 2,081 1,688 1,937 2,130 2,240 2,658 2,933 3,568 3,853 3,480
United States of America 2,455 2,392 2,149 2,758 2,704 3,059 3,417 4,770 5,324 5,353
West Europe 2,094 1,899 2,250 2,656 2,697 2,919 3,082 3,348 3,659 3,451
Australia and New Zealand 2,390 2,130 2,395 3,019 3,140 3,973 4,041 5,252 5,820 5,229
Canada 2,152 1,768 1,779 2,167 2,286 3,199 2,669 4,052 4,519 3,921
Others 2,760 2,201 2,447 2,699 2,740 2,982 3,230 4,037 4,247 3,927
Total 2,220 2,073 2,260 2,677 2,633 3,022 3,137 3,913 4,302 4,147
Length of stay (nights)
Japan 2.58 2.76 2.67 2.65 2.63 2.59 2.37 2.48 2.50 2.58
South East Asiat 3.36 4.09 3.88 3.72 3.58 3.58 3.75 3.64 3.56 3.51
United States of America 4.72 4.51 4.71 4.15 3.84 3.74 3.77 3.87 3.87 3.64
West Europe 4.35 4.09 4.27 4.05 3.97 4.04 4.10 4.16 3.88 3.75
Australia and New Zealand 4.54 4.32 4.77 4.64 4.99 4.68 4.67 4.83 4.98 4.98
Canada 5.05 3.85 4.31 4.04 3.89 4.20 3.81 4.18 4.27 4.31
Others 4.42 4.02 3.99 3.77 3.52 3.57 3.46 3.34 3.57 3.50
Total 3.91 3.78 3.86 3.66 3.60 3.59 3.57 3.62 3.62 3.55
Note: tExcludes Taiwan.
140

Section 13: BUILDING AND CONSTRUCTION
Statistics concerning the output, cost structure and other salient features of the building, construction and real estate sectors in Tables 13.l to 13.5 are compiled from the Annual Survey of Building, Construction and Real Estate Sectors. The surveys were conducted on a sample basis, with establishments selected from a comprehensive register maintained by the Census and Statistics Department and updated by reference to the records of the Business Registration Office of the Inland Revenue Department. The figures on output for 1985 in Table 13.6 were provisional estimates based on results of the Quarterly Survey of Construction Output. Results of the Annual Survey are subject to smaller sampling errors by virtue of a larger sample size.
The following explanatory notes apply to Tables 13.1 to 13.6: (1) The statistics cover all establishments that had operated during the reference year, including both the reporting and non-reporting establishments. Non-reporting establishments refer to those which operated during the whole or part of the reference years but became untraceable during the survey enumeration period owing to closure or removal. The economic contributions of non-reporting establishments are imputed on the basis of reporting establishments of the same trade and employment size. (2) Labour-only sub-contractors were not covered in the Survey but their output was included in that of the contractors commissioning their services. (3) For real estate leasing, brokerage and maintenance management services establishments, only those engaging two or more persons or those that were subsidiaries of real estate enterprises were covered in the Survey.
Statistics in Tables 13. 7-13.11 on completed new buildings certified for occupation and private domestic units with consent to commence work are compiled from details contained in the monthly returns of the Buildings Ordinance Office of the Building Development Department. Private domestic units with consent to commence work in Tables 13.10 and 13.11 do not include those belonging to the Private Sector Participation Scheme and the Middle Income Housing but include small village-type houses. Statistics on small village-type houses are supplied by the Lands Department.
The 'usable floor area' of a flat is defined as the total floor area within the flat excluding any staircases, lavatories; water closets, kitchens and other common areas of the building.
The 'gross floor area' of a building is defined as 'the aggregate of the areas of the floor( s) in a building'. 'Combined' refers to combined domestic/non-domestic buildings such as apartment/commercial buildings or tenement
commercial buildings. 'Consents' to commence work are issued by the Buildings Ordinance Office of the Building Development Department for
private buildings except small village-type houses where consents are issued by the Lands Department. Statistics on stock, supply and vacancy position of domestic and non-domestic premises in Tables 13.12-13.16 are extracted
from 'Property Review' and 'Annual Summary' respectively published by the Rating and Valuation Department. Figures in these tables relate to private building development in areas where rates are levied and do not cover premises provided by the Private Sector Participation Scheme (PSPS), the Hong Kong Housing Authority, the Hong Kong Housing Society, the Home Ownership Scheme, the Hong Kong Settlers Housing Corporation Ltd., or other public works of any kind.
Private domestic units are defined as independent dwellings with separate cooking facilities and bathroom (and/or lavatory). They are sub-divided by reference to floor area. 'A' units have a saleable area not exceeding 39.9 square metres. 'B' units have a saleable area of at least 40 square metres but not exceeding 69.9 square metres. 'C' units have a saleable area of at least 70 square metres but not exceeding 99 .9 square metres. 'D' units have a saleable area of at least 100 square metres but not exceeding 159.9 square metres. 'E' units have a saleable area of at least 160 square metres.
The floor area of domestic units is calculated by reference to 'saleable area', which is defined as the floor area exclusively allocated to the unit including balconies and verandahs but excluding common areas such as stairs, lift shafts, lobbies and communal toilets. It is measured from the exterior of the enclosing walls of the unit and the middle of the party walls between two units. Bay windows, yards, gardens, terraces, flat roofs, carports and the like are excluded from the area.
The floor area of non-domestic accommodation is calculated by reference to 'internal floor area', which is defined as the area of all enclosed space of the unit measured to the internal face of enclosing external and/ or party walls.
Statistics on price and rental indexes in Tables 13.17 and 13.18 are supplied by the Rating and Valuation Department. Shops comprise only those premises designed for retail trade with a frontage to a public throughfare. Offices cover only those in the districts of Sheung Wan, Central, Wanchai/Causeway Bay, Tsim Sha Tsui, Yau Ma
Tei/Mongkok. Grade A refers to the well constructed, designed and managed, centrally air-conditioned premises in suitable locations within the district. Grade B refers to the less superior buildings in good locations or high quality buildings in secondary locations within the district. Grade C refers to the poorer quality buildings on less attractive sites within the district.
Flatted factories refer to the upper floor premises for general manufacturing processes. Statistics on instruments registered in the Land Office in Table 13.19 are provided by the Registrar General. Statistics on disposals of Government land in Table 13.20 are supplied by the Lands Department.
141

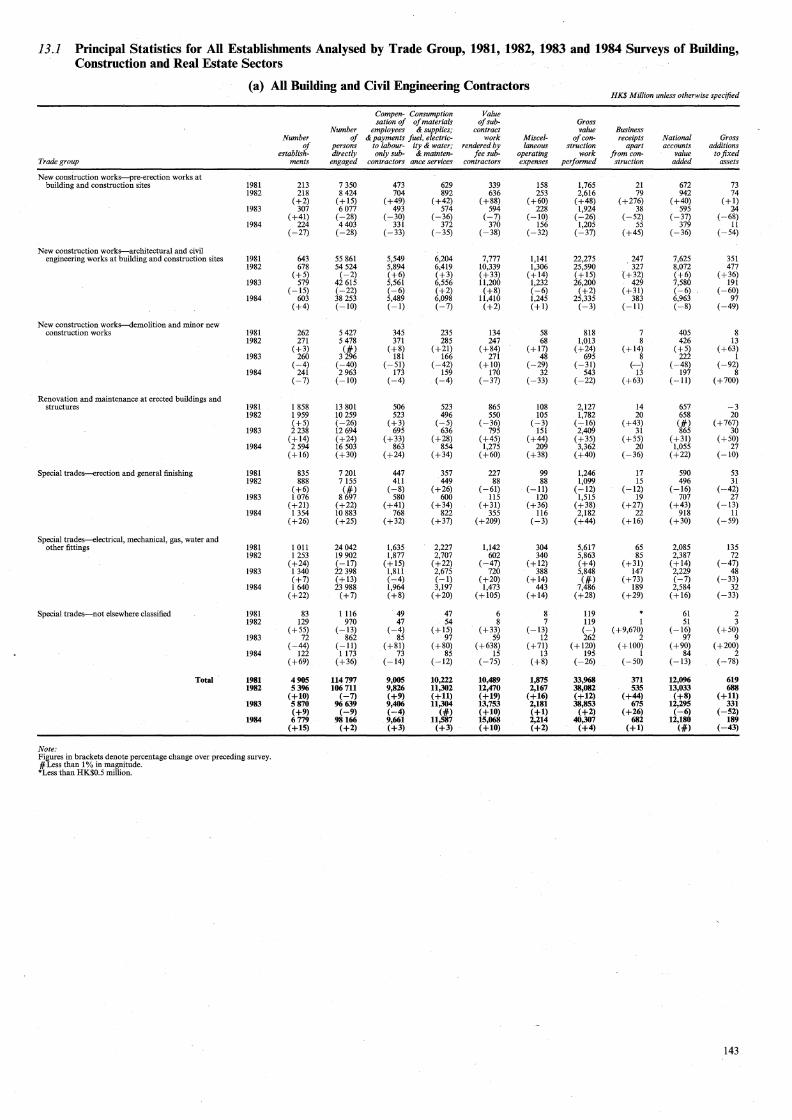
13.I Principal Statistics for All Establishments Analysed by Trade Group, 1981, 1982, 1983 and 1984 Surveys of Building, Construction and Real Estate Sectors
(a) All Building and Civil Engineering Contractors HK.$ Million unless otherwise specified
Compen- Consumption Value sation of of materials of sub- Gross
Number employees &supplies; contract value Business Number of & payments fuel, electric- work Miscel- of con- receipts National Gross
of persons to labour- ity & water; rendered by laneous struction apart accounts additions establish- directly only sub- &mainten- fee sub- operating work from con- value to fixed
Trade group ments engaged contractors ance services contractors expenses performed struction added assets
New construction works-pre-erection works at building and construction sites 1981 213 7 350 473 629 339 158 1,765 21 672 73
1982 218 8 424 704 892 636 253 2,616 79 942 74 (+2) ( +15) (+49) (+42) ( +88) (+60) (+48) ( +276) (+40) (+I)
1983 307 6077 493 574 594 228 1,924 38 595 :l4 (+41) (-28) (-30) (-36) (-7) (-10) (-26) (-52) (-37) (-68)
1984 224 4403 331 372 370 156 1,205 55 379 II (-27) (-28) (-33) (-35) (-38) (-32) (-37) (+45) (-36) (-54)
New construction works-architectural and civil engineering works at building and construction sites 1981 643 55 861 5,549 6,204 7,777 1,141 22,275 247 7,625 351
1982 678 54 524 5,894 6,419 10,339 1,306 25,590 327 8,072 477 ( +5) (-2) (+6) (+3) (+33) (+14) (+15) (+32) (+6) (+36)
1983 579 42 615 5,561 6,556 11,200 1,232 26,200 429 7,580 191 (-15) (-22) (-6) (+2) (+8) (-6) (+2) (+31) (-6) (-60)
1984 603 38 253 5,489 6,098 11,410 1,245 25,335 383 6,963 97 (+4) (-10) (-1) (-7) (+2) (+!) (-3) (-11) (-8) (-49)
New construction works--demolition and minor new construction works 1981 262 5 427 345 235 134 58 818 7 405 8
1982 271 5 478 371 285 247 68 1,013 8 426 13 (+3) (If) (+8) (+21) (+84) (+17) (+24) (+14) (+5) ( +63)
1983 260 3 296 181 166 271 48 695 8 222 I (-4) (-40) (-51) (-42) (+10) (-29) (-31) (-) (-48) (-92)
1984 241 2963 173 159 170 32 543 13 197 8 (-7) (-10) (-4) (-4) (-37) (-33) (-22) (+63) (-11) ( + 700)
Renovation and maintenance at erected buildings and structures 1981 l 858 13 801 506 523 865 108 2,127 14 657 -3
1982 1959 10 259 523 496 550 105 1,782 20 658 20 (+5) (-26) (+3) (-5) (-36) (-3) (-16) (+43) (If) ( + 767)
1983 2238 12 694 695 636 795 151 2,409 31 865 30 (+14) (+24) ( +33) (+28) (+45) (+44) (+35) (+55) (+31) (+50)
1984 2 594 16 503 863 854 1,275 209 3,362 20 1,055 27 (+16) (+30) (+24) (+34) (+60) (+38) (+40) (-36) (+22) (-10)
Special trade~rection and general :finishing 1981 835 7 201 447 357 227 99 1,246 17 590 53 1982 888 7 155 411 449 88 88 1,099 15 496 31
(+6) (If) (-8) (+26) (-61) (-11) (-12) (-12) (-16) (-42) 1983 I 076 8 697 580 600 115 120 1,515 19 707 27
(+21) (+22) (+41) (+34) (+31) (+36) ( +38) (+27) (+43) (-13) 1984 I 354 10 883 768 822 355 116 2,182 22 918 II
(+26) (+25) (+32) (+37) (+209) (-3) (+44) (+16) (+30) (-59)
Special trade~lectrical, mechanical, gas, water and other fittings 1981 I 011 24042 1,635 2,227 1,142 304 5,617 65 2,085 135
1982 1253 19 902 1,877 2,707 602 340 5,863 85 2,387 72 (+24) (-17) (+15) (+22) (-47) (+12) (+4) (+31) (+14) (-47)
1983 I 340 22 398 1,811 2,675 720 388 5,848 147 2,229 48 (+7) (+13) (-4) (-1) (+20) (+14) (If) (+73) (-7) (-33)
1984 I 640 23 988 1,964 3,197 1,473 443 7,486 189 2,584 32 (+22) (+7) (+8) (+20) ( +105) (+14) (+28) (+29) (+16) (-33)
Special trades-not elsewhere classified 1981 83 1116 49 47 6 8 119 61 2 1982 129 970 47 54 8 7 119 I 51 3
(+55) (-13) (-4) (+15) (+33) (-13) (-) ( +9,670) (-16) (+50) 1983 72 862 85 97 59 12 262 2 97 9
(-44) (-11) (+81) (+80) (+638) (+71) (+120) ( + 100) (+90) (+200) 1984 122 1173 73 85 15 13 195 I 84 2
(+69) (+36) (-14) (-12) (-75) (+8) (-26) (-50) (-13) (-78)
Total 1981 4905 114 797 9,005 10,222 10,489 1,875 33,968 371 12,096 619 1982 5396 106 711 9,826 11,302 12,470 2,167 38,082 535 13,033 688
(+10) (-7) (+9) (+11) (+19) (+16) (+12) (+44) (+8) (+11) 1983 5870 96639 9,406 11,304 13.753 2,181 38,853 675 12,295 331
(+9) (-9) (-4) (#) (+10) (+l) (+2) (+26) (-6) (-52) 1984 6779 98166 9,661 11,587 15,068 2,214 40,307 682 12,180 189
(+15) (+2) (+3) (+3) (+10) (+2) (+4) (+l) (#) (-43)
Note: Figures in brackets denote percentage change over preceding survey. #Less than 1 % in magnitude. *Less than HK$0.5 million.
143

13.1 Principal Statistics for AU Establishments Analysed by Trade Group, 1981, 1982, 1983 and 1984 Surveys of Building, Construction and Real Estate Sectors (Continued)
(b) AU Architectural, Surveying and Project Engineering Firms HK$ Million unless otherwise specified
Consumption of sundry supplies;
Nwnber fuel, Number of electricity Payments Misce/- National Gross
of persons Compen- & water; & for /aneous Other accounts additions establish- directly sation of maintenance commission operating Service business value to fixed
Trade group ments engaged employees services work expenses income receipts added assets
Architectural design 1981 136 I 357 57 7 39 26 166 4 98 5 1982 150 1882 135 12 64 54 304 13 188 5
(+10) (+39) ( + 137) ( +71) (+64) ( +108) (+83) ( +225) (+92) (-) 1983 146 I 658 141 11 53 63 323 7 204 6
(-3) (-12) (+4) (-8) (-17) (+17) (+6) (-46) (+9) (+202 1984 131 1562 122 10 64 49 297 12 187
(-10) (-6) (-13) (-9) (+21) (-22) (-8) (+71) (-8) (-95)
Real estate surveying, valuation and consultancy 1981 54 1681 133 12 15 48 277 5 211 8 1982 118 1666 150 19 28 58 328 7 236 8
( + 119) (IF) ( +13) (+58) (+87) ( +21) (+18) (+40) (+12) (-) 1983 136 1882 161 13 25 61 333 10 245 5
( + 15) (+13) (+7) (-32) (-11) ( +5) (+2) (+43) (+4) (-38) 1984 146 2028 203 15 21 79 450 25 361 18
(+7) ( +8) (+26) ( + 15) (-16) (+30) (+35) (+150) (+47) ( +260)
Structural engineering 1981 33 233 10 I 4 4 28 19 I 1982 42 294 18 3 2 7 43 33 5
(+27) (+26) (+80) (+200) (-50) (+75) (+54) (+20) (+74) ( +400) 1983 30 183 10 1 3 5 35 I 26 2
(-29) (-38) (-44) (-67) (+50) (-29) (-19) ( +279) (-21) (-60) 1984 36 181 10 I 4 4 35 . 27 3
(+20) (-1) (-) (-) (+33) (-20) (-) (-68) (+4) (+50)
Building services engineering 1981 39 761 44 3 11 16 99 3 71 3 1982 33 735 59 3 14 17 108 8 82 2
(-15) (-3) (+34) (-) (+27) (+6) (+9) (+167) (+15) (-33) 1983 33 857 97 6 11 30 200 6 159 2
(-) (+17) (+64) ( +100) (-21) (+76) (+85) (-25) (+94) (-) 1984 27 686 69 4 10 26 118 3 79 2
(-18) (-20) (-29) (-33) (-9) (-13) (-41) (-50) (-50) (-)
Civil and geotechnical engineering 1981 27 1196 102 4 63 30 247 4 155 8 1982 32 1194 131 5 52 37 259 6 170 5
(+19) (IF l (+28) (+25) (-17) (+23) ( +5) (+50) (+10) (-38) 1983 29 868 120 6 29 37 206 4 136 3
(-9) (-27) (-8) (+20) (-44) (-) (-20) (-33) (-20) (-40) 1984 20 702 113 6 14 31 187 7 141 11
(-31) (-19) (-6) (-) (-52) (-16) (-9) (+75) (+4) ( +267)
Architectural design and structural engineering 1981 34 I 059 69 5 21 16 162 3 123 5 1982 53 1130 81 7 20 29 197 2 145 5
(+56) (+7) (+17) (+40) (-5) (+81) (+22) (-33) (+18) (-) 1983 55 1 004 76 6 16 27 171 2 122 I
(+4) (-11) (-6) (-14) (-20) (-7) (-13) (-) (-16) (-80) 1984 55 1 027 86 8 38 38 192 7 114 1
(-) (+2) (+13) ( +33) (+138) (+41) ( +12) ( +250) (-7) (-)
Combination of preceding services 1981 109 3 450 286 19 127 80 670 . 11 459 25 1982 90 3 367 353 21 187 91 787 15 507 13
(-17) (-2) (+23) ( +11) (+47) (+14) (+17) (+36) (+10) (--,48) 1983 67 2634 312 16 136 78 594 12 374 3
(-26) (-22) (-12) (-24) (-27) (-14) (-25) (-20) (-26) (-77) 1984 70 I 799 220 13 75 56 424 9 285 5
(+4) (-32) (-29) (-19) (-45) (-28) (-29) (-25) (-24) (+67)
Total 1981 433 9737 699 51 281 221 1,649 30 1,136 55 1982 518 10268 926 70 366 294 2,027 50 1,360 43
(+20) (+5) (+32) (+37) (+30) (+33) (+23) (+67) (+20) (-22) 1983 496 9086 916 59 272 302 1,862 43 1,266 22
(-4) (-12) (-1) (-16) (-26) (+3) (-8) (-14) (-7) (-49) 1984 486 7985 824 56 226 284 1,704 62 1,193 40
(-2) (-12) (-10) (-5) (-17) (-6) (-8) (+44) (-6) (+82)
Note: Figures in bra~kets denote percentage change over preceding survey. IF Less than 1 % in magnitude. *Less than HK$0.5 million.
(c) AU Real Estate Development, Leasing, Brokerage and Maintenance Management Establishments HK$ Million unless otherwise specified
Consumption of materials &supplies;
Number fuel, Number of electricity Miscel- Gross National Gross
of persons Campen- & water; & laneous Service margin of accounts additions establish- directly sation of maintenance operating & rental real estate value to.fixed
Trade group ments engaged employees services expenses income development added assets
Real estate development and/or leasing 1983 2290 9 908 560 438 3,546 6,583 7,038 13,113 4,899 1984 2488 10 740 601 549 3,807 7,087 6,090 12,534 3,272
(+9) (+8) (+7) (+25) (+7) (+8) (-13) (-4) (-33)
Real estate maintenance management 1983 193 14 552 383 388 248 1,065 483 II 1984 288 11 098 336 473 340 1,170 441 11
(+49) (-24) (-12) (+22) (+37) (+JO) (-9) (-)
Real estate brokerage and agency 1983 355 1903 92 14 155 185 144 4 1984 509 2 924 126 21 118 264 197 12
(+43) (+54) (+37) ( +50) (-24) (+43) (+37) ( +200)
Total 1983 2838 26363 1,034 839 3,949 7,834 7,038 13,740 4,914 1984 3285 24762 1,063 1,042 4,265 8,522 6,090 13,171 3,295
(+16) (-6) (+3) (+24) (+8) (+9) (-13) (-4) (-33)
Note: Figures in brackets denote percentage change over preceding survey. Statistics for real estate development establishments, available from 1983 onwards, are published for the first time.
144

13.2 Principal Statistics for All Building and Civil Engineering Contractors Analysed by Gross Value of Construction Work Performed, 1984 Survey of Building, Construction and Real Estate Sectors
HK$ Million unless otherwise specified
Consump-Compen- tionof Value sation of materials of sub- Gross
Number employees &supplies; contract value Business Number of &payments fuel, electric- work Misce/- of con- receipts National Gross
of persons to labour- ity & water; rendered by laneous struction apart accounts additions Gross value of construction work establish- directly only sub- &mainten- fee sub- operating work from con- value to fixed performed (HK$'000) ments engaged contractors ance services contractors expenses performed struction added assets
Under 500 3 056 9 067 182 196 44 53 512 229 12
500-1,999 1946 16170 630 615 425 149 1,874 51 744 23
2,000-4,999 890 12 541 793 703 702 170 2,440 34 913 16
5,000-9 ,999 355 7 701 800 746 591 144 2,323 30 883 15
10,000-19,999 186 6 786 715 773 899 146 2,615 21 826 19
20,000-49,999 209 10 691 1,347 1,625 2,067 360 5,499 46 1,538 -13
50,000-99,999 68 7 751 1,012 1,323 1,609 268 4,398 96 1,315 28
100,000 and over 69 27 458 4,181 5,606 8,730 925 20,646 395 5,733 89
Total 6779 98166 9,661 11,587 15,068 2,214 40,307 682 12,180 189
13.3 Principal Statistics for All Building and Civil Engineering Contractors Analysed by National Accounts V aloe Added, 1984 Survey of Building, Construction and Real Estate Sectors
HK$ Million unless otherwise specified
Consump-Campen- tionof Value sation of materials of sub- Gross
Nwnber employees &supplies; contract value Business Number of &payments fuel, electric- work Miscel- of con- receipts National Gross
of persons to labour- ity& water; rendered by /aneous struction apart accounts additions National accounts establish- directly only sub- &mainten· fee sub- operating work from con- value to fixed value added (HK$'000) ments engaged contractors ance services contractors expenses performed struction added assets
Under 500 4 534 19 293 536 - 687 1,122 259 2,550 24 537 21
500-999 955 10 568 520 478 616 113 1,784 21 606 18
1,000-2,499 620 10470 787 759 1,370 180 3,164 53 918 17
2,500-4,999 244 8 739 730 761 936 161 2,639 45 839
5,000-9,999 234 9 750 1,143 1,343 1,292 249 4,142 44 1,321 31
10,000-24,999 107 8 974 1,240 1,592 1,324 265 4,650 62 1,552 -3
25,000-49,999 40 6917 985 1,723 1,587 219 4,821 128 1,411 28
50,000 and over 44 23 454 3,721 4,244 6,821 768 16,556 305 4,996 69
Total 6779 98166 9,661 11,587 15,068 2,214 40,307 682 12,180 189
145

13 .4 Construction Site Statistics, 1984 Survey of Building, Construction and Real Estate Sectors
Client party
Public sector*
Private sector
Note:
Total
(a) Analysed by Client Party
Number of sites
682
1100
1782
Total expenses
7,425
10,770
18,195
Major project expenses
Materials& supplies as
input/or construction Wages to
work operatives
1,860 575
3,015 528
4,875 1,103
*Includes the Hong Kong Government, Mass Transit Railway Corporation and Kowloon-Canton Railway Corporation.
Nature of construction activity
Site formation and clearance
Piling and related foundation work
Erection of architectural superstructure
Civil engineering construction
Total
(b) Analysed by Nature of Construction Activity
Number of sites
54
379
934
415
1,782
Total expenses
441
980
12,021
4,753
18,195
Major project expenses
Materials& supplies as
input/or construction Wages to
work opertitives
58 34
446 67
3,207 550
1,164 452
4,875 1,103
HK$ Million unless otherwise specifi.ed
Gross value Sub-contract of construction
work work performed
4,990 8,933
7,227 12,227
12,217 21,160
HK$ Million unless otherwise specified
Gross value Sub-contract of construction
wo'rk work performed
349 515
467 1,161
8,264 13,438
3,136 6,046
12,217 21,160
13 .5 Real Estate Project Statistics Analysed by End-use of Building, 1984 Survey of Building, Construction and Real Estate Sectors
End-use of building
Private residential premises
Government Home Ownership Schemes (Private Sector Participation Schemes)
Office buildings
Hotels and boarding houses
Multi-purpose commercial premises
Commercial/residential (composite) buildings
Flatted factory blocks
Warehouses
Total
Note: *Less than lIK$0.5 million.
146
Number of
projects
300
105
35
171
58
12
694
Total expenses
4,454
1,236
410
71
2,624
1,610
824
250
11,478
Payments to
contractors
2,971
1,000
335
27
1,936
1,246
654
162
8,331
Building materials&
fittings supplied
18
15
17
59
Project expenses incurred during reporting period
Architectural iksign & technical
consultancy fees
207
16
11
8
64
77
31
5
418
Interest , payments
1,169
215
56
35
598
251
121
63
2,508
Other project
expenses
89
12
28
17
161
HK$ Million unless otherwise specified
Value Gross floor accrued to area of
project Land buildings during area of when
reporting projects completed period ('OOO m2 ) ('OOO m2 )
5,515 3 853 6 435
1,791 145 924
751 27 327
53 60
3,486 95 967
2,467 275 2003
788 220 2083
208 44 412
15,060 4664 13211

13.6 Gross Value of Construction Work Performed by All Building and Civil Engineering Contractors, Analysed by Broad Trade Group, Contractor's Role and Type of Construction Location
HK$Million
Gross value of construction work performed Broad trade group/Contractor's role/ Type of construction location 1979 1980 1981 1982 1983 1984 1985#
New construction works and renovation and maintenance
Main contractors
Building and construction sites 12,195 15,438 19,485 22,295 21,955 21,160 19,156 Other minor new construction work locations 601 972 1,145 884 783 856 Erected buildings and structures 1,275* 874 1,755 1,904 2,281 2,979 2,864
Sub-contractors
Building and construction sites 1,989 2,241 3,270 4,452 4,815 4,026 4,654 Other minor new construction work locations 303 544 575 507 451 282 Erected buildings and structures 258 960 630 786 1,045 605
Sub-total 15.459 19,715 26.986 31.001 31,228 30,445 28,416
Special trades
Main contractors
Other minor new construction work locations 8 54 510 383 820 1,339 755 Erected buildings and structures "659* 495 652 627 585 .1,037 1,039
Sub-contractors
Building and construction sites 2,492 3,199 4,990 5,300 5,511 6,697 6,503 Other minor new construction work locations 43 303 321 399 271 424 Erected buildings and structures 438 528 451 310 518 536
Sub-total 3,159 4,229 6,982 7,081 7,625 9,862 9,257
All building and civil engineering contractors 18,618 23,944 33,968 38,082 38,853 40,307 37,674
Note: *Includes gross value of construction work performed by sub-contractors at erected buildings and structures. #Figures for the year 1985 were provisional estimates ba_sed on the results of the Quarterly Survey of Construction Output whilst figures for the years 1979 to 1984 were obtained from the Annual Survey of Building, Construction and Real Estate Sectors. Results of the Annual Survey are subject to smaller sampling errors by virtue of a larger sample size.
147

13.7 Completed New Buildings Certified for Occupation by Type
Type of building 1976 1977 1978 1979 1980 1981 1982 1983 1984 1985
Residential
Number of building projects 86 93 95. 92 106 147 125 94 65 73
Total cost of construction (HK$'000) 321,416 416,643 503,342 588,442 949,864 1,711,798 1,371,501 1,668,970 937,410 1,066,004
Cost of usable floor area (HK$/m2)* 1,708 1,597 1,631 2,069 2,624 3,694 3,890 5,247 5,310 3,928
Non-residential
Number of building projects 207 244 235 209 209 237 270 257 245(23) 173(5)
Total cost of construction (HK$'000) 733,599 1,256,946 1,461,390 1,456,428 2,350,867 3,512,530 5,691,909 5,575,888 3,548,477 4,394,580
Cost of usable floor· area (HK$/m2)* 985 905 919 816 1,494 1,869 2,562 3,454 3,154 3,646
Combined residential and non-residential
Number of building projects 301 265 257 257 229 216 187 172 172(1) 168
Total cost of construction (HK$'000) 675,174 761,436 1,060,042 1,223,846 1,373,735 2,013,829 3,058,033 4,792,383 2,447,979 4,909,890
Cost of usable floor area (HK$/m2)* 1,129 1,128 1,220 1,472 2,004 2,304 3,631 4,085 3,870 3,442
Total
Number of building projects 594 602 587 558 544 600 582 523 482(24) 414(5)
Total cost of construction (HK.$'000) 1,730,188 2,435,026 3,024,774 3,268,716 4,674,466 7,238,157 10,121,443 12,037,240 6,933,867 10,370,475
Cost of usable floor area (HK$/m2)* 1,133 1,048 1,096 1,130 1,785 2,253 2,967 3,878 3,591 3,571
Note: Figures in brackets denote the numbers of building projects, included in the corresponding total building projects, for which the construction costs are still not available. *Calculation excludes projects with no area given or construction costs still not available.
13.8 Usable Floor Area of Completed New Buildings by End-use by Census Area 'OOO m 2
End-use/Census area 1976 1977 1978 1979 1980 1981 1982 1983 1984 1985
For residential use
Hong Kong Island 282 358 511 487 359 409 264 569 219 525
Kowloon 93 113 146 178 81 99 49 120 56 95
New Kowloon 154 130 144 75 164 166 64 56 97 278
New Territories 86 131 146 123 255 409 551 358 255 565
Total 616 732 947 863 858 1084 927 1103 627 1463
For non-residential use
Hong Kong Island 316 477 420 297 375 381 522 689 332 367
Kowloon 160 216 163 185 180 373 530 426 223 105
New Kowloon 162 343 510 376 464 305 239 297 320 210
New Territories 250 541 675 1 154 732 1 049 1 158 577 429 762
Total 888 1577 1769 2013 1750 2108 2449 1989 1304 1444
148

13.9 Completed New Buildings by Cost of Construction HK$'000 unless otherwise specified
Cost of construction (HK$) 1976 1977 1978 1979 1980 1981 1982 1983 1984 1985
Under 500,000
Number of building projects 192 149 99 77 38 20 24 26 39 22 Total cost of construction 59,165 43,941 31,042 23,703 11,428 5,105 5,957 7,229 7,133 6,705
500,000-999,999
Number of building projects 95 78 80 85 83 61 51 50 40 33 Total cost of construction 66,677 56,671 54,642 60,247 61,444 45,792 38,957 38,805 31,188 24,697
1,000,000-1,999,999
Number of building projects 94 96 81 95 79 68 ' 66 57 45 36 Total cost of construction 136,483 141,619 114,297 145,230 114,934 98,088 91,946 84,839 65,346 49,139
2,000,000-3,999,999
Number of building projects 100 107 129 113 100 115 81 78 66 62 Total cost of construction 295,784 309,157 369,108 326,129 292,377 346,056 234,746 230,835 190,650 188,215
4,000,000--6,999,999
Number of building projects 60 69 78 69 95 95 91 86 89 73 Total cost of construction 310,897 352,559 420,291 355,971 495,987 511,704 469,404 450,715 470,041 391,999
7,000,000-9,999,999
Number of building projects 23 47 45 35 46 66 54 45 27 40 Total cost of construction 180,695 384,789 362,593 279,767 374,241 552,836 444,425 378,791 228,047 324,117
10,000,000-14,999,999
Number of building projects 62 52 44 40 20 Total cost of construction 747,707 635,121 541,292 483,811 248,188
15,000,000-19,999,999
Number of building projects 30 55 75 84 103 30 32 24 25 21 Total cost of construction 680,487 1,146,289 1,672,802 2,077,669 3,324,055 507,189 566,491 413,749 422,795 357,824
20,000,000 and above
Number of building projects 81 130 112 87 99 Total cost of construction 4,423,680 7,634,396 9,890,984 5,034,856 8,779,590
Note: In case only the aggregated cost of construction can be given, a number of related projects are regarded as one single project and classified under the category corresponding to the aggregated value. Therefore, the total number of building projects in this table may not reconcile with that in Table 13.7. Figures for 1984 and 1985 do not include 24 and 5 building projects respectively for which the construction costs are still not available.
13.10 Private Domestic Units with Consent to Commence Work by Geographic Area Number of units
Area 1977 1978 1979 1980 1981 1982 1983 1984 1985
Hong Kong Island 12 498 13 878 12 168 9 954 7 552 5 072 5 110 13 638 12079
Kowloon and New Kowloon 7 840 9 083 6182 6 901 2 346 3 929 5 743 2 928 5 867
Tsuen Wan 1 070 4482 3 107 888 5 762 571 2144 1 727 6 358
Sha Tin 184 446 3 523 5 462 613 4227 7 313 3 612 4206
TuenMun 249 466 689 1 120 2 520 328 2 111 518 2560
Tai Po
} 607 692 799 742 3 475 1 838
Fanling/Sheung Shui 1 583 2 911 2 257 269 325 229 132 120 276
Rest of New Territories 1 997 2372 2 061 2119 976 1 478
Total 23424 31266 27926 27198 22182 17216 25414 26994 34662
149
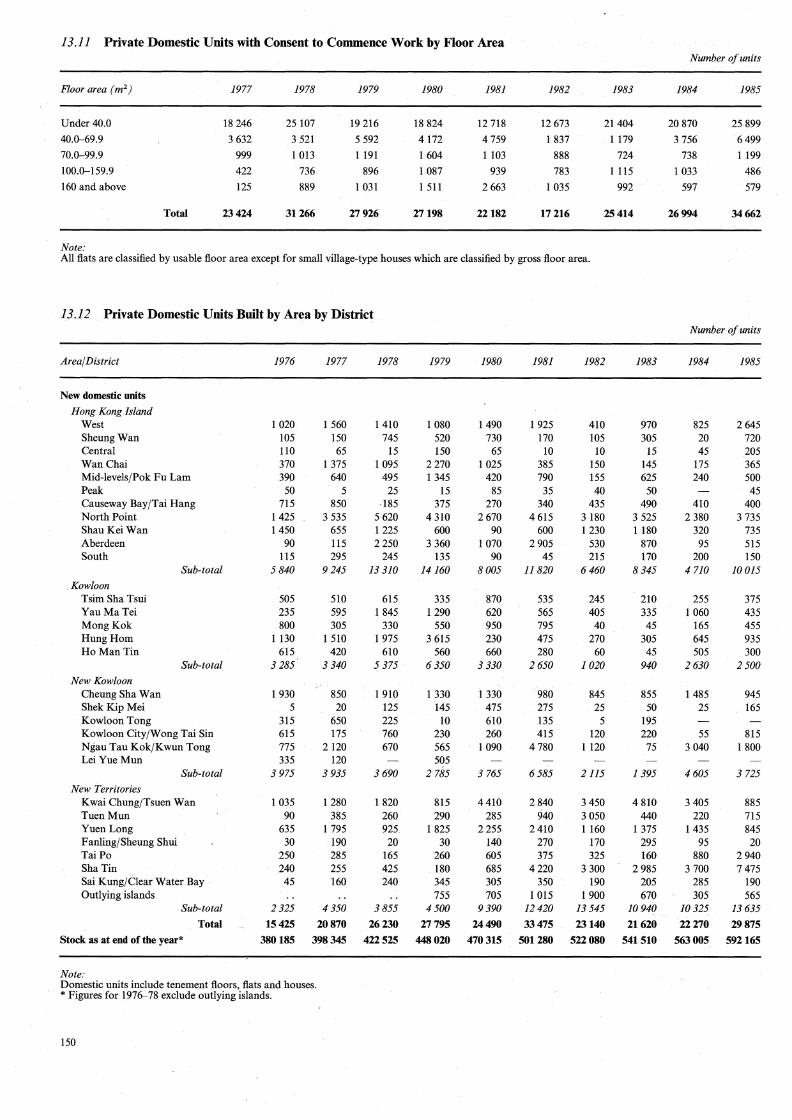
13.11 Private Domestic Units with Consent to Commence Work by Floor Area
Floor area ( m 2 )
Under 40.0 40.0---69.9
70.0-99.9 100.0-159.9 160 and above
Note:
Total
1977
18 246 3 632
999 422 125
23424
1978
25 107 3 521 1 013
736 889
31266
1979
19 216
5 592
1 191 896
1 031
27926
1980
18 824 4172 1604 1 087 1 511
27198
1981
12 718 4 759 1 103
939 2 663
22182
1982
12 673 1 837
888 783
1 035
17216
1983
21404 1179
724 1115
992
25414
All flats are classified by usable floor area except for small village-type houses which are classified by gross floor area.
13.12 Private Domestic Units Built by Area by District
Area/ District
New domestic units
Hong Kong Island West SheungWan Central Wan Chai Mid-levels/Pok Fu Lam Peak Causeway Bay/Tai Hang North Point ShauKei Wan Aberdeen South
Kowloon Tsim Sha Tsui Yau Ma Tei Mong Kok Hung Hom Ho Man Tin
New Kowloon Cheung Sha Wan Shek Kip Mei Kowloon Tong
Sub-total
Sub-total
Kowloon City/Wong Tai Sin Ngau Tau Kok/Kwun Tong Lei Yue Mun
Sub-total
New Territories Kwai Chung/Tsuen Wan TuenMun Yuen Long Fanling/Sheung Shui Tai Po Sha Tin Sai Kung/Clear Water Bay Outlying islands
. Sub-total
Total
Stock as at end of the year*
Note:
1976
1 020 105 110 370 390
50 715
1425 1 450
90 115
5 840
505 235 800
I 130 615
3 285
I 930 5
315 615 775 335
3 975
1 035 90
635 30
250 240 45
2325
15425
380185
1977
1 560 150 65
1 375 640
5 850
3 535 655 115 295
9245
510 595 305
I 510 420
3 340
850 20
650 175
2 120 120
3 935
1 280 385
1 795 190 285 255 160
4 350
20870
398345
Domestic units include tenement floors, fiats and houses. *Figures for 1976--78 exclude outlying islands.
150
1978
1 410 745
15 1 095
495 25
·185 5 620 1 225 2 250
245 13 310
615 I 845
330 I 975
610 5 375
1 910 125 225 760 670
3690
1 820 260 925 20
165 425 240
3855
26230
422525
1979
1 080 520 150
2 270 I 345
15 375
4 310 600
3 360 135
14160
335 I 290
550 3 615
560 6 350
I 330 145 10
230 565 505
2 785
815 290
1 825 30
260 180 345 755
4500
27795
448020
1980
1490 730
65 I 025
420 85
270 2670
90 1 070
90 8005
870 620 950 230 660
3 330
I 330 475 610 260
1090
3 765
4410 285
2255 140 605 685 305 705
9390
24490
470315
1981
1 925 170 10
385 790
35 340
4 615 600
2 905 45
11820
535 565 795 475 280
2650
980 275 135 415
4780
6585
2840 940
2410 270 375
4220 350
I 015 12420
33475
501280
1982
410 105 10
150 155 40
435 3 180 1230
530 215
6 460
245 405 40
270 60
1020
845 25 5
120 1120
2115
3 450 3050 1 160
170 325
3 300 190
1 900 13 545
23140
522080
1983
970 305
15 145 625
50 490
3 525 I 180
870 170
8 345
210 335 45
305 45
940
855 50
195 220
75
1395
4 810 440
1 375 295 160
2 985 205 670
10940
21620
541510
Number of units
1984
20 870 3 756
738 1 033
597
26994
1985
25 899 6499 1 199
486
579
34662
Number of units
1984
825 20 45
175 240
410 2 380
320 95
200 4 710
255 I 060
165 645 505
2630
1 485 25
55 3 040
4 605
3405 220
1 435 95
880 3 700
285 305
10325
22270
563005
1985
2 645 720 205 365 500 45
400 3 735
735 515 150
10015
375 435 455 935 300
2 500
945 165
815 1 800
3 725
885 715 845 20
2940 7 475
190 565
13635
29875
592165
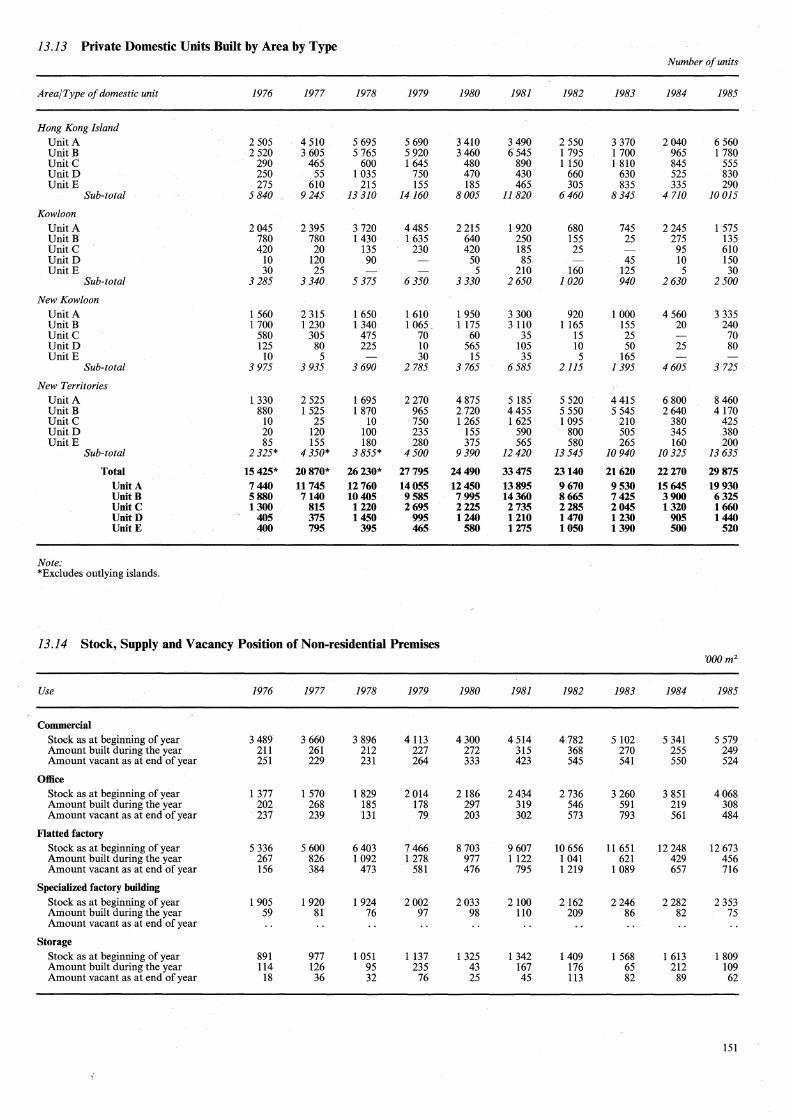
13.13 Private Domestic Units Built by Area by Type Number of units
Area/Type of domestic unit 1976 1977 1978 1979 1980 1981 1982 1983 1984 1985
Hong Kong Island Unit A 2 505 4 510 5 695 5 690 3 410 3490 2 550 3 370 2040 6 560 UnitB 2 520 3 605 5 765 5 920 3 460 6 545 1 795 1 700 965 1 780 Unit C 290 465 600 1 645 480 890 1150 1 810 845 555 UnitD 250 55 1 035 750 470 430 660 630 525 830 UnitE 275 610 215 155 185 465 305 835 335 290
Sub-total 5 840 9245 13 310 14160 8005 11820 6460 8 345 4 710 JO 015
Kowloon
Unit A 2 045 2 395 3 720 4485 2 215 1 920 680 745 2245 1 575 UnitB 780 780 1 430 1 635 640 250 155 25 275 135 Unit C 420 20 135 230 420 185 25 95 610 UnitD 10 120 90 50 85 45 10 150 UnitE 30 25 5 210 160 125 5 30
Sub-total 3 285 3 340 5 375 6 350 3 330 2650 1020 940 2630 2 500
New Kowloon
Unit A 1 560 2 315 1 650 1 610 1 950 3300 920 1 OOO 4 560 3 335 Unit B 1 700 1 230 1 340 1 065. 1 175 3 110 1165 155 20 240 UnitC 580 305 475 70 60 35 15 25 70 UnitD 125 80 225 10 565 105 10 50 25 80 UnitE 10 5 30 15 35 5 165
Sub-total 3 975 3 935 3 690 2 785 3 765 6585 2115 1395 4 605 3 725
New Territories Unit A 1 330 2 525 1 695 2 270 4 875 5 185- 5 520 4 415 6 800 8 460 Unit B 880 1 525 1 870 965 2 720 4455 5 550 5 545 2640 4 170 UnitC 10 25 10 750 1265 1 625 1 095 210 380 425 UnitD 20 120 100 235 155 590 800 505 345 380 UnitE 85 155 180 280 375 565 580 265 160 200
Sub-total 2 325* 4350* 3855* 4500 9390 12420 13 545 10 940 10325 13 635
Total 15 425* 20870* 26230* 27795 24490 33475 23140 21620 22270 29875 Unit A 7 440 11745 12760 14055 12450 13895 9670 9530 15645 19930 UnitB 5880 7140 10405 9585 7995 14360 8665 7425 3900 6325 Unite 1300 815 1220 2695 2225 2735 2285 2045 1320 1660 UnitD 405 375 1450 995 1240 1210 1470 1230 905 1440 UnitE 400 795 395 465 580 1275 1050 1390 500 520
Note: *Excludes outlying islands.
13.14 Stock, Supply and Vacancy Position of Non-residential Premises 'OOO m2
Use 1976 1977 1978 1979 1980 1981 1982 1983 1984 1985
Commercial Stock as at beginning of year 3 489 3 660 3 896 4 113 4300 4 514 4 782 5 102 5 341 5 579 Amount built during the year 211 261 212 227 272 315 368 270 255 249 Amount vacant as at end of year 251 229 231 264 333 423 545 541 550 524
Office Stock as at beginning of year 1 377 1 570 1 829 2 014 2 186 2434 2 736 3 260 3 851 4068 Amount built during the year 202 268 185 178 297 319 546 591 219 308 Amount vacant as at end of year . 237 239 131 79 203 302 573 793 561 484
Flatted factory Stock as at beginning of year 5 336 5 600 6 403 7 466 8 703 9607 10 656 11 651 12 248 12 673 Amount built during the year 267 826 1 092 1278 977 1 122 1 041 621 429 456 Amount vacant as at end of year 156 384 473 581 476 795 1219 1 089 657 716
Specialized factory building Stock as at beginning of year 1 905 1 920 1924 2002 2 033 2 100 2162 2246 2282 2 353 Amount built during the year 59 81 76 97 98 110 209 86 82 75 Amount vacant as at end of year
Storage Stock as at beginning of year 891 977 1 051 1137 1 325 1 342 1409 1 568 1 613 1 809 Amount built during the year 114 126 95 235 43 167 176 65 212 109 Amount vacant as at end of year 18 36 32 76 25 45 113 82 89 62
151

13.15 Supply of New Flatted Factory Space by Area by District '000m2
Area/ District 1976 1977 1978 1979 1980 1981 1982 1983 1984 1985
Hong Kong Island
West 2 36
SheungWan
Central
Wan Chai
Mid-levels/Pok Fu Lam
Peak -Causeway Bay/Tai Hang
North Point 7 28 19 11 35 29
ShauKei Wan 46 120 56 7 21 14 37 12 13 12
Aberdeen 18 12 44 46 59 36 49 33
South
Sub-total 72 160 119 20 68 109 73 61 82 41
Kowloon
Tsim Sha Tsui
Yau Ma Tei
Mong Kok 5 52 3 30 35 22
Hung Hom 29 31 37 75 8 44 25 11 33 27
Ho Man Tin
Sub-total 30 31 37 79 60 47 54 46 54 27
New Kowloon
Cheung Sha Wan 35 131 78 83 64 28 95 20 10 21
ShekKip Mei
Kowloon City/Wong Tai Sin 23 17 l 21 37 17 22
Ngau Tau Kok/Kwun Tong 14 74 232 125 228 158 35 114 69 78
Lei Yue Mun 21 40 89 57 35 5 39
Sub-total 70 245 422 282 328 212 167 150 119 121
New Territories
Kwai Chung/Tsuen Wan 70 328 363 578 470 493 370 135 123 197
TuenMun 25 35 88 257 36 110 150 129 8
Yuen Long 28 5 4 5 15 8 5
Fanling/Sheung Shui * 3 4 11 3
Tai Po 12 16 26 70 15
Sha Tin 15 32 36 121 152 70 37 66
Sai Kung/Clear Water Bay
Sub-total 95 390 514 896 521 754 747 363 175 267
Total 267 826 1092 1278 977 1122 1041 621 429 456
Note: *Less than 500m2 .
. 152
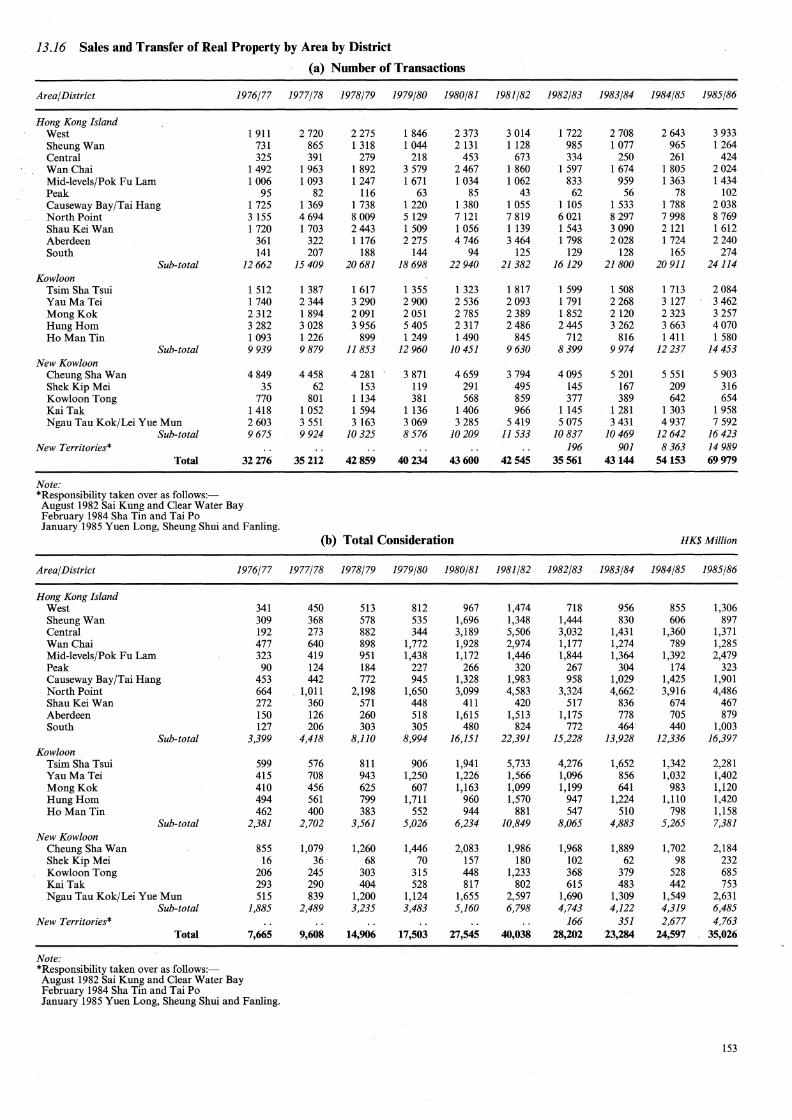
13.16 Sales and Transfer of Real Property by Area by District
(a) Number of Transactions
Area/ District 1976/77 1977/78 1978/79 1979/80 1980/81 1981/82 1982/83 1983/84 1984/85 1985/86
Hong Kong Island West 1 911 2 720 2 275 1 846 2 373 3 014 1 722 2 708 2 643 3 933 SheungWan 731 865 1 318 1 044 2 131 1 128 985 1 077 965 1264 Central 325 391 279 218 453 673 334 250 261 424 Wan Chai 1 492 1 963 1 892 3 579 2467 1 860 1 597 1 674 1 805 2024 Mid-levels/Pok Fu Lam 1 006 1 093 1247 1 671 1 034 1 062 833 959 1 363 1 434 Peak 95 82 116 63 85 43 62 56 78 102 Causeway Bay/Tai Hang 1 725 1 369 1 738 1 220 1 380 1 055 1 105 1 533 1 788 2 038 North Point 3 155 4694 8 009 5 129 7 121 7 819 6 021 8 297 7 998 8 769 ShauKei Wan 1 720 1 703 2443 1 509 1 056 1139 1 543 3 090 2 121 1 612 Aberdeen 361 322 1 176 2 275 4746 3 464 1 798 2028 1 724 2 240 South 141 207 188 144 94 125 129 128 165 274
Sub-total 12662 15 409 20681 18698 22940 21382 16129 21800 20911 24114 Kowloon
Tsim Sha Tsui 1 512 1 387 1 617 1 355 1 323 1 817 1 599 1 508 1 713 2084 Yau Ma Tei 1 740 2 344 3 290 2900 2 536 2 093 1 791 2 268 3 127 3 462 Mong Kok 2 312 1 894 2 091 2 051 2 785 2 389 1 852 2 120 2 323 3 257 Hung Hom 3 282 3 028 3 956 5 405 2 317 2 486 2445 3 262 3 663 4070 Ho Man Tin 1 093 1 226 899 1249 1490 845 712 816 1 411 1 580
Sub-total 9939 9879 11853 12 960 10451 9630 8 399 9 974 12 237 14 453 New Kowloon
Cheung Sha Wan 4849 4 458 4 281 3 871 4 659 3 794 4095 5 201 5 551 5 903 ShekKipMei 35 62 153 119 291 495 145 167 209 316 Kowloon Tong 770 801 1 134 381 568 859 377 389 642 654 Kai Tak 1 418 1 052 1 594 1136 1 406 966 1 145 1 281 1 303 1 958 Ngau Tau Kok/Lei Yue Mun 2 603 3 551 3 163 3 069 3 285 5 419 5 075 3 431 4 937 7 592
Sub-total 9675 9 924 10325 8 576 10209 11533 10837 10469 12642 16 423 New Territories* 196 901 8 363 14 989
Total 32276 35212 42859 40234 43600 42545 35561 43144 54153 69979
Note: *Responsibility taken over as follows:-August 1982 Sai Kung and Clear Water Bay February 1984 Sha Tin and Tai Po January 1985 Yuen Long, Sheung Shui and Fanling.
(b) Total Consideration HK$ Million
Area/District 1976/77 1977/78 1978/79 1979/80 1980/81 1981/82 1982/83 1983/84 1984/85 1985/86
Hong Kong Island West 341 450 513 812 967 1,474 718 956 855 1,306 SheungWan 309 368 578 535 1,696 1,348 1,444 830 606 897 Central 192 273 882 344 3,189 5,506 3,032 1,431 1,360 1,371 Wan Chai 477 640 898 1,772 1,928 2,974 1,177 1,274 789 1,285 Mid-levels/Pok Fu Lam 323 419 951 1,438 1,172 1,446 1,844 1,364 1,392 2,479 Peak 90 124 184 227 266 320 267 304 174 323 Causeway Bay/Tai Hang 453 442 772 945 1,328 1,983 958 1,029 1,425 1,901 North Point 664 1,011 2,198 1,650 3,099 4,583 3,324 4,662 3,916 4,486 Shau Kei Wan 272 360 571 448 411 420 517 836 674 467 Aberdeen 150 126 260 518 1,615 1,513 1,175 778 705 879 South 127 206 303 305 480 824 772 464 440 1,003
Sub-total 3,399 4,418 8,110 8,994 16,151 22,391 15,228 13,928 12,336 16,397 Kowloon
Tsim Sha Tsui 599 576 811 906 1,941 5,733 4,276 1,652 1,342 2,281 Yau Ma Tei 415 708 943 1,250 1,226 1,566 1,096 856 1,032 1,402 Mong Kok 410 456 625 607 1,163 1,099 1,199 641 983 1,120 Hung Hom 494 561 799 1,711 960 1,570 947 1,224 1,110 1,420 Ho Man Tin 462 400 383 552 944 881 547 510 798 1,158
Sub-total 2,381 2,702 3,561 5,026 6,234 10,849 8,065 4,883 5,265 7,381 New Kowloon
Cheung Sha Wan 855 1,079 1,260 1,446 2,083 1,986 1,968 1,889 1,702 2,184 ShekKip Mei 16 36 68 70 157 180 102 62 98 232 Kowloon Tong 206 245 303 315 448 1,233 368 379 528 685 Kai Tak 293 290 404 528 817 802 615 483 442 753 Ngau Tau Kok/Lei Yue Mun 515 839 1,200 1,124 1,655 2,597 1,690 1,309 1,549 2,631
Sub-total l,885 2,489 3,235 3,483 5,160 6,798 4,743 4,122 4,319 6,485 New Territories* 166 351 2,677 4,763
Total 7,665 9,608 14,906 17,503 27,545 40,038 28,202 23,284 24,597 35,026
Note: *Responsibility taken over as follows:-August 1982 Sai Kung and Clear Water Bay February 1984 Sha Tin and Tai Po January 1985 Yuen Long, Sheung Shui and Fanling.
153
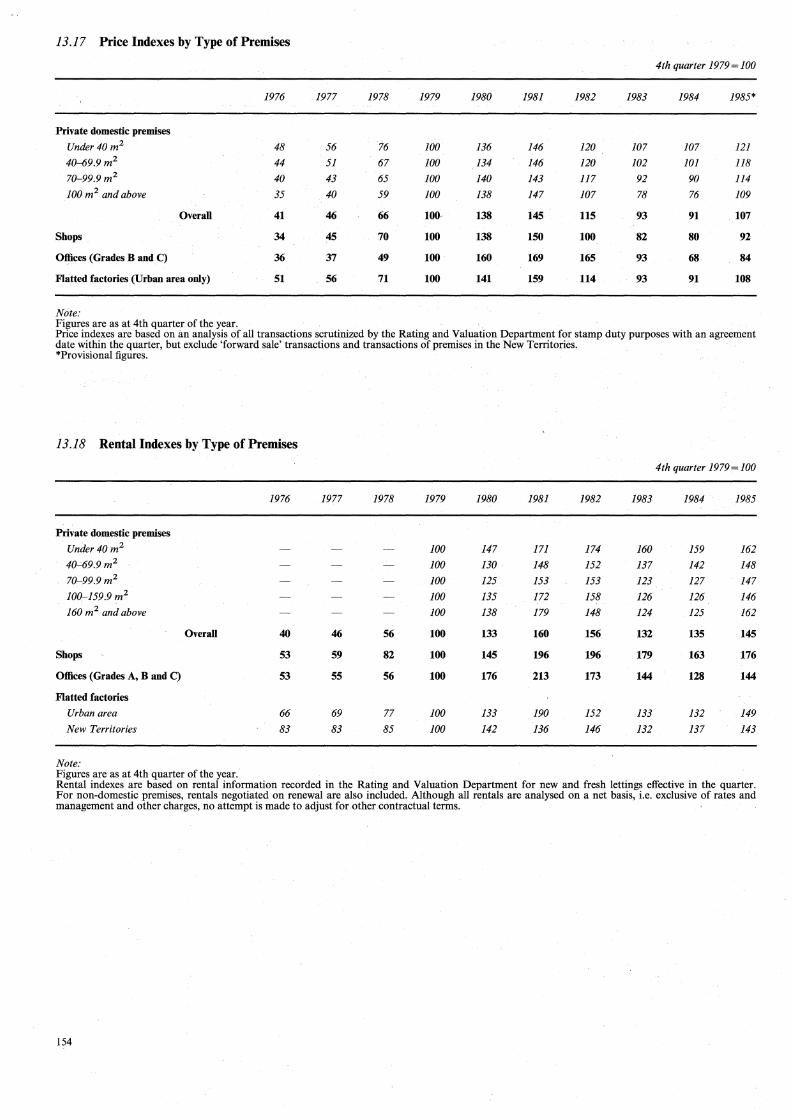
13.17 Price Indexes by Type of Premises
4th quarter 1979=100
1976 1977 1978 1979 1980 1981 1982 1983 1984 1985*
Private domestic premises
Under40m 2 48 56 76 JOO 136 146 120 107 107 121 40--69.9 m2 44 51 67 JOO 134 146 120 102 IOI 118 70-99.9 m2 40 43 65 100 140 143 117 92 90 114
JOO m2 and above 35 40 59 100 138 147 107 78 76 109
Overall 41 46 66 100~ 138 145 115 93 91 107
Shops 34 45 70 100 138 150 100 82 80 92
Offices (Grades Band C) 36 37 49 100 160 169 165 93 68 84
Flatted factories (Urban area only) 51 56 71 100 141 159 114 93 91 108
Note: Figures are as at 4th quarter of the year. Price indexes are based on an analysis of all transactions scrutinized by the Rating and Valuation Department for stamp duty purposes with an agreement date within the quarter, but exclude 'forward sale' transactions and transactions of premises in the New Territories. *Provisional figures.
13.18 Rental Indexes by Type of Premises
4th quarter 1979=100
1976 1977 1978 1979 1980 1981 1982 1983 1984 1985
Private domestic premises
Under40m 2 JOO 147 171 174 160 159 162 40-'69.9 m2 JOO 130 148 152 137 142 148 70-99.9m2 JOO 125 153 153 123 127 147 100-159.9 m2 JOO 135 172 158 126 126 146 160 m2 and above JOO 138 179 148 124 125 162
Overall 40 46 56 100 133 160 156 132 135 145
Shops 53 59 82 100 145 196 196 179 163 176
Offices (Grades A, Band C) 53 55 56 100 176 213 173 144 128 144
Flatted factories
Urban area 66 69 77 JOO 133 190 152 133 132 149 New Territories 83 83 85 JOO 142 136 146 132 137 143
Note: Figures are as at 4th quarter of the year. Rental indexes are based on rental information recorded in the Rating and Valuation Department for new and fresh lettings effective in the quarter. For non-domestic premises, rentals negotiated on renewal are also included. Although all rentals are analysed on a net basis, i.e. exclusive of rates and management and other charges, no attempt is made to adjust for other contractual terms.
154

13.19 Instruments Registered in the Land Office
1976 1977 1978 1979 1980 1981 1982 1983 1984 1985
Assignments of properties
Assignments of lot Number 632 628 645 491 388 460 255 201 201 293 Value (HK$ Million) 1,149.50 1,554.11 1,810.67 3,417.81 3,239.73 10,580.90 3,848.81 # 2,032.08 683.31 3,168.49
Assignments of share of lot Number 11 508 12 401 17 048 14 779 16 025 17 939 17 365 17 888 19 816 28 931 Value (HK$ Million) 2,133.50 2,961.98 4,216.66 4,509.93 7,705.73 17,709.73 12,723.21 10,028.74 9,364.00 13,216.58
Assignments of section Number 603 622 638 497 498 508 275 247 217 301 Value (HK$ Million) 1,019.35 1,021.42 1,605.84 3,255.28 4,048.01 10,063.06 3,368.75# 2,750.34 1,490.62 3, 751.07
Assignments of share of section Number 20 861 24190 30 732 31 313 32 149 33 608 30 650 30 376 32 542 44 860 Value (HK$ Million) 3,123.94 4,169.88 6,519.55 7,834.47 12,147.19 19,276.12 18,822.44 13,927.55 13,014.61 18,091.98
Mortgages
Building mortgages/building legal charges Number 152 114 127 121 154 130 119 54 46 52 Value (HK$ Million) 493.96 728.49 586.75 801.63 2,217.45 1,366.88 1,483.27# 608.35 286.09 974.10
Mortgages/legal charges other than building mortgages/ building legal charges Number 31 214 36 590 46 347 44288 56 975 56 974 49709 41 022 43 857 64602 Value (HK$ Million) 5,705.96 7,673.55 11,575.87 16,876.35 30,846.04 48,760.26 38,148.25 40,615.00 15,362.74 25,147.89
Receipts, discharges and releases Number 20970 22177 25 323 26 450 33 266 35 462 30072 26 957 26726 36 633 Value (HK$ Million) 3,043.66 4,005.22 5,185.04 6,430.44 10,521.77 18,218.29 21,011.26 12,255.23 # 14,586.35 22,735.10
Agreements for sale and purchase Number 15 810 25 728 33 290 31 354 31 943 24998 17 436 24447 29 959 54405 Value (HK$ Million) 11,934.64t 36,965.12
Tenancy agreements Number 1 862 1 793 2 127 2130 1 853 2 329 2 831 2 179 2 580 2 349 Value (HK$ Million)
Exclusion orders issued under Landlord and Tenant Ordinance
Number 86 50 56 36 38 27 15 4 4 3 Value (HK$ Million)
Miscellaneous* Number 7 238 9 345 14 382 18 595 19 803 17 310 16 499 17 008 20677 30 505 Value (HK$ Million) 11.46 17.24 35.25 402.93 27.05 14.60 62.48# 261.02 148.59 50.31
Total instruments registered Number 110 936 133638 170715 170054 193092 189745 165226 160 383 176625 262934
Value (HK$ Million) 16,681.34 22,131.88 31,535.64 43,528.84 70,752.98 125,989.84 99,468.48# 82,478.30 66,870.94 124,100.63
Note: Assignments of lot refer to documents which effect the transfer of ownership of property of a parcel of ground (a lot). Assignments of share of lot refer to documents which effect the transfer of ownership of property of undivided shares of a lot. Assignments of section refer to documents which effect the transfer of ownership of property of a portion of ground (a section). Assignments of share of section refer to documents which effect the transfer of ownership of property of undivided shares of a section of a lot. Receipts, discharges and releases refer to documents which effect the release of a property from a charge upon repayment of loan and include reassignments and certificates of satisfaction. *These refer to documents lodged by solicitors for registration in the Land Office other than those listed in the table. They include Probates and Letters of Administration, Deeds of Covenant, Court Orders, Declaration of Trust, Undertakings, various Agreements and Memoranda etc.
tFigure for April to December 1984. #Revised figure.
155
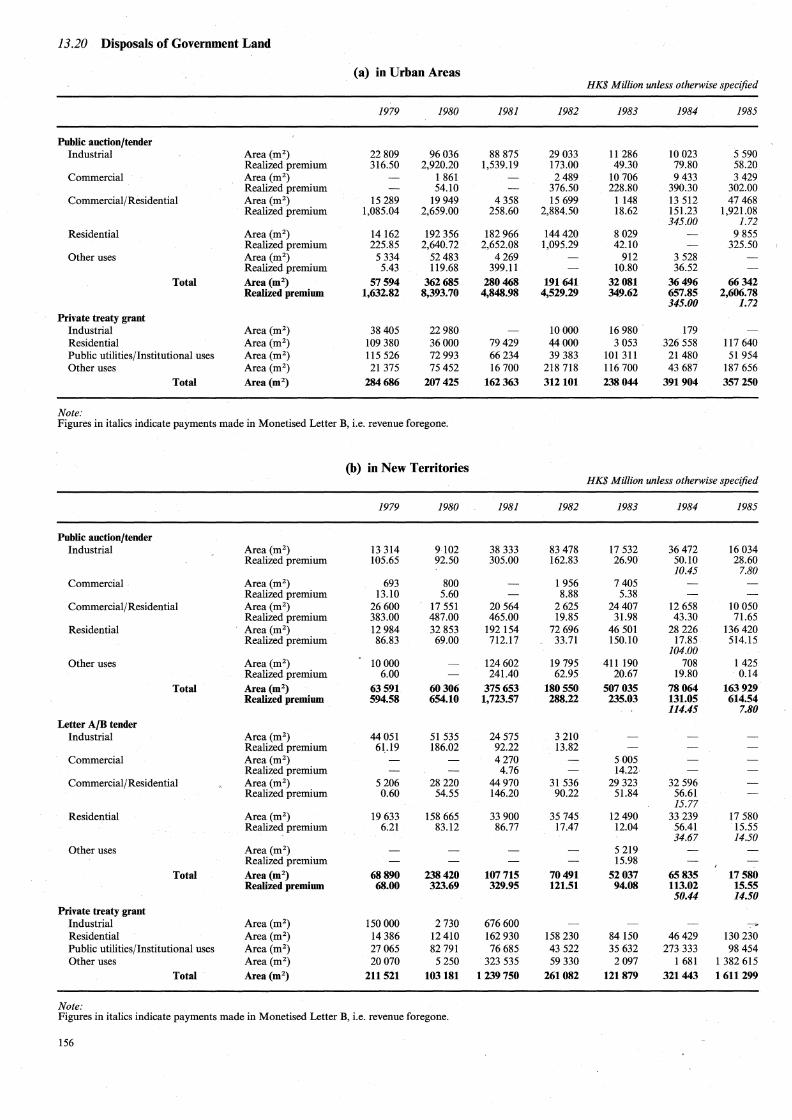
13.20 Disposals of Government Land
(a) in Urban Areas HK$ Million unless otherwise specified
1979 1980 1981 1982 1983 1984 1985
Public auction/tender Industrial Area (m2 ) 22 809 96036 88 875 29 033 11 286 10 023 5 590
Realized premium 316.50 2,920.20 1,539.19 173.00 49.30 79.80 58.20 Commercial Area (m2) 1 861 2 489 10 706 9 433 3 429
Realized premium 54.10 376.50 228.80 390.30 302.00 Commercial/Residential Area (m2 ) 15 289 19 949 4 358 15 699 1148 13 512 47 468
Realized premium 1,085.04 2,659.00 258.60 2,884.50 18.62 151.23 1,921.08 345.00 1.72
Residential Area (m2) 14162 192 356 182 966 144 420 8 029 9 855 Realized premium 225.85 2,640.72 2,652.08 1,095.29 42.10 325.50
Other uses Area (m2 ) 5 334 52483 4269 912 3 528 Realized premium 5.43 119.68 399.11 10.80 36.52
Total Area (m2 ) 57594 362685 280468 191641 32081 36496 66342 Realized premium 1,632.82 8,393.70 4,848.98 4,529.29 349.62 657.85 2,606.78
345.00 1.72
Private treaty grant Industrial Area (m2 ) 38 405 22 980 10000 16 980 179 Residential Area (m2) 109 380 36000 79429 44000 3 053 326 558 117 640 Public utilities/Institutional uses Area (m2 ) 115 526 72 993 66234 39 383 101 311 21 480 51 954 Other uses Area (m2) 21 375 75 452 16 700 218 718 116 700 43 687 187 656
Total Area (m2) 284686 207 425 162363 312101 238044 391904 357 250
Note: Figures in italics indicate payments made in Monetised Letter B, i.e. revenue foregone.
(b) in New Territories HK$ Million unless otherwise specified
1979 1980 1981 1982 1983 1984 1985
Public auction/tender Industrial Area (m2 ) 13 314 9 102 38 333 83 478 17 532 36472 16 034
Realized premium 105.65 92.50 305.00 162.83 26.90 50.10 28.60 10.45 7.80
Commercial Area (m2 ) 693 800 1 956 7 405 Realized premium 13.10 5.60 8.88 5.38
Commercial/Residential Area (m2 ) 26600 17 551 20564 2 625 24407 12 658 10 050 Realized premium 383.00 487.00 465.00 19.85 31.98 43.30 71.65
Residential Area (m2 ) 12 984 32 853 192 154 72 696 46 501 28 226 136 420 Realized premium 86.83 69.00 712.17 33.71 150.10 17.85 514.15
104.00 Other uses Area (m2 ) 10000 124 602 19 795 411190 708 1 425
Realized premium 6.00 241.40 62.95 20.67 19.80 0.14
Total Area (m2) 63591 60306 375 653 180550 507 035 78064 163929 Realized premium 594.58 654.10 1,723.57 288.22 235.03 131.05 614.54
114.45 7.80
Letter A/B tender Industrial Area (m2 ) 44 051 51 535 24 575 3 210
Realized premium 6Ll9 186.02 92.22 13.82 Commercial Area (m2 ) 4270 5 005
Realized premium 4.76 14.22 Commercial/Residential Area (m2 ) 5 206 28 220 44970 31 536 29 323 32 596
Realized premium 0.60 54.55 146.20 90.22 51.84 56.61 15.77
Residential Area (m2 ) 19 633 158 665 33 900 35 745 12 490 33 239 17 580 Realized premium 6.21 83.12 86.77 17.47 12.04 56.41 15.55
34.67 14.50 Other uses Area (m2 ) 5 219
Realized premium 15.98
Total Area (m2) 68890 238420 107715 70491 52037 65835 17 580 Realized premium 68.00 323.69 329.95 121.51 94.08 113.02 15.55
50.44 14.50
Private treaty grant Industrial Area (m2) 150 OOO 2 730 676 600 Residential Area (m2 ) 14 386 12 410 162 930 158 230 84 150 46429 130 230 Public utilities/Institutional uses Area (m2 ) 27 065 82 791 76 685 43 522 35 632 273 333 98 454 Other uses Area (m2 ) 20070 5 250 323 535 59 330 2097 1 681 1 382 615
Total Area (m2) 211521 103181 1239750 261082 121879 321443 1611299
Note: Figures in italics indicate payments made in Monetised Letter B, i.e. revenue foregone.
156

Section 14: HOUSING
Figures in Tables 14.l to 14.9 are obtained from population censuses, except Table 14.4 (Stock of living quarters) which is based on the computerized frame of quarters.
A living quarters is either (i) an occupied/unoccupied residential quarters or (ii) a non-residential quarters which has one or more persons residing in it usually or during the census reference night (i.e. the night prior to the first visit by the enumerator). For an enclosed space to be counted as a quarters, it must be internally connected so that the occupants can move between rooms/cubicles or from one corner to another without going outside onto a public corridor, landing or staircase; and have direct access to the street, a corridor or landing without going through another unit.
Type of Living Quarters is defined as the type of building in which a household's living quarters is located. A self-contained quarters is a complete unit of residence which has its own entrance, an internal kitchen/cooking place, a toilet/bathroom and an internal piped water supply. Type of Accommodation is classified by the portion ofliving space occupied by the household on the reference night.
Figures on the stock of living quarters (Table 14.4) are derived from the computerized frame of quarters which include both occupied/unoccupied residential quarters and non-residential quarters which had one or more persons residing therein during field up-dating.
Tables 14.10 to 14.24 are based on data supplied by the Housing Department. The Housing Department is the executive arm of the Housing Authority which is responsible for public housing matters in Hong Kong.
There are three forms of public housing provisions: rental flats, Home Ownership Scheme flats, and temporary housing in Housing Authority cottage areas and temporary housing areas. The stock, production, size and population capacity of these housing units, their distribution by geographic area and typical rents are shown in Tables 14.10 to 14.19.
The Housing Authority is also active in the provision of commercial and community facilities in its domestic estates and flatted factories in industrial estates. The pro_duction of such non-residential buildings is shown in Tables 14.20 and 14.21.
The Government has subsidized public housing heavily to support the activities of the Housing Authority. Recurrent income is also generated in the form of domestic rents, and rents and other income from non-domestic properties. The recurrent account of the Housing Authority and public housing capital expenditures is shown in Tables 14.22 to 14.24.
A flat is a unit of accommodation in the Housing Authority estate block let or designated to be let for domestic purposes. A Housing Authority block is 'completed' when it has been certified as substantially completed by the Chief Architects of the Housing Department.
'Consent to commence work' refers to the award of contracts to a contractor(s) by the Housing Authority. 'Authorized population' refers to the persons registered on the tenancy records kept by the Housing Department.
157

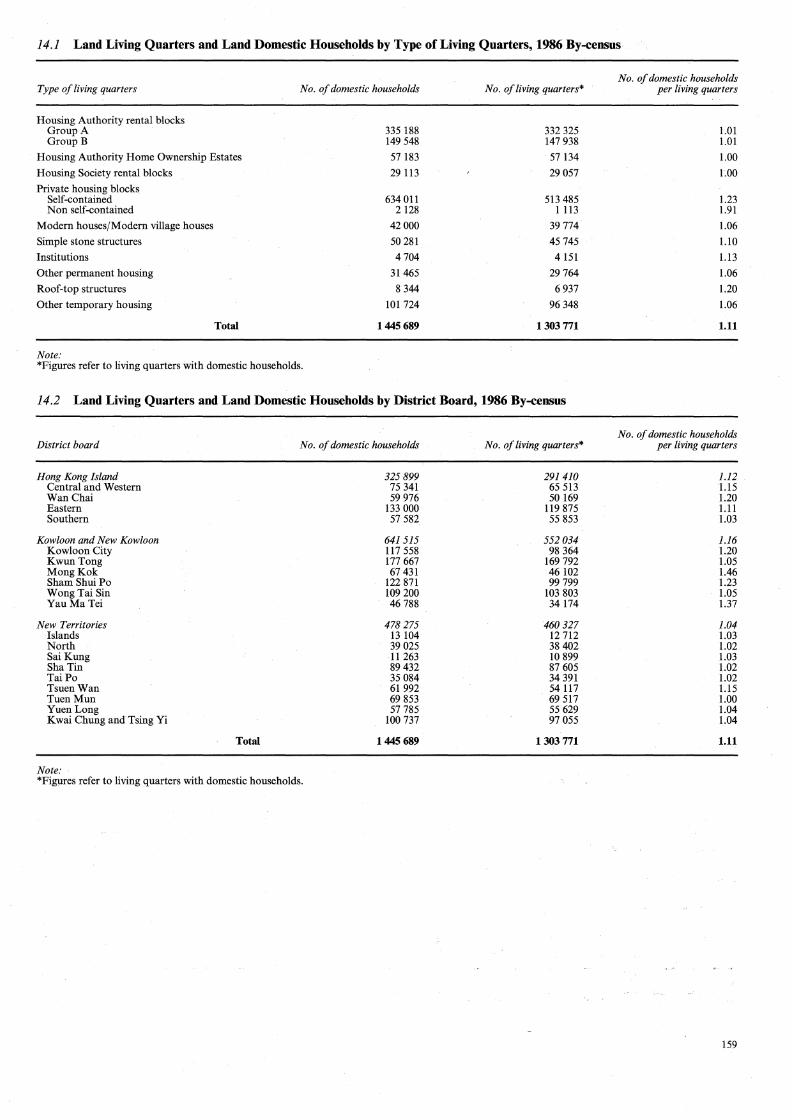
14.1 Land Living Quarters and Land Domestic Households by Type of Living Quarters, 1986 By-census
Type of living quarters
Housing Authority rental blocks Group A Group B
Housing Authority Home Ownership Estates
Housing Society rental blocks
Private housing blocks Self-contained Non self-contained
Modern houses/Modern village houses
Simple stone structures
Institutions
Other permanent housing
Roof-top structures
Other temporary housing
Note:
Total
No. of domestic households
335 188 149 548
57 183
29 113
634 Oil 2 128
42000
50 281
4704
31465
8 344
101 724
1445689
*Figures refer to living quarters with domestic households.
No. of living quarters*
332 325 147 938
57 134
29 057
513 485 1113
39 774
45 745
4151
29764
6 937
96 348
1303771
14.2 Land Living Quarters and Land Domestic Households by District Board, 1986 By-census
District board No. of domestic households No. of living quarters*
Hong Kong Island 325 899 291410 Central and Western 75 341 65 513 Wan Chai 59 976 50 169 Eastern 133 OOO 119 875 Southern 57 582 55 853
Kowloon and New Kowloon 641 515 552 034 Kowloon City 117 558 98 364 Kwun Tong 177 667 169 792 Mong Kok 67 431 46102 Sham ShuiPo 122 871 99 799 Wong Tai Sin 109 200 103 803 Yau Ma Tei 46 788 34174
New Territories 478 275 460 327 Islands 13 104 12 712 North 39 025 38 402 Sai Kung 11 263 10 899 Sha Tin 89 432 87 605 Tai Po 35 084 34 391 Tsuen Wan 61992 54 117 TuenMun 69 853 69 517 Yuen Long 57 785 55 629 K wai Chung and Tsing Yi 100 737 97 055
Total 1445 689 1303 771
Note: *Figures refer to living quarters with domestic households.
No. of domestic households per living quarters
1.01 I.OJ
1.00
1.00
1.23 1.91
1.06
1.10
1.13
1.06
1.20
1.06
1.11
No. of domestic households per living quarters
1.12 1.15 1.20 1.11 1.03
1.16 1.20 1.05 1.46 1.23 1.05 1.37
1.04 1.03 1.02 1.03 1.02 1.02 1.15 1.00 1.04 1.04
1.11
159
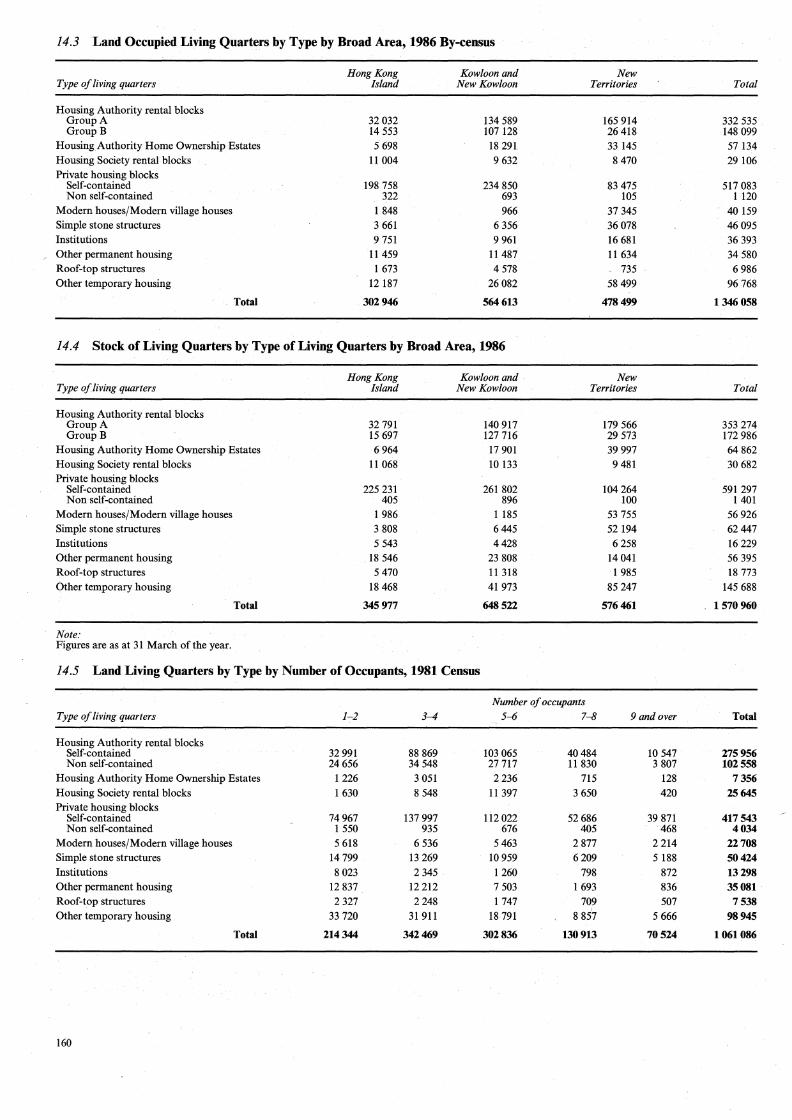
14.3 Land Occupied Living Quarters by Type by Broad Area, 1986 By-census
Hong Kong Kowloon and New Type of living quarters Island New Kowloon Territories Total
Housing Authority rental blocks Group A 32032 134 589 165 914 332 535 GroupB 14 553 107 128 26 418 148 099
Housing Authority Home Ownership Estates 5 698 18 291 33 145 57 134 Housing Society rental blocks 11 004 9 632 8470 29 106 Private housing blocks
Self-contained 198 758 234 850 83 475 517 083 Non self-contained 322 693 105 1120
Modem houses/Modern village houses 1 848 966 37 345 40 159 Simple stone structures 3 661 6 356 36078 46 095 Institutions 9 751 9 961 16 681 36 393 Other permanent housing 11459 11487 11634 34 580 Roof-top structures 1 673 4 578 735 6 986 Other temporary housing 12 187 26082 58 499 96 768
Total 302946 564613 478499 1346 058
14.4 Stock of Living Quarters by Type of Living Quarters by Broad Area, 1986
Hong Kong Kowloon and New Type of living quarters Island New Kowloon Territories Total
Housing Authority rental blocks Group A 32 791 140917 179 566 353 274 Group B 15 697 127 716 29 573 172 986
Housing Authority Home Ownership Estates 6964 17 901 39 997 64 862 Housing Society rental blocks 11 068 10 133 9 481 30 682 Private housing blocks
Self"contained 225 231 261 802 104 264 591 297 Non self-contained 405 896 100 1 401
Modern houses/Modern village houses 1 986 1185 53 755 56926 Simple stone structures 3 808 6445 52194 62447 Institutions 5 543 4428 6 258 16 229 Other permanent housing 18 546 23 808 14 041 56 395 Roof-top structures 5 470 11 318 1 985 18 773 Other temporary housing 18 468 41 973 85 247 145 688
Total 345977 648 522 576 461 1570 960
Note: Figures are as at 31 March of the year.
14.5 Land Living Quarters by Type by Number of Occupants, 1981 Census
Number of occupants Type of living quarters 1-2 3--4 5--6 7~ 9 and over Total
Housing Authority rental blocks Self-contained 32 991 88 869 103 065 40484 10 547 275 956 Non self-contained 24656 34 548 27 717 11 830 3 807 102558
Housing Authority Home Ownership Estates 1226 3 051 2236 715 128 7356 Housing Society rental blocks 1 630 8 548 11 397 3 650 420 25645 Private housing blocks
Self-contained 74967 137 997 112 022 52 686 39 871 417543 Non self-contained 1 550 935 676 405 468 4034
Modern houses/Modern village houses 5 618 6 536 5 463 2877 2 214 22708 Simple stone structures 14 799 13 269 10959 6209 5 188 50424 Institutions 8 023 2 345 1260 798 872 13298 Other permanent housing 12 837 12 212 7 503 1 693 836 35081 Roof-top structures 2 327 2248 1 747 709 507 7538 Other temporary housing 33 720 31 911 18 791 8 857 5 666 98945
Total 214344 342469 302836 130913 70524 1061086
160

14.6 Distribution of Land Domestic Households by Tenure, 1961-1986 Censuses
1961 Census* 1971 Census 1976 By-census 1981 Census 1986 By-census
Number of Number of Number of Number of Number of Tenure households % households % households % households % households %
Owner 134 186 20.1 152 874 18.1 229 620 23.2 345 026 27.9 506 926 35.1
Sole tenant
} 384 897 45.5 459 140 46.3 545 158 44.0 657 818 45.4
Main tenant 50160 5.9 42090 4.3 48 634 3.9 24 353 1.7 491 614 73.7
Sub-tenant 170 992 20.2 143 240 14.5 145 382 11.7 73 570 5.1
Co-tenant 34 866 4.1 46 570 4.7 68 910 5.6 85 274 5.9
Rent free 40 837 6.2 52 881 6.2 34 980 3.5 30 534 2.5 31486 2.2
Rent subsidised t t t t 34 650 3.5 53 999 4.4 66 262 4.6
Total 666637 100.0 846670 100.0 990290 100.0 1237643 100.0 1445 689 100.0
Note: *Includes domestic and non-domestic households. tFigures have been classified in the other appropriate 'tenant' category depending on the terms under which the accommodation was held.
14.7 Land Domestic Households by Type of Living Quarters and Accommodation by Household Size, 1981 Census
Household size (persons)
Type of living quarters and JO and accommodation I 2 3 4 5 6 7 8 9 over Total
Housing Authority rental blocks Self-contained 15 247 22 265 34836 55 370 57600 45 588 27 248 13 915 6243 4471 282 783 Non self-contained 12436 15 571 16546 17 253 15 487 11795 7 392 4210 1957 1663 104 310
Housing Authority Home Ownership Estates 279 932 1450 1535 1319 844 456 237 87 37 7176
Housing Society rental blocks 252 1426 2845 5 808 6442 5 061 2676 1026 286 150 25 972
Private housing blocks Self-contained 112421 111 352 98448 95631 68 764 43 513 24625 12 769 6170 6311 '580004
Whole house/Flat 22968 46 037 55 714 66404 52 840 35 260 20 663 10 957 5 358 5 689 321890 Room/Cubicle 64 577 63 234 41960 28 809 15 605 8 082 3 872 1 766 790 610 229305 Beds pace 18 597 1 151 400 222 170 67 28 20 6 20661 Cockloft, etc. 6279 930 374 196 149 104 62 26 22 6 8148
Non self-contained 3 332 1220 713 582 382 235 .152 116 67 35 6834 Whole house/Flat 735 404 293 313 235 164 103 78 33 14 2372 Room/Cubicle 988 659 375 254 137 67 34 32 34 21 2601 Beds pace 1 284 79 10 5 5 6 1389 Cockloft, etc. 325 78 35 10 10 4 10 472
Modern houses/Modern village houses 3 378 4468 3 963 4 220 3 399 2 388 1680 1118 739 975 26328
Simple stone structures JO 621 9154 8172 8412 6877 5126 3679 2 313 1394 2027 57775
Institutions 690 431 335 458 236 113 29 11 5 5 2313
Other permanent housing 7 204 3 991 4 284 5 821 4051 2 360 I 039 367 236 132 29485
Roof-top structures 2 310 2088 1634 1339 1024 594 320 127 56 60 9552
Other temporary housing 20540 18423 18 229 16835 11364 7898 4917 3064 1679 2162 105111
Total 188710 191321 191455 213 264 176945 125515 74213 39273 18919 18 028 1 237 643
161

14 .8 Land Domestic Households by Type of Living Quarters and Accommodation by Tenure, 1981 Census
Type of living quarters and accommodation
Housing Authority rental blocks Self-contained Non self-contained
Housing Authority Home Ownership Estates
Housing Society rental blocks Private housing blocks
Self-contained Whole house/Flat Room/Cubicle Bedspace Cockloft, etc.
Non self-contained Whole house/Flat Room/Cubicle Bedspace Cockloft, etc.
Modern houses/Modern village houses
Simple stone structures Institutions Other permanent housing Roof-top structures Other temporary housing
Total
Owner
7136
231005 213 241
17 566 173 25
788 697
86
5
14 701 34124
56 3645
53 571
345026
Sole tenant
274 539 97402
JO 25 830
90445 89 736
709 1313 1184
129
5 501 11857
953 1611
35697
545158
Main tenant
46009
44765 913 331 456
405 31 20
533 813
319 504
48634
Tenure
Subtenant
136 558
117 952 14 078 4 528 1572
1 003 395 174
1415 3 332
922 1583
145382
Cotenant
6219 6166
46481
41 329 3 949 1203 1835
932 857 46
1618 2945
954 2692
68910
Rent free
372 318
4 15
9 798 3 733 4759
853 453 411 196 130 67 18
1023 3472
214 1879 2085
10943 . 30534
Provided/ Subsidised
by employer
1653 424
26 127
19 708 15 180 2934
695 899 459 295 45 39 80
1537 1232 2099
26597 16
121
53999
Total
282 783 104310
7176 25972
580004 321890 229305 20661 8148 6834 2372 2601 1389
472
26328 57775 2 313
29485 9552
105111
1237643
14.9 Land Domestic Households by Type of Living Quarters and Accommodation by Monthly Household Rent, 1981 Census
Type of living quarters and accommodation
Housing Authority rental blocks Self-contained Non self-contained
Housing Authority Home Ownership Estates
Housing Society rental blocks
Private housing blocks Self-contained
Whole house/Flat Room/Cubicle Bedspace Cockloft, etc.
Non self-contained Whole house/Flat Room/Cubicle Bed.space Cockloft, etc.
Modern houses/Modern village houses
Simple stone structures
Institutions Other permanent housing
Roof-top structures
Other temporary housing
Total
Household rent (HK$) Rent Under 50- JOO- 200- 300- 400- 600- 800- 1,000- 1,500- 2,000- 3,000- 4,000- 5,000-free 50 99 199 299 399 599 799 999 1,499 1,999 2,999 3,999 4,999 and over
503 2 520 58 539 107 813 76 923 32 751 3 344 452 14413 57605 28327 3402 Ill
7 166 JO
n " m 6ill 13lli 3ffl 2m
259937 226 926
29 793 1862 1 356 1696 1162
331 111 92
16982
5 211 149
1471 2 803
788 898
37 268 468 125
396
17 360 328
4999 9026 3007 I 117
58 451 536
72
302
33855 2246
24622 5 283 1 704 I 067
191 581 233
62
799
37870 1 873
33 799 1687
511 636 203 356
41 36
924
38959 2806
36 013
140 465 194 266
5
I 097
58649 11610 46558
481 460 183 202
75
I 784
365
67
43 221 17 260 25 857
104 205 101 99
I 428
25 .
24760 12 894 11 809
57 129
82 47
633
30135 19276 10859
118 118
798
12 117 9 617 2500
43 43
361
9808 8 841
967
294
3547 3489
58
97
1665 1 665
38
2 910 2910
395
Total
282 783 104310
7176 25 972
580004 321890 229 305
20661 8148 6834 2372 2601 1389
472
26328 38 831 3 671 2 610 4 929 3 238 I 948 I 634 482 200 178 54 57 775
956 JOO 143 230 44 70 532 114 109 15 2 313 8 932 534 4 289 9 409 883 791 I 651 976 714 819 211 212 14 10 40 29 485 5 761 76 257 565 643 708 819 435 151 117 20 9 552
64718 9720 20127 6009 2063 1253 776 308 137 105111
405 985 37 554 162 502 199 165 139 762 82 112 72 088 47 601 26 858 32180 12 806 10 314 3 658 1 713 3 345 1 237 643
14.10 Housing Authority Rental Flats Completed by Geographic Area
Geographic area
Hong Kong Island Kowloon New Kowloon Tsuen Wan Sha Tin TuenMun Other areas
Note:
Total
1977/78
1440
4700 270
2 170 4440
13020
1978/79
1 590
9 210 2 350
980
14130
1979/80
3 347 258
10096 5 491 3 601 6 784
182
29759
1980/81
20 73
7 lll 3 112 4458 5 706 6 289
26769
1981/82
752 192
9 201 4064 5 811 7 703 3 623
31346
1982/83
4577 98
10079 411
5402 5 105 2207
27879
1983/84
144 5 882
9 565 7 291 5 682
28564
Flats completed refer to new flats certified as substantially completed by the Chief Architects of the Housing Department.
162
1984/85
405 9408 7723 3 451
5 367
26354
1985/86
10 211 4462 3 194 6072 5447
29386

14.11 Housing Authority Rental Flats Completed by Flat Size
Flat size in person-spaces 1977/78 1978/79 1979/80 1980/81 1981/82 1982/83 1983/84 1984/85 1985/86
1 8 4 998
2 37 6 33 47 31 168
3 260 250 590 838 180 629 2 323 1 570 115
4 2 33 4 45 6 2
5 1 590 3 770 14 483 11 609 17 139 14 059 7 217 13 561 9 346
6 1 010 890 1 082 98 327 195 452 24
7 6960 6 050 8 696 10 732 10 339 9 452 13 608 8 315 14 372 8 1 570 1 990 3 161 2 785 1 083 890 1 526 305 154
9 1 300 938 556 81 1 211 1 595 2480 441 2242 10 and over 330 240 1 121 616 981 1 002 927 1 968 -2 159
Total 13020 14130 29759 26769 31346 27879 28564 26354 29386
Note: Flats completed refer to new flats certified as substantially completed by the Chief Architects of the Housing Department. Person-spaces are currently calculated at a standard of 4 sq. m. (43 sq. ft.) net living area per person. Net living area excludes such areas as the toilet, kitchen and balcony.
14.12 Distribution of Stock of Flats and Authorised Persons in Housing Authority Rental Estates by Geographic Area
Geographic area 1976/77 1977/78 1978/79 1979/80 1980/81 1981/82 1982/83 1983/84 1984/85 1985/86
Hong Kong Island Flats 40 600 41200 44200 46000 46 700 47 500 51 300 49 600 49 600 49 700 Persons 204 OOO 205 OOO 216 OOO 221 300 226 OOO 225 500 232 900 231 900 229 700 226 400
Kowloon Flats 17 100 17 100 16 800 16 900 16 600 16 500 16 400 16 200 16 700 16 700 Persons 91 OOO 89000 89000 89 500 87000 85 500 83 400 81 600 80 500 78 700
New Kowloon Flats 222 900 223 OOO 232 400 237 700 241 500 247 500 249 400 255 OOO 260 500 261 900 Persons l 103 OOO l 084 OOO 1 093 OOO l 090 600 l 066 900 1050200 1 043 OOO 1032600 l 019 300 l 003 900
Tsuen Wan Flats 72 800 75 900 78 300 80000 83 600 88 600 88 400 89 100 93 700 95 100 Persons 362 OOO 378 OOO 386 OOO 401 OOO 409 700 417 800 421 600 419 100 419 400 417 700
Sha Tin Flats 3 300 5 400 6400 9 600 14 400 20200 25 100 34 OOO 38 100 41 800 Persons 14 OOO 24000 29000 43 OOO 62 500 91 OOO 119 OOO 149 900 177 900 192 100
TuenMun Flats 2 100 5 900 6 500 12 600 17100 26000 29 900 39100 39100 45 200 Persons 10000 25 OOO 28 OOO 35 800 72 700 94400 125 300 163 300 167 600 185 700
Other areas Flats 3 500 3 500 3 500 3 500 6 500 12 900 15 OOO 19 700 25 900 32200 Persons 14 OOO 14 OOO 14 OOO 13 800 22900 41 500 59 500 77 800 99900 120 800
Total Flats 362 300 372 OOO 388100 406 300 426 500 459 300 475 500 502 700 523 700 542600 Persons 1 797 OOO 1821 OOO 1854000 1895100 1947 600 2 005 900 2 084700 2156100 2194200 2 225 300
Note: Figures are as at end of the financial year.
163

14.13 Housing Authority Rental Flats Allocated and Persons Rehoused by Category
Category 1976/77 1977/78 1978/79 1979/80 1980/81 1981/82
Emergency Flats 631 219t 526 898t 362 962 Persons 2 957 887 2208 3 611 1 450 3 853
Compassionate Flats 366t 482t 562t 608t 713t 747 Persons 1 462 1 889 2049 2 300 2 439 2466
Clearance Flats 3 134 3 276t 7258 6482t 5 448t 6 789t Persons 14 369 14 736 31 925 27 558 23 504 27 938
Redevelopment Flats 2006 1 724 3 292t 4949 3 167t 3 220 Persons 9 836 9 937 16 377 22 844 13 852 14 098
Waiting list applicants Flats 5 629t 5 336 3 010 12 854t 13 550 13 471 Persons 28 190 24660 15 561 56 594 59 520 59 523
Transfers Flats 2 828t 2 353t 2 576t 2000t 3 797t 5 215-! Persons 17 610 14 568 17 017 12 658 22 267 28 044
Junior civil servants Flats 1 499-! 706-! 486 1 100 1 100 1 500 Persons 6138 3 184 2 342 5 138 5 197 7 004
Total Flats 16095 14098f 17711t 2889Jt 28139 31905 Persons 80562 69861 87 479 130 703 128229 142 926
14.14 Average Monthly Rent of Typical Flats in Housing Authority Estates
Type
Group A Estates:
Former Government Low Cost Housing
Former Housing Authority
New Housing Authority
Group B Estates:
Note: *Position as at March 1986. t Revised figure.
164
Year of completion
1963-1966
1967-1973
1958-1965
1966-1973
Post 1973 (Urban)
Post 1973 (New Towns)
1954-1964
1964-1966
1966-1969
1969-1972
1972-1974
Size of typical fiat
(m2)
15.9 18.8 21.6
23.5 27.4 29.9 34.8
24.1 30.6 41.2
28.3 30.6 33.l 36.5
23.5 33.2 39.9
23.lt 33.l 37.2t
8.0 l l.2t 14.1
12.5 15.9 18.8
12.7 15.7 18.6
16.4 20.5
14.0 16.9 22.l 26.9
1982/83 1983/84 1984/85 1985/86
830 746 495 580 3 113 3 OOO 1 891 2000
800 800 820 910 2 693 2 844 2 887 2 866
8 OOO 8 OOO 7 500 4 700 33 145 34 401 30 520 14 709
6 OOO 6000 6 061 8 200 27 560 24 323 27 189 34 196
13 570 14 826 15 038 17600 55 965 61 120 61 966 66 560
3 837 1 937 2 127 1 927 20 725 9170 11 027 9 347
I 539 1 500 1 500 1 700 6 865 6 594 6 334 6 693
34576 33809 33541 35617 150 336 141452 141814 136371
Monthly* Monthly rent rent per unit area
. (HK$) (HK$perm2)
164 10.31 188 10.00 220 10.19
254 10.81 304 11.09 329 11.00 408 11.72
305t 12.66t 387t 12.65t 522t 12.67t
335 11.84 394t 12.88t 425t 12.84t 450 12.33
445 18.94 585 17.62 690 17.29
310t 13.42t soot 15.11 t 515t 13.84t
64 8.00 90 8.04t
116 8.23
111 8.88 140 8.81 166 8.83
117 9.21 143 9.11 172 9.25
150 9.15 191 9.32
130 9.29 158 9.35 213 9.64 261 9.70

Number of persons
1976/77 1977/78 1978/79 1979/80 1980/81 1981/82 1982/83 1983/84 1984/85 1985/86
Cottage areas
Hong Kong Island 10 700 10 500 10 100 8 OOO 7900 7 700 7400 7 300 6400 4400
New Kowloon 20 900 20 700 17 500 11 300 5 500 5 300 2100 1900 1 900 1 900
New Territories 8 500 8 300 8 200 7 700 7600 7100 7300 7400 7200 6900
Total 40100 39500 35800 26900 21 OOO 20200 16900 16600 15500 13200
Temporary housing areast
Hong Kong Island 6 500 10 600 8 500 8 300 9 300 9 800 8 200 6 300 7300 6 500
Kowloon 1 700 1 800 3 OOO 2 OOO 2000 2 700 2 600 2 800 3 200 2 100
New Kowloon 26 500 28 600 32 700 23 400 30 800 30600 29 700 37 600 38 800 33 200
New Territories 12 600 19 200 21 500 27 200 37 700 47 500 67 800 80 300 83 OOO 76 300
Total 47 300 60200 65700 60800 79800 90600 108400 127 OOO 132300 118100
Note: Figures from 1979/80 onwards are based on a more accurate new computerized population series and therefore are not exactly comparable with the pre 1979/80 figures. Figures are as at end of the financial year. tFormerly known as licensed areas.
14.16 Housing Authority Rental Flats with Consent to Commence Work by Geographic Area
Geographic area 1982/83 1983/84
Hong Kong Island
Kowloon
New Kowloon 12 882 7 014
Tsuen Wan 8 402 4 394
Sha Tin 10 626 4 817
TuenMun 6072
Other areas 4 753 8 062
Total 36663 30359
14.17 Housing Authority Rental Flats with Consent to Commence Work by Flat Size
Flat size in person-spaces 1982/83 1983/84
1 318
2
3 1 921 55
4
5 16 331 11 276
6
7 13 261 14069
8 134 240
9 1 844 1 053
10 and over 3 172 3 348
Total 36663 30359
Note:
1984/85 1985/86
9 086
8 974 4 196
3 426 905
8 528 5 036
3 136
14 746 7 848
44760 21121
1984/85 1985/86
1 048 344
1 777 879
13 475 8 018
1 224
19 230 7 632
238
3 910 2 065
3 858 2 183
44760 21121
Person-spaces are currently calculated at a standard of 4 sq. m. (43 sq. ft.) net living area per person. Net living area excludes such areas as the toilet, kitchen and balcony.
165

14.18 Home Ownership Scheme* Residential Units with Consent to Commence Work by Geographic Area by Saleable Area
Geographic area/ Saleable area 1982/83 1983/84 1984/85 1985/86
Hong Kong Island Under 39.9 m2
1960
40.0-69.9 m2 1 960 70.0-99.9 m2
Kowloon Under 39.9 m2
40.0-69.9 m2
70.0-99.9 m2
New Kowloon 1978 3178 3 340 Under 39.9 m 2 1 558 1 306 3 340 40.0-69.9 m2 420 1 872 70.0-99.9 m 2
Tsuen Wan 1120 1340 2180 Under 39.9 m2 840 536 872 40.0-69.9 m2 280 804 1 308 70.0-99.9 m 2
Sha Tin 560 1050 1680 Under 39.9 m2 420 40.0-69.9 m2 560 630 1 680 70.0-99.9 m 2
TuenMun 2800 Under 39.9 m2 2 520 40.0-69.9 m 2 280 70.0-99.9 m2
Other areas 3 544 1680 1050 Under 39.9 m2 2 082 1 260 420 40.0-69.9 m2 1462 420 630 70.0-99.9 m2
Total Under 39.9 m2 4480 5086 4296 1292 40.0--69.9 m2 2 722 2 572 1434 5 578 70.0-99.9 m 2
All districts 7202 7658 5730 6870
Note: *Excludes Private Sector Participation Scheme (P.S.P.S.) and Middle Income Housing (MIH).
14.19 Home Ownership Scheme* Residential Units Completed by Geographic Area by Saleable Area
Geographic area/Saleable area 1979/80 1980/81 1981/82 1982/83 1983/84 1984/85 1985/86.
Hong Kong Island 440 1104 1272 304 Under 39.9 m 2 440 1104 822 40.0-69.9 m2 450 304 70.0-99.9 m2
Kowloon 600 1050 150 Under 39.9 m2
40.0-69.9 m2 600 1 050 150 70.0-99.9 m2
New Kowloon 1010 925 1256 2 208 2133 1536 Under 39.9 m2 529 512 396 72 322 40.0-69.9 m2 1 010 396 744 1 812 2 061 1 214 70.0-99.9 m2
Tsuen Wan 1556 410 800 1120 Under 39.9 m2 850 328 600 980 40.0-69.9 m 2 706 82 200 140 70.0-99.9 m2
Sha Tin 389 3642 1704 1424 4080 560 Under 39.9 m2 66 792 426 3 060 420 40.0-69.9 m2 323 2 850 1 278 1424 1 020 140 70.0-99.9 m 2
TuenMun 1 311 2044 2 336 2168 2800 Under 39.9 m 2 440 210 2 800 40.0-69.9 m 2 1 311 1 604 2 336 1 958 70.0-99.9 m2
Other areas 395 1248 1984 1584 2 208 Under 39.9 m2 1 188 1 656 40.0-69.9 m2 395 1248 1 984 396 552 70.0-99.9 m2
Total Under 39.9 m2 506 3 275 1662 1262 72 5 380 5 856 40.0--69.9 m 2 1933 5397 2 737 6246 7805 4 788 832 70.0-99.9 m 2
All districts 2439 8672 4399 7508 7877 10168 6688
Note: Flats completed refer to new flats certified as substantially completed by the Chief Architects of the Housing Department. *Excludes Private Sector Participation Scheme (P.S.P.S.) and Middle Income Housing (MIH).
166

14.20 Non-residential/Composite Buildings with Consent to Commence Work by Housing Authority by Type
Type 1982/83 1983/84
Housing Authority rental Residential/ Commercial 34 27 Commercial 9 5 Industrial Others 8 11
Total 51 43 Home Ownership Schemes*
Residential/ Commercial Commercial 2 Others 3 9
Total 3 11
Note: Figures refer to the number of buildings, either partly or wholly, used for non-residential purposes. *Exclude Private Sector Participation Scheme (P.S.P.S.) and Middle Income Housing (MIH).
14.21 Non-residential/Composite Buildings Completed by Housing Authority by Type
Type 1982/83 1983/84
Housing Authority rental Residential/ Commercial 32 24 Commercial 7 8 Industrial 3 1 Others 10 28
Total 52 61 Home Ownership Schemes*
Residential/ Commercial 3 Commercial 1 Others 3 6
Total 3 10
Note: Figures refer to the number of buildings, either partly or wholly, used for non-residential purposes. *Exclude Private Sector Participation Scheme (P.S.P.S.) and Middle Income Housing (MIH).
14.22 Recurrent Account of Housing Authority
1976/77 1977/78 1978/79 1979/80 1980/81
Housing Authority Estate Working Account Income 439.0 506.6 587.7 729.8 940.7
Domestic rents 321.8 395.6 458.5 558.2 669.9 Non-domestic rents 69.6 88.9 117.9 158.5 256.8 Other income 2.6 3.3 3.0 4.1 9.3 Government grants 45.0 18.8 8.3 9.0 4.7
Expenditure 348.1 427.2 526.2 682.4 857.5 Rates 96.3 127.1 139.8 153.l 164.1 Personal emoluments 80.l 91.3 107.3 129.5 163.3 Maintenance and improvements 46.5 62.5 90.8 152.4 199.6 Utility services 49.8 52.7 58.8 77.4 108.3 Administrative and others 37.0 46.6 54.5 49.7 75.0 Finance charges 38.4 47.0 75.0 120.3 .147.2
Surplus 90.9 79.4 61.5 47.4 83.2 Squatter Control, Clearances & Temporary
Housing Areas Income 3.0 5.6 8.6 11.3 19.6
Temporary housing and temporary industrial areas fees 3.0 5.6 8.6 11.3 19.6
Expenditure 32.7 41.0 52.4 70.0 110.6 Management of temporary housing
and temporary industrial areas 7.2 10.3 15.8 23.8 37.2 Squatter control and squatter
area improvements 16.4 19.4 21.7 29.0 49.1 Clearance 9.1 11.3 14.9 17.2 24.3
Deficit (met by Government grants) 29.7 35.4 43.8 58.7 91.0
Note: *Subject to audit.
1981/82
1,254.9 822.0 415.4
11.2 6.3
1,101.3 179.4 206.9 228.7 147.0 97.4
241.9 153.6
25.7
25.7 168.8
55.3
86.4 27.1
143.1
1984/85
42 7
14 63
1 2 3
1984/85
25 6 2
22 55
3
2 5
1982/83 1983/84
1,604.5 2,031.9 1,014.1 1,275.7
568.9 723.1 13.4 17.7 8.1 15.4
1,465.8 1,861.4 195.2 251.7 261.3 333.2 305.4 352.9 167.7 190.3 160.l 194.8 376.1 538.5 138.7 170.5
29.6 35.2
29.6 35.2 272.1 312.3
67.2 89.1
169.5 181.3 35.4 41.9
242.5 277.1
26 2
14 42
6 6
1985/86
31 6
7 44
1 3 4
HK$ Million
1984/85 1985/86*
2,548.5 3,037.8 1,572.1 1,920.2
936.9 1,077.2 24.4 27.7 15.l 12.7
2,206.2 2,601.5 328.2 422.7 384.9 428.8 396.7 453.4 209.9 237.7 216.0 286.0 670.5 772.9 342.3 436.3
40.8 40.6
40.8 40.6 317.2 328.6
87.7 88.4
184.0 190.2 45.5 50.0
276.4 288.0
167

14.23 Housing Capital Expenditure-Housing Authority HK$ Million
1976/77 1977/78 1978/79 1979/80 1980/81 1981/82 1982/83 1983/84 1984/85 1985/86
Capital expenditure to be financed
New Public Rental Housing Estates 140.5 325.7 652.8 1,048.4 1,563.1 1,937.9 2,218.3 2,239.8 1,991.3 1,953.1 Redevelopment of existing estates 2.7 14.4 51.5 96.2 182.4 335.6 426.8 447.6 347.5 412.5 Home Ownership commercial facilities* 3.6 23.2 44.5 ·60.0 97.2 79.9 86.3 68.4 71.9 Flatted factories 38.1 51.9 99.0 132.0 69.3 50.8 35.7 (0.2) New Housing Authority Headquarters 0.7
Total 143.2 343.7 765.6 1,241.0 1,904.5 2,502.7 2,794.3 2,824.5 2,442.9 2,438.0
Sources of funds
From the Housing Authority Estate Working Account
Excess of income over expenditure 90.9 79.4 61.5 47.4 83.2 153.6 138.7 170.5 342.3 436.3 Provision for depreciation 38.4 44.7 53.4 66.1 94.0 131.0 180.8 236.7 289.1 343.2
Interest charged by Government on loans for Public Rental Housing 2.3 20.3 56.8 108.3 180.1 259.2 349.9 417.2 466.6
General Working Account Premium on new commercial lettings
and gas supply 15.2 13.2 25.9 22.3 0.9 17.0 17.7 20.6 31.2 Miscellaneous 3.8 1.1 4.7 2.1 4.4 1.0 30.4 36.7 (8.6)
Decre~se (Increase) in Working Capital (5.1) 38.9 16.1 47.0 63.1 (34.7) 21.2 (203.3) (424.9) (5.5)
Sub-total 143.2 179.6 177.2 244.3 351.6 451.4 618.6 604.8 691.6 1,232.0
From the Hong Kong Government Development Loan Fund for
Public Rental Housing 164.l 542.0 875.0 1,390.0 1,690.0 1,900.0 1,600.0 1,400.0 1,400.0 Home Ownership commercial
facilities 31.0 43.5 50.0 86.0 69.0 81.9 61.2 57.5 Flatted factories 45.0 105.0 105.0 70.2 35.7 32.0 4.8
Asian Development Bank 15.4 37.3 25.6 15.4 28.6 48.1 15.2 4.2 Reimbursement from Home Ownership
Fund 196.0 188.1 584.3 432.4 37.9
Sub-total 164.1 588.4 1,000.8 1,570.6 2,092.4 2,255.9 2,350.0 1,940.8 1,504.4
Application of funds
Repayment of Development Loan Fund-Principal 4.1 17.7 41.1 80.2 130.3 189.5 298.4
Total funds applied to finance capital expenditure 143.2 343.7 765.6 1,241.0 1,904.5 2,502.7 2,794.3 2,824.5 2,442.9 2,438.0
Note: Figures in brackets denote negative value. *Include land premium paid.
14.24 Housing Capital Expenditure-Hong Kong Government HK$ Million
1976/77 1977/78 1978/79 1979/80 1980/81 1981/82 1982/83 1983/84 1984/85 1985/86
Capital expenditure to be financed
Government built rental estates handed over to Housing Authority 103.7 135.3 129.5 59.0 14.3 22.2 5.4 3.6 4.0 2.0
Home Ownership domestic fiats* 562.7 263.9 395.6 935.6 1,054.0 715.5 569.0 608.2 653.8 Temporary housing areas 16.l 30.3 41.5 32.3 23.7 39.7 87.4 49.8 40.8 73.7 Temporary industrial areas 1.7 3.2 1.2 Squatter area improvement 12.7 21.1 19.9
Total 119.8 728.3 434.9 488.6 976.8 1,117.1 808.3 635.1 674.1 749.4
Sources of funds
Hong Kong Government general revenue 119.8 165.6 171.0 93.0 41.2 63.1 92.8 66.1 65.9 95.6 Hong Kong Government Home
Ownership Fund 562.7 263.9 395.6 935.6 1,054.0 715.5 569.0 608.2 653.8
Total funds applied to finance capital expenditure 119.8 728.3 434.9 488.6 976.8 1,117.1 808.3 635.1 674.1 749.4
Note: *Include land premium paid.
168

Section 15: EDUCATION
Data on educational attainment of the population are obtained from population censuses. Statistics on educational institutions and enrolment etc. are supplied by the Education Department, the University and
Polytechnic Grants Committee, the Hong Kong Examinations Authority and the Technical Education and Industrial Training Department. The figures for institutions and enrolment by type of education refer to both day and evening classes if not otherwise specified.
169


15.1 Whole Population by Educational Attainment by Sex, 1961-1981 Censuses
1961 Census 1966 By-census* 1971 Census 1976 By-census 1981 Census
Number of Number of Number of Number of Number of Educational attainment Sex persons % persons % persons % persons % persons %
No schooling and kindergarten M 428 534 13.7 463 520 12.7 404 138 10.3 395 780 9.2 408 448 8.2 F 777 231 24.8 806 230 22.l 716 233 18.2 705 240 16.4 692 831 13.9
Private tutor M 70 594 2.3 104 860 2.9 86 969 2.2 ~ ~ ~ ~ F 38 106 1.2 57 650 1.6 47 400 1.2 ~ ~ ~ ~
Primary M 763 499 24.4 836 230 22.9 942 221 23.9 997 770 23.l 1006880 20.2 F 541 392 17.3 675 800 18.5 813 683 20.7 857 120 19.9 824 253 16.5
Secondary and matriculationt M 295 261 9.4 370 770 10.2 490 365 12.5 707 570 16.4 1029677 20.6 F 146 654 4.7 230460 6.3 323 961 8.2 505 380 11.7 774 924 15.6
Post secondary and universityt M 49 891 1.6 68400 1.9 76 909 2.0 99 710 2.3 159 163 3.2 F 18 486 0.6 31 400 0.9 34 751 0.9 44140 1.0 90 384 1.8
Total (excluding transients) M 1607779 51.4 1843780 50.6 2000602 50.8 2 200830 51.0 2604168 52.2 F 1521869 48.6 1801540 49.4 1936028 49.2 2111880 49.0 2382392 47.8
Note: *Excludes persons living in institutions such as barracks, hospitals, prisons. ~ncludes under primary. tinclude craft level courses in technical institutes. tinclude post-secondary colleges, colleges of education, technical teachers' college and school of nursing. It includes also diploma/certificate courses, endorsement certificate courses and associateship of equivalent courses in polytechnic and technical institutes.
15.2 Whole Population by Quinquennial Age Group by Sex by Educational Attainment, 1981 Census
Educational attainment No Poly-
schooling/ technic/ Age Kinder- Lower Upper* Matri- Post- Technical group Sex garten Primary secondary secondary culation secondary Institute University Total
~ M 202 451 499 202950 F 185 085 648 185733
5-9 M 56 012 156 341 212353 F 50 323 146 214 196537
10-14 M 1 315 128 894 95 952 901 227062 F 1470 115 144 95 438 820 212872
15-19 M 2 381 38 742 118 578 109 304 18 453 874 3 358 914 292604 F 3 262 43 341 89700 113 036 16 532 1 899 2 945 606 271321
20-24 M 4 876 79 196 78 900 91 751 22 680 5 747 14043 10 407 307 600 F 7 698 87 261 48 869 91 809 17 723 8 495 7 672 6 705 276232
25-29 M 5 599 85 902 62 281 64 384 11 682 5 543 8 596 14 918 258905 F 10 676 88 122 40104 59 167 8 386 7130 2894 7 742 224221
30-34 M 6 862 75 723 48 156 56 469 9499 4909 4974 12 661 219253 F 12 992 76174 29 801 42 214 5 365 6002 1445 5 823 179816
35-39 M 6676 49 985 26 782 28 602 4945 3 186 2211 9 920 132307 F 13 573 42209 14 908 17 971 2 833 3 921 507 4649 100571
4~4 M 10 916 60413 22 958 24374 3 814 4046 1 822 12 465 140808 F 26 541 47 609 11910 12 794 2060 3 824 291 4672 109701
45-49 M 17 145 73 259 18 694 16 819 2436 2 631 1453 8 788 141225 F 48 829 49032 7 958 7774 1129 1 994 163 2444 119323
50-54 M 22440 77793 14 795 12 393 1 525 1 356 645 5 360 136307 F 63 295 41 663 6226 5 140 815 1 233 110 1 329 119811
55-59 M 19 183 62024 10 858 10 272 1234 1 181 351 4 373 109476 F 58 631 31 571 4948 4500 677 1 011 56 1160 102554
60-64 M 17 587 50 279 7 669 8 473 1 391 1 071 260 3 995 90725 F 57 764 23 351 3 066 3 306 422 841 37 697 89484
65 and over M 35 005 67 830 9 087 12 064 1 502 1 536 205 5 364 132593 F 152 692 31 914 3 283 3 787 453 1270 15 802 194 216
Total M 408448 1006880 514710 435806 79161 32080 37918 89165 2604168 F 692831 824253 356211 362318 56395 37620 16135 36629 2382392
Note: *Includes craft courses in technical institutes.
171

15.3 Student/Population Ratios by Age Group by Sex, 1971-1986 Censuses Percentage
1971 Census 1976 By-census 1981 Census 1986 By-census
Age group Male Female Total Male Female Total Male Female Total Male Female Total
5-9 93.0 91.6 92.3 96.8 96.3 96.5 98.2 98.2 98.2 99.3 99.4 99.3
10-14 92.5 86.5 89.6 93.2 89.6 91.4 94.4 94.5 94.4 98.6 98.9 98.8
15-19 49.2 39.7 44.6 53.l 46.2 49.7 50.8 51.4 51.1 60.2 63.4 61.8
20-24 9.2 6.7 8.0 9.7 7.0 8.4 7.3 4.7 6.1 10.6 7.2 8.9
Note: Students in 1976 refer to those who attended full-time educational institutions prior to the school summer vacation.
15.4 · Summary of Enrolment and Operating Educational Institutions, 1985
Day Evening
Govern- Govern- Total Level ment Aided Private Sub-total ment Aided Private Sub-total enrolment
Kindergarten No. of schools 787 787 Enrolment 229089 229089 229089
Primary No. of schools 50 592 94 736 33 33 Enrolment 37 028 443 240 54 635 534 903 4025 4025 538928
Secondary and matriculation No. of schools 36 281 107 424 1 90 91 Enrolment 35 437 283 528 125 556 444 521 2 535 41 878 44413 488934
Special education
Special schools No. of schools 71 71 Enrolment 7 196 7196 7196
Special classes in ordinary schools Enrolment 552 907 1459 1459
Colleges of Education* No. of institutions 4 4 Enrolment 2 614 2614 2253 2 253 4867
Technical institutes* No. of institutions 5 5 Enrolment 18 069 18069 26 319 26319 44388
Private post-secondary No. of institutions 9 9 13 13 Enrolment 7 103 7103 1 576 1576 8679
Polytechnics* and Baptist College No. of institutions 3 3
Enrolment 15 852t 15 852f 13 910 13 910 29762
Universities No. of institutions 2 2 Enrolment 14 207t 14 207f 432@ 432@ 14639
Adult educationt No. of schools 86 86 2 120 122 Enrolment 22 611 22611 21 865 46 113 67978 90589
Note: Figures are as at September of the year, except those for the universities and polytechnics and Baptist College which are based on enumerations made in December and those for technical institutes which are based on enumerations made in October. tincludes part-time students. *Also operate evening classes. @Part-time Degree Programmes in the Chinese University of Hong Kong. tRefers to courses in government evening institutes, the Evening School of Higher Chinese Studies and in various private schools offering a variety of subjects. Evening courses in technical institutes and polytechnics and Baptist College and extra-mural courses in universities are not included.
172

15.5 Operating Educational Institutions by Level of Education by Type of School
Level/Type 1976 1977 1978 1979 1980 1981 1982 1983 1984 1985
Kindergarten
Private 807 786 788 765 761 729 709 724 775 787
Primary
Government and aided 726 712 708 698 676 666 658 659 655 642 Private· 349 310 263 226 206 186 165 157 144 127
Secondary and matriculation
Government and aided 139 161 200 209 211 220 298 305 313 318 Private 378 381 357 347 318 304 228 225 216 197
Special education
Aided 35 37 39 54 62 68 71 71 69 71 Private
Colleges of Education and Technical Teachers' College
Government 4 4 4 4 4 4 4 4 4 4
Technical institutes
Government 3 4 4 5 5 5 5 5 5 5
Private post-secondary** 20 22 19 21 23 25 25 23 25 22
Polytechnics and Baptist College#
Government subvented 2 3 3
Universities
Government subvented 2 2 2 2 2 2 2 2 2 2
Adult education*
Government and aided 2 2 2 2 2 2 2 2 2 2 Private 235 238 209 201 201 192 187 192 197 206
Note: Figures are as at September of the year, except those for the universities and polytechnics and Baptist College which are based on enumerations made in December and those for technical institutes which are based on enumerations made in October. *Refers to courses in government evening institutes, the Evening School of Higher Chinese Studies and various private schools offering a variety of subjects. Evening courses in technical institutes and polytechnics and extra-mural courses in universities are not included. /fSenior studies courses of Baptist College are funded by the University and Polytechnic Grants Committee commencing from April 1983, and for basic
studies courses, from July 1985. **Also includes basic studies courses of Baptist College up to 1984.
15 .6 Operating Schools by Level of Education by Type of School by Area, 1985
Level/Type
Kindergarten
Private
Primary
Government and aided Private
Secondary and matriculation
Government and aided Private
Note: Figures are as at September 1985.
Hong Kong Island
176
99 45
81 51
Kowloon
283
189 72
123 111
New Territories
328
354 10
114 35
Total
787
642 127
318 197
173

15.7 Full-time Enrolment by Level of Education by Type of Institution
Level/Type 1976 1977 1978 1979 1980 1981 1982 1983 1984 1985
Kindergarten
Private 161 471 171 879 186 130 192 517 197 410 200426 205 200 209 869 226 450 229 089
Primary
Government and aided 520 476 494 840 475 207 472 198 472 513 471 627 476 384 480 678 480 074 480 268 Private 87 514 80002 74760 70 129 67 747 65496 62074 59 178 56 146 54 635
Secondary and matriculation
Government and aided 118 316 132 109 189 266 197 953 203 461 212 491 293 420 302 187 311 377 318 965 Private 274492 288 526 274 944 265 845 265 514 252 432 166 191 151 182 136 436 125 556
Special education 5 675 6 698 7 730 9 633 11 208 12 117 11 666 10 622 9 475 8 655
Colleges of Education
Government 1 204 933 948 1 121 1 314 1 732 2196 2 519 2 774 2 614
Technical institutes
Government 1 638 2277 2 575 2 978 2 921 3 516 3 676 4 955 6 248 5 846
Private post-secondary 6 362 6 557 7 035 8 678 9727 10 055 9 838 9 612 6740 7 103
Polytechnics and Baptist College*
Government subvented 4 801 5 610 6449 6 682 7 547 7 625 7 506 8 200 10 231 11 406
Universities
Government subvented 8 161 8 622 9100 9 315 9 661 9 908 10295 10 615 11 307 11 915
Note: Figures are as at September of the year, except those for the universities and polytechnics and Baptist College which are based on enumerations made in December and those for technical institutes which are based on enumerations made in October. *Baptist College (senior studies courses only) was included as from 1983; basic studies courses are also included in 1985.
15.8 Enrolment in Kindergarten, Primary, Secondary and Matriculation Course by Age by Sex, 1985
Kindergarten Primary Secondary ·Matriculation
Age Male Female Male Female Male Female Male Female
0-3 35 316 32 912 4 39 950 38 086 5 40421 38 059 9 641 9 488 6 2 312 1 832 41 351 38 834 7 108 83 41 710 39 254 8 8 1 42 921 39 255 9 1 41294 38 274 10 43 762 39 912 11 39 766 36 521 4924 5 506 12 13 707 9 473 30 417 31 551 13 4092 2 780 39 469 38 424 14 1469 1 052 39 891 38 485 15 552 429 34 529 35 733 16 1 737 1 654 28 489 31126 1 179 1 431 17 18 845 18 630 5 550 5 942 18 9727 9 216 7 765 6 588 19 4702 4759 6 121 4 313 20 2 561 2 868 3 857 2272 21 1 611 1 791 1 901 1122 22 and over 3 036 3206 893 504
Total 118115 110974 282002 256926 218201 221295 27266 22172
Note: Figures are as at September 1985.
174

15.9 Enrohnent in Primary Schools by Type of School by Grade
Type of school/Grade 1976 1977 1978 1979 1980 1981 1982 1983 1984 1985
Day schools
Government and aided P.1 74028 72867 75 156 77 305 79 875 76479 76 181 76 525 76 774 77 673 P.2 77 399 74307 73 838 77 628 79 048 80 963 78 588 78 431 77 867 78 137 P.3 85 393 79 025 76 552 77160 79 958 80 995 83 596 80 587 80 023 79 335 P.4 91 623 85 673 80 258 79 182 78 955 81151 82 525 85 010 81 886 81 342 P.5 97 712 88 979 83 671 79 328 77 571 76 681 80 550 81 392 83 858 81424 P.6 94 321 93 989 85 732 81 595 77106 75 358 74944 78 733 79 666 82 357
All grades 520476 494 840 475 207 472198 472 513 471627 476 384 480 678 480 074 480268
Private P.l 16 374 15 761 14 878 13 253 12 659 11 704 10 581 10 388 9 390 9426 P.2 13 002 12 682 12 616 12 685 11 794 11401 10 686 9 708 9 895 9 305 P.3 13 529 12 608 12 252 12 170 12 006 11 383 10 809 10 050 9116 9 706 P.4 14 579 12 657 11 972 11 599 11 372 11 272 10 510 10 118 9 529 8 578 P.5 15 097 13 275 11 448 10 692 10540 10 341 10 299 9 771 9 282 9 078 P.6 14 933 13 019 11 594 9 730 9 376 9 395 9 189 9 143 8 934 8 542
All grades 87 514 80002 74 760 70129 67747 65 496 62074 59178 56146 54635
Total P.1 90402 88 628 90 034 90 558 92 534 88 183 86 762 86 913 86 164 87 099 P.2 90401 86 989 86 454 90 313 90842 92 364 89274 88 139 87 762 87 442 P.3 98 922 91 633 88 804 89 330 91964 92 378 94405 90 637 89 139 89 041 P.4 106 202 98 330 92 230 90 781 90327 92423 93 035 95 128 91 415 89 920 P.5 112 809 102 254 95 119 90020 88 111 87 022 90849 91163 93 140 90 502 P.6 109 254 107 008 97 326 91 325 86482 84 753 84133 87 876 88 600 90 899
All grades 607 990 574842 549967 542327 540260 537123 538458 539856 536220 534903
Evening schools
Aided P.1 56 48 27 10 14 P.2 126 157 119 64 16 P.3 139 219 203 95 19 P.4 275 208 208 176 20 P.5 201 201 175 108 109 P.6 301 173 111 87 58 76
All grades 1098 1006 843 540 236 76
Private* P.1 62 89 28 121 102 135 151 236 135 177 P.2 110 72 64 38 103 56 32 78 74 84 P.3 1 352 1488 1195 1 592 1448 1 654 976 1 010 610 536 P.4 4082 4409 3 778 4265 3 860 3 569 2 820 1 916 1 418 1 005 P.5 4 546 4 638 3 798 3 499 3 240 3 107 2 534 2 127 1 245 1 023 P.6 4 501 4723 3 711 3 163 2 842 3 039 2 541 2 057 1 513 1 200
All grades 14653 15 419 12 574 12678 11595 11560 9054 7 424 4 995 4025
Total P.1 118 137 55 131 116 135 151 236 135 177 P.2 236 229 183 102 119 56 32 78 74 84 P.3 1 491 1 707 1 398 1 687 1467 1 654 976 1 010 610 536 P.4 4 357 4 617 3 986 4441 3 880 3 569 2820 1 916 1 418 1 005 P.5 4747 4 839 3 973 3 607 3 349 3 107 2534 2 127 1 245 1 023 P.6 4802 4 896 3 822 3 250 2900 3 115 2 541 2 057 1 513 1200
All grades 15751 16425 13417 13218 11831 11636 9054 7 424 4995 4025
Note: Figures are as at September of the year. *Includes primary English tutorial schools.
175
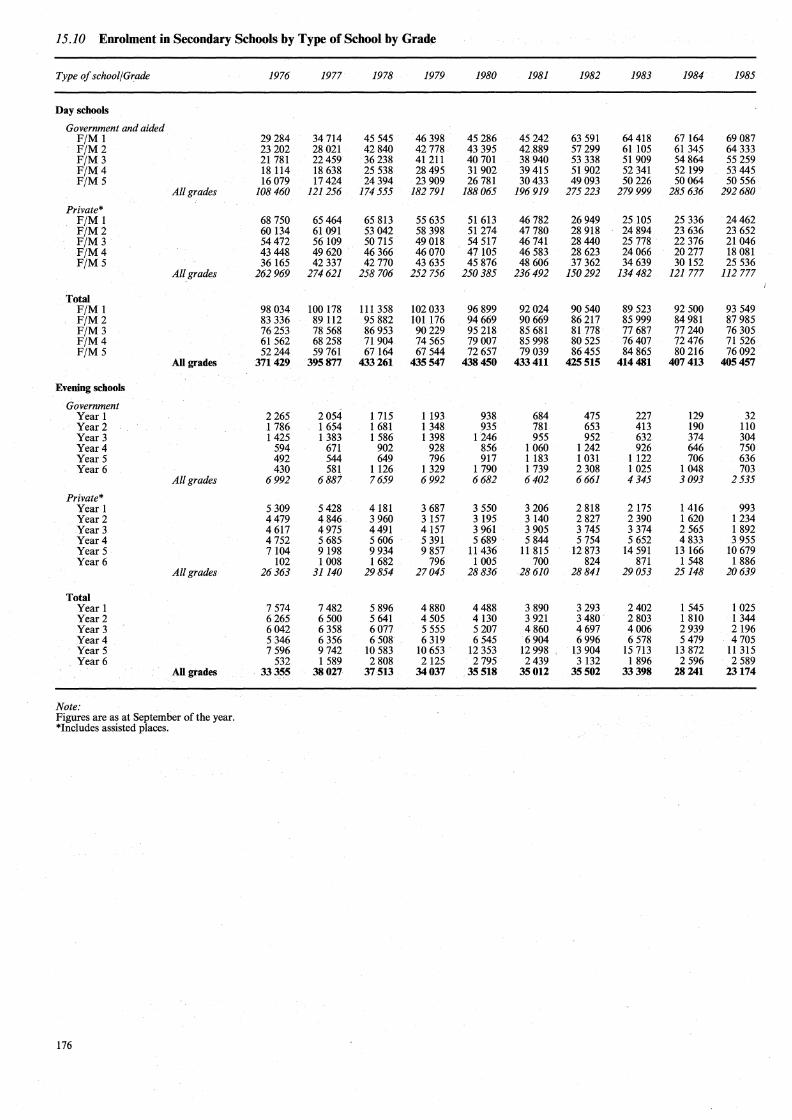
15.10 Enrolment in Secondary Schools by Type of School by Grade
Type of school/Grade 1976 1977 1978 1979 1980 1981 1982 1983 1984 1985
Day schools
Government and aided F/M 1 29284 34 714 45 545 46 398 45 286 45 242 63 591 64 418 67164 69 087 F/M2 23 202 28 021 42 840 42 778 43 395 42.889 57299 61105 61 345 64 333 F/M3 21 781 22459 36238 41211 40 701 38 940 53 338 51 909 54 864 55 259 F/M4 18 114 18 638 25 538 28495 31 902 39 415 51902 52 341 52 199 53 445 F/M5 16 079 17 424 24394 23 909 26 781 30433 49093 50 226 50064 50 556
All grades 108460 121256 174 555 182 791 188 065 196 919 275 223 279 999 285 636 292680
Private* F/M 1 68 750 65464 65 813 55 635 51 613 46782 26949 25 105 25 336 24462 F/M2 60 134 61 091 53 042 58 398 51 274 47780 28 918 24894 23 636 23 652 F/M3 54472 56109 50 715 49 018 54 517 46 741 28440 25 778 22 376 21046 F/M4 43448 49 620 46 366 46070 47105 46 583 28 623 24066 20277 18 081 F/M5 36 165 42 337 42 770 43 635 45 876 48 606 37 362 34 639 30 152 25 536
All grades 262 969 274 621 258 706 252 756 250385 236 492 150 292 134 482 121 777 112 777
Total F/M 1 98034 100 178 111 358 102 033 96 899 92024 90540 89 523 92 500 93 549 F/M2 83 336 89 112 95 882 101 176 94669 90669 86 217 85 999 84 981 87 985 F/M3 76253 78 568 86953 90229 95 218 85 681 81 778 77 687 77 240 76 305 F/M4 61 562 68 258 71904 74 565 79 007 85 998 80 525 76407 72476 71 526 F/M5 52244 59 761 67164 67 544 72657 79 039 86455 84 865 80 216 76092
All grades 371429 395877 433261 435547 438450 433411 425515 414481 407 413 405457
Evening schools
Government Year 1 2265 2054 1 715 1 193 938 684 475 227 129 32 Year 2 1 786 1 654 1 681 1 348 935 781 653 413 190 110 Year 3 1425 1 383 1 586 1 398 1246 955 952 632 374 304 Year4 594 671 902 928 856 1 060 1242 926 646 750 Year 5 492 544 649 796 917 1183 1 031 1122 706 636 Year6 430 581 1126 1 329 1 790 1 739 2 308 1 025 1 048 703
All grades 6992 6887 7659 6992 6682 6402 6661 4 345 3093 2 535
Private* Year 1 5 309 5 428 4181 3 687 3 550 3 206 2 818 2 175 1 416 993 Year2 4479 4846 3 960 3 157 3 195 3 140 2 827 2390 1620 1234 Year 3 4 617 4 975 4491 4157 3 961 3 905 3 745 3 374 2 565 1 892 Year4 4752 5 685 5 606 5 391 5 689 5 844 5 754 5 652 4 833 3 955 Year 5 7104 9 198 9 934 9 857 11436 11 815 12 873 14 591 13 166 10 679 Year6 102 1 008 1 682 796 1 005 700 824 871 1 548 1 886
All grades 26 363 31140 29854 27045 28836 28610 28841 29053 25148 20639
Total Year 1 7 574 7482 5 896 4 880 4488 3 890 3 293 2402 1 545 1 025 Year 2 6265 6 500 5 641 4 505 4 130 3 921 3480 2 803 1 810 1 344 Year 3 6042 6 358 6077 5 555 5207 4860 4697 4006 2 939 2 196 Year4 5 346 6 356 6 508 6 319 6 545 6904 6996 6 578 5 479 4 705 Year 5 7 596 9742 10 583 10 653 12 353 12 998 13 904 15 713 13 872 11 315 Year 6 532 1 589 2 808 2 125 2 795 2439 3 132 1 896 2 596 2 589
All grades 33355 38027 37513 34037 35518 35012 35502 33398 28241 23174
Note: Figures are as at September of the year. *Includes assisted places.
176

15.11 Enrolment in Matriculation Course by Type of School by Grade
Type of school/Grade 1976 1977 1978 1979 1980 1981 1982 1983 1984 1985
Day schools
Government and aided
Form Lower/Middle 6 6247 6505 9097 9228 9016 9223 11048 14206 15191 15040 Form Upper6 .3 609 4348 5 614 5 934 6 380 6349 7149 7982 10 550 11245
Private
Form Lower/Middle 6 7 839 9992 10572 9 808 11149 11548 11954 11942 9 837 8250 Form Upper6 1191 1476 1419 1 595 2063 2327 2074 2 917 2983 2799
Total
Form Lower/Middle 6 14086 16497 19669 19036 20165 20771 23002 26148 25028 23290 FormUpper6 4800 5824 7033 7529 8443 8676 9223 10899 13533 14044
Evening schools
Private
Form Lower/Middle 6 3373 4549 6490 5841 5255 5614 7045 8663 8582 . 7104 FormUpper6 1525 2169 3142 2739 2478 2299 3438 3823 4769 5000
Note: Figures are as at September of the year.
15.12 Enrolment in Technical Institutes by Type of Course
Type of course 1976 1977 1978 1979 1980 1981 1982 1983 1984 1985
Full-time courses
Technical courses Technician level 449 665 927 1135 1178 1 346 1 363 1 792 2393 2234 Craft level 768 985 899 859 780 1 039 1111 1 554 1960 1 788
Non-technical courses Technician level 343 469 592 664 677 947 975 1250 1456 1316 Craft level 78 158 157 320 286 184 227 359 439 508
Sub-total 1638 2 277 2 575 2978 2921 3 516 3676 4955 6248 5 846
Part-time day courses
Technical courses Technician level 448 508 612 975 1502 1 961 2362 2 561 2 542 2673 Craft level 1 793 3 504 4780 6 613 6 853 7 457 7160 7 081 7 159 8 373
Non-technical courses Technician level 47 299 252 269 314 294 492 526 Craft level 27 135 33 324 409 439 398 525 651
Sub-total 2 241 4039 5 574 7920 8 931 10096 10275 10334 JO 718 12223
Part-time evening courses
Technical courses Technician level 2 737 2804 2 885 3 063 3 519 4492 6063 6 781 7 568 7 303 Craft level 2424 3404 4092 4092 4605 4 573 5 166 6134. 7111 7 155
Non-technical courses Technician level 1278 1 596 1 648 2431 3 185 3 774 5726 6834 6872 6685 Craft level 5 255 4839 4750 3 125 3 518 3406 4228 4990 4856 5 176
Sub-total 11694 12643 13 375 12 711 14827 16245 21183 24739 26407 26319
Total 15573 18959 21524 23609 26679 29857 35134 40028 43373 44388
Short courses throughout the academic year 2814 2870 4 275 1342 2809 2 310 3002
Note: The Morrison Hill Technical Institute started operation in September 1969, Kwai Chung and Kwun Tong Technical Institutes in September 1975, Raking Wong Technical Institute in September 1977 and Lee Wai Lee Technical Institute in September 1979. Figures are as at October of the year except those for short courses. Non-technical courses include all courses offered by the Commercial Studies, the Hotel-keeping and Tourism, the Design and the General Studies Departments of various institutes. All courses offered by other department of various institutes are technical courses. Part-time day courses include both part-time day-release and part-time block-release courses.
177

15.13 Enrolment in Teachers' Training Colleges by Type of Course by Sex
Course Sex 1976 1977 1978 1979 1980 1981 1982 1983 1984 1985
Colleges of Education
Full-time training
Three-year course@ M 130 287 399 375 352 341 F 348 858 1 161 1 150 1 019 1 017
Two-year course M 290 248 225 273 164 79 91 163 267 246 F 569 387 451 578 374 190 278 572 889 757
3rd year course M 48 32 32 32 F 120 76 79 62
One-year special refresher course§ M 18 13
F 18 44 Advanced courses of teacher
education@ M 37 54 32 17 19 29 F 96 103 68 43 39 48
Part-time training
Three-year secondary course Li M 65 122 150 uo 108 F 79 158 198 165 138
Two-year secondary course M 247 238 178 182 203 116 65 45 30 36 F 323 437 380 314 356 254 114 84 68 58
One-year secondary course M 66 F 136
Two-year primary course* M 111 82 62 30 37 21 18 50 94 223 F 641 426 190 261 295 172 107 257 464 498
Two-year kindergarten course M 1 l F 50 49 58 109 113 174 231 120 238 351
One-year course for teachers of handicapped children # M 25 48 70 76 85 88 128 85 102 98
F 79 138 139 163 150 141 245 228 205 181 Short course for
secondary teacherst M 27 26 .F 23 28
Short course for primary teachers M 5 11 19 14
F 35 69 61 106
Short course for kindergarten teachers M
F 165 179 165 179 School Librarian~ M 51 37 26 77 24 19
F 107 91 90 187 55 40
Technical Teachers' College
Full-time training
Three-year course M 11 50 87 118 112 94 F 18 38 57 55 50 52
Two-year course M 76 77 103 123 87 27 F 30 25 28 34 37 18
One-year course M 22 15 28 18 9 26 21 8 9 F 1 2 2 l 3 2 2 4 2
3rd yei;tr course M 11 12 F 1 2
Advanced courses of teacher education M 14 16 21
F 9
Part-time training
Three-year course M 17 25 9 12 7 F 1 5 4 2 3
Two-year course M 83 79 127 129 58 33 11 31 F 14 15 22 12 7 5 1 4
One-year course M 46 127 86 32 73 129 37 36 40 33 F 4 10 4 2 16 16 9 18 20 9
Short coursest M 12 45 26 40 21 203 142 99 82 F l 29 11 2 59 53 16 16
Note: Figures are as at September of the year. @Commenced operation in September 1980. §Commenced operation in September 1976. Li Commenced operation in September 1981.
*Three-year course from 1983. #Two-year course from 1981. ~Commenced operation in December 1979. tD.uration of courses less than one year. tCommenced operation in September 1984.
178

15.14 Enrolment in Polytechnics and Baptist College
Department
Hong Kong Polytechnic
Accountancy
Applied Science
Building and Surveying
Business and Management Studies
Building Services Engineering
Centre of Environmental Studies
Centre of Land and Engineering Surveying
,Civil and Structural Engineering
Computing Studies
Design
Electrical Engineering
Electronic Engineering
Industrial Centre
lnstitntional Management and Catering Stndies
Languages
Mathematical Studies
Mechanical and Marine Engineering
Medical and Health Care
Nautical Studies
Production and Industrial Engineering
Social Work
Textiles and Clothing
1979 1980 1981 1982 1983 1984 1985 FT PTDR PTE FT PTDR PTE FT PTDR PTE FT PTDR* PTE FT PTDR* PTE FT PTDR* PTE FT PTDR* PTE
777 128 3 672 810 168 3 398 785 222 3 101 797 269 2 883 828 246 2 706 782 204 2 519 757 218 2 005
125 341 264 142 354 337 142 346 346 165 355 405 317 311 382 488 351 462 594 241 440
B ~1m m w1m ~ m ~ m ~ w ~~ID m ~ m ~ m 1~
ru m1m m e1m ™ ~1m ~ ~1• • ~1m m m1m B m 1m
240
290
446
335 341
471
308 355
39
546
317 376
40 265 102
81
154 107
657
357 398
33 248 114 39 271 106 78
128 126
199
129
87 30 191
588
386 396
81
62
87 51 139
506 155
374 412
330
60
384
448 325 I 492 542 263 I 438 478 326 I 394 499 251 I 334 419 255 1170 332 278 I 133 286 278 I 080
539 309 I 032 546 321 I 027 548 321 I 141 551 282 1155 496 243 I 034 391 309 963 391 351
69
80
143
40
41
128
95
551 169
40
80
161
92
625 190
34
81
141
113
606 203
36
143
139
130
586 213
39 120
38 171
142
451 226
39 123
74 181
145
316 230
40
90
932
181
269
527 469 I 572 617 489 I 704 650 455 I 342 481 555 1240 675 277 1160 357 562 1154 354 595 1179
407 203 95 542 161 115 546 117 65 618 99 221 699 72 216 825 104 236 967 165
244 15 11 233 13 199 38 223 27 229 20 223 19 246
444 150 450 472 158 452 526 165 424 396 272 464 471 154 521 393 258 582 401 267
181 128 187 184 196 200 219 169 268 191 78 297 173 223 313 162
641 67 835 702 48 803 715 84, 506 604 217 487 709 75 452 553 252 543 625 302
273
490
380
627
Total 6 682 3 274 14 953 7 547 3 57214 986 7 625 3 83613 576 7 506 413113 578 8 200 3 55912 944 7 697 417913 133 7 900 4 340 12 668
Short courses throughout the academic year
City Polytechnic of Hong Kong
Accountancy
Building and Construction
Business and Management
Computer Studies
Electronic Engineering
Social Administration
Mathematics and Science
Languages
Hong Kong Baptist Colleget
Arts
Business
Science
Social Science
Pre~music programme
Note:
7548
Total
Total
Figures are as at December of the year except those for short courses.
7455
FT denotes full-time courses and for Hong Kong Polytechnic it includes mixed-mode courses. PTDR denotes part-time.day-release courses. PTE denotes part-time evening courses. *Include !>l9ck release c9urses and sandwich courses. tSenior st\idies only: ff Mixed-mode courses.
7820 6855 8524
179
103
117
81
480
361
607
371
715
2054
8276
247 377
76
197 261
124 253
91
110 155
42
71 45
86 ff 351
20 ff 310
185
82
179
135
749 1 300 106 ff 1 242
387
637
402
718
62
2206
179

15.15 Full-time Enrolment in Universities by Faculty by Sex
University/Course/Faculty Sex 1976 1977 1978 1979 1980 1981 1982 1983 1984 1985
University of Hong Kong Undergraduates
Architecture M 161 180 185 196 203 202 216 224 233 219 F 35 39 36 40 44 52 47 48 52 56
Arts M 353 313 323 370 392 394 364 379 373* 397 F 510 538 625 644 709 713 769 789 839* 871
Dental Studies M 59 121 180 239 283 274 F 20 28 41 54 66 58
Engineering M 679 702 734 762 781 789 835 833 849 933 F 7 8 12 14 17 23 30 26 30 30
Law M 82 94 90 79 97 103 113 106 116 127 F 57 53 60 80 95 112 Ill 108 151 179
Medicine M 659 665 667 657 646 655 640 621 611 604 F 106 97 93 99 105 105 113 135 145 153
Science M 426 426 471 499 536 511 510 527 562 670 F 85 87 91 102 114 133 167 179 177 166
Social Science M 304 322 331 351 377 412 435 432 417 439 F 291 279 338 387 439 411 414 439 474 482
Post-graduates M 188 210 233 220 204 208 281 286 334* 383 F 99 114 118 81 106 127 158 142 209* 223
Total M 2852 2912 3034 3134 3295 3395 3574 3647 3778* 4046 F 1190 1215 1373 1447 1649 1704 1850 1920 2143* 2218
The Chinese University of Hong Kong
Undergraduates Arts M 431 463 444 422 428 425 394 387 380 343
F 508 582 618 628 623 615 625 646 658 703
Business Administration M 554 614 664 681 649 618 576 580 593 547 F 185 210 225 254 259 253 269 285 295 369
Social Science M 692 689 682 644 662 665 664 675 696 632 F 439 510 553 588 567 559 560 561 600 680
Science M 905 979 l 041 l 057 l 091 l 094 1116 1171 l 238 1255 F 153 150 148 153 138 142 155 175 214 295
Medicine M 53 125 193 275 340 F 7 14 26 45 71
Post-graduates M 189 228 236 221 219 262 256 243 254* 275 F 63 70 82 86 81 116 117 106 138* 141
Total M 2771 2973 3067 3025 3049 3117 3131 3249 3436* 3392 F 1348 1522 1626 1709 1668 1692 1740 1799 1950* 2259
Note: Figures are as at December of the year. *Revised figure.
15.16 Enrolment in Adult Education by Type of Course by Type of Institution by Sex
Course/Type of institution Sex 1976 1977 1978 1979 1980 1981 1982 1983 1984 1985
Arts and general subjects Government M 5 717 6152 6777 6735 6234 5 980 6120 7 415 7 285 8034
F 9277 10265 10 834 9924 10627 9924 10941 13407 13 719 13 831 Private M 4924 4606 5776 7061 8 827 8 586 9110 10647 11954 11 889
F 5374 5787 7039 9 321 9 714 9934 9 214 11276 12 811 14442 Sub-total M 10641 JO 758 12553 13 796 15061 14566 ·15 230 18062 19239 19923
F 14651 16052 17873 19245 20 341 . 19858 20155 24683 26530 28273 Technical and vocational courses*
M 13544 13177 13039 14563 15 212 18180 14596 13 580 12953 15 469 F 12906 14261 14441 17068 17740 22842 22715 24585 26391 26924
All courses Government M 5 717 6152 6777 6735 6234 5980 6120 7 415 7285 8034
F 9277 10265 10834 9924 10627 9924 10941 13 407 13 719 13 831 Private M 18468 17 783 18 815 21624 24039 26766 23 706 24227 24907 27 358
F 18 280 20048 21480 26 389 27454 32 776 31929 35 861 39 202 41366
Total M 24185 23935 25592 28359 30273 32746 29826 31642 32192 35392 F 27557 30313 32314 36313 38081 42700 42870 49268 52921 55197
Note: Figures are' as at September of the year. Adult education refers to courses in government evening institutes, the Evening School of Higher Chinese Studies and in various private schools offering a variety of subjects. Evening courses in technical institutes and polytechnics and Baptist College and extra-mural courses in universities are not included. *Refer to private institutions only.
180

15 .17 Enrolment in Private Commercial/English Tutorial Classes
1976 1977 1978 1979 1980 1981 1982 1983 1984 1985
Day schools 2 493 2437 2247 1 686 1 917 2065 1 871 1 841 1 839 1 730
Evening schools 22 730 22664 20 357 17 977 14 033 13 733 13 125 12 439 12 395 9135 Total 25223 25101 22604 19663 15950 15798 14996 14280 14234 10865
Note: Figures are as at September of the year.
15.18 Schools and Enrolment in Special Education Schools by Sex
Type of school Sex 1976 1977 1978 1979 1980 1981 1982 1983 1984 1985
Blind Number of schools 2 2 2 3 3 3 3 3 3 3 Enrolment M 80 76 75 97 106 118 124 122 101 97
F 50 53 50 76 90 85 82 86 81 85 Deaf
Number of schools 4 4 4 4 4 5 5 5 5 4 Enrolment M 348 362 332 322 346 346 339 349 326 331
F 276 294 296 308 313 329 346 355 327 340
Maladjusted Number of schools 7 7 8 8 8 8 8 8 8 8 Enrolment M 911 946 917 953 919 970 959 900 935 887
F 143 159 153 163 158 126 129 149 95 112
Physically handicapped Number of schools 17 18 18 20 20 20 20 20 18 19 Enrolment M 429 496 486 563 604 604 636 639 598 604
F 307 308 311 379 373 402 379 385 390 399 Slow learning/Mentally
handicapped Number of schools 5 6 7 19 27 32 35 35 35 37 Enrolm1mt M 381 420 547 1 066 1 567 1 908 2245 2 415 2 580 2 636
F 306 339 437 885 1125 1 289 1447 1 549 1 671 1 705
All types Number of schools 35 37 39 54 62 68 71 71 69 71 Enrolment M 2149 2300 2357 3001 3542 3946 4303 4425 4540 4555
F 1082 1153 1247 1811 2059 2231 2383 2524 2564 2641
Note: Figures are as at September of the year.
15.19 Special Classes in Normal Schools and Enrolment in These Oasses
Type of special class 1976 1977 1978 1979 1980 1981 1982 1983 1984 1985
Partially sighted Number of classes 6 7 8 8 8 8 8 8 Enrolment 52 56 76 75 82 66 73 73
Partially hearing Number of classes 28 32 36 35 35 32 30 27 Enrolment 221 259 274 265 251 245 233 211
Slow learning Number of classes 222 267 314 352 299 210 132 72 Enrolment 3260 3 913 4 680 4991 4273 3 211 2065 1 175
Maladjusted and socially deprived Number of classes 51 60 66 67 44 18 Enrolment 528 536 532 566 344 120
English-speaking Number of classes 6 7 8 6 6 5 Enrolment 65 57 45 43 30 31
All Types Number of classes 216 260 313 373 432 468 392 273 170 107 Enrolment 2444 3245 4126 4821 5607 5940 4980 3673 2371 1459
Note: Figures are as at September of the year.
181
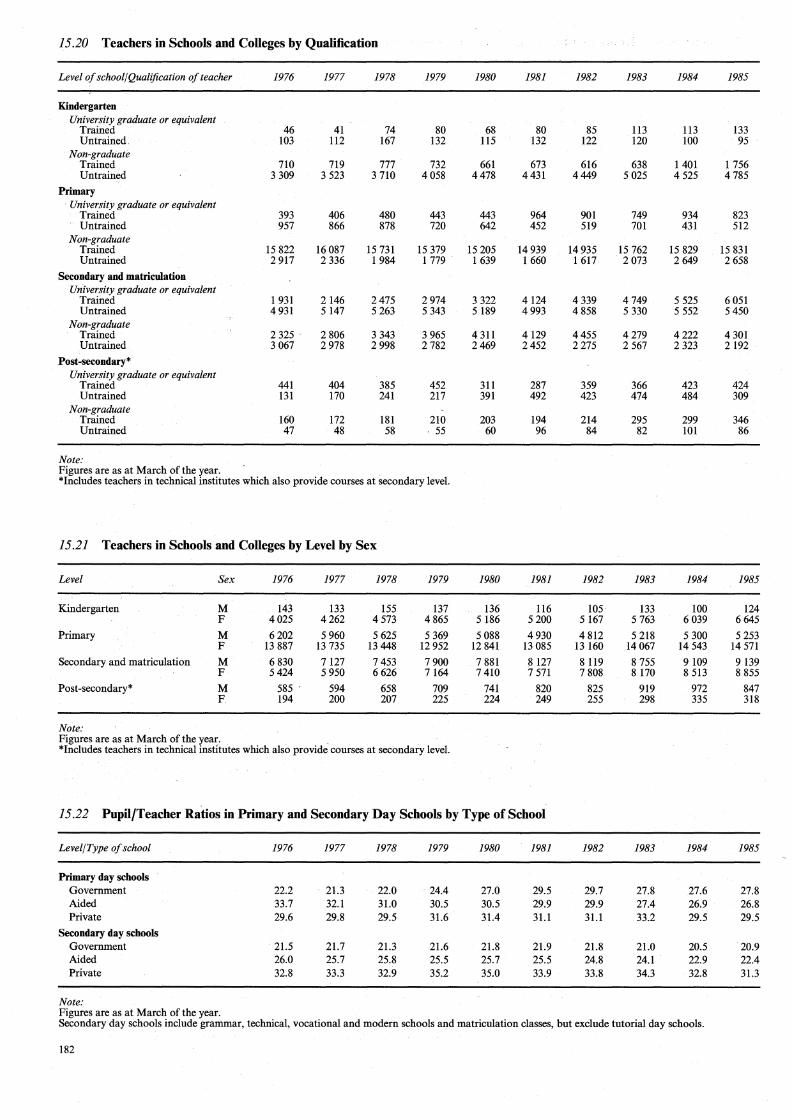
15.20 Teachers in Schools and Colleges by Qualification
Level of school/Qualification of teacher 1976 1977 1978 1979 1980 1981 1982 1983 1984 1985
Kindergarten University graduate or equivalent
Trained 46 41 74 80 68 80 85 113 113 133 Untrained. 103 112 167 132 115 132 122 120 100 95
Non-graduate Trained 710 719 777 732 661 673 616 638 1 401 1 756 Untrained 3 309 3 523 3 710 4058 4478 4 431 4449 5 025 4 525 4 785
Primary University graduate or equivalent
Trained 393 406 480 443 443 964 901 749 934 823 Untrained 957 866 878 720 642 452 519 701 431 512
Non-graduate Trained 15 822 16 087 15 731 15 379 15 205 14 939 14 935 15 762 15 829 15 831 Untrained 2 917 2 336 1 984 1 779 1 639 1 660 1 617 2 073 2649 2 658
Secondary and matriculation University graduate or equivalent
Trained 1 931 2 146 2475 2974 3 322 4124 4 339 4 749 5 525 6 051 Untrained 4 931 5 147 5 263 5 343 5 189 4993 4 858 5 330 5 552 5 450
Non-graduate Trained 2 325 . 2806 3 343 3 965 4 311 4129 4455 4279 4222 4 301 Untrained 3 067 2 978 2998 2 782 2469 2452 2275 2 567 2 323 2 192
Post-secondary* University graduate or equivalent
Trained 441 404 385 452 311 287 359 366 423 424 Untrained 131 170 241 217 391 492 423 474 484 309
Non-graduate Trained 160 172 181 210 203 194 214 295 299 346 Untrained 47 48 58 55 60 96 84 82 101 86
Note: Figures are as at March of the year. *Includes teachers in technical institutes which also provide courses at secondary level.
15.21 Teachers in Schools and Colleges by Level by Sex
Level Sex 1976 1977 1978 1979 1980 1981 1982 1983 1984 1985
Kindergarten M 143 133 155 137 136 116 105 133 100 124 F 4025 4262 4 573 4 865 5 186 5200 5 167 5 763 6 039 6645
Primary M 6202 5 960 5 625 5 369 5 088 4930 4 812 5 218 5 300 5 253 F 13 887 13 735 13448 12 952 12 841 13 085 13 160 14 067 14 543 14 571
Secondary and matriculation M 6 830 7 127 7 453 7900 7 881 8 127 8 119 8 755 9109 9139 F 5424 5 950 6 626 7164 7410 7 571 7 808 8 170 8 513 8 855
Post-secondary* M 585 . 594 658 709 741 820 825 919 972 847 F 194 200 207 225 224 249 255 298 335 318
Note: Figures are as at March of the year. . *Includes teachers in technical institutes which also provide courses at secondary level.
15.22 Pupil/Teacher Ratios in Primary and Secondary Day Schools by Type of School
Level/Type of school 1976 1977 1978 1979 1980 1981 1982 1983 1984 1985
Primary day schools Government 22.2 21.3 22.0 24.4 27.0 29.5 29.7 27.8 27.6 27.8 Aided 33.7 32.l 31.0 30.5 30.5 29.9 29.9 27.4 26.9 26.8 Private 29.6 29.8 29.5 31.6 31.4 31.l 31.l 33.2 29.5 29.5
Secondary day schools Government 21.5 21.7 21.3 21.6 21.8 21.9 21.8 21.0 20.5 20.9 Aided 26.0 25.7 25.8 25.5 25.7 25.5 24.8 24.l 22.9 22.4 Private 32.8 33.3 32.9 35.2 35.0 33.9 33.8 34.3 32.8 31.3
Note: Figures are as at March of the year. Secondary day schools include grammar, technical, vocational and modern schools and matriculation classes, but exclude tutorial day schools.
182

15.23 Hong Kong Certificate of Education Examination 1985 Grade Analysis by Subject
Grades achieved
Number Number A A-B A-C A-D A-E A-F Subject entered sat % % % % % %
Add. Mathematics (C) 2 951 2 586 2.94 12.99 28.34 52.86 77.26 86.97 Add. Mathematics (E) 30 850 25 643 4.39 13.96 30.60 54.17 78.04 87.84 Art (C) 2 733 2441 3.32 7.29 14.42 43.10 73.37 84.31 Art (E) 7 009 6422 3.21 7.35 16.86 49.69 81.38 90.05 Biology (C) 6 534 5 871 0.49 4.28 15.65 39.64 63.50 82.32 Biology (E) 49 873 43 301 2.53 9.35 20.99 40.89 60.42 77.04 Buddhist Studies (Sy!. 1) 384 361 3.05 9.70 26.04 44.32 72.02 88.92 Buddhist Studies (Sy!. 2) 945 853 3.05 10.43 26.26 48.77 72.10 90.97 Chemistry (C) 3 583 3 188 0.78 4.17 15.21 42.79 73.15 88.99 Chemistry (E) 45 156 39 291 2.19 9.09 21.45 43.26 65.49 80.02 Chinese Literature 40 501 33 971 1.78 5.53 13.10 31.67 54.25 69.82 Chinese History (AB) 48 959 42488 2.13 6.38 14.18 31.51 53.61 73.60 Chinese History (BC) 24009 20 995 1.53 5.59 13.55 32.83 57.21 77.10 Chinese Language 133 348 121 128 1.27 4.91 13.41 37.44 65.90 92.10 Commerce (C) 205 145 0.00 0.69 10.34 46.21 77.93 88.97 Commerce (E) 9 179 6 971 2.48 7.30 17.14 33.48 51.99 69.52 Computer Studies (C) 152 147 2.04 12.24 25.17 60.54 72.79 . 80.27 Computer Studies (E) 4996 4248 3.01 8.55 16.22 36.79 49.60 56.47 Design and Technology (M) (E) 477 474 4.22 14.35 28.48 54.22 79.11 92.83 Design and Technology (W) (E) - 371 367 3.27 12.81 31.61 59.40 85.83 96.73 Dressmaking (C) 9 9 0.00 0.00 22.22 33.33 88.89 100.00 Dressmaking (E) 255 243 2.88 8.64 25.93 63.37 94.65 98.35 Econ. and Pub. Alf. (C) 4 578 3 987 3.16 8.13 19.31 46.73 71.51 90.59 Econ. and Pub. Alf. (E) 17 483 14 279 1.44 3.67 8.83 21.76 38.75 58.25 Economics (C) 1 734 1 499 0.20 2.00 8.14 28.62 59.84 80.92 Economics (E) 42 336 35 058 1.81 5.79 13.67 30.80 51.19 67.59 Electronics and Electricity (C) 280 268 4.10 14.93 36.57 67.54 91.04 97.76 Electronics and Electricity (E) 846 819 3.91 10.87 24.91 52.50 77.66 89.99 Eng. Lang. (Sy!. A) 8 257 7 683 2.06 5.77 11.82 33.98 64.09 78.43 Eng. Lang. (Sy!. B) 158 168 146 523 0.97 3.52 8.53 35.24 65.00 77.63 Eng. Literature 1 685 1 552 3.61 12.18 25.64 52.45 74.87 90.27 Eng. Science (C) 99 96 2.08 9.38 33.33 64.58 94.79 100.00 Eng. Science (E) 678 600 2.17 7.50 17.67 34.17 59.67 87.50 French 166 140 8.57 19.29 33.57 56.43 82.14 92.14 Geography (C) 6 127 5 418 1.37 6.31 17.55 42.43 70.39 90.99 Geography (E) 48 140 40 921 1.89 6.01 13.64 30.58 52.72 74.48 German 27 17 11.76 11.76 41.18 52.94 88.24 88.24 History (C) 5 222 4426 0.99 4.77 14.35 35.52 62.56 83.01 History (E) 38 486 31 769 1.99 6.53 15.19 32.17 53.02 71.72 Home Economics (C) 4 4 0.00 25.00 50.00 75.00 100.00 100.00 Home Economics (E) 554 550 4.00 18.18 41.64 76.18 94.73 96.55 Human Biology (C) 296 285 0.00 3.86 15.79 46.32 77.54 95.44 Human Biology (E) 3 028 2 774 2.99 9.44 19.90 35.80 54.79 72.21 Mathematics (Sy!. A) (C) 5497 4842 1.61 11.26 23.69 42.01 64.19 74.16 Mathematics (Sy!. A) (E) 61 380 53 473 2.83 12.06 24.43 44.71 68.52 77.65 Mathematics (Sy!. B) (C) 5 019 4494 3.83 15.93 31.58 54.74 76.75 84.71 Mathematics (Sy!. B) (E) 61 730 54 781 4.90 17.23 32.04 54.39 77.00 84.71 Metalwork (C) 256 243 9.88 23.46 44.03 79.01 96.30 98.77 Metalwork (E) 681 634 2.21 8.20 17.98 43.22 75.39 91.64 Music (C) 42 26 0.00 0.00 0.00 26.92 65.38 76.92 Music (E) 257 195 5.64 9.23 25.13 54.36 75.38 89.74 Needle/Dress (E) 62 60 6.67 16.67 33.33 68.33 90.00 95.00 Physics (Sy!. 1) (C) 3 044 2 712 1.92 9.37 22.86 46.42 70.06 86.17 Physics (Sy!. 1) (E) 26 581 23 163 2.45 10.54 22.69 42.24 61.35 76.48 Physics (Sy!. 2) (C) 681 616 1.79 7.14 18.51 43.67 74.68 91.07 Physics (Sy!. 2) (E) 21 054 19 331 2.66 11.19 24.75 45.93 66.61 82.60 Pottery (C) 3 3 0.00 0.00 0.00 0.00 33.33 33.33 Pottery(E) 54 54 11.11 24.07 44.44 77.78 98.15 100.00 Practical Electricity (E) 24 18 5.56 5.56 11.11 27.78 61.11 83.33 Principles of Accounts (C) 227 142 0.00 0.00 0.70 6.34 28.17 52.82 Principles of Accounts (E) 18 071 13 983 3.88 8.29 15.22 33.33 58.66 75.17 Religious Studies (AB/BC) (E) 7 572 7044 3.69 10.63 22.37 43.81 66.27 84.28 Religious Studies (BD) (E) l 571 1 486 3.36 8.28 20.12 44.35 71.47 91.59 Religious Studies (AB/BC) (C) 3 844 3 528 2.01 7.34 18.57 42.72 71.66 90.76 Religious Studies (BD) (C) l 658 1 551 0.13 1.93 7.99 29.53 60.54 86.91 Shorthand 1139 824 7.28 13.35 26.21 39.68 57.04 63.71 Technical Drawing (C) 51 43 0.00 9.30 23.26 55.81 65.12 86.05 Technical Drawing (E) 4 373 3 984 2.08 10.07 24.90 51.66 74.87 89.36 Typewriting 8 407 7 689 5.85 14.29 27.70 49.43 67.47 80.61 Woodwork (E) 188 174 3.45 10.92 25.86 56.32 83.91 93.10
183

15.24 Results of Higher and Advanced Level Examinations
University of Hong Kong
Advanced Level Examination
Number of candidates entered
Number of candidates successfully completing university entrance requirements :
The Chinese University of Hong Kong
Higher Level Examination
Number of candidates entered
Number of candidates successfully completing university entrance requirements
Note:
1976
6244
3 549
11 390
3 228t
1977 1978
7 477 9 188
4 358 5 514
11 611 13 065
3060 3 774
1979
10 348
6 563
19 74It
4 308
1980 1981 1982 1983 1984 1985
12 164 13 435 14 660 15 588 16 488 18 844
7774t 8407 7676 8 846 9279 10 958
21 407 18 336 18 558 18 726 17 226 12 585
5044 4429 4 636 4 661 4 868 2 681
The Hong Kong Examinations Authority assumed responsibility for the conduct of the Hong Kong Higher and Advanced Level Examinations starting from 1979 and 1980 respectively. Figures in 1978 and before in the Higher Level Examination refer to the .candidates for the former Chinese University Matriculation Examination. Those in 1979 and before in the Advanced Level Examination refer to the candidates for the former University of Hong Kong Advanced Level Examination. t Revised figure.
15.25 Polytechnic Academic Awards Conferred (Full-time Courses)
1979 1980 1981 1982 1983 1984 1985
H H H H H H H Department Asso. Dip. Dip. Cert. Asso. Dip. Dip. Cert. Asso. Dip. Dip. Cert. Asso. Dip. Dip. Cert. Asso. Dip. Dip. Cert. Asso. Dip. Dip. Cert. Asso. Dip. Dip. Cert.
Accountancy
Applied Science
Building and Surveying
Building Services
Business and Management Studies
Civil and Structural Engineering
Computing Studies
Design
Electrical Engineering
Electronic Engineering
Institutional Management and Catering Studies
Languages
Mathematical Studies
Mechanical and Marine Engineering
Medical and Health Care
Nautical Studies
Production and Industrial Engineering
Social Work
Textiles and Clothing
Total
Note:
194 32
21
40 90 35
133 148
14 77 67
61
59 89
75 76
14 87 75
18 11
30
103 69
17
12 71 70
59 30
94 71
89 1109 823 30
216 22
27
41 94 29
154 103
16 65 81
66 69
129
14 85 78
23 115 61
23
33
16 109 42
39
18
13 68 52
70 32
106 93
129 1 152 895 32
217 29
26 17
47 81
172 119
47 74 64
38 69
54 83
19 92 81
52 113 66
32
16 19
36
34 119 49
117 62
15
33 112 34
69 37
6 114 90
238 1 396 883 37
240
20 20
45 106
154 111
21 70 67
40 70
96 88
16 104 74
25 113 74
29 30
17 17
56
16 99 59
96 79
32
16 69 20
73 37
12 129 37
152 1 470 819 37
Asso. denotes Associateship and includes Advanced Higher Diploma, Professional Diploma and Post Graduate/Experience. H. Dip. denotes Higher Diploma. Dip. denotes Diploma. Cert. denotes Certificate. *Degree award recipients.
184
236
26 19
58 106
16
88 91 103
29 83 60
96
76 85
27 105 61
46 115 66
31 26
20 20
56
20 115 62
120 79
29 102 30
75 39
133 38
267
29 30
93 34
22
116 43 20
29 72 75
39 34
83 110
34 96 62
43 109 74
29
17 17
54
17 124 67
133 74
40 26
32 112
97 40
25 148 35
660 1 081 820 39 789 1 051 721 40
255
34 25
147 39
36
124 45
20 111
130 32
69 115
35 109 .
41 109
48
29 17
56
30 104 25
171 87
39 25
37 97
29* 98 40
20 119
9091174 424 40

15.26 Baptist College Academic Awards Conferred (Full-time Courses)
Department
Honours Diploma
Arts
Business
Natural Science and Engineering
Social Science
Note:
Total
1983
47 112 62
119
340
1984
88 154 127 189
558
Senior studies courses of Baptist College are funded by the University and Polytechnic Grants Committee commencing from April 1983.
15.27 University Degrees and Diplomas Conferred
1976 1977 1978 1979 1980 1981 1982 1983
University of Hong Kong
Degrees D.Sc. 3 M.D. 2 2 3 5 M.S. 3 Ph.D. 20 11 11 7 10 11 18 21 M.A. 23 3 13 9 30 17 10 23 M.Med.Sc. l 2 2 2 l M.Ed. 40 16 23 35 M.Phil. 31 36 47 34 36 36 35 35 M.Sc.(Eng.) 11 15 10 35 33 55 M.Sc. (Urban Planning) 4 M.Soc.Sc. 4 2 6 17 29 25 39 M.S.W. 6 5 13 11 8 16 19 14 M.B.A. 6 5 14 21 26 M.B., B.S. 152 141 160 148 146 144 156 144 B.Sc.(Eng.) 158 207 212 238 242 260 241 286 B.Sc. (Bulg. Studies) 11 15 11 B.Arch. 24 22 34 20 26 32 30 31 B.Building 9 13 15 15 15 B.Sc. 136 164 159 166 165 210 206 212 B.A. 216 278 265 292 277 359 365 362 B.A.(Arch.Studies) 43 24 44 46 51 37 44 42 B.Soc.Sc. 160 186 199 196 196 266 263 275 LL.B. 30 34 45 42 49 50 57 70 B.Sc. (Biomedical Sc.) 2 B.Sc. (Computer Studies) B.Sc. (Q.S.) B.D.S.
Diplomas/ certificates Education 108 146 221 191 285 304 401 320
· P.C.LL. 24 27 32 50 53 54 60 64 Others* 98 78 115 91 107 87 87 124
Chinese University of Hong Kong
Degrees Ph.D. 1 M.Phil. 38 52 50 47 57 43 39 68 M.B.A. 24 20 28 32 57 70 77 71 M.S.W. 5 2 2 2 4 M.A. 2 4 2 1 1 M.A.(Ed.) 2 1 2 5 4 8 16 25 M.Div. 2 2 2 2 B.A. 199 183 225 243 256 259 259 245 B.Sc. 184 194 229 230 267 268 293 271 B.B.A. 111 141 195 174 235 250 241 200 B.S.Sc. 234 238 271 302 318 295 313 307
Diplomas Education 142 138 253 288 323 320 258 295
Note: *Include Dip.M.S., Dip.Chin.Language, Cert.Chin.Language, Cert. in Engineering Science, Dip.Soc., Cert.Psych., Cert.Med.Sc. t Revised figure.
1984
26 9 2
24 31 26 11 55 10 28
151 257t
38 9
207 366 41
271 61 1
435 85
100
4 69 73 7 l
13 1
248 254 212 325
317
1985
97 164 112 220
593
1985
14 32
24 40 65 15 51 19 66
146 252
48
207 381 43
292 73
28 13 68
433 82
115
6 66 85 4 1 7 1
251 267 207 309
344
185

15.28 Expenditure on Education HK$'000
1975/76 1976/77 1977/78 1978/79 1979/80 1980/81 1981/82 1982/83 1983/84 1984/85
Recurrent
Education Departmentt Pre-primary services 5,388 14,966 24,144
Primary 565,261 643,793 707,336 774,966 874,190 1,095,528 1,295,911 1,703,196 1,671,845 1,942,184
Secondary 247,471 314,868 391,245 521,662 691,673 1,038,138 1,260,312 1,572,127 1,734,142 2,045,264
Special education #= 207,699 170,333
Teacher training 17,769 18,631 21,992 19,220 20,825 27,289 32,836 47,529 60,455 72,686
Technical and vocational 15,328 19,491 24,672 28,823 35,693 51,192 69,908
Post-secondary 1,005 614 603 3 3,230 17,288 32,143 41,806 32,887 20,382
Other education 5,244 6,250 7,532 15,624 19,148 17,241 22,447 43,552 56,796 52,239
Administrative (non-allocated) 34,192 39,658 49,540 49,088 66,900 72,097 104,981 103,209 116,443 135,349
Technical Education and Industrial Training Department@ Technical and vocational 128,653 170,841 226,748
University and Polytechnic Grants Committee* Tertiary 214,838 252,038 302,544 348,930 411,779 582,445 748,174 924,155 1,037,834 1,401,295
Non-recurrent
Education Department 60,806 42,451 57,330 63,911 104,650 124,698 245,751 337,868 274,670 404,308
Technical Education and Industrial Training Department@ Technical and vocational 1,763 38,488 132,899
University and Polytechnic Grants Committee* Tertiary 92,629 40,139 24,435 65,395 135,716 237,110 150,264 133,916 150,540 200,998
Total expenditure 1,254,543 1,377,933 1,587,229 1,887,622 2,363,804 3,263,026 3,962,727 5,043,162 5,567,606 6,828,829
Note: tincludes subventions on education. *Includes grants to the two universities, polytechnics, Baptist College and students etc., and the figures in 1977 /78 and before exclude reimbursements of rates. #=Expenditure on special education is separated from primary and secondary level commencing from 1983/84. @Technical Education and Industrial Training Department was formed in April 1982 to take over the responsibility of providing technical and vocational
training.
186

Section 16: MEDICAL AND HEALTH
In the public sector, medical and health services are provided through a network of out-patient clinics, specialist clinics, maternal and child health clinics, accident and emergency units, hospitals and medical rehabilitation centres. There are 64 existing government clinics and polyclinics throughout the territory. To complement the coverage, people in remote areas of the New Territories are served by mobile dispensaries. Islands are visited by 'floating clinics'. Helicopters provide a 'flying doctor' service to the more isolated and inaccessible communities. To further expand the utilization of the existing facilities, evening and public holiday out-patient sessions are available at 17 clinics in the more densely populated regions. In the private sector there are about 2 700 registered private practitioner offices and surgeries in operation throughout the territory.
Statistics in this Section are all obtained from the Medical and Health Department. Hospital beds statistics are compiled from the annual hospital beds surveys. Other statistics are derived from the Infectious
Disease Registry, the Tuberculosis Registry, the Cancer Registry and also from various other surveys and administrative records of the Medical and Health Department.
187


16.1 Hospital Beds by Classification of Bed by Census Area by Type of Institution, 1985 Number of beds
Hong Kong Island Kowloon New Territories
Govern- Govern- Govern-Govern- ment Govern- ment Govern- ment
ment assisted Private ment assisted Private ment assisted Private Classification of bed institution institution institution institution institution institution institution institution institution Total
Internal medicine 353 902 344 514 1483 219 607 195 41 4658
Surgery 343 710 308 705 872 202 507 170 3817
Orthopaedics 147 284 40 493 492 360 51 1867
Gynaecology 107 84 116 119 231 2 108 10 777
Obstetrics/maternity 336 132 184 434 430 238 439 82 24 2299
Paediatrics and babies 185 66 168 367 438 95 405 35 15 1774
Mentally-ill 15 5 456 30 3 097 3603
Mentally handicapped 300 200 500
Tuberculosis and chest diseases 714 5 126 177 161 1183
Other infectious diseases 22 60 40 14 172 308
Geriatrics 47 434 40 184 705
Rehabilitation and chronic 220 3 80 98 401
Radio-therapy and oncology 18 192 16 97 64 63 450
Other specialties 52 28 43 97 45 74 339
Casualty, observation and custodian 177 8 126 17 432 760
Unclassified 121 76 117 109 275 412 83 4 1197
Total 1854 3408 1426 3703 5408 1222 6731 806 80 24638
Note: Figures are as at end of 1985. 'Other specialties' beds include eye, ear-nose-throat, skin and dental beds. 'Unclassified' beds include staff beds, beds in private wards, mixed beds in intensive care units and overflow beds.
189

16.2 Medical Institutions and Beds by Census Area by Type
Census area/Type of institutions 1976 1977 1978 1979 1980 1981 1982 1983 1984 1985
Hong Kong Island
Government hospitals Establishments 3 3 3 3 3 3 3 3 3 3 Number of beds I 533 I 537 I 555 I 560 I 559 I 576 I 673 I 671 I 671 I 686
Hospitals in Correctional Institutions Establishments 4 4 5 5 5 5 5 6 5 6 Number of beds 166 135 133 127 145 145 139 125 134 142
Government maternity homes/clinics Establishments 2 I I I I I I I I I Number of beds 51 26 26 26 26 26 26 26 26 26
Government-assisted hospitals Establishments 10 10 10 9 9 9 9 9 10 10 Number of beds 3 028 3 185 3 328 3 322 3 170 3 245 3 245 3245 3 355 3 408
Private hospitals Establishments 6 6 6 6 6 6 6 6 6 6 Number of beds I 231 I 305 I 298 1405 1431 1445 I 451 1436 1439 I 426
Private nursing and maternity homes Establishments 6 4 2 2 2 Number of beds 14 II 6 6 6
Kowloon
Government hospitals Establishments 3 3 3 3 3 3 3 3 3 3 Number of beds 3 098 3 223 3 385t 3 429t 3 429t 3 43It 3 43It 3 485t 3 447t 3 441*
Hospitals in Correctional Institutions Establishments I 2 I I 1 I I 2 2 2 Number of beds 8 100 94 94 94 94 94 98 98 98
Government maternity homes/clinics Establishments 6 6 6 6 6 6 7 7 7 7 Number of beds 145 140 140 140 140 140 164 164 164 164
Government-assisted hospitals Establishments 7 7 7 7 7 7 7 7 7 7 Number of beds 4 283 4 358 4 367 4606 4 695 4846 5 313 5427 5 417 5 408
Private hospitals Establishments 4 4 4 4 4 4 4 4 4 4 Number of beds 831 870 909 925 935 938 1111 I 131 I 156 I 160
Private nursing and maternity homes Establishments 15 11 8 8 6 6 5 4 3 2 Number of beds 114 91 75 75 52 84 80 71 61 62
New Territories
Government hospitals Establishments 6 6 6 6 7 7 7 7 8 8 Number of beds 3 549 3 526 3 536 3 558 3 765 4 341 4 616 4744 5 599 6105
Hospitals in Correctional Institutions Establishments 10 10 11 12 12 12 11 11 12 13 Number of beds 264 267 284 287 305 305 347 347 403 411
Government maternity homes/clinics Establishments 14 14 14 14 14 14 15 14 14 14 Number of beds 227 227 227 224 221 223 253 221 217 215
Government-assisted hospitals Establishments 4 4 4 4 4 3 3 3 3 3 Number of beds 602 656 652 702 720 664 664 664 806 806
Private hospitals Establishments I I I I 1 1 I 1 I 1 Number of beds 113 114 113 113 113 83 83 80 80 80
Private nursing and maternity homes Establishments 4 2 2 2 Number of beds 13 8 7 7
Total number of beds 19270 19779 20135 20606 20806 21586 22690 22935 24073 24638
Beds per thousand population 4.3 4.4 4.4 4.2 4.1 4.2 4.3 4.3 4.5 4.5
Note: Figures are as at end of the year. tincludes 80 beds in the British Military Hospital. *Includes 71 beds in the British Military Hospital.
190

16.3 Hospital Beds by Classification of Bed Number of beds
Classification of bed 1976 1977 1978 1979 1980 1981 1982 1983 1984 1985
Internal medicine 3 881 3 999 4 159 4227 4165 4183 4 313 4380 4 561 4 658
Surgery/ orthopaedics 4154 4362 4 534 4652 4626 4 851 5077 5 191 5 461 5 684
Gynaecology 743 713 699 753 728 695 708 707 761 777
Obstetrics/maternity 2 215 2192 2 176 2183 2 154 2096 2 155 2142 2 259 2299
Paediatrics and babies 1417 1426 1 453 1 540 l 582 1 552 l 633 l 594 1 768 l 774
Mentally-ill/mentally handicapped 2 587 2 720 2 728 2 780 3 044 3 590 3 936 3 990 4047 4103
Tuberculosis and chest diseases 1457 l 311 l 268 l 242 1211 l 205 l 201 l 213 l 192 l 183
Radio-therapy and oncologyt 375 376 376 379 389 453 450
Other infectious diseases 249 260 263 342 359 294 296 295 297 308
Others 2 567 2 796 2 855 2 512 2 561 2 744 2992 3 034 3 274 3 402
Total 19270 19779 20135 20606 20806 21586 22690 22935 24073 24638
Note: Figures are as at end of the year. tBefore 1979, radio-therapy and oncology beds were included in 'Others'.
16.4 Prophylactic Immunizations
Immunological procedure 1976 1977 1978 1979 1980 1981 1982 1983 1984 1985
Anti-smallpox vaccination 324 587 231 488 124 006 75 184 21 686 l 676 l 041 578 229
Anti-cholera inoculation 114 545 91 150 86 833 61 793 21 881 7 870 8 053 5 887 5 595 5 691
Triple vaccine inoculation (Diph/Pert/Tet.) 211 838 225 258 219 942 226 249 225 090 251 384 267 477 267 365 263 317 257 083
Combined Diphtheria and Tetanus vaccine inoculation 98 358 153 786 109 692 119 375 77252 102 954 186 054 147 262 177 964 141 742
Anti-typhoid inoculations lst dose 15 636 15 458 14 626 24600 23 840 25 999 8 258 829 1 180 l 147 2nd dose 9074 5434 3 613 6374 3 856 3 687 1 168 63 102 138 Booster dose 52 326 44327 43 142 38 781 37 651 40508 12 663 l 097 720 858
Anti-tuberculosis (B.C.G.) inoculations Infants 77 736 79 118 80 298 82 886 86 305 87 694 86 562 84186 78 389 77199 Others 80 550 47149 58 149 53 904 47 808 51 208 57 213 72050 52622 60 393
Oral poliovaccine type I for newborn 74768 76 709 77063 79 364 82 525 84094 83 823 81 528 76096 74 312
Anti-poliomyelitis vaccinations lst dose 64256 76 252 73 151 83 749 76246 80 750 78 844 75 670 70 608 67 302 2nd dose 72 071 73 883 71 358 73 843 71 540 76 501 79 586 77 768 74679 72 175 Booster dose 65 231 62876 65 058 196 970 135 890 131 835 229 322 193 452 224226 212 710
Anti-measles inoculation 61207 61 057 64256 68 061 59 023 65022 70 919 76 211 74 788 71820
Anti-rubella inoculationt 101 517 40825 46 336 35 763 28 474 41662 44079 45 611
Note: tSince September 1978.
191

16.5 Infectious Diseases Notified (Cases and Deaths)
Disease 1976 1977 1978 1979 1980 1981 1982 1983 1984 1985
Cholera Cases It 2 4 3t 8 #= 2 Deaths I
Amoebiasis Cases 33 26 I2 46 39 48 37 37 29 I6 Deaths 3 5 2 I 6 2 2 I 2
Bacillary dysentery Cases 356 322 406 429 437 563 550 479 396 5I9 Deaths 3 I 2 3 I 3 I I
Cerebro-spinal meningitis and meningococcal infections Cases 9 IO 4 33 29 I8 I6 13 8 I2
Deaths 3 7 3 I I I
Chickenpox Cases I 743 899 9I2 I 052 2 I76 I I40 I 62I I 228 2433 I I94 Deaths 3 I I I 3 I 3
Diphtheria Cases I I 2 Deaths I
Enteric fever (typhoid and paratyphoid) Cases 500 389 369 357 500 500 392 369 33I 287
Deaths 4 2 2 3 6 4 3 I I
Food poisoning Outbreaks 112 213 204 I46 102 I75 2I5 I69 233 278 (Persons affected) (423) (555) (543) (587) (754) (666) (870) (642) (I 340) (958) Deaths I I 2
Leprosy Cases 76 73 74 70 60 55 57 38 32 32 Deaths 2 I§ I§ 2 I§
Malaria Cases 39 40 47 40 49 62 80 I25 113 I68 Deaths I I
Measles Cases I 463 I 537 240 1 929 I 669 249 1 863 888 678 280 Deaths 10 I2 1 32 5 5 2 2 I
Ophthalmia neonatorum Cases 10 5 4 3 I 5 4 1 6 5 Deaths
Poliomyelitis Cases 2 3 Deaths I
Puerperal fever Cases 2 2 2 Deaths 2
Rabies (human) Cases It 2 I 2t Deaths I 2 I 2
Scarlet fever Cases I24 28 13 I2 I8 3 4 3 5 Deaths
Tuberculosis Cases 7 928 7 I9I 6 623 7 907 8 065 7 729 7 527 7 30I 7 843 7 545 Deaths 568 532 420 523 55I 489 454 446 420 409
Typhus (urban) Cases It Deaths
Typhus (scrub) Cases 2 It 3 5 6 5 3 6 I2 Deaths
Viral hepatitis Cases 969 I 008 I 230 964 I 554 I 738 I 8I4 I 783 I 780 I 60I Deaths 45 42 47 44 38 26 42 28 I2 I3
Whooping cough Cases 2 I2 2 I8 2I Deaths
Total Cases 13368 11745 10140 12997 14724 12302 14195 12438 13915 11975 Deaths 642 596 475 619 615 527 510 485 443 426
Note: :j:Imported case. §Death of old case. #=Includes 5 imported cases.
I92

16.6 Notification and Death Rates of Certain Infectious Diseases
Disease
Amoebiasis N.R. D.R.
Bacillary dysentery N.R. D.R.
Cerebro-spinal meningitis and meningococcal infections N.R.
Diphtheria
Enteric fever (typhoid and paratyphoid)
Measles
Poliomyelitis
Tuberculosis
Viral hepatitis
Note:
D.R.
N.R. D.R.
N.R. D.R.
N.R. D.R.
N.R. D.R.
N.R. D.R.
N.R. D.R.
1976
0.74 0.68
8.01 0.68
0.20 0.68
0.02 0.23
11.25 0.90
32.92 2.25
178.41 127.82
21.81 10.13
N. R. refers to notification rate per 100 OOO population. D.R. refers to death rate per million population.
16.7 Causes of Death
Cause
Infectious and parasitic diseases
Neoplasms
Endocrine, nutritional metabolic diseases and immunity disorders
Diseases of blood and blood-forming organs ·
Mental disorders
Diseases of nervous system and sense organs
Diseases of circulatory system
Diseases of respiratory system
Diseases of digestive system
Diseases of genitourinary system
Complications of pregnancy, childbirth and puerperium
Diseases of the skin and subcutaneous tissue
Diseases of the musculoskeleta system and connective tissue
Congenital anomalies
Certain conditions originating in the perinatal period
Symptoms, signs and ill-defined conditions
Injury and poisoning
Total
Note:
1976*
757
5 378
329
71
41
166
6699
3 368
1 158
773
14
56
30
377
493
1 598
1 887
23195
1977
0.58 1.11
7.14 0.22
0.22
0.02
8.63 0.44
34.08 2.66
159.45 117.97
22.35 9.31
1977*
749
5 658
292
78
23
179
6 737
3 607
1133
824
13
35
39
399
470
1456
1 767
23459
1978
0.26 0.44
8.83 0.44
0.09
8.03 0.44
5.22 0.22
144.07 91.36
26.76 10.22
1978*
634
5 988
308
46
17
164
7096
3 288
994
831
5
46
20
358
440
1435
1173
22843
1979
0.94 0.20
8.79 0.61
0.68 1.43
7.32 0.61
39.54 6.56
162.08 107.20
19.76 9.02
1979
833
6212
363
57
4
172
7 668
4079
1047
913
7
15
43
325
526
1849
2066
26179
1980
0.77 1.19
8.67 0.20
0.58 0.60
0.04
9.92 1.19
33.12 0.99
0.04
160.07 109.36
30.84 7.54
1980
816
6447
338
43
6
169
7 507
3 969
1128
988
4
12
39
293
517
1 633
2 078
25987
1981
0.93
10.92 0.58
0.35 0.19
9.70 0.78
4.83
0.06 0.19
149.96 94.88
33.72 5.04
1981
777
6 595
283
36
6
160
7224
3 930
1 078
982
7
4
57
259
447
1190
1 943
24978
1982
0.71 0.38
10.51 0.19
0.31 0.19
0.02 0.19
7.49
35.60 0.96
143.84 86.76
34.67 8.03
1982
783
6 829
217
21
2
203
7 462
4033
1 178
1 039
5
49
273
463
1 053
1 849
25460
1983
0.70 0.38
9.02 0.19
0.24 0.19
6.94 0.56
16.71 0.38
0.02
137.41 83.94
33.56 5.27
1984
0.54 0.19
7.38
0.15
6.17 0.19
12.64 0.37
146.22 78.30
33.18 2.24
1985
0.30 0.37
9.57
0.22
5.29 0.18
5.16 0.18
0.02
139.13 75.42
29.52 2.40
Number of registered deaths
1983
788
7 242
232
33
7
219
7 757
4475
1 150
1 045
6
4
54
313
424
1 036
1 700
26485
1984
751
7 369
252
29
2
185
7 441
4228
1 098
1100
5
9
39
272
355
852
1 593
25580
1985
769
7 553
252
31
2
193
7 381
4127
1 093
1 106
4
11
53
231
277
639
1 603
25325
*Data regrouped according to International Classification of Diseases, Injuries and Causes of Death (1.C.D.) 9th Revision (1975).
193

16.8 Leading Causes of Death by Sex by Age, 1985 Number of registered deaths
Cause of death Sex Al/ages 0 1-4 5-14 15-44 45--64 65 & over Unknown
Malignant neoplasms M 4590 2 3 19 414 2124 2028 F 2945 3 9 23 224 1 008 1 677
Heart diseases, including hypertensive heart disease M 2211 1 2 7 69 709 1 421 2
F 2000 2 2 4 35 332 1 625
Cerebrovascular disease M 1425 62 447 911 3 F 1534 31 254 1246
Pneumonia, all forms M 816 18 10 5 25 158 599 F 818 16 5 4 14 72 707
Injury and poisoning M 992 5 23 33 475 264 190 2 F 611 8 20 25 199 156 202 1
Nephritis, nephrotic syndrome and nephrosis M 416 2 2 2 35 127 247
F 496 1 29 129 337
Bronchitis, chronic and unspecified, emphysema and asthma M 410 3 22 141 243
F 219 1 7 30 181
Tuberculosis (including late effects of tuberculosis) M 321 19 134 168
F 88 7 17 64
Chronic liver diseases and cirrhosis M 221 16 131 74 F 100 3 26 70
Certain conditions originating in the perinatal period M 159(2) 159(2)
F 118 118
Diabetes mellitus M 100 33 66 F 133 36 96
Congenital anomalies M 130(1) 112(1) 12 2 4 F 101 91 6 2 1
Other causes M 2 293(8) 25 24 26 157 584 1 465 12(8) F 2078 16 14 17 94 244 1 690 3
All causes M 14 084(11) 325(3) 76 98 1299 4852 7412 22(8) F 11241 255 57 79 645 2305 7895 5
T 25 325(11) 580(3) 133 177 1944 7157 15307 27(8)
Note: Figures in brackets denote unknown sex included.
194
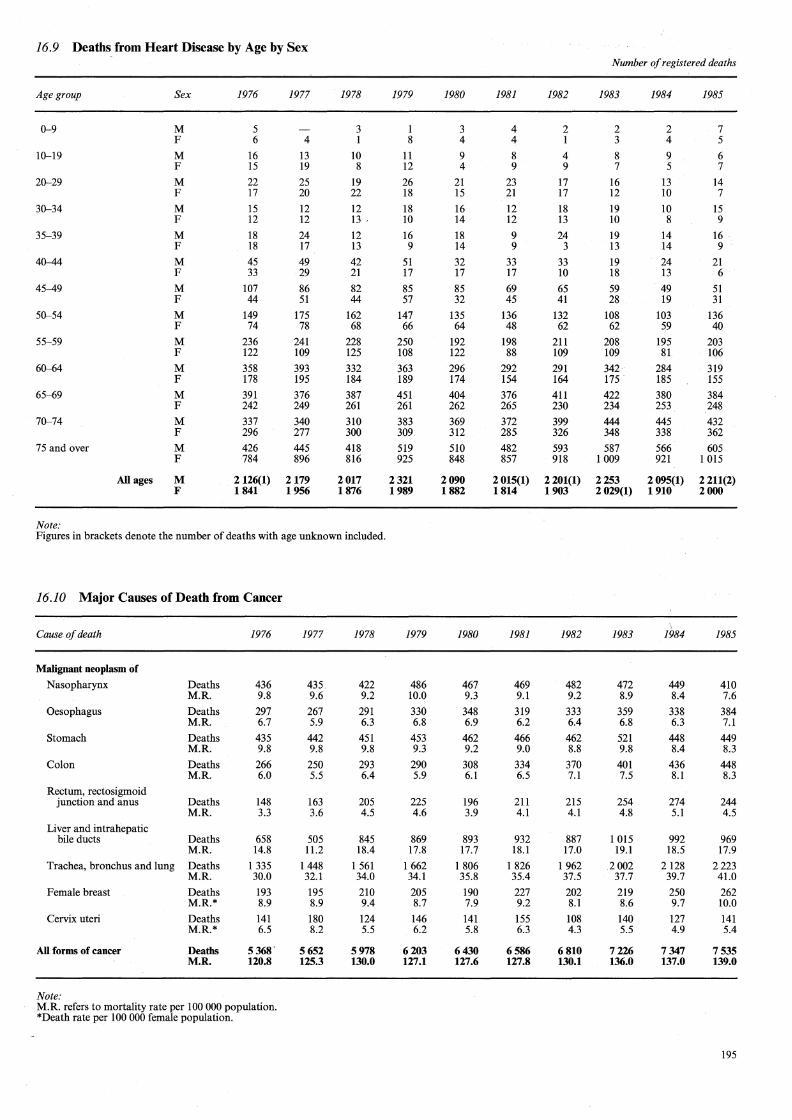
16.9 Deaths from Heart Disease by Age by Sex
Age group
0--9
10--19
20--29
30--34
35-39
40--44
45-49
50--54
55-59
60--64
65-69
70--74
75 and over
Note:
All ages
Sex
M F
M F
M F
M F
M F
M F
M F
M F
M F
M F
M F
M F
M F
M F
1976 1977
5 6 4
16 13 15 19 22 25 17 20 15 12 12 12 18 24 18 17 45 49 33 29
107 86 44 51
149 175 74 78
236 241 122 109 358 393 178 195 391 376 242 249 337 340 296 277 426 445 784 896
2 126(1) 2 179 1841 1956
1978
3 1
10 8
19 22 12 13 .
12 13
42 21 82 44
162 68
228 125 332 184 387 261 310 300 418 816
2017 1876
Figures in brackets denote the number of deaths with age unknown included.
16.10 Major Causes of Death from Cancer
Cause of death
Malignant neoplasm of
Nasopharynx Deaths M.R.
Oesophagus Deaths M.R.
Stomach Deaths M.R.
Colon Deaths M.R.
Rectum, rectosigmoid junction and anus Deaths
M.R.
Liver and intrahepatic bile ducts Deaths
M.R.
Trachea, bronchus and lung Deaths M.R.
Female breast Deaths M.R.*
Cervix uteri Deaths M.R.*
All forms of cancer Deaths M.R.
Note:
1976
436 9.8 297 6.7
435 9.8 266 6.0
148 3.3
658 14.8
1 335 30.0 193 8.9 141 6.5
5368' 120.8
M.R. refers to mortality rate per 100 OOO population. *Death rate per 100 OOO female population.
1977
435 9.6 267 5.9
442 9.8 250 5.5
163 3.6
505 11.2
1448 32.1 195 8.9
180 8.2
5652 125.3
1978
422 9.2 291 6.3
451 9.8 293 6.4
205 4.5
845 18.4
1 561 34.0 210 9.4 124 5.5
5978 130.0
1979
1 8
11 12 26 18 18 10 16 9
51 17 85 57
147 66
250 108 363 189 451 261 383 309 519 925
2321 1989
1979
486 10.0 330 6.8 453 9.3
290 5.9
225 4.6
869 17.8
I 662 34.1 205 8.7
146 6.2
6203 127.1
1980
3 4
9 4
21 15 16 14 18 14 32 17 85 32
135 64
192 122 296 174 404 262 369 312 510 848
2090 1882
1980
467 9.3 348 6.9 462 9.2
308 6.1
196 3.9
893 17.7
1 806 35.8 190 7.9
141 5.8
6430 127.6
Number of registered deaths
1981 1982 1983 1984 1985
4 2 2 2 7 4 I 3 4 5
8 4 8 9 6 9 9 7 5 7
23 17 16 13 14 21 17 12 10 7 12 18 19 10 15 12 13 10 8 9 9 24 19 14 16 9 3 13 14 9
33 33 19 24 21 17 10 18 13 6 69 65 59 49 51 45 41 28 19 31
136 132 108 103 136 48 62 62 59 40
198 211 208 195 203 88 109 109 81 106
292 291 342 284 319 154 164 175 185 155 376 411 422 380 384 265 230 234 253 248 372 399 444 445 432 285 326 348 338 362 482 593 587 566 605 857 918 1 009 921 I 015
2 015(1) 2 201(1) 2 253 2 095(1) 2 211(2) 1 814 1 903 2 029(1) 1 910 2 OOO
1981
469 9.1 319 6.2
466 9.0 334 6.5
211 4.1
932 18.l
1 826 35.4 227 9.2 155 6.3
6586 127.8
1982
482 9.2 333 6.4 462 8.8
370 7.1
215 4.1
887 17.0
1962 37.5 202 8.1
108 4.3
6810 130.1
1983
472 8.9 359 6.8
521 9.8
401 7.5
254 4.8
1 015 19.1
2002 37.7 219 8.6 140 5.5
7226 136.0
1984
449 8.4 338 6.3 448 8.4 436 8.1
274 5.1
992 18.5
2 128 39.7 250 9.7
127 4.9
7347 137.0
1985
410 7.6
384 7.1 449 8.3
448 8.3
244 4.5
969 17.9
2 223 41.0 262 10.0 141 5.4
7535 139.0
195

16.11 Causes of Infant Death Number of registered deaths
Cause, 1979 1980 1981 1982 1983 1984 1985
Meningitis 15 8 8 15 8 4
Bronchitis 5 3 3 3
Viral pneumonia 5 4 3 4
Pneumococcal pneumonia 5 2
Other bacterial pneumonia
Bronchopneumonia, organism unspecified 77 64 29 28 50 35 22
Pneumonia, organism specified 50 39 34 21 21 14 11
Gastroenteritis, colitis and other diarrhoeal disease 32 14 13 6
Congenital anomalies 277 249 221 240 254 236 203
Obstetric complications and birth trauma 16 3 6 2 6 2 3
Intrauterine hypoxia and birth asphyxia 110 113 103 86 73 65 50
Respiratory distress syndrome 143 161 115 123 107 95 49
Other respiratory conditions of fetus and newborn 63 69 58 64 71 56 39
Disorders relating to short gestation and unspecified low birthweight 95 50 82 61 76 43 66
Infections specific to perinatal period 7 16 6 16 20 17 19
Feta! and neonatal haemorrhage 45 40 38 66 22 28 11
Haemolytic disease of fetus or newborn due to isoimmunization and other perinatal jaundice 28 13 6 3 6 5 2
Endocrine and metabolic disturbances specific to the fetus and newborn 1 2 1 2 5
Haematological disorders of fetus and newborn 3 8 7 9 5 6 4
Perinatal disorders of digestive system 13 20 6 4 9 9 5
Conditions involving the integument and temperature regulation of fetus and newborn 22 19 27 29 28 24
Other and ill-defined conditions originating in the perinatal period 1
Others 100 107 89 73 68 68 62
All causes 1092 1008 846 853 830 709 580
Infant mortality rate (per 1 OOO registered live births) 13.3 11.8 9.7 9.9 10.1 9.1 7.6
Neo-natal mortality rate (per 1 OOO registered live births) 8.4 7.8 6.6 7.0 7.0 6.4 5.0
'196

16.12 Causes of Maternal Death Number of registered deaths
Cause 1976* 1977* 1978* 1979 1980 1981 1982 1983 1984 1985
Pregnancy with abortive outcome other than spontaneous or legally induced abortion 2 3
Toxaemia of pregnancy 3 3 2 2
Haemorrhage of pregnancy and childbirth 5 6 3 2
Major puerperal infection 2
Ectopic pregnancy 1 1 3 3
Others 3 3 3 2 2 1
Total 14 13 5 7 4 7 1 6 5 4
Maternal mortality rate (per 1 OOO total births) 0.18 0.16 0.06 0.08 0.05 0.08 O.Ql 0.07 0.06 0.05
Note: *Data regrouped according to International Classification of Diseases, Injuries and Causes of Death (I.C.D.) 9th Revision (1975).
16.13 Disease Classification of In-patients Treated in Government, Government Assisted and Private Hospitals
Disease classification 1976* 1977* 1978* 1979t 1980t 198lt 1982t 1983t 1984t 1985t
Infectious and parasitic diseases 22101 24696 22602 27 521 25 955 25 606 31 539 29 211 26 979 25 056
Neoplasms 25 794 31 876 35 356 36 908 37 811 39 853 44293 48 388 52 027 55 690
Endocrine, nutritional and metabolic diseases and immunity disorders 5 241 7 847 8 379 9 459 10200 11 226 11 963 12 998 13 919 15 112
Diseases of the blood and blood-forming organs 3 452 4 363 4475 5 171 5 398 5 827 6 395 6 850 7 823 7 912
Mental disorders 8 956 10 111 11133 12090 12116 13 957 14 099 15 103 14 679 15 507
Diseases of the nervous system and sense organs 7 841 11 706 12 886 14 733 16167 17 303 18 746 19 182 20282 22082
Diseases of the circulatory system 25 481 33 580 38 919 40245 40 813 42 544 46067 49 566 51 001 51 556
Diseases of the respiratory system 34063 50496 55 494 63 289 64960 67 667 76 717 82135 74409 75 442
Diseases of the digestive system 44049 58 011 62 591 67 098 69710 71 868 78 807 80260 80 723 81 377
Diseases of the genitourinary system 24044 34400 35 188 52 310 57 658 60 185 64 403 67 173 71943 75 370
Complications of pregnancy, childbirth and the puerperium 73 836 92 375 94690 105 396 108 916 113 829 116 451 116 036 112 656 115 266
Diseases of the skin and subcutaneous tissue 7 007 8 847 8 649 10 134 11 330 11 646 12424 13 344 13 322 13 570
Diseases of the musculoskeletal system and connective tissue 6 355 8 814 10 199 11 786 12 584 14 141 17 685 18 310 19 106 21 032
Congenital anomalies 3 803 4684 4 393 4 382 4697 4 741 4834 4745 5 639 5 416
Certain conditions originating in the perinatal period 9 333 10 381 11 924 13 923 15 432 17 897 16 880 17 523 15 629 15 876
Symptoms, signs and ill-defined conditions 42221 59 087 64892 55 722 58 519 59 794 78 343 80640 73 643 78 537
Injury and poisoning 55792 63 434 70752 76 712 76485 87 398 125 322 104 218 91 353 89 354
Total (in-patients treated) 399369 514708 552522 606879 628751 665482 764968 765682 745133 764155
Note: Patients treated in maternity homes and in-patients encountering health services for other reasons are excluded. Before 1977, patients treated in private hospitals were excluded. *Data regrouped according to International Classification of Diseases, Injuries and Causes of Death (I.C.D.) 8th Revision (1965). tData regrouped according to International Classification of Diseases, Injuries and Causes of Death (I.C.D.) 9th Revision (1975).
197

16.14 Out-patient Attendances at Government and Government Assisted Institutions
General clinics
General ,
Casualty
Special clinics
General*
Child health
Ante-natal
Post-natal
Family planning
Methadone
Eye
Ear-nose-throat
Tuberculosis
Psychiatric
Leprosy
Social hygiene
Dermatology
Total attendances
Note:
1976
4 932 003
729 323
1977
4 738 323
821 072
1978
4864318
876 925
1979
5 111 757
949 651
1980
5 021 381
1 018 745
1981
5 194 412
1 068 948
1982
5 600 548
1 125 682
1983
6 006 373
1175 401
Number of attendances
1984 1985
6 260 853 6 340 039
1 221 620 1 300 565
2 459 648 2 682 175 2 942 232 1 766 004t 1 806 396t 1 974 916t 2 239 748t 2 511 228t 2 974 475t 3 262 933
1147 766
484 866
53 392
254 631
1 262 378
284 230
72 774
1257038
140 452
24441
151 915
54 806
1141 470
500 824
56 622
276474
1 956 730
283 138
79 537
1190 284
140 180
24972
137 453
59 216
1115 526
524 129
57 007
297 058
1 955 788
246462
87644
1 128 636
151 033
22 549
138 858
58 637
1104 008
532 654
55 941
312 173
1 073 863
558 073
56 021
333 250
1 091 298
573 570
56 637
340 611
2 321 280 2 505 200 2 451 141
215 738
89 372
1035777
169 665
20 325
142 691
54 710
242 646
99 804
851 398
173 012
19 511
144 641
55 297
222 635
98 927
763 061
178 865
18 471
150 852
59 501
1 194 182
576 701
59000
368 104
1 221 350
576 450
60 513
408 810
1299 490
555 089
56 978
446 301
1236216
554 765
57 244
468 643
2 546 134 2 300 480 2 793 575 2 806 992
227 104
117 528
715 432
199 260
18 241
166 933
62 997
237 319
122 893
717 738
204165
15 401
173 957
65 398
250 236
132 024
780 597
213 305
13 671
176 024
68 021
255 855
131 520
774433
243 129
13 381
184 725
69 843
13 309 663 14 088 470 14 466 802 13 881746t13 959 238t 14 243 845t 15 217 594t 15 797 476t 17 242 259t 17 700 283
*Figures for 1979 onwards were revised to exclude treatments of in-patient on physiotherapy and occupational-therapy services, which were previously included. The total attendance figures of the corresponding years were revised accordingly. Revised figures before 1979 were not available.
t Revised figure.
16.15 Analysis of Attendances in Accident and Emergence Departments of Government and Government Assisted Institutions
Accident and emergence cases
Traumatic attendances
Assault
Traffic
Industrial
Domestic
Animal bite
Sport
Insect bite
Others
Sub-total
Non-traumatic attendances
Infectious
Tuberculosis
Medical ..
Surgical
0 bstetrical
Gynaecological
Paediatric
Psychiatric
Orthopaedics
Dental/Oph/ENT
Others
Sub-total
Total
198
1976
18 417
16 451
62440
46692
4482
7 300
16 211
171 993
11 566
15 414
161 746
75 597
4 963
18 747
96 988
3 522
45 085
433628
605 621
1977
21463
20 128
80 210
51 899
6 166
7234
16 897
203 997
15 253
13 645
184 271
83 451
6223
21 584
115 200
3 520
46210
489357
693354
1978
22260
23 192
90 357
65 758
5 534
9204
832
11406
228 543
16 197
15 032
201 871
90 855
4824
20969
109 564
3 975
29 158
8 994
12 514
513 953
742496
1979
23447
23941
93 377
70 048
5 566
9 571
905
10 724
237 579
21155
16 166
218 361
92 675
11177
24212
123 624
4703
29 350
10 179
11 756
563 358
800937
1980
26 654
26 715
102 646
70 601
9 371
8 733
884
8 871
254 475
20 829
16 758
244 897
97 521
10 476
23 577
126 271
4 859
31 346
8 948
8 666
594148
848623
1981
28062
27249
103 605
71978
11982
9 916
1 264
8 562
262618
13 714
14 548
254 558
116 245
12250
26 360
130 605
5 508
27 881
11 878
7 863
621410
884028
1982
36 795
31198
101 030
90 142
7 668
11187
1 204
11126
290 350
21172
14 486
262 873
119 999
14 097
30 365
135 275
6 174
37 560
13 779
12 048
667 828
1983
38 316
32 630
108 173
100 507
7 935
9 567
1 551
8 776
307 455
17 586
9 193
295 655
124 968
12 545
27282
145 953
5 889
37 082
14 981
14 621
705 755
1984
39 192
35 272
115 429
101 897
8 560
11 016
1 351
10 608
323 325
17 074
7139
325 494
126 376
13 333
28 038
158 509
5 810
35 262
16 525
14 359
747919
1985
35 423
35 252
120 051
111 358
7 718
11 321
1454
9 124
331 701
15 614
6 966
347 425
139 249
14222
27 385
180 588
6010
46 721
19 907
14 761
818848
958 178 1 013 210 1 071 244 1150 549

16.16 Work of the Ophthalmic, Ear-nose-throat and Dental Services
1976 1977 1978 1979 1980 1981 1982 1983 1984 1985
Ophthalmic service
New out-patient attendances 94348 99264 80680 53 171 60101 57778 54854 56127 57084 51549
Total out-patient attendances 269 280 268 209 229037 196 934 226 520 206 226 209 237 218 786 231 960 230 899
Operations performed 3 859 3 892 2992 3469 4 512 4576 4989 4667 4652 5 075
Home visits by Health Visitors 2 777 1452 1222 1235 1 391 852 1 OOO 657 629 1186
Number of persons first registered as blind 971 818 886 872 703 707 977 968 1 079 835
Ear-nose-throat service
New out-patient attendances 19 458 17 918 18 219 20340 22340 21435 24777 24563 24953 26118
Total out-patient attendances 58 501 61 779 60562 65 352 76 365 68 952 80 358 88 519 91 598 97048
Total in-patients treated 2672t 2 59lt 2679t 2438t 4874§ 2 881 2 619 2610 2 608 2695
Operations performed 2100 2346 2183 2186 2667§ 2 651 2 640 2894 2927 3 196
Speech therapy cases 2240 2092 5 349 5172 5163 4 581 4921 4216 3 605 3 577
Dental service
Attendances 274949 285 695 331 229 345 878 344025 367 394 367 330 398 625 427 165 446 503
Number of persons rendered dentally fit 56 531 56695 71829 76 883 78 771 75 784 82 372 94756 107 721 124 382
Note: tFigures refer to total in-patients admitted. §Figures refer to the financial year ending 31 March 1981.
16.17 Work of Para-medical Services
1976 1977 1978 1979 1980 1981 1982 1983 1984 1985
Physiotherapy service
Number of patients treated 87 320 105 562 120 734 134 869 144622 152413 172422 183879 198643 224 571 In-patients 78108 79668 79408 89200 94294 96978 103 900 Out-patients 56761 64954 73005 83 222 89 585 101 665 120 671
Total treatments* 847 849 1051328 1198 333 1202 214 1120550 1202457 1313 413 1489586 1659 735 1813127 In-patients 677 750 608 128 632 857 674 526 791 914 852403 947 249 Out-patients 524464 512 422 569 600 638 887 697 672 807 332 865 878
Occupational therapy service
Number of patients treated 12464 12112 12433 13679 14182 15980 20894 24864 32512 36169 In-patients 8 657 8 655 9 375 12 320 15 031 20930 23 120 Out-patients 5022 5 527 6605 8 574 9 833 11 582 13 049
Total treatments* 681294 655 528 679399 721780 698999 702124 798 275 1005 668 1329810 1633 518 In-patients 482 552 446077 425 206 486468 663 062 936 959 1111134 Out-patients 239 228 252 922 276 918 311 807 342 606 392 851 522 384
Prosthetic-orthotic service
Number of patients treated 7841 7732 7080 7925 8205 8478 11835 15 389 In-patients 2020 1 317 1162 967 420 515 2402 4334 Out-patients 5 821 6 415 5 918 6958 7785 7963 9433 11055
Total attendances 19223 16030 16862 17 368 18910 19193 22819 22891 29415 39553 In-patients 5139 3 344 4432 2892 1 564 1917 8 283 14299 Out-patients 14084 12 686 12430 14476 17 346 17 276 21132 25254
Radio-diagnostic division
Total number of examinations done 799960 755 457 825 220 853892 877 369 897 775 1019557 1 041 721 1070146 1117 620
Radio-therapeutic division
Number of patients treated 4141 4375 4657 5002 5057 4997 5 248 5526 5506 6146 With malignant disease 3 553 3 798 4110 4 513 4444 4362 4 611 4877 4845 5419 With non-malignant disease 588 577 547 489 613 635 637 649 661 727
Radiation treatments given 104138 105077 119 922 125199 132 262 143112 160810 176224 181103 192640
Note: *Figures before 1979 refer to the number of attendances.
199

16.18 Work of the Pharmaceutical Service
1976 1977 1978 1979 1980 1981 1982 1983 1984 1985
Cost of supplies (HK$'000) ' Drugs and dressing 31,608 39,515 52,246 62,796 62,010 92,003 106,863 125,896 154,989 183,817
Instruments, medical and surgical equipment 3,946 6,420 10,083 11,768 9,461 21,300 11,772 5,273 6,611 1,118
Pharmaceutical control
Wholesale poisons licences issued 511 548 603 615 672 696 756 807 835 868
Authorized seller licences issued 65 74 84 99 108 124 132 147 152 163
Listed seller licences issued 2100 2245 2306 2350 2 375 2352 2 326 2468 2 539 2566
Dangerous drugs licences issued 85 109 97 105 125 i31 136 145 151 162
Antibiotics permits issued 340 380 426 431 424 444 469 485 519 535
Licences for movement of dangerous 344 drugs issued 237 255 306 21.6 213 166 184 118 121
Premises inspected 6175 5 793 4767 3 565 5 383 5130 5 743 9 771 9704 11206
Prosecutions initiated 60 76 85 82 39 77 55 122 115 118
Pharmaceutical products registered*# 3 008 10802 14 527 16 500 18 526 16 516 19 281 24846
Pharinaceutical manufacturers licences issued* 86 84 90 91 94 95 101 100
Pharmaceutical import/export licences issued* 13 999 28 616 28075 29907 29 890 31197 31 483 34075
Registration of pharmaceutical importer/exporter§ 322 447 415 440 469
Note: *Implemented on 1.7.78. §Implemented on 1.7.81. #Figures are as at end of the year.
16.19 Work of Institute of Pathology and Forensic Pathology
1976 1977 1978 1979 1980 1981 1982 1983 1984 1985
Institute of pathology
Number of tests* 3136 524 3 899 822 4 563 578 5 710 919 5 878 471 6 619 068 8 928 254 9 846 251 10 833 726 13 016 497
Autopsies on medical legal cases performed 952 1258 655 784 739 744 929 847 790 682
Vaccine production (in millilitres) 769.285 773 970 605 350 738 930 417 220 384105 654 775 290790 608 680 639. 765
Forensic pathology
Attendances at scenes of crimes 185 248 236 108 134 181 199 211 155 116
Attendances at courts 219 181 198 147 195 228 235 203 198 198
Examinations of victims at¥ suspects 963 858 817 929 866 763 949 1003 1079 1164
Medical-legal examinations of weapons 111 96 88
Examination of clothing 1167 882 1139
Note: *Includes Prince of Wales Hospital which commenced service in May 1984.
200

16.20 Work of Blood Banks
Blood received from
Hong Kong Red Cross
Patients' relatives and friends
Other donors
British Military Hospital and other government hospitals other than QMH, QEH, PMH & PWH
Blood distributed to
Government hospitals
Government-assisted hospitals*
Private hospitals*
British Military Hospital
Unusable due to various causes
Note:
1976
49 828
214
11
165
32 875
8 487
4 236
103
3 759
Blood is collected in bags of either 300 c.c. or 430 c.c.
1977
54902
208
2
136
38 291
8 050
5 456
50
3 867
1978
48 180
67
4
101
32 710
5 574
5 338
46
4 153
1979
50473
146
5
22
32 616
5 738
6 963
230
4 518
1980
69049
125
9
12
43 459
6 078
8 028
38
6062
1981
78 661
156
9
12
46422
10 795
11 334
148
4370
1982
80 039
171
74
46 179
8 241
11 905
77
12 266
1983
78 374
28
38
50 831
9110
10940
94
6964
Number of bags
1984
63 812
83
54
54 948
4120
4124
30
3 974
1985
45064
50
46
48 956
43
49
1 764
*The Hong Kong Red Cross blood transfusion service took over the issuing and processing of donated blood to Government-assisted and private hospitals w.e.f. 1984.
16.21 Work of the Family Health Services
Centres---Maternal and child health#
Full-time service With midwifery Without midwifery
Subsidiary service With midwifery Without midwifery
cenxes---Family planning# F ll-time service
Su sidiary service
Centres---Comprehensive Observation Service#
Full-time service
Subsidiary service
Total attendances for
Ante-natal sessions
Post-natal sessions
Infant welfare sessions
1976
37t
22 10 12
J5t 12 3t
40
5
35
181 262
15 149
1977
38t
23 9
14
15t 12 3t
41
5
36
190 303
18 741
1978
38t
23 9
14
15t 12 3t
41
6
35
29*
8
21
189 387
20 075
1979
38t
23 9
14
J5t 12 3t
41
6
35
34
8
26
1980
38t
23 9
14
15t 12 3t
41
6
35
34
8
26
205 395 234 619
21717 23401
1981
40t
25 9
16
15t 11 4t
42
6
36
37
18
19
1982
42
28 11 17
14 10 4
45
4
41
41
21
20
248 446 258 191
24 841 27 815
1983
42
29 10 19
13 10 3
46
4
42
42
23
19
1984
44
30 11 19
14 9 5
47
4
43
44
23
21
257 084 243 778
29 081 26 851
1985
44
30 10 20
14 9 5
47
4
43
44
24
20
238 695
25 992
(0-2 years of age) 1 005 131 1016606 992 347 981 434 961 072 972 407 1 049 283 1062216 1 127 879 1 089 902
Toddler welfare sessions (2-5 years of age) 122 407 104 881 103 556 101 075 92 333 97 999 123 812 138 181 152 692 141 846
Family planning sessions
Comprehensive Observation Service
254 631 276 474 297 058 312 173 333 250 340 611 368 104 408 801 446 301 468 643
Home visits for
Maternal and childhealth service
Family planning service
Note: #o Figures are as at end of the year.
80 862
4 752
83 239
5 603
tincludes 1 subsidiary centre temporarily suspended. *Comprehensive Observation Service commenced from April 1978.
51108* 89 831
78 667
6 163
79 105
5 234
97 801 118 791 145 367 163 068 184 226 195 691
89 837
6 787
92 067
9 227
93 900 102 295 105 949 105 156
12 269 13 866 13 773 15 466
201
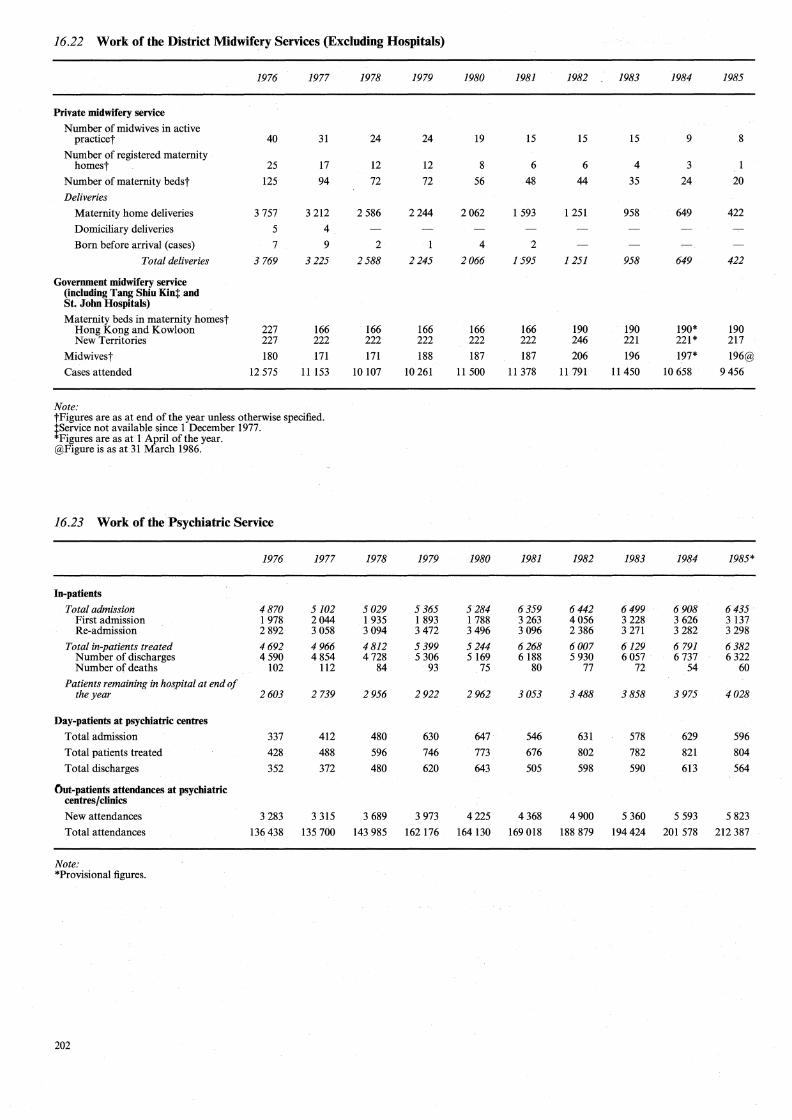
16.22 Work of the District Midwifery Services (Excluding Hospitals)
1976 1977 1978 1979 1980 1981 1982 1983 1984 1985
Private midwifery service
Number of midwives in active practicet 40 31 24 24 19 15 15 15 9 8
Number of registered maternity homest 25 17 12 12 8 6 6 4 3 1
Number of maternity bedst 125 94 72 72 56 48 44 35 24 20
Deliveries
Maternity home deliveries 3 757 3 212 2 586 2244 2062 1 593 1 251 958 649 422
Domiciliary deliveries 5 4
Born before arrival (cases) 7 9 2 4 2
Total deliveries 3 769 3 225 2588 2 245 2066 1595 1251 958 649 422
Government midwifery service (including Tang Shiu Kini and St. John Hospitals)
Maternity beds in maternity homest Hong Kong and Kowloon 227 166 166 166 166 166 190 190 190* 190 New Territories 227 222 222 222 222 222 246 221 221* 217
Midwivest 180 171 171 188 187 187 206 196 197* 196@
Cases attended 12 575 11153 10107 10 261 11 500 11 378 11 791 11450 10 658 9 456
Note: t Figures are as at end of the year unless otherwise specified. tService not available since 1 December 1977. *Figures are as at 1 April of the year. @Figure is as at 31 March 1986.
16.23 Work of the Psychiatric Service
1976 1977 1978 1979 1980 1981 1982 1983 1984 1985*
In-patients
Total admission 4870 5102 5029 5 365 5 284 6359 6442 6499 6908 6435 First admission 1 978 2044 1 935 1 893 1 788 3 263 4 056 3 228 3 626 3 137 Re-admission 2 892 3 058 3094 3472 3 496 3 096 2 386 3 271 3 282 3 298
Total in-patients treated 4692 4966 4812 5 399 5 244 6268 6007 6129 6 791 6382 Number of discharges 4590 4854 4728 5 306 5 169 6188 5 930 6 057 6 737 6 322 Number of deaths 102 112 84 93 75 80 77 72 54 60
Patients remaining in hospital at end of the year 2603 2 739 2956 2922 2962 3053 3488 3858 3 975 4028
Day-patients at psychiatric centres
Total admission 337 412 480 630 647 546 631 578 629 596
Total patients treated 428 488 596 746 773 676 802 782 821 804
Total discharges 352 372 480 620 643 505 598 590 613 564
C>ut-patients attendances at psychiatric centres/clinics
New attendances 3 283 3 315 3 689 3 973 4225 4 368 4900 5 360 5 593 5 823
Total attendances 136 438 135 700 143 985 162 176 164 130 169 018 188 879 194 424 201 578 212 387
Note: *Provisional figures.
202

16.24 Work of the Tuberculosis and Chest Service
Total notifications Total deaths from tuberculosis Tuberculosis deaths as percentage of
total deaths Average age at death from tuberculosis Percentage of newborns receiving
B.C.G.* Percentage of tuberculosis deaths
below 5 years Percentage of tuberculosis deaths
under 1 year Infantile mortality from tuberculosis
per 1 OOO live births
1976
7 928 568
2.4 59.5
97.9
0.70
1977
7 191 532
2.3 61.0
97.8
0.38
1978
6 623 420
1.8 61.0
98.1
0.48
0.24
0.01
1979
7907 523
2.0 61.0
99.6
0.96
0.19
0.01
1980
8 065 551
2.1 62.0
99.5
0.73
0.18
0.01
1981
7 729 489
2.0 63.0
99.5
0.41
1982
7 527 454
1.8 63.0
98.9
0.22
Work of tuberculosis and chest service Total attendances 1 215 522 1 159 223 I 113 844 I 019 863 837 594
99 310 51902 29 531
749 759 91 959 48662 27 375
703 343 101 769 53825 31 521 9 257
Total patients attending (old and new) Number of new patients
N.S.D. Diseases other than tuberculosis Non-respiratory tuberculosis Respiratory tuberculosis active Not active and unknown activity
Note:
103 422 90 368 97 183 95 112 48 544 26 730
6223 565
5 560 8 947
39395 20 665
5 925 420
5 018 7 115
48109 27 366
7 441 452
4772 7 804
51592 28 593 7 712
335 5 887 8 628
7 632 379
5964 8 108
7 796 404
5 965 6961
432 5407 7 053
*Percentage of newborns based on known live-birth figures.
16.25 Annual Incidence and Trend of Venereal Disease
New attendances Venereal disease Non-venereal disease Skin-disease
Total Total attendances (all types)
1976
6 615 6 693
16 438
29746 154871
1977
5 018 5 906
15 982
26906 139711
1978
4 601 5 316
16 907
26824 138858
1979
5 388 4900
16 392
26680 142691
1980
6 302 6 250
15 470
28022 144641
1981
7 601 6 643
14964
29208 150852
16.26 Schools, Pupils and Doctors Participating in School Medical Service by Area
Hong Kong Island School Pupil Doctor
Kowloon School Pupil Doctor
New Territories School Pupil Doctor
All areas School Pupil Doctor
Note:
1977
203 19 712
57
372 67 811
127
181 18 670
24
756 106193
208
Figures are as at 31 March of the year.
1978
187 21454
52
369 69 582
124
191 20 458
26
747 111494
202
1979
189 24 561
53
386 83 174
129
193 24287
29
768 132022
211
1980
192 31 225
56
368 104662
121
203 34 687
27
763 170574
204
1981
204 39 992
57
372 116 879
122
225 50 637
32
801 207 508
211
1982
211 46 786
54
394 131 072
136
247 67 006
42
852 244864
232
1982
9 806 6820
16 960
33586 166933
1983
213 51 117
58
391 142 722
142
255 87724
51
859 281563
251
1983
7 301 446
1.7 63.0
99.4
0.45
702 950 98 266 53469 32040
8 627 404
5 431 6 775
1983
9 516 7 701
17 664
34881 173957
1984
177 52 333
64
322 146 256
143
284 109 855
55
783 308 444
262
1984
7 843 420
1.6 64.5
99.9
0.24
0.24
0.01
766 263 105 902 59532 33 474 12 089
484 6 057 7 214
1984
10 353 8 273
14 922
33548 176024
1985
187 50074
74
334 145 122
146
321 117 343
73
842 312539
293
1985
7 545 409
1.6 65.0
99.4
763 420 99 178 54505 30 876 10 720
476 5 629 6 282
1985
11 657 14 935 8 696
35288 184534
1986
189 55 763
82
338 153 223
174
352 140 078
105
879 349064
361
203
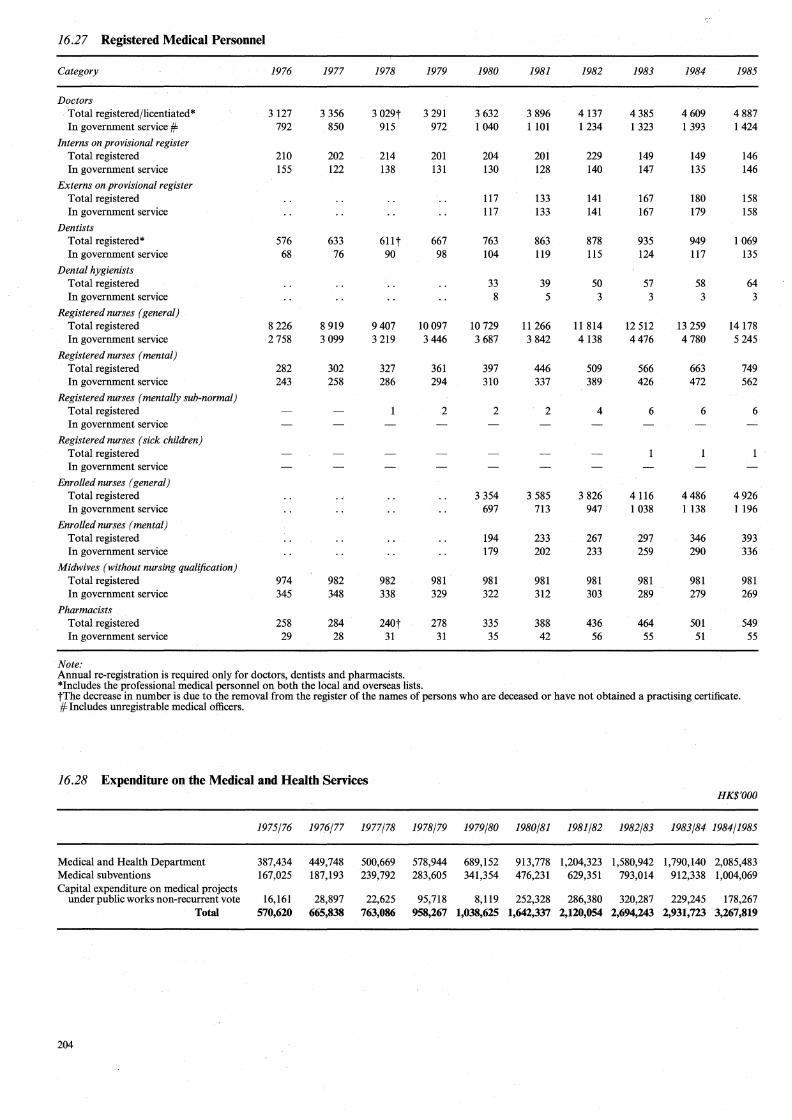
16.27 Registered Medical Personnel
Category 1976 1977 1978 1979 1980 1981 1982 1983 1984 1985
Doctors Total registered/licentiated* 3 127 3 356 3 029t 3 291 3 632 3 896 4137 4 385 4609 4 887 In government service ff 792 850 915 972 l 040 l 101 1234 1 323 1 393 1424
Interns on provisional register Total registered 210 202 214 201 204 201 229 149 149 146 In government service 155 122 138 131 130 128 140 147 135 146
Externs on provisional register Total registered 117 133 141 167 180 158 In government service 117 133 141 167 179 158
Dentists Total registered* 576 633 6llt 667 763 863 878 935 949 1069 In government service 68 76 90 98 104 119 115 124 117 135
Dental hygienists Total registered 33 39 50 57 58 64 In government service 8 5 3 3 3 3
Registered nurses (general) Total registered 8226 8 919 9407 10097 10729 11266 11 814 12 512 13 259 14178 In government service 2 758 3 099 3 219 3446 3 687 3 842 4138 4476 4780 5 245
Registered nurses (mental) Total registered 282 302 327 361 397 446 509 566 663 749 In government service 243 258 286 294 310 337 389 426 472 562
Registered nurses (mentally sub-normal) Total registered 2 2 2 4 6 6 6 In government service
Registered nurses (sick children) Total registered In government service
Enrolled nurses (general) Total registered 3 354 3 585 3 826 4116 4486 4926 In government service 697 713 947 1 038 1 138 1 196
Enrolled nurses (mental) Total registered 194 233 267 297 346 393 In government service 179 202 233 259 290 336
Midwives (without nursing qualification) Total registered 974 982 982 981 981 981 981 981 981 981 In government service 345 348 338 329 322 312 303 289 279 269
Pharmacists Total registered 258 284 240t 278 335 388 436 464 501 549 In government service 29 28 31 31 35 42 56 55 51 55
Note: Annual re-registration is required only for doctors, dentists and pharmacists. *Includes the professional medical personnel on both the local and overseas lists. tThe decrease in number is due to the removal from the register of the names of persons who are deceased or have not obtained a practising certificate. ff Includes unregistrable medical officers.
16.28 Expenditure on the Medical and Health Services HK$'000
1975/76 1976/77 1977/78 1978/79 1979/80 1980/81 1981/82 1982/83 1983/84 1984/1985
Medical and Health Department 387,434 449,748 500,669 578,944 689,152 913,778 1,204,323 1,580,942 1,790,140 2,085,483 Medical subventions 167,025 187,193 239,792 283,605 341,354 476,231 629,351 793,014 912,338 1,004,069 Capital expenditure on medical projects
under public works non-recurrent vote 16,161 28,897 22,625 95,718 8,119 252,328 286,380 320,287 229,245 178,267 Total 570,620 665,838 763,086 958,267 1,038,625 1,642,337 2,120,054 2,694,243 2,931,723 3,267,819
204

Section 17: SOCIAL WELFARE
Figures in Tables 17 .1 and 17 .2 on number and types of applications for legal aid are supplied by the Legal Aid Department. Figures in Tables 17.3 to 17.12 on Public Assistance, Disability and Old Age Allowances, rehabilitation services for the
disabled etc. are obtained from the Social Welfare Department. The Public Assistance Scheme became a cash assistance scheme as from 1 April 1971. Before 1 April 1971, public assistance
was mainly in the form of cooked meals or rice.
205


17.1 Applications for Legal Aid
1976 1977 1978 1979 1980 1981 1982 1983 1984 1985
Civil cases
Applications received 5224 7 312 8 048 10 885 13 629 15 574 14 712 13 864 13 957 13 804
Certificates issued 2872 3 939 3 568 4142 5 810 6 547 4359 4937 4934 4974
Cases finalised 2469 2049 4668 4 841 8220 10 557 11 018 11457 8 598 8 791
Criminal cases
Applications received
Trials l 098 866 927 I 089 l 550 l 815 l 963 l 876 l 558 l 639 Appeals 459 523 577 788 819 984 l 102 l 038 1 150 l 376 Committal Proceedings* 340 254
Legal aid granted
Trials 877 882 800 956 1468 1694 l 684 l 605 l 382 1459 Appeals 128 134 180 191 135 128 137 277 209 255 Committal Proceedings* 247 223
Note: *Figures refer to committal proceedings cases in Magistracies only, which were effective from 1.10.1984.
17.2 Type of Applications for Legal Aid in Civil Cases
1976 1977 1978 1979 1980 1981 1982 1983 1984 1985
Running down cases l 045 1 176 1 826 1 833 1 358 1414 1 259 1 162 1 037 931
Matrimonial proceedings/Separation and maintenance 1204 1 674 2406 3105 3 703 4226 5 012 5 907 6702 7102
Employee's compensation 296 432 421 626 725 828 818 721 807 781
Wages 22 101 219 220 196 18 31 36
Winding-up } 1676 2 356 l 892 375 414 492 491 1 199 2210 1222
Bankruptcy 834 732 708 221 313 273 324
Other supreme court/full court cases 118 166 183
Appeal to Privy Council 3 3
Mis.-Landlord and tenant } 899 1 957 3 399 2 721 1 521 1134 703 l 330 1 564 1 771
Other cases 2221 2602 3 089 4272 3 790 3 512 3469
Total 5214 7323 8048 11414 13629 15574 14712 13864 13957 13804
207

17.3 Social Security
1976/77 1977/78 1978/79 1979/80 1980/81 1981/82 1982/83 1983/84 1984/85 1985/86
Public Assistance
Number of cases* 48 917 48 157 46 580 45 590 45 813 45752 51267 56090 59900 63 713 Amount (HK$ Million) 147.6 143.7 191.2 193.3 222.6 291.3 407.8 486.6 583.4 625.5
Persons receiving emergency relief 10 700 2 501 6 159 16 550 15 638 34147 13 377 13 265 5 668 6842
Fee Assistance
Number of child care centre cases* 11 314 12 251 11345 11 562 Number of kindergarten cases* 6 819 8 533 8 304 8970 Amountt (HK$ Million) 20.9 36.5 34.9 37.6
Special Needs Allowance
Number of cases* 72437 81136 152 884 169 394 187 683 203 517 221 953 240 311 260095 278 770 Amount (HK$ Million) 89.6 99.9 157.8 236.9 306.3 436.8 622.9 709.2 832.3 909.6
Disability Allowance Number of cases* 16 039 18 026 21402 23 892 28 641 31 614 35 824 40138 44896 48 336 Amount (HK$ Million) 59.0 81.2 121.3 174.3 201.2 246.3 277.6
Old Age Allowance Number ofcases* 56 398 63 110 131482 145 502 159 042 171 903 186 129 200 173 215 199 230434 Amount (HK$ Million) 177.8 225.0 315.5 448.6 508.0 586.0 631.9
Criminal and Law Enforcement Injuries Compensation
Number of cases authorized for payment 475 412 325 317 410 450 545 585 - 654 690 Amount (HK$ Million) 1.5 1.4 0.9 1.0 1.5 2.2 2.6 3.3 4.2 4.8
Traffic Accident Victims Assistance
Number of cases authorized for payment 3 134 4436 5 187 6648 5789 5 188 5234 Amount (HK$ Million) 10.7 18.2 24.1 32.9 31.0 31.7 34.4
Note: Fee Assistance was first introduced on l September 1982. The Traffic Accident Victims Assistance Scheme was first introduced in May 1979. *Figures are as at end of the financial year. tFor child care centre cases only. The amount for kindergarten cases is reported as pre-primary services expenditures in Table 15.28 Expenditure on Education.
208

17.4 Type of Public Assistance Cases
1976/77 1977/78 1978/79 1979/80 1980/81 1981/82 1982/83 1983/84 1984/85 1985/86
Old age 30007 29 614 29 537 28 801 29262 31154 33 910 35 894 37644 40 214
Ill health 6 354 6 856 6 579 7 195 7 522 6088 6962 7 731 8 346 8 878
Low earnings 5 623 5 284 4058 3 169 2495 1 377 1 655 1 916 2080 1 799
Unemployed 1455 503 304 312 283 521 985 1 574 1 744 2225
Single parent family 2 291 2466 2478 2426 2 188 2206 2287 2 561 2 541 3 635
Blind 596 656 658 717 665 792 768 784 891 806
Deaf 53 58 97 55 97 95 124 123 190 139
Men tally ill 758 759 778 912 946 965 1166 1442 1 794 2 051
Physically disabled 557 685 796 876 989 1101 l 120 1250 1 383 1403
Others 1223 1 276 1295 1127 1 366 1453 2290 2 815 3 287 2 563
Total 48917 48157 46580 45590 45813 45752 51267 56090 59900 63713
Note: Figures are as at end of the financial year. Figures for single parent family cases before 1984/85 cover only widow(er) with dependent children cases while those from 1984/85 onwards are extended to include the deserted, separated or divorced parents with dependent children, which were previously classified under 'others'.
17.5 Type of Special Needs Allowance Cases
1976/77 1977/78 1978/79 1979/80 1980/81 1981/82 1982/83 1983/84 1984/85 1985/86
Disability Allowa:nce 16039 18026 21402 23892 28641 31614 35 824 40138 44896 48 336
Physically injured or blind 7749 8 113 8 782 8664 9054 9025 9 866 10491 11 311 11229
Disabling physical or mental condition 3 904 4 816 5 998 6 563 7 378 8 507 9926 11077 12 396 12 130
Disabled mentally or physically, requiring constant attendance 3 229 3 831 4907 6005 6543 7 201 8 135 9 303 10 661 12 915
Profoundly deaf 2742 3 240 3 526 3 869 3 986 4289
Others 1157 1 266 1 715 2660 2924 3 641 4371 5 398 6542 7 773
Old Age Allowance 56398 63110 131482 145 502 159042 171903 186129 200173 215199 230434
Total 72437 81136 152884 169394 187683 203 517 221953 240311 260095 278770
Note: Figures are as at end of the financial year.
209

17.6 Disabled Persons Receiving Rehabilitation Services of Social Welfare Department
Type of service 1976/77 1977/78 1978/79 1979/80 1980/81 1981/82 1982/83 1983/84 1984/85 1985/86
Sheltered work 395 413 477 362 357 646 687 716 726 828
Work activities training 70 72 73 95 108 292 296 298 347 353
Place of refuge
Recreational service 194
Residential facilities 340 332 238 359 347 328 323 272 279 350
Total 806 817 788 816 812 1266 1306 1286 1352 1726
Note: Since 1980/81, there has been a progressive handover of responsibility for the education and training of disabled children to Education Department, the pre-vocational and vocational training of disabled young persons and adults to Technical Education and Industrial Training Department and the job placement service for the disabled to Labour Department. The statistics of these services previous to the handover are not published w .e.f. the 1986 Edition. Figures are as at end of the financial year.
17.7 New /Re-activated Cases of Family Services Centres of Social Welfare Department by Nature of Problems
1976/77 1977/78 1978/79 1979/80 1980/81 1981/82 1982/83 1983/84 1984/85 1985/86
New/Re-activated cases 9194 10926 11 721 10667 13489 11118 12233 12726 12817 12438
Nature of problems*
Problems involving children and young person 3801 4 598 4062 3 964 5 115 3 513 3 464 3485 3428 3 312
Problems involving physical or mental health 4 564 5 664 6045 7640 7 447 6009 6 507 7900 7 577 6452
Problems involving family relationship 3 749 4248 4 163 4224 4447 3 517 3 522 3 634 4143 5022
Problems mainly financial 4 722 5 812 5 493 5 641 6776 7060 8 034 6 792 6 583 6 413
Total 16836 20322 19763 21469 23785 20099 21527 21811 21731 21199
Note: *Each case may have more than one problem.
17.8 Admissions* to Children's, Boys' and Girls' Homes by Type of Custody
1976/77 1977/78 1978/79 1979/80 1980/81 1981/82 1982/83 1983/84 1984/85 1985/86
Remand 2 885 2 650 2 936 4 822 7 566 5 568 6066 7 033 5 813 3 295 School order 84 109 109 IOI 112 107 110 113 95 107 Probation order 236 196 208 281 290 315 270 293 297 263 Care and protection 235 211 193 271 276 521 408 383 319 433
Total 3440 3166 3446 5475 8244 6511 6854 7822 6524 4098
Note: *Figures before 1985/86 include re-admission cases.
210

17.9 Child Care Places under the Supervision of Child Care Advisory Inspectorate by Type
1976/77 1977/78 1978/79 1979/80 1980/81 1981/82 1982/83 1983/84 1984/85 1985/86
Subveuted/ Aided
Full day nursery
Residential nursery
Full day creche
Residential creche
Special child care centre
Non-profit-making
Full day nursery
Full day creche
Private
Full day nursery
Half day nursery (Chinese speaking)
Half day nursery (English speaking)
Full day creche
Residential creche
Mixed centres (nursery and creche centres etc.)
Note:
Total
Figures are as at end of the financial year.
8 155
206
783
I92
I43
9 877
126
883
222
I62
3 547 4 294
13026 15564
9 2I9
150
853
222
179
} 508
9 694
I58
853
226
I87
454
54
956
} 269I 3 535
14666
6
3I4
248
15841
10 093
I58
913
226
233
458
102
I 794
986
I 78I
505
I22
17371
IO 588
I58
913
246
3I8
458
48
I 760
2 3I6
I 708
5I8
I60
19191
II 705
I64
888
240
360
380
48
2 55I
3 234
I 623
303
270
21766
17.10 Child Care Centres under the Supervision of Child Care Advisory Inspectorate by Type
13 4I4
I64
888
240
420
399
64
2 663
3 205
I 6I4
27I
24I
23583
I4 397
I64
888
240
480
469
64
2 760
3 072
I 726
54
274
232
24820
I4 924
I64
853
240
480
564
64
2960
3 790
I 7I6
I44
258
232
26389
1976/77 1977/78 1978/79 1979/80 1980/81 1981/82 1982/83 1983/84 1984/85 1985/86
Subvented/Aided
Full day nursery
Residential nursery
Full day creche
Residential creche
Special child care centre
Non-profit-making
Full day nursery
Full day creche
Private
Full day nursery
Half day nursery (Chinese speaking)
Half day nursery (English speaking)
Full day creche
Residential creche
Mixed centres (nursery and creche centres etc.)
Note:
Total
Figures are as at end of the financial year.
73
3
I6
2
6
96
It 18
2t 6
I52 190
252 314
83
It I8
2t 6
89
205
87
It I8
2t 6
4
I4
13
7
202
9I
It
I9
2t 6
4
2
I9
8
36
I6
3
208
94
It
I9
2t 8
4
20
I5
3I
I6
3
215
I04
2
I9
2
9
3
24
I5
26
I2
5
222
I2I
2
I8
2
10
3
25
I5
23
11
5
236
I30
2
I8
2
11
4
25
I5
25
11
4
249
134
2
I7
2
11
4
27
I7
24
2
10
4
255
211

17.11 Cases Referred to and W aitlisted for Elderly Institutions by Type of Institution
Referred to Waitlistedfor*
1979/80 1980/81 1981/82 1982/83 1983/84 1984/85 1985/86 1979/80 1980/81 1981/82 1982/83 1983/84 1984/85 1985/86
Hostel 285 155 140 323 365 353 324 1284 1486 1490 1216 1 205 1305 1345
Home for the aged/aged blind 270 286 409 720 1039 577 1125 928 1 138 1291 1 713 2069 2100 2 551
Care and attention home 88 81 70 90 587 332 587 1200 668 704 3 575 2414 3 046 4 312
Total 643 522 619 1133 1991 1262 2036 3412 3292 3485 6504 5688 6451 8208
Note: Cases under Medical Social Service merged with Social Welfare Department as from October 1982. *Figures are as at end of the financial year.
17.12 Expenditure on Social Welfare HK$ 'OOO
1976/77 1977/78 1978/79 1979/80 1980/81 1981/82 1982/83 1983/84 1984/85 1985/86
Departmental expenditure 55,620 63,977 74,171 110,153 136,930 173,727 239,805 278,757 282,062 309,915
Payments for Social Security Schemes* 238,710 244,976 349,872 431,167 530,340 730,328 1,033,418 1,199,072 1,419,992 1,540,039
Subvention to Voluntary Agencies 53,619 68,581 89,005 109,887 146,298 189,990 267,303 333,249 383,729 449,097
Total 347,949 377,534 513,048 651,207 813,568 1,094,045 1,540,526 1,811,078 2,085,783 2,299,051
Note: *Payments for Traffic Accidents Victims Assistance are excluded as the Scheme is financed by the Traffic Accidents Victims Assistance Fund.
212

Section 18: LAW AND ORDER
Statistics in Tables 18.1 to 18.10 on reported and detected crimes, number of cases and persons prosecuted etc. are supplied by the Royal Hong Kong Police Force.
With effect from 1.1.1983 the following general rules are applied for the counting of crimes. (1) For offences against the person, one crime will be counted for each person against whom an offence has been committed. (2) For offences against property or public order, one crime will be counted for each distinct incident. (3) Notwithstanding Rule (1) and Rule (2), one crime will be counted for each crime or series of similar or allied crimes
committed by the same offender(s) on different occasions involving, as victims, the same or different person(s) or organization( s ).
(4) Offences which are naturally connected or can be expected be conjoined with a more serious offence will not be counted. After discounting these offences, each category of the remaining offences will be counted according to Rules (1), (2) and/or (3) above.
The offences affected by these new counting rules mainly are blackmail, going equipped for stealing, unlawful possession, possession of unlawful instrument, possession of arms and ammunition and possession of an offensive weapon in a public place. The total reported crimes in 1982 basing on the revised counting rules is 3.4 per cent lower than the original number.
A crime is 'detected' when: 1. a suspect is arrested and charged with the offence; or 2. the offender admits the offence and the offence is 'taken into consideration' (t.i.c.) by the court; or 3. the offender has died, or has been committed to a mental hospital before proceedings are instituted; or 4. the ·offender admits the offence but the police exercise discretion not to prosecute. In cases where an offence has obviously been committed by several people but only one is arrested and charged, the crime is regarded as 'detected'. Also, if a suspect is prosecuted for an offence, it is classified as 'detected' even if he is later acquitted, or if for any reason the prosecution is not proceeded with.
If a person is charged on two or more separate occasions, on each occasion he is counted as a separate person. When a person is charged on the same occasion for two or more offences, one offence only is selected for tabulation, the offence being the one carrying the heaviest maximum penalty.
Statistics relating to courts, magistracies and tribunals are provided by the Judiciary. Figures on prisoners and inmates detained in prisons, correctional institutions and remand centres are compiled by the
Correctional Services Department. The number of offenders referred for social enquiry, the number of probation orders and the number of children and
juveniles under protection of women and juveniles ordinance are provided by the Social Welfare Department.
213


18.1 Cases of Reported Crime by Type of Offence by Area
Area/Type of offence 1976 1977 1978 1979 1980 1981 1982 t 1982 1983 1984 1985
Hong Kong Island
Against lawful authority 1 411 736 717 711 909 926 936 t 855 942 905 618 Against public morality 386 300 312 306 353 229 324 t 324 317 246 310 Against the person 1 215 1 155 1 094 1 144 1 218 1 145 1 285 t 1 285 1 300 1 277 1 152 Against property 10 083 9 753 10 188 11 571 14205 14 759 14 591 t 14 206 13 585 12 705 13 397 Other crimes 328 451 293 854 613 665 568 t 563 351 272 452 Narcotic offences 517 313 318 231 227 306 342 t 342 399 336 572
Kowloon and New Kowloon
Against lawful authority 4073 3 611 2 481 2 214 2 307 1 761 2080 t 1 731 1 774 1 806 1 952 Against public morality 1 005 884 514 694 758 737 711 t 711 773 728 973 Against the person 3 513 3 635 3 556 4 157 4 138 4076 4760 t 4760 4908 5 107 5 188 Against property 29 605 26 373 27 291 30908 33 547 35 281 37 304 t 35 929 36 580 35 652 35 356 Other crimes 353 506 394 420 495 986 1 465 t 1424 937 855 1 238 Narcotic offences 1 981 1 122 1 120 961 1 003 1 210 1 483 t 1483 1 860 1 640 2254
New Territories
Against lawful authority 708 579 531 508 539 679 817 t 752 781 738 1 079 Against public morality 297 265 277 251 400 371 322 t 322 332 434 462 Against the person 864 1 114 1 310 1 280 1 647 1 704 1 922 t 1 922 2069 2240 2088 Against property 5 049 5 315 5 981 7 757 12 283 13 390 16 673 t 16005 17 487 16 892 17 719 Other crimes 183 135 177 151 315 467 520 t 504 360 505 830 Narcotic offences 210 220 256 171 207 309 405 t 405 517 538 704
Marine
Against lawful authority 13 46 20 11 44 69 102 t 101 121 114 57 Against public morality 7 4 9 10 71 15 17 t 17 11 10 13 Against the person 36 28 30 50 71 83 95 t 95 95 110 68 Against property 158 178 199 274 370 382 416 t 412 447 357 403 Other crimes 5 13 2 6 28 55 81 t 81 40 48 40 Narcotic offences 9 13 6 13 6 12 8 t 8 14 17 19
Note: tThe counting rules of crime were revised w.e.f. 1.1.1983. The 1982 figures were revised based on the new crime counting system.
18.2 Cases Reported by Type of Offence
Offence 1976 1977 1978 1979 1980 1981 1982 t 1982 1983 1984 1985
Against lawful authority
Against public order 1 362 1424 1 312 1 456 I 784 1 693 1 988 t I 492 1 730 I 595 1 734 Unlawful society 4089 2 877 1 874 1 334 1 252 919 940 t 940 695 1 058 1 392 Other offences 754 671 563 654 763 823 1 007 t 1 007 1 193 910 580
Against public morality
Rape 62 55 62 104 75 103 79 t 79 78 87 80 Indecent assault 850 876 710 715 795 720 784 t 784 778 768 801 Other offences 783 522 340 442 712 529 511 t 511 577 563 877
Against the person
Murder and manslaughter 82 57 63 68 86 105 93 t 93 84 84 89 Attempted murder 3 4 I 2 2 7 3 t 3 12 4 11 Serious assaults 4 613 5 039 5 206 5 810 6 314 6 231 7 265 t 7 265 7 610 7 874 7 589 Other offences 930 832 720 751 672 665 701 t 701 666 772 807
Against property
Robbery with firearms 57 24 23 14 22 30 21 t 21 30 23 17 Other robberies 8 838 6 501 5 637 7 606 9 334 8 233 8 527 t 8 527 8 278 7222 6 728 All burglaries 5 665 5 565 5 412 7 470 8 989 10 583 11 526 t 11 526 11 308 12 663 13922 Theft from persons 1 647 1 565 1 816 2 752 3 901 4275 4869 t 4869 5 746 5 327 5 393 Other thefts 16 598 16 829 19 939 22 520 27 315 29 278 32 300 t 31 781 31 202 28046 29 617 Other offences 12 090 11 135 10 832 10 148 10844 11 413 11 741 t 9 828 11 535 12 325 11198
Other crimes
Forgery and coinage 413 708 680 1 163 1 039 1 486 1 827 t 995 454 538 379 Bribery and corruption 53 67 37 42 38 31 27 t 27 17 21 15 Possession of arms and
ammunition 142 130 55 86 112 142 135 t 73 71 99 48 Others 261 200 94 140 262 514 645 t I 477 1 146 1022 2 118
Serious narcotic offences 2 717 1 668 1 700 1 376 1443 1 837 2 238 t 2238 2 790 2 531 3 549
Total 62009 56749 57076 64653 75754 79617 87227 t 84237 86000 83532 86944
Note: tThe counting rules of crime were revised w.e.f. 1.1.1983. The 1982 figures were revised based on the new crime counting system.
215

18.3 Cases Detected by Type of Offence
Offence 1976 1977 1978 1979 1980 1981 1982 t 1982 1983 1984 1985
Against lawful authority Against public order 1 353 1 410 1 301 1447 1 767 1 682 1 969 t 1 473 1 696 1 566 1 718 Unlawful society 4061 2 870 1 867 1 326 1 247 911 924 t 924 659 1 017 1 326 Other offences 689 591 515 597 712 798 953 t 953 1142 878 563
Against public morality
Rape 32 31 37 65 39 70 49 t 49 36 46 48 Indecent assault 547 584 426 503 563 504 542 t 542 491 444 492 Other offences 683 449 302 368 636 483 455 t 455 527 494 812
Against the person Murder and manslaughter 52 40 41 40 63 62 63 t 63 55 55 66 Attempted murder 3 4 1 2 2 7 3 t 3 9 4 11 Serious assaults 3 064 3 639 4 143 4 396 4667 4572 5029 t 5 029 5 088 5 230 5 272 Other offences 728 687 619 667 593 575 589 t 589 465 524 578
Against property Robbery with firearms 18 11 14 5 8 10 11 t 11 11 10 8 Other robberies 1 579 1 160 1 309 1 742 2 131 1 737 1 849 t 1 849 1 315 1 314 1 328 All burglaries 558 849 895 1 236 1 415 1 756 1407 t 1407 1 228 1254 1 467 Theft from persons 413 328 369 618 1 005 1 123 1 230 t 1 230 1 161 845 960 Other thefts 9 731 9 857 10746 10 791 13 072 14 161 12 525 t 12 006 11 797 10 789 13 193 Other offences 9 977 9 155 8 959 7 960 8482 8 450 8 080 t 6 231 6 882 7 183 6263
Other crimes
Forgery and coinage 367 668 649 1137 1 019 1 459 1 769 t 937 368 462 311 Bribery and corruption 52 67 37 42 38 31 27 t 27 16 21 15 Possession of arms and
ammunition 139 130 55 86 112 139 134 t 72 71 98 47 Others 249 190 79 136 254 511 628 t 1460 1109 985 2052
Serious narcotic offences 2 704 1 664 1690 1 371 1440 1 831 2 235 t 2 235 2 788 2 525 3 543
Total 36999 34384 34054 34535 39265 40872 40471 t 37545 36914 35744 40073
Note: tThe counting rules of crime were revised w.e.f. 1.1.1983. The 1982 figures were revised based on the new crime counting system.
18.4 Persons Prosecuted by Type of Offence by Age Group
Type of offence/Age group 1976 1977 1978 1979 1980 1981 1982 1983 1984 1985
Against lawful authority
under 16 years 294 197 183 274 342 314 330 273 319 394 16-20 years 1 992 1272 1 037 942 1 062 947 1 301 1 006 1 032 1 090 21 years and over 3 067 2 519 2 164 2023 2 189 2 317 2909 3 040 3 014 3 135
Against public morality under 16 years 54 54 38 58 69 60 57 59 57 73 16-20 years 273 237 171 253 277 231 247 313 283 331 21 years and over 435 387 388 380 393 401 399 1 079 776 1 183
Against the person
under 16 years 109 117 211 226 277 273 296 335 408 363 16-20 years 686 688 801 850 1 045 1 039 I 094 1110 1120 1 081 21 years and over 2 667 2990 3 417 3 657 3493 3 411 3 653 3 836 4187 4086
Against property
under 16 years 1 074 1294 1140 2049 3 098 2943 2063 2 216 2037 2244 16-20 years 1 961 2099 2050 2 640 3 540 3 856 3 949 4114 4300 4 175 21 years and over 7 215 7 466 7 526 7 772 9 330 10 143 10 784 12 142 13 098 13 495
Other crimes
under 16 years 25 18 9 10 39 45 36 37 50 39 16-20 years 76 56 37 47 91 230 324 225 223 284 21 years and over 428 349 199 338 416 1125 1 468 1 187 1 201 2205
Serious narcotic offences under 16 years 11 5 16 24 28 50 64 68 38 51 16-20 years 135 110 136 126 173 299 419 460 382 441 21 years and over 2 983 1 981 2010 1 705 1 690 2054 2622 3 273 3 013 4079
Total under 16 years 1567 1685 1597 2641 3853 3685 2846 2988 2909 3164 16-20 years 5123 4462 4232 4858 6188 6602 7334 7 228 7 340 7402 21 years and over 16795 15692 15704 15875 17 511 19451 21835 24557 25289 28183
216

18.5 Age-specific Prosecution Rates per 100 OOO population
Age group 1976 1977 1978 1979 1980 1981 1982 1983 1984 1985
7-11 32 44 39 56 75 85 49 52 48 63
12-13 170 212 196 354 577 587 411 444 410 464
14--15 463 460 468 791 1 173 1147 1 030 1 129 1 169 1242
16--20 991 838 775 845 1 049 1128 1 302 1 347 1 453 1 552
21-30 1 217 1 057 1 002 966 1 017 1 078 1 158 1209 1 175 1 233
31--40 684 665 701 636 645 673 723 807 812 897
41-50 475 445 399 362 351 369 404 448 497 581
51-60 352 307 303 258 253 256 270 346 355 396
61 and over 192 178 155 121 118 119 146 170 181 212
18.6 Persons Prosecuted by Type of Offence by Age Group, 1985
61 and Offence/Age group 7-11 12-13 14-15 16-20 21-30 31-40 41-50 51--60 over Total
Against lawful authority
Against public order 31 163 723 1400 660 266 155 82 3480 Unlawful society 1 42 139 336 137 22 4 1 682 Other offences 2 5 11 31 138 141 79 31 19 457
Against public morality
Rape 4 19 21 5 1 1 51 Indecent assault 12 41 77 140 74 38 19 29 430 Other offences 1 15 235 546 187 62 46 14 1106
Against the person
Murder and manslaughter 3 19 33 15 3 5 5 83 Attempted murder 5 1 2 8 Serious assaults 6 54 263 963 1 888 955 332 244 143 4848 Other offences 1 6 30 99 261 123 48 16 7 591
Against property
Robbery with firearms 1 10 3 14 Other robberies 12 98 320 514 479 114 19 7 1 1564 All burglaries 42 100 178 337 438 112 30 14 3 1254 Theft from persons 8 17 24 154 474 167 33 30 18 925 Other thefts 160 315 572 2093 3479 1 842 765 457 320 10003 Other offences 23 98 277 1 076 2 576 1 284 488 246 86 6154
Other crimes
Forgery and coinage 2 4 43 83 37 15 3 188 Bribery and corruption 6 2 3 2 13 Possession of arms and ammunition 7 24 10 4 2 2 49 Others 7 25 234 961 471 288 191 100 2278
Serious narcotic offences 4 5 42 441 1 523 1 211 418 535 392 4571
Total 260 793 2111 7402 14622 7436 2897 2005 1223 38749
217

18.7 Minor Narcotic Offences Dealt with by the Police
Offence
Possession of drug
Possession of pipe, equipment, etc.
Keeping a divan
Smoking, consuming, etc.
Other narcotic offences
Total
1976
5 938
925
82
2 111
130
9186
1977
4034
I 298
113
I 304
85
6834
18 .8 Miscellaneous Offences Dealt with by the Police
1978
4 115
I 837
84
I 056
68
7160
1979
2 789
I 269
37
464
117
4676
1980
2 377
I 046
36
348
125
3932
1981
3 829
I 461
34
494
153
5971
1982
4400
I 821
56
651
169
7097
1983
5 088
2470
42
669
109
8378
1984
5 325
2463
49
628
356
8821
1985
5 662
2 846
57
531
152
9248
Offence 1976 1977 1978 1979 1980 1981 1982 1983 1984 1985
Gambling 42 593 13 689 14 766 13 104 12 963 14 294 7 368 2 646 2 419 2 002
Hawking 115 887 93 004 81 250 64 689 64 847 65 134 48 507 42 058 29 381 18 523
Obstruction 74 575 73 201 54 157 34 197 38 888 52 408 47 919 44 535 50 839 47 983
Prostitution 4 308 3 585 3 085 I 219 974 I 146 I 561 973 I 154 I 091
Other offences 20 641 21 936 18 448 19 465 31 955 38 011 28 146 30 195 32 282 34 996
Total ~~ ~ill m~ mrn mrn mm rn~ w• mm ~~
Note: Gambling offences broadly include minor gambling offences and serious gambling offences. As serious gambling offences were classified as crime starting fron11.l.1985, therefore gambling offences exclude serious gambling offences and refer to minor gambling offences only with effect from 1.1.1985.
18 .9 Value of Property Stolen and Recovered for Certain Categories of Crime
Robberies
Burglaries
Value stolen Value recovered
Value stolen Value recovered
Snatching Value stolen Value recovered
Pickpocketing Value stolen Value recovered
Theft from vehicle Value stolen Value recovered
Theft from ship and wharf Value stolen Value recovered
Taking conveyance without authority Value stolen Value recovered
Miscellaneous thefts Value stolen Value recovered
Frauds Value stolen Value recovered
Obtaining by means of forgery Value stolen Value recovered
Conspiracy to defraud Value stolen Value recovered
1976
21,414 398
11,426 109
281 8
1,008 13
891 17
1,567 1,409
5,734 1,054
30,131 944
21,920 410
1,051 172
5,156 1,050
1977 1978 1979 1980 1981 1982 1983 1984
16,306 23,413 49,416 103,432 4,335
126,759 135,333 190,794 147,650 871 5,224 2,449 5,267 4,811 6,558 12,220
13,787 25,547 39,377 48,866 3,042
54,756 68,760 95,724 267,900 1,135 1,671 1,535 2,577 1,405 1,444 2,496
661 45
732 28
1,050 54
34 I
5,737 1,416
13,449 1,732
13,306 218
475 1,024 3,765 2,052 2,521 4,488 5,683 46 95 294 356 246 284 714
1,140 1,235 1,359 2,086 2,521 3,314 5,141 31 56 103 91 131 86 152
1,367 2,506 4,210 6,530 11,538 14,549 10,840 22 60 177 123 233 753 418
130 4
129 6
198 2
147 3
45 3
489 143
249
14,045 22,015 34,382 20,259 85,760 90,250 70,899 9,937 17,418 23,577 14,962 42,599 62,988 47,577
19,522 26,831 38,770 50,926 62,845 70,571 112,697 2,987 4,241 2,898 4,146 9,446 2,845 11,155
14,083 41,063 30,992 33,310 53,714 62,683 87,637 509 145 576 572 277 383 1,065
HK$ 'OOO
1985
73,412 3,748
130,128 2,888
4,194 228
4,479 98
10,835 202
68,239 49,679
121,456 9,621
203,349 940
958 40
2,126 35
368 I
2,461 5
1,010 2,256 34,343 1,857 301,016 3 11 2 I
53 1,561 3 18,868 19,272 2,326 10,335,240 43 3
Total Value stolen 100,579 66,072 101,848 185,525 268,438 297,835 444,161 586,477 712,879 11,252,349 Value recovered 5,585 5,538 20,466 26,006 35,009 28,100 59,162 75,486 75,841 67,406
Note: "Theft from ship and wharf" was grouped under "Miscellaneous thefts" starting from 1.1.1985.
218

18.10 Strength and Annual Cost of the Police Force
1976 1977 1978 1979 1980 1981 1982 1983 1984 1985
Strength of regular police force*
Inspectorate or above officers
Male 1 351 1 506 1634 1 737 1 785 1 839 1936 2078 2 153 2238 Female 86 116 141 166 185 212 232 243 247 261
Rank and file
Male 12 715 13 597 14 501 15 145 15 876 16 894 18 223 19 247 20056 20567 Female 1 386 1 527 1 673 1 847 1 878 1 861 1 797 1 782 1 749 1 766
Total Male 14066 15103 16135 16882 17661 18733 20159 21325 22209 22805 Female 1472 1643 1814 2013 2063 2073 2029 2025 1996 2027
Ratio of police to population (per 100 OOO population) 350 371 390 392 394 405 425 441 452 459
Annual expenditure (HK$ Million)# 496 565 664 879 1,213t 1,510t .. 1,745 1,947 2,210t 2,517
Note: *Refers to 1 July of the year. #Refers to financial year. tRevised figure.
18.11 Cases in the Supreme Court, District Court, Tenancy Tribunal and Labour Tribunal
1976 1977 1978 1979 1980 1981 1982 1983 1984 1985
Snpreine Court
Civil appeals 67 74 107 104 153 159 168 173 192 206 Criminal appeals 1 338 1 373 1239 1215 1114 1162 1 212 1 623 1444 1677 Original jurisdiction 2 822 3 773 4760 5 800 7 525 9 316 12 896 15 573 8 799 7943 Miscellaneous proceedings 771 842 768 850 1250 1 754 2 359 3 001 3909 2923 Adoptions 392 415 347 409 412 398 400 69 2 1 Divorce 39 160 59 66 76 80 79 20 9 9 Criminal sessions 149 124 127 115 176 215 319 308 335 262 Admiralty jurisdiction 154 208 287 240 341 353 376 433 379 315 Bankruptcy 64 89 76 107 119 151 186 289 765 1 050 Company winding-up 73 82 94 111 132 142 267 334 424 368
Total 5869t 7140t 7864t 9017t 11298t 13730t 18262t 21823t 16258t 14754
District Court
Criminal jurisdiction 950 763 855 1 009 1145 1238 1119 1277 1246 1 359 Civil jurisdiction 18 971 15 896 17104 20448 27 537 30153 40643 39626 51274 44 815 Workmen's compensation 302 356 330 375 454 504 490 465 447 520 Distress for rent 2032 2120 2107 2104 2048 2346 3 295 4061 3 955 4 385 Divorce jurisdiction 1 054 1 372 1 728 2018 2421 2 811 3 120 3 734 4764 5047 Small Claims Tribunal 1 031 8 881 11 597 14 738 17 347 19 923 25255 30037 31402 32 681 Adoption 386 437 Lands cases* 36t 376t 39t 9t 12t 19t 111t 2883t 3228t 3 676
Total 24376t 29764t 33760t 4070lt 50964t 56994t 74033t 82469t 96753t 92483
Tenancy Tribunal
. Ordinary cases 304 159 129 72 81 35 15 Exemption cases 187 160 166 174 136 112 43 Demolished building cases 16 20 12 79 82 19 2
Total 50'7 339 307 325 299 166 60
Labour Tribunal
Claims filed 1982 2799 3508 4235 4473 5008 5484 4685 3962 4660
Note: *Include Lands Tribunal cases. Starting from 11.6.82, lands cases also include Tenancy Tribunal cases. tRevised figure.
219
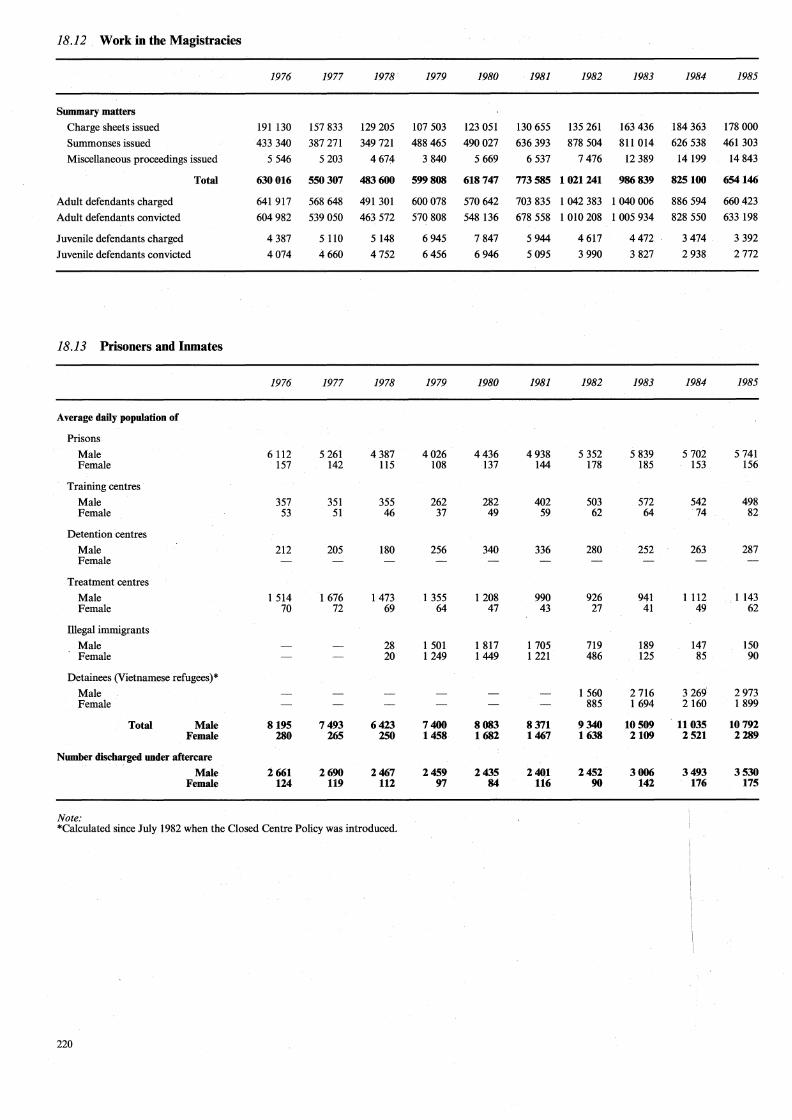
18.12 Work in the Magistracies
1976 1977 1978 1979 1980 1981 1982 1983 1984 1985
Summary matters
Charge sheets issued 191 130 157 833 129 205 107 503 123 051 130 655 135 261 163 436 184 363 178 OOO
Summonses issued 433 340 387 271 349 721 488 465 490027 636 393 878 504 811 014 626 538 461 303
Miscellaneous proceedings issued 5 546 5 203 4674 3 840 5 669 6 537 7 476 12 389 14 199 14 843
Total 630 016 550307 483 600 599808 618 747 773585 1021241 986 839 825100 654146
Adult defendants charged 641 917 568 648 491 301 600 078 570 642 703 835 1042383 1040006 886 594 660 423
Adult defendants convicted 604 982 539 050 463 572 570 808 548 136 678 558 1010208 1005934 828 550 633 198
Juvenile defendants charged 4 387 5 110 5 148 6945 7 847 5 944 4 617 4472 3474 3 392
Juvenile defendants convicted 4074 4660 4752 6456 6946 5 095 3 990 3 827 2 938 2 772
18.13 Prisoners and Inmates
1976 1977 1978 1979 1980 1981 1982 1983 1984 1985
Average daily population of
Prisons
Male 6 112 5 261 4387 4026 4436 4938 5 352 5 839 5 702 5 741 Female 157 142 115 108 137 144 178 185 153 156
Training centres
Male 357 351 355 262 282 402 503 572 542 498 Female 53 51 46 37 49 59 62 64 74 82
Detention centres
Male 212 205 180 256 340 336 280 252 263 287 Female
Treatment centres
Male 1 514 1 676 1 473 1 355 1 208 990 926 941 1 112 1 143 Female 70 72 69 64 47 43 27 41 49 62
Illegal immigrants
Male 28 1 501 1 817 1 705 719 189 147 150 Female 20 1249 1449 1 221 486 125 85 90
Detainees (Vietnamese refugees)*
Male 1 560 2 716 3 269 2973 Female 885 1 694 2160 1 899
Total Male 8195 7493 6423 7400 8083 8371 9340 10509 11035 10792 Female 280 265 250 1458 1682 1467 1638 2109 2521 2289
Number discharged under aftercare
Male 2661 2690 2467 2459 2435 24Ql 2452 3006 3493 3530 Female 124 119 112 97 84 116 90 142 176 175
Note: *Calculated since July 1982 when the Closed Centre Policy was introduced.
220

18.14 Reception of Convicted Prisoners/Inmates by Sex by Type of Sentence by Age on Conviction
Sex/Sentence/Age 1976 1977 1978 1979 1980 1981 1982 1983 1984 1985
Male
Prison Under 16 years 5 3 1 2 4 5 1 4 16-20 years 402 279 167 210 ·251 436 507 537 408 431 21-24years 1 532 1 173 779 809 802 1222 1 365 1 253 1 093 1123 25-39 years 3 611 2 824 2 481 2 282 2 345 2 715 2 912 3 285 3094 3 219 40 years and over 4 188 2495 1 890 1 323 1 117 1 328 1 298 1424 1 371 1 480
Training Centre Under 16 years 16 20 8 22 31 56 67 82 59 67 16-20 years 180 222 109 115 226 223 275 292 226 262 21-24 years 25-39 years 40 years and over
Detention Centre Under 16 years 72 44 13 60 120 124 100 70 84 94
. 16-20 years 411 286 263 362 481 418 402 347 326 366 21-24 yea1's 15 69 75 78 38 72 74 60 70 25-39 years 40 years and over
Drug Addiction Treatment Centre Under 16 years 3 3 1 6 7 18 16 20 16-20 years 167 111 62 83 47 107 207 363 355 363 21-24 years 465 335 263 238 184 191 220 297 409 476 25-39 years 856 956 903 758 840 803 836 916 1 106 1 206 40 years and over 576 773 698 508 401 516 473 449 612 455
Total 12484 9539 7707 6845 6925 8187 8746 9408 9219 9636
Female
Prison Under 21 years 23 16 6 19 9 36 76 51 17 39 21-39 years 160 101 62 93 94 164 253 273 203 266 40 years and over 122 59 45 30 43 27 40 45 34 49
Training Centre Under 21 years 53 33 16 31 32 33 30 38 47 37 21-39 years 40 years and over
Drug Addiction Treatment Centre Under 21 years 16 12 12 6 5 3 6 14 19 22 21-39 years 54 57 46 45 33 43 28 51 54 68 40 years and over 23 22 14 17 8 6 6 8 6 11
Total 451 300 201 241 224 312 439 480 380 492
Note: Figures exclude recalls.
221

18.15 Reception of Convicted Prisoners/Inmates by Type of Offence by Sex of Offender
Type of offence/Sex 1976 1977 1978 1979 1980 1981 1982 1983 1984 1985
Convicted prisoners/inmates
Against lawful authority
Male 363 381 288 253 220 216 190 222 301 311 Female 13 8 7 5 6 59 16 9 7
Against public morality
Male 121 126 124 109 98 83 90 133 115 128 Female 2 1 2 2. 1 3 1 2
Against the person
Male 574 450 388 472 402 394 411 359 460 514 Female 18 13 12 10 19 10 15 11 14 11
Against property
Male 3 850 3 827 3 146 2 981 3 357 3 413 3 715 3 865 3 526 3 274 Female 85 65 53 61 79 53 68 82 86 88
Against the penal code
Male 422 254 98 226 217 578 955 706 325 259 Female 4 2 4 5 64 141 155 56 38
Against local laws
Male 1 207 520 390 411 707 940 584 802 989 1 370 Female 147 76 28 70 53 108 87 111 116 213
Narcotic offences
Male 5 947 3 981 3 273 2 393 1924 2 563 2 801 3 321 3 503 3 780 Female 188 132 105 87 61 71 68 102 98 133
All offences Male 12484 9539 7707 6845 6925 8187 8746 9408 9219 9636 Female 451 300 201 241 224 312 439 480 380 492
Note: Figures exclude recalls.
222

18.16 Reception of Prisoners under Sentence of Imprisonment by Sex by Length of Sentence by Age on Conviction
Sex/Length of sentence/Age 1976 1977 1978 1979 1980 1981 1982 1983 1984 1985
Male
Less than 1 month Under 21 years 26 20 13 13 18 31 30 51 32 31 21-39 years 335 178 124 104 164 342 185 169 343 301 40 years and over 553 195 119 109 78 151 94 117 250 196
l month to less than 3 months Under 21 years 23 17 18 32 19 47 64 61 33 55 21-39 years 438 383 401 405 271 294 538 842 516 461 40 years and over 604 374 360 254 141 153 236 339 257 274
3 months to less than 12 months Under 21 years 99 98 49 44 65 145 200 177 134 211 21-39 years 2608 2104 l 657 1405 1432 l 848 1904 1 773 l 730 2036 40 years and over 2468 1406 l 083 678 578 756 673 648 567 673
12 months to less than 18 months Under 21 years 33 24 7 14 10 21 54 46 36 25 21-39 years 545 381 309 295 330 316 486 539 395 451 40 years and over 192 170 108 71 99 89 92 115 101 117
18 months to less than 3 years Under 21 years 74 48 18 36 27 44 28 52 49 33 21-39 years 717 533 342 422 472 433 459 497 542 524 40 years and over 271 228 131 138 138 108 Ill 136 116 138
3 years to less than 6 years Under 21 years 124 66 50 66 103 Ill 103 107 85 60 21-39 years 416 326 331 385 423 532 451 426 363 352 40 years and over 74 90 59 59 69 58 61 56 52 54
6 years and over Under 21 years 25 6 12 2 8 40 25 37 31 17 21-39 years 71 82 90 66 46 149 241 273 286 206 40 years and over 25 27 27 12 13 9 30 13 28 28
Detained during Her Majesty's Pleasure be known Under 21 years 2 l 3 6 4 21-39 years 2 1 4 40 years and over 2
Death Under 21 years 3 3 l 3 1 5 1 4 3 21-39 years 13 8 6 9 8 19 13 19 12 11 40 years and over 1 5 3 2 1 2 l
Total reception Under 21 years 407 282 168 210 253 440 512 538 408 435 21-39 years 5143 3 997 3260 3091 3147 3 937 4277 4538 4187 4 342 40 years and over 4188 2495 1890 1323 1117 1328 1298 1424 1371 1480
Female Total 9738 6774 5318 4624 4517 5705 6087 6500 5966 6257
Less than 6 months Under 21 years 18 11 3 13 8 26 21 21 9 18 21-39 years 100 54 21 59 40 107 103 130 95 161 40 years and over 71 33 26 20 21 11 18 28 20 28
6 months to less than 12 months Under 21 years 3 2 l 2 1 5 39 16 3 16 21-39 years 24 18 18 15 19 26 97 90 59 62 40 years and over 24 6 7 3 10 7 13 5 6 10
12 months to less than 3 years Under 21 years 1 2 1 1 4 9 12 3 3 21-39 years 23 21 16 12 20 22 40 44 37 35 40 years and over 15 12 5 6 8 7 7 8 5 7
3 years and over Under 21 years 1 1 l 3 1 5 2 2 2 21-39 years 12 8 7 7 14 9 12 9 11 8 40 years and over 12 8 7 l 4 2 2 4 3 4
Detained during Her Majesty's Pleasure be known Under 21 years 2 21-39 years 40 years and over
Death Under 21 years 21-39 years 40 years and over
Total reception Under 21 years 23 16 6 19 9 36 76 51 17 39 21-39 years 160 101 62 93 94 164 253 273 203 266 40 years and over 122 59 45 30 43 27 40 45 34 49
Total 305 176 113 142 146 227 369 369 254 354
223

18.17 Reception of Prisoners under Sentence of Imprisonment by Sex by Length of Sentence by Type of Offence, 1985
Against Against Against Against lawful publi<; the Against the penal
Sex/Length of sentence/Type of offence authority morality person property code
Male
7 days or less 10 3 6 73 4 More than 7 days and under 1 month 16 6 17 137 11 1 month to less than 3 months 46 5 56 320 20 3 months to less than 6 months 37 34 83 443 48 6 months to less than 12 months 68 13 67 600 58 12 months to less than 18 months 13 12 23 250 33 18 months to less than 3 years 6 12 44 267 30 3 years 5 14 72 8 More than 3 years to less than 6 years 5 18 162 16 6 years and over 8 34 93 24 Detained during Her Majesty's Pleasure
be known Death 14
Total 197 103 376 2417 252
Female
Under 6 months 2 43 7 6 months to less than 12 months 1 17 16 12 months to less than 3 years 4 4 14 3 years Over 3 years 2 Detained during Her Majesty's Pleasure
be known Death
Total 3 2 7 65 38
18.18 Committal Made to Correctional Institutions on Remand by Sex of Offender
Sex
Male
Female
Total
224
1976
19 676
838
20514
1977
14 297
709
15006
1978
12 850
516
13366
1979
11 801
540
12341
1980
13 431
457
13888
1981
14 441
480
14921
1982
13 433
472
13905
Against local laws
66 73
185 360 451 113 15 11 8
1282
144 47 12
203
1983
14263
484
14747
Narcotic offences
27 79
158 324 334 149 321 48 98 92
1630
9 6
11 1 9
36
1984
13 257
467
13724
Total
189 339 790
1J29 1591
593 695 158 308 251
14
6257
207 88 45
1 13
354
1985
12 830
592
13422

18.19 Cases Referred for Social Enquiry by Type of Offence by Age Group of Offender
Type of offence/Age group 1976/77 1977/78 1978/79 1979/80 1980/81 1981/82 1982/83 1983/84 1984/85 1985/86
Against lawful authority Under 16 years 153 104 71 85 99 72 48 41 80 98 16-20years 557 211 189 lll 112 81 116 64 101 129 21 years and over 255 142 128 96 106 77 50 45 64 106
Against public morality Under 16 years 61 46 42 37 33 35 37 30 39 44 16-20years 220 195 113 164 167 112 138 102 135 187 21 years and over 214 175 178 133 164 131 83 126 178 257
Against the person Under 16 years 67 90 129 93 135 154 131 136 173 192 l6-20years 222 250 243 239 297 200 225 197 187 326 21 years and over 286 384 448 347 329 235 186 203 231 337
Against property Under 16 years 609 797 904 1 108 1600 1536 1262 1364 1249 1244 16-20 years 976 916 991 1 379 1655 1435 1520 1491 1 536 1637 21 years and over 1 108 1103 1 421 1 451 1632 1364 I 117 1313 1 367 1 617
Against the penal code Under 16 years 44 37 30 31 48 30 38 49 64 48 16-20 years 85 70 54 76 114 88 98 82 90 61 21 years and over 89 85 82 109 168 135 120 75 114 115
Against local laws Under 16 years 105 128 159 116 224 292 358 272 254 303 16-20 years 428 282 266 295 337 468 555 1 093 557 685 21 years and over 1 930 1 568 1640 1 113 1397 I 030 1 101 987 1 511 2065
Total Under 16 years 1039 1202 1335 1470 2139 2119 1874 1892 1859 1929 16-20 years 2488 1924 1856 2264 2682 2384 2652 3029 2606 3025 21 years and over 3882 3457 3897 3249 3796 2972 2657 2 749 3465 4497
Total 7409 6583 7088 6983 8617 7475 7183 7670 7930 9451
225

18.20 Probation Orders by Type of Offence by Age Group of Offender
Type of offence/Age group 1976/77 1977/78 1978/79 1979/80 1980/81 1981/82 1982/83 1983/84 1984/85 1985/86
Against lawful authority Under 16 years 82 64 52 53 43 39 29 25 26 64 16-20 years 326 149 98 52 44 30 31 32 41 72 21 years and over 68 22 19 7 21 10 9 6 14 12
Against public morality Under 16 years 30 25 25 38 24 27 25 19 25 33 16-20 years 107 89 71 79 64 43 66 62 69 97 21 years and over 46 26 37 27 35 28 25 37 43 51
Against the person Under 16 years 29 51 59 52 57 88 68 74 94 123 16-20 years 80 117 123 77 95 65 80 71 83 148 21 years and over 42 52 62 34 22 45 29 45 33 64
Against property Under 16 years 290 383 506 558 813 821 847 800 789 773 16-20 years 314 332 396 435 525 498 603 564 595 581 21 years and over 159 144 155 163 153 177 338 228 224 260
Against the penal code Under 16 years 16 20 14 21 16 3 19 21 19 28 16-20 years 26 28 17 18 30 12 26 10 28 26 21 years and over 5 14 6 11 9 5 10 8 11 12
Against local laws Under 16 years 30 24 70 34 51 116 71 114 92 87 16-20 years 134 63 64 70 89 108 55 157 191 182
· 21 years and over 174 132 143 76 92 116 6 277 311 356
Total Under 16 years 477 567 726 756 1004 1094 1059 1053 1045 1108 16-20 years 987 778 769 731 847 756 861 896 1007 1106 21 years and over 494 390 422 318 332 381 417 601 636 755
Total 1958 1735 1917 1805 2183 2231 2337 2550 2688 2969
18.21 Children and Juveniles under Protection of Women and Juveniles Ordinance
1976/77 1977/78 1978/79 1979/80 1980/81 1981/82 1982/83 1983/84 1984/85 1985/86
WardY of Director of Social Welfare 849 889 890 953 955 964 1033 1038 847 862
Registered Ward 488 275 249 249 232 187 173 165 50 32
Declared Ward 78 51 53 53 53 40 40 40 18 16
Ward by order of the Juvenile Court 283 563 588 651 670 737 820 833 779 814
Supervision order 682 774 846 1118 1277 1046 926 1061 1144 993
Total 1531 1663 1736 2071 2232 2010 1959 2099 1991 1855
Note: Figures are as at end of the financial year.
226

Section 19: CULTURE AND RECREATION
Culture and recreation statistics in respect of the Hong Kong and Kowloon region are provided by the Urban Services Department and of the Regional Council area by the Regional Services Department.
The Regional Services Department was formed on 1 April 1985 by merging the former New Territories Services Department and the component units of the former Recreation and Culture Department and Cultural Services Department operating in the New Territories.
227


19.1 Facilities and Usage of Public Libraries Number unless otherwise specified
1978 1979 1980 1981 1982 1983 1984 1985
Urban Council Public Libraries
Number of libraries
Facilities 12 15 15 16 20 23 25 25 English books
Junior 62 783 66856 72239 83 091 79 308 81962 106803 125 263 Adult 153 516 178 390 189 783 215 938 217 949 219 314 241437 267 581 Reference 40325 42827 45198 47 391 48743 56 705 60407 67 965
Chinese books
Junior 119082 144 059 158 853 166 176 205992 233 101 287 874 271 988 Adult 293 762 334 952 336 786 397 483 456 826 564409 700790 759134 Reference 171 310 171 846 174 394 178 744 177 077 169440 175 715 185 922
Total
Junior 181865 210915 231092 249 267 285 300 315063 394 677 397 251 Adult 447 278 513 342 556569 613421 674 775 783 723 942 227 1026 705 Reference 211635 214673 219592 226135 225 820 226145 236122 253887
Number of items of audio-visual materials* 14116 15115 16530 17784 36302 50284 62 764 7p 185
Usage
Number of library materials issued # 3 342 708 3 878102 4()95 569 4291452 4 769456 5696623 6640186 7 211836
Number of reference enquiries handled 51914 50381 58281 72368 83909 94442 118103 130513
Number of reference books consulted 372 521 345269 369371 356605 352681 359843 463820 484987
Number of users of audio-visual services 36373 53156 99006 127 360 . 127401 125 139 136476 158676
Regional Council Public Libraries
Number of libraries 8 8 9 10 11 13 16 18 Facilities
English books
Junior 5141 8 165 10 313 16 891 29 233 50295 71426 100 274 Adult 15 685 22 718 26183 42143 68491 95848 119 594 147 991 Reference 704 1201 1631 4369 9 835 14189 18 872 24149
Chinese books
Junior 33 618 40694 46054 61 781 91710 125 914 140 864 169 396 Adult 56234 66955 69994 100 359 170 655 255 033 327 397 397 965 Referei;ice 1 587 1 701 3 033 4456 11212 19 037 26273 37 868
Total
Junior 38759 48859. 56367 78672 120 943· 176209 212 290 269670 Adult 71919 89673 96177 142 502 239146 350881 446991 545 956 Reference 2291 2902 4664 8825 21047 33226 45145 62017
Number of items of audio-visual materials# 1365 7786 15 202 28649 33996
Usage
Number of library materials issued # 819083 871295 1098838 1177995 1505 915 1893410 2886225 3423178
Number of reference enquiries handled 926 1672 3 212 4517 4468 4881 Ji 460 19189
Number of reference books consulted 109504 176025 354 759 372671
Number of users of audio-visual services 1926 4045 2989 2148 8295 10940
Note: *Includes audio cassette, video-cassette, slides microfilm, audio-compact disc, video-disc and microfilm. #Includes books, periodicals and audio cassettes.
229

19.2 Functions Presented at Selected Venues
Function 1976 1977 1978 1979 1980 1981 1982
Urban Council
City Hall
Concerts and recitals 300 302 300 329 368 348 351 Operas 39 45 51 58 41 41 36 Plays 131 157 123 104 119 195 151 Ballet and dance 65 52 64 45 83 58 100 Film shows 200 160 216 248 232 243 203 Otherst 877 772 981 1 019 937 757 688
Ko Shan Theatre
Concerts and recitals Operas Plays Ballet and dance Film shows Otherst
The Queen Elizabeth Stadium
Cultural 5 12 15 Entertainment 4 32 31 Sports 8 32 35 Others 1 17 12
Hong Kong Coliseum
Cultural Entertainment Sports Others
Regional Council
Tsuen Wan Town Hall
Concerts and recitals 79 Operas 27 Plays 19 Ballet and dance 28 Film shows* Otherst 20
Lut Sau Hall
Concerts and recitals Operas Plays Ballet and dance Film shows* ' Otherst
North District Town Hall
Concerts and recitals Operas Plays Ballet and dance Film shows* Otherst
Tai Po Civic Centre # Concerts and recitals Operas Plays Ballet and dance Film shows* Otherst
Note: Figures include those functions presented jointly by Urban Council or Regional Council with other cultural organizations. The functions at Queen Elizabeth Stadium and Hong Kong Coliseum are classified as follows: Cultural: include classical concerts, dances, dramas and operas. Entertainment: include pop concerts, musical shows, family entertainment events and contests. Sports: include competitions or displays of ice sports, roller skating, Chinese martial arts and wrestling. Others: include conferences, school events, displays of commercial and industrial products and works of arts. *Included in 'Others', tinclude variety shows, rehearsals and other functions. #=From August to December 1985 only.
230
Number
1983 1984 1985
368 342 417 47 35 38
132 96 132 69 83 88
216 315 279 699 634 767
66 26 29 18 17 13 10 17 3 23 18 28 12 53 37 60 78 74
8 9 10 22 18 35 43 45 18 10 17 15
3 4 8 16 18 23 7 5 6 2 4 9
80 81 86 26 20 29 30 31 22 31 33 30
23 42 43
39 10 2 9
23
24 19 8 7 4 6 9 13
20 37
13 3 1 2
9
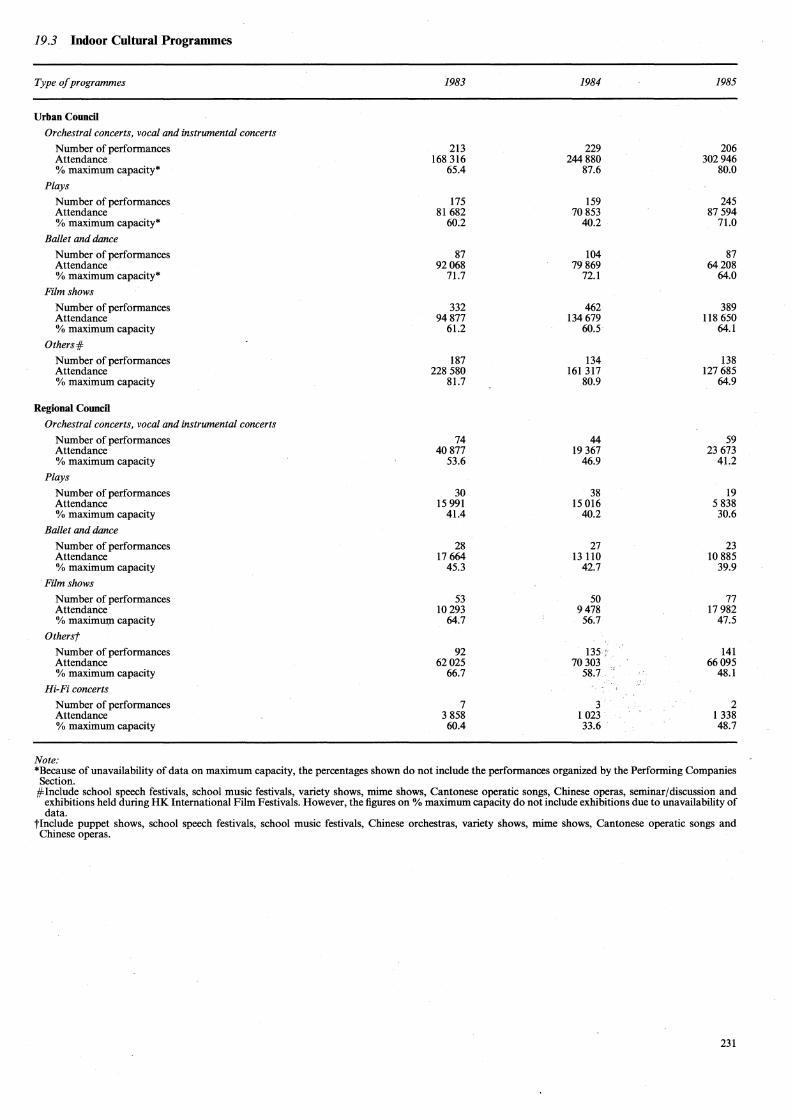
19 .3 Indoor Cultural Programmes
Type of programmes
Urban Council Orchestral concerts, vocal and instrumental concerts
Number of performances Attendance % maximum capacity*
Plays
Number of performances Attendance % maximum capacity*
Ballet and dance
Number of performances Attendance % maximum capacity*
Film shows
Number of performances Attendance % maximum capacity
Others#
Number of performances Attendance % maximum capacity
Regional Council Orchestral concerts, vocal and instrumental concerts
Number of performances Attendance % maximum capacity
Plays
Number of performances Attendance % maximum capacity
Ballet and dance
Number of performances Attendance % maximum capacity
Film shows
Number of performances Attendance % maximum capacity
Othersf
Number of performances Attendance % maximum capacity
Hi-Fi concerts
Number of performances Attendance % maximum capacity
Note:
1983
213 168 316
65.4
175 81 682
60.2
87 92068
71.7
332 94877
61.2
187 228 580
81.7
74 40877
53.6
30 15 991
41.4
28 17 664
45.3
53 10293
64.7
92 62025
66.7
7 3 858 60.4
1984 1985
229 206 244880 302 946
87.6 80.0
159 245 70 853 87 594
40.2 71.0
104 87 79 869 64208
72.1 64.0
462 389 134 679 118 650
60.5 64.l
134 138 161 317 127 685
80.9 64.9
44 59 19 367 23 673
46.9 41.2
38 19 15 016 5 838
40.2 30.6
27 23 13 110 10 885
42.7 39.9
50 77 9478 17 982 56.7 47.5
135 '. 141 70 303 66095
58.7. 48.1
3 2 1 023 l 338 33.6 48.7
*Because of unavailability of data on maximum capacity, the percentages shown do not include the performances organized by the Performing Companies Section.
#Include school speech festivals, school music festivals, variety shows, mime shows, Cantonese operatic songs, Chinese operas, seminar/discussion and exhibitions held during HK International Film Festivals. However, the figures on % maximum capacity do not include exhibitions due to unavailability of data.
tinclude puppet shows, school speech festivals, school music festivals, Chinese orchestras, variety shows, mime shows, Cantonese operatic songs and Chinese operas.
231

19.4 Outdoor Public Entertainment Programmes
1978 1979 1980 1981 1982 1983 1984 1985
Urban Council
Orchestral concert Number of performances 15 21 35 39 36 40 50 42 Attendance 13 550 15 200 42360 29750 35 570 27 255 20 271 23 341
Ballet and dance Number of performances 50 56 81 61 46 34 53 36 Attendance 22225 36 929 63 355 51 622 37 118 32 350 32 012 18 818
Film sliows Number of performances 118 163 174 166 137 137 53 Attendance 25 340 36490 46 215 30 090 31 990 21265 5107
Others* Number of performances 644 619 662 687 568 666 662 487 Attendance 851 719 1103 368 1067195 1245958 940072 1452 432 814 559 650 640
Regional Council
Orchestral concert Number of performances 28 38 35 Attendance 13 350 12 540 11 500
Ballet and dance Number of performances 4 9 4 Attendance 2200 5 910 4500
Film shows Number of performances 43 33 10 Attendance 13 360 6 980 1 980
Others* Number of performances 229 246 263 Attendance 173 490 168 630 120 030
Note: *Include outdoor entertainment activities such as all star shows, variety shows, popular concerts, operas, puppet shows, etc.
232
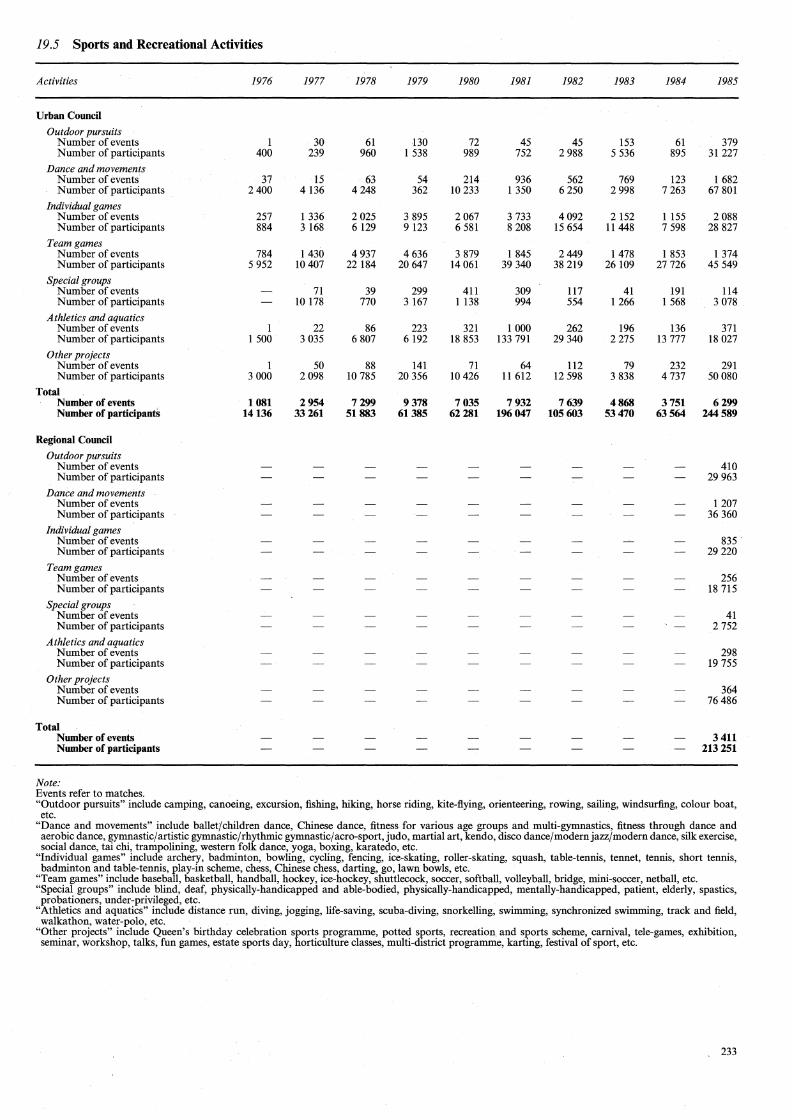
19.5 Sports and Recreational Activities
Activities
Urban Council
Outdoor pursuits Number of events Number of participants
Dance and movements Number of events Number of participants
Individual games Number of events Number of participants
Team games Number of events Number of participants
Special groups Number of events Number of participants
Athletics and aquatics Number of events Number of participants
Other projects Number of events Number of participants
Total Number of events Number of participants
Regional Council
Outdoor pursuits Number of events Number of participants
Dance and movements Number of events Number of participants
Individual games Number of events Number of participants
Team games Number of events Number of participants
Special groups Number of events Number of participants
Athletics and aquatics Number of events Number of participants
Other projects Number of events Number of participants
Total Number of events Number of participants
Note: Events refer to matches.
1976
1 400
37 2400
257 884
784 5 952
l l 500
l 3 OOO
1081 14136
1977 1978 1979
30 61 130 239 960 1 538
15 63 54 4136 4248 362
1 336 2 025 3 895 3 168 6 129 9 123
1430 4 937 4 636 10407 22 184 20647
71 39 299 10 178 770 3 167
22 86 223 3 035 6 807 6 192
50 88 141 2098 10 785 20 356
2954 7299 9378 33261 51883 61385
1980 1981 1982
72 45 45 989 752 2 988
214 936 562 10 233 1 350 6250
2067 3 733 4092 6 581 8 208 15 654
3 879 l 845 2449 14 061 39 340 38 219
411 309 117 l 138 994 554
321 l OOO 262 18 853 133 791 29 340
71 64 112 10 426 11 612 12 598
7035 7932 7639 62281 196 047 105603
1983 1984
153 61 5 536 895
769 123 2 998 7 263
2 152 l 155 11448 7 598
l 478 l 853 26 109 27726
41 191 l 266 l 568
196 136 2275 13 777
79 232 3 838 4 737
4868 3751 53470 63564
1985
379 31 227
1 682 67 801
2 088 28 827
l 374 45 549
114 3 078
371 18 027
291 50 080
6299 244589
410 29 963
l 207 36 360
835 29 220
256 18 715
41 2 752
298 19 755
364 76 486
3411 213 251
"Outdoor pursuits" include camping, canoeing, excursion, fishing, hiking, horse riding, kite-flying, orienteering, rowing, sailing, windsurfing, colour boat, etc.
"Dance and movements" include ballet/children dance, Chinese dance, fitness for various age groups and multi-gymnastics, fitness through dance and aerobic dance, gymnastic/ artistic gymnastic/rhythmic gymnastic/ aero-sport, judo, martial art, ken do, disco dance/modem jazz/modern dance, silk exercise, social dance, tai chi, trampolining, western folk dance, yoga, boxing, karatedo, etc.
"Individual games" include archery, badminton, bowling, cycling, fencing, ice-skating, roller-skating, squash, table-tennis, tennet, tennis, short tennis, badminton and table-tennis, play-in scheme, chess, Chinese chess, darting, go, lawn bowls, etc.
"Team games" include baseball, basketball, handball, hockey, ice-hockey, shuttlecock, soccer, softball, volleyball, bridge, mini-soccer, netball, etc. "Special groups" include blind, deaf, physically-handicapped and able-bodied, physically-handicapped, mentally-handicapped, patient, elderly, spastics, probationers, under-privileged, etc.
"Athletics and aquatics" include distance run, diving, jogging, life-saving, scuba-diving, snorkelling, swimming, synchronized swimming, track and field, walkathon, water-polo, etc.
"Other projects" include Queen's birthday celebration sports programme, potted sports, recreation_ and sports scheme, carnival, tele-games, exhibition, seminar, workshop, talks, fun games, estate sports day, horticulture classes, multi-district programme, karting, festival of sport, etc.
233

19.6 Recreational Facilities
Facilities
Urban Council Children's playgrounds
Parks and gardens
Grass games pitches
Hardsurface mini soccer pitches
Basketball/Volleyball/Badminton courts
Tennis courts
Running tracks
Beaches
Swimming pools
Indoor games halls (multi-purpose)
Other sports grounds*
Other recreational amenitiest
Sports centres
Other facilities+
Total area of public open space administered (hectares)
Regional Council Children's playgrounds
Parks and gardens
Grass games pitches
Hardsurface mini soccer pitches
Basketball/Volleyball/Badminton courts
Tennis courts
Running tracks
Beaches
Swimming pools
Indoor games halls (multi-purpose)
Other sports grounds*
Other recreational amenitiest
Camps
Water sports centres
Sports centres
Other facilities+
Total area of public open space administered (hectares)
Note:
1980 1981
149 163 379 410 42 43 97 93
290 290 57 56 6 6
12 12 10 10 5 5
110 119 72 210
754 983
429 438
Number unless otherwise specified
1982 1983 1984 1985
173 183 186 201 396 419 434 449 39 40 40 40 90 97 100 99
291 299 301 309 68 84 84 90 6 7 7 7
12 12 12 12 10 10 11 13 7 9 10 11
128 130 132 145 218 232 238 242
2 2 2 1 029 1 052 1 060 1 042
440 463 467 496
83 173
9 40
132 35 10 28 6 2
73 101
2 2 3
714
306
*Include obstacle golf course; squash courts, practice tennis courts, bowling and putting greens, soil surfaced mini soccer pitches, roller skating rinks and table tennis.
tinclude aviaries and mammal exhibits, concrete chess tables, model boat pools, television sets and open air theatres. tinclude bandstands, barbecue pits, composite beach buildings, car parks, changing rooms, fountains, dog's gardens, refreshment kiosks, public lavatories, public libraries, pavilions/shelters and spectators stands.
234

19.7 Parks and Playgrounds* by District
District
Urban Council Area
Hong Kong
Central
Eastern
Wan Chai
Western
Southernt
Kowloon
Kowloon City
Kwun Tong
Mong Kok
Sham ShuiPo
Wong Tai Sin
Yau Ma Tei
Regional Council Area
Tsuen Wan
Kwai Chung
TuenMun
Yuen Long
North
Tai Po
Sha Tin
Sai Kung
Islands
Note:
Total
Total
}
Total
1976
60 62
48
50
220
72
43
20
43
42
33
253
97
28
16
10
10
161
1977
64
64
50
53
231
77
44
20 45
44
33
263
100
29
17
10 13
169
1978
66 67
51
54
238
83
46
22
45
44
37
277
45 24 17 25
30
11
21 19
192
1979
69
70
55
57
251
86
49
22
48
47
41
293
49 27 19
28
12 22 13
25
23
218
1980
70
46
61
34
57
268
87 49
25
49
49
46
305
56
35
24
33
13
23 17
39
27
267
1981
70
46
63
35
57
271
92
51
30 54
50
49
326
56 35 25 33 13
24
17 39
27
269
1982
71 54
70
45
51
291
94
61
33 58 52 50
348
57
35
29
34
13
24 18
39 27
276
1983
71 54
74
47
56
302
82
76
35
60 54
47
354
34
33 27 21 11
22 29 26 22
225
1984
72
60 79 4g
58
317
95
80 35
60
56
59
385
45 61
54 34 29
30
54
51 45
403
Number
1985
73 64
79
49
62
327
97
80 36
63 51 61
388
47
25 47 41
62 32 54
55
53
416
*Parks and Playgrounds refer to public pleasure grounds which include rest gardens, children's playgrounds, sitting-out areas and amenity plots, etc. tThe new Southern District-came into operation w.e.f. 1.12.80.
19.8 Attendances at Museums
Urban Council
Museum of Art
Flagstaff House Museum of Tea Ware*
Museum of History
Lei Cheng Uk Brarich Museum
Hong Kong Space Museum
Science Museum
Regional Council
Sheung Yiu Folk Museum
Hong Kong Railway Museum
Note:
1976 1977 1978 1979 1980 1981 1982 1983 1984 1985
188 837 191 743 237 564 264 033 277 530 230 800 278 315 285 144 291 067 259 729
409 040 317 327 290 673 356 729
31 351 t 60 797
428 383
46 364
142 860
1 002
424 673
44959
531 885
87 525
148 610 # 427 114
42 883
489 643
2 879
47 356
432 262
97 048
111 124 92 050
309 687 1 011 462
51 339 45 692
425 844 415 956
48 169 2 009
71 374 60 624
18 366
The Sheung Yiu Folk Museum and the Hong Kong Railway Museum opened to the public on 21 January 1984 and 21 December 1985 respectively. *A Branch Museum of the Hong Kong Museum of Art opened on 26 January 1984. tLei Cheng Uk Branch Museum was closed for major conservation of the old tomb preserved in situ and renovation work of the building from January
1976 to September 1978. #Museum of History closed in October~December 1982 for removal from Star House premises to Kowloon Park.
235


Section 20: MISCELLANEOUS STATISTICS
Statistics on mass media are obtained from the Administrative Services and Information Branch, the Television and Entertainment Licensing Authority and the Post Office.
Statistics relating to public markets and stalls, and licences and permits in force are obtained in the case of the urban area from the Urban Services Department, and in the case of the New Territories from the Regional Services Department. Since 1 April 1985, the work of the Urban Services Department in the New Territories has been transferred to the Regional Services Department.
Petroleum statistics are prepared from monthly returns submitted by petroleum companies. Fire services statistics are supplied by the Fire Services Department. Information on companies registered and dissolved, and on companies incorporated outside Hong Kong is supplied by the
Registrar General.
237


20.1 Statistics on Mass Media Number
1976 1977 1978 1979 1980 1981 1982 1983 1984 1985
Newspapers English 12 12 12 13 11 11 13 13 11 13 Chinese 103 107 111 98 84 59 54 54 51 50 Bilingual l 3 2 l l l l l l Japanese 2 1 1 2 2 2
Periodicals English 47 50 61 83 87 90 101 110 123 127 Chinese 171 194 206 211 257 278 294 298 325 326 Bilingual 22 23 28 33 42 43 41 45 46 59 Japanese 2 2 2 3 Tri-lingual 2
Radio Stations 2 2 2 2 2 2 3 3 3 3 Channelst 7 7 7 7 7 10 9 10 10 10
Television Stations 3 3 3 2 2 2 2 2 2 2 Channels 5 5 5 4 4 4 4 4 4 4
Note: tProgramme broadcast on different frequencies is counted as one channel.
20.2 Public Markets and Stalls in Public Markets by Type of Stall
1976/77 1977/78 1978/79 1979/80 1980/81 1981/82 1982/83 1983/84 1984/85 1985/86
Hong Kong Number of public markets 23 23 26 26 26 27 27 29 29 30 Number of stalls
Fish 400 404 419 419 406 513 506 518 518 520 Poultry 183 183 217 217 213 235 234 240 240 240 Meat 367 376 409 409 396 455 451 463 463 474 Wet goods* 311 311 656 656 644 l 075 l 501 l 619 l 619 l 509 Dry goodst 164 164 493 493 458 752 808 880 880 993 Cooked food 40 40 66 82 92 92 92 92 Siu mei/Lo mei l • 5 5 5 5 9 9 9 9 Otherst 23 23 36 36 40 42 44 45 45 34
Sub-total 1448 1462 2 275 2 275 2 228 3159 3645 3866 3866 3871
Kowloon Number of public markets 19 19 20 21 21 23 23 24 25 26 Number of stalls
Fish 410 370 400 408 412 448 448 451 451 451 Poultry 134 125 132 160 159 170 170 176 176 177 Meat 287 272 305 320 322 367 370 370 371 373 Wet goods* 328 331 348 661 674 910 910 l 183 l 467 l 529 Dry goodst 177 178 289 458 434 710 674 823 l 037 l 121 Cooked food 35 42 92 110 136 172 236 Siu mei/Lo mei 6 6 6 10 15 17 17 17 17 17 Otherst 10 11 11 22 23 24 25 27 27 18
Sub-total 1352 1293 1491 2074 2081 2 738 2 724 3183 3 718 3 922
New Territories Number of public markets 24 24 25 28 29 35 36 40 37 40 Number of stalls
Fish 391 423 434 437 447 477 517 558 550 568 Poultry 55 70 75 79 84 96 117 132 134 138 Meat 303 321 331 343 377 377 404 454 466 483 Wet goods* 305 479 608 770 936 l 070 l 308 l 399 l 841 l 805 Dry goodst 454 624 518 603 637 761 963 l 078 l 051 l 151 Cooked food 87 87 165 165 285 306 362 Siu mei/Lo mei 13 19 19 20 29 32 36 51 60 62 Otherst l l l I 2 4 11 11 15 37
Sub-total 1522 1937 1986 2 340 2 599 2 982 3 521 3 968 4423 4606
Total number of public markets 66 66 71 75 76 85 86 93 91 96
Total number of stalls 4322 4692 5752 6689 6908 8879 9890 11017 12007 12399
Note: *Include vegetable, fruit, bean curd, aquarium fish and fresh flowers. tinclude grocery, haberdashery, household wares and other miscellaneous items other than wet goods. tinclude ice, newspaper and tradesman stalls.
239
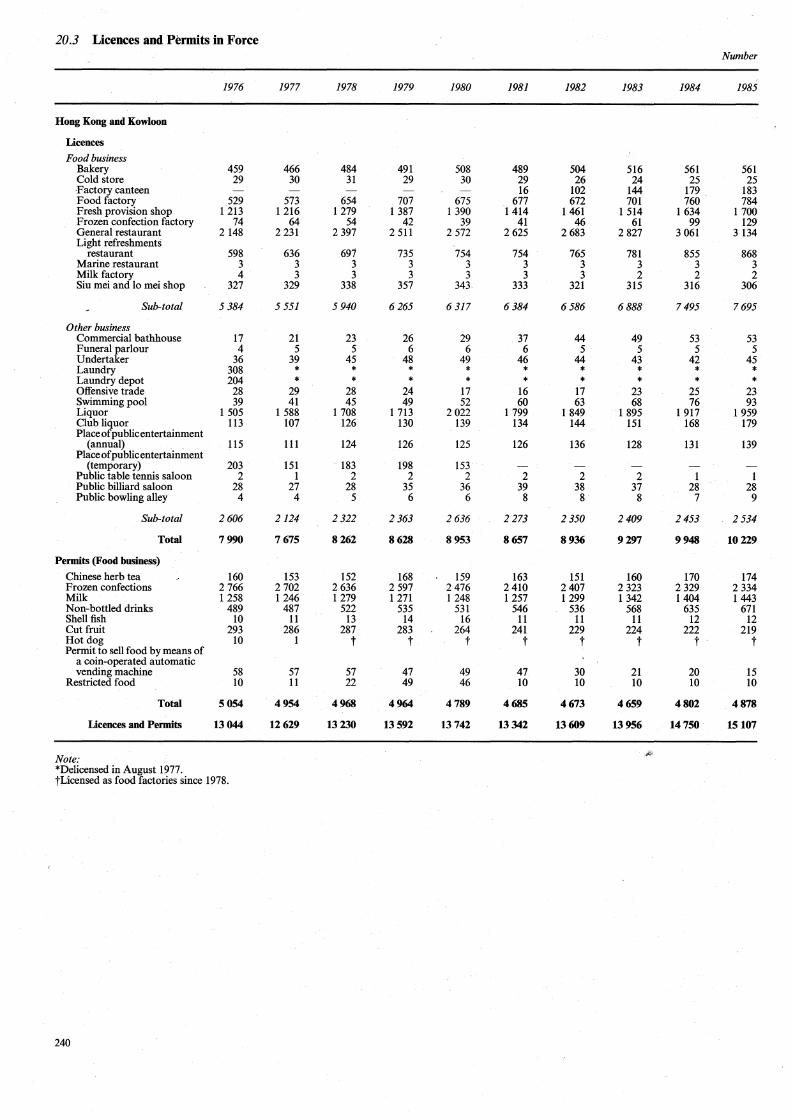
20.3 Licences and Permits in Force Number
1976 1977 1978 1979 1980 1981 1982 1983 1984 1985
Hong Kong and Kowloon
Licences
Food business Bakery 459 466 484 491 508 489 504 516 561 561 Cold store 29 30 31 29 30 29 26 24 25 25 ·Factory canteen 16 102 144 179 183 Food factory 529 573 654 707 675 677 672 701 760 784 Fresh provision shop 1 213 1 216 1 279 1 387 1 390 1 414 1461 1 514 1 634 1 700 Frozen confection factory 74 64 54 42 39 41 46 61 99 129 General restaurant 2 148 2 231 2 397 2 511 2 572 2625 2 683 2 827 3 061 3 134 Light refreshments
691 restaurant 598 636 735 754 754 765 781 855 868 Marine restaurant 3 3 3 3 3 3 3 3 3 3 Milk factory 4 3 3 3 3 3 3 2 2 2 Siu mei and lo mei shop 327 329 338 357 343 333 321 315 316 306
Sub-total 5 384 5 551 5 940 6265 6317 6384 6586 6888 7495 7695
Other business Commercial bathhouse 17 21 23 26 29 37 44 49 53 53 Funeral parlour 4 5 5 6 6 6 5 5 5 5 Undertaker 36 39 45 48 49 46 44 43 42 45 Laundry 308 * * * * * * * * * Laundry depot 204 * * * * * * * * * Offensive trade 28 29 28 24 17 16 17 23 25 23 Swimming pool 39 41 45 49 52 60 63 68 76 93 Liquor 1 505 1 588 1 708 1 713 2 022 1 799 1 849 1 895 1 917 1 959 Club liquor 113 107 126 130 139 134 144 151 168 179 Place of publicentertainment
(annual) 115 111 124 126 125 126 136 128 131 139 Pface of public entertainment
(temporary) 203 151 183 198 153 Public table tennis saloon 2 1 2 2 2 2 2 2 1 1 Public billiard saloon 28 27 28 35 36 39 38 37 28 28 Public bowling alley 4 4 5 6 6 8 8 8 7 9
Sub-total 2606 2124 2 322 2 363 2636 2 273 2 350 2409 2453 2 534
Total 7990 7675 8262 8628 8953 8657 8936 9297 9948 10229
Permits (Food business)
Chinese herb tea 160 153 152 168 159 163 151 160 170 174 Frozen confections 2 766 2 702 2 636 2 597 2476 2410 2407 2 323 2 329 2 334 Milk 1 258 1246 1 279 1 271 1 248 1 257 1 299 1 342 1404 1443 Non-bottled drinks 489 487 522 535 531 546 536 568 635 671 Shell fish 10 11 13 14 16 11 11 11 12 12 Cut fruit 293 286 287 283 264 241 229 224 222 219 Hot dog 10 1 t t Permit to sell food by means of
t t t t t t
a coin-operated automatic vending machine 58 57 57 47 49 47 30 21 20 15
Restricted food 10 11 22 49 46 10 10 10 10 10
Total 5054 4954 4968 4964 4789 4685 4673 4659 4802 4878
Licences and Permits 13044 12629 13230 13592 13742 13342 13609 13956 14750 15107
Note: ~~
*Delicensed in August 1977. tLicensed as food factories since 1978.
240
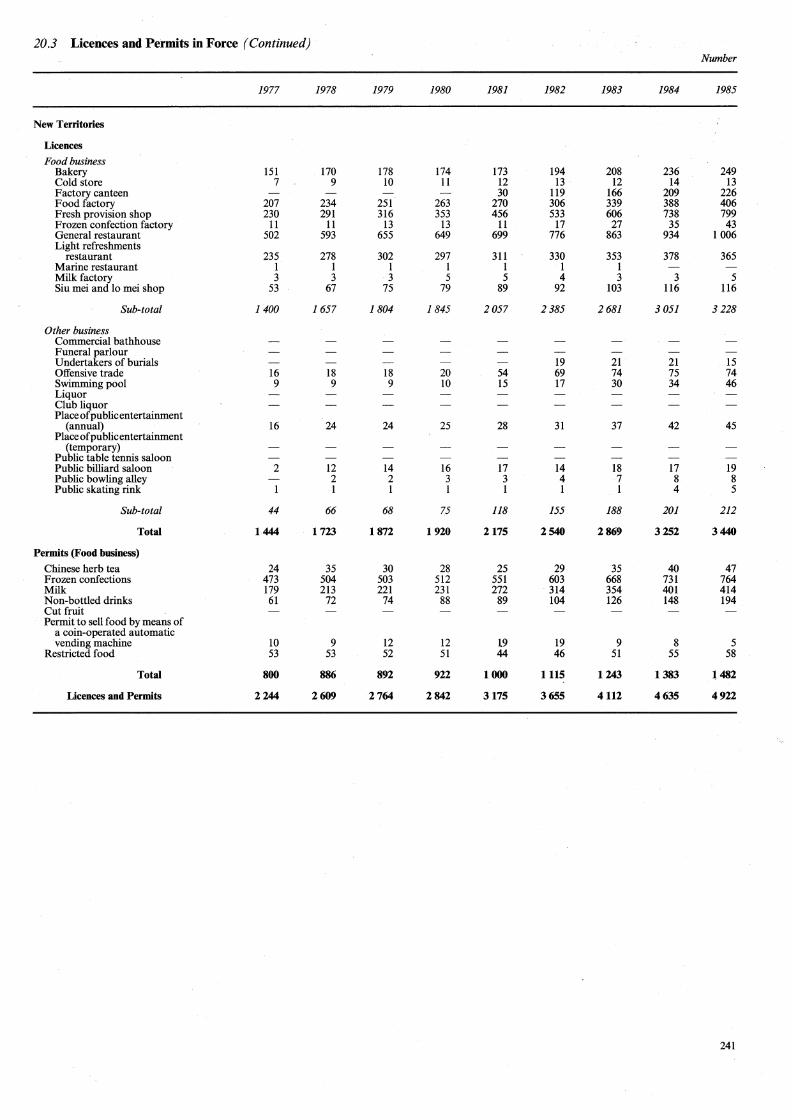
20.3 Licences and Permits in Force (Continued) Number
1977 1978 1979 1980 1981 1982 1983 1984 1985
New Territories
Licences
Food business Bakery 151 170 178 174 173 194 208 236 249 Cold store 7 9 10 11 12 13 12 14 13 Factory canteen 30 119 166 209 226 Food factory 207 234 251 263 270 306 339 388 406 Fresh provision shop 230 291 316 353 456 533 606 738 799 Frozen confection factory 11 11 13 13 11 17 27 35 43 General restaurant 502 593 655 649 699 776 863 934 1006 Light refreshments
restaurant 235 278 302 297 311 330 353 378 365 Marine restaurant 1 1 1 1 1 1 1 Milk factory 3 3 3 5 5 4 3 3 5 Siu mei and lo mei shop 53 67 75 79 89 92 103 116 116
Sub-total 1400 1657 1804 1845 2057 2385 2681 3051 3228
Other business Commercial bathhouse Funeral parlour Undertakers of burials 19 21 21 15 Offensive trade 16 18 18 20 54 69 74 75 74 Swimming pool Liquor ·
9 9 9 10 15 17 30 34 46
Club liquor Place of public entertainment
(annual) 16 24 24 25 28 31 37 42 45 Placeofpublicentertainment
(temporary) Public table tennis saloon Public billiard saloon 2 12 14 16 17 14 18 17 19 Public bowling alley 2 2 3 3 4 7 8 8 Public skating rink 1 1 1 1 1 1 4 5
Sub-total 44 66 68 75 118 155 188 201 212
Total 1444 1723 1872 1920 2175 2540 2869 3252 3440
Permits (Footl business)
Chinese herb tea 24 35 30 28 25 29 35 40 47 Frozen confections 473 504 503 512 551 603 668 731 764 Milk 179 213 221 231 272 314 354 401 414 Non-bottled drinks 61 72 74 88 89 104 126 148 194 Cut fruit
·Permit to sell food by means of a coin-operated automatic vending machine 10 9 12 12 19 19 9 8 5
Restricted food 53 53 52 51 44 46 51 55 58
Total 800 886 892 922 1000 1115 1243 1383 \482
Licences and Permits 2244 2609 2764 2842 3175 3655 4112 4635 4922
241

20.4 Petroleum Products: Releases from Bond by Type 'OOO m3 unless otherwise specified
1976 1977 1978 1979 1980 1981 1982 1983 1984 1985
light oils
Motor spirit 177.77 199.86 236.00 271.39 303.26 336.52 . 348.65 313.92 303.35 291.40
Aviation spirit 0.25 0.28 0.23 0.28 0.30 0.23 0.23 0.32 0.26 0.26
Aviation turbine fuel 733.64 756.41 774.99 861.61 885.39 939.41 948.90 958.05 I 030.90 I 020.13
Other light oils 98.16 100.13 124.62 143.10 158.50 184.55 206.67 243.47 306.06 337.27
Heavy oils
Light diesel for buses 58.96 62.18 63.77 62.93 69.20 76.32 82.91 92.65 101.03 107.82
Light diesel, other road users 253.65 285.58 394.44 380.55 371.50 442.58 465.47 450.69 507.57 526.07
Light diesel; industrial and marine uses 735.21 767.12 789.05 813.02 693.04 724.61 805.41 836.54 763.81 631.88
Kerosene 252.98 224.01 226.24 242.79 212.88 193.35 182.10 165.85 158.93 149.07
Medium, heavy diesel fuel 262.39 278.75 295.43 234.85 129.31 116.60 142.19 124.98 119.14 122.54
Furnace fuel oil 3 530.92 3 869.81 4077.02 4114.63 4 562.19 4 589.79 4300.90 3 440.40 3 113.69 2 716.20
Others
Lubricating oils 72.31 75.00 84.27 83.90 76.94 76.30 71.85 72.92 71.78 83.33
Petroleum products not otherwise classified 0.26 4.50 3.57 5.09 4.60 4.62 8.20 6.43
Total 6176.23 6619.13 7066.33 7213.55 7 466.06 .7685.36 7 559.87 6704.40 6484.70 5992.40
liquefied petroleum gas ('000 tonnes) 87.81 90.83 101.58 107.48 111.36 118.17 129.61 141.62 151.97 157.53
20.5 Fire, Special Service, AmbUlance Calls and Fatalities
1976 1977 1978 1979 1980 1981 1982 1983 1984 1985
Fire calls
Industrial 506 502 552 617 654 526 408 479 545 538
Non-industrial 6860 8 031 7123 9244 8453 9004 7905 8 875 9985 9307
False alarms 2307 3029 3 687 3910 4886 6290 6782 7764 6949 7660
Special service calls 3284 3 564 3 959 4966 5 535 5845 6 173 6 813 6 218 6 811
Ambulance calls
·Emergency lll 703 121 789 139 790 158 812 171404 189 179 203 634 220242 220 768 235 200
Removal 33 817 38 773 34026 40340 49653 63 788 72 591 83 281 92444 106 766
Fatalities
Fire Industrial 10 4 8 22 3 19 1 1 1 Non-industrial 32 43 21 23 34 25 40 40 52 28
Special service 316 283 308 353 338 367 330 375 340 322
242
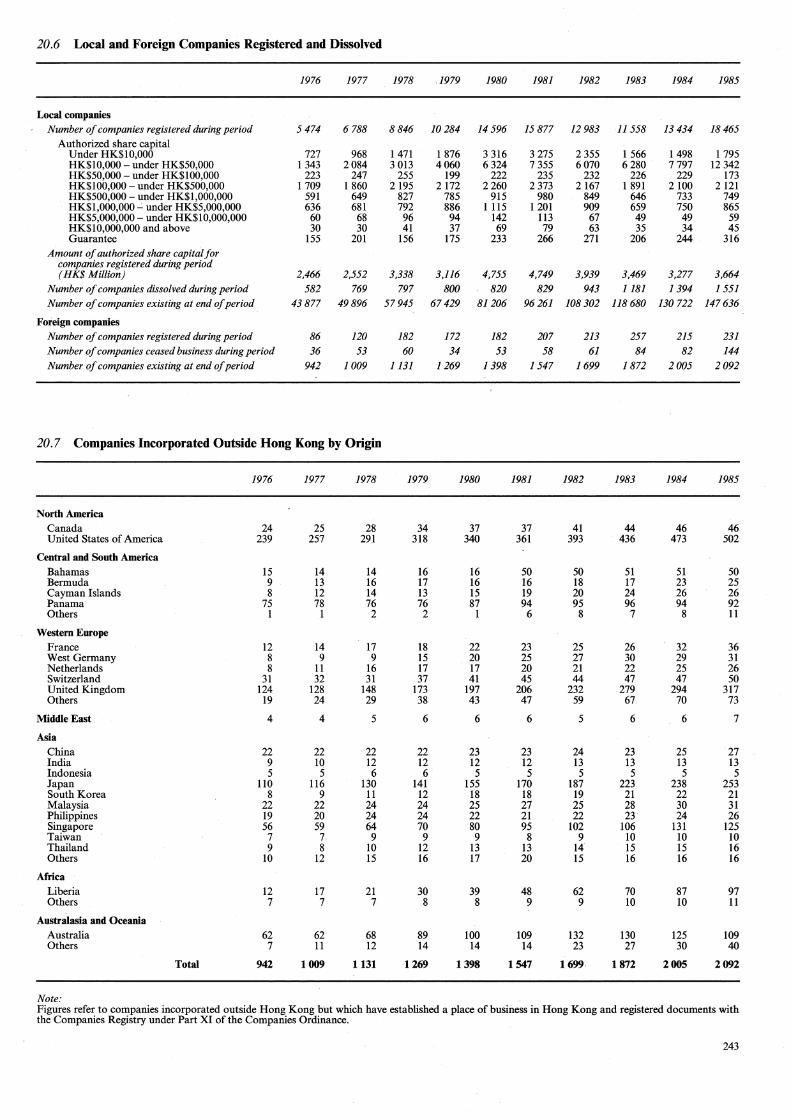
20.6 Local and Foreign Companies Registered and Dissolved
1976 1977 1978 .1979 1980 1981 1982 1983 1984 1985
Local companies Number of companies registered during period 5 474 6 788 8846 10284 14596 15 877 12983 11558 13434 18465
Authorized share capital Under HK$10,000 727 968 1471 I 876 3 316 3 275 2 355 I 566 1498 I 795 HK$10,000 - under HK$50,000 I 343 2084 3 013 4060 6324 7 355 6070 6280 7797 12 342 HK$50,000- under HK$100,000 223 247 255 199 222 235 232 226 229 173 HK$100,000 - under HK$500,000 I 709 I 860 2 195 2172 2260 2 373 2167 I 891 2100 2 121 HK$500,000- under HK$1,000,000 591 649 827 785 915 980 849 646 733 749 HK$1,000,000..:. under HK$5,000,000 636 681 792 886 1115 1201 909 659 750 865 HK$5,000,000 - under HK$10,000,000 60 68 96 94 142 113 67 49 49 59 HK$10,000,000 and above 30 30 41 37 69 79 63 35 34 45 Guarantee 155 201 156 175 233 266 271 206 244 316
Amount of authorized share capital for companies registered during period (HK$ Million) 2,466 2,552 3,338 3,116 4,755 4,749 3,939 3,469 3,277 3,664
Number of companies dissolved during period 582 769 797 800 820 829 943 1181 1394 1551
Number of companies existing at end of period 43877 49896 57945 67429 81206 96261 108 302 118680 130 722 147636
Foreign companies Number of companies registered during period 86 120 182 172 182 207 213 257 215 231
Number of companies ceased business during period 36 53 60 34 53 58 61 84 82 144 Number of companies existing at end of period 942 1009 1131 1269 1398 1547. 1699 1872 2005 2092
20.7 Companies Incorporated Outside Hong Kong by Origin
1976 1977 1978 1979 1980 1981 1982 1983 1984 1985
North America
Canada 24 25 28 34 37 37 41 44 46 46 United States of America 239 257 291 318 340 361 393 436 473 502
Central and Sooth America
Bahamas 15 14 14 16 16 50 50 51 51 50 Bermuda 9 13 16 17 16 16 18 17 23 25 Cayman Islands 8 12 14 13 15 19 20 24 26 26 Panama 75 78 76 76 87 94 95 96 94 92 Others I I 2 2 I 6 8 7 8 11
Western Europe
France 12 14 17 18 22 23 25 26 32 36 West Germany 8 9 9 15 20 25 27 30 29 31 Netherlands 8 11 16 17 17 20 21 22 25 26 Switzerland 31 32 31 37 41 45 44 47 47 50 United Kingdom 124 128 148 173 197 206 232 279 294 317 Others 19 24 29 38 43 47 59 67 70 73
Middle East 4 4 5 6 6 6 5 6 6 7
Asia China 22 22 22 22 23 23 24 23 25 27 India 9 10 12 12 12 12 13 13 13 13 Indonesia 5 5 6 6 5 5 5 5 5 5 Japan 110 116 130 141 155 170 187 223 238 253 South Korea 8 9 11 12 18 18 19 21 22 21 Malaysia 22 22 24 24 25 27 25 28 30 31 Philippines 19 20 24 24 22 21 22 23 24 26 Singapore 56 59 64 70 80 95 102 106 131 125 Taiwan 7 7 9 9 9 8 9 10 10 10 Thailand 9 8 10 12 13 13 14 15 15 16 Others 10 12 15 16 17 20 15 16 16 16
Africa
Liberia 12 17 21 30 39 48 62 70 87 97 Others 7 7 7 8 8 9 9 10 10 11
Australasia and Oceania
Australia 62 62 68 89 100 109 132 130 125 109 Others 7 11 12 14 14 14 23 27 30 40
Total 942 1009 1131 1269 1398 1547 1699. 1872 2005 2092
Note: Figures refer to companies incorporated outside Hong Kong but which have established a place of business in Hong Kong and registered documents with the Companies Registry under Part XI of the Companies Ordinance.
243


~ ,,_
~ V1
MAP OF HONG KONG CLASSIFIED BY 1976 CENSUS AREA
I ~ \ \ "o "-/
) Sheung Shui Township
) t:?,_ : '-l . . ) '1 Fanling Township
/ l--··-··
7 Yuen Long Township (: Tai Po .../f.l.
, .... ·-..,. Township\..'-· ~·-·"" . .
Yuen Long Other Areas
0\3 .. C3
~o
\
() .$:; ~ 'I) Islands, Sai Kung South and Hang Hau •
~ 0
{/
..
- ...........
~\ J
I
Islands, Sai Kung South and Hang Hau
O" V- c1 \A .ci '-Y ,,,,----/ ,_.,,,
-+- International Boundary
- • • - Area Boundary
_...---(;J (J/-- • - District Boundary


MAP OF HONG KONG ISLAND, KOWLOON AND NEW KOWLOON CLASSIFIED BY 1976 CENSUS DISTRICT
~
~- _,.r··""-.. . ..-r--··__; .. -··-. ""\r O..:,. .. wu j I l. \ ~ S~~ l -i"0 '*' l... Kai Tak •
• P""\10o• \ '\.~ei . 1'0"8 '1 \ } a:) 7. .-·-: M..;, .. . ' ""\ ··- Ho • • ( -...; ./} •.
\ Man tffun~-1: • A._ \...
Yau Tin \j{0 g ~J . ..r·.J -. ' M • m v~ ' T: ·\r.J ""<fa ·-;?
._....}.. ¥ N_,-. ~ ! 0
• ?\;?
<> d
<()
- • • - Area Boundary
- • - District Boundary
~


~ ()~
~
~ \ \ , I
9/ '-
~" ~o
()
MAP OF HONG KONG CLASSIFIED BY 1981 CENSUS AREA
'9
-~ Q;\ J
Yuen Long New Town
~1.. ;.,- • ._.>
.\3 0 d
,(} ,,~-~/ --+- International Boundary
- • · - Area Boundary ------/p (} J
0 - · - District Boundary


N ..,.
0
~
d
MAP OF HONG KONG ISLAND, KOWLOON AND NEW KOWLOON CLASSIFIED BY 1981 CENSUS DISTRICT
~0~ Point <t Quar...
. f" "J.,. • ~ . wan c"•') \_r "') ~ ( '-·r---~~f".r \" \ \ A~'._,., - ~\ TO- • ( .... KOW ,, . ~ . '-'°~ -~ f'I\ ·'l.__(/" . •
l/l(/ . ....._,.... --.. ) ""w. Aberdeen ..._.-)
l I
0
South
Un "
~
~
()
- • • - Area Boundary
- • - District Boundary


c.o 00 0
)
....
>
... ro o
"'O 8
§ N
0 ID
Iii ..
0
g 8
(J
~
Q)
iii "E ro 0
0 ID
...
8 (J
LO
•t:
(/) ...
" (/)
lo
c ~
253


N v. v.
MAP OF KOWLOON AND NEW KOWLOON CLASSIFIED BY DISTRICT BOARD 1986
·"'---·..../'"-·~· 7 ~ .
_j·---J"·~-~·\·,,__j \
. ""--"' 1 \. "" WONG TAI SIN DISTRICT \
~ . . .
SHAM SHUI PO DISTRICT j \.L.~--V·""'-·~ I
~. KOWLOON CITY DISTRICT (' \
. MONG KOK DISTRICT . -~· . KWUN TONG DISTRICT ~-../)
- .""' I ~ YAU MA TEI DISTRICT \ ~ /
i \
(J District Board Electoral Boundary -·-
Metres 500 0 ~
1 OOO 2 OOO
~-~.,i -) /./ ~-~ L ~. ·~., ·-----·-----·---.__,,,/· ~-~


N v. -:i
r-· i i r----1
i i i
i~ i I v I i
'il
MAP OF NEW TERRITORIES AND ISLANDS CLASSIFIED BY 1 DISTRICT BOARD 1986
b p
{.,-...·", r ._ . ...,..-."""'. .v--~..l
,....r-'-·rrv->
,-·~t NORTH DISTRICT I
r.J )
a
HONG KONG
<l
{l
(} .. ~
~
i i I i i i i i i i I
International Boundary -•-•- 1 11> ./ '- ..........._ • ....._,J"\..r ,;} i·~-~- t> ~~ 1-_\ ~.. District Board Electoral f
~ ~ ~ [_) Boundary -·- I . () ~- . i '·,, ~ 't> ISLANDS DISTRICT 00 (J I Kilometres 2 1 0 2 4 6 8 10 i
'· ... . i ',~ - J .
.. ~~·--·- .. -·-·-·-·-·-""-... -·-·-·-·-.. -·-·-·-·-·-·-·-·-·-•--+-•--•-+--1-t +-+-.. -4-+-•-·-·-·-·-·-·-·-•-+-+-+j

PUBLICATIONS Produced by Census and Statistics Department
Title of Publication
Price in HK$ (excluding
postage)
Regular:
Hong Kong Economic Trends (monthly) ............................. .
Hong Kong Monthly Digest of Statistics (monthly) .......... ..
Hong Kong Trade Statistics Summary (monthly) ............... .
Hong Kong External Trade (monthly) .................................. .
Hong Kong Trade Index Numbers (monthly) ...................... .
Hong Kong Trade Statistics 1986: Imports (monthly) ............................................................... . Exports & Re-exports (monthly) ...................................... .. Annual Supplement
Imports ............................................................................. . Exports & Re-exports ...................................................... .
Consumer Price Index Report (monthly) ............................. .
Monthly Survey of Employment, Payroll and Orders-on-Hand (monthly) .................................................................. .
Report on Monthly Survey of Retail Sales (monthly) ........ .
Report on Quarterly Survey of Restaurant Receipts and Purchases (quarterly} ......................................................... .
Quarterly Business Survey Report (quarterly) .................... ..
Report on the Quarterly Index of Industrial Production (quarterly) ........................................................................... ..
Textile Production Statistics (quarterly) ............................... .
Report on the Quarterly Survey of Construction Output (quarterly} ............................................................................ .
Employment, Wages and Material Prices in the Construction Industry (quarterly} ............................................................. .
Report of Employment, Vacancies and Payroll Statistics (quarterly) ............................................................................ .
General Household Survey Labour Force Characteristics (quarterly} ............................................................................ .
Quarterly Report of Wages, Salaries and Employee Benefits Statistics (quarterly):
Volume I ........................................................................... . (Detailed Tables) Volume II ........................................... .
Hong Kong Energy Statistics (Quarterly Supplement) ....... .
Hong Kong Shipping Statistics (quarterly) ........................ ..
Hong Kong Shipping Statistics (yearly) .............................. .
Employment & Vacancies Statistics (Detailed Tables) in Manufacturing, Mining & Quarrying, Electricity & Gas 1985 (yearly) ....................................................................... .
Employment & Vacancies Statistics (Detailed Tables) in Transport, Storage & Communication, Financing, Insurance, Real Estate&. Business Services, Community, Social & Personal Services 1985 (yearly) ....................... ..
Employment & Vacancies Statistics (Detailed Tables) in Wholesale, Retail, Import & Export Trades, Restaurants & Hotels 1985 (yearly) ........................................................... .
Hong Kong Annual Digest of Statistics 1985 Edition (yearly) ................................................................................. .
Report of Salaries and Employee Benefits StatisticsManagerial and Professional Employees (Excluding Top Management) 1985 (yearly} ............................................. .
Annual Report on the Consumer Price Index 1985 (yearly)
Import/Export Price Indexes 1983 (yearly) ......................... .
1.00
28.00
5.00
13.50
2.50
70.00 70.00
70.00 70.00
3.00
1.50
1.00
1.00
3.00
3.00
1.00
2.00
3.00
11.00
8.50
8.00 7.00
4.00
14.00
19.00
53.00
36.00
22.00
90.00
15.00
7.00
3.00
Title of Publication
Price in HK$ (excluding
postage)
Hong Kong Review of Overseas Trade in 1985 (yearly) .... .
Hong Kong Energy Statistics 1975-1985 (yearly) ............. . 1984 Survey of Industrial Production (yearly) ................... ..
1984 Survey of Wholesale, Retail and Import/Export Trades, Restaurants and Hotels (yearly} ........................................ .
1984 Survey of Storage, Communications, Financing, In-surance and Business Services (yearly) ........................... .
1984 Survey of Transport and Related Services (yearly) ... . 1984 Survey of Building, Construction and Real Estate
Sectors (yearly) ................................................................... .
An Outline of Statistical Development 1986 (yearly) ........ ..
Estimates of Gross Domestic Product 1966 to 1985 (yearly) Hong Kong Social and Economic Trends 1974-1984
(triennial) ............................................................................. .
Irregular:
Hong Kong 1981 Census: Tertiary Planning Unit Population by Age ........................ . Living Quarters, Households and Population by Type of
Living Quarter and Tertiary Planning Unit .................... . Basic Tables ......................................................................... . District Board Tabulations ................................................. .. District Board Constituency Area Population by Age ..... . Tertiary Planning Unit Tabulations:
Hong Kong Island ........................................................... . Kowloon and New Kowloon .......................................... . New Territories ................................................................ .
Street Block/Village Cluster Tabulations: Hong Kong Island East ................................................... . Hong Kong Island West .................................................. . Kowloon ........................................................................... . New Kowloon .................................................. ; ................ . Tai Po and Fanling .......................................... ! ................ . Tsuen Wan, Yuen Long and Tuen Mun ........ : ............... . Sha Tin, Sai Kung and Islands ....................................... .
Graphic Guide (-JLA-~'l!i'mtft J:JM:ttM:ttlifti¥) ....... . Main Report:
Volume 1: Analysis .......................................................... . Volume 2: Tables ............................................................ ..
Educational Attainment, Median Household Income, Occupation & Labour Force .......................................... ..
Hong Kong Population A 20-Year Projection ..................... . Hong Kong Population A 20-Year Projection (Revised
Edition) ................................................................................. . Hong Kong Life Tables .......................................................... ..
Demographic Trends in Hong Kong 1971-82 .................... ..
Hong Kong Imports & Exports Classification List 1982 Issue ...................................................................................... .
Report on The Household Expenditure Survey, 1984-85 .. .
Special Topics Report Ill-Social Data Collected by the General Household Survey ................................................ .
Crime And Its Victims in Hong Kong 1981: English Version .................................................................... . Chinese Version (-1LA-~'l!i'mt~:'El¥J1W~.&_fl..:5¥:~ ~) ..................................................................................... .
Free:
Average Daily Wages of Workers Engaged in Government Building and Construction Projects (monthly)
Hong Kong in Figures, 1986 Edition
21.00
8.50 12.50
7.50
8.50
7.50
9.00
10.00
20.00
30.00
6.00
8.00 6.00 9.00 5.00
42.00 48.00 77.00
60.00 66.00 63.00 71.00 65.00 85.00 56.00
6.50
101.00 106.00
2.00 24.00
4.00 16.00
26.00
16.00
25.00
12.00
16.00
16.00
Enquiries concerning the above publications or their back issues should be addressed to the Publications Officer, Census and Statistics Department, Kai Tak Commercial Building, 317 Des Voeux Road Central, Hong Kong. Telephone No. 5-444938.
Saleable copies are purchasable from the Government Publications Centre, General Post Office Building, Ground Floor, Connaught Place, Hong Kong and from the Publications Sales Counter of Census and Statistics Department at Room 1904, Kai Tak Commercial Building, 317 Des Voeux Road Central, Hong Kong.
Order for local and overseas mailings please contact the Director of Information Services, Information Services Department, Baskerville House, Duddell Street, Hong Kong.

140633-24L- 11 /86 $95-J331286 I