Hong Kong Monthly Digest of Statistics (June 1981)
98
June, 1981
-
Upload
khangminh22 -
Category
Documents
-
view
0 -
download
0
Transcript of Hong Kong Monthly Digest of Statistics (June 1981)
June, 1981
這份刊物的 PDF 版本的文字是從印刷版掃描而成,再利用光學字符識別軟
件轉換成電子格式。由於原印刷版本已印製並保存多年,光學字符識別技
術未必能準確地識別某些文字或數字。因此,搜索或複製此 PDF 檔案內的
文字時應加以注意。 The text of this PDF publication was scanned from its printed version and then converted to electronic text using Optical Character Recognition (OCR) software. Because of the age and condition of the original printed copy, the OCR may not recognise certain characters or figures accurately. Caution should therefore be taken when searching or copying text from this PDF publication.

Hong Kong
Monthly Digest of Statistics
June, 1981
Census and Statistics Department, Hong Kong

PRINTED AND PUBLISHED BY THE GOVERNMENT PRINTER, HONG KONO

INTRODUCTION
The Hong Kong Monthly Digest of Statistics is prepared by the Census and Statistics Department. It is designed to provide up-to-date statistical information about the social and economic characteristics of Hong Kong.
Statistical data are, wherever possible, presented in the form of monthly figures for the past twenty-five months together with annual figures for the latest complete six years. Detailed description of the scope and nature of the data and definitions of the terms used in the publication are provided in the Explanatory Notes.
Most of the statistics have been compiled by the Census and Statistics Department. Where other Government departments and organizations have contributed data, references are made in the Explanatory Notes. The Census and Statistics Department gratefully acknowledges such contributions.
Symbols
The following symbols are used throughout the Digest:
nil or not applicable N.A. not available * revised figures
Units of Measurement
1 terajoule (TJ)
1 tonne (t)
1 kilogram (kg)
1 square metre (m2)
1 cubic metre (m3)
Values
277 778
9 478.17
kilowatt hours
therms
2 204.62 pounds
0.984 207 ton
2.204 62 pounds
1.653 47
10.763 9
219.969
catties
square feet
imperial gallons
All figures quoted are in Hong Kong dollars.
Exchange Rate
The official rate for conversion to US dollars was HK$5.085= US$1.00 until 25 November 1974. The Hong Kong dollar floated on 26 November 1974.
Rounding of Figures
Some figures have been rounded off to the nearest final digit. This may result in a slight discrepancy between the sum of the individual items and the total as shown in the tables.
Hong Kong Monthly Digest of Statistics lune 1981 iii


TABLE OF CONTENTS
Sections/tables
INTRODUCTION
PART I REGULAR TABLES
Section 1: Climate
Meteorological observations 1.1
1.2 Meteorological observations during May 1981
Section 2: Vital Statistics
2.1
2.2
2.3
Registered births and marriages Registered deaths Deaths by cause
Section 3: Labour
3.1 Establishments and persons engaged by industry 3.2 Time series of establishments and persons engaged by industry 3.3 3.4 3.5 3.6
3.7 3.8 3.9
Reported vacancies by industry Establishments and persons engaged by employment size Employment in Government service Indexes of average daily wages of workers Reported accidents Industrial accidents in lst quarter 1981
Stoppages of work by industry
Section 4: Production
4.1 4.2 4.3 4.4
Mining production Cement production Textile production statistics Index of textile production
Section 5: External Trade
5.1 External trade statistics 5.2 Imports by area 5;3 Domestic exports by area 5.4 Imports and domestic exports by major trading country 5.5 Re-exports by area of destination 5.6 Re-exports by major country of origin 5.7 Imports by commodity section 5.8 Domestic exports by commodity section 5.9 Re-exports by commodity section 5.10 Imports and re-exports by end-use category 5.11 Domestic exports of principal commodities 5.12 Trade index numbers 5.13 Trade index numbers for imports 5.14 Trade index numbers for domestic exports 5.15 Trade index numbers for re-exports 5.16 Trade index numbers for main suppliers of imports 5.17 Trade index numbers for main markets of domestic exports
Section 6: Food Supplies
6.1 Rice 6.2 Other foodstuffs
Hong Kong Monthly Digest of Statistics lune 1981
Page
iii
1
1
2 2
3
4-6 7
8-9
10 11
12
13 14 15
16 16 17 18
19 19
20 20 21
21
22 22 2j
23 24 24 25 26
27 28 28
.29'
29
v

Sections/tables
Section 7: Transport and Communications 7 .1 Aircraft movements 7;2 Ocean-going vessels entered and cleared 7 .3 River steamers, hydrofoil vessels, hoverferries, junks and launches entered and cleared 7.4 Kowloon-Canton Railway traffic 7.5 International movements of commercial cargo 7.6 Commercial cargo carried by vessels 7.7 Containers carried by ocean-going vessels 7.8 Public transport: passenger journeys by undertaking 7.9 Public transport: passenger journeys by area 1.10 Vehicular traffic through toll-charged tunnels and vehicular ferry services 7.11 Motor vehicles registered 7.12 Traffic accidents and casualties 7.13 Telephone services 7.14 Postal services 7 .15 Telecommunication services
Section 8: Prices
8.1 Average retail prices of selected foodstuffs 8.·2 Average wholesale prices of selected foodstuffs 8:3 Consumer Price Index (A) 8.4 Consumer Price Index (B) 8i5 Hang Seng Consumer Price Index 8.•6 New Consumer Price Index (A) 8.7 New Consumer Price Index (B) 8.8 New Hang Seng Consumer Price Index
Section 9: Finance 9.1 Money supply 9.2 Banks: balance sheets 9.'3 Deposit-taking companies: balance sheets 9 .4 Money markets 9.5 Analysis of loans and advances 9.6 Interest rates paid and charged by principal banks 9.i7 Inter-bank lending rate and bank cheques cleared 9.8 Banks: external liabilities and claims at 31 March 1981 9.9 9:10 9:11 9:12
9~13
9:14 9.15 9.16
~J7 9.18
•.
9.19 9.20
Deposit-taking companies: external liabilities and claims at 31 March 1981 Exchange rates and the effective exchange rate indexes Exchange rates and the effective exchange rate indexes in May 1981 Index of share prices and value of stock exchange turnover Index of share prices and value of stock exchange turnover in May 1981 Commodity exchange turnover Closing quotations of commodity futures and commodity exchange turnover in May 1981 Gold and silver exchange trading prices Gold and silver exchange trading prices in May 1981 Revenue and expenditure of the Hong Kong Government Instruments registered in the Land Office Local and foreign companies registered and dissolved
Section JO: Housing, Buildings and Land 10.1 Stock of living quarters 10.2 Stock and authorized population of public housing ,rental flats 10.3 Residential units/flats completed by geographic area 10.4 Number of residential units/flats completed by floor area 10.5 Residential units/flats with consent to commence work by geographic area 10.6 Number of residential units/flats with consent to commence work by floor area
Page
30 30-31
32 33 34 34 35 35 36 36
37-38 39 39 40 40
41 42 42 43 43 44 44 44
45 46 47 48
49-50 51 51
52-53 54-55
56 57 58 58 59
59-60 60 61 61 62 63
. 64 .64 65 65 66 66
vi lfong !«~ng Monthly pigest qf Statistics lune 1981

Sections/tables
10.7 Buildings completed by type 10.8 Buildings with consent to commence work by type 10.9 Disposals of Crown land
Section 11 : Travelling and Tourism 11.1 Passenger arrivals 11.2 Passenger departures 11.3 Incoming tourists by country of residence
11.4 Hotel statistics
Section 12: Social Statistics 12.1 Crime 12.2 In-patient and out-patient statistics in Government and Government-assisted institutions 12.3 Notified infectious diseases 12.4 Public assistance schemes 12.5 Special needs allowance schemes
Section 13: Energy 13.1 Electricity consumption 13.2 Gas consumption 13.3 Petroleum products: releases from petroleum companies by type 13.4 Petroleum products: releases from petroleum companies, duty free and duty paid
Section 14: Miscellaneous 14.1 Water supplies 14.2 Fire services
PART Il SPECIAL TABLES
Section 15: Population 15.1 Total population ... appears in August issue 15.2 Estimated population by age group at mid-1981 ... appears in August issue 15.3 Estimated population and growth rates ... appears in February and August issues 15.4 Labour force characteristics ... appears in June and December issues
Section 16: Education ... appears in February issue 16.1 Schools and enrolment
Section 17: National Accounts , .. appears in April and October issues 17.1 Expenditure on the gross domestic product by components: at constant (1973) market prices 17 .2 Expenditure on the gross domestic product by components: at current market prices
Section 18: Summary Statistics from Annual Economic Censuses/Surveys . . . appears once annually
PART ID SPECIAL REVIEW ... appears in January, April, July and October issues
January 1981: Hong Kong's Industries in 1978 April 1981: Marriages in Hong Kong, 1976-1980
EXPLANATORY NOTES
Hong Kong Monthly Digest of Statistics June 1981
Page
67 67
68-69
70 70 71 72
73-76 76 77 78 79
80 80 81 81
82 83
84
I-III
vii
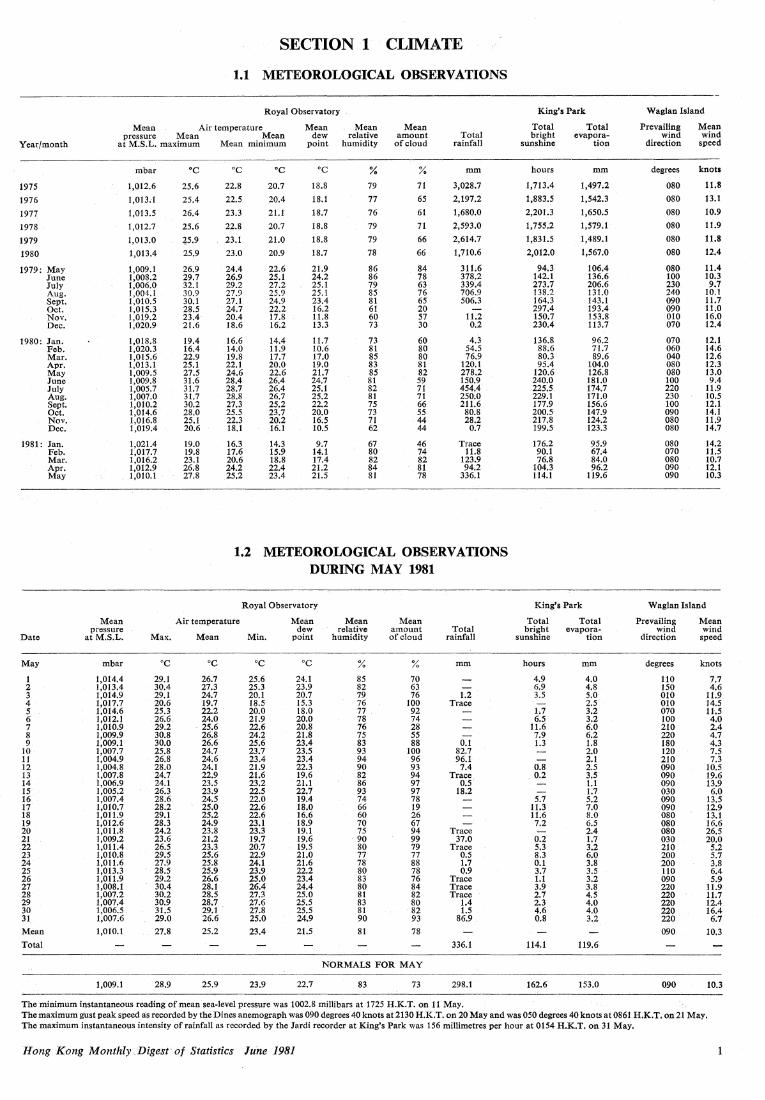
SECTION 1 CLIMATE
1.1 METEOROLOGICAL OBSERVATIONS
Royal Observatory King's Park Waglan Island
Mean Air temperature Mean Mean Mean Total Total Prevailing Mean pressure Mean Mean dew relative amount Total bright evapora- wind wind
Year/month at M.S.L. maximum Mean minimum point humidity of cloud rainfall sunshine tion direction speed
mbar •c 'C 'C 'C % % mm hours mm degrees knots
1975 1,012.6 25.6 22.8 20.7 18.8 79 71 3,028.7 1,713.4 1,497.2 080 11.8
1976 1,013.1 25.4 22.5 20.4 18.l 77 65 2,197.2 1,883.5 1,542.3 080 13.1
1977 1,013.5 26.4 23.3 21.1 18.7 76 61 1,680.0 2,201.3 1,650.5 080 10.9
1978 1,012.7 25.6 22.8 20.7 18.8 79 71 2,593.0 1,755.2 1,579.1 080 11.9
1979 1,013.0 45.9 23.l 21.0 18.8 79 66 2,614.7 1,831.5 1,489.1 080 11.8
1980 1,013.4 25.9 23.0 20.9 18.7 78 66 1,710.6 2,012.0 1,567.0 080 12.4
1979: May 1,009.1 26.9 24.4 22.6 21.9 86 84 311.6 94.3 106.4 080 11.4 June 1,008.2 29.7 26.9 25.1 24.2 86 78 378.2 142.1 136.6 100 10.3 July 1,006.0 32.1 29.2 27.2 25.1 79 63 339.4 273.7 206.6 230 9.7 Aug. 1,004.1 30.9 27.9 25.9 25.1 85 76 706.9 138.2 131.0 240 10.1 Sept. 1,010.5 30.1 27.1 24.9 23.4 81 65 506.3 164.3 143.1 090 11.7 Oct. 1,015.3 28.5 24.7 22.2 16.2 61 20 297.4 193.4 090 11.0 Nov. l,019.2 23.4 20.4 17.8 11.8 60 57 11.2 150.7 153.8 010 16.0 Dec. 1,020.9 21.6 18.6 16.2 13.3 73 30 0.2 230.4 113.7 070 12.4
1980: Jan. 1,018.8 19.4 16.6 14.4 11.7 73 60 4.3 136.8 96.2 070 12.1 Feb. 1,020.3 16.4 14.0 11.9 10.6 81 80 54.5 88;6 71.7 060 14.6 Mar. 1,015.6 22.9 19.8 17.7 17.0 85 80 76.9 80.3 89.6 040 12.6 Apr. 1,013.l 25.l 22.1 20.0 19.0 83 81 120.1 95.4 104.0 080 12.3 May 1,009.5 27.5 24.6 22.6 21.7 85 82 278.2 120.6 126.8 080 13.0 June 1,009.8 31.6 28.4 26.4 24.7 81 59 150.9 240.0 181.0 100 9.4 July 1,005.7 31.7 28.7 26.4 25.l 82 71 454.4 225.5 174.7 220 11.9 Aug. 1,007.0 31.7 28.8 26.7 25.2 81 71 250;0 229.J 171.0 230 10.5 Sept. 1,010.2 30.2 27.3 25.2 22.2 75 66 211.6 177.9 156.6 100 12.1 Oct. 1,014.6 28.0 25.5 23.7 20.0 73 55 80.8 200.5 147.9 090 14.1 Nov. 1,016.8 25.l 22.3 20.2 16.5 71 44 28.2 217.8 124.2 080 11.9 Dec. 1,019.4 20.6 18.1 16.1 10.5 62 44 0.7 199.5 123.3 080 14.7
1981: Jan. 1,021.4 19.0 16.3 14.3 9.7 67 46 Trace 176.2 95.9 080 14.2 Feb. 1,017.7 19.8 17.6 15.9 14.l 80 74 11.8 90.1 67.4 070 11.5 Mar. 1,016.2 23.1 20.6 18.8 17.4 82 82 123.9 76.8 84.0 080 10.7 Apr. 1,012.9 26.8 24.2 22.4 21.2 84 81 94.2 104.3 96.2 090 12.1 May 1,010.l 27.8 25.2 23.4 21.5 81 78 336.l 114.1 119.6 090 10.3
1.2 METEOROLOGICAL OBSERVATIONS DURING MAY 1981
Royal Observatory King's Park Waglan Island
Mean Air temperature Mean Mean Mean Total Total Prevailing Mean pressure dew relative amount Total bright evapora- wind wind
Date at M.S.L. Max. Mean Min. point humidity of cloud rainfall sunshine tion direction speed
May mbar 'C oc 'C 'C % % mm hours mm degrees knots
1 1,014.4 29.l 26.7 25.6 24.1 85 70 4.9 4.0 110 7.7 2 1,013.4 30.4 27.3 25.3 23.9 82 63 6.9 4.8 150 4.6 3 1,014.9 29.1 24.7 20.1 20.7 79 76 1.2 3.5 5.0 010 11.9 4 1,017.7 20.6 19.7 18.5 15.3 76 100 Trace 2.5 010 14.5 5 1,014.6 25.3 22.2 20.0 18.0 77 92 1.7 3.2 070 ll.5 6 1,012.1 26.6 24.0 21.9 20.0 78 74 6.5 3.2 100 4.0 7 1,010.9 29.2 25.6 22.6 20.8 76 28 11.6 6.0 210 2.4 8 1,009.9 30.8 26.8 24.2 21.8 75 55 7.9 6.2 220 4.7 9 1,009.1 30.0 26.6 25.6 23.4 83 88 0.1 1.3 1.8 180 4.3
10 1,007.7 25.8 24.7 23.7 23.5 93 100 82.7 2.0 120 7.5 11 1,004.9 26.8 24.6 23.4 23.4 94 96 96.1 2.1 210 7.3 12 1,004.8 28.0 24.1 21.9 22.3 90 93 7.4 0.8 2.5 090 10.5 13 1,007.8 24.7 22.9 21.6 19.6 82 94 Trace 0.2 3.5 090 19.6 14 1,006.9 24.1 23.5 23.2 21.1 86 97 0.5 1.1 090 13.9 15 1,005.2 26.3 23.9 22.5 22.7 93 97 18.2 1.7 030 6.0 16 1,007.4 28.6 24.5 22.0 19.4 74 78 5.7 5.2 090 13.5 17 1,010.7 28.2 25.0 22.6 18.0 66 19 11.3 7.0 090 12.9 18 1,011.9 29.1 25.2 22.6 16.6 60 26 11.6 8.0 080 13.1 19 1,012.6 28.3 24.9 23.1 18.9 70 67 7.2 6.5 080 16.6 20 1,011.8 24.2 23.8 23.3 19.1 75 94 Trace 2.4 080 26.5 21 1,009.2 23.6 21.2 19.7 19.6 90 99 37.0 0.2 1.7 030 20.0 22 1,011.4 26.5 23.3 20.7 19.5 80 79 Trace 5.3 3.2 210 5.2 23 1,010.8 29.5 25.6 22.9 21.0 77 77 0.5 8.3 6.0 200 5.7 24 1,011.6 27.9 25:8 24.J 21.6 78 88 1.7 0.1 3.8 200 3.8 25 1,013.3 28.5 25.9 23.9 22.2 80 78 0.9 3.7 3.5 110 6.4 26 1,011.9 29.2 26.6 25.0 23.4 83 76 Trace 1.1 3.2 090 5.9 27 1,008.1 30.4 28.1 26.4 24.4 80 84 Trace 3.9 3.8 220 11.9 28 1,007.2 30.2 28;5 27.3 25.0 81 82 Trace 2.7 4.5 220 11.7 29 1,007.4 30.9 28.7 27.6 25.5 83 80 1.4 2.3 4.0 220 12.4 30 1,006.5 31.5 29.1 27.8 25.5 81 82 1.5 4.6 4.0 220 16.4 31 1,007.6 29.0 26.6 25.0 24.9 90 93 86.9 0.8 3.2 220 6.7
Mean 1,010.1 27.8 25.2 23.4 21.5 81 78 090 10.3
Total 336.l 114.1 119.6
NORMALS FOR MAY
1,009.l 28.9 25.9 23.9 22.7 83 73 298.1 162.6 153.0 090 10.3
The minimum instantaneous reading of mean sea-level pressure was 1002.8 millibars at 1725 H.K.T. on 11 May. The maximum gust peak speed as recorded by the Dines anemograph was 090 degrees 40 knots at2130 H.K.T. on 20 May and was 050 degrees 40knots at0861 H.K.T. on 21 May. The maximum instantaneous intensity of rainfall as recorded by the Jardi recorder at King's Park was 156 millimetres per hour at 0154 H.K.T. on 31 May.
Hong Kong Monthly Digest of Statistics June 1981
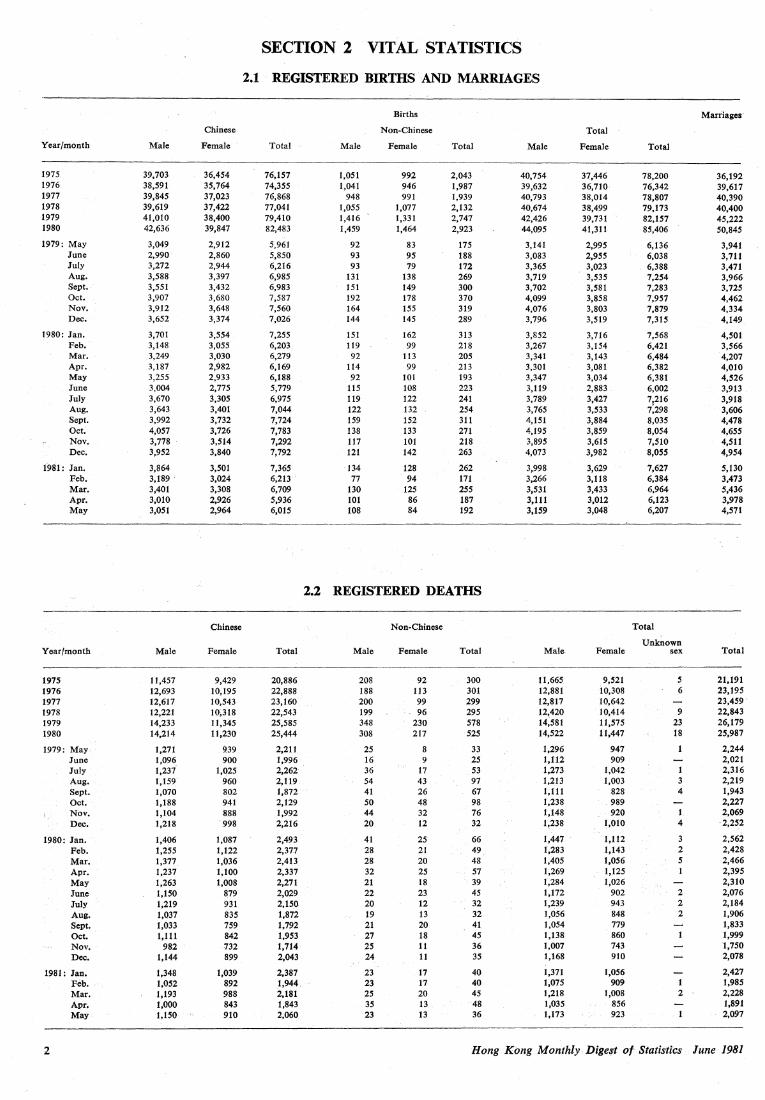
SECTION 2 VITAL STATISTICS
2.1 REGISTERED BIRTHS AND MARRIAGES
Births Mariiases
Chinese Non-Chinese Total
Year/month Male Female Total Male Female Total Male Female Total
1975. 39,703 36,454 76,157 1,051 992 2,043 40,754 37,446 78,200 36,192 1976 38,591 35,764 74,355 1,041 946 1,987 39,632 36,710 76,342 39,617 1977 39,845 37,023 76,868 948 991 1,939 40,793 38,014 78,807 40,390 1978 39,619 37,422 77,041 1,055 1,077 2,132 40,674 38,499 79,173 40,400 1979 41,010 38,400 79,410 1,416 1,331 2,747 42,426 39,731 82,157 45,222 1980 42,636 39,847 82,483 1,459 1,464 2,923 44,095 41,311 85,406 50,845
1979: May 3,049 2,912 5,961 92 83 175 3,141 2,995 6,136 3,941 June 2,990 2,860 5,850 93 95 188 3,083 2,955 6,038 3,711 July 3,272 2,944 6,216 93 79 172 3,365 3,023 6,388 3,471 Aug. 3,588 3,397 6,985 131 138 269 3,719 3,535 7,254 3,966 Sept.· 3,551 3,432 6,983 151 149 300 3,702 3,581 7,283 3,725 Oct. 3,907 3,680 7,587 192 178 370 4,099 3,858 7,957 4,462 Nov. 3,912 3,648 7,560 164 155 319 4,076 3,803 7,879 4,334 Dec. 3,652 3;374 7,026 144 145 289 3,796 3,519 7,315 4,149
1980: Jan. 3,701 3,554 7,255 151 162 313 3,852 3,716 7,568 4,501 Feb. 3,148 3,055 6,203 119 99 218 3,267 3,154 6,421 3,566 Mar. 3,249 3,030 6,279 92 113 205 3,341 3,143 6,484 4,207 Apr. 3,187 2,982 6,169 114 99 213 3,301 3,081 6,382 4,010 May 3,255 2,933 6,188 92 101 193 3,347 3,034 6,381 4,526 June 3,004 2,775 5,779 115 108 223 3,119 2,883 6,002 3,913 July 3,670 3,305 6,975 119 122 241 3,789 3,427 1,216 3,918 Aug. 3,643 3,401 7,044 122 132 254 3,765 3,533 7,298 3,606 Sept. 3,992 3,732 7,724 159 152 311 4,151 3,884 8,035 4,478 Oct. 4,057 3,726 7,783 138 133 271 4,195 3,859 8,054 4,655 Nov. 3,778 . 3,514 7,292 117 101 218 3,895 3,615 7,510 4,511 Dec. 3,952 3,840 7,792 121 142 263 4,073 3,982 8,055 4,954
1981: Jan. 3,864 3,501 7,365 134 128 262 3,998 3,629 7,627 5,130 Feb. 3,189' 3,024 6,213. 77 94 171 3,266 3,118 6,384 3,473 Mar. 3,401 3,308 6,709 130 125 255 3,531 3,433 6,964 5,436 Apr. 3,010 2,926 5,936 101 86 187 3,111 3,012 6,123 3,978 May 3,051 2,964 6,015 108 84 192 3,159 3,048· 6,207 4,571
2.2 REGISTERED DEATHS
Chinese Non-Chinese Total
Unknown Year/month Male Female Total Male Female Total Male. Female sex Total
1975 11,457 9,429 20,886 208 92 300 11,665. 9,521 s 21,191 1976 12,693 10,195 22,888 188 113 301 12,881 10,308 6 23,195 1977 12,617 10,543 23,160 200 99 299 12,817 10,642 23,459' 1978 12,221 10,318 22,543 199 - 96 295 12,420 I0,414 9 22,843 1979 14,233 11,345 25,585 348 230 578 14,581 11,575 23 26,179 1980 14,214 11,230 25,444 308 217 525 14,522 11,447 18 25,987
1979: May 1,271 239 2,211. 25 8 33 1,296 947 2,244 June 1,096 900 1,996 16 9 25 1,112 909 2,021 July 1,237 l,()25 2,262 36 17 53 1,273 1,042 1 2,31.6 Aug. l,159. 960 2,119 54 43 97 1,213 1,003 3 2,219 Sept. 1,070 802 1,872 41 26 67 1,111 828 4 1,943 Oct. 1,188 941 2,129 so 48 98 1,238 . 989 2,227 Nov. 1,104 888 1,992 44 32 76 1,148 920 1 2,069 Dec. 1,218 '998 2,216 20 12 32 1,238 1,010 4 2,252
1980: Jan. 1,406 1,087 2,493 41 25 66 1,447 1,112 3 2,562 Feb. 1,255 1,122 2,377 28 21 49 1,283 .1,143 2 2,428 Mar. 1,377 1,036 2,413 28 20 48 1,405 1,056 5 2,466 Apr. 1,237 1,100 2,337 32 25 57 1,269 1,125 1 2,395 May 1,263 1,008 2,271 21 18 39 1,284 1,026 2,310 June 1,150 879 2,029 22 23 45 1,172 902 2 2,076 July 1,219 931 2,150 20 12 32 1,239 943 2 2,184 Aug. 1,037 835 1,872 19 13 32 1,056 848 2 1,906 SCP!. 1,033 759 1,792 21 20 41 1,054 779 1,833 Oct. 1,111 842 1,953 27 18 45 1,138 860 1,999 .Nov.· 982 732 1,714 25 11 36 1,007 743 1,750 Dec. 1,144 899 2,043 24 11 35 1,168 910 2,078
1981: Jan. 1,348 1,039 2,387 23 17 40 1,371 1,056 2,427 Feb. 1,052 892 1,944. 23 17 40 1,07S 909 1 1,985 Mar. 1,193 988 2,181 25 20 45 1,218 1,008 2 2,228 Apr; 1,000 843 1,843 35 13 48 1,035 856 1,891 May 1,150 910 2;060 23 13 36 1,173 923 2,097
2 Hong Kong Monthly. Digest of Statistics lune 1981

Cause of death
Infective and parasitic
Neoplasms
Endocrine, nutritional, metabolic disease and immunity disorders
Blood and blood-forming organs
Mental disorders
Nervous system and sense organs
Circulatory system
Respiratory system
Digestive system
Genito-urinary system
Complication of pregnancy, childbirth and puerperium
Skin and subcutaneous
Musculoskeletal system and connective tissue
Congenital anomalies
Certain conditions originating in the perinatal period
Symptoms, signs and ill-defined conditions
Injury and poisoning
1975 1976 1977
854 757 749
2.3 DEATHS BY CAUSE
1979 1979 1979 lst 2nd 3rd
1978 1979 1980 qtr. qtr. qtr.
VITAL STATISTICS
1979 1980 1980 4th lst 2nd qtr. qtr. qtr.
1980 1980 3rd 4th qtr. qtr.
1981 lst
qtr.
634 833 816 187 201 238 207 190 194 203 229 201
5,122 5,378 5,658 5,988 6,212 6,447 1,488 1,536 1,573 1,615 1,552 1,666 1,577 1,652 1,670
256
62
50
135
329
71
41
166
292
78
23
179
308
46
17
164
363
57
4
172
338 107
43 12
6
169 42
85
12
34
84
16
2
50
87 105
17 14
4
46 54
97 60
12 12
53 28
76
5
34
85
7
3
45
5,865 6,699 6,737 7,096 7,668 7,507 2,075 1,845 1,747 2,001 2,240 1,971 1,611 1,685 2,087
3,340 3,368 3,607 3,288 4,079 3,969 1,028 1,005 1,062 984 1,248 1,069 871 781 1,061
980 1,158 1,133 994 1,047 1,128 273 280 266 228 311 297 268 252 266
682 773 824 . 831 913 988 252 209 221 231 321 263 184 220 272
2
27
14
56
13
35
5
46
7
15
4
12
2
6 7
5
2
1
6
2
3 3
3
36 30 39 20 43 39 5 5 20 13 12 6 11 10 12
395 377 399 358 325 293 87 68 82 88 66 73 80 74 51
538 493 470 440 526 517 131 114 148 133 116 114 170 117 88
1,427 1,598 1,456 1,435 1,849 1,633 480 551 433 385 621 412 314 286 380
1,420 1,887 1,767 1,173 2,066 2,078 387 635 530 514 595 548 522 413 408
Total 21,191 23,195 23,459 22,843 26,179 25,987 6,563 6,588 6,479 6,549 7,456 6,780 5,916 5,835 6,639
Hong Kong Monthly Digest of Statistics lune 198l 3

SECTION 3 LABOUR
3.1 ESTABLISHMENTS AND .PERSONS ENGAGED BY INDUSTRY
International Standard Industrial Classification (J.S.I.C.)
Major Divisi.on 2 Mining and quarrying
By groups:
Iron ore mining
• Stone quarrying, clay and sandpits
Mining and quarrying not elsewhere classified ,
Major Division 3 Manufactming
By major groups:
Food prodt1cts
Beverages
Tobacco·
Total
Wearing. apparel, except footwear
Leather and leather products, except footwear and wearing apparel
Footwear, except robber, plastic and wooden footwear
Textiles
Wood and cork products except furniture
Fu,::.~~re and fixtures, except primarily of
. Paper and' paper products ·
Printing, publishing and allied industries
Chemicals and chemical products
Product$ of petroleum and coal
Rubber products (figures for rubber footwear in italics) !
··'Plastic products (figilres for ·p1astic toys in italic)
Non-metallic· mineral products, except products of petroleum and coal
Basic metal industries
Fabricated metal products, except machinery and equipment
Machinery, except electrical
Electrical machinery, apparatus, ap_Pliances and supplies (figures for electromc parts and components for computers and . transistorized radios in italic)
Transport equipment
Professional and scientific, measuring and controlling equipment not elsewhere classified, and of photographic and optical goods
Other manufacturing industries
Total
4th quartet .1979
Establish- Persons engaged ments Male Female Total
IS
s
21
39
720
39
798
.1.153 13,007
26 3,151
4 517
2
16
40
733
41
814
3,560 . 16,567
293 3,444
295 812
9,641 83,161 194,109 277,270
148
435
•3,657
1,273
1,711
4,147
58,409
6,943
894 2,605
1,968 6,115
:42,416 100,825
1,367 8,310
. i,418 8,787 628 9,415
1;180 . 9,212 1,965 11,177
2,457 20,286 4,843 25,129
577 4,503 2,371 6,874
5 ' 117 3 120
435 3,722 1,576 5,298 219 2,478 1,362 3,840
4,674 42,393 45,460 87,853 1,636 17,547 29,158 46,705 •
366 3,974 829 4,803
333 3,843 353 4,196
7,330 57,969 26,836 84,805
1,471 12,455 1,127 13,582
1,860 1,075
307
40,083 27,264
13,583
77,630 117,713 63,303 90,567
544 14,127
920 19,290 20,055 39,345
2,606 17,438 13,075 30,513
42,282 428,701 442,197 870,898
3rd quarter 1980
Establish- Persons engaged ments Male Female Total
14
6
21
2
852
38
89i
1,194 14,213
28 4,076
3 532
s
s
10
2
857
43
902
4,028 .. 18,241
318 4,394
304 836
8,991 77,460 178,217 255,677§
212
509
5,013
1,312
2,342
4,515
64,936
6,469
1,541 10,152
1,296 9,892
2,589 21,456
633 5,134
s 140
398 3,271 172 1,833
4,816 42,224 1,634 17,436
392 3,914
331 4,480
7,707 58,163
1,778 13,099
2,188 43,242 1,197 27,939
396 14,305
1,215 22,551
2,862 18,128
1,348 3,690
2,114 6,629
59,637' 124,573§
1,297 7,766
749 10,901
1,915 11,807
4,993 26,449
2,512 7,646
3 143
1,498 4;769 1,226 3,059
44,090 86,314 27,981 45,417
939 4,853
427 4,907
26,590 84, 753
1,033 14,132
75,899 119,141 60,944 88,883
679 14,984
25,928
12,928
48,479
31,056
45,409 444,694 447,446 892,140
4th quarter 1980
Establish- Persons engaged ments . Male Female Total
12
6
19
2
762
36
800
i,153 14,118
28 3,667
541
6
3
9
2
768
39
809
3,849 17,967
. 307 . 3,974
314 855
8,654 80,425 183,257 263,682§
215
476
4,970
1,277
2,355
4,656
65;461
6,124
1;399 3,754
2,234 6;890
62,148 127,609§
1,271 7,395
1,536 10,580 778 11,358
1,308 9,878 1,931 11,809 !
2,654 22,148 5,118 27,266
628 5,374 2,590 7,964
4 89 I 90
409 3,397 1,476 4,873 179 1,921 1,154 3,075
4,939 42,338 43, 726 86,064 1,616 17,773 26,866 44,639
387 3,801 962 4, 763
309 4,484 430 4,914
7,519 57,931 26,309 84,240
1,859 13,277 993 14,270
2,132 1,104
404
44,702 28,066
14,608
77,422 122,124 61,773 89,839
753 15,361
1,346 23,044 25,093 48,137
2,815 18,776 13,328 32,104
45,025 451,774 455,689 907,463
§Due to a re-classification of activities between textiles and wearing apparel industries, the industry manufacturing knitwear from yarn was grouped under wearing appare is now re-grouped into textiles. ·
4 Hong Kong Monthly Digest of Statistics June ·1981

International Standard Industrial Classification (I.S.I.C.)
Major Division 4 Electricity, gas and water
By selected groups:
Electric light and power
Gas manufacture and distribution
Major Division 5 Construction
Building and construction worksites by type of contracting party: ·
Public Works Department
Housing Department
Mass Transit Railway
Private sector
Major Division 6 Wholesale, retail and import/export trades, restaurants and hotels
Wholesale:
Foodstuffs
·Fuel
Alcoholic drinks and tobacco
Clothing and footwear
Consumer goods
Consumer durables
Capital goods
Raw materials and semi-manufactures
General commodities
Retail:
Foodstuffs
Fuel
Alcoholic drinks and tobacco
Clothing and footwear
Consumer goods
Consumer durables
Import/export:
Foodstuffs
Fuel
Alcoholic drinks and tobacco
Clothing and footwear
Consumer goods
Consumer durables
Capital goods
Sub-total
Sub-total
Raw materials and semi-manufactures
General commodities
Sub-total
4th quarter 1979
Establish- Persons engaged ments· Male Female Total
3 6,499
827
232 IS,668
78 17,042
26 S,348
861 39,247
1,869 11,SOS
88 1,293
lOS 1,233
1,168 3,682
1,970 7,940
391 2,741
221 991
1,245 S,164
456 1,208
7,513 36,057
474
112
6,973
939
744 16,412
1,168 18,210
32 5,380
2,630 41,877
l ,252 13,057
206 1,499
144 1,377
1,722 5,404
2,494 10,434
825 3,566
268 1,259
1,177 6,341
256 1,464
8,344 44,401
16,597 34,865 lS,650 S0,515
498 3,625 504 4,129
235 363 IS9 522
4,290 7,642 7,34S 14,987
ll,l 7S 33,298 22,034 55,332
2,7S5 11,378 3,3S2 14,730
35,550 91,171 49,044 140,215
783 4,355
32 1,163
54 604
2,402 8,088
3,013 12,146
1,023 7,120
421 2,655
1,250 5,802
6,005 27,126
1,077 5,432
208 1,371
221 825
5,852 13,940
7,010 19,1S6
2,964 10,084
1,019 3,674
2,447 8,249
14,734 41,860
14,983 69,059 35,532 104,591
Hong Kong Monthly Digest of Statistics June 1981
. 3rd quarter 1980
Establishments
Persons engaged Male Female Total
3 7,449
862
229 13,857
77 14,983
12 4,421
882 48,831
2,008 12, 712
87 1,162
109 .1,256
. 1,335 4,365
2,381 9,447
434 2,677
263 1,033
1,544 6,4Sl
463 1,222
8,624 40,32S
572
199
8,021
1,061
S92 14,449
933 IS,916
11 4,432
2,558 51,389
1,375 14,087
224 1,386
162 1,418
1,914 6,279
2, 777 12,224
820 3,497
278 1,311
1,684 8,135
275 1,497
9,S09 49,834
17,451 37,456 15,700 53,156
507 3,602 542 4,144
210 331 208 539
4,910 8,034 8,684 16,718
12,177 36,822 21,194 58,016
3,262 13,319 3,681 17,000
38,517 99,564 50,009 149,573
883 4,326
43 1,188
66 731
2,840 9,287
3,690 14,481
1,197 7,643
455 3,133
l,581 6,767
6,491 27,800
1,271 S,597
222 1,410
295 1,026
6,966 16,253
8,224 22, 705
3,097 10, 740
1,314 4,447
2,738 9,505
15,S45 43,34S
17,246 75,3S6 39,672 115,028
LABOUR
4th quarter 1980
Establishments
Persons engaged Male Female Total
7,623
902
278 15,875
87 15,124
12 3,833
849 48,797
2,097 12,948
87 l,171
115 1,323
1,389 4,Sl4
2,467 9,400
452 2,720
268 1,147
1,572 6,634
455 1,168
I 8,902 4),025
598
189
8,221
1,091
577 16,452
871 15,995
11 3,844
2,186 50,983
1,37S 14,323
222 1,393
162 l,48S
1,975 6,489
2,849 12,249
7S7 3,477
324 1,471
1,131 8;36S
258 1,426
9,653 50,678
; 17,634 37,689 16,227 53,916
I 509 3,74S SSS 4,303
210 397 215 612
5,0S3 8,6SO 9,044 17,694
I 12,540 37,020 21,372 S8,392
! 3,379 13,977 3,947 17,924
I 39,325 101,478, SJ,363 IS2,841
908 4,370 1,230 S,600
48 l,2S5 229 1,484
67 710 289 999
2,978 9,603 6, 725 16,328
I 3,499 13,283 7,891 21,174
1,273 7,440 3,124 10,564
487 3,357. 1,351, 4,708
1,71S 6,933 2,893 9,826
6,479 27,89S 15,183 43,078
17,4S4 74,846 38,915 113,761
5

LABOUR
International Standard Industrial Classification (l.S.I.C.)
Restaurants, hotels, and other eating and lodging places:
Restaurants, cafes, bars and other eating and drinking places .
Hotels
Boarding houses
Sub-total
Total
Major Division 7 Transport, storage and commuoication
By.selected groups:
Urban, sub-urban and inter-urban highway passenger transport (motor buses and tramways only)
t Supporting services to land transport
Ocean and coastal water transport (excluding seamen)
Inland water transport (harbour ferry only)
Supporting services to water transport
Air transport carriers
Services incidental to transport
·. Storage and warehousing
i Communication
· ·Major Division 8 mDancing, insurance, real estate and business services
By groups:
Monetary institutions
Other financial institutions
Financial services
Insurance
Real estate
Legal services
Accounting, auditing and book-keeping services . · · ·
Data processing and tabulating services
Engineering, architectural and technical services
Advertising services
Business services, except machinery and equipment rental and leasing, not elsewhere classified.
. Machinery and equipment rental and leasing
Total
4th quarter 1979
Establish- Persons engaged ments Male Female Total
4,211 80,832 29,704 110,536
47 12,543. 4,134 16,677
627 1,007 1,222 2,229
4,885 94,382 35,060 129,442
62,931 290,669 127,980 418,649
5 12,441 663 13,104
26 414 31 445
196 4,699 1,671
2. 1,961 83
6,370
2,044
3,402
5,454
18,164:
121 ,3,134 ' ' 268
69
1,777
.3,115 '"· 2,339
13,377 4, 787
227 .4,213 695 4,908
27 ·10,774. 3,337 14,lU
1,064 21,893 16,311 38,204
2,135 _10,951 5,658 16,609
'104 519 145 664
558 3,362
2,498 13,000
309 2,733
398 ' 3,178
58 623
515 6,040
870 3,699
1,058 7,283
71 483
2,649 6,011
4,172 17,172
2,135 4,868
1,972 5,150
325 948
1,445 7,485
1,897 5,596
2,807 10,090;
109 592
9,638 '73,764 39,625 113;389
Note: t Until June 1981, statistics do not cover car parks.
3rd quarter 1980
Establish, Persons engaged · ments Male Female Total
4,276
47
643
82,937' 31,051 113,988
12,150 4,444 16,594
995 1,277 2,272
4,966 96,082 36, 772 132,854
69,353 l'il,327 135,962 447,289
6 14,478 789 15,267
26 431 34 465
' 173 4,689 '' ' 1,748 6,437
2,095
3,690
2' '2,000
125 3,384
74, 3,394
1,985 15,233
243 4,071
37 ·, 11,554
95
306
2,695 6,089
5,696 20,929
500 4,571
3,876 15,430
1,216 23,526 19,110 42,636
2,288 11,980 6,912 18,892
91 478 121 599
632 3,445
2,635 13,832
355 . 3,000
452 3,445
69 859
504 6,479
909 4,140
1,088 8,707
82 526
2,937 6,382
4,560 18,392
2,458 5,458
:Z,467 S,912
436 1,295
1,636 8,115
2,175 6,315
3,233 11,940
122 648
10,321 ' 80,417 46,167 126,584
4th quarter 1980
Establish- . Persons engaged ments Male Female T.otal
4,400 85,856 32,343 118, 199
46 12,682 4,607 17,289
639 1,019 1,313 2,332
5,085 99,557 38,263 137,820
70,766 316,906 138,194 455,lOO
6 15,135 873,· 16,008
171
2
198
74
2,011
443
4,858
2,016
3,851
479
1,776 6,634
95 2,111
316 A,167
3,485 ' 2,756' 6,241
15,304 5,492 20,796
239 4,233 568 4,801
36 11,923 4,153 16,076
1,259 25,093 20,068 45,161
2,352 12,646 7,312 19,958
91 467 i37 604
707 3,689 3,039 '·~.728 1 .. ,··
2,880 14;110 5,134 ' 19,304
364
469
77
545
926
1,114
88
3,036 2,564 5,600
3,318 2,306. S,624
876 439 1,315
6,664 1,659 8,323
4,038 2,180 6,218
9,143 3,337 12;480
535 129, 664
10,872 83,675 48,304 131,979
i Until June 1981, statistics do not cover mesiiage delivery & telecommunication: services.
6 'Hong Kbng.·Monthly Digest of Statistics lune 1981

LABOUR
3.2. TIME SERIES OF ESTABLISHMENTS AND PERSONS ENGAGED BY IN'DUSTRY I
International Standard Industrial Classification (I.S.I.C,)
Major Division 2 Major Division 3 Major Division 4§
Mining and quarrying Manufacturing Electricity, gas and water
Establish- Persons engaged Establish- Persons engaged Establish- I, Persons engaged Year/quarter ments Male Female Total ments Male Female Total ments Male Female Total
1975 19 614 23 637 '31,034 328,231 350,626 678,857 6 5,992 370 6,362 1976 17 451 8 459 36,303 374,765 398,981 773,746 4 6,062 423 6,485
1977 19 641 16 657 37,568 368,851 386,257 755,108 4 6,284 450 6,734 1978 17 613 4 617 41,240 402,741 413,942 816,683 4 6,721 483 7,204 t979 21 798 16 814 42,282 428,701 442,197 870,898 4 I 7,326 586 7,912 1980 19 800 9 809 45,025 451,774 455,689 907,463 4 8,525 787 9,312
1978: 4th qtr. 17 613 4 617 41,240 402,741 413,942 816,683 4 i 6,721 483 7,204
1979: lst qtr. 18 568 8 576 40,631 400,588 411,858 812,446 4 6,614 521 7,135 2nd qtr. 18 743 14 757 41,498 428,433 448,951 877,384 4 6,691 540 7,231 3rd qtr. 20 746 4 750 42,199 432,246 447,496 879,742 4 7,012 554 7,566 4th qtr. 21 798 16 814 42,282 428,701 442,197 870,898 4 7,326 586 7,912
1980: lst qtr. 24 836 13 849 43,457 436,019 447,808 883,827 4 7,473 639 8,112 2dn qtr. 21 848 22 870 44,781* 459,930* 466,722* 926,652* 4 7,726 654 8,380 3rd qtr. 21 892 10 902 45,409 444,694 447,446 892,140 4 8,311 771 9,082 4th qtr. 19 800 9 809 45,025 451,774 455,689 907,463 4 8,525 787 9,312
International Standard Industrial Classification (I.S.I.C.)
Major Division 5 MajorlDivision 6
Construction Wholesale, retail artd import/export trades, . restaurants and hotels
Persons engaged Establish- Persons engaged Year/quarter Site Male Female Total ments Male Female Total
i. 1975 N.A. N.A. N.A. N.A. 57,976 258,116 95,645 353,761 1976 1,093 45,406 3,355 48,761 60,177 269,325 ' 101,756 371,081
1977 1,2.02 58,791 4,219 63,010 60,315 276,659 109,610 386,269 1978 1,255 69,006 4,710 73,716 64,401 288,944 122,441 411,385 1979 1,197 77,305 4,574 81,879 62,931 290,669 127,980 418,649 1980 1,226 83,629 3,645 87,274 70,766 316,906 138,194 455,100
1978: 4th qtr. 1,255 69,006 4,710 73,716 64,401 288,944 122,441 411,385
1979: lst qtr. 1,243 67,254 4,327 71,581 63,950 284,433 i 119,510 . 403,943 2nd qtr. 1,200 71,293 4,258 75,551 65,155 289,590 124,065 413,655 3rd qtr. 1,205 75,700 4,382 80,082 65,008 290,970 I 126;455 417,425 4th qtr. 1,197 77,305 4,574 81,879 62,931 290,669 127,980 418,649
1980: lst qtr. 1,241 77,470 4,085 81,555 66,496 294,699 129,566 424,265 2nd qtr. 1,216 81,432 4,013 85,445 68,055 308,107 132,806 440,913 3rd qtr. 1,200 82,092 4,094 86,186 69,353 311,327 I 135,962 447,289 4th qtr. 1,226 83,629 3,645 87,274 70,766 316,906 138,194 455,100
International Standard Industrial Classification (I.S.I.C.)
Major Division 7t Major fDivision 8
Transpo~t, storage and communication Financing, insurance, re~l estate and business services
Establish· Persons engaged Establish- Persons engaged Year I quarter ments Male Female Total ments Male Female Total
1975 898 37,453 6,506 43,959 5,285 46,204 19,776 65,980 1976 1,735 42,932 8,532 51,464 5,962 50,097 22,368 72,465
1977 1,989 47,534 10,041 57,575 6,994 56,433 I 26,652 83,085 1978 2,258 49,734 11,726 61,460 8,482 65,110 33,115 98,225 1979 2,450 54,128 13,874 68,002 9,638 73,764 39,625 113,389 1980 2,763 61,248 16,065 77,313 10,872 83,675 48,304 131,979
1978: 4th qtr. 2,258 49,734 11,726 61,460 8,482 65,110 33,115 98,225
1979: lst qtr. 2,265 49,915 11,937 61,852 8,658 66,417 33,972 100,389 2nd qtr. 2,400 51,690 12,593 64,283 9,014 68,756 35,980 104,736 3rd qtr. 2,394 53,508 13,294 66,802 9,173 71,466 38,411 109,877 4th qtr. 2,450 54,128 13,874 68,002 9,638 73,764
' 39,625 113,389
1980: lst qtr. 2,578 56,273 14,156 70,429 10,171 75,290 40,710 116,000 2ndqtr. 2,631 58,634 15,127 73,761 10,162 78,089 43,257 121,346 3rd qtr. 2,671 59,234 15,739 74,973 10,321 80,417 46,167 126,584 4th qtr. 2,763 61,248 16,065 77,313 10,872 83,675 I 48,304 131,979
Note: Annual Figures for 1975-1980 refer to the 4th quarter of the year.
§ Statistics cover the entire division except the water supply industry. t As from t!ie June 81 issue, the old series was replaced by a new series due to an expansion in coverage which occurred in 1977. However, the cov4rage is as yet incomplete.
Hon,g ,Kong Monthly Digest •of Statistics lune 1981 7

LABOUR
3.3 REPORTED VACANCIES··BY INDUSTRY
International Standard Industrial Classification (I:S.J:C.)
Major Division 3 Manufacturing.
By major groups:
Food products
Beverages
Tobacco
Textiles
Wearing apparel, except footwear
Leather and leather products, except footwear and wearing apparel
Footwear, except rubber, plastic and wooden footwear
Wood ancl cork products except furniture
Furniture and fixtures, except primarily of metal
Paper and paper products
Printing, publishing and allied industries
Chemicals and chemical products ·
Products of petroleum and coal
Rubber products
Plastic products
Non-metallic mineral product$, except products of petroleum and coal
Basic metal industries
Fabricated metal products, except machinery and equipment
Machinery, except electrical
Electrical machinery, apparatus, appliances and supplies (figures for electronic parts and components for computers and transitoi:ized radios ill bracket) ··
Transport equipment
Professional linc(scientific, i:rieasuring and controlling equipment not elsewhere classified, and of photographic and optical goods
Other manuf~ctUring industries
Total
Major Division 6 Wholesale, retail and import/export trades, restaurants and hotels
Wholesale:
Foodstuffs
Fuel··
Alcoholic drinb.and tobacc;o.
Clothing and footwear
Consumer goods
.Consumer durables
4th quarter 1979
278
30
2,312
29,430
86
95
248
224
124
537
209
32
4,328
116
46
3,315
328
. 9,831 (8,298)
81
2,268
•. 1,~35
55,253
115
8
7
55
131
61
3rd quarter 1980 4th quarter 1980
229 353
29 27
2,786§ 3,693§
17,689§ 21,109§
142 123
209 67
145 152
188 197
152 244
389 556
133 139
111 60
2,400 2,657
90 112
39 50
2,634 2,142
316 293
6,557 6,860 (5,355) .(5,253)
27 so,
2,149 '2,091
995 .l,065
37,409 42,040
53 15
10 5
9 53.
93 90
220 182
57 52
Note: Starting, from the second quarter of 1980 onwards, all quai;terly vacancies statistics refer to the number of reported vacancies in March, ·· June, September and December.
§These figures are different from the ones published before due fo a re-classification of activities between the textiles and wearing apparel industries. Previously, the industry manufacturing knitwear from yarn was grouped under well.ring apparel.Jt is now re-grouped into textiles.
8 Hong Kong Monthly ·Digest of Statistics lune 1981

LABOUR
International Standar Industrial Classification (I.S.I.C.) 4th quarter 1979 3rd quarter 1980 4th quarter 1980
Capital goods 12 29 33
Raw materials and emi-manufactures 74 118 100
General cm:nmoditi s 2 5' 11
Sub-total 465 594 541
Retail:
Foodstuffs 371 270 281
Fuel 71 38 35
Alcoholic drinks a d tobacco 7 2 2
Clothing and foot ar 197 379 236
Consumer goods 644 1,095 795
Consumer durables 261 383 377
Sub-total 1,551 2,167 1,726
Import/export:
Foodstuffs 48 57 84
Fuel 24 7 9
Alcoholic drinks a tobacco 18 10 20
Clothing and footw ar 330 189 300
Consumer goods 443 440 391
Consumer durables 205 395 343
Capital goods 109 86 136
Raw materials and emi-manufactures 114 224 190 General commoditi 601 502 749
Sub-total 1,892 1,910 2,222
Restaurants and hote :
Restaurants, cafes nd bars 1,035. 926 980
Hotels 276 303 365
Boarding houses 3 19 4
Sub-total 1,314 1,248 1,349
Total 5,222 5,919 5,838
Major Division 8 cing, insurance, real estate and business services
By groups:
Monetary institutio s 82 132 262
Other financial inst tutions 281 410 492
Financial services 2 14 4
Insurance 90 153 235
Real estate 252 278 405
Legal services 36 43 57
Accounting, audif g and book-keeping services 153 184 243
Data processing an tabulating services 28 33 35
Engineering, archit tural and technical· services 103 109 172
Advertising service 157 297 309
Business services, e cept machinery and equipment rental and leasing not elsewhere classifi d 618 780 ' 718
Machinery and eq "pment rental and leasing 5 8 3
Total 1,807 . 2,441 2,935
Hong Kong Month Digest of Statistics lune 1981 9

LABOUR
3.4 ESTABLISHMENTS AND PERSONS ENGAGED BY EMPLOYMENT SIZE .. . . ~ . ' .
size of establishment (number of persons engaged)
M~ior Division 3 Manufacturing 1-9
'10--19 20--49 50-99 100-199 200-499 500-999 1,000-1,999 2,000 & over
Size of establishment (number of persons engaged)
Major Division 6 Wholesale, retail and import/export trades, restaurants and hotels ·
Wholesale, retail and import/export trades
'1-4 5-9 10:...19
; 20-49 50,..99 lci0--199
,200-;_499 . 500-999
1,000-1,999
Re8taurants and hotels: 1-4 S-9 10-19 20-49 50-99 100-199 200-499 500-999 1,000-1,999
Size. of establishment (number of persons engaged)·
Total
Total
Total
Major Division 8 Financing, insurance, real estate and bnsiness services l-4 5-9 10-19 20--49 50-99 100-199 200--499 500-999 1,000-1,999 2,000 & over
Total
10
3rd quarter 1978
Establish~ ments
Persons engaged Male Female Total
25,288 78,663 6,324 50,817 3,956 64,450 1,850 54,991
813 42,291 383· .. 45,086 98 26,325 32 17,725
5 5,619
29,570 34,298 60,527 73,090 67,042 67,457 39,999 26,367
6,756
108,233 85,115
124,977 128,081 109,333 112,543 66,324 44,092 12,375
38,749 385,967 405,106 791,073
2nd quarter 1978
Establishments
41,791' 10,543 3,194 l,089 .
196 73 30
3
Persons engaged Male Female Total
62,700 .48,234 31,163 22,765 8,873 6,198 S,127 1,458
31,751 17,890 10,102 8,098 4,252 3,505 3,900
680
94,451 66,124 41,265 30,863 13,125 9,703 9,027 2,138
56,919 186,518 80,178 266,696
1,521 931 921 751 263 198
57 7 5
2,256 4,430 9,927
17,432 13,510 19,177 10,437 4,316 4,873
1,705 1,780 2,905 4,985 4,949 7,803 4,750 1,273 1,498
3,961 6,210
12,832 22,417 18,459 26,980 15,187 5,589 6,371
4,654 86,358 31,648 118,006
lst quarter 1978
Establish- Persons engaged ments Male Female Total
3,847 1,595
937 530 175 56 31 2 3 I
5,990 7,215 8,254
10,357 8,137 5,416 7,105
855 2,954 1,071
2,646 3,124 4,362 5,013 3,947 2,536 2,861
355 801
1,459
8,636 10,339 12,616 15,370 12,084 7,952 9,966 1,210 3,755 2,530
7,177 57,354 27,104 84,458
Establishments
27,156 1;101 4,455 2,023
907 408 106 38 5
3rd quarter 1979
Persons engaged Male Female Total
86,800 58,973 72,306 62,232 49,294 45,565 29,767 20,425 6,884
31,329 40,360 69,685 77,655 74,172 73,309 42,322 30,826 7,838
118,129 99,333
141,991 139,887 123,466 118,874 72,089 51,251 14,722
42,199 432,246 447,496 879,742
Establishments
44,029 11,135 3,461 1,171
218 81 35
.• 2
I
2nd quarter 1979
Persons engaged Male Female Total
64,931 50,243 32,994 23,926 9,686 7,192 5,833
658 989
34,693 19,494 11,406 9,372 4,730 3,753 4,443
473 244
99,624 69,737 44,400 33,298 14,416 10,945 10,276 1,131 1,233
60,133 196,452 88,608 285,060
1,569 1,074
982 834 280 202 68 9 4
2,410 5,022
10,462 19,239 14,480 19,358 12,641 5,522 4,004,
1,769 2,143 3,170 5,560 5,562 8,574 5,662 1,859 1,158
4,179 7,165
13,632 24,799 20,042 27,932 18,303 7,381 5;162
5,022 93,138 35,457 128,595
Establishments
4,665 1,958 1,094
632 203 57 42 3 3 I
lst quarter 1979
Persons engaged Male Female Total
7,203 8,595 9,377
11,895 9,339 5,249 8,763 1,221 3,428 1,347
3,328 4,034 5,433 6,384 4,827 2,503 3,858
611 926
2,068
10,531' 12,629 14,810 18,279 14,166 7,752 12,621 1,832 4,354 3,415
8,658 66,417 33,972 100,389
3rd quarter 1980
Establish- Persons engaged ments Male Female Total
29,747 6,970 5,119
. 2,111 895 410 117 36 4
88,332 56,645 81,067 64,631 48,695 50,459 30,901 18,176 5,788
28,792 37,253 76,155 80,343 73;935 69,894 46,666 28,576
5,782
117,124 93,898
157,222 144,974 122,680 120,353 77,567 46,752
· 11,570
45,409. 444,694 447,446 892,140
Establishments
45,278 12,079 3,915 1,388
248 82 31 4 2,
2nd quarter 1980
Persons engaged Male Female Total
66,497 54,478 37,185 27,668
,11,047 6,973 5,622
·t,549 1,244
35,295 101,792 21,277 ' 75,755 13,624 50,809 11,032 38,700 5,456 16,503 4,048 11;021 4,000 9,622
660 2,209 1,256 2,500
63,027 212,263 96,648 308,911
1,294 1,307 1,030
839 266 203 75 10 4
1,955 5,621
10,717 20,638 13,775 20,169 13,127 5,986 3,856
1,562 2,533 3,695 5,697 4,894 8,007 6,369 2,149 1,252
3,517 8,154
14,412 26,335 18,669 28,176 19,496 8,135 5,108
5,028 95,844 36,158 132,002
lst quarter 1980
Establish- Persons en11aged ments Male Female Total
5,565 2,209 1,322
725 216 84 40 6 3
8,525 9,638
11,043 13,404 9,561 7,705 8,013 2,483 3,557 1,361
4,154 4,678 6,907 7,906 5,278 3,584 3,965 1,086 1,074 2,078
12,679 14,316 17,950 21,310 14,839 11,289 11,978 3,569 4,631 3,439
10,171 75,290 40,710 116,000
Hong Ifong. Monthly Digest of Statistics lune 1981

3.5 EMPLOYMENT IN GOVERNMENT SERVICE
Purpose
General pub1ic services
General adn1inistration
Public order and safety
Police
Judiciary and prison
Fire protection
Defence
Education
Health
Social security and welfare services
Housing and community amenities
Housing
Community infrastructure
Sanitary services
Other community and social services
Recreation and related cultural services
Economic services
Agriculture, fisheries and forestry
Mining, manufacturing
Water
Land transport
Water transport
Air transport
Commerce and industry
Post services
Total
October 1979
Male Female
37,322 8,835
8,377 4,762
28,945 4,073
19,714 3,252
4,799 714
4,432 107
196 16
3,187 2,578
6,948 9,179
1,243 1,274
27,561 4,907
5,694 1,016
8,714 900
13,153 2,991
2,764 375
2,764 375
18,434 2,525
2,707 604
4,581 146
3,209 367
1,623 196
528 90
367 82
2,631 987
2,788 53
97,655 29,689
January 1980
Male Female
38,046 8,889
8,485 4,812
29,561 4,077
20,097 3,240
4,841 729
4,623 108
197 17
3,192 2,576
6,982 9,352
1,254 1,280
27,973 4,983
5,965 1,045
8,828 888
13,180 3,050
2,797 363
2,797 363
18,562 2,635
2,739 635
4,629 155
3,163 416
1,621 200
524 90
367 89
2,676 998
2,843 52
99,003 30,095
Hong Kong Monthly Digest of Statistics June 1981
April 1980 June 1980
Male Female Male Female
38,445 9 ,045 38,425 9,292
8,640 4,932 8,728 5,125
29,805 4,113 29,697 4,167
20,342 3,252 20,298 3,296
4,794 753 4,727 760
4,669 108 4,672 111
196 18 195 18
3,058 2,426 3,022 2,456
7,010 9,511 7,037 9,615
1,248 1,290 1,243 1,299
27,994 4,930 28,561 5,065
6,126 1,074 6,244 1,103
8,637 941 8,677 941
13,231 2,915 13,640 3,021
2,834 402 2,818 472
2,834 402 2,818 472
18,960 2,686 19,036 2,619
2,759 648 2,674 544
4,635 154 4,624 150
3,287 414 3,250 415
1,660 211 1,677 234
530 93 514 93
361 97 370 96
2,687 1,017 2,708 1,034
3,041 52 3,219 53
99,745 30,308 100,337 30,836
September 1980
Male Female
39,250 9,741
8,930 5,474
30,320 4,267
20, 768 3,345
4,716 809
4,836 113
196 18
3,100 2,472
7,546 9,572
1,297 1,309
29,125 5,034
6,502 1,142
9,003 971
13,620 2,921
2,863 463
2,863 463
19,400 2,771
2,715 554
4,663 150
3,307 428
1,709 241
517 98
355 103
2,836 1,139
3,298 58
102,777 31,380
LABOUR
December 1980
Male Female
40,182 10,368
9,475 5,981
30,707 4,387
21,020 3,372
4,815 901
4,872 114
196 17
3,106 2,492
7,396 9,988
1,284 1,366
30,054 5,149
6,655 1,172
9,051 1,015
14,348 2,962
2,895 458
2,895 458
19,562 2,924
2,835 591
4,620 173
3,345 438
1,716 253
557 102
353 105
2,848 1,173
3,288 89
104,675 32,762
11

LABOUR
3.6 INDEXES OF AVERAGE DAILY WAGES OF WORKERS
Nonimal average daily wages
Overall
Manufacturing
Textiles
Bleaching and dyeing
Cotton knitting
Cotton spinning
Cotton weaving
Woollen knitting
Bakery products
Dockyards
Electrical appliances Electronics
Enamelware
Garments Gloves
Handbags Leather footwear
Metal torch cases
Paper boxes
Plastic flowers
Plastic products, misc.
Plastic toys
Printing
Rubber footwear
Torch bulbs
Wigs
Wooden furniture & fixtures
Wrist watch bands
Public utilities Bus and tramway operators Electricity supply Telephone service
.Godown
Motor vehicle repairing
Real average daily wages
Overall
12
(July 73-June 74=100)
Excluding fringe benefits
Wages in
1978 1979 1980 Sept. Mar. Sept. Mar. Sept. Mar. Sept. 1980
$
146 156 174 180 196 209 47.09
146
147
147
141
136
150
152
155 179 154
150 145
138 141
136 128
149
142
138
162
157
146
145
156 157
125
172
148 145 142 157
167
151
156
158
161
151
147
160
161
165 191
168 158
151 147
148 144
145
163
154
175 181 196 208 173 182 203 213
171 182 205 219
161 174 189 200
164 173 195 203
177 189 209 217
176 178 196 210
174 189 199 202 203 220 230 261 188 189 202 216
171 181 208 216
167 167 191 203 172 172 182 197
156 160 167 179 156 168 194 195
163 182 185 204
167 171 175 177
172 177 207 211
46.49
45.62
52.81
50.73
40.57
43.91
48.54
44.44 61.65
42.15
43.24 49.16
46.84 43.16
45.09 59.23
33.32
50.62
148 163 177 187 201 42.76
173 198 215 233
168 178 181 200
170 179 213 222
153 171 189 199
166 185 180 193 158 188 203 211
125 133 135 140 193 204 211 216
161 163 178 197 154 156 170 178 153 156 170 190
176 175 194 220
167 181 181 205
151 168 180 207
238 49.54
204 40.06
254 55.43
202 44.70
198 43.54 215 50.88
147 70.40
240 48.62
220 54.06
192 44.45 217 58.77
253 63.46
205 53.84
226 56.14
121 125 135 129 130 130 29.34
Including fringe benefits
Wages in
1978 1979 1980 Sept. Mar. Sept. Mar. Sept. Mar. Sept. 1980
$
148 158 177 185 202 215 56.29
148 159
148 160
156 168
149 160
135 149
152 164
157 167
164 '176 189 201
157 174 152 161
147 158 144 153
147 153 143 152 133 151
151 165
143 155 145
158
153
150
153
162 165
128
176
149
147
143 157
169
153
157
170
165 174
163
176
167 128
198
162 155
154 177
169
153
178
176
179
170
165
180 184
185 212
193 176 170
180 163
166 171
169
174
185 185
189
183
170
191
187
200 229
194
187 170 182
166 177 190
171
180 173 189
195 212
177 180 182 217
180 197
198 195 202 220
137 139 211 218
163 179
158 172 157 170
175 194
183 183
170 183
202 205
209
199
190
213
205
210 239
211 218
195
193 175 209
194
177
211
214 217
224
210
200
220
220
211
268 225 226 210
208 188 208 212
178
217
55.46 60.04
72.90
57.02
56.90
58.83
53.47
51.02 64.50 51.04
55.88 61.90
53.34 47.29 52.41 63.50
38.12
66.83 201 216 51.03
228 231 58.61
197 200 48.37 226 264 69.94
207 209 49.38
210 216 51.22 229 237 59.38
142 149 74.15
226 254 58.77
197 220 66.35 180 194 57.81
191 217 70.29 220 252 74.64
207 207 61.25
212 230 68.98
123 127 137 132 134 134 35.07
Hong Kong Monthly Digest of Statistics June 1981

3.7 REPORTED ACCIDENTS
Year/quarter
1975 1976 1977 1978 1979 1980
1979: lst qtr. 2nd qtr. 3rd qtr. 4th qtr.
1980: lst qtr. 2nd qtr. 3rd qtr. 4th qtr.
1981: lst qtr.
Year/quarter
1975 1976 1977 1978 1979 1980
1979: ls! qtr, 2nd qtr. 3rd qtr. 4th qtr.
1980: lst qtr. 2nd qtr. 3rd qtr. 4th qtr.
1981: lst qtr.
Year/quarter
1975 1976 1977 1978 1979 1980
1979: lst qtr. 2nd qtr. 3rd qtr. 4th qtr.
1980: lst qtr. 2nd qtr. 3rd qtr. 4th qtr.
1981: lst qtr.
Machinery: power driven
Non. Fatal fatal Total
9 7,408 12 9,894
9,371 9,120
30 11,399 18 13,663
5 13 4
2 5
4
l,623 2,467 3,181 3,727
2,217 2,941 3,466 4,253
2,099
7,417 9,906 9,379 9,128
11,429 13,681
1,628 2,472 3,194 3,731
2,222 2,943 3,471 4,257
2,099
Gassing, poisoning and other toxic substances
Fatal
7
6 I
5
Nonfatal
51 35 76 39 32 48
11 4
14
2.
34 9
Total
51 42 76 45 33 53
4 11 4
14
2
34
9
Falls of grounds
Fatal
2
6
2 2
2
Nonfatal
9 6
14 26 26 36
3 2
8 12
4 3
10 18
17
Total
11 6
17 27 32 39
5 4 8
14
4 3
11 19
17
Machinery: other
Fatal
Fatal
4
6 22 17 18
7 2
3
4 8
4
Nonfatal
446
724
638 481 676 665
90 147 200 226
113 136 191 192
84
Electricity
Nonfatal
89
99 122 142 212 212
26 37 70 71
19 38 75 71
14
Total
446
724 639
482 677 666
90 147 201 226
113 136 191 193
84
Total
93 102 128 164 229 230
27 44 72 74
20 42 83 75
15
Handling without machinery
Fatal
5
4
2
Nonfatal
4,021 5,765 6,745 6,291 7,560 8,079
1,343 1,818 l,907 2,318
1,386 1,658 2,068 2,470
1,188
Total
4,022 5,768 6,746 6,296
7,563 8,083
1,346 1,818 1,907 2,318
1,386 1,659 2,070 2,470
1,189
Note: Figures in the annual series are with amendments.
Hong Kong Monthly .Digest of Statistics June .1981
Fatal
42 46 53
50 61 44
15 14 15 13
11 4 7
14
7
Transport
Nonfatal
1,201 1,703 1,156 1,543 2,178 2,673
359 489 520 755
460
553 753 761
417
Total
1,243 1,749 1,209 1,593 2,239 2,717
374 503 535 768
471 557 760 775
424
------·----
Falls of persons
Fatal
55 45 59 53 59
55
8 16 15 12
7 16 17 10
11
Fatal
2
Nonfatal
3,915 4,639 5,273 5,990 5,750 5,988
905 1,431 1,525 1,778
1,018 1,247 1,691 1,734
1,037
Hand tools
Nonfatal
3,449 4,379 4,275 4,906 5,446
5,990
797 1,242 1,403 l,863
l,032 l,238 1,536 1,855
970
Total
3,970
4,684 5,332 6,043 5,809 6,043
913 1,447 1,540 1,790
l,025
1,263 1,708 1,744
1,048
Total
3,449 4,379 4,275 4,908 5,446 5,990
797 1,242 1,403 1,863
1,032 1,238 1,536 1,855
970
Explosions or fires
Non-Fatal fatal Total
8 28
7 9
31 18
4
8
3 14
3 7
14
297 305 250
321 174
307
13 22 49 81
38 60 75
115
84
305 333 257 330 205 325
17 30 52
95
41 67 76
120
98
Stepping on or striking against objects
Non-Fatal fatal
7 6,619 1 8,862
11 13,166 14 16,697 9 17,346 2 15,764
2,649 2 3,919
5,022 4 5,442
2,532 3,090 4,695 4,696
2,303
Total
6,626 8,863
13,177 16,711 17,355 15,766
2,650 3,921 5,023 5,446
2,532 3,091 4,696 4,696
2,303
Miscellaneous or causes not yet assessed
Fatal
75 90 86 92
69 60
13 16 15 22
JI 10 18 14
18
Nonfatal
3,047 3,963 3,371 2,184 8,887 9,958
423 511 524 873
598 679 748 896
537
Total
3,122 4,053
3,457 2,276 8,956
10,018
436 527 539 895
609 689 766 910
555
LABOUR
Hot or corrosive substances
Non· Fatal fatal Total
2
2
2
1,601 2,080 2,313 2,507 3,096 3,242
422 707 899 997
505 667
1,017 911
393
1,601 2,080 2,315 2,509 3,096 3,243
422 707 899 997
505 667
1,019 911
393
Falling objects
Fatal
9
14 28 13 14 6
2 2 5
3
2
2
2
Nonfatal
2,040 2,354 2,819 3,127 3,752 3,761
560 856
1,088 1,149
685
778 1,062 1,079
601
Total
2,049 2,368 2,847 3,140 3,766 3,767
562 858
1,093 1,152
686 780
l,064 1,080
603
Grand total
Fatal
212 249 265 278
301 235
55 72 70
77
Nonfatal
34,193 44,808 49,589 53,374 66,534 70,386
9,216 13,659 16,400 19,306
39 10,609 52 13,091 64 17,421 54 19,060
54 9,745
Total
34,405 45,057 49,854 53,652 66,835 70,621
9,271 13,731 16,470 19,383
10,648 13,143 17,485 19,114
9,799
13

LABOUR
3.8 INDUSTRIAV,ACCIDENTS JN, lST QUARTER 1981
Machinery .Transport Gas.sing, poison- Miscel-
Hot or ing and Stepping Hand- laneous Work- corro- other on or ling &causes
in~fee~ Ex~lo- sive toxic Falls striking Falls without Hiind
not yet Prime Trans- SlOll sub- sub- Electri- of against Falling of machin- ascer .. Grand
Industry mover mission parts Power other or fires stances stances city persons objects objects ground ery tools tained total
Food, beverages and tobacco 4 14 3 3 2 9 2 14 26 4 22 16 11 131
Wearing apparel, leather products and footwear 2 2 5.67 8 3 5 9 41 6 18 72 13 747
Textiles 31 258 44 23 37(1) 134 35 54 57 25 700(1)
Furniture and wood products 54 3 2(1) 8 13 5 12 9 107(1)
Paper products, ·printing and allied industries .5 56 5 3 2 3 14 5 4 11 110
Products of chemicals, petroleum and rubber 4 2 5 10 2 27
Plastic products 2 110 7 2 9 7 28 5 14 17 2 203
Non-metallic mineral products 10 2 3 15 5 17 2 59
Basic metal industries 4 5 4 13 5 8 41
Fabricated metal products s 12 416 5 s 18 .14 154 35 96 33 32 826
Machinery,. transport,
· scientific and other equipment 2 7 244 5(1) 17 14 22 2 112(1) 212 56 109(1) 57 28(1) 887(4)
oihermanti-· facturing
i0dustries . 28 11(11) 3 7 3 3 2 60(11)
Electricity and gas 10 3 3 17 9 3 1 23 10 4 84
Construction 10 255 23(2) 13 18 31 8 426(5) 970 301(2) 15 440 170 145(5) 2,826(14)
Land transport and allied industries 18 9 15 4 6 1(1) 58(1) 128 47 92 16 24 419(2)
Repair services not elsewhere specified 4 2 24 5 6 3 8 56
Other non-manufacturing industries 2 5 14 9 6 6 4 53
Industries· not ascertained
Total 11 76 2,054 . ,47(3) 127 71(12) 141 15(1) 733(8) 1,802 518(2) 16 931(1) 483 310(6) 7,336(33)
Note: Figures refer to the total number of accldents with the number of fatalities given in brackets. ·,',
14 Hong Kong Monthly· Digest of S~atistics lune 1981

Hong Kong Monthly Digest of Statistics June 1981 15

Year/quarter
1975
1976
1977
1978
1979
1980
1979: lst qtr. 2nd qtr. 3rd qtr. 4th qtr.
1980: lst qtr. 2nd qtr. 3rd qtr. 4th qtr.
1981: lst qtr.
§Including 63,805 tonnes of crude clay. tDerived from washing of kaolin.
16
SECTION: 4 PRODUCTION
4.i ' MINING< PRODUCF.ION
Iron ore
Feldspar (50%Fe
concentrate) Kaolin
2,059 167,200 1,490
2,299 37,058 1,305
3,378 2.466
3,157 89,460§
742 2,841
2,974 748
248 71 115 981 172 961 207 828
1,218 467 716 - 86 851 109 189 86
63 80
4.2 CEMENT PRODUCTION
Year/month
1975
1976
1977
1978
1979
1980
1979: May June July Aug, Sept. Oct. Nov. Dec.
1980: Jan. Feb, Mar, Apr, May June July
Au&. Sept, Oct. Nov. Dec.
1981: Jan. Feb. Mar, Apr. May
Total production
574,509
764,600
1,029,073
1,236,163
1,278,669
1,488,736
107,650 100,008 101,430 95,631 93,333
113,261 126,378 111,585
140,895 79,629
110,302 114,040 135,579 117,749 116,053 127,399 120,134 140,118 144,120 142,718
146,997 86,787
128,635 135,370 120,464
Tomie
Quartz Feldspar
sandt
761
982
2;063
665
2
12 12,964
...,..
2
1,419 10 3,550_ 1 5,995
~,ooo
1,150
Tonne
Hong Kong Monthly Digest of Statistics lune 1981
PRODUCTION
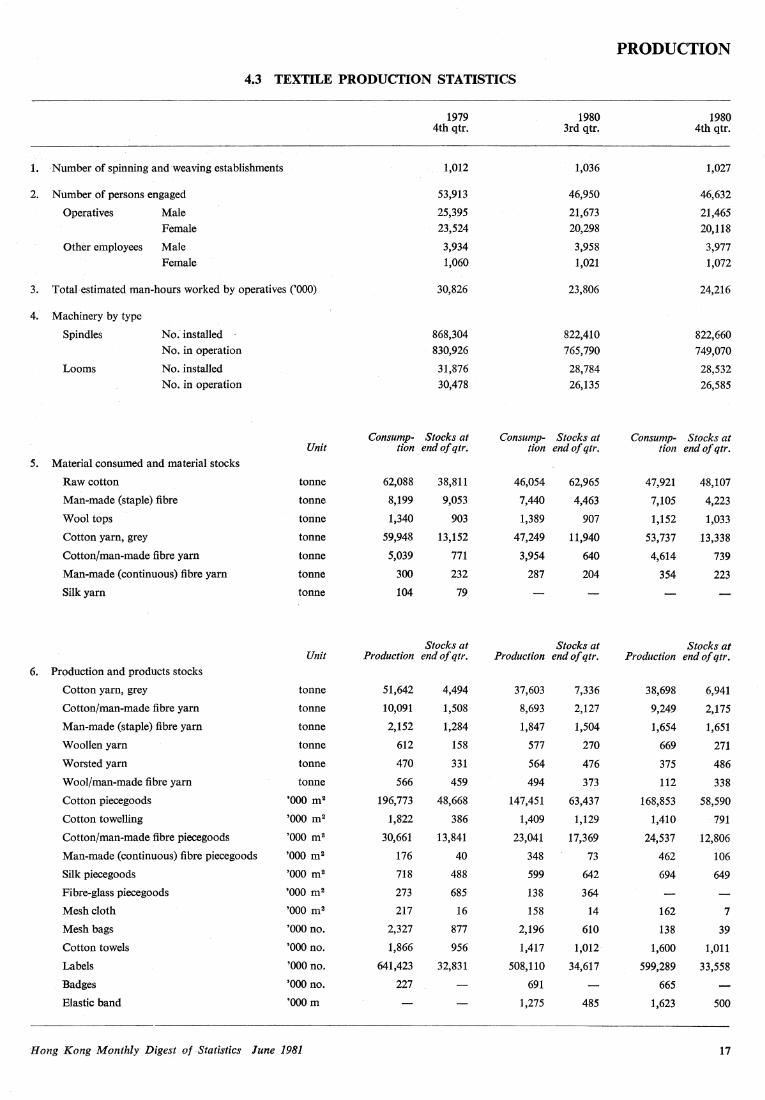
4.3 TEXTILE PRODUCTION STATISTICS
1979 1980 1980 4th qtr. 3rd qtr. 4th qtr.
1. ·Number of spinning and weaving establishments 1,012 1,036 1,027
2. Number of persons engaged 53,913 46,950 46,632
Operatives Male 25,395 21,673 21,465
Female 23,524 20,298 2-0,118
Other employees Male 3,934 3,958 3,977
Female 1,060 1,021 1,072
3. Total estimated man-hours worked by operatives ('OOO) 30,826 23,806 24,216
4. Machinery by type
Spindles No: installed 868,304 822,410 822,660 No. in operation 830,926 765,790 749,070
Looms No. installed 31,876 28,784 28,532 No. in operation 30,478 26,135 26,585
Consump- Stocks at, Consump- Stocks at Consump- Stocks at Unit tion end of qtr; tion endofqtr. tion end of qtr.
5. Material consumed and material stocks
Raw cotton tonne 62,088 38,811 46,054 62,965 47,921 48,107
Man-made (staple) fibre tonne 8,199 9,053 7,440 4,463 7,105 4,223
Wool tops tonne 1,340 903 1,389 907 1,152 1,033
Cotton yam, grey tonne 59,948 13,152 47,249 11,940 53,737 13,338
Cotton/man-made fibre yam tonne 5,039 771 3,954 640 4,614 739
Man-made (continuous) fibre yam tonne 300 232 287 204 354 223
Silk yam tonne 104 79
Stocks at Stocks at Stocks at Unit Production endofqtr. Production end of qtr. Production end of qtr.
6. Production and products stocks
Cotton yam, grey tonne 51,642 4,494 37,603 7,336 38,698 6,941
Cotton/man-made fibre yam tonne 10,091 1,508 8,693 2,127 9,249 2,175
Man-made (staple) fibre yam tonne 2,152 1,284 1,847 1,504 1,654 1,651
Woollen yam tonne 612 158 577 270 669 271
Worsted yarn tonne 470 331 564 476 375 486
Wool/man-made fibre yarn tonne 566 459 494 373 112 338
Cotton piecegoods 'OOO m 1 196,773 48,668 147,451 63,437 168,853 58,590
Cotton towelling 'OOO m 2 1,822 386 1,409 1,129 1,410 791
Cotton/man-made fibre piecegoods 'OOO m1 30,661 13,841 23,041 17,369 24,537 12,806
Man-made (continuous) fibre piecegoods 'OOO m 2 176 40 348 73 462 106
Silk piecegoods 'OOO m 1 718 488 599 642 694 649
Fibre-glass piecegoods 'OOO m 2 273 685 138 364
Mesh cloth 'OOO m 2 217 16 158 14 162 7
Mesh bags 'OOO no. 2,327 877 2,196 610 138 39
Cotton towels 'OOO no. 1,866 956 1,417 1,012 1,600 1,011
Labels 'OOO no. 641,423 32,831 508,110 34,617 599,289 33,558
Badges 'OOO no. 227 691 665
Elastic band 'OOOm 1,275 485 1,623 500
'Hong Kong. M on_thly. Digest. of ·Statistics lune 1981 17

PRODUCTION
4.4 INDEX OF TEXTILE PRODUCTION
(1973-100)
Spinning and
Spinning sector Weaving sector
weaving Sector Cotton yarn Cotton/ Woollen Sector Cotton piecegoods Cotton/ industries index MMF and index MMF
All Under 15's and yarn§ worsted All Yarn piece .. Year/quarter types 15's over yarn types Grey dyed goods§
Weights 1,000 603 362 194 168 175 66 397 359 273 86 38
1975 105 101 124 161 82 66 68 112 117 76 248 66
1976 126 115 138 198 69 80 79 143 150 71 400 77
1977 110 106 120 164 69 97 51 115 120 65 294 73
1978 111 110 119 165 67 115 47 111 112 75 229 107
1979 118 117 130 179 74 115 45 121 123 82 252 100
1980 108 105 115 163 59 108 50 112 116 69 264 79
1978: 4th qtr. 120 120 128 177 71 126 54 122 119 86 226 145
1979: lstqtr. 105 105 116 162 62 106 45 105 105 76 197 104
2nd qtr. ll 5 114 125 164 81 117 44 117 118 83 230 JOO
3rd qtr. 123 121 136 184 81 117 48 126 129 84 273 96
4th qtr. 130 126 144 206 72 120 45 135 139 85 309 98
1980: lst qtr. 114 113 125 182 60 111 47 117 120 75 264 82
2nd qtr. 112 110 119 169 62 110 61 115 118 70 272 80
3rd qtr. 100 99 105 148 57 103 48 101 104 63 234 74
4th qtr. 107 101 108 154 56 107 43 117 121 69 287 79
§Including yarn/fabrics of pure MMF material.
18 Hong Kong Monthly Digest of Statistics June 1981

SECTION 5 EXTERNAL TRADE
5.1 EXTERNAL TRADE STATISTICS
$million
Imports Domestic Re- Total Merchan- Cumulative totals exports exports exports dise
trade Imports Total exports balance
%change % change % change % change on on on on
Year to previous 12 months previous Year to previous 12 months previous Year/month date year to date 12 months date year to date 12 months
1975 33,471.62 22,858.89 6,973.08 29,831.97 -3,639.65 - 1.90 - 0.68 1976 43,292.53 32,629.09 8,927.82 41,556.91 -1,735.62 +29.34 +39.30 1977 48,701.03 35,003.93 9,829.26 44,833.18 -3,867.85 +12.49 + 7.88 1978 63,055.51 40,711.16 13,197.07 53,908.23 -9,147.28 +29.47 +20.24 1979 85,837.06 55,912.09 20,022.08 75,934.17 -9,902.89 +36.13 +40.86 1980 111,650.54 68,170.53 30,071.94 98,242.47 -13,408.07 +30.07 +29.38
1979: May 6,884.03 4,552.21 1,655.81 6,208.03 -676.00 31,560.18 +36.41 71,480.20 + 36.44 26,275.50 +38.38 61,196.43 +29.73 June 6,965.38 4,590.26 1,745.12 6,335.39 -629.99 38,515.61 +36.32 73,317.32 +37.00 32,604.20 +39.36 63,116.01 +31.92 July 7,541.99 5,174.47 1,653.46 6,827.93 -714.06 46,052.63 +38.27 75,802.39 +39.53 39,425.67 +41.28 65,427.20 +35.90 Aug. 7,347.50 5,805.63 1,757.27 7,562.90 +215.40 53,383.24 +38.40 77,866.42 +39.46 46,974.59 +41.79 67,753.63 +37.69 Sept. 7,647.70 5,316.42 I, 734.20 7,050.63 -597.07 61,019.26 +38.37 79,976.88 +38.81 54,015.96 +41.84 69,841.28 +38.70 Oct. 8,299.09 5,322.29 1,796.20 7,118.48 -1,180.61 69,308.54 +39.34 82,624.20 +40.09 61,126.71 +41.65 71,880.48 +39.22 Nov. 8,231.69 5,336.82 2,001.95 7,338.77 -892.92 77,523.90 +37.91 84,364.77 +38.01 68,455.69 +41.53 73,995.62 +39.83 Dec. 8,327.78 5,602.13 1,891.17 7,493.31 -834.47 85,837.06 +36.13 85,837.06 +36.13 75,934.17 +40.86 75,934.17 +40.86
1980: Jan. 8,132.42 4,996.80 2,047.21 7,044.01 -1,088.41 8,132.42 +50.58 88,568.91 +38.03 7,044.01 +36.32 77,811.05 +40.27 Feb. 7,123.82 4,131.21 1,787.90 5,919.11 -1,204.71 15,256.23 +38.09 90,045.48 +36.63 12,962.66 +45.24 79,971.89 +41.98 Mar. 8,958.96 4,584.51 2,202.04 6,786.55 -2,172.41 24,211.82 +37.89 92,490.13 +36.94 19,744.41 +37.85 81,355.35 +40.56 Apr. 9,536.78 5,388.71 2,301.68 7,690.39 -1,846.39 33,725.97 +36.67 94,886.74 +36.20 27,429.06 +36.70 83,297.88 +39.83 May 9,456.41 5,968.03 2,526.56 8,494.60 -961.81 43,169.78 +36.79 97,446.66 +36.33 35,911.61 +36.67 85,570.28 +39.83 June 8,824.04 6,079.50 2,377.71 8,457.21 -366.83 51,973.09 +34.94 99,294.54 +35.43 44,359.39 +36.05 87,689.36 +38.93 July 9,192.87 6,087.24 2,423.12 8,510.36 -682.51 61,129.74 +32.74 100,914.17 +33.13 52,857.69 +34.07 89,366.19 +36.59 Aug. 9,448.24 6,768.69 2,695.86 9,464.55 + 16.31 70,560.41 +32.18 103,014.23 +32.30 62,313.92 +32.65 91,273.50 +34.71 Sept. 9,388.23 5,980.34 2,781.58 8,761.92 -626.31 79,927.48 +30.99 104,745.28 +30.97 71,061.57 +31.56 92,979.78 +33.13 Oct. 9,572.15 6,106.27 2,899.10 9,005.37 -566.78 89,482.03 +29.11 106,010.55 +28.30 80,053.73 +30.96 94,861.19 +31.97 Nov. 10,900.60 5,893.09 2,933.45 8,826.54 -2,074.06 100,375.09 +29.48 108,688.25 +28.83 88,869.36 +29.82 96,347.84 +30.21 Dec. 11,306.04 6,270.30 3,120.28 9,390.58 -1,915.46 111,650.54 +30.07 111,650.54 +30.07 98,242.47 +29.38 98,242.47 +29.38
1981: Jan. 10,685.42 6,345.98 3,327.89 9,673.87 -1,011.55 10,685.42 +31.39 114,203.29 +28.94 9,673.87 +37.33 100,871.46 +29.64 Feb. 9,090.54 3,938.47 2,878.44 6,816.91 -2,273.63 19,775.45 +29.62 116,169.75 +29.01 16,484.03 +27.17 101,763.84 +27.25 Mar. 11,325.87 5,784.28 3,326.35 9,110.64 -2,215.23 31,080.59 +28.37 118,519.31 +28.14 25,589.80 +29.61 104,087.86 +27.94 Apr. 11,397.99 5,844.13 3,327.50 9,171.63 -2,226.36 42,467.80 +25.92 120,392.37 +26.88 34,754.12 +26.71 105,567.53 +26.73 May 11,737.11 6,879.84 3,421.70 10,301.53 -1,435.58 54,198.59 +25.55 122,679.35 +25.89 45,048.26 +25.44 107,379.12 +25.49
5.2 IMPORTS BY AREA
$million
Soviet Central Union and and Australasia
North Western Eastern South Middle and Postal Total Year/month America Europe Europe America East Asia Africa Oceania packages merchandise
1975 4,191.60 5,603.87 195.23 437.09 536.31 21,062.83 541.67 896.35 6.65 33,471.62
1976 5,566.69 6,779.30 271.59 536.41 802.38 27,506.24 695.92 1,127.29 6.73 43,292.53
1977 6,424.54 7,972.90 302.38 470.27 907.20 30,580.01 845.43 1,191.46 6.84 48,701.03
1978 7,954.70 11,685.39 284.77 495.66 1,424.68 38,380.26 1,180.73 1,543.26 106.07 63,055.51
1979 10,944.03 15,371.97 317.25 601.25 1,245.71 53,777.10 1,413.04 1,966.38 200.32 85,837.06
1980 13,992.94 17,252.56 326.16 647.52 l,320.19 73,962.53 1,582.01 2,176.42 390.23 111,650.54
1979: May 921.70 1,192.09 28.49 36.74 97.87 4,334.17 99.21 162.06 11.71 6,884.03 June 916.12 1,178.66 35.08 55.84 87.44 4,431.20 100.83 150.81 9.40 6,965.38 July 1,139.09 1,407.90 22.20 41.73 87.49 4,507.57 120.78 203.39 11.84 7,541.99 Aug. 976.35 1,340.27 20.42 56.86 67.04 4,569.82 126.49 177.10 13.15 7,347.50 Sept. 901.03 1,298.89 13.89 49.28 117.82 4,953.87 139.43 152.66 20.84 7,647.70 Oct. 1,037.24 1,438.17 22.89 46.73 171.20 5,219.28 151.71 181.07 30.81 8,299.09 Nov. 1,072.51 1,529.58 30.02 73.49 99.42 5,088.52 109.20 199.14 29.81 8,231.69 Dec. 962.78 1,326.28 22.76 49.62 79.99 5,549.00 125.43 170.11 41.84 8,327.78
1980: Jan. 922.45 1,377.58 33.59 53.50 72.12 5,401.64 104.51 144.72 22.32 8,132.42 Feb. l,013.38 1,096.29 15.25 58.32 111.58 4,590.98 102.70 112.11 23.22 7,123.82 Mar. 1,133.38 1,518.13 30.48 52.04 175.65 5,729.88 142.86 147.91 28.64 8,958.96 Apr. 1,159.64 1,533.50 30.94 114.13 140.61 6,223.12 113.99 192.76 28.07 9,536.78 May 1,576.48 1,343.24 30.78 61.72 79.31 5,970.35 145.21 210.73 38.60 9,456.41 June 1,058.94 1,379.09 31.03 48.17 84.38 5,860.44 105.37 215.07 41.56 8,824.04 July 1,359.45 1,433.77 19.03 41.79 134.18 5,837.37 167.78 164.29 35.20 9,192.87 Aug. 1,192.81 1,433.37 19.89 42.42 59.02 6,359.14 90.76 221.77 29.06 9,448.24 Sept. 1,026.63 1,336.01 24.47 50.08 81.49 6,480.80 180.02 175.26 33.47 9,388.23 Oct. 1,082.07 1,516.46 29.94 49.31 142.57 6,346.36 138.96 233.62 32.86 9,572.15 Nov. 1,178.62 1,763.85 30.71 39.26 138.95 7,403.59 117.53 191.15 36.95 10,900.60 Dec. 1,323.74 1,547.19 30.45 37.87 101.81 7,874.68 181.27 168.76 40.28 11,306.04
1981: Jan. 1,247.71 1,444.75 32.93 39.26 129.59 7,450.38 118.53 196.75 25.52 10,685.42 Feb. l,071.79 1,379.77 24.08 45.25 101.07 6,219.24 72.34 150.54 26.47 9,090.54 Mar. 1,250.34 1,699.26 60.26 34.30 133.70 7,845.37 119.36 149.62 33.66 11,325.87 Apr. 1,297.30 1,773.23 38.05 63.09 128.81 7,745:97 107.19 211.13 33.21 11,397.99 May 1,288.78 1,742.62 41.39 51.01 102.38 8,122.24 123.01 233.16 32.54 11,737.11
Hong Kong Monthly Digest of Statistics June 1981 19

EXTERNAL TRADE
5.3 DOMESTIC EXPORTS BY ,AREA
$million
Soviet Central Union and and Australasia
North Western Eastern South Middle and Postal Total· Year/month America Europe Europe America Bast Asia Africa Oceania packages merchandise
1975 8,108.73 8,321.68 62.01 380.89 785.60 2,644.91 1,186.12 1,359.23 9.73 22,858.89 1976 12,632.28 11,510.36 116.93 534.76 1,175.36 3,617.69 1,291.03 1,737.92 12.77 32,629.09 1977 14,723.09 10,864.29 112.86 767.69 1,359.25 4,101.01 1,491.47 1,574.81 9.46 35,003.93 1978 16,395.92 12,803.87 117.81 876.70 1,446.83 5,460.38 1,607.94 1,830.87 170.82 40,711.16 1979 20,434.79 19,497.89 204.67 1,591.81 2,087.25 7,818.58 1,707.96 2,245.75 323.39 55,912.09 1980 24,373.62 23,198.75 273.27 2,387.97 2,593.08 9,821.35 2,747.32 2,368.25 406.92 68,170.53
1979: May 1,756.63 1,530.84 13.83 109.20 183.43 637.97 124.85 173.32 22.15 4,552.21 June 1,789.67 1,559.86 13.38 127.27 201.00 636.49 110.95 142.25 9.39 4,590.26 July 1,998.90 1,710.47 13.76 171.63 196.31 684.61 155.26 214.23 29.30 5,174.47 Aug. 2,117.43 2,059.30 25.73 179.54 216.58 767.68 177.21 233.39 28.77 5,805.63 Sept. 1,978.55 1,724.27 23.46 179.04 222.45 779.48 163.84 211.05 34.28 5,316.42 Oct. 2,011.82 1,723.78 21.61 168.19 188.35 759.03 184.49 209.85 55.17 5,322.29 Nov. 1,866.96 1,904.50 19.77 165.65 158.70 745.93 184.82 232.41 58.08 5,336.82 Dec. 1,940.68 2,188.01 16.62 148.80 178.87 685.23 199.62 199.27 45.04 5,602.13
1980: Jan. 1,634.01 1,851.06 21.11 155.53 173.45 744.68 180.78 221.37 14.82 4,996.80 Feb. 1,446.92 1,491.02 17.28 129.46 142.0J 568.21 157.92 166.98 11.40 4,131.21 Mar. 1,619.15 l,521.72 11.12 130.73 178.39 769.25 169.72 160.46 23.97 4,584.51 Apr. 1,922.02 1,837.95 22.13 177.60 201.89. 799.85 206.52 170.04 50.72 5,388.71 May 2,259.54 1,972.14 18.33 194.94 239.04 844.58 184.45 200.08 54.94 5,968.03 June 2,304.28 2,091.63 23.90- 221.70 233.95 782.77 192.39 178.84 50.05 6,079.50 July 2,366.39 1,988.36 23.63 241.57 231.84 787.37 208.42 210.13 29.54 6,087.24 Aug. 2,511.87 2,268.75 25.24 267.28 284.23 913.34 236.01 233.61 28.37 6,768.69 Sept. 2,180.05 1,839.20 37.12 253.58 278.35 856.29 296.20 212.14 27.41 5,980.34 Oct. 2,179.54 1,947.08 24.69 244.78 234.49 896.76 306.09 229.25 43.58 6,106.27 Nov. 1,944.45 2,039.82 26.02 186.52 193.81 945.99 310.36 205.99 40.13 5,893.09 Dec. 2,040.65 2,376.91 22.70· 191.20 203.81 920.54 300.50 181.98 32.00 6,270.30
1981: Jan. 2,384.54 2,055.48 23.75 193.35 208.08 908.32 318.66 240.87 12.92 6,345.98 Feb. 1,380.62 1,201.46 11.73 142.65 152.79 649.56 221.28 171.31 7.07 3,938.47 Mar. 2,025.71 1,941.30 19.16 194.69 226.26 904.08 263.14 201.42 8.54 5,784.28 Apr. 2,188.24 1,695.44 31.01 223.27 283.92 899.62 308.74 206.58 7.32 5,844.13 May 2,790.04 l,975.53 23.45 242.30 329.4_7 974.48 324.02 213.28 7.27 6,879.84
5.4 IMPORTS AND DOMESTIC EXPORTS BY MAJOR TRADING COUNTRY
$million'
Imports Domestic exports
Fed.
Year/month Japan China U.S.A. Taiwan Singapore U.K. u.s.A. Rep. of
Germany U.K. Japan Australia Canada \
\
1975 6,991.15 6,804.94 3,960.76 1,942.53 1,920.98 1,715.45 7,333.51 2,859.62 2,777.51 956.12 1,033.53 775.22
1976 9,348.36 7,761.19 5,308.95 3,056.65 2,516.74 1,832.51 11,236.39 3,994.99 3,285.87 1,400.48 1,368.00 1,395.89
1977 11,547.31 8,081.89 6,093.15 3,253.74 2,888.49 2,191.98 13,551.92 3,668.91 3,034.53 1,386.14 1,247.12 1,171.17
1978 14,404.74 10,549.77 7,519.28 4,257.34 3,219.22 2,975.25 15,124.51 4,426.48 3,870.77 1,855.86 1,494.32 l,271.40
1979 19,320.27 .15,130.02 .10,365.43 6,035.28 4,820.66 4,350.40 18,797.48 6,343.77 5,974.19 2,656.15 l,788.96 1,637.32
1980 25,643.89 21,948.23 13,210.00 7,961.15 7,383.75 5,456.42 22,591.49 7,383.60 6,791.43 2,328.60 1,941.46 1,782.13
1979: May 1,616.31 1,237.60 877.20 473.81 332.59 410.68 1,609.55 477.62 511.96 227.00 133.71 147.08 June l,701.93 l,186.53 873.20 541.46 394.00 309.28 1,646.84 503.79 461.74 209.66 119.13 142.84 July l,629.32 1,257.33 1,086.66 466.32 486.03 422.76 1,833.89 558.38 486.94 241.42 156.26 165.00 Aug. 1,634.52 1,318.18 947.16 496.99 458.23 470.24 1,970.01 692.52 612.16 277.68 185.37 147.42 Sept. 1,711.29 1,365.27 855.34 525.76 499.93 390.47 1,830.26 562.09 545.42 302.68 171.56 148.29 Oct. 1,811.63 1,557.41 987.69 563.54 458.25 386.17 1,865.63 558.42 537.38 235.51 172.92 146.19 Nov. 1,705;92 1,538.34 998.32 590.92 433.64 454.08 1,722.65 593.72 561.46 223.12 183.99 144.31 Dec. 1,938.23 1,704.80 901.71 665.88 462.53 318.19 1,760.36 745.18 617.48 190.94 166.77 180.32
1980: Jan. 1,600.47 1,635.64 872.66 581.80 696.86 436.16 1,515.12 634.51 527.92 181.46 183.40 118.90 Feb. 1,692.10 1,239.88 949.86 464.31 355.41 271.87 1,341.25 498.96 417.77 133.97 134.96 105.68 Mar. 2,091.24 1,544.59 1,070.13 649.45 480.15 402.90 1,496.86 483.63 427.34 182.13 134.50 122.28 Apr. 2,111.12 1;666.72 1,085.07 675.48 733.72 541.26 1,799.60 539.80 572.73 182.09 136.24 122.41 May 2,149.23 1,778.69 1,506.99 683.14 477.39 417.28 2,120.30 588.87 555.41 185.82 158.34 139:4_4 June 2,028.41 1,768.70 1,007.72 602.30 634.06 468.23 2,149.88 649.96 628.15 170.76 149.23 154.40 July 2,122.84 1,688.58 1,292.60 588.53 546.19 410.96 2,191.53 682.97 528.72 183.23 168.53 174.86 Aug. 2,214.12 1,931.74 1,134.59 686.46 709.16 490.78 2,319.23 771.14 629.11 237.75 196.22 192.64 Sept. 2,187.81 2,038.33 961.36 635.84 740.12 447.12 2,019.91 582.26 573.30 217.31 174.87 160.15 Oct. 2,315.03 2,o-73.20 1,014.13 700.42 321.69 486.81 2,029.88 597.42 608.82 228.42 193.14 149.66 Nov. 2,423.56 2,285.66 1,103.47 803.66 883.57 599.82 1,786.67 612.21 604.63 229.49 167.96 157.78 Dec. 2,755.60 2,325.21 1,245.04 906.82 808.09 496.45 1,854.64 751.03 724.48 197.83 146.66 186.01
1981: Jan. 2,254.34 2,226.67 1,120.05 914.28 972.86 469.54 2,222.03 667.88 554.84 197.62 m:~~ 162.51 Feb. 2,513.17 1,485.93 1,006.30 740.67 527.91 398.98 1,268.79 389.96 323.03 142.57 111.83 Mar. 2,712.58 2,342.o-7 1,183.94 884.47 805.66 571.54 1,872.05 549.26 638.65 214.82 168.78 153.66 Apr. 2,755.48 2,277.15 1,228.23 869.74 700.27 437.81 2,030.57 455.51 585.86 220.85 171.81 157;66 May 2,629.42 2,471.28 1,213.78 976.28 980.02 579.76 2,589.35 572.10 652.97 244.57 168.74 200.69
20 Hong Kong Monthly .Digest of Statistics lune 1981

EXTERNAL TRADE
5.5 RE-EXPORTS BY AREA OF DESTINATION
$million
Soviet Central Union and and Australasia
North Western Eastern South Middle and Total Year/month America Europe Europe America East Asia Africa Oceania merchandise
1975 613.16 737.21 10.63 172.30 287.46 4,575.21 310.24 266.87 6,973.08
1976 942.32 819.65 7.38 177.95 313.12 5,923.21 373.08 371.12 8,927.82
1977 948.35 905.11 3.54 221.19 325.87 6,654.07 429.99 341.14 9,829.26
1978 1,302.79 1,169.96 5.57 243.76 515.25 9,029.79 542.90 387.06 13, 197.07
1979 2,135.45 2,310.71 11.84 395.87 840.94 12,878.01 939.27 510.00 20,022.08
1980 3,266.04 3,285.76 34.44 661.75 1,279.60 19,343.89 1,566.50 633.96 30,071.94
1979: May 218.35 169.54 0.67 25.82 83.14 1,060.03 63.91 34.37 1,655.81 June 182.67 188.98 1.50 32.00 83.33 1,151.57 69.18 35.88 1,745.12 July 191.57 162.57 2.13 42.16 77.74 1,039.30 94.42 43.56 1,653.46 Aug. 223.04 215.67 1.66 37.24 70.15 1,072.46 94.58 42.48 1,757.27 Sept. 138.16 206.25 2.68 62.34 66.13 1,071.56 87.08 50.00 1,734.20 Oct. 175.34 230.20 1.17 38.23 69.32 1,145.04 89.46 47.44 1,796.20 Nov. 204.29 299.62 0.46 35.99 75.76 1,214.59 103.05 68.18 2,001.95 Dec. 178.62 270.62 0.53 32.85 80.44 1,169.90 115.70 42.52 1,891.17
1980: Jan, 196.22 360.03 1.03 31.01 89.27 l,243.06 82.37 44.23 2,047.21 Feb. 188.43 293.54 3.92 28.90 63.63 1,065.01 95.95 48.51 1,787.90 Mar. 231.88 264.52 4.89 30.97 92.68 1,421.62 106.56 48.93 2,202.04 Apr. 219.61 217.09 0.68 43.78 85.17 1,549.62 133.69 52.03 2,301.68 May 272.01 209.08 1.62 48.57 109.73 1,730.31 102.08 53.15 2,526.56 June 225.54 228.98 3.30 60.10 83.12 1,617.60 114.16 44.92 2,377.71 July 264.59 261.88 2.83 55.37 98.35 1,557.91 120.75 61.44 2,423.12 Aug. 309.52 245.08 2.49 68.94 100.94 1,779.29 130.21 59.38 2,695.86 Sept. 291.04 209.08 3.75 75.16 241.75 1, 736.01 165.95 58.84 2,781.58 Oct. 331.87 345.32 3.66 75.78 84.57 1,822.42 182.08 53.41 2 899.10 Nov. 396.15 336.42 2.10 68.91 99.35 1,811.03 159.17 60.31 2,933.45 Dec. 344.39 318.75 4.17 74.37 131.76 2,022.89 174.37 49.57 3,120.28
1981: Jan. 390.84 347.30 2.01 58.46 150.34 2,153.86 166.50 58.58 3,327.89 Feb. 298.93 267.35 1.76 59.91 140.21 1,924.77 131.60 53.91 2,878.44 Mar. 380.47 266.89 4.38 78.45 157.69 2,232.77 137.95 67.75 3,326.35 Apr. 422.13 266.78 3.28 81.79 141.93 2,179.76 164.36 67.47 3,327.50 May 435.13 258.55 2.26 87.58 158.53 2,257.55 154.32 67.77 3,421.70
5.6 RE-EXPORTS BY MAJOR COUNTRY OF ORIGIN
$million
Belgium and
Year/month China Japan U.S.A. Taiwan Switzerland Luxembourg
1975 1,743.02 1,209.73 968.69 196.20 307.21 245.76
1976 2,402.35 1,225.15 1,237.54 257.58 375.35 227.57
1977 2,491.54 1,735.31 1,249.39 362.08 415.34 243.01
1978 3,658.98 2,242.82 1,593.61 402.23 501.34 441.70
1979 5,663.48 3,392.90 2,285.58 898.09 660.18 545.29
1980 8,393.90 5,884.49 3,156.67 2,133.78 839.86 555.60
1979: May 487.78 266.48 200.43 53.60 55.56 49.98 June 470.49 282.56 192.32 58.86 53.22 52.45 July 473.61 299.79 187.60 68.10 60.52 33.54 Aug. 482.55 309.44 202.61 68.38 52.48 60.47 Sept. 501.11 282.97 215.57 72.15 53.92 33.74 Oct. 503.17 324.21 184.86 99.75 62.32 29.46 Nov. 574.89 343.72 208.38 92.83 66.42 27.86 Dec. 553.17 321.12 197.40 123.61 63.92 37.98
1980: Jan. 525.75 346.00 221.16 114.29 66.68 41.27 Feb. 467.46 315.26 213.37 88.07 54.12 68.30 Mar. 609.43 370.14 229.97 141.56 61.34 22.45 Apr. 616.38 465.75 256.14 129.16 81.71 36.67 May 751.89 487.80 325.27 137.81 71.84 37.72 June 668.41 483.24 276.44 161.01 84.34 46.93 July 662.35 520.37 267.84 164.99 79.01 22.45 Aug. 790.51 557.23 215.06 217.24 70.36 44.88 Sept. 767.77 549.55 406.22' 197.29 61.49 75.98 Oct. 827.50 582.35 255.08 242.73 67.94 49.86 Nov. 865.16 564.36 234.98 236.19 70.32 51.99 Dec. 847.64 646.79 257.29 304.74 71.87 57.90
1981: Jan. 990.14 575.38 278.04 313.95 62.32 52.82 Feb. 766.42 601.56 225.83 296.45 78.97 41.10 Mar. 950.96 709.57 299.11 293.09 82.56 24.54 Apr. 970.67 704.54 312.65 310.08 83.46 61.46 May 1,042.15 664.20 338.95 288.34 85.94 43.01
Hong Kong Monthly Digest of Statistics June 1981 21

EXTERNAL TRADE
5.7 IMPORTS BY COMMODITY SECTION
$,million
Standard International Trade Classification (Revised 2) Commodi-
ties and Food Mineral Animal Manufac- Miscel- transac-
and live Crude fuels, and Chemicals tured goods Machinery laneous tions not animals Beverages materials, lubricants vegetable and related classified and manufac- classified
chiefly and inedible, and related oils, fats products, chiefly by transport tured according Total Year/month for food tobacco except fuels materials and waxes n.e.s. material equipment articles to kind merchandis·e
1975 6,112.98 583.23 2,499.72 2,125.77 212.62 2,496.24 9,828.06 5,642.56 3,892.23 78.20 33,471.62 1976 6,686.60 733.10 3,327.76 2,680.16 216.58 3,419.01 13,366.94 7,701.32 5,074.79 86.27 43,292.53 1977 7 229.69 736.44 3,321.60 2,995.11 251.34 3,633.09 14,465.86 9,330.57 6,654.86 82.47 48,701.03 1978 8,206.78 988.69 3,756.24 3,122.40 279.48 4,605.99 20,497.51 12,466.76 8,884.49 247.18 63,055.51 1979 9,646.42 1,353.04 4,312.41 4,906.44 355.49 6,819.50 26,931.14 18,609.41 12,524.56 378.66 85,837.06 1980 I 1,558.13 1,583.43 5,266.81 7,882.23 376.09 7,933.71 33,719.97 25,132.93 17,627.74 569.49 111,650.54
1979: May 770.98 105.90 328.77 413.31 33.23 549.28 2,136.02 1,521.02 999.16 26.36 6,884.03 June 767.86 102.98 325.22 382.39 48.36 616.81 2,159.69 1,475.86 1,064.07 22.14 6,965.38 July 820.79 121.48 322.12 450.71 40.23 583.98 2,201.88 1,867.22 1,105.46 28.11 7,541.99 Ang. 813.29 118.45 359.79 490.94 25.11 647.56 2,144.25 1,689.10 1,030.41 28.60 7,347.50 Sept. 882.00 111.49 329.44 682.05 24.19 606.43 2,310.97 1,525.87 1,134.98 40.29 7,647.70 Oct. 921.88 95.82 429.19 484.94 21.30 624.66 2,688.70 1,725.81 1,257.25 49.54 8,299.09 Nov. 935.45 145.01 388.25 393.81 25.75 641.71 2,641.12 1,754.00 1,259.90 46.70 8,231.69 Dec. 934.14 165.93 460.97 440.87 31.56 713.28 2,526.10 1,705.65 1,291.43 57.85 8,327.78
1980: Jan. 881.33 128.79 512.11 732.66 47.10 690.23 2,350.76 1,671.95 1,083.43 34.06 8,132.42 Feb. 740.69 135.06 436.83 435.48 24.37 606.18 2,032.97 1,576.36 1,102.25 33.62 7,123.82 Mar. 883.03 131.07 528.94 544.20 22.37 821.52 2,838.54 1,880.71 1,266.74 41.84 8,958.96 Apr. 907.73 120.72 571.62 729.85 28.68 769.54 2,951.98 2,085.81 1,329.88 40.98 9,536.78 May 872.32 151.53 507.28 534.45 26.21 752.64 2,865.66 2,323.86 1,371.63 50.82 9,456.41 June 889.64 113.52 424.49 705.19 28.00 626.74 2,663.91 1,971.60 1,346.69 54.26 8,824.04 July 865.34 115.04 371.34 622.97 18.72 602.16 2,696.20 2,302.87 1,546.77 51.46 9.192.87 Aug. 1,082.36 151.14 390.75 767.60 29.27 580.52 2,681.81 2,232.66 1,487.05 45.07 9,448.24 Sept. 1,098.13 100.96 314.99 881.19 36.33 542.27 2,752.69 1,936.93 . 1,676.61 48.11 9,388.23 Oct. 1,085.65 123.26 360.52 316.24 43.81 585.35 3,120.21 2,154.10 1,732.76 50.24 9,572.15 Nov. 1,061.18 150.42 440.96 887.85 33.40 680.36 3,421.47 2,353.32 1,812.74 58.90 10,900.60 Dec. 1,209.57 166.29 418.58 724.84 37.87 685.57 3,416.07 2,697.36 1,889.75 60.12 U,306.04
1981: Jan. 1,186.31 148.39 479.56 990.37 41.91 775.40 3,223.03 2,253.82 1,544.67 41.97 10,685.42 Feb. 872.19 154.21 410.37 508.36 20.36 611.90 2,631.68 2,265.31 1,576.29 39.88 9,090.54 Mar. t,018.05 170.18 572.97 905.67 26.30 724.85 3,358.94 2,580.79 1,921.19 46.92 11,325.87 Apr. 1,050.39 178.13 542.70 921.80 31.25 707.92 3,376.81 2,668.79 1,873.35 46.85 11,397.99 May 1,102.20 142.58 510.59 988.11 42.03 745.97 3,363.22 2,796.31 1,998.37 47.72 11,737.11
5.8 DOMESTIC EXPORTS BY COMMODITY SECTION $million
Standard International Trade Classification (Revised 2) Commodi-
ties and Food Mineral Animal Manufac- Miscel- transacu
and live Crude fuels, and Chemicals tured goods Machinery laneous tions not animals Beverages materials, lubricants vegetable and related classified and manufac- classified
chiefly and inedible, and related oils, fats products, chiefly by transport tured according Total Year/month for food tobacco except fue1s materials and waxes n.e.s. material equipment articles to kind merchandise
1975 351.25 51.96 215.40 0.02 4.40 192.43 3,079.31 3,331.63 15,564.54 67.94 22,858.89 1976 550.72 45.01 296.46 2.29 234.99 4,308.13 4,791.06 22,322.18 78.25 32,629.09 1977 622.99 59.08 379.87 0.01 2.79 296.18 4,142.88 5,614.54 23,812.60 72.99 35,003.93 1978 710.92 55.47 412.36 0.08 3.17 345.04 4,634.83 6,403.16 27,815.26 330.87 40,711.16 1979 843.83 73.10 650.07 50.26 5.16 432.03 6,508.66 9,314.02 37,524.64 510.31 55,912.09 1980 812.58 1!4.29 1,107.68 88.53 10.17 541.52 7,732.50 12,375.25 44,814.47 573.54 68,170.53
1979: May 70.03 7.31 55.80 3.74 0.36 35.82 506.98 715.57 3,117.04 39.57 4,552.21 June 67.96 6.41 53.68 4.94 0.56 32.05 486.70 728.96 3,188.69 20.32 4,590.26 July 71.70 6.24 55.86 6.18 0.26 39.66 572.72 822.17 3,554.37 45.32 5,174.47 Aug. 78.25 7.49 55.39 5.08 0.64 41.56 621.46 962.79 3,989.52 43.44 5,805.63 Sept. 88.89 4.87 52.33 5.12 0.28 37.72 597.83 916.04 3,561.65 51.70 5,316.42 Oct. 67.69 9.35 61.77 6.99 0.38 38.66 612.75 961.48 3,492.42 70.79 5,322.29 Nov. 63.89 7.29 57.89 7.31 0.43 43.95 643.94 931.53 3,506.64 73.94 5,336.82 Dec. 58.76 5.63 76.99 6.81 1.00 44.92 649.28 956.35 3,741.47 60.91 5,602.13
1980: Jan. 61.78 13.34 62.92 8.04 0.47 38.45 616.33 931.29 3,235.79 28.38 4,996.80 Feb. 46.26 5.18 54.20 7.82 0.76 28.11 511.97 724.30 2,729.41 23.19 4, 131.21 Mar. 60.51 8.00 76.32 7.56 0.88 49.39 589.51 916.54 2,836.81 38.98 4,584.51 Apr. 74.01 7.97 92.60 8.60 0.78 49.66 664.87 979.26 3,448.47 62.49 5,388.71 May 60.75 11.31 94.24 5.76 0.80 50.87 632.17 1,027.26 4,017.10 67.76 5,968.03 June 63.50 7.04 169.37 6.01 0.87 40.60 620.06 1,023.89 4,084.11 64.04 6,079.50 July 63.82 5.98 83.52 7.56 0.99 42.21 614.75 l,027.97 4,196.53 43.92 6,087.24 Aug. 79.41 10.59 79.27 3.02 0.95 47.45 702.72 1,166.47 4,635.92 42.89 6,768.69 Sept. 64.02 12.32 122.47 5.64 1.41 50.82 660.66 1,130.71 3,885.35 46.95 5,980.34 Oct. 71.94 6.81 95.83 9.08 0.27 49.77 692.71 1,221.00 3,902.66 56.19 6,106.27 Nov. 83.40 13.13 96;21 10.12 0.87 56.03 698.11 1,096.40 3,786.56 52.25 5,893.09 Dec. 84.13 12.65 80.98 9.82 1.11 39.21 733.47 1,148.03 4,114.38 46.51 6,270.30
1981: Jan. 67.57 15.37 97.63 10.75 0.19 57.81 707.67 1,141.61 4,220.05 27.33 6,345.98 Feb. 60.75 15.36 63.67 11.10 0.64 41.29 463.33 755.28 2;507.05 20.00 3,938.47 Mar. 81.66 10.41 92.45 13.12 0.51 57.33 665.37 1,184.33 3,655.16 23.93 5,784.28 Apr. 89.60 11.59 82.36 12.72 0.39 55.02 674.98 1,117.19 3,780.31 19.98 5,844.13 May 83.92 13.52 81.80 5.29 0.52 56.50 710.33 1,358.02 4,550.12 19.82 6,879.84
22 Hong Kong Monthly Digest of Statistics June 1981

EXTERNAL TRADE
5.9 RE-EXPORTS BY COMMODITY SECTION
$million
Standard International Trade Classification (Revised 2) Commodi-
ties and Food Mineral Animal Manufac- Miscel- transac-
and live Crude fuels, and Chemicals turedgoods Machinery laneous tionsnot animals Beverages materials, lubricants vegetable and related classified and manufac- classified
chiefly and inedible, and related oils, fats products, chiefly by transport tured according Total Year/month for food tobacco except fuels materials and waxes n.e.s. material equipment articles to kind merchandise
1975 558.60 52.45 538.20 92.78 15.30 902.21 2,259.08 1,034.82 1,485.13 34.51 6,973.08
1976 927.78 108.01 910.24 121.33 18.44 1,169.12 2,676.69 1,210.34 1,751.92 33.95 8,927.82
1977 823.11 92.98 877.42 162.59 17.48 1,266.54 2,881.59 1,642.95 2,035.98 28.61 9,829.26
1978 873.28 100.37 1,156.08 196.94 35.50 1,575.77 4,327.29 2,287.08 2,588.92 55.83 13,197.07
1979 1,220.46 183.70 1,580.24 239.41 32.62 2,200.92 6,440.06 3,916.07 4,091.23 117.38 20,022.08
1980 1,417.88 291.49 2,373.04 331.96 45.85 2,816.89 8,762.12 6,761.80 6,564.52 706.38 30,071.94
1979: May 76.77 24.89 117.20 36.16 2.26 198.47 538.46 310.94 343.47 7.17 1,655.81 June 93.69 13.37 153.11 35.56 3.21 177.32 561.71 349.15 352.65 5.35 1,745.12 July 89.37 8.71 118.33 22.35 2.36 173.07 496.76 356.51 377.29 8.70 1,653.46 Aug. 124.85 13.54 119.99 18.12 4.10 210.18 524.19 364.43 371.04 6.81 1,757.27 Sept. 120.40 12.04 144.17 17.91 1.39 197.46 521.83 340.26 369.69 9.05 1,734.20 Oct. 100.85 30.35 '; 149.04 17.93 1.65 190.19 552.40 350.99 386.69 16.11 1,796.20 Nov. 111.19 13.78 168.85 15.93 1.89 206.66 622.92 407.12 436.46 17.15 2,001.95 Dec. 99.66 17.89 156.65 14.36 2.43 197.77 579.19 390.89 407.25 25.08 1,891.17
1980: Jan. 116.48 27.79 212.54 20.96 3.05 221.05 629.39 379.72 415.35 20.88 2,047.21 Feb. 68.51 19.16 167.61 16.27 2.43 202.13 581.54 342.65 379.67 7.94 1,787.90 Mar. 120.26 24.61 212.41 20.64 2.38 237.75 688.78 412.21 449.21 33.80 2,202.04 Apr. 111.40 39.52 190.44 36.04 4.13 254.77 644.34 536.08 478;53 6.43 2,301.68 May 103.93 34.65 204.25 46.49 4.11 238.76 711.68 599.80 575.06 7.83 2,526.56 June 96.19 24.66 180.23 30.85 2.48 232.95 704.84 541.64 538.74 25.13 2,377.71 foly 95.39 16.83 157.47 22.04 3.85 214.41 660.63 585.07 573.89 93.54 2,423.12 Aug. 150.35 21.16 187.85 32.09 4.17 247.09 765.56 618.78 609.19 59.61 2,695.86 Sept. 124.21 22.87 211.20 36.06 2.97 212.49 780.62 747.14 585.33 58.69 2,781.58 Oct. 131.12 15.67 172.01 27.42 5.13 265.73 830.40 626.18 634.30 191.13 2,899.10 Nov. 136.89 16.84 225.56 24.41 6.81 234.34 875.51 620.98 649.89 142.23 2,933.45 Dec. 164.75 27.84 253.83 18.68 4.35 256,58 894.74 759.51 680.84 59.17 3,120.28
1981: Jan. 150.41 37.89 376.83 24.56 4.10 278.34 1,032.75 739.01 597.55 86.45 3,327.89 Feb. 138.57 38.54 263.86 20.73 4.22 243.05 779.65 731.95 607.51 50.36 2,878.44 Mar. 149.61 31.33 311.69 36.21 4.02 296.93 976.85 818.19 679.32 22.21 3,326.35 Apr. 162.23 41.74 342.74 44.79 4.26 268.32 963.80 841.25 646.95 11.42 3,327.50 May 161.59 35.54 303.27 41.64 6.14 293.03 1,009.02 804.10 711.31 56.04 3,421.70
5.10 IMPORTS AND RE-EXPORTS BY END-USE CATEGORY
$million
Imports Re-exports
Raw .Raw materials materials
Consumer and semi- Capital . Consumer and semi- Capital Year/month Foodstuffs goods manufactures Fuels goods Foodstuffs goods manufactures Fuels goods
1975 6,283.27 7,234.53 13,581.17 2,032.96 4,339.69 613.27 3,403.19 2,137.74 48.09 770.78 1976 6,924.77 9,264.53 19,102.71 2,550;29 5,450.22 1,000.01 4;076.24 2,904.23 60.25 887.10 1977 7,540.70 11,435.65 20,390.74 2,834.22 6,499.71 899.87 4,295.84 3,404.31 88.80 1,140.42 1978 8,546.98 16,757.43 26,623;53 2,962.11 8,165.46 978.06 5,782.12 4,854.98 113.40 1,468.50 1979 9,967.58 21,530.05 .37,507.17 4,676.33 12,155.93 1,318.76 8,615.12 7,583.34 130.81 2,374.06 1980 12,064.96 29,469.43 46,488.66 7,572.63 16,054.86 1,602.08 13,110.46 .11,599.53 193.08 3,566.80
1979: May 806.09 1,680.77 2,995.61 381.49 1,020.07 86.11 773.80 586.40 27.98 181.53 June 798.16 1,756.57 3,104.58 364.18 941.89 106.61 771.61 631.59 25.07 210.21 July 850.75 1,840.64 3,134.61 434.54 1,281.45 97.83 721.22 605.71 11.08 217.67 Aug. 826.10 1,726.67 3,195.08 462.28 1,137.37 134.56 766.10 626.04 6.31 224.25 Sept. 887.88 1,834.28 3,292.14 664.00 969.41 129.34 718.35 675.21 7.52 203.78 Oct. 949.36 2,085.63 ' 3,640.66 465.16 1,158.28 ll0.73 759.64 701.63 8.24 215.95 Nov. 976.03 2,143.04 3,604.09 366.87 1,141.65 123.35 816.86 797.04 7.68 257.02 Dec. 986.19 2,121.82 3,766.13 422.81 1,030.84 112.87 800.21 757.44 6.50 214.15
1980: Jan. 953.25 1,857.15 3,553.84 712.86 1,055.32 130.97 822.39 870.29 9.12 214.44 Feb. 778.72 1,871.42 3,080.01 415.65 978.01 74.11 800.87 710.88 6.34 195.71 Mar. 931.37 2,174.65 4,131.92 516.65 1,204.37 133.34 869.57 953.27 9.09 236.78 Apr. 938.09 2,285.34 4,210.17 701.19 1,401.99 116.50 956.79 903.74 21.21 303.44 May 913.42 2,294.15 4,165.14 503.89 1,579;81 125.35 1,065.45 989.14 37.16 309.47 June 917.13 2,221.44 3,759.07 682.12 1,244.27 115.48 1,047.01 951.65 19.13 244.44 July 881.65 2,487.11 3,664.44 602.66 1,557.02 108.09 1,108.89 897.79 12.27 296.08 Aug. 1,109.05 2,522.23 3,664.55 736.80 1,415.61 165.67 1,203.22 993.41 20.20 313.36 Sept. 1,114.43 2,563.02 3,625.11 855.78 1,229.90 134.93 1,194.49 984.15 19.67 448.33 Oct. 1,144.02 2,881.98 3,939.21 274.23 1,332.71 145.75 1,388.46 1,044.39 16.69 303.82 Nov. 1,146.36 3,115.28 4,315.64 866.72 1,456.61 155.09 1,323.19 1,117.21 13.88 324.08 Dec. 1,256.03 3,229.05 4,484.61 704.15 1,632.20 198.95 1,338.17 1,196.02 8.33 378.82
1981: Jan. 1,234.99 2,699.44 4,491.98 963.11 1,295.91 176.71 1,318.61 1,479.55 8.54 344.48 Feb. 931.16 2,616.45 3,734.89 474.52 1,333.52 166.40 1,201.67 1,137.07 6.96 366.34 Mar. 1,098.14 3,048.88 4,687.66 876.80 1,614.40 209.80 1,383.78 1;323.98 18.98 389.81 Apr. 1,103.81 3,022.67 4,744.79 888.76 1,637.97 236.!17 1,319.29 1,345.48 26.55 399.22 May 1,181.65 3,085.99 4,729.73 954.44 1,785.30 227.36 1,399.35 1,370.38 23.91 400.71
Hong Kong Monthly Digest of Statistics lune 1981 23

EXTERNAL TRADE
5.11 DOMESTIC EXPORTS OF· PRINCIPAL COMMODITIES
$million
Manufac-tures of
metal Travel Electronic Articles of Radio Qargely goods, components
apparel and broadcast cutlery and handbags and parts Fish and clothing Toys and Watches Textile receivers-of household and similar Artificial for Transi.stors fish pre-
Year/month accessories dolls and cl9cks fabrics all kinds utensils) containers flowers computers and diodes Footwear parations
1975 10,201.54 1,467.17 644.41 1,611.76 1,293.05 605.02 455.44 201.24 340.08 258.98 256.40 183.34 1976 14,288.03 2,175.90 1,207.52 2,352.38 1,875.30 844.00 689.85 305.44 466.68 350.66 340.54 350.98 1977 13,908.48 2,786.55 1,693.58 1,931.37 2,143.67 991.13 711.37 467.78 682.82 382.10 365.03 384A9' 1978 15,708.76 3,079.81 2,733.71 2,192.17 1,522.82 1;124.38 913.20 640.76 678.21 430.90 427.36 399.53 1979 20,131.12 4,372.89' 4,354.11 3,110.35 2,080.33 1;537.17 1,223.06 813.71 786.58 594.09 518.16 460.59;
. 1980 23,258.22 4,911.36 6,288.33 3,441.66 2,701.46 2,037.20 l,505.34 873.23 1,465.11 . 642.81 623.79 346.06.
1979: May 1,719.77 366.87 336.62 247.64 156.28 120.96 100.95 69.51 59.09 51.48 41.00 36.73 June 1,771.78 386.63 364.35 221.89 . 164.01 108.45 93.79 70.37 64.81 45.09 41.51 35.09 July 1,952.05 457.42 357.63 260.42 199.91 151.24 112.85 79.26 60.48 54.04 41.40 38.21 Aug. 2,147.89 526.69 421.10 284.95 . 213.42 153.04 134.98 93.77 77.86 53.95 46.09 .43.08 Sept. 1,834.93 441.97 437.66 281.69 212.07 138.64 114.03 76.70 72.86 58.90 45.82 51.64 Oct. 1,748.52 397.49 496.90 282.16 216.31 151.15 109.58 62.88 74.97 50.77 43.19 35.19 Nov. 1,710.09 374.14 553.23 324.06 219.49 146.15 110.60 61.95 66.06 56.62 51.92 33.55 Dec. 2,084.25 411.87 398.24 319.41 232.83 153.55 123.21 80.70 79.02 50.52 55.58 25.19
1980: Jan. 1,741.86 326.16 362.59 271.48 206.01 162.77 113.54 80.96 96.12 63.15 57.32 26.67 . Feb. 1,491.85 264.88 315.53 226.46 174.54 130.57 103.86 55.35 62.28 38.34 41.42 l(i,10. Mar. 1,342.92 317.30 4.36.22 259.33 214.85 139.94 105.37 60.95 89.63 52.98 45.39 26.29 Apr. 1,776.40 391.06 430.41 284.56 213.62 165.97 120.76 74.23 106.22 55.90 53.28 31.45 May 2,085.04 449.42 560.20 259.12 212.33 168.32 135.34 . 83.05 105.21 57.45 52.76 21.46 June 2,161.06 481.27 517.15 272.70 225.87 162.62 143.13 79.02 110.74 55.31 48.64 22.32 July 2,200.43 528.37. 516.14 248.95 223.42 180.40 141.49 82.78 98.92 54.27 46.85 21.34 Aug. 2,404.01 569.51 624.89 312.35 254.80 197.53 147.54 91.20 135.31 55.24 52.15 36.67 Sept. 1,958.12 431.58 599.87 293.10 245.15 185.20 126.80 70.51 170.29 58.38 46.83 29.36 Oct. 1,945.02 380.08 680.96 318.01 264.67 187.29 121.58 60.22 178.09 60.64 53.01 29.97 Nov. 1,825.37 408.19 695.51 326.08 230.64 189.18 126.50 62.04 124.46 48.95 59.29 46.10 Dec. 2,362.65 366.66 560.81 ;372.80 240.25 168.23 121.69 73.46 188.62 44.43 67.51 38.49
1981: Jan. 2,456.90 374.95 483.41 306.28 220.05 205.48 136.88 84.96 182.27 41.34 71.42 24.65 Feb. 1,355.06 185.14 434.51 220.41 130.70 104.76 72.60 28.71 141.65 27.06 38.88 26.18 Mar. 1,859.45 391.03 561.37 317.65 211.78 147.98 125.54 68.06 212.58 38.73 65.18 36.22 Apr. 1,901.57 425.89 586.30 314.46 194.26 158.34 122.73 74.07 175.37 36.83 65.62 43.19 May 2,377.56 554.57 620.66 333.82 219.39 174.12 150.23 77.49 258.29 41.79 72.08 38.71
s~12 TRADE INDEX· NUMBERS
(1973=100)
Terms of Domestic exports Imports Re-exports trade
Unit Unit . Unit Year/month Value value Quantum Value value Quantum Value value Quantum
1975 117.4 117.3 100.l 115.4 123.7 93.3 106.9 115.2 92.8 94.4 1976 167.5 128.9 130.0 149.3 128.6 116.1 136.8 116.1 117.8 100.0 1977 179.7 13).8 136.4 167.9 134.4 124.9 150.6 125.0 120.5 98.5. 1978 209.1 138.9 150.5 217.4 142.8 152.2 202.3 139.3 145.2 97;2 1979 287.1 163.6 175.5 295.9 168.4 175.7 306.9 166.6 184.2 97.2 1980 350.l 179.8 194.7 384.9 184.1 209.1 460.9 182:5 252.6: 97;8
1979: Apr. 256.0 156.5 163.6 294.3 161.7 182.0 291.7 160.6 181.6 96.3 May 280.5 159.3 176.1 284.8 165.1 172.5 304.5 163.6 186.1 96.4 Jul'.le 282.8 162.8 173.7 288.2 168.4 171.2 320.9 168.0 191.0 97.0 July 318.8 165.7 192.4 312.0 171.l 182.4 304.1 1.70.4 178.5 97.1 Aug. 357.7 169.1 211.5 304.0 174;0 174.7 323.2 173.6 186.2 97.1 Sept. 327.6 170.8 191.8 316.4 175.8 179.9 318.9 174.3 182.9 97.2 Oct. 328.0 171.0 191.8 343.4 176.5 194.5 330.3 174.9 188.9 96.6 Nov. 328.9 1'71.8 191.4 340.6 178.0 191.3 368.2 174.8 210.7 96.6 Dec. 345.2 171.3 201.6 344.5 177.8 193.8 347.8 174.7 199.1 96.1
1980: Jan. 307.9 171.6 179.4 336.5 177.9 189.l 376.5 174.9 215.3 96.6 Feb. 254.6 172.8 147.3 294.7 177;6 165.9 328.8 -176.1 186.7 97.2 Mar. 282.5 173.6 162.8 370.7 178.9 207.1 405.0 176.4 229.5 97.2 Apr. 332.0 175.0 189.7 394.6 179.l ·220.2 423.3 176.8 239.4 97.8 May 367.7 176.6 208.3 391.2 181.0 216.2 464.7 178.7 260.1 97.8 fone 374.6 178.5 209.8 365.1 183.9 198.5 437.3 180.2 242.7 97.3 July 375.1 180.9 207.3 380.3 185.1 205.5 445.6 181.9 245.0 97.8 Aug. 417.1 183.2 227.6 390.9 186.6 209.5 495.8 184.0 269.4 97.9 Sept. 368.5 184.2 200.0 388.4 187.8 206.8 511.6 186.0 275.1 97.9 Oct. 376.3 185.8 202.5 396.0 189.4 209.1 533.2 187.8 283.9 98.4 Nov. 363.1 185.6 195.7 451.0 189.3 238.2 539.5 189.1 285.4 98.4 Dec. 386.4 185.2 208.6 467.8 189.7 246.6 573.8 190.6 301.l 97.4
1981: Jan. 391.0 185.5 210.9 442.l 191.5 230.9 612.0 191.0 320.5 96.9 Feb. 242.7 187.3 129.6 376.1 195.4 192.5 529.4 192.3 275.3 95.9 Mar. 356.4 187.0 190.6 468.6 197.2 237.6 611.7 192.5 -317.7 94.9 Apr. 360.1 189.2 190.4 471.6 199.3 236.6 612.0 194.1 315.3 95.0
24 Hdng Kong Monthly Digest 'of· Statistics lunel981

EXTERNAL TRADE
5.13 TRADE INDEX NUMBERS FOR IMPORTS
UNIT VALUE INDEX NUMBERS (1973= 100)
Food, Fuels Industrial materials Finished manufactures Merchandise beverages total
and Basic Chemi- Other semi-manufactures Total tobacco materials· cals
Metal and mis- Machinery
cellaneous and metal transport
Year/month Textiles products Total equipment Other Total
SITC section/ 67, 68 2,4, division
(Revised 1) 0&1 3 2&4 5 65 &69 6 5&6 7 8 7&8 0 to 9
Weights 189 27 77 76 167 so 337 490 170 121 291 1,000
1975 125 283 117 134 102 124 110 114 126 117 122 123.7 1976 128 296 130 140 111 121 114 120 133 118 126 128.6 1977 133 304 143 139 113 126 120 126 134 126 130 134.4 1978 141 306 138 146 118 135 128 132 146 139 143 142.8 1979 IS6 442 158 180 143 174 156 160 163 157 160 168.4 1980 172 658 171 216 149 194 166 174 170 156 164 184.1
19.79: Apr. 152 370 154 166 139 166 151 154 156 157 156 161.7 May m 395 155 172 142 168 155 157 161 156 158 16S.1 June 420 157 179 146 173 159 162 162 157 159 168A July 1S7 452 160 183 148 17S 160 163 164 160 162 171.1 Aug. 1S9 482 .. 160 189 150 180 163 166 166 160 163 174.0 Sept. 160 S20 162 192 149 183 163 167 170 160 16S 175.8 Oct. 160 S3S 164 197 149 186 163 168 170 159 16S 176.S Nov. 161 560 165 202 149 188 164 169 170 159 164 178.0 Dec. 162 561 167 204 147 190 163 170 166 157 162 177.8
1980: Jan. 163 565 168 206 147 187 163 170 165 160 162 177.9 Feb. 163 577 168 206 147 189 162 169 163 160 161 177.6 Mar. 165 588 168 209 149 187 163 170 167 157 162 178.9 Apr. 166 607 170 213 i48 191 163 171 164 156 160 179.1 May 168 626 170 215 149 192 164 172 167 156 162 181.0 June 170 661 170 219 ISO 195 166 174 169 157 164 183.9 July 171 683 . 171 221 150 196 167 175 171 156 164 185.1 Aug. 174 692 171 221 150 198 168 176 172 156 165 186.6 Sept. ··m 707 171 223 150 199 169 177 173 156 166 187.8 Oct. 719 173 224 151 198 169 177 17S 158 168 189.4 Nov. 179 732 178 224 150 200 169 178 174 153 165 189.3 Dec. 183 758 179 220 150 195 167 176 175 152 165 189.7
.1981. Jan. 186 758 183 216 152 201 170 178 175 156 167 191.S . Feb. 190 813 . 188 218 .155 205 173 182 174 162 169 195.4
·.:·. Mar. . 192 835 191 218 157 206 173 182 178 163 171 197.2 Apr. . 193 846. 194 221 158 207 173 183 187 161 175 199.3
QUANTUM INDEX NUMBERS (1973=100)
Food, Fuels Industrial materials Finished manufactures Merchandise beverages total
and Basic Chemi- Other semi-manufactures Total tobacco materials cals
Metal andmis-' Machinery
cellaneous and metal
Year/month Textiles products Total transport
equipment Other 'Total
SITC section/ 67, 68 division 2,4,
7 (Revised 1) O&l 3 2&4 5 65 &69 6 S&6 8 7&8 0 to 9
197S 98 95 104 8S 97 91 91 92 91 94 93 93.3 1976 106 115 122 110 123 134 120 119 117 122 120 116.1 1977 109 124 112 118 119 150 123 121 141 150 145 124.9 1978 119 129 133 143 150 190 163. 155 169 189 178 1S2.2 1979 129 140 135 171 170 222 176 169 225 237 231 175.7 1980 139 lSl 151 166 203 261 206 191 292 336 310 209.1
1979: Apr. ·. 124 1S2 144 178 179 231 189 180 236 230 234 182.0 May 124 1S9 128 173 165 207 169 163 224 229 226 172.5 June 122 138 130 . 187 160 210 166 164 216 242 227 171.2 July 131 151 124 173 1S5 217 168 162 272 244 261 182.4 Aug. 128 1S4 131 186 146 248 161 161 243 228 238 174.7 Sept. 136 199 119 171 162 23S 173 16S 213 252 230 179.9 Oct. 139 138 lSO 172 193 256 201 189 243 279 258 194.S Nov. 146 107 137 173 190 257 197 184 245 283 261 191.3 Dec. 148 119 160 ·190 204 234 188 18S 242 294 264 193.8
1980: Jan. 136 197 181 182 179 218 176 178 240 244 242 189.l Feb. 117 114 150 160 140 196 153 154 228 247 237 165.9 Mar. 134 140 180 214 201 267 212 208 266 290 276 207.1 Apr. 13S 183 193 196 217 286 221 213 303 303 304 220.2 May 133 129 174 191 205 282 212 203 331 313 325 216.2 June 129 162 148 156 187 253 19S 181 276 306 288 198.S .. July 125 138 126 148 ·118 272 197 177 322 350 334 205.5 Aug. 1S5 168 136 143 194 241 194 176 309 339 321 209.S Sept. 149 189 113 132 195 2S6 198 173 267 377 311 206.8 Oct. 148 67 128 142 223 290 225 195 290 391 330 209.1 Nov. 147 184 146 16S 257 293 247 216 317 427 361 238.2 Dec. 164 145 140 169 272 292 249 217 363 447 396 246.6
1981: Jan. 157 198 1S6 195 241 320 231 213 305 3S4 325 230.9 Feb. 118 95 125 153 196 207 185 170 303 3S4 324 192.5 Mar. 136 165 172 181 264 255 236 216 342 422 375 237.6 Apr. 139 165 162 174 2S3 280 237 214 337 418 369 236.6
Hong. Kong Monthly": Digest of Statistics . lune 1981 25

EXTERNAL TRADE
5.14 TRADE INDEX NUMBERS FOR DOMESTIC EXPORTS
UNIT VALUE INDEX NUMBERS (1973=100)
Food, Industrial Manufactures Merchandise beverages materials total
and and fuels Chemicals Textiles Metals Machinery and Clothing Footwear Other Total tobacco andmis- transport manufac-
cellaneous equipment tures metal
manufac- Electrical Year/month tures machinery Total
SITC section/ division 67, 68 Rest of (Revised 1) 0&1 2, 3 & 4 5 65 &69 72 7 84 85 6&8 5 to 8 0 to 9
Weights 17 14 9 121 31 135 149 383 14 260 967 1,000
1975 123 108 149 102 130 116 111 121 116 128 117 117.3 1976' 132 122 160 117 133 121 116 139 121 138 131 128.9 1977 138 128 167 118 136 120 114 140 121 150 133 131.8 1978 146 134 174 117 150 116 111 148 129 165 139 138.9 1979 172 163 224 144 177 129 124 179 140 182 164 163.6 1980 173 185 261 153 207 144 136 200 153 186 179 179.8
1979: Apr. 175 157 222 139 167 123 118 169 138 176 156 156.5 May 171 158 222 142 170 127 121 174 136 177 159 159.3 June 164 163 221 145 175 127 122 179 137 183 164 162.8 July 172 168 228 148 179 128 123 185 138 184 167 165.7 Aug. 169 170 234 150 183 131 126 190 140 186 171 169.1 Sept. 174 173 222 152 186 133 128 191 142 186 172 170.8 Oct. 173 172 228 150 187 135 129 190 143 187 172 171.0 Nov. 172 175 253 152 191 137 132 189 143 186 172 171.8 Dec. 178 173 256 153 191 137 132 186 145 186 171 171.3
1980: Jan. 177 173 237 152 194 137 130 187 147 186 171 171.6 Feb. 163 179 250 151 197 140 133 188 147 185 172 172.8 Mar. 165 183 251 152 197 137 131 190 148 187 173 173.6 Apr. 169 183 259 154 199 140 133 192 . 150 185 174 175.0 May 167 186 256 154 202 140 133 194 151 186 175 176.6 June 165 190 261 153 204 143 136 198 154 185 178 178.5 July 168 187 261 154 207 143 135 203 157 188 181 180.9 Aug. 177 187 264 155 211 146 138 207 160 186 183 183.2 Sept. 176 186 260 153 217 148 140 210 159 184 184 184.2 . Oct. 182 191 275 153 218 147 139 211 158 188 185 185.8 Nov. 181 188 270 153 221 150 141 207 156 188 184 185.6 Dec. 187 182 286 1.55 219 154 144 204 154 186 183 185.2
19.81: Jan. 191 180 275 157 216 .152 144 205 151 184 183 185.5 Feb. 195 184 286 1,60 221 '153 '. 145 204 153 187 184 187.3 Mar. 190 186 294 160 216 .155 ' 146 204 147 186 184 187.0 Apr. 190 183 283 163 215 160 150 206 147 187 186 189.2
QUANTUM INDEX NUMBERS (1973=c100)
Food, Industrial Manufactures Merchandise beverages materials
Machin~ry and total
and and fuels Chemicals Textiles Metals Clothing Footwear Other Total tobacco and mis- 'transport ma.tmfac-
cellaneous equipment tures metal
manufac- Electrical Year/month tures machinery Total
SITC section/ division 67, 68 Rest of (Revised 1) O&l 2, 3 &4 5 65 &69 72 7 84 85 6&8 5 to 8 0 to 9
1975 98 75 75 90 84 92 104 113 83 83 101 100.1 1976 136 90 86 111 113 132 142 138 105 115 128 130.0 1977 149 110 104 95 132 163 170 134 113 131 136 136.4 1978 158 116 113 102 133 180 194 142 124 149 150 150.5 1979 160 162 110 117 159 230 250 151 139 195 174 175.S 1980 160 247 119 122 180 283 305 156 153 236 194 194.7
1979: Apr. 183 176 107 126 163 201 222 140 141 176 163 163.6 May 163 168 111 113 156 218 236 159 136 192 175 176.1 June 163 166 98 103 140 221 239 159 136 190 173 173.7 July 163 168 118 114 185 249 268 170 135 214 190 192.4 Aug. 183 159 121 127 181 283 306 182 148 243 210 211.5 Sept. 195 153 116 122 165 266 286 155 146 228 189 191.8 Oct. 161 178 116 125 175 269 297 148 136 230 189 191.8 Nov. 149 166 120 138 166 259 283 146 164 235 190 191.4 Dec. 131 217 120 137 177 266 290 180 172 217 201 201.6
1980: Jan. 153 182 111 121 181 266 286 150 175 197 180 179.4 Feb. 114 155 77 101 150 196 217 128 127 165 148 147.3 Mar. 150 206 136 116 169 261 281 114 138 197 162 162.8 Apr. 175 246 132 131 185 275 297 149 160 221 188 189.7 May 156 288 137 113 185 289 310 173 157 254 207 208.3 June 154 417 107 117 176 284 304 175 143 255 207 209.8 July 150 219 111 109 190 285 307 175 135 259 207 207.3 Aug. 184 197 124 128 204 321 344 187 147 292 228 227.6 Sept. 157 321 135 122 184 306 330 150 132 255 198 200.0 Oct. 156 255 125 130 183 333 355 149 151 255 202 202.5 Nov. 192 251 143 132 189 291 315 142 171 253 195 195.7 Dec. 187 231 93 149 170 293 . 319 186 198 230 210 208.6
1981: Jan.· 156 276 145 126 205 301 320 193 213 234 213 210.9 Feb. 141 181 100 91 104 193 209 107 114 . 152 130 129.6 Mar. 174 274 136 129 153 303 321 147 200 . 237 193 190.6 Apr. 192 232 134 128 162 280 297 148 201 246 193 190.4
26 Hong Kong Monthly Digest of Statistics June 1981

EXTERNAL TRADE
5.15 TRADE INDEX NUMBERS FOR RE-EXPORTS
UNIT VALUE INDEX.NUMBERS (i973=100)
Food, Fuels Industrial materials Finished manufactures Merchandise beverages total
and Basic Chemi- Other semi-manufactures Total tobacco materials cals
Metal andmis- Machinery
cellaneous and metal transport
Year/month Textiles products Total equipment Other Total
SITC section/ division 67, 68 (Revised 1) 0&1 3 2&4 5 65 &69 6
2,4, 5&6 7 8 7&8 Oto9
Weights 83 9 83 114 166 24 422 619 119 166 285 1,000
1975 124 183 119 148 105 132 105 114 115 115 115 115.2 1976 145 199 124 156 108 136 102 114 109 116 114 116.1 1977 186 200 133 157 114 141 108 120 113 125 121 125.0 1978 195 185 141 167 122 159 125 -134 122 142 135 139.3 1979 223 240 166 202 145 206 157 164 139 162 154 166.6 1980 232 347 201 236 153 246 171 185 149. 166 161 182.5
1979: Apr. 220 210 155 186 142 197 154 158 131 161 150 160.6 May 224 243 160 197 141 202 155 161 138 157 151 163.6 June 225 229 168 200 146 209 161 167 141 159 153 168.0 July 228 255 165 208 148 224 163 169 144 162 156 170.4 Aug. 228 261 170 212 149 212 165 172 145 169 160 173.6 Sept, 228 271 178 215 151 212 164 173 145 168 160 174.3 Oct. 232 280 178 225 152 213 164 174 145 166 159 174.9 Nov. 236 281 183 221 151 219 163 174 144 165 158 174.8 Dec. 234 309 178 215 154 234 165 174 142 164 157 174.7
1980: Jan. 231 295 188 220 146 235 161 174 143 167 159 174.9 Feb. 229 304 188 224 145 246 162 175 144 169 160 176.1 Mar. 228 302 193 229 147 255 165 178 142 165 157 176.4 Apr. 232 318 193 225 146 239 164 177 143 168 159 176.8 May 235 337 194 229 147 240 166 180 148 165 160 178.7 June 234 347 196 230 149 240 169 182 149 166 161 180.2 July 232 333 202 236 152 234 173 186 150 162 159 181.9 Aug. 232 362 206 244 155 244 173 189 148 167 161 184.0 Sept. 233 385 207 246 156 260 177 191 151 163 161 186.0 Oct. 231 408 215 246 157 250 177 193 153 166 163 187.8 Nov. , 234 406 216 257 161 244 178 196 152 166 162 189.1 Dec. 233 399 213 254 160 269 181 196 158 167 166 190.6
1981: Jan. 243 389 213 243 166 256 180 195 156 172 168 191.0 Feb. 251 410 219 251 164 257 179 195 160 176 172 192.3 Mar. 247 442 222 252 167 240 177 195 161 177 173 192.S Apr. 256 444 219 268 167 228 177 196 162 177 173 194.1
QUANTUM INDEX NUMBERS (1973=100)
Food, Fuels Industrial materials Finished manufactures Merchandise beverages total
and Basic Chemi- Other semi-manufactures Total tobacco materials cals
Metal and mis- Machinery
cellaneous and metal transport
Year/month Textiles products Total equipment Other Total
SITC section/ division 67,68 2,4, (Revised 1) 0&1 3 2&4 5 65 &69 6 5&6 7 8 7&8 0 to 9
1975 91 89 86 8·1 70 110. 78 81 116 119 118 92.8 1976 131 108 138 100 82 113 95 104 143 139 140 117.8 1977 90 144 125 108 97 130 97 104 188 150 164 120.5 1978 92 188 157 127 137 178 125 131 238 171 194 145.2 1979 116 176 181 146 176 267 149 154 351 241 280 184.2 1980 136 169 224 159 259 367 185 187 566 378 446 252.6
1979: Apr. 105 212 204 157 175 257 147 159 350 215 262 181.6 May 100 315 167 162 172 260 151 158 335 250 280 186.1 June 105 329 208 142 160 282 151 159 370 '254 296 191.0 July 95 186 164 134 171 197 132 139 377 262 303 178.5 Aug. 134 147 163 159 157 280 138 148 379 250 296 186.2 Sept. 128 140 182 147 172 230 138 148 352 252 287 182.9 Oct. 125 136 189 136 183 263 147 152 363 267 301 188.9 Nov. 117 120 210 150 201 393 166 171 431 298 345 210.7 Dec. 111 99 200 147 188 296 152 160 408 286 329 199.1
1980: Jan. 138 151 257 161 164 555 169 182 403 280 324 215.3 Feb. 84 113 203 145 144 366 156 162 354 258 291 186.7 Mar. 140 145 250 167 237 418 181 190 436 310 354 229.5 Apr. 144 241 227 181 216 350 170 183 564 326 412 239.4 May 131 292 240 168 285 280 186 191 611 397 475 260.1 June 114 189 209 162 269 268 181 183 547 370 434 242.7 July 107 141 179 146 267 272. 166 165 586 404 470 245.0 Aug. 163 188 207 163 291 377. 192 189 627 418 493 269.4 Sept. 140 199 230 138 286 300 192 .187 745 410 535 275.1 Oct. 141 142 184 173 309 387 203 195 611 440 501 283.9 Nov. 145 127 240 146 312 463 213 204 601 455 506 285.4 Dec. 183 99 270 162 336 368 215 213 719 469 561 301.1
1981: Jan. 172 134 399 184 384 456 249 258 700 408 516 320.5 Feb. 156 107 272 156 302 313 189 196 693 394 505 275.3 Mar. 162 174 316 189 387 421 · 240 242 756 446 560 317.7 Apr. 176 214 354 161 363 432 236 239 784 419 555 315.3
Hong Kong Monthly Digest of Statistics lune 1'981 27

EXTERNAL TRADE
5.16 TRADE INDEX NUMBERS FOR MAIN SUPPLIERS OF IMPORTS
(1973=100)
Unit value index Quantum index
United United Year/month China U.S.A. Japan Kingdom Taiwan China U.S.A. Japan Kingdom Taiwan
1975 121 120 116 138 107 100 89 103 72 108 1976 121 130 124 142 117 114 111 129 75 155 1977 128 133 127 153 115 112 124 155 83 168 1978 134 140 142 171 119 140 145 173 101 212 1979 152 165 168 205 149 177 170 196 124 240 1980 170 182 178 236 162 229 196 246 134 292
1979: Apr. 146 157 164 195 144 162 162 193 145 236 May 148 161 168 198 147 178 177 198 145 229 June 151 165 171 203 150 168 171 204 107 257 July 153 168 173 207 153 175 209 193 143 216 Aug. 156 172 173 212 156 180 179 194 155 227' Sept. 157 173 173 214 156 185 161 203 128 240 Oct. 159 174 173 218 157 209 183 215 124 256 Nov. 160 177 172 222 157 205 183 203 143 268 Dec. 161 179 173 223 158 226 164 230 100 300
1980: Jan. 161 179 172 225 158 216 158 191 136 263 Feb. 163 179 171 227 158 162 172 203 84 209 Mar. 164 178 171 229 157 201 194 250 123 294 Apr. 165 179 172 230 158 216 197 251 164 304 May 166 180 174 231 160 228 272 253 126 305 June 168 182 176 234 162 224 180 236 140 265 July 170 183 178 236 162 211 229 244 122 258 Aug. 173 184 180 238 164 238 200 252 144 297 Sept. 175 186 183 241 165 249 168 245 130 275 Oct. 176 186 185 245 164 251 176 257 139 303 Nov. 177 186 186 247 166 275 192 268 170 345 Dec. 178 189 186 248 165' 278 214 304 140 392
1981: Jan. 179 194 189 251 168 265 187 244 131 387 Feb. 181 \98 193 254 173 175 165 267 110 304 Mar. 182 201 197 260 176 275 191 282 154 358 Apr. 183 206 200 264 177 265 193 283 116 350
5.17 TRADE INDEX NUMBERS FOR MAIN MARKETS OF DOMESTIC EXPORTS
(1973=100)
Unit value index Quantum index
United P.R. of United P.R. of Year/month U.S.A. Kingdom Germany U.S.A. Kingdom Germany
1975 118 109 121 91 90 124
1976 129 124 142 127 94 148
1977 132 124 150 150 87 129
1978 138 134 159 161 103 146
1979 160 161 187 172 132 178
1980 175 183 205 189 132 189
i 1979,: Apr. 153 152 178 152 141 157
May 156 156 181 181 140 166 June 160 160 185 181 123 171 July 163 163 189 198 127 186 Aug. 165 167 193 210 156 226 Sept. 166 169 196 193 137 181 Oct. 167 171 197 196 134 179 Nov. 167 173 197 181 139 190 Dec. 167 173 197 185 152 239
1980: Jan. 167 174 196 160 130 204 Feb. 167 174 197 141 102 160 Mar. 168 176 198 157 104 154 Apr. 169 178 199 187 138 171 May 171 179 201 218 132 185 June 173 181 203 218 148 202 July 176 184 206 219 123 209 Aug. 178 186 209 229 144 232 Sept. 180 189 210 197 129 175 Oct. 182 191 213 196 136 177 Nov. 184 189 213 171 136 181 Dec. 184 188 210 177 164 225
1981: Jan. 185 188 210 211 126 201 Feb. 185 189 212 121 73 116 Mar. 183 187 214 179 146 162 Apr. 1.86 189 212 191 132 135
28 Hong Kong Monthly Digest of Statistics· June 1981

SECTION 6 FOOD SUPPLIES
6.1 RICE
Tonne
Stock at Year/month Intakes Off-takes. end of period
1975 333,980 339,782 68,228
1976 347,724 342,678 73,275
1977 327,021 337,259 63,037
1978 334,752 328,118 69,671'
1979 346,266 354,219' 61,718
1980 357,047 351,919 66,846
1979: ·May 23,326 24,072 69,361 June 18,109 19,462 68,008 July 28,178 31,759 64,427 Aug. 21,900 27,339 58,988 Sept. 29,756 29,171 59,573 Oct. 36,751 32,451 63,873 Nov. 29,499 29,504 63,868 Dec. 30,946 '33,096 61,718
1980: Jan. 36,583 35,395 62,906 Feb. 31,315 23,351 70,870 Mar. 39,246 31,315 78,801 Apr. 22,823 29,312 72,312 May 24,379 24,550 72,141 June 29,021 30,868 70,294 July 28,254 25,052 73,496 Aug. 22,065 24,747 70,814 Sept. 34,902 31,853 73,863 Oct. 24,814 27,498 71,179 Nov; 25,122 30,778 65,523 Dec. 38,523 37,200 66,846
1981: Jan. 31,056 32,345 65,557 Feb. 29,714 22,012 73,259 Mar. 36,956 35,166 75,049 tt.,r· 29,650 23,235 81,464
ay 18,828 27,940 72,352
6.2 OTHER FOODSTUFFS
Live animals slaughtered Supplies of fresh vegetables Supplies offresh fish (head) (fonne) (tonne)
Locally Fresh-Goats/ grown Imported water Marine
Year/month Cattle Swine sheep Total vegetables vegetables Total fish fish Total
1975 200,183 2,986,690 20,038 3,206,911 109,843 249,572 359,415 31,447 96,633 128,080
1976 196,393 3,196,448 16,196 3,409,037 117,558 268,947 386,505 42,336 98,919 141,255
1977 198,065 3,254,508 16,973 3,469,546 170,654 271,083 441,737 41,057 97,195 138,252
1978 200,425 3,457,789 16,622 3,674,836 152,482 300,145 452,627 41,324 96,660 137,984
1979 225,594 3,412,898 16,108 3,654,600 177,945 325,237 503,182 50,799 95,073 145,872
1980 235,622 3,436,059 18,451 3,690,132 193,447 347,120 540,567 52,905 91,779 144,684
1979: May 17,030 286,647 321 303,998 16,755 20,648 37,403 5,207 8,545 13,752 June 19,924 272,795 334 293,053 15,500 37,159 52,659 4,197 8,501 12,698 July 20,420 285,117 260 305,797 15,659 32,596 48,255 3,065 7,768 10,833 Aug. 20,753 296,324 287 317,364 8,588 23,920 32,508 3,159 6,720 9,879 Sept. 20,007 299,439 387 319;833 9,811 22,901 · 32,712 4,194 6,678 10,872 Oct. 21,708 307,538 1,571 330,817 13,993 30,168 44,161 5,417 7,917 13,334 Nov. 20,714 269,402 3,698 293,814 16,616 30,290 46,906 6,264 7,829 14,093 Dec. 21,894 293,946 3.593 319,433 17,171 31,227 48,398 5,604 8,401 14,005
1980: Jan. 22,892 300,370 4,344 327,606 17,714 32,425 50,139 4,421 8,443 12,864 Feb. 15,909 260,486 2,567 278,962 15,729 22,006 37,735 3,196 5,217 8,413 Mar. 19,117 295,749 630 315,496 14,979 33,523 48,502 3,185 8,945 12,130 Apr. 19,339 291,686 366 311,391 19,099 26,462 45,561 3,469 8,223 11,692 May 20,979 312,069 317 333,365 18,564 24,983 43,547 4,576 7,980 12,556 June 19,047 260,956 149 280,152 18,419 29,375 47,794 3,825 6,855 10,680 July 18,613 266,922 67 285,602 18,100 28,489 46,589 4,583 6,883 11,466 Aug, 17,922 291,007 400 309,329 13,196 30,191 43,387 4,073 7,223 11,296 Sept. 20,305 284,812 773 305,890 10,747 28,747 39,494 4,478 7,472 11,950 Oct. 20,725 293,602 1,351 315,678 14,505 29,400 43,905 4,925 8,347 13,272 Nov. 20,489 283,066 3,082 306,637 14,9'66 32,217 47,183 6,510 7,754 14,264 Dec. 20,285 295,334 4,405 320,024 17,429 29,302 46,731 5,664 8,437 14,101
1981: Jan. 20,818 307,908 3,855 332,581 22,717 32,075 54,792 6,151 9,010 15,161 Feb. 14,646 219,146 654 234,446 21,372 16,193 . 37,565 5,513 4,712 10,225 Mar. 17,247 293,370 486 311,103 13,924 25,050 38,974 3,658 8,966 12,624 Apr. 18,336 284,006 373 302,715 19,003 25,491 44,494 3,517 7,828 11,345 May 18,504 297,517 365 316,386 19,924 23,902 43,826 3,110 7,952 11,062
'Hong iMong Monthly Digest of 'Statistics · l:Une -198.l ''29
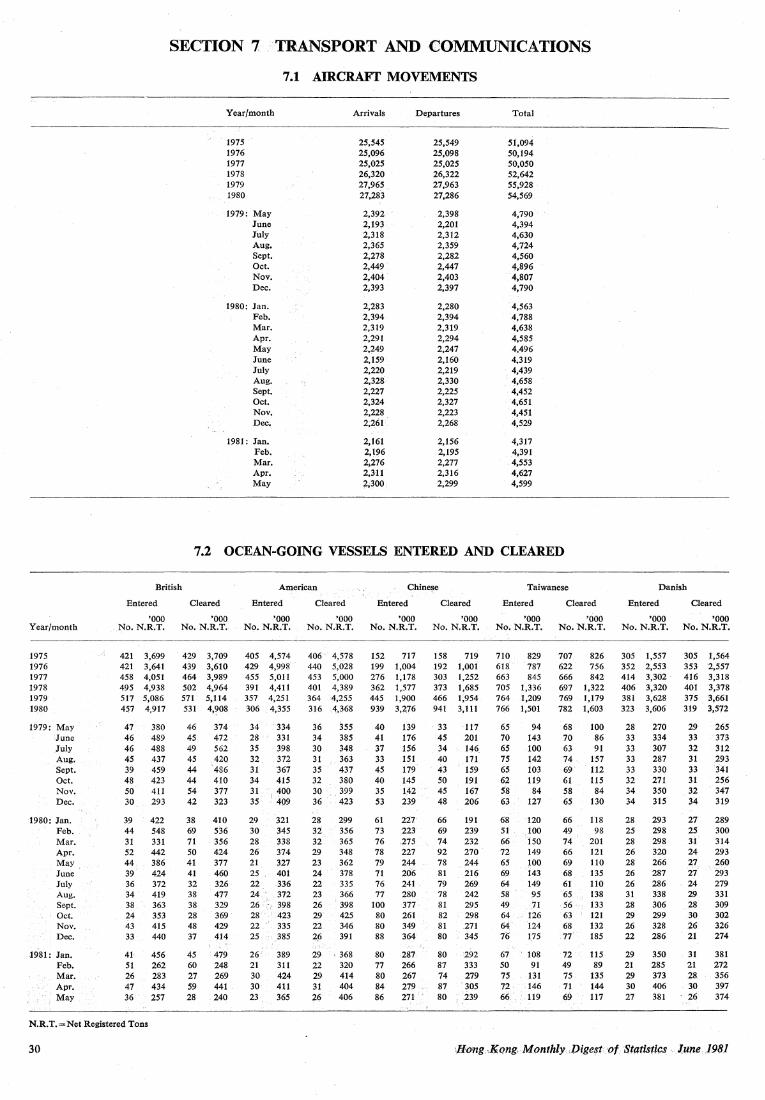
Year/month
1975 1976 1977 1978 1979 1980
1979: May June July Aug. Sept. Oct. Nov. Dec.
1980: Jan. Feb. Mar. Apr. May June ,
July Aug. Sept. Oct. Nov. Dec.
1981: Jan. Feb. Mar. Apr. May
SECTION 7 TRANSPORT AND COMMUNICATIONS
British
Entered
Year/month
1975 1976 1977 1978 1979 1980
1979: May June July Aug. Sept. Oct. Nov. Dec.
1980: Jan. Feb. Mar. Apr. May June July Aug. Sept. Oct. Nov. Dec.
1981: Jan. Feb. Mar. Apr. May
7.1 AIRCRAFT MOVEMENTS
Arrivals
25,545 25,096 25,025 26,320 27,965 27,283
2,392 2,193 2,318 2,365 2,278 2,449 2,404 2,393
2,283 2,394 2,319 2,291 2,249 2,159 2,220 2,328 2,227 2,324 2,228 2,261
2,161 2,196 2,276 2,311 2;300
Departures
25,549 25,098 25,025 26,322 27,963 27,286
2,398 2,201 2,312 2,359 2,282 2,447 2,403 2,397
2,280 2,394 2,319 2,294 2,247 2,160 2,219 2,330 2,225 2,327 2,223 2,268
2,156 2,195 2,277 2,316 2,299
Total
51,094 50,194 50,050 52,642 55,928 54,569
4,790 4,394 4,630 4,724 4,560 4,896 4,807 4,790
4,563 4,788 4,638 4,585 4,496 4,319 4,439 4,658 4,452 4,651 4,451 4,529
4,317 4,391 4,553 4,627 4,599
7.2 OCEAN-GOING VESSELS ENTERED AND CLEARED
American Chinese Taiwanese
Cleared Entered Cleared Entered Cleared Entered Cleared
Danish
Entered Cleared
'OOO 'OOO 'OOO 'OOO 'OOO 'OOO 'OOO 'OOO '000 '000 No. N.R.T. No. N.R.T. No. N.R.T. No. N.R.T. No. N.R.T. No. N.R.T. No. N.R.T. No. N.R.T. No. N.R.T. No. N.R.T.
421 3,699 421 3,641 458 4,051 495 4,938 517 5,086 457 4,917
47 380 46 489 46 488 45 437 39 459 48 423 50 411 30 293
39 422 44 548 31 331 52 442 44 386 39 424 36 372 34 419 38 363 24 353 43 415 33 440
41 456 51 262 26 283 47 434 36 257
429 3,709 439 3,610 464 3,989 502 4,964 571 5,114 531 4,908
46 374 45 472 49 562 45 420 44 486 44 410 54 377 42 323
38 410 69 536 71 356 50 424 41 377 41 460 32 326 38 477 38 329 28 369 48 429 37 414
45 479 60 248 27 269 59 441 28 240
405 4,574 429 4,998 455 5,011 391 4,411 357 4,251 306 4,355
34 334 28 331 35 398 32 372 31 367 34 415 31 ' 400 35 . 409
29 321 30 345 28 338 26 374 21 327 25 401 22 336 24 372 26 398 28 423 22 335 25 385
26' 389 21 311 30 424 30 411 23 365
406 4,578 440 5,028 453 5,000 401 4,389 364 4,255 316 4,368
36 355 34 385 30 348 31 363 35 437 32 380 30 399 36 423
28 299 32 356 32 365 29 348 23 362 24 378 22 335 23 366 26 398 29 425 22 346 26 391
29 ' 368 22 320 29 414 31 404 26 406
152 717 199 1,004 276 1,178 362 1,577 445 1,900 939 3,276
40 139 41 176 37 156 33 151 45 179 40 145 35 142 53 239
61 227 73 223 76 275 78 227 79 244 71 206 76 241 77 280
100 377 80 261 80 349 88 364
80 287 77 266 80 267 84 279 86 271
158 719 192 1,001 303 1,252 373 1,685 466 1,954 941 3,111
33 117 45 201 34 146 40 171 43 159 50 191 45 167 48 206
66 191 69 239 74 232 92 270 78 244 81 216 79 269 78 242 81 295 82 298 81 271 80 345
80 292 87 333 74 279 87 305 80 239
710 829 618 787 663 845 705 1,336 764 1,209 766 1,501
65 70 65 75 65 62 5'3 63
68 51 66 72 65 69 64 58 49 64 64. 76
67 50 75 72 66
94 143 100 142 i03 119
84 127
120 100 150 149 100 143 149 95 71
126 124 175
108 91
131 146 119
707 826 622 756 666 842 697 1,322 769 1,179 782 1,603
68 100 70 86 63 91 74 157 69 112 61 115 58 84 65 130
66 118 49 98 74 201 66 121 69 110 68 135 61 110 65 138 56 . 133 63 121 68 132 77 185
72 115 49 89 75 135 71 144 69 117
305 1,557 352 2,553 414 3,302 406 3,320 381 3,628 323 3,606
28 270 33 334 33 307 33 287 33 330 32 271 34 350 34 315
28 293 25 298 28 298 26 320 28 266 26 287 26 286 31 338 28 306 29 299 26 328 22 286
29 350 21 285 29 373 30 406 27 381
305 1,564 353 2,557 416 3,318 401 3,378 375 3,661 319 3,572
29 265 33 373 32 312 31 293 33 341 31 256 32 347 34 319
27 289 25 300 31 314 24 293 27 260 27 293 24 279 29 331 28 309 30 302 26 326 21 274
31 381 21 272 28 356 30 397 26 374
N.R.T.=Net Registered Tons
30 '!long, .lfqng. Monthly JJigest. of. Stqtistics 1,une . } 981

Year/month
1975 1976 1977 1978 1979 1980
1979: May June July Aug. Sept. Oct. Nov. Dec.
1980: Jan. Feb. Mar. Apr. May June July Aug. Sept. Oct. Nov. Dec.
1981: Jan. Feb. Mar. Apr. May
Year/month
1975 1976 1977 1978 1979 1980
1979: May June July Aug. Sept. Oct. Nov. Dec.
1980: Jan. Feb. Mar. Apr. May June July Aug. Sept. Oct. Nov. Dec.
1981: Jan. Feb. -Mar. Apr. May
TRANSPORT
Dutch German Greek Japanese Liberian
Entered Cleared Entered Cleared Entered Cleared Entered Cleared Entered Cleared
'OOO '000 '000 'OOO 'OOO 'OOO '000 'OOO 'OOO 'OOO No. N.R.T. No. N.R.T. No. N.R.T. No. N.R.T. No. N.R.T. No. N.R.T. No. N.R.T. No. N.R.T. No. N.R.T. No. N.R.T.
256 1,443 224 1,328 249 1,801 238 1,908 230 2,170 212 2,137
21 217 18 191 20 183 19 179 16 135 21 220 20 147 19 177
15 130 15 113 22 203 18 136 19 210 17 112 19 243 12 113 22 258 20 208 13 185 20 226
16 195 13 181 20 216 15 155 16 228
259 1,443 224 1,316 247 1,811 234 1,881 228 2,094 212 2,123
19 226 17 154 19 179 19 174 19 143 20 219 20 112 20 206
14 124 16 144 25 205 16 131 20 214 15 95 21 252 13 148 21 221 18 199 15 193 18 198
17 196 14 182 20 218 14 151 17 233
Norwegian
Entered Cleared
214 173 166 170 180 253
1,604 1,599 1,231 1,443 2,301 2,174
17 234 10 129 18 233 13 206 14 166 16 213 17 251 17 185
19 211 19 113 20 232 20 150 21 115 22 157 21 199 27 242 20 183 23 208 20 149 21 21,;;
20 124 22 232 26 256 20 229 22 209
213 176 167 166 180 255
1,608 1,604 1,230 1,396 2,312 2.100
16 196 13 182 18 260 11 164 17 214 14 173 17 256 18 192
19 2~0 17 96 21 241 21 157 22 131 20 127 21 196 28 250 19 163 24 208 20 112 23 209
20 119 21 234 25 233 19 180 21 188
Panamanian
Entered Cleared
231 153 136 201 201 192
1,068 831 810
1,577 1,630 1,402
17 126 13 81 17 156 15 147 17 119 21 149 13 112 18 136
12 76 10 57 16 90 19 113 16 116 14 -88 15 113 18 137 19 166 19 153 15 114 19 179
9 101 10 82 17 154 14 136 11 76
233 158 137 199 197 188
17 16 16 14 18 20 14 18
11 11 14 19 17 13 12 18 15 19 19 20
7 11 18 15 11
Singaporean
1,030 1,000 3,743 3,866 4,300 4,631 4,440 4,380
851 923 823 980
1,558 1,012 1,588 972 1,381 985
124 103 153 144 124 142 118 132
71 60 84
111 126 88 87
133 138 146 153 182
54 114 162 143 82
83 452 80 347 78 379 68 322 75 285 69 290 78 290 95 463
89 363 76 377 64 241 90 462 80 463 83 429 68 273 88 355 87 310 87 379 84 332 89 395
88 332 70 302 92 445 94 394 73 418
1,009 930 972 995 983 977
3,770 3,876 4,307 4,640 4,438 4,366
79 410 92 402 72 349 68 293 79 324 72 311 79 263
101 480
83 346 81 390 70 260 86 436 80 458 78 423 68 274 88 355 81 304 88 382 86 364 88 374
90 335 72 322 85 416 93 392 80 439
Others
Entered Cleared Entered Cleared
784 902 936 973
1,022 958
3,516 4,065 4,282 4,805 5,061 5,824
96 506 85 427 91 493 76 359 73 366 82 441 96 473 82 343
86 402 60 318 74 381 89 473 86 473 85 615 93 603 78 454 84 497 77 588 77 541 69 479
95 564 64 404 70 432 69 448 77 557
771 899 930 966
1,021 957
3,324 4,085 4,242 4,853 5,000 5,814
89 478 89 444 90 520 75 359 77 351 82 415 92 466 91 373
85 404 60 328 79 388 83 474 87 465 84 623 88 538 83 494 80 482 75 539 83 593 70 487
86 510 66 384 73 487 72 460 77 564
Total
Entered Cleared
'OOO '000 'OOO 'OOO 'OOO '000 'OOO 'OOO 'OOO 'OOO No. N.R.T. No. N.R.T. No. N.R.T. No. N.R.T. No. N.R.T. No. N.R.T. No. N.R.T. No. N.R.T. No. N.R.T. No. N.R.T.
192 1,036 174 1,118 175 1,395 172 1,458 143 1,399 122 1,325
10 96 12 128 11 56 12 139 12 81 14 165 12 113 14 164
9 100 7 56
15 178 13 211 11 100 11 110 9 75 8 110 8 64
11 122 9 80
11 119
10 109 7 59
14 213 8 65
12 155
190 170 164 164 145 123
1,036 1,315 3,579 1,340 3,609 1,100 1,997 4,958 2,093 5,293 1,368 2,427 6,834 2,465 7,006 1,424 2,559 7,613 2,549 7,628 1,412 2,645 8,298 2,653 8,339 1,373 2,680 9,422 2,707 9,552
9 88 220 685 222 703 13 134 212 660 230 730 9 50 216 712 212 695
13 139 233 694 220 659 12 81 226 708 239 733 14 165 238 693 228 680 12 113 217 667 222 688 14 164 236 739 235 756
9 112 225 748 231 757 7 56 195 622 190 603
15 178 204 637 223 754 13 211 227 825 214 725 11 100 216 741 216 748 10 96 227 859 228 871 10 89 225 849 213 838 8 110 217 800 242 889 8 64 256 883 241 829
11 122 241 862 236 843 9 80 219 754 233 839
12 155 228 841 240 856
10 109 221 762 212 734 9 101 197 745 200 776
11 119 240 830 235 787 8 65 236 821 231 837
12 155 242 929 251 956
252 875 225 902 305 1,588 360 1,929 462 2,449 504 2,979
44 43 43 34 32 37 44 42
39 35 36 42 46 30 42 42 49 46 45 52
41 40 46 51 40
242 222 187 198 183 230 217 298
193 196 196 232 313 173 273 261 297 274 257 313
254 244 289 290 257
258 890 1,169 4,536 231 927 1,281 4,954 307 l,610 1,276 6,178 352 1,890 1,392 7,076 453 2,414 1,491 7,650 503 2,963 1,532 8,353
41 45 36 38 30 37 42 43
38 38 36 41 45 33 39 41 47 48 49 48
39 39 44 51 43
212 240 166 210 178 231 207 285
203 214 213 221 277 186 258 256 289 270 291 286
252 225 279 279 273
126 119 121 120 117 125 142 141
145 113 121 134 140 141 124 121 139 110 120 124
147 114 144 141 139
602 668 577 630 619 674 751 668
727 528 655 733 747 752 682 700 803 664 700 662
839 581 750 811 742
1,170 4,514 7,406 32,776 7,448 32,619 1,205 4,639 8,071 36,604 8,132 36,643 1,277 6,124 8,916 42,806 8,968 42,922 1,397 7,074 9,436 48,021 9,396 48,082 1,495 7,635 9,810 51,472 9,900 51,395 1,529 8,358 10,229 55,650 10,340 55,593
124 576 127 772 114 540 118 623 119 597 121 665 135 738 152 722
140 724 111 528 135 711 121 660 147 773 129 726 124 717 128 704 138 759 113 656 123 738 120 661
144 807 115 588 141 763 145 809 145 792
848 4,379 810 4,327 831 4,425 808 4,262 795 4,099 839 4,449 847 4,406 879 4,555
864 4,334 753 3,894 801 4,205 906 4,846 872 4,601 860 4,757 840 4,694 835 4,677 925 4,976 859 4,921 837 4,664 877 5,081
890 4,871 757 4,043 909 5,063 911 5,025 870 4,961
828 4,226 869 4,676 794 4,371 797 4,170 834 4,278 826 4,354 852 4,334 917 4,712
855 4,258 775 3,947 900 4,503 875 4,584 883 4,644 851 4,717 814 4,568 882 4,892 879 4,716 864 4,881 882 4,865 880 5,017
882 4,752 786 4,190 885 4,916 926 5,007 886 5,059
N.R.T.=Net Registered Tons
Hong Kimg Monthly Digest of Statistics lune 1981 31
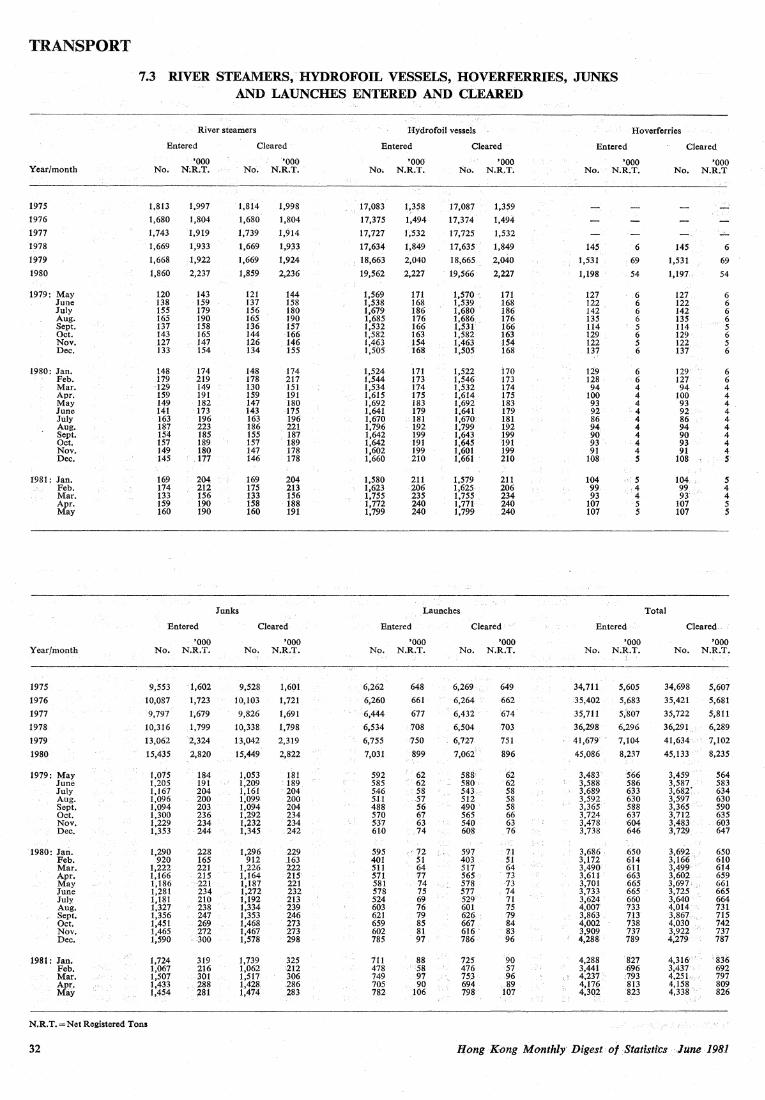
TRANSPORT
Year/month
1975
1976
1977
1978
1979
1980
1979: May June Ju1y Aug. Sept. Oct. Nov. Dec.
1980: Jan. Feb. Mar. Apr. May June July Aug. Sept. Oct. Nov. Dec.
1981: Jan. Feb. Mar. Apr. May
Year/month
1975
1976
1977
1978
1979
1980
1979: May June July Aug. Sept. Oct. Nov. Dec.
·1980: Jan. Feb. Mar. Apr. May June July Aug, Sept. Oct. Nov. Dec.
1981: Jan. Feb. Mar. Apr. May
7.3 RIVER STEAMERS, HYDROFOIL VESSELS, HOVERFERRIES, JUNKS AND LAUNCHES ENTERED AND CLEARED
River steamers Hydrofoil vessels Hoverferries
Entered
'OOO No. N;R.T.
1,813
1,680
1,743
1,669
1,668
1,860
120 138 155 165 137 143 127 133
148 179 ·129 159 149 141 163 187 154 157 149 145
169 174 133 159 160
1,997
1,804
1,919
1,933
1,922
2,237
143 159 179 190 158 165 147 154
174 219 149 191 182 173 196 223 185 189 180 177
204 212 156 190 190
Entered
'OOO No. N.R.T.
9,553 · 1,602
10,087 1,723
9,797 1,679
10,316 1,799
13,062 2,324
15,435 2,820
1,075 184 1,205 191 1,167 204 1,096 200 1,094 203 1,300 236 1,229 234 1,353 244
1,290 228 920 165
1,222 221 1,166 215 1,186 221 1,281 234 1,181 210 1,327 238 1,356 247 1,451 269 1,465 272 1,590 300
1,724 319 1,067 216 1,507 301 1,433 288 1,454 281
Cleared
'OOO No. N.R.T.
1,814
1,680
1,739
1,669
1,669
1,859
121 137 156 165 136 144 126 134
148 178 130 159 147 143 163 186 155 157 147 146
Junks
169 175 133 158 160
1,998
1,804
1,914
1,933
1,924
2,236
144 158 180 190 157 166 146 155
174 217 151 191 180 175 196 221 187 189 178 178
204 213 156 188 191
Cleared
'OOO No. N.R.T.
Entered
'OOO No. N.R.T.
17,083
17,375
17,727
17,634
18,663
19,562
1,569 1,538 1,679 1,685 1,532 1,582 J,463 1,505
1,524 1,544 J,534 1,615 J,692 1,641 1,670 1,796 1,642 1,642 1,602 1,660
1,580 1,623 1,755 1,772 1,799
1,358
1,494
1,532
1,849
2,040
2,227
171 168 186 176 166 163 154 168
171 173 174 175 183 179 181 192 199 191 199 210
211 206 235 240 240
Cleared
'OOO No. N.R.T.
17,087
17,374
1,359
1,494
17, 725 1,532
17,635 1,849
18,665 ~.040
19,566 2,227
1,570 ' 1,539 1,680 1,686 1,531 1,582 1,463 1,505
1,522 l,546 1,532 1,614 1,692 1,641 1,670 1,799 1,643 1,645 1,601 1,661
1,579 1,625 1,755 1,771 1,799
171 168 186 176 166 163 154 168
170 173 174 175 183 179 181 192 199 '191 199 210
211 206 234 240 240
Launches
Entered
'000 No. N.R.T.
Cleared
'OOO No. N.R.T.
----------:----·~--. ------------~-
9,528
10,103
9,826
10,338
13,042
15,449
1,053 1,209 1,161 1,099 1,094 1,292 1,232 1,345
1,296 912
1,226 1,164 1,187 1,272 1,192 1,334 1,353 1,468 1,467 1,578
1,739 1,062 1,517 1,428 1,474
1,601
1,721
1,691
1,798
2,319
2,822
181 189 204 200 204 234 234 242
229 163 222 215 221 232 213 239 246 273 273 298
325 212 306 286 283
6,262
6,260
6,444
6,534
6,755
7,031
592 585 5.46. 511 488 570 537 610
595 401 511 571 581 578 524 603 621 659 602 785
711 478 749 705 782
648
661
677
708
750
899
62 . 62
58 57 56 67 63 74
. 72 51 64 77 74 75 69 76 79 85 81 97
88 58 97 90
106
6,269
6,264
6,432
6,504
6,727
7,062
588 580 543 512 490 565 540 608
597 403 517 565 578 577 529 601 626 667 616 786
725 476 753 694 798
649
662
674'
703
751
896
62 62 58 58 58 66 63 76
71 51 64 73 73 74 71 75 79 84 83 96
90 57 96 89
107
Entered
'OOO No. N.R.T.
145
1,531
1,198
127 122 142 135 114 129 122 137
129 128 94
100 93 92 86 94 90 93 91
108
104 99 93
107 107
6
69
54
6 6 6 6 5 6 5 6
6 6 4 4 4 4 4 4 4 4 4 5
5 '4 4 5 5
Entered
'OOO No. N.R.T.
34,711
35,402
35, 711
36,298
41,679
45,086
3,483 3,588 3,689 3.592 3;365 3,724 3,478 3,738
3,686 3,172 3,490 3,611 3,701 3,733 3,624 4,007 3,863 4,002 3,909 4,288
4,288 3,441 4,237 4,176 4,302
5,605
5,683
5,807
6,296
7,104
8,237
'566 586 633 630 588 637 604 646
650 614 611 663 665 665 660 733 713 738 737 789
827 696 793 813 823
Cleared
'000 No. N.R.T
Total
145
1,531
1,197
127 122 142 135 114 129 122 137
129 127 94
100 93 92 86 94 90 93 91
108
104 99 93
107 107
6
69
54
6 6 6 6 5 6 5 6
6 6 4 4 4 4 4 4 4 4 4 s
5 4 4 5 5
Cleared,
'OOO No. N.R.T.
34,698
35,421
35,722
36,291
41,634
45,133
3,459 3,587 3,682' 3,597 3,365 3,712 3,483 3,729
3,692 3,166 3,499 3,602 3,697. 3,725 3,640 4,014 3,867 4,030 3,922 4,279
4,316 3,437 4,251 4,158 4,338
5,607
5,681
5;811
6,289
7,102
8,235
564 583 634 630 590 635 603 647
650 610 614 659 661 665 664 731 715 742 737 787
, 836 692 797 809 826
N.R.T.=NetRegistered Tons
32 [fang Kong Mqnthly· Digest of Statistics June 1981

TRANSPORT
7.4 KOWLOON-CANTON RAILWAY TRAFFIC
(A) BRITISH SECTION
Passengers carried Revenue ($'000)
Upward' Downward Adver·
Passenger Passenger Passenger Goods tising Miscel· Year/month Persons kilometres Persons kilometres tickets tickets charges Rents laneous Total
1975 6,843,037 141,339,864 6,608,789 137,851,207 17,412.0 17,093.3 748.2 763.5 53.9 36,070.9
1976 6,328,692 127,314,949 6,161,970 123,875,384 15,906.2 16,313.1 1,380.5 1,525.0 29.3 35,154.1 1977 6,927,882 140,373,790 6,868,499 138,835,584 18,435.3 17,105.9 1,212.5 1,596.6 53.6 38,403.9 1978 7,997,403 162,039,054 7,837,276 162,159,025 21,843.4 21,028.4 198.9 1,972.0 68.2 45,111.2 1979 9,013,277 193,810,821 8,989,050 197,584,332 24,262.1 27,201.1 146.1 2,221.1 82.1 53,912.5
1980 9,194,531 191,139,816 ·9,257,517 212,260,542 31,661.8 33,352.6 78.2 2,547.0 100.3 67,739.9
1979: May 673,076 13,124,717 677,735 13,554,572 1,461.0 2,367.4 15.3 185.0 6.3 4,035.0 June 664,661 13,944,777 642,801 13,609,218 1,515.9 2,483.4 13.8 193.7 2.4 4,209.1 July 789,876 17,013,327 771,671 17,161,631 1,864.0 2,792.2 13.9 173.8 10.1 4,854.0 Aug. 757,014 15,315,258 760,869 16,679,293 1,749.9 2,489.6 13.6 180.5 34.8 4,468.4 Sept. 634,066 12,525,366 608,138 12,660,655 1,689.8 2,558.0 II.I 192.2 3.1 4,454.2 Oct. 812,809 19,540,282 811,262 20,287,134 2,236.1 2,615.9 13.0 192.2 5,057.2 Nov. 774,047 16,244,857 765,444 J6,671,807 2,067.8 2,616.6 5.1 207.8 4,897.3 Dec. 869,352 18,793,659 854,116 19,090,232 2,387.5 2,302.4 3.9 243.6 16.0 4,953.4
1980: Jan. 717,854 14,026,821 731,452 15,359,664 1,936.9 2,509.9 4.0 193.5 4,644.2 Feb. 877,252 20,649,552 881,470 21,796,202 2,594.6 1,780.4 4.0 182.9 1.9 4,563.7 Mar. 826,175 15,427,989 844,228 18,747,497 2,332.1 2,579.1 4.4 251.1 3.9 5,170.6 Apr. 890,349 19,712,774 946,059 22,226,957 3,375.7 2,545,2 4.9 197.5 4.7 6,128.0 May 710,866 14,328,360 715,499 15,349,557 2,554.7 3,315.5 6.4 198.4 4.2 6,079.1 June 694,581 14,512,926 691,273 15,611,635 2,544.0 3,006.7 7.0 199.5 3.6 5,760.7 July 711,140 15 175,369 699,434 16,078,108 2,628.2 3,087.8 11.6 217.1 2.9 5,947.6 Aug. 741,777 15,935,218 765,822 18,030,456 2,859.1 3,058.3 11.6 199.5 11.6 6,140.0 Sept. 719,075 13,342,685 618,177 14,808,289 2,385.I 2,931.8 7.4 239.0 5.9 5,569.2 Oct. 771,965 15,890,577 785,308 18,013,151 2,786.8 2,870.8 6.2 206.3 21.9 5,892.0 Nov. 751,250 15,181,625 777,184 16,818,171 2,720.2 2,822.3 6.2 245.4 9.7 5,803.8 Dec. 782,247 16,955,920 801,611 19,420,855 2,944.4 2,844.7 4;g 216.9 30.0 6,040.8
1981: Jan. 708,034 11,513,132 609,317 17,178,808 2,406.7 2,795.0 14.4 363.5 t 5,579.5 Feb. 796,323 18,936,179 847;079 21,921,534 3,208.0 2,121.3 17.8 246.8 25.7 5,619.4 Mar. 735,855 16,224,350 759,202 18,287,724 2,822.2 3,254.4 21.4 355.7 28.7 6,482.4 Apr. 730,485 16,621,893 759,761 18,961,342 2,844.6 2,684.8 23.4 537.8 4.0 6,094.6 May 597,366 12,287,530 614,961 14,323,684 2,270.8 3,059.6 18.3 421.6 150.4 5,920.7
t Less than $50.
(B) THROUGH TRAIN
Passengers carried• Revenue ($'000)
Upward Downward
Passenger Passenger Passenger Goods Year/month Persons kilometres Persons kilometres tickets tickets Total
1980 448,643* 15,253,862* 440,148• 14,965,032* 8,813.1 482.6 9,295.7
1979:.May 22,096 751,264 20,206 687,004 418.7 15.5 434.2 June 19,091 649,094 18,921 643,314 375.7 15.6 391.2 ·July 18,637 633,658 20,084 682,856 375.5 14.3 389.8 Aug. 19,899 676,566 19,680 669,120 386.4 15.9 402.3 Sept. 19,110 649,740 18,110 615,740 369.3 21.2 390.5 Oct. 18,933 643,722 19,422 660,348 382.4 31.9 414.4 Nov. 21,131 777,716 20,449 636,004 413.8 32.2 446.0 Dec. 18,776 638,384 20,114 683,876 381.2 25.7 406.9
19'80: Jan. 18,147 616,998 18,852 640,968 365.7 25.6 391.3 Feb. 35,932 1,221,688 28,059 95.4,006 624.5 33.0 657.5 Mar. 41,264 1,402,976 44,320 1,506,880 841.6 45.4 887.1 Apr. 38,466 1,307.844 37,987 1,291,558 762.3 46.2 808.6 May 41,576 1,413,584 41,556 1,412,904 830.3 51.3 881.5 June 39,122 1.330,148 38,206 1,299,004 771.8 41.3 813.2 July 39,797 1,353,098 41,592 1,414,128 793.7 37.8 831.4 Aug. 37,398 l,271,532 38,625 l,313,250 745.3 36.7 782.0 Sept. 40,149 1,365,066 38,522 1,309,748 786.9 43.4 830.3 Oct. 39,216 1,333,344 38,843 1,320,662 782.0 43.5 825.5 Nov. 37,403 1,271,702 36,774 1,250,316 745.6 43.2 788.9 Dec. 40,173 1,365,88? 36,812 1,251,608 763.4 35.1 798.5
1981: Jan. 46,006 1,564,204 30,082 1,022,788 758.0 42.2 800,2 Feb. 30,239 1,028,126 32,691 l,111,494 626.1 33.1 659.2 Mar. 38,833 1,320,322 39,279 1,335,486 775.3 40.6 815.9 Apr. 38,679 1,315,086 36,764 1,249,976 750.1 39.8 790.0 May 43,636 1,483,624 43,414 1,476,076 870.3 50.6 920.9
*Figures have been revised for the period April 1980 t.o February 1981.
Hong Kong Monthly Digesi .of Statistics June 1981 33

TRANSPORT
7.5 INTERNATIONAL MOVEMENTS OF COMMERCIAL CARGO
By sea By air By railway Byroad (tonne) (tonne) (tonne)
Import Export
Tonne Tonne Year/month Import Export Total Import Export Total Tonne kilometres Tonne kilometres
1975 13,517,633 5,083,199 18,600,832 40,789 100,831 141,620 1,480,993 51,664,345 721 25,171 68,510
1976 17,374,136 5,966,805 23,340,941 51,207 112,028 163,235 1,421,358 47,318,097 752 25,575 72,070
1977 19,112,226 6,525,061 25,637,287 70,639 113,374 184,013 1,447,149 49,203,128 785 26,703 80,683
1978 20,909,017 6,923,416 27,832,433 91,307 137,624 228,931 1,832,368 62,300,539 1,224 41,616 71,309
1979 22,598,774 7,711,080 30,309,854 107,019 150,389 257,408 1,937,545 65,876,549 4,021 136,717 138,986
1980 24,622,506 8,939,622 33,562,128 105,200 152,666 257,866 1,942,944 66,060,088 6,762 229,869 307,730
1979: May 1,911,844 631,120 2,542,964 9,644 11,446 21,090 156,553 5,322,802 414 14,081 10,574 June 1,792,221 673,495 2,465,716 9,504 10,897 20,401 171,012 5,814,416 376 12,787 9,097 July 1,841,534 670,546 2,512,080 9,398 12,850 22,248 189,451 6,441,326 366 12,437 7,350 Aug. 1,965,354 706,665 2,672,019 9,831 13,233 23,064 167,094 5,681,185 363 12,330 14,701 Sept. 2,031,934 679,382 2,711,316 8,396 14,492 22,888 178,108 6,055,689 449 15,281 12,495 Oct. 1,951,323 706,067 2,657,390 8,770 15,796 24,566 189,090 6,429,061 493 16,758 20,082 Nov. 1,964,198 660,852 2,625,050 8,814 15,709 24,523 187,585 6,377,906 473 16,070 22,960 Dec. 2,039,037 744,519 2,783,556 8,543 12,092 20,635 159,629 5,427,395 396 13,479 12,611
1980: Jan. 2,097,425 642,160 2,739,585 7,608 10,628 18,236 171,582 5,833,784 374 12,732 15,742 Feb. 1,778,727 617,112 2,395,839 8,284 10,732 19,016 115,076 3,912,592 992 33,737 12,112 Mar. 1,883,599 708,871 2,592,470 9,957 13,109 23,066 169,280 5,755,527 600 20,396 19,292 Apr. 2,021,224 707,540 2,728,764 9,144 12,714 21,858 164,731 5,600,860 632 21,500 18,026 May 2,155,634 843,970 2,999,604 9,463 11,576 21,039 185,491 6,306,674 617 20,967 22,785 June 2,104,734 780,254 2,884,988 8,322 10,812 19,134 168,087 5,714,961 502 17,081 32,261 July 2,094,332 755,004 2,849,336 9,133 12,458 21,591 171,144 5,818,903 479 16,280 28,578 Aug. l,975,018 857,697 2,832,715 8,740 14,633 23,373 166,300 5,654,206 477 16,198 28,483 Sept. 2,262,659 749,902 3,012,561 7,735 13,983 21,718 161,890 5,504,238 577 19,606 34,689 Oct. 1,919,665 741,749 2,661,414 8,811 15,308 24,119 162,121 5,512,112 549 18,655 30,778 Nov. 2,044,110 786,106 2,830,216 8,991 14,448 23,439 159,787 5,432,764 504 17,119 31,272 Dec. 2,285,379 749,257 3,034,636 9,012 12,265 21,277 147,455 5,013,467 459 15,598 33,712
1981: Jan. 2,473,452 757,806 3,231,258 7,941 10,722 18,663 146,898 4,994,533 802 27,254 38,591 Feb. 1,632,077 633,326 2,265,403 7,521 9,561 17,082 92,999 3,161,957 1,011 34,358 22,164 Mar. 2,203,896 749,512 2,953,408 10,346 14,988 25,334 155,777 5,296,406 534 18,143 40,808 Apr. 2,221,469 761,800 2,983,269 10,251 13,643 23,894 128,924 4,383,403 499 16,955 40,050 May 2,194,951 770,856 2,965,807 12,505 12,966 25,471 154,296 5,246,059 564 19,159 44,605
7.6 COMMERCIAL CARGO CARRIED BY VESSELS
Tonne
Cargo discharged Cargo loaded
River River Ocean-going steamers and Ocean-going steamers and
Year/month vesse]s Junks launches Total vessels Junks launches Total
1975 11,859,817 1,014,691 643,125 13,517,633 4,917,296 157,117 8,786 5,083,199
1976 15,751,680 999,840 622,616 17,374,136 5,776,720 179,623 10,462 5,966,805
1977 17,485,516 983,849 642,861 19,112,226 6,290,567 216,367 18,127 6,525,061
1978 18,999,101 1,153,814 756,102 20,909,017 6,716,634 184,353 22,429 6,923,416
1979 20,447,703 1,416,141 734,930 22,598,774 7,430,768 217,471 62,841 7,711,080
1980 22,128,138 1,621,632 872,736 24,622,506 8,563,560 242,011 134,051 8,939,622
1979: May 1,736,601 108,166 67,077 1,911,844 609,394 18,398 3,328 631,120 June l,610,108 116,394 65,719 1,792,221 649,375 19,803 4,317 673,495 July 1,676,696 109,660 55,178 1,841,534 848,066 19,168 3,312 670,546 Aug. 1,788,461 119,175 57,718 1,965,354 684,237 15,357 7,071 706,665 Sept. 1,850,585 130,004 51,345 2,031,934 658,641 13,878 6,863 679,382 Oct. 1,744,902 144,876 61,545 1,951,323 676,605 23,061 6,401 706,067 Nov. 1,759,816 145,089 59,293 1,964,198 630,236 21,943 8,673 660,852 Dec. 1,832,637 141,616 64,784 2,039,037 718,118 16,616 9,785 744,519
1980: Jan. 1,895,959 130,286 71,180 2,097,425 611,552 22,627 7,981 642,160 Feb. 1,638,026 93,207 47,494 1,778,727 601,975 12,810 2,327 617,112 Mar. 1,684,974 135,834 62,791 1,883,599 680,568 22,603 5,700 708,871 Apr. 1,821,882 134,868 64,474 2,021,224 685,643 17,062 4,835 707,540 May 1,952,676 128,574 74;384 2,155,634 815,993 17,154 10,823 843,970 June 1,896,863 135,843 72,028 2,104,734 755,183 18,710 6,361 780,254 July 1,914,646 120,821 58,865 2,094,332 704,168 19,912 30,924 755,004 Aug. 1,763,324 136,818 74,876 1,975,018 807,998 17,985 31,714 857,697 Sept. 2,044,023 148,097 70,539 2,262,659 720,701 19,940 9,261 749,902 Oct. 1,672,962 156,851 89,852 1,919,665 715,896 18,157 7,696 741,749 Nov. 1,814,864 146,629 82,617 2,044,110 751,162 25,427 9,517 786,106 Dec. 2,027,939 153,804 103,636 2,285,379 712,721 29,624 6,912 749,257
1981: Jan. 2,224,499 163,606 85,347 2,473,452 714,696 35,559 7,551 757,806 Feb. 1,466,039 110,263 55,775 1,632,077 606,047 24,291 2,988 633,326 Mar. 1,970,553 140,034 93,309 2,203,896 699,140 40,273 10,099 749,512 Apr. 1,993,213 144,442 83,814 2,221,469 711,68.8 38,952 11,160 761,800 May 1,956,945 136,603 101,403 2,194,951 720,417 39,693 10,746 770,856
34 Hong Kong Monthly Digest of Statistics June 1981

TRANSPORT
7.7 CONTAINERS CARRIED BY OCEAN-GOING VESSELS
Discharged Loaded
Full Empty Cargo Full Empty Cargo
T.E.U.s T.E.U.s Dead weight T.E.U.s T.E.U.s Deadweight ton ton
Transhlp- Tranship- Tranship- Tranship-Year/month Local ment Local ment Local ment Local ment
1975 150,016 152,303 90,325 8,282 2,702,730 186,070 145,247 59,828 10,222 2,544,268 1976 200,379 187,457 114,665 15,720 3,547,719 255,790 172,709 60,990 21,349 3,492,012 1977 237,058 252,664 106,375 30,438 4,558,150 276,748 244,854 74,995 35,650 4,033,236 lll78 271,330 230,134 87,912 23,692 4,510,533 293,968 225,358 64,924 28,938 3,868,493 1979 315,041 215,836 104,084 '14,734 4,970,419 358,611 212,726 65,856 17,035 4,395,118 1980 370,516 224,460 125,347 14,619 5,365,202 401,114 223,047 90,330 15,528 4,636,093
1979: May 27,039 15,702 7,583 735 406,413 30,054 15,298 4,692 1,064 334,855 June 25,677 17,790 7,314 1,183 424,895 30,911 17,931 3,795 1,522 364,692 July 28,231 19,716 10,318 929 460,553 33,285 19,490 4,428 1,192 399,687 Aug. 26,066 19,112 11,271 774 435,000 34,122 18,422 4,665 1,295 435,578 Sept. 27,733 20,164 12,990 1,170 470,035 33,447 19,419 6,181 1,285 398,275 Oct. 27,560 21,370 11,810 1,914 450,165 31,060 20,777 5,760 1,780 408,324 Nov. 26,592 19,948 10,270 1,914 470,487 30,317 19,810 6,568 2,324 383,379 Dec. 30,267 19,891 9,938 1,901 440,042 37,440 20,415 6,995 1,971 412,827
1980: Jan. 28,217 18,964 11,444 l,056 444,942 29,848 17,894 7,637 1,563 381,666 Feb. 26,352 14,684 7,447 1,155 380,393 27,419 15,502 7,426 1,307 336,279 Mar. 33;949 20,265 6,360 1,910 502,586 30,076 20,327 10,277 2,044 399,774 Apr. 32,531 19,204 6,424 944 501,712 30,739 17,995 7,925 1,033 358,811 May 31,688 19,532 9,779 947 483,141 36,530 20,257 5,509 1,283 408,884 June 30,218 18,782 11,707 1,593 422,468 35,983 18,840 6,482 963 411,239 July 28,721 19,288 12,134 849 427,733 36,397 18,318 6,750 1,087 386,706 Aug. 32,506 19,553 13,691 1,476 413,774 38,335 20,371 6,537 1,306 430,934 Sept. 28,551 17,255 12,799 1,110 409,741 32,180 18,023 7,048 1,331 351,459 Oct. 30,835 20,206 12,672 1,231 447,494 33,242 18,869 6,997 1,255 364,113 Nov. 32,253 16,609 10,365 1,682 401,462 34,347 17,077 9,496 1,343 406,224 Dec. 34,695 20,118 10,525 666 529,756 36,018 19,574 8,246 1,013 400,004
1981: .Jan. 36,450 20,932 9,391 336 512;242 34,975 20,064 9,665 742 399,423 Feb. 30,1~ 17,225 5,830 762 431,360 23,541 17,727 13,456 777 312,216 Mar. 35,254 20,520 6,803 724 495,825 35,998 19,838 9,957 811 408,354 Apr. 33,987 20,240 9,927 1,254 495,396 34,830 19,599 7,428 1,227 378,872 May 33,693 21,812 9,981 790 486,347 40,296 20,665 6,876 587 433,637
Note: 'T.E.U.s' refers to Twenty-Foot Equivalent Units (based on a standardised container size of 20 ft. x 8 ft. x8 ft,) 'Local' means containers with Hong Kong as the countty of origin or destination. 'Full' includes containers partially filled with cargo.
7.8 PUBLIC TRANSPORT: PASSENGER JOURNEYS BY UNDERTAKING
Thousand
Hongkong Ocean Kowloon China Mass and Kowloon• New Park
Motor Motor Transit Hongkong Yaumati Star PLB Canton Minor• Lmitao Peak Cable Year/month Bus Bus Railway Tramways Ferry Ferry 'Maxicab' Railway Ferries Bus Tramways Car Total•
1975 634,562 215,761 144,011 143,467 53,197 2,760 13,452 5,846 1,373 2,034 1,216,463 1976 716,430 230,556 128,163 135,324 50,700 3,651 12,491 6;762 1,685 1,821 1,287,583 1977 810,930 239,608 131,455 133,443 50,961 5,449 13,796 7,060 2,007 1,942 2,029 1,401;680 1978 860,480 254,687 138,655 131,183 54,213 6,593 15,835 7,623 2,203 1,971 1,532 1,474,975 1979 934,339 274,324 11,742 150,935 142,415 56,538 18,003 18,353 8,036 2,481 2,107 1,586 1,620,859 1980 911,657 275,533 167,533 159,183 131,994 46,551 37,617 19,341 .7,557 2,802 2,041 1,290 1,763,099
1979: May 79,141 23,512 12,408 11,539 4,653 1,311 1,393 674 172 155 113 135,071 June 76,833 22,829 12,197 11,526 4,691 1,563 1,345 627 189 155 78 132,033 July 77,707 22,963 13,123 12,466 5,030 1,814 1,600 684 258 185 98 135,928 Aug. 74,719 20,993 12,831 11,745 4,852 1,874 1,557 632 259 189 126 129,777 Sept. 78,174 21,635 13,073 11,949 4,561 1,958 1,279 630 190 ·172 87 133,708 Oct. 83,052 23,597 3,946 14.006 13,277 4,978 1,976 1,662 767 257 221 158 147,897 Nov; 79,451 22,995 2,605 12;811 12,199 4,819 1,983 1,581 672 193 170 110 139,655 Dec. 82,304 23,631 5,191 13,043 12,610 5,277 2,169 1,762 702 226 205 180 147,300
1980: Jan. 81,601 23,426 8,947 12,590 12,017 5,124 2,149 1,486 694 171 164 103 148,472 Feb. 70,347 20,730 12,396 12,431 10,703 3,845 2,226 1,823 676 213 166 156 135,712 Mar. 76,976 22,383 12,630 13,277 11,069 3,868 2,801 1,756 662 212 165 88 145,887 Apr. 71,497 21,211 11,334 12,204 10,552 3,493 2,723 1,913 739 243 158 108 136,175 May 75,506 22,803 12,691 13,100 10,873 3,659 3,074 1,509 622 188 147 85 144,257 June. 71,819 22,271 13,295 12,901 10,750 3,564 3,123 1,463 624 221 154 71 140,256 July 70,739 22,102 14,924 13,176 10,290 3,618 3,301 1,492 567 245 145 77 140,676 Aug. 73,550 23,196 15,772 13,605 11,145. 3,869 3,466 1,584 578 372 203 129 147,469 Sept, 76.763 23,562 15,954 13,513 10,808 3,625 3,579 1,416 624 222 172 76 150,314 Oct. 80,586 24,630 16,434 14,315 11,359 3,898 3,704 1,635 602 240 192 111 157,706 Nov. 80,177 24,530 16,179 13,839 11,176 3,899 3,655 .. 1,603 568 232 185 136 156,179 Dec. 82,097 24,688 16,977 14,231 11,254 4,090 3,816 1,661 602 242 187 152 159,997
1981: Jan. 83;141 24,821 17,042 13,928 10,883 3,745 3,795 1,393 564 175 158 80 159,725 Feb. 75,164 22,171 16,069 12,434 9,908 3,166 3,443 1,706 547 259 157 158 145,182 Mar. 83,114 24,275 16,822 13,921 10,809 3,682 3,732 1,573 530 238 161 90 158,947 Apr. 76,181 22,697 15.711 13,777 10,750 3,474 3,840 1,566 409 293 174 103 148,975 May 77,263 23,240 17,444 14,590 10,924 3,536 4,206 1,315 410 237 ·164 77 153,406
*Figures have been revised.
Hong Kong Monthly Digest of Statistics lune 1981 35
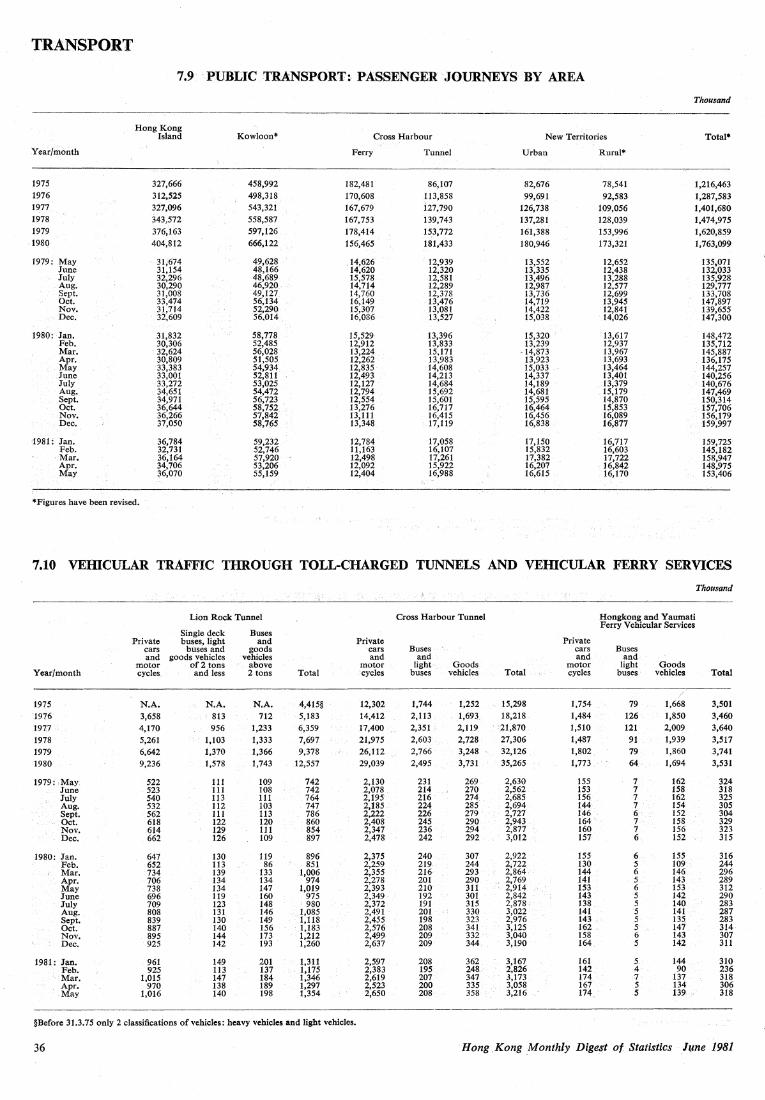
TRANSPORT
7.9 PUBLIC TRANSPORT: PASSENGER JOURNEYS BY AREA
Thousand
----·----·------·-----· Hong Kong
Island Kowloon* Cross Harbour New Territories Total*
Year/month Ferry Tunnel Urban Rural*
1975 327,666 458,992 182,481 86,107 82,676 78,541 1,216,463 1976 312,525 498,318 170,608 113,858 99,691 92,583 1,287,583 1977 327,096 543,321 167,679 i27,790 126,738 109,056 1,401,680 1978 343,572 558,587 167, 753 139,743 137,281 128,039 1,474,975 1979 376,163 597,126 178,414 153,772 161,388 153,996 1,620,859 1980 404,812 666,122 156,465 181,433 180,946 173,321 1,763,099
1979: May 31;674 49,628 14,626 12,939 13,552 12,652 135,071 June 31,154 48,166 14,620 12,320 13,335 12,438 132,033 July 32,296 48,689 15,578 12,581 13,496 13,288 135,928 Aug. 30,290 46,920 14,714 12,289 12,987 12,577 129,777 Sept. 31,008 49,127 14,760 12,378 13,736 12,699 133,708 Oct. 33,474 56,134 16,149 13,476 14,719 13,945 147,897 Nov. 31,714 52,290 15,307 13,081 14,422 12,841 139,655 Dec. 32,609 56,014 16,086 13,527 15,038 14,026 147,300
1980: Jan, 31,832 58,778 15,529 13,396 15,320 13,617 148,472 Feb. 30,306 52,485 12,912 13,833 13,239 12,937 135,712 Mar, 32,624 56,028 13,224 15,171 -14,873 13,967 145,887 Apr. 30,809 51,505 12,262 13,983 13,923 13,693 136,175 May 33,383 54,934 12,835 14,608 15,033 13,464 144,257 June 33,001 52,811 12,493 14,213 14,337 13,401 140,256 July 33,272 53,025 12,127 14,684 14,189 13,379 140,676 Aug. 34,651 54,472 12,794 15,692 14,681 15,179 147,469 Sept. 34,971 56,723 12,554 15,601 15,595 14,870 150,314 Oct. 36,644 58,752 13,276 16,717 16,464 15,853 157,706 Nov. 36,266 57,842 13,111 16,415 16,456 16,089 156,179 Dec. 37,050 58,765 13,348 17,119 16,838 16,877 159,997
1981: Jan. 36,784 59,232 12,784 17,058 17,150 16,717 159,725 Feb. 32,731 52,746 11,163 16,107 15,832 16,603 145,182 Mar. 36,164 57,920 12,498 17,261 17,382 17,722 158,947 Apr. 34,706 53,206 12,092 15,922 16,207 16,842 148,975 May 36,070 55,159 12,404 16,988 16,615 16,170 153,406
*Figures have been revised.
7.10 VEIDCULAR TRAFFIC THROUGH TOLL-CHARGED TUNNELS AND VEIIlCULAR FERRY SERVICES
Thousand
Lion Rock Tunnel Cross Harbour Tunnel Hongkong and Yaumati Ferry Vehicular Services
Single deck Buses Private buses, light and Private Private
cars buses and goods cars Buses cars Buses and goods vehicles vehicles and and and and
motor of 2 tons above motor light Goods motor light Goods Year/month cycles and less 2 tons Total cycles buses vehicles Total cycles buses vehicles Total
1975 N.A. N.A. N.A. 4,415§ 12,302 1,744 1,252 15,298 1,754 79 1,668 3,501
1976 3,658 813 712 5,183 14,412 2,113 1,693 18,218 1,484 126 1,850 3,460
1977 4,170 956 1,233 6,359 17,400 2,351 2,119 21,870 1,510 121 2,009 3,640
1978 5,261 1,103 1,333 7,697 21,975 2,603 2,728 27,306 1,487 91 1,939 3,517
1979 6,642 1,370 1,366 9,378 26,112 2,766 3,248 32,126 1,802 79 1,860 3,741
1980 9,236 1,578 1,743 12,557 29,039 2,495 3,731 35,265 1,773 64 1,694 3,531
1979: May 522 111 109 742 2,130 231 269 2,630 155 7 162 324 June 523 111 108 742 2,078 214 270 2,562 153 7 158 318 July 540 113 111 764 2,195 216 274 2,685 156. 7 162 325 Aug. 532 112 103 747 2,185 224 285 2,694 144 7 154 305 Sept. 562 111 113 786 2,222 226 279 2,727 146 6 152 304 Oct. 618 122 120 860 2,408 245 290 2,943 164 7 158 329 Nov. 614 129 111 854 2,347 236 294 2,877 160 7 156 323 Dec. 662 126 109 897 2,478 242 292 3,012 157 6 152 315
1980: Jan. 647 130 119 896 2,375 240 307 2,922 155 6 155 316 Feb. 652 113 86 851 2,259 219 244 2;722 130 5 109 244 Mar. 734 139 133 l,006 2,355 216 293 2,864 144 6 146 296 Apr. 706 134 134 974 2,278 201 290 2,769 141 5 143 289 May 738 134 147 1,019 2,393 210 311 2,914 153 6 153 312 June 696 119 160 975 2,349 192 301 2,842 143 5 142 290 July 709 123 148 980 2,372 191 315 2,878 138 5 140 283 Aug. 808 131 146 1,085 2,491 201 330 3,022 141 5 141 287 Sept. 839 130 149 1,118 2,455 198 323 2,976 143 5 135 283 Oct. 887 140 156 1,183 2,576 208 341 3,125 162 5 147 314 Nov. 895 144 173 1,212 2,499 209 332 3,040 158 6 143 307 Dec. 925 142 193 l,260 2,637 209 344 3,190 164 5 142 311
1981: Jan. 961 149 201 1,311 2,597 208 362 3,167 161 5 144 310 Feb. 925 113 137 l,175 2,383 195 248 2,826 142 4 90 236 Mar. 1,015 147 184 1,346 2,619 207 347 3,173 174 7 137 318 Apr. 970 138 189 1,297 2,523 200 335 3,058 167 5 134 306 May 1,016 140 198 1,354 2,650 208 358 3,216 174 5 139 318
§Before 31.3.75 only 2 classifications of vehicles: heavy vehicles and light vehicles.
36 Hong Kong Monthly Digest of Statistics lune 1981

TRANSPORT
7.11 MOTOR VEIIlCLES REGISTERED
Motor Motor Private Taxis cycles tricycles cars
Hong Kong and New
Kowloon Territories
New New New New New Year/month Total Registration · Total Registration Total Registration Total Registration To.tat Registration
1975 22,290 1,436 26 114,260 7,093 4,754 329
1976 21,285 1,687 18 113,665 12,425 4,754 341 240 240 1977 21,344 2,250 14 122,858 19,163 5,465 1,212 738 541 1978 22,093 2,945 12 142,049 27,429 6,925 2,342 738 72 1979 23,289 3,364 7 162,762 30,706 8,024 2,513 738 93 1980 25,536 4,438 7 190,146 38,030 9,118 2,513 738 80
1979: May 22,556 240 11 149,757 2,136 7,254 223 738 2 June 22,630 249 11 152,040 2,999 7,477 321 738 5 July 22,660 220 11 153,475 2,226 7,568 195 738 4 Aug. 22,838 357 11 155,378 2,728 7,5n 177 738 8 Sept. 22,913 274 11 157,070 2,599 7,699 208 738 11 Oct. 23,111 393 9 158,976 2,747 7,848 260 738 5 Nov. 23,248 322 9 160,887 2,742 7,929 227 738 20 Dec. 23,289 203 7 162,762 3,007 8,024 233 738 13
1980: Jan. 23,440 287 7 165,959 4,144 8,118 204 738 13 Feb. 23,633 338 7 171,367 6,154 8,151 168 738 11 Mar. 23,674 241 7 171,739 1,167 8,214 210 738 5 Apr. 23,784 286 7 172,788 1,885 8,317 213 738 6 May 23,945 342 7 174,497 2,748 8,449 260 738 2 June 24,244 304 7 176,659 2,912 8,573 275 738 July 24,285 405 7 179,379 3,513 8,703 246 738 8 Aug. 24,554 449 7 181,637 3,059 8,774 164 738 1 Sept. 24,731 395 7 183,063 2,746 8,898 213 738 5 Oct. 25,117 603 7 185,917 3,772 9,009 216 738 12 Nov. 25,300 379 7 188,252 3,105 9,066 148 738 10 Dec. 25,536 409 7 190,146 2,825 9,118 196 738 7
1981: Jan. 25,728 381 7 193,625 4,167 9,241 184 753 30 Feb. 25,900 315 7 196,233 3,667 9,335 179 776 28 Mar. 26,175 473 7 196,772 1,627 9,402 197 790 18
.Apr. 26,358 353 6 198,223 2,153 9,490 161 800 15 May 26,584 468 6 199,590 2,514 9,574 166 801 5
Public buses
China Motor Kowloon Motor NewLantao Bus Co. Ltd. Bus Co. Ltd. Bus Co. Ltd.
Single Double Single Double Single Double deck deck deck deck deck deck
New New New New New New Rogistra- Registr!I- Registra- Registra- Registra- Registra-
Year/month Total tion Total tion Total tion Total tion ·Total tion Total tion
1975 50 I 579 103 448 86 1,112 106 41 4 1976 31 7 671 92 498 50 1,202 98 44 4 1977 12 739 81 483 1,225 89 49 8 1978 12 808 97 486 4 1,318 107 53 4 1979 8 840 66 431 1 1,436 151 58 7 1980 8 977 179 382 1,707 297 54 2 2
-1979: May 8 820 6 478 1,348 5 54 June 8 817 11 478 1,356 8 58 4 July 8 820 4 457 1,353 58 Aug. 8 836 16 456 1,3'60 10 58 Sept. 8 838 2 453 1,393 45 58 Oct. 8 844 6 453 1,394 7 58 Nov. 8 839 9 448 1,422 30 58 Dec. 8 840 1 431 1,436 18 58
1980: Jan. 8 840 424 1,455 25 56 2 2 Feb. 8 868 28 420 1,478 27 56 2 Mar. 8 886 18 416 1,476 56 2 Apr. 8 905 19 416 1,495 20 56 2 May 8 918 14 413 1,488 56 2 June 8 932 14 393 1,523 26· 56 2 July 8 949 17 391 1,539 22 56 2 Aug. 8 914 5 389 1,575 37 54 2 Sept. 8 925 11 385 1,608 36 54 2 Oct. 8 940 15 386 1,642 35 54 2 Nov. 8 961 21 385 1,667 27 54 2 Dec. 8 977 17 382 1,707 42 54 2
1981: Jan. 9 990 13 378 1,735 36 54 2 Feb. 8 992 2 376 1,736 6 54 2 Mar; 8 1,006 14 372 1,777 48 54 2 Apr. 8 1,015 9 . 370 1,806 40 54 2 May 7 1,027 13 366 1,852 51 54 3
Hong Kong Monthly Digest. of Statistics 'lune 19'81 37

TRANSPORT
Public buses - continued Private Public Private Public Others buses light buses light buses cars
Single Double Single Double deck deck deck deck
New New New New New New New
Year/month Total Registra-
tion Total Registra- Registra-
tion Total tion Total Registra- Registra- Registra- Registra-
tion Total tion Total tion Total tion
1975 1,187 40 293 12 4,307 184 1,447 100 1,283 72 1976 1,208 82 265 7 4,346 184 1,245 85 1,322 97 1977 1,227 64 263 25 4,350 197 1,079 79 916 201 1978 1,416 215 242 29 4,350 327 1,026 128 126 1979 1,602 256 7 7 222 19 4,350 398 964 129 1980 1,788 218 10 3 213 34 13 13 4,350 262 955 140
1979: May 1,514 13 227 4,346 26 1,005 9 June 1,529 19 227 4,350 34 999 12 July 1,541 18 224 I 4,350 23 999 14 Aug. 1,560 26 223 2 4,350 47 992 20 Sept. 1,564 10 5 5 223 4,350 29 982 8 Oct. 1,581 18 7 2 222 3 4,350 23 972 6 Nov. 1,596 26 7 223 4 4,350 23 972 8 Dec. 1,602 19 7 222 3 4,350 24 964 6
1980; Jan. 1,607 7 9 2 225 9 4,350 28 968 14 Feb. 1,627 22 10 I 222 I 5 5 4,350 19 972 17 Mar. 1,638 15 10 223 3 8 3 4,350 6 959 10 Apr. 1,645 9 10 223 2 10 2 4,350 18 958 5 May 1,664 24 10 219 1 II 1 4,350 22 955 9 June 1,669 8 10 217 II 4,350 20 958 11 July 1,696 27 10 213 I 11 4,349 19 957 10 Aug. 1,732 38 10 211. 2 11 4,350 25 958 13 Sept. 1,754 25 10 211 3 13 2 4,350 29 965 19 Oct. 1,765 14 10 212 3 13 4,350 29 955 8 Nov. 1,772 12 10 210 2 13 4,350 30 955 14 Dec. 1,788 17 10 213 7 13 4,350 17 955. 10
1981: Jan. 1,798 18 10 210 4 13 4,350 17 949 7 Feb. 1,811 20 10 211 2 14 4,350 9 947 5 Mar. 1,825 15 10 208 15 4,350 18 938 3 Apr. 1,848 24 10 208. 2 16 4,350 22 943 14 May 1,865 20 18 201 3 17 4,350 19 942 12
Goods vehicles Crown vehicles Grand total (Excluding vehicles
of H.M. Forces)
Commercial Construction sites
Prime Lorries Cycles Other movers vehicles
New New New New New New Registra- Registra- Registra- Registra- Registra~ Registra-
Year/month Total tion Total tion Total tion Total tion Total tion Total tion
1.975 360 21 31,651 2,643 20 913 60 2,994 117 188,018 12,407 1976 539 179 36,553 6,986 16 857 2,987 52 191,746 22,617 1977 653 114 42,131 7,687 14 943 144 3,018 100 207,521 31,955 1978 795 142 46,601 6,884 9 997 253 3,220 258 233,150 41,362
1979 1,268 473 50,503 7,936 9 915 14 3,495 296 260,928 46,429
1980 1,608 374 57,187 11,420 6 936 68 3,654 299 299,395 58,371
1979: May 928 54 47,827 645 9 950 3,336 8 243,166 3,368 June 984 56 48,242 694 9 946 3,411 75 246,310 4,487 July 1,040 56 48,596 683 9 946 3,417 6 248,270 3,450 Aug. 1,118 78 49,018 789 9 938 3,443 26 250,925 4,284 Sept. 1,178 60 49,435 773 9 935 3,483 40 253,345 4,064 Oct. 1,210 32 49,670 671 9 924 3,470 255,854 4,173 Nov. 1,244 34 50,102 806 9 922 3,462 258,473 4,251 Dec. 1,268 24 50,503 892 9 915 3,495 33 260,928 4,476
1980: Jan. 1,300 32 50,979 911 9 910 3,515 20 264,919 5,698 Feb. 1,340 40 51,578 943 9 909 3,530 15 271,280 7,789 Mar. 1,363 23 51,925 773 9 930 21 3,495 272,126 2,495 Apr. 1,407 44 52,533 1,061 9 923 , 3,456 274,040 3,570 May 1,457 50 53,179 1,174 8 935 22 3,525 69 276,834 4,738 June 1,461 26 53,931 953 8 929 3,535 10 280,214 4,559 July 1,499 40 54,525 1,015 8 935 6 3,503 283,763 5,329 Aug. 1,508 10 55,114 896 8 934 3,541 38 287,029 4,737 Sept. 1,527 19 55,666 996 8 937 8 3,560 19 289,420. 4,526 Oct. 1,571 45 56,261 1,007 8 931 6 3,598 72 293,494 5,838 Nov. 1,596 28 56,857 928 8 931 3,612 14 296,754 4,718 Dec. 1,608 17 57,187 763 6 936 3,654 42 299,395 4,374
1981: Jan. 1,621 19 57,709 980 6 939 6 3,679 25 303,806 5,889 Feb. 1,660 39 58,061 662 6 940 4 3,721 42 307,150 4,981 Mar: 1,701 41 58,430 751 4 922 3,708 54 308,476 3,260 Apr. l,723 23 58,949 771 3 919 3,815 107 310,916 3,695 May 1,741 23 59,361 891 3 926 24 3,833 18 313,121 4,237
38 Hong Kong Monthly Digest of Statistics lune 1981
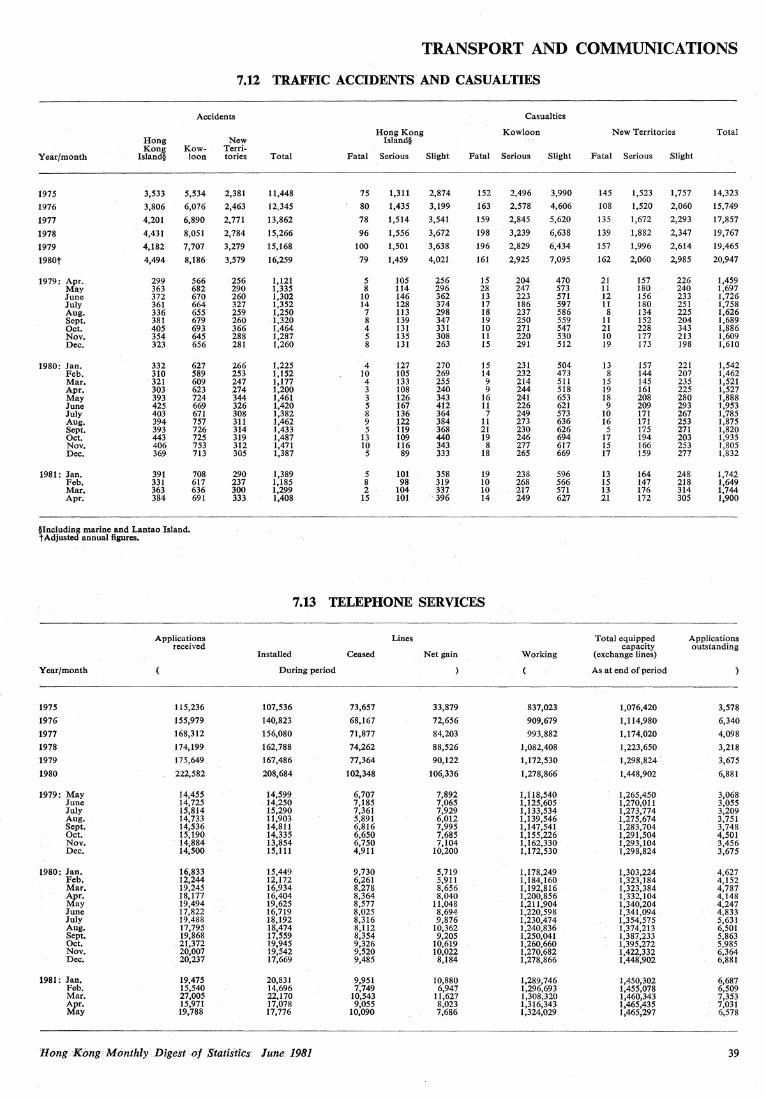
TRANSPORT AND COMMUNICATIONS
7.12 TRAFFIC ACCIDENTS• AND CASUALTIES
Accidents Casualties
Hong Kong Kowloon New Territories Total Hong New Island§ Kong Kow- Terri-
Year/month Island§ loon tories Total Fatal Serious Slight Fatal Serious Slight Fatal Serious Slight
1975 3,533 5,534 2,381 11,448 75 1,311 2,874 152 2,496 3,990 145 1,523 1,757 14,323
1976 3,806 6,076 2,463 12,345 80 1,435 3,199 163 2,578 4,606 108 1,520 2,060 15,749
1977 4,201 6,890 2,771 13,862 78 1,514 3,541 159 2,845 5,620 135 1,672 2,293 17,857
1978 4,431 8,051 2,784 15,266 96 1,556 3,672 198 3,239 6,638 139 1,882 2,347 19,767
1979 4,182 7,707 3,279 15,168 100 1,501 3,638 196 2,829 6,434 157 1,996 2,614 19,465
1980t 4,494 8,186 3,579 16,259 79 1,459 4,021 161 2,925 7,095 162 2,060 2,985 20,947
1979: Apr. 299 566 256 1,121 5 105 256 15 204 470 21 157 226 1,459 May 363 682 290 1,335 8 114 296 28 247 573 11 180 240 1,697 June 372 670 260 1,302 10 146 362 13 223 571 12 156 233 1,726 July 361 664 327 1,352 14 128 374 17 186 597 11 180 251 1,758 Aug. 336 655 259 1,250 7 113 298 18 237 586 8 134 225 1,626 Sept. 381 679 260 1,320 8 139 347 19 250 559 11 152 204 1,689 Oct. 405 693 366 1,464 4 131 331 10 271 547 21 228 343 1,886 Nov. 354 645 288 1,287 5 135 308 11 220 530 10 177 213 1,609 Dec. 323 656 281 1,260 8 131 263 15 291 512 19 173 198 1,610
1980: Jan. 332 627 266 1,225 4 127 270 15 231 504 13 157 221 1,542 Feb. 310 589 253 1,152 10 105 269 14 232 473 8 144 207 1,462 Mar. 321 609 247 1,177 4 133 255 9 214 511 15 145 235 1,521 Apr. 303 623 274 1,200 3 108 240 9 244 518 19 161 225 1,527 May 393 724 344 1,461 3 126 343 16 241 653 18 208 280 1,888 June 425 669 326 1,420 5 167 412 11 226 621 9 209 293 1,953 July 403 671 308 1,382 8 136 364 7 249 573 10 171 267 1,785 Aug. 394 757 311 1,462 9 122 384 11 273 636 16 171 253 1,875 Sept. 393 726 314 1,433 5 119 368 21 230 626 5 175 271 1,820 Oct. 443 725 319 1,487 13 109 440 19 246 694 17 194 203 1,935 Nov. 406 753 312 1,471 10 116 343 8 277 617 15 166 253 1,805 Dec. 369 713 305 1,387 5 89 333 18 265 669 17 159 277 1,832
1981: Jan. 391 708 290 1,389 5 101 358 19 238 596 13 164 248 1,742 Feb. 331 617 237 1,185 8 98 319 10 268 566 15 147 218 1,649 Mar. 363 636 300 1,299 2 104 337 10 217 571 13 176 314 1,744 Apr. 384 691 333 1,408 15 101 396 14 249 627 21 172 305 1,900
§Including marine and Lantao Island. t Adjusted annual figures.
7.13 TELEPHONE SERVICES
Applications Lines Total equipped Applications received capacity outstanding
Installed Ceased Netgain Working (exchange lines)
Year/month During period As at end of period
1975 115,236 107,536 73,657 33,879 837,023 1,076,420 3,578
1976 155,979 140,823 68,167 72,656 909,679 1,114,980 6,340
1977 168,312 156,080 71,877 84,203 993,882 1,174,020 4,098
1978 174,199 162,788 74,262 88,526 1,082,408 1,223,650 3,218
1979 175,649 167,486 77,364 90,122 1,172,530 1,298,824 < 3,675
1980 222,582 208,684 102,348 106,336 1,278,866 1,448,902 6,881
1979: May 14,455 14,599 6,707 7,892 1,118,540 1,265,450 3,068 June 14,725 14,250 7,185 7,065 1,125,605 1,270,011 3,055 July 15,814 15,290 7,361 7,929 1,133,534 1,273,774 3,209 Aug. 14,733 11,903 5,891 6,012 1,139,546 1,275,674 3,751 Sept. 14,536 14,811 6,816 7,995 1,147,541 1,283,704 3,748 Oct. 15,190 14,335 6,650 7,685 1,155,226 1,291,504 4,501 Nov. 14,884 13,854 6,750 7,104 1,162,330 1,293,104 3,456 Dec. 14,500 15,111 4,911 10,200 1,172,530 1,298,824 3,675
1980: Jan. 16,833 15,449 9,730 5,719 1,178,249 1,303,224 4,627 Feb, 12,244 12,172 6,261 5,911 1,184,160 1,323,184 4,152 Mar. 19,245 16,934 8,278 8,656 < 1,192,816 1,323,384 4,787 Apr. 18,177 16,404 8,364 8,040 1,200,856 1,332,104 4,148 May 19,494 19,625 8,577 11,048 1,211,904 1,340,204 4,247 June 17,822 16,719 8,025 8,694 1,220,598 1,341,094 4,833 July 19,488 18,192 8,316 9,876 1,230,474 1,354,575 5,631 Aug, 17,795 18,474 8,112 10,362 1,240,836 1,374,213 6,501 Sept. 19,868 17,559 8,354 9,205 1,250,041 1,387,233 5,863 Oct. < 21,372 19,945 9,326 10,619 1,260,660 1,395,272 5,985 Nov. 20,007 19,542 9,520 10,022 1,270,682 1,422,332 6,364 Dec. 20,237 17,669 9,485 8,184 1,278,866 1,448,902 6,881
1981: Jan. 19,475 20,831 9,951 10,880 1,289,746 1,450,302 6,687 Feb. 15,540 14,696 7,749 6,947 1,296,693 1,455,078 6,509 Mar. 27,005 22,170 10,543 11,627 1,308,320 1,460,343 7,353 Apr. 15,971 17,078 9,055 8,023 1,316,343 1,465,435 7,031 May 19,788 17,776 10,090 7,686 1,324,029 1,465,297 6,578
Hong. '1<.0ng · MonthlY· Digest ·of· Statistics~ lune' 1981 39
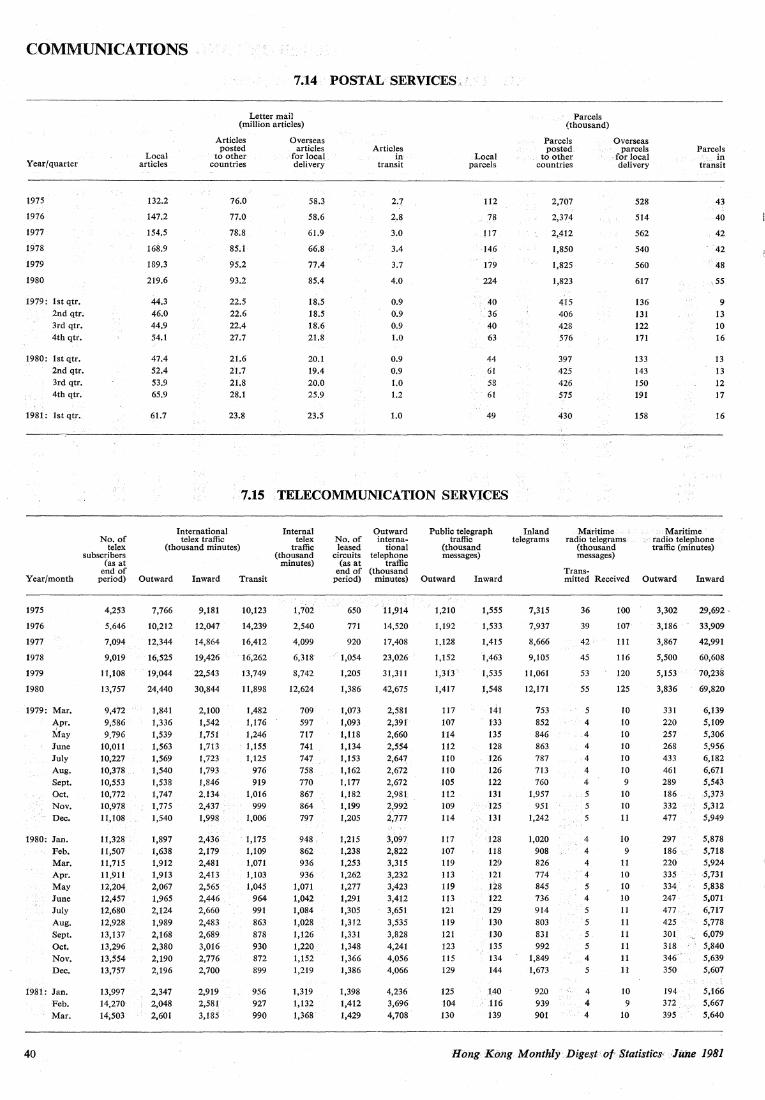
COMMUNICATIONS .
Year/quarter
1975
197(j
1977
1978
1979
1980
1979: lst qtr. 2nd qtr. 3rd qtr. 4th qtr.
1980: lst qtr. 2nd qtr. 3rd qtr. 4th qtr.
1981: lst qtr ..
No.of telex
Year/month
subscribers (as at
end of period)
1975
1976
1977
1978
1979
1980
1979: Mar. Apr. :May June July Aug. Sept. Oct. Nov. Dec.
1980: Jan. Feb. Mar. Apr. May June July Aug. Sept. Oct. Nov. Dec.
1981: Jan. ·Feb. Mar.
4,2S3
5,646
7,094
9,019•
11,108
13,7S7
9,472 9,586 9,796
10,011 10,227 10,378 10,SS3 10,772 10,978 11,108
11,328 ll;S07 11,715 1t911 12,204. 12,4S( 12,680 12,928 13,137 .
13,296 13,SS4
13,7S7
13,997 14,270 14,S03
7.14 POSTALSERVICES, •
Local articles
132.2
147.2
154.5
168.9
189.3
219.6
44.3 46.0 44.9 54.1
47.4 52.4 S3.9 65.9
61.7
Letter mail (million articles)
Articles posted
to other countries
76.0
77.0
78;8
8S;l
95.2
93.2
22.5 22.6 22.4 27.7
21.6 it.7 21.8 28.1
23.8
Overseas articles
·for local. delivery·
sq S8,6
61.9
66;8
77.4
85.4
18.5 18;5 18;6 21;8
20.1 19.4 20.0 25.9
23.S
Articles in
transit
2.7
2.8
3..0
3.4
3.7
4.0
0.9 0.9 0.9 1.0
0.9 0.9 1.0 1.2
LO
.Local parcels
112
.. 78
117
146
179
224
4o :. 36
40 63
44 61 58 61
49
7.15 .TELECOMMQNICATION SERVICES
International telex traffic
(thousand minutes)
Outward
7,766
10,212
12,344
16,S25
19;044
24,440
1,841 1,336 1,S39 1,S63 1,569 1,540. 1,538 1,747 1,77S 1,540
1,897 1,638 1,912 1,913 2,067 1,965 2,124
1,989 2,168 2,380 2,190 2,196
2,347 2,048 2,601
Inward
9,181
12,047
14,864
19,426
22,S43
30,844
2,100 1,S42 1,751 1,713 1,723 1,793 l,846 2.134 2,437 1,998
2,436 2,179 2,481 2,413 2,565 2,446 2,660 2,483 2,689 3,016 2,776 2,700
2,919 2,581 3,185
Transit
10,123
14,239
16,412
16,262
13,749
11,898
1,482 1,176 1,246
. 1,155
1,125 976 919
1,016 999
1,006
1,17S 1,109 1,071
. 1,103
1,045 964 991 863 878 930 872 899
956 927 990
Internal telex
traffic (thousand
minutes)
1,702
2,S40
4,099
6,318
8,742
12,624
709 597 717 741 747 758 770 867 864 797
948 ..
862 936 936
1,071 1,042 1,084 1,028 1,126 1,220 1;152 1,219
1,319 1,132 1,368
No.of leased
circuits (as at
end of period)
6SO
771
920
1,054
1,205
1,386
1,073 1,093 1,118 1,134 1,1S3 1,162 1,177 1,182 1,199 1,205
1,21S 1,238 1,2S3 1,262 1,277 1,291 1,305 1,312 1,331 1,348 l,366 1,386
1,398 1,412 1,429
Outward intern a ..
tional telephone
traffic (thousand
minutes)
11,914
14,520
17,408
23,026
31,311
42,67S
2,581 2;39l 2,660 2,5S4 2,647 2,672 2,672 2,98.l: 2;992
2,777
3,007 2,822 3,315 3,232 3;423 3,412 3,6SI 3,535 3,828 4,241 4,056 4,066
4,236 3,696 4,708
Public telegraph traffic
(thousand messages)
Outward
1,210 .
1,192
1,128
1,152
1,313
1,417
117 107 114 112 110 110 105 112 109 114
117 107 119 113 119 113 121 119 121
123 115 129
125 104 130
Inward
1,5S5
1,533
1,415
1,463
1,S35
1,548
141
133. 135 128 1.26 126 122 131 125 .
131
128 118 129 121 i28 122 129 130 130 1.35 134 144
1.40 : .116
139
Parcels (thousand)
Parcels posted
to other countries
2,707
2,374
2,412
1,8SO
1,825
1,823
415 406 .428 576
397 425 426 S75
430
Overseas parcels
for local delivery
528
S14
S62
S40
560
617
136 131 122 171
133 143 lSO 191
158
Parcels
tr~il~~
·,.Maritime
43
40
. 42
42
48
,SS
9 13 10 16
13 13 12 17
16
Inland telegrams
Mliritime radio telegrams
(thousand messages)
·." tadio telephone traffic (minutes)
7,31S
7,937
8,666
9,105
11,061
12,171
7S3 852 846 863 787 713 760
1,957 951
1,242
1,020 908 826 774 845 736 914 803 831 992
1,849 1,673
920 939 901
Trans-mitted Received
36
39
42.
45
53
5S
5 4
. .4 4
4 4 4
5 5
5
4 4 4 4
s 4 s
5 s 4 5
4 4 4
100
107
111
116
120
12S
10 10 10 10 10 10 9
10 10 11
10 9
11 10 10 10 11 11 11 11 11 11
10
9 10
Outward
3,302
3,186
3,867
5,500
5,1S3··
3,836
331 220 257 268 433 461 289 186 332 477
297 186 . 220 335 334"
247 477. 425 301. 318 346' 350
194 372 395 ..
Inward
29,692.
33,909
42,991
60,608
70,238
69,820
6,139 5,109
5,306 ~;95!)
6,18~
6,671 S,543 .S,373 S,312 S,949
S,878 S,718 S,924 5,731 5,838 S,071 6,717 S,778 6,079 S,840 5,639 S,607
5,166 5,667 S,640
40 HO.iJgKi>ilg MonthiyDigE14t.iof' Statistfcfl'. .·lune 1981

SECTION 8 PRICES
8.1 AVERAGE RETAIL PRICES OF SELECTED FOODSTUFFS
$per kilogram, except where otherwise stated
Rice Meat and poultry Marine fish, fresh
Middle Beef, Beef, Chicken, Duck, Top and low Pork, Pork best belly top top Golden Mac-
Year/month grade grade best cut chop quality flesh grade grade thread kerel Garoupa
Monthly average
1975 2.86 2.51 12.05 15.21 16.27 9.71 13.23 8.63 7.19 7.90 14.80
1976 2.55 2.25 12.90 16.44 16.50 9.84 14.91 9.36 8.17 8.63 17.23
1977 2.50 2.15 14.22 18.22 16.30 9.54 14.70 10.38 9.62 10.40 19.48
1978 2.68 2.38 13.21 16.96 16.29 9.59 16.12 10.32 11.18 11.64 23.02
1979 2.83 2.51 14.10 18.39 19.36 11.00 16.90 11.46 11.13 13.18 25.63
1980 3.31 2.96 15.41 20.33 23.13 12.63 20.40 13.00 13.13 17.41 31.42
1979: May 2.76 2.45 14.00 18.30 19.97 11.46 15.89 9.61 11.38 11.66 25.27 June 2.76 2.46 13.89 18.22 19.83 11.14 16.10 9.62 11.76 12.73 25.81 July 2.76 2.46 13.86 18.17 20.34 11.21 15.91 10.52 11.59 14.98 27.91 Aug. 2.78 2.50 13.91 18.25 20.19 11.21 16.60 11.57 12.48 17.21 30.70 Sept. 2.88 2.56 13.86 18.25 20.24 11.03 17.79 14.15 10.80 15.16 27.55 Oct. 2.96 2.61 14.25 18.44 20.16 11.00 19.18 13.94 11.87 13.66 30.08 Nov. 3.09 2.66 14.75 19.35 20.82 11.39 17.77 12.43 11.67 14.68 26.47 Dec. 3.13 2.74 15.03 19.86 21.05 11.74 18.60 11.79 11.48 14.95 25.88
1980: Jan. 3.13 2.73 15.00 19.79 21.02 11.79 19.71 11.77 11.99 15.89 25.00 Feb. 3.13 2.68 15.53 20.27 21.71 12.19 23.43 12.80 12.50 17.63 28.14 Mar. 3.14 2.70 15.46 20.12 23.05 12.85 21.64 11.81 11.59 18.06 26.92 Apr. 3.22 2.79 15.13 19.87 22.83 12.57 20.21 12.12 11.16 15.13 25.69 May 3.26 2.84 15.01 19.76 22.40 12.27 19.15 11.90 12.57 14.10 25.27 June 3.31 2.88 15.23 20.06 22.26 11.99 21.18 13.06 13.43 16.85 28.69 July 3.32 2.89 15.29 20.27 23.46 12.33 21.89 14.58 15.48 21.05 35.78 Aug. 3.36§ 3.11§ 15.56 20.70 25.55 13.39 21.33 14.60 12.83 17.64 35.67 Sept. 3.36 3.13 15.74 20.87 24.31 13.00 21.15 14.30 14.35 19.06 41.32 Oct. 3.39 3.16 15.64 20.83 23.41 12.85 20.22 13.99 13.81 17.44 34.67 Nov. 3.49 3.27 15.63 20.75 23.74 13.10 17.58 12.60 14.02 18.04 38.63 Dec. 3.59 3.36 15.67 20.72 23.83 13.18 17.30 12.52 13.84 17.99 31.30
1981: Jan. 3.65 3.42 15.82 21.05 23.94 13.19 18.87 13.29 13.76 19.10 30.06 Feb. 3.75 3.51 16.93 22.17 24.12 13.24 21.96 13.76 14.32 21.10 35.85 Mar. 3.92 3.67 16.57 21.89 25.08 13.74 19.25 13.26 12.91 19.05 27.93 Apr. 3.97 3.70 16.82 22.16 24.82 13.29 18.82 13.11 13.18 16.67 26.64 May 3.98 3.74 16.82 22.17 24.97 13.08 20.42 13.49 14.45 15.94 29.63
Fresh-water Fresh vegetables Fresh fruits Fresh Fresh Flour, fish, fresh
Flow-
milk (per bottle)
hen eggs (per piece)
wheat Sugar
Grass Big White ering Apples Oranges Bananas Year/month carp head cabbage cabbage Tomato (per piece) (per piece)
Monthly average
1975 13.06 10.02 2.74 3.72 4.33 0.92 0.48 2.23 1.20 0.32 2.18 4.96
1976 15.20 11.59 2.58 3.77 4.13 0.91 0.46 2.76 1.20 0.35 2.12 3.79
1977 18.40 13.81 2.68 4.05 3.92 0.97 0.52 3.22 1.20 0.35 1.98 3.09
1978 19.79 14.47 3.77 5.21 4.18 1.22 0.59 2.89 1.20 0.33 1.97 2.87
1979 20.73 16.06 3.98 5.72 4.94 1.17 0.84 3.68 1.33 0.36 2.13 3.13
1980 23.30 18.44 4.65 6.60 5.44 1.28 0.80 4.44 1.60 0.36 2.44 '5.28
1979: May 20.02 16.32 3.06 4.89 5.03 1.22 0.86 3.37 1.30 0.36 2.10 2.91 June 19.43 14.75 3.54 4.89 4.80 1.29 0.84 3.64. 1.30 0.35 2.12 2.95 July 20.32 15.11 4.43 5.54 4.70 1.16 0.82 3.62 1.30 0.34 2.23 3.00 Aug. 21.88 16.32 6.61 7.61 7.01 1.10 0.77 4.37 1.30 0.35 2.15 3.02 Sept. 21.79 15.28 5.97 6.99 6.28 1.10 0.93 4.96 1.30 0.35 2.22 3.11 Oct. 21.15 15.39 4.35 5.72 6.70 1.15 1.11 4.48 1.30 0.34 2.23 3.37 Nov. 20.73 15.96 2.53 5.09 5.80 1.07 0.89 4.06 1.50 0.34 2.28 3.79 Dec. 20.02 15.61 2.63 5.01 4.53 1.20 0.82 3.99 1.50 0.34 2.25 3.81
1980: Jan. 21.61 16.47 3.72 6.10 4.05 1.16 0.71 3.95 1.50 0.34 2.35 3.86 Feb. 25.78 18.82 5.61 8.02 4.80 1.16 0.74 4.06 1.50 0.35 2.33 4.08 Mar. 24.39 20.27 5.90 8.42 4.83 1.47 0.82 4.12 1.50 0.35 2.50 4.23 Apr. 23.10 19.64 3.14 4.83 4.00 1.33 0.84 4.08 1.50 0.34 2.38 4.28 May 22.47 18.54 4.20 6.22 4.38 1.20 0.76 4.10 1.50 0.35 2.43 4.55 June 22.75 18.04 3.55 4.63 4.94 1.27 0.72 4.25 1.50 0.35 2.63 4.86 July 24.47 19.89 5.24 6.32 5.29 1.18 0.77 4.23 1.70 0.35 2.46 5.16 Aug. 23.05 18.02 6.23 7.61 6.08 1.28 0.76 4.78 1.70 0.35 2.33§ 5.86§ Sept. 23.48 17.96 5.95 7.61 6.85 1.27 0.77 5.69 1.70 0.35 2.35 6.22 Oct. 23.07 17.54 3.92 5.99 9.13 1.35 0.79 4.70 1.70. 0.35 2.41 6.53 Nov. 22.50 17.84 4.18 6.42 6.27 1.38 0.95 4.67 1.70 0.38 2.55 6.79 Dec. 22.98 18.19 4.20 6.98 4.70 1.32 0.91 4.63 1.70 0.42 2.55 6.88
1981: Jan. 23.02 18.32 3.34 4.96 4.10 1.19 0.75 4.65 1.70 0.51 2.60 7.10 Feb. 26.82 20.22 3.90 7.13 4.05 1.20 0.77 4.54 1.70 0.57 2.66 7.03 Mar, 24.84 20.04 6.51 8.93 4.37 1.18 0.76 5.25 1.70 0.48 2.68 6.88 Apr. 25.63 21.20 4.61 6.71 4.91 1.26§ 1.16§ 5.56§ 1.70 0.43 2.61§ 7.14§ May 25.38 20.06 4.28 5.85 6.91 1.32 1.24 5.95 1.70 0.42 2.63 6.78
§Data from this month onwards are based on a revised price survey.
Hong Kong Monthly. Digest of Statistics June 1981 41

PRICES
8.2 AVERAGE WHOLESALE PRICES OF SELECTED FOODSTUFFS
$per kilogram, except where otherwise stated
Rice (per tonne) Live pigs Live cattle Marine fish, fresh Fresh vegetables, (per tonne) (per tonne) locally produced
South Thai See China 100% Golden Flowering White
Year/month - mew jien whole thread Mackerel Garoupa cabbage cabbage Tomato
Monthly average
1975 2,346.27 2,235.82 2,186.88 5,208.43 8,085.47 4.78 4.58 10.32 2.03 1.26 2.93 1976 2,030.30 1,842.79 1,813.53 5,605.26 7,771.31 4.99 4.68 11.29 2.08 1.17 2.20 1977 2,095.28 1,889.59 1,732.84 5,836.75 7,308.34 6,42 5.34 12.73 2.18 1.22 2.05 1978 2,129.50 2,078.08 2,091.97 5,506.06 7,473.68 6.20 5.87 13.08 2.99 1.80 2.30 1979 2,171.67 1,940.18 2,161.58 5,985.56 9,226.36 6.60 6.76 14.80 3.13 1.82 2.74 1980 2;590.51 2,515.45 2,643.65 6,397.55 10,223.96 7.60 8.03 17.92 3.46 2.08 2.85
1979: May 2,151.16 1,922.82 2.100.07 5,919.42 10,400.33 6.80 6.54 15.07 2.41 0.79 3.17 June 2,182.25 1,939.69 2,104.37 5,886.35 8,912.20 7.23 6.56 16.18 2.71 1.32 2.63 July 2, 111.65 1,914.39 2,129;67 5,902.89 10,086.17 7.01 7.60 17.12 2.89 1.98 2.73 Aug. 2,052.95 1,893.39 2,210,36 5,935.96 8,879.13 6.84 7.05 16.33 4.53 3.72 4.20 Sept. 2,176.63 1,917.36 2,317.34 5,952.49 9,193.29 7.08 8.84 16.25 3.79 2.93 2.50 Oct. 2,277.16 1,991.67 2,372.56 6,051.70 8,846.06 7.75 6.49 17.59 2.78 1.89 3.32 Nov. 2,495.91 2,076.59 2,365.95 6,332.79 9,970.42 7.64 6.79 15.11 2.71 0.89 2.99 Dec. 2,558.08 2,071.14 2,394.06 6,481.60 9,639.73 7.52 8.22 15.35 2.58 1.14 2.73
1980: Jan. 2,513.77 2,414.07 2,457.06 6,481.60 9,507.45 7.85 8.92 15. 73 3.69 2.20 2.91 Feb. 2,507.16 2,442.34 2,528.16 6,498.14 11,359.34 7.88 9.83 16.20 3.94 2.46 2.60 Mar. 2,499.88 2,433.58 2,575.94 6,481.60 10,879.83 6.82 8.78 16.00 3.14 2.56 2.40 Apr. 2,529.81 2,462.84 2,637.45 6,448.53 9,755.47 6.95 9.29 16.55 2.18 0.81 1.84 May 2,572.14 2,495.91 2,648.20 6,415.46 10,152.31 7.38 7.37 15.67 3.39 1.85 1.64 June 2,592.97 2,496.08 2,649.02 6,183.98 9,557.06 7.28 9.59 15.91 2.20 1.36 2.51 July 2,611.16 2,500.05 2,649.02 6,250.12 10,681.42 7.68 10.20 20.77 3.26 2.13 3.37 Aug. 2,605.87 2,555.44 2,649.35 6,398.93 10,995.58 7.37 9.84 21.72 4.55 2.89 1.79 Sept. 2,605.87 2,548.82 2,648'53 6,432.00 9,226.36 8.95 8.27 23.51 4.37 3.13 3.72 Oct. 2,604.05 2,555.44 2,664.24 6,382.39 9,457.85 8.02 5.20 19.74 2.96 1.64 5.59 Nov. 2,666.72 2,552.63 2,773.37 6,382.39 10,582.21 7.86 7.83 21.27 3.61 1.96 2.94 Dec. 2,776.67 2,728.23 2,843.47 6,415.46 10,532.60 8.21 7.36 17.52 4.21 1.96 2.89
1981.: Jan. 2,813.71 2,692.84 2,879.19 6,746.16 9,160.22 8.87 9.91 17.90 1.72 1.06 1.87 Feb. 2,969.14 2,932.10 3,044.04 6,878.44 9,722.40 7.59 11.64 19.80 3.13 1.37 2.01 Mar. 3,101.58 2,961.20 3,161.93 6,861.90 10,003.49 6.55 9.79 15.71 4.84 3.34 2.04 Apr. 3,118.44 3,030.65 3,188.22 6,861.90 9,143.69 7.43 8.87 15.95 3.56 1.49 1.80 May 3,153.50 3,043.87 3,170.20 6,828.83 9,986.96 7.86 7.88 17.53 2.53 1.46 3.33
8.3 CONSUMER PRICE INDEX (A)
(July 73-June 74=100)
Alcoholic Clothing Miscel- Transport Food- Fuel and drinks and and Durable laneous and
Year/month All items stuffs Housing light tobacco footwear goods goods vehicles Services
Weights attached 100.00 56.60 14.08 3.39 2.65 3.82 1.41 4.58 4.36 9.11
Monthly average
1975 107.5 103.2 110.7 129.3 120.5 98.0 105.8 115.3 107.6 116.8 1976 111.2 106.3 115.8 132.6 129.1 97.9 106.4 119.8 111.9 123.3 1977 117.7. 113.5 124.3 134.9 133.4 100.8 109.2 124.7 115.3 129.9
1978 124.7 121.3 130.3 134.7 141.7 103.3 114.4 133.2 121.7 137.1
1979 139.2 134.3 142.6 172.7 160.0 110.0 126.0 146.2 152.3 148.0 1980 160.8 154.1 152.6 264.4 181.8 121.1 134.4 168.9 196.7 169.5
1979: May 136 131 141 167 157 109 125 142 150 146 June 137 132 143 168 158 110 126 143 151 147 July 140 135 144 179 158 110 127 145 152 147 Aug. 144 141 144 191 161 111 128 146 152 148 Sept. 145 . 141 146 193 167 112 129 147 159 148 Oct. 146 142 146 199 167 112 130 148 159 155 Nov. 145 139 146 198 168 117 130 162 163 156 Dec. 147 140 148 208 168 117 131 163 165 157
1980: Jan. 150 142 148 239 168 117 131 164 167 158 Feb. 158 152 148 259 181 118 131 165 191 165 Mar. 158 153 148 263 181 118 133 166 192 163 Apr. 156 148 151 263 181 118 133 167 194 165 May 157 150 151 262 182 120 134 167 195 166 June 158 150 151 262 184 120 134 168 196 167 July 163 157 154 268 184 121 135 170 197 168 Aug. 164 158 154 269 184 121 135 171 198 169 Sept. 165 161 154 268 184 122 136 171 201 170 Oct. 165 158 154 270 184 123 136 172 205 180 Nov. 167 160 157 272 184 127 137 173 211 180 Dec. 168 160 161 278 185 128 138 173 213 183
1981; Jan. 171 162 162 298 190 127 139 173 214 188 Feb.· 176 168 166 318 196 128 140 175 220 191 Mar. 178 171 166 '.129 196 130 143 176 216 189 Apr. 179 170 170 330 196 128 145 177 231 191 May 181 171 170 330 196 135 145 178 240 191
42 Hong Kong Monthly Digest of Statistics June 1981
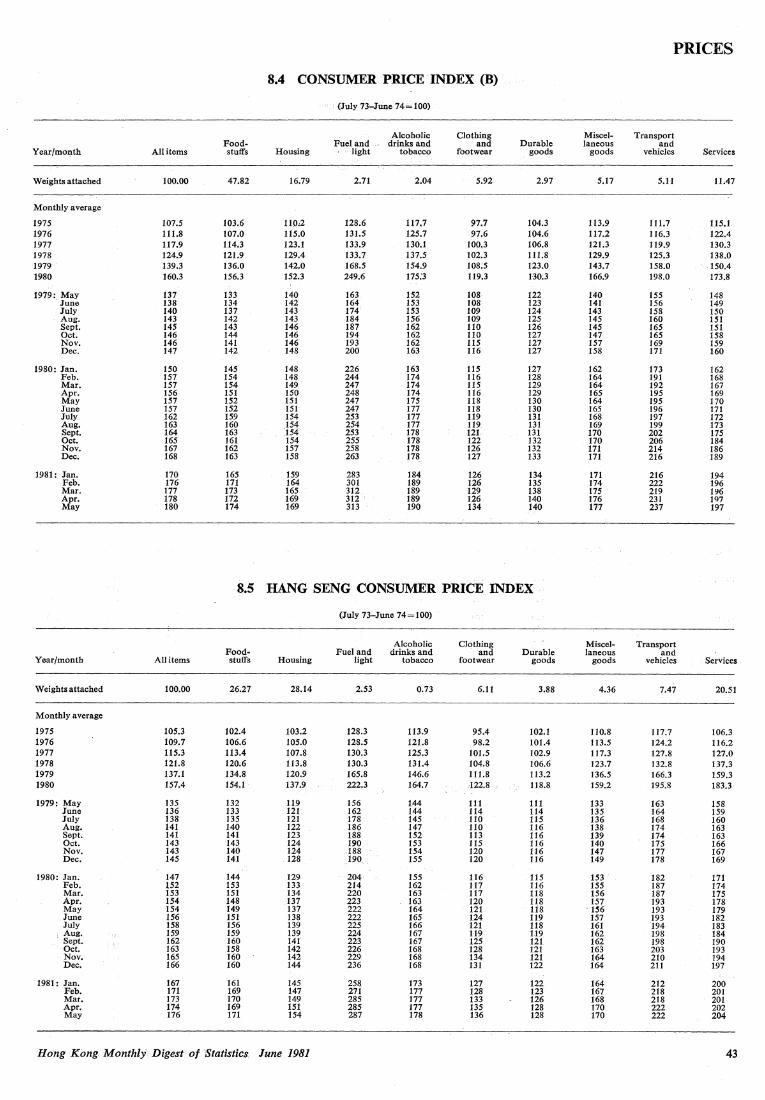
PRICES
8.4 CONSUMER PRICE INDEX (B)
(July 73-June 74= 100)
Alcoholic Clothing Miscel- Transport Food- Fuel and drinks and and Durable laneous and
Year/month All items stuffs Housing light tobacco footwear goods goods vehicles Services
Weights attached 100.00 47.82 16.79 2.71 2.04 5.92 2.97 5.17 5.11 11.47
Monthly average
1975 107.5 103.6 11p2 128.6 117.7 97.7 104.3 113.9 111.7 115.1 1976 111.8 107.0 115.0 131.5 125.7 97.6 104.6 117.2 116.3 122.4 1977 117.9 114.3 123.1 133.9 130.l 100.3 106.8 121.3 119.9 130.3 1978 124.9 121.9 129.4 133.7 137.5 102.3 111.8 129.9 125.3 138.0 1979 139.3 136.0 142.0 168.5 154.9 108:5 123.0 143.7 158.0 150.4 1980 160.3 156.3 152.3 249.6 175:3 119.3 130.3 166.9 198.0 173.8
1979: May 137 133 140 163 152 108 122 140 155 148 June 138 134 142 164 153 108 123 141 156 149 July 140 137 143 174 153 109 124 143 158 150 Aug. 143 142 143 184 156 109 125 145 160 151 Sept. 145 143 146 187 162 110 126 145 165 151 Oct. 146 144 146 194 162 110 127 147 165 158 Nov. 146 141 146 193 162 115 127 157 169 159 Dec. 147 142 148 200 163 116 127 158 171 160
1980: Jan. 150 145 148 226 163 115 127 162 173 162 Feb. 157 154 148 244 174 116 128 164 191 168 Mar. 157 154 149 247 174 115 129 164 192 167 Apr. 156 151 150 248 174 116 129 165 195 169 May 157 152 151 247 175 118 130 164 195 170 June 157 152 151 247 177 118 130 165 196 171 July 162 159 154 253 177 119 131 168 197 172 Aug. 163 160 154 254 177 119 131 169 199 173 Sept. 164 163 154 253 178 121 131 170 202 175 Oct. 165 161 154 255 178 122 132 170 206 184 Nov. 167 162 157 258 178 126 132 171 214 186 Dec. 168 163 158 263 178 127 133 171 216 189
1981: Jan. 170 165 159 283 184 126 134 171 216 194 Feb. 176 171 164 301 189 126 135 174 222 196 Mar. 177 173 165 312 189 129 138 175 219 196 Apr. 178 172 169 312 189 126 140 176 231 197 May 180 174 169 313 190 134 140 177 237 197
8.5 HANG SENG CONSUMER PRICE INDEX
(July 73-June 74= 100)
Alcoholic Clothing Miscel- Transport Food- Fuel and drinks and and Durable laneous and
Year/month All items stuffs Housing light tobacco footwear goods goods vehicles Services
Weights attached 100.00 26.27 28.14 2.53 0.73 6.11 3.88 4.36 7.47 20.51
Monthly average
1975 105.3 102.4 103.2 128.3 113.9 95.4 102.1 110.8 117.7 106.3 1976 109.7 106.6 105.0 128.5 121.8 98.2 101.4 113.5 124.2 116.2 1977 115.3 113.4 107.8 130.3 125.3 101.5 102.9 117.3 127.8 127.0 1978 121.8 120.6 113.8 130.3 131.4 104.8 106.6 123.7 132.8 137.3 1979 137.1 134.8 120.9 165.8 146.6 111.8 113.2 136.5 166.3 159.3 1980 157.4 154.1 137.9 222.3 164.7 122.8 118.8 159.2 195.8 183.3
1979: May 135 132 119 156 144 111 111 133 163 158 June 136 133 121 162 144 114 114 135 164 159 July 138 135 121 178 145 110 115 136 168 160 Aug. 141 140 122 186 147 110 116 138 174 163 Sept. 141 141 123 188 152 113 116 139 174 163 Oct. 143 143 124 190 153 115 116 140 175 166 Nov. 143 140 124 188 154 120 116 147 177 167 Dec. 145 141 128 190, 155 120 116 149 178 169
1980: Jan. 147 144 129 204 155 ll6 115 153 182 171 Feb. 152 153 133 214 162 117 116 155 187 174 Mar. 153 151 134 220 163 117 118 156 187 175 Apr. 154 148 137 223 163 120 118 157 193 178 May 154 149 137 222 164 121 118 156 193 179 June 156 151 138 222 165 124 119 157 193 182 July 158 156 139 225 166 121 118 161 194 183 Aug. 159 159 139 224 167 H9 119 162 198 184 Sept. 162 160 141 223 167 125 121 162 198 190 Oct. 163 158 142 226 168 128 121 163 203 193 Nov. 165 160 142 229 168 134 121 164 210 194 Dec. 166 160 144 236 168 131 122 164 211 197
1981: Jan. 167 161 145 258 173 127 122 164 212 200 Feb. 171 169 147 271 177 128 123 167 218 201 Mar. 173 170 149 285 177 133 126 168 218 201 Apr. 174 169 151 285 177 135 128 170 222 202 May 176 171 154 287 178 136 128 170 222 204
HOng Kong Monthly Digest of Statistics June 1981 43

PRICES
8.6 NEW CONSUMER PRICEINDEX (A)
(October 79-September 80= 100) --------------
Alcoholic drinks and
tobacco Clothing Miscel- Transport Food- Fuel and (for home and Durable laneous and
Year/montli All items stuffs Housing light consumption) footwear goods goods vehicles Services
Weights attached 100.00 46.39 15.05 3.63 2.67 5.02 6.71 5.68 5.27 9.58
1980: Oct. 106 106 104 109 104 104 101 105 110 108 Nov. 107 107 104 110 104 109 102 106 113 109 Dec. 108 108 106 113 104 110 102 106 114 110
1981: Jan. 110 110 109 122 107 109 103 106 114 113 Feb. 112 114. 109 130 111 109 104 107 117 115 Mar. 113 115 109 135 111 111 105 107 115 114 Apr. 114 115 112 135 111 109 107 108 123 115 May 116 116 112 135 111 115 108 108 129 115
8.7 NEW CONSUMER PRICE INDEX (B)
(October 79-September 80= 100)
Alcoholic drinks and
tobacco Clothing Miscel- Transport Food- Fuel and (for home and Durable larieous and
Year/month All items stuffs Housing light consumption) footwear goods goods venicles Services
Weights attached 100.00 38.59 17.77 2.71 1.90 7.03 7.53 6.07 6.09 12.31
1980: Oct. 106 106 105 109 104 104 lOi 106 109 107 Nov. 107 108 105 no 104 109 102 107 112 108 Dec. 108 108 105 113 104 109 103 107 113 110
1981: Jan. 110 110 109 123 107 109 104 106 114 113 Feb. 112 114 109 130 110 109 104 108 117 114 Mar. 113 115 109 136 110 111 105 107 116 114 Apr. 114 115 112 136 110 108 107 108 122 115 May 115 116 112 136 110 115 108 108 126 115
8.8 NEW HANG SENG CONSUMER PRICE INDEX
(October 79-September 80= 100)
Alcoholic drinks and
tobacco Clothing Miscel- Transport Food- Fuel and (for home and Durable laneous and
Year/month All items stuffs Housing light consumption) footwear goods goods vehicles Services
Weights attached 100.00 26.21 27.20 1.85 1.07 7.50 6.88 6.59 9.13 13.57
1980: Oct. 107 108 106 107 104 107 102 107 107 108 Nov. 108 109 107 109 104 108 102 108 110 108 Dec. 108 llO 107 113 104 107 103 108 110 109
1981: Jan. 109 110 107 126 107 103 103 106 111 112 Feb. 111 115 109 133 109 103 104 108 114 114 Mar. 113 117 112 140 110 107 106 106 114 114 Apr. 114 116 113 141 110 108 107 108 116 115 May 115 117 114 141 110 109 108 108 118 115
44 Hong Kong Monthly Digest of Statistics lime 1981

SECTION 9 FINANCE
9.1 MONEY SUPPLY
$million
--~ ------------------·
Legal tender coins and notes in circulation Licensed banks' and deposit-taking Legal tender
companies' holdings coins ·and notes Demand As at end of Commercial Government of legal tender in hands of deposits with year/month bank issues issues Total coins and notes public licensed banks
(A) (B) (A)-(B)=(C) (D)
1978 6,986 789 7,775 1,232 6,543 13,567
1979 7,920 864 8,784 1,499 7,285 13,566
1980 9,374 1,090 10,464 2,092 8,372 15,752
1979: May 7,065 839 7,904 l,309 6,595 11,736 June 7,075 831 7,906 1,156 6,750 11,776 July 7,110 818 7,928 1,338 6,590 12;077 Aug. 7,310 818 8,128 1,430 6,698 11,751 Sept. 7,285 818 8,103 1,231 6,872 12,150 Oct. 7,400 817 8,217 l,458 6,759 12,933 Nov. 7,500 838 8,338 l,409 6,929 13,110 Dec. 7,920 864 8,784 1,499 7,285 13,566
1980: Jan. 8,225 l,029 9,254 1,881 7,373 13,853 Feb. 8,805 1,083 9,888 1,734 8,154 13,493 Mar. 8,350 1,007 9,357 1,641 7,716 12,594 Apr. 8,220 963 9,183 1,719 7,464 12,575 May 8,141 938 9,079 1,525 7,554 13,396 June 8,290 926 9,216 l,511 7,705 15,048 July 8,486 925 9,411 1,636 7,775 15,570 Aug. 8,634 929 9,563 1,575 7,988 16,086 Sept. 9,088 933 10,021 1,841 8,180 17,406 Oct. 9,001 950 9,951 1,722 8,229 17,346 Nov. 8,943 983 9,926 1,683 8,243 16,151 Dec. 9,374 l,090 10,464 2,092 8,372 15,752
1981: Jan. 10,882 1,239 12,121 2,065 10,056 16,551 Feb. 9,621 l,202 10,823 1,743 9,080 14,535 Mar. 9,515 1,197 10,712 2,066 8,646 15,099 Apr. 9,696 1,196 10,892 2,191 8,701 14,334 May 9,546 l,171 10,717 1,952 8,765 16,064
Ml Time Savings M2 Deposits with M3 As at end of (Money supply deposits with deposits with (Money supply deposit-taking (Money supply year/month definition l) licensed banks licensed banks definition 2) companies definition 3)
(C)+(D)=(E) (F) (G) (E)+(F)+(G)=(H) (I) (H) +(I) = (J)
1978 20,110 21,512 24,850 66,472 10,447 76,919
1979 20,851 21,161 33,258 75,270 24,495 99,765
1980 24,124 29,929 42,809 96,862 42,716 139,578
1979: May 18,331 23,966 24,254 66,551 16,964 83,515 June 18,526 23,294 25,567 67,387 17,855 85,242 July 18,667 23,360 25,910 67,937 18,835 86,772 Aug. 18,449 22,785 26,816 68,050 20,414 88,464 Sept. 19,022 22,077 28,318 69,417 21,422 90,839 Oct. 19,692 21,362 29,790 70,844 22,752 93,596 Nov. 20,039 21,228 31,690 72,957 22,876 95,833 Dec. 20,851 21,161 33,258 75,270 24,495 99,765
1980: Jan. 21,226 23,071 33,139 77,436 27,596 105,032 Feb. 21,647 22,473 34,099 78,219 29,551 107,770 Mar. 20,310 21,656 34,143 76,109 30,548 106,657 Apr. 20,039 21.993 34,941 76,973 30,994 107,967 May 20,950 22,705 37,266 80,921 30,961 111,882 June 22,753 23,728 42,005 88,486 30,634 119,120 July 23,345 23,929 43,348 90,622 29,859 120,481 Aug. 24,074 24,946 43,984 93,004 31,203 124,207 Sept. 25,586 24,826 45,165 95,577 32,880 128,457 Oct. 25,575 26,210 43,851 95,636 35,675 131,311 Nov. 24,394 27,656 43,008 95,058 39,059 134,117 Dec. 24,124 29,929 42,809 96,862 42,716 139,578
1981: Jan. 26,607 34,301 41,837 102,745 43,685 146,430 Feb. 23,615 36,149 41,501 101,265 46,488 147,753 Mar. 23,745 35,817 42,928 102,490 47,243 149,733 Apr. 23,035 37,235 42,484 102,754 47,885 150,639 May 24,829 37,475 41,368 103,672 55,444 159,116
-~-~·~~------·-
Hong Kong Morithly Digest of Statistics, June 1981 45

FINANCE
9.2 BANKS! BALANCE SHEETS
$million
No. of Liabilities ,·Jicepsed
··banks Amount due to As at end of Amount due to deposit-taking Total year/month Deposits banks abroad companies Other liabilities liabilities/assets
1978 88 59,929 51,385 6,929 13,624 131,867
1979 105 67,985 73,685 20,029 24,159 185,858
1980 113 88,490 117,704 28,992 32,917 268,103
1979: May 99 59,957 60,020 12,063 19,730 151,770 ., \ June 101 60,637 62,374 13,535 20,055 156,601
July 103 61,347 63,869 14,594 20,678 160,488 Aug. 103 61,352 66,236 15,883 21,073 164,544 Sept. 103 62,545 72,140 16,484 22,715 173,884 Oct. 105 64,085 74,045 17,074 23,838 179,042 Nov. 105 66,028 75,468 17,577 24,391 ·183,464 Dec. 105 67,985 73,685 20,029 24,159 '185,858
1980: Jan. 106 70,063 75,691 21,641 23,504 190,899 Feb. 106 70,065 78,096 23,006 25,732 196,899 Mar. 110 68,393 80,448 23,695 28,518 201,054 Apr. 112 69,509 80,178 23,451 29,058 202,196 May 113 73,367 81,919 20,570 28,430 204,286 June 113 80,781 87,031 19,672 27,477 214,961 July 113 82,847 91,824 18,528 28,457 221,656 Aug. 113 85,016 96,020 19,742 28,060 228,838 Sept. 113 87,396 101,617 20,812 30,119 239,944 Oct. 113 87,407 105,102 24,068 30,298 246,875 Nov. 113 86,816 112,134 .· 24,865 32,294 256,109 Dec. 113 88,490 117,704 28,992 32,917 . 268,103
1981: Jan. 114 92,689 123,831 28,435 33,645 278,600 Feb. 115 92,185 122,835 31,467 ' 32,841 279,328 Mar; 115 93,844 126,292 31,588 34,915 286,639 Apr. 115 94,053 124,536 31,447 36,956 286,992 May 115 94,907 129,955 37,309 38,491 300,662
Assets Cash Amount due from Amount Loans and Investments Other assets Average
banks abroad due from advances liquidity deposit- during
'Demand taking ·month/ and short t''.' · companies last
As at.end of term Time Hong Hong Hong month year/month claims d~posits Kong Abroad Kong Abroad Kong Abroad of year
% 1978 1,227 37,425 13,381 6,386 ·46,428 16,411 4,294 137 5,980 198 46.2
1979 1,495 46,568 19,867 11,463 62,227 20,778 5,462 180 9,581 8,237 48.0
1980 2,087 58,310 32,583 20,790' 94,970 29,433 7,276 190 13,126 9,338 48.4
1979: May 1,304 36,925 14,544 8,106 52,534 18,537. 4,733 251 8,469 6,367 48.2 June 1,150 38,740 14;688 9,074 .· 53,284 19,066 4,813 280 8,536 6,970 48.8 July 1,333 39,764 13,930 9,378 .. 54,890 20,261 4,864 311 8,633 7,124 49.2 Aug. 1,424 40,736 16;327 9,601 55,118 20,067 4,913 303 8,647 7,408 48.7 Sept. 1,228 42,667 19,792 10,629 56,562 20,134 5,058 324 9,424 8,066 49.2 Oct. 1,453 44,570 . : 21;194 10,944 .· 57,773 19,712 5,083 202 9,801 8,310 50.1 Nov. 1,404 46,767 ; 20,819 11,483 58,653 20,260 5,108 179 10,699 8,092 48.9 Dec. 1,495 46,568 19,867 11,463 62,227 20,778 5,462 180 9,581 8,237 48.0
1980: Jan. h874 50,570 18,647 11,323 66,223 20,705 5,533 172 8,526 7,326 53.6 Feb. 1,730 52,868 17,928 11,983 ' 69,306 21,485 5,720 . 172 9,234 6,473 53.6 Mar. 1,636 51,994 19,436 13,387 69,560 22,639 5,795 151 9,898 6,558 52.6 Apr. 1,715 51,324 18,824 12,252 72,024 22,157 5,849 147 10,369 7,535 49.6 May 1,520 51,625 ·, 20,119 14,199 69,916 22,764 5,914 160 10,353 7,716 48.7 June 1,507 53,901 22,015 15,022 73,561 24,226 5,935 182 10,777 7,835 49.4 July 1,632 56,307 r;22,745 15,841 73,722 25,680 6,135 182 11,656 7,756 49.3 Aug. 1,570 57,815 25,624 16,584 76,764 25,519 6,304 191 10,755 7,712 48.6 Sept. 1,837 58,304 . 27,176 18,897 80,485 26,558 6,363 190 11,942 8,192 47.8 Oct. 1,717 58,282 29,009 17,971 85,278 27,449 6,506 200 12,220 8,243 46.8 Nov. 1,677 58,723 .29,779 19,100 90,865 28,333 5,940 198 13,011 8,483 48.2 Dec. 2,087 58,310 32,583 20,790 94,970 29,433 7,276 190 13,126 9,338 48.4
1981: Jan. 2,060 60,012 . 36,711 20,224 100,830 30,105 7,312 181 11,729 9,436 46.3 Feb. 1,J38 - 61,073 33,010 20,553 103,335 30,486 7,438 180 12,551 8,964 46.1 Mar. 2,061 61,571 . 31,~78 23,275 1()6,154 30,810 .. 7,680 218 14,184 9,108 46.4 Apr. 2,183 59,440 .. 33,294 22,157 106,670 31,063 . 7,866 183 13,963 10,173 47.6 May 1,946 64,746 33,409 22,997 113,457 31,489 ' 7,245 186 15,307 9,880 49.4
46 Hong Kong Monthly. Digest of Statistics lune 1981

FINANCE
9.3 DEPOSIT-TAKING COMPANIES: BALANCE SHEETS
$million
No. of Liabilities registered
deposit- Deposits of which: Amount due to banks Other Total As at end of taking short-term liabilities liabilities/assets year/month companies Hong Kong Abroad
1978 241 10,447 N.A. 6,386 27,398 8,121 52,352
1979 269 24,495 N.A. 11,463 31,160 10,347 77,465
1980 302 42,716 7,649 21,314 49,929 16,125 130,084
1979: May 246 16,964 N.A. 8,106 24,943 9,043 59,056 June 248 17,855 N.A. 9,074 26,402 9,194 62,525 July 247 18,835 N.A. 9,378 26,305 9,582 64,100 Aug. 252 20,414 N.A. 9,601 26,775 9,688 66,478 Sept. 258 21,422 N.A. 10,629 27,578 10,342 69,971 Oct. 264 22,752 N.A. 10,944 27,251 9,788 70,735 Nov. 265 22,876 N.A. 11,483 30,213 9,967 74,539 Dec. 269 24,495 N.A. 11,463 31,160 10,347 77,465
1980: Jan. 272 27,596 4,016 11,659 32,510 10,961 82,726 Feb. 272 29,551 4,848 12,214 33,919 11,361 87,045 Mar. 272 30,548 4,516 13,609 34,988 11,942 91,087 Apr. 273 30,994 4,389 12,290 35,685 11,726 90,695 May 279 30,961 5,000 14,414 36,928 12,019 94,322 June 283 30,634 5,541 15,308 39,023 12,281 97,246 July 290 29,859 5,675 16,054 40,579 12,839 99,331 Aug. 294 31,203 6,243 16,681 42,145 12,963 102,992 Sept. 297 32,880 6,542 19,250 45,018 13,317 110,465 Oct. 298 35,675 6,909 17,962 45,210 13,620 112,467 Nov. 300 39,059 7,171 19,200 48,696 14,285 121,240 Dec. 302 42,716 7,649 21,314 49,929 16,125 130,084
1981: Jan. 312 43,685 6,191 20,525 54,060 15,698 133,968 Feb. 317 46,488 10,013 21,233 55,931 16,530 140,182 Mar. 332 47,243 10,038 24,067 62,192 17,117 150,619 Apr. 342 47,885 9,880 22,334 61,338 17,299 148,856 May 344 55,444 14,504 23,422 64,312 17,681 160,859
Assets
Cash Amount due from Amount Loans and Investments Other assets Average banks abroad due from advances liquidity
banks in during Demand Hong month/
and short Kong last As at end of term Time Hong Hong Hong month year/month claims deposits Kong Abroad Kong Abroad Kong Abroad of year
% 1978 5 2,753 6,190 6,929 9,970 21,165 1,062 842 1,644 1,792 N.A.
1979 4 3,293 10,266 20,029 13,566 24,778 1,157 997 1,459 1,916 N.A.
1980 5 18,217 10,676 29,217 29,317 30,232 2,505 2,805 3,622 3,488 44.2
1979: May 5 2,902 7,285 12,063 10,491 22,198 860 663 1,150 1,438 N.A. June 6 2,989 8,551 13,535 10,831 22,376 888 693 1,082 1,574 N.A. July 5 2,754 8,432 14,594 11,108 22,567 899 944 1,181 1,616 N.A. Aug. 6 1,986 9,043 15,883 11,515 22,737 876 1,216 1,283 1,933 N.A. Sept. 3 3,197 9,912 16,484 11,964 22,603 1,043 1,162 1,457 2,147 N.A. Oct. 5 3,300 9,302 17,074 12,281 22,940 1,129 974 1,536 2,194 N.A. Nov. 5 3,537 10,218 17,577 13,085 24,399 1,134 948 1,609 2,027 N.A. Dec. 4 3,293 10,266 20,029 1,3,566 24,778 1,157 997 1,459 1,916 N.A.
1980: Jan. 7 9,541 6,615. 21,788 14,552 23,190 1,213 1,768 1,768 2,284 49.0 Feb. 4 9,978 7,110 23,383 15,304 23,756 1,243 1,904 1,915 2,448 48.1 Mar. 5 10,246 7,420 23,866 16,742 24,040 1,275 2,042 2,295 3,156 44.6 Apr. 4 10,987 8,047 23,746 17,581 23,558 1,297 1,021 2,323 2,131 41.9 May 5 11,649 7,993 20,910 21,691 24,342 1,308 1,371 2,679 2,374 43.4 June 4 12,879 8,422 20,193 23,021 24,914 1,318 1,554 2,423 2,518 44.2 July 4 13,043 9,107 19,274 23,987 25,806 1,403 1,591 2,512 2,604 46.2. Aug. 5 13,510 8,902 20,528 24,784 26,485 1,478 1,922 2,485 2,893 46.4 Sept. 4 15,811 9,106 22,023 26,021 27,639 1,439 2,148 3,147 3,127 47.5 Oct. 5 14,332 9,166 23,624 27,149 28,750 1,882 1,757 2,844 2,958 47.9 Nov. 6 17,554 9,893 25,173 28,689 29,346 1,997 2,676 2,998 2,908 46.6 Dec. 5 18,217 10,676 29,217 29,317 30,232 2,505 2,805 3,622 3,488 44.2
1981: Jan. 5 18,672 11,554 28,662 30,965 31,539 2,528 2,975 3,697 3,371 44.2 Feb. 5 · 19,254 11,192 31,890 31,454 33,326 2,525 3,416 3,879 3,241 45.0 Mar. 5 23,641 11,812 32,384 32,515 35,230 2,481 4.,203 4,507 3,841 44.2 Apr. 7 21,658 12,100 31,949 33,659 37,216 2,563 2,470 3,798 3,436 45.6 May 6 22,337 12,742 37,868 36,475 38,364 2,574 2,927 3,922 3,644 45.9
Hong Kong Monthly Digest of Statistics June 1981 47

-------------------
FINANCE
9.4 MONEY MARKETS
$million
Inter-bank liabilities Inter-deposit-taking company liabilities
As at end of Demand Short Time Demand Short Time year/month and call notice deposits Total and call notice deposits Loans Total
1978 4,035 553 3,141 7,729 189 279 3,525 526 4,519
1979 5,447 3,252 8,930 17,629 458 587 4,917 1,025 6,987
1980 6,085 4,146 16,646 26,877 326 1,971 6,706 1,265 10,268
1979: May 5,082 610 4,700 10,392 439 289 3,462 1,045 5,235 June 5,278 1,313 4,935 11,526 294 417 3,440 1,077 5,228 July 5,401 979 5,396 11,776 355 253 4,151 875 5,634 Aug. 5,075 1,746 5,853 12,674 191 638 4,143 835 5,807 Sept. 5,965 1,945 6,653 14,563 454 397 4,572 1,058 6,481 Oct. 5,903 1;745 8,166 15,814 352 399 4,766 940 6,457 Nov. 4,265 3,374 8,838 16,477 184 636 5,069 919 6,808 Dec. 5,447 3,252 8,930 17,629 458 587 4,917 1,025 6,987
1980: Jan. 4,854 1,200 8,881 14,935 667 688 4,818 1,020 7,193 Feb. 3,865 1,991 10,170 16,026 260 1,084 4,611 1,100 7,055 Mar. 4,644 1,374 11,917 17,935 574 548 5,087 925 7,134 Apr. 5,051 1,674 11,742 18,467 729 649 4,638 1,020 7,036 May 4,924 2,379 13,742 21,045 469 991 4,946 790 7,196 June ·5,477 2,877 14,093 22,447 461 897 5,236 816 7,410 July 5,834 1,878 14,986 22,698 658 784 5,048 936 7,426 Aug. 5,425 1,943 15,264 22,632 325 1,303 . 5,436 1,075 8,139 Sept. 6,299 1,878 15,626 23,803 740 1,192 5,726 1,165 8,823 Oct. 5,121 2,417 15,144 22,682 381 2,135 5,873 1,124 9,513 Nov. 6,042 2,477 15,975 24,494 695 1,461 6,129 1,198 9,483 Dec. 6,085 4,146 16,646 26,877 326 1,971 6,706 1,265 10,268
1981: Jan. 5,440 2,728 20,671 28,839 633 1,632 6,975 1,282 10,522 Feb. 5,726 4,280 18,819 28,825 461 2,756 6,483 1,373 11,073 Mar. 7,506 2,419 18,942 28,867 1,428 1,327 7,230 1,177 11,162 Apr. 6,810 3,660 17,987 28,457 1,360 1,079 6,887 1,224 10,550 May 6,028 3,619 18,416 28,063 1,156 2,240 8,162 1,244 12,802
Banks' liabilities to deposit-taking companies Deposit-taking companies' liabilities to banks
As at end of Demand Short Time Demand Short Time year/month and call notice deposits Loans Total and call notice deposits Loans Total
1978 2,969 402 3,389 169 6,929 922 228 4,197 1,039 6,386
1979 10,773 994 8,140 122 20,029 451 496 8,027 2,489 11,463
1980 10,008 2,741 15,343 900 28,992 1,122 3,059 13,631 3,502 21,314
1979: May 7,062 514 4,374 113 12,063 784 246 5,460 1,616 8,106 June 7,794 839 4,788 114 13,535 894 374 6,059 1,747 9,074 July 8,547 505 5,437 105 14,594 762. 332 6,351 1,933 9,378 Aug. 9,696 719 5,364 104 15,883 801 328. 6,351 2,121 9,601 Sept. 10,253 574 5,550 107 16,484 1,043 861 6,626 2,099 10,629 Oct. 10,125 558 6,288 103 17,074 1,526 247 7,173 1,998 10,944 Nov. 10,618 579 6,252 128 17,577 1,093 603 7,722 2,065 11,483 Dec. 10,773 994 8,140 122 20,029 451 496 8,027 2,489 11,463
1980: Jan. 8,035 481 12,703 422 21,641 659 477 8,040 2,483 11,659 Feb. 7,404 1,150 14,215 237 23,006 484 690 8,751 2,289 12,214 Mar. 7,139 838 15,431 287 23,695 818 553 9,859 2,379 13,609 Apr. 7,618 849 14,686 298 23,451 813 506 8,639 2,332 12,290 May 7,021 1,398 11,886 265 20,570 527 972 10,565 2,350 14,414 June 6,850 1,343 11,272 207 19,672 702 1,034 11,062 2,510 15,308 July 6,512 1,208 10,356 452 18,528 889 946 11,544 2,675 16,054 Aug. 6,760 1,755 10,774 453 19,742 635 1,142 12,474 2,430 16,681 Sept. 8,045 1,064 10,277 1,426 20,812 1,416 2,375 12,843 2,616 19,250 Oct. 8,431 1,985 13,269 383 24,068 524 1,517 13,300 2,621 17,962 Nov. 8,965 1,849 13,673 378 24,865 1,400 1,469 13,156 3,175 19,200 Dec. 10,008 2,741 15,343 900 28,992 1,122 3,059 13,631 3,502 21,314
1981: Jan. 9,248 1,764 17,015 408 28,435 1,314 1,586 14,179 3,446 20,525 Feb. 10,206 3,324 17,517 420 31,467 1,306 2,283 14,201 3,443 21,233 Mar. 11,065 1,914 18,165 444 31,588 4,042 2,047 14,483 3,495 24,067 Apr. 10,558 1,753 18,650 486 31,447 2,361 1,373 •15,149 3,451 22,334 May . 12,021 3,518 21,250 520 37,309 2,809 1,377 16,042 3,194 23,422
Note: Throughout this table "bank" signifies a licensed bank.
48 Hong Kong Monthly Digest of Statistics lune 1981

9.5 ANALYSIS OF LOANS A'ND.:ADVANCES
As at last day of quarter ended
L Manufact~ring:
· (a) textiles : (i) cotton (ii) other
(b) footwear and wearing apparel
(c) metal products and engineering
(d) rubber, plastics and chemicals
(e) shipbuilding and repair (f) electrical and electronic (g) food (h) beverages and tobacco (i) printing and publishing (j) miscellaneous
2. Agriculture and fisheries: (a) fisheries (b) livestock and livestock
products (c) vegetables and horticulture
3. Transport and transport · .· equipment
4. Electricity, gas and telephone
5; Building and construction
6. General commerce: (a) impott, export and
wholesale trade (b) retail trade
7. Mining and quarrying
8. Miscellaneous: (a) hotels, boarding houses
and catering (b) :financial concerns
including banks (c) stockbrokers
.. (d) professional and private individuals: ·
(i) to purchase resident.ial property ·
(ii) for other business pilrposes·
(iii). for other private purposes
(e) all others
Total loans and advances
Dec. 1978
6,642
1,789 (1,083)
(706)
1,083
683
5,75 333
769
130
100.
248
932
45
16
19
10
4,154
275
5,288 .··
15,539
14,502
1,037
38
14,447
536
25
462
9,631
(4,940)
(2;007)
(2,684)
3,793
46,428
Mar. 1979
7,564
2,004 (1,173)
(831)
1,186
812
714
351
891
138
160
251
1,057
39
16
15
8
4,001
334
5,430
16,348
15,289
1,059
25
16,698
611
944
462
10,397
(5,554)
(1;885)
(2,958)
4,282.
50,439
Hong Kong Mtmthly Digest of Statistics 1tine 1981
(A) BANKS
June 1979
7,453
1,887 (1,079)
(808)
1,214
776
592
418
949
125
134
256
1,102
46
21
13
12
4,473
399 ..
6,272
17,215
16,101
1,114
34
17,392
557
1,582
457
10,789
(6;060)
(2;051)
(2,678)
4,007
53,284
Sept. 1979
7,686
1,864 ' (1,072)
(792)
1,206
791
677
434
1,041
217
126
237
1,093
48
.23
17
8
4,407
573
6,650
18,393
17,261
1,132
18,783
513
1,839
621
11,664
(6;812)
(2,098)
(2,754)
4,146
56,562
Dec. 1979
8,540·
1,941 (1,071)
(870)
1,393
887
742
457
1,134
243 143
253
1,347
58
30
15
13
5,112
311
7,299
19,695
18,583
1,112
87
21,125
450
2,239
692
12,872
(7;.524)
(1,961)
(3,387)
4,8.72
62,227
Mar. 1980
9,954
2,370 (1,369) (1,001)
1,553
982
866
523
1,400
261
172
302
1,525
74
36
24 14
5,645
394
8,779
21,187·
20,032
1,155
10
23,517
878
2,843
579
13,912
(7;729)
(2;474)'
(3,709)
5,305 .·
69,560
June 1980
10,587
2,628 (1,565) (1,063)
1,552
1,068
853
674
1,481
254 ' 210
328
1,539
75
31
31
13
8,510
620
8,725
23,157
21,854
1,303
14
21,873
419
3,285
655
11,935
(5,531)
(2,651)
(3,753)
5,579
73,561
Sept. 1980
10,778
2,403 (1,345) (1,058)
1,579
1,137
951
696
1,525
261
196
335
1,695
79
31
31
17
7;855
458
11,057
23,981.
22,540
1,441
63
26,214
393
4,2?9
1,018
13,727
(6,121)
(3,217)
(4,389)
6,817
80,485
FINANCE
Dec. 1980
11,905
2,675 (1,643) (1,032)
1,786
1,351
963
1,003
1,581
350
206
343
1,647
92
.37
30
25
7,699
537
14,064
27,308'
25,701
1,607
148
33,217
773
'5,336 . l,5~7.
16,125
(7,173)
(3,409)
(5,543)
9,416
94,970
$million
Mar. 1981
13,673
3,106 (1,825) (1,281)
2,054
1,519
1,097
873
1,921
341
285
401
2,076
96
42
27
27
7,260
880
16,753
29,021
27,112
1,909
131.:
38,340
626
6,030
2,062
17,898
(7,921)
(3,617)
(6,360)
. 11,724
106,154
49

FINANCE
As at last day of quarter ended
1. Manufacturing: (a) textiles:
(i) ·cotton (ii) other
(b) footwear and wearing apparel · · ·
(c) metal products and engineering · ·
(d) rubber, plastics and chemicals •.
(e) shipbuilding and repair (f) electrical and electronic (g) food
· · (h) bev~rages and tobacco ( i) -printing and publishing (j) miscellaneous · ' •
2, . AgricultUre and fisheries:
(a) fisheries (b) livestock and livestock
products (c) vegetables and ~orticulture
3. . Transport and transport equipment
4. Electricity; gas and telephone.
5. Building and construction
6. · Generalcominerce:• (a) import, export and
.:ec wholesale trade ·. ·
(b) ret~iUi;ade
7. ': Mining and1 quarrying
8: Miscellaneous: (a) hotels, boarding houses
andiciitering · ·
(b) financial concerns inciuding banks
(c) sto.~kbrokers
.. (d) prof~s~ional and private individ\ials: ·.
(i) to purchase residential ·~;;property
(ii) for other business · : . ,. purposes' •
(iii) for other private · 1. • purposes.
(~) aU9th1:rs •"-. -
Total loans·and advances
'"· : (B) Ul;JpOSIT-T~KING COMPANIES
Dec. 1978
654
165 (77)' (88)
51
32
130
84
33
34 80
5
3
2
2,104
9
1,63'6.
1,675
1,574!
101
6
3,88'1
69
Mar. 1979
848
239 (117) (122) '
30
48
140 142
94
9
61
85
33
6
2
25
2,161
30
1,428
1,722
1,635
87
4,057
102
716 613
81 57
1,502 1,752
(782'}; (899) .·
(261) (415)
(459) (438) .
1,513 1,533
June 1979
892
225 (122) . (103).
43
53
49
119 183
27
3
64
126
23 12
6 5
2,496
22
1,662:
1,964·
1,785
179
3,772
70
480
137
1,723
(873) I
(39,5)
(455)
1,362
Sept. 1979
917
239 (110) (129)
40
74
57
108
189
31
1 89 89'
18
14
4
2,585
15
2,136
2,076'
1,942 134
4,217
111
Dec. 1979
932
206 (83)
- (123)
52
102
48
77
204
51 2
92
98
Mar. 1980.
1,082
217 (113) (104)
39
114
71
98
253 69
96
125
14 18
14 15
3
2,651 2,919
37 37
2,586 2,875
2,334 2,743
2,185 . 2,58'8
149 155
5,011 7,067
.58 81
688 987 865
169 136 153
1,947 2,283
(949) . (1,128)
(585) (589)
(413) (566) 1,335 1,530
4,276
(1,605)
(2,013)
(658)
1,676
.Tune 1980
1,460
245 (93)
(152)
87
139
117
87 290
68
102
325
15 12
3
3,226
79
3,355
3,213
3,033
180
11
11,662
114
1,165
297
7,553
(3,630)
(1,594)
(2,329)
2,533
9,970 ' 10,279; 10,831 11,964 13,566 16,742 23,021
N~te: Figu~s comprise only loans and advances in Hong Kong.
Sept. 1980
1,460
243 (106) (137)
94
109
72
77
331
54
117
363
12
12
3,521
34
4,153
3,752
3,606
146
11
13,078
172
1,360 406
8,813
(3,986)
(3,729)
(1,098)
2,327
26,021
Dec. 1980
1,418
270 (90)
.(180)
80
110
90
87 328
70
121
262
12
12
3,822
20
5,143
4,904
4,758
146
14
$million
Mar. 1981
l,602
248 (101) (147)
73
119
101
91 308
65
5 . 117
475
12 12
3,765
138
6,545
5,025.
4,865
160
15
13,984 15,413
.387 343
1,289
269
8,391
(4,530)
(2,923)
(938)
3,648
29,317
1,668
313
9,830
(4,786)
(3,522)
{1,522)
3,259
32,515
50 Hong Kimg Monthly· Digestof Statistfcs lune 1981

9.7 INTER-BANK LENDING RATE AND BANK CHEQUES CLEARED
Inter-bank lending rate Bank cheques Value of bank
Year/month (24-hour call) cleared cheques cleared
%perannum Items $million
1975 !--lot 33,657,302 394,291 1976 1-7t 39,067,421 546,978 1977 1-6 41,450,772 647,487 1978 4-12!- "' 49,621,611 1,006,598 1979 7-19!- 56,958,063. 1,605,812 1980 4-19 67,669,491 3,019,546
1979: May 9!---18!- 4,798,565 122,763 June 10-13! 4,634,667 126,208 July 8-11! 4,643,126. 133,214 J>: Aug. 9-14 4,606,395 144,582 Sept. 7-15 4,652,592 150,030 Oct. 7-13 5,400,910' 165,609 Nov. 7!-13 5,300,121 166,895 Dec. 13-16 5,347,261 171,244
;
1980: .Jan. ll!-16 6,007,922, 218,352 Feb. 12i-19 4,955,077 182,052 Mar. 10!--16! 4,738,92l' 192,536 Apr. 11-16 5,034,455 188,452 May 9i-16 5,427,149 207,305 .. i .. June 3!--10! 5,189,43_'.? 216,735 July 4-9!- 5,705,061 255,882 Aug. 7-10 5,345,266 234,815 ....
Sept. 8-10 5,933,516 279,753 '·'·
Oct. 9-14 6,415,733 329,319 Nov. llt-17 6,517,511 388,106 Dec. 12!--18 6,399,441 326,240
1981: Jan. H>!-19 7,013,252 i'·:·;
355,966 Feb. 16!--22 4,604,894 295,038 . Mar. 16-17! 5,949,221 370,930 . ' Apr. 16-17! . 5,413,347 302,629 May 15-18!- 6,348,135 376,512
~Hdng Kong Monthly Digest of: Statistica:. lune · 1&81 51
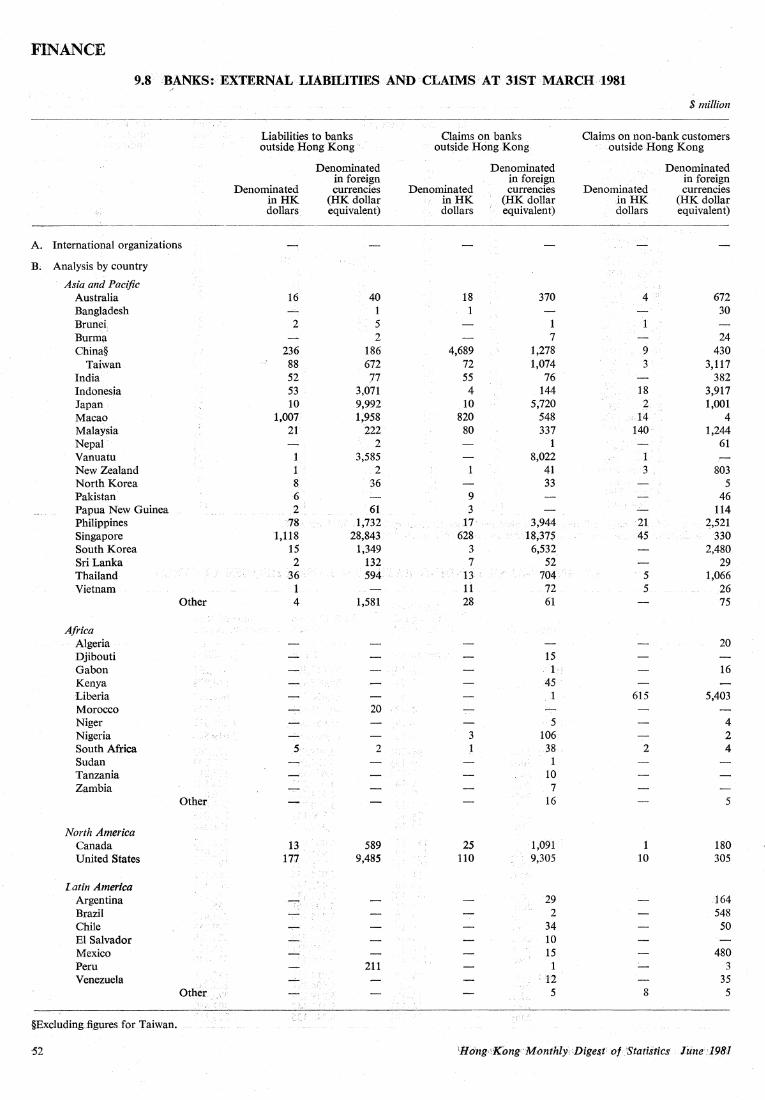
FINANCE
9.8 ,BANKS: EXTERNAL LIABILITIES AND ·CLAIMS AT 31ST MARCH 1981 ,•
A. International organizations
B; Analysis by country
Asia. and Pacific Australia Bangladesh Brunei Burma China§
Taiwan India Indonesia Japan Macao Malaysia Nepal Vanuatu New Zealand North Korea Pakistan Papua New Guinea Philippines Singapore South Korea Sri Lanka Thailand Vietnam
Other
Africa Algeria Djibouti .Gabon Kenya Liberia Morocco Niger Nigeria >''t:'
South Africa Sudan Tanzania Zambia
Other
North America Canada United States
Latin America Argentina Brazil Chile El Salvador Mexico Peru Venezuela
other '' . \ -.~
·,·;,,
§Excluding.figures.for.Taiwan.
·52
Liabilities to banks outside. Hong Kong
Denominated inHK dollars
16
2
236 88 52 53 10
1,007 21
1 1 g 6 2'
78 1,118
15 2
•36 1 4
..:...
-
---5
-
l3 177
"'""':""'!'
-
Denominated in foreign currencies
(HK dollar equivalent)
40 1 5 2
186 672 77
3,071 9,992 1,958
222 2
3,585 2
36
61 ,l,732 28,843
1,349 132 594
1,581
20
2
589 9,485
211
Claims on banks outside Hong Kong.
Denominated . inHK
dollars
18 1
4,689 72 55 4
10 820
80
9 3
17 628
3 7
13 li 28
3 J
25 110
Denominated in foreign currencies
(HK dollar equivalent)
370
1 7
1,278 1,074
76 144
5,720 548 337
1 &,022
41 33
3,944 '18,37$ .
6,532 52
704 72 61
15 1
45 ,l
5 106 38
1 10 7
16
1,091 9,305
29 2
34 10 15 1
'12 5
$million
Claims on non-bank customers .outside Hong Kong
Denominated .in HK dollars
4
9 3
18 2.
d4' 140
1 3 '
21 45
5 5
615
2
1 10
8
Denominated in foreign currencies
(HK dollar equivalent)
672 30
24 430
3,117 382
3,917 1,001
4 1,244
61
803 5
46 114
2,521 330
2,480 29
1,066 26 75
20
16
5,403
4 2 4
5
180 305
.164 548
50
480 3
35 5
IH<lng»Kong ·Monthly, •Digeft' of 'Statistics .. liine··~98l

FINANCE
9.8 BANKS: EXTERNAL LIABILITIES AND CLAIMS AT 31ST ·MARCH 1981-contd.
Liabilities to banks outside Hong Kong
Denominated in foreign ·
Denominated currencies inHK (HK dollar dollars equivalent)
Caribbean Bahamas 2,981 Barbados 1 Bermuda 1 27 Cayman Islands 39 2,683 Cuba Netherlands Antilles 250 Panama 1 3 Trinidad & Tobago 25
Other 132
Middle East Bahrain 2 2,886 Egypt 40 Iran 11 4 Israel 419 Jordan Kuwait 358 Lebanon 5 Libya Oman 85 Qatar 10 Saudi Arabia 366 United Arab Emirates 911
Other
Western Europe Austria 334 Belgium/Luxembourg i2 3,268 Denmark 2 70 France 55 3,632 Greece 211 Iceland Italy 1 234 Netherlands 10 885 Norway 3 542 Republic of Ireland 2 Spain 286 Sweden 15 42 Switzerland 55 1,545 United Kingdom 300 34,766 West Germany 75 1,238 Yugoslavia -
Other 8 1
Eastern Europe Czechoslovakia Germany Democratic
Republic 4 Hungary Poland Rumania {JSSR
Unallocated 8 1
c. Summary
International ·organizations Countries 3,544 122,694 Unallocated 8 1
Total 3,552 122,695
Hong Kong Monthly·.Digest ofStatis.tics· lune:l981
· Claims on banks outside Hong Kong
Denominated in foreign
Denominated . currencies inHK (HK dollar dollars equivalent)
25 862
1 721 6
251 68
22
48 3,138 11 31
1 10 1
33 43
2 26 26
3 100 4· 199
3
4 340 46 1,994 u 41 32 3,494
8
8 521 12 727 2 2 1 2
64 r2 58 63 1,123
376 12,215 37 959
105 2 60
99
50 25 11 25
133
15· 85
7,315 85,734 l5 85
7,330 85,819
$million
Claims on non-bank customers outside Hong Kong
Denominated inHK dollars
. 45 14
6
-
12
1 11
64 11
17
1,071 ff
1,088
Denominated in foreign currencies
(HK dollar equivalent)
83 21 16 57
991
16
3
14 8
104
122
11 132
1
10 208
1 47
129 80
21 134
1
2
5
27,813 5
27,818
53
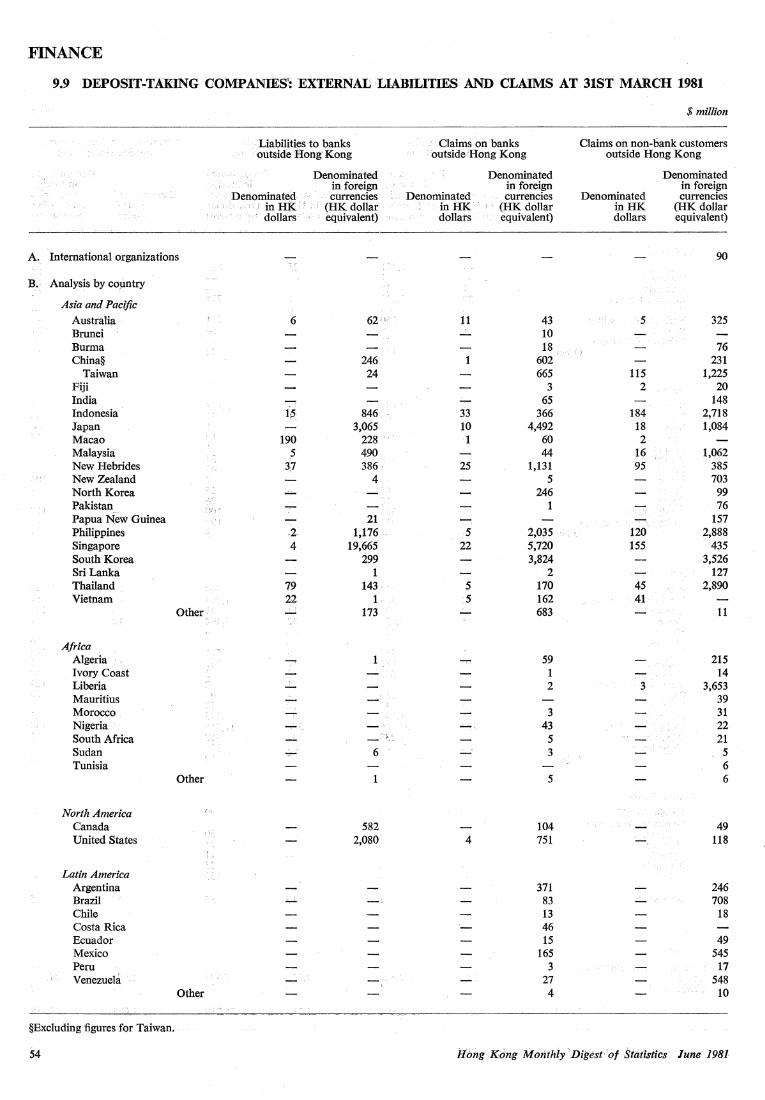
FINANCE
9.9 DEPOSIT-TAnNG COMPANIES": EXTERNAL LIABIUTIES AND CLAIMS AT 31ST MARCH 1981
A. International organizations
B. Analysis by coµntry
Asia and Pacific
Australia Brunei Burma China§
Taiwan Fiji India Indonesia Japan Macao Malaysia New Hebrides New Zealand North Korea Pakistan Papua New Guinea Philippines Singapore South Korea Sri Lanka Thailand Vietnam
Africa Algeria Ivory Coast Liberia Mauritius Morocco Nigeria South Africa Sudan Tunisia
North America Canada United States
Latin America Argentina Brazil Chile Costa Rica Ecuador Mexico Peru Venezuela
§Excluding figures for Taiwan.
S4
Other•
Other
Other
· · Liabilities to banks outside llong'Kong
Denominated in foreign
Denominated currencies · · ; in HK' ' · · (HK dollar
dollars · equivalent)
.!
6
-· 2 4
79 i2
246 24
846 3,065
228 ' 490 386
4
-· 21
1,176. 19,665
299 1
143. 1
173
1
6
1
582 2,080'
· Claims on banks outside Hong Kong
Denominated in HK. dollars
11
1
33 10 1
25
5 22
5 ·5
4
Denominated in foreign currencies
(HK dollar equivalent)
43 10 18 ;
602 665
3 65
366 4,492
60 44
1,131 5
246 1
2,035 5,720 3,824
2 170 162 683
59 1 2
3 43
5 3
5
104 751
371 83 13 46 15
165 3
27 4
$million
Claims on non-6ank customers outside Hong Kong
Denominated inHK dollars
'}
5
115 2
184 18 2
16 95
120 155
45 41
3
Denominated in foreign currencies
(HK dollar equivalent)
90
325
76 231
1,225 20
148 2,718 1,084
1,062 385 703 99 76
157 2,888
435 3,526
127 2,890
11
215 14
3,653 39 31 22 21 5 6 6
49 118
246 708
18
49 545
17 548 10
il&ng Kdng Monthly °'..Digest; 'of Siatisiics · lune· 1981

FINANCE
9.9 DEPOSIT-TAKING COMPANIES: EXTERNAL LIABILITIES AND CLAIMS
Caribbean Bahamas Bermuda Cayman Islands Cuba Jamaica Netherlands Antilles Panama Trinidad & Tobago
Other
Middle East
Bahrain Egypt Jordan Kuwait Lebanon Libya Oman Saudi Arabia United Arab Emirates
Other
Western Europe
Austria Belgium/Luxembourg Cyprus Denmark Finland France Greece Iceland Italy Monaco Netherlands Norway Portugal Republic of Ireland Spain Sweden Switzerland United Kingdom West Germany Yugoslavia
Other
Eastern Europe
Bulgaria Czechoslovakia Germany Democratic
Republic Hungary Poland Rumania USSR
Unallocated
C. Summary International organizations Countries Unallocated
Total
AT 31ST MARCH 1981-contd.
Liabilities to banks outside Hong Kong
Denominated inHK dollars
46
8
2
1
4 6
16 1
444 1
445
Denominated in foreign currencies
(HK dollar equivalent)
1,943 26
1,127
16
2,511 324
61 164
53 27 19 5
187 1
265 2,882
26 40
964 10
80
242 5
34 50
337 19,750 1,055
14
61,704 14
61,718
Claims on banks outside Hong Kong
Denominated inHK dollars
155
10
22
5
15 2
2
332 2
334
Denominated in foreign currencies
(HK dollar equivalent)
1,022
390 10
51 35
879 28
3 1
8 1
47 6
24 369
7 103 294 117
116
252 19 31 11
154 14 90
4,327 3,397
93 353
20 54
233 98
261 72 71
7
35,111 7
35,118
Hong Kong Monthly Digest of Statistics lune 1981
$million
Claims on non-bank customers outside Hong Kong
Denominated inHK dollars
6
1
4
133
946
946
Denominated in foreign currencies
(HK dollar equivalent)
17 99 37
21 1,444 2,110
22
5 6
45 193
3
66
12
130 30
183 50 80
463 104 533 84 6
18 150
355 345 20
448 2,521
23 7
23 5
10
21
90 34,174
21
34,285
55

FINANCE
9~10 •.EXCHANGE; RA::'.E.ES'. AND·THE' EFFECTIVE EXCHANGE· RATE INDEXES
Year/month
1975 1976 1977 '
~9# 1~79'
1980
1979: May June July Aug. Sept. Oct. Nov. Dec.
1980: Jan. .. Fob.
Mar; Apr. May June July Aug. Sept. Oct. Nov. Dec.
1981: Jan. Feb. Mar. Apr. May
¥ear/month
·.i.•ns 1976 1977 1978 1979 1980
1979: May June July Aug. Sept. Oct. Nov. Dec.
1980i Jan. Feb. Mar. Apr. May June July Aug. Sept. Oct. Nov. Dec.
19,81: Jan. l'eb. Mar. Apr. .May
Chinese Renminbi
2.6657 2.5401 2.5131 2.4681 3.1971 3.3190
3.1817 3.2112 3.2978 3.3429 3.3085 3.2798 3.2798 3.2798
3.2700 3.2532 3.2783 3.2552 3.2664 3.3230 3.3648 3.3648 3.3648 3.3795 3.3588 3.3399
3.3491 3.3083 3.2688 3.2510 3.1982
U.S. dollar Sterling
Deutsche mark
Japanese Yen
Canadian dollar
Australian dollar
Singapore dollar
Dutch New Taiwan Guilder dollar
Swiss franc
(Hong Kong dollirs to o~~ unlt'of foreJgn currency)
4.939 4.904 4.662
'4.685 5.003 4.976
5.065 5.116 5.151 5.129 5.056 4.996 5.017 4.950
4.865 4.900 5.020 4.993 .4.912 4.922 4.920 4.951 4.958 5.028 5.100 5.144
5.184 5.037 5.299 5.355 5.447
10.90 '8.86 8,14
Mo .10.64 li.60'
10.43 10.79 11.66
' 11.50 11.15 10.74
·10.69 !0.90
11.02 11.23 11.11 11.09 11.33 11.52
'Jl.69 '11.75
11.93 12.16
'12.24 12.08
12.48 12.17 11.82
'11.70 11.42
Republic' of Belgian Korea
franc .wpp French
franc
2.01 1.95 2.01 2.34;' 2.73 2.74
2.65 2.71 2.83 2.80 2.82 2.79 2.83 2.86
2.82 2.80 2.72 .. 2.67 2.74 2.79 2.82 2.77 2.77 2.74 2.65 2.61
2.58 2.47. 2.51 2.48 2.38
Italian lira
0.0167 0.0165 0.0174 'i>'.h225 0.0229 0.0221
0.0232 0.0234 0.0238 0.0236 0.0228 0.0217 0.0205 0.0205
0.0205 0.0201 0.0202 0.0200 0.0216 0.0226 0.0223 0.0221 0.0231 0.0241 0.0240 0.0245
0.0256 0.0258 0.0254 0.0249 0.0247
4.86 ,•;MS . 4~3!1' ;fi), .. ;4~27 4.26
4.39 4.37 4.43 4.39
'4.34 '4.25
4.25 4.23
4.18 4.24 4.29 4.21 4.19 4.28 4.27 4.27 4.26 4.31 4.31 4.30
4.36 4.43 4.45 4.50 4.54
6.47 6.00 5.16 5.;6 S.59 5:69
5.60 5.68 5.81 5.79 5.70 5.56 ·5~49
S.47
5.42 · 5.42 5.48 5.48 S.57 5.69 5.71 5.7S 5.81 5.91 5.96 6.02
6.11 6.17 6.17 6.18 6.22
Thai Indonesian Philippine Malaysian . baht , rupiah Peso dollar
· '.:(Hong Kong dollars to one unit of foreign cilrrency)
0.135 0.128 0.131 0.149 0.170 0.170
0.165 0.169 0.176 0.175 0.175 0.173 0.174 0.175
0.173 0.172 0.168 0.165 0.170 0.174 0.175 0.173 0.173 0.170 0.165 0.162
0.160 0.154 0.154 0.153 0.147
0.0098 o.qri99 0.0()96 0.00))6 0.0103 0.0083'
o.oio5 O.Q105 0.0105 0.0106 0.0105 0.0103 0.0103 0.0103
0.0098 0.0084 0.0086 0.0084 0.0082 0.0082 0.0081 0.0080 0.0080 0.0079 0.0077 0.0078
0.0078 0.0079' O.Q079. 0.0079 O.Q()79.
1.16 1.03 0.95 1.05 1.18 1.18
1.15 1.17 1.22 1.21 1.21 1.19 1.21 1.22
1.21 l.20 1.17 t.i5 1.18 1.20 1.22 1.20 1.20 1.19 1.15 1.13
1.12 1.07 l.07 1.05 1.00
0.0076 ().0060 0.0053 0.0056 0.0060
'·0.0059
0.0060 0.0061 0.0063 0.0063 0.0062 0.0061 0.0061 0.0061
0.0061 0.0061 0.0059 0.0057 0.0058 0.0059 0.0059 0.6059 0.0059 0.0058 0.0056 0.0055
0.0055 . 0.9052 0.0052 0.0050
'0.0048
0.244 0.243 0.231 0.232 0.246 0.247
0.248 0.251 0.253 0.253 0.250 0.247 0.248 0.246
0.241 0.242 0.248 0.247 0.244 0.245 0.245 0.246 0.246 0.249 0.253 0.256
0.257 0.264 0.262 0.264 0.267
0.0113 0.0113 0.0109 0.0106 0.0078 0.0077
'0~0077 0.0078
... 0.0079
0.0080 0.0079 0.0077
. 0.0079 0.0078
0.0076 0.0076 0.0077 0.0078
.. 0.0078 0.0078 0.0076
"0.0076 0.0076 0.0078 0.0079 0.0079
0.0079 0.0082 0.008'2
; 0.0082 0.0084
0.688 0.660 0.628 0.635.
0.679 0.662 ,,
0.687 0.695 0.700 0.698 0.688 0.678 0.682 0.673
0.658 0.662 0.677. 0.674 0.658 0.656 0.655 0.656' 0.653 0.658 0.667 0.674
0.681 0.694 0.693 0.696 0.701
2.06 1.93 1.89 2.03 2.29 2.29
2.28 2.33 2.39 2.38 2.35 2.31 2.29 2.27
2.24 2.25 2.26 2.19 2.25 2.30 2.30 2.31 2.33 2.36 2.36 2.33
2.33 2.34 2.32 2.32 2.33
2.08 1.99 1.91 2.06 2.30 2.33
2.30 2.33 2.39 2.38 2.36 2.31 2.30 2.28
2.26 2.28 2.27 2.24 2.28 2.32 2.33 2.33 2.34 2.41 2.44 2.44
2.48 2.54 2.52 2.54 2.54
1.95 1.85 1.90 2.17 2.49 2.51
2.43 2.47 2.57 2.55 2.56 2.52 2.54 2.58
2.56 2.54 2.48 2.43 2.49 2.54 2.58 2.54 2.55 2.53 2.45 2.41
2.38 2.27 .2.27 2.24 2.14
0.130 0.129 0.123 0.126 0.125 0.130
0.118
~:!~'' 0.134 0.135
'0.134 0.130' 0.132
"'0:12; '0.130 0.130 0.126 0.120
.. 0.126 ·' 0.132 0.133 0.13·&. 0.135' 0;132 o.i31 0.1·36 0.131 0.132 0.136 0.135
Effective exchange, rate indexes for the Hong,:f{.ong dollar
(18.12.71 ="1'00)
1.91 1.96 1.95 2.65 3.01 2.98
2.93 3.01 3.13 3.10 3.14 3.o7 3.0!! 3.10
3.06 3.00 2.86 2.86 2.96 3•02 3.07 3.00 3.03 3.04 2.96 2.89
2.85 2.73 2.76 2.73 2.65
Trade (import and Import• Bxport-SDR export)-weighted weigh\"4 weighted
5.99521 5;66088 5.44302 6.04662 6.46438 6.01165
6.43746 6.53359 ·, . 6.71386 6.66739 6.59565 6.49010 6.49140 6.49430
6.42350 6.43360 6.41822 6.34151 6.40785 6.49960 6.53209 6.50269 6.53732 6.57788 6.54325 6.51462
6.57823 6.54053 6.51952' 6.49436 6.43121
105.9 104;0, 110.0 ' .iri7 .7 112.3 fo~.8 100.0 94::; 92;0, ' ; ,g7 .i 91.6 · s1:0
'92.3 91;0' 88.4 88.7 9(),0. 92.0 93.1
; ·92;9
93.9 94.1 94.1 95.1 93.3 91.3 90.9 91.2 90.0 88.8 89.2 88.9
87.7 s&.1 88.6 88~9 89.7
87.6. '816.3 83.9 84.l 85,4 . 87.4 88.9
; '88.7
.89.S 9,0.l
"''"?O,l '"·"·~,i..1. '"88.8
86.5 86.1
·S.6.s 85.i 83.8 84.4 83.9
s2.6 8~;2 83.8
184.3 85.3
108.4 112.8 116.8 107.6 98.4 97.8
98.8 97.2 94.S 95.1 96.3 98.1 98.5 98.5
99.7 99.5 99.4
100.4 99.4 97.8 97.3 97.S 96.7 95.6 95.8 95.6
94.6 94.8 95.2 95.2 95.7
Note: Figures are average exchange rates .for. the respective periods derived frpm closing middle-market T/T rates.
Hong K:-Ont· Mi>nt'fily Digest of Statistics lune 1981

FINANCE
9.11 EXCHANGE RATES AND THE EFFECTIVE EXCHANGE RATE INDEXES IN MAY 1981
As at end U.S. Deutsche Japanese Canadian Australian Singapore Dutch New Taiwan Swiss of day dollar Sterling mark Yen dollar dollar dollar Guilder dollar franc
May (Hong Kong dollars to one unit of foreign currency)
1 5.385 11.55 2.44 0.0250 4.51 6.18 2.54 2.20 0.137 2.67 2 5.395 11.54 2.44 0.0250 4.51 6.20 2.55 2.21 0.137 2.67
4 5.420 11.50 2.43 0.0250 4.53 6.22 2.55 2.19 0.137 2.66 5 5.450 11.51 2.42 0.0250 4.54 6.23 2.55 2.17 0.137 2.65 6 5.442 11.56 2.42 0.0251 4.55 6.22 2.55 2.18 0.136 2.65 7 5.442 11.55 2.42 0.0251 4.54 6.22 2.55 2.18 0.136 2.65 8 5.445 11.49 2.41 0.0250 4.55 6.22 2.55 2.17 0.137 2.64 9 5.420 11.57 2.43 0.0251 4.53 6.22 2.55 2.18 0.137 2.66
11 5.434 11.52 2.40 0.0250 4.54 6.23 2.55 2.17 0.137 2.64 12 5.442 11.47 2.39 0.0250 4.54 6.23 2.54 2.16 0.138 2.63 13 5.445 11.47 2.40 0.0249 4.54 6.22 2.54 2.16 0.138 2.66 14 5.490 11.43 2.39 0.0248 4.58 6.24 2.55 2.15 0.138 2.65 15 5.472 11.44 2.39 0.0247 4.57 6.24 2.55 2.16 0.138 2.66 16 5.460 11.43 2.39 0.0247 4.56 6.23 2.55 2.15 0.138 2.66
18 5.453 11.44 2.40 0.0247 4.56 6.21 2.54 2.16 0.138 2.67 19 5.452 11.47 2.39 0.0248 4.56 6.23 2.54 2.15 0.138 2.69 20 5.470 11.40 2.38 0.0247 4.57 6.25 2.55 2.14 0.138 2.67 21 5.465 11.47 2.40 0.0248 4.57 6.27 2.55 2.16 0.138 2.69 22 5.477 11.39 2.38 0.0246 4.57 6.26 2.55 2.14 0.138 2.66 23 5.468 11.40 2.39 0.0247 4.57 6.25 2.55 2.14 0.138 2.66
25 5.464 11.42 2.39 0.0247 4.56 6.24 2.55 2.15 0.138 2.68 26 5.481 11.38 2.38 0.0245 4.58 6.26 2.55 2.14 0.138 2.66 27 5.483 11.38 2.36 0.0245 4.57 6.25 2.55 2.12 0.138 2.65 29 5.490 11.38 2.36 0.0244 4.57 6.25 2.55 2.12 0.138 2.66 29 5.478 11.40 2.38 0.0245 4.57 6.24 2.55 2.14 0.138 2.66 30 5.478 11.41 2.37 0.0246 4.57 6.26 2.55 2.13 0.138 2.66
Effective exchange rate indexes for the Hong Kong dollar
(18.12.71=100) Republic of
Italian Thai Indonesian Philippine Malaysian Trade (import and As at end Chinese Belgian Korea French Import- Export-of day Renminbi franc won franc Jira baht rupiah Peso dollar SDR export)-weighted weighted weighted
May (Hong Kong dollars to one unit of foreign currency)
1 3.2595 0.154 0.0079 1.04 0.0050 0.270 0.0086 0.700 2.33 6.44951 89.4 84.8 95.8 2 3.2595 0.155 0.0079 1.04 0.0051 0.270 0.0086 0.700 2.34 89.3 84.7 95.6
4 3.2342 0.156 0.0079 1.04 0.0051 0.270 0.0086 0.701 2.33 6.45083 89.4 84.9 95.6 5 3.2342 0.152 0.0079 1.03 0.0050 0.273 0.0086 0.706 2.34 6.46076 89.5 84.9 95.6 6 3.2342 0.152 0.0080 1.03 0.0050 0.273 0.0086 0.706 2.35 6.46912 89.3 84.8 95.5 7 3.2342 0.152 0.0080 1.03 0.0050 0.272 0.0086 0.706 2.34 6.46140 89.3 84.8 95.4 8 3.2342 0.152 0.0080 1.03 0.0050 0.272 0.0086 0.707 2.35 6.47590 89.5 84.9 95.6 9 3.2342 0.152 0.0080 1.03 0.0050 0.271 0.0086 0.705 2.35 89.4 84.8 95.6
11 3.2082 0.151 0.0080 1.01 0.0050 0.272 0.0086 0.706 2.35 6.43250 89.6 85.l 95.7 12 3.2082 0.150 0.0080 1.00 0.0050 0.272 0.0086 0.707 2.34 6.41982 89.7 85.2 95.8 13 3.2082 0.150 0.0080 1.00 0.0049 0.272 0.0086 0.705 2.33 6.42031 89.7 85.2 95.8 14 3.2082 0.150 0.0080 1.00 0.0049 0.273 0.0086 0.709 2.35 6.43362 89.7 85.3 95.5 15 3.2082 0.151 0.0080 1.00 0.0049 0.274 0.0086 0.709 2.35 6.42823 89.7 85.3 95.7 16 3.2082 0.150 0.0080 1.00 0.0049 0.273. 0.0086 0.708 2.35 89.8 85.4 95:8
18 3.1827 0.150 0.0080 1.00 . 0.0049 0.273 0.0086 0.706 2.34 6.41998 8'1.9 85.5 95.8 19 3.1827 0.150 0.0080 1.00 0.0049 0.273 0.0086 0.706 2.34 6.42022 89.8 85.4 95.7 20 3.1827 0.150 0.0079 1.00 0.0049 0.272 0.0086 0.708 2.35 6.44322 89.9 85.6 95.8 21 3.1827 0.151 0.0080 l.01 0.0049 0.270 0.0086 0.706 2.35 6.41662 89.6 85.2 95.5 22 3.1827 0.150 0.0080 l.00 0.0049 0.271 0.0086 0.709 2.35 6.41707 90.0 85.6 95.8 23 3.1827 0.149 0.0080 1.00 0.0049 0.271 0.0086 0.706 2.35 90.0 85.6 95.8
25 3.1827 0.149 0.0080 1.00 0.0049 0.271 0.0086 0.705 2.35 6.40627 89.9 85.6 95.8 26 3.1827 0.149 0.0080 1.00 0.0049 0.271 0.0086 0.706 2.35 6.40691 90.l 85.8 95.9 27 3.1827 0.149 0.0080 1.01 0.0049 0.272 0.0086 0.708 2.34 6.39998 90.l 85.8 96.0 28 3.1827 0.148 . - <J.0080 1.01 0.0049 0.272 0.0086 0.708 2.34 6.41358 90.2 85.9 96.0 29 3.1827 0.149 0.0080 LOI 0.0049 0.271 0.0086 0.707 2.34 6.41008 90.l 85.7 95.9 30 3.1827 0.148 0.0080 1.00 0.0050 0.271 0.0086 0.707 2.34 90.l 85.7 95.9
Note: The effective exchange rate indexes are based_ on closing middle-market T/T rates while other figures are closing selling T/T rates.
Hong Kong Monthly Digest of Statistics June 1981 57

FINANCE
·9,12 ·INDEX OF: SHARE PRICES AND•. VALUE OF STOCK EXCHANGE TURNOVER
Index§ Turnover ($ million)
Hang Seng Index Far East Index Kam Ngan Index Hong. Kong Stock Far East Kam Ngan Stock Kowloon Stock Year/month (31.7.64=100) (1.4.71=1,000) '(2.1. 73=1,000) Exchange Ltd. Exchange Ltd. Exchange Ltd. Exchange Ltd. Total turnover
1975 300.51 1,486.40 255.80 2,503.53 4,724.90 2,807.73 299.02 10,335.18
1976 419.50 2,099.51 358.14 3,188.72' 6,018'.18 3,755.54 193.49 13,155.93
1977 425.30 2,060,36 364.75 1,621.07 2,898.79 1,575.40 31.48 6,126.74
1978 526.91 2,499.54 461.52 5,317.56 13,728.25 8,253.18 120.02 27,419.01
1979 619.71 2,889.64 ·528.88 5,607.05' 11,747.42 8,216.81 61.46 25,632.74
1980 1,121.17 5,506.37 972.39 19,371.88 43,595.49 32,481.03 235.93 95,684.33
1979: May 562.96 2,577.64 480.90 275.07 '441.82 316.23 2.43 1,035.55 June 539.32 2,439.13 460.78 185.63 325.56 221.11 1.39 733,69 July 605.23 2,794.46 ~H6.56 457.58 1,079.07 730.64 5.13 2,272.42. Aug. 581.77 2,665:78 498.27 430.12 948.07 659.58 5.03 2,042.80 Sept. 685.83 3,329.75 580.22 566.74 1,284.74 815.26 7.23 2,673.97 Oct. 674.18 ' 3,252.91 579.02 717.96 ' 1,608.74 1,109.01 8.12 3,443.83 Nov. 762.45 3,632.30 653.50 995.12 2,066.93 1,572.16 9.91 4,644.12 Dec. 879.38 4,201.24 751.36 1,024.84 1,994.80 1,490.32 10.68 4,520.64
1980: Jan. 907.50 4,358.13 789.06 1,342.25 2,790:36 '2,262.22 16.85 6,411.68 Feb. 914.91 ' 4,441.15 783.32 1,035.68 1,995.77 1,589.96 10.22 4,631.63 Mar. 783;22 3,823.2-0 '674.48 749.51 1,533.74 '1,220.49 12.10 3,515.84 Apr. 867.90 4,1!13.06 740.47 488.84 1,13-5.54 872.70 5.30 2,502.38 May 894.32 4,283.63 764.41 666.47 1,432.45 1,135.80 5.52 3,240.24 June 1,066.84 5,107.59 898.48 1,182.81 2,401.25 1,912.19 15.94 5,512.19 July 1,166.55 5,666A1 990.52 1,658.57 3,369.18 2,807.87 21.83 7,857.45' Aug. 1,221.12 6,075.99 .t,052.87 1,786.51 3,625.88 2,990.96 18.07 8,421.42 Sept. 1,213.68 5,997.63 J.;065.70 2,307.49 5,284;61 .3,800.41 24.68 11,417.19 Oct. 1,498.86 7,486.43 1,305.52 2,722.67 6,212;64 4,673.38 30.55 ' 13,639.24 Nov. 1,445.51 7,204.46 1,298.79 3,600.95 7,721.57 5,538.29 50.03 16,910.84 Dec. 1,473.59 7,448.08 1,305.09 1,830.12 6,092.50 3,676.76 24.81 11,624.19
1981: Jan. 1,588.08 7,979.69 1,408.46 1,714.82 5,785.34 3,862.21 20.34 ll,382.71 Feb. 1,487.88 7,445.52 1,328.17 1,047.81 3,854.04 2,894.86 8.32 7,805.03 Mar. 1,369.65 6,839.97 1,224.63 1,309.08 4,569.56 3,201.92 14.45 9,095.01 Apr. 1,424.26 7,181.52 1,261.67 924.07 2,168.25 1,775,37 7.47 4,875.16 May 1,667.34 8,712.18 1,455.02 1,606.31 4,462.61 3,419.46 16.13 9,504.51
§Monthly indexes refer to the positions as at end of month and annual indexes arc monthly averages.
"
9.13 INDEX OF SHARE PRICES AND VALUE OF STOCK EXCHANGE TURNOVER IN MAY 1981
Index Turnover ($ 'million)
As; at Hang SengJndex Far East In,dex Kam Ngan Index Hon's Kong Stock Far East Kain Ngan. Stock Kowloo.n Stock end of day (31.7.64= 100) (1.4.71=1,000) (2.l.73=1,000) Exchange Ltd.· Exc)11mge Ltd. Exchange Ltd. Exchange Ltd •. Total turnover
May
1,439.23 7·,28).16 1,279 •. 46' 47,20 173.41 126.06 0.25 346.92
4 1,428.56 7,180.58 1,267.28 44.94 158.69 104.68 0.41 308.72 5 1,413.47 7,Ul.86 1,254.36 37.50 126.87 96.68 0.29 261.34
,6 1,420.34 7,155.69 1,261.77 23.97' '91.31 67.96 0.32 183.56 7 1,413.49 7,125;21 1,253.53 37.52 116.97 91.00 0.32 245.81 '8 ' 1,431.11 7,218.91 1,270.80 47.42 138.41 124.50 0.45 310.78.
t'l 1,450.91 7,:iOL61 1,281.93 65.48 174.27 136.66 0.51 376.92 12 1,460.49 7,349.14 1,293.56 55.43 187.93 136.89 0.33 380.58 l3 1,482.62 7,432.15 1,311.86 71.62 126.14 134.54 0.38 332.68
}1 1,532.05 7,714.49 1,352.37 93.37 258.06 228.12 0.65 580.20 1,548.21 7;835.07 1,368.81 126.02 361.48 226.46 1.42 715.38'
i's 1,562.23 7,887.78 1,380.16 99.05 '278.69 22!;93 0.55 600.22 19 1,554.37 7,820.52 1,372.20 94.35 258.79 196.19 1.48 550.81 20 1,585.10 8,040.81 1,398.99 80.98 202.25 171.68 0.84 455.75 21 1,606.63 8,172.74 1,411.09 148.69 309.05 235.55 1.95 695.24 22 1,596.62 8,134.20 1,401.45 102.60 236.98 198.87 1.61 540.06
25 1,588.90 8:o99.81 1,392.99 50.47 226.48 162.65 1.28 440.88 26 1;633.35 8,309.40 1,429.2,8 71.66 248.45 181.74 0.75 502.60 27 1,636.27 8,340.60 1,431.52 94.63 196.05 '159.05 0.67 450.40 28 1,624.34 8,275.53 1,418.30 89.94 245.86 197.22 0.51 533.53 29 1,667.34 8,712.18 1,455.02 123.47 346.47 221.03 1.16 692.13
58 Hong·Koog Monthly )Jigest of Statistics lune19~1
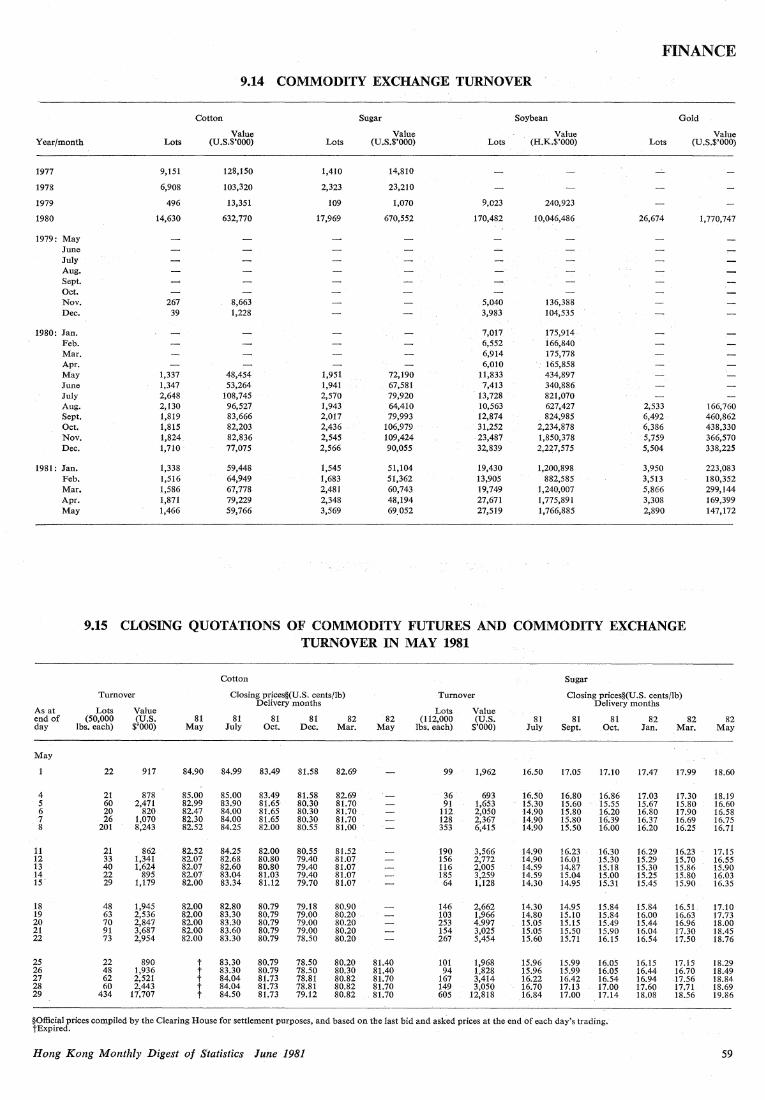
FINANCE
9.14 COMMODITY EXCHANGE TURNOVER
Cotton Sugar Soy bean Gold
Value Value Value Value Year/month Lots (U.S.$'000) Lots (U .S.$'000) Lots (H.K.$'000) Lots (U.S.$'000)
1977 9,151 128,150 1,410 14,810 ..-'.
1978 6,908 103,320 2,323 23,210
1979 496 13,351 109 1,070 9,023 240,923
1980 14,630 632,770 17,969 670,552 170,482 10,046,486 26,674 1,770,747
1979: May June July Aug. Sept. Oct. Nov. 267 8,663 5,040 136,388 Dec. 39 1,228 3,983 104,535
1980: Jan. 7,017 175,914 Feb. 6,552 166,840 Mar. 6,914 175,778 Apr. 6,010 165,858 May 1,337 48,454 1,951 72,190 Jl,833 434,897 June 1,347 53,264 1,941 67,581 7,413 340,886 July 2,648 108,745 2,570 79,920 13,728 821,070 Aug. 2,130 96,527 1,943 64,410 10,563 627,427 2,533 166,760 Sept. 1,819 83,666 2,017 79,993 12,874 . 824,985 6,492 460,862 Oct. 1,815 82,203 2,436 106,979 31,2S2 2,234,878 6,386 438,330 Nov. 1,824 82,836 2,545 109,424 23,487 1,850,378 5,759 366,570 Dec. 1,710 77,075 2,566 90,055 32,839 2,227,575 5,S04 338,225
1981: Jan. 1,338 59,448 1,545 51,104 19,430 l,200,898 3,950 223,083 Feb, 1,516 64,949 1,683 51,362 13,905 882,585 3,513 180,352 Mar. 1,586 67,778 2,481 60,743 19,749 1,240,007 5,866 299,144 Apr. 1,871 79,229 2,348 48,194 27,671 l,77S,891 3,308 169,399 May 1,466 59,766 3,S69 69.0S2 27,519 1,766,885 2,890 147,172
9.15 CLOSING QUOTATIONS OF COMMODITY FUTURES AND COMMODITY EXCHANGE TURNOVER IN MAY 1981
Cotton Sugar
Tum over Closing prices§(U.S. cents/lb) ·Turnover Closing prices§(U.S. cents/lb) Delivery months Delivery months
As at Lots Value Lots Value 81 end of (50,000 (U.S. 81 81 81 81 82 82 (112,000 (U.S. 81 81 82 82 82
day lbs. each) $'000) May July Oct. Dec. Mar. May lbs. each) $'000) July Sept. Oct. Jan. Mar. May
May
22 917 84.90 84.99 83.49 81.58 82.69 99 1,962 16.50 17.05 17.10 17.47 17.99 18.60
4 21 878 85.00 85.00 83.49 81.58 82.69 36 693 16.50 16.80 16.86 17.03 17.30 18.19 5 60 2,471 82.99 83.90 81.65 80.30 81.70 91 1,653 15.30 15.60 15.55 15.67 lS.80 16.60 6 20 820 82.47 84.00 81.6S 80.30 81.70 112 2,0SO 14.90 lS.80 16.20 16.80 17.90 16.S8 7 26 1,070 82.30 84.00 81.65 80.30 81.70 128 2,367 14.90 lS.80 16.39 16.37 16.69 16.7S 8 201 8,243 82.52 84.25 82.00 80.SS 81.00 3S3 6,41S 14.90 lS.SO 16.00 16.20 16.2S 16.71
11 21 862 82.52 84.25 82.00 80.55 81.S2 190 3,566 14;90 16.23 16.30 16.29 16.23 17.15 12 33 1,341 82.07 82.68 80.80 79.40 81.07 1S6 2,772 14.90 16.01 lS.30 IS.29 15.70 16.5S 13 40 1,624 82.07 82.60 80.80 79.40 81.07 116 2,005 14.59 14.87 15.18 lS.30 15.86 15.90 14 22 895 82.07 83.04 81.03 79.40 81.07 18S 3,259 14.59 lS.04 1S.OO 15.2S 1S.80 16.03 1s· 29 1,179 82.00 83.34 81.12 79.70 81.07 64 1,128 14.30 14.9S 15.31 1S.4S lS.90 16.3S
18 48 1,945 82.00 82.80 80.79 79.18 80.90 146 2,662 14.30 14.9S 1S.84 1S.84 16.Sl. 17.10 19 63 2,S36 8200 83.30 80.79 79.00 80.20 103 1,966 14.80 1S.10 1S.84 16.00 16.63 17.73 20 70 2,847 82.00 83.30 80.79 79.00 80.20 2S3 4.997 lS.OS lS.lS lS.49 lS.44 16.96 18.00 21 91 3,687 82.00 83.60 80.79 79.00 80.20 1S4 3,02S JS.OS 1S.SO lS.90 16.04 17.30 18.4S 22 73 2,9S4 82.00 83.30 80.79 78.SO 80.20 267 5,4S4 15.60 15.71 16.lS 16.54 17.50 18.76
25 22 890 t 83.30 80.79 78.50 80.20 81.40 101 1,968 15.96 15.99 16.os 16.15 17.15 18.29 26 48 1,936 t 83.30 80.79 78.50 80.30 81.40 94 1,828 15.96 15.99 16.0S 16.44 16.70 18.49 27 62 2,521 t 84.04 81.73 78.81 80.82 81.70 167 3,414 16.22 16.42 16.54 16.94 17.56 18.84 28 60 2,443 t 84.04 81.73 78.81 80.82 81.70 149 3,050 16.70 17.13 17.00 17.60 17.71 18.69 29 434 17,707 t 84.SO 81.73 79.12 80.82 81.70 605 12,818 16.84 17.00 17.14 18.08 18.56 19.86
§Official prices compiled by the Clearing House for settlement purposes, and based on the last bid and asked prices at the end of each day's trading. tExpired.
Hong Kong Monthly Digest of Statistics June 1981 59

FINANCE
9.15 CLOSING QUOTATIONS OF COMMODITY FUTURES AND COMMODITY EXCHANGE TURNOVER IN MAY 1981-contd.
Soy bean Gold
Turnover Closing prices§ (H.K. dollars/60 kg) Turnover Closing prices§. (U.S dollars/troy oz) Delivery months Dehvery months
As at Lots Value Lots Value end of (30,000 (H.K. 81 81 81 81 81 81 81 (100 troy <U.S. 81 81 81 81 82 82 day kg. each) $'000) May June July Aug. Sept. Oct. Nov. oz each) $'000) June Aug. Oct. Dec. Feb. Apr.
May
l,144 73,949 113.80 120.40 126:80 128.60 131.00 131.80 101 5,203 496.0 509.5 519.5 534.5 545.5 559.0
4 647 41,629 113.00 118.80 125.50 127.60 129.20 131.20 61 3,042 488.0 503.0 517.0 530.0 544.0 558.0 5 858 54,580 109.40 116.20 123.00 127.20 128.20 129.20 72 3,516 487.5 502.0 516.0 534.0 544.0 559.0 6 1,202 77,243 110.20 117.40 124.20 128.20 129.40 130.40 87 4,439 493.0 508.0 522.0 537.0 552.0 567.0 7 853 54,311 110.60 116.80 123.00 127.40 129.40 129.80 82 4,124 489.9 502.0 517.0 531.0 545.0 562.0 8 1,498 93,354 110.60 116.60 123.80 127.00 129.20 130.00 112 5,728 492.0 506.0 520.0 534.5 548.0 562.0
11 604 38,476 110.60 116.20 123.40 126.80 128.60 129.80 300 15,714 510.l 527.0 542.0 556.0 571.0 584.0 12 1,932 122,824 111.00 115.80 122.60 126.80 128.40 129.80 143 7,261 498.5 512.3 527.0 541.0 555.0 570.0 13 1,218 77,285 111.40 114.80 122.00 125.60 128.80 128.20 94 4,841 498.0 512.0 528.0 542.0 557.0 570.0 14 822 51,781 112.60 113.60 123.00 125.60 128.00 128.80 76 3,775 492.5 505.0 520.0 535.0 549.0 564.0 15 1,302 80,334 116.00 118.00 122.80 126.20 128.60 129.20 123 6,262 494.0 507.0 522.0 535.0 550.0 566.0
18 868 55,403 t 116.20 123.00 126.20 127.60 129.20 129.20 124 6,297 592.9 506.3 521.0 535.0 549.0 563.0 19 977 62,676 t 117.20 124.20 127.00 128.40 129.00 129.20 111 5,667 496.0 509.0 523.0 537.0 553.0 565.0 20 1,461 92,926 t 119.00 123.80 126.60 128.00 128.20 128.20 187 9,567 491.0 503.8 519.0 533.5 547.0 561.0 21 818 52,212 t 119.00 123.20 126.80 127.80 128.40 128.60 132 6,959 493.5 505.8 520.0 534.0 548.0 562.0 22 1,473 94,404 t 120.20 123.60 126.80 128.80 129.80 129.00 362 18.174 484.5 497.8 511.0 524.0 537.0 549.0
25 1,802 116,687 t 124.00 125.60 127.40 130.00 130.00 129.80 150 7,606 484.3 497.5 515.0 527.0 540.0 553.0 26 l, 185 76,823 t 124.80 127.00 128.00 130.20 130.40 130.00 154 7,896 480.6 495.6 511.0 524.0 537.0 550.0 27 2,581 168,952 t 127.00 129.00 129.00 130.60 132.00 132.40 104 5,185 477.0 490.3 50§.0 517.0 531.0 544.0 28 2,926 192,636 t 127.40 130.00 130.40 130.80 132.20 132.40 87 4,374 480.5 494.5 507.0 520.0 533.0 546.0 29 1,348 88,400 t 129.20 129.60 129.80 130.20 131.00 131.80 228 11,542 486.5 499.0 515.0 529.0 544.0 558.0
§Official prices compiled by the Clearing House for settlement purposes, and based on the last bid and asked prices at the end of each day's trading. tExpired.
9.16 GOLD AND SILVER EXCHANGE TRADING PRICES
Gold ($/tael) Silver ($/10 oz)
Opening Closing High Low Opening Closing High Low
1975 1,048.00 853.00 1,048.00 790.70
1976 847.00 754.20 849.20 606.00
1977 751.00 916.80 942.20 714.00
1978 919.00 1,304.00 l,388.90 910.80 250.50 285.00 285.00 244.00
1979 1,308.00 3,088.00 3,091.00 1,230.80 286.00 l,360.00 1,360.00 286.00
1980 3,135.00 3,592.00 4,855.00 2,760.00 1,680.00 780.00 2,350.00 550.00
1979.: May 1,495.00 1,639.00 1,691.70 1,487.00 373.50 450.00 450.00 373.50 June 1,687.00 1,710.30 1,735.50 1,659.70 450.00 520.00 520.00 450.00 July l,717.00 1,816.00 1,899.00 1,713.80 515.00 575.00 575.00 515.00 Aug. 1,777.00 1,918.00 1,928.20 1,737.00 545.00 620.00 620.00 545.00 ~cpt. 1,923.00 2,375.20 2,426.00 l,918.00 620.00 825.00 960.00 620.00 Oct. 2,367.00 2,280.50 2,520.00 2,163.00 825.00 820.00 875.00 760.00 Nov. 2,282.00 2,455.0() 2,462.00 2,207.00 825.00 905.00 905.00 805.00 Dec. 2,485.00 3,088.00 3,091.00 2,485.00 935.00 1,360.00 1,360.00 935.00
1980: Jan. 3,135.00 3,940.00 4,855.00 3,135.00 1,680.00 l,630.00 2,350.00 1,580.00 Feb. 3,980.00 3,780.00 4,185.00 3,625.00 1,620.00 1,730.00 1,800.00 1,580.00 Mar. 3,725.00 3,113.00 3,810.00 2,760.00 1,745.00 610.00 1,790.00 550.00 Apr. 3,120.00 3,000.00 3,297.00 2,863.00 710.00 665.00 830.00 650.00 May 2,970.00 3,173.00 3,180.00 2,953.00 615.00 680.00 680.00 555.00 June 3,185.00 3,824.00 3,832.00 3,185.00 680.00 815.00 820.00 680.00 July 3,890.00 3,562.00 3,992.00 3,493.00 825.00 770.00 845.00 745.00 Aug. 3,660.00 3,710.00 3,804.00 3,533.00 760.00 805.00 810.00 760.00 Sept. 3,698.00 3,997.00 4,236.00 3,664.00 805.00 1,015.00 1,210.00 800.00 Oct. 4,015.00 3,850.00 4,094.00 3,740.00 1,035.00 975.00 1,095.00 945.00 Nov. 3,815.00 3,781.00 3,993.00 3,652.00 955.00 945.00 990.00 900.00 Dec. 3,784.00 3,592.00 3,860.00 3,348.00 945.00 780.00 950.00 700.00
i981: Jan. 3,611.00 3,160.00 3,663.00 3,145.00 780.00 710.00 835.00 690.00 Feb. 3,154.00 3,080.00 3,305.00 3,072.00 710.00 650.00 745.00 650.00 Mar. 3,070.00 3,230.00 3,485.00 2,923.00 650.00 640.00 705.00 610.00 Apr. 3,229.00 3,083.00 3,372.00 3,038.00 630.00 600.00 680.00 595.00 May 3,114.00 3,133.00 3,288.00 3,049.00 600.00 585.00 620.00 565.00
60 Hong Kong Monthly Digest of Statistics June 1981

FINANCE
9.17 GOLD AND SILVER EXCHANGE TRADING PRICES IN MAY 1981
Date
May
2
4 5 6 7 8 9
11 12 13 14 15 16
18 19 20 21 22 23
25 26 27 28 29 30
Opening
3,114 3,140
3,125 3,088 3,108 3,100 3,122 3,170
3,205 3,140 3,156 3,110 3,160 3,120
3,135 3,135 3,107 3,126 3,065 3,072
3,095 3,085 3,060 3,074 3,140 3,135
Closing
3,113 3,117
3,093 3,084 3,124 3,103 3,114 3,167
3,263 3,159 3,154 3,129 3,137 3,134
3,132 3,133 3,113 3,125 3,081 3,092
3,081 3,071 3,064 3,088 3,126 3,133
Gold ($/tael)
High
3,124 3,143
3,128 3,105 3,129 3,106 3,135 3,173
3,288 3,160 3,169 3,133 3,160 3,135
3,144 3,142 3,117 3,134 3,085 3,096
3,095 3,087 3,064 3,090 3,153 3,138
Low
3,105 3,116
3,091 3,081 3,107 3,092 3,113 3,163
3,205 3,130 3,150 3,105 3,133 3,114
3,128 3,122 3,105 3,123 3,059 3,072
3,077 3,066 3,049 3,074 3,122 3,131
Silver ($/10 oz)
600 600
600 595
595 595 600 620
620 610 600 600 595 600
600 600 600 600 585 575
575 575 565 570 590 585
9.18 REVENUE AND EXPENDITURE OF THE HONG KONG GOVERNMENT
Year§/ quarter
1974-1975
1975-1976
1976-1977
1977-1978
1978-1979
1979-1980
1978: Oct.-Dec.
1979: Jan.-Mar.
Apr.-June
July-Sept.
Oct.-Dec.
1980: Jan.-Mar.
Apr.-June
July-Sept.
Oct.-Dec.
Direct taxes
2,186
2,299
2,784
3,467
4,243
5,923
1,391
2,110
797
257
1,693
3,175
1,283
443
2,238
§Fiscal year from 1 April to 31 March.
lo direct tm<es
1,402
1,814
2,245
2,724
3,633
4,263
923
1,025
934
871
1,124
1,335
1,146
1,237
1,753
Revenue
Other revenue
2,287
2,407
2,465
4,042
4,681
6,609
1.056
1,345
1,061
1,363
1,364
2,821
1,459
3,779
4,994
l{ong Kong Monthly Digest of Statistics June 1981
Total
5;875
6,520
7,494
10,233
12,557
16,796
3,370
4,480
2,793
2,490
4,182
7,331
3,888
5,459
8,985
Economic services
866
696
787
1,470
1,720
2,209
442
598
440
530
519
721
593
615
602
Social services
3,499
3,358
3,541
4,006
4,737
5,818
"1,178
1,347
1,219
1,394
1,522
1,C$83
1,553
1,910
2,122
Expenditure
General Unallocable services expenditure
1,732 159
1,793 185
2,026 236
3,241 280
4,320 313
5,431 413
921 90
1,852 73
793 94
1,104 93
1,574 104
1,961 122
1,104 109
1,640 119
1,924 407
$million
Total
6,255
6,032
6,591
8,997
11,090
13,872
2,630
3,871
2,546
3,121
3,719
4,487
3,359
4,284
5,055
61

FINANCE
9.19 INSTRUMENTS REGISTERED. IN TIIE LAND OFFICE
Assignments of properties Mort!iages
Mortgages other Assignments Assignments Assignments Assignments of Building than building
of lots of share oflot of section share of section mortgages· mortgages
Year/month No. Value No. Value No. Value No. Value No. Value No. Value
$Mn. $Mn. $Mn. $Mn. $Mn. $Mn.
1975 407 642.80 9,884 1,633.63 407 1,082.34 19,773 2,566.21 109 316.28 26,278 3,983.53
1976 632 1,149.50 11,508 2,133.50 603 1,019.35 20,861 3,123.94 152 493.96 31,214 5,705.96
1977 628 1,554.11 12,401 2,961.98 622 1,021.42 24,190 4,169.88 114 728.49 36,589 7,673.55
1978 645 1,810.67 17,048 4,216.66 638 1,605.84 30,732 6,519.55 127 586.75 46,347 11,575.87
1979 491 3,417.81 14,779,, 4,509.93 497 3,255.28 31,313 7,834.47 121 801.63 44,288 16,876.35
1980 388 3,239.73 16,025; 7,705.73 498 4,048.01 32,149 12,147.19 154 2,217.45 56,975 30,846.04
1979: May 43 123.80 1,113 349.87 45 191.89 2,327 716.08 9 26.65 3,346 1,104.17 Juno 41 153.18 1,421 472.63 48 344.76 2,665 709.12 12 91.00 3,817 1,307.33 July 40 103.38 1,047 430.91 28 82.46 2,853 686.81 10 50.00 3,997 1,204.44 Aug. 30 1,161.78 1,272 333.68 41 164.28 2,711 629.84 11 42.80 3,887 1,001.45 Sept. 36 182.88 1,284, 366.93 43 388.10 2,380 656.74 13 262.35 3,827 1,409.77 Oct. 38 90.55 1,157 378.66 26 391.65 2,027 533.97 14 95.25 3,595 1,375.55 Nov. 36 130.13 1,254 441.60 40 88.49 2,158 651.37 9 36.59 3,963 1,350.81 Dec. 28 55.70 1,085 360.45 40 580.77 1,782 487.99 6 28.60 3,410 1,784.25
1980: Jan. 39 163.53 1,078 413.02 52 299.59 2,676 801.83 10 95.20 4,415 1,688.78 Feb. 45 381.25 1,421 568.68 63 444.99 2,151 807.49 11 47.52 4,134 1,734.45 Mar. 42 209.79 1,402 747.96 61 878.88 3,002 1,077.35 11 157.80 4,683 2,721.83 Apr. '27 201.96 1,235 512.62 46 187.43 1,846 802.20 17 297.68 3,754 1,899.53 May 40 275.09 1,567 706.95 50 561.04 3,137 1,203.32 22 174.13 5,027 2,337.37 June 24 182.11 1,51l 524.51 37 338.89 2,526 845.08 8 30.62 4,365 2,018.04 July 20 119.79 1,534 640.85 29 351.89 2,657 1,115.97 12 300.60 4,590 1,948.22 Aug. 21 1,173.82 1,099 394.31 21 142.51 3,260 943.18 10 56.35 4,501 2,935.80 Sept. 34 143.86 1,097 458.12 39 169.44 2,610 983.21 11 193.52 4,557 2,719.93 Oct. 29 102.52 1,316 629.34 25 156.46 2,508 1,217.28 14 234.40 5,631 2,976.63 Nov. 28 71.59 1,451 638.05 36 268.45 2,969 1,203.51 14 453.30 5,772 4,098.03 Dec. 39 214.42 1,314 ,' 1,471.31 3.9 248.44 2,807 1.146.77 14 176.34 5,546 3,767.44
1981: Jan. 61 589.48 1,580 885.62 55 601.30 2,998 3,112.57 9 106.45 5,590 3,677.55 Feb. 32 167.89 1,167, 842.87 ·~~ 1,060.09 2,553 1,068.22 9 75.84 4,150 4,339.28 Mar. 40 410.01 1,554' 1,805.19 474.85 3,519 1,685.09 7 139.40 5,872 4,317.54 Apr. 42 4,105.04 1,254 1,703.85 24 2,302.92 1,795 1,059.09 13 164.70 3,723 3,32$.62 May 58 2,128.16 2,017 1,169.35 58 1,646.62 3,280 2,402.38 12 102.80 6,306 5,174.02
Exclusion .orders
.issued under Reassignments and Agreements Landlord
certificates of for sale Tenancy andTenant satisfaction and purchase agreements Ordinance Miscellaneous Total
Year/month No. Value No. No. No. No. Value No. Value
$Mn. $Mn. $Mn.
1975 18,926 2,404.69 7,329 1,675 58 7,292 64.46 92,138 12,693.94
1976· 20,970 3,043.66 15,810 1,862 86 7,238 11.46 110,936 16,681.34
1977 22,177 4,005.22 25,728 1,793 50 9,346 17.24 133,638 22,131.88
1978 25,323 5,185.04 33;290 2,127 56 14,382 35.25 170,715 31,535.64
1979 26,450 6,430.44 3),354 2,130 36 18,595 402.93 170,054 43,528.84
1980 33,266 10,521.77 31,943 1,853 38 19,803 27.05 193,092 70,752.98
1979. May 2,508 644.3,4 3,016 180 5 1,731 4.02 14,323 3,160.82 June 2,486 489.53 3,288 208 1,685 1.03 15,671 3,568.58 July 2,293 655.82 2,070 147 1 1,156. 3.23 13,642 3,217.05 Aug. 2,030 415;87 2,381 171 5 1,362 2.19 13,901 3,751.90 Sept. 2,043 485.10 2,775 159 2 1,731 0.84 14,293 3,752.73 Oct. 2,249 575;79 3,072 188 4 1,488 § 13,858 3,441.42 Nov. 2,483 486.85 3,097 187. 3 1,983 293.72 15,213 3,479.57 Dec. 1,938 705.61 1,926 147 4 1,337 11,703 4,003.37
1980: Jan. 2,418 1,074:65 3,018 157 4 1,887 15,754 4,536.59 Feb. 2,106 626.72 2,891 108 6 1,472 0.55 14,408 4,611.64 Mar. 2,610 780.63 2,329 148 2 1,491 8.52 15,781 6,582.77 Apr. 2,200 906.87 ·3,307 148 1,570 3.02 14,150 4,811.31 May 3,117 814.51 2,385 175 1 1,831 6.38 17,352 6,078.79 June 3,013 671:21 1,873 157 3 1,595 0.12 15,112 4,616.58 July 2,944 895,28 1,878 143 5 1,520 15,332 5,372.60 Aug. 2,479 908.66 2,316 148 6 1,552 15,413 6,554.63 Sept; 3,058 847.24 2,953 139 5 1,388 0.47 15,891 5,515.77 Oct. 3,228' 960~77 3,083 202 5 1,839 17,880 6,277.41 Nov. 2,896 867.03 3,426 179 1 1,840 § 18,612 7,599.97 Dec. 3,197 1,162.21 2,484 149 1,818 7.98 17,407 8,194.92
1981: Jan. 3,792 1,439.96 2,153 265 5 1,595 6.48 18,103 10,419.42 Feb. 2,643 817.32 2,340 241 2 1,269 0.52 14,457 8,372.02 Mar. 3,397 1,375.16 2,783 182 1 1,826 1.65 19,234 10,208.90 Apr. 2,455 842.17 3,018 159 1 1,450 1.66 13,934 13,508.05 May 3,797 1,679.53 2,232 262 1 1,884 0.14 19,907 14,302.99
§Less than $0.005 million.
62 Hong Kong Monthly Digest of Statistics lune 1981

9.20 LOCAL AND FOREIGN COMPANIES REGISTERED AND DISSOLVED
Local companies
Amount of authorized share capital Total
Year/month
1915
1976
1977
1978
1979
1980
1979: May
June
July
Aug.
Sept.
Oct.
Nov.
Dec.
1980: Jan.
Feb.
Mar.
Apr.
May
June
July
Aug.
Sept.
Oct.
Nov.
Dec.
1981: Jan.
Feb.
Mar.
Apr.
May
$10,000 $50,000 $100,000 and and and
Under under under under $10,000 $50,000 $100,000 $500,000
447
727
968
1,471
1,876
3,316
168
178
182
169
116
209
255
195
246
272
286
290
210
220
244
255
320
301
357
315
325
230
300
303
353
1,053
1,343
2,084
3,013
4,060
6,324
327
305
392
343
348
504
425
533
525
616
522
348
436
418
450
495
594
513
630
777
768
618
691
677
622
195
223
247
255
199
222
26
10
30
24
13
11
10
10
24
12
24
26
23
15
15
16
19
19
15
14
21
12
17
24
34
1,301
1,709
1,860
2,195
2,172
2,260
215
198
195
163
181
212
186
140
184
128
199
195
248
212
189
225
186
191
162
141
186
148
189
205
278
§Including 1 company restored to the Register.
$500,000 and
under $1,000,000
465
591
649
827
785
915
74
73
68
77
64
56
77
63
78
58
81
73
95
99
72
85
79
82
50
63
60
63
83
89
112
Hong Kong Monthly Digest of Statistics June 1981
Amount No. of of
$1,000,000 $5,000,000 and and
corrl- authOr-panies ized
under under $10,000,000 Guar- reg is- share $5,000,000 $10,000,000 and above antee tered capital
476
636
681
792
886
1.115
93
82
68
67
70
98
94
56
79
70
62
87
117
95
107
106
120
111
81
80
99
97
87
112
135
30
60
68
96
94
142
13
6
7
9
6
10
11
7
12
10
II
7
12
9
16
18
14
13
12
12
17
9
13
10
$million
33 170 4,170 1,824.41
30 . 155 5,474 2,466.20
30 201 6,788 2,552.01
41 156 8,846 3,338.16
37 175 10,284 3,116.27
69 233 14,596 4,755.26
2
4
2
4
6
3
2
6
4
4
14
9
8
7
8
7
12
9
17
13
15
14
16
935 288.14
869 235.86
959 253.13
869 264.47
814 199.29
23 1,127 264.84
22 1,086 359.01
15 1,022 298.58
11 1,162 266.89
16 1,184 263.33
21 1,212 344.03
16 1,045 362.92
22 1,167 413.57
20 1,092 361.64
25 1,121 433.98
20 1,224 49 5 .49
17 1,362 425.55
24 1,263 629.25
19 1,332 286.00
22 1,432 472.63
22 1,500 375.17
26 1,219 415.61
22 1,405 416.48
10 1,445 581.01
20 1,573 461.69
Total dis
solved during period
Total exist
ing at end of period
602 38,985
582 43,877
769 49,896
797 57,945
800 67,429
820 81,206§
56 61,214
63 62,020
34 62,945
43 63,771
90 64,495
116 65,506
89 66,503
96 67,429
28 68,563
34 69,713
62 70,863
161 71,747
69 72,845
8 73,929
52 74,998
64 76,158
55 77,465
202 78,527§
50 79,809
35 81,206
11 82,696§
85 83,830
103 85,133§
55 86,523
69 88,027
FINANCE
Foreign companies
Total registered
during period
57
86
120
182
172
182
23
9
15
24
11
23
15
6
19
11
19
7
19
17
15
9
23
17
17
9
11
13
23
18
51
Total ceased
buSiness
during period
Total existing at
end of period
35 892
36 942
53 1,009
60 1,131
34 1,269
53 1,398
7 1,183
1,189
2 1,202
2 1,224
2 1,233
1,255
4 1,266
1,269
1,283
6 1,288
4 1,303
3 1,307
7 1,319
4 1,332
4 1,343
3 1,349
2 1,370
1,382
1,391
2 1,398
2 1,407
4 1,416
6 1,433
1,446
13 l,484
63

SECTION 10 HOUSING, BUILDINGS AND LAND
Year/quarter
1976: 2nd qtr.
1977: 2nd qtr.
1978: 2nd qtr.
3rd qtr.
1979: lst qtr.
3rd qtr.
1980: lst qtr.
3rd qtr.
10.1 STOCK OF LIVING QUARTERS
Hong Kong Island
228.1
238.0
251.5
253.6
264.1
266.7
278.4
289.8
Kowloon
152.7
155.9
160.7
160.6
171.l
178.3
180.7
185.4
New Kowloon
349.6
353.1
364.8
364.2
371.6
375.6
385.8
402.2
New Territories
217.5
231.5
246.1
250.4
260.2
265.5
292.3
317.4
Total
947.9
978.5
1,023.1
1,028.8
1,067.0
1,086.1
1,137.2
1,194.8
10.2 STOCK AND AUIBORIZED POPULATION OF PUBLIC HOUSING RENTAL FLATS
Hong Kong Island Kowloon New Kowloon Tsuen Wan Sha Tin Tuen Mun
Rest of New Territories
Thousand
Total As at end of year/quarter Flats Persons Flats Persons Flats Persons Flats Persons Flats Persons Flats Persons Flats Persons Flats Persons
1975 47,922 266,400 23,040 130,000 227,319 1,201,800 64,884 334,600 1,082 4,600 2,108 8,500 3,511 14,700 369,866 1,960,600
1976 52,004 273,800 23,057 133,200 227,561 1,178,200 72,069 367,900 3,269 12,300 2,108 9,900 3,511 14,700 383,579 1,989,900
1977 51,646 278,800 23,055 131,900 228,152 1,156,000 78,385 405,200 5,389 22,600 4,275 19,000 3,511 14,500 394,413 2,028,100
1978 54,972 289,000 22,771 130,000 232,947 1,160,200 79,684 412,400 5,817 29,600 6,538 27,700 3,511 14,300 406,240 2,063,200
1979 54,923 291,100 22,761 129,200 238,245 1,155,300 83,465 430,800 8,036 35,200 7,084 29,900 3,511 14;200 418,025 2,085,800
1980 57,723 295,300 22,506 126,000 244,144 1,100,300 86,940 434,700 11,524 53,600 17,070 65,600 5,755 19,900 445,662 2,095,400
1979: lst qtr. 55,218 292,000 22,766 130,000 236,826 1,157,500 81,459 418,900 6,393 30,100 6,541 28,500 3,511 14,200 412,714 2,071,200
2nd qtr. 55,738 292,100 22,761 129,800 236,902 1,158,100 82,505 424,200 6,393 32,000 6,541 29,300 3,511 14,200 . 414,351 2,079,800
3rd qtr. 55,020 292,100 22,761 129,600 237,720 1,156,700 83,408 428,700 6,393 32,100 6,540 29,800 3,511 14,200 415,353 2,083,200
4th qtr. 54,923 291,100 22,761 129,200 238,245 1,155,300 83,465 430,800 8,036 35,200 7,084 29,900 3,511 14,200 418,025 2,085,800
1980: *lst qtr. 56,992 290,500 22,878 127,900 242,144 1,119,200 84,010 426,000 9,609 43,000 12,598 35,800 3,511 13,800 431,742 2,056,400
*2nd qtr.
*3rd qtr.
57,297 294,900 22,570 127,700 243,687
57,720 295,800 22,518 126,500 244,311
I, 118,000 86,515 432,300 9,984
1,109,600 86,670 430,000 10,624
47,200 13,328
51,000 14,494
51,300
57,800
4,051
4,426
14,600 437,432 2,085,800
15,400 440,763 2,086,400
4th qtr. 57,723 295,300 22,506 126,000 244,144 1,100,300 86,940 434,700 11,524 53,600 17,070 65,600 5;755 19,900 445,662 2,095,400
1981: lstqtr. 57,754 295,300 22,559 125,400 245,915 1,095,600 88,178 438,800 14,444 62,500 17,135 72,700 6,535 22,900 452,520 2,113,100
*The population figures have been revised.
64 Hong Kong Monthly Digest of Statistics lune 1981

HOUSING
10.3 RESIDENTIAL UNITS/FLATS COMPLETED BY GEOGRAPHIC AREA*
Year/quarter
1977
1978
1979
1980
1979: lst qtr.
2nd qtr.
3rd qtr.
4th qtr.
1980: lst qtr.
2nd qtr.
Jrd qtr.
4th qtr.
1981: lst qtr.
Public
Hong New Kong KowIsland loon
Kow- Tsuen loon Wan
Rest of New
Sha. Tuen Terri-Tin Mun tories Total
882
3,382
2,259
2,657
253
918
1,088
1,928
660
69
464
886 5,364 2,169 4,442 13,743
10,581 1,965 378 16,306
426 9,930 3,675 3,529 1,056 20,875
882 6,600 4,322 6,311 9,536 2,837 33,145
2,453 899 606
126 1,606 1,024
1,568 734
300 4,303 1,018 2,923 1,056
432 3,629 3,192 1,067 5,728
1,339 530 1,126
4,211
3,674
2,302
10,688
182 16,158
731 3,726
150 826 778 2,590 1,126 778 6,908
300 806 352 2,124 1,556 1,146 6,353
673 5,065 3,538 2,856 1,898 4,031 18,525
Hong Kong Kow
lslimd loon
Private
New Kow• Tsuen loon Wan
9,208 3,566 4,537 679
13,238 5,336 3,671 1,822
12,146 6,478 2,802 821
9,213 2,878 4,166 4,417
1,976 1,376
2,367 2,530
2,339 1,480
5,464 1,092
2,851 748
2,295 335
598
904
864
82
15
436. 724
741 2,932
445 76
1,174 1,182 1,351 863
546 2,893 613 1,629
857 304 1,296 414
Note: Prior to 3rd quarter 1980, private housing figures do not include small village-type houses. *Figures have been revised.
sha Tin
104
190
432
621
12
2
418
165
Rest of New
Tuen Terri" Mun tories Total
385 2,285 20,764
210 1,313 25,780
286 1,482 24,447
273 2,626 24,194
40
118
128
120
427 4,499
331 6,144
461 5,219
263 8,525
676 8,113
385 3,656
169 23 727 5,489
287 130 838 6,936
819 1,316 666 5,672
10.4 NUMBER OF RESIDENTIAL UNITS/FLATS COMPLETED BY FLOOR AREA*
Year/quarter
1977
1978
1979
1980
1979: lst qtr.
2nd qtr.
3rd qtr.
4th qtr.
1980: lst qtr.
2nd qtr.
3rd qtr.
4th qtr.
1981: lst qtr.
Under 39.9
11,764
14,715
18,493
27,792
3,797
3,463
2,227
9,006
14,437
3,407
5,076
4,872
16,061
Public
40 70 -69.9 -99.9
1,979
1,591
2,382
5,353
414
211
75
1,682
1,721
319
1,832
1,481
2,464
ma
100 and above
)
Under 39.9
16,943
19,094
19,942
18,607
3,803
5,346
4,197
6,596
6~761
2,675
4,160
5,011
4,408
Note: Prior to 3rd quarter 1980, private housing figures do not include small village-type houses.
40 -69.9
2,605
5,200
2,832
3,410
277
540
604
1,411
1,105
661
850
794
532
Private
70 -99.9 ms
444
993
1,226
862
358
172
364
332
88
182
93
499
120
100 -159.9
677
390
343
595
44
80
74
145
139
75
92
289
323
Total
34,507
42,086
45,322
57,339
8,710
9,818
7,581
19,213
24,271
7,382
12,397
13,289
24,197
160 and above
)
95
103
104
720
17
6
40
41
20
63
294
343
. 289
Under public, Housing Authority flats are classified by lettable floor area and Housing Society flats by usable floor area. Under private, small village-type houses are classified by gross floor area and all others by usable floor area. ·. *Figures have been revised.
Hong Kong Monthly Digest.of Statistics lune 1981 65

HOUSING
10.5 RESIDENTIAL UNITS/FLATS WITH CONSENT TO COMMENCE WORK BY GEOGRAPHIC AREA
Year/quarter
1978
1979
198(}
§1979: lst qtr.
2nd qtr.
3rd qtr •.
4th qtr.
1980: lst qtr.
2nd qtr..
3rd qtr.
4th qtr.
1981: lst qtr.
Hong Kong KowIsland · loon
3;754,
795
3,611
195
600
720
1,556
1,335
Public
New Kow~ Tsuen Sha
Tin
Rest of New
Tuen TerriMun tories loon Wan Total
1,881 3,816 3,932 4,586 2,837 20,806
9,007 3,636 5,098. 7,200 . 4,783 30,519
15,782
2,085
5,164
120 6,390 7,949 . 6,322 40,774
3;973 2,576 8,634
292 1,120 4,783 11,554
1,758 1,311 3,069
7,262
2,336
3,636
2,855
6,955
622
3,344 1,125 2,193
720 2,886 2,632, 3,257. 11,831
1,084 5,440
3,504 3,273 3,065 14,253 ,
960 9,250
6,872 7,494
§Quarterly figures for 1979 do not include small village-type houses. *Figures have been revised.
· Private*
Hong Kong Island
Kowloon
New Kow- Tsuen
loon Wan
13,878 5,328 3,755 4;482
Sha Tin
446
12,168 2,908 3,780 3,107 3,523
Rest of New
Tuen Terri-Mun tories· Total
Total*
466 2,911 31,266 52,072
689 2,257 28,432 58,951
9,954 1,808 5,093 888 5,462 2,122 2,873 28,200 68,974
3,547 1,011 1,242 578
3,177
2,676
2,768
5,117
1,527
1,250
2,060
2,382
793 437 695
366 1,065 1,385 2,238
738 1,036 985 596
495 2,453
569 2,001
548
196
286
353
295 2,459
21 892
570 1,887
2 224
282 212 2,940 34
12
162
148
334
523
672
683
244
839
612 7,003
541 5,805
269 8,147
223 6,680
15,637
17,359
11,216
13,942
742. 12,084 23,915
548 6,230
819 6,043
764 3,843
906 7,595
11,670
20,296
13,093
15,089
10.6 NUMBER OF RESIDENTIAL UNITS/FLATS WITH CONSENT TO COMMENCE WORK BY FLOOR AREA
Year/quarter
1978
1979
1980
§1979: lst qtr.
2nci qtr.
3rd qtr.
4th qtr.
)980: lst qtr.
2nd qtr,:
3rd qtr.
4th qtr.
1981: lst qtr.
Under 39.9
19;298
26,153
32,664
8,395
9,712
1,642
6,404
11,172
4,118
10,127
7,247
7,167
Public
40 70 -69.9 -99.9
l,508
4,366
8,110
239
1,842
1,427
858
659
1,322
4,126
2,003
327
ms
100 and above
)
Under 39.9
25,107
19,722
19,698
4,699
4,684
6,459
3,880
8,609
3,989
4,950
2,150
5,256
40 .:..69.9
3,521
5;592
4,300.
1,501
822
1,023
2,246
2,114.
973
525
688
857
Private*
70 -99.9 m•
1,013
1,191
1,604
310
179
554
148
481
541
87
495
58
100 -159.9
736
896
1,087
381
50
73
392
402
385
90,
210
106
160 and above
)
889
1,031
1,511
112
70
38
14
478
342
391
300
1,318
Note: Under public, Housing Authority flats are classified by lettable f'loor area and Housing Society flats by usable floor area. Under private, small village-type houses are classified by gross floor area and· all other8 by usable floor area.
§Quarterly figures for 1979 do not include smal.l yma~e~type houses.
*Figures have been revised.
Hong Kong Mon~hly Digest of Statistics lune 1981

Year/month
1977
1978
1979
1980
1979: May June July Aug. Sept. Oct. Nov. Dec.
1980: Jan. Feb. Mar. Apr. May June July Aug. Sept. Oct. Nov. Dec.
1981: Jan. Feb. Mar. Apr. May
Residential
Usable floor
No. area
304
319
291
549
36 33 12 26 62 18 28 24
37 2
21 37 95 49 57 79 21 95 22 34
56 90
118 86 32
'OOO m• 261
318
280
362
12 32
3 12 61 39 11 65
31 8
40 14 16 26 50 38 15 38 7
79
32 38 29 12 16
tLess than 500 square metres. •Figures have been revised.
10.7 BUILDINGS COMPLETED ,BY TYPE*
Residential/ commercial
Usable floor area Non
Residen- residen-No. tial tial
260
255
243
238
18 17 23 17 18 13 24 29
36 19 19 18 15 12 18 14 18 29 16 24
19 7
24 25 16
'OOO m• 'OOO m•
461
574
538
475
114 27 36 12 61 26 53
101
116 54 13 41 24 10 18 22 36 82 16 41
38 10 45 90 37
171
159
181
148
26 11 16
5 19 7
17 29
20 13 5
13 10
5 11 10 15 19 10 17
15 7
10 14 10
Commercial
Usable floor
No. area
81
73
44
63
5 3 2 6 2 3 2 4
3 5 9 5 5 4 2 2 7
13 3 5
4 6 6 5 5
'OOO m•
345
257
200
287
12 4 2
12 1
66 5
44
14 9
13 11 2 6 1
66 13
100 34 17
47 31 36 57
6
Industrial
Usable floor
No. area
'OOO m• 118 931
118 1,257
97 1,524
124 1,197
4 13 8
10 9 6 9 7
8 6 5 3 8 9 7 7
17 5
43 6
9 13 13 8 3
57 224 123 147 150 72
164 242
92 103 71 75 49 88 52
118 158 160 111 121
60 206 184 80 35
Others
Usable floor area Non
Residen- residen-N o. tial tial
89
81
113
78
8 12
6 6 2
13 24 19
10 4 7
9 7 6 8
10 7 2 8
10 5
16 8 8
'OOO m• 'OOO m• 9
14
29
13
11 2 2 2 2
it t
t 1 3 3
+ t
l t
10 1 t
129
101
106
114
15 24 4 6 3 1
16 17
2 1 3
6 t 5
53 24
5 7 7
2 26
8 68
l
10.8 BUILDINGS WITH CONSENT TO COMMENCE WORK BY TYPE*
Year/month
1977
1978
1979
1980
1979: May June July Aug. Sept. Oct. Nov. Dec.
1980: Jan. Feb. Mar. Apr. May June July Aug. Sept. Oct. Nov. Dec.
1981: Jan. Feb. Mar. Apr. May
Residential
Usable floor
No. area
331
600
544
752
11 25 17 10 60 21 68 21
16 106 119 150
31 13
104 42 13 8
132 18
36 14 1
59 69
'OOO m• 275
368
484
536
18 21 14 22 67 32 47 61
99 33 99 28 66 56 35
5 17 11 48 40
92 18 8
33 47
tLess than 500 square metres. *Figures have been revised.
Residential/ commercial
Usable floor area Non
Residen- residen-No. tial tial
257
289
224
217
12 20 13 26 21 20 19 21
23 23
9 27 16 17 18 19 23 12 12 18
20 14 13 10 21
'OOO m• 'OOO m• 515
659
555
465
15 74 26 86 66 33 45 47
57 129
11 59 24 12 35 17 65 21 16 19
285 33 20 23 73
169
204
207
168
23 15 5
26 28 17 15 29
20 35
5 23
7 9
14 12 13 7
12 12
31 15 8 7
23
Hong Kong Monthly Digest of Statistics June 1981
Commercial
Usable floor
No. area
64
59
63
101
5 4 6 6
11 5 7 6
21 4 5 5
12 7 9 8 7 9 5 9
13 6 8 5
11
'OOO m•
109
481
423
410
12 5 5
62 63 42 22 53
112 8 2 6
81 12 41 26 40 24 27 32
92 50 65 59
115
Industrial
Usable floor
No. area
'OOO m2
112 1,478
122 1,749
97 1,257
98 1,201
10 8 6 7
13 7
11 5
14 3 9
11 3 9
10 4 7 6 8
14
9 10 7 8 4
87 113 120 42
208 99
119 68
148 51 92 67 21
125 79
169 98 43
126 183
280 135 49
121 38
Others
Usable floor area Non
Residen- residen-No. tial tial
119
105
117
99
2 6 7
13 32 14 7 5
9 14 1 5 4 8 8
16 14
6 11
3
21 10 10 18 12
'OOO m• 'OOO m2
31
16
16
26
1 t
t 1
11 t
t 8 t 2
t t
16
2 1 t 2 t
176
87
182
153
3 7
12 8
12 56 24 17
11 32
l 24 28 12
6 15 2
11 8
14 16 3
17 13
BUILDINGS
Total
Usable floor area Non
Residen- residen-No. tial tial
852
846
788
1,052
71 78 51 65 93 53 87. 83
94 36 61 63
132 81 90
110 73
149 86 77
98 121 177 132 64
'OOO m• 'OOO m• 732 1,577
907 1,775
848 2,010
850 1,747
138 61 41 25
124 64 74
166
152 62 53 55 40 36 69 63 54
120 24
120
72 49 85
102 53
Total
110 264 144 170 172 147 203 332
128 126 92 98 67
100 69
247 210 285 162 163
124 270 238 219
52
Usable floor area Non
Residen- residen-No. tial tial
'OOO m• 'OOO m2
883 821 1,934
1,175 1,042 2,521
1,045 1,055 2,069
1,267 1,027 1,931
40 63 49 62
137 67
112 58
83 150 143 198 66 54
149 89 64 41
168 62
99 54 39
100 117
34 95 40
108 134 65
103 108
157 170 110 89 90 68 70 21 98 32 64 59
378 51 28 59
120
125 141 141 138 311 214 180 166
291 125 98 99
133 173 146 212 167 76
176 235
417 216 125 205 189
67

LAND
Year/quarter
1979
1980
1979: 4th qtr.
1980: lst qtr. 2nd qtr. 3rd qtr. 4th qtr.
1981: lst qtr.
Year/quarter
1979
1980
1979: 4th qtr.
1980.: lst qtr. 2nd qtr. 3rd qtr. 4th qtr.
1981: lst qtr.
Year/quarter
1979
1980
1979: 4th qtr.
1980: lst qtr. 2nd qtr. 3rd qtr. 4th qtr.
1981: lst qtr.
. 68
Industrial
Realised Area premium
m• $Mn.
22,809 316.50
71,136 2,102.00
1,879
12,619 5,300
20,714 32,503
46.00
355.00 132.00 686.00 929.00
28,648 679.00
Industrial
Realised Area premium
m• $Mn.
13,314 105.65
9,102
5,869 1,080 2,153
7,435
92.50
40.00 13.00 39.50
38.10
Industrial
Realised Area premium
m• $Mn.
44,051 61.19
51,535 186.02
15,394 34.42
15,341 10,134 13,861 12,199
11,199
59.37 41.79 57.51 27.35
36.19
10.9 DISPOSALS OF CROWN LAND
Commercial
Public auction/tender
Urban areas
Commercial/ residential
Realised Area premium
Realised Area premium
m• $Mn. m• $Mn.
Residential
Realised Area premium
m• $Mn.
15,289 1,085.04 14,162 225.85
Other uses
Realised Area premium
m• $Mn.
Total
Realised Area premium
m• $Mn.
5,334 5.43 57,594 1,632.82
1,861 54.10 19,949 2,659.00 192,356 2,640.72 52,483 119.68 337,785 7,575.50
1,776 267.75
1,476 39.50 7,588 211.00 1,077 39.70
385 14.60 11,284 2,408.30
1,947 98.00
6,923 134.25
30,384 6,872
10,600 144,500
8,652
399.00 52.00
364.00 1,825.72
24.88
Public auction/tender-continued
New Territories
Commercial
Realised Area premium
m• $Mn.
Commercial/ residential
Realised Area premium
m• $Mn.
Residential
Realised Area premium
m• $Mn.
5,334
51,363
5.43 15,912 453.43
530 590
116.50
1.08 2.10
103,430 13,249 43,513
177,593
l,121.00 223.70
3,473.98 2,756.82
4,269 399.11 43,516 1,200.99
Other uses
Realised Area premium
$Mn.
Total
Realised Area premium
m• $Mn.
693
800
13.10 26,600 383.00 12,984 86.83 10,000 6.00 63,591 594.58
5.60 17,551 487.00 32,853 69.00
800 5.60 10,680 191.00
6,871 296.00
3,589
6,435 13,258 13,160
5,012 169.00 22,828
20.00
11.30 19.70 38.00
58.10
Letter A/B tender (New Territories only)
Commercial
Realised Area premium
m• $Mn.
1,248 1.61
Commercial/ residential Residential
Realised Area premium
Realised Area premium
m•
5,206
28,220
990
7,766 3,200
778 16,476
35,632
$Mn.
0.60 19,633
54.55 158,665
0.19 16,763
7.14 26,687 3.05 95,932 1.19 32,781
43.17 3,265
122.79 10,553
$Mn.
6.21
83.12
5.47
15.37 46.69 18.18 2.88
28.34
60,306 654.10
3,589
23,784 14,338 22,184
20.00
247.90 32.70
373.50
4,602 241.00 39,877 506.20
Other uses
Realised Area premium
m• $Mn.
Total
Realised Area premium
m• $Mn.
68,890 68.00
238,420 323.69
33,147 40.08
49,794 81.88 109,266 91.53 47,420 76.88 31,940 73.40
58,632 188.93
Hong Kong Monthly Digest of Statistics lune 1981

LAND
Private treaty grant
Urban areas
Public utilities/ Industrial Residential institutional uses Other uses Total
Year/quarter Area Area Area Area Area
m• ms m• m• m•
1979 38,405 109,380 115,526 21,375 284,686
1980 22,980 36,000 72;993 75,452 207,425
1979: 4th qtr. 88,684 12,345 101,029
1980: lst qtr. 12,350 73,265 85,615
2nd qtr. 6,150 40,941 931 48,022
3rd qtr. 13,130 5,602 596 19,328
4th qtr. 3,700 36,000 14,100 660 54,460
1981: 1st qtr. 49,000 8,900 57,900
Private treaty grant-continued
New Territories
Industrial Residential Public utilities/
institutional uses Other uses Total
Year/quarter Area Area Area Area Area
m• m• m• m• m•
1979 150,000 14,386 27,065 20,070 211,521
1980 2,730 12,410 82,791 5,250 103,181
1979: 4th qtr. 3,296 25 4,359 7,680
1980: lst qtr. 6,714 5,237 11,951
2nd qtr. 6,320 5,250 11,570
3rd qtr. 5,696 23,982 29,678
4th qtr. 2,730 47,252 49,982
1981: lst qtr. 24,730 61,804 86,534
Hong Kong Monthly Digest of Statistics . lune 1981 69
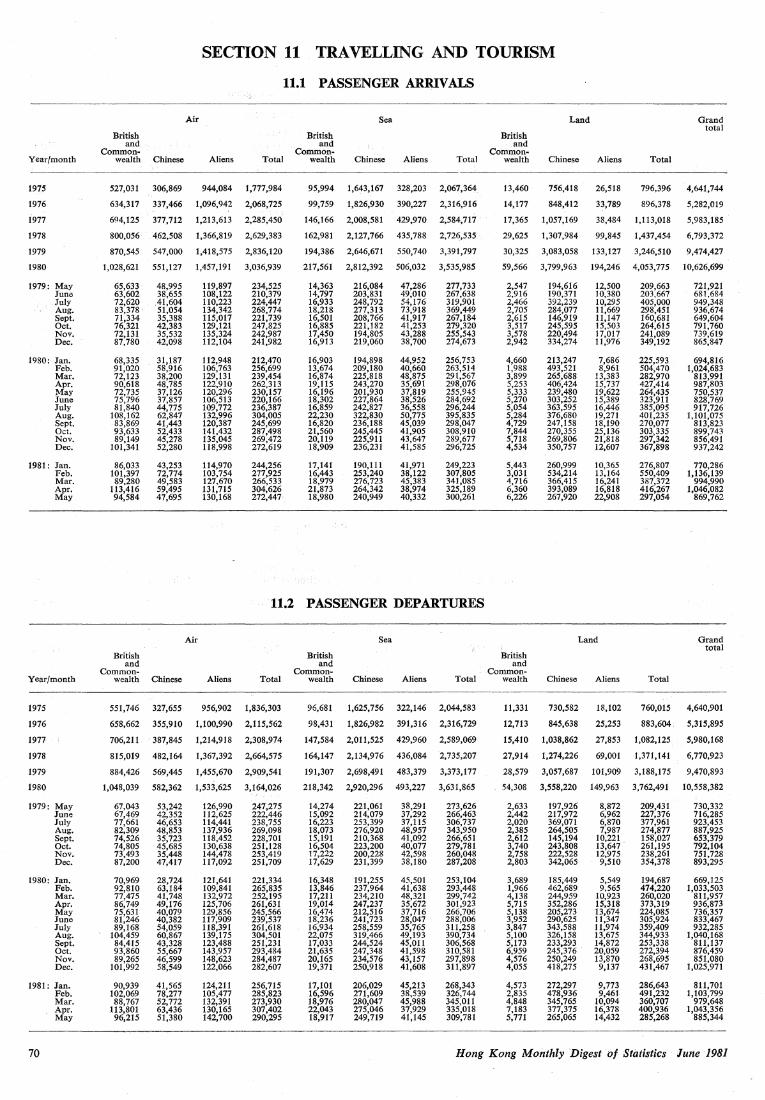
Year/month
1975
1976
1977
1978
1979
1980
1979: May June July Aug. Sept. Oct. Nov. Dec.
1980: Jan. Feb. Mar. Apr. May June July Aug. Sept. Oct. Nov. Dec.
1981: Jan. Feb. Mar. Apr. May
Year/month
1975
1976
1977
1978
1979
1980
1979: May June July Aug. Sept. Oct. Nov. Dec.
1980: Jan. Feb. Mar. Apr. May June July Aug. Sept. Oct. Nov. Dec.
1981: Jan.
70
Feb. Mar. Apr. May
SECTION 11 TRAVELLING AND TOURISM
British and
Common ..
Air
11.1 PASSENGER ARRIVALS
British and
Common-
Sea
British and
Common ..
Land Grand total
wealth Chinese Aliens Total wealth Chinese Aliens Total wealth Chinese Aliens Total
527,031 306,869 944,084 1,777,984
634,317 337,466 1,096,942 2,068,725
694,125 377,712 1,213,613 2,285,450
800,056 462,508 1,366,819 2,629,383
870,545 547,000 1,418,575 2,836,120
1,028,621 551,127 1,457,191 3,036,939
65,633 63,602 72,620 83,378 71,334 76,321 72,131 87,780
68,335 91,020 72,123 90,618 72,735 75,796 81,840
108,162 83,869 93,633 89,149
101,341
86,033 101,397 89.280
113,416 94,584
48,995 38,655
,41,604 51,054 35,388 42,383 35,532 42,098
31,187 58,916 38,200 48,785 37,126 37,857 44,775 62,847 41,443 52,433 45,278 52,280
43,253 72,774 49,583 59,495 47,695
119,897 108,122 110,223 134,342 115,017 129,121 135,324 112,104
112,948 106,763 129,131 122,910 120,296 106,513 109,772 132,996 120,387 141,432 135,045 118,998
114,970 103,754 127,670 131,715 130,168
234,525 210,379 224,447 268,774 221,739 247,825 242,987 241,982
212,470 256,699 239,454 262,313 230,157 220,166 236,387 304,005 245,699 287,498 269,472 272,619
244,256 277,925 266,533 304,626 272,447
95,994 1,643,167 328,203 2,067,364
99,759 1,826,930 390,227 2,316,916
146,166 2,008,581 429,970 2,584,717
162,981 2,127,766 435,788 2,726,535
194,386 2,646,671 550,740 3,391,797
217,561 2,812,392 506,032 3,535,985
14,363 14,797 16,933 18,218 16,501 16,885 17,450 16,913
16,903 13,674 16,874 19,115 16,196 18,302 16,859 22,230 16,820 21,560 20,119 18,909
17,141 16,443 18,979 21,873 18,980
216,084 203,831 248,792 277,313 208,766 221,182 194,805 219,060
194,898 209,180 225,818 243,270 201,930 227,864 242,827 322,830 236,188 245,445 225,911 236,231
190,111 253,240 276,723 264,342 240,949
47,286 49,010 54,176 73,918 41,917 41,253 43,288 38,700
44,952 40,660 48,875 35,691 37,819 38,526 36,558 50,775 45,039 41,905 43,647 41,585
41,971 38,122 45,383 38,974 40,332
277,733 267,638 319,901 369,449 267,184 279,320 255,543 274,673
256,753 263,514 291,567 298,076 255,945 284,692 296,244 395,835 298,047 308,910 289,677 296;725
249,223 307,805 341,085 325,189 300,261
11.2 PASSENGER DEPARTURES
British and
Common ..
Air
British and
Common ..
Sea
13,460 756,418 26,518 796,396 4,641,744
14,177 848,412 33,789 896,378 5,282,019
17,365 1,057,169 38,484 1,113,018 5,983,185
29,625 1,307,984 99,845 1,437,454 6,793,372
30,325 3,083,058 133,127 3,246,510 9,474,427
59,566 3, 799,963 194,246 4,053,775 10,626,699
2,547 2,916 2,466 2,705 2,615 3,517 3,578 2,942
4,660 1,988 3,899 5,253 5,333 5,270 5,054 5,284 4,729 7,844 5,718 4,534
5,443 3,031 4,716 6,360 6,226
British and
Common ..
194,616 190,371 392,239 284,077 146,919 245,595 220,494 334,274
213,247 493,521 265,688 406,424 239,480 303,252 363,595 376,680 247,158 270,355 269,806 350,757
260,999 534,214 366,415 393,089 267,920
12,500 10,380 10,295 11,669 11,147 15,503 17,017 11,976
7,686 8,961
13,383 15,737 19,622 15,389 16,446 19,271 18,190 25,136 21,818 12,607
10,365 13,164 16,241 16,818 22,908
Land
209,663 203,667 405,000 298,451 160,681 264,615 241,089 349,192
225,593 504,470 282,970 427,414 264,435 323,911 385,095 401,235 270,077
~g~:m 367,898
276,807 550,409 387,372 416,267 297,054
721,921 681,684 949,348 936,674 649,604 791,760 739,619 865,847
694,816 1,024,683
813,991 987,803 750,537 828,769 917,726
1,101,075 813,823 899,743 856,491 937,242
770,286 1,136,139
994,990 1,046,082
869,762
Grand total
wealth Chinese Aliens Total wealth Chinese Aliens Total wealth Chinese Aliens Total
551,746
658,662
706,211
815,019
884,426
1,048,039
67,043 67,469 77,661 82,309 74,526 74,805 73,493 87,200
70,969 92,810 77,475 86,749 75,631 81,246 89,168
104,459 84,415 93,860 89,265
101,992
90,939 102,069 88,767
113,801 96,215
327,655
355,910
387,845
482,164
569,445
582,362
53,242 42,352 46,653 48,853 35,723 45,685 35,448 47,417
28,724 63,184 41,748 49,176 40,079 40,382 54,059 60,867 43,328 55,667 46,599 58,549
41,565 78,277 52,772 63,436 51,380
956,902
1,100,990
1,214,918
1,367,392
1,455,670
1,533,625
126,990 112,625 114,441 137,936 118,452 130,638 144,478 117,092
121,641 109,841 132,972 125,706 129,856 117,909 118,391 139,175 123,488 143,957 148,623 122,066
124,211 105,477 132,391 130,165 142,700
1,836,303
2,115,562
2,308,974
2,664,575
2,909,541
3,164,026
247,275 222,446 238,755 269,098 228,701 251,128 253,419 251,709
221,334 265,835 252,195 261,631 245,566 239,537 261,618 304,501 251,231 293,484 284,487 282,607
256,715 285,823 273,930 307,402 290,295
96,681
98,431
147,584
164,147
191,307
218,342
14,274 15,092 16,223 18,073 15,191 16,504 17,222 17,629
16,348 13,846 17,211 19,014 16,474 18,236 16,934 22,075 17,033 21,635 20,165 19,371
17,101 16,596 18,976 22,043 18,917
1,625,756 322,146
1,826,982 391,316
2,011,525 429,960
2,134,976 436,084
2,698,491 483,379
2,920,296 493,227
221,061 214,079 253,399 276,920 210,368 223,200 200,228 231,399
191,255 237,964 234,210 247,237 212,516 241,723 258,559 319,466 244,524 247,348 234,576 250,918
206,029 271,609 280,047 275,046 249,719
38,291 37,292 37,115 48,957 41,092 40,077 42,598 38,180
45,501 41,638 48,321 35,672 37,716 28,047 35,765 49,193 45,011 41,598 43,157 41,608
45,213 38,539 45,988 37,929 41,145
2,044,583
2,316,729
2,589,069
2,735,207
3,373,177
3,631,865
273,626 266,463 306,737 343,950 266,651 279,781 260,048 287,208
253,104 293,448 299,742 301,923 266,706 288,006 311,258 390,734 306,568 310,581 297,898 311,897
268,343 326,744 345,011 335,018 309,781
11,331
12,713
15,410
27,914
28,579
54,308
2,633 2,442 2,020 2,385 2,612 3,740 2,758 2,803
3,689 1,966 4,138 5,715 5,138 3,952 3,847 5,100 5,173 6,959 4,576 4,055
4,573 2,835 4,848 7,183 5,771
730,582
845,638
1,038,862
1,274,226
3,057,687
3,558,220
197,926 217,972 369,071 264,505 145,194 243,808 222,528 342,065
185,449 462,689 244,959 352,286 205,273 290,625 343,588 326,158 233,293 245,376 250,249 418,275
272,297 478,936 345,765 377,375 265,065
18,102 760,015 4,640,901
25,253 883,604 5,315,895
27,853 1,082,125 5,980,168
69,001 1,371,141 6,770,923
101,909 3,188,175 9,470,893
149,963 3,762,491 10,558,382
8,872 6,962 6,870 7,987
10,221 13,647 12,975 9,510
5,549 9,565
10,923 15,318 13,674 11,347 11,974 13,675 14,872 20,059 13,870 9,137
9,773 9,461
10,094 16,378 14,432
209,431 227,376 377,961 274,877 158,027 261,195 238,261 354,378
194,687 474,220 260,020 373,319 224,085 305,924 359,409 344,933 253,338 272,394 268,695 431,467
286,643 491,232 360,707 400,936 285,268
730,332 716,285 923,453 887,925 653,379 792,104 751,728 893,295
669,125 1,033,503
811,957 936,873 736,357 833,467 932,285
1,040,168 811,137 876,459 851,080
1,025,971
811,701 1,103,799
979,648 1,043,356
885,344
Hong Kong Monthly Digest of Statistics June 1981
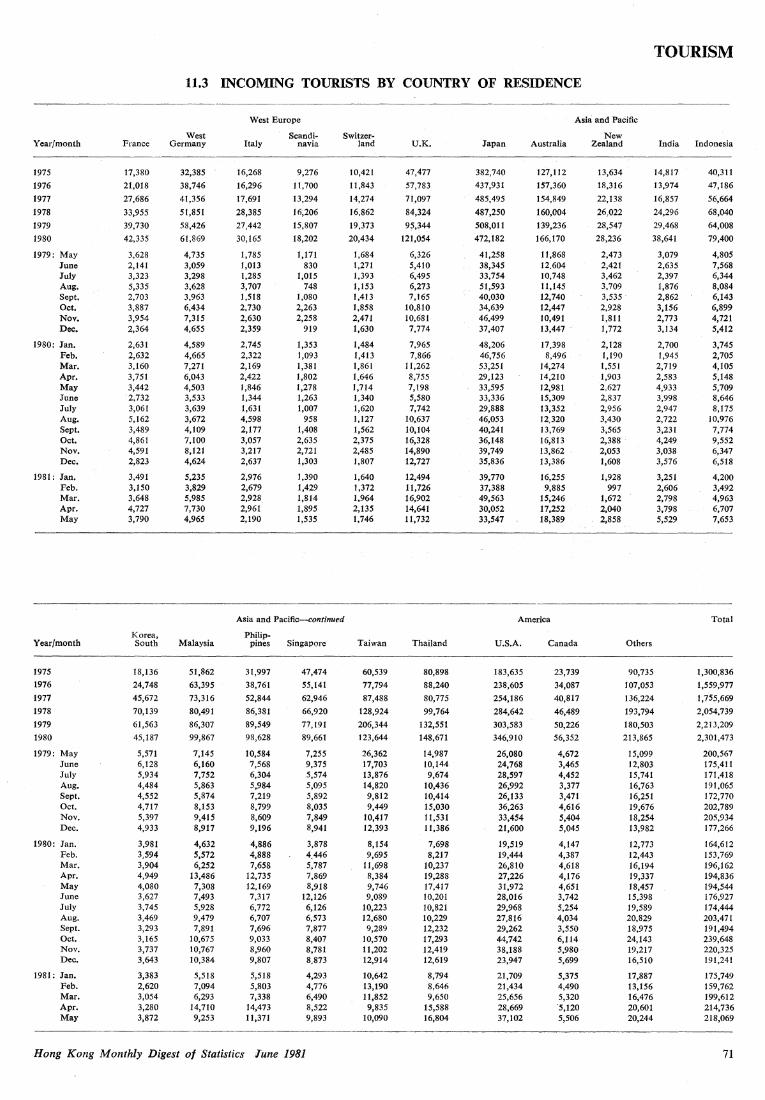
TOURISM
11.3 INCOMING TOURISTS BY COUNTRY OF RESIDENCE
West Europe Asia and Pacific
West Scandi- Switzer- New Year/month France Germany Italy navia land U.K. Japan Australia Zealand India Indonesia
1975 17,380 32,385 16,268 9,276 10,421 47,477 382,740 127,112 13,634 14,817 40,311
1976 21,018 38,746 16,296 11,700 11,843 57,783 437,931 157,360 18,316 13,974 47,186
1977 27,686 41,356 17,691 13,294 14,274 71,097 485,495 154,849 22,138 16,857 56,664
1978 33,955 51,851 28,385 16;206 16,862 84,324 487,250 160,004 26,022 24,296 68,040
1979 39,730 58,426 27,442 15,807 19,373 95,344 508,011 139,236 28,547 29,468 64,008
1980 42,335 61,869 30,165 18,202 20,434 121,054 472,182 166,170 28,236 38,641 79,400
1979: May 3,628 4,735 1,785 1,171 1,684 6,326 41,258 11,868 2,473 3,079 4,805 June 2,141 3,059 l,013 830 1,271 5,410 38,345 12,604 2,421 2,635 7,568 July 3,323 3,298 1,285 1,015 1,393 6,495 33,754 10,748 3,462 2,397 6,344 Aug. 5,335 3,628 3,707 748 1,153 6,273 51,593 11,145 3,709 1,876 8,084 Sept. 2,703 3,963 1,518 1,080 1,413 7,165 40,030 12,740 3,535 2,862 6,143 Oct. 3,887 6,434 2,730 2,263 l,858 10,810 34,639 12,447 2,928 3,156 6,899 Nov. 3,954 7,315 2,630 2,258 2,471 10,681 46,499 10,491 1,811 2,773 4,721 Dec. 2,364 4,655 2,359 919 1,630 7,774 37,407 13,447 l,772 3,134 5,412
1980: Jan. 2,631 4,589 2,745 1,353 1,484 7,965 48,206 17,398 2,128 2,700 3,745 Feb. 2,632 4,665 2,322 l,093 l,413 7,866 46,756 8,496 1,190 l,945 2,705 Mar. 3,160 7,271 2,169 1,381 1,861 11,262 53,251 14,274 1,551 2,719 4,105 Apr. 3,751 6,043 2,422 1,802 1,646 8,755 29,123 14,210 1,903 2,583 5,148 May 3,442 4,503 l,846 1,278 1,714 7,198 33,595 12,981 2,627 4,933 5,709 June ·2,732 3,533 1,344 1,263 1,340 5,580 33,336 15,309 2,837 3,998 8,646 July 3,061 3,639 1,631 1,007 1,620 7,742 29,888 13,352 2,956 2,947 8,175 Aug. 5,162 3,672 4,598 958 1,127 10,637 46,053 12,320 3,430 2,722 10,976 Sept. 3,489 4,109 2,177 1,408 1,562 10,104 40,241 13,769 3,565 3,231 7,774 Oct. 4,861 7,100 3,057 2,635 2,375 16,328 36,148 16,813 2,388 4,249 9,552 Nov. 4,591 8,121 3,217 2,721 2,485 14,890 39,749 13,862 2,053 3,038 6,347 Dec. 2,823 4,624 2,637 1,303 1,807 12,727 35,836 13,386 1,608 3,576 6,518
1981: Jan. 3,491 5,235 2,976 l,390 l,640 12;494 39,770 16,255 1,928 3,251 4,200 Feb. 3,150 3,829 2,679 1,429 1,372 11,726 37,388 9,885 997 2,606 3,492 Mar. 3,648 5,985 2,928 1,814 1,964 16,902 49,563 15,246 1,672 2,798 4,963 Apr. 4,727 7,730 2,961 1,895 2,135 14,641 30,052 17,252 2,040 3,798 6,707 May 3,790 4,965 2,190 1,535 1,746 11,732 33,547 18,389 2,858 5,529 7,653
Asia and Pacific-continued America Total
Year/month Korea, South Malaysia
Philip-pines Singapore Taiwan Thailand U.S.A. Canada Others
1975 18,136 51,862 31,997 47,474 60,539 80,898 183,635 23,739 90,735 1,300,836 1976 24,748 63,395 38,761 55,141 77,794 88,240 238,605 34,087 107,053 1,559,977
1977 45,672 73,316 52,844 62,946 87,488 80,775 254,186 40,817 136,224 1,755,669
1978 70,139 80,491 86,381 66,920 128,924 99,764 284,642 46,489 193,794 2,054,739
1979 61,563 86,307 89,549 77,191 206,344 132,551 303,583 50,226 180,503 2,213,209
1980 45,187 99,867 98,628 89,661 123,644 148,671 346,910 56,352 213,865 2,301,473
1979: May 5,571 7,145 10,584 7,255 26,362 14,987 26,080 4,672 15,099 200,567 June 6,128 6,160 7,568 9,375 17,703 10,144 24,768 3,465 12,803 175,411 July 5,934 7,752 6,304 5,574 13,876 9,674 28,597 4,452 15,741 171,418 Aug. 4,484 5,863 5,984 5,095 14,820 10,436 26,992 3,377 16,763 191,065 Sept. 4,552 5,874 7,219 5,892 9,812 I0,414 26,133 3,471 16,251 172,770 Oct. 4,717 8,153 8,799 8,035 9,449 15,030 36,263 4,616 19,676 202,789 Nov. 5,397 9,415 8,609 7,849 10,417 11,531 33,454 5,404 18,254 205,934 Dec. 4,933 8,917 9,196 8,941 12,393 11,386 21,600 5,045 13,982 177,266
1980: Jan. 3,981 4,632 4,886 3,878 8,154 7,698 19,519 4,147 12,773 164,612 Feb. 3,594 5,572 4,888 4_446 9,695 8,217 19,444 4,387 12,443 153,769 Mar. 3,904 6,252 7,658 5,787 11,698 10,237 26,810 4,618 16,194 196,162 Apr. 4,949 13,486 12,735 7,869 8,384 19,288 27,226 4,176 19,337 194,836 May 4,080 7,308 12,169 8,918 9,746 17,417 31,972 4,651 18,457 194,544 June 3,627 7,493 7,317 12,126 9,089 I0,201 28,016 3,742 15,398 176,927 July 3,745 5,928 6,772 6,126 10,223 I0,821 29,968 5,254 19,589 174,444 Aug. 3,469 9,479 6,707 6,573 12,680 I0,229 27,816 4,034 20,829 203,471 Sept. 3,293 7,891 7,696 7,877 9,289 12,232 29,262 3,550 18,975 191,494 Oct. 3,165 10,675 9,033 8,407 10,570 17,293 44,742 6,114 24,143 239,648 Nov. 3,737 I0,767 8,960 8,781 11,202 12,419 38,188 5,980 19,217 220,325 Dec. 3,643 10,384 9,807 8.873 12,914 12,619 23,947 5,699 16,510 191,241
1981: Jan. 3,383 5,518 5,518 4,293 10,642 8,794 21,709 5,375 17,887 175,749 Feb. 2,620 7,094 5,803 4,776 13,190 8,646 21,434 4,490 13,156 159,762 Mar. 3,054 6,293 7,338 6,490 11,852 9,650 25,656 5,320 16,476 199,612 Apr. 3,280 14,710 14,473 8,522 9,835 15,588 28,669 ·s,120 20,601 214,736 May 3,872 9,253 11,371 9,893 10,090 16,804 37,102 5,506 20,244 218,069
Hong Kong Monthly Digest of Statistics lune 1981 71
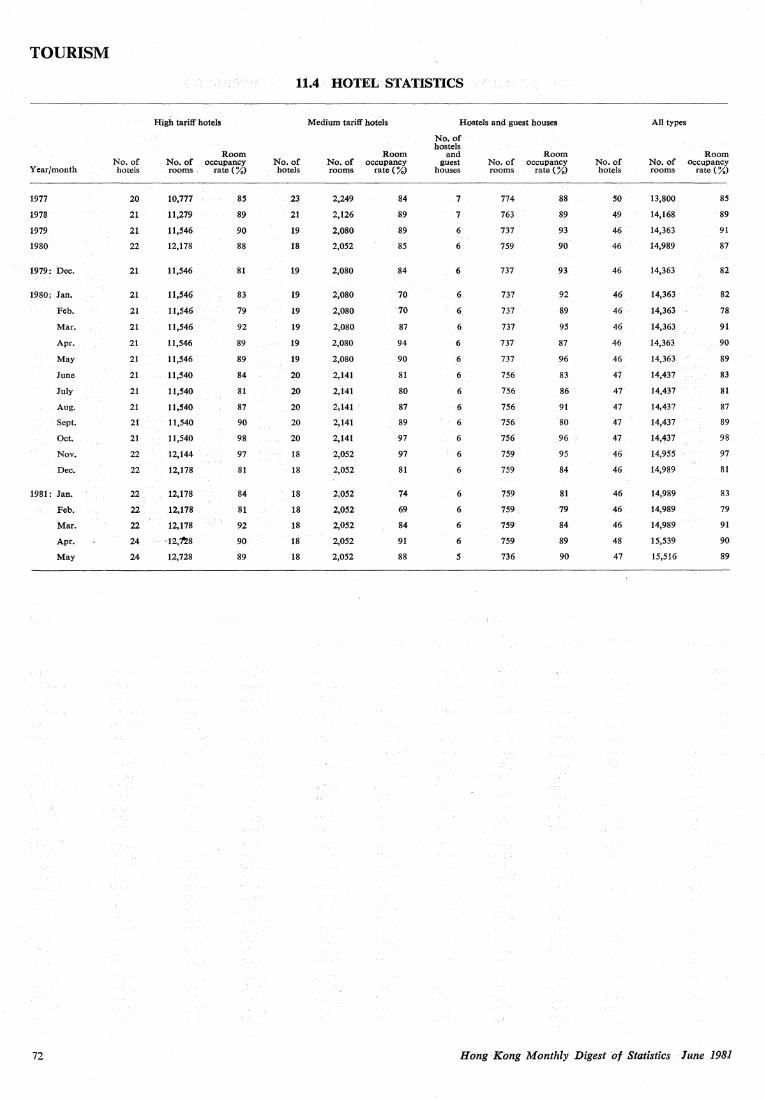
TOURISM
Year/month
1977
1978
1979
1980
1979: Dec.
19.80: Jan.
Feb.
Mar.
Apr.
May
June
July
Aug.
Sept.
Oct.
Nov.
Dec.
1981: Jan.
72
Feb.
Mar.
Apr.
May
No.of hotels,
20
21
21
22
21
21
21
21
21
21
21
21
21
21
21
22 '
22
22
22
22
24
24
'fligh tariff hotels
No.of rooms.
10,777
11,279
11,546
12,178
11,546
11,546
11,546
11,546
11,546
11,546 '
11,540
11,540
11,540
11,540
11,540
12,144
12,178
12,178
12,178
12,178
·12,~8
12,728
Room occupancy
rate(%)
85
89
90
88
81
83
79
92
89
89
84
81
87
90
98
97
81
84
81
92
90
89
11.4 HOTEL STATISTICS
No.of hotels
23
21
19
18
19
19
19
19
19
19
20
20
20
20
20
18
18
18
18
18
18 18
Medium tariff hotels
No.of roon:µ;
2,249
2,126
2,080
2,052
2,080
2;080
2;080
2,080
2,080
2,080
2,141
2,l41
2;141 '
2,141
2,141
2;052
2,052
2,052
2,052
2,052
2,052
2,052
Room occupan~.y
rate(::-".)
84
89
89
85
84
70
70
87
94
90
81
80
87
89
97 97
81
74
69
84
91
88
Hostels and guest houses
No.of hostels
and guest
houses
7
7
6
6
6
6
6
6
6
6
6
6
,6
6
6
6
6
6
6
6
6
5
No.of rooms
774
763
737
759
737
737
737
737
737
737
756
756
756
756
756
759
759
759
759
759
759
736
Room occupancy
rate(::-".)
88
8? 93
90
93
92
89
95
87
96
83
86
91
·so
96
95
84
81
79
84
89
90
No.of hotels
so 49
46
46
46
46
46
46
46
46
47
47
47
47
47
46
46
46
46
46
48
47
All types
No. of rooms
13,800
14,168
14,363
14,989
14,363
14,363
14,363
14,363
14,363
14,363
14,437
14,437
14,437
14,437
14,437
14,955
14,989
14,989
14,989
14,989
15,539
15,516
Room oecupan_cy
rate(%)
85
89
91
87
82
82
78
91
90
89
83
81
87
89
98
97
81
83
79
91
90
89
Hong Kong Monthly Digest .of Statistics ·lune 1981

SECTION 12 SOCIAL STATISTICS
Year/quarter
1975*
1976*
1977*
1978*
1979*
1980*
1980
1979: lst qtr. 2nd qtr. 3rd qtr. 4th qtr.
1980: lst qtr. 2nd qtr. 3rd qtr. 4th qtr.
1981: lst qtr.
Year/quarter
1975*
1976*
1977*
1978*
1979*
1980*
1980
1979: lst qtr. 2nd qtr. 3rd qtr. 4th qtr.
1980: lst qtr. 2nd qtr. 3rd qtr. 4th qtr.
1981: lst qtr.
Year/quarter
1975*
1976*
1977*
1978*
1979*
1980*
1980
1979: lst qtr. 2nd qtr. 3rd qtr. 4th qtr.
1980: lst qtr. 2nd qtr. 3rd qtr. 4th qtr.
1981: lst qtr.
Against public order
Cases reported
1,236
1,362
1,424
1,312
1,456
1,784
1,747
324 326 391 394
414 390 456 487
396
Cases reported
83
62
55
62
104
75
75
17 21 29 35
22 11 24 18
21
Persons prosecuted
Rape
1,670
1,783
1,885
1,994
2,121
2,569
2,548
527 483 534 566
569 560 702 717
537
Persons prosecuted
42
24
32
36
37
26
26
2 11 10
5
6 4
10 6
15
Murder and manslaughter
Cases reported
105
82
57
63
68
86
87
12 19 23 13
14 29 24 20
23
Persons prosecuted
75
59
48
45
61
87
68
8 14 15 4
7 24 24 13
16
12.1 CRIME
Against lawful authority
Unlawful society Other offences
Cases reported
4,233
4,089
2,877
1,874
1,334
1,252
1,218
328 315 361 308
283 483 224 228
210
Persons prosecuted
3,220
3,054
1,766
1,081
740 573
550
179 182 203 164
160 231
85 74
105
Cases reported
502
754
671
563
654
763
730
173 154 164 148
143 212 192 183
174
Against public morality
Indecent assault
Persons prosecuted
308
516
337
309
378
451
434
112 86 84 85
87 102 129 116
82
on female Other offences
Cases reported
664
850
876
710
715
795
766
179 172 180 180
148 191 208 219
151
Persons prosecuted
265
338
353
307
350
388
369
81 84 89 90
74 82
114 99
73
Cases reported
842
783
522
340
442
712
723
108 89
124 117
135 181 162 245
142
Persons prosecuted
298
400
293
254
304
325
320
82 56 84 69
. 89 76 67 88
68
Against the person
Attempted murder
Cases reported
5
4
2
2
2
2
5
Persons prosecuted
4
4
Serious assaults
Cases reported
4,676
4,613
5,039
5,206
5,810
6,314
6,196
1,122 1,451 1,729 1,469
1,361 1,490
. 1,670 1,675
1,326
Persons prosecuted·
2,485
2,765
3,206
3,890
4,152
4,240
3,841
756 971
1,137 965
842 913
1,021 1,065
829
*These are the revised, official annual series, in contrast to the corresponding sums of quarterly figures.
Hong Kong Monthly Digest of Statistics 'lune 1981
Cases reported
5,971
6,205
4,972
3,749
3,444
3,799
3,695
825 795 916 850
840 1,085
872 898
780
Cases reported
1,589
1,695
1,453
1,112
1,261
1,582
1,564
304 282 333 332
305 383 394 482
314
Total
Persons prosecuted
Total
5,198
5,353
3,988
3;384
3,239
3,593
3,532
818 751 821 815
816 893 916 907
724
Persons prosecuted
605
762
678
59.1
691
739
715
165 151 183 164
169 162 191 193
156
Abortion
Cases reported
21
11
10
5
3
5
5
2 3
Persons prosecuted
16
13
17
4 5
5
s
3 2
5
73

SOCIAL STATISTICS
Year/quarter
1975•
1976*
1977*
1978*
1979*
1980*
1980
1979: lst qtr. 2nd qtr. 3rd qtr. 4th qtr.
1980: lst qtr. 2nd qtr. 3rd. qtr. 4th qtr.
1981: lst qtr.
Year I quarter
1975*
1976*
1977*
1978*
1979*
1980*
1980
1979: tst qtr. 2nd qtr. 3rd qtr. 4th qtr.
1980: lst qtr. 2nd qtr. 3rd qtr. 4th qtr.
1981: lst qtr.
Year/quarter
1975*
1976*
1977*
1978*
1979*
1980*
1980
1979: lst qtr. 2nd qtr. 3rd qtr. 4th qtr.
1980: lst qtr. 2nd qt(. 3rd qtr. 4th qtr.
1981: lst qtr.
Kidnapping
Cases reported
9
4
3
3
7
9
9
2 3 2
3 4 1 1
2
Persons prosecuted
14
5
3
9
40
33
1 3
9 19 3 2
3
Other robberies
Cases reported
11,054
8,838
6,501
5,637
1,606
9,334
9,054
.1,424 1,424 2,412 2,284
2,344 2,180 2,319 2,211
2,239
Persons prosecuted
l,758
1,278
990
974
1,445
1,822
i,534
244 231 338 383
370 379
. 424
. 361
426
Theft from vehicle
,Cases reported
1,812
1,736
1,817
2,080
2,908
3,889
3,827
673 702 820 685
739 987
1,017 1;084
l,049
Persons prosecull'.d
187
_152
182
221
347
482
490
82 100 104 55
103 112 141 134
.127
Against the person-continued
Other offences
Cases reported
666
915
819
712_
741
658
645
160 173 205 186
147 180 144 174
167
Persons prosecuted
426
620
518
487
502
442
427
114 114 118 124
96 114 93
124
97
Cases reported
5,482
5,628
5,932
5,990
6,631
7,074
6,944
1,297 1,647 1,961 1,670
1,527 1,706 1,839 1,872
1,523
Total
Persons 1>rosecuted
3,020
3,462
3,795
. 4,429
4,733
4,815
4,375
882 1,105 1,273 1,093
954 1,075 1,141 1,205
946
Against property-continued
All burglaries
Cases reported
6,368
5,665
. S,565
5,412
7,470
8,989
8,823
1,454 1,585 2,131 2,197
2,131 2,065 2,262 2,365
2,347
Persons prosecuted
548
471
445
543
784
1,241
1,083
147 167 207 165
219 261 27'J
. 330
311
Theft from persons (snatching)
Cases reported
638
541
601
748
1,187
2,104
2,072
177 199 397 411
360 504 621 587
495
Persons prosecuted
109
95
83
Ill
168
199
180
20 45 so 42
37 41 57 45
55
Against property---contlnued
Theft of vehicle/taking conveyance without
.authority ·
Cases reported
2,001
1,459
1,353
2,728
3,220
3,798
3,728
825 834 777 737
909 943 997 879
827
Persons prosecuted
363
328
312
313
323
443
435
85 92 70 68
96 77
140 122
77
Theft associated with blackmail
Cases reported
1,981
4,422
2,299
2,011
879
702
674
123 112 111 533
228 203 148 95
145
Persons prosecuted
Against property
Robbery with firearms
Cases reported
66
57
24
23
14
22
22
3 4 2 5
9 8 5
8
Persons prosecuted
65
21
21
16
6
20
12
2 1
3
s 4 3
6
Theft from persons (pickpocketing)
Cases reported
1,082
1,106
964
1,068
1,565
1,797
1,766
331 325 392 501
459 336 372 599
686
Persons prosecuted
275
299
231
202
353
710
689
75 60 77
141
223 140 146 180
261
Other thefts
Cases reported
7,746
8,981
11,360
13,120
15,513
18,926
18,512
3,532 3,506 3,995. 4,281
4,062 4,651 4,614 5,185
5,088
Persons prosecuted
3,385
3,371
3,900
4,052
4,713
6,414
6,506
927 1,047 1,277 1,337
l,572 1,555 1,579 1,800
1,784
*These are the revised, official annual series, in contrast to the corresponding sums of_qua~erly figures •.
~4 J/;ong. Kopg ktOJ'rtJily _Digest of Statistics lune -1981

Year/quarter
1975*
1976•
1977*
1978*
1979*
1980*
1980
1979: lst qtr. 2nd qtr. 3rd qtr. 4th qtr.
1980: lst qtr. 2nd qtr. 3rd qtr. 4th qtr.
1981: lst qtr.
Year/quarter
1975*
1976•
1977*
1978*
1979*
1980*
1980
1979: lst qtr. 2nd qtr. 3rd qtr. 4th qtr.
1980: lst qtr. 2nd qtr. 3rd qtr. 4th qtr.
1981: lst qtr.
Year/quarter
197S•
1976*
1977*
1978*
1979•
1980*
1980
1979: lst qtr. 2nd qtr. 3rd qtr. 4th qtr.
1980: ht qtr. 2nd qtr. 3rd qtr. 4th qtr.
1981: lst qtr.
Blackmail.
Cases reported
2,489
4,775
2,840
2,678
1,428
1,214.
1,193
222 222 2S2 716
309 371 276 237
377
Persons prosecuted
68S
669
732
600
657
706
686
148 156 162 172
143 209 149 185
167
Against property--continued
Cases reported
40,768
44,895
41,619
43,6S9
50,510
60,40S
59,0SO
10,808 10,832 13,609 14,6S4
13,703 14,4S5 14,932 lS,960
1S,85S
Total
Persons prosecuted
10,001
10,250
10,859
10,716
12,461
lS,968
15,449
2,478 2,675 3,344 3,366.
3,60S 3,709 3,956 4,179
4,194
Possession of arms and ammunition
Cases reported
Persons· prosecuted
193
142
130
SS
86
112
109
28 16 10 2S
16 2S 30 38
36
94
82
77
42
43
67
68
13 6 9
14
11 19 17 21
22
SOCIAL STATISTICS
Against property--continued
A)I frauds
Cases reported
2,098
2,412
2,052
1,942
1,861
2,319
2,165
358 543 506 408
359 465 579 762
788
Persons prosecuted
561
838
sso 621
490
494
438
95 144 92
105
78 121 139 100
121
Criminal damage to ,property
Cases reported
Persons prosecuted
1,116
1,375
l,5S8
1,852
2,212
2,561
2,533
551 535 S41 SSS
S06 633 622 772
71S
Other crimes
365
39S
493
611
672
769
7S2
168 142 171 165
lSI 191 182 228
203
Other offences
Cases reported
2,317
3,S28
4,685
4,360
4,647
4,7SO
4,681
1,135 841
1,273 1,338
1,297 l,108 1,097 1,179
1,091
Persons prosecuted
1,700
2,333
2,890
2,452
2,S03
2,668
2,644
48S 490 796 730
613 618 722 691
656
Forgery and coinage Bribery and corruption
Cases reported
463
413
708
680
1,163
1,039
978
32S 14S 408 240
186 2S8 144 390
302
Persons prosecuted
96
113
123
90
103
140
107
18 11 15 13
14 24 22 47
46
Police cases
Cases reported
44
53
67
37
42
38
35
9 16 10 5
10 5 8
12
9
Persons. prosecuted
33
43
40
21
32
20
19
4 14 6 6
4 4 l
10
7
Other crimes-continued
Cases reported
389
261
200
94
140
262
249
29 20 2S 48
59 42 29
119
135
Others
Persons prosecuted
410
291
183
92
217
319
308
S9 37 41 46
48 60 31
169
110
ICAC cases
Cases reported
Cases reported
1,089
869
l,IOS
866
1,431
1,451
1,371
391 197 4S3 318
271 330 211 SS9
482
1,359
1,073
945
803
l,023
842
842
300 303 195 225
198 201 194 249
26S
Total
Persons prosecuted
174
210
21S
151
246
296
296
53 60 66 67
91 80 56 69
119
Persons prosecuted
633
S29
423
24S
39S
S46
S02
94 68 71 79
77 107
71 247
185
*These are the revised, official annual series, in contrast to the corresponding sums of quarterly figlires.
Hong Kong Monthly Digest· uf Statistics June 1981 75
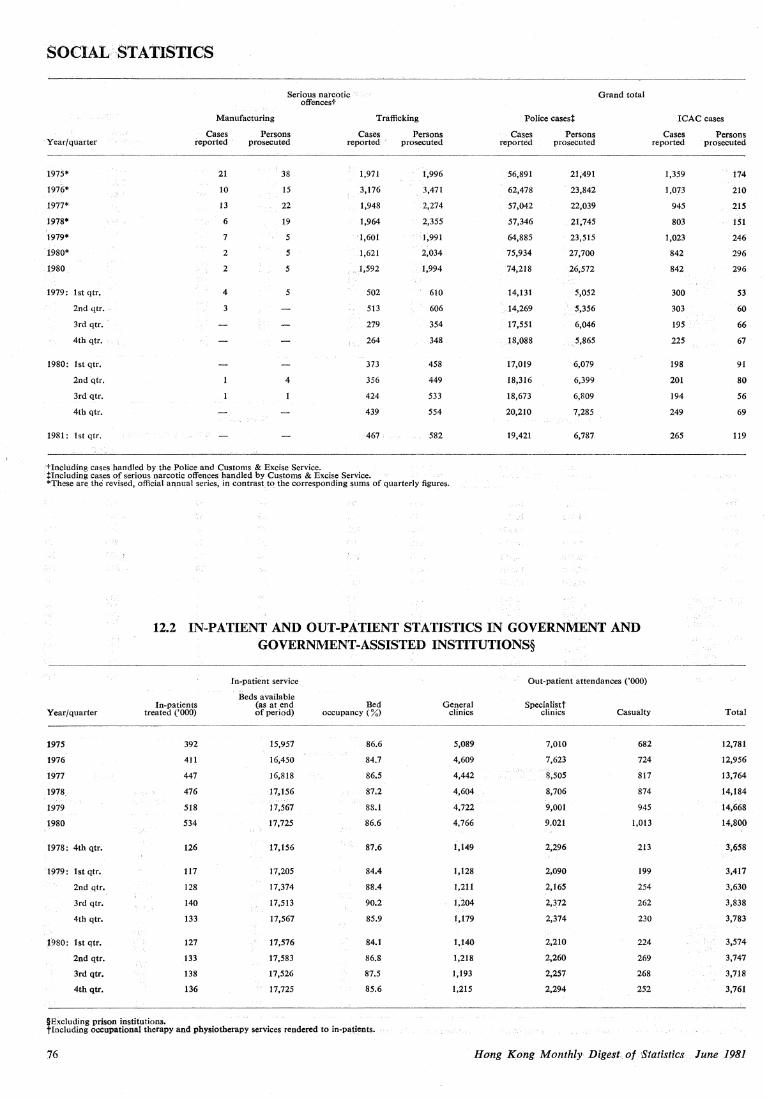
SOCIAV·STATISTICS
SeriouS narcotic·.· otrencest
Year/quarter
1975*
J97!i*
1977*
1978*
J979*
'1980*
1980
1979: lst qtr.
2nd qtr •.
3rd qtr. ·
4th qtr.
1980: lst qtr.
2nd qtr.
3rd qtr.
4th qtr.
1981: lst qtr.
Manufacturing
Cases reported
21
JO
13
6
7
2
2
4
3
Persons prosecuted
38
JS
22
19
5
5
5
4
Trafficking
Cases Persons reported ·· prosecuted
1,971 1,996
3, 176 . 3,471
1,948 2,274
1,964 2,355
·l,601
.1,621
. , 1,592
502
513
279
264
373
356
424
439
467'
J,991
2,034
1,994
610
606
354
348
458
449
533
554
582
·t1nchiding cases handled by the Police and Customs & Excise Service. irncluding cases of serious narcotic offences handled by Customs & Excise Senice. *These are. the revised, official aqnual series, in contrastJo. the corresponding sums of quarterly figures.
Cases reported
56,891
62,478
57,042
57,346
64,885
75,934
74,218
14,J31
.. 14,269
17,551
18,088
17,019
18,316
18,673
20,210
19,421
Persons prosecuted
21;491
23,842
22,039
21;745
23;515
27,700
26,572
5,052
·5,356
6,046
.5.865
6,079
6,399
6,809
7,285
6,787
Grand total
12.2 IN-PATIENT AND OUT-PATIENT STATISTICS IN GOVERNMENT AND GOVERNMENT-ASSIST}:,D INSTITUTIONS§
Year/quarter
1975
1976
1977
1978.
·1979
1980
1978: 4th qtr.
· 1979: lst qtr.
2nd qtr.
3rd qtr.
4th qtr.
l980: lst qtr.
2nd qtr.
3rd qtr.
4th qtr.
In-patients treated ('OOO)
392
411
447
476
518
534
126
117
128
140
133
127
133
138
136
In-patient service
Beds available (as at end of period)
15,957
J6,4SO
16,818
17,156
i'i,567
17,725
17,156
J7,205
J7,374
17,513
J7,567
17,576
17,583
17,526
17,725
Bed occupancy ( %)
86.6
84.7
86.5
87.2
88.1
86.6
87.6
84.4
88.4
90.2
85.9
84.1
86.8
87.5
85.6
§Excluding prison institutions. · · tincluding occupational therapy and physiotherapy services rendered to in·P'!tients.
General clinics
5,089
4,609
4,442
4,604
4,722
4,766
1,149
1,128
1,211
J;204
1,179
1,140
1,2J8
J;l93
J,2J5
Out-patientattendances ('000)
Specialistt clinics
7,0JO
7,623
S,505
8,706
9,001
9.021
2,296
'.2;090
2,J65
2,372
2,374
2,210
2,260
2,257
2,294
Casualty
682
724
817
874
945
J,OJ3
213
199
254
262
230
224
269
268
252
ICAC cases
Cases reported
1,359
J,073
945
803
1,023
842
842
300
303
195
225
198
201
194
249
265
Persons prosecuted
174
210
21S
151
246
296
296
53
60
66
67
91
80
56
69
119
Total
J2,781
12,956
13,764
14,184
14,668
14,800
3,658
3,417
3,630
3,838
3,783
3,574
·3,747
3,718
3,761
76 Horzg Kong Monthly Digest of Statistics lune 1981
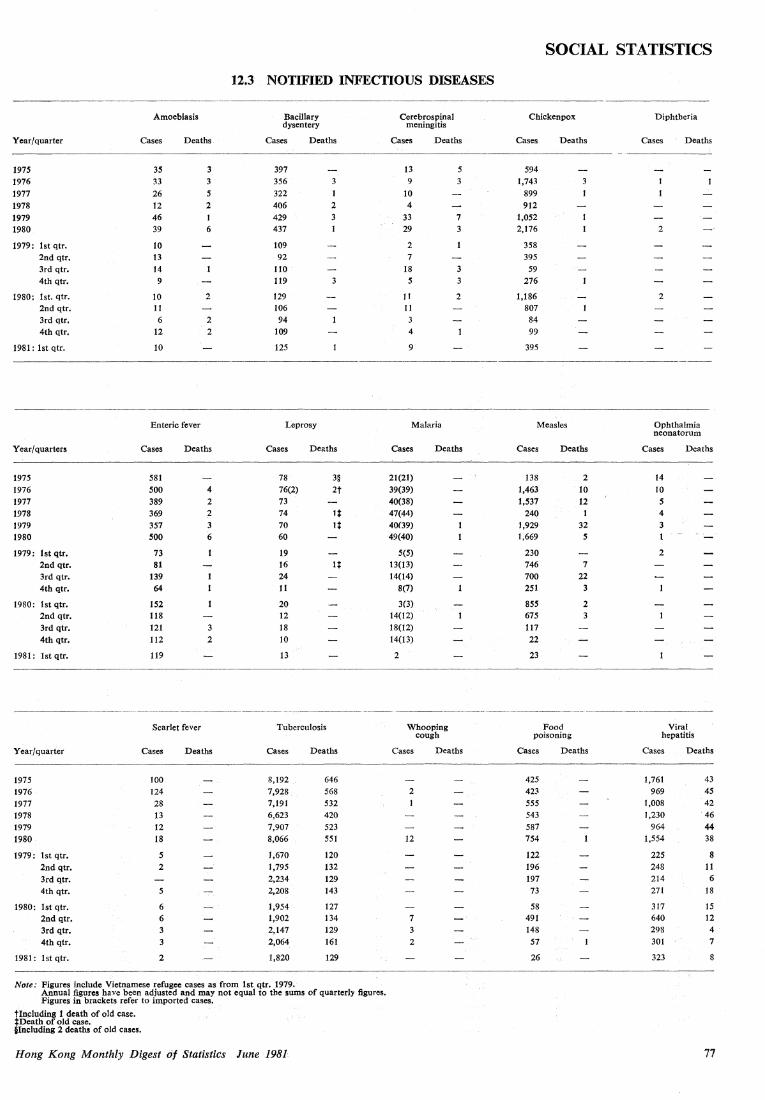
SOCIAL STATISTICS
12.3 NOTIFIED INFECTIOUS DISEASES
Year/quarter
197S 1976 1977 1978 1979 1980.
1979: lst qtr. 2nd qtr, 3rd qtr. 4th qtr.
1980: lst. qtr. 2nd qtr. 3rd qtr. 4th qtr.
1981: lstqtr.
Year/quarters
1975 1976 1977 1978 1979 1980
1979: tst qtr. 2nd qtr. 3rd qtr. 4th qtr.
1980: lst qtr. 2nd qtr. 3rd qtr. 4th qtr.
1981: lst qtr.
Amoebiasis
Cases
3S 33 26 12 46 39
10 13 14 9
10 11 6
12
10
Deaths
3 3 s 2 1 6
2
2 2
Enteric fever
Cases
581 SOO 389 369 3S7 SOO
73 81
139 64
1S2 118 121 112
119
Deaths
4 2 2 3 6
3 2
Bacillary dysentery
Cases Deaths
397 356 322 406 429 437
109 92
110 119
129 106 94
109
125
3
2 3 I
Leprosy
Cases
78 76(2) 73 74 70 60
19 16 24 11
20 12 18 10
13
Deaths
3§
2t
--------------·-·--·-----Scarlet fever Tuberculosis
Year/quarter
1975 1976 1977 1978 1979 1980
1979: lst qtr. 2nd qtr, 3rd qtr. 4th qtr.
1980: lst qtr. 2nd qtr. 3rd qtr. 4th qtr.
1981: lst qtr.
Cases
100 124 28 13 12 18
s 2
5
6 6 3 3
2
Deaths Cases
8,192 7,928 7,191 6,623 7,907 8,066
1,670 1,795 2,234 2,208
1,954 1,902 2,147 2,064
1,820
Deaths
646 568 532 420 523 551
120 132 129 143
127 134
129 161
129
Note: Figures include Vietnamese refugee cases as from lst qtr. 1979. Annual figures have been adjusted and may not equal to the sums of quarterly figures. Figures in brackets refer to imported cases,
tinpluding 1 death of old case. Death of old case.
§Including 2 deaths of old cases.
Hong Kong Monthly Digest of Statistics lune 1981
Cerebrospinal meningitis
Cases Deaths
13 9
10 4
33 29
2 7
18 s
II II 3 4
9
5
3
7 3
3 3
2
Malaria
Cases
21(21) 39(39) 40(38) 47(44) 40(39) 49(40)
5(5) 13(13) 14(14)
8(7)
3(3) 14(12) 18(12) 14(13)
2
Deaths
Chickenpox
Cases
594 1,743
899 912
1,052 2,176
358 395
59
276
1,186 807 84 99
395
Deaths
Measles
Cases
138 1,463 1,537
240 l,929 l,669
230 746 700 2St
SSS 675 117 22
23
Deaths
2 10 12
32 s
7 22
3
2 3
-------·------------Whooping
cough
Cases
2
12
7 3 2
Deaths
Food poisoning
Cases
425 423 555 543 587 754
122 196 197 73
58 491 148 57
26
Deaths
Diphtheria
Cases Deaths
2
2
Ophthalmia neonatorum
Cases Deaths
14 JO s 4 3
2
Viral hepatitis
Cases Deaths
1,761 969
1,008 1,230
964 1,554
225 248 214
271
317 640 298 301
323
43
45 42 46 44 38
8 II 6
18
15 12 4 7
8
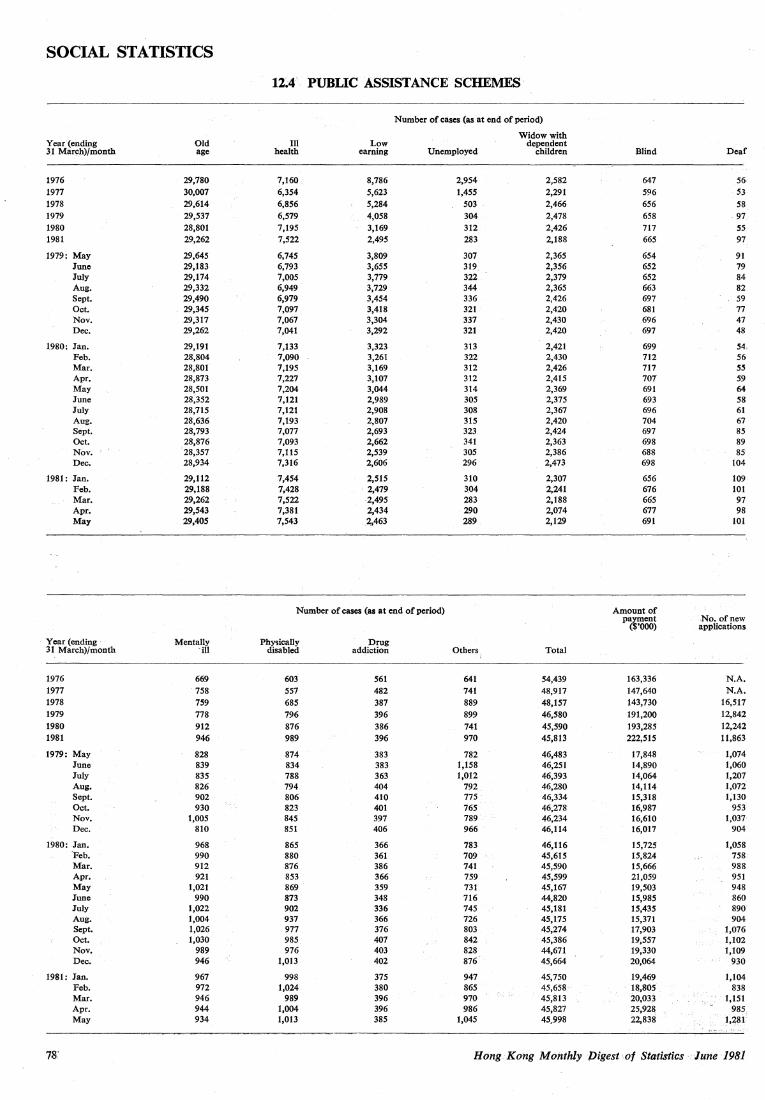
SOCIAL STATISTICS
12~4' PUBLIC ASSISTANCE SCHEMES-
Number of cases (as at end of period)
Widow with Year·(ending Old Ill Low dependent 31 March)/month age health earning Unemployed children Blind Deaf
1976 29,780 7,160 - 8,786 2,954 2,582 647 56-1977 30,007 6,354 5,623 1,455 2,291 596 53 1978 29,614 6,856 5,284 503 2,466 656 58 1979 29,537 6,579 4,058 304 2,478 658 97 1980 28,801 7,195 3,169 312 2,426 717 SS-
1981 29,262 7,522 2,49S 283 2,188 665 97
1979: May 29,645 6,745 3,809 307 2,365 654 91 June 29,183 6,793 3,65S 319 2,356 652 79 July 29,174 7,005 3,779 322 2,379 652 84 Aug. 29,332 6,949 3,729 344 2,365 663 82 Sept. 29,490 6,979 3,454 336 2,426 697 59 Oct. 29,345 7,097 3,418 321 2,420 681 77 Nov. 29,317 7,067 3,304 337 2,430 696 47 Dec. 29,262 7,041 3,292 321 2,420 697 48
1980: Jan. 29,191 7,133 3,323 313 2,421 699 S4, Feb. 28,804 7,090 3,261 322 2,430 712 56 Mar. 28,801 7,195 3,169 312 2,426 717 SS Apr. 28,873 7,227 3,107 312 2,415 707 59 May 28,501 7,204 3,044 314 2,369 691 64 June 28;352 7,121 2,989 305 2,375 693 58 July 28,715 7,121 2,908 308 2,367 696 61 Aug. 28,636 7,193 2,807 315 2,420 704 67 Sept. 28,793 7,077 2,693 323 2,424 697 85 Oct. 28,876 7,093 2,662 341 2,363 698 89 Nov. 28,357 7,115 2,539 305 2,386 688 85' Dec. 28,934 7,316 2,606 296 2,473 698 104
1981: Jan. 29,112 7,454 2,515 310 2,307 656 109 Feb. 29,188 7,428 - 2,479 304 2,241 676 101 Mar. 29,262 7,522 2,495 283 2,188 665 97 Apr. 29,543 7,381 2,434 290 2,074 677 98 May 29,405 7,543 2,463 289 2,129 691 101
Number of cases (as at end of period) Amount of paFoent No. of new
( '000) applications
Year (ending Mentally Ph~ically Drug 31 March)/month -m disabled addiction Others Total
1976 669 603 561 641 54,439 163,336 N.A. 1977 - 758 557 482 741 48,917 147,640 N.A. 1978 759 685 387 889 48,157 143,730 16,517 1979 778 796 396 899 46,580 191,200 12,842 1980 912 876 386 741 45,590 193,285 12,242 1981 946 989 396 970 45,813 222,515 11,863
1979: May 828 874 383 782 46,483 17,848 1,074 June 839 834 383 1,158 46,251 14,890 1,060 July 835 788 363 1,012 46,393 14,064 1,207 Aug. 826 794 404 792 46,280 14,114 1,072 Sept. 902 806 410 775 46,334 15,318 1;130 Oct. 930 823 401 765 46,278 16,987 953 Nov. 1,005 845 397 789 46,234 16,610 1,037 Dec. 810 851 406 966 46,114 16,017 904
1980: Jan. 968 865 366 783 46,116 15;725 1,058 Jleb. 990 880 361 709 45,615 15,824 758 Mar. 912 876 386 741 45,590 15,666 988 Apr. 921 853 366 759 45,599 21,059 951 May 1,021 869 359 731 45,167 19,503 948 June 990 873 348 716 44,820 15,985 860 July 1,022 902 336 745 4S,181 15,435 890 Aug. 1,004 937 366 726 45,175 15,371 904 Sept. 1,026 977 376 803 45,274 17,903 1,076 Oct. 1,030 985 407 842 45,386 19,557 1,102 Nov. 989 976 403 828 44,671 19,330 1,109 Dec. 946 1,013 402 876 45,664 20,064 930
1981: Jan. 967 998 375 947 45,750 19,469 1,104 Feb. 972 1,024 380 865 45,658 . 11!,805 838 Mar. 946 989 396 970 45,813 2o,033 1,151 Apr. 944 1,004 396 986 45,827 25,921!
' ·~ 985,
May 934 1,013 385 1,045 45.998 22,838 1.2~1 ':"' ~· _,__, .
78: Heng Kong Monthly -J)igest of Statistics - ·lune 1981

SOCIAL STATISTICS
12.5 SPECIAL NEEDS ALLOWANCE SCHEMES
Number of cases (as at end of period) Amount of Number of new payment ($'000) applications
Year (ending Disability Old age 31 March)/month allowance allowance Total
1976 13,940 52,281 66,221 78,210 17,061
1977 16,039 56,398 72,437 89,584 14,196
1978 18,026 63,110 81,136 99,899 16,135
1979 21,402 131,482 152,884 157,747 88,528
1980 23,892 145,502 169,394 236,845 29,386
1981 28,641 159,042 187,683 306,227 30,960
1979: May 21,742 134,598 156,340 17,383 2,906
June 21,675 136,413 158,088 17,720 2,666
July 21,888 137,372 159,260 17,590 2,280
Aug. 21,793 138,373 160,166 17,762 2,050
Sept. 21,983 139,726 161,709 20,698 2,555
Oct. 22,250 141,206 163,456 20,746 2,445
Nov. 22,455 .142,825 165,280 21,192 2,599
Dec. 22,652 143,669 166,321 21,104 2,019
1980: Jan. 22,918 144,743 167,661 20,983 2,414
Feb. 23,047 144,932 167,979 21,633 1,511
Mar. 23,892 145,502 169,394 24,685 3,213
Apr. 25,437 146,679 172,116 17,674 3,557
May 25,844 146,692 172,536 21,834 2,251
June 25,890 147,012 172,902 21,670 2,109
July 26,218 148,756 174,974 21,529 2,147
Aug. 26,569 149,830 176,399 22,096 2,324
Sept. 26,876 151,107 177,983 26,839 2,504
Oct. 27,223 152,634 179,857 27,551 2,840
Nov. 27,514 154,183 181,697 27,769 2,848
Dec. 27,817 155,549 183,366 28,110 2,607
1981: Jan. 28,040 156,807 184,847 28,257 2,514
Feb. 28,330 157,678 186,008 28,704 2,234
Mar. 28,641 159,042 187,683 34,195 3,025
Apr. 28,771 159,978 188,749 24,644 2,345
May 29,159 161,763 190,922 29,409 3,533
Hong K~ng Monthly Digest of Statistics lune 1981 79

SECTION 13 ENERGY
13.1_ E:{;,ECl'RICITY CONSUMPTION
Terajoule
Street Export Year/month Domestic Commercial Industrial lighting to China Total
1975 5,507.10 8,671.46 8,843.28 104.47 23,126.31'
1976 5,939.71 9,607.20 10,534.71 108.65 26,190.2T
1977 6,944.14 11,236.28 11,499.22 111.89 29,791.52
1978 7,363.77 12,532.82 12,780.55 116.57 32,793.70
1979 7,555.56 13,763.28 14,124.42 120.48 906.58 36,470.32
1980 8,413.55 15,647.08 15,125.43 132.41 1,108.74 40,427.21
1979: May 578.27 1,145.39 1,209.75 10.35 80.47 3,024.23 June 641.58. 1,220.19 1,257.45 8.46 102.97 3,230.66 July 821.57 1,372.96 1,341.78 9 .• 70 116.35 3,662.36 Aug. 893.11 1,384.97 1,353.80 8.94 88.33 3,729.14 Sept. 823.56 1,331.11 1;283.13 9.25 81.91 3,528.95 Oct. 644.38 1,240.51 1,268.01 10.17 107.45 3,270.53 Nov. 526.83 1,134.48 1,216.52 10.21 120.54 3,008.58 Dec. 507.58 1,020.14 i,.154.35 1L38 112.22 2,805.67
1980: Jan. 557.59 1,063.72 1,184.79 ·12.23 120.31 2,938.64 Feb. 564.27 953.66 893.06 11.52 105.96 2,528.46 Mar. 535.30 1,006.34 1,034.31 10.93 101.00 2,687.87 Apr. 560.35 1,167.52 .· l,260.25 10.63 104.67 3,103.43 May 582.16 1,278.60 1,341.94 10.28 71.67 3,284.65 June 738.06 1,417.53 1,315.24 10,29 72.81 3,553.92 July 1,043.77 1,618.47 1,446.71 10.03 91.56 4,210.53 Aug. 982.90 1,556.41 1,424.97 lMi 37.31 4,012.01 Sept. 944.73 1,558.51 1,382.56 1.0.92 71.42 3,968.14 Oct. 763.58. 1,518.89 1,366.10 1L25 109.94 3,769.76 Nov. 607.61 1,302.39 1,252.67 l2.J9 116.52 3,291.38 Dec. 533.22 1,205.05 1,222.83 11.74 105.57 3,078.40
1981: Jan. 598.93 1,154.73 1,162.65 12.38 115.48 3,044.18 Feb. 584.79 1,105.82 855.20 12.71 98.73 2,657.25 Mar. 545.53 1,180.19 1,119.62 11.74 110.72 2,967.80 Apr. 611.63 1,363.79 1,246.57 11.39 101.65 3,335.03 May 680.75 1,487.56 1,376.00 lf.08 41.17 3,596.56
·· 13.2 GAS CONSUMPTION Tera}oule
Year/month Domestic Commercial Industrial Total
1975 850.48 638.63 119.91 1,609.02
1976 929.91 800.85 160.13 1,890.90
1977 993.51 903.68 180.09 2,077.28
1978 1,248.92 1,075.64 li8.59 2,503.15
1979 1,500.86 1,318.39 202;00 3,021.25
1980 1,758.15 1,553.31 212.14 3,523.60
1979: May 119.80 108.02 16.46 244.29 June 123.10 112.36 19.io 254.57 July 115.04 105.84 . 18.55 239.43 Aug. 101.56 104.51 18.03 224.10 Sept, 104.90 109.38 18.49 232.76 Oct. 111.71 109.45 17.26 238.42 Nov. 126.36 118.90 17.73 262.98 Dec. 142.37 118.61 15.85 276.83
1980: Jan. 164.43 130.51 18.68 313.62 Feb. 172.60 132.70 15.51 320.80 Mar. 172.79 122.85 14.71 310.35 Apr. 170.21 134.57 19.01 323.80 May 144.47 127.67 19.06 291.20 June 140.28 126.40 18.86 285.54 July 122.66 124.44 18.22 265.32 Aug. 113.69 124.75 17.68 256.12 Sept. 115.70 123.69 17.61 257.00 Oct. 130.99 130.77 16.22 277.99 Nov. 145.83 135.73 17.70 299.26 Dec. 164.50 139.23 18.87 322.60
1981: Jan. 192.27 151.86 18.83 362.96 Feb. 210.39 153.13 14.45 377.98 Mar. 182.78 135.20 17.43 335.42 Apr. 177,29 146.28 19.40 342.97 May 166.88 144.27 17.57 328.71
80 Hong Kong Monthly Digest·ot Statistics lune 1981

ENERGY
13.3 PETROLEUM PRODUCTS: RELEASES FROM PETROLEUM COMPANIES BY TYPE
Cubic metre
Dutiable Non-dutiable Total Non-dutiable
Light oils Heavy oils Llght oils Heavy oils Others liquefied Light
Petroleum petroleum
Light diesel, in- gas Light diesel. dustrial Medium/ products (tonne)
Avia- diesel other Aviation Other and heavy Furnace Lubri- not Motor tion for road turbine light marine Kero- diesel fuel eating otherwise
Year/month spirit spirit buses users fuel oils uses sene fuel oil oils classified
1975 170,997 518 52,362 233,897 696,371 87,621 652,733 240;138 207,493 2,965,677 58,708 95 5,366,611 79,413
1976 177,766 251 58,956 253,654 733,636 98,158 735,208 252,977 262,385 3,530,924 72,313 6,176,228 87,813
1977 199,858 279 62,181 285,576 756,410 100,133 767,122 224,014 278,750 3,869,807 74,996 6,619,127 90,827
1978 236,002 231 63,774 394,443 774,986 124,621 789,048 226,240 295,432 4,077,016 84,273 261 7,066,327 101,582
1979 271,394 280 62,928 380,549 861,606 143,100 813,020 242,788 234,853 4,114,631 83,896 4,502 7,213,547 107,475
1980 303,256 297 69,195 371,504 885,393 158,504 693,037 212,884 129,306 4,562,185 76,936 3,569 7,466,064 111,361
1979: Apr. 20,988 10 5,230 35,900 68,826 12,283 67,407 20,072 15,156 305,077 7,208 237 558,392 9,116 May 22,248 20 5,450 50,070 73,506 11,163 71,366 19,981 18,664 364,304 9,467 528 646,768 8,578 June 22,541 15 5,239 27,649 66,599 11,848 72,398 25,873 21,338 386,199 6,770 598 647,068 8,117 July 23,384 7 5,245 28,955 70,275 10,963 67,813 17,912 19,904 408,492 7,585 456 660,991 7,564 Aug. 22,399 56 5,013 27,921 72,710 11,142 65,208 17,475· 15,258 373,372 6,189 241 616,983 7,575 Sept. 24,006 20 4,858 28,211 71,538 10,178 61,716 16,589 15,730 376,909 6,883 230 616,867 7,564 Oct. 25,278 21 5,295 30,265 77,231 12,837 70,541 20,335 17,466 340,975 7,189 675 608,108 9,085 Nov. 23,469 34 5,200 29,789 77,660 13,243 69,131 21,061 18,088 327,578 6,209 237 591,700 9,636 Dec. 23,825 19 5,479 30,349 76,214 13,615 68,070 22,375 21,379 322,642 6,362 137 590,467 10,391
1980: Jan. 23,514 38 5,584 30,018 74,985 14,487 65,133 22,073 19,228 322,434 8,059 1,027 586,580 10,733 Feb. 21,935 14 5,283 25,457 68,968 13,114 44,197 18,368 11,044 264,513 5,306 294 478,492 9,995 Mar. 23,357 19 5,552 29,767 70,742 12,858 56,749 17,733 14,769 334,306 7,472 314 573,637 9,818 Apr. 23,444 23 5,439 28,969 72,414 13,187 58,929 17,452 10,496 393,626 4,828 497 629,304 9,341 May 25,901 19 5,701 31,012 72,855 13,317 62,511 18,914 12,134 414,416 5,623 235 662,638 9,502 June 25,872 16 5,599 30,655 72,689 12,374 59,129 16,008 9,898 419,273 6,568 109 658,190 8,486 July 25,573 18 5,733 32,273 73,093 11,767 57,036 16,852 9,913 449,997 6,941 213 689,409 7,845 Aug. 26,012 19 5,884 32,573 78,378 12,141 58,205 lli,072 8,887 430,994 6,179 255 675,600 7,794 Sept. 26,520 62 5,755 31,419 74,451 12,394 57,564 15,632 8,103 390,204 6,961 211 629,275 8,203 Oct. 27,636 13 6,178 33,078 78,704 13,625 58,126 16,660 7,817 426,923 6,088 287 675,136 9,050 Nov. 25,981 26 6,063 32,644 73,191 13,176 56,998 17,103 9,490 377,965 6,636 43 619,315 9,353 Dec. 27,511 30 6,424 33,639 74,923 16,064 58,460 20,017 7,527 337,534 6,275 84 588,488 11,238
1981: Jan. 27,666 30 6,482 35,653 74,446 17,256 62,005 23,710 7,013 332,227 7,338 108 593,936 12,470 Feb. 22,827 9 5,872 26,363 66,881 12,050 41,892 13,714 7.615 250,794 5,236 453,252 8,751 Mar. 27,144 18 6,320 32,674 74,235 17,387 57,047 17,054 8,677 348,242 7,537 484 596,818 10,315 Apr. 26,959 16 6,143 32,276 74,435 14,915 62,388 15,720 9,624 391,155 6,286 2,432 642,349 9,548
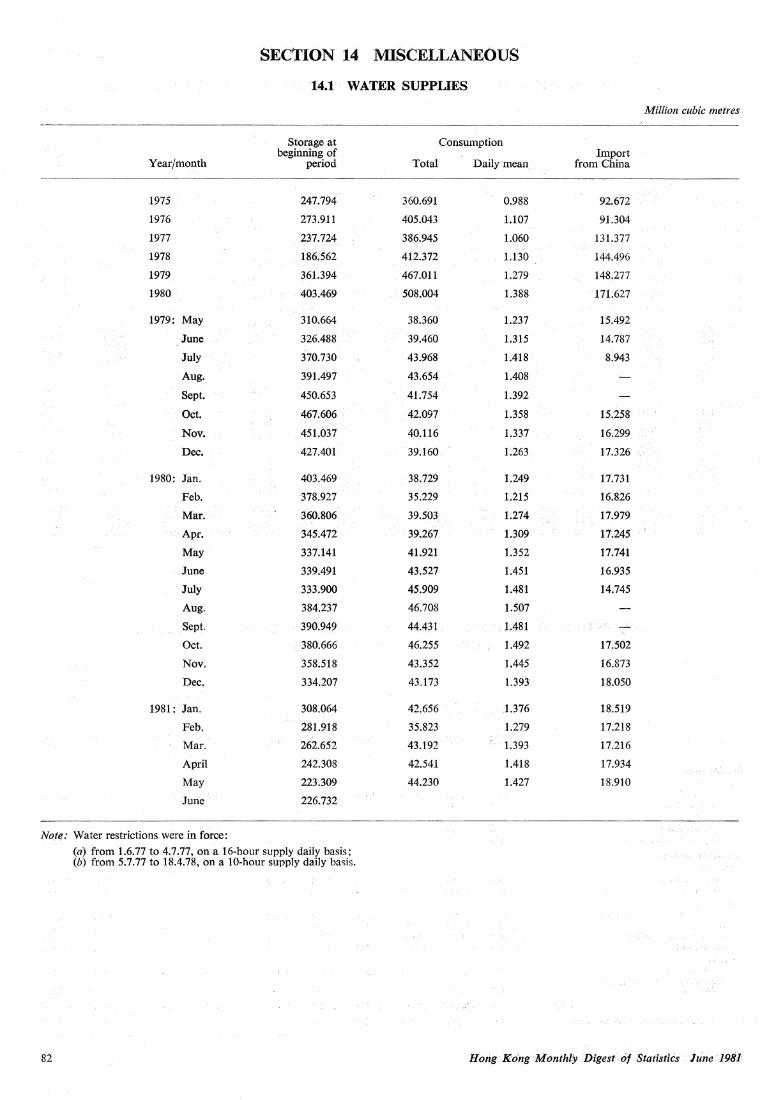
SECTION 14 MISCELLANEOUS
14~1 WATER SUPPLIES
Million cubic metres
Storage at Consumption beginning .of Import
Year/month period Total Daily mean from China
1975 247.794 360.691 0.988 92.672
1976 273.911 405.043 1.107 91.304
1977 237.724 386.945 1.060 131.377
1978 186.562 412.372 1.130 144.496
1979 361.394 467.011 1.279 148,277
1980 403.469 508.004 1.388 171.627
1979: May 310.664 38.360 1.237 15.492
June 326.488 39.460 1.315 14.787
July 370.730 43.968 1.418 8.943
Aug. 391.497 43.654 1.408
Sept. 450.653 41.754 1.392
Oct. 467.606 42.097 1.358 15.258
Nov. 451.037 40.116 1.337 16.299
Dec. 427.401 39.160 1.263 17.326
1980: Jan. 403.469 38.729 1.249 17.731
Feb. 378.927 35.229 1.215 16.826
. Mar. 3:60.806 . 39.503 1.274 17.979
·Apr. 345.472· 39.267 1.309 17.245
May 337.141 41.921 1.352 17.741
June 339.491 43.527 1.451 16.935
July 333.900 45.909 1.481 14.745
Aug. 384.237 46.708 1.507
Sept. 390.949 44:.431 .l..481
Oct. . 380.666 46.255 1.492 17.502
Nov. 358.518 43.352 l.445 16.873
Dec. 334.207 43.173 1.393 18.050
1981: Jan. 308.064 42.656 J.376 18.519
Feb. 281.918 35.823 1.279 17.218
Mar. 262.652 43.192 1.393 17.216
April 242.308 42.541 l.418 17.934
May 223.309 44.230 1.427 18.910
June' 226.732
Note: Water restrictions were in force:
(a) from 1.6.77 to 4.7.77, on a 16-hour supply daily basis; (b) from 5.7.77 to 18.4.78, on a 10-hour supply daily basis.
82 Hong· Kling Monthly 'Digest <>t Statistics lune' 1981·
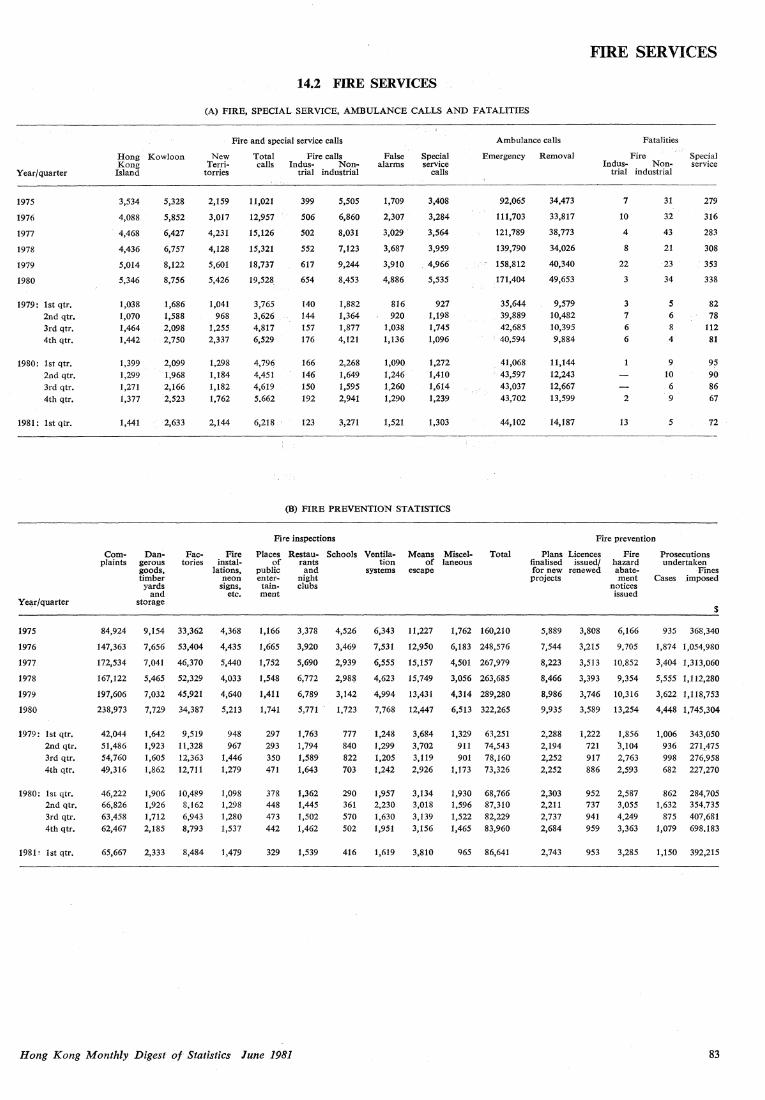
Year/quarter
1975
1976
1977
1978
1979
1980
1979: lst qtr. 2nd qtr. 3rd qtr. 4thqtr.
1980: lst qtr. 2nd qtr. 3rd qtr.
4th qtr.
1981; lst qtr.
Year/quarter
1975
1976
1977
1978
1979
1980
1979; lst qtr.
2nd qtr. 3rd qtr.
4th qtr.
1980: lst qtr.
2nd qtr. 3rd qtr. 4th qtr.
1981' lst qtr.
Hong Kowloon Kong
Island
3,534
4,088
4,468
4,436
5,014
5,346
1,038 1,070 1,464 1,442
1,399
1,299 1,271 1,377
1,441
5,328
5,852
6,427
6,757
8,122
8,756
1,686 1,588 2,098 2,750
2,099
1,968 2,166 2,523
2,633
Complaints
Dangerous goods, timber
Factories
84,924
147,363
172,534
167,122
197,606
238,973
42,044
51,486 54,760 49,316
46,222 66,826 63,458 62,467
65,667
yards and
storage
9,154 33,362
7 ,656 53,404
7,041 46,370
5,465 52,329
7,032 45,921
7,729 34,387
1,642
1,923 1,605 1,862
1,906 1,926 1,712 2,185
2,333
9,519
11,328 12,363 12,711
10,489 8,162 6,943 8,793
8,484
FIRE SERVICES
14.2 FIRE SERVICES
(A) FIRE, SPECIAL SERVICE, AMBULANCE CALLS AND FATALITIES
Fire and special service calls Ambulance calls Fatalities
New Terri
torries
2,159
3,017
4,231
4,128
5,601
5,426
1,041 968
1,255 2,337
1,298 1,184 1,182
1,762
2,144
Fire instal
Jations, neon
signs, etc.
4,368
4,435
5,440
4,033
4,640
5,213
948
967 1,446 l,279
1,098 1,298 l,280
1,537
l,479
Total Fire calls False alarms
Special service
calls
Emergency Removal Fire Special service calls Ind us- Non-
11,021
12,957
15,126
15,321
18,737
19,528
3,765 3,626
4,817 6,529
4,796
4,451 4,619 5.662
6,218
trial industrial
399
506
502
552
617
654
140 144 157 176
166 146
150 192
123
5,505
6,860
8,031
7,123
9,244
8,453
1,882 1,364 l,877 4,121
2,268
1,649 1,595 2,941
3,271
1,709
2,307
3,029
3,687
3,910
4,886
816 920
1,038
1,136
1,090 1,246 1,260
1,290
1,521
3,408
3,284
3,564
3,959
4,966
5,535
927 1,198 1,745 1,096
1,272 1,410 1,614
1,239
1,303
(B) FIRE PREVENTION STATISTICS
92,065
111,703
121,789
139,790
158,812
171,404
35,644 39,889 42,685 40,594
41,068 43,597
43,037 43,702
44,102
Fi re inspections
Places of
public entertain~ ment
1,166
1,665
1,752
1,548
1,411
1,741
297
293 350
471
378 448 473
442
329
Restaurants
and night clubs
3,378
3,920
5,690
6,772
6,789
5,771
1,763 1,794
1,589 1,643
1,362 1,445
l,502 1,462
1,539
Schools Ventilation
systems
Means Miscelof laneous
escape
Total
4,526
3,469
2,939
2,988
3,142
l,723
777 840 822
703
290 361
570 502
416
6,343 11,227
7,531 12,950
6,555 15,157
4,623 15,749
4,994 13,431
7,768 12,447
1,248 1,299 1,205 1,242
1,957 2,230
1,630 1,951
1,619
3,684
3,702 3,119 2,926
3,134 3,018 3,139 3,156
3,810
1,762 160,210
6,183 248,576
4,501 267,979
3,056 263,685
4,314 289,280
6,513 322,265
1,329
911 901
l,173
1,930 1,596
1,522 1,465
965
63,251
74,543 78,160 73,326
68,766 87,310 82,229
83,960
86,641
Indus- Non-trial industrial
34,473
33,817
38,773
34,026
40,340
49,653
9,579 10,482 10,395 9,884
11,144 12,243
12,667 13,599
14,187
7
10
4
8
22
7 6 6
2
13
31
32
43
21
23
34
5
6
4
9 10
6
9
5
279
316
283
308
353
338
82
78 112 81
95 90
86 67
72
Fire prevention
Plans Licences finalised issued/ for new renewed projects
Fire hazard abatement
5,889
7,544
8,223
8,466
8,986
9,935
2,288 2,194 2,252 2,252
2,303 2,211 2,737 2,684
2,743
3,808
notices issued
6,166
3,215 9,705
3,513 10,852
3,393 9,354
3,746 10,316
3,589 13,254
1,222 721 917 886
952 737 941 959
953
l,856
3,104 2,763
2,593
2,587 3,055 4,249 3,363
3,285
Prosecutions undertaken
Fines Cases imposed
$
935 368,340
1,874 1,054,980
3,404 1,313,060
5,555 l,112,280
3,622 l,118,753
4,448 1,745,304
1,006 936
998 682
862 1,632
875
1,079
1,150
343,050 271,475 276,958 227,270
284,705 354,735 407,681
698.183
392,215
Hong Kong Monthly Digest of Statistics lune 1981 83

SECTION 15 POPULATION
15.4 LABOUR FORCE CHARACTERISTICS
Labour force Labour force Unemployment ('OOO) Unemployed participation rate rate
Year/month Male Female ('OOO) (%) (%)
1975: Sept. 1.282.1 681.8 176.0 65.9 9.0
1976: Mar. 1,259.1 673.4 107.0 64.1 5.6
Sept. 1,246.3 656.7 87.0 62.6 4.6
1977: Mar. 1,261.7 653.1 85.0 62.4 4.4
Sept. 1,260.6 678.7 78.1 62.1 4.0
1978: Mar. 1,286.3 705.7 59.3 62.5 3.0
Sept. 1.329.8 720.8 55.0 62.6 2.7
1979: Mar. 1,372.5 719.l 48.0 61.5 2.3
Sept. 1,430.9 759.4 74.2 62.4 3.4
1980: Mar. 1.487.4 788.5 72.6 62.8 3.2
Sept. 1.546.1 824.6 101.9 63.8 4.3
1981: Mar. 1,574.7 891.9 101.1 66.7 4.1
84 Hong Kong M~nthly Digest of Statistics June 1981

EXPLANATORY NOTES
PART I REGULAR TABLES
Section 1 CLIMATE
Statistics of meteorological observations are taken from the records of the Royal Observatory, King's Park and Waglan Island stations. The normals for various meteorological items refer to the averages during the period 1947-1976.
Section 2 VITAL STATISTICS
Statistics relating to births, deaths and marriages refer to such events as were registered with the Director of Immigration durin~ the period covered, and do not necessarily equate exactly to the number of events which occurred duringthatperiod. The marriage figures include marriages performed at the official registries and at licensed places of public worship; they include also marriages other than first marriages.
Statistics of deaths by cause are supplied by the Medical and Health Department.
Section 3 LABOUR
Statistics of employment in the mining and quarrying, manufacturing, electricity and gas industries are obtained from quarterly surveys which cover all such establishments known to the Census and Statistics Department, including those registered with or recorded by the Labour Department. ·During 1974, an exercise was undertaken to match records of the Business Registration Office with those of the Census and Statistics Department, and unmatched records were added to the register of establishments, which is now as complete as it can be and will be so maintained. Employment figures based on the complete register are available as from December 1974.
Statistics of employment in the construction sector are compiled on the basis of quarterly surveys conducted among private building and construction sites recorded by the Buildings Ordinance Office of Public Works Department, and of returns forwarded to the Census and Statistics Department by the Public Works Department, Housing Department, and the Mass Transit Railway Corporation for work sites under their charge. The statistics cover manual workers of all types participating in site work but exclude professional, administrative and clerical staff of construction· companies. Statistics exclude minor alterations and additions, repairs, maintenance, partitioning and interior decoration work on existing buildings.
Statistics of employment in the wholesale(including import/export) and retail trades, restaurants and hotels are obtained from a series of q_uarterly employment surveys. The register which serves as a frame for the surveys 1s maintained by reference to records of the Business Registration Office of the Inland Revenue Department, restaurant and liquor licenses issued by the Urban Services Department, and market stalls registered with the Urban Services Department and Housing Department. The register excludes hawkers, street vendors, retail pitches (other than market stalls) and canteens in factory plants and offices.
Statistics of employment in selected trades of the transport, storage and communication sector, and in the financing, insurance, real estate and business services are compiled on the basis of quarterly surveys covering establishments registered with the Business Registration Office of the Inland Revenue Department, or with other organizations notably the Hong Kong Law Society, Hong Kong Barrister Association and H9ng Kong Society of Accountants.
An 'establishment' is defined as an economic unit which engages, under a single ownership, or control, in one ·cor predominantly one) kind of economic activity at a single physical location. 'Persons engaged' refer to working proprietors, active business partners, unpaid family workers and all employees of the establishment who are either at work for pay or profit, or are temporarily absent from work, i.e. on shortterm leave such as sick leave, casual leave or paid vacation. Excluded are outworkers, and persons on indefinite leave and on pension. Part-time and casual employees and unpaid family workers who worked for less than 3 hours of the normal working time on the reference date are also not included.
The classification of establishments is based on the United Nations International Standard Industrial Classification (1968) published in U.N. Statistical Papers Series M, No. 4 Rev. 2. Starting from the second quarter of 1980, the following manufacturing industries have been re-classified: ·, ,
Industry Description Knitwear from Yam Paper cutting
Umbrella ribs
Old Classification Wearing apparel Printing, publishing and allied industries Fabricated metal products
New Classification Textiles Paper and paper products
Other manufacturing industries
The following commodity groups in the wholesale, retail and import/export trades have also been re-classified:
Description Wholesale of yarn
Import/export of yarn
Retail of ice
Old Classification Wholesale of clothing, footwear and allied products Import/export of clothing, footwear and allied products
Retail of consumer goods
New Classification Wholesale of raw materials and semi-manufactures Import/export of raw materials and semi-manufactures Wholesale of consumer goods
Statistics of employment in Government service are compiled from quarterly returns made by Government departments. Classification of Government,departments and sections by purpose is based on the System of National Accounts Classification for Government expenditure with some modifications.
Figures of establishments, employment and vacancies refer to March, June, September and December of the year. But prior to the second quarter of 1980, figures for Major Division 7 and 8 referred to February, May, August and November of each year; and those for government service referred to January, April, July and October of each year.
Indexes of average daily wages are compiled half-yearly by the Census and Statistics Department from April 1973 to show the movements of wages, both including and excluding fringe benefits, in selected industries and services. The wage indexes cover operative employees, foremen, supervisors and service .technical workers such as fitters, mechanics and electrical workers. Office employees and managerial staff are all excluded. Up to September 1974, the index was compiled with March 1964 as the base period. As from 1975, the base period has been shifted to July 1973 - June 197.4 so as to conform to a new Consumer Price Index .. The series of wage indexes with the new base f eriod begins with March 197 4. The wage indexes are weighted by the number o workers employed in the month indicated and measure the percentage changes in average daily wages since the base period. The index of nominal wages measures the changes in the amount of mo11ey earned as wages, while the index of real wages measures the changes in the purchasing power of money earned as wages. The real wage index numbers are calculated by deflating the nominal index numbers by the average monthly Consumer Price Index (A) for the previous six months.
Hong Kong Monthly Digest of Statistics lune 1981
According to the Hong Kong Telephone Company, the fasi increase in wage rate in telephone service in recent years is the result of, inter alia, employment of better qualified workers within the sample of staff surveyed following technological develop-ments in the telephone industry. .
Statistics on reported accidents, industrial accidents and industrial work stoppages are supplied by the Labour Department.
Reported accidents refer to all accidents reported to the Labour Department which have resulted in the death of an employee or the total or partial incapacity of an employee for more tha.n three days.
Industrial accidents refer to accidents occurred in industrial undertakings and arising out of industrial activities.
Statistics on industrial work stoppages refer to number of work stoppages and the corresponding number of working days (or man-days) classified by International Standard Industrial Classification major divisions. These figures cover stoppages of work arising from disputes connected with terms and conditions of emplo~ment. Stoppages involving fewer than ten workers or lasting less than one day are excluded, unless the aggregate of working days lost exceeds 100. The number of workers involved is the number who actually cease work at the establishments where the disputes occur.
Section 4 PRODUCTION
Statistics of mining production are supplied by the Commissioner of Mines and those of cement production by the cement manufacturing companies.
Statistics of textile production are compiled from quarterly returns submitted by establishments classified to the spinning and weaving sector on the Register of Manufacturing Establishments maintained by the Census . and Statistics Department. Establishments engaging less than 20 persons are selected on a sampling basis. Production of similar items by establishments outside the spinning and weaving sector is not included. ,
Items 3 to 6 in Table 4.3 exclude contribution from establishments engaged principally in providing supporting services to spinning and weaving, but these establishments are also classified as spinning and weaving establishments and their details included in it.ems 1 and 2. Examples of such supporting services are: yarn doubling, yarn winding, texturiziitg, fabric mercerizing, fabric shrinking and webbing. Commodity items with a quantity ofless than 100 OOO units are not individually listed. They include materials such as man-made (staple) fibre yarn, woollen yarn, worsted yarn, wool/man-made fibre yam, metallic yam, elastic thread and glass fibre yarn; products such as man-made (staple) fibre piecegoods, worsted piecegoods, silk/manmade fibre piecegoods, elastic bands and laces.
On. the basis of the production statistics collected1 a quarterly index of textile production is compiled with 1973 taken as 100. Quantity relatives of output are .first calculated for each constituent product item. These series are then weighted by the value of sales at the commodity level and further by Census value added at the industry level to give the overal.1 index. The weights are denved from results of the 1973 Census of Industrial Production.
Section 5 EXTERNAL TRADE
External trade statistics comprise movements of cargo between Hong Kong and other trading partners; by land, air and water and to a limited extent by post, with the exception of the following classea of goods:
1. Transhipment cargo under through bill of lading or through air waybill;
2. Transit cargo;
3. Articles imported or exported by the armed forces of the Crown;
4. Ships' stores, including bunker fuel; aircraft stores, including aviation fuel;
S. Personal baggage and possessions of travellers, not including motor vehit:les;
6. Advertising materials supplied free of charge and samples of no commercial value or valued at less than five hundred dollars;
7. Marine fish arriving direct from fishing grounds on fishing craft registered or licens~d in Hong Kong;
8. Gifts of a personal nature where no payment has been made by the receiver;
9. Articles temporarily imported and exported solely for exhibition and subsequent return;
10. Articles imported or exported under and in accordance with an A.T.A. carnet for the temporary admission of goods;
11. Circulatory used freight containers and the like;
12. Banknotes after issue into circulation, being legal tender in any country.
The trade accounts relate to movements of merchandise only, and do not include those of bullion and specie.
Imports are c.i.f. values, exports and re-exports are f.o.b. values.
Due to the adoption of Standard International Trade Classification (Revised 2) as from January 1978, figures for earlier years are not strictly comparable with those for 1978 onwards.
The monthly figures are subject to adjustment of errors which may arise from various sources, such as mis-classification of commodity or country of consignment, wrong reporting of values or quantities, and lodgement of more than one declaration for the same consignment. As from 1978, adjustments to these errors for consignments relating to earlier months are made to the cumulative totals only. It follows that the sums of the monthly figures may differ from the cumulative totals.
The trade index numbers are compiled from value and quantity data as published in the Hong Kong Trade Statistics. The unit values for domestic exports and re-exports are on an 'f.o,b. - free-on-board' basis while those for imports are on a 'c.i.f. - cost, insurance and ·rreight' basis.
The un.it value for each commodity classification item is the quotient of the value over its corresponding quantity. As such, the unit value series (as opposed to mark•t prices) are not free of the effect of change, especially improvements, in quality or of change in product mix included within a commodity classification.
Quantum index numbers are derived by dividing the value index numbers by corresponding unit value index numbers; and as a result are derived as a residual and subject to the limitations mentioned above. The unit value index numbers are baseweighted while the quantum index numbers are current-weighted. The monthly value and quantum indexes are derived by comparing trade figures in the current month with the average monthly data of the base year 197J.
I
The terms of trade index is the ratio of unit value index for domestic exports to that for imports. ·
For inclusion in the compilation of the trade index numbers, 471 items out of a total of 1,144 items for domestic exports, 1,046 out of 2,129 for imports and 623 out of 1,857.for re-exports are selected. In terms of value, the selecteMtems accounted for 72 per cent, 80 per cent and . 72 per cent for domestic· exports, imports and re-exports respectively in the base year 1973. ·
Section 6 FOOD SUPPLIES Statistics of rice supplies are provided by the Trade, Industry and Customs Department, The intakes, off-takes and stock figures refer to the position at the godowns.
Statistics of live animals slaughtered and supplies of fresh vegetables and fresh fish are provided by the Agriculture and Fisheries Department. They refer to quantities available for sale over the period under consideration. Figures of live animals slaughtered refer to those handled in both urban and rural abattoirs. Statistics of supplies of locally grown vegetables and m<1rine fish include estimates for those not sold through the Vegetable Marketing Organization and the Fish Marketing Organization respectively.
.Section 7 TRANSPORT AND COMMUNICATIONS Statistics on aircraft movements ·are tal<en· from the reports of the civil Aviation Department.
Statistics on vessels and containers are supplied by the Marine Department. Ocean-going vessels are classified according to nationality. 'Vessels entered' refers to vessels arriving at Hong Kong whereas 'vessels cleared' refeni'to vessels leaving Hong Kong. As.from January 1978, the container figures cover only the Kwai Chung Terminal operations because'some 98 % ofthroughpilt is achieved at Kwai Chung.
The Kuwloon-Canton Railway traffic statistics are supplied· by the Kowlooncanton. Railway. The through train started operation in April 1979.
Statistics on airborne cargoes are supplied by the Civil Aviation Department, on seaborne cargoes by the Marine Department, on· cargoes carried by railway by the Kowloon-Canton Railway and on cargoes transported by road by the Trade, Industry and Customs Department. ·
Statistics of passenger journeys on public transport, of motor vehicles registered and of vehicular traffic through toll-charged tunnels and vehicular ferry services are compiled by the Transport Department. Statistics on traffic accidents and casualties are supplied by the Rpya!Hong Kong Police Force. The passenger journey figures exclude those of public .light bl!Ses, taxis and Kowloon-Canton Railway platform ticket holders, but include passengers carried by Ocean Park cable cars which started operation on 15 .January 1977; they also include estimated passengers in vehicles carried by the Hong Kong & Yaumati Ferry Co.'s vehicular ferry services. 'Urban' means bus routes commuting .between Kowloon and the New Territories while 'rural' means bus routes originating and.ending in the New Territories. A minor ferry service is any ferry service (other than Hongkong & Yaumati Ferry and Star Ferry) operated under a licence granted under the Ferries Ordinance, Cap. 104.
Statistics on motor vehicles registered sho~ in Table 7.11 do not include the 163 tram cars and 20 trailers of the Hongkong Tramways Ltd. and the 3 tramcars ·or the Peak Tram Co. Ltd. ·
The traffic accident figures exclude accidents involVing damages only.
Statistics on telephone services are snpplied by the Hong Kong Telephone Company Ltd. and those on postal and telecommunication services by the Post Office. ·
Section 8 PRICES The average retail prices ofthe principal foodstuffs are obtained by price investigators from market stalls and shops throughout Hong Kong during the periods specified.
The average wholesale prices of rice are supplied by the Trade, Industry and Customs Department, while those of live pigs, live cattle, fresh marine fish and fresh vegetables are supplied by the Agriculture and Fisheries Department.
The Consumer Price Index (A) and Consumer Price Index (B), compiled monthly by the Census and Statistics Department, are based on the sample survey carried out during the period July 1973 to June 1974. For the Index (A) the weights are derived from the pattern ·.of· households with a monthly expenditure between HK$400 and HK$1,499, and for the Index (B) between HK$1,500 and HK$2,999 at the time of the survey in 1973-74. .
The Hang. Seng Consumer Price Index, compiled by Hang Seng Bank Ltd., supplements the Consumer Price Indexes (A) and (B). The weights of the Hang Seng Consumer Price Index are derived from the pattern of ·households with a monthly j~)~~diture between HK$3,000 and HK$9,999 during the period July 1973 .to June
The three new Consumer Price Index series, derived from the 1979-80 Household Expenditure Survey, are defined mainly in terms of the percentage distribution of households by ~xpenditure as follows:
Index
New CPI(A) NewCPl(B) New Hang Seng CPI
Approximate percent of households covered
50 30 10
Monthly expenditure range in 1979/80
$1,000-$ 3,499 $3,500--$ 6,499 $6,500-$19,999
The remaining 10 percent of households - at top and bottom of the household expenditure scale - are exc.luded. ·
Section 9 FINANCE Money supply and banks statistics are supplied by the Commissioner of Banking and statistics on deposit-taking companies by the . Commissioner: of Deposit-taking Companies. ·
The figures of money supply on the narrower definitions, Ml and M2, have been recalculated from December 1978. Monthly and annual figures on the previous basis are available up to December 1979.
The banking statistics (in Table 9;2) exclnd~ inter-bank balances within Hong Kong, certificates of indebtedness and the equivalent note issue. The method ofcom· putin¥ the average liquidity during the month is prescribed in Section 18 of the Banking Ordinance. .
Short-term deposits in. deposit-taking companies are deman!i deposits, deposits repayable within 7 days or at 7 days' notiee or less, and. time deposits where the depositors may obtain repayment before maturity.
Bank's quoted best lending rate, which refers to the .Hongkong· & Shanghai Banking Corporation and Chartered Bank's quoted best lending rate for general guidance of other banks, as well as interest rates paid to depositors are supplied by the Hang Seng Bank Ltd. Interest rates for deposits over 12 months are determined by agreement between individual depositors and. the banks concerned.
The inter-bank lending rates· are obtained by the Census and Statistics Department from 'Wah Kiu Yat Po'. Figures of bank cheques cleared are supplied by the Hong Kong Bankers' Clearing House. · · ·
Liabilities to and claims on banks outside Hong Kong are analysed by the country of the branch making or accepting the deposit, and not by the country of that branch's head office - e.g. a claim on the London branch of a US bank is shown against the Uni~ed Kingdom, and not against the United .States.
II
., Claims on non-.bank customers incorporated outside Hong Kong are analysed by the.country of incorporation, while claims on unincorporated customers are analysed by their recorded address. Columns l to 4 of Table 9.8 include liabilities to and claims on the head office(ifany) overseas, and on any otherbranchespverseas of the reporting bank in Hong Kong.
The figures for liabilities to banks outside Hong Kong, for claims on banks outside Hong Kong, and for claims on non-bank customers outside Hong Kong in Tables 9.8 and 9.9 do not exactly correspond with the appropriate items in Tables 9.2 f!i'cl:ss~ifl~tf~~ crrero~:-!~~Jif.~mpanies) respectively. This results from differences
Statistics of exchange rates between the Hong Kong dollar and currencies of selected countries are compiled bl' the Census and Statistics Department from quotations supplied mainly by the Hang Seng Bank Limited. Figures in Table 9.10 refer to average closing middle-market telegraphic transfer rates. In Table 9.11, the effective exchange rate indexes are based on closing middle-market telegraphic transfer rates while other exchange rate figures are closing selling telegraphic transfer rates. The currencies are selected for those countries which are major trading partners of Hong Kong. The exchange rates of the SDR are derived.by multiplying the U.S. dollar value of the SDR as published by the IMF by the appropriate exchange rates of Hong Kong dollar against U.S. dollar as published in the tables. The effective exchange rate indexes measure movements in the weighted average of nominal exchange rates of Hong Kong dellar against the currencies of 15 principal trading partners. The principal trading partners are selected on the basis of their merchandise trade with Hong Kong and their relative importance in world trade. The weighting system is derived from the trade pattem in 1972. The base date is 18 December 1971 when the Smithsonian Agreement was reached. For more details on the trade-weighted effective exchange 'lit.;'J.ndex, see the Special Review in 'Hpng Kong Monthly Digest of.Statistics' April
The following table shows the weights attached to each of the three indexes:
Weights attached ( %) Trade
Selected (import and
export)·. Import- Export-trading weighted weighted weighted partners Currencies index index index
Australia Dollar 3.44 3.43 3.44 Belgium Franc 1.48 1.74 1.16 Canada Dollar 1.97 0.66 3.54 China Renminbi 10.61 18.90 0.67 France Franc 1.31 1.71 . 0.82 Germany, F.R. Deutsche Mark 7.12 4.57 10.19 Italy Lira 1.12 1.36 0.84 Japan Yen 18.87 27.50 8.52 Netherlands Guilder L63 1.25 2.08 Singapore Dollar 4.50 4.00 5.09 South Korea Won 1.72 2.18 1.16 Switzerland Franc 2.65 3.40 1.76 Taiwan Dollar 5.49 6.92 3.79 U.K. Sterling 10.91 7.61 14.87 u.s.A. Dollar 27.19 14.76 42.08
.. Statistics on stockexchangeturnover aresuj>plied.bythe Hong KongStocl<Exchange Ltd., the Far East Exchange Ltd., the Kam Ngan Stock Exchange Ltd. aJJd .the Kowloon Stock Exchange Ltd. The indexes of share prices are compiled by the Hang Seng Bank Ltd., the Far East Exchange Ltd. and the Kam Ngan, Stock Exchange Ltd. The Hang Seng Index refers to transactions in the Hong Kong Stock Exchange Ltd.; the Far East Index and. the Kam Ngan Index refer. to transactions in the Far East Exchange Ltd. and the Kam Ngan Stock Exchange Ltd. respectively.
Statistics on commodity trading and gold and silver exchange trading are supplied by the Hong Kong Commodity Exchange Ltd. and the Chinese Gold and Silver Exchange Society respectively.
Cotton was first traded in·the Commodity Exchange on 9May1977, sugar on 15 November 1977 and soybean on 1 November 1979. The lot units for cotton were changed from 25,000 lb to 50,000 lb on I 3 November 1979 and for soybean from 15,000 kg to 30,000 kg on 18 August 1980 respectively; lot unit for sugar is 112,000 lb .each.
Government revenrie and expenditure statistics are supplied by the Treasury; the analyses of revenue by source and expenditure by functional purpose are made by the Census and Statistics Department. 'Economic services' include primarr products, airport and harbour, commerce and industry, transport and communications, roads and civil engineering: 'social services' include education, medical and health, water, housing, fire services, labour, social welfare, amenities and related services; 'general services' include administration, law and order, defence, public relations, revenue collection and financiafcontrol; 'unallocable expenditure' include interest and repay, ment on public debt, pensions and advances.
Information on instruments registered and companies registered and dissolved is supplied by the Registrar General. .The terms used in Table 9.19 are explained as follows: ·
•Assignment' : a deed transferring property from one part to another.
'Lot': a piece ofCrown land originally granted by the Government by auction, tender or private treaty grant.
'Share of lot': a lot can be shared jointly by two or more persons, the entitlement of each is called a share oflot. Unlike a 'section', a share is just a percentage value with no explicit boundary defined as in a 'section'. Assignments of discrete fiats are included here if the relevant building is located in an undivided lot.
'Section': a lot can be carved into a number of smaller parts ·called sections. The sections may be of varying size and the area of each is clearly defined and labelled accordingly.
'Share of section': same meaning as. 'share of lot' except that the land is a section instead of a lot. Assignments of discrete flats are included here ifthe relevant building is located in a particular section of a lot.
'Building mortgages' : mortgages secured for the purpose of financing building construction.
'Mortgages other than building mortgages': highly varied and the mortgagee is not obliged to state the purpose of the mortgage .. Many of these relate to. mortgage arrangements fo~ the. purchase of residential fiats and other building.premises;
'R;eassignment and certificates of satisfaction'! when a' loan is fully repaid and the mortgage redeemed, a 'reassignment' or 'certificate of satisfaction' will be prepared and registered at the Land Office.
'Agreements for sale and purchase': an agreement for future sale or purchase of property. The property may be a building under construction or a completed building.
'Tenancy agreements': agreement between a lessor and lessee concerning property letting.
Hong Kong Monthly 'Digest of Statistics· lune 1981

'Exclusion orders issued under the Landlord and Tenant Ordinance': landlords of pre-war buildings who wanted to re-develop the property have to apply for an Exclusion Order with respect to Part One of the Landlord and Tenant Ordinance which mainly protects the interests of the existing tenants. 1 Miscellaneous1 : all other types of transaction.
Section 10 HOUSING, BUILDINGS AND LAND
Living quarters statistics are compiled by the Census and Statistics Department. A living quarter is defined as 'a dwelling unit used exclusively by one household or shared by a number of households for eating, living and sleeping, internally connected so that the occupants could move between rooms/cubicles without going outside onto a public corridor, landing or staircase, and having direct external access to the street, a corridor, a landing or staircase without going through another household's accomm:Jdation'. These statistics include permanent and temporary living quarters for residential purpose only, non-domestic quarters with persons staying overnight and vacant quarters.
Public housing comprises Housing Authority estate blocks, Home Ownership and Housing Society buildings. Statistics on Housing Authority blocks are supplied by the Housing Department; statistics on Housing Society buildings are obtained from the Hong Kong Housing Society and details contained in the monthly returns of the Buildings Ordinance Office of the Public Works Department. With regard to private housing, statistics are supplied by the New Territories Administration for small vi11age-type houses; for aJI other private building projects, statistics are compiled from the monthly returns of the Buildings Ordinance Office of the Public Works Department.
A building is said to be 'completed' upon the issuance of an Occupation Permit by the Buildings Ordinance Office of the Public Works Department in the case of a Housing Society building or a private building (except small village-type houses); and in the case of a small viJlage-type house, a compliance certificate issued by the New Territories Administration; a Housing Authority block is 'completed' when it has been certified as substantially completed by the Chief Architects of the Housing Department.
'Consents' to commence work are issued by the Buildings Ordinance Office of the Public Works Department for Housing Society buildings and private buildings except small village-type houses where consents are issued by the New Territories Administration. In the case of Housing Authority blocks, 'consents' are not required and the date of a ward of contracts by the Housing Authority is taken as the consent date.
The 'usable floor area' of a flat is defined as the total floor area within the flat excluding any staircases, lavatories, water closets, kitchens and other common areas of the building.
The 'lettable floor area' of a flat refers to the total floor area inside the flat measured to the outside of the external walls and to the centre lines of the party walls, including the balcony, kitchen and water closet inside the flat. All common areas of the building are excluded.
The 'gross floor area' of a building is defined as 'the aggregate of the areas of the floor(s) in a building.'
Building statistics in Tables 10. 7 and 10.8 include only building activities in the private sector but exclude small village-type houses.
Statistics on disposals of Crown land are supplied by the Environment Branch of Government Secretariat.
Letter 'A' and 'B' tender system in the New Territories: when it is necessary for Government to acquire land for public purposes the Government exercises its power under the Crown Lands Resumption Ordinance. Where land is required within an area embraced by an approved layout plan, the policy is to give the lessee of private land the opportunity of surrendering his land voluntarily in exchange for the right to be granted Crown land at some future date. This right is contained in a Letter called Letter 'A' or Letter 'B'.
The realised premium of land acquired by a land exchange entitlement is calculated by deducting the Government's value of the resumed land from the value of the land to be granted prevailing at the time when the exchange entitlement letter was issued. The realised premium of land acquired through auction or public tender is the auctioned/tendered price of the land.
Land for special low cost housing projects, Home Ownership Schemes, for public utilities, schools, churches, temples, clinics welfare and certain charitable purposes is usually granted by private treaty, and in such cases, the premium charged varies from nothing for non-profit-making purposes up to the full market value for public utilities.
Section 11 TRA YELLING AND TOURISM
Statistics on arrivals and departures of passengers by air, sea and land are compiled from the reports of the Immigration Department and refer exclusively to international movements of passengers. Particulars on incoming tourists and hotels are supplied by the Hong Kong Tourist Association.
Statistics of hotels and number of rooms are obtained from surveys conducted in June and December each year among Hong Kong Tourist Association members. These statistics are revised from time to time as information on current situation of hotel industry becomes available. Room occupancy rate is based on surveys conducted monthly among HKTA members.
Section 12 SOCIAL STATISTICS
Statistics of reported crime are supplied by the Royal Hong Kong Police Force and the Independent Commission Against Corruption. If a person is prosecuted on two or more occasions he is recorded once on each occasion; and when a person is prosecuted on the same occasion for two or more offences, one offence is selected for tabulation,
Statistics on notified infectious diseases and the number of in-patients treated and out·patient attendances in government and government-assisted institutions are supplied by the Medical and Health Department.
Statistics on public assistance schemes and special needs allowance schemes are supplied by the Social Welfare Department.
Section 13 ENERGY
Statistics on electricity and gas are supplied by the public utilities companies and those on petroleum products are obtained from the monthly returns submitted by the leading petroleum companies.
Section 14 MISCELLANEOUS
Statistics on water supplies are supplied by the Water Supplies Department of Public Works and refer to fresh water supply only (while salt water for flushing purposes is excluded). The maximum capacity of the existing 18 storage reservoirs is 577.896 million cubic metres; before storage at the High Island Reservoir (since August 1977) began the maximum capacity was 305.396 million cubic metres.
The fire services statistics are supplied by the Fire Services Department and refer to operational and preventive work.
Hong Kong Monthly Digest of Statistics June 1981
PART II SPECIAL TABLES
Section 15 POPULATION
The de facto method was applied in the population censuses; that is to say, all persons who were actually found within the territory at the census moment, regardless of whether they were loca1 nationals, permanent foreign residents or transients, were included.
The mid-year and end-year population figures are estimated by adjusting the 1976 By-Census results for total births, deaths and balance of migration whether legal or illegal, over the period.
The mid-year or end-year estimates are de facto. They include local nationals, permanent foreign residents as well as transients at a point of time, i.e. 30 June or 3 J December each year.
The birth rates, death rates, rates of naturaJ increase and infant mortality rates refer to calendar years and were calculated by relating the known births and deaths for each year to the respective mid-year population. The population growth rates refer to annual periods from 1 July to 30 June.
Labour force figures refer to the land civilian population aged 15 and above and are estimated from the half-yearly Labour Force Surveys except for the 1976 August figures which are estimated from the 1976 Population By-Census.
Section 16 EDUCATION
Statistics of schools and enrolment are supplied by the Education Department except those for the Universities and Polytechnic which are supplied by the University and Polytechnic Grants Committee. The figures for institutes and enrolment by type of education refer to both day and evening classes. Enrolment for the Universities include undergraduates and postgraduates but exclude participants of extra-mural courses. Post-secondary colleges include the approved private post-secondary colleges and schools operating courses at the post·secondary level.
Section 17 NATIONAL ACCOUNTS
Gross domestic product is an aggregate measure of the value of goods and services produced by residents within the domestic boundary of a country before provision for depreciation (or capital consumption). Gross domestic product at current market prices is valued at current period transaction prices, inclusive of taxes and subsidies. The constant price estimates are obtained by deflating the current price estimates by the appropriate price indexes or by revaluating current period quantities at base year prices.
Estimates of gross domestic product are compiled by the Census and Statistics Department using the expenditure approach and comprise the following major components:
( 1) Private consumption expenditure:
This covers all expenditure by the household sector (including non-profit making bodies) on goods and services for current uses. It is the sum of the estimates of consumption expenditure on goods and services in the domestic market and the expendi .. ture of Hong Kong residents abroad less the expenditure of non-residents in the domestic market.
Data sources for compiling the estimates are varied, including trade statistics, administrative statistics from government departments and various organizations, data collected from economic censuses/surveys, Household Expenditure Surveys, Labour Force Surveys and other expenditure surveys conducted by the Census and Statistics Department.
( 2) Government consumption expenditure:
This differs from the expenditure data published in Table 9.18. According to natioval accounting methods, government consumption expenditure refers to the current expenditure on goods and services by non-trading goyernment departments. Trading departments are distinguished from non-trading departments in that the former are engaged mainly in the production of goods and services for sales to the public and their output is covered in private consumption expenditure where appropriate.
Current expenditure on goods and services by non,;,trading departments is the sum of compensation of employees and purchases of goods and services less receipts from sales of goods and services. The estimates are compiled by analysis of government accounts. Disbursements which are transfer payments are not included.
( 3) Gross domestic fixed capital formation:
This represents the gross value (i.e. no allowance having been made for capital consumption) of investment expenditure in land, bui1ding and construction, plant, machinery and equipment by the public and private sectors.
Transfer costs of land and buildings are the net expenditure incurred in connection with transfer of ownership of land and buildings. Private sector building and construction estimates are based on monthly statistical reports of the Buildings Ordinance Office and information supplied by other construction companies con .. cerned. Investment in building and construction works of the public sector is estjmated from data obtained from government accounts and the MTR Corporation.
Investment in plant and machinery is compiled from retained import statistics and local production statistics available from economic censuses/suneys.
( 4) Increase in stocks:
The estimates refer to the change in the value of work in progress and stocks of goods held by manufacturers and distributors. The information is based on the openir!? and closing book values of stocks reported by the establishments in censuses/sun eys. Increase in stocks reflects changes in the physical quantities of stocks. Adjustments have been made for stock appreciation (i.e. the increase/decrease in value of stocks attributed to price changes) by revaluing the opening and closing stocks at the average current prices of the period.
(5) Exports of goods less imports of goods:
Exports of goods include domestic exports and re-exports of merchandise on f.o.b. basis, exclusive of monetary gold. Imports of goods are valued at c.i.f. basis, covering all merchandise imports, water and imports of non-monetary gold.
(6) Exports less imports of services:
These comprise transactions in services betwee.n Hong Kong residents and the rest of the world. Data for compiling various items of imports and exports of services originate from Hong Kong Tourist Association, various sources of administrathe statistics, and the Survey of Imports and Exports of Services.
Further details on the methodology and data sources for compiling the estimates of gross domestic product are contained in the publication 'The 1981-82 Budget: Estimates of gross domestic product 1966 to 1979.'
III
PUBLICATIONS Produced by Census and Statistics Department
Title of Publication
Price in HK$ (excluding
postage)
Regular:
Hong Kong Economic Trends (monthly) ........... . ....... . .. . .
Hong Kong Monthly Digest of Statistics (monthly) .. ..... .. .. .
Hong Kong Trade Statistics Summary (monthly) ...... .. ... .
Hong Kong External Trade (monthly) ...... ... ............ . ...• .
Hong Kong Trade Index Numbers (monthly)
Hong Kong Trade Statistics 1981:
Imports (monthly) .... ..... .. . . . .
Exports & Re-exports (monthly)
Annual Supplement
Imports ... .. ........ ..... ...... ... ...... ........ . ........... .
Exports & Re-exports ........... . ...... ............. .. ..... .
Consumer Price Index Report (monthly) ... ................... . .
Monthly Survey of Employment, Payroll and Orders-on-Hand (monthly) .... ... . . .... ... ............ .. ............ .. ......... .
Quarterly Business Survey Report (quarterly) .... .... .... ... . ..
Textile Production Statistics (quarterly) .... .... .. ............. .
Employment, Wages and Material Prices in the Construction Industry (quarterly) ...... ...... ... ......... ... ................. .
Statistics of Establishments and Employment (quarterly)
Ho.ng Kong"s Economic Prospects (half-yearly) - .............. .
Wage Statistics Report (half-yearly) .......... .... .. .. ....... ..
Labour Force Survey (half-yearly):
Preliminary Report:
English Version .. ..... .... .... .. ....... .. ................ .. .
Chinese Version {~l!fJJAr:!ITT!E irJ-f)J ?J7~1'5-i! l ........... . Main Report ............... ..... ..... . .... . . .... .............. .
An Outline of Statistical Development 1981 (yearly) .... .... .
Estimates of Gross Domestic Product 1966to1979 (yearly) .. .
Hong Kong Review of Overseas Trade in 1979 (yearly) ..... .
Hong Kong Social and Economic Trends 1967-1977 (triennial) .................. .. ................................ . .
Irregular:
Report of The By-Census 1966 (Volumes I & II) .. ............ .
Hong Kong Population and Housing Census 1971:
Basic Tables ..................... .. ...... ....... ... .. ..... .. .. .
A Graphic Guide (-j1,-·l:.;-~1"tfmP r:JITT!EttlJ!,llffW) Main Report:
English Version .... ...... .. ........................ . ....... .
Chinese Version (-JL1::;-~1"tfmAr:Jl?i.~~1HE:±~ ~1'5-1! ) ···· ····· ···· ···· ·· ················· ··· ············ ·· ·
Technical Report ....... .. ... .... ..... ...... ... .............. . .. .
1.00
14.00
3.00
10.00
2.00
40.00
40.00
40.00
40.00
2.00
1.00
3.00
1.00
3.00
6.00
2.00
10.00
2.00
2.00
12.00
4.00
7.00
25.00
42.00
40.00
5.00
5.00
23.00
10.00
50.00
Title of Publication
Price in HK$ (excluding
postage)
Hong Kong By-Census 1976:
Basic Tables .. . . ...... ..... . . . .... . . . ... . . . ... . . ... ... ... .... .. 5.00
A Graphic Guide (-JL1::;1'~1"tfm<p:Jtllp r:JITT!Clli"IJ!,llffW) ... 5.00
Main Report (Volumes I & II) ....... .. . .... ................... 100.00
Tertiary Planning Unit Tabulations:
Volume 1: Hong Kong Island . .. .. . . .. .. . . . . .. . . . . . . . . . . . . . 50.00
Volume 2: Kowloon & New Kowloon .... .. .... ... .. ..... .
Volume 3: The New Territories & The Marine . .. . ..... .. .
Contribution to the WFS ... ..... . .................. ... . .•.••...
Hong Kong Population A 20-Year Projection .... .. .......... . .
Hong Kong Life Tables .. .................... .... ...... . . . ... .. . .
Births, Deaths and Marriages 1970-1973 ....... . ..... .. ..... .
Hong Kong Statistics 1947-1967 .................. ....... .... .
Hong Kong Annual Digest of Statistics 1978 Edition . ....... .
Hong Kong Imports & Exports Classification List 1978 Issue
The Household Expenditure Survey 1973-74 and The Consumer Price Indexes ..... ... ............ .... ... .... ... .... .
-1971 Census of Manufacturing Establishments
1973 Census of Industrial Production:
Volume I: Report and Summary Statistics
Volume II: Industry Statistics by Industry Sector/Group:
Part 1 ... .... . . ... ..... ... .. . . ... . . .... ... ......... . ...... . ... .
Part 2 .... .. . ..... .... ............. . .. . ... ... ... ..... . .. ... ... .
Part 3
Part 4
Part 5
1977 Census of Wholesale, Retail and Import/Export Trades, Restaurants and Hotels:
Volume I: Report and Summary Statistics .. .... ........... .
Volume II: Statistics by Trade Sector:
Part 1 Wholesale Trade .......... . .......... ... ...... . ... ..
Part 2 Retail Trade, Restaurants and Hotels .............. .
Part 3 Import/ Export Trade ................. . ... .. . ........ .
Crime and Its Victims in Hong Kong:
English Version .... ..... . ...................... . ... ... ..... . .. .
Chinese Version (;(E1"tfm~~J'fJ!if-'tlE7it.!'t'31:~~ )
Free:
Average Daily Wages of Workers Engaged in Government Building and Construction Projects (monthly)
Hong Kong in Figures, 1981 Edition 1977 Census of Industry Report
50.00
70.00
32.00
6.00
6.00
25.00
15.00
60.00
12.00
16.00
45.00
30.00
6.00
17.00
9.00
9.00
17.00
25.00
35.00
35.00
35.00
9.00
9.00
Enquiries concerning the above publications or their back issues shou ld be addressed to the Publications Officer, Census and Statistics Department, Kai Tak Commercial Building, 317 Des Voeux Road Central, Hong Kong . Telephone No. 5-444938.
Saleable copies are purchasable from the Government Publications Centre, General Post Office Building, Ground Floor, Connaught Place, Hong Kong.
Order for local and overseas mailings please contact the Director of Information Services, Information Services Department, Beaconsfield House, Hong Kong
442715-36L-8/ 81 $14-J470681