RIDERS DIGEST - RLB
100
2022 RIDERS DIGEST QUEENSLAND, AUSTRALIA EDITION
-
Upload
khangminh22 -
Category
Documents
-
view
1 -
download
0
Transcript of RIDERS DIGEST - RLB

RID
ER
S DIG
EST 20
22 Q
UE
EN
SL
AN
D, A
US
TR
ALIA
ED
ITIO
N
2022RIDERS DIGEST
QUEENSLAND,AUSTRALIAEDITION
Queensland Offices
BRISBANELevel 13, 10 Eagle Street,Brisbane QLD 4000Telephone: +61 7 3009 6933 CAIRNSSuite 7, 1st Floor,Cairns Professional Centre,92-96 Pease Street,Cairns QLD 4870Telephone: +61 7 4032 1533 GOLD COASTLevel 1, 45 Nerang Street,Southport QLD 4215Telephone: +61 7 5595 6900 SUNSHINE COASTSuite 307, La Balsa45 Brisbane Road,Mooloolaba QLD 4557Telephone: +61 7 5443 3622 TOWNSVILLELevel 1, 45 Eyre Street,North Ward, Townsville QLD 4810Telephone: +61 7 4771 5718

A yearly publication from RLB’s Research & Development department.
Riders Digest is a compendium of cost information and related data specifically prepared by RLB for the Australian construction industry.
RIDERS DIGEST50TH EDITION
While the information in this publication is believed to be correct, no responsibility is accepted for its accuracy. Persons desiring to utilise any information appearing in this publication should verify its applicability to their specific circumstances. Cost information in this publication is indicative and for general guidance only and is based on rates ruling at Fourth Quarter 2021 (unless stated differently). All figures exclude GST.
© Rider Levett Bucknall 2021
Reproduction in whole or part forbidden

Rider Levett Bucknall | Riders Digest 20222
RLB PROFESSIONAL SERVICESCost Management and Quantity Surveying 6Project Programming 8Superintendent Services 8Advisory 9
INTERNATIONAL CONSTRUCTIONBuilding Cost Ranges 14RLB Escalation Forecasts 18
AUSTRALIAN CONSTRUCTIONBuilding Cost Ranges 20Building Services Cost Ranges 24RLB Tender Price Index 28Definitions 30Acknowledgements 32
CONSTRUCTION COSTSBuilding Services Ranges 34Unit Costs 38Site Works 39Demolition 40Hotel Furniture, Fittings & Equipment 40Office Fitout 41Recreational Facilities 42Vertical Transportation 44
DEVELOPMENTStamp Duties 48Land Tax 49Planning – Car Parking 50Land Values 51Rental Rates 52Sector Data 53Historical Construction Activity 59RLB Market Activity Cycle 64
CONTENTS
Rider Levett Bucknall | Riders Digest 2022 3
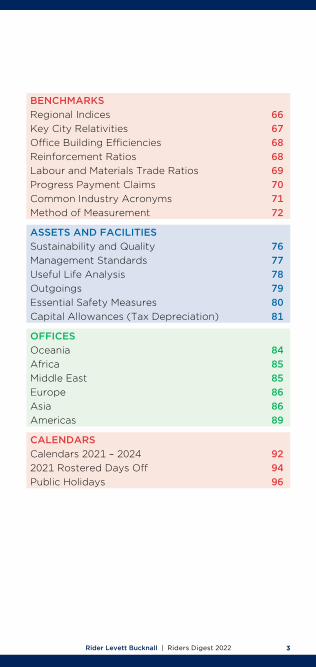
BENCHMARKSRegional Indices 66Key City Relativities 67Office Building Efficiencies 68Reinforcement Ratios 68Labour and Materials Trade Ratios 69Progress Payment Claims 70Common Industry Acronyms 71Method of Measurement 72
ASSETS AND FACILITIESSustainability and Quality 76Management Standards 77Useful Life Analysis 78Outgoings 79Essential Safety Measures 80Capital Allowances (Tax Depreciation) 81
OFFICESOceania 84Africa 85Middle East 85Europe 86Asia 86Americas 89
CALENDARSCalendars 2021 – 2024 922021 Rostered Days Off 94Public Holidays 96
Rider Levett Bucknall | Riders Digest 20224
INTRODUCTION RIDER LEVETT BUCKNALL
“CONFIDENCE TODAY INSPIRES TOMORROW”With a network that covers the globe and a heritage spanning over two centuries, Rider Levett Bucknall is a leading independent organisation in quantity surveying and advisory services.
Our achievements are renowned: from the early days of pioneering quantity surveying, to landmark projects such as the Sydney Opera House, HSBC Headquarters Building in Hong Kong, the 2012 London Olympic Games and CityCenter in Las Vegas.
We continue this successful legacy with our dedication to the value, quality and sustainability of the built environment. Our innovative thinking, global reach, and flawless execution push the boundaries. Taking ambitious projects from an idea to reality.
“CREATING A BETTER TOMORROW”The Rider Levett Bucknall vision is to be the global leader in the market, through flawless execution, a fresh perspective and independent advice.
Our focus is to create value for our customers, through the skills and passion of our people, and to nurture strong long-term partnerships.
By fostering confidence in our customers, we empower them to bring their imagination to life, to shape the future of the built environment, and to create a better tomorrow.
PROFESSIONAL SERVICES
Cost Management and Quantity Surveying 6
Project Programming 8
Superintendent Services 8
Advisory 9
Rider Levett Bucknall | Riders Digest 20226
COST MANAGEMENT AND QUANTITY SURVEYING SERVICES
The skilled cost management professionals at RLB use many tools when creating a plan that optimises the relationship between the cost and quality of a project and a client’s cost objectives. The services offered by the firm to achieve these objectives are:
§ Preparation of preliminary elemental estimates based on preliminary design
§ Preparation of detailed estimates and cost planning advice throughout design development
§ Estimation of building services § Participation and leadership in the value
management process § Comparative cost studies and advice on cost
effective design solutions § Advice on materials selection and general buildability
advice § Advice on selection of tenderers § Attendance at design meetings and construction
control meetings
Feasibility Analysis
An accurate, reliable feasibility study is an essential prerequisite to any procurement decision-making process. Feasibility studies assess the viability of a project over its expected life and indicate the probable return, either at the point of sale or over a period of time, generally using discounted cash flow techniques. They can also assist in the process of obtaining project financing, as well as highlight variables that have the greatest impact on project returns.
Whether it’s a simple developer’s return on capital cost feasibility or a detailed discounted cash flow feasibility based on a range of rates of return and risk sensitivity tests, RLB can provide expert analysis and materials.
Financial Institution Auditing
RLB takes a two-step approach to financial institution audits.
At the pre-commencement stage, the firm looks beyond the items identified in the financier’s brief, and expands upon it with a full analysis of all risk-related issues, providing a comprehensive profile of the project.

Rider Levett Bucknall | Riders Digest 2022 7
During the post-contract stage, the company provides detailed cost-to-complete assessments. This ensures there are adequate funds should the financier be required to initiate step-in rights.
To provide effective financial management of the development process for the duration of the project, RLB will prepare a pre-commencement report including auditing project costs and the adequacy of project documentation, monitor authority approvals, prepare progress payment assessments and recommendations, and prepare cost-to-complete assessments.
Post-Contract ServicesRLB ensures the successful performance building contracts by applying proven cost management, monitoring and cost reporting procedures, as well as through managing a productive working relationship with the project team.
To ensure efficient progress as specified in the cost plan, the firm will: § Review progress claims for work in progress and
recommend payment values § Monitor documentation changes § Prepare regular financial statements forecasting final
end cost § Measure, price, and negotiate variations § Structure agreement of final account § Attend meetings to represent the financial interests
of the client
Tendering and Documentation
Among the tendering and documentation services offered by RLB: § Preparation of bills/schedule bills of quantities or
schedule of rates § Preparation of bid documentation for tendering
contractors § Strategic advice of method of project procurement
and tendering § Advice on suitability of contractor tender lists § Review of tenders received, reconciliation to budget,
and recommendation of contractor § Attendance at tender interviews
Rider Levett Bucknall | Riders Digest 20228
COST MANAGEMENT AND QUANTITY SURVEYING SERVICES
Value ManagementRLB offers a strategic value-management process that is dedicated to assisting with the improvement of value obtained in capital expenditure. This is achieved through participatory workshops which challenge option and design assumptions and encourage creative and lateral thinking for better value solutions.
The integration of value management with cost management results in a powerful and dynamic approach to the economic management of projects, especially during the design process.
PROJECT PROGRAMMINGWith an in-depth knowledge of a wide range of construction techniques and delivery methodologies, and experience working for owners and developers as well as contractors, we manage the time related risks on your projects, allowing you to focus on what you do best.
The skilled project programming professionals at RLB have strong capabilities across all building sectors, and utilise the latest project planning techniques.
We bring a solid reputation for providing reliable and accurate information and translating complex information into a format that can be easily understood and acted upon.
SUPERINTENDENT SERVICESRLB’s skilled professionals utilise their construction knowledge, cost management expertise for progress claim and variation assessments, contract document interpretation proficiency and programming know-how to deliver a full rounded superintendent service to our clients.
The Superintendent must have the trust and respect of all contract parties. RLB are independent to the design and construction processes and also the Client, and therefore, we can provide a truly independent, impartial professional service.
If RLB is also undertaking a cost management role on a project, there is efficiency in some of the service delivery.
Expertise and experience backed by a rigorous approach sees us deliver assurance to our Clients. RLB understands the importance of a robust methodology to ensure all aspects of the Contract is administered in a fair and diligent manner.
Placing client and contractor needs and project drivers at the core, our Superintendent(s) works closely with stakeholders to meet time, cost and quality requirements, whilst maintaining predictability, compliance and rigour at every stage.
Rider Levett Bucknall | Riders Digest 2022 9
ADVISORY SERVICES
RLB’s depth of experience in all aspects of the property cycle enables us to deliver mature and innovative solutions for property, construction, and facilities sector clients in seven principal areas:
Asset Advisory
With total operating costs amounting to several times the initial capital cost, clients are increasingly focused on longer term strategies that span their investment horizons and beyond, to ensure they are able to consider the impact on value at all points in a property’s useful life. RLB works with owners and occupiers of buildings to ensure that they are able to take full account of the total impact of their buildings and can advise on many alternate methods of identifying and accounting for assets.
RLB is expert in the following strategic services: § Total Asset Management Planning to ISO Standards § Asset Recognition and Rationalisation § Cost-Benefit Analysis § Sustainability and Environmental Performance Issues § Whole-Life Cost Modeling
RElifing of Assets
RLB is a pioneer in using building life-extension and repositioning studies to realise and optimise the use of buildings. This methodology identifies if, when, and where to spend money to capture remaining asset values and extend the life of existing buildings.
Facilities Consultancy
Facilities management is the business practice of optimising people, process, assets, and the work environment to support the delivery of the organisation’s business objectives. As acknowledged thought-leaders in the facilities management field, RLB works with a diverse range of clients to enhance facilities performance through: § Facilities Management (FM) Planning § Building Quality Assessments (BQA) § Facilities and Operational Performance Audits § Maintenance Planning and Operating Expenditure
Forecast § Performance Reviews and Benchmarking § Post-Occupancy Evaluations § Space Audits and Utilisation Studies

Rider Levett Bucknall | Riders Digest 202210
Building SurveyingRLB works closely with major developers, corporations, fund managers, financial institutions, and property owners and tenants to understand, maintain, and enhance the value of their built assets. The firm’s expertise includes: § Condition/Dilapidation Surveys § Compliance Advisory § Conservation and Heritage Surveys § Tenancy Make-Good Reinstatements Surveys
By combining a practical knowledge of construction issues with a strong understanding of property law, RLB offers a multi-faceted building surveying service that is responsive to the client’s needs. The firm’s understanding of local markets enables us to deliver a solution that is appropriate to your specific requirements.
Risk Mitigation and Due Diligence
RLB understands that clients and stakeholders are increasingly requiring more detailed information to ensure a level of confidence is achieved and maintained in terms of enhancing value and mitigating risks. The firm can conduct risk assessments to review the scope of required work, identify project risks, prioritise key issues, provide risk analysis and develop risk management action plans for your strategic asset/facilities plan or next capital works project.
RLB can provide key advisory services targeted at risk mitigation, including: § Review of the scope of required work § Identification of project risks § Capital Expenditure Forecasting § Prioritisation of key issues § Risk analysis and customized risk-management
action plans
In addition, RLB’s expert services extend to specific associated property risks, among them: § Insurance replacement cost assessments § Technical due diligence (for owners, vendors,
purchasers and tenants) § Services procurement, outsourcing, compliance, and
supply chain issues
ADVISORY SERVICES
Rider Levett Bucknall | Riders Digest 2022 11
Property TaxationRLB recognises the financial, compliance, and management benefits that can be achieved by adopting taxation advice from professionals who understand the business of property. The firm provides its clients with advice on capital allowances and property tax assessment and depreciation, inventories and asset registers, and changes in tax legislation to enable them to optimise their entitlements and potential for existing assets and new projects. Its experienced and qualified staff can provide proactive reporting and analysis of how taxation changes may affect a client’s real estate decisions, including capital gains tax, land taxes and rating assessments, and stamp duty.
RLB’s experience in property taxation covers all asset types. Data has been retained and compiled over many years to enable the firm to produce dynamic models that can quickly produce accurate indicative analysis for all property situations.
Litigation Support
RLB has a team of highly seasoned professionals with considerable expertise in the litigation arena. The firm offers comprehensive front-end, claims management, and dispute resolution services, and has particular expertise in scope definition claims appraisal, documentation, and negotiation; expert witness and determination; and arbitration and mediation.
Procurement Strategies
RLB develops procurement strategies that provide a systematic means of analysing the costs and benefits during project development, before any commitment is given to a particular option, including: § Clear definition of project objectives § Identification of practical ranges of options § Quantification of the costs and benefits of each
option § Consideration for qualitative aspects § Identification of the preferred option and
development of action plans

Rider Levett Bucknall | Riders Digest 202212
ADVISORY SERVICES
RLB can examine the issues and assist in the development and evaluation of a project or service delivery with vast experience and knowledge of value enhancement through: § Needs Analysis and Brief Definition § Feasibility Studies § Develop, Own and Lease Options § Contractual Arrangements § Project Monitoring and Certifications § Value Engineering/Management Workshops
Our services do not deal with asset creation and capital projects alone. RLB’s expertise and experience extends to property transactions, services procurement, outsourcing operations and supply chain management. RLB is uniquely positioned to provide independent and specialist advisory services and supplementary support to a client who wishes for certainty in contractual outcomes.
Research
§ Industry and sectoral workload § Cost escalation § Cost benchmarking by sector § Industry trend analysis
INTERNATIONAL CONSTRUCTION
Building Cost Ranges 14
RLB Escalation Forecasts 18
Rider Levett Bucknall | Riders Digest 202214
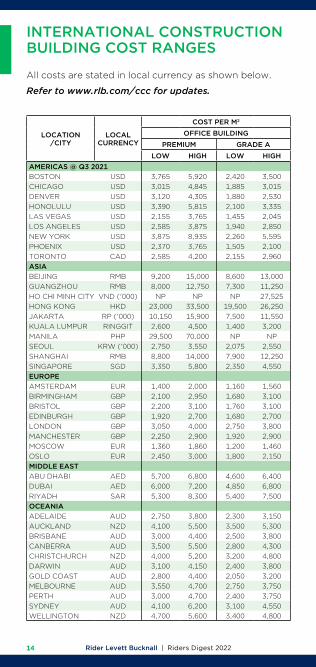
All costs are stated in local currency as shown below.
Refer to www.rlb.com/ccc for updates.
INTERNATIONAL CONSTRUCTION BUILDING COST RANGES
LOCATION /CITY
LOCAL CURRENCY
COST PER M2 COST PER M2
OFFICE BUILDING RETAIL RESIDENTIAL MULTI STOREYPREMIUM GRADE A MALL STRIP SHOPPING
LOW HIGH LOW HIGH LOW HIGH LOW HIGH LOW HIGHAMERICAS @ Q3 2021BOSTON USD 3,765 5,920 2,420 3,500 2,155 3,230 1,615 2,585 1,990 3,390CHICAGO USD 3,015 4,845 1,885 3,015 1,990 3,120 1,455 2,370 1,775 4,305DENVER USD 3,120 4,305 1,880 2,530 1,345 2,420 1,130 1,885 1,670 3,120HONOLULU USD 3,390 5,815 2,100 3,335 2,635 5,650 2,420 4,200 2,690 4,520LAS VEGAS USD 2,155 3,765 1,455 2,045 1,290 5,165 1,130 2,045 1,615 3,820LOS ANGELES USD 2,585 3,875 1,940 2,850 1,720 3,765 1,455 2,100 2,530 3,985NEW YORK USD 3,875 8,935 2,260 5,595 3,335 6,675 3,875 7,210 2,370 4,520PHOENIX USD 2,370 3,765 1,505 2,100 1,885 3,175 1,025 1,830 1,670 2,635TORONTO CAD 2,585 4,200 2,155 2,960 1,940 4,035 1,560 2,045 1,940 2,635ASIABEIJING RMB 9,200 15,000 8,600 13,000 10,250 15,500 8,800 14,000 4,800 9,900GUANGZHOU RMB 8,000 12,750 7,300 11,250 9,100 13,000 7,800 11,750 4,200 8,300HO CHI MINH CITY VND ('000) NP NP NP 27,525 21,175 28,175 NP NP 16,025 25,300HONG KONG HKD 23,000 33,500 19,500 26,250 22,500 28,250 19,500 25,250 21,500 42,500JAKARTA RP ('000) 10,150 15,900 7,500 11,550 6,525 9,000 NP NP 6,875 16,000KUALA LUMPUR RINGGIT 2,600 4,500 1,400 3,200 2,100 3,500 NP NP 1,900 4,500MANILA PHP 29,500 70,000 NP NP 31,750 58,000 NP NP 31,000 73,000SEOUL KRW ('000) 2,750 3,550 2,075 2,550 1,850 2,700 1,550 2,375 1,775 3,000SHANGHAI RMB 8,800 14,000 7,900 12,250 9,200 14,750 8,100 13,250 4,350 8,800SINGAPORE SGD 3,350 5,800 2,350 4,550 2,300 3,850 NP NP 2,200 3,550EUROPEAMSTERDAM EUR 1,400 2,000 1,160 1,560 1,540 2,200 1,000 1,540 1,160 1,860BIRMINGHAM GBP 2,100 2,950 1,680 3,100 3,100 4,350 980 1,860 1,740 2,450BRISTOL GBP 2,200 3,100 1,760 3,100 3,050 4,300 960 1,820 1,280 1,820EDINBURGH GBP 1,920 2,700 1,680 2,700 2,950 4,150 940 1,760 1,760 2,500LONDON GBP 3,050 4,000 2,750 3,800 3,700 5,200 1,180 2,200 2,600 4,550MANCHESTER GBP 2,250 2,900 1,920 2,900 3,100 4,400 1,000 1,880 1,860 2,700MOSCOW EUR 1,360 1,860 1,200 1,460 1,100 1,800 1,060 1,300 650 1,200OSLO EUR 2,450 3,000 1,800 2,150 2,100 2,700 1,800 2,150 1,880 1,780MIDDLE EASTABU DHABI AED 5,700 6,800 4,600 6,400 4,000 6,300 NP NP 4,400 6,500DUBAI AED 6,000 7,200 4,850 6,800 4,250 6,700 NP NP 4,650 6,900RIYADH SAR 5,300 8,300 5,400 7,500 3,350 6,100 3,650 5,200 3,200 14,000OCEANIAADELAIDE AUD 2,750 3,800 2,300 3,150 1,640 3,000 1,300 1,840 2,350 3,550AUCKLAND NZD 4,100 5,500 3,500 5,300 3,350 3,700 2,000 2,400 4,300 5,500BRISBANE AUD 3,000 4,400 2,500 3,800 2,200 3,600 1,400 2,000 2,400 4,400CANBERRA AUD 3,500 5,500 2,800 4,300 2,400 4,050 1,260 2,550 2,950 5,200CHRISTCHURCH NZD 4,000 5,200 3,200 4,800 2,900 3,200 1,660 2,100 3,750 4,500DARWIN AUD 3,100 4,150 2,400 3,800 1,760 2,650 1,260 2,150 2,050 2,650GOLD COAST AUD 2,800 4,400 2,050 3,200 2,500 3,500 1,200 1,800 1,760 4,500MELBOURNE AUD 3,550 4,700 2,750 3,750 2,400 3,500 1,360 1,820 2,750 4,750PERTH AUD 3,000 4,700 2,400 3,750 1,900 2,900 1,000 2,500 1,900 4,100SYDNEY AUD 4,100 6,200 3,100 4,550 2,300 4,900 1,740 2,350 3,050 6,700WELLINGTON NZD 4,700 5,600 3,400 4,800 3,300 3,500 NP NP 4,350 5,300
Rider Levett Bucknall | Riders Digest 2022 15
LOCATION /CITY
LOCAL CURRENCY
COST PER M2 COST PER M2
OFFICE BUILDING RETAIL RESIDENTIAL MULTI STOREYPREMIUM GRADE A MALL STRIP SHOPPING
LOW HIGH LOW HIGH LOW HIGH LOW HIGH LOW HIGHAMERICAS @ Q3 2021BOSTON USD 3,765 5,920 2,420 3,500 2,155 3,230 1,615 2,585 1,990 3,390CHICAGO USD 3,015 4,845 1,885 3,015 1,990 3,120 1,455 2,370 1,775 4,305DENVER USD 3,120 4,305 1,880 2,530 1,345 2,420 1,130 1,885 1,670 3,120HONOLULU USD 3,390 5,815 2,100 3,335 2,635 5,650 2,420 4,200 2,690 4,520LAS VEGAS USD 2,155 3,765 1,455 2,045 1,290 5,165 1,130 2,045 1,615 3,820LOS ANGELES USD 2,585 3,875 1,940 2,850 1,720 3,765 1,455 2,100 2,530 3,985NEW YORK USD 3,875 8,935 2,260 5,595 3,335 6,675 3,875 7,210 2,370 4,520PHOENIX USD 2,370 3,765 1,505 2,100 1,885 3,175 1,025 1,830 1,670 2,635TORONTO CAD 2,585 4,200 2,155 2,960 1,940 4,035 1,560 2,045 1,940 2,635ASIABEIJING RMB 9,200 15,000 8,600 13,000 10,250 15,500 8,800 14,000 4,800 9,900GUANGZHOU RMB 8,000 12,750 7,300 11,250 9,100 13,000 7,800 11,750 4,200 8,300HO CHI MINH CITY VND ('000) NP NP NP 27,525 21,175 28,175 NP NP 16,025 25,300HONG KONG HKD 23,000 33,500 19,500 26,250 22,500 28,250 19,500 25,250 21,500 42,500JAKARTA RP ('000) 10,150 15,900 7,500 11,550 6,525 9,000 NP NP 6,875 16,000KUALA LUMPUR RINGGIT 2,600 4,500 1,400 3,200 2,100 3,500 NP NP 1,900 4,500MANILA PHP 29,500 70,000 NP NP 31,750 58,000 NP NP 31,000 73,000SEOUL KRW ('000) 2,750 3,550 2,075 2,550 1,850 2,700 1,550 2,375 1,775 3,000SHANGHAI RMB 8,800 14,000 7,900 12,250 9,200 14,750 8,100 13,250 4,350 8,800SINGAPORE SGD 3,350 5,800 2,350 4,550 2,300 3,850 NP NP 2,200 3,550EUROPEAMSTERDAM EUR 1,400 2,000 1,160 1,560 1,540 2,200 1,000 1,540 1,160 1,860BIRMINGHAM GBP 2,100 2,950 1,680 3,100 3,100 4,350 980 1,860 1,740 2,450BRISTOL GBP 2,200 3,100 1,760 3,100 3,050 4,300 960 1,820 1,280 1,820EDINBURGH GBP 1,920 2,700 1,680 2,700 2,950 4,150 940 1,760 1,760 2,500LONDON GBP 3,050 4,000 2,750 3,800 3,700 5,200 1,180 2,200 2,600 4,550MANCHESTER GBP 2,250 2,900 1,920 2,900 3,100 4,400 1,000 1,880 1,860 2,700MOSCOW EUR 1,360 1,860 1,200 1,460 1,100 1,800 1,060 1,300 650 1,200OSLO EUR 2,450 3,000 1,800 2,150 2,100 2,700 1,800 2,150 1,880 1,780MIDDLE EASTABU DHABI AED 5,700 6,800 4,600 6,400 4,000 6,300 NP NP 4,400 6,500DUBAI AED 6,000 7,200 4,850 6,800 4,250 6,700 NP NP 4,650 6,900RIYADH SAR 5,300 8,300 5,400 7,500 3,350 6,100 3,650 5,200 3,200 14,000OCEANIAADELAIDE AUD 2,750 3,800 2,300 3,150 1,640 3,000 1,300 1,840 2,350 3,550AUCKLAND NZD 4,100 5,500 3,500 5,300 3,350 3,700 2,000 2,400 4,300 5,500BRISBANE AUD 3,000 4,400 2,500 3,800 2,200 3,600 1,400 2,000 2,400 4,400CANBERRA AUD 3,500 5,500 2,800 4,300 2,400 4,050 1,260 2,550 2,950 5,200CHRISTCHURCH NZD 4,000 5,200 3,200 4,800 2,900 3,200 1,660 2,100 3,750 4,500DARWIN AUD 3,100 4,150 2,400 3,800 1,760 2,650 1,260 2,150 2,050 2,650GOLD COAST AUD 2,800 4,400 2,050 3,200 2,500 3,500 1,200 1,800 1,760 4,500MELBOURNE AUD 3,550 4,700 2,750 3,750 2,400 3,500 1,360 1,820 2,750 4,750PERTH AUD 3,000 4,700 2,400 3,750 1,900 2,900 1,000 2,500 1,900 4,100SYDNEY AUD 4,100 6,200 3,100 4,550 2,300 4,900 1,740 2,350 3,050 6,700WELLINGTON NZD 4,700 5,600 3,400 4,800 3,300 3,500 NP NP 4,350 5,300
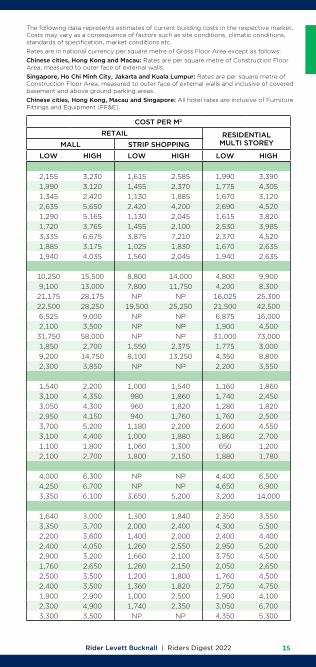
The following data represents estimates of current building costs in the respective market. Costs may vary as a consequence of factors such as site conditions, climatic conditions, standards of specification, market conditions etc.
Rates are in national currency per square metre of Gross Floor Area except as follows:
Chinese cities, Hong Kong and Macau: Rates are per square metre of Construction Floor Area, measured to outer face of external walls.
Singapore, Ho Chi Minh City, Jakarta and Kuala Lumpur: Rates are per square metre of Construction Floor Area, measured to outer face of external walls and inclusive of covered basement and above ground parking areas.
Chinese cities, Hong Kong, Macau and Singapore: All hotel rates are inclusive of Furniture Fittings and Equipment (FF&E).

Rider Levett Bucknall | Riders Digest 202216
All costs are stated in local currency as shown below.
Refer to www.rlb.com/ccc for updates.
INTERNATIONAL CONSTRUCTION BUILDING COST RANGES
LOCATION /CITY
LOCAL CURRENCY
COST PER M2 COST PER M2
HOTELS CAR PARKING INDUSTRIAL WAREHOUSE3 STAR 5 STAR MULTI STOREY BASEMENT
LOW HIGH LOW HIGH LOW HIGH LOW HIGH LOW HIGHAMERICAS @ Q3 2021BOSTON USD 2,960 4,200 4,305 6,245 915 1,505 1,075 1,720 1,185 2,045CHICAGO USD 3,120 4,415 4,305 7,105 860 1,345 1,345 1,830 1,185 1,990DENVER USD 2,690 3,765 3,605 5,490 1,345 1,560 1,505 1,990 1,075 1,990HONOLULU USD 3,765 6,030 6,565 8,020 1,505 2,045 1,670 2,745 1,185 2,530LAS VEGAS USD 1,990 3,390 3,335 6,245 540 915 755 1,560 755 1,075LOS ANGELES USD 3,070 3,930 4,090 6,030 1,130 1,345 1,455 2,100 1,345 2,045NEW YORK USD 3,550 4,790 4,790 7,210 1,075 1,940 1,505 2,370 1,290 2,260PHOENIX USD 1,990 2,960 3,765 5,920 540 970 860 1,455 805 1,345TORONTO CAD 2,205 2,690 3,765 6,890 1,025 1,345 1,290 1,940 1,130 1,615ASIABEIJING RMB 11,750 15,000 15,750 20,750 2,700 3,650 4,500 7,800 5,200 6,600GUANGZHOU RMB 10,750 13,000 14,500 18,500 2,300 3,300 4,100 7,100 4,600 5,700HO CHI MINH CITY VND ('000) 26,150 33,800 37,250 44,650 9,300 13,875 19,075 26,050 6,350 9,950HONG KONG HKD 28,500 33,250 34,250 42,000 9,700 12,500 21,000 28,750 15,250 19,000JAKARTA RP ('000) 13,500 19,000 18,000 24,000 3,500 4,500 6,000 8,000 4,800 6,100KUALA LUMPUR RINGGIT 2,500 3,500 5,000 7,000 800 1,200 1,400 3,400 1,000 1,800MANILA PHP np np np np NP NP NP NP 54,000 69,000SEOUL KRW ('000) 2,025 2,825 3,725 5,525 770 960 990 1,275 1,400 1,725SHANGHAI RMB 11,250 14,500 15,250 20,000 2,550 3,550 4,600 7,800 4,650 6,100SINGAPORE SGD 3,750 4,200 4,900 6,400 880 1,420 1,660 2,300 1,260 1,840EUROPE AMSTERDAM EUR 1,340 1,700 1,920 2,850 430 650 800 1,240 460 820BIRMINGHAM GBP 1,440 2,200 2,400 3,350 400 760 900 1,540 460 650BRISTOL GBP 1,480 1,980 2,550 3,400 450 880 1,060 1,660 450 710EDINBURGH GBP 1,420 2,100 2,250 3,100 370 710 890 1,520 400 710LONDON GBP 1,960 2,500 2,900 3,900 470 940 1,240 2,050 520 930MANCHESTER GBP 1,600 2,000 2,400 3,250 590 750 1,120 1,620 520 750MOSCOW EUR 1,600 2,000 2,300 2,950 440 560 810 1,020 500 700OSLO EUR 2,850 3,100 3,150 3,800 480 550 980 1,080 1,260 1,540MIDDLE EASTABU DHABI AED 5,900 8,300 8,800 11,750 1,760 3,500 2,800 4,400 1,460 2,650DUBAI AED 6,200 9,300 9,300 14,500 2,400 3,700 3,200 4,650 1,900 3,000RIYADH SAR 6,500 8,200 17,250 20,500 2,500 3,100 3,350 3,950 3,600 4,400OCEANIAADELAIDE AUD 2,750 3,550 3,700 4,550 690 980 1,360 1,960 650 1,100AUCKLAND NZD 5,000 6,000 6,800 7,500 1,360 2,000 2,800 3,200 1,000 1,360BRISBANE AUD 3,000 4,200 4,200 5,700 1,000 1,500 1,700 2,200 750 1,200CANBERRA AUD 3,100 5,300 4,250 6,400 790 1,320 1,060 1,840 740 1,400CHRISTCHURCH NZD 4,700 5,100 5,600 6,800 1,200 1,660 2,300 2,500 900 1,300DARWIN AUD 2,850 3,550 3,600 4,450 750 1,260 1,180 1,540 800 1,420GOLD COAST AUD 2,800 4,000 4,000 5,600 850 1,400 1,600 2,200 750 1,200MELBOURNE AUD 3,200 4,100 4,500 6,100 880 1,400 1,400 1,920 720 1,340PERTH AUD 2,600 3,600 3,600 4,800 650 1,000 1,800 3,100 550 1,060SYDNEY AUD 3,700 4,700 5,100 7,000 880 1,380 1,280 2,150 850 1,380WELLINGTON NZD 4,600 5,100 5,700 7,500 1,600 1,840 3,200 3,400 1,140 1,560
Rider Levett Bucknall | Riders Digest 2022 17
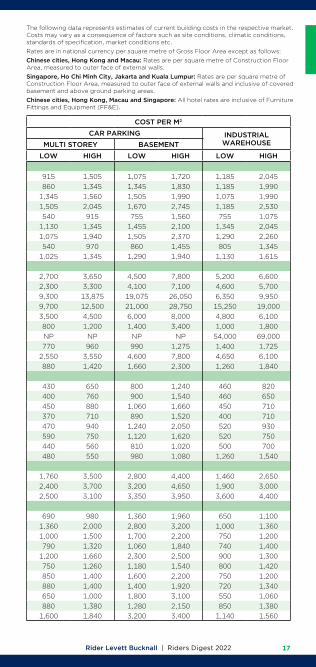
The following data represents estimates of current building costs in the respective market. Costs may vary as a consequence of factors such as site conditions, climatic conditions, standards of specification, market conditions etc.
Rates are in national currency per square metre of Gross Floor Area except as follows:
Chinese cities, Hong Kong and Macau: Rates are per square metre of Construction Floor Area, measured to outer face of external walls.
Singapore, Ho Chi Minh City, Jakarta and Kuala Lumpur: Rates are per square metre of Construction Floor Area, measured to outer face of external walls and inclusive of covered basement and above ground parking areas.
Chinese cities, Hong Kong, Macau and Singapore: All hotel rates are inclusive of Furniture Fittings and Equipment (FF&E).
LOCATION /CITY
LOCAL CURRENCY
COST PER M2 COST PER M2
HOTELS CAR PARKING INDUSTRIAL WAREHOUSE3 STAR 5 STAR MULTI STOREY BASEMENT
LOW HIGH LOW HIGH LOW HIGH LOW HIGH LOW HIGHAMERICAS @ Q3 2021BOSTON USD 2,960 4,200 4,305 6,245 915 1,505 1,075 1,720 1,185 2,045CHICAGO USD 3,120 4,415 4,305 7,105 860 1,345 1,345 1,830 1,185 1,990DENVER USD 2,690 3,765 3,605 5,490 1,345 1,560 1,505 1,990 1,075 1,990HONOLULU USD 3,765 6,030 6,565 8,020 1,505 2,045 1,670 2,745 1,185 2,530LAS VEGAS USD 1,990 3,390 3,335 6,245 540 915 755 1,560 755 1,075LOS ANGELES USD 3,070 3,930 4,090 6,030 1,130 1,345 1,455 2,100 1,345 2,045NEW YORK USD 3,550 4,790 4,790 7,210 1,075 1,940 1,505 2,370 1,290 2,260PHOENIX USD 1,990 2,960 3,765 5,920 540 970 860 1,455 805 1,345TORONTO CAD 2,205 2,690 3,765 6,890 1,025 1,345 1,290 1,940 1,130 1,615ASIABEIJING RMB 11,750 15,000 15,750 20,750 2,700 3,650 4,500 7,800 5,200 6,600GUANGZHOU RMB 10,750 13,000 14,500 18,500 2,300 3,300 4,100 7,100 4,600 5,700HO CHI MINH CITY VND ('000) 26,150 33,800 37,250 44,650 9,300 13,875 19,075 26,050 6,350 9,950HONG KONG HKD 28,500 33,250 34,250 42,000 9,700 12,500 21,000 28,750 15,250 19,000JAKARTA RP ('000) 13,500 19,000 18,000 24,000 3,500 4,500 6,000 8,000 4,800 6,100KUALA LUMPUR RINGGIT 2,500 3,500 5,000 7,000 800 1,200 1,400 3,400 1,000 1,800MANILA PHP np np np np NP NP NP NP 54,000 69,000SEOUL KRW ('000) 2,025 2,825 3,725 5,525 770 960 990 1,275 1,400 1,725SHANGHAI RMB 11,250 14,500 15,250 20,000 2,550 3,550 4,600 7,800 4,650 6,100SINGAPORE SGD 3,750 4,200 4,900 6,400 880 1,420 1,660 2,300 1,260 1,840EUROPE AMSTERDAM EUR 1,340 1,700 1,920 2,850 430 650 800 1,240 460 820BIRMINGHAM GBP 1,440 2,200 2,400 3,350 400 760 900 1,540 460 650BRISTOL GBP 1,480 1,980 2,550 3,400 450 880 1,060 1,660 450 710EDINBURGH GBP 1,420 2,100 2,250 3,100 370 710 890 1,520 400 710LONDON GBP 1,960 2,500 2,900 3,900 470 940 1,240 2,050 520 930MANCHESTER GBP 1,600 2,000 2,400 3,250 590 750 1,120 1,620 520 750MOSCOW EUR 1,600 2,000 2,300 2,950 440 560 810 1,020 500 700OSLO EUR 2,850 3,100 3,150 3,800 480 550 980 1,080 1,260 1,540MIDDLE EASTABU DHABI AED 5,900 8,300 8,800 11,750 1,760 3,500 2,800 4,400 1,460 2,650DUBAI AED 6,200 9,300 9,300 14,500 2,400 3,700 3,200 4,650 1,900 3,000RIYADH SAR 6,500 8,200 17,250 20,500 2,500 3,100 3,350 3,950 3,600 4,400OCEANIAADELAIDE AUD 2,750 3,550 3,700 4,550 690 980 1,360 1,960 650 1,100AUCKLAND NZD 5,000 6,000 6,800 7,500 1,360 2,000 2,800 3,200 1,000 1,360BRISBANE AUD 3,000 4,200 4,200 5,700 1,000 1,500 1,700 2,200 750 1,200CANBERRA AUD 3,100 5,300 4,250 6,400 790 1,320 1,060 1,840 740 1,400CHRISTCHURCH NZD 4,700 5,100 5,600 6,800 1,200 1,660 2,300 2,500 900 1,300DARWIN AUD 2,850 3,550 3,600 4,450 750 1,260 1,180 1,540 800 1,420GOLD COAST AUD 2,800 4,000 4,000 5,600 850 1,400 1,600 2,200 750 1,200MELBOURNE AUD 3,200 4,100 4,500 6,100 880 1,400 1,400 1,920 720 1,340PERTH AUD 2,600 3,600 3,600 4,800 650 1,000 1,800 3,100 550 1,060SYDNEY AUD 3,700 4,700 5,100 7,000 880 1,380 1,280 2,150 850 1,380WELLINGTON NZD 4,600 5,100 5,700 7,500 1,600 1,840 3,200 3,400 1,140 1,560

Rider Levett Bucknall | Riders Digest 202218
INTERNATIONAL CONSTRUCTION RLB ESCALATION FORECASTS
RLB TENDER PRICE INDEX ANNUAL CHANGEAll indices are stated as annual percentage changes.Refer to www.rlb.com/ccc for updates.
CALENDAR YEAR 2019 2020 2021 (F)
2022 (F)
2023 (F)
2024 (F)
AFRICA @ Q4 2021 DURBAN 5.0 4.5 6.1 9.4 6.6 NPJOHANNESBURG 5.1 5.5 4.2 NP NP NPMAPUTO 1.0 1.1 3.1 4.1 NP NPAMERICAS @ Q4 2021BOSTON 4.4 3.2 7.8 5.5 5.5 5.0CALGARY 0.0 4.6 8.7 4.5 4.0 4.0CHICAGO 5.5 -1.3 7.4 3.0 3.0 3.0HONOLULU 6.1 1.2 3.2 3.5 4.0 5.0LAS VEGAS 4.9 1.5 5.9 4.0 3.5 3.5LOS ANGELES 2.0 3.2 6.3 4.5 4.0 3.5NEW YORK 5.4 3.2 7.0 5.0 5.0 4.5PHOENIX 4.7 1.3 7.9 5.0 4.5 4.0SEATTLE 5.6 1.7 7.0 3.0 3.5 3.5TORONTO 13.7 6.1 10.9 4.5 4.0 4.0WASHINGTON D.C. 4.3 2.6 7.9 4.0 4.5 4.5ASIA @ Q4 2021BEIJING 2.0 1.5 5.0 2.0 2.0 2.0CHENGDU 0.9 2.0 3.0 3.0 3.0 3.0GUANGZHOU 0.0 0.0 4.1 4.0 3.0 3.0HONG KONG -4.1 -3.8 4.9 1.0 2.0 2.0MACAU -4.1 -6.0 -2.0 -1.0 2.0 2.0SEOUL 3.0 3.8 5.1 1.1 2.0 1.9SHANGHAI -1.5 2.5 7.8 4.0 4.0 3.5SHENZHEN 2.0 0.0 4.0 3.0 3.0 3.0SINGAPORE 0.9 7.0 10.0 5.0 3.0 3.0EUROPE @ Q4 2021AMSTERDAM 3.1 0.0 -3.5 NP NP NPBIRMINGHAM 2.3 0.0 3.5 3.5 3.5 4.0BRISTOL 2.4 0.5 3.5 5.5 4.7 3.6BUDAPEST 10.0 8.0 4.0 NP NP NPLONDON 1.0 0.0 3.8 3.3 3.3 3.0SHEFFIELD 2.0 2.6 3.2 4.0 3.8 3.8MANCHESTER 2.0 2.5 4.5 3.5 3.5 3.5MOSCOW 5.0 2.0 9.8 NP NP NPOSLO 3.5 -4.0 3.5 3.5 NP NPMIDDLE EAST @ Q4 2021ABU DHABI 2.2 1.6 1.9 2.5 3.0 3.0DOHA 7.2 2.2 2.5 2.0 2.0 2.0DUBAI 2.2 1.6 1.9 2.5 3.0 3.0RIYADH 3.1 2.0 3.0 5.0 6.5 7.0OCEANIA @ Q4 2021ADELAIDE 3.9 0.2 2.4 3.0 2.8 3.0AUCKLAND 3.5 -1.9 8.5 5.5 2.5 2.5BRISBANE 1.5 -4.1 9.6 5.0 3.0 3.0CANBERRA 3.5 3.0 3.3 3.5 3.0 3.0CHRISTCHURCH 2.0 1.0 3.0 4.0 3.0 3.0DARWIN 0.5 0.8 1.0 2.5 3.0 4.0GOLD COAST 1.3 -3.5 10.5 5.0 3.0 3.0MELBOURNE 3.0 1.0 2.0 3.0 3.5 3.5PERTH 1.5 1.5 11.3 4.5 3.5 3.5SYDNEY 4.1 0.0 4.1 5.6 3.7 3.5TOWNSVILLE 3.0 1.0 4.0 3.0 3.0 3.0WELLINGTON 3.0 3.0 8.5 5.5 3.0 3.0
NP: Not published

4
AUSTRALIAN CONSTRUCTION
Building Cost Ranges 20
Building Services Cost Ranges 24
RLB Tender Price Index 28
Definitions 30
Acknowledgements 32

Rider Levett Bucknall | Riders Digest 202220
CONSTRUCTION RATESThe following range of current building costs could be expected should tenders be called in the respective city. Items specifically included are those normally contained in a Building Contract.
Specific exclusions:¾ Goods & Services Tax (GST)¾ Land¾ Legal and professional fees¾ Loose furniture and fittings¾ Site works and drainage
¾ Subdivisional partitions in office buildings
¾ Telstra and private telephone systems (PABX)
¾ Tenancy works
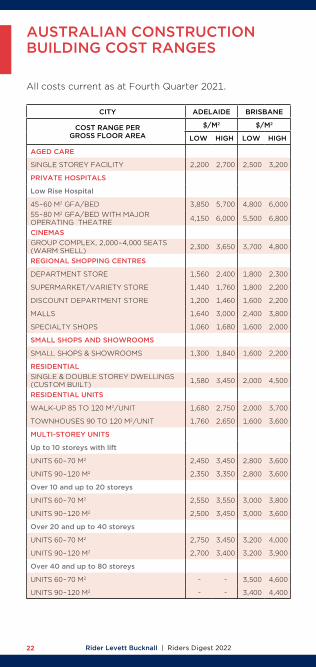
AUSTRALIAN CONSTRUCTIONBUILDING COST RANGES
All costs current as at Fourth Quarter 2021.
CITY ADELAIDE BRISBANE CANBERRA DARWIN MELBOURNE PERTH SYDNEY
COST RANGE PER GROSS FLOOR AREA
$/M2 $/M2 $/M2 $/M2 $/M2 $/M2 $/M2
LOW HIGH LOW HIGH LOW HIGH LOW HIGH LOW HIGH LOW HIGH LOW HIGH
OFFICE BUILDINGS
Prestige, CBD
10 TO 25 STOREYS (75 – 80% EFFICIENCY) 2,750 3,400 3,200 4,100 3,600 5,300 3,300 4,300 3,550 4,050 3,500 4,700 4,100 4,800
25 TO 40 STOREYS (70 – 75% EFFICIENCY) 3,000 3,800 3,300 4,200 3,850 5,700 3,250 4,150 4,050 4,450 3,800 5,200 4,750 5,700
40 TO 55 STOREYS (68 – 73% EFFICIENCY) - - 3,500 4,500 - - - - 4,150 4,700 4,050 5,500 5,300 6,200
Investment, CBD
UP TO 10 STOREYS (81 – 85% EFFICIENCY) 2,300 2,700 2,700 3,200 2,900 4,100 2,400 3,600 2,750 3,200 2,800 3,900 3,100 3,700
10 TO 25 STOREYS (76 – 81% EFFICIENCY) 2,400 2,950 3,000 3,500 3,000 4,300 2,550 3,800 3,100 3,550 2,900 4,150 3,700 4,200
25 TO 40 STOREYS (71 – 76% EFFICIENCY) 2,600 3,150 3,000 3,900 3,050 4,450 - - 3,150 3,750 3,050 4,350 3,800 4,550
Investment, other than CBD
WALK UP (83 – 87% EFFICIENCY) 1,940 2,300 2,100 2,500 1,540 2,600 2,400 2,900 1,960 2,550 2,150 3,050 2,500 3,000
UP TO 10 STOREYS (82 – 86% EFFICIENCY) 2,150 2,550 2,300 2,700 2,250 3,050 2,500 3,500 2,250 3,000 2,350 3,250 2,700 3,500
10 TO 25 STOREYS (77 – 82% EFFICIENCY) - - 2,500 2,900 2,350 3,600 2,550 3,550 2,550 3,350 2,600 3,600 3,100 4,050
HOTELS
Multi-Storey (ex FF&E)
FIVE STAR 3,700 4,550 4,600 6,000 4,400 6,600 3,600 4,500 4,500 6,100 4,150 5,600 5,100 7,000
FOUR STAR 3,200 4,250 3,800 5,000 3,800 6,200 3,350 4,100 4,050 5,300 3,600 4,700 4,300 6,200
THREE STAR 2,750 3,550 3,200 4,500 3,200 5,500 2,850 3,550 3,200 4,100 3,050 4,250 3,700 4,700
CAR PARK
OPEN DECK MULTI-STOREY 690 980 1,100 1,600 810 1,360 800 1,360 880 1,400 780 1,240 880 1,380
BASEMENT: CBD 1,360 1,960 1,760 2,300 1,100 1,900 1,300 1,660 1,400 1,920 2,150 3,700 1,280 2,150
BASEMENT: OTHER THAN CBD 940 1,760 1,200 1,900 1,080 1,900 1,180 1,560 1,440 1,760 1,560 3,250 1,260 1,940
UNDERCROFT: OTHER THAN CBD 590 890 800 1,000 810 1,240 800 1,100 880 1,060 780 1,340 - -
INDUSTRIAL BUILDINGS
6.00 M to underside of truss and 4,500 M2 Gross Floor Area with:
ZINCALUME METAL CLADDING 650 1,000 850 1,200 760 950 850 1,500 720 1,220 670 900 850 1,080
PRECAST CONCRETE CLADDING 750 1,100 950 1,260 880 1,440 890 1,560 820 1,340 670 1,240 920 1,380
Attached Airconditioned Offices
200 M2 1,560 2,150 2,100 2,750 1,800 2,850 1,900 2,600 1,700 2,250 1,560 2,250 2,350 3,100
400 M2 1,560 2,150 2,100 2,600 1,720 2,750 1,900 2,600 1,640 2,150 1,560 2,250 2,400 3,300

Rider Levett Bucknall | Riders Digest 2022 21
All costs current as at Fourth Quarter 2021.
CITY ADELAIDE BRISBANE CANBERRA DARWIN MELBOURNE PERTH SYDNEY
COST RANGE PER GROSS FLOOR AREA
$/M2 $/M2 $/M2 $/M2 $/M2 $/M2 $/M2
LOW HIGH LOW HIGH LOW HIGH LOW HIGH LOW HIGH LOW HIGH LOW HIGH
OFFICE BUILDINGS
Prestige, CBD
10 TO 25 STOREYS (75 – 80% EFFICIENCY) 2,750 3,400 3,200 4,100 3,600 5,300 3,300 4,300 3,550 4,050 3,500 4,700 4,100 4,800
25 TO 40 STOREYS (70 – 75% EFFICIENCY) 3,000 3,800 3,300 4,200 3,850 5,700 3,250 4,150 4,050 4,450 3,800 5,200 4,750 5,700
40 TO 55 STOREYS (68 – 73% EFFICIENCY) - - 3,500 4,500 - - - - 4,150 4,700 4,050 5,500 5,300 6,200
Investment, CBD
UP TO 10 STOREYS (81 – 85% EFFICIENCY) 2,300 2,700 2,700 3,200 2,900 4,100 2,400 3,600 2,750 3,200 2,800 3,900 3,100 3,700
10 TO 25 STOREYS (76 – 81% EFFICIENCY) 2,400 2,950 3,000 3,500 3,000 4,300 2,550 3,800 3,100 3,550 2,900 4,150 3,700 4,200
25 TO 40 STOREYS (71 – 76% EFFICIENCY) 2,600 3,150 3,000 3,900 3,050 4,450 - - 3,150 3,750 3,050 4,350 3,800 4,550
Investment, other than CBD
WALK UP (83 – 87% EFFICIENCY) 1,940 2,300 2,100 2,500 1,540 2,600 2,400 2,900 1,960 2,550 2,150 3,050 2,500 3,000
UP TO 10 STOREYS (82 – 86% EFFICIENCY) 2,150 2,550 2,300 2,700 2,250 3,050 2,500 3,500 2,250 3,000 2,350 3,250 2,700 3,500
10 TO 25 STOREYS (77 – 82% EFFICIENCY) - - 2,500 2,900 2,350 3,600 2,550 3,550 2,550 3,350 2,600 3,600 3,100 4,050
HOTELS
Multi-Storey (ex FF&E)
FIVE STAR 3,700 4,550 4,600 6,000 4,400 6,600 3,600 4,500 4,500 6,100 4,150 5,600 5,100 7,000
FOUR STAR 3,200 4,250 3,800 5,000 3,800 6,200 3,350 4,100 4,050 5,300 3,600 4,700 4,300 6,200
THREE STAR 2,750 3,550 3,200 4,500 3,200 5,500 2,850 3,550 3,200 4,100 3,050 4,250 3,700 4,700
CAR PARK
OPEN DECK MULTI-STOREY 690 980 1,100 1,600 810 1,360 800 1,360 880 1,400 780 1,240 880 1,380
BASEMENT: CBD 1,360 1,960 1,760 2,300 1,100 1,900 1,300 1,660 1,400 1,920 2,150 3,700 1,280 2,150
BASEMENT: OTHER THAN CBD 940 1,760 1,200 1,900 1,080 1,900 1,180 1,560 1,440 1,760 1,560 3,250 1,260 1,940
UNDERCROFT: OTHER THAN CBD 590 890 800 1,000 810 1,240 800 1,100 880 1,060 780 1,340 - -
INDUSTRIAL BUILDINGS
6.00 M to underside of truss and 4,500 M2 Gross Floor Area with:
ZINCALUME METAL CLADDING 650 1,000 850 1,200 760 950 850 1,500 720 1,220 670 900 850 1,080
PRECAST CONCRETE CLADDING 750 1,100 950 1,260 880 1,440 890 1,560 820 1,340 670 1,240 920 1,380
Attached Airconditioned Offices
200 M2 1,560 2,150 2,100 2,750 1,800 2,850 1,900 2,600 1,700 2,250 1,560 2,250 2,350 3,100
400 M2 1,560 2,150 2,100 2,600 1,720 2,750 1,900 2,600 1,640 2,150 1,560 2,250 2,400 3,300
NOTESi Car Parking costs have been excluded to arrive at the various building rates.
ii Refer to Page 30 for definitions.
ii The percentages shown against each building may be used to calculate the rate per Net Lettable Area.
Example: the NLA rate for a Premium Office CBD 10 to 25 Storeys would be calculated NLA rate = $/M2 ÷ efficiency percentage.
Refer to www.rlb.com/ccc for updates.
Rider Levett Bucknall | Riders Digest 202222
AUSTRALIAN CONSTRUCTIONBUILDING COST RANGES
All costs current as at Fourth Quarter 2021.
CITY ADELAIDE BRISBANE CANBERRA DARWIN MELBOURNE PERTH SYDNEY
COST RANGE PER GROSS FLOOR AREA
$/M2 $/M2 $/M2 $/M2 $/M2 $/M2 $/M2
LOW HIGH LOW HIGH LOW HIGH LOW HIGH LOW HIGH LOW HIGH LOW HIGH
AGED CARE
SINGLE STOREY FACILITY 2,200 2,700 2,500 3,200 2,200 3,600 2,500 3,600 2,100 3,400 2,400 3,450 3,100 4,100
PRIVATE HOSPITALS
Low Rise Hospital
45 – 60 M2 GFA/BED 3,850 5,700 4,800 6,000 4,550 7,500 4,000 4,750 3,150 3,750 4,200 5,200 3,250 4,250 55 – 80 M2 GFA/BED WITH MAJOR OPERATING THEATRE 4,150 6,000 5,500 6,800 4,950 8,200 5,200 6,100 3,500 4,750 4,550 5,800 4,100 5,700
CINEMASGROUP COMPLEX, 2,000 – 4,000 SEATS (WARM SHELL) 2,300 3,650 3,700 4,800 3,150 4,350 2,900 3,600 2,750 3,600 2,600 3,150 3,800 5,500
REGIONAL SHOPPING CENTRES
DEPARTMENT STORE 1,560 2,400 1,800 2,300 2,550 3,300 1,800 2,550 2,300 2,750 2,250 3,150 1,740 2,650
SUPERMARKET/VARIETY STORE 1,440 1,760 1,800 2,200 1,520 2,550 1,860 2,700 1,420 2,100 1,460 2,150 1,700 3,400
DISCOUNT DEPARTMENT STORE 1,200 1,460 1,600 2,200 1,380 1,980 1,700 2,400 1,460 1,860 1,460 2,050 1,500 1,880
MALLS 1,640 3,000 2,400 3,800 2,500 4,200 1,800 2,700 2,400 3,500 2,250 3,500 2,300 4,900
SPECIALTY SHOPS 1,060 1,680 1,600 2,000 1,280 2,150 1,500 2,200 1,360 1,860 1,240 1,800 1,940 3,100
SMALL SHOPS AND SHOWROOMS
SMALL SHOPS & SHOWROOMS 1,300 1,840 1,600 2,200 1,760 3,500 1,360 2,200 1,360 1,820 1,240 3,050 1,740 2,350
RESIDENTIALSINGLE & DOUBLE STOREY DWELLINGS (CUSTOM BUILT) 1,580 3,450 2,000 4,500 1,760 3,500 1,800 2,800 1,860 3,600 2,050 3,800 1,960 5,900
RESIDENTIAL UNITS
WALK-UP 85 TO 120 M2/UNIT 1,680 2,750 2,000 3,700 1,860 4,550 1,980 2,400 1,960 3,600 2,050 4,050 - -
TOWNHOUSES 90 TO 120 M2/UNIT 1,760 2,650 1,600 3,600 1,860 4,450 1,980 2,400 1,960 3,350 2,050 4,050 - -
MULTI-STOREY UNITS
Up to 10 storeys with lift
UNITS 60 – 70 M2 2,450 3,450 2,800 3,600 3,100 4,650 2,050 2,450 2,750 3,450 2,350 3,700 3,300 4,450
UNITS 90 – 120 M2 2,350 3,350 2,800 3,600 3,050 4,550 2,050 2,400 2,750 3,500 2,250 3,600 3,050 4,150
Over 10 and up to 20 storeys
UNITS 60 – 70 M2 2,550 3,550 3,000 3,800 3,350 4,950 2,100 2,550 3,050 3,900 2,800 4,050 3,450 4,800
UNITS 90 – 120 M2 2,500 3,450 3,000 3,600 3,300 4,950 2,050 2,500 3,050 3,950 2,700 3,900 3,300 4,550
Over 20 and up to 40 storeys
UNITS 60 – 70 M2 2,750 3,450 3,200 4,000 3,850 5,400 2,350 2,650 3,550 4,200 3,350 4,350 4,550 6,000
UNITS 90 – 120 M2 2,700 3,400 3,200 3,900 3,750 5,100 2,300 2,600 3,550 4,300 3,250 4,250 4,250 5,300
Over 40 and up to 80 storeys
UNITS 60 – 70 M2 - - 3,500 4,600 - - - - 3,950 4,650 3,900 5,100 5,200 6,700
UNITS 90 – 120 M2 - - 3,400 4,400 - - - - 3,950 4,750 3,800 4,900 5,000 6,500

Rider Levett Bucknall | Riders Digest 2022 23
All costs current as at Fourth Quarter 2021.
CITY ADELAIDE BRISBANE CANBERRA DARWIN MELBOURNE PERTH SYDNEY
COST RANGE PER GROSS FLOOR AREA
$/M2 $/M2 $/M2 $/M2 $/M2 $/M2 $/M2
LOW HIGH LOW HIGH LOW HIGH LOW HIGH LOW HIGH LOW HIGH LOW HIGH
AGED CARE
SINGLE STOREY FACILITY 2,200 2,700 2,500 3,200 2,200 3,600 2,500 3,600 2,100 3,400 2,400 3,450 3,100 4,100
PRIVATE HOSPITALS
Low Rise Hospital
45 – 60 M2 GFA/BED 3,850 5,700 4,800 6,000 4,550 7,500 4,000 4,750 3,150 3,750 4,200 5,200 3,250 4,250 55 – 80 M2 GFA/BED WITH MAJOR OPERATING THEATRE 4,150 6,000 5,500 6,800 4,950 8,200 5,200 6,100 3,500 4,750 4,550 5,800 4,100 5,700
CINEMASGROUP COMPLEX, 2,000 – 4,000 SEATS (WARM SHELL) 2,300 3,650 3,700 4,800 3,150 4,350 2,900 3,600 2,750 3,600 2,600 3,150 3,800 5,500
REGIONAL SHOPPING CENTRES
DEPARTMENT STORE 1,560 2,400 1,800 2,300 2,550 3,300 1,800 2,550 2,300 2,750 2,250 3,150 1,740 2,650
SUPERMARKET/VARIETY STORE 1,440 1,760 1,800 2,200 1,520 2,550 1,860 2,700 1,420 2,100 1,460 2,150 1,700 3,400
DISCOUNT DEPARTMENT STORE 1,200 1,460 1,600 2,200 1,380 1,980 1,700 2,400 1,460 1,860 1,460 2,050 1,500 1,880
MALLS 1,640 3,000 2,400 3,800 2,500 4,200 1,800 2,700 2,400 3,500 2,250 3,500 2,300 4,900
SPECIALTY SHOPS 1,060 1,680 1,600 2,000 1,280 2,150 1,500 2,200 1,360 1,860 1,240 1,800 1,940 3,100
SMALL SHOPS AND SHOWROOMS
SMALL SHOPS & SHOWROOMS 1,300 1,840 1,600 2,200 1,760 3,500 1,360 2,200 1,360 1,820 1,240 3,050 1,740 2,350
RESIDENTIALSINGLE & DOUBLE STOREY DWELLINGS (CUSTOM BUILT) 1,580 3,450 2,000 4,500 1,760 3,500 1,800 2,800 1,860 3,600 2,050 3,800 1,960 5,900
RESIDENTIAL UNITS
WALK-UP 85 TO 120 M2/UNIT 1,680 2,750 2,000 3,700 1,860 4,550 1,980 2,400 1,960 3,600 2,050 4,050 - -
TOWNHOUSES 90 TO 120 M2/UNIT 1,760 2,650 1,600 3,600 1,860 4,450 1,980 2,400 1,960 3,350 2,050 4,050 - -
MULTI-STOREY UNITS
Up to 10 storeys with lift
UNITS 60 – 70 M2 2,450 3,450 2,800 3,600 3,100 4,650 2,050 2,450 2,750 3,450 2,350 3,700 3,300 4,450
UNITS 90 – 120 M2 2,350 3,350 2,800 3,600 3,050 4,550 2,050 2,400 2,750 3,500 2,250 3,600 3,050 4,150
Over 10 and up to 20 storeys
UNITS 60 – 70 M2 2,550 3,550 3,000 3,800 3,350 4,950 2,100 2,550 3,050 3,900 2,800 4,050 3,450 4,800
UNITS 90 – 120 M2 2,500 3,450 3,000 3,600 3,300 4,950 2,050 2,500 3,050 3,950 2,700 3,900 3,300 4,550
Over 20 and up to 40 storeys
UNITS 60 – 70 M2 2,750 3,450 3,200 4,000 3,850 5,400 2,350 2,650 3,550 4,200 3,350 4,350 4,550 6,000
UNITS 90 – 120 M2 2,700 3,400 3,200 3,900 3,750 5,100 2,300 2,600 3,550 4,300 3,250 4,250 4,250 5,300
Over 40 and up to 80 storeys
UNITS 60 – 70 M2 - - 3,500 4,600 - - - - 3,950 4,650 3,900 5,100 5,200 6,700
UNITS 90 – 120 M2 - - 3,400 4,400 - - - - 3,950 4,750 3,800 4,900 5,000 6,500
Building Costs include Building Works and Building Services
Refer to www.rlb.com/ccc for updates.
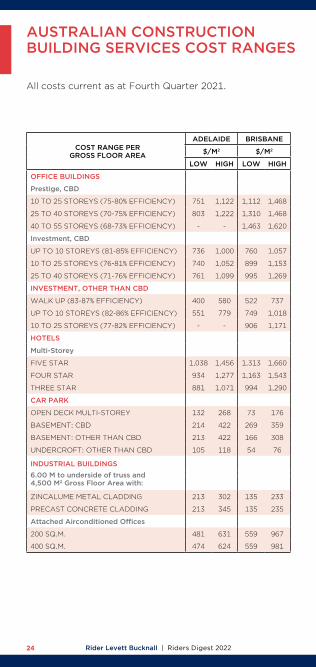
Rider Levett Bucknall | Riders Digest 202224
AUSTRALIAN CONSTRUCTIONBUILDING SERVICES COST RANGES
All costs current as at Fourth Quarter 2021.
COST RANGE PER GROSS FLOOR AREA
ADELAIDE BRISBANE CANBERRA DARWIN MELBOURNE PERTH SYDNEY
$/M2 $/M2 $/M2 $/M2 $/M2 $/M2 $/M2
LOW HIGH LOW HIGH LOW HIGH LOW HIGH LOW HIGH LOW HIGH LOW HIGH
OFFICE BUILDINGS
Prestige, CBD
10 TO 25 STOREYS (75-80% EFFICIENCY) 751 1,122 1,112 1,468 931 1,352 1,065 1,405 827 1,285 1,065 1,405 1,013 1,377
25 TO 40 STOREYS (70-75% EFFICIENCY) 803 1,222 1,310 1,468 988 1,465 1,255 1,405 978 1,365 1,255 1,405 1,193 1,377
40 TO 55 STOREYS (68-73% EFFICIENCY) - - 1,463 1,620 - - 1,401 1,551 1,034 1,461 1,401 1,551 1,328 1,521
Investment, CBD
UP TO 10 STOREYS (81-85% EFFICIENCY) 736 1,000 760 1,057 772 1,238 727 1,011 645 1,104 727 1,011 693 991
10 TO 25 STOREYS (76-81% EFFICIENCY) 740 1,052 899 1,153 818 1,238 861 1,104 715 1,173 861 1,104 819 1,082
25 TO 40 STOREYS (71-76% EFFICIENCY) 761 1,099 995 1,269 818 1,295 952 1,215 789 1,232 952 1,215 907 1,192
INVESTMENT, OTHER THAN CBD
WALK UP (83-87% EFFICIENCY) 400 580 522 737 488 670 499 705 448 725 499 705 476 689
UP TO 10 STOREYS (82-86% EFFICIENCY) 551 779 749 1,018 647 931 717 975 560 888 717 975 685 954
10 TO 25 STOREYS (77-82% EFFICIENCY) - - 906 1,171 716 1,056 868 1,121 619 1,008 868 1,121 827 1,099
HOTELS
Multi-Storey
FIVE STAR 1,038 1,456 1,313 1,660 1,328 1,805 1,257 1,591 1,786 2,255 1,257 1,591 1,196 1,558
FOUR STAR 934 1,277 1,163 1,543 1,211 1,619 1,114 1,478 1,290 1,925 1,114 1,478 1,061 1,448
THREE STAR 881 1,071 994 1,290 955 1,386 952 1,236 976 1,472 952 1,236 907 1,211
CAR PARK
OPEN DECK MULTI-STOREY 132 268 73 176 180 293 70 169 99 292 70 169 67 167
BASEMENT: CBD 214 422 269 359 248 495 258 344 174 377 258 344 250 337
BASEMENT: OTHER THAN CBD 213 422 166 308 180 484 159 296 163 346 159 296 154 290
UNDERCROFT: OTHER THAN CBD 105 118 54 76 68 124 52 73 32 64 52 73 50 73
INDUSTRIAL BUILDINGS6.00 M to underside of truss and 4,500 M2 Gross Floor Area with:
ZINCALUME METAL CLADDING 213 302 135 233 238 420 130 224 187 331 130 224 124 219
PRECAST CONCRETE CLADDING 213 345 135 235 238 408 130 226 187 331 130 226 124 221
Attached Airconditioned Offices
200 SQ.M. 481 631 559 967 545 726 535 925 480 667 535 925 509 907
400 SQ.M. 474 624 559 981 545 658 535 939 480 885 535 939 509 920

Rider Levett Bucknall | Riders Digest 2022 25
COST RANGE PER GROSS FLOOR AREA
ADELAIDE BRISBANE CANBERRA DARWIN MELBOURNE PERTH SYDNEY
$/M2 $/M2 $/M2 $/M2 $/M2 $/M2 $/M2
LOW HIGH LOW HIGH LOW HIGH LOW HIGH LOW HIGH LOW HIGH LOW HIGH
OFFICE BUILDINGS
Prestige, CBD
10 TO 25 STOREYS (75-80% EFFICIENCY) 751 1,122 1,112 1,468 931 1,352 1,065 1,405 827 1,285 1,065 1,405 1,013 1,377
25 TO 40 STOREYS (70-75% EFFICIENCY) 803 1,222 1,310 1,468 988 1,465 1,255 1,405 978 1,365 1,255 1,405 1,193 1,377
40 TO 55 STOREYS (68-73% EFFICIENCY) - - 1,463 1,620 - - 1,401 1,551 1,034 1,461 1,401 1,551 1,328 1,521
Investment, CBD
UP TO 10 STOREYS (81-85% EFFICIENCY) 736 1,000 760 1,057 772 1,238 727 1,011 645 1,104 727 1,011 693 991
10 TO 25 STOREYS (76-81% EFFICIENCY) 740 1,052 899 1,153 818 1,238 861 1,104 715 1,173 861 1,104 819 1,082
25 TO 40 STOREYS (71-76% EFFICIENCY) 761 1,099 995 1,269 818 1,295 952 1,215 789 1,232 952 1,215 907 1,192
INVESTMENT, OTHER THAN CBD
WALK UP (83-87% EFFICIENCY) 400 580 522 737 488 670 499 705 448 725 499 705 476 689
UP TO 10 STOREYS (82-86% EFFICIENCY) 551 779 749 1,018 647 931 717 975 560 888 717 975 685 954
10 TO 25 STOREYS (77-82% EFFICIENCY) - - 906 1,171 716 1,056 868 1,121 619 1,008 868 1,121 827 1,099
HOTELS
Multi-Storey
FIVE STAR 1,038 1,456 1,313 1,660 1,328 1,805 1,257 1,591 1,786 2,255 1,257 1,591 1,196 1,558
FOUR STAR 934 1,277 1,163 1,543 1,211 1,619 1,114 1,478 1,290 1,925 1,114 1,478 1,061 1,448
THREE STAR 881 1,071 994 1,290 955 1,386 952 1,236 976 1,472 952 1,236 907 1,211
CAR PARK
OPEN DECK MULTI-STOREY 132 268 73 176 180 293 70 169 99 292 70 169 67 167
BASEMENT: CBD 214 422 269 359 248 495 258 344 174 377 258 344 250 337
BASEMENT: OTHER THAN CBD 213 422 166 308 180 484 159 296 163 346 159 296 154 290
UNDERCROFT: OTHER THAN CBD 105 118 54 76 68 124 52 73 32 64 52 73 50 73
INDUSTRIAL BUILDINGS6.00 M to underside of truss and 4,500 M2 Gross Floor Area with:
ZINCALUME METAL CLADDING 213 302 135 233 238 420 130 224 187 331 130 224 124 219
PRECAST CONCRETE CLADDING 213 345 135 235 238 408 130 226 187 331 130 226 124 221
Attached Airconditioned Offices
200 SQ.M. 481 631 559 967 545 726 535 925 480 667 535 925 509 907
400 SQ.M. 474 624 559 981 545 658 535 939 480 885 535 939 509 920
BUILDING SERVICES COSTS INCLUDE:¾ Building Management¾ Electrical¾ Fire Protection¾ Hydraulic¾ Mechanical¾ Special Equipment¾ Vertical Transport
Refer to page 34 to 37 for detailed services costs.
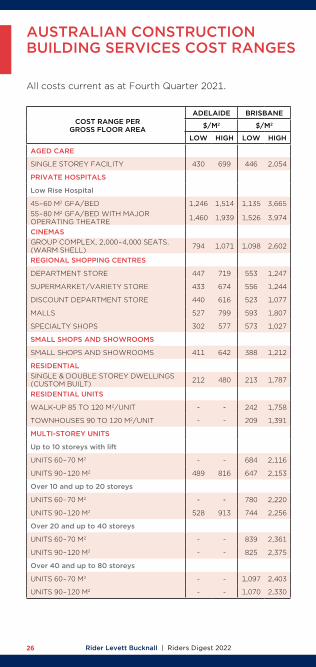
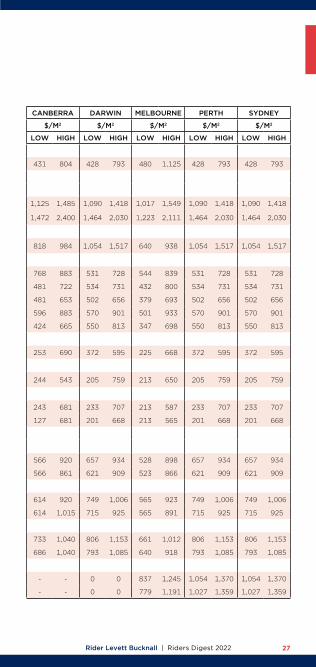
Rider Levett Bucknall | Riders Digest 202226
COST RANGE PER GROSS FLOOR AREA
ADELAIDE BRISBANE CANBERRA DARWIN MELBOURNE PERTH SYDNEY
$/M2 $/M2 $/M2 $/M2 $/M2 $/M2 $/M2
LOW HIGH LOW HIGH LOW HIGH LOW HIGH LOW HIGH LOW HIGH LOW HIGH
AGED CARE
SINGLE STOREY FACILITY 430 699 446 2,054 431 804 428 793 480 1,125 428 793 428 793
PRIVATE HOSPITALS
Low Rise Hospital
45 – 60 M2 GFA/BED 1,246 1,514 1,135 3,665 1,125 1,485 1,090 1,418 1,017 1,549 1,090 1,418 1,090 1,418 55 – 80 M2 GFA/BED WITH MAJOR OPERATING THEATRE 1,460 1,939 1,526 3,974 1,472 2,400 1,464 2,030 1,223 2,111 1,464 2,030 1,464 2,030
CINEMASGROUP COMPLEX, 2,000 – 4,000 SEATS. (WARM SHELL) 794 1,071 1,098 2,602 818 984 1,054 1,517 640 938 1,054 1,517 1,054 1,517
REGIONAL SHOPPING CENTRES
DEPARTMENT STORE 447 719 553 1,247 768 883 531 728 544 839 531 728 531 728
SUPERMARKET/VARIETY STORE 433 674 556 1,244 481 722 534 731 432 800 534 731 534 731
DISCOUNT DEPARTMENT STORE 440 616 523 1,077 481 653 502 656 379 693 502 656 502 656
MALLS 527 799 593 1,807 596 883 570 901 501 933 570 901 570 901
SPECIALTY SHOPS 302 577 573 1,027 424 665 550 813 347 698 550 813 550 813
SMALL SHOPS AND SHOWROOMS 411 642 - - - - - - -
SMALL SHOPS AND SHOWROOMS 411 642 388 1,212 253 690 372 595 225 668 372 595 372 595
RESIDENTIALSINGLE & DOUBLE STOREY DWELLINGS (CUSTOM BUILT) 212 480 213 1,787 244 543 205 759 213 650 205 759 205 759
RESIDENTIAL UNITS
WALK-UP 85 TO 120 M2/UNIT - - 242 1,758 243 681 233 707 213 587 233 707 233 707
TOWNHOUSES 90 TO 120 M2/UNIT - - 209 1,391 127 681 201 668 213 565 201 668 201 668
MULTI-STOREY UNITS
Up to 10 storeys with lift
UNITS 60 – 70 M2 - - 684 2,116 566 920 657 934 528 898 657 934 657 934
UNITS 90 – 120 M2 489 816 647 2,153 566 861 621 909 523 866 621 909 621 909
Over 10 and up to 20 storeys
UNITS 60 – 70 M2 - - 780 2,220 614 920 749 1,006 565 923 749 1,006 749 1,006
UNITS 90 – 120 M2 528 913 744 2,256 614 1,015 715 925 565 891 715 925 715 925
Over 20 and up to 40 storeys
UNITS 60 – 70 M2 - - 839 2,361 733 1,040 806 1,153 661 1,012 806 1,153 806 1,153
UNITS 90 – 120 M2 - - 825 2,375 686 1,040 793 1,085 640 918 793 1,085 793 1,085
Over 40 and up to 80 storeys
UNITS 60 – 70 M2 - - 1,097 2,403 - - 0 0 837 1,245 1,054 1,370 1,054 1,370
UNITS 90 – 120 M2 - - 1,070 2,330 - - 0 0 779 1,191 1,027 1,359 1,027 1,359
All costs current as at Fourth Quarter 2021.
AUSTRALIAN CONSTRUCTIONBUILDING SERVICES COST RANGES
Rider Levett Bucknall | Riders Digest 2022 27
COST RANGE PER GROSS FLOOR AREA
ADELAIDE BRISBANE CANBERRA DARWIN MELBOURNE PERTH SYDNEY
$/M2 $/M2 $/M2 $/M2 $/M2 $/M2 $/M2
LOW HIGH LOW HIGH LOW HIGH LOW HIGH LOW HIGH LOW HIGH LOW HIGH
AGED CARE
SINGLE STOREY FACILITY 430 699 446 2,054 431 804 428 793 480 1,125 428 793 428 793
PRIVATE HOSPITALS
Low Rise Hospital
45 – 60 M2 GFA/BED 1,246 1,514 1,135 3,665 1,125 1,485 1,090 1,418 1,017 1,549 1,090 1,418 1,090 1,418 55 – 80 M2 GFA/BED WITH MAJOR OPERATING THEATRE 1,460 1,939 1,526 3,974 1,472 2,400 1,464 2,030 1,223 2,111 1,464 2,030 1,464 2,030
CINEMASGROUP COMPLEX, 2,000 – 4,000 SEATS. (WARM SHELL) 794 1,071 1,098 2,602 818 984 1,054 1,517 640 938 1,054 1,517 1,054 1,517
REGIONAL SHOPPING CENTRES
DEPARTMENT STORE 447 719 553 1,247 768 883 531 728 544 839 531 728 531 728
SUPERMARKET/VARIETY STORE 433 674 556 1,244 481 722 534 731 432 800 534 731 534 731
DISCOUNT DEPARTMENT STORE 440 616 523 1,077 481 653 502 656 379 693 502 656 502 656
MALLS 527 799 593 1,807 596 883 570 901 501 933 570 901 570 901
SPECIALTY SHOPS 302 577 573 1,027 424 665 550 813 347 698 550 813 550 813
SMALL SHOPS AND SHOWROOMS 411 642 - - - - - - -
SMALL SHOPS AND SHOWROOMS 411 642 388 1,212 253 690 372 595 225 668 372 595 372 595
RESIDENTIALSINGLE & DOUBLE STOREY DWELLINGS (CUSTOM BUILT) 212 480 213 1,787 244 543 205 759 213 650 205 759 205 759
RESIDENTIAL UNITS
WALK-UP 85 TO 120 M2/UNIT - - 242 1,758 243 681 233 707 213 587 233 707 233 707
TOWNHOUSES 90 TO 120 M2/UNIT - - 209 1,391 127 681 201 668 213 565 201 668 201 668
MULTI-STOREY UNITS
Up to 10 storeys with lift
UNITS 60 – 70 M2 - - 684 2,116 566 920 657 934 528 898 657 934 657 934
UNITS 90 – 120 M2 489 816 647 2,153 566 861 621 909 523 866 621 909 621 909
Over 10 and up to 20 storeys
UNITS 60 – 70 M2 - - 780 2,220 614 920 749 1,006 565 923 749 1,006 749 1,006
UNITS 90 – 120 M2 528 913 744 2,256 614 1,015 715 925 565 891 715 925 715 925
Over 20 and up to 40 storeys
UNITS 60 – 70 M2 - - 839 2,361 733 1,040 806 1,153 661 1,012 806 1,153 806 1,153
UNITS 90 – 120 M2 - - 825 2,375 686 1,040 793 1,085 640 918 793 1,085 793 1,085
Over 40 and up to 80 storeys
UNITS 60 – 70 M2 - - 1,097 2,403 - - 0 0 837 1,245 1,054 1,370 1,054 1,370
UNITS 90 – 120 M2 - - 1,070 2,330 - - 0 0 779 1,191 1,027 1,359 1,027 1,359
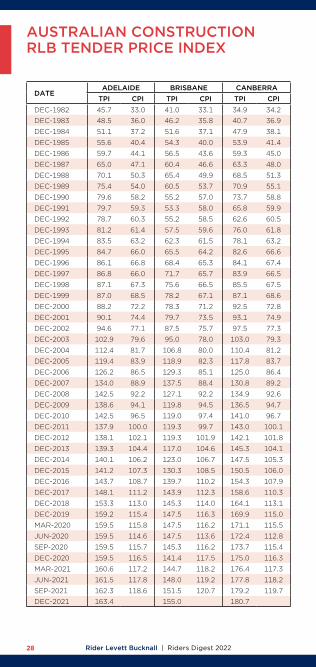
Rider Levett Bucknall | Riders Digest 202228
AUSTRALIAN CONSTRUCTIONRLB TENDER PRICE INDEX
DATEADELAIDE BRISBANE CANBERRA DARWIN MELBOURNE PERTH SYDNEY
TPI CPI TPI CPI TPI CPI TPI CPI TPI CPI TPI CPI TPI CPIDEC-1982 45.7 33.0 41.0 33.1 34.9 34.2 36.4 44.4 33.7 51.3 33.7 46.9 33.7
DEC-1983 48.5 36.0 46.2 35.8 40.7 36.9 38.8 47.3 37.0 53.4 36.5 49.7 36.2
DEC-1984 51.1 37.2 51.6 37.1 47.9 38.1 39.9 52.0 37.9 56.0 37.2 52.6 37.1
DEC-1985 55.6 40.4 54.3 40.0 53.9 41.4 43.1 58.5 41.0 65.8 40.3 60.6 40.2
DEC-1986 59.7 44.1 56.5 43.6 59.3 45.0 47.2 63.4 45.2 72.6 44.4 67.2 44.1
DEC-1987 65.0 47.1 60.4 46.6 63.3 48.0 50.4 69.3 48.4 76.5 47.5 74.1 47.2
DEC-1988 70.1 50.3 65.4 49.9 68.5 51.3 52.8 74.9 51.7 81.7 51.1 80.6 51.6
DEC-1989 75.4 54.0 60.5 53.7 70.9 55.1 56.2 81.9 56.0 89.5 55.1 86.8 55.4
DEC-1990 79.6 58.2 55.2 57.0 73.7 58.8 60.2 82.6 60.2 92.1 59.2 84.1 58.9
DEC-1991 79.7 59.3 53.3 58.0 65.8 59.9 61.2 76.7 61.2 91.2 59.1 75.1 59.8
DEC-1992 78.7 60.3 55.2 58.5 62.6 60.5 61.7 74.8 61.1 91.2 59.1 71.4 60.0
DEC-1993 81.2 61.4 57.5 59.6 76.0 61.8 63.2 77.0 62.6 91.2 60.5 72.5 60.8
DEC-1994 83.5 63.2 62.3 61.5 78.1 63.2 64.3 78.3 63.9 92.1 61.8 75.4 62.4
DEC-1995 84.7 66.0 65.5 64.2 82.6 66.6 67.4 79.8 66.9 93.0 64.8 79.1 66.1
DEC-1996 86.1 66.8 68.4 65.3 84.1 67.4 68.8 82.0 67.7 95.0 66.0 83.8 67.2
DEC-1997 86.8 66.0 71.7 65.7 83.9 66.5 68.3 84.1 67.7 97.2 65.5 89.7 67.1
DEC-1998 87.1 67.3 75.6 66.5 85.5 67.5 69.3 86.8 68.3 99.3 67.0 96.1 68.4
DEC-1999 87.0 68.5 78.2 67.1 87.1 68.6 88.0 69.9 89.4 69.7 101.9 68.3 100.0 69.7
DEC-2000 88.2 72.2 78.3 71.2 92.5 72.8 89.8 73.9 93.8 73.9 102.6 71.8 99.9 73.8
DEC-2001 90.1 74.4 79.7 73.5 93.1 74.9 91.8 75.5 96.7 76.1 100.6 73.9 100.9 76.3
DEC-2002 94.6 77.1 87.5 75.7 97.5 77.3 93.7 77.0 104.6 78.5 103.8 76.0 103.9 78.4
DEC-2003 102.9 79.6 95.0 78.0 103.0 79.3 101.1 78.3 110.1 80.3 112.1 77.5 110.1 80.2
DEC-2004 112.4 81.7 106.8 80.0 110.4 81.2 113.2 79.8 114.7 82.1 124.5 79.8 117.8 82.3
DEC-2005 119.4 83.9 118.9 82.3 117.8 83.7 121.8 82.2 118.4 84.3 135.0 83.0 123.1 84.3
DEC-2006 126.2 86.5 129.3 85.1 125.0 86.4 132.7 86.3 122.2 86.7 147.2 86.6 128.7 87.0
DEC-2007 134.0 88.9 137.5 88.4 130.8 89.2 144.7 88.8 128.0 89.5 163.4 89.3 133.2 89.1
DEC-2008 142.5 92.2 127.1 92.2 134.9 92.6 159.1 92.1 129.6 92.3 159.9 92.6 139.2 92.4
DEC-2009 138.6 94.1 119.8 94.5 136.5 94.7 164.7 94.9 131.8 94.0 150.0 94.5 139.2 94.4
DEC-2010 142.5 96.5 119.0 97.4 141.0 96.7 168.0 97.1 137.4 96.9 147.6 97.0 140.6 96.7
DEC-2011 137.9 100.0 119.3 99.7 143.0 100.1 148.8 99.5 141.4 99.9 149.5 99.8 143.7 99.8
DEC-2012 138.1 102.1 119.3 101.9 142.1 101.8 151.8 102.0 141.4 102.0 146.1 101.9 145.4 102.3
DEC-2013 139.3 104.4 117.0 104.6 145.3 104.1 156.4 106.5 141.8 104.8 147.7 104.9 148.3 105.0
DEC-2014 140.1 106.2 123.0 106.7 147.5 105.3 159.1 108.5 143.9 106.3 148.9 107.0 152.8 106.8
DEC-2015 141.2 107.3 130.3 108.5 150.5 106.0 160.7 109.0 146.8 108.3 150.0 108.6 159.7 108.9
DEC-2016 143.7 108.7 139.7 110.2 154.3 107.9 162.3 108.6 149.7 109.9 150.0 109.0 167.3 110.9
DEC-2017 148.1 111.2 143.9 112.3 158.6 110.3 163.6 109.7 154.2 112.3 150.0 109.9 174.4 113.3
DEC-2018 153.3 113.0 145.3 114.0 164.1 113.1 164.4 111.0 160.4 114.6 151.5 111.3 183.0 115.2
DEC-2019 159.2 115.4 147.5 116.3 169.9 115.0 165.2 111.5 165.2 116.9 153.7 113.1 190.5 117.1
MAR-2020 159.5 115.8 147.5 116.2 171.1 115.5 165.6 111.8 165.6 117.8 154.3 113.5 190.5 117.4
JUN-2020 159.5 114.6 147.5 113.6 172.4 112.8 165.9 109.0 166.0 115.7 154.9 112.1 190.5 114.7
SEP-2020 159.5 115.7 145.3 116.2 173.7 115.4 166.2 110.8 166.4 116.7 155.5 114.1 190.5 116.8
DEC-2020 159.5 116.5 141.4 117.5 175.0 116.3 166.6 111.5 166.9 118.4 156.0 113.0 190.5 118.0
MAR-2021 160.6 117.2 144.7 118.2 176.4 117.3 167.0 114.4 167.7 118.8 158.7 114.6 190.5 118.5
JUN-2021 161.5 117.8 148.0 119.2 177.8 118.2 167.4 115.6 168.5 119.1 162.2 116.8 191.6 119.4
SEP-2021 162.3 118.6 151.5 120.7 179.2 119.7 167.8 117.3 169.4 120.1 168.7 117.7 192.8 120.2
DEC-2021 163.4 155.0 180.7 168.2 170.2 173.7 193.9

Rider Levett Bucknall | Riders Digest 2022 29
DATEADELAIDE BRISBANE CANBERRA DARWIN MELBOURNE PERTH SYDNEY
TPI CPI TPI CPI TPI CPI TPI CPI TPI CPI TPI CPI TPI CPIDEC-1982 45.7 33.0 41.0 33.1 34.9 34.2 36.4 44.4 33.7 51.3 33.7 46.9 33.7
DEC-1983 48.5 36.0 46.2 35.8 40.7 36.9 38.8 47.3 37.0 53.4 36.5 49.7 36.2
DEC-1984 51.1 37.2 51.6 37.1 47.9 38.1 39.9 52.0 37.9 56.0 37.2 52.6 37.1
DEC-1985 55.6 40.4 54.3 40.0 53.9 41.4 43.1 58.5 41.0 65.8 40.3 60.6 40.2
DEC-1986 59.7 44.1 56.5 43.6 59.3 45.0 47.2 63.4 45.2 72.6 44.4 67.2 44.1
DEC-1987 65.0 47.1 60.4 46.6 63.3 48.0 50.4 69.3 48.4 76.5 47.5 74.1 47.2
DEC-1988 70.1 50.3 65.4 49.9 68.5 51.3 52.8 74.9 51.7 81.7 51.1 80.6 51.6
DEC-1989 75.4 54.0 60.5 53.7 70.9 55.1 56.2 81.9 56.0 89.5 55.1 86.8 55.4
DEC-1990 79.6 58.2 55.2 57.0 73.7 58.8 60.2 82.6 60.2 92.1 59.2 84.1 58.9
DEC-1991 79.7 59.3 53.3 58.0 65.8 59.9 61.2 76.7 61.2 91.2 59.1 75.1 59.8
DEC-1992 78.7 60.3 55.2 58.5 62.6 60.5 61.7 74.8 61.1 91.2 59.1 71.4 60.0
DEC-1993 81.2 61.4 57.5 59.6 76.0 61.8 63.2 77.0 62.6 91.2 60.5 72.5 60.8
DEC-1994 83.5 63.2 62.3 61.5 78.1 63.2 64.3 78.3 63.9 92.1 61.8 75.4 62.4
DEC-1995 84.7 66.0 65.5 64.2 82.6 66.6 67.4 79.8 66.9 93.0 64.8 79.1 66.1
DEC-1996 86.1 66.8 68.4 65.3 84.1 67.4 68.8 82.0 67.7 95.0 66.0 83.8 67.2
DEC-1997 86.8 66.0 71.7 65.7 83.9 66.5 68.3 84.1 67.7 97.2 65.5 89.7 67.1
DEC-1998 87.1 67.3 75.6 66.5 85.5 67.5 69.3 86.8 68.3 99.3 67.0 96.1 68.4
DEC-1999 87.0 68.5 78.2 67.1 87.1 68.6 88.0 69.9 89.4 69.7 101.9 68.3 100.0 69.7
DEC-2000 88.2 72.2 78.3 71.2 92.5 72.8 89.8 73.9 93.8 73.9 102.6 71.8 99.9 73.8
DEC-2001 90.1 74.4 79.7 73.5 93.1 74.9 91.8 75.5 96.7 76.1 100.6 73.9 100.9 76.3
DEC-2002 94.6 77.1 87.5 75.7 97.5 77.3 93.7 77.0 104.6 78.5 103.8 76.0 103.9 78.4
DEC-2003 102.9 79.6 95.0 78.0 103.0 79.3 101.1 78.3 110.1 80.3 112.1 77.5 110.1 80.2
DEC-2004 112.4 81.7 106.8 80.0 110.4 81.2 113.2 79.8 114.7 82.1 124.5 79.8 117.8 82.3
DEC-2005 119.4 83.9 118.9 82.3 117.8 83.7 121.8 82.2 118.4 84.3 135.0 83.0 123.1 84.3
DEC-2006 126.2 86.5 129.3 85.1 125.0 86.4 132.7 86.3 122.2 86.7 147.2 86.6 128.7 87.0
DEC-2007 134.0 88.9 137.5 88.4 130.8 89.2 144.7 88.8 128.0 89.5 163.4 89.3 133.2 89.1
DEC-2008 142.5 92.2 127.1 92.2 134.9 92.6 159.1 92.1 129.6 92.3 159.9 92.6 139.2 92.4
DEC-2009 138.6 94.1 119.8 94.5 136.5 94.7 164.7 94.9 131.8 94.0 150.0 94.5 139.2 94.4
DEC-2010 142.5 96.5 119.0 97.4 141.0 96.7 168.0 97.1 137.4 96.9 147.6 97.0 140.6 96.7
DEC-2011 137.9 100.0 119.3 99.7 143.0 100.1 148.8 99.5 141.4 99.9 149.5 99.8 143.7 99.8
DEC-2012 138.1 102.1 119.3 101.9 142.1 101.8 151.8 102.0 141.4 102.0 146.1 101.9 145.4 102.3
DEC-2013 139.3 104.4 117.0 104.6 145.3 104.1 156.4 106.5 141.8 104.8 147.7 104.9 148.3 105.0
DEC-2014 140.1 106.2 123.0 106.7 147.5 105.3 159.1 108.5 143.9 106.3 148.9 107.0 152.8 106.8
DEC-2015 141.2 107.3 130.3 108.5 150.5 106.0 160.7 109.0 146.8 108.3 150.0 108.6 159.7 108.9
DEC-2016 143.7 108.7 139.7 110.2 154.3 107.9 162.3 108.6 149.7 109.9 150.0 109.0 167.3 110.9
DEC-2017 148.1 111.2 143.9 112.3 158.6 110.3 163.6 109.7 154.2 112.3 150.0 109.9 174.4 113.3
DEC-2018 153.3 113.0 145.3 114.0 164.1 113.1 164.4 111.0 160.4 114.6 151.5 111.3 183.0 115.2
DEC-2019 159.2 115.4 147.5 116.3 169.9 115.0 165.2 111.5 165.2 116.9 153.7 113.1 190.5 117.1
MAR-2020 159.5 115.8 147.5 116.2 171.1 115.5 165.6 111.8 165.6 117.8 154.3 113.5 190.5 117.4
JUN-2020 159.5 114.6 147.5 113.6 172.4 112.8 165.9 109.0 166.0 115.7 154.9 112.1 190.5 114.7
SEP-2020 159.5 115.7 145.3 116.2 173.7 115.4 166.2 110.8 166.4 116.7 155.5 114.1 190.5 116.8
DEC-2020 159.5 116.5 141.4 117.5 175.0 116.3 166.6 111.5 166.9 118.4 156.0 113.0 190.5 118.0
MAR-2021 160.6 117.2 144.7 118.2 176.4 117.3 167.0 114.4 167.7 118.8 158.7 114.6 190.5 118.5
JUN-2021 161.5 117.8 148.0 119.2 177.8 118.2 167.4 115.6 168.5 119.1 162.2 116.8 191.6 119.4
SEP-2021 162.3 118.6 151.5 120.7 179.2 119.7 167.8 117.3 169.4 120.1 168.7 117.7 192.8 120.2
DEC-2021 163.4 155.0 180.7 168.2 170.2 173.7 193.9
The following indices reflect the change in tender levels for buildings, other than housing, as compared with the consumer price index. The Tender Price Index figures take into account labour and material cost changes and market conditions.
Rider Levett Bucknall | Riders Digest 202230
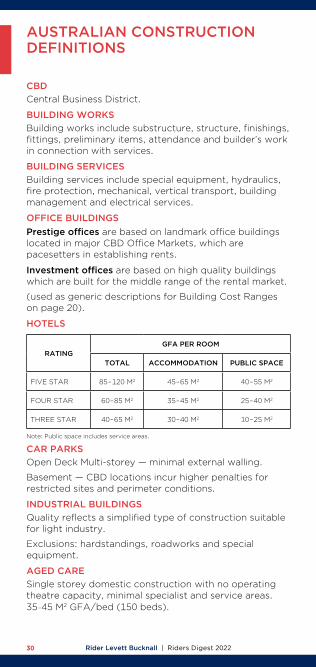
CBDCentral Business District.
BUILDING WORKSBuilding works include substructure, structure, finishings, fittings, preliminary items, attendance and builder’s work in connection with services.
BUILDING SERVICESBuilding services include special equipment, hydraulics, fire protection, mechanical, vertical transport, building management and electrical services.
OFFICE BUILDINGSPrestige offices are based on landmark office buildings located in major CBD Office Markets, which are pacesetters in establishing rents.
Investment offices are based on high quality buildings which are built for the middle range of the rental market.
(used as generic descriptions for Building Cost Ranges on page 20).
HOTELS
RATINGGFA PER ROOM
TOTAL ACCOMMODATION PUBLIC SPACE
FIVE STAR 85 – 120 M2 45 – 65 M2 40 – 55 M2
FOUR STAR 60 – 85 M2 35 – 45 M2 25 – 40 M2
THREE STAR 40 – 65 M2 30 – 40 M2 10 – 25 M2
Note: Public space includes service areas.
CAR PARKSOpen Deck Multi-storey — minimal external walling.
Basement — CBD locations incur higher penalties for restricted sites and perimeter conditions.
INDUSTRIAL BUILDINGSQuality reflects a simplified type of construction suitable for light industry.
Exclusions: hardstandings, roadworks and special equipment.
AGED CARE Single storey domestic construction with no operating theatre capacity, minimal specialist and service areas. 35 –45 M2 GFA/bed (150 beds).
AUSTRALIAN CONSTRUCTIONDEFINITIONS
Rider Levett Bucknall | Riders Digest 2022 31
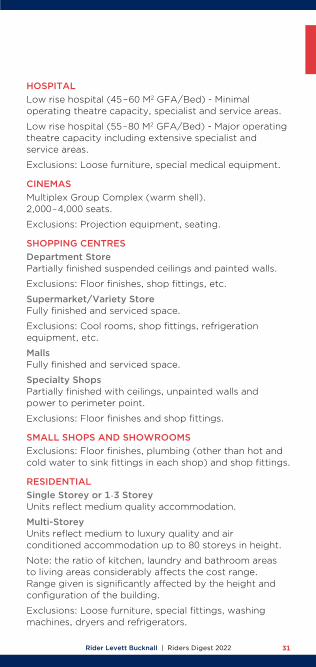
HOSPITAL Low rise hospital (45 – 60 M2 GFA/Bed) - Minimal operating theatre capacity, specialist and service areas.
Low rise hospital (55 – 80 M2 GFA/Bed) - Major operating theatre capacity including extensive specialist and service areas.
Exclusions: Loose furniture, special medical equipment.
CINEMASMultiplex Group Complex (warm shell). 2,000 – 4,000 seats.
Exclusions: Projection equipment, seating.
SHOPPING CENTRESDepartment StorePartially finished suspended ceilings and painted walls.
Exclusions: Floor finishes, shop fittings, etc.
Supermarket/Variety StoreFully finished and serviced space.
Exclusions: Cool rooms, shop fittings, refrigeration equipment, etc.
MallsFully finished and serviced space.
Specialty ShopsPartially finished with ceilings, unpainted walls and power to perimeter point.
Exclusions: Floor finishes and shop fittings.
SMALL SHOPS AND SHOWROOMSExclusions: Floor finishes, plumbing (other than hot and cold water to sink fittings in each shop) and shop fittings.
RESIDENTIALSingle Storey or 1 - 3 StoreyUnits reflect medium quality accommodation.
Multi-StoreyUnits reflect medium to luxury quality and air conditioned accommodation up to 80 storeys in height.
Note: the ratio of kitchen, laundry and bathroom areas to living areas considerably affects the cost range. Range given is significantly affected by the height and configuration of the building.
Exclusions: Loose furniture, special fittings, washing machines, dryers and refrigerators.

Rider Levett Bucknall | Riders Digest 202232
ACKNOWLEDGEMENTSRider Levett Bucknall wish to express their appreciation for advice received from the following organisations in the preparation of this compendium:
Property Council of AustraliaMeasurement of Net Lettable Area.
Savills ResearchLand Values, Rents and Yields, Rental Growth Rates and Construction Sector Data.
Colliers International – NTNorthern Territory Land Values & Yields and Rental Rates.
WSP StructuresReinforcement Ratios.
Australian Bureau of StatisticsConstruction and Building Data and CPI information.
RIDERS DIGEST50TH EDITION
For further information or feedback contact:
John Cross Oceania Research & Development Manager [email protected]
or your local RLB office (page 84)
Rider Levett Bucknall13th Floor, 380 St Kilda Road, Melbourne Vic. 3004
Telephone: (03) 9690 6111Facsimile: (03) 9690 6577
QUEENSLAND CONSTRUCTIONCOSTS
Building Services 34
Unit Costs 38
Siteworks 39
Demolition 40
Hotel Furniture, Fittings & Equipment 40
Office Fitout 41
Recreational Facilities 42
Vertical Transportation 44
Rider Levett Bucknall | Riders Digest – Queensland 202234Q
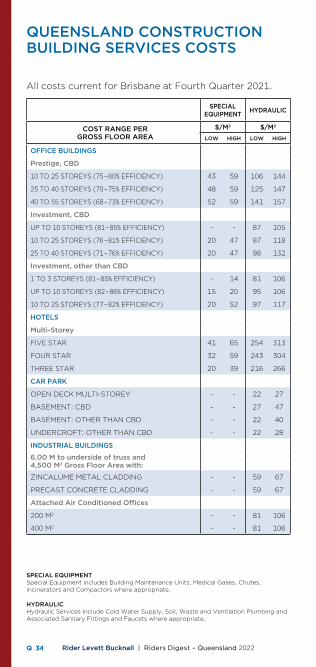
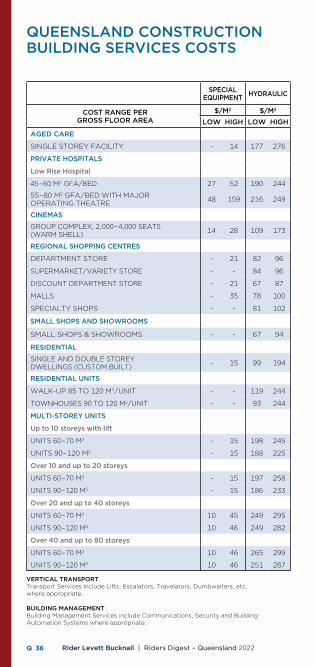
QUEENSLAND CONSTRUCTIONBUILDING SERVICES COSTS
All costs current for Brisbane at Fourth Quarter 2021.
SPECIAL EQUIPMENT HYDRAULIC FIRE MECH. VERTICAL
TRANSPORTBUILDING
MGT. ELECTRICAL TOTAL
COST RANGE PER GROSS FLOOR AREA
$/M2 $/M2 $/M2 $/M2 $/M2 $/M2 $/M2 $/M2
LOW HIGH LOW HIGH LOW HIGH LOW HIGH LOW HIGH LOW HIGH LOW HIGH LOW HIGH
OFFICE BUILDINGS
Prestige, CBD
10 TO 25 STOREYS (75 – 80% EFFICIENCY) 43 59 106 144 79 109 408 478 210 282 41 99 226 297 1,112 1,468
25 TO 40 STOREYS (70 – 75% EFFICIENCY) 48 59 125 147 87 109 419 493 289 236 60 99 283 326 1,310 1,468
40 TO 55 STOREYS (68 – 73% EFFICIENCY) 52 59 141 157 93 109 472 504 314 357 82 99 310 336 1,463 1,620
Investment, CBD
UP TO 10 STOREYS (81 – 85% EFFICIENCY) - - 87 105 16 98 319 401 159 193 16 36 163 224 760 1,057
10 TO 25 STOREYS (76 – 81% EFFICIENCY) 20 47 87 118 68 102 342 414 185 205 28 49 168 218 899 1,153
25 TO 40 STOREYS (71 – 76% EFFICIENCY) 20 47 98 132 79 102 354 414 222 271 23 55 199 248 995 1,269
Investment, other than CBD
1 TO 3 STOREYS (81 – 85% EFFICIENCY) - 14 81 106 16 41 280 319 - 58 14 36 130 163 522 737
UP TO 10 STOREYS (82 – 86% EFFICIENCY) 15 20 95 106 68 93 293 365 119 180 14 36 145 218 749 1,018
10 TO 25 STOREYS (77 – 82% EFFICIENCY) 20 52 97 117 79 93 331 403 187 233 23 41 170 231 906 1,171
HOTELS
Multi-Storey
FIVE STAR 41 65 254 313 79 110 447 496 197 273 40 82 255 323 1,313 1,660
FOUR STAR 32 59 243 304 79 110 359 469 197 236 40 70 213 297 1,163 1,543
THREE STAR 20 39 216 266 15 86 343 420 157 187 29 36 213 256 994 1,290
CAR PARK
OPEN DECK MULTI-STOREY - - 22 27 15 28 - 22 - 32 - 14 36 53 73 176
BASEMENT: CBD - - 27 47 72 89 60 78 41 56 14 23 55 65 269 359
BASEMENT: OTHER THAN CBD - - 22 40 15 70 46 72 28 38 - 23 55 65 166 308
UNDERCROFT: OTHER THAN CBD - - 22 28 9 11 - - - - - 9 24 28 54 76
INDUSTRIAL BUILDINGS
6.00 M to underside of truss and 4,500 M2 Gross Floor Area with:
ZINCALUME METAL CLADDING - - 59 67 15 28 - 15 - - - 8 61 115 135 233
PRECAST CONCRETE CLADDING - - 59 67 15 28 - 15 - - - 8 61 117 135 235
Attached Air Conditioned Offices
200 M2 - - 81 106 15 36 281 366 - 197 23 55 159 206 559 967
400 M2 - - 81 106 15 36 281 371 - 195 23 55 159 218 559 981
SPECIAL EQUIPMENTSpecial Equipment includes Building Maintenance Units, Medical Gases, Chutes, Incinerators and Compactors where appropriate.
HYDRAULICHydraulic Services include Cold Water Supply, Soil, Waste and Ventilation Plumbing and Associated Sanitary Fittings and Faucets where appropriate.

Rider Levett Bucknall | Riders Digest – Queensland 2022 35Q
All costs current for Brisbane at Fourth Quarter 2021.
SPECIAL EQUIPMENT HYDRAULIC FIRE MECH. VERTICAL
TRANSPORTBUILDING
MGT. ELECTRICAL TOTAL
COST RANGE PER GROSS FLOOR AREA
$/M2 $/M2 $/M2 $/M2 $/M2 $/M2 $/M2 $/M2
LOW HIGH LOW HIGH LOW HIGH LOW HIGH LOW HIGH LOW HIGH LOW HIGH LOW HIGH
OFFICE BUILDINGS
Prestige, CBD
10 TO 25 STOREYS (75 – 80% EFFICIENCY) 43 59 106 144 79 109 408 478 210 282 41 99 226 297 1,112 1,468
25 TO 40 STOREYS (70 – 75% EFFICIENCY) 48 59 125 147 87 109 419 493 289 236 60 99 283 326 1,310 1,468
40 TO 55 STOREYS (68 – 73% EFFICIENCY) 52 59 141 157 93 109 472 504 314 357 82 99 310 336 1,463 1,620
Investment, CBD
UP TO 10 STOREYS (81 – 85% EFFICIENCY) - - 87 105 16 98 319 401 159 193 16 36 163 224 760 1,057
10 TO 25 STOREYS (76 – 81% EFFICIENCY) 20 47 87 118 68 102 342 414 185 205 28 49 168 218 899 1,153
25 TO 40 STOREYS (71 – 76% EFFICIENCY) 20 47 98 132 79 102 354 414 222 271 23 55 199 248 995 1,269
Investment, other than CBD
1 TO 3 STOREYS (81 – 85% EFFICIENCY) - 14 81 106 16 41 280 319 - 58 14 36 130 163 522 737
UP TO 10 STOREYS (82 – 86% EFFICIENCY) 15 20 95 106 68 93 293 365 119 180 14 36 145 218 749 1,018
10 TO 25 STOREYS (77 – 82% EFFICIENCY) 20 52 97 117 79 93 331 403 187 233 23 41 170 231 906 1,171
HOTELS
Multi-Storey
FIVE STAR 41 65 254 313 79 110 447 496 197 273 40 82 255 323 1,313 1,660
FOUR STAR 32 59 243 304 79 110 359 469 197 236 40 70 213 297 1,163 1,543
THREE STAR 20 39 216 266 15 86 343 420 157 187 29 36 213 256 994 1,290
CAR PARK
OPEN DECK MULTI-STOREY - - 22 27 15 28 - 22 - 32 - 14 36 53 73 176
BASEMENT: CBD - - 27 47 72 89 60 78 41 56 14 23 55 65 269 359
BASEMENT: OTHER THAN CBD - - 22 40 15 70 46 72 28 38 - 23 55 65 166 308
UNDERCROFT: OTHER THAN CBD - - 22 28 9 11 - - - - - 9 24 28 54 76
INDUSTRIAL BUILDINGS
6.00 M to underside of truss and 4,500 M2 Gross Floor Area with:
ZINCALUME METAL CLADDING - - 59 67 15 28 - 15 - - - 8 61 115 135 233
PRECAST CONCRETE CLADDING - - 59 67 15 28 - 15 - - - 8 61 117 135 235
Attached Air Conditioned Offices
200 M2 - - 81 106 15 36 281 366 - 197 23 55 159 206 559 967
400 M2 - - 81 106 15 36 281 371 - 195 23 55 159 218 559 981
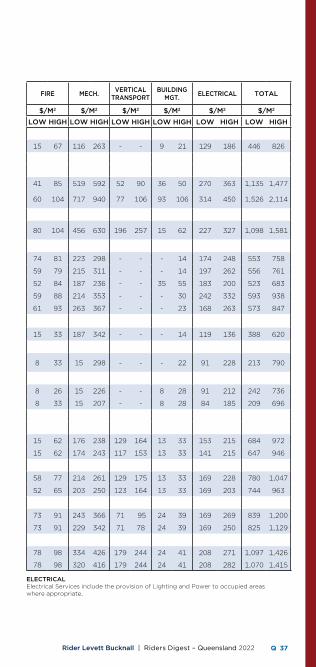
FIRE PROTECTIONFire Services include Detectors, Warden Communication, Sprinklers, Hydrants, Hose Reels and Extinguishers.
MECHANICALMechanical Services include Air Conditioning, Ventilation, Heating and Domestic Hot Water where appropriate.
Rider Levett Bucknall | Riders Digest – Queensland 202236Q
QUEENSLAND CONSTRUCTIONBUILDING SERVICES COSTS
VERTICAL TRANSPORTTransport Services include Lifts, Escalators, Travelators, Dumbwaiters, etc. where appropriate.
BUILDING MANAGEMENTBuilding Management Services include Communications, Security and Building Automation Systems where appropriate.
SPECIAL EQUIPMENT HYDRAULIC FIRE MECH. VERTICAL
TRANSPORTBUILDING
MGT. ELECTRICAL TOTAL
COST RANGE PER GROSS FLOOR AREA
$/M2 $/M2 $/M2 $/M2 $/M2 $/M2 $/M2 $/M2
LOW HIGH LOW HIGH LOW HIGH LOW HIGH LOW HIGH LOW HIGH LOW HIGH LOW HIGH
AGED CARE
SINGLE STOREY FACILITY - 14 177 276 15 67 116 263 - - 9 21 129 186 446 826
PRIVATE HOSPITALS
Low Rise Hospital
45 – 60 M2 GFA/BED 27 52 190 244 41 85 519 592 52 90 36 50 270 363 1,135 1,477
55 – 80 M2 GFA/BED WITH MAJOR OPERATING THEATRE 48 159 216 249 60 104 717 940 77 106 93 106 314 450 1,526 2,114
CINEMAS
GROUP COMPLEX, 2,000 – 4,000 SEATS (WARM SHELL) 14 28 109 173 80 104 456 630 196 257 15 62 227 327 1,098 1,581
REGIONAL SHOPPING CENTRES
DEPARTMENT STORE - 21 82 96 74 81 223 298 - - - 14 174 248 553 758
SUPERMARKET/VARIETY STORE - - 84 96 59 79 215 311 - - - 14 197 262 556 761
DISCOUNT DEPARTMENT STORE - 21 67 87 52 84 187 236 - - 35 55 183 200 523 683
MALLS - 35 78 100 59 88 214 353 - - - 30 242 332 593 938
SPECIALTY SHOPS - - 81 102 61 93 263 367 - - - 23 168 263 573 847
SMALL SHOPS AND SHOWROOMS
SMALL SHOPS & SHOWROOMS - - 67 94 15 33 187 342 - - - 14 119 136 388 620
RESIDENTIAL
SINGLE AND DOUBLE STOREY DWELLINGS (CUSTOM BUILT) - 15 99 194 8 33 15 298 - - - 22 91 228 213 790
RESIDENTIAL UNITS
WALK-UP 85 TO 120 M2/UNIT - - 119 244 8 26 15 226 - - 8 28 91 212 242 736
TOWNHOUSES 90 TO 120 M2/UNIT - - 93 244 8 33 15 207 - - 8 28 84 185 209 696
MULTI-STOREY UNITS
Up to 10 storeys with lift
UNITS 60 – 70 M2 - 15 198 245 15 62 176 238 129 164 13 33 153 215 684 972
UNITS 90 – 120 M2 - 15 188 225 15 62 174 243 117 153 13 33 141 215 647 946
Over 10 and up to 20 storeys
UNITS 60 – 70 M2 - 15 197 258 58 77 214 261 129 175 13 33 169 228 780 1,047
UNITS 90 – 120 M2 - 15 186 233 52 65 203 250 123 164 13 33 169 203 744 963
Over 20 and up to 40 storeys
UNITS 60 – 70 M2 10 45 249 295 73 91 243 366 71 95 24 39 169 269 839 1,200
UNITS 90 – 120 M2 10 46 249 282 73 91 229 342 71 78 24 39 169 250 825 1,129
Over 40 and up to 80 storeys
UNITS 60 – 70 M2 10 46 265 299 78 98 334 426 179 244 24 41 208 271 1,097 1,426
UNITS 90 – 120 M2 10 46 251 287 78 98 320 416 179 244 24 41 208 282 1,070 1,415
Rider Levett Bucknall | Riders Digest – Queensland 2022 37Q
ELECTRICAL Electrical Services include the provision of Lighting and Power to occupied areas where appropriate.
SPECIAL EQUIPMENT HYDRAULIC FIRE MECH. VERTICAL
TRANSPORTBUILDING
MGT. ELECTRICAL TOTAL
COST RANGE PER GROSS FLOOR AREA
$/M2 $/M2 $/M2 $/M2 $/M2 $/M2 $/M2 $/M2
LOW HIGH LOW HIGH LOW HIGH LOW HIGH LOW HIGH LOW HIGH LOW HIGH LOW HIGH
AGED CARE
SINGLE STOREY FACILITY - 14 177 276 15 67 116 263 - - 9 21 129 186 446 826
PRIVATE HOSPITALS
Low Rise Hospital
45 – 60 M2 GFA/BED 27 52 190 244 41 85 519 592 52 90 36 50 270 363 1,135 1,477
55 – 80 M2 GFA/BED WITH MAJOR OPERATING THEATRE 48 159 216 249 60 104 717 940 77 106 93 106 314 450 1,526 2,114
CINEMAS
GROUP COMPLEX, 2,000 – 4,000 SEATS (WARM SHELL) 14 28 109 173 80 104 456 630 196 257 15 62 227 327 1,098 1,581
REGIONAL SHOPPING CENTRES
DEPARTMENT STORE - 21 82 96 74 81 223 298 - - - 14 174 248 553 758
SUPERMARKET/VARIETY STORE - - 84 96 59 79 215 311 - - - 14 197 262 556 761
DISCOUNT DEPARTMENT STORE - 21 67 87 52 84 187 236 - - 35 55 183 200 523 683
MALLS - 35 78 100 59 88 214 353 - - - 30 242 332 593 938
SPECIALTY SHOPS - - 81 102 61 93 263 367 - - - 23 168 263 573 847
SMALL SHOPS AND SHOWROOMS
SMALL SHOPS & SHOWROOMS - - 67 94 15 33 187 342 - - - 14 119 136 388 620
RESIDENTIAL
SINGLE AND DOUBLE STOREY DWELLINGS (CUSTOM BUILT) - 15 99 194 8 33 15 298 - - - 22 91 228 213 790
RESIDENTIAL UNITS
WALK-UP 85 TO 120 M2/UNIT - - 119 244 8 26 15 226 - - 8 28 91 212 242 736
TOWNHOUSES 90 TO 120 M2/UNIT - - 93 244 8 33 15 207 - - 8 28 84 185 209 696
MULTI-STOREY UNITS
Up to 10 storeys with lift
UNITS 60 – 70 M2 - 15 198 245 15 62 176 238 129 164 13 33 153 215 684 972
UNITS 90 – 120 M2 - 15 188 225 15 62 174 243 117 153 13 33 141 215 647 946
Over 10 and up to 20 storeys
UNITS 60 – 70 M2 - 15 197 258 58 77 214 261 129 175 13 33 169 228 780 1,047
UNITS 90 – 120 M2 - 15 186 233 52 65 203 250 123 164 13 33 169 203 744 963
Over 20 and up to 40 storeys
UNITS 60 – 70 M2 10 45 249 295 73 91 243 366 71 95 24 39 169 269 839 1,200
UNITS 90 – 120 M2 10 46 249 282 73 91 229 342 71 78 24 39 169 250 825 1,129
Over 40 and up to 80 storeys
UNITS 60 – 70 M2 10 46 265 299 78 98 334 426 179 244 24 41 208 271 1,097 1,426
UNITS 90 – 120 M2 10 46 251 287 78 98 320 416 179 244 24 41 208 282 1,070 1,415
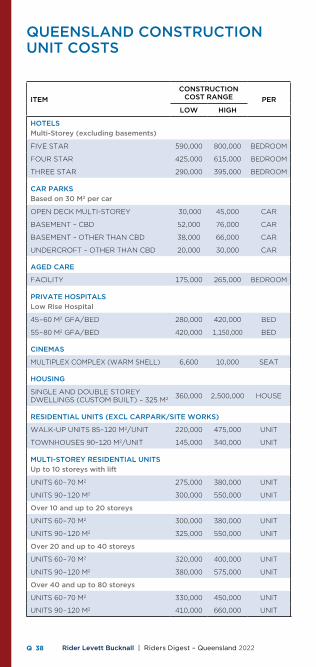
Rider Levett Bucknall | Riders Digest – Queensland 202238Q
QUEENSLAND CONSTRUCTIONUNIT COSTS
ITEMCONSTRUCTION
COST RANGE PERLOW HIGH
HOTELSMulti-Storey (excluding basements)
FIVE STAR 590,000 800,000 BEDROOM
FOUR STAR 425,000 615,000 BEDROOM
THREE STAR 290,000 395,000 BEDROOM
CAR PARKSBased on 30 M2 per car
OPEN DECK MULTI-STOREY 30,000 45,000 CAR
BASEMENT – CBD 52,000 76,000 CAR
BASEMENT – OTHER THAN CBD 38,000 66,000 CAR
UNDERCROFT – OTHER THAN CBD 20,000 30,000 CAR
AGED CARE
FACILITY 175,000 265,000 BEDROOM
PRIVATE HOSPITALSLow Rise Hospital
45 – 60 M2 GFA/BED 280,000 420,000 BED
55 – 80 M2 GFA/BED 420,000 1,150,000 BED
CINEMAS
MULTIPLEX COMPLEX (WARM SHELL) 6,600 10,000 SEAT
HOUSING
SINGLE AND DOUBLE STOREY DWELLINGS (CUSTOM BUILT) – 325 M2 360,000 2,500,000 HOUSE
RESIDENTIAL UNITS (EXCL CARPARK/SITE WORKS)
WALK-UP UNITS 85–120 M2/UNIT 220,000 475,000 UNIT
TOWNHOUSES 90–120 M2/UNIT 145,000 340,000 UNIT
MULTI-STOREY RESIDENTIAL UNITS Up to 10 storeys with lift
UNITS 60 – 70 M2 275,000 380,000 UNIT
UNITS 90 – 120 M2 300,000 550,000 UNIT
Over 10 and up to 20 storeys
UNITS 60 – 70 M2 300,000 380,000 UNIT
UNITS 90 – 120 M2 325,000 550,000 UNIT
Over 20 and up to 40 storeys
UNITS 60 – 70 M2 320,000 400,000 UNIT
UNITS 90 – 120 M2 380,000 575,000 UNIT
Over 40 and up to 80 storeys
UNITS 60 – 70 M2 330,000 450,000 UNIT
UNITS 90 – 120 M2 410,000 660,000 UNIT

Rider Levett Bucknall | Riders Digest – Queensland 2022 39Q
LANDSCAPING
LOW HIGH PER
LIGHT LANDSCAPING TO LARGE AREAS WITH MINIMAL PLANTING AND SITE FORMATION BUT EXCLUDING TOPSOIL AND GRASSING
45,000 75,000 HECTARE
DENSE LANDSCAPING AROUND BUILDINGS INCLUDING SHRUBS, PLANTS, TOPSOIL AND GRASSING
150 350 M2
GRASSING ONLY TO LARGE AREAS INCLUDING TOPSOIL, SOWING AND TREATING
20 25 M2
CAR PARKS – ON GROUNDBased on 30 M2 overall area per car with asphalt paving including sub base and sealing.
LOW HIGH PER
LIGHT DUTY PAVING 3,000 3,600 CARSPACE
HEAVY DUTY PAVING TO FACTORY TYPE COMPLEX, LARGE AREA WITH MINIMAL SITE FORMATION, DRAINAGE AND KERB TREATMENT
4,000 6,500 CARSPACE
LIGHT DUTY PAVING TO SHOPPING CENTRE COMPLEX, LARGE AREA WITH MINIMAL SITE FORMATION, AND INCLUDING DRAINAGE AND KERB TREATMENT
3,400 4,800 CARSPACE
ROADSAsphalt finish including kerb, channel and drainage.
LOW HIGH PER
RESIDENTIAL ESTATE 6.80 METRES WIDE EXCLUDING FOOT PATH AND NATURE STRIP
2,400 3,000 M
INDUSTRIAL ESTATE 10.4 METRES WIDE INCLUDING MINIMAL TO EXTENSIVE FORMATION
3,600 4,000 M
QUEENSLAND CONSTRUCTIONSITEWORKS COSTS
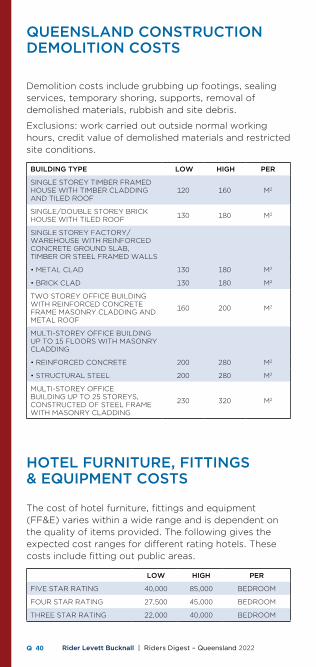
Rider Levett Bucknall | Riders Digest – Queensland 202240Q
Demolition costs include grubbing up footings, sealing services, temporary shoring, supports, removal of demolished materials, rubbish and site debris.
Exclusions: work carried out outside normal working hours, credit value of demolished materials and restricted site conditions.
BUILDING TYPE LOW HIGH PER
SINGLE STOREY TIMBER FRAMED HOUSE WITH TIMBER CLADDING AND TILED ROOF
120 160 M2
SINGLE/DOUBLE STOREY BRICK HOUSE WITH TILED ROOF 130 180 M2
SINGLE STOREY FACTORY/WAREHOUSE WITH REINFORCED CONCRETE GROUND SLAB, TIMBER OR STEEL FRAMED WALLS
• METAL CLAD 130 180 M2
• BRICK CLAD 130 180 M2
TWO STOREY OFFICE BUILDING WITH REINFORCED CONCRETE FRAME MASONRY CLADDING AND METAL ROOF
160 200 M2
MULTI-STOREY OFFICE BUILDING UP TO 15 FLOORS WITH MASONRY CLADDING
• REINFORCED CONCRETE 200 280 M2
• STRUCTURAL STEEL 200 280 M2
MULTI-STOREY OFFICE BUILDING UP TO 25 STOREYS, CONSTRUCTED OF STEEL FRAME WITH MASONRY CLADDING
230 320 M2
QUEENSLAND CONSTRUCTION DEMOLITION COSTS
HOTEL FURNITURE, FITTINGS & EQUIPMENT COSTS
The cost of hotel furniture, fittings and equipment (FF&E) varies within a wide range and is dependent on the quality of items provided. The following gives the expected cost ranges for different rating hotels. These costs include fitting out public areas.
LOW HIGH PER
FIVE STAR RATING 40,000 85,000 BEDROOM
FOUR STAR RATING 27,500 45,000 BEDROOM
THREE STAR RATING 22,000 40,000 BEDROOM
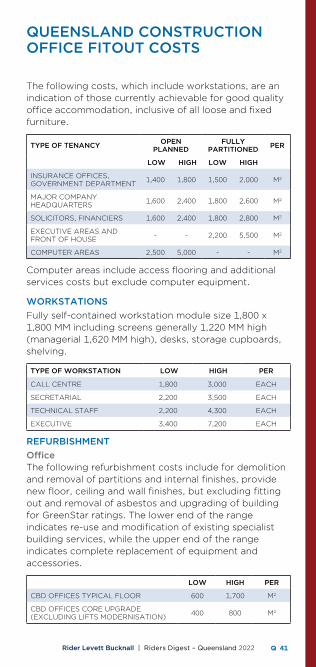
Rider Levett Bucknall | Riders Digest – Queensland 2022 41Q
QUEENSLAND CONSTRUCTIONOFFICE FITOUT COSTS
The following costs, which include workstations, are an indication of those currently achievable for good quality office accommodation, inclusive of all loose and fixed furniture.
TYPE OF TENANCY OPEN PLANNED
FULLY PARTITIONED PER
LOW HIGH LOW HIGH
INSURANCE OFFICES, GOVERNMENT DEPARTMENT 1,400 1,800 1,500 2,000 M2
MAJOR COMPANY HEADQUARTERS 1,600 2,400 1,800 2,600 M2
SOLICITORS, FINANCIERS 1,600 2,400 1,800 2,800 M2
EXECUTIVE AREAS AND FRONT OF HOUSE - - 2,200 5,500 M2
COMPUTER AREAS 2,500 5,000 - - M2
Computer areas include access flooring and additional services costs but exclude computer equipment.
WORKSTATIONSFully self-contained workstation module size 1,800 x 1,800 MM including screens generally 1,220 MM high (managerial 1,620 MM high), desks, storage cupboards, shelving.
TYPE OF WORKSTATION LOW HIGH PER
CALL CENTRE 1,800 3,000 EACH
SECRETARIAL 2,200 3,500 EACH
TECHNICAL STAFF 2,200 4,300 EACH
EXECUTIVE 3,400 7,200 EACH
REFURBISHMENTOfficeThe following refurbishment costs include for demolition and removal of partitions and internal finishes, provide new floor, ceiling and wall finishes, but excluding fitting out and removal of asbestos and upgrading of building for GreenStar ratings. The lower end of the range indicates re-use and modification of existing specialist building services, while the upper end of the range indicates complete replacement of equipment and accessories.
LOW HIGH PER
CBD OFFICES TYPICAL FLOOR 600 1,700 M2
CBD OFFICES CORE UPGRADE (EXCLUDING LIFTS MODERNISATION) 400 800 M2
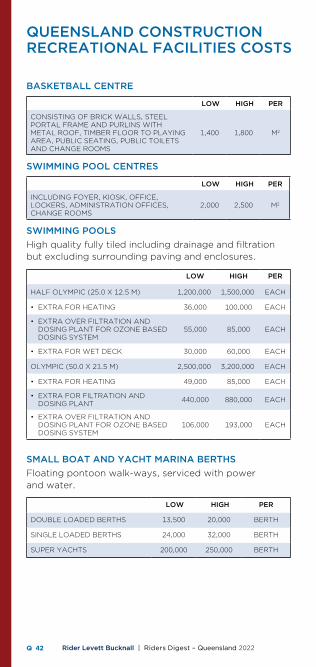
Rider Levett Bucknall | Riders Digest – Queensland 202242Q
BASKETBALL CENTRE
LOW HIGH PER
CONSISTING OF BRICK WALLS, STEEL PORTAL FRAME AND PURLINS WITH METAL ROOF, TIMBER FLOOR TO PLAYING AREA, PUBLIC SEATING, PUBLIC TOILETS AND CHANGE ROOMS
1,400 1,800 M2
SWIMMING POOL CENTRES
LOW HIGH PER
INCLUDING FOYER, KIOSK, OFFICE, LOCKERS, ADMINISTRATION OFFICES, CHANGE ROOMS
2,000 2,500 M2
SWIMMING POOLSHigh quality fully tiled including drainage and filtration but excluding surrounding paving and enclosures.
LOW HIGH PER
HALF OLYMPIC (25.0 X 12.5 M) 1,200,000 1,500,000 EACH
• EXTRA FOR HEATING 36,000 100,000 EACH
• EXTRA OVER FILTRATION AND DOSING PLANT FOR OZONE BASED DOSING SYSTEM
55,000 85,000 EACH
• EXTRA FOR WET DECK 30,000 60,000 EACH
OLYMPIC (50.0 X 21.5 M) 2,500,000 3,200,000 EACH
• EXTRA FOR HEATING 49,000 85,000 EACH
• EXTRA FOR FILTRATION AND DOSING PLANT 440,000 880,000 EACH
• EXTRA OVER FILTRATION AND DOSING PLANT FOR OZONE BASED DOSING SYSTEM
106,000 193,000 EACH
SMALL BOAT AND YACHT MARINA BERTHSFloating pontoon walk-ways, serviced with power and water.
LOW HIGH PER
DOUBLE LOADED BERTHS 13,500 20,000 BERTH
SINGLE LOADED BERTHS 24,000 32,000 BERTH
SUPER YACHTS 200,000 250,000 BERTH
QUEENSLAND CONSTRUCTION RECREATIONAL FACILITIES COSTS
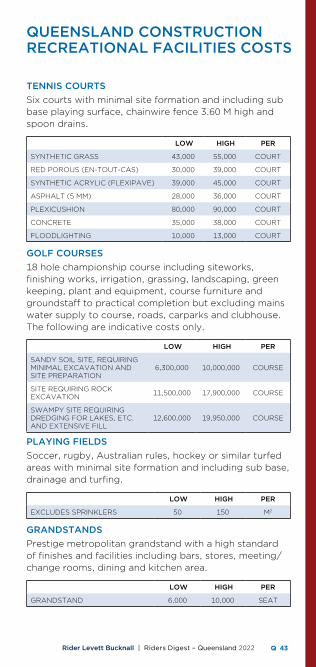
Rider Levett Bucknall | Riders Digest – Queensland 2022 43Q
TENNIS COURTSSix courts with minimal site formation and including sub base playing surface, chainwire fence 3.60 M high and spoon drains.
LOW HIGH PER
SYNTHETIC GRASS 43,000 55,000 COURT
RED POROUS (EN-TOUT-CAS) 30,000 39,000 COURT
SYNTHETIC ACRYLIC (FLEXIPAVE) 39,000 45,000 COURT
ASPHALT (5 MM) 28,000 36,000 COURT
PLEXICUSHION 80,000 90,000 COURT
CONCRETE 35,000 38,000 COURT
FLOODLIGHTING 10,000 13,000 COURT
GOLF COURSES18 hole championship course including siteworks, finishing works, irrigation, grassing, landscaping, green keeping, plant and equipment, course furniture and groundstaff to practical completion but excluding mains water supply to course, roads, carparks and clubhouse. The following are indicative costs only.
LOW HIGH PER
SANDY SOIL SITE, REQUIRING MINIMAL EXCAVATION AND SITE PREPARATION
6,300,000 10,000,000 COURSE
SITE REQUIRING ROCK EXCAVATION 11,500,000 17,900,000 COURSE
SWAMPY SITE REQUIRING DREDGING FOR LAKES, ETC. AND EXTENSIVE FILL
12,600,000 19,950,000 COURSE
PLAYING FIELDSSoccer, rugby, Australian rules, hockey or similar turfed areas with minimal site formation and including sub base, drainage and turfing.
LOW HIGH PER
EXCLUDES SPRINKLERS 50 150 M2
GRANDSTANDSPrestige metropolitan grandstand with a high standard of finishes and facilities including bars, stores, meeting/change rooms, dining and kitchen area.
LOW HIGH PER
GRANDSTAND 6,000 10,000 SEAT
QUEENSLAND CONSTRUCTION RECREATIONAL FACILITIES COSTS
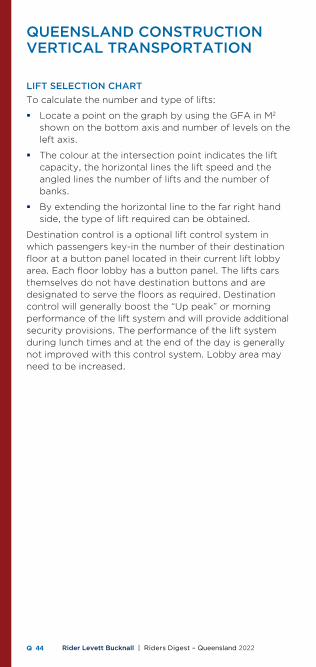
Rider Levett Bucknall | Riders Digest – Queensland 202244Q
LIFT SELECTION CHARTTo calculate the number and type of lifts:
§ Locate a point on the graph by using the GFA in M2 shown on the bottom axis and number of levels on the left axis.
§ The colour at the intersection point indicates the lift capacity, the horizontal lines the lift speed and the angled lines the number of lifts and the number of banks.
§ By extending the horizontal line to the far right hand side, the type of lift required can be obtained.
Destination control is a optional lift control system in which passengers key-in the number of their destination floor at a button panel located in their current lift lobby area. Each floor lobby has a button panel. The lifts cars themselves do not have destination buttons and are designated to serve the floors as required. Destination control will generally boost the “Up peak” or morning performance of the lift system and will provide additional security provisions. The performance of the lift system during lunch times and at the end of the day is generally not improved with this control system. Lobby area may need to be increased.
QUEENSLAND CONSTRUCTION VERTICAL TRANSPORTATION
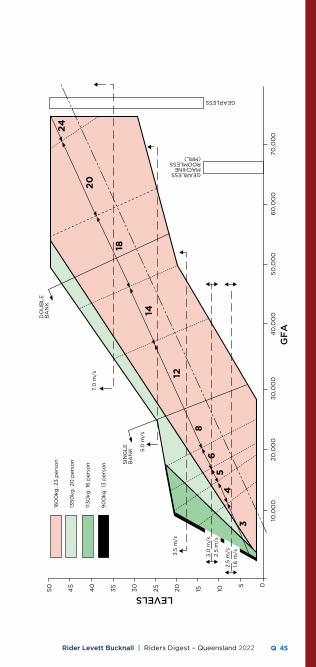
Rider Levett Bucknall | Riders Digest – Queensland 2022 45Q
70
,00
06
0,0
00
50
,00
04
0,0
00
30
,00
020
,00
010
,00
0
50
45
40
35
30
25
20
15 10
5 0
GF
A
LEVELS
GEARLESS
GEARLESS MACHINEROOMLESS (MRL)
24
20
18
14
12
8
65
4
3
3.5
m/s
5.0
m/s
3.0
m/s
2.5
m/s
160
0kg
. 23
pers
on
135
0kg
. 20
pers
on
113
0kg
. 16
pers
on
90
0kg
. 13
pers
on
1.6
m/s
2.5
m/s
7.0
m/s
SIN
GL
EB
AN
K
DO
UB
LE
BA
NK

Rider Levett Bucknall | Riders Digest – Queensland 202246Q
QUEENSLAND CONSTRUCTION VERTICAL TRANSPORTATION
APPLICATION LIFT TYPE SPEED M/S
NO. OF FLOORS SERVED
BASE COST$
ADDITIONAL FLOOR
EXPRESS FLOOR
LOW HIGH RATE RATE
OFFICE & RESIDENTIAL
ELECTRO-HYDRAULIC PASSENGER
0.5 2 109,500 130,000 13,200 8,100
GEARLESS TO 17 PASSENGER
1 5 112,600 139,000 13,200 8,100
GEARLESS UP TO 17 PASSENGER
1.6 8 150,400 194,000 13,200 8,000
GEARLESS 2.5 10 265,000 325,500 13,200 8,000
GEARLESS 3.5 10 687,000 775,500 13,200 8,000
GEARLESS 4 10 725,000 794,000 14,300 10,300
GEARLESS 5 10 748,000 815,000 14,300 10,300
GEARLESS 6 10 815,500 878,000 14,300 10,300
GEARLESS 7 10 1,230,000 1,290,000 14,300 10,300
GEARLESS 8 10 1,345,500 1,385,000 19,500 11,900
HOSPITAL
GEARED UP TO 40 PASSENGER
2 5 385,000 455,000 16,500 10,300
GEARLESS 2.5 10 370,000 326,000 17,000 10,300
LARGE GOODS
GEARLESS MRL TO 2,000 KG
1.6 10 217,000 268,500 13,500 9,100
ELECTRO-HYDRAULIC TO 5,000 KG
0.5 2 375,500 428,500 24,800 17,000
GEARLESS 2,500 KG 2.5 10 568,000 625,500 17,000 10,300
ESCALATORS RISE 2,600 TO 5,000 MM
0.5 - 194,000 237,800 - -
MOVING WALKS 2,500 TO 5,000 MM 0.5 - 295,500 375,000 - -
SERVICE LIFTBENCH HEIGHT UNIT 0.2 3 31,000 42,500 4,300 1,600
LARGER UNIT 0.2 3 48,000 58,000 5,100 1,600
DISABLED PLATFORM LIFT
TO 1,000 MM 0.1 2 32,000 39,000 - -
1,000 TO 4,000 MM 0.1 2 43,000 75,000 - -
Note: Destination Control Lift System option costs are not included in the above rates.
QUEENSLAND DEVELOPMENT
Stamp Duties 48
Land Tax 49
Planning – Car Parking 50
Land Values 51
Rental Rates 52
Office Sector Data 53
Retail Sector Data 56
Industrial Sector Data 58
Construction Work Done 59
RLB Market Activity Cycle 63

Rider Levett Bucknall | Riders Digest – Queensland 202248Q
A transfer duty liability is created when a person enters into a dutiable transaction relating to dutiable property in Queensland.
Transfer duty is calculated on the dutiable value of a transaction, which is generally, the greater of the consideration paid for, or the unencumbered value of the property acquired.
Depending on the nature of the transaction, certain concessions and exemptions are available.
HOME CONCESSION RATES
PURCHASE PRICE/VALUE DUTY RATE
$0 - $350,000 $1.00 FOR EVERY $100 OR PART OF $100
$350,000 - $540,000 $3,500 PLUS $3.50 FOR EVERY $100 OR PART OF $100 OVER $350,000
$540,000 - $1,000,000 $10,150 PLUS $4.50 FOR EVERY $100 OR PART OF $100 OVER $540,000
MORE THAN $1,000,000 $30,850 PLUS $5.75 FOR EVERY $100 OR PART OF $100 OVER $1,000,000
TRANSFER DUTY RATES
DUTIABLE VALUE DUTY RATE
$0 - $5,000 NIL
$5,000 - $75,000 $1.50 FOR EVERY $100 OR PART OF $100 OVER $5,000
$75,000 - $540,000 $1,050 PLUS $3.50 FOR EVERY $100 OR PART OF $100 OVER $75,000
$540,000 - $1,000,000 $17,325 PLUS $4.50 FOR EVERY $100 OR PART OF $100 OVER $540,000
MORE THAN $1,000,000 $38,025 PLUS $5.75 FOR EVERY $100 OR PART OF $100 OVER $1,000,000
An additional duty of 7% applies to acquisitions of residential land by foreign persons (including companies and trusts).
For further details refer to www.qld.gov.au.
QUEENSLAND DEVELOPMENTSTAMP DUTIES
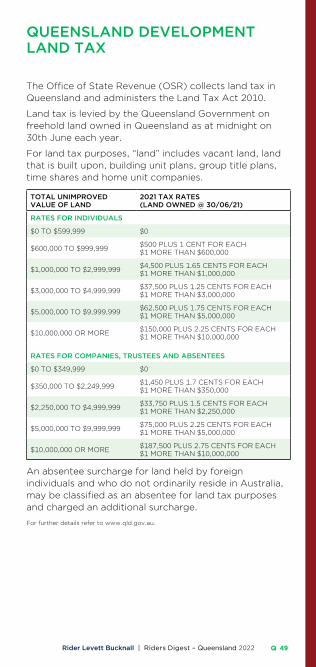
Rider Levett Bucknall | Riders Digest – Queensland 2022 49Q
The Office of State Revenue (OSR) collects land tax in Queensland and administers the Land Tax Act 2010.
Land tax is levied by the Queensland Government on freehold land owned in Queensland as at midnight on 30th June each year.
For land tax purposes, “land” includes vacant land, land that is built upon, building unit plans, group title plans, time shares and home unit companies.
TOTAL UNIMPROVED VALUE OF LAND
2021 TAX RATES (LAND OWNED @ 30/06/21)
RATES FOR INDIVIDUALS
$0 TO $599,999 $0
$600,000 TO $999,999 $500 PLUS 1 CENT FOR EACH $1 MORE THAN $600,000
$1,000,000 TO $2,999,999 $4,500 PLUS 1.65 CENTS FOR EACH $1 MORE THAN $1,000,000
$3,000,000 TO $4,999,999 $37,500 PLUS 1.25 CENTS FOR EACH $1 MORE THAN $3,000,000
$5,000,000 TO $9,999,999 $62,500 PLUS 1.75 CENTS FOR EACH $1 MORE THAN $5,000,000
$10,000,000 OR MORE $150,000 PLUS 2.25 CENTS FOR EACH $1 MORE THAN $10,000,000
RATES FOR COMPANIES, TRUSTEES AND ABSENTEES
$0 TO $349,999 $0
$350,000 TO $2,249,999 $1,450 PLUS 1.7 CENTS FOR EACH $1 MORE THAN $350,000
$2,250,000 TO $4,999,999 $33,750 PLUS 1.5 CENTS FOR EACH $1 MORE THAN $2,250,000
$5,000,000 TO $9,999,999 $75,000 PLUS 2.25 CENTS FOR EACH $1 MORE THAN $5,000,000
$10,000,000 OR MORE $187,500 PLUS 2.75 CENTS FOR EACH $1 MORE THAN $10,000,000
An absentee surcharge for land held by foreign individuals and who do not ordinarily reside in Australia, may be classified as an absentee for land tax purposes and charged an additional surcharge.
For further details refer to www.qld.gov.au.
QUEENSLAND DEVELOPMENT LAND TAX
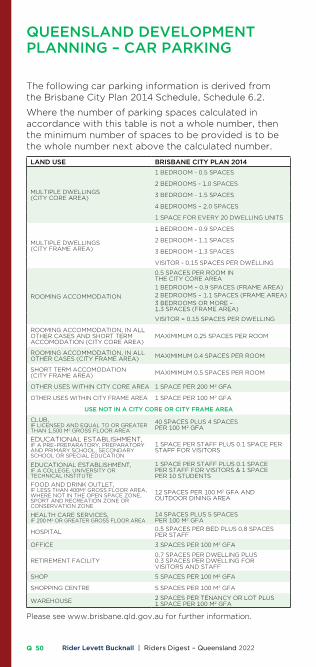
Rider Levett Bucknall | Riders Digest – Queensland 202250Q
The following car parking information is derived from the Brisbane City Plan 2014 Schedule, Schedule 6.2.
Where the number of parking spaces calculated in accordance with this table is not a whole number, then the minimum number of spaces to be provided is to be the whole number next above the calculated number.
LAND USE BRISBANE CITY PLAN 2014
MULTIPLE DWELLINGS (CITY CORE AREA)
1 BEDROOM - 0.5 SPACES
2 BEDROOMS - 1.0 SPACES
3 BEDROOM - 1.5 SPACES
4 BEDROOMS – 2.0 SPACES
1 SPACE FOR EVERY 20 DWELLING UNITS
MULTIPLE DWELLINGS (CITY FRAME AREA)
1 BEDROOM - 0.9 SPACES
2 BEDROOM - 1.1 SPACES
3 BEDROOM - 1.3 SPACES
VISITOR - 0.15 SPACES PER DWELLING
ROOMING ACCOMMODATION
0.5 SPACES PER ROOM IN THE CITY CORE AREA1 BEDROOM – 0.9 SPACES (FRAME AREA)2 BEDROOMS – 1.1 SPACES (FRAME AREA)3 BEDROOMS OR MORE – 1.3 SPACES (FRAME AREA)
VISITOR = 0.15 SPACES PER DWELLING
ROOMING ACCOMMODATION, IN ALL OTHER CASES AND SHORT TERM ACCOMODATION (CITY CORE AREA)
MAXIMIMUM 0.25 SPACES PER ROOM
ROOMING ACCOMMODATION, IN ALL OTHER CASES (CITY FRAME AREA) MAXIMIMUM 0.4 SPACES PER ROOM
SHORT TERM ACCOMODATION (CITY FRAME AREA) MAXIMIMUM 0.5 SPACES PER ROOM
OTHER USES WITHIN CITY CORE AREA 1 SPACE PER 200 M2 GFA
OTHER USES WITHIN CITY FRAME AREA 1 SPACE PER 100 M2 GFA
USE NOT IN A CITY CORE OR CITY FRAME AREA
CLUB, IF LICENSED AND EQUAL TO OR GREATER THAN 1,500 M2 GROSS FLOOR AREA
40 SPACES PLUS 4 SPACES PER 100 M2 GFA
EDUCATIONAL ESTABLISHMENT, IF A PRE–PREPARATORY, PREPARATORY AND PRIMARY SCHOOL, SECONDARY SCHOOL OR SPECIAL EDUCATION
1 SPACE PER STAFF PLUS 0.1 SPACE PER STAFF FOR VISITORS
EDUCATIONAL ESTABLISHMENT, IF A COLLEGE, UNIVERSITY OR TECHNICAL INSTITUTE
1 SPACE PER STAFF PLUS 0.1 SPACE PER STAFF FOR VISITORS & 1 SPACE PER 10 STUDENTS
FOOD AND DRINK OUTLET, IF LESS THAN 400M2 GROSS FLOOR AREA, WHERE NOT IN THE OPEN SPACE ZONE, SPORT AND RECREATION ZONE OR CONSERVATION ZONE
12 SPACES PER 100 M2 GFA AND OUTDOOR DINING AREA
HEALTH CARE SERVICES, IF 200 M2 OR GREATER GROSS FLOOR AREA
14 SPACES PLUS 5 SPACES PER 100 M2 GFA
HOSPITAL 0.5 SPACES PER BED PLUS 0.8 SPACES PER STAFF
OFFICE 3 SPACES PER 100 M2 GFA
RETIREMENT FACILITY0.7 SPACES PER DWELLING PLUS 0.3 SPACES PER DWELLING FOR VISITORS AND STAFF
SHOP 5 SPACES PER 100 M2 GFA
SHOPPING CENTRE 5 SPACES PER 100 M2 GFA
WAREHOUSE 2 SPACES PER TENANCY OR LOT PLUS 1 SPACE PER 100 M2 GFA
Please see www.brisbane.qld.gov.au for further information.
QUEENSLAND DEVELOPMENT PLANNING – CAR PARKING
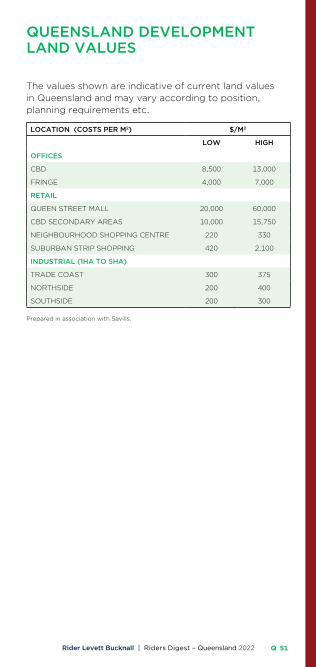
Rider Levett Bucknall | Riders Digest – Queensland 2022 51Q
The values shown are indicative of current land values in Queensland and may vary according to position, planning requirements etc.
LOCATION (COSTS PER M2) $/M2
LOW HIGH
OFFICES
CBD 8,500 13,000
FRINGE 4,000 7,000
RETAIL
QUEEN STREET MALL 20,000 60,000
CBD SECONDARY AREAS 10,000 15,750
NEIGHBOURHOOD SHOPPING CENTRE 220 330
SUBURBAN STRIP SHOPPING 420 2,100
INDUSTRIAL (1HA TO 5HA)
TRADE COAST 300 375
NORTHSIDE 200 400
SOUTHSIDE 200 300
Prepared in association with Savills.
QUEENSLAND DEVELOPMENTLAND VALUES
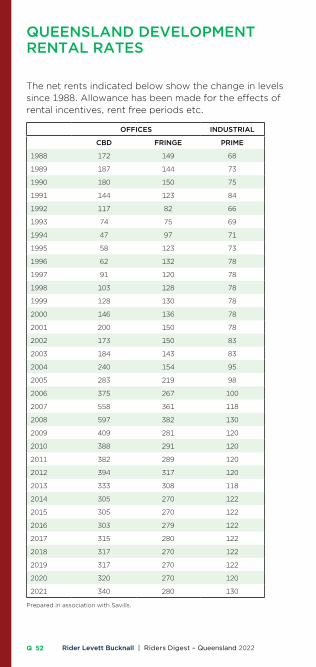
Rider Levett Bucknall | Riders Digest – Queensland 202252Q
QUEENSLAND DEVELOPMENT RENTAL RATES
The net rents indicated below show the change in levels since 1988. Allowance has been made for the effects of rental incentives, rent free periods etc.
OFFICES INDUSTRIAL
CBD FRINGE PRIME
1988 172 149 68
1989 187 144 73
1990 180 150 75
1991 144 123 84
1992 117 82 66
1993 74 75 69
1994 47 97 71
1995 58 123 73
1996 62 132 78
1997 91 120 78
1998 103 128 78
1999 128 130 78
2000 146 136 78
2001 200 150 78
2002 173 150 83
2003 184 143 83
2004 240 154 95
2005 283 219 98
2006 375 267 100
2007 558 361 118
2008 597 382 130
2009 409 281 120
2010 388 291 120
2011 382 289 120
2012 394 317 120
2013 333 308 118
2014 305 270 122
2015 305 270 122
2016 303 279 122
2017 315 280 122
2018 317 270 122
2019 317 270 122
2020 320 270 120
2021 340 280 130
Prepared in association with Savills.
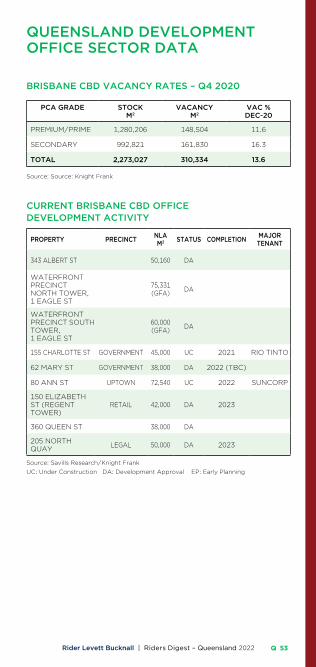
Rider Levett Bucknall | Riders Digest – Queensland 2022 53Q
QUEENSLAND DEVELOPMENTOFFICE SECTOR DATA
BRISBANE CBD VACANCY RATES – Q4 2020
PCA GRADE STOCK M2
VACANCY M2
VAC % DEC-20
PREMIUM/PRIME 1,280,206 148,504 11.6
SECONDARY 992,821 161,830 16.3
TOTAL 2,273,027 310,334 13.6
Source: Source: Knight Frank
CURRENT BRISBANE CBD OFFICE DEVELOPMENT ACTIVITY
PROPERTY PRECINCT NLA M2 STATUS COMPLETION MAJOR
TENANT
343 ALBERT ST 50,160 DA
WATERFRONT PRECINCT NORTH TOWER, 1 EAGLE ST
75,331 (GFA) DA
WATERFRONT PRECINCT SOUTH TOWER, 1 EAGLE ST
60,000 (GFA) DA
155 CHARLOTTE ST GOVERNMENT 45,000 UC 2021 RIO TINTO
62 MARY ST GOVERNMENT 38,000 DA 2022 (TBC)
80 ANN ST UPTOWN 72,540 UC 2022 SUNCORP
150 ELIZABETH ST (REGENT TOWER)
RETAIL 42,000 DA 2023
360 QUEEN ST 38,000 DA
205 NORTH QUAY LEGAL 50,000 DA 2023
Source: Savills Research/Knight Frank
UC: Under Construction DA: Development Approval EP: Early Planning
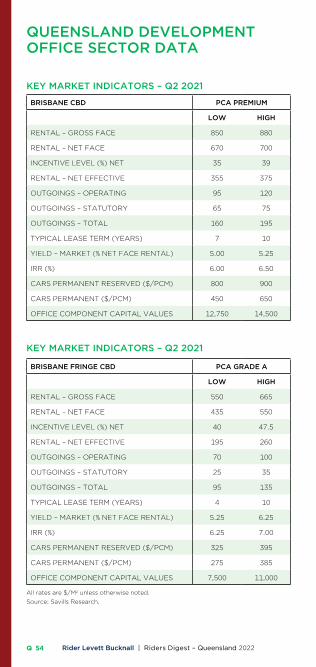
Rider Levett Bucknall | Riders Digest – Queensland 202254Q
KEY MARKET INDICATORS – Q2 2021
BRISBANE CBD PCA PREMIUM PCA GRADE A PCA GRADE B
LOW HIGH LOW HIGH LOW HIGH
RENTAL – GROSS FACE 850 880 690 795 550 625
RENTAL – NET FACE 670 700 530 635 405 480
INCENTIVE LEVEL (%) NET 35 39 37.5 45 40 50
RENTAL – NET EFFECTIVE 355 375 245 305 160 200
OUTGOINGS – OPERATING 95 120 85 95 70 85
OUTGOINGS – STATUTORY 65 75 60 80 55 80
OUTGOINGS – TOTAL 160 195 145 175 125 165
TYPICAL LEASE TERM (YEARS) 7 10 4 7 2 5
YIELD – MARKET (% NET FACE RENTAL) 5.00 5.25 5.25 5.75 6.00 7.25
IRR (%) 6.00 6.50 6.00 6.88 6.88 7.25
CARS PERMANENT RESERVED ($/PCM) 800 900 650 800 500 600
CARS PERMANENT ($/PCM) 450 650 400 550 300 500
OFFICE COMPONENT CAPITAL VALUES 12,750 14,500 9,500 12,000 6,000 8,500
KEY MARKET INDICATORS – Q2 2021
BRISBANE FRINGE CBD PCA GRADE A PCA GRADE B
LOW HIGH LOW HIGH
RENTAL – GROSS FACE 550 665 425 500
RENTAL – NET FACE 435 550 320 395
INCENTIVE LEVEL (%) NET 40 47.5 40 47.5
RENTAL – NET EFFECTIVE 195 260 135 175
OUTGOINGS – OPERATING 70 100 65 90
OUTGOINGS – STATUTORY 25 35 20 35
OUTGOINGS – TOTAL 95 135 85 125
TYPICAL LEASE TERM (YEARS) 4 10 2 5
YIELD – MARKET (% NET FACE RENTAL) 5.25 6.25 6.75 7.75
IRR (%) 6.25 7.00 7.25 7.75
CARS PERMANENT RESERVED ($/PCM) 325 395 300 325
CARS PERMANENT ($/PCM) 275 385 200 300
OFFICE COMPONENT CAPITAL VALUES 7,500 11,000 4,500 7,000
All rates are $/M2 unless otherwise noted.
Source: Savills Research.
QUEENSLAND DEVELOPMENTOFFICE SECTOR DATA
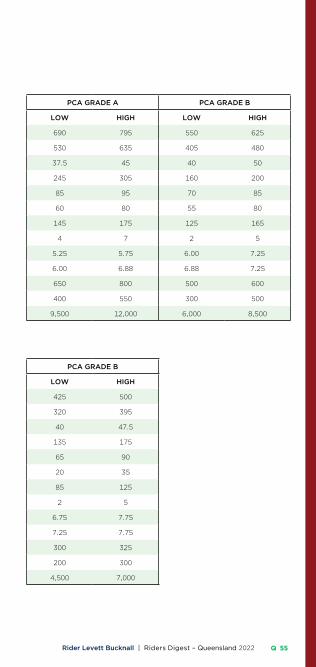
Rider Levett Bucknall | Riders Digest – Queensland 2022 55Q
KEY MARKET INDICATORS – Q2 2021
BRISBANE CBD PCA PREMIUM PCA GRADE A PCA GRADE B
LOW HIGH LOW HIGH LOW HIGH
RENTAL – GROSS FACE 850 880 690 795 550 625
RENTAL – NET FACE 670 700 530 635 405 480
INCENTIVE LEVEL (%) NET 35 39 37.5 45 40 50
RENTAL – NET EFFECTIVE 355 375 245 305 160 200
OUTGOINGS – OPERATING 95 120 85 95 70 85
OUTGOINGS – STATUTORY 65 75 60 80 55 80
OUTGOINGS – TOTAL 160 195 145 175 125 165
TYPICAL LEASE TERM (YEARS) 7 10 4 7 2 5
YIELD – MARKET (% NET FACE RENTAL) 5.00 5.25 5.25 5.75 6.00 7.25
IRR (%) 6.00 6.50 6.00 6.88 6.88 7.25
CARS PERMANENT RESERVED ($/PCM) 800 900 650 800 500 600
CARS PERMANENT ($/PCM) 450 650 400 550 300 500
OFFICE COMPONENT CAPITAL VALUES 12,750 14,500 9,500 12,000 6,000 8,500
KEY MARKET INDICATORS – Q2 2021
BRISBANE FRINGE CBD PCA GRADE A PCA GRADE B
LOW HIGH LOW HIGH
RENTAL – GROSS FACE 550 665 425 500
RENTAL – NET FACE 435 550 320 395
INCENTIVE LEVEL (%) NET 40 47.5 40 47.5
RENTAL – NET EFFECTIVE 195 260 135 175
OUTGOINGS – OPERATING 70 100 65 90
OUTGOINGS – STATUTORY 25 35 20 35
OUTGOINGS – TOTAL 95 135 85 125
TYPICAL LEASE TERM (YEARS) 4 10 2 5
YIELD – MARKET (% NET FACE RENTAL) 5.25 6.25 6.75 7.75
IRR (%) 6.25 7.00 7.25 7.75
CARS PERMANENT RESERVED ($/PCM) 325 395 300 325
CARS PERMANENT ($/PCM) 275 385 200 300
OFFICE COMPONENT CAPITAL VALUES 7,500 11,000 4,500 7,000
All rates are $/M2 unless otherwise noted.
Source: Savills Research.

Rider Levett Bucknall | Riders Digest – Queensland 202256Q
QUEENSLAND DEVELOPMENTRETAIL SECTOR DATA
KEY MARKET INDICATORS – Q2 2021
BRISBANE ENCLOSED CENTRES REGIONAL SUB REGIONAL NEIGHBOURHOOD LARGE FORMAT
LOW HIGH LOW HIGH LOW HIGH LOW HIGH
DEPARTMENT STORE RENT (GROSS) 150 300
DDS RENT (GROSS) 150 300 150 275
SUPERMARKET RENT (GROSS) 350 450 350 450 350 450
SPECIALTY TENANT RENT (GROSS) 1000 1,800 700 1,500 550 900 150 330
MINI-MAJOR RENT (GROSS) 500 1,500 400 1,000 200 650
YIELD – MARKET (%) 4.50 6.25 6.25 7.75 5.25 7.50 5.75 7.75
IRR (%) 6.00 7.00 6.75 7.75 6.00 7.75 6.50 8.50
OUTGOINGS – OPERATING 134 196 81 157 66 122 21 42
OUTGOINGS – STATUTORY 38 60 33 52 24 47 18 27
OUTGOINGS – TOTAL 172 256 114 209 90 169 39 69
CAPITAL VALUES 7,000 14,000 2,500 7,000 3,000 7,000 1,750 5,000
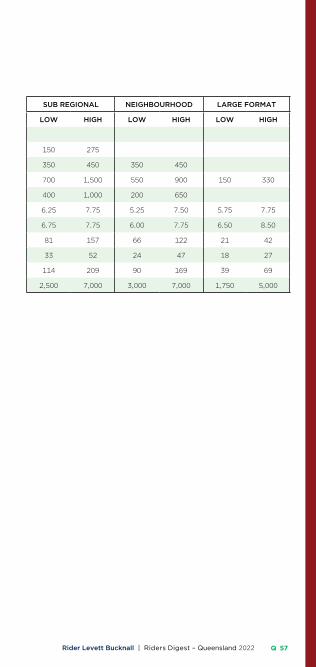
Rider Levett Bucknall | Riders Digest – Queensland 2022 57Q
KEY MARKET INDICATORS – Q2 2021
BRISBANE ENCLOSED CENTRES REGIONAL SUB REGIONAL NEIGHBOURHOOD LARGE FORMAT
LOW HIGH LOW HIGH LOW HIGH LOW HIGH
DEPARTMENT STORE RENT (GROSS) 150 300
DDS RENT (GROSS) 150 300 150 275
SUPERMARKET RENT (GROSS) 350 450 350 450 350 450
SPECIALTY TENANT RENT (GROSS) 1000 1,800 700 1,500 550 900 150 330
MINI-MAJOR RENT (GROSS) 500 1,500 400 1,000 200 650
YIELD – MARKET (%) 4.50 6.25 6.25 7.75 5.25 7.50 5.75 7.75
IRR (%) 6.00 7.00 6.75 7.75 6.00 7.75 6.50 8.50
OUTGOINGS – OPERATING 134 196 81 157 66 122 21 42
OUTGOINGS – STATUTORY 38 60 33 52 24 47 18 27
OUTGOINGS – TOTAL 172 256 114 209 90 169 39 69
CAPITAL VALUES 7,000 14,000 2,500 7,000 3,000 7,000 1,750 5,000
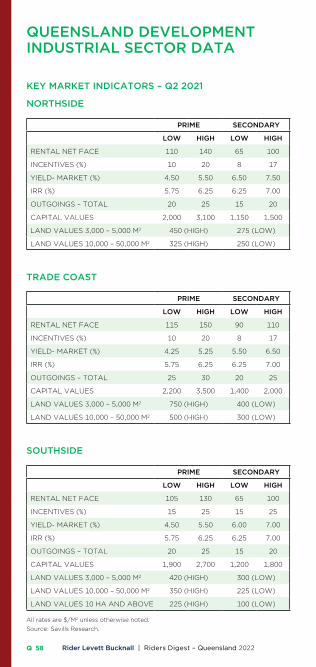
Rider Levett Bucknall | Riders Digest – Queensland 202258Q
QUEENSLAND DEVELOPMENT INDUSTRIAL SECTOR DATA
KEY MARKET INDICATORS – Q2 2021
NORTHSIDE
PRIME SECONDARY
LOW HIGH LOW HIGH
RENTAL NET FACE 110 140 65 100
INCENTIVES (%) 10 20 8 17
YIELD- MARKET (%) 4.50 5.50 6.50 7.50
IRR (%) 5.75 6.25 6.25 7.00
OUTGOINGS – TOTAL 20 25 15 20
CAPITAL VALUES 2,000 3,100 1,150 1,500
LAND VALUES 3,000 – 5,000 M2 450 (HIGH) 275 (LOW)
LAND VALUES 10,000 – 50,000 M2 325 (HIGH) 250 (LOW)
TRADE COAST
PRIME SECONDARY
LOW HIGH LOW HIGH
RENTAL NET FACE 115 150 90 110
INCENTIVES (%) 10 20 8 17
YIELD- MARKET (%) 4.25 5.25 5.50 6.50
IRR (%) 5.75 6.25 6.25 7.00
OUTGOINGS – TOTAL 25 30 20 25
CAPITAL VALUES 2,200 3,500 1,400 2,000
LAND VALUES 3,000 – 5,000 M2 750 (HIGH) 400 (LOW)
LAND VALUES 10,000 – 50,000 M2 500 (HIGH) 300 (LOW)
SOUTHSIDE
PRIME SECONDARY
LOW HIGH LOW HIGH
RENTAL NET FACE 105 130 65 100
INCENTIVES (%) 15 25 15 25
YIELD- MARKET (%) 4.50 5.50 6.00 7.00
IRR (%) 5.75 6.25 6.25 7.00
OUTGOINGS – TOTAL 20 25 15 20
CAPITAL VALUES 1,900 2,700 1,200 1,800
LAND VALUES 3,000 – 5,000 M2 420 (HIGH) 300 (LOW)
LAND VALUES 10,000 – 50,000 M2 350 (HIGH) 225 (LOW)
LAND VALUES 10 HA AND ABOVE 225 (HIGH) 100 (LOW)
All rates are $/M2 unless otherwise noted.
Source: Savills Research.

Rider Levett Bucknall | Riders Digest – Queensland 2022 59Q
QUEENSLAND DEVELOPMENT CONSTRUCTION WORK DONE
ANNUAL VALUE OF CONSTRUCTION WORK DONE IN QUEENSLAND
YEAR ENDING RESIDENTIAL NON-
RESIDENTIAL ENGINEERING TOTAL CONSTRUCTION
JUN-1993 3,959 1,508 2,497 7,964
JUN-1994 4,425 1,568 2,804 8,797
JUN-1995 4,593 2,227 3,019 9,839
JUN-1996 3,376 2,416 3,036 8,828
JUN-1997 3,442 2,523 3,593 9,558
JUN-1998 3,965 2,596 3,859 10,420
JUN-1999 3,573 2,648 4,575 10,796
JUN-2000 4,372 2,585 5,221 12,178
JUN-2001 3,561 2,426 4,744 10,732
JUN-2002 5,075 2,480 4,628 12,182
JUN-2003 6,560 2,509 5,559 14,628
JUN-2004 8,460 3,176 5,540 17,176
JUN-2005 9,578 3,815 7,087 20,480
JUN-2006 9,843 5,301 9,678 24,822
JUN-2007 10,857 6,576 12,947 30,379
JUN-2008 11,735 7,233 16,787 35,754
JUN-2009 11,058 7,986 21,069 40,112
JUN-2010 10,621 7,694 19,578 37,892
JUN-2011 9,614 8,153 24,134 41,901
JUN-2012 8,616 7,504 36,977 53,097
JUN-2013 8,704 6,891 42,096 57,691
JUN-2014 9,611 7,286 45,847 62,744
JUN-2015 11,319 6,884 30,353 48,556
JUN-2016 13,794 7,315 18,577 39,686
JUN-2017 14,856 7,342 19,304 41,503
JUN-2018 14,204 8,206 22,706 45,116
JUN-2019 13,454 7,188 21,392 42,035
JUN-2020 12,051 8,297 20,222 40,570
JUN-2021 12,857 7,648 19,053 39,558
Source: ABS 8752.0 & 8762.0 (Current Prices – Original Series - $Millions).
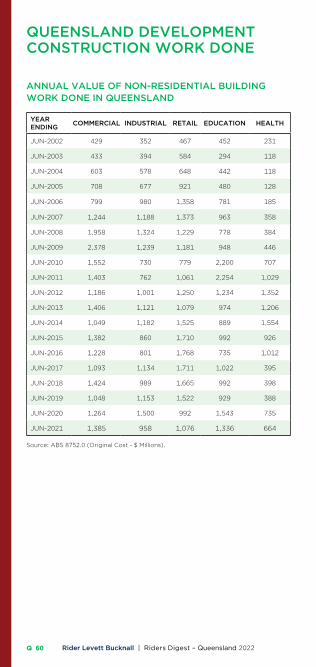
Rider Levett Bucknall | Riders Digest – Queensland 202260Q
ANNUAL VALUE OF NON-RESIDENTIAL BUILDING WORK DONE IN QUEENSLAND
YEAR ENDING COMMERCIAL INDUSTRIAL RETAIL EDUCATION HEALTH AGED
CARE HOTELS ENTERTAINMENT & RECREATION OTHER TOTAL
JUN-2002 429 352 467 452 231 102 110 174 163 2,480
JUN-2003 433 394 584 294 118 97 123 336 130 2,509
JUN-2004 603 578 648 442 118 135 179 249 225 3,176
JUN-2005 708 677 921 480 128 192 246 247 216 3,815
JUN-2006 799 980 1,358 781 185 213 338 415 232 5,301
JUN-2007 1,244 1,188 1,373 963 358 218 364 415 453 6,576
JUN-2008 1,958 1,324 1,229 778 384 227 386 365 583 7,233
JUN-2009 2,378 1,239 1,181 948 446 272 255 387 878 7,986
JUN-2010 1,552 730 779 2,200 707 149 173 316 1090 7,694
JUN-2011 1,403 762 1,061 2,254 1,029 142 192 456 854 8,153
JUN-2012 1,186 1,001 1,250 1,234 1,352 143 210 425 702 7,504
JUN-2013 1,406 1,121 1,079 974 1,206 126 238 286 455 6,891
JUN-2014 1,049 1,182 1,525 889 1,554 243 242 230 370 7,286
JUN-2015 1,382 860 1,710 992 926 213 307 201 294 6,884
JUN-2016 1,228 801 1,768 735 1,012 436 442 596 298 7,315
JUN-2017 1,093 1,134 1,711 1,022 395 536 546 522 384 7,342
JUN-2018 1,424 989 1,665 992 398 579 970 638 552 8,206
JUN-2019 1,048 1,153 1,522 929 388 409 688 438 614 7,188
JUN-2020 1,264 1,500 992 1,543 735 414 456 615 777 8,297
JUN-2021 1,385 958 1,076 1,336 664 222 408 743 857 7,648
Source: ABS 8752.0 (Original Cost - $ Millions).
QUEENSLAND DEVELOPMENT CONSTRUCTION WORK DONE

Rider Levett Bucknall | Riders Digest – Queensland 2022 61Q
ANNUAL VALUE OF NON-RESIDENTIAL BUILDING WORK DONE IN QUEENSLAND
YEAR ENDING COMMERCIAL INDUSTRIAL RETAIL EDUCATION HEALTH AGED
CARE HOTELS ENTERTAINMENT & RECREATION OTHER TOTAL
JUN-2002 429 352 467 452 231 102 110 174 163 2,480
JUN-2003 433 394 584 294 118 97 123 336 130 2,509
JUN-2004 603 578 648 442 118 135 179 249 225 3,176
JUN-2005 708 677 921 480 128 192 246 247 216 3,815
JUN-2006 799 980 1,358 781 185 213 338 415 232 5,301
JUN-2007 1,244 1,188 1,373 963 358 218 364 415 453 6,576
JUN-2008 1,958 1,324 1,229 778 384 227 386 365 583 7,233
JUN-2009 2,378 1,239 1,181 948 446 272 255 387 878 7,986
JUN-2010 1,552 730 779 2,200 707 149 173 316 1090 7,694
JUN-2011 1,403 762 1,061 2,254 1,029 142 192 456 854 8,153
JUN-2012 1,186 1,001 1,250 1,234 1,352 143 210 425 702 7,504
JUN-2013 1,406 1,121 1,079 974 1,206 126 238 286 455 6,891
JUN-2014 1,049 1,182 1,525 889 1,554 243 242 230 370 7,286
JUN-2015 1,382 860 1,710 992 926 213 307 201 294 6,884
JUN-2016 1,228 801 1,768 735 1,012 436 442 596 298 7,315
JUN-2017 1,093 1,134 1,711 1,022 395 536 546 522 384 7,342
JUN-2018 1,424 989 1,665 992 398 579 970 638 552 8,206
JUN-2019 1,048 1,153 1,522 929 388 409 688 438 614 7,188
JUN-2020 1,264 1,500 992 1,543 735 414 456 615 777 8,297
JUN-2021 1,385 958 1,076 1,336 664 222 408 743 857 7,648
Source: ABS 8752.0 (Original Cost - $ Millions).
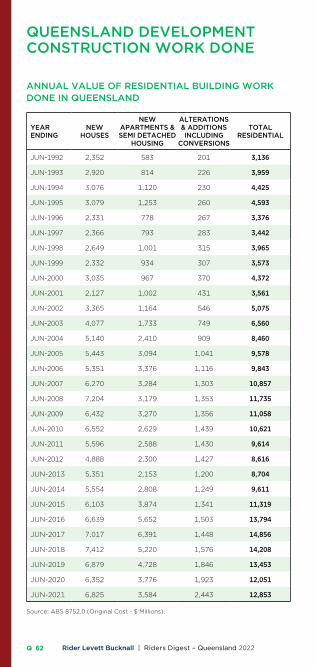
Rider Levett Bucknall | Riders Digest – Queensland 202262Q
QUEENSLAND DEVELOPMENT CONSTRUCTION WORK DONE
ANNUAL VALUE OF RESIDENTIAL BUILDING WORK DONE IN QUEENSLAND
YEAR ENDING
NEW HOUSES
NEW APARTMENTS & SEMI DETACHED
HOUSING
ALTERATIONS & ADDITIONS INCLUDING
CONVERSIONS
TOTAL RESIDENTIAL
JUN-1992 2,352 583 201 3,136
JUN-1993 2,920 814 226 3,959
JUN-1994 3,076 1,120 230 4,425
JUN-1995 3,079 1,253 260 4,593
JUN-1996 2,331 778 267 3,376
JUN-1997 2,366 793 283 3,442
JUN-1998 2,649 1,001 315 3,965
JUN-1999 2,332 934 307 3,573
JUN-2000 3,035 967 370 4,372
JUN-2001 2,127 1,002 431 3,561
JUN-2002 3,365 1,164 546 5,075
JUN-2003 4,077 1,733 749 6,560
JUN-2004 5,140 2,410 909 8,460
JUN-2005 5,443 3,094 1,041 9,578
JUN-2006 5,351 3,376 1,116 9,843
JUN-2007 6,270 3,284 1,303 10,857
JUN-2008 7,204 3,179 1,353 11,735
JUN-2009 6,432 3,270 1,356 11,058
JUN-2010 6,552 2,629 1,439 10,621
JUN-2011 5,596 2,588 1,430 9,614
JUN-2012 4,888 2,300 1,427 8,616
JUN-2013 5,351 2,153 1,200 8,704
JUN-2014 5,554 2,808 1,249 9,611
JUN-2015 6,103 3,874 1,341 11,319
JUN-2016 6,639 5,652 1,503 13,794
JUN-2017 7,017 6,391 1,448 14,856
JUN-2018 7,412 5,220 1,576 14,208
JUN-2019 6,879 4,728 1,846 13,453
JUN-2020 6,352 3,776 1,923 12,051
JUN-2021 6,825 3,584 2,443 12,853
Source: ABS 8752.0 (Original Cost - $ Millions).
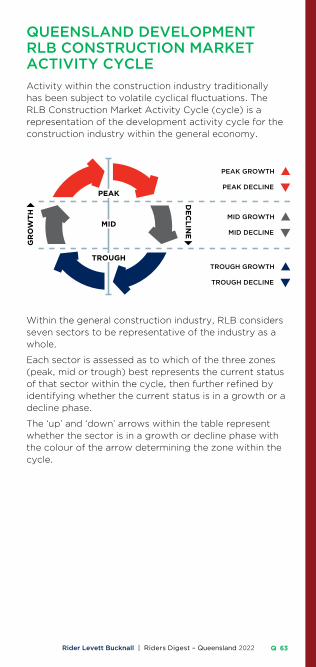
Rider Levett Bucknall | Riders Digest – Queensland 2022 63Q
QUEENSLAND DEVELOPMENT RLB CONSTRUCTION MARKET ACTIVITY CYCLEActivity within the construction industry traditionally has been subject to volatile cyclical fluctuations. The RLB Construction Market Activity Cycle (cycle) is a representation of the development activity cycle for the construction industry within the general economy.
PEAK GROWTH
PEAK DECLINE
MID GROWTH
MID DECLINE
TROUGH GROWTH
TROUGH DECLINE
Within the general construction industry, RLB considers seven sectors to be representative of the industry as a whole.
Each sector is assessed as to which of the three zones (peak, mid or trough) best represents the current status of that sector within the cycle, then further refined by identifying whether the current status is in a growth or a decline phase.
The ‘up’ and ‘down’ arrows within the table represent whether the sector is in a growth or decline phase with the colour of the arrow determining the zone within the cycle.

Rider Levett Bucknall | Riders Digest – Queensland 202264Q
QUEENSLAND DEVELOPMENT RLB CONSTRUCTION MARKET ACTIVITY CYCLEThe following tables represent the position of each sector within the RLB Market Activity Cycle for the major cities within Queensland. The tables reflect the movement of each sector within the cycle for the period represented.
BRISBANE Q2 2019
Q4 2019
Q2 2020
Q4 2020
Q2 2021
Q4 2021
HOUSES
APARTMENTS
OFFICES
INDUSTRIAL
RETAIL
HOTEL
CIVIL
GOLD COAST Q2 2019
Q4 2019
Q2 2020
Q4 2020
Q2 2021
Q4 2021
HOUSES
APARTMENTS
OFFICES
INDUSTRIAL
RETAIL
HOTEL
CIVIL
TOWNSVILLE Q2 2019
Q4 2019
Q2 2020
Q4 2020
Q2 2021
Q4 2021
HOUSES
APARTMENTS
OFFICES
INDUSTRIAL
RETAIL
HOTEL - - - - - -
CIVIL

BENCHMARKS
Regional Indices 66
Key City Relativities 67
Office Building Efficiencies 68
Reinforcement Ratios 68
Labour and Materials Trade Ratios 69
Progress Payment Claims 70
Common Industry Acronyms 71
Method of Measurement 72
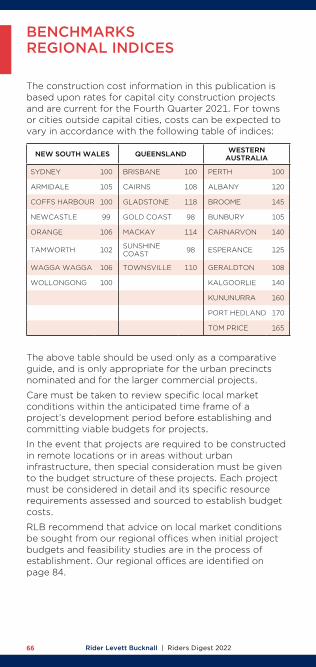
Rider Levett Bucknall | Riders Digest 202266
BENCHMARKSREGIONAL INDICES
The construction cost information in this publication is based upon rates for capital city construction projects and are current for the Fourth Quarter 2021. For towns or cities outside capital cities, costs can be expected to vary in accordance with the following table of indices:
NEW SOUTH WALES QUEENSLAND WESTERN AUSTRALIA
SYDNEY 100 BRISBANE 100 PERTH 100
ARMIDALE 105 CAIRNS 108 ALBANY 120
COFFS HARBOUR 100 GLADSTONE 118 BROOME 145
NEWCASTLE 99 GOLD COAST 98 BUNBURY 105
ORANGE 106 MACKAY 114 CARNARVON 140
TAMWORTH 102 SUNSHINE COAST 98 ESPERANCE 125
WAGGA WAGGA 106 TOWNSVILLE 110 GERALDTON 108
WOLLONGONG 100 KALGOORLIE 140
KUNUNURRA 160
PORT HEDLAND 170
TOM PRICE 165
The above table should be used only as a comparative guide, and is only appropriate for the urban precincts nominated and for the larger commercial projects.
Care must be taken to review specific local market conditions within the anticipated time frame of a project’s development period before establishing and committing viable budgets for projects.
In the event that projects are required to be constructed in remote locations or in areas without urban infrastructure, then special consideration must be given to the budget structure of these projects. Each project must be considered in detail and its specific resource requirements assessed and sourced to establish budget costs.
RLB recommend that advice on local market conditions be sought from our regional offices when initial project budgets and feasibility studies are in the process of establishment. Our regional offices are identified on page 84.

Rider Levett Bucknall | Riders Digest 2022 67
BENCHMARKSKEY CITY RELATIVITIES – Q4 2021
ADELAIDE100
BRISBANE100
CANBERRA100
DARWIN 100
GOLD COAST 100
BNE 95 ADE 105 ADE 90 ADE 97 ADE 119
CAN 111 CAN 117 BNE 86 BNE 92 BNE 113
DAR 103 DAR 109 DAR 93 CAN 107 CAN 132
GC 84 GC 89 GC 76 GC 82 DAR 122
MEL 104 MEL 110 MEL 94 MEL 101 MEL 124
PER 106 PER 112 PER 96 PER 103 PER 126
SYD 119 SYD 125 SYD 107 SYD 115 SYD 141
TVE 101 TVE 106 TVE 91 TVE 98 TVE 120
MELBOURNE100
PERTH100
SYDNEY100
TOWNSVILLE100
ADE 96 ADE 94 ADE 84 ADE 99
BNE 91 BNE 89 BNE 80 BNE 94
CAN 106 CAN 104 CAN 93 CAN 110
DAR 99 DAR 97 DAR 87 DAR 102
GC 81 GC 79 GC 71 GC 83
PER 102 MEL 98 MEL 88 MEL 103
SYD 114 SYD 112 PER 90 PER 105
TVE 97 TVE 95 TVE 85 SYD 118
RLB’s Key City Relativity Matrix highlights the cost relativity between key Australian cities. The Relativity Matrix compares the general cost of building between cities. Each column represents a base city indexed to 100 with other city’s relativities re-indexed to that base city.
In order to calculate the relativity between different cities, the difference can be calculated using the following formula:
where:
Ccc = Compared city costBcc = Base city cost
Cr = Relativity of compared city Cb = Relativity of base city
For example, when comparing costs between Sydney (base city) and Perth (compared city), Sydney building costs are generally 20.5% more than Perth i.e. (100/83) and Perth is 17.4% cheaper than Sydney i.e. (100/121)
If the tendered price of a building in Sydney was $1,000,000, the equivalent cost in Perth would be $830,000 i.e. (1,000,000 x (100/83)-1 and conversely a $1,000,000 building in Perth would cost $1,210,000 in Sydney, i.e. 1,000,000 x (100/121)-1
Ccc = Bcc x ( )-1Cr
Cb

Rider Levett Bucknall | Riders Digest 202268
The efficiency of an office building is expressed as a percentage of the Net Lettable Area (NLA) to the Gross Floor Area (GFA). The table below indicates that relationship to the GFA of the whole building both with car parks and basements included and excluded, that could be expected for an average project in the nominated category. Also shown is the average net to gross efficiency of the office floors only in each of the eight building types listed below.
TYPE OF CBD OFFICE BUILDING
EFFICIENCY
BASEMENTS AND CAR PARKSINCLUDED
%EXCLUDED
%OFFICE FLOORS
%PRESTIGE
10 TO 25 STOREYS 63 – 68 75 – 80 85 – 90
25 TO 40 STOREYS 58 – 63 70 – 75 80 – 85
40 TO 55 STOREYS 53 – 58 68 – 73 75 – 80
INVESTMENT
UP TO 10 STOREYS 69 – 74 81 – 85 86 – 91
10 TO 25 STOREYS 64 – 69 76 – 81 81 – 86
25 TO 40 STOREYS 59 – 64 71 – 76 76 – 81
INVESTMENT, OTHER THAN
UP TO 10 STOREYS 70 – 75 82 – 86 87 – 92
10 TO 25 STOREYS 65 – 70 77 – 82 82 – 87
PLANT ROOM SPACEGenerally plant room space represents 6 – 11% of the GFA of a multi-storey office building.
REINFORCEMENT RATIOSThe following ratios give an indication of the average weight of reinforcement per cubic metre of concrete for the listed elements. Differing structural systems and sizes of individual elements and grid sizes will cause considerable variation to the stated ratios. For project specific ratios a structural engineer should be consulted.
AVE KG/M3 AVE KG/M3
STRIP FOOTINGS 50 STRAP BEAMS 120
COLUMN BASES 40 SLAB ON GROUND 40PILE CAPS 50 SUSPENDED SLABS
100 – 150 MM ONE AND TWO WAY
90
BORED PIER 90 250 MM FLAT PLATE 120
RAFT FOUNDATION 70 250 MM WAFFLE 160PEDESTAL & STUB COLUMNS
240 COLUMNS 240
RETAINING WALLS
1 – 2 STOREY 70 BEAMS 170
2 – 3 STOREY 120
GROUND BEAMS 120 WALLS (CORE) 140
STAIRS 80
BENCHMARKS OFFICE BUILDING EFFICIENCIES

Rider Levett Bucknall | Riders Digest 2022 69
BENCHMARKS LABOUR AND MATERIALS TRADE RATIOS
LABOUR MATERIAL FIXED FACTOR
The following represents the ratio of on-site labour to material for various trades and sub-trades based upon our own survey.
The figures are relevant to all works constructed by traditional methods; variations to these methods will change the ratios, i.e. on-site fabrication of items traditionally factory fabricated such as joinery fittings, metalwork items, etc.
PRELIMINARIES 40 10 50
DEMOLISHER 85 15
EXCAVATOR 32 15 53
PILER 20 50 30
IN SITU CONCRETOR 25 75
FORMWORKER 70 30
REINFORCEMENT FIXER 20 80
PRECAST CONCRETOR 20 80
BRICKLAYER & BLOCKLAYER 50 50
MASON 10 90
ASPHALTOR 40 60
STRUCTURAL STEELWORK 60 40
METALWORKER 20 80
SUSPENDED CEILING FIXER 40 60
CARPENTER 45 55
JOINER 15 85
STEEL DECK ROOFER 40 60
BITUMINOUS BUILT UP ROOFER 30 70
PIPEWORK PLUMBER 60 40
FITTING PLUMBER 25 75
DRAINER 65 35
PLASTERER 80 20
PLASTERBOARD & FIB. PLASTER FIXER 40 60
CERAMIC TILER 55 45
VINYL TILER 45 55
IN SITU PAVIOR 75 25
GLAZIER 20 80
PAINTER 75 25
CARPET LAYER 10 90
ROADWORKER & EXTERNAL PAVIOR 15 85
AIR CONDITIONING SPECIALIST 35 65
LIFT INSTALLER 25 75
ELECTRICAL SPECIALIST 40 60
WATER FIRE SERVICE SPECIALIST 44 56
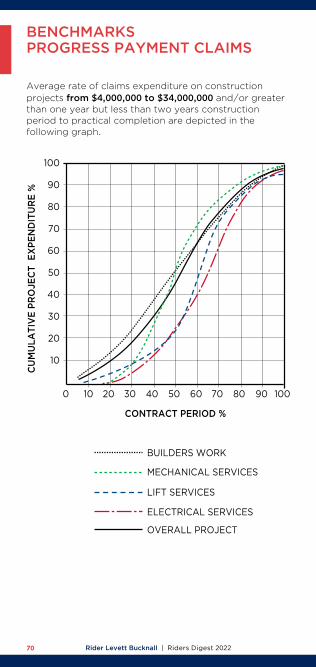
Rider Levett Bucknall | Riders Digest 202270
Average rate of claims expenditure on construction projects from $4,000,000 to $34,000,000 and/or greater than one year but less than two years construction period to practical completion are depicted in the following graph.
BENCHMARKS PROGRESS PAYMENT CLAIMS
100
90
80
70
60
50
40
30
20
10
CU
MU
LA
TIV
E P
RO
JEC
T E
XP
EN
DIT
UR
E %
100 20 30 40 50 60 70 80 90 100
CONTRACT PERIOD %
BUILDERS WORK
MECHANICAL SERVICES
LIFT SERVICES
ELECTRICAL SERVICES
OVERALL PROJECT

Rider Levett Bucknall | Riders Digest 2022 71
BENCHMARKS COMMON INDUSTRY ACRONYMS
PROJECT MANAGEMENTAA Architects AdviceABIC Australian Building Industry
ContractsAI Architects InstructionAIA Australian Institute of
ArchitectsBCA Building Code of AustraliaBOQ Bill of QuantitiesBP Building PermitBS Building SurveyorCA Contract AdministrationCAN Consultants Advice NoticeDA Development ApplicationDD Design DevelopmentDWG Drawing (also an Autocad
file format)EBD Evidence Based DesignESD Environmentally
Sustainable DesignPI Professional Indemnity
(Insurance)PM Project ManagerQS Quantity SurveyorRCP Reflected Ceiling PlanRFI Request for InformationSD Schematic Design
ARCHITECTURAL DRAWINGSABS Acrylonitrile Butadiene
Styrene (Edging)AS Australian StandardsCOL ColumnCTS Centres (Spacing)DP DownpipeENS EnsuiteEX ExistingFC Fibre Cement (Sheet)FCL Finished Ceiling LevelFFL Finished Floor LevelFR Fire RatedGFA Gross Floor AreaHMR Highly Moisture Resistant
(Particleboard)KDHW Kiln Dried HardwoodMDF Medium Density FibreboardPB PlasterboardRL Relative LevelSS Stainless SteelTYP TypicalVOC Volatile Organic CompoundWC Water Closet (Toilet)
LAND SURVEYSAHD Australian Height DatumAMG Australian Mapping GridDP DownpipeIL Invert LevelU/G UndergroundRL Relative Level
STRUCTURAL DRAWINGSCFW Continuous Fillet WeldCHS Cylindrical Hollow SectionCJ Construction JointEA Equal AnglePFC Parallel Flange ChannelRB Roof BeamRHS Rectangular Hollow SectionSB Sill BeamSHS Square Hollow SectionTB Tie BeamUA Unequal AngleUB Universal BeamUC Universal ColumnWT Wall Tie
HYDRAULIC DRAWINGSDCW Domestic Cold WaterDHW Domestic Hot WaterFH Fire HydrantFHR Fire Hose ReelFIP Fire Indicator PanelFS Fire ServiceFW FloorwasteHWS Hot Water SystemTD TundishTMV Thermostatic Mixing ValveUPVC Unplasticated Polyvinyl
Chloride (Pipework)VP Vent Pipe
MECHANICAL DRAWINGSA/C Air ConditioningA/P Access PanelACU Air Conditioning UnitAHU Air Handling UnitCU Condensing UnitFCU Fan Coil UnitFD Fire DamperR/A Return AirS/A Supply AirSD Smoke Damper
ELECTRICAL DRAWINGSDB Distribution BoardDGPO Double General Power
OutletGPO General Power OutletMSB Main SwitchboardRCD Residual Current DeviceSB Switchboard
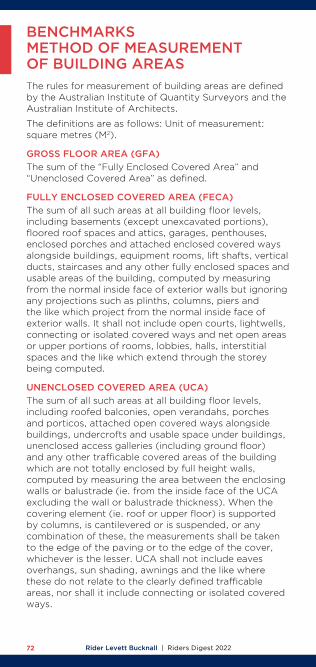
Rider Levett Bucknall | Riders Digest 202272
BENCHMARKS METHOD OF MEASUREMENT OF BUILDING AREASThe rules for measurement of building areas are defined by the Australian Institute of Quantity Surveyors and the Australian Institute of Architects.
The definitions are as follows: Unit of measurement: square metres (M2).
GROSS FLOOR AREA (GFA)The sum of the “Fully Enclosed Covered Area” and “Unenclosed Covered Area” as defined.
FULLY ENCLOSED COVERED AREA (FECA)The sum of all such areas at all building floor levels, including basements (except unexcavated portions), floored roof spaces and attics, garages, penthouses, enclosed porches and attached enclosed covered ways alongside buildings, equipment rooms, lift shafts, vertical ducts, staircases and any other fully enclosed spaces and usable areas of the building, computed by measuring from the normal inside face of exterior walls but ignoring any projections such as plinths, columns, piers and the like which project from the normal inside face of exterior walls. It shall not include open courts, lightwells, connecting or isolated covered ways and net open areas or upper portions of rooms, lobbies, halls, interstitial spaces and the like which extend through the storey being computed.
UNENCLOSED COVERED AREA (UCA)The sum of all such areas at all building floor levels, including roofed balconies, open verandahs, porches and porticos, attached open covered ways alongside buildings, undercrofts and usable space under buildings, unenclosed access galleries (including ground floor) and any other trafficable covered areas of the building which are not totally enclosed by full height walls, computed by measuring the area between the enclosing walls or balustrade (ie. from the inside face of the UCA excluding the wall or balustrade thickness). When the covering element (ie. roof or upper floor) is supported by columns, is cantilevered or is suspended, or any combination of these, the measurements shall be taken to the edge of the paving or to the edge of the cover, whichever is the lesser. UCA shall not include eaves overhangs, sun shading, awnings and the like where these do not relate to the clearly defined trafficable areas, nor shall it include connecting or isolated covered ways.
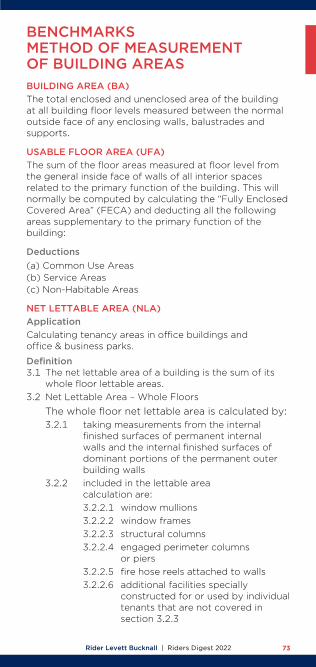
Rider Levett Bucknall | Riders Digest 2022 73
BUILDING AREA (BA)The total enclosed and unenclosed area of the building at all building floor levels measured between the normal outside face of any enclosing walls, balustrades and supports.
USABLE FLOOR AREA (UFA)The sum of the floor areas measured at floor level from the general inside face of walls of all interior spaces related to the primary function of the building. This will normally be computed by calculating the “Fully Enclosed Covered Area” (FECA) and deducting all the following areas supplementary to the primary function of the building:
Deductions(a) Common Use Areas(b) Service Areas(c) Non-Habitable Areas
NET LETTABLE AREA (NLA)ApplicationCalculating tenancy areas in office buildings andoffice & business parks.
Definition3.1 The net lettable area of a building is the sum of its
whole floor lettable areas.3.2 Net Lettable Area – Whole Floors
The whole floor net lettable area is calculated by: 3.2.1 taking measurements from the internal
finished surfaces of permanent internal walls and the internal finished surfaces of dominant portions of the permanent outer building walls
3.2.2 included in the lettable area calculation are:
3.2.2.1 window mullions 3.2.2.2 window frames 3.2.2.3 structural columns 3.2.2.4 engaged perimeter columns
or piers 3.2.2.5 fire hose reels attached to walls 3.2.2.6 additional facilities specially
constructed for or used by individual tenants that are not covered in section 3.2.3
BENCHMARKS METHOD OF MEASUREMENT OF BUILDING AREAS

Rider Levett Bucknall | Riders Digest 202274
3.2.3 excluded from the lettable area of each tenancy are:
3.2.3.1 stairs, accessways, fire stairs, toilets, recessed doorways, cupboards, telecommunication cupboards, fire hose reel cupboards, lift shafts, escalators, smoke lobbies, plant/motor rooms, tea rooms and other service areas, where all are provided as standard facilities in the building
3.2.3.2 lift lobbies where lifts face other lifts, blank walls or areas listed in section 3.2.3.1 above
3.2.3.3 areas set aside for the provision of all services, such as electrical or telephone ducts and air conditioning risers to the floor, where such facilities are standard facilities in the building
3.2.3.4 area dedicated as public spaces or thoroughfares such as foyers, atria and accessways in lift and building service areas
3.2.3.5 areas and accessways set aside for use by service vehicles and for delivery of goods, where such areas are not for the exclusive use of occupiers of the floor or building
3.2.3.6 areas and accessways set aside for car parking
3.2.3.7 areas where there is less than 1.5 metre height clearance above floor level – these spaces should be measured and recorded separately
3.3 Net Lettable Area (NLA) - Sub Divided Floors Follow 3.2 but measure to the centre line of inter-tenancy walls or partitions except where the walls or partitions adjoin public areas, such as lobbies and corridors, in which case measure to the line of the dominant portion of their public area faces.
3.4 Treatment of Balconies, Verandahs etc. Balconies, terraces, planter boxes, verandahs, awnings and covered areas should be excluded from tenancy area calculations, but may be separately identified for the purpose of negotiating rentals.
Areas should be measured to the inside face of the enclosing walls or structures. The outer edge of the awning or covered area is the defined edge.
BENCHMARKS METHOD OF MEASUREMENT OF BUILDING AREAS

ASSETS AND FACILITIES
Through the Rider Levett Bucknall | Life suite of services, we are able to provide meaningful, practical, commercial advice to clients in the delivery of sustainable and economically responsible projects.
The services help building owners understand the life value and expectancy of their buildings’ whole life costs and provide options to extend the useful life of buildings and maintain quality.
Sustainability and Quality 76
Management Standards 77
Useful Life Analysis 78
Outgoings 79
Essential Safety Measures 80
Capital Allowances (Tax Depreciation) 81

Rider Levett Bucknall | Riders Digest 202276
Sustainability is concerned with improving the quality of life while living within the carrying capacity of supporting ecosystems. The planning, delivering and managing of our Built Environment requires a balance between environmental, economic and social factors.The provision of a more productive, sustainable and liveable Built Environment is best considered in collaboration with all the stakeholders, including owners, managers and tenants. This process should include not only the review of sustainability objectives and initiatives, but address functional requirements and whole of life costings along with the implementation of facilities planning and asset management strategies. Rating systems developed to assist with performance benchmarking within Australia include:Green Star – The Green Building Council of Australia’s (GBCA) six star environmental rating system evaluates: communities, design, as-built of buildings, interiors, building performance in terms of energy and water efficiency, indoor environmental quality and resource conservation. NABERS – National Australian Built Environment Rating System is a national program managed by the NSW Department of Environment and Heritage. NABERS measures the environmental performance of Australian offices, tenancies, shopping centres, hotels, data centers and homes. There are NABERS tools for energy efficiency, water usage, waste management and indoor environment quality. Additionally, a NABERS Energy rating forms part of the Building Energy Efficiency Certificate (BEEC) requirement under the Commercial Building Disclosure (CBD) program. The CBD Program requires most sellers and lessors of office space of 2,000 M2 or more to have an up-to-date Building Energy Efficiency Certificate (BEEC). IS – The Infrastructure Sustainability Council of Australia’s (ISCA) Infrastructure Sustainability (IS) rating scheme. IS is Australia’s only comprehensive rating system for evaluating sustainability across design, construction and operation of infrastructure. IS evaluates the sustainability (including environmental, social, economic and governance aspects) of infrastructure projects and assets including transport, energy, water and communications sectors.Quality – Property Council of Australia’s (PCA) “a Guide to Office Building Quality” (2006, 2012), provides separate tools for assessing office building quality in new and existing buildings. The tools provide a guide to parameters that typically influence building quality. They offer a voluntary, market-based approach to classifying building characteristics and performance. The 2nd edition of the guide took effect on 1 January 2012 and includes expanded environmental performance criteria for Energy, Water, Waste and Indoor Environment. Additionally, the Building Management criteria was expanded to include Level of Service, Energy and Water Sub-Metering and Life Cycle/Maintenance Plan requirements.RLB have staff accredited in the use of Green Star, NABERS, along with access to LEED, BREEAM, GreenMark and other international standards. RLB also provides Building Quality Assessment (BQA) services for PCA Quality gradings.
ASSETS AND FACILITIESSUSTAINABILITY AND QUALITY
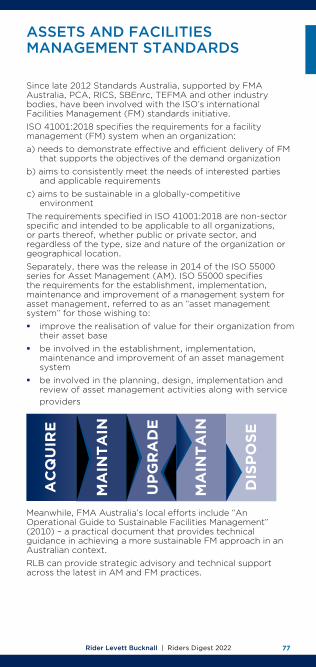
Rider Levett Bucknall | Riders Digest 2022 77
Since late 2012 Standards Australia, supported by FMA Australia, PCA, RICS, SBEnrc, TEFMA and other industry bodies, have been involved with the ISO’s international Facilities Management (FM) standards initiative. ISO 41001:2018 specifies the requirements for a facility management (FM) system when an organization:a) needs to demonstrate effective and efficient delivery of FM
that supports the objectives of the demand organizationb) aims to consistently meet the needs of interested parties
and applicable requirementsc) aims to be sustainable in a globally-competitive
environmentThe requirements specified in ISO 41001:2018 are non-sector specific and intended to be applicable to all organizations, or parts thereof, whether public or private sector, and regardless of the type, size and nature of the organization or geographical location.Separately, there was the release in 2014 of the ISO 55000 series for Asset Management (AM). ISO 55000 specifies the requirements for the establishment, implementation, maintenance and improvement of a management system for asset management, referred to as an “asset management system” for those wishing to: § improve the realisation of value for their organization from
their asset base § be involved in the establishment, implementation,
maintenance and improvement of an asset management system
§ be involved in the planning, design, implementation and review of asset management activities along with service providers
AC
QU
IRE
MA
INTA
IN
MA
INTA
IN
DIS
PO
SE
UP
GR
AD
E
Meanwhile, FMA Australia’s local efforts include “An Operational Guide to Sustainable Facilities Management” (2010) – a practical document that provides technical guidance in achieving a more sustainable FM approach in an Australian context.RLB can provide strategic advisory and technical support across the latest in AM and FM practices.
ASSETS AND FACILITIES MANAGEMENT STANDARDS
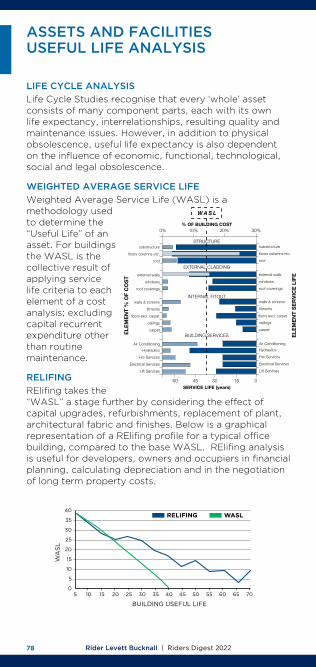
Rider Levett Bucknall | Riders Digest 202278
ASSETS AND FACILITIESUSEFUL LIFE ANALYSIS
LIFE CYCLE ANALYSISLife Cycle Studies recognise that every ‘whole’ asset consists of many component parts, each with its own life expectancy, interrelationships, resulting quality and maintenance issues. However, in addition to physical obsolescence, useful life expectancy is also dependent on the influence of economic, functional, technological, social and legal obsolescence.
WEIGHTED AVERAGE SERVICE LIFEWeighted Average Service Life (WASL) is a methodology used to determine the “Useful Life” of an asset. For buildings the WASL is the collective result of applying service life criteria to each element of a cost analysis; excluding capital recurrent expenditure other than routine maintenance.
RELIFINGRElifing takes the “WASL” a stage further by considering the effect of capital upgrades, refurbishments, replacement of plant, architectural fabric and finishes. Below is a graphical representation of a RElifing profile for a typical office building, compared to the base WASL. RElifing analysis is useful for developers, owners and occupiers in financial planning, calculating depreciation and in the negotiation of long term property costs.
40
35
30
25
20
15
10
5
05 10 15 20 25 30 35 40 45 50 55 60 65 70
RELIFING WASL
WA
SL
BUILDING USEFUL LIFE
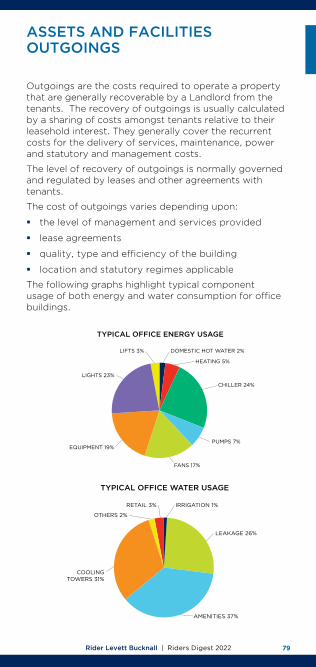
Rider Levett Bucknall | Riders Digest 2022 79
Outgoings are the costs required to operate a property that are generally recoverable by a Landlord from the tenants. The recovery of outgoings is usually calculated by a sharing of costs amongst tenants relative to their leasehold interest. They generally cover the recurrent costs for the delivery of services, maintenance, power and statutory and management costs.
The level of recovery of outgoings is normally governed and regulated by leases and other agreements with tenants.
The cost of outgoings varies depending upon:
§ the level of management and services provided
§ lease agreements
§ quality, type and efficiency of the building
§ location and statutory regimes applicable
The following graphs highlight typical component usage of both energy and water consumption for office buildings.
ASSETS AND FACILITIES OUTGOINGS
TYPICAL OFFICE ENERGY USAGE
DOMESTIC HOT WATER 2%
HEATING 5%
CHILLER 24%
PUMPS 7%
FANS 17%
EQUIPMENT 19%
LIGHTS 23%
LIFTS 3%
TYPICAL OFFICE WATER USAGE
IRRIGATION 1%
LEAKAGE 26%
AMENITIES 37%
COOLING TOWERS 31%
OTHERS 2%
RETAIL 3%
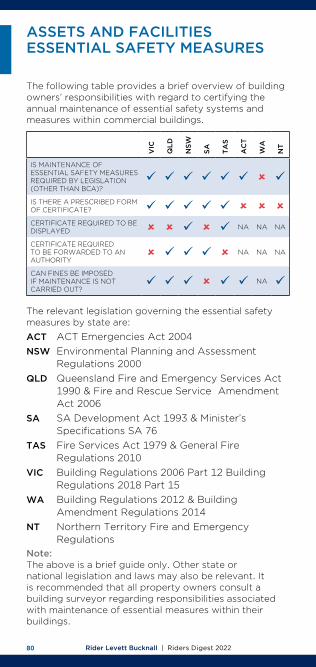
Rider Levett Bucknall | Riders Digest 202280
The following table provides a brief overview of building owners’ responsibilities with regard to certifying the annual maintenance of essential safety systems and measures within commercial buildings.
ASSETS AND FACILITIES ESSENTIAL SAFETY MEASURES
The relevant legislation governing the essential safety measures by state are:
ACT ACT Emergencies Act 2004 NSW Environmental Planning and Assessment
Regulations 2000 QLD Queensland Fire and Emergency Services Act
1990 & Fire and Rescue Service Amendment Act 2006
SA SA Development Act 1993 & Minister’s Specifications SA 76
TAS Fire Services Act 1979 & General Fire Regulations 2010
VIC Building Regulations 2006 Part 12 Building Regulations 2018 Part 15
WA Building Regulations 2012 & Building Amendment Regulations 2014
NT Northern Territory Fire and Emergency Regulations
Note:The above is a brief guide only. Other state or national legislation and laws may also be relevant. It is recommended that all property owners consult a building surveyor regarding responsibilities associated with maintenance of essential measures within their buildings.
VIC
QLD
NSW
SA TAS
AC
T
WA
NT
IS MAINTENANCE OF ESSENTIAL SAFETY MEASURES REQUIRED BY LEGISLATION (OTHER THAN BCA)?
IS THERE A PRESCRIBED FORM OF CERTIFICATE? CERTIFICATE REQUIRED TO BE DISPLAYED NA NA NA
CERTIFICATE REQUIRED TO BE FORWARDED TO AN AUTHORITY
NA NA NA
CAN FINES BE IMPOSED IF MAINTENANCE IS NOT CARRIED OUT?
NA
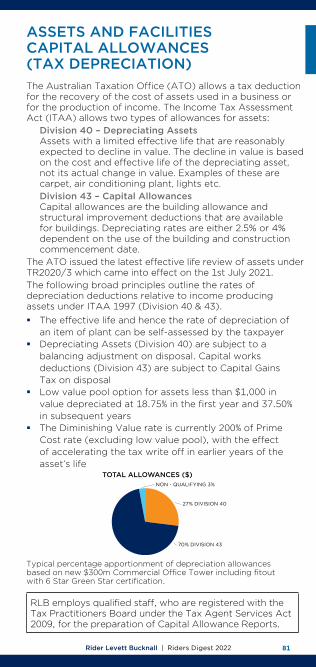
Rider Levett Bucknall | Riders Digest 2022 81
The Australian Taxation Office (ATO) allows a tax deduction for the recovery of the cost of assets used in a business or for the production of income. The Income Tax Assessment Act (ITAA) allows two types of allowances for assets: Division 40 – Depreciating Assets Assets with a limited effective life that are reasonably
expected to decline in value. The decline in value is based on the cost and effective life of the depreciating asset, not its actual change in value. Examples of these are carpet, air conditioning plant, lights etc.
Division 43 – Capital Allowances Capital allowances are the building allowance and
structural improvement deductions that are available for buildings. Depreciating rates are either 2.5% or 4% dependent on the use of the building and construction commencement date.
The ATO issued the latest effective life review of assets under TR2020/3 which came into effect on the 1st July 2021. The following broad principles outline the rates of depreciation deductions relative to income producing assets under ITAA 1997 (Division 40 & 43). § The effective life and hence the rate of depreciation of
an item of plant can be self-assessed by the taxpayer § Depreciating Assets (Division 40) are subject to a
balancing adjustment on disposal. Capital works deductions (Division 43) are subject to Capital Gains Tax on disposal
§ Low value pool option for assets less than $1,000 in value depreciated at 18.75% in the first year and 37.50% in subsequent years
§ The Diminishing Value rate is currently 200% of Prime Cost rate (excluding low value pool), with the effect of accelerating the tax write off in earlier years of the asset’s life
TOTAL ALLOWANCES ($)
27% DIVISION 40
70% DIVISION 43
NON - QUALIFYING 3%
ASSETS AND FACILITIES CAPITAL ALLOWANCES (TAX DEPRECIATION)
Typical percentage apportionment of depreciation allowances based on new $300m Commercial Office Tower including fitout with 6 Star Green Star certification.
RLB employs qualified staff, who are registered with the Tax Practitioners Board under the Tax Agent Services Act 2009, for the preparation of Capital Allowance Reports.
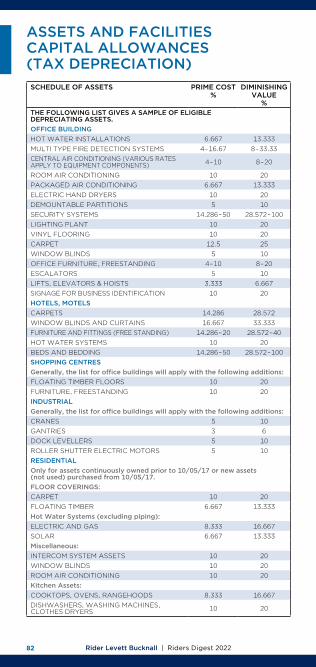
Rider Levett Bucknall | Riders Digest 202282
SCHEDULE OF ASSETS PRIME COST %
DIMINISHING VALUE
%THE FOLLOWING LIST GIVES A SAMPLE OF ELIGIBLE DEPRECIATING ASSETS.OFFICE BUILDINGHOT WATER INSTALLATIONS 6.667 13.333MULTI TYPE FIRE DETECTION SYSTEMS 4 – 16.67 8 – 33.33CENTRAL AIR CONDITIONING (VARIOUS RATES APPLY TO EQUIPMENT COMPONENTS) 4 – 10 8 – 20
ROOM AIR CONDITIONING 10 20PACKAGED AIR CONDITIONING 6.667 13.333ELECTRIC HAND DRYERS 10 20DEMOUNTABLE PARTITIONS 5 10SECURITY SYSTEMS 14.286 – 50 28.572 – 100LIGHTING PLANT 10 20VINYL FLOORING 10 20CARPET 12.5 25WINDOW BLINDS 5 10 OFFICE FURNITURE, FREESTANDING 4 – 10 8 – 20ESCALATORS 5 10LIFTS, ELEVATORS & HOISTS 3.333 6.667 SIGNAGE FOR BUSINESS IDENTIFICATION 10 20HOTELS, MOTELSCARPETS 14.286 28.572WINDOW BLINDS AND CURTAINS 16.667 33.333FURNITURE AND FITTINGS (FREE STANDING) 14.286 – 20 28.572 – 40HOT WATER SYSTEMS 10 20BEDS AND BEDDING 14.286 – 50 28.572 – 100SHOPPING CENTRESGenerally, the list for office buildings will apply with the following additions:FLOATING TIMBER FLOORS 10 20FURNITURE, FREESTANDING 10 20INDUSTRIALGenerally, the list for office buildings will apply with the following additions:CRANES 5 10GANTRIES 3 6DOCK LEVELLERS 5 10ROLLER SHUTTER ELECTRIC MOTORS 5 10RESIDENTIALOnly for assets continuously owned prior to 10/05/17 or new assets (not used) purchased from 10/05/17.FLOOR COVERINGS:CARPET 10 20FLOATING TIMBER 6.667 13.333Hot Water Systems (excluding piping):ELECTRIC AND GAS 8.333 16.667SOLAR 6.667 13.333Miscellaneous:INTERCOM SYSTEM ASSETS 10 20WINDOW BLINDS 10 20ROOM AIR CONDITIONING 10 20Kitchen Assets:COOKTOPS, OVENS, RANGEHOODS 8.333 16.667DISHWASHERS, WASHING MACHINES, CLOTHES DRYERS 10 20
ASSETS AND FACILITIES CAPITAL ALLOWANCES (TAX DEPRECIATION)

OFFICES AROUND THE WORLD
Oceania 84
Africa 85
Middle East 85
Europe 86
Asia 86
Americas 89

Rider Levett Bucknall | Riders Digest 202284
OFFICES AROUND THE WORLD
AUSTRALIAADELAIDERider Levett Bucknall SA Pty LtdLevel 1, 8 Leigh Street, Adelaide, SA 5000T: +61 8 8100 1200E: [email protected]: John Drillis
BRISBANERider Levett Bucknall QLD Pty LtdLevel 13, 10 Eagle Street, Brisbane, QLD 4000T: +61 7 3009 6933E: [email protected]: Matt Long
CAIRNSRider Levett Bucknall QLD Pty LtdSuite 7, 1st Floor, Cairns Professional Centre,92-96 Pease Street, Cairns, QLD 4870T: +61 7 4032 1533E: [email protected]: Brad Bell
CANBERRARider Levett Bucknall ACT Pty Ltd16 Bentham Street, Yarralumla, ACT 2600T: +61 2 6281 5446E: [email protected]: Fiona Doherty
COFFS HARBOURRider Levett Bucknall NSW Pty LtdLevel 1, 9 Park Avenue, Coffs Harbour, NSW 2450T: +61 2 4940 0000E: [email protected]: Mark Hocking
DARWINRider Levett Bucknall NT Pty LtdLevel 4, 62 Cavenagh Street, Darwin, NT 0800T: +61 8 8941 2262E: [email protected]: Paul Lassemillante
GOLD COASTRider Levett Bucknall QLD Pty LtdLevel 1, 45 Nerang Street, Southport, QLD 4215T: +61 7 5595 6900E: [email protected]: Jim Krebs
MELBOURNERider Levett Bucknall VIC Pty LtdLevel 13, 380 St. Kilda Road, Melbourne, VIC 3004T: +61 3 9690 6111E: [email protected]: Tony Moleta
NEWCASTLERider Levett Bucknall NSW Pty LtdSuite 4, Level 1, 101 Hannell Street, Wickham NSW 2293T: +61 2 4940 0000E: [email protected]: Mark Hocking
PERTHRider Levett Bucknall WA Pty LtdLevel 9, 160 St Georges Tce, Perth, WA 6000T: +61 8 9421 1230E: [email protected]: Mark Bendotti
SUNSHINE COASTRider Levett Bucknall QLD Pty LtdSuite 307, La Balsa45 Brisbane Road,Mooloolaba QLD 4557T: +61 7 5443 3622E: [email protected]: Nick Duncan
SYDNEYRider Levett Bucknall NSW Pty LtdLevel 19, 141 Walker Street, North Sydney, NSW 2060T: +61 2 9922 2277E: [email protected]: Stephen Mee
TOWNSVILLERider Levett Bucknall QLD Pty LtdLevel 1, 45 Eyre Street, North Ward, Townsville, QLD 4810T: +61 7 4771 5718E: [email protected]: Chris Marais
NEW ZEALANDAUCKLANDRider Levett Bucknall Auckland LtdLevel 16, Vero Centre, 48 Shortland Street, Auckland 1141T: +64 9 309 1074E: [email protected]: Stephen Gracey
CHRISTCHURCHRider Levett Bucknall Christchurch LtdLevel 1, 254 Montreal Street,Christchurch 8013T: +64 3 354 6873 E: [email protected] Contact: Neil O’Donnell
HAMILTON Rider Levett Bucknall HamiltonLevel 3, 103 London Street,Hamilton 3204T: +64 7 839 1306E: [email protected]: Richard Anderson
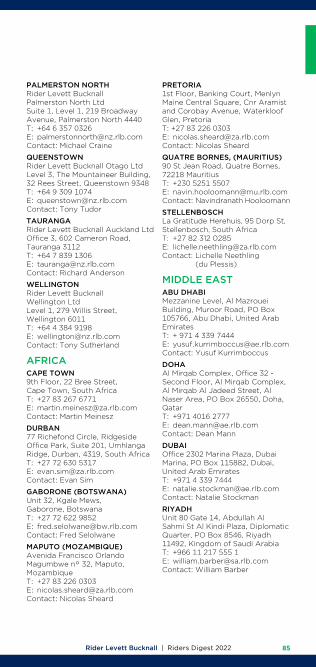
Rider Levett Bucknall | Riders Digest 2022 85
PALMERSTON NORTHRider Levett Bucknall Palmerston North LtdSuite 1, Level 1, 219 Broadway Avenue, Palmerston North 4440T: +64 6 357 0326E: [email protected]: Michael Craine
QUEENSTOWNRider Levett Bucknall Otago Ltd Level 3, The Mountaineer Building, 32 Rees Street, Queenstown 9348T: +64 9 309 1074 E: [email protected]: Tony Tudor
TAURANGARider Levett Bucknall Auckland LtdOffice 3, 602 Cameron Road, Tauranga 3112T: +64 7 839 1306E: [email protected]: Richard Anderson
WELLINGTONRider Levett Bucknall Wellington LtdLevel 1, 279 Willis Street, Wellington 6011T: +64 4 384 9198E: [email protected]: Tony Sutherland
AFRICACAPE TOWN9th Floor, 22 Bree Street, Cape Town, South AfricaT: +27 83 267 6771E: [email protected] Contact: Martin Meinesz
DURBAN 77 Richefond Circle, Ridgeside Office Park, Suite 201, Umhlanga Ridge, Durban, 4319, South AfricaT: +27 72 630 5317E: [email protected] Contact: Evan Sim
GABORONE (BOTSWANA)Unit 32, Kgale Mews, Gaborone, BotswanaT: +27 72 622 9852E: [email protected]: Fred Selolwane
MAPUTO (MOZAMBIQUE)Avenida Francisco Orlando Magumbwe n° 32, Maputo, MozambiqueT: +27 83 226 0303E: [email protected]: Nicolas Sheard
PRETORIA 1st Floor, Banking Court, Menlyn Maine Central Square, Cnr Aramist and Corobay Avenue, Waterkloof Glen, PretoriaT: +27 83 226 0303E: [email protected] Contact: Nicolas Sheard
QUATRE BORNES, (MAURITIUS)90 St Jean Road, Quatre Bornes, 72218 MauritiusT: +230 5251 5507E: [email protected]: Navindranath Hooloomann
STELLENBOSCH La Gratitude Herehuis, 95 Dorp St, Stellenbosch, South Africa T: +27 82 312 0285 E: [email protected] Contact: Lichelle Neethling (du Plessis)
MIDDLE EASTABU DHABIMezzanine Level, Al Mazrouei Building, Muroor Road, PO Box 105766, Abu Dhabi, United Arab Emirates T: + 971 4 339 7444E: [email protected]: Yusuf Kurrimboccus
DOHAAl Mirqab Complex, Office 32 - Second Floor, Al Mirqab Complex, Al Mirqab Al Jadeed Street, Al Naser Area, PO Box 26550, Doha, QatarT: +971 4016 2777E: [email protected]: Dean Mann
DUBAIOffice 2302 Marina Plaza, Dubai Marina, PO Box 115882, Dubai, United Arab EmiratesT: +971 4 339 7444E: [email protected]: Natalie Stockman
RIYADHUnit 80 Gate 14, Abdullah Al Sahmi St Al Kindi Plaza, Diplomatic Quarter, PO Box 8546, Riyadh 11492, Kingdom of Saudi ArabiaT: +966 11 217 555 1E: [email protected]: William Barber

Rider Levett Bucknall | Riders Digest 202286
OFFICES AROUND THE WORLD
EUROPE BIRMINGHAM15 Colmore Row, Birmingham, B3 2BHT: +44 121 503 1500 E: [email protected] Contact: Jo Reynolds
BRISTOLEmbassy House, 86 Queen’s Avenue, Bristol, BS8 1SBT: +44 117 974 1122E: [email protected] Contact: Jackie Pinder
CUMBRIA44 Springfield Road,Egremont, Cumbria, CA22 2TQT: +44 1925 851 787E: [email protected] Contact: Mark Clive
LEEDS4D, Platform, New Station Street, Leeds LS1 4JBT: +44 114 273 3300E: [email protected] Contact: Matt Summerhill
LIVERPOOL 8 Princes Parade, Liverpool, L3 1DL, United KingdomT: +44 151 236 6864E: [email protected] Contact: Steve Gillingham
LONDON2nd Floor, 60 New Broad Street, London, EC2M 1JJT: +44 20 7398 8300E: [email protected]: Nick Eliot
MANCHESTER1 King Street, Manchester, M2 6AWT: +44 161 868 7700E: [email protected] Contact: Steve Gillingham
PARIS, FRANCE94, Boulevard de Courcelles, 75017 Paris, FranceT: +33 1 53 40 94 80E: [email protected] Contact: Matthieu Lamy
SHEFFIELD6th Floor Orchard Lane Wing, Fountain Precinct, Balm Green, Sheffield, S1 2JA T: +44 114 273 3300E: [email protected]: Matt Summerhill
THAMES VALLEY1000 Eskdale Road,Winnersh Triangle, Wokingham, Berkshire, RG41 5TST: +44 118 974 3600 E: [email protected]: Mike Righton
WARRINGTONGround South Wing, 401 Faraday Street, Birchwood Park, Warrington, Cheshire WA3 6GAT: +44 1925 851787E: [email protected] Contact: Mark Clive
CHINABEIJINGRoom 1803-1809, 18th Floor, East Ocean Centre, 24A Jian Guo Men Wai Avenue, Chaoyang District, Beijing 100004, ChinaT: +86 10 6515 5818E: [email protected]: Simon Tuen
CHENGDURoom 2901-2904, 29th Floor, Square One, No. 18 Dongyu Street, Jinjiang District, Chengdu 610016, Sichuan Province, ChinaT: +86 28 8670 3382E: [email protected]: Eric Lau
CHONGQINGRoom 1-3 & 17-18, 39/F,IFS Tower T1, No. 1 Qingyun Road,Jiangbei District, Chongqing 400024, ChinaT: +86 28 8670 3382E: [email protected]: Eric Lau
GUANGZHOURoom 1302-1308, Central Tower,5 Xiancun Road, Guangzhou 510623Guangdong Province T: 852 2823 3910E: [email protected]: Danny Chow
GUIYANGRoom E, 12th Floor, Fuzhong International Plaza, 126 Xin Hua Road, Guiyang 550002, Guizhou Province, ChinaT: + 86 20 8732 1801E: [email protected]: Danny Chow
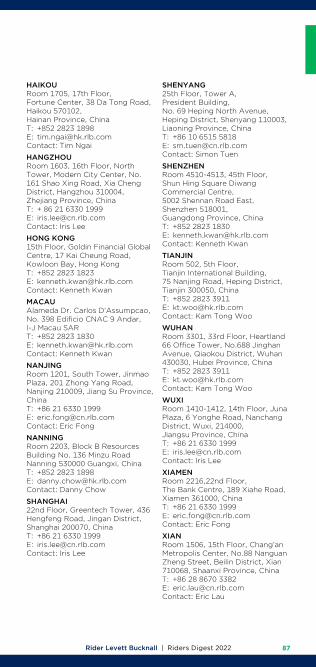
Rider Levett Bucknall | Riders Digest 2022 87
HAIKOURoom 1705, 17th Floor, Fortune Center, 38 Da Tong Road, Haikou 570102, Hainan Province, ChinaT: +852 2823 1898E: [email protected]: Tim Ngai
HANGZHOURoom 1603, 16th Floor, North Tower, Modern City Center, No. 161 Shao Xing Road, Xia Cheng District, Hangzhou 310004, Zhejiang Province, ChinaT: + 86 21 6330 1999E: [email protected]: Iris Lee
HONG KONG15th Floor, Goldin Financial Global Centre, 17 Kai Cheung Road, Kowloon Bay, Hong KongT: +852 2823 1823E: [email protected]: Kenneth Kwan
MACAUAlameda Dr. Carlos D’Assumpcao, No. 398 Edificio CNAC 9 Andar,I-J Macau SART: +852 2823 1830E: [email protected]: Kenneth Kwan
NANJINGRoom 1201, South Tower, Jinmao Plaza, 201 Zhong Yang Road, Nanjing 210009, Jiang Su Province, ChinaT: +86 21 6330 1999E: [email protected]: Eric Fong
NANNINGRoom 2203, Block B Resources Building No. 136 Minzu Road Nanning 530000 Guangxi, ChinaT: +852 2823 1898E: [email protected]: Danny Chow
SHANGHAI22nd Floor, Greentech Tower, 436 Hengfeng Road, Jingan District, Shanghai 200070, China T: +86 21 6330 1999 E: [email protected] Contact: Iris Lee
SHENYANG25th Floor, Tower A, President Building, No. 69 Heping North Avenue, Heping District, Shenyang 110003, Liaoning Province, ChinaT: +86 10 6515 5818E: [email protected]: Simon Tuen
SHENZHENRoom 4510-4513, 45th Floor, Shun Hing Square Diwang Commercial Centre, 5002 Shennan Road East, Shenzhen 518001, Guangdong Province, ChinaT: +852 2823 1830E: [email protected]: Kenneth Kwan
TIANJINRoom 502, 5th Floor, Tianjin International Building,75 Nanjing Road, Heping District, Tianjin 300050, ChinaT: +852 2823 3911E: [email protected] Contact: Kam Tong Woo
WUHANRoom 3301, 33rd Floor, Heartland 66 Office Tower, No.688 Jinghan Avenue, Qiaokou District, Wuhan 430030, Hubei Province, China T: +852 2823 3911E: [email protected] Contact: Kam Tong Woo
WUXIRoom 1410-1412, 14th Floor, Juna Plaza, 6 Yonghe Road, Nanchang District, Wuxi, 214000, Jiangsu Province, ChinaT: +86 21 6330 1999E: [email protected] Contact: Iris Lee
XIAMENRoom 2216,22nd Floor, The Bank Centre, 189 Xiahe Road, Xiamen 361000, ChinaT: +86 21 6330 1999E: [email protected]: Eric Fong
XIANRoom 1506, 15th Floor, Chang’an Metropolis Center, No.88 Nanguan Zheng Street, Beilin District, Xian 710068, Shaanxi Province, ChinaT: +86 28 8670 3382E: [email protected]: Eric Lau
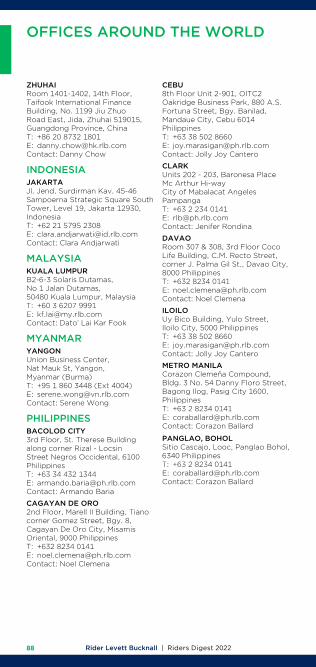
Rider Levett Bucknall | Riders Digest 202288
OFFICES AROUND THE WORLD
ZHUHAIRoom 1401-1402, 14th Floor, Taifook International Finance Building, No. 1199 Jiu Zhuo Road East, Jida, Zhuhai 519015, Guangdong Province, ChinaT: +86 20 8732 1801E: [email protected]: Danny Chow
INDONESIAJAKARTAJl. Jend. Surdirman Kav. 45-46 Sampoerna Strategic Square South Tower, Level 19, Jakarta 12930, IndonesiaT: +62 21 5795 2308 E: [email protected]: Clara Andjarwati
MALAYSIAKUALA LUMPURB2-6-3 Solaris Dutamas, No 1 Jalan Dutamas, 50480 Kuala Lumpur, MalaysiaT: +60 3 6207 9991E: [email protected]: Dato’ Lai Kar Fook
MYANMARYANGONUnion Business Center,Nat Mauk St, Yangon,Myanmar (Burma)T: +95 1 860 3448 (Ext 4004)E: [email protected]: Serene Wong
PHILIPPINESBACOLOD CITY3rd Floor, St. Therese Building along corner Rizal - Locsin Street Negros Occidental, 6100 PhilippinesT: +63 34 432 1344E: [email protected]: Armando Baria
CAGAYAN DE ORO2nd Floor, Marell II Building, Tiano corner Gomez Street, Bgy. 8, Cagayan De Oro City, Misamis Oriental, 9000 PhilippinesT: +632 8234 0141E: [email protected]: Noel Clemena
CEBU8th Floor Unit 2-901, OITC2 Oakridge Business Park, 880 A.S. Fortuna Street, Bgy. Banilad, Mandaue City, Cebu 6014 PhilippinesT: +63 38 502 8660E: [email protected]: Jolly Joy Cantero
CLARKUnits 202 - 203, Baronesa PlaceMc Arthur Hi-wayCity of Mabalacat AngelesPampangaT: +63 2 234 0141E: [email protected]: Jenifer Rondina
DAVAORoom 307 & 308, 3rd Floor Coco Life Building, C.M. Recto Street, corner J. Palma Gil St., Davao City, 8000 PhilippinesT: +632 8234 0141E: [email protected]: Noel Clemena
ILOILOUy Bico Building, Yulo Street,Iloilo City, 5000 PhilippinesT: +63 38 502 8660 E: [email protected]: Jolly Joy Cantero
METRO MANILACorazon Clemeña Compound, Bldg. 3 No. 54 Danny Floro Street, Bagong Ilog, Pasig City 1600, PhilippinesT: +63 2 8234 0141 E: [email protected]: Corazon Ballard
PANGLAO, BOHOLSitio Cascajo, Looc, Panglao Bohol, 6340 PhilippinesT: +63 2 8234 0141E: [email protected]: Corazon Ballard
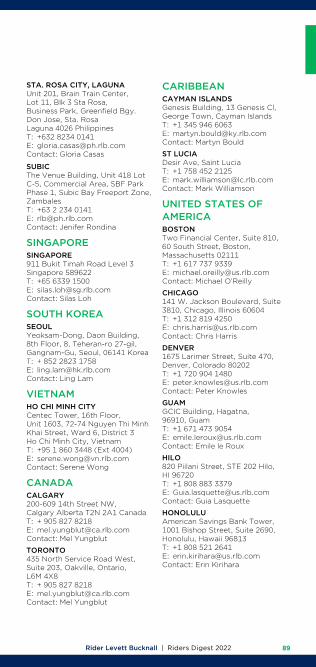
Rider Levett Bucknall | Riders Digest 2022 89
STA. ROSA CITY, LAGUNAUnit 201, Brain Train Center,Lot 11, Blk 3 Sta Rosa, Business Park, Greenfield Bgy. Don Jose, Sta. RosaLaguna 4026 PhilippinesT: +632 8234 0141E: [email protected]: Gloria Casas
SUBICThe Venue Building, Unit 418 Lot C-5, Commercial Area, SBF Park Phase 1, Subic Bay Freeport Zone, ZambalesT: +63 2 234 0141E: [email protected]: Jenifer Rondina
SINGAPORESINGAPORE911 Bukit Timah Road Level 3Singapore 589622T: +65 6339 1500E: [email protected]: Silas Loh
SOUTH KOREASEOULYeoksam-Dong, Daon Building, 8th Floor, 8, Teheran-ro 27-gil, Gangnam-Gu, Seoul, 06141 KoreaT: + 852 2823 1758E: [email protected] Contact: Ling Lam
VIETNAMHO CHI MINH CITYCentec Tower, 16th Floor, Unit 1603, 72-74 Nguyen Thi Minh Khai Street, Ward 6, District 3 Ho Chi Minh City, VietnamT: +95 1 860 3448 (Ext 4004)E: [email protected]: Serene Wong
CANADACALGARY200-609 14th Street NW, Calgary Alberta T2N 2A1 CanadaT: + 905 827 8218E: [email protected]: Mel Yungblut
TORONTO435 North Service Road West, Suite 203, Oakville, Ontario, L6M 4X8T: + 905 827 8218E: [email protected]: Mel Yungblut
CARIBBEANCAYMAN ISLANDSGenesis Building, 13 Genesis Cl, George Town, Cayman IslandsT: +1 345 946 6063E: [email protected]: Martyn Bould
ST LUCIADesir Ave, Saint LuciaT: +1 758 452 2125E: [email protected]: Mark Williamson
UNITED STATES OF AMERICABOSTONTwo Financial Center, Suite 810, 60 South Street, Boston, Massachusetts 02111T: +1 617 737 9339E: [email protected]: Michael O’Reilly
CHICAGO141 W. Jackson Boulevard, Suite 3810, Chicago, Illinois 60604T: +1 312 819 4250E: [email protected]: Chris Harris
DENVER1675 Larimer Street, Suite 470, Denver, Colorado 80202T: +1 720 904 1480E: [email protected]: Peter Knowles
GUAMGCIC Building, Hagatna, 96910, GuamT: +1 671 473 9054E: [email protected]: Emile le Roux
HILO820 Piilani Street, STE 202 Hilo, HI 96720T: +1 808 883 3379 E: [email protected]: Guia Lasquette
HONOLULUAmerican Savings Bank Tower, 1001 Bishop Street, Suite 2690, Honolulu, Hawaii 96813T: +1 808 521 2641E: [email protected]: Erin Kirihara
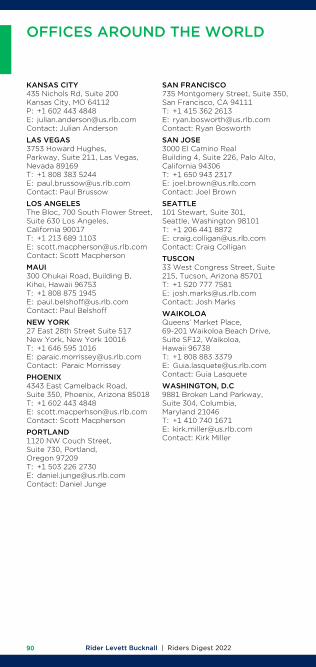
Rider Levett Bucknall | Riders Digest 202290
OFFICES AROUND THE WORLD
KANSAS CITY435 Nichols Rd, Suite 200 Kansas City, MO 64112P: +1 602 443 4848E: [email protected]: Julian Anderson
LAS VEGAS3753 Howard Hughes, Parkway, Suite 211, Las Vegas, Nevada 89169T: +1 808 383 5244E: [email protected]: Paul Brussow
LOS ANGELESThe Bloc, 700 South Flower Street,Suite 630 Los Angeles, California 90017T: +1 213 689 1103 E: [email protected] Contact: Scott Macpherson
MAUI300 Ohukai Road, Building B, Kihei, Hawaii 96753T: +1 808 875 1945E: [email protected]: Paul Belshoff
NEW YORK27 East 28th Street Suite 517 New York, New York 10016T: +1 646 595 1016E: [email protected]: Paraic Morrissey
PHOENIX4343 East Camelback Road, Suite 350, Phoenix, Arizona 85018T: +1 602 443 4848E: [email protected]: Scott Macpherson
PORTLAND1120 NW Couch Street, Suite 730, Portland, Oregon 97209T: +1 503 226 2730E: [email protected]: Daniel Junge
SAN FRANCISCO735 Montgomery Street, Suite 350, San Francisco, CA 94111T: +1 415 362 2613E: [email protected] Contact: Ryan Bosworth
SAN JOSE 3000 El Camino Real Building 4, Suite 226, Palo Alto, California 94306T: +1 650 943 2317E: [email protected]: Joel Brown
SEATTLE101 Stewart, Suite 301, Seattle, Washington 98101T: +1 206 441 8872E: [email protected]: Craig Colligan
TUSCON33 West Congress Street, Suite 215, Tucson, Arizona 85701T: +1 520 777 7581E: [email protected]: Josh Marks
WAIKOLOAQueens’ Market Place, 69-201 Waikoloa Beach Drive, Suite SF12, Waikoloa, Hawaii 96738T: +1 808 883 3379E: [email protected] Contact: Guia Lasquete
WASHINGTON, D.C9881 Broken Land Parkway, Suite 304, Columbia, Maryland 21046T: +1 410 740 1671E: [email protected] Contact: Kirk Miller
CALENDARS
Calendars 2021 – 2024 92
2022 Rostered Days Off 94
Public Holidays 96
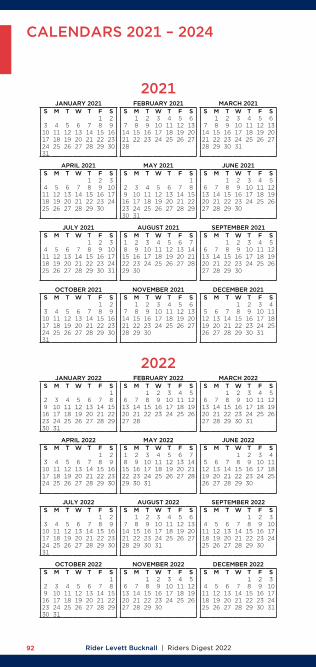
Rider Levett Bucknall | Riders Digest 202292
CALENDARS 2021 – 2024
JANUARY 2021S M T W T F S
1 23 4 5 6 7 8 910 11 12 13 14 15 1617 18 19 20 21 22 2324 25 26 27 28 29 3031
APRIL 2021S M T W T F S
1 2 34 5 6 7 8 9 1011 12 13 14 15 16 1718 19 20 21 22 23 2425 26 27 28 29 30
JULY 2021S M T W T F S
1 2 34 5 6 7 8 9 1011 12 13 14 15 16 1718 19 20 21 22 23 2425 26 27 28 29 30 31
OCTOBER 2021S M T W T F S
1 23 4 5 6 7 8 910 11 12 13 14 15 1617 18 19 20 21 22 2324 25 26 27 28 29 3031
FEBRUARY 2021S M T W T F S
1 2 3 4 5 67 8 9 10 11 12 1314 15 16 17 18 19 2021 22 23 24 25 26 2728
MAY 2021S M T W T F S
12 3 4 5 6 7 89 10 11 12 13 14 1516 17 18 19 20 21 2223 24 25 26 27 28 2930 31
AUGUST 2021S M T W T F S1 2 3 4 5 6 78 9 10 11 12 13 1415 16 17 18 19 20 2122 23 24 25 26 27 2829 30
NOVEMBER 2021S M T W T F S
1 2 3 4 5 67 8 9 10 11 12 1314 15 16 17 18 19 2021 22 23 24 25 26 2728 29 30
MARCH 2021S M T W T F S
1 2 3 4 5 67 8 9 10 11 12 1314 15 16 17 18 19 2021 22 23 24 25 26 2728 29 30 31
JUNE 2021S M T W T F S
1 2 3 4 56 7 8 9 10 11 1213 14 15 16 17 18 1920 21 22 23 24 25 2627 28 29 30
SEPTEMBER 2021S M T W T F S
1 2 3 4 56 7 8 9 10 11 1213 14 15 16 17 18 1920 21 22 23 24 25 2627 28 29 30
DECEMBER 2021S M T W T F S 1 2 3 45 6 7 8 9 10 1112 13 14 15 16 17 1819 20 21 22 23 24 2526 27 28 29 30 31
2021
JANUARY 2022S M T W T F S 12 3 4 5 6 7 89 10 11 12 13 14 1516 17 18 19 20 21 2223 24 25 26 27 28 2930 31
APRIL 2022S M T W T F S
1 23 4 5 6 7 8 910 11 12 13 14 15 1617 18 19 20 21 22 2324 25 26 27 28 29 30
JULY 2022S M T W T F S
1 23 4 5 6 7 8 910 11 12 13 14 15 1617 18 19 20 21 22 2324 25 26 27 28 29 3031
OCTOBER 2022S M T W T F S 12 3 4 5 6 7 89 10 11 12 13 14 1516 17 18 19 20 21 2223 24 25 26 27 28 2930 31
FEBRUARY 2022S M T W T F S
1 2 3 4 56 7 8 9 10 11 1213 14 15 16 17 18 1920 21 22 23 24 25 2627 28
MAY 2022S M T W T F S1 2 3 4 5 6 78 9 10 11 12 13 1415 16 17 18 19 20 2122 23 24 25 26 27 2829 30 31
AUGUST 2022S M T W T F S
1 2 3 4 5 67 8 9 10 11 12 1314 15 16 17 18 19 2021 22 23 24 25 26 2728 29 30 31
NOVEMBER 2022S M T W T F S
1 2 3 4 56 7 8 9 10 11 1213 14 15 16 17 18 1920 21 22 23 24 25 2627 28 29 30
MARCH 2022S M T W T F S
1 2 3 4 56 7 8 9 10 11 1213 14 15 16 17 18 1920 21 22 23 24 25 2627 28 29 30 31
JUNE 2022S M T W T F S 1 2 3 45 6 7 8 9 10 1112 13 14 15 16 17 1819 20 21 22 23 24 2526 27 28 29 30
SEPTEMBER 2022S M T W T F S
1 2 34 5 6 7 8 9 1011 12 13 14 15 16 1718 19 20 21 22 23 2425 26 27 28 29 30
DECEMBER 2022S M T W T F S
1 2 34 5 6 7 8 9 1011 12 13 14 15 16 1718 19 20 21 22 23 2425 26 27 28 29 30 31
2022
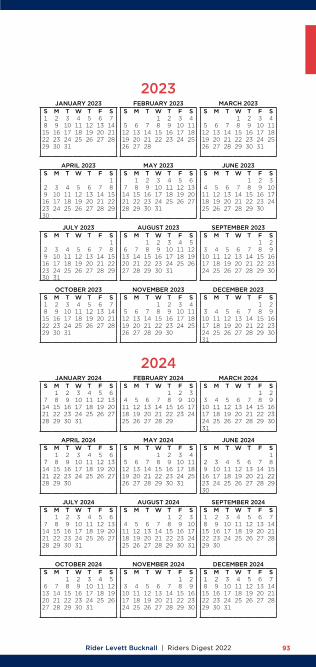
Rider Levett Bucknall | Riders Digest 2022 93
JANUARY 2024S M T W T F S
1 2 3 4 5 67 8 9 10 11 12 1314 15 16 17 18 19 2021 22 23 24 25 26 2728 29 30 31
APRIL 2024S M T W T F S
1 2 3 4 5 67 8 9 10 11 12 1314 15 16 17 18 19 2021 22 23 24 25 26 2728 29 30
JULY 2024S M T W T F S
1 2 3 4 5 67 8 9 10 11 12 1314 15 16 17 18 19 2021 22 23 24 25 26 2728 29 30 31
OCTOBER 2024S M T W T F S
1 2 3 4 56 7 8 9 10 11 1213 14 15 16 17 18 1920 21 22 23 24 25 2627 28 29 30 31
FEBRUARY 2024S M T W T F S
1 2 34 5 6 7 8 9 1011 12 13 14 15 16 1718 19 20 21 22 23 2425 26 27 28 29
MAY 2024S M T W T F S
1 2 3 45 6 7 8 9 10 1112 13 14 15 16 17 1819 20 21 22 23 24 2526 27 28 29 30 31
AUGUST 2024S M T W T F S
1 2 34 5 6 7 8 9 1011 12 13 14 15 16 1718 19 20 21 22 23 2425 26 27 28 29 30 31
NOVEMBER 2024S M T W T F S
1 23 4 5 6 7 8 910 11 12 13 14 15 1617 18 19 20 21 22 2324 25 26 27 28 29 30
MARCH 2024S M T W T F S
1 23 4 5 6 7 8 910 11 12 13 14 15 1617 18 19 20 21 22 2324 25 26 27 28 29 3031
JUNE 2024S M T W T F S 12 3 4 5 6 7 89 10 11 12 13 14 1516 17 18 19 20 21 2223 24 25 26 27 28 2930
SEPTEMBER 2024S M T W T F S1 2 3 4 5 6 78 9 10 11 12 13 1415 16 17 18 19 20 2122 23 24 25 26 27 2829 30
DECEMBER 2024S M T W T F S1 2 3 4 5 6 78 9 10 11 12 13 1415 16 17 18 19 20 2122 23 24 25 26 27 2829 30 31
2024
JANUARY 2023S M T W T F S1 2 3 4 5 6 78 9 10 11 12 13 1415 16 17 18 19 20 2122 23 24 25 26 27 2829 30 31
APRIL 2023S M T W T F S 12 3 4 5 6 7 89 10 11 12 13 14 1516 17 18 19 20 21 2223 24 25 26 27 28 2930
JULY 2023S M T W T F S 12 3 4 5 6 7 89 10 11 12 13 14 1516 17 18 19 20 21 2223 24 25 26 27 28 2930 31
OCTOBER 2023S M T W T F S1 2 3 4 5 6 78 9 10 11 12 13 1415 16 17 18 19 20 2122 23 24 25 26 27 2829 30 31
FEBRUARY 2023S M T W T F S
1 2 3 45 6 7 8 9 10 1112 13 14 15 16 17 1819 20 21 22 23 24 2526 27 28
MAY 2023S M T W T F S
1 2 3 4 5 67 8 9 10 11 12 1314 15 16 17 18 19 2021 22 23 24 25 26 2728 29 30 31
AUGUST 2023S M T W T F S
1 2 3 4 56 7 8 9 10 11 1213 14 15 16 17 18 1920 21 22 23 24 25 2627 28 29 30 31
NOVEMBER 2023S M T W T F S
1 2 3 45 6 7 8 9 10 1112 13 14 15 16 17 1819 20 21 22 23 24 2526 27 28 29 30
MARCH 2023S M T W T F S
1 2 3 45 6 7 8 9 10 1112 13 14 15 16 17 1819 20 21 22 23 24 2526 27 28 29 30 31
JUNE 2023S M T W T F S
1 2 34 5 6 7 8 9 1011 12 13 14 15 16 1718 19 20 21 22 23 2425 26 27 28 29 30
SEPTEMBER 2023S M T W T F S
1 23 4 5 6 7 8 910 11 12 13 14 15 1617 18 19 20 21 22 2324 25 26 27 28 29 30
DECEMBER 2023S M T W T F S
1 23 4 5 6 7 8 910 11 12 13 14 15 1617 18 19 20 21 22 2324 25 26 27 28 29 3031
2023
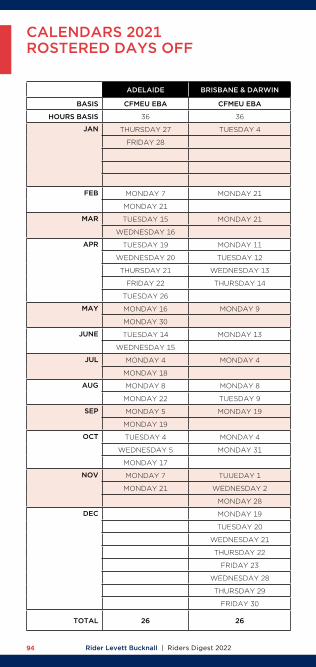
Rider Levett Bucknall | Riders Digest 202294
CALENDARS 2021 ROSTERED DAYS OFF
ADELAIDE BRISBANE & DARWIN CANBERRA MELBOURNE PERTH SYDNEY
BASIS CFMEU EBA CFMEU EBA CFMEU EBA CFMEU EBA CFMEU EBA CFMEU EBA
HOURS BASIS 36 36 36 36 36 36
JAN THURSDAY 27 TUESDAY 4 THURSDAY 27 MONDAY 10 TUESDAY 4 TUESDAY 4
FRIDAY 28 FRIDAY 28 TUESDAY 24 WEDNESDAY 5 FRIDAY 27
WEDNESDAY 25 THURSDAY 6 FRIDAY 28
FRIDAY 7
TUESDAY 25
FEB MONDAY 7 MONDAY 21 MONDAY 7 MONDAY 7 MONDAY 28 MONDAY 7
MONDAY 21 MONDAY 21 MONDAY 21 MONDAY 21
MAR TUESDAY 15 MONDAY 21 TUESDAY 15 TUESDAY 15 TUESDAY 8 MONDAY 7
WEDNESDAY 16 MONDAY 28 MONDAY 28 MONDAY 21
APR TUESDAY 19 MONDAY 11 THURSDAY 14 TUESDAY 19 TUESDAY 19 MONDAY 4
WEDNESDAY 20 TUESDAY 12 TUESDAY 19 WEDNESDAY 20 TUESDAY 19
THURSDAY 21 WEDNESDAY 13 FRIDAY 22 FRIDAY 22 TUESDAY 26
FRIDAY 22 THURSDAY 14
TUESDAY 26
MAY MONDAY 16 MONDAY 9 MONDAY 2 MONDAY 9 MONDAY 16 MONDAY 9
MONDAY 30 TUESDAY 31 MONDAY 23 MONDAY 23
JUNE TUESDAY 14 MONDAY 13 TUESDAY 14 TUESDAY 14 TUESDAY 7 TUESDAY 14
WEDNESDAY 15 MONDAY 27 MONDAY 27 MONDAY 27
JUL MONDAY 4 MONDAY 4 MONDAY 4 MONDAY 11 MONDAY 4 MONDAY 11
MONDAY 18 MONDAY 25 MONDAY 25 FRIDAY 29 MONDAY 25
AUG MONDAY 8 MONDAY 8 MONDAY 1 MONDAY 8 MONDAY 1 MONDAY 8
MONDAY 22 TUESDAY 9 MONDAY 22 MONDAY 22 MONDAY 22
SEP MONDAY 5 MONDAY 19 MONDAY 5 MONDAY 12 MONDAY 5 MONDAY 5
MONDAY 19 MONDAY 26 MONDAY 26 MONDAY 19
OCT TUESDAY 4 MONDAY 4 TUESDAY 4 MONDAY 3 MONDAY 3 TUESDAY 4
WEDNESDAY 5 MONDAY 31 MONDAY 24 MONDAY 17 MONDAY 17
MONDAY 17 MONDAY 31
NOV MONDAY 7 TUUEDAY 1 MONDAY 7 MONDAY 2 MONDAY 7 MONDAY 7
MONDAY 21 WEDNESDAY 2 MONDAY 28 MONDAY 14 MONDAY 21
MONDAY 28
DEC MONDAY 19 MONDAY 5 MONDAY 23 THURSDAY 22 TUESDAY 6
TUESDAY 20 FRIDAY 23 FRIDAY 23 WEDNESDAY 28
WEDNESDAY 21 WEDNESDAY 28 WEDNESDAY 28
THURSDAY 22 THURSDAY 29
FRIDAY 23 FRIDAY 30
WEDNESDAY 28
THURSDAY 29
FRIDAY 30
TOTAL 26 26 26 26 21 FIXED & 5 VARIABLE 26
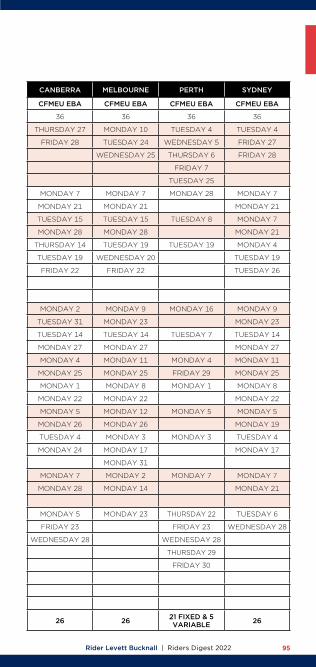
Rider Levett Bucknall | Riders Digest 2022 95
ADELAIDE BRISBANE & DARWIN CANBERRA MELBOURNE PERTH SYDNEY
BASIS CFMEU EBA CFMEU EBA CFMEU EBA CFMEU EBA CFMEU EBA CFMEU EBA
HOURS BASIS 36 36 36 36 36 36
JAN THURSDAY 27 TUESDAY 4 THURSDAY 27 MONDAY 10 TUESDAY 4 TUESDAY 4
FRIDAY 28 FRIDAY 28 TUESDAY 24 WEDNESDAY 5 FRIDAY 27
WEDNESDAY 25 THURSDAY 6 FRIDAY 28
FRIDAY 7
TUESDAY 25
FEB MONDAY 7 MONDAY 21 MONDAY 7 MONDAY 7 MONDAY 28 MONDAY 7
MONDAY 21 MONDAY 21 MONDAY 21 MONDAY 21
MAR TUESDAY 15 MONDAY 21 TUESDAY 15 TUESDAY 15 TUESDAY 8 MONDAY 7
WEDNESDAY 16 MONDAY 28 MONDAY 28 MONDAY 21
APR TUESDAY 19 MONDAY 11 THURSDAY 14 TUESDAY 19 TUESDAY 19 MONDAY 4
WEDNESDAY 20 TUESDAY 12 TUESDAY 19 WEDNESDAY 20 TUESDAY 19
THURSDAY 21 WEDNESDAY 13 FRIDAY 22 FRIDAY 22 TUESDAY 26
FRIDAY 22 THURSDAY 14
TUESDAY 26
MAY MONDAY 16 MONDAY 9 MONDAY 2 MONDAY 9 MONDAY 16 MONDAY 9
MONDAY 30 TUESDAY 31 MONDAY 23 MONDAY 23
JUNE TUESDAY 14 MONDAY 13 TUESDAY 14 TUESDAY 14 TUESDAY 7 TUESDAY 14
WEDNESDAY 15 MONDAY 27 MONDAY 27 MONDAY 27
JUL MONDAY 4 MONDAY 4 MONDAY 4 MONDAY 11 MONDAY 4 MONDAY 11
MONDAY 18 MONDAY 25 MONDAY 25 FRIDAY 29 MONDAY 25
AUG MONDAY 8 MONDAY 8 MONDAY 1 MONDAY 8 MONDAY 1 MONDAY 8
MONDAY 22 TUESDAY 9 MONDAY 22 MONDAY 22 MONDAY 22
SEP MONDAY 5 MONDAY 19 MONDAY 5 MONDAY 12 MONDAY 5 MONDAY 5
MONDAY 19 MONDAY 26 MONDAY 26 MONDAY 19
OCT TUESDAY 4 MONDAY 4 TUESDAY 4 MONDAY 3 MONDAY 3 TUESDAY 4
WEDNESDAY 5 MONDAY 31 MONDAY 24 MONDAY 17 MONDAY 17
MONDAY 17 MONDAY 31
NOV MONDAY 7 TUUEDAY 1 MONDAY 7 MONDAY 2 MONDAY 7 MONDAY 7
MONDAY 21 WEDNESDAY 2 MONDAY 28 MONDAY 14 MONDAY 21
MONDAY 28
DEC MONDAY 19 MONDAY 5 MONDAY 23 THURSDAY 22 TUESDAY 6
TUESDAY 20 FRIDAY 23 FRIDAY 23 WEDNESDAY 28
WEDNESDAY 21 WEDNESDAY 28 WEDNESDAY 28
THURSDAY 22 THURSDAY 29
FRIDAY 23 FRIDAY 30
WEDNESDAY 28
THURSDAY 29
FRIDAY 30
TOTAL 26 26 26 26 21 FIXED & 5 VARIABLE 26

Rider Levett Bucknall | Riders Digest 202296
CALENDARS PUBLIC HOLIDAYS IN AUSTRALIA
ALL STATES 2022 2023 2024NEW YEARS DAY 1 & 3 JAN 1 & 2 JAN 1 JANAUSTRALIA DAY 26 JAN 26 JAN 26 JANGOOD FRIDAY 15 APR 7 APR 29 MAREASTER MONDAY 18 APR 10 APR 1 APRANZAC DAY 25 APR 25 APR 25 APRQUEENS BIRTHDAY (EXCL QLD & WA) 13 JUN 12 JUN 10 JUN
CHRISTMAS DAY 25 & 27 DEC 25 DEC 25 DECBOXING DAY 26 DEC 26 DEC 26 DECAUSTRALIAN CAPITAL TERRITORYCANBERRA DAY 14 MAR 13 MAR 11 MAREASTER SATURDAY 16 APR 8 APR 30 MAREASTER SUNDAY 17 APR 9 APR 31 MARRECONCILIATION DAY 30 MAY 29 MAY 27 MAYLABOUR DAY 3 OCT 2 OCT 7 OCTNEW SOUTH WALESEASTER SATURDAY 16 APR 8 APR 30 MAREASTER SUNDAY 17 APR 9 APR 31 MARBANK HOLIDAY 1 AUG 7 AUG 5 AUGLABOUR DAY 3 OCT 2 OCT 7 OCTNORTHERN TERRITORYEASTER SATURDAY 16 APR 8 APR 30 MARMAY DAY 2 MAY 1 MAY 6 MAYPICNIC DAY 1 AUG 7 AUG 5 AUGCHRISTMAS EVE (7PM -12AM) 24 DEC 24 DEC 24 DECNEW YEAR'S EVE (7PM-12AM) 31 DEC 31 DEC 31 DECQUEENSLANDEASTER SATURDAY 16 APR 9 APR 30 MARLABOUR DAY 2 MAY 1 MAY 6 MAYROYAL QUEENSLAND SHOW 10 AUG 16 AUG 14 AUGQUEENS BIRTHDAY 3 OCT 2 OCT 7 OCTSOUTH AUSTRALIAEASTER SATURDAY 16 APR 9 APR 30 MARADELAIDE CUP DAY 14 MAR 13 MAR 11 MARLABOUR DAY 3 OCT 2 OCT 7 OCTCHRISMAS EVE (7PM-12AM) 24 DEC 24 DEC 24 DECNEW YEAR'S EVE (7PM-12AM) 31 DEC 31 DEC 31 DECTASMANIAROYAL HOBART REGATTA 14 FEB 13 FEB 12 FEBLAUNCESTON CUP 23 FEB 22 FEB 28 FEBEIGHT HOURS DAY 14 MAR 13 MAR 11 MAREASTER TUESDAY 19 APR 11 APR 2 APRLAUNCESTON SHOW 6 OCT 12 OCT 10 OCTHOBART SHOW 20 OCT 26 OCT 24 OCTRECREATION DAY (NORTHERN) 7 NOV 6 NOV 4 NOVVICTORIALABOUR DAY 14 MAR 13 MAR 11 MAREASTER SATURDAY 16 APR 8 APR 30 MAREASTER SUNDAY 17 APR 9 APR 31 MARGRAND FINAL EVE DAY TBA TBA TBAMELBOURNE CUP DAY 1 NOV 7 NOV 5 NOVWESTERN AUSTRALIALABOUR DAY 7 MAR 6 MAR 4 MARFOUNDATION DAY 6 JUN 5 JUN 3 JUNQUEENS BIRTHDAY 26 SEP 25 SEP TBA

RLB.com

RLB.com