FSM Education Data Digest 1
132
FSM Education Data Digest 1
-
Upload
khangminh22 -
Category
Documents
-
view
0 -
download
0
Transcript of FSM Education Data Digest 1

FSM Education Data Digest 1

FSM Education Data Digest P a g e | ii
FOREWORD
This report is the first version of the 2018 edition of the Digest of Education Statistics. This digest contains data from mostly a single integrated source: The Federated States of Micronesia Education Management Information System (FedEMIS). There are various parts of the system that do not yet have the most current data as it has not been processed in the EMIS or submitted by the data sources. There are also some parts that the source of data is completely different and not yet integrated in the EMIS. The report clarifies this in their own respective sections.
There is a total of six main sections: Indicators, Students, Schools, Teachers, School Accreditations and Student Assessment. Each section is divided into subsections presenting all the data available in the FedEMIS data warehouse accompanied with details of the source of raw data, methods of calculation when appropriate, data analysis and limitations discussions.
All the tables in this report will be made available online. However, this will not be ready at the time of the release of the first version of this document. This report will also be accompanied by a short infographic poster version to reach a non-data audience and a presentation version for the same audience.
Since this is our first attempt to consolidate data from different sources including some of the historical data that were collected in the past, we expect some inconsistency in the quality of data as well as some apparent gaps in our presentation. Hence, we encourage constructive feedback from data users, planners and policy makers so as to improve the quality and consistency of our data.

FSM Education Data Digest P a g e | iii
MESSAGE FROM THE SECRETARY

FSM Education Data Digest P a g e | iv
TABLE OF CONTENTS Foreword ............................................................................................................................. ii Message by the Secretary ................................................................................................ iii List of Figures ................................................................................................................... vii List of Tables .................................................................................................................... viii Reader’s Guide ................................................................................................................... x
Summary ........................................................................................................................ x Data Sources .................................................................................................................. x Data Analysis and Interpretations ................................................................................ x Limitations of the Data ................................................................................................. xi Policy Notes ................................................................................................................... xi Timeline ......................................................................................................................... xi Data Cycle .................................................................................................................... xii
Revision History ............................................................................................................... xiii Indicators ............................................................................................................................ 2
Background .................................................................................................................... 2 Data Source ................................................................................................................. 2 Limitations ................................................................................................................... 2
Gross Enrollment Ratio and Net Enrollment Rate ...................................................... 2 Definition and Purpose .............................................................................................. 2 Methods of Calculation .............................................................................................. 3 Analysis and Discussions ........................................................................................... 3
Gross Intake Ratio and Net Intake Rate ....................................................................... 7 Definition and Purpose .............................................................................................. 7 Methods of Calculation .............................................................................................. 7 Analysis and Discussions ........................................................................................... 8
Access Rate ................................................................................................................... 12 Definition and Purpose ............................................................................................ 12 Methods of Calculation ............................................................................................ 12 Analysis and Discussions ......................................................................................... 12
Graduation Rate ........................................................................................................... 15 Definition and Purpose ............................................................................................ 15 Methods of Calculation ............................................................................................ 15 Analysis and Discussions ......................................................................................... 15
Age Specific Enrollment Rate ...................................................................................... 18 Definition and Purpose ............................................................................................ 18 Methods of Calculation ............................................................................................ 18 Analysis and Discussions ......................................................................................... 18
Out-of-school Children ................................................................................................ 20

FSM Education Data Digest P a g e | v
Definition and Purpose ............................................................................................ 20 Methods of Calculation ............................................................................................ 20 Analysis and Discussions ......................................................................................... 20
Transition, Repetition, Survival, Promotion, Dropout Rates .................................... 21 Definition and Purpose ............................................................................................ 21 Methods of Calculation ............................................................................................ 22 Important Considerations ........................................................................................ 23 Analysis and Discussions ......................................................................................... 24
Students ............................................................................................................................ 46 Background .................................................................................................................. 46
Data Source ............................................................................................................... 46 Limitations ................................................................................................................. 46
Student Enrollment by Age Distribution .................................................................... 46 Definition and Purpose ............................................................................................ 46 Methods of Calculation ............................................................................................ 46 Analysis and Discussions ......................................................................................... 46
Student Attendance ..................................................................................................... 49 Definition and Purpose ............................................................................................ 49 Methods of Calculation ............................................................................................ 49 Analysis and Discussions ......................................................................................... 49
Student Enrollment Data Nation/State Wide ............................................................ 50 Definition and Purpose ............................................................................................ 50 Methods of Calculation ............................................................................................ 50 Analysis and Discussions ......................................................................................... 50
Schools .............................................................................................................................. 76 Background .................................................................................................................. 76
Data Source ............................................................................................................... 76 Limitations ................................................................................................................. 76
Schools Ownership and Management....................................................................... 76 Definition and Purpose ............................................................................................ 76 Methods of Calculation ............................................................................................ 76 Analysis and Discussions ......................................................................................... 76
Teachers ............................................................................................................................ 83 Data Source ............................................................................................................... 83 Methods of Calculation ............................................................................................ 83
Teachers in Early Childhood Education ..................................................................... 83 Teachers in Primary ..................................................................................................... 84 Teachers in Secondary ................................................................................................ 86 Teachers Qualifications/Certifications All Data......................................................... 88

FSM Education Data Digest P a g e | vi
Pupil-Teacher Ratios .................................................................................................... 93 Definition and Purpose ............................................................................................ 93 Methods of Calculation ............................................................................................ 93 Analysis and Discussions ......................................................................................... 93
School Accreditations ...................................................................................................... 97 Background .................................................................................................................. 97
Data Source ............................................................................................................... 97 Methods of Calculation ............................................................................................ 97 Limitations ................................................................................................................. 98
Standard Performance Accreditation Progress Nation Wide .................................. 98 Analysis and Discussions ......................................................................................... 98
Standard Performance Percentages Nation Wide.................................................... 99 Analysis and Discussions ......................................................................................... 99
Standard Performance Scores Nation Wide ........................................................... 100 Analysis and Discussions ....................................................................................... 100
College of Micronesia Entrance Test (COMET) ............................................................ 109 Exams .............................................................................................................................. 110
Exams Results for Nation-wide Performance by Benchmarks.............................. 110 Exam Results for Recent Years by Standards ......................................................... 110 Exams Results Comparing States ............................................................................. 110 Sixth Grade Reading Results ................................................................................. 110 Eighth Grade Reading Results ............................................................................... 112 Tenth Grade Reading Results ................................................................................ 112 Sixth Grade Math Results ...................................................................................... 114 Eighth Grade Math Results .................................................................................... 116 Tenth Grade Math Results ..................................................................................... 116
Financial .......................................................................................................................... 118 Appendix A. Schools Standards, Criteria and Levels .................................................. 119 References ...................................................................................................................... 120
FSM Education Data Digest P a g e | vii
LIST OF FIGURES Figure 1: GER and NER by Education Level and Gender Chart ...................................... 4
Figure 2: Historic trend by GER/NER nation .................................................................... 5
Figure 3: Historic trend by GER/NER by gender .............................................................. 5
Figure 4: GER by State and Level for 2018 ....................................................................... 6
Figure 5: NER by State and Level for 2018 ....................................................................... 6
Figure 6: GER Historic Trend by State .............................................................................. 6
Figure 7: NER Historic trend by State ............................................................................... 7
Figure 8: GIR/NIR First/Last Year of Primary Education with Gender Chart for 2018 . 9
Figure 9: NIR/GIR First/Last Year of Primary Education Trend Chart .......................... 10
Figure 10: GIR/NIR First/Last Year of Primary Education by state for 2018 ............... 10
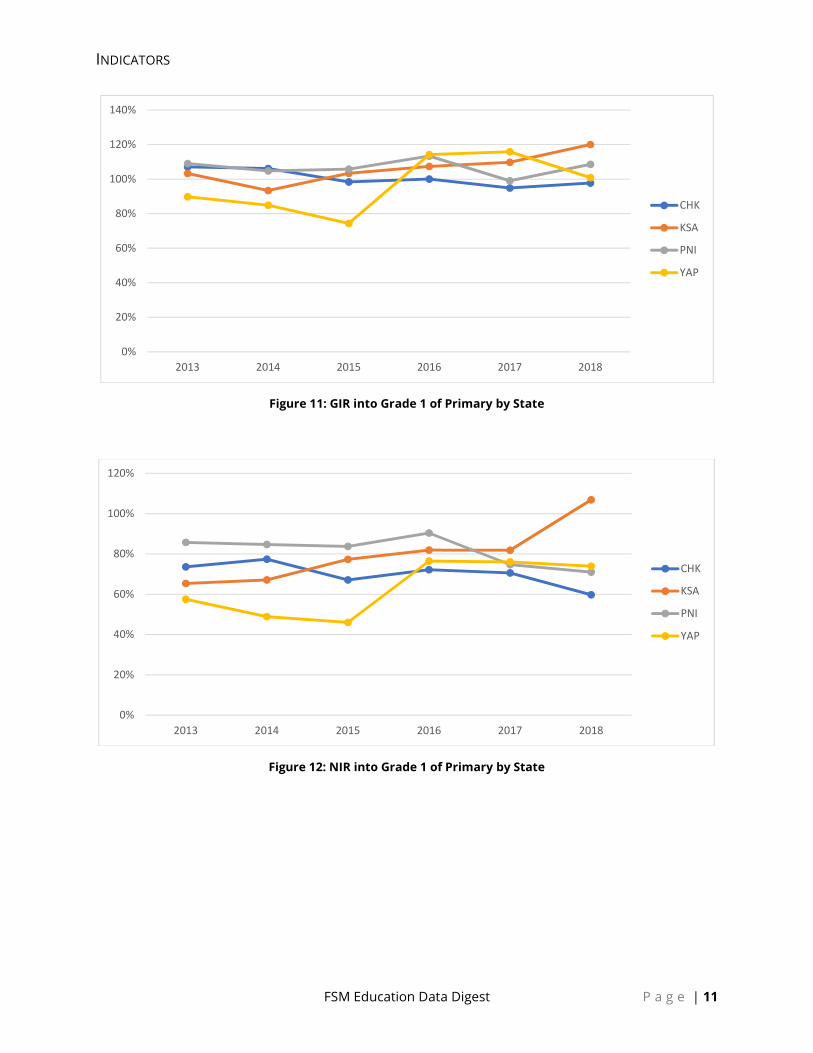
Figure 11: GIR into Grade 1 of Primary by State ........................................................... 11
Figure 12: NIR into Grade 1 of Primary by State ........................................................... 11
Figure 13: Access Rate for 2018 ...................................................................................... 13
Figure 14: Access Rate by Grade and State for 2018 .................................................... 14
Figure 15: Graduation Rate (Primary/Secondary) by Gender for 2018....................... 16
Figure 16: Graduation Rate (Primary/Secondary) by Gender and State for 2018 ..... 16
Figure 17: 8th Grade Cohort Graduation Rate .............................................................. 17
Figure 18: 12th Grade Cohort Graduation Rate ............................................................ 17
Figure 19: Age Specific Participation to Education System Chart ................................ 19
Figure 20: Age Specific Enrollment Rate trend .............................................................. 19
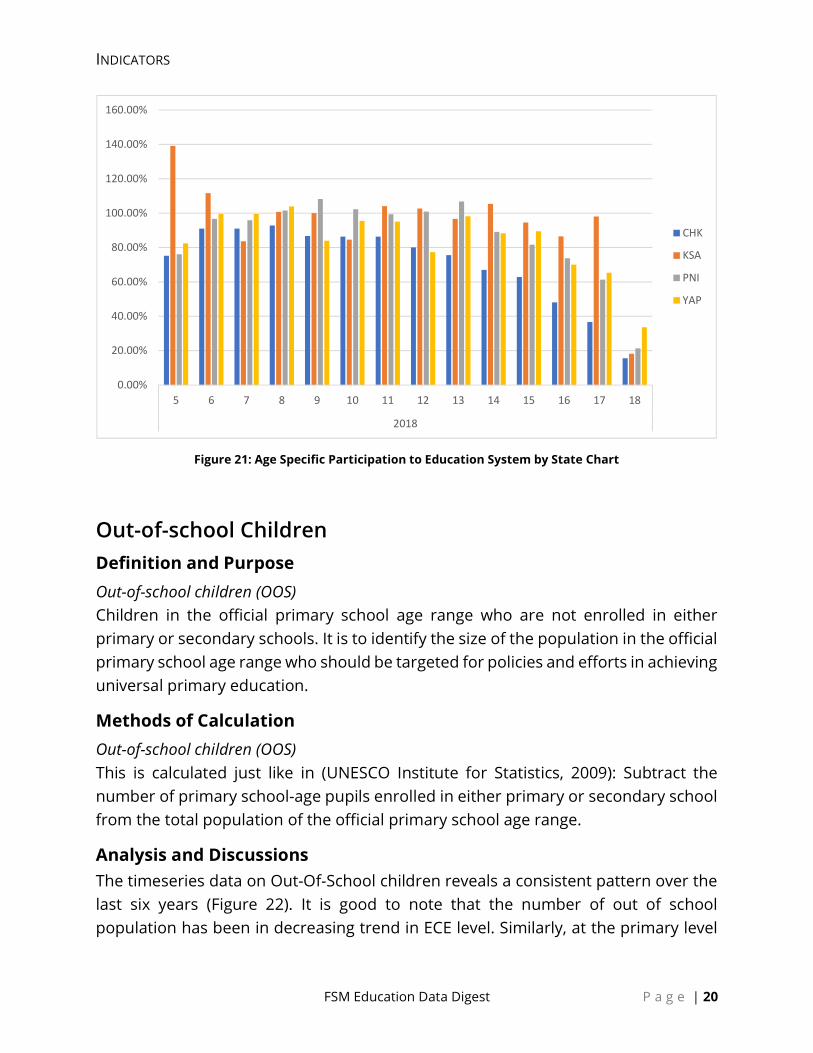
Figure 21: Age Specific Participation to Education System by State Chart ................. 20
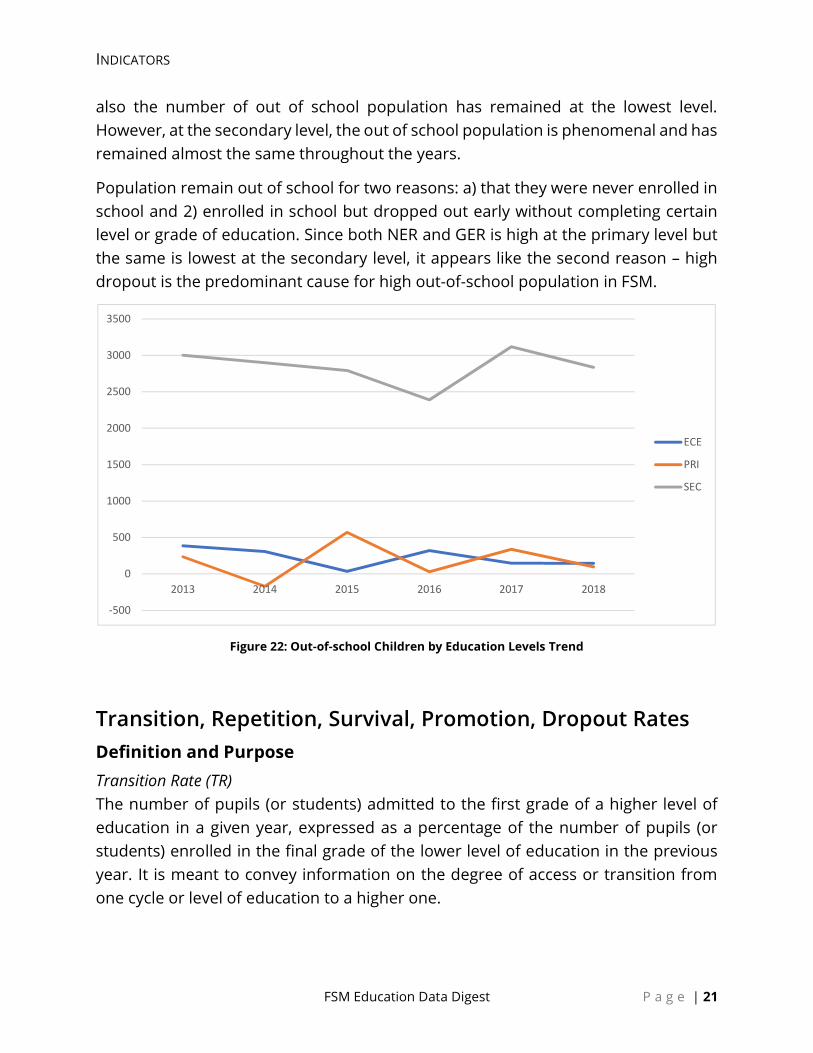
Figure 22: Out-of-school Children by Education Levels Trend .................................... 21
Figure 23: Promotion, repetition and dropout rates – 2017-18 .................................. 24
Figure 24: Transition and Survival Rate 2017-18........................................................... 25
Figure 25: Age Distribution for 2018 .............................................................................. 47
Figure 26: Age Distribution Trend .................................................................................. 48
Figure 27: Age Distribution by State and Gender for 2018 .......................................... 48
Figure 28: Student Attendance Rate 2018 ..................................................................... 49
Figure 29: Distribution of Students ................................................................................ 50
Figure 30: Distribution schools by State ........................................................................ 77
Figure 31: Distribution of Schools by State ................................................................... 77
Figure 32: Distribution of Schools by State ................................................................... 78
Figure 33: Qualified/Certified Teachers in ECE by State ............................................... 83
Figure 34: Qualified/Certified Teachers in ECE by State ............................................... 84

FSM Education Data Digest P a g e | viii
Figure 35: Qualified/Certified Teachers in Primary Nation .......................................... 85
Figure 36: Qualified/Certified Teachers in Primary by State ........................................ 86
Figure 37: Qualified/Certified Teachers in Secondary Nation ..................................... 87
Figure 38: Qualified/Certified Teachers in Secondary by State ................................... 88
Figure 39: Distribution teachers by State ...................................................................... 94
Figure 40: Distribution of Teachers in ECE by State...................................................... 94
Figure 41: Distribution of Teachers in Primary by State .............................................. 95
Figure 42: Distribution of Teachers in Secondary by State .......................................... 95
Figure 43: Total Schools by Accreditation Level ............................................................ 99
Figure 31: School Accreditation Progress ...................................................................... 99
Figure 32: National Schools' Accreditation Level Percentages .................................. 100
Figure 33: National Leadership Score .......................................................................... 101
Figure 34: National Teacher Performance Score ........................................................ 101
Figure 35: National Data Management Scores ........................................................... 102
Figure 36: National NCSB Scores .................................................................................. 102
Figure 37: National Facilities Scores ............................................................................. 103
Figure 38: National School Improvement Planning .................................................... 103
LIST OF TABLES Table 1: Release Log ....................................................................................................... xiii Table 2: GER/NER by Year, Education Level and Gender ............................................. 26
Table 3: GER/NER by State, Year, Education Level and Gender ................................... 26
Table 4: NIR/GIR by Year, First/Last Year of Primary Education and Gender ............. 29
Table 5: GIR/NIR by State, First/Last Grade of Primary Education and Gender ......... 29
Table 6: Nation Access Rate by Year, Grade Level and Gender ................................... 31
Table 7: Access Rate by Year, Grade Level, State and Gender .................................... 34
Table 8: Graduation Rate (Primary/Secondary) by Year and Gender ......................... 37
Table 9: Graduation Rate (Primary/Secondary) by State and Year and Gender ........ 37
Table 10: 8th Grade Cohort Graduation Rate (Primary) by State ................................. 38
Table 11: 12th Grade Cohort Graduation Rate (Secondary) by State .......................... 38
Table 12: ASER by Year, State and Gender .................................................................... 39
Table 13: Out-of-school Children by Year, Education Level and Gender ................... 42
Table 14: Out-of-school Children by Year, Education Level, State and Gender ......... 43
Table 15: National Flow Rates by Year and Grade ........................................................ 44
Table 16: Students by Year, Education Level, Grade, Gender and Age Distribution . 51

FSM Education Data Digest P a g e | ix
Table 17: Students by State, Grade, Gender and Age Distribution ............................. 55
Table 18: Attendance Rate (Primary/Secondary) by State ........................................... 57
Table 19: Enrolments Data by Year, Grade and Gender .............................................. 57
Table 20: Enrolment Data by Year, Education Level and Gender ............................... 60
Table 21: Enrolment Data by Year, State, Education Levels and Gender ................... 61
Table 22: Enrolment Data by Year, State, Grade and Gender ..................................... 65
Table 23: Schools by Authority Type, Authority and State ........................................... 78
Table 24: Schools by Government/Non-Government Managed and State ................ 79
Table 25: Schools by Government/Non-Government Managed and State ................ 79
Table 26: Schools by State, Local Electorate, Island/Municipality ............................... 79
Table 27: Teacher Qualified and Certifications by State, and Age Group .................. 89
Table 28: Pupil-Teacher Ratio by State and Education Level ....................................... 96
Table 24: Schools Evaluated/Accredited by State ......................................................... 99
Table 25: Schools Accredited by States .......................................................................... 99
Table 26: School Accreditation Form B Results ........................................................... 104

FSM Education Data Digest P a g e | x
READER’S GUIDE Summary This report is divided into six major sections. The first section called Indicators contains all our supported key education statistics indicators. These are developed in compliance with our general agreement with regional and global forums that require us to track and report our progress on these key indicators. For example, the Compact Agreement with the US government, UN global agenda such as the Sustainable Development Goals, and our recent agreement with the Asian Development Bank. Besides, we also need to standardize our data quality and reporting framework across the states. The student, teacher, school accreditations and exam sections contain their own respective key data and statistics. Most of the raw data is included in the form of table which will also be made available online. Charts are included to analyze the data in the current years and identify trends and patterns over time.
Data Sources The data is available for all four states of the FSM: Yap, Chuuk, Pohnpei and Kosrae. Before being stored into the FedEMIS and processed into the main data warehouse, data comes in from various sources:
The primary data collection tool is an annual census referred to internally within the NDOE and SDOEs as the annual census workbook;
The population projections come from the National Statistics Office (NSO); The school accreditations data come from the states in scanned PDF as
aggregated data; and, The exams data come from the scanning machine that can output the results
into excel spreadsheets;
Data Analysis and Interpretations It is important to note that the FedEMIS system is new and while data from previous years has been processed and loaded into it, the quality of data for previous years vary. In addition, the data collection method and tools have changed over the years which affects the reconstructed cohort calculation method in use in the system. The FedEMIS brings in a new consistent data collection annual census tool, and a centralized data management system and improved data collection processes. While
FSM Education Data Digest P a g e | xi
the quality of data has improved and will continue improving going forward, caution is warranted when analyzing trends and patterns over the years.
Limitations of the Data There are several limitations to bear in mind while analyzing the data. Some statistics have some higher (or lower) then normal calculated figures. The small sizes of populations in the FSM, especially in Kosrae state, combined with re-constructed cohort analysis can significantly distort results. Less remote schools have had data quality inspections to validate the submitted data but more remote schools did not due to logistics issues.
Policy Notes A number of policies are important to provide some context in various part of this report. Those will be listed here as they become relevant.
The non-official age of 5 for ECE level is used in the system for calculations, Primary level (grades 1-8) is age 6 to 13 and for Secondary level (grades 9-12) is age 13 to 17.
Timeline Timeline Activity August Registration of new students (August 10)
Continue to update school staff and student demographics and other information needed. Collect information on student’s official birth certificate. (until September 14) Beginning enrollment data from school to State DOE (September 15) Schools will submit student enrollment and other information as per the format to State DOE.
September Data cleaning and validation (September 29) Compile, verify, edit and approve the data by the Director SDOE. Submission of the data to NDOE (September 30)
October Dissemination of School Report Card (Oct 30) Generate school report card and disseminate to each school through online or hardcopies as feasible.
March Annual Data Meet – Data managers and head of the State DOE meet to discuss data quality and other issues related to FedEMIS/FedSIS.
June
End of school year report to NDOE (June 30). Upload the end year data in the FedEMIS/FedSIS. Teacher Certification results (June 30) NMCT results (June 30)

FSM Education Data Digest P a g e | xii
Registration of New Student
(AUG 10) Beginning Enrollment Data from School to
State DOE (SEPT 15)
Data cleaning and validation
(SEPT 29)
Submission of Data to NDOE (SEPT 30)
Annual Data Meet(MARCH)
End School Year Data
(JUN 30)
Annual Digest -State Level
(July)
Annual Digest -National(AUG 31)
School Accreditation (Issuance of Form B) by State DOE July Annual Digest (State Level) July 30 August Annual Digest (National)
Issuance of School Accreditation certificates
Data Cycle

FSM Education Data Digest P a g e | xiii
REVISION HISTORY The release history of this document is logged in Table 1: Release Log. Any type of additional work whether it is based on feedback from stakeholders, data quality fixes, new features it all gets logged.
Table 1: Release Log
Date Release Version Sections Affected Comments July 7, 2018 0.5 All Rough first draft August 3, 2018 0.75 All First Draft version September 30, 2018
1.0 All First Final Version

INDICATORS
FSM Education Data Digest P a g e | 2
INDICATORS Indicators in this section are mostly based on internationally recognized standards as documented in (UNESCO Institute for Statistics, 2009).
Background Data Source There a two primary data sources for the production of all these key education indicators: the population projection from NSO and the annual school census from NDOE/SDOE. The data sources for previous years varied but was mostly done through a student roster similar to the current improved annual census.
Limitations Due to small population, especially in Kosrae, various indicators can fluctuate significantly for small data quality issues. It is important to bear this in mind when analyzing the statistical indicators.
Gross Enrollment Ratio and Net Enrollment Rate Definition and Purpose Gross Enrollment Ratio (GER) It is total enrolment in a specific level of education, regardless of age, expressed as a percentage of the eligible official school-age population1 corresponding to the same level of education in a given school year. It shows the general level of participation in a given level of education. It indicates the capacity of the education system to enroll students of a particular age group. It can also be a complementary indicator to net enrolment rate (NER) by indicating the extent of over-aged and under-aged enrolment.
Net Enrollment Rate (NER) It is the enrolment of the official age group for a given level of education expressed as a percentage of the corresponding population. It is to show the extent of coverage in a given level of education of children and youths belonging to the official age group corresponding to the given level of education.
1 The non-official age group for ECE level is 5 has used in the system for calculations, Primary level (grades 1-8) is age 6 to 13 and for Secondary level (grades 9-12) is age 13 to 17.

INDICATORS
FSM Education Data Digest P a g e | 3
Methods of Calculation Gross Enrollment Ratio (GER) This is calculated just like in (UNESCO Institute for Statistics, 2009): divide the number of pupils (or students) enrolled in a given level of education regardless of age by the population of the age group which officially corresponds to the given level of education and multiply the result by 100.
Net Enrollment Rate (NER) This is calculated just like in (UNESCO Institute for Statistics, 2009): divide the number of pupils (or students) who are enrolled and in the official age group for a given level of education by the population for the same age group and multiply the result by 100.
Analysis and Discussions As indicated in the definition of GER, higher GER would mean a higher proportion of overaged or under aged students in the given level of education. There are two primary reasons for higher GER: a) due to early or late enrollment in school or b) repetition in certain grades. In some cases, both – late entry and grade repetition – is also possible. It is therefore that the GER tends to go higher - more than 100%. As an indicator of education status, GER is considered an indicator of in-efficiency. In other words, higher GER is taken as wastage of educational resources. NER on the other hand is considered an efficiency indicator as it reveals percentage of students in the official age group enrolled in school.
In the figure below (Figure 1), both GER and NER is presented by gender for all three level of education – Early Childhood Education (ECE), Primary or Elementary, and the Secondary level. At a glance, it is clear that the difference between male and female students is marginal in both GER and NER at all levels of education. This signifies that the gender parity or gender ratio is well balanced at all levels of education in FSM.
However, the gap between GER and NER is highest at the ECE level. Gross enrollment rate is higher than 90% whereas the NER is only at 56% at this level. That means, there are higher number of overaged and underaged students at ECE level. At the Primary and Secondary level, the gap between GER and NER is the least. Which indicates higher proportion of children in right age are at this level.
At the ECE and Secondary level, NER falls below 60% of the population. This suggest that almost 40% of the population at these age-group are out of school. This is alarmingly high and need to develop plans to bring this population in the school.
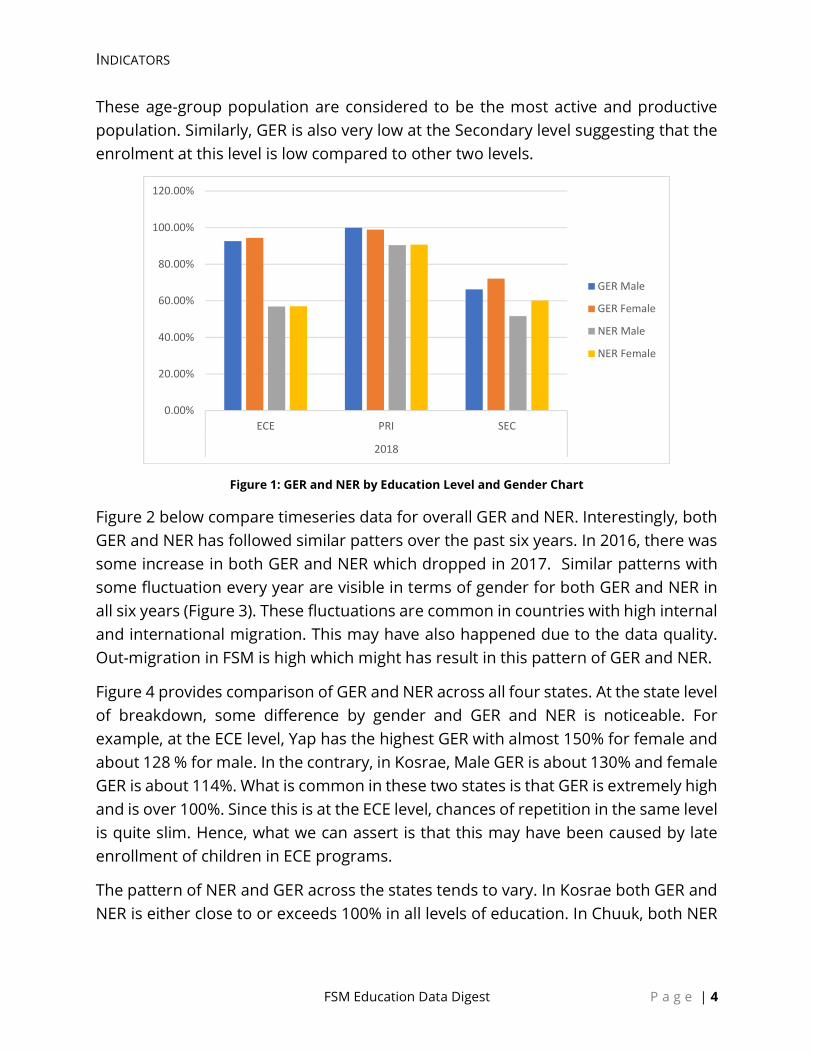
INDICATORS
FSM Education Data Digest P a g e | 4
These age-group population are considered to be the most active and productive population. Similarly, GER is also very low at the Secondary level suggesting that the enrolment at this level is low compared to other two levels.
Figure 1: GER and NER by Education Level and Gender Chart
Figure 2 below compare timeseries data for overall GER and NER. Interestingly, both GER and NER has followed similar patters over the past six years. In 2016, there was some increase in both GER and NER which dropped in 2017. Similar patterns with some fluctuation every year are visible in terms of gender for both GER and NER in all six years (Figure 3). These fluctuations are common in countries with high internal and international migration. This may have also happened due to the data quality. Out-migration in FSM is high which might has result in this pattern of GER and NER.
Figure 4 provides comparison of GER and NER across all four states. At the state level of breakdown, some difference by gender and GER and NER is noticeable. For example, at the ECE level, Yap has the highest GER with almost 150% for female and about 128 % for male. In the contrary, in Kosrae, Male GER is about 130% and female GER is about 114%. What is common in these two states is that GER is extremely high and is over 100%. Since this is at the ECE level, chances of repetition in the same level is quite slim. Hence, what we can assert is that this may have been caused by late enrollment of children in ECE programs.
The pattern of NER and GER across the states tends to vary. In Kosrae both GER and NER is either close to or exceeds 100% in all levels of education. In Chuuk, both NER
0.00%
20.00%
40.00%
60.00%
80.00%
100.00%
120.00%
ECE PRI SEC
2018
GER Male
GER Female
NER Male
NER Female

INDICATORS
FSM Education Data Digest P a g e | 5
GER is below 100% at all level of education (Figures 4 and 5). This is a likely scenario when there’s a mismatch between population projection and out migration trends.
Figures 6 and 7 describes trends of GER and NER by state over the past six years. There is nothing significant to note in all those years as the trends are smooth in both GER and NER except for Yap. In Yap there’s a sharp increase in both GER and NER by almost 20% in one year – from 2015 to 2016.
Figure 2: Historic trend by GER/NER nation
Figure 3: Historic trend by GER/NER by gender
0.00%
10.00%
20.00%
30.00%
40.00%
50.00%
60.00%
70.00%
80.00%
90.00%
100.00%
2013 2014 2015 2016 2017 2018
GER
NER
0.00%
10.00%
20.00%
30.00%
40.00%
50.00%
60.00%
70.00%
80.00%
90.00%
100.00%
2013 2014 2015 2016 2017 2018
GER Male
GER Female
NER Male
NER Female

INDICATORS
FSM Education Data Digest P a g e | 6
Figure 4: GER by State and Level for 2018
Figure 5: NER by State and Level for 2018
Figure 6: GER Historic Trend by State
0.00%
20.00%
40.00%
60.00%
80.00%
100.00%
120.00%
140.00%
160.00%
ECE PRI SEC ECE PRI SEC ECE PRI SEC ECE PRI SEC
2018 2018 2018 2018
CHK KSA PNI YAP
GER Male
GER Female
0.00%
20.00%
40.00%
60.00%
80.00%
100.00%
120.00%
ECE PRI SEC ECE PRI SEC ECE PRI SEC ECE PRI SEC
2018 2018 2018 2018
CHK KSA PNI YAP
NER Male
NER Female
0%
20%
40%
60%
80%
100%
120%
2013 2014 2015 2016 2017 2018
CHK
KSA
PNI
YAP

INDICATORS
FSM Education Data Digest P a g e | 7
Figure 7: NER Historic trend by State
Gross Intake Ratio and Net Intake Rate Definition and Purpose Gross Intake Ratio (GIR) Is the total number of new entrants in the first grade of primary education, regardless of age, expressed as a percentage of the population at the official primary school-entrance age. It helps indicate the general level of access to primary education. It also indicates the capacity of the education system to provide access to grade 1 for the official school-entrance age population.
Net Intake Rate (NIR) Defines the new entrants in the first grade of primary education who are of the official primary school-entrance age, expressed as a percentage of the population of the same age. It is meant to precisely measure access to primary education by the eligible population of primary school-entrance age.
Methods of Calculation Gross Intake Ratio (GIR) in First Grade of Primary (G1) This is calculated just like in (UNESCO Institute for Statistics, 2009): Divide the number of new entrants in grade 1, irrespective of age, by the population of official school-entrance age, and multiply the result by 100.
0%
20%
40%
60%
80%
100%
120%
2013 2014 2015 2016 2017 2018
CHK
KSA
PNI
YAP

INDICATORS
FSM Education Data Digest P a g e | 8
Net Intake Rate (NIR) in First Grade of Primary (G1) This is calculated just like in (UNESCO Institute for Statistics, 2009): Divide the number of children of official primary school-entrance age who enter the first grade of primary education for the first time by the population of the same age and multiply the result by 100.
Gross Intake Ratio (GIRLG) in Last Grade of Primary (G8) Also known as the Primary Completion Rate (PCR) in other publication. This is calculated just like in (UNESCO Institute for Statistics, 2009): Divide the number of new entrants in last grade of primary, irrespective of age, by the population of theoretical entrance age to the last grade of primary and multiply the result by 100.
Net Intake Rate (NIRLG) in Last Grade of Primary (G8) This is calculated just like in (UNESCO Institute for Statistics, 2009): Divide the number of children of official primary school-entrance age who enter the last grade of primary education for the first time by the population of the same age and multiply the result by 100.
Analysis and Discussions Both the GIR and NIR is almost consistent for male and female students in grade 1 (Figure 8). However, GIR exceeds 100% whereas NIR is slightly over 68% for both male and female students. This entails that over 30% of students who enroll in grade 1 are already overage or underage. Higher GER was also noted in ECE enrollment. Hence it is likely that these overage or underage students have come from the ECE.
At the end of Primary grade (in grade 8) the gap between NIR and GIR has slightly widened to almost 40%. Suggesting that some students might have repeat grades in between. Since the GIR is higher for female in grade 8. It means female students tend to repeat grades more than male students. At the same time and interestingly, the proportion of female students in the correct age group in grade 8 is also higher than that of male students. This may have been because of higher proportion of female students in grade 8.
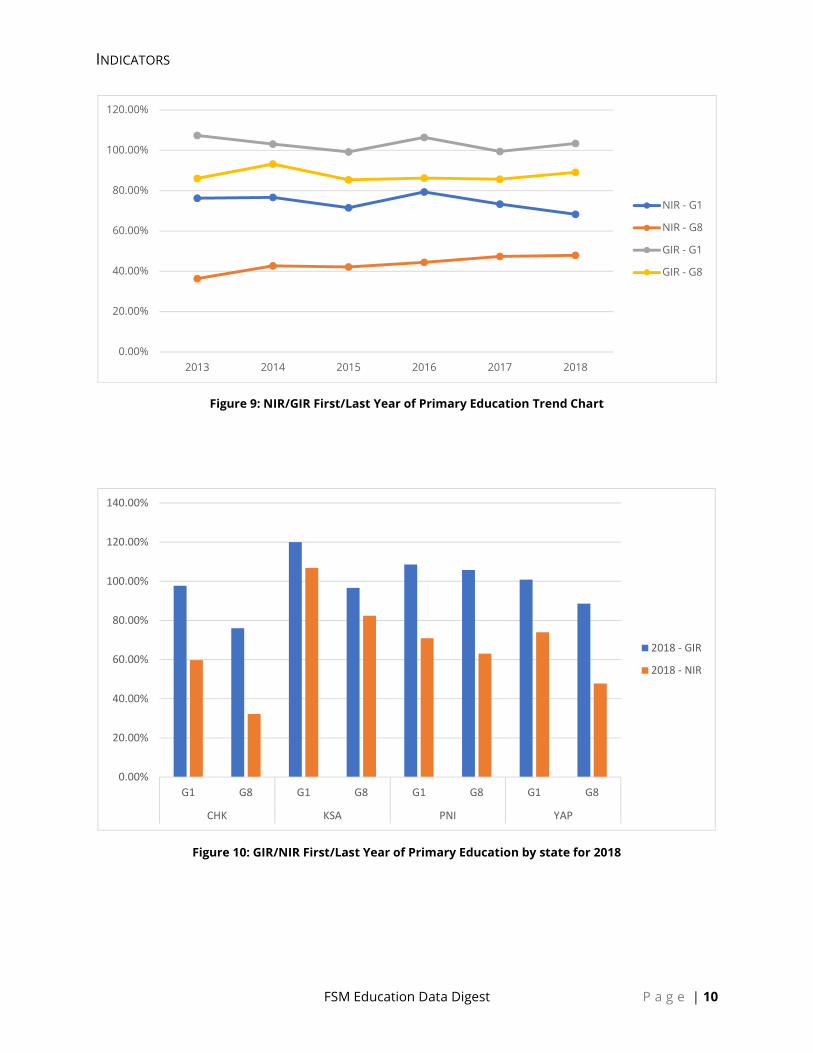
Over the years between 2013 and 2018, trends in both GIR and NIR has similar patterns (Figure 9). However, for grade 1 the NIR is in decreasing trends whereas the same is in increasing trend in grade 8. GIR on the other hand has almost the same trend with no significant increase or decrease. What is noteworthy is that over the past six years, there has been no change in the gap between NIR and GIR. In other

INDICATORS
FSM Education Data Digest P a g e | 9
words, there’s no change in the number of over and underage students in the system for last six years.
Comparison across the states reveal that except in the state of Chuuk, GIR in grade 1 exceeds 100% in other three states (Figure 10). Both GIR and NIR in grade 1 and 8 is lowest in Chuuk and highest in Kosrae. To have highest NIR is always preferred as it indicates educational efficiency. However, having highest GIR is not well perceived as it is an inefficiency indicator that reflect on educational wastage caused by grade repetition or late enrollment.
Distribution of GIR over the past six years suggests that there has been a steady pattern for three states but Yap (Figure 11). Yap shows a sharp increase of 40% from 74% to114% in its GIR at grade one in just one year from 2015 to 2016. This may have been caused by some data quality issue. However, in 2018, all four states stand almost neck to neck with each other close to or slightly higher than 100% GIR. Chuuk in the other hand, has shown a decreasing trend of GIR in grade 1.
Even in NIR, Yap has shown an increase of about 8% from 2015 to 2016 in grade 8. Kosrae has shown an increase of 14% in its NIR at grade 8 from 2017 to 2018 (Figure 12).
Figure 8: GIR/NIR First/Last Year of Primary Education with Gender Chart for 2018
0.00%
20.00%
40.00%
60.00%
80.00%
100.00%
120.00%
G1 G8
2018
NIR Male
NIR Female
GIR Male
GIR Female
INDICATORS
FSM Education Data Digest P a g e | 10
Figure 9: NIR/GIR First/Last Year of Primary Education Trend Chart
Figure 10: GIR/NIR First/Last Year of Primary Education by state for 2018
0.00%
20.00%
40.00%
60.00%
80.00%
100.00%
120.00%
2013 2014 2015 2016 2017 2018
NIR - G1
NIR - G8
GIR - G1
GIR - G8
0.00%
20.00%
40.00%
60.00%
80.00%
100.00%
120.00%
140.00%
G1 G8 G1 G8 G1 G8 G1 G8
CHK KSA PNI YAP
2018 - GIR
2018 - NIR
INDICATORS
FSM Education Data Digest P a g e | 11
Figure 11: GIR into Grade 1 of Primary by State
Figure 12: NIR into Grade 1 of Primary by State
0%
20%
40%
60%
80%
100%
120%
140%
2013 2014 2015 2016 2017 2018
CHK
KSA
PNI
YAP
0%
20%
40%
60%
80%
100%
120%
2013 2014 2015 2016 2017 2018
CHK
KSA
PNI
YAP

INDICATORS
FSM Education Data Digest P a g e | 12
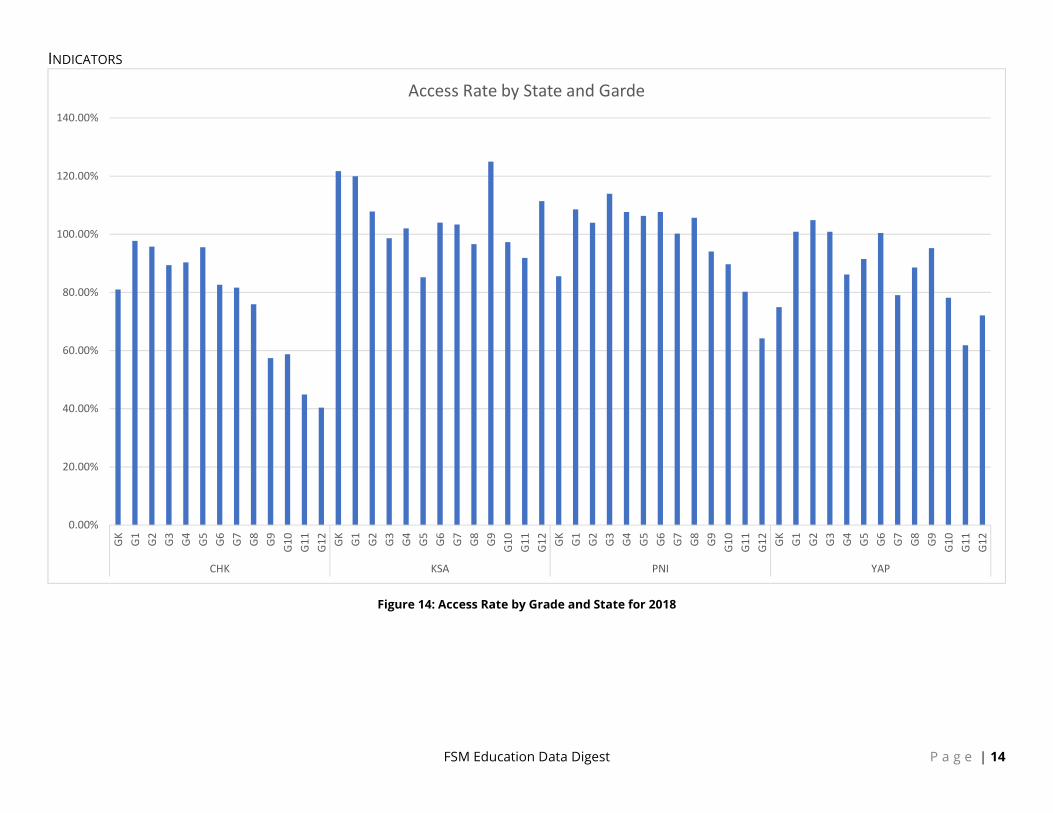
Access Rate Access Rate is not specifically defined in the UNESCO technical guideline (UNESCO Institute for Statistics, 2009). It is an indicator defined in (UNESCO, World Bank, UNICEF, 2014) and is one of FSM’s required indicator. It is essentially the GIR by grade instead of specifically only just for the first and last year of primary education.
Definition and Purpose Access Rate (AR) by Grade The AR is the total number of new entrants in a particular grade, regardless of age, expressed as a percentage of the population for that grade. It helps indicate the general level of access to any grade and indicates the capacity of the education system to provide access to specific grade levels for the official age population for that the specific grade levels.
Methods of Calculation Access Rate (AR) by Grade This is calculated just like in (UNESCO Institute for Statistics, 2009) for the GIR but by individual grades: Divide the number of new entrants in grade i, irrespective of age, by the population of official school-entrance age, and multiply the result by 100.
Analysis and Discussions Access rate is quite stable in grades 1 through 5. Beyond this point, there’s a steady decline in enrollment up to grade 12 (Figure 13). This pattern is similar for both male and female students. One of the common reasons for this decline in enrollment is associated with early drop-out of students, especially because there’s almost 100% or even higher access rate in grade 1. What is noteworthy is that the access rate at ECE level is only about 85%, whereas the same is over 100% in grade 1. This means there are students in the system who have enrolled without ECE experience. Such students are in the range of 15% of the total enrollment in grade 1.
Looking at the grade-wise access rate across the states, it reveals that except in Chuuk, all three states have higher ratio of over 100% in some of their grades (Figure 14). While the general trend is declining student enrollment in higher grades in all four states, the decline is steeper in Chuuk than in other three states. That means Chuuk has the higher rates of student drop-out in its schools.

INDICATORS
FSM Education Data Digest P a g e | 13
Figure 13: Access Rate for 2018
0.00%
20.00%
40.00%
60.00%
80.00%
100.00%
120.00%
GK G1 G2 G3 G4 G5 G6 G7 G8 G9 G10 G11 G12
2018
AR Male
AR Female
INDICATORS
FSM Education Data Digest P a g e | 14
Figure 14: Access Rate by Grade and State for 2018
0.00%
20.00%
40.00%
60.00%
80.00%
100.00%
120.00%
140.00%G
KG
1G
2G
3G
4G
5G
6G
7G
8G
9G
10G
11G
12 GK
G1
G2
G3
G4
G5
G6
G7
G8
G9
G10
G11
G12 G
KG
1G
2G
3G
4G
5G
6G
7G
8G
9G
10G
11G
12 GK
G1
G2
G3
G4
G5
G6
G7
G8
G9
G10
G11
G12
CHK KSA PNI YAP
Access Rate by State and Garde
INDICATORS
FSM Education Data Digest P a g e | 15
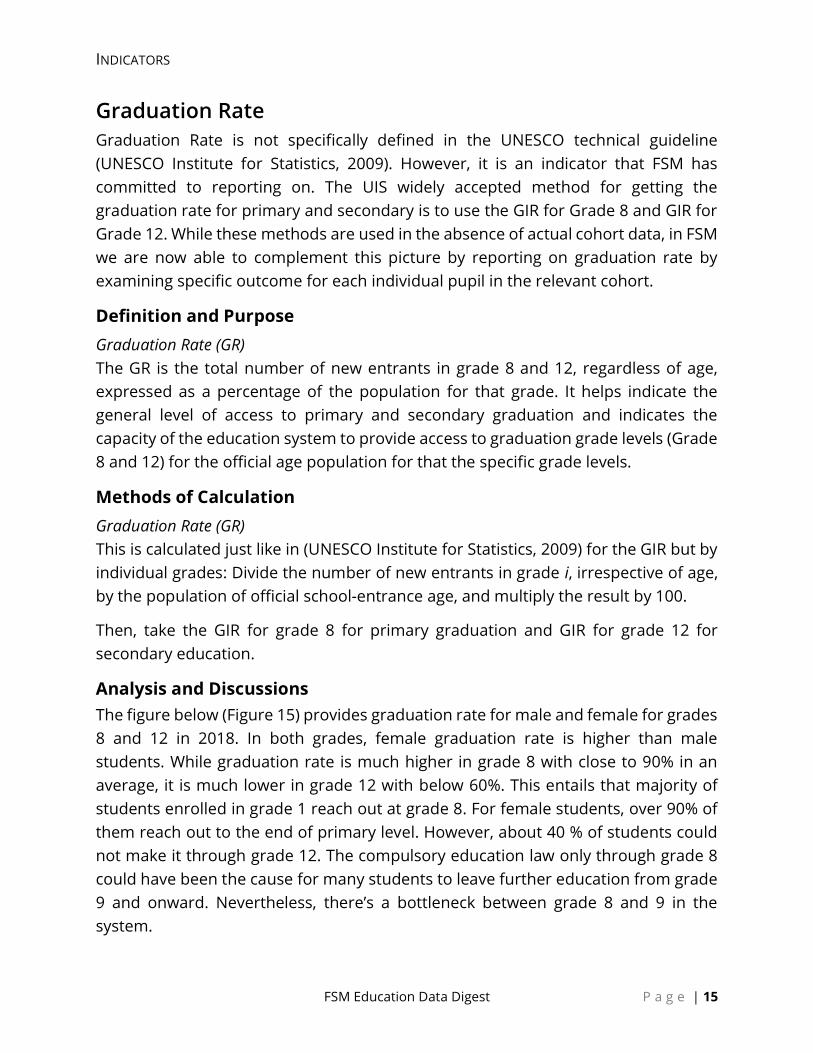
Graduation Rate Graduation Rate is not specifically defined in the UNESCO technical guideline (UNESCO Institute for Statistics, 2009). However, it is an indicator that FSM has committed to reporting on. The UIS widely accepted method for getting the graduation rate for primary and secondary is to use the GIR for Grade 8 and GIR for Grade 12. While these methods are used in the absence of actual cohort data, in FSM we are now able to complement this picture by reporting on graduation rate by examining specific outcome for each individual pupil in the relevant cohort.
Definition and Purpose Graduation Rate (GR) The GR is the total number of new entrants in grade 8 and 12, regardless of age, expressed as a percentage of the population for that grade. It helps indicate the general level of access to primary and secondary graduation and indicates the capacity of the education system to provide access to graduation grade levels (Grade 8 and 12) for the official age population for that the specific grade levels.
Methods of Calculation Graduation Rate (GR) This is calculated just like in (UNESCO Institute for Statistics, 2009) for the GIR but by individual grades: Divide the number of new entrants in grade i, irrespective of age, by the population of official school-entrance age, and multiply the result by 100.
Then, take the GIR for grade 8 for primary graduation and GIR for grade 12 for secondary education.
Analysis and Discussions The figure below (Figure 15) provides graduation rate for male and female for grades 8 and 12 in 2018. In both grades, female graduation rate is higher than male students. While graduation rate is much higher in grade 8 with close to 90% in an average, it is much lower in grade 12 with below 60%. This entails that majority of students enrolled in grade 1 reach out at grade 8. For female students, over 90% of them reach out to the end of primary level. However, about 40 % of students could not make it through grade 12. The compulsory education law only through grade 8 could have been the cause for many students to leave further education from grade 9 and onward. Nevertheless, there’s a bottleneck between grade 8 and 9 in the system.

INDICATORS
FSM Education Data Digest P a g e | 16
Looking at the distribution of graduation rates across the states, it is evident that the rates vary considerably from one state to the other (Figure 16). For example, Chuuk has the lowest graduation rates among all four states. Pohnpei has the highest graduation rate at grade 8 and Kosrae has the highest graduation rates in grade 12. Since Chuuk has the highest student population and lowest graduation rate, the aggregate results on graduation rate at the national level is likely to have skewed. What is also common across the states is that graduation rates are normally higher for female students than their male counterparts.
Figure 15: Graduation Rate (Primary/Secondary) by Gender for 2018
Figure 16: Graduation Rate (Primary/Secondary) by Gender and State for 2018
0.00%
20.00%
40.00%
60.00%
80.00%
100.00%
G8 G12
2018
GR Male
GR Female
0.00%
20.00%
40.00%
60.00%
80.00%
100.00%
120.00%
140.00%
G8 G12 G8 G12 G8 G12 G8 G12
CHK KSA PNI YAP
2018 - GR Male
2018 - GR Female

INDICATORS
FSM Education Data Digest P a g e | 17
Figure 17: 8th Grade Cohort Graduation Rate
Figure 18: 12th Grade Cohort Graduation Rate
79.8% 83.2%
99.8% 100.5%
0.0%
20.0%
40.0%
60.0%
80.0%
100.0%
120.0%
0
100
200
300
400
500
600
700
800
900
1000
Chuuk Kosrae Pohnpei Yap
Starting Enrollment Total Completers/Graduates Rate
106.6%
92.2%
97.4% 96.7%
80.0%
85.0%
90.0%
95.0%
100.0%
105.0%
110.0%
0
100
200
300
400
500
600
Chuuk Kosrae Pohnpei Yap
Starting Enrollment Total Completers/Graduates Rate
INDICATORS
FSM Education Data Digest P a g e | 18
Age Specific Enrollment Rate Definition and Purpose Age Specific Enrollment Rate (ASER) Enrolment of a specific single age enrolled, irrespective of the level of education, as a percentage of the population of the same age. It is meant to show the extent of the educational participation of a specific age cohort.
Methods of Calculation Age Specific Enrollment Rate (ASER) This is calculated just like in (UNESCO Institute for Statistics, 2009): Divide the number of pupils (or students) of a specific age enrolled in educational institutions at all levels of education by the population of the same age and multiply the result by 100.
Analysis and Discussions Enrollment by single age tends to correspond with the general pattern of GER/NER and GIR/NIR discussed earlier (Figure 19). These distributions indicate that there are students yet to be enrolled in almost all grades from ECE to the secondary level. At the age 5 which is the age considered to be the right age to enroll in ECE programs, there are almost 20% of students out of school. Similarly, population that is yet to be enrolled start increasing from age 14 and on-wards. Age 14 is the official age for primary level and especially for grade 8. This is when the compulsory law tends to be ineffective. As such the non-enrolled population increases substantially. By the age of 18 which corresponds with grade 12 education, over 80 percent are out of school.
Over the past six years, there’s no significant change in the distribution pattern of student enrollment by single year age (Figure 20). Across the state as well, the pattern is almost the same except a few anomalies (Figure 21). Such as in Kosrae, there’s a very high enrollment of 5 and 6-year age population.

INDICATORS
FSM Education Data Digest P a g e | 19
Figure 19: Age Specific Participation to Education System Chart
Figure 20: Age Specific Enrollment Rate trend
0%10%20%30%40%50%60%70%80%90%
100%
5 6 7 8 9 10 11 12 13 14 15 16 17 18
Group1 Group2 Group3 Group4
2018
Not Enrolled
Enrolled
0%
20%
40%
60%
80%
100%
120%
5 6 7 8 9 10 11 12 13 14 15 16 17 18
2013 2014 2015 2016 2017 2018
INDICATORS
FSM Education Data Digest P a g e | 20
Figure 21: Age Specific Participation to Education System by State Chart
Out-of-school Children Definition and Purpose Out-of-school children (OOS) Children in the official primary school age range who are not enrolled in either primary or secondary schools. It is to identify the size of the population in the official primary school age range who should be targeted for policies and efforts in achieving universal primary education.
Methods of Calculation Out-of-school children (OOS) This is calculated just like in (UNESCO Institute for Statistics, 2009): Subtract the number of primary school-age pupils enrolled in either primary or secondary school from the total population of the official primary school age range.
Analysis and Discussions The timeseries data on Out-Of-School children reveals a consistent pattern over the last six years (Figure 22). It is good to note that the number of out of school population has been in decreasing trend in ECE level. Similarly, at the primary level
0.00%
20.00%
40.00%
60.00%
80.00%
100.00%
120.00%
140.00%
160.00%
5 6 7 8 9 10 11 12 13 14 15 16 17 18
2018
CHK
KSA
PNI
YAP
INDICATORS
FSM Education Data Digest P a g e | 21
also the number of out of school population has remained at the lowest level. However, at the secondary level, the out of school population is phenomenal and has remained almost the same throughout the years.
Population remain out of school for two reasons: a) that they were never enrolled in school and 2) enrolled in school but dropped out early without completing certain level or grade of education. Since both NER and GER is high at the primary level but the same is lowest at the secondary level, it appears like the second reason – high dropout is the predominant cause for high out-of-school population in FSM.
Figure 22: Out-of-school Children by Education Levels Trend
Transition, Repetition, Survival, Promotion, Dropout Rates Definition and Purpose Transition Rate (TR) The number of pupils (or students) admitted to the first grade of a higher level of education in a given year, expressed as a percentage of the number of pupils (or students) enrolled in the final grade of the lower level of education in the previous year. It is meant to convey information on the degree of access or transition from one cycle or level of education to a higher one.
-500
0
500
1000
1500
2000
2500
3000
3500
2013 2014 2015 2016 2017 2018
ECE
PRI
SEC

INDICATORS
FSM Education Data Digest P a g e | 22
Repetition Rate (RR) Proportion of pupils from a cohort enrolled in a given grade at a given school year who study in the same grade in the following school year. It is meant to measure the rate at which pupils from a cohort repeat a grade, and its effect on the internal efficiency of educational systems. In addition, it is one of the key indicators for analyzing and projecting pupil flows from grade to grade within the educational cycle.
Survival Rate (SR) Percentage of a cohort of pupils (or students) enrolled in the first grade of a given level or cycle of education in a given school year who are expected to reach successive grades. It is meant to measure the retention capacity and internal efficiency of an education system. It illustrates the situation regarding retention of pupils (or students) from grade to grade in schools, and conversely the magnitude of dropout by grade.
Promotion Rate (PR) Proportion of pupils from a cohort enrolled in a given grade at a given school year who study in the next grade in the following school year. It is meant to measure the performance of the education system in promoting pupils from a cohort from grade to grade, and its effect on the internal efficiency of educational systems. It is also a key indicator for analyzing and projecting pupil flows from grade to grade within the educational cycle.
Dropout Rates (DR) Proportion of pupils from a cohort enrolled in a given grade at a given school year who are no longer enrolled in the following school year. It is meant to measure the phenomenon of pupils from a cohort leaving school without completion, and its effect on the internal efficiency of educational systems. In addition, it is one of the key indicators for analyzing and projecting pupil flows from grade to grade within the educational cycle.
Methods of Calculation Transition Rate (TR) Here we simply make use of the Promotion Rate ECE=>G1 for Transition Rate for ECE to Primary and Promotion Rate G8=>G9 for Transition Rate for Primary to Secondary since the Promotion Rate is essentially a more general granular version (by grade instead of through education levels) of the Transition Rate.
INDICATORS
FSM Education Data Digest P a g e | 23
Repetition Rate (RR) This is calculated just like in (UNESCO Institute for Statistics, 2009): Divide the number of repeaters in a given grade in school year t+1 by the number of pupils from the same cohort enrolled in the same grade in the previous school year t.
Survival Rate (SR) This is calculated just like in (UNESCO Institute for Statistics, 2009): Divide the total number of pupils belonging to a school-cohort who reached each successive grade of the specified level of education by the number of pupils in the school-cohort i.e. those originally enrolled in the first grade of primary education, and multiply the result by 100. The survival rate is calculated on the basis of the reconstructed cohort method, which uses data on enrolment and repeaters for two consecutive years.
Promotion Rate (PR) This is calculated just like in (UNESCO Institute for Statistics, 2009): Divide the number of new enrolments in a given grade in school year t+1 by the number of pupils from the same cohort enrolled in the preceding grade in the previous school year t.
Dropout Rates (DR) This is calculated just like in (UNESCO Institute for Statistics, 2009): Dropout rate by grade is calculated by subtracting the sum of promotion rate and repetition rate from 100 in the given school year. For cumulative dropout rate in primary education, it is calculated by subtracting the survival rate from 100 at a given grade (see survival rate).
Important Considerations All the flow data shown in Table 13: Nation Flow Rates by Year and Grade are calculated using the reconstructed cohort method. As stated in (UNESCO Institute for Statistics, 2009) Pupil-flow rates (dropouts, promotion, repetition rates and derived indicators) are derived by analyzing data on enrolment and repeaters by grade for two consecutive years. One should therefore ensure that such data are consistent in terms of coverage over time and across grades. Since the FedEMIS is new the data collection across consecutive years is not as consistent has it will be going forward. Special attention should also be paid to minimizing some common errors which may bias these flow-rates, such as: Over-reporting enrolment/repeaters (particularly in grade one); incorrect distinction between new entrants and repeaters; transfers of pupils between grades and schools. The new FedEMIS goes a long way in eliminating these common errors.

INDICATORS
FSM Education Data Digest P a g e | 24
This is the reason why one will observe what seems to be theoretically “impossible” values such as negative dropouts. But looking at the raw data we have more enrollments recorded on the second of the two consecutive years and this is why we arrived at such negative dropout rate. Going forward with our single same consistent data collection tools we should see less and less of this even when using the reconstructed cohort. Furthermore, we plan to include the dropouts calculated directed and put it side by side with the reconstructed cohort method for comparison since we are collecting this data.
Analysis and Discussions As stated in earlier in this section, data on promotion, repetition and dropouts tends to be most challenging for a variety of reasons. This is not just the case in FSM but in general it is common issue across the nations. As such even UIS uses some estimates to derive these rates. Some of the common cause of the discrepancy is linked with poor student tracking system and frequent student transfers caused by both international and internal migration. Because student movement within FSM and abroad is all to common, getting to the exact numbers is always challenging. With the introduction of Student Information System next year, we believe to have more reliable data on PRD.
Nevertheless, current statistics reveals quite promising results on the student promotion rates in the FSM. In almost all grades, promotion rate is over 90% (Figure 23). Transition from one grade to the other and the survival rates are also higher in all grades (Figure 24)
Figure 23: Promotion, repetition and dropout rates – 2017-18
-20.00% 0.00% 20.00% 40.00% 60.00% 80.00% 100.00% 120.00%
2
4
6
8
10
12
Promotion Rate Repetition Rate Dropout Rate

INDICATORS
FSM Education Data Digest P a g e | 25
Figure 24: Transition and Survival Rate 2017-18
0.00%
20.00%
40.00%
60.00%
80.00%
100.00%
120.00%
2 3 4 5 6 7 8 9 10 11 12
Transition Rate Survival Rate (from G1)

INDICATORS
FSM Education Data Digest P a g e | 26
Table 2: GER/NER by Year, Education Level and Gender
GER GER Male GER Female NER NER Male NER Female
2013 88.33% 88.82% 87.82% 74.11% 73.30% 74.96%
ECE 83.38% 87.12% 79.53% 63.02% 66.53% 59.41%
PRI 98.76% 99.50% 97.97% 87.27% 87.19% 87.36%
SEC 69.65% 68.93% 70.42% 51.64% 48.50% 54.98%
2014 90.13% 90.41% 89.83% 76.35% 75.05% 77.71%
ECE 86.80% 89.59% 83.94% 67.74% 68.95% 66.49%
PRI 100.91% 102.33% 99.43% 89.78% 89.99% 89.57%
SEC 70.49% 68.09% 73.02% 52.96% 48.26% 57.92%
2015 88.86% 89.67% 88.02% 75.84% 75.04% 76.69%
ECE 98.51% 106.66% 90.18% 74.70% 79.95% 69.34%
PRI 96.91% 97.76% 96.01% 87.48% 87.18% 87.80%
SEC 71.21% 70.29% 72.18% 53.95% 50.85% 57.23%
2016 90.96% 91.26% 90.64% 78.38% 77.53% 79.26%
ECE 86.43% 85.74% 87.17% 66.79% 66.15% 67.49%
PRI 99.84% 101.41% 98.21% 90.82% 91.33% 90.29%
SEC 74.92% 73.19% 76.75% 57.21% 53.92% 60.70%
2017 87.98% 88.05% 87.91% 76.45% 75.51% 77.44%
ECE 93.53% 97.38% 89.40% 69.44% 74.13% 64.40%
PRI 98.16% 98.58% 97.72% 89.89% 89.50% 90.30%
SEC 66.59% 65.19% 68.07% 51.73% 48.54% 55.10%
2018 89.64% 88.97% 90.35% 77.31% 75.84% 78.84%
ECE 93.46% 92.64% 94.34% 56.96% 56.88% 57.05%
PRI 99.46% 99.98% 98.93% 90.59% 90.45% 90.74%
SEC 69.14% 66.31% 72.15% 55.79% 51.62% 60.22%
Annual Average 89.31% 89.53% 89.09% 76.39% 75.37% 77.47%
Table 3: GER/NER by State, Year, Education Level and Gender
GER GER Male GER Female NER NER Male NER Female
CHK (Annual Average) 82.66% 82.46% 82.87% 71.31% 70.13% 72.55%
2013 81.56% 81.70% 81.42% 70.23% 69.06% 71.46%
ECE 67.40% 70.26% 64.48% 54.04% 56.17% 51.87%
PRI 95.41% 96.37% 94.41% 85.88% 85.70% 86.06%
SEC 58.16% 55.94% 60.49% 43.84% 39.80% 48.09%
2014 85.09% 84.75% 85.43% 73.75% 72.26% 75.30%
ECE 68.92% 70.17% 67.65% 57.75% 57.76% 57.74%
PRI 98.77% 99.76% 97.73% 89.18% 89.35% 88.99%
SEC 62.55% 59.15% 66.12% 47.78% 42.59% 53.24%
2015 84.92% 85.00% 84.83% 72.61% 71.21% 74.07%

INDICATORS
FSM Education Data Digest P a g e | 27
GER GER Male GER Female NER NER Male NER Female
ECE 90.41% 101.36% 79.49% 68.34% 73.30% 63.39%
PRI 95.58% 95.60% 95.56% 85.55% 84.62% 86.53%
SEC 62.59% 60.15% 65.16% 48.33% 44.46% 52.41%
2016 84.02% 84.21% 83.83% 72.80% 72.23% 73.39%
ECE 81.29% 83.56% 78.86% 63.30% 64.90% 61.58%
PRI 96.18% 98.49% 93.78% 86.94% 88.08% 85.76%
SEC 60.47% 56.20% 65.00% 46.98% 42.81% 51.40%
2017 80.34% 79.79% 80.92% 70.19% 68.92% 71.52%
ECE 83.63% 85.71% 81.38% 62.26% 64.82% 59.50%
PRI 93.58% 94.68% 92.44% 85.08% 85.19% 84.97%
SEC 52.77% 48.62% 57.19% 42.02% 37.46% 46.89%
2018 79.93% 79.20% 80.70% 68.19% 67.00% 69.43%
ECE 86.67% 87.78% 85.49% 49.95% 52.96% 46.72%
PRI 93.10% 93.96% 92.21% 83.48% 83.78% 83.17%
SEC 51.45% 47.46% 55.71% 41.38% 36.65% 46.43%
KSA (Annual Average) 104.94% 106.27% 103.54% 93.96% 93.01% 94.97%
2013 104.49% 106.93% 101.93% 90.77% 91.63% 89.87%
ECE 101.96% 111.54% 92.00% 56.86% 61.54% 52.00%
PRI 103.39% 102.03% 104.84% 96.12% 96.09% 96.16%
SEC 107.24% 115.53% 98.72% 88.50% 90.06% 86.90%
2014 107.31% 110.27% 104.19% 94.28% 93.22% 95.40%
ECE 116.45% 114.29% 118.67% 82.24% 74.03% 90.67%
PRI 106.79% 107.13% 106.42% 101.64% 101.74% 101.52%
SEC 106.13% 115.43% 96.47% 83.02% 81.17% 84.94%
2015 102.97% 104.03% 101.86% 93.00% 91.94% 94.11%
ECE 114.09% 124.32% 104.00% 82.55% 94.59% 70.67%
PRI 103.23% 101.61% 104.95% 98.51% 96.62% 100.51%
SEC 99.84% 104.04% 95.42% 84.87% 82.30% 87.58%
2016 103.85% 104.04% 103.65% 93.52% 91.23% 95.93%
ECE 116.13% 108.64% 124.32% 89.03% 77.78% 101.35%
PRI 101.67% 101.30% 102.05% 96.42% 95.45% 97.43%
SEC 105.01% 108.18% 101.66% 89.01% 86.48% 91.69%
2017 106.17% 107.59% 104.66% 95.89% 95.90% 95.87%
ECE 128.77% 140.79% 115.71% 91.10% 97.37% 84.29%
PRI 103.34% 102.61% 104.12% 99.50% 98.86% 100.17%
SEC 106.29% 109.29% 103.08% 89.90% 89.74% 90.07%
2018 104.85% 104.64% 105.06% 96.51% 94.25% 98.92%
ECE 121.74% 129.17% 113.64% 102.90% 108.33% 96.97%
PRI 102.19% 98.69% 105.89% 96.97% 92.96% 101.21%
SEC 106.24% 110.71% 101.40% 94.10% 93.51% 94.74%
PNI (Annual Average) 93.58% 93.28% 93.89% 80.91% 79.72% 82.15%
2013 93.27% 93.09% 93.46% 77.59% 76.59% 78.64%
INDICATORS
FSM Education Data Digest P a g e | 28
GER GER Male GER Female NER NER Male NER Female
ECE 75.90% 79.37% 72.26% 72.55% 77.18% 67.68%
PRI 104.45% 105.03% 103.84% 90.20% 90.26% 90.15%
SEC 76.21% 73.92% 78.65% 55.03% 50.96% 59.34%
2014 94.03% 93.70% 94.38% 80.04% 78.63% 81.51%
ECE 82.15% 85.89% 78.21% 77.78% 81.27% 74.10%
PRI 107.60% 109.79% 105.32% 94.23% 94.98% 93.43%
SEC 71.48% 65.67% 77.59% 54.15% 47.76% 60.88%
2015 91.66% 92.29% 91.01% 79.79% 79.29% 80.32%
ECE 84.53% 87.59% 81.25% 80.25% 83.45% 76.82%
PRI 101.71% 103.77% 99.56% 92.42% 93.03% 91.79%
SEC 74.58% 72.04% 77.25% 56.17% 52.83% 59.67%
2016 94.68% 94.31% 95.06% 82.45% 81.38% 83.58%
ECE 68.45% 65.13% 71.99% 64.17% 61.89% 66.58%
PRI 103.61% 103.68% 103.53% 94.99% 94.55% 95.45%
SEC 84.34% 83.93% 84.76% 63.38% 61.46% 65.39%
2017 90.68% 90.81% 90.55% 80.56% 79.84% 81.32%
ECE 79.21% 86.71% 71.22% 73.44% 81.12% 65.26%
PRI 102.38% 101.46% 103.34% 94.68% 93.07% 96.37%
SEC 71.09% 71.36% 70.81% 55.22% 54.06% 56.43%
2018 97.18% 95.50% 98.95% 85.20% 82.75% 87.77%
ECE 84.95% 82.82% 87.22% 55.34% 52.47% 58.40%
PRI 107.07% 106.25% 107.93% 98.91% 97.33% 100.57%
SEC 80.88% 77.55% 84.35% 65.81% 61.73% 70.06%
YAP (Annual Average) 93.67% 96.82% 90.32% 71.83% 71.95% 71.71%
2013 85.37% 88.20% 82.33% 64.16% 64.43% 63.87%
ECE 149.78% 149.57% 150.00% 65.64% 67.83% 63.39%
PRI 82.89% 84.65% 81.03% 70.39% 70.03% 70.77%
SEC 75.88% 81.64% 69.54% 52.62% 53.82% 51.30%
2014 86.26% 89.87% 82.43% 62.34% 62.09% 62.62%
ECE 148.67% 159.65% 137.50% 61.95% 65.79% 58.04%
PRI 81.86% 83.25% 80.40% 67.39% 65.75% 69.10%
SEC 80.57% 86.81% 73.75% 53.49% 54.95% 51.90%
2015 85.69% 90.33% 80.77% 64.49% 65.45% 63.48%
ECE 152.65% 163.16% 141.96% 71.68% 78.95% 64.29%
PRI 80.33% 82.55% 78.01% 70.33% 70.77% 69.87%
SEC 80.49% 88.41% 71.84% 52.49% 53.27% 51.63%
2016 102.70% 105.89% 99.32% 80.92% 80.42% 81.45%
ECE 155.74% 154.10% 157.52% 78.30% 79.51% 76.99%
PRI 103.37% 107.81% 98.76% 91.49% 93.17% 89.74%
SEC 88.96% 91.14% 86.58% 62.35% 58.00% 67.09%
2017 103.30% 105.20% 101.30% 79.37% 78.56% 80.22%
ECE 170.18% 163.56% 177.27% 75.00% 77.97% 71.82%

INDICATORS
FSM Education Data Digest P a g e | 29
GER GER Male GER Female NER NER Male NER Female
PRI 102.32% 104.89% 99.66% 90.21% 91.75% 88.61%
SEC 89.32% 92.00% 86.42% 60.06% 54.40% 66.16%
2018 99.53% 102.34% 96.58% 80.60% 81.74% 79.40%
ECE 138.16% 127.97% 149.09% 67.11% 59.32% 75.45%
PRI 101.83% 107.93% 95.49% 91.65% 96.85% 86.25%
SEC 86.10% 86.00% 86.21% 63.07% 59.20% 67.24%
National Annual Average 89.09% 89.30% 88.87% 76.23% 75.20% 77.32%
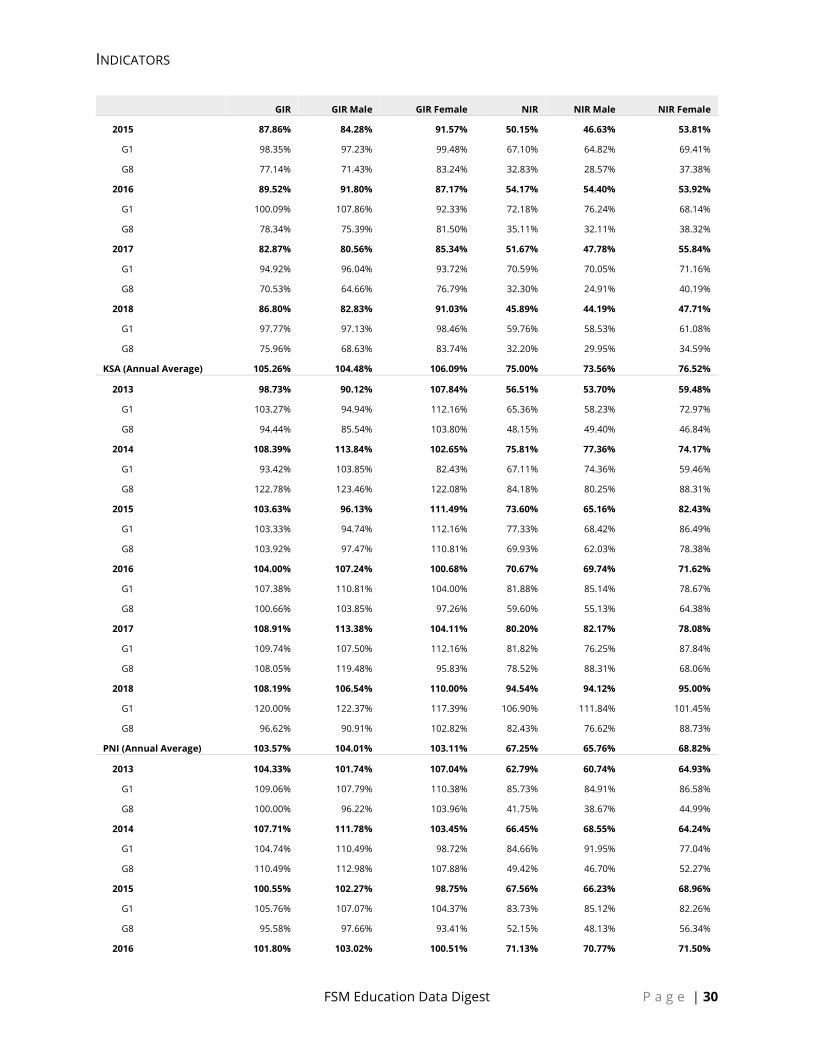
Table 4: NIR/GIR by Year, First/Last Year of Primary Education and Gender
NIR NIR Male NIR Female GIR GIR Male GIR Female
2013 55.67% 54.79% 56.59% 96.42% 97.30% 95.50%
G1 76.27% 78.16% 74.29% 107.41% 111.72% 102.92%
G8 36.36% 33.04% 39.87% 86.12% 83.87% 88.49%
2014 59.32% 60.06% 58.54% 98.07% 101.70% 94.28%
G1 76.66% 80.99% 72.18% 103.12% 109.12% 96.92%
G8 42.69% 40.23% 45.30% 93.23% 94.67% 91.71%
2015 56.76% 53.87% 59.78% 92.24% 90.79% 93.76%
G1 71.56% 70.35% 72.80% 99.23% 98.98% 99.48%
G8 42.17% 37.87% 46.72% 85.35% 82.84% 88.01%
2016 61.99% 61.72% 62.28% 96.37% 98.90% 93.73%
G1 79.38% 83.50% 75.17% 106.42% 112.61% 100.09%
G8 44.43% 40.08% 49.02% 86.21% 85.29% 87.19%
2017 60.54% 56.93% 64.37% 92.68% 90.83% 94.65%
G1 73.34% 70.68% 76.19% 99.45% 98.68% 100.26%
G8 47.37% 42.71% 52.30% 85.73% 82.69% 88.93%
2018 58.15% 56.61% 59.78% 96.29% 94.80% 97.87%
G1 68.27% 68.27% 68.27% 103.41% 105.08% 101.63%
G8 47.95% 44.76% 51.31% 89.11% 84.36% 94.12%
Annual Average 58.72% 57.32% 60.20% 95.35% 95.73% 94.95%
Table 5: GIR/NIR by State, First/Last Grade of Primary Education and Gender
GIR GIR Male GIR Female NIR NIR Male NIR Female
CHK (Annual Average) 88.47% 88.34% 88.60% 51.78% 50.59% 53.03%
2013 90.92% 94.79% 86.88% 52.84% 53.59% 52.05%
G1 107.03% 117.13% 96.56% 73.58% 79.20% 67.75%
G8 75.39% 73.41% 77.46% 32.85% 29.10% 36.80%
2014 92.61% 95.43% 89.68% 55.67% 56.64% 54.67%
G1 106.11% 112.43% 99.64% 77.43% 80.56% 74.24%
G8 79.28% 78.95% 79.64% 34.18% 33.45% 34.95%
INDICATORS
FSM Education Data Digest P a g e | 30
GIR GIR Male GIR Female NIR NIR Male NIR Female
2015 87.86% 84.28% 91.57% 50.15% 46.63% 53.81%
G1 98.35% 97.23% 99.48% 67.10% 64.82% 69.41%
G8 77.14% 71.43% 83.24% 32.83% 28.57% 37.38%
2016 89.52% 91.80% 87.17% 54.17% 54.40% 53.92%
G1 100.09% 107.86% 92.33% 72.18% 76.24% 68.14%
G8 78.34% 75.39% 81.50% 35.11% 32.11% 38.32%
2017 82.87% 80.56% 85.34% 51.67% 47.78% 55.84%
G1 94.92% 96.04% 93.72% 70.59% 70.05% 71.16%
G8 70.53% 64.66% 76.79% 32.30% 24.91% 40.19%
2018 86.80% 82.83% 91.03% 45.89% 44.19% 47.71%
G1 97.77% 97.13% 98.46% 59.76% 58.53% 61.08%
G8 75.96% 68.63% 83.74% 32.20% 29.95% 34.59%
KSA (Annual Average) 105.26% 104.48% 106.09% 75.00% 73.56% 76.52%
2013 98.73% 90.12% 107.84% 56.51% 53.70% 59.48%
G1 103.27% 94.94% 112.16% 65.36% 58.23% 72.97%
G8 94.44% 85.54% 103.80% 48.15% 49.40% 46.84%
2014 108.39% 113.84% 102.65% 75.81% 77.36% 74.17%
G1 93.42% 103.85% 82.43% 67.11% 74.36% 59.46%
G8 122.78% 123.46% 122.08% 84.18% 80.25% 88.31%
2015 103.63% 96.13% 111.49% 73.60% 65.16% 82.43%
G1 103.33% 94.74% 112.16% 77.33% 68.42% 86.49%
G8 103.92% 97.47% 110.81% 69.93% 62.03% 78.38%
2016 104.00% 107.24% 100.68% 70.67% 69.74% 71.62%
G1 107.38% 110.81% 104.00% 81.88% 85.14% 78.67%
G8 100.66% 103.85% 97.26% 59.60% 55.13% 64.38%
2017 108.91% 113.38% 104.11% 80.20% 82.17% 78.08%
G1 109.74% 107.50% 112.16% 81.82% 76.25% 87.84%
G8 108.05% 119.48% 95.83% 78.52% 88.31% 68.06%
2018 108.19% 106.54% 110.00% 94.54% 94.12% 95.00%
G1 120.00% 122.37% 117.39% 106.90% 111.84% 101.45%
G8 96.62% 90.91% 102.82% 82.43% 76.62% 88.73%
PNI (Annual Average) 103.57% 104.01% 103.11% 67.25% 65.76% 68.82%
2013 104.33% 101.74% 107.04% 62.79% 60.74% 64.93%
G1 109.06% 107.79% 110.38% 85.73% 84.91% 86.58%
G8 100.00% 96.22% 103.96% 41.75% 38.67% 44.99%
2014 107.71% 111.78% 103.45% 66.45% 68.55% 64.24%
G1 104.74% 110.49% 98.72% 84.66% 91.95% 77.04%
G8 110.49% 112.98% 107.88% 49.42% 46.70% 52.27%
2015 100.55% 102.27% 98.75% 67.56% 66.23% 68.96%
G1 105.76% 107.07% 104.37% 83.73% 85.12% 82.26%
G8 95.58% 97.66% 93.41% 52.15% 48.13% 56.34%
2016 101.80% 103.02% 100.51% 71.13% 70.77% 71.50%
INDICATORS
FSM Education Data Digest P a g e | 31
GIR GIR Male GIR Female NIR NIR Male NIR Female
G1 113.38% 115.65% 110.97% 90.40% 93.40% 87.21%
G8 90.63% 90.69% 90.57% 52.55% 48.69% 56.58%
2017 99.82% 97.99% 101.74% 68.71% 64.38% 73.26%
G1 99.05% 95.37% 102.96% 74.70% 69.21% 80.54%
G8 100.62% 100.73% 100.50% 62.52% 59.32% 65.83%
2018 107.16% 107.29% 107.04% 67.05% 64.04% 70.23%
G1 108.55% 111.92% 104.98% 70.96% 70.33% 71.64%
G8 105.73% 102.44% 109.14% 63.01% 57.46% 68.78%
YAP (Annual Average) 91.05% 94.31% 87.61% 50.82% 48.54% 53.23%
2013 85.09% 89.56% 80.34% 40.99% 36.55% 45.73%
G1 89.82% 91.30% 88.29% 57.52% 53.91% 61.26%
G8 80.93% 88.06% 73.17% 26.46% 21.64% 31.71%
2014 81.82% 86.42% 76.96% 40.17% 34.57% 46.09%
G1 84.89% 86.84% 82.88% 48.89% 46.49% 51.35%
G8 79.03% 86.05% 71.43% 32.26% 24.03% 41.18%
2015 75.32% 76.89% 73.68% 39.48% 37.82% 41.23%
G1 74.34% 78.07% 70.54% 46.02% 45.61% 46.43%
G8 76.25% 75.81% 76.72% 33.33% 30.65% 36.21%
2016 106.33% 114.10% 98.21% 63.10% 60.68% 65.63%
G1 114.22% 127.19% 100.90% 76.44% 84.21% 68.47%
G8 98.71% 101.67% 95.58% 50.21% 38.33% 62.83%
2017 103.68% 100.00% 107.59% 61.04% 57.98% 64.29%
G1 115.81% 117.36% 114.16% 76.07% 75.21% 76.99%
G8 91.23% 82.05% 100.90% 45.61% 40.17% 51.35%
2018 94.81% 99.58% 89.73% 61.04% 64.71% 57.14%
G1 100.85% 106.61% 94.69% 73.93% 78.51% 69.03%
G8 88.60% 92.31% 84.68% 47.81% 50.43% 45.05%
National Annual Average 95.15% 95.52% 94.76% 58.65% 57.23% 60.15%
Table 6: Nation Access Rate by Year, Grade Level and Gender AR AR Male AR Female
2013 87.64% 88.06% 87.20%
GK 75.94% 79.83% 71.92%
G1 107.41% 111.72% 102.92%
G2 105.64% 105.34% 105.94%
G3 101.30% 101.27% 101.33%
G4 98.10% 98.99% 97.16%
G5 95.72% 97.75% 93.56%
G6 95.19% 94.75% 95.66%
G7 101.45% 103.46% 99.32%
G8 86.12% 83.87% 88.49%
G9 88.25% 86.59% 89.99%
INDICATORS
FSM Education Data Digest P a g e | 32
AR AR Male AR Female
G10 66.60% 64.39% 68.93%
G11 64.31% 63.81% 64.83%
G12 57.22% 57.75% 56.65%
2014 90.13% 90.41% 89.83%
GK 86.80% 89.59% 83.94%
G1 103.12% 109.12% 96.92%
G2 108.09% 110.17% 105.94%
G3 106.66% 106.91% 106.41%
G4 102.48% 101.27% 103.75%
G5 102.78% 106.59% 98.75%
G6 97.59% 97.66% 97.52%
G7 93.95% 93.09% 94.86%
G8 93.23% 94.67% 91.71%
G9 87.65% 84.83% 90.63%
G10 72.64% 67.27% 78.29%
G11 61.22% 60.55% 61.92%
G12 60.37% 59.71% 61.07%
2015 88.86% 89.67% 88.02%
GK 98.51% 106.66% 90.18%
G1 99.23% 98.98% 99.48%
G2 97.04% 103.00% 90.90%
G3 102.93% 105.49% 100.27%
G4 101.97% 101.71% 102.23%
G5 100.13% 99.57% 100.72%
G6 96.78% 98.48% 94.99%
G7 92.20% 92.71% 91.66%
G8 85.35% 82.84% 88.01%
G9 93.50% 99.27% 87.38%
G10 70.01% 68.91% 71.17%
G11 65.71% 59.15% 72.62%
G12 55.89% 54.13% 57.75%
2016 88.50% 88.39% 88.63%
GK 78.07% 77.79% 78.38%
G1 106.42% 112.61% 100.09%
G2 100.91% 100.77% 101.05%
G3 96.99% 100.34% 93.52%
G4 100.40% 102.59% 98.12%
G5 97.89% 96.65% 99.19%
G6 97.11% 94.53% 99.82%
G7 94.89% 94.99% 94.79%
G8 86.21% 85.29% 87.19%
G9 85.81% 82.45% 89.38%

INDICATORS
FSM Education Data Digest P a g e | 33
AR AR Male AR Female
G10 86.03% 89.13% 82.76%
G11 60.04% 59.02% 61.12%
G12 62.51% 56.69% 68.63%
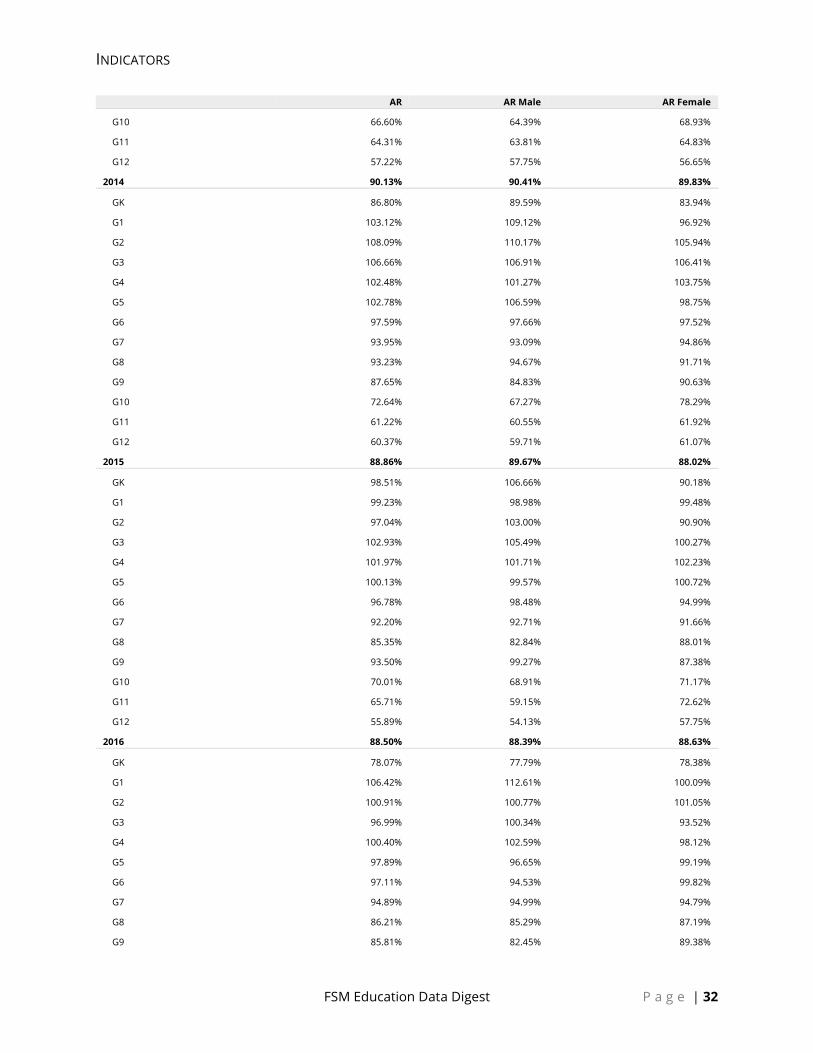
2017 84.92% 84.43% 85.43%
GK 84.87% 89.69% 79.71%
G1 99.45% 98.68% 100.26%
G2 101.85% 107.31% 96.26%
G3 97.01% 96.06% 97.98%
G4 95.79% 98.96% 92.53%
G5 97.40% 98.70% 96.05%
G6 89.91% 86.64% 93.33%
G7 93.80% 89.44% 98.38%
G8 85.73% 82.69% 88.93%
G9 77.77% 75.27% 80.41%
G10 67.25% 63.52% 71.21%
G11 61.27% 59.34% 63.32%
G12 53.22% 53.47% 52.96%
2018 86.77% 85.64% 87.94%
GK 84.59% 84.16% 85.06%
G1 103.41% 105.08% 101.63%
G2 100.39% 101.75% 98.94%
G3 99.44% 103.24% 95.55%
G4 96.69% 95.70% 97.71%
G5 98.24% 99.83% 96.61%
G6 94.61% 92.19% 97.12% G7 89.40% 87.90% 90.97% G8 89.11% 84.36% 94.12% G9 78.64% 75.43% 82.04% G10 74.26% 70.85% 77.88% G11 62.39% 58.48% 66.55%
G12 56.99% 55.19% 58.90% National Annual Average 87.82% 87.79% 87.85%

INDICATORS
FSM Education Data Digest P a g e | 34
Table 7: Access Rate by Year, Grade Level, State and Gender
AR AR Male AR Female
CHK KSA PNI YAP CHK KSA PNI YAP CHK KSA PNI YAP
2013 81.56% 104.49% 93.27% 79.01% 81.70% 106.93% 93.09% 81.36% 81.42% 101.93% 93.46% 76.51%
GK 67.40% 101.96% 75.90% 80.18% 70.26% 111.54% 79.37% 83.48% 64.48% 92.00% 72.26% 76.79%
G1 107.03% 103.27% 109.06% 89.82% 117.13% 94.94% 107.79% 91.30% 96.56% 112.16% 110.38% 88.29%
G2 105.54% 97.39% 109.89% 77.43% 104.36% 98.73% 110.92% 75.65% 106.78% 95.95% 108.82% 79.28%
G3 97.40% 90.79% 108.49% 90.31% 97.21% 94.94% 106.28% 98.28% 97.60% 86.30% 110.78% 81.98%
G4 97.40% 110.53% 96.70% 85.22% 100.35% 112.66% 96.40% 77.97% 94.26% 108.22% 97.01% 92.86%
G5 99.20% 107.84% 92.27% 78.97% 98.45% 107.59% 96.93% 85.83% 100.00% 108.11% 87.41% 71.68%
G6 89.52% 104.52% 104.51% 80.42% 87.71% 102.50% 106.98% 78.23% 91.44% 106.67% 101.94% 82.76%
G7 92.78% 118.35% 114.77% 80.72% 93.58% 119.75% 118.86% 82.17% 91.94% 116.88% 110.48% 79.17%
G8 75.39% 94.44% 100.00% 80.93% 73.41% 85.54% 96.22% 88.06% 77.46% 103.80% 103.96% 73.17%
G9 77.37% 112.12% 101.57% 76.89% 74.96% 101.19% 100.44% 82.61% 79.90% 123.46% 102.76% 70.63%
G10 59.92% 92.64% 70.31% 67.79% 56.55% 104.82% 62.61% 80.00% 63.43% 80.00% 78.44% 54.33%
G11 51.20% 107.59% 70.09% 76.81% 50.08% 117.50% 69.74% 72.46% 52.38% 97.44% 70.47% 81.60%
G12 43.56% 117.45% 62.43% 65.49% 41.77% 141.33% 62.64% 64.93% 45.47% 93.24% 62.20% 66.12%
2014 85.09% 107.31% 94.03% 86.26% 84.75% 110.27% 93.70% 89.87% 85.43% 104.19% 94.38% 82.43%
GK 68.92% 116.45% 82.15% 148.67% 70.17% 114.29% 85.89% 159.65% 67.65% 118.67% 78.21% 137.50%
G1 106.11% 93.42% 104.74% 84.89% 112.43% 103.85% 110.49% 86.84% 99.64% 82.43% 98.72% 82.88%
G2 110.92% 111.18% 109.45% 82.22% 119.72% 94.87% 107.32% 77.19% 101.82% 128.38% 111.68% 87.39%
G3 110.97% 102.65% 109.05% 76.99% 110.90% 102.56% 108.76% 81.74% 111.05% 102.74% 109.34% 72.07%
G4 102.16% 101.32% 107.15% 84.58% 100.70% 100.00% 106.05% 83.62% 103.71% 102.74% 108.29% 85.59%
G5 100.99% 112.58% 107.97% 86.40% 104.71% 123.08% 111.30% 88.03% 97.02% 101.37% 104.50% 84.68%
G6 96.06% 109.21% 102.55% 79.83% 90.83% 112.66% 109.03% 80.83% 101.67% 105.48% 95.79% 78.76%
G7 84.32% 100.65% 109.29% 81.25% 81.13% 96.25% 112.12% 81.45% 87.73% 105.33% 106.33% 81.03%
G8 79.28% 122.78% 110.49% 79.03% 78.95% 123.46% 112.98% 86.05% 79.64% 122.08% 107.88% 71.43%
G9 80.43% 113.04% 92.24% 88.72% 74.79% 119.51% 88.39% 96.27% 86.37% 106.33% 96.26% 80.49%
G10 67.38% 112.96% 69.03% 83.27% 59.90% 113.25% 61.54% 90.51% 75.22% 112.66% 76.91% 75.40%
G11 52.81% 102.52% 62.46% 68.94% 53.13% 128.40% 51.87% 81.16% 52.48% 75.64% 73.61% 55.56%
G12 49.25% 95.45% 62.33% 81.61% 48.55% 100.00% 61.20% 79.56% 50.00% 90.79% 63.53% 83.87%
2015 84.92% 102.97% 91.66% 85.69% 85.00% 104.03% 92.29% 90.33% 84.83% 101.86% 91.01% 80.77%
GK 90.41% 114.09% 84.53% 152.65% 101.36% 124.32% 87.59% 163.16% 79.49% 104.00% 81.25% 141.96%
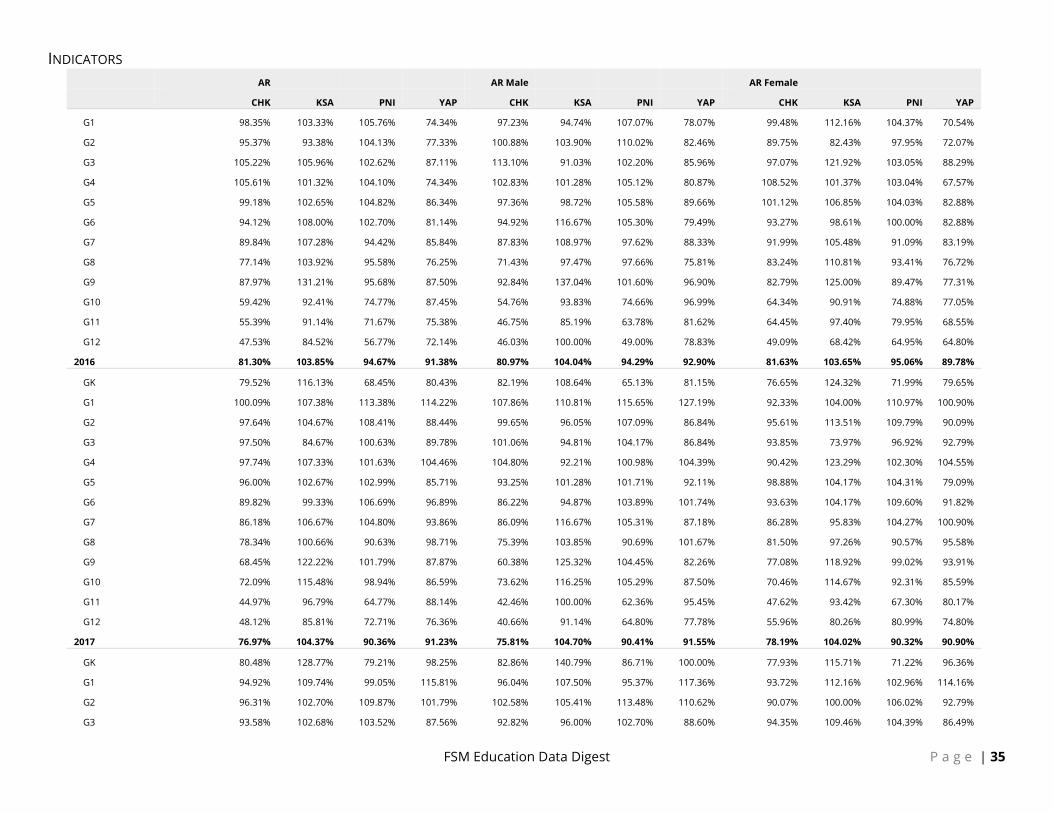
INDICATORS
FSM Education Data Digest P a g e | 35
AR AR Male AR Female
CHK KSA PNI YAP CHK KSA PNI YAP CHK KSA PNI YAP
G1 98.35% 103.33% 105.76% 74.34% 97.23% 94.74% 107.07% 78.07% 99.48% 112.16% 104.37% 70.54%
G2 95.37% 93.38% 104.13% 77.33% 100.88% 103.90% 110.02% 82.46% 89.75% 82.43% 97.95% 72.07%
G3 105.22% 105.96% 102.62% 87.11% 113.10% 91.03% 102.20% 85.96% 97.07% 121.92% 103.05% 88.29%
G4 105.61% 101.32% 104.10% 74.34% 102.83% 101.28% 105.12% 80.87% 108.52% 101.37% 103.04% 67.57%
G5 99.18% 102.65% 104.82% 86.34% 97.36% 98.72% 105.58% 89.66% 101.12% 106.85% 104.03% 82.88%
G6 94.12% 108.00% 102.70% 81.14% 94.92% 116.67% 105.30% 79.49% 93.27% 98.61% 100.00% 82.88%
G7 89.84% 107.28% 94.42% 85.84% 87.83% 108.97% 97.62% 88.33% 91.99% 105.48% 91.09% 83.19%
G8 77.14% 103.92% 95.58% 76.25% 71.43% 97.47% 97.66% 75.81% 83.24% 110.81% 93.41% 76.72%
G9 87.97% 131.21% 95.68% 87.50% 92.84% 137.04% 101.60% 96.90% 82.79% 125.00% 89.47% 77.31%
G10 59.42% 92.41% 74.77% 87.45% 54.76% 93.83% 74.66% 96.99% 64.34% 90.91% 74.88% 77.05%
G11 55.39% 91.14% 71.67% 75.38% 46.75% 85.19% 63.78% 81.62% 64.45% 97.40% 79.95% 68.55%
G12 47.53% 84.52% 56.77% 72.14% 46.03% 100.00% 49.00% 78.83% 49.09% 68.42% 64.95% 64.80%
2016 81.30% 103.85% 94.67% 91.38% 80.97% 104.04% 94.29% 92.90% 81.63% 103.65% 95.06% 89.78%
GK 79.52% 116.13% 68.45% 80.43% 82.19% 108.64% 65.13% 81.15% 76.65% 124.32% 71.99% 79.65%
G1 100.09% 107.38% 113.38% 114.22% 107.86% 110.81% 115.65% 127.19% 92.33% 104.00% 110.97% 100.90%
G2 97.64% 104.67% 108.41% 88.44% 99.65% 96.05% 107.09% 86.84% 95.61% 113.51% 109.79% 90.09%
G3 97.50% 84.67% 100.63% 89.78% 101.06% 94.81% 104.17% 86.84% 93.85% 73.97% 96.92% 92.79%
G4 97.74% 107.33% 101.63% 104.46% 104.80% 92.21% 100.98% 104.39% 90.42% 123.29% 102.30% 104.55%
G5 96.00% 102.67% 102.99% 85.71% 93.25% 101.28% 101.71% 92.11% 98.88% 104.17% 104.31% 79.09%
G6 89.82% 99.33% 106.69% 96.89% 86.22% 94.87% 103.89% 101.74% 93.63% 104.17% 109.60% 91.82%
G7 86.18% 106.67% 104.80% 93.86% 86.09% 116.67% 105.31% 87.18% 86.28% 95.83% 104.27% 100.90%
G8 78.34% 100.66% 90.63% 98.71% 75.39% 103.85% 90.69% 101.67% 81.50% 97.26% 90.57% 95.58%
G9 68.45% 122.22% 101.79% 87.87% 60.38% 125.32% 104.45% 82.26% 77.08% 118.92% 99.02% 93.91%
G10 72.09% 115.48% 98.94% 86.59% 73.62% 116.25% 105.29% 87.50% 70.46% 114.67% 92.31% 85.59%
G11 44.97% 96.79% 64.77% 88.14% 42.46% 100.00% 62.36% 95.45% 47.62% 93.42% 67.30% 80.17%
G12 48.12% 85.81% 72.71% 76.36% 40.66% 91.14% 64.80% 77.78% 55.96% 80.26% 80.99% 74.80%
2017 76.97% 104.37% 90.36% 91.23% 75.81% 104.70% 90.41% 91.55% 78.19% 104.02% 90.32% 90.90%
GK 80.48% 128.77% 79.21% 98.25% 82.86% 140.79% 86.71% 100.00% 77.93% 115.71% 71.22% 96.36%
G1 94.92% 109.74% 99.05% 115.81% 96.04% 107.50% 95.37% 117.36% 93.72% 112.16% 102.96% 114.16%
G2 96.31% 102.70% 109.87% 101.79% 102.58% 105.41% 113.48% 110.62% 90.07% 100.00% 106.02% 92.79%
G3 93.58% 102.68% 103.52% 87.56% 92.82% 96.00% 102.70% 88.60% 94.35% 109.46% 104.39% 86.49%

INDICATORS
FSM Education Data Digest P a g e | 36
AR AR Male AR Female
CHK KSA PNI YAP CHK KSA PNI YAP CHK KSA PNI YAP
G4 96.23% 88.59% 100.00% 83.48% 101.25% 101.32% 101.97% 75.22% 91.11% 75.34% 97.95% 91.89%
G5 90.63% 109.40% 102.38% 104.91% 95.89% 87.01% 101.97% 108.77% 85.19% 133.33% 102.81% 100.91%
G6 84.95% 105.37% 96.88% 79.02% 79.14% 105.19% 94.36% 83.33% 91.03% 105.56% 99.49% 74.55%
G7 83.27% 100.00% 105.84% 97.78% 78.51% 98.70% 100.24% 98.26% 88.32% 101.39% 111.65% 97.27%
G8 70.53% 108.05% 100.62% 91.23% 64.66% 119.48% 100.73% 82.05% 76.79% 95.83% 100.50% 100.90%
G9 67.60% 109.33% 80.24% 96.97% 61.93% 111.54% 80.86% 95.80% 73.68% 106.94% 79.60% 98.21%
G10 53.71% 97.35% 76.20% 79.83% 47.90% 87.18% 77.41% 73.17% 59.93% 108.22% 74.94% 86.96%
G11 45.69% 102.65% 69.08% 79.10% 44.11% 102.56% 66.36% 77.17% 47.38% 102.74% 71.91% 81.20%
G12 40.78% 92.76% 56.43% 72.91% 37.46% 98.72% 57.44% 82.44% 44.30% 86.49% 55.37% 62.50%
2018 76.44% 104.90% 97.35% 87.00% 75.12% 104.64% 95.72% 88.04% 77.83% 105.17% 99.07% 85.90%
GK 81.02% 121.74% 85.56% 75.00% 81.48% 129.17% 83.29% 72.03% 80.52% 113.64% 87.97% 78.18%
G1 97.77% 120.00% 108.55% 100.85% 97.13% 122.37% 111.92% 106.61% 98.46% 117.39% 104.98% 94.69%
G2 95.79% 107.84% 103.95% 104.91% 98.62% 105.00% 101.86% 115.04% 92.75% 110.96% 106.17% 94.59%
G3 89.40% 98.64% 113.96% 100.89% 96.03% 94.52% 112.53% 112.28% 82.79% 102.70% 115.49% 89.19%
G4 90.36% 102.03% 107.70% 86.16% 88.03% 96.00% 108.37% 88.50% 92.72% 108.22% 106.99% 83.78%
G5 95.58% 85.23% 106.30% 91.52% 98.21% 94.74% 106.42% 87.72% 92.88% 75.34% 106.17% 95.45%
G6 82.65% 104.03% 107.66% 100.45% 84.38% 81.82% 104.44% 93.86% 80.86% 127.78% 111.00% 107.27%
G7 81.67% 103.36% 100.25% 79.11% 77.60% 103.90% 98.77% 88.70% 85.93% 102.78% 101.78% 69.09%
G8 75.96% 96.62% 105.73% 88.60% 68.63% 90.91% 102.44% 92.31% 83.74% 102.82% 109.14% 84.68%
G9 57.42% 125.00% 94.07% 95.24% 51.77% 146.75% 89.08% 94.12% 63.45% 101.41% 99.24% 96.43%
G10 58.72% 97.30% 89.71% 78.15% 53.01% 103.90% 87.02% 77.24% 64.83% 90.14% 92.50% 79.13%
G11 44.93% 91.89% 80.22% 61.89% 40.82% 84.42% 78.57% 54.33% 49.33% 100.00% 81.93% 70.09%
G12 40.39% 111.41% 64.23% 72.11% 39.89% 107.79% 61.59% 68.70% 40.92% 115.28% 66.99% 75.83%
Annual Average 81.08% 104.65% 93.55% 86.70% 80.60% 105.79% 93.25% 88.95% 81.59% 103.45% 93.87% 84.30%
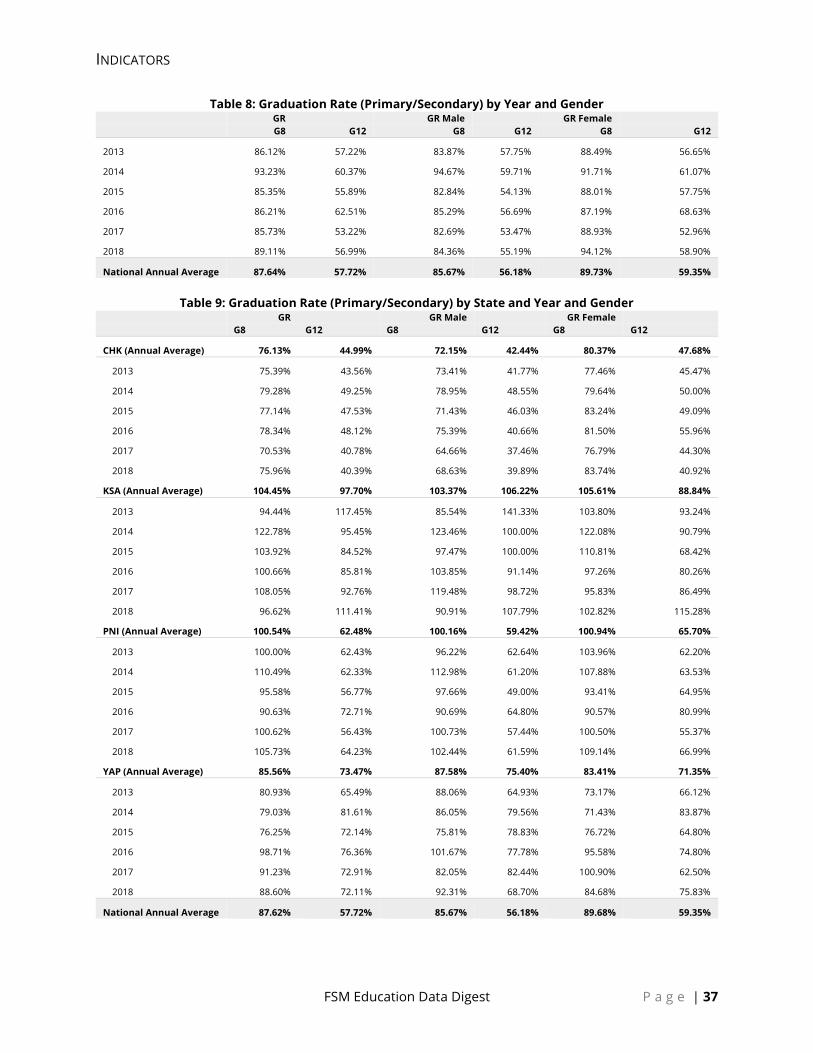
INDICATORS
FSM Education Data Digest P a g e | 37
Table 8: Graduation Rate (Primary/Secondary) by Year and Gender GR GR Male GR Female
G8 G12 G8 G12 G8 G12
2013 86.12% 57.22% 83.87% 57.75% 88.49% 56.65%
2014 93.23% 60.37% 94.67% 59.71% 91.71% 61.07%
2015 85.35% 55.89% 82.84% 54.13% 88.01% 57.75%
2016 86.21% 62.51% 85.29% 56.69% 87.19% 68.63%
2017 85.73% 53.22% 82.69% 53.47% 88.93% 52.96%
2018 89.11% 56.99% 84.36% 55.19% 94.12% 58.90%
National Annual Average 87.64% 57.72% 85.67% 56.18% 89.73% 59.35%
Table 9: Graduation Rate (Primary/Secondary) by State and Year and Gender GR GR Male GR Female
G8 G12 G8 G12 G8 G12
CHK (Annual Average) 76.13% 44.99% 72.15% 42.44% 80.37% 47.68%
2013 75.39% 43.56% 73.41% 41.77% 77.46% 45.47%
2014 79.28% 49.25% 78.95% 48.55% 79.64% 50.00%
2015 77.14% 47.53% 71.43% 46.03% 83.24% 49.09%
2016 78.34% 48.12% 75.39% 40.66% 81.50% 55.96%
2017 70.53% 40.78% 64.66% 37.46% 76.79% 44.30%
2018 75.96% 40.39% 68.63% 39.89% 83.74% 40.92%
KSA (Annual Average) 104.45% 97.70% 103.37% 106.22% 105.61% 88.84%
2013 94.44% 117.45% 85.54% 141.33% 103.80% 93.24%
2014 122.78% 95.45% 123.46% 100.00% 122.08% 90.79%
2015 103.92% 84.52% 97.47% 100.00% 110.81% 68.42%
2016 100.66% 85.81% 103.85% 91.14% 97.26% 80.26%
2017 108.05% 92.76% 119.48% 98.72% 95.83% 86.49%
2018 96.62% 111.41% 90.91% 107.79% 102.82% 115.28%
PNI (Annual Average) 100.54% 62.48% 100.16% 59.42% 100.94% 65.70%
2013 100.00% 62.43% 96.22% 62.64% 103.96% 62.20%
2014 110.49% 62.33% 112.98% 61.20% 107.88% 63.53%
2015 95.58% 56.77% 97.66% 49.00% 93.41% 64.95%
2016 90.63% 72.71% 90.69% 64.80% 90.57% 80.99%
2017 100.62% 56.43% 100.73% 57.44% 100.50% 55.37%
2018 105.73% 64.23% 102.44% 61.59% 109.14% 66.99%
YAP (Annual Average) 85.56% 73.47% 87.58% 75.40% 83.41% 71.35%
2013 80.93% 65.49% 88.06% 64.93% 73.17% 66.12%
2014 79.03% 81.61% 86.05% 79.56% 71.43% 83.87%
2015 76.25% 72.14% 75.81% 78.83% 76.72% 64.80%
2016 98.71% 76.36% 101.67% 77.78% 95.58% 74.80%
2017 91.23% 72.91% 82.05% 82.44% 100.90% 62.50%
2018 88.60% 72.11% 92.31% 68.70% 84.68% 75.83%
National Annual Average 87.62% 57.72% 85.67% 56.18% 89.68% 59.35%

INDICATORS
FSM Education Data Digest P a g e | 38
Table 10: 8th Grade Cohort Graduation Rate (Primary) by State
State Starting Enrollment Total Completers/Graduates Rate
Chuuk 861 687 79.8%
Kosrae 143 119 83.2%
Pohnpei 861 859 99.8%
Yap 204 205 100.5%
National 2069 1870 90.4%
Table 11: 12th Grade Cohort Graduation Rate (Secondary) by State
State Starting Enrollment Total Completers/Graduates Rate Chuuk 438 467 106.6%
Kosrae 166 153 92.2%
Pohnpei 540 526 97.4%
Yap 183 177 96.7% National 1327 1323 99.7%

INDICATORS
FSM Education Data Digest P a g e | 39
Table 12: ASER by Year, State and Gender
CHK KSA PNI YAP
ASER ASER Male ASER Female ASER ASER Male ASER Female ASER ASER Male ASER Female ASER ASER Male ASER Female
2013 74.60% 74.19% 75.04% 94.19% 95.23% 93.10% 83.00% 82.44% 83.59% 70.60% 72.54% 68.51%
5 64.15% 66.43% 61.81% 60.13% 65.38% 54.67% 75.28% 80.10% 70.23% 76.21% 78.26% 74.11%
6 88.79% 94.93% 82.43% 100.00% 98.73% 101.35% 88.96% 89.29% 88.61% 73.45% 67.83% 79.28%
7 94.10% 94.42% 93.77% 96.73% 94.94% 98.65% 98.27% 98.54% 97.98% 62.83% 69.57% 55.86%
8 90.86% 90.59% 91.14% 95.39% 96.20% 94.52% 99.14% 95.65% 102.76% 75.33% 77.59% 72.97%
9 91.13% 84.03% 98.70% 105.26% 111.39% 98.63% 86.80% 83.45% 90.27% 78.70% 75.42% 82.14%
10 92.07% 95.52% 88.38% 92.81% 91.14% 94.59% 76.93% 79.43% 74.32% 84.55% 77.50% 92.04%
11 86.96% 83.62% 90.53% 110.32% 112.50% 108.00% 91.69% 91.16% 92.23% 63.75% 70.16% 56.90%
12 90.35% 91.89% 88.71% 113.92% 108.64% 119.48% 90.81% 92.73% 88.81% 75.10% 71.32% 79.17%
13 79.67% 76.76% 82.75% 90.74% 95.18% 86.08% 91.58% 94.22% 88.81% 65.76% 65.67% 65.85%
14 77.37% 76.78% 77.99% 130.30% 107.14% 154.32% 93.51% 87.34% 100.00% 71.59% 75.36% 67.46%
15 59.83% 55.72% 64.12% 85.28% 81.93% 88.75% 79.46% 73.91% 85.32% 70.79% 81.43% 59.06%
16 56.70% 56.45% 56.97% 82.28% 83.75% 80.77% 73.81% 70.83% 76.98% 77.57% 82.61% 72.00%
17 46.36% 44.31% 48.55% 109.40% 133.33% 85.14% 69.36% 70.69% 67.94% 72.55% 72.39% 72.73%
18 27.85% 29.47% 26.10% 40.14% 49.30% 30.99% 47.52% 49.43% 45.45% 41.30% 50.00% 31.62%
2014 77.83% 76.85% 78.86% 96.15% 97.01% 95.24% 84.27% 83.65% 84.92% 70.04% 72.22% 67.73%
5 67.19% 67.41% 66.96% 86.18% 79.22% 93.33% 80.52% 83.21% 77.69% 67.70% 72.81% 62.50%
6 90.53% 95.10% 85.87% 89.47% 94.87% 83.78% 88.53% 95.12% 81.63% 65.78% 66.67% 64.86%
7 93.02% 101.76% 83.97% 111.84% 106.41% 117.57% 98.26% 97.32% 99.24% 64.89% 57.02% 72.97%
8 101.62% 101.05% 102.21% 103.31% 96.15% 110.96% 101.49% 101.46% 101.52% 60.18% 66.96% 53.15%
9 93.24% 93.52% 92.95% 100.00% 96.20% 104.11% 101.73% 97.58% 106.03% 68.72% 69.83% 67.57%
10 95.23% 87.43% 103.54% 105.30% 119.23% 90.41% 93.87% 91.83% 96.00% 72.81% 70.09% 75.68%
11 91.41% 90.48% 92.41% 98.68% 96.20% 101.37% 88.00% 90.50% 85.40% 85.84% 80.83% 91.15%
12 83.79% 79.76% 88.10% 108.39% 110.00% 106.67% 94.29% 95.80% 92.70% 65.42% 70.97% 59.48%
13 89.25% 88.62% 89.91% 115.19% 113.58% 116.88% 90.91% 92.03% 89.74% 70.16% 64.34% 76.47%
14 79.05% 74.12% 84.25% 92.55% 96.34% 88.61% 88.24% 90.85% 85.51% 67.32% 67.16% 67.48%
15 71.33% 70.30% 72.41% 112.35% 101.20% 124.05% 80.86% 75.82% 86.14% 75.67% 83.21% 67.46%
16 55.84% 50.08% 61.88% 76.73% 71.60% 82.05% 70.69% 63.08% 78.70% 76.52% 83.33% 69.05%
17 50.40% 47.52% 53.43% 85.06% 91.03% 78.95% 67.24% 61.86% 72.94% 81.61% 88.32% 74.19%
18 29.33% 30.90% 27.64% 58.62% 84.93% 31.94% 39.60% 40.95% 38.16% 55.95% 64.66% 46.22%

INDICATORS
FSM Education Data Digest P a g e | 40
CHK KSA PNI YAP
ASER ASER Male ASER Female ASER ASER Male ASER Female ASER ASER Male ASER Female ASER ASER Male ASER Female
2015 77.42% 76.93% 77.93% 92.97% 92.96% 92.99% 81.91% 82.28% 81.51% 70.17% 73.24% 66.91%
5 77.16% 81.80% 72.54% 85.91% 101.35% 70.67% 84.53% 88.08% 80.73% 77.88% 87.72% 67.86%
6 81.98% 82.50% 81.47% 101.33% 93.42% 109.46% 86.73% 87.56% 85.86% 64.60% 69.30% 59.82%
7 91.37% 94.54% 88.13% 92.05% 96.10% 87.84% 92.63% 98.78% 86.19% 72.89% 75.44% 70.27%
8 94.60% 100.35% 88.64% 106.62% 98.72% 115.07% 95.89% 96.09% 95.67% 71.56% 69.30% 73.87%
9 102.17% 99.47% 105.00% 103.31% 98.72% 108.22% 96.15% 96.59% 95.70% 65.04% 72.17% 57.66%
10 87.23% 85.04% 89.55% 99.34% 96.15% 102.74% 101.48% 97.82% 105.29% 73.13% 75.00% 71.17%
11 89.51% 83.01% 96.45% 105.33% 115.38% 94.44% 93.49% 93.01% 93.98% 76.75% 75.21% 78.38%
12 87.59% 88.52% 86.59% 96.69% 96.15% 97.26% 85.92% 88.33% 83.42% 87.12% 80.83% 93.81%
13 79.80% 74.53% 85.45% 107.84% 102.53% 113.51% 89.74% 89.25% 90.24% 70.42% 72.58% 68.10%
14 84.90% 86.54% 83.15% 110.83% 106.17% 115.79% 81.07% 86.30% 75.60% 71.77% 66.67% 77.31%
15 71.99% 70.41% 73.66% 89.24% 96.30% 81.82% 72.59% 75.78% 69.25% 64.31% 67.67% 60.66%
16 61.44% 59.42% 63.55% 101.27% 86.42% 116.88% 72.24% 68.22% 76.46% 71.15% 76.47% 65.32%
17 47.00% 42.24% 51.99% 70.32% 72.15% 68.42% 60.98% 53.66% 68.69% 69.08% 77.37% 60.00%
18 28.16% 30.02% 26.20% 30.67% 40.79% 20.27% 39.75% 40.13% 39.34% 49.61% 61.76% 36.07%
2016 75.72% 75.65% 75.80% 94.22% 93.14% 95.36% 84.25% 83.62% 84.92% 86.18% 87.40% 84.88%
5 70.12% 71.40% 68.75% 90.32% 77.78% 104.05% 68.21% 64.90% 71.74% 85.96% 82.79% 89.38%
6 88.74% 93.85% 83.65% 108.05% 117.57% 98.67% 96.21% 100.00% 92.17% 96.00% 104.39% 87.39%
7 87.66% 90.77% 84.53% 104.67% 98.68% 110.81% 93.98% 93.40% 94.59% 87.56% 92.11% 82.88%
8 95.44% 99.29% 91.50% 86.00% 93.51% 78.08% 96.62% 99.02% 94.10% 96.89% 100.00% 93.69%
9 91.67% 96.80% 86.37% 108.00% 93.51% 123.29% 96.87% 97.05% 96.68% 92.41% 85.09% 100.00%
10 99.55% 98.40% 100.74% 103.33% 101.28% 105.56% 99.88% 96.58% 103.30% 82.59% 90.35% 74.55%
11 84.64% 83.39% 85.96% 96.67% 92.31% 101.39% 101.24% 96.84% 105.81% 93.78% 103.48% 83.64%
12 83.45% 77.46% 89.85% 102.00% 114.10% 88.89% 97.04% 95.89% 98.24% 101.32% 100.85% 101.80%
13 83.03% 81.85% 84.30% 89.40% 84.62% 94.52% 85.89% 87.35% 84.37% 100.00% 88.33% 112.39%
14 69.44% 64.71% 74.49% 106.54% 102.53% 110.81% 91.39% 89.23% 93.64% 83.68% 88.71% 78.26%
15 73.51% 73.10% 73.94% 110.97% 108.75% 113.33% 83.31% 87.59% 78.85% 85.77% 78.13% 94.07%
16 59.75% 57.71% 61.90% 87.18% 95.00% 78.95% 70.80% 72.11% 69.43% 73.52% 75.76% 71.07%
17 49.73% 49.56% 49.91% 90.97% 84.81% 97.37% 67.43% 61.88% 73.24% 81.78% 85.19% 78.05%
18 23.15% 21.62% 24.77% 35.95% 41.03% 30.67% 37.66% 36.32% 39.06% 52.12% 57.35% 46.34%
2017 73.00% 72.28% 73.76% 96.33% 96.48% 96.17% 90.78% 89.59% 92.03% 85.10% 85.42% 84.78%
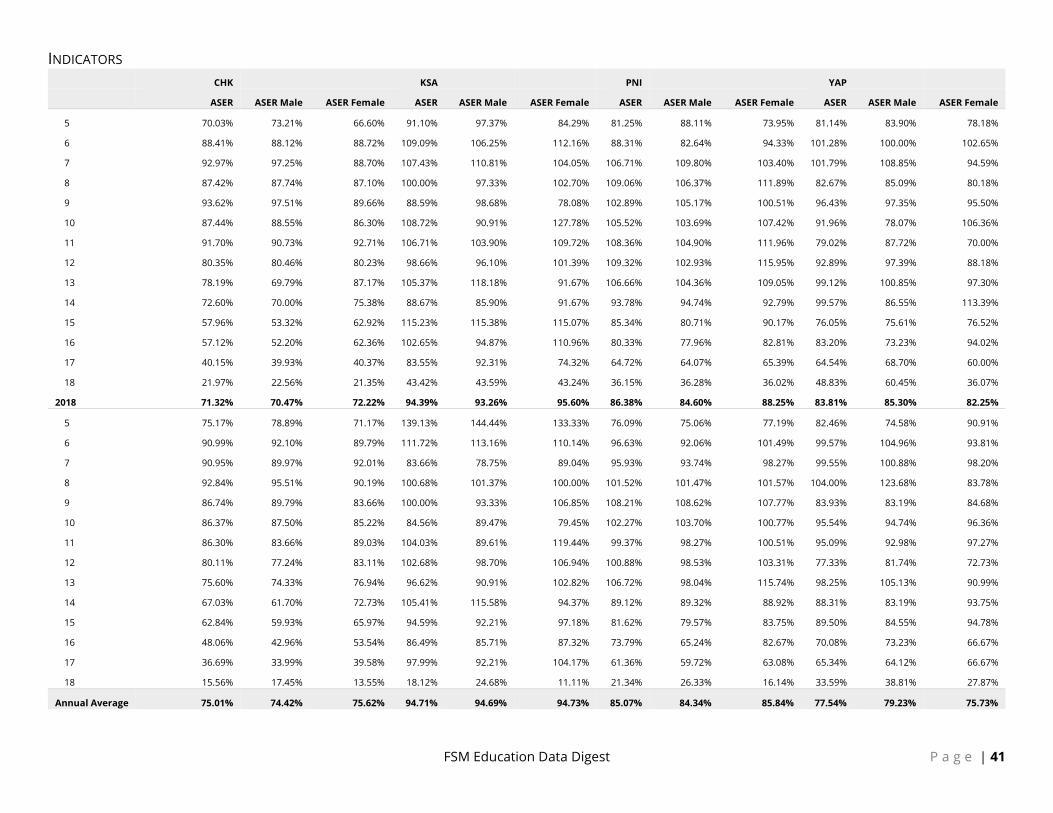
INDICATORS
FSM Education Data Digest P a g e | 41
CHK KSA PNI YAP
ASER ASER Male ASER Female ASER ASER Male ASER Female ASER ASER Male ASER Female ASER ASER Male ASER Female
5 70.03% 73.21% 66.60% 91.10% 97.37% 84.29% 81.25% 88.11% 73.95% 81.14% 83.90% 78.18%
6 88.41% 88.12% 88.72% 109.09% 106.25% 112.16% 88.31% 82.64% 94.33% 101.28% 100.00% 102.65%
7 92.97% 97.25% 88.70% 107.43% 110.81% 104.05% 106.71% 109.80% 103.40% 101.79% 108.85% 94.59%
8 87.42% 87.74% 87.10% 100.00% 97.33% 102.70% 109.06% 106.37% 111.89% 82.67% 85.09% 80.18%
9 93.62% 97.51% 89.66% 88.59% 98.68% 78.08% 102.89% 105.17% 100.51% 96.43% 97.35% 95.50%
10 87.44% 88.55% 86.30% 108.72% 90.91% 127.78% 105.52% 103.69% 107.42% 91.96% 78.07% 106.36%
11 91.70% 90.73% 92.71% 106.71% 103.90% 109.72% 108.36% 104.90% 111.96% 79.02% 87.72% 70.00%
12 80.35% 80.46% 80.23% 98.66% 96.10% 101.39% 109.32% 102.93% 115.95% 92.89% 97.39% 88.18%
13 78.19% 69.79% 87.17% 105.37% 118.18% 91.67% 106.66% 104.36% 109.05% 99.12% 100.85% 97.30%
14 72.60% 70.00% 75.38% 88.67% 85.90% 91.67% 93.78% 94.74% 92.79% 99.57% 86.55% 113.39%
15 57.96% 53.32% 62.92% 115.23% 115.38% 115.07% 85.34% 80.71% 90.17% 76.05% 75.61% 76.52%
16 57.12% 52.20% 62.36% 102.65% 94.87% 110.96% 80.33% 77.96% 82.81% 83.20% 73.23% 94.02%
17 40.15% 39.93% 40.37% 83.55% 92.31% 74.32% 64.72% 64.07% 65.39% 64.54% 68.70% 60.00%
18 21.97% 22.56% 21.35% 43.42% 43.59% 43.24% 36.15% 36.28% 36.02% 48.83% 60.45% 36.07%
2018 71.32% 70.47% 72.22% 94.39% 93.26% 95.60% 86.38% 84.60% 88.25% 83.81% 85.30% 82.25%
5 75.17% 78.89% 71.17% 139.13% 144.44% 133.33% 76.09% 75.06% 77.19% 82.46% 74.58% 90.91%
6 90.99% 92.10% 89.79% 111.72% 113.16% 110.14% 96.63% 92.06% 101.49% 99.57% 104.96% 93.81%
7 90.95% 89.97% 92.01% 83.66% 78.75% 89.04% 95.93% 93.74% 98.27% 99.55% 100.88% 98.20%
8 92.84% 95.51% 90.19% 100.68% 101.37% 100.00% 101.52% 101.47% 101.57% 104.00% 123.68% 83.78%
9 86.74% 89.79% 83.66% 100.00% 93.33% 106.85% 108.21% 108.62% 107.77% 83.93% 83.19% 84.68%
10 86.37% 87.50% 85.22% 84.56% 89.47% 79.45% 102.27% 103.70% 100.77% 95.54% 94.74% 96.36%
11 86.30% 83.66% 89.03% 104.03% 89.61% 119.44% 99.37% 98.27% 100.51% 95.09% 92.98% 97.27%
12 80.11% 77.24% 83.11% 102.68% 98.70% 106.94% 100.88% 98.53% 103.31% 77.33% 81.74% 72.73%
13 75.60% 74.33% 76.94% 96.62% 90.91% 102.82% 106.72% 98.04% 115.74% 98.25% 105.13% 90.99%
14 67.03% 61.70% 72.73% 105.41% 115.58% 94.37% 89.12% 89.32% 88.92% 88.31% 83.19% 93.75%
15 62.84% 59.93% 65.97% 94.59% 92.21% 97.18% 81.62% 79.57% 83.75% 89.50% 84.55% 94.78%
16 48.06% 42.96% 53.54% 86.49% 85.71% 87.32% 73.79% 65.24% 82.67% 70.08% 73.23% 66.67%
17 36.69% 33.99% 39.58% 97.99% 92.21% 104.17% 61.36% 59.72% 63.08% 65.34% 64.12% 66.67%
18 15.56% 17.45% 13.55% 18.12% 24.68% 11.11% 21.34% 26.33% 16.14% 33.59% 38.81% 27.87%
Annual Average 75.01% 74.42% 75.62% 94.71% 94.69% 94.73% 85.07% 84.34% 85.84% 77.54% 79.23% 75.73%
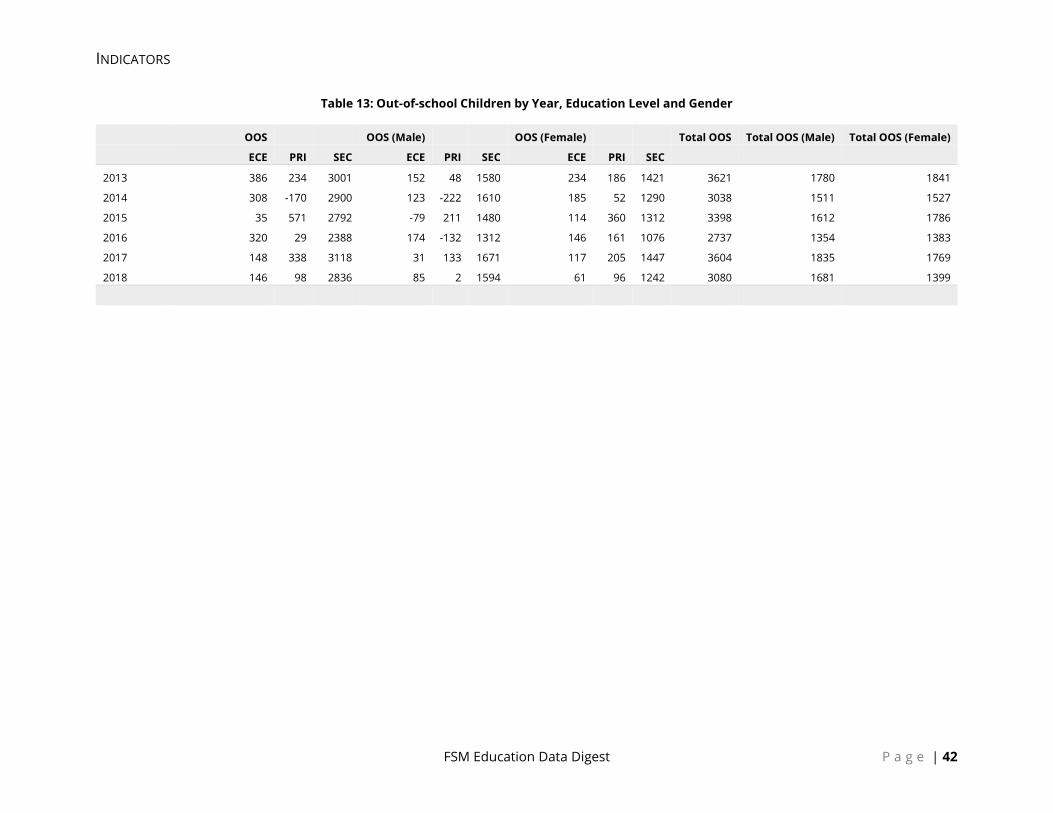
INDICATORS
FSM Education Data Digest P a g e | 42
Table 13: Out-of-school Children by Year, Education Level and Gender
OOS OOS (Male) OOS (Female) Total OOS Total OOS (Male) Total OOS (Female)
ECE PRI SEC ECE PRI SEC ECE PRI SEC 2013 386 234 3001 152 48 1580 234 186 1421 3621 1780 1841
2014 308 -170 2900 123 -222 1610 185 52 1290 3038 1511 1527
2015 35 571 2792 -79 211 1480 114 360 1312 3398 1612 1786
2016 320 29 2388 174 -132 1312 146 161 1076 2737 1354 1383
2017 148 338 3118 31 133 1671 117 205 1447 3604 1835 1769
2018 146 98 2836 85 2 1594 61 96 1242 3080 1681 1399
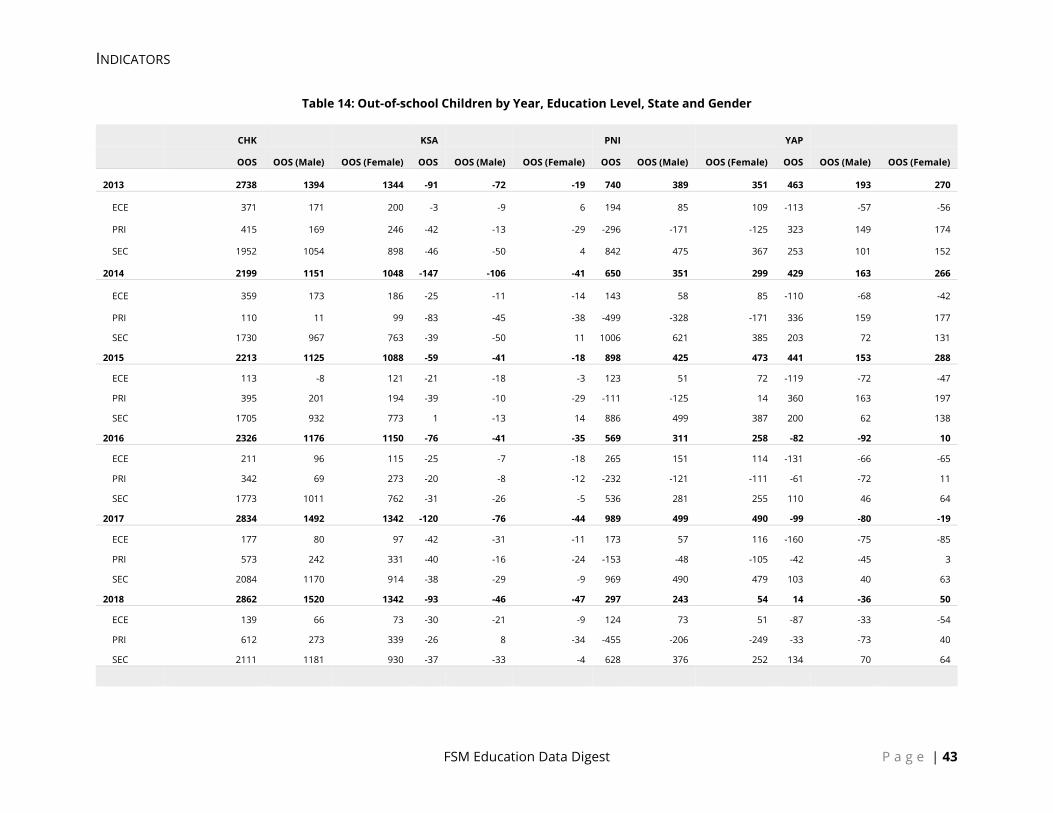
INDICATORS
FSM Education Data Digest P a g e | 43
Table 14: Out-of-school Children by Year, Education Level, State and Gender
CHK KSA PNI YAP
OOS OOS (Male) OOS (Female) OOS OOS (Male) OOS (Female) OOS OOS (Male) OOS (Female) OOS OOS (Male) OOS (Female)
2013 2738 1394 1344 -91 -72 -19 740 389 351 463 193 270
ECE 371 171 200 -3 -9 6 194 85 109 -113 -57 -56
PRI 415 169 246 -42 -13 -29 -296 -171 -125 323 149 174
SEC 1952 1054 898 -46 -50 4 842 475 367 253 101 152
2014 2199 1151 1048 -147 -106 -41 650 351 299 429 163 266
ECE 359 173 186 -25 -11 -14 143 58 85 -110 -68 -42
PRI 110 11 99 -83 -45 -38 -499 -328 -171 336 159 177
SEC 1730 967 763 -39 -50 11 1006 621 385 203 72 131
2015 2213 1125 1088 -59 -41 -18 898 425 473 441 153 288
ECE 113 -8 121 -21 -18 -3 123 51 72 -119 -72 -47
PRI 395 201 194 -39 -10 -29 -111 -125 14 360 163 197
SEC 1705 932 773 1 -13 14 886 499 387 200 62 138
2016 2326 1176 1150 -76 -41 -35 569 311 258 -82 -92 10
ECE 211 96 115 -25 -7 -18 265 151 114 -131 -66 -65
PRI 342 69 273 -20 -8 -12 -232 -121 -111 -61 -72 11
SEC 1773 1011 762 -31 -26 -5 536 281 255 110 46 64
2017 2834 1492 1342 -120 -76 -44 989 499 490 -99 -80 -19
ECE 177 80 97 -42 -31 -11 173 57 116 -160 -75 -85
PRI 573 242 331 -40 -16 -24 -153 -48 -105 -42 -45 3
SEC 2084 1170 914 -38 -29 -9 969 490 479 103 40 63
2018 2862 1520 1342 -93 -46 -47 297 243 54 14 -36 50
ECE 139 66 73 -30 -21 -9 124 73 51 -87 -33 -54
PRI 612 273 339 -26 8 -34 -455 -206 -249 -33 -73 40
SEC 2111 1181 930 -37 -33 -4 628 376 252 134 70 64

INDICATORS
FSM Education Data Digest P a g e | 44
Table 15: National Flow Rates by Year and Grade
Year Flow Year Grade Level
Promotion Rate
Repetition Rate
Transition Rate
Dropout Rate
Survival Rate (from G1)
Survival Rate (from G9)
SY2014-2015=>SY2015-2016 2015 0 107.57% 8.52% 117.58% -16.08% SY2014-2015=>SY2015-2016 2015 1 101.30% 3.34% 104.80% -4.64% 100.00% SY2014-2015=>SY2015-2016 2015 2 99.55% 2.33% 101.93% -1.88% 104.80% SY2014-2015=>SY2015-2016 2015 3 97.07% 3.10% 100.18% -0.17% 106.82% SY2014-2015=>SY2015-2016 2015 4 95.54% 1.97% 97.46% 2.49% 107.01% SY2014-2015=>SY2015-2016 2015 5 96.60% 3.01% 99.60% 0.39% 104.29% SY2014-2015=>SY2015-2016 2015 6 97.71% 1.80% 99.50% 0.49% 103.87% SY2014-2015=>SY2015-2016 2015 7 93.27% 2.01% 95.18% 4.72% 103.35% SY2014-2015=>SY2015-2016 2015 8 100.20% 0.50% 100.70% -0.70% 98.37% SY2014-2015=>SY2015-2016 2015 9 91.13% 3.12% 94.07% 5.75% 99.06% 100.00%
SY2014-2015=>SY2015-2016 2015 10 84.49% 1.94% 86.16% 13.57% 93.18% 94.07%
SY2014-2015=>SY2015-2016 2015 11 93.76% 1.62% 95.30% 4.62% 80.28% 81.05%
SY2014-2015=>SY2015-2016 2015 12 0.44% 76.51% 77.24%
SY2015-2016=>SY2016-2017 2016 0 114.57% 9.72% 126.90% -24.29% SY2015-2016=>SY2016-2017 2016 1 92.44% 4.33% 96.62% 3.24% 100.00% SY2015-2016=>SY2016-2017 2016 2 93.68% 2.97% 96.55% 3.35% 96.62% SY2015-2016=>SY2016-2017 2016 3 95.25% 2.35% 97.55% 2.40% 93.28% SY2015-2016=>SY2016-2017 2016 4 94.73% 2.66% 97.31% 2.61% 90.99% SY2015-2016=>SY2016-2017 2016 5 88.82% 3.18% 91.73% 8.01% 88.55% SY2015-2016=>SY2016-2017 2016 6 94.50% 2.26% 96.69% 3.24% 81.23% SY2015-2016=>SY2016-2017 2016 7 88.36% 4.02% 92.05% 7.63% 78.54% SY2015-2016=>SY2016-2017 2016 8 89.33% 2.04% 91.19% 8.63% 72.30% SY2015-2016=>SY2016-2017 2016 9 75.10% 4.22% 78.41% 20.68% 65.93% 100.00%
SY2015-2016=>SY2016-2017 2016 10 69.06% 1.92% 70.41% 29.02% 51.69% 78.41%
SY2015-2016=>SY2016-2017 2016 11 85.79% 2.05% 87.59% 12.16% 36.40% 55.21%
SY2015-2016=>SY2016-2017 2016 12 0.60% 31.88% 48.36%
SY2016-2017=>SY2017-2018 2017 0 110.47% 10.10% 122.88% -20.57% SY2016-2017=>SY2017-2018 2017 1 95.58% 4.37% 99.96% 0.04% 100.00%

INDICATORS
FSM Education Data Digest P a g e | 45
Year Flow Year Grade Level
Promotion Rate
Repetition Rate
Transition Rate
Dropout Rate
Survival Rate (from G1)
Survival Rate (from G9)
SY2016-2017=>SY2017-2018 2017 2 94.47% 4.71% 99.14% 0.82% 99.96% SY2016-2017=>SY2017-2018 2017 3 96.86% 3.58% 100.45% -0.44% 99.10% SY2016-2017=>SY2017-2018 2017 4 99.42% 1.87% 101.31% -1.29% 99.55% SY2016-2017=>SY2017-2018 2017 5 93.82% 2.19% 95.92% 3.99% 100.86% SY2016-2017=>SY2017-2018 2017 6 96.80% 3.06% 99.85% 0.14% 96.75% SY2016-2017=>SY2017-2018 2017 7 91.04% 5.18% 96.01% 3.78% 96.60% SY2016-2017=>SY2017-2018 2017 8 89.69% 2.35% 91.85% 7.95% 92.75% SY2016-2017=>SY2017-2018 2017 9 90.58% 3.67% 94.03% 5.75% 85.19% 100.00%
SY2016-2017=>SY2017-2018 2017 10 89.41% 2.31% 91.52% 8.29% 80.11% 94.03%
SY2016-2017=>SY2017-2018 2017 11 90.17% 2.18% 92.18% 7.65% 73.32% 86.06%
SY2016-2017=>SY2017-2018 2017 12 0.47% 67.59% 79.33%

STUDENTS
FSM Education Data Digest P a g e | 46
STUDENTS All the student data comes from the FedEMIS system data warehouse. The data herein will also be made available online on our website though will not be available or the first version of this document.
Background Data Source There is one primary data source for the production of all the following students related data: the annual school census from NDOE/SDOE. The data sources for previous years varied but was mostly done through a student roster similar to the current improved annual census. A growing number of schools will also use a Student Information System which will also be integrated with the FedEMIS.
Limitations The quality of the student data is higher in less remote school where the team organized a data audit (full head student count). For remote schools the exact number of students may be of poorer quality due to the lack of time and hard logistics of doing a data audit for all remote schools.
Student Enrollment by Age Distribution The following analysis shows the age distribution of students by grades, over recent years and for each state.
Definition and Purpose Age distribution takes a closer look at the percentage of students enrolled of official age versus that of under and over age.
Methods of Calculation This is merely a count on the number of students of official age (i.e. 6 years of age before December 31 in grade 1, etc.) and a count of the students that are either over or under that age.
Analysis and Discussions Distribution of over, under and correct age students by grade provides some enriching information about student characteristics (Figure 25). While majority of students in all grades including ECE are at the correct ages, quite a number of them are over and underage at the ECE level and some in the first and second grades. This

STUDENTS
FSM Education Data Digest P a g e | 47
is quite normal. Similarly, proportion of overage student have increased in some higher grades which is also natural as some repeat grades and gain higher age. However, presence of underage children in some higher grades especially at grade 10 provide the reason for further validation of age data.
The trend of over and underage enrollment in schools have followed almost consistent patters over the last six years. Only that on the last years, i.e., from 2017 to 2018 there’s slight increase in underage enrollment and a slight decrease in the over age enrollment (Figure 26).
In terms of distribution of over and underage enrollment across the state and by gender, there’s not much difference. All four states share almost similar ratio of male and female distribution with correct age population being predominant (Figure 27).
Figure 25: Age Distribution for 2018
0
500
1000
1500
2000
2500
3000
GK G1 G2 G3 G4 G5 G6 G7 G8 G9 G10 G11 G12
Under Age
Official Age
Over Age

STUDENTS
FSM Education Data Digest P a g e | 48
Figure 26: Age Distribution Trend
Figure 27: Age Distribution by State and Gender for 2018
0150030004500600075009000
105001200013500150001650018000195002100022500240002550027000
2013 2014 2015 2016 2017 2018
Under Age
Official Age
Over Age
0
1000
2000
3000
4000
5000
6000
F M F M F M F M
CHK KSA PNI YAP
Under Age
Officia lAge
Over Age

STUDENTS
FSM Education Data Digest P a g e | 49
Student Attendance The following raw data and analysis shows attendance data by grade, states and schools for only this year.
Definition and Purpose Whether or not the students are attending to class. This is meant to measure the participation of students to the education system on a daily basis.
Methods of Calculation Currently only the total number of absences for each student is recorded. This number can be subtracted from the total number of official school days to get the total attendance of students. Granular attendance data for high schools (i.e. per course attendance) is not currently recorded though the Student Information System being launched will support this feature.
Analysis and Discussions Student attendance data is based on school register that maintains student attendance or absences. In all four states, attendance rate is over 90% (Figure 28).
Figure 28: Student Attendance Rate 2018
0.0%
20.0%
40.0%
60.0%
80.0%
100.0%
120.0%
Chuuk Kosrae Pohnpei Yap
Attendance Rate

FSM Education Data Digest P a g e | 50
Student Enrollment Data Nation/State Wide The total enrollment of students disaggregated by year, grade, education levels and state.
Definition and Purpose From the raw data below “Enrol” is the total enrolment (i.e. new entrants, repeaters, transfers), “Net Enrol” is the total enrollment of official age, Intake are the new entrants (i.e. no repeaters), “Net Intake” are the new entrants of official age and Population is the total population of the relevant age group. The purpose of the this data is to calculate the key indicators (refer to Indicators) and also to produce some basic statistics to support decision making within the NDOE/SDOEs.
Methods of Calculation There is no calculation involved here. This is merely data processed in familiar table format with disaggregation from the FedEMIS SQL database.
Analysis and Discussions Student enrollment trends have been already discussed under indicators and in other sections. Distribution of student have been discussed. Of the total student enrolment, Chuuk has the highest share with 43% followed by Pohnpei 39%, Yap 11% and Kosrae has the least share with only 7% of the enrollment in FSM (Figure 29).
Figure 29: Distribution of Students
7%
39%43%
11%
Distribution of Students by State
Kosrae
Pohnpei
Chuuk
Yap

STUDENTS
FSM Education Data Digest P a g e | 51
Table 16: Students by Year, Education Level, Grade, Gender and Age Distribution
Under Age Official Age Over Age Enrolled Total Under Age Total Official Age Total Over Age Total Enrolled
F M F M F M F M 2013 301 278 11914 12386 1062 1479 13277 14143 579 24300 2541 27420
Early Childhood 151 149 679 785 79 94 909 1028 300 1464 173 1937
GK 151 149 679 785 79 94 909 1028 300 1464 173 1937
Primary 104 95 9121 9485 861 1151 10086 10731 199 18606 2012 20817
G1 62 58 1103 1257 1165 1315 120 2360 2480
G9 1 0 573 447 527 674 1101 1121 1 1020 1201 2222
G2 8 3 1186 1238 1 1 1195 1242 11 2424 2 2437
G3 4 4 1136 1192 0 2 1140 1198 8 2328 2 2338
G4 13 13 1075 1153 6 12 1094 1178 26 2228 18 2272
G5 9 8 1043 1154 9 13 1061 1175 17 2197 22 2236
G6 4 5 1062 1108 36 43 1102 1156 9 2170 79 2258
G7 3 4 1086 1148 78 133 1167 1285 7 2234 211 2452
G8 857 788 204 273 1061 1061 1645 477 2122
Secondary 46 34 2114 2116 122 234 2282 2384 80 4230 356 4666
G10 40 30 780 783 23 33 843 846 70 1563 56 1689
G11 6 3 740 752 32 62 778 817 9 1492 94 1595
G12 0 1 594 581 67 139 661 721 1 1175 206 1382
2014 273 287 12147 12506 1063 1455 13483 14248 560 24653 2518 27731
Early Childhood 141 172 766 815 60 72 967 1059 313 1581 132 2026
GK 141 172 766 815 60 72 967 1059 313 1581 132 2026
Primary 80 77 9140 9587 888 1157 10108 10821 157 18727 2045 20929
G1 59 59 1042 1221 1101 1280 118 2263 2381
G9 532 431 551 637 1083 1068 963 1188 2151
G2 3 1 1192 1288 1195 1289 4 2480 2484
G3 1 0 1193 1251 1 3 1195 1254 1 2444 4 2449
G4 3 1 1153 1187 7 6 1163 1194 4 2340 13 2357
G5 5 8 1079 1218 23 36 1107 1262 13 2297 59 2369
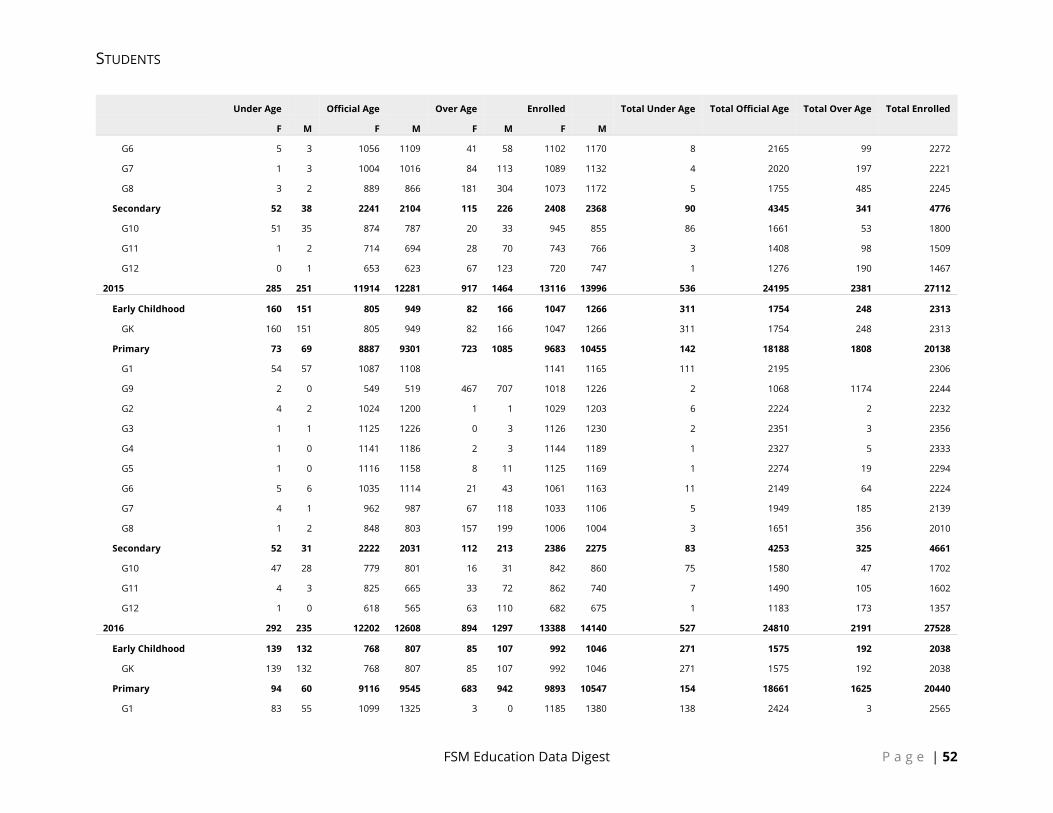
STUDENTS
FSM Education Data Digest P a g e | 52
Under Age Official Age Over Age Enrolled Total Under Age Total Official Age Total Over Age Total Enrolled
F M F M F M F M G6 5 3 1056 1109 41 58 1102 1170 8 2165 99 2272
G7 1 3 1004 1016 84 113 1089 1132 4 2020 197 2221
G8 3 2 889 866 181 304 1073 1172 5 1755 485 2245
Secondary 52 38 2241 2104 115 226 2408 2368 90 4345 341 4776
G10 51 35 874 787 20 33 945 855 86 1661 53 1800
G11 1 2 714 694 28 70 743 766 3 1408 98 1509
G12 0 1 653 623 67 123 720 747 1 1276 190 1467
2015 285 251 11914 12281 917 1464 13116 13996 536 24195 2381 27112
Early Childhood 160 151 805 949 82 166 1047 1266 311 1754 248 2313
GK 160 151 805 949 82 166 1047 1266 311 1754 248 2313
Primary 73 69 8887 9301 723 1085 9683 10455 142 18188 1808 20138
G1 54 57 1087 1108 1141 1165 111 2195 2306
G9 2 0 549 519 467 707 1018 1226 2 1068 1174 2244
G2 4 2 1024 1200 1 1 1029 1203 6 2224 2 2232
G3 1 1 1125 1226 0 3 1126 1230 2 2351 3 2356
G4 1 0 1141 1186 2 3 1144 1189 1 2327 5 2333
G5 1 0 1116 1158 8 11 1125 1169 1 2274 19 2294
G6 5 6 1035 1114 21 43 1061 1163 11 2149 64 2224
G7 4 1 962 987 67 118 1033 1106 5 1949 185 2139
G8 1 2 848 803 157 199 1006 1004 3 1651 356 2010
Secondary 52 31 2222 2031 112 213 2386 2275 83 4253 325 4661
G10 47 28 779 801 16 31 842 860 75 1580 47 1702
G11 4 3 825 665 33 72 862 740 7 1490 105 1602
G12 1 0 618 565 63 110 682 675 1 1183 173 1357
2016 292 235 12202 12608 894 1297 13388 14140 527 24810 2191 27528
Early Childhood 139 132 768 807 85 107 992 1046 271 1575 192 2038
GK 139 132 768 807 85 107 992 1046 271 1575 192 2038
Primary 94 60 9116 9545 683 942 9893 10547 154 18661 1625 20440
G1 83 55 1099 1325 3 0 1185 1380 138 2424 3 2565

STUDENTS
FSM Education Data Digest P a g e | 53
Under Age Official Age Over Age Enrolled Total Under Age Total Official Age Total Over Age Total Enrolled
F M F M F M F M G9 1 0 614 510 434 525 1049 1035 1 1124 959 2084
G2 2 2 1166 1218 1168 1220 4 2384 2388
G3 3 0 1068 1222 0 2 1071 1224 3 2290 2 2295
G4 1 1 1111 1216 2 2 1114 1219 2 2327 4 2333
G5 1 1 1122 1149 7 18 1130 1168 2 2271 25 2298
G6 1 0 1094 1100 26 35 1121 1135 1 2194 61 2256
G7 1 1 1003 1010 69 132 1073 1143 2 2013 201 2216
G8 1 0 839 795 142 228 982 1023 1 1634 370 2005
Secondary 59 43 2318 2256 126 248 2503 2547 102 4574 374 5050
G10 54 40 909 1031 11 33 974 1104 94 1940 44 2078
G11 4 3 690 670 30 67 724 740 7 1360 97 1464
G12 1 0 719 555 85 148 805 703 1 1274 233 1508
2017 292 260 11766 12160 799 1098 12857 13518 552 23926 1897 26375
Early Childhood 175 157 711 877 101 118 987 1152 332 1588 219 2139
GK 175 157 711 877 101 118 987 1152 332 1588 219 2139
Primary 57 68 9030 9310 625 811 9712 10189 125 18340 1436 19901
G1 51 68 1123 1204 1174 1272 119 2327 2446
G9 549 468 378 484 927 952 1017 862 1879
G2 6 0 1129 1307 1135 1307 6 2436 2442
G3 1133 1156 0 2 1133 1158 2289 2 2291
G4 1061 1181 4 2 1065 1183 2242 6 2248
G5 1093 1168 7 15 1100 1183 2261 22 2283
G6 1047 1009 10 26 1057 1035 2056 36 2092
G7 1035 1027 83 76 1118 1103 2062 159 2221
G8 860 790 143 206 1003 996 1650 349 1999
Secondary 60 35 2025 1973 73 169 2158 2177 95 3998 242 4335
G10 58 31 751 732 9 24 818 787 89 1483 33 1605
G11 2 4 702 684 25 48 729 736 6 1386 73 1465
G12 572 557 39 97 611 654 1129 136 1265

STUDENTS
FSM Education Data Digest P a g e | 54
Under Age Official Age Over Age Enrolled Total Under Age Total Official Age Total Over Age Total Enrolled
F M F M F M F M 2018 777 791 11737 11969 578 793 13092 13553 1568 23706 1371 26645
Early Childhood 341 354 615 657 61 59 1017 1070 695 1272 120 2087
GK 341 354 615 657 61 59 1017 1070 695 1272 120 2087
Primary 266 299 9069 9363 453 608 9788 10270 565 18432 1061 20058
G1 237 271 905 1034 1 1142 1306 508 1939 1 2448
G9 673 560 257 364 930 924 1233 621 1854
G2 29 27 1138 1249 1 1168 1276 56 2387 1 2444
G3 1 1122 1250 1 1 1123 1252 1 2372 2 2375
G4 1119 1133 1 4 1120 1137 2252 5 2257
G5 1085 1172 6 13 1091 1185 2257 19 2276
G6 1095 1068 11 28 1106 1096 2163 39 2202
G7 1005 1015 46 72 1051 1087 2020 118 2138
G8 927 882 130 125 1057 1007 1809 255 2064
Secondary 170 138 2053 1949 64 126 2287 2213 308 4002 190 4500
G10 160 127 702 710 8 17 870 854 287 1412 25 1724
G11 10 8 729 658 15 37 754 703 18 1387 52 1457
G12 3 622 581 41 72 663 656 3 1203 113 1319
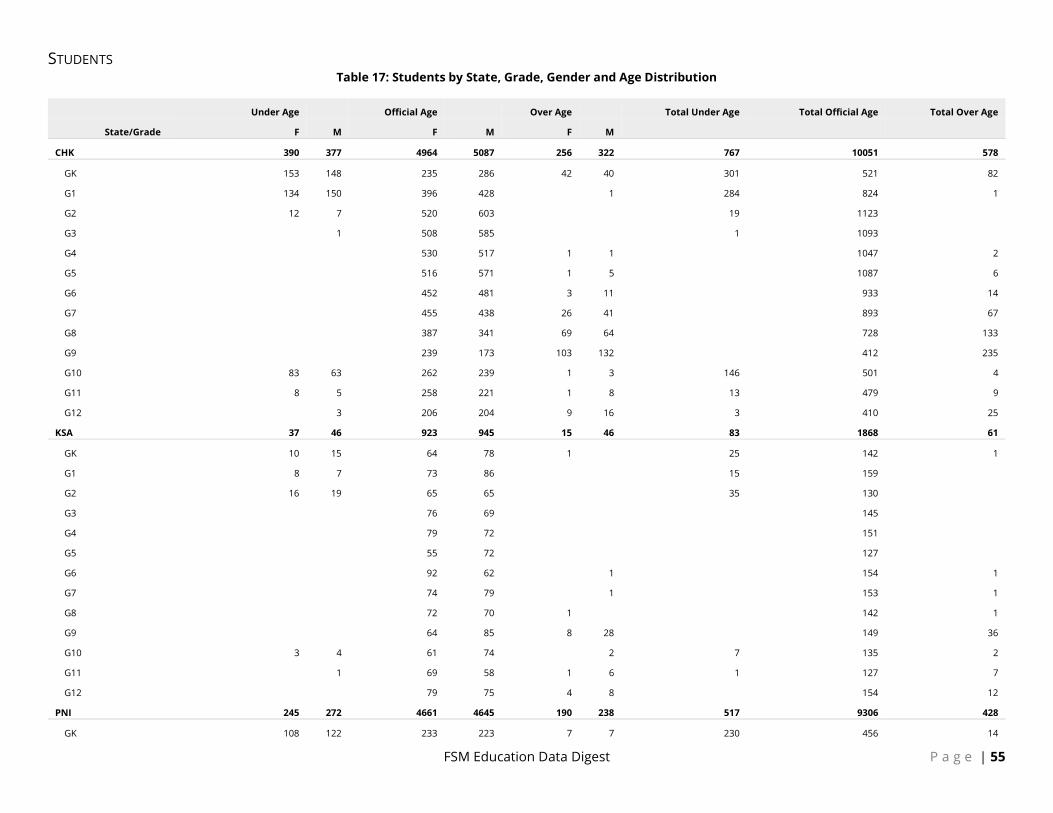
STUDENTS
FSM Education Data Digest P a g e | 55
Table 17: Students by State, Grade, Gender and Age Distribution
Under Age Official Age Over Age Total Under Age Total Official Age Total Over Age
State/Grade F M F M F M CHK 390 377 4964 5087 256 322 767 10051 578
GK 153 148 235 286 42 40 301 521 82
G1 134 150 396 428 1 284 824 1
G2 12 7 520 603 19 1123
G3 1 508 585 1 1093
G4 530 517 1 1 1047 2
G5 516 571 1 5 1087 6
G6 452 481 3 11 933 14
G7 455 438 26 41 893 67
G8 387 341 69 64 728 133
G9 239 173 103 132 412 235
G10 83 63 262 239 1 3 146 501 4
G11 8 5 258 221 1 8 13 479 9
G12 3 206 204 9 16 3 410 25
KSA 37 46 923 945 15 46 83 1868 61
GK 10 15 64 78 1 25 142 1
G1 8 7 73 86 15 159
G2 16 19 65 65 35 130
G3 76 69 145
G4 79 72 151
G5 55 72 127
G6 92 62 1 154 1
G7 74 79 1 153 1
G8 72 70 1 142 1
G9 64 85 8 28 149 36
G10 3 4 61 74 2 7 135 2
G11 1 69 58 1 6 1 127 7
G12 79 75 4 8 154 12
PNI 245 272 4661 4645 190 238 517 9306 428
GK 108 122 233 223 7 7 230 456 14
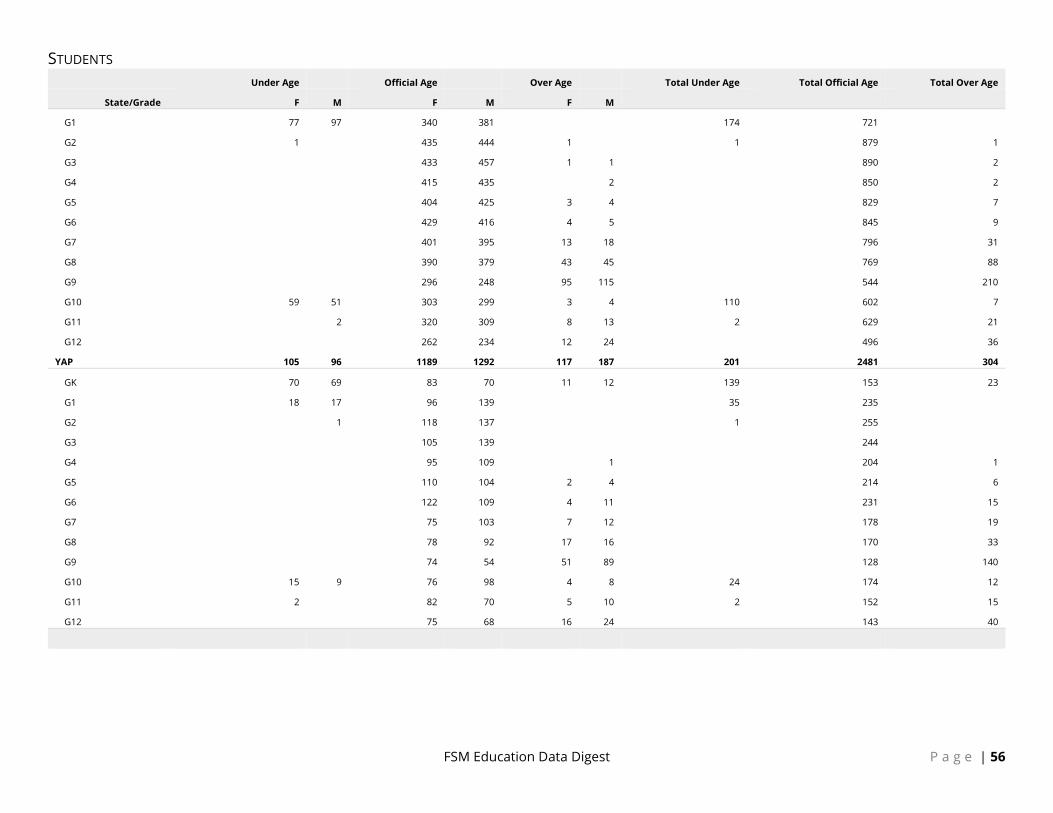
STUDENTS
FSM Education Data Digest P a g e | 56
Under Age Official Age Over Age Total Under Age Total Official Age Total Over Age
State/Grade F M F M F M G1 77 97 340 381 174 721
G2 1 435 444 1 1 879 1
G3 433 457 1 1 890 2
G4 415 435 2 850 2
G5 404 425 3 4 829 7
G6 429 416 4 5 845 9
G7 401 395 13 18 796 31
G8 390 379 43 45 769 88
G9 296 248 95 115 544 210
G10 59 51 303 299 3 4 110 602 7
G11 2 320 309 8 13 2 629 21
G12 262 234 12 24 496 36
YAP 105 96 1189 1292 117 187 201 2481 304
GK 70 69 83 70 11 12 139 153 23
G1 18 17 96 139 35 235
G2 1 118 137 1 255
G3 105 139 244
G4 95 109 1 204 1
G5 110 104 2 4 214 6
G6 122 109 4 11 231 15
G7 75 103 7 12 178 19
G8 78 92 17 16 170 33
G9 74 54 51 89 128 140
G10 15 9 76 98 4 8 24 174 12
G11 2 82 70 5 10 2 152 15
G12 75 68 16 24 143 40

STUDENTS
FSM Education Data Digest P a g e | 57
Table 18: Attendance Rate (Primary/Secondary) by State
State Attendance Rate
Chuuk 88.9%
Kosrae 96.2%
Pohnpei 97.3%
Yap 98.5%
Nation 93.8%
Table 19: Enrolments Data by Year, Grade and Gender
Enrol Male
Enrol Female
Enrol Total
Net Enrol Male
Net Enrol Female
Net Enrol
Intake Male
Intake Female
Intake Total
Net Intake Male
Net Intake Female
Net Intake Total
Population Male
Population Female
Population Total
2013 14143 13277 27420 6987 7323 14310 14021 13183 27204 6932 7279 14211 15923 15118 31041
GK 1028 909 1937 785 679 1464 942 822 1764 732 635 1367 1180 1143 2323
G1 1315 1165 2480 920 841 1761 1315 1165 2480 920 841 1761 1177 1132 2309
G2 1242 1195 2437 798 767 1565 1242 1195 2437 798 767 1565 1179 1128 2307
G3 1198 1140 2338 696 692 1388 1198 1140 2338 696 692 1388 1183 1125 2308
G4 1178 1094 2272 567 639 1206 1178 1094 2272 567 639 1206 1190 1126 2316
G5 1175 1061 2236 546 548 1094 1175 1061 2236 546 548 1094 1202 1134 2336
G6 1156 1102 2258 543 582 1125 1156 1102 2258 543 582 1125 1220 1152 2372
G7 1285 1167 2452 536 568 1104 1285 1167 2452 536 568 1104 1242 1175 2417
G8 1061 1061 2122 418 478 896 1061 1061 2122 418 478 896 1265 1199 2464
G9 1121 1101 2222 410 517 927 1111 1097 2208 410 517 927 1283 1219 2502
G10 846 843 1689 267 375 642 828 841 1669 265 375 640 1286 1220 2506
G11 817 778 1595 256 349 605 811 778 1589 256 349 605 1271 1200 2471
G12 721 661 1382 245 288 533 719 660 1379 245 288 533 1245 1165 2410
2014 14248 13483 27731 7429 7670 15099 14248 13483 27731 7429 7670 15099 15759 15010 30769
GK 1059 967 2026 815 766 1581 1059 967 2026 815 766 1581 1182 1152 2334
G1 1280 1101 2381 950 820 1770 1280 1101 2381 950 820 1770 1173 1136 2309
G2 1289 1195 2484 872 806 1678 1289 1195 2484 872 806 1678 1170 1128 2298
G3 1254 1195 2449 776 747 1523 1254 1195 2449 776 747 1523 1173 1123 2296
G4 1194 1163 2357 683 676 1359 1194 1163 2357 683 676 1359 1179 1121 2300
G5 1262 1107 2369 601 646 1247 1262 1107 2369 601 646 1247 1184 1121 2305

STUDENTS
FSM Education Data Digest P a g e | 58
Enrol Male
Enrol Female
Enrol Total
Net Enrol Male
Net Enrol Female
Net Enrol
Intake Male
Intake Female
Intake Total
Net Intake Male
Net Intake Female
Net Intake Total
Population Male
Population Female
Population Total
G6 1170 1102 2272 534 585 1119 1170 1102 2272 534 585 1119 1198 1130 2328
G7 1132 1089 2221 508 543 1051 1132 1089 2221 508 543 1051 1216 1148 2364
G8 1172 1073 2245 498 530 1028 1172 1073 2245 498 530 1028 1238 1170 2408
G9 1068 1083 2151 400 465 865 1068 1083 2151 400 465 865 1259 1195 2454
G10 855 945 1800 315 430 745 855 945 1800 315 430 745 1271 1207 2478
G11 766 743 1509 226 334 560 766 743 1509 226 334 560 1265 1200 2465
G12 747 720 1467 251 322 573 747 720 1467 251 322 573 1251 1179 2430
2015 13996 13116 27112 7474 7634 15108 13996 13116 27112 7474 7634 15108 15608 14902 30510
GK 1266 1047 2313 949 805 1754 1266 1047 2313 949 805 1754 1187 1161 2348
G1 1165 1141 2306 828 835 1663 1165 1141 2306 828 835 1663 1177 1147 2324
G2 1203 1029 2232 827 718 1545 1203 1029 2232 827 718 1545 1168 1132 2300
G3 1230 1126 2356 763 735 1498 1230 1126 2356 763 735 1498 1166 1123 2289
G4 1189 1144 2333 696 710 1406 1189 1144 2333 696 710 1406 1169 1119 2288
G5 1169 1125 2294 624 626 1250 1169 1125 2294 624 626 1250 1174 1117 2291
G6 1163 1061 2224 539 592 1131 1163 1061 2224 539 592 1131 1181 1117 2298
G7 1106 1033 2139 513 546 1059 1106 1033 2139 513 546 1059 1193 1127 2320
G8 1004 1006 2010 459 534 993 1004 1006 2010 459 534 993 1212 1143 2355
G9 1226 1018 2244 474 489 963 1226 1018 2244 474 489 963 1235 1165 2400
G10 860 842 1702 313 354 667 860 842 1702 313 354 667 1248 1183 2431
G11 740 862 1602 273 384 657 740 862 1602 273 384 657 1251 1187 2438
G12 675 682 1357 216 306 522 675 682 1357 216 306 522 1247 1181 2428
2016 14140 13388 27528 7689 8027 15716 13695 13091 26786 7586 7925 15511 15494 14771 30265
GK 1046 992 2038 807 768 1575 949 892 1841 747 707 1454 1220 1138 2358
G1 1380 1185 2565 994 876 1870 1331 1157 2488 987 869 1856 1182 1156 2338
G2 1220 1168 2388 779 806 1585 1182 1154 2336 773 803 1576 1173 1142 2315
G3 1224 1071 2295 766 720 1486 1168 1054 2222 759 716 1475 1164 1127 2291
G4 1219 1114 2333 715 703 1418 1190 1097 2287 709 702 1411 1160 1118 2278
G5 1168 1130 2298 648 702 1350 1125 1104 2229 644 696 1340 1164 1113 2277
G6 1135 1121 2256 601 626 1227 1106 1110 2216 596 622 1218 1170 1112 2282
G7 1143 1073 2216 528 606 1134 1118 1055 2173 525 603 1128 1177 1113 2290
G8 1023 982 2005 477 551 1028 1015 980 1995 477 551 1028 1190 1124 2314
G9 1035 1049 2084 445 538 983 996 1018 2014 444 533 977 1208 1139 2347

STUDENTS
FSM Education Data Digest P a g e | 59
Enrol Male
Enrol Female
Enrol Total
Net Enrol Male
Net Enrol Female
Net Enrol
Intake Male
Intake Female
Intake Total
Net Intake Male
Net Intake Female
Net Intake Total
Population Male
Population Female
Population Total
G10 1104 974 2078 418 468 886 1090 955 2045 416 462 878 1223 1154 2377
G11 740 724 1464 262 309 571 726 712 1438 260 307 567 1230 1165 2395
G12 703 805 1508 249 354 603 699 803 1502 249 354 603 1233 1170 2403
2017 13518 12857 26375 7641 7903 15544 12963 12495 25458 7519 7796 15315 15353 14626 29979
GK 1152 987 2139 877 711 1588 1061 880 1941 827 656 1483 1183 1104 2287
G1 1272 1174 2446 877 874 1751 1198 1137 2335 858 864 1722 1214 1134 2348
G2 1307 1135 2442 888 810 1698 1263 1108 2371 876 801 1677 1177 1151 2328
G3 1158 1133 2291 706 765 1471 1122 1115 2237 697 760 1457 1168 1138 2306
G4 1183 1065 2248 716 678 1394 1145 1041 2186 709 674 1383 1157 1125 2282
G5 1183 1100 2283 635 679 1314 1141 1069 2210 628 672 1300 1156 1113 2269
G6 1035 1057 2092 575 648 1223 1005 1036 2041 572 646 1218 1160 1110 2270
G7 1103 1118 2221 558 605 1163 1042 1090 2132 552 599 1151 1165 1108 2273
G8 996 1003 1999 505 583 1088 970 988 1958 501 581 1082 1173 1111 2284
G9 952 927 1879 428 490 918 892 899 1791 425 488 913 1185 1118 2303
G10 787 818 1605 334 410 744 761 804 1565 334 408 742 1198 1129 2327
G11 736 729 1465 307 382 689 715 720 1435 306 379 685 1205 1137 2342
G12 654 611 1265 235 268 503 648 608 1256 234 268 502 1212 1148 2360
2018 13625 13148 26773 7182 7493 14675 13047 12744 25791 7052 7364 14416 15234 14491 29725
GK 1078 1027 2105 657 615 1272 972 917 1889 592 547 1139 1155 1078 2233
G1 1318 1152 2470 822 760 1582 1242 1121 2363 807 753 1560 1182 1103 2285
G2 1283 1170 2453 720 723 1443 1223 1115 2338 707 707 1414 1202 1127 2329
G3 1258 1131 2389 737 685 1422 1211 1096 2307 732 676 1408 1173 1147 2320
G4 1141 1120 2261 623 647 1270 1112 1107 2219 616 645 1261 1162 1133 2295
G5 1188 1097 2285 599 611 1210 1153 1082 2235 594 608 1202 1155 1120 2275
G6 1099 1107 2206 558 637 1195 1063 1079 2142 557 634 1191 1153 1111 2264
G7 1088 1052 2140 529 563 1092 1017 1008 2025 517 558 1075 1157 1108 2265
G8 1010 1059 2069 524 573 1097 982 1040 2022 521 567 1088 1164 1105 2269
G9 929 933 1862 437 490 927 884 909 1793 436 485 921 1172 1108 2280
G10 862 877 1739 395 448 843 836 866 1702 393 446 839 1180 1112 2292
G11 709 758 1467 290 385 675 693 742 1435 289 382 671 1185 1115 2300
G12 662 665 1327 291 356 647 659 662 1321 291 356 647 1194 1124 2318

STUDENTS
FSM Education Data Digest P a g e | 60
Table 20: Enrolment Data by Year, Education Level and Gender
Enrol Total
Enrol Male
Enrol Female
Net Enrol Total
Net Enrol Male
Net Enrol
Female Intake
Total Intake
Male Intake
Female Net
Intake Net Intake
Male Net Intake
Female Population
Total Population
Male Population
Female
2013 27420 14143 13277 23004 11672 11332 6452 3368 3084 4055 2062 1993 31041 15923 15118
ECE 1937 1028 909 1464 785 679 1764 942 822 1367 732 635 2323 1180 1143
PRI 18595 9610 8985 16433 8421 8012 2480 1315 1165 1761 920 841 18829 9658 9171
SEC 6888 3505 3383 5107 2466 2641 2208 1111 1097 927 410 517 9889 5085 4804
2014 27731 14248 13483 23492 11827 11665 6558 3407 3151 4216 2165 2051 30769 15759 15010
ECE 2026 1059 967 1581 815 766 2026 1059 967 1581 815 766 2334 1182 1152
PRI 18778 9753 9025 16707 8577 8130 2381 1280 1101 1770 950 820 18608 9531 9077
SEC 6927 3436 3491 5204 2435 2769 2151 1068 1083 865 400 465 9827 5046 4781
2015 27112 13996 13116 23140 11712 11428 6863 3657 3206 4380 2251 2129 30510 15608 14902
ECE 2313 1266 1047 1754 949 805 2313 1266 1047 1754 949 805 2348 1187 1161
PRI 17894 9229 8665 16154 8230 7924 2306 1165 1141 1663 828 835 18465 9440 9025
SEC 6905 3501 3404 5232 2533 2699 2244 1226 1018 963 474 489 9697 4981 4716
2016 27528 14140 13388 23721 12013 11708 6343 3276 3067 4287 2178 2109 30265 15494 14771
ECE 2038 1046 992 1575 807 768 1841 949 892 1454 747 707 2358 1220 1138
PRI 18356 9512 8844 16698 8567 8131 2488 1331 1157 1856 987 869 18385 9380 9005
SEC 7134 3582 3552 5448 2639 2809 2014 996 1018 977 444 533 9522 4894 4628
2017 26375 13518 12857 22919 11593 11326 6067 3151 2916 4118 2110 2008 29979 15353 14626
ECE 2139 1152 987 1588 877 711 1941 1061 880 1483 827 656 2287 1183 1104
PRI 18022 9237 8785 16504 8386 8118 2335 1198 1137 1722 858 864 18360 9370 8990
SEC 6214 3129 3085 4827 2330 2497 1791 892 899 913 425 488 9332 4800 4532
2018 26773 13625 13148 23107 11626 11481 6045 3098 2947 3667 1859 1808 29725 15234 14491
ECE 2105 1078 1027 1290 665 625 1889 972 917 1157 600 557 2233 1155 1078
PRI 18273 9385 8888 16649 8494 8155 2363 1242 1121 1581 818 763 18302 9348 8954
SEC 6395 3162 3233 5168 2467 2701 1793 884 909 929 441 488 9190 4731 4459

STUDENTS
FSM Education Data Digest P a g e | 61
Table 21: Enrolment Data by Year, State, Education Levels and Gender
Enrol Total
Enrol Male
Enrol Female
Net Enrol Total
Net Enrol Male
Net Enrol Female
Intake Total
Intake Male
Intake Female
Net Intake Total
Net Intake Male
Net Intake Female
Population Total
Population Male
Population Female
CHK
2013 12113 6224 5889 10430 5261 5169 2883 1526 1357 1816 941 875 14851 7618 7233
ECE 767 404 363 615 323 292 767 404 363 615 323 292 1138 575 563
PRI 8633 4482 4151 7770 3986 3784 1203 670 533 827 453 374 9048 4651 4397
SEC 2713 1338 1375 2045 952 1093 913 452 461 374 165 209 4665 2392 2273
2014 12545 6398 6147 10873 5455 5418 2928 1494 1434 1925 965 960 14744 7549 7195
ECE 796 407 389 667 335 332 796 407 389 667 335 332 1155 580 575
PRI 8860 4591 4269 7999 4112 3887 1199 642 557 875 460 415 8970 4602 4368
SEC 2889 1400 1489 2207 1008 1199 933 445 488 383 170 213 4619 2367 2252
2015 12459 6373 6086 10653 5339 5314 3197 1702 1495 1965 1000 965 14672 7498 7174
ECE 1065 596 469 805 431 374 1065 596 469 805 431 374 1178 588 590
PRI 8541 4370 4171 7645 3868 3777 1130 561 569 771 374 397 8936 4571 4365
SEC 2853 1407 1446 2203 1040 1163 1002 545 457 389 195 194 4558 2339 2219
2016 12233 6272 5961 10599 5380 5219 2836 1460 1376 1855 952 903 14559 7448 7111
ECE 917 488 429 714 379 335 897 480 417 697 372 325 1128 584 544
PRI 8604 4487 4117 7778 4013 3765 1173 631 542 846 446 400 8946 4556 4390
SEC 2712 1297 1415 2107 988 1119 766 349 417 312 134 178 4485 2308 2177
2017 11582 5890 5692 10119 5088 5031 2680 1375 1305 1777 912 865 14416 7382 7034
ECE 904 480 424 673 363 310 870 464 406 651 353 298 1081 560 521
PRI 8350 4303 4047 7592 3872 3720 1065 558 507 792 407 385 8923 4545 4378
SEC 2328 1107 1221 1854 853 1001 745 353 392 334 152 182 4412 2277 2135
2018 11396 5786 5610 9722 4895 4827 2509 1265 1244 1405 705 700 14258 7306 6952
ECE 904 474 430 521 286 235 832 434 398 484 265 219 1043 540 503
PRI 8255 4245 4010 7402 3785 3617 1051 540 511 643 326 317 8867 4518 4349
SEC 2237 1067 1170 1799 824 975 626 291 335 278 114 164 4348 2248 2100
KSA
2013 2117 1111 1006 1839 952 887 499 247 252 326 154 172 2026 1039 987
ECE 156 87 69 87 48 39 156 87 69 87 48 39 153 78 75
PRI 1280 652 628 1190 614 576 158 75 83 100 46 54 1238 639 599
SEC 681 372 309 562 290 272 185 85 100 139 60 79 635 322 313
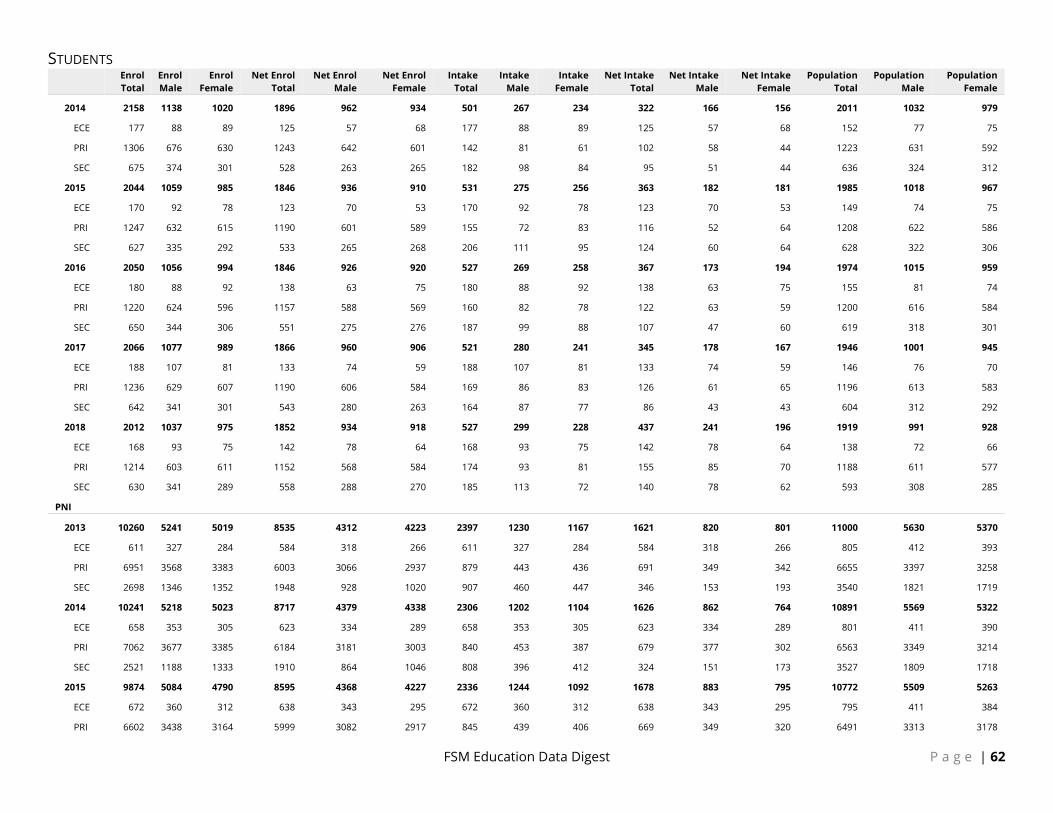
STUDENTS
FSM Education Data Digest P a g e | 62
Enrol Total
Enrol Male
Enrol Female
Net Enrol Total
Net Enrol Male
Net Enrol Female
Intake Total
Intake Male
Intake Female
Net Intake Total
Net Intake Male
Net Intake Female
Population Total
Population Male
Population Female
2014 2158 1138 1020 1896 962 934 501 267 234 322 166 156 2011 1032 979
ECE 177 88 89 125 57 68 177 88 89 125 57 68 152 77 75
PRI 1306 676 630 1243 642 601 142 81 61 102 58 44 1223 631 592
SEC 675 374 301 528 263 265 182 98 84 95 51 44 636 324 312
2015 2044 1059 985 1846 936 910 531 275 256 363 182 181 1985 1018 967
ECE 170 92 78 123 70 53 170 92 78 123 70 53 149 74 75
PRI 1247 632 615 1190 601 589 155 72 83 116 52 64 1208 622 586
SEC 627 335 292 533 265 268 206 111 95 124 60 64 628 322 306
2016 2050 1056 994 1846 926 920 527 269 258 367 173 194 1974 1015 959
ECE 180 88 92 138 63 75 180 88 92 138 63 75 155 81 74
PRI 1220 624 596 1157 588 569 160 82 78 122 63 59 1200 616 584
SEC 650 344 306 551 275 276 187 99 88 107 47 60 619 318 301
2017 2066 1077 989 1866 960 906 521 280 241 345 178 167 1946 1001 945
ECE 188 107 81 133 74 59 188 107 81 133 74 59 146 76 70
PRI 1236 629 607 1190 606 584 169 86 83 126 61 65 1196 613 583
SEC 642 341 301 543 280 263 164 87 77 86 43 43 604 312 292
2018 2012 1037 975 1852 934 918 527 299 228 437 241 196 1919 991 928
ECE 168 93 75 142 78 64 168 93 75 142 78 64 138 72 66
PRI 1214 603 611 1152 568 584 174 93 81 155 85 70 1188 611 577
SEC 630 341 289 558 288 270 185 113 72 140 78 62 593 308 285
PNI
2013 10260 5241 5019 8535 4312 4223 2397 1230 1167 1621 820 801 11000 5630 5370
ECE 611 327 284 584 318 266 611 327 284 584 318 266 805 412 393
PRI 6951 3568 3383 6003 3066 2937 879 443 436 691 349 342 6655 3397 3258
SEC 2698 1346 1352 1948 928 1020 907 460 447 346 153 193 3540 1821 1719
2014 10241 5218 5023 8717 4379 4338 2306 1202 1104 1626 862 764 10891 5569 5322
ECE 658 353 305 623 334 289 658 353 305 623 334 289 801 411 390
PRI 7062 3677 3385 6184 3181 3003 840 453 387 679 377 302 6563 3349 3214
SEC 2521 1188 1333 1910 864 1046 808 396 412 324 151 173 3527 1809 1718
2015 9874 5084 4790 8595 4368 4227 2336 1244 1092 1678 883 795 10772 5509 5263
ECE 672 360 312 638 343 295 672 360 312 638 343 295 795 411 384
PRI 6602 3438 3164 5999 3082 2917 845 439 406 669 349 320 6491 3313 3178
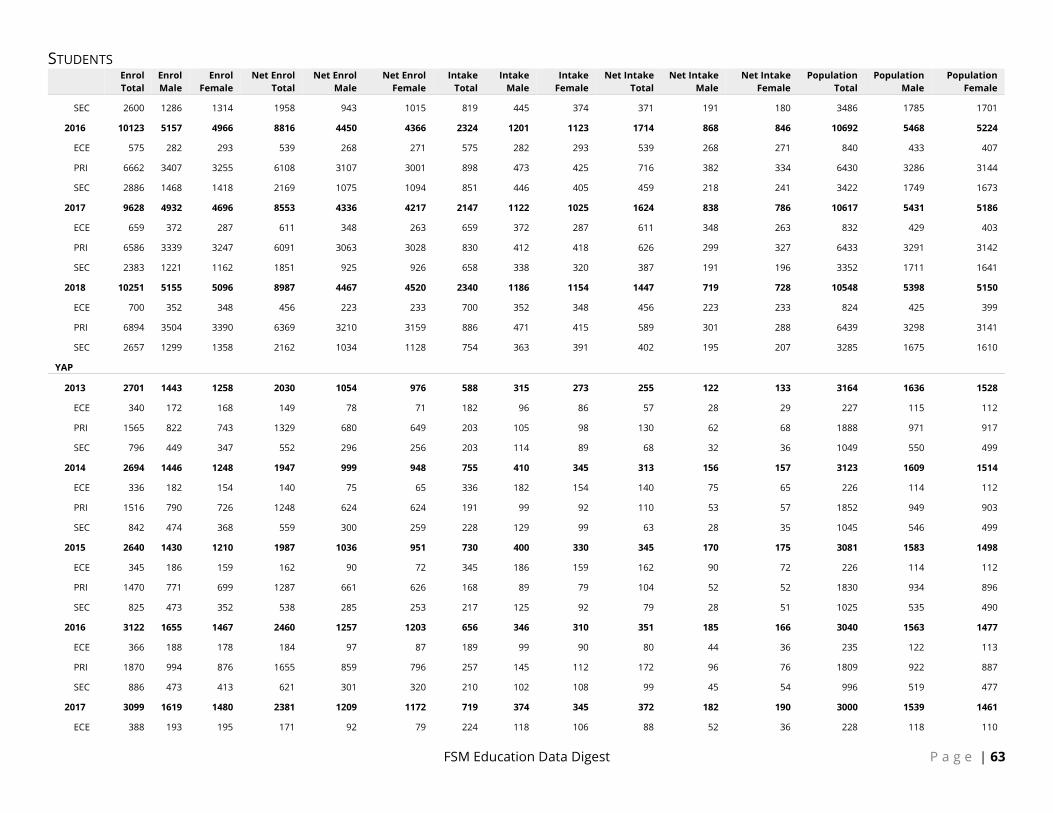
STUDENTS
FSM Education Data Digest P a g e | 63
Enrol Total
Enrol Male
Enrol Female
Net Enrol Total
Net Enrol Male
Net Enrol Female
Intake Total
Intake Male
Intake Female
Net Intake Total
Net Intake Male
Net Intake Female
Population Total
Population Male
Population Female
SEC 2600 1286 1314 1958 943 1015 819 445 374 371 191 180 3486 1785 1701
2016 10123 5157 4966 8816 4450 4366 2324 1201 1123 1714 868 846 10692 5468 5224
ECE 575 282 293 539 268 271 575 282 293 539 268 271 840 433 407
PRI 6662 3407 3255 6108 3107 3001 898 473 425 716 382 334 6430 3286 3144
SEC 2886 1468 1418 2169 1075 1094 851 446 405 459 218 241 3422 1749 1673
2017 9628 4932 4696 8553 4336 4217 2147 1122 1025 1624 838 786 10617 5431 5186
ECE 659 372 287 611 348 263 659 372 287 611 348 263 832 429 403
PRI 6586 3339 3247 6091 3063 3028 830 412 418 626 299 327 6433 3291 3142
SEC 2383 1221 1162 1851 925 926 658 338 320 387 191 196 3352 1711 1641
2018 10251 5155 5096 8987 4467 4520 2340 1186 1154 1447 719 728 10548 5398 5150
ECE 700 352 348 456 223 233 700 352 348 456 223 233 824 425 399
PRI 6894 3504 3390 6369 3210 3159 886 471 415 589 301 288 6439 3298 3141
SEC 2657 1299 1358 2162 1034 1128 754 363 391 402 195 207 3285 1675 1610
YAP
2013 2701 1443 1258 2030 1054 976 588 315 273 255 122 133 3164 1636 1528
ECE 340 172 168 149 78 71 182 96 86 57 28 29 227 115 112
PRI 1565 822 743 1329 680 649 203 105 98 130 62 68 1888 971 917
SEC 796 449 347 552 296 256 203 114 89 68 32 36 1049 550 499
2014 2694 1446 1248 1947 999 948 755 410 345 313 156 157 3123 1609 1514
ECE 336 182 154 140 75 65 336 182 154 140 75 65 226 114 112
PRI 1516 790 726 1248 624 624 191 99 92 110 53 57 1852 949 903
SEC 842 474 368 559 300 259 228 129 99 63 28 35 1045 546 499
2015 2640 1430 1210 1987 1036 951 730 400 330 345 170 175 3081 1583 1498
ECE 345 186 159 162 90 72 345 186 159 162 90 72 226 114 112
PRI 1470 771 699 1287 661 626 168 89 79 104 52 52 1830 934 896
SEC 825 473 352 538 285 253 217 125 92 79 28 51 1025 535 490
2016 3122 1655 1467 2460 1257 1203 656 346 310 351 185 166 3040 1563 1477
ECE 366 188 178 184 97 87 189 99 90 80 44 36 235 122 113
PRI 1870 994 876 1655 859 796 257 145 112 172 96 76 1809 922 887
SEC 886 473 413 621 301 320 210 102 108 99 45 54 996 519 477
2017 3099 1619 1480 2381 1209 1172 719 374 345 372 182 190 3000 1539 1461
ECE 388 193 195 171 92 79 224 118 106 88 52 36 228 118 110

STUDENTS
FSM Education Data Digest P a g e | 64
Enrol Total
Enrol Male
Enrol Female
Net Enrol Total
Net Enrol Male
Net Enrol Female
Intake Total
Intake Male
Intake Female
Net Intake Total
Net Intake Male
Net Intake Female
Population Total
Population Male
Population Female
PRI 1850 966 884 1631 845 786 271 142 129 178 91 87 1808 921 887
SEC 861 460 401 579 272 307 224 114 110 106 39 67 964 500 464
2018 2986 1575 1411 2418 1258 1160 622 324 298 331 170 161 3000 1539 1461
ECE 315 151 164 153 70 83 171 85 86 57 26 31 228 118 110
PRI 1841 994 847 1657 892 765 231 127 104 173 95 78 1808 921 887
SEC 830 430 400 608 296 312 220 112 108 101 49 52 964 500 464
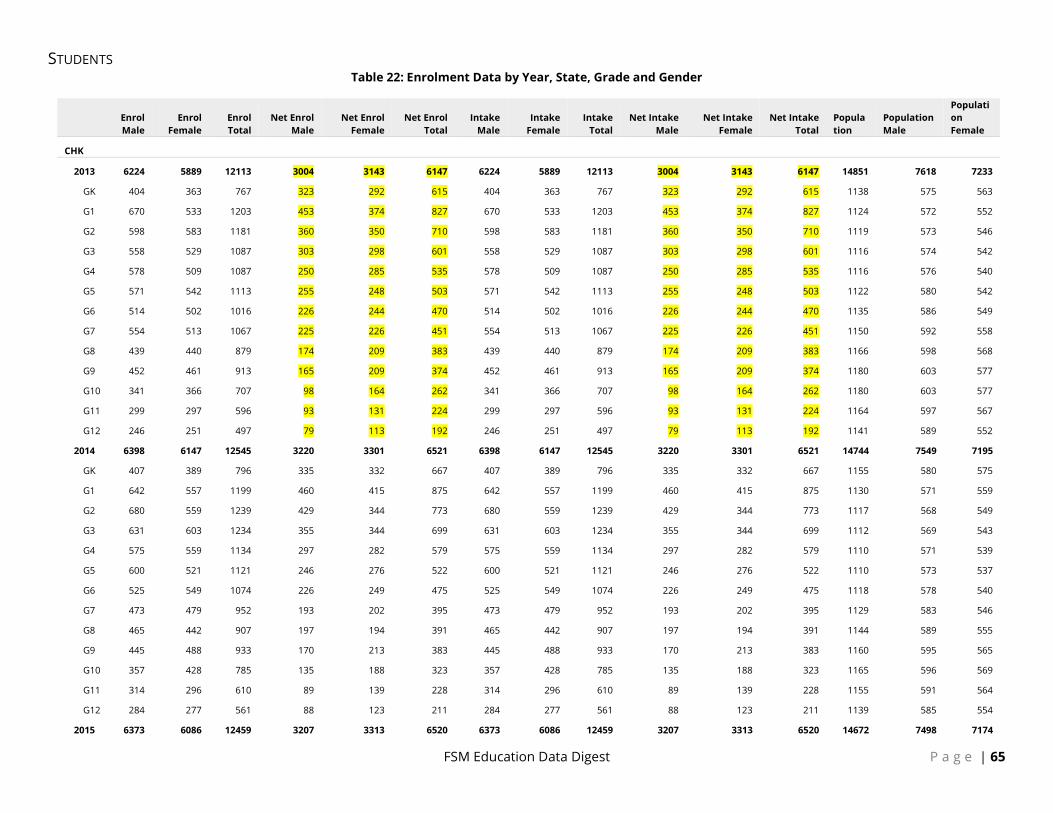
STUDENTS
FSM Education Data Digest P a g e | 65
Table 22: Enrolment Data by Year, State, Grade and Gender
Enrol Male
Enrol Female
Enrol Total
Net Enrol Male
Net Enrol Female
Net Enrol Total
Intake Male
Intake Female
Intake Total
Net Intake Male
Net Intake Female
Net Intake Total
Population
Population Male
Population Female
CHK
2013 6224 5889 12113 3004 3143 6147 6224 5889 12113 3004 3143 6147 14851 7618 7233
GK 404 363 767 323 292 615 404 363 767 323 292 615 1138 575 563
G1 670 533 1203 453 374 827 670 533 1203 453 374 827 1124 572 552
G2 598 583 1181 360 350 710 598 583 1181 360 350 710 1119 573 546
G3 558 529 1087 303 298 601 558 529 1087 303 298 601 1116 574 542
G4 578 509 1087 250 285 535 578 509 1087 250 285 535 1116 576 540
G5 571 542 1113 255 248 503 571 542 1113 255 248 503 1122 580 542
G6 514 502 1016 226 244 470 514 502 1016 226 244 470 1135 586 549
G7 554 513 1067 225 226 451 554 513 1067 225 226 451 1150 592 558
G8 439 440 879 174 209 383 439 440 879 174 209 383 1166 598 568
G9 452 461 913 165 209 374 452 461 913 165 209 374 1180 603 577
G10 341 366 707 98 164 262 341 366 707 98 164 262 1180 603 577
G11 299 297 596 93 131 224 299 297 596 93 131 224 1164 597 567
G12 246 251 497 79 113 192 246 251 497 79 113 192 1141 589 552
2014 6398 6147 12545 3220 3301 6521 6398 6147 12545 3220 3301 6521 14744 7549 7195
GK 407 389 796 335 332 667 407 389 796 335 332 667 1155 580 575
G1 642 557 1199 460 415 875 642 557 1199 460 415 875 1130 571 559
G2 680 559 1239 429 344 773 680 559 1239 429 344 773 1117 568 549
G3 631 603 1234 355 344 699 631 603 1234 355 344 699 1112 569 543
G4 575 559 1134 297 282 579 575 559 1134 297 282 579 1110 571 539
G5 600 521 1121 246 276 522 600 521 1121 246 276 522 1110 573 537
G6 525 549 1074 226 249 475 525 549 1074 226 249 475 1118 578 540
G7 473 479 952 193 202 395 473 479 952 193 202 395 1129 583 546
G8 465 442 907 197 194 391 465 442 907 197 194 391 1144 589 555
G9 445 488 933 170 213 383 445 488 933 170 213 383 1160 595 565
G10 357 428 785 135 188 323 357 428 785 135 188 323 1165 596 569
G11 314 296 610 89 139 228 314 296 610 89 139 228 1155 591 564
G12 284 277 561 88 123 211 284 277 561 88 123 211 1139 585 554
2015 6373 6086 12459 3207 3313 6520 6373 6086 12459 3207 3313 6520 14672 7498 7174

STUDENTS
FSM Education Data Digest P a g e | 66
Enrol Male
Enrol Female
Enrol Total
Net Enrol Male
Net Enrol Female
Net Enrol Total
Intake Male
Intake Female
Intake Total
Net Intake Male
Net Intake Female
Net Intake Total
Population
Population Male
Population Female
GK 596 469 1065 431 374 805 596 469 1065 431 374 805 1178 588 590
G1 561 569 1130 374 397 771 561 569 1130 374 397 771 1149 577 572
G2 573 499 1072 372 341 713 573 499 1072 372 341 713 1124 568 556
G3 639 530 1169 369 321 690 639 530 1169 369 321 690 1111 565 546
G4 582 586 1168 311 345 656 582 586 1168 311 345 656 1106 566 540
G5 553 542 1095 256 247 503 553 542 1095 256 247 503 1104 568 536
G6 542 499 1041 201 239 440 542 499 1041 201 239 440 1106 571 535
G7 505 494 999 212 219 431 505 494 999 212 219 431 1112 575 537
G8 415 452 867 166 203 369 415 452 867 166 203 369 1124 581 543
G9 545 457 1002 195 194 389 545 457 1002 195 194 389 1139 587 552
G10 322 359 681 123 156 279 322 359 681 123 156 279 1146 588 558
G11 273 359 632 113 151 264 273 359 632 113 151 264 1141 584 557
G12 267 271 538 84 126 210 267 271 538 84 126 210 1132 580 552
2016 6272 5961 12233 3182 3309 6491 6031 5805 11836 3136 3259 6395 14559 7448 7111
GK 488 429 917 379 335 714 480 417 897 372 325 697 1128 584 544
G1 661 561 1222 452 407 859 631 542 1173 446 400 846 1172 585 587
G2 598 554 1152 350 370 720 572 544 1116 344 367 711 1143 574 569
G3 616 530 1146 353 344 697 571 519 1090 346 340 686 1118 565 553
G4 611 506 1117 329 282 611 589 491 1080 323 281 604 1105 562 543
G5 560 551 1111 271 306 577 525 531 1056 267 300 567 1100 563 537
G6 505 508 1013 224 229 453 488 500 988 221 225 446 1100 566 534
G7 502 471 973 176 233 409 489 459 948 174 231 405 1100 568 532
G8 434 436 870 184 205 389 432 436 868 184 205 389 1108 573 535
G9 371 443 814 135 183 318 349 417 766 134 178 312 1119 578 541
G10 436 397 833 150 168 318 427 384 811 148 162 310 1125 580 545
G11 254 270 524 89 119 208 245 260 505 87 117 204 1123 577 546
G12 236 305 541 90 128 218 233 305 538 90 128 218 1118 573 545
2017 5890 5692 11582 3171 3281 6452 5596 5500 11096 3094 3221 6315 14416 7382 7034
GK 480 424 904 363 310 673 464 406 870 353 298 651 1081 560 521
G1 609 536 1145 423 394 817 558 507 1065 407 385 792 1122 581 541
G2 632 549 1181 418 386 804 597 526 1123 406 377 783 1166 582 584
G3 553 550 1103 318 353 671 530 534 1064 309 349 658 1137 571 566

STUDENTS
FSM Education Data Digest P a g e | 67
Enrol Male
Enrol Female
Enrol Total
Net Enrol Male
Net Enrol Female
Net Enrol Total
Intake Male
Intake Female
Intake Total
Net Intake Male
Net Intake Female
Net Intake Total
Population
Population Male
Population Female
G4 601 521 1122 333 319 652 569 502 1071 326 315 641 1113 562 551
G5 567 480 1047 279 256 535 536 460 996 272 250 522 1099 559 540
G6 465 503 968 226 276 502 444 487 931 224 274 498 1096 561 535
G7 493 493 986 206 212 418 442 469 911 200 206 406 1094 563 531
G8 383 415 798 145 215 360 366 407 773 141 213 354 1096 566 530
G9 363 400 763 155 183 338 353 392 745 152 182 334 1102 570 532
G10 276 325 601 117 141 258 274 320 594 117 139 256 1106 572 534
G11 255 258 513 109 130 239 251 253 504 108 127 235 1103 569 534
G12 213 238 451 79 106 185 212 237 449 79 106 185 1101 566 535
2018 5794 5619 11413 2770 2885 5655 5488 5411 10899 2710 2832 5542 14258 7306 6952
GK 480 437 917 286 235 521 440 405 845 265 219 484 1043 540 503
G1 580 530 1110 333 322 655 541 511 1052 326 317 643 1076 557 519
G2 610 532 1142 333 333 666 570 499 1069 323 325 648 1116 578 538
G3 586 508 1094 327 304 631 556 481 1037 322 297 619 1160 579 581
G4 518 531 1049 245 264 509 500 522 1022 242 263 505 1131 568 563
G5 576 517 1093 253 263 516 550 509 1059 250 260 510 1108 560 548
G6 492 455 947 217 234 451 470 435 905 216 231 447 1095 557 538
G7 479 481 960 176 212 388 433 458 891 171 211 382 1091 558 533
G8 405 456 861 171 187 358 385 443 828 168 183 351 1090 561 529
G9 306 342 648 114 166 280 292 335 627 114 164 278 1092 564 528
G10 305 348 653 136 153 289 299 341 640 135 151 286 1090 564 526
G11 234 267 501 97 114 211 229 258 487 96 113 209 1084 561 523
G12 223 215 438 82 98 180 223 214 437 82 98 180 1082 559 523
KSA
2013 1111 1006 2117 630 617 1247 1111 1006 2117 630 617 1247 2026 1039 987
GK 87 69 156 48 39 87 87 69 156 48 39 87 153 78 75
G1 75 83 158 46 54 100 75 83 158 46 54 100 153 79 74
G2 78 71 149 53 45 98 78 71 149 53 45 98 153 79 74
G3 75 63 138 46 42 88 75 63 138 46 42 88 152 79 73
G4 89 79 168 59 48 107 89 79 168 59 48 107 152 79 73
G5 85 80 165 45 40 85 85 80 165 45 40 85 153 79 74
G6 82 80 162 47 49 96 82 80 162 47 49 96 155 80 75

STUDENTS
FSM Education Data Digest P a g e | 68
Enrol Male
Enrol Female
Enrol Total
Net Enrol Male
Net Enrol Female
Net Enrol Total
Intake Male
Intake Female
Intake Total
Net Intake Male
Net Intake Female
Net Intake Total
Population
Population Male
Population Female
G7 97 90 187 53 57 110 97 90 187 53 57 110 158 81 77
G8 71 82 153 41 37 78 71 82 153 41 37 78 162 83 79
G9 85 100 185 60 79 139 85 100 185 60 79 139 165 84 81
G10 87 64 151 45 44 89 87 64 151 45 44 89 163 83 80
G11 94 76 170 32 44 76 94 76 170 32 44 76 158 80 78
G12 106 69 175 55 39 94 106 69 175 55 39 94 149 75 74
2014 1138 1020 2158 694 717 1411 1138 1020 2158 694 717 1411 2011 1032 979
GK 88 89 177 57 68 125 88 89 177 57 68 125 152 77 75
G1 81 61 142 58 44 102 81 61 142 58 44 102 152 78 74
G2 74 95 169 61 70 131 74 95 169 61 70 131 152 78 74
G3 80 75 155 62 60 122 80 75 155 62 60 122 151 78 73
G4 79 75 154 58 60 118 79 75 154 58 60 118 152 79 73
G5 96 74 170 73 54 127 96 74 170 73 54 127 151 78 73
G6 89 77 166 52 51 103 89 77 166 52 51 103 152 79 73
G7 77 79 156 48 57 105 77 79 156 48 57 105 155 80 75
G8 100 94 194 65 68 133 100 94 194 65 68 133 158 81 77
G9 98 84 182 51 44 95 98 84 182 51 44 95 161 82 79
G10 94 89 183 49 63 112 94 89 183 49 63 112 162 83 79
G11 104 59 163 33 37 70 104 59 163 33 37 70 159 81 78
G12 78 69 147 27 41 68 78 69 147 27 41 68 154 78 76
2015 1059 985 2044 692 694 1386 1059 985 2044 692 694 1386 1985 1018 967
GK 92 78 170 70 53 123 92 78 170 70 53 123 149 74 75
G1 72 83 155 52 64 116 72 83 155 52 64 116 150 76 74
G2 80 61 141 56 44 100 80 61 141 56 44 100 151 77 74
G3 71 89 160 53 66 119 71 89 160 53 66 119 151 78 73
G4 79 74 153 61 58 119 79 74 153 61 58 119 151 78 73
G5 77 78 155 56 59 115 77 78 155 56 59 115 151 78 73
G6 91 71 162 69 53 122 91 71 162 69 53 122 150 78 72
G7 85 77 162 52 49 101 85 77 162 52 49 101 151 78 73
G8 77 82 159 49 58 107 77 82 159 49 58 107 153 79 74
G9 111 95 206 60 64 124 111 95 206 60 64 124 157 81 76
G10 76 70 146 41 36 77 76 70 146 41 36 77 158 81 77

STUDENTS
FSM Education Data Digest P a g e | 69
Enrol Male
Enrol Female
Enrol Total
Net Enrol Male
Net Enrol Female
Net Enrol Total
Intake Male
Intake Female
Intake Total
Net Intake Male
Net Intake Female
Net Intake Total
Population
Population Male
Population Female
G11 69 75 144 40 54 94 69 75 144 40 54 94 158 81 77
G12 79 52 131 33 36 69 79 52 131 33 36 69 155 79 76
2016 1056 994 2050 681 707 1388 1056 994 2050 681 707 1388 1974 1015 959
GK 88 92 180 63 75 138 88 92 180 63 75 138 155 81 74
G1 82 78 160 63 59 122 82 78 160 63 59 122 149 74 75
G2 73 84 157 53 64 117 73 84 157 53 64 117 150 76 74
G3 73 54 127 53 37 90 73 54 127 53 37 90 150 77 73
G4 71 90 161 52 70 122 71 90 161 52 70 122 150 77 73
G5 79 75 154 61 59 120 79 75 154 61 59 120 150 78 72
G6 74 75 149 55 57 112 74 75 149 55 57 112 150 78 72
G7 91 69 160 67 49 116 91 69 160 67 49 116 150 78 72
G8 81 71 152 43 47 90 81 71 152 43 47 90 151 78 73
G9 99 88 187 47 60 107 99 88 187 47 60 107 153 79 74
G10 93 86 179 48 59 107 93 86 179 48 59 107 155 80 75
G11 80 71 151 43 33 76 80 71 151 43 33 76 156 80 76
G12 72 61 133 33 38 71 72 61 133 33 38 71 155 79 76
2017 1077 989 2066 689 689 1378 1048 983 2031 689 689 1378 1946 1001 945
GK 107 81 188 74 59 133 107 81 188 74 59 133 146 76 70
G1 86 83 169 61 65 126 86 83 169 61 65 126 154 80 74
G2 78 74 152 56 58 114 78 74 152 56 58 114 148 74 74
G3 72 81 153 52 59 111 72 81 153 52 59 111 149 75 74
G4 77 55 132 54 36 90 77 55 132 54 36 90 149 76 73
G5 67 96 163 47 70 117 67 96 163 47 70 117 149 77 72
G6 81 76 157 61 57 118 81 76 157 61 57 118 149 77 72
G7 76 73 149 53 54 107 76 73 149 53 54 107 149 77 72
G8 92 69 161 68 49 117 92 69 161 68 49 117 149 77 72
G9 101 78 179 43 43 86 87 77 164 43 43 86 150 78 72
G10 79 82 161 38 55 93 68 79 147 38 55 93 151 78 73
G11 83 77 160 41 52 93 80 75 155 41 52 93 151 78 73
G12 78 64 142 41 32 73 77 64 141 41 32 73 152 78 74
2018 1037 976 2013 825 815 1640 1037 976 2013 825 815 1640 1919 991 928
GK 93 75 168 78 64 142 93 75 168 78 64 142 138 72 66
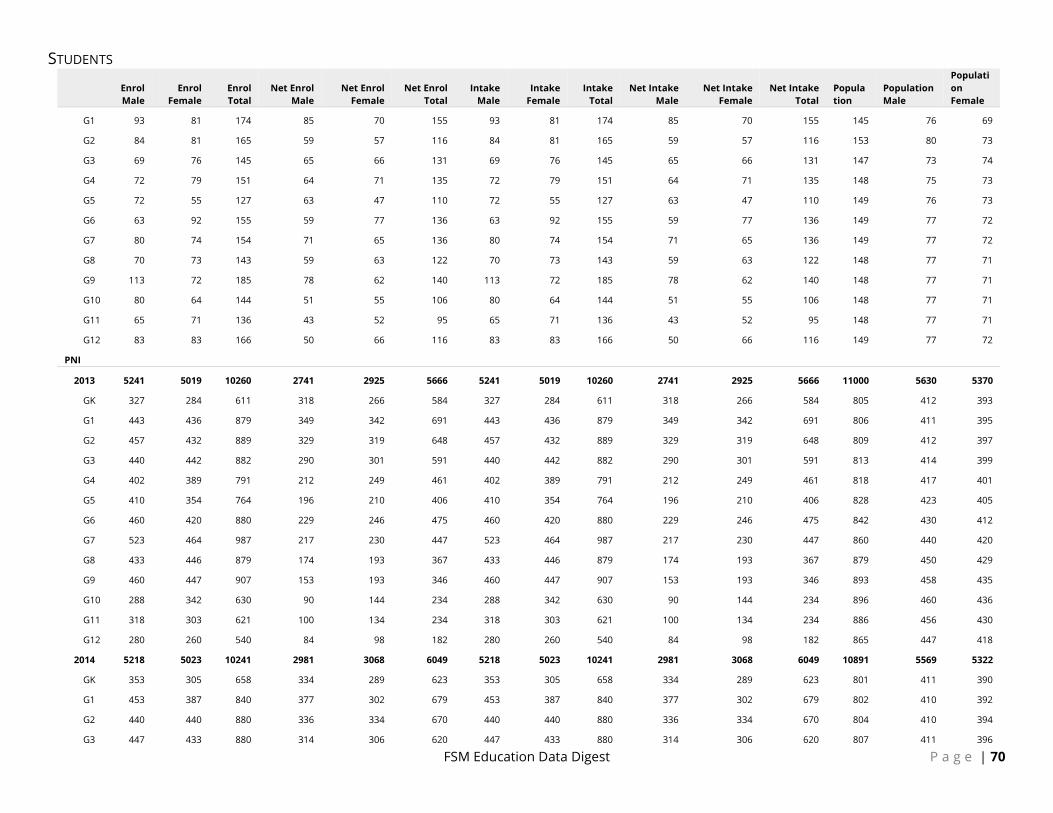
STUDENTS
FSM Education Data Digest P a g e | 70
Enrol Male
Enrol Female
Enrol Total
Net Enrol Male
Net Enrol Female
Net Enrol Total
Intake Male
Intake Female
Intake Total
Net Intake Male
Net Intake Female
Net Intake Total
Population
Population Male
Population Female
G1 93 81 174 85 70 155 93 81 174 85 70 155 145 76 69
G2 84 81 165 59 57 116 84 81 165 59 57 116 153 80 73
G3 69 76 145 65 66 131 69 76 145 65 66 131 147 73 74
G4 72 79 151 64 71 135 72 79 151 64 71 135 148 75 73
G5 72 55 127 63 47 110 72 55 127 63 47 110 149 76 73
G6 63 92 155 59 77 136 63 92 155 59 77 136 149 77 72
G7 80 74 154 71 65 136 80 74 154 71 65 136 149 77 72
G8 70 73 143 59 63 122 70 73 143 59 63 122 148 77 71
G9 113 72 185 78 62 140 113 72 185 78 62 140 148 77 71
G10 80 64 144 51 55 106 80 64 144 51 55 106 148 77 71
G11 65 71 136 43 52 95 65 71 136 43 52 95 148 77 71
G12 83 83 166 50 66 116 83 83 166 50 66 116 149 77 72
PNI
2013 5241 5019 10260 2741 2925 5666 5241 5019 10260 2741 2925 5666 11000 5630 5370
GK 327 284 611 318 266 584 327 284 611 318 266 584 805 412 393
G1 443 436 879 349 342 691 443 436 879 349 342 691 806 411 395
G2 457 432 889 329 319 648 457 432 889 329 319 648 809 412 397
G3 440 442 882 290 301 591 440 442 882 290 301 591 813 414 399
G4 402 389 791 212 249 461 402 389 791 212 249 461 818 417 401
G5 410 354 764 196 210 406 410 354 764 196 210 406 828 423 405
G6 460 420 880 229 246 475 460 420 880 229 246 475 842 430 412
G7 523 464 987 217 230 447 523 464 987 217 230 447 860 440 420
G8 433 446 879 174 193 367 433 446 879 174 193 367 879 450 429
G9 460 447 907 153 193 346 460 447 907 153 193 346 893 458 435
G10 288 342 630 90 144 234 288 342 630 90 144 234 896 460 436
G11 318 303 621 100 134 234 318 303 621 100 134 234 886 456 430
G12 280 260 540 84 98 182 280 260 540 84 98 182 865 447 418
2014 5218 5023 10241 2981 3068 6049 5218 5023 10241 2981 3068 6049 10891 5569 5322
GK 353 305 658 334 289 623 353 305 658 334 289 623 801 411 390
G1 453 387 840 377 302 679 453 387 840 377 302 679 802 410 392
G2 440 440 880 336 334 670 440 440 880 336 334 670 804 410 394
G3 447 433 880 314 306 620 447 433 880 314 306 620 807 411 396
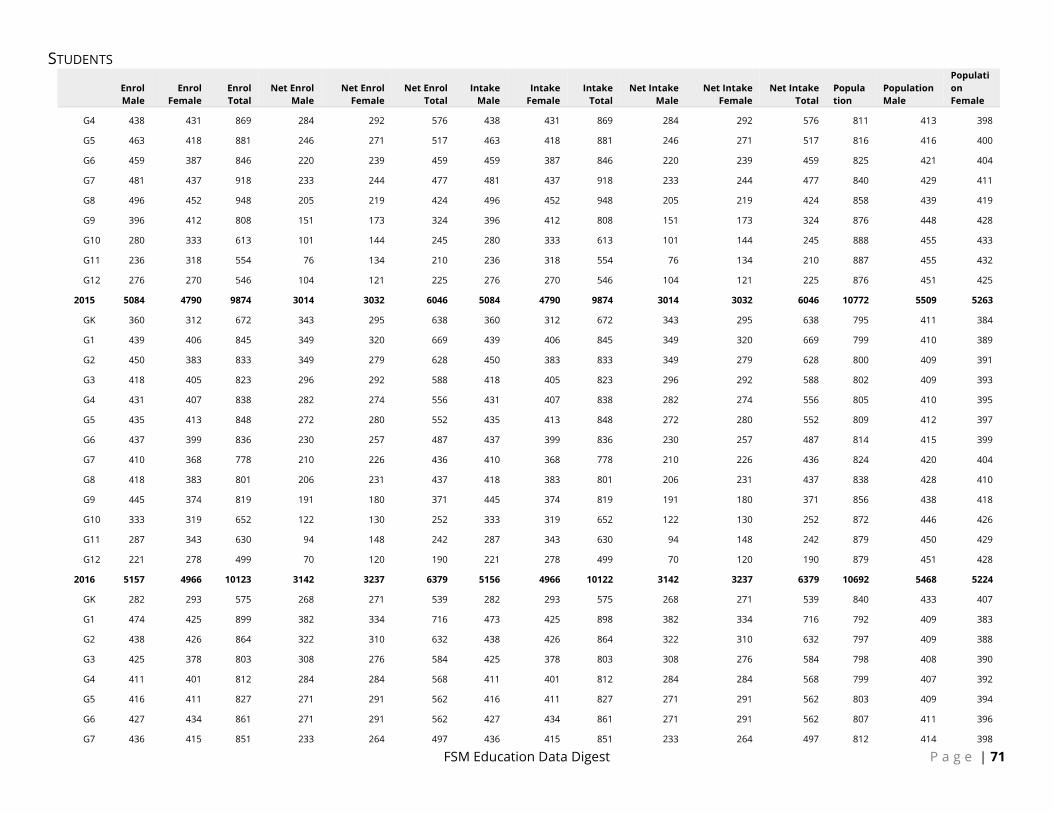
STUDENTS
FSM Education Data Digest P a g e | 71
Enrol Male
Enrol Female
Enrol Total
Net Enrol Male
Net Enrol Female
Net Enrol Total
Intake Male
Intake Female
Intake Total
Net Intake Male
Net Intake Female
Net Intake Total
Population
Population Male
Population Female
G4 438 431 869 284 292 576 438 431 869 284 292 576 811 413 398
G5 463 418 881 246 271 517 463 418 881 246 271 517 816 416 400
G6 459 387 846 220 239 459 459 387 846 220 239 459 825 421 404
G7 481 437 918 233 244 477 481 437 918 233 244 477 840 429 411
G8 496 452 948 205 219 424 496 452 948 205 219 424 858 439 419
G9 396 412 808 151 173 324 396 412 808 151 173 324 876 448 428
G10 280 333 613 101 144 245 280 333 613 101 144 245 888 455 433
G11 236 318 554 76 134 210 236 318 554 76 134 210 887 455 432
G12 276 270 546 104 121 225 276 270 546 104 121 225 876 451 425
2015 5084 4790 9874 3014 3032 6046 5084 4790 9874 3014 3032 6046 10772 5509 5263
GK 360 312 672 343 295 638 360 312 672 343 295 638 795 411 384
G1 439 406 845 349 320 669 439 406 845 349 320 669 799 410 389
G2 450 383 833 349 279 628 450 383 833 349 279 628 800 409 391
G3 418 405 823 296 292 588 418 405 823 296 292 588 802 409 393
G4 431 407 838 282 274 556 431 407 838 282 274 556 805 410 395
G5 435 413 848 272 280 552 435 413 848 272 280 552 809 412 397
G6 437 399 836 230 257 487 437 399 836 230 257 487 814 415 399
G7 410 368 778 210 226 436 410 368 778 210 226 436 824 420 404
G8 418 383 801 206 231 437 418 383 801 206 231 437 838 428 410
G9 445 374 819 191 180 371 445 374 819 191 180 371 856 438 418
G10 333 319 652 122 130 252 333 319 652 122 130 252 872 446 426
G11 287 343 630 94 148 242 287 343 630 94 148 242 879 450 429
G12 221 278 499 70 120 190 221 278 499 70 120 190 879 451 428
2016 5157 4966 10123 3142 3237 6379 5156 4966 10122 3142 3237 6379 10692 5468 5224
GK 282 293 575 268 271 539 282 293 575 268 271 539 840 433 407
G1 474 425 899 382 334 716 473 425 898 382 334 716 792 409 383
G2 438 426 864 322 310 632 438 426 864 322 310 632 797 409 388
G3 425 378 803 308 276 584 425 378 803 308 276 584 798 408 390
G4 411 401 812 284 284 568 411 401 812 284 284 568 799 407 392
G5 416 411 827 271 291 562 416 411 827 271 291 562 803 409 394
G6 427 434 861 271 291 562 427 434 861 271 291 562 807 411 396
G7 436 415 851 233 264 497 436 415 851 233 264 497 812 414 398
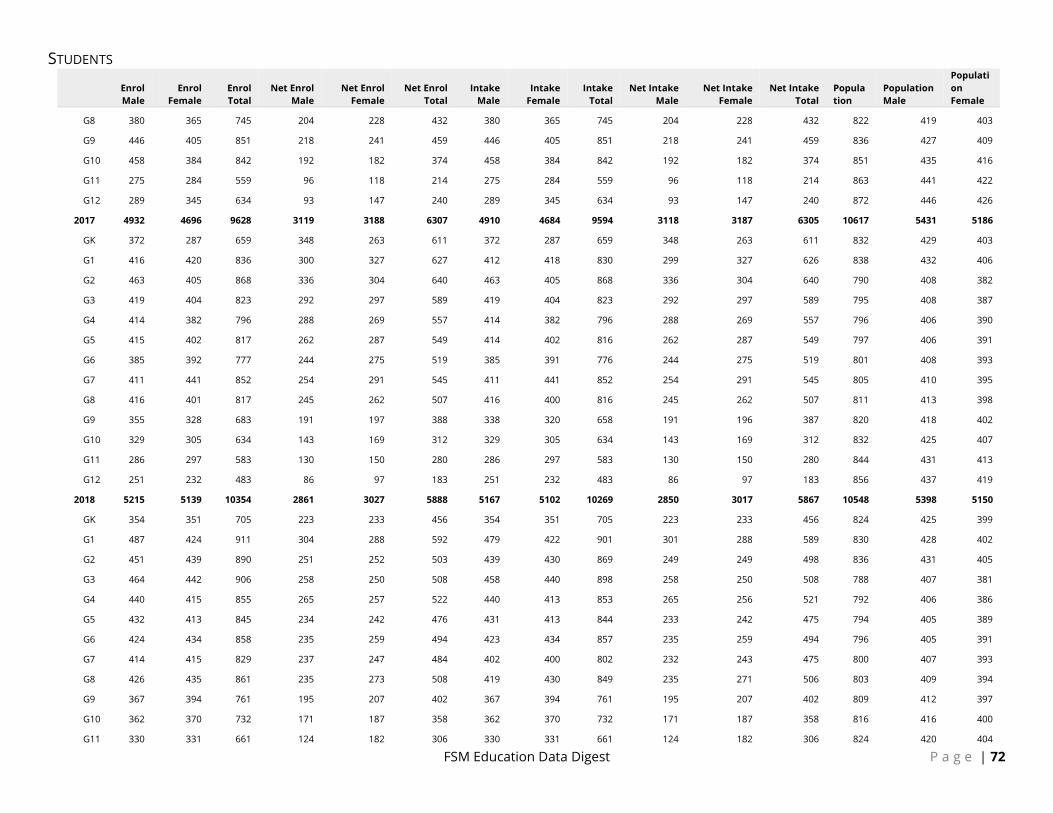
STUDENTS
FSM Education Data Digest P a g e | 72
Enrol Male
Enrol Female
Enrol Total
Net Enrol Male
Net Enrol Female
Net Enrol Total
Intake Male
Intake Female
Intake Total
Net Intake Male
Net Intake Female
Net Intake Total
Population
Population Male
Population Female
G8 380 365 745 204 228 432 380 365 745 204 228 432 822 419 403
G9 446 405 851 218 241 459 446 405 851 218 241 459 836 427 409
G10 458 384 842 192 182 374 458 384 842 192 182 374 851 435 416
G11 275 284 559 96 118 214 275 284 559 96 118 214 863 441 422
G12 289 345 634 93 147 240 289 345 634 93 147 240 872 446 426
2017 4932 4696 9628 3119 3188 6307 4910 4684 9594 3118 3187 6305 10617 5431 5186
GK 372 287 659 348 263 611 372 287 659 348 263 611 832 429 403
G1 416 420 836 300 327 627 412 418 830 299 327 626 838 432 406
G2 463 405 868 336 304 640 463 405 868 336 304 640 790 408 382
G3 419 404 823 292 297 589 419 404 823 292 297 589 795 408 387
G4 414 382 796 288 269 557 414 382 796 288 269 557 796 406 390
G5 415 402 817 262 287 549 414 402 816 262 287 549 797 406 391
G6 385 392 777 244 275 519 385 391 776 244 275 519 801 408 393
G7 411 441 852 254 291 545 411 441 852 254 291 545 805 410 395
G8 416 401 817 245 262 507 416 400 816 245 262 507 811 413 398
G9 355 328 683 191 197 388 338 320 658 191 196 387 820 418 402
G10 329 305 634 143 169 312 329 305 634 143 169 312 832 425 407
G11 286 297 583 130 150 280 286 297 583 130 150 280 844 431 413
G12 251 232 483 86 97 183 251 232 483 86 97 183 856 437 419
2018 5215 5139 10354 2861 3027 5888 5167 5102 10269 2850 3017 5867 10548 5398 5150
GK 354 351 705 223 233 456 354 351 705 223 233 456 824 425 399
G1 487 424 911 304 288 592 479 422 901 301 288 589 830 428 402
G2 451 439 890 251 252 503 439 430 869 249 249 498 836 431 405
G3 464 442 906 258 250 508 458 440 898 258 250 508 788 407 381
G4 440 415 855 265 257 522 440 413 853 265 256 521 792 406 386
G5 432 413 845 234 242 476 431 413 844 233 242 475 794 405 389
G6 424 434 858 235 259 494 423 434 857 235 259 494 796 405 391
G7 414 415 829 237 247 484 402 400 802 232 243 475 800 407 393
G8 426 435 861 235 273 508 419 430 849 235 271 506 803 409 394
G9 367 394 761 195 207 402 367 394 761 195 207 402 809 412 397
G10 362 370 732 171 187 358 362 370 732 171 187 358 816 416 400
G11 330 331 661 124 182 306 330 331 661 124 182 306 824 420 404

STUDENTS
FSM Education Data Digest P a g e | 73
Enrol Male
Enrol Female
Enrol Total
Net Enrol Male
Net Enrol Female
Net Enrol Total
Intake Male
Intake Female
Intake Total
Net Intake Male
Net Intake Female
Net Intake Total
Population
Population Male
Population Female
G12 264 276 540 129 150 279 263 274 537 129 150 279 836 427 409
YAP
2013 1443 1258 2701 560 600 1160 1331 1169 2500 508 558 1066 3164 1636 1528
GK 172 168 340 78 71 149 96 86 182 28 29 57 227 115 112
G1 105 98 203 62 68 130 105 98 203 62 68 130 226 115 111
G2 87 88 175 46 44 90 87 88 175 46 44 90 226 115 111
G3 114 91 205 51 45 96 114 91 205 51 45 96 227 116 111
G4 92 104 196 42 52 94 92 104 196 42 52 94 230 118 112
G5 103 81 184 48 48 96 103 81 184 48 48 96 233 120 113
G6 97 96 193 40 42 82 97 96 193 40 42 82 240 124 116
G7 106 95 201 40 54 94 106 95 201 40 54 94 249 129 120
G8 118 90 208 29 39 68 118 90 208 29 39 68 257 134 123
G9 124 93 217 32 36 68 114 89 203 32 36 68 264 138 126
G10 130 71 201 34 23 57 112 69 181 32 23 55 267 140 127
G11 106 102 208 31 40 71 100 102 202 31 40 71 263 138 125
G12 89 81 170 27 38 65 87 80 167 27 38 65 255 134 121
2014 1446 1248 2694 513 566 1079 1446 1248 2694 513 566 1079 3123 1609 1514
GK 182 154 336 75 65 140 182 154 336 75 65 140 226 114 112
G1 99 92 191 53 57 110 99 92 191 53 57 110 225 114 111
G2 88 97 185 44 57 101 88 97 185 44 57 101 225 114 111
G3 94 80 174 44 37 81 94 80 174 44 37 81 226 115 111
G4 97 95 192 42 39 81 97 95 192 42 39 81 227 116 111
G5 103 94 197 36 45 81 103 94 197 36 45 81 228 117 111
G6 97 89 186 36 46 82 97 89 186 36 46 82 233 120 113
G7 101 94 195 34 40 74 101 94 195 34 40 74 240 124 116
G8 111 85 196 31 49 80 111 85 196 31 49 80 248 129 119
G9 129 99 228 28 35 63 129 99 228 28 35 63 257 134 123
G10 124 95 219 30 35 65 124 95 219 30 35 65 263 137 126
G11 112 70 182 28 24 52 112 70 182 28 24 52 264 138 126
G12 109 104 213 32 37 69 109 104 213 32 37 69 261 137 124
2015 1430 1210 2640 540 574 1114 1430 1210 2640 540 574 1114 3081 1583 1498
GK 186 159 345 90 72 162 186 159 345 90 72 162 226 114 112
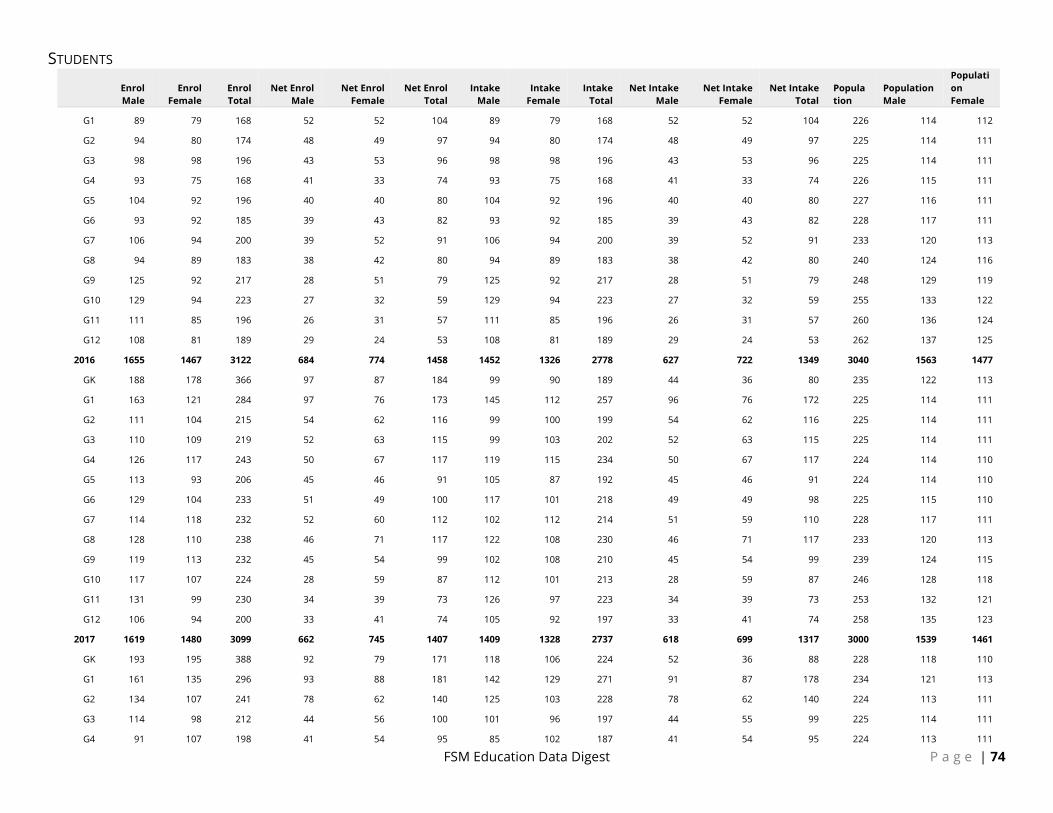
STUDENTS
FSM Education Data Digest P a g e | 74
Enrol Male
Enrol Female
Enrol Total
Net Enrol Male
Net Enrol Female
Net Enrol Total
Intake Male
Intake Female
Intake Total
Net Intake Male
Net Intake Female
Net Intake Total
Population
Population Male
Population Female
G1 89 79 168 52 52 104 89 79 168 52 52 104 226 114 112
G2 94 80 174 48 49 97 94 80 174 48 49 97 225 114 111
G3 98 98 196 43 53 96 98 98 196 43 53 96 225 114 111
G4 93 75 168 41 33 74 93 75 168 41 33 74 226 115 111
G5 104 92 196 40 40 80 104 92 196 40 40 80 227 116 111
G6 93 92 185 39 43 82 93 92 185 39 43 82 228 117 111
G7 106 94 200 39 52 91 106 94 200 39 52 91 233 120 113
G8 94 89 183 38 42 80 94 89 183 38 42 80 240 124 116
G9 125 92 217 28 51 79 125 92 217 28 51 79 248 129 119
G10 129 94 223 27 32 59 129 94 223 27 32 59 255 133 122
G11 111 85 196 26 31 57 111 85 196 26 31 57 260 136 124
G12 108 81 189 29 24 53 108 81 189 29 24 53 262 137 125
2016 1655 1467 3122 684 774 1458 1452 1326 2778 627 722 1349 3040 1563 1477
GK 188 178 366 97 87 184 99 90 189 44 36 80 235 122 113
G1 163 121 284 97 76 173 145 112 257 96 76 172 225 114 111
G2 111 104 215 54 62 116 99 100 199 54 62 116 225 114 111
G3 110 109 219 52 63 115 99 103 202 52 63 115 225 114 111
G4 126 117 243 50 67 117 119 115 234 50 67 117 224 114 110
G5 113 93 206 45 46 91 105 87 192 45 46 91 224 114 110
G6 129 104 233 51 49 100 117 101 218 49 49 98 225 115 110
G7 114 118 232 52 60 112 102 112 214 51 59 110 228 117 111
G8 128 110 238 46 71 117 122 108 230 46 71 117 233 120 113
G9 119 113 232 45 54 99 102 108 210 45 54 99 239 124 115
G10 117 107 224 28 59 87 112 101 213 28 59 87 246 128 118
G11 131 99 230 34 39 73 126 97 223 34 39 73 253 132 121
G12 106 94 200 33 41 74 105 92 197 33 41 74 258 135 123
2017 1619 1480 3099 662 745 1407 1409 1328 2737 618 699 1317 3000 1539 1461
GK 193 195 388 92 79 171 118 106 224 52 36 88 228 118 110
G1 161 135 296 93 88 181 142 129 271 91 87 178 234 121 113
G2 134 107 241 78 62 140 125 103 228 78 62 140 224 113 111
G3 114 98 212 44 56 100 101 96 197 44 55 99 225 114 111
G4 91 107 198 41 54 95 85 102 187 41 54 95 224 113 111
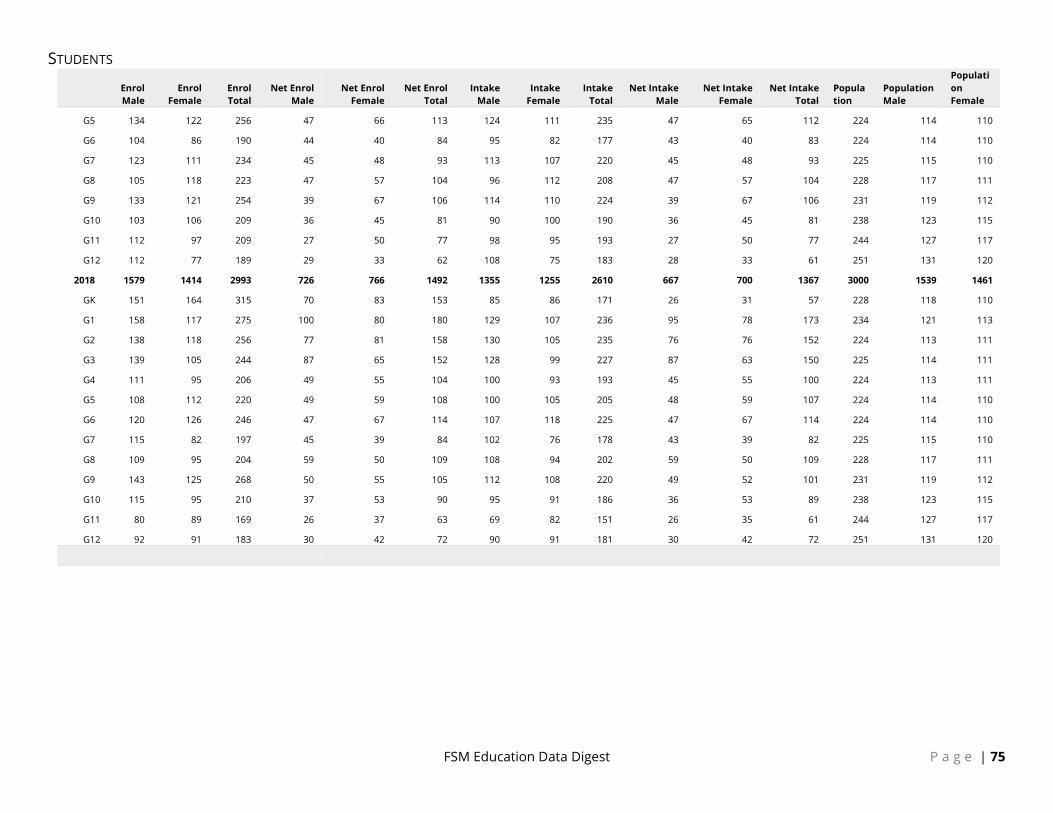
STUDENTS
FSM Education Data Digest P a g e | 75
Enrol Male
Enrol Female
Enrol Total
Net Enrol Male
Net Enrol Female
Net Enrol Total
Intake Male
Intake Female
Intake Total
Net Intake Male
Net Intake Female
Net Intake Total
Population
Population Male
Population Female
G5 134 122 256 47 66 113 124 111 235 47 65 112 224 114 110
G6 104 86 190 44 40 84 95 82 177 43 40 83 224 114 110
G7 123 111 234 45 48 93 113 107 220 45 48 93 225 115 110
G8 105 118 223 47 57 104 96 112 208 47 57 104 228 117 111
G9 133 121 254 39 67 106 114 110 224 39 67 106 231 119 112
G10 103 106 209 36 45 81 90 100 190 36 45 81 238 123 115
G11 112 97 209 27 50 77 98 95 193 27 50 77 244 127 117
G12 112 77 189 29 33 62 108 75 183 28 33 61 251 131 120
2018 1579 1414 2993 726 766 1492 1355 1255 2610 667 700 1367 3000 1539 1461
GK 151 164 315 70 83 153 85 86 171 26 31 57 228 118 110
G1 158 117 275 100 80 180 129 107 236 95 78 173 234 121 113
G2 138 118 256 77 81 158 130 105 235 76 76 152 224 113 111
G3 139 105 244 87 65 152 128 99 227 87 63 150 225 114 111
G4 111 95 206 49 55 104 100 93 193 45 55 100 224 113 111
G5 108 112 220 49 59 108 100 105 205 48 59 107 224 114 110
G6 120 126 246 47 67 114 107 118 225 47 67 114 224 114 110
G7 115 82 197 45 39 84 102 76 178 43 39 82 225 115 110
G8 109 95 204 59 50 109 108 94 202 59 50 109 228 117 111
G9 143 125 268 50 55 105 112 108 220 49 52 101 231 119 112
G10 115 95 210 37 53 90 95 91 186 36 53 89 238 123 115
G11 80 89 169 26 37 63 69 82 151 26 35 61 244 127 117
G12 92 91 183 30 42 72 90 91 181 30 42 72 251 131 120

FSM Education Data Digest P a g e | 76
SCHOOLS Basic statistics on the schools in FSM such as school ownership and management, resources and water, sanitation and hygiene (WASH).
Background Data Source The primary data source for the data herein is the FedEMIS. Schools can manage their school profile online and a lot of the data can be upgraded through the FedEMIS annual school census.
Limitations There is currently a small misunderstanding about how to submit the Common Toilet number. Schools (and state data offices) have in many cases simply added the Male toilet to Female toilet. This is in fact the total toilet but the data should be toilet that are for both female and male in addition to separate female and male toilets. Many schools (and state data offices) have not fully entered the data for school’s resources and WASH and therefore this data set will be incomplete for the first release of this document.
Schools Ownership and Management Definition and Purpose
Methods of Calculation Each school in the FedEMIS can assign its geographical location (i.e. state, national/local electorate, Island/municipality), its managing authority (i.e. Government run, Non-government). Producing the statistics in the table below is simply an automated count and processing.
Analysis and Discussions Of all public and private schools in FSM, Chuuk has the largest share with 42% of schools, followed by Yap (31%), Pohnpei 22% and Kosrae with only 5% of schools (Figure 30). Schools operated by non-government entity such as the Church and private sector is about 11% with highest number of non-government schools in Chuuk followed by Pohnpei (Figure 31).
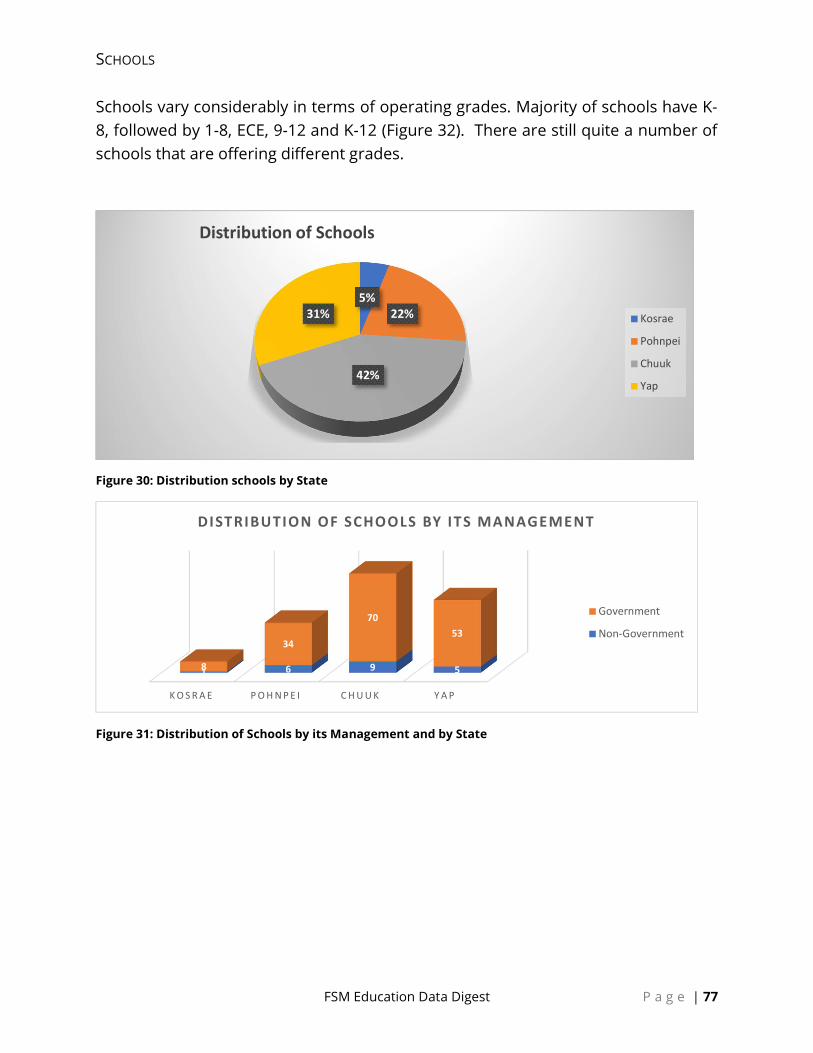
SCHOOLS
FSM Education Data Digest P a g e | 77
Schools vary considerably in terms of operating grades. Majority of schools have K-8, followed by 1-8, ECE, 9-12 and K-12 (Figure 32). There are still quite a number of schools that are offering different grades.
Figure 30: Distribution schools by State
Figure 31: Distribution of Schools by its Management and by State
5%22%
42%
31%
Distribution of Schools
Kosrae
Pohnpei
Chuuk
Yap
K O S R A E P O H N P E I C H U U K Y A P
1 6 9 58
34
7053
DISTRIBUTION OF SCHOOLS BY ITS MANAGEMENT
Government
Non-Government

SCHOOLS
FSM Education Data Digest P a g e | 78
Figure 32: Distribution of Schools by Grades Served
Table 23: Schools by Authority Type, Authority and State
Chuuk Kosrae Pohnpei Yap Grand Total
Church 7 1 6 5 19
Assembly of God Church 1 1
Baptist Church 1 1 2
Church of God 1 1
Evangelical Christian Church 1 1
Protestant 1 1 2
Roman Catholic Church 4 2 2 8
Seventh Day Adventist 1 1 1 1 4
Private 2 2
Organization (Ship-Hoops) 1 1
Pentecostal 1 1
State 70 8 34 53 165
Chuuk DOE 70 70
Kosrae DOE 8 8
Pohnpei DOE 34 34
Yap DOE 53 53
Grand Total 79 9 40 58 186
0
10
20
30
40
50
60
70
80
ECE K-5 K-8 K-10 K-11 K-12 1-4 1-5 1-6 1-7 1-8 1-10 9-11 9-12
Schools by Grades Served
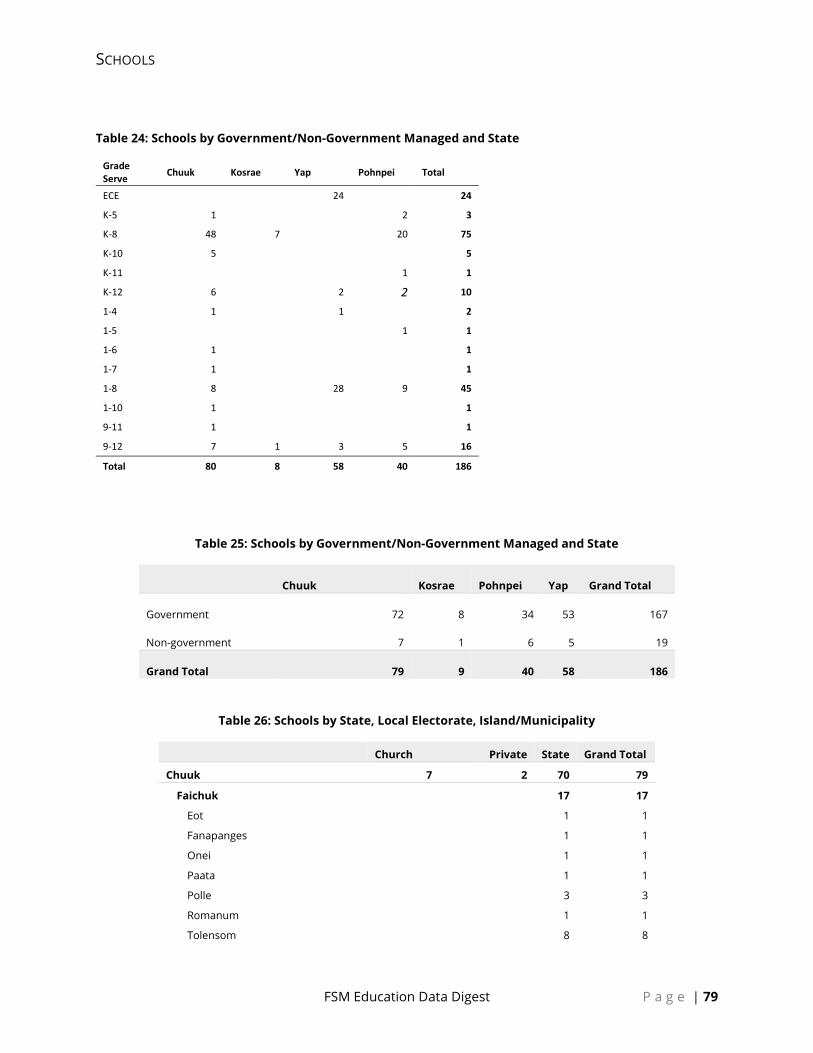
SCHOOLS
FSM Education Data Digest P a g e | 79
Table 24: Schools by Government/Non-Government Managed and State
Grade Serve Chuuk Kosrae Yap Pohnpei Total
ECE 24 24
K-5 1 2 3
K-8 48 7 20 75
K-10 5 5
K-11 1 1
K-12 6 2 2 10
1-4 1 1 2
1-5 1 1
1-6 1 1
1-7 1 1
1-8 8 28 9 45
1-10 1 1
9-11 1 1
9-12 7 1 3 5 16
Total 80 8 58 40 186
Table 25: Schools by Government/Non-Government Managed and State
Chuuk Kosrae Pohnpei Yap Grand Total
Government 72 8 34 53 167
Non-government 7 1 6 5 19
Grand Total 79 9 40 58 186
Table 26: Schools by State, Local Electorate, Island/Municipality
Church Private State Grand Total
Chuuk 7 2 70 79
Faichuk 17 17
Eot 1 1
Fanapanges 1 1
Onei 1 1
Paata 1 1
Polle 3 3
Romanum 1 1
Tolensom 8 8
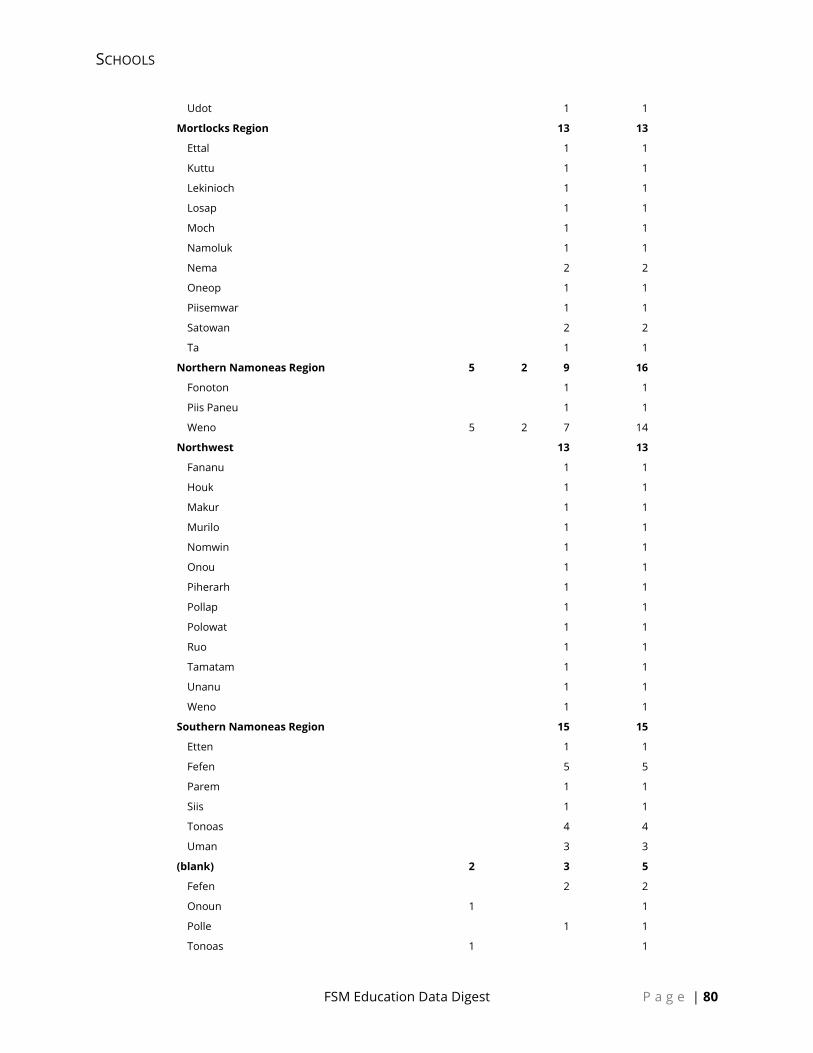
SCHOOLS
FSM Education Data Digest P a g e | 80
Udot 1 1
Mortlocks Region 13 13
Ettal 1 1
Kuttu 1 1
Lekinioch 1 1
Losap 1 1
Moch 1 1
Namoluk 1 1
Nema 2 2
Oneop 1 1
Piisemwar 1 1
Satowan 2 2
Ta 1 1
Northern Namoneas Region 5 2 9 16
Fonoton 1 1
Piis Paneu 1 1
Weno 5 2 7 14
Northwest 13 13
Fananu 1 1
Houk 1 1
Makur 1 1
Murilo 1 1
Nomwin 1 1
Onou 1 1
Piherarh 1 1
Pollap 1 1
Polowat 1 1
Ruo 1 1
Tamatam 1 1
Unanu 1 1
Weno 1 1
Southern Namoneas Region 15 15
Etten 1 1
Fefen 5 5
Parem 1 1
Siis 1 1
Tonoas 4 4
Uman 3 3
(blank) 2 3 5
Fefen 2 2
Onoun 1 1
Polle 1 1
Tonoas 1 1

SCHOOLS
FSM Education Data Digest P a g e | 81
Kosrae 1 8 9
Lelu 5 5
Kosrae 5 5
Malem 1 1
Kosrae 1 1
Tafunsak 1 1 2
Kosrae 1 1 2
Utwe 1 1
Kosrae 1 1
Pohnpei 6 34 40
Pohnpei Electoral Division 1 4 11 15
Kapingamarangi 1 1
Kolonia 4 2 6
Nukuoro 1 1
Sapwuafik 1 1
Sokehs 6 6
Pohnpei Electoral Division 2 1 15 16
Kitti 7 7
Madolenimw 1 8 9
Pohnpei Electoral Division 3 1 8 9
Kitti 1 1
Mwokil 1 1
Nett 1 3 4
Pingelap 1 1
U 2 2
Yap 5 53 58
Ifalik Zone 8 8
Eaurapik 1 1
Eauripik 1 1
Faraulap 1 1
Ifalik 3 3
Piig 2 2
Satawal Zone 8 8
Elato 2 2
Lamotrek 2 2
Satawal 4 4
Ulithi Zone 8 8
Asor 1 1
Fadraii 1 1
Fais 2 2
Falalop 1 1
Mogmog 2 2
Ulithi 1 1
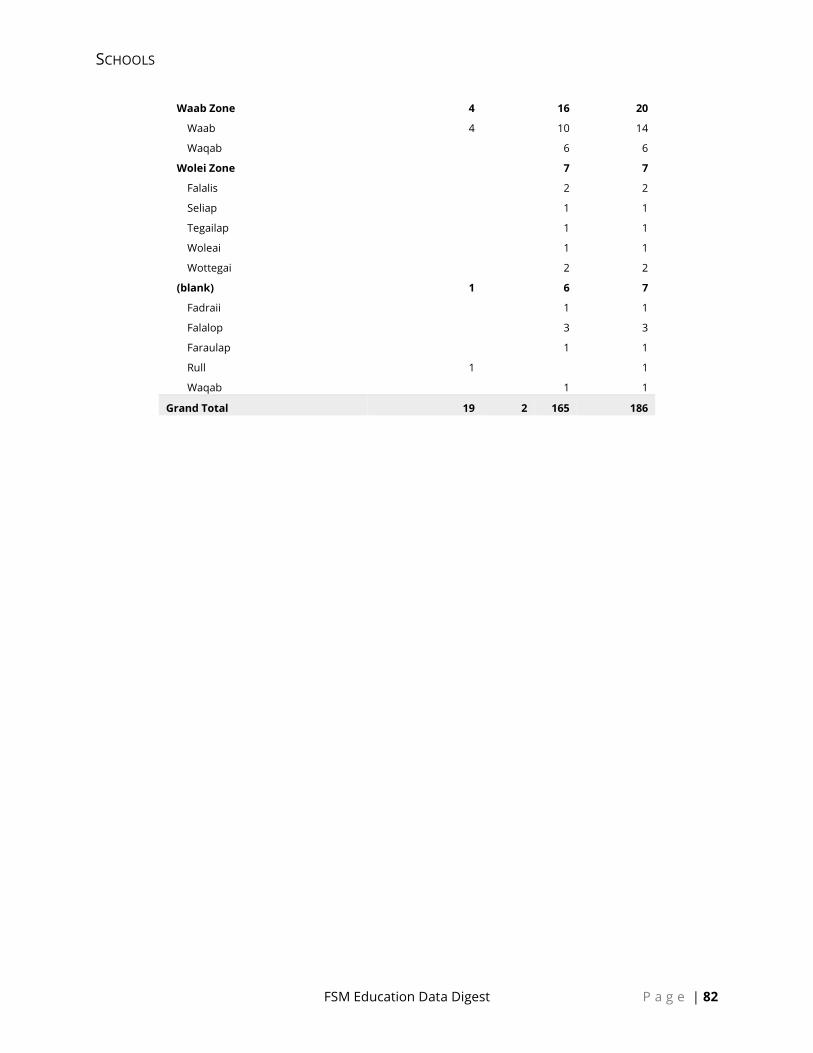
SCHOOLS
FSM Education Data Digest P a g e | 82
Waab Zone 4 16 20
Waab 4 10 14
Waqab 6 6
Wolei Zone 7 7
Falalis 2 2
Seliap 1 1
Tegailap 1 1
Woleai 1 1
Wottegai 2 2
(blank) 1 6 7
Fadraii 1 1
Falalop 3 3
Faraulap 1 1
Rull 1 1
Waqab 1 1
Grand Total 19 2 165 186

TEACHERS
FSM Education Data Digest P a g e | 83
TEACHERS The teachers’ data herein is processed directly from the FedEMIS. The foundation sources come from the annual school census and a number of small spreadsheet managed by various teams. The NDOE is going through the process of migrating most teacher data management directly within the FedEMIS. The teacher qualifications and certifications will soon be directly managed using the FedEMIS online user interface with the annual census’ teacher qualification and certification data used as an additional “check”.
Data Source
Methods of Calculation Teacher qualifications in this context are all the formal training teachers can have including academic degrees and specialized technical and vocational training. Certifications in this context refers to certifications given by the FSM National Department of Education as detailed in (FSM National Department of Education, 2016).
Teachers in Early Childhood Education Majority of teachers in Early Childhood Education programs are above 30 years of age and only one teacher, out of 113 ECE teachers in FSM, is below 20 year of age (Figure 24). Out of the total teachers in ECE, 72.5% have the minimum qualifications required. However, only 26.5% of teachers have both minimum qualification and has also acquired teaching certificate. In other words, almost 74% ECE teachers do not have the teaching certificate (Figure 33).
Figure 33: Qualified/Certified Teachers in ECE by State
0 5 10 15 20 25 30 35
<20
20-29
30-39
40-49
50-59
60+
ECE - Certified & Qualified Teachers
ECE - Certified Teachers
ECE - Qualified Teachers
ECE - Teachers

TEACHERS
FSM Education Data Digest P a g e | 84
Figure 34: Qualified/Certified Teachers in ECE by State
Teachers in Primary Like in ECE programs, teachers in primary level are also in majority at the age 30 or above. The largest group of teachers are at the age range of 30-39 (Figure 34). Out of 1157 teachers at the primary kevel, 92% of them have the minimum academic qualification. However, only 38% of them have the teaching certificate. In other words, about 8% of school teachers in primary level do not have the required qualification and almost 72% do not have the teaching certificate (Figure 34).
0 2 4 6 8 10 12 14 16
20-29
30-39
40-49
50-59
60+
20-29
30-39
50-59
<20
20-29
30-39
40-49
50-59
60+
20-29
30-39
40-49
50-59
60+CH
KKS
APN
IYA
P
ECE - Certified & Qualified Teachers
ECE - Certified Teachers
ECE - Qualified Teachers
ECE - Teachers
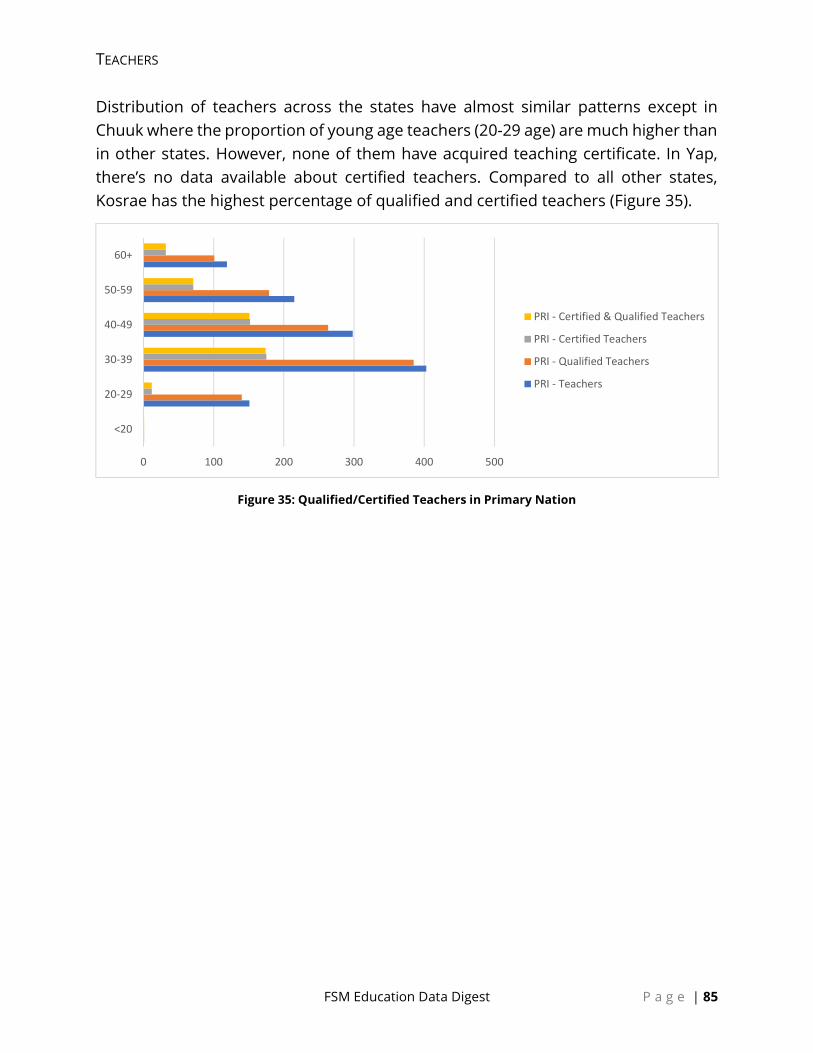
TEACHERS
FSM Education Data Digest P a g e | 85
Distribution of teachers across the states have almost similar patterns except in Chuuk where the proportion of young age teachers (20-29 age) are much higher than in other states. However, none of them have acquired teaching certificate. In Yap, there’s no data available about certified teachers. Compared to all other states, Kosrae has the highest percentage of qualified and certified teachers (Figure 35).
Figure 35: Qualified/Certified Teachers in Primary Nation
0 100 200 300 400 500
<20
20-29
30-39
40-49
50-59
60+
PRI - Certified & Qualified Teachers
PRI - Certified Teachers
PRI - Qualified Teachers
PRI - Teachers

TEACHERS
FSM Education Data Digest P a g e | 86
Figure 36: Qualified/Certified Teachers in Primary by State
Teachers in Secondary Similar patterns of teacher characteristics can be found in secondary level. Majority of the teachers are at age 30 and above. Out of 437 school teachers in secondary level, about 90% of them have the required qualification. However, only about 31% of them have acquired teaching certificate (Figure 36). In other words, 10% of school teachers at the secondary level do not have the required qualifications and about 60% of the teachers do not have the teaching certificate.
0 50 100 150 200
20-29
30-39
40-49
50-59
60+
20-29
30-39
40-49
50-59
60+
<20
20-29
30-39
40-49
50-59
60+
20-29
30-39
40-49
50-59
60+CH
KKS
APN
IYA
P
PRI - Certified & Qualified Teachers
PRI - Certified Teachers
PRI - Qualified Teachers
PRI - Teachers

TEACHERS
FSM Education Data Digest P a g e | 87
Distribution of secondary level school teachers across the state reveal similar patterns as in primary level. Teachers in Chuuk has the highest number of young teachers in 20-29 age range but do not have the certificates. Similarly, there’s no data available for teacher certificates in Yap. Again, has the highest proportion of qualified and certified teachers (Figure 36).
Figure 37: Qualified/Certified Teachers in Secondary Nation
0 20 40 60 80 100 120 140 160
<20
20-29
30-39
40-49
50-59
60+
SEC - Certified & Qualified Teachers
SEC - Certified Teachers
SEC - Qualified Teachers
SEC - Teachers
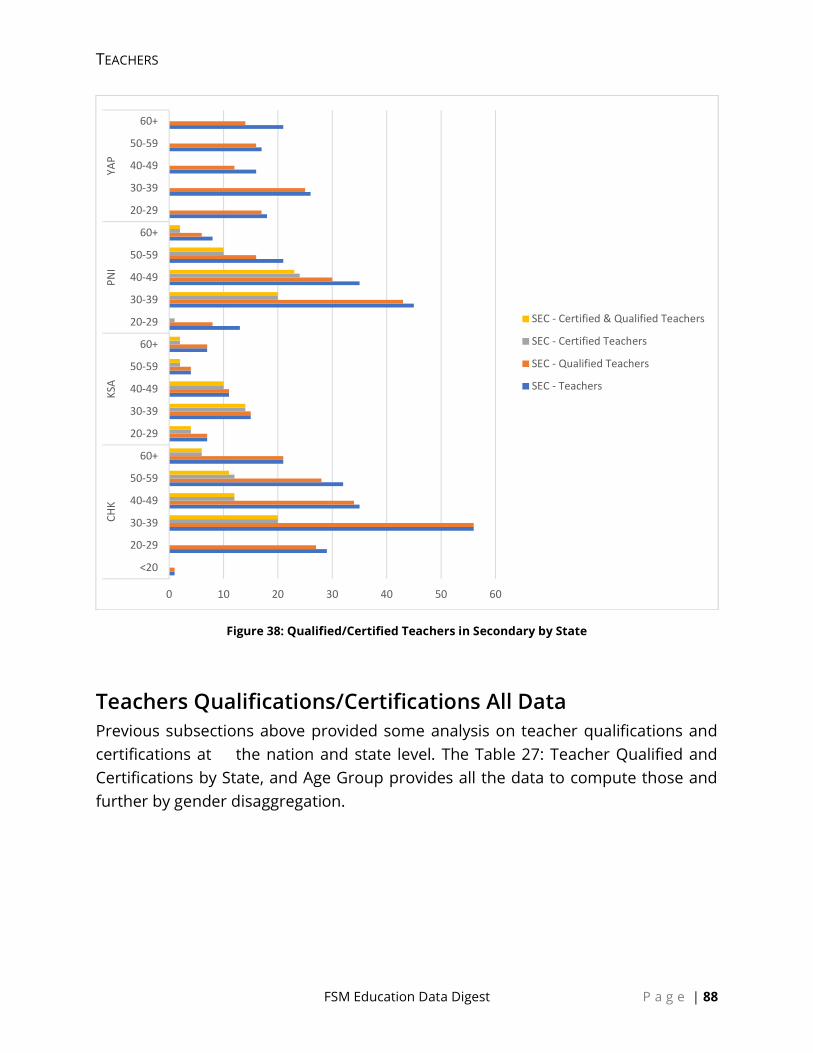
TEACHERS
FSM Education Data Digest P a g e | 88
Figure 38: Qualified/Certified Teachers in Secondary by State
Teachers Qualifications/Certifications All Data Previous subsections above provided some analysis on teacher qualifications and certifications at the nation and state level. The Table 27: Teacher Qualified and Certifications by State, and Age Group provides all the data to compute those and further by gender disaggregation.
0 10 20 30 40 50 60
<20
20-29
30-39
40-49
50-59
60+
20-29
30-39
40-49
50-59
60+
20-29
30-39
40-49
50-59
60+
20-29
30-39
40-49
50-59
60+CH
KKS
APN
IYA
P
SEC - Certified & Qualified Teachers
SEC - Certified Teachers
SEC - Qualified Teachers
SEC - Teachers

FSM Education Data Digest P a g e | 89
Table 27: Teacher Qualified and Certifications by State, and Age Group
Teachers Qualified Teachers Certified Teachers Certified and Qualified Teachers Total Teachers Total Qualified
Teachers Total Certified
Teachers Total Certified and Qualified Teachers
F M F M F M F M CHK 400 360 352 260 90 70 90 69 760 612 160 159
(blank) 31 96 5 11 1 2 1 2 127 16 3 3
20-29 5 5 1 1 0 0 0 0 10 2 0 0
30-39 11 18 3 3 0 1 0 1 29 6 1 1
40-49 5 23 1 1 1 0 1 0 28 2 1 1
50-59 8 35 0 3 0 1 0 1 43 3 1 1
60+ 2 15 0 3 0 0 0 0 17 3 0 0
PRI 257 174 239 162 62 40 62 40 431 401 102 102
20-29 66 23 64 20 1 0 1 0 89 84 1 1
30-39 65 44 63 41 20 9 20 9 109 104 29 29
40-49 46 35 38 32 17 13 17 13 81 70 30 30
50-59 45 30 41 28 13 8 13 8 75 69 21 21
60+ 35 42 33 41 11 10 11 10 77 74 21 21
ECE 25 3 25 3 4 1 4 1 28 28 5 5
20-29 3 1 3 1 0 0 0 0 4 4 0 0
30-39 5 5 2 2 5 5 2 2
40-49 4 1 4 1 0 0 0 0 5 5 0 0
50-59 4 1 4 1 0 1 0 1 5 5 1 1
60+ 9 9 2 2 9 9 2 2
SEC 87 87 83 84 23 27 23 26 174 167 50 49
<20 1 1 0 0 1 1 0 0
20-29 17 12 15 12 0 0 0 0 29 27 0 0
30-39 30 26 30 26 13 7 13 7 56 56 20 20
40-49 19 16 18 16 6 6 6 6 35 34 12 12
50-59 9 23 8 20 2 10 2 9 32 28 12 11
60+ 11 10 11 10 2 4 2 4 21 21 6 6
KSA 94 115 87 104 68 71 67 71 209 191 139 138
(blank) 11 24 4 13 1 1 0 1 35 17 2 1
20-29 1 1 1 1 0 0 0 0 2 2 0 0
30-39 3 5 0 1 1 1 0 1 8 1 2 1
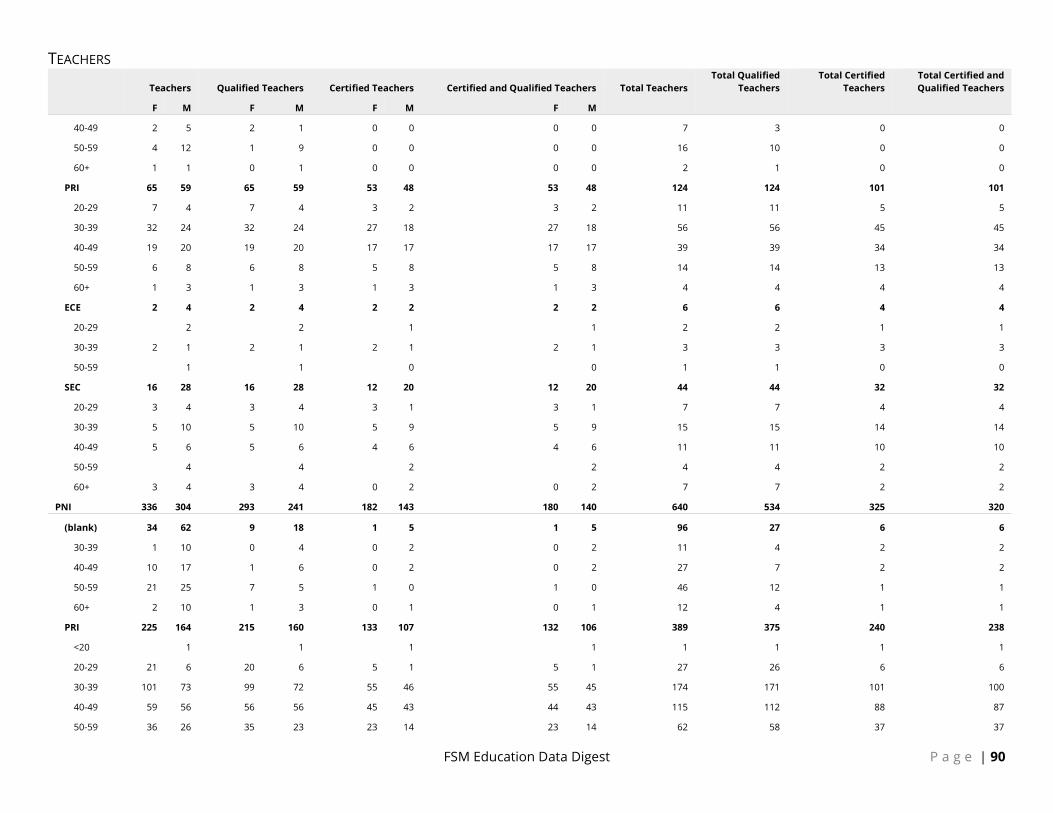
TEACHERS
FSM Education Data Digest P a g e | 90
Teachers Qualified Teachers Certified Teachers Certified and Qualified Teachers Total Teachers Total Qualified
Teachers Total Certified
Teachers Total Certified and Qualified Teachers
F M F M F M F M 40-49 2 5 2 1 0 0 0 0 7 3 0 0
50-59 4 12 1 9 0 0 0 0 16 10 0 0
60+ 1 1 0 1 0 0 0 0 2 1 0 0
PRI 65 59 65 59 53 48 53 48 124 124 101 101
20-29 7 4 7 4 3 2 3 2 11 11 5 5
30-39 32 24 32 24 27 18 27 18 56 56 45 45
40-49 19 20 19 20 17 17 17 17 39 39 34 34
50-59 6 8 6 8 5 8 5 8 14 14 13 13
60+ 1 3 1 3 1 3 1 3 4 4 4 4
ECE 2 4 2 4 2 2 2 2 6 6 4 4
20-29 2 2 1 1 2 2 1 1
30-39 2 1 2 1 2 1 2 1 3 3 3 3
50-59 1 1 0 0 1 1 0 0
SEC 16 28 16 28 12 20 12 20 44 44 32 32
20-29 3 4 3 4 3 1 3 1 7 7 4 4
30-39 5 10 5 10 5 9 5 9 15 15 14 14
40-49 5 6 5 6 4 6 4 6 11 11 10 10
50-59 4 4 2 2 4 4 2 2
60+ 3 4 3 4 0 2 0 2 7 7 2 2
PNI 336 304 293 241 182 143 180 140 640 534 325 320
(blank) 34 62 9 18 1 5 1 5 96 27 6 6
30-39 1 10 0 4 0 2 0 2 11 4 2 2
40-49 10 17 1 6 0 2 0 2 27 7 2 2
50-59 21 25 7 5 1 0 1 0 46 12 1 1
60+ 2 10 1 3 0 1 0 1 12 4 1 1
PRI 225 164 215 160 133 107 132 106 389 375 240 238
<20 1 1 1 1 1 1 1 1
20-29 21 6 20 6 5 1 5 1 27 26 6 6
30-39 101 73 99 72 55 46 55 45 174 171 101 100
40-49 59 56 56 56 45 43 44 43 115 112 88 87
50-59 36 26 35 23 23 14 23 14 62 58 37 37

TEACHERS
FSM Education Data Digest P a g e | 91
Teachers Qualified Teachers Certified Teachers Certified and Qualified Teachers Total Teachers Total Qualified
Teachers Total Certified
Teachers Total Certified and Qualified Teachers
F M F M F M F M 60+ 8 2 5 2 5 2 5 2 10 7 7 7
ECE 25 8 25 4 19 3 19 2 33 29 22 21
<20 1 1 0 0 1 1 0 0
20-29 2 1 2 1 2 0 2 0 3 3 2 2
30-39 5 3 5 2 4 2 4 1 8 7 6 5
40-49 13 2 13 1 10 1 10 1 15 14 11 11
50-59 3 2 3 0 3 0 3 0 5 3 3 3
60+ 1 1 0 0 1 1 0 0
SEC 52 70 44 59 29 28 28 27 122 103 57 55
20-29 8 5 4 4 1 0 0 0 13 8 1 0
30-39 21 24 21 22 11 9 11 9 45 43 20 20
40-49 16 19 13 17 12 12 12 11 35 30 24 23
50-59 4 17 4 12 4 6 4 6 21 16 10 10
60+ 3 5 2 4 1 1 1 1 8 6 2 2
YAP 241 201 163 149 0 0 0 0 442 312 0 0
(blank) 28 27 8 12 0 0 0 0 55 20 0 0
20-29 2 2 0 0 2 2 0 0
30-39 4 6 3 2 0 0 0 0 10 5 0 0
40-49 9 6 1 2 0 0 0 0 15 3 0 0
50-59 9 8 2 4 0 0 0 0 17 6 0 0
60+ 6 5 2 2 0 0 0 0 11 4 0 0
PRI 141 102 93 76 0 0 0 0 243 169 0 0
20-29 22 2 17 2 0 0 0 0 24 19 0 0
30-39 42 22 33 21 0 0 0 0 64 54 0 0
40-49 34 29 21 21 0 0 0 0 63 42 0 0
50-59 32 32 17 21 0 0 0 0 64 38 0 0
60+ 11 17 5 11 0 0 0 0 28 16 0 0
ECE 31 15 26 13 0 0 0 0 46 39 0 0
20-29 3 1 1 1 0 0 0 0 4 2 0 0
30-39 10 3 10 3 0 0 0 0 13 13 0 0
40-49 4 4 4 4 0 0 0 0 8 8 0 0
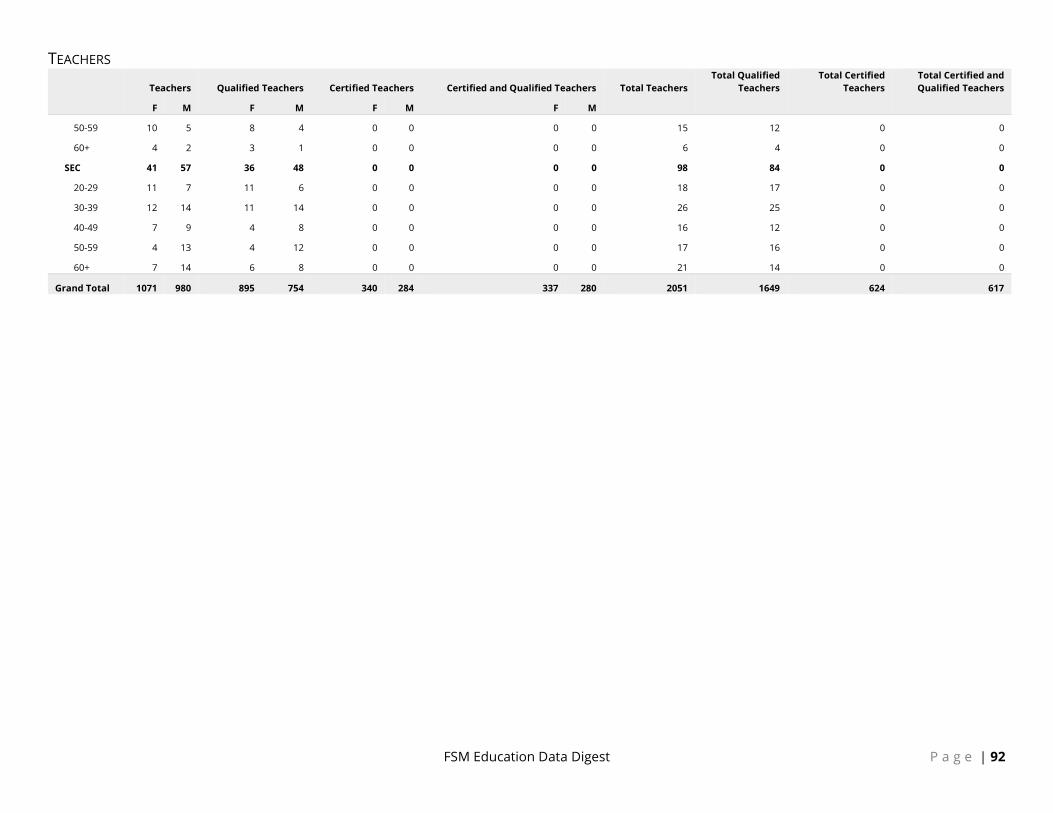
TEACHERS
FSM Education Data Digest P a g e | 92
Teachers Qualified Teachers Certified Teachers Certified and Qualified Teachers Total Teachers Total Qualified
Teachers Total Certified
Teachers Total Certified and Qualified Teachers
F M F M F M F M 50-59 10 5 8 4 0 0 0 0 15 12 0 0
60+ 4 2 3 1 0 0 0 0 6 4 0 0
SEC 41 57 36 48 0 0 0 0 98 84 0 0
20-29 11 7 11 6 0 0 0 0 18 17 0 0
30-39 12 14 11 14 0 0 0 0 26 25 0 0
40-49 7 9 4 8 0 0 0 0 16 12 0 0
50-59 4 13 4 12 0 0 0 0 17 16 0 0
60+ 7 14 6 8 0 0 0 0 21 14 0 0
Grand Total 1071 980 895 754 340 284 337 280 2051 1649 624 617

FSM Education Data Digest P a g e | 93
Pupil-Teacher Ratios Here in addition to the standard Pupil-Teacher Ratio as defined in (UNESCO Institute for Statistics, 2009) we also include the following additional variations:
Pupil-Qualified Teacher Ratio Pupil-Certified Teacher Ratio Pupil-Qualified and Certified Teacher Ratio
Definition and Purpose Pupil-Teacher Ratio (PTR) Average number of pupils (students) per teacher at a specific level of education in a given school year. It is meant to measure the level of human resources input in terms of the number of teachers in relation to the size of the pupil population. The results can be compared with established national norms on the number of pupils per teacher for each level or type of education.
Methods of Calculation Pupil-Teacher Ratio (PTR) Divide the total number of pupils enrolled at the specified level of education by the number of teachers at the same level. The same method was used for the certified, qualified, and certified and qualified teachers.
Analysis and Discussions The basic pupil-teacher ratio (PTR), regardless of qualification and certification, is lowest in Yap and is highest in Pohnpei. In other words, number of students per teacher is highest in Pohnpei and the same is lowest in Yap. Nevertheless, the pupil-teacher ratio is generally low in the FSM. The highest PTR is in Pohnpei with 19 students per teacher and the lowest is in Yap with only 8 students per teacher. National norm for PTR is 25. At this rate, many schools have more teachers than the PTR norms would recommend.
However, when looked into availability of qualified and certified teachers, the story is entirely different.
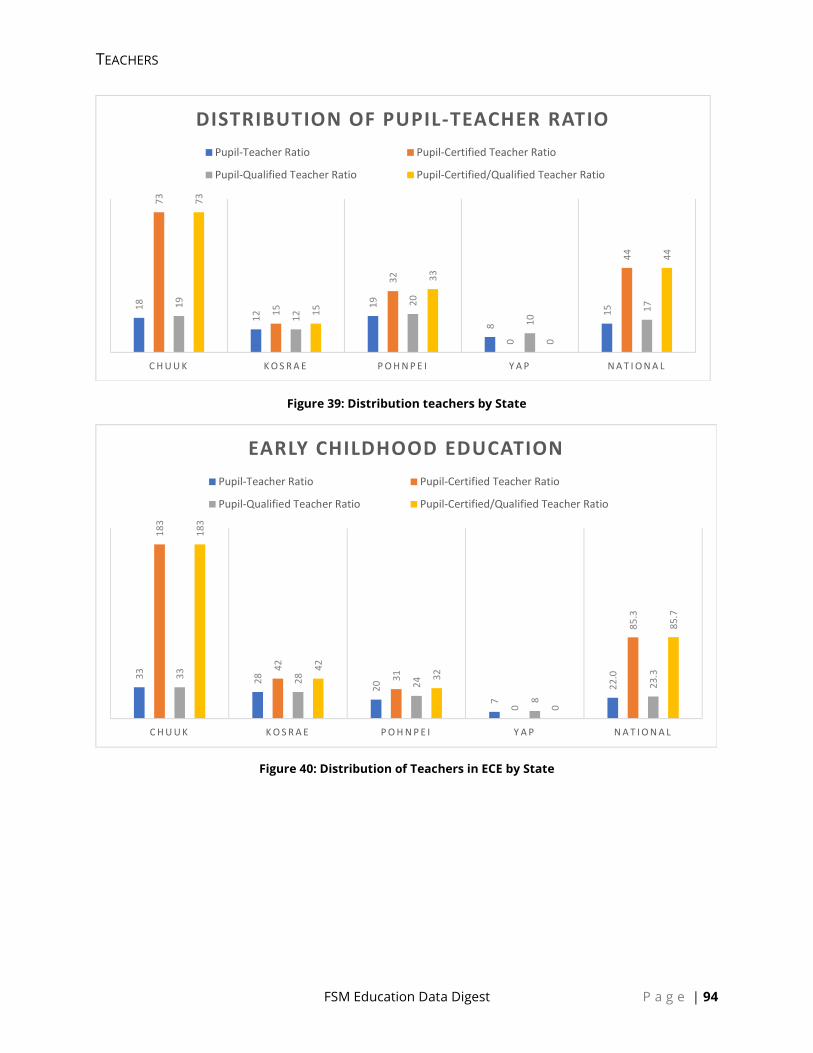
TEACHERS
FSM Education Data Digest P a g e | 94
Figure 39: Distribution teachers by State
Figure 40: Distribution of Teachers in ECE by State
18
12
19
8
15
73
15
32
0
44
19
12
20
10
17
73
15
33
0
44
C H U U K K O S R A E P O H N P E I Y A P N A T I O N A L
DISTRIBUTION OF PUPIL-TEACHER RATIOPupil-Teacher Ratio Pupil-Certified Teacher Ratio
Pupil-Qualified Teacher Ratio Pupil-Certified/Qualified Teacher Ratio
33 28
20
7
22.0
183
42
31
0
85.3
33 28 24
8
23.3
183
42
32
0
85.7
C H U U K K O S R A E P O H N P E I Y A P N A T I O N A L
EARLY CHILDHOOD EDUCATIONPupil-Teacher Ratio Pupil-Certified Teacher Ratio
Pupil-Qualified Teacher Ratio Pupil-Certified/Qualified Teacher Ratio
TEACHERS
FSM Education Data Digest P a g e | 95
Figure 41: Distribution of Teachers in Primary by State
Figure 42: Distribution of Teachers in Secondary by State
19
10
17
8
13.5
81
12
29
0
40.7
21
10
18
11
15.0
81
12
29
0
40.7
C H U U K K O S R A E P O H N P E I Y A P N A T I O N A L
PRIMARY EDUCATIONPupil-Teacher Ratio Pupil-Certified Teacher Ratio
Pupil-Qualified Teacher Ratio Pupil-Certified/Qualified Teacher Ratio
13 14
22
8
14.3
45
20
47
0
37.3
13 14
26
10
15.8
46
20
49
0
38.3
C H U U K K O S R A E P O H N P E I Y A P N A T I O N A L
SECONDARY EDUCATIONPupil-Teacher Ratio Pupil-Certified Teacher Ratio
Pupil-Qualified Teacher Ratio Pupil-Certified/Qualified Teacher Ratio
TEACHERS
FSM Education Data Digest P a g e | 96
Table 288: Pupil-Teacher Ratio by State and Education Level
Pupil-Teacher
Ratio Pupil-Certified Teacher
Ratio Pupil-Qualified Teacher
Ratio Pupil-Certified/Qualified
Teacher Ratio
Chuuk 18 73 19 73
ECE 33 183 33 183
PRI 19 81 21 81
SEC 13 45 13 46
Kosrae 12 15 12 15
ECE 28 42 28 42
PRI 10 12 10 12
SEC 14 20 14 20
Pohnpei 19 32 20 33
ECE 20 31 24 32
PRI 17 29 18 29
SEC 22 47 26 49
Yap 8 N/A 10 N/A
ECE 7 N/A 8 N/A
PRI 8 N/A 11 N/A
SEC 8 N/A 10 N/A Grand Total 15 44 17 44

FSM Education Data Digest P a g e | 97
SCHOOL ACCREDITATIONS School accreditation data included herein is drawn directly from the FedEMIS. However, while efforts have been made to include at least all most recent data for each school more work is required here to cleanup historical data.
Background Data Source Until now data came from states in scanned PDF with aggregated results. The archived copies are messy and there is no source of all data into a single place to get all the historical data. The process to include all archived data into the FedEMIS has started. Most data are in the FedEMIS but it will require tedious work to double check all the historical records.
Methods of Calculation Each year both public and private schools in the FSM are evaluated using standardized tool. There’s a school accreditation procedure manual which provides norms and guidelines for the use of the tool. Same tool is used in all four states, however, due to different geographies and spread out populations, time for school surveys have been different in different states. The Evaluation of schools is done by the state departments within their jurisdiction.
Once the school visits are done, summary of results is produced in a standard format called Form B. Form B provides initial results of the evaluation and the determination of school’s level. Schools are measured using four different levels of criteria:
“Level-4” include schools that has met or exceed standards as specified in the school accreditation manual. In other words, schools having a score of 90% and above in school evaluation report are placed under level 4.
“Level-3” includes schools that has just met the standards as specified in the school accreditation manual. In other words, schools having a score of 76-90% in school evaluation report are placed under level 3.
“Level-2” include schools that has partially met the standards as specified in the school accreditation manual. In other words, schools having a score of 51-75% and above in school evaluation report are placed under level 2.

SCHOOL ACCREDITATIONS
FSM Education Data Digest P a g e | 98
“Level-1” include schools that has failed to meet the standards as specified in the school accreditation manual. In other words, schools having a score of 50% or below in school evaluation report are included under level 1.
All schools that are determined at level 4 and 3 receive national special certificate of achievement. Such schools do not require to be evaluated for next three years. They only require to prepare and self-study plan. Schools that are determined at level 2 will receive a national certificate of accreditation. Schools that are determined at level 1 will undergo through Special measures and will be required to produce a recovery and re-start plans in three year.
Limitations In addition, some past submitted records had erroneous results; in other words, the level of the school shown on the scanned copy is not the same as calculated from the scores and thus there are some discrepancies between submitted scanned results and FedEMIS calculated data.
The school accreditation system has been recently revised and some of the policies and regulations have been changed including the tools and procedures. The new tool and procedures is going to be effective from January 2019. As such the reporting frame and the data tables will have some issues around comparability and consistency.
Standard Performance Accreditation Progress Nation Wide The following analysis shows the progress of the school accreditation process.
Analysis and Discussions To be done

SCHOOL ACCREDITATIONS
FSM Education Data Digest P a g e | 99
Figure 43: Total Schools by Accreditation Level
Figure 44: School Accreditation Progress
Table 29: Schools Evaluated/Accredited by State
FSM Schools Evaluated Schools Accredited Schools
Chuuk 79 49 13
Kosrae 9 6 6
Pohnpei 40 39 28
Yap 57 41 40
Grand Total 185 135 87
Table 30: Schools Accredited by States
Level 1 Level 2 Level 3 Level 4 Grand Total
Chuuk 36 7 4 2 49
Kosrae 6 6
Pohnpei 12 12 12 3 39
Yap 1 14 25 1 41
Grand Total 49 33 47 6 135
Standard Performance Percentages Nation Wide The following analysis shows for the whole nation the percentage of schools that do not meet, complies with, substantially complies and exceeds the accreditations standards for each standard.
Analysis and Discussions To be done
0
5
10
15
20
25
30
35
40
Chuuk Kosrae Pohnpei Yap
Level 1
Level 2
Level 3
Level 4
0
10
20
30
40
50
60
70
80
90
Chuuk Kosrae Pohnpei Yap
FSM Schools
EvaluatedSchools
AccreditedSchools

SCHOOL ACCREDITATIONS
FSM Education Data Digest P a g e | 100
Figure 45: National Schools' Accreditation Level Percentages
Standard Performance Scores Nation Wide The following analysis shows for the whole nation the percentage of schools that does not meet, complies with, substantially complies and exceeds the accreditations standards for each standard and their respective criteria.
Analysis and Discussions To be done
0.00%
10.00%
20.00%
30.00%
40.00%
50.00%
60.00%
70.00%
Does not meet the accreditationstandard
Complies with the accreditationstandards
Substantially complies
Exceeds the accreditation standards

SCHOOL ACCREDITATIONS
FSM Education Data Digest P a g e | 101
Figure 46: National Leadership Score
Figure 47: National Teacher Performance Score
0 20 40 60 80
Leadership Criteria 1
Leadership Criteria 2
Leadership Criteria 3
Leadership Criteria 4
Exceeds the accreditationstandards
Substantially complies
Complies with the accreditationstandards
Does not meet the accreditationstandard
0 20 40 60 80
Teacher Performance Criteria1
Teacher Performance Criteria2
Teacher Performance Criteria3
Teacher Performance Criteria4
Exceeds the accreditationstandards
Substantially complies
Complies with the accreditationstandards
Does not meet the accreditationstandard

SCHOOL ACCREDITATIONS
FSM Education Data Digest P a g e | 102
Figure 48: National Data Management Scores
Figure 49: National NCSB Scores
0 20 40 60 80
Data Management Criteria 1
Data Management Criteria 2
Data Management Criteria 3
Data Management Criteria 4
Exceeds the accreditationstandards
Substantially complies
Complies with the accreditationstandards
Does not meet the accreditationstandard
0 20 40 60 80
National CurriculumStandards, Benchmarks andStudent Learning Outcomes
Criteria 1
National CurriculumStandards, Benchmarks andStudent Learning Outcomes
Criteria 2
National CurriculumStandards, Benchmarks andStudent Learning Outcomes
Criteria 3
National CurriculumStandards, Benchmarks andStudent Learning Outcomes
Criteria 4Exceeds the accreditationstandards
Substantially complies
Complies with the accreditationstandards
Does not meet the accreditationstandard
SCHOOL ACCREDITATIONS
FSM Education Data Digest P a g e | 103
Figure 50: National Facilities Scores
Figure 51: National School Improvement Planning
0 20 40 60 80
School Campus, Classroomsand Facilities Criteria 1
School Campus, Classroomsand Facilities Criteria 2
School Campus, Classroomsand Facilities Criteria 3
School Campus, Classroomsand Facilities Criteria 4
Exceeds the accreditationstandards
Substantially complies
Complies with the accreditationstandards
Does not meet the accreditationstandard
0 20 40 60 80
School Improvement PlanningCriteria 1
School Improvement PlanningCriteria 2
School Improvement PlanningCriteria 3
School Improvement PlanningCriteria 4
Exceeds the accreditationstandards
Substantially complies
Complies with the accreditationstandards
Does not meet the accreditationstandard

SCHOOL ACCREDITATIONS
FSM Education Data Digest P a g e | 104
Table 31: School Accreditation Form B Results
L 1 L 2 L 3 L 4 T 2 T 3 T 4 T 1 D 1
D 2
D 3
D 4
N 1
N 2
N 3
N 4 F 1 F 2 F 3 F 4 S 1 S 2 S 3 S 4
CO 1
CO 2
Chuuk 10
2 92 96 81 93 89 69 90 10
1 92 78 81 83 60 80 77 10
3 98 92 91 86 88 81 80 Berea Christian School 1 2 2 2 2 2 1 1 1 2 1 2 1 1 2 2 3 3 3 3 2 2 2 2 Chukuram Elementary School 1 2 3 2 2 2 1 2 2 2 1 1 2 1 2 1 3 3 2 2 1 1 1 1 Faichuk High School/Fason Elementary School 3 2 2 2 2 2 1 2 3 2 2 2 1 2 3 3 3 3 2 2 2 2 2 2 Fanapanges Elementary School 1 1 1 1 1 1 1 1 1 1 1 1 1 1 1 1 1 1 1 1 2 1 1 1 Fonoton Elementary School 4 3 4 3 3 3 3 3 4 3 3 3 2 3 3 2 3 3 2 2 4 4 4 4 Foup Elementary School 3 2 3 2 3 3 2 2 3 3 2 2 1 1 2 2 3 2 1 1 2 3 2 2 Halls Jr. High School/Fananu Elementary School 2 2 2 2 2 1 1 2 2 2 1 1 1 1 1 1 1 1 1 1 2 2 2 2 Houk Elementary School 2 1 2 1 1 1 1 1 2 1 1 1 1 1 1 1 1 1 1 1 1 1 1 1 Inaka Elementary School 1 1 1 1 2 2 1 2 2 1 1 1 2 1 2 2 1 2 2 2 1 1 1 1 Iras Demo Elementay School 2 2 2 1 2 2 1 1 1 1 1 1 2 1 2 2 2 2 2 2 1 1 1 1 Kuchu Elementary School 3 3 2 1 2 2 1 2 2 2 2 2 2 1 2 2 3 2 1 2 1 1 1 1 Kuttu Elementary School 1 1 1 1 1 2 1 1 1 1 1 1 1 1 1 1 1 1 1 1 1 1 1 1 Manaio Elementary School 1 1 2 1 1 1 1 1 2 1 1 1 1 1 1 1 2 3 2 1 1 1 1 1 Messa Elementary School 2 1 2 1 1 2 1 2 2 1 1 1 1 1 1 1 2 1 1 1 1 1 1 1 Munien/Nechocho Elementary School 2 1 2 1 1 1 2 2 2 2 1 1 2 1 1 1 2 1 1 2 2 2 1 1 Murilo Elementary School 2 2 2 2 1 1 1 2 1 1 1 1 1 1 1 1 2 1 1 2 2 2 2 2 Mwan Elementary School 3 2 2 2 2 2 2 2 2 2 2 2 2 1 2 1 2 2 3 1 2 3 2 1 Neauo Annex (Wichap) 2 2 2 2 2 2 1 2 3 2 3 3 2 1 2 2 3 2 3 2 2 2 2 2 Nechap Elementary School 3 2 2 2 3 3 2 2 2 3 2 2 2 1 2 1 3 2 1 1 1 1 1 1 Neirenomw Elementary School 1 1 2 1 1 1 1 2 2 1 1 1 1 1 1 2 2 2 1 1 1 1 1 1 Nomusofo JHS/Udot Elementary School 3 3 3 3 2 3 2 3 3 3 2 2 3 1 2 2 3 2 3 2 3 3 3 3 Nomwin Elementary School 3 3 2 2 3 1 2 2 3 3 2 2 2 1 2 2 3 3 3 3 3 3 2 2 Nukuno Christian High School 1 1 1 1 1 1 1 1 1 1 1 1 1 1 1 1 2 2 2 2 1 1 1 1 Nukuno Elementary School 2 2 2 1 2 1 1 2 2 2 1 1 2 1 1 1 2 2 2 1 2 1 1 1 P&P Elementary School 3 2 2 2 1 2 1 2 2 2 2 2 2 1 1 1 1 1 1 1 1 1 1 1 Panitiw Elementary School 3 2 2 1 2 2 1 2 1 1 1 1 2 1 2 1 2 3 3 3 1 1 1 1 Pattiw Jr. High School/Polowat Elementary School 2 2 2 1 2 2 1 1 2 1 1 1 2 1 2 1 1 1 1 2 2 2 2 2 Pentecostal Light House Academy 1 1 1 1 1 1 1 1 1 1 1 1 1 1 1 1 1 1 1 1 1 1 1 1

SCHOOL ACCREDITATIONS
FSM Education Data Digest P a g e | 105
L 1 L 2 L 3 L 4 T 2 T 3 T 4 T 1 D 1
D 2
D 3
D 4
N 1
N 2
N 3
N 4 F 1 F 2 F 3 F 4 S 1 S 2 S 3 S 4
CO 1
CO 2
Piherarh Elementary School 1 1 1 1 2 1 1 2 1 1 1 1 1 1 1 1 1 1 1 1 1 1 1 1 Piis Paneu Elementary School 1 1 1 1 2 1 1 2 1 1 1 1 1 1 1 1 1 1 1 1 1 1 1 1 Pollap & Tamatam Jr. High School/Pollap
Elementary School 3 2 2 2 3 2 1 2 3 3 2 3 2 1 2 1 3 3 3 3 2 3 2 2 Pwene Elementary School 3 3 3 2 2 2 2 2 3 3 1 2 2 1 1 2 1 2 1 2 2 2 2 2 Romanum Elementary School 3 3 3 2 3 3 3 2 3 3 2 3 3 2 2 2 2 3 2 3 2 3 2 2 Ruo Elementary School 3 2 2 2 2 1 1 2 2 2 2 2 1 1 1 1 2 2 1 2 2 2 2 2 Saint Cecilia School 1 2 1 2 1 1 1 1 3 2 2 1 1 2 1 1 3 3 3 3 1 1 1 1 Sapota Elementary School 1 1 1 1 1 1 1 1 2 2 1 1 2 1 1 1 1 1 1 2 1 1 1 1 Sapota Paata Elementary School 1 1 2 1 2 2 1 2 2 2 2 2 1 1 1 2 2 1 1 1 2 2 2 2 Sapuk Elementary School 3 3 2 3 2 3 2 3 3 3 2 2 3 1 2 2 2 2 3 2 2 2 2 2 Saramen Chuuk Academy 2 2 2 2 2 2 1 2 2 1 2 2 2 1 3 3 2 2 3 3 3 3 2 3 Seventh Days Adventist School 4 4 3 4 4 4 4 4 4 4 4 4 4 4 4 4 4 4 4 4 4 4 4 4 Siis Elementary School 3 3 3 2 2 2 1 2 2 2 2 2 1 1 1 2 1 1 1 1 2 2 2 2 Southern Namoneas High School 1 1 1 1 1 1 1 1 1 1 1 1 1 1 1 1 1 1 1 1 1 1 1 1 Southern Namoneas High School/Sapore
Elementary School 3 2 2 2 2 2 2 2 3 3 2 2 2 1 2 2 3 3 3 3 2 3 2 2 Tamatam Elementary School 3 2 2 2 3 2 1 2 2 2 2 2 2 1 2 2 3 3 3 2 3 3 3 3 Teruo Bokuku Elementary School 1 1 1 1 1 1 1 1 1 1 1 1 1 1 1 1 3 2 2 2 1 1 1 1 UFO Elementary School 1 2 2 1 2 2 2 1 1 1 1 1 2 1 2 1 2 2 2 2 1 1 1 1 West Fefen Elementary School 1 1 1 1 2 2 1 2 2 2 2 2 2 1 1 2 3 3 3 2 2 1 2 1 Wichukuno Elementary School 1 1 1 1 1 1 1 1 1 1 1 1 1 1 1 1 1 1 1 1 1 1 1 1 Xavier High School 4 4 4 4 4 4 4 4 4 4 4 4 4 4 4 4 4 4 4 4 4 4 4 4
Kosrae 19 18 14 17 16 17 15 17 16 15 17 18 19 18 14 19 16 16 18 13 17 16 15 14 6 6
Kosrae Seventh Day Adventist School 4 3 2 4 3 3 2 3 2 2 3 3 2 4 3 4 2 3 3 2 2 2 1 1 1 1
Lelu Elementary School 3 3 2 2 3 3 2 2 3 2 2 3 3 3 2 2 3 2 3 2 3 3 3 2 1 1
Malem Elementary School 3 3 2 2 3 3 3 3 2 2 3 3 4 4 3 4 2 2 3 3 3 3 3 2 1 1
Sansrik Elementary School 3 3 3 3 2 3 3 3 3 3 3 3 4 3 2 3 3 3 3 2 3 3 3 3 1 1
Tafunsak Elementary School 3 3 2 3 2 2 2 3 3 3 3 3 2 2 2 3 3 3 3 2 3 3 3 3 1 1
Utwe Elementary School 3 3 3 3 3 3 3 3 3 3 3 3 4 2 2 3 3 3 3 2 3 2 2 3 1 1
Pohnpei 92 85 96 91 99 92 83 96 78 78 71 83 11
6 85 91 80 10
2 95 97 98 10
2 91 81 86 39 39
Awak Elementary School 3 4 4 4 4 3 4 3 2 3 3 3 4 3 3 2 4 4 3 4 4 4 2 3 1 1
Calvary Christian Academy 3 2 2 2 3 3 2 2 3 2 2 2 2 4 4 2 3 2 4 3 2 1 1 1 1 1

SCHOOL ACCREDITATIONS
FSM Education Data Digest P a g e | 106
L 1 L 2 L 3 L 4 T 2 T 3 T 4 T 1 D 1
D 2
D 3
D 4
N 1
N 2
N 3
N 4 F 1 F 2 F 3 F 4 S 1 S 2 S 3 S 4
CO 1
CO 2
Enipein Elementary School 3 3 3 3 3 3 3 3 2 2 3 2 3 3 2 2 2 2 2 2 3 2 2 2 1 1
ESDM Elementary School 2 2 2 2 3 2 2 3 2 2 2 2 3 2 3 3 3 3 3 3 3 3 2 3 1 1
Kapingamarangi Elementary School 1 1 1 2 1 2 1 1 2 1 1 1 1 1 2 2 1 1 1 1 2 2 2 1 1 1
Kolonia Elementary School 2 2 3 2 3 3 2 3 2 1 1 2 3 2 2 2 3 2 2 2 3 3 2 2 1 1
Lewetik Elementary School 1 1 1 1 1 1 1 1 1 1 1 2 3 2 2 2 2 2 2 1 2 2 2 2 1 1
Lukop Elementary School 3 2 2 2 3 2 2 3 2 2 2 3 4 2 2 2 3 3 3 3 3 2 2 2 1 1
Madolenihmw High School 1 2 3 3 3 2 2 2 1 1 1 2 3 2 2 2 4 2 1 2 3 2 1 2 1 1
Mand Elementary School 2 1 3 3 2 1 3 2 2 1 1 1 3 1 2 1 2 2 2 2 2 2 2 2 1 1
Mwoakilloa Elementary School 1 1 1 1 1 1 1 1 1 1 1 1 1 1 1 1 1 1 1 1 1 1 1 1 1 1
Nanpei Memorial High School 3 2 2 2 3 3 2 3 2 2 2 2 2 2 3 2 3 3 3 3 2 3 3 3 1 1
Nanpei Memorial School 3 2 3 3 3 3 3 3 2 3 2 2 4 2 2 2 3 2 2 3 3 2 2 3 1 1
Nett Elementary School 3 2 3 2 3 3 2 3 2 2 2 4 4 2 2 3 4 4 3 3 3 3 3 3 1 1
Nukuoro Elementary School 1 2 2 1 1 2 1 1 1 1 1 2 3 2 3 2 2 2 2 2 2 2 2 2 1 1
Ohmine Elementary School 3 3 3 3 4 3 3 3 3 4 3 4 4 3 4 1 4 4 3 4 4 4 3 3 1 1
Ohwa Christian School 3 3 3 3 2 2 2 2 2 2 2 2 3 2 2 4 2 3 2 3 3 3 3 3 1 1
Our Lady of Mercy Catholic High School 4 3 4 4 4 4 4 4 3 4 3 2 3 4 4 4 4 4 4 3 4 4 2 4 1 1
Pakein Elementary School 1 1 1 1 1 1 1 1 1 1 1 1 1 2 2 1 1 3 2 2 2 1 2 1 1 1
Palikir Elementary School 2 2 2 2 3 3 3 3 2 2 2 2 3 2 2 2 4 3 3 3 2 2 2 2 1 1
Parem Elementary School Pohnpei 1 2 2 2 3 2 1 2 1 1 1 2 3 2 2 1 1 2 2 2 3 2 2 2 1 1
Pehleng Elementary School 2 1 3 3 3 3 2 3 2 2 1 2 3 2 2 1 3 2 2 3 2 2 2 2 1 1
PICS High School 2 2 2 2 2 2 1 3 2 1 2 1 3 2 2 2 3 1 1 2 2 2 1 1 1 1
Pingelap Elementary School 1 2 2 2 2 2 2 2 2 2 1 2 3 1 2 2 2 1 3 1 2 2 1 1 1 1
Pohnlangas Elementary School 4 3 4 3 3 3 3 2 4 2 2 3 4 2 2 2 3 2 3 2 2 2 2 2 1 1
Pohnpei Catholic School 3 2 3 2 4 4 2 3 2 2 2 2 4 3 4 3 3 3 3 4 3 3 4 3 1 1
Pohnpei St. Paul Christian 3 2 2 2 2 2 2 2 2 2 2 2 2 2 3 2 2 2 2 2 2 2 2 1 1 1
Rohi Elementary School 3 3 4 3 3 3 3 3 2 2 2 3 3 4 2 2 3 3 3 2 4 3 2 3 1 1
RSP Elementary School 2 2 2 1 2 2 2 2 2 2 1 2 2 2 2 2 2 2 3 2 3 2 2 3 1 1
Saladak Elementary School 2 3 2 2 3 2 2 3 2 2 2 2 4 2 2 2 3 3 3 4 3 3 2 2 1 1
Salapwuk Elementary School 1 2 2 2 2 1 1 2 1 1 2 1 3 2 2 2 2 3 2 2 1 1 1 1 1 1
Sapwalap Elementary School 3 4 4 4 3 3 4 4 2 4 4 4 3 2 2 2 3 3 3 4 4 4 4 4 1 1
Sapwuafik Elementary School 3 2 1 2 2 2 2 2 2 2 2 2 4 2 2 2 3 2 2 1 2 2 2 2 1 1
Seinwar Elementary School 3 2 2 3 3 3 2 3 3 2 2 2 3 2 2 2 2 2 3 3 3 2 2 3 1 1
SCHOOL ACCREDITATIONS
FSM Education Data Digest P a g e | 107
L 1 L 2 L 3 L 4 T 2 T 3 T 4 T 1 D 1
D 2
D 3
D 4
N 1
N 2
N 3
N 4 F 1 F 2 F 3 F 4 S 1 S 2 S 3 S 4
CO 1
CO 2
Sekere Elementary School 4 3 3 3 2 3 2 2 3 3 2 3 4 2 2 3 4 2 3 3 4 4 3 4 1 1
Sokehs Powe Elementary School 2 3 3 3 2 2 2 3 2 3 2 3 3 2 2 1 3 2 3 3 2 2 3 2 1 1
Temwen Elementary School 3 2 2 3 3 2 2 2 2 3 2 2 2 3 3 2 2 3 3 3 3 2 2 2 1 1
Wapar Elementary School 3 3 3 2 2 2 3 3 2 2 2 2 3 2 2 3 2 3 3 3 3 2 2 2 1 1
Wone Elementary School 2 1 2 1 2 2 1 3 2 2 1 1 3 2 2 2 1 2 2 2 1 1 1 1 1 1
Yap 10
7 10
5 98 98 10
8 10
7 10
0 11
0 11
1 10
8 10
3 10
5 11
3 91 10
0 10
6 10
6 10
4 10
2 10
7 12
1 11
9 11
3 11
9 41 24
Bael Elementary School 3 2 2 2 1 2 1 2 3 3 1 3 3 1 3 2 2 3 3 3 3 3 3 3 1 1
Colonia Middle School 3 3 3 3 3 3 3 3 3 3 3 3 3 3 3 3 3 3 3 3 3 3 3 3 1 1
Dalipebinaw ECE Center 2 3 2 1 3 2 1 3 3 3 2 2 3 2 2 3 3 3 3 3 2 2 2 2 1
Dalipebinaw Elementary School 2 3 2 1 3 2 1 3 3 3 2 2 3 2 2 3 3 3 3 3 2 2 2 2 1
Eauripik ECE Center 2 2 2 2 2 2 2 2 2 2 2 2 2 2 2 2 2 1 1 1 3 3 2 3 1
Eauripik Elementary School 3 2 2 2 2 3 3 3 2 2 2 3 3 2 2 2 1 1 1 2 3 3 2 3 1 1
Elato ECE Center 2 2 2 2 2 2 2 2 2 2 2 2 2 2 2 2 2 2 2 2 3 3 2 3 1
Elato Elementary School 3 2 2 2 2 2 2 3 2 2 2 3 3 2 2 2 2 2 3 3 3 3 2 3 1 1
Fais ECE Center 2 2 2 2 2 2 2 2 2 2 2 2 2 2 2 2 2 2 2 2 3 3 3 3 1
Fais Elementary School 3 3 2 3 3 3 3 3 3 3 3 3 3 2 2 3 3 3 3 3 3 3 3 3 1 1
Falachig ECE Center 3 2 2 2 3 3 2 3 3 3 3 2 2 2 2 2 3 2 2 3 3 3 3 3 1
Falalis ECE Center 2 2 2 2 2 3 3 2 2 2 2 2 3 2 2 2 2 2 2 2 3 2 3 3 1
Falalis Elementary School 2 3 2 2 2 3 2 2 3 2 3 2 3 2 3 2 3 3 3 2 3 2 3 3 1 1
Falalop Ulithi Elementary School 3 2 2 3 3 3 3 3 3 2 3 3 3 2 2 3 3 3 2 3 3 3 3 3 1 1
Falalop Woleai ECE Center 2 2 2 2 2 2 2 2 2 2 2 2 2 2 2 2 2 2 2 2 3 3 3 3 1
Faraulap Elementary School 3 3 3 3 3 3 3 3 3 3 3 3 3 2 2 3 3 2 2 3 3 3 3 3 1 1
Gaanelay Elementary School 3 3 3 3 3 3 3 3 3 3 3 3 3 3 3 3 3 3 3 3 3 3 3 3 1 1
Gagil ECE Center 2 2 2 2 2 2 2 2 2 2 2 2 2 2 2 2 2 2 2 2 3 3 3 3 1
Gagil Elementary School 3 3 3 3 3 3 3 3 3 3 3 3 3 2 3 3 3 3 3 3 3 3 3 3 1 1
Gilman ECE Center 2 3 2 2 3 2 3 3 3 3 2 2 3 2 3 3 3 3 3 3 3 3 3 3 1
Gilman Elementary School 3 3 2 3 3 3 3 3 3 3 3 3 3 2 3 3 3 3 3 3 3 3 3 3 1 1
Ifalik Elementary School 3 2 2 3 3 3 3 3 3 2 3 3 3 2 2 3 3 3 3 3 3 3 3 3 1 1
Kanifay ECE Center ** 3 3 3 1 3 2 1 3 3 3 2 2 3 2 3 3 3 3 3 3 3 3 3 3 1
Kanifay Elementary School 3 3 3 3 3 3 3 3 3 3 3 3 3 2 3 3 2 2 2 2 3 3 3 3 1 1
Lamotrek ECE Center 2 2 2 2 2 2 2 2 2 3 2 2 2 2 2 2 2 2 2 2 3 3 3 3 1
Lamotrek Elementary School 3 3 3 3 3 3 3 3 3 3 3 3 3 3 2 3 2 2 2 2 3 3 3 3 1 1

SCHOOL ACCREDITATIONS
FSM Education Data Digest P a g e | 108
L 1 L 2 L 3 L 4 T 2 T 3 T 4 T 1 D 1
D 2
D 3
D 4
N 1
N 2
N 3
N 4 F 1 F 2 F 3 F 4 S 1 S 2 S 3 S 4
CO 1
CO 2
Maap ECE Center 2 2 2 2 3 3 3 3 3 3 3 2 3 3 2 2 2 3 2 3 3 3 3 3 1
Maap Elementary School 3 3 3 3 3 3 3 3 3 3 3 3 3 2 3 3 3 3 3 3 3 3 3 3 1 1
North Fanif Elementary School 3 3 3 3 3 3 3 3 3 3 3 3 3 3 3 3 3 3 3 3 3 3 3 3 1 1
Piig ECE Center 2 2 2 2 2 2 2 2 2 2 2 2 2 2 2 2 2 2 1 1 3 3 2 3 1
Piig Elementary School 3 2 2 2 2 2 2 2 2 2 2 3 3 2 2 2 2 2 2 2 3 3 2 3 1 1
Rawaii ECE Center 2 2 2 2 3 2 2 3 2 2 2 2 2 2 2 2 2 2 2 2 3 3 3 3 1
Seliap Elementary School 3 3 3 3 3 3 3 3 3 3 3 3 3 2 3 3 3 3 3 3 3 3 3 3 1 1
St. Mary's School 3 3 3 3 2 2 2 2 3 3 3 3 3 3 3 3 3 3 3 3 3 3 3 3 1 1
Tamilang ECE Center 2 2 2 2 3 3 2 3 3 3 2 2 3 3 2 3 3 3 3 3 3 3 3 3 1
Tamilang Elementary School 3 3 3 3 3 3 3 3 3 3 3 3 3 2 3 3 3 3 3 3 3 3 3 3 1 1
Wottegai ECE Center 2 2 2 2 2 2 2 2 2 2 2 2 2 2 2 2 2 1 1 2 3 3 2 2 1
Wottegai Elementary School 3 3 3 3 3 4 3 3 3 3 3 3 3 3 2 3 3 3 3 3 3 3 2 2 1 1
Yap Catholic High School 4 4 4 4 4 4 4 4 4 4 4 4 4 4 4 4 4 4 4 4 4 4 4 4 1 1
Yap High School 3 4 3 3 3 3 3 3 3 3 3 3 3 2 3 3 3 3 3 3 3 3 3 3 1 1
Yap Seventh Day Adventist School 2 2 2 2 3 2 2 2 3 2 2 2 2 2 3 2 3 3 3 3 2 2 2 2 1 1
Grand Total 32
0 30
0 30
4 28
7 31
6 30
5 26
7 31
3 30
6 29
3 26
9 28
7 33
1 25
4 28
5 28
2 32
7 31
3 30
9 30
9 32
6 31
4 29
0 29
9 86 69
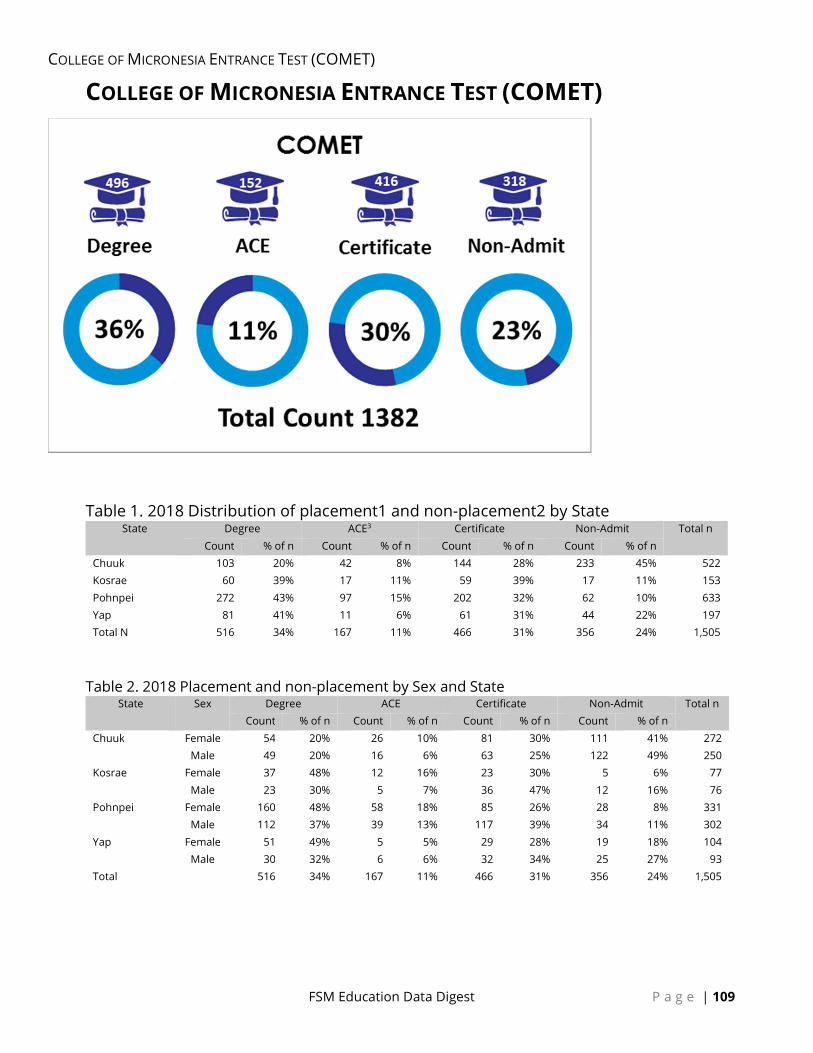
COLLEGE OF MICRONESIA ENTRANCE TEST (COMET)
FSM Education Data Digest P a g e | 109
COLLEGE OF MICRONESIA ENTRANCE TEST (COMET)
Table 1. 2018 Distribution of placement1 and non-placement2 by State State Degree ACE3 Certificate Non-Admit Total n
Count % of n Count % of n Count % of n Count % of n Chuuk 103 20% 42 8% 144 28% 233 45% 522 Kosrae 60 39% 17 11% 59 39% 17 11% 153 Pohnpei 272 43% 97 15% 202 32% 62 10% 633 Yap 81 41% 11 6% 61 31% 44 22% 197 Total N 516 34% 167 11% 466 31% 356 24% 1,505
Table 2. 2018 Placement and non-placement by Sex and State State Sex Degree ACE Certificate Non-Admit Total n
Count % of n Count % of n Count % of n Count % of n Chuuk Female 54 20% 26 10% 81 30% 111 41% 272
Male 49 20% 16 6% 63 25% 122 49% 250 Kosrae Female 37 48% 12 16% 23 30% 5 6% 77
Male 23 30% 5 7% 36 47% 12 16% 76 Pohnpei Female 160 48% 58 18% 85 26% 28 8% 331
Male 112 37% 39 13% 117 39% 34 11% 302 Yap Female 51 49% 5 5% 29 28% 19 18% 104
Male 30 32% 6 6% 32 34% 25 27% 93 Total 516 34% 167 11% 466 31% 356 24% 1,505

EXAMS
FSM Education Data Digest P a g e | 110
EXAMS Exams data herein is processed and retrieved from the FedEMIS. It is not the complete dataset and some work is still in progress to improve this and load all this year’s exams raw data. The source data comes from the NMCT database. It has until now been exported to an excel spreadsheet but the NDOE is in the process of loading this into the FedEMIS for further processing and integration with other data such as teacher and their qualifications.
Exams Results for Nation-wide Performance by Benchmarks This subsection’s analysis shows how the whole nation performs on each benchmark of the NMCT exams.
To be done
Exam Results for Recent Years by Standards This subsection’s analysis shows the performance of the whole nation throughout recent years in all the standards of the NMCT exams.
Exams Results Comparing States This subsection’s analysis shows the performance of states against for all the standards of the NMCT exams.
NMCT Overall Performance Trend
The FSM National Minimum Competency Test (NMCT) is a standards-based assessment tool that allows to measure students’ level of learning with respect to standards and benchmarks in Language Arts and Mathematics. The reporting of the NMCT results will be analyzed based on an increase of 2% target each year against the set baseline data to show whether students understand the basic concepts and can do the basic skills on the standards and benchmarks.
Sixth Grade Reading Results The chart below shows gradual improvement over the years in grade six reading. It is very evident that students’ level of understanding of the benchmarks is substantially improving. Although the second-year result did not meet the two percent (2%) target, the performance level is still above the set baseline data. The current result, 2017-2018 is significantly showing 4% increase from the baseline, and interestingly the 35% target is achieved.

EXAMS
FSM Education Data Digest P a g e | 111
Chart No. 1: Grade 6th - Percent of benchmarks meeting or exceeding the expected level of performance
Note: Grade six data is Incomplete in school year 2014-2015.
These results suggest the need to continually improve students learning outcomes on the basic concepts and skills on the standards and benchmarks throughout the grade levels. It is very obvious that the lower grades, if mastering the basic skills and concepts, learning will improve throughout the rest of the grade levels.
31% 32%35%
31%33%
35%
0%
5%
10%
15%
20%
25%
30%
35%
40%
2015-2016 2016-2017 2017-2018
NMCT Reading Trend
6th Reading Target 2%

EXAMS
FSM Education Data Digest P a g e | 112
Eighth Grade Reading Results Compared to the results at fourth grade, student performance in reading is below the benchmark in three consecutive years with almost no progress over the three years. A slight increase of 1% is recorded in the last year but that is quite insignificant, given that the gap to the target is 12% point.
Chart No. 2: Grade 8th - Percent of benchmarks meeting or exceeding the expected level of performance
Tenth Grade Reading Results Results of reading test at grade 10 shows some steady progress and also higher percent of students already meeting the benchmark. Percent of students meeting the benchmarks has exceeded the target in last three years with an increase of almost 7% points in the year 2017-18.
Chart No. 3: Grade 10th - Percent of benchmarks meeting or exceeding the expected level of performance
35%
28% 28% 29%35% 37% 39% 41%
0%
10%
20%
30%
40%
50%
2014-2015 2015-2016 2016-2017 2017-2018
NMCT Reading Trend
8th Reading Target 2%
35%39%
45%48%
35% 37% 39% 41%
0%
10%
20%
30%
40%
50%
60%
2014-2015 2015-2016 2016-2017 2017-2018
NMCT Reading Trend
10th Reading Target 2%
EXAMS
FSM Education Data Digest P a g e | 113
The overall trend in reading competencies indicates that less than 50% of the students are meeting the reading benchmarks. Percentage of students meeting the reading benchmarks is even lowest at lower grades than at the higher grades. Suggest that there’s need to focus more into lower grades to improve their reading competencies.

EXAMS
FSM Education Data Digest P a g e | 114
Fourth Grade Math Results
Fourth graders math competency is relatively better than reading competency. Percent of students meeting the benchmarks are higher than the target for last two consecutive years. However, it is generally low in all three years with only about 33% of students meeting or exceeding the benchmarks at grade four.
Chart No. 4: Grade 4th - Percent of benchmarks meeting or exceeding the expected level of performance
Note: Grade four data is Incomplete in school year 2015-2016.
Sixth Grade Math Results Students at grade six has also been able to record slightly higher percentage of them meeting the benchmarks compared to the target in last three consecutive years. However, the increments are only marginal and that the overall percentage has remained below 30%.
Chart No. 5: Grade 6th - Percent of benchmarks meeting or exceeding the expected level of performance
25%
30%33%
25%27%
29%
0%
5%
10%
15%
20%
25%
30%
35%
2014-2015 2016-2017 2017-2018
NMCT Math Trend
4th Math Target 2%
21%
25% 26%29%
21%23%
25%27%
0%
5%
10%
15%
20%
25%
30%
35%
2014-2015 2015-2016 2016-2017 2017-2018
6th Math Target 2%
EXAMS
FSM Education Data Digest P a g e | 115

EXAMS
FSM Education Data Digest P a g e | 116
Eighth Grade Math Results The math results at grade eight reveals weak performance of student compared to grade four. Students have not been able to meet the math benchmarks in the all three consecutive years. While there has been a steady improvement from one year to the other but it is quite insignificant. More importantly, the overall percent of students meeting the benchmarks is only 22%, which is about 6% less than the target.
Chart No. 6: Grade 8th - Percent of benchmarks meeting or exceeding the expected level of performance
Tenth Grade Math Results The result of math test score reveals further gap in percent of students meeting the benchmarks. The gap is almost 9% between the target and percent of students meeting the benchmark in math skills.
Chart No. 7: Grade 10th - Percent of benchmarks meeting or exceeding the expected level of performance
22%20% 21% 22%22%24%
26%28%
0%
5%
10%
15%
20%
25%
30%
2014-2015 2015-2016 2016-2017 2017-2018
8th Math Target 2%
25%
21% 22% 22%25%
27%29%
31%
0%
5%
10%
15%
20%
25%
30%
35%
2014-2015 2015-2016 2016-2017 2017-2018
NMCT Math Trend
10th Math Target 2%
EXAMS
FSM Education Data Digest P a g e | 117
The overall trends in math competency is that students have done relatively better in junior grades compared to their counterparts in higher grades. This is just opposite to what has been the case with reading skills. Students are better in reading competencies at their higher grades. One of the possible reason could be that math contents and skills becomes heavier in higher grades, while students develop reading habit and skills as they progress to higher grade.

FSM Education Data Digest P a g e | 118
FINANCIAL To be done
APPENDIX A. SCHOOLS STANDARDS, CRITERIA AND LEVELS
FSM Education Data Digest P a g e | 119
APPENDIX A. SCHOOLS STANDARDS, CRITERIA AND LEVELS Include school accreditation standard criteria and levels descriptions.
FSM Education Data Digest P a g e | 120
REFERENCES FSM National Department of Education. (2016). FSM Teacher Certification Policy.
Palikir: NDOE.
Hachey, G., Weital, W., & Syne, D. (2018, February 15). FedEMIS Workplan Medium to Long Term. Palikir, Pohnpei, Federated States of Micronesia.
Hachey, G., Weital, W., & Syne, D. (2018, February 16). FedEMIS Workplan Phase 1. Palikir, Pohnpei, Federated States of Micronesia.
UNESCO Institute for Statistics. (2009). Education Indicators Technical Guidelines. United Nation, Educational, Scientific and Cultural Organization (UNESCO).