Hong Kong Annual Digest of Statistics (1991 Edition)
306
這份刊物的 PDF 版本的文字是從印刷版掃描而成,再利用光學字符識別軟 件轉換成電子格式。由於原印刷版本已印製並保存多年,光學字符識別技 術未必能準確地識別某些文字或數字。因此,搜索或複製此 PDF 檔案內的 文字時應加以注意。 The text of this PDF publication was scanned from its printed version and then converted to electronic text using Optical Character Recognition (OCR) software. Because of the age and condition of the original printed copy, the OCR may not recognise certain characters or figures accurately. Caution should therefore be taken when searching or copying text from this PDF publication.
-
Upload
khangminh22 -
Category
Documents
-
view
0 -
download
0
Transcript of Hong Kong Annual Digest of Statistics (1991 Edition)

這份刊物的 PDF 版本的文字是從印刷版掃描而成,再利用光學字符識別軟
件轉換成電子格式。由於原印刷版本已印製並保存多年,光學字符識別技
術未必能準確地識別某些文字或數字。因此,搜索或複製此 PDF 檔案內的
文字時應加以注意。 The text of this PDF publication was scanned from its printed version and then converted to electronic text using Optical Character Recognition (OCR) software. Because of the age and condition of the original printed copy, the OCR may not recognise certain characters or figures accurately. Caution should therefore be taken when searching or copying text from this PDF publication.


Hong Kong Annual
Digest of Statistics
1991 Edition
Census and Statistics Department, Hong Kong

\
PRINTED AND PUBLISHED BY THE GoVERNMENT PRINTER, HONG KONG

Foreword
The purpose of this annual publication is to bring together in one volume some of the
more important statistical series on Hong Kong, compiled by the Census and Statistics
Department and by other government departments and organizations. Wherever
possible, data are presented for the ten years 1981 to 1990.
The Census and Statistics Department hopes that this publication will meet the need for
up-to-date and comprehensive statistics on social and economic developments in Hong
Kong. Suggestions for improvement will be most welcome.
BENJAMIN MOK Commissioner for Census and Statistics
December 1991


Introduction
The Hong Kong Annual Digest of Statistics is prepared by the Census and Statistics Department in collaboration with other government departments and organizations. The names of the departments or organizations providing the statistics are given as sources under each table. Some of the statistics compiled by the Census and Statistics Department are actually collected by other government departments or organizations. The Census and Statistics Department gratefully acknowledges such contributions from these departments/organizations.
This publication covers annual series of social and economic data of Hong Kong for the period from 1981to1990 as far as data are available. Monthly series for some of the data in the Annual Digest are available in the publication Hong Kong Monthly Digest of Statistics published by the Census and Statistics Department.
Explanatory Notes
Wherever possible and appropriate, the explanatory notes preceding each Section are divided into five main topics, covering the following information:-
(i) General Information-It outlines main topics included in the Section and some background information on the data or contributing departments/organizations.
(ii) Concepts and Definitions-It describes the terms, concepts and definitions pertaining to the tables, including changes in definitions, and classifications adopted.
(iii) Data Sources-It provides information on the surveys/statistical systems for collecting data, including a brief introduction to the survey coverage, reference period and data collection method.
(iv) Compilation and Calculation-It provides reference information on main stages of the calculation procedures,· systematic revisions and seasonal adjustments. It also provides a brief description of the estimation methods.
(v) Further References-It gives the titles of the publications in which further information on the methodology and detailed statistics can be found.
Revisions and Changes in Content
The Hong Kong Annual Digest of Statistics is revised from time to time to include new statistical information as it becomes available and to improve the format of the publication and table content as far as applicable.
Conventions and Symbols
Rounding of figures-In tables where figures have been rounded to the nearest final digit, there may be an apparent discrepancy between the sum of the constituent items and the total as shown.
Financial year-The symbol/ represents financial year. Thus 1990/91 means the financial year starting on 1April1990 and ending on 31March1991.
Symbols-The following symbols have been used throughout this edition .
. . =not available
-=nil or not applicable
iii

iv
Units of Measurement
1 terajoule (TJ) 277 778 kilowatt hours 9 478.17 therms
1 tonne (t) 2 204.62 pounds 0.984 207 ton
1 kilogram (kg) 2.204 62 pounds 1.653 47 catties
1 kilometre (km) 0.621 mile
1 square kilometre (km2 ) 0.386 square mile
1 square metre (m2 ) 10.763 9 square feet
1 cubic metre (m3) 219.969 imperial gallons
1 hectopascal millibar
1 km/h 0.54 knot
Values
Unless otherwise specified, all values quoted in this publication are in Hong Kong dollars.
Exchange Rate
The official rate for conversion of Hong Kong dollars to US dollars was HK$5.085 = US$1.00 until 25 November 1974. The Hong Kong dollar floated on 26 November 1974. As from 17 October 1983, the Hong Kong dollar was linked to US dollar through a new arrangement in the note-issue mechanism at a fixed exchange rate ofHK$7.80= US$1.00.

Section I
*1.1
*1.2
1.3
1.4
1.5
Section 2
*2.1
*2.2
*2.3
2.4
2.5
2.6
*2.7
*2.8
*2.9
*2.10
2.11
2.12
2.13
2.14
2.15
2.16
Section 3
*3.1
*3.2
3.3
3.4
3.5
*3.6
*3.7
*3.8
3.9
3.10
3.11
3.12
3.13
3.14
3.15
3.16
Contents
Foreword
Introduction
Climate and Geography
Climatological normals (1961-1990)
Climatological summary, 1990
Summary of meteorological observations
Area of Hong Kong in 1990 by district board
Land utilization in urban and rural areas
Population and Vital Statistics
Resident population, 1911-1991 Censuses
Resident population by broad area, 1971-1991 Censuses
Density ofresiden't population by district board district, 1981-1991 Censuses
Population aged 15 and over by age, marital status and sex, 1971-1991 Censuses
Domestic households by district board district, 1981-1991 Censuses
Domestic households by household size, 1971-1991 Censuses
Domestic households by monthly household income, 1971-1991 Censuses
Working population by activity status, 1971-1991 Censuses
Estimated mid-year population and growth rates
Estimated mid-year population by age group by sex
Total live births by age of mother
Total live births by birth order
Total deaths by age group by sex
First marriages registered by sex by age group
Marriages registered by age group of bridegroom and bride
Divorce statistics
Labour
Labour force and labour force participation rate by age group by sex
Unemployment and unemployment rate by age group and sex
Labour force by occupation, 1990
Labour force by industry, 1990
Labour force by activity status, 1990
Working population by occupation, sex and educational attainment, 1991 Census
Working population by occupation, sex and activity status, 1991 Census
Working population by industry, sex and activity status, 1991 Census
Establishments and persons engaged in the Civil Service and private sectors by major division
Establishments in the private sector by industry group
Persons engaged in the private sector by industry group
Establishments and persons engaged in selected major divisions by employment size
Establishments in selected major divisions by census district
Persons engaged in selected major divisions by census district
Reported vacancies in the Civil Service and private sectors by industry group
Nominal and real indexes of payroll per person engaged by industry group
*New or revised table in this edition.
Page
iii
3
3
4
4
5
7
11
11
12
13
14
15
15
16
16
17
18
18
19
20
21
21
23
31
31
32
32
32
33
33
34
34
35
36
37
39
41
43
44
v

vi
Page
3.17 Wage indexes by industry 45 3.18 Average daily wages of workers engaged in government building and construction
projects by occupation 46 3.19 Salary index (A) by major divisions by company size 47 3.20 Salary index (B) by major divisions by company size 47 3.21 Reported occupational accidents by cause 48 3.22 Stoppages of work by major divisions 48
Section 4 Industrial Production 49 4.1 Principal statistics for all establishments classified by industrial activity, 1989 Survey
of Industrial Production 53 4.2 Principal statistics for all manufacturing establishments analysed by industry group,
1989 Survey oflndustrial Production 53 4.3 Principal statistics for all manufacturing establishments analysed by number of
persons engaged, 1989 Survey oflndustrial Production 54 4.4 Principal statistics for all manufacturing establishments analysed by value of gross
output, 1989 Survey of Industrial Production 54 4.5 Principal statistics for all manufacturing establishments analysed by value added,
1989 Survey oflndustrial Production 54 4.6 Comparison of selected principal statistics for all manufacturing establishments
analysed by broad industry group, 1980-1989 55 *4.7 Indexes of industrial production 58 4.8 Textile production statistics 59 4.9 Mining, cement and quarry production 60 4.10 Electricity, gas and water consumption 60
Section 5 Distributive Trades, Transport and Services 61 5.1 Principal statistics for all establishments classified by activity, 1989 Survey of
Wholesale and Retail Trades, Restaurants and Hotels 69 5.2 Principal statistics for all establishments classified by activity and analysed by
number of persons engaged, 1989 Survey of Wholesale and Retail Trades, Restaurants and Hotels 70
5.3 Principal statistics for all establishments classified by activity and analysed by sales and other receipts, 1989 Survey of Wholesale and Retail Trades, Restaurants and Hotels 71
5.4 Principal statistics for all establishments classified by activity and analysed by value added, 1989 Survey of Wholesale and Retail Trades, Restaurants and Hotels 72
5.5 Comparison of principal statistics for all establishments in the wholesale and retail trades, restaurant and hotel sectors classified by activity and major group, 1983-1989 73
5.6 Principal statistics for all establishments classified by major group and analysed by number of persons engaged, 1989 Survey of Transport and Related Services 77
5. 7 Principal statistics for all establishments classified by major group and analysed by business receipts and other income, 1989 Survey of Transport and Related Services 79
5.8 Principal statistics for all establishments classified by major group and analysed by value added, 1989 Survey of Transport and Related Services 81
5.9 Comparison of principal statistics for all transport establishments, 1983-1989 83 5.10 Principal statistics for all establishments in the storage, communication, financing
and business services sectors classified by sector and analysed by number of persons engaged, 1989 Survey of Storage, Communication, Financing, Insurance and Business Services 85
5.11 Principal statistics for all establishments in the storage, communication, financing and business services sectors classified by sector and analysed by business receipts and other income, 1989 Survey of Storage, Communication, Financing, Insurance and Business Services 86
5.12 Principal statistics for all establishments in the storage, communication, financing and business services sectors classified by sector and analysed by value added, 1989 Survey of Storage, Communication, Financing, Insurance and Business Services 87
*New or revised table in this edition.

5.13
5.14
5.15
*5.16
5.17
5.18
Section 6
6.1
6.2
6.3
6.4
6.5
6.6
6.7
6.8
6.9
6.10
6.11
6.12
6.13
6.14
6.15
6.16
Section 7
*7.1
*7.2
7.3
7.4
7.5
7.6
7.7
7.8
Section 8
*8.1
*8.2
*8.3
*8.4
Principal statistics for all establishments in the insurance sector analysed by number of persons engaged, 1989 Survey of Storage, Communication, Financing, Insurance and Business Services
Principal statistics for all establishments in the insurance sector analysed by income and receipts, 1989 Survey of Storage, Communication, Financing, Insurance and Business Services
Comparison of principal statistics for all establishments in the storage, communication, financing, insurance and business services sectors, 1983-1989
Summary statistics from the Annual Survey of Banks, Deposit-taking Companies and Representative Offices of Foreign Banks for 1980-1989
Value and volume indexes of retail sales by trade groups/selected trades
Value and volume indexes of restaurant receipts by type of restaurant
External Trade
Overseas merchandise trade
Trade by area
Trade by main country
Trade by Standard International Trade Classification Commodity Section
Imports, re-exports and retained imports by end-use
Imports by end-use category
Imports by end-use by main supplier
Domestic exports by industrial origin
Domestic exports of principal commodities by main market
Re-exports of principal commodities by main country of destination
Re-exports of principal commodities by main country of origin
Trade indexes
Unit value indexes and quantum indexes of domestic exports by principal commodity
Unit value indexes and quantum indexes of imports and re-exports by end-use
Unit value indexes and quantum indexes of imports by main supplier
Unit value indexes and quantum indexes of domestic exports by main market
Gross Domestic Product
Expenditure on the gross domestic product
Main components of gross domestic product
Implicit price deflators of gross domestic product and its components
Composition of private consumption expenditure
Composition of government consumption expenditure
Composition of gross domestic fixed capital formation analysed by public/private sector
Composition of imports and exports of goods and services at current market prices
Gross domestic product at current prices by economic activity
Public Finance
Government's reserve balances (general revenue account and funds)
Actual revenue (general revenue account and funds)
Actual expenditure (general revenue account and funds)
Size of the Civil Service
*New or revised table in this edition.
Page
88
88
89
90
92
92
93
95
95
96
96
97
97
98
98
99
100
101
102
103
104
105
105
107
109
109
110
111
112
113
114
116
117
119
119
120
120
vii

viii
Section 9 Money, Banking and Finance
9.1 Money supply
9.2
9.3
9.4
*9.5
9.6
9.7
*9.8
*9.9
9.10
9.11
9.12
9.13
*9.14
Section 10
10.1
10.2
10.3
*10.4
Section 11
11.1
11.2
11.3
11.4
11.5
11.6
11.7
Section 12
12.1
12.2
12.3
12.4
*12.5
12.6
12.7
12.8
12.9
12.10
12.11
12.12
12.13
12.14
12.15
12.16
12.17
12.18
Deposits from customers
Money supply and deposits from customers adjusted for foreign currency swap deposits
Balance sheets: licensed banks
Balance sheets: restricted licence banks
Balance sheets: deposit-taking companies
Analysis of loans and advances for use in Hong Kong
Money markets
Foreign currency positions
Interest rates charged and bank cheques cleared
Exchange rates and the effective exchange rate indexes
Value of stock exchange turnover and index of share prices
Gold and silver exchange trading prices
Futures exchange turnover
Prices and Household Expenditure
Average retail prices of selected foodstuffs
Average wholesale prices of selected foodstuffs
Consumer price indexes (October 1984-September 1985=100)
Household expenditure pattern by monthly expenditure group, Household Expenditure Survey 1989-90
Food Supplies
Food supplies
Estimated local production of foodstuffs
Imports of foodstuffs
Imported vegetables sold through Cheung Sha Wan Imported Vegetable Market
Poultry sold through Cheung Sha Wan Temporary Wholesale Poultry Market
Fresh marine fish sold through the Fish Marketing Organization
Salted/dried marine fish sold through the Fish Marketing Organization
Transport, Communications and Tourism
Movements of aircrafts, ocean-going and other vessels
International movements of commercial cargo
Containers carried by ocean-going vessels
Ocean-going vessel movements by ship type
Cargo carried by ocean-going vessels by type of shipment
Public transport: estimated passenger-journeys by undertaking
Public transport: estimated passenger-journeys by area
Motor vehicles registered by type
Motor vehicles licensed by type
New registration of motor vehicles by type
Public roads
Traffic accidents and casualties
Telephone services
International telephone and telegraph services
Postal services
Arrivals and departures of passengers by mode of transport
Hong Kong resident departures by destination
Visitor arrivals by country of residence
*New or revised table in this edition.
Page
121
125
125
126
127
128
129
130
133
135
135
136
136
137
137
139
141
141
142
142
143
145
145
146
147
147
148
148
149
153
153
154
154
155
155
155
156
156
157
157
158
158
159
159
160
160
161

12.19
12.20
12.21
12.22
12.23
12.24
Section 13
13.1
13.2
13.3
13.4
*13.5
13.6
13.7
13.8
13.9
13.10
13.11
13.12
13.13
13.14
*13.15
*13.16
13.17
13.18
Section 14
14.1
14.2
14.3
14.4
14.5
14.6
14.7
14.8
14.9
14.10
14.11
Visitor arrivals by mode of transport by country of residence
Visitor spending by country of residence
Per capita visitor spending by country of residence
Average length of stay of visitors by country ofresidence
Hotel statistics
Average hotel room occupancy
Building and Construction
Principal statistics for all establishments analysed by trade group, 1984-1989 Surveys of Building, Construction and Real Estate Sectors
Principal statistics for all building and civil engineering contractors analysed by gross value of construction work performed, 1989 Survey of Building, Construction and Real Estate Sectors
Principal statistics for all building and civil engineering contractors analysed by value added, 1989 Survey of Building, Construction and Real Estate Sectors
Real estate project statistics analysed by end-use of buildings, 1989 Survey of Building, Construction and Real Estate Sectors
Gross value of construction work performed by building and civil engineering contractors
Completed new buildings certified for occupation by type
Usable floor area of completed new buildings by end-use by area
Completed new buildings by cost of construction
Private domestic units with consent to commence work by area
Private domestic units with consent to commence work by floor area
Private domestic units built by area by district
Private domestic units built by area by type
Stock, supply and vacancy position of non-residential premises by end-use
Supply of new private flatted factory space by area by district
Price indexes by type of premises
Rental indexes by type of premises
Instruments registered in the Land Office by type
Disposals of Government land
Housing
Stock of land living quarters by type by area, 1991
Land occupied living quarters by type ofliving quarters and area, 1991 Census
Land occupied living quarters by type of living quarters and\number of occupants, 1991 Census
Land living quarters and land domestic households by type of living quarters, 1991 Census
Land living quarters and land domestic households by district board district, 1991 Census
Land domestic households by tenure, 1971-1991 Censuses
Land domestic households by type of living quarters and accommodation by household size, 1991 Census
Land domestic households by broad type ofliving quarters and tenure, 1991 Census
Land domestic households by type of living quarters and accommodation by monthly household rent, 1991 Census
Housing Authority rental flats completed by area
Housing Authority rental flats completed by flat type
*New or revised table in this edition.
Page
162
162
163
163
164
164
165
171
174
174
174
174
175
175
176
176
177
177
178
178
179
180
180
181
182
183
185
185
185
186
186
187
187
188
188
189
189
ix

X•
14.12
14.13
14.14
14.15
14.16
14.17
*14.18
*14.19
14.20
14.21
14.22
14.23
14.24
Section 15
15.1
15.2
*15.3
15.4
15.5
15.6
15.7
15.8
15.9
15.10
15.11
15.12
15.13
15.14
15.15
15.16
15J7
15.18
15.19
15.20
15.21
15.22
15.23
*15.24
15.25
Distribution of stock of flats and authorized persons in Housing Authority rental estates by area
Housing Authority rental flats allocated and persons rehoused by category
Monthly rent of typical flats in Housing Authority estates as at March 1991
Distribution of authorized population in Housing Authority cottage areas and temporary housing areas by area
Housing Authority rental flats with consent to commence work by area
Housing Authority rental flats with consent to commence work by flat type
Home Ownership Scheme residential units with consent to commence work by area by saleable area
Home Ownership Scheme residential units completed by area by saleable area
Non-residential/composite buildings with consent to commence work by Housing Authority by type
Non~residential/composite buildings completed by Housing Authority by type
Recurrent account of Housing Authority
Housing capital expenditure-Housing Authority
Housing capital expenditure-Hong Kong Government
Education
Population aged 15 and over by educational attainment and sex, 1971-1991 Censuses
Population by age, sex and educational attainment, 1991 Census
School attendance rate, 1971-1991 Censuses
Operating educational institutions by level of education by type of institution
Full-time enrolment by level of education by type of institution
Operating schools by level of education by type of school by area, 1990
Operating educational institutions and enrolment by level of education, 1990
Enrolment in kindergarten, primary, secondary and sixth form course by age by sex, 1990
Enrolment in primary schools by type· of school by grade
Enrolment in secondary schools by type of school by grade
Enrolment in sixth form course by type of school by grade
Enrolment in Technical Institutes by type of course
Enrolment in Colleges of Education and Hong Kong Technical Teachers' College by type of course
Enrolment in Polytechnics and Baptist College by department
Full-time enrolment in Universities by faculty
Enrolment in adult education by type of course by type of institution
Enrolment in private commercial/English tutorial classes
Schools and enrolment in special education schools by type of school
Special classes in normal schools and enrolment by type of class
Teaching staff by qualification
Teaching staff by level by sex
Pupil/teacher ratios in primary and secondary day schools by type of school
Analysis of results of Hong Kong Certificate of Education Examination, 1990
Results of advanced and higher level examinations
Academic awards conferred (full-time courses) at Hong Kong Polytechnic
*New or revised table in this edition.
Page
189
190
190
191
191
191
192
192
193
193
193
194
194
195
197
197
198
198
199
199
200
201
202
203
204
204
205
206
208
208
209
209
209
210
210
211
211
212
212
15.26
15.27
*15.28
15.29
15.30
Section 16
16.l
16.2
16.3
16.4
16.5
*16.6
16.7
16.8
16.9
*16.10
16.11
16.12
16.13
16.14
16.15
16.16
16.17
16.18
16.19
16.20
16.21
16.22
16.23
16.24
16.25
16.26
16.27
*16.28
Section 17
17.1
17.2
17.3
17.4
17.5
*17.6
*17.7
17.8
17.9
*17.10
17.11
Academic awards conferred (sandwich courses) at Hong Kong Polytechnic
Academic awards conferred (full-time courses) at City Polytechnic of Hong Kong
Academic awards conferred (full-time courses) at Baptist College
University degrees and diplomas conferred
Expenditure on education
Medical and Health Medical institutions and beds by area by type
Hospital beds by classification of bed
Hospital beds by classification of bed by area by type of institution, 1990
Prophylactic immunizations
Notification of infectious diseases
Notification and death rates of certain infectious diseases
Registered deaths by cause
Leading causes of death by sex by age, 1990
Deaths from heart disease by age by sex
Deaths from cancer by major cause
Infant deaths by cause
Causes of maternal death
In-patients treated in government, government-assisted and private hospitals classified by disease
Out-patient attendances at government and government-assisted institutions
Attendances in accident and emergency departments of government and governmentassisted institutions
Statistics on ophthalmic, ear-nose-throat and dental services
Statistics on para-medical services
Statistics on pharmaceutical service
Work of pathology service and forensic pathology service
Work of blood banks
Work of the family health services
Work of the district midwifery services (excluding hospitals)
Work of the psychiatric service
Work of the tuberculosis and chest service
Incidence of venereal disease
Participants of school medical service by area
Registered medical personnel
Expenditure on the medical and health services
Social Welfare Applications for legal aid
Applications for legal aid in civil cases by type
Social security
Public assistance cases by type
Special needs allowance cases by type
Disabled persons enrolled in rehabilitation services
Active cases of family services centres by nature of problems
Admissions to children's, boys' and girls' homes by type of custody
Child care centres under the supervision of child care centres advisory inspectorate by type
Persons enrolled in elderly institutions by type of institution
Expenditure on social welfare
*New or revised table in this edition.
Page
213
214
214
215
216
217
219
220
220
221
222
223
223
224
225
225
226
227
227
228
228
229
229
230
230
231
231
232
232
233
233
233
234
234
235
239
239
240
241
241
242
242
242
243
244
244
xi

Page
Section 18 Law and Order 245
18 .1 Reported crime by area by type of offence 249
18.2 Reported crime by type of offence 249
18.3 Detected crime by type of offence 250
*18.4 Persons prosecuted by type of offence by age group 250
18.5 Persons prosecuted by type of offence by age group, 1990 251
18.6 Minor offences dealt with by the police 251
18.7 Value of property stolen and recovered by selected categories of crime 252
*18.8 Strength and annual cost of the police force 252
18.9 Work in the Judiciary 253
18.10 Prisoners and inmates 254
18.11 Reception of convicted prisoners/inmates by sex by type of sentence by age on conviction 255
18.12 Reception of convicted prisoners/inmates by type of offence by sex of offender 256
18.13 Reception of prisoners under sentence of imprisonment by sex by length of sentence by age on conviction 257
18.14 Reception of prisoners under sentence of imprisonment by sex by length of sentence by type of offence, 1990 258
18.15 Remanded persons in correctional institutions by sex 258
18 .16 Cases referred for social enquiry by type of offence by age group of offender 259
18.17 Probation orders by type of offence by age group of offender 260
18 .18 Children and juveniles under protection of Women and Juveniles Ordinance 260
Section 19 Culture, Entertainment and Recreation 261
19.1 Facilities available and usage of public libraries 263
19.2 Attendances at museums 264
19.3 Usage rate of major cultural venues by location 264
19.4 Cultural, entertainment and sports presentations at selected venues by type of event 265
19.5 Presentations, attendance and attendance rate of indoor cultural programmes by type of event 266
19.6 Presentations and attendance of public entertainment programmes by type of event 267
19.7 Events and participants of sports and recreational activities by type of event 268
19.8 Recreational facilities by type of facility 269
19.9 Parks and playgrounds by district 270
Section 20 Miscellaneous Statistics 271
20.1 Statistics on mass media 273
20.2 Public markets and market stalls by type of stall 273
20.3 Food inspection by type of food 274
20.4 Licences and permits in force by type oflicence and permit 275
20.5 Hawker licences by type oflicence 277
20.6 Petroleum products: releases from bond by type 278
20. 7 Fire, special service, ambulance calls and fatalities 278
20.8 Local and overseas companies registered and dissolved 279
20.9 Companies incorporated outside Hong Kong by origin 279
*New or revised table in this edition.
xii

Maps
Map of Hong Kong
Map of Hong Kong Island classified by district board 1991
Map of Kowloon and New Kowloon classified by district board 1991
Map of New Territories and Islands classified by district board 1991
Page
281
283
285
287
xiii

Section 1 Climate and Geography
Tables 1.1 to 1.3 General Information
Hong Kong is on the southeast coast of China, adjoining the province of Guangdong. It lies between latitudes 22°9' and 22°37'N and longitudes 113°52' and 114°30'E. The twin cities of Victoria on Hong Kong Island, and Kowloon on the mainland, stand on either side of the harbour, and are about 130 kilometres southeast of Guangzhou and 65 kilometres east of Macau.
Hong Kong's climate is sub-tropical, tending towards temperate for nearly half the year. The winter monsoon normally begins in September and lasts to mid-March or occasionally to May of the following year. Early winter is the most pleasant time of the year. The summer monsoon occurs from mid-April to September but is not so persistent. Summer is the rainy season and is almost continuously hot and humid. Tropical cyclones are most common from June to October. In an average year, about five tropical cyclones can be expected to cause strong winds (41-62 km/h) and about one or two tropical cyclones to cause gale or storm force winds (63-117 km/h). About once in every four years the centre of a fully developed typhoon comes close enough to cause sustained winds of hurricane force, i.e. 118 km/h or more.
Concepts and Definitions
Normals are defined as period averages computed for a uniform and relatively long duration comprising at least three consecutive ten-year periods. The period 1961-1990 is used for computing the climatological normal of the meteorological elements in Hong Kong.
The maximum and minimum air temperatures refer to the highest and lowest temperatures respectively attained during the continuous time interval of the 24 hours for each day. The monthly and annual mean values of maximum and minimum air temperatures therefore refer to the mean daily maximum and minimum temperatures.
Data Sources
Statistics of meteorological observations are taken from the records of the Royal Observatory. They refer to observations made at the Royal Observatory Headquarters in Tsim Sha Tsui, except that sunshine and evaporation are measured at King's Park Meteorological Station and winds are recorded at W aglan Island.
Compilation and Calculation
With the exception of the total evaporation, all the meteorological elements presented in the tables are observed on an hourly basis. Measurements of the total evaporation are made daily at 0800 hours Hong Kong Time. The monthly and annual mean values are calculated from either the daily observations or the mean values of the hourly observations.
Further References
Further details of the climatological data can be found in the Monthly Weather Summary and Surface Observations in Hong Kong (formerly known as Meteorological Results Part I) and Tropical Cyclones in 1990 (formerly known as Meteorological Results Part III-Tropical Cyclone Summaries) published by the Royal Observatory, Hong Kong.
Tables 1.4 to 1.5 General Information
The total land area of Hong Kong was 1 074.78 square kilometres in December 1990. The area of Hong Kong Island itself, together with a number of small adjacent islands, was 79.87 square kilometres and that of Kowloon and Stonecutters Island was 42.62 square kilometres. The New Territories, which consists of a peninsula containing several 'new towns' and more than 230 islands, had a total area of 952.29 square kilometres.
Data Sources
Information on land utilization is collated by the Planning Department (Plan D) in consultation with the Agriculture and Fisheries Department (AFD). AFD carries out routine survey on uses of arable land. Plan D supplies data on built-up land. Estimates of woodland etc. are based on vegetation map.

2
Further References
For more detailed definitions on land uses, please refer to the land usage table in Appendix 35 of the 1991 Hong Kong Annual Report published by the Information Services Department.

I.I Climatological Normals (1961-1990)
Mean pressure at mean sea-level (hectopascals)
Air temperature (0 C) Mean maximum Mean Mean minimum
Mean dew point (0 C)
Mean relative humidity(%)
Mean amount of cloud(%)
Total rainfall (mm)
Total bright sunshine (hours)
Total evaporation (mm)
Prevailing wind direction (degrees)
Mean wind speed (km/h)
Source: Royal Observatory.
Jan Feb Mar Apr May Jun Jui Aug Sep Oct Nov Dec Year
1 020.2 1 018.7 1 016.2 1 013.l 1 009.l 1 006.0 1 005.3 1 005.l 1 008.8 1 014.0 1 017.9 1 020.2 1 012.9
18.6 15.8 13.6
10.2
71
58
23.4
152.4
97.5
070
24.0
18.6 15.9 13.9
11.8
78
73
48.0
97.7
79.0
070
23.8
21.3 18.5 16.5
15.0
81
76
24.9 22.2 20.2
19.0
83
78
28.7 25.9 23.9
22.6
83
74
30.3 27.8 25.9
24.4
83
75
31.5 28.8 26.6
24.9
80
65
31.3 28.4 26.3
24.8
81
66
30.3 27.6 25.5
23.3
78
63
27.9 25.2 23.l
19.8
73
56
24.2 21.4 19.2
15.2
69
53
20.5 17.6 15.4
11.2
68
49
25.7 23.0 20.9
18.6
77
65
66.9 161.5 316.7 376.0 323.5 391.4 299.7 144.8 35.l 27.3 2 214.3
96.4 108.9 153.8 161.1 231.1 207.0 181.7 195.0 181.5 181.5 1948.1
92.2 106.9 137.7 143.9 171.6 156.9 150.3 152.2 129.l 111.5 1528.8
070
22.l
080
19.7
090
19.2
090
21.6
230
20.0
090
18.5
090
21.9
090
27.6
080
27.2
080
25.5
080
22.6
1.2 Climatological Summary, 1990
Mean pressure at mean sea-level (hectopascals)
Air temperature (0 C) Mean maximum Mean Mean minimum
Mean dew point (0 C)
Mean relative humidity(%)
Mean amount of cloud (%)
Total rainfall (mm)
Total bright sunshine (hours)
Total evaporation (mm)
Prevailing wind direction (degrees)
Mean wind speed (km/h)
Source: Royal Observatory.
Jan Feb Mar Apr May Jun Jui Aug Sep Oct Nov Dec Year
1 020.0 1 019.4 1 018.2 1 011.9 1 009.9 1 004.8 1 005.8 1 003.4 1 007.9 1 015.7 1 016.9 1 021.0 1 012.9
17.8 15.9 14.l
12.7
82
79
18.2 16.2 14.5
13.8
86
85
21.3 18.5 16.7
14.8
80
72
23.7 21.4 19.7
19.2
87
87
27.2 24.6 22.7
21.2
82
73
30.l 27.9 26.2
25.0
85
77
31.6 29.0 26.9
25.0
79
66
32.l 29.5 27.4
24.6
75
67
30.2 27.8 25.8
23.8
79
65
27.2 25.l 23.5
19.8
73
47
24.2 22.l 20.4
17.0
73
56
21.1 18.8 17.0
12.6
69
39
25.4 23.1 21.3
19.1
79
67
47.5 195.7 29.9 257.6 102.4 448.l 268.0 150.l 409.9 100.7 36.9 0.1 2 046.9
87.2 56.4 121.7 73.8 146.5 149.7 248.0 205.8 168.8 233.8 160.6 218.7 1871.0
53.3 44.l 71.6 57.3 96.4 105.6 147.6 156.l 107.5 131.7 83.9 89.0 1144.1
080
28.7
030
24.7
070
23.7
070
24.5
090
20.l
100
24.8
220
21.7
230
25.l
100
22.3
100
33.8
100
33.5
090
25.5
090
25.7
3

1.3 Summary of Meteorological Observations
1981 1982
Mean pressure at mean sea-level (hectopascals) 1 013.1 1 013.0
Air temperature (0 C) Mean maximum 25.5 25.2 Mean 23.1 22.9 Mean minimum 21.2 21.0
Mean dew point (0 C) 18.7 18.7
Mean relative humidity (%) 77 78
Mean amount of cloud (%) 68 68
Total rainfall (mm) 1 659.5 3 247.5
Total bright sunshine (hours) 1802.9 1 785.0
Total evaporation (mm) 1 383.4 1429.1
Prevailing wind direction (degrees) 080 080
Mean wind speed (km/h) 23.7 22.8
Source: Royal Observatory.
1.4 Area of Hong Kong in 1990 by District Board
District board
Hong Kong Island
Central and Western
Wan Chai
Eastern
Southern
Kowloon and New Kowloon
Kowloon City
KwunTong
Mong Kok
ShamShuiPo
Wong Tai Sin
Yau Ma Tei
New Territories
Islands
North
SaiKung
Sha Tin
Tai Po
TsuenWan
Kwai Chung and Tsing Yi
TuenMun
Yuen Long
Note: Figures are as at December 1990.
Source: Planning Department.
4
1983
1 013.7
25.4 23.0 21.1
18.7
78
69
2 893.8
1 859.4
1 365.3
070
25.0
Sub-total
Sub-total
Sub-total
Total
1984
1 012.5
24.9 22.5 20.7
18.l
77
72
2017.0
1 701.9
1276.6
080
23.7
1985 1986
1 012.3 1 013.1
25.0 25.3 22.6 22.8 20.8 20.8
18.8 18.4
80 78
71 63
2 191.4 2 338.3
1 711.2 2 014.0
1199.0 1 315.2
080 080
22.6 24.8
Area (km2 )
12.37
9.94
18.60
38.96
79.87
9.65
11.00
1.46
7.80
9.35
3.36
42.62
163.27
136.78
134.15
69.16
147.17
59.78
21.00
82.85
138.13
952.29
1074.78
1987 1988 1989 1990
1 013.8 1 013.1 1 013.0 1 012.9
25.7 25.1 25.3 25.4 23.4 22.8 23.0 23.1 21.6 21.0 21.1 21.3
19.4 18.6 18.8 19.1
79 78 78 79
68 66 66 67
2 319.3 1 685.0 1 944.6 2046.9
1 878.0 1 881.9 1 888.5 1 871.0
1206.3 1248.4 1 219.8 1144.1
080 070 080 090
24.2 23.3 24.9 25.7

1.5 Land Utilization in Urban and Rural Areas Percentage
Type of land use 1981 1982 1983 1984 1985 1986 1987 1988 1989 1990
Built-up land 16.0 16.l 16.2 16.3 16.5 16.6 16.8 18.5# 18.8# 19.1 #
Afforested areas and other woodland* 20.6 20.6 20.6 20.6 20.6 20.6 20.6 20.5 20.6 20.5
Scrubland and grassland* 49.8 49.7 49.7 49.7 49.6 49.8 49.8 48.5 48.4 48.3
Badland 4.3 4.3 4.3 4.3 4.2 4.1 4.1 4.1 4.1 4.0
Swamp 0.1 0.1 0.1 0.1 0.1 0.1 0.1 0.1 0.1 0.1
Paddy land
Market gardening land 2.8 2.8 2.6 2.6 2.5 2.5 2.3 2.3 2.0 2.0
Other crop land 0.7 0.7 0.7 0.6 0.6 0.5 0.5 0.5 0.6 0.6
Fallow/abandoned land 4.0 3.9 3.8 3.8 3.9 3.8 3.8 3.8 3.8 3.8
Fish ponds 1.7 1.8 2.0 2.0 2.0 2.0 2.0 1.7 1.6 1.6
Total area of land (square kilometres) 1064 1065 1066 1067 1069 1070 1071 1073 1074 1075
Notes: *denotes revised series. # Figure includes reservoirs, temporary structures and other uses.
Source: Planning Department.
5


Section 2 Population and Vital Statistics
Tables 2.1 to 2.8 General Information
To collect information on the demographic, social and economic characteristics of the population, population censuses were conducted in Hong Kong in 1911, 1921, 1931, 1961, 1971, 1981 and 1991. Sample by-censuses were also conducted midway between two full censuses in 1966, 1976 and 1986.
Concepts and Definitions
The enumerated population includes all residents staying in the territory on the Census reference date of 15 March 1991. Estimates of transients and Vietnamese migrants (previously known as boat people) were obtained separately.
The figures covered in most of the tables refer to the enumerated resident population of Hong Kong. The figures in Tables 2.1-2.3 however refer to the entire resident population (i.e. all persons usually residing in Hong Kong including those temporarily away on the Census reference date). A domestic household is defined as a group of persons who live together and make common provision for essentials for living. These persons need not be related. If a person makes provision for essentials for living without sharing with other persons, he is also regarded as a household. In this case the household is a one-person household.
Monthly household income is defined as follows:-
1991 Census -Sum of personal income (i.e. earnings in cash from employment and other cash income) of persons aged 15 and over who were found to be in the household on the Census reference date.
1986 By-Census-Sum of personal income (i.e. earnings in cash from employment and other cash income) of persons aged 13 and over who were found to be in the household on the By-Census reference date.
1981 Census -Sum of personal income (i.e. earnings in cash from employment and other cash income) of persons aged 12 and over who were found to be in the household on the Census reference date.
1976 By-Census-Sum of personal income (i.e. earnings in cash from main employment and other cash income) of persons aged 12 and over who were found to be in the household on the By-Census reference night.
1971 Census -The total monthly receipts of all members of the household from all sources, whether earned (salaries, commissions and earnings from part-time work, but excluding annual bonuses) or unearned payments (dividends, interest, rent, remittances, pensions, etc.), or profits from the household's own business were all included.
The definitions of activity status used in the 1991 Census follow the recommendations of the Thirteenth International Conference of Labour Statistics. By this approach, the economically active population comprises all persons aged 15 and over who are available for work, i.e. either working or seeking work, during the 7 days prior to the Census reference date. These persons include all who work for wages or salaries, the self-employed, employers and unpaid workers in family enterprises. They also include the unemployed, who were persons out of work but seeking work, first-time job-seekers, persons waiting to take up new job or business, persons not seeking work because of expecting to return to original job or believing no suitable work available. All other enumerated persons aged 15 and over are classified as economically inactive. The definitions differ slightly from those used in previous censuses/by-censuses in the following respects:
(i) in the 1991 Census and the 1986 By-Census, one was regarded as employed if he performed some work during the reference week, whereas in previous censuses the minimum work duration had to be 15 hours;
(ii) voluntary workers in social or religious organizations were classified as economically inactive in the 1991 Census and the 1986 By-Census whereas previously these persons were regarded as employed;
(iii) persons who were not at work and not seeking work because of temporary sickness or injury were considered inactive in the 1991 Census and the 1986 By-Census but unemployed in the previous censuses;
7

8
(iv) In the 1991 Census and the 1986 By-Census, the job-seekers who were not available for work because of reasons other than temporary sickness or injury were classified economically inactive instead, previously, all job-seekers were regarded as unemployed.
Data Sources
The 1991 Census covered the entire population of Hong Kong including transients, the armed forces, inmates of institutions and persons living on board vessels.
The land enumeration of the 1991 Census was conducted between 15 March 1991and24 March 1991. It comprised a 100 per cent simple enumeration of all persons by age and sex and a one-in-seven sample enquiry on a broad range of social, economic and demographic characteristics. The sampling frame comprised a comprehensive list of all permanent living quarters and a detailed record of area segments of temporary structures in rural areas and temporary structure areas. The system was updated continuously and a full scale updating was undertaken before the sampling for the 1991 Census.
The 1991 Census detailed enumeration adopted a stratified replicated systematic selection procedure. The sampling frame was stratified into 19 District Board Districts. Within each stratum, living quarters or segments were selected with an equal probability of one-in-seven.
The marine enumeration of the 1991 Census was conducted between 15 March 1991 and 19 March 1991. It covered all vessels in the Hong Kong Waters.
The 1981 Census used a similar two-phase design which comprised a complete count of the population by age and sex and a 20 per cent sample enquiry on a broad range of social, economic and demographic characteristics. The 1971 and 1961 Censuses were complete enumerations.
Details of the sample size of the previous by-censuses are given as follows:
1986 By-Census--A one-seventh sample of all households (including households living afloat in vessels) were taken for enumeration.
1976 By-Census-A 10 per cent sample of all households (including households living afloat in vessels) were taken for enumeration.
1966 By-Census-For the land population a 5 per cent random sample of enumerator blocks was taken as the first stage sample, followed by a 20 per cent sample of households of the selected blocks at the second stage. For the boat population, a single stage 2t per cent sample of boats, stratified of size, was used.
Compilation and Calculation
Figures since 1976 have incorporated an upward adjustment to allow for persons m non-contacted households.
Further References
Further details of the 1991 Census results can be found in the following publications published by the Census and Statistics Department:-
1991 Population Census: Summary Results
Tabulations for District Board Districts and Constituency Areas: Population by Age and Sex
Tabulations for District Board Districts and Constituency Areas: Living Quarters, Households and Population by Type of Living Quarters
Tabulations for Tertiary Planning Units: Population by Age and Sex
Tabulations for Tertiary Planning Units: Living Quarters, Households and Population by Type of Living Quarters
Boundary Maps Complementary to Tabulations for District Board Districts and Constituency Areas
Boundary Maps Complementary to Tabulations for Tertiary Planning Units
More detailed reports and tabulations on the 1991 Population Census will be published in 1992.
The Department had also published a number of reports on the results of the previous censuses and by-censuses taken since 1961.
Tables 2.9 to 2.15 General Information
Figures on births, deaths and marriages are obtained through the vital registration systems, while estimates of population data are made by up-dating census population data periodically using the vital and migration statistics collected through vital registration and immigration control systems.

Concepts and Definitions
Population data are de facto in nature. They include local and foreign residents, visitors, military personnel and Vietnamese migrants (or refugees before 1988) in Hong Kong as at specific moments in time.
A live birth refers to the complete expulsion or extraction from its mother of a product of conception which after such separation breathes or shows any other evidence of life.
A death represents a deceased of whom the cause of death either has been determined with the support of a medical certificate or the coroner's report or has been classified under the cause 'Senility without mention of psychosis' according to a special provision of the law. When the coroner's investigation into the true cause of death is still pending, such a death is still included in the tabulation irrespective of whether it has been registered.
Figures on births and deaths refer to known occurrences of such events, excluding those of Vietnamese migrants.
A registered marriage is defined as a voluntary union for life of one man with one woman to the exclusion of all others which has been contracted in accordance with the Marriage Ordinance. Those customary marriages contracted before 7 October 1971, which have been post-registered in accordance with the Marriage Reform Ordinance after that date, are also covered in the marriage statistics. Marriage statistics are restricted to registered marriages only.
Data Sources
Population estimates are prepared by a Government Inter-departmental Working Party on Half-yearly Population Estimates.
Figures on births, deaths and marriages are collected as by-products from the civil registration systems. These vital statistics systems are operated through the co-operation of the Immigration Department, Census and Statistics Department, Department of Health and Hospital Services Department.
Compilation and Calculation
The mid-year population estimate is derived from the latest census or by-census. A population base is first established by adjusting the census count for possible under-enumeration and different treatment of local residents away to China and Macau (whose need arises from the absence of accurate statistics to account for changes in their subsequent balance). Transients found in the census are also included. The population estimate (excluding Vietnamese migrants) can then be obtained by updating this population base with births, deaths and balance of arrivals and departures occurring since the census moment. The mid-year population of Vietnamese migrants is added to this figure for an estimate of total population.
The birth rate relates the number of live births occurring in a year to the population at the middle of that year.
The death rate relates the number of deaths occurring in a year to the population at the middle of that year.
The rate of natural increase relates the balance of births over deaths occurring in a year to the population at the middle of the year.
The infant mortality rate relates the total number of deaths of age under one to the total number of live births occurring in that year.
Table 2.16 Data Sources
Divorce statistics are supplied by the Divorce Registry of the Judiciary.
9


2.1 Resident Population, 1911-1991 Censuses Number of Persons
1911 1921 1931 1961 1966 1971 1976 1981 1986 1991 Census Census Census Census By-Census Census By-Census Census By-Census Census
Male 296 151 382 857 482 580 1607779 1 880 870 2 OOO 602 2 251 060 2 672 641 2 834 603 2 900 344
Female 160 588 242 309 357 893 1 521 869 1 828 050 1936028 2 151 930 2437171 2 660 885 2 773 770
Total 456739* 625166* 840473* 3129 648* 3708920* 3936630* 4402990* 5 109 812 # 5 495 488t 5674114@
Notes: * Resident population of the 1911-1976 Censuses/By-Censuses did not include residents temporarily away from Hong Kong at the time of the Census/By-Census.
#The figure includes 123 252 residents temporarily away from Hong Kong at the time of the 1981 Census. t The figure includes 99 491 residents temporarily away from Hong Kong at the time of the 1986 By-Census. @The figure includes 151 833 residents temporarily away from Hong Kong at the time of the 1991 Census.
Source: Census Planning Section, Census and Statistics Department.
2.2 Resident Population by Broad Area, 1971-1991 Censuses
1971 Census 1976 By-Census 1981 Census 1986 By-Census No.of No.of No.of No.of
Broad Area persons % persons % persons % persons %
Hong Kong Island 996 183 25.3 1 026 870 23.3 1 215 656 23.8 1 201 459 21.9
Kowloon and New Kowloon* 2 194 853 55.8 2 378 480 54.1 2 515 374 49.2 2 349 445 42.7
New Territories* 665 700 16.9 938 440 21.3 1329035 26.0 1 907 031 34.7
Marine 79 894 2.0 59 200 1.3 49 747 1.0 37 553 0.7
Total 3936 630# 100.0 4402 990# 100.0 5109 812t 100.0 5 495 488@ 100.0
Notes: * Areas have been revised based on District Board district boundaries in 1981, 1986 and 1991.
1991 Census No.of
persons %
1250993 22.0
2 030 683 35.8
2 374 818 41.9
17 620 0.3
5 674114t 100.0
#Resident population of the 1971 Census and 1976 By-Census did not include residents temporarily away from Hong Kong at the time of the Census/By-Census.
t The figure includes 123 252 residents temporarily away from Hong Kong at the time of the 1981 Census. @The figure includes 99 491 residents temporarily away from Hong Kong at the time of the 1986 By-Census. t The figure includes 151 833 residents temporarily away from Hong Kong at the time of the 1991 Census.
Source: Census Planning Section, Census and Statistics Department.
11
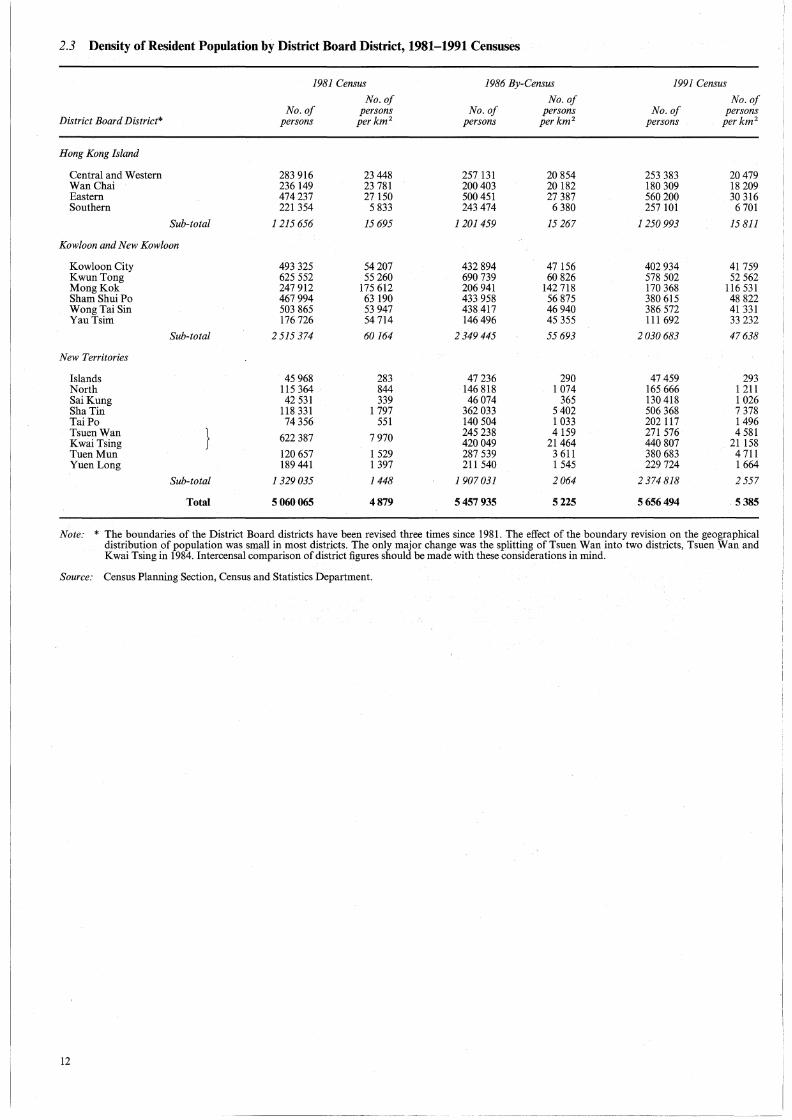
2.3 Density of Resident Population by District Board District, 1981-1991 Censuses
1981 Census 1986 By-Census 1991 Census
No.of No.of No.of No.of persons No.of persons No.of persons
District Board District* persons per km 2 persons per km 2 persons perkm 2
Hong Kong Island
Central and Western 283 916 23 448 257 131 20 854 253 383 20 479 Wan Chai 236 149 23 781 200 403 20 182 180 309 18 209 Eastern 474 237 27 150 500 451 27 387 560 200 30 316 Southern 221 354 5 833 243 474 6 380 257 101 6 701
Sub-total 1215656 15 695 1 201459 15 267 1250 993 15 811
Kowloon and New Kowloon
Kowloon City 493 325 54 207 432 894 47 156 402 934 41 759 Kwun Tong 625 552 55 260 690 739 60 826 578 502 52 562 Mong Kok 247 912 175 612 206 941 142 718 170 368 116 531 Sham ShuiPo 467 994 63 190 433 958 56 875 380 615 48 822 Wong Tai Sin 503 865 53 947 438 417 46940 386 572 41 331 YauTsim 176 726 54 714 146 496 45 355 111 692 33 232
Sub-total 2 515 374 60164 2 349445 55693 2030 683 47638
New Territories
Islands 45 968 283 47 236 290 47 459 293 North 115 364 844 146 818 1 074 165 666 1211 Sai Kung 42 531 339 46074 365 130 418 1 026 Sha Tin 118 331 1 797 362 033 5 402 506 368 7 378 Tai Po 74 356 551 140 504 1 033 202 117 1 496 Tsuen Wan } 622 387 7 970 245 238 4159 271 576 4 581 Kwai Tsing 420 049 21464 440 807 21 158 TuenMun 120 657 1 529 287 539 3 611 380 683 4 711 Yuen Long 189 441 1 397 211 540 1 545 229 724 1 664
Sub-total 1329035 1448 1907 031 2064 2 374 818 2 557
Total 5060065 4879 5457 935 5225 5656494 5385
Note: * The boundaries of the District Board districts have been revised three times since 1981. The effect of the boundary revision on the geographical distribution of population was small in most districts. The only major change was the splitting of Tsuen Wan into two districts, Tsuen Wan and Kwai Tsing in 1984. Intercensal comparison of district figures should be made with these considerations in mind.
Source: Census Planning Section, Census and Statistics Department.
12

2.4 Population Aged 15 and over by Age, Marital Status and Sex, 1971-1991 Censuses Number of persons
1971 Census 1976 By-Census 1981 Census 1986 By-Census 1991 Census
Age group Marital status M F M F M F M F M F
15-19 Never married 218 660 202 111 266 030 245 530 288 843 262 108 233 459 211 938 212 131 193 034 Married 988 6 039 1 730 9 960 3 685 9 090 1 421 4408 1 301 3 155 Widowed 5 28 44 69 7 14 7 Divorced/separated 4 9 60 32 54 14 63 14
20-24 Never married 159 525 110 228 195 210 141 890 274992 196 963 262 992 217 588 202 248 177 247 Married 13 628 52 733 23 220 65 260 32 136 78 459 21 867 58 087 13 761 36 159 Widowed 17 95 20 50 103 256 21 112 14 66 Divorced/ separated 41 86 160 210 369 554 308 560 257 447
25-29 Never married 68 043 17 438 108 350 42 590 148 863 67 988 190 940 110 009 189 995 133 723 Married 38 856 68 807 80760 123 070 108 607 154 542 115 508 180 836 91 977 158 280 Widowed 82 209 50 230 289 563 196 539 142 447 Divorced/ separated 140 149 480 470 1146 1128 1 741 1 848 1263 1 740
30--34 Never married 40 343 5 350 32 520 6 180 59 962 19 817 76095 34 503 100 439 59 029 Married 76068 89 260 79 990 82 260 157 323 157 350 178 370 199 088 199 669 233 117 Widowed 251 689 160 480 373 1 210 476 1 582 328 1105 Divorced/separated 404 260 600 310 1 595 1439 2 919 3 178 2 764 . 4270
35-39 Never married 25 210 3 414 22440 2 710 20096 4 509 30 518 14 063 40 234 24 961 Married 102 861 109 964 98 450 93 460 110 506 93 404 180 608 170 045 207 001 207 262 Widowed 713 1 805 430 1 410 529 1 669 630 2772 552 2 451 Divorced/ separated 706 448 1 070 620 1176 989 3 381 3 353 3 585 5 284
40--44 Never married 15 054 3 584 14 830 2 510 16 736 2 952 11 375 4102 20776 12 862 Married 116 283 113 203 110 840 108 560 121 037 102 069 118 418 99 758 185 333 166 739 Widowed 1493 4 533 990 3 250 1233 3 625 994 3 241 866 4 613 Divorced/ separated 829 570 1 360 800 1 802 1 055 2 142 2 002 3 883 4630
45-49 Never married 8 131 3 984 10130 2990 13 037 2 707 10 346 2 821 8 415 4 018 Married 102 138 93 946 112 700 102 070 124 302 107 541 124 267 104 882 119 OOO 97 011 Widowed 1 937 6930 1 590 6 260 2 182 7 736 1 819 7 140 1 231 4495 Divorced/separated 740 564 1 510 1 050 1 704 1 339 2 597 2163 2411 2459
50-54 Never married 4 785 5 121 6 650 3 880 10 103 3 078 10 010 2079 8 161 2468 Married 92 916 77 574 103 700 98 400 120 418 100 196 128 536 107 365 122 643 98 619 Widowed 2653 11 083 2 650 10 790 4129 15 153 3 457 13 328 2052 9459 Divorced/ separated 614 517 1 320 1 050 1 657 1 384 2 338 2 086 2 591 2 625
55 and over Never married 5 899 17 381 8 910 21 260 15 405 22 308 17 962 19 852 25 044 19 212 Married 166 395 158 994 221 750 194 760 281 842 198 852 338 554 237 832 392 364 290 518 Widowed 13 062 80 054 17 220 99400 32 610 161193 42 891 196 652 43 392 187 754 Divorced/separated 1 008 1 084 2 690 3 330 2937 3 901 5 649 6 335 7 117 8 145
Total Never married 545650 368611 665070 469540 848037 582430 843 697 616 955 807 443 626554 Married 710133 770520 833140 877800 1059856 1001503 1207 549 1162 301 1333 049 1290860 Widowed 20 213 105426 23110 121870 41492 191474 50491 225380 48584 210390 Divorced/separated 4486 3687 9190 7900 12418 11843 21089 21588 23871 29 614
Source: Census Planning Section, Census and Statistics Department.
13

2.5 Domestic Households by District Board District, 1981-1991 Censuses Number of domestic households
1981 1986 1991 District Board District* Census By-Census Census
Hong Kong Island
Central and Western 73 391 75 341 77 310 Wan Chai 64953 59 976 57197 Eastern 115 740 133 OOO 158 264 Southern 47959 57 582 64358
Sub-total 302043 325 899 357 129
Kowloon and New Kowloon
Kowloon City 124 625 117 558 114 914 KwunTong 145 575 177 667 160 791 Mong Kok 73 556 67 431 57 351 ShamShuiPo 124 169 122 871 114 956 Wong Tai Sin 114 458 109 200 103 196 Yau Tsim 51920 46788 36 051
Sub-total 634303 641515 587 259
New Territories
Islands 10 988 13 104 13 413 North 27290 39 025 44215 SaiKung 9 572 11263 33 746 Sha Tin 26 081 89 432 134972 Tai Po 16922 35 084 53 238 TsuenWan } 139 009 61 992 76000 Kwai Tsing 100 737 116 233 TuenMun 26 930 69 853 100046 Yuen Long 44 505 57 785 63 821
Sub-total 301297 478 275 635 684
Plus Marine 7095 6887 2143
Total 1244738 1452576 1582215
Note: *The boundaries of the District Board distl"icts have been revised three times since 1981. The effect of the boundary revision on the geographical distribution of population was small in most districts. The only major change was the splitting of Tsuen Wan into two districts, Tsuen Wan and Kwai Tsing in 1984. Intercensal comparison of district figures should be made with these considerations in mind.
Source: Census Planning Section, Census and Statistics Department.
14

2.6 Domestic Households by Household Size, 1971--1991 Censuses Number of domestic households
1971 1976 1981 1986 1991 Household size (No. of persons) Census By-Census Census By-Census Census
126 247 147 440 189 087 214 921 225 930
2 110 497 140 720 191 841 237 177 290 585
3 103 994 134 660 191 995 251 507 307 558
4 109 342 146 590 213 908 299 050 359 904
5 107 473 138 430 177618 217 838 225 933
6 99 758 115 610 126 247 125 021 105 217
7 79 169 79 360 74 971 59 869 41 043
8 54 662 48 850 39 996 26277 16 553
9 32270 24 360 19 497 11 303 5 275
10 and over 33 596 23 370 19 578 9 613 4 217
Total 857008 999390 1244738 1452576 1582 215
Average household size (No. of persons) 4.5 4.2 3.9 3.7 3.4
Source: Census Planning Section, Census and Statistics Department.
2.7 Domestic Households by Monthly Household Income, 1971-1991 Censuses Number of domestic households
1971 1976* 1981 1986 1991 Monthly household income (HK$) Census By-Census Census By-Census Census
Under 600 337 081 97 820 67 465 27 896 21 146
600-999 265 996 178 940 50 952 25 030 17 659
1,000-1,499 143 551 231 510 113 271 36164 22 786
1,500-1,999 40 384 154 080 123 749 52199 13 961
2,000-2,499 28 333 98 810 157 256 81 067 23 477
2,500-2,999 55 920 120 449 78 610 20 301
3,000-3,999
} 200 290 209 207 71 458
4,000-4,999 102 140 124 576 187 427 93 731
5,000-5,999 84 705 153 444 108 780
6,000-6,999
} 54936 118 246 114 977
7,000-7,999 36 686 91 114 103 411 41 663 22 580
8,000-8,999 25 635 71 857 101 085
9,000-9,999 17 107 53 774 80 761
10,000-11,999 } } 79 490 147 225 6 390 39 375
12,000-14,999 66 709 167 154
15,000-19,999 1600 12 250 53 412 176 406
20,000-24,999 920 6152 25 931 99 649
25,000-29,999 650 2 599 12 628 56 851
30,000-34,999 460 1 774 8 939 37 727
35,000-39,999 200 787 4 634 22 442
40,000 and over 560 4724 14 798 81228
Total 857008 952580 1244738 1452 576 1582 215
Note: *Figures exclude 46 810 households whose wage-earners were not in the household on the Census reference date, and whose other members had no 'other cash income'.
Source: Census Planning Section, Census and Statistics Department.
15

2.8 Working Population by Activity Status, 1971-1991 Censuses Percentage
1971 1976* 1981 1986 1991 Activity status Census By-Census Census By-Census Census
Self-employed 8.4 9.0 6.1 6.5 5.4
Employers 2.6 2.9 3.7 4.2 5.6
Employees# 86.7 85.3 88.6 87.4 87.8
Unpaid family workers@ 2.3 2.8 1.6 1.9 1.2
Total 100.0 100.0 100.0 100.0 100.0
Notes: * The figures include all students taking up work during the school su=er vacation and those job-seekers having just completed their education before the summer vacation.
#The figures include outworkers and student workers. @The figures for 1971 Census, 1976 By-Census and 1981 Census include voluntary workers in social or religious organizations.
Source: Census Planning Section, Census and Statistics Department.
2.9 Estimated Mid-year Population* and Growth Rates
1981 1982 1983 1984 1985 1986 1987 1988 1989 1990
Estimated mid-year population 5 183 400 5264 500 5 345 100 5 397 900 5456200 5 524600 5 580 500 5 627 600 5 686 200 5704 500
Growth rate(%) 2.4 1.6 1.5 1.0 I.I 1.3 1.0 0.8 1.0 0.3
Birth rate# per thousand population 16.8 16.4 15.6 14.4 14.0 13.0 12.6 13.4 12.3 12.0
Death rate# per thousand population 4.8 4.8 5.0 4.7 4.6 4.7 4.8 4.9 5.1 5.2
Rate of natural increase# per thousand population 12.0 11.6 10.6 9.6 9.3 8.3 7.7 8.5 7.2 6.8
Infant mortality rate# per thousand live births 9.7 9.9 9.9 8.8 7.5 7.7 7.4 7.4 7.4 6.2
Notes: * Revised estimates based on the 1991 Census. #The rates were calculated by using live births and deaths known to have occurred in a year but excluding those of Vietnamese migrants.
Source: Demographic Statistics Section, Census and Statistics Department.
16

2.10 Estimated Mid-year Population by Age Group by Sex I Number of persons
Age group Sex 1981 1982 1983 1984 1985 1986 1987 1988 1989 1990
0--4 M 214 500 218 200 220 900 220 500 218 600 215 900 208 300 201 300 199 400 194 900 F 200200 204000 206 500 205 700 203 500 200 600 193 400 186 200 184 600 180 800
5-9 M 215 300 218 200 218 500 217 900 217 OOO 217 400 220 700 223 700 225 400 221 300 F 200 900 201 400 201 900 201 300 201100 201 600 204 600 208 OOO 209 400 204900
10-14 M 229 700 227 300 227 600 228 OOO 228 800 229 200 226 200 222 400 219 500 221100 F 216 700 212 300 210 300 209 500 209 300 209 OOO 207 400 204 200 202 200 203 300
15-19 M 295 700 280 400 267 200 254 500 244 600 237 200 229 700 225 900 226 600 226 200 F 276 200 264100 250 600 237 600 226400 217 500 210 100 207 200 209 200 208 OOO
20-24 M 318 100 317 100 313 OOO 304 900 296 700 290 OOO 278 300 262 900 248 300 235 OOO F 287 500 292100 293 400 290 100 284 300 278 500 268 300 254 700 241 100 226 900
25-29 M 270 500 281 OOO 293 200 303 300 310 400 315 400 317 800 316 OOO 312 100 302 200 F 235 600 249 300 264400 277 900 289 500 298 OOO 303 500 307 600 308 900 305 100
30--34 M 231 400 241 500 249 100 253 400 258 300 267 OOO 279 700 291 200 303 100 310 200 F 190 600 203 800 214 OOO 222 400 232 400 245 OOO 259 400 273 700 288 200 298 OOO
35-39 M 142 800 157 200 175 800 193 800 210 600 224200 236 100 244 700 251 OOO 256 OOO F 108 600 123 300 142 200 161 800 180 500 196 500 210 100 220 200 229 700 238 700
40-44 M 146100 141 800 136 800 133 200 134 200 140 600 154 100 172 700 191 900 208 500 F 113 300 110 700 107 700 105 500 107 OOO 114 100 127 400 145 OOO 164 500 181 900
45-49 M 147 100 148 500 149 300 147 600 145 400 141 300 137 500 134 100 131 900 132 600 F 123 600 123 800 123 800 122 300 120 500 117 500 113 OOO 108 600 106 200 107 100
50-54 M 141 300 142 600 144 200 145 200 146 600 147 600 147 200 146 300 144 300 141 500 F 124 600 125 600 126 400 126 500 126 400 126 900 125 800 124 OOO 121 500 117 900
55-59 M 114100 118 600 123 300 127 100 129 800 132 300 136 200 138 900 140 100 139 700 F 107 400 111 500 115 100 118 OOO 120 100 121 600 123 200 124 600 . 124 800 123 500
60--64 M 94000 95 500 97 700 100 200 104 100 108 100 111 500 115 300 118 200 121 200 F 93 300 95 400 97 600 100 100 103 700 107 600 110 300 112 400 114 100 115 200
65-69 M 68 200 71 300 73 800 75 800 77700 79 700 82400 85 600 88 OOO 90000 F 76 300 78 700 80 900 82 400 83 800 85 900 88 700 91 500 93 900 95 500
70--74 M 39 900 42 700 45 700 48 900 52 500 55 600 57 600 59 200 60 500 62 200 F 57 OOO 58 700 60 700 63 200 66 200 68 800 70 300 70 800 71 900 73 300
75 and over M 31 OOO 32 900 35 100 37 400 40 300 43400 47 600 51 800 55 800 59 500 F 71 900 75 OOO 78 400 81 900 85 900 90 600 94 100 96 900 99 900 102 300
All Ages M 2699700 2734800 2771200 2 791700 2 815 600 2844900 2870900 2892 OOO 2 916100 2922100 F 2483700 2529700 2573900 2606200 2640600 2679700 2709600 2735 600 2770100 2 782400 T 5183400 5264500 5345100 5397900 5456200 5524600 5580500 5627 600 5686200 5704500
Note: Figures refer to revised estimates based on the 1991 Census.
Source: Demographic Statistics Section, Census and Statistics Department.
17
i_

2.11 Total Live Births* by Age of Mother
Age of mother 1981 1982 1983 1984 1985 1986 1987 1988 1989 1990
Under 20 3 221 2 627 2439 1999 1 877 1 512 1 306 1 327 1 254 1201
20---24 24 560 23 179 21 868 18 201 16 342 13 327 11254 10 652 9 277 8 489
25-29 35 881 36 504 36 039 34270 34 246 32 433 31 243 33 068 29 210 28 168
30-34 18 486 18 816 18 044 17 743 18 223 18 674 20082 23 307 22466 22 335
35-39 3 718 4194 4234 4 517 4 883 5 173 5 491 6 255 6403 6432
40-44 766 677 531 513 492 450 535 693 777 777
45-49 83 74 69 31 46 29 25 27 23 27
50 and over 5 2 8 2 5 3
Unknown 35 44 69 22 15 14 22 81 206 299
Total 86751 86120 83293 77297 76126 71620 69958 75412 69621 67731
Note: *Live births known to have occurred in a year but excluding those given by Vietnamese migrants.
Source: Demographic Statistics Section, Census and Statistics Department.
2.12 Total Live Births* by Birth Order
Birth order 1981 1982 1983 1984 1985 1986 1987 1988 1989 1990
First 37 916 36 905 36 829 33 411 34 340 32063 30 681 34 609 31 897 31 019
Second 29 055 30 180 29 294 27 840 26 908 25 972 26 249 27 616 25 620 25 287
Third 12 710 12 545 11674 11187 10 547 9 691 9 422 9 602 8 710 8 321
Fourth and higher 7069 6483 5 488 4 857 4 324 3 885 3 585 3 483 3 164 2 806
Unknown 7 8 2 7 9 21 102 230 298
Total 86751 86120 83293 77297 76126 71620 69958 75 412 69621 67731
Note: *Live births known to have occurred in a year but excluding those given by Vietnamese migrants.
Source: Demographic Statistics Section, Census and Statistics Department.
18

2.13 Total Deaths* by Age Group by Sex
Age group
Less than 7 days
7-27 days
28 days-less than I year
!~years
5-9 years
10-14 years
15-19 years
20-24 years
25-29 years
30-34 years
35-39 years
40~4years
45~9 years
50-54 years
55-59 years
60-64 years
65-69 years
70-74 years
75-79 years
80-84 years
85 years and over
Unknown
Total
Sex
M F
M F
M F
M F
M F
M F
M F
M F
M F
M F
M F
M F
M F
M F
M F
M F
M F
M F
M F
M F
M F
M F
M F
1981
260(1) 206
51 55
149 117
lll 59
53 38
70 63
161 65
217 119
254 131
267 128
243 111
409 177
682 330
I 077 484
I 382 712
I 828 916
2 092 1264
1982
270(4) 218
54 58
125 125
92 87
61 34
63 46
134 73
232 100
258 121
254 154
248 119
416 164
681 321
I 161 453
1441 641
I 854 I 020
2080 I 252
I 887 I 953 I 422 I 567
I 312 I 390 I 556 I 551
806 872 I 541 I 445
424 539 I 570 I 617
15(11) 16(25) 6 7
13 750(12) 14 194(29) 11 070 11173
1983
277(1) 195
61(1) 43
112 132
91 90
46 29
55 55
117 75
204 143
199 134
241 126
258 106
392 136
626 280
I 117 470
I 512 688
I 997 I 024
2 235 1283
2 341 I 561
1489 I 562
966 I 622
517 I 871
18(22) 2
14 871(24) 11627
1984
203(4) 171
63 47
112 83
80 68
50 47
49 39
100 54
196 88
222 126
233 132
254 121
353 117
603 264
I 048 427
I 451 641
I 910 953
2133 I 265
2 219 1 660
I 530 I 603
952 I 614
528 I 665
18(22) 2
14 307(26) 11187
1985
160(3) 129
48 32
112 88
81 59
43 41
54 39
91 47
157 92
205 130
235 121
280 116
317 132
575 254
I 050 400
I 386 691
I 822 939
2 063 I 304
2223 I 617
I 584 I 571
937 I 603
595 I 800
11(16) 5
14 029(19) 11210
Notes: Figures in brackets indicate the number of deaths of unknown sex excluded. *Deaths known to have occurred in a year but excluding those of Vietnamese migrants.
Source: Demographic Statistics Section, Census and Statistics Department.
1986
168(1) 128
45 37
80(1) 94
60 63
41 36
52 48
84 64
165 81
191 111
248 129
295 160
328 137
509 222
983 453
I 358 626
I 854 928
2172 I 266
1987
139(1) 115
42 43
102 73
71 48
40 31
48 28
83 39
132 76
196 121
236 145
271 167
297 126
554 202
968 401
1421 625
I 808 967
2 291 1294
2 334 2 390 I 636 I 709
1751 1990 1758 1811
I 027 I 154 I 482 I 692
656 746 2023 2194
9(18) 19(2) 8
14 410(20) 14 998(3) 11482 11915
1988
157(3) 102
43 44
118 92
62 54
43(1) 36
50 31
104(1) 49
118 104
206 110
243 143
344 166
353 146
468 180
931 375
1479 604
I 873 947
2237 I 367
2 397 I 628
2105 I 986
I 172 I 745
840 2 387
8(1) 6
15 351(6) 12302
1989
131(2) 107
51 42
99 85
48 42
35 31
42 32
86 56
157 94
231 105
282 169
316 193
413 163
511 188
908 376
1478 633
I 949 908
2 326 I 293
2 653 I 716
2 316 1988
I 322 I 780
891 2468
19(4) 6
16 264(6) 12475
1990
125(4) 80
35 17
84 74
61 51
25 26
44 40
96 65
147 74
218 120
296 149
347 184
410 189
480 173
808 339
1462 573
I 899 913
2 381 1402
2 604 I 737
2406 2 091
1414 I 872
956 2 643
15 7
16 313(4) 12819
19

2.14 First Marriages Registered by Sex by Age Group Number of first marriages
Sex/Age group 1981 1982 1983 1984 1985 1986 1987 1988 1989 1990
Bridegrooms
16-19 718 584 526 428 415 302 282 296 259 257
20-24 11904 11199 9 364 10 117 8457 6 898 6 932 5 837 5 350 5 426
25-29 18 361 19 386 17 312 21 924 17 873 17 023 20 347 18 694 16 590 18 105
30-34 7 944 8 425 7 481 9107 7 886 7 937 9 939 10 052 9 580 11 063
35-39 1 818 1 856 1 883 2 171 2 129 2287 2 706 2 783 2 522 2 970
40-44 695 588 542 517 460 538 634 694 692 844
45-49 362 252 267 261 229 227 269 263 232 247
50 and over 238 190 225 205 209 280 342 421 523 562
Total 42040 42480 37600 44730 37658 35492 41451 39040 35748 39474
Brides
16-19 4 017 3 261 2 774 2426 2135 1 644 1 578 1497 1428 1 544
20-24 22443 22 067 18 545 21 701 17 021 14 770 16 187 14160 12 273 12 799
25-29 12 564 13 909 12 907 16 620 14 533 14 624 18 132 17 456 15 904 18 269
30--34 2478 2672 2 728 3 222 3 092 3 331 4 207 4435 4440 5 012
35-39 396 413 475 610 628 739 947 1 029 961 1109
40-44 142 115 109 110 132 146 187 225 260 307
45-49 82 82 66 73 69 69 105 77 101 112
50and over 109 106 129 104 110 142 162 231 331 322
Total 42231 42625 37733 44866 37720 35465 41505 39110 35698 39474
Source: Demographic Statistics Section, Census and Statistics Department.
20

2.15 Marriages Registered by Age Group of Bridegroom and Bride
Age of bridegroom
Below 20
20-24
25-29
30-34
35-39
40-44
45 and over
Age of bride
Below20 20-24 25-29 30-34 35-39 40-44 45 and over Below 20 20-24 25-29 30-34 35-39 40-44 45 and over Below20 20-24 25-29 30-34 35-39 40-44 45 and over Below20 20-24 25-29 30-34 35-39 40-44 45 and over Below 20 20-24 25-29 30-34 35-39 40-44 45 and over Below 20 20-24 25-29 30-34 35-39 40-44 45 and over Below 20 20-24 25-29 30-34 35-39 40-44 45 and over
Total
1981
530 182
7
2190 8 447 1 314
63 7
6 1 022
10 561 6 723
622 45 7 2
267 3 053 4162 1 359
110 13 6
26 532 995 878 338 47 12 8
112 343 550 431 280
72 3
77 194 376 383 734
3 665 50756
1982
405 169
10
1 1 778 8 033 1402
90 7
2 884
10 707 7 711
633 46 4 4
183 3 035 4482 1 559
149 21 12 28
446 984 946 356 39 18 6
89 272 500 450 277
77 2
52 143 299 463 704
3 988 51467
1983
367 154
7
1 513 6 584 1259
92 6
734 9 218 7 197
643 60 4
138 2 441 4136 1 532
169 23
3 34
416 972
1 022 457
54 9 5
83 245 424 464 267
65 1
42 167 322 534 742
5 172 47778
Source: Demographic Statistics Section, Census and Statistics Department.
2.16 Divorce Statistics
Petitions filed*
Cases transferred to High Court :fl:
Divorce decrees
Notes: * Figures include defended cases.
1981
2 811
80
2060
1982
3 120
79
2673
1983
3 734
20
2 857
1984
310 107
10 2
1 307 7 294 1488
85 5
694 11 311 9 507
776 71 6
100 2 820 5 164 1 675
197 14 4
21 422
1 088 1 066
442 43 11
58 214 369 458 214
57 2
49 119 281 480 643
4423 53409
1984
4 764
9
4086
1985
305 102
6
1158 5 958 1 307
90 2
2 553
8 564 8 335
792 70 12 2
102 2 237 4450 1 635
216 17 6
18 377
1138 1 011
432 38 12 4
62 189 318 417 172 48
2 36
131 273 425 539
3 491 45056
1985
5 047
9
4 313
1986
217 78 5 1
872 4 825 1156
80 8 2
454 7709 8 405
823 79 9 2
96 2037 4 611 1 768
219 27 6
15 340
1154 1 084
481 62 19
60 181 335 430 186 40
26 132 256 470 627
3 890 43280
1986
5 339
9
4257
1987
195 81 6
799 4 865 1195
99 6
453 8 663
10 514 998
89 12 1
113 2 366 5 690 2 211
295 31 6
21 371
1 225 1 226
513 83 17 4
68 198 369 398 180
39 4
25 110 247 436 569
3 769 48561
1987
5 747
6
5 055
1988
208 81 7
726 3 966 1 057
97 15
464 7 514 9 950
941 119
8 2
89 2 319 5 668 2 339
301 43
6 20
389 1154 1 321
507 77 9
66 252 377 378 187
36 3
21 107 219 376 469
3 350 45238
1988
5 893
5
5 098
:f1: Figures include cases transferred to the High Court as a defended suit or in respect of application for ancillary relief.
Source: Judiciary.
Number of marriages
1989
197 55 7
709 3 584
975 86 17 2
422 6 416 8 974
947 89 15 5
100 2022 5 307 2402
328 44 4
14 291
1 061 1194
473 88 22
2 62
227 412 351 179 36
3 22 97
208 322 493
5 683 43947
1989
6275
5
5 507
1990
193 60 4
717 3 596 1 010
100 12
479 6 612
10 126 1 042
120 13 4
136 2208 6 207 2 742
354 47
7 23
343 1 292 1 373
508 104
15
69 263 415 405 193
37
41 102 213 320 535
5 127 47168
Number
1990
6 767
8
5 551
21


Section 3 Labour
Tables 3.1 to 3.5 General Information
Figures on the labour force, labour force participation rate, unemployment and unemployment rate are obtained from the General Household Surveys which started from August 1981.
Concepts and Definitions
The labour force or economically active population consists of the land-based civilian population who fulfil the requirements for inclusion in the employed and unemployed population. Hotel transients and inmates of institutions are excluded.
In the General Household Survey before 1985, labour force was defined as persons aged 15 and over who performed some work for pay or profit during the seven days before enumeration; or who had a job or enterprise but were not at work for reasons such as illness or injury, industrial dispute, leave, mechanicalbreakdown and bad weather; or who were unpaid workers working for at least 15 hours during the seven days before enumeration; and persons aged 15 and over who would have been engaged in productive work but were currently unemployed.
In the General Household Survey from 1985 onwards, labour force is defined as persons aged 15 and over who performed some work for pay or profit (including unpaid family workers) during the seven days before enumeration; or who had a formal job attachment or an enterprise but were temporarily not at work; and persons aged 15 and over who would have been engaged in productive work but were currently unemployed.
Unemployed population refers to all persons aged 15 and over who, during the seven days before enumeration, were without a job but were available for work and were seeking work for pay or profit. This includes those 'discouraged' workers who did not look for work because they believed work was not available.
Labour force participation rate refers to the proportion of labour force in the population aged 15 and over.
Unemployment rate refers to the proportion of unemployed persons in the labour force.
Data Sources
The General Household Survey is based on a quarterly sample of about one percent of the total population in Hong Kong. For the purpose of the survey, the universe is defined to cover the land-based civilian non-institutional population.
The survey is conducted on a continuous month-to-month basis. Each month a sub-sample (about 0.3% sample) of households are surveyed. These households are interviewed by rotation, such that about 50% of the sample is the same for any two consecutive quarters. Personal and labour force data are collected by interviewing each individual member in the household (except the labour force data of children aged under 13). These interviews are conducted by permanent field staff of the Census and Statistics Department. A 'shifting survey moment' or 'yesterday' approach is employed; that is to say, the number of persons in the household is as at 'yesterday'. The labour force characteristics of these persons, on the other hand, relate to the week before 'yesterday'.
Compilation and Calculation
The total labour force in each quarter is derived by making use of the data obtained from the General Household Survey and an independent population estimate.
Specifically, the estimate of the labour force is derived, using a ratio estimation method, from the sum of the products of the age-sex-specific participation rates obtained from the survey and an independent estimate of the population for the corresponding age-sex groups.
The estimate of unemployment rate is obtained by dividing the number of unemployed persons by the labour force enumerated in the sample while that of unemployment is derived by multiplying the unemployment rate by the estimated labour force.
Further References
Labour force statistics are published in the Quarterly Report of General Household Survey Labour Force Characteristics published by the Census and Statistics Department.
23

24
Tables 3.6 to 3.8 General Information
Figures on working population in these tables are obtained from the 1991 Census. The tables refer to the enumerated resident population and exclude transients and Vietnamese migrants.
Concepts and Definitions
Working population refers to persons aged 15 and above who performed some work for wage/ salary or were on leave/holiday during the seven days before enumeration in the 1991 Census.
Included in this category are:-Self-employed -A person who works on his own account, neither employed by
someone else nor employing others. Employer -A person who works on his own account and employs one or more
persons to work for him. Employee -A person who works for wage/salary in local/overseas government
or private/ government subsidized organizations. Domestic helpers working for wage, .outworker who is free to take his work home or anywhere he likes, and student workers are also grouped in this category.
Unpaid family worker ~A person who lives with his family and does work (not domestic work) as part of the family enterprise in return for food and lodging.
Industry is classified on the basis of the Hong Kong Standard Industrial Classification (HSIC), which is an adapted version of the International Standard Industrial Classification (ISIC, Rev. 2).
Occupation is classified on the basis of the International Standard Classification of Occupation (ISC0-88).
Educational attainment refers to the highest level of education ever attained by a person in school or other educational institution, regardless of whether he/she had completed the course. Only formal courses are counted as educational attainment. A formal course shall be one that lasts for at least one academic year, requires specific academic entrance qualifications (with the exception of the degree courses offered by the Open Learning Institute of Hong Kong) and includes examinations for assessment purposes.
Data Sources
Information on the 1991 Census can be found in Section 2 of this publication.
Tables 3.9 to 3.16 General Information
The government has been publishing quarterly statistics of employment and vacancies since 1947. Prior to 1980, the statistics were compiled from a number of separate employment surveys which covered business firms in various economic sectors.
Starting from April 1980, an integrated quarterly Survey of Employment, Vacancies and Payroll ( SEVP) is introduced to replace the various employment surveys. The survey results, supplemented by those of the quarterly Employment Survey of Construction Sites (the site survey), provide a full picture of the labour demand in the local economy.
Concepts and Definitions
The unit of enquiry in the SEVP is an establishment, which is defined as an economic unit which engages, under a single ownership or control, in one (or predominantly one) kind of economic activity at a single physical location.
The unit of enquiry in the site survey is a construction site, which refers to a demarcated locality where one or more stages of construction work are being carried on. A construction site is categorised into a private or public site depending on whether the contracting party is a private company or a government department. Sites under the control of the Mass Transit Railway Corporation and Kowloon-Canton Railway Corporation are classified as public sites.
In the SEVP and site survey, employment is actually measured in terms of number of persons engaged. The number of persons engaged provides a measure of the satisfied demand for labour. The information is useful for monitoring short-term changes of the labour market as well as for time-series analysis of changes in employment structure of the local economy.
In the SEVP, persons engaged include working proprietors and partners actively engaged in the work of the establishment; all full-time employees paid by the establishment on the survey reference date (which is usually the last full working day in each quarter) and part-time employees and unpaid family workers working more than three hours on the reference date. Paid employees who are temporarily absent from work because of one reason or the other are also included.

On the other hand, the definition of persons engaged in the site survey is restricted to manual workers who work in the construction sites only. Manual workers include foremen, technicians, craftsmen, semi-skilled and unskilled workers who are either directly employed by the main contractor, or being called upon by sub-contractors and gang leaders. For sites under the charge of government departments, manual workers are further refined to 34 selected major occupations at the technician, craftsman and operative levels.
Persons engaged in the Civil Service sector include all permanent officers on the establishment of individual government departments and agencies. Those who are on trial, probation and terminal leave prior to leaving the service are also counted.
Vacancies measured in the SEVP and site survey are defined to refer to those unfilled, immediately available job openings for which the establishment or site is actively trying to recruit personnel. However, vacancies at construction sites include only those job openings for manual workers. The statistics give an indication of the size of the unsatisfied demand for workers. Together with the statistics on the number of persons engaged, these statistics provide a snapshot of the total number of job opportunities available in the labour market.
The total employment is compiled by adding up the number of persons engaged reported by individual establishments. For sample surveys, the data furnished by each selected establishments are first multiplied by a grossing-up factor, which is the reciprocal of the sampling fraction, before they are summed together.
The total number of vacancies and monthly payroll are also compiled in the same way.
Apart from employment and vacancy statistics, payroll per person engaged is also collected by the SEVP. Payroll refers to wages and salaries, bonuses and gratuities, commissions and cash payment in other forms paid directly to all employees. Profits earned by proprietors and business partners, pensions, and payment to outworkers are, however, excluded.
The payroll per person engaged is derived by dividing the total monthly payroll by the total employment.
Payroll per person engaged should not be interpreted as average income of employees. Firstly, the time period covered by employment figures (which is usually the last full working day in the last month of each quarter) is not the same as that covered by monthly payroll figures (which is the wnole of the last month of each quarter). Secondly, payroll refers to payments to employees, whereas persons engaged include more than just employees. They also include working proprietors, business partners and unpaid family members who normally are not on the payroll. Finally, as far as income is concerned, employees' income usually is not just limited to cash payments for work as reflected in payroll figures.
In addition, nominal and real indices of payroll per person engaged are also compiled to reflect the changes in payroll per person engaged in money terms as well as in real terms. The nominal index of payroll per person engaged is the ratio obtained by comparing the payroll per person engaged for a particular time point with that for June 1980, which is taken as 100. The real index of payroll per person engaged is obtained by deflating its nominal counterpart by the Consumer Price Index (A).
Data Sources
The SEVP covers almost all kinds of private business undertakings in Hong Kong. It is organised into annual cycles such that undertakings having the same sort of business activity are enumerated in full in one quarter and are sampled in the remaining three quarters of every year. To spread out the workload, the full-scale surveys covering different major economic sectors are staggered over the year in the following way so that on average about 100 OOO establishments are surveyed in each quarter:-
I.S.l.C. Reference Month of Major Division Economic Sector Full-scale Survey
2 Mining and Quarrying September 3 Manufacturing September 4 Electricity and Gas September 6 Wholesale, Retail and Import/ June
Export Trades, Restaurants and Hotels
7 Transport, Storage and March Communication
8 Financing, Insurance, Real March Estate and Business Services
9 Community, Social and March Personal Services
25

26
The following economic activities are, however, not covered in the survey:
/.S.I.C. Major Division
5
6
7
9
Economic Sector Economic Activities Not Covered
Agriculture, Hunting, Fon;stry The whole sector and Fishing
Construction
Wholesale, Retail and Import/Export Trades, Restaurants and Hotels
Transport, Storage and Communication
Community, Social and Personal Services
The whole sector except construction sites
Hawkers, street vendors, retail pitches other than market stalls
Taxis, public light buses, marine cargo handling services and tow boats
Veterinary services, religious organisations, authors and other independent artists, domestic servants, and miscellaneous recreational and personal services
Questionnaires are mailed to each sampled establishment to collect the required data. If the establishment does not respond timely, data will be collected either by face-to-face interview or by computer-assisted-telephone interview (CA TI) carried out by field officers of this Department.
The quarterly Employment Survey of Construction Sites, which merged with the six-monthly Survey of Vacancies at Construction Sites in June 1990, provides both employment and vacancy statistics for manual workers at construction sites on a quarterly basis. Data are collected by personal interviews with the responsible site agents of each private construction site. On the other hand, employment data of public construction sites are extracted from administrative records completed by respective site agents of various Departments under the charge of Works Branch (including Architectural Services Department, Civil Engineering Services Department, Drainage Services Department, Highways Department, Territory Development Department and Water Supplies Department) and Housing Department.
The civil service employment is compiled from regular labour returns forwarded to the Department by individual government departments via the Civil Service Branch. The employment figures refer to the first of January, April, July and October.
Compilation and Calculation
When doing time-series comparisons of the above statistics, readers are reminded to take note of the fact that there are changes in methodologies between the surveys undertaken prior to 1980 and after 1980. Moreover, industry updating surveys are conducted from time to time to reclassify establishments according to their most current business activity. This affects the statistics of certain industries which may show an abrupt change between periods when results of the industry updating surveys are incorporated into the employment surveys. A table showing the periods when results of the past industry updating surveys were effected in the employment surveys is given below:-
I.S.J.C. Periods When Results Of Industry Major Division Economic Sector Updating Surveys Were Effected
2 Mining and Quarrying September of 1983, 1985, 1987 and 1989
3 Manufacturing June 1979, September of 1983, 1985, 1987 and 1989
4 Electricity and Gas September of 1983, 1985, 1987 and 1989
6 Wholesale, Retail and Import/ June of 1979, 1984, 1986 and 1988 Export Trades, Restaurants and Hotels
7 Transport, Storage and March of 1985, 1987 and 1989 Communication
8 Financing, Insurance, Real March of 1985, 1987 and 1989 Estate and Business Services
9 Community, Social and March of 1985, 1987 and 1989 Personal Services

A summary of the findings of the second round of industry updating survey for M.D. 2, 3, 4 and M.D. 6 and the first round of the industry updating survey for M.D. 7, 8, 9 are given in the Special Review Article contained in the May 1984, July 1985 and January 1986 issue of the Hong Kong Monthly Digest of Statistics respectively.
In the case of the civil service employment, the former Kowloon-Canton Railway Department has been separated from the government with effect from 1.2.1983 and accordingly its employment is excluded from government employment.
Further References
Summary statistics in the form of time series for all economic sectors are contained in the publication entitled Report of Employment, Vacancies and Payroll Statistics and more detailed statistics in Employment and Vacancies Statistics (Detailed Tables) published by the Census and Statistics Department. Statistics in relation to construction sites before June 1990 are given in separate reports entitled Employment, Wages and Material Prices in the Construction Industry and Report of Vacancies at Construction Sites. Starting from 1990, construction sites statistics are published in the Quarterly Report of Employment and Vacancies at Construction Sites.
Table 3.17 General Information
A new Quarterly Survey of Wages, Salaries and Employees has been conducted as from March 1982 to replace the old Wage Survey conducted since 1964. The new survey extends to include supervisory, technical, clerical and miscellaneous non-production workers in addition to craftsmen and other operatives in 41 industries. Starting from September 1989, the survey is conducted at half-yearly interval in March and September of the year.
Employees at the administrative and professional levels are enumerated in another annual Survey of Salaries and Employee Benefits-Managerial and Professional Employees (Excluding Top Management).
Concepts and Definitions
Wage rate is usually thought of as the 'price' of labour. Therefore, wage rates are usually expressed as time rates which refer to the amount of money paid for normal time of work and relate to a time-unit such as an hour, a day, a week or a month.
For the purpose of the new wage survey, wage rates are defined to include basic wages or salaries, cost-of-living allowance, meal benefits, commission and tips, good attendance bonus, night shift allowance, year-end bonus and other guaranteed and regular bonuses and allowances. When compiling wage indexes, year-end and other regular bonuses and allowances that are paid less frequently than monthly are averaged out to an equivalent monthly rate.
Nominal and real wage indexes are also compiled from results of the new wage survey. They are designed to measure the 'pure' changes in wage rates by holding the structural pattern of the labour force with respect to industry, occupation, sex and mode of payment the same as that of March 1982, which is the base period of the wage indexes. Whilst the Nominal Wage Index measures the changes in wage rates in money terms, the Real Wage Index measures the changes in the purchasing power of the amount of money earned.
Regarding the wage statistics, the change in the wage index for a particular industry between any two months may be different from the change derived by comparing the published wage rate figures for that industry over the corresponding months. As the wage index is designed to measure the 'pure' change in wage rates by holding constant the structure of the labour force with respect to industry, occupation, sex and mode of payment, the movement as indicated by the wage indexes should always be used to measure changes in wage rates.
There are differences between the wage indexes and the indexes of payroll per person engaged which are published by the Census and Statistics Department. While the former provides a measure in changes in the price of labour, the latter is a measure in changes in average earnings of workers. Total payroll is the amount of direct cash payments that employees receive from employers. Apart from cash receipts, it also includes overtime pay and other non-guaranteed and irregular bonuses and allowances. Hence, the indexes of payroll per person engaged tend to be sensitive to changes in the number of hours actually worked, the timing of the payment of bonuses, allowances and back-pay, and the composition of the labour force. As a result, movements in the wage indexes do not necessarily conform with those in the indexes of payroll per person engaged.
27

28
Data Sources
The Survey of Wages, Salaries and Employee Benefits covers a total of 41 principal industries spanning the manufacturing; wholesale/retail, import/export trades, restaurants and hotels; transport services; business services and personal services sectors. For each of these industries, a number of representative occupations (up to supervisory level) with clearly understood and definable duties are selected, for which wage data of both male and female employees are collected.
In each round of the survey, a total of some 2 OOO establishments are covered. The sample consists of 4 replicates each of which is stratified by industry and size in terms of employment. In each round of the survey, one replicate is replaced in order to spread the burden on respondents of selected establishments.
Apart from wage rates, establishment data such as total number of employees, number of normal working hours per day and number of standard working days per month are also enquired in each round of survey whilst those on entitlement to various types of fringe benefits are collected biennially.
Compilation and Calculation
To estimate the average wage rate of a particular occupation in a particular industry, it is necessary to estimate first the total wage bill (wage rate x number of workers) for that category of worker, and second the total number of workers in that category. The estimated average wage rate is given by the ratio of the estimated total wage bill to the estimated total number of workers.
Because the Nominal Wage Index is designed to measure the change in wage rate unaffected by changes in occupational and industrial structure, a Laspeyres base-weighted aggregative index is used. The base period is March 1982 and the weights are determined in the March 1982 Survey.
The Real Wage Index is obtained by deflating the Nominal Wage Index by the Consumer Price Index (A).
Further References
For details on the scope and methodology of the survey, please refer to the Report on Half-yearly Survey of Wages, Salaries and Employee Benefits, Volumes I and II published by the Census and Statistics Department.
Table 3.18 Generallnformation
Since 1970, the Census and Statistics Department has compiled and published average daily wages for 34 different classes of occupations in building and construction industry on a monthly basis. These average daily wages are especially useful to government departments in determining the amount that should be reimbursed to contractors as a result of inflation in labour costs during the completion period of building and construction projects.
Concepts and Definitions
The wage rate is defined to include basic wage, meal allowance, transportation allowance and adjustments for public holidays and statutory holidays for all daily rated workers; and in addition, adjustments for paid sick leave and guaranteed year-end bonus for monthly-rated workers.
Data Sources
Contractors of all active public works under the charge of Architectural Services Department, Civil Engineering Services Department, Drainage Services Department, Highways Department, Territory Development Department and Water Supplies Department are required to complete and submit a standard proforma monthly to the Census and Statistics Department. The contractors have to fill in the number of mandays worked in each day during the reference month and by the end of the month, the total number of mandays worked. They have also to give the maximum, minimum and weighted average of the daily wage rates of workers of each trade.
Compilation and Calculation
To estimate the average daily wage rate of a particular occupation for the reference month, it is necessary to estimate the total wage bill paid for the occupation in the month. This is equal to the sum of the products obtained by multiplying the number of mandays worked in each contract and its weighted average daily wage rate. Then the average wage rate can be derived by dividing the total wage bill by the total number ofmandays worked in all contracts.

Further References
Average monthly daily wages are available in the pamphlet entitled Average Daily Wages of Workers Engaged in Government Building and Construction Projects prepared monthly by the Census and Statistics Department.
Tables 3.19 to 3.20 General Information
As a first step towards enhancing the employee coverage of the Survey of Wages, Salaries and Employee Benefits, an annual Survey of Salaries and Employee Benefits-Managerial & Professional Employees (Excluding Top Management) has been conducted since September 1984. It collects information on salaries and employee entitlement to fringe benefits of managerial and professional staff, since these are excluded from the Survey of Wages, Salaries and Employee Benefits. However, employees at the top managerial level are still excluded from the annual survey owing to difficulties in data collection.
Concepts and Definitions
Salary rate is defined to include basic salaries, cost-of-living allowance, guaranteed year-end bonus, commissions and tips and other regular and guaranteed bonuses and allowances. Other items which may contribute significantly to the total pay package of employees at the managerial and professional grades such as profit-sharing bonus and housing allowance are not included. Fringe benefits and payments in kind are not converted into monetary terms and therefore are also excluded from the definition of salary rate. Information on employee entitlements to benefits are separately collected and analysed.
Salary indexes are compiled to measure the changes in salary rates in both nominal and real terms. Apart from the Salary Index (A) which measures general changes in average salary rates, a Salary Index ( B) is also derived to reflect changes in salary rates of only those employees who have been in the same occupation and in the same company in two consecutive years ending the reference period of the survey. In other words, the Salary Index (B) accounts only for changes in salary rates due to a general increment, meriterious increase and gain in seniority. On the other hand, the Salary Index (A) is a more comprehensive measure of change in salary levels. Apart from those measured by the Salary Index (B), it also takes into account changes in salary levels resulting from movements across companies and in and out of occupations.
Data Sources
A company is used as the survey umt m the survey. A company is defined as a business undertaking including establishments having the same first 7 digits of the Business Registration Number.
A total of about 200 companies are selected from the manufacturing, electricity, gas and steam; building and construction and related trades; wholesale/retail and import/export trades; transport, storage and communication and financial institutions and insurance sector, with an average of about 40 in each selected sector. All large companies in these economic sectors are covered, whilst a panel sample of medium-sized companies is randomly taken from each of selected major economic sector. Supplementary samples are also drawn in each year to take into account companies which are newly established or fall into the scope of the survey for the first time.
Within each major economic sector, common occupations relating to managerial and professional employees and suitable to the scope of the survey are covered if they have clearly defined duty areas. Salary rates of individual employees of the selected occupations for June of both the previous and reference years are collected. In addition, data on entitlements to fringe benefits of those surveyed employees are enquired.
Compilation and Calculation
The salary indexes are base-weighted chained indexes with June 1983 taken as 100. They are designed to measure pure changes in salary rates unaffected by changes in occupational and industrial structures. The Nominal Salary Indexes are compiled by chaining the change in average salary levels between June of the previous year and June of the reference year with the related index for June of the previous year. On the other hand, the Real Salary Indexes are obtained by deflating their nominal counterparts by the Hang Seng Consumer Price Index in the reference month.
Further References
Further details of the survey methodology can be found in the Report of Salaries and Employee Benefits-Managerial and Professional Employees (Excluding Top Management) published by the Census and Statistics Department.
29

30
Tables 3.21 to 3.22 Concepts and Definitions
Reported occupational accidents refer to all accidents reported to the Labour Department which have resulted in the death of an employee or the total or partial incapacity of an employee for more than three days.
Statistics on industrial work stoppages refer to the number of work stoppages and the corresponding number of working days (or man-days) classified by International Standard Industrial Classification major divisions. These figures cover stoppages of work arising from disputes connected with terms and conditions of employment. Stoppages involving fewer than ten workers or lasting less than one day are excluded, unless the aggregate of working days lost exceeds 100. The number of workers involved is the number who actually cease work at the establishments where the disputes occur.

3.1 Labour Force and Labour Force Participation Rate by Age Group by Sex
1986 1987 1988 1989 1990
Number Rate Number Rate Number Rate Number Rate Number Rate Age group/Sex ('OOO) (%) ('OOO) (%) ('OOO) (%) ('OOO) (%) ('OOO) (%)
15-19 143.7 33.2 132.9 31.0 131.4 30.2 124.6 28.8 118.4 28.0 Male 77.4 34.5 71.4 32.5 73.0 32.6 69.6 31.l 65.8 29.8 Female 66.3 31.7 61.6 29.5 58.4 27.6 55.0 26.4 52.6 26.l
20-24 470.1 86.2 444.2 86.4 423.7 86.2 399.1 85.2 375.5 84.7 Male 240.7 88.0 226.3 88.4 214.9 87.3 199.6 86.3 191.5 86.0 Female 229.4 84.3 217.8 84.5 208.8 85.l 199.4 84.l 184.0 83.4
25-29 499.7 85.4 504.3 86.0 506.4 87.0 509.6 87.4 494.8 88.0 Male 297.3 98.5 291.3 98.5 289.2 98.6 287.6 98.3 273.7 98.4 Female 202.4 71.5 213.0 73.2 217.2 75.2 222.0 76.4 221.l 77.9
30-34 386.9 78.2 405.l 77.5 424.7 78.5 429.7 77.1 448.5 77.4 Male 256.7 98.8 269.9 99.0 281.2 99.2 282.8 98.9 290.8 98.9 Female 130.2 55.4 135.2 54.0 143.5 55.7 146.9 54.l 157.8 55.3
35-39 320.0 77.4 337.8 77.5 348.4 76.9 352.3 76.6 361.6 76.l Male 218.2 98.7 229.5 99.0 235.5 98.8 237.2 98.9 240.5 98.8 Female 101.8 52.8 108.3 53.1 112.9 52.6 115.l 52.2 121.l 52.3
40-44 208.3 80.0 229.7 79.9 258.l 79.6 274.4 78.0 303.6 78.0 Male 144.9 98.1 158.2 98.8 173.7 98.5 188.0 99.0 207.9 98.9 Female 63.4 56.3 71.5 56.0 84.3 57.l 86.5 53.4 95.7 53.5
45-49 188.2 77.2 181.9 77.7 182.5 77.6 179.9 77.2 185.7 77.9 Male 132.l 97.l 127.5 97.3 130.3 97.3 127.7 97.7 131.3 97.8 Female 56.1 52.1 54.4 52.8 52.l 51.6 52.2 51.0 54.4 52.3
50-54 183.7 68.5 189.2 69.7 182.5 68.9 180.1 68.8 171.1 68.3 Male 132.9 93.6 137.2 93.3 134.3 93.5 133.0 93.3 128.3 92.8 Female 50.8 40.3 52.0 41.8 48.3 39.8 47.l 39.5 42.7 38.l
55-59 141.2 57.5 140.4 57.2 144.8 56.7 143.3 55.9 135.4 55.2 Male 104.7 81.6 103.7 80.8 108.1 80.9 108.5 81.2 103.4 81.2 Female 36.4 31.l 36.7 31.4 36.7 30.l 34.8 28.3 32.0 27.1
60--M 87.2 39.l 91.0 39.7 90.5 39.0 92.9 38.6 91.l 37.0 Male 63.0 56.5 66.2 57.8 66.5 55.8 70.0 56.8 69.0 54.7 Female 24.3 21.7 24.9 21.7 24.0 21.2 22.9 19.5 22.2 18.4
65 and over 70.8 16.3 71.7 15.9 69.9 15.2 66.9 14.1 62.4 12.7 Male 45.8 25.0 46.4 23.9 47.4 24.0 46.6 22.5 45.8 21.4 Female 25.0 10.0 25.4 9.9 22.5 8.6 20.2 7.6 16.5 5.9
Total 2699.7 65.1 2 728.2 64.9 2762.8 64.7 2 752.8 63.7 2 748.1 63.2 Male 1 713.7 80.5 1 727.5 80.3 1 754.1 80.1 1 750.6 79.5 1 747.9 79.1
Female 986.0 48.9 1000.7 48.7 1008.7 48.4 1002.2 47.3 1000.2 46.8
Notes: Figures are averages of the quarterly General Household Surveys of the year. Figures since 1986 have been revised using the 1991 Census-based revised population estimates.
Source: General Household Survey Section, Census and Statistics Department.
3.2 Unemployment and Unemployment Rate by Age Group and Sex
1986 1987 1988 1989 1990
Number Rate Number Rate Number Rate Number Rate Number Rate Age group ('OOO) (%) ('OOO) (%) ('OOO) (%) ('OOO) (%) ('OOO) (%)
15-19 14.9 10.3 8.8 6.6 7.5 5.7 5.5 4.4 7.4 6.2
20-29 31.7 3.3 20.2 2.1 17.5 1.9 14.5 1.6 15.8 1.8
30-39 11.9 1.7 8.1 1.1 6.1 0.8 4.4 0.6 5.9 0.7
40--49 6.2 1.6 4.1 1.0 3.1 0.7 2.4 0.5 3.9 0.8
50-59 8.8 2.7 4.6 1.4 2.7 0.8 2.2 0.7 2.9 1.0
60 and over 2.9 1.9 1.5 0.9 0.9 0.6 0.6 0.4 0.8 0.5
Total 76.2 2.8 47.4 1.7 37.7 1.4 29.7 1.1 36.6 1.3 Male 51.3 3.0 29.7 1.7 24.0 1.4 19.1 1.1 23.3 1.3
Female 25.0 2.5 17.6 1.8 13.7 1.4 10.6 1.1 13.3 1.3
Notes: Figures are averages of the quarterly General Household Surveys of the year. Figures since 1986 have been revised using the 1991 Census-based revised population estimates.
Source: General Household Survey Section, Census and Statistics Department.
31

3.3 Labour Force by Occupation, 1990
Occupation
Professional, technical and related workers
Administrative and managerial workers
Clerical and related workers
Sales workers
Service workers
Agriculture, animal husbandry and forestry workers and fishermen
Production and related workers, transport equipment operators and labourers
Unclassifiable
Unemployed without previous job
Total
Note: Figures are averages of the 1990 quarterly General Household Surveys.
Source: General Household Survey Section, Census and Statistics Department.
3.4 Labour Force by Industry, 1990
Industry
Agriculture, forestry, hunting and fishing
Mining and quarrying
Manufacturing (textiles and wearing apparel)
Manufacturing (others)
Electricity, gas and water
Construction
Wholesale and retail trade, restaurants and hotels
Transport, storage and communication
Financing, insurance, real estate and business services
Services
Unclassifiable
Unemployed without previous job
Total
Note: Figures are averages of the 1990 quarterly General Household Surveys.
Source: General Household Survey Section, Census and Statistics Department. ·
3.5 Labour Force by Activity Status, 1990
Activity status
Self-employed and outworkers
Employers
Employees
Unpaid family workers
Student workers
Unemployed
Total
Note: Figures are averages of the 1990 quarterly General Household Surveys.
Source: General Household Survey Section, Census and Statistics Department.
32
Number of persons
221 600
116 300
527 OOO
346 100
476400
24 500
1 031 700
100
4400
2748100
Number of persons
23 500
600
324 200
437 200
18 700
229 100
713 OOO
272 300
210 200
514 900
4400
2748100
Number of persons
150 200
144 500
2 381100
28 900
6 800
36 600
2748100

I I
I !
3.6 Working Population by Occupation, Sex and Educational Attainment, 1991 Census Number of persons
Educational attainment
No Tertiary education schooling/
Kinder- Lower Upper* Matri- Non-degree# Degree Occupation Sex garten Primary secondary secondary culation courses courses Total
Managers and administrators M 2 685 24143 27 969 63 136 17 555 18 183 45 186 198 857 F 1150 5 637 5 216 17 685 4789 4 870 11 043 50390
Professionals M 33 171 589 4 500 2 757 13 565 46 901 68516 F 22 30 132 1 966 1 394 7 933 19 338 30815
Associate professionals M 169 894 9 681 66 896 21 997 40 675 23 809 164121 F 48 198 3 971 50 221 14 711 33 404 13 235 115 788
Clerks M 315 10466 19 335 74 291 17 126 8 291 5 841 135 665 F 308 10 158 27 412 198 747 30 749 21 975 6 637 295986
Service workers and shop sales workers M 7 650 57 791 71 094 74 835 9 109 5 052 5 292 230823
F 6413 27 031 34948 45 173 5 782 4 606 4 543 128 496
Skilled agricultural and fishermen workers M 4169 6289 1 933 941 145 100 111 13688
F 3 817 2 134 458 281 35 21 21 6767 Craft and related workers M 14 291 113 095 127 760 77 068 5 771 11 529 2 750 352264
F 4 397 16 420 14 048 9 031 870 719 243 45728
Plant and machine operators and assemblers M 9 197 86 436 84 715 46 930 3 824 2 212 1 615 234929
F 10 207 59 533 41 887 165 559 1 583 646 482 130897 Elementary occupations M 35 735 123 094 71 593 40776 4288 2 526 2422 280434
F 51 957 78 235 27 789 38 666 9 580 4 875 12 296 223398 Armed forces and unclassifiable M 127 274 1 508 2 931 1 758 113 358 7069
F 24 37 33 184 82 67 45 472 Total M 74371 422653 416177 452304 84330 102246 134 285 1686 366
F 78343 199413 155894 378513 69575 79116 67883 1028737 T 152 714 622066 572071 830 817 153905 181362 202168 2 715103
Notes: *Figures include craft/apprenticeship courses in technical institutes. fr Figures include all diploma/certificate courses and higher diploma/endorsement certificate courses in technical institutes/polytechnics,
associateship and other non-degree courses in polytechnics and other post-secondary colleges, diploma/certificate courses in colleges of education and in Hong Kong Technical Teachers' College, and nurse training courses.
Source: Census Planning Section, Census and Statistics Department.
3.7 Working Population by Occupation, Sex and Activity Status, 1991 Census Number of persons
Activity Status
Unpaid Self- family
Occupation Sex employed Employers Employees* workers Total
Managers and administrators M 30 155 85 216 82 797 689 198 857 F 5 969 14 301 26 394 3 726 50390
Professionals M 2 160 4258 62 090 8 68516 F 585 560 29 616 54 30 815
Associate professionals M 6 461 4 381 153 050 229 164121 F 2134 1 512 111 400 742 115 788
Clerks M 1179 1 721 132 241 524 135 665 F 1 018 2 280 289 440 3 248 295986
Service workers and shop sales workers M 14 341 8 126 206 476 1 880 230 823 F 7 990 2978 111 287 6 241 128496
Skilled agricultural and fishery workers M 7 255 1168 3 508 1 757 13688
F 2 763 201 925 2 878 6767 Craft and related workers M 13 549 11 783 326 501 431 352264
F 868 754 42966 1140 45728 Plant and machine
operators and assemblers M 21 093 5 938 207 587 311 234929 F 1410 834 127 682 971 130 897
Elementary occupation M 18 492 4 970 254 984 1 988 280 434 F 8 004 1 860 206 839 6 695 223398
Armed forces and unclassifiable M 27 88 6 953 1 7069 F 28 14 423 7 472
Total M 114712 127 649 1436187 7818 1686 366 F 30769 25294 946972 25702 1028 737 T 145 481 152 943 2383159 33520 2 715103
Note: *The figures include outworkers and student workers.
Source: Census Planning Section, Census and Statistics Department.
33

3.8 Working Population by Industry, Sex and Activity Status, 1991 Census Nwnber of persons
Activity Status Unpaid Self- family
Industry Sex employed Employers Employees* workers Total
Agriculture and fishing M 7 868 1640 7 322 1 951 18781 F 2954 235 1 954 3 345 8488
Mining and quarrying M 6 25 759 790 F 92 92
Manufacturing M 19 956 43 073 382 419 1228 446676 F 3 506 7 082 304822 6035 321445
Electricity, gas and water M 119 231 16 060 16410 F 18 14 2022 2054
Construction M 4 836 9694 161 930 169 176629 F 213 400 10099 510 11222
Wholesale, retail and import/export trades, restaurants and hotels M 42213 42 598 275 179 3 693 363683
F 15 287 10458 209 242 12 716 247703 Transport, storage and co=unication M 21417 8 987 190 336 234 220974
F 924 919 42205 664 44712 Financing, insurance, real estate
and business services M 5 837 10013 155 649 119 171618 F 1 549 2452 110 842 707 115550
Community, social and personal services M 12010 11 063 241 374 374 264821 F 6194 3 684 262 883 1 541 274302
Unclassifiable M 450 325 5 159 50 5984 F 124 50 2 811 184 3169
Total M 114712 127649 1436187 7818 1686366 F 30769 25294 946972 25702 1028737 T 145481 152943 2383159 33520 2715103
Note: *The figures include outworkers and student workers.
Source: Census Planning Section, Census and Statistics Department.
3.9 Establishments and Persons Engaged in the Civil Service and Private Sectors by Major Division Nwnber
Major division 1981 1982 1983 1984 1985 1986 1987 1988 1989 1990 Civil Service sector Persons engaged 149 638 164 483 169 712 173 452 174 891 178 094 182 199 185 486 187 883 189 868
Private sector Mining and quarrying Establishments 18 18 11 10 9 10 7 7 7 7
Persons engaged 864 900 771 637 638 613 543 514 499 511 Manufacturing Establishments 47996 46448 45 576 48 038 45 915 46 816 49403 49 843 50 566 49449
Persons engaged 905 899 847 194 855 417 898 947 847 615 865 614 867 947 837 072 791 519 715 597 Electricity and gas Establishments 4 4 4 3 3 3 3 3 3 3
Persons engaged 10 562 11458 10684 10 543 10 975 11 219 11 014 10 884 11182 11481 Construction sites Sites 1 306 1243 1 094 1 046 1 078 1157 1235 1249 1 363 1285
Persons engaged 88 877 82055 70611 68 603 66 313 70 808 72480 76340 69489 69 138 Wholesale, retail and import/export
trades, restaurants and hotels Establishments 76181 83 168 87 778 94012 99 916 102 704 107 139 118 278 127 962 140 893 Persons engaged 483 818 517 710 531 959 573 828 600405 620 081 657 856 711 327 774020 829 591
Transport, storage and co=unication Establishments 3 311 3 345 3 090 3 481 3 623 3 635 4143 4828 5 637 6057
Persons engaged 85 067 87 578 89726 95 655 95 352 98 645 105 974 115 549 126 036 132 792 Financing, insurance, real estate
and business services Establishments 12 892 13 660 13 981 14757 15 673 16 965 18 597 22 584 26260 30 071 Persons engaged 154 769 166 124 161 691 169 523 180 851 194 261 212 243 235 452 254 792 276 621
Co=unity, social and personal services Establishments 16040 17 428 18 326 19 040 19 280 19 616 20044 20600 21 847 23 560
Persons engaged 181 205 190 390 194 770 201 829 205 403 208 468 215 252 224828 236445 250 241
Notes: Figures refer to the fourth quarter (or more specifically to the last full working day) of the year except those for the Civil Service sector for 1985 and onwards which refer to the first of January of the following year.
Source: Employment and Earnings Statistics Section, Census and Statistics Department.
34

3.10 Establishments in the Private Sector by Industry Group Number of establishments
Industry group 1981 1982 1983 1984 1985 1986 1987 1988 1989 1990
Mining and quarrying 18 18 11 10 9 10 7 7 7 7 Iron ore mining Other mining 18 18 11 10 9 10 7 7 7 7
Manufacturing 47996 46448 45576 48038 45915 46816 49403 49843 50566 49449 Food products 1127 1124 971 974 924 952 946 925 874 822 Beverages 23 28 32 30 29 30 31 27 30 28 Tobacco 3 3 3 3 3 4 7 7 7 5 Wearing apparel, except footwear 9 805 9 107 9 004 9 396 8 559 8 798 9 126 8 890 9 116 8 623 Leather and leather products, except footwear
and wearing apparel 251 220 203 215 238 227 248 239 231 193 Footwear, except rubber, plastic and wooden footwear 560 542 530 504 456 455 488 428 386 344 Textiles 4 865 4 854 4 737 4 971 4 555 4 809 5 196 5 188 5 366 5 241 Wood and cork products, except furniture 1222 1 152 1 039 1 012 958 901 850 819 780 723 Furniture and fixtures, except primarily of metal 1 521 1489 1 281 1 369 1 261 1237 1224 1149 1144 1 022 Paper and paper products 1 308 1 341 1 288 1 384 1 394 1 501 1 606 1 720 1 657 1 608 Printing, publishlng and allied industries 2 874 2 930 2 809 3 102 3 246 3 282 3 574 3 765 3 998 4407 Chemicals and chemical products 693 710 761 822 818 793 811 881 866 848 Products of petroleum and coal 6 7 6 5 6 5 3 3 3 3 Rubber products 416 348 322 313 268 256 224 216 197 191 Plastic products 5 431 5 021 5 041 5 336 5 031 5 506 5 605 5 599 5 553 5 308 Non-metallic mineral products, except products of
petroleum and coal 398 398 375 376 358 367 393 414 451 396 Basic metal industries 302 286 245 264 254 229 264 267 255 260 Fabricated metal products, except machlnery and . equipment 7747 7 119 6458 6 715 6 360 6243 6 696 6 727 6497 6 455 Machinery, except electrical 2 230 2403 3 123 3 526 3 806 4083 4 558 5 010 5 392 5 478 Electrical machlnery, apparatus, appliances and supplies 2 331 2 378 2273 2 392 1 972 1 921 2 123 2 019 2 135 1 837 Transport equipment 452 489 521 546 557 547 504 489 481 585 Scientific, measuring and controlling equipment n.e.c.
and photographic and optical goods 1 415 1489 1 571 1 540 1 629 1 361 1 537 1 581 1 569 1 636 Other manufacturing industries 3 017 3 008 2 984 3 243 3 234 3307 3 389 3481 3 580 3 437
Electricity and gas 4 4 4 3 3 3 3 3 3 3
Construction sites 1306 1243 1094 1046 1078 1157 1235 1249 1363 1285 Public Sector
Building } 456
176 175 146 153 172 162 177 180 187 Civil Engineering 288 292 301 269 248 229 206 225 229
Private Sector Building
} 850 678 557 543 588 660 768 768 755 721
Civil Engineering 101 70 56 68 77 76 98 203 148
Wholesale, retail aud 1/E trades and restaurants and hotels 76181 83168 87778 94012 99916 102 704 107139 118278 127 962 140 893 Wholesale 9 613 10 539 11136 11 392 11 554 11441 12 343 13 278 14 668 15 716 Retail 40 378 44 381 45 374 45 623 48 204 48 019 47 835 49 176 50 499 52 711 Import/Export 20 588 22 338 24 991 30 069 32 890 35 753 38 946 47 431 53 817 62 660 Restaurants, cafes and bars 4949 5 253 5 544 6078 6 388 6 634 6 910 7 096 7 643 8 407 Hotels and boarding houses 654 657 734 850 881 857 1 104 1 297 1 335 1 399
Transport, storage and communication 3311 3345 3090 3481 3623 3635 4143 4828 5637 6057 Land transport 36 37 49 68 76 72 81 104 137 131 Water transport 551 739 624 819 907 925 1 084 1 331 1 836 1 851 Air transport 74 87 85 109 119 117 113 124 141 129 Services allied to transport 2 587 2 395 2 214 2 346 2 361 2 342 2 656 2 956 3 197 3 416 Communication 64 87 119 139 161 180 209 312 327 531
Financing, insurance, real estate and business services 12892 13660 13981 14757 15673 16965 18597 22584 26260 30071 Financial institutions 4176 4 358 4 105 3 960 4050 4066 4 218 4 848 4999 5 342 Insurance 815 1100 1163 1 377 1 614 1 975 2450 3 269 3 933 4 377 Real estate 3 636 3 360 3 616 3 643 3 899 4232 4 503 5 563 6 676 8 083 Machinery and equipment rental and leasing 122 157 128 95 68 77 68 75 92 107 Business services except machinery and equipment
rental and leasing 4 142 4 686 4969 5 682 6 042 6 615 7 358 8 828 10 560 12 162
Community, social and personal services 16040 17428 18326 19040 19280 19 616 20044 20600 21847 23560 Sanitary and similar services 497 626 731 756 815 703 710 761 820 963 Education services 2 119 2086 2110 2170 2102 2 121 2 037 2 035 1 974 2 107 Research and scientific institutes 16 22 25 23 40 26 21 15 15 19 Medical, dental, other health and veterinary services 2 624 2 774 2 901 3 017 3 260 3 339 3 565 3 592 3 828 3 947 Welfare institutions 128 204 226 356 526 644 661 766 849 1146 Business, professional and labour associations 360 406 395 420 365 327 370 342 275 331 Other social and related community services 689 713 690 701 711 718 653 672 632 971 Motion picture and other entertainment services 533 657 736 871 975 1 028 1 242 1 679 2036 2 354 Libraries, museums, gardens, and other cultural
services, n.e.c. 24 27 19 19 31 43 31 29 31 25 Amusement and recreational services n.e.c. 232 188 227 226 247 216 237 310 260 213 Repair services n.e.c. 4255 4 661 4943 4720 4 341 4 346 4100 3 988 4 201 4 333 Laundries, laundry services, and cleaning and
dyeing plants 670 733 768 865 902 940 983 974 1 028 1 127 Miscellaneous personal services 3 892 4 332 4 555 4 896 4965 5 165 5 433 5 436 5 899 6026
Notes: Figures refer to the fourth quarter (or more specifically to the last full working day) of the year. 'n.e.c.' denotes not elsewhere classified.
Source: Employment and Earnings Statistics Section, Census and Statistics Department.
35

3.11 Persons Engaged in the Private Sector by Industry group Number of persons
Industry group 1981 1982 1983 1984 1985 1986 1987 1988 1989 1990
Mining and quarrying 864 900 771 637 638 613 543 514 499 511 Iron ore mining Other mining 864 900 771 637 638 613 543 514 499 511
Manufacturing 905899 847194 855417 898947 847615 865614 867947 837072 791519 715597 Food products 17 268 18 392 16 733 17 140 17 995 17 825 18 667 17 635 18 079 18 255 Beverages 4192 4339 4465 4360 4 291 4 558 4288 4217 4782 4487 Tobacco 906 890 912 1 051 1204 1114 1167 1174 1227 1297 Wearing apparel, except footwear 259709 257 257 253 307 268 938 264 569 263 428 258 221 247 557 237 345 214 108 Leather and leather products, except footwear
and wearing apparel 3 600 2959 3 122 3 399 3 269 3 253 3 099 2636 2276 1 796 Footwear, except rubber, plastic and wooden footwear 8 053 7424 7296 7464 7 513 8493 8 556 7207 5 142 4103 Textiles 122 623 111 871 111 344 117 356 110 606 116 334 119 081 116 509 113 487 100 150 Wood and cork products, except furnitlire 6965 6337 5742 5 389 4766 4 812 4111 3 831 3 550 3 259 Furniture and fixtures, except primarily of metal 10733 9 369 8 115 8 338 7955 8 069 7 487 6 808 6695 5 387 Paper and paper products 11 716 12 385 11999 12 887 13 488 14276 15 425 16 694 16 527 15 668 Printing, publishing and allied industries 28 513 28477 27 357 29 554 30 809 32049 32 718 35 800 35 351 37 356 Chemicals and chemical products 7910 7 615 8 152 8 645 8 087 8 347 8 654 8 761 8 758 8 255 Products of petroleum and coal 261 348 213 182 225 195 186 201 277 216 Rubber products 4 561 3 752 2 846 3 225 2 391 2 328 1827 1634 1 623 1454 Plastic products 89131 .80749 81 076 90620 82 517 87 703 77 963 70 145 59 248 53 413 Non-metallic mineral products, except products of
petroleum and coal 4855 4639 4879 4175 4190 4 538 4655 4133 4 518 3 692 Basic metal industries 4682 4174 3 411 3 502 3 682 3 573 3740 3 379 3 175 3 032 Fabricated metal products, except machinery and
equipment 82419 70820 66134 66 709 61 773 62329 60800 59720 54670 50942 Machinery, except electrical 16280 14075 17 887 20 885 21 918 24227 25 693 28 984 29 621 29208 Electrical machinery, apparatus, appliances and supplies 124 807 113 058 131 566 135 268 lll 186 115 250 125 841 117 471 105 985 85 266 Transport equipment 17 134 17159 14482 13 313 12 627 12 918 13 197 12184 13 043 12 974 Scientific, measuring and controlling equipment n.e.c.
and photographic and optical goods 46507 43 356 45 524 46 238 42130 38 827 38 305 36 862 34047 31 966 Other manufacturing industries 33 072 27749 28 856 30310 30427 31167 34266 33 531 32095 29 314
Electricity and gas 10562 11458 10684 10543 10975 11219 11014 10884 11182 11481
Construction sites (for manual workers only) 88877 82055 70611 68603 66313 70808 72480 76340 69489 69138 Public Sector
Building } 38 863 21938 17996 14468 15 343 17 503 16 216 16 637 17005 14461 Civil Engineering 19 655 21159 18 101 12 915 12 357 12174 10 901 12 936 12437
Private Sector Building } 50 014 34707 26179 31 722 34694 37 084 39 673 44280 35 061 38 101 Civil Engineering 5 755 5277 4 312 3 361 3 864 4417 4522 4487 4139
Wholesale, retail and I/E trades and restaurants and hotels 483818 517710 531959 573828 600405 620081 657856 711327 774020 829591 Wholesale 53 332 57181 59774 58 195 60798 56274 60 819 62471 67 596 72120 Retail 156 470 167 656 165 880 165 357 174 361 165 578 172 663 179 899 190 790 200 291 Import/Export 124 001 132629 140 212 172 033 191 852 216 225 240 167 278 448 311 045 341 583 Restaurants, cafes and bars 128 633 137 599 143 389 154407 149 045 155 678 156 062 158 272 168 737 179 223 Hotels and boarding houses 21 382 22645 22704 23 836 24 350 26 325 28 145 32237 35 852 36 375
Transport, storage and communication 85067 87578 89726 95655 95352 98645 105974 115549 126036 132792 Land transport 16 914 18 405 20927 21 749 22 813 23 211 23 381 23 308 24 853 25165 Water transport 14 638 15 789 15 416 16967 17 087 17 460 18447 20922 23 753 24927 Air transport 6308 6 617 6609 7 213 7 623 8 278 9 111 10 869 12 312 13 459 Services allied to transport 29 418 27 568 27 315 29 376 27884 29 385 33 954 37 311 39 461 41227 Communication 17 790 19199 19460 20 351 19945 20 313 21 081 23138 25 658 28 014
Financing, insurance, real estate and business services 154769 166124 161691 169523 180851 194261 212243 235452 254792 276621 Financial institutions 76275 78 591 73 719 75 723 78440 82 612 90299 97 885 102 796 108 850 Insurance 7736 8 728 8040 8 652 9283 11274 12 325 14 612 17 786 18 783 Real estate 23103 25420 26424 27728 28 313 30909 32 775 38 093 40247 44994 Machinery and equipment rental and leasing 836 800 735 651 507 573 330 372 452 576 Business services except machinery and equipment
rental and leasing 46 819 52 585 52 774 56 769 64309 68 892 76 513 84490 93 512 103 418
Community, social and personal services 181205 190390 194770 201829 205403 208468 215252 224828 236445 250241 Sanitary and similar services 12 335 15 215 14 652 16 812 17 990 16 565 19 734 21 641 24896 25 201 Education services 62 744 64270 67 590 69 552 71414 72 885 74105 76148 76158 82296 Research and scientific institutes 144 257 300 326 413 450 187 74 105 105 Medical, dental, other health and veterinary services 22 776 24575 25 667 26 312 27 217 27927 28 230 29127 30 516 31 633 Welfare institutions 6 647 7927 8 598 9 825 8 635 9 901 10 439 11594 12 515 16 222 Business, professional and labour associations 2337 2 852 2487 2 658 2 536 2444 2592 2609 2488 2688 Other social and related community services 5842 5 886 6470 6 550 7169 7 591 7 129 7726 8 355 9 148 Motion picture and other entertainment services . 8 810 9282 9442 10 013 10 501 11 313 12 594 13 343 16727 18 008 Libraries, museums, gardens, and other cultural
services, n.e.c. 360 342 296 302 316 446 530 358 310 430 Amusement and recreational services n.e.c. 6709 6690 6 935 7 854 8 783 8 485 9045 9 833 10 300 9 262 Repair services n.e.c. 23984 21 773 20484 19 310 16 694 16 834 16 692 17 606 18 303 19 134 Laundries, laundry services, and cleaning and
dyeing plants 4465 4958 4 858 4729 5458 5087 5 230 5490 5 770 6 556 Miscellaneous personal services 24052 26 363 26993 27 586 28 278 28 539 28746 29 281 30 001 29 558
Notes: Figures refer to the fourth quarter (or more specifically to the last full working day) of the year. 'n.e.c.' denotes not elsewhere classified.
Source: Employment and Earnings Statistics Section, Census and Statistics Department.
36

3.12 Establishments and Persons Engaged in Selected Major Divisions by Employment Size
(a) Manufacturing (as at September of the year) Number
Number of persons engaged 1981 1982 1983 1984 1985 1986 1987 1988 1989 1990
1-9 Establishments 30 541 31 741 31 368 33 022 32 827 32987 34 354 35 066 34 802 35 915 Persons engaged 120 129 120 410 118 192 124 413 121 291 123 787 128 079 133 425 129 666 130 957
10-19 Establishments 7294 6 791 6 875 7028 6760 7010 7 241 7219 7270 6 366 Persons engaged 98 216 91 641 92141 94 303 90 156 93 704 97 061 96 809 97 739 87 038
20-49 Establishments 5198 5097 5 108 5 342 5 040 5084 5 336 5 032 4735 4219 Persons engaged 161 637 155 949 157 434 164 478 154 161 156 457 164 012 154 807 145 104 136 092
50-99 Establishments 2181 2041 1 993 2095 2 016 2115 2090 1 977 1919 1 520 Persons engaged 146 760 139 058 135 722 142 352 137 110 143 876 142 618 135 628 131443 113 673
100-199 Establishments 958 897 938 942 904 889 869 828 741 668 Persons engaged 130 633 122 043 127 159 128 684 122 734 120 249 118 898 112 678 100 345 91 280
200-499 Establishments 419 386 396 424 393 414 387 356 346 302 Persons engaged 123 905 112 688 116 213 126 911 117 266 120 946 114 423 105 068 103 178 91 307
500-999 Establishments 105 108 107 104 99 93 104 105 88 77 Persons engaged 71 355 71378 70926 71362 67 257 64348 71210 71949 58 611 50 173
1 000-1 999 Establishments 30 24 28 31 23 27 26 20 24 18 Persons engaged 40115 31228 35 890 40828 29 143 34 360 31 568 25 145 29 510 22 565
2 OOO and over Establishments 4 4 4 4 3 4 2 3 2 2 Persons engaged 11 895 11 742 11 396 11 378 9782 12026 7 381 9066 7 386 7132
Total Establishments 46729 47089 46817 48992 48065 48623 50409 50606 49926 49087 Persons engaged 904646 856137 865073 904709 848900 869753 875250 844575 802983 730217
37

3.12 Establishments and Persons Engaged in Selected Major Divisions by Employment Size (Continued)
(b) Wholesale, Retail and Import/Export Trades, Restaurants and Hotels (as at June of the year) Number
Number of persons engaged 1981 1982 1983 1984 1985 1986 1987 1988 1989 1990
Wholesale, retail and import/ export trades
1-4 Establishments 51 098 57 237 61165 65 600 72 837 74 815 78 294 83 908 88 295 95 591 Persons engaged 112 429 123 219 129 498 136 802 150 606 155 947 163 231 177 944 187 268 202 022
5-9 Establishments 12 288 13 020 13 280 13 434 14 584 15 113 15 757 18 435 19 539 21 051 Persons engaged 77 150 82064 83 576 84470 92 016 95 290 99 613 116 538 123 142 133 293
10-19 Establishments 3 765 4194 4247 4428 4 868 5 161 5 693 6 370 6 743 7107 Persons engaged 48 860 54174 55 025 57145 62 986 66 673 73 659 82 048 85 925 91 795
20-49 Establishments 1297 1462 1452 I 597 1 751 I 848 2 053 2208 2 362 2 596 Persons engaged 36 869 41108 41 008 45 175 50040 52 918 58 472 63 308 64 212 77 028
50-99 Establishments 241 269 264 296 326 333 388 443 472 485 Persons engaged 15 978 17 947 17 927 20045 22 526 22 873 26 586 29 853 34 629 37 372
100-199 Establishments 84 90 112 110 120 129 141 176 187 187 Persons engaged 11 333 11 805 15 191 15 065 16142 17 649 19 342 23 446 26 124 25 911
200-499 Establishments 32 43 38 46 53 53 61 63 68 77 Persons engaged 9436 12 281 11 568 13 528 15 304 15 485 17 337 18 068 20779 22 674
500-999 Establishments 4 2 3 3 5 7 9 11 8 7 Persons engaged 2429 1 307 I 886 I 971 3 264 4438 5 799 6 389 5 181 4193
I OOO and over Establishments 1 1 1 1 I Persons engaged 1468 1483 I 397 1 368 I 295
Sub-total Establishments 68810 76318 80562 85 515 94545 97459 102 396 111614 117 674 127 101 Persons engaged 315 952 345 388 357076 375 569 414179 431 273 464 039 517 594 547 260 594 288
Restaurants and hotels
1-4 Establishments 1 530 1 592 1 720 1 939 2 241 2433 2 556 2 668 2 779 2 858 Persons engaged 4078 4234 4 619 5 230 5 855 6482 6 792 6 932 7 376 7 538
5-9 Establishments 1147 1292 1469 1646 1 794 1 908 1 967 2 192 2 185 2 395 Persons engaged 7 650 8 605 9 813 11 020 11 996 12 771 12 981 14 840 14 680 16 100
10-19 Establishments I 089 1200 1 305 1437 1 523 1 541 1 607 1 738 1 779 1 879 Persons engaged 14 976 16 427 17 787 19 616 20 487 20 845 21 619 23 751 24107 25 402
20-49 Establishments 891 972 1 025 1109 1 063 1 051 1119 1 213 1 219 I 394 Persons engaged 26 775 28 995 30 633 33 344 31 827 31 357 33 331 36 571 35 782 41 639
50-99 Establishments 287 298 297 330 330 339 357 391 385 411 Persons engaged 19 857 20 238 20448 22 835 23 438 23 354 24 395 27 496 29 613 32 561
100-199 Establishments 217 235 236 245 235 246 256 257 264 260 Persons engaged 30462 33 244 32 948 34642 33 788 34407 35 983 35 813 36 966 36 366
200-499 Establishments 81 93 109 104 101 111 107 95 97 95 Persons engaged 21 388 25 357 29 831 27 986 28 584 31 513 29 591 27 066 26 812 26 489
500-999 Establishments 11 12 15 18 18 17 20 19 24 25 Persons engaged 9 242 9 550 11 549 13 593 13 761 12 963 15 220 14 671 17 683 18 188
I OOO and over Establishments 5 6 5 4 4 5 4 5 5 5 Persons engaged 5 372 6 685 5 648 4 759 4 763 5 799 4726 5 683 6029 5 855
Sub-total Establishments 5 258 5700 6181 6832 7 309 7651 7993 8 578 8 737 9322 Persons engaged 139800 153 335 163 276 173 025 174 499 179491 184 638 192823 199048 210 138
Total Establishments 74068 82018 86743 92347 101854 105110 110 389 120192 126 411 136423 Persons engaged 455752 498723 520352 548594 588 678 610764 648 677 710 417 746308 804426
38

3.12 Establishments and Persons Engaged in Selected Major Divisions by Employment Size (Continued)
(c) Financing, Insurance, Real Estate and Business Services (as at March of the year) Number
Number of persons engaged 1981 1982 1983 1984 1985 1986 1987 1988 1989 1990
1-4 Establishments 6 307 7 518 8094 8 621 9 354 10440 11965 13 925 17 655 20495 Persons engaged 13 778 15 741 16 328 17 217 18 482 20696 23 373 27063 34240 40007
5-9 Establishments 2423 2655 2 775 2 756 2 837 3 036 3 186 3 634 3 906 4270 Persons engaged 15 958 17 472 18 264 18 101 18 581 19 857 20 809 23 517 25 260 27 514
10-19 Establishments 1 613 1 777 1 791 1 813 1 853 1879 1 957 2 019 2179 2288 Persons engaged 21 879 24040 24270 24409 24996 25 316 26439 27 387 29 365 30 785
20-49 Establishments 829 1 005 1 023 969 991 1 071 1119 1217 1 344 1429 Persons engaged 24556 29 608 30232 28 336 29 253 31456 32972 35 822 39 764 42 349
50-99 Establishments 226 275 283 280 274 298 325 341 362 383 Persons engaged 15 553 18 860 19 522 19 559 19 OOO 20 683 22 704 23 494 24 841 26 256
100-199 Establishments 106 115 113 123 127 129 143 174 186 201 Persons engaged 14 564 15 469 15 688 17 014 17 309 17 388 19 078 23 431 25 353 27072
200-499 Establishments 50 61 63 67 74 84 86 96 108 111 Persons engaged 15 233 17 810 18 999 20659 22 627 25 481 25 288 30005 33 522 33 407
500-999 Establishments 5 10 13 17 17 15 19 17 17 25 Persons engaged 3134 6479 8444 11105 11 986 10 511 12 648 11496 11 329 15 821
1 OOO and over Establishments 4 5 6 5 5 7 6 6 9 10 Persons engaged 9 392 12184 12 706 8 632 9 397 14 314 13 938 11 665 17 341 20124
Total Establishments 11563 13421 14161 14651 15532 16959 18806 21429 25766 29212 Persons engaged 134047 157663 164453 165032 171631 185702 197 249 . 213 880 241015 263335
Note: Figures refer to the period in which a full-scale survey of the economic sector is carried out. (Full-scale surveys of different economic sectors are carried out in different quarters of a year.) However, figures for the manufacturing sector are compiled based on a one-sixth and a one-third sample survey of the sector for the year 1989 and 1990 respectively, and figures for the wholesale, retail and import/export trades, restaurants and hotels sector for 1989 and 1990 are compiled based on a one-third sample survey of the sector.
Source: Employment and Earnings Statistics Section, Census and Statistics Department.
3.13 Establishments in Selected Major Divisions by Census District
(a) Manufacturing (as at September of the year) Number of establishments
Census area/district 1981 1982 1983 1984 1985 1986 1987 1988 1989 1990
Hong Kong Island
Central 425 376 376 373 357 363 358 367 SheungWan 1 081 1 041 1 062 1040 1 047 1 045 1 059 1 048 West 1250 1175 1133 1 073 1 034 997 986 803 Mid-levels and Pokfulam 50 45 39 30 34 38 29 30 Peak 1 Wan Chai 1260 1 181 1156 1102 1071 1 070 1 056 932 Tai Hang 318 283 286 246 234 229 200 146 North Point 1105 1 067 1114 1 062 1 025 1 005 1 005 934 ShauKeiWan 1 543 1470 1 548 1456 1456 1 604 1655 1 780 Aberdeen 785 845 941 991 1088 1189 1190 1184 South 35 30 27 30 31 34 30 30
Sub-total 7853 7 513 7682 7403 7 377 7 574 7 568 7254 Kowloon
Tsim Sha Tsui 1027 1 001 1130 1 063 1020 1 027 1 032 992 Yau Ma Tei 1613 1380 1 378 1290 1254 1198 1137 1 085 Mong Kok 2952 2855 2 837 2 595 2647 2 612 2 549 2231 Hung Hom 3 003 2 768 2704 2 560 2 556 2 812 2749 2 309 Ho Man Tin 96 87 74 66 61 67 68 43
Sub-total 8691 8091 8123 7574 7 538 7716 7 535 6660 New Kowloon
Cheung Sha Wan 5 817 5 857 5929 5 951 5 937 5 831 5 639 5 065 ShekKipMei 460 454 434 390 357 294 272 234 Kowloon Tong 74 70 68 63 53 49 52 51 KaiTak 3900 3 637 3 597 3 334 3 271 3 169 3 127 2 809 NgauTauKok 5 528 5 578 5 983 5 967 6433 7110 7 493 7406 Lei Yue Mun 704 662 649 594 562 549 536 518
Sub-total 16483 16258 16660 16299 16613 17002 17119 16083 New Territories
Tsuen Wan area 9534 10 161 10 985 11130 11292 11 811 11 682 11 938 Yuen Long area 2 329 2 568 2955 3 017 3 079 3438 3 595 3 711 Tai Po area 1 715 1 783 2182 2 315 2 398 2 582 2 792 3 175 Islands and Sai Kung area 484 443 405 327 326 286 315 266
Sub-total 14062 14955 16527 16789 17095 18117 18384 19090 Total 47089 46817 48992 48065 48623 50409 50606 49087
39

3.13 Establishments in Selected Major Divisions by Census District (Continued)
(b) Wholesale, Retail and Import/Export Trades, Restaurants and Hotels (as at June of the year) Number of establishments
Census area/district 1981 1982 1983 1984 1985 1986 1987 1988 1989 1990
Hong Kong Island Central 4221 4211 4122 4225 4 534 4764 5 180 5 407 5 381 5 158 SheungWan 6498 6995 6 940 7 317 7 569 7 675 7 995 8 898 8 844 9 274 West 2132 2437 2 712 2 685 2 862 3 030 3 101 3 361 3 345 3 749 Mid-levels and Pokfulam 284 285 303 313 303 291 269 317 } 450 447 Peak 39 37 57 54 57 46 35 48 Wan Chai 3 676 3 935 4192 4 515 5 107 5 488 5 724 6 254 6 510 6 629 Tai Hang 2209 2 330 2272 2 416 2649 2 788 2 820 2 982 3 142 3 226 North Point 2 956 3 317 3 653 3 814 4258 4490 4776 5 294 5 665 6060 ShauKei Wan 1 699 1 902 1 916 2169 2 298 2 345 2462 2413 2 671 3 212 Aberdeen 1132 1 584 1 938 2020 2 037 2054 2 131 2205 2 312 2486 South 205 209 227 238 269 272 280 322 316 356
Sub-total 25 051 27 242 28 332 29 766 31943 33 243 34 773 37 501 38636 40597 Kowloon
Tsim Sha Tsui 7 306 7 960 8 989 9 789 11 010 11419 11 647 12 634 13 302 13 551 Yau Ma Tei 5 968 6 320 6287 6449 7 162 7 315 7 908 8 677 9 106 9 126 Mong Kok 3 944 4287 4 364 4 581 5 101 5 137 5 387 5 848 6 284 6 562 Hung Hom 2 899 3 049 3 195 3 751 4 102 4198 4 564 4 943 5 370 5 690 Ho Man Tin 950 989 984 992 957 924 939 994 1 044 1 142
Sub-total 21067 22605 23819 25 562 28 332 28993 30445 33096 35106 36071 New Kowloon
Cheung Sha Wan 4 875 5440 5 825 6 317 6 788 7 033 7 461 8 444 8 766 9 601 ShekKip Mei 1249 1 272 1270 1247 1 161 1166 1 075 1128 1 082 1 037 Kowloon Tong 181 204 226 234 240 231 235 259 245 266 Kai Tak 4 867 5 191 5 166 5 148 5 867 5 836 5 940 5 894 5 500 5 979 Ngau Tau Kok 2255 3 153 3 257 3 424 4504 4 602 4 981 6 371 7 118 8 535 Lei Yue Mun 1 973 1 893 1 858 1 843 2 112 2008 1 900 1 846 1 804 1 993
Sub-total 15 400 17153 17602 18 213 20672 20876 21592 23 942 24515 27411 New Territories
Tsuen Wan area 5 508 6722 7 160 8 054 8 867 9 358 9 787 10 380 11 155 13 043 Yuen Long area 3 203 3 904 4471 4 830 5 263 5 581 6129 6 643 7 176 8 051 Tai Po area 2 755 3 277 4132 4 661 5 342 5 582 6239 7 129 8 066 9 302 Islands and Sai Kung area 1 084 1115 1227 1 261 1435 1477 1424 1 501 1 757 1 948
Sub-total 12 550 15 018 16990 18806 20907 21998 23 579 25653 28154 32 344
Total 74068 82018 86743 92347 101854 105110 110 389 120192 126 411 136423
( c) Financing, Insurance, Real Estate and Business Services (as at March of the year) Number of establishments
Census area/ district 1981 1982 1983 1984 1985 1986 1987 1988 1989 1990
Hong Kong Island Central 3 126 3 370 3 246 3 241 3 472 3 795 4156 4 572 5 170 4968 SheungWan 1 617 1 728 1 732 1 695 1 716 1 732 1 867 2 095 2405 2 717 West 153 203 228 225 248 249 277 312 392 516 Mid-levels and Pokfulam 136 167 194 221 211 223 233 241 332 393 Peak 10 15 19 27 27 25 21 27 30 43 Wan Chai 1 153 1 345 1485 1 585 1 813 2072 2242 2 521 2903 3 049 TaiHang 572 696 740 755 818 915 1 085 1216 1 312 1 569 North Point 409 521 594 687 704 801 948 1 230 1 550 1 877 ShauKeiWan 116 136 144 181 182 195 231 283 399 590 Aberdeen 87 113 168 196 182 221 236 229 290 373 South 30 33 28 33 31 37 32 55 71 101
Sub-total 7409 8 327 8578 8846 9404 10265 11328 12 781 14 854 16196 Kowloon
Tsim Sha Tsui 728 874 1 052 1 161 1 283 1 539 1 673 1 892 2 413 2 666 Yau Ma Tei 907 1 018 984 907 919 983 1 086 1 131 1 386 1 588 Mong Kok 477 545 546 574 593 623 638 675 767 855 Hung Hom 264 297 326 338 365 380 431 530 651 749 Ho Man Tin 156 208 245 243 240 230 255 298 333 369.
Sub-total 2532 2942 3153 3 223 3400 3 755 4083 4526 5 550 6227 New Kowloon
Cheung Sha Wan 360 473 534 620 586 608 695 790 928 1 101 ShekKip Mei 33 48 53 58 58 63 72 79 105 134 Kowloon Tong 60 91 108 103 126 127 128 121 136 158 KaiTak 199 240 269 268 269 268 289 323 404 480 Ngau Tau Kok 217 304 341 350 340 379 462 627 787 1 015 Lei Yue Mun 41 50 55 59 52 53 60 72 98 127
Sub-total 910 1206 1360 1458 1431 1498 1706 2012 2458 3 015 New Territories
Tsuen Wan area 321 426 476 500 591 627 706 834 1 037 1 322 Yuen Long area 205 279 289 297 311 322 408 529 744 940 Tai Po area 139 190 240 252 319 396 477 631 919 1234 Islands and Sai Kung area 47 51 65 75 76 96 98 116 204 278
Sub-total 712 946 1070 1124 1297 1441 1689 2110 2904 3 774
Total 11563 13421 14161 14651 15532 16959 18806 21429 25766 29 212
Note: Figures refer to the period in which a full-scale survey of the economic sector is carried out. (Full-scale surveys of different economic sectors are carried out in different quarters of a year.) However, figures for the manufacturing sector for 1990 and figures for the wholesale, retail and import/export trades, restaurants and hotels sector for 1989 and 1990 are compiled based on a one-third sample survey of the sector.
Source: Employment and Earnings Statistics Section, Census and Statistics Department.
40

3.14 Persons Engaged in Selected Major Divisions by Census District I
(a) Manufacturing (as at September of the year) Number of persons
Census area/district 1981 1982 1983 1984 1985 1986 1987 1988 1989 1990
Hong Kong Island Central 3 983 3 473 3 509 2 838 2 820 3 023 3 028 2 886 SheungWan 7 366 6 597 6 540 6 081 5 980 5 502 5 360 4 925 West 14 142 13 852 13 368 11 650 10 934 10 156 9 381 7156 Mid-levels and Pokfulam 364 273 184 76 83 140 100 145 Peak I Wan Chai 7 960 7 016 6 688 5 830 5 635 5 789 5 792 4 662 Tai Hang 1 682 1 505 1 863 1 279 1167 1 088 980 716 North Point 28 536 28 345 29 557 29244 27 514 24 495 22299 18 208 ShauKei Wan 31 071 31 544 30 944 27 689 27 765 27 993 25 490 22 094 Aberdeen 25 246 25 029 25 214 24 309 23 392 24 418 24 216 18 139 South 262 216 142 118 149 141 122 139
Sub-total 120613 117 850 118009 109114 105 439 102 745 96 768 79070 Kowloon
Tsim Sha Tsui 8 513 8 019 8 124 7 601 7 160 7 159 6 890 6 638 Yau Ma Tei 8 359 7 179 6 723 6084 5 532 5 196 4 973 5 113 Mong Kok 39 079 37 474 37 871 36 270 35 742 34 910 32 649 25 488 Hung Hom 63 819 58 853 60 558 57 479 58 479 62292 62 039 43 637 Ho Man Tin 432 390 341 262 278 267 233 175
Sub-total 120202 111915 113 617 107696 107 191 109824 106 784 81051 New Kowloon
Cheung Sha Wan 102 801 101 821 103 884 JOO 869 101 541 99 013 93 127 75 372 ShekKip Mei 2023 1 957 I 918 1 751 1498 1 048 946 845 Kowloon Tong 429 419 373 303 254 234 248 179 Kai Tak 89 942 91 968 94 170 85 476 85 490 82 687 78 694 67 581 Ngau Tau Kok 144 773 147 253 156 824 143 308 151 286 154 127 150 594 131 692 Lei Yue Mun 15 215 14444 14 793 12 756 12 805 13 789 11 577 JO 601
Sub-total 355 183 357 862 371 962 344 463 352874 350898 335 186 286 270 New Territories
Tsuen Wan area 191 875 203 804 216 721 200 991 211 018 212 059 205 590 185 790 Yuen Long area 35 174 37 599 42 722 42 153 46 971 50 261 48 553 47 011 Tai Po area 26 598 30 123 36289 40 144 42 364 45 717 48 163 47 365 Islands and Sai Kung area 6492 5920 5 389 4 339 3 896 3 746 3 531 3 660
Sub-total 260139 277 446 301121 287627 304 249 311 783 305 837 283 826 Total 856137 865 073 904709 848900 869753 875250 844575 730 217
(b) Wholesale, Retail and Import/Export Trades, Restaurants and Hotels (as at June of the year)
Number of persons
Census area/district 1981 1982 1983 1984 1985 1986 1987 1988 1989 1990
Hong Kong Island Central 36 935 36 717 34 803 35 219 37 556 39 432 44089 45 025 47 968 45 600 SheungWan 39 865 41271 41 011 41 276 42468 42 317 42 640 46 147 44 575 46 825 West 11130 12 124 12 557 12469 12 885 13 222 13 548 15 100 14 622 15 831 Mid-levels and Pokfulam 859 801 874 856 806 819 779 905
} 1 362 1 555 Peak 383 327 345 340 331 364 358 292 Wan Chai 30002 32 329 33 687 36413 39 391 41 731 44495 49 604 49 220 52 275 Tai Hang 21455 23 873 22 522 22 605 24 354 24 919 25 323 25 246 25 220 26 386 North Point 18 048 20 191 20 801 21119 23 097 24207 28 585 32 147 33 345 37 938 ShauKeiWan 6 717 7 332 7 635 8 070 8 313 8 558 9 122 9 980 12 160 15 315 Aberdeen 6 739 8 123 9 877 JO 738 12 082 12 204 13 119 13 199 14292 15 330 South 1196 I 231 1142 1 313 1 501 1 367 I 310 1 564 1497 1 888
Sub-total 173 329 184 319 185 254 190 418 202 784 209140 223 368 239 209 244 261 258 943 Kowloon
Tsim Sha Tsui 63 602 69 155 77 679 85 564 95 055 98 461 101 198 107 955 114 892 113 951 Yau Ma Tei 39 083 40 505 40 223 40 187 42 075 42046 44 704 47 628 49 588 47 992 Mong Kok 23 718 25 135 25 269 25 834 26 672 27 006 27 632 29 727 30 296 32 976 Hung Hom 18 093 19 861 21127 22 970 24485 25 276 28 763 32 710 35 916 38 588 Ho Man Tin 5 396 5 590 5 300 5 156 5 170 5 148 4 883 5 526 5 451 6 018
Sub-total 149892 160 246 169 598 179 711 193 457 197 937 207 180 223 546 236143 239525 New Kowloon
Cheung Sha Wan 30 415 32 994 34970 38 378 39 379 40 632 43 108 47 563 48 264 53 886 ShekKipMei 3 563 3 834 3 983 3 770 4 106 4161 3 594 3 667 3 860 3 817 Kowloon Tong 910 1297 I 434 1432 I 384 I 342 1490 1 806 2 057 1 791 Kai Tak 20 913 23 539 22 982 22 619 24 102 24 557 25 358 26 384 24 588 27 376 Ngau Tau Kok 13 322 17 426 . 17 920 19 490 21 912 24 578 28 126 36 042 41 933 50 245 Lei Yue Mun 7 269 7 216 6 679 6 533 6 740 6 731 6 663 6 643 7 196 7 466
Sub-total 76392 86306 87968 92 222 97623 102 001 108 339 122105 127 898 144 581 New Territories
Tsuen Wan area 25 849 32469 35 984 40 288 43 141 46 250 48 457 53 858 59 036 68 891 Yuen Long area 14 448 16 750 18 596 20 169 20 798 22420 23 661 28 158 31 887 37 056 Tai Po area 12 338 14 769 18 518 21 428 25 937 28 161 32449 38 292 40 999 48 578 Islands and Sai Kung area 3 504 3 864 4434 4 358 4 938 4 855 5 223 5 249 6084 6 852
Sub-total 56139 67852 77 532 86243 94 814 101686 109 790 125 557 138 006 161 377 Total 455752 498 723 520 352 548594 588678 610764 648677 710 417 746308 804426
41
I '

3.14 Persons Engaged in Selected Major Divisions by Census District (Continued)
(c) Financing, Insurance, Real Estate and Business Services (as at March of the year) Number of persons
Census area/district 1981 1982 1983 1984 1985 1986 1987 1988 1989 1990
Hong Kong Island
Central 54009 61542 59 632 57 608 58 968 65 256 70 363 76 591 84 858 87 364 SheungWan 14054 14 817 15 214 14 617 15 270 15 333 16 359 17 244 18 833 21 352 West 899 1188 1458 1170 1 317 1229 1280 1445 1 730 2216 Mid-levels and Pokfulam 904 585 641 1406 1444 1114 703 700 907 1104 Peak 27 31 61 86 108 101 75 94 75 104 Wan Chai 15 351 19 089 21 779 21 391 23 908 27 387 27602 30268 32240 34234 Tai Hang 5497 7 684 7936 7972 7474 8 322 8 791 9 852 10 087 11129 North Point 3 318 4205 4 865 5702 5101 5778 6 582 8 348 9249 12203 ShauKeiWan 901 1024 1 069 1110 1110 1 099 1247 1 551 1838 2527 Aberdeen 748 934 1 346 1 554 1 570 1922 1926 1907 1966 2267 South 94 90 78 93 94 109 93 162 180 313
Sub~total 95802 111189 114079 112 709 116 364 127650 135 021 148162 161963 174813 Kowloon
Tsim Sha Tsui 7 884 9234 10 385 11153 12 928 14124 14 601 15 573 17 952 19 585 Yau Ma Tei 7 623 8426 8 458 8460 8 121 8 820 9 043 9014 10 693 11 779 Mong Kok 3 414 3 936 3 799 3 932 4051 4320 4226 4327 4642 5185 Hung Hom 2 394 3 127 3 423 2987 3 284 3 229 4990 5159 5 300 6057 Ho Man Tin 676 798 808 767 762 788 1 050 908 1047 1204
Sub-total 21991 25521 26873 27 299 29146 31281 33910 34981 39634 43810 New Kowloon
Cheung Sha Wan 4928 6 562 6 509 7101 6 718 7127 6 589 6 850 9 676 10 747 ShekKipMei 178 219 209 224 204 234 234 300 385 455 Kowloon Tong 238 334 443 394 469 402 416 368 442 540 KaiTak 2 580 2 755 2 951 3082 3 021 3 011 3274 3 272 3 834 3 779 NgauTauKok 2 015 2 738 3 331 3 361 3 679 3 987 4057 4933 6064 6135 Lei Yue Mun 344 362 381 695 392 358 433 444 483 552
Sub-total 10283 12970 13824 14857 14483 15119 15003 16167 20884 22 208 New Territories
Tsuen Wan area 2953 4027 5172 5440 6 518 6 582 7 319 7 357 8 590 10 035 Yuen Long area 1694 2195 2237 2 219 2146 1999 2483 2855 3 839 4 681 Tai Po area 1 088 1497 1957 2097 2448 2679 3 100 3 873 5402 6884 Islands and Sai Kung area 236 264 311 411 526 392 413 485 703 904
Sub-total 5 971 7983 9677 JO 167 11638 11652 13 315 14570 18 534 22504
Total 134047 157663 164453 165032 171631 185702 197249 213880 241015 263335
Note: Figures refer to the period in which a full-scale survey of the economic sector is carried out. (Full-scale surveys of different economic sectors are carried out in different quarters of a year.) However, figures for the manufacturing sector for 1990 and figures for the wholesale, retail and im-port/export trades, restaurants and hotels sector for 1989 and 1990 are compiled based on a one-third sample survey of the sector.
Source: Employment and Earnings Statistics Section, Census and Statistics Department.
42

3.15 Reported Vacancies in the Civil Service and Private Sectors by Industry Group Number of reported vacancies
Industry group 1981 1982 1983 1984 1985 1986 1987 1988 1989 1990
Civil Service sector 15541 8126 6357 7160 6069 6531 7654 10052 10613 10 316 Private sector
Mining and quarrying Iron ore mining Other mining 8 15 2 2 3 ** 3 3
Sub-total 8 15 2 2 3 ** 3 3 Manufacturing
Food products 222 175 120 217 101 230 543 845 378 285 Beverages 23 13 6 12 11 112 95 81 81 95 Tobacco 4 43 36 31 28 Wearing apparel, except footwear 22 151 13 699 15 427 13 114 8 619 10 877 16 523 21 568 16 323 14 670 Leather and leather products, except footwear and wearing
apparel 153 85 133 91 37 86 143 109 76 32 Footwear, except rubber, plastic and wooden footwear 86 110 86 57 37 78 123 28 52 61 Textiles 2 514 1 544 1 960 1 710 1 077 1 010 1 830 3 517 2 346 1 910 Wood and cork products, except furniture 136 35 98 40 13 59 100 178 81 114 Furniture and fixtures, except primarily of metal 190 23 155 178 119 62 221 335 220 137 Paper and paper products 184 123 117 46 147 275 489 904 379 295 Printing, publishing and allied industries 336 196 343 412 214 518 1 056 1 671 1 382 1 093 Chemicals and chemical products 179 104 93 52 76 129 146 371 270 196 Products of petroleum and coal 5 2 2 14 3 2 1 ** Rubber products 53 22 49 44 53' 24 53 51 22 30 Plastic products 4096 1 070 2 539 1103 733 1 544 2 611 3 159 1 569 1 219 Non-metallic mineral products, except products ofpetroleurn
and coal 85 77 81 73 24 116 144 153 229 166 Basic metal industries 52 29 27 38 19 82 111 135 82 66 Fabricated metal products, except machinery and equipment 2 569 801 1 581 1118 475 1 502 2 915 3 313 2 179 1 989 Machinery, except electrical 366 249 365 469 405 803 2108 2 722 2 186 1 818 Electrical machinery, apparatus, appliances and supplies 7 439 3 357 6434 3 507 1 860 6 118 9 053 8 136 5 676 2 838 Transport equipment 166 68 140 6 37 65 53 93 133 248 Scientific, measuring and controlling equipment n.e.c. and
photographic and optical goods 1 744 1 596 2 212 1187 614 999 2 301 2 605 1 643 856 Other manufacturing industries 1 334 406 560 325 407 1 070 1 060 1 775 834 830
Sub-total 44083 23 783 32 526 23814 15 081 25 764 41722 51787 36174 28 974 Electricity and gas 270 32 46 88 24 101 55 252 206 227 Construction sites (for manual workers only)
Public Sector Building 3 917 2 329 581 Civil Engineering 1 596 988 406
Private Sector Building 1 979 700 303 Civil Engineering 108 37 44
Sub-total 7600 4054 1334 Wholesale, retail and l/E trades and restaurants and hotels
Wholesale 645 407 530 713 733 955 1 677 2 414 1 658 1 999 Retail 1 781 1 077 1139 1285 1437 3 105 7 818 7240 6 928 7 238 Import/Export 2286 1 323 1 884 2435 2 322 3 902 8 506 14 231 10 569 10 364 Restaurants, cafes and bars 1 248 645 1 026 1405 824 2 389 5 234 6 802 5 447 5 840 Hotels and boarding houses 581 403 243 321 211 496 829 1 910 2450 2 224
Sub-total 6541 3855 4822 6160 5 527 10848 24064 32 598 27053 27665 Transport, storage and communication
Land transport 724 245 185 145 84 118 216 569 1255 712 Water transport 185 45 55 111 65 118 528 728 675 936 Air transport 53 29 28 24 21 56 76 95 96 114 Services allied to transport 482 164 312 397 313 432 1 035 1 832 1 700 1 184 Communication 180 80 81 186 90 241 403 495 676 899
Sub-total 1625 564 661 862 574 963 2259 3 719 4403 3846 Financing, insurance, real estate and business services
Financial institutions 500 232 312 279 342 588 1270 2 892 1 863 l 620 Insurance 120 269 230 127 341 314 628 1148 1 730 2 045 Real estate 263 567 228 460 251 417 879 1 639 1 612 1 266 Machinery and equipment rental and leasing 5 7 21 8 7 10 6 29 22 Business services except machinery and equipment rental and
leasing 1 379 726 1 001 1440 1411 1 972 4083 4953 5 283 3 920 Sub-total 2266 1793 1778 2 328 2352 3 299 6870 10637 10 517 8872
Community, social and personal services Sanitary and similar services 409 278 212 776 311 372 901 1 061 1106 783 Education services 516 425 411 379 397 494 603 954 1 034 1 031 Research and scientific institutes 6 7 3 8 10 ** 5 ** 7 42 Medical, dental, other health and veterinary services 1 036 1 021 779 641 681 555 858 1 306 1444 1 530 Welfare institutions 117 118 102 387 144 153 314 414 543 725 Business, professional and labour associations 49 60 55 17 70 49 131 131 145 173 Other social and related community services 58 35 121 70 49 26 76 228 354 290 Motion picture and other entertainment services 206 80 92 132 163 257 403 657 709 626 Libraries, museums, gardens, and other cultural services n.e.c. 8 9 3 4 ** 4 ** 6 2 Amusement and recreational services n.e.c. 149 61 78 42 40 690 227 547 1 079 349 Repair services n.e.c. 366 181 207 208 116 264 650 980 993 687 Laundries, laundry services, and cleaning and dyeing plants 66 14 29 92 35 112 164 234 212 224 Miscellaneous personal services 411 488 460 661 581 802 1 457 1 724 1 736 1 615
Sub-total 3 396 2 777 2549 3416 2601 3803 5 792 8 238 9367 8077 Total iu Private sector 58189 32819 42384 36670 26162 44778 80 762 114 831 91 777 78998 Total iu Public and Private sector 73730 40945 48741 43830 32231 51309 88 416 124 883 102 390 893i4
Notes: Figures refer to the fourth quarter (or more specifically to the last full working day) of the year except those for the Civil Service sector for 1985 and onwards which refer to the first of January of the fol~ lowing year and those for the construction sites (for manual workers only) before 1990 which refer to the third quarter of the year. 'n.e.c.' denotes not elsewhere classified. **Figure is suppressed for confidentiality reasons.
Source: Employment and Earnings Statistics Section, Census and Statistics Department.
43

3.16 Nominal and Real Indexes of Payroll Per Person Engaged by Industry Group
Major dfyision/ Industry gro!IJI
Nominal index
1981 1982 1983 1984 1985 1986 1987 1988 1989 1990
Minillg andquarryiog 120.8 151.4 163.S 165.4 176.8 235.2 221.0 '137.2 362.0 321.1 Othermining 120.5 150.9 162.9 164.9 176.2 234.3 220.1 236.2 360.2 319.7
Mamifacttiring 138.4 150.7 171.9 190.3 212.2 242A 263.4 307.4 355.0 389.4 Food products 148.5 154.8 174.9 184.9 222.3 246.0 260.2 324.2 390.3 442.8 Beverages 135.4 141.2 171.6 163.5 179.6 237.1 257.3 326.8 403.6 338.7 Tobacco 145.3 197.1 247.7 256.3 228.3 316.3 305.5 327.9 466.1 485.7 Wearing apparel, except footwear 143.0 161.0 191.3 209.7 232.9 259.9 281.5 327.5 359.4 378.2 Leather and leather products, except footwear
and wearing apparel 118.3 135.6 145.4 162.7 153.5 215.0 232.4 247.8 266.1 324.8 Footwear, except rubber, plastic and
wooden footwear ll5.0 146.0 173.0 186.1 190.6 228.6 222.5 233.1 251.5 293.9 Textiles 129.8 143.8 167.7 180.4 202.4 244.9 250.4 298.7 322.1 364.6 Wood and cork products, except furniture 143.6 141.7 153.4 183.5 190.8 220.7 229.7 269.8 302.8 364.1 Furnitute and fixtures, except primarily
ofmetal 167.9 141.4 177.0 197.1 198.1 222.5 253.0 287.7 342.6 339.1 Paper and paper products 126.9 141.2 151.5 161.2 199.6 223.5 228.4 279.1 313.6 391.5 !'tinting, publishing and allied industries 144.1 148:5 184.1 203.0 217.2 231.8 263.3 294.5 335.5 394.8 Cheniicals an\! chemical products including
products of petroleum and coal 159.8 194.7 196.5 196.7 213.1 244.8 253.6 306.8 334.1 368.5 Rubberproducts 110.5 122.3 128.3 164.4 158.8 168.5 198.9 202.6 266.4 266.8 Plastic products 137.7 142.5 162.9 181.9 219.3 215.5 250.1 298.2 357.1 383.8 Non•metallic mineral products, except
products of petroleum and coal 142.9 177.2 209.8 198.3 240.7 270.3 290.0 308.1 384.7 444.4 Basicmetalindustries 134.3 155.0 158..2 177.2 161.7 180.2 217.0 256.4 325.9 390c5 Fabricated metal products, except machinery
and eqcipment 142.2 153.9 164.3 185.8 201.0 232.6 269.4 306.8 324.7 389.6 Machinery, except electrical 134.3 136.3 136.1 159.1 164.4 207.3 210.4 234.5 2'>3.5 321.7 Electrical machinery, apparatus, appliances
and supplies 136.2 147.1 168.7 193.9 210.4 258.1 277.7 327.9 422.9 438.6 Transporteqcipment 163.9 130.3 156.4 179.7 198.6 225.9 251.0 274.1 332.6 381.4 Scientific, measuring and controlling
equipment n.e.c. and photographic and optical goods
Other manufacturing industries
Electricity and gas
Wholesale, retail and IJE trades and restaurants and hotels Wholesale Retail Import/Export Restaurants, cafes and bars Hotels and boarding houses
Transport, storage ·and eonnnunication Land transPQrt Water transport Air transport Services allied to tra!lllport Commu!lication
Financing, ~-real estilte aud business
~-Financial institutions Insurance Real estate Machinery and equipment rental and leasing Business services except machinery and
equipment rental and· leasing
Community, social and personal services Sanitary and similar services Education services, including research and
scientific· institutes Medical, dental, other health and
veterinary services Welfare insti!lltions Business, professional and labour
associations Other social and related community services Motion picture, other entertainment and
cultural services n.e.c., including libraries, museums and gardens
Amusement and recreational services n.e.c. Repair services n.e.c. Laundries, laundry services, and cleaning and
dyeing· plants Miscellaneous personal services
Notes: Figures refer to December of the year. 'n.e.c.' denotes not elsewhere classified.
107.1 129.2 133.3 151.7 174.6 193.4 225.2 254.7 292.8 330.9 148.0 154.3 165.7 195.8 213.9 252.2 264.4 306.0 376.3 415.1
171.3 197.6 212.4 238.1 299.6 325.6 390.8 408.8 505.7 566.1
155.6 168.7 152.3 169.1 146.8 164.3 170.1 186.3 139.9 142.5 176.5 195.7
'142.9 175.4 122.2 149.0 155.2 195.5
** ••
190.0 215.9 229.2 264.9 288;5 318.4 371.2 426.2 177.7 207.4 218.1 237.6 266.9 279.1 350.7 394.4 166.9 196.5 209.8 227.6 259.9 303.6 350.3 393.5 222.4 238.2 242.7 290.8 297.2 308.9 360.0 417.0 159.1 176.6 186.7 207.2 235.0 273.8 310.4 341.4 217.3 258.2 312.0 291.7 341.1 380.2 406.5 502.4
191.3 220.4 241.6 274.1 301.8 355.8 427.5 435~1 164.2 179.2 184.0 209.0 205.7 235.4 287.3 337.0 188.6 221.2 232.9 273.0 292.0 349.6 395.2 467.8 .. ..
164.3 198.6 207.6 258.8 249.8 281.9 318.3 346.4 390.9 419.1 ** ** •• •• ••
172.9 14)4.9, '131.2 253.8. 279.3 305.8 327.7 358.1 405.l 464.8 181.7 230.2 281.6 313.0 348.0 392.8 386.6. 451.0 520.8 573.2 183.2 182.9 241.9 247.7 295.3 273.3 329.3 317.9 308.2 352.0 218.7 196.!} 224.3 254.3 285.0 293.3 276.0 329.9 403.5 412.8 148.9 203.5 336.8 303.2 334.0 337.3 405.3 366.2 349.8 351.7
145.8 149.1 169.1 184.9 199.7 220.3 276.6 276.7 308.3 394. 7
148.3 168.6 185.8 199.3 222.2 251.9 273.9 299.3 345.7 408.5 152.4 156.9 150.7 153.2 155.1 171.9 195.0 214.9 296.7 286.6
151.6 178.0 195.5 210.4 241.l 275.4 295,8 323.4. 377.3 447.5
143.9 172.5 183.0 202.6 210.4 248.0 274.5 293.9 358.7 423.1 151.5 174.1 175.0 210.2 220.4 233.8 245.8 276.1 329.4 377.0
•• 121.3 170.5 174.1 204.1 275.3 263.3 299.9 277.5 364.4 408.9
130.1 170.7 186.6 194.8 238.9 246.4 261.4 266.9 329.0 380.1 .. .. .. .. 137.9 137.3 143.2 155.9 171.1 177.8 200.4 256.5 279.0 326.9
115.6 127.9 125.0 158.2 158.3 168.0 202.3 207.1 219.4 249.3 149.1 140.7 172.7 167.7 176.4 194.6 225.4 242.7 274.4 310.0
**Figure is suppressed for confidentiality reasons.
Source: Employment and Earnings Statistics Section, Census and Statistics Department.
44
June 1980=100
Rea/index
1981 1982 1983 1984 1985 1986 1987 1988 1989 1990
99.5 113.7 110.6 106.9 111.3 142.8 124.9 124.5 173.1 138.0 99.:! 113.3 110.2 106.6 111.0 142.3 124.4 124.0 172.3 137.4
114.0 113.1 116.3 123.0 133.6 147.2 148.8 161.4 170.0 167.3 122.3 116.2 118.3 119.5 140.0 149.4 147.0 170.2 . 186.7 190.3 111.5 106.0 116.1 105.7 113.1 144.0 145.4 171.5 193.0 145.6 119.7 148.0 167.6 165.7 143.8 192.0 172.6 172.1 222.9 208.7 117.8 120.9 129.4 135.6 146.7 157.8 159.0 171.9 171.9 162.5
97.4 101.8 98.4 105.2 96.7 130.5 131.3 130.1 127.3 139.6
94.7 109.6 117.1 120.3 120.0 138.8 125.7 122.4 120.3 126.3 106.9 108.0 113.5 116.6 127.5 148.7 141.5 156.8 154.0 156.7 118.3 106.4 103.8 118.6 120.2 134.0 129.8 141.6 144.8 156.5
138.3 106.2 119.8 127.4 124.7 135.1 142,9 151.0 163.8 145.7 104.5 106.0 102.5 104.2 125.7 135.7 129.0 146.5 150.0 168.2 118.7 111.5 124.6 131.2 136.8 140.7 148.8 154.6 160.4 169.7
131.6 146.2 132.9 127.1 134.2 148.6 143.3 161:0 160.0 158.4 91.0 91.8 86.8 106.3 100.0 102.3 112.4 106.4 127.4 114. 7
113.4 107.0 110.2. 117.6 138.l 130.8 141.3 156.5 170.8 164.9
.117.7 133.0 141.9 128.2 151.6 164.1 163.8 161.7 184.0 191.0 ll0.6 116.4 107.0 114.5 101.8 109.4 122.6 134.6 155.9 167.8
117.1 115.5 111.2 120.1 126.6 141.2 152.2 161.0 155.3 167.4 110.6 102.3 92.1 102.8 103.5 125.9 118.9 123.1 140.4 138.2
112.2 110.4 114.1 125.3 132.5 156.7 156.9 172.1 202.2 188.5 135.0 97.8 105.8 116.2 125.l 137.2 141.8 143.9 159.1 163.9
88.2 97.0 90.2 98.1 109.9 117.4 127.2 133.7 140.0 142.2 121.9 115.8 112.1 126.6 134.7 153.l 149.4 160.6 180.0 178.4
141.1 148.3 143.7 153.9 188.7 197.7 220.8 214.6 241.8 243.3
128.2. 126.7 128.6 139.6 144.3 160.8 163.0 167.1 177.5 183.2 125.5 127.0 120.2 134.1 137.3 144.3 150.8 146.5 167.7 169.5 120.9 123.3 112.9 127.0 132.1 138.2 146.8 159.4 167.5 169.1 140.1 139.9 150.5 154.0 152.8 176.6 167.9 162.2 172.2 179.2 115.2 107.0 107.6 114.2 117.6 125.8 132.8 143.7 148.4 146.7 145.4 146.9 147.0 166.9 196.5 177.1 192.7 199.6 194.4 215.9 117.7 131.7 129.4 142.5 152.1 166.4 170.5 186.8 204.4 187.0 100.7 111.9 Ill.I 115.8 115.9 126.9 116.2 123.6 137.4 144.8 127.8 146.8 127.6 143.0 146.7 165.8 165.0 183.5 189.0 201.0
** •• •• 135.3 149.1 140.5 167.3 157.3 171.2 179.8 181.8 186.9 180.1
"'"' **
142.4 146.3 156.4 164.1 175.9 185.7 185.1 188.0 193.7 199.7 149.7 172.8 190.5 202.3 219.1 238.5 218.4 236.7 249.1 246.3 150.9 137.3 163.7 160.1 186.0 165.9 186.0 )66.9 147.4 151.3 180.1 147.8 151.8 164.4 179.5 178.1 155.9 173.2 193.0 177.4 122.7 152.8 227.9 196.0 210.3 204.S 229.0 192.2 167.3 151.1
120.1 lll.9 114.4 119.5 125.8 133.7 156.3 145.2 147.4 169.6
u2.2 126.6 125.7 128.8 139.9 1s2,9 154.7 157.l 165.3 175.5 125.5 117.8 102.0 99.0 97.7 104.4 110.2 112.8 141.9 123.2
124.9 133.6 132.3 136.0 151.8 167.2 167.1 169.8 180.4 192.3
118.5 12'>.5 123.8 131.0 132.5 150.6 155.1 154.3 171.5 181.8 124.8 130.7 118.4 135.9 138.8 142.0 138.9 144.9 157.5 162c0
99.9 128.0 117.8 131.9 173.4 159.9 169.4 145.7 174.3 175.7
107.2 128.2 126.3 125.9 150.4 149.6 147.7 140.1 157.3 163.3 ** •• ••
113.6 103.1 96.9 ' 100.8 107c7 107.9 113.2 134.6 133.4 140.5
95.2 96.0 84.6 102.3 99.7 102.0 114.3 108.7 104.9 107.1 122c8 105.6 116.8 108.4 Ill.I 118.2 127.3 127.4 131.2 133.2

3.17 Wage Indexes by Industry
Craftsmen and other operatives
Daily Wages
in 1990 Major division/ Industry 1982 1983 1984 1985 1986 1987 1988 1989 1990 (HK$)
Nominal wage index
Manufacturing
Bakery products
Garments
Gloves
Handbags
Footwear
Cotton spinning and weaving
Knitting
Bleaching and dyeing
Wooden furniture and fixtures
Paper boxes
Printing
Plastic products
Metal products
Wrist watch bands
Electrical appliances
Electronics
Boatyards and shipyards
Photographic and optical goods
Watches and clocks
Jewellery
Wholesale/retail trades, restaurants and hotels
Wholesale
Retail
Import/export
Restaurants, exclusively Chinese
Restaurants, other than Chinese
Hotels
Transport services
Air freight forwarder/travel agency
Business services
Banks
Insurance
Technical consultancy firms
Personal services
Sanitary and similar services
Motor vehicles repairing
Overall
Real wage index
Overall
102.9 109.6 118.8 125.3 132.3 145.0 156.5 174.3 195.4
101.5 111.7 117.3 125.8 141.4 161.4 188.0 216.l 242.1
102.5 107.8 113.5 117.5 122.3 127.6 133.7 145.5 162.3
103.5 106.6 131.1 138.7 144.6 154.4 169.5 191.9 200.2
101.4 104.9 113.l 120.7 126.4 138.l 142.3 168.9 189.9
103.0 102.3 106.0 105.6 107.0 111.6 114.0 113.8 118.8
101.9 109.5 117.8 126.4 140.8 158.6 167.5 184.5 206.0
104.7 112.l 121.6 125.3 132.7 141.0 143.6 154.4 163.2
103.2 111.6 120.9 131.7 148.6 168.7 182.6 201.0 218.9
103.2 96.8 103.6 112.8 116.5 137.4 164.2 166.l 208.3
102.9 110.8 121.l 131.4 144.4 158.9 180.8 197.0 220.6
105.1 113.5 123.9 134.6 141.1 161.7 186.5 222.0 268.0
100.9 108.2 119.8 123.1 130.4 140.4 152.2 160.0 179.8
101.2 111.3 117.4 126.7 137.3 150.4 165.7 186.0 202.9
100.7 105.7 114.8 125.7 133.6 149.9 159.0 183.9 204.l
103.0 115.2 134.9 143.2 154.8 174.8 194.1 239.0 265.2
103.7 110.8 124.2 132.5 139.9 166.0 188.2 215.7 247.9
112.1 121.8 130.4 142.2 150.l 163.0 179.9 208.2 246.3
100.4 117.8 136.4 155.5 170.4 185.3 205.2 247.0 269.4
103.5 113.2 121.4 131.7 141.8 174.8 190.3 228.l 250.l
99.6 100.2 111.9 116.5 116.7 130.0 148.3 162.3 174.8
102.0 JOO.I 108.7 124.7 134.7 156.0 181.1 217.7 252.6
102.0 100.l 108.7 124.7 134.7 156.0 181.l 217.7 252.6
103.6 110.5 120.1 127.0 134.3 147.1 158.9 177.5 199.4
99.0 95.5 96.9 98.8 102.4 105.9 105.3 106.8 109.4
Notes: Figures are as at September of the year. *Real wages are expressed in terms of March 1982 dollars.
**Figure is suppressed for confidentiality reasons.
Source: Wages and Labour Costs Statistics Section, Census and Statistics Department.
184
168
178
131
154
178
176
172
237
230
242
244
161
153
148
156
156
223
165
170
317
257
257
189
104*
March 1982~100
Supervisory, technical, clerical and misc.
non-production workers All employees
Monthly Salaries m/990
1982 1983 1984 1985 1986 1987 1988 1989 1990 (HK$) 1990
102.5 113.1 125.0 134.4 144.5 159.3 176.0 201.2 227.2
101.8 125.0 145.3 153.8 170.7 176.6 206.2 250.4 280.6
103.l 112.1 123.3 133.8 142.5 154.2 166.3 188.5 214.9
103.4 112.8 124.0 135.5 143.3 153.7 166.9 193.l 228.3
100.6 112.5 123.6 130.5 137.l 153.9 183.5 221.6 255.2
99.l 107.3 114.7 120.7 123.9 135.8 144.2 161.5 175.5
100.8 114.7 125.7 134.1 151.9 177.4 190.2 211.5 240.8
102.l 113.2 127.7 139.8 152.2 164.7 174.2 200.9 228.9
101.4 109.2 121.4 135.6 147.7 167.4 180.3 199.4 215.9
104.3 108.0 120.9 130.6 136.3 175.5 193.6 231.7 257.8
101.7 113.8 130.0 142.8 150.7 169.1 194.7 217.6 247.0
103.6 112.9 122.9 131.4 142.3 163.5 186.5 224.2 265.4
103.5 121.3 135.5 143.9 154.4 170.2 188.0 209.3 228.2
103.4 116.4 128.7 136.6 142.8 157.8 179.5 209.7 232.5
101.6 108.2 118.3 129.l 140.l 153.7 174.1 183.2 207.0
101.3 106.0 116.1 123.0 132.2 143.7 167.7 200.0 232.6
102.2 113.4 123.l 130.7 141.3 152.6 172.5 197.1 223.2
105.2 112.0 120.1 125.4 132.8 142.9 150.2 170.4 196.4
100.6 109.4 118.2 129.1 135.7 156.2 181.8 229.1 250.5
102.0 112.l 132.8 142.0 152.2 173.7 191.3 214.8 231.0
103.2 112.9 132.l 145.3 158.5 177.1 202.4 233.6 258.5
101.7 108.1 115.6 120.8 128.3 141.5 159.6 181.0 200.9
103.2 115.9 126.5 136.6 148.l 167.0 187.8 202.6 231.0
101.l 108.0 121.2 132.8 148.l 178.0 215.5 248.3 289.7
105.2 117.8 140.0 151.9 169.8 194.9 224.1 250.0 295.6
101.4 106.4 109.7 111.7 114.9 123.5 137.0 154.9 167.6
101.8 107.5 114.7 121.3 132.1 146.0 162.3 185.6 203.4
100.2 108.3 121.9 132.2 146.2 158.8 180.2 206.l 238.2
105.0 112.9 124.4 136.4 147.8 163.0 184.2 220.4 252.3
103.1 112.7 123.l 135.9 144.3 159.3 185.4 214.l 244.5
102.6 110.4 120.4 130.3 143.7 155.8 182.3 217.0 252.7
101.7 109.9 120.5 129.6 143.9 156.0 186.0 215.6 251.6
102.3 113.3 125.6 142.7 155.0 167.9 191.5 235.2 262.5
107.7 109.9 115.2 122.4 131.7 143.3 155.8 203.2 243.5
5,831
6,349
5,081
5,129
5,804
5,045
5,258
5,906
7,242
5,722
6,204
6,841
6,052
5,484
5,534
5.861
5,678
7,040
6,359
5,941
7,564
5,850
5,716
5,544
7,444
5,869
5,869
5,538
6,764
5,495
7,744
7,795
6,713
9,064
103.l 112.5 117.3 124.5 129.3 144.1 169.7 207.9 234.6 3,378
103.3 114.1 118.2 124.5 128.2 141.9 168.l 207.2 233.l 3,179
102.2 102.6 112.1 125.l 137.7 160.7 180.8 212.6 244.5 5,472
102.6 110.9 120.6 128.5 138.1 151.9 171.3 197.2 222.6 6,060
98.1 95.9 97.4 99.9 105.3 109.5 113.5 118.7 122.1 3,324*
202.8
258.1
171.5
203.8
205.5
127.2
216.9
182.4
218.0
216.0
231.2
267.2
190.l
212.8
205.3
256.4
241.1
234.6
266.4
245.2
194.2
200.9
231.0
289.7
295.6
167.6
203.4
238.2
253.5
244.5
252.7
251.6
262.5
243.5
237.2
233.1
249.4
210.3
115.3
45

3.18 Average Daily Wages of Workers Engaged in Government Building and Construction Projects by Occupation HK$
Occupation 1981 1982 1983 1984 1985 1986 1987 1988 1989 1990
Male labourer 105.5 113.7 119.1 123.5 129.7 145.7 185.7 226.9 270.4 306.2
Female labourer 85.3 93.3 93.0 103.4 103.3 118.6 154.2 188.0 221.9 248.0
Concretor /Bricklayer 161.8 175.7 170.5 176.4 185.5 207.1 249.3 316.7 382.3 446.8
Mason 164.5 179.1 183.8 180.9 199.2 183.0 249.0 316.4 357.8 417.4
Steel bender 193.3 215.4 210.6 211.2 237.9 271.6 357.2 450.2 494.3 585.0
Blacksmith 164.2 182.6 177.3 182.3 186.1 203.1 256.9 293.0 373.0 430.8
Carpenter and joiner 166.1 180.0 180.l 186.5 192.1 208.9 280.2 349.3 396.8 451.1
Plumber 137.9 157.6 160.4 162.5 176.0 197.9 236.2 295.9 363.8 403.4
Fitter 127.2 139.5 149.3 153.2 162.0 175.6 211.3 275.6 334.3 364.6
Plasterer 167.2 185.4 181.0 186.7 198.2 216.1 282.5 339.5 411.1 453.7
Terrazzo and granolithic worker 185.9 204.6 169.6 205.5 217.1 212.5 291.8 321.5 418.1 472.8
Glazier 160.7 174.8 168.2 173.4 179.8 207.1 247.7 303.0 362.5 412.8
Painter 154.7 163.0 166.8 176.8 177.0 200.7 251.6 290.0 337.8 391.6
Electrician 122.9 141.3 142.0 160.4 171.5 180.4 213.5 254.2 325.8 365.2
Plant operator 126.8 154.7 159.8 164.0 167.7 179.2 220.0 261.9 315.7 367.3
Truck driver 115.8 127.6 138.2 146.5 151.7 162.8 193.9 240.6 286.2 326.0
Coolie 135.7 149.8 157.1 155.4 168.4 181.7 220.3 298.l 326.0 386.5
Pneumatic driller 151.5 175.5 160.6 179.3 179.5 202.3 263.4 313.7 373.5 412.9
Bamboo worker and scaffolder 199.1 214.1 207.2 208.6 223.2 241.7 286.5 390.5 456.1 519.1
Structural steel erector 136.1 201.3 173.4 189.l 219.7 212.9 253.0 317.8 409.2 421.5
Diver 317.4 252.8 288.0 294.9 332.9 388.3 407.3 421.3 513.5 579.9
Diver's linesman 109.5 127.l 133.3 122.5 148.7 160.1 231.6 256.3 291.1 258.5
Note: Figures are as at December of the year.
Source: Wages and Labour Costs Statistics Section, Census and Statistics Department.
46
------------------ ---

3.19 Salary Index (A) by Major Divisions by Company Size June 1983=100
Nominal salary index Real salary index Major division/ Company size (Number of persons engaged) 1984 1985 1986 1987 1988 1989 1990 1984 1985 1986 1987 1988 1989 1990
Manufacturing/electricity, gas and steam Medium (200-1 999) 114.8 128.6 134.8 144.3 167.0 185.8 205.8 104.2 113.0 112.8 113.4 121.0 121.3 120.8 Large (2 OOO and over) 110.0 123.2 133.2 145.0 153.l 178.5 201.3 99.8 108.3 111.4 113.9 110.9 116.5 118.l All companies (200 and over) 113.8 127.5 134.5 144.4 164.1 184.2 204.8 103.3 112.1 112.5 113.5 118.9 120.3 120.2
Building and construction and related trades Medium (50-499) 106.6 121.0 134.0 140.0 163.l 186.5 217.9 96.8 106.3 112.2 109.9 118.2 121.8 127.9 Large (500 and over) 98.l 105.8 115.3 122.3 133.2 147.8 172.4 89.0 93.0 96.4 96.l 96.5 96.5 101.2 All companies ( 50 and over) 105.6 119.2 131.8 137.9 159.6 182.0 212.6 95.8 104.8 110.3 108.3 115.7 118.9 124.8
Wholesale/retail and import/export trades Medium (100-499) 114.3 128.l 143.8 161.6 175.9 198.8 217.7 103.7 112.6 120.4 127.0 127.4 129.8 127.7 Large (500 rnd over) 112.7 119.2 130.7 145.9 166.5 195.4 217.0 102.3 104.7 109.4 114.6 120.6 127.6 127.3 All companies (JOO and over) 114.0 126.5 141.5 158.9 174.2 J98.2 217.5 J03.5 111.2 118.4 124.8 J26.2 J29.4 127.7
Transport, storage and communication Medium (100-499) 109.9 122.4 127.9 128.5 140.9 165.6 177.7 99.7 107.6 107.l 101.0 102.l 108.l 104.3 Large (500 and over) 112.0 122.l 134.0 140.4 150.l 172.0 192.8 101.6 107.3 112. l 110.3 108.8 112.3 113.l All companies (JOO and over) 110.9 122.2 130.9 134.4 145.4 168.7 185.1 100.6 107.5 109.5 105.6 105.4 110.2 108.6
Financial institutions and insurance Medium* (100-999) 114.9 131.3 142.3 155.7 178.6 211.8 248.3 104.3 115.4 119.l 122.3 129.4 138.3 145.7 Large# (1 OOO and over) 111.6 123.3 136.2 153.0 169.0 203.9 236.0 101.3 108.4 114.0 120.2 122.5 133.l 138.5 All companiest (JOO and over) 114.J 129.3 140.9 J55.I 176.3 209.9 245.3 103.5 113.7 117.9 121.8 127.7 137.1 144.0
Overall Medium 112.3 126.3 137.5 147.7 168.2 192.8 219.1 101.9 111.0 115.0 116.1 121.9 125.9 128.6 Large 110.0 119.7 131.0 142.6 155.4 181.2 205.9 99.9 105.2 109.6 112.0 112.6 118.3 120.8 All companies 111.8 124.9 136.1 146.6 165.5 190.3 216.2 101.5 109.8 113.9 115.2 119.9 124.3 126.9
Notes: Figures are as at June of the year and refer only to managerial and professional employees. *Investment and holding companies with 20-499 persons engaged are also included.
#Investment and holding companies with 500 or more persons engaged are also included. tinvestment and holding companies with 20 or more persons engaged are also included.
Source: Wages and Labour Costs Statistics Section, Census and Statistics Department.
3.20 Salary Index (B) by Major Divisions by Company Size June 1983=100
Nominal salary index Real salary index Major division/ Company size (Number of persons engaged) 1984 1985 1986 J987 1988 J989 1990 J984 J985 J986 J987 J988 1989 1990
Manufacturing/electricity, gas and steam Medium (200-1 999) 114.4 130.0 140.0 159.6 186.l 215.3 243.7 103.8 114.3 117.2 125.4 134.8 140.6 143.0 Large (2 OOO and over) 112.l 128.0 143.7 162.3 182.7 231.9 266.l 101.7 112.5 120.3 127.5 132.4 151.4 156.2 All companies (200 and over) 113.9 129.6 140.8 160.2 185.3 2J9.3 249.0 103.4 113.9 117.8 125.8 134.3 143.2 146.J
Building and construction and related trades Medium (50-499) 110.6 124.9 140.7 156.8 191.4 235.l 275.6 100.3 109.8 117.7 123.2 138.6 153.5 161.7 Large (500 and over) 108.0 122.7 140.4 157.6 184.4 218.7 264.7 98.0 107.9 117.5 123.8 133.6 142.8 155.3 All companies (50 and over) 110.3 124.7 140.7 156.9 190.7 233.5 274.6 JOO.I 109.6 117.7 123.2 138.2 J52.5 161.I
Wholesale/retail and import/export trades Medium (100-499) 115.9 132.5 151.8 174.5 195.9 238.9 274.0 105.2 116.4 127.0 137.l 141.9 156.0 160.8 Large (500 and over) 112.4 126.9 142.6 160.8 187.7 230.6 272.3 102.0 111.6 119.3 126.3 136.0 150.6 159.8 All companies (JOO and over) 115.3 13J.5 150.2 172.1 194.4 237.4 273.7 104.6 115.6 125.7 135.2 140.9 155.0 160.6
Transport, storage and communication Medium (100-499) 114.2 126.8 137.l 148.9 168.7 202.5 234.6 103.6 111.5 114.8 117.0 122.2 132.2 137.7 Large (500 and over) 112.5 127.4 142.9 157.9 178.8 214.8 256.5 102.l 112.0 119.6 124.0 129.6 140.2 150.5 All companies (JOO and over) 113.3 127.J 140.J 153.5 173.8 208.7 245.7 J02.9 111.7 117.2 J20.6 J26.0 136.3 144.2
Financial institutions and insurance Medium* (100-999) 114.7 134.l 151.5 171.2 205.0 246.4 291.7 104.l 117.9 126.8 134.5 148.5 160.9 171.2 Large# (1 OOO and over) 112.3 127.2 145.8 168.5 194.9 237.l 285.6 102.0 111.8 122.0 132.4 141.3 154.8 167.6 All companiest (JOO and over) 114.1 132.5 J50.J 170.6 202.5 244.1 290.2 103.6 116.4 125.6 134.0 146.7 159.4 170.3
Overall Medium 113.6 129.6 144.8 163.5 192.5 232.3 269.8 103.l 113.9 121.1 128.4 139.5 151.7 158.4 Large 111.8 126.8 143.3 161.9 185.8 227.1 269.4 101.4 111.5 119.9 127.2 134.6 148.3 158.1 All companies 113.2 129.0 144.5 163.1 191.1 231.2 269.8 102.7 113.4 120.9 128.2 138.5 150.9 158.3
Notes: Figures are as at June of the year and refer only to managerial and professional employees. *Investment and holding companies with 20-499 persons engaged are also included.
#Investment and holding companies with 500 or more persons engaged are also included. tinvestment and holding companies with 20 or more persons engaged are also included.
Source: Wages and Labour Costs Statistics Section, Census and Statistics Department.
47
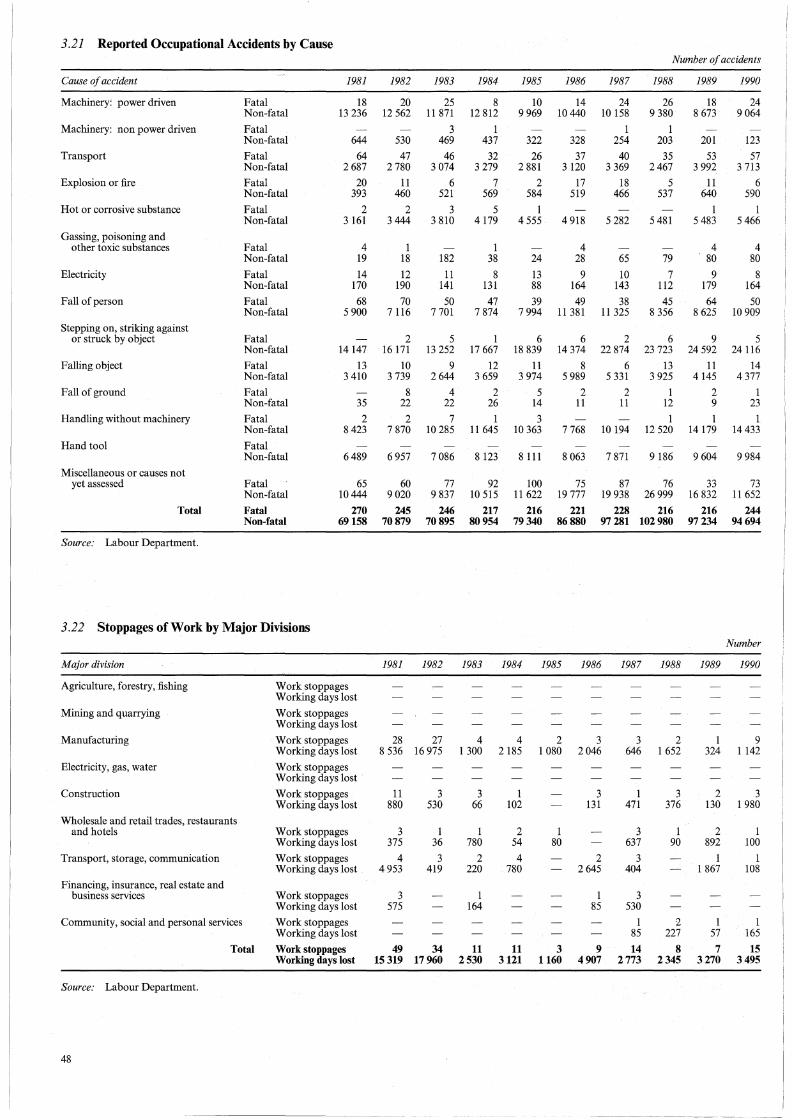
3.21 Reported Occupational Accidents by Cause
Cause of accident
Machinery: power driven
Machinery: non power driven
Transport
Explosion or fire
Hot or corrosive substance
Gassing, poisoning and other toxic substances
Electricity
Fall of person
Stepping on, striking against or struck by object
Falling object
Fall of ground
Handling without machinery
Hand tool
Miscellaneous or causes not yet assessed
Total
Source: Labour Department.
Fatal Non-fatal
Fatal Non-fatal
Fatal Non-fatal
Fatal Non-fatal
Fatal Non-fatal
Fatal Non-fatal
Fatal Non-fatal
Fatal Non-fatal
Fatal Non-fatal
Fatal Non-fatal
Fatal Non-fatal
Fatal Non-fatal
Fatal Non-fatal
Fatal Non-fatal
Fatal Non-fatal
1981
18 13 236
644
64 2 687
20 393
2 3 161
4 19
14 170
68 5 900
14147
13 3 410
35
2 8423
6489
65 10444
1982
20 12 562
530
47 2 780
11 460
2 3 444
1 18
12 190
70 7116
2 16 171
10 3 739
8 22 2
7 870
6 957
60 9 020
1983
25 11 871
3 469
46 3 074
6 521
3 3 810
182
11 141
50 7701
5 13 252
9 2644
4 22 7
10 285
7 086
77 9 837
1984
8 12 812
1 437
32 3 279
7 569
5 4179
1 38
8 131
47 7 874
1 17 667
12 3 659
2 26
1 11 645
8 123
92 10 515
1985
10 9 969
322
26 2 881
2 584
1 4 555
24
13 88 39
7 994
6 18 839
11 3 974
5 14
3 10 363
8 111
100 11 622
1986
14 10440
328
37 3 120
17 519
4 918
4 28
9 164
49 11 381
6 14 374
8 5 989
2 11
7 768
8 063
75 19 777
1987
24 10 158
1 254
40 3 369
18 466
5 282
65
10 143
38 11 325
2 22 874
6 5 331
2 11
10 194
7 871
87 19 938
Number of accidents
1988
26 9 380
1 203
35 2467
5 537
5 481
79
7 112
45 8 356
6 23 723
13 3 925
1 12
1 12 520
9 186
76 26999
1989
18 8 673
201
53 3 992
11 640
1 5 483
4 80
9 179
64 8 625
9 24 592
11 4145
2 9
1 14179
9604
33 16 832
1990
24 9 064
123
57 3 713
6 590
1 5 466
4 80
8 164
50 10 909
5 24116
14 4 377
1 23
1 14 433
9 984
73 11 652
270 245 246 217 216 221 228 216 216 244 69 158 70 879 70 895 80 954 79 340 86 880 97 281 102 980 97 234 94 694
3.22 Stoppages of Work by Major Divisions
Major division
Agriculture, forestry, fishing
Mining and quarrying
Manufacturing
Electricity, gas, water
Construction
Wholesale and retail trades, restaurants and hotels
Transport, storage, communication
Financing, insurance, real estate and business services
Community, social and personal services
Work stoppages Working days lost
Work stoppages Working days lost
Work stoppages Working days lost
Work stoppages Working days lost
Work stoppages Working days lost
Work stoppages Working days lost
Work stoppages Working days lost
Work stoppages Working days lost
Work stoppages Working days lost
Number
1981 1982 1983 1984 1985 1986 1987 1988 1989 1990
28 27 4 4 2 3 8 536 16 975 1 300 2 185 1 080 2 046
11 880
3 375
4 4953
3 575
3 530
1 36
3 419
3 66
1 780
2 220
1 164
1 102
2 54
4 780
1 80
3 131
2 2645
1 85
3 2 646 1 652
1 471
3 637
3 404
3 530
1 85
3 376
1 90
2 227
1 9 324 1 142
2 3 130 1 980
2 1 892 100
1 1 867
1 57
1 108
1 165
Total Work stoppages 49 34 11 11 3 9 14 8 7 15 Working days lost 15 319 17 960 2 530 3121 1160 4 907 2 773 2 345 3 270 3 495
Source: Labour Department.
48

Section 4 Industrial Production
Tables 4.1to4.8 General Information Statistics concerning the output, cost structure and other salient features of the manufacturing industry in Tables 4.1 to 4.6 are obtained from the Annual Survey of Industrial Production, while the indexes of industrial production and the textile production statistics in Tables 4. 7 and 4.8 are compiled from data collected in the Quarterly Survey of Industrial Production and the Quarterly Textile Production Survey respectively.
Concepts and Definitions Government industrial undertakings consist of 1 quarry, 1 printing house, 19 prison workshops (treated collectively as 1 establishment), 2 abattoirs and 1 water works establishment. Workshops in non-profit institutions are those run by the Social Welfare Department and other voluntary agencies. Establishment
Number of persons engaged
Compensation of employees
Purchases of materials, supplies and industrial work/services*
Consumption of materials, supplies and industrial work/services
Other expenses
Sales of goods, industrial work and industrial services#
Other receipts
Gross outputf
-An establishment is ideally an economic unit which engages, under a single ownership or control, in one or predominantly one kind of economic activity at a single physical location. Where separate figures relating to different activities or different locations under the same management are not available, a combined return is accepted and in this case, the reporting unit is treated as an establishment.
--equals number of working proprietors, active partners and unpaid family workers
plus number of employees averaged over the four quarters covered by the reporting period
--equals wages and salaries to operatives and other employees plus payments in kind and employer's social security expenditure plus payments to outworkers
--equals purchases of fuels plus purchases of electricity plus purchases of water plus value of all other purchases of materials/supplies for pro
duction and business operation plus payments for sub-contract work plus payments for repair and maintenance services
--equals purchases 9f materials, supplies and industrial work/ services*
plus stocks of materials/ supplies at beginning of year less stocks of materials/supplies at end of year
--equals plus plus plus plus
--equals plus plus plus
--equals plus plus
--equals plus plus plus
rent and rates for land and buildings rentals for hiring machinery and equipment interest payments textile export quota transfer payments other operating expenses value of all sales of goods produced machinery produced for own use value of resales of goods in same condition as purchased receipts for industrial work and industrial services rendered to other establishments rents received textile export quota transfer receipts income from other sources sales of goods, industrial work and industrial services rents received income from other sources stocks of work-in-progress, finished products and goods for resale at end of year
*As from the 1984 Survey, the 'Purchases of goods for resale in same condition' is not included. #As from the 1986 Survey, the term 'Sales of goods, industrial work and industrial services' is adopted to replace the term
'Sales and work done', but the definition remains unchanged.
49

50
Value added@
Gross surplus
Gross additions to fixed assets
Data Sources
less
less ---equals
less
less less less
---equals plus less
less less
---equals
less
stocks of work-in-progress, finished products and goods for resale at beginning of year purchases of goods for resale in same condition gross output (net of stock appreciation for work-in-progress, finished products and goods for resale) consumption of materials, supplies and industrial work/ services (net of stock appreciation for materials/supplies) rent and rates for land and buildings rentals for hiring machinery and equipment other operating expenses gross output textile export quota transfer receipts consumption of materials, supplies and industrial work/ services other expenses compensation of employees acquisitions of fixed assets of
(i) land and buildings (ii) plant and machinery (iii) other fixed assets disposals of fixed assets of
(i) land and buildings (ii) plant and machinery (iii) other fixed assets
The 1989 Survey of Industrial Production was one in a series of annual surveys covering the economic activities of mining and quarrying; manufacturing; and electricity, gas and water. For establishments in the manufacturing industry (other than Government industrial undertakings and non-profit institutions), a stratified sample was selected from a comprehensive register maintained by the Census and Statistics Department, using industry and employment size range as the two stratifying factors and adopting the Neyman's allocation method in determining the sample size for each stratum. Establishments engaged in the economic activities of mining and quarrying, electricity and gas (including manufacturing of town gas and distribution of town gas and liquefied petroleum gas through systems of mains), together with Government industrial undertakings and workshops in non-profit institutions were enumerated in full. Data collected in the survey included the number of persons engaged; compensation of employees; sales of goods, industrial work and industrial services; purchases of materials, supplies and industrial work/services; other expenses; and capital expenditure. Establishments were required to provide data relating to a particular reference year (e.g. the calendar year 1989 in the case of the 1989 Survey), or any 12-month period between 1 January of the reference year and 31 March of the subsequent year. Because of differences in the accounting practices of establishments, the data collected were in fact a mixture of data over slightly different periods. For establishments which commenced or ceased operation during the reference year, data reported were for that part of the reference year during which the establishments were in operation.
The indexes of industrial production, the purpose of which is to reflect the changes over time of net output at constant prices, are based on results of the Quarterly Survey of Industrial Production. This survey is conducted by the Census and Statistics Department and covers all manufacturing establishments engaging 500 or more persons as well as a sample of the smaller establishments. The production index for an industry is compiled by aggregating the production quantity relatives or deflated value relatives of the primary products or industrial work/services in respect of the industry, using the values of sales of goods, industrial work and industrial services as weights. Deflated value relatives are adopted for those products that are too heterogeneous for quantity measurement. The production indexes of different industries are then aggregated to form indexes of industry groups, broad industry groups and "All manufacturing industries", using the value added of different industries as weights which are updated annually based on the results of the latest round of the Annual Survey of Industrial Production.
The indexes of industrial production in Table 4.7 cover the whole manufacturing industry, including the spinning and weaving industries. Statistics for the latter two industries, obtained by enumerating all spinning and weaving establishments engaging 20 or more persons and a random sample of the smaller establishments, are also shown separately in greater detail in Table 4.8.
t As from the 1984 Survey, the 'Purchases of goods for resale in same condition' is included in the definition as an item to be deducted in calculating gross output.
@As from the 1986 Survey, the term 'Value added' is adopted to replace the term 'National accounts value added', but the definition remains unchanged.

Compilation and Calculation
The statistics contained in the tables covered all establishments that had ever operated during the whole or part of the reference year, including both the reporting and non-reporting establishments. Non-reporting establishments refer to those which operated during the whole or part of the reference year but became untraceable during the survey enumeration period due to closure or removal. The economic contributions of non-reporting establishments were imputed on the basis of reporting establishments of the same industry and employment size group.
The definition of gross output has been revised from the 1984 Survey of Industrial Production onwards. The values of gross output given in Table 4.6 for the years prior to 1984 have already been adjusted to the new definition for the sake of comparison with figures of the latter years.
Further References
Further details about the methodology and results of the Annual Survey of Industrial Production are available in the report 1989 Survey of Industrial Production and those about the methodology and results of the Quarterly Survey of Industrial Production and the Quarterly Textile Production Survey are available in the reports entitled Report on the Quarterly Index of Industrial Production and Report on Textile Production Statistics, both published by the Census and Statistics Department.
Table 4.9 Data Sources
Statistics of mining production are supplied by the Mines Division of the Labour Department and those of cement and quarry production by the cement manufacturing companies and the Geotechnical Control Office of the Civil Engineering Services Department respectively.
Table 4.10 Data Sources
Electricity and gas consumption are provided by the respective public utilities companies, and water supplies data by the Water Supplies Department.
51


l 4.1 Principal Statistics for All Establishments Oassified by Industrial Activity, 1989 Surver of Industrial Production
Industrial activity
All establishments, iµ<cept Government and non-profit insdtntions
Manufacturing establishments
Mining and quarrying establishments
Electricity and gas establishments:
Manufacture and distribution of electricity and town gas
Distribution of LP gas through systems of mains
Sub-total
Government and non-profit institutions
Government industrial undertakings
Workshops in non-profit institutions
Sub-total
Total
Number of establish
ments
52475
6
18
52502
6
32
38
52540
Note: *denotes figure within ± HK$0.5 million.
Purchases Number of materials,
of supplies and persons Compensation industrial engaged of employees work/services
829 723
513
10903
265
841404
13431
3747
17178
858581
52,897
64
1,747
16
54,724
991
51
1,042
55,766
209,861
107
3,497
134
213,599
586
21
607
214,207
Source: Industrial Production Statistics Section, Census and Statistics Department.
Other expenses
31,623
97
1,966
10
33,697
100
107
33,804
Sales of goods,
industrial work and industrial
services
369,712
489
15,305
192
385,698
2,158
46
2,204
387,902
Other receipts
4,553
14
37
2
4,606
954
954
5,560
HK$ million unless otherwise specified
Gross output
325,411
417
15,073
177
341,079
2,363
44
2,407
343,486
Value added
89,645
214
10,566
33
100,458
1,672
15
1,688
102,145
Gross additions
to fixed assets
11,790
8
5,219
17,018
646
649
17,667
4.2 Principal Statistics for All Manufacturing Establishments Analysed by Industry Group, 1989 Survey of Industrial Production
Industry group
Food
Beverages
Tobacco
Wearing apparel, except knitwear and footwear
Leather and leather products, except footwear and wearing apparel
Footwear, except rubber, plastic and wooden footwear
Textiles (including knitting)
Wood and cork products, except furniture
Furniture and fixtures, except primarily of metal
Paper and paper products
Printing, publishing and allied industries
Chemicals and chemical products
Products of petroleum and coal
Rubber products
Plastic products
Non-metallic mineral products, except products of petroleum and coal
Basic metal industries
Fabricated metal products, except machinery and equipment
Machinery, except electrical
Electrical and electronic consumer products
Electrical and electronic parts, accessories and machinery
Professional and scientific, measuring and controlling equipment, not elsewhere classified, and of photographic and optical goods
Transport equipment
Other manufacturing industries
Total
Number of establish
ments
928
21
9758
232
405
5118
758
1196
1886
4793
864
4
216
5281
392
259
7293
5527
766
959
1694
650
3472
52475
Note: *denotes figure within ± HK$0.5 million.
Purchases Number of materials,
of supplies and persons Compensation industrial engaged of employees work/services
18 652 1,245 4,891
4 894 491 1,414
1188
236 708
2843
7068
126098
3 998
7109
18 483
40130
9230
228
1571
63999
4855
3249
59985
29904
57248
47782
37 775
15 330
31395
829723
157
13,645
178
380
8,754
185
400
1,229
2,806
733
29
82
3,765
382
265
3,339
1,805
3,584
3,215
2,407
1,701
2,120
52,897
955
37,610
967
1,235
36,556
870
920
4,614
6,162
4,271
124
192
15,869
3,462
3,092
13,405
5,934
25,115
13,521
16,480
1,336
10,868
209,861
Source: Industrial Production Statistics Section, Census and Statistics Department.
Other expenses
928
544
500
6,051
130
156
5,290
138
232
830
1,712
722
26
39
2,330
626
224
1,809
1,094
3,069
2,226
1,517
331
1,100
31,623
Sales of goods,
industrial work and industrial
services
9,033
3,067
3,922
70,064
1,713
2,394
60,901
1,622
1,856
7,510
12,805
7,618
249
427
28,928
4,911
4,334
21,753
11,186
40,402
28,482
26,587
3,977
15,971
369,712
Other receipts
145
45
15
1,531
16
787
35
33
235
183
139
115
24
194
86
443
170
137
95
109
4,553
HK$ million unless otherwise specified
Gross output
8,217
2,978
2,413
61,631
1,405
1,978
54,907
1,278
1,739
7,210
13,020
6,556
249
374
24,795
4,834
3,740
20,729
10,453
33,956
21,830
21,871
3,978
15,271
325,411
Value added
2,438
1,019
1,073
19,194
322
603
14,297
282
604
1,915
5,561
1,714
101
148
6,931
838
614
5,882
3,553
6,238
6,455
4,170
2,324
3,367
89,645
Gross additions
to fixed assets
246
-50
197
820
19
144
2,088
46
37
444
950
-488
17
20
1,141
231
366
856
662
1,302
1,588
434
432
286
11,790
53

~ ..
4.3 Principal Statistics for All Manufacturing Establishments Analysed by Number of Persons Engaged, 1989 Survey of Industrial Production
Number o.f persons engaged
1-9
1()-19
20-49
5()-99
10()-199
200-499
50()-999
I OOO and over
Total
Number of establish
ments
37 445
6 684
5 194
1924
745
361
82
39
52475
Purchases Number of materials,
of supplies and persons Compensation industrial engaged of employees work/services
132 657 5,420 18,753
88 676 5,431 19,149
157 953 10,028 37,119
128 887 8,747 35,979
100 316 7,193 31,027
105 986 7,681 31,884
55 657 4,127 20,423
59 591 4,269 15,528
829 723 52,897 209,861
Source: Industrial Production Statistics Section, Census and Statistics Department.
Other expenses
3,196
2,601
5,094
4,837
4,669
5,795
3,354
2,077
31,623
Sales of goods,
industrial work and industrial
services
34,475
31,766
64,251
59,875
53,312
60,674
38,992
26,368
369,712
Other receipts
105
108
382
532
847
1,181
711
687
4,553
HK$ million unless otherwise specified
Gross output
31,535
29,695
56,644
53,846
46,654
50,915
31,648
24,475
325,411
Value added
9,931
8,359
15,202
14,001
12,203
14,118
8,577
7,254
89,645
Gross additions
to fixed assets
1,420
1,205
1,540
1,096
2,323
1,991
1,058
1,157
11,790
4.4 Principal Statistics for All Manufacturing Establishments Analysed by Value of Gross Output, 1989 Survey of Industrial Production
Value of gross output (HK$'000)
Under 100
100-499
50()-999
1,00()-1,999
2,000-4,999
5,00()-9,999
10,00()-19,999
20,000-49,999
50,00()-99,999
100,000 and over
Total
Number of establish
ments
4005
15 648
9046
7195
7 478
3 699
2534
I 762
649
459
52475
Purchases Number of materials,
of supplies and persons Compensation industrial engaged of employees work/services
4695
37 811
41434
55 477
99 653
85 190
100497
127 285
83 630
194050
829723
13
974
1,737
2,735
5,569
5,362
6,524
8,966
6,175
14,842
52,897
57
1,393
2,987
5,197
13,691
16,116
22,479
35,973
30,805
81,162
209,861
Source: Industrial Production Statistics Section, Census and Statistics Department.
Other expenses
52
656
772
1,065
2,294
2,388
3,123
5,133
4,056
12,083
31,623
Sales of goods,
industrial work and industrial
services
227
4,013
6,712
10,531
25,851
29,082
40,353
60,196
51,121
141,628
369,712
Other receipts
19
31
61
85
123
249
657
862
2,466
4,553
HK$ million unless otherwise specified
Gross output
225
3,976
6,414
10,020
23,428
25,685
34,889
54,148
45,069
121,557
325,411
Value added
123
1,953
2,743
3,857
7,782
7,602
9,615
14,089
11,043
30,839
89,645
Gross additions
to fixed assets
77
349
407
649
826
1,301
557
1,794
1,026
4,805
11,790
4.5 Principal Statistics for All Manufacturing Establishments Analysed by Value Added, 1989 Survey of Industrial Production
Value added (HK$'000)
Under 50
5()-249
250-499
50()-999
1,00()-2,499
2,500-4,999
5,00()-9 ,999
10,00()-24,999
25,000 and over
Total
Number of estabUsh
ments
4639
17 460
10 008
8 087
6 333
2924
1576
953
494
52475
Purchases Nwnber of materials,
of supplies and persons Compensation industrial
engaged of employees work/services
12 295 409 1,839
42 429 975 3,lll
51435 2,314 6,318
73 238 3, 789 11, 706
118 687 7,037 22,109
lll 306 7,151 25,508
100 299 6,919 29,487
116 863 8,547 37,698
203 171 15,756 72,085
829 723 52,897 209,861
Source: Industrial Production Statistics Section, Census and Statistics Department.
54
Other expenses
508
855
1,017
1,676
3,087
3,321
3,944
5,205
12,010
31,623
Sales of goods,
industrial work and industrial
services
2,296
6,204
11,147
19,917
38,627
42,082
49,508
62,706
137,226
369,712
Other receipts
15
22
29
83
120
270
518
767
2,730
4,553
HK$ million unless otherwise specified
Gross output
1,925
6,150
10,667
18,734
34,526
38,587
43,410
56,041
115,372
325,411
Value added
-212
2,228
3,445
5,558
9,758
10,143
10,753
14,285
33,687
89,645
Gross additions
to fixed assets
548
307
561
758
890
1,167
1,202
1,969
4,389
11,790
----- -------- --------------------------

4.6 Comparison of Selected Principal Statistics for All Manufacturing Establishments Analysed by Broad Industry Group, 1980--1989
HK$ million unless otherwise specified
Sales of Purchases of goods,
materials, industrial supplies and work and Gross
Compensation industrial industrial additions to Broad industry group of employees work/ services services Gross output Value added fixed assets
Food, beverages and tobacco 1980 578 2,260 4,430 3,990 1,306 227 (+28.1) ( +29.8) ( +22.6) ( +25.9) ( + 15.6) ( +28.8)
1981 653 2,880 5,017# 4,638# 1,254# 215 ( + 12.9) ( +27.5) (#) (#) (#) ( -5.6)
1982 804 3,963 6,606 6,199 1,582 335 (+23.1) (+37.6) ( +31.7) ( +33.6) ( +26.1) ( +55.8)
1983 893 4,293 7,382 6,817 1,815 434 (+11.1) ( +8.3) ( + 11.8) ( + 10.0) ( + 14.8) ( +29.8)
1984 1,039 5,075 8,806 8,021 2,181 293 ( + 16.3) ( + 18.2) ( + 19.3) (+17.7) ( +20.2) ( -32.5)
1985 1,126 4,793 9,201 8,155 2,398 102 ( +8.3) ( -5.6) ( +4.5) ( + 1.7) ( +9.9) (-65.1)
1986 1,254 5,199 10,217 8,785 2,566 336 (+11.4) ( +8.5) ( + 11.0) (+7.7) ( +7.0) ( +228.6)
1987 1,430 5,711 11,805 10,250 3,205 135 ( + 14.0) ( +9.8) ( + 15.5) ( + 16.7) ( +24.9) (-59.9)
1988 1,607 6,888 14,547 12,335 4,140 553 ( + 12.4) ( +20.6) ( +23.2) ( +20.3) ( +29.2) ( +309.6)
1989 1,892 7,259 16,022 13,607 4,530 393 ( + 17.7) ( + 5.4) ( + 10.1) ( + 10.3) ( +9.4) ( -28.9)
Textiles (including knitting) 1980 3,054 12,567 18,536 18,209 4,387 840 ( + 12.9) ( + 7.8) ( + 10.0) ( +9.7) ( + 10.8) ( + 12.2)
1981 3,211 14,144 21,196 20,087 4,594 557 (+5.1) ( + 12.5) ( + 14.3) ( +10.3) ( +4.7) ( -33.7)
1982 3,110 13,274 20,109 19,126 4,537 312 (-3.l) (-6.2) (-5.1) (-4.8) ( -1.2) ( -43.9)
1983 3,775 19,231 28,173 26,610 6,409 728 ( +21.4) ( +44.9) ( +40.1) (+39.1) ( +41.3) ( + 133.0)
1984 4,179 19,818 32,923 29,076 7,294 631 ( + 10.7) (+3.1) ( + 16.9) ( +9.3) ( + 13.8) (-13.2)
1985 4,782 19,648 32,552 28,966 7,509 865 ( + 14.4) (-0.9) (-1.1) ( -0.4) ( +2.9) (+37.0)
1986 6,241 27,844 44,462 40,813 10,990 2,017 ( +30.5) ( +41.7) ( +36.6) ( +40.9) ( +46.4) ( + 133.1)
1987 7,141 29,360 48,612 44,376 12,578 1,830 ( + 14.4) ( +5.4) ( +9.3) ( +8.7) (+14.5) ( -9.3)
1988 7,644 31,314 50,070 47,445 12,925 1,525 ( +7.0) ( +6.7) ( +3.0) ( +6.9) ( +2.8) ( -16.7)
1989 8,754 36,556 60,901 54,907 14,297 2,088 ( + 14.5) (+16.7) ( + 21.6) (+15.7) ( + 10.6) ( +36.9)
Wearing apparel, except knitwear and footwear 1980 6,223 16,182 26,782 25,795 7,880 698
( +20.4) ( + 16.6) ( + 19.2) ( + 18.6) ( +20.3) (+32.1) 1981 6,814 18,497 30,216 29,135 9,057 987
( +9.5) ( + 14.3) ( + 12.8) ( + 12.9) ( + 14.9) ( +41.4) 1982 7,214 16,396 29,347 27,958 9,600 589
( +5.9) ( -11.4) ( -2.9) (-4.0) ( +6.0) (-40.3) 1983 8,223 21,001 35,669 34,026 11,132 611
( + 14.0) ( + 28.1) (+21.5) ( +21.7) ( + 16.0) ( +3.8) 1984 9,874 25,508 43,488 41,309 13,171 625
(+20.l) ( +21.5) ( + 21.9) ( +21.4) ( + 18.3) ( +2.3) 1985 9,877 23,190 40,185 38,100 12,416 667
(*) ( -9.1) ( - 7.6) ( - 7.8) (-5.7) ( +6.6) 1986 11,307 29,195 48,879 46,071 14,540 920
( + 14.5) ( +25.8) ( + 21.6) ( +20.9) (+17.1) ( +38.0) 1987 12,969 38,831 66,951 60,806 17,835 1,434
( + 14.7) ( + 33.1) ( +37.0) ( +32.0) ( +22.7) ( +55.9) 1988 13,041 38,004 64,505 59,771 17,858 1,808
( +0.6) (-2.1) (-3.7) (-1.7) (+0.1) (+26.1) 1989 13,645 37,610 70,064 61,631 19,194 820
( +4.6) ( -1.0) ( +8.6) ( +3.1) ( + 7.5) (-54.6) Leather, wood and cork products 1980 727 1,883 3,077 3,037 920 86
( + 19.6) (-2.3) ( + 7.6) ( + 7.1) ( +20.4) ( +51.1) 1981 842 2,460 3,971 3,861 1,105 87
( + 15.8) ( +30.6) ( +29.1) ( +27.2) ( +20.1) ( +0.7) 1982 698 1,807 3,158 2,996 914 41
( -17.1) ( -26.5) (-20.5) ( -22.4) (-17.3) ( -52.8) 1983 798 2,562 4,430 3,999 1,097 75
( + 14.3) ( +41.8) ( +40.3) ( +33.5) (+20.1) ( +82.4) 1984 1,013 2,885 4,961 4,590 1,356 82
( +27.0) ( + 12.6) ( + 12.0) ( + 14.8) ( +23.5) ( +9.1) 1985 1,046 2,788 4,844 4,509 1,352 66
( +3.3) ( -3.4) (-2.4) ( -1.8) (-0.3) (-19.4) 1986 1,101 3,264 5,602 5,181 1,487 138
( +5.3) (+17.1) (+15.7) ( + 14.9) ( + 10.0) ( + 110.6) 1987 1,187 4,042 7,145 6,292 1,753 164
( + 7.8) (+23.8) (+27.5) ( +21.5) ( + 17.8) ( + 18.3) 1988 1,215 4,036 7,498 6,292 1,744 166
( +2.4) ( -0.1) ( +4.9) (*) ( -0.5) ( + 1.2) 1989 1,143 3,992 7,586 6,400 1,811 246
( -5.9) ( -1.1) ( + 1.2) ( + 1.7) ( +3.8) ( +48.2)
55

4.6 Comparison of Selected Principal Statistics for All Manufacturing Establishments Analysed by Broad Industry Group, 1980--1989 (Continued)
HK$ million unless otherwise specified
Sales of Purchases of goods,
materials, industrial supplies and work and Gross
Compensation industrial industrial additions to Broad industry group of employees work/services services Gross output Value added fixed assets
Paper products, printing and publishing 1980 1,118 2,920 5,054 5,072 1,716 356 ( +28.4) ( +28.3) ( +28.4) ( +29.3) ( +28.1) ( +9.1)
1981 1,282 3,643 6,403 6,399 2,210 447 ( + 14.6) ( +24.8) ( +26.7) ( +26.2) ( +28.8) ( +25.4)
1982 1,340 3,331 6,124 6,109 2,212 368 ( +4.5) (-8.6) (-4.4) ( -4.5) ( +0.1) (-17.7)
1983 1,515 4,506 7,716 7,700 2,584 233 (+13.1) ( +35.3) ( +26.0) ( +26.0) ( + 16.8) ( -36.6)
1984 1,811 5,776 9,871 9,742 3,158 397 ( + 19.5) ( +28.2) ( +27.9) ( +26.5) ( +22.2) ( + 70.3)
1985 2,001 5,271 9,890 9,591 3,435 516 ( + 10.4) (-8.7) ( +0.2) (-1.5) ( +8.8) ( +29.9)
1986 2,336 6,876 11,861 11,734 3,934 947 ( + 16.8) ( +30.4) ( + 19.9) ( +22.3) ( + 14.5) ( +83.7)
1987 2,681 8,387 14,750 14,506 4,987 1,518 (+14.7) ( +22.0) ( +24.4) ( +23.6) ( +26.8) ( +60.3)
1988 3,474 11,518 20,051 19,631 6,525 2,014 ( +29.6) ( +37.3) ( +35.9) ( +35.3) ( +30.8) (+32.7)
1989 4,035 10,776 20,315 20,230 7,477 1,394 ( + 16.1) ( -6.4) (+1.3) ( +3.1) ( + 14.6) ( -30.8)
Chemicals, rubber and non-metallic mineral products 1980 412 2,549 3,854 3,697 846 280
( +8.9) ( +33.2) ( +26.0) ( +25.6) ( +0.4) ( +37.2) 1981 484 3,102 4,550 4,467 1,043 381
(+17.6) ( +21.7) (+18.1) ( +20.8) ( +23.3) ( +36.0) 1982 540 3,013 4,379 4,332 1,005 353
(+11.5) (-2.9) (-3.8) ( -3.0) ( -3.6) (- 7.3) 1983 671 4,148 6,038 5,942 1,348 397
( +24.3) ( +37.7) ( +37.9) ( +37.2) ( +34.0) ( + 12.5) 1984 751 4,105 6,412 6,146 1,532 -72
( + 11.8) ( -1.1) ( +6.2) ( + 3.4) ( + 13.7) (t) 1985 725 3,858 6,216 5,846 1,392 274
(-3.5) (-6.0) ( -3.1) (-4.9) ( -9.2) (t) 1986 880 4,900 7,784 7,497 1,854 232
( +21.4) ( +27.0) ( +25.2) ( +28.2) ( +33.2) (-15.5) 1987 995 6,082 9,899 8,904 1,941 -697
(+13.1) (+24.1) ( +27.2) ( + 18.8) ( +4.7) (t) 1988 1,031 7,753 11,958 10,816 2,148 306
( +3.6) ( +27.5) ( +20.8) ( +21.5) ( + 10.7) (t) 1989 1,227 8,048 13,204 12,013 2,801 -219
( + 19.0) ( +3.8) ( + 10.4) (+11.1) ( +30.4) (t) Plastic products 1980 1,696 4,583 7,765 7,663 2,383 460
( +4.4) ( + 1.7) ( +7.0) ( +6.3) ( + 7.2) ( +9.9) 1981 1,991 5,515 9,271 9,218 2,923 350
(+17.4) ( +20.3) ( + 19.4) ( +20.3) ( +22.7) ( -24.0) 1982 2,026 5,208 9,061 8,888 2,919 410
( + 1.7) (-5.6) ( -2.3) (-3.6) (-0.1) (+17.l) 1983 2,213 7,170 11,765 11,244 3,252 492
( +9.2) ( +37.7) ( +29.8) ( +26.5) (+11.4) ( +20.2) 1984 2,967 10,901 17,579 16,864 4,809 747
( +34.1) ( +52.0) ( +49.4) ( +50.0) ( +47.9) (+51.7) 1985 2,962 9,624 16,834 15,713 4,769 706
( -0.2) (-11.7) (-4.2) ( -6.8) ( -0.8) ( -5.5) 1986 3,757 13,454 22,601 21,094 6,196 1,406
( +26.9) ( +39.8) ( +34.3) ( +34.2) ( +29.9) (+99.1) 1987 3,872 15,695 27,331 23,778 6,064 813
( +3.1) (+16.7) ( +20.9) ( + 12.7) (-2.1) (-42.2) 1988 3,846 16,389 28,760 24,966 6,619 1,622
( -0.7) ( +4.4) ( +5.2) ( +5.0) ( +9.2) ( +99.5) 1989 3,765 15,869 28,928 24,795 6,931 1,141
(-2.1) (-3.2) ( +0.6) (-0.7) ( +4.7) ( -29.7) Basic metals, fabricated metal products,
machinery and equipment 1980 4,386 15,113 22,877 22,528 6,078 1,087 ( +32.7) ( +26.5) ( +30.3) ( +30.5) ( +34.0) (-12.2)
1981 4,616 16,761 25,544 24,874 6,625 900 ( +5.2) ( + 10.9) (+11.7) ( + 10.4) ( +9.0) (-17.2)
1982 4,568 15,122 24,420 23,445 6,485 879 (-1.0) ( -9.8) ( -4.4) (-5.7) ( -2.1) (-2.2)
1983 5,067 20,188 31,137 29,382 7,627 686 ( + 10.9) ( +33.5) ( +27.5) ( +25.3) (+17.6) ( -22.0)
1984 5,384 20,105 32,283 30,193 8,325 838 ( +6.3) ( -0.4) ( +3.7) ( +2.8) ( +9.2) ( +22.2)
1985 5,859 20,188 33,099 31,060 8,558 832 ( +8.8) ( +0.4) ( +2.5) ( +2.9) ( +2.8) ( -0.7)
1986 6,424 26,379 41,439 38,764 10,235 959 ( +9.6) (+30.7) ( +25.2) ( +24.8) ( + 19.6) (+15.2)
1987 7,636 33,621 53,062 48,629 12,539 2,021 ( + 18.9) ( +27.5) ( +28.0) ( +25.4) ( +22.5) (+110.7)
1988 8,775 41,645 65,258 60,093 15,408 2,029 ( + 14.9) ( +23.9) ( +23.0) ( +23.6) ( +22.9) ( +0.4)
1989 9,517 40,247 67,837 60,771 16,544 2,751 ( +8.5) ( -3.4) ( +4.0) ( + 1.1) ( + 7.4) ( +35.6)
56

4.6 Comparison of Selected Principal Statistics for All Manufacturing Establishments Analysed by Broad Industry Group, 1980-1989 (Continued)
HK$ million unless otherwise specified
Sales of Purchases of goods,
materials, industrial supplies and work and Gross
Compensation industrial industrial additions to Broad industry group of employees work/services services Gross output Value added fixed assets
Electrical and electronic products 1980 2,700 12,948 19,171 18,276 4,092 683 ( +22.3) ( + 19.8) ( +22.3) ( + 21.8) ( + 13.8) ( + 25.4)
1981 2,950 16,378 24,885 23,603 5,898 729 ( +9.3) ( +26.5) ( +29.8) ( +29.2) (+44.1) ( +6.8)
1982 3,139 15,027 24,147 22,592 5,869 771 ( +6.4) (-8.2) ( -3.0) (-4.3) ( -0.5) ( +5.7)
1983 3,835 20,671 30,610 28,986 7,246 994 (+22.1) (+37.6) ( +26.8) ( +28.3) ( +23.5) ( +28.9)
1984 4,670 24,958 40,746 35,815 8,912 1,561 ( +21.8) ( +20.7) (+33.1) ( +23.6) ( +23.0) (+57.1)
1985 4,332 18,587 31,466 28,291 6,489 1,172 (-7.2) ( -25.5) (-22.8) ( -21.0) (-27.2) (-24.9)
1986 5,030 27,870 43,499 38,730 8,780 1,781 (+16.1) ( +49.9) ( +38.2) ( +36.9) ( +35.3) ( +52.0)
1987 5,878 38,939 60,475 53,389 11,570 2,581 ( + 16.9) ( +39.7) ( +39.0) (+37.8) ( +31.8) ( +44.9)
1988 6,510 44,922 71,926 60,186 12,670 3,166 ( + 10.8) ( + 15.4) ( + 18.9) ( + 12.7) ( +9.5) ( +22.7)
1989 6,799 38,636 68,884 55,786 12,694 2,890 ( +4.4) ( -14.0) ( -4.2) ( - 7.3) ( +0.2) ( -8.7)
Other manufacturing industries 1980 850 2,430 4,021 3,826 1,152 105 ( +23.9) ( +20.5) ( +24.7) ( +24.8) (+37.5) ( +28.7)
1981 962 2,919 4,608 4,533 1,341 107 ( + 13.2) (+20.1) ( + 14.6) ( + 18.5) ( + 16.4) ( + 1.0)
1982 897 2,944 4,691 4,505 1,266 78 ( -6.8) ( +0.8) ( + 1.8) ( -0.6) ( -5.6) (-27.0)
1983 1,066 3,845 5,886 5,815 1,629 113 ( + 18.9) ( +30.6) ( +25.5) ( + 29.1) ( +28.7) ( +45.4)
1984 1,241 5,512 8,047 7,855 2,004 153 ( + 16.4) ( +43.4) (+36.7) ( +35.1) ( +23.0) ( +35.1)
1985 1,315 4,423 7,028 6,774 1,970 157 ( +6.0) (-19.7) (-12.7) ( -13.8) (-1.7) ( +2.5)
1986 1,355 6,023 8,840 8,556 2,198 302 ( +3.1) ( +36.2) (+25.8) ( +26.3) ( + 11.6) ( +92.9)
1987 1,782 8,655 12,781 12,410 3,290 386 (+31.5) ( +43.7) ( +44.6) ( +45.0) ( +49.7) ( +27.6)
1988 1,920 10,597 15,147 14,405 3,146 334 ( + 7.7) ( +22.4) ( + 18.5) (+16.1) ( -4.4) (-13.5)
1989 2,120 10,868 15,971 15,271 3,367 286 ( + 10.4) ( +2.6) ( + 5.4) ( +6.0) ( + 7.0) ( -14.4)
All manufacturing industries 1980 21,745 73,434 115,566 112,093 30,761 4,822 ( +20.8) ( + 17.2) (+19.8) ( + 19.6) ( + 19.3) (+11.5)
1981 23,805 86,299 135,661 130,816 36,049 4,758 ( +9.5) (+17.5) (+17.4) (+16.7) ( + 17.2) ( -1.3)
1982 24,336 80,086 132,043 126,149 36,390 4,135 ( +2.2) ( - 7.2) ( -2.7) ( -3.6) ( +0.9) (-13.1)
1983 28,056 107,616 168,807 160,522 44,140 4,763 ( + 15.3) ( +34.4) ( +27.8) ( +27.2) ( +21.3) ( + 15.2)
1984 32,930 124,644 205,115 189,612 52,741 5,255 (+17.4) ( + 15.8) ( +21.5) ( + 18.1) ( + 19.5) ( + 10.3)
1985 34,024 112,370 191,314 177,006 50,287 5,357 ( +3.3) (-9.8) ( -6.7) (-6.6) (-4.7) ( + 1.9)
1986 39,686 150,985 245,183 227,225 63,779 9,038 ( + 16.6) ( +34.4) ( +28.2) ( +28.4) ( +24.8) ( +68.7)
1987 45,569 189,322 312,811 283,340 75,761 10,184 ( + 14.8) ( +25.4) (+27.6) ( +24.7) ( +20.7) ( + 12.7)
1988 49,062 213,067 349,720 315,940 83,182 13,523 ( + 7.7) ( + 12.5) ( + 11.8) ( +11.5) ( +9.8) ( +32.8)
1989 52,897 209,861 369,712 325,411 89,645 11,790 ( + 7.8) (-1.5) ( +5.7) ( +3.0) ( + 7.8) ( -12.8)
Notes: Figures in brackets denote percentage changes over the preceding year. As from the 1984 Survey, new definitions have been adopted for "Purchases of materials, supplies and industrial work/services" and "Gross output''. The relevant figures for past years have been adjusted to the new definitions.
*denotes changes within ± 0.05%. #Prior to 1981, excise duties for tobacco and alcoholic beverages were included in the values of sales, gross output and value added. As from the
1981 Survey, excise duties for tobacco and alcoholic beverages have been excluded so as to derive value added at factor cost. tPercentage changes are not presented whenever any of the two figures being compared is negative, as it is very difficult to interpret meaningfully
the percentage change obtained.
Source: Industrial Production Statistics Section, Census and Statistics Department.
57

4.7 Indexes of Industrial Production 1986 =JOO
Broad industry group/ Indexes of industrial production
Selected industry group 1982 1983 1984 1985 1986 1987 1988 1989 1990
Food, beverages and tobacco 67 74 80 93 100 108 122 127 142
Wearing apparel, except knitwear and footwear 80 85 91 84 100 113 112 113 111
Textiles (including knitting) 63 69 77 80 100 114 lll 117 115
Paper products and printing 61 73 86 86 100 126 153 167 182
Chemicals, rubber, plastic and non-metallic mineral products 59 67 88 88 100 107 104 95 90
Plastic products 55 62 89 87 100 106 101 88 76
Basic metals, fabricated metal products and non-electrical machinery 69 71 89 88 100 119 144 140 129
Fabricated metal products, except machinery and equipment 65 63 91 88 100 116 139 125 111
Electrical and electronic products, professional equipment and optical goods 69 85 92 89 100 126 143 142 146
Consumer electrical and electronic products 61 72 95 86 100 136 136 131 133
Electrical and electronic parts, accessories and machinery 90 114 105 100 100 134 159 161 162
Miscellaneous manufacturing industries 72 90 119 88 100 113 120 114 111
All manufacturing industries 69 78 91 87 100 116 123 124 123
Source: Industrial Research Section, Census and Statistics Department.
58

4.8 Textile Production Statistics
(a) Production Indexes
Spinning industry
Cotton yarn
Cotton/man-made fibre yarn*
Woollen and worsted yarn
Weaving industry
Cotton piece-goods
Cotton/man-made fibre piece-goods#
Spinning and weaving industries
Weights
444
364
37
43
556
535
21
1 OOO
1981
95
74.
278
100
83
78
233
88
1982
86
74
199
76
75
71
153
79
1983
88
79
197
64
86
83
158
87
Production index
1984
85
78
151
76
83
80
140
83
1985
84
80
109
83
82
82
95
83
1986
100
100
100
100
100
100
100
100
1987
116
119
95
104
118
118
91
117
1988
113
118
76
103
110
111
94
111
1986 =JOO
1989
115
121
62
104
117
119
66
116
1990
99
106
50
84
117
120
39
109
(b) Production and Stocks of Selected Products
Unit
Cotton yarn,
1981 1982 1983 1984 1985
Stocks Stocks Stocks Stocks
-~ -~ -~ -~ Produc- of Produc- of Produc- of Produc- of Produc-
Stocks at end
of tion year tion year tion year tion year tion year
1986 1987 1988 1989 1990
Stocks Stocks Stocks Stocks
-~ -~ -~ -~ Produc- of Produc- of Produc- of Produc- of Produc-
Stocks at end
of tion year tion year tion year tion year tion year
grey Tonne 129 360 2 913 126 379 2 652 140 570 2 359 136 463 4 761 142 477 4 451 180 149 2 958 215 132 4 891 210 606 3 485 216 922 5 977 191 847 4190
Cotton/man-made fibre yarn Tonne 31 945 1 123 21 914 1 858 21 560 1 023 16 849 1 494 11 572 1 300 10 511 431 9 769 564 7 604 308 4 512 509 2 972 334
Man-made (staple) fibre yarn Tonne
Cotton piece-
5 467 1 037 4 813 978 4961 928 3 470 595 3 162 744 2 803 428 3 047 695 2 555 622 3 808 956 3 641 788
goods 'OOO m' 612 697 51 191 563 398 47 340 637 517 49 251 654 739 46 848 634 746 28 409 757 650 32 600 848 157 47 651 802 063 45 352 816 365 47 769 816 427 35 050
Cotton towelling 'OOO m'
Cotton/manmade fibre piece-
2 990 356 2 871 233 4463 209 4441 383 4 146 354 158 3 043 174 2232 102 1158 184 1 513 93
goods 'OOO m' 95 654 10 124 62 992 10 445 65 030 6 431 58 003 9 312 39 285 3 554 40 632 3 181 37 276 2 652 37 327 3 103 26 645 1 905 16 155 1 439
Labels 'OOO 2 456 097 49 145 3 172 156 94 451 3 702 687 29 125 4 588 914 37 407 5 172 408 38 779 6 348 336 50 420 3 896 402 53 488 3 754 366 51 423 7 443 883 70 587 7 085 976 61 639
Notes: *Figures include pure man-made fibre yam. #Figures include pure man-made fibre piece-goods. **Figure is suppressed for confidentiality reasons.
Source: Industrial Research Section, Census and Statistics Department.
59

4.9 Mining, Cement and Quarry Production
1981 1982 1983 1984 1985 1986 1987 1988 1989
Mining production
Feldspar 194 1 744 5 275 23 101 26 777 35 208 22 853 11 050 5 152 Quartz 34 116 33 Kaolin/feldspar sand 11 541 31400 52106 92 363 92048 69 587 92 504 61 888 44 562
Cement production 1517 315 1 435 596 1716577 1 847 492 1835413 2 236 087 2 226 225 2 189 186 2 141 030
Quarry production* 15 597 621 14 196 646 12 441 706 11447968 10 912 848 10 834 530 10 090 185 10 687 673 10 999 089
Note: *Figures include Government quarries, contract quarries, rock crushing sites and site crushers.
Sources: Mines Division, Labour Department. Publications Section, Census and Statistics Department. Geotechnical Control Office, Civil Engineering Services Department.
4.10 Electricity, Gas and Water Consumption
1981 1982 1983
Electricity ( terajoules)
Domestic 8 733 9 227 10 685
Commercial 17 340 19 953 22 849
Industrial 15 406 15 436 16 820
Street lighting 141 153 171
Export to China 851 979 1 323
Total 42471 45748 51849
Gas (terajoules)
Domestic 2024 2 500 3 021
Commercial 1 784 2 138 2 670
Industrial 225 220 233
Total 4033 4858 5924
Water (million cubic metres) 507.41 519.46 592.03
1984
10 817
24609
18 543
196
2 663
56829
3 476
3 174
257
6907
627.11
Notes: Figures on water consumption are affected by water restrictions imposed: a. from 8.10.81to25.10.81ona16-hour supply daily basis; b. from 26.10.81to4.5.82 on a 10-hour supply daily basis; c. from 5.5.82 to 28.5.82 on a 16-hour supply daily basis.
Sources: Publications Section, Census and Statistics Department. Hong Kong and China Gas Co., Ltd. Water Supplies Department.
60
1985
11 519
26 793
18 819
208
3 780
61120
4036
3 669
273
7979
636.98
---------------- ------
1986 1987 1988 1989
12 808 14 022 15 711 17 075
29 180 32403 34 818 38 097
21 391 23 979 24876 25 178
213 222 228 239
4 350 4904 5 186 6 371
67942 75529 80819 86960
4 593 5 254 6127 6943
4123 4930 5 680 6 218
327 399 440 510
9043 10584 12247 13671
703.02 750.12 807.53 845.03
Tonne
1990
3 820
16 587
1808206
9 349 614
1990
19 037
41 582
24 934
248
6470
92271
7 596
6 877
583
15056
873.17

Section 5 Distributive Trades, Transport and Services
Tables 5. I to 5 .15 Generallnformation
Statistics in Tables 5.1 to 5.5 are obtained from the Survey of Wholesale, Retail and Import/ Export Trades, Restaurants and Hotels. Those in Tables 5.6 to 5.9 are obtained from the Survey of Transport and Related Services; and those in Tables 5.10 to 5.15 are obtained from the Survey of Storage, Communication, Financing, Insurance and Business Services. All these surveys are conducted annually by the Census and Statistics Department.
Concepts and Definitions
For wholesale, retail and import/export trades, restaurants and hotel industries: Establishment -An establishment is ideally an economic unit which engages under a
Number of persons engaged
Compensation of employees Operating expenses
Purchases of foodstuffs, beverages and other goods for sale (for restaurants and hotels/boarding houses) Changes in stocks
Sales and other receipts (for wholesale, retail and import/ export establishments)
Sales and other receipts (for restaurants and hotels/ boarding houses) Gross margin (for wholesale, retail and import/export establishments) Value added (for wholesale, retail and import/export establishments)
single ownership or control, in one or predominantly one kind of economic activity at a single physical location. Where separate figures relating to different activities or different locations under the same management are not available, a combined return is accepted and in this case, the reporting unit is treated as an establishment.
-equals number of working proprietors, active partners and unpaid family workers number of employees wages and salaries
plus -equals
plus -equals
plus plus plus plus plus plus plus plus
payments in kind and employer's social security expenditure rent and rates for land and buildings interest payments repair and maintenance materials and supplies used in business fuels water electricity commissions and contract work textiles export quota transfer payments restaurants and hotels/boarding houses) other operating expenses
(not applicable to
plus -equals
plus plus
purchases of foodstuffs purchases of beverages purchases of other goods for sale
-equals book value of stocks at end of reporting year less book value of stocks at beginning of reporting year
-equals value of all sales of goods plus receipts for services plus rentalincome plus textiles export quota transfer receipts plus income from other sources
-equals sales of foodstuffs, beverages and other goods plus room sales and receipts for services plus rental income plus income from other sources
-equals value of all sales of goods plus receipts for services less purchases of goods for sale plus changes in stocks
-equals sales and other receipts less income from other sources less textiles export quota transfer receipts less purchases of goods for sale less operating expenses
61
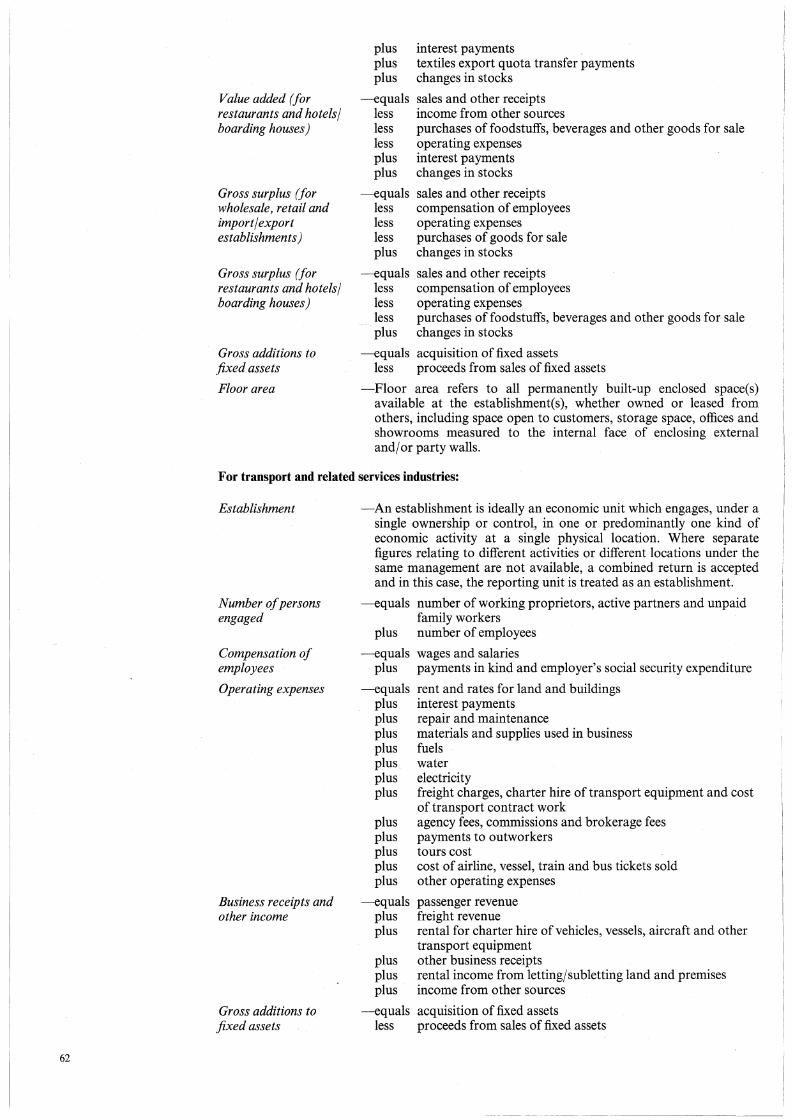
62
Value added (for restaurants and hotels/ boarding houses)
Gross surplus (for wholesale, retail and import/ export establishments)
Gross surplus (for restaurants and hotels/ boarding houses)
Gross additions to fixed assets
Floor area
plus interest payments plus textiles export quota transfer payments plus changes in stocks
-equals less less less plus plus
-equals less less less plus
-equals less less less plus
sales and other receipts income from other sources purchases of foodstuffs, beverages and other goods for sale operating expenses interest payments changes in stocks
sales and other receipts compensation of employees operating expenses purchases of goods for sale changes in stocks
sales and other receipts compensation of employees operating expenses purchases of foodstuffs, beverages and other goods for sale changes in stocks
-equals acquisition of fixed assets less proceeds from sales of fixed assets
-Floor area refers to all permanently built-up enclosed space(s) available at the establishment(s), whether owned or leased from others, including space open to customers, storage space, offices and showrooms measured to the internal face of enclosing external and/ or party walls.
For transport and related services industries:
Establishment
Number of persons engaged
Compensation of employees
Operating expenses
Business receipts and other income
Gross additions to fixed assets
-An establishment is ideally an economic unit which engages, under a single ownership or control, in one or predominantly one kind of economic activity at a single physical location. Where separate figures relating to different activities or different locations under the same management are not available, a combined return is accepted and in this case, the reporting unit is treated as an establishment.
-equals number of working proprietors, active partners and unpaid family workers
plus number of employees
-equals wages and salaries plus payments in kind and employer's social security expenditure
-equals plus plus plus plus plus plus plus
plus plus plus plus plus
-equals plus plus
plus plus plus
rent and rates for land and buildings interest payments repair and maintenance materials and supplies used in business fuels water electricity freight charges, charter hire of transport equipment and cost of transport contract work agency fees, commissions and brokerage fees payments to outworkers tours cost cost of airline, vessel, train and bus tickets sold other operating expenses
passenger revenue freight revenue rental for charter hire of vehicles, vessels, aircraft and other transport equipment other business receipts rental income from letting/subletting land and premises income from other sources
-equals acquisition of fixed assets less proceeds from sales of fixed assets

Value added
Gross surplus
Floor area
Land passenger transport
Land freight transport
Supporting services to land transport
Ocean and coastal water transport
Inland water transport
Supporting services to water transport
Air transport
Services incidental to transport
-equals less less plus plus
business receipts and other income income from other sources operating expenses interest payments payments to outworkers
-equals business receipts and other income less compensation of employees less operating expenses
-Floor area refers to all permanently built-up enclosed space(s) available at the establishment(s), whether owned or leased from others, including space open to customers, storage space, offices and showrooms measured to the internal face of enclosing external and/ or party walls.
-Includes the Hong Kong Tramways Ltd.; Peak Tramways Co. Ltd.; Mass Transit Railway Corp.; Kowloon-Canton Railway Corp.; Kowloon Motor Bus Co. (1933) Ltd.; China Motor Bus Co. Ltd.; New Lantao Bus Co. (1973) Ltd.; owners of urban, New Territories and Lantao taxis; owners of public light buses; and establishments operating maxicab service, school hired car service, rental of tourist buses, school buses and other passenger vehicles with drivers and miscellaneous land passenger transport service, including passenger transportation service by trucks in the New Territories.
-Includes establishments engaging in land transport service by trucks or vans, either self-owned or rented from others, for cargo handling or furniture-moving; also includes rental of trucks with drivers and labour services for cargo handling on land.
-Includes the Cross Harbour Tunnel; rental of automobiles without driver (except rental of taxis or public light buses without driver which are classified under 'Land passenger transport'); and car parks. Excludes car parks for use only by occupants of a building, and those operated as part of real-estate or other businesses (e.g. restaurants, supermarkets) with no separate accounts, and temporary parking lots with no business registration, such as those on vacant construction sites.
-Includes ship agents and managers (including general agents, management agents, crew agents, port agents and freight agents); shipowners and operators of sea-going and Hong Kong-Macau vessels; container terminals; and branch offices of overseas shipping companies in Hong Kong.
-Includes owners and operators of licensed ferries, wala-walas, barges, lighters, tugboats, and other inland passenger and cargo vessels. Excludes sampans and vessels mainly for fishing or recreational purposes, and owners of both inland cargo vessels and trucks (which are classified as stevedoring establishments under 'Supporting services to water transport').
-Includes establishments engaged in haulage of containers and container leasing; stevedoring establishments; container freight stations; and establishments offering pilotage or salvaging service. Excludes stevedoring establishments with only vessels (which are classified under 'Inland water transport'); ship repairing (which is included in the Manufacturing sector); and ship chandling (which is included in the Wholesale and Retail Trade sector).
-Includes Hong Kong-based airline companies; ground handling services at airport; and branch offices of overseas airline companies in Hong Kong. Excludes aircraft catering service and repair of aircraft (which are included in the Manufacturing sector).
-Includes travel agents and airline ticket agents; air and sea cargo forwarding agents; shipbrokers; establishments engaged in packing and crating of goods for transportation; and establishments providing inspecting, sampling, weighing and measuring services connected with transportation.
63

64
For storage, communication, financing and business services industries:
Establishment
Number of persons engaged
Compensation of employees
Operating expenses
Changes in stocks (communication and business services sectors)
Business receipts and other income
Value added (except loan companies, finance leasing companies, investment and holding companies and pawnshops in .financing sector)
Value added (loan companies, finance leasing companies and pawnshops in .financing sector)
Gross surplus
-An establishment is ideally an economic unit which engages, under a single ownership or control, in one or predominantly one kind of economic activity at a single physical location. Where separate figures relating to different activities or different locations under the same management are not available, a combined return is accepted and in this case, the reporting unit is treated as an establishment.
--equals number of working proprietors, active partners and unpaid family workers
plus number of employees
--equals wages and salaries plus payments in kind and employer's social security expenditure
--equals plus plus plus plus plus plus plus plus plus plus
rent and rates for land and buildings interest payments repair and maintenance materials and supplies used in business fuels water electricity commissions and brokerage fees cost of contract work (except financing sector) payments to outworkers (storage sector only) other operating expenses
--equals book value of stocks at end of reporting year less book value of stocks at beginning of reporting year
--equals plus plus
plus
plus plus plus plus
plus
--equals plus plus
plus
plus less plus plus less
plus
--equals plus plus less
receipts from services rendered receipts from warehousing rental (storage sector only) receipts from leasing/rental of machinery and equipment (communication and business services sectors only) value of sales of goods (communication and business services sectors only) interest receipts rental income from letting/subletting land and premises dividends gain/loss from trading of financial assets (financing sector only) income from other sources
receipts from services rendered receipts from warehousing rental (storage sector only) receipts from leasing/rental of machinery and equipment (communication and business services sectors only) value of sales of goods (communication and business services sectors only) rental income from letting/subletting land and premises operating expenses interest payments payments to outworkers (storage sector only) total value of purchases of goods for sale (communication and business services sectors only) changes in stocks (communication and business services sectors only)
receipts from services rendered interest receipts rental income from letting/subletting land and premises operating expenses
--equals business receipts and other income less compensation of employees less operating expenses
-------------------------

Gross additions to fixed assets
Floor area
For insurance industry:
Establishment
Number of persons engaged
Compensation of employees
Operating expenses
Premiums received (direct insurance)
Premiums received (inward reinsurance)
Total premiums received (general and life insurers)
Net premiums (direct insurance)
Net premiums (inward reinsurance)
Total net premiums (general and life insurers)
Net claims (direct insurance)
Net claims (inward reinsurance)
Total net claims (general and life insurers)
Funds and reserves (general and life insurers)
Net income from investment (general and life insurers)
less total value of purchases of goods for sale (communication and business services sectors only)
plus changes in stocks (communication and business services sectors only)
-equals acquisition of fixed assets less proceeds from sales of fixed assets
-Floor area refers to all permanently built-up enclosed space(s) available at the establishment(s), whether owned or leased from others, including space open to customers, storage space, offices and showrooms measured to the internal face of enclosing external and/or party walls.
-An establishment is ideally an economic unit which engages, under a single ownership or control, in one or predominantly one kind of economic activity at a single physical location. Where separate figures relating to different activities or different locations under the same management are not available, a combined return is accepted and in this case, the reporting unit is treated as an establishment.
-equals number of working proprietors, active partners and unpaid family workers
plus number of employees
-equals wages and salaries plus payments in kind and employer's social security expenditure
-equals plus plus plus plus plus plus plus plus
rent and rates for land and buildings interest payments repair and maintenance materials and supplies used in business fuels water electricity claims-handling expenses (insurers only) other operating expenses
-equals gross premiums less reinsurance premiums ceded
-equals gross reinsurance premiums accepted less premiums retro-ceded
-equals premiums received (direct insurance) plus premiums received (inward reinsurance)
-equals less
premiums received commissions and brokerages paid
premiums received -equals less less
reinsurance commissions paid to ceding insurers commissions and brokerages paid to reinsurance agents and brokers
-equals net premiums (direct insurance) plus net premiums (inward reinsurance)
-equals less
-equals less
-equals plus
gross value of claims recoveries from salvage, subrogation and reinsurers
share of claims recoveries from salvage, subrogation and reinsurers
net claims (direct insurance) net claims (inward reinsurance)
-equals unexpired risk reserve at end of reporting year plus outstanding claims reserve at end of reporting year plus life funds at end of reporting year (life insurers only)
-equals net income from financial assets during reporting year plus net income from fixed assets during reporting year
65

66
Income and receipts (general and life insurers)
Income and receipts (insurance agents, brokers and other insurance services)
Gross additions to fixed assets
Floor area
Data sources
-equals plus
plus plus plus
total premiums received total reinsurance commissions received in respect of direct insurance and inward reinsurance net income from investment receipts from services rendered income from other sources
-equals receipts from services rendered plus rental income from letting/subletting land and premises plus income from other sources
-equals acquisition of fixed assets less proceeds from sales of fixed assets
-Floor area refers to all permanently built-up enclosed space(s) available at the establishment(s), whether owned or leased from others, including space open to customers, storage space, offices and showrooms measured to the internal face of enclosing external and/ or party walls.
The Survey of Wholesale, Retail and Import/Export Trades, Restaurants and Hotels covered all wholesale, retail and import/export establishments, restaurants and hotels registered with the Business Registration Office of the Inland Revenue Department, and market stalls registered with the Urban Services Department, the Regional Services Department and the Housing Department. Government and non-profit institutions included in the survey were the Government Publications Centre, the Fish and Vegetable Marketing Organisations, welfare handicraft shops of the Hong Kong Council of Social Service, canteens and hostels of the Chinese Young Men's Christian Association, the Young Men's Christian Association of Hong Kong, the Young Women's Christian Association and the Hong Kong Caritas. Excluded from the survey were hawkers, street vendors, retail pitches (other than market stalls), cooked food stalls operated outside the main structure of buildings, canteens attached to organisations open to members only, and establishments mainly engaged in gas distribution through system of mains.
The Survey of Transport and Related Services covered all transport establishments listed in a comprehensive register maintained by the Census and Statistics Department and updated by reference to records of the Business Registration Office of the Inland Revenue Department, taxi and public light bus owner records of the Transport Department and vessel owner records of the Marine Department. As the vehicle owner records of the Transport Department were used for compiling the register for urban taxis, New Territories taxis, Lantao taxis and public light buses, the survey included vehicle owners in these transport services irrespective of whether they operated their vehicles or rented them to others. Non-owner operators of taxis and public light buses were excluded because a sampling frame of such operators did not exist. Also excluded from the survey were minor transport activities such as those carried out by rickshaws, individual transport labourers, and temporary parking lots with no business registration.
The Survey of Storage, Communication, Financing, Insurance and Business Services covered all storage, communication, financing, insurance and business services establishments listed in a comprehensive register maintained by the Census and Statistics Department and updated by reference to records of the Business Registration Office of the Inland Revenue Department and the Office of the Commissioner of Insurance. Excluded from the survey were banks, deposit-taking companies and representative offices of foreign banks which were separately covered by the Survey of Banks, Deposit-taking Companies, and Representative Offices of Foreign· Banks. Also excluded were private warehouses, cold storage services for fur offered by fur companies to their customers, safe deposit vaults operated by banks, overseas insurance companies without local branch/represep.tative offices but operating entirely through general agents, agents and/or management/accounting/legal firms, and self-employed insurance agents not registered with the Business Registration Office.
The above surveys were conducted on a sample basis, with the sample size for each trade/service group and employment size stratum determined by Neyman's allocation according to a desired level of precision for the estimated value added of each major trade/service group. Individual establishments were systematically selected at a uniform interval after a random start.

Compilation and Calculation
The statistics contained in the tables covered all establishments that had operated during the whole or part of the reference year, including both the reporting and non-reporting establishments. Non-reporting establishments refer to those which operated during the whole or part of the reference year but became untraceable during the survey enumeration period as a result of closure or removal. The economic contributions of non-reporting establishments are imputed on the basis of reporting establishments of the same trade/service group and employment size range.
Further References
Further details on the above surveys can be found in the publications entitled Survey of Wholesale, Retail and Import/Export Trades, Restaurants and Hotels, Survey of Transport and Related Services and Survey of Storage, Communication, Financing, Insurance and Business Services, published annually by the Census and Statistics Department.
Table 5 .16 General Information
An Annual Survey of Banks, Deposit-taking Companies and Representative Offices of Foreign Banks has been implemented since the reference year 1980. In view of the number of establishments in the group, the nature of their business, and the distribution of business amongst them, it is not considered appropriate to collect and present statistics on these establishments in the same format, and in particular in the same degree of detail, as in the case of other groups of establishments covered in the Survey of Storage, Communication, Financing, Insurance and Business Services. Accordingly, a separate survey was organized, the main purpose of which was to obtain data for the compilation of estimates of gross domestic product. Summary statistics of the survey results for the years 1980 to 1989 are presented in this table.
Data Sources
The survey covers all banks, deposit-taking companies and representative offices of foreign banks.
Table 5.17 Generallnformation
The retail sales indexes are based on the period October 1984 to September 1985 (monthly average in the period taken as 100), and are compiled on the basis of data collected from the Monthly Survey of Retail Sales conducted by the Census and Statistics Department.
Data Sources
The Monthly Survey of Retail Sales covers all the retail establishments registered with the Business Registration Office of the Inland Revenue Department, and market stalls registered with the Urban Services Department, the Regional Services Department and the Housing Department. Excluded from the survey are hawkers, street vendors and retail pitches.
The survey is conducted on a sample basis, with the sample size for each trade and employment size stratum determined by Neyman's allocation according to a desired level of precision for the estimated sales value of each stratum.
Compilation and Calculation
Value and volume indexes are being compiled for the entire retail trade sector as well as for major trade groups and selected trades. The value index measures the change in value terms, while the volume index, obtained by deflating the value index by specially constructed price index, measures the change in real terms.
Further References
Further details on the retail sales indexes can be found in the publication entitled Report on Monthly Survey of Retail Sales published by the Census and Statistics Department.
Table 5.18 Generallnformation
the indexes of restaurant receipts are based on the period October 1984 to September 1985 (quarterly average in the period taken as 100), and are compiled on the basis of data collected from the Quarterly Survey of Restaurant Receipts and Purchases conducted by the Census and Statistics Department.
Data Sources
The Quarterly Survey of Restaurant Receipts and Purchases covers all catering establishments registered with the Business Registration Office of the Inland Revenue Department, the Urban Services Department, the Regional Services Department and the Housing Department. Excluded from the survey are cooked food stalls operated outside the main structure of buildings, canteens attached to organizations open to members only, and catering outlets operated by and situated within hotels.
67
I_

68
The survey is conducted on a sample basis, with the sample size for each restaurant type and employment size stratum determined by Neyman's allocation according to a desired level of precision for the estimated restaurant receipts of each stratum.
Compilation and Calculation
Value and volume indexes of restaurant receipts are compiled for the entire restaurant sector as well as for each major type of restaurant. The value index measures the change in value terms, while the volume index, obtained by deflating the value index by specially constructed price index, measures the change in real terms.
Further References
Further details on the restaurant receipts indexes can be found in the publication entitled Report on Quarterly Survey of Restaurant Receipts and Purchases published by the Census and Statistics Department.
----------- -----·---------~--- -- --~----

5.1 Principal Statistics for All Establishments Classified by Activity, 1989 Survey of Wholesale and Retail Trades, Restaurants and Hotels
HK$ million unless otherwise specified
Gross Number of Number of Compensa- Purchases Salesond additions Floor establish- persons Number of tionof Operating of goods Changes other Gross Value to fixed area
Activity ments engaged employees employees expenses for sale in stocks receipts margin added assets ('000m2 )
All establishments, except Government and non-profit institntions
Wholesale 16103 70899 53462 3,579 7,064 86,643 534 99,942 13,608 7,043 853 1326
Retail 51102 192 358 134032 9,209 17,779 107,170 3,187 140,587 35,742 19,393 3,085 3 337
Import/export 58507 328 513 287 386 28,537 83,893 722,383 6,731 869,796 143,667 72,499 9,658 8210
Restaurants 7 835 177 959 167959 11,018 8,789 15,108 32 38,749 15,016 1,710 1 769
Hotels/boarding houses 1543 36233 34904 2,830 4,482 1,094 13 11,199 6,659 3,165 1985
Sub-total 135 090 805962 677743 55,172 122,006 932,399 10,497 1,160,272 120,610 18,471 16626
Government and non-profit institntions
Wholesale and retail trades 6 972 972 61 14 113 87 75 2 60
Restaurants and boarding houses 19 678 677 49 35 11 168 122 46
Sub-total 25 1650 1649 110 49 18 281 87 198 5 106
Total 135115 807612 679392 SS,282 122,056 932,417 10,497 1,160,553 120,808 18,476 16732
Note: *denotes figure within ± HK$0.5 million.
Source: Wholesale/Retail Trade Statistics Section, Census and Statistics Department.
69
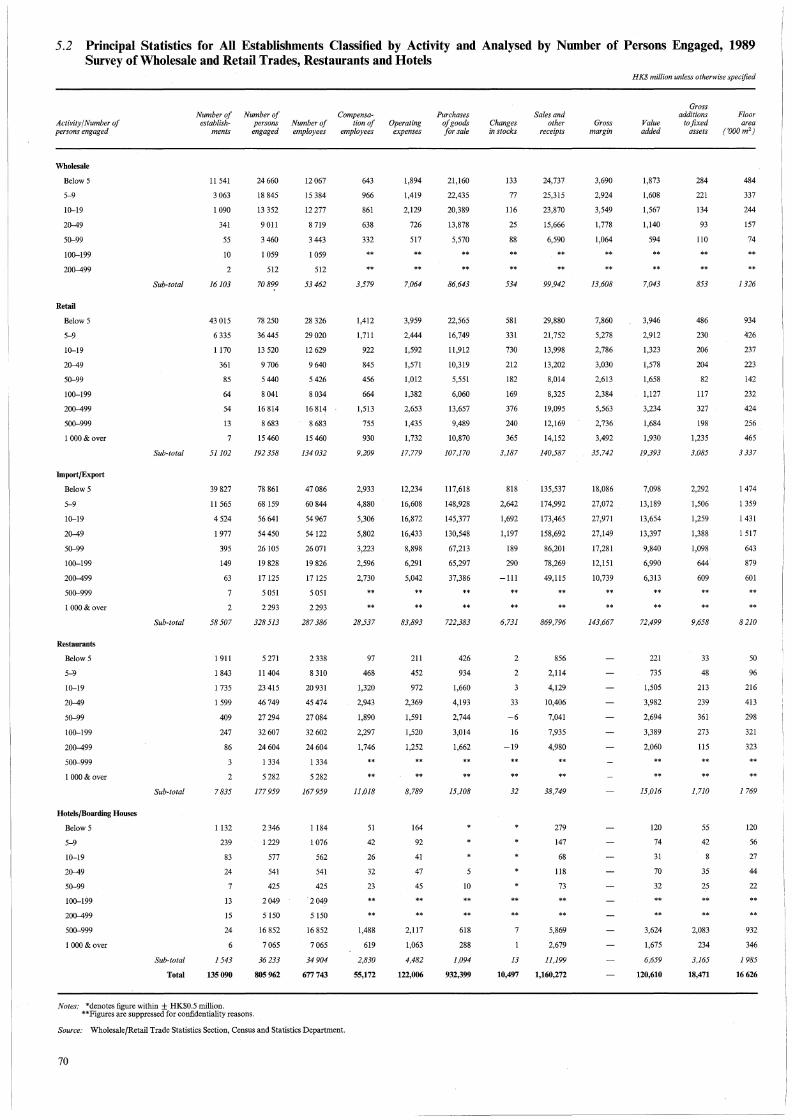
5.2 Principal Statistics for All Establishments Classified by Activity and Analysed by Number of Persons Engaged, 1989 Survey of Wholesale and Retail Trades, Restaurants and Hotels
Number of Number of Cornpensa-Activity/Number of persons engaged
establish- persons Number of tion of Operating ments engaged employees employees expenses
Wholesale
Below 5
5-9
10-19
20-49
50-99
100-199
200-499
Retail
Below 5
5-9
10-19
20-49
50-99
100-199
200-499
500-999
I OOO & over
Import/Export
Below 5
5-9
10-19
20-49
50-99
100-199
200-499
500-999
I OOO & over
Restaurants
Below 5
5-'9
10-19
20-49
50-99
100-199
200-499
500-999
I OOO & over
HotelsjBoarding Houses
Below 5
5-9
10-19
20-49
50-99
100-199
200-499
500-999
I OOO & over
Sub-total
Sub-total
Sub-total
Sub-total
Sub-total
Total
11 541
3 063
I 090
341
55
10
2
16103
43 015
6 335
1170
361
85
64
54
13
51102
39 827
11565
4 524
1977
395
149
63
2
58 507
1911
1843
1 735
I 599
409
247
86
7 835
1132
239
83
24
13
15
24
1543
135 090
Notes: *denotes figure within ± HK$0.5 million. **Figures are suppressed for confidentiality reasons.
24660
18 845
13 352
9 Oil
3 460
I 059
512
70899
78 250
36445
13 520
9 706
5 440
8 041
16 814
8 683
15460
192 358
78 861
68 159
56 641
54450
26105
19 828
17125
5 051
2 293
328 513
5 271
11404
23 415
46 749
27 294
32 607
24604
1334
5 282
177959
2346
1229
577
541
425
2049
5 150
16 852
7 065
36 233
805 962
12 067
15 384
12277
8 719
3 443
I 059
512
53462
28 326
29020
12 629
9 640
5426
8 034
16814
8 683
15 460
134 032
47086
60844
54 967
54122
26071
19 826
17125
5 051
2293
287 386
2 338
8 310
20931
45 474
27084
32602
24604
I 334
5 282
167 959
1184
I 076
562
541
425
. 2049
5150
16 852
7065
34904
677743
Source: Wholesale/Retail Trade Statistics Section, Census and Statistics Department.
70
643
966
861
638
332
3,579
1,412
1,711
922
845
456
664
1,513
755
930
9,209
2,933
4,880
5,306
5,802
3,223
2,596
2,730
28,537
97
468
1,320
2,943
1,890
2,297
1,746
11,018
51
42
26
32
23
1,488
619
2,830
55,172
1,894
1,419
2,129
726
517
7,064
3,959
2,444
1,592
1,571
1,012
1,382
2,653
1,435
1,732
17,779
12,234
16,608
16,872
16,433
8,898
6,291
5,042
83,893
211
452
972
2,369
1,591
1,520
1,252
8,789
164
92
41
47
45
2,117
1,063
4,482
122,006
Purchases of goods for sale
21,160
22,435
20,389
13,878
5,570
86,643
22,565
16,749
11,912
10,319
5,551
6,060
13,657
9,489
10,870
107,170
117,618
148,928
145,377
130,548
67,213
65,297
37,386
722,383
426
934
1,660
4,193
2,744
3,014
1,662
15,108
10
618
288
1,094
932,399
Changes in stocks
133
77
116
25
88
534
581
331
730
212
182
169
376
240
365
3,187
818
2,642
1,692
1,197
189
290
-lll
6,731
33
-6
16
-19
32
13
10,497
Sales and other
receipts
24,737
25,315
23,870
15,666
6,590
99,942
29,880
21,752
13,998
13,202
8,014
8,325
19,095
12,169
14,152
140,587
135,537
174,992
173,465
158,692
86,201
78,269
49,115
869,796
856
2,114
4,129
10,406
7,041
7,935
4,980
38,749
279
147
68
118
73
5,869
2,679
11,199
1,160,272
Gross margin
3,690
2,924
3,549
1,778
1,064
13,608
7,860
5,278
2,786
3,030
2,613
2,384
5,563
2,736
3,492
35,742
18,086
27,072
27,971
27,149
17,281
12,151
10,739
143,667
HK$ million u:nless otherwise specified
Value added
1,873
1,608
1,567
1,140
594
7,043
3,946
2,912
1,323
1,578
1,658
1,127
3,234
1,684
1,930
19,393
7,098
13,189
13,654
13,397
9,840
6,990
6,313
72,499
221
735
1,505
3,982
2,694
3,389
2,060
15,016
120
74
31
70
32
3,624
1,675
6,659
120,610
Gross additions Floor
to fixed area assets ('OOO m 2 )
284
221
134
93
110
853
486
230
206
204
82
117
327
198
1,235
3,085
2,292
1,506
1,259
1,388
1,098
644
609
9,658
33
48
213
239
361
273
115
1,710
55
42
35
25
2,083
234
3,165
18,471
484
337
244
157
74
1326
934
426
237
223
142
232
424
256
465
3 337
1474
1359
1431
1517
643
879
601
8 210
50
96
216
413
298
321
323
1 769
120
56
27
44
22
932
346
1985
16626

5.3 Principal Statistics for All Establishments Classified by Activity and Analysed by Sales and Other Receipts, 1989 Survey of Wholesale and Retail Trades, Restaurants and Hotels
Activity/ Sales and other receipts ( HK$'000)
Wholesale
Below 100
100-499
500-999
1,000-4,999
5,000-9,999
10,000-19,999
20,000-49,999
50,000-99,999
100,000 & over
Retail
Below 100
100-499
500-999
1,000-4,999
5,000-9,999
10,000-19,999
20,000-49,999
50,000-99,999
100,000 & over
Import/Export
Below 100
100-499
500-999
1,000-4,999
5,000-9,999
10,000-19,999
20,000-49,999
50,000-99,999
100,000 & over
Restaurants
Below 100
100-499
500-999
1,000-4,999
5,000-9,999
10,000-19,999
20,000-49,999
50,000-99,999
100,000 & over
Hotels/Boarding Houses
Below 100
100-499
500-999
1,000-4,999
5,000-9,999
10,000-19,999
20,000-49,999
50,000-99,999
100,000 & over
Sub-total
Sub-total
Sub-total
Sub-total
Suh-total
Total
Number of Number of Compensa-establish- persons Number of tion of Operating
ments engaged employees employees expenses
724
2480
2 267
6 513
1903
1181
790
134
Ill
16103
3 169
19 507
10926
14 585
1683
499
422
170
142
51102
3 736
6 035
7 319
19 285
7194
7061
4570
1905
1402
58 507
104
1045
1611
3 148
973
538
303
108
7 835
200
923
238
107
11
II
II
35
1543
135 090
1105
3 806
4 539
21 772
II 548
9 862
10 323
3 045
4 898
70899
3 507
26872
22574
56178
12 772
6 407
9476
8206
46 366
192 358
8 292
9 707
11998
53 606
34129
46 376
54974
33 831
75 599
328 513
157
2 721
7 835
40 520
29 039
29 409
36 073
25 591
6 616
177959
216
2239
1191
712
437
442
2 058
4 007
24930
36233
805962
431
1 065
2036
14080
9 710
8 560
9 785
2941
4 853
53462
106
6 341
7 978
38 593
10 866
6207
9394
8 191
46 355
134 032
3 488
4 796
5 698
38 694
29 623
42680
53 594
33 411
75 401
287 386
93
737
5177
36 098
28 382
29205
36 062
25 591
6 616
167 959
1289
1 037
701
437
442
2058
4007
24 930
34904
677 743
39
87
791
624
559
737
261
479
3,579
222
332
2,236
736
445
761
702
3,774
9,209
99
213
241
2,735
2,359
3,530
5,020
3,709
10,630
28,537
25
204
2,077
1,740
2,108
2,510
2,097
257
11,018
52
42
37
24
26
135
245
2,269
2,830
55,172
10
108
191
1,454
999
916
1,706
604
1,077
7,064
29
855
1,044
3,760
1,109
1,070
1,459
1,152
7,302
17,779
231
712
883
7,129
5,437
10,431
15,306
11,692
32,070
83,893
2
77
254
1,544
1,399
1,773
1,970
1,349
420
8,789
118
97
92
31
48
204
344
3,542
4,482
122,006
Note: *denotes figure within ± HK$0.5 million.
Source: Wholesale/Retail Trade Statistics Section, Census and Statistics Department.
Purchases of goods for sale
25
507
1,172
11,283
10,876
14,328
19,654
7,645
21,153
86,643
101
3,512
4,965
21,693
8,385
4,733
9,647
9,102
45,032
107,170
23
1,034
3,710
34,151
38,621
80,632
116,077
103,182
344,954
722,383
162
532
2,820
2,483
2,848
3,357
2,427
475
15,108
34
99
945
1,094
932,399
Changes in stocks
148
71
-51
73
204
76
534
301
80
373
267
142
560
271
1,194
3,187
-1
151
425
1,118
1,138
1,664
715
1,519
6,731
14
31
-18
-2
1
32
13
10,497
Sales and other
receipts
34
717
1,591
13,987
12,935
16,293
22,649
8,510
23,225
99,942
172
4,871
7,065
29,159
10,421
6,259
11,538
11,161
59,940
140,587
75
1,855
4,896
44,884
47,353
96,625
140,387
123,820
409,900
869,796
330
1,118
6,743
6,065
7,511
9,273
6,414
1,287
38,749
12
202
166
149
83
94
425
802
9,267
11,199
1,160,272
Gross margin
II
214
423
2,839
2,107
1,892
3,018
1,057
2,047
13,608
72
1,638
2,176
7,794
2,292
1,627
2,385
2,283
15,475
35,742
52
732
1,300
10,670
9,298
16,561
24,169
20,400
60,486
143,667
HK$ million unless otherwise spedfied
Value added
2
108
237
1,448
1,171
1,034
1,462
488
1,093
7,043
45
803
1,136
4,097
1,230
627
1,082
1,192
9,181
19,393
-176
119
456
4,267
4,611
7,087
11,573
10,232
34,330
72,499
92
337
2,403
2,226
2,997
3,883
2,644
431
15,016
95
81
59
49
51
265
385
5,668
6,659
120,610
Gross additions
to fixed assets
15
276
226
51
193
77
853
192
99
385
92
113
219
190
1,796
3,085
135
10
167
1,438
205
1,625
1,517
820
3,741
9,658
13
90
405
322
264
117
67
428
1,710
74
19
35
II
44
430
102
2,449
3,165
18,471
Floor area
('OOO m2 )
94
75
403
183
171
228
55
111
1326
49
257
257
709
200
128
211
190
1 337
3 337
132
147
181
1010
669
1 011
1654
801
2 606
8 210
2
27
58
345
282
311
384
307
52
1 769
10
94
62
53
39
21
132
200
1 373
1 985
16 626
71

5.4 Principal Statistics for All Establishments Classified by Activity and Analysed by Value Added, 1989 Survey of Wholesale and Retail Trades, Restaurants and Hotels
Activity/Value added (HK$'000)
Wholesale
Below 50
5()-249
25()-499
50()-2,499
2,50()-4,999
5,00()-9,999
10,00()-24,999
25,000 & over
Retail
Below 50
5()-249
25()-499
50()-2,499
2,50()-4,999
5,00()-9,999
10,00()-24,999
25,000 & over
Import/Export
Below 50
5()-249
25()-499
50()-2,499
2,50()-4,999
5,00()-9,999
10,00()-24,999
25,000 & over
Restaurants
Below 50
5()-249
25()-499
50()-2,499
2,50()-4,999
5,00()-9,999
10,00()-24,999
25,000 & over
Hotels/Boarding Houses
Below 50
5()-249
25()-499
50()-2,499
2,50()-4,999
5,00()-9,999
10,00()-24,999
25,000 & over
Sub-total
Sub-total
Sub-total
Sub-total
Sub-total
Total
Nwnber of Number of establish- persons
ments engaged
3245
6 683
2 911
2850
256
101
49
16103
17 463
23 214
6119
3 754
245
129
85
93
51102
16 763
16 980
7 267
12 413
2 375
1 567
750
392
58 507
661
I 713
1126
2957
581
449
308
41
7835
301
925
62
175
10
12
49
1543
135090
5 399
16 527
12 367
24627
5198
3 OOO
3 088
692
70899
23 887
51 067
27 382
28 448
6401
5 911
7 789
41474
192 358
36 708
39 232
26152
81 887
37 077
31338
29 710
46408
328 513
2656
6439
7609
50 197
22017
25 560
45 507
17 975
177959
694
2 364
341
1001
253
I 093
1280
29 206
36233
805 962
Note: *denotes fignre within ± HK$0.5 million.
Compensa-Nwnber of tion of employees employees
2436
8 115
9225
21910
5042
2954
3 088
692
53462
5 656
22058
19 603
25 185
6 383
5 888
7784
41474
134 032
24075
22874
21 056
75 684
36 496
31165
29 640
46 396
287 386
1634
3 797
5 505
46273
21 720
25 560
45496
17 975
167 959
300
1502
330
941
253
1 093
1280
29206
34904
677743
116
388
497
1,491
409
256
334
86
3,579
286
938
1,106
1,831
506
508
646
3,388
9,209
1,535
1,245
1,324
6,299
3,654
3,648
3,690
7,141
28,537
81
150
248
2,618
1,491
1,875
3,388
1,167
11,018
13
61
14
43
14
63
92
2,529
2,830
55,172
Source: Wholesale/Retail Trade Statistics Section, Census and Statistics Department.
72
Operating expenses
341
983
828
2,427
1,055
545
451
434
7,064
1,324
2,519
1,705
2,745
900
776
1,300
6,510
17,779
6,246
4,526
3,927
18,646
11,389
9,940
11,491
17,727
83,893
190
246
260
1,922
1,202
1,591
2,360
1,017
8,789
46
163
17
102
13
79
176
3,886
4,482
122,006
Purchases of goods for sale
3,254
9,455
10,902
34,128
12,885
6,888
7,333
1,799
86,643
4,523
15,304
11,576
19,381
6,542
5,216
6,738
37,891
107,170
40,365
37,657
42,896
188,409
83,872
83,350
91,466
154,369
722,383
135
467
500
3,890
1,807
2,754
4,312
1,244
15,108
19
26
1,044
1,094
932,399
Changes mstocks
-33
53
73
135
128
109
16
53
534
495
352
82
514
128
190
185
1,240
3,187
955
-142
1,068
1,776
1,167
903
881
123
6,731
4
21
21
-12
-6
32
2
11
13
10,497
HK$ million unless otherwise specified
Sales and other
receipts
3,582
11,197
12,601
39,074
14,585
7,984
8,405
2,515
99,942
5,619
20,010
15,056
24,713
8,066
6,582
8,996
51,545
140,587
44,234
44,365
47,999
217,417
101,825
102,070
112,711
199,175
869,796
296
984
1,131
8,996
4,756
7,211
11,537
3,837
38,749
51
261
33
189
38
168
308
10,152
11,199
1,160,272
Gross margin
282
1,791
1,764
5,026
1,797
1,184
1,061
704
13,608
1,572
5,026
3,544
5,784
1,603
1,524
2,410
14,278
35,742
3,793
6,376
5,962
29,162
18,008
18,413
20,450
41,504
143,667
Value added
-39
832
978
2,781
833
673
680
304
7,043
304
2,546
1,866
3,161
797
806
1,204
8,709
19,393
-1,582
2,085
2,468
13,132
8,099
10,264
11,329
26,704
72,499
-22
275
377
3,223
1,788
2,931
4,822
1,622
15,016
4
lll
16
100
22
76
152
6,178
6,659
120,610
----- -----~--- -
Gross additions
to fixed assets
41
90
133
340
41
128
66
14
853
283
292
145
278
84
88
91
1,823
3,085
692
1,054
665
2,035
479
1,411
827
2,495
9,658
167
67
73
574
53
183
145
448
1,710
71
29
45
2
415
58
2,539
3,165
18,471
Floor area
('OOO m2 )
121
303
204
431
101
70
72
24
1,326
302
599
333
431
129
153
220
I 171
3 337
683
641
507
I 788
1121
842
738
1889
8 210
25
53
60
415
262
253
498
203
1 769
32
104
19
65
18
83
89
1 576
1985
16626

5.5 Comparison of Principal Statistics for All Establishments in the Wholesale and Retail Trades, Restaurant and Hotel Sectors Classified by Activity and Major Group, 1983--1989
HK$ million unless otherwise specified
Gross Number of Number of Compensa- Purchases Sales and additions
establish- persons Number of tionof Operating of goods Changes other Gross Value to fixed Activity/Major group ments engaged employees employees expenses for sale in stocks receipts margin added assets
Wholesale
Foodstuffs, alcoholic drinks and tobacco 1983 3 267 20 163 16 031 544 575 19,641 103 21,057 1,500 973 54
1984 3 678 22 811 17 753 699 728 18,464 -26 20,474 1,937 1,271 83 1985 3 057 18 937 15 217 651 710 17,900 -77 19,740 1,723 1,053 29
(-17) (-17) (-14) (-7) (-2) (-3) (t) (-4) (-II) (-17) (-65) 1986 3 430 19 231 14804 673 603 19,943 80 21,539 1,652 1,080 95
(+12) (+2) (-3) (+4) (-15) (+11) (t) (+9) (-4) (+3) (+225) 1987 3 315 19456 14979 757 720 25,909 89 27,763 1,917 1,234 67
(-3) (+l) (+I) (+12) (+19) ( +30) (+12) (+29) (+16) (+14) (-29) 1988 3 235 18 410 13 860 747 785 25,172 167 27,018 1,992 1,252 56
(-2) (-5) (-7) (-1) (+9) (-3) (+87) (-3) (+4) (+2) (-17) 1989 3 302 18 884 14624 915 916 25,338 48 27,726 2,422 1,560 132
(+2) ( +3) (+6) ( +23) (+17) (+l) (-71) (+3) (+22) (+25) ( +137)
Fuel 1983 131 I 957 1840 69 74 2,268 -I 2,452 176 109 26 1984 142 I 772 I 615 68 85 2,594 49 2,753 194 116 124 1985 142 1505 I 368 68 71 2,122 3 2,331 194 128 13
(jl=) (-15) (-15) (II) (-16) (-18) (-94) (-15) (II) (+11) (-90) 1986 163 1 861 1673 90 86 1,636 7 1,913 274 193 35
(+15) ( +24) (+22) (+34) (+22) (-23) ( + 118) (-18) (+41) (+50) (+176) 1987 164 1958 1804 102 112 2,054 7 2,399 338 233 27
(+l) (+5) (+8) ( +13) (+30) ( +26) (-1) (+25) ( +23) (+21) (-25) 1988 164 1891 1 773 123 139 2,232 10 2,652 403 274 41
(II) (-3) (-2) (+21) (+24) (+9) (+46) (+11) (+19) (+18) (+54) 1989 152 I 780 I 634 128 150 2,227 -2 2,651 396 256 24
(-7) (-6) (-8) (+4) (+8) (II) (t) (II) (-2) (-7) (-41)
Clothing, footwear and allied products 1983 2233 8 205 5 674 193 676 5,520 42 6,543 1,040 435 35 1984 2520 8 411 5 622 203 816 7,127 33 8,428 1,318 560 32 1985 2 810 9 533 6237 235 l,003 7,028 116 8,435 1,511 559 44
(+12) (+13) (+II) (+16) ( +23) (-I) ( +250) (II) (+15) (II) (+37) 1986 3 023 10 211 6 865 307 1,632 11,291 198 13,564 2,451 878 111
(+8) (+7) (+10) (+30) (+63) (+61) (+70) (+61) (+62) (+57) (+154) 1987 3 316 11355 7 868 393 1,987 13,753 325 16,689 3,231 1,319 146
( +10) (+II) ( +15) (+28) ( +22) (+22) (+65) (+23) (+32) (+50) (+31) 1988 3 317 12 155 8 821 513 2,118 14,447 309 17,421 3,207 1,224 271
(II) (+7) (+12) (+31) (+7) ( +5) (-5) (+4) (-1) (-7) (+86) 1989 3 752 12 814 9 063 641 2,810 17,765 398 21,621 4,197 1,531 197
(+13) ( +5) (+3) (+25) (+33) (+23) (+29) ( +24) (+31) (+25) (-27)
Consumer durables and other consumer goods 1983 3 733 17 370 13 679 460 641 10,064 214 11,345 1,440 966 42
1984 3 754 15 171 11 317 470 672 11,328 181 12,742 1,542 977 89 1985 4 343 19 851 15 310 644 734 11,831 267 13,510 1,862 1,207 98
(+16) ( +31) (+35) (+37) (+9) (+4) (+47) (+6) (+21) (+24) ( +10) 1986 4499 19 082 14070 668 906 14,555 263 16,450 2,131 1,295 96
(+4) (-4) (-8) (+4) (+23) (+23) (-1) (+22) (+14) (+7) (-2) 1987 4 891 20742 15220 788 1,152 18,403 391 20,865 2,817 1,762 173
(+9) (+9) (+8) (+18) (+27) (+26) (+49) (+27) (+32) (+36) (+80) 1988 4 955 22089 16 680 993 1,341 21,042 477 23,848 3,228 1,979 199
(+l) (+6) (+10) (+26) (+16) (+14) (+22) (+14) (+15) (+12) (+15) 1989 5 346 23 425 17 847 1,179 1,850 23,628 174 27,300 3,761 2,064 177
(+8) (+6) (+7) ( +19) (+38) (+12) (-63) (+14) (+16) (+4) (-11)
Capital goods 1983 330 1380 968 33 45 484 31 545 90 50 8 1984 307 I 094 814 28 47 485 23 557 89 47 10 1985 323 I 068 770 29 51 496 10 586 99 50 11
(+5) (-2) (-5) (+2) (+9) (+2) (-56) (+5) (+11) (+7) ( +9) 1986 321 1 338 995 46 63 787 37 888 138 78 12
(-1) ( +25) (+29) (+59) ( +23) (+59) ( +275) (+52) (+39) (+54) (+4) 1987 379 1588 1219 68 244 1,352 18 l,556 220 63 30
(+18) (+19) (+23) (+47) (+287) (+72) (-52) (+75) (+59) (-19) (+156) 1988 389 1470 I 049 65 96 1,115 24 1,326 234 147 33
(+3) (-7) (-14) (-4) (-61) (-18) (+35) (-15) (+6) ( +132) (+II) 1989 411 1444 1 063 78 143 1,335 -22 1,666 308 176 28
(+6) (-2) (+I) (+20) (+49) (+20) (t) (+26) ( +32) (+20) (-15)
Raw materials and semi-manufactures 1983 1673 7 576 5 666 209 365 6,418 113 7,188 872 543 26 1984 1654 6 823 5 087 207 374 6,096 66 6,837 787 477 25 1985 2174 8497 6 353 274 454 6,973 60 7,897 963 548 44
(+31) (+25) ( +25) (+32) (+21) (+14) (-8) (+16) (+22) (+15) ( +74) 1986 2252 8920 6131 284 595 9,331 144 10,422 1,155 671 90
(+4) (+5) (-3) ( +3) (+31) ( +34) (+140) (+32) ( +20) (+22) (+107) 1987 2272 10476 8165 436 945 11,947 279 13,595 1,811 1,059 175
(+l) (+17) (+33) (+54) (+59) (+28) (+94) (+30) (+57) (+58) (+95) 1988 2 387 10 656 8 185 527 989 12,266 172 14,239 2,133 1,207 184
( +5) (+2) (jl=) (+21) (+5) (+3) (-38) (+5) (+18) (+14) (+5) 1989 2605 10 858 8 290 576 l,110 15,375 -66 17,794 2,314 1,326 275
(+9) (+2) (+I) (+9) (+12) (+25) (tl (+25) (+8) (+10) (+50)
General commodities 1983 362 1248 755 25 33 271 2 352 82 50 6 1984 550 1693 I 006 36 51 428 7 540 118 69 9 1985 596 I 759 922 37 49 373 * 497 123 76 9
(+8) (+4) (-8) (+2) (-4) (-13) (t) (-8) (+4) (+10) (+5) 1986 510 1579 895 35 47 300 -3 421 117 71 4
(-14) (-10) (-3) (-5) (-3) (-19) ct2 (-15) (-5) (-7) (-51) 1987 505 1480 730 35 61 514 664 148 89 13
(-1) (-6) (-18) (II) (+28) (+71) (t) (+58) (+26) (+25) ( +193) 1988 470 1 557 991 60 62 692 9 858 173 115 16
(-7) (+5) (+36) (+71) (+2) (+35) (t) (+29) (+17) ( +30) (+20) 1989 535 I 692 940 61 84 976 5 1,183 211 130 18
(+14) (+9) (-5) (+2) (+35) (+41) (-46) (+38) (+22) ( +13) (+19)
Sub-total 1983 11729 57 899 44613 1,532 2,409 44,667 504 49,482 5,200 3,127 198 1984 12605 57775 43 214 1,712 2,772 46,522 332 52,330 5,986 3,517 373 1985 13446 61149 46179 1,938 3,072 46,723 379 52,996 6,476 3,623 248
( +7) (+6) ( +7) ( +13) (+II) (#) ( +14) ( +1) (+8) ( +3) (-34) 1986 14199 62222 45 434 2,104 3,932 57,843 724 65,198 7,919 4,265 443
( +6) ( +2) (-2) ( +9) ( +28) ( +24) ( +91) ( +23) ( +22) ( +18) ( +79) 1987 14843 67055 49 984 2,578 5,221 73,931 1,109 83,532 10,481 5,759 631
( +5) ( +8) ( +10) ( +23) ( +33) ( +28) ( +53) ( +28) ( +32) ( +35) ( +42) 1988 14917 68229 51359 3,029 5,530 76,966 1,166 87,363 11,370 6,199 799
(#) ( +2) ( +3) ( +17) ( +6) ( +4) ( +5) ( +5) (+8) (+8) ( +27) 1989 16103 70899 53462 3 579 7,064 86,643 534 99,942 13,608 7,043 853
(+8) (+4) ( +4) ( +18) ( +28) ( +13) (-54) ( +14) ( +20) ( +14) ( +7)
73

5.5 Comparison of Principal Statistics for All Establishments in the Wholesale and Retail Trades, Restaurant and Hotel Sectors Classified by Activity and Major Group, 1983-1989 (Continued)
HK$ million unless otherwise specified
Gross Number of Number of Compensa- Purchases Sales and additions establish- persons Number of tionof Operating of goods Changes other Gross Value to fixed
Activity/Major group ments engaged employees employees expenses for sale in stocks receipts margin added assets
Retail
Foodstuffs, alcoholic drinks and tobacco 1983 20260 50 976 24 528 732 1,306 11,952 195 14,966 3,189 1,915 251
1984 21 813 53 649 25 633 877 1,669 13,631 211 17,063 3,606 1,994 295 1985 20 763 56199 27 088 1,058 1,737 14,874 83 18,793 3,975 2,267 154
(-5) ( +5) (+6) (+21) (+4) (+9) (-61) (+10) (+10) (+14) (-48) 1986 22 819 59 366 29 274 1,233 2,033 17,022 177 21,494 4,571 2,608 244
(+10) (+6) (+8) (+17) ( +17) (+14) (+113) (+14) (+15) (+15) (+59) 1987 21 879 59 282 29 709 1,440 2,560 19,348 106 24,622 5,336 2,808 364
(-4) (#) (+1) (+17) (+26) (+14) (-40) (+15) (+17) (+8) (+49) 1988 20699 59 284 31 799 1,614 2,930 21,887 178 28,233 6,327 3,565 323
(-5) (#) (+7) (+12) (+14) (+13) (+68) (+15) (+19) (+27) (-11) 1989 20409 58 858 32115 1,945 3,074 23,697 241 30,496 6,956 3,989 1,028
(-1) (-1) (+1) (+20) (+5) (+8) (+35) (+8) (+10) (+12) (+219)
Fuel 1983 497 4443 3 983 122 61 3,734 3,978 247 188 3 1984 480 4 387 3 952 132 79 3,828 4,090 256 181 11 1985 518 4478 4024 142 87 3,578 3,861 278 197 10
(+8) (+2) (+2) (+8) (+10) (-7) (-91) (-6) (+9) (+9) (-9) 1986 432 4 059 3 639 136 65 3,061 -1 3,313 247 188 8
(-17) (-9) (-10) (-4) (-26) (-14) (t) (-14) (-11) (-5) (-21) 1987 417 3 789 3 470 148 73 3,665 5 3,934 269 202 8
(-3) (-7) (-5) (+9) ( +13) ( +20) (t) (+19) (+9) (+7) (+3) 1988 446 3 988 3 568 168 95 3,855 13 4,173 327 236 15
(+7) (+5) (+3) (+14) (+30) (+5) (+183) (+6) (+21) (+17) (+79) 1989 449 3 624 3 212 172 99 3,990 7 4,316 328 233 13
(+1) (-9) (-10) (+2) (+5) (+4) (-46) ( +3) (#) (-1) (-10)
Clothing, footwear and allied products 1983 7168 22 009 14 813 493 1,236 3,747 151 5,690 2,065 894 137 1984 8 161 23 509 15 432 597 1,568 4,494 191 6,998 2,681 1,156 149 1985 8 776 26138 17748 684 1,738 5,051 120 7,815 2,842 1,174 157
(+8) (+11) (+15) (+14) (+11) (+12) (-37) (+12) (+6) (+2) (+6) 1986 9 739 29992 19 904 823 2,298 6,549 333 10,108 3,872 1,637 327
(+11) (+15) (+12) (+20) (+32) (+30) (+178) (+29) (+36) (+39) (+108) 1987 9 908 30 370 19 577 978 2,568 7,783 299 . 12,249 4,679 2,194 275
(+2) (+1) (-2) (+19) (+12) (+19) (-10) (+21) (+21) (+34) (-16) 1988 9 956 33 616 23 050 1,357 3,516 9,826 512 15,809 6,391 3,087 923
(#) (+11) ( +18) (+39) (+37) (+26) ( +71) (+29) ( +37) (+41) (+236) 1989 10 196 33 804 23101 1,551 4,522 11,335 829 18,115 7,523 3,190 516
(+2) (+l) (#) (+14) (+29) (+15) (+62) (+15) (+18) (+3) (-44)
Consumer durables and other consumer goods 1983 17762 81 839 62 063 2,412 4,336 29,899 743 37,455 7,935 4,352 775
1984 18 154 82 463 61999 2,744 4,396 33,515 622 42,407 9,129 5,212 353 1985 17 973 81 680 60750 2,798 4,608 33,781 841 42,662 9,368 5,242 876
(-1) (-1) (-2) (+2) (+5) (+l) (+35) (+1) (+3) (+l) (+148) 1986 18 379 80 526 59 987 3,082 5,180 38,305 1,587 47,995 10,903 6,209 699
(+2) (-1) (-1) (+10) (+12) (+13) (+89) (+13) (+16) (+18) (-20) 1987 18 739 85 303 62494 3,633 6,708 50,475 2,509 62,854 14,521 8,413 1,086
(+2) (+6) (+4) (+18) ( +30) (+32) (+58) (+31) (+33) (+36) (+55) 1988 20 132 93 256 71272 4,666 7,966 63,623 2,595 79,381 17,534 10,575 1,692
(+7) ( +9) (+14) ( +28) (+19) (+26) (+3) (+26) (+21) (+26) (+56) 1989 20048 96 073 75 604 5,541 10,083 68,148 2,110 87,660 20,935 11,981 1,528
(#) (+3) (+6) (+19) (+27) (+7) (-19) (+10) (+19) (+13) (-10)
Sub-total 1983 45688 159 267 105 387 3,758 6,939 49,332 1,093 62,089 13,435 7,348 I,J65 1984 48608 164 008 107016 4,351 7,712 55,469 1,025 70,558 15,672 8,543 808 1985 48030 168 496 109 609 4,683 8,170 57,285 1,044 73,131 16,462 8,880 J,197
(-1) ( +3) ( +2) ( +8) (+6) ( +3) ( +2) ( +4) ( +5) ( +4) ( +48) 1986 51 369 173 943 ll2 803 5,274 9,576 64,936 2,095 82,910 19,593 10,640 1,279
( +7) ( +3) ( +3) ( +13) ( +17) ( +13) ( +101) ( +13) ( +19) ( +20) ( +7) 1987 50943 178 744 ]]5 250 6,199 11,909 81,271 2,919 103,659 24,805 13,617 1,734
(-1) ( +3) ( +2) ( +18) ( +24) ( +25) ( +39) ( +25) ( +27) ( +28) ( +36) 1988 51233 190145 129 690 7,806 14,506 99,191 3,298 127,596 30,578 17,463 2,953
( +l) (+6) ( +13) ( +26) ( +22) ( +22) ( +13) ( +23) ( +23) ( +28) (+70) 1989 51102 192 358 134 032 9,209 17,779 107,170 3,187 140,587 35,742 19,393 3,085
(#) ( +l) ( +3) ( +18) ( +23) (+8) (-3) ( +10) ( +17) (+II) (+4)
bnportjExport
Foodstuffs, alcoholic drinks and tobacco 1983 1479 10062 8 814 523 1,647 20,426 317 23,217 2,927 1,575 132 1984 2188 13 861 11 827 642 2,014 27,017 153 30,823 3,687 1,960 93 1985 2652 15 236 13 062 765 2,420 25,891 352 29,552 3,790 1,735 88
(+21) ( +10) (+10) (+19) ( +20) (-4) ( +129) (-4) (+3) (-12) (-6) 1986 2 856 15 223 12 934 866 2,859 30,456 234 35,240 4,678 2,055 238
(+8) (#) (-1) (+13) (+18) (+18) (-33) (+19) (+23) (+18) (+171) 1987 2 905 15 925 13 405 1,003 2,878 40,383 88 46,050 5,394 2,778 487
( +2) (+5) (+4) (+16) (+1) (+33) (-62) (+31) (+15) ( +35) (+105) 1988 3416 17 338 14961 1,250 3,592 50,097 695 56,518 6,659 3,522 725
( +18) (+9) (+12) (+25) (+25) (+24) (+688) (+23) ( +23) (+27) ( +49) 1989 3 475 17 809 14701 1,459 5,062 52,774 300 61,502 8,027 3,620 384
(+2) ( +3) (-2) (+17) (+41) (+5) (-57) (+9) (+21) (+3) (-47)
-Fuel 1983 36 1 707 1 681 171 420 10,454 50 11,937 1,455 1,126 157 1984 49 1 733 1 713 186 502 13,010 -167 14,447 1,189 794 199 1985 55 2 059 2049 232 593 11,012 -292 12,718 1,359 850 -107
(+12) ( +19) (+20) (+24) (+18) (-15) (t) (-12) (+14) (+7) (t) 1986 55 1820 1803 236 772 8,015 -216 10,073 1,761 1,066 349
(#) (-12) (-12) ( +2) (+30) (-27) (t) (-21) (+30) (+25) (t) 1987 62 1 777 1 759 253 660 9,721 -17 11,746 1,949 1,364 -2,732
( +13) (-2) (-2) (+7) (-14) (+21) (t) (+17) (+11) (+28) (t) 1988 83 1967 1940 287 763 10,347 -21 13,448 2,989 2,293 211
(+34) (+11) (+10) (+13) (+16) (+6) (t) (+14) ( +53) (+68) (t) 1989 117 2 375 2 333 469 1,324 16,033 228 19,832 3,910 2,896 884
(+41) (+21) (+20) (+63) (+73) ( +55) (t) (+47) (+31) (+26) ( +318)
Clothing, footwear and allied products 1983 4 729 28 960 25 569 1,344 4,415 39,302 320 47,490 7,653 4,167 238 1984 6008 37 797 33 802 2,296 6,548 56,005 488 68,220 11,771 6,430 382 1985 5 925 40325 37 226 2,353 7,189 54,605 43 67,504 11,993 5,967 363
(-1) (+7) (+10) (+2) (+10) (-2) (-91) (-1) (+2) (-7) (-5) 1986 7015 47213 42018 2,779 9,737 77,281 999 93,421 16,069 8,065 1,354
( +18) (+17) (+13) (+18) (+35) (+42) (+2,205) ( +38) (+34) (+35) (+274) 1987 7 527 56 013 51 766 4,118 13,920 108,177 -59 133,796 24,014 12,644 1,703
(+7) (+19) (+23) (+48) ( +43) (+40) (t) (+43) (+49) (+57) (+26) 1988 10078 65 184 58 763 5,007 17,842 129,339 1,669 157,135 27,172 12,863 1,247
(+34) (+16) (+14) (+22) (+28) (+20) (t) (+17) (+13) (+2) (-27) 1989 12012 75 621 65 589 6,299 23,311 152,857 2,993 189,481 36,831 17,137 2,264
(+19) ( +16) (+12) (+26) (+31) (+18) (+79) (+21) (+36) (+33) (+82)
74

5.5 Comparison of Principal Statistics for All Establishments in the Wholesale and Retail Trades, Restaurant and Hotel Sectors Classified by Activity and Major Group, 1983-1989 (Continued) ·
HK$ million unless otherwise specified
Gross Number of Number of Compensa- Purchases Sales and additions
establish- persons Number of tionof Operating of goods Changes other Gross Value to fixed Activity/ M ajar group rnents engaged employees employees expenses for sale in stocks receipts margin added assets
Import/Export (Continued)
Consumer durables and other consumer goods 1983 8244 53 282 47760 2,470 5,855 55,538 1,423 66,315 11,727 6,761 591
1984 IO 418 66 650 59 387 3,435 7,618 72,582 886 89,360 16,925 I0,324 827 1985 11 538 76 374 68 079 4,360 I0,016 94,199 1,005 114,748 20,780 11,837 1,024
(+II) ( +15) (+15) (+27) (+31) ( +30) (+13) ( +28) (+23) ( +15) (+24) 1986 13 482 84 830 74 267 5,216 11,695 I09,474 2,690 131,473 23,977 13,290 1,518
(+17) ( +11) (+9) (+20) (+17) (+16) ( +168) ( +15) (+15) (+12) (+48) 1987 14978 97 315 83144 6,431 14,400 154,975 2,700 185,166 31,762 18,544 1,963
( +11) (+15) (+12) (+23) (+23) (+42) (#) (+41) (+32) (+40) ( +29) 1988 17 766 115 355 I04205 8,979 21,266 198,069 4,423 239,032 43,726 24,380 2,723
(+19) (+19) ( +25) (+40) (+48) ( +28) (+64) (+29) (+38) (+31) ( +39) 1989 21390 127 560 I09 996 10,552 28,865 228,397 2,600 281,985 53,991 28,168 3,067
(+20) (+11) (+6) (+18) ( +36) (+15) (-41) ( +18) (+23) (+16) (+13)
Capital goods 1983 786 6 391 6 053 402 6IO 4,520 171 5,939 1,527 999 53 1984 1074 8 173 7649 531 813 5,614 143 7,333 1,816 1,106 71 1985 1 613 12454 11452 824 1,318 8,235 224 I0,967 2,768 1,587 155
(+50) (+52) (+50) (+55) (+62) (+47) (+57) (+50) ( +52) (+44) (+120) 1986 2113 15 360 14443 l,IOl 1,700 I0,488 177 13,972 3,5IO 1,937 168
(+31) (+23) (+26) (+34) (+29) (+27) (-21) (+27) (+27) (+22) (+8) 1987 2259 16314 14822 1,356 2,025 14,014 320 18,189 4,261 2,429 255
(+7) (+6) (+3) (+23) (+19) (+34) (+80) (+30) ( +21) (+25) ( +51) 1988 2 537 18 686 17 352 1,729 2,783 21,613 715 26,774 5,624 3,092 190
(+12) (+15) ( +17) (+28) ( +37) (+54) (+124) (+47) (+32) (+27) (-25) 1989 2862 19204 17 355 1,951 3,186 22,345 664 28,661 6,7IO 3,787 323
(+13) (+3) (#) ( +13) (+14) (+3) (-7) (+7) (+19) (+22) (+70)
Raw materials and semi-manufactures 1983 2928 15 808 14008 871 2,365 26,986 1,090 30,297 4,150 2,281 217 1984 4066 24256 21617 1,596 3,789 39,626 1,374 45,590 6,930 3,862 295 1985 4 896 26091 23 054 1,519 3,562 42,899 -374 49,532 5,807 2,940 393
(+20) (+8) (+7) (-5) (-6) (+8) (t) (+9) (-16) (-24) (+33) 1986 5 913 30201 26 250 2,033 4,526 70,407 1,745 78,206 9,085 5,218 230
(+21) (+16) (+14) (+34) (+27) (+64) (t) (+58) (+56) (+77) (-41) 1987 6 556 36 919 31 815 2,905 6,404 96,923 3,241 I08,187 13,674 8,239 1,117
(+11) (+22) (+21) (+43) (+41) ( .w.38) (+86) (+38) (+51) (+58) (+385) 1988 8 302 41605 36 599 3,569 10,076 136,436 4,027 152,458 19,180 I0,412 1,902
( +27) (+13) (+15) ( +23) (+57) (+41) ( +24) (+41) (+40) (+26) (+70) 1989 9131 45 404 40 377 4,254 12,513 151,017 267 172,991 20,227 I0,405 1,252
(+IO) (+9) (+IO) (+19) (+24) ( +11) (-93) ( +13) (+5) (#) (-34)
General commodities 1983 8 037 42 717 37174 1,962 4,729 54,633 533 64,404 9,192 5,733 598 1984 7 137 35 332 30266 1,743 5,126 55,454 188 65,360 8,381 5,006 274 1985 7 201 33 242 28248 1,802 4,673 56,927 324 64,745 6,494 3,392 717
(+I) (-6) (-7) (+3) (-9) (+3) (+72) (-1) (-23) (-32) (+162) 1986 6 512 30 386 26 658 1,967 4,328 58,680 506 67,277 8,030 4,540 529
(-IO) (-9) (-6) (+9) (-7) (+3) (+56) (+4) (+24) (+34) (-26) 1987 6910 31453 26479 2,044 5,513 76,867 942 86,293 8,946 4,757 696
(+6) (+4) (-1) (+4) (+27) (+31) (+86) (+28) (+11) (+5) (+32) 1988 8 013 35 006 30 187 2,473 8,234 I03,062 432 117,037 12,805 6,470 1,335
(+16) (+11) (+14) (+21) (+49) ( +34) (-54) (+36) (+43) (+36) (+92) 1989 9 520 40540 37 033 3,552 9,631 98,960 -321 115,343 13,970 6,487 1,484
(+19) (+16) ( +23) (+44) ( +17) (-4) (t) (-1) (+9) (#) ( + 11)
Sub-total 1983 26240 158 926 141059 7,744 20,042 211,860 3,905 249,599 38,632 22,642 1,986 1984 30939 187 802 166 259 10,431 26,409 269,309 3,065 321,133 50,699 29,482 2,141 1985 33881 205 780 183169 11,856 29,771 293,767 1,282 349,765 52,993 28,308 2,631
( +10) ( +10) ( +10) ( +14) ( +13) ( +9) (-58) (+9) ( +5) (-4) ( +23) 1986 37947 225 032 198 373 14,197 35,618 364,801 6,135 429,662 67,111 36,172 4,386
( +12) (+9) (+8) ( +20) ( +20) ( +24) ( +379) ( +23) ( +27) ( +28) ( +67) 1987 41198 255 715 223191 18,110 45,801 501,060 7,215 589,427 89,999 50,754 3,487
(+9) ( +14) ( +13) ( +28) ( +29) ( +37) ( +18) ( +37) ( +34) ( +40) (-21) 1988 50195 295141 264007 23,293 64,557 648,963 11,939 762,401 118,155 63,032 8,334
( +22) (+15) ( +18) ( +29) ( +41) ( +30) ( +65) ( +29) ( +31) ( +24) (+139) 1989 58 507 328 513 287 386 28,537 83,893 722,383 6,731 869,796 143,667 72,499 9,658
( +17) (+11) (+9) ( +23) ( +30) ( +11) (-44) ( +14) ( +22) ( +15) ( +16)
Restaurants
Chinese restaurants 1983 3 047 I09 584 I05 351 3,473 2,702 5,412 20 11,869 3,803 700 1984 3 432 111 658 I07 514 3,800 3,302 5,918 -46 13,689 4,479 637 1985 3 379 112 587 I09 272 4,273 3,494 6,373 4 14,725 4,879 300
(-2) (+I) (+2) (+12) (+6) (+8) (t) (+8) (-) (+9) (-53) 1986 3 524 116 382 111 592 4,676 3,566 6,847 40 15,964 5,628 850
(+4) (+3) (+2) (+9) (+2) (+7) ( + 796) (+8) (-) (+15) (+184) 1987 3 692 118 516 113 306 5,606 4,334 8,750 94 20,I05 7,172 619
(+5) (+2) (+2) (+20) ( +22) (+28) ( +135) (+26) (-) ( +27) (-27) 1988 3 774 116 377 111 635 6,269 4,841 9,576 18 22,526 8,136 570
(+2) (-2) (-1) (+12) (+12) (+9) (-81) (+12) (-) (+13) (-8) 1989 3 778 119 778 114 851 7,962 5,692 I0,805 24 27,147 - I0,738 779
(#) (+3) (+3) (+27) (+18) ( +13) (+36) (+21) (-) (+32) (+37)
Restaurants, other than Chinese 1983 2 018 29 974 27 754 886 844 1,254 12 3,181 1,102 177 1984 2 331 31185 28194 988 919 1,409 3 3,580 1,268 IOI 1985 2118 30 645 28 059 1,131 965 1,425 -I 3,784 1,399 IOI
(-9) (-2) (#) ( +14) ( +5) (+l) (t) (+6) (-) (+IO) (#) 1986 2265 31498 28 866 1,156 1,013 1,539 3 3,983 1,438 153
( +7) (+3) (+3) (+2) (+5) (+8) (t) (+5) (-) (+3) (+51) 1987 2461 33 387 29 849 1,362 1,178 1,977 11 4,907 1,771 177
(+9) (+6) (+3) ( +18) (+16) (+28) ( +230) (+23) (-) (+23) (+16) 1988 2 508 34 232 30821 1,645 1,434 2,216 15 5,910 2,288 192
(+2) (+3) (+3) (+21) (+22) (+12) (+37) (+20) (-) ( +29) (+8) 1989 2616 36 891 33 258 1,986 1,744 2,650 . 7,018 - 2,631 327
(+4) (+8) ( +8) (+21) (+22) (+20) (-99) (+19) (-) (+15) (+71)
Fast food shops 1983 630 7 748 7 013 192 315 463 5 1,074 314 103 1984 657 8 670 7 965 226 389 538 2 1,248 344 199 1985 713 9 455 8 643 292 459 657 I 1,537 442 62
(+9) (+9) (+9) (+29) (+18) (+22) (-36) (+23) (-) (+29) (-69) 1986 883 IO 795 9 770 348 518 740 2 1,799 565 133
(+24) (+14) (+13) (+19) (+13) (+13) (+96) (+17) (-) (+28) (+114) 1987 883 12009 11 012 450 686 949 3 2,337 725 273
(#) ( +11) ( +13) (+29) (+33) (+28) (+15) (+30) (-) (+28) (+106) 1988 914 13 671 12 976 628 898 1,246 12 3,059 - 956 324
(+4) (+14) (+18) (+40) (+31) (+31) ( +363) ( +31) (-) ( +32) (+19) 1989 951 16 889 16014 796 1,081 1,451 7 3,735 1,268 549
(+4) (+24) (+23) ( +27) (+20) (+16) (-44) (+22) (-) ( +33) (+69)
75
L

5.5 Comparison of Principal Statistics for All Establishments in the Wholesale and Retail Trades, Restaurant and Hotel Sectors Oassified by Activity and Major Group, 1983-1989 (Continued)
HK$ million unless otherwise specified
Gross Number of Number of Compensa- Purchases Sales and additions
establish- persons Number of tionof Operating of goods Changes other Gross Value to fixed Activity/Major group ments engaged employees employees expenses for sale in stocks receipts margin added assets
RC$1aurants (Continued)
Bar 1983 114 4036 4013 159 114 65 2 362 186 22 1984 148 3769 3 644 155 124 60 -2 365 180 31 1985 155 3626 3480 163 135 93 407 184 37
(+5) (-4) (-5) (+5) (+9) (+55) Ctl (+12) H (+2) (+22) 1986 157 4155 4063 196 132 88 . 445 - 228 6
(+I) (+15) (+17) (+21) (-2) (-5) (t) (+to) (-) (+24) (-84) 1987 142 3046 2979 199 131 92 3 465 247. 27
(-to) (-27) (-27) (+l) (-1) (+4) (t) (+4) (-) (+8) (+347) 1988 155 2868 2 787 185 151 144 2 547 255 22
(+9) (-6) (-6) (-7) (+15) (+57) (-27) (+18) (-) (+3) (-18) 1989 163 2782 2694 215 173 130 1 576 273 44
(+5) (-3) (-3) (+16) (+14) (-9) (-30) (+5) (-) (+7) (+97)
Other eating and drinking places 1983 313 1121 749 19 37 50 129 44 4 1984 260 1169 806 24 47 46 133 41 8 1985 255 1141 817 27 46 44 132 42 4
(-2) (-2) (+l) (+12) (-2) (-5) (-91) (#) (-) (+3) (-49) 1986 284 1286 951 34 57 50 . 158 51 8
(+11) (:+-13) (+16) (+25) (+24) (+13) (t) (+20) (-) (+21) (+95) 1987 285 1394 1077 44 71 67 . 2to 74 50
(#) (+8) (+13) (+31) (+24) (+34) (t) (+33) (-) (+43) ( +527) 1988 303 1620 1140 46 80 69 . 229 83 28
(+6) (+16) (+6) (+6) (+12) (+4) (-24) (+9) (-) (+14) (-44) 1989 327 1620 1142 59 98 72 -1 272 106 11
(+8) (#) (#) (+27) (+22) (+4) (t) (+19) (-) (+27) (-61)
Sub-total 1983 6122 152463 144880 4,729 4,013 7,243 39 16,614 5,448 1,007 1984 6828 156 452 148123 5,193 4,781 7,971 -42 19,014 6,312 976 1985 6620 157453 150270 5,887 5,100 8,592 5 20,585 6,946 504
(-3) (+1) (+1) (+13) (+7) (+8) (t) (+8) (-) (+10) (-48) 1986 7113 164116 155 243 6,410 5,286 9,264 45 22,350 7,910 1,150
(+7) (+4) (+3) (+9) (+4) (+8) ( +851) (+9) (-) (+14) ( +128) 1987 7463 168351 158223 7,661 6,400 11,834 110 28,025 - 9,987 1,147
(+5) (+3) (+2) (+20) (+21) (+28) ( +146) (+25) (-) (+26) (#) 1988 7654 168 768 159359 8,774 7,404 13,251 47 32,272 11,719 1,135
(+3) (#) (+l) (+15) (+16) (+12) (-58) (+15) (-) (+17) (-1) 1989 7835 177959 167959 11,018 8,789 15,108 32 38,749 15,016 1,710
(+2) (+5) (+5) (+26) ( +19) (+14) (-32) (+20) (-) (+28) ( +51)
Hotels{Boatding houses
Hotels 1983 50 20763 20763 866 1,415 424 6 3,589 1,953 248 1984 51 21307 21307 1,020 1,616 480 -1 4,518 2,551 178 1985 52 21 717 21 717 1,181 1,757 512 2 5,065 2,968 1,692
(+2) (+2) (+2) (+16) (+9) (+6) (t) (+12) (-) (+16) (+852) 1986 56 24254 24254 1,343 1,926 616 8 6,029 3,595 1,177
(+8) (+12) (+12) (+14) (+to) (+20) (+235) (+19) (-) (+21) (-30) 1987 61 25673 25 671 1,637 2,386 804 16 7,409 4,506 710
(+9) (+6) (+6) (+22) (+24) (+31) (+89) (+23) (-) (+25) (-40) 1988 61 27056 27056 1,945 2,965 958 13 9,130 5,723 -1,653
(#) (+5) (+5) (+19) (+24) (+19) (-17) (+23) H (+27) (t) 1989 70 31690 31690 2,688 4,141 1,088 13 to,608 6,373 3,032
(+15) (+17) (+17) (+38) (+40) (+14) (+2) (+16) (-) (+11) (t)
Boarding houses 1983 726 2392 1761 43 too 2 185 86 16 1984 795 2642 2071 56 117 2 217 too 16 1985 890 2655 1973 57 124 2 234 111 44
(+12) (#) (-5) (+1) (+6) (-4) (t) (+8) (-) (+to) (+170) 1986 982 2958 1998 64 142 4 • 268 124 26
(+to) (+11) (+l) (+12) (+15) (+60) (+27) (+15) (-) (+12) (-41) 1987 1180 3476 2448 80 183 3 • 347 171 92
(+20) (+18) (+23) (+26) (+28) (-14) (t) (+29) (-) (+38) (+258) 1988 1308 4002 2721 111 252 3 • 468 224 to3
(+11) (+15) (+11) (+39) (+38) (-4) (t) (+35) (-) (+31) (+12) 1989 1473 4543 3215 142 341 7 • 591 286 134
(+13) (+14) (+18) (+28) (+35) (+123) (t) (+26) (-) (+28) (+30)
Sub-total 1983 776 23155 22524 909 1,515 426 6 3,774 2,039 263 1984 846 23948 23377 1,076 1,733 483 -1 4,735 2,652 194 1985 942 24372 23690 1,238 1,881 514 3 5,299 3,079 1,736
(+11) (+2) ( +1) (+15) (+9) (+6) (t) (+12) (-) (+16) ( +795) 1986 1038 27 212 26252 1,407 2,069 619 8 6,298 - 3,719 1,202
(+10) (+12) (+11) (+14) ( +10) (+21) ( +233) (+19) (-) (+21) (-31) 1987 1241 29149 28119 1,717 2,569 808 16 7,756 4,677 802
(+20) (+7) (+7) (+22) (+24) (+30) (+88) (+23) (-) (+26) (-33) 1988 1369 31058 29 777 2,056 3,217 961 13 9,599 5,947 -1,550
(+10) (+7) (+6) (+20) (+25) ( +19) (-17) (+24) (-) (+27) (t) 1989 1543 36233 34904 2,830 4,482 1,094 13 11,199 6,659 3,165
(+13) (+17) (+17) (+38) (+39) (+14) (+2) (+17) (-) (+12) (t)
Total 1983 90554 551 711 458463 18,672 34,918 313,527 5,547 381,559 40,605 4,619 1984 99825 589986 487990 22,763 43,407 379,753 4,379 467,770 50,506 4,491 1985 102919 617 250 512917 25,601 47,994 406,881 2,712 501,776 50,836 6,317
(+3) (+5) (+5) (+12) (+11) (+7) (-38) (+7) (-) (+l) (+41) 1986 111666 652525 538104 29,392 56,481 497,464 9,008 606,418 62,707 8,460
(+8) (+6) . (+5) (+15) (+18) (+22) (+232) (+21) (-) (+23) (+34) 1987 115688 699015 574768 36,265 71,901 668,905 11,369 812,400 - 84,793 7,800
(+4) (+7) (+7) (+23) (+27) (+34) (+26) (+34) (-) (+35) (-8) 1988 125367 753341 634192 44,958 95,213 839,333 16,464 1,019,230 104,359 11,671
(+8) (+8) (+10) (+24) (+32) (+25) (+45) (+25) (-) (+23) (+50) 1989 135090 805962 677743 SS 172 122,006 932,399 10,497 1,160,272 120,610 18,471
(+8) (+7) (+7) (+23) (+28) (+11) (-36) (+14) (-) (+16) (+58)
Notes: Figures in brackets deooting perceotage changes over the preceding year are derived from unrounded figures. *deootes figure within ± HK$0.5 million.
#denotes figure within ± 0.5%. f Percentage changes are not presented whenever any of the two figures being compared is negative, as it is very difficult to interpret meaningfully the percentage change obtained.
Source: Wholesale/Retail Trade Statistics Section, Census and Sllttistics Department.
76

5.6 Principal Statistics for All Establishments Classified by Major Group and Analysed by Number of Persons Engaged, 1989 Survey of Transport and Related Services
Major group/Number of persons engaged
Land passenger transport
Below 5 5-9 10-19 2o--49 50-99 100-199 200-499 500 and over
Sub-total
Land freight transport
Below 5 5-9 10-19 2o--49 50-99 100-199
Sub-total
Supporting services to land transport
Below 5 5-9 10-19 2o--49 50-99 100-199 200-499 500 and over
Sub-total
Ocean and coastal water transport
Below 5 5-9 10-19 2o--49 50-99 100-199 20o--499 500 and over
Sub-total
Inland water transport
Below 5 5-9 10-19 20-49 50-99 100-199 200-499 500 and over
Sub-total
Number of
establishments
18 804 123 87 40 24 11 2
5
19095
9184 1 382
287 139
23 5
11020
39 27
9
5
3 2
2
87
171 43 67 62 23 18 12 5
402
358 188 49 61
5
2
2
666
Number of
persons engaged
18 796 709
1149 1275 1 552 1434
439 21 718 47072
12 648 7 613
3 834 3 706 1 349
590 29 741
50 160 112 109 216 321 543 521
2032
333 286 862
1 701 1 598 2 714 3 539 5 517
16549
789 1173
548 1404
304 251 730
1 547 6 747
Number of
employees
837 545
1 109 1 220 1 506 1 367
439 21 718 28 741
3460 5 837 3 498 3 552 1 349
590 18 288
36 144
111
109 215 320 543 521
1998
321 286 862
1 699 1 598 2 714 3 539 5 517
16536
325 938 516
1 291 304 251 730
1 547 5 902
Compensation of
employees
60 45 65 72
83 90 ** **
2,630
229 397 241 248 106 50
1,271
1
7
**
7
13
** ** **
126
29 45 73
270 227 357 496 740
2,235
19 67 38 96
32 ** ** **
492
Operating expenses
1,363 95
176 104 120 116
** **
5,350
1,532 666 344 409 210 84
3,245
18 26 ** 16 77
** ** **
639
348 275 187
4,503 2,275
636 2,798 1,605
12,627
93 46
111
221 98 ** ** **
1,154
Business receipts
and other income
2,736 158 260 206 229 236
** **
10,427
2,508 1,268
674 760 335 148
5,694
23 38 ** 37
115
** ** **
1,153
435 326 264
4,937 2,579 1,128 3,633 4,315
17,618
174 143 197 524 136
** ** **
2,227
HK$. million unless otherwise specified
Gross additions
to fixed assets
623 27 53 72
24 47 ** **
3,872
255 150
59 34 31
8
538
-1
-38 ** 16 6
** ** ** 20
16 -3
7
113
67 54
456 1,392 2,104
-13
-2 5
33 18 ** ** **
195
Value added
1,731 80
113 105 115
126 ** **
7,118
1,288 736 416 418 144 77
3,079
6
17 **
23 38 ** ** **
530
144 47 81
423 295 459 703
2,887 5,039
90 103 105 314 40 ** ** **
1,110
Floor area
("OOO m2 )
6
6
13 7
6
** **
1273
17 41 20 19 12 2
111
9
37 ** 9
239 ** ** **
969
5
4
10 23 13
23 24
1 179 1280
1
# 2
** **
** 124
77

5.6 Principal Statistics for All Establishments Classified by Major Group and Analysed by Number of Persons Engaged, 1989 Survey of Transport and Related Services (Continued)
Major group/Number of persons engaged
Supporting services to water transport
Below 5
5-9
10-19
20-49
50-99
100--199
200-499
Air transport
Below 5
5-9
10--19
20-49
50--99
100--199
200-499
500 and over
Sub-total
Sub-total
Services incidental to transport
Below 5
5-9
10-19
20-49
50-99
100-199
200-499
500 and over
Sub-total
Total
Number of
establishments
1 057
330
152
29
29
7
2
1605
14
7
2
7
9
5
6
3
54
1 098
912
363
216
83
28
9
2 710
35638
Notes: *denotes figure within ± HK$0.5 million. # denotes figure less than 500 m 2 .
Number of
persons engaged
1952
1 954
1 885
877
1 995
888
582
10133
39
50
33
264
654
631
2 316
11 372
15 359
2299
5 788
4 750
6 250
6024
3 524
2 328
1 601
32563
160195
**Figures are suppressed for confidentiality reasons.
Number of
employees
620
1 536
1 714
863
1 988
888
582
8191
39
50
33
264
654
631
2 316
11 372
15 359
1 745
5 334
4746
6 249
6024
3 524
2 328
1 601
31551
126 565
Compensation of
employees
52
143
156
78
194
**
**
818
9
11
**
39
110
**
318
3,352
3,953
87
369
389
548
563
325
**
** 2,589
14,115
Source: Transport and Services Statistics Section, Census and Statistics Department.
78
-------__ ,,_, ____ _
Operating expenses
445
553
526
241
515
**
**
2,729
24
8
**
32
205
**
408
11,141
11,866
5,695
6,341
4,577
11,363
13,131
5,932
**
** 50,203
87,814
Business receipts
and other income
640
795
878
364
824
**
**
4,200
32
19
**
73
301
**
743
18,135
19,475
5,799
6,770
5,064
12,195
13,906
6,513
**
**
53,784
114,578
HK$ million unless otherwise specified
Gross additions
to fixed assets
714
50
75
37
69
**
**
368
*
**
* 67
**
36
2,317
2,485
3
17
44
185
176
71
** **
547
10,129
Value added
266
302
451
136
373
**
**
1,818
8
11
**
40
96
**
322
8,021
8,621
105
416
480
806
768
546
**
**
3,568
30,882
Floor area
('OOO m2 )
28
7
57
53
352
**
**
747
**
4
6
**
12
167
198
30
59
79
79
108
84
**
**
496
5197

5. 7 Principal Statistics for All Establishments Classified by Major Group and Analysed by Business Receipts and Other Income, 1989 Survey of Transport and Related Services
Major group/Business receipts and other income ( HK$'000)
Land passenger transport
Below 100
100-499
500-999
1,000-4,999
5,000-9,999
10,000--19,999
20,000-49,999
50,000 and over
Sub-total
Land freight transport
Below 100
100-499
500-999
1,000-4,999
5,000-9,999
10,000-19,999
20,000-49,999
50,000 and over
Sub-total
Supporting services to land transport
Below 100
100-499
500--999
1,000-4,999
5,000-9,999
10,000-19,999
20,000-49,999
50,000 and over
Sub-total
Ocean and coastal water transport
Below 100
100-499
500-999
1,000-4,999
5,000--9,999
10,000-19,999
20,000-49,999
50,000 and over
Sub-total
Number of
establishments
4 578
14 035
250
169
29
18
11
5
19095
2 169
6409
956
I 381
63
34
7
11020
4
22
19
24
7
2
5
5
87
46
53
19
138
28
41
43
34
402
Number of
persons engaged
4209
14293
738
2069
I 324
1205
I 515
21 718
47072
2445
9 668
4034
9774
I 714
I 308
730
67
29 741
5
77
89
126
75
44
434
I 181
2032
74
188
171
1109
613
I 283
2 316
10 795
16549
Number of
employees
98
634
428
I 941
1270
1153
1498
21 718
28 741
263
3 061
2 887
8 321
I 652
I 308
730
67
18 288
64
76
125
74
44
433
1180
1998
65
188
171
I 107
613
I 283
2 315
10 795
16 536
Compensation of
employees
53
19
111
81
77
**
**
2,630
9
159
195
584
128
**
61
**
1,271
* **
2
7
5
** 20
87
126
9
9
132
80
184
310
1,510
2,235
Operating expenses
151
1,095
93
243
103
129
**
**
5,350
69
657
297
1,485
269
**
126
**
3,245
* ** 10
27
27
**
112
451
639
3
7
4
177
IOI
282
826
11,226
12,627
Business receipts
and other income
301
2,288
152
390
197
243
**
**
10,427
144
1,329
601
2,423
463
**
204
**
5,694
* ** 11
42
44
** 149
878
1,153
2
14
14
331
210
544
1,196
15,307
17,618
HK$ million unless otherwise specified
Gross additions
to fixed assets
140
444
32
99
21
70
**
**
3,872
46
169
57
205
24
**
II
**
538
* **
-46
-I
4
** 35
8
20
* 0
0
14
-2
23
144
1,924
2,104
Value added
196
1,454
87
188
105
134
**
**
7,118
85
766
374
1,255
268
**
93
**
3,079
* **
4
17
19
** 76
396
530
-I
7
10
145
86
265
412
4,116
5,039
Floor area
('OOO m2 )
0
#
18
3
8
**
**
1273
5
7
5
52
21
**
11
**
111
* ** 13
41
62
** 288
558
969
2
17
11
12
20
I 216
1280
79

5. 7 Principal Statistics for All Establishments Classified by Major Group and Analysed by Business Receipts and Other Income, 1989 Survey of Transport and Related Services (Continued)
Major group/Business receipts and other income (HK$'000)
Inland water transport
Below 100
100-499
500--999
1,000-4,999
5,000-9,999
10,000-19,999
20,000-49,999
50,000 and over
Sub-total
Snpporting services to water transport
Below 100
100-499
500-999
1,000-4,999
5,000-9,999
10,000--19,999
20,000-49,999
50,000 and over
Air transport
100-499
500-999
1,000-4,999
5,000-9,999
10,000-19,999
20,000-49,999
50,000 and over
Sub-total
Sub-total
Services incidental to transport
Below 100
100-499
500-999
1,000-4,999
5,000-9,999
10,000-19,999
20,000-49,999
50,000 and over
Sub-total
Total
Number of
establishments
111
167
178
145
42
11
3
9
666
41
705
165
559
80
23
22
9
I 605
2
7
13
4
10
6
11
54
68
171
268
838
391
350
413
210
2 710
35638
Notes: *denotes figure within ± HK$0.5 million. # denotes figure less than 500 m 2 .
Number of
persons engaged
190
497
875
1 332
742
374
259
2479
6 747
40
1115
432
3 830
1 004
852
1 620
1 240
JO 133
6
17
110
177
504
673
13 873
15 359
64
484
954
3 874
3 119
3 697
4 988
15 384
32 563
160195
**Figures are suppressed for confidentiality reasons.
Number of
employees
29
242
661
1137
725
370
259
2479
5902
0
188
119
3 213
966
845
1 620
1240
8 191
6
17
110
177
504
673
13 873
15 359
3
453
764
3 323
2 953
3 683
4987
15 384
31551
126565
Compensation of
employees
*
9
44
84
57
33
31
233
492
0
11
6
264
99
79
177
181
818
**
3
18
20
79
**
3,721
3,953
* 14
38
186
243
283
418
1,408
2,589
14,115
Source: Transport and Services Statistics Section, Census and Statistics Department.
80
Operating expenses
2
29
39
112
166
115
68
623
1,154
138
85
809
361
212
491
632
2,729
**
2
16
12
63
**
11,722
11,866
5
49
128
1,747
2,463
4,270
10,853
30,689
50,203
87,814
Business receipts
and Mher income
7
55
111
277
268
174
110
1226
2,227
3
208
110
1,254
500
323
738
1,063
4,200
**
6
34
32
149
** 19,085
19,475
5
59
181
1,970
2,701
4,661
11,381
32,827
53,784
114,578
HK$ million unless otherwise specified
Gross additions
to fixed assets
5
-6
-4
6
12
31
149
195
0
88
13
96
56
30
23
61
368
**
*
* 2
**
2,419
2,485
* 7
3
* 23
22
155
337
547
10,129
Value added
5
29
76
176
120
65
48
590
1,110
2
78
32
522
216
158
294
516
1,818
**
3
18
20
86
**
8,378
8,621
* 10
53
221
248
388
487
2,160
3,568
30,882
Floor area
('OOO m2 )
0
# 2
# 119
124
0
1
21
46
54
263
362
747
**
# 2
5
**
180
198
4
11
39
60
51
63
266
496
5197
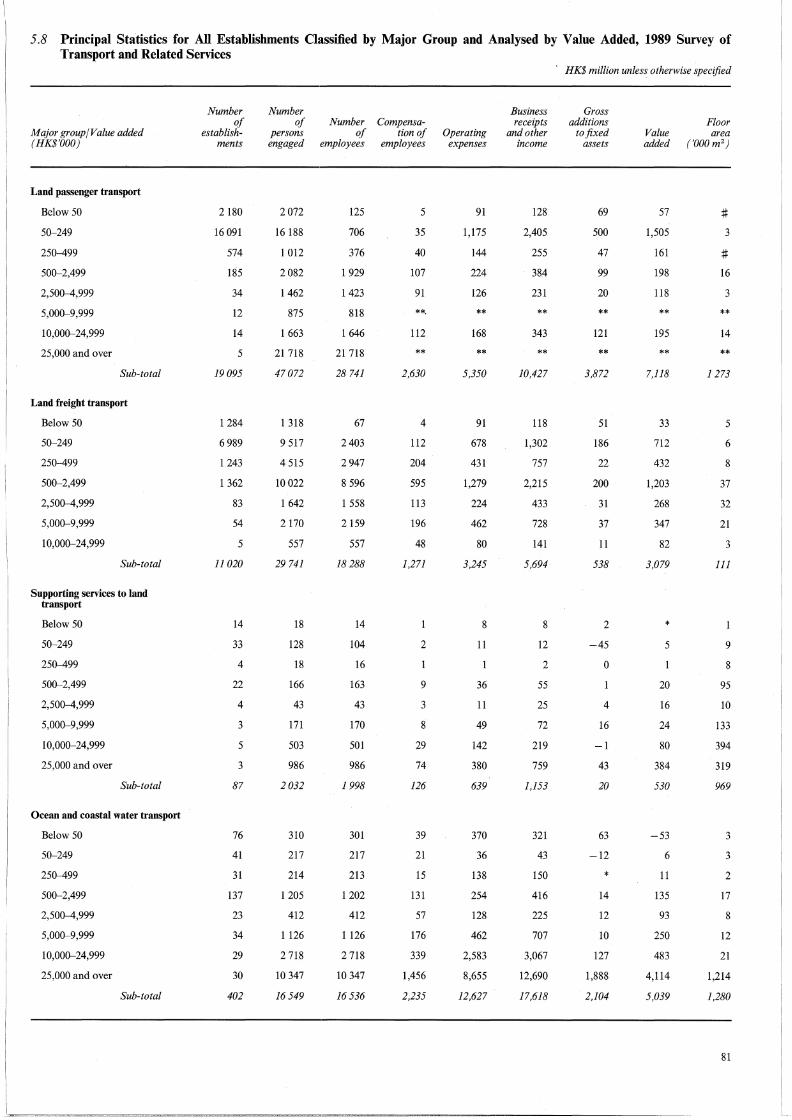
5.8 Principal Statistics for All Establishments Classified by Major Group and Analysed by Value Added, 1989 Survey of Transport and Related Services
Major group/Value added (HK$'000)
Land passenger transport
Below 50
50-249
250-499
500-2,499
2,500-4,999
5,000-9,999
10,000-24,999
25,000 and over
Sub-total
Land freight transport
Below 50
50-249
250-499
500-2,499
2,500-4,999
5,000-9,999
10,000-24,999
Sub-total
Supporting services to land transport
Below 50
50-249
250-499
500-2,499
2,500-4,999
5,000-9,999
10,000-24,999
25,000 and over
Sub-total
Ocean and coastal water transport
Below 50
50-249
250-499
500-2,499
2,500-4,999
5,000-9,999
10,000-24,999
25,000 and over
Sub-total
Number of
establishments
2180
16 091
574
185
34
12
14
5
19095
1284
6989
1 243
1 362
83
54
5
11020
14
33
4
22
4
3
5
3
87
76
41
31
137
23
34
29
30
402
Number of
persons engaged
2072
16 188
1 012
2082
1462
875
1 663
21 718
47072
1 318
9 517
4 515
10 022
1 642
2 170
557
29 741
18
128
18
166
43
171
503
986
2032
310
217
214
1205
412
1126
2 718
10 347
16549
Number of
employees
125
706
376
1 929
1423
818
1 646
21 718
28 741
67
2403
2 947
8 596
1 558
2 159
557
18 288
14
104
16
163
43
170
501
986
1998
301
217
213
1202
412
1126
2 718
10 347
16536
Compensation of
employees
5
35
40
107
91
**·
112
**
2,630
4
112
204
595
113
196
48
1,271
2
9
3
8
29
74
126
39
21
15
131
57
176
339
1,456
2,235
Operating expenses
91
1,175
144
224
126
**
168
**
5,350
91
678
431
1,279
224
462
80
3,245
8
11
36
11
49
142
380
639
370
36
138
254
128
462
2,583
8,655
12,627
Business receipts
and other income
128
2,405
255
384
231
**
343
**
10,427
118
1,302
757
2,215
433
728
141
5,694
8
12
2
55
25
72
219
759
1,153
321
43
150
416
225
707
3,067
12,690
17,618
HK$ million unless otherwise specified
Gross additions
to fixed assets
69
500
47
99
20
**
121
**
3,872
51
186
22
200
31
37
11
538
2
-45
0
4
16
-1
43
20
63
-12
* 14
12
10
127
1,888
2,104
Value added
57
1,505
161
198
118
**
195
**
7,118
33
712
432
1,203
268
347
82
3,079
* 5
20
16
24
80
384
530
-53
6
11
135
93
250
483
4,114
5,039
Floor area
('OOO m2 )
# 3
# 16
3
**
14
**
1273
5
6
8
37
32
21
3
111
9
8
95
10
133
394
319
969
3
3
2
17
8
12
21
1,214
1,280
81

5.8 Principal Statistics for All Establishments Classified by Major Group and Analysed by Value Added, 1989 Survey of Transport and Related Services (Continued)
Major group/Value added (HK$'000)
Inland water transport
Below 50
50-249
250-499
500-2,499
2,500-4,999
5,000-9,999
10,000-24,999
25,000 and over
Sub-total
Supporting services to water transport
Below 50
50-249
250-499
500-2,499
2,500-4,999
5,000-9,999
10,000-24,999
25,000 and over
Air transport
50-249
250-499
500-2,499
2,500-4,999
5,000-9,999
10,000-24,999
25,000 and over
Sub-total
Sub-total
Service incidental to transport
Below 50
50-249
250-499
500-2,499
2,500-4,999
5,000-9,999
10,000-24,999
25,000 and over
Sub-total
Total
Number of
establishments
48
176
151
223
46
11
3
8
666
132
727
78
561
54
19
25
8
1605
4
5
13
4
10
8
10
54
347
930
474
660
137
84
58
20
2 710
35638
Notes: *denotes figure within ± HK$0.5 million. # denotes figure less than 500 m 2 •
Number of
persons engaged
73
353
721
1 695
842
380
259
2424
6747
354
1 038
273
3 943
869
710
1 865
1 080
10133
8
13
73
98
547
797
13 823
15 359
1 527
2 704
2 721
7 590
3 820
4 341
5494
4367
32 563
160 195
**Figures are suppressed for confidentiality reasons.
Number of
employees
0
144
475
1485
735
380
259
2424
5 902
96
145
197
3 259
843
710
1 861
1 080
8 191
8
13
73
98
547
797
13 823
15 359
1465
2047
2 525
7 493
3 820
4 341
5494
4 366
31551
126565
Compensation of
employees
0
5
28
108
**
34
31
**
492
6
10
11
280
79
60
204
169
818
2
16
13
87
123
3,713
3,953
77
100
137
580
351
394
550
401
2,589
14,115
Source: Transport and Services Statistics Section, Census and Statistics Department.
82
Operating expenses
24
31
184
**
131
68
**
1,154
53
186
29
943
241
202
499
576
2,729
4
2
26
7
198
72
11,557
11,866
2,904
3,596
2,326
11,382
5,787
7,484
12,277
4,448
50,203
87,814
Business receipts
and other income
2
40
76
361
**
193
110
** 2,227
44
271
53
1,415
355
302
758
1,003
4,200
5
3
42
20
276
200
18,929
19,475
2,767
3,728
2,476
12,182
6,277
8,079
13,089
5,187
53,784
114,578
HK$ million unless otherwise specified
Gross additions
to fixed assets
-3
10
-12
** 15
31
**
195
-1
94
28
87
48
28
35
49
368
* *
* 67
64
2,354
2,485
5
-7
6
107
104
136
132
64
547
10,129
Value added
18
49
190
**
69
48
** 1,110
-8
95
26
549
182
138
333
504
1,818
2
16
13
77
127
8,385
8,621
-138
120
153
723
488
561
801
859
3,568
30,882
Floor area
('OOO m2 )
0
#
2
**
# **
124
34
32
123
263
293
747
# #
6
9
180
198
16
28
27
89
68
71
115
83
496
5197
---------------------~·--·~-

5.9 Comparison of Principal Statistics for All Transport Establishments, 1983-1989 HK$ million unless otherwise specified
Number Number Business Gross of of Number Compensa- receipts additions
establish- persons of tion of Operating and other to fixed Value Major group ments engaged employees employees expenses income assets added
Land passenger transport 1983 18 013 47 396 29 723 1,528 2,912 5,056 7,238 3,230 1984 19 902 49 481 29 241 1,683 3,227 5,894 4,268 3,808
( +10) ( +4) (-2) ( + 10) ( + 11) ( + 17) (-41) ( + 18) 1985 20 947 51 317 29 764 1,822 3,837 6,782 10,609 4,247
( +5) (+4) ( +2) ( +8) ( + 19) ( + 15) ( + 149) ( + 12) 1986 20944 50 304 29 211 1,892 4,080 7,307 3,741 4,720
(*) ( +2) (-2) ( +4) ( +6) ( +8) (-65) ( + 11) 1987 20 707 48 058 28 639 2,004 4,631 11,705 1,202 5,564
(-1) (-4) (-2) ( +6) ( + 14) ( +60) (-68) ( + 18) 1988 19 664 46 748 28 026 2,186 4,774 9,524 2,735 6,170
(-5) (-3) ( -2) ( +9) ( +3) (-19) ( + 128) ( + 11) 1989 19 095 47072 28 741 2,630 5,350 10,427 3,872 7,118
(-3) ( + 1) ( +3) ( +20) ( + 12) ( +9) ( +42) ( + 15)
Land freight transport 1983 11 948 26 689 14 985 497 1,413 2,592 152 1,494 1984 10 837 23 300 12 217 466 1,340 2,453 146 1,405
(-9) ( -13) (-18) (-6) (-5) (-5) (-4) (-6) 1985 9 870 25 095 14 890 605 1,469 2,718 187 1,534
(-9) (+s) ( +22) ( +30) ( +10) ( + 11) ( +28) ( +9) 1986 9 391 25 250 15 821 686 1,714 3,131 302 1,744
(-5) ( + 1) (+6) ( + 13) ( + 17) ( + 15) ( +61) ( + 14) 1987 9 556 26 703 17 172 873 2,299 4,006 442 2,243
( +2) ( +6) ( +9) ( +27) ( +34) ( +28) ( +46) ( +29) 1988 10 919 31 067 20 286 1,156 3,289 5,498 647 2,946
( + 14) ( + 16) ( + 18) ( +32) ( +43) ( +37) ( +46) ( +31) 1989 11 020 29 741 18 288 1,271 3,245 5,694 538 3,079
( +1) (-4) (-10) ( +10) (-1) ( +4) (-17) ( +4)
Supporting services to land transport ' 1983 49 675 654 31 70 381 5 306
1984 102 1 019 969 43 148 467 21 314 ( + 108) ( +51) ( +48) ( +37) ( + 112) ( +23) ( + 317) ( +2)
1985 79 1 098 1 063 51 179 513 12 327 (-23) ( +8) ( +10) ( +20) ( +21) ( + 10) (-43) ( +4)
1986 77 1 212 1182 60 206 581 4 369 (-3) ( + 10) ( + 11) ( + 17) ( + 15) ( + 13) ( -64) ( + 13)
1987 86 1 608 1 586 88 365 872 165 503 ( + 12) ( +33) ( +34) ( +47) ( +77) ( +50) ( +3 752) ( +36)
1988 78 1 594 1 548 92 486 923 13 419 (-9) (-1) (-2) ( +5) ( +33) (+6) (-92) (-17)
1989 87 2032 1 998 126 639 1,153 20 530 ( + 12) ( +27) ( +29) ( +37) ( +32) ( +25) ( +58) ( +27)
Ocean and coastal water transport 1983 421 15 655 15 626 1,236 8,239 10,494 146 2,304
1984 410 15 210 15 167 1,332 9,503 12,347 284 2,923 (-3) (-3) (-3) ( +8) ( + 15) ( + 18) ( +94) ( +27)
1985 401 15 097 15 081 1,352 9,555 12,121 718 2,690 (-2) (-1) (-1) ( + 1) ( + 1) (-2) ( + 153) (-8)
1986 347 14 047 14 021 1,383 9,886 12,775 90 2,784 (-13) (-7) (-7) ( +2) ( +3) ( +5) (-87) ( +4)
1987 388 14 913 14 888 1,550 10,261 14,219 469 3,939 ( + 12) ( +6) ( +6) ( + 12) ( +4) ( + 11) ( +421) ( +41)
1988 379 15 176 15 151 1,772 10,909 15,986 1,461 5,058 (-2) ( +2) ( +2) ( + 14) (+6) ( + 12) ( +212) ( +28)
1989 402 16 549 16 536 2,235 12,627 17,618 2,104 5,039 ( +6) ( +9) ( +9) ( +26) ( + 16) ( + 10) ( +44) (*)
Inland water transport 1983 789 7093 5 617 248 536 967 104 470 1984 718 6454 5 354 266 638 1,097 140 523
(-9) (-9) (-5) ( + 7) ( + 19) ( + 13) ( +34) ( + 11) 1985 747 6 738 5 640 299 729 1,275 133 603
( +4) ( +4) ( +5) ( + 12) ( + 14) ( + 16) (-5) ( + 15) 1986 656 5 965 5 020 282 831 1,367 107 581
(-12) (-11) ( -11) (-6) ( + 14) ( + 7) (-20) (-4) 1987 610 5 999 4974 319 713 1,301 121 622
(- 7) ( + 1) (-1) ( + 13) (-14) (-5) ( + 14) ( + 7) 1988 661 6 517 5 753 421 1,071 1,853 455 825
( +8) ( +9) ( + 16) ( +32) ( +50) ( +42) ( +276) ( +33) 1989 666 6 747 5 902 492 1,154 2,227 195 1,110
( + 1) ( +4) ( +3) ( + 17) (+s) ( +20) (-57) ( +35)
Supporting services to water transport 1983 683 5 026 4498 222 797 1,273 156 652
1984 626 5 392 4 842 260 1,015 1,534 265 688 (-8) ( +7) ( +8) ( + 17) ( +27) ( +21) ( + 70) ( +6)
1985 758 6 836 6154 347 1,243 1,917 313 923 ( +21) ( +27) ( +27) ( +33) ( +22) ( +25) ( + 18) ( +34)
1986 953 8 037 7276 497 1,618 2,506 156 1,189 ( +26) ( + 18) ( + 18) ( +43) ( +30) ( +31) (-50) ( +29)
1987 1130 8 792 7 730 579 2,274 3,333 324 1,417 ( + 19) ( +9) ( +6) ( + 16) (+40) ( +33) ( + 108) ( + 19)
1988 1 376 8 517 7 068 613 2,382 3,514 359 1,466 ( +22) ( -3) (-9) (+6) ( +5) ( +5) ( + 11) ( +3)
1989 1 605 10 133 8 191 818 2,729 4,200 368 1,818 ( + 17) ( + 19) ( + 16) ( +33) ( + 15) ( +20) ( +2) ( +24)
83

5.9 Comparison of Principal Statistics for All Transport Establishments, 1983--1989 (Continued)
HK$ million unless otherwise specified
Number Number Business Gross of of Number Compensa- receipts additions
establish- persons of tion of Operating and other to fixed Value Major group ments engaged employees employees expenses income assets added
Air transport 1983 46 8441 8441 1,051 4,231 6,227 -1,847 1,891 1984 47 8 905 8 905 1,249 5,624 8,043 -318 2,013
( +2) (+5) ( +5) ( +19) ( +33) ( +29) (t) (+6) 1985 50 9 388 9 388 1,470 6,218 8,571 199 1,922
( +6) ( +5) ( +5) ( + 18) ( + 11) ( +7) (t) (-5) 1986 54 10224 10224 1,818 7,047 10,464 593 2,733
(+8) (+9) ( +9) ( +24) (+13) (+22) ( + 198) ( +42) 1987 54 11 507 11 507 2,353 7,839 12,815 599 5,609
(-) ( +13) ( +13) ( +29) ( + 11) (+22) ( +52) ( + 105) 1988 53 13 090 13 090 3,127 9,064 16,716 2,126 8,432
(-2) ( +14) ( +14) (+33) ( +16) ( +30) ( +255) ( +50) 1989 54 15 359 15 359 3,953 11,866 19,475 2,485 8,621
(+2) ( +17) ( + 17) (+26) ( +31) ( +17) ( + 17) ( +2)
Services incidental to transport 1983 1 787 18 703 17934 807 14,897 16,207 160 1,288 1984 1838 20577 19 820 954 19,928 21,519 199 1,430
(+3) ( + 10) (+11) ( + 18) (+34) ( +33) ( +24) ( + 11) 1985 1960 21 875 20956 1,114 21,141 22,838 342 1,685
(+7) (+6) (+6) ( +17) (+6) ( +6) (+72) ( +18) 1986 1882 23 216 22 583 1,311 27,451 29,557 331 2,138
(-4) (+6) (+8) ( +18) (+30) (+29) (-3) ( +27) 1987 2 031 25 656 25 153 1,570 32,942 35,478 417 2,525
(+8) (+11) ( +11) (+20) (+20) (+20) (+26) ( +18) 1988 2402 30023 28 730 2,049 39,989 43,201 923 3,219
( + 18) ( +17) (+14) ( +31) ( +21) ( +22) ( + 121) (+27) 1989 2 710 32 563 31 551 2,589 50,203 53,784 547 3,568
(+13) ( +8) (+10) (+26) (+26) ( +24) (-41) ( + 11)
i\11.transportgroups 1983 33 736 129 678 97 478 5,620 33,095 43,198 6,114 11,634 1984 34479 130 337 96 516 6,254 41,422 53,354 5,005 13,103
(+2) ( +1) (-1) ( + 11) (+25) (+24) (-18) (+13) 1985 34 811 137 445 102 935 7,060 44,372 56,734 12,513 13,933
( +1) ( +5) ( +7) (+13) ( +7) (+6) ( + 150) (+6) 1986 34304 138 255 105 337 7,928 52,834 67,688 5,125 16,258
(-1) (+1) (+2) ( + 12) ( + 19) ( + 19) (-59) ( + 17) 1987 34562 143 236 111 649 9,336 61,323 83,728 3,739 22,423
( + 1) (+4) (+6) ( +18) ( + 16) (+24) (-27) ( +38) 1988 35 531 152 733 119 652 11,416 71,963 97,215 8,720 28,535
(+3) (+7) (+7) ( +22) ( + 17) ( + 16) ( + 133) ( +27) 1989 35 638 160 195 126 565 14,115 87,814 114,578 10,129 30,882
(*) (+5) (+6) (+24) ( +22) ( + 18) ( + 16) (+8)
Government transport services 1983 3 1276 1276 125 288 965 54 730 1984 3 1156 1156 148 243 1,021 78 735
(-) (-9) (-9) ( + 18) (-16) (+6) (+44) ( +1) 1985 3 1179 1179 162 257 1,206 47 851
(-) (+2) ( +2) (+9) ( +6) ( + 18) (-40) ( + 16) 1986 3 1185 1185 179 291 1,335 94 933
(-) ( + 1) ( +1) ( + 11) (+13) ( + 11) ( + 101) ( +10) 1987 3 1199 1199 197 300 1,542 288 1,123
(-) ( + 1) ( + 1) (+9) (+3) ( + 16) ( +208) ( +20) 1988 3 1254 1254 219 337 1,927 204 1,290
(-) (+5) (+5) ( +12) ( +13) ( +25) (-29) ( + 15) 1989 3 1175 1175 249 363 1,985 150 1,605
(-) (-6) (-6) ( + 14) (+8) (+3) (-26) (+24)
Notes: Figures in brackets denoting the percentage changes over the preceding year are derived from unrounded figures. *denotes figure within ±0.5%. tPercentage changes are not presented whenever any of the two figures being compared is negative, as it is very difficult to interpret meaningfully the percentage change obtained.
Source: Transport and Services Statistics Section, Census and Statistics Department.
84
·----·-----

5 .10 Principal Statistics for All Establishments in the Storage, Communication, Financing and Business Services Sectors Classified by Sector and Analysed by Number of Persons Engaged, 1989 Survey of Storage, Communication, Financing, Insurance and Business Services
Sector/Number of persons engaged
Storage
Below 5
5-9
10-19
20-49
50-99
100-199
200-499
Communication
Below 5
5-9
10-19
10-49
50-99
100-199
200-499
500 and over
Finan~ing
Below 5
5-9
10-19
20-49
50-99
100-199
200-499
500 and over
Business services
Below 5
5-9
10-19
20-49
50-99
100-199
200-499
500 and over
Sub-total
Sub-total
Sub-total
Sub-total
Total
Number of
establishments
32
72
55
24
17
207
208
77
95
13
17
424
2133
494
439
186
65
41
26
3 386
7166
1442
611
396
112
56
34
16
9833
13850
Nwnber of
persons engaged
85
477
710
801
1203
813
294
4384
420
466
1077
339
1104
499
1375
20825
26105
3144
3 263
5427
5 758
4615
5 275
7021
1100
35 603
11194
8 457
8132
11178
6684
7 569
10 904
16002
80121
146 212
Number of
employees
76
459
708
801
1203
813
294
4 355
243
415
I 077
329
1104
499
1 375
20 825
25 867
2496
2 982
5 225
5 755
4615
5 269
7015
1100
34458
5 763
7 461
7 803
10 681
6534
7497
10 773
15 864
72 377
137 057
Compensation of
employees
33
59
69
125
383
10
23
51
15
73
24
157
2.558
2,910
357
290
923
1,128
966
1,275
6,487
361
773
806
1,645
1.004
1.120
1,253
1,202
8,164
17,944
Operating expenses
18
149
237
329
353
1,439
17
11
29
15
120
54
652
4.044
4,942
4,624
916
2,671
2,758
3,063
1,839
19,896
2.378
1,797
1,619
2.489
1.557
2,358
1,129
368
13,693
39,970
Total value of
purchases of goods for sale
66
232
638
949
12
10
45
56
89
82
34
327
1,276
Changes in
stocks
-LO
-0.2
27.6
0.6
12.3
32,l
71.4
-OJ
0.2
0.3
1.8
4.2
6.4
2.5
3.7
19.1
90.5
Business receipts
and other income
32
185
390
491
795
2,423
45
42
92
35
224
66
1,514
12,402
14,419
7,144
1,589
7,593
10,660
6,797
8,864
54,249
3,527
2,949
3,393
5,110
3,162
4,104
3,613
2,211
28,070
99,161
HK$ million unless otherwise specifi,ed
Gross additions
to fixed assets
-4
4
-86
18
-58
198
355
2,740
3,299
40
79
150
1,118
110
369
2,149
162
389
67
240
123
-4
367
62
1,406
6,796
Value added
17
50
189
181
428
1,117
27
24
64
17
69
601
7,637
8,446
585
344
396
884
1,225
521
5,373
1,159
1,165
1,671
2,560
1,502
1,666
2,457
1,759
13,938
28,875
Floor area
('OOO m2 )
60
513
311
385
674
2496
17
461
497
34
31
92
87
47
75
434
165
148
86
154
67
69
118
53
860
4288
Notes: In the financing sector, value added was not compiled for investment and holding companies due to the special features of their business operation. Hence, total value added for the sector did not include that of investment and holding companies.
*denotes figure within ± HK$0.5 million. **Figures are suppressed for confidentiality reasons.
Source: Transport and Services Statistics Section, Census and Statistics Department.
85
l_

5.11 Principal Statistics for All Establishments in the Storage, Communication, Financing and Business Services Sectors Classified by Sector and Analysed ·by Business Receipts and Other Income, 1989 Survey of Storage, Communication, Financing, Insurance and Business Services
Sector/Business receipts and other income (HK$'000)
Storage
Below 500
500-999
1,000-4,999
5,00(}-9,999
10,000-19,999
20,000-49,999
50,000 and over
Communication
Below500
500-999
1,000-4,999
5,000-9,999
10,()()(}-19,999
20,000-49,999
50,000 and over
Financing
Below 500
50(}-999
1,000-4,999
5,00(}-9,999
IQ,()()(}-19,999
20,000-49,999
50,000 and over
-....Sservices
Below 500
50(}-999
1,000-4,999
5,00(}-9,999
10,000-19,999
20,000-49,999
50,000 and over
Suh-total
Sub· total
Sub-total
Sub-total
Total
Number of
establish· ments
18
80
48
20
21
12
207
254
91
47
11
13
424
1561
297
852
218
166
120
173
3386
5760
1143
1995
403
289
164
78
9833
13850
Number of
persons engaged
67
59
578
534
630
I 005
1511
4384
720
I 034
785
397
625
176
22367
26105
2 706
I 777
6560
2389
3141
6 353
12678
35603
8 616
3 391
14886
7256
10634
12278
23059
80121
146212
Number of
employees
49
59
568
534
630
1005
1511
4355
492
1034
775
397
625
176
22367
25867
2169
I 534
6215
2382
3135
6348
12675
34458
4318
2544
13 355
7011
10 373
12103
22672
72377
137057
Compensation of
employees
2
4
41
45
57
100
136
383
16
39
26
35 .. 2,738
2,910
138
104
587
335
527
1,014
3,783
6,487
218
140
1,251
653
924
1,824
3,153
8,164
17,944
Operating expenses
4
4
117
247
188
367
512
1,439
15
22
27
36
4,776
4,942
409
95
1,039
. 567
1,149
2,032
14,604
19,896
550
462
2,491
1,087
2,037
2,085
4,981
13,693
39,970
Total value of
purchases of goods for sale
2
23
917
949
10 .
11
83
80
16
127
327
1,276
Changes in
stocks
-0.2
-1.0
5.7
67.0
71.4
-0.1
0.3
0.3
4.0
1.1
13.5
19.1
90.5
Business receipts
and other income
7
175
332
288
641
976
2,423
36
80
70
95
14,030
14,419
-35
201
1,810
1,308
2,322
3,543
45,101
54,249
1,002
750
4,096
2,679
3,976
4,657
10,910
28,070
99,161
HK$ million unless otherwise specified
Gross additions
to fixed assets
-1
-1
-108
39
11
-58
7 .. 3,285
3,299
51
42
23
47
25
389
1,572
2,149
52
166
375
54
79
147
533
1,406
6,796
Value added
78
n5
98
295
527
1,117
21
56
36
40 .. 8,250
8,446
60
82
464
398
478
380
3,510
5,373
453
311
1,604
1,502
1,858
2,492
5,719
13,938
28,875
Floor area
('000m2 )
14
13
359
410
268
531
901
2496
2
2
2
481
497
19
15
81
29
39
67
185
434
IOI
59
175
84
99
114
228
860
4288
Notes: In the financing sector, value added was not compiled for investment and holding companies due to the special features of their business operation. Hence, total value added for the sector did not include that of investment and holding companies.
*denotes figure within ± HK$0.5 million. #denotes figure within ± HK$0.05 million. **Figures are suppressed for confidentiality reasons.
SllUl'ce: Transport and Services Statistics Section, Census and Statistics Department.
86
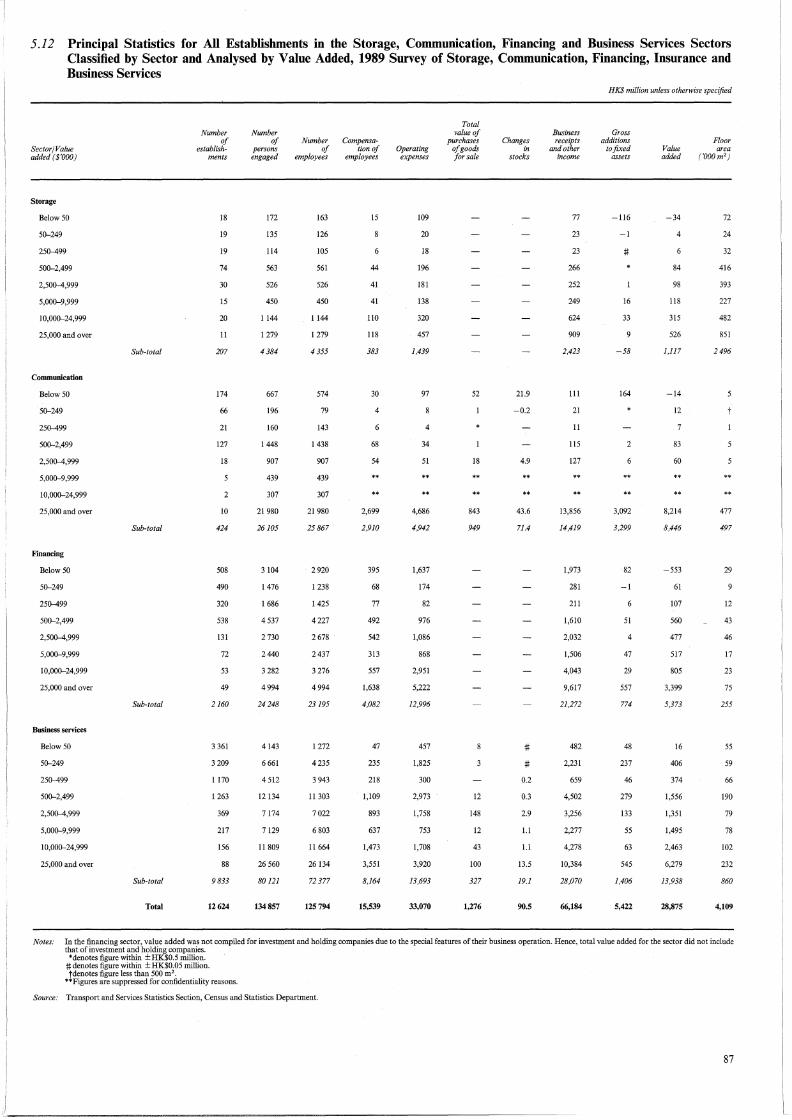
5.12 Principal Statistics for All Establishments in the Storage, Communication, Financing and Business Services Sectors Classified by Sector and Analysed by Value Added, 1989 Survey of Storage, Communication, Financing, Insurance and Business Services
Sector/Value added ($'000)
Storage
Below 50
50-249
250-499
500-2,499
2,500-4,999
5,000-9,999
10,000-24,999
25,000 and over
Communication
Below 50
50-249
250-499
500-2,499
2,500-4,999
5,000-9,999
10,000-24,999
25,000 and over
Financing
Below 50
50-249
250-499
500-2,499
2,500-4,999
5,000-9,999
10,000-24,999
25,000 and over
Busines.s services
Below 50
50-249
250-499
500-2,499
2,500-4,999
5,000-9,999
10,000-24,999
25,000 and over
Sub-total
Sub-total
Sub-total
Sub-total
Total
Nwnber of
establishments
18
19
19
74
30
15
20
11
207
174
66
21
127
18
lO
424
508
490
320
538
131
72
53
49
2160
3 361
3209
1170
1263
369
217
156
88
9833
12624
Number of
persons engaged
172
135
114
563
526
450
1144
1279
4384
667
196
160
1448
907
439
307
21980
26105
3104
1476
1686
4 537
2 730
2440
3 282
4994
24248
4143
6661
4 512
12134
7174
7129
11 809
26 560
80121
134857
Number of
employees
163
126
105
561
526
450
1144
1279
4 355
574
79
143
1438
907
439
307
21 980
25 867
2920
1238
1425
4227
2 678
2437
3276
4994
23 195
1272
4235
3 943
11 303
7022
6 803
11664
26134
72 377
125794
Compensation of
employees
15
44
41
41
110
118
383
30
4
68
54
2,699
2,910
395
68
77
492
542
313
557
1,638
4,082
47
235
218
1,109
893
637
1,473
3,551
8,164
15,539
Operating expenses
109
20
18
196
181
138
320
457
1,439
97
4
34
51
4,686
4,942
1,637
174
82
976
1,086
868
2,951
5,222
12,996
457
1,825
300
2,973
1,758
753
1,708
3,920
13,693
33,070
Total value of
purchases of goods for sale
52
18
843
949
12
148
12
43
100
327
1,276
Changes in
stocks
21.9
-0.2
4.9
43.6
71.4
0.2
0.3
2.9
I.I
I.I
13.5
19.1
90.5
Business receipts
and other income
77
23
23
266
252
249
624
909
2,423
Ill
21
11
115
127
13,856
14,419
1,973
281
211
1,610
2,032
1,506
4,043
9,617
21,272
482
2,231
659
4,502
3,256
2,277
4,278
10,384
28,070
66,184
HK$ million unless otherwise specified
Gross additions
to fixed assets
-116
-I
16
33
-58
164
3,092
3,299
82
-I
51
4
47
29
557
774
48
237
46
279
133
55
63
545
1,406
5,422
Value added
-34
84
98
118
315
526
1,117
-14
12
83
60
8,214
8,446
-553
61
107
560
477
517
805
3,399
5,373
16
406
374
1,556
1,351
1,495
2,463
6,279
13,938
28,875
Floor area
('OOO m2 )
72
24
32
416
393
227
482
851
2496
477
497
29
12
43
46
17
23
75
255
55
59
66
190
79
78
102
232
860
4,109
Notes: In the financing sector, value added was not compiled for investment and holding companies due to the special features of their business operation. Hence, total value added for the sector did not include that of investment and holding companies.
*denotes figure within ±HK$0.5 million. jj: denotes figure within ± HK$0.05 million. tdenotes figure less than 500 m'.
**Figures are suppressed for confidentiality reasons.
Source: Transport and Services Statistics Section, Census and Statistics Department.
87
I L_

5.13 Principal Statistics for All Establishments in the Insurance Sector Analysed by Number of Persons Engaged, 1989 Survey of Storage, Communication, Financing, Insurance and Business Services
HK$ million unless otherwise specified
Number Gross Number of Number Compensa- Funds Income additions Floor of estab- persons of tionof Operating Net Net and and to fixed area
Number of persOns engaged lishments engaged employees employees expenses premiums claims reserves receipts assets ('OOO m2 )
Below 5 1347 2208 1456 128 452 2,109 1,695 8,139 4,068 -21 17
5--9 156 903 835 87 74 85 112 86 371 -8
10-19 73 896 896 138 118 254 176 345 742 10 12
20-49 76 2 319 2 318 369 286 1,131 867 1,939 2,874 130 33
50-99 26 1860 1 860 267 231 598 507 1,212 2,086 32 26
100-199 12 l 886 1886 254 138 1,008 1,269 3,797 2,593 55 20
200-499 1260 1260 156 84 525 328 1,176 1,126 12
500 and over 8478 8 478 1,286 347 2,618 816 4,967 3,244 29 46
Total 1699 19810 18988 2,685 1,731 8,327 5,771 21,661 17,105 234 175
Source: Transport and Services Statistics Section, Census and Statistics Department.
5.14 Principal Statistics for All Establishments in the Insurance Sector Analysed by Income and Receipts, 1989 Survey of Storage, Communication, Financing, Insurance and Business Services
HK$ million unless otherwise specified
Number Gross Number of Nwnber Compensa- Funds Income additions Floor of estab- persons of tionof Operating Net Net and and to fixed area
Income and receipts ( HK$'000) lishments engaged employees employees expenses premiums claims reserves receipts assets ('OOO m2 )
Below 500 1231 2099 1295 80 98 2 181 -21 13
500-999 88 313 295 31 26 57 -1 4
1,000-4,999 177 1123 1123 144 200 29 40 493 13
5,000-9,999 54 773 772 112 91 53 43 77 339 -8
10,000-19.999 32 789 789 123 111 92 63 149 459 10 11
20,000-49,999 52 1662 1662 265 230 505 386 880 1,671 139 23
50,000 and over 65 13 052 13 052 1,930 973 7,667 5,249 20,507 13,904 111 103
Total 1699 19810 18988 2,685 1,731 8,327 5,771 21,661 17,105 234 175
Note: *denotes figure within ±HK$0.5 million.
Source: Transport and Services Statistics Section, Census and Statistics Department.
88

5.15 Comparison of Principal Statistics for All Establishments in the Storage, Communication, Financing, Insurance and Business Services Sectors, 1983-1989
HK$ million unless otherwise specified
Number Number Business of of Number Compensa- receipts
establish- persons of tionof Operating and other Value Sector ments engaged employees employees expenses income added
Storage 1983 201 3 840 3 827 167 530 995 445 1984 191 3 476 3 466 161 547 915 455 1985 172 3 322 3 317 165 573 873 405
(-10) (-4) (-4) ( +3) ( +5) (-5) (-11) 1986 194 4072 4064 209 708 1,097 533
( +13) ( +23) ( +23) ( +26) ( +24) ( +26) ( +32) 1987 194 3 772 3 755 232 871 1,388 672
(-) (-7) (-8) ( + 11) ( +23) ( +26) ( +26) 1988 189 4313 4 306 323 1,104 1,764 825
(-3) ( +14) ( + 15) ( +40) (+27) ( +27) ( +23) 1989 207 4 384 4 355 383 1,439 2,423 1,117
( + 10) ( +2) (+I) ( + 19) ( +30) ( +37) ( +35)
Communication 1983 109 19 487 19402 1,276 2,069 5,253 3,056 1984 132 19 355 19 319 1,399 2,552 6,226 3,479 1985 162 19 616 19 532 1,543 1,757 6,548 4,225
(+23) (+I) ( + 1) ( + 10) (-31) ( +5) ( +21) 1986 181 22 663 22 533 1,672 2,343 8,024 4,895
( + 12) ( +16) ( + 15) ( +8) ( +33) ( +23) ( +16) 1987 201 22 171 22043 1,970 3,133 9,955 5,834
( + 11) (-2) (-2) (+18) ( +34) ( +24) ( + 19) 1988 286 24 803 24 575 2,347 4,085 12,372 7,115
( +42) ( +12) ( + 11) (+19) ( +30) ( +24) ( +22) 1989 424 26105 25 867 2,910 4,942 14,419 8,446
( +48) ( +5) ( +5) ( +24) ( +21) ( + 17) ( + 19)
Financing 1983 2 117 18 535 17 123 1,368 5,084 13,982 2,269 1984 2036 18 067 16 926 1,663 6,222 16,956 3,144 1985 2009 19 814 18 664 1,957 5,781 18,190 3,147
(-1) (+10) ( + 10) ( + 18) (-7) ( + 7) (*) 1986 2 141 21 262 20 244 2,472 7,866 26,766 5,120
(+7) ( + 7) ( +8) ( +26) ( +36) ( +47) ( +63) 1987 2433 26464 25 412 3,687 11,376 41,077 5,831
( + 14) ( +24) ( +26) ( +49) ( +45) ( +53) ( + 14) 1988 2958 32013 30 747 4,603 15,436 42,876 4,770
( +22) ( +21) ( +21) ( +25) ( +36) ( +4) (-18) 1989 3 386 35 603 34458 6,487 19,896 54,249 5,373
( +14) ( + 11) ( +12) ( +41) (+29) ( +27) ( + 13)
Business services 1983 3 867 40 438 37 023 2,199 3,789 7,856 3,912 1984 4405 45 891 42 304 2,794 4,522 9,513 4,764 1985 5 189 52 889 48 459 3,403 5,306 11,234 5,690
( + 18) (+15) ( + 15) ( +22) (+17) ( +18) ( +19) 1986 6043 58 272 53 016 3,990 7,203 14,585 7,129
( +16) ( + 10) (+9) ( +17) ( +36) ( +30) ( +25) 1987 6 697 65 530 59 867 5,255 9,263 19,026 9,470
( + 11) ( + 12) ( + 13) ( +32) ( +29) ( +30) ( +33) 1988 8 097 73 686 67 311 6,641 11,172 24,137 12,665
(+21) ( + 12) ( +12) ( +26) ( +21) ( +27) ( +34) 1989 9 833 80 121 72 377 8,164 13,693 28,070 13,938
( +21) (+9) ( +8) ( +23) ( +23) (+16) ( +10)
Insurance 1983 I 007 9 579 9 084 659 641 6,199 1984 I 003 10 608 10077 737 628 6,967 1985 I 073 11 964 11428 922 825 8,582
(+7) (+13) ( + 13) (+25) ( +31) ( +23) (-) 1986 1 053 13 235 12 616 1,087 904 11,461
(-2) ( + 11) ( + 10) ( + 18) ( + 10) ( +34) (-) 1987 1 426 15 580 14 732 1,499 1,113 12,077
( +35) ( +18) ( + 17) ( +38) ( +23) ( +5) (-) 1988 1 650 17 851 16 791 2,002 1,435 14,133
(+16) ( + 15) ( +14) ( +34) ( +29) ( +17) (-) 1989 I 699 19 810 18 988 2,685 1,731 17,105 -
( +3) ( +11) ( + 13) ( +34) ( +21) ( +21) (-)
Government/Semi-government iustitutions 1983 2 4347 4 347 314 337 758 1984 2 4 431 4431 366 333 877 1985 2 4 512 4 512 423 433 1,067
(-) ( +2) ( +2) ( + 15) ( +30) (+22) (-) 1986 2 4605 4605 479 544 1,229
(-) ( +2) (+2) (+13) ( +26) ( + 15) (-) 1987 2 4 711 4 711 545 645 1,406
(-) ( +2) ( +2) ( +14) ( + 19) ( + 14) (-) 1988 2 4900 4900 631 684 1,661
(-) ( +4) ( +4) ( +16) ( +6) ( + 18) (-) 1989 2 5 011 5 011 754 775 1,841
(-) ( +2) ( +2) ( +20) ( + 13) (+II) (-)
Notes: In the financing sector, value added was not compiled for investment and holding companies due to the special features of their business operation. Hence, total value added for the sector did not include that of investment and holding companies. Figures in brackets denoting percentage changes over the preceding year are derived from unrounded figures. *denotes figure within ± 0.5%.
Source: Transport and Services Statistics Section, Census and Statistics Department.
89

5.16 Summary Statistics from the Annual Survey of Banks, Deposit-taking Companies and Representative Offices of Foreign Banks for 1980-1989
(a) Banks HK$ 'OOO unless otherwise specified
1980 1981 1982 1983 1984 1985 1986 1987 1988 1989
(1) Number of establishments 115 123 131 136 140 143 148 156 160 169
(2) Commissions, fees and charges received for the provision of the following services
(a) Credit bills transactions and loans (excluding syndicated loans) 701,077 862,268 951,015 1,219,371 1,407,546 1,439,357 1,818,302 2,366,095 2,764,819 3,265,085
(b) Current account operations, executor and trustee services, guarantees, portfolio management, remittance, merchant banking advisory services 281,950 299,379 331,710 425,778 574,033 716,229 967,037 1,510,415 1,542,185 1,856,172
(c) Syndication ofloans 88,683 90,513 105,851 100,883 100,691 114,175 147,410 198,722 268,795 330,235
(3) Net interest receipts i.e. interest received minus interest paid 5,023,610 7,271,401 8,021,149 8,079,941 8,176,752 8,260,531 9,823,737 13,166,283 15,881,348 18,169,522
(4) Profit from foreign exchange dealing 1,112,195 1,362,110 1,383,077 1,645,629 1,323,461 2,026,673 2,825,784 4,488,314 3,982,341 4,345,261
(5) Dividends received and profit from trading in securities 1,186,060 1,440,800 1,426,471 1,136,825 1,677,730 1,683,076 2,486,964 3,939,406 4,990,091 3,618,488
(6) Wages and salaries paid and other employee benefits offered 1,746,565 2,465,515 3,159,801 3,656,111 4,080,073 4,644,665 4,973,282 5,746,999 7,223,974 8,677,906
(7) Rental payment 450,876 881,377 1,112,857 1,419,908 1,430,437 1,472,880 1,378,632 1,446,307 1,624,851 2,008,933
(8) Office stationery and supplies 170,242 247,970 277,262 314,861 353,171 381,696 389,196 464,348 542,173 624,072
(9) Advertising, promotion, communication, entertainment and staff travelling expenses 248,770 321,580 388,581 404,928 433,259 520,057 635,872 842,612 968,917 1,179,146
(10) Other administrative expenses, including professional fees, insurance premiums, etc. 405,635 576,455 787,914 788,086 780,428 876,301 1,044,205 1,172,343 1,391,089 1,643,305
(11) Amongst expenses covered by items (9) and (10) above, the amount incurred outside Hong Kong 43,553 72,431 75,573 102,710 108,221 138,793 127,741 148,233 193,240 180,051
Note: Items (2) to (8) include expenses incurred or income generated in Hong Kong only; whereas items (9) and (10) include expenses incurred both in Hong Kong and outside Hong Kong.
90

5.16 Summary Statistics from the Annual Survey of Banks, Deposit-taking Companies and Representative Offices of Foreign Banks for 1980-1989 (Continued)
(b) Deposit-taking Companies HK$ 'OOO unless otherwise specified
1980 1981 1982 1983 1984 1985 1986 1987 1988 1989
(1) Number of establishments 296 350 360 364 362 347 318 290 268 258
(2) Commissions, fees and charges received for the provision of the following services
(a) Credit bills transactions and loans (excluding syndicated loans) 117,509 176,366 159,917 145,794 177,252 194,614 231,454 304,272 325,999 520,676
(b) Executor and trustee services, guarantees, portfolio management, remittance, merchant banking advisory services 170,635 254,805 176,513 215,453 335,165 414,401 507,788 571,330 569,348 531,319
(c) Syndication ofloans 169,469 281,637 297,906 298,943 283,241 242,720 203,416 221,012 238,879 282,090
(3) Net interest receipts i.e. interest received minus interest paid 1,607,094 2,299,991 2,824,959 3,082,579 3,171,643 2,668,475 2,550,710 3,417,094 3,799,473 3,941,133
(4) Profit from foreign exchange dealing 167,039 251,773 272,836 294,183 138,467 312,326 265,433 352,017 394,277 273,698
(5) Dividends received and profit from trading in securities 120,934 979,449 748,435 1,003,285 1,198,747 1,823,782 1,915,857 514,859 872,845 901,335
(6) Wages and salaries paid and other employee benefits offered 377,407 536,997 656,426 809,019 940,059 995,744 1,147,079 1,237,446 1,301,986 1,442,891
(7) Rental payment 93,433 172,906 229,661 275,374 264,068 238,455 248,862 252,693 294,617 387,187
(8) Office stationery and supplies 26,082 36,465 42,637 44,745 54,142 56,885 62,390 68,022 67,139 71,186
(9) Advertising, promotion, communication, entertainment and staff travelling expenses 108,876 142,634 171,453 195,525 218,186 232,059 265,684 306,848 309,749 327,529
(10) Other administrative expenses, including professional fees, insurance premiums, etc. 166,093 185,311 243,495 243,908 202,892 201,344 232,987 269,076 279,161 304,666
(11) Amongst expenses covered by items (9) and (10) above, the amount incurred outside Hong Kong 31,069 46,030 61,458 72,367 95,149 98,630 122,679 109,524 125,141 143,533
Note: Items (2) to (8) include expenses incurred or income generated in Hong Kong only; whereas items (9) and (10) include expenses incurred both in Hong Kong and outside Hong Kong.
(c) Representative Offices of Foreign Banks HK$'000 unless otherwise specified
1980 1981 1982 1983 1984 1985 1986 1987 1988 1989
Number of establishments 107 121 118 129 132 148 152 157 175 184
Wages and salaries paid to staff located in Hong Kong and other employee benefits offered to them 31,953 43,365 36,964 53,704 58,852 79,032 89,135 104,467 117,073 159,466
Other operating expenses 41,500 54,228 58,514 64,215 70,874 71,937 98,680 118,517 117,035 179,494
Source: Distribution and Services Statistics Branch, Census and Statistics Department.
91

5.17 Value and Volume Indexes of Retail Sales by Trade Groups/Selected Trades
Monthly average of October 1984-September 1985=100
Index 1981 1982 1983 1984 1985 1986 1987 1988 1989 1990
Major trade groups
Foodstuffs, alcoholic drinks and tobacco Value 68 74 86 98 101 106 117 130 147 165 Volume 90 88 93 98 101 105 110 112 116 122
Fuels Value 69 80 94 99 101 89 94 102 112 137 Volume 89 97 98 99 100 100 104 110 112 113
Clothing, footwear and allied products Value 62 66 75 93 104 119 138 169 181 189 Volume 88 84 89 99 102 111 121 134 131 127
Consumer durables Value 81 77 81 98 101 111 131 157 153 168 Volume 101 91 91 99 101 103 113 126 115 121
Other consumer goods Value 75 80 89 100 101 106 129 165 173 178 Volume 96 95 95 100 100 100 113 135 134 130
Selected trades
Supermarkets Value 45 56 74 95 103 115 138 160 182 211 Volume 64 71 84 96 103 112 129 137 141 150
Motor vehicles and parts Value 126 89 64 79 102 125 178 247 278 295 Volume 192 119 73 82 101 106 138 175 185 182
Consumer durables (other than motor Value 67 73 86 103 101 107 117 130 114 129 vehicles and parts) Volume 80 85 95 103 101 102 105 110 94 102
Department stores Value 66 72 80 96 102 106 137 190 211 238 Volume 84 85 86 96 101 100 120 152 155 163
All retail trades Value 73 77 85 98 101 107 125 152 160 172 Volume 95 92 93 99 101 103 113 126 125 125
Value of total retail sales (HK$ million) 48,960 51,471 57,377 66,108 67,901 71,996 84,003 101,896 107,524 115,365
Notes: 'Supermarkets' are included in 'foodstuffs, alcoholic drinks and tobacco'. 'Motor vehicles and parts' are included in 'consumer durables'. 'Department stores' are included in 'other consumer goods'.
Source: Wholesale/Retail Trade Statistics Section, Census and Statistics Department.
. 5.18 Value and Volume Indexes of Restaurant Receipts by Type of Restaurant
Quarterly average of October 1984-September 1985=100
Type of restaurant Index 1983 1984 1985 1986 1987 1988 1989 1990
Chinese restaurants Value 87 97 101 109 130 146 166 183 Volume 94 99 101 106 120 122 119 114
Non-Chinese restaurants Value 87 98 100 105 121 143 170 195 Volume 96 IOI 99 100 108 118 123 124
Fast food shops Value 79 90 103 119 137 170 217 255 Volume 88 91 102 116 129 150 167 174
Bars Value 86 92 102 112 123 129 136 160 Volume 92 96 101 105 110 112 112 122
Other eating and drinking places Value 90 100 103 112 128 135 153 161 Volume 102 104 101 108 115 116 112 108
All restaurants Value 86 97 101 109 128 147 170 190 Volume 94 99 100 105 118 123 123 120
Value of total restaurant receipts (HK$ million) 16,029 17,994 18,792 20,224 23,850 27,285 31,524 35,311
Source: Wholesale/Retail Trade Statistics Section, Census and Statistics Department.
92

Section 6 External Trade
Tables 6.1 to 6.16 General Information
This section provides an overview of significant changes in the direction and composition of Hong Kong's external trade over the past ten years, with analyses by major trading partners and by major commodities. To facilitate analyses, trade indexes are also included to indicate value, unit value and quantum changes over time.
The Federal Republic of Germany (FRG) and German Democratic Republic (GDR) came into unification on 3 October 1990. The unified new state is known as FRG. As from 1990, statistics on Hong Kong's trade with the FRG refer to those with the unified Germany. Where past data are presented, they are the total figures of the previous FRG and GDR in order to ensure comparability with the figures after unification. For separate statistics on Hong Kong's trade with the two independent states prior to 1990, reference should be made to earlier publications.
As from 1990, statistics on Hong Kong's trade with "Soviet Union and Eastern Europe" no longer include GDR. The statistics of the unified Germany are included in those of "Western Europe". Where past data are presented, the trade values for GDR have been deducted from those for "Soviet Union and Eastern Europe" and added to those for "Western Europe" in order to ensure comparability with the figures after German unification. For trade statistics of these regions prior to 1990 without making any adjustment for German unification, reference should be made to earlier publications.
Similar approach is also adopted for presenting the quantum index for FRG. For simplicity and since Hong Kong had relatively little trade with the previous GDR, the unit value indexes of previous FRG alone are used for deflating the value index of the two states taken together to obtain the quantum index.
Concepts and Definitions
External trade statistics cover movements of merchandise between Hong Kong and her trading partners, by land, air and water and to a limited extent by post, except the following classes of goods:
Transhipment cargo under through bill oflading or through air waybill;
Transit cargo;
Articles imported or exported by the armed forces of the Crown;
Ships' stores, including bunker fuel; aircraft stores, including aviation fuel;
Personal baggage and possessions of travellers, not including motor vehicles;
Advertising materials supplied free of charge and samples of no commercial value or valued at less than one thousand dollars;
Marine fish arriving direct from fishing grounds on fishing craft registered or licensed in Hong Kong;
Gifts of a personal nature where no payment has been made by the receiver;
Articles temporarily imported and exported solely for exhibition and subsequent return;
Articles imported or exported under and in accordance with an A. T.A. carnet;
Circulatory used freight containers and the like;
Banknotes after issue into circulation, being legal tender in any country.
The external trade statistics relate to movements of merchandise only. Statistics on gold and specie are not included but are separately available.
Imports are c.i.f. (cost, insurance and freight) values while exports and re-exports are f.o.b. (free-on-board) values.
Imports are goods which have been produced or manufactured in places outside the jurisdiction of Hong Kong and brought into Hong Kong by land, air or water for domestic use or for subsequent re-export.
93

94
Domestic exports are the natural produce of Hong Kong or the products of a manufacturing process in Hong Kong which has changed permanently the shape, nature, form or utility of the basic materials used in manufacture.
Re-exports are products which have previously been imported into Hong Kong and which are re-exported without having undergone in Hong Kong a manufacturing process which has changed permanently the shape, nature, form or utility of the product. ·
Commodity items are classified and arranged in accordance with the Hong Kong Trade Statistics Classification List, 1988 which is based on the United Nations Standard International Trade Classification (S.I.T.C.) Revision 2, with some modifications to suit Hong Kong's local requirements. Owing to the re-classification of commodity items in 1981 and 1986, the trade indexes as well as values of imports and re-exports of consumer goods, raw materials and semi-manufactures and capital goods are not strictly comparable throughout the periods described in the tables. Explanatory footnotes on specific comparability problems are further provided in individual tables where necessary.
Statistics on domestic exports by industrial origin are derived by re-grouping all six-digit merchandise export items under the external trade classification system according to the industries in which these merchandise items are normally produced. Transactions in gold and specie are excluded.
The classification of merchandise export items by industrial origin is structured upon the United Nations International Standard Industrial Classification of All Economic Activities (I.S.I.C.) Revision 2, as distinct from the United Nations Standard International Trade Classification (S.I.T.C.) Revision 2, which is adopted in compiling external trade statistics in Hong Kong.
Caution must be taken when referring to the domestic export statistics classified by industrial origin. Certain merchandise export items may require several intermediate processing stages for their production. In such cases, the industry in which an item is finally produced is not the sole contributor to the export value of that item. Nevertheless, for statistical purpose, the total value of the item has wholly been allocated to that industry in compiling these domestic export statistics classified by industrial origin.
Besides, the classification of a merchandise export item to a particular industry does not imply that the entire export value of the item is attributable to the establishments of that industry, since part of the value may be attributable to establishments classified under other industries as secondary products.
Data sources The value and quantity statistics of external trade are based on information reported in trade declarations which importers and exporters are required by the Import and Export (Registration) Regulations to lodge with the Customs and Excise Department. All declarations are checked against cargo manifests supplied by carriers to ensure that there are no omissions or duplications.
Compilation and Calculation Statistics of trade value and quantity and trade indexes are compiled from external transaction data reported by traders on trade declarations.
The unit value for a commodity item is the quotient of the value over its quantity. As such, the unit value data (as opposed to market prices) are not free of the effect of change, especially improvements, in quality or of change in product mix within a commodity classification. As from March 1983, prices of selected imports (c.i.f.) and exports (f.o.b.) are collected and used to compile price indexes. These price indexes, which are based on product specifications, are used where appropriate to substitute the unit value indexes where problems of change in quality, product mix, markets, sources, etc. exist.
The unit value index is obtained by first computing the price relative (based on unit values and specification price data) in the current period over that in the previous year, using the trade values in the previous year as weights to aggregate the price relatives of different commodity items. The result, being an index with previous year as base, is converted to an index with 1981 as base by the method of chaining to the index in the previous year.
Quantum index numbers are derived by dividing the value indexes by the corresponding unit value indexes, and as a result are derived as a residual and subject to the limitations mentioned above.
Further References Trade statistics are published monthly by the Census and Statistics Department in such reports as the Hong Kong Trade Statistics, Hong Kong External Trade, Hong Kong Trade Index Numbers, and annually in the Hong Kong Review of Overseas Trade and Hong Kong Trade Statistics Annual Supplement.

6.1 Overseas Merchandise Trade HK$ million
Type of trade 1981 1982 1983 1984 1985 1986 1987 1988 1989 1990
Imports
Value 138,375 142,893 175,442 223,370 231,420 275,955 377,948 498,798 562,781 642,530
Annual change(%) +24 +3 +23 +27 +4 +19 +37 +32 +13 +14
Domestic exports
Value 80,423 83,032 104,405 137,936 129,882 153,983 195,254 217,664 224,104 225,875
Annual change(%) + 18 +3 +26 +32 -6 +19 +27 +11 +3 +I
Re-exports
Value 41,739 44,353 56,294 83,504 105,270 122,546 182,780 275,405 346,405 413,999
Annual change(%) +39 +6 +27 +48 +26 +16 +49 +51 +26 +20
Total trade
Value 260,537 270,277 336,142 444,811 466,572 552,484 755,982 991,867 1,133,291 1,282,405
Annualchange(o/o) +24 +4 +24 +32 +5 +18 +37 +31 +14 +13
Merchandise trade balance -16,212 -15,508 -14,743 -1,929 +3,733 +575 +87 -5,729 +7,728 -2,656
Source: Trade Analysis Section, Census and Statistics Department.
6.2 Trade by Area HK$ million
Type of trade/Area 1981 1982 1983 1984 1985 1986 1987 1988 1989 1990
Imports
North America* 15,337 16,579 20,446 25,708 23,473 24,724 34,276 44,027 49,015 54,504 Western Europe# 19,852 21,003 24,760 30,198 32,274 39,529 52,490 65,303 70,289 78,878 Soviet Union and Eastern Europe# 408 370 703 715 643 752 1,165 1,687 1,260 1,169 Central and South America* 887 931 1,465 1,863 1,836 1,690 2,941 5,329 5,562 4,860 Middle East 1,394 1,748 1,322 1,390 1,780 2,704 3,887 5,214 5,666 5,293 Asia 96,077 97,796 121,451 156,986 164,379 198,371 274,098 365,897 419,386 486,257 Africa 1,468 1,102 1,646 2,096 2,524 2,976 2,973 4,206 4,466 4,041 Australasia and Oceania 2,524 2,939 3,349 4,093 4,132 4,810 5,735 6,791 6,830 7,294
Postal packages 428 425 300 321 379 397 383 343 307 235
Total imports 138,375 142,893 175,442 223,370 231,420 275,955 377,948 498,798 562,781 642,530
Domestic exports
North America* 31,555 33,860 47,573 65,935 62,133 69,163 78,533 78,868 78,460 71,736 Western Europe# 23,725 23,718 27,145 33,102 28,501 37,307 50,083 56,190 53,396 54,811 Soviet Union and Eastern Europe# 197 177 242 349 449 327 253 334 399 664 Central and South America* 2,642 2,032 1,209 1,616 1,632 2,270 2,833 2,793 2,949 3,622 Middle East 3,225 3,508 3,506 3,369 2,765 3,022 2,996 2,858 2,446 2,099 Asia 11,970 13,397 18,271 26,191 27,884 34,847 52,036 67,673 78,238 85,679 Africa 3,709 2,548 2,440 2,200 1,654 2,052 2,848 2,850 2,187 2,084 Australasia and Oceania 3,230 3,421 3,573 4,628 4,084 4,150 4,725 5,242 5,215 4,417
Postal packages 170 371 446 547 780 847 946 855 813 762
Total domestic exports 80,423 83,032 104,405 137,936 129,882 153,983 195,254 217,664 224,104 225,875
Re-exports
North America* 5,079 5,971 8,737 13,068 15,892 24,006 34,994 53,225 77,446 94,280 Western Europe# 3,259 3,161 3,692 4,706 6,445 10,766 21,141 34,437 49,305 74,200 Soviet Union and Eastern Europe# 30 77 124 203 387 412 470 659 1,346 1,635 Central and South America* 1,014 799 579 947 1,049 1,541 2,436 3,249 6,467 8,608 Middle East 1,926 2,273 3,000 2,837 2,797 3,373 4,211 5,265 6,636 6,835 Asia 27,453 29,221 36,965 57,799 74,941 77,220 110,867 166,207 190,301 210,955 Africa 2,087 1,842 1,900 1,991 1,900 2,764 4,772 6,537 7,369 9,664 Australasia and Oceania 891 1,010 1,299 1,952 1,859 2,464 3,888 5,826 7,536 7,821
Total re-exports 41,739 44,353 56,294 83,504 105,270 122,546 182,780 275,405 346,405 413,999
Notes: *Puerto Rico was classified under the region of North America before 1988 and under the region of Central and South America with effect from 1988.
#In connection with the unification of Federal Republic of Germany (FRG) and German Democratic Republic (GDR) in October 1990, trade figures for 'Western Europe' in 1990 and previous years have been revised by adding the trade figures for the previous GDR. At the same time, trade values for GDR are deducted from those for 'Soviet Union and Eastern Europe'. The purpose of these adjustments is to ensure comparability with the trade figures after the German unification.
Source: Trade Analysis Section, Census and Statistics Department.
95

6.3 Trade by Main Country HK$ million
Type of trade/Main country 1981 1982 1983 1984 1985 1986 1987 1988 1989 1990 Imports (Main supplier) 138,375 142,893 175,442 223,370 231,420 275,955 377,948 498,798 562,781 642,530
China 29,510 32,935 42,821 55,753 58,963 81,633 117,357 155,634 196,676 236,134 Japan 32,130 31,540 40,333 52,620 53,350 56,398 71,905 93,008 93,202 103,362 Taiwan 10,762 10,198 12,448 17,347 20,898 23,977 33,337 44,357 51,587 58,084 United States of America 14,442 15,459 19,179 24,377 21,896 23,198 32,242 41,347 46,234 51,788 Republic of Korea 5,495 4,557 5,050 7,289 8,293 10,970 16,959 26,257 25,465 28,155
Domestic exports (Main market) 80,423 83,032 104,405 137,936 129,882 153,983 195,254 217,664 224,104 225,875 United States of America 29,200 31,223 43,802 61,374 57,687 64,219 72,817 72,884 72,162 66,370 China 2,924 3,806 6,223 11,283 15,189 18,022 27,871 38,043 43,272 47,470 Federal Republic of Germany* 7,071 7,045 8,074 9,602 8,083 11,086 14,942 16,242 15,757 17,991 United Kingdom 7,710 7,187 8,538 10,497 8,546 9,918 12,905 15,524 14,638 13,496 Japan 2,940 3,167 3,910 5,151 4,480 6,212 9,489 11,435 13,028 12,079
Re-exports (Main country of destination) 41,739 44,353 56,294 83,504 105,270 122,546 182,780 275,405 346,405 413,999 China 8,044 7,992 12,183 28,064 46,023 40,894 60,170 94,895 103,492 110,908 United States of America 4,785 5,615 8,028 12,109 14,705 22,362 32,454 49,483 72,033 87,752 Japan 2,792 2,566 3,176 4,633 5,486 6,676 9,772 17,418 22,268 24,376 Federal Republic of Germany* 626 694 779 1,087 1,611 2,818 5,759 8,983 13,502 23,406 Taiwan 2,420 2,662 3,454 4,868 4,325 5,939 9,685 14,130 16,478 21,248
Re-exports (Main country of origin) 41,739 44,353 56,294 83,504 105,270 122,546 182,780 275,405 346,405 413,999 China 12,834 14,694 19,680 28,107 34,628 51,597 84,266 131,525 188,271 240,410 Japan 8,394 9,084 11,629 18,695 22,504 18,579 24,599 37,714 38,998 42,280 Taiwan 3,379 2,500 2,573 5,111 9,561 8,681 12,680 21,208 26,960 30,283 United States of America 4,041 4,940 6,038 8,516 9,474 10,411 13,586 19,153 22,325 24,490 Republic of Korea 1,954 1,363 1,360 2,314 3,667 3,596 6,188 13,050 11,278 11,610
Note: *In connection with the unification of Federal Republic of Germany (FRG) and German Democratic Republic (GDR) in October 1990, the trade figures for FRG in 1990 and previous years have been revised by adding those of the previous GDR. This is to ensure comparability of those trade figures with those after the German unification.
Source: Trade Analysis Section, Census and Statistics Department.
6.4 Trade by Standard International Trade Classification Commodity Section HK$ million
Type oftrade/S.l.T.C. Commodity Section 1981 1982 1983 1984 1985 1986 1987 1988 1989 1990 Imports 138,375 142,893 175,442 223,370 231,420 275,955 377,948 498,798 562,781 642,530
Food and live animals 13,993 16,172 18,911 20,134 19,965 22,481 25,530 31,303 32,922 35,588 Beverages and tobacco 2,060 2,327 2,672 3,241 3,852 3,944 5,460 7,652 9,836 13,611 Crude materials* 5,616 5,581 7,345 9,310 8,991 9,865 14,806 17,042 17,632 15,701 Mineral fuels and lubricants 10,966 11,477 11,657 12,263 10,826 8,860 9,472 9,520 13,482 15,654 Animal and vegetable oils and fats 427 436 596 688 731 684 672 786 1,041 1,236 Chemicals* 9,059 9,486 12,942 15,523 16,236 21,226 30,679 44,659 43,627 47,802 Manufactured goods classified chiefly
by material# t 40,149 39,734 49,500 63,844 64,621 80,241 107,563 131,769 145,879 158,293 Machinery and transport equipment# 32,298 32,029 39,424 57,741 59,427 66,247 98,184 143,685 156,204 179,383 Miscellaneous manufactured
articles# t 23,179 24,978 31,783 39,715 45,400 60,876 83,520 110,004 139,358 172,376 Commodities and transactions not
classified according to kind 628 671 612 909 1,370 1,533 2,061 2,380 2,801 2,887 Domestic exports 80,423 83,032 104,405 137,936 129,882 153,983 195,254 217,664 224,104 225,875
Food and live animals 1,018 1,150 1,360 1,372 1,346 1,620 1,730 2,016 2,097 2,341 Beverages and tobacco 191 191 404 655 1,116 1,146 1,531 2,086 2,340 3,350 Crude materials* 985 835 1,880 1,920 1,493 1,235 1,912 2,207 2,356 2,155 Mineral fuels and lubricants 99 107 160 312 443 463 502 521 669 780 Animal and vegetable oils. and fats 8 8 10 11 9 10 18 71 97 84 Chemicals* 755 785 1,016 1,312 1,278 1,502 2,512 4,208 5,347 6,651 Manufactured goods classified chiefly
by material# t 8,606 8,313 11,069 13,884 12,911 17,042 24,160 25,845 26,996 26,695 Machinery and transport equipment# 15,043 15,074 23,328 33,300 28,782 33,306 43,155 55,104 56,235 56,124 Miscellaneous manufactured
articles# t 53,381 55,996 64,400 84,041 80,862 95,783 117,205 123,086 125,180 124,806 Commodities and transactions not
classified according to kind 338 574 777 1,129 1,642 1,876 2,529 2,519 2,786 2,890 Re-exports 41,739 44,353 56,294 83,504 105,270 122,546 182,780 275,405 346,405 413,999
Food and live animals 2,128 2,883 3,647 4,055 4,809 6,525 7,477 11,123 11,370 11,423 Beverages and tobacco 466 524 789 1,132 1,497 1,591 2,135 3,690 4,840 8,166 Crude materials* 3,249 3,002 3,642 5,185 5,627 5,807 8,984 12,405 12,684 9,956 Mineral fuels and lubricants 444 506 622 716 691 1,154 1,224 1,677 3,553 3,391 Animal and vegetable oils and fats 59 107 163 148 123 266 241 271 436 555 Chemicals* 3,581 3,909 4,940 6,431 8,027 10,254 15,364 24,641 24,506 27,175 Manufactured goods classified chiefly
by material# t 12,233 12,000 14,168 21,045 27,433 32,474 45,549 62,067 76,427 87,639 Machinery and transport equipment# 10,415 10,905 13,631 23,953 31,299 28,083 45,551 77,426 92,960 108,801 Miscellaneous manufactured
articles# t 8,788 10,385 14,449 20,494 25,239 35,825 55,416 81,171 118,479 155,653 Commodities and transactions not
classified according to kind 378 132 243 347 525 568 838 934 1,151 1,242
Notes: *As there was a re-classification of commodities in 1987, figures for 1985 and 1986 (but not those for 1981to1984) have been revised according to the new classification to permit comparison with those for 1987.
#As there was a re-classification of commodities in 1986, figures for 1985 (but not those for 1981 to 1984) have been revised according to the new classification to permit comparison with those for 1986.
tAs there was a re-classification of commodities in 1989, figures for 1987 and 1988 (but not those for 1981to1986) have been revised according to the new classification to permit comparison with those for 1989.
Source: Trade Analysis Section, Census and Statistics Department.
96

6.5 Imports, Re-exports and Retained Imports by End-use HK$ million
End-use 1981 1982 1983 1984 1985 1986 1987 1988 1989 1990
Raw materials and semi-manufactures* :j:j:
Imports*# 57,235 56,444 75,258 99,740 97,359 119,518 165,470 216,344 230,455 248,690 Re-exports* :j:j: 16,748 16,796 21,411 34,683 42,829 49,161 72,543 108,200 119,513 127,198 Retained raw materials* :j:j: 40,487 39,648 53,847 65,058 54,530 70,357 92,928 108,144 110,942 121,492
Consumer goods* :j:j:
Imports* :j:j: 37,070 38,614 46,659 58,380 66,712 85,181 119,990 164,389 201,482 247,748 Re-exports* :j:j: 17,282 18,074 22,831 30,648 38,454 49,479 77,392 117,000 166,092 219,323 Retained consumer goods* :j:j: 19,788 20,540 23,828 27,732 28,258 35,701 42,598 47,389 35,390 28,425
Capital goods :j:j: Imports# 18,822 19,943 22,540 32,781 36,273 39,501 56,914 77,182 84,394 94,560 Re-exports :j:j: 4,862 5,904 7,596 13,420 18,489 16,259 24,192 37,814 46,621 53,515 Retained capital goods :j:j: 13,960 14,038 14,945 19,360 17,784 23,243 32,722 39,368 37,773 41,045
Foodstuffs Imports 14,660 16,785 19,732 20,681 20,752 23,484 26,754 32,070 33,969 36,991 Re-exports 2,575 3,241 4,022 4,255 5,077 6,861 7,899 11,329 11,414 11,446 Retained foodstuffs 12,084 13,543 15,710 16,426 15,676 16,623 18,855 20,741 22,555 25,546
Fuels Imports 10,588 11,107 11,253 11,788 10,324 8,271 8,819 8,813 12,481 14,542 Re-exports 272 337 435 498 422 787 755 1,062 2,765 2,517 Retained fuels 10,316 10,770 10,818 11,290 9,902 7,484 8,064 7,751 9,716 12,024
Total imports 138,375 142,893 175,442 223,370 231,420 275,955 377,948 498,798 562,781 642,530
Total re-exports 41,739 44,353 56,294 83,504 105,270 122,546 182,780 275,405 346,405 413,999
Total retained imports 96,635 98,540 119,148 139,866 126,149 153,408 195,167 223,393 216,376 228,532
Notes: Retained imports are derived by subtracting the re-export statistics from the corresponding import statistics. Since trading margins and other charges have not been deducted from the re-export figures, the resulting values of retained imports are understated to that extent. There is also a time lag between importation and subsequent re-exportation. *As there was a re-classification of commodities in 1989, figures for 1987 and 1988 (but not those for 1981 to 1986) have been revised according to the new classification to permit comparison with those for 1989.
:j:j: As there was a re-classification of commodities in 1986, figures for 1985 (but not those for 1981 to 1984) have been revised according to the new classification to permit comparison with those for 1986.
Source: Trade Analysis Section, Census and Statistics Department.
6.6 Imports by End-use Category HK$ million
End-use/ Principal commodity 1981 1982 1983 1984 1985 1986 1987 1988 1989 1990
Raw materials and semi-manufactures* :j:j: 57,235 56,444 75,258 99,740 97,359 119,518 165,470 216,344 230,455 248,960 Thermionic, cold cathode and
photo-cathode valves and tubes, photocells, transistors, etc., and parts thereof 4,412 5,036 8,491 12,535 9,394 11,730 17,462 27,204 27,205 28,856
Fabrics of man-made fibres 6,585 6,068 6,804 8,967 9,979 13,506 17,734 18,600 21,419 27,450 Plastic moulding materials :j:j: 2,705 2,828 4,246 5,440 5,127 6,892 11,590 20,892 18,620 20,176 Watch and clock movements 4,187 3,437 4,259 4,725 5,379 7,193 8,587 11,804 12,160 13,834 Iron and steel 3,842 4,035 4,334 5,604 6,072 6,865 7,939 12,139 11,900 11,559 Others* :j:j: 35,504 35,040 47,124 62,469 61,408 73,332 102,158 125,705 139,151 146,816
Consumer goods* :j:j: 37,070 38,614 46,659 58,380 66,712 85,181 119,990 164,389 201,482 247,748 Clothing 5,219 6,464 8,537 11,613 13,216 19,667 25,944 32,360 44,998 54,563 Radios, television sets, gramophones,
records and tape recorders 3,829 2,984 3,900 6,588 7,619 8,629 12,785 21,171 24,813 32,387 Baby carriages, toys, games and
sporting goods :j:j: 995 1,331 1,485 2,180 3,036 4,462 7,382 10,330 13,738 17,585 Footwear 839 1,063 1,284 1,461 1,701 2,089 3,311 5,212 8,103 13,508 Diamonds 3,625 3,660 3,844 3,959 4,028 6,268 8,278 11,600 12,898 12,967 Others* :j:j: 22,563 23,113 27,610 32,579 37,112 44,066 62,290 83,716 96,931 117,187
Capital goods :j:j: 18,822 19,943 22,540 32,781 36,273 39,501 56,914 77,182 84,394 94,560 Electrical, textile and other
industrial machinery and parts :j:j: 4,511 4,020 5,306 7,401 8,507 10,691 15,196 20,163 22,367 23,415 Others# 14,311 15,923 17,234 25,380 27,766 28,810 41,718 57,019 62,027 71,145
Foodstuffs 14,660 16,785 19,732 20,681 20,752 23,484 26,754 32,070 33,969 36,991
Fuels 10,588 11,107 11,253 11,788 10,324 8,271 8,819 8,813 12,481 14,542
Total imports 138,375 142,893 175,442 223,370 231,420 275,955 377,948 498,798 562,781 642,530
Note: *As there was a re-classification of commodities in 1989, figures for 1987 and 1988 (but not those for 1981to1986) have been revised according to the new classification to permit comparison with those for 1989.
:j:j:As there was a re-classification of commodities in 1986, figures for 1985 (but not those for 1981to1984) have been revised according to the new classification to permit comparison with those for 1986.
Source: Trade Analysis Section, Census and Statistics Department.
97

6.7 Imports by End-use by Main Supplier HK$ million
End-use/Main supplier 1981 1982 1983 1984 1985 1986 1987 1988 1989 1990
Raw materials and semi-manufactures# t 57,235 56,444 75,258 99,740 97,359 119,518 165,470 216,344 230,455 248,690
Chinat 9,315 10,010 14,676 21,150 21,608 28,630 41,909 51,160 56,269 58,205 Ja pant 15,280 15,134 20,660 26,073 23,960 27,765 34,431 42,973 43,492 46,354 Taiwant 7,728 7,113 8,328 11,729 13,303 16,256 22,244 28,930 34,496 40,292 Republic of Korea t 3,720 3,129 3,592 5,417 5,967 7,773 11,789 17,801 18,630 21,066 United States of Americat 4,886 4,912 6,650 9,577 7,168 7,402 11,043 16,617 16,965 18,596
Consumer goods# t 37,070 38,614 46,659 58,380 66,712 85,181 119,990 164,389 201,482 247,748
Chinat 9,727 11,423 14,971 21,089 24,405 37,738 56,869 79,106 110,711 143,755 Ja pant 9,001 8,603 10,420 12,770 13,528 12,938 15,437 21,806 20,464 24,892 United States of Americat 3,418 3,827 4,143 4,454 4,889 5,306 7,236 9,108 11,334 13,072 Taiwant 1,650 1,721 2,155 2,746 4,025 3,721 5,000 6,462 7,110 7,968 Switzerland 1,305 1,478 1,814 1,798 1,973 3,130 4,311 5,725 6,112 7,522
Capital goodst 18,822 19,943 22,540 32,781 36,273 39,501 56,914 77,182 84,394 94,560
Ja pant 6,733 6,582 7,829 12,230 14,365 13,991 20,060 26,195 26,399 29,376 Chinat 989 1,054 1,336 1,752 2,138 3,553 6,074 10,857 15,327 18,830 United States of Americat 4,229 4,451 5,168 7,220 6,642 7,160 10,060 11,397 12,863 14,497 Taiwant 787 850 1,268 2,164 2,843 3,346 5,316 8,220 9,017 8,857 Singapore 321 434 639 1,049 1,144 1,285 1,946 2,572 3,226 4,335
Foodstuffs 14,660 16,785 19,732 20,681 20,752 23,484 26,754 32,070 33,969 36,991
China 7,240 7,941 9,071 9,295 8,797 10,210 10,819 13,083 12,627 13,148 United States of America 1,909 2,152 2,494 2,667 2,944 3,116 3,792 4,221 5,024 5,749 Japan 974 1,125 1,377 1,517 1,488 1,702 1,975 2,020 2,165 2,428 Thailand 799 844 1,064 949 1,008 1,164 1,268 1,593 1,930 2,254 Australia 663 789 776 882 846 1,058 1,230 1,431 1,528 1,784
Fuels 10,588 11,107 11,253 11,788 10,324 8,271 8,819 8,813 12,481 14,542
Singapore 7,335 6,829 6,100 6,411 5,757 4,416 4,797 4,878 6,875 9,062 China 2,239 2,507 2,767 2,468 2,015 1,502 1,686 1,428 1,742 2,196 Australia * 180 381 658 623 705 777 656 798 980 Republic of South Africa 154 175 426 555 711 730 580 1,221 1,313 907 Japan 142 96 48 30 8 1 1 14 682 312
Notes: *denotes figure less than HK$0.5 million in magnitude. #As there was a re-classification of commodities in 1989, figures for 1987 and 1988 (but not those for 1981 to 1986) have been revised according to
the new classification to permit comparison with those for 1989. tAs there was a re-classification of commodities in 1986, figures for 1985 (but not those for 1981 to 1984) have been revised according to the new classification to permit comparison with those for 1986.
Source: Trade Analysis Section, Census and Statistics Department.
6.8 Domestic Exports by Industrial Origin HK$million
Industrial origin of the commodities exported 1981 1982 1983 1984 1985 1986 1987 1988 1989 1990
Agriculture, forestry and fishing Agricultural, livestock and poultry
production 43 39 18 12 11 10 Forestry and logging * Fishing 133 132 180 241 243 375 526 626 604 553
Mining and quarrying 2 4 3 7 5
Manufacturing Food 957 1,071 1,252 1,219 1,189 1,317 1,324 1,508 1,652 1,899 Beverages 29 38 97 137 215 229 245 338 334 348 Tobacco 162 154 310 522 907 927 1,294 1,765 2,013 3,017 Textiles (including knitting) 14,387 14,093 18,810 25,281 23,938 30,918 41,471 41,326 44,946 45,195 Wearing apparel, except footwear and knitwear 20,432 20,999 23,979 31,663 29,968 33,343 40,959 42,418 44,499 44,578 Leather and leather products 521 484 589 488 468 427 720 901 964 995 Footwear 424 382 343 522 669 873 1,108 1,236 1,030 861 Wood and cork products, furniture and fixtures 582 493 610 779 752 766 874 859 729 647 Paper and paper products, printing and publishing 1,081 1,236 1,619 2,144 2,356 3,002 4,050 4,955 5,438 6,080 Chemicals and chemical products 832 867 l,o9z 1,433 1,350 1,604 2,507 3,814 4,672 5,952 Products of petroleum and coal 2 1 4 7 6 Rubber products 94 67 154 200 166 147 180 182 132 124 Plastic products 6,713 7,240 7,416 11,819 10,337 12,307 13,647 12,063 10,382 8,753 Non~metallic mineral products 291 225 327 565 474 623 741 747 691 524 Basic metals and fabricated metal products 4,515 4,152 5,644 6,577 5,918 6,277 8,303 10,379 10,166 9,097 Machinery, except electrical 741 886 1,119 1,932 2,958 2,698 4,238 6,611 7,694 7,461 Electrical and electronic products 16,014 16,601 24,928 33,421 27,757 33,784 42,764 53,512 52,792 52,356 Transport equipment 194 158 427 149 146 159 147 174 229 172 Professional and optical equipment 8,173 8,187 9,514 10,571 11,008 13,478 16,432 20,380 20,705 22,530 Other manufacturing industries 3,511 4,694 5,727 7,881 8,558 10,196 13,147 13,239 13,612 13,817
Electricity 99 107 160 312 443 463 502 517 662 774
Miscellaneous items 492 721 83 64 54 58 60 90 140 117
Total 80,423 83,032 104,405 137,936 129,882 153,983 195,254 217,664 224,104 225,875
Notes: Figures from 1983 onwards are based on a new ISIC-SITC conversion which has been updated to take account of changes in trade and industrial classification, whereas the figures for earlier years were based on the old conversion. *denotes figure less than HK$0.5 million in magnitude.
Source: Industrial Research Section, Census and Statistics Department.
98

6.9 Domestic Exports of Principal Commodities by Main Market HK$ million
Principal commodity/Main market 1981 1982 1983 1984 1985 1986 1987 1988 1989 1990
Articles of apparel and clothing accessories 28,288 28,824 34,365 46,714 44,912 52,162 65,321 67,309 71,874 72,165
United States of America 10,950 11,594 16,160 23,632 24,790 26,921 32,023 30,986 34,093 33,778 Federal Republic of Germany# 4,347 4,346 4,616 5,633 4,646 6,411 8,730 9,473 9,274 10,288 United Kingdom 3,580 3,381 3,477 4,449 3,872 4,869 6,091 7,214 7,264 7,231
Watches and clockst 7,104 7,168 8,259 8,875 9,088 11,323 13,393 16,588 16,344 18,319
United States of Americat 1,947 2,509 3,079 3,469 3,735 3,887 4,516 5,539 5,021 5,339 Chinat 372 275 335 387 733 996 1,340 1,836 2,095 2,665 Federal Republic of Germanyt # 521 467 588 597 560 840 1,028 1,186 1,113 1,371
Textiles fabrics 4,116 3,898 5,461 6,759 6,195 9,014 13,600 13,234 14,513 14,832
China 444 594 994 1,356 1,550 2,946 4,555 4,450 5,261 5,853 United States of America 569 443 809 949 809 902 1,225 1,185 1,252 1,209 Philippines 435 373 479 521 427 527 774 789 961 867
Telecommunications equipment, and parts of and accessories for the apparatus and equipment falling within Division 7 6 1,001 1,476 3,900 5,003 4,641 5,887 7,998 11,092 11,840 12,683
China 301 499 705 1,813 1,995 2,359 3,749 5,670 6,465 7,467 United States of America 196 437 2,401 2,038 1,507 2,152 2,577 3,135 2,720 2,374 United Kingdom 76 72 39 102 142 134 244 570 578 498
Electronic components and parts for computers 2,126 1,694 3,833 6,147 4,427 4,327 5,007 7,090 8,197 9,632
United States of America 1,980 1,516 3,115 4,066 2,952 2,888 3,019 3,688 3,758 3,412 Singapore 4 5 78 177 217 331 633 1,350 1,529 2,497 Federal Republic of Germany# 18 20 164 338 251 354 351 302 6)8 755
Jewellery, goldsmiths' and silversmiths' wares and other articles of precious or semi-precious metals, n.e.s. 1,208 1,367 1,718 2,475 2,878 3,611 5,120 6,229 6,577 6,881
United States of America 464 498 755 1,246 1,483 1,650 2,067 2,226 2,349 2,367 Japan 74 122 196 264 276 525 1,107 1,628 1,845 1,800 Switzerland 84 107 118 125 120 139 175 242 264 335
Artificial resins and plastic materials, and cellulose esters and ethers 221 210 301 488 509 597 1,344 2,617 3,586 4,567
China 111 52 101 261 321 393 1,038 2,203 3,088 3,910 Japan 18 63 107 96 90 67 102 102 127 175 Singapore 15 13 6 7 5 3 9 22 53 103
Manufactures of metal 2,027 2,044 2,478 3,152 2,936 3,474 4,510 5,659 5,317 4,523
China 93 156 249 392 489 670 945 1,581 1,494 1,361 United States of America 454 505 700 1,014 888 998 1,232 1,281 1,077 871 United Kingdom 185 183 212 224 229 272 340 411 385 303
Plastic articles 952 1,052 1,452 2,116 2,164 3,106 4,131 4,423 4,789 4,274
China 88 110 198 314 372 559 944 1,261 1,585 1,635 United States of America 309 351 553 883 931 1,304 1,621 1,446 1,466 869 United Kingdom 57 65 89 111 103 171 200 245 246 273
Automatic data processing machines and units thereof 97 112 618 1,459 826 1,279 1,873 3,722 3,949 3,660
United States of America 66 73 317 711 446 496 547 1,079 1,473 1,078 Federal Republic of Germany# 7 10 37 124 30 234 359 702 643 996 Netherlands * * 7 62 39 35 122 502 587 578
Electrical and non-electrical household equipment 2,997 2,728 3,673 5,218 4,551 4,871 5,667 5,479 4,252 3,376
United States of America 1,877 1,688 2,458 3,541 2,854 3,063 2,953 2,201 1,456 913 China 16 20 87 250 386 233 501 789 762 841 Federal Republic of Germany# 96 123 145 181 173 273 452 457 405 367
Notes: 'n.e.s.' denotes not elsewhere specified. *denotes figure less than HK$0.5 million.
#In connection with the unification of Federal Republic of Germany (FRG) and German Democratic Republic (GDR) in October 1990, the trade figures for FRG in 1990 and previous years have been revised by adding those of the previous GDR. This is to ensure comparability of those trade figures with those after the German unification.
tAs there was a re-classification of commodities in 1986, figures for 1985 (but not those for 1981 to 1984) have been revised according to the new classification to permit comparison with those for 1986.
Source: Trade Analysis Section, Census and Statistics Department.
99
I

6.10 Re-exports of Principal Commodities by Main Country of Destination HK$ million
Principal commodity/Main destination 1981 1982 1983 1984 1985 1986 1987 1988 1989 1990
Articles of apparel and clothing accessories 2,197 3,021 4,495 6,184 7,652 13,366 18,279 24,697 37,281 47,822
United States of America 854 1,427 2,278 3,068 3,894 7,727 7,788 8,621 12,930 15,240 Federal Republic of Germany* 73 118 172 294 402 749 1,477 2,384 3,390 6,363 Japan 100 149 174 350 430 646 1,378 3,210 5,903 6,181
Textile yarn, fabrics, made-up articles and related products 6,981 6,431 7,822 12,708 15,999 20,094 28,332 34,375 42,529 47,143
China 3,170 2,670 3,165 6,519 9,626 11,260 14,836 18,422 23,541 28,252 Republic of Korea 241 289 324 574 1,009 1,623 2,825 3,133 3,771 3,309 Philippines 224 220 199 308 318 437 617 711 962 1,066
Baby carriages, toys, games and sporting goods# 255 389 514 1,693 2,838 4,767 9,247 16,196 24,621 32,483
United States of America 38 106 226 1,153 1,999 3,253 5,814 9,455 13,721 . 17,008 United Kingdom 4 13 29 56 98 259 667 1,131 1,845 2,558 Federal Republic of Germany*:# 14 15 17 41 60 192 465 998 1,443 2,356
Thermionic, cold cathode and photo-cathode valves and tubes 2,236 2,200 3,248 5,844 5,376 5,906 9,374 16,340 16,101 15,677
Taiwan 497 511 869 1,537 997 1,859 3,055 4,087 4,653 5,113 China 207 94 206 806 1,712 812 1,586 4,470 3,619 3,105 Singapore 404 487 610 708 467 510 898 1,569 2,318 2,337
Radio-broadcast receivers (including receivers incorporating sound recorders or reproducers) 366 453 550 805 881 1,379 3,938 7,012 11,033 15,253
United States of America 28 39 99 322 276 416 1,267 2,341 3,850 3,890 Federal Republic of Germany* 4 2 5 8 18 87 451 642 1,197 2,769 United Kingdom 12 18 20 24 35 88 244 392 798 813
Travel goods, handbags and similar containers 342 532 840 1,497 2,160 3,199 5,831 8,942 11,823 15,202
United States of America 96 168 361 778 1,216 1,609 2,552 3,641 4,545 5,408 Federal Republic of Germany* 13 15 45 78 110 219 488 713 957 1,544 United Kingdom 19 40 53 83 122 204 435 747 948 1,197
Footwear 360 480 609 783 902 1,199 2,362 4,349 7,806 13,775
United States of America 123 147 181 270 295 495 1,095 2,494 4,935 9,062 Japan 2 2 8 13 23 45 53 100 235 665 Federal Republic of Germany* 6 3 5 8 10 18 62 102 257 588
Telecommunications equipment, and parts of and accessories for the apparatus and equipment falling within Division 76 570 543 872 2,059 3,233 3,231 5,065 7,760 10,297 13,061
China 157 193 458 1,492 2,651 2,308 3,559 4,931 4,962 5,060 United States of America 39 31 67 127 106 243 542 982 2,197 2,827 United Kingdom 11 7 8 13 17 28 68 116 201 512
Watches and clocks:# 2,584 2,265 2,903 3,225 2,926 3,504 4,666 7,000 9,325 10,819
China# 221 180 222 404 433 616 928 1,752 1,904 2,427 United States of America# 204 111 143 194 198 259 613 914 1,436 1,744 Japan# 33 69 93 165 160 334 414 743 1,426 1,406
Other miscellaneous manufactured articles (mainly artificial Dowers of textile material)t 880 967 1,367 1,959 2,135 3,166 5,002 6,525 8,929 10,636
United States of Americat 393 444 637 1,051 1,157 1,518 2,187 2,567 3,511 3,444 China 70 87 212 277 240 321 436 560 808 1,207 Japant 48 52 51 58 113 229 345 533 721 1,043
Notes: *In connection with the unification of Federal Republic of Germany (FRG) and German Democratic Republic (GDR) in October 1990, the trade figures for FRG in 1990 and previous years have been revised by adding those of the previous GDR. This is to ensure comparability of those trade figures with those after the German unification.
:#As there was a re-classification of commodities in 1986, figures for 1985 (but not those for 1981 to 1984) have been revised according to the new classification to permit comparison with those for 1986.
tAs there was a re-classification of commodities in 1989, figures for 1987 and 1988 (but not those for 1981 to 1986) have been revised according to the new classification to permit comparison with those for 1989.
Source: Trade Analysis Section, Census and Statistics Department.
100

6.11 Re-exports of Principal Commodities by Main Country of Origin HK$ million
Principal commodity/Main origin 1981 1982 1983 1984 1985 1986 1987 1988 1989 1990
Articles of apparel and clothing accessories 2,197 3,021 4,495 6,184 7,652 13,~66 18,279 24,697 37,281 47,822
China 1,838 2,711 4,092 5,689 7,168 12,742 17,396 23,724 35,890 46,453 Italy 27 27 29 46 38 68 135 192 286 288 France 23 25 27 37 28 52 102 134 256 190
Textile yarn, fabrics, made-up articles, and related products 6,981 6,431 7,822 12,708 15,999 20,094 28,332 34,375 42,529 47,143
China 2,732 2,811 3,728 5,785 6,915 9,838 15,112 18,880 23,812 24,903 Taiwan 1,782 1,313 1,161 2,430 3,934 4,068 5,385 6,851 8,551 10,931 Republic of Korea 590 479 411 998 1,153 1,325 2,129 3,386 3,831 4,182
Baby carriages, toys, games and sporting goods* 255 389 514 1,693 2,838 4,767 9,247 16,196 24,621 32,483
China 107 187 326 1,421 2,497 4,478 8,817 15,626 23,918 31,587 Taiwan* 48 57 24 22 80 40 66 163 288 366 Japan* 40 77 83 98 72 88 114 146 168 267
Thermionic, cold cathode and photo-cathode valves and tubes 2,236 2,200 3,248 5,844 5,376 5,906 9,374 16,340 16,101 15,677
Japan 330 370 718 1,679 1,749 1,977 2,808 4,815 4,809 4,630 -United States of America 692 757 967 1,728 1,024 1,269 1,984 3,034 3,909 3,846 Republic of Korea 308 295 350 507 728 646 1,091 3,089 2,101 2,049
Radio-broadcast receivers (including receivers incorporating sound recorders or reproducers) 366 453 550 805 881 1,379 3,938 7,012 11,033 15,253
China 40 80 129 371 369 913 3,249 6,157 10,275 14,496 Japan 241 300 340 293 341 269 361 484 509 475 Republic of Korea 3 4 7 12 23 56 95 130 79 63
Travel goods, handbags and similar containers 342 532 840 1,497 2,160 3,199 5,831 8,942 11,823 15,202
China 207 376 676 1,288 1,935 2,813 5,097 7,855 10,419 13,620 France 37 46 63 81 84 161 322 560 798 1,027 Italy 54 67 42 52 51 95 179 258 304 313
Footwear 360 480 609 783 902 1,199 2,362 4,349 7,806 13,775
China 326 434 553 691 760 1,099 2,143 4,114 7,591 13,543 Taiwan 19 24 27 55 117 67 131 133 100 80 Republic of Korea 3 1 1 1 2 5 38 35 27 42
Telecommunications equipment, and parts of and accessories for the apparatus and equipment falling within Division 76 570 543 872 2,059 3,233 3,231 5,065 7,760 10,297 13,061
China 7 5 14 22 17 145 640 1,533 3,617 5,751 Japan 225 273 416 1,036 1,659 1,269 1,806 2,953 3,406 3,628 Taiwan 117 59 48 182 282 331 425 683 1,031 1,187
Watches and clocks* 2,584 2,265 2,903 3,225 2,926 3,504 4,666 7,000 9,325 10,819
China 55 63 108 154 152 378 813 1,853 3,021 3,973 Japan* 1,355 1,302 1,840 1,955 1,853 2,023 2,421 3,265 3,567 3,655 Switzerland 435 358 377 422 480 578 690 1,108 1,709 2,046
Other miscellaneous manufactured articles (mainly artificial flowers of textile material)# 880 967 1,367 1,959 2,135 3,166 5,002 6,525 8,929 10,636
China# 626 717 949 1,481 1,678 2,531 4,224 5,540 7,709 9,062 Taiwan 59 36 166 175 137 205 269 349 499 714 Japan 71 85 84 91 94 104 108 142 199 343
Notes: *As there was a re-classification of commodities in 1986, figures for 1985 (but not those for 1981 to 1984) have been revised according to the new classification to permit comparison with those for 1986.
:jj:As there was a re-classification of commodities in 1989, figures for 1987 and 1988 (but not those for 1981to1986) have been revised according to the new classification to permit comparison with those for 1989.
Source: Trade Analysis Section, Census and Statistics Department.
101

6.12 Trade Indexes 1981 =JOO
Type of trade 1981 1982 1983 1984 1985 1986 1987 1988 1989 1990
Total exports
Value 100.0 104.3 131.5 181.3 192.5 226.4 309.5 403.6 467.0 523.8
Unit value 100.0 107.2 118.0 133.4 134.l 136.9 142.0 146.4 153.7 157.9
Quantum 100.0 97.3 111.5 135.8 143.5 165.3 218.0 275.6 303.8 331.7
Domestic exports
Value 100.0 103.2 129.8 171.5 161.5 191.5 242.8 270.6 278.7 280.9
Unit value 100.0 106.0 116.6 131.3 130.7 133.5 139.4 142.6 146.6 148.6
Quantum 100.0 97.4 111.4 130.6 123.6 143.5 174.l 189.8 190.0 189.0
Imports
Value 100.0 103.3 126.8 161.4 167.2 199.4 273.l 360.5 406.7 464.3
Unit value 100.0 105.6 118.4 131.4 128.0 134.4 139.9 145.7 150.9 154.6
Quantum 100.0 97.8 107.l 122.8 130.6 148.3 195.3 247.4 269.4 300.3
Re-exports
Value 100.0 106.3 134.9 200.l 252.2 293.6 437.9 659.8 829.9 991.9
Unit value 100.0 109.6 120.7 137.1 138.6 141.6 144.7 149.6 158.7 163.5
Quantum 100.0 96.9 111.7 145.9 181.9 207.4 302.6 441.0 522.9 606.6
Terms of trade* 100.0 101.5 99.7 101.5 104.8 101.9 101.5 100.5 101.9 102.1
Note: *The terms of trade index is derived from the ratio of the unit value index for total exports to that for imports.
Source: Trade Analysis Section, Census and Statistics Department.
102

6.13 Unit Value Indexes and Quantum Indexes of Domestic Exports by Principal Commodity 1981 = 100
Principal Commodity 1981 1982 1983 1984 1985 1986 1987 1988 1989 1990
Clothing*# Unit value index 100.0 109.6 122.7 145.6 148.2 151.6 163.1 164.9 169.5 172.5 Quantum index 100.0 93.0 99.0 113.4 107.2 121.7 141.6 144.3 149.9 147.9
Textile fabrics Unit value index 100.0 105.1 114.0 133.2 126.9 125.7 132.9 134.1 135.5 139.1 Quantum index 100.0 90.1 116.4 123.3 118.6 174.3 248.6 239.8 260.2 259.0
Textile yarn and thread Unit value index 100.0 94.0 99.8 112.5 115.3 115.2 121.2 122.6 126.2 129.8 Quantum index 100.0 112.3 157.4 150.2 122.6 154.2 197.7 188.5 199.4 181.5
Textile made-ups and related articles Unit value index 100.0 114.1 132.0 154.7 162.9 168.9 175.5 185.1 197.0 197.9
Quantum index 100.0 79.1 89.3 98.0 87.0 94.0 99.3 96.9 79.9 70.0
Radios of all kindst Unit value index 100.0 98.8 100.6 111.5 105.7 96.9 100.7 102.3 102.3 104.6 Quantum index 100.0 92.2 92.0 109.9 81.9 104.0 112.7 72.8 42.7 29.8
Electronic components Unit value index 100.0 103.2 112.0 114.0 114.5 115.1 112.9 110.1 106.7 106.5 Quantum index 100.0 84.0 133.1 205.0 154.4 148.6 178.1 256.3 311.9 368.4
Footwear Unit value index 100.0 108.0 115.0 127.8 121.7 122.8 128.0 132.0 131.7 136.0 Quantum index 100.0 82.9 81.0 100.6 104.0 119.1 135.9 134.3 108.3 82.2
Metal manufacturest Unit value index 100.0 108.4 115.4 132.6 136.6 137.0 139.9 150.2 165.2 174.9 Quantum index 100.0 94.0 107.8 119.l 108.8 125.7 159.4 189.8 166.4 139.0
Metal ores and scrapt Unit value index 100.0 92.6 112.8 108.5 91.2 86.0 89.8 92.7 93.5 89.5 Quantum index 100.0 81.8 197.6 196.1 183.7 135.8 209.7 247.5 274.2 264.5
Watches and clockst Unit value index 100.0 91.8 94.6 93.7 85.9 91.8 92.4 95.5 94.6 95.0 Quantum index 100.0 109.9 122.9 133.3 151.3 176.8 208.1 248.7 248.9 277.9
Travel goods, handbags and similar articles Unit value index 100.0 108.8 121.0 146.2 153.8 164.1 171.4 172.3 180.8 184.5
Quantum index 100.0 86.9 88.0 85.4 63.9 59.9 59.4 52.3 43.2 35.9
Domestic electrical appliancest Unit value index 100.0 101.2 107.1 116.3 106.8 102.0 105.0 108.7 113.6 115.1 Quantum index 100.0 90.0 114.4 149.8 142.2 159.4 180.2 168.1 124.9 97.8
Other exports*# t Unit value index 100.0 112.0 123.5 135.7 136.2 140.6 145.1 149.8 155.7 157.0 Quantum index 100.0 101.9 118.6 145.8 142.4 168.5 210.9 245.6 241.5 239.5
All domestic exports* Unit value index 100.0 106.0 116.6 131.3 130.7 133.5 139.4 142.6 146.6 148.6 Quantum index 100.0 97.4 111.4 130.6 123.6 143.5 174.1 189.8 190.0 189.0
Notes: *Indexes for 1987 onwards are strictly not directly comparable to those for earlier years due to incorporation of the specification price indexes for toys and knitted outer garments.
#Indexes for 1984 onwards are not strictly comparable to those in the past due to re-classification of commodity items. tlndexes for 1986 onwards are not strictly comparable to those in the past due to re-classification of commodity items.
Source: Trade Analysis Section, Census and Statistics Department.
103

-~
6.14 Unit Value Indexes and Quantum Indexes of Imports and Re-exports by End-use 1981=100
End-use 1981 1982 1983 1984 1985 1986 1987 1988 1989 1990
Imports
Foodstuffs Unit value index 100.0 107.0 120.2 132.4 123.4 123.6 125.6 130.1 134.3 138.6 Quantum index 100.0 107.0 112.0 106.6 114.7 129.6 145.3 168.1 172.5 182.1
Consumer goods* Unit value index 100.0 104.6 119.3 130.9 131.5 143.8 149.3 154.7 162.7 169.8 Quantum index 100.0 99.6 105.5 120.3 136.9 159.0 215.8 285.2 332.3 391.7
Raw materials and semi-manufactures* Unit value index 100.0 105.l 117.0 133.5 128.4 132.5 137.4 143.9 147.1 146.2
Quantum index 100.0 93.9 112.4 130.5 132.5 157.5 210.3 262.5 273.6 297.1
Fuels Unit value index 100.0 98.4 107.1 111.6 104.4 69.9 72.3 69.3 77.6 93.6 Quantum index 100.0 106.6 99.2 99.8 93.4 111.7 115.2 120.l 151.8 146.8
Capital goods* Unit value index 100.0 112.2 125.7 135.0 134.6 155.6 166.5 175.4 181.2 187.3 Quantum index 100.0 94.4 95.3 129.1 143.0 136.5 183.8 236.6 250.4 271.5
All imports Unit value index 100.0 105.6 118.4 131.4 128.0 134.4 139.9 145.7 150.9 154.6 Quantum index 100.0 97.8 107.1 122.8 130.6 148.3 195.3 247.4 269.4 300.3
Re-exports
Foodstuffs Unit value index 100.0 112.6 127.5 144.0 144.6 147.6 146.0 149.6 157.7 160.0 Quantum index 100.0 111.8 122.5 114.8 136.3 180.5 210.1 293.9 281.1 277.8
Consumer goods* Unit value index 100.0 107.8 119.0 133.7 135.0 . 140.l 142.9 145.5 153.8 159.4 Quantum index 100.0 97.0 111.0 132.7 164.6 201.6 309.1 458.8 616.4 785.2
Raw materials and semi-manufactures* Unit value index 100.0 109.6 118.9 136.8 137.2 134.1 138.8 145.3 155.2 159.3
Quantum index 100.0 91.5 107.5 151.3 186.2 218.9 312.2 444.7 459.9 476.7
Fuels Unit value index 100.0 106.3 122.7 134.6 141.7 95:6 105.8 94.l 104.1 114.3 Quantum index 100.0 116.6 130.4 135.9 109.6 302.5 262.4 414.8 976.6 809.6
Capital goods* Unit value index 100.0 115.0 128.4 146.4 150.8 165.4 165.3 173.4 182.9 185.7 Quantum index 100.0 105.6 121.7 188.5 253.3 212.8 316.8 472.l 551.8 623.8
All re-exports Unit value index 100.0 109.6 120.7 137.1 138.6 141.6 144.7 149.6 158.7 163.5 Quantum index 100.0 96.9 111.7 145.9 181.9 207.4 302.6 441.0 522.9 606.6
Note: *Indexes for 1986 onwards are not strictly comparable to those in the past due to re-classification of commodity items.
Source: Trade Analysis Section, Census and Statistics Department.
104
-----~--- ------------------------

6.15 Unit Value Indexes and Quantum Indexes of Imports by Main Supplier 1981 = JOO
Main supplier 1981 1982 1983 1984 1985 1986 1987 1988 1989 1990
China Unit value index 100.0 105.5 112.2 127.5 124.6 120.7 122.5 124.2 128.8 132.3 Quantum index 100.0 105.8 129.4 148.1 160.3 229.2 324.6 424.6 517.4 604.8
Japan Unit value index 100.0 99.5 113.8 124.9 119.9 135.1 138.5 144.8 147.6 145.3 Quantum index 100.0 98.7 110.3 131.1 138.5 129.9 161.6 199.9 196.5 221.5
United States of America Unit value index 100.0 118.0 141.0 155.8 155.7 157.8 166.6 171.6 176.1 178.9 Quantum index 100.0 90.7 94.2 108.3 97.4 101.8 134.0 166.8 181.8 200.5
Taiwan Unit value index 100.0 106.6 113.2 127.3 126.3 128.0 135.1 139.9 145.6 148.8 Quantum index 100.0 88.9 102.2 126.6 153.8 174.0 229.3 294.5 329.3 362.7
United Kingdom Unit value index 100.0 112.7 124.3 132.4 132.3 139.3 146.5 151.5 156.0 161.4 Quantum index 100.0 97.4 95.5 104.7 101.7 106.8 127.3 135.7 132.3 139.2
Source: Trade Analysis Section, Census and Statistics Department.
6.16 Unit Value Indexes and Quantum Indexes of Domestic Exports by Main Market 1981 = 100
Main market 1981 1982 1983 1984 1985 1986 1987 1988 1989 1990
United States of America Unit value index 100.0 108.1 121.3 139.9 141.3 144.5 150.4 152.9 157.5 161.0 Quantum index 100.0 98.9 123.7 150.3 139.8 152.2 165.8 163.3 156.9 141.2
China Unit value index 100.0 108.1 117.9 134.0 136.1 139.4 144.8 146.7 149.2 152.2 Quantum index 100.0 120.5 180.5 287.9 381.5 442.3 658.0 886.6 991.9 1,066.5
United Kingdom Unit value index 100.0 103.7 110.0 124.8 123.6 127.3 132.0 137.0 141.4 143.4 Quantum index 100.0 89.9 100.6 109.1 89.7 101.0 126.8 147.0 134.3 122.1
Federal Republic of Germany* Unit value index 100.0 103.l 108.6 121.4 118.5 121.4 129.7 135.6 137.8 141.7 Quantum index 100.0 96.6 105.1 111.8 96.5 129.1 162.9 169.4 161.7 179.5
Japan Unit value index 100.0 113.9 128.5 136.0 134.2 142.2 155.4 153.8 151.5 153.2 Quantum index 100.0 94.6 103.5 128.9 113.6 148.6 207.7 252.9 292.6 268.2
Notes: *In connection with the unification of FR Germany and German Democratic Republic as from October 1990, the volume indexes for the FR Germany for 1990 and previous years have been revised by combining the trade figures of the two previous states in order to ensure comparability with the figures after unification. For simplicity and because Hong Kong had relatively little trade with the previous German Democratic Republic, the UVIs of previous Federal Republic of Germany alone are used for deflating the value index of the two states taken together to obtain the quantum index.
Source: Trade Analysis Section, Census and Statistics Department.
105

Section 7 Gross Domestic Product
Tables 7.1 to 7.8 Generallnformation
Estimates of Gross Domestic Product (GDP) compiled using the expenditure approach for the period 1981 to 1990 are presented in Tables 7.1 to 7.7. The expenditure-based estimates are available at current market prices and at constant (1980) market prices.
Estimates of GDP compiled using the production approach for the period 1981-1989 are given in Table 7.8. The production-based estimates are available at current market prices.
The GDP estimates are updated in stages to incorporate latest available data. To distinguish the estimates produced at various stages of revision, a nomenclature has been adopted since August 1991 for GDP estimates. The first estimates published for a given year are labelled as 'preliminary estimates'. All estimates subsequently revised will be called 'revised estimates', qualified in brackets by the month and year in which the revised estimates are released. For example, the revised annual estimates for 1990 to be published in March 1992 will be named as 'Revised(March 92) estimates for 1990'. 'Final estimates' are estimates with data from all regular sources incorporated and are not subject to further routine revisions.
Apart from these routine revisions, the GDP estimates also undergo non-routine revisions occasionally. Non-routine revisions incorporated new data sources, improved methods of estimation, and changes in definitions and classifications through continuous research and development of the GDP compilation framework. The expenditure-based GDP estimates in this edition are the latest estimates which reflect the results of a recent non-routine revision released in August 1991.
Concepts and Definitions
Expenditure-based estimates:
The expenditure-based estimates measure the total value of goods and services produced for final use, net of their import content, and comprise the following major components:
(i) Private consumption expenditure:
This refers to the value of all expenditure by the household sector and private non-profit bodies serving households on goods and services for final consumption. It is the sum of the estimates of consumption expenditure on goods and services in the domestic market and the expenditure of Hong Kong residents abroad less the expenditure of non-residents in the domestic market.
(ii) Government consumption expenditure:
Government consumption expenditure refers to the current expenditure on goods and services by non-trading government departments and quasi-government non-profit bodies. Government trading departments are distinguished from non-trading departments in that they are engaged in the production of goods and services mainly for sale to the public. Current expenditure on goods and services by non-trading departments is the sum of compensation of employees and purchases of goods and services less receipts from sales of goods and services.
(iii) Gross domestic fixed capital formation:
This covers the gross value of investment expenditure on buildings and construction as well as plant, machinery and equipment; real estate developers' margin; and transfer costs of land and buildings.
(iv) Change in stocks:
The estimates refer to the value of physical change in the stocks of work-in-progress, raw materials and finished goods held by manufacturers and distributors.
(v) Exports of goods and services less imports of goods and services:
Exports of goods include domestic exports and re-exports of merchandise recorded on an f.o.b. basis, excluding gold. Imports of goods are valued at c.i.f., covering all merchandise imports and a proportion of retained imports of gold which is for industrial use. Exports and imports of services cover transactions in services between Hong Kong residents and the rest of the world.
107

108
Production-based estimates:
The production-based estimates measure the sum of 'value-added' or 'net output' of all productive units, such as, factorit;s, shops and service organizations, in the economy. The value-added of a productive unit is equal to the value of total production by the unit (i.e. the gross output) less the value of non-durable goods and services consumed in the process of production (i.e. the intermediate consumption). Value-added comprises factor incomes, i.e. 'compensation of employees' and 'gross operating surplus'; the former refers to wages and salaries, payments in kind and employer's expenditure on social security and the latter refers to the value attributed to non-labour factors of production inclusive of the provision for consumption of fixed capital.
Economic activities covered by the production-based estimates are broadly classified as follows: agriculture and fishing; mining and quarrying; manufacturing; electricity, gas and water; construction; wholesale, retail and import/export trades, restaurants and hotels; transport, storage and communication; financing, insurance, real estate and business services; community, social and personal services and ownership of premises. In addition, a separate item of imputed bank services charge is included .in the estimates as an adjustment for the 'imputed service' charge of financial services. ·
Ownership of premises is treated as an economic activity in the national accounts. It covers rental services which owners of premises like households, government and private non-profit bodies provide to themselves, and which owners of premises provide to tenants in their individual capacity. An imputed estimate of rent is introduced into the national income calculations to reflect the value of services rendered by owner-occupiers to themselves.
The item on imputed bank service charge is a provision for the adjustment for financial services. An imputed service charge, equal to net interest receipts (i.e. interest received minus interest paid), is included in valuing the output of the banking sector. In principle, it is necessary to charge other economic activities for their respective use of these financial services. However, there is virtually no basis to make this allocation separately for each economic activity. The internationally accepted practice is thus to create a dummy or nominal account to which the total imputed bank charge is debited.
Data Sources
The compilation of the expenditure-based GDP estimates utilizes extensive data from many different sources including trade statistics; price statistics; administrative data from government departments and various organizations; data collected from annual and quarterly economic surveys; household expenditure surveys and special surveys conducted to collect specific data for compiling component estimates.
The production-based estimates are ~ompiled mainly based on results of the Annual Economic Surveys covering the mining and quarrying; manufacturing; electricity, gas and water; construction; wholesale, retail and import/export trades, restaurants and hotels; transport, storage and communication; financing, insurance, real estate and business services and community, social and personal services sectors. In addition, supplementary data sources including administrative data from government departments and various organizations are used in the compilation.
Further References
Details on data sources and methods for compiling the GDP estimates are contained in the publication Estimates of Gross Domestic Product, 1966-1990 and details of the non-routine revision introduced in August 1991 are contained in the publication Gross Dometic Product: Quarterly Estimates and Revised Annual Estimates published by the Census and Statistics Department.

7.1 Expenditure on the Gross Domestic Product
Expenditure on GDP
At current market prices
Total expenditure (HK$ million)
Per capita expenditure (HK$)#
At constant (1980) market prices
Total expenditure (HK$ million)
Per capita expenditure (HK$)#
1981 1982 1983 1984
164,762 185,728 206,217 247,933 (+20.5) (+12.7) (+11.0) (+20.2)
31,786 35,279 (+17.7). (+11.0)
149,585 ( +9.4)
28,858 ( +6.8)
153,560 ( +2.7)
29,169 ( + 1.1)
38,581 45,931 (+9.4) (+19.1)
163,260 ( +6.3)
30,544 ( +4.7)
179,238 ( +9.8)
33,205 ( +8.7)
Notes: Figures in brackets denote percentage changes over the preceding year. *Figures are revised(August 91) estimates.
1985 1986 1987 1988 1989* 1990*
261,070 298,515 367,603 433,657 496,385 553,243 ( +5.3) ( + 14.3) ( +23.1) ( + 18.0) ( + 14.5) ( + 11.5)
47,848 54,034 65,873 77,059 87,296 96,984 (+4.2) (+12.9) (+21.9) (+17.0) (+13.3) (+11.1)
179,580 199,498 228,483 ( +0.2) ( + 11.1) ( + 14.5)
32,913 ( -0.9)
36, 111 40,943 ( +9.7) ( + 13.4)
247,415 ( +8.3)
43,965 ( + 7.4)
254,218 ( +2.7)
44,708 ( + 1.7)
261,209 ( +2.8)
45,790 ( +2.4)
#Subsequent to the publication of the 1991 Population Census results, population estimates for 1986 to 1990 have been revised. Accordingly, the per capita expenditure figures for the same period have also been revised.
Source: National Income Branch, Census and Statistics Department.
7.2 Main Components of Gross Domestic Product
Main GDP Components
At current market prices
Private consumption expenditure
Government consumption expenditure
Gross domestic fixed capital formation
Change in stocks
Exports of goods (f.o.b.)
Less imports of goods ( c.i.f.)
Exports of services
Less imports of services
Total expenditure
Per capita expenditure (HK$)#
At constant (1980) market prices
Private consumption expenditure
Government consumption expenditure
Gross domestic fixed capital formation
Change in stocks
Exports of goods (f.o.b.)
Less imports of goods (c.i.f.)
Exports of services
Less imports of services
Total expenditure
Per capita expenditure (HK$)#
Notes: *Figures are revised(August 91) estimates.
1981
101,665
12,402
55,985
3,953
122,163
139,246
27,155
19,315
164,762
31,786
90,806
10,790
50,106
3,796
112,314
125,336
24,758
17,649
149,585
28,858
1982
117,656
14,910
58,530
1,403
127,385
143,769
30,604
20,991
185,728
35,279
95,506
11,391
50,949
1,185
109,305
122,579
25,687
17,884
153,560
29,169
1983
136,760
16,724
52,589
4,329
160,699
176,574
36,925
25,235
206,217
38,581
102,852
11,994
46,713
3,217
125,304
134,334
28,354
20,840
163,260
30,544
1984
156,303
18,292
57,085
5,803
221,441
224,802
43,847
30,036
247,933
45,931
108,709
12,323
47,928
3,999
152,694
154,025
31,273
23,663
179,238
33,205
1985
167,698
19,916
57,147
1,469
235,152
232,617
45,846
33,541
261,070
47,848
113,362
12,546
47,884
1,026
161,413
163,566
32,408
25,493
179,580
32,913
1986
187,658
22,969
67,655
6,183
276,530
277,500
54,287
39,267
298,515
54,034
122,430
13,328
50,895
4,394
185,924
185,854
37,509
29,128
199,498
36,111
1987
217,711
25,779
91,645
9,746
378,034
379,989
70,832
46,155
367,603
65,873
136,280
13,889
58,443
6,324
247,164
244,623
44,359
33,353
228,483
40,943
1988
251,803
30,008
115,742
14,132
493,069
501,174
85,490
55,413
433,657
77,059
148,162
14,600
62,753
8,183
312,379
309,691
49,871
38,842
247,415
43,965
HK$ million
1989*
283,533
36,324
133,018
3,463
570,509
565,219
97,455
62,698
496,385
87,296
153,486
15,483
64,718
2,375
344,150
337,134
52,489
41,349
254,218
44,708
1990*
321,641
43,705
152,622
5,236
639,874
645,200
107,833
72,468
553,243
96,984
160,445
16,504
69,670
3,230
375,842
375,700
55,937
44,719
261,209
45,790
#Subsequent to the publication of the 1991 Population Census results, population estimates for 1986 to 1990 have been revised. Accordingly, the per capita expenditure figures for the same period have also been revised.
Source: National Income Branch, Census and Statistics Department.
109

7.3 Implicit Price Deftators of Gross Domestic Product and Its Components (1980=100)
Main GDP components 1981 1982 1983 1984 1985 1986 1987 1988 1989* 1990*
Private consumption expenditure 112.0 123.2 133.0 143.8 147.9 153.3 159.8 170.0 184.7 200.5
Government consumption expenditure 114.9 130.9 139.4 148.4 158.7 172.3 185.6 205.5 234.6 264.8
Gross domestic fixed capital formation 111.7 114.9 112.6 119.1 119.3 132.9 156.8 184.4 205.5 219.1
Exports of goods (f.o.b.) 108.8 116.5 128.2 145.0 145.7 148.7 152.9 157.8 165.8 170.3
Imports of goods ( c.i.f.) 111.1 117.3 131.4 146.0 142.2 149.3 155.3 161.8 167.7 171.7
Exports of services 109.7 119.1 130.2 140.2 141.5 144.7 159.7 171.4 185.7 192.8
Imports of services 109.4 117.4 121.1 126.9 131.6 134.8 138.4 142.7 151.6 162.1
Implicit price deflator of GDP 110.1 120.9 126.3 138.3 145.4 149.6 160.9 175.3 195.3 211.8
Notes: *Figures are revised(August 91) estimates.
Source: National Income Branch, Census and Statistics Department.
110

7.4 Composition of Private Consumption Expenditure
At current market prices
Food and non-alcoholic beverages
Alcoholic beverages
Tobacco
Clothing, footwear and other personal effects
Rent, rates, water and housing maintenance charges
Fuel and light
Furniture, furnishings and household equipment
Household operation
Personal care
Medical care and health expenses
Transport and communication
Recreation and entertainment
Education
Other services
Consumption expenditure of goods and services in the domestic market
Expenditure ofresidents abroad
Less Expenditure of non-residents in the domestic market
Private consumption expenditure
At constant (1980) market prices
Food and non-alcoholic beverages
Alcoholic beverages
Tobacco
Clothing, footwear and other personal effects
Rent, rates, water and housing maintenance charges
Fuel and light
Furniture, furnishings and household equipment
Household operation
Personal care
Medical care and health expenses
Transport and communication
Recreation and entertainment
Education
Other services
Consumption expenditure of goods and services in the domestic market
Expenditure ofresidents abroad
Less Expenditure of non-residents
1981
22,920
1,319
1,058
16,248
12,296
2,477
9,597
1,654
1,855
3,572
7,673
7,112
1,069
13,511
102,361
7,757
8,453
101,665
20,130
1,190
952
15,312
11,040
1,955
8,877
1,429
1,645
3,147
6,679
6,393
936
11,655
91,340
7,154
1982
26,238
1,470
1,262
18,797
15,204
2,501
9,743
1,948
2,084
4,179
9,134
8,259
1,260
16,009
118,088
8,681
9,113
117,656
21,111
1,280
1,021
16,160
12,243
1,928
8,815
1,456
1,661
3,281
6,833
6,750
948
12,107
95,594
7,585
1983
29,884
1,580
1,406
22,826
17,892
2,907
12,179
2,147
2,677
5,459
9,958
9,646
1,456
18,072
138,089
10,424
11,753
136,760
22,087
1,117
718
17,927
13,332
2,073
10,418
1,462
1,964
3,758
6,827
7,512
923
12,713
102,831
8,763
1984
32,690
1,564
1,570
26,629
20,148
3,362
15,107
2,427
3,038
6,160
11,579
11,460
1,698
21,040
158,472
12,268
14,437
156,303
22,404
962
682
18,932
13,987
2,402
11,784
1,493
2,048
3,604
7,118
8,248
941
13,822
108,427
9,832
1985
32,625
1,688
1,762
28,810
22,351
3,215
15,400
2,684
3,217
6,766
12,648
13,135
1,871
23,691
169,863
13,056
15,221
167,698
22,888
983
692
19,786
14,638
2,303
12,066
1,539
2,069
3,724
7,366
9,035
903
14,876
112,868
10,131
1986
34,405
2,041
1,658
35,565
25,037
3,387
18,429
3,007
3,390
7,607
13,850
14,426
2,067
26,915
191,784
14,424
18,550
187,658
24,046
1,088
611
22,662
15,795
2,607
13,836
1,631
2,105
4,075
7,648
9,552
895
15,944
122,495
10,956
1987
37,618
2,518
1,597
44,467
28,277
3,718
23,711
3,350
4,133
8,625
16,558
17,302
2,349
32,653
226,876
17,079
26,244
217,711
24,792
1,244
554
26,180
17,250
2,870
16,916
1,696
2,476
4,479
8,645
11,075
904
18,569
137,650
12,766
1988
41,401
2,910
1,974
54,302
33,126
3,950
28,566
3,900
4,575
9,456
20,553
20,269
2,657
37,316
264,955
21,259
34,411
251,803
25,060
1,402
651
29,824
19,590
2,971
19,285
1,778
2,593
4,485
10,126
12,231
882
18,738
149,616
15,352
HK$ million
1989*
45,620
2,575
2,486
60,054
38,346
4,511
29,996
4,474
5,319
9,902
22,712
22,668
3,110
45,852
297,625
24,011
38,103
283,533
24,990
1,157
770
30,649
21,381
3,328
19,532
1,833
2,798
4,223
10,535
13,394
877
20,095
155,568
15,318
1990*
51,743
3,271
2,801
62,907
44,109
5,180
31,451
5,088
6,427
12,390
27,015
24,229
3,705
54,525
334,841
27,349
40,549
321,641
26,737
1,273
726
30,370
22,706
3,470
19,896
1,870
3,135
4,923
11,487
13,657
870
20,891
162,011
16,067
in the domestic market 7,688 7,673 8,742 9,550 9,637 11,021 14,136 16,806 17,400 17,633
Private consumption expenditure 90,806 95,506 102,852 108,709 113,362 122,430 136,280 148,162 153,486 160,445
Notes: *Figures are revised(August 91) estimates.
Source: National Income Branch, Census and Statistics Department.
111

7.5 Composition of Government Consumption Expenditure HK$ million
1981 1982 1983 1984 1985 1986 1987 1988 1989* 1990*
At current market prices
Compensation of employees 7,133 9,646 11,258 12,973 14,789 17,062 19,150 22,019 26,144 31,091
Purchases of goods and services 5,783 5,917 6,304 6,314 6,291 7,158 8,095 9,669 12,014 14,885
Less Sales by non-trading government departments to households and enterprises 514 653 838 995 1,164 1,251 1,466 1,680 1,834 2,271
Government consumption expenditure 12,402 14,910 16,724 18,292 19,916 22,969 25,779 30,008 36,324 43,705
At constant (1980) market prices
Compensation of employees 6,077 7,019 7,566 8,005 8,282 8,598 8,961 9,310 9,718 10,145
Purchases of goods and services 5,142 4,835 4,890 4,761 4,725 5,179 5,408 5,779 6,246 6,894
Less Sales by non-trading government departments to households and enterprises 429 463 462 443 461 449 480 489 481 535
Government consumption expenditure 10,790 11,391 11,994 12,323 12,546 13,328 13,889 14,600 15,483 16,504
Notes: *Figures are revised( August 91) estimates.
Source: National Income Branch, Census and Statistics Department.
112
---------------- ----~

7.6 Composition of Gross Domestic Fixed Capital Formation Analysed by Public/Private Sector
At current market prices
Transfer costs of land and buildings
Buildings and construction
Residential buildings, including combined residential and non-residential buildings
Non-residential buildings
Other construction works
Real estate developers' margin
Plant, machinery and equipment
Transport equipment
Machinery and other plant and equipment
Gross domestic fixed capital formation
At constant (1980) market prices
Transfer costs of land and buildings
Buildings and construction
Residential buildings, including combined residential and non-residential buildings
Non-residential buildings
Other construction works
Real estate developers' margin
Plant, machinery and equipment
Transport equipment
Machinery and other plant and equipment
Gross domestic fixed capital formation
Notes: *Figures are revised(August 91) estimates.
Public/Private sector 1981
Public Private Total
Public Private Total
Public Private Total
Public Private Total
Public Private Total
Public Private Total
Public Private Total
Public Private Total
Public Private Total
Public Private Total
Public Private Total
Public Private Total
Public Private Total
Public Private Total
Public Private Total
Public Private Total
Public Private Total
Public Private Total
Public Private Total
Public Private Total
1,965 1,965
7,127 12,810 19,937
1,994 5,214 7,208
867 6.090 6,957
4,266 1,506 5,772
15,890 15,890
1,075 17,118 18,193
796 3,000 3,796
279 14,118 14,397
8,202 47,783 55,985
1,568 1,568
6,392 11,488 17,880
1,788 4.675 6,463
778 5,462 6,240
3,826 1,351 5,177
14,413 14,413
945 15,300 16,245
697 2,704 3,401
248 12,596 12,844
7,337 42,769 50,106
Source: National Income Branch, Census and Statistics Department.
1982
1,601 1,601
10,340 14,447 24,787
2,476 5,946 8,422
1,316 7,113 8.429
6,548 1,388 7,936
14,482 14,482
1,166 16,494 17,660
823 2,900 3,723
343 13.594 13,937
11,506 47,024 58,530
1,517 1,517
8,511 11,906 20,417
2,038 4,901 6.939
1,084 5,862 6,946
5,389 1,143 6,532
14,958 14,958
928 13,129 14,057
656 2,310 2,966
272 10,819 11,091
9,439 41,510 50,949
1983
1,262 1,262
10,873 14,239 25,112
2,459 5,751 8,210
1,439 7,106 8,545
6,975 1,382 8.357
7,200 7,200
1,276 17,739 19,015
806 2,394 3,200
470 15,345 15,815
12,149 40.440 52.589
1,433 1,433
8,815 11,558 20,373
1,996 4.669 6,665
1,169 5,769 6,938
5,650 1,120 6,770
11,385 11,385
914 12,608 13,522
578 1,706 2,284
336 10,902 11,238
9.729 36.984 46,713
1984
1,373 1,373
10,135 14,279 24,414
2,398 6,399 8,797
10488 6,379 7,867
6.249 10501 7,750
6,369 6,369
1,046 23,883 24,929
293 2,750 3,043
753 21,133 21,886
11,181 45,904 57,085
1,429 1,429
7,963 11,147 19,110
1,918 4,994 6,912
1,165 4,981 6,146
4,880 1,172 6,052
10,900 10,900
694 15,795 16,489
194 1,817 2,011
500 13,978 14,478
8,657 39,271 47,928
1985
2,064 2,064
7,875 15,095 22,970
2,136 7.680 9,816
1.466 6,013 7,479
4,273 1,402 5,675
6,747 6,747
814 24,552 25,366
237 3,428 3,665
577 21,124 21,701
8,689 48,458 57,147
2,046 2,046
6,259 11,375 17,634
1.916 5,786 7,702
1,118 4,532 5,650
3,225 1,057 4,282
11,399 11,399
540 16,265 16,805
157 2,269 2.426
383 13,996 14,379
6,799 41,085 47,884
1986
2,726 2,726
7,985 16,418 24,403
2,320 9,347
11,667
1,626 5,177 6,803
4,039 1,894 5,933
9,537 9,537
657 30,332 30,989
273 4,166 4,439
384 26,166 26,550
8,642 59,013 67,655
2,621 2,621
6,044 11,556 17,600
2.035 6,581 8,616
1,158 3,648 4,806
2,851 1,327 4.178
12,893 12,893
377 17,404 17,781
155 2,403 2,558
222 15,001 15,223
6,421 44,474 50,895
1987
4,283 4,283
10,067 20,195 30,262
3,149 9,719
12,868
1.789 8,133 9,922
5.129 2,343 7,472
14,893 14,893
828 41,379 42,207
354 7,052 7,406
474 34,327 34,801
10,895 80,750 91,645
3,649 3,649
6,551 12,082 18,633
2,375 5.826 8,201
1,091 4,848 5,939
3,085 1,408 4,493
13,518 13,518
445 22,198 22,643
188 3,791 3.979
257 18,407 18.664
6.996 51,447 58,443
1988
5,052 5,052
12,097 26,405 38,502
4.267 13,123 17,390
1,906 10,130 12,036
5,924 3,152 9,076
20,801 20,801
1,286 50,101 51,387
542 5,717 6,259
744 44,384 45,128
13,383 102,359 115,742
3,396 3,396
6,370 12,947 19,317
2,511 6,426 8,937
942 4.976 5,918
2,917 1,545 4,462
13,879 13,879
656 25,505 26,161
277 2,913 3,190
379 22.592 22,971
7,026 55,727 62,753
1989*
5,839 5,839
15,865 32,799 48,664
5,226 14,685 19,911
3,396 13.016 16,412
7,243 5,098
12,341
24,438 24,438
1,537 52,540 54,077
734 7,000 7,734
803 45,540 46,343
17,402 115,616 133,018
3,132 3,132
7,210 13,978 21,188
2,673 6,247 8,920
1,455 5,556 7,011
3,082 2,175 5,257
13,757 13,757
753 25,888 26,641
359 3,453 3,812
394 22,435 22,829
7,963 56,755 64,718
HK$million
1990*
6,160 6,160
18,028 40,489 58,517
5,118 18,983 24,101
4,087 16,695 20,782
8,823 4,811
13,634
29,741 29,741
1,390 56,814 58,204
191 8,418 8.609
1,199 48,396 49,595
19,418 133.204 152.622
3,180 3,180
7,547 15,722 23,269
2.485 7,368 9,853
1,627 6,486 8,113
3,435 1,868 5,303
15,453 15,453
661 27,107 27,768
91 4,034 4,125
570 23,073 23,643
8,208 61,462 69,670
113
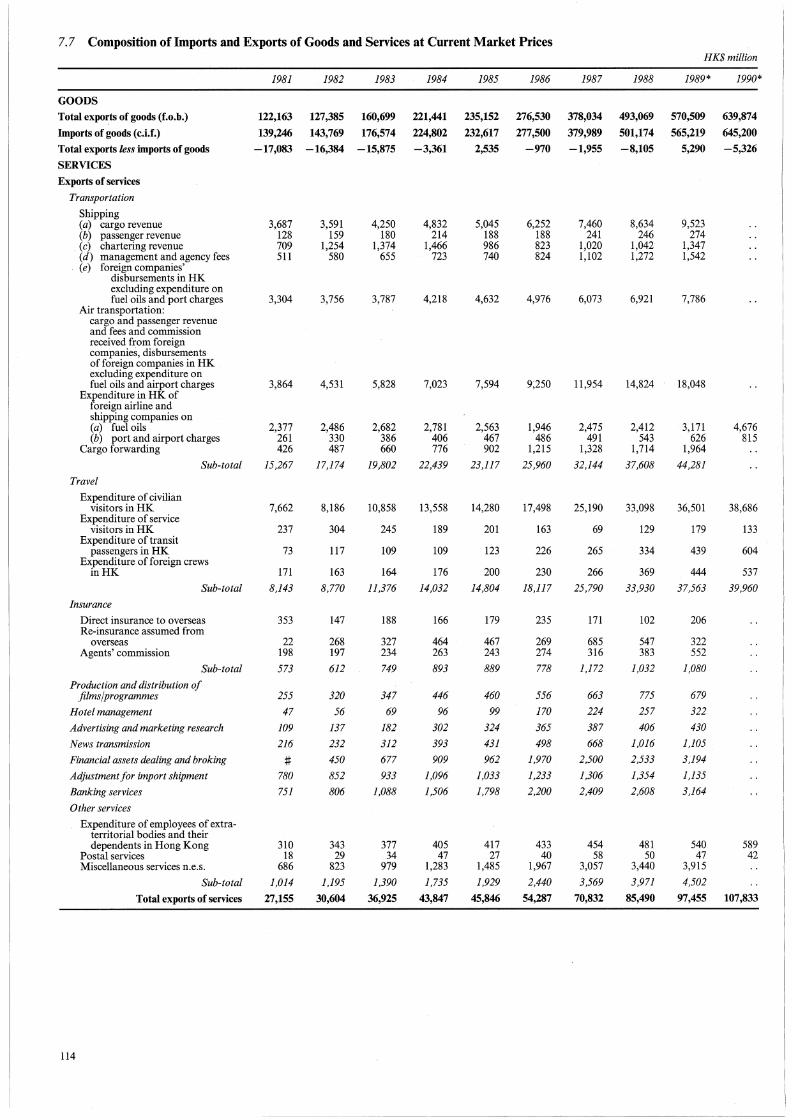
7. 7 Composition of Imports and Exports of Goods and Services at Current Market Prices
GOODS
Total exports of goods (f.o.b.)
Imports of goods (c.i.f.)
Total exports less imports of goods
SERVICES
Exports of services
Transportation
Shipping (a) cargo revenue (b) passenger revenue ( c) chartering revenue (d) management and agency fees (e) foreign companies'
disbursements in HK excluding expenditure on fuel oils and port charges
Air transportation: cargo and passenger revenue and fees and commission received from foreign companies, disbursements of foreign companies in HK excluding expenditure on fuel oils and airport charges
Expenditure in HK of foreign airline and shipping companies on (a) fuel oils (b) port and airport charges
Cargo forwarding
Sub-total
Travel
Expenditure of civilian visitors in HK
Expenditure of service visitors in HK
Expenditure of transit passengers in HK
Expenditure of foreign crews inHK
Sub-total
Insurance
Direct insurance to overseas Re-insurance assumed from
overseas Agents' commission
Sub-total
Production and distribution of films/programmes
Hotel management
Advertising and marketing research
News transmission
Financial assets dealing and broking
Adjustment for import shipment
Banking services
0 ther services
114
Expenditure of employees of extraterritorial bodies and their dependents in Hong Kong
Postal services Miscellaneous services n.e.s.
Sub-total
Total exports of services
1981
122,163
139,246
1982
127,385
143,769
1983
160,699
176,574
-17,083 -16,384 -15,875
3,687 128 709 511
3,304
3,864
2,377 261 426
15,267
7,662
237
73
171
8,143
353
22 198
573
255
47
109
216
# 780
751
310 18
686
1,014
27,155
3,591 159
1,254 580
3,756
4,531
2,486 330 487
17,174
8,186
304
117
163
8,770
147
268 197
612
320
56
137
232
450
852
806
343 29
823
1,195
30,604
4,250 180
1,374 655
3,787
5,828
2,682 386 660
19,802
10,858
245
109
164
11,376
188
327 234
749
347
69
182
312
677
933
1,088
377 34
979
1,390
36,925
1984
221,441
224,802
-3,361
4,832 214
1,466 723
4,218
7,023
2,781 406 776
22,439
13,558
189
109
176
14,032
166
464 263
893
446
96
302
393
909
1,096
1,506
405 47
1,283
1,735
43,847
1985
235,152
232,617
2,535
5,045 188 986 740
4,632
7,594
2,563 467 902
23,117
14,280
201
123
200
14,804
179
467 243
889
460
99
324
431
962
1,033
1,798
417 27
1,485
1,929
45,846
1986
276,530
277,500
-970
6,252 188 823 824
4,976
9;250
1,946 486
1,215
25,960
17,498
163
226
230
18,117
235
269 274
778
556
170
365
498
1,970
1,233
2,200
433 40
1,967
2,440
54,287
1987
378,034
379,989
-1,955
7,460 241
1,020 1,102
6,073
11,954
2,475 491
1,328
32,144
25,190
69
265
266
25,790
171
685 316
1,172
663
224
387
668
2,500
1,306
2,409
454 58
3,057
3,569
70,832
1988
493,069
501,174
-8,105
8,634 246
1,042 1,272
6,921
14,824
2,412 543
1,714
37,608
33,098
129
334
369
33,930
102
547 383
1,032
775
257
406
1,016
2,533
1,354
2,608
481 50
3,440
3,971
85,490
HK$million
1989*
570,509
565,219
5,290
9,523 274
1,347 1,542
7,786
18,048
3,171 626
1,964
44,281
36,501
179
439
444
37,563
206
322 552
1,080
679
322
430
1,105
3,194
1,135
3,164
1990*
639,874
645,200
-5,326
4,676 815
38,686
133
604
537
39,960
540 589 47 42
3,915
4,502
97,455 107,833

7.7 Composition of Imports and Exports of Goods and Services at Current Market Prices (Continued) HK$ million
1981 1982 1983 1984 1985 1986 1987 1988 1989* 1990*
Imports of services
Transportation
Shipping: charter hire 977 902 1,086 1,272 1,345 1,708 1,682 2,130 3,192
Shipping and air transportation (a) disbursements of HK
companies abroad 5,064 5,670 6,732 7,555 8,096 9,573 11,278 12,353 12,728 (b) other revenue of
foreign companies in HK 141 164 213 222 196 147 176 281 485
Passenger fares 2,195 2,401 2,621 3,071 3,028 3,434 3,863 5,018 5,806 6,873
Sub-total 8,377 9,137 10,652 12,120 12,665 14,862 16,999 19,782 22,211
Travel
Expenditure of HK residents abroad 5,557 6,428 8,062 10,155 12,558 14,400 17,441 21,936 24,841 30,445
Expenditure of HK students abroad 1,297 1,401 1,510 1,607 1,594 1,606 1,832 2,259 3,002 3,600
Sub-total 6,854 7,829 9,572 11,762 14,152 16,006 19,273 24,195 27,843 34,045
Insurance
Direct insurance from overseas 333 303 326 489 534 513 593 747 709 Re-insurance ceded overseas 222 347 410 555 611 648 775 594 888 Expenses of local insurance
companies abroad 43 54 87 103 148 167 212 265 210
Sub-total 598 704 823 1,147 1,293 1,328 1,580 1,606 1,807
Production and distribution of films/programmes 159 180 219 188 189 232 298 198 230
Hotel management 87 87 107 141 168 183 211 248 292
Advertising and marketing research 83 57 74 88 91 145 168 251 249
News transmission 103 155 202 250 251 378 298 572 647
Financial assets dealing and broking # 219 378 438 559 1,246 1,364 1,350 1,614
Banking services 340 406 454 655 777 809 861 996 1,031
Other services
Government expenditure abroad 1,724 1,037 1,369 1,363 1,378 1,537 1,685 1,634 1,639 1,870 Postal services 178 212 235 271 258 334 438 493 523 599 Miscellaneous services n.e.s. 812 968 1,150 1,613 1,760 2,207 2,980 4,088 4,612
Sub-total 2,714 2,217 2,754 3,247 3,396 4,078 5,103 6,215 6,774
Total imports of services 19,315 20,991 25,235 30,036 33,541 39,267 46,155 55,413 62,698 72,468
Exports less imports of services 7,840 9,613 11,690 13,811 12,305 15,020 24,677 30,077 34,757 35,365
Total exports of goods and services 149,318 157,989 197,624 265,288 280,998 330,817 448,866 578,559 667,964 747,707
Total imports of goods and services 158,561 164,760 201,809 254,838 266,158 316,767 426,144 556,587 627,917 717,668
Export less imports of goods and services -9,243 -6,771 -4,185 10,450 14,840 14,050 22,722 21,972 40,047 30,039
Notes: 'n.e.s.' denotes not elsewhere specified. *Figures are revised (August 91) estimates.
#Token estimates were made and included in 'miscellaneous services n.e.s.' . . . Detailed breakdown is not available. An estimate of the sum of these items is included in the totals.
Source: National Income Branch, Census and Statistics Department.
115

7.8 Gross Domestic Product at Current Prices by Economic Activity HK$million
Economic Activity 1981 1982 1983 1984 1985 1986 1987 1988 1989*
Agriculture and fishing 1,122 1,229 1,242 1,273 1,238 1,332 1,358 1,437 1,415 (0.7) (0.7) (0.6) (0.5) (0.5) (0.5) (0.4) (0.3) (0.3)
Mining and quarrying 253 308 316 299 385 346 257 229 224 (0.2) (0.2) (0.2) (0.1) (0.2) (0.1) (0.1) (0.1) (#)
Manufacturing 36,049 36,390 44,140 55,535 53,071 62,779 75,761 83,182 89,645 (22.8) (20.7) (22.8) (24.1) (21.9) (22.3) (21.7) (20.1) (18.9)
Electricity, gas and water 2,229 3,243 4,740 5,687 6,665 8,385 9,691 10,200 10,860 (1.4) (1.8) (2.4) (2.5) (2.7) (3.0) (2.8) (2:5) (2.3)
Construction 11,922 12,904 12,269 12,218 12,038 13,556 16,400 19,900 24,937 (7.5) (7.3) (6.3) (5.3) (5.0) (4.8) (4.7) (4.8) (5.3)
Wholesale, retail and import/export trades, restaurants and hotels 30,749 33,647 37,893 51,117 52,831 59,890 80,720 98,518 113,998
(19.5) (19.1) (19.5) (22.2) (21.8) (21.3) (23.2) (23.8) (24.0)
Transport, storage and communication 11,853 13,632 15,980 17,958 19,677 22,895 30,309 38,053 42,214 (7.5) (7.7) (8.2) (7.8) (8.1) (8.1) (8.7) (9.2) (8.9)
Financing, insurance, real estate and business services 37,688 39,746 34,614 36,526 39,589 48,588 63,365 79,436 94,034
(23.8) (22.6) (17.9) (15.9) (16.3) (17.3) (18.2) (19.2) (19.8)
Community, social and personal services 21,071 27,563 31,781 36,549 41,979 46,778 52,298 60,195 69,224 (13.3) (15.6) (16.4) (15.9) (17.3) (16.6) (15.0) (14.6) (14.6)
Ownership of premises 15,475 18,943 22,851 24,855 26,672 30,053 35,901 43,525 51,728 (9.8) (10.8) (11.8) (10.8) (11.0) (10.7) (10.3) (10.5) (10.9)
Less Imputed bank service charge 10,325 11,405 11,847 11,725 11,722 13,079 17,743 21,313 23,800 (6.5) (6.5) (6.1) (5.1) (4.8) (4.7) (5.1) (5.1) (5.0)
Gross domestic product at factor cost (production-based estimate) 158,086 176,200 193,979 230,292 242,423 281,523 348,317 413,362 474,479
(100.0) (100.0) (100.0) (100.0) (100.0) (100.0) (100.0) (100.0) (100.0)
Indirect taxes less subsidies 6,117 6,230 8,103 9,894 12,333 14,750 18,649 21,451 25,402
Gross domestic product at market prices (production-based estimate) 164,203 182,430 202,082 240,186 254,756 296,273 366,966 434,813 499,881
Gross domestic product at market prices (expenditure-based estimate) 164,762 185,728 206,217 247,933 261,070 298,515 367,603 433,657 496,385
Statistical discrepancy (%) -0.3 -1.8 -2.0 -3.1 -2.4 -0.8 -0.2 +0.3 +0.7
Notes: Figures in brackets denote the percentage contribution in total GDP. 'GDP at market prices (production-based estimate)' equals to the sum of'GDP at factor cost (production-based estimate)' and 'Indirect taxes less subsidies'. 'Statistical discrepancy(%)' equals to the quotient obtained by dividing the difference between 'GDP at market prices (production-based estimate)' and 'GDP at market prices (expenditure-based estimate)' by 'GDP at market prices (expenditure-based estimate)'; expressed in terms of percentage. *Figures are revised (August 91) estimates.
#Less than 0.05%.
Source: National Income Branch, Census and Statistics Department.
116

Section 8 Public Finance
Tables 8.1 to 8.4 General Information
Actual Government revenue and expenditure are set out in Table 8.1 to 8.3. Transfers between the General Revenue Account and the funds are not included. The size of the civil service is shown in Table 8.4.
Concepts and Definitions
For control and funding purposes, Government's financial activity is undertaken through a variety of accounts and funds. The General Revenue Account acts as the main funding device with resources being transferred as necessary to a number of funds established to finance specific activities. These funds include the Capital Works Reserve Fund, the Capital Investment Fund and the Loan Fund.
The Capital Works Reserve Fund finances the Public Works Programme, land acquisitions, capital subventions, major systems/equipment and computers. When the Sino-British Joint Declaration came into effect on 27 May 1985, the fund was restructured to enable the premium income from land transactions to be accounted for in accordance with the arrangements in Annex III of the Joint Declaration. The income of the fund is derived mainly from land premia.
The Capital Investment Fund is used to finance the Government's investments in public bodies which are not part of the Government structure itself, such as equity injections in the Mass Transit Railway Corporation and capital investment in the Hong Kong Housing Authority. Its income is derived mainly from interest and dividends on investments and repayments.
The Loan Fund is used to finance schemes of Government loans, such as housing loans and student loans. The main sources of income are loan repayments and interest.
Transfers are made from the General Revenue Account as necessary to enable the funds to meet their commitments.
The Urban and Regional Councils and the Hong Kong Housing Authority which are financially autonomous, are not included.
Data Sources
Information in this Section is provided by the Finance Branch of Government Secretariat.
Further References
Details of revenue and expenditure can be found in the Annual Report of the Director of Accounting Services published by the Treasury.
117

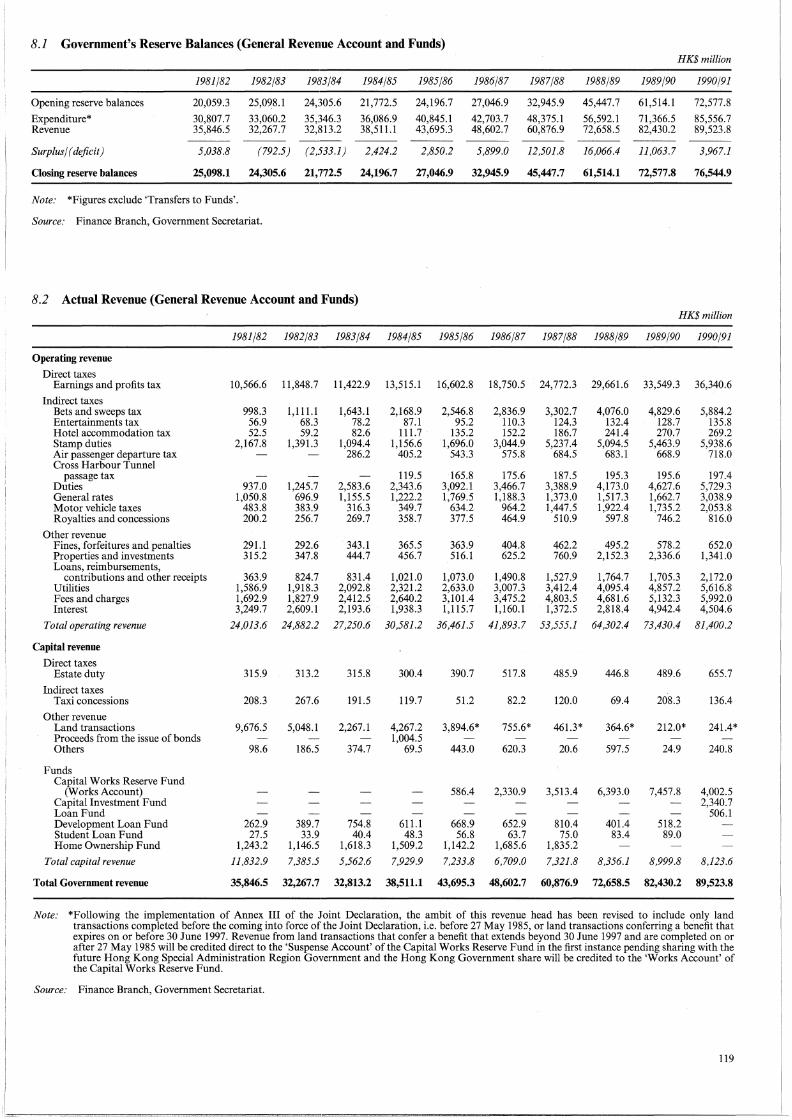
8.1 Government's Reserve Balances (General Revenue Account and Funds) HK$ million
1981/82 1982/83 1983/84 1984/85 1985/86 1986/87 1987/88 1988/89 1989/90 1990/91
Opening reserve balances 20,059.3 25,098.1 24,305.6 21,772.5 24,196.7 27,046.9 32,945.9 45,447.7 61,514.1 72,577.8
Expenditure* 30,807.7 33,060.2 35,346.3 36,086.9 40,845.1 42,703.7 48,375.l 56,592.l 71,366.5 85,556.7 Revenue 35,846.5 32,267.7 32,813.2 38,511.1 43,695.3 48,602.7 60,876.9 72,658.5 82,430.2 89,523.8
Surplus/ (deficit) 5,038.8 (792.5) (2,533.1) 2,424.2 2,850.2 5,899.0 12,501.8 16,066.4 11,063.7 3,967.1
Closing reserve balances 25,098.1 24,305.6 21,772.5 24,196.7 27,046.9 32,945.9 45,447.7 61,514.1 72,577.8 76,544.9
Note: *Figures exclude 'Transfers to Funds'.
Source: Finance Branch, Government Secretariat.
8.2 Actual Revenue (General Revenue Account and Funds) HK$ million
1981/82 1982/83 1983/84 1984/85 1985/86 1986/87 1987/88 1988/89 1989/90 1990/91
Operating revenne
Direct taxes Earnings and profits tax 10,566.6 11,848.7 11,422.9 13,515.1 16,602.8 18,750.5 24,772.3 29,661.6 33,549.3 36,340.6
Indirect taxes Bets and sweeps tax 998.3 1,111.1 1,643.l 2,168.9 2,546.8 2,836.9 3,302.7 4,076.0 4,829.6 5,884.2 Entertainments tax 56.9 68.3 78.2 87.l 95.2 110.3 124.3 132.4 128.7 135.8 Hotel accommodation tax 52.5 59.2 82.6 111.7 135.2 152.2 186.7 241.4 270.7 269.2 Stamp duties 2,167.8 1,391.3 1,094.4 1,156.6 1,696.0 3,044.9 5,237.4 5,094.5 5,463.9 5,938.6 Air passenger departure tax 286.2 405.2 543.3 575.8 684.5 683.l 668.9 718.0 Cross Harbour Tunnel
passage tax 119.5 165.8 175.6 187.5 195.3 195.6 197.4 Duties 937.0 1,245.7 2,583.6 2,343.6 3,092.l 3,466.7 3,388.9 4,173.0 4,627.6 5,729.3 General rates 1,050.8 696.9 1,155.5 1,222.2 1,769.5 1,188.3 1,373.0 1,517.3 1,662.7 3,038.9 Motor vehicle taxes 483.8 383.9 316.3 349.7 634.2 964.2 1,447.5 1,922.4 1,735.2 2,053.8 Royalties and concessions 200.2 256.7 269.7 358.7 377.5 464.9 510.9 597.8 746.2 816.0
Other revenue Fines, forfeitures and penalties 291.1 292.6 343.l 365.5 363.9 404.8 462.2 495.2 578.2 652.0 Properties and investments 315.2 347.8 444.7 456.7 516.l 625.2 760.9 2,152.3 2,336.6 1,341.0 Loans, reimbursements,
contributions and other receipts 363.9 824.7 831.4 1,021.0 1,073.0 1,490.8 1,527.9 1,764.7 1, 705.3 2,172.0 Utilities 1,586.9 1,918.3 2,092.8 2,321.2 2,633.0 3,007.3 3,412.4 4,095.4 4,857.2 5,616.8 Fees and charges 1,692.9 1,827.9 2,412.5 2,640.2 3,101.4 3,475.2 4,803.5 4,681.6 5,132.3 5,992.0 Interest 3,249.7 2,609.l 2,193.6 1,938.3 1,115.7 1,160.l 1,372.5 2,818.4 4,942.4 4,504.6
Total operating revenue 24,013.6 24,882.2 27,250.6 30,581.2 36,461.5 41,893.7 53,555.1 64,302.4 73,430.4 81,400.2
Capital revenue
Direct taxes Estate duty 315.9 313.2 315.8 300.4 390.7 517.8 485.9 446.8 489.6 655.7
Indirect taxes Taxi concessions 208.3 267.6 191.5 119.7 51.2 82.2 120.0 69.4 208.3 136.4
Other revenue Land transactions 9,676.5 5,048.l 2,267.l 4,267.2 3,894.6* 755.6* 461.3* 364.6* 212.0* 241.4* Proceeds from the issue of bonds 1,004.5 Others 98.6 186.5 374.7 69.5 443.0 620.3 20.6 597.5 24.9 240.8
Funds Capital Works Reserve Fund
(Works Account) 586.4 2,330.9 3,513.4 6,393.0 7,457.8 4,002.5 Capital Investment Fund 2,340.7 Loan Fund 506.1 Development Loan Fund 262.9 389.7 754.8 611.1 668.9 652.9 810.4 401.4 518.2 Student Loan Fund 27.5 33.9 40.4 48.3 56.8 63.7 75.0 83.4 89.0 Home Ownership Fund 1,243.2 1,146.5 1,618.3 1,509.2 1,142.2 1,685.6 1,835.2
Total capital revenue 11,832.9 7,385.5 5,562.6 7,929.9 7,233.8 6,709.0 7,321.8 8,356.1 8,999.8 8,123.6
Total Government revenue 35,846.5 32,267.7 32,813.2 38,511.1 43,695.3 48,602.7 60,876.9 72,658.5 82,430.2 89,523.8
Note: *Following the implementation of Annex III of the Joint Declaration, the ambit of this revenue head has been revised to include only land transactions completed before the coming into force of the Joint Declaration, i.e. before 27 May 1985, or land transactions conferring a benefit that expires on or before 30 June 1997. Revenue from land transactions that confer a benefit that extends beyond 30 June 1997 and are completed on or after 27 May 1985 will be credited direct to the 'Suspense Account' of the Capital Works Reserve Fund in the first instance pending sharing with the future Hong Kong Special Administration Region Government and the Hong Kong Government share will be credited to the 'Works Account' of the Capital Works Reserve Fund.
Source: Finance Branch, Government Secretariat.
119

8.3 Actual Expenditure (General Revenue Account and Funds) HK$ million
1981/82 1982/83 1983/84 1984/85 1985/86 1986/87 1987/88 1988/89 1989/90 1990/91
Operating expenditure
Recurrent expenditure Personal emoluments 5,977.0 7,479.1 8,334.7 9,602.6 10,963.3 12,184.3 13,500.0 15,828.0 18,855.0 23,442.8 Personnel related expenses 421.4 808.6 987.5 1,093.7 1,183.1 1,360.3 1,495.7 1,617.4 1,802.6 2,396.4 Pensions 600.5 742.3 893.1 1,054.9 1,226.4 1,289.7 1,350.0 1,604.1 1,949. l 2,541.1 Departmental expenses 5,313.4 2,564.2 2,742.3 2,829.3 2,906.4 3,159.3 3,556.9 3,667.5 3,850.1 4,552.3 Other charges 3,605.8 3,997.2 4,407.3 4,837.7 5,156.6 5,545.2 6,631.9 8,401.6 9,711.7
Subventions Education 2,254.4 2,989.2 3,270.3 3,762.1 4,227.8 4,882.6 5,349.3 6,074.9 7,075.8 8,736.7 Medical 583.8 724.8 813.7 941.3 1,060.3 1,218.8 1,342.1 1,495.4 1,789.6 2,273.6 Social Welfare 190.0 267.3 321.8 374.6 448.5 504.4 637.1 776.4 984.2 1,253.5 University and Polytechnic 724.0 898.0 1,009.3 1,401.3 1,561.5 1,798.5 1,956.4 2,307.9 2,763.8 3,400.3 Vocational Training Council 125.3 180.9 150.2 260.0 335.0 403.0 462.1 571.7 705.7 Miscellaneous 230.4 293.8 325.2 374.3 490.6 533.4 593.2 794.4 1,033.5 1,363.6
Other non-recurrent 692.2 354.2 248.6 211.7 666.7 419.4 590.0 774.7 1,128.9 1,091.1
Total operating expenditure 16,987.1 20,852.6 23,124.6 26,203.3 29,832.3 32,842.3 36,3'18.9 42,034.7 50,205.9 61,468.8
Capital expenditure
Plant, Equipment and Works 493.4 598.6 546.3 443.1 370.7 372.2 385.6 377.8 515.7 759.7
Defence Cost Agreement 55.6 64.4 80.8 75.0 34.7 28.4 41.9 27.8 27.1 16.0
Subventions Education 126.3 100.8 114.9 161.8 173.0 147.4 192.2 120.6 106.4 157.5 Medical 45.5 68.2 98.6 62.8 43.5 49.3 83.2 26.3 23.1 22.9 Social Welfare 11.4 9.1 0.6 0.6 University and Polytechnic 148.9 132.9 150.1 201.0 157.0 173.1 286.3 0.1 0.5 Vocational Training Council 9.0 70.7 168.9 113.2 208.3 107.6 31.6 16.7 12.8 Miscellaneous 35.0 17.2 15.5 71.2 20.2 6.7 5.7 23.7 66.2 189.6
Debt repayment 1,000.0
Funds Capital Works Reserve Funds
(Works Account)*/Public Works non-recurrent 6,938.2 7,602.6 7,575.0 5,808.0 5,705.9 6,432.8 7,316.2 10,574.0 16,627.2 15,641.0
Capital Investment Fund (Equity Investments)# 6,214.3
Loan Fund# 1,074.1 Development Loan Fund 2,110.3 2,442.0 1,892.9 1,672.8 1,806.0 1,595.2 1,737.4 416.1 2,585.6 Mass Transit Fund 2,711.3 373.5 76.0 64.7 1,743.4 54.0 1,108.9 87.2 87.1 Student Loan Fund 102.1 82.9 78.2 86.6 90.2 81.1 76.5 76.6 105.0 Home Ownership Fund 1,054.0 715.5 1,511.3 1,058.6 754.4 712.9 714.1 2,795.6t
Total capital expenditure and Equity Investments 13,820.6 12,207.6 12,221.7 9,883.6 11,012.8 9,861.4 12,056.2 14,557.4 21,160.6 24,087.9
Total Government expenditure and Equity Investments 30,807.7 33,060.2 35,346.3 36,086§ 40,845.1 42,703.7 48,375.1 56,592.1 71,366.5 85,556.7
Notes: *The Capital Works Reserve Fund was established on 20 January 1982 by Resolution of the Legislative Council for the purpose of financing the Public Works Programme and the acquisition of land.
#The Capital Investment Fund and the Loan Fund were established on I April 1990 by Resolution of the Legislative Council. These funds assumed the functions of the former Development Loan Fund, the Mass Transit Fund and the Student Loan Fund.
tThe Home Ownership Fund was dis-established on I April 1988 and the balance of $2,795.6 million as on that date was transferred to the Hong Kong Housing Authority to become part of the Government's investment in the Authority.
Source: Finance Branch, Government Secretariat.
8.4 Size of the Civil Service
1981/82 1982/83 1983/84 1984/85 1985/86 1986/87 1987/88 1988/89 1989/90 1990/91
Establishment* 130 919 135 869 137 948 141 395 143 060 146 776 152 212 157 152 157 223 159 371 Year-on-year growth rate 7.7% 3.8% 1.5% 2.5% 1.2% 2.6% 3.7% 3.2% 0.0% 1.4%
Strength* 120 090 130 367 133 761 137 448 140 007 143 321 146 846 149 173 150 853 152 551 Year-on-year growth rate 9.9% 8.6% 2.6% 2.8% 1.9% 2.4% 2.5% 1.6% 1.1% 1.1 %
Notes: *The figures presented exclude staff of Hong Kong Housing Authority, Urban Council, Regional Council and other seconded staff. Figures refer to the end of the financial year.
Source: Finance Branch, Government Secretariat.
120

Section 9 Money, Banking and Finance
Tables 9.1to9.9 Generallnformation
The statistics on the money supply and on licensed banks, restricted licensed banks and deposittaking companies, in Tables 9.1-9.6 and 9.8 are supplied by the Secretary for Monetary Affairs. These statistics commenced in December 1980 except those on foreign currency swap deposits in Table 9.3, which commenced in December 1984.
Statistics on analysis ofloans and advances for use in Hong Kong (Table 9.7) and on spot and forward foreign currency positions (Table 9 .9) are supplied by the Commissioner of Banking.
With effect from 1 February 1990, 'licensed deposit-taking companies' and 'registered deposit-taking companies' were renamed as 'restricted licence banks' and 'deposit-taking companies' respectively. The category of restricted licence banks (formerly known as licensed deposit-taking companies) was introduced in 1981 and the first licence was granted in 1982. All authorized institutions include licensed banks, restricted licensed banks and deposit-taking companies.
Some figures for 'deposits', 'money supply' and 'other liabilities' as from July 1982 have been revised.
Amounts are shown in Hong Kong dollars or Hong Kong dollar equivalent in case of foreign currency items.
Concepts and Definitions
The definitions of money supply are:
Money supply definition 1 (Ml)- Legal tender notes and coins with the public, plus customers' demand deposits with licensed banks.
Money supply definition 2 ( M2 )- M 1 plus customers' savings and time deposits with licensed banks, plus negotiable certificates of deposit issued by licensed banks and held outside the monetary sector.
Money supply definition 3 ( M3 )- M2 plus customers' deposits with restricted licence banks and deposit-taking companies, plus negotiable certificates of deposit issued by restricted licence banks and deposit-taking companies and held outside the monetary sector.
For Table 9.4, banks' note issues and their corresponding holdings of certificates of indebtedness are excluded from the balance sheets of licensed banks.
For Table 9.8, money on demand means money payable on demand. Money at call means money payable within not more than 24 hours of a demand therefor, but does not include money payable on demand. M~oney at short notice means money, other than money at call, payable within not more than 7 days of a demand therefor.
Data Sources
The statistics on analysis of loans and advances for use in Hong Kong and on spot and forward foreign currency positions are based on the regular returns submitted by individual licensed banks, restricted licence banks and deposit-taking companies to the Commissioner of Banking. The statistics on the money supply and on licensed banks, restricted licence banks and deposit-taking companies are based on the regular returns submitted to the Secretary for Monetary Affairs by individual licensed banks, restricted licence banks and deposit-taking companies.
Compilation and Calculation
Statistics are derived from the data obtained by summing up all the returns.
Further References
The statistics are now published in Chapter 3 of the Economic Report published by Government Secretariat and Section 7 of the Hong Kong Monthly Digest of Statistics published by the Census and Statistics Department.
121

122
Table 9.10 Data Sources
The Hong Kong Dollar Inter-bank Offered Rates (HIBOR) before 1986 are quoted from The Hongkong and Shanghai Banking Corporation Limited and those from 1986 onwards are quoted from Standard Chartered Bank. Figures of bank cheques cleared are supplied by the Clearing House of The Hong Kong Association of Banks.
Table 9 .11 General Information
This table shows the exchange rates of the Hong Kong dollar against major foreign currencies and the effective exchange rate index for the Hong Kong dollar.
Concepts and Definitions
The value of the Special Drawing Right (SDR) by the International Monetary Fund (IMF) is determined daily on the basis · of a basket of currencies with each assigned a weight in determining that value. The SDR valuation basket currently consists of the currencies of 5 member countries having the largest exports of goods and services in 1980-84, namely the U.S. dollar, Deutsche mark, French franc, Japanese yen and Sterling pound.
The effective exchange rate index is an indicator of the overall external value of the Hong Kong dollar. It measures the movements in the nominal exchange rates of the Hong Kong dollar against the weighted average of 15 selected currencies.
Data Sources
Statistics of exchange rates between the Hong Kong dollar and selected foreign currencies are compiled from quotations supplied mainly by the Hang Seng Bank Limited. Figures are based on closing middle-market telegraphic transfer rates as at the last trading day of the year. The exchange rates of the SDR are derived by multiplying the U.S. dollar value of the SDR as published by the IMF by the appropriate exchange rates of Hong Kong dollar against U.S. dollar as published in the tables.
Compilation and Calculation
For compiling the effective exchange rate index, the currencies of 15 principal trading partners are selected, on the basis of their merchandise trade with Hong Kong and their relative importance in world trade. A new series ofEERI has been released since 28 September 1987.
The new and the old EERI series have the following differences:
(a) Base period
(b) Trade weights
New
24-28 Oct. 1983
(i) 1975-1980, 1972 weights (ii) 1981-Sep. 1983, 1981 weights (iii) Oct. 1983 onwards, average of
1984-1986 weights
( c) Averaging method Geometric
(d) Frequencies of 1975-1980, annual indexes indices
1981-1986, monthly and annual indexes
Jan. 1987 onwards, daily and monthly indexes
Old
18 Dec. 1971
} 1981
Arithmetic
1975-1980 annual indexes
1981-1982, monthly and annual indexes
1983-1987, daily, monthly and annual indexes
For more details in the new EERI, see the Special Review in the November 1987 issue of the Hong Kong Monthly Digest of Statistics.
Further References
Further details on exchange rates and the effective exchange rate index can be found in the Hong Kong Monthly Digest of Statistics published by the Census and Statistics Department.
Table 9.12 General Information
The Stock Exchange of Hong Kong Limited, which was formed by merging the former Far East Exchange Limited, Hong Kong Stock Exchange Limited, Kam Ngan Stock Exchange Limited and Kowloon Stock Exchange Limited, commenced trading on April 2, 1986 after 10 years of planning and preparation into its modern computerized trading and management system.

Data Sources
The Hong Kong Index on share prices and value of stock exchange turnover are supplied by the Stock Exchange of Hong Kong Limited. The Hang Seng Index and Sectoral Sub-indices are compiled by the Hang Seng Bank Limited. Sectoral Sub-indices of the Hang Seng Index have been introduced since 13 January 1984, and closing share prices on that day are used as the basis for calculation. The base value of the Sub-indices is 975.47 i.e. the closing Hang Seng Index for that day.
Table 9 .13 General Information .
The Chinese Gold and Silver Exchange Society operates a gold bullion market which is among the most active in the world. Gold traded through the society is of 99 per cent fineness and is measured in taels and quoted in Hong Kong dollars. After allowing for exchange rate fluctuations, prices follow closely those in the major markets in London, Zurich and New York.
Data Sources
Statistics on gold and silver exchange trading are supplied by The Chinese Gold and Silver Exchange Society.
Table 9 .14 General Information
The Hong Kong Futures Exchange Limited (The Exchange) was incorporated in December 1976 as the Hong Kong Commodity Exchange Limited is a non-profit organization providing a marketplace for agricultural, financial, metals and stock index futures contracts, enabling commercial users to hedge against the risk of adverse price movements while providing additional trading opportunities to both commercial and non-commercial interests. In its early years, The Exchange provided trading floors for trading in Cotton, Sugar, Soybeans and Gold. The Cotton contract was delisted in October, 1981.
In 1985, the Exchange was restructured and took on its present name. The first financial futures contract-the Hang Seng Index Futures contract was launched in 1986. In February 1990, an interest rate futures contract based on the 3-month Hong Kong Interbank Offered Rate (HIBOR) was launched.
The Exchange plays continuous efforts in improving its service by introducing more varieties of futures contracts. For instance, the Hang Seng Commerce and Industry Sub Index, which is the first of a series of contracts based on sub-indices of the Hang Seng Index, was launched in July 1991. The other three sub-indices-Properties, Finance, Utilities will be introduced by the 4th quarter of 1991. Currency futures and options contracts will also be introducted in the near future.
Data Sources
Statistics on future trading are supplied by The Hong Kong Futures Exchange Limited.
123


9.1 Money Supply HK$ million
1981 1982 1983 1984 1985 1986 1987 1988 1989 1990
Legal tender notes and coins in circulation
Commercial bank issues 11,066 12,646 13,930 14,246 17,966 20,626 26,926 31,826 37,286 40,886 Government issues 1,241 1,282 1,413 1,375 1,493 1,786 1,841 2,262 2,384 2,375
Total 12,307 13,928 15,343 15,621 19,458 22,412 28,766 34,087 39,670 43,261
Authorised institutions' holdings of legal tender notes and coins , 2,480 2,486 2,629 2,347 2,601 3,117 4,002 4,210 5,478 5,568
Legal tender notes and coins in hands of public 9,827 11,442 12,714 13,273 16,857 19,295 24,764 29,877 34,192 37,693
Money supply ( defiuitiou 1)
Hong Kong dollar 23,748 26,086 28,277 33,351 41,806 51,600 73,826 79,257 85,183 91,826 Foreign currency 1,446 1,399 2,619 3,440 3,460 4,494 8,076 9,577 9,675 15,683
Total 25,194 27,485 30,896 36,791 45,266 56,094 81,902 88,834 94,858 107,509
Money supply (definition 2) Hong Kong dollar:j:j: 96,761 120,956 138,818 172,547 194,641 237,776 310,910 355,065 403,987 471,934 Foreign currency:j:j: 19,995 85,732 118,867 141,533 195,597 280,355 366,132 469,583 584,849 738,116
Total 116,756 206,688 257,685 314,081 390,239 518,131 677,042 824,648 988,836 1,210,050
Money supply (definition 3) Hong Kong dollar :j:I: 145,933 149,254 168,020 208,266 233,230 270,517 342,847 389,052 434,376 503,482 Foreign currency :j:I: 30,885 100,985t 138,919t 166,613t 224,573t 311,691 400,506 504,291 625,831 784,546
Total 176,818 250,240t 306,939t 374,879t 457,803t 582,208 743,353 893,342 1,060,207 1,288,028
Notes: Figures are as at end of the year. :j:I: Figures are unadjusted for foreign currency swap deposits. Adjusted figures are published in Table 9.3. tRevised figure. ·
Source: Monetary Affairs Branch, Government Secretariat.
9.2 Deposits from Customers HK$ million
1981 1982 1983 1984 1985 1986 1987 1988 1989 1990
Demand deposits with licensed banks Hong Kong dollar 13,921 14,644 15,564 20,078 24,949 32,305 49,061 49,381 50,992 54,132 Foreign currency 1,446 1,399 2,619 3,440 3,460 4,494 8,076 9,577 9,675 15,683
Total 15,367 16,043 18,182 23,518 28,409 36,799 57,138 58,958 60,666 69,815
Savings deposits with licensed banks Hong Kong dollar 48,073 61,907 58,704 66,241 81,216 97,949 138,612 118,951 135,413 159,468 Foreign currency 4,779 7,683 12,452 14,909 17,549 27,527 42,497 56,578 57,773 72,204
Total 52,852 69,590 71,156 81,150 98,765 125,476 181,109 175,529 193,186 231,672
Time deposits with licensed banks Hong Kong dollar* 23,876 31,324 50,406 71,686 67,955 83,083 90,820 145,637 171,725 207,959 Foreign currency* 12,363 73,302 100,129 119,750 172,095 245,995 312,619 398,865 512,077 645,673
Total 36,239 104,626 150,535 191,436 240,050 329,078 403,439 544,502 683,802 853,632
Total deposits with licensed banks Hong Kong dollar* 85,870 107,876 124,674 158,005 174,121 213,337 278,494 313,969 358,130 421,560 Foreign currency* 18,588 82,384 115,200 138,099 193,104 278,016 363,192 465,020 579,524 733,559
Total 104,457 190,259 239,874 296,103 367,224 491,353 641,685 778,989 937,654 1,155,119
Deposits with restricted licence banks Hong Kong dollar 3,455 5,264 7,734 6,948 6,496 7,840 9,888 8,646 10,968 Foreign currency ,5,755 :j:I: 10,142 :j:I: 10,997 :j:I: 13,999 :j:I: 16,105 20,398 20,820 28,753 32,816
Total 9,210:j:j: 15,407:j:j: 18,731 :j:I: 20,947:j:I: 22,601 28,238 30,708 37,399 43,784
Deposits with deposit-taking companies Hong Kong dollar 48,489 24,053 23,463 27,450 31,063 25,269 23,210 22,886 20,865 19,855 Foreign currency 10,678 9,243# 9,300:j:I: 12,680 :j:I: 11,577 :j:I: 11,428 10,477 12,937 11,740 12,513
Total 59,167 33,296:j:j: 32,763:j:j: 40,131:j:j: 42,640:j:j: 36,697 33,687 35,823 32,605 32,368
Deposits with all deposit-taking companies Hong Kong dollar 48,489 27,508 28,728 35,185 38,011 31,766 31,049 32,775 29,511 30,823 Foreign currency 10,678 14,998 :j:I: 19,442 :j:I: 23,677:j:j: 25,576:j:j: 27,533 30,875 33,756 40,493 45,329
Total 59,167 42,506:j:I: 48,170:j:I: 58,861:j:I: 63,587:j:I: 59,298 61,924 66,531 70,004 76,152
Deposits with all authorized institutions Hong Kong dollar* 134,359 135,384 153,401 193,190 212,132 245,103 309,543 346,744 387,640 452,382 Foreign currency* 29,266 97,381 # 134,642:j:I: 161,776 :j:I: 218,680 :j:I: 305,549 394,066 498,776 620,017 778,889
Total 163,625 232,765:j:j: 288,044:j:j: 354,965:j:j: 430,8ll:j:I: 550,651 703,609 845,520 1,007,658 1,231,271
Notes: Figures are as at end of the year. *Figures are unadjusted for foreign currency swap deposits. Adjusted figures are published in Table 9.3.
:j:I: Revised figure.
Source: Monetary Affairs Branch, Government Secretariat.
125
i
I !!. _______________________________________________ _

9.3 Money Supply and Deposits from Customers Adjusted for Freign Currency Swap Deposits HK$ million
1984 1985 1986 1987 1988 1989 1990
Foreign currency swap deposits* 20,121 24,362 28,266 21,151 43,689 63,122 67,733
Money supply (definition 2)
Hong Kong dollar :j:f 192,668 219,003 266,042 332,061 398,754 467,109 539,667
Foreign currencyt 121,412 171,235 252,089 344,981 425,894 521,727 670,383
Total 314,081 390,239 518,131 677,042 824,648 988,836 1,210,050
Money supply (definition 3)
Hong Kong dollar :J:1: 228,387 257,592 298,783 363,998 432,741 497,498 571,215
Foreign currencyt 146,492 200,211 283,425 379,355 460,602 562,709 716,813
Total 374,879 457,803 582,208 743,353 893,342 1,060,207 1,288,028
Deposits with all authorized institutions
Hong Kong dollar :J:1: 213,311 236,494 273,369 330,694 390,433 450,762 520,115
Foreign currencyt 141,655 194,318 277,283 372,915 455,087 556,895 711,156
Total 354,965 430,811 550,651 703,609 845,520 1,007,658 1,231,271
Notes: *Foreign currency swap deposits are deposits involving customers buying foreign currencies in the spot market and placing them as deposits with authorized institutions, while at the same time entering into a forward contract to sell such foreign currencies (principal plus interest) upon maturity of such deposits. For most analytical purposes, they should be regarded as Hong Kong dollar deposits.
:J:1: Figures are adjusted to include foreign currency swap deposits. tFigures are adjusted to exclude foreign currency swap deposits.
Source: Monetary Affairs Branch, Government Secretariat.
126

9 .4 Balance Sheets: Licensed Banks
Number of licensed banks
Liabilities
Amount due to authorized institutions in Hong Kong
Amount due to banks abroad Deposits from customers* Negotiable certificates of deposit
outstanding Other liabilities
Total liabilities
Assets Notes and coins Amount due from authorized
institutions in Hong Kong Amount due from banks abroad Negotiable certificates of deposit held:
Issued by licensed banks in Hong Kong Issued by restricted licence banks Issued by deposit-taking companies Issued by banks outside Hong Kong
Total negotiable certificates of deposit Loans and advances to customers:
To finance imports to, and exports and re-exports from Hong Kong
To finance merchandising trade not touching Hong Kong
Other loans for use in Hong Kong Other loans for use outside
Hong Kong Other loans where the place of use
is not known Total loans and advances
Bank acceptances and bank bills of exchange held
Floating rate notes and commercial paper held
Treasury bills, securities, shareholdings and interests in land and buildings
Other assets
Total assets
9.4 (Continued)
Number oflicensed banks
Liabilities
Amount due to authorized institutions in Hong Kong
Amount due to banks abroad Deposits from customers* Negotiable certificates of deposit
outstanding Other liabilities
Total liabilities
Assets Notes and coins Amount due from authorized
institutions in Hong Kong Amotmt due from banks abroad Negotiable certificates of deposit held:
Issued by licensed banks in Hong Kong Issued by restricted licence banks Issued by deposit-taking companies Issued by banks outside Hong Kong
Total negotiable certificates of deposit Loans and advances to customers:
To finance imports to, and exports and re-exports from Hong Kong
To finance merchandising trade not touching Hong Kong
Other loans for use in Hong Kong Other loans for use outside
Hong Kong Other loans where the place of use
is not known Total loans and advances
Bank acceptances and bank bills of exchange held
Floating rate notes and commercial paper held
Treasury bills, securities, shareholdings and interests in land and buildings
Other assets
Total assets
Notes: Figures are as at end of the year.
1981 Foreign
HK$ currency Total
61,524 6,089
85,870
2,568 36,258
121
26, 724 88,248 164,134 170,223 18,588 104,457
2,237 10,355
4,805 46,613
192,308 222,039 414,346
2,473 2,473
37,300 37,174 74,474 6,499 112,160 118,659
565
55 5
625
16,202
147 90,962
1,338
190
99 5,749 6,038
3,516
1,170 12,413
32,072
756
155 5,754 6,665
19,718
1,317 103,375
33,410
627 3,352 3,979 109,276 52,523 161,799
1,064
934
7,739 14,503
8,927
3,480
947 12,683
9,991
4,414
8,686 27,187
180,414 233,932 414,346
1986 Foreign
HK$ currency Total
148
101,526 175,084 276,610 19,973 811,068 831,041
213,337 278,016 491,353
17,853 50,047
4,945 25,676
22,798 75,723
402,735 1,294,789 1,697,524
3,108 3,108
104,229 236,657 340,886 28,255 790,042 818,297
7,138 250 541
2 7,931
20,041
1,467 8
242 9,173
10,889
13,071
8,606 258 782
9,175 18,821
33,112
375 3,779 4,154 183,904 44,298 228,202
5,940 97,567 103,507
2,138 19,635 21,773 212,398 178,349 390,747
1,020 13,016 14,036
6,395 27,419 33,814
23,857 14,137
8,973 30,849
32,831 44,986
401,331 1,296,194 1,697,524
1982 Foreign
HK$ currency Total
128
58,898 38,814 97,712 6,129 226,725 232,854
107,876 82,384 190,259
4,.l77 51,563
5,752 14,271
9,929 65,833
228,642 367,946 596,588
2,474 2,474
56,774 59,699 116,473 7,997 187,647 195,644
1,067 29 59 12
1,167
17,332
195 119,700
683
3,612 4,295
6,293
1,316 17,419
38,859
1,749 29 59
3,624 5,461
23,624
1,510 137,118
40,053 1,195
928 139,348
5,467 6,395 69,353 208,702
917
753
9,885 20,780
8,640
4,384
1,314 21,162
9,557
5,137
11,199 41,942
240,094 356,494 596,588
1987 Foreign
HK$ currency Total
154
124,245 197,566 321,811 24,809 1,632,839 1,657,648
278,494 363,192 641,685
21,113 57,126
6,582 46,532
27,695 103,658
505, 786 2,246, 711 2, 752,497
3,996 3,996
128,437 269,710 398,147 25,520 1,468,285 1,493,805
8,524 382 700 99
9,705
23,318
2,016
206 8,359
10,581
18,201
10,541 382 906
8,458 20,287
41,519
510 5,951 6,461 232,769 74,308 307,077
8,397 249,865 258,262
2,613 50,139 52,753 267,607 398,464 666,072
1,164 15,627 16,791
7,547 37,906 45,452
27,556 14,391
17,984 48,017
45,540 62,408
485,97A 2,266,573 2, 752,497
*Figures are unadjusted for foreign currency swap deposits. Adjusted figures are published in Table 9.3.
Source: Monetary Affairs Branch, Government Secretariat.
1983 Foreign
HK$ currency Total
134
69,118 62,618 131,736 8,870 315,006 323,875
124,674 115,200 239,874
4,549 6,817 11,366 57,556 24,219 81,774
264,766 523,859 788,625
2,621 2,621
66,439 98,696 165,135 12,881 258,707 271,588
1,371 48 71
1,489
19,200
1,086
31 6,350 7,467
7,880
2,457 48
102 6,350 8,956
27,080
193 1,911 2,104 133,851 28,022 161,873
1,713 53,454 55,167
1,376 156,332
7,566 8,942 98,833 255,165
947 9,581 10,528
900 6,409 7,309
11,282 1,574 12,856 23,074 31,395 54,469
275,965 512,661 788,625
1988 Foreign
HK$ currency Total
158
149,007 195,443 344,449 48,304 1,955,791 2,004,095
313,969 465,020 778,989
22,335 63,569
7,676 65,280
30,012 128,849
597,184 2,689,210 3,286,394
4,203 4,203
149,581 234,843 384,424 30,811 1,770,582 1,801,393
7,570 372 586 114
8,642
29,104
1,974
223 8,936
11,133
24,952
9,544 372 808
9,051 19,776
54,056
1,371 10,211 11,582 313,626 93,068 406,693
10,539 332,755 343,294
4,077 46,778 50,855 358,716 507,764 866,480
1,335 17,063 18,398
8,499 44,005 52,504
27,780 18,270
30,843 62,324
58,624 80,593
607,837 2,678,557 3,286,394
1984 Foreign
HK$ currency Total
140
79 ,622 81,860 161,482 8,586 364,415 373,001
158,005 138,099 296,103
4,838 44,846
6,765 16,534
11,602 61,380
295,897 607 ,671 903,568
2,340 2,340
74,877 120,447 195,323 13,808 315,018 328,826
1,661 122 90
1,873
19,983
206 142,631
2,391
1,349
63 8,090 9,502
10,073
3,459 33,600
62,982
3,010 122 153
8,090 11,374
30,056
3,665 176,231
65,373
1,609 9,344 10,952 166,820 119,457 286,277
1,052
1,064
13,309 16,470
9,109
10,976
2,243 25,206
10,160
12,040
15,552 41,676
291,611 611,957 903,568
1989 Foreign
HK$ currency Total
165
194,105 216,150 410,255 82,077 2,259,893 2,341,970
358,130 579,524 937,654
23,483 74,409
7,536 79,039
31,019 153,448
732,204 3,142,141 3,874,345
5,467 5,467
198,169 248,340 446,508 22,042 1,957,288 1,979,330
7,307 257 405 114
8,083
31,873
1,432
125 8,000 9,557
27,857
8,739 257 530
8,115 17,641
59,730
1,921 7,670 9,591 426,450 103,570 530,019
8,803 461,329 470,131
5,297 98,237 103,534 474,343 698,662 1,173,005
1,308 21,937 23,245
9,145 45,535 54,679
29,278 23,415
42,485 71,763 79,293 102,708
771,250 3,103,095 3,874,345
HK$million
1985 Foreign
HK$ currency Total
143
89,769 94,227 183,996 13,691 450,473 464,163
174,121 193,104 367,224
9,429 54,207
4,811 17,191
14,240 71,398
341,216 759,806 1,101,021
2,594 2,594
83,308 142,127 225,434 24,598 419,365 443,963
2,804 123 315
3,242
18,588
221 159,096
4,165
991 35
316 8,711
10,053
9,766
2,951 32,913
71,122
3,794 158 631
8,711 13,294
28,354
3,172 192,009
75,287
2,066 12,056 14,121 184,135 128,808 312,942
867
3,516
23,360 16,194
9,145
20,799
4,995 23,918
10,012
24,314
28,355 40,113
341,812 759,209 1,101,021
HK$million
1990 Foreign
HK$ currency Total
166
194,184 244,802 438,985 99,939 2,952,025 3,051,964
421,560 733,559 1,155,119
26,344 90,313
6,455 89,029
32,800 179,342
832,340 4,025,870 4,858,210
5,561 5,561
210,075 262,931 473,006 37,314 2,356,751 2,394,065
9,239 261 338 92
9,931
35,261
1,212
109 7,705 9,026
31,475
10,451 261 448
7,797 18,957
66,736
1,889 7,009 8,898 488,686 131,502 620,189
9,387 842,165 851,552
7,680 124,523 132,202 542,902 1,136,674 1,679,576
1,435 19,275 20,710
8,634 46,606 55,240
43,284 26,981
56,809 100,092 84,020 JI 1,002
886,118 3,972,092 4,858,210
127

9.5 Balance Sheets: Restricted Licence Banks
Number of restricted licence banks
Liabilities
Amount due to authorized institutions in Hong Kong
Amount due to banks abroad Deposits from customers Negotiable certificates of deposit
outstanding Other liabilities
1982 Foreign
HK$ currency
3,512 123
3,455
100 2,995
8,568 24,296 5,755
2,809
Total
18
12,080 24,419
9,210
100 5,804
1983 Foreign
HK$ currency
6,299 203
5,264
213 4,583
16,411 33,197 10,142
70 7,125
Total
30
22,709 33,400 15,407
284 11,707
1984 Foreign
HK$ currency
15,998 702
7,734
475 4,974
17,687 34,248 10,997
75 12,854
Total
33
33,684 34,950 18,731
550 17,828
1985 Foreign
HK$ currency
18,190 435
6,948
412 5,367
21,045 54,292 13,999
203 18,063
Total
35
39,235 54,727 20,947
614 23,430
Total liabilities 10,185 41,427 51,613 16,561 66,946 83,507 29,882 75,861 105,743 31,351 107,602 138,953
Assets
Notes and coins Amount due from authorized
institutions in Hong Kong Amount due from banks abroad Negotiable certificates of deposit held:
Issued by licensed banks in Hong Kong
Issued by restricted licence banks Issued by deposit-taking companies Issued by licensed banks outside
Hong Kong Total negotiable certificates of deposit Loans and advances to customers:
To finance imports to, and exports and.re-exports from Hong Kong
To finance merchandising trade not touching Hong Kong
Other loans for use in Hong Kong Other loans for use outside
Hong Kong Other loans where the place of use
is not known Total loans and advances
Bank acceptances and bank bills of exchange held
Floating rate notes and commercial paper held
Treasury bills, securities, shareholdings and interests in land and buildings
Other assets
3,849 629
536 69
114
719
157
2 7,686
110
787 8,743
28
64
783 634
7,210 9,401
228
665 892
52
63 5,784
7,454
1,702 15,054
174
282
1,752 1,395
11,059 10,031
764 69
114
665 1,612
209
65 13,470
7,564
2,489 23,797
203
346
2,535 2,029
6,511 600
831 74
135
1,040
232
3 8,555
205
432 9,428
42
139
722 947
10,722 24,987
235
31
1,723 1,989
83
91 2,673
16,030
2,785 21,662
128
1,835
478 2,278
17,233 25,587
1,066 74
166
1,723 3,029
315
94 11,228
16,235
3,217 31,089
169
1,974
1,200 3,225
8,358 536
770 107 117
993
245
6 16,443
422
607 17,723
50
303
689 1,081
11,370 24,454
262
222
2,579 3,062
231
88 2,518
22,772
1,654 27,263
116
4,100
1,268 4,376
19,728 24,990
1,031 107 339
2,579 4,056
476
94 18,961
23,194
2,261 44,987
165
4,403
1,957 5,457
8,986 522
1,500 86
270
1,855
396
10 15,013
587
1,128 17,134
74
976
589 1,274
14,854 32,367
223 105 125
2,972 3,425
222
70 2,743
21,120
1,736 25,890
210
10,807
4,339 15,650
23,840 32,889
1,723 191 394
2,972 5,280
617
80 17,756
21,707
2,864 43,024
284
11,783
4,928 16,925
Total assets 15,451 36,161 51,613 19,429 64,078 83,507 29,733 76,010 105,743 31,411 107,541 138,953
9.5 (Continued)
Number of restricted licence banks
Liabilities
Amount due to authorized institutions in Hong Kong
Amount due to banks abroad Deposits from customers Negotiable certificates of deposit
outstanding Other liabilities
Assets
Notes and coins
Total liabilities
Amount due from authorized institutions in Hong Kong
Amount due from banks abroad Negotiable certificates of deposit held:
Issued by licensed banks in Hong Kong
Issued by restricted licence banks Issued by deposit-taking companies Issued by licensed banks outside
Hong Kong Total negotiable certificates of deposit Loans and advances to customers:
To finance imports to, and exports and re-exports from Hong Kong
To finance merchandising trade not touching Hong Kong
Other loans for use in Hong Kong Other loans for use outside
Hong Kong Other loans where the place of use
is not known Total loans and advances
Bank acceptances and bank bills of exchange held
Floating rate notes and commercial paper held
Treasury bills, securities, shareholdings and interests in land and buildings
Other assets
Total assets
Notes: Figures are as at end of the year.
1987 Foreign
HK$ currency
26,006 756
7,840
731 5,535
19,713 45,777 20,398
193 15,866
Total
35
45,719 46,532 28,238
924 21,400
40,867 101,946 142,813
17,231 260
2,262 68
219
2,550
310
4 18,129
526
167 19,136
16,812 28,163
544 116 66
1,443 2,169
153
28 2,752
13,367
1,533 17,833
34,042 28,423
2,805 185 285
1,444 4,719
463
32 20,881
13,894
1,700 36,969
16 222 238
1,736 12,460 14,196
484 2,500 2,984 1,289 19,952 21,241
42,703 100,110 142,813
*Figures denote less than HK$0.5 million in magnitude.
Source: Monetary Affairs Branch, Government Secretariat.
128
1988 Foreign
HK$ currency Total
23,343 1,104 9,888
660 7,102
42,097
17,301 611
1,777 82
197
4 2,060
184
48 20,322
624
64 21,242
26
1,795
656 1,387
45,077
15,281 44,095 20,820
16,518
35
38,624 45,200 30,708
660 23,620
96, 714 138,811
14,567 28,077
538
59
814 1,410
248
47 2,525
12,280
924 16,025
266
11,395
2,516 19,479
31,867 28,688
2,314 82
256
818 3,470
432
96 22,847
12,904
988 37,266
292
13,190
3,172 20,865
93,734 138,811
1989 Foreign
HK$ currency
22,644 766
8,646
459 7,436
19,854 45,930 28,753
121 24,289
Total
36
42,499 46,696 37,399
579 31,725
39,951 118,948 158,899
15,463 698
2,640 106 287
4 3,036
168
22,674
930
215 23,986
1,834
861 1,300
18,091 36,154
473
43
1,349 1,864
228
2 2,946
12,410
1,288 16,874
33,554 36,852
3,112 106 330
1,352 4,900
396
2 25,620
13,339
1,503 40,860
303 311
14,629
7,090 16,707
16,463
7,952 18,007
47,187 111,711 158,899
HK$mil/ion
1986 Foreign
HK$ currency Total
21,028 682
6,496
811 5,717
17,391 41,650 16,105
200 16,251
38
38,419 42,332 22,601
1,011 21,968
34, 733 91,597 126,330
9,864 719
2,376 133 271
2,780
359
4 16,311
232
516 17,421
26
2,696
431 1,444
17,274 24,058
273 117 78
2,326 2,793
152
23 2,398
16,800
1,710 21,082
257
12,062
3,973 9,449
27,138 24,777
2,649 250 349
2,326 5,574
510
26 18,709
17,032
2,226 38,504
283
14,758
4,404 10,893
35,381 90,949 126,330
HK$million
1990 Foreign
HK$ currency Total
27,924 684
10,968
21,970 55,621 32,816
44
49,894 56,305 43,784
500 589 1,089 8,122 26,139 34,260
48,198 137,134 185,332
16,999 526
2,902 107 401
10 3,419
145
30,308
923
138 31,514
22,660 44,086
284
23
2,176 2,483
248
40 3,614
11,085
969 15,956
39,658 44,612
3,185 107 424
2,186 5,902
393
40 33,922
12,008
1,107 47,470
17 201 217
2,357 17,434 19,791
1,868 6,521 8,388 1,218 18,076 19,294
57,918 127,415 185,332

9.6 Balance Sheets: Deposit-taking Companies
Number of deposit-taking companies
Liabilities
Amount due to authorized institutions in Hong Kong
Amount due to banks abroad Deposits from customers* Negotiable certificates of deposit
outstanding Other liabilities
Assets Notes and coins
Total liabilities
Amount due from authorized institutions in Hong Kong
Amount due from banks abroad Negotiable certificates of deposit held:
Issued by licensed banks in Hong Kong Issued by restricted licence banks Issued by deposit-taking companies Issued by licensed banks outside
Hong Kong Total negotiable certificates of deposit Loans and advances to customers:
To finance imports to, and exports and re-exports from Hong Kong
To finance merchandising trade not touching Hong Kong
Other loans for use in Hong Kong Other loans for use outside
Hong Kong Other loans where the place of use
is not known Total loans and advances
Bank acceptances and bank bills of exchange held
Floating rate notes and commercial paper held
Treasury bills, securities, shareholdings and interests in land and buildings
Other assets
Total assets
9.6 (Continued)
Number of deposit-taking companies
Liabilities
Amount due to authorized institutions in Hong Kong
Amount due to banks abroad Deposits from customers Negotiable certificates of deposit
outstanding Other liabilities
Assets Notes and coins
Total liabilities
Amount due from authorized institutions in Hong Kong
Amount due from banks abroad Negotiable certificates of deposit held:
Issued by licensed banks in Hong Kong
Issued by restricted licence banks Issued by deposit-taking companies Issued by licensed banks outside
Hong Kong Total negotiable certfficates of deposit Loans and advances to customers:
To finance imports to, and exports and re-exports from Hong Kong
To finance merchandising trade not touching Hong Kong
Other loans for use in Hong Kong Other loans for use outside
Hong Kong Other loans where the place of use
is not known Total loans and advances
Bank acceptances and bank bills of exchange held
Floating rate notes and commercial paper held
Treasury bills, securities, shareholdings and interests in land and buildings
Other assets
Total assets
Notes: Figures are as at end of the year.
1981 Foreign
HK$ currency
14,842 700
48,489
975 14,208
31,219 87,030 10,678
454 9,840
Total
350
46,062 87,730 59,167
1,430 24,048
79,215 139,221 218,436
8
39,609 944
939
237
1,176
1,380
150 32,360
781
1,633 36.305
87
89
17,986 38,000
640
143
5,825 6,608
788
741 7,673
44,444
5,792 59,438
696
4.376
8
57,596 38,944
1,578
380
5,825 7,783
2,167
891 40,034
45,225
7.425 95,742
783
4,465
2,337 1,724 4,061 2,944 6,111 9,055
83,499 134,937 218,436
1986 Foreign
HK$ currency Total
254
26,766 84,934 111,700 994 111,342 112,335
25,269 11,428 36,697
1,770 10,904
4,204 48,826
5,974 59,730
65, 703 260, 733 326.436
35.065 295
3,194 87
325
3,606
772
14 18,729
587
303 20.406
23.374 90.959
866
156
11,265 12,286
1,107
400 5,090
39,568
4,775 50,940
58,439 91,253
4,060 87
481
11,265 15,893
1,880
414 23,819
40,155
5.077 71,346
41 656 697
1,816 45,369 47.185
799 19,915 20,714 1,452 19.451 20,902
63.488 262,949 326,436
*Figures denote less than HK$0.5 million in magnitude.
Source: Monetary Affairs Branch, Government Secretariat.
1982 Foreign
HK$ currency
20,847 933
24,053
1,041 11,821
39,852 94,301
9,243
413 12,404
Total
341
60,698 95,234 33,296
1,454 24,224
58.694 156,212 214,907
12
22,644 418
936
79
1,015
1,525
111 30,810
804
753 34,003
57
42
16,395 41,235
1,493
158
9,022 10,673
980
606 5,923
52,530
4,693 64,731
1,447
7,763
12
39,039 41,652
2,429
236
9,022 11,688
2,505
716 36,733
53,334
5,446 98,734
1,504
7.805
1,199 2,592 3,790 1,861 8,821 10,682
61,250 153,657 214,907
1987 Foreign
HK$ currency Total
22,592 1,514
23,210
1,936 10,874
232
95,164 117,756 95, 774 97,288 10,477 33,687
3,862 57.077
5,798 67,951
60,127 262,353 322,479
6
27,119 648
2,675 86
325
3.086
903
24 20,638
668
369 22,602
26,174 88,153
1,082 8
159
12,270 13.520
1,372
485 4,089
39,707
7,487 53,139
6
53,292 88.801
3,757 93
484
12,270 16.605
2,274
510 24,727
40,375
7,856 75,741
32 350 382
1,981 33,500 35.481
1,035 32,923 33,959 1,708 16,506 18,213
58,215 264,264 322,479
1983 Foreign
HK$ currency
21,565 50,650 1,697 106,612
23,463 9,300
655 12,448
990 15,950
Total
319
72,215 108,309 32,763
1,644 28,399
59,828 183,502 243,330
8
23,785 647
916 21 45
982
1,013
100 29,416
606
18,737 52,005
1.829
389
12,219 14,437
1,074
589 6,414
59,490
8
42,521 52,652
2,746 21
434
12,219 15,419
2,087
689 35,830
60,095
281 6,116 6,397 31,415 73,683 105.098
29
130
909 2,308
945
9,719
5,537 8,054
974
9.850
6,446 10,361
60,214 183,116 243,330
1988 Foreign
HK$ currency
17,503 3,075
22,886
2,073 10,999
60,271 79,736 12,937
1,365 61,926
Total
216
77,774 82,811 35,823
3,438 72,926
56.537 216.234 272,772
22,878 349
1,770 47
235
2,058
1,158
3 22,561
632
259 24,614
23.218 96.816
601
133
7,134 7.868
1,375
664 4,386
24,694
2,698 33,817
46,096 97,165
2,371 47
368
7,139 9.926
2,533
667 26,948
25,326
2,957 58,431
34 675 709
1.010 23.232 24.242
954 21,564 22,517 1,380 12,300 13,679
53,282 219,489 272, 772
1984 Foreign
HK$ currency
18,656 54,851 884 107,621
27,450 12,680
649 11,304
1,998 24,253
Total
310
73,507 108,505 40,131
2,647 35,557
58,944 201.403 260.347
31,268 499
1,138 82 72
1,293
969
89 20,272
676
380 22.386
27
474
892 1.884
20,351 60,047
1,719
387
12,609 14,715
965
600 5,442
53,547
6,846 67.399
624
19.532
8,001 10,948
51,619 60,546
2,857 82
459
12,609 16,008
1,935
689 25,714
54,223
7,226 89,786
651
20.006
8,893 12,832
58,730 201,617 260,347
1989 Foreign
HK$ currency
18,082 1,078
20,865
1,662 11,740
51,534 38,634 11,740
637 58,248
Total
202
69,617 39,712 32,605
2,298 69,988
53,426 160,793 214.219
II
19,836 168
1,872 15
172
37 2.096
1,522
9 24,569
562
248 26,910
23,069 61,610
306
102
2,735 3,143
1,914
826 4,385
21,363
2,635 31,124
37 473
1.179 20,737
869 11,393 1,388 10,179
II
42,905 61,778
2,177 15
273
2,773 5.239
3,436
834 28,954
21,925
2,884 58,033
509
21.916
12,261 11,567
52,493 161,726 214,219
HK$million
1985 Foreign
HK$ currency
21,229 957
31,063
1,107 10,733
63,908 131,665
11,577
4,258 39,152
Total
278
85,137 132,622 42,640
5,365 49,885
65,090 250,559 315,649
36,806 371
1,461 35
114
21,465 84,798
1,104 19
460
,12,429 1,610 "14.013
758
38 19,820
771
273 21,661
20
983
1,125
448 5,358
48,555
6,851 62,338
1,462
37,672
58,271 85,170
2,565 54
574
12,429 15,622
1,884
487 25,179
49,326
7,124 83,998
1.482
38,655
951 16.883 17,833 1,541 13.G?O 14,611
63,950 251,700 315,649
HK$million
1990 Foreign
HK$ currency
22,252 885
19,855
1,508 12,397
40,230 29,529 12,513
831 50,501
Total
190
62,482 30,414 32,368
2,339 62,897
56,896 133,604 190,500
18,217 332
1,522 63
114
12 1,710
1,833
18 30,033
508
210 32,601
19.921 43.552
403
187
1,584 2,174
2,126
681 5,225
18,610
2,320 28,962
31 463
654 18,484
872 12.288 1,432 8,800
38,139 43.884
1,925 63
301
1,596 3,884
3,958
699 35,258
19,118
2,530 61,563
494
19,139
13,160 10.232
55,855 134,644 190.500
129
I

9.7 Analysis of Loans and Advances for Use in Hong Kong
(a) Licensed Banks HK$million
Use 1981 1982 1983 1984 1985 1986 1987 1988 1989 1990
Manufacturing 12,430 14,439 16,210 16,940 17,962 23,479 27,876 36,203 42,948 45,552
Textiles 2,466 2,807 3,103 2,945 3,330 4,051 5,290 5,818 7,733 6,821 Cotton 1,261 1,317 1,554 1,367 1,652 1,771 2,305 2,520 3,301 2,183 Others 1,205 1,490 1,549 1,578 1,678 2,280 2,985 3,298 4,433 4,638
Footwear and wearing apparel 1,558 1,930 1,990 1,937 2,015 2,162 2,054 2,839 3,888 4,984 Meta/ products and engineering 1,415 1,576 1,574 1,591 1,972 2,271 3,011 3,881 4,872 5,309 Rubber, plastics and chemicals 912 1,051 1,301 1,245 1,080 1,580 2,056 3,307 3,875 4,213 Shipbuilding and repair 1,209 1,051 1,017 1,491 1,009 646 807 656 545 615 Electrical and electronic 1,456 1,717 2,186 2,698 3,167 5,151 4,901 6,184 7,690 8,354 Food 421 609 750 735 1,121 1,354 1,034 1,699 1,987 2,265 Beverages and tobacco 267 304 450 381 638 615 627 370 436 639 Printing and publishing 451 516 538 540 688 667 1,202 2,204 2,293 2,183 Mis_cellaneous 2,275 2,877 3,300 3,377 2,942 4,982 6,894 9,246 9,629 10,170
Agriculture and fisheries 97 119 138 l15 189 163 150 341 386 389
Fisheries 36 52 59 82 74 69 62 159 142 152 Livestock and livestock products 37 43 54 116 89 68 45 65 136 114 Vegetables and horticultures 24 24 25 17 25 26 42 117 108 124
Transport and transport equipment 6,680 10,509 13,811 13,985 13,818 12,483 14,089 16,143 28,802 31,342
Electricity, gas and telephone 1,075 2,242 2,684 4,135 4,407 4,304 3,849 3,908 4,803 7,019
Building, construction and property development 24,123 36,192 37,194 39,332 33,813 31,265 36,909 54,899 92,429 103,116
Wholesale and retail trade 14,982 17,711 23,165 26,024 28,221 32,601 42,415 58,283 61,034 72,353
Mlning and quarrying 139 211 175 270 148 141 246 375 625 1,174
Miseellaneous 43,849 55,696 68,496 75,329 93,452 123,766 181,545 236,542 298,992 359,244
Hotels, boarding houses and catering 704 1,198 1,562 2,312 3,359 3,684 4,991 7,299 12,949 13,572
Financial concerns (other than banks and deposit-taking compan.ies) 7,431 8,975 13,973 13,377 15,844 19,302 30,870 50,783 81,918 102,268
Stockbrokers 1,796 1,893 1,247 1,224 1,646 2,354 2,434 2,715 3,002 2,457 Professional and private
individuals 20,918 25,754 30,286 33,039 41,625 57,449 85,646 109,634 139,103 171,564 To purchase fiats in the
Home Ownership Scheme aod Private Sector Participation Scheme 989 1,258 2,002 2,370 3,296 3,782 4,595 5,444 6,830 8,953
To purchase other resideotial property 7,983 10,128 12,569 14,631 18,984 28,553 42,960 61,448 83,039 107,721
For credit card advances 129 219 311 416 598 1,045 1,583 2,239 3,189 4,791 For other business purposes 4,469 4,915 5,413 4,851 7,048 9,372 14,952 16,924 18,528 19,128 For other private purposes 7,348 9,235 9,991 10,771 11,698 14;696 21,556 23,578 27,517 30,971
All others 13,000 17,876 21,429 25,378 30,979 40,977 57,604 66,110 62,019 69,382
Total 103,375 137,118 161,873 176,231 192,009 228,202 307,077 406,693 530,019 620,189
130

9.7 (Continued)
(b) Restricted Licence Banks HK$million
Use 1982 1983 1984 1985 1986 1987 1988 1989 1990
Manufacturing 308 576 503 431 351 306 599 1,080 1,164
Textiles 5 32 54 50 68 83 79 108 117 Cotton . 32 36 34 3 2 . 8 8 Others 5 18 17 65 81 79 100 109
Footwear and wearing apparel 1 30 31 23 15 16 38 38 Metal products and engineering 8 25 33 20 38 11 70 82 55 Rubber, plastics and chemicals 14 91 86 30 73 15 77 104 54 Shipbuilding and repair 36 82 103 122 . 44 * Electrical and electronic 17 47 41 34 15 10 162 121 101 Food 3 4 11 11 5 24 24 Beverages and tobacco 75 75 13 11 23 12 13 86 Printing and publishing 5 4 13 38 28 33 48 71 54 Miscellaneous 146 219 127 92 72 85 130 520 636
Agriculture and fisheries 17 28 43 69 91
Fisheries 17 28 43 69 91 Livestock and livestock products Vegetables and horticultures
Transport and transport equipment 947 2,260 2,579 2,242 2,007 2,494 3,465 4,210 4,744
Electricity, gas and telephone 115 154 225 88 151 127 114 73 560
Building, construction and property development 5,183 4,647 5,602 3,811 1,741 1,340 2,454 2,219 3,148
Wholesale and retail trade 159 513 456 394 281 323 381 359 319
Mining and quarrying 15 15 19 4
Miscellaneous 6,744 3,063 9.597 10,790 14,161 16,246 15,788 17,607 23,896
Hotels, boarding houses and catering 292 323 278 253 241 420 235 288 348
Financial concerns (other than banks and deposit~taking companies) 482 644 873 898 1,349 1,202 785 2,134 1,913
Stockbrokers 3 44 29 61 419 1,209 451 247 239 Professional and private
individuals 4,587 942 6,729 8,036 10,250 11,432 12,138 12,650 18,223 To purchase fiats in the
Home Ownership Scheme and Private Sector Participation Scheme 1,285 2,153 2,295
To purchase other residential 2,747 3,055 3,647 4,606
property 199 291 4,323 4,944 For credit card advances
6,606 6,946 6,825 6,299 10,823
For other business purposes 4,311 587 988 709 964 990 1,416 1,467 1,672 For other private purposes 76 58 134 230 385 750 842 1,237 1,121
All others 1,380 1,110 1,687 1,543 1,903 1,983 2,179 2,287 3,174
Total 13,470 11,228 18,961 17,756 18,709 20,881 22,847 25,620 33,922
131
l

9.7 (Continued)
(c) Deposit-taking Companies HK$million
Use 1981 1982 1983 1984 1985 1986 1987 1988 1989 1990
Manufacturing 1,761 2,189 1,881 1,350 1,334 1,311 1,652 2,208 2,240 2,599
Tex'files 167 194 182 111 124 125 197 337 181 211 Cotton 38 55 38 23 35 41 57 26 25 25 Others 129 139 143 89 89 85 139 310 156 186
Footwear and wearing apparel 99 112 124 81 88 94 103 47 287 224 Meta/ products and engineering 116 113 127 81 146 156 355 419 439 443 Rubber, plastics and chemicals 124 109 65 70 67 60 127 145 162 144 Shipbuilding and repair 310 531 285 156 167 146 36 3 7 2 Electrical and electronic 220 278 222 138 138 68 116 282 262 292 Food 58 61 33 16 33 41 29 35 17 21 Beverages and tobacco 1 12 . 14 3 3 7 Printing and publishing 118 124 154 141 185 207 390 529 558 554 Miscellaneous 548 668 676 556 372 414 299 408 326 700
Agriculture and fisheries 8 3 12 10 21 85 140 132 105
Fisheries 4 2 12 JO 20 76 140 132 ,105 Livestock and livestock products 3 . . 1 • Vegetables and horticultures 1 JO
Transport and transport equipment 3,830 4,188 4,7111 4,034 3,685 3,571 3,015 3,772 4,161 5,146
Electricity, gas and telephone 235 145 442 429 447 280 222 65 97 495
Building, oonstrnction and property development 9,619 8,161 5,278 3,181 2,456 1,596 1,263 1,512 1,651 1,849
Wholesale and retai1 trade 2,799 2,487 2,586 1,764 925 768 667 1,080 1,270 1,969
Mining and quarrying 17 20 12 6 19 6 43 7 12
Miscellaneons 21,765 19,540 20,912 14,943 16,306 16,273 17,818 18,127 19,397 23,084
Hotels, boarding houses and catering 446 220 252 237 84 76 70 231 391 359
Financial concerns (other than banks and deposit-taking
St~~kf,.':k~:; 1,614 2,701 2,600 2,701 2,790 2,413 2,373 1,471 1,105 548 566 286 113 112 312 501 192 78 210 99
Professional and private individuals 14,366 12,816 14,920 9,660 10,559 J0,874 12,352 12,293 13,450 16,940 To purchase flats in the
Home Ownership Scheme and Private Sector Participation Scheme 592 1,005 1,203 257 259 183 155 158 129 106
To purchase other residential property 5,788 6,515 9,024 6,498 7,594 7,743 8,009 9,085 10,155 13,621
For credit card advances 2 8 4 5 11 11 12 14 18 For other business purposes 6,641 4,lll 3,502 2,058 1,708 1,574 2,161 2,001 1,923 1,544 For other private purposes 1,345 1,183 1,184 844 993 1,363 2,016 1,038 1,230 1,651
All others 4,773 3,516 3,028 2,234 2,561 2,409 2,831 4,054 4,240 5,138
Total 40,034 36,733 35,830 25,714 25,179 23,819 24,727 26,948 28,954 35,258
Notes: Figures are as at end of the year and exclude those to finance visible trade. *Figures denote less than HK$0.5 millioo ih magnitude.
Source: Office o{the Commissioner of Banking, Government Secretariat (From 1988 oowards). Monetary Affairs Branch, Goveroment Secretariat (1981-1987).
132

9.8 Money Markets
Inter-licensed banks' liabilities
Demand and call
Short notice
Time deposits
Licensed banks' liabilities to restricted licence banks
Demand and call
Short notice
Time deposits
Licensed banks' liabilities to deposit-taking companies
Demand and call
Short notice
Time deposits
Inter-restricted licence banks' fiabilities
Demand and call
Short notice
Time deposits
Total
Total
Total
Total
Restricted licence banks' liabilities to licensed banks
Demand and call
Short notice
Time deposits
Total
Restricted licence banks' liabilities to deposit-taking companies
Demand and call
Short notice
Time deposits
Inter-deposit-taking companies' liabilities
Demand and call
Short notice
Time deposits
Total
Total
Deposit-taking companies' liabilities to licensed banks
Demand and call
Short notice
Time deposits
Total
Deposit-taking companies' liabilities to restricted licence banks
Demand and call
Short notice
Time deposits
Total
1981
Foreign HK$ currency Total
5,622 1,000 6,622
5,117 3,564 8,681
15,982 14,412 30,394
26,721 18,977 45,698
11,009 1,474 12,483
2.328 2,007 4,335
21,466 4,266 25,732
34,803 7,747 42,550
362 322 684
1,630 1,622 3,253
2,728 8,276 11,005
4,721 10,221 14,941
980 378 1,358
1,815 1,892 3,707
7,326 18,729 26,055
10,122 20,999 31,120
1982
Foreign HK$ currency Total
4,528 1,156 5,684
8,793 4,614 13,408
23,090 20,299 43,389
36,411 26,069 62,481
168 71 239
691 2,191 2,882
1,530 1,492 3,022
2,388 3,754 6,143
5,955 1,519 7,474
2,025 1,930 3,955
12,117 5,542 17,659
20,098 8,991 29,088
117
295
412
75
362
438
2
193
657
850
10
540 308 848
1,501 5,160 6,660
2,049 5,469 7,518
276 34 309
218 339 557
558 2,288 2,846
1,051 2,661 3, 712
523 1,041 1,565
419 882 1,301
890 4,018 4,907
1,832 5,941 7,773
1,333 560 1,893
1,594 1,944 3,538
15,142 28,404 43,545
18,068 30,908 48,976
53 154 207
194 579 773
700 2,269 2,969
946 3,003 3,949
1983
Foreign HK$ currency Total
4,060 2,055 6,115
9,829 10,676 20,505
27,654 30,559 58,213
41,543 43,289 84,833
355 362
908 1,267 2,176
4,043 4,619 8,662
5,307 5,893 11,200
7,066 1,644 8,709
1,816 2,729 4,544
13,387 9,063 22,451
22,269 13,436 35, 704
46
216
261
65
243 289
495 711
738 1,000
54 119
793 1,495 2,288
4,494 11,108 15,602
5,351 12,658 18,009
246 84 330
127 439 566
314 2,491 2,805
687 3,014 3,701
133 62 195
241 362 603
657 3,221 3,878
1,031 3,644 4,676
923 342 1,265
1,359 3,918 5,277
17,535 39,666 57,201
19,817 43,926 63,742
20 56 76
192 746 937
506 2,279 2,785
717 3,080 3,797
1984
Foreign HK$ currency Total
4,904 1,980 6,884
10,564 14,642 25,206
36,875 44,199 81,074
52,343 60,820 113,164
904 90 994
975 2,320 3,294
5,290 4,531 9,821
7,169 6,940 14,109
6,504 927 7,431
1,499 2,706 4,204
12,107 10,467 22,574
20,110 14,099 34,209
142
352
493
68
17 17
192 334
720 1,072
929 1,422
331 399
575 1,147 1,722
4,663 12,581 17,244
5,306 14,060 19,365
261 114 374
211 634 845
9,727 1,950 11,677
10,199 2,698 12,896
61 102 163
154 723 877
396 2,966 3,361
611 3, 791 4,402
547 482 1,029
1,594 4,112 5,706
14,989 43,013 58.002
17,130 47,607 64,736
116 120
93 831 924
818 2,507 3,325
915 3,454 4,369
HK$mil/ion
1985
Foreign HK$ currency Total
4,635 2,109 6,744
13,349 14,367 27,716
39,697 53,863 93,559
57,680 70,338 128,019
687 137 824
1,325 4,156 5,481
5,142 4,645 9,787
7,154 8,938 16,092
8,545 1,436 9,980
2,403 2.933 5,336
13,987 10,583 24,570
24,935 14,951 39,886
129
557
686
34
19 19
365 494
569 1.126
953 1,640
458 492
1,174 4,554 5,727
4,471 11,925 16,396
5,679 16,937 22,616
394 209 603
253 567 820
11,178 2,379 13,557
11,825 3,154 14,979
38 58 95
50 451 501
126 2,956 3,082
214 3,464 3,678
634 2,891 3,525
1,961 6,617 8,578
17,191 46,406 63,597
19, 786 55,913 75,699
12 328 339
202 487 690
1,015 3,716 4,730
1,229 4,531 5,760
133

9.8 (Continued)
Inter-licensed banks' liabilities
Demand and call
Short notice
Time deposits
Licensed banks' liabilities to restricted liceoce banks
Demand and call
Short notice
Time deposits
Licensed banks' liabilities to deposit-taking companies
Demand and call
Short notice
Time deposits
lnter-f'eStricted liceoce banks' liabilities
Demand and call
Short notice
Time deposits
Total
Total
Total
Total
Restricted licence banks' liabHities to licensed banks
Demand and call
Short notice
Time deposits
Total
Restricted licence banks' liabilities to deposit-taking companies
Demand and call
Short notice
Time deposits
Inter-<leposit-taking companies' lialu'lities
Demand and call
Short notice
Time deposits
Total
Total
Deposit-taking companies' liabHities to licensed banks
Demand and call
Short notice
Time deposits
Total
Deposit-taking companies' liabilities to restricted licence banks
Demand and call
Short notice
Time deposits
Total
Notes: Figures are as at end of the year.
1986
Foreign HK$ currency Total
4,142 1,198 5,339
18,737 25,594 44,331
47,369 116,622 163,992
70,248 143,414 213,662
693 688 1,382
2,118 3,690 5,808
6,023 8,913 14,936
8,834 13,291 22,125
5,670
1,883
14,891
22,444
199
448
647
1,488 7,158
4,091 5,973
12,800 27,692
18,379 40,823
11 11
252 450
348 796
611 1,257
243 1,352 1,594
2,026 3,501 5,527
5,511 9, 774 15,285
7,779 14,627 22,406
156
434
251
411
408
845
12,011 1,491 13,503
12,602 2,154 14,756
19 40 59
51 596 647
91 2,157 2,248
161 2, 7<n. 2,953
1,821 1,169 2,990
2,511 15,153 17,663
21,710 62,746 84,456
26,042 79,068 105,110
12 95 107
140 793 933
412 2,186 2,597
563 3,074 3,637
*Figures denote less than HK$0.5 million in magnitude.
Source: Monetary Affairs Branch, Government SecrCtariat.
134
1987
Foreign HK$ currency Total
8,177 998 9,175
16,716 32,713 49,429
64,162 126,979 191,141
89,054 160,691 249,745
1,071 487 1,557
2,941 5,036 7,976
11,606 8,547 20,153
15,617 14,069 29,687
4,792 1,340 6,132
1,928 3,371 5,299
12,852 18,096 30,948
19,573 22,806 42,379
139
555
694
442 581
278 833
721 1,414
1,812 127 1,938
I, 767 6,455 8,222
14,329 10,223 24,552
17,908 16,805 34,713
93
502
303
463
396
965
6,810 1,422 8,231
7,404 2,188 9,592
98 40 138
21 511 531
46 2,290 2,337
165 2,841 3,006
815 869 1,683
2,031 12,492 14,522
18,624 76,566 95,190
21,470 89,926 111,396
4 36 40
191 487 678
763 1,874 2,637
958 2,397 3,354
1988
Foreign HK$ currency Total
3,007 3,990 6,997
26,278 31,053 57,332
82,961 125,177 208,137
112,246 160,220 272,465
606 155 761
3,318 4,420 7,738
12,450 8,358 20,807
16,374 12,932 29,306
5,012 807 5,818
5,180
31,679
42,678
1,609 3,571
13,767 17,913
20,387 22,291
128
480
608
153 281
333 814
486 1,094
2,535 326 2,860
1,664 4,292 5,956
16,254 9,672 25,926
20,452 14,290 34, 742
63
68
2,151
2,282
6
12
103
75
171
389 2,540
505 2,787
16 22
20 335 354
37 1,720 1,757
62 2,072 2,134
424 1,537 1,961
1,997 4,453 6,451
14,687 51,504 66,191
17,109 57,493 74,602
28
50
254
332
31
24 74
679 933
706 1,038
1989
Foreign HK$ currency Total
3,843 2,034 5,877
34,696 48,867 83,563
121,944 125,130 247,074
160,483 176,030 336,513
481 311 792
2,534 4,484 7,017
11,337 8,151 19,489
14,352 12,945 27,297
3,901 850 4, 751
1,607 4,274 5,882
13,762 22,050 35,812
19,270 27,174 46,444
343
335
678
177
129
307
520
464
985
30 182 213
2, 705 5,998 8, 703
18,659 12,922 31,580
21,394 19,102 40,496
28
98
447
573
179
37
276
258 705
446 1,019
2 2
10 36 47
79 1,279 1,358
89 1,318 1,407
150 1,072 1,222
1,559 6,131 7,689
15,942 42,819 58,761
17,651 50,022 67,672
30
313
343
59
136
195
89
449
538
HK$million
1990
Foreign HK$ currency Total
4,039 2,555 6,593
31,788 53,630 85,417
125,095 148,815 273,910
160,921 204,999 365,920
588 403 991
2,313 4,983 7 ,296
12,699 13,440 26,140
15,601 18,826 34,427
3,187
1,442
13,034
17,662
62
513
575
1,025 4,211
3,183 4,625
16,770 29,803
20,977 38,639
189
163
352
250
676
927
26 133 159
2,957 4,155 7,112
23,888 16,998 40,886
26,870 21,286 48,156
60
136
284
479
33
41
258
332
92
177
542
811
20 88 108
15 1,092 1,107
35 1,181 1,216
836 872 1,708
1,090 2,479 3,568
19,851 35,378 55,229
21, 776 38, 729 60,505
76
364
440
69
251
320
145
616
760

9.9 Foreign Currency Positions
Banks
Spot assets
Forward purchases
Spot liabilities
Forward sales
Net spot position
Net forward position
Open position
Restricted licence banks and deposit-taking companies
Spot assets
Forward purchas.es
Spot liabilities
Forward sales
Net spot position
Net forward position
Open position
All authorized institutions
Spot assets
Forward purchases
Spot liabilities
Forward sales
Net spot position
Net forward position
Open position
1981
233,175
113,775
224,453
104,494
+8,722
+9,281
18,003
126,054
46,267
128,973
41,747
-2,919
+4,520
1,601
359,229
160,042
353,426
146,241
+5,803
+ 13,801
19,604
Notes: Figures are as at end of the year.
1982
359,178
185,950
374,738
154,107
-15,560
+31,843
16,283
191,655
55,651
195,592
49,902
-3,937
+5,749
1,812
550,833
241,601
570,330
204,009
-19,497
+37,592
18,095
1983
517,777
258,965
533,515
223,367
-15,738
+35,598
19,860
250,779
50,758
252,033
44,597
-1,254
+6,161
4,907
768,556
309,723
785,548
267,964
-16,992
+41,759
24,767
' +' denotes net assets and ' - ' denotes net liabilities.
1984
632,162
292,543
630,880
274,283
+1,282
+ 18,260
19,542
280,895
57,929
278,873
55,673
+2,022
+2,256
4,278
913,057
350,472
909,753
329,956
+3,304
+20,516
23,820
1985
762,131
426,126
767,163
402,828
-5,032
+23,298
18,266
361,697
105,228
359,065
103,748
+2,632
+ 1,480
4,112
1,123,828
531,354
1,126,228
506,576
-2,400
+24,778
22,378
1986
1,277,626
680,241
1,289,115
639,993
-11,489
+40,248
28,759
355,597
138,804
353,734
136,779
+ 1,863
+2,025
3,888
1,633,223
819,045
1,642,849
776,772
-9,626
+42,273
32,647
1987
2,237,548
1,672,566
2,258,110
1,640,090
-20,562
+32,476
11,914
375,572
201,207
373,456
199,741
+2,116
+ 1,466
3,582
2,613,120
1,873,773
2,631,566
1,839,831
-18,446
+33,942
15,496
1988
2,677,986
2,475,415
2,701,460
2,423,859
-23,474
+51,556
28,082
1989
3,153,946
3,394,186
3,195,704
3,324,480
-41,758
+69,706
27,948
HK$ million
1990
4,100,790
4,532,368
4,152,640
4,469,795
-51,850
+62,573
10,723
. 314,975 284,999 267,046
126,679
272,024
120,967
-4,978
+5,712
203,906 132,085
312,794 . 284,062
201,634 128,618
+2,181 +937
+2,272 +3,467
4,453 4,404 734
2,992,961
2,679,321
3,014,254
2,625,493
-21,293
+53,828
32,535
3,438,945 4,367,836
3,526,271 4,659,047
3,479,766 4,424,664
3,453,098 4,590,762
-40,821 -56,828
+ 73,173 +68,285
32,352 11,457
From the quarter ended September 1990 onwards, structural assets or liabilities (including investments in fixed assets and premises, overseas branch capital, investments in overseas subsidiaries and related companies and loan capital) are excluded from foreign currency positions.
Source: Office of the Commissioner of Banking, Government Secretariat.
9.10 Interest Rates Charged and Bank Cheques Cleared
The Hongkong and Shanghai Banking Corporation Limited's quoted best lending rate (%per annnm)
Hong Kong Dollar Inter-bank Offered Rate (0/o per annum)
Overnight High/low during the period Rate at end of period
One week High/low during the period Rate at end of period
One month High/low during the period Rate at end of period
Three months Highflow during the period Rate at end of period
Six months High/low during the period Rate at end of period
Bank cheques cleared ('OOO items)
Value of bank cheques cleared
(HK$ million)
1981 1982 1983
16.0G-20.00 10.5()-15.00 10.5()-16.00
5.5G-23.00 3.0G-16.00 l.OG-32.00 6.00 3.00 13.50
12.44-19.00 13.13
13.75-18.88 13.75
13.75-18.88 13.88
73 537
4,807,863
5.75-15.63 7.88
7.63-15.63 8.94
8.38-15.50 9.50
9.13-15.25 9.13
74 833
5,792,607
4.25-30.00 15.00
6.5G-26.00 14.88
7.06-20.00 15.00
7.81-19.00 13.25
77 252
6,040,255
Sources: Monetary Affairs Branch, Government Secretariat. The Hong Kong Association of Banks.
1984
8.5()-17.00
0.13-48.00 7.00
!.OG-39.00 8.25
3.13-28.00 8.25
5.75-25.00 8.50
7.0G-21.00 9.50
82 347
7,099,064
1985
6.0G-11.00
0.5()-12.00 7.00
2.25-9.00 6.88
4.0G-8.50 6.69
5.0G-9.00 6.63
5.94-9.63 6.69
86 654
7,334,287
1986
6.5G-8.00
0.25-15.00 12.00
2.0G-12.00 8.00
3.37-9.00 5.25
4.12-7.75 4.68
4.5G-7.75 4.68
94127
9,691,488
1987
5.0G-8.50
0.25-9.00 0.25
0.25-8.12 0.25
0.25-7.50 0.25
1.0G-7.50 1.75
2.75-7.93 3.12
110 819
15,533,342
1988 1989 1990
5.25-10.00 10.0G-11.50 10.0G-11.00
0.25-9.87 6.25-12.25 5.37-14.00 8.75 9.75 14.00
0.25-9.75 9.25
0.25-9.75 9.12
0.75-9.75 9.25
2.12-9.75 9.43
117 311
18,702,748
7.0G-12.25 8.87
8.0G-12.25 8.68
8.25-12.00 8.62
8.25-11.62 8.43
125 079
19,798,331
6.87-11.00 8.37
7.62-10.00 8.25
7.81-10.12 8.00
7.75-10.20 7.93
134 132
21,214,118
135

9.11 Exchange Rates and the Effective Exchange Rate Indexes HK dollar per unit of foreign currency
US dollar
Sterling
Deutsche mark
Japanese yen
Canadian dollar
Australian dollar
Singapore dollar
Dutch guilder
New Taiwan dollar
Swiss franc
Chinese renminbi
Belgian franc
Republic of Korea won
French franc
Italian lira
Thai baht
Indonesian rupiah
Philippine peso
Malaysian dollar
1981
5.675
10.88
2.52
0.0260
4.80
6.44
2.79
2.31
0.143
3.17
3.2468
0.153
0.0081
1.00
0.0048
0.254
0.0083
0.723
2.55
1982
6.495
10.58
2.73
0.0278
5.29
6.38
3.10
2.47
0.155
3.25
3.3557
0.143
0.0086
0.97
0.0048
0.287
0.0089
0.745
2.82
1983
7.780
11.32
2.86
0.0337
6.26
7.02
3.68
2.55
0.184
3.57
3.9526
0.142
0.0098
0.94
0.0047
0.344
0.0077
0.575
3.35
1984
7.823
9.11
2.49
0.0312
5.94
6.49
3.60
2.21
0.184
3.02
2.8178
0.127
0.0095
0.82
0.0041
0.294
0.0072
0.400
3.24
1985
7.811
11.27
3.18
0.0390
5.60
5.34
3.72
2.82
0.189
3.77
2.4516
0.161
0.0088
1.04
0.0047
0.297
0.0070
0.413
3.24
1986
7.795
11.48
4.01
0.0488
5.67
5.19
3.60
3.55
0.213
4.79
2.0974
0.196
0.0091
1.21
0.0058
0.302
0.0048
0.382
3.01
1987
7.760
14.52
4.91
0.0637
5.99
5.59
3.90
4.37
0.265
6.07
2.0879
0.237
0.0098
1.45
0.0067
0.310
0.0049
0.370
3.13
1988
7.808
14.17
4.42
0.0626
6.57
6.69
4.03
3.91
0.262
5.21
2.1007
0.214
0.0114
1.29
0.0060
0.317
0.0047
0.380
2.89
1989
7.807
12.60
4.63
0.0544
6.76
6.17
4.13
4.09
0.283
5.07
1.6535
0.224
0.0115
1.36
0.0062
0.307
0.0046
0.353
2.90
1990
7.801
14.95
5.20
0.0576
6.72
6.00
4.50
4.61
0.271
6.08
1,4927
0.257
0.0109
1.53
0.0070
0.313
0.0042
0.260
2.89
SDR 6.60547 7.16470 8.14527 7.66814 8.57976 9.53415 11.00880 10.50723 10.26096 11.09817
Effective Exchange Rate Indexes for the Hong Kong Dollar (24-28 Oct. 83=100)
Trade (Import and Export)-weighted
Import-weighted
Export-weighted
125.3
125.0
125.7
117.2
117.7
116.5
101.l
101.l
101.2
115.4
116.5
114.3
112.7
111.8
113.6
110.3
107.2
113.7
Note: Figures are based on closing middle-market telegraphic transfer rates as at the last trading day of the year.
Sources: Trade Analysis Section, Census and Statistics Department. Monetary Affairs Branch, Government Secretariat.
9.12 Value of Stock Exchange Turnover and Index of Share Prices
1981 1982 1983 1984 1985 1986
100.5
94.9
106.9
1987
100.6
94.9
106.9
1988
109.3
104.6
114.6
1989
109.3
104.4
114.7
1990
Total stock exchange turnover* (HK$ million) 105,986.85 46,229.87 37,164.68 48,786.98 75,808.05 123,128.01 371,406.45 199,480.54 299,146.70 288,714.92
. Index of share prices# Hang Seng Index (31.7.64= 100)
Sectoral Sub-indices: Finance
Utilities
Properties
Commerce and industry
Hong Kong Index (2.4.86=1000)
1 506.84 1 105. 79 933.03 1 008.54 1 567.56 1 960.06 2 884.88 2 556.72 2 781.04 3 027.47
991.86 1 290.40 1 379.74 1 933.37 1 625.69 1 808.10 1 906.92
1128.80 1 902.98 2 659.87 3 594.42 3 486.63 3 198.71 3 840.58
1 063.54
910.54
1 952.31
1376.60
2 435.92 4 257.11
1 759.33 2 536.89
1 293. 76t 1 875.34
3 847.90
2317.96
1 684.70
4 535.15
2 686.98
1 834.45
4 874.47
2 797.00
1 987.88
Notes: *Figures prior to April 1986 were total tradings of the four stock exchange companies before the amalgamation. # Figures are average of indexes as at end of each month. tFigure refers to April to December.
Sources: Stock Exchange of Hong Kong Ltd. Hang Seng Bank Ltd.
136
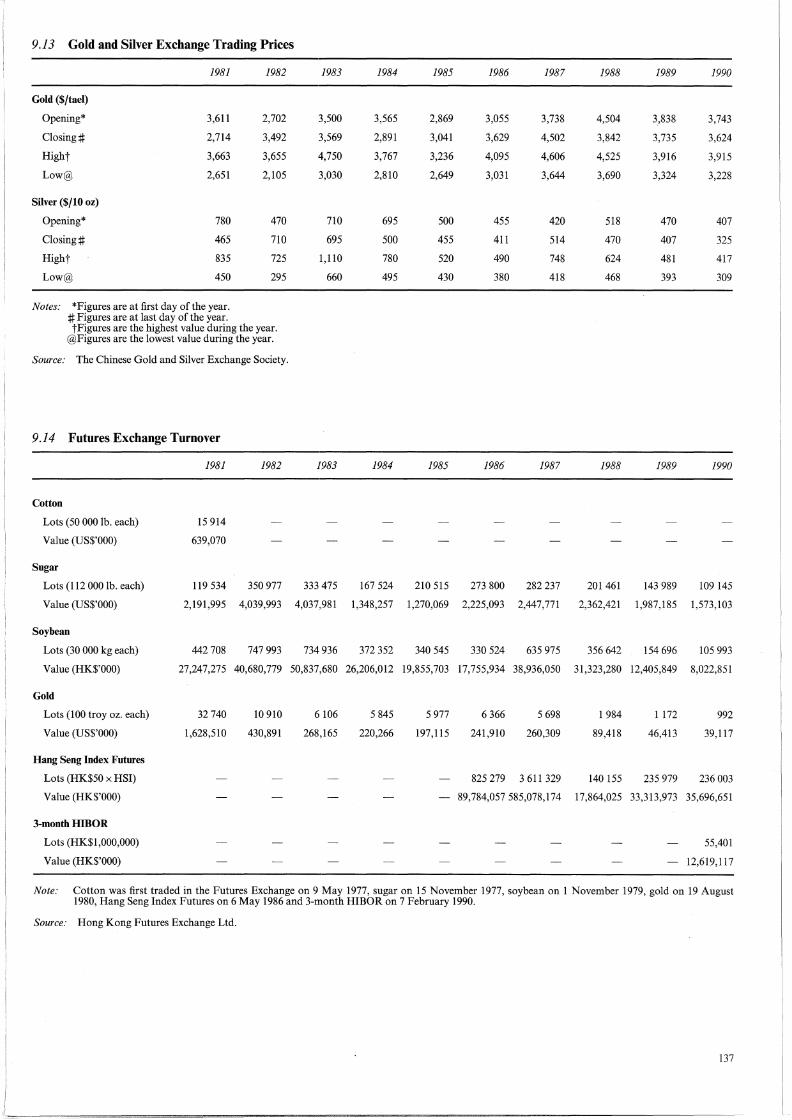
9.13 Gold and Silver Exchange Trading Prices
1981 1982 1983 1984 1985 1986 1987 1988 1989 1990
Gold ($/tael)
Opening* 3,611 2,702 3,500 3,565 2,869 3,055 3,738 4,504 3,838 3,743
Closing# 2,714 3,492 3,569 2,891 3,041 3,629 4,502 3,842 3,735 3,624
Hight 3,663 3,655 4,750 3,767 3,236 4,095 4,606 4,525 3,916 3,915
Low@ 2,651 2,105 3,030 2,810 2,649 3,031 3,644 3,690 3,324 3,228
Silver ($/10 oz)
Opening* 780 470 710 695 500 455 420 518 470 407
Closing# 465 710 695 500 455 411 514 470 407 325
Hight 835 725 1,110 780 520 490 748 624 481 417
Low@ 450 295 660 495 430 380 418 468 393 309
Notes: *Figures are at first day of the year. #Figures are at last day of the year. tFigures are the highest value during the year.
@Figures are the lowest value during the year.
Source: The Chinese Gold and Silver Exchange Society.
9.14 Futures Exchange Turnover
1981 1982 1983 1984 1985 1986 1987 1988 1989 1990
Cotton
Lots (50 OOO lb. each) 15 914
Value (US$'000) 639,070
Sugar
Lots (112 OOO lb. each) 119 534 350 977 333 475 167 524 210 515 273 800 282 237 201 461 143 989 109 145
Value (US$'000) 2,191,995 4,039,993 4,037,981 1,348,257 1,270,069 2,225,093 2,447,771 2,362,421 1,987,185 1,573,103
Soybeau
Lots (30 OOO kg each) 442 708 747 993 734 936 372 352 340 545 330 524 635 975 356 642 154 696 105 993
Value (HK$'000) 27,247,275 40,680,779 50,837,680 26,206,012 19,855,703 17,755,934 38,936,050 31,323,280 12,405,849 8,022,851
Gold
Lots (100 troy oz. each) 32 740 10 910 6106 5 845 5 977 6 366 5 698 1 984 1 172 992
Value (US$'000) 1,628,510 430,891 268,165 220,266 197,115 241,910 260,309 89,418 46,413 39,117
Hang Seng Index Futures
Lots (HK$50 x HSI) 825 279 3 611 329 140 155 235 979 236 003
Value (HK$'000) 89,784,057 585,078,174 17,864,025 33,313,973 35,696,651
3-month HIBOR
Lots (HK$1,000,000) 55,401
Value (HK$'000) 12,619,117
Note: Cotton was first traded in the Futures Exchange on 9 May 1977, sugar on 15 November 1977, soybean on 1 November 1979, gold on 19 August 1980, Hang Seng Index Futures on 6 May 1986 and 3-month HIBOR on 7 February 1990.
Source: Hong Kong Futures Exchange Ltd.
137


Section 10 Prices and Household Expenditure
Tables 10.1 to 10.4 Generallnformation
This section covers statistics showing the movements of average retail prices and average wholesale prices of selected foodstuffs and three different consumer price index (CPI) series, and the household expenditure pattern obtained from the 1989/90 Household Expenditure Survey (HES).
The average retail prices of selected foodstuffs are obtained from a sample of market stalls and shops throughout Hong Kong during the period specified.
Three CPI series are published monthly. The CPI(A) and CPI(B) are compiled by the Consumer Price Index Section of the Census and Statistics Department whereas the Hang Seng CPI is compiled by the Hang Seng Bank Limited.
HES is conducted periodically to update the basket of goods and services which may become out-of-date with the passage of time owing to changes in, among others, the socio-economic characteristics of the population, consumers' tastes and products available in the market.
Concepts and Definitions
The CPI measures the change in the cost of a constant basket of goods and services representative of the purchases made by households in a particular expenditure group in a specified time period.
The 1979/80-based CPI( A), CPI( B) and Hang Seng CPI were based on the HES carried out between October 1979 and September 1980. For CPI(A), the weights were derived from the expenditure pattern of urban households with monthly expenditures between $1,000 and $3,499, for CPI(B) between $3,500 and $6,499, and for Hang Seng CPI between $6,500 and $19,999 at the time of the survey in 1979/80.
The 1984/85-based CPI(A), CPI(B) and Hang Seng CPI were based on the HES carried out between October 1984 and September 1985. For CPI(A), the weights were derived from the expenditure pattern of urban households with monthly expenditures between $2,000 and $6,499, for CPI(B) between $6,500 and $9,999, and for Hang Seng CPI between $10,000 and $24,999 at the time of the survey in 1984/85.
Households associated with the CPI(A), CPI(B) and Hang Seng CPI constituted 50%, 30% and 10% respectively of urban households in Hong Kong. The remaining 10% of households at the top and the bottom of the expenditure scale were excluded from the coverage of the indexes.
Data Sources
Two sets of data are essential in the construction of a CPI.
The first set comprises the prices of various kind of goods and services commonly purchased by households. Retail prices of popular items of goods and services are collected regularly, partly by personal visit and partly by telephone enquiry, from different types of retail outlets in various districts throughout Hong Kong by field officers from the Census and Statistics Department. With the data collected from the price survey, the current month's price is compared with the base period price for each item, and the percentage change is used as a starting point for the index construction.
The second set of data used in the CPI computation is the 'weight' assigned to each item included in the index. The weight of an item, expressed as a percentage with the weights of all items in the CPI adding up to 100 per cent, represents the relative importance of the item iri the total expenditure of an average household. These weights are derived from the results of a HES and applied to price changes of individual items to arrive at the CPI for a month.
The latest HES was conducted between October 1989 and September 1990 and covered all land domestic urban households throughout Hong Kong. The survey period was divided into 26 bi-weekly cycles. The sampling frame of living quarters is divided into a number of strata according to 'geographic area' and 'type of housing', and the stratified proportionate sampling design was used whereby 26 sub-samples were selected by systematic sampling from each of these
139
I
==-==~-~~~~-~-~---~---------------------------1-

140
strata for use in the 26 bi-weekly cycles. All households within a selected living quarters were asked to complete an expenditure record diary for two weeks. A total of 4 854 households participated in the survey.
The average wholesale prices of rice are supplied by the Trade Department while those of live pigs, live cattle, fresh marine fish and fresh vegetables are supplied by the Agriculture and Fisheries Department, based on returns from the Urban Services Department Abattoirs and market throughput and sales data available in the markets run by the Fish and Vegetable Marketing Organizations.
Compilation and Calculation
Figures in these tables are annual averages of the periods concerned.
The CPI is basically a base-weighted Laspeyres' type of index and can be expressed mathematically as follows:-
where
p ti It= LWi(-)
Poi
Wi is the weight of item i, representing its relative importance in terms of expenditure in an average household budget in the base period;
P ti and P oi are the average prices of item i for the current and base periods respectively; and
L means the summation over all items included in the CPI basket.
Further References
Statistics on consumer prices are published by the Census and Statistics Department in the publications Consumer Price Index Report (Monthly) and Annual Report on the Consumer Price Index. Results and methodology of the 1989/90 Household Expenditure Survey are published by the Census and Statistics Department in the publication The 1989/90 Household Expenditure Survey and the Rebasing of the Consumer Price Indexes.

JO.I Average Retail Prices of Selected Foodstuffs HK$ per kg unless otherwise specified
1981 1982 1983 1984 1985 1986 1987 1988 1989
Rice
Top grade 4.04 4.20 4.42 4.70 4.65 4.65 4.68 5.22 5.66 Middle and low grade 3.79 3.95 4.09 4.36 4.31 4.26 , 4.11 4.57 5.09
Meat and poultry
Pork, best cut 17.20 19.94 22.12 23.52 21.75 20.84 20.54 22.48 24.47 Pork chop 22.75 26.06 28.51 30.14 27.99 26.74 26.24 28.93 31.90 Beef, best quality 25.13 27.23 28.03 30.92 30.34 30.50 30.44 31.82 35.52 Beef, belly flesh 13.40 14.10 14.45 16.22 15.84 15.83 16.15 17.59 20.07 Chicken, top grade 20.04 22.43 22.84 26.36 23.41 22.96 24.33 24.57 29.06 Duck, top grade 14.24 14.19 15.99 16.85 15.21 14.33 15.53 16.54 19.13
Marine fish, fresh
Golden thread 15.50 16.74 18.71 17.36 17.70 19.11 21.37 25.16 27.58 Mackerel 19.62 21.34 25.41 24.39 24.52 28.38 29.91 33.53 33.88 Garoupa 37.43 40.67 43.46 45.48 46.63 50.24 52.13 59.84 66.73
Fresh-water fish, fresh
Grass carp 25.55 26.80 25.80 26.45 23.39 22.50 23.51 26.67 26.75 Big head 19.82 21.41 21.05 21.71 19.17 18.57 19.35 21.93 22.65
Fresh vegetables
White cabbage 5.81 6.40 7.68 6.19 6.55 5.98 6.96 6.92 7.95 Flowering cabbage 7.93 8.75 10.53 8.52 8.86 7.82 8.81 8.81 9.89 Tomato 6.89 6.48 8.58 7.38 7.50 7.76 8.12 9.07 8.98
Fresh fruit
Apples (per piece) 1.47 1.78 1.97 2.18 2.21 2.43 2.35 2.41 2.40 Oranges (per piece) 1.17 1.67 1.72 1.97 2.03 2.01 2.06 2.18 2.14 Bananas 5.32 5.24 5.62 6.09 5.67 5.25 5.31 5.68 6.33
Fresh hen eggs (per piece) 0.47 0.50 0.52 0.59 0.56 0.54 0.52 0.56 0.61
Fresh milk (per bottle) 1.74 1.96 2.15 2.40 2.41 2.43 2.66 2.85 3.34
Flour, wheat 2.68 2.87 3.17 3.63 3.79 3.95 4.76 5.05 5.70
Sugar 6.76 5.79 5.67 5.79 5.30 5.27 5.33 6.70 8.20
Source: Consumer Price Index Section, Census and Statistics Department.
10.2 Average Wholesale Prices of Selected Foodstuffs
1981 1982 1983 1984 1985 1986 1987 1988 1989
Rice
Chinese See Mew 3.19 3.03 3.15 3.09 2.84 2.91 2.91 3.60 4.19 Australian Long Grain 3.83 3.61 4.26 4.61 4.47 4.71 4.73 5.65 5.82 Thai 100% whole 3.34 3.15 3.20 3.14 3.00 3.02 2.96 3.75 3.92
Live pigs* 7.05 7.91 8.86 9.41 8.65 8.16 8.43 9.51 10.71
Live cattle # 10.10 10.84 11.22 12.58 12.40 12.97 12.79 13.70 14.90
Marine fish, fresh
Golden thread 8.02 8.02 8.55 7.84 7.04 6.98 6.59 7.50 8.24 Mackerel 9.82 9.27 10.90 10.38 10.25 12.09 11.16 11.11 11.53 Garoupa 20.31 22.98 25.68 23.46 24.51 25.34 25.77 29.50 31.61
Fresh vegetables, locally produced
Flowering cabbaget 3.54 4.05 5.27 4.07 4.43 3.55 4.30 4.36 5.27 White cabbaget 2.36 2.53 3.34 2.39 2.62 2.16 2.54 2.50 3.06 Toma tot 2.21 1.71 4.30 3.69 3.43 3.79 3.62 4.42 4.08
Notes: *Live weight (weight of the animal before being slaughtered) is used in calculating average prices. #Dressed weight (weight of the slaughtered animal after the removal of head, blood, offal and hair) is used in calculating average prices. tFigures prior to 1983 refer to average weighted prices and as from 1983 onwards, they refer to simple average prices.
Sources: Trade Department. Agriculture and Fisheries Department.
1990
5.84 5.33
25.41 32.69 36.58 21.45 29.02 18.96
26.95 36.77 74.16
26.52 22.68
7.68 9.55 8.87
2.42 2.07 6.83
0.68
3.57
6.13
9.02
HK$perkg
1990
4.02 5.79 3.93
11.46
14.55
9.09 13.29 32.90
4.44 2.62 3.63
141

10.3 Consumer Price Indexes (October 1984-September 1985=100)
Weights (%) 1981 1982 1983 1984 1985 1986 1987 1988 1989 1990
Consumer Price Index (A)
All items 100.00 74.3 82.2 90.3 97.7 100.8 103.7 109.4 117.5 129.4 142.0 Food 45.48 77.0 86.1 93.5 99.7 100.1 101.4 106.2 116.4 130.8 143.8 Housing 15.31 74.2 81.5 88.7 94.8 101.0 105.0 109.9 113.7 121.7 132.3 Fuel and light 3.41 91.5 93.0 99.7 101.4 99.8 92.5 92.1 93.1 95.9 106.4 Alcoholic drinks and tobacco 2.57 50.7 55.8 81.7 93.4 102.9 108.5 115.7 123.2 132.7 155.6 Clothing and footwear 5.24 68.9 77.9 84.3 93.7 101.6 106.9 113.4 123.7 135.1 145.0 Durable goods 5.72 86.6 87.5 92.0 100.9 99.8 105.3 111.3 117.9 121.8 125.5 Miscellaneous goods 5.84 73.2 81.2 88.8 99.2 100.2 104.9 115.7 123.2 132.4 139.4 Transport 6.79 71.4 78.5 86.2 95.1 101.7 106.1 114.7 120.1 134.6 152.6 Services 9.64 65.2 74.2 84.1 94.0 102.0 109.8 116.7 127.4 141.9 160.4
Consumer Price Index (B)
All items 100.0 73.9 81.7 89.8 97.4 100.8 104.0 109.5 117.6 129.0 141.5 Food 38.92 76.6 85.8 93.2 99.5 100.2 101.7 106.8 117.1 131.9 145.6 Housing 20.16 74.5 81.7 88.8 95.4 100.8 104.3 107.6 110.8 117.0 127.0 Fuel and light 2.76 92.1 93.3 100.0 101.2 99.9 93.0 92.8 93.7 96.3 106.1 Alcoholic drinks and tobacco 1.67 52.5 57.6 82.2 93.7 102.8 108.4 115.9 123.9 133.8 156.6 Clothing and footwear 6.98 68.2 77.3 84.0 93.3 101.7 107.7 114.9 125.8 137.8 147.8 Durable goods 5.60 83.9 85.9 91.0 100.2 100.1 104.6 110.5 117.0 121.0 124.4 Miscellaneous goods 6.06 74.6 81.2 90.1 99.4 100.5 105.3 115.4 123.2 132.0 139.4 Transport 6.83 69.6 77.6 86.9 95.7 101.4 105.5 113.5 119.4 133.8 152.l Services 11.02 66.5 75.5 84.9 94.8 101.8 109.3 116.1 127.2 142.0 160.0
Hang Seng Consumer Price Index
All items 100.0 72.2 80.6 89.0 97.1 100.9 105.7 112.5 122.3 135.6 150.9 Food 29.98 76.0 85.5 92.8 99.1 100.3 102.4 108.5 118.7 133.5 146.3 Housing 25.77 71.0 80.4 88.5 96.1 100.9 109.1 11s.4 125.3 139.6 160.4 Fuel and light 2.35 92.1 93.7 100.3 101.0 99.9 93.4 9 .1 94.9 97.7 107.1 Alcoholic drinks and tobacco 1.20 55.1 60.0 83.9 94.8 102.5 107.6 116.3 126.0 136.9 158.9 Clothing and footwear 7.93 75.2 81.0 83.6 94.9 101.6 107.5 113.6 128.1 142.0 155.3 Durable goods 5.82 81.4 83.7 89.5 99.3 100.5 104.8 111.5 119.7 125.3 131.1 Miscellaneous goods 5.89 76.5 81.4 91.8 99.8 100.5 105.4 115.2 123.6 131.4 138.9 Transport 7.10 63.9 74.1 87.5 96.5 101.1 104.2 110.5 117.5 131.7 150.2 Services 13.96 66.4 76.1 84.5 94.6 101.8 108.7 116.1 128.2 143.6 160.8
Notes: The weights for the nine sections are derived from the results of the 1984/85 Household Expenditure Survey and they are used in the compilation of the 1984/85-based Consumer Price Indices starting from the reference month of October 1985. The Consumer Price Indices for 1981to1985 were.derived from the 1979/80-based series.
Source: Consumer Price Index Section, Census and Statistics Department.
10.4 Household Expenditure Pattern by Monthly Expenditure Group, Household Expenditure Survey 1989-90 Percentage
Monthly expenditure group
$2,500- $5,000-- $7,500- $10,000- $12,500- $15,000- $17,500- $22,500- $27,500- $37,500 Below below below below below below below below below below and
Commodity/ Service $2,500 $5,000 $7,500 $10,000 $12,500 $15,000 $17,500 $22,500 $27,500 $37,500 over All
Food 50.0 47.5 45.4 40.8 38,7 36,0 33.6 30.1 29.4 25.0 14.8 34.2
Housing 19.0 19.6 20.5 23.5 23.6 24.7 25,5 26.2 25,6 29.2 36.5 25.6
Fuel and light 4.1 3.8 3.5 3.1 2.6 2.5 2.2 1.9 1.7 1.6 1.1 2.4
Alcoholic drinks and tobacco 6.2 3.5 2.1 1.7 1.2 1.1 1.4 1.0 0.7 0.6 0,7 1.4
Clothing and footwear 1.8 4.2 4.5 5.8 6.9 7.7 8.6 9.2 9.8 11.2 8.9 7.5
Durable goods 0.7 1.7 2,3 3.4 3.8 4.4 3.7 4,7 4.8 3,8 5.2 3.8
Miscellaneous goods 5,2 5.3 6,2 6.5 6.9 6.7 7.0 7.6 7.2 6.8 6.2 6.7
Transport 7.1 6.9 6.8 6.5 6.8 6.5 6.8 7.9 7.6 6.4 13.2 7.6
Services 5.9 7.5 8.8 8.8 9.4 10.5 11.3 11.4 13.3 15.4 13.6 10.8
Total 100.0 100.0 100.0 100.0 100.0 100.0 100.0 100.0 100.0 100.0 100.0 100.0
Source: Consumer Price Index Section, Census and Statistics Department.
142

Section 11 Food Supplies
Tables I I. I to I I. 7 General Information
Much of the wholesale marketing of primary products, particularly fresh foods, is the responsibility of the Agriculture and Fisheries Department and the Vegetable and Fish Marketing Organizations.
The Agriculture & Fisheries Department currently operates six temporary wholesale markets for fresh foodstuffs including freshwater fish, poultry, fruits and vegetables. The department provides facilities for traders and transporters on a rental basis calculated on full-cost recovery.
The Vegetable Marketing Organization operates under the Agricultural Products (Marketing) Ordinance (Cap. 277), which also provides for the establishment of a Marketing Advisory Board. The organization is responsible for transporting locally produced vegetables from the New Territories to the wholesale market in Kowloon, providing marketing facilities, and supervising sales and financial transactions in the market. It operates as a non-profit concern and if surpluses arise, they are reinvested in the development of marketing services and farming industry.
The Fish Marketing Organization operates under the Marine Fish (Marketing) Ordinance, which also provides for the establishment of a Fish Marketing Advisory Board. The Ordinance provides for the control of the landing, wholesale marketing, and the import and export of marine fish. The organization is a non-profit concern. It operates seven wholesale fish markets.
Data Sources
Statistics of rice supplies are provided by the Trade Department. The intakes, off-takes and stock figures refer to the position at the godowns.
Statistics of live animals slaughtered and supplies of fresh vegetables and fresh fish are provided by the Agriculture and Fisheries Department. They refer to quantities available for sale, except in Table 11.1 where they refer to the net quantities available for consumption.
Estimates of local production foodstuffs are provided by the Agriculture and Fisheries Department on the basis of market throughput statistics as well as results of routine economic surveys.
Further References
Figures on imports of foodstuffs are derived from Hong Kong Trade Statistics published by the Census and Statistics Department.
143


11.1 Food Supplies
1981 1982 1983 1984 1985 1986 1987 1988 1989 1990
Rice (tonne)
Intakes 347 792 353 231 354 442 349 532 355 627 345 730 345 566 349 290 353 701 348 300 Off-takes 345 101 352 739 358 490 351 548 352 952 356 288 343 857 355 822 348 683 351182 Stock at end of period 69 537 70 029 65 981 63 965 66 640 56 082 57 791 51 259 56 277 53 395
Live animals slanghtered * (head)
Pigs 3 419 550 3 485 OOO 3 470 840 3 548 620 3 597 460 3 671 350 3 594 830 3 507 730 3 327 760 3 203 820 Cattle 220 880 214 560 200 410 178 160 186 600 184 310 181 550 180 970 168 640 165 070 Goats/sheep 17 980 16 020 14020 16 310 17160 20 470 16 300 20 600 19 630 17 530
Supplies of fresh vegetables ('OOO tonnes)
Locally grown vegetables# 176 155 153 159 151 158 141 132 131 112 Imported vegetables (net) 292 341 342 299 306 304 274 261 268 260
Supplies of live, chilled or frozen fish (tonne)
Fresh water fish 47 710 50040 52030 47 280 44670 48 360 44 560 41 760 38 780 44 980 Marine fisht 92 780 94000 99 670 102 490 92 780 106 330 104 990 112 580 110 010 127 750
Notes: *Figures include live animals slaughtered in both urban and rural abattoirs. #Figures include estimates for those not sold through the Vegetable Marketing Organization. tFigures include estimates for those not sold through the Fish Marketing Organization.
Sources: Trade Department. Agriculture and Fisheries Department.
11.2 Estimated Local Production of Foodstuffs
1981 1982 1983 1984 1985 1986 1987 1988 1989 1990
Crops (tonne)
Rice (paddy) 30 20 10 20 15 10 5 3 3 2 Field crops 2 530 2120 1 810 1 730 1480 1 510 1 540 1 590 1440 1 540 Vegetables 176 OOO 155 OOO 153 OOO 159 OOO 151 OOO 158 OOO 141 OOO 132 OOO 131 OOO 112 OOO Fruit 4980 5 490 4920 2490 1150 2040 2 350 2020 3 050 4 310
Livestocks (head)
Pigs* 797 030 753 420 607 280 625 420 650 100 633 190 657 900 629 110 536 360 415 410 Cattle 790 1100 860 540 810 970 790 750 470 280
Poultry ('OOO heads)
Chickens 17 388 17 873 15 548 14244 14 017 16 893 16 813 15 715 14 699 14 025 Ducks 4446 4680 5 033 4 559 4413 3 672 3 015 2 749 3 089 2 690 Geese 232 145 151 90 192 203 176 211 287 192 Quails 12 019 12 431 8 694 14 630 12 435 13 332 12 495 10 741 10 589 9 923 Pigeons 1464 1 724 2 171 2 822 3 179 4 508 5 136 6 392 5 786 4 548
Dairy products and eggs ('OOO unless otherwise specified)
Milk (fresh) (tonne) 4470 5 110 4 210 3 080 2 930 2450 2 210 2020 1 850 1 820 Hen eggs 46170 43 930 39 260 34076 29492 41 416 42 742 41158 36 306 34 662 Duck eggs 1 270 700 520 288 1 619 1 527 1 755 1 370 1 531 1 335 Goose eggs 1 4 3 3 3 4 3 Quail eggs 126 040 130 100 133 430 140 089 149 188 159 955 149 909 137507 120 083 75 925
Fish and fishery products (tonne)
Fish (live, chilled or frozen) Marine fish 133 080 133 290 144 040 151 640 146 400 153 980 155 410 162 820 174 340 168 470 Fresh water fish 6 780 7 780 7 100 6 500 5 800 5 740 6 500 6 640 5 780 6 130
Fish (dried, salted or smoked) Marine fish 3 960 3 460 3 230 3 160 3 020 3 660 3 090 2490 1 800 1 430
Crustacean and molluscs (fresh, frozen, dried, salted, etc.) 26 680 23 850 24 100 25 740 29 130 33 890 34 680 30 680 25 890 23 830
Other marine products and preparations 260 280 330 530 470 540 690 510 610 400
Note: *Figures include local pigs not slaughtered in abattoirs.
Source: Agriculture and Fisheries Department.
145
i __

11.3 Imports of Foodstuffs
Crops (tonne)
Rice (un\msked)
Wheat
Other cereals and cereal preparations
Other field crops
Vegetables (fresh, frozen or simply preserved)
Vegetables (preserved or prepared)
Fresh fruit and nuts
Dried fruit and fruit preparations
Sugar and honey
Coffee
Cocoa
Teaandmate
Livestock (head)
Pigs ('OOO)
Cattle
Sheep, lambs and goats
Poultry (tonne)
Chickens
Other poultry
Live animals
Meat and meat preparations
Dairy products and eggs (tonne uuless otherwise specified)
Milk (fresh)
Cream (fresh)
Milk and cream (evaporated, condensed, powdered etc.)
Butter, cheese and curd
Eggs (fresh) (million)
Eggs (preserved) (million)
Fish and fish preparations (tonne)
Fish (fresh, chilled or frozen) Marine water fish Fresh water fish
Fish (dried, salted or smoked) Marine water fish Fresh water fish
Fish products and preparations
Crustacean and molluscs (fresh, frozen, dried, salted etc.)
Crustacean and molluscs products and preparations
Note: *denotes figure less than half a unit.
1981
362102
115 625
424 891
78 948
413 467
137 066
408 172
82475
126448
2 873
286
10672
2984
219 531
16 877
19268
20932
2 587
172 359
13 656
1453
40088
7079
1206
111
12 211 41621
8 716 *
4451
29 836
1 885
1982
365 394
124 129
479 915
107 042
454 533
148 707
411044
85 483
134252
2646
224
11043
3102
216 395
16170
18 115
22869
2903
196 433
16 040
675
44006
6268
1202
138
14445 42671
9448
4308
44 515
1861
1983
370 547
126 194
520 997
92628
440114
147 186
426977
71 824
161 947
12 237
170
11875
3 053
198 450
14157
15 951
21 700
3422
217 246
14 803
722
48 843
5 909
1196
118
14706 45475
8674 10
6764
46257
2183
Source: Trade Analysis Section, Census and Statistics Department.
146
1984
365 809
123 093
423 265
56 302
388 757
123 945
409498
63 493
151 244
14 365
235
14190
2997
178 141
18 311
20237
17 808
3 289
212 528
21977
587
43 384
6 518
1 306
150
15 003 41281
10 824 2
3 865
49 257
2258
1985
378 336
118 766
472 514
64689
405 273
142 274
455 220
68124
162 916
18 109
278
15 642
2978
185 830
16 859
34125
23 381
3425
223 202
27 375
520
48077
7286
1245
142
19 460 39204
8102 1
4577
60 308
2462
1986
367 679
119 923
493 765
92 777
584 774
180 044
495 110
77 339
179 931
9165
1176
17086
3 085
184 836
21063
42666
29 845
3 421
229 601
28 626
591
53 424
7 965
1 315
172
25 678 42862
9243
5724
76 814
3 316
1987
372 588
119 237
466029
95 680
402 307
206 805
502 330
92216
219 563
5 350
454
18 848
2 981
181 637
16130
43 998
28 855
3 362
249405
32480
652
58 524
9074
1 394
201
1988
363 637
112 861
325 225
78 858
445 138
218 664
543 618
98 623
309 530
17 889
9 919
21046
2923
178 323
19 836
44782
26440
4765
283 203
35 228
659
62 560
10066
1479
181
33 076 46160 38 498 38 240
10 644 9 575 7 120
7 451 7 871
93 879 119 408
4439 4424
1989
406 578
124 307
385 184
82178
408 155
235 152
563 767
93 225
292105
5 568
1 501
18 760
2 821
167 488
19 781
44708
24072
4704
315 077
39 029
454
60483
9 800
1356
193
64019 36194
8 601 139
9289
114 537
4446
1990
374075
126 667
353 141
91 074
389 151
223 806
561 969
95448
200 599
4 853
477
21627
2 848
172 262
16163
51 830
23 446
4558
401155
42676
556
60439
10 698
1386
191
81952 41 778
9 791 136
10208
117 962
4124

11.4 Imported Vegetables Sold Through Cheung Sha Wan Imported Vegetable Market
Bitter cucumber
Cabbage
Cabbage, flowering
Cabbage, Tien Tsin
Cabbage, white
Carrot
Chinese kale
Chinese radish
Celery (Chinese and European)
Fresh mushroom
Green cucumber
Hairy gourd
Leaf mustard
U;_ttuce (Chinese and European)
Onion
Potato
Silky gourd
Spinach
String bean, green
String bean, white
Sweet pepper
Sweet potato
Tomato
Wax gourd
Other vegetables
Total
1981
3 530
10 640
10010
11 860
8020
4240
5460
6990
2680
190
2 750
9440
3 750
8130
3 890
7 550
2910
2260
2000
1 690
3 780
2940
8 620
4410
25490
153230
1982
4630
13 530
13 330
15480
6 300
5 950
4 560
8 970
5 310
60
5410
13 630
2460
12 970
5940
9900
4700
2320
3720
2210
6710
4000
12280
8 880
30230
203480
1983
3 660
11 750
18 040
15 340
5 500
7920
5290
8050
4370
40
4130
10 310
1 800
12110
3020
6 910
4570
2210
3 530
2 550
5440
3600
9180
7980
51 960
209260
1984
2650
8 120
14870
12 940
5150
8600
8230
6110
4140
20
3 290
8400
1650
9770
3020
4620
3 810
1990
2900
1960
4320
2 580
8 730
5400
54430
187700
1985
3 919
9 681
12 353
9 310
6024
5 323
6179
6 343
4768
120
4186
8 047
1215
10 858
3 221
3 321
3 941
1 677
3 087
1252
3 691
1242
11446
8 636
60114
189954
1986
3 340
8 970
11200
10170
5 560
5150
4110
7920
4910
260
3 730
5 500
1 020
10050
4 830
4440
3 560
1 920
2 520
1020
2910
2 730
8 740
11210
43 790
169560
1987
2 530
9 850
5 510
13 820
3 260
4910
2500
6 560
4 870
420
3410
4390
460
8 110
4900
4 630
2260
780
1910
1400
2660
1040
7 680
10210
42 530
150600
1988
1937
9 396
4 361
12 819
2 319
6211
1 862
8473
4895
199
2802
3 801
601
10142
5 892
5796
2 310
832
1282
1 046
2032
247
8 899
8 727
46 719
153600
1989
2 575
9 419
3 926
10 572
2 565
16 238
1 657
8204
4503
365
3 159
4394
353
10 819
6 691
10 375
1841
487
1265
1240
3459
250
12672
9 881
30769
157679
Tonne
1990
2068
8 309
2268
8 743
1247
8 886
1 380
5 207
6137
229
3 279
3 836
117
13 714
5429
5 881
2049
209
500
484
2069
331
10 331
8202
53 OOO
153905
Note: Imported vegetables are sold through two main markets: Cheung Sha Wan Imported Vegetable Market and Kennedy Town Wholesale Market.
Source: Agriculture and Fisheries Department.
11.5 Poultry Sold Through Cheung Sha Wan Temporary Wholesale Poultry Market
Chicken
Duck
Goose
Pigeon
Total
Imports Local
Imports Local
Imports Local
Imports Local
Imports Local
1981
9 858 11 882
4889 1987
2048
2636
19431 13869
1982
9698 12 550
3 669 2204
2049
2 559
17975 14754
1983
9 514 10 130
2877 2 300
1 529
2228
16148 12430
1984
9 861 9 767
2 588 2428
1 165
2285
15899 12195
1985
14147 10 800
2872 2 325
1 537
2372
20928 13125
1986
22163 13 809
4124 2 737
1 702
2 368
30357 16546
1987
20 885 13 127
5 012 2122
1 871
2 641
30409 15249
1988
22262 13 717
4840 1 761
1 735
2625
31462 15478
1989
22600 13 355
4 391 1470
1 795
1 783
30569 14825
'OOO heads
1990
23 639 12422
3 752 1448
1943
1648
30982 13870
Note: Poultry are sold through two main markets: Cheung Sha Wan Temporary Wholesale Poultry Market and Western Temporary Wholesale Poultry Market. The latter was commissioned in September 1987 to replace the Forbes Street Wholesale Poultry Market.
Source: Agriculture and Fisheries Department.
147

11.6 Fresh Marine Fish Sold Through the Fish Marketing Organization
Species
Fork-tail Ginkgo Golden Thread Melon Coat Melon Seed Red Goatfish Red Snapper Yellow Belly
Genera
Big-eyes Conger-pike Eels Crevalles Hair-tails Horse-heads Lizard fishes Mackerels Sardines Scads Soles Tuna
Families
Anchovies Breams Croakers Groupers Pomfrets Round Herrings Snappers Yellow Croakers
Order
Sharks
Mixed
Others
Total
1981
1 309 691
5 448 1 309
578 1 388 1 059 3 357
10232 3 191
752 1969 1108 5 348 1 716
987 5206
209 5
66 749
2003 1 789 2100
289 283
1888
1208
17 486
73723
Source: Agriculture and Fisheries Department.
1982
1289 628
4 821 1165
480 1233
813 2 732
10 123 2 739
657 ·2271
969 4771 1 788
467 4 815
207 6
45 821
1940 1 596 2231
124 315
1 818
1127
17 705
69696
1983
1 019 489
4224 673
1 056 1 001
733 2 730
8 179 2573
495 1993
912 4 318 1 706
542 5436
205 10
60 1062 1892 1 521 1858
117 356
2308
817
17 300
65585
1984
1 008 456
5 815 1165 1442
734 697
2024
6000 3 008
461 2610 1 309 5 601 1945
371 4 733
188 8
30 1 558 2180 1661 2005
135 344
3 345
621
17 419
68873
1985
786 348
5 328 1394 1 510
593 488
1 577
5 216 2482
328 2 596
801 5145 1 737
179 3 123
175 7
33 1147 2 212 1490 2113
101 356
2 586
498
15 158
59507
11. 7 Salted/Dried Marine Fish Sold Through the Fish Marketing Organization
Anchovies
Croakers
Golden Thread
Ginkgo
Lizard fishes
Round Herrings
Sardines
Scads
Snappers
Others
Total
1981
205
246
36
27
129
65
54
45
4
696
1507
Source: Agriculture and Fisheries Department.
148
1982
179
335
56
25
125
22
29
101
5
602
1479
1983
168
215
45
14
91
36
42
98
4
495
1208
1984
190
309
44
11
161
14
29
98
5
567
1428
1985
78
248
53
4
120
24
27
93
7
501
1155
1986
672 365
5 798 1 853 3 337
716 502
2128
6438 2 695
278 3 061
721 5156 1 573
147 2268
249 13
50 977
2174 1607 1899
66 472
1418
475
15 103
62211
1986
100
206
41
8
112
16
21
78
6
497
1085
1987
757 459
7 687 1467 3 128
446 518
2 015
5 551 2 731
312 2348
867 5256 1652
185 2274
184 16
30 854
2638 1 719 1 615
73 520 571
456
15 510
61839
1987
66
143
21
3
73
25
22
36
3
515
907
1988
760 425
7153 1919 2 584
642 555
2 528
5 758 2342
406 1937
641 6 369 1 887
577 2048
240 6
12 688
3 678 1 551 1676
44 451 592
525
21 305
69299
1988
87
75
19
2
37
17
14
25
1
509
786
1989
359 439
7 547 634
2497 491 474
1 989
8 631 2 718
278 2106
625 6700 2493
389 2157
313 18
8 591
3 526 1180 2008
156 384 577
426
18 924
68638
1989
75
60
14
41
20
10
17
1
432
671
Tonne
1990
234 325
8 502 661
1 543 566 362
1479
9 387 2086
200 1 526
624 6 347 2138
211 1994
337 16
6 577
4 315 908
1 566 118 336 757
409
14 754
62284
Tonne
1990
21
32
3
50
39
12
10
1
219
387

Section 12 Transport, Communications and Tourism
Tables 12.1 to 12.3 General Information
The Civil Aviation Department is responsible for all aspects of civil aviation in Hong Kong. The department consists of five divisions dealing with air traffic control, aviation safety, technical matters and planning, international relations governing air services and management of the Hong Kong International Airport.
The administration of the port is the responsibility of the Director of Marine, who is advised by various committees through which the closest liaison with shipping and commercial interests is maintained to ensure that facilities and services are developed to meet the changing needs of Hong Kong and of ships using the port.
The container terminals at K wai Chung provide twelve berths with more than 4 300 metres of quay backed by about 160 hectares of cargo handling area. This area includes container yards and container freight stations, all of which are operated by private companies or consortia. Other wharves and terminals provided and operated by private enterprise are capable of accommodating vessels up to 350 metres in length with draughts up to 16.5 metres. Cargo handling facilities in the public sector include cargo working area at Wan Chai, Yau Ma Tei, Kwun Tong, Tsuen Wan, Western District, Rambler Channel, Chai Wan, Sham Shui Po, Sheung Wan, Cha Kwo Ling, Kowloon Bay and Tuen Mun. These areas are administered by the Marine Department.
Cargoes transported by road, compiled by the Customs and Excise Department, refer to cross frontier traffic through Man Kam To and Sha Tau Kok to and from China.
Concepts and Definitions
Vessels entered refer to vessels arriving at Hong Kong whereas vessels cleared refer to vessels leaving Hong Kong, excluding yachts and pleasure craft.
Starting with the 1986 edition, statistics on international movements of commercial cargo by railway refer to the actual tonnage of cargo conveyed whereas those published in previous editions represent the loading capacity of wagons used for conveyance.
The total cargo discharged includes inward direct shipment (or imports) and inward transhipment, and total cargo loaded includes outward direct shipment (or exports, including domestic exports and re-exports) and outward transhipment.
Data Sources
Statistics on aircraft movements are extracted from the reports of the Civil Aviation Department; on ocean-going vessels entered and cleared from the Hong Kong Shipping Statistics System, and on other vessels entered and cleared from the reports of the Marine Department.
Statistics on cargoes carried by ocean-going vessels are based on the Shipping Statistics System set up by the Census and Statistics Department and are estimated from a sample of consignments on ocean cargo manifests.
Statistics on cargoes carried by river vessels are supplied by the Marine Department, on airborne cargoes by Civil Aviation Department, on cargoes carried by railway by the KowloonCanton Railway Corporation and on cargoes transported by road by the Customs and Excise Department.
Tables 12.4 to 12.5 General Information
The Hong Kong Shipping Statistics System was set up by the Census and Statistics Department in 1983 to produce shipping and cargo statistics for Hong Kong. Shipping statistics on the movement of ocean-going vessels are compiled based on all general declarations submitted by ship masters or shipping agents to the Marine Department. Cargo statistics are compiled based on a sample of consignments listed in ocean cargo manifests supplied by shipping companies or agents to the Census and Statistics Department.
Concepts and Definitions
Shipping and cargo statistics cover all ocean-going vessels entering and leaving Hong Kong, excluding yachts and pleasure craft. Ship type refers to the known specific function of the
149

150
ship. Type of shipment indicates the type of seaborne cargo discharged/loaded in Hong Kong. Cargo imported into Hong Kong or exported/re-exported from Hong Kong are classified as direct shipments, whereas cargo transhipped in Hong Kong under a through bill of lading are classified as transhipments. Cargo in transit through Hong Kong are not included in the statistics.
Data Sources
Shipping statistics are compiled primarily from all general declarations submitted to the Marine Department by ship masters or shipping agents.
Cargo statistics are compiled based on a sample of all consignments listed in ocean cargo manifests supplied by shipping companies or agents to the Census and Statistics Department.
Further References
More statistics on the movement of ocean-going vessels and on the tonnage and volume of seaborne cargo discharged/loaded in Hong Kong are available in the quarterly Hong Kong Shipping Statistics report and the annual Hong Kong Shipping Statistics report published by the Census and Statistics Department.
Tables 12.6 to 12.10 Generallnformation
The Transport Department administers the Road Traffic Ordinance and other legislation regulating public transport operations other than railways. Its responsibilities cover road traffic management, including government road tunnels, carparks and metered parking spaces, and the regulation of internal road and waterborne public transport. The department is also responsible for the licensing of drivers and the registration, licensing and inspection of vehicles.
Concepts and Definitions
Light goods vehicles refer to goods vehicles of permitted gross vehicle weight not exceeding 5.5 tonnes.
Medium goods vehicles refer to goods vehicles of permitted gross vehicle weight exceeding 5.5 but not exceeding 24 tonnes.
Heavy goods vehicles refer to goods vehicles of permitted gross vehicle weight exceeding 24 but not exceeding 38 tonnes.
Special purpose vehicles refer to vehicles not for the carrying of goods or passengers.
Estimated passenger journeys in Hong Kong Island include passenger traffic on China Motor Bus Island services; Mass Transit Railway intra-Hong Kong Island journeys; Hongkong Tramways; Peak Tramways; Hongkong and Yaumati Ferry's coastal services (terminated in July 1985); Hong Kong Island green minibus (GMB); Hong Kong Island residential coach services and minor ferry between Aplichau and Aberdeen.
Estimated passenger journeys in Kowloon include passenger traffic on Mass Transit Railway other than intra-Hong Kong and cross harbour journeys; Kowloon Motor Bus Kowloon Urban routes; Kowloon green minibus and minor ferry crossing Tsau Wan.
Estimated passenger journeys by Cross Harbour Ferry include passenger traffic on Hongkong and Yaumati Ferry cross harbour ferry services; Star Ferry and minor ferry between Shau Kei Wan and Rennie's Mill.
Estimated passenger journeys through Cross Harbour Tunnels include passenger traffic on cross harbour bus services and Mass Transit Railway cross harbour journeys. Passengers boarding and alighting cross harbour tunnel buses on the same side of the harbour are also included.
Estimated passenger journeys in New Territories include passenger traffic on Kowloon Motor Bus N.T. routes; N.T. green minibus; N.T. residential coach services; New Lantao Bus; KowloonCanton Railway; Kowloon-Canton Railway Bus; KCR Light Rail; Hong Kong and Yaumati Ferry outlying districts services and minor ferry services to outlying districts.
Data Sources
Passenger journey figures for the various modes (except for taxi and public light bus (PLB) other than GMB) are compiled from monthly operating returns submitted by the respective public transport operators to the Transport Department.
Figures for PLB (other than GMB) are estimated basing on the daily average extracted from Traffic and Transport Survey Division Survey Report multiplied by the number of licensed PLBs (other than GMBs) and number of days.
Figures for taxi are estimated basing on the results from Taxi Surveys and the number of taxis licensed.

Further References
Further details on the Transport Statistics (e.g. monthly figures) and related data can be found in the monthly Traffic and Transport Digest published by the Transport Department.
Table 12.11 General Information
The Highways Department is responsible to Transport Branch for transport policy and the highway development programme and to the Works Branch for works policy, construction standards, contract procedures and co-ordination of the Public Works Programme.
Table 12.12 General Information
Statistics on traffic accidents and casualties are provided by the Traffic Wing of Royal Hong Kong Police Force. The Traffic Wing is responsible for the formulation and dissemination of traffic policies, the processing of traffic prosecutions (other than those dealt with by arrest) and the evaluation of traffic management schemes.
Tables 12.13 to 12.14 Generallnformation
The local telephone service is operated as a public franchise by the Hong Kong Telephone Company Limited under the Telephone Ordinance while international telecommunication services are provided by the Hong Kong Telecom International Limited under a licence issued within the provisions of the Telecommunication Ordinance.
Data Sources
Statistics on international telecommunication services including telephone, telegraph, telex, leased circuits and television transmission/reception programmes are provided by the Hong Kong Telecom International Limited. Figures about local telephone services are supplied by the Hong Kong Telephone Company Limited.
Table 12.15 General Information
Statistics on the number of letter mail items and parcels handled are maintained by the Post Office.
Concepts and Definitions
Letter mail refer to first class letter mail and printed papers.
Items posted to other countries refer to outward mails despatched by air, sea or by train.
Overseas items for local delivery refer to inward mails received by air, sea or by train.
Items in transit refer to overseas mails passing through Hong Kong to another postal administration in sealed bags. Items of this category are not individually sorted and processed.
Data Sources
Primary data on the amount of letter mail and parcels are collected on a continuous basis during the course of their processing in the Post Office.
Compilation and Calculation
Statistics on parcels are based on records of the actual number of items handled.
In the case of letter mail, raw data are in the form of physical count figures, weight of items or bags of mails handled depending on the source of the mail. Sampling exercises are conducted regularly and the results used to convert the weight and bags into number of items. Since the raw data are continuously collected and sampling exercise regularly performed, seasonal fluctuations are taken into account in reckoning the traffic.
Tables 12.16 to 12.17 Generallnformation
The Immigration Department is responsible for controlling people moving into and out of Hong Kong, and providing travel documents and registration facilities for local residents. Much effort also goes into the detection and prosecution of those who breach the immigration laws and the repatriation of those who are in Hong Kong illegally. Immigration policies are framed to limit permanent population growth, and every effort is made to streamline immigration procedures for Hong Kong residents, tourists and businessmen.
Concepts and Definitions
Statistics on arrivals and departures of passengers by air, sea and land refer exclusively to international movements of passengers.
151

152
Tables 12.18 to 12.24 Generallnformation
Tourism statistics are supplied by the Hong Kong Tourist Association. Main topics include number of visitor arrivals, mode of transport of visitors, total and per capita spending by visitors, average length of stay of visitors, number of hotels and rooms and average hotel room occupancy rate.
Concepts and Definitions
Visitor Arrivals refer to arrivals by all non-Hong· Kong residents through immigration formalities.
Hotel Room Occupancy Rate as compiled based on the number of rooms available only. Rooms under repair or being refurbished are excluded from calculation.
Data Sources
Raw data on visitor arrivals and mode of transport of visitors are supplied by the Immigration Department.
Particulars on spending by visitors and their average length of stay are based on a continuous sample survey conducted among departing visitors by the Hong Kong Tourist Association.
Hotel statistics are based on regular mail surveys among hotel members of the Hong Kong Tourist Association.
Further References
Further details on tourism statistics can be found in the following Hong Kong Tourist Association research publications:
A Statistical Review of Tourism in Hong Kong, published annually
Tourism Receipts, published 3 issues per year
Visitor Arrival Statistics, published monthly
Visitor Profile Report, published annually
Hotel Room Occupancy Report, published monthly
Hotel Supply Situation, published quarterly
Hong Kong Hotel Industry Report, published annually
------- -------- --------

12.1 Movements of Aircrafts, Ocean-going and Other Vessels
1981 1982 1983 1984 1985 1986 1987 1988 1989 1990
Aircraft
Arrivals 27 699 27 312 27 140 28 505 29 849 32 438 36 823 43 507 47140 52 886 Departures 27 694 27 323 27141 28 511 29 852 32 436 36 820 43 517 47 160 52 896
Ocean-going vessels
Entered
Number 11 195 11 695 13 076 13 760 14 876 16 411 17 763 18 847 N.R.T.('000) 68 186 68 730 76 580 82 371 89 960 98 041 107 637 112 325
Cleared
Number 11202 11 716 13 047 13 761 14 853 16 365 17 785 18 824 N.R.T.('000) 68 043 68 793 76 557 82423 90 010 97 756 107 858 112 158
River steamers*
Number entered 1 991 2 748 3 612 4428 6 529 8 065 8 716 9 862 10 180 10 444 Number cleared 1 990 2 746 3 609 4432 6 528 8 066 8 716 9 861 10 184 10445
Hydrofoil vessels
Number entered 21 044 24045 24 574 25 265 24 514 24039 25 265 26 506 28 513 30 057 Number cleared 21 044 24047 24572 25 266 24 515 24 039 25 260 26 503 28 514 30 073
Hoverferries
Number entered 1 189 1 518 2 847 4684 5 277 5 759 5 984 5 987 5 377 4 825 Number cleared 1189 1 518 2 848 4686 5 278 5 759 5 985 5 985 5 367 4 822
River trading vessels
Number entered 27 500 29 865 33 753 37 564 43 931 44096 47 347 52 577 50 216 54 141 Number cleared 27 578 30 115 33 699 37 562 43 959 43 940 47 232 52 500 50 412 54 262
Notes: N.R.T. =net registered tons. *Figures include catamarans since 1982.
Sources: Civil Aviation Department. Marine Department. Trade Surveys and Shipping Statistics Section, Census and Statistics Department.
12.2 International Movements of Commercial Cargo
1981 1982 1983 1984 1985 1986 1987 1988 1989 1990
By ocean-going vessels (tonne)
Discharged 24 138 321 26 451 377 29 656 576 35 101 285 38 942 081 44 257 978 45 791 999 46241967 Loaded 7430186 8 841 636 10 032 288 12 367 431 14 615 191 17 062 591 18 862 724 19 766 OOO
Total 31568507 35293013 39 688864 47 468716 53 557272 61320 569 64654723 66007967
By river vessels (tonne)
Discharged 3 073 787 3 399 829 4 243 830 4 258 110 5 264 123 6 314 576 6 151 633 6 009 045 5 477 112 6 025 821 Loaded 576 343 731 931 1173 830 1 681 682 2 600 282 2 505 908 3 257 778 4 060 241 3 549 439 3 261 603
Total 3650130 4131 760 5417 660 5939792 7864405 8820484 9409 411 10069286 9 026 551 9287 424
By air (tonne)
Discharged 121 405 133 148 144 890 162 457 182 842 204446 234 407 286 135 307 279 352 887 Loaded 168 900 172 609 223 276 254 689 247 141 332 314 376 158 407 929 422 741 449 052
Total 290305 305757 368166 417146 429983 536760 610565 694064 730 020 801939
By railway
Discharged Tonne I 032 466 1 035 676 1253432 1 343 152 I 384 136 I 804 756 I 890 271 1 728 826 I 745 164 1 849 830 Tonne-kilometres 34 805 144 35 196 930 42 317 862 43 546 964 44 991 808 56 689 301 58 805 063 53 737 543 54 589 587 58 043 788
Loaded Tonne 40 595 34 038 72 039 104 267 203 273 366 706 374 795 484 152 452 992 366 888 Tonne-kilometres I 380 216 I 157 301 2 449 326 3 545 078 6 764 402 12 440 412 12 729 362 16 364 022 14 526 753 II 714 588
By road (tonne)
Discharged 225 289 394 339 702 004 1134476 I 435 677 2124651 2 967 003 3 525 415 4 102 846 4 564 978 Loaded 299 686 446 622 810 677 I 061 039 1249392 1702881 2 439 781 3 216 487 3 857 528 4 496 075
Total 524975 840961 1512 681 2195 515 2685069 3827532 5406784 6741902 7960374 9061053
Sources: Civil Aviation Department. Customs and Excise Department. Kowloon-Canton Railway Corporation. Marine Department. Trade Surveys and Shipping Statistics Section, Census and Statistics Department.
153

12.3 Containers Carried by Ocean-going Vessels
1981 1982 1983 1984 1985 1986 1987 1988 1989 1990
Kwai Chung Terminals
Discharged
Full (T.E.U.s) Local 395 655 384 813 389 933 430 290 501 028 526 437 624 017 770 119 796 056 937 706 Transhipment 235 405 209 466 229 910 239 906 242 497 273 930 315 703 355 410 328 032 352 192
Empty (T.E.U.s) Local 127 388 145 478 177 211 212 337 179 395 247 999 325 594 318 221 460 929 508 451 Transhipment 12 665 13 157 14 841 19 690 22026 17 942 24 207 20 980 15 978 31 600
Cargo ('OOO tonnes) 5 851 5 696 5 816 6 319 6 987 7 633 8 858 10 761 10 758 12 250
Loaded
Full (T.E.U.s) Local 456 814 461 088 499 896 566 721 594 794 756 140 914 113 1 082 783 1304409 1513117 Transhipment 230 875 204 414 225 771 235 762 229 044 273 929 308 245 350 430 323 856 346 355
Empty (T.E.U.s) Local 88 422 75 130 83 648 78 053 103 907 75 393 78 649 84 354 72408 111 782 Transhipment 12 595 13 738 14 531 19 084 22136 17 681 23 039 19 874 15 423 30 008
Cargo ('OOO tonnes) 4 985 4 847 5 129 5 563 5 800 7085 8 340 10 016 10 848 12 368
Elsewhere in Hong Kong
Discharged
Full (T.E.U.s) 57177 81 084 132 236 187 739 237 917 350 624 445 936 490 079 543 522 Empty (T.E.U.s) 16 085 25 510 30 739 21 432 35 007 65 529 76248 84 702 119 766
Loaded
Full (T.E.U.s) 60 241 68 467 96 825 114 813 160 315 282 592 354 228 413 522 463 601 Empty (T.E.U.s) 19 156 26 245 46940 70 142 77 277 81 321 73 430 78 977 71 596
Notes: 'T.E.U.s' refers to Twenty-Foot Equivalent Units (based on a standardized container size of20 ft. x 8 ft. x 8 ft.). 'Local' means containers with Hong Kong as the country of origin or destination. 'Full' includes containers partially filled with cargo.
Source: Marine Department.
12.4 Ocean-going Vessel Movements by Ship Type Number of vessels
Ship type 1983 1984 1985 1986 1987 1988 1989 1990
Conventional cargo vessel Entered 4116 3 728 3 809 3 717 3 605 3 666 3 799 4027 Cleared 4143 3 733 3 808 3 715 3 597 3 640 3 817 4026
Semi-container vessel Entered 988 1 121 1 235 1 069 1126 1190 1 073 1 138 Cleared 982 1121 1 232 1 063 1122 1 190 1 082 1135
Container vessel Entered 3 489 3 750 4426 5 158 5 927 6 692 7 319 7 953 Cleared 3 480 3 755 4420 5 163 5 930 6 684 7 312 7 934
Roll-on/roll-off Entered 302 440 603 426 441 507 410 432 Cleared 302 440 600 424 443 509 412 433
Oil tanker Entered 651 689 592 807 758 1247 2 055 2006 Cleared 646 687 602 807 756 1248 2 050 2006
Dry bulk carrier Entered 704 772 990 969 1109 1123 1 215 1 307 Cleared 699 769 987 973 1 110 1 115 1 218 1299
Log/timber carrier Entered 193 152 195 203 204 228 218 207 Cleared 192 156 191 201 205 229 217 207
Others Entered 752 1 043 1 226 1411 1 706 1 758 1674 1 777 Cleared 758 1 055 1207 1 415 1 690 1 750 1 677 1 784
Total Entered 11195 11695 13076 13760 14876 16411 17763 18847 Cleared 11202 11716 13047 13761 14853 16365 17785 18824
Source: Trade Surveys and Shipping Statistics Section, Census and Statistics Department.
154
~------- --------------- -------- -- -·--·---------

12.5 Cargo Carried by Ocean-going Vessels by Type of Shipment Tonne
Type of shipment 1983 1984 1985 1986 1987 1988 1989 1990
Inward direct shipment
Outward direct shipment
Inward transhipment
Outward transhipment
21 859 034
4 589 088
2 279 287
23 519 526
5 347 188
2 931 851
25 632 767
5 706 500
4 023 809
30 149 378
7025719
4 951 907
32 878 056
8 114 222
6 064 025
37 451 224
10 052 558
6 806 754
39 238 602 40 168 078
11 577 981 12 535 288
6 553 397 6 073 889
2 841 098 3 494 448 4 325 788 5 341 712 6 500 969 7 010 033 7 284 743 7 230 712
66007 967 Total n~m ~mm ~~~ ~~m ~mm fil~M M~m
Source: Trade Surveys and Shipping Statistics Section, Census and Statistics Department.
12.6 Public Transport: Estimated Passenger-journeys by Undertaking
Undertaking
Kowloon Motor Bus
Public Light Bus (other than GMB)
China Motor Bus
Green Minibus (GMB)*
Kowloon-Canton Railway Bus # New Lantao Bus
Residential Coach
Taxit
Mass Transit Railway
Kowloon-Canton Railway@
Hongkong Tramways
KCR Light Railt
Peak Tramways
Hongkong and Y aumati Ferry
Star Ferry
Minor Ferries
1981
933 025
481 920
287 461
50 780
3 140
330 389
222 914
17123
160 442
2097
126 557
41 359
5 823
1982
940 396
463 048
311 909
69 947
3 370
556
371 470
351 082
22 215
143 371
I 765
114 765
38 113
6 140
Notes: *GMB was known as PLB 'Maxicab' before March 1985. # KCRC bus was introduced on 6 September 1987. tTaxi is treated as personalized public transport.
@Figures include passengers travelling to and from Lo Wu. tKCR Light Rail was introduced on 18 September 1988. §denotes provisional figures.
Source: Transport Department.
1983 1984 1985 1986 1987 1988
981 823 I 069 322 I 079 045 I 108 286 1 088 363 1 081 832
416 114 363 566 369 742 362 906 356 616 351 259
348084 362633 344031 318397 318396 317607
104 082 138 349 170 418 189 511 212 802 228 408
3 153
I 905
401 179
411 955
48 110
131 093
1 744
100 132
37 406
6 918
3 164
2409
404 210
410 556
79 973
122 502
2 054
90 511
41 593
6 790
3 187
4762
422 091
462 894
103 270
120 831
2 318
83 727
43 285
6 255
3 028
5 619
437 119
532 074
115 866
122 245
2 637
76 474
40 808
6 070
1 403 10 143
3 232
6 391
441 923
592 912
136 352
128 677
2 684
74966
39 911
5 768
3 442
7 882
445 056
629 857
154 615
131 917
16 112
2 708
75 691
41 707
5 924
12.7 Public Transport: Estimated Passenger-journeys by Area
Area 1981 1982 1983 1984 1985 1986 1987 1988
'OOO passenger journeys
1989
973 886
394 584
298 813
241 978
27 081
3 877
10 814
445 198
687 598
173 094
127 562
62 596
2 828
70 531
39 808
6 614
1990
965 858
387 232
280 884
249 003
27 972
4232
16 279§
451 665
719 111
181 077
127 644
73 149
3 211
55 202
37 907
6 823
'OOO passenger journeys
1989 1990#
Hong Kong Island
Kowloon
423 477 432 056 452 283 451 894 462 040 474 850 504 901 522 773 513 810* 500 876
Cross Harbour Ferry Tunnels
New Territories
Total
666 452 748 681 824 499 861 448 846 820 849 020 844 900 837 687 804 571 * 788 232
143 137 128 332 116 926 113 953 108 301 97 949 94 597 96 944 87 699 69 505 211 355 247 192 268 268 289 816 319 455 344 256 359 796 375 749 392 017 411 336
406 300 447 368 514 429 612 745 687 407 754 940 807 663 874 692 928 983* 978 403
1850 721 2 003 629 2176 405 2 329 856 2 424 023 2 521 015 2 611 857 2 707 845 2 727 080 2 748 352
Notes: Figures exclude taxis and public light buses (other than green minibus). *denotes revised figures.
# denotes provisional figures.
Source: Transport Department.
155

12.8 Motor Vehicles Registered by Type
Type
Motor cycles
Motor tricycles
Private cars
Taxis
Public buses
Private buses
Public light buses
Private light buses
Goods vehicles
Crown vehicles (excluding vehicles ofHM Forces)
Total
1981
27 438
5
211 556
11 061
5496
224
4350
924
64214
5041
330309
1982
27434
3
214 849
12 756
5 611
248
4350
1330
67606
5 380
339567
1983
25 685
200 923
14421
5 715
231
4350
1 724
69057
5 697
327803
1984
22417
182 985
15 984
5 787
186
4 350
1 886
72469
5 786
311850
1985
19 331
7
168 200
16 481
5 887
158
4350
2107
77 918
6122
300561
Note: Figures refer to position as at end of the year.
Source': Transport Department.
12.9 Motor Vehicles Licensed by Type
Type
Motor cycles
Motor tricycles
Private cars
Taxis Hong Kong and Kowloon New Territories Lan tau
Public buses China Motor Bus Co. Ltd.
Single deck Double deck
Kowloon Motor Bus Co. Ltd. Single deck Double deck
New Larttao Bus Co. Ltd. Single deck Double deck
Other public buses Single deck Double deck
Private buses Single deck Double deck
Public light buses
Private lightbuses
Goods vehicles Light Medium Heavy Special purpose vehicles
}
1981
21106
190 307
10 165 880
6 935
347 2028
47 6
1914 26
175 28
4348
796
54785
1982
19 515
184 585
11342 1376
4 985
288 2084
44 8
1 971 32
175 53
4340
1213
59 511
1983
16 836
159 488
12403 1 887
20
4 1 036
202 2144
45 9
1961 56
157 47
4327
1600
59 399
1984
15 345
147 616
13499 2260
30
2 959 '
167 2245
44 9
2001 72
126 33
4332
1 782
48 610 13 342
188 351
1985
14060
7
144 723
13 795 2 388
40
891
138 2 373
43 11
2041 82
108 26
4344
2025
54648 14492
182 351
1986
17 761
9
161 279
16 682
6123
130
4350
2265
86 347
6049
300995
1986
13 314
7
139 053
14004 2494
40
1 923
132 2 581
43 11
2129 87
102 19
4348
2183
63149 15 846
188 74
1987 1988
17 045 17 311
12 12
166 977 178 234
16 810 17 080
6 450 6 875
137 144
4350 4350
2413 2484
101 970 114 451
6 126 6 461
322 290 347 402
1987
13 489
10
145 809
14116 2382
40
915
81 2747
43 13
2323 126
110 19
4340
2329
75 543 18 531
193 101
1988
13 943
10
160 579
14 334 2431
40
2 876
93 2633
32 13
2 751 165
120 12
4341
2408
83 415 21110
434 113
Crown vehicles (excluding vehicles ofHM Forces) Motor cycles 1 067 1 206 1184 1160
4626 1 331 1174 1 209 1 224
Other vehicles 3 974 4 174 4 513
Total 292 940 292 906 267 318
Note: Figures refer to position as at end of the year.
Source: Transport Department.
156
4.791 4 875 4 917 5 237
258799 262 890 266 777 289 386 316 316
Number of vehicles
1989
18 931
13
195 818
17 351
7282
150
4 350
2 519
123 329
6410
376153
1990
20 683
14
215 709
17 380
7 625
185
4350
2 551
130 270
6640
405407
Number of vehicles
1989
15 553
8
180 184
14 529 2445
40
3 917
112 2 683
40 12
3 007 177
121 20
4340
2421
88 716 22884
609 154
1278 5 132
345385
1990
16 621
7
197 852
14 584 2436
40
3 958
167 2 718
46 12
3 191 214
159 21
4 336
2410
91 868 24907
758 212
1259 5 381
370160

12.10 New Registration of Motor Vehicles by Type
Type
Motor cycles
Motor tricycles
Private cars
Taxis Hong Kong and Kowloon New Territories Lantau
Public buses China Motor Bus Co. Ltd.
Single deck Double deck
Kowloon Motor Bus Co. Ltd. Single deck Double deck
New Lantao Bus Co. Ltd. Single deck Double deck
Other public buses Single deck Double deck
Private buses Single deck Double deck
Public light buses
Private light buses
Goods vehicles Light Medium Heavy Special purpose vehicles
Crown vehicles (excluding vehicles ofHM Forces) Motor cycles Other vehicles
}
Total
1981
4 391
33 761
2076 238
1 115
413
4
246 17
23 16
264
100
10 194
268 388
52515
Note: Figures refer to position as at end of the year.
Source: Transport Department.
12. II Public Roads
Length of Public Roads
Hong Kong Island Flexible pavement Rigid pavement
Kowloon Flexible pavement Rigid pavement
New Territories Flexible pavement Rigid pavement
Total
Lane Length of Public Roads
Hong Kong
Kowloon
New Territories
Total
}
}
1980
257 92
238 108
412 47
1154
1981
260 92
241 ll1
429 49
1182
Notes: Figures refer to position as at end of the year. *Figures adjusted to tie in with District Board.
Source: Highways Department.
1982
2 683
19 624
2049 596
81
160
2
134 6
17 38
233
514
10 109
281 556
37083
1982*
262 96
235 109
464 51
1217
753
1 034
1119
2906
1983
1 533
7 108
1909 585 20
88
105
78 28
23 4
851
566
8 199
238 652
21988
1983
263 102
235 ll1
483 50
1244
772
1 046
1 170
2988
1984
1 010
6 569
1 819 503
10
1 28
179
94 18
8 4
1 504
371
9494
223 323
22158
1984
266 110
238 111
503 51
1279
811
1 055
1 281
3147
1985
1 028
7
11 119
2 006 260
11
13 188
4 2
126 15
3
778
458
10 306 2 251
6 41
358 472
29452
1985
268 111
240 111
538 55
1323
822
1 062
1404
3288
1986
1100
2
13 816
2165 226
7 363
133 8
11 10
262
427
12 815 2 321
52 23
156 431
34330
1986
268 112
245 114
549 62
1350
826
1 089
1465
3380
1987
1 601
3
19 967
2497 399
1
13
9 324
6 2
220 67
24
243
254
17 572 3 663
84 27
129 262
47367
1987
273 114
245 120
577 66
1395
846
1 110
1 558
3514
1988
2070
24 281
2 415 496
2 26
28 148
8
488 50
32
467
199
13 987 3 765
260 19
166 806
49713
1988
275 116
243 128
603 69
1434
858
1134
1 659
3651
Number of vehicles
1989
3 198
28 097
3 039 632
2
42
23 199
6
359 38
22 5
695
179
11 902 3 123
194 49
250 624
52679
1989
279 123
245 131
617 70
1465
879
1 161
1 702
3742
1990
3 278
28 926
3 334 546
36
68 50
10
336 49
47 3
549
198
10 855 3 434
155 70
439 1 112
53496
Km
1990
279 124
244 135
628 74
1484
884
1 166
1 751
3801
157

12.12 Traffic Accidents and Casualties
1981 1982 1983 1984 1985 1986 1987 1988 1989 1990
Accidents (number)
Hong Kong Island* 4 901 4725 4208 3 596 3 505 3 336 3 768 3 877 3 656 3 724
Kowloon 9 003 9102 8 580 7792 7 921 7 843 8 410 8 481 8 326 7 847
New Territories 4130 4 510 4050 3 732 3 492 3 556 3 859 3 960 3 922 3 416
Total 18034 18337 16838 15120 14918 14735 16037 16318 15904 14987
Casualties (number of persons)
Hong Kong Island* Fatal 109 104 63 46 56 59 56 54 75 70 Serious 1 575 2 016 1 579 1185 1144 1 150 1 245 1 089 914 814 Slight 4407 3 889 3 712 3 299 3 206 2972 3 423 3 924 3 726 3 954
Kowloon Fatal 177 182 127 130 126 116 128 128 143 155 Serious 3 430 4070 2947 2279 2 419 2121 2411 2259 2125 1 798 Slight 7 676 7 136 7 557 7 463 7 714 7 784 8 435 8 541 8 458 8 149
New Territories Fatal 192 171 150 146 127 135 97 120 120 94 Serious 2441 3 548 2 559 1 905 1475 1433 1 576 1476 1441 1 314 Slight 3 595 3 163 3 306 3 682 3 597 3 664 4192 4 606 4249 3 700
Total 23602 24279 22000 20135 19864 19434 21563 22197 21251 20048
Notes: Figures exclude accidents involving damages only. *Hong Kong Island includes marine and Lantau Island.
Source: Royal Hong Kong Police Force.
12.13 Telephone Services
1981 1982 1983 .1984 1985 1986 1987 1988 1989 1990
Number of applications*
Received during period 240 639 245 491 244 776 248 119 279 921 285 503 335 431 375 600 411 762 457 134
Outstanding at end of period 5 209 3174 1662 1 518 1544# 1984# 1 862 2 676 3 909 3 902
Number of exchange lines
Installed during period 227 419 238 475 234 350 234 920 264 595 273 984 326 452 366 146 401 630 448 856
Ceased during period 122 618 145 177 157 209 148 304 163 732 171166 180 197 200 894 250 834 306 439
Working at end of period 1 383 667 1476965 1 554 106 1640 722 1 741 585 1844403 1 988 524 2 153 776 2 304 572 2 446 989
Effective capacity
(Thousand exchange lines) 1 591 1 749 1 870 1 905 1 998 2 108 2 213 2 441 2 544 2 688
Notes: *Figures refer to number of exchange lines requested for installation. :Ff denotes revised figure.
Source: Hong Kong Telephone Company Limited.
158

12.14 International Telephone and Telegraph Services
1981 1982 1983 1984 1985 1986 1987 1988 1989 1990
Number of telex subscribers* 16 635 18 863 20 868 23 657 26 993 28 813 29 700 27 645 23 835 21 672
International telex traffic ('OOO minutes)
Outward 30 663 35 036 36 395 41160 43 993 46 985 44 662 38 411 31 186 26 682 Inward 37 290 37 565 40 542 45 482 50 545 53 349 50 571 44 121 36 245 31 300 Transit 11 865 12 607 16 516 18 013 19 491 18 130 19 089 18 860 25 401 25 765
Internal telex traffic ('OOO minutes) 16 804 20495 23 769 27 936 31 521 36 607 38 577 33 620 29 930 25 306
Number ofleased circuits* 1 550 1 630 1621 1 674 1 734 1 744 1 856 1 907 1 908 1 805
Outward international telephone traffic ('OOO minutes) 57 759 72 509 89 443 110 681 144 761 184 202 253 156 350 776 458 402 581 952
Public telegraph traffic ('OOO messages)
Outward 1443 1 313 1242 1286 1165 939 801 741 577 393 Inward 1 616 1426 1 233 1172 1 135 955 843 779 580 407
Inland telegrams (number of messages) 13 133 12 190 9 115 9 569 7 256 7 596 7 013 7 113 5 848 8 271
Television programmes#
Number 88 62 85 291 214 335 443 631 2 164 1 008 Minutes 3 350 3 157 4 203 16 486 4 768 15 163 6 594 10 323 48 863 34 121
Television programmes reception
Number 792 963 964 1250 1 054 1 255 1 393 1 636 2 632 2 216 Minutes 11 335 22 364 16 255 42 312 24 825 37 718 30 539 67 459 68 878 74 745
Maritime radio telegrams (number of messages)
Transmitted 54486 53 434 53 559 54 376 54 782 54118 55 492 57 502 57 853 56 431 Received 123 933 129 382 126 762 128 954 131 666 126 357 130 297 143 846 144 871 137 095
Maritime radio telephone traffic (minutes)
Outward 4463 4867 5 210 5 638 6466 6 063 5 594 5 454 4489 3 574 Incoming 72 736 91414 133 617 155 675 168 686 155 608 183 174 228 767 229 009 221 618
Maritime radio telex (minutes)
Outward 25464 41 800 42 019 47 370 53 867 63 520 21 392 19 681 24 330 28 188 Inward 36222 44 715 64 618 69 702 54 679 46 792 167 096 225 021 226 741 224 515
Notes: *Figures refer to end of the year. #Prior to 1984, figures refer to television programmes via satellite; from 1984 onwards, figures refer to television programmes via all media (i.e. both
by satellite and by microwave link).
Source: Hong Kong Telecom International Limited.
12.15 Postal Services
1981 1982 1983 1984 1985 1986 1987 1988 1989 1990
Letter mail (million)
Local articles 265.6 294.l 293.6 319.9 358.4 404.9 456.9 532.7 594.5 639.6
Articles posted to other countries 97.l 97.5 97.l 108.0 115.3 118.0 120.4 126.6 133.8 136.l
Overseas articles for local delivery 91.6 97.6 81.8 82.0 85.0 81.6 83.8 86.6 84.3 88.3
Articles in transit 4.0 4.6 3.8 3.8 3.8 3.7 3.7 3.8 4.0 3.9
Total 458.3 493.8 476.3 513.7 562.5 608.2 664.8 749.7 816.6 867.9
Parcels ('OOO)
Local parcels 227 193 94 104 203 141 123 149 107 74
Parcels posted to other countries 1 709 1 509 1 528 1491 1490 1485 1466 1 352 1276 1 330
Overseas parcels for local delivery 642 616 568 572 636 613 548 540 549 554
Parcels in transit 59 55 55 48 52 49 47 40 45 38
Total 2637 2373 2245 2215 2381 2288 2184 2081 1977 1996
Source: Post Office.
159

Note: Figures exclude refused landing passengers and cruise passengers. Servicemen are also excluded starting from 1990. *Figures include passengers to/from Macau by helicopter as from November 1990 onwards.
Source: Immigration Department.
12.17 Hong Kong Resident Departures by Destination
Destination 1981 1982 1983 1984 1985 1986 1987 1988
People's Republic of China 4 537 463 4 615 784 5 724 418 8 036 452 10 960 747 11 867 896 14 088 643 16 306 978
Macau 3 015 910 3 355 578 3 341 945 3 519 115 3 716 413 3 742 011 4 455 953 4 736477
Taiwan 306 961 306 824 288 202 294 231 270 872 276 616 271 318 264 572
Japan 136 188 174 480 199 348 184 296 198 612 149 281 150 113 157 613
Thailand 149 035 160 337 134 258 137 743 139 504 175 343 254 528 326 723
Philippines 111 954 99 543 97 245 96 484 88 801 113 706 133 553 172 553
United Kingdom 70 896 67 957 73 523 78 139 78 626 77 763 87 990 89 415
United States of America 68 756 76409 83 670 80 737 77 369 93 062 102 171 113 086
Singapore 59 071 63 784 70 817 81110 76 358 80023 89 318 92458
Canada 27 667 28 281 34092 34 973 33 306 40 879 59 136 78 118
Australia and New Zealand 20 612 23 904 25 386 26 838 30469 41 114 55 038 70 196
West Germany 5 282 5 100 5 329 11 011 14 870 13 022 14 731 17 883
Others 116 748 131 849 127 665 118 365 127 013 150 350 177 380 396 874
Total 8626543 9109830 10205898 12699494 15 812 960 16 821066 19939872 22822946
Note: Hong Kong residents may travel to more than one country other than the destination claimed.
Source: Immigration Department.
160
Number of persons
1989 1990
15 207 079 16 688 371
4 907 740 5 095 776
281 212 262 803
204 870 248 589
361 528 384 700
187 833 138 623
101 364 109 995
111 276 135 406
113 307 149 668
89 425 96 836
83 757 100 119
20 769 24 487
271 084 402 219
21941244 23837 592
-------- - ----
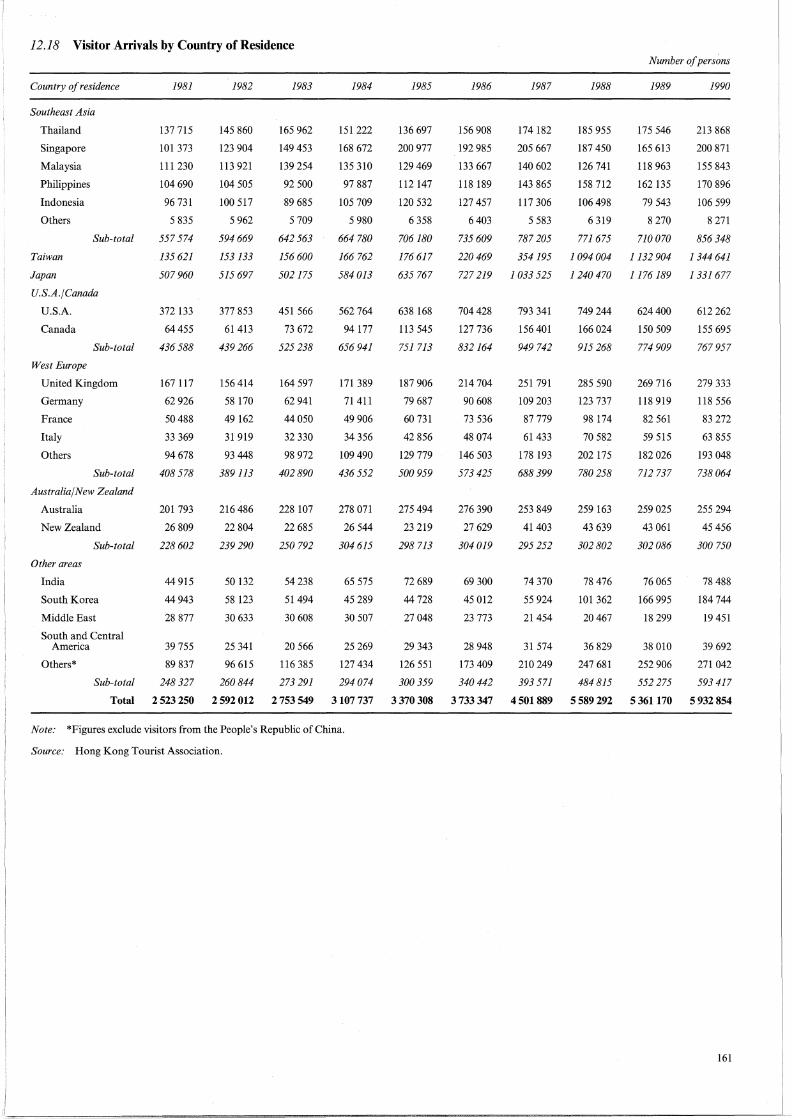
12 .18 Visitor Arrivals by Country of Residence
Country of residence
Southeast Asia
Thailand
Singapore
Malaysia
Philippines
Indonesia
Others
Sub-total
Taiwan
Japan
U.S.A./Canada
U.S.A.
Canada
Sub-total
West Europe
United Kingdom
Germany
France
Italy
Others
Sub-total
Australia/New Zealand
Australia
New Zealand
Sub-total
Other areas
1981
137 715
101 373
111 230
104 690
96 731
5 835
557 574
135 621
507960
372 133
64455
436 588
167 117
62 926
50 488
33 369
94 678
408 578
201 793
26 809
228602
1982
145 860
123 904
113 921
104 505
100 517
5 962
594 669
153 133
515 697
377 853
61413
439 266
156 414
58 170
49 162
31 919
93 448
389113
216 486
22 804
239 290
India 44 915 50 132
South Korea 44 943 58 123
Middle East 28 877 30 633
South and Central America 39 755 25 341
Others* 89 837 96 615
Sub-total 248 327 260 844
Total 2 523 250 2 592 012
1983
165 962
149 453
139 254
92 500
89 685
5 709
642 563
156 600
502175
451 566
73 672
525 238
164 597
62 941
44050
32 330
98 972
402890
228 107
22 685
250 792
54 238
51494
30 608
20 566
116 385
273 291
2753549
1984
151 222
168 672
135 310
97 887
105 709
5 980
664 780
166 762
584013
562 764
94 177
656 941
171 389
71411
49 906
34 356
109 490
436 552
278 071
26 544
304 615
65 575
45 289
30 507
25 269
127 434
294 074
3107737
Note: *Figures exclude visitors from the People's Republic of China.
Source: Hong Kong Tourist Association.
1985
136 697
200 977
129 469
112 147
120 532
6 358
706 180
176 617
635 767
638 168
113 545
751 713
187 906
79 687
60 731
42 856
129 779
500 959
275 494
23 219
298 713
72 689
44728
27 048
29 343
126 551
300 359
3370308
1986
156 908
192 985
133 667
118 189
127 457
6403
735 609
220469
727 219
704 428
127 736
832164
214 704
90 608
73 536
48 074
146 503
573 425
276 390
27 629
304 019
69 300
45 012
23 773
28 948
173 409
340442
3733 347
1987
174 182
205 667
140 602
143 865
117 306
5 583
787 205
354195
1033 525
793 341
156 401
949 742
251 791
109 203
87 779
61433
178 193
688 399
253 849
41403
295 252
74 370
55 924
21 454
31 574
210 249
393 571
4501889
1988
185 955
187 450
126 741
158 712
106 498
6 319
771675
1094 004
1240470
749 244
166 024
915 268
285 590
123 737
98 174
70 582
202 175
780 258
259 163
43 639
302802
78 476
101 362
20 467
36 829
247 681
484 815
5589292
Number of persons
1989
175 546
165 613
118 963
162 135
79 543
8 270
710 070
1132 904
1176189
624 400
150 509
774 909
269 716
118 919
82 561
59 515
182 026
712 737
259 025
43 061
302086
76 065
166 995
18 299
38 010
252 906
552 275
5 361170
1990
213 868
200 871
155 843
170 896
106 599
8 271
856 348
1344641
1 331677
612 262
155 695
767957
279 333
118 556
83 272
63 855
193 048
738 064
255 294
45 456
300 750
78 488
184 744
19 451
39 692
271 042
593 417
5932854
161

12.19 Visitor Arrivals by Mode of Transport by Country of Residence
Mode of transport/ Country of residence
By air
Southeast Asia
Taiwan
Japan
U.S.A./Canada
West Europe
Australia/New Zealand
Others*
By sea
Southeast Asia
Taiwan
Japan
U.S.A./Canada
Sub-total
1981
516 925
135 574
462036
360 881
359 828
192 886
234 179
12 782
1982
552 911
152 494
472973
375 996
344229
208 295
246 938
13 272
639
8 030
1983
594672
155 520
455 133
445 594
353 654
221 388
250 560
17 018
1 080
11 688
20294
11135
1984
609 765
166 007
504203
557 446
371 706
268 603
262 559
16 780
755
17 720
25079
17 500
1985
618 573
175 983
523 666
611 870
413 390
260946
259 793
28 372
634
23404
31 797
23 855
1986
628 260
217 084
595 926
665 536
466244
261269
268 352
27 663
3 385
24343
37 533
25920
11 391
1987
675 582
344 818
870 537
747 679
559 701
252 373
285 037
26 809
9 377
33 471
47 431
29 511
10 718
1988
660 128
844125
1092324
722 343
629 514
257 956
350 223
23 855
25 836
35 120
46922
32035
10 547
Number of persons
1989
615 395
902464
1077932
632 736
604274
264182
409448
20 313
25 725
30407
36 656
23 421
9473
1990
725 095
975 969
1 219 401
613 213
621 663
262 199
438 825
28 831
40418
33 367
37 823
26 706
7403
West Europe
Australia/New Zealand
Others*
47
7 833
7 368
6124
8 014
1517
10 836
6964
8480
1 773
5 896
2 810
69921
6 919
3727
88480
9 451
5 416
122 929
17 837 51 754 74 165 85 287 94 308
Sub-total 43685 49994 148 072 209 071 248 480 231 282 268 856
Byland
Southeast Asia
Taiwan
Japan
U.S.A./Canada
West Europe
Australia/New Zealand
Others*
Sub-total
27 867
38 091
68 339
42626
27702
12 631
217 256
28 486 30 873 38 235 59 235 79 686
34 694 35 354 62 090 88 697 106 950
52 434 59 350 74 416 108 046 129 095
37 920 38 101 47 346 63 714 81 261
22 515 23 508 29 093 28 316 31 359
12 133 19 921 27 788 35 150 54 253
188 182 207 107 278 968 383 158 482 604
84 814
129 517
154 632
99187
32161
56 780
557091
Note: *Figures exclude visitors from the People's Republic of China.
Source: Hong Kong Tourist Association.
12.20 Visitor Spending by Country of Residence
Country of residence
Southeast Asia
Taiwan
Japan
U.S.A./Canada
West Europe
Australia/New Zealand
Others*
1981
1,482.27
308.19
1,553.50
1,344.57
1,192.80
908.15
832.53
1982 1983 1984
1,743.88 2,292.71 2,561.61
452.54 552.20 625.52
1,428.30 1,624.06 2,060.51
1,455.01 2,452.66 3,421.97
1,199.32 1,348.80 1,597.45
966.92 1,317.20 1,772.77
880.40 1,177.56 1,306.33
1985 1986 1987
2,457.58 3,073.95 3,464.50
579.14 778.52 1,584.07
2,511.09 3,612.72 7,024.04
3,861.33 4,259.28 5,309.73
1,729.02 2,257.60 3,456.10
1,561.95 1,700.13 1,736.80
1,247.00 1,561.73 2,261.90
87 692
224043
113 026
146 003
118 709
34299
60427
784199
1988
3,565.41
4,765.92
9,149.21
5,936.84
4,207.70
2,030.15
2,840.93
74 362 102 422
204 715 328 254
67 850 78 909
105517 116921
85 042 89 695
28 431 31148
57 540 60 284
623 457 807 633
1989
4,578.96
5,558.60
9,113.70
5,631.99
4,522.33
2,601.15
3,836.13
HK$ million
1990
5,604.37
7,263.62
9,227.19
5,197.66
4,697.93
2,231.25
3,755.84
Total 7,622.01 8,126.37 10,765.19 13,346.16 13,947.11 17,243.93 24,837.14 32,496.16 35,842.86 37,977.86
Note: *Figures exclude visitors from the People's Republic of China.
Source: Hong Kong Tourist Association.
162

12.21 Per Capita Visitor Spending by Country of Residence HK$
Country of residence 1981 1982 1983 1984 1985 1986 1987 1988 1989 1990
Southeast Asia 2,658 2,933 3,568 3,853 3,480 4,179 4,401 4,620 6,449 6,545
Taiwan 2,272 2,955 3,526 3,751 3,279 3,531 4,472 4,356 4,907 5,402
Japan 3,058 2,770 3,234 3,528 3,950 4,968 6,796 7,376 7,748 6,929
U.S.A./Canada 3,080 3,312 4,670 5,209 5,137 5,118 5,591 6,486 7,268 6,768
West Europe 2,919 3,082 3,348 3,659 3,451 3,937 5,021 5,393 6,345 6,365
Australia/New Zealand 3,973 4,041 5,252 5,820 5,229 5,592 5,882 6,705 8,611 7,419
Others* 3,353 3,375 4,309 4,442 4,152 4,587 5,747 5,860 6,946 6,329
Total 3,021 3,135 3,910 4,295 4,138 4,619 5,517 5,814 6,686 6,401
Note: *Figures exclude visitors from the People's Republic of China.
Source: Hong Kong Tourist Association.
12.22 Average Length of Stay of Visitors by Country of Residence Nights
Country of residence 1981 1982 1983 1984 1985 1986 1987 1988 1989 1990
Southeast Asia 3.58 3.75 3.64 3.56 3.51 3.57 3.60 3.75 4.01 3.95
Taiwan 3.59 3.42 3.05 3.43 3.31 3.25 3.11 2.64 2.31 2.21
Japan 2.59 2.37 2.48 2.50 2.58 2.72 2.83 2.74 2.95 2.92
U.S.A./Canada 3.81 3.78 3.92 3.93 3.74 3.56 3.67 3.76 3.78 3.85
West Europe 4.04 4.10 4.16 3.88 3.75 3.65 3.75 3.91 4.07 4.08
Australia/New Zealand 4.68 4.67 4.83 4.98 4.98 5.02 4.91 5.20 5.33 4.84
Others* 3.55 3.49 3.57 3.68 3.66 3.54 3.72 3.59 3.60 3.54
Total 3.59 3.57 3.62 3.62 3.55 3.51 3.50 3.40 3.42 3.33
Note: *Figures exclude visitors from the People's Republic of China.
Source: Hong Kong Tourist Association.
163
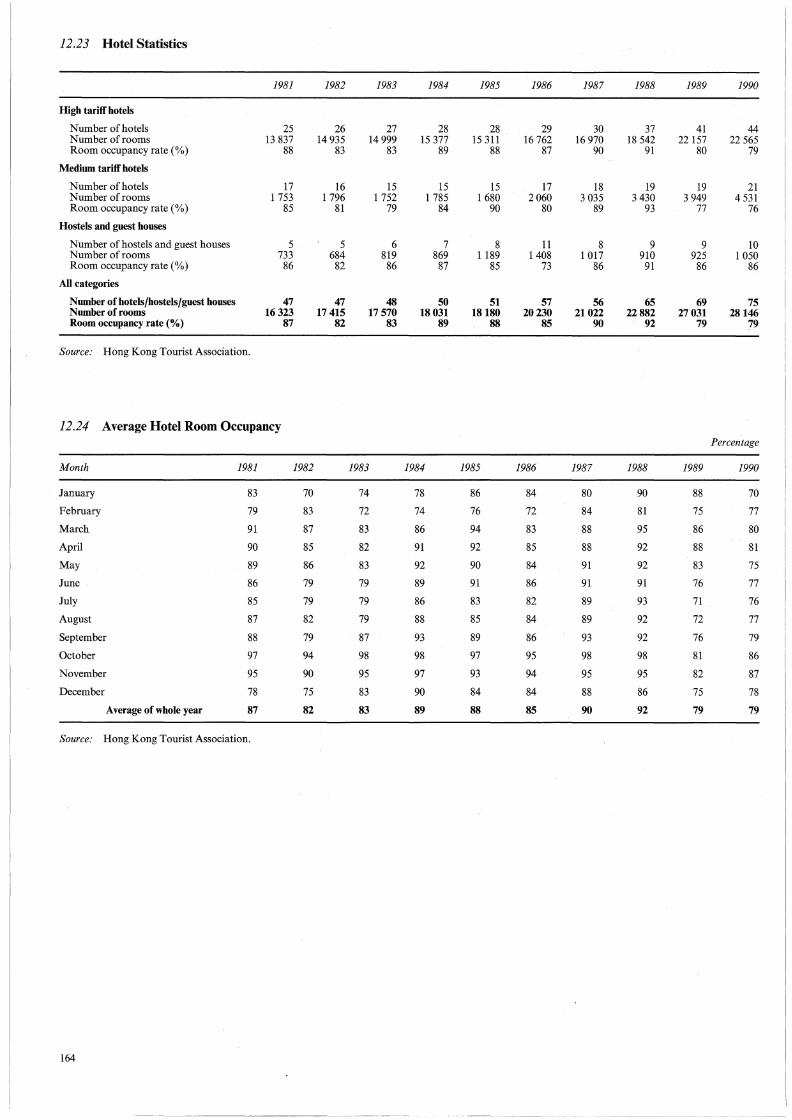
12.23 Hotel Statistics
1981 1982 1983 1984 1985 1986 1987 1988 1989 1990
High tariff hotels
Number of hotels 25 26 27 28 28 29 30 37 41 44 Number of rooms 13 837 14 935 14 999 15 377 15 311 16 762 16 970 18 542 22 157 22 565 Room occupancy rate(%) 88 83 83 89 88 87 90 91 80 79
Medium tariff hotels
Number of hotels 17 16 15 15 15 17 18 19 19 21 Number of rooms 1 753 1 796 1 752 1 785 1 680 2060 3 035 3 430 3 949 4 531 Room occupancy rate(%) 85 81 79 84 90 80 89 93 77 76
Hostels and guest houses
Number of hostels and guest houses 5 5 6 7 8 11 8 9 9 10 Number of rooms 733 684 819 869 1189 1408 1 017 910 925 1 050 Room occupancy rate(%) 86 82 86 87 85 73 86 91 86 86
All categories
Number of hotels/hostels/guest houses 47 47 48 50 51 57 56 65 69 75 Number of rooms 16323 17 415 17570 18031 18180 20230 21022 22882 27031 28146 Room occupancy rate(%) 87 82 83 89 88 85 90 92 79 79
Source: Hong Kong Tourist Association.
12.24 Average Hotel Room Occupancy Percentage
Month 1981 1982 1983 1984 1985 1986 1987 1988 1989 1990
January 83 70 74 78 86 84 80 90 88 70
February 79 83 72 74 76 72 84 81 75 77
March 91 87 83 86 94 83 88 95 86 80
April 90 85 82 91 92 85 88 92 88 81
May 89 86 83 92 90 84 91 92 83 75
June 86 79 79 89 91 86 91 91 76 77
July 85 79 79 86 83 82 89 93 71 76
August 87 82 79 88 85 84 89 92 72 77
September 88 79 87 93 89 86 93 92 76 79
October 97 94 98 98 97 95 98 98 81 86
November 95 90 95 97 93 94 95 95 82 87
December 78 75 83 90 84 84 88 86 75 78
Average of whole year 87 82 83 89 88 85 90 92 79 79
Source: Hong Kong Tourist Association.
164

Section 13 Building and Construction
Tables 13.1 to 13.5 Generallnformation
Statistics concerning the output, cost structure and other salient features of the building, construction and real estate industries in Tables 13.1 to 13.4 are obtained from the Annual Survey of Building, Construction and Real Estate Sectors. The figures in Table 13.5 on the gross value of construction work performed are based on results of the Quarterly Survey of Construction Output.
Concepts and Definitions
Statistical units:
Establishment
Construction site
Project
-An establishment is ideally an economic unit which engages, under a single ownership or control, in one or predominantly one kind of economic activity at a single physical location. In the context of construction, the requirement of a single physical location is relaxed for practical purposes. Where separate figures relating to different activities or different locations under the same management are not available, a combined return is accepted and in this case, the reporting unit is treated as an establishment.
-A construction site refers to a demarcated locality where one or more major stages or processes of construction work are being carried on. A construction site differs from an erected building or structure in that the unfinished building or structure relating to the construction site in question has not yet been issued with a Certificate of Practical Completion/Occupation Permit and is as yet not ready for use.
-A real estate development project is concerned with the development of land and/or re-development of existing premises into a new form of property for sale or lease. A development project is not regarded as active if the works that have been initiated relate only to pre-construction preparation.
For building and civil engineering construction industry:
Number of persons -equals number of working proprietors, active partners and directly engaged unpaid family workers
Compensation of employees and payments to labouronly sub-contractors
Miscellaneous operating expenses
Gross value of construction work performed
· Other business receipts
Gross output
plus number of direct employees, comprising operatives and other employees
-equals
plus
-equals plus plus plus
-equals
plus
-equals plus
remunerations to direct employees (comprising wages and salaries to operatives and to other employees; and payments in kind and employer's social security expenditure) payments to labour-only sub-contractors
rent and rates for land and buildings rentals for hiring machinery and equipment interest payments other operating expenses
construction work performed as main contractor at (i) construction sites
(ii) other minor new construction work locations (iii) erected buildings and structures construction work performed as sub-contractor at
(i) construction sites (ii) other minor new construction work locations
(iii) erected buildings and structures interest income other income
-equals gross value of construction work performed plus other income
165

166
Value added
Gross surplus
Gross additions to fixed assets
--equals less less
less less less
--equals plus less less
gross output value of sub-contract work rendered by fee sub-contractors consumption of materials and supplies; fuels, electricity and water; and maintenance services rent and rates for land and buildings rentals for hiring machinery and equipment other operating expenses
value added interest income interest payments compensation of employees and payments to labour-only sub-contractors
--equals acquisitions of fixed assets less disposals of fixed assets
For real estate development, leasing, brokerage and maintenance management services:
Number of persons --equals number of working proprietors, active business partners directly engaged and unpaid family workers
Compensation of employees
Miscellaneous operating expenses
Total project expenses
Value accrued to project during reporting period
Gross margin of real estate development projects
Other business receipts
Gross output
Value added
Gross surplus
Gross additions to fixed assets
plus number of direct employees
--equals plus
--equals plus
plus plus
wages and salaries payments in kind and employer's social security expenditure
rent and rates for land and buildings interest payments apart from those for financing real estate development projects estate management expenses other operating expenses
--equals payments to contractors plus building materials and fittings supplied outside the contract
price plus architectural design and technical consultancy fees plus interest payments to finance the real estate development
projects plus other project expenses
--equals (P1 -L1)+(P2 -L2) x (C2 -C1) 2
P: market value of the property if completed L: market value of the underlying land lot C: percentage of project completion Subscript 1: the beginning of reporting period Subscript 2: the end of reporting period
--equals value accrued to project less total project expenses plus interest payments to finance real estate development projects
--equals interest income plus otherincome
--equals gross margin of real estate development projects plus service and rental income plus other income
--equals gross output less consumption of sundry supplies; fuels, electricity and
water; and maintenance services less rent and rates for land and buildings less estate management expenses less other operating expenses
--equals value added plus interest income less interest payments to finance the real estate development
projects and other activities less compensation of employees
--equals acquisitions of fixed assets less disposals of fixed assets

For architectural, surveying and project engineering services:
Number of persons --equals number of working proprietors and active business partners directly engaged plus number of direct employees
Compensation of employees
Miscellaneous operating expenses
Gross output
Value added
Gross surplus
Gross additions to fixed assets
Data Sources
--equals plus
--equals plus plus
wages and salaries payments in kind and employer's social security expenditure
rent and rates for land and buildings interest payments other operating expenses
--equals service income plus other income
--equals less
less less less
--equals plus less less
gross output consumption of sundry supplies; fuels, electricity and water; and maintenance services payments for commission work rent and rates for land and buildings other operating expenses
value added interest income interest payments compensation of employees
--equals acquisitions of fixed assets less disposals of fixed assets
The Annual Survey of Building, Construction and Real Estate Sectors covers all establishments engaged in the activities of building and civil engineering construction; real estate development, leasing, brokerage and maintenance management services; and architectural, surveying and project engineering services. A register of establishments maintained by the Census and Statistics Department and updated by reference to records of the Business Registration Office of the Inland Revenue Department provides the frame for selecting the survey sample. The register is supplemented by information from the Quarterly Employment Survey of Construction Sites conducted by the Census and Statistics Department and also from the annual company reports of real estate enterprises.
Building and civil engineering construction includes all new architectural and civil engineering works, as well as repair and maintenance services. However, the survey does not cover construction work undertaken by direct employees of the Government, the value of which is trivial as public works projects are mainly carried out by private contractors. Labour-only sub-contractors who only provide labour on a job-to-job basis are also excluded from the survey, but their output is implicitly included in that of contractors commissioning their services. On the other hand, fee sub-contractors, who have to furnish the necessary building materials/plant, labour and other support services required for the construction work sub-contracted to them, are covered in the survey. Real estate development refers to private development projects for which active construction work was undertaken during the survey reference period, including the Private Sector Participation Schemes. However, real estate development purely or predominantly for own occupation and firms set up purely for land holding are excluded. For real estate leasing, brokerage and maintenance management services, only those establishments engaging two or more persons or which are subsidiaries of real estate enterprises are included. Other small undertakings, mostly self-employed persons, or persons operating on a casual basis, are excluded from the survey as they cannot be adequately enumerated in an establishment-type enquiry.
Main contractors at construction sites and real estate developers are enumerated in full. The rest of the sampling frame for the survey is stratified by trade and, within each trade, by employment size range. The sample size for each trade and employment size stratum is determined by Neyman's allocation according to a desired level of precision for the estimated value added of each trade group.
Data collected in the survey include the number of persons engaged, compensation of employees, purchases and other operating expenses, construction output, service and rental income, value accrued to real estate development projects, and capital expenditure. Establishments are required to provide data relating to the reference year or any 12-month period between 1 January of the reference year and 31 March of the subsequent year. Because of differences in the accounting practices of establishments, the data collected are in fact a mixture of data over slightly different periods. For establishments which commence or cease operation during the reference period, data reported are for that part of the reference period during which the establishments are in operation.
167

168
The Quarterly Survey of Construction Output covers establishments engaged in building and civil engineering construction. It is aimed at providing a prompt indication of output in the construction industry. The information collected is the gross value of construction work performed, with breakdown by different types of work location and by work performed as main contractors or sub-contractors.
Main contractors of construction sites, irrespective of their employment sizes, and other construction establishments engaging 100 persons or more are enumerated in full in the Quarterly Survey of Construction Output. As regards the other establishments in the frame, a random sample stratified by trade and employment size is selected for enumeration. In addition, a supplementary sample of new establishments is selected every quarter.
Both the annual and quarterly surveys cover all establishments that have ever operated during the whole or part of the reference period, including reporting and non-reporting establishments. The economic contributions of non-reporting establishments are imputed on the basis of reporting establishments of the same trade and employment size range.
Further References
Further details about the methodology and results of the surveys are available in the reports entitled 1989 Survey of Building, Construction and Real Estate Sectors and Report on the Quarterly Survey of Construction Output published by the Census and Statistics Department.
Tables 13.6 to 13.10 Concepts and Definitions
A building is said to be completed upon the issuance of an Occupation Permit by the Buildings Ordinance Office of the Buildings and Lands Department.
Consents to commence work are issued by the Buildings Ordinance Office of the Buildings and Lands Department for private buildings except small village-type houses where 'consents' are not necessary.
Usable floor area is defined as the aggregate of the areas of the floor or floors in a storey or a building excluding any staircases, public circulation space, lift landings, lavatories, water-closets, kitchens and any space occupied by machinery for any lift, air-conditioning system or similar service provided for the building.
The usable floor area of a flat is defined as the total floor area within the flat excluding any staircases, lavatories, water-closets, kitchens and other common areas of the building.
The gross floor area of a building is defined as the aggregate of the areas of the floor(s) in a building.
Non-residential buildings include industrial buildings, commercial buildings, hotels, educational buildings without dormitory, health buildings and other non-residential buildings.
Combined residential and non-residential buildings refer to combined domestic/non-domestic buildings such as apartment/commercil'.ll buildings, tenement/commercial buildings or educational buildings with dormitory.
Data Sources
Statistics on completed new buildings certified for occupation and consents to commence work are compiled from details contained in the monthly returns of the· Buildings Ordinance Office of the Buildings and Lands Department. Data for tables 13.6 to 13.8 include building activities in the private sector and those for Housing Society, Private Sector Participation Scheme and Middle Income Housing but exclude small village-type houses while those for tables 13.9 and 13.10 covers only building activities in the private sector.
Tables 13.11 to 13.16 General Information
The Rating and Valuation Department is Government's principal adviser on valuation matters and is consulted by other government departments and official bodies concerning the capital and rental valuation of real property.
Concepts and Definitions
Domestic units built under the Private Sector Participation Scheme (PSPS), and all units built under the Home Ownership Scheme, the Urban Improvement Scheme and the Flat-for-Sale Scheme are excluded from statistics for the private sector.
Private domestic units are defined as independent dwellings with separate cooking facilities and bathroom (and/or lavatory). They are sub-divided by reference to floor area. 'A' units have a saleable area not exceeding 39.9 square metres. 'B' units have a saleable area of at least 40 square metres but not exceeding 69.9 square metres. 'C' units have a saleable area of at least 70 square
-------- ----------------------------------------------

metres but not exceeding 99.9 square metres. 'D' units have a saleable area of at least 100 square metres but not exceeding 159.9 square metres. 'E' units have a saleable area of at least 160 square metres.
Private commercial premises include retail premises and other premises designed or adapted for commercial use with the exception of purpose-built offices.
Private offices comprise premises situated in buildings designed for commercial/business purposes, excluding non-domestic floors in composite buildings. Offices are sub-divided as follows:-
Grade
Grade
A-well constructed, designed and managed, centrally air-conditioned premises in suitable locations within the district.
B-less superior buildings in good locations or high quality buildings in secondary locations within the district, with or without central air-conditioning.
Grade C/D-poorer buildings on less attractive sites within the district.
Private flatted factories comprise premises designed for general manufacturing processes normally intended for sale or letting by the developers.
Private specialised factories comprise all other factory premises, being primarily purpose-built for a specialised manufacturing process, usually for occupation by a single operator.
Private storage premises comprise premises designed or adapted for use as a godown or cold store. Similar premises located within container terminals are excluded.
The floor area of domestic units is calculated by reference to saleable area, which is defined as the floor area exclusively allocated to the unit including balconies and verandahs but excluding common areas such as stairs, lift shafts, lobbies and communal toilets. It is measured from the exterior of the enclosing walls of the unit and the middle of the party walls between two units. Bay windows, yards, gardens, terraces, flat roofs, carports and the like are excluded from the area.
The floor area of non-domestic accommodation is calculated by reference to internal floor area, which is defined as the area of all enclosed space of the unit measured to the internal face of enclosing external and/ or party walls.
The price and rental indexes measure value changes by reference to the factor of rental or price divided by rateable value of the subject properties. For domestic premises, only new and fresh rentals effective in the quarter are analysed. For non-domestic premises, rentals negotiated on renewal are also included. All rentals are analysed on a net basis, i.e. exclusive of rates, management and other charges. Prices are derived from all transactions scrutinized by the Rating and Valuation Department for stamp duty purposes with an agreement date within the quarter being analysed.
Further References
Statistics on stock, supply and vacancy position of domestic and non-domestic premises in Tables 13.11-13.14 and price and rental indexes statistics in Tables 13.15 to 13.16 are available in the publication Property Review published by the Rating and Valuation Department. Figures in these tables relate to private building development in areas where rates are levied.
Table 13.17 Generallnformation
Statistics on instruments registered in the Land Office only relate to instruments registered in respect ofland in Hong Kong, Kowloon, portions of New Kowloon and a number of lots in the New Territories which have been exempted from the provisions of Part II of the New Territories Ordinance.
Concepts and Definitions
Assignments of lot/section refer to documents which effect the transfer of ownership of property of a parcel of ground.
Assignments of share of lot/section refer to documents which effect the transfer of ownership of property of undivided shares of a lot.
Receipts, discharges and releases refer to documents which effect the release of a property from a charge upon repayment of loan and include re-assignments and certificates of satisfaction.
Miscellaneous refer to documents lodged by solicitors for registration in the Land Office other than those listed in the table. They include Probates and Letters of Administration, Deeds of Covenant, Court Orders, Declaration of Trust, Undertakings, Various Agreements and Memoranda, etc.
169

170
Table 13.18 Concepts and Definitions
Letter 'A' and 'B' tender system in the New Territories: when it is necessary for Government to acquire land for public purposes, the Government exercises its power under the Crown Lands Resumption Ordinance. Where land is required within an area embraced by an approved layout plan, the policy is to give the leasee of private land the opportunity of surrendering his land voluntarily in exchange for the right to be granted Government land at some future date. This right is contained in a Letter called Letter 'A' or Letter 'B'.
The realised premium of land acquired by a land exchange entitlement is calculated by deducting the Government's value of the resumed land from the value of the land to be granted prevailing at the time when the exchange entitlement letter was issued. The realised premium of land acquired through auction or public tender is the auctioned/tendered price of the land.
Land for special low cost housing projects, Home Ownership Schemes, public utilities, schools, churches, temples, clinics, welfare and certain charitable purposes is usually granted by private treaty, and in such cases, the premium charged varies from nothing for non-profit-making purposes up to the full market value for public utilities.

13.1 Principal Statistics for All Establishments Analysed by Trade Group, 1984-1989 Surveys of Building, Construction and Real Estate Sectors
(a) Building and Civil Engineering Contractors HK$ n:illion unless otherwise specified
Consumption Campen- of materials Value sationof &supplies; of sub· Gross
Number employees fuels, contract value Number of &payments electricity work Miscel- of con- Gross
of persons to labour- & water; & rendered by laneous struction Other additions establish- directly. only sub- maintenance fee sub- operating work business Value Gross to fixed
Trade group ments engaged contractors services contractors expenses performed receipts added surplus assets
New construction works-pre-erection works at construction sites 1984 224 4403 331 372 370 156 1,205 55 379 31 II
1985 190 4927 425 505 409 158 1,490 35 464 29 78 (-15.2) ( +11.9) (+28.3) (+35.9) ( + 10.5) ( +1.4) (+23.7) (-35.5) ( +22.5) (-7.4) ( +583.1)
1986 177 5464 584 582 674 206 2,081 36 667 71 58 (-6.8) (+10.9) ( +37.6) (+15.3) (+64.7) (+30.0) (+39.6) (+3.3) (+43.6) ( +149.3) (-25.6)
1987 181 4747 551 599 601 180 1,963 38 632 71 II ( +2.3) (-13.1) (-5.6) (+2.8) (-10.8) (-12.6) (-5.6) (+4.7) (-5.2) (-0.7) (-80.6)
1988 174 4 558 638 753 1,096 229 2,825 70 825 179 113 ( -3.9) (-4.0) (+15.8) ( +25.8) (+82.4) ( +27.4) (+43.9) ( +83.6) ( +30.4) (+153.5) ( +902.9)
1989 204 5 663 992 1,156 1,364 342 4,073 61 1,281 280 94 ( +17.2) ( +24.2) ( +55.4) ( +53.5) ( +24.5) (+49.0) (+44.1) (-13.2) (+55.3) (+56.2) (-16.9)
New construction works-architectural and civil engineering works at construction sites 1984 603 38 253 5,489 6,098 11,410 1,245 25,335 383 6,963 1,477 97
1985 653 37 315 5.294 5,935 11,051 1,294 23,977 445 6,136 848 201 (+8.3) (-2.5) (-3.6) (-2.7) (-3.1) (+3.9) (-5.4) (+16.2) (-11.9) (-42.6) (+107.1)
1986 647 39159 6,180 7,242 11,958 1,412 27,062 458 6,917 727 249 (-0.9) ( +4.9) (+16.7) (+22.0) ( +8.2) (+9.1) (+12.9) (+2.9) ( +12.7) (-14.3) ( +24.2)
1987 622 43 318 7,734 8,121 16,269 1,598 33,677 636 8,281 590 235 (-3.9) ( +10.6) (+25.1) (+12.1) ( +36.0) ( +13.2) ( +24.4) ( +38.7) (+19.7) (-18.8) (-5.8)
1988 657 43 187 9,103 9,699 19,975 1,983 40,874 616 9,905 729 287 (+5.6) (-0.3) (+17.7) (+19.4) ( +22.8) (+24.1) (+21.4) (-3.1) (+19.6) (+23.6) ( +22.3)
1989 622 41673 10,258 11,173 25,952 2,849 51,714 815 12,686 2,297 418 (-5.3) (-3.5) (+12.7) (+15.2) ( +29.9) ( +43.6) (+26.5) ( +32.2) (+28.1) (+214.9) ( +45.7)
Minor new construction works 1984 241 2 963 173 159 170 32 543 13 197 21 8 1985 244 2 569 176 143 116 28 486 3 205 26 6
(+1.2) (-13.3) ( +1.4) (-10.1) (-31.6) (-13.4) (-10.4) (-77.6) (+4.2) (+22.5) (-18.2) 1986 298 3 389 258 198 371 58 930 14 321 60 14
(+22.1) (+31.9) (+46.6) ( +38.4) ( +218.3) (+106.7) (+91.2) ( +380.4) ( +56.4) (+128.8) (+131.6) 1987 345 3 386 266 199 283 58 869 19 349 82 10
( +15.8) (-0.1) (+3.1) ( +0.4) (-23.5) (+0.3) (-6.6) (+36.7) (+8.7) (+37.0) (-27.9) 1988 318 3 570 342 242 529 82 1,227 30 407 62 20
(-7.8) (+5.4) (+28.5) ( +21.9) (+86.7) (+40.9) (+41.3) (+58.3) (+16.7) (-23.5) (+97.1) 1989 324 2 775 322 292 371 60 1,073 47 399 75 22
(+1.9) (-22.3) (-5.8) (+20.6) (-29.9) (-26.2) (-12.5) ( +54.4) (-1.9) ( +19.8) (+9.1)
Renovation and maintenance at erected buildings and structures 1984 2 594 16 503 863 854 1,275 209 3,362 20 1,055 180 27
1985 2 815 15 881 890 890 1,330 207 3,510 18 1,111 211 36 (+8.5) (-3.8) (+3.0) (+4.3) ( +4.4) (-1.2) (+4.4) (-8.0) ( +5.3) (+17.1) ( +31.7)
1986 3 514 19779 1,333 1,191 1,914 288 4,939 51 1,611 262 74 (+24.8) ( +24.5) ( +49.8) (+33.8) (+43.9) ( +39.4) (+40.7) (+178.4) (+45.0) (+24.4) ( +105.4)
1987 3 644 21837 1,638 1,447 2,622 340 6,324 92 2,032 369 53 ( +3.7) ( + 10.4) (+22.9) (+21.4) ( +37.0) (+18.1) (+28.1) ( +81.3) ( +26.2) ( +40.6) (-28.5)
1988 4259 22 313 1,677 1,675 3,164 440 7,335 110 2,192 489 62 (+16.9) (+2.2) (+2.4) (+15.7) (+20.7) ( +29.2) (+16.0) (+19.7) (+7.9) ( +32.6) (+17.2)
1989 4 735 23 680 2,279 1,871 4,381 609 9,650 163 2,976 672 107 (+11.2) (+6.1) (+35.9) (+11.8) ( +38.5) ( +38.5) (+31.6) (+47.1) ( +35.8) ( +37.3) (+73.5)
Special trades-erection and general finishing 1984 1354 10 883 768 822 355 116 2,182 22 918 143 II
1985 1313 9 320 738 705 173 147 1,898 28 908 162 49 (-3.0) (-14.4) (-3.9) (-14.3) (-51.1) (+27.1) (-13.0) (+27.5) (-I.I) (+13.7) ( +324.2)
1986 1297 10 715 894 808 161 180 2,133 33 1,022 123 47 (-1.2) (+15.0) ( +21.1) ( +14.7) (-7.2) ( +22.5) ( +12.4) (+19.9) (+12.5) (-24.6) (-4.3)
1987 1670 II 782 1,068 1,162 258 224 2,823 75 1,258 186 89 ( +28.8) ( +10.0) ( +19.5) ( +43.7) ( +60.2) (+24.2) ( +32.4) (+125.1) ( +23.2) ( +52.0) (+91.8)
1988 I 712 11 150 1,137 1,433 254 226 3,238 44 1,383 232 73 (+2.5) (-5.4) ( +6.5) ( +23.4) (-1.6) (+1.0) (+14.7) (-41.1) (+9.9) ( +24.4) (-18.0)
1989 I 700 9 918 1,649 1,388 553 392 4,170 84 1,947 271 155 (-0.7) (-11.0) (+45.0) (-3.2) ( + 118.0) (+73.3) (+28.8) (+91.2) ( +40.8) (+17.0) ( + 112.4)
Special trades-electrical and mechanical fitting 1984 I 300 20489 1,660 2,881 1,429 399 6,763 177 2,249 572 25
1985 1542 21896 2,081 3,154 671 392 6,726 112 2,645 539 13 (+18.6) (+6.9) ( +25.4) ( +9.5) (-53.0) (-1.6) (-0.6) (-36.7) (+17.6) (-5.7) (-47.8)
1986 2105 27076 2,087 3,089 835 419 6,723 173 2,544 466 56 ( +36.5) (+23.7) (+0.3) (-2.1) (+24.3) (+6.9) (#) ( +54.4) (-3.8) (-13.6) (+319.3)
1987 2366 25 935 2,563 3,997 1,180 572 8,586 327 3,148 601 129 (+12.4) (-4.2) ( +22.8) ( +29.4) (+41.4) ( +36.4) ( +27.7) ( +89.0) (+23.7) (+29.1) (+131.6)
1988 2 830 27 037 3,344 4,695 2,350 696 11,742 279 4,265 937 125 (+19.6) (+4.2) ( +30.5) (+17.5) (+99.2) (+21.8) ( +36.8) (-14.5) (+35.5) (+55.8) (-2.9)
1989 3 614 28 879 3,992 5,788 2,288 952 13,401 407 4,739 789 205 ( +27.7) (+6.8) (+19.4) ( +23.3) (-2.7) (+36.7) (+14.1) ( +45.8) (+II.I) (-15.8) (+64.0)
Special trades-gas and water fitting 1984 318 3 342 299 293 44 41 689 12 328 24 7 1985 369 3 524 421 434 42 50 983 7 471 43 21
(+16.0) ( +5.4) (+40.7) (+48.3) (-6.2) ( +23.2) (+42.6) (-44.3) (+43.6) ( + 76.8) (+213.2) 1986 331 2910 296 340 46 33 752 6 343 43 16
(-10.3) (-17.4) (-29.8) (-21.7) (+10.1) (-34.4) (-23.6) (-16.8) (-27.2) (#) (-22.5) 1987 371 3222 455 489 65 48 1,127 7 538 77 13
(+12.1) ( +10.7) (+54.0) (+43.8) (+42.6) ( +45.6) (+49.9) (+30.2) ( +56.8) ( + 78.9) (-20.6) 1988 416 3172 583 620 59 62 1,371 10 646 56 8
(+12.1) (-1.6) (+28.0) (+26.9) (-9.3) (+30.0) (+21.6) ( +32.8) (+20.1) (-27.4) (-42.2) 1989 428 3 070 519 448 165 80 1,261 10 586 59 14
(+2.9) (-3.2) (-11.0) (-27.8) (+179.5) ( +27.9) (-8.0) (+1.2) (-9.2) (+5.5) (+87.1)
Special trades--other fitting 1984 22 157 5 23 3 34 7 2 1985 29 133 5 14 I I 22 6 I
(+31.8) (-15.3) (-6.9) (-40.0) (-) ( -55.6) (-33.4) (-) (-13.7) (-31.Si (-) 1986 17 53 I 5 . I 7 . 2 .
(-41.4) (-60.2) (-73.8) (-67.9) <-i (-57.5) (-69.1) c-i (-71.0) (-) (-) 1987 15 61 5 II I 18 6 . 1
(-11.8) (+15.1) ( +320.5) (+143.1) (-) ( + 105.8) ( +160.5) c-i ( +227.4) (-) c-i 1988 12 38 3 4 2 I 12 4 I
(-20.0) (-37.7) ( -37.5) (-59.9) (-) (-2.8) (-34.6) (-) (-27.1) (-) (-) 1989 26 107 2 3 - . 6 3 I
( + 116.7) (+181.6) (-33.7) (-42.7) (-) (-) (-47.8) (-) (-21.8) (+24.2) (-)
171
L

13.1 Principal Statistics for All Establishments Analysed by Trade Group, 1984-1989 Surveys of Building, Construction and Real Estate Sectors (Continued)
(a) Building and Civil Engineering Contractors (Continued) HK$ million unless otherwise specified
Consumption Campen- of materials Value sation of &supplies; of sub- Gross
Number employees fuels, contract value Number of &payments electricity work Misce/- of con- Gross
of persons to labour- & water;& rendered by laneous struction Other additions establish- directly only sub- maintenance fee sub- operating work business Value Gross to fixed
Trade group ments engaged contractors services contractors expenses performed receipts added surplus assets
Special trades-not elsewhere classified 1984 122 1173 73 85 15 13 195 1 84 10 2 1985 165 1 583 92 94 27 14 241 1 107 14 5
( +35.2) ( +35.0) ( +27.0) (+11.3) ( + 79.7) (+7.1) ( +23.6) ( +56.0) (+27.8) (+42.3) (+155.1) 1986 183 1498 99 103 7 17 235 3 112 13 5
( +10.9) (-5.4) ( + 7.4) ( +9.1) (-74.7) ( +24.2) (-2.2) ( +220.8) (+4.8) (-11.8) (+1.5) 1987 295 2 348 176 203 17 31 450 4 206 27 17
(+61.2) (+56.7) (+78.3) ( +97.4) ( +146.3) (+79.2) ( +91.3) ( +35.2) (+83.2) ( + 116.2) ( +251.1) 1988 294 1991 262 263 45 47 644 7 299 34 10
( -0.3) (-15.2) (+48.6) ( +29.5) (+169.6) ( +53.4) ( +43.0) (+81.4) (+45.5) (+23.7) (-40.0) 1989 371 2664 293 261 26 63 659 15 328 32 27
( +26.2) ( +33.8) (+11.7) (-0.9) (-42.9) ( +34.2) (+2.4) ( +95.2) ( +9.6) (-6.7) ( +167.6)
Total 1984 6779 98166 9,661 11,587 15,068 2,214 40,307 682 12,180 2,460 189 1985 7321 97148 10,120 11,875 13,821 2,292 39,333 649 12,053 1,874 409
(+8.0) (-1.0) (+4.8) (+2.5) (-8.3) (+3.5) (-2.4) (-4.9) (-1.0) (-23.8) ( +116.5) 1986 8570 110044 11,732 13,559 15,966 2,614 44,860 774 13,538 1,765 519
( +17.1) (+13.3) ( +15.9) (+14.2) (+15.5) ( +14.0) ( +14.1) (+19.3) (+12.3) (-5.9) (+26.9) 1987 9508 116635 14,457 16,227 21,296 3,052 55,837 1,198 16,450 2,004 557
(+10.9) (+6.0) (+23.2) (+19.7) ( +33.4) (+16.8) ( +24.5) (+54.7) ( +21.5) ( +13.5) (+7.4) 1988 10672 117 015 17,090 19,384 27,474 3,767 69,267 1,167 19,926 2,719 698
( +12.2) (+0.3) (+18.2) (+19.5) ( +29.0) (+23.4) (+24.1) (-2.5) ( +21.l) ( +35.7) (+25.2) 1989 12023 118428 20,306 22,379 35,100 5,347 86,007 1,601 24,945 4,476 1,043
(+12.7) (+1.2) (+18.8) ( +15.5) (+27.8) ( +41.9) (+24.2) (+37.1) (+25.2) (+64.6) ( +49.4)
(b) Architectural, Surveying and Project Engineering Establishments HK$ million unless otherwise specified
Consumption of sundry supplies;
Number fuels, Number of electricity Payments Miscel- Gross
of persons Campen- & water; & for laneous Other additions establish- directly sation of maintenance commission operating Service business Value Gross to fixed
Trade group ments engaged employees services work expenses income receipts added surplus assets
Architectural design 1984 131 1562 122 10 64 49 297 12 187 64 1985 219 1 743 156 II 84 61 351 19 206 58 9
( +67.2) (+11.6) ( +27.8) ( +12.8) (+31.7) (+24.3) (+18.1) (+64.4) (+9.8) (-9.5) (-) 1986 212 2042 184 13 72 78 397 28 259 78 8
(-3.2) (+17.2) (+18.2) ( +22.0) (-14.8) ( +26.8) (+13.1) (+45.8) (+25.8) (+34.2) (-9.6) 1987 226 2062 217 16 70 90 450 24 302 81 7
(+6.6) (+1.0) (+17.9) (+22.7) (-2.9) (+15.6) ( + 13.4) (-15.4) (+16.9) (+3.8) (-12.7) 1988 243 2327 301 19 91 145 614 71 405 129 14
(+7.5) (+12.9) (+38.6) (+17.1) ( +30.4) ( +61.2) ( +36.4) ( +202.9) (+34.1) (+60.3) ( +93.4) 1989 255 2421 318 23 177 176 814 44 488 164 17
(+4.9) (+4.0) (+5.7) (+22.6) (+95.0) ( +21.3) (+32.6) (-37.7) ( +20.4) ( +27.0) ( +23.4)
Real estate surveying. valuation and consultancy 1984 146 2028 203 15 21 79 450 25 361 157 18
1985 146 2 551 256 22 33 117 585 37 450 195 12 (-) ( +25.8) ( +26.1) ( +41.2) ( +56.8) (+48.5) (+30.0) (+51.6) ( +24.6) ( +24.5) (-37.3)
1986 142 2 628 269 25 35 129 598 35 449 175 22 (-2.7) (+3.0) ( +5.1) (+15.1) (+6.7) ( + 10.0) (+2.1) (-5.8) (-0.3) (-10.2 ( +87.7)
1987 153 3 125 347 28 26 174 751 38 567 213 31 (+7.7) (+18.9) ( +29.1) ( + 14.3) (-24.7) (+35.1) ( +25.5) ( +9.5) ( +26.2) (+21.4) ( +44.3)
1988 192 2 657 417 21 49 180 759 39 561 131 24 (+25.5) (-15.0) ( +20.1) (-24.3) (+87.9) ( +3.2) (+I.I) (+2.7) (-0.9) (-38.4) (-22.1)
1989 183 2 894 468 24 37 213 923 39 692 220 23 (-4.7} ( +8.9) (+12.1) (+13.4) (-25.4) ( + 18.5) ( +21.6) (-0.4) ( +23.3) ( +68.0) (-4.8)
Structural engineering 1984 36 181 10 1 4 4 35 27 16 3 1985 47 203 17 1 5 7 38 26 9 I
( +30.6) (+12.2) (+61.4) (-34.6) ( +26.7) (+76.2) (+7.7) <-: ( -3.6) (-44.0) (-52.82 1986 27 264 14 1 4 5 27 18 5
(-42.6) (+30.0) (-18.8) (+57.2) (-31.1) (-33.3) ( -28.4) (-: (-28.9) (-46.5) (-/ 1987 18 127 7 1 3 3 15 8 1
(-33.3) (-51.9) (-48.7) (-45.1) (-16.9) (-25.0) (-43.8) (-) (-54.2) (-71.4) (-) 1988 8 108 7 1 5 4 21 I 11 5 4
(-55.6) (-15.0) (-2.9) (+21.4) (+74.8) (+21.7) ( +34.8) (-) ( +36.2) ( +239.0) (-) 1989 42 159 II l 5 6 29 I 17 6 I
(+425.0) (+47.2) ( +63.6) (+89.2) (-0.7) (+42.0) (+38.7) (+36.1) (+51.2) (+35.7) (-76.7)
Building services engineering 1984 27 686 69 4 10 26 118 3 79 12 2 1985 27 703 65 4 14 20 107 3 72 7 2
(-) (+2.5) (-5.3) (-8.4) ( +33.9) (-23.9) (-9.4) (-11.4) (-8.6) (-39.9) (+18.3) 1986 39 796 63 4 12 21 113 4 79 16 2
( +44.4) (+13.2) (-3.3) (+13.7) (-12.9) (+3.7) (+5.1) (+41.2) ( + 10.4) ( +132.3) (-7.6) 1987 52 864 80 5 16 25 146 3 104 24 3
( +33.3) ( +8.5) (+26.1) (+21.6) (+30.8) ( +20.2) (+30.1) ( -19.4) (+31.0) ( +48.3) ( +69.4) 1988 39 1105 127 9 20 40 233 6 170 43 11
(-25.0) (+27.9) ( +59.4) (+87.8) ( +27.9) (+60.9) ( +59.4) ( +107.4) (+63.2) (+78.7) ( +273.2) 1989 52 1292 158 10 20 67 302 12 218 59 13
(+33.3) (+16.9) ( +24.9) (+9.3) (-1.4) (+66.2) ( +29.2) (+94.5) ( +28.4) ( +35.6) ( +25.7)
Civil and geotechnical engineering 1984 20 702 113 6 14 31 187 7 141 30 11 1985 38 962 132 6 11 33 189 23 161 30 1
( +90.0) ( +37.0) (+16.9) (+5.7) (-24.9) ( +6.4) (+I.I) ( +238.7) (+14.9) (+2.0) (-95.2) 1986 39 842 111 6 29 36 185 16 130 19 9
(+2.6) (-12.5) (-15.7) (+4.4) ( + 170.7) (+6.8) (-2.1) (-31.0) (-19.4) (-37.1) ( +l 599.6) 1987 50 626 86 4 30 31 163 3 103 16 2
( +28.2) (-25.7) (-22.8) (-33.6) (+1.6) (-14.1) (-11.9) (-78.2) (-20.9) (-13.7) (-72.9) 1988 32 960 108 7 33 47 217 3 133 25 II
(-36.0) ( +53.4) ( +25.3) (+80.3) (+11.1) ( +52.9) ( +33.0) (-10.6) (+29.7) (+55.0) ( +365.9) 1989 32 863 119 8 44 48 . 240 6 149 26 15
(#) (-10.1) (+10.7) ( + 1.1) ( +35.3) (+2.1) (+10.7) (+88.9) (+11.8) (+4.2) ( +29.4)
172

13.1 Principal Statistics for All Establishments Analysed by Trade Group, 1984-1989 Surveys of Building, Construction and Real Estate Sectors (Continued)
(b) Architectural, Surveying and Project Engineering Establishments (Continued) HK$ million unless otherwise specijied
Consumption of sundry supplies;
Number feels, Number of electricity Payments Miscel- Gross
of persons Compen- & water; & for /aneous Other additions establish- directly sation of maintenance commission operating Service business Value Gross to fixed
Trade group ments engaged_ employees services work expenses income receipts added surplus assets
Architectural design and structural engineering 1984 55 I 027 86 8 38 38 192 7 114 28 1
1985 49 1 029 93 8 33 29 194 8 132 39 I (-10.9) (+0.2) (+7.7) (+5.3) (-12.9) (-23.4) (+I.I) (+26.1) (+15.8) (+37.8) (+48.0)
1986 77 1224 126 10 37 38 239 11 166 40 4 (+57.1) (+19.0) (+35.0) (+18.0) (+11.9) (+28.0) (+22.7) (+36.8) (+25.9) (+2.3) (+172.0)
1987 55 1512 154 13 44 54 302 8 202 46 9 (-28.6) (+23.5) (+22.7) (+32.8) (+17.9) (+43.1) (+26.7) (-25.2) (+21.8) ( +15.9) (+170.5)
1988 75 1165 137 10 67 67 313 9 178 42 6 ( +36.4) (-22.9) (-11.2) (-24.9) (+53.3) (+24.9) (+3.7) (+6.9) (-11.7) (-9.5) (-32.8)
1989 64 1179 167 13 83 70 405 7 246 80 3 (-14.7) (+1.2) (+21.6) (+36.7) (+23.9) (+4.6) ( +29.4) (-19.2) (+37.7) (+91.6) (-48.3)
Combination of preceding services 1984 70 I 799 220 13 75 56 424 9 285 69 5 1985 48 2 078 269 15 53 76 533 19 405 139 6
(-31.4) (+15.5) (+22.2) (+22.2) (-29.2) (+35.7) (+25.8) ( + 114.4) (+42.1) (+101.3) (+28.4) 1986 77 2475 334 19 105 82 644 21 457 126 -7
(+60.4) (+19.1) (+24.1) ( +24.4) ( +97.4) (+7.4) (+21.0) (+7.9) ( +12.7) (-9.1) (-) 1987 82 2 938 457 26 136 119 837 21 574 119 43
(+6.5) (+18.7) ( +36.8) (+37.3) (+30.2) (+45.8) ( +29.9) (-2.1) (+25.7) (-5.4) (-) 1988 69 3 334 554 31 213 157 1,100 29 722 174 35
(-15.9) (+13.5) ( +21.1) (+19.6) (+56.3) (+31.7) (+31.4) (+41.6) (+25.8) (+46.3) (-18.3) 1989 111 3 485 705 33 243 208 1,290 82 879 183 43
(+60.9) (+4.5) (+27.4) (+5.1) (+14.2) ( +32.3) (+17.3) (+180.6) (+21.7) (+5.0) (+22.1)
Total 1984 486 7985 824 56 226 284 1,704 62 1,193 375 40 1985 575 9270 988 66 233 344 1,998 110 1,452 477 32
(+18.3) (+16.1) (+19.9) (+18.5) (+2.8) (+21.1) (+17.3) ( +77.7) ( +21.7) (+27.0) (-19.4) 1986 613 10271 1,101 78 293 387 2,203 115 1,558 459 37
(+6.6) (+10.8) (+11.4) (+18.2) (+25.9) (+12.4) (+10.3) (+4.6) (+7.3) (-3.8) ( +17.0) 1987 636 11254 1,348 93 324 496 2,665 97 1,860 501 96
(+3.8) (+9.6) (+22.4) (+19.5) (+10.6) (+28.2) (+21.0) (-15.4) (+19.4) (+9.1) (+157.6) 1988 658 11656 1,650 99 478 641 3,257 159 2,182 550 105
(+3.5) (+3.6) ( +22.4) (+5.8) (+47.6) (+29.0) (+22.2) ( +63.4) (+17.3) (+9.8) (+9.2) 1989 738 12293 1,946 113 609 788 4,003 192 2,689 739 116
(+12.2) (+5.5) (+18.0) (+14.8) (+27.4) (+23.0) (+22.9) ( +20.7) (+23.2) ( +34.4) (+9.7)
(c) Real Estate Development, Leasing, Brokerage and Maintenance Management Establishments HK$ million unless otherwise specified
Consumption of sundry supplies;
Number fuels, Number of electricity Miscel- Gross Gross
of persons Com pen- &water; & laneous margin of Service additions establish- directly sation of maintenance operating real estate &rental Value Gross to fixed
Trade group ments engaged employees services expenses development income added surplus assets
Real estate development and/or leasing 1984 2488 10740 601 549 3,807 6,090 7,087 12,534 7,759 3,272 1985 2483 12 320 712 599 3,531 6,217 8,186 13,189 9,611 -841
(-0.2) (+14.7) ( + 18.4) (+9.3) (-7.2) (+2.1) (+15.5) (+5.2) (+23.9) (-) 1986 2446 12205 838 693 4,188 8,727 8,503 15,819 11,814 796
(-1.5) (-0.9) (+17.7) (+15.5) (+18.6) (+40.4) (+3.9) (+19.9) (+22.9) (-) 1987 2644 11 377 852 726 3,846 13,906 9,158 21,417 17,962 4,776
(+8.1) (-6.8) (+1.6) (+4.8) (-8.2) ( +59.3) (+7.7) ( +35.4) (+52.0) (+500.1) 1988 2 984 12281 1,071 939 4,469 20,068 12,112 29,965 25,872 5,218
(+12.9) (+7.9) (+25.7) ( +29.4) (+16.2) (+44.3) (+32.3) ( +39.9) (+44.0) (+9.3) 1989 3 465 12431 1,059 1,045 6,569 23,028 17,237 37,676 30,396 10,215
(+16.1) (+1.2) (-1.1) (+11.3) (+47.0) (+14.8) (+42.3) (+25.7) (+17.5) (+95.8)
Real estate maintenance management 1984 288 11 098 336 473 340 1,170 441 86 11 1985 248 12 801 414 560 338 1,383 526 127 7
(-13.9) (+15.3) (+23.5) (+18.3) (-0.6) (-) (+18.2) (+19.5) ( +47.4) (-35.2) 1986 268 14843 519 620 340 1,582 667 155 115
(+8.1) (+16.0) (+25.2) (+10.9) (+0.6) (-) (+14.4) (+26.8) (+22.2) ( + l,487.3) 1987 310 16029 614 737 490 - 1,922 746 145 4
(+15.7) (+8.0) ( + 18.4) (+18.9) (+44.1) (-) (+21.5) (+11.8) (-6.6) (-96.9) 1988 269 17 108 764 843 590 2,325 999 245 -86
(-13.2) (+6.7) ( +24.4) (+14.3) (+20.3) (-) (+21.0) (+34.0) (+69.3) (-) 1989 295 19 287 980 1,042 654 2,810 1,195 260 17
(+9.7) (+12.7) (+28.2) (+23.6) (+10.8) (-) (+20.9) (+19.5) (+6.2) (-) Real estate brokerage and agency 1984 509 2924 126 21 118 264 197 112 12
1985 922 3 792 171 21 362 580 372 263 26 ( +81.1) (+29.7) (+35.9) (+0.5) (+205.2) (-) (+119.4) (+89.2) ( +134.9) ( + 111.6)
1986 986 4 679 225 . 26 264 - 512 333 106 4 (+6.9) ( +23.4) (+31.3) (+25.6) (-27.0) (-) (-11.8) (-10.5) (-59.6) (-83.9)
1987 1168 5 902 293 32 381 727 426 117 -42 (+18.5) (+26.1) (+30.1) (+24.2) ( +44.2) (-) (+42.1) (+28.0) (+9.7) (-)
1988 I 560 8 604 658 58 719 - 1,761 1,231 558 150 (+33.6) (+45.8) (+124.5) ( +80.3) ( +88.8) (-) (+142.1) (+189.0) ( +377.8) (-)
1989 1 763 8 675 653 84 949 1,783 999 396 132 (+13.0) (+0.8) (-0.7) (+44.2) (+32.0) (-) (+1.3) (-18.9) (-29.1) (-11.8)
Total 1984 3285 24762 1,063 1,042 4,265 6,090 8,522 13,171 7,957 3,295 1985 3652 28913 1,298 1,180 4,230 6,217 10,149 14,087 10,001 -808
(+11.2) (+16.8) (+22.1) (+13.2) (-0.8) (+2.1) (+19.1) (+7.0) (+25.7) (-) 1986 3699 31728 1,582 1,339 4,793 8,727 10,596 16,819 12,075 915
(+1.3) (+9.7) (+21.9) ( +13.5) (+13.3) (+40.4) (+4.4) (+19.4) (+20.7) (-) 1987 4123 33307 1,759 1,495 4,718 13,906 11,807 22,589 18,223 4,738
(+11.5) (+5.0) (+11.2) (+11.7) (-1.6) (+59.3) (+11.4) (+34.3) (+50.9) (+417.6) 1988 4814 37992 2,493 1,840 5,778 20,068 16,198 32,196 26,675 5,281
(+16.8) (+14.1) (+41.7) (+23.0) ( +22.5) (+44.3) (+37.2) (+42.5) (+46.4) (+11.5) 1989 5522 40393 2,691 2,170 8,172 23,028 21,830 39,869 31,051 10,364
(+14.7) (+6.3) (+8.0) (+18.0) (+41.4) (+14.8) (+34.8) (+23.8) (+16.4) (+96.2)
Notes: Figures in brackets denote percentage change over preceding survey. * denotes figure less than HK$0.5 million in magnitude. #denotes figure less than 0.05% in magnitude.
Source: Building Construction and Real Estate Statistics Section, Census and Statistics Department.
173
11_

13.2 Principal Statistics for All Building and Civil Engineering Contractors Analysed by Gross Value of Construction Work Performed, 1989 Survey of Building, Construction and Real Estate Sectors
HK$ million unless otherwise specified
Consumption Campen- of materials Value sation of &supplies; of sub· Gross
Number employees fuels, contract value Number of &payments electricity work Miscel- of con- Gross
of persons to labour- &water;& rendered by /aneous struction Other additions Gross value of construction work establish- directly only sub- maintenance fee sub- operating work business Value Gross to fixed performed ( HK$'000) ments engaged contractors services contractors expenses performed receipts added Surplus assets
Under 500 5496 12 880 428 472 141 147 1,298 88 617 198 85 500-1.999 3 614 19420 1,228 1,364 593 276 3,770 91 1,643 400 120 2.000-4,999 1241 9 684 1,171 1,071 1,031 402 3,820 87 1,428 232 95 5,000-9.999 734 11 114 1,393 1,306 1,681 401 4,909 105 1,641 233 55 10,000-19,999 361 7 630 1,593 1,531 1,456 297 5,049 65 1,849 238 50 20,000-49,999 341 11 321 2,798 2,550 3,740 615 10,028 212 3,352 536 103 50,000-99,999 97 6 659 1,676 1,735 2,741 401 6,656 134 1,930 237 136 100,000 and over 140 39 721 10,018 12,350 23,718 2,808 50,476 819 12,486 2,400 400
Total 12023 118428 20,306 22,379 35,100 5,347 86,007 1,601 24,945 4,476 1,043
Source: Building Construction and Real Estate Statistics Section, Census and Statistics Department.
13.3 Principal Statistics for All Building and Civil Engineering Contractors Analysed by Value Added, 1989 Survey of Building, Construction and Real Estate Sectors
HK$ million unless otherwise specified
Conswnption Com pen- of materials Value sationof &supplies; of sub- Gross
Number employees fuels, contract value Number of &payments electricity work Miscel- of con- Gross
of persons to labour- &water; & rendered by laneous struction Other additions establish- directly only sub- maintenance fee sub- operating work business Value Gross to fixed
Value added (HK$'000) ments engaged contractors services contractors expenses performed receipts added Surplus assets
Under 500 8152 24342 1,017 1,453 3,815 470 7,014 72 1,350 331 138 500-999 1 501 10 518 816 719 912 246 2,880 40 1,059 226 52 1,000-2,499 1127 11205 1,353 1,351 2,106 388 5,384 134 1,697 319 124 2,500-4,999 564 10 437 1,553 1,666 2,408 383 6,127 135 1,828 251 55 5,000-9,999 304 8 610 1,840 1,753 1,941 394 6,067 144 2,135 284 58 10,000-24,999 220 11218 2,846 2,749 2,977 559 9,503 169 3,404 541 122 25,000-49,999 73 7 805 2,021 2,444 4,788 688 10,221 209 2,535 489 151 50,000 and over 81 34293 8,859 10,244 16,153 2,218 38,810 698 10,938 2,035 343
Total 12023 118 428 20,306 22,379 35,100 5,347 86,007 1,601 24,945 4,476 1,043
Source: Building Construction and Real Estate Statistics Section, Census and Statistics Department.
13 .4 Real Estate Project Statistics Analysed by End-use of Buildings, 1989 Survey of Building, Construction and Real Estate Sectors
Project expenses incurred during reporting period
Architectural Building design&
Number Payments materials & technical of Total to fittings consultancy
End-use of buildings projects expenses contractors supplied fees
Private residential premises* 477 15,807 12,173 286 559
Government Home Ownership Schemes (Private Sector Participation Schemes) 1,190 942 32
Office buildings 68 1,812 1,159 10 101
Hotels and boarding houses 23 1,041 779 # 103
Multi-purpose commercial premises 52 3,138 2,403 151
F1atted factory blocks 99 2,949 2,581 2 80
Warehouses 17 602 433 35
Total 745 26,539 20,471 304 1,060
Note: *Figures include buildings purely for residential purpose and combined residential and non-residential buildings. #denotes figure less than HK$0,5 million,
Source: Building Construction and Real Estate Statistics Section, Census and Statistics Department.
Interest payments
2,313
209
515
150
547
225
110
4,069
Other project
expenses
476
27
9
31
61
24
634
13.5 Gross Value of Construction Work Performed by Building and Civil Engineering Contractors
1984 1985 1986 1987
Index of gros.s value of construction work performed by main contractors (quarterly average of 1982~100) 95,8 93.6 98.6 123.9
Main contractors by broad trade group
New construction works and renovation and maintenance 24,051 22,876 24,139 30,051 Special trades 1,200 1,794 1,851 2,599
Total 25,250 24,672 25,991 32,650
Gross value of construction work perfonned by main contractors at construction sites 20,707 19,156 20,531 24,904
Note: Figures are based on results of the Quarterly Survey of Construction Output.
Source: Building Construction and Real Estate Statistics Section, Census and Statistics Department.
174
HK$ million unless otherwise specified
Value Gross floor accrued to area Of
project Land buildings during area of when
reporting projects completed period ('OOO m2 ) ('OOO m 2 )
26,149 5,317 11,685
1,388 230 1,020
3,243 64 865
1,641 44 569
6,090 141 1,642
6,061 315 2,918
926 118 840
45,498 6,229 19,540
HK$mil/ion
1988 1989 1990
155,l 189.4 233,2
37,511 45,500 56,508 3,364 4,410 4,937
40,875 49,910 61,447
31,415 38,015 44,740

13.6 Completed New Buildings Certified for Occupation by Type
Type of building
Residential
Number of building projects
Total cost of construction (HK$"000)
Cost of usable floor area (HK$/m2)*
Non-residential
Number of building projects
Total cost of construction (HK$'000)
Cost of usable floor area (HK$/m2)*
Combined residential and non-residential
Number of building projects
Total cost of construction (HK$'000)
Cost of usable floor area (HK$/m2)*
Total
Number of building projects
Total cost of construction (HK$'000)
Cost of usable floor area (HK$/m')*
1981 1982 1983
147 125 94
1,711,798 1,371,501 1,668,970
3,694 3,890 5,247
237 270 257
3,512,530 5,691,909 5,575,888
1,869 2,562 3,454
216 187 172
2,013,829 3,058,033 4,792,383
2,304 3,631 4,085
600 582 523
7,238,157 10,121,443 12,037,240
2,253 2,967 3,878
1984 1985 1986 1987 1988 1989
65 73 89 121 163 145(3)
937,410 1,066,004 1,421,735 2,752,447 2,846,618 4,077,193
5,310 3,928 3,981 4,293 4,732 5,177
245(23) 173(5) 164(5) 203(7) 258(15) 254(2)
3,548,477 4,394,580 3,753,215 3,952,741 7,143,270 6,121,980
3,154 3,646 3,323 3,198 3,238 3,596
172(1) 168 159 134 127 114
2,447,979 4,909,890 9,107,710 3,502,589 3,390,930 6,064,971
3,870 3,442 8,573 3,634 3,736 5,105
482(24) 414(5) 412(5) 458(7) 548(15) 513(5)
6,933,867 10,370,475 14,282,661 10,207,777 13,380,819 16,264,145
3,591 3,571 5,617 3,599 3,603 4,430
Notes: Figures in brackets denote the numbers of building projects, included in the corresponding total building projects, for which the construction costs are not available. *Calculation excludes projects with no area given or construction costs not available.
Source: Publications Section, Census and Statistics Department.
13.7 Usable Floor Area of Completed New Buildings by End-use by Area
End-use/ Area
Residential
Hong Kong Island
Kowloon
New Kowloon
New Territories
Sub-total
Non-residential
Hong Kong Island
Kowloon
New Kowloon
New Territories
Sub-total
Residential/Non-residential
Hong Kong Island
Kowloon
New Kowloon
New Territories
Total
1981
409
99
166
409
1084
381
373
305
1 049
2108
790
472
471
1458
3192
1982
264
49
64
551
927
522
530
239
1158
2449
786
579
303
1709
3377
Source: Publications Section, Census and Statistics Department.
1983
569
120
56
358
1103
689
426
297
577
1989
1258
546
353
935
3092
1984
219
56
97
255
627
332
223
320
429
1304
551
279
418
684
1931
1985
525
95
278
565
1463
367
105
210
762
1444
892
200
488
1326
2907
1986
559
94
64
466
1184
381
180
361
430
1352
941
274
424
897
2536
1987
524
133
136
610
1403
385
143
312
555
1395
909
277
448
1165
2798
1988
529
152
32
608
1 321
394
312
246
1456
2408
923
464
278
2064
3729
1989
634
92
175
888
1789
509
162
248
941
1859
1143
254
422
1828
3648
1990
110
4,811,910
6,870
200
7,728,788
5,782
98
3,780,538
4,935
408
16,321,236
5,823
'OOO m2
1990
266
34
228
843
1371
530
183
205
505
1423
796
217
433
1348
2794
175

13 .8 Completed New Buildings by Cost of Construction
Cost of construction (HK$)
Under 500,000
Number of building projects Total cost of construction
(HK$'000)
500,000-999,999
Number of building projects Total cost of construction
(HK$'000)
1,000,000-1,999,999
Number of building projects Total cost of construction
(HK$'000)
2,000,000-3,999,999
Number of building projects Total cost of construction
(HK$'000)
4,000,000-6,999,999
Number of building projects Total cost of construction
(HK$'000)
7,000,000-9,999,999 Number of building projects Total cost of construction
(HK$'000)
10,000,000-14,999,999
Number of building projects Total cost of construction
(HK$'000)
15,000,000-19,999,999
Number of building projects Total cost of construction
(HK$'000)
20,000,000 and above
Number of building projects Total cost of construction
(HK$'000)
1981
20
5,105
61
45,792
68
98,088
1982
24
5,957
51
38,957
66
91,946
1983
26
7,229
50
38,805
57
84,839
1984
39
7,133
40
31,188
45
65,346
1985
22
6,705
33
24,697
36
49,139
1986
19
4,864
30
23,692
54
79,184
1987
19
4,161
31
23,022
1988
25
5,776
27
20,312
58 69
83,674 104,350
1989
19
4,128
18
14,232
45
65,334
1990
6
1,953
10
6,862
32
45,491
115 81 78 66 62 52 57 72 66 53
346,056 234,746 230,835 190,650 188,215 150,065 167,129 216,391 188,016 150,473
95 91 86 89 73 61 65 71 83 58
511,704 469,404 450,715 470,041 391,999 316,816 360,336 392,438 456,815 319,422
66 54 45 27 40 38 41 43 38 32
552,836 444,425 378,791 228,047 324,117 314,768 338,031 353,055 313,501 264,626
62 52 44 40 20 25 39 50 49 34
747,707 635,121 541,292 483,811 248,188 304,075 472,553 607,708 603,524 413,777
30 32 24 25 21 20 20 35 30 36
507,189 566,491 413,749 422,795 357,824 329,945 338,350 593,657 523,031 614,063
81 130 112 87 99 107 121 141 160 146
4,423,680 7,634,396 9,890,984 5,034,856 8,779,590 12,759,252 8,420,520 11,087,133 14,095,563 14,504,569
Notes: In case only the aggregated cost of construction can be given, a number of related projects are regarded as one single project and classified under the category corresponding to the aggregated value. Therefore, the total number of building projects in this table may not reconcile with that in Table 13.7. Figures for 1984, 1985, 1986, 1987, 1988 and 1989 do not include 24, 5, 5, 7, 15 and 5 building projects respectively for which the construction costs are not available.
Source: Publications Section, Census and Statistics Department.
13.9 Private Domestic Units with Consent to Commence Work by Area
Area
Hong Kong Island
Kowloon and New Kowloon
Tsuen Wan
Sha Tin
TuenMun
Tai Po
Fanling/Sheung Shui
Rest of New Territories
Total
1981
7 552
2 346
5 762
613
2 520
692
325
2 372
22182
1982
5 072
3 929
571
4227
328
799
229
2 061
17 216
Source: Publications Section, Census and Statistics Department.
176
1983
5 110
5 743
2 144
7 313
2 111
742
132
2 119
25414
1984
13 638
2 928
1 727
3 612
518
3 475
120
976
26994
1985
12 079
5 867
6 358
4 206
2 560
1 838
276
1478
34662
1986
10 379
5 954
5492
3 627
5 530
1 686
60
3 302
36030
1987
12 413
3 082
6 171
338
3 270
1 471
43
1 744
28532
1988
6 497
5 843
5 057
372
9 410
2 008
2 865
2272
34324
Number of units
1989
5 617
7 488
2 945
2 589
4057
2112
2474
1 512
28794
1990
6 658
3 498
711
1 158
4 170
2 686
1 375
7109
27365

13.10 Private Domestic Units with Consent to Commence Work by Floor Area Number of units
Floor area ( m2 ) 1981 1982 1983 1984 1985 1986 1987 1988 1989 1990
Under40.0 12 718 12 673 21 404 20 870 25 899 24056 16 042 22 649 15 153 16 853
40.0-69.9 4 759 1 837 1 179 3 756 6499 7 974 8 941 9469 11 482 8 374
70.0-99.9 1103 888 724 738 1199 2 555 2204 769 676 846
100.0-159.9 939 783 1 115 1 033 486 643 563 748 702 519
160 and above 2 663 1 035 992 597 579 802 782 689 781 773
Total 22182 17216 25414 26994 34662 36030 28532 34324 28794 27365
Note: All flats are classified by usable floor area except for small village-type houses which are classified by gross floor area.
Source: Publications Section, Census and Statistics Department.
13.11 Private Domestic Units Built by Area by District Number of units
Area/ District 1981 1982 1983 1984 1985 1986 1987 1988 1989 1990
New domestic units
Hong Kong Island
West 1 925 410 970 825 2 645 1 725 1 080 475 1235 1 105 SheungWan 170 105 305 20 720 565 660 315 390 50 Central 10 10 15 45 205 345 60 230 100 575 Wan Chai 385 150 145 175 365 255 505 1 145 890 465 Mid-levels 790 155 625 240 500 665 330 1105 2260 815 Peak 35 40 50 45 30 25 15 20 15 Causeway Bay 340 435 490 410 400 980 665 1420 700 555 North Point 4 615 3 180 3 525 2 380 3 735 6165 5 915 3 175 3 510 490 ShauKei Wan 600 1 230 1180 320 735 900 2260 4 955 2100 1 005 Aberdeen 2 905 530 870 95 515 680 140 210 460 235 South 45 215 170 200 150 565 225 570 905 590
Sub-total 11820 6460 8 345 4 710 10015 12875 11865 13615 12 570 5900
Kowloon
Tsim Sha Tsui 535 245 210 255 375 200 95 130 35 25 Yau Ma Tei 565 405 335 1 060 435 380 280 50 285 300 Mong Kok 795 40 45 165 455 270 165 105 340 245 Hung Hom 475 270 305 645 935 2 335 2 715 2 285 2470 905 Ho Man Tin 280 60 45 505 300 30 105 165 345 145
Sub-total 2650 1020 940 2630 2 500 3 215 3 360 2 735 3475 1620
New Kowloon
Cheung Sha Wan 980 845 855 1 485 945 975 335 480 510 400 ShekKip Mei 275 25 50 25 165 410 680 115 175 95 Kowloon Tong 135 5 195 30 70 80 35 10 Wong Tai Sin 415 120 220 55 815 555 185 70 930 505 Kwun Tong 4 780 1120 75 3 040 1 800 1 445 3 015 Lei Yue Mun 60
Sub-total 6585 2115 1395 4605 3 725 1970 2 715 805 1650 4025
New Territories
Tsuen Wan 2 840 3 450 4 810 3 405 885 5 825 2 800 5 300 10 450 4 030 TuenMun 940 3 050 440 220 715 960 3 725 4 585 4 315 6 565 Yuen Long 2 410 1160 1 375 1435 845 950 1 285 2 140 1 575 1125 North 270 170 295 95 20 50 295 65 95 1440 Tai Po 375 325 160 880 2940 1 790 2 005 1 480 530 1 660 Sha Tin 4220 3300 2 985 3 700 7 475 5 665 4985 1 725 985 1175 Sai Kung 350 190 205 285 190 205 570 475 550 560 Outlying islands 1 015 1 900 670 305 565 600 770 1 545 290 1 300
Sub-total 12420 13 545 10940 10325 13635 16045 16 435 17 315 18 790 17 855
Total 33475 23140 21620 22270 29875 34105 34375 34470 36485 29400
Stock as at end of the year 501280 522080 541510 563005 592165 625075 657 845 691825 725640 752170
Source: Rating and Valuation Department.
177

13.12 Private Domestic Units Built by Area by Type Number of units
Area/Type of domestic unit 1981 1982 1983 1984 1985 1986 1987 1988 1989 1990
Hong Kong Island
Unit A 3490 2 550 3 370 2040 6 560 3290 2 850 2970 1940 2250 UnitB 6 545 1 795 1 700 965 1 780 6210 7085 7140 6300 1 925 Unite 890 1150 1 810 845 555 1 590 1035 1485 2770 445 UnitD 430 660 630 525 830 1040 585 1 595 1 OOO 935 UnitE 465 305 835 335 290 745 310 425 560 345
Sub-total 11820 6460 8345 4710 10015 12875 11865 13615 12 570 5900
Kowloon
Unit A 1920 680 745 2245 1575 1 855 1255 405 805 695 UnitB 250 155 25 275 135 1170 1 555 1 330 1 935 620 Unite 185 25 95 610 190 480 1 OOO 715 255 UnitD 85 45 10 150 15 20 45 UnitE 210 160 125 5 30 55 5
Sub-total 2650 1020 940 2630 2500 3215 3 360 2735 3475 1620
New Kowloon
Unit A 3300 920 1 OOO 4560 3 335 1490 615 340 1 070 775 UnitB 3 110 1165 155 20 240 30 1365 225 395 3 155 Unite 35 15 25 70 195 570 45 35 50 UnitD 105 10 50 25 80 220 140 175 130 35 UnitE 35 5 165 35 25 20 20 10
·Sub-total 6585 2115 1395 4605 3 725 1970 2715 805 1650 4025
New Territories
Unit A 5185 5 520 4415 6 800 8460 10 550 6270 7165 3 115 3 480 UnitB 4455 5 550 5 545 2640 4170 4465 8 225 7935 13 685 11 825 Unite 1625 1095 210 380 425 520 1055 1275 1 045 1945 UnitD 590 800 505 345 380 385 725 605 640 410 UnitE 565 580 265 160 200 125 160 335 305 195
Sub-total 12420 13545 10940 10325 13635 16045 16435 17 315 18 790 17855
Total 33475 23140 21620 22270 29875 34105 34375 34470 36485 29400
Unit A 13895 9670 9530 15645 19930 17185 10990 10880 6930 7200 UnitB 14360 8665 7425 3900 6325 11875 18230 16630 22315 17525 UnitC 2735 2285 2045 1320 1660 2495 3140 3805 4565 2695 UnitD 1210 1470 1230 905 1440 1645 1465 2375 1790 1425 UnitE 1275 1050 1390 500 520 905 550 780 885 555
Source: Rating and Valuation Department.
13.13 Stock, Supply and Vacancy Position of Private Non-residential Premises by End-use '000m 2
End-use 1981 1982 1983 1984 1985 1986 1987 1988 1989 1990
Commercial
Stock as at beginning of year 4 514 4782 5 102 5 341 5 579 5 817 6 521* 6 791 6978 7118 Amount built during the year 315 368 270 255 249 174 284 238 197 239 Amount vacant as at end of year 423 545 541 550 524 466 368 381 395 382
Office
Stock as at beginning of year 2434 2 736 3260 3 851 4068 4 376 4177* 4420 4657 4 897 Amount built during the year 319 546 591 219 308 46 247 247 269 200 Amount vacant as at end of year 302 573 793 561 484 266 241 124 261 308
Flatted factory
Stock as at beginning of year 9 607 10 656 11651 12248 12673 13 121 13 926* 14 461 15 506 16 307 Amount built during the year 1122 1 041 621 429 456 611 541 1105 864 586 Amount vacant as at end of year 795 1219 1 089 657 716 516 247 704 833 886
Specialized factory building
Stock as at beginning of year 2100 2162 2246 2282 2 353 2 349 2481 * 2475 2 581 2 702 Amount built during the year 110 209 86 82 75 117 117 142 197 151 Amount vacant as at end of year
Storage
Stock as at beginning of year 1342 1409 1 568 1613 1809 1 910 1 870* 1 890 2088 2086 Amount built during the year 167 176 65 212 109 110 33 214 61 76 Amount vacant as at end of year 45 113 82 89 62 52 4 53 58 23
Note: *The stock figures are based on rating records, adjusted to reflect completions and demolitions. They have been updated in the course of preparing for the 1988-89 rating revaluation.
Source: Rating and Valuation Department.
178

13.14 Supply of New Private Flatted Factory Space by Area by District '000m2
Area/District 1981 1982 1983 1984 1985 1986 1987 1988 1989 1990
Hong Kong Island
West 36 5 9 North Point 35 29 32 31 ShauKeiWan 14 37 12 13 12 39 30 89 79 Aberdeen 59 36 49 33 24 15 139
Sub-total 109 73 61 82* 41 63 5 76* 130* 218 Kowloon
Mong Kok 3 30 35 22 20 5 Hung Hom 44 25 11 33 27 117 63 72 32
Sub-total 47 54* 46 54* 27 117 63 1 91* 38* New Kowloon
Cheung Sha Wan 28 95 20 10 21 24 10 6 3 13 Wong Tai Sin 21 37 17 22 10 Kwun Tong 158 35 114 69 78 223 230 146 135 92 Lei Yue Mun 5 39 85
Sub-total 212 167 150* 119* 121 248* 240 236* 148 105 New Territories
Tsuen Wan 493 370 135 123 197 43 64 287 301 62 TuenMun 110 150 129 8 51 48 187 107 107 Yuen Long 5 15 8 5 53 20 49 10 North 3 3 11 44 15 'fai Po 26 70 15 Sha Tin 121 152 70 37 66 36 99 217 42 31 SaiKung 42 Outlying Islands
Sub-total 754* 747 363* 175* 267* 183 233* 792* 496* 226 Total 1122 1041 621* 429* 456 611 541 1105* 864* 586*
Note: *Figures do not add up to the sub-total/total due to rounding.
Source: Rating and Valuation Department.
179

13.15 Price Indexes by Type of Premises 1989=100
1981 1982 1983 1984 1985 1986 1987 1988 1989 1990*
Private domestic premises
Under40m2 59 52 45 44 48 54 66 80 100 111
40--69.9 m 2 62 53 45 43 48 52 64 78 100 110
70--99.9 m 2 64 54 43 39 47 53 63 78 100 112
100 m 2 and above 78 65 47 41 49 56 65 80 100 103
Overall 61 53 45 43 48 53 65 79 100 110
Private retail premises 68 54 42 38 40 47 57 76 100 112
Private offices (Grades A, Band C) 53 50 33 23 25 30 41 62 100 94
Private flatted factories (Upper-floor units) 63 49 39 36 41 42 57 79 100 105
Notes: Prices for properties in the New Territories were gradually added by district from 1984. Since 1987, all districts have been included. From 1989, the indexes for retail premises refer to all types of retail premises. They are not strictly comparable to the earlier indexes which are in respect of shop premises with street frontage only. *Provisional figures.
Source: Rating and Valuation Department.
13.16 Rental Indexes by Type of Premises 1989=100
1981 1982 1983 1984 1985 1986 1987 1988 1989 1990*
Private domestic premises
Under40m2 61 63 59 57 59 61 68 79 100 115
40--69.9 m 2 57 59 55 54 57 60 67 78 100 112
70--99.9 m 2 58 61 53 50 55 60 68 80 100 113
100--159.9 m 2 63 62 53 47 53 61 68 81 100 104
160 m 2 and above 69 67 54 48 58 68 71 81 100 98
Overall 60 61 56 54 57 62 68 79 100 110
Private retail premises 56 64 60 55 58 61 69 81 100 112
Private offices (Grades A, Band C) 49 48 36 32 32 38 48 61 100 101
Private flatted factories (Upper-floor units) 48 51 42 42 44 47 55 77 100 105
Notes: From 1989, the indexes for retail premises refer to an types of retail premises. They are not strictly comparable to the earlier indexes which are in respect of shop premises with street frontage only. *Provisional figures.
Source: Rating and Valuation Department.
180
------------ ----------

13.17 Instruments Registered in the Land Office by Type
Type of instruments 1981 1982 1983 1984 1985 1986 1987 1988 1989 1990
Assignments of properties
Assignments oflot/section Number 968 530 448 418 594 653 968 992 760 441 Value (HK$ million) 20,643.96 7,217.56 4,782.42 2,173.93 6,919.56 28,122.39 17,915.31 32,410.52 31,176.10 21,419.61
Assignments of share of lot/ section Number 51 547 48 015 48264 52 358 73 791 80487 94436 90 486 87 676 91 088 Value (HK$ million) 36,985.85 31,545.65 23,956.29 22,378.61 31,308.56 45,501.35 61,918.36 79,096.36 98,842.22 108,526.82
Mortgages
Building mortgages/building legal charges Number 130 119 54 46 52 49 51 55 60 61 Value (HK$ million) 1,366.88 1,483.27 608.35 286.09 974.10 908.61 765.45 783.44 2,555.33 7,715.64
Mortgages/legal charges other than building mortgages/ building legal charges Number 56 974 49 709 41022 43 857 64 602 76 004 100 272 97 423 90 822 95 975 Value (HK$ million) 48,760.26 38,148.25 40,615.00 15,362.74 25,147.89 33,085.76 47,927.88 74,034.29 59,597.09 57,989.64
Receipts, discharges and releases
Number 35 462 30 072 26 957 26726 36 633 41 061 54 627 62069 67 890 67 851 Value (HK$ million) 18,218.29 21,011.26 12,255.23 14,586.35 22,735.10 22,182.20 24,435.94 28,656.29 35,029.76 24,254.42
Agreements for sale and purchase
Number 24 998 17 436 24447 29 959 54405 56 549 55 504 67 270 61 896 69 619 Value (HK$ million) .. 11,934.64* 36,965.12 48,954.29 73,222.06 106,414.01 110,008.81 108,370.26
Tenancy agreements
Number 2 329 2 831 2 179 2 580 2 349 2 588 3 045 3 465 3 754 3 872 Value (HK$ million)
Exclusion orders issued under Landlord and Tenant Ordinance
Number 27 15 4 4 3 4 5 11 10 Value (HK$ million)
Miscellaneous
Number 17 310 16 499 17 008 20677 30 505 35 401 27 444 33 811 37 524 40277 Value (HK$ million) 14.60 62.48 261.02 148.59 50.31 83.72 81.27 52.75 49.09 118.18
Total instruments registered
Number 189745 165 226 160383 176 625 262934 292 796 336347 355 576 350393 369194
Value (HK$ million) 125,989.84 99,468.48 82,478.30 66,870.94 124,100.63 178,838.32 226,266.27 321,447.66 337,258.40 328,394.60
Note: *Figure refers to April to December 1984.
Source: Registrar General's Department.
181

13.18 Disposals of Government Land
l'llblic auction/tender Industrial
Commercial
Commercial/Residential
Residential
Other uses
Private 1reaty grant Industrial Residential Public utilities/
Institutional uses Other uses
l'llblic auction/tender Industrial
Commercial
Total
Total
Commercial/Residential
Residential
Other uses
LetW A/B tender Industrial
Commercial
Total
Commercial/Residential
Residential
Other uses
Private 1reaty grant Industrial Residential Public utilities/
Institutional uses Other uses
Total
Total
Area(m2 )
Realized premium (HK$ million)
Area(m2 )
Realized premium (HK$ million)
Area(m2 )
Realized premium (HK$ million)
Area(m2 )
Realized premium (HK$ million)
Area(m2) Realized premium (HK$ million)
Area(m2 )
Reali7.ed premium (HK$ million)
Area(m2) Area(m2)
Area(m2) Area(m2)
Area(m2 )
Area(m2 )
Realized premium (HK$ million)
Area(m2 ).
Realized premium (HK$ million)
Area(m2) Realized premium (HK$ million)
Area(m2) Realized premium (HK$ million)
Area(m2) Realized premium (HK$ million)
Area(m2 )
Reali7.ed preminm (HK$ million)
Area(m2) Realized premium (HK$ million)
Area(m2 )
Realized premium (HK$ million)
Area(m2) Realized premium (HK$ million)
Area(m2 )
Realized premium (HK$ million)
Area(m2) Realized premium (HK$ million)
Area(m2 )
ReaJi7.ed premiinn (HK$ nn11ion)
Area(m2 )
Area(m2 )
Area(m2 )
Area(m2)
Area(m2 )
(a) in Urban Areas
1981
88875 1,539.19
4358 258.60
1982
29033 173.00
2489 376.50
15 699 2,884.50
182 966 144 420 2,652.08 1,095.29
4269 399.11
280468 4,848.98
79429
66234 16700
162363
191641 4,529.29
10000 44000
39 383 218 718
312101
1983
11286 49.30
10706 228.80
1148 18.62
8029 42.10
912 10.80
32081 349.62
16980 3 053
101 311 116 700
238044
1984
10023 79.80
9433 390.30
13 512 151.23 345.00*
3 528 36.52
36496 657.85 345.00*
179 326 558
21480 43 687
391904
(b) in New Territories
1981
38 333 305.00
20564 465.00
192154 712.17
124602 241.40
375653 1,723.57
24575 92.22
4270 4.76
44970 146.20
33 900 86.77
107715 329.95
676 600
1982
83478 162.83
1956 8.88
2625 19.85
72696 33.71
19795 62.95
180550 288.22
3210 13.82
31 536 90.22
35745 17.47
70491 121.51
1983
17 532 26.90
7405 5.38
24407 31.98
46501 150.10
411190t 20.67
507035 235.03
5005 14.22
29323 51.84
12490 12.04
5219 15.98
52037 94.08
1984
36472 50.10 10.45*
12658 43.30
28226 17.85
104.00*
708 19.80
78064 131.05 114.45*
32596 56.61 15.77*
33239 56.41 34.67*
65835 113.02 50.44*
1985
5590 58.20
3429 302.00
47468 1,921.08
1.72*
1986
4020 64.50
10 875 99.80
18 611 1,192.90
9 855 83 961 325.50 1,469.00
66 342 117 467 2,606.78 2,826.20
1.72*
-(1057)# 117 640 13 588(3 394) #
51 954 52 797(67 429) # 187 800 21 597(11 739) #
357 394 87 982(83 619) #
1985
16034 28.60
7.80*
10050 71.65
136420 514.15
1425 0.14
163929 614.54
7.80*
17 580 15.55 14.50*
17580 15.55 14.50*
1986
23 775 68.40
15627 114.68
4574 29.20
23 450 175.49
6591 111.20
74017 498.97
1685 0.10
11.90*
28 776 70.61
65 575 131.57 28.80*
96036 202.28 40.70*
-(-)# 162 930 158 230 84 150 46 429 130 230 34 650(36 580) #
76 685 43 522 35 632 273 333 98 454 323 535 59 330 2 097 1 681 1 382 615
1 239 750 261 082 121 879 321 443 1 611 299
18 760(40 619)# 167 644(1461)#
221 054(78 660) #
Notes: *Figures indicate payments made in Monetized Letter B, i.e. revenue foregone.
1987
12744 323.00
2098 840.00
4917 207.60
1988
13 913 585.00
4500 420.00
2110 142.00
1989
8 735 525.00
34 775 7,433.60
11220 328.00
18 938 799.00
12611 27 300 651.00 1,065.00
22280 470.00
60977 2,639.60
20944
36440
57384
1987
33134 1,798.00
387 74081
41244 36270
151982
1988
21 469@ 30 746 188.09@ 277.87
315 2.94
95 351 94 411 1,233.83 894.15
938 320 244 43.80 4,648.68
118 073@ 445 401 1,468.66@ 5,820. 70
35 745 100.58
32 889 129.30
68634 229.88
37 672 200.91
28144 122.28
65816 323.19
82030 9,351.60
69 666
18427 14546
102639
1989
35707 654.27
134276 2,144.24
10 750 141.80
180733 2,940.31
57446 478.23
14899 81.87
72345 560.10
96 608
37106 219 637
145 274 75 098
27 638 678 007
353351 172 912 753 105
.1990
10 503 434.00
20304 857.00
30807 1,291.00
32 783
57 758 792
91333
1990
20191 509.40
5433 70.00
99168 1,315.80
3 590 77.50
128382 1,972.70
8463 72.50
28 579 144.40
37042 216.90
30150
48981
79131
# Figures in brackets denote the new series of 'private treaty grant' statistics which have been adopted since 1986. Figures for the new series are on 'Agreement' basis, i.e. land disposal based on the date on which the offer of a grant ofland by Government is accepted by the grantee; whereas those for the old series refer to the 'Approval' basis, i.e. land disposal based on the date on which a grant is approved by Executive Council or its delegated function. To facilitate compatison with past data, the old series will be published in parallel with the new series in 1986 after which it will be discontinued.
tFigure includes 210 OOO square metres of sea area. @This figure includes the sale of FSS TL 17 (Area 3 372m2 @ a premium of $28M) which was cancelled on 10.11.87 due to non-payment of balance of premium ($27M).
Source: Buildings and Lands Department.
182

Section 14 Housing
Tables 14.1to14.9 Generallnformation
Figures in these tables are obtained from population censuses, except Table 14.1 (stock of land living quarters) which is based on the computerized frame of quarters maintained by the Census and Statistics Department.
Concepts and Definitions
Living Quarters include (1) quarters which are built for residential purpose, irrespective of whether there is any body living there; and (2) units of accommodation which are built for non-residential purpose but normally have one or more persons living there or where occupied on the Census reference date. Figures in Tables 14.2-14.5 refer to occupied living quarters i.e. living quarters with occupants on the Census reference date irrespective of their usage.
Type of Living Quarters is classified according to the type of building in which the living quarters are located. The buildings are classified by the type of construction materials; the purpose for which they are built; and the sector responsible for their construction/management.
Type of accommodation is classified according to the portion of space occupied by a household in a living quarters on the Census reference date.
Figures on the stock of land living quarters (Table 14.1) are obtained from the computerized frame of quarters which includes both occupied and unoccupied residential quarters and non-residential quarters which had one or more persons residing therein during field up-dating.
Data Sources
Information on the population censuses can be found in Section 2 of this publication.
Tables 14. l 0 to 14.24 General Information
Statistics in these tables are based on data supplied by the Housing Department. The Housing Department is the executive arm of the Housing Authority which is mainly responsible for public housing matters in Hong Kong. The Authority has been reorganised to become a largely independent body and assumes most of the duties of the former Housing Branch which was abolished on 1 April 1988.
There are three forms of public housing provisions: rental flats, Home Ownership Scheme flats, and temporary housing in Housing Authority cottage areas and temporary housing areas. The stock, production, size and authorized population of these housing units, their distribution by geographic area and typical rents are shown in Tables 14.10 to 14.19.
The Housing Authority is also active in the provision of commercial and community facilities in its rental estates, Home Ownership Scheme courts and flatted factories in industrial estates. The production of such non-residential buildings is shown in Tables 14.20 and 14.21.
The Government has subsidized public housing heavily to support the activities of the Housing Authority. Recurrent income is also generated in the form of domestic rents, and rents and other income from non-domestic properties. The recurrent account of the Housing Authority and public housing capital expenditures are shown in Tables 14.22 to 14.24.
Concepts and Definitions
A.fiat is a unit of accommodation in the Housing Authority estate block let or designated to be let for domestic purposes. A Housing Authority block is 'completed' when it has been certified as substantially completed by the Housing Department.
Saleable floor area refers to the total area inside the flat measured to the outside of external and corridor walls and to the centre line of party-walls, i.e. including all parts of the flat (kitchen, bathroom, balcony, etc.), but excluding any common areas.
Consent to commence work refers to the award of contracts to a contractor(s) by the Housing Authority.
Authorized population refers to the persons registered on the tenancy records kept by the Housing Department.
183

184
Data Sources
Data are based on the administrative records of the various sections/units and estate offices of the Housing Department.
Compilation and Calculation
Data are compiled from the regtilar statistical returns submitted by the various sections/units and estate offices of the Housing Department or extracted from the records of the domestic tenancies of the Housing Authority which are computerized under the Housing Applications and Tenancies Management Information System (HATMIS).

14.1 Stock of Land Living Quarters by Type by Area, 1991 Number of living quarters
Hong Kong Kowloon and New Type of living quarters Island New Kowloon Territories Total
Housing Authority rental blocks Group A 45 784 168 959 266 547 481290 GroupB 15 993 100 502 25 856 142 351
Housing Authority Home Ownership Estates 11 769 30 894 78 360 121 023 Housing Society rental blocks 10 740 11 791 9 719 32250 Private housing blocks
Self-contained 271 533 280 925 172 602 725060 Non self-contained 337 789 99 1225
Villas/Bungalows/Modem village houses 2453 I 073 69 726 73252 Simple stone structures I 853 3 810 49 911 55754 Institutions 5 755 4 604 6 932 17 291 Other permanent housing 24 390 27 712 17 820 69922 Roof-top structures 4 878 10 624 2 030 17 532 Other temporary housing 14 786 30 182 82 939 127 907
Total 410 271 671865 782 541 1864677
Note: Figures are as at 31 March of the year.
Source: Census Planning Section, Census and Statistics Department.
14.2 Land Occupied Living Quarters by Type of Living Quarters and Area, 1991 Census Number of living quarters
Other areas Hong Kong Kowloon and New in the New
Type of living quarters Island New Kowloon towns Territories Total
Housing Authority rental blocks Group A 45 414 157 916 246 039 857 450 226 GroupB 10 721 64 553 20 945 96 219
Housing Society rental blocks 10 632 8 994 8 094 726 28446 Housing Authority home ownership estates II 466 30 161 74 091 115 718 Private housing blocks
Self-contained 237 285 241 072 145 256 3 939 627 552 Non self-contained 210 360 36 72 678
Villas/Bungalows/Modem village houses I 964 832 17 449 29724 49969 Simple stone structures I 327 2265 8 882 18 632 31106 Institutions* 4498 3 443 I 559 3 807 13 307 Other permanent housing# 10 266 9 798 9 441 1410 30 915 Roof-top structures 466 2 058 545 17 3086 Other temporary housing 7 061 15 626 21 516 16 572 60775
Total 341310 537 078 553853 75756 1507 997
Notes: *Institutions include hospitals, prisons, old people's homes, religious houses and British Forces barracks. :j:I: Other permanent housing includes boarding houses, staff quarters buildings and quarters in non-residential buildings.
Source: Census Planning Section, Census and Statistics Department.
14.3 Land Occupied Living Quarters by Type of Living Quarters and Number of Occupants, 1991 Census Number of living quarters
Number of occupants Type of living quarters I 2 3 4 5 6 and over Total
Housing Authority rental blocks Group A 22 917 47 174 83 271 132 462 92 914 71 488 450 226 GroupB 19 859 23 517 18 298 15 411 10 158 8 976 96219
Housing Society rental blocks 1425 4 744 5 636 7 893 5 456 3 292 28446 Housing Authority home ownership estates 5 962 21 284 28 101 33 498 17 054 9 819 115 718 Private housing blocks
Self-contained 71 358 133 233 131 062 134 524 81 798 75 577 627 552 Non self-contained 102 121 91 116 90 158 678
Villas/Bungalows/Modern village houses 6437 10 528 8 577 9 059 6 772 8 596 49969 Simple stone structures 6 859 5 973 4 814 4"640 3 527 5 293 31106 Institutions* 5 779 2244 I 631 1 311 635 I 707 13 307 Other permanent housing :j:I: 7 644 7 438 5 355 5 846 3 015 1 617 30915 Roof-top structures 645 672 603 547 273 346 3086 Other temporary housing 16 410 11 337 9 841 10 289 6 360 6 538 60775
Total 165397 268265 297280 355596 228052 193 407 1507 997
Notes: *Institutions include hospitals, prisons, old people's homes, religious houses and British Forces barracks. :j:I: Other permanent housing includes boarding houses, staff quarters buildings and quarters in non-residential buildings.
Source: Census Planning Section, Census and Statistics Department.
185

14.4 Land Living Quarters and Land Domestic Households by Type of Living Quarters, 1991 Census
Type of living quarters
Housing Authority rental blocks Group A Group B
Housing Society rental blocks
Housing Authority home ownership estates
Private housing blocks Self-contained Non self-contained
Villas/Bungalows/Modern village houses
Simple stone structures
Institutions :f1:
Other permanent housingt
Roof-top structures
Other temporary housing
Total
No. of living quarters*
448 501 96 063
28 426
115 681
624 832 671
49 558
30 917
3 466
28 325
3 067
60 603
1490110
Notes: *Figures refer to living quarters with domestic households.
No. of domestic households
451 088 96722
28 503
115 729
705 629 1 056
50 752
32200
3 766
28 970
3 797
61 860
1580072
:fl: Institutions include hospitals, prisons, old people's homes, religious houses and British Forces barracks. tOther permanent housing includes boarding houses, staff quarters buildings and quarters in non-residential buildings.
Source: Census Planning Section, Census and Statistics Department.
14.5 Land Living Quarters and Land Domestic Households by District Board District, 1991 Census
District Board District No. of living quarters*
Hong Kong Island Central and Western Wan Chai Eastern Southern
Kowloon and New Kowloon Kowloon City KwunTong Mong Kok Sham ShuiPo Wong Tai Sin Yau Tsim
New Territories Islands North SaiKung Sha Tin Tai Po Tsuen Wan TuenMun Yuen Long Kwai Tsing
Sub-total
Sub-total
Sub-total
Total
Note: *Figures refer to living quarters with domestic households.
Source: Census Planning Section, Census and Statistics Department.
186
71 519 50 645
149 507 63 348
335 019
101 657 157 104 43 427 98 569
101 288 29 683
531728
13 314 43 658 33 586
133 663 52 674 69 774 99 591 62 876
114 227 623 363
1490110
No. of domestic households
77 310 57 197
158 264 64 358
357 129
114 914 160 791
57 351 114 956 103 196 36 051
587 259
13 413 44 215 33 746
134 972 53 238 76 OOO
100 046 63 821
116 233 635 684
1580072
No. of domestic households per living quarters
1.01 1.01
1.00
1.00
1.13 1.57
1.02
1.04
1.09
1.02
1.24
1.02
1.06
No. of domestic households per living quarters
1.08 1.13 1.06 1.02 1.07
1.13 1.02 1.32 1.17 1.02 1.21 I.JO
1.01 1.01 1.00 1.01 1.01 1.09 1.00 1.02 1.02 1.02
1.06

14.6 Land Domestic Households by Tenure, 1971-1991 Censuses
1971 Census 1976 By-Census 1981 Census 1986 By-Census 1991 Census
Number of Number of Number of Number of Number of Tenure households % households % households % households % households %
Owner-occupier 152 874 18.l 229 620 23.2 345 026 27.9 506 926 35.l 673 067 42.6
Sole tenant 384 897 45.5 459 140 46.3 545 158 44.0 657 818 45.4 719 954 45.6
Main tenant 50 160 5.9 42 090 4.3 48 634 3.9 24 353 1.7 12 209 0.8
Sub-tenant 170 992 20.2 143 240 14.5 145 382 11.7 73 570 5.1 41 505 2.6
Co-tenant 34 866 4.1 46 570 4.7 68 910 5.6 85 274 5.9 63 683 4.0
Rent free 52 881 6.2 34980 3.5 30 534 2.5 31486 2.2 16 969 1.1
Provided by employer* # # 34 650 3.5 53 999 4.4 66 262 4.6 52 685 3.3
Total 846670 100.0 990290 100.0 1237 643 100.0 1445689 100.0 1580072 100.0
Notes: *Figures in 1976 By-Census, 1981 Census and 1986 By-Census included those households with rental subsidized by employer. In 1991 Census, such households had been re-distributed to other tenure categories except 'Rent free'.
#Figures have been classified in the other appropriate 'tenant' categories depending on the terms under which the accommodation was held.
Source: Census Planning Section, Census and Statistics Department.
14.7 Land Domestic Households by Type of Living Quarters and Accommodation by Household Size, 1991 Census
Number of domestic households
Household size (persons) Type of living quarters and accommodation 1 2 3 4 5 6 and over Total*
Housing Authority rental blocks Group A 30576 46 338 81829 129 247 91312 71786 451088 GroupB 21990 22655 17941 14 752 10348 9036 96722
Housing Society rental blocks 1677 4 760 5 775 7833 5046 3 412 28503
Housing Authority home ownership estates 6217 21112 27 763 33 720 16889 10028 115729
Private housing blocks Self-contained 130 137 156 568 142 286 138 230 81637 56647 705505
Whole house/Flat 69 692 128 267 126 847 128 318 77 559 54 709 585 392 Room/Cubicle 48 961 27 745 15 181 9 750 4 041 1 917 107 595 Bedspace/Cockloft, etc. 11484 556 258 162 37 21 12518
Non self-contained 454 255 134 191 94 52 1180
Villas/ Bungalows/Modern village houses 7082 10838 8 714 9417 6784 7928 50763
Simple stone structures 8 295 6391 5 249 4380 3 385 4489 32189
Institutions# 624 851 872 1 064 335 155 3901
Other permanent housingf 8539 6094 4 792 5 465 2646 1299 28835
Roof-top structures 1605 1160 1010 709 331 219 5034
Other temporary housing 16536 11414 9 756 10532 6295 6090 60623
Total 233732 288436 306121 355540 225102 171141 1580072
Notes: *The figures by type of living quarters may not tally with those in table 14.4 because they are estimated from the information collected in the detailed sample enquiry.
#Figures include staff quarters in institutions such as hospitals, prisons, old people's homes, religious houses and British Forces barracks. tOther permanent housing includes boarding houses, staff quarters buildings and quarters in non-residential buildings.
Source: Census Planning Section, Census and Statistics Department.
187

14.8 Land Domestic Households by Broad Type of Living Quarters and Tenure, 1991 Census Number of domestic households
Tenure Provided by*
employer Owner- Sole Main Sub- Co- Rent (including all #
Broad type of living quarters occupier tenant tenant tenant tenant free staff quarters) Total
Public and aided housing blocks 566 696 7 553 286 1 778 576313 Private housing blocks
(including Housing Authority home ownership estates) Self-contained 595 209 91 095 11 845 40 091 52 442 8 867 21 685 821234 Non self-contained 198 232 70 205 383 77 15 1180
Villas/Bungalows/Modern village houses 33 560 12 797 167 406 747 1 412 1 674 50763
Simple stone structures 19 581 9 074 54 295 1 076 1 720 389 32189 Institutionst 53 3 848 3901 Other permanent housing@ 723 3 834 7 24 126 1 369 22 752 28835 Temporary housing 23 796 36226 66 484 1 356 3 185 544 65657
Total 673067 719954 12209 41505 63683 16969 52685 1580072
Notes: *Figures excluded domestic households with rental subsidized by employer. The number of such households had been re-distributed to other type of tenure except 'Rent free' category.
#The figures by type of living quarters may not tally with those in table 14.4 because they are estimated from the information collected in the detailed sample enquiry.
tFigures include staff quarters in institutions such as hospitals, prisons, old people's homes, religious houses and British Forces barracks. @Other permanent housing includes boarding houses, staff quarters buildings and quarters in non-residential buildings.
Source: Census Planning Section, Census and Statistics Department.
14.9 Land Domestic Households by Type of Living Quarters and Accommodation by Monthly Household Rent, 1991 Census
Number of domestic households
Monthly household rent (HK$)
Type of living quarters Zero* 1- lO!J- 20!J- 300- 40!J- 60!J- 80!J- 1,00!J- 1,500- 2,00!J- 2,50{}- 3,00!J- 4.00!J- 5.000 # and accommodation rent 99 199 299 399 599 799 999 1,499 1,999 2,499 2,999 3,999 4,999 and over Total
Housing Authority rental blocks Group A 1434 43 3 229 8 700 10 952 109 335 162 960 110 133 39 076 3 782 1247 162 35 451088 Group B 220 234 7741 39 877 21230 19 696 5 978 1322 392 24 8 96722
Housing Society rental blocks 66 14 156 251 7 557 8773 6484 4 737 457 28503
Housing Authority home ownership estates 114 387 28 70 87 254 56 84 99 37 85 58 162 133 189 115 729
Private housing blocks Self-contained 505 697 806 2369 6 173 7 618 15 523 16 864 14 743 27 949 17 401 15 117 11 910 18 393 11 931 33 011 705 505
Whole house/Flat 488 471 169 240 995 1121 3 027 1 714 1 631 5 178 6 864 8 926 8 586 15409 10 851 32210 585 392 Room/Cubicle 15 417 342 749 1950 3 340 11 023 14 735 12 817 22497 10 465 6163 3 296 2941 1 059 801 107 595 Bedspace/Cockloft, etc. 1809 295 I 380 3 228 3 157 1473 415 295 274 72 28 28 43 21 12518
Non self-contained 297 18 64 57 50 139 149 151 167 37 23 14 1180
Villas/Bungalows/Modern village houses 36 162 248 203 114 78 358 644 940 2239 1 831 1271 1 068 1 744 856 3 007 50763
Simple stone structures 21642 1333 859 902 1 098 2124 1 381 699 1157 463 241 114 89 33 54 32189
Institutions 2053 64 389 144 41 364 580 168 61 19 15 3901
Other permanent housing 8 211 440 743 2036 4872 4974 1 917 611 1421 754 655 580 916 381 324 28835
Roof-top structures 2377 10 35 73 87 443 331 333 703 326 173 94 49 5034
Other temporary housing 25097 13 010 11 001 4907 2901 1978 652 344 413 130 71 35 59 25 60623
Total 717 643 16220 26272 63068 49613 162525 199 746 136208 78933 25410 18952 14062 21469 13366 36585 1580 072
Notes: *Zero rent households include 673 067 households living in their owned quarters, 16 969 households living in accommodation of friends or relatives without paying any rent with or without permission, and those households whose quarters are provided free by employers or for main tenant with total rental receipts from sub-tenant(s) greater than or equal to rent paid.
#The figures by type of living quarters may not tally with those in table 14.4 because they are estimated from the information collected in the detailed sample enquiry.
Source: Census Planning Section, Census and Statistics Department.
188
-------------- ---------~--------------

14.10 Housing Authority Rental Flats Completed by Area
Area 1981/82 1982/83 1983/84 1984/85 1985/86
Hong Kong Island 752 4 577
Kowloon/New Kowloon 9 393 10 177 6 026 9 813 10 211
Tsuen Wan 4064 411 7 723 4462
Sha Tin 5 811 5 402 9 565 3 451 3 194
TuenMun 7 703 5 105 7 291 6 072
Other areas 3 623 2 207 5 682 5 367 5 447
Total 31346 27879 28564 26354 29386
Note: Figures refer to new flats certified as substantially completed by the Housing Department.
Source: Housing Department.
14.11 Housing Authority Rental Flats Completed by Flat Type
Flat type Average size in saleable floor area 1986/87
Singleton 14-15 m 2 1 074
Doubleton 21-24 m 2
A type 25-33 m 2 6176
B type 36--40 m2 14074
Ctype 42-47m2 4 714
Dtype over 50 m 2 1 035
Total 27073
1986/87
5 838
2 912
9 164
9 159
27073
1987/88
5 867
8 849
4417
858
19991
Notes: Figures refer to new flats certified as substantially completed by the Housing Department.
Number of fiats
1987/88 1988/89 1989/90 1990/91
1624 3 964 1 790 4140
7 308 8 043 10 341 8 082
4 331 8 135 3 777 3 162
1420 7 688 1 556 1224
892 2 652 3 622 5 528
4 416 9 036 12 824 10 483
19 991 39518 33910 32619
Number of fiats
1988/89 1989/90 1990/91
1 346 1 074 1 310
1 886 2089 2 019
10 654 7 808 10 385
16 464 14 885 11 898
7 075 6424 5 366
2093 1630 1 641
39518 33910 32619
Starting from 1986/87, Housing Authority rental flats completed are classified by flat type whereas in the past, they were classified by flat size in person spaces. Figures in the new classification before 1986/87 are not available.
Source: Housing Department.
14.12 Distribution of Stock of Flats and Authorized Persons in Housing Authority Rental Estates by Area
Area 1981/82 1982/83 1983/84 1984/85 1985/86 1986/87 1987/88 1988/89 1989/90 1990/91
Hong Kong Island Flats 47 500 51 300 49 600 49600 49 700 52 200 56 500 60 OOO 61 800 65 900 Persons 225 500 232 900 231 900 229 700 226 400 226 800 237 800 245 800 245 600 251 OOO
Kowloon/New Kowloon Flats 264 OOO 265 800 271 200 277 200 278 600 271 700 275 300 272 400 273 400 263 300 Persons 1 135 700 1126 400 1114 200 1 099 800 1082600 1 059 OOO 1 024 800 994 100 961 800 925 600
Tsuen Wan Flats 88 600 88 400 89100 93 700 95 100 95 OOO 95 800 100 900 102 900 106 800 Persons 417 800 421 600 419 100 419 400 417 700 414 200 411 700 415 200 414 100 409 900
Sha Tin Flats 20200 25 100 34000 38 100 41 800 46 700 51 OOO 56 700 61 700 62 900 Persons 91 OOO 119 OOO 149 900 177 900 192100 212 200 234 800 254 OOO 266 600 264 600
TuenMun Flats 26000 29 900 39 100 39 100 45 200 45 200 46 100 48 700 52400 58 OOO Persons 94400 125 300 163 300 167 600 185 700 195 600 197 200 204 700 208 400 220 300
Other areas Flats 12 900 15 OOO 19 700 25 900 32 200 38 800 41 600 51 600 67 600 78 OOO Persons 41 500 59 500 77 800 99 900 120 800 152 100 172 100 203 300 246 400 279 200
Total Flats 459300 475500 502 700 523700 542600 549500 566300 590 300 619 800 634900 Persons 2005900 2084700 2156100 2194 200 2225 300 2259900 2278400 2 317100 2342 900 2350700
Note: Figures are as at end of the financial year and may not add up to total due to rounding.
Source: Housing Department.
189

14.13 Housing Authority Rental Flats Allocated and Persons Rehoused by Category
Category 1981/82 1982/83 1983/84 1984/85 1985/86 1986/87 1987/88 1988/89 1989/90 1990/91
Emergency Flats 962 830 746 495 580 270 468 368 300 300 Persons 3 853 3 113 3 OOO 1 891 2000 1 053 1487 846 1248 1 035
Compassionate Flats 747 800. 800 820 910 918 900 1 OOO 1200 1200 Persons 2466 2 693 2844 2 887 2 866 2 816 2 378 2 386 2 019 3 114
Clearance Flats 6789t 8 OOO 8 OOO 7 500 4700 5 500 5 300 5 OOO 6 800 10 100 Persons 27 938 33 415 34 401 30 520 14 709 20 614 15 220 16 675 23424 30 799
Redevelopment Flats 3 220 6000 6000 6 061 8 200 8 700 9 215 9 OOO 14 OOO 12 100 Persons 14 098 27 560 24 323 27 189 34196 42 058 34403 34 610 45 051 43 165
Waiting list applicants Flats 13 471 13 570 14 826 15 038 17 600 17 962 18 756 13100 19 300 14 OOO Persons 59 523 55 965 61120 61 966 66 560 62 153 66 037 47 741 65 959 53 692
Transfers Flats 5 215t 3 837 1 937 2 127 1 927 2 508 2 199 3 476 3 445 4 660 Persons 28 044 20 725 9 170 11 027 9 347 10 724 9024 18 219 16 287 23 440
Junior civil servants Flats 1 500 1 539 1 500 1 500 1 700 1 700 1 661 1 700 1 700 1 300 Persons 7004 6 865 6 594 6 334 6 693 6 456 5 747 5 617 5 636 6 058
Total Flats 31905 34576 33809 33541 35 617 37558 38499 33644 46745 43660 Persons 142926 150336 141452 141814 136 371 145874 134 296 126 094 159624 161303
Note: The rehousing sub-category. 'Re-use of THAs' is excluded from 'Waiting List Applicants' and included in 'Clearance' as from 1990/91, rendering figures for these two categories for 1990/91 not comparable with those for previous years.
Source: Housing Department.
14.14 Monthly Rent of Typical Flats in Housing Authority Estates as at March 1991
Size of Monthly Monthly rent Year of typical fiat rent per unit area
Type completion (m2) (HK$) (HK$ per m2)
Group A Estates:
Former Government Low Cost Housing 1963-1966 15.9 311 19.56 18.8 360 19.15 21.6 418 19.35
1967-1973 21.8 464 21.28 27.4 570 20.80 29.9 616 20.60 34.8 750 21.55
Former Housing Authority 1958-1965 24.1 467 19.38 30.6 592 19.35 41.2 799 19.39
1966-1973 28.3 622 21.98 30.6 599 19.58 33.1 646 19.52 36.5 822 22.52
New Housing Authority Post 1973 (Urban) 23.5 569 24.21 33.2 895 26.96 42.l 960 22.80 52.2 1,269 24.31
Post 1973 23.6 531 22.50 *(New Towns and Rural) 32.l 640 19.94
42.2 840 19.91
Group B Estates: 1954-1964 8.0 97 12.13 11.2 137 12.23 14.l 175 12.41
1964-1966 12.5 207 16.56 15.9 260 16.35 18.8 308 16.38
1966-1969 12.7 222 17.48 15.7 273 17.39 18.6 326 17.53
1969-1972 13.7 231 16.86 16.4 285 17.38 20.5 360 17.56
1972-1974 14.0 248 17.71 16.9 301 17.81 22.l 401 18.14 26.9 490 18.22
Note: *Figures refer to flats in Tuen Mun, Yuen Long, Tai Po, Fanling/Sheung Shui, Sai Kung/Tseung Kwan 0 and outlying islands.
Source: Housing Department.
190

14.15 Distribution of Authorized Population in Housing Authority Cottage Areas and Temporary Housing Areas by Area
I Number of persons
1981/82 1982/83 1983/84 1984/85 1985/86 1986/87 19~7/88 1988/89 1989/90 1990/91
Cottage areas Hong Kong Island 7700 7400 7 300 6400 4400 3400 poo 2100 2 100 2000 Kowloon/New Kowloon 5 300 2 100 1 900 1 900 1900 1 800 I 800 1 800 1 700 1 700 Tsuen Wan 400 400 400 300 200 200 200 200 Sha Tin 300 300 500 500 500 500 I 500 500 500 400 TuenMun Other areas 6 500 6 700 6 500 6400 6200 5 300 5 200 5 300 5 400 5 500
Total 20200 16900 16600 15500 13200 11200 1~000 9900 9700 9600
Temporary housing areas Hong Kong Island 9 800 8200 6 300 7300 6 500 6 500 8 400 10 200 10 500 8 200 Kowloon/New Kowloon 33 300 32 300 40400 42000 35 300 41 300 411800 41 300 37 400 31 800 Tsuen Wan 20 300 22 700 22200 21 700 16 200 15 300 14 700 12 900 11 700 9 500 Sha Tin 7 100 17 800 20100 20 300 18 100 16 700 15 300 13 200 12 300 13 400 TuenMun 1400 2 800 7 700 10 OOO 8 100 8 100 J 400 5 200 4 900 3 100 Other areas 18 700 24600 30 300 31 OOO 33 900 29 300 2 900 27 500 21 500 15 400
Total 90600 108400 127000 132300 118100 117200 114500 110300 98300 81400
Note: Figures are as at end of the financial year. I
Source: Housing Department.
14.16 Housing Authority Rental Flats with Consent to Commence Work by Area Number of fiats
Area 1982/83 1983/84 1984/85 1985/86 1986/87 1987/~8 1988/89 1989/90 1990/91
Hong Kong Island 9 086 4644 5 455 1428 3 227 2 720
Kowloon/New Kowloon 12 882 7014 8 974 4196 7 888 14 7~4 11 100 2453 7 391
Tsuen Wan 8 402 4 394 3 426 905 12 228 2 856 1 681 768 5 206
Sha Tin 10 626 4 817 8 528 5 036 5 652
7 8~8 1 926
TuenMun 6072 3 136 3 920 1224
Other areas 4 753 8 062 14746 7 848 7 757 11 080 14 083 13 477 10 157
Total 36663 30359 44760 21121 42089 420~3 29516 19 925 27400
Source: Housing Department.
14.17 Housing Authority Rental Flats with Consent to Commence Work by Flat Type Number of fiats
Flat type Average size in saleable floor area 1986/87 1987/88 11988/89 1989/90 1990/91
I Singleton 14--15 m2 1 074 956 1 580 1179 2 153
Doubleton 21-24 m2 1 558 1 871 1 899 104 1158
A type 25-33 m2 11 478 10 891 9 045 5 713 3 808
Btype 36--40 m 2 17 221 17 444 11298 7 868 11426
Ctype 42-47 m2 7 610 8 088 4 617 4164 3 223
Dtype over 50m2 3 148 2 773 1 077 897 5 632
Total 42089 42023 29516 19925 27400
Note: Starting from 1986/87, Housing Authority rental flats with consent to commence work are classified by flat type whereas in the past, they were classified by flat size in person spaces. Figures in the new classification before 1986/87 are not available.
Source: Housing Department.
191
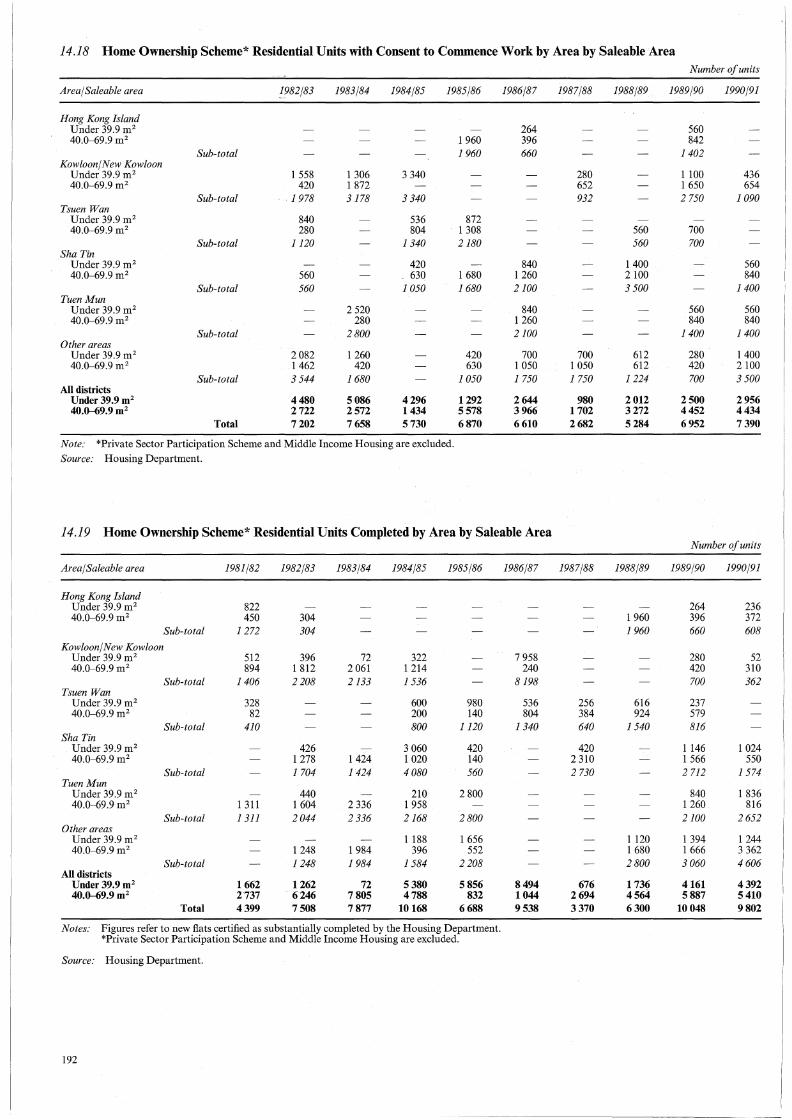
14.18 Home Ownership Scheme* Residential Units with Consent to Commence Work by Area by Saleable Area Number of units
Area/ Saleable area 1982/83 1983/84 1984/85 1985/86 1986/87 1987/88 1988/89 1989/90 1990/91
Hong Kong Island Under 39.9 m2 264 560 40.0-69.9 m2 1960 396 842
Sub-total 1960 660 1402 Kowloon/New Kowloon
Under 39.9 m2 1 558 1 306 3 340 280 1100 436 40.0-69.9 m2 420 1 872 652 1 650 654
Sub-total 1978 3178 3 340 932 2 750 1090 Tsuen Wan
Under 39.9 m2 840 536 872 40.0-69.9 m2 280 804 1 308 560 700
Sub-total 1120 1340 2180 560 700 Sha Tin
Under 39.9 m2 420 840 1400 560 40.0-69.9 m2 560 630 1 680 1260 2 100 840
Sub-total 560 1050 1680 2100 3 500 1400 TuenMun
Under 39.9 m2 2 520 840 560 560 40.0-69.9 m2 280 1260 840 840
Sub-total 2800 2100 1400 1400 Other areas
Under 39.9 m2 2 082 1260 420 700 700 612 280 1400 40.0-69.9 m2 1462 420 630 1 050 1 050 612 420 2100
Sub-total 3 544 1680 1050 1750 1750 1224 700 3 500 All districts
Under 39.9 m2 4480 5086 4296 1292 2644 980 2012 2500 2956 40.0--69.9 m2 2722 2572 1434 5578 3966 1702 3272 4452 4434
Total 7202 7658 5730 6870 6610 2682 5284 6952 7390
Note: *Private Sector Participation Scheme and Middle Income Housing are excluded. Source: Housing Department.
14.19 Home Ownership Scheme* Residential Units Completed by Area by Saleable Area Number of units
Area/ Saleable area 1981/82 1982/83 1983/84 1984/85 1985/86 1986/87 1987/88 1988/89 1989/90 1990/91
Hong Kong Island Under 39.9 m2 822 264 236 40.0-69.9 m2 450 304 1 960 396 372
Sub-total 1272 304 1960 660 608
Kowloon/New Kowloon Under 39.9 m2 512 396 72 322 7 958 280 52 40.0-69.9 m2 894 1 812 2 061 1214 240 420 310
Sub-total 1406 2 208 2133 1536 8198 700 362 Tsuen Wan
Under 39.9 m2 328 600 980 536 256 616 237 40.0-69.9 m2 82 200 140 804 384 924 579
Sub-total 410 800 1120 1340 640 1540 816 Sha Tin
Under 39.9 m2 426 3 060 420 420 1146 1 024 40.0-69.9 m2 1278 1424 1 020 140 2 310 1 566 550
Sub-total 1704 1424 4080 560 2 730 2 712 1574 TuenMun
Under 39.9 m 2 440 210 2 800 840 1 836 40.0-69.9 m2 1 311 1 604 2 336 1 958 1260 816
Sub-total 1 311 2044 2 336 2168 2800 2100 2652 Other areas
Under 39.9 m2 1188 1 656 1120 1 394 1 244 40.0-69.9 m2 1 248 1984 396 552 1 680 1 666 3 362
Sub-total 1248 1984 1584 2 208 2800 3060 4606 All districts
Under 39.9 m2 1662 1262 72 5380 5856 8494 676 1736 4161 4392 40.0--69.9 m2 2737 6246 7805 4788 832 1044 2694 4564 5887 5410
Total 4399 7508 7877 10168 6688 9538 3370 6300 10048 9802
Notes: Figures refer to new fiats certified as substantially completed by the Housing Department. *Private Sector Participation Scheme and Middle Income Housing are excluded.
Source: Housing Department.
192

I
14.20 Non-residential/Composite Buildings with Consent to Commence Work by Housing Aqthority by Type
Number of buildings
Type 1982/83 1983/84 1984/85 1985/86 1986/87 198y/88 1988/89 1989/90 1990/91
Housing Authority rental Residential/ Commercial 34 27 42 26 43 42 25 22 27 Commercial 9 5 7 2 13 4 7 Industrial Others 8 11 14 14 26 10 18 10 11
Total 51 43 63 42 82 56 50 33 39 Home Ownership Scheme*
Residential/Commercial Commercial 2 2 Others 3 9 2 6 2 3 3 2 1
Total 3 11 3 6 2 4 5 3 1
Notes: Figures refer to the number of buildings, either partly or wholly, used for non-residential purposes. *Private Sector Participation Scheme and Middle Income Housing are excluded.
Source: Housing Department.
14.21 Non-residential/Composite Buildings Completed by Housing Authority by Type Number of buildings
Type 1982/83 1983/84 1984/85 1985/86 1986/87 198?/88 1988/89 1989/90 1990/91
Housing Authority rental Residential/ Commercial 32 24 25 31 31 27 45 36 34 Commercial 7 8 6 6 3 13 10 7 6 Industrial 3 2 Others 10 28 22 7 12 29 16 13 10
Total 52 61 55 44 46 69 71 56 50 Home Ownership Scheme*
Residential/ Commercial 3 3 4 7 Commercial 1 1 2 Others 3 6 2 3 4 4 2 1
Total 3 10 5 4 1 5 4 8 8
Notes: Figures refer to the number of buildings, either partly or wholly, used for non-residential purposes. *Private Sector Participation Scheme and Middle Income Housing are excluded.
Source: Housing Department.
14.22 Recurrent Account of Housing Authority HK$million
1981/82 1982/83 1983/84 1984/85 1985/86 1986/87 1987/88 1988/89 1989/90 1990/91*
Housing Authority Estate Working Account
Income 1,254.9 1,604.5 2,031.9 2,548.5 3,037.8 3,456.3 3,970.2 4,560.1 5,358.6 6,230.4 Domestic rents 822.0 1,014.1 1,275.7 1,572.1 1,920.2 2,235.4 2,616.0 3,074.2 3,628.9 4,222.1 NonRdomestic rents 415.4 568.9 723.l 936.9 1,077.2 1,184.l 1,313.9 1,453.8 1,691.3 1,959.2 Other income 11.2 13.4 17.7 24.4 27.7 28.5 30.6 32.1 38.4 49.l Government grants 6.3 8.1 15.4 15.l 12.7 8.3 9.7
Expenditure 1,101.3 1,465.8 1,861.4 2,206.2 2,601.5 2,944.9 '
3,365.1 3,739.0 4,474.0 4,880.5 Rates 179.4 195.2 251.7 328.2 422.7 520.4 633.6 688.2 736.0 929.4 Personal emoluments 206.9 261.3 333.2 384.9 428.8 487.1 535.5 643.9 724.8 917.4 Maintenance and improvements 228.7 305.4 352.9 396.7 453.4 451.2 I 496.2 844.0 1,155.5 847.6 Utility services 147.0 167.7 190.3 209.9 237.7 242.8 251.9 331.5 394.0 451.8 Administrative and others 97.4 160.l 194.8 216.0 286.0 373.7 465.7 578.1 684.7 956.5 Finance charges 241.9 376.1 538.5 670.5 772.9 869.7 982.2 517.5 631.3 745.1 Construction of temporary housing units 135.8 147.7 32.7
Surplus before appropriations 153.6 138.7 170.5 342.3 436.3 511.4 605.1 821.1 884.6 1,349.9 Interest on permanent capital 725.4 881.0 1,016.9 Dividend on nonRdomestic equity 406.4 438.5 589.0
Surplus/( deficit) after appropriations 153.6 138.7 170.5 342,3 436.3 511.4 605.1 (310.7) (434.9) (256.0)
Squatter Control, Clearances and Temporary Housing Areas Income 25.7 29.6 35.2 40.8 40.6 45.1 52.1
Temporary housing and temporary industrial areas fees# 25.7 29.6 35.2 40.8 40.6 45.l 52.1
Expenditure 168.8 272.1 312.3 317.2 328.6 337.7 387.3 314.9 320.1 397.2 Management of temporary housing and temporary
industrial areas :j::j: 55.3 67.2 89.1 87.7 88.4 76.2 88.7 Squatter control and squatter area improvements 86.4 169.5 181.3 184.0 190.2 203.0 221.3 231.4 230.1 278.2 Clearance 27.1 35.4 41.9 45.5 50.0 58.5 77.3 83.5 90.0 119.0
Deficit (met by Government grants) 143.1 242.5 277,l 276,4 288.0 292.6 335.2 314.9 320.1 397.2
Notes: Figures in brackets denote negative value. * 1990/91 account is subject to audit. #Starting from 1988/89, income and expenditure for this item are included under Housing Authority estate working account.
Source: Housing Department.
193

14.23 Housing Capital Expenditure-Housing Authority HK$million
1981/82 1982/83 1983/84 1984/85 198~/86 1986/87 1987/88 1988/89 1989/90 1990/91*
Capital expenditure to be financed New Rental Public Housing Estates 1,937.9 2,218.3 2,239.8 1,991.3 1,953.l 2,224.0 3,035.5 3,242.6 3,549.1 3,330.8 Redevelopment of existing estates 335.6 426.8 447.6 347.5 412.5 532.9 649.l 928.9 1,313.4 1,380.l Home Ownership domestic flats 1,520.6 1,858.9 2,336.7 Home Ownership commercial facilities# 97.2 79.9 86.3 68.4 71.9 54.8 56.5 43.1 70.2 105.5 Flatted factories 132.0 69.3 50.8 35.7 (0.2) 0.5 1.4 0.9 0.8 0.0 New Housing Authority Headquarters 0.7 2.4 50.5 93.7 188.9 179.0 Home Purchase loans (net of repayments) 37.0 311.7 310.3
Total 2,502.7 2,794.3 2,824.5 2,442.9 2,438.0 2,814.6 3,793.0 5,866.8 7,293.0 7,642.4
Sources of funds From the Housing Authority
Estate Working Account Excess of income over expenditure 153.6 138.7 170.5 342.3 436.3 506.5 605.1 (310.7) (434.9) (256.0) Provision for depreciation 131.0 180.8 236.7 289.l 343.2 388.9 442.1 517.5 631.3 745.l
Interest charged by Government on loans for Rental Public Housing 180.1 259.2 349.9 417.2 466.6 522.3 587.7
General Working Account Premium on new commercial lettings
and gas supply 17.0 17.7 20.6 31.2 Miscellaneous 4.4 1.0 30.4 36.7 (8.6) (19.9)
Net receipts from sales of Home Ownership domestic flats and Private Sector Participation Scheme 2,596.4 3,821.4 3,346.2
Decrease (Increase) in Working Capital (34.7) 21.2 (203.3) (424.9) (5.5) 423.7 923.3 198.0 1,075.2 (1,942.9) Sub-total 451.4 618.6 604.8 691.6 1,232.0 1,821.5 2,558.2 3,001.2 5,093.0 1,892.4
From the Hong Kong Government Development Loan Fund for
Rental Public Housing 1,690.0 1,900.0 1,600.0 1,400.0 1,400.0 1,200.0 1,450.0 Home Ownership commercial
facilities 86.0 69.0 81.9 61.2 57.5 54.8 50.5 Flatted factories 105.0 70.2 35.7 32.0 4.8 4.8 New Housing Authority Headquarters 2.1 47.0
Asian Development Bank 15.4 28.6 48.1 15.2 4.2 1.2 Reimbursement from Home Ownership
Fund 196.0 188.l 584.3 432.4 37.9 6.0 1.2 Government permanent capital 2,865.6 2,200.0 5,750.0
Sub-total 2,092.4 2,255.9 2,350.0 1,940.8 1,504.4 1,268.9 1,548.7 2,865.6 2,200.0 5,750.0
Application of funds Repayment of Development Loan
Fund-Principal 41.1 80.2 130.3 189.5 298.4 275.8 313.9
Total funds applied to finance capital expenditure 2,502.7 2,794.3 2,824.5 2,442.9 2,438.0 2,814.6 3,793.0 5,866.8 7,293.0 7,642.4
Notes: Figures in brackets denote negative value. * 1990/91 account is subject to audit. #Figures for the period prior to 1988/89 include land premium paid.
Source: Housing Department.
14.24 Housing Capital Expenditure-Hong Kong Government HK$million
1981/82 1982/83 1983/84 1984/85 1985/86 1986/87 1987/88 1988/89 1989/90 1990/91*
Capital expenditure to be financed Government built rental estates handed
over to Housing Authority 22.2 5.4 3.6 4.0 2.0 0.8 0.1 Home Ownership domestic flats# 1,054.0 715.5 569.0 608.2 653.8 626.7 703.6 Temporary housing areas 39.7 87.4 49.8 40.8 73.7 82.2 130.6 Temporary industrial areas 1.2 Squatter area improvement 12.7 21.1 19.9 22.2 23.l 27.6 30.3 13.5
Total 1,117.1 808.3 635.1 674.1 749.4 731.9 857.4 27.6 30.3 13.5
Sources of funds Hong Kong Government general revenue 63.l 92.8 66.1 65.9 95.6 105.2 153.8 27.6 30.3 13.5 Hong Kong Government Home
Ownership Fund 1,054.0 715.5 569.0 608.2 653.8 626.7 703.6
Total funds applied to finance capital expenditure 1,117.1 808.3 635.1 674.1 749.4 731.9 857.4 27.6 30.3 13.5
Notes: * 1990/91 account is subject to audit. # Figures include land premium paid.
Source: Housing Department.
194
- ------------ --· ----- -----

Section 15 Education
Tables 15.l to 15.3 Generallnformation
Figures in these tables are obtained from the 1991 Census. The tables refer to the enumerated resident population and exclude transients and Vietnamese migrants.
Concepts and Definitions
Educational attainment refers to the highest level of education ever attained by a person in school or other educational institution, regardless of whether he/she had completed the course. Only formal courses are counted as educational attainment. A formal course shall be one that lasts for at least one academic year, requires specific academic entrance qualifications (with the exception of the degree courses offered by the Open Learning Institute of Hong Kong) and includes examinations for assessment purposes.
Data Sources
Information on the 1991 Census can be found in Section 2 of this publication.
Tables 15.4 to 15.30 Generallnformation
The education statistics presented relate mainly to enrolment, number of operating schools or institutes and number of teachers analysed by level of education, type of schools and type of courses. Educational institutions under the jurisdiction of the Education Department include all kindergartens, primary and secondary schools, special schools, the Colleges of Education, the approved post-secondary colleges and other private schools offering a variety of courses.
Statistics on educational institutions and enrolment, etc. are supplied by the Education Department, the University and Polytechnic Grants Committee, the Hong Kong Examinations Authority, the Technical Education and Industrial Training Department, the University of Hong Kong and the Chinese University of Hong Kong. The figures for institutions and enrolment by type of education refer to both day and evening classes if not otherwise specified.
Concepts and Definitions
Enrolment in general refers to the number of pupils enrolled in the school register as at the beginning of a school year (usually in September).
The number of schools counted is based on the number of schools registered and the number of government schools which are not required to be registered. If a school with one registration operates more than one level of education, say both primary and secondary classes, it is counted separately both as a primary and secondary school.
Unless otherwise specified, statistics on the number of educational institutions and enrolment cover both day and evening classes in full-time or part-time courses.
Teaching staff refer to serving full-time equivalent teachers or lecturers including the school principals unless otherwise specified. For the purpose of calculating full-time equivalent teachers, all part-time teachers are assumed to have half of the teaching load of a full-time teacher.
University graduate or equivalent teachers are those holding university degree or equivalent qualifications obtained from local or overseas universities. Non-graduate teachers refer to those without any university degree or equivalent qualifications.
Expenditure on education under Education Department covers all the actual expenses incurred by the Hong Kong Government during the relevant financial year on the following aspects:
(i) operation of government schools and colleges,
(ii) supervision of all schools in the territory,
(iii) provision of advisory services and guidances to all schools in the territory,
(iv) planning and implementation of school projects, and
(v) subventions and subsidies given to organizations/sponsoring bodies for the operation of kindergartens, schools and colleges.
195

196
Data Sources
Statistics on enrolment and number of educational institutions under the jurisdiction of the Education Department are essentially based on results of the September round of the Enrolment Survey. The survey covers all Government, aided and private day and evening educational institutions offering full-time or part-time educational courses.
Unless otherwise specified, statistics on teaching staff are based on Survey of Teachers conducted in September every year. The survey covers all Government, aided and private day schools and colleges, excluding the special schools.
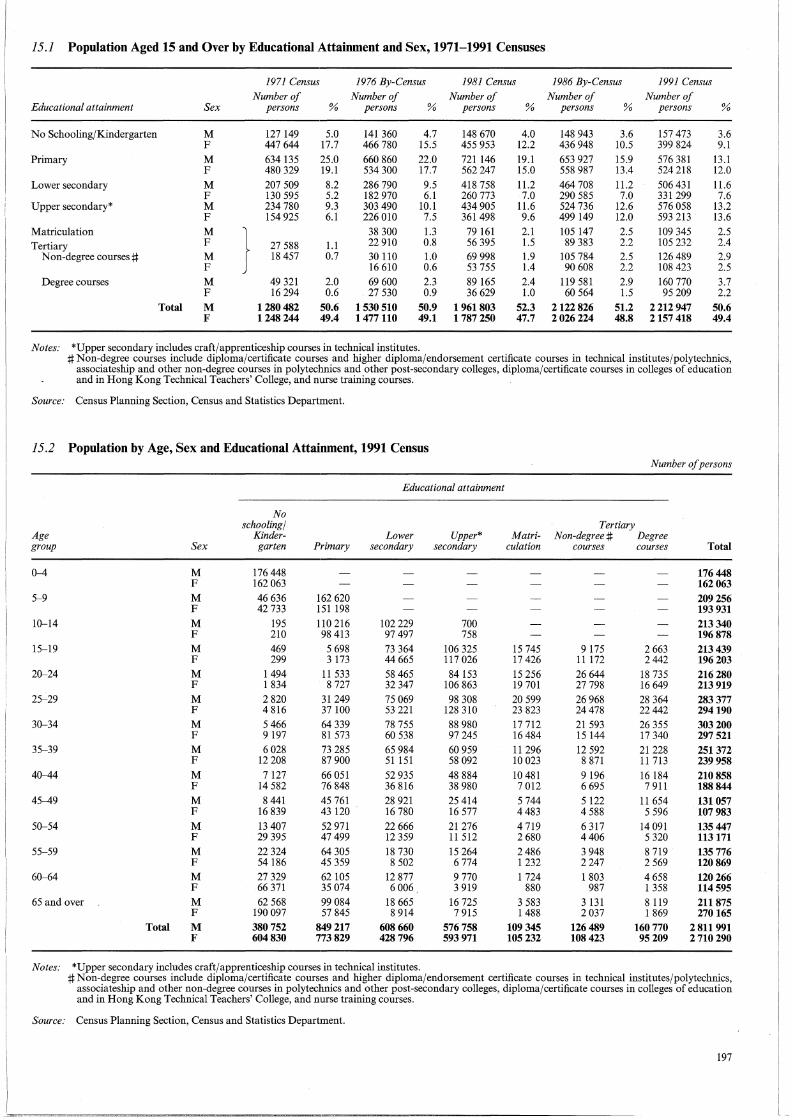
15.1 Population Aged 15 and Over by Educational Attainment and Sex, 1971-1991 Censuses
1971 Census 1976 By-Census 1981 Census 1986 By-Census 1991 Census
Number of Number of Number of Number of Number of Educational attainment Sex persons % persons % persons % persons % persons %
No Schooling/Kindergarten M 127 149 5.0 141 360 4.7 148 670 4.0 148 943 3.6 157 473 3.6 F 447 644 17.7 466 780 15.5 455 953 12.2 436 948 10.5 399 824 9.1
Primary M 634135 25.0 660 860 22.0 721146 19.l 653 927 15.9 576 381 13.l F 480 329 19.l 534 300 17.7 562 247 15.0 558 987 13.4 524 218 12.0
Lower secondary M 207 509 8.2 286 790 9.5 418 758 11.2 464 708 11.2 506 431 11.6 F 130 595 5.2 182 970 6.1 260 773 7.0 290 585 7.0 331 299 7.6
Upper secondary* M 234 780 9.3 303 490 10.l 434 905 11.6 524 736 12.6 576 058 13.2 F 154 925 6.1 226 010 7.5 361 498 9.6 499 149 12.0 593 213 13.6
Matriculation M
} 38 300 1.3 79 161 2.1 105 147 2.5 109 345 2.5
Tertiary F 27 588 1.1 22 910 0.8 56 395 1.5 89 383 2.2 105 232 2.4
Non-degree courses# M 18 457 0.7 30 110 1.0 69 998 1.9 105 784 2.5 126 489 2.9 F 16 610 0.6 53 755 1.4 90 608 2.2 108 423 2.5
Degree courses M 49 321 2.0 69 600 2.3 89 165 2.4 119 581 2.9 160 770 3.7 F 16 294 0.6 27 530 0.9 36 629 1.0 60 564 1.5 95 209 2.2
Total M 1280482 50.6 1530510 50.9 1961803 52.3 2122826 51.2 2 212 947 50.6 F 1248244 49.4 1477110 49.1 1787250 47.7 2026224 48.8 2157 418 49.4
Notes: *Upper secondary includes craft/apprenticeship courses in technical institutes. #Non-degree courses include diploma/certificate courses and higher diploma/endorsement certificate courses in technical institutes/polytechnics,
associateship and other non-degree courses in polytechnics and other post-secondary colleges, diploma/certificate courses in colleges of education and in Hong Kong Technical Teachers' College, and nurse training courses.
Source: Census Planning Section, Census and Statistics Department.
15.2 Population by Age, Sex and Educational Attainment, 1991 Census Number of persons
Educational attainment
No schooling/ Tertiary
Age Kinder- Lower Upper* Matri- Non-degree# Degree group Sex garten Primary secondary secondary culation courses courses Total
0-4 M 176 448 176448 F 162 063 162 063
5-9 M 46 636 162 620 209256 F 42 733 151 198 193 931
10-14 M 195 110 216 102 229 700 213340 F 210 98 413 97 497 758 196 878
15-19 M 469 5 698 73 364 106 325 15 745 9 175 2 663 213439 F 299 3 173 44 665 117 026 17 426 11 172 2442 196 203
20-24 M 1494 11 533 58 465 84153 15 256 26 644 18 735 216 280 F I 834 8 727 32 347 106 863 19 701 27 798 16 649 213919
25-29 M 2 820 31 249 75 069 98 308 20 599 26 968 28 364 283377 F 4 816 37 100 53 221 128 310 23 823 24478 22442 294190
30-34 M 5 466 64 339 78 755 88 980 17 712 21 593 26 355 303200 F 9 197 81 573 60 538 97 245 16 484 15 144 17 340 297 521
35-39 M 6 028 73 285 65 984 60 959 11296 12 592 21 228 251372 F 12 208 87 900 51 151 58 092 10 023 8 871 11 713 239958
40-44 M 7127 66 051 52 935 48 884 10 481 9 196 16 184 210858 F 14 582 76 848 36 816 38 980 7 012 6 695 7 911 188844
45-49 M 8 441 45 761 28 921 25 414 5 744 5 122 11 654 131057 F 16 839 43 120 16 780 16 577 4483 4 588 5 596 107983
50-54 M 13 407 52 971 22 666 21 276 4 719 6 317 14 091 135 447 F 29 395 47 499 12 359 11 512 2 680 4406 5 320 113171
55-59 M 22 324 64 305 18 730 15 264 2486 3 948 8 719 135 776 F 54186 45 359 8 502 6774 1232 2 247 2 569 120 869
60-64 M 27 329 62105 12 877 9770 1 724 1 803 4 658 120266 F 66 371 35 074 6 006 3 919 880 987 I 358 114 595
65 and over M 62 568 99 084 18 665 16 725 3 583 3 131 8 119 211875 F 190 097 57 845 8 914 7 915 1488 2037 1 869 270165
Total M 380752 849217 608660 576758 109 345 126489 160770 2 811991 F 604830 773829 428 796 593 971 105232 108 423 95209 2 710290
Notes: *Upper secondary includes craft/apprenticeship courses in technical institutes. #Non-degree courses include diploma/certificate courses and higher diploma/endorsement certificate courses in technical institutes/polytechnics,
associateship and other non-degree courses in polytechnics and other post-secondary colleges, diploma/certificate courses in colleges of education and in Hong Kong Technical Teachers' College, and nurse training courses.
Source: Census Planning Section, Census and Statistics Department.
197
I
l -

15.3 School Attendance Rate, 1971-1991 Censuses
1971 Census 1976 By-Census• 1981 Census
Age group Male Female Both Sexes Male Female Both Sexes Mrile Female Both Sexes
3-5 56.5 53.2 54.9 60.7 60.1 60.4 83.5 82.7 83.1
6-11 95.5 94.4 94.9 98.1 97.8 98.0 98.5 98.5 98.5
12-16 80.0 69.2 74-8 82.5 75.5 79.1 83.4 84.6 84.0
17-18 42.4 35.2 38-8 46.2 41.2 43.8 44.9 45.0 45.0
Note: *Students in the 1976 By-Census refer to those who attended full-time educational institutions prior to the school summer vacation.
Source: Census Planning Section, Census and Statistics Department.
Male
91.5
99.5
92.2
53.9
15.4 Operating Educational Institutions by Level of Education by Type of Institution
Level/Type 1981 1982 1983 1984 1985 1986
Kindergarten
Private 729 709 724 775 787 825
Primary
Government and aided 666 658 659 655 642 630 Private 186 165 157 144 127 112
Secondary and Sixth Form
Government and aided 220 298 305 313 318 320 Private 304 228 225 216 197 177
Special education
Aided 68 71 71 69 71 70
Colleges of Education and Technical Teachers' College
Government 4 4 4 4 4 4
Technical Institutes
Government 5 5 5 5 5 7
Approved post-secondary* 3 3 3 2 2 2
Polytechnics and Baptist College#
Government subvented 3 3 3
Universities
Government subvented 2 2 2 2 2 2
Adult education and othersf
Government and aided 2 2 2 2 2 2 Private 214 209 212 219 226 257
Percentage
1986 By-Census 1991 Census
Female Both Sexes Male Female Both Sexes
91.7 91.6 94.9 94.9 94.9
99.5 99.5 99.8 99.8 99.8
94.5 93.3 91.8 95.6 93.6
58.3 56.0 54.3 62.7 58.3
Number of institutions
1987 1988 1989 1990
829 814 791 785
623 608 604 590 102 97 98 91
337 344 350 358 173 154 143 131
69 70 71 71
4 4 4 4
8 8 8 8
2 2 2 2
3 3 3 3
2 2 2 2
2 2 2 1 271 248 240 249
Notes: Figures are as at September of the year, except those for the Universities and Polytechnics and Baptist College which are based on enumerations made in December and those for Technical Institutes which are based on enumerations made in October for years up to 1985, and in November for years 1986 afterwards. Figures for approved post-secondary colleges, schools offering adult education & other courses as from 1986 and Colleges of Education as from 1987 are as at October of the year. *Approved post-secondary includes basic studies courses of Baptist College up to 1984.
#Senior studies courses of Baptist College are funded by the University and Polytechnic Grants Comlnittee commencing November 1983, and for basic studies courses, commencing July 1985.
t Adult education and others refer to courses in Government evening institutes, the Evening School of Higher Chinese Studies and various private schools offering a variety of subjects. Evening courses in Technical Institutes and Polytechnics and extra-mural courses in Universities are not included.
Sources: Education Department. Vocational Training Council and Technical Education and Industrial Training Department. University and Polytechnic Grants Comlnittee.
198
------------- ------ --- ----

15.5 Full-time Enrolment by Level of Education by Type of Institution Number of pupils
Level/Type 1981 1982 1983 1984 1985 1986 1987 1988 1989 1990
Kindergarten
Private 200 426 205 200 209 869 226 450 229 089 231 610 225 108 214 703 201 750 196 466
Primary
Government and aided 471 627 476 384 480 678 480 074 480 268 479 635 482 253 483 232 483 191 475 054 Private 65 496 62074 59 178 56 146 54 635 52 358 52 056 51 805 51 259 49 865
Secondary and Sixth Form
Government and aided 212 491 293 420 302 187 311 377 318 965 330 630 338 638 347 417 355 349 363 229 Private 252 432 166 191 151 182 136 436 125 556 117 128 109 391 96 484 82 946 69 979
Special education* 12117 11 666 10 622 9 475 8 655 8 109 7 999 7 971 8 184 7 999
Colleges of Education
Government 1 732 2 196 2 519 2 774 2 614 2 573 2435 2 355 2 351 2 663
Technical Institutes
Government 3 516 3 676 4955 6 248 5 846 7 980 10 415 11 296 11 853 12 319
Approved post-secondary 7 543 7 377 7084 4 634 4 789 5 253 5 426 5 230 5 049 4 730
Polytechnics and Baptist College#
Government subvented 7 625 7 506 8 200 10 231 11 406 13 674 14 845 16 337 18 346 20 204
Universities
Government subvented 9 908 10 295 10 615 11 307 11 915 12 321 12 890 13 254 13 786 14 352
Notes: Figures are as at September of the year, except those for the Universities and Polytechnics and Baptist College which are based on enumerations made in December and those for Technical Institutes which are based on enumerations made in October for years up to 1985, and in November for years 1986 afterwards. Figures for approved post-secondary colleges as from 1986 and College of Education as from 1987 are as at October of the year. *Special education includes special classes in normal schools.
#Baptist College was included as from 1984; basic studies courses are also included in 1985.
Sources: Education Department. Vocational Training Council and Technical Education and Industrial Training Department. University and Polytechnic Grants Committee.
15.6 Operating Schools* by Level of Education by Type of School by Area, 1990
Level/Type Hong Kong Island Kowloon New Territories Total
Kindergarten
Private 185 257 372 814
Primary
Government and aided 95 170 325 590 Private 36 48 10 94
Secondary and Sixth Form
Government and aided 80 128 166 374 Private 41 77 35 153
Note: Figures are as at September 1990. *Operating Schools include subsection schools.
Source: Education Department.
199

15.7 Operating Educational Institutions and Enrolment by Level of Education, 1990
Day Evening
Govern- Govern-Level ment Aided Private Sub-total ment Aided Private Sub-total Total
Kindergarten No. of schools 785 785 785 Enrolment 196466 196466 1%466
Primary No. of schools 50 540 78 668 13 13 681 Enrolment 33 146 441 908 49 865 524919 1 801 1801 526720
Secondary and Sixth Form No. of schools 41* 317 76 434 55 55 489 Enrolment 37 625 325 604 69 979 433 208 22042 22042 455250
Special schools No. of schools 71 71 71 Enrolment 7 823 7823 7823
Special classes in ordinary schools Enrolment 176 176 176
Colleges of Education# No. of institutions 4 4 4 Enrolment 2 663 2663 2 316 2316 4979
Technical Institutes# No. of institutions 8 8 8 Enrolment 27295 27 295 29 616 29616 56911
Approved post-secondary No. of institutions 2 2 2 Enrolment 4730 4730 4730
Polytechnics# and Baptist College No. of institutions 3 3 3
Enrolment 24059t 24059t 15 659 15659 39718
Universities No. of institutions 2 2 2 Enrolment 17 063t 17063t 883@ 883@ 17946
Adult education No. of schools 116 116 1 133 134 250 and otherst Enrolment 22 993 22993 17 495 63 617 81112 104105
Total No. of schools 103 933 1057 2093 1 201 202 2295 Enrolment 100905 816457 344033 1261395 49427 16542 87460 153429 1414824
Notes: Figures are as at September 1990, except those for the Universities and Polytechnics and Baptist College which are based on enumerations made in December and those for Technical Institutes which are based on enumerations made in November. Figures for approved post-secondary colleges, Colleges of Education and schools offering adult education and other courses are as at October 1990. *Figure excludes the Practical Education Centre opened in September 1986.
#Evening courses are also operated by the institution. tFigure includes part-time students.
@Figure refers to part-time Degree Programmes in the Chinese University of Hong Kong. tAdult education and others refer to courses in Government evening institutes, the Evening School of Higher Chinese Studies and in various private schools offering a variety of subjects. Evening courses in Technical Institutes and Polytechnics and Baptist College and extra-mural courses in Universities are not included.
Sources: Education Department. Vocational Training Council and Technical Education and Industrial Training Department. University and Polytechnic Grants Committee.
200

15.8 Enrolment in Kindergarten, Primary, Secondary and Sixth Form Course by Age by Sex, 1990
Kindergarten Primary Secondary* Sixth Form
Age Male Female Male Female Male Female Male Female
Under4 30 678 28 767
4 33 254 31 660
5 35 975 33 964 11 298 11 123
6 1145 959 40 065 37 226
7 36 25 42 967 40 695
8 2 44926 42022
9 44202 41 654
10 43 451 40 627
11 35 067 31 619 6 953 7 388
12 7 476 5 430 33 857 33 894
13 1 978 1410 39 727 37 428
14 834 531 37 334 36 195
15 283 170 34 544 35 121
16 627 1 039 28 419 31 739 938 1 155
17 15 170 15 565 5 326 6104
18 6 602 5 552 6239 6 392
19 2 380 2 079 3 899 3 464
20 870 735 1 096 846
21 381 343 334 241
22 and over 573 613 205 131
Total 101 090 95376 273174 253546 206810 206652 18037 18333
Notes: Figures are as at September 1990. *Figures exclude commercial schools.
Source: Education Department.
201
I

15 .9 Enrolment in Primary Schools by Type of School by Grade
Type of school/Grade
Day schools
Government and aided
Primary 1
Primary2
Primary 3
Primary4
Primary 5
Primary6
Private
Primary 1
Primary 2
Primary3
Primary4
Primary 5
Primary 6
Total
Primary 1
Primary2
Primary3
Primary4
Primary5
Primary6
Evening schools
Aided
Primary 1
Primary2
Primary3
Primary4
Primary 5
Sub-total
Sub-total
All grades
1981
76479
80963
80995
81151
76 681
75 358
471627
11 704
11401
11 383
11272
10 341
9 395
65 496
88183
92364
92378
92423
87022
84753
537123
Primary 6 76
Private*
Primary 1
Primary2
Primary3
Primary4
Primary 5
Primary6
Total
Primary 1
Primary2
Primary3
Primary4
Primary5
Primary6
Sub-total 76
Sub-total
All grades
135
56
1. 654
3 569
3107
3 039
11560
135
56
1654
3569
3107
3115
11636
1982
76181
78 588
83 596
82 525
80 550
74944
476 384
10 581
10 686
10 809
10 510
10299
9189
62074
86762
89274
94405
93035
90849
84133
538458
151
32
976
2 820
2534
2 541
9054
151
32
976
2820
2534
2-541
9054
1983
76 525
78 431
80 587
85 010
81 392
78 733
480678
10 388
9 708
10050
10 118
9 771
9143
. 59178
86913
88139
90637
95128
91163
87876
539856
236
78
1 010
1916
2127
2057
7424
236
78
1010
1916
2127
2057
7424
1984
76774
77 867
80023
81 886
83 858
79666
480074
9 390
9 895
9116
9 529
9 282
8 934
56146
86164
87762
89139
91415
93140
88600
536220
135
74
610
1418
1245
1 513
4995
135
74
610
1418
1245
1513
4995
Notes: Figures are as at September of the year. *Private evening schools include primary English tutorial schools.
Source: Education Department.
202
1985
77 673
78137
79 335
81 342
81424
82 357
480268
9426
9 305
9706
8 578
9078
8 542
54635
87099
87442
89041
89920
90502
90899
534903
177
84
536
1005
1023
1200
4025
177
84
536
1005
1023
1200
4025
1986
78 914
79040
79 655
80 560
81233
80233
479635
8 813
8 984
8 951
9224
8 120
8 266
52 358
87727
88024
88606
89784
89353
88499
531993
109
34
377
624
711
888
2743
109
34
377
624
711
888
2743
1987
81002
80 183
80 306
80678
80 189
79 895
482 253
8 994
8 743
8900
8 855
8 905
7 659
52056
89996
88926
89206
89533
89094
87554
534309
81
36
197
315
397
524
1550
81
36
197
315
397
524
1550
1988
80292
81 916
81 300
81 075
80063
78 586
483 232
9 181
8 740
8 496
8 749
8 421
8 218
51805
89473
90656
89796
89824
88484
86804
535037
114
56
143
311
334
516
1474
114
56
143
311
334
516
1474
Number of pupils
1989
78 300
81 015
82660
82181
80470
78 565
483191
9164
9 011
8 580
8 311
8430
7763
51259
87464
90026
91240
90492
88900
86328
534450
156
14
226
396
346
548
1686
156
14
226
396
346
548
1686
1990
71 740
78469
81432
83 276
81192
78 945
475054
8 728
8 594
8 592
8 139
8 002
7 810
49865
80468
87063
90024
91415
89194
86755
524919
224
71
206
399
433
468
1801
224
71
206
399
433
468
1801
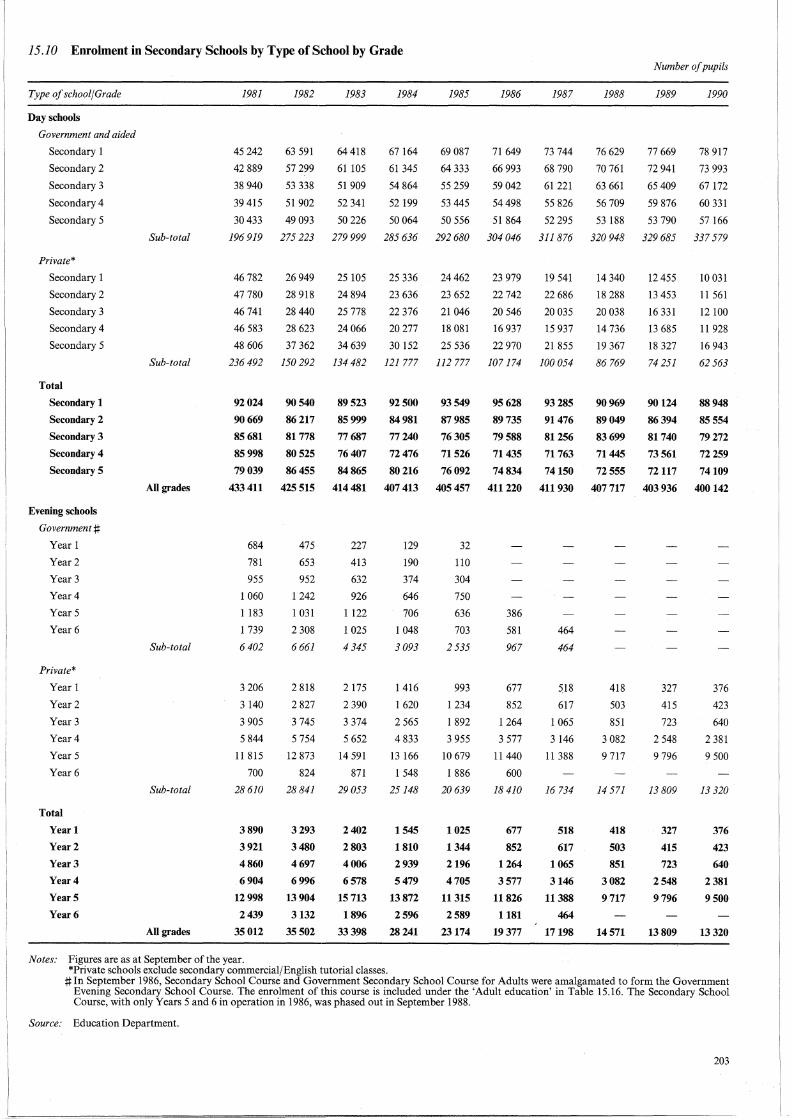
15 .10 Enrolment in Secondary Schools by Type of School by Grade
Type of school/Grade
Day schools
1981
45 242
42 889
38 940
39 415
1982
63 591
57 299
53 338
51 902
1983
64 418
61 105
51 909
52 341
1984
67 164
61 345
54 864
52 199
1985
69 087
64 333
55 259
53 445
1986
71 649
66 993
59 042
54498
1987
73 744
68 790
61 221
55 826
1988
76 629
70 761
63 661
56 709
Number of pupils
1989
77 669
72 941
65 409
59 876
1990
78 917
73 993
67 172
60 331
Government and aided
Secondary 1
Secondary 2
Secondary 3
Secondary 4
Secondary 5 30 433 49 093 50 226 50 064 50 556 51 864 52 295 53 188 53 790 57 166
Sub-total 196 919 275 223 279 999 285 636 292 680 304 046 311 876 320 948 329 685 337 579
Private*
Secondary 1
Secondary 2
Secondary 3
Secondary4
Secondary 5
Total
Secondary 1
Secondary 2
Secondary 3
Secondary4
Secondary 5
Evening schools
Government :j:I:
Year 1
Year2
Year 3
Year4
Year5
Year6
Private*
Year 1
Year2
Year3
Year4
Year 5
Year6
Total
Year 1
Year2
Year3
Year4
Years
Year6
Sub-total
All grades
Sub-total
Sub-total
All grades
26 949
28 918
28 440
25 105
24 894
25 778
25 336
23 636
22 376
24462
23 652
21 046
23 979
22 742
20 546
46 782
47 780
46 741
46 583
48 606
28623 24066 20277 18081 16937
19 541
22 686
20 035
15 937
21 855 37 362 34 639 30 152 25 536 22 970
236 492 150 292 134 482 121 777 112 777 107 174 100054
92024
90669
90540
86217
85681 81 778
85998 80525
79039 86455
433 411 425 515
684
781
955
1 060
1 183
1 739
6402
3 206
3 140
3 905
5 844
11 815
700
28610
3890
3921
4860
6904
12998
2439
35012
475
653
952
1 242
1 031
2 308
6661
2 818
2 827
3 745
5 754
12 873
824
28841
3293
3480
4697
6996
13904
3132
35502
89523
85999
92500
84981
77687 77240
76407 72476
84865 80216
414 481 407 413
227
413
632
926
1122
1 025
4345
2175
2 390
3 374
5 652
14 591
871
29053
2402
2803
4006
6578
15713
1896
33398
129
190
374
646
706
1 048
3093
1 416
1 620
2 565
4 833
13 166
1 548
25148
1545
1810
2939
5479
13872
2596
28241
93549
87985
76305
71526
76092
405457
32
110
304
750
636
703
2535
993
1234
1 892
3 955
10 679
1 886
20639
1025
1344
2196
4705
11315
2589
23174
95628
89735
93285
91476
79 588 81256
71435 71 763
74834 74150
411 220 411 930
386
581
967
677
852
1 264
3 577
11440
600
18410
677
852
1264
3577
11826
1181
19377
464
464
518
617
1 065
3 146
11 388
16 734
518
617
1065
3146
11388
464
17198
Notes: Figures are as at September of the year. *Private schools exclude secondary commercial/English tutorial classes.
14 340
18 288
20 038
14 736
19 367
86769
90969
89049
83699
71445
72555
407717
418
503
851
3 082
9 717
14 571
418
503
851
3082
9717
14571
12 455
13 453
16 331
13 685
18 327
74 251
90124
86394
81 740
73 561
72117
403936
327
415
723
2 548
9 796
13 809
327
415
723
2548
9796
13809
10 031
11 561
12 100
11 928
16 943
62 563
88948
85554
79272
72259
74109
400142
376
423
640
2 381
9 500
13 320
376
423
640
2381
9500
13320
:j:l:In September 1986, Secondary School Course and Government Secondary School Course for Adults were amalgamated to form the Government Evening Secondary School Course. The enrolment of this course is included under the 'Adult education' in Table 15.16. The Secondary School Course, with only Years 5 and 6 in operation in 1986, was phased out in September 1988.
Source: Education Department.
203

15.11 Enrolment in Sixth Form Course by Type of School by Grade Number of pupils
Type of school/Grade 1981 1982 1983 1984 1985 1986 1987 1988 1989 1990
Day schools
Government and aided
Secondary 6 9223 11 048 14206 15 191 15 040 14 999 15 252 15 142 14 825 15 263 Secondary 7 6 349 7149 7 982 10 550 11 245 11 585 11 510 11 327 10 839 10 387
Private
Secondary6 11 548 11 954 11942 9 837 8 250 5 856 4904 5 024 4307 3 872 Secondary? 2 327 2074 2917 2983 2 799 2 533 2 888 2 830 2 521 1 717
Total
Secondary6 20771 23002 26148 25028 23290 20855 20156 20166 19132 19135 Secondary 7 8676 9223 10899 13533 14044 14118 14398 14157 13360 12104
Evening schools
Private
Secondary6 5614 7045 8663 8582 7104 7057 7244 3492 3017 1671 Secondary 7 2299 3438 3823 4769 5000 6752 7312 5305 5162 3460
Note: Figures are as at September of the year.
Source: Education Department.
15.12 Enrolment in Technical Institutes by Type of Course Number of pupils
Type of course 1981 1982 1983 1984 1985 1986 1987 1988 1989 1990
Full-time courses
Technical courses Technician level 1 346 1 363 1 792 2 393 2234 2809 3 717 4167 4226 4 416 Craft level 1 039 1 111 1 554 1960 1 788 2 410 2 683 2 848 3 245 2942
Non-technical courses Technician level 947 975 1250 1456 1 316 I 962 2 626 2 825 2 739 3 068 Craft level 184 227 359 439 508 799 1 389 1456 1 643 1 893
Sub-total 3 516 3676 4955 6.248 5 846 7980 10415 11296 11853 12 319
· Part-time day courses
Technical courses Technician level 1 961 2 362 2 561 2 542 2 683 2 718 3 018 3 217 3 211 3 419 Craft level 7 457 7 160 7 081 7 159 8 363 8732 8 767 8 735 8 824 9 329
Non-technical courses Technician level 269 314 294 492 526 665 878 912 888 853 Craft level 409 439 398 525 651 I 027 1213 1293 1 413 1 375
Sub-total 10096 10275 10 334 10 718 12 223 13142 13 876 14157 14336 14 976
Part-time evening courses
Technical courses Technician level 4492 6063 6 781 7 568 7 303 7 806 7 729 8 049 8 106 8 058 Craft level 4 573 5166 6134 7 lll 7 155 7163 6 726 6085 6 228 6426
Non-technical courses Technician level 3 774 5 726 6 834 6 872 6 685 7 008 7 386 8 323 8 514 8 628 Craft level 3 406 4228 4990 4 856 5 176 6 183 6 556 6245 5 918 6 504
Sub-total 16245 21183 24 739 26407 26319 28160 28 397 28 702 28 766 29616
Total 29857 35134 40028 43373 44388 49282 52688 54155 54955 56911
Short courses throughout the academic year 2 310 3002
Notes: The Morrison Hill Technical Institute started operation in September 1969, Kwai Chung and Kwun Tong Technical Institutes in September 1975, Raking Wong Technical Institute in September 1977 and Lee Wai Lee Technical Institute in September 1979, Tuen Mun and Sha Tin Technical Institutes in September 1986 and Chai Wan Technical Institute in September 1987. Figures are as at October for years up to 1985, and as at November for years 1986 afterwards except those for short courses. Non-technical courses include all courses offered by the Commercial Studies, the Hotel-keeping and Tourism, the Design and the General Studies Departments of various institutes. All courses offered by other departments of various institutes are technical courses. Part-time day courses include both part-time day-release and part-time block-release courses.
Source: Vocational Training Council and Technical Education and Industrial Training Department.
204

15.13 Enrolment in Colleges of Education and Hong Kong Technical Teachers' College by Type of Course Number of pupils
Course Sex 1981 1982 1983 1984 1985 1986 1987 1988 1989 1990
Colleges of Education
Full-time Courses of Teacher Education*
3-year Initial Course M 337 486 493 464 435 381 312 274 257 290 F 896 1 218 1 205 1 069 1 069 I 079 936 882 797 943
2-year Initial Course M 106 91 163 267 246 229 259 287 324 353 F 208 278 572 889 757 752 793 793 875 1 008
I-year Initial Course, Hong Kong Technical Teachers' College (HKTTC) M 26 21 8 9 12 12 5 6
F 2 2 4 2 1
!-year Advanced Course of Teacher Education M 54 32 31 35 50 56 48 52 45 26
F 103 68 43 39 57 64 75 67 47 37
Part-time In-service Courses of Teacher Training (ICTT) #
3-year ICTT (Secondary) M 65 122 150 110 108 105 142 107 99 132 F 79 158 198 165 138 192 204 194 143 141
2-year ICTT (Secondary) M 116 65 45 30 36 32 43 57 71 66 F 254 114 84 68 58 55 56 81 101 74
3-year ICTT (Primary) M 17 50 94 223 120 93 47 37 34 F 99 257 464 498 541 439 322 317 309
2-year ICTT (Primary) M 21 1 40 76 74 67 60 F 172 8 82 143 156 177 140
2-year ICTT (Technical) M 24 11 31 15 12 8 15 F 1 I 4 7 6 8 10
2 or 3-year ICTT (Prevocational) M 9 9 12 7 8 8 F 4 4 2 3
2-year ICTT (Technical Institutes) M 82 78 64 97 F 18. 17 8 18
2-year ICTT (Kindergarten) M I F 174 231 120 238 351 465 469 467 461 501
3-year ICTT (Special Schools) M 7 7 7 F 10 9 9
1 or 2-year ICTT (Special Education) M 88 128 85 102 98 75 78 84 96 61 F 141 245 228 205 181 170 130 144 174 165
I-year ICTT (Training & Development) M 19 21 26
F 11 9 6
12-week ICTT (Kindergarten) F 172 156 68 104
In-service Course for Workshop Instructors in Prevocational M 19
F I
Refresher/Retraining Courses
Primary M 5 11 19 14 20 26 23 18 13 F 35 69 61 106 139 174 202 77 50
Secondary M 66 27 26 12 11 7 3 4 F 136 23 28 23 13 21 8 11
Short Courses ( HKTTC) M 150 240 178 139 115 68 143 207 190 142 F 18 68 71 36 25 9 22 50 53 54
Notes: Figures are as at September of the year up to 1986 and as at October of the year as from 1987. *As from 1980, the 3-year course was introduced to replace the 2-year course for students with Hong Kong Certificate of Education Examination qualification whilst the latter was re-structured to cater for students with Advanced Level qualifications. Prior to 1980, the Advanced Course of Teacher Education was known as the Third Year Course.
#The duration of the 2-year in-service courses was extended to 3 years in 1981 for secondary school teachers and in 1982 for primary school teachers. Correspondingly, a new 2-year secondary course was introduced in 1981 and a two-year primary course in 1986 for graduates of Hong Kong Baptist College, Hong Kong Shue Yan College and Lingnan College as well as holders of a Higher Diploma from the Polytechnics. The in-service course for teachers of children with special educational needs was originally administered by the Special Education Section of Education Department and since 1981, the Colleges of Education have taken over the full responsibility in the operation of the course.
Source: Education Department.
205

15 .14 Enrolment in Polytechnics and Baptist College by Department
Department
Hong Kong Polytechnic
Accountancy
Applied Science
Applied Social Studies
Building and Surveying
Business and Management Studies
Business Studies
Building Services Engineering
Centre of Environmental Studies
Civil and Structural Engineering
Computing Studies
Design
Diagnostic Sciences
Electrical Engineering
Electronic Engineering
Industrial Centre
Health Sciences
Hospitality Management
Land and Engineering Surveying
Languages
Management Studies
Mathematical Studies
Manufacturing Engineering
Mechanical and Marine Engineering
Medical and Health Care
Nautical Studies
Production and Industrial Engineering
Rehabilitation Science
Textiles and Clothing
Short courses throughout the academic year
Total
City Polytechnic of Hong Kong
Accountancy
Applied Mathematics
Applied Science
Applied Social Studies
Building and Construction
Business and Management
Centralized Laboratories
Computer Studies
Economic & Finance
Electronic Engineering
Public and Social Administration
Manufacturing Engineering
Mathematics and Science
Languages
Applied Linguistics
English
Information System
Law
Hong Kong Baptist College
Arts
Business
Science
Social Sciences
Pre-music programme
206
Total
Total
1981 FT PTDR PTE
785
142
196
402
744
425
471
355
478
548
161
92
190
650
546
199
526
715
7625
222 3 IOI
346 346
200
892 808
344 I 870
292 I 575
317
326 I 394
321 1141
81
34
606
455 I 342
117 65
38
165 424
84 506
3836 13 576
7820
1982 FT PTDR* PTE
797
165
219
432
661
39
442
546
376
499
551
141
113
203
481
618
223
396
604
7506
269 2 883
355 405
169
754 625
267 I 704
40
81
265
303 1 602
357
251 1 334
282 1155
36
154
143
107
586
555 I 240
99 221
27
272 464
217 487
4131 13 578
6855
1983 FT PTDR* PTE
828
317
268
460
549
102
441
657
398
419
496
139
130
213
675
699
229
471
709
8200
246 2 706
311 382
191 78
691 567
268 1 712
33
126
248
321 1 654
386
255 1170
243 1 034
39 120
38
199 87
451
277 1160
72 216
20
154 521
75 452
3559 12944
8524
1984 FT PTDR* PTE
782
488
297
476
555
114
358
588
396
332
391
171
30
142
226
357
825
223
393
553
7697
179
103
117
81
480
361
607
371
715
2054
204 2 519
351 462
173 223
541 919
271 I 714
39
129
271
62
304 1452
81
374
278 1 133
309 963
39 123
74
191 87
316
562 1 154
104 236
19
258 582
252 543
4179 13133
8276
247
197
124
110
71
749
1985 FT PTDR* PTE
757
594
313
430
569
106
336
506
412
286
391
181
51
145
230
354
967
246
401
625
7900
377
76
261
253
91
155
42
45
1300
387
637
402
718
62
2206
218 2 005
241 440
162 380
536 1 065
261 1 835
78
128
330
60
334 1 138
155
384
278 1 080
351 932
40 181
90
139
269
595 1179
165 273
267 490
302 627
4340 12668
10257
86# 351
20# 310
185
82
179
135
106# 1242
1986 FT PTDR* PTE
784
679
327
411
612
107
312
504
471
245
351
179
75
151
229
347
I 087
282
375
714
8242
588
148
428
331
177
280
82
84
2118
410
642
439
767
66
2324
229 1817
274 343
137 544
420 1 223
269 1 864
113
128
374
231
330
92
901
37
390
288 I 137
391 884
41 283
109
85
262
650 I 043
242 253
250 559
341 820
4572 12 782
11374
433
128#
36:ff 393
87* 372
144
243
49
180
251 1814

15.14 Enrolment in Polytechnics and Baptist College by Department (Continued)
1987 Department FT Sand MM PTDR PTE
Hong Kong Polytechnic
Accountancy
Applied Science
Applied Social Studies
Building and Surveying
Business and Management Studies
Business Studies
811
316
279
456
315
Building Services Engineering 101
Centre of Environmental Studies
Civil and Structural Engineering
Computing Studies
Design
Diagnostic Sciences
Electrical Engineering
Electronic Engineering
Industrial Centre
Health Sciences
Hospitality Management
Land and Engineering Surveying
Languages
Management Studies
266
403
472
325
195
349
261
184
72
424
178
Mathematical Studies 218
Manufacturing Engineering 383
Mechanical and Marine Engineering
Medical and Health Care
Nautical Studies
Production and Industrial Engineering
364
261
Rehabilitation Science 529
103
223
263
161
179
116
305
Textiles and Clothing 786 241
Total 7 948 1 591
Short courses throughout the academic year
City Polytechnic of Hong Kong
Accountancy 641
Applied Mathematics 121
Applied Science
Applied Social Studies
Building and Construction 216
Business and Management 505
Centralized Laboratories
Computer Studies 322
Economic & Finance
Electronic Engineering 253
Public & Social Administration 384
Manufacturing Engineering
Mathematics and Science
Languages
Applied Linguistics
English
Information System
Law
131
Total 2573
Hong Kong Baptist College
Arts 454
Business 666
Science 523
Social Sciences 86 l
Pre-music programme 65
Total 2569
164
164
526
39
146
29
224 2087
301 268
102 644
369 985
65
885
439
231 784
71
404
94 141
153 1178
228 968
33 284
162
87
93
42
147 1051
254
97 605
322 940
136
152 1 105
740 2 860 13 271
10 031
152
38
29
473
75
27
483
430
250
302
169
219 2209
1988 FT Sand MM PTDR PTE
829
384
263
460
400
108
251
411
506
312
211
367
225
121
78
496
179
232
354
386
273
516
130
234
299
141
188
129
119
21l6
819 269
8181 1 795
586
136
156
175
277
698
375
379
331
76
127
60
3376
465
712
602
884
68
2 731
227
227
558
78
142
132 1 915
99 211
100 671
346 774
67
923
435
335 703
102
423
57 126
183 1152
221 881
173
80
113 21
106
134
320
324
39
882
227
546
943
143
147 1174
778 2 634 12 594
180
50
83
556
161
83
166
40
592
486
39
417
137
57
172
76
313 2 982
Notes: Figures are as at December of the year except those for short courses.
1989 FT Sand MM PTDR PTE
829
439
351
500
389
109
225
409
520
289
222
365
267
62
78
547
177
228
359
418
276
486
150
244
305
142
191
256
144
263
837 265
8382 1960
635
206
356
266
395
887
505
540
391
237
140
125
4683
476
843
657
971
64
3011
310
310
564
159
170
41
34
75 1 927
84 219
65 685
311 686
58
997
396
286 534
100
420
40 73
216 1 003
224 873
159
136
104
44
106
85
338
161
43
683
234
559
849
142
146 1 346
968 2 477 11 930
200
66
56
237
248
138
220 17
740
2
566
67
501
199
164
258
138
322 3495
FT denotes full-time courses and for Hong Kong Polytechnic it includes mixed-mode courses before 1987. MM denotes mixed modes. PTDR denotes part-time day-release courses. PTE denotes part-time evening courses. Sand denotes sandwich courses. *PTDR include block release courses and sandwich courses.
:j:I: Figure refers to mixed-mode courses. tFigure excludes 27 Higher Degree Students.
@Figure excludes 35 Higher Degree Students.
Source: University and Polytechnic Grants Committee.
1990 FT Sand MM PTDR PTE
774
509
437
490
475
105
252
331
515
256
188
355
294
70
561
103
253
333
449
298
470
40
167
254
325
163
205
398
159
181
786 272
8304 2164
719
314
532
201
519
1 135
458
848
485
428
233
211
6084
550
925
727
1 017
66
3285
340
340
409
212
32
155
83
43
47
52 1 844
102 252
32 712
286 628
1165
24 457
289
18
221
262
153
158
112
21
128
84
376
483
107
302
79
897
758
181
40
605
229
564
943
126
149 802
981 2 467 11174@
228
120
59
375
322
214
291
27
759
587
66
558
228
310
206
75
116
316
407 4450
207

15.15 Full-time Enrolment in Universities by Faculty
University/Course/Faculty
University of Hong Kong
Undergraduates
Architecture
Arts
Dental Studies
Engineering
Law
Medicine
Science
Social Sciences
Speech & Hearing Science
Post-graduates
The Chinese University of Hong Kong
Undergraduates
Arts
Total
Business Administration
Social Sciences
Science
Engineering and Technology
Medicine
Post-graduates
Total
1981
254
1 107
149
812
215
760
644
823
335
5099
1 040
871
1 224
1236
60
378
4809
Note: Figures are as at December of the year.
1982
263
1 133 221
865
224
753
677 849
439
5424
1 019
845
1 224
1 271
139
373
4871
Source: University and Polytechnic Grants Committee.
1983
272
1 168
293
859
214
756
706
871
428
5567
1 033
865
1 236
1 346
219
349
5048
1984
285
1 212
349
879
267
756
739
891
543
5921
1 038
888
1 296 1452
320
392
5386
1985
275
1 268
332
963
306
757
836
921
606
6264
1 046
916
1 312
1 550
411
416
5651
· 15 .16 Enrolment in Adult Education by Type of Course by Type of Institution
Course/Type of institution
Arts and general subjects
Government
Private
Sub-total
Technical and vocational courses*
All courses
Government
Private
Total
1981
15 904
18 520
34424
41022
15 904
59 542
75446
1982
17 061
18 324
35 385
37 311
17 061
55 635
72696
1983
20 822
21 923
42 745
38165
20 822
60 088
80910
1984
21 004
24 765
45 769
39344
21 004
64 109
85113
1985
21 865
26 331
48196
42 393
21 865
68 724
90589
1986
276
1 303
319
980
347
753
924 998
630
6530
1 083
940
1 324
1 555
484
405
5791
1986
22 302
33 515
55 817
41507
1987
283
1 367
312
998
389
772
1 025
1 068
647
6861
1 089
1 015
1 382
1 586
525
373
5970
1987
24265
43 590
67855
43 988
1988
293
1 373
285
1234
423
757
849
1114
20
631
6979
1 096
1.090
1 378
1 672
582
457
6275
1988
22 904
40 888
63 792
40 780
1989
328
1 350
271
1278
437
767
837
1 145
39
635
7087
1 089
1177
1446
1 881
596
496
6685
1989
21 564
42 640
64204
39674
1990
275
1 372
247
1296
434
762
830
1184
58
778
7236
1 152
1254
1493
1 309
642
467
642
7090
1990
17 495
43 824
61319
39675
22 302 24 265 22 904 21 564 17 495
75 022 87 578 81 668 82 314 83 499
97 324 111 843 104 572 103 878 100 994
Notes: Figures are as at September of the year up to 1985 and as at October of the year as from 1986. Adult education refers to courses in Government evening institutes, the Evening School of Higher Chinese Studies and in various private schools offering a variety of subjects. Evening courses in Technical Institutes and Polytechnics and Baptist College and extra-mural courses in Universities are not included. *Technical and vocational courses refer to private institutions only.
Source: Education Department.
208

15.17 Enrolment in Private Commercial/English Tutorial Classes
1981 1982 1983 1984 1985 1986 1987 1988 1989 1990
Day schools 2065 1 871 1 841 1 839 1 730 1 565 1 545 1 861 1 867 1 827 Evening schools 13 733 13 125 12 439 12 395 9 135 7 921 5 705 4 815 4 665 3 591
Total 15798 14996 14280 14234 10865 9486 7250 6676 6532 5418
Note: Figures are as at September of the year.
Source: Education Department.
15.18 Schools and Enrolment in Special Education Schools by Type of School
Type of school 1981 1982 1983 1984 1985 1986 1987 1988 1989 1990
Blind Number of schools 3 3 3 3 3 3 2 2 2 2 Enrolment 203 206 208 182 182 166 146 153 157 164
Deaf Number of schools 5 5 5 5 4 4 4 4 4 4 Enrolment 675 685 704 653 671 659 647 638 621 608
Maladjusted Number of schools 8 8 8 8 8 8 8 8 8 8 Enrolment 1 096 1 088 1 049 1 030 999 1 055 1 181 1 153 1182 1130
Physically handicapped Number of schools 20 20 20 18 19 19 19 19 18 18 Enrolment 1 006 1 015 1 024 988 1 003 989 1 050 1 022 1 014 999
Slow learning/Mentally handicapped Number of schools 32 35 35 35 37 36 36 37 39 39 Enrolment 3 197 3 692 3 964 4 251 4 341 4447 4 543 4775 5 002 4922
All types Number of schools 68 71 71 69 71 70 69 70 71 71 Enrolment 6177 6686 6949 7104 7196 7 316 7567 7741 7976 7823
Note: Figures are as at September of the year.
Source: Education Department.
15.19 Special Classes in Normal Schools and Enrolment by Type of Class
Type of special class 1981 1982 1983 1984 1985 1986 1987 1988 1989 1990
Partially sighted Number of classes 8 8 8 8 8 7 7 8 8 8 Enrolment 75 82 66 73 73 79 80 80 75 63
Partially hearing Number of classes 35 35 32 30 27 24 21 18 16 14 Enrolment 265 251 245 233 211 181 162 150 133 113
Slow learning Number of classes 352 299 210 132 72 34 14 Enrolment 4 991 4273 3 211 2065 1175 533 190
Maladjusted and socially deprived Number of classes 67 44 18 Enrolment 566 344 120
English-speaking Number of classes 6 6 5 Enrolment 43 30 31
All Types Number of classes 468 392 273 170 107 65 42 26 24 22 Enrolment 5940 4980 3673 2371 1459 793 432 230 208 176
Note: Figures are as at September of the year.
Source: Education Department.
209

15.20 Teaching Staff by Qualification Number of teachers
Level of school/Qualification of teacher 1981 1982 1983 1984 1985 1986 1987 1988 1989 1990
Kindergarten University graduate or equivalent
Trained 104 102 103 65 65 55 61 58 55 88 Untrained 118 118 103 94 95 103 108 101 82 98
Non-graduate Trained 599 586 1 218 1 367 1 544 1 791 2 167 2 576 2 969 3106 Untrained 4540 4666 4 522 5 076 5 255 5 556 5 292 4 797 4032 4 303
Primary University graduate or equivalent
Trained 857 983 988 959 949 914 927 903 532 885 Untrained 370 409 368 407 394 409 481 508 445 467
Non-graduate Trained 14 916 15 637 15 425 15 517 15 556 15 688 15 950 16197 16 108 15 877 Untrained 1 721 2 359 2 650 2 738 2 505 2 350 2267 2 205 2169 2 289
Secondary and matriculation University graduate or equivalent
Trained 4 281 4 871 5 634 6125 6 738 7 454 8 169 8 706 8 606 9 253 Untrained 4898 5 404 5470 5 377 5 055 4 906 4672 4444 4 091 4063
Non-graduate Trained 4296 4 012 4084 4185 4 543 4840 5 OOO 5 115 5 429 5 566 Untrained 2 564 2 584 2292 2 153 1 956 1 724 1 578 1 462 1 351 1 277
Technical institute University graduate or equivalent
Trained 58 53 53 58 72 72 117 159 153 233 Untrained 93 89 109 113 124 161 207 181 211 175
Non-graduate Trained 110 129 154 167 186 205 223 318 306 329 Untrained 96 78 72 75 78 107 145 99 116 73
Post-secondary* University graduate or equivalent
Trained 229 306 313 365 352 402 400 437 465 473 Untrained 399 334 365 371 185 219 168 160 250 237
Non-graduate Trained 84 85 141 132 160 122 150 145 110 137 Untrained 6 10 26 8 8 12 5 4 4
Notes: Figures are as at September of the year except for post-secondary colleges the statistics of which are as at March of the year for 1980-1985. From 1989, figures refer to permanent teachers only. Teachers in English Schools Foundation Schools and International Schools were not covered in 1989. *Figures include lecturers in Colleges of Education, approved post-secondary colleges, and schools offering courses of a post-secondary nature.
Sources: Education Department. Vocational Training Council and Technical Education and Industrial Training Department.
15.21 Teaching Staff by Level by Sex
Level Sex 1981 1982 1983 1984 1985 1986 1987 1988 1989 1990
Kindergarten M 134 123 102 113 109 106 99 87 67 75 F 5 227 5 349 5 844 6489 6 850 7 399 7 529 7 445 7 071 7 520
Primary M 4 798 5 203 5 189 5 170 5 019 4963 5 006 4997 4 823 4938 F 13 066 14185 14 242 14 451 14 385 14 398 14 619 14 816 14 431 14 580
Secondary and matriculation M 8 233 8 707 8 971 9055 9 123 9439 9 576 9 798 9 672 10 160 F 7 806 8 164 8 509 8 785 9 169 9 485 9 843 9 929 9 805 9 999
Technical institute M 310 302 338 361 396 452 562 616 633 647 F 47 47 50 52 64 93 130 141 153 163
Post-secondary* M 510 523 581 611 451 483 466 473 573 564 F 202 208 248 283 254 268 264 274 256 287
Notes: Figures are as at September of the year except for post-secondary colleges the statistics of which are as at March of the year for 1980-1985. From 1989, figures refer to permanent teachers only. Teachers in English Schools Foundation Schools and International Schools were not covered in 1989. *Figures include lecturers in Colleges of Education, approved post-secondary colleges and schools offering courses of a post-secondary nature.
Sources: Education Department. Vocational Training Council and Technical Education and Industrial Training Department.
210
--------------- -- ---------

15.22 Pupil/Teacher Ratios in Primary and Secondary Day Schools by Type of School
Level/Type of school 1981 1982 1983 1984 1985 1986 1987 1988 1989 1990
Primary day schools
Government 29.4 27.5 27.4 27.1 27.9 27.6 27.1 26.7 26.5 27.0 Aided 29.8 27.3 27.5 27.1 27.5 27.4 27.2 26.9 27.l 27.0 Private 32.3 31.5 30.5 29.0 28.2 28.0 27.4 28.4 29.2 26.l
Secondary day schools
Government 21.7 21.4 20.6 21.4 21.0 20.5 20.1 20.0 19.9 21.0 Aided 24.8 24.4 23.2 22.9 22.3 22.1 21.7 21.5 21.4 21.2 Private 34.6 35.7 35.2 33.0 32.3 30.7 29.5 27.9 29.0 23.8
Notes: Figures are as at September of the year. From 1989, figures refer to permanent teachers only. Teachers in English Schools Foundation Schools and International Schools were not covered in 1989. Secondary day schools include grammar, technical and pre-vocational schools, matriculation and commercial classes, but exclude tutorial day schools. From 1989, aided secondary schools also cover caput/assisted private schools.
Source: Education Department.
15.23 Analysis of results of Hong Kong Certificate of Education Examination, 1990 Percentage
Grades achieved Number Number
Subject entered sat A A-B A-C A-D A-E A-F
Accommodation and Catering Services 71 71 1.41 5.63 15.49 45.07 74.65 92.96 Additional Mathematics 25 088 22096 5.35 15.58 33.51 58.94 79.70 92.04 Art 8 112 7 584 2.61 7.25 16.09 40.02 68.18 88.28 Biology 37 579 34269 3.65 11.02 25.22 46.03 66.21 80.95 Buddhist Studies (Syl. 1) 217 194 1.55 4.12 9.79 26.80 47.94 70.10 Buddhist Studies (Syl. 2) 1275 1 129 1.95 7.00 17.80 38.18 60.23 80.16 Chemistry 37 063 33 015 3.71 11.08 26.67 49.86 69.82 85.44 Chinese History 43 555 39 226 2.10 6.29 14.11 34.34 58.79 78.99 Chinese Language 97 579 90 179 2.10 6.88 16.56 36.39 60.25 80.26 Chinese Literature 23 505 20 835 2.19 7.14 16.94 37.96 62.05 80.59 Commerce 11 025 9445 1.88 5.24 12.63 28.71 48.30 69.30 Computer Studies 14 771 13 349 3.90 11.63 24.16 44.55 65.92 81.23 Design and Technology 906 865 1.50 5.66 15.72 38.73 66.59 87.51 Dressmaking 250 238 1.68 6.72 18.49 50.42 81.93 96.64 Economic and Public Affairs 4 363 3 880 2.53 7.55 17.99 38.27 59.20 77.65 Economics 40 880 35 874 2.17 6.96 16.75 36.84 59.02 76.81 Electronics and Electricity 1 331 1298 2.47 8.78 21.57 44.53 70.88 88.91 Engineering Science 1 015 920 1.85 6.41 16.63 36.41 61.52 82.61 English Language (Syl. A) 5 970 5 728 1.41 6.11 17.95 37.22 60.09 79.10 English Language (Syl. B) 128 336 120 341 1.23 3.38 8.36 32.81 60.31 83.11 English Literature 1 032 987 10.64 23.40 42.76 72.85 91.08 98.18 Fashion and Clothing 101 101 1.98 6.93 18.81 45.54 75.25 93.07 French 175 147 19.05 29.93 43.54 55.10 66.67 76.87 Geography 35 702 32 371 2.60 8.01 18.71 39.84 62.84 80.52 German 19 12 16.67 25.00 50.00 58.33 66.67 83.33 Government & Public Affairs 970 842 3.68 11.76 24.82 44.30 66.27 85.63 History 25 064 22 538 2.45 7.40 18.05 38.86 62.24 80.50 Home Economics 664 652 2.15 10.12 29.45 55.37 76.69 90.49 Human Biology 4 938 4 555 3.49 10.21 23.38 48.36 73.13 89.44 Mathematics 99 935 90 777 3.66 11.93 27.66 50.73 70.78 85.34 Metalwork 979 939 2.13 6.39 15.02 36.74 63.37 84.77 Music 222 205 5.37 12.68 25.85 43.41 63.41 80.00 Needlework/Dress 36 36 8.33 25.00 50.00 77.78 94.44 100.00 Physics 39 538 36063 3.25 10.29 25.95 46.87 67.17 82.98 Pottery 50 50 10.00 24.00 40.00 62.00 82.00 94.00 Principles of Accounts 20 169 17 120 2.22 5.52 13.14 31.20 54.11 76.35 Religious Studies 13 136 12 366 2.94 9.21 22.38 45.22 68.82 87.31 Shorthand 494 459 14.60 33.77 47.06 69.06 82.35 86.27 Social Studies 550 457 2.19 6.35 15.54 40.48 68.93 89.50 Technical Drawing 3 327 3 083 1.39 5.58 16.35 38.01 64.26 84.72 Textiles 111 110 0.91 2.73 7.27 27.27 59.09 85.45 Typewriting 10 626 9774 5.44 12.49 26.16 42.78 60.10 76.21 Woodwork 121 115 0.87 2.61 7.83 21.74 45.22 70.43
Note: Most subjects offered in this examination may be taken either in Chinese or English. With effect from 1986, the Hong Kong Examinations Authority decided not to print the language medium indicator on Certificate of Education Examination certificates. Following this decision, it has been the practice to combine the examination statistics for both language versions of the same subject.
Source: Hong Kong Examinations Authority.
211

15.24 Results of Advanced and Higher Level Examinations
Hong Kong Advanced Level Examination*
Number of candidates entered
Number of candidates successfully completing entrance requirements of University of Hong Kong :fl:
Hong Kong Higher Level Examination
Number of candidates entered
Number of candidates successfully completing entrance requirements of The Chinese University of HongKongt
1981
13 435
8 407
18 336
4429
1982 1983
14 660 15 588
7 676 8 846
18 558 18 726
4 636 4 661
1984
16 488
9 279
17 226
4 868
1985 1986 1~87 1988
18 844 21 200 21432 21 315
10 958 12 357 12404 12 212
12 585 9 219 6 956 6426
2 681 I 553 1 001 858
Notes: The Hong Kong Advanced and Higher Level Examinations are conducted by the Hong Kong Examinations Authority.
1989 1990
19 502 17 851
6757 6493
5 425 4 836
730 706
*Degree-granting tertiary institutions other than the University of Hong Kong also use the Advanced Level Examination results as a basis for admissions to first-degree courses.
:fl: With effect from 1989, Hong Kong University raises its entry requirement for Use of English from grade E to grade D. Because of this change, the figure on the number of candidates successfully completing the Hong Kong University entrance requirements shows a substantial decrease in 1989.
tFrom 1985, the Chinese University uses the Provisional Acceptance Scheme (PAS) as one of its admission channels. Under this Scheme, a substantial number of places for degree courses are offered to Anglo-Chinese lower 6 students, many of whom have not taken the Higher Level Examination. The number of such students is not reflected in the statistics on candidates successfully completing the Chinese University entrance requirements. Therefore, the statistics do not relate to the situation concerning admissing to the Chinese University.
Sources: Hong Kong Examinations Authority. University of Hong Kong. The Chinese University of Hong Kong.
15.25 Academic Awards Conferred (Full-time Courses) at Hong Kong Polytechnic
Department
Accountancy
Applied Science
Building and Surveying
Building Services Engineering
Business and Management Studies
Civil and Structural Engineering
Computing Studies
Design
Electrical Engineering
Electronic Engineering
Hospitality Management
Institutional Management and Catering Studies
Land & Engineering Surveying
Languages
Manufacturing Engineering
Mathematical Studies
Mechanical and Marine Engineering
Medical and Health Care
Nautical Studies
Production and Industrial Engineering
Social Work
Textiles and Clothing
Total
212
1981 H.
Asso. Dip. Dip. Cert.
217 29
26 17
47 81
172 119
47 74 64
38 69
54 83
19 92 81
52 113 66
32
16 19
36
34 119 49
117 62
15
33 112 34
69 37
114 90
238 1 396 883 37
1982 H.
Asso. Dip. Dip. Cert.
240
20 20
45 106
154 lll
21 70 67
40 70
96 88
16 104 74
25 113 74
29 30
17 17
56
16 99 59
96 79
32
16 69 20
73 37
12 129 37
152 1 470 819 37
1983 H.
Asso. Dip. Dip. Cert.
236
26 19
58 106
16
88 91 103
29 83 60
96
76 85
27 105 61
46 115 66
31 26
20 20
56
20 115 62
120 79
29 102 30
75 39
133 38
660 1 081 820 39
1984 H.
Asso. Dip. Dip. Cert.
267
29 30
93 34
22
116 43 20
29 72 75
39 34
83 110
34 96 62
43 109 74
29
17 17
54
17 124 67
133 74
40 26
32 112
97 40
25 148 35
789 1 051 721 40
1985 H.
Asso. Dip. Dip. Cert.
255
34 25
147 39
36
124 45
20 Ill
130 32
69 115
35 109
41 109
48
29 17
56
30 104 25
171 87
39 25
37 97
29* 98 40
20 119
909 1174 424 40
1986 H.
Asso. Dip. Dip. Cert.
227
33 22
115 39
34
130 53
44 108
125 31
28 118
32 96
43 109
63
33 14
73
20 74 26
198 92
22 35
22 122
28* 97 40
14 162
873 1174 435 40

15.25 Academic Awards Conferred (Full-time Courses) at Hong Kong Polytechnic (Continued)
Department
Accountancy
Applied Science
Building and Surveying
Building Services Engineering
Business and Management Studies
Civil and Structural Engineering
Computing Studies
Design
Electrical Engineering
Electronic Engineering
Hospitality Management
Institutional Management and Catering Studies
Land & Engineering Surveying
Languages
Manufacturing Engineering
Mathematical Studies
Mechanical and Marine Engineering
Medical and Health Care
Nautical Studies
Production and Industrial Engineering
Social Work
Textiles and Oothing
Total
1987
Prof H. Degree Asso. Dip. Dip. Dip. Cert. P.R.D.
22
45
46
33
14
14
45
25
248
80
130
227
64
39
36
55
77
129 31
28 120
72
112
55
21
33
116
68
95
18
31
98
54 51
93
33 166
38
91 154 718 I 220 442 38
18
18
1988 Assa. Prof H. P.R.D.
Master Degree Dip. Dip. P.R.C. Dip.
55
48
243
121
122
240
88
35
27
85
130
69
113
62
16
98
113
57
99
39
32 199
103 776 1231
109
17
32
29 131
52
97
29 438
Notes: Assa. denotes Associateship and includes Advanced Higher Diploma and Post Graduate/Experience. Prof. Dip. denotes Professional Diploma. H. Dip. denotes Higher Diploma. Dip. denotes Diploma. Cert. denotes Certificate. P.R.D. denotes Post Registration Diploma. P.R.C. denotes Post Registration Certificate. *Figure refers degree award recipients.
Source: University and Polytechnic Grants Committee.
1989 Asso. hof H. P.R.D./
Master Degree Dip. Dip. P.R.C./ Dip.
248
67
104 27
33
40 135
81
40
249
94
143
60
114
59
18
97
110
69
76
42
27 207
161 769 1216
21
112
29
90
45
89
21 365
15.26 Academic Awards Conferred (Sandwich Courses) at Hong Kong Polytechnic
1988 Associateship/
Professional Higher Higher Higher Higher
1990 As so. Prof H. P.R.D./
Master Degree Dip. Dip. P.R.C. Dip.
282
124
41 94 34
34
41 135
86
38
38
241
63
144
56
117
62
29
116
117
64
124
95
42
33 225
244 785 1446
21
118
35
12
23
84
21 272
Department Degree Diploma Diploma Certificate Degree
1989 Associateship/
Professional Diploma Diploma Certificate Degree
1990 Associateship/
Professional Diploma
Higher Diploma
Building Services Engineering
Civil and Structural Engineering
Computing Studies
Electrical Engineering
Electronic Engineering
Manufacturing Engineering
Mechanical & Marine Engineering
Textiles and Clothing
Total
49
31
23
37
30
170
36
36
34
40
74
23
23
24
52
71
21
45
25
32
32
302
Note: Higher Certificate Courses were shifted to Technical Institutes starting from 1990.
Source: University and Polytechnic Grants Committee.
32
32
38
38
14
14
36
53
76
30
39
25
31
34
324
27
27
27
27
213

15.27 Academic Awards Conferred (Full-time Courses) at City Polytechnic of Hong Kong
1988 1989 1990 Professional Higher Professional Higher Professional Higher
Department Degree Diploma Diploma Diploma Degree Diploma Diploma Diploma Degree Diploma Diploma Diploma
Accountancy 201 214 204
Applied Mathematics 37 44 39
Applied Social Studies 83 84
Building and Construction 27 31 36 43 37 36
Business and Management 60 99 89 98 74 89
Computer Studies 95 42 39 53 47 76
Electronic Engineering 41 38 39 38 42 43
Languages 40 41
Applied Linguistics 46
Public and Social Administration 87 58 43 53 38
Total 101 360 250 87 305 215 316 83 292 204 328 84
Source: University and Polytechnic Grants Committee.
15.28 Academic Awards Conferred (Full-time Courses) at Baptist College
1988 1989 1990 Honours Honours First Honours Senior Cert. of
Department Diploma Diploma Degree Diploma Diploma Completion
Arts 114 157 167
Business 187 218
Science 137 181
Social Sciences 219 283 184
Sub-total 657 839 351
Computing Studies 31
Sub-total 31
Pre-Music Programme 30
Sub-total 30
BBA (Accounting) 50
BBA (Applied Economics) 51
BBA (Finance) 55
BBA (Marketing) 44
BBA (Office Management) 39
BSC (Applied Biology) 45
BSC (Applied Chemistry) 44
BSC (Applied Physics) 32
BSC (Mathematical Science) 40
BSS (Film & Video) 30
BSS (Journalism) 35
BSS (Public Relation & Advertising) 25
BSW 32
Sub-total 522
Total 657 839 522 351 31 30
Source: University and Polytechnic Grants Committee.
214

15.29 University Degrees and Diplomas Conferred
University of Hong Kong
Degrees
D.Sc.
M.D.
M.S.
Ph.D.
M.D.S.
M.A.
M.Med.Sc.
M.Ed.
M.Phil.
M.Sc. (Eng.)
M.Sc. (Urban Planning)
M.Sc. (Construction Project Management)
M. (Urban Design)
M.Soc.Sc.
M.S.W.
M.B.A.
M.P.A.
LL.M.
M.B., B.S.
B.Sc. (Eng.)
B.Sc. (Bulg. Studies)
B.Arch.
B. Building
B.Sc.
B.A.
B.A. (Arch.Studies)
B.Soc.Sc.
LL.B.
B.Sc. (Biomedical Sc.)
B.Sc. (Computer Studies)
B.Sc. (Q.S.)
B.D.S.
B.S.W.
Diplomas/ certificates
Education
P.C.LL.
Others*
Chinese University of Hong Kong
Degrees
M.D.
Ph.D.
M.Phil.
M.B.A.
M.S.W.
M.A.
M.A. (Ed.)
M.Div.
M.Sc.
M.Soc.Sc.
B.A.
B.Sc.
B.B.A.
B.S.Sc.
M.B.Ch.B
B.Med.Sc.
Diplomas
Education
Social Work
1981
2 3
11
17 2
16 36 35
29 16 14
144 260
11 32 15
210 359 37
266 50
304 54 87
43 70 2
I
8
259 268 250 295
320
1982
3
18
10 2
23 35 33
25 19 21
156 241
15 30 15
206 365 44
263 57
2
401 60 87
39 77
2
16 2
259 293 241 313
258
1983
5
21
23
35 35 55 4
39 14 26
144 286
11 31 15
212 362 42
275 70
320 64
124
68 71 4
25
245 271 200 307
295
1984
26
9
2
24 31 26 11
55
10 28
151 257
38 9
207 366 41
271 61
435 85
100
4
69 73
7
13
248 254 212 325
317
1985
14
32
24 40 65 15
51 19 66
146 252
48
207 381 43
292 73
28 13
68
433 82
115
6 66 85 4
I
7
251 267 207 309
344
1986
23
18
29 34 23 14
31 18 25
142 308
40
215 402
42 294 74
2
28 16 72
539 110 60
I
It 75t 89t 3t
16t
19t 3
242 330 220 328 46
393 17
1987
2
28 5
43
50 60 82 14
58 32 38
153 290
32
209 399 40
300 111
2 30 16 67
563 113 61
10 77 83
6
15 17 4
272 329 224 321
67
437 2
Note: Others include Cert.Chln.Language, Cert.Psych., Cert.Med.Sc., P.Dip.B.S. and Cert.Eng.Subj. (Extra-Mural Studies).
Source: University and Polytechnic Grants Committee.
1988
4 I
46 5
8
22 46 57
8
14
63 34 28
17 145 306
38
270 445
48 317 105
54 14 70
540 126 90
3 85
104 3
20 25
2
3
303 349 255
381 66
364 11
1989
2 I
29 4
44
49 65 72 8
2
80 20 41
9
141 293
34
273 452 42
308 128
3 55 16 54 59
479 140 141
9 87
100
14 26
2
309 315 271 349 101
426 16
1990
4
39 5 7 2
38 51
113 17 16
54 35 32 14 15
145 325
21
276 433
41 313
141 5
63 18 58 54
437 137 106
3
10 101 106
22 8
2
I 4
277 341 271 375 86
3
393 15
215

15.30 Expenditure on Education HK$'000
1981/82 1982/83 1983/84 1984/85 1985/86 1986/87 1987/88 1988/89 1989/90
Recurrent
Education Department*
Pre-primary services 5,388 14,966 24,144 33,204 45,334 51,481 56,465 65,009
Primary 1,295,911 1,703,196 1,671,845 1,942,184 2,146,100 2,375,962 2,544,345 2,847,494 3,263,776
Secondary 1,260,312 1,572,127 1,734,142 2,045,264 2,318,463 2,756,439 3,072,915 3,647,846 4,289,387
Special education# 207,699 170,333 202,240 238,405 264,633 306,286 367,543
Teacher training 32,836 47,529 60,455 72,686 86,220 102,461 111,671 125,428 147,498
Technical and vocational 69,908
Post-secondary 32,143 41,806 32,887 20,382 18,078 18,330 18,307 27,986 44,075
Other education 22,447 43,552 56,796 52,239 56,357 64,852 74,697 100,086 120,236
Administrative (non-allocated) 104,981 103,209 116,443 135,349 140,106 163,659 185,200 220,367 259,029
Technical Education and Industrial Training Departmentt
Technical and vocational 128,653 170,841 226,748 295,197 363,458 458,210 539,370 663,092
University and Polytechnic Grants Committee@
Tertiary 748,174 924,155 1,037,834 1,401,295 1,632,221 1,885,804 2,022,606 2,432,269 2,966,948
Non-recurrent
Education Department 245,751 337,868 274,670 404,308 307,936 312,721 396,447 620,911 620,206
Technical Education and Industrial Training Departmentt
Technical and vocational 1,763 38,488 132,899 138,296 235,621 103,694 77,534 123,094
University and Polytechnic Grants Committee@
Tertiary. 150,264 133,916 150,540 200,998 157,302 175,753 289,712 724,611 686,261
Total expenditure 3,962,727 5,043,162 5,567,606 6,828,829 7,531,720 8,738,799 9,593,918 11,726,653 13,616,154
Notes: *Subventions on education are included. #Expenditure on special education is separated from primary and secondary level commencing from 1983/84. tTechnical Education and Industrial Training Department was formed in April 1982 to take over the responsibility of providing technical and vocational training.
@Grants to the two Universities, Polytechnics and Baptist College are included.
Sources: Education Department. Vocational Training Council and Technical Education and Industrial Training Department. University and Polytechnic Grants Committee.
216

Section 16 Medical and Health
Tables 16.1to16.28 General Information
The population of Hong Kong is provided with a comprehensive range of medical and health services by the Department of Health and Hospital Services Department, Government-assisted institutions and private practitioner clinics and hospitals.
There are 25 282 beds in 14 Government hospitals, 23 hospitals/treatment centres in Correctional Institutions, 19 Government maternity homes/clinics, 20 Government-assisted hospitals, 11 private hospitals and 1 private nursing home as at end of 1990. This represents a bed-population ratio of 4.3 beds per 1 OOO population.
A wide spectrum of out-patient services is provided by the Government through the general out-patient clinics, polyclinics/specialist clinics, maternal and child health clinics, accident and emergency units and medical rehabilitation centres. The Government operates 64 (55 public and 9 non-public) general out-patient clinics. Apart from Government-run medical and health institutions, the Government-assisted and private sectors also play a significant complementary role in the provision of easily-accessible medical facilities to the public at a reasonable cost.
Details on the mortality and morbidity experiences of Hong Kong as well as workload statistics in respect of the public sector are presented in this Section.
Data Sources
Statistics in this Section are obtained from the routine statistical systems of the Department of Health and Hospital Services Department.
Hospital beds statistics are compiled from annual hospital beds survey while figures on deaths are obtained through the Death Statistics System jointly maintained by the Census and Statistics Department, Immigration Department, the Department of Health and Hospital Services Department. Data on the registered medical personnel are maintained by the Medical Council and Licentiate Committee for doctors and licentiates, Dental Council for dentists and dental hygienists, Nursing and Midwives Boards for nurses and midwives and Pharmacy and Poisons Board for pharmacists. Annual re-registration is required only for doctors, dentists and pharmacists. Other statistics are derived from the Infectious Diseases Registry, the Tuberculosis Registry, the Cancer Registry and from various other surveys and administrative records of the Department of Health and Hospital Services Department. Most of the workload statistics (Tables 16.4 and 16.13 to 16.24) are obtained from routine statistical systems where monthly and quarterly data are maintained to produce the annual statistics presented in this publication.
Further References
Further details on medical and health statistics are available from the Annual Departmental Reports prepared by the Director of Health and the Director of Hospital Services.
217


16.l Medical Institutions and Beds by Area by Type
Area/Type of institutions 198J J982 J983 J984 J985 J986 J987 J988 J989 J990
Hong Kong Island
Government hospitals Establishments 3 3 3 3 3 3 3 3 3 3 Number of beds 1 576 1 673 1 671 1 671 1 686 1 686 1 686 1 686 1 628 1 594
Hospitals in Correctional Institutions Establishments 5 5 6 5 6 6 6 6 8 7 Number of beds 145 139 125 134 142 136 140 141 152 145
Government maternity homes/clinics Establishments 1 1 1 1 1 1 Number of beds 26 26 26 26 26 26
Government-assisted hospitals Establishments 9 9 9 10 10 10 10 10 10 10 Number of beds 3 245 3 245 3 245 3 355 3408 3408 3 352 3 377 3 397 3 349
Private hospitals Establishments 6 6 6 6 6 6 6 6 6 6 Number of beds 1 445 1 451 1436 1439 1 426 1 383 1 375 1 419 1 426 1 418
Private nursing and maternity homes Establishments Number of beds
Sub-total Establishments 24 24 25 25 26 26 25 25 27 26 Number of beds 6437 6534 6503 6625 6688 6639 6553 6623 6603 6506
Kowloon
Government hospitals Establishments 3 3 3 3 3 3 3 3 3 3 Number of beds 3 431* 3 431* 3 485* 3 447* 3 441 # 3 386 3 386 3 386 3 370 3 351
Hospitals in Correctional Institutions Establishments 1 1 2 2 2 2 2 3 3 2 Number of beds 94 94 98 98 98 98 98 105 106 98
Government maternity homes/clinics Establishments 6 7 7 7 7 7 7 7 6 . 5 Number of beds 140 164 164 164 164 164 164 164 142 118
Government-assisted hospitals Establishments 7 7 7 7 7 7 7 7 7 7 Number of beds 4 846 5 313 5 427 5 417 5 408 5 387 5 382 5 394 5 415 5 314
Private hospitals Establishments 4 4 4 4 4 4 4 4 4 4 Number of beds 938 1 111 1 131 1 156 1 160 1136 1205 1250 1 257 1 292
Private nursing and maternity homes Establishments 6 5 4 3 2 2 2 1 1 1 Number of beds 84 80 71 61 62 65 65 44 44 44
Sub-total Establishments 27 27 27 26 25 25 25 25 24 22 Number of beds 9533 JO J93 JO 376 J0343 JO 333 JO 236 J0300 J0343 J0334 J0217
New Territories
Government hospitals Establishments 7 7 7 8 8 8 8 8 8 8 Number of beds 4 341 4 616 4 744 5 599 6105 6195 6 563 6 585 6 681 6 989
Hospitals in Correctional Institutions Establishments 12 11 11 12 13 13 13 14 15 14 Number of beds 305 347 347 403 411 379 379 399 415 516
Government maternity homes/clinics Establishments 14 15 14 14 14 15 15 15 15 14 Number of beds 223 253 221 217 215 215 215 221 221 197
Government-assisted hospitals Establishments 3 3 3 3 3 3 3 3 3 3 Number of beds 664 664 664 806 806 806 806 806 725 777
Private hospitals Establishments 1 1 1 1 1 1 1 1 1 1 Number of beds 83 83 80 80 80 80 80 80 80 80
Private nursing and maternity homes Establishments Number of beds
Sub-total Establishments 37 37 36 38 39 40 40 4J 42 40 Number of beds 5 6J6 5 963 6056 7105 7617 7675 8043 809J 8 J22 8559
Total number of beds 21586 22690 22935 24073 24638 24550 24896 25057 25059 25282
Beds per thousand populationt 4.1 4.3 4.3 4.4 4.5 4.4 4.4 4.4 4.3 4.3
Notes: Figures are as at end of the year. *Figure includes 80 beds in the British Military Hospital.
#Figure includes 71 beds in the British Military Hospital. tFigures are revised based on end-year population derived using the 1986 By-Census results.
Sources: Hospital Services Department.
219

16.2 Hospital Beds by Classification of Bed
Classification of bed
Internal medicine
Surgery
Orthopaedics & traumatology
Gynaecology
Obstetrics/maternity
Paediatrics and babies
Mentally-ill
Mentally handicapped
Tuberculosis and chest diseases
Infectious diseases
Geriatrics
Rehabilitation and physical medicine
Radio-therapy and oncology
Mixed specialties
Casualty, observation and custodian
Unclassified
Total
Notes: Figures are as at end of the year.
1981
4183
3 387
1464
695
2096
1 552
3 190
400
1205
294
419
264
376
227
643
1 191
21586
1982
4 313
3 437
1 640
708
2 155
1 633
3 436
500
1 201
296
611
262
379
249
678
1 192
22690
1983
4 380
3 470
1 721
707
2142
1 594
3 490
500
1 213
295
603
260
389
262
661
1 248
22935
1984
4 561
3 695
1 766
761
2259
1 768
3 547
500
1 192
297
623
421
453
287
731
1 212
24073
'Mixed specialties' beds include eye, ear-nose-throat, skin and dental beds.
1985
4 658
3 817
1 867
777
2299
1 774
3 603
500
1 183
308
705
401
450
339
760
1 197
24638
1986
4477
3 765
1 851
748
2 212
1 700
3 736
500
1 167
269
717
451
470
330
724
1433
24550
1987
4452
3 801
1 871
756
2 168
1 662
4 074
500
1 167
268
721
451
470
344
727 1464
24896
1988
4470
3 858
1 840
758
2 182
1 705
4074
500
1 161
256
724
466
470
373
755
1 465
25057
Number of beds
1989
4484
3 879
1 805
746
2 116
1 691
4140
500
1132
256
724
466
458
385
785
1492
25059
1990
4 510
3 693
1 893
746
2057
1 688
4 146
500
1 082
244
681
474
478
408
876
1 806
25282
'Unclassified' beds include staff beds, beds in private wards, mixed beds in intensive care units and overflow beds.
Sources: Hospital Services Department.
16.3 Hospital Beds by Classification of Bed by Area by Type of Institution, 1990
Hong Kong Island
Govern-Govern- ment-
ment assisted Private Classification of bed institution institution institution
Internal medicine
Surgery
Orthopaedics & traumatology
Gynaecology
Obstetrics/maternity
Paediatrics and babies
Mentally-ill
Mentally handicapped
Tuberculosis and chest diseases
Infectious diseases
Geriatrics
Rehabilitation and physical medicine
Radio-therapy and oncology
Mixed specialties
Casualty, observation and custodian
Unclassified
Total
Notes: Figures are as at end of 1990.
352
341
147
107
195
182
48
18
52
179
118
1739
862
691
296
75
132
80
630
30
240
180
68
65
3349
368
247
51
147
181
156
5
5
20
24
3
17
41
8
145
1418
Kowloon
Govern-Govern- ment-
ment assisted Private institution institution institution
485
666
440
84
370
287
507
127
20
97
104
126
254
3567
1 384
868
510
181
373
397
30
300
177
40
434
80
64
48
17
411
5314
144
121
4
221
123
54
669
1336
'Mixed specialties' beds include eye, ear-nose-throat, skin and dental beds.
Number of beds
New Territories
Govern-Govern- ment-
ment assisted Private institution institution institution
724
613
385
138
479
434
3 556
200
164
124
65
91
88
546
95
7702
191
146
64
10
82
20
143
15
86
11
7
2
777
24
9
47
80
Total
4510
3693
1893
746
2057
1688
4146
500
1082
244
681
474
478
408
876
1806
25282
'Unclassified' beds include staff beds, beds in private wards, mixed beds in intensive care units and overflow beds.
Sources: Hospital Services Department.
220

16.4 Prophylactic Immunizations
Immunological procedure 1981 1982 1983 1984 1985 1986 1987 1988 1989 1990
Anti-smallpox vaccination 1 676 1 041 578 229
Anti-cholera inoculation 7 870 8 053 5 887 5 595 5 691 138 872 7146 6 238 5 542 5 025
Triple vaccine inoculation (Diph./Pert./Tet.) 251 384 267 477 267 365 263 317 257 083 243 069 234 391 231 818 250 872 237 967
Combined Diphtheria and Tetanus vaccine inoculation 102 954 186 054 147 262 177 964 141 742 178 733 177 864 191 294 194 478 170 352
Anti-typhoid inoculations lst dose 25 999 8 258 829 1 180 1147 1 530 58 20 24 5 2nddose 3 687 1 168 63 102 138 75 41 12 66 19 Booster dose 40 508 12 663 1 097 720 858 856 1 718 1 798 2 731' 1 952
Anti-tuberculosis (B.C.G.) inoculations Infants 87 694 86 562 84 186 78 389 77 199 72 780 71 049 77 187 72 699 71 034 Others 51 208 57 213 72 050 52 622 60 393 68 956 57 705 67 816 62 466: 83 277
Oral poliovaccine type I for newborn 84094 83 823 81 528 76096 74 312 69 357 67 338 74 071 69 879 68 898
Anti-poliomyelitis vaccinations lst dose 80 750 78 844 75 670 70 608 67 302 63 137 63 813 70 237 77 573 66 378 2nddose 76 501 79 586 77 768 74679 72 175 67 020 63 545 66 200 74 501 65 425 Booster dose 131 835 229 322 193 452 224 226 212 710 227 505 225 159 227 775 227 913 218 956
Anti-measles inoculation 65 022 70 919 76 211 74 788 71 820 67 417 62 905 100 878 103 135 7 608
Anti-MMR inoculationt 66275
Anti-rubella inoculation 35 763 28 474 41 662 44079 45 611 43 388 47 101 47 478 44 793 43 416
Anti-tetanus inoculation* 237 661 223 339 229 419 216 845
Hepatitis B vaccination# 13 920 191 104 197 562
Notes: *Inoculation was introduced since January 1987. #Inoculation was given to newborns since 15 November 1988. tinoculation was introduced since January 1990.
Source: Department of Health.
221

16.5 Notification of Infectious Diseases
Disease 1981 1982 1983 1984 1985 1986 1987 1988 1989 1990
Cholera Cases 3# 8# 2 30# 4# 2# 29# 5# Deaths 1
Amoebiasis Cases 48 37 37 29 16 13 6 8 9 15 Deaths 2 2 1 2 2 1
Bacillary dysentery Cases 563 550 479 396 519 344 381 454 433 359 Deaths 3 1 1 1 2 1
Cerebro-spinal meningitis and meningococcal infections Cases 18 16 13 8 12 6 2 6 8
Deaths 1 1 1 1 2
Chickenpox Cases 1140 1 621 1 228 2433 1194 1 635 1 879 3 436 2 708 1 881 Deaths 3 1 3 1 1 1
Diphtheria Cases Deaths
Enteric fever (typhoid and paratyphoid) Cases 500 392 369 331 287 198 273 182 173 143
Deaths 4 3 1 1 1 1 2 1
Food poisoning Outbreaks 175 215 169 233 278 223 378 534 188 96 (Persons affected) (666) (870) (642) (1 340) (958) (1 076) (1 566) (1 239) (763) (422) Deaths 1 2
Leprosy Cases 55 57 38 32 32 29 21 22 26 30 Deaths 2 lt
Malaria Cases 62 80 125 113 168 143 106 98 744 312 Deaths 1 1 1
Measles Cases 249 1 863 888 678 280 215 194 3 162 139 48 Deaths 5 2 2 1 1 8 1
Ophthalmia neonatorum Cases 5 4 6 5 5 10 9 3 7 Deaths
Poliomyelitis Cases 3 Deaths 1
Puerperal fever Cases 2 Deaths
Rabies (human) Cases 2* 2* 1* Deaths 2 2 1
Scarlet fever Cases 3 4 3 5 9 3 10 4 2 Deaths
Tuberculosis Cases 7729 7 527 7 301 7 843 7 545 7 432 7 269 7 021 6 704 6 510 Deaths 489 454 446 420 409 407 405 388 403 382
Typhus (urban) Cases 1 1 3 Deaths
Typhus (scrub) Cases 6 5 3 6 12 5 4 12 Deaths
Viral hepatitis Cases 1 738 1 814 1 783 1 780 1 601 1425 1 554 2 398 1 232 1 984 Deaths 26 42 28 12 13 19 23 37 12 20
Whooping cough Cases 2 18 21 8 4 8 Deaths
Total Cases 12302 14195 12438 13915 11975 11716 12084 17366 12400 11409 Deaths 527 510 485 443 426 433 434 438 422 405
Notes: No case of smallpox, plague, epidemic louse-borne typhus, yellow fever or relapsing fever was reported during the specified years. *Figures refer to imported case.
#Figures include 3 imported cases in 1981, 5 in 1982, 7 in 1986, 1in1987, 1in1988, 3 in 1989 and 2 in 1990. tFigure refers to death of old case.
Source: Department of Health.
222
----- -- --· ---· --- ---~-----

16.6 Notification and Death Rates of Certain Infectious Diseases
Disease
Amoebiasis N.R. D.R.
Bacillary dysentery N.R. D.R.
Cerebra-spinal meningitis and meningococcal infections N.R.
Diphtheria
Enteric fever (typhoid and paratyphoid)
Measles
Poliomyelitis
Tuberculosis
Viral hepatitis
D.R.
N.R. D.R.
N.R. D.R.
N.R. D.R.
N.R. D.R.
N.R. D.R.
N.R. D.R.
1981
0.93
10.86 0.58
0.35 0.19
9.65 0.77
4.80
0.06 0.19
149.11 94.34
33.53 5.02
1982
0.70 0.38
10.45 0.19
0.30 0.19
0.02 0.19
7.45
35.39 0.95
142.98 86.24
34.46 7.98
1983
0.69 0.37
8.96 0.19
0.24 0.19
6.90 0.56
16.61 0.37
0.02
136.59 83.44
33.36 5.24
1984
0.54 0.19
7.34
0.15
6.13 0.19
12.56 0.37
145.30 77.81
32.98 2.22
1985
0.29 0.37
9.51
0.22
5.26 0.18
5.13 0.18
0.02
138.28 74.96
29.34 2.38
1986
0.24
6.23 0.18
0.11 0.18
3.58 0.18
3.89
134.53 73.67
25.79 3.44
Notes: Figures are calculated basing on the mid-year population estimates derived using the 1991 Census results. N.R. refers to notification rate per 100 OOO population. D.R. refers to death rate per million population.
Source: Department of Health.
16.7 Registered Deaths by Cause
Cause
Infectious and parasitic diseases
Neoplasms
Endocrine, nutritional metabolic diseases and immunity disorders
Diseases of blood and blood-forming organs
Mental disorders
Diseases of nervous system and sense organs
Diseases of circulatory system
Diseases of respiratory system
Diseases of digestive system
Diseases of genitourinary system
Complications of pregnancy, childbirth and puerperium
Diseases of the skin and subcutaneous tissue
Diseases of the musculoskeleta system and connective tissue
Congenital anomalies
Certain conditions originating in the perinatal period
Symptoms, signs and ill-defined conditions
Injury and poisoning
Total
1981
777
6 595
283
36
6
160
7 224
3 930
1 078
982
7
4
57
259
447
1190
1943
24978
1982
783
6 829
217
21
2
203
7 462
4033
1178
1 039
5
49
273
463
1 053
1 849
25460
1983
788
7 242
232
33
7
219
7 757
4475
1150
1 045
6
4
54
313
424
1 036
1 700
26485
Note: Figure in brackets denotes the number of deaths with cause unknown.
Source: Department of Health.
1984
751
7 369
252
29
2
185
7 441
4228
1 098
1100
5
9
39
272
355
852
1 593
25580
1985
769
7 553
252
31
2
193
7 381
4127
1 093
1106
4
11
53
231
277
639
1 603
25325
1986
782
8 072
259
40
180
7 527
4119
1 068
1207
2
8
62
229
282
616
1 576
26030
1987
0.11 0.36
6.83
0.04
4.89 0.18
3.48 0.18
130.26 72.57
27.85 4.12
1987
825
8 274
250
25
2
233
7 861
4404
1 088
1217
3
7
56
246
237
647
1 584
26959
1988
0.14
8.07 0.36
0.11
3.23 0.36
56.19 1.42
124.76 68.95
42.61 6.57
1988
859
8 197
231
27
190
7 946
4 798
1 122
1243
3
7
45
228
248
681
1 551
27376
1989
0.16 0.18
7.61 0.18
0.02 0.18
3.04 0.18
2.44 0.18
117.90 70.87
21.67 2.11
1990
0.26
6.29
0.14 0.35
2.51
0.84
114.12 66.96
34.78 3.51
Number of deaths
1989
1 009
8 603
263
38
216
7 994
4975
1 251
1267
4
10
51
213
1990
1 030
8 686
287
20
234
8 313
5 046
1 219
1 358
3
2
65
186
238 181
697 819
1 653 1 752
28 485(2) 29 201
223

16.8 Leading Causes of Death by Sex by Age, 1990 Number of deaths
Cause of death Sex All ages 0 1-4 5-14 15-44 45-64 65 & over Unknown
Malignant neoplasms M 5383 11 17 435 2 091 2 828 F 3286 8 16 290 933 2038
Heart diseases, including hypertensive heart disease M 2574 1 2 99 622 1 849
F 2402 2 3 4 50 290 2053
Cerebrovascular disease M 1450 1 3 53 391 999 2 F 1625 1 2 26 210 1 385 1
Pneumonia, all forms M 1108 8 12 2 58 187 839 2 F 892 14 6 3 29 54 786
Injury and poisoning M 1143 2 17 25 605 260 234 F 609 7 8 20 242 112 219
Nephritis, nephrotic syndrome and nephrosis M 537 2 3 32 135 364
F 587 1 21 102 463
Septicaemia M 269 2 1 12 46 206 F 347 1 2 7 25 312
Bronchitis, chronic and unspecified, emphysema and asthma M 344 22 100 221
F 211 12 24 174
Tuberculosis (including late effects of tuberculosis) M 295 17 100 177
F 87 4 17 64
Chronic liver diseases and cirrhosis M 221 21 107 90 F 98 6 28 64
Diabetes mellitus M 126 4 32 90 F 144 6 21 117
Certain conditions originating in the perinatal period M 112 112
F 69 69
Other causes M 2 757(5) 107(3) 16 14(1) 168 564 1 884 4(1) F 2525 86 21 15 112 191 2 100
All causes M 16 319(5) 235(3) 60 69(1) 1526 4635 9781 13(1) F 12882 180 48 65 805 2007 9775 2
T 29 201(5) 415(3) 108 134(1) 2331 6642 19 556 15(1)
Note: Figures in brackets denote the number of deaths with sex unknown. These have been included in the corresponding figures for males.
Source: Department of Health.
224

16.9 Deaths from Heart Disease by Age by Sex
Age group
0-9
10-19
20-29
30-34
35-39
40-44
45-49
50-54
55-59
60-64
65-69
70-74
75 and over
All ages
Sex
M F
M F
M F
M F
M F
M F
M F
M F
M F
M F
M F
M F
M F
M F
1981
4 4
8 9
23 21 12 12 9 9
33 17 69 45
136 48
198 88
292 154 376 265 372 285 482 857
2 015(1) 1814
1982
2 I
4 9
17 17 18 13
24 3
33 10 65 41
132 62
211 109
1983
2 3
8 7
16 12 19 10 19 13
19 18 59 28
108 62
208 109
291 342 164 175 411 422 230 234 399 444 326 348 593 587 918 I 009
2 201(1) 2 253 1903 2 029(1)
1984
2 4
9 5
13 10 10 8
14 14 24 13
49 19
103 59
195 81
284 185 380 253 445 338 566 921
2 095(1) 1910
1985
7 5
6 7
14 7
15 9
16 9
21 6
51 31
136 40
203 106 319 155 384 248 432 362 605
I 015 2 211(2) 2000
1986
I 8
5 5
24 11 24
8
36 9
34 11 53 13
115 50
197 73
293 157 362 225 463 336 713
I 111 2320 2017
1987
4 2
8 4
18 8
20 13
24 13
30 5
65 20 99 48
183 82
297 177 417 257 462 361 762
I 135 2 390(1) 2125
1988
4 6
15 6
23 10 11 11
30 13 24
6
45 13
104 30
188 80
281 181 395 274 486 334
807 1221 2 414(1) 2185
Number of deaths
1989
5 5
7 3
26 17 15 11
34 10 31 10 52 18
121 31
188 83
304 156 392 250 487 343 878
I 359 2540 2296
1990
2 6
6 8
18 7
14 5
24 18 38 15 47
8
93 47
194 71
288 164 397 275 514 366 938
1412 2 574(1) 2402
Note: Figures in brackets denote the number of deaths with age unknown. These have been included in the corresponding figures for 'All ages' for males.
Source: Department of Health.
16.10 Deaths from Cancer by Major Cause
Cause of death
Malignant neoplasm of Nasopharynx Deaths
M.R.
Oesophagus Deaths M.R.
Stomach Deaths M.R.
Colon Deaths M.R.
Rectum, rectosigmoid junction and anus Deaths
M.R.
Liver and intrahepatic bile ducts Deaths
M.R.
Trachea, bronchus and lung Deaths M.R.
Female breast Deaths M.R.*
Cervix uteri Deaths M.R.*
All forms of cancer Deaths M.R.
1981
469 9.0 319 6.2
466 9.0
334 6.4
211 4.1
932 18.0
I 826 35.2 227 9.1 155 6.2
6586 127.1
1982
482 9.2
333 6.3 462 8.8
370 7.0
215 4.1
887 16.8
1 962 37.3 202 8.0 108 4.3
6810 129.4
1983
472 8.8
359 6.7
521 9.7
401 7.5
254 4.8
1 015 19.0
2002 37.5 219 8.5 140 5.4
7226 135.2
1984
449 8.3 338 6.3 448 8.3 436 8.1
274 5.1
992 18.4
2128 39.4
250 9.6
127 4.9
7347 136.1
1985
410 7.5
384 7.0
449 8.2 448 8.2
244 4.5
969 17.8
2223 40.7 262 9.9
141 5.3
7535 138.1
1986
438 7.9 375 6.8
552 10.0 444 8.0
266 4.8
1 054 19.l
2 348 42.5 243 9.1 150 5.6
8054 145.8
1987
442 7.9 371 6.6
544 9.7 510 9.1
287 5.1
I 054 18.9
2465 44.2 262 9.7
129 4.8
8258 148.0
1988
442 7.9 379 6.7 504 9.0
526 9.3
273 4.9
I 104 19.6
2 361 42.0 260 9.5
124 4.5
8177 145.3
1989
442 7.8
385 6.8 581 10.2 565 9.9
292 5.1
I 077 18.9
2 592 45.6 283 10.2 123 4.4
8585 151.0
1990
421 7.4
375 6.6
559 9.8
575 10.l
314 5.5
I 102 19.3
2 638 46.2 277 10.0 130 4.7
8669 152.0
Notes: 'M.R.' refers to mortality rate per 100 OOO population which are based on the mid-year population estimates derived using the 1991 Census results. *denotes death rate per I 00 OOO female population.
Source: Department of Health.
225

16.11 Infant Deaths by Cause Number of deaths
Cause 1981 1982 1983 1984 1985 1986 1987 1988 1989 1990
Meningitis 8 15 8 4 4 2 3
Bronchitis 3 3 3 2
Viral pneumonia 3 4
Pneumococcal pneumonia
Other bacterial pneumonia
Bronchopneumonia, organism unspecified 29 28 50 35 22 10 10 11 14 18
Pneumonia, organism unspecified 34 21 21 14 11 5 7 11 7 3
Gastroenteritis, colitis and other diarrhoeal disease 13 6 4
Congenital anomalies 221 240 254 236 203 205 218 208 181 159
Obstetric complications and birth trauma 6 2 6 2 3 1
Intrauterine hypoxia and birth asphyxia 103 86 73 65 50 47 35 38 41 29
Respiratory distress syndrome 115 123 107 95 49 87 70 69 63 65
Other respiratory conditions of fetus and newborn 58 64 71 56 39 20 20 29 13 7
Disorders relating to short gestation and unspecified low birthweight 82 61 76 43 66 52 42 56 49 31
Infections specific to perinatal period 6 16 20 17 19 23 7 5 14 11
Feta! and neonatal haemorrhage 38 66 22 28 11 8 19 10 9 10
Haemolytic disease of fetus or newborn due to isoimmunization and other perinatal jaundice 6 3 6 5 2 3
Endocrine and metabolic disturbances specific to the fetus and newborn 1 2 5 2 1
Haematological disorders of fetus and newborn 7 9 5 6 4 2 2 5 7 4
Perinatal disorders of digestive system 6 4 9 9 5 6 8 21 11 11
Conditions involving the integument and temperature regulation of fetus and newborn 19 27 29 28 24 34 29 12 31 12
Others 89 73 68 68 62 43 48 73 57 49
All causes 846 853 830 709 580 553 525 556 499 415
Infant mortality rate (per 1 OOO registered live births) 9.7 9.9 10.1 9.1 7.6 7.7 7.5 7.6 6.9 5.9
Neo-natal mortality rate (per 1 OOO registered live births) 6.6 7.0 7.0 6.5 5.0 5.3 4.8 4.8 4.4 3.8
Source: Department of Health.
226
- -------------- - -----------

16.12 Causes of Maternal Death Number of deaths
Cause 1981 1982 1983 1984 1985 1986 1987 1988 1989 1990
Pregnancy with abortive outcome other than spontaneous or legally induced abortion
Toxaemia of pregnancy 2 2
Haemorrhage of pregnancy and childbirth 3 2 2
Obstetrical Pulmonary embolism 2 2 4
Ectopic pregnancy 3
Others
Total 7 1 6 5 4 2 3 3 4 3
Maternal mortality rate (per 1 OOO total births) 0.08 0.01 0.07 0.06 0.05 0.03 0.04 0.04 0.06 0.04
, Source: Department of Health.
16.13 In-patients Treated in Government, Government-Assisted and Private Hospitals Classified by Disease Number of in-patients treated
Disease classification 1981 1982 1983 1984 1985 1986 1987 1988 1989 1990
Infectious and parasitic diseases 25 606 31 539 29 211 26 979 25 056 23 948 25 245 32 240 26 308 26 220
Neoplasms 39 853 44293 48 388 52027 55 690 59 647 62 241 64 644 66 980 68 315
Endocrine, nutritional and metabolic diseases and immunity disorders 11 226 11 963 12 998 13 919 15 112 15 868 17 025 17 524 18 469 19 099
Diseases of the blood and blood-forming organs 5 827 6 395 6 850 7 823 7 912 8 389 8 746 9 084 9 565 9 582
Mental disorders 13 957 14 099 15 103 14 679 15 507 16 018 16 331 16 269 16 077 15 487
Diseases of the nervous system and sense organs 17 303 18 746 19 182 20 282 22 082 24 639 27 093 29 789 29 349 29 467
Diseases of the circulatory system 42544 46 067 49 566 51 001 51 556 54 039 57 152 59 387 59 363 59 673
Diseases of the respiratory system 67 667 76 717 82135 74409 75 442 74407 81 515 80 560 75 441 74 274
Diseases of the digestive system 71 868 78 807 80 260 80 723 81 377 81 206 84 176 80 380 78 689 75 772
Diseases of the genitourinary system 60 185 64403 67173 71 943 75 370 81 127 83 574 87 551 87 901 89 876
Complications of pregnancy, childbirth and the puerperium 113 829 116 451 116 036 112 656 115 266 115 166 121 103 140 642 142 683 146 787
Diseases of the skin and subcutaneous tissue 11646 12424 13 344 13 322 13 570 13 240 13 999 14 848 14 354 13 609
Diseases of the musculoskeletal system and connective tissue 14 141 17 685 18 310 19 106 21 032 22 564 23 548 25 124 23 599 22 510
Congenital anomalies 4 741 4834 4 745 5 639 5 416 5 537 5 578 5 615 5 278 5 580
Certain conditions originating in the perinatal period 17 897 16 880 17 523 15 629 15 876 16 198 15 485 16 367 16 747 17 337
Symptoms, signs and ill-defined conditions 59 794 78 343 80 640 73 643 78 537 78 088 82 418 80 208 73 934 71 009
Injury and poisoning 87 398 125 322 104 218 91 353 89 354 88 341 93 738 90 663 81 998 76 058
Total 665482 764968 765682 745133 764155 778422 818967 850895 826735 820 655
Notes: Data are grouped according to International Classification of Diseases, Injuries and Causes of Death (I.C.D.) 9th Revision (1975). Patients treated in maternity homes and in-patients encountering health services for other reasons are excluded.
Sources: Hospital Services Department.
227

16.14 Out-patient Attendances at Government and Government-Assisted Institutions Number of attendances
General clinics
General
Casualty
Special clinics
General*
Child health
Ante-natal
Post-natal
Family planning
Methadone
Eye
Ear-nose-throat
Tuberculosis
Psychiatric
Leprosy
Social hygiene
Dermatology
1981 1982 1983 1984 1985 1986 1987 1988 1989
5 194 412 5 600 548 6 006 373 6 260 853 6 340 039 6 455 446 6 595 961 6 636 803 6 415 778
1068948 1125 682 1175 401 1 221 620 1300565 1276 034 1400 966 1376205 1 348 815
1 629 316
1 091 298
573 570
56 637
340 611
2451141
222 635
98 927
763 061
178 865
18 471
150 852
59 501
1857075
1 194 182
576 701
59 OOO
368 104
2 546 134
227 104
117 528
715 432
199 260
18 241
166 933
62 997
2 092 164
1 221 350
576 450
60 513
408 810
2 300 480
237 319
122 893
717 738
204 165
15 401
173 957
65 398
2 463 599
1299 490
555 089
56 978
446 301
2 793 575
250 236
132 024
780 597
213 305
13 671
176 024
68 021
2 652 153
1236216
554 765
57 244
468 643
2 806 992
255 855
131 520
774 433
243 129
13 381
184 725
69 843
2 887 550
1 194 708
519 821
54134
472 686
3 120 130
278 358
148 254
736 715
257 530
12 435
180 286
70 161
3 040 437
I 182 947
515 439
51 923
472468
3 411 313
292 481
166 705
732 012
273 503
II 654
177 577
70 598
2 870 037
I 237 118
546 861
51 595
472 924
2 950 872
293 043
171 912
736 549
288 949
10 917
154 074
69 832
2 890 114
1284697
492 732
49 898
464 954
2 630 435
288 865
192 145
725 503
281 425
9770
140 524
75 640
1990
6 462 819
1352640
2 938 662
1 147 993
473 651
43 463
434 855
2 977 490
295 433
205 705
736 343
274 OOO
9 320
138 642
74 671
Total 13 898 245 14 834 921 15 378 4U 16 731383 17 089 503 17 664 248 18 395 984 17 867 691 17291295 17 565 687
Notes: *Figures from 1980-1987 were revised to include out-patient attendances at Government physiotherapy and occupational therapy services. Out-patient treatment figures are still being presented for Government-assisted physiotherapy and occupational therapy services. Figures for 1988 onwards were further revised to include out-patient attendances at both Government and Government-assisted physiotherapy and occupational therapy services. The total attendance figures of the corresponding years were revised accordingly.
Sources: Department of Health. Hospital Services Department.
16.15 Attendances in Accident and Emergency Departments of Government and Government-Assisted Institutions
Traumatic attendances
Assault
Traffic
Industrial
Domestic
Animal bite
Sport
Insect bite
Others
Sub-total
Non-traumatic attendances
Infectious
Tuberculosis
Medical
Surgical
Obstetrical
Gynaecological
Paediatric
Psychiatries
Orthopaedics
Dental/Oph./E.N.T.
Others
Sub-total
Total
1981
28 062
27 249
103 605
71 978
11 982
9 916
1264
8 562
262618
13 714
14 548
254 558
116 245
12 250
26 360
130 605
5 508
27 881
11 878
7 863
621 410
884028
1982
36 795
31198
101 030
90142
7 668
11187
1204
11 126
290350
21172
14 486
262 873
119 999
14 097
30 365
135 275
6174
37 560
13 779
12 048
667 828
958178
1983
38 316
32 630
108 173
100 507
7 935
9 567
I 551
8 776
307 455
17 586
9 193
295 655
124 968
12 545
27 282
145 953
5 889
37 082
14 981
14 621
705 755
1013 210
1984
39 192
35 272
115 429
IOI 897
8 560
11 016
I 351
10 608
323 325
17 074
7139
325 494
126 376
13 333
28 038
158 509
5 810
35 262
16 525
14 359
747 919
1071244
1985
35 423
35 252
120 051
111 358
7 718
11 321
1454
9 124
331 701
15 614
6 966
347 425
139 249
14222
27 385
180 588
6 010
46 721
19 907
14 761
818848
1150549
1986
32 136
33 652
114 008
111 030
11 912
14182
I 761
9 451
328132
20 330
14157
329 140
130 285
17 580
32 200
161 258
6270
47 800
20463
15 487
794 970
1123102
1987
28 217
27 645
119 331
106 858
11 359
18 670
I 920
12 045
326045
21 645
16 123
358 363
149 988
15 251
32 176
174 461
6 481
55 302
23 559
18 129
871 478
1197 523
1988
26 697
26 796
123 813
100 241
9 068
17 166
I 658
11 707
317146
28 264
18 336
350 649
152 727
16 891
34 287
166 147
6 498
61 270
26 507
21 687
883 263
1200409
Note: *Figures for 1990 were revised to include Accident and Emergency Departments under Hospital Services Department Only.
Source: Hospital Services Department.
228
Number of attendances
1989
24466
26 283
118 462
89122
8 570
14 470
I 573
9 175
292 121
22 062
16 487
361 398
152 462
15 242
31 072
151 934
5 368
67 987
24 350
25 919
874 281
1166 402
1990*
23 802
22 342
100 482
75 226
6 681
12 192
1467
8 837
251029
16 422
5 902
369 318
139 517
14 318
27965
141 095
5 625
71 928
25 381
27 792
845 263
1096292

16.16 Statistics on Ophthalmic, Ear-nose-throat and Dental Services
1981 1982 1983 1984 1985 1986 1987 1988 1989 1990
Ophthalmic service
New out-patient attendances 57 778 54 854 56127 57 084 51 549 54 703 53 446 52 055 47 282 42 333
Total out-patient attendances 206 226 209 237 218 786 231 960 230 899 248 017 258 263 259 007 253 131 253 998
Operations performed 4 576 4989 4667 4652 5 075 6 050 7044 7 143 7 129 8 059
Home visits by Health Visitors 852 I OOO 657 629 1186 1249 1 061 919 959 1144
Number of persons first registered as blind 707 977 968 1 079 835 998 812 636 537 623
Ear-nose-throat service
New out-patient attendances 21435 24777 24 563 24953 26 118 25 672 25 697 27 566 29 888 30 077
Total out-patient attendances 68 952 80 358 88 519 91 598 97 048 102 104 109 861 118 968 130 615 140 875
Total in-patients treated 2 881 2 619 2 610 2 608 2 695 2 767 2 898 2 760 2 705 3 160
Operations performed 2 651 2640 2894 2927 3 196 3 512 3 439 3 356 3 432 3 773
Speech therapy cases 4 581 4 921 4 216 3 605 3 577 4277 6 575 7 405 11 208 13 909
Dental service
Attendances 367 394 367 330 398 625 427 165 446 503 462 936 505 224 525 468 512 184 510 964
Number of persons rendered dentally fit 75 784 82 372 94 756 107 721 124 382 134 394 150 173 164 974 159 709 159 992
Sources: Department of Health. Hospital Services Department.
16.17 Statistics on Para-medical Services
1981 1982 1983 1984 1985 1986 1987 1988 1989 1990
Physiotherapy service
Number of patients treated 152 413 172422 183 879 198643 224 571 238 390 257056 264 021 261683 268 358 In-patients 79408 89 200 94294 96978 103 900 104 366 116 335 118 886 109 980 111144 Out-patients 73 005 83 222 89 585 101 665 120 671 134 024 140 721 145 135 151 703 157 214
Total attendances 803 379 887 478 957 314 1037029 1141 502 1204 624 1257070 1303 009 1 304 739 1327882 In-patients 448 778 487 507 527 661 556 137 614 764 640 866 670 115 694 948 685 328 729 921 Out-patients 354 601 399 971 429 653 480 892 526 738 563 758 586 955 608 061 619 411 597 961
Occnpational therapy service
Number of patients treated 15 980 20894 24864 32 512 36169 35198 35 469 40195 39012 40 784 In-patients 9 375 12 320 15 031 20 930 23 120 20 653 20 552 23 093 22121 22 364 Out-patients 6 605 8 574 9 833 11 582 13 049 14 545 14 917 17 102 16 291 18 420
Total attendances 529438 620 257 724 569 847 443 963 814 983 580 1127 610 1246 593 1319254 1275920 In-patients 383 121 452 207 533 008 639 102 713 070 699440 814 311 921 236 998 039 950 390 Out-patients 146 317 168 050 191 561 208 341 250 744 284140 313 299 325 357 321 215 325 530
Prosthetic-orthotic service
Number of patients treated 8478 11835 15 389 18 725 22 769 23 202 22 253 23423 In-patients 515 2402 4 334 5 033 5 433 5 251 4 956 5 959 Out-patients 7 963 9433 11 055 13 692 17 336 17 951 17 297 17 464
Total attendances 19193 22819 22891 29415 39553 47642 56104 59490 58601 62 351 In-patients 1 917 8 283 14 299 16 558 17 367 17 069 16 734 20 019 Out-patients 17 276 21132 25 254 31 084 38 737 42421 41 867 42 332
Radio-diagnostic division
Total number of examinations done 897 775 1019557 1041 721 1070146 1117 620 1123 969 1 201114 1273098 1 241492 1273 646
Radio-therapeutic division
Number of patients treated 4997 5 248 5 526 5 506 6146 6779 5 852 5606 5 475 5 567 With malignant disease 4362 4 611 4 877 4 845 5 419 5 816 4 798 4 645 4 541 4 563 With non-malignant disease 635 637 649 661 727 963 I 054 961 934 I 004
Radiation treatments given 143 112 160810 176 224 181103 192640 208001 213 278 202 260 196 482 185 874
Sources: Hospital Services Department.
229

16.18 Statistics on Pharmaceutical Service
1981 1982 1983 1984 1985 1986 1987 1988 1989
Cost of supplies (HK.$'000)
Drugs and dressing 92,003 106,863 · 125,896 154,989 183,817 225,327 257,331 338,737 370,328
Instruments, medical and surgical equipment 21,300 11,772 5,273 6,611 1,118 5,481 7,941 8,388 4,468
Pharmaceutical control
Wholesale poisons licences issued 696 756 807 835 868 923 992 1 041 1077
Authorized seller licences issued 124 132 147 152 163 177 181 173 176
Listed seller licences issued 2 352 2326 2468 2 539 2 566 2 633 2 661 2 631 2647
Dangerous drugs licences issued 131 136 145 151 162 161 165 163 164
Antibiotics permits issued 444 469 485 519 535 589 653 700 728
Licences for movement of dangerous drugs issued 166 184 118 121 344 338 305 336 304
Premises inspected 5130 5 743 9 771 9704 11206 10432 10 868 8220 7 665
Prosecutions initiated 77 55 122 115 118 112 93 76 38
Pharmaceutical products registered* 16 500 18 526 16 516 19 281 24846 26864 23 458 24 885 26480
Pharmaceutical manufacturers licences issued 91 94 95 101 100 100 100 95 93
Pharmaceutical import/export licences issued 29907 29890 31197 31483 34075 41439 47200 50 624 51644
Registration of pharmaceutical importer/ exporter# 322 447 415 440 469 430 435 434 484
Notes: *Figures are as at end of the year. #Registration of pharmaceutical importer/exporter was implemented on 1.7.1981.
Sources: Department of Health. Hospital Services Department.
16.19 Work of Pathology Service and Forensic Pathology Service
1981 1982 1983 1984 1985 1986 1987 1988 1989
Pathology
Number of tests* 6 619 068 8 928 254 9 846 251 10 833 726 13 016 497 14 787 138 17 026 467 19 270 500 19 837 709
Autopsies on medical legal cases performed 744 929 847 790 682 528
Vaccine production (in millilitres) 384105 654 775 290 790 608 680 639 765 928 175
Forensic pathology
Attendances at scenes of crimes 192# 201# 217# 158# 123# 96#
Attendances at courts 228 235 203 198 198 187
Examinations of victims and suspects 763 949 1 003 1 079 1164 1 099
Notes: *Figures from 1984 onwards include Prince of Wales Hospital which commenced service in May 1984. # Figures were revised to include attendances for raids.
Source: Department of Health. Hospital Services Department.
230
552 451 365
148 345 158 975 169 435
113 141 147
234 283 271
993 1127 1 049
1990
407,459
1,711
1 054
186
2 573
162
720
203
6292
56
27 868
94
56100
446
1990
21767105
544
159 390
156
315
884

16.20 Work of Blood Banks
Blood received from
Hong Kong Red Cross
Patients' relatives and friends
Other donors
British Military Hospital and other government hospitals other than QMH, QEH, PMH & PWH
Blood distributed to
Government hospitals
Government-assisted hospitals*
Private hospitals*
British Military Hospital
Not transfused due to various causes
1981
78 661
156
9
12
46422
10 795
11 334
148
4 370
1982
80 039
171
74
46179
8 241
11 905
77
12 266
Notes: Blood is collected in bags of either 300 c.c. or 430 c.c.
1983
78 374
28
38
50 831
9110
10 940
94
6964
1984
63 812
88
54
54 948
4120
4124
30
3 974
1985
45 064
50
46
48 956
43
49
1 764
1986
45 659
4
50 001
36
2 087
1987
45 928
6
51 667
46
2 410
1988
39 550
46 468
64
1260
Number of bags
1989
50 581
62 892
163
2 555
1990
36 600
55 887
143
2 639
*The Hong Kong Red Cross blood transfusion service took over the issuing and processing of donated blood to Government-assisted and private hospitals w.e.f. 1984.
Sources: Hospital Services Department.
16.21 Work of the Family Health Services
Centres-Maternal and child health*
Full-time service With midwifery Without midwifery
Subsidiary service With midwifery Without midwifery
Centres-Family planning*
Full-time service
Subsidiary service
Centres-Comprehensive observation service*
Full-time service
Subsidiary service
Total attendances for
Ante-natal sessions
Post-natal sessions
Child health sessions (Aged under 1)
(Aged 1-5)
Family planning sessions
Comprehensive observation service
Home visits for
Maternal and child health service
Family planning service
Notes: *Figures are as at end of the year.
1981
40# 25 9
16
15# 11 4#
42
6
36
37
18
19
1982
42
28 11 17
14 10 4
45
4
41
41
21
20
1983
42
29 10 19
13 10 3
46
4
42
42
23
19
248 446 258 191 257 084
24 841 27 815 29 081
775 164 813 135 784 241
295 242 359 960 416 156
340611 368104 408810
118 791 145 367 163 068
1984
44
30 11 19
14 9 5
47
4
43
44
23
21
243 778
26 851
835 522
445 049
446 301
184 226
1985
44
30 10 20
14 9 5
47
4
43
44
24
20
238 695
25 992
827 622
404 126
468 643
195 691
92067
9 227
93900 102295 105949 105156
12 269 13 866 13 773 15 466
#Figures include 1 subsidiary centre temporarily suspended.
Source: Department of Health.
1986
44
30 10 20
14 9 5
47
5
42
44
33
11
211 666
25 020
815 301
374 487
472 686
199 209
1987
45
31 9
22
14 9 5
48
5
43
45
34
11
203 986
23 959
802 191
375 830
472468
198 787
95 940 106 415
12 527 14 243
1988
45
32 10 22
13 8 5
48
5
43
45
34
11
212 681
23 757
840 292
392 165
472 924
201 319
97 541
11 840
1989
45
32 9
23
13 8 5
48
5
43
45
35
10
1990
45
33 6
27
12 7 5
48
5
43
45
35
10
190 685 170 438
23215 20837
872 629 819 053
408 930 326 217
464 954 434 855
202 137 183 542
73 113
9 035
25 946
2 154
231

16.22 Work of the District Midwifery Services (Excluding Hospitals)
1981 1982 1983 1984 1985 1986 1987 1988 1989 1990
Private midwifery service
Number of midwives in active practice* 15 15 15 9 8 8 8
Number of registered maternity homes* 6 6 4 3
Number of maternity beds* 48 44 35 24 20 20 20
Deliveries
Maternity home deliveries 1 593 1251 958 649 422 299 260 50@
Born before arrival (cases) 2
Total deliveries 1595 1251 958 649 422 299 260 50@
Government midwifery service (including St. John Hospital)
Maternity beds in maternity homes* Hong Kong and Kowloon 166 190 190 190# 190 190 164 164 140 94 New Territories 222 246 221 221# 217 215 221 221 221 161
Midwives* 187 206 196 197# 196t 199t 194t 19lt 137t 108t
Cases attended 11 378 11 791 11450 10658 9456 8 120 6969 6162 5202 3 945
Notes: *Figures are as at end of the year unless otherwise specified. #Figures are as at 1 April of the year. t Figures are as at 31 March of the following year.
@Figures are from 1.1.1988 to 31.3.1988.
Source: Department of Health.
16.23 Work of the Psychiatric Service
1981 1982 1983 1984 1985 1986 1987 1988 1989 1990
In-patients
Total admission 6359 6442 6499 6908 6435 6399 6295 6301 5999 5534 First admission 3 263 4056 3 228 3 626 3137 3 027 2 865 2 733 2474 2264 Re-admission 3 096 2 386 3 271 3 282 3 298 3 372 3 430 3 568 3 525 3 270
Total in-patients treated 6268 6007 6129 6791 6382 6369 5969 6131 5 871 5 764 Number of discharges 6188 5 930 6057 6737 6 322 6 318 5 914 6088 5 835* 5720 Number of deaths 80 77 72 54 60 51 55 43 36* 44
Patients remaining in hospital at end of the year 3053 3488 3858 3975 4028 4028 4354 4524 4652 4422
Day-patients at psychiatric centres
Total admission 546 631 578 629 596 748 751 709 664 612
Total patients treated 676 802 782 821 804 988 1 036 996 962 917
Total discharges 505 598 590 613 564 703 749 698 657 614
Out-patients attendances at psychiatric centres/clinics
New attendances 4 368 4900 5 360 5 593 5 823 5 594 5 918 6240 6189 5 848
Total attendances 169 018 188 879 194424 201 578 212 387 224 281 238 232 251 861 243 892 237 288
Note: *denotes revised figure.
Source: Hospital Services Department.
232

16.24 Work of the Tuberculosis and Chest Service
Total notifications
Total deaths from tuberculosis
Tuberculosis deaths as percentage of total deaths
Average age at death from tuberculosis
Percentage of newborns receiving B.C.G.*
Percentage of tuberculosis deaths below 5 years
Percentage of tuberculosis deaths under I year
Infantile mortality from tuberculosis per 1 OOO live births
Work of tuberculosis and chest service
Total attendances
Total patients attending (old and new)
Number of new patients
Nil significance detected
Diseases other than tuberculosis
Non-respiratory tuberculosis
Respiratory tuberculosis active
Not active and unknown activity
Unknown or incomplete examination
1981
7 729
489
2.0
63.0
99.5
0.41
749 759
91 959
48662 27 375
7 796
404
5 965
6 961
161
1982
7 527
454
1.8
63.0
98.9
0.22
703 343
101 769
53825 31 521
9 257
432
5 407
7053
155
1983
7 301
446
1.7
63.0
99.4
0.45
702 950
98 266
53469 32 040
8 627
404
5 431
6 775
192
1984
7 843
420
1.6
64.5
99.9
0.24
0.24
0.01
766 263
105 902
59532 33 474
12 089
484
6 057
7 214
214
1985
7 545
409
1.6
65.0
99.4
763 420
99 178
54505 30 876
10 720
476
5 629
6282
522
Note: *Figure refer to percentage of newborns based on known live-birth figures.
Source: Department of Health.
16.25 Incidence of Venereal Disease
New attendances Venereal disease
Non-venereal disease
Skin-disease
Total
Total attendances (all types)
1981
7 601
6 643
14 964
29208 150852
1982
9 806
6 820
16 960
33586 166933
1983
9 516
7701 17 664
34881 173957
1984
10 353
8 273
14922
33548 176024
1985
11 657
14 935
8 696
35288 184 534
1986
7 432
407
1.6
68.0
99.6
726 295
91 396
45 958 23 479
10 347
433
5 260
6249
1986
11 850
9 226
10 729
31805 180072
190
1987
7 269
405
1.5
68.5
99.5
720 282
90 642
42685 20 500
10 440
467
5 515
5 587
176
1987
14 213
8 522
12 271
35006 177 327
1988
7 021
388
1.4
69.0
99.5
0.52
0.26
0.01
725 468
90 510
42863 19 608
10 677
412
5 590
6 375
201
1988*
14 820
6 186
10 321
25606 153 851
1989
6 704
403
1.4
69.0
99.6
0.25
0.25
0.01
715 976
90068
40369 18 641
9 623
432
5 169
6 346
158
1990
6 510
382
1.3
69.0
99.1
0.52
728 510
89 021
39532 17 820
10 072
425
5 136
5 831
248
Number of attendances
1989*
12 503
6064
9 891
22245 140 205
1990*
10 483
6 036
9 857
20951 138387
Note: *The figures of new attendances of different types of diseases do not add up to the total number of new attendances because starting from 1988, each new patient attending the clinics could be classified under one or more than one type of diseases; whereas prior to 1988, each new patient could only be classified under one type.
Source: Department of Health.
16.26 Participants of School Medical Service by Area
Hong Kong Island School Pupil Doctor
Kowloon School Pupil Doctor
New Territories School Pupil Doctor
All areas School Pupil Doctor
1982
211 46 786
54
394 131 072
136
247 67 006
42
852 244864
232
1983
213 51 117
58
391 142 722
142
255 87 724
51
859 281563
251
Note: Figures are as at 31 March of the year.
Source: Department of Health.
1984
177 52 333
64
322 146 256
143
284 109 855
55
783 308444
262
1985
187 50074
74
334 145 122
146
321 117 343
73
842 312539
293
1986
189 55 763
82
338 153 223
174
352 140 078
105
879 349064
361
1987
191 58 033
97
329 150 540
179
367 160 462
122
887 369035
398
1988
194 59 146
105
337 151 037
199
381 169 983
135
912 380166
439
1989
230 82 182
121
383 157 343
220
456 188 782
133
1069 428307
474
1990
221 66 311
126
382 125 913
256
496 175 322
180
1099 367546
562
Number
1991
214 62022
119
380 113 358
236
522 177 478
175
1116 352858
530
233

16.27 Registered Medical Personnel
Personnel
Doctors Total registered/licentiated * In government service#
Interns on provisional register Total registered In government service
Externs on provisional register Total registered In government service
Dentists Total registered* In government service
Dental hygienists Total registered In government service
Registered nurses (general) Total registered In government servicet
Registered nurses (psychiatric) Total registered In government servicet
Registered nurses (mentally sub-normal) Total registered In government servicet
Registered nurses (sick children) Total registered In government servicet
Enrolled nurses (general) Total registered In government servicet
Enrolled nurses (psychiatric) Total registered In government servicet
Midwives (without nursing qualification) Total registered In government service
Pharmacists Total registered In government service
1981
3 896 1 101
201 128
133 133
863 119
39 5
11266 3 842
446 337
2
3 585 713
233 202
981 312
388 42
1982
4137 1 234
229 140
141 141
878 115
50 3
11 814 4138
509 389
4
3 826 947
267 233
981 303
433 56
1983
4 385 1 323
149 147
167 167
935 124
57 3
12 512 4476
566 426
6
4116 1 038
297 259
981 289
464 55
1984
4 609 1 393
149 135
180 179
949 117
58 3
13 259 4 780
663 472
6
4486 1 138
346 290
981 279
501 51
Notes: Annual re-registration is required only for doctors, dentists and pharmacists.
1985
4 887 1424
146 146
158 158
1 069 135
64
3
14178 5 245
749 562
6
4926 1 196
393 336
981 269
549 55
*Figures include the professional medical personnel on both the local and overseas lists. # Figures include unregistrable medical officers.
1986
5 147 1 491
192 192
149 149
1 158 147
67 3
15 229 5 796
896 687
6
5 422 1 327
447 380
981 254
588 59
tFigures include nurses working in Department of Health and Hospital Services Department only. @denotes revised figure.
Source: Department of Health. Hospital Services Department.
16.28 Expenditure on the Medical and Health Services
1987
5 484 1 568
223 223
104 104
1240 162
73 4
16 159 6 229
1 046 817
8
2
5 764 1 414
464
387
981 249
623 66
1988
5 785 1 643
214 213
71 70
1 346 165
79 5
16 991 6 332
1 124 859
10
2
6123 1412
502 412
981 236
646 62
1989
6 025 1 700@
242 240
58 58
1 431 163@
83 6
18 058 6384@
1162 833
10
3
6406 1 384
520 415
981 222
678 62
1990
6 260 1 846
234 234
54 54
1 532 173
89 4
19 121 6207
1242 834
11
3
6724 1 350
578 444
981 211
694 80
HK$ million
1980/81 1981/82 1982/83 1983/84 1984/85 1985/86 1986/87 1987/88 1988/89 1989/90
Government Department of Health
Hospital Services Department Medical Subventions
Medical Subventions under Department of Health
Medical Subventions under Hospital Services Department
} 914*
} 476*
Total 1,390
1,204* 1,581* 1,790*
629* 793* 912*
1,834 2,374 2,702
2,085* 2,388* 2,775*
1,004* 1,132* 1,268*
3,090 3,520 4,043
3,095*
1,425*
4,520
3,507*
1,522*
5,029
839
3,426
129
1,684 6,078
Notes: Upon re-organisation of the former Medical & Health Department, the Department of Health and Hospital Services Department were established on 1April1989. This table has been revised to cater for this re-organisation. All figures exclude capital expenditure on medical projects under public works non-recurrent votes. *Figures refer to the former Medical & Health Department.
Sources: Department of Health. Hospital Services Department.
234

Section 17 Social Welfare
Tables 17.1 to 17.2 Generallnfonnation
The Legal Aid Department provides legal representation in both civil and criminal courts to those persons who are unable to bear the cost of protecting their lawful rights and freedom.
Legal Aid as administered by the Legal Aid Department is available to both residents and non-residents in Hong Kong who satisfy the Director of Legal Aid on financial eligibility and justification for legal action. The financial limits in both civil and criminal cases are the same. The maximum eligibility limits for legal aid were changed in 1986 to a monthly disposable income of $2,200 and a disposable capital of $15,000. A new form of means testing has been passed by the legislature but the date of its operation has not yet been fixed.
In addition to financial eligibility, the applicant must satisfy the Director of Legal Aid in civil cases that he has a reasonable chance of succeeding in the litigation for which he seeks aid and in recovering the judgement debt thereafter.
Tables 17.3 to 17.5 General Information
Social Security services in Hong Kong provide the community with a system of assistance to meet the basic and special needs of vulnerable people who require financial and material help. The main types of social security provided by Social Welfare Department are the Public Assistance, the Special Needs Allowance, the Criminal and Law Enforcement Injuries Compensation, the Traffic Accident Victims Assistance and Emergency Relief.
The Public Assistance Scheme, which is means-tested and non-contributory, is intended to bring the income of needy individuals and families up to a prescribed level. The majority who are on Public Assistance are the elderly persons (defined as those aged 60 or above), the disabled and the ill health.
The Special Needs Allowance Scheme comprises Old Age Allowance (OAA) and Disability Allowance (DA) and is non-contributory. It provides cash assistance, in addition to any public assistance payment, to meet the additional special needs of the elderly and the severely disabled. The qualifying age of OAA has hitherto been 70 but this is being lowered to 65 in stages: the first stage, encompassing the 68 and 69 age groups, was implemented in September 1988; the second stage, encompassing the 67 age group, was implemented in April 1989; and the third stage, encompassing the 66 age group, was implemented in April 1990. To qualify for OAA, the under 70 age groups are subject to a simple income declaration while the 70 and above groups are non-means-tested and receive a higher rate than those aged under 70. As for Disability Allowance, it is non-means-tested and covers disabled persons who are certified by the Director of Health or Director of Hospital Services as likely to be severely disabled within the meaning of the Scheme for at least six months. The categories of severe disability are physically injured or blind, disabling physical or mental conditions, disabled mentally or physically requiring constant attendance, profoundly deaf and others. From lst April 1988, a Higher Disability Allowance (HDA), which doubled the rate of the Disability Allowance (DA), has been introduced as a further step to assist those severely disabled persons who are certified to be in need of constant attendance.
The Criminal and Law Enforcement Injuries Compensation Scheme provides cash assistance for victims (or their dependants in case of death) who are injured, disabled or killed as a result of a crime of violence or as a result of law enforcement.
The Traffic Accident Victims Assistance Scheme provides prompt financial assistance to traffic accident victims or their dependants regardless of who was at fault in the accident. Damage to property is not included. The Scheme does not affect an applicant's right to claim common law damages or compensation in the usual way. Beneficiaries of the Scheme who subsequently receive damages or compensation from other sources in respect of the same accident are required to reimburse the payments they have received under the Scheme. The amount of reimbursement shall not exceed the amount of damages or compensation received.
Under the Emergency Relief Scheme, assistance is provided by the Social Welfare Department in Hong Kong, Kowloon, and most parts of the New Territories, with the exception of outlying islands and remote areas which are not accessible to',lorries. The City and New Territories Administration is responsible for the provision of emergency relief services in these areas. Emergency relief is provided for victims of natural and other disasters. It includes immediate
235

236
material assistance in the form of hot meals or dry rations, blankets, ground mats, eating utensils and toilet articles. Grants may also be made to the victims or their families to cover burial expenses and the loss of earning due to death or injury of the victims.
The Fee Assistance Scheme is means-tested and provides assistance to families who have a need to place their children in full day care but cannot afford to meet in full the fees charged. Before September 1990, assistance under the Scheme was provided to children in either kindergartens or child care centres and all applications for assistance were handled by the Social Welfare Department although the expenditure in respect of the kindergarten cases was under the administration of the Education Department. From September 1990 onwards, a new financial assistance scheme, the Fee Remission Scheme, was introduced for children being placed in kindergartens and the assessment of applications under this Scheme was henceforth put under the charge of the Education Department.
The payments of the Public Assistance Scheme, Special Needs Allowance Scheme and Fee Assistance Scheme are made on a monthly basis. Therefore the statistics on the caseload at the end of each financial year are presented. For the Criminal and Law Enforcement Injuries Compensation Scheme and the Traffic Accident Victims Assistance Scheme, the payments are made in the form of lump sum grant and thus the number of cases authorized for payment are presented. In the tables, one case refers to one person except in the case of Public Assistance Scheme where a case may refer to a family.
Table 17.6 General Information
Rehabilitation services in Hong Kong aim at enabling disabled people to develop their physical, mental and social capabilities to the fullest extent. Services provided include sheltered work, day activity training, recreational service and residential facilities to disabled persons. Sheltered workshops provide work for disabled persons who cannot enter into open employment. Day activity centres provide day care and training programmes for low, moderate and severely mentally handicapped adults. The training programmes focus on acquiring daily living skills, self-care, personal hygiene and simple manual tasks. Residential care is provided for the disabled persons who have no families or relatives to care for them and cannot live independently and those who live in remote areas and are required to attend schools, vocational training or places of work. Recreational service is provided to the disabled persons in the form of a composite club. The statistics are reported in terms of active caseload as at end of the financial year.
Table 17. 7 General Information
Family casework services are provided through Family Service Centres distributed throughout the territory. It aims at preserving and strengthening the family as a unit by helping individuals and families to prevent serious problems or crises and by providing assistance and practical support during crisis periods. Cases may be referred from court or other government departments or the clients may come forward by themselves. Casework may include not only direct counselling but also referrals to other government departments when housing, medical or educational problems exist and arrangements in connection with schooling, employment, residence in institutions, home help service and other welfare services. Problems handled mainly involve care and protection of children and young persons, adjustments to mental and physical disabilities, difficulties in family relationship and hardships arising from unemployment or loss of the chief bread-winner. The statistics are presented in the table in terms of active caseload as at end of the financial year and the nature of problems.
Table 17.8 General Information
The Social Welfare Department provides remand service for boys and girls from 7 to 16 years pending court appearance or police investigation. The service is provided by the remand sections of the boys'/girls' home, which also provides residential care, academic training, prevocational training and social training for young persons in need of protection and for juvenile offenders under Probation Order. In addition, the Department also operates a hostel for male probationers aged 16-21 who take up outside employment during the day and two reformatory schools for boys placed under School Order. The statistics reflect the number of admissions in the financial year.
Table 17 .9 General Information
The majority of the child care centres in Hong Kong are operated by non-governmental organizations and private organizations. They are supervised and regularly inspected after registration at the Child Care Centres Advisory Inspectorate of Social Welfare Department, which is responsible for the enforcement of the Child Care Centres Ordinance and Regulations. The child care centres are categorized into creches which take care of children aged under 2, nurseries which take care of children aged 2 to below 6, and mixed centres which take care of all age groups under 6.
--- ------------------
Table 17 .10 Generallnformation
Residential services are provided for those elderly who, for health or other reasons, are unable to look after themselves and who have no relatives or friends to assist when required. The three types of institutions are (i) the hostels for the elderly which provide sheltered communal living accommodation for those capable of taking care of themselves, (ii) the homes for the aged which provide residential care for the elderly in the form of accommodation, meal, laundry service, limited personal care and organized social activities, and (iii) care and attention homes which provide accommodation with general personal care and limited nursing care to the elderly with poor health or physical disabilities.
Table 17 .11 General Information
Other than the services directly provided by the Social Welfare Department, 164 non-governmental organizations are receiving subvention for providing welfare services as at March 1991. The subvention presented in the table covers personal emolument, capital expenditure such as fitting out of new projects and purchasing of furniture and equipment, and other costs in running the services.
237


17.1 Applications for Legal Aid Number of cases
1981 1982 1983 1984 1985 1986 1987 1988 1989 1990
Civil cases
Applications received 15 574 14 712 13 864 13 957 13 804 14402 15 639 15 757 15 205 16 631
Certificates issued 6 547 4359 4 937 4 934 5 161 :j:j: 5 314 5 288 4 745 4 607 5 687
Cases finalised 10 557 11 018 11457 8 598 8 791 12 581 4237 11 573 9 580 12 854
Criminal cases
Applications received
Trials 1 815 1 963 1 876 1 558 1 639 1 711 1 614 1 950 2263 2 059 Appeals 984 1102 1 038 1150 1 376 1 639 1490 2257 2 017 2 640 Committal proceedings* 340 254 257 266 329 474 512
Legal aid granted
Trials I 694 1 684 1 605 1 382 1459 1 515 1484 1 738 2 063 1 816 Appeals 128 137 277 209 255 306 311 463 403 432 Committal proceedings* 247 223 235 249 336 455 500
Notes: *Figures refer to committal proceedings cases in Magistracies only, which were effective from 1.10.1984. :j:j: denotes revised figure.
Source: Legal Aid Department.
17.2 Applications for Legal Aid in Civil Cases by Type Number of cases
Type 1981 1982 1983 1984 1985 1986 1987 1988 1989 1990
Running down cases 1414 1259 1162 1 037 931 998 955 1 080 1 051 1 053
Matrimonial proceedings/separation and maintenance 4226 5 012 5 907 6 702 7102 7 308 8 058 8 341 7 816 7 693
Employee's compensation 828 818 721 807 781 868 863 859 1142 I 389
Wages 18 31 36
Winding-up 1 892 375 414 492 491 488 373 409 374 623
Bankruptcy 708 221 313 273 324 304 242 219 233 254
Appeal to Privy Council 3 3 8
Mis.~Landlord and tenant 3 399 2 721 I 521 I 134 703 774 I 017 689 669 812
Other cases 3 089 4272 3 790 3 512 3 469 3 639 4123 4160 3 919 4 807
Total 15574 14712 13864 13957 13804 14379 15639 15757 15205 16631
Source: Legal Aid Department.
239

17.3 Social Security
1981/82 1982/83 1983/84 1984/85 1985/86 1986/87 1987/88 1988/89 1989/90 1990/91
Public Assistance
Number of cases* 45 752 51 267 56 090 59 900 63 713 63 288 63 366 64222 66288 66 675 Amount (HK$ million) 291.3 407.8 486.6 583.4 625.6 678.4 706.0 779.3 854.8 960.1
Special Needs Allowance
Number of cases* 203 517 221 953 240 311 260 095 278 770 294 491 308 307 365 887 411 884 444 517 Amount (HK$ million) 436.8 622.9 709.2 832.3 909.7 965.2 1,022.8 1,374.0 1,772.1 2,159.8
Disability Allowance Number of cases* 31 614 35 824 40138 44896 48 336 52 704 56 051 59440 62 720 65 387 Amount (HK$ million) 121.3 174.3 201.2 246.3 277.7 299.6 322.6 392.8 483.2 583.4
Old Age Allowance Number of cases* 171 903 186 129 200 173 215 199 230 434 241 787 252 256 306 447 349 164 379 130 Amount (HK$ million) 315.5 448.6 508.0 586.0 632.0 665.6 700.2 981.2 1,288.9 1,576.4
Criminal and Law Enforcement Injuries Compensation
Number of cases authorized for payment 450 545 585 656 690 930 824 887 680 801 Amount (HK$ million) 2.2 2.6 3.3 4.2 4.8 6.0 4.9 5.7 5.7 6.8
Traffic Accident Victims Assistance
Number of cases authorized for payment 5 187 6 648 5 789 5 188 5 234 5 356 5 699 5 629 5 891 5 310 Amount (HK$ million) 24.1 32.9 31.0 31.7 34.4 37.3 40.6 42.4 50.7 49.9
Emergency Relief
Number of cases authorized for payment 34 147 13 377 13 265 5 668 6 842 8 305 5 927 2432 4497 2 182 Amount (HK$ million) 3.5 I.I 0.4 0.3 0.4 0.5 0.3 0.3 0.4 0.5
Fee Assistance
Number of child care centre cases* 11 314 12 251 11 345 11 562 10 720 9 983 9182 9 121 9 096 Number of kindergarten cases* 6 819 8 533 8 304 8 970 7474 5 475 4465 4456 t Amount :fl: (HK$ million) 20.9 36.5 34.9 37.6 40.2 40.2 39.1 41.6 53.1
Notes: Fee Assistance was first introduced on 1 September 1982. *Figures are as at end of the financial year.
:fl: Figures refer to child care centre cases only. The amount for kindergarten cases is reported as pre-primary services expenditures in Table 15.30 Expenditure on Education. .
tA new Fee Remission Scheme was introduced for kindergartens as from September 1990 and assessment of applications for assistance under this Scheme was henceforth handled by the Education Department.
Source: Social Welfare Department.
240

17.4 Public Assistance Cases by Type Number of cases
Type 1981/82 1982/83 1983/84 1984/85 1985/86 1986/87 1987/88 1988/89 1989/90 1990/91
Old age 31154 33 910 35 894 37 644 40 214 40 825 42 135 43 099 44 070 44 806
Ill health 6088 6 962 7 731 8 346 8 878 8 215 7 438 7 176 7 657 7 294
Low earnings 1 377 1 655 1 916 2080 1 799 1 515 1 268 1173 1 012 918
Unemployed 521 985 1 574 1 744 2225 2 143 1 877 1 591 1 618 1 754
Single parent family 2206 2 287 2 561 2 541 3 635 3 806 3 762 3 714 3 977 3 899
Blind 792 768 784 891 806 768 710 757 808 764
Deaf 95 124 123 190 139 145 138 163 217 216
Mentally ill 965 1166 1442 1 794 2 051 2 348 2 628 2 890 3 272 3 628
Physically disabled 1101 1120 1250 1 383 1403 1260 1262 1 389 1467 1422
Others 1453 2290 2 815 3 287 2 563 2263 2 148 2270 2 190 1 974
Total 45752 51267 56090 59900 63713 63288 63366 64222 66288 66675
Notes: Figures are as at end of the financial year. Figures for single parent family cases before 1985/86 cover only widow(er) with dependent children cases while those from 1985/86 onwards are extended to include the deserted, separated or divorced parents with dependent children, which were previously classified under 'others'.
Source: Social Welfare Department.
17.5 Special Needs Allowance Cases by Type Number of cases
Type 1981/82 1982/83 1983/84 1984/85 1985/86 1986/87 1987/88 1988/89 1989/90 1990/91
Disability Allowance 31614 35 824 40138 44896 48 336 52 704 56051 59440 62 720 65 387
Physically injured or blind 9025 9 866 10 491 11 311 11 229 11497 11 695 15 750 19 371 23 681
Disabling physical or mental condition 8 507 9 926 11 077 12 396 12 130 13 295 14 191 13 909 14 597 15 048
Disabled mentally or physically, requiring constant atten4ance 7201 8 135 9 303 10 661 12 915 14 238 15 102 14 736 14 137 12 990
Profoundly deaf 3 240 3 526 3 869 3 986 4289 4 550 4692 4 703 4 857 4 822
Others 3 641 4 371 5 398 6 542 7 773 9 124 10 371 10 342 9 758 8 846
Old Age Allowance 171903 186129 200173 215 199 230434 241 787 252 256 306 447 349164 379130
Total 203 517 221953 240311 260095 278770 294491 308307 365 887 411884 444 517
Note: Figures are as at end of the financial year.
Source: Social Welfare Department.
241

17.6 Disabled Persons Enrolled in Rehabilitation Services Number of persons
Type of service 1983/84 1984/85 1985/86 1986/87 1987/88 1988/89 1989/90 1990/91
Sheltered work Subvented agencies 1 061 1205 1259 1 335 1 558 1659 1 810 1929 SWD 689 734 823 1037 1094 1 169 1208 1 183
Total 1750 1939 2082 2372 2652 2828 3018 3112
Day activities training* Subvented agencies 256 289 327 435 621 703 730 792 SWD 268 342 350 399 451 485 505 515
Total 524 631 677 834 1072 1188 1235 1307
Place of refuge SWD 2 2
Recreational service Subvented agencies 12174 12 810 15 266 16 680 9 761 8 003 12 833 9642 SWD. 153 194 222 93 90 101 114
Total 12174 12963 15460 16902 9854 8093 12934 9756
Residential facilities Subvented agencies 622 723 780 962 1199 1 368 1490 1666 SWD 332 343 347 354 358 406 422 406
Total 954 1066 1127 1316 1557 1774 1912 2072
Notes: Figures are as at end of the financial year. *Figures were presented as work activities training previously.
Source: Social Welfare Department.
17.7 Active Cases of Family Services Centres by Nature of Problems
Number of cases
1983/84 1984/85 1985/86 1986/87 1987/88 1988/89 1989/90 1990/91
Active cases Subvented agencies 6 579 7234 7 668 7 896 8 249 8 191 8 385 8 869 SWD 21 383 21346 21646 23 789 25445 28447 27 808 21 586
Total 27962 28580 29314 31685 33694 36638 36193 30455
Nature of problems*
Problems involving children and young persons Subvented agencies 1 374 1453 1407 1458 1483 1439 1 508 1 390
SWD 6868 6966 6 811 7 848 11 559 11 379 10 660 9 763
Problems involving physical or mental health Subvented agencies 986 1 066 1 069 1197 1218 1214 1257 1401
SWD 12 756 13 230 12 998 13 996 15 111 17222 17 747 11 632
Problems involving family relationship Subvented agencies 3 818 4282 4740 4824 5 109 5136 5 225 5 533
SWD 4946 6646 6995 8 012 8 678 8 421 8 616 7 729
Problems mainly financial/ accommodation Subvented agencies 401 433 452 417 439 402 395 545
SWD 6000 5435 5446 6 566 7 577 7 339 7 485 6249
Notes: Figures are as at end of the financial year. *Each case may have more than one problem and therefore may have been classified under more than one nature of problems.
Source: Social Welfare Department.
17.8 Admissions to Children's, Boys' and Girls' Homes by Type of Custody Number of persons
Type of custody 1981/82* 1982/83* 1983/84* 1984/85* 1985/86 1986/87 1987/88 1988/89 1989/90 1990/91
Remand 5 568 6066 7033 5 813 3105 3 785 4139 4476 4986 4614 School Order 107 110 113 95 106 108 128 137 126 124 Probation Order 315 270 293 297 263 296 266 282 276 281 Care and Protection 521 408 383 319 433 496 437 531 607 775
Total 6511 6854 7822 6524 3907 4685 4970 5426 5995 5794
Note: *Figures include re-admission cases.
Source: Social Welfare Department.
242
--------- --------------

17.9 Child Care Centres under the Supervision of Child Care Centres Advisory Inspectorate by Type
Type 1981/82 1982/83 1983/84 1984/85 1985/86 1986/87 1987/88 1988/89 1989/90 1990/91
Subvented/ Aided
Full day nursery Number of centres 94 104 121 130 134 141 147 163 172 178 Number of places 10 588 11 705 13 414 14 397 14924 15 408 16 182 17 756 18 787 19 561
Residential nursery Number of centres I! 2 2 2 2 2 2 2 2 2 Number of places 158 164 164 164 164 164 164 164 164 169
Full day creche Number of centres 19 19 18 18 17 17 17 17 17 17 Number of places 913 888 888 888 853 879 917 917 917 937
Residential creche Number of centres 2! 2 2 2 2 2 2 2 2 2 Number of places 246 240 240 240 240 252 252 252 282 277
Special child care centre Number of centres 8 9 10 11 11 11 14 14 14 15 Number of places 318 360 420 480 480 480 660 675 675 795
Non-profit-making
Full day nursery Number of centres 4 3 3 4 4 4 4 4 5 6 Number of places 458 380 399 469 564 594 594 594 694 755
Half day nursery Number of centres 1 1 I Number of places 92 92 92
Full day creche Number of centres 1 I 1 1 I I I 1 1 I Number of places 48 48 64 64 64 64 64 64 64 64
Private
Full day nursery Number of centres 20 24 25 25 27 36 41 45 47 49 Number of places I 760 2 551 2 663 2 760 2960 3 366 3 734 3 891 4078 4 545
Half day nursery (Chinese speaking) Number of centres 15 15 15 15 17 16 13 10 10 10 Number of places 2 316 3 234 3 205 3 072 3 790 4 609 4970 4 775 5 164 5 024
Half day nursery (English speaking) Number of centres 31 26 23 25 24 25 25 23 22 21 Number of places I 708 I 623 I 614 1 726 I 716 I 636 I 339 I 350 1240 1 190
Full day creche Number of centres I 2 I I I Number of places 54 144 90 40 55
Residential creche Number of centres 16 12 11 11 10 10 7 7 7 6 Number of places 518 303 271 274 258 258 201 178 186 171
Mixed centres Number of centres 3 5 5 4 4 4 5 5 4 3 Number of places 160 270 241 232 232 231 312 302 240 181
Total number of centres 215 222 236 249 255 270 278 294 305 312 Total number of places 19191 21766 23583 24820 26389 28031 29389 31010 32623 33816
Note: Figures are as at end of the financial year.
Source: Social Welfare Department.
243

17.10 Persons Enrolled in Elderly Institutions by Type of Institution
Number of persons
Type of institution 1983/84 1984/85 1985/86 1986/87 1987/88 1988/89 1989/90
Hostel Subvented agencies 2332 2 585 3 016 3 581 3 876 4123 4434 SWD 63 66
Total 2332 2585 3016 3581 3876 4186 4500
Home for the aged/aged blind Subvented agencies 996 1120 1144 1257 1 393 1 332 1263
SWD 81 80
Total 996 1120 1144 1257 1393 1413 1343
Care and attention home Subvented agencies 707 867 1 099 1 313 1414 1618 1 657
Note: Figures are as at end of the financial year.
Source: Social Welfare Department.
17.11 Expenditure on Social Welfare
1981/82 1982/83 1983/84 1984/85 1985/86 1986/87 1987/88 1988/89 1989/90
Departmental expenditure 173,727 239,805 278,757 282,062 309,915 353,446 393,182 450,748 538,287
Payments for Social Security Schemes* 730,328 1,033,418 1,199,072 1,419,992 1,540,039 1,650,072 1,733,966 2,159,252 2,632,988
Subvention to Non-governmental Organizations 189,990 267,303 333,249 383,729 449,097 504,447 637,711 776,421 984,191
Total 1,094,045 1,540,526 1,811,078 2,085,783 2,299,051 2,507,965 2,764,859 3,386,421 4,155,466
Note: *Payments for Traffic Accident Victims Assistance are excluded as the Scheme is financed by the Traffic Accident Victims Assistance Fund.
Source: Social Welfare Department.
244
1990/91
4916 63
4979
1413 81
1494
2077
HK$'000
1990/91
678,874
3,127,215
1,253,528
5,059,617

Section 18 Law and Order
Tables 18.1to18.8 Generallnformation
Figures on the crimes and offenders are obtained from the records of Royal Hong Kong Police Force (RHKPF).
Concepts and Definitions
The crime figures in Table 18.1 refer to number of cases classified by police only. They do not include crimes which are not reported to police for various reasons. Also, criminal offences handled by government departments other than RHKPF are not included.
Compilation and Calculation
The crime figures are compiled according to the following four principles:
Rule 1: Offences Against the Person
One crime will be counted for each person on whom an offence has been committed.
Rule 2: Offences Against Property or Public Order
One crime will be counted for each distinct incident.
Rule 3: Series of Similar or Allied Crimes
Notwithstanding Rule (1) and Rule (2), one crime will be counted for each crime or series of similar or allied crimes committed by the same offender(s) on different occasions involving, as victims, the same or different person(s) or organizations.
Rule 4: Naturally connected offences
Offences which are naturally connected or can be expected to be conjoined with a more serious offence will not be counted. After discounting these offences, each category of the remaining offences will be counted according to Rules (1 ), (2) or (3).
The statistics on offenders refer to persons prosecuted, regardless of whether they are convicted or not. They are counted according to the following rule:
The counting of offences will be based on the number of occasions on which offenders are proceeded against; not the number of different offenders dealt with nor the number of charges involved. An offender will appear more than once in the statistical tables if he is proceeded against on two or more separate occasions. If an offender is prosecuted on one occasion for two or more offences, only one offence is selected for tabulation, the offence being the one for which the maximum penalty is the heaviest.
The number of detected cases in Table 18.3 includes only detected cases out of the crimes reported in the same calendar year. Detected cases which were reported in previous calendar years are not included. The figures on property recovered in Table 18.7 are compiled on the same basis.
Table 18.9 General Information
The courts in Hong Kong are the Supreme Court (comprising the Court of Appeal and the High Court), the District Court, the Magistrates' Court, the Coroner's Court, and also include the Lands Tribunal, the Labour Tribunal, the Small Claims Tribunal and the Obscene Articles Tribunal.
The Court of Appeal is the highest court in Hong Kong. It hears appeals on all matters, civil and criminal, from the High Court and the District Court, as well as appeals from the Lands Tribunal. Further appeals can be brought from the Court of Appeal to the Judicial Committee of the Privy Council in London. Such appeals are not frequent because of the expense involved and the stringent conditions which govern the grant of special leave to appeal.
The jurisdiction of the High Court is unlimited in both civil and criminal matters. The court also exercises jurisdiction in bankruptcy, company winding-up, divorce, adoption, and probate matters. The most serious criminal offences, such as murder, manslaughter, rape, armed robbery and drug offences involving large quantities are tried by a judge of the High Court, sitting with a jury of seven or, where a judge orders, nine.
245

246
The District Court has limited jurisdiction in both civil and criminal matters. It has civil jurisdiction to hear monetary claims up to $120,000 or, where the claims are for recovery ofland, the annual rent or rateable value does not exceed $100,000. In addition, it has exclusive jurisdiction to hear applications for compensation under the Employees' Compensation Ordinance and actions for recovery of outstanding taxes under the Inland Revenue Ordinance notwithstanding that the amount claimed is in excess of $120,000. In its criminal jurisdiction, the court may try the more serious cases with the exceptions of a few very serious offences such as murder, manslaughter and rape. The maximum term of imprisonment it can impose is seven years. It also exercises appellate jurisdiction in appeals against the assessment of stamp duty imposed by the Collector of Stamp Revenue.
Magistrates exercise criminal jurisdiction over a wide range of indictable and summary offences. Although there is a general restriction of two years imprisonment or a fine of $10,000 on indictable offences which are dealt with summarily, a growing number of ordinances give magistrates the power to impose sentences of up to three years imprisonment and substantially larger fines, in some cases up to $1,000,000.
Coroner's Court inquires into the cause of and the circumstances connected with the death of any person by accident or violence or under suspicious circumstances. A Coroner's Court may sit with a jury of three people and must so sit when a death occurs in official detention.
The Lands Tribunal has three principal judicial functions. First, it determines the amount payable by the Government and others for compensation to persons whose land is compulsorily resumed or has its value reduced because of public or private developments. Second, it deals with appeals in respect of rateable values under the Rating Ordinance and appeals against certificates of increase in rent and other determinations under the Landlord and Tenant (Consolidation) Ordinance. Third, the tribunal has jurisdiction in all claims for possession of premises under the Landlord and Tenant (Consolidation) Ordinance, and the ancillary monetary claims related thereto.
The Labour Tribunal deals with monetary claims arising from the breach of a term, whether expressed or implied, of a contract of employment, whether the performance thereof is to be in Hong Kong or under an overseas contract as definite in the Contracts for Employment Outside Hong Kong Ordinance, or of a contract of apprenticeship. It also deals with claims for a sum of money arising from the failure of a person to comply with the provisions of the Employment Ordinance or the Apprenticeship Ordinance. There is no limit to the amount which may be claimed in the tribunal.
The Small Claims Tribunal deals with monetary claims involving amounts not exceeding $15,000.
The Obscene Articles Tribunal has two functions. Firstly, it has exclusive jurisdiction to determine whether an article referred to it by a court or a magistrate is an obscene or indecent article and where the matter publicly displayed is indecent. These referrals by the court are a result of a defendant facing a charge under the penal provisions of the ordinance. Secondly, a .tribunal also has power to classify an article as Class I (neither obscene nor indecent), Class II (an indecent article) or Class III (an obscene article). An author, printer, manufacturer, publisher, importer, distributor or owner of copyright of an article, can submit it to a tribunal for classification. A tribunal is required to make an interim classification within five days of the submission. The presiding officer is a magistrate who sits with two or more adjudicators.
Tables 18.10 to 18.15 General Information
Statistics in these tables cover all convicted persons sentenced by the court to serve a custodial sentence in the correctional programmes operated by the Correctional Services Department (CSD). The programmes include prisons, training centres, detention centres and drug addiction treatment centres. Offenders sentenced to the latter three programmes and young prisoners are provided with a fixed period of aftercare supervision after discharge. Besides the prison population, Table 18.10 also covers illegal immigrants detained in CSD institutions pending for repatriation to their home countries as well as Vietnamese refugees/Vietnamese migrants placed under the Department's custody.
Further References
For more detailed analysis of the prison population, reference may be made to the Annual Statistical Tables on penal receptions published by the Correctional Services Department.
Tables 18.16 to 18.17 General Information
Social Welfare Department provides information on some offenders' character and background at the request of the courts prior to the sentencing. Statistics presented in Table 18.16 are confined to social enquiry service provided through Probation Officers, who also provide

supervision and personal guidance to offenders under Probation Order through regular home visits and interviews during the probation period, by working closely with their families and arranging for special treatment or services necessary for the successful rehabilitation of the probationer. Some of the juvenile offenders under Probation Order are also required by the court to have residential institutional care during the probation period.
Table 18.18 Generallnformation
Social Welfare Department also provides guardianship and/ or supervision for boys and girls vested upon the Department under the Protection of Women and Juveniles Ordinance, Cap. 213. The cases are classified into four types. Registered wards are girls under 21 who were adopted under Chinese law and customs before 31 December 1972 and whose guardianship were vested upon the Department. From 1973 onwards, all adoptions have to be legalized by court. Declared wards are girls under 21 whose guardianship was declared by the Director of Social Welfare under the Ordinance without court proceedings. Juvenile Court Wards are children or juveniles in need of care and protection whose guardianship are vested upon the Department by a juvenile court order. Children and juveniles under supervision order are those in need of care and protection, who are committed to the supervision of the Social Welfare Department for a specified period not exceeding three years or until the children or juveniles reach the age of 18.
247


18.1 Reported Crime by Area by Type of Offence Number of cases
Area/Type of offence 1981 1982* 1983 1984 1985 1986 1987 1988 1989 1990
Hong Kong Island Against lawful authority 926 855 942 905 618 601 565 676 622 652 Against public morality 229 324 317 246 310 336 338 394 344 310 Against the person 1 145 1 285 1 300 1277 1 152 1116 1 311 1 315 1 526 1487 Against property 14 759 14 206 13 585 12 705 13 397 12 369 12 232 11 176 11920 13 332 Other crimes 665 563 351 272 452 566 621 533 561 749 Narcotic offences 306 342 399 336 572 665 638 709 626 324
Kowloon and New Kowloon Against lawful authority 1 761 1 731 1 774 1 806 1 952 1 833 1 883 1 635 1 694 1 814 Against public morality 737 711 773 728 973 1 030 1 389 1 504 1 536 1482 Against the person 4076 4 760 4 908 5 107 5 188 5 404 5 493 5 111 5 375 5 063 Against property 35 281 35 929 36 580 35 652 35 356 32 660 31 666 27 410 26400 28 073 Other crimes 986 1424 937 855 1238 1406 1408 1 298 1461 2002 Narcotic offences 1 210 1483 1 860 1 640 2254 2 751 2 699 3 701 3 442 2 601
New Territories Against lawful authority 679 752 781 738 1 079 822 765 861 1 065 1 067 Against public morality 371 322 332 434 462 407 457 609 612 588 Against the person 1 704 1 922 2 069 2240 2 088 1 920 2 169 2 326 2 887 3 162 Against property 13 390 16 005 17 487 16 892 17 719 15 315 16 929 17 885 18 766 22 284 Other crimes 467 504 360 505 830 900 987 944 1 086 1 743 Narcotic offences 309 405 517 538 704 683 788 1 082 944 675
Marine Against lawful authority 69 101 121 114 57 41 34 27 25. 36 Against public morality 15 17 11 10 13 8 17 29 65 32 Against the person 83 95 95 110 68 80 87 155 180 170 Against property 382 412 447 357 403 447 399 409 605 566 Other crimes 55 81 40 48 40 32 21 35 38 84 Narcotic offences 12 8 14 17 19 19 18 35 28 4
Total Against lawful authority 3435 3439 3618 3563 3706 3297 3247 3199 3406 3569 Against public morality 1352 1374 1433 1418 1 758 1 781 2201 2536 2557 2412 Against the person 7008 8062 8372 8734 8496 8520 9060 8907 9968 9882 Against property 63812 66552 68099 65606 66875 60791 61226 56880 57 691 64255 Other crimes 2173 2572 1688 1680 2560 2904 3037 2810 3146 4578 Narcotic offences 1837 2238 2790 2531 3549 4118 4143 5527 5040 3604
Note: *The counting rules of crime were revised w.e.f. 1.1.1983. Figures prior to 1982 were therefore not directly comparable.
Source: Royal Hong Kong Police Force.
18.2 Reported Crime by Type of Offence Number of cases
Type of offence 1981 1982* 1983 1984 1985 1986 1987 1988 1989 1990
Against lawful authority Against public order 1 693 1492 1 730 1 595 1 734 1 692 1 780 1 805 1 984 2098 Unlawful society 919 940 695 1 058 1 392 1 055 963 908 1 041 1 084 Other offences 823 1 007 1 193 910 580 550 504 486 381 387
Against public morality Rape 103 79 78 87 80 72 66 97 120 111 Indecent assault 720 784 778 768 801 808 979 922 1 019 1 078 Other offences 529 511 577 563 877 901 1 156 1 517 1 418 1 223
Against the person Murder and manslaughter 105 93 84 84 89 67 72 71 102 137 Attempted murder 7 3 12 4 11 4 12 7 5 11 Serious assaults 6 231 7 265 7 610 7 874 7 589 7 804 8 310 8 183 9 194 9 096 Other offences 665 701 666 772 807 645 666 646 667 638
Against property Robbery with firearms 30 21 30 23 17 18 7 19 33 66 Other robberies 8 233 8 527 8 278 7 222 6 728 5 354 5 454 5 686 6 419 7 963 All burglaries 10 583 11 526 11 308 12 663 13 922 11 942 11 587 10 749 10 913 12 701 Theft from persons 4275 4869 5 746 5 327 5 393 4 916 4973 2 959 2 450 2 956 Shop theft 2 970 2 800 3 985 3 897 6482 6170 7077 5 611 5 140 5 847 Other thefts 26 308# 28 981 # 27 217 # 24 149 # 23 135# 22 195 21 502 21 938 22 189 23 350 Other offences 11413 9 828 11 535 12 325 11 198 10 196 10 626 9 918 10 547 11 372
Other crimes Forgery and coinage 1486 995 454 538 379 291 291 356 484 528 Bribery and corruption 31 27 17 21 15 25 28 23 14 21 Possession of arms and
ammunition 142 73 71 99 48 41 50 48 87 122 Others 514 1477 1 146 1 022 2 118 2 547 2 668 2 383 2 561 3 907
Serious narcotic offences 1 837 2238 2 790 2 531 3 549 4118 4143 5 527 5 040 3 604 Total 79617 84237 86000 83532 86944 81411 82914 79859 81808 88300
Notes: *The counting rules of crime were revised w.e.f. 1.1.1983. Figures prior to 1982 were therefore not directly comparable. # Revised figure.
Source: Royal Hong Kong Police Force.
249

18.3 Detected Crime by Type of Offence Number of cases
Type of offence 1981 1982* 1983 1984 1985 1986 1987 1988 1989 1990
Against lawful authority
Against public order 1 682 1473 1 696 1 566 I 718 1 683 1 766 I 788 1 961 2085 Unlawful society 911 924 659 I 017 I 326 993 877 816 923 955 Other offences 798 953 1142 878 563 526 468 451 349 359
Against public morality Rape 70 49 36 46 48 41 43 61 70 66 Indecent assault 504 542 491 444 492 500 588 580 647 731 Other offences 483 455 527 494 812 825 I 076 1421 1 316 I 145
Against the person Murder and manslaughter 62 63 55 55 66 49 44 43 77 91 Attempted murder 7 3 9 4 11 4 12 6 4 9 Serious assaults 4572 5 029 5 088 5 230 5 272 5 698 5 616 5 521 6180 5 986 Other offences 575 589 465 524 578 448 475 457 506 445
Against property Robbery with firearms 10 11 11 10 8 6 3 11 7 21 Other robberies I 737 I 849 I 315 I 314 I 328 I 156 I 109 I 335 I 644 I 733 All burglaries I 756 1407 1228 1254 1467 1262 I 104 1 175 I 135 1208 Theft from persons I 123 I 230 I 161 845 960 I 007 772 616 638 846 Shop theft # 2 720 3 898 3 773 6 285 5 891 6 644 5 036 4 540 5 041 Other thefts 14 161 9 286t 7 899t 7 OI6t 6 908t 6 393 5 315 4 895 5 600 5 242 Other offences 8 450 6 231 6 882 7183 6263 5 631 5 524 4 796 5 552 5 892
Other crimes Forgery and coinage 1459 937 368 462 311 255 216 286 409 477 Bribery and corruption 31 27 16 21 15 25 27 23 13 21 Possession of arms and
ammunition 139 72 71 98 47 41 49 47 86 122 Others 511 1460 I 109 985 2052 2437 2478 2262 2478 3 817
Serious narcotic offences I 831 2235 2 788 2 525 3 543 4107 4128 5 516 5 035 3 603 Total 40872 37545 36914 35744 40073 38978 38334 37142 39170 39895
% of total reported crime 51.3 44.6 42.9 42.8 46.1 47.9 46.2 46.5 47.9 45.2
Notes: *The counting rules of crime were revised w.e.f. 1.1.1983. Figures prior to 1982 were therefore not directly comparable. # Included in other thefts. t Revised figure.
Source: Royal Hong Kong Police Force.
18.4 Persons Prosecuted by Type of Offence by Age Group
Type of offence/Age group 1981 1982 1983 1984 1985 1986 1987 1988 1989 1990
Against lawful authority under 16 years 314 330 273 319 394 266 351 380 522 430 16-20 years 947 1301 1 006 I 032 1 090 819 954 I 069 I 193 I 066 21 years and over 2 317 2 909 3 040 3 014 3 135 3 116 3 255 3 135 3 049 2 750
Against public morality under 16 years 60 57 59 57 73 71 85 95 122 123 16-20 years 231 247 313 283 331 337 416 435 407 356 21 years and over 401 399 I 079 776 I 183 1207 1234 1424 I 389 I 311
Against the person under 16 years 273 296 335 408 363 325 413 463 560 456 16-20 years I 039 I 094 I 110 I 120 I 081 I 161 I 159 I 151 I 390 I 157 21 years and over 3 411 3 653 3 836 4187 4086 4422 4423 4 507 4424 4113
Against property under 16 years 2943 2063 2 216 2037 2244 I 835 2 301 2 647 3 353 2992 16-20 years 3 856 3 949 4114 4 300 4 175 3 356 3 320 3 334 4082 4126 21 years and over 10 143 10 784 12 142 13 098 13 495 12 807 11 428 9 698 10 449 11 104
Other crimes under 16 years 45 36 37 50 39 53 70 94 122 177 16-20 years 230 324 225 223 284 304 324 379 431 642 21 years and over I 125 1468 I 187 1201 2205 2488 2 597 2 525 2 737 3 551
Serious narcotic offences under 16 years 50 64 68 38 51 48 40 55 46 46 16-20 years 299 419 460 382 441 474 378 415 423 332 21 years and over 2054 2 622 3 273 3 013 4079 4774 4 813 6109 5 581 4 012
Total under 16 years 3685 2846 2988 2909 3164 2598 3260 3734 4725 4224 16-20 years 6602 7334 7228 7340 7402 6451 6551 6783 7926 7679 21 years and over 19451 21835 24557 25289 28183 28814 27750 27398 27629 26841
Total prosecution rate* (per 100 OOO population) under 16 years 459.4 359.4 381.9 374.2 408.0 334.6 422.2 485.1 611.2 545.1 16-20 years 1122.6 1296.9 1336.8 1425.8 1506.0 1368.7 1462.8 1562.5 1832.2 1 776.2 21 years and over 607.6 659.0 718.4 721.8 784.5 780.4 733.4 709.9 704.0 677.9
Note: *Figures are revised based on the mid-year population estimates derived using the 1991 Census results.
Source: Royal Hong Kong Police Force.
250
-------------~----------

18.5 Persons Prosecuted by Type of Offence by Age Group, 1990
Offence/Age group Under 16 years 16-20 years 21 years and over Total
Against lawful authority
Against public order 258 821 2 348 3427 Unlawful society 149 201 169 519 Other offences 23 44 233 300
Against public morality
Rape 10 36 56 102 Indecent assault 66 91 461 618 Other offences 47 229 794 1070
Against the person
Murder and manslaughter 9 51 105 165 Attempted murder 5 5 Serious assaults 418 1 022 3 707 5147 Other offences 29 84 296 409
Against property
Robbery with firearms 7 22 29 Other robberies 673 688 721 2082 All burglaries 330 345 551 1226 Theft from persons 67 147 483 697 Shop theft 556 611 2 839 4006 Other thefts 826 1 214 2 745 4785 Other offences 540 1114 3 743 5397
Other crimes
Forgery and coinage 11 59 362 432 Bribery and corruption 1 13 14 Possession of arms and ammunition 13 26 111 150 Others 153 556 3 065 3774
Serious narcotic offences 46 332 4 012 4390
Total 4224 7679 26841 38744
Source: Royal Hong Kong Police Force.
18.6 Minor Offences Dealt with by the Police Number of cases
Offences 1981 1982 1983 1984 1985 1986 1987 1988 1989 1990
Minor Narcotic Offence
Possession of drug 3 829 4400 5 088 5 325 5 662 4 806 3 815 2 838 2090 1 970
Possession of pipe, equipment, etc. 1461 1 821 2470 2463 2 846 2 868 2 539 2 399 1 343 671
Keeping a divan 34 56 42 49 57 53 53 34 17 9
Smoking, consuming, etc. 494 651 669 628 531 551 372 250 285 116
Other narcotic offences 153 169 109 356 152 73 45 83 40 56
Sub-total 5 971 7097 8378 8821 9248 8 351 6824 5604 3 775 2822
Miscellaneous Offence
Gambling 14 294 7 368 2 646 2 419 2002 1 630 1238 1154 1 353 1 131
Hawking 65134 48 507 42058 29 381 18 523 19 706 15 777 8 251 5 294 8 766
Obstruction 52408 47 919. 44 535 50 839 47 983 42240 39 528 33 857 26040 26 237
Prostitution 1146 1 561 973 1154 1 091 1 297 800 214 233 283
Other offences 38 011 28 146 30 195 32 282 34996 36 128 24405 22 028 18 751 12 881
Sub-total 170 993 133 501 120407 116075 104 595 101001 81748 65 504 51671 49298
Total 176964 140598 128785 124 896 113843 109352 88572 71108 55446 52120
Note: Gambling offences broadly include minor gambling offences and serious gambling offences. Since serious gambling offences were classified as crime starting from 1.1.1985, all figures for gambling offences have excluded serious gambling offences and referred to minor gambling offences only with effect from 1.1.1985.
Source: Royal Hong Kong Police Force.
251
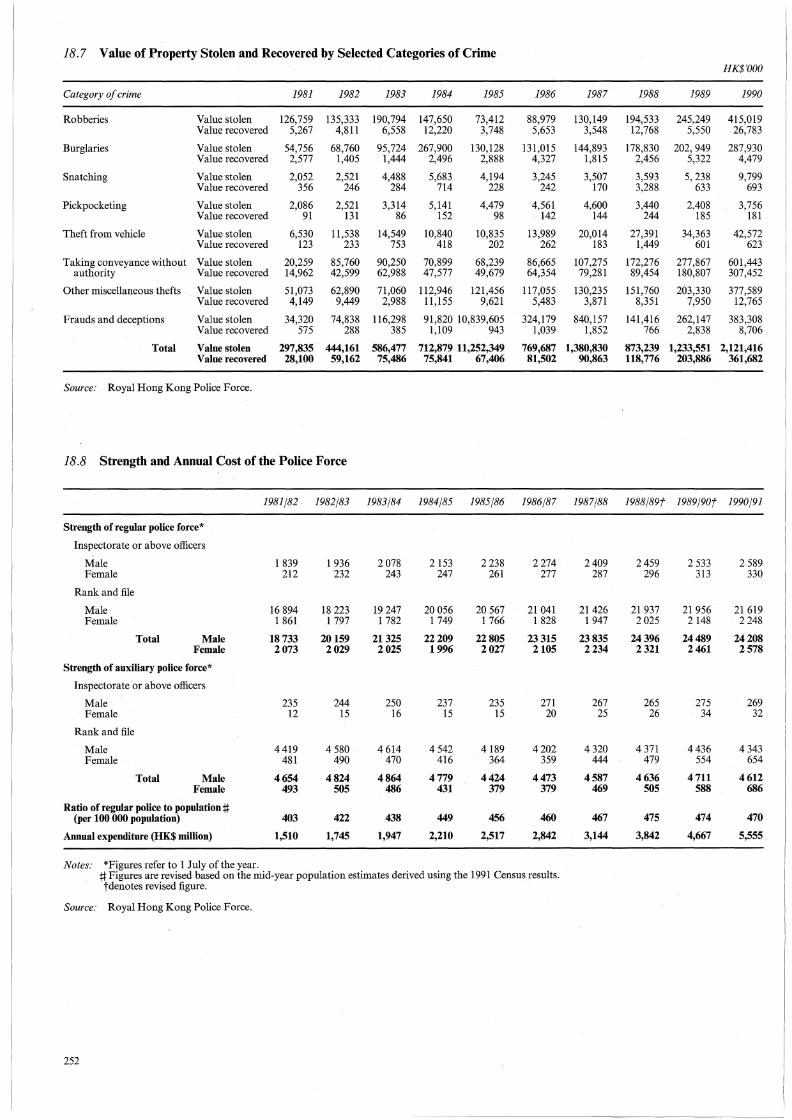
18.7 Value of Property Stolen and Recovered by Selected Categories of Crime HK$'000
Category of crime 1981 1982 1983 1984 1985 1986 1987 1988 1989 1990
Robberies Value stolen 126,759 135,333 190,794 147,650 73,412 88,979 130,149 194,533 245,249 415,019 Value recovered 5,267 4,811 6,558 12,220 3,748 5,653 3,548 12,768 5,550 26,783
Burglaries Value stolen 54,756 68,760 95,724 267,900 130,128 131,015 144,893 178,830 202,949 287,930 Value recovered 2,577 1,405 1,444 2,496 2,888 4,327 1,815 2,456 5,322 4,479
Snatching Value stolen 2,052 2,521 4,488 5,683 4,194 3,245 3,507 3,593 5,238 9,799 Value recovered 356 246 284 714 228 242 170 3,288 633 693
Pickpocketing Value stolen 2,086 2,521 3,314 5,141 4,479 4,561 4,600 3,440 2,408 3,756 Value recovered 91 131 86 152 98 142 144 244 185 181
Theft from vehicle Value stolen 6,530 11,538 14,549 10,840 10,835 13,989 20,014 27,391 34,363 42,572 Value recovered 123 233 753 418 202 262 183 1,449 601 623
Taking conveyance without Value stolen 20,259 85,760 90,250 70,899 68,239 86,665 107,275 172,276 277,867 601,443 authority Value recovered 14,962 42,599 62,988 47,577 49,679 64,354 79,281 89,454 180,807 307,452
Other miscellaneous thefts Value stolen 51,073 62,890 71,060 112,946 121,456 117,055 130,235 151,760 203,330 377,589 Value recovered 4,149 9,449 2,988 11,155 9,621 5,483 3,871 8,351 7,950 12,765
Frauds and deceptions Value stolen 34,320 74,838 116,298 91,820 10,839,605 324,179 840,157 141,416 262,147 383,308 Value recovered 575 288 385 1,109 943 1,039 1,852 766 2,838 8,706
Total Value stolen 297,835 444,161 586,477 712,879 11,252,349 769,687 1,380,830 873,239 1,233,551 2,121,416 Value recovered 28,100 59,162 75,486 75,841 67,406 81,502 90,863 118,776 203,886 361,682
Source: Royal Hong Kong Police Force.
18.8 Strength and Annual Cost of the Police Force
1981/82. 1982/83 1983/84 1984/85 1985/86 1986/87 1987/88 1988/89f 1989/90f 1990/91
Strength ofregular police force*
Inspectorate or above officers
Male 1 839 1 936 2078 2153 2 238 2 274 2409 2459 2 533 2 589 Female 212 232 243 247 261 277 287 296 313 330
Rank and file
Male 16 894 18 223 19 247 20056 20 567 21 041 21426 21 937 21 956 21 619 Female 1 861 1 797 1 782 1 749 1 766 1 828 1 947 2025 2 148 2248
Total Male 18733 20159 21325 22209 22805 23315 23835 24396 24489 24208 Female 2073 2029 2025 1996 2027 2105 2234 2321 2461 2578
Strength of auxiliary police force*
Inspectorate or above officers
Male 235 244 250 237 235 271 267 265 275 269 Female 12 15 16 15 15 20 25 26 34 32
Rank and file
Male 4419 4 580 4614 4 542 4189 4 202 4 320 4 371 4436 4 343 Female 481 490 470 416 364 359 444 479 554 654
Total Male 4654 4824 4864 4779 4424 4473 4587 4636 4711 4612 Female 493 505 486 431 379 379 469 505 588 686
Ratio of regular police to population :j:j: (per 100 OOO population) 403 422 438 449 456 460 467 475 474 470
Annual expenditure (HK$ million) 1,510 1,745 1,947 2,210 2,517 2,842 3,144 3,842 4,667 5,555
Notes: *Figures refer to 1 July of the year. :j:j: Figures are revised based on the mid-year population estimates derived using the 1991 Census results. tdenotes revised figure.
Source: Royal Hong Kong Police Force.
252

18.9 Work in the Judiciary
1981 1982 1983 1984 1985 1986 1987 1988 1989 1990
Supreme Court
Court of Appeal Civil appeals 159 167 173 192 206 173 168 164 202 198 Criminal appeals 478 521 646 598 533 628 637 627 638 604
Total 637 688 819 790 739 801 805 791 840 802
High Court
Civil cases 9 316 12 896 15 573 8 799 7 943 7 397 8 648 8 303 7 926 8 901 Miscellaneous proceedings I 754 2 359 3 001 3 909 2 923 2 789 2 757 2 642 3 496 4052 Adoptions 398 400 69 2 1 9 2 3 4 Divorce 80 79 20 9 9 9 6 5 5 8 Admiralty cases 353 376 433 379 315 228 204 208 360 387 Bankruptcy 151 186 289 765 I 050 I 055 956 845 711 955 Company winding-up 142 267 334 424 368 398 252 219 224 401 Commercial cases 82 153 155 114 IOI 271 148 174 Construction cases 12 27 15 21 17 Criminal cases 215 319 308 335 262 270 234 296 387 356 Appeals from Magistracy 684 689 977 846 1144 I 330 I 090 I 814 I 601 I 817 Appeals from Small Claims
and Labour Tribunals 13 74 105 76 71 146 109 111 113 101
Total 13106 17645 21191 15697 14241 13757 14384 14731 14995 17173
District Court
Criminal jurisdiction I 238 1119 1277 1246 I 359 1479 1 369 I 514 I 521 1407 Civil jurisdiction 30 153 40 643 39 626 51274 44 815 36 538 32 314 28 975 27 651 29 782 Stamp Appeals 18 60 33 22 29 14 41 19 16 29 Workmen's compensation 504 490 465 447 520 495 534 493 621 780 Distress for rent 2 346 3 295 4061 3 955 4 385 4065 3 182 2 892 3 099 3 781 Divorce jurisdiction 2 811 3 120 3 734 4764 5 047 5 339 5 747 5 893 6275 6 767 Adoption 386 437 300 322 292 280 290 Lands cases* 19 111 2 883 3 228 3 676 4229 5121 5 661 6180 5 182
Total 37089 48838 52465 65373 59831 52459 48630 45739 45643 48018
Small Claims Tribunal
Claims filed 19923 25255 30037 31402 32681 32557 33243 36022 37771 39194
Tenancy Tribunal#
Ordinary cases 35 15 Exemption cases 112 43 Demolished building cases 19 2
Total 166 60
Labour Tribunal
Claims filed 5008 5484 4685 3962 4660 5485 4426 4312 4285 4551
Obscene Articles Tribunal
Number of cases filed 300 1 771 1515 1802
Coroner's Court
Number of death inquiries made 245 199 188 141 179 224 305 333 327 292
Magistracy
Charge cases 130 655 135 261 163 436 184 363 178 OOO 172 459 167 623 147 045 128 220 130 321 Summonses issued 636 393 878 504 811 014 626 538 461 303 420 573 389 064 360 103 363 643 366 544 Miscellaneous proceedings 6 537 7 476 12 389 14199 14 843 14 207 18 452 18 638 18 009 16774
Total 773 585 1021241 986839 825100 654146 607239 575139 525786 509872 513639
Adult defendants charged 703835 1042383 1040006 886594 660423 633488 574086 515192 519 527 510 515 Adult defendants convicted 678558 1010 208 1005934 828550 633198 592807 544138 481261 493067 483890 Juvenile defendants charged 5944 4617 4472 3474 3392 3310 3471 3498 3800 3429 Juvenile defendants convicted 5095 3990 3827 2938 2772 2626 2861 2717 3044 2659
Notes: *Land cases include Lands Tribunal cases. #Tenancy Tribunal ceased operation with effect from 11.6.1982.
Source: Judiciary.
253

18.10 Prisoners and Inmates
1981 1982 1983 1984 1985 1986 1987 1988 1989 1990
Average daily population of
Prisons
Male 4938 5 352 5 839 5 702 5 741 5 733 5 872 6 378 7 991 8 902 Female 144 178 185 153 156 208 220 282 399 410
Training centres
Male 402 503 572 542 498 514 522 555 627 660 Female 59 62 64 74 82 86 69 77 74 80
Detention centre
Male 336 280 252 263 287 257 280 312 372 372 Female
Treatment centres
Male 990 926 941 1112 1 143 1 218 1 096 1175 1189 909 Female 43 27 41 49 62 91 101 93 77 64
Illegal immigrants
Male 1 705 719 189 147 150 113 828 310 567 479 Female 1221 486 125 85 90 65 407 96 234 239
Detainees (Vietnamese refugees)
Male 1 560* 2 716 3 269 2973 2 531 2 943 5 401 5 274 2 192* Female 885* 1 694 2 160 1 899 1 582 1 971 4083 4064 2004*
Vietnamese migrants
Male 2 731 # 10 108 15 603 ·Female 2280# 8 866 13 827
Total Male 8371 9340 10509 11035 10792 10366 11541 16862 26128 29117 Female 1467 1638 2109 2521 2289 2032 2768 6911 13714 16624
Discharged under aftercare supervision (at end of year)
Male 2401 2452 3006 3493 3530 3482 3180 3222 3531 2813 Female 116 90 142 176 175 231 263 246 212 131
Notes: *The figure for 1982 was calculated from July 1982 onwards when the Closed Centre Policy was introduced, whereas that for 1990 was calculated up to May when all closed centres were handed over to the Housing Department.
#The figure was calculated from June 1988 onwards when the policy for the screening of Vietnamese migrants was introduced.
Source: Correctional Services Department.
254
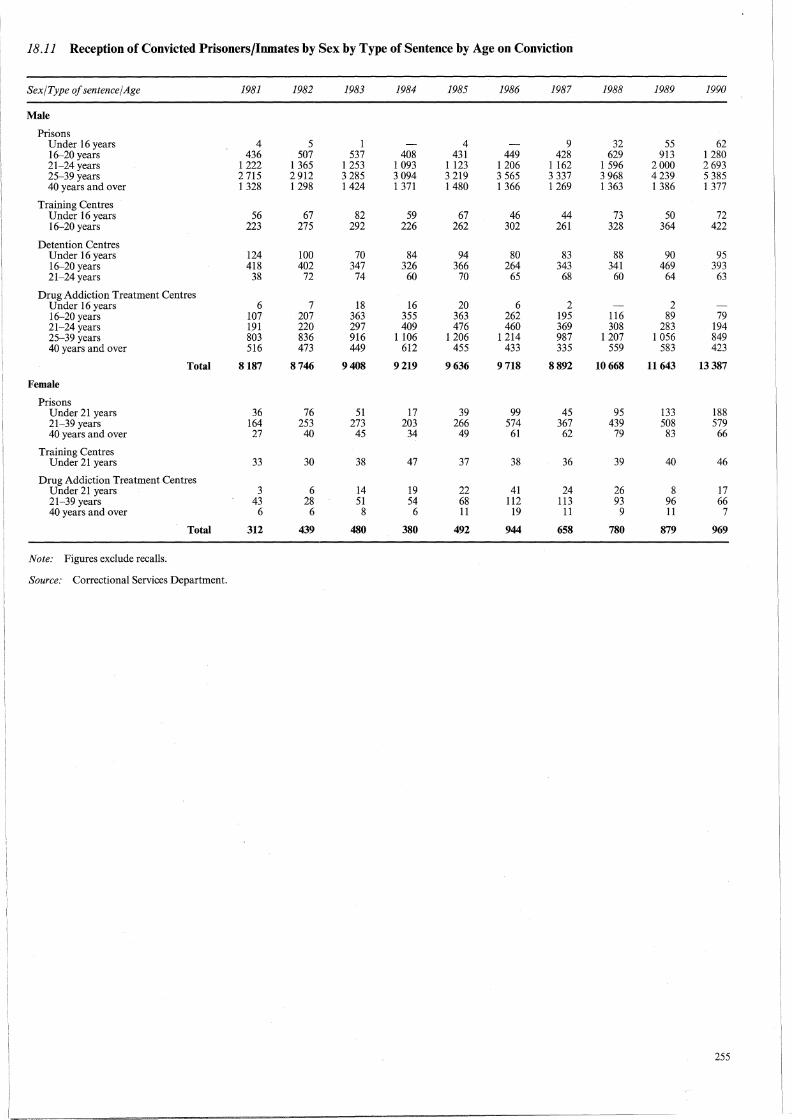
I '
18.11 Reception of Convicted Prisoners/Inmates by Sex by Type of Sentence by Age on Conviction I
Sex/Type of sentence/Age 1981 1982 1983 1984 1985 1986 1987 1988 1989 1990
Male
Prisons Under 16 years 4 5 1 4 9 32 55 62 16-20 years 436 507 537 408 431 449 428 629 913 1280 21-24 years 1222 1 365 1 253 1 093 1123 1206 1162 1 596 2000 2 693 25-39 years 2 715 2 912 3 285 3 094 3 219 3 565 3 337 3 968 4239 5 385 40 years and over 1 328 1298 1424 1 371 1480 1 366 1269 1 363 1 386 1 377
Training Centres Under 16 years 56 67 82 59 67 46 44 73 50 72 16-20 years 223 275 292 226 262 302 261 328 364 422
Detention Centres Under 16 years 124 100 70 84 94 80 83 88 90 95 16-20 years 418 402 347 326 366 264 343 341 469 393 21-24years 38 72 74 60 70 65 68 60 64 63
Drug Addiction Treatment Centres Under 16 years 6 7 18 16 20 6 2 2 16-20 years 107 207 363 355 363 262 195 116 89 79 21-24 years 191 220 297 409 476 460 369 308 283 194 25-39 years 803 836 916 1106 1206 1214 987 1207 1 056 849 40 years and over 516 473 449 612 455 433 335 559 583 423
Total 8187 8746 9408 9219 9636 9718 8892 10668 11643 13387
Female
Prisons Under 21 years 36 76 51 17 39 99 45 95 133 188 21-39 years 164 253 273 203 266 574 367 439 508 579 40 years and over 27 40 45 34 49 61 62 79 83 66
Training Centres Under 21 years 33 30 38 47 37 38 36 39 40 46
Drug Addiction Treatment Centres Under 21 years 3 6 14 19 22 41 24 26 8 17 21-39 years 43 28 51 54 68 112 113 93 96 66 40 years and over 6 6 8 6 11 19 11 9 11 7
Total 312 439 480 380 492 944 658 780 879 969
Note: Figures exclude recalls.
Source: Correctional Services Department.
255

18.12 Reception of Convicted Prisoners/Inmates by Type of Offence by Sex of Offender
Type of offence/ Sex 1981 1982 1983 1984 1985 1986 1987 1988 1989 1990
Convicted prisoners/inmates
Against lawful authority
Male 216 190 222 301 311 417 387 448 513 549 Female 6 59 16 9 7 3 9 25 36 22
Against public morality
Male 83 90 133 115 128 142 213 384 365 310 Female 1 3 1 2 1 5 12 32 12
Against the person
Male 394 411 359 460 514 470 510 512 571 524 Female 10 15 11 14 11 17 14 6 12 21
Against property
Male 3 413 3 715 3 865 3 526 3 274 3 217 2 658 2 573 2 645 2 944 Female 53 68 82 86 88 110 102 123 133 109
Against the penal code
Male 578 955 706 325 259 188 250 232 506 514 Female 64 141 155 56 38 20 20 20 67 115
Against local laws
Male 940 584 802 989 1 370 1459 1 682 2947 3 629 6069 Female 108 87 ll1 116 213 586 316 395 430 560
Narcotic offences
Male 2 563 2 801 3 321 3 503 3 780 3 825 3 192 3 572 3 414 2477 Female 71 68 102 98 133 207 192 199 169 130
All offences Male 8187 8746 9408 9219 9636 9718 8892 10668 11643 13 387 Female 312 439 480 380 492 944 658 780 879 969
Note: Figures exclude recalls.
Source: Correctional Services Department.
256
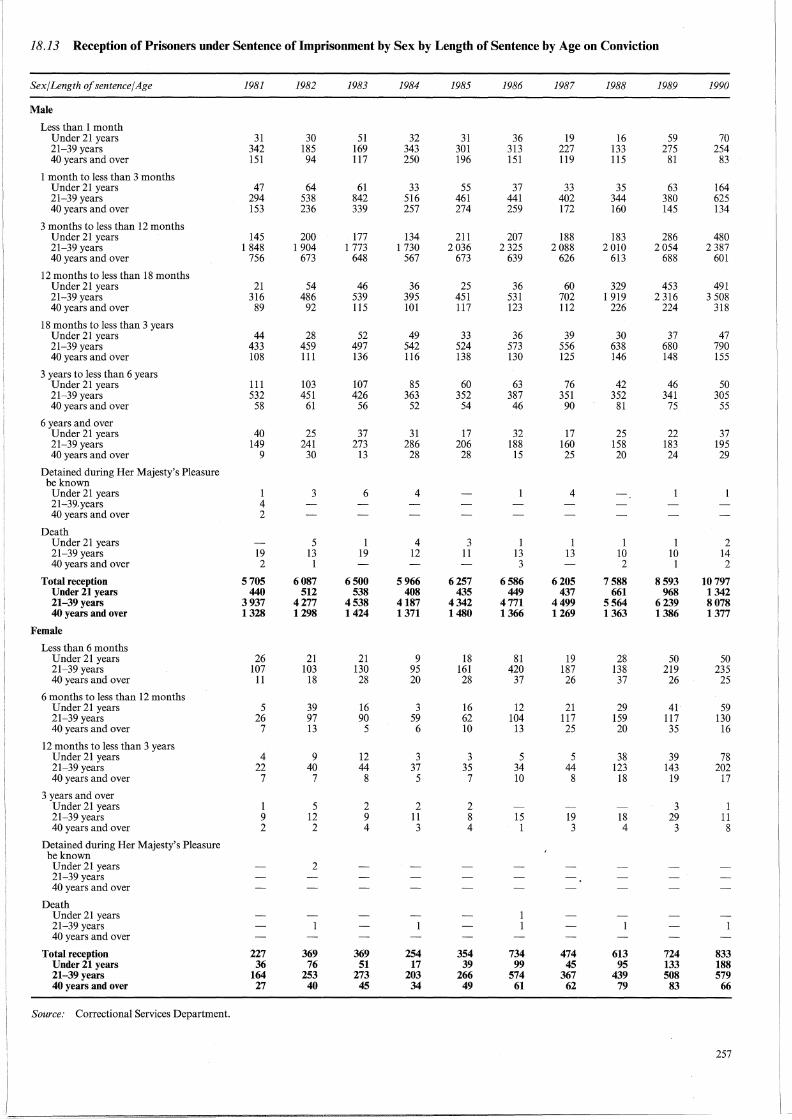
18.13 Reception of Prisoners under Sentence of Imprisonment by Sex by Length of Sentence by Age on Conviction
Sex/Length of sentence/Age 1981 1982 1983 1984 1985 1986 1987 1988 1989 1990
Male
Less than 1 month Under 21 years 31 30 51 32 31 36 19 16 59 70 21-39 years 342 185 169 343 301 313 227 133 275 254 40 years and over 151 94 117 250 196 151 119 115 81 83
1 month to less than 3 months Under 21 years 47 64 61 33 55 37 33 35 63 164 21-39 years 294 538 842 516 461 441 402 344 380 625 40 years and over 153 236 339 257 274 259 172 160 145 134
3 months to less than 12 months Under 21 years 145 200 177 134 211 207 188 183 286 480 21-39 years 1 848 1 904 1 773 1 730 2 036 2 325 2 088 2 010 2054 2 387 40 years and over 756 673 648 567 673 639 626 613 688 601
12 months to less than 18 months Under 21 years 21 54 46 36 25 36 60 329 453 491 21-39 years 316 486 539 395 451 531 702 1 919 2 316 3 508 40 years and over 89 92 115 101 117 123 112 226 224 318
18 months to less than 3 years Under 21 years 44 28 52 49 33 36 39 30 37 47 21-39 years 433 459 497 542 524 573 556 638 680 790 40 years and over 108 111 136 116 138 130 125 146 148 155
3 years to less than 6 years Under 21 years 111 103 107 85 60 63 76 42 46 50 21-39 years 532 451 426 363 352 387 351 352 341 305 40 years and over 58 61 56 52 54 46 90 81 75 55
6 years and over Under 21 years 40 25 37 31 17 32 17 25 22 37 21-39 years 149 241 273 286 206 188 160 158 183 195 40 years and over 9 30 13 28 28 15 25 20 24 29
Detained during Her Majesty's Pleasure be known
Under 21 years 1 3 6 4 4 21-39.years 4 40 years and over 2
Death Under 21 years 5 1 4 3 1 1 1 1 2 21-39 years 19 13 19 12 11 13 13 10 10 14 40 years and over 2 1 3 2 1 2
Total reception 5705 6087 6500 5966 6257 6586 6205 7588 8593 10797 Under 21 years 440 512 538 408 435 449 437 661 968 1342 21-39 years 3937 4277 4538 4187 4342 4771 4499 5564 6239 8078 40 years and over 1328 1298 1424 1371 1480 1366 1269 1363 1386 1377
Female
Less than 6 months Under 21 years 26 21 21 9 18 81 19 28 50 50 21-39 years 107 103 130 95 161 420 187 138 219 235 40 years and over 11 18 28 20 28 37 26 37 26 25
6 months to less than 12 months Under 21 years 5 39 16 3 16 12 21 29 41 59 21-39 years 26 97 90 59 62 104 117 159 117 130 40 years and over 7 13 5 6 10 13 25 20 35 16
12 months to less than 3 years Under 21 years 4 9 12 3 3 5 5 38 39 78 21-39 years 22 40 44 37 35 34 44 123 143 202 40 years and over 7 7 8 5 7 10 8 18 19 17
3 years and over Under 21 years 1 5 2 2 2 3 I 21-39 years 9 12 9 11 8 15 19 18 29 11 40 years and over 2 2 4 3 4 1 3 4 3 8
Detained during Her Majesty's Pleasure be known
Under 21 years 2 21-39 years 40 years and over
Death Under 21 years 21-39 years 40 years and over
Total reception 227 369 369 254 354 734 474 613 724 833 Under 21 years 36 76 51 17 39 99 45 95 133 188 21-39 years 164 253 273 203 266 574 367 439 508 579 40 years and over 27 40 45 34 49 61 62 79 83 66
Source: Correctional Services Department.
257

18.14 Reception of Prisoners under Sentence of Imprisonment by Sex by Length of Sentence by Type of Offence, 1990
Against "Against Against Against Against lawful public the Against the penal local Narcotic
Sex/ Length of sentence/Type of offence authority morality person property code laws offences Total
Male
7 days or less 10 1 5 26 1 57 5 105 More than 7 days and under 1 month 39 7 31 92 1 115 17 302 1 month to less than 3 months 80 18 62 226 8 480 49 923 3 months to less than 6 months 79 80 92 368 43 558 184 1404 6 months to less than 12 months 152 89 78 585 136 682 342 2064 12 months to less than 18 months 43 23 27 279 201 3 697 47 4317 18 months to less than 3 years 9 13 41 228 63 368 270 992 3 years to less than 6 years 1 9 36 147 25 42 150 410 6 years and over 14 22 77 20 128 261 Detained during Her Majesty's
Pleasure be known 1 1 Death 18 18
Total 413 254 413 2028 498 5999 1192 10797
Female
Under 6 months 7 6 10 39 12 226 10 310 6 months to less than 12 months 7 3 2 21 54 108 10 205 12 months to less than 3 years 4 2 10 48 216 17 297 3 years and over 1 1 18 20 Death 1 1
Total 18 9 16 71 114 550 55 833
Source: Correctional Services Department.
18.15 Remanded Persons in Correctional Institutions by Sex
Sex 1981 1982 1983 1984 1985 1986 1987 1988 1989 1990
Male 14 441 13 433 14 263 13 257 12 830 12 194 10 708 12 264 12 949 13 298
Female 480 472 484 467 592 782 723 805 842 770
Total 14921 13905 14747 13724 13422 12976 11431 13069 13791 14068
Source: Correctional Services Department.
258

18.16 Cases Referred for Social Enquiry by Type of Offence by Age Group of Offender
Type of offence/Age group 1981/82 1982/83 1983/84 1984/85 1985/86 1986/87* 1987/88* 1988/89* 1989/90* 1990/91*
Against lawful authority Under 16 years 72 48 41 80 100 69 104 75 91 102 16-20 years 81 116 64 101 127 132 134 134 181 201 21 years and over 77 50 45 64 99 99 95 91 67 122
Against public morality Under 16 years 35 37 30 39 40 38 46 52 66 75 16-20 years 112 138 102 135 186 187 192 214 236 223 21 years and over 131 83 126 178 259 176 199 221 267 307
Against the person Under 16 years 154 131 136 173 170 143 182 195 262 263 16-20 years 200 225 197 187 277 296 327 314 339 329 21 years and over 235 186 203 231 289 290 361 341 309 261
Against property Under 16 years 1 536 1262 1 364 1249 1 261 1 205 1 305 1482 1498 1 270 16-20 years 1435 1 520 1 491 1 536 1 582 1 267 1 270 1440 1 632 1 579 21 years and over 1 364 1117 1 313 1 367 1 926 1 260 1 257 1 196 1 309 1 344
Against the penal code Under 16 years 30 38 49 64 58 16-20 years 88 98 82 90 56 21 years and over 135 120 75 114 106
Against local laws Under 16 years 292 358 272 254 300 16-20 years 468 555 1 093 557 797 21 years and over 1 030 1 101 987 1 511 1 818
Other serious offences Under 16 years 38 57 58 31 40 16-20 years 211 157 159 115 147 21 years and over 356 348 342 209 281
Minor offences Under 16 years 195 226 257 322 338 16-20 years 505 433 363 483 510 21 years and over 1 863 1 608 1 914 1 646 1435
Total 7475 7183 7670 7930 9451 8330 8301 8848 9063 8827 Under 16 years 2119 1874 1892 1859 1929 1688 1920 2119 2270 2088 16-20 years 2384 2652 3029 2606 3025 2598 2513 2624 2986 2989 21 years and over 2972 2657 2749 3465 4497 4044 3868 4105 3807 3750
Note: *Offences were re-classified in 1986/87. Figures for 1986/87 and onwards are therefore not strictly comparable with those for the previous years.
Source: Social Welfare Department.
259

18.17 Probation Orders by Type of Offence* by Age Group of Offender
Type of offence/Age group 1981/82 1982/83 1983/84 1984/85 1985/86 1986/87 1987/88 1988/89 1989/90 1990/91
Against lawful authority Under 16 years 39 29 25 26 64 40 59 47 42 32 16-20 years 30 31 32 41 69 60 44 45 70 45 21 years and over 10 9 6 14 19 16 7 16 7 9
Against public morality Under 16 years 27 25 19 25 31 30 22 30 35 27 16-20 years 43 66 62 69 108 80 78 98 81 77 21 years and over 28 25 37 43 59 40 43 50 53 55
Against the person Under 16 years 88 68 74 94 102 93 128 122 128 108 16-20 years 65 80 71 83 128 128 146 110 145 120 21 years and over 45 29 45 33 66 55 55 54 40 26
Against property Under 16 years 821 847 800 789 780 829 875 982 1220 840 16-20 years 498 603 564 595 602 553 464 566 673 708 21 years and over 177 338 228 224 254 174 173 198 233 233
Against the penal code Under 16 years 3 19 21 19 26 16-20 years 12 26 10 28 16 21 years and over 5 10 8 11 6
Against local laws Under 16 years 116 71 114 92 105 16-20 years 108 55 157 191 183 21 years and over 116 6 277 311 351
Other serious offences Under 16 years 21 16 21 32 21 16-20 years 34 33 52 44 43 21 years and over 24 34 26 21 27
Minor offences Under 16 years 109 106 104 111 104 16-20 years 174 145 121 136 153 21 years and over 443 386 452 502 426
Total 2231 2337 2550 2688 2969 2903 2814 3094 3573 3054 Under 16 years 1094 1059 1053 1045 1108 1122 1206 1306 1568 1132 16-20 years 756 861 896 1007 1106 1029 910 992 1149 1146 21 years and over 381 417 601 636 755 752 698 796 856 776
Note: *Offences are re-classified in 1986/87 and again in 1989/90. Figures for 1986/87 and from 1989/90 onwards are therefore not strictly comparable with those for the past years.
Source: Social Welfare Department.
18.18 Children and Juveniles under Protection of Women and Juveniles Ordinance
1981/82 1982/83 1983/84 1984/85 1985/86 1986/87 1987/88 1988/89 1989/90 1990/91
Wards of Director of Social Welfare 964 1033 1038 847 862 816 754 700 678 652
Registered Ward 187 173 165 50 32 29 4 1 1
Declared Ward 40 40 40 18 16 12 7 3 2 2
Ward by order of the Juvenile Court 737 820 833 779 814 775 743 696 675 649
Supervision order 1046 926 1061 1144 993 1093 1275 1377 1417 1319
Total 2010 1959 2099 1991 1855 1909 2029 2077 2095 1917
Note: Figures are as at end of the financial year.
Source: Social Welfare Department.
260

Section 19 Culture, Entertainment, and Recreation
Tables 19.1to19.9 Generallnformation
Culture and entertainment statistics in respect of the Urban Council (UC) areas (the Hong Kong Island, Kowloon and New Kowloon) are provided by the Urban Services Department (USD). The same statistics for the Regional Council (RC) areas (the New Territories and Outlying Islands) are provided by the Regional Services Department (RSD).
The Urban Services Department is the executive arm of the Urban Council, which is the statutory policy and decision-making body for provision of municipal services to the urban areas. Part of the services are provided through a wide range of cultural and entertainment facilities, covering libraries, museums, cultural venues, civic centres and stadia.
The Regional Services Department is the executive arm of the Regional Council. It was formed in April 1985 by merging the former New Territories Services Department, and the component units of the former Recreation and Culture Department and Cultural Services Department operating in the New Territories. The Regional Council provides also a wide range of cultural and entertainment facilities in the New Territories covering libraries, museums and civic centres.
Also, the UC and the RC provide sports and recreational activities as· well as establish related facilities for the public of all ages, hoping for better use of leisure time.
Concepts and Definitions
Table 19.3 The usage rate of a venue is expressed by the total number of function days as a percentage of the total number of days available for booking, excluding those days closed for maintenance. Function days refer to those days for which the venue is hired, disregarding whether it is occupied for setting up, performance or dismantling.
Table 19.4 The number of cultural, entertainment and sports presentations includes events presented by the UC/RC, presented jointly by the UCjRC with other cultural organizations, and presented by the hirers.
Events refer to the number of programmes/productions whereas presentations refer to the number of performances (i.e. an event/programme may consist of one or more presentations/performances performed by the same artist/ artist group).
Table 19.5 Indoor cultural programmes are organized by the Festivals Office, the Performing Companies Office, and the Cultural Presentations Office of the USD and by the Cultural Services Section of the RSD. These programmes are mainly presented in UC/RC venues.
Table 19.6 Public entertainment programmes are organized by the Entertainment Office of the USD and by the Cultural Services Section of the RSD to bring amusement to the general public and are mainly presented in community halls or outdoor places.
Table 19.7 Events refer to the number of competitions, training courses and recreational activities.
'Outdoor pursuits' include camping, canoeing, excursion, fishing, hiking, horse riding, kiteflying, orienteering, rowing, sailing, windsurfing, colour boat, etc.
'Dance and movements' include ballet/children dance, Chinese dance, fitness for various age groups and multi-gymnastics, fitness through dance and aerobic dance, gymnastic/artistic gymnastic/rhythmic gymnastic/aero-sport, judo, martial art, kendo, disco dance/modern jazz/modern dance, silk exercise, social dance, tai chi, trampolining, western folk dance, yoga, boxing, karatedo, body-building, taekwondo, etc.
'Individual games' include archery, badminton, bowling, cycling, fencing, ice-skating, rollerskating, squash, table-tennis, tennet, tennis, short tennis, badminton and table-tennis, play-in scheme, chess, Chinese chess, darting, go, lawn bowls, etc.
'Team games' include baseball, basketball, handball, hockey, ice-hockey, shuttlecock, soccer, softball, volleyball, bridge, mini-soccer, netball, etc.
'Special groups' include blind, deaf, physically-handicapped and able-bodied, physicallyhandicapped, mentally-handicapped, patient, elderly,. spastics, probationers, under-privileged, etc.
'Athletics and aquatics' include distance run, diving, jogging, life-saving, scuba-diving, snorkelling, swimming, synchronized swimming, track and field, walkathon, water-polo, etc.
261

262
'Other projects' include Queen's birthday celebration sports programme, potted sports, recreation and sports scheme, carnival, tele-games, exhibition, seminar, workshop, talks, fun games, estate sports day, horticulture classes, multi-district programme, karting, festival of sport, etc.
Table 19.9 Parks and playgrounds refer to public pleasure grounds which include children's playgrounds, sitting-out areas, rest gardens, gardens and parks.
Data Sources
Data are based on the administrative records of the various divisions/offices of the Urban Services Department and the Regional Services Department.
Statistics on facilities and usage of public libraries are provided by the Urban Council Public Libraries Office and Regional Council Public Libraries Section. Statistics on number of functions presented and usage of selected venues are supplied by the City Hall Offices, Hong Kong Cultural Centre Office, Culture and Entertainment Office, Stadia Office and Space Museum Office of USD as well as the Culture and Entertainment Division of RSD. Statistics on indoor cultural programmes, public entertainment programmes and sports and recreation activities are obtained from the responsible Offices/Divisions of USD and RSD. On the other hand, attendances at museums are provided by the various museums.
Compilation and Calculation
Data are compiled from the statistical returns submitted by the various divisions/ offices of the Urban Services Department and of the Regional Services Department.
Further References
Further details on culture, entertainment, recreation and leisure statistics are available from the Monthly and Annual Urban Couni:il and Urban Services Department Statistical Reports and the Quarterly Statistical Reports of the Regional Council and Regional Services Department prepared respectively by the departments.

! -
19.1 Facilities Available in and Usage of Public Libraries Number
1981 1982 1983 1984 1985 1986 1987 1988 1989 1990
Urban Council Public Libraries
Libraries 16 20 23 25 25 26 28 29 29 30 Facilities available
English books
Junior 83 091 79 308 81 962 106 803 125 263 136 966 153 650 162 252 165 937 177 643 Adult 215 938 217 949 219 314 241 437 267 581 291 282 303 819 319 764 334 140 350 030 Reference 47 391 48 743 56 705 60 407 67 965 79 025 90 250 102 605 112 284 122 531
Chinese books
Junior 166 176 205 992 233 101 287 874 271 988 269 469 293 887 338 579 341 833 403 943 Adult 397 483 456 826 564 409 700 790 759 134 798 822 875 153 927 933 1024142 1006018 Reference 178 744 177 077 169 440 175715 185 922 192 683 200 598 214 543 225 136 233 851
Total
Junior 249 267 285 300 315 063 394 677 397 251 406 435 447 537 500 831 507 770 581 586 Adult 613 421 674 775 783 723 942 227 1026715 1090 104 1178 972 1247697 1358 282 1356048 Reference 226135 225 820 226145 236122 253 887 271 708 290848 317 148 337 420 356 382
Audio-visual materials* 17 784 36 302 50284 62 764 76185 83 512 95 837 103 110 113 486 125 293
Usage
Library materials issued# 4 291452 4 769456 5 696 623 6640186 7 211836 6974 513 7 211422 7 727 489 8 367136 8190488
Reference enquiries handled 72 368 83 909 94442 118 103 130 513 130 784 148 944 164 810 187 805 208 583
Reference books consulted 356 605 352681 359843 463 820 484 987 506 463 572837 626103 704 363 776 778
Users of audio-visual services 127 360 127 401 125 139 136 476 158676 185 011 171819 169 433 168446 207 367
Regional Council Public Libraries
Libraries 10 11 13 16 18 21 22 22 23 24 Facilities available
English books
Junior 16 891 29 233 50 295 71 426 100 274 114 158 118 686 128 149 131 752 132 663 Adult 42 143 68 491 95 848 119 594 147 991 163 789 177 997 201150 214 517 226 497 Reference 4369 9 835 14189 18 872 24149 30 334 32 670 37 487 41 813 46 920
Chinese books
Junior 61 781 91 710 125 914 140 864 169 396 202 931 220 701 243 519 260 868 271 207 Adult 100 359 170 655 255 033 327 397 397 965 466 439 552 558 622 205 701 470 747 131 Reference 4456 11 212 19 037 26 273 37 868 50 550 78 943 89 060 93 475 104 565
Total
Junior 78672 120 943 176 209 212 290 269670 317089 339 387 371668 392620 403 870 Adult 142 502 239146 350881 446991 545 956 630 228 730555 823 355 915 987 973 628 Reference 8825 21047 33 226 45145 62017 80884 111613 126 547 135 288 151 485
Audio-visual materials* 1365 7786 15 202 28649 33 996 47434 64475 75 702 83 691 91578
Usage
Library materials issued# 1177995 1 505 915 1893410 2886 225 3423178 4 080 141 5 291198 5052 365 4 734 614 5 518 454
Reference enquiries handled 4 517 4468 4 881 11460 19189 29109 53 972 60540 58 291 80980
Reference books consulted 109504 176025 354 759 372 671 417 879 497 231 454 337 427 885 524 378
Users of audio-visual services 4045 2 989 2148 8 295 10 940 14482 49132 39 745 40141 83010
Notes: *Figures include audio cassette, video-cassette, slides, audio-compact disc, video-disc, microfilm, microfiche and digital compact discs (CD-ROM). #Figures include books, periodicals and audio cassettes.
Sources: Urban Services Department. Regional Services Department.
263

19.2 Attendances at Museums Number of visitors
1981 1982 1983 1984 1985 1986 1987 1988 1989 1990
Urban Council Museum of Art 230 800 278 315 269 416 239 012 219 986 243 343 289 996 267 100 266 912 317 800 Flagstaff House Museum
of Tea Ware* 110 790 92050 95 187 100 995 117 267 119 042 115 402 Museum of History 424 673 148 610# 427 114 309 687 1 011 462 599 135 634 018 287 251 # 485 918 # 546 114 Law Uk Folk Museumt 122 223 Lei Cheng Uk Branch Museum 44 959 42 883 47 356 51 339 45 692 45 031 41 988 45 714 43 139@ 45 887 Hong Kong Space Museum 531 885 489 643 432 262 425 844 415 956 1 159 622 1609652 1 978 270 2 209 033t 1 280 703t Hong Kong Science Museum§ 87 525 2 879 97 048 48 169 2009 4959 4894 4069 2 815 5 462
Regional Council Sheung Yiu Folk Museum 71 374 72412 85 626 66 686 84683 80 681 74 765 Hong Kong Railway Museum 18 366 421 098 339 242 334 094 318 926 373 641 Sam Tung Uk Museumtt 28 829 610 126 544 378 612 704
Notes: The Sheung Yiu Folk Museum and the Hong Kong Railway Museum opened to the public on 21January1984 and 21December1985 respectively. * A Branch Museum of the Hong Kong Museum of Art opened on 26 January 1984. #Museum of History closed in October-December 1982 for removal from Star House premises to Kowloon Park, and was closed from February
to March and from September 1988 to February 1989 for renovation work. t Law Uk Museum, a Branch Museum of Museum of History, was opened to public on 20.1.1990. @Lei Cheung Uk Branch Museum was closed from 16.1.89 to 28.1.89 for repainting. t The Space Museum was closed from 1.9.89 to 27.10.89 for renovation. Its exhibition halls had been closed for renewal since July 90 and would
re-open in July 91. § The Hong Kong Science Museum, which is still in its planning stage, will be completed in 1991. The figures represent the total attendance at the
extension activities organised by the planning office. ttSam Tung Uk Museum was opened to the public with effect from 28.11.1987.
Sources: Urban Services Department. Regional Services Department.
19.3 Usage Rate of Major Cultural Venues by Location Percentage
Venue 1985/86 1986/87 1987/88 1988/89 1989/90 1990/91
Urban Council City Hall
Concert Hall 100.0 100.0 95.3 97.3 85.7 85.4 Theatre 100.0 100.0 100.0 95.4 86.0 87.2
Hong Kong Cultural Centre* Concert Hall 81.5 70.5 Grand Theatre 99.3 96.0 Studio Theatre 78.5 75.9
Ko Shan Theatre 65.7 74.2 60.0 53.9 44.8 53.2 Queen Elizabeth Stadium (Arena) 50.4 51.0 57.4 56.7 44.7 43.6 Hong Kong Coliseum (Arena) 64.4 75.5 74.9 75.l 65.5 72.l Space Museum Lecture Hall 54.5 92.6 58.3 62.3 73.3 53.2 Sheung Wan Civic Centre (Theatre) 85.8 65.9 68.6 Ngau Chi Wan Civic Centre (Theatre) 60.1 68.l 64.8 63.2 Sai Wan Ho Civic Centre (Theatre)# 66.0
Regional Council Auditorium 75.4 65.2 73.8 72.3 60.8 69.9 Cultural Activities Hall 70.8 49.0 70.2 69.5 66.5 53.5
Tuen Mun Town Hall Auditorium 31.0 31.2 28.9 46.6 Cultural Activities Hall 27.0 31.5 24.0 40.5
Lut Sau Hall Auditorium 54.5 59.5 51.7 63.0 56.0 66.7
North District Town Hall Auditorium 67.1 58.8 66.0 64.7 62.l 58.2
Tai Po Civic Centre Auditorium 48.0 47.5 52.2 50.0 66.6 47.4
Sha Tin Town Hall Auditorium 62.0 71.3 71.0 60.9 68.0 Cultural Activities Hall 40.0 88.0 70.0 66.5 74.4
Notes: *The Hong Kong Cultural Centre was opened in November 1989. #The Sai Wan Ho Civic Centre was opend in December 1990.
Sources: Urban Services Department. Regional Services Department.
264
-----------------··-~·-- .. ··-··-------

19.4 Cultural, Entertainment and Sports Presentations at Selected Venues by Type of Event Number of presentations
Venue/Type of event 1981 1982 1983 1984 1985 1986 1987 1988 1989 1990
Urban Council City Hall
Concerts and recitals 348 351 368 342 417 252 345 328 256 182 Operas 41 36 47 35 38 26 48 36 54 44 Plays 195 151 132 96 132 147 92 113 82 64 Ballet and dance 58 100 69 83 88 84 74 61 36 28 Film shows 243 203 216 315 279 281 347 227 249 161 Others* 757 688 699 634 767 740 817 175 163 180
Hong Kong Cultural Centre# Concerts and recitals 51 264 Operas 17 38 Plays 34 149 Ballet and dance 21 78 Film shows 50 Others* 5 70
Ko Shan Theatre Concerts and recitals 66 26 29 31 21 8 10 8 Operas 18 17 13 13 28 30 44 38 Plays 10 17 3 29 35 24 1 3 Ballet and dance 23 18 28 6 11 5 7 8 Film shows 12 53 37 38 39 41 46 3 Others* 60 78 74 49 56 61 43 63
The Queen Elizabeth Stadiumt Cultural 12 15 42 23 37 34 21 15 17 7 Entertainment 32 23 34 25 66 51 78 71 39 50 Sports 32 45 60 67 39 54 67 72 61 31 Others 17 12 12 19 21 22 26 46 23 41
Hong Kong Coliseum Cultural 20 18 21 22 7 13 4 9 Entertainment 104 152 97 131 154 148 144 235 Sports 22 9 11 6 5 13 4 3 Others 3 5 13 19 20 14 27 24
Regional Council Tsuen Wan Town Hall
Concerts and recitals 79 80 81 86 44 50 64 35 51 Operas 27 26 20 29 10 23 29 16 20 Plays 19 30 31 22 8 33 25 26 17 Ballet and dance 28 31 33 30 4 26 17 5 13 Film shows @ @ @ @ @ 143 120 84 65 Others* 20 23 42 43 50 24 29 15 26
Tuen Mun Town Hallt Concerts and recitals 19 30 25 33 Operas 11 19 13 16 Plays 9 7 13 16 Ballet and dance 4 10 9 4 Film shows 6 40 28 29 Others 10 7 10 22
Lut Sau Hall Concerts and recitals 39 24 26 13 12 9 Operas 10 10 17 7 8 9 Plays 2 5 5 2 3 Ballet and dance 9 4 9 5 1 3 Film shows @ @ 15 12 9 6 Others* 23 9 8 2 6 10
North District Town Hall Concerts and recitals 24 19 18 3 11 11 8 Operas 8 7 7 12 10 6 8 Plays 4 6 2 6 4 2 2 Ballet and dance 9 13 5 1 6 1 1 Film shows @ @ @ 14 10 10 5 Others* 20 37 15 8 1 6 5
Tai Po Civic Centre Concerts and recitals 13 21 10 8 8 10 Operas 3 12 15 7 13 9 Plays 1 2 4 7 7 5 Ballet and dance 2 4 2 4 2 4 Film shows @ @ 15 13 14 11 Others* 9 10 11 5 3 3
Sha Tin Town Hall§ Concerts and recitals 5 78 66 56 69 Operas 1 18 19 23 28 Plays 1 47 48 29 35 Ballet and dance 2 19 17 16 25 Film shows 42 43 36 46 Others 13 5 11 12
Notes: The functions at Queen Elizabeth Stadium and Hong Kong Coliseum are classified as follows: Cultural: include classical concerts, dances, dramas and operas. Entertainment: include pop concerts, musical shows, family entertainment events and contests. Sports: include competitions or displays of ice sports, roller skating, Chinese martial arts and wrestling. Others: include conferences, school events, displays of commercial and industrial products and works of arts. * Figures include variety shows, pop concerts, compact disc and laser disc concerts, social dance and disco nites, Hong Kong Schools Music/Speech Festival events and school functions. #Figures refer to November and December only in 1989. t Figures for 1980, 1981and1982 refer to the number of programmes presented. @Figures are included in 'Others'. i Figures refer to June to December only in 1987. § Figures refer to November and December only in 1986.
Sources: Urban Services Department. Regional Services Department.
265
I
I J_

19.5 Presentations, Attendance and Attendance Rate of Indoor Cultural Programmes by Type of Event
Type of event 1983 1984 1985 1986 1987 1988 1989 1990
Urban Conncil
Orchestral, vocal and instrumental concerts
Number of presentations 213 229 206 222 224 250 360 264 Attendance 168 316 244 880 302 946 289 779 241 357 239 579 407 790 307 315 Attendance rate(%) 67.5 83.3 79.5 74.7 75.2 69.l 78.l 73.6
Plays
Number of presentations 175 159 245 219 260 176 355 223 Attendance 81 682 70 853 87 594 105 465 83 119 75 762 144 411 91 502 Attendance rate(%) 92.4 79.5 85.0 89.6 82.4 85.5 85.4 89.1
Ballet and dance
Number of presentations 87 104 87 105 100 126 224 115 Attendance 92068 79 869 64208 85 254 68 941 109 358 92 713 91 016 Attendance rate(%) 68.2 75.5 72.2 72.5 59.8 70.8 90.l 77.8
Film shows
Number of presentations 332 462 389 362 467 487 787 366 Attendance 94 877 134 679 118 650 100 896 122 002 111 914 174 002 102 571 Attendance rate(%) 61.2 60.5 64.l 65.1 63.4 63.4 54.7 62.7
Operas, Chinese and Western
Number of presentations * * * * * * 43 9 Attendance * * * * * * 48 635 10 184 Attendance rate(%) * * * * * * 79.6 84.l
Others#
Number of presentations 187 134 138 78 94 141 150 80 Attendance 228 580 161 317 127 685 96 906 93 383 91112 109 651 100 625 Attendance rate(%) 81.7 80.9 64.9 77.7 89.8 81.0 77.6 71.0
Regional Council
Orchestral, vocal and instrumental concertst
Number of presentations 74 44 59 61 186 192 147 177 Attendance 40877 19 367 23 673 21453 116 078 114 483 85 494 108 174 Attendence rate(%) 53.6 46.9 41.2 37.3 60.6 57.1 59.6 60.8
Plays@
Number of presentations 30 38 19 12 104 96 79 78 Attendance 15 991 15 016 5 838 4 399 48 099 29 496 27 512 23 589 Attendence rate(%) 41.4 40.2 30.6 40.3 64.8 52.7 65.7 69.6
Ballet and dance
Number of presentations 28 27 23 16 61 59 34 50 Attendance 17 664 13 110 10 885 8 357 36 921 38 605 30 545 41 699 Attendance rate(%) 45.3 42.7 39.9 49.4 47.8 59.7 70.9 69.3
Film shows
Number of presentations 53 50 77 66 235 238 181 162 Attendance 10 293 9 478 17 982 19 863 63 255 52 178 40 728 37 147 Attendance rate(%) 64.7 56.7 47.5 74.9 71.7 63.l 67.l 69.3
Operas, Chinese and Western
Number of presentations t t t t 96 91 79 90 Attendance t t t t 73 034 75 OOO 67 084 79 081 Attendance rate(%) t t t t 66.2 67.4 71.1 72.2
Hi-Fi concerts
Number of presentations 7 3 2 2 t t t 3 Attendance 3 858 I 023 1 338 972 t t t 214 Attendance rate(%) 60.4 33.6 48.7 54.8 t t t 47 .6
Others
Number of presentations 92§ 135§ 141§ 113§ 74tt 49tt Sitt 78 Attendance 62 025 70 303 66 095 57 499 37 344tt 14 192tt 17 668tt 36 702 Attendance rate(%) 66.7 58.7 48.l 53.4 66.9tt 53.2tt 58.4tt 77.6
Notes: *Figures are included in 'Plays' and 'Others'. #Figures include school speech festivals, school music festivals, variety shows, mime shows, puppet shows, seminars/ discussions and exhibitions
held during HK International Film Festivals and International Arts Carnival. However, the figures on attendance rate (%) do not include seminars/discussions and exhibitions due to unavailability of data.
tFigures include Chinese Orchestral and instrumental concerts. @Figures include drama and mime presentation. tFigures are included in 'Others.' §Figures include puppet shows, school speech festivals, school music festivals, variety shows, mime shows, Cantonese operatic songs and Chinese operas.
ttFigures include pop concerts, compact disc, concerts, laser disc concerts, social dance and disco nites and Hong Kong School Music/Speech Festival events.
Sources: Urban Services Department. Regional Services Department.
266

19.6 Presentations and Attendance of Public Entertainment Programmes by Type of Event
Type of event 1981 1982 1983 1984 1985 1986 1987 1988 1989 1990
Urban Council
Orchestral concert
Number of presentations 39 '36 40 50 42 44 40 33 22 23 Attendance 29 750 35 570 27 255 20 271 23 341 24 780 20094 13 882 6 591 8 350
Ballet and dance
Number of presentations 61 46 34 53 36 53 56 40 14 20 Attendance 51 622 37118 32 350 32 012 18 818 31199 24222 16 808 5 201 7 544
Film shows
Number of presentations 166 137 137 53 8 25 10 Attendance 30 090 31 990 21 265 5107 2 814 5 365 6980
Cantonese opera and operatic songs
Number of presentations * * * * * * * * 88 116 Attendance * * * * * * * * 42 547 57 382
Magic and acrobatic show
Number of presentations * * * * * * * * 4 6 Attendance * * * * * * * * 2 756 3 560
Others#
Number of presentations 687 568 666 662 487 548 441 319 122 126 Attendance 1245958 940 072 I 452 432 814 559 650 640 810 836 259 235 152 551 60 614 75 156
Regional Council
Orchestral concert
Number of presentations 28 38 35 44 23 22 36 36 Attendance 13 350 12 540 11 500 8 570 5 540 5 940 10 250 8 430
Ballet and dance
Number of presentations 4 9 4 5 29 32 33 8 Attendance 2200 5 910 4 500 970 7 330 8 680 8 950 2 780
Film shows
Number of presentations 43 33 10 18 15 7 Attendance 13 360 6980 I 980 3 580 1110 840
Cantonese opera and operatic songs
Number of presentations 83 90 92 98 Attendance 23 560 28 110 28 230 27 170
Magic and acrobatic show
Number of presentations 32 42 29 30 Attendance 11 500 19 010 10 170 9190
Others#
Number of presentations 229t 246t 263t 247t 168 161 140 166 Attendance 173 490 168 630 120 030 117 278 198 478 121 860 74 605 158 530
Notes: *Figure is included in 'Others'. :fl: Figures include entertainment activities such as all star shows, variety shows, popular concerts, D. J. shows, puppet shows, etc. From the year
1987, the figures for special festivals/carnivals organized by the Urban Council have been excluded. tCantonese opera and operatic songs are also included.
Sources: Urban Services Department. Regional Services Department.
267

19.7 Events and Participants of Sports and Recreational Activities by Type of Event Number
Type of event 1981 1982 1983 1984 1985 1986 1987 1988 1989 1990
Urban Council
Outdoor pursuits
Events 45 45 153 61 379 269 235 183 190 185 Participants 752 2 988 5 536 895 31 227 22 662 22 652 19 688 18 555 14 952
Dance and movements
Events 936 562 769 123 1 682 2 331 2 610 3 395 4 021 4485 Participants I 350 6250 2 998 7 263 67 801 76 342 91 643 110 031 118 247 127 238
Individual games
Events 3 733 4092 2152 1155 2 088 2439 2 514 1276 1385 I 375 Participants 8 208 15 654 11448 7 598 28 827 32 532 53 667 57 001 62 875 77 425
Team games
Events I 845 2449 1478 I 853 I 374 760 1620 189 165 199 Participants 39 340 38 219 26 109 27726 45 549 47 161 100 043 183 416 155 071 266 561
Special groups
Events 309 117 41 191 114 354 181 135 322 174 Participants 994 554 1266 I 568 3078 7 057 9 395 16 617 22 126 14 080
Athletics and aquatics
Events 1 OOO 262 196 136 371 1136 2 014 1 585 1 586 1558 Participants 133 791 29 340 2275 13 777 18 027 43 379 76 302 84 662 111 810 97 504
Other projects
Events 64 112 79 232 291 161 117 78 96 86 Participants 11 612 12 598 3 838 4 737 50 080 51 695 43 043 36 569 41 387 33 941
Total
Events 7932 7639 4868 3751 6299 7450 9291 6841 7765 8062 Participants 196047 105603 53470 63564 244589 280828 396745 507984 530071 631 701
Regional Council
Outdoor pursuits
Events 410 382 390 359 335 388 Participants 29 963 27 472 26 248 20 011 19 347 27 225
Dance and movements
Events 1207 1 357 1 607 I 978 2 145 2 334 Participants 36 360 40 545 42 677 51 607 49 885 61 020
Individual games
Events 835 940 984 1 106 1 210 1259 Participants 29220 32 131 33 885 33 648 33 227 32 801
Team games
Events 256 231 204 184 203 192 Participants 18 715 18 171 14 708 12 328 14 364 13 434
Special groups
Events 41 46 91 145 226 61 Number of participants 2 752 2 531 4 843 8 878 9 726 2 617
Athletics and aquatics
Events 298 315 391 462 478 477 Participants 19 755 18 339 19 859 20 905 22174 21 080
Other projects
Events 364 402 375 411 423 445 Participants 76486 83 761 73 351 65 940 70 941 185 296
Total
Events 3411 3673 4042 4645 5020 5156 Participants 213 251 222950 215 571 213 317 219 664 343473
Note: Prior to 1988, the number of events might, to some extent, be composed of number of matches/training sessions, and not strictly comparable with later data.
Sources: Urban Services Department. Regional Services Department.
268

19.8 Recreational Facilities by Type of Facility
Type of facility
Urban Council
Children's playgrounds
Parks and gardens
Grass games pitches
Hardsurface mini soccer pitches
Basketball/Valley ball/Badminton courts#
Tennis courts
Running tracks
Beaches
Swimming pools
Indoor games halls (multi-purpose)
Other sports groundst
Other recreational amenities@
Fitness centres
Camps
Other facilitiest
Total area of public open space administered (hectares)
Regional Council (a)
Children's playgrounds
Parks and gardens
Grass games pitches
Hardsurface mini soccer pitches
Basketball/Volleyball/Badminton courts#
Tennis courts
Running tracks
Beaches
Swimming pools
Indoor games halls complexes (multi-purpose)/Recreation centres
Other sports groundst
Other recreational amenities@
Camps
Water sports centres
Sports centres
Other facilitiest
Total area of public open space administered (hect&res)
1981
163
410
43
93
290
56
6
12
10
5
119
210
983
438
1982
173
396
39
90
291
68
6
12
10
7
128
218
1 029
440
1983
183
419
40
97
299
84
7
12
10
9
130
232
2
1 052
463
Notes: *Figure includes planted areas/amenity plots starting from the year 1987.
1984
186
434
40
100
301
84
7
12
11
10 132
238
2
1 060
467
1985
201
449
40
99
309
90
7
12
13
11
145 242
2
1 042
496
83
173
9
40
132
35 10
28
6
2
73 101
2
2
3
714
306
1986
203
454
40
101
332
96
7
12
13
13
186
242
2
1 048
497
120
174
10
40
161 39
10
29
7
4
77
102
2
2
4
1 050
311
1987
220
675*
42
104
367
96
9
12
13
20
241
248
4
1 073
511
134§
264 10 41
211
40 10
30 7
6
115
85
2
2
4
1 010
348
1988
223
702
42
104
416 101
9
12
13
27
316
245 6
1 100
575
156§ 302
9
46
256
39
10 30 7
11
153
121 2
3
4
1 350
429
1989
229
705 40
107
446 106
13 12
14
28
332
342
10
1129
589
181§
343
9
50
279
45
10
30 8
13
178
157 2
3
4
1 350
510
Number
1990
242
716
38
117
499
112
19
12
14 30
358
347
10
1 551
598
195§
373 12
51
324 54 10 30 8
18
201
166
2
3
4
1437
615
#Figures refer to the summation of the maximum nurnber of basketball courts, volleyball courts and baminton courts that can be demarcated individually on relevant UC(RC facilities.
tFigures include obstacle golf courses, squash courts, practice tennis courts, bowling greens, roller skating rinks and table tennis tables. @Figures include aviaries and mammal exhibits, concrete chess tables, model boat pools and open air theatres. tFigures include bandstands, barbecue pits, composite beach buildings, changing rooms, fountains, dog's gardens, refreshment kiosks, public toilets, pavilions/shelters and spectators stands.
§Figure includes children's play areas.
Sources: Urban Services Department. Regional Services Department. (a) Figures refer to the number of facilities as at end September of the year. The same series of figures has been published in the Hong Kong
Annual Reports
269

19.9 Parks and Playgrounds by District Number
District 1981 1982 1983 1984 1985 1986 1987 1988 1989 1990
Urban Council Area Hong Kong
Central and Western 86 84 89 92 95 98 151 153 152 159 Eastern 63 62 65 66 72 72 98 98 94 103 Wan Chai 50 50 56 59 61 62 102 102 107 110 Southern 30 30 38 38 41 45 59 59 52 52
Sub-total 229 226 248 255 269 277 410 412 405 424 Kowloon
Kowloon City 72 72 75 81 83 83 110 132 149 150 Kwun Tong 59 59 62 62 63 64 103 104 111 112 Mong Kok 41 41 43 44 46 48 45 46 46 47 ShamShuiPo 65 65 65 67 68 68 76 77 80 80 Wong Tai Sin 56 55 57 59 59 59 64 65 55 55 Yau Tsim 51 51 52 52 62 58 87 89 88 90
Sub-total 344 343 354 365 381 380 485 513 529 534
Total 573 569 602 620 650 657 895 925 934 958
Regional Council Area
Tsuen Wan 56 57 34 45 47 50 79 84 94 97 Kwai Tsing 35 35 33 61 25 47 96 132 135 136 TuenMun 25 29 27 54 47 95 74 78 78 86 Yuen Long 33 34 21 34 41 42 57 59 107 125 North 13 13 11 29 62 83 88 134 158 166 Tai Po 24 24 22 30 32 44 34 41 62 49 Sha Tin 17 18 29 54 54 72 75 80 85 88 SaiKung 39 39 26 51 55 58 65 73 79 82 Islands 27 27 22 45 53 65 68 92 102 111
Total 269 276 225 403 416 556 636 773 900 940
Sources: Urban Services Department. Regional Services Department.
270

Section 20 Miscellaneous Statistics
Table 20.1 Data Sources
Statistics on number of newspapers and periodicals are obtained from the Television and Entertainment Licensing Authority while those on number of radio and television stations and channels are provided by the Post Office.
Tables 20.2 to 20.5 General Information
The Urban Council and the Regional Council are responsible for safeguarding environmental hygiene and public health, besides providing cultural and leisure services as shown in Section 19. Part of the safeguard is done through market administration, food inspection, licences and permits issue, and hawker control.
Concepts and Definitions
Table 20.2 Wet goods include vegetable, fruit, bean curd, aquarium fish and fresh flowers.
Dry goods include grocery, haberdashery, household wares and other miscellaneous items other than wet goods.
Others include ice, newspaper and tradesman stalls.
Table 20.5 A fixed pitch means any pitch delineated on the ground in any street or in a hawker permitted area or hawker bazaar.
An itinerant hawker licence authorizes the licensee to hawk in a hawker permitted area or in such places as may be specified in the licence, otherwise than from a fixed pitch.
A temporary licence permits the licensee to hawk for a period not exceeding one month under certain conditions and is renewable.
A deputy's permit is issued when a licensee of a hawker licence leaves Hong Kong, or is incapacitated by illness, and appoints an eligible person to be his deputy for running the business during his absence or incapacity.
A wall stall means a stall which is affixed to or placed against any external part of any building or similar structure and which faces onto a street.
Tables 20.2 to 20.5 Data Sources
Statistics relating to public markets and stalls, licences and permits in force and hawker licences are obtained in the case of the Urban Council areas from the Urban Services Department, and in the case of Regional Council areas from the Regional Services Department. Statistics on food inspection are supplied by the Hygiene Division of the Department of Health.
Table 20.6 Data Sources
Petroleum statistics are prepared from monthly returns submitted by petroleum companies.
Table 20.7 General Information
The Fire Services Department is responsible for enforcing fire safety regulations. It also advises and assists all sections of the community with regard to fire protection measures generally and in the abatement of fire hazards.
Tables 20.8 to 20.9 General Information
The Companies Registry of the Registrar General's Department keeps records of all companies incorporated in Hong Kong and of all oversea companies that have established a place of business in Hong Kong.
271


20.I Statistics on Mass Media Number
1981 1982 1983 1984 1985 1986 1987 1988 1989 1990
Newspapers
English 11 13 13 11 13 15 14 15 15 17 Chinese 59 54 54 51 50 51 52 47 50 53 Bilingual I 1 I I I I I I I 1 Japanese 1 1 2 2 2 2 I 1 I I
Periodicals English 90 IOI 110 123 127 129 140 154 146 148 Chinese 278 294 298 325 326 319 343 346 311 332 Bilingual 43 41 45 46 59 70 81 102 96 104 Japanese 2 3 I I I I 5 5 6 8 Tri-lingual I 2 I 7 6 4 5 Other language 1 1 3 3
Radio
Stations 2 3 3 3 3 3 3 3 3 4 Channels* 10 9 10 10 10 10 10 10 12 13
Television
Stations 2 2 2 2 2 2 2 2 2 2 Channels 4 4 4 4 4 4 4 4 4 4
Note: *Programme broadcasted on different frequencies is counted as one channel.
Sources: Television and Entertainment Licensing Authority. Post Office.
20.2 Public Markets and Market Stalls by Type of Stall Number
Type of stall 1981/82 1982/83 1983/84 1984/85 1985/86 1986/87 1987/88 1988/89 1989/90 1990/91
Hong Kong Public markets 27 27 29 29 30 31 31 31 30 30
Stalls Fish 513 506 518 518 520 525 525 528 527 527 Poultry 235 234 240 240 240 242 240 236 243 241 Meat 455 451 463 463 474 473 473 473 405 396 Wet goods I 075 I 501 I 619 I 619 I 509 I 598 I 598 I 646 I 526 I 523 Dry goods 752 808 880 880 993 I 027 1 027 946 979 972 Cooked food 82 92 92 92 92 115 143 147 170 170 Siu mei/Lo mei 5 9 9 9 9 11 11 10 12 12 Others 42 44 45 45 34 37 37 41 43 55
Sub-total 3159 3645 3866 3866 3 871 4028 4054 4027 3 905 3896
Kowloon
Public markets 23 23 24 25 26 26 26 27 30 30
Stalls Fish 448 448 451 451 451 451 431 439 460 463 Poultry 170 170 176 176 177 177 166 173 190 190 Meat 367 370 370 371 373 373 380 385 404 401 Wet goods 910 910 1 183 1 467 1 529 1495 2 299 2 358 2 703 2 630 Dry goods 710 674 823 1 037 1 121 1 121 975 I 123 I 015 1212 Cooked food 92 110 136 172 236 236 310 313 374 393 Siu mei/Lo mei 17 17 17 17 17 17 16 20 24 24 Others 24 25 27 27 18 18 19 20 26 31
Sub-total 2 738 2 724 3183 3 718 3922 3888 4596 4 831 5196 5 344
New Territories and Outlying Islands
Public markets 35 36 40 37 40 41 43 43 43 43
Stalls Fish 477 517 558 550 568 598 597 597 608 582 Poultry 96 117 132 134 138 147 147 147 147 149 Meat 377 404 454 466 483 510 506 505 507 517 Wet goods I 070 I 308 I 399 I 841 I 805 I 917 I 792 I 792 I 816 I 874 Dry goods 761 963 I 078 1 051 I 151 I 191 I 175 I 175 1202 I 378 Cooked food 165 165 285 306 362 362 374 374 386 362 Siu mei/Lo mei 32 36 51 60 62 68 68 69 73 77 Others 4 11 11 15 37 40 35 35 35 36
Sub-total 2982 3 521 3 968 4423 4606 4833 4694 4694 4 774 4975
Total Public markets 85 86 93 91 96 98 100 101 103 103
Stalls 8879 9890 11017 12007 12399 12749 13344 13552 13875 14215
Sources: Urban Services Department. Regional Services Department.
273

20.3 Food Inspection by Type of Food Kg unless otherwise specified
Type of food 1985/86 1986/87 1987/88 1988/89 1989/90 1990/91
Urban Council
Imported Foods
Number of inspections 4 594 3 864 4424 1 518 1 678 2 108 Weight of food inspected
Meat and poultry Sub-total 35 771 749 25 036 404 27096635 5109685 4 705 834 5 293 814
Exported Foods
Number of inspections 450 499 359 279 157 162 Weight of food inspected
Meat and meat products 305 727 334 265 345 166 122 258 26 267 66 338 Poultry and poultry products 221 468 154 446 186 238 103 087 2 207 16 880 Fruit and vegetable products 18 325 15 622 83 617 15 093 35 176 34 376 Marine products 144 581 203 039 38 619 33 161 30 061 11 619 Others 78 712 156 662 342 078 359 197 112 071 132 675
Sub-total 768 813 864 034 995 718 632 796 205 782 261888
Total 36540562 25900438 28092353 5742481 4 911616 5555702
Local Foods
Number of inspections 9 331 9 530 11 902 10 732 10 718 10 329
Regional Council
Imported Foods
Number of inspections 2 231 2476 2 154 2474 2 326 1 927 Weight of food inspected
Meat 12 624 162 11 601 289 12 150 041 18 223 033 13 169 354 12 321 010 Poultry 13 147 084 16 018 513 18 631 489 18 215 182 19 750 209 15 059 586
Sub-total 25 771246 27619802 30 781530 36 438 215 32 919 563 27 380596
Exported Foods
Number of inspections 776 935 1112 918 838 565 Weight of food inspected
Meat and meat products 1737028 1 192 138 1 541 244 1 666 620 755 880 606 521 Poultry and poultry products 2 258 006 3 368 767 5 057 686 3 402 162 1 348 143 292 769 Fruit and vegetable products 33 602 16 193 19 956 545 26 0 Marine products 96 956 86 560 9 460 9 988 25 947 1 716 Others 314 491 1127 795 1755481 2 737 975 2 719 560 2 371 599
Sub-total 4 440083 5 791 453 8 383 827 7 817 290 4 849 556 3 272605
Total 30211329 33411255 39165357 44255 505 37769119 30653201
Sources: Urban Services Department. Regional Services Department.
274

1-
I
20.4 Licences and Permits in Force by Type of Licence and Permit Number
Type of licence and permit 1981/82 1982/83 1983/84 1984/85 1985/86 1986/87 1987/88 1988/89 1989/90 1990/91
Hong Kong and Kowloon
Licences
Food business Bakery 491 509 530 561 567 569 586 596 592 596 Cold store 30 26 24 25 26 26 25 23 21 20 Factory canteen 42 121 153 179 194 203 217 239 244 234 Food factory 680 682 710 760 778 826 886 919 932 963 Fresh provision shop 1422 1482 1 544 1 634 1 739 1 814 1 854 1 903 1 859 1 845 Frozen confection factory 42 50 65 99 130 193 223 225 229 234 General restaurant 2 652 2 731 2 883 3 061 3 148 3 190 3 253 3 330 3 475 3 548 Light refreshments
restaurant 761 768 796 855 861 870 905 912 910 918 Marine restaurant 3 3 3 3 3 3 3 3 2 2 Milk factory 3 2 2 2 2 2 3 3 3 3 Siu mei and lo mei shop 330 326 319 316 303 293 288 273 260 234
Sub-total 6456 6700 7029 7495 7751 7989 8 243 8426 8527 8 597
0 ther business Commercial bathhouse 38 44 49 53 52 50 57 63 67 73 Funeral parlour 6 5 5 5 5 3 5 3 4 5 Undertaker 44 44 43 42 44 22 42 23 27 44 Offensive trade 15 21 24 25 24 21 20 10 15 15 Swimming pool 61 64 64 76 97 115 128 143 171 205 Liquor 1 810 1 849 1 895 1 917 1 981 1 990 2 001 1 564 1 576 2 171 Club liquor 137 144 151 168 189 221 233 189 177 259 Place of public
entertainment (annual) 126 136 130 131 142 143 144 211 221 226 Public table tennis saloon 2 2 2 1 1 1 1 Billiard establishment 37 39 37 28 29 32 27 23 41 67 Public bowling alley 7 8 8 7 9 10 10 9 9 9 Public skating rink 1 3 4 3 3 1 4 4 4 4
Sub-total 2 284 2 359 2412 2456 2576 2609 2672 2 242 2 312 3078
Total 8740 9059 9441 9951 10327 10598 10 915 10668 10839 11675
Permits (Food business)
Chinese herb tea 156 149 164 170 181 198 183 191 205 209 Frozen confections 2408 2 388 2 323 2 329 2298 2 316 2266 2 178 2040 1 827 Milk 1 287 1 301 1 356 1404 1 462 1 519 1 533 1 498 1 415 1288 Non-bottled drinks 554 540 580 635 667 755 804 818 836 772 Shell fish 11 11 11 12 12 12 14 14 13 10 Cut fruit 241 225 224 222 216 235 242 247 274 268 Permit to sell food by means
of a coin-operated automatic vending machine 47 29 23 20 15 9 3 2 30 149
Total 4704 4643 4681 4792 4851 5044 5045 4948 4813 4523
Licences and Permits 13444 13702 14122 14743 15178 15 642 15960 15 616 15652 16198
275

20.4 Licences and Permits in Force by Type of Licence and Permit (Continued) Number
Type of licence and permit 1981/82 1982/83 1983/84 1984/85 1985/86 1986/87 1987/88 1988/89 1989/90 1990/91
New Territories and Outlying Islands
Licences
Food business Bakery 179 197 211 233 246 259 280 285 287 291 Cold store 12 12 12 14 13 15 14 16 18 19 Factory canteen 63 132 187 211 233 261 269 278 267 266 Food factory 275 307 360 392 428 465 514 538 548 555 Fresh provision shop 470 549 632 744 803 854 960 1 005 1 045 1 097 Frozen confection factory 10 20 26 33 47 77 109 115 129 133 General restaurant 712 793 889 942 1 013 1 079 1178 1267 1 328 1423 Light refreshments
restaurant 320 337 361 375 373 391 421 443 449 464 Marine restaurant 1 1 1 Milk factory 5 4 3 4 5 6 6 6 6 6 Siu mei and lo mei shop 87 93 105 115 119 119 ll3 135 140 135
Sub-total 2134 2445 2787 3063 3280 3 526 3884 4088 4217 4389
Other,business Slaughter house 2 2 3 3 3 3 2 2 2 2 Funeral parlour Undertakers of burials 20 21 14 14 14 13 13 15 14 Offensive trade 57 68 75 71 74 73 62 52 52 49 Swimming pool 15 18 31 33 47 67 83 92 101 119 Liquor 469 516 551 589 668 Club liquor 36 40 40 40 44 Place of public
entertainment 29 36 39 38 45 51 53 55 58 61 Public table tennis saloon Billiard establishment 17 14 18 17 19 17 16 14 17 36 Public bowling alley 3 4 8 8 8 8 7 6 6 7 Public skating rink 1 1 3 4 5 5 4 4 4 4
Sub-total 124 163 198 188 215 743 796 829 884 1004
Totitl 2258 2608 2985 3251 3495 4269 4680 4917 5101 5393
Permits (Food business)
Chinese herb tea 25 30 35 39 46 63 75 86 83 93 Frozen confections 558 626 . 685 707 776 852 925 943 920 877 Milk 277 328 365 393 429 485 545 567 568 529 Non-bottled drinks 91 105 130 158 200 275 330 343 355 351 Permit to sell food by means
of a coin-operated automatic vending machine 19 19 9 7 2 12 68
Restricted food (including cut fruit) 44 46 52 55 58 68 79 81 89 77
Total 1014 1154 1276 1359 1511 1744 1955 2021 2027 1995
Licences and Permits 3272 3762 4261 4610 5006 6013 6635 6938 7128 7388
Sources: Urban Services Department. Regional Services Department.
276
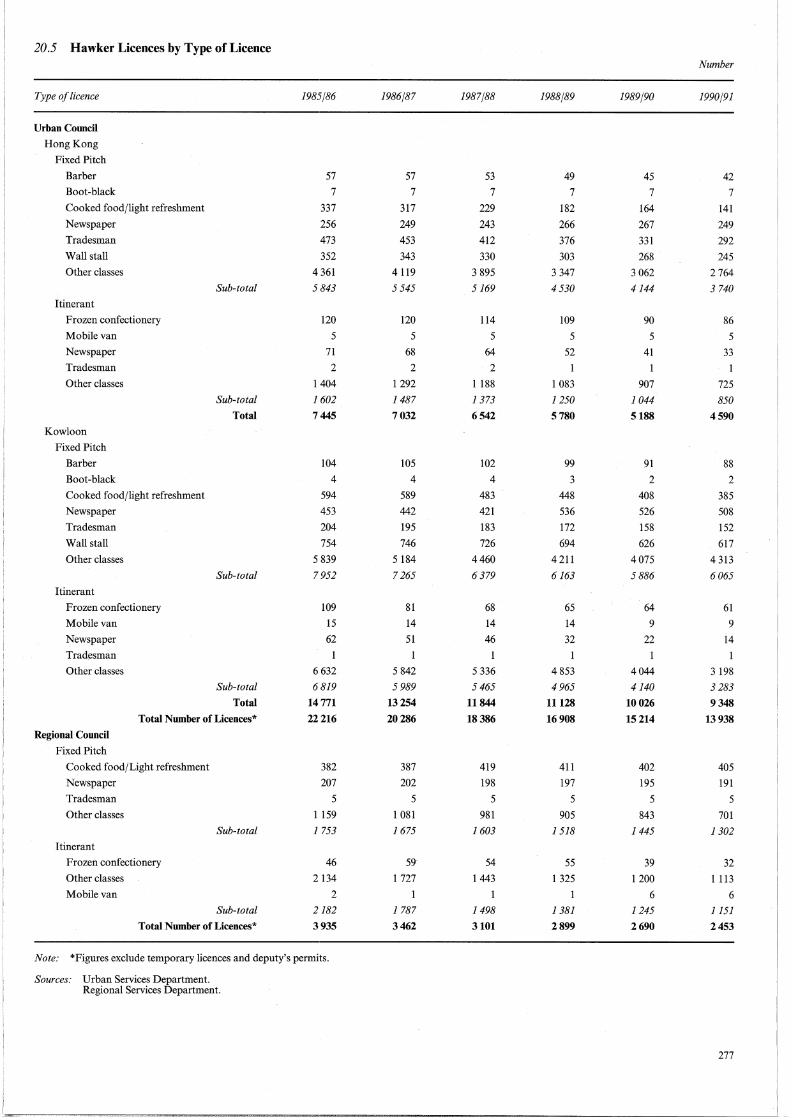
20 .5 Hawker Licences by Type of Licence
Type of licence
Urban Council
Hong Kong
Fixed Pitch
Barber
Boot-black
Cooked food/light refreshment
Newspaper
Tradesman
Wall stall
Other classes
Itinerant
Frozen confectionery
Mobile van
Newspaper
Tradesman
Other classes
Kowloon
Fixed Pitch
Barber
Boot-black
Cooked food/light refreshment
Newspaper
Tradesman
Wall stall
Other classes
Itinerant
Frozen confectionery
Mobile van
Newspaper
Tradesman
Other classes
Sub-total
Sub-total
Total
Sub-total
Sub-total
Total
Total Number of Licences*
Regional Council
Fixed Pitch
Cooked food/Light refreshment
Newspaper
Tradesman
Other classes
Itinerant
Frozen confectionery
Other classes
Mobile van
Sub-total
Sub-total
Total Number of Licences*
1985/86
57 7
337 256 473 352
4 361 5843
120 5
71 2
1404 1602
7445
104 4
594 453 204 754
5 839 7952
109 15 62
6632 6819
14771 22216
382 207
5
1159 1753
46 2134
2
2182
3935
Note: *Figures exclude temporary licences and deputy's permits.
Sources: Urban Services Department. Regional Services Department.
1986/87
57 7
317 249 453 343
4119 5 545
120 5
68 2
1292 1487
7032
105 4
589 442 195 746
5 184 7 265
81 14 51
5842 5989
13254 20286
387 202
5
1 081 1675
59 1 727
1787
3462
1987/88
53 7
229 243 412 330
3 895 5169
114 5
64
2
1188 1373
6542
102 4
483 421 183 726
4460 6379
68 14 46
5 336 5 465
11844 18386
419 198
5
981 1603
54 1443
1498
3101
1988/89
49 7
182 266 376 303
3 347 4530
109 5
52 1
1 083 1250
5780
99 3
448 536 172 694
4211 6163
65 14 32
4 853 4965
11128 16908
411 197
5
905 1518
55
1 325
1381
2899
1989/90
45 7
164
267 331 268
3 062 4144
90 5
41
907 1044
5188
91 2
408 526 158 626
4075 5 886
64 9
22
4044 4140
10026
15214
402
195 5
843 1445
39 1200
6
1245
2690
Number
1990/91
42 7
141 249 292 245
2764 3 740
86 5
33 1
725 850
4590
88 2
385 508 152 617
4313 6065
61 9
i4
3 198 3 283
9348 13938
405
191 5
701 1302
32 1113
6
1151
2453
277

20.6 Petroleum Products: Releases from Bond by Type
Light oils
Motor spirit
Aviation spirit
Aviation turbine fuel
Other light oils
Heavy oils
Light diesel for buses
Light diesel, other road users
Light diesel, industrial and marine uses
Kerosene
Medium/heavy diesel fuel
Furnace fuel oil
Others
Lubricating oils*
Petroleum products not otherwise classified
Non-dutiable liquefied petroleum gas ('000 tonnes)
Total
1981
336.52
0.23
939.41
184.55
1982
348.65
0.23
948.90
206.67
'OOO m 3 unless otherwise specified
1983 1984 1985 1986 1987 1988 1989 1990
313.92 303.35 291.40 297.83 306.76 360.61 454.40 472.56
0.32 0.26 0.26 0.24 0.21 0.15 0.14 0.10
958.05 1030.90 1020.13 1172.12 1237.71 1447.84 1855.43 2126.02
243.47 306.06 337.27 457.04 402.63 464.57 529.44 751.13
76.32 82.91 92.65 101.03 107.82 117.91 127.43 127.15 122.71 128.86
442.58 465.47 450.69 507.57 526.07 931.54 822.78 1164.39 1 875.34 1 479.43
724.61 805.41 836.54 763.81 631.88 988.92 903.39 1100.84 1 249.29 1 403.19
193.35 182.10 165.85 158.93 149.07 155.23 159.13 144.28 137.11 111.62
116.60 142.19 124.98 119.14 122.54 116.53 145.45 143.30 140.30 105.02
4 589.79 4 300.90 3 440.40 3 113.69 2 716.20 2 584.89 2 286.37 2 637.21 2 864.01 2 613.25
76.30 71.85 72.92 71.78 83.33 106.90 123.28 146.86 166.08 176.72
5.09 4.60 4.62 8.20 6.43 5.90 5.67 3.99 2.30 2.40
7 685.36 7 559.87 6 704.40 6 484.70 5 992.40 6 935.03 6 520.82 7 741.18 9 396.55 9,370.29
118.17 129.61 141.62 151.97 157.53 167.09 177.35 193.87 221.45 250.95
Note: *Lubricating oils include greases from May 1986 onwards.
Source: Publications Section, Census and Statistics Department.
20. 7 Fire, Special Service, Ambulance Calls and Fatalities
Fire calls
Industrial
Non-industrial
False alanns
Special service calls
Ambulance calls
Emergency
Removal
Fatalities
Fire Industrial Non-industrial
Special service
Source: Fire Services Department.
278
1981
526
9004
6290
5 845
1982
408
7 905
6782
6173
1983
479
8 875
7764
6 813
1984
545
9985
6949
6 218
1985
538
9 307
7660
6 811
1986
648
10 567
9 862
8 626
1987
618
10 881
13 022
9214
1988
513
11 356
13 615
10068
1989
522
11264
17 293
9 214
Number
1990
443
11042
18 459
8 992
189179 203634 220242 220768 235200 250323 281345 302849 312630 312465
63 788 72 591 83 281 92 444 106 766 115 251 119 586 118 817 115 571 120 475
19 25
367
1 40
330
40
375
1 52
340
1 28
322
14 31
408
2 20
422
5 19
432
5 44
409
2 39
384
----·--·--------------------------

20.8 Local and Overseas Companies Registered and Dissolved
1981 1982 1983 1984 1985 1986 1987 1988 1989 1990
Local companies
Number of companies registered during period 15 877 12 983 11 558 13434 18465 16 743 26 380 30474 31674 26147
Authorized share capital Under HK$10,000 3 275 2 355 1 566 1498 1 795 1 389 2 031 1 966 1 532 1 079 HK$10,000-under HK$50,000 7 355 6070 6 280 7 797 12 342 11 432 20 665 24 773 26 530 22259 HK$50,000-under HK$100,000 235 232 226 229 173 182 182 142 136 128 HK$100,000- under HK$500,000 2 373 2 167 1 891 2100 2 121 1 875 1 827 1 724 1 688 1295 HK$500,000- under HK$1,000,000 980 849 646 733 749 670 627 661 684 453 HK$1,000,000-under HK$5,000,000 1 201 909 659 750 865 780 730 854 809 624 HK$5,000,000 - under HK$10,000,000 113 67 49 49 59 61 62 59 81 54 HK$10,000,000 and above 79 63 35 34 45 36 37 53 32 35 Guarantee 266 271 206 244 316 318 219 242 182 220
Amount of authorized share capital for companies registered during period (HK$ Million) 4,749 3,939 3,469 3,277 3,664 3,356 4,133 4,400 3,371 3,163
Number of companies dissolved during period 829 943 1181 1394 1551 2 393 2 778 2548 2483 3408
Number of companies existing at end of period 96261 108 302 118 680 130 722 147636 161986 185 588 213 515 242 709 265 452
Overseas companies
Number of companies registered during period 207 213 257 215 231 288 240 250 266 350
Number of companies ceased business during period 58 61 84 82 144 142 189 191 150 179
Number of companies existing at end of period 1547 1699 1872 2005 2092 2238 2 289 2 348 2464 2635
Source: Registrar General's Department.
20.9 Companies Incorporated Outside Hong Kong by Origin
1981 1982 1983 1984 1985 1986 1987 1988 1989 1990
North America
Canada 37 41 44 46 46 56 57 52 56 64 United States of America 361 393 436 473 502 551 575 587 605 624
Central and South America
Bahamas 50 50 51 51 50 49 26 27 26 27 Bermuda 16 18 17 23 25 31 44 56 84 132 Cayman Islands 19 20 24 26 26 24 25 26 33 46 Panama 94 95 96 94 92 90 87 92 83 85 Others 6 8 7 8 11 18 29 33 47 106
Western Europe
France 23 25 26 32 36 46 47 48 54 50 West Germany 25 27 30 29 31 30 28 27 30 31 Netherlands 20 21 22 25 26 29 29 32 33 37 Switzerland 45 44 47 47 50 52 52 50 53 51 United Kingdom 206 232 279 294 317 328 341 344 350 349 Others 47 59 67 70 73 93 98 106 108 119
Middle East 6 5 6 6 7 10 11 12 11 11
Asia
China 23 24 23 25 27 29 31 33 33 33 India 12 13 13 13 13 14 14 13 14 14 Indonesia 5 5 5 5 5 5 5 5 5 7 Japan 170 187 223 238 253 267 274 275 286 293 South Korea 18 19 21 22 21 26 25 25 25 26 Malaysia 27 25 28 30 31 31 33 32 32 33 Philippines 21 22 23 24 26 24 24 24 24 24 Singapore 95 102 106 131 125 128 135 144 146 136 Taiwan 8 9 10 10 10 10 9 8 9 11 Thailand 13 14 15 15 16 16 14 13 13 11 Others 20 15 16 16 16 16 15 15 15 15
Africa
Liberia 48 62 70 87 97 106 99 95 113 122 Others 9 9 10 10 11 11 10 10 9 10
Australasia and Oceania
Australia 109 132 130 125 109 100 96 102 104 104 Others 14 23 27 30 40 48 56 62 63 64
Total 1547 1699 1872 2005 2092 2238 2289 2348 2464 2635
Note: Figures refer to companies incorporated outside Hong Kong but which have established a place of business in Hong Kong and registered documents with the Companies Registry under Part XI of the Companies Ordinance.
Source: Registrar General's Department.
279


i:' o
l -0
c: =
~
i:' O
j .. -0
c: c:
.2 =
~
0
=
E ..
~ e <
I
I +
I
~'if
~
z 0 ~ ~
z 0 =
~
0 ~
-< ~
~
0
281
i


>
... ro -g
§ :J
N
0 CXl
-e £ §
CJ ..91 w
"E ro 0
0 CXl ...
8 CJ
"'
·~ e
i5 ~
I i
283


N 00 '-"
MAP OF KOWLOON AND NEW KOWLOON CLASSIFIED BY DISTRICT BOARD 1991
L ~-~-~
·-----· -~ ----- -~ District Board Electoral Boundary -·- ·~
Metres 500 O 1 OOO 2 OOO ·~


N 00 -l
r--· i i r---_ i . i i i i 8' I i i v ! I
MAP OF NEW TERRITORIES AND ISLANDS CLASSIFIED BY DISTRICT BOARD 1991
cS
r! .\\'A
..
. I i i i i I
International Boundary -+-+- f
Boundary -· · - i ~ District Board Electoral j
. i ''-. ...~ ~ - ISLANDS DISTRICT . Kilometres 2 1 o 2 4 6 s 10 [
",~ 0 -·--·-·J·-·-·-·-·-·-·-·-·-·-·-·-·-·-·-·-·j "'--+-•-·-·-·-·-.. -·-·-·-·-·-·-·-·-·-·-·-... -·-·-·-·-·-·-·--.-·-

PUBLICATIONS Produced by Census and Statistics Department
Title of Publication
Price in HK$ (excluding
postage)
Regular: Hong Kong Economic Trends (month ly) Hong Kong M onthly Digest of Statistics (monthly) .. Hong Kong External Trade (monthly) ..... ..... .. . Hong Kong Trade Index Numbers (month ly) Hong Kong Trade Statistics 1991:
Imports (monthly) ......... ................... ..... . Domest ic Exports & Re-exports (monthly)
Hong Kong Trade Stat istics 1990: Annual Supplement, Country by Commodity
Imports .. . . ................. ... ................................. .. .. . Domest ic Exports & Re-exports ... . ................. .
Consumer Price Index Report (month ly). Monthly Survey of Employment, Payro ll and Orders-on-
Hand (month ly) . . ........ ... ..... ..... ..... . ................ ..... . . Report on M onthly Survey of Reta il Sales (month ly) .. . Report on Quarter ly Survey of Restaurant Receipts and
Purchases (quarterly) .. ..... ............................... ... ...... ..... ..... . . Report on Quarterly Business Survey (quarterly) .. ..... ..... ..... . . Report on the Quarter ly Index of Industr ial Product ion
(quarterly) ...................... ... ..... . . ........... ... . Report on Text ile Product ion Statist ics (quarterly) ...... ... ...... . Report on the Quarterly Survey of Construct ion Output
(quarterly) ........... .... ..... .............. ..... . ........................... . Quarter ly Report of Employment and Vacancies at
Construction Sites (quarterly) ............. ... ..... ..... . ..... ... ..... .. . Report of Employment, Vacancies and Payroll Stat istics
(quarter ly) . ....................... . ........... ..... ..... ..... ... ..... . General Household Survey Labour Force Characterist ics
(quarterl y) ........ ..... ... . Report on half -yearly Survey of Wages, Salaries and
Employee Benefits (half-yearly) : Volume I ..... ... .... ...... .... .... ..... . ........ ..... ..... ... .. . (Detailed Tables) Volume II .......................... .
Hong Kong Energy Statist ics (Quarterly Supplement) Hong Kong Shipping Stat istics (quarterl y) ....... . Hong Kong Shipping Statistics (yearly) ................................. . Employment & Vacanci es Statistics (Detai led Tables) in
Man ufacturing, Mining & Qu arrying, Electricity & Gas 1990 (yearly) ........... ..... .. ...... ..... ... ..... ..... ........ ..... ..... ..... .. .
Employment & Vacancies Statistics (Detailed Tables) in Transport, Storage & Communication. Financing, Insurance, Real Estate & Business Services, Commun ity, Socia l & Personal Services 1990 (yearl y) . ......................... .
Employment & Vacancies Statistics (Detailed Tables) in Wholesa le, Reta il, Import & Export Trades, Restau rants & Hote ls 1990 (yearly) .. ..... ....... ... ... ....... .
Hong Kong Annua l Digest of Statistics 1991 Edition (year ly) ....................................................................... ........... .
Report of Sa laries and Employee Benefits Statist icsM anagerial and Professional Employees (Exclud ing Top Management) 1991 (year ly) ....... ..... .... . .
Annu al Report on the Consumer Price Index 1990 (yearly) Hong Kong Review of Overseas Trade in 1990 (yea rly) Hong Kong Energy Statistics 1980- 1990 (yearly) .. ..... ..... ... . . 1989 Survey of Industrial Production (yearly) 1989 Survey of Wholesa le, Reta il and Import/ Export
Trades, Restaurants and Hotels (yearly) ..... .. . 1989 Survey of Storage, Communicat ion, Financing,
Insurance and Business Services (yearly) .......................... . 1989 Survey of Transport and Related Services (year ly) . 1989 Survey of Building, Construction and Rea l Estate
Sectors (yearly) .. ..... ..... . ...... ..... ... ..... ..... ..... ..... ..... ..... ..... ..... .. . An Outline of Statistical Development 1991 (yearly) .. Est imates of Gross Domestic Product 1966 to 1990 (year ly) *!i!l~:: ifilt.~l fili. 1i!i fi l ·- ;IL/\/\1:f:.3':- ;I L ;I LO "=F ( 0=FfjX) ................ .
1.50 48.00 33.50
4.00
100.00 100.00
95.00 95 .00
7.00
4.50 1.50
1.50 8.00
3.00 2.00
3.00
8.50
13.50
13.50
9.50 21 .00
6.50 34.50 50.00
71 .00
152.00
54.00
98.00
25.00 27.00 25.00 23.00 26.00
24.00
25.00 22.00
26.00 17.50 61.00 61 .00
Title of Publication
Price in HK$ (exclud ing
postage)
Quarter ly Estimates of Gross Domest ic Product (Quarterly) Hong Kong Social and Economic Trends 1978- 1988
(Biennial) .... . .......................................................... ..... ... .. .
Irregular: Hong Kong 1991 Population Census:
Summary Resu lts ...................... ......... ... ..... .......... . Tertiary Planning Units: Popu lation by Age and Sex Tertiary Planning Units: Living Quarters, Households and
Popu lation by Type of Living Quarters ... ......................... . Distr ict Board Districts and Const ituency Areas: Popu la-
tion by Age and Sex ............................................. . District Board Districts and Constituency Areas: Living
Quarters, Households and Populat ion by Type of Living Quarters ......................................... .... ... ... .
Boundary Maps Complementary to Tabu lat ions for Tertiary Planning Units ......... ..................................... .
Boundary Maps Complementary to Tabu lations for District Board Districts and Const ituency Areas
Hong Kong 1986 By-Census: Summary Results ...... ..... ... ..... ..... ..... ..... ..... . .................... . Tert iary Planning Unit: Population by Age ........... ... .. . Tertiary Planning Uni t: Living Quarters, Households and
Population by Type of Living Quarters .. ..... ..... . District Board Constituency Area: Popu lation by Age District Board Constituency Area: Living Quarters,
Households and Population by Type of Living Quarters District Board Const ituency Area Summary Tables District Board District Summary Tab les .... . Di stri ct Board Distr ict Tabu lations (in 19 volumes)
Tertiary Planning Unit Summary Tables: Hong Kong Island ......... ..... . Kowloon and New Kowloon .. ... ....... ... . ...... ..................... . New Territories .. ..... ..... . ......... ..... ....... ..
Main Report: Volume 1 ................. . ..... ..... ........ . Volume 2 .. .... ..... ..... .... .... . . ..... ..... .... .......... .
Socia l At las ( :f±ir ~;f;j. Ji!l l/fill ~ ) ........... ........... ......... . Graph ic Guide ( - ;iL/\./\1f:{!i:i:ll;i:j:iWJp o ?.JUf l·!.1tm·ll01/q~) . Hong Kong Population A 20-Year Projection ...... ... .. .... . Hong Kong Life Tables (1971 - 2006) .. . ................. ............. ... . Demographic Trends in Hong Kong 1971 - 82 .................. . Hong Kong Trade Statisti cs Classificat ion (S.l.T.C., Rev. 2) 1~8 . . .. ...... ... .... .... . ................ ..... ......... ................ ..... ... .
Hong Kong Imports & Exports Classificat ion Li st (Harmonized System) 1992 Edition .. . ............................. .
{!i:i:ll;ifll tl:l o J!i'.!1&171-!J'JH!~ ( tii»Rfft~ OC l i:J:i :'icii\'ll*.&1f IMJ~~ ~JM -;fLfL=1¥~ ............. ................... ..... ..... ... .
Hong Kong Harmonized Commodity Description and Coding System Handbook 1992 Editi on ............. .......... .... .
wi:11;J!l:•~M.&mMmR•OC•$-;1L;iL=1¥~ . ................. . Summary of Changes in the Hong Kong Imports and
Exports Classification List (Harmonized System) from the 1988 Edition to the 1992 Ed ition ...... . ................................. .
1989/90 Household Expenditure Survey and the Rebasing of the Consumer Price Indexes ..... ..... . ................ ......... ........ .
-fLAfL.¥: fL 01f:tt rs ~~!.1tMR•.&mumn•mma& WI ...... . ................................. .......... ..................... .
Socia l Data Collected by the General Household Survey: Special Topics Report VI ...... ............... ........ . Special Topics Report VI I .... ..... .... .... ..... ... ..... .... ... ... .... .
Crime And Its Victims in Hong Kong 1989 ....... ... ..... ..... .. .
-fLAfL1f:~w••~~••.&~~••···················· Gross Domestic Product: Quarterly Estimates and Revised
Annua l Est imates (Publ ished in August 1991) ................ .. . *Ji!l ~ifil.~~Hili.: =Bl:*ft ill.& f~~Tl:b:1¥1tirfl· ( - ;IL11-1f:AF.I t~ ~) · · · · ·· · · · ·· · ···· · ·············· ·· ··· •····· ··· .... . .... . .. . . . .. . .... . . . .. . . .
Free: Average Daily Wages of Workers Engaged in Government
Buil ding and Construction Projects (month ly) Hong Kong in Figures, 1991 Edition
2.00
46.00
20.00 22.00
22.00
31.00
24.00
72.00
48.00
6.00 10.00
10.00 12.00
10.00 144.00
37.00 20.00-25.00
90.00 95.00
150.00 80.00
200.00 25.00 10.00 15.00 16.00 26.00
60.00
43 .00
43 .00
10.00 10.00
44.00
56 .00
60.00
28.00 46 .00 54.00 54.00
12.00
12.00
Enquiries concerning the above publicat ions or their back issues shou ld be addressed to the Publi cat ions Officer, Census and Statistics Department, Wanchai Tower 1, 12 Harbour Road, Wan Chai , Hong Kong . Telephone No. 582 5073.
Saleable copies are purchasable from the Government Publications Centre, General Post Office Bui lding, Ground Floor, Connaught Place, Hong Kong and from the Publicat ions Sales Counter of Census and Statistics Department on 19/ F, Wanchai Tower 1, 12 Harbour Road, Wan Chai, Hong Kong.
Order for local and overseas mailings please contact the Director of Information Services, Information Services Department, 1 Battery Path, G/ F, Central, Hong Kong .

Hong Kong Annual Digest of Statistics The most comprehensive and convenient source of official statistics for experts in every field
300 tables in 20 separate sections cover just about every aspect of economic, social and industrial life
Climate & Geography Transport Medical & Health Population & Vital Events Communication & Tourism Social Welfare Labour Force Gross Domestic Product Law and Order Employment & Wages External Trade Public Finance Industrial Production Food Supplies Finance & Banking Building & Construction Housing Prices Distributive Trades Education Recreation & Culture
Most of the data in the Annual Digest are annual and cover periods of about 10 years
The Annual Digest and other Census & Statistics publications are available from: -
Government Publications Centre General Post Office Building G/F Connaught Place Central Hong Kong
Publications Sales Counter, Census & Statistics Department 19/F Wanchai Tower 1 12 Harbour Road Wan Chai Hong Kong
Information Services Department 1 Battery Path G/F Central Hong Kong (for mail order only)
212193-34L-2/92 $98-J47009100EO