novel strategies for improving the pharmacological - Wake ...
Upload
khangminh22Category
view
2download
0
F O R F I S C A L Y E A R E N D I N GJ U N E 3 0 ,
2018
T O W N O F WA K E F O R E S T
ComprehensiveAnnual Financial Report

COMPREHENSIVE ANNUAL
FINANCIAL REPORT
For the Fiscal Year Ended
June 30, 2018
Town of Wake Forest, North Carolina
Town of Wake Forest, North Carolina
Prepared by the Finance Department

TOWN OF WAKE FORESTBOARD OF COMMISSIONERS
Commissioner Greg Harrington
Commissioner Liz Simpers
Commissioner Anne Reeve
Commissioner Bridget Wall-Lennon
Commissioner Brian Pate
MayorVivian A. Jones
Commissioner Anne M. Reeve
TOWN OF WAKE FOREST STAFF Kipling D. Padgett
Town Manager Candace Davis Assistant to the Town Manager
Virginia Jones Human Resources Director
Aileen J. Staples Chief Financial Officer
Roger A. Russell Community Development Director
Cathy Gouge Renaissance Centre Director
Eric Vernon Town Attorney
Deeda Harris Town Clerk
Jeff Leonard Police Chief
Ruben Wall Parks Recreation Director
Magda Holloway Public Works Director
Tom LaBarge Bill Crabtree Chief Information Officer Communications and Public Affairs Director
J J Carr Mickey Rochelle Inspections Director Public Facilities Director
Lisa Hayes Jason Cannon Downtown Development Director Economic Development Director
ADVISORY BOARDS AND COMMISSIONS
Planning and Zoning Board Ed Gary, Chairperson
Cemetery Advisory Board Alan O’Shaughnessy, Chairperson
Cultural Resources Advisory Board Teel Anderson, Chairperson
Design Review Board Paul Eitel, Chairperson
Greenway Advisory Board Deanna Welker, Chairperson
Historic Preservation Commission Ellen Turco, Chairperson
Human Relations Council Robin Smith, Chairperson
Board of Adjustment Will Hedrick, Chairperson
Public Art Commission John Pelosi, Chairperson
Recreation Advisory Board Shinica Thomas, Chairperson
Senior Center Advisory Board Jetske Insinger, Chairperson
Technical Advisory Board Zee Khan, Chairperson
Urban Forestry Advisory Board Mindy Hidenfelter, Chairperson
Youth In Government Yara Mahmoud, Chairperson
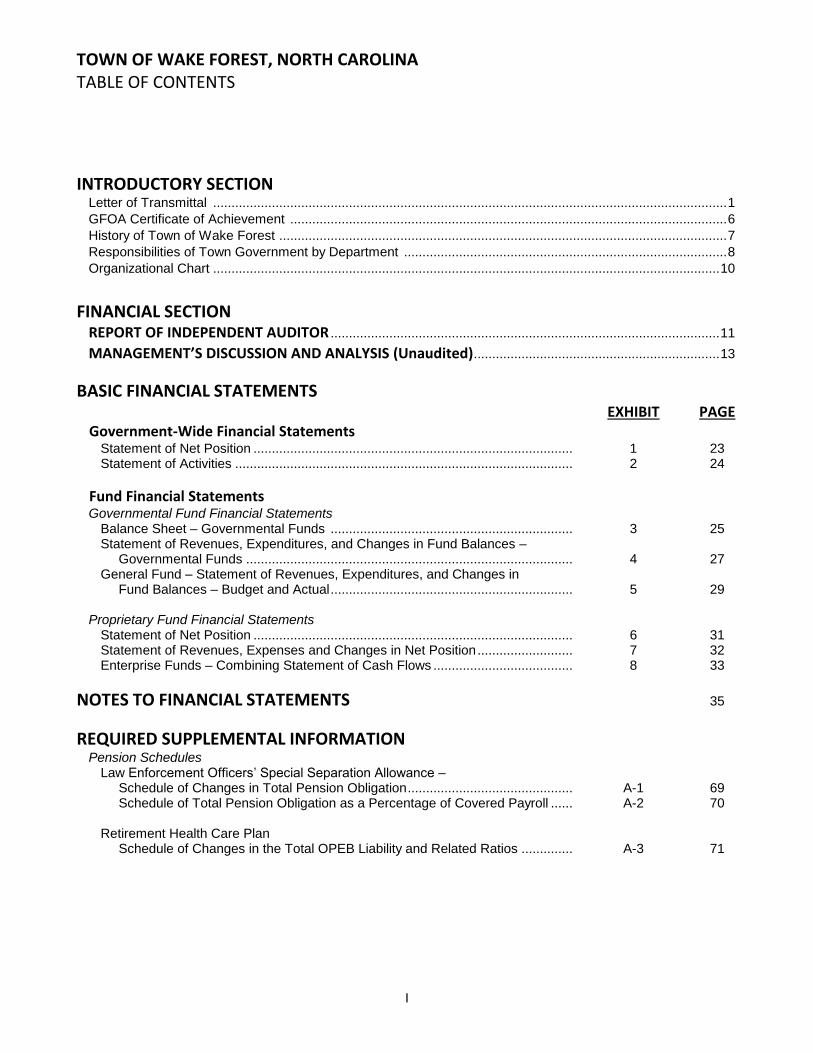
TOWN OF WAKE FOREST, NORTH CAROLINA TABLE OF CONTENTS
I
INTRODUCTORY SECTION Letter of Transmittal ............................................................................................................................................ 1 GFOA Certificate of Achievement ....................................................................................................................... 6 History of Town of Wake Forest .......................................................................................................................... 7 Responsibilities of Town Government by Department ........................................................................................ 8 Organizational Chart .......................................................................................................................................... 10
FINANCIAL SECTION REPORT OF INDEPENDENT AUDITOR .......................................................................................................... 11 MANAGEMENT’S DISCUSSION AND ANALYSIS (Unaudited) ................................................................... 13
BASIC FINANCIAL STATEMENTS EXHIBIT PAGE
Government-Wide Financial Statements Statement of Net Position ....................................................................................... 1 23 Statement of Activities ............................................................................................ 2 24
Fund Financial StatementsGovernmental Fund Financial Statements
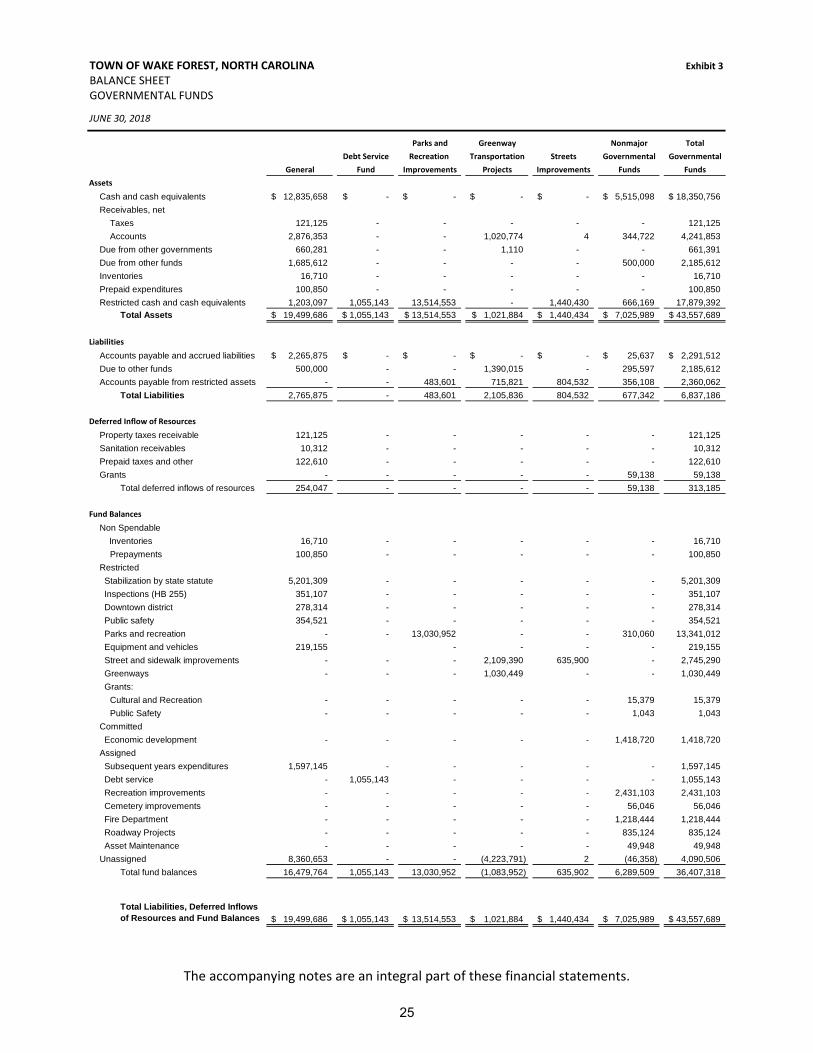
Balance Sheet – Governmental Funds .................................................................. 3 25 Statement of Revenues, Expenditures, and Changes in Fund Balances –
Governmental Funds ......................................................................................... 4 27 General Fund – Statement of Revenues, Expenditures, and Changes in
Fund Balances – Budget and Actual .................................................................. 5 29
Proprietary Fund Financial Statements Statement of Net Position ....................................................................................... 6 31 Statement of Revenues, Expenses and Changes in Net Position .......................... 7 32 Enterprise Funds – Combining Statement of Cash Flows ...................................... 8 33
NOTES TO FINANCIAL STATEMENTS 35
REQUIRED SUPPLEMENTAL INFORMATION Pension Schedules
Law Enforcement Officers’ Special Separation Allowance – Schedule of Changes in Total Pension Obligation ............................................. A-1 69 Schedule of Total Pension Obligation as a Percentage of Covered Payroll ...... A-2 70
Retirement Health Care Plan Schedule of Changes in the Total OPEB Liability and Related Ratios .............. A-3 71
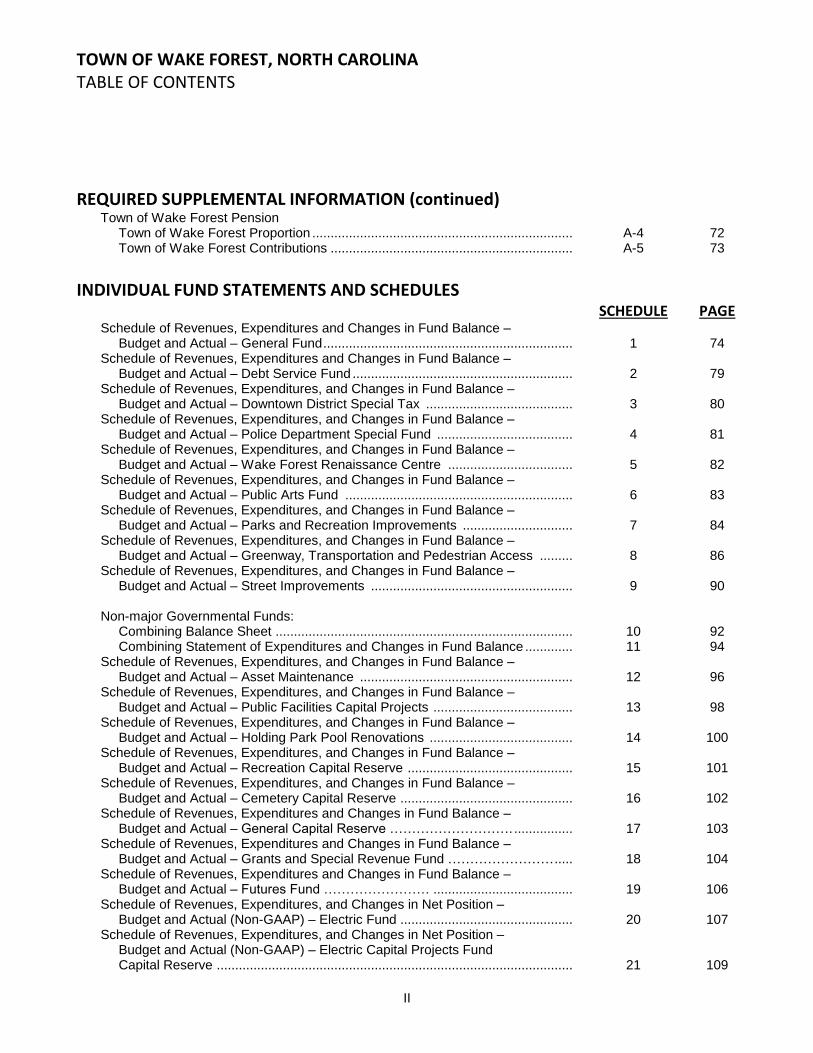
TOWN OF WAKE FOREST, NORTH CAROLINA TABLE OF CONTENTS
II
REQUIRED SUPPLEMENTAL INFORMATION (continued) Town of Wake Forest Pension
Town of Wake Forest Proportion ....................................................................... A-4 72 Town of Wake Forest Contributions .................................................................. A-5 73
INDIVIDUAL FUND STATEMENTS AND SCHEDULES SCHEDULE PAGE
Schedule of Revenues, Expenditures and Changes in Fund Balance – Budget and Actual – General Fund .................................................................... 1 74
Schedule of Revenues, Expenditures and Changes in Fund Balance – Budget and Actual – Debt Service Fund ............................................................ 2 79
Schedule of Revenues, Expenditures, and Changes in Fund Balance – Budget and Actual – Downtown District Special Tax ........................................ 3 80
Schedule of Revenues, Expenditures, and Changes in Fund Balance – Budget and Actual – Police Department Special Fund ..................................... 4 81
Schedule of Revenues, Expenditures, and Changes in Fund Balance – Budget and Actual – Wake Forest Renaissance Centre .................................. 5 82
Schedule of Revenues, Expenditures, and Changes in Fund Balance – Budget and Actual – Public Arts Fund .............................................................. 6 83
Schedule of Revenues, Expenditures, and Changes in Fund Balance – Budget and Actual – Parks and Recreation Improvements .............................. 7 84
Schedule of Revenues, Expenditures, and Changes in Fund Balance – Budget and Actual – Greenway, Transportation and Pedestrian Access ......... 8 86
Schedule of Revenues, Expenditures, and Changes in Fund Balance – Budget and Actual – Street Improvements ....................................................... 9 90
Non-major Governmental Funds: Combining Balance Sheet ................................................................................. 10 92 Combining Statement of Expenditures and Changes in Fund Balance ............. 11 94
Schedule of Revenues, Expenditures, and Changes in Fund Balance – Budget and Actual – Asset Maintenance .......................................................... 12 96
Schedule of Revenues, Expenditures, and Changes in Fund Balance – Budget and Actual – Public Facilities Capital Projects ...................................... 13 98
Schedule of Revenues, Expenditures, and Changes in Fund Balance – Budget and Actual – Holding Park Pool Renovations ....................................... 14 100
Schedule of Revenues, Expenditures, and Changes in Fund Balance – Budget and Actual – Recreation Capital Reserve ............................................. 15 101
Schedule of Revenues, Expenditures, and Changes in Fund Balance – Budget and Actual – Cemetery Capital Reserve ............................................... 16 102
Schedule of Revenues, Expenditures and Changes in Fund Balance – Budget and Actual – General Capital Reserve ………………………. ................ 17 103
Schedule of Revenues, Expenditures and Changes in Fund Balance – Budget and Actual – Grants and Special Revenue Fund …………………… ..... 18 104
Schedule of Revenues, Expenditures and Changes in Fund Balance – Budget and Actual – Futures Fund …………………… ...................................... 19 106
Schedule of Revenues, Expenditures, and Changes in Net Position – Budget and Actual (Non-GAAP) – Electric Fund ............................................... 20 107
Schedule of Revenues, Expenditures, and Changes in Net Position – Budget and Actual (Non-GAAP) – Electric Capital Projects Fund Capital Reserve ................................................................................................. 21 109
TOWN OF WAKE FOREST, NORTH CAROLINA TABLE OF CONTENTS
III
OTHER SCHEDULES
Ad Valorem Taxes Receivable ............................................................................... 22 110 Analysis of Current Tax Levy .................................................................................. 23 111 General Obligation Debt Service Requirements and Maturity Schedule ................ 24 112
STATISTICAL SECTION
TABLE PAGE Net Position by Category ........................................................................................ 1 114 Changes in Net Position.......................................................................................... 2 116 Fund Balances – Governmental Funds .................................................................. 3 120 Changes in Fund Balances – Governmental Funds ............................................... 4 122 Government-wide Revenues ................................................................................. 5 124 General Governmental Revenues by Source ........................................................ 6 126 General Governmental Expenditures by Function .................................................. 7 127 Government-wide Expenses by Function ............................................................... 8 128 Assessed Value of Taxable Property ..................................................................... 9 130 Property Tax Rates – Direct and Overlapping Governments ................................. 10 131 Principal Property Taxpayers ................................................................................. 11 132 Ratio of annual Debt Service Expenditures for General Obligation Bonded Debt to Total General Governmental Expenditures ........................................... 12 133 Property Tax Levies and Collections ...................................................................... 13 134 Demographic Statistics ........................................................................................... 14 136 Legal Debt Margin Information ................................................................................ 15 137 Ratio of Net General Obligation Bonded Debt to Assessed Value and Net Bonded Debt Per Capital ................................................................................... 16 138 Direct and Overlapping – Governmental Activities Debt ......................................... 17 140 Commercial Activity ............................................................................................... 18 141 Employee Position Authorization by Department .................................................... 19 142 Governmental Activities Tax Revenues by Source ................................................. 20 144 Ratios Outstanding Debt by Type ........................................................................... 21 146 Miscellaneous Statistics .......................................................................................... 22 147
COMPLIANCE SECTION
Report of Independent Auditor on Internal Control over Financial Reporting and on Compliance and Other Matters Based on an Audit of Financial Statements Performed in Accordance with Government Auditing Standards ............................................. 149
Report of Independent Auditor on Compliance with Requirements Applicable for Each Major Federal Program and on Internal Control over Compliance in Accordance with OMB Uniform Guidance and the State Single Audit Implementation Act ....... 151
Report of Independent Auditor on Compliance with Requirements Applicable to
Each Major State Program and Internal Control on over Compliance in Accordance with OMB Uniform Guidance and the State Single Audit Implementation Act ....... 153
Schedule of Findings and Questioned Costs ............................................................ 155 Corrective Action Plan ................................................................................................ 157 Schedule of Prior Audit Findings ................................................................................ 158 Schedule of Expenditures of Federal and State Awards ........................................... 159
301 S. Brooks Street ● Wake Forest, NC 27587 ● (919) 435-9400 ● www.wakeforestnc.gov
October 25, 2018 Honorable Mayor Vivian A. Jones Members of the Governing Board and Citizens of the Town of Wake Forest: We are pleased to present the Comprehensive Annual Financial Report (CAFR) of the Town of Wake Forest (the “Town”) for your review and use. This report was prepared by the Town’s Finance Department, and it is the comprehensive publication of the Town’s financial position and results of operations as of and for the fiscal year ended June 30, 2018. The Town, like all other local governments in the State, is required by state law to publish a complete set of financial statements within four months of the close of each fiscal year. The financial statements must be presented in conformity with generally accepted accounting principles (GAAP) and audited in accordance with generally accepted auditing standards by a firm of licensed certified public accountants. This report is published to fulfill that requirement and to provide further accountability to citizens and other interested parties by providing a more all-inclusive report in lieu of the minimum basic financial statement requirements. This document provides financial detail and historical trends beyond the basic financial statements in the Financial Section. Management’s discussion and analysis (MD&A) immediately follows the independent auditor’s report and provides a narrative introduction, overview and analysis of the basic financial statements. This letter of transmittal is written to complement the MD&A. Beyond the basic financial statements, the report includes Supplementary Information which provides details on retirement health care, law enforcement special separation allowance and pension liability information. The Statistical Section provides trend information on financial performance, revenue capacity, debt capacity, demographic and economic indicators as well as operating information. A Compliance Section includes documentation on federal and state grants and award compliance along with reports from auditors and schedule of findings. Town management is responsible for both the accuracy of the data along with the completeness and fairness of the report. To ensure reliability of the information Town management has established a comprehensive framework of internal control. Internal controls protect the Town’s assets from loss, theft and misuse and ensure that information is reliable for the preparation of this report. Because the cost of internal controls should not outweigh their benefits, the Town’s controls have been designed to provide reasonable, rather than absolute assurance that the financial statements are free of any material misstatements. We believe to the best of our knowledge, this financial report is complete, accurate and reliable in all material aspects. As noted earlier, the Town is required by state law to have an annual independent financial audit. A compliance audit on federal and state financial assistance is also required under the Federal Single Audit Act of 1984 and the State Single Audit Implementation Act. Cherry Bekaert LLP, Certified Public Accountants, has examined the financial records of the Town and their opinion can be found in the Report of the Independent Auditor included with the basic financial statements located at the beginning of the financial section of this document. Profile of the Town Wake Forest, incorporated in 1909, is a vibrant community located in northern Wake County that is part of the Triangle metropolitan area, which includes Raleigh, Durham and Chapel Hill. The Triangle area continues to be repeatedly ranked among the top places in the nation to raise a family, get an education, do business or retire. While Wake Forest is in a growing region, its small town charm and unique identity has been carefully
maintained. The Town covers an area of 18.23 square miles and the extraterritorial or planning jurisdiction of the Town (“ETJ”) covers an additional 4.02 square miles in Wake and Franklin counties located in the Piedmont region of the state. The Town adjoins the City of Raleigh, which is the state capital and the county seat, at the Town’s southern boundary, just across US 1/Capital Boulevard. Residents enjoy 972 acres of open space, greenways and trails, excellent schools and access to higher education, all in close proximity to Research Triangle Park (“RTP”) and Raleigh-Durham International Airport (“RDU”).
The Town operates under the council-manager form of government. The governing body is comprised of a Mayor and a five-member Board of Commissioners, elected on a nonpartisan, at-large basis for staggered four-year terms in odd-numbered years. The Board of Commissioners appoints members of various Town boards and commissions, the Town Manager and the Town Attorney. The Board of Commissioners enacts all general and technical ordinances including budgetary appropriations within a balanced budget, establishes a tax rate for supported Town programs and originates general management policies as recommended by the Town Manager. The Town Manager is responsible for implementing the Board’s policies and Town Ordinances, managing daily operations and appointing department directors.
The Town provides its citizens with a full range of services, including police, leisure and recreational opportunities, land use development administration and management, solid waste collection and disposal, construction and maintenance of streets, curbs, gutters, sidewalks and other infrastructure. In addition, as a Public Power community, the Town operates Wake Forest Power, an electric utility providing residential and commercial service. Fire protection is provided through a contract with the Wake Forest Fire Department, a private non-profit entity. This report includes all the Town’s activities in delivering and administering these services.
The Wake Forest Board of Commissioners is required to adopt an annual operating budget by July 1 each year. The Town is empowered to levy a property tax on both real and personal property located within its boundaries. The Town’s budget ordinance creates a legal limit on spending authorizations and serves as the foundation for financial planning and control. The Town Manager is authorized by the budget ordinance to make transfers within funds to facilitate budget execution consistent with the Board of Commissioner’s intent.
Local Economy
Like the national and state economy, the local economy continued to improve in fiscal year 2018 with the number of new construction permits and the value of the estimated construction costs both increasing from fiscal years 2016 and 2017. The total number of building permits for new construction, additions and alterations was 1,188, an increase of 27% over the previous fiscal year. This is a record number of building permits issued with the previous highest, 1,125, issued back in fiscal year 2006 (pre-recession). Retail sales increased and resulted in a 5.8% increase in sales tax revenues over fiscal year 2017. The state government, healthcare and university employers in the area continued to provide stable employment. Due to sustained positive growth in the region, Wake Forest continues to benefit from above average economic indicators as compared to the rest of the state and nation.
Southeastern Baptist Theological Seminary opened its doors in 1950 and is located on the former campus of Wake Forest College in downtown. The student body has grown to more than 3,400 students with an increase in enrollment over 30% in the past ten years. The Seminary offers study in 40 different undergraduate and post-graduate degree programs. A recent analysis conducted in January 2017 reports that the Seminary has a direct annual economic impact of $37.5 million in Wake Forest. In addition, over 1,540 full-time jobs, an average of over 308 per year, have been created and sustained over the last five years by the Seminary’s direct and indirect expenditures.
Wake Forest is home to The Wireless Research Center of NC (WRCNC), a non-profit 501 (c) (3) research organization focused on economic growth supporting research, development, testing and regulatory assistance for current and next generation wireless antenna technologies. As the only facility of its kind in the state, the WRCNC is an international destination for customers and partners who require specialized facilities coupled with applied and theoretical expertise, such as telecommunications, government/defense and medical industries. Current customers include mobile device companies, antenna design companies, defense
2
contractors and universities/researchers. The center serves as a hub for job creation, retention and expansion around the growing field of wireless and antenna technology for communications, medical and government use. It also serves as a catalyst for university research initiatives in wireless and antenna technology by providing cost-effective ready access to test laboratories and expertise that will make area universities more competitive when seeking government and commercial research grants and in the commercialization of technology.
The number of small firms in town has more than tripled over the last 15 years. This includes a variety of technology employers as follows: Ultra Electronics 3 Phoenix, BTC Electronics, Superior Tooling, Sunthonix, RxMedic, Trident Technologies and PowerSecure just to name a few.
As of June 30, 2018, the Town’s estimated population was 43,287 - an increase of 4.9% from fiscal year ended June 30, 2017. Total growth has been 59% since 2009. Wake Forest’s tax base has grown from $3.3 billion in 2009 to over $4.9 billion in 2018. The Town’s tax base is approximately 25% commercial/industrial and 75% residential for fiscal year 2017-18.
During the fiscal year, the Town issued a record number of permits as follows: 1,066 for residential construction and 122 for commercial construction. Permits issued for residential and commercial new construction and alteration cost values of over $239 million, an increase of approximately 49% over fiscal year 2017. Construction continued in the following developments during 2018:
o Heritage, the single largest subdivision in Wake Forest, consists of 1,350 acres that includes agolf course, shopping centers, three (3) public schools, commercial opportunities and over 2,250residential homes.
o Traditions, single and multi-family development that runs along the Wake Forest reservoir.o Holding Village, a traditional neighborhood located on the Dr. Calvin Jones Highway/NC 98
Bypass and Franklin Street. With over 1,350 residential homes planned, this neighborhood willconnect Heritage to downtown Wake Forest.
o Legacy Wake Forest, multi-family apartments located at Debarmore and Durham Road. Includes298 units.
o Several other active residential developments include: Austin Creek, Bishops Grant, Tryon,Bridgeport, Stonemill and Reynolds Mill.
There are a wide variety of projects completed or under construction, including residential subdivisions, apartments, townhomes, senior living opportunities, auto repair and supply, several new restaurants and other initiatives.
PowerHouse Row is a project that consists of two multi-use buildings that will face South White Street and will extend downtown Wake Forest’s main street activity. The estimated investment of $13 million, which is part of many public and private investments in the Renaissance Area in the heart of Wake Forest. Phase I includes approximately 9,800 square foot building with retail and restaurant spaces on the first floor with 18 to 20 apartments on the two upper floors. Construction started in August and is expected to be completed in 2019.
The Board adopted a fiscal year 2019 budget based on growth patterns similar to 2018, with slightly increasing sales tax revenues and tax base. In planning for the future and keeping with the fourth goal of the strategic plan, focusing on fiscal strength, the Town continues to maintain a high priority on the delivery of quality services, infrastructure maintenance and financial stability. Recently, in a comparative cost analysis of Wake County municipalities, Wake Forest ranks number three in customer costs for municipal services provided for fiscal year 2019. This is based on average median value of a single-family residential unit along with average water/sewer usage for the year.
Long Term Financial Planning and Major Initiatives
Our regional location, quality of life and small town atmosphere continues to make Wake Forest a destination for people and businesses moving into our region. Careful planning for growth based on values for an attractive community, environmental stewardship and protection, adequate public facilities and a variety of cultural and recreational opportunities while maintaining a strong financial position.
3
The Town’s strong fiscal management remains its hallmark. We continue to maintain sufficient unassigned (unreserved) fund balance to ensure consistent cash flow and provide flexibility for unanticipated opportunities and needs during emergencies or disasters. In addition, the Town’s conservative philosophy and approach to budgeting has been key in maintaining its fiscal position as evidenced by its AAA and Aa1 ratings from three major credit rating agencies. Some highlights of fiscal year 2017-2018 are as follows:
o Additional positions added to meet the demands of our growing community o Ten (10) full time positions added o Three (3) positions converted from part time to full time o Two (2) permanent part time positions added
o Reorganization of four departments o Performance management (measures and workload indicators) system implemented o Debt model updated April 2018 o Completed internal IT strategy and organization assessment o Comprehensive Transportation Plan update launched – expected to be completed by mid-2019 o Parks and Recreation Impact Fee study completed – new fees implemented August 2018 o Comprehensive fee analysis for Parks, Recreation and Cultural Resources and the Renaissance
Centre – Fee policy approved in March 2018 – new fees adopted in May 2018
The Town maintains a five-year capital improvement plan which serves as its planning document to ensure that its facilities, equipment and infrastructure are well maintained. This process provides the ability to plan for capital needs and allocate short and term resources appropriately. The plan also serves as the basis for determining future debt issuance. The following projects have been completed over the past year or are in progress:
o Holding Park Pool was formally renamed Holding Park Aquatic Center. Renovations totaling $3.2 million and includes three (3) bodies of water, including a six-lane, 25 yard lap pool; two water slides; and a children’s pool with a sprayground. Project was completed in September 2018.
o Second phase of renovations at the Wake Forest Renaissance Centre totaling approximately $744,500 included: raised ceiling, extended stage, theater lighting and upgraded sound system in the Grand Hall. This project was made possible due to a grant received from the Wake County Board of Commissioners. Grand opening of the Centre was held in June 2018.
o With remaining funds in project budget – additional enhancements are expected to be completed in 2019.
o Acquisition of 353 S. White Street (formerly SunTrust building) for $1.5 million in May 2018 – located in the Renaissance area of downtown – purpose for future economic development.
o Joyner Park Community Center construction underway and expected to be complete by summer 2019. Project cost estimated at $12 million includes 32,000 square foot facility with walking track, gymnasium for basketball, volleyball and pickleball; multi-purpose rooms; dance studio; and kitchen.
o Northern Wake Senior Center expansion underway. The $3.1 million construction project consists of adding almost 9,000 square feet, interior renovations to approximately 80% of the existing center and a complete redecoration.
o Construction commenced for Royal Mill road connection, street rehabilitation and pavement resurfacing along with Owen Avenue parking lot. Street rehabilitation completed in June and others expected to be complete by early 2019.
o Stadium Drive Complete Street project construction underway and expected completion in late 2019.
o Priority Pedestrian Corridor project which includes Wait Avenue and Oak Avenue. Construction started during the fiscal year and expected completion date is late 2019.
o Acquisition of 5031 Unicon Drive located in South Forest Business Park for $2.9 million was finalized in October 2018
o Wake Forest Power will relocate from 234 Friendship Chapel Road to this site in early 2019.
4
5
6
History of the Town of Wake Forest The Town of Wake Forest grew up around a college founded by North Carolina Baptists in 1834. After purchasing a plantation, which originally belonged to Dr. Calvin Jones, the North Carolina Baptist Convention opened the doors of the college on February 3, 1834. Lots were sold around the campus until gradually a town developed. The first Town Charter was obtained in 1880 for the Town of Wake Forest College. It was not until February 20, 1909 – 29 years later – that the Town of Wake Forest was chartered. When the college made plans to relocate in the 1950s, the campus was sold to the Southern Baptist Convention for use as a seminary, which opened in 1951. For the next five years Southeastern Baptist Seminary and Wake Forest College existed on the same campus. These dates – 1834, 1909, 1951 – are significant to the Town and consequently are represented on the town seal. Wake Forest remained a quiet village throughout the 1960s and 70s. Along with most other Wake County towns, however, it began to experience significant growth in the 80s and 90s. Tremendous progress and development continue today as easy access to Raleigh and the Research Triangle area, combined with the many amenities of small-town living, make Wake Forest a desirable destination for residential and commercial development. An emphasis on planned growth and professional management continue to ensure that the Town’s unique personality is maintained and enhanced by the changes currently in progress.
7
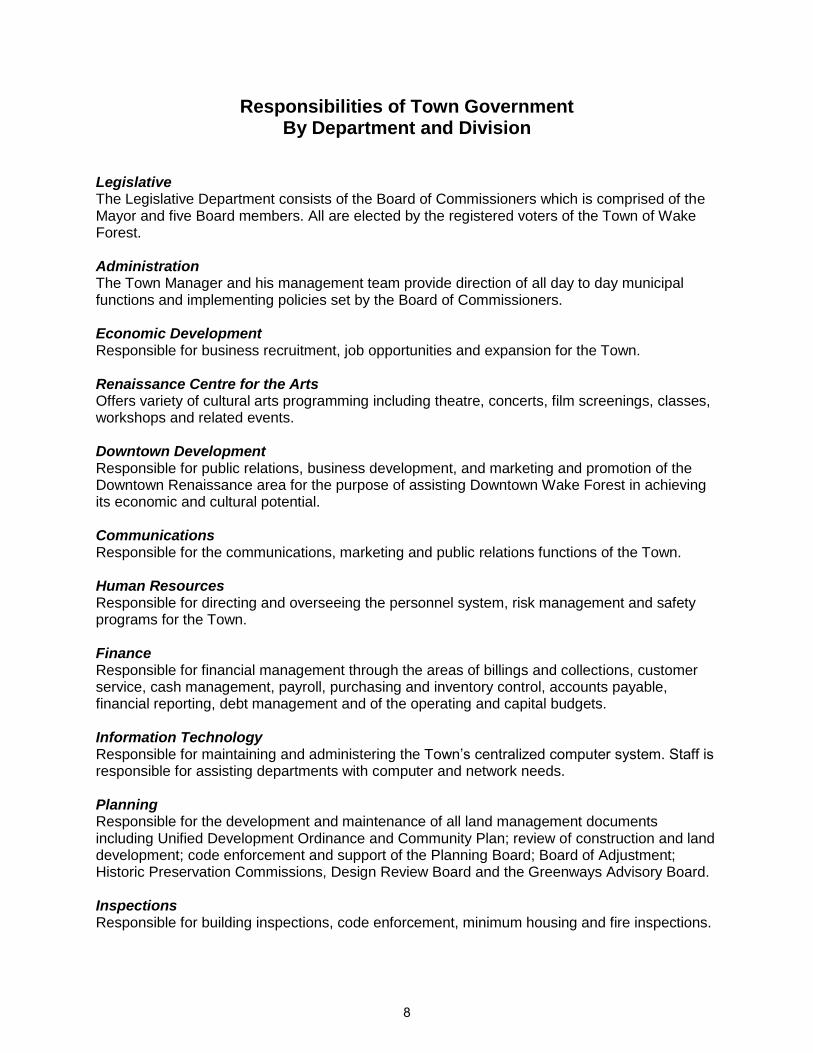
Responsibilities of Town Government By Department and Division
Legislative The Legislative Department consists of the Board of Commissioners which is comprised of the Mayor and five Board members. All are elected by the registered voters of the Town of Wake Forest. Administration The Town Manager and his management team provide direction of all day to day municipal functions and implementing policies set by the Board of Commissioners. Economic Development Responsible for business recruitment, job opportunities and expansion for the Town. Renaissance Centre for the Arts Offers variety of cultural arts programming including theatre, concerts, film screenings, classes, workshops and related events. Downtown Development Responsible for public relations, business development, and marketing and promotion of the Downtown Renaissance area for the purpose of assisting Downtown Wake Forest in achieving its economic and cultural potential. Communications Responsible for the communications, marketing and public relations functions of the Town. Human Resources Responsible for directing and overseeing the personnel system, risk management and safety programs for the Town. Finance Responsible for financial management through the areas of billings and collections, customer service, cash management, payroll, purchasing and inventory control, accounts payable, financial reporting, debt management and of the operating and capital budgets. Information Technology Responsible for maintaining and administering the Town’s centralized computer system. Staff is responsible for assisting departments with computer and network needs. Planning Responsible for the development and maintenance of all land management documents including Unified Development Ordinance and Community Plan; review of construction and land development; code enforcement and support of the Planning Board; Board of Adjustment; Historic Preservation Commissions, Design Review Board and the Greenways Advisory Board. Inspections Responsible for building inspections, code enforcement, minimum housing and fire inspections.
8
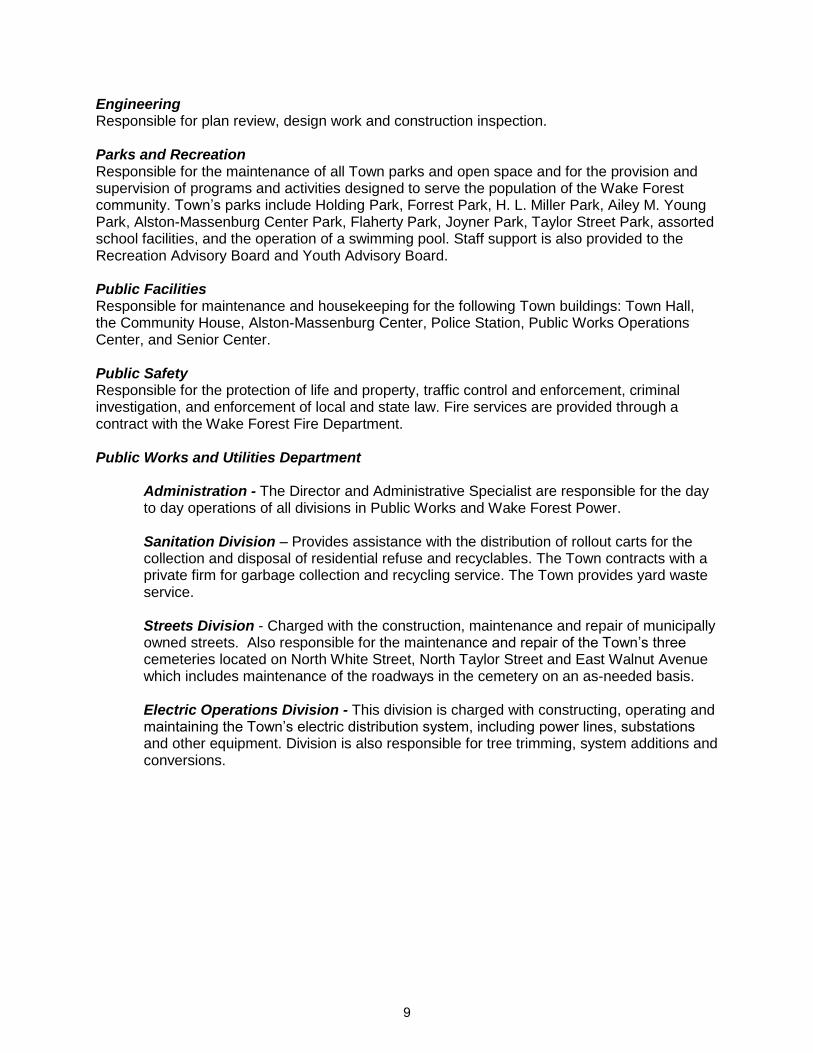
Engineering Responsible for plan review, design work and construction inspection. Parks and Recreation Responsible for the maintenance of all Town parks and open space and for the provision and supervision of programs and activities designed to serve the population of the Wake Forest community. Town’s parks include Holding Park, Forrest Park, H. L. Miller Park, Ailey M. Young Park, Alston-Massenburg Center Park, Flaherty Park, Joyner Park, Taylor Street Park, assorted school facilities, and the operation of a swimming pool. Staff support is also provided to the Recreation Advisory Board and Youth Advisory Board. Public Facilities Responsible for maintenance and housekeeping for the following Town buildings: Town Hall, the Community House, Alston-Massenburg Center, Police Station, Public Works Operations Center, and Senior Center. Public Safety Responsible for the protection of life and property, traffic control and enforcement, criminal investigation, and enforcement of local and state law. Fire services are provided through a contract with the Wake Forest Fire Department. Public Works and Utilities Department Administration - The Director and Administrative Specialist are responsible for the day
to day operations of all divisions in Public Works and Wake Forest Power. Sanitation Division – Provides assistance with the distribution of rollout carts for the
collection and disposal of residential refuse and recyclables. The Town contracts with a private firm for garbage collection and recycling service. The Town provides yard waste service. Streets Division - Charged with the construction, maintenance and repair of municipally owned streets. Also responsible for the maintenance and repair of the Town’s three cemeteries located on North White Street, North Taylor Street and East Walnut Avenue which includes maintenance of the roadways in the cemetery on an as-needed basis. Electric Operations Division - This division is charged with constructing, operating and maintaining the Town’s electric distribution system, including power lines, substations and other equipment. Division is also responsible for tree trimming, system additions and conversions.
9
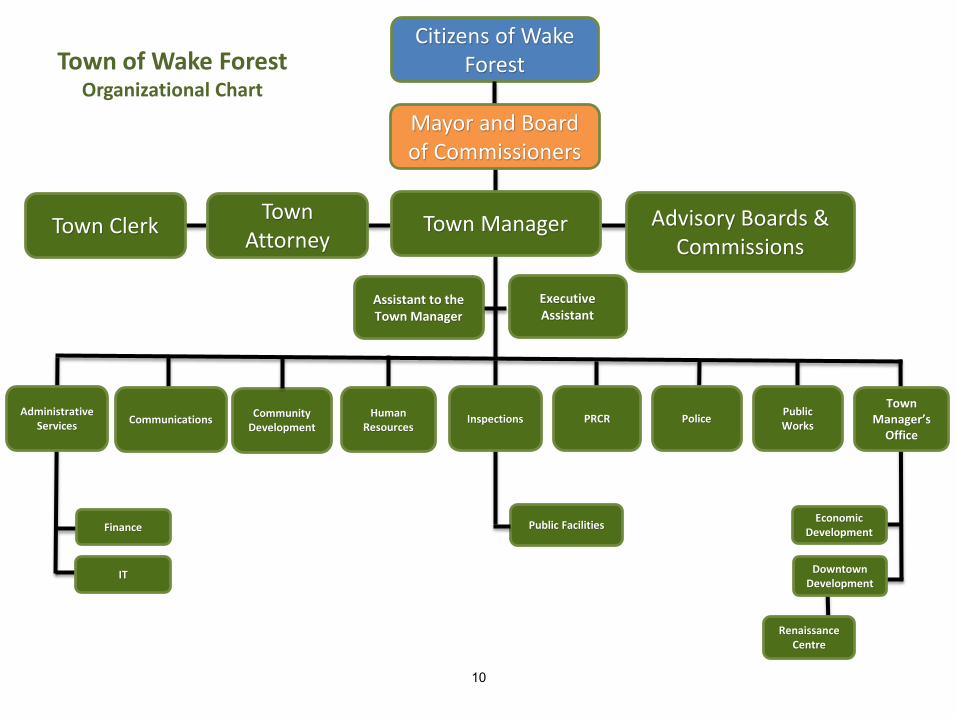
Citizens of Wake Forest
Mayor and Board of Commissioners
Town ManagerTown Clerk
Assistant to the Town Manager
Executive Assistant
Public Facilities
Town Attorney
Advisory Boards & Commissions
Finance
IT
Communications Human Resources
PRCRAdministrative Services
RenaissanceCentre
InspectionsCommunity Development
Police Public Works
Town Manager’s
Office
Economic Development
Downtown Development
Town of Wake ForestOrganizational Chart
10
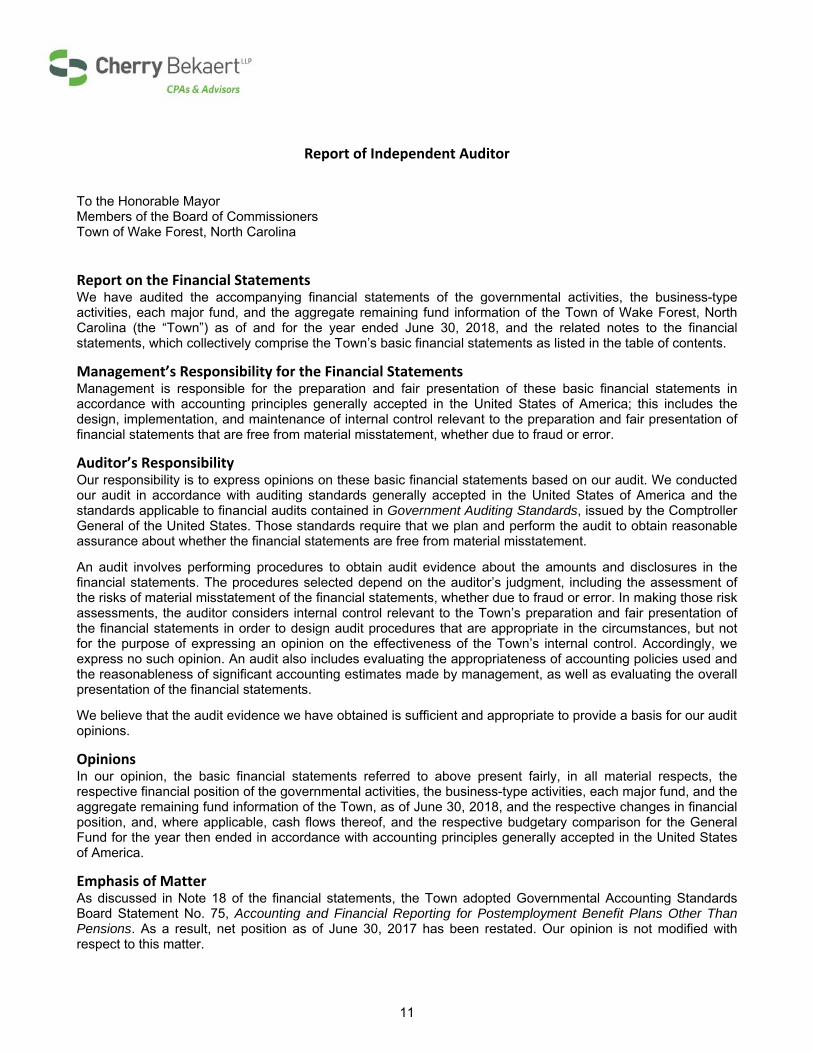
Report of Independent Auditor To the Honorable Mayor Members of the Board of Commissioners Town of Wake Forest, North Carolina Report on the Financial Statements We have audited the accompanying financial statements of the governmental activities, the business-type activities, each major fund, and the aggregate remaining fund information of the Town of Wake Forest, North Carolina (the “Town”) as of and for the year ended June 30, 2018, and the related notes to the financial statements, which collectively comprise the Town’s basic financial statements as listed in the table of contents.
Management’s Responsibility for the Financial Statements Management is responsible for the preparation and fair presentation of these basic financial statements in accordance with accounting principles generally accepted in the United States of America; this includes the design, implementation, and maintenance of internal control relevant to the preparation and fair presentation of financial statements that are free from material misstatement, whether due to fraud or error.
Auditor’s Responsibility Our responsibility is to express opinions on these basic financial statements based on our audit. We conducted our audit in accordance with auditing standards generally accepted in the United States of America and the standards applicable to financial audits contained in Government Auditing Standards, issued by the Comptroller General of the United States. Those standards require that we plan and perform the audit to obtain reasonable assurance about whether the financial statements are free from material misstatement. An audit involves performing procedures to obtain audit evidence about the amounts and disclosures in the financial statements. The procedures selected depend on the auditor’s judgment, including the assessment of the risks of material misstatement of the financial statements, whether due to fraud or error. In making those risk assessments, the auditor considers internal control relevant to the Town’s preparation and fair presentation of the financial statements in order to design audit procedures that are appropriate in the circumstances, but not for the purpose of expressing an opinion on the effectiveness of the Town’s internal control. Accordingly, we express no such opinion. An audit also includes evaluating the appropriateness of accounting policies used and the reasonableness of significant accounting estimates made by management, as well as evaluating the overall presentation of the financial statements. We believe that the audit evidence we have obtained is sufficient and appropriate to provide a basis for our audit opinions.
Opinions In our opinion, the basic financial statements referred to above present fairly, in all material respects, the respective financial position of the governmental activities, the business-type activities, each major fund, and the aggregate remaining fund information of the Town, as of June 30, 2018, and the respective changes in financial position, and, where applicable, cash flows thereof, and the respective budgetary comparison for the General Fund for the year then ended in accordance with accounting principles generally accepted in the United States of America.
Emphasis of Matter As discussed in Note 18 of the financial statements, the Town adopted Governmental Accounting Standards Board Statement No. 75, Accounting and Financial Reporting for Postemployment Benefit Plans Other Than Pensions. As a result, net position as of June 30, 2017 has been restated. Our opinion is not modified with respect to this matter.
11
Other Matters Required Supplementary Information Accounting principles generally accepted in the United States of America require that the management’s discussion and analysis and required supplementary information, as listed in the table of contents, be presented to supplement the basic financial statements. Such information, although not a part of the basic financial statements, is required by the Governmental Accounting Standards Board who considers it to be an essential part of financial reporting for placing the basic financial statements in an appropriate operational, economic, or historical context. We have applied certain limited procedures to the required supplementary information in accordance with auditing standards generally accepted in the United States of America, which consist of inquiries of management about the methods of preparing the information and comparing the information for consistency with management’s responses to our inquiries, the basic financial statements, and other knowledge we obtained during our audit of the basic financial statements. We do not express an opinion or provide any assurance on the information because the limited procedures do not provide us with sufficient evidence to express an opinion or provide any assurance. Supplementary and Other Information Our audit was conducted for the purpose of forming opinions on the financial statements that collectively comprise the Town’s basic financial statements. The introductory section, individual fund statements and schedules, other schedules, and statistical section, as listed in the table of contents, as well as the schedule of expenditures of federal and state awards as required by Title 2 U.S. Code of Federal Regulations (CFR) Part 200, Uniform Administrative Requirements, Cost Principles, and Audit Requirements for Federal Awards (Uniform Guidance), and the State Single Audit Implementation Act are presented for purposes of additional analysis and are not a required part of the basic financial statements. The individual fund statements and schedules and other schedules for the years ended June 30, 2018 and 2017 and the schedule of expenditures of federal and state awards for the year ended June 30, 2018 is the responsibility of management and were derived from and relate directly to the underlying accounting and other records used to prepare the basic financial statements. Such information has been subjected to the auditing procedures applied in the audit of the basic financial statements and certain additional procedures, including comparing and reconciling such information directly to the underlying accounting and other records used to prepare the basic financial statements or to the basic financial statements themselves, and other additional procedures in accordance with auditing standards generally accepted in the United States of America. In our opinion, the information is fairly stated, in all material respects, in relation to the basic financial statements as a whole. The introductory and statistical sections have not been subjected to the auditing procedures applied in the audit of the basic financial statements and, accordingly, we do not express an opinion or provide any assurance on them. Other Reporting Required by Government Auditing Standards In accordance with Government Auditing Standards, we have also issued our report dated October 25, 2018 on our consideration of the Town’s internal control over financial reporting and on our tests of its compliance with certain provisions of laws, regulations, contracts, and grant agreements and other matters. The purpose of that report is to describe the scope of our testing of internal control over financial reporting and compliance and the results of that testing, and not to provide an opinion on internal control over financial reporting or on compliance. That report is an integral part of an audit performed in accordance with Government Auditing Standards in considering the Town’s internal control over financial reporting and compliance.
Raleigh, North Carolina October 25, 2018
12
Management’s Discussion and Analysis As management of the Town of Wake Forest (the “Town”), we offer readers of the Town’s financial statements this narrative overview and analysis of the financial activities of the Town for the fiscal year ended June 30, 2018. We encourage readers to read the information presented here in conjunction with additional information that we have furnished in the Town’s financial statements, which follow this narrative. Financial Highlights In FY 2017-18, the Town maintained its strong financial position. Key indicators of this were overall positive budget variances, increases in fund balance amounts, as well as growth of key general revenues. In preparation for issuance of the General Obligation (GO) Bonds the Town obtained a rating from Fitch which resulted in AAA. The town’s other current bond ratings are AAA (Standard & Poor’) and Aa1 (Moody’s).
The assets and deferred outflows of the Town exceeded its liabilities and deferred inflows of resources at
the close of the fiscal year by $187,331,353 (net position) or a 0.46% decrease from prior year.
The Town’s total net position increased by $10,791,034, primarily due to an increase in the governmental-type activities net position of $9,862,167. Business-type activities position increased $928,867 for the fiscal year.
As of the close of the current fiscal year, the Town’s governmental funds reported combined ending fund balance of $36,407,318.
o $4,090,506 or 11.2% is unassigned and available for spending at the Town’s discretion o $23,537,579 or 64.7% is restricted by external agencies o $1,418,720 or 3.9% is committed for economic development purposes o $117,560 or 0.3% is considered non-spendable o $7,242,953 or 19.9% is assigned for specific purposes as identified by the Town
The Town’s total debt increased by $20,081,191 (81.8%) during the current fiscal year. Along with retiring a significant amount of debt during the year, four (4) installment purchase agreements and three (3) general obligation bonds were issued: General Obligation Bonds:
o $830,000 – Street and Sidewalk Improvements and Greenway Improvements (various projects) – June 2018 – twenty year term – 2.98%
o $14,200,000 – Parks and Recreation Improvements (Joyner Park and Northern Wake Senior Center) – June 2018 – twenty year term – 2.98%
o $1,650,000 – Street and Sidewalk Improvements Bonds (Roger Road Underpass) – June 2018 - twenty year term – 2.98%
Installment Purchase Agreements:
o $2,900,000 – Holding Park Pool Phase II Renovations – September 2017 – 10 year term – 2.85%
o $1,068,550 – Rolling Stock - December 2017 – 3 year term – 1.95% o $2,400,000 – Street Improvements (Street Resurfacing, Street Connections and Police Parking
Lot) – May 2018 – 8 year term – 3.39% o $1,000,000 – 353 South White Street – May 2018 – 4 ½ year term – 3.10%
Overview of the Financial Statements This discussion and analysis are intended to serve as an introduction to the Town’s basic financial statements. The Town’s basic financial statements consist of three components: 1) government-wide financial statements, 2) fund financial statements, and 3) notes to the financial statements. The basic financial statements present two (2) different views of the Town through the use of government-wide statements and fund financial statements. In
13
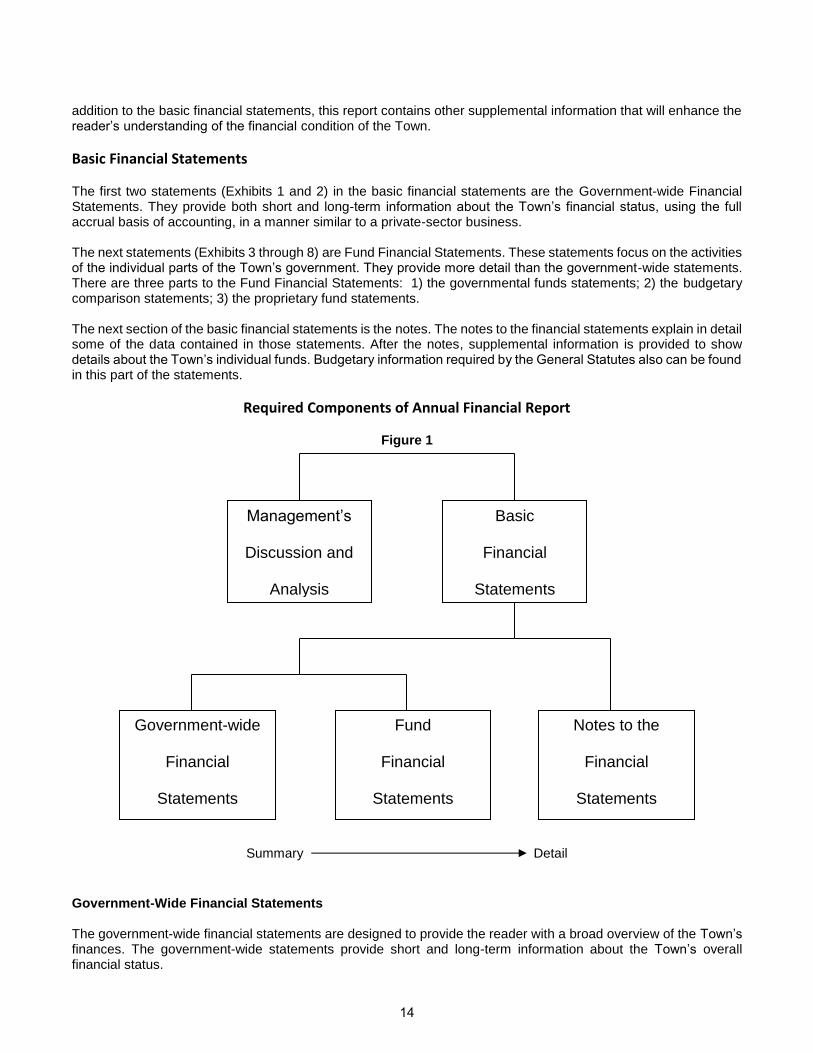
addition to the basic financial statements, this report contains other supplemental information that will enhance the reader’s understanding of the financial condition of the Town. Basic Financial Statements The first two statements (Exhibits 1 and 2) in the basic financial statements are the Government-wide Financial Statements. They provide both short and long-term information about the Town’s financial status, using the full accrual basis of accounting, in a manner similar to a private-sector business. The next statements (Exhibits 3 through 8) are Fund Financial Statements. These statements focus on the activities of the individual parts of the Town’s government. They provide more detail than the government-wide statements. There are three parts to the Fund Financial Statements: 1) the governmental funds statements; 2) the budgetary comparison statements; 3) the proprietary fund statements. The next section of the basic financial statements is the notes. The notes to the financial statements explain in detail some of the data contained in those statements. After the notes, supplemental information is provided to show details about the Town’s individual funds. Budgetary information required by the General Statutes also can be found in this part of the statements.
Required Components of Annual Financial Report
Figure 1
Summary Detail Government-Wide Financial Statements
The government-wide financial statements are designed to provide the reader with a broad overview of the Town’s finances. The government-wide statements provide short and long-term information about the Town’s overall financial status.
Management’s
Discussion and
Analysis
Basic
Financial
Statements
Government-wide
Financial
Statements
Fund
Financial
Statements
Notes to the
Financial
Statements
14
The two government-wide statements report the Town’s net position and how it has changed. Net position is the difference between the Town’s total assets and deferred outflows of resources if applicable, and total liabilities and deferred inflows of resources. Measuring net position is one way to gauge the Town’s financial condition. The government-wide statements are divided into two categories: 1) governmental activities; 2) business-type activities. The governmental activities include most of the Town’s basic services such as general government, public safety, public works, environmental protection and cultural and recreation. Property taxes and intergovernmental revenues finance most of these activities. The business-type activities are those that the Town charges customers to provide which includes the municipally owned electric system known as Wake Forest Power. In accordance with the Governmental Accounting Standards Board criteria for inclusion in the reporting entity, the Town has one component unit, Wake Forest Business and Industry Partnership, Inc. (BIP). The component, however, did not have any activity that must be included in this report. The government-wide financial statements are on Exhibits 1 and 2 of this report. Fund Financial Statements The fund financial statements provide a more detailed look at the Town’s most significant activities. A fund is a grouping of related accounts that is used to maintain control over resources that have been segregated for specific activities or objectives. The Town, like all other governmental entities in North Carolina, uses fund accounting to ensure and reflect compliance (or non-compliance) with finance-related legal requirements, such as the General Statutes or the Town’s budget ordinance. All of the funds of the Town can be divided into two categories: governmental funds and proprietary funds. Governmental Funds – Governmental funds are used to account for those functions reported as governmental activities in the government-wide financial statements. Most of the Town’s basic services are accounted for in governmental funds. These funds focus on how assets can readily be converted into cash flow in and out, and what monies are left at year-end that will be available for spending in the next year. Governmental funds are reported using an accounting method called modified accrual accounting which provides a short-term spending focus. As a result, the governmental fund financial statements give the reader a detailed short-term view that helps him or her determine if there are more or less financial resources available to finance the Town’s programs. The relationship between government activities (reported in the Statement of Net Position and the Statement of Activities) and governmental funds is described in a reconciliation that is a part of the fund financial statements. The Town adopts an annual appropriated budget for its General Fund, as required by the General Statutes. The budget is a legally adopted document that incorporates input from the citizens of the Town, the management of the Town, and the decisions of the Board about which services to provide and how to pay for them. It also authorizes the Town to obtain funds from identified sources to finance these current period activities. The budgetary statement provided for the General Fund demonstrates how well the Town complied with the budget ordinance and whether or not the Town succeeded in providing the services as planned when the budget was adopted. The budgetary comparison statement uses the budgetary basis of accounting and is presented using the same format, language, and classifications as the legal budget document. The statement shows four columns: 1) the original budget as adopted by the board; 2) the final budget as amended by the board; 3) the actual resources, charges to appropriations, and ending balances in the General Fund; and 4) the difference or variance between the final budget and the actual resources and charges. The basic governmental fund financial statements can be found on Exhibits 3 through 5. Governmental funds considered to be non-major are presented as a single column in these statements. Proprietary Funds – Proprietary funds provide the same type of information as the entity-wide financial statements, only in more detail. The Town of Wake Forest uses enterprise funds to account for its electric services. The Electric Fund is classified as a major fund. The basic proprietary fund financial statements can be found on Exhibits 6 through 8 of this report.
15
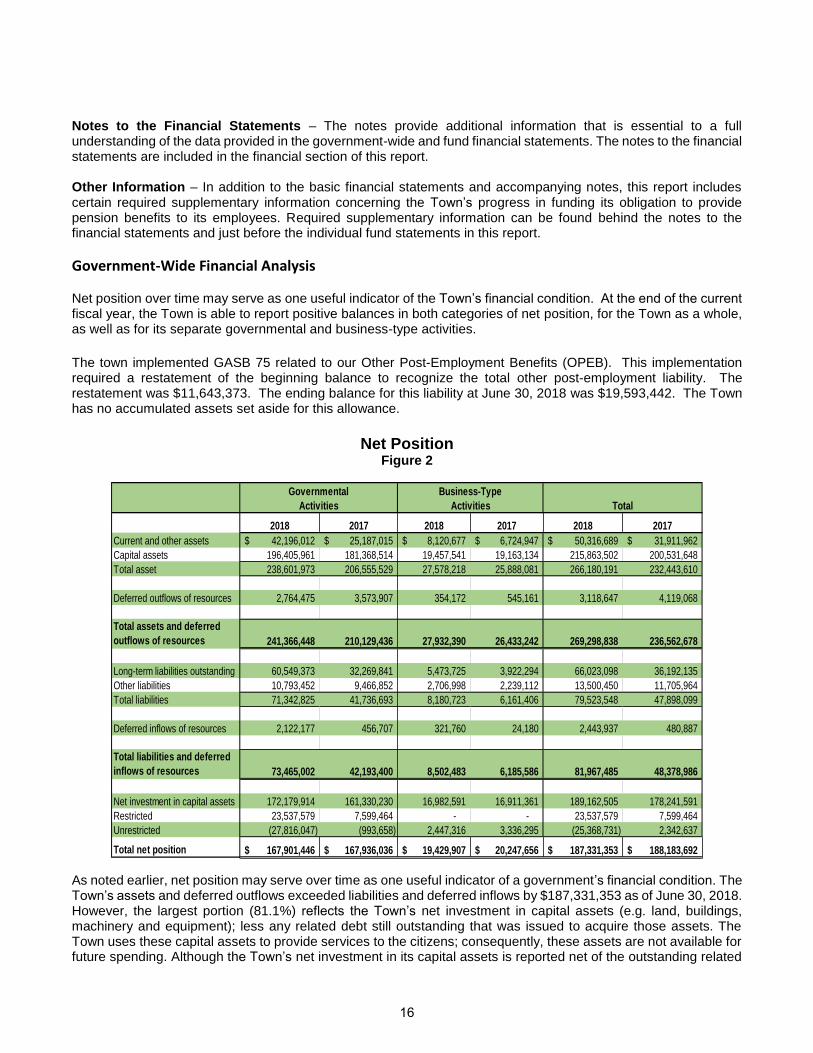
Notes to the Financial Statements – The notes provide additional information that is essential to a full understanding of the data provided in the government-wide and fund financial statements. The notes to the financial statements are included in the financial section of this report. Other Information – In addition to the basic financial statements and accompanying notes, this report includes certain required supplementary information concerning the Town’s progress in funding its obligation to provide pension benefits to its employees. Required supplementary information can be found behind the notes to the financial statements and just before the individual fund statements in this report. Government-Wide Financial Analysis Net position over time may serve as one useful indicator of the Town’s financial condition. At the end of the current fiscal year, the Town is able to report positive balances in both categories of net position, for the Town as a whole, as well as for its separate governmental and business-type activities.
The town implemented GASB 75 related to our Other Post-Employment Benefits (OPEB). This implementation required a restatement of the beginning balance to recognize the total other post-employment liability. The restatement was $11,643,373. The ending balance for this liability at June 30, 2018 was $19,593,442. The Town has no accumulated assets set aside for this allowance.
Net Position
Figure 2
2018 2017 2018 2017 2018 2017Current and other assets 42,196,012$ 25,187,015$ 8,120,677$ 6,724,947$ 50,316,689$ 31,911,962$ Capital assets 196,405,961 181,368,514 19,457,541 19,163,134 215,863,502 200,531,648 Total asset 238,601,973 206,555,529 27,578,218 25,888,081 266,180,191 232,443,610
Deferred outflows of resources 2,764,475 3,573,907 354,172 545,161 3,118,647 4,119,068
Total assets and deferred outflows of resources 241,366,448 210,129,436 27,932,390 26,433,242 269,298,838 236,562,678
Long-term liabilities outstanding 60,549,373 32,269,841 5,473,725 3,922,294 66,023,098 36,192,135 Other liabilities 10,793,452 9,466,852 2,706,998 2,239,112 13,500,450 11,705,964 Total liabilities 71,342,825 41,736,693 8,180,723 6,161,406 79,523,548 47,898,099
Deferred inflows of resources 2,122,177 456,707 321,760 24,180 2,443,937 480,887
Total liabilities and deferred inflows of resources 73,465,002 42,193,400 8,502,483 6,185,586 81,967,485 48,378,986
Net investment in capital assets 172,179,914 161,330,230 16,982,591 16,911,361 189,162,505 178,241,591 Restricted 23,537,579 7,599,464 - - 23,537,579 7,599,464 Unrestricted (27,816,047) (993,658) 2,447,316 3,336,295 (25,368,731) 2,342,637
Total net position 167,901,446$ 167,936,036$ 19,429,907$ 20,247,656$ 187,331,353$ 188,183,692$
GovernmentalActivities
Business-TypeActivities Total
As noted earlier, net position may serve over time as one useful indicator of a government’s financial condition. The Town’s assets and deferred outflows exceeded liabilities and deferred inflows by $187,331,353 as of June 30, 2018. However, the largest portion (81.1%) reflects the Town’s net investment in capital assets (e.g. land, buildings, machinery and equipment); less any related debt still outstanding that was issued to acquire those assets. The Town uses these capital assets to provide services to the citizens; consequently, these assets are not available for future spending. Although the Town’s net investment in its capital assets is reported net of the outstanding related
16
debt, it should be noted that the resources needed to repay this debt must be provided from other sources, since the capital assets cannot be used to liquidate these liabilities.
Changes in Net Position Figure 3
2018 2017 2018 2017 2018 2017Revenues:
Program revenues:Charges for services 4,984,727$ 4,879,735$ 20,670,944$ 19,948,850$ 25,655,671$ 24,828,585$ Operating grants and contributions 1,704,026 1,016,302 - - 1,704,026 1,016,302 Capital grants and contributions 8,369,287 13,547,149 - - 8,369,287 13,547,149
General revenuesProperty taxes 25,966,222 24,545,443 - - 25,966,222 24,545,443 Other taxes 75,096 70,711 - - 75,096 70,711 Investment earnings 293,076 177,663 35,208 33,004 328,284 210,667 Other 11,356,593 11,292,793 423,602 255,592 11,780,195 11,548,385
Total revenues 52,749,027 55,529,796 21,129,754 20,237,446 73,878,781 75,767,242
Expenses:General government 13,074,362 12,869,405 - - 13,074,362 12,869,405 Public safety 15,553,468 14,515,834 - - 15,553,468 14,515,834 Transportation 5,606,567 2,276,688 - - 5,606,567 2,276,688 Environmental protection 3,594,622 3,312,425 - - 3,594,622 3,312,425 Cultural and recreation 4,432,829 6,865,664 - - 4,432,829 6,865,664 Interest on long-term debt 625,012 604,099 - - 625,012 604,099 Water and sewer - - - 11,907 - 11,907 Electric - - 20,200,887 19,562,897 20,200,887 19,562,897
Total expenses 42,886,860 40,444,115 20,200,887 19,574,804 63,087,747 60,018,919 Change in net position 9,862,167 15,085,681 928,867 662,642 10,791,034 15,748,323 Net position - July 1 167,936,036 153,995,923 20,247,656 19,585,014 188,183,692 173,580,937 Restatement (9,896,757) (1,145,568) (1,746,616) - (11,643,373) (1,145,568) Net position - June 30 167,901,446$ 167,936,036$ 19,429,907$ 20,247,656$ 187,331,353$ 188,183,692$
Governmental Business-Type Total
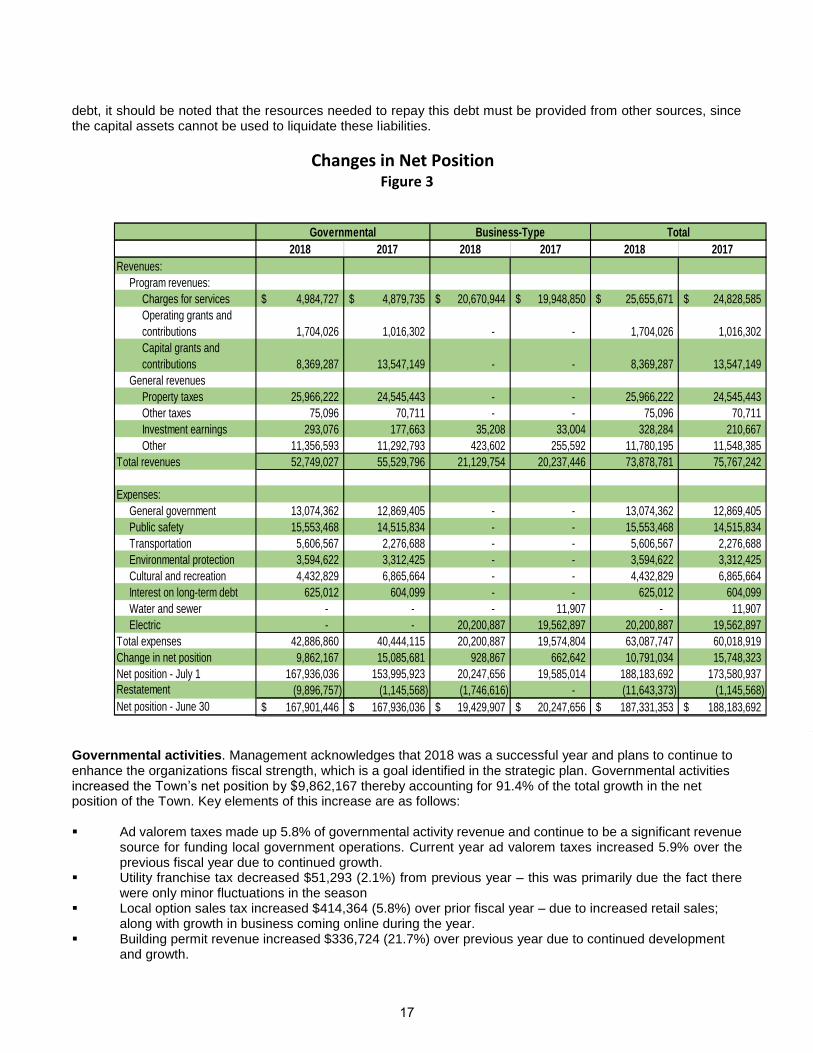
Governmental activities. Management acknowledges that 2018 was a successful year and plans to continue to enhance the organizations fiscal strength, which is a goal identified in the strategic plan. Governmental activities increased the Town’s net position by $9,862,167 thereby accounting for 91.4% of the total growth in the net position of the Town. Key elements of this increase are as follows: Ad valorem taxes made up 5.8% of governmental activity revenue and continue to be a significant revenue
source for funding local government operations. Current year ad valorem taxes increased 5.9% over the previous fiscal year due to continued growth.
Utility franchise tax decreased $51,293 (2.1%) from previous year – this was primarily due the fact there were only minor fluctuations in the season
Local option sales tax increased $414,364 (5.8%) over prior fiscal year – due to increased retail sales; along with growth in business coming online during the year.
Building permit revenue increased $336,724 (21.7%) over previous year due to continued development and growth.
17

Total governmental activity revenue decreased 5.0% while expenses increased 6.0% from the previous fiscal year. Developer contributions decreased significantly, $5,177,862 or 38.2%, from 2017 to 2018. This is due to the number of streets and sidewalks accepted into the town’s system.
Business-type activities. Business-type activities increased the Town of Wake Forest’s net position by $928,867. Key elements of this increase are as follows: Charges for services from the Sale of Power increased slightly, 3.5%, compared to previous fiscal year
ended June 30, 2017. This is attributed to an abnormally cold winter season. Total business-type expenses increased $626,083 (3.2%). There were several items which contributed to
this: LGERS pension expense, OPEB expense, personnel allocation, banking services related to increased credit card transactions processed, as well as the power purchases.
Financial Analysis of the Town’s Funds As noted earlier, the Town uses fund accounting to ensure and demonstrate compliance with finance-related legal requirements. Governmental Funds. The focus of the Town’s governmental funds is to provide information on near-term inflows, outflows, and balances of usable resources. Such information is useful in assessing the Town’s financing requirements. The general fund is the chief operating fund of the Town. At the end of the current fiscal year, fund balance available in the General Fund was $8,360,653 while total fund balance was $16,479,764. As a measure of the General Fund’s liquidity, it may be useful to compare both unassigned (available) fund balance and total fund balance to total general fund expenditures. Unassigned fund balance represents 19.9% of the total General Fund expenditures, while total fund balance represents 39.1% of that same amount. Per the policy, unassigned fund balances at the close of each fiscal year should be between 20% - 25% of general fund expenditures and total fund balance should be at least 35% of general fund expenditures. In the event that funds are available over and beyond the targeted amount as defined above, those funds may be transferred to capital reserve funds or capital project funds, at the Board of Commissioners discretion. The Board of Commissioners may, from time-to-time, appropriate fund balances that will reduce unassigned fund balances below the 20% – 25% policy for the purposes of a declared fiscal emergency or other such global purpose as to protect the long-term fiscal stability and security of the Town of Wake Forest. In such circumstances, the Town will strive to replenish the unassigned fund balances to the policy level within 36 months from the date of the appropriation.
10.00%
15.00%
20.00%
25.00%
30.00%
Unassigned General Fund -Fund Balance vs. Policy Level
Town PolicyLower Limit - 20%
General FundFund Balance
Town PolicyUpper Limit - 25%
30.00%
32.50%
35.00%
37.50%
40.00%
42.50%
45.00%
1 2 3 4 5 6
Total General Fund - Fund Balance vs Policy Level
Total GeneralFund Balance
Town Policy - 35%
18
At June 30, 2018, the governmental funds of the Town reported a combined fund balance of $36,407,318 with a net increase in fund balance of $17,191,650. The General Fund, Debt Service Fund, special revenue funds, capital project funds and future capital reserve funds are included in this combined amount. This increase is attributed to the issuance of the outstanding general obligation bond authorization. During the current year debt was issued for Joyner Park, Northern Wake Senior Center, Roger Road Widening and Underpass, as well as various other greenway improvements and street and sidewalk improvements. General Fund Budgetary Highlights. During the fiscal year, the Town revised the budget on several occasions. Generally, budget amendments fall into one of three categories: 1) amendments made to adjust the estimates that are used to prepare the original budget ordinance once exact information is available; 2) amendments made to recognize new funding amounts from external sources, such as Federal and State grants; and 3) increases in appropriations that become necessary to maintain services. Some differences between the original budget and the final amended budget are as follows:
Ad valorem taxes received exceeded original budget estimates by $950,542 (4.0% increase) due to conservative budgeting regarding the collection rate along with growth in the tax base.
Unrestricted intergovernmental revenues was less than the original estimates by $129,039 (1.0% decrease). This is attributed to decreased realized in utility distribution sales tax revenues.
Due to the town’s conservative management practices the operating expenditures for the fiscal year was approximately $2.8 million or 7.0%, under budgeted expectations.
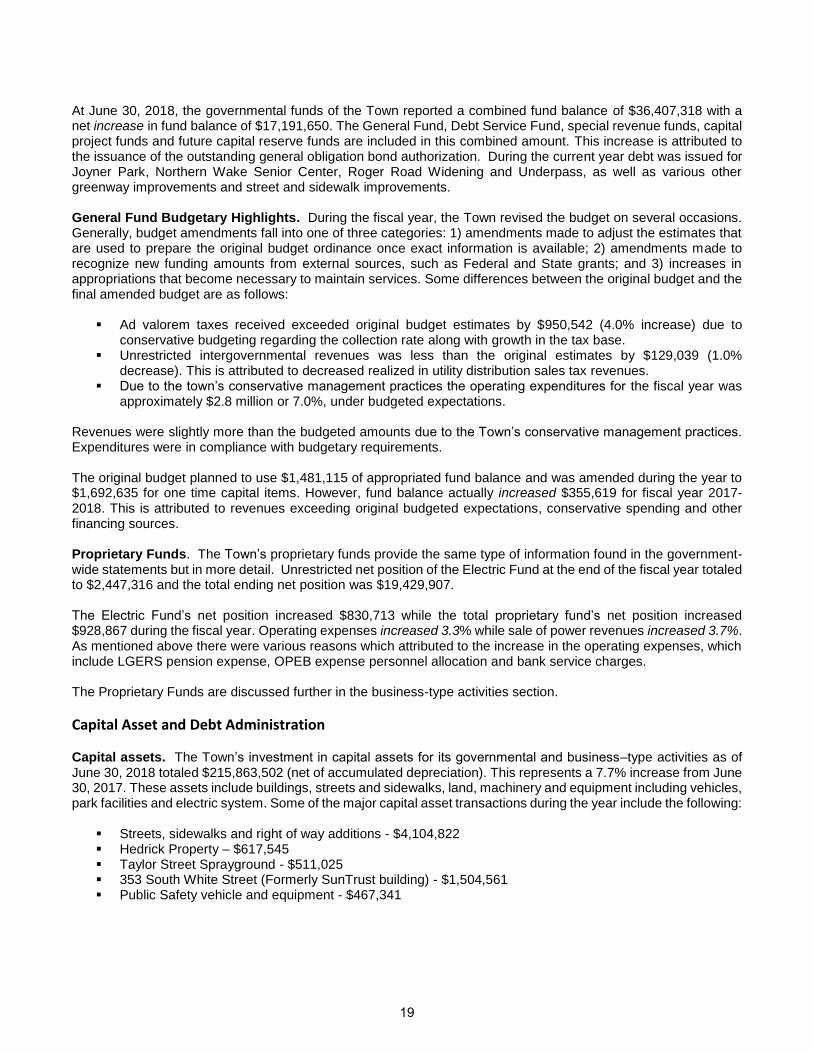
Revenues were slightly more than the budgeted amounts due to the Town’s conservative management practices. Expenditures were in compliance with budgetary requirements. The original budget planned to use $1,481,115 of appropriated fund balance and was amended during the year to $1,692,635 for one time capital items. However, fund balance actually increased $355,619 for fiscal year 2017-2018. This is attributed to revenues exceeding original budgeted expectations, conservative spending and other financing sources. Proprietary Funds. The Town’s proprietary funds provide the same type of information found in the government-wide statements but in more detail. Unrestricted net position of the Electric Fund at the end of the fiscal year totaled to $2,447,316 and the total ending net position was $19,429,907. The Electric Fund’s net position increased $830,713 while the total proprietary fund’s net position increased $928,867 during the fiscal year. Operating expenses increased 3.3% while sale of power revenues increased 3.7%. As mentioned above there were various reasons which attributed to the increase in the operating expenses, which include LGERS pension expense, OPEB expense personnel allocation and bank service charges. The Proprietary Funds are discussed further in the business-type activities section. Capital Asset and Debt Administration Capital assets. The Town’s investment in capital assets for its governmental and business–type activities as of June 30, 2018 totaled $215,863,502 (net of accumulated depreciation). This represents a 7.7% increase from June 30, 2017. These assets include buildings, streets and sidewalks, land, machinery and equipment including vehicles, park facilities and electric system. Some of the major capital asset transactions during the year include the following:
Streets, sidewalks and right of way additions - $4,104,822 Hedrick Property – $617,545 Taylor Street Sprayground - $511,025 353 South White Street (Formerly SunTrust building) - $1,504,561 Public Safety vehicle and equipment - $467,341
19
Town of Wake Forest Capital Assets (net of depreciation)
Figure 4
2018 2017 2018 2017 2018 2017Land, rights and easements 45,717,726$ 41,475,939$ 510,605$ 510,605$ 46,228,331$ 41,986,544$ Buildings and system 13,955,231 13,004,703 - - 13,955,231 13,004,703 Other improvements 111,187,932 111,115,991 16,977,522 17,224,068 128,165,454 128,340,059 Equipment and furniture 1,656,741 1,779,767 808,075 893,126 2,464,816 2,672,893 Vehicles and motorized equipment 4,320,209 4,302,907 1,161,339 535,335 5,481,548 4,838,242 Construction in progress 19,568,122 9,689,207 - - 19,568,122 9,689,207 Total 196,405,961$ 181,368,514$ 19,457,541$ 19,163,134$ 215,863,502$ 200,531,648$
GovernmentalActivities
Business-TypeActivities Total
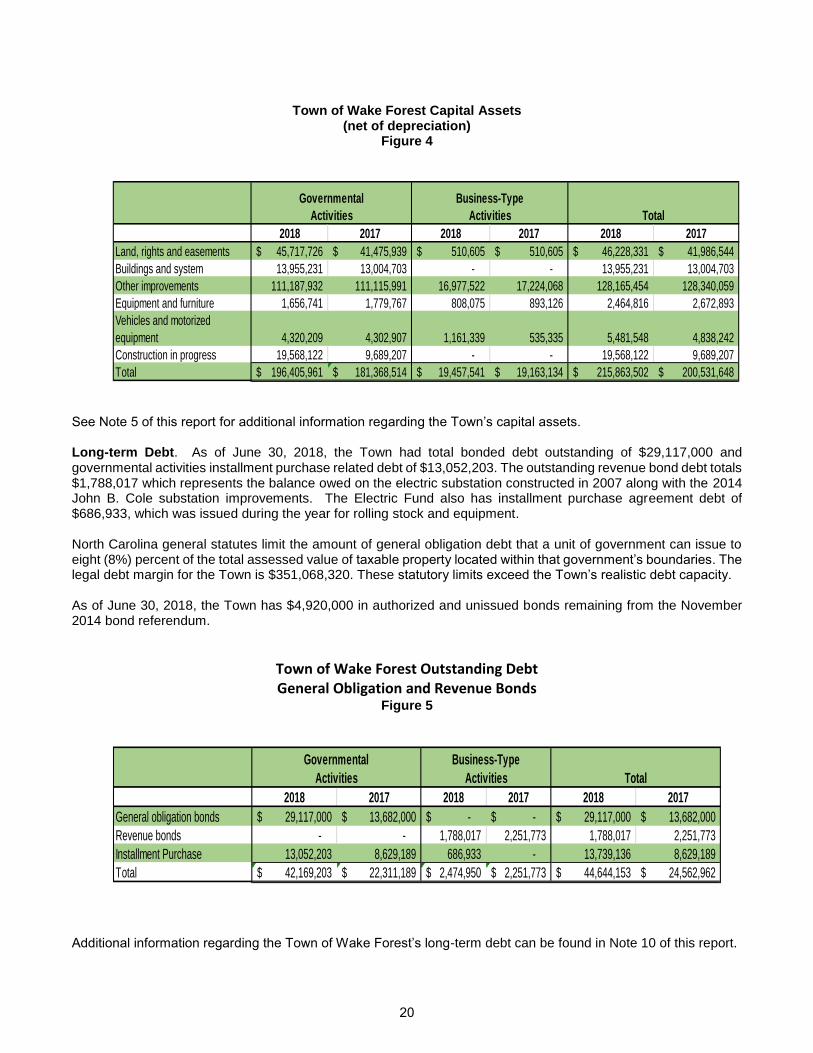
See Note 5 of this report for additional information regarding the Town’s capital assets. Long-term Debt. As of June 30, 2018, the Town had total bonded debt outstanding of $29,117,000 and governmental activities installment purchase related debt of $13,052,203. The outstanding revenue bond debt totals $1,788,017 which represents the balance owed on the electric substation constructed in 2007 along with the 2014 John B. Cole substation improvements. The Electric Fund also has installment purchase agreement debt of $686,933, which was issued during the year for rolling stock and equipment. North Carolina general statutes limit the amount of general obligation debt that a unit of government can issue to eight (8%) percent of the total assessed value of taxable property located within that government’s boundaries. The legal debt margin for the Town is $351,068,320. These statutory limits exceed the Town’s realistic debt capacity. As of June 30, 2018, the Town has $4,920,000 in authorized and unissued bonds remaining from the November 2014 bond referendum.
Town of Wake Forest Outstanding Debt General Obligation and Revenue Bonds
Figure 5
2018 2017 2018 2017 2018 2017General obligation bonds 29,117,000$ 13,682,000$ -$ -$ 29,117,000$ 13,682,000$ Revenue bonds - - 1,788,017 2,251,773 1,788,017 2,251,773 Installment Purchase 13,052,203 8,629,189 686,933 - 13,739,136 8,629,189 Total 42,169,203$ 22,311,189$ 2,474,950$ 2,251,773$ 44,644,153$ 24,562,962$
GovernmentalActivities
Business-TypeActivities Total
Additional information regarding the Town of Wake Forest’s long-term debt can be found in Note 10 of this report.
20
Budget Highlights for the Fiscal Year Ending June 30, 2018 Governmental Activities: The 2018-2019 Adopted Budget decreased (1.6%) from the 2017-2018 Amended Budget, but increased 3.8% over the 2017-2018 Adopted Budget. The foundation of this budget is the strategic plan which sets the roadmap for all decisions over the next few years. The budget endeavors to achieve the four key goals in the strategic plan by maintaining current service levels, enhancing infrastructure and providing for employees. Performance pay (merit), market adjustments and career ladder funds for eligible departments were included. Sixteen (16) new positions were included in the approved budget. The Town’s tax rate remained unchanged at $ .52 for the coming fiscal year. This equates to a breakdown of $.41 for town operations and debt service and $ .11 for fire services. The final budget for the General Fund totaled $44.5 million. In addition, the Downtown Municipal Service District tax rate remains unchanged at $.14. Despite the appearance of renewed fiscal growth and other positive changes in economic conditions, the Town will continue to focus on financial sustainability. The budget represents the fundamental philosophy of being conservative with revenue projections and maintaining fiscal constraint on the expenditure side. As part of the town’s commitment to focus on economic development a 501(c)(3) was formed in 2017, known as the Wake Forest Business and Industry Partnership (BIP). The town will continue its recurring revenue stream established for this endeavor, which includes a $75,000 transfer to the Futures Fund. In addition, the Town’s has taken steps to effectively manage the growing other post-employment benefits liability. The Board of Commissioners took action to limit this benefit to include only those employees hired on or before June 30, 2018. Further, there is an allocation in the 2018-2019 budget to begin funding this liability. The budgets are set as follows: OPEB $100,000 and LEOSSA $50,000.
Decision making will still require much care and prudence as we continue to focus on providing the core services our citizens expect. Prioritizing how our resources are utilized is critical as we make long term plans for capital investments, as well as addressing future debt service and additional upcoming legislative mandates. This budget document incorporates a performance management system, which better defines departmental goal and objectives, as well as measures of workload effectiveness. In addition, a five year financial forecast has been included, which will assist in the evaluation of current and future fiscal conditions that will enable the Board of Commissioners to make policy and programmatic decisions that will have a long-term effect on the town. Business–type Activities: Utility rates were unchanged in the Electric Fund with the Adopted 2018-2019 Budget. The total budget was $21.4 million for the Electric Fund. Included in the Electric Fund budget is an allocation for the electric rate study, which is conducted on a three year cycle and a full year salary for the Electric Systems Division Manager, as well as the Tree Trimming Urban Forestry positions.
Effective July 1, 2005 the City of Raleigh operates the water and wastewater systems. Requests for Information This report is designed to provide an overview of the Town’s finances for those with an interest in this area. Questions concerning any of the information found in this report or requests for additional information should be directed to the Chief Financial Officer, Town of Wake Forest, 301 S. Brooks Street Wake Forest, North Carolina 27587; (919) 435-9461 or [email protected].
21
22
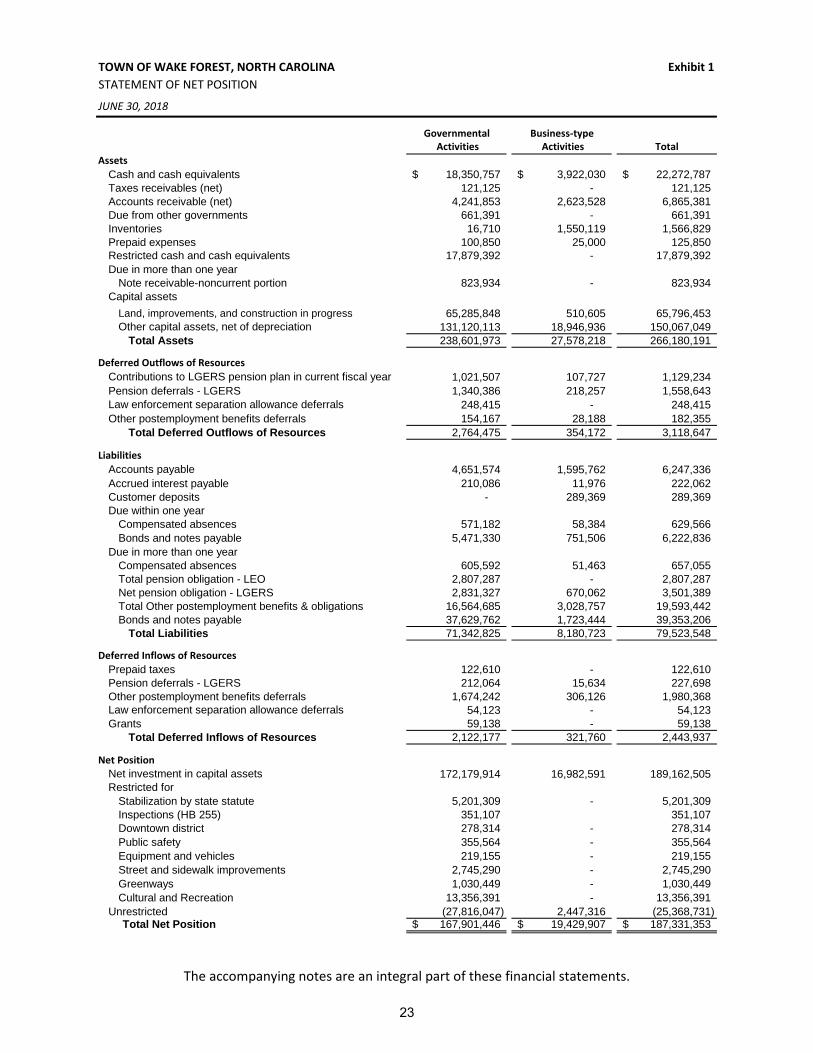
TOWN OF WAKE FOREST, NORTH CAROLINA Exhibit 1
Governmental Business-type Activities Activities Total
Assets
Cash and cash equivalents 18,350,757$ 3,922,030$ 22,272,787$ Taxes receivables (net) 121,125 - 121,125 Accounts receivable (net) 4,241,853 2,623,528 6,865,381 Due from other governments 661,391 - 661,391 Inventories 16,710 1,550,119 1,566,829 Prepaid expenses 100,850 25,000 125,850 Restricted cash and cash equivalents 17,879,392 - 17,879,392 Due in more than one year
Note receivable-noncurrent portion 823,934 - 823,934 Capital assets
Land, improvements, and construction in progress 65,285,848 510,605 65,796,453 Other capital assets, net of depreciation 131,120,113 18,946,936 150,067,049
Total Assets 238,601,973 27,578,218 266,180,191
Deferred Outflows of Resources
Contributions to LGERS pension plan in current fiscal year 1,021,507 107,727 1,129,234 Pension deferrals - LGERS 1,340,386 218,257 1,558,643 Law enforcement separation allowance deferrals 248,415 - 248,415 Other postemployment benefits deferrals 154,167 28,188 182,355
Total Deferred Outflows of Resources 2,764,475 354,172 3,118,647
Liabilities
Accounts payable 4,651,574 1,595,762 6,247,336 Accrued interest payable 210,086 11,976 222,062 Customer deposits - 289,369 289,369 Due within one year
Compensated absences 571,182 58,384 629,566 Bonds and notes payable 5,471,330 751,506 6,222,836
Due in more than one yearCompensated absences 605,592 51,463 657,055 Total pension obligation - LEO 2,807,287 - 2,807,287 Net pension obligation - LGERS 2,831,327 670,062 3,501,389 Total Other postemployment benefits & obligations 16,564,685 3,028,757 19,593,442 Bonds and notes payable 37,629,762 1,723,444 39,353,206
Total Liabilities 71,342,825 8,180,723 79,523,548
Deferred Inflows of Resources
Prepaid taxes 122,610 - 122,610 Pension deferrals - LGERS 212,064 15,634 227,698 Other postemployment benefits deferrals 1,674,242 306,126 1,980,368 Law enforcement separation allowance deferrals 54,123 - 54,123 Grants 59,138 - 59,138
Total Deferred Inflows of Resources 2,122,177 321,760 2,443,937
Net Position
Net investment in capital assets 172,179,914 16,982,591 189,162,505 Restricted for
Stabilization by state statute 5,201,309 - 5,201,309 Inspections (HB 255) 351,107 351,107 Downtown district 278,314 - 278,314 Public safety 355,564 - 355,564 Equipment and vehicles 219,155 - 219,155 Street and sidewalk improvements 2,745,290 - 2,745,290 Greenways 1,030,449 - 1,030,449 Cultural and Recreation 13,356,391 - 13,356,391
Unrestricted (27,816,047) 2,447,316 (25,368,731) Total Net Position 167,901,446$ 19,429,907$ 187,331,353$
STATEMENT OF NET POSITION
JUNE 30, 2018
The accompanying notes are an integral part of these financial statements.
23
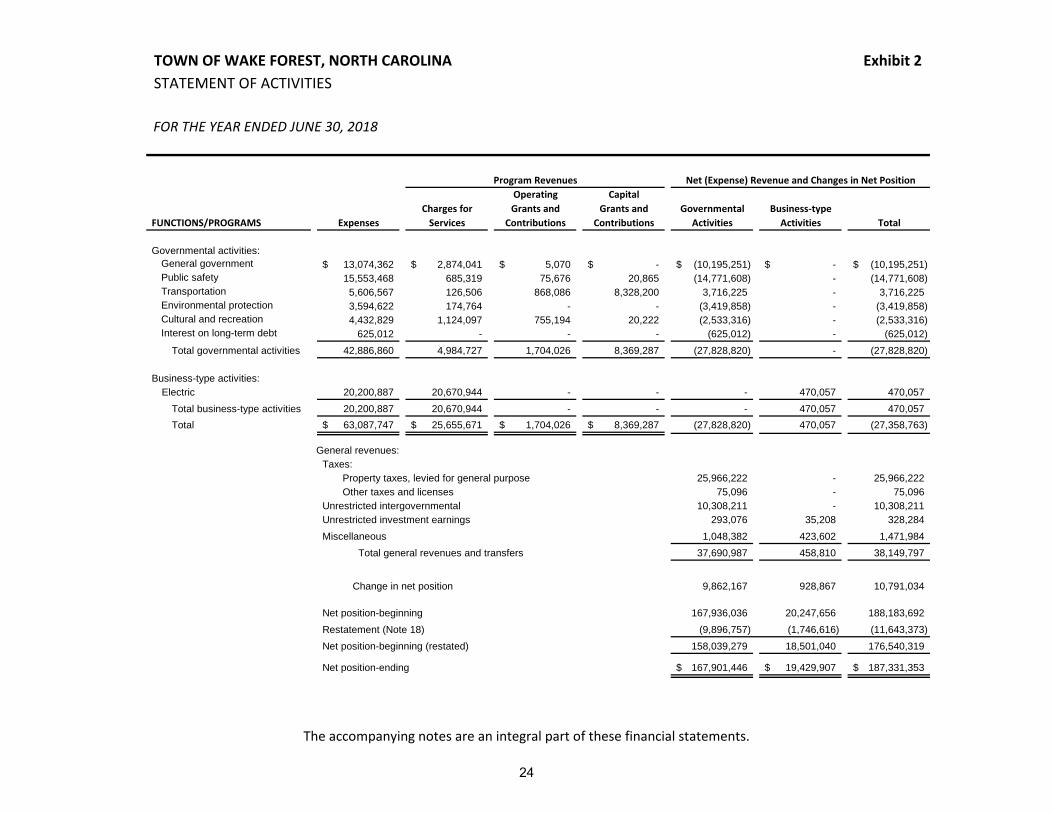
TOWN OF WAKE FOREST, NORTH CAROLINA Exhibit 2
Operating Capital
Charges for Grants and Grants and Governmental Business-type
FUNCTIONS/PROGRAMS Expenses Services Contributions Contributions Activities Activities Total
Governmental activities: General government 13,074,362$ 2,874,041$ 5,070$ -$ (10,195,251)$ -$ (10,195,251)$ Public safety 15,553,468 685,319 75,676 20,865 (14,771,608) - (14,771,608) Transportation 5,606,567 126,506 868,086 8,328,200 3,716,225 - 3,716,225 Environmental protection 3,594,622 174,764 - - (3,419,858) - (3,419,858) Cultural and recreation 4,432,829 1,124,097 755,194 20,222 (2,533,316) - (2,533,316) Interest on long-term debt 625,012 - - - (625,012) - (625,012)
Total governmental activities 42,886,860 4,984,727 1,704,026 8,369,287 (27,828,820) - (27,828,820)
Business-type activities:Electric 20,200,887 20,670,944 - - - 470,057 470,057
Total business-type activities 20,200,887 20,670,944 - - - 470,057 470,057 Total 63,087,747$ 25,655,671$ 1,704,026$ 8,369,287$ (27,828,820) 470,057 (27,358,763)
General revenues:Taxes:
Property taxes, levied for general purpose 25,966,222 - 25,966,222 Other taxes and licenses 75,096 - 75,096
Unrestricted intergovernmental 10,308,211 - 10,308,211 Unrestricted investment earnings 293,076 35,208 328,284 Miscellaneous 1,048,382 423,602 1,471,984
Total general revenues and transfers 37,690,987 458,810 38,149,797
Change in net position 9,862,167 928,867 10,791,034
Net position-beginning 167,936,036 20,247,656 188,183,692 Restatement (Note 18) (9,896,757) (1,746,616) (11,643,373) Net position-beginning (restated) 158,039,279 18,501,040 176,540,319
Net position-ending 167,901,446$ 19,429,907$ 187,331,353$
STATEMENT OF ACTIVITIES
FOR THE YEAR ENDED JUNE 30, 2018
Program Revenues Net (Expense) Revenue and Changes in Net Position
The accompanying notes are an integral part of these financial statements.
24
TOWN OF WAKE FOREST, NORTH CAROLINA Exhibit 3
Parks and Greenway Nonmajor Total
Debt Service Recreation Transportation Streets Governmental Governmental
General Fund Improvements Projects Improvements Funds Funds
Assets
Cash and cash equivalents 12,835,658$ -$ -$ -$ -$ 5,515,098$ 18,350,756$ Receivables, net
Taxes 121,125 - - - - - 121,125 Accounts 2,876,353 - - 1,020,774 4 344,722 4,241,853 Due from other governments 660,281 - - 1,110 - - 661,391 Due from other funds 1,685,612 - - - - 500,000 2,185,612 Inventories 16,710 - - - - - 16,710 Prepaid expenditures 100,850 - - - - - 100,850 Restricted cash and cash equivalents 1,203,097 1,055,143 13,514,553 - 1,440,430 666,169 17,879,392
Total Assets 19,499,686$ 1,055,143$ 13,514,553$ 1,021,884$ 1,440,434$ 7,025,989$ 43,557,689$
Liabilities
Accounts payable and accrued liabilities 2,265,875$ -$ -$ -$ -$ 25,637$ 2,291,512$ Due to other funds 500,000 - - 1,390,015 - 295,597 2,185,612 Accounts payable from restricted assets - - 483,601 715,821 804,532 356,108 2,360,062
Total Liabilities 2,765,875 - 483,601 2,105,836 804,532 677,342 6,837,186
Deferred Inflow of Resources
Property taxes receivable 121,125 - - - - - 121,125 Sanitation receivables 10,312 - - - - - 10,312 Prepaid taxes and other 122,610 - - - - - 122,610 Grants - - - - - 59,138 59,138
Total deferred inflows of resources 254,047 - - - - 59,138 313,185
Fund Balances
Non Spendable Inventories 16,710 - - - - - 16,710
Prepayments 100,850 - - - - - 100,850 Restricted Stabilization by state statute 5,201,309 - - - - - 5,201,309 Inspections (HB 255) 351,107 - - - - - 351,107 Downtown district 278,314 - - - - - 278,314 Public safety 354,521 - - - - - 354,521 Parks and recreation - - 13,030,952 - - 310,060 13,341,012 Equipment and vehicles 219,155 - - - - 219,155 Street and sidewalk improvements - - - 2,109,390 635,900 - 2,745,290 Greenways - - - 1,030,449 - - 1,030,449 Grants:
Cultural and Recreation - - - - - 15,379 15,379 Public Safety - - - - - 1,043 1,043
Committed Economic development - - - - - 1,418,720 1,418,720 Assigned Subsequent years expenditures 1,597,145 - - - - - 1,597,145 Debt service - 1,055,143 - - - - 1,055,143 Recreation improvements - - - - - 2,431,103 2,431,103 Cemetery improvements - - - - - 56,046 56,046 Fire Department - - - - - 1,218,444 1,218,444 Roadway Projects - - - - - 835,124 835,124 Asset Maintenance - - - - - 49,948 49,948 Unassigned 8,360,653 - - (4,223,791) 2 (46,358) 4,090,506
Total fund balances 16,479,764 1,055,143 13,030,952 (1,083,952) 635,902 6,289,509 36,407,318
Total Liabilities, Deferred Inflows of Resources and Fund Balances 19,499,686$ 1,055,143$ 13,514,553$ 1,021,884$ 1,440,434$ 7,025,989$ 43,557,689$
BALANCE SHEETGOVERNMENTAL FUNDS
JUNE 30, 2018
The accompanying notes are an integral part of these financial statements.
25
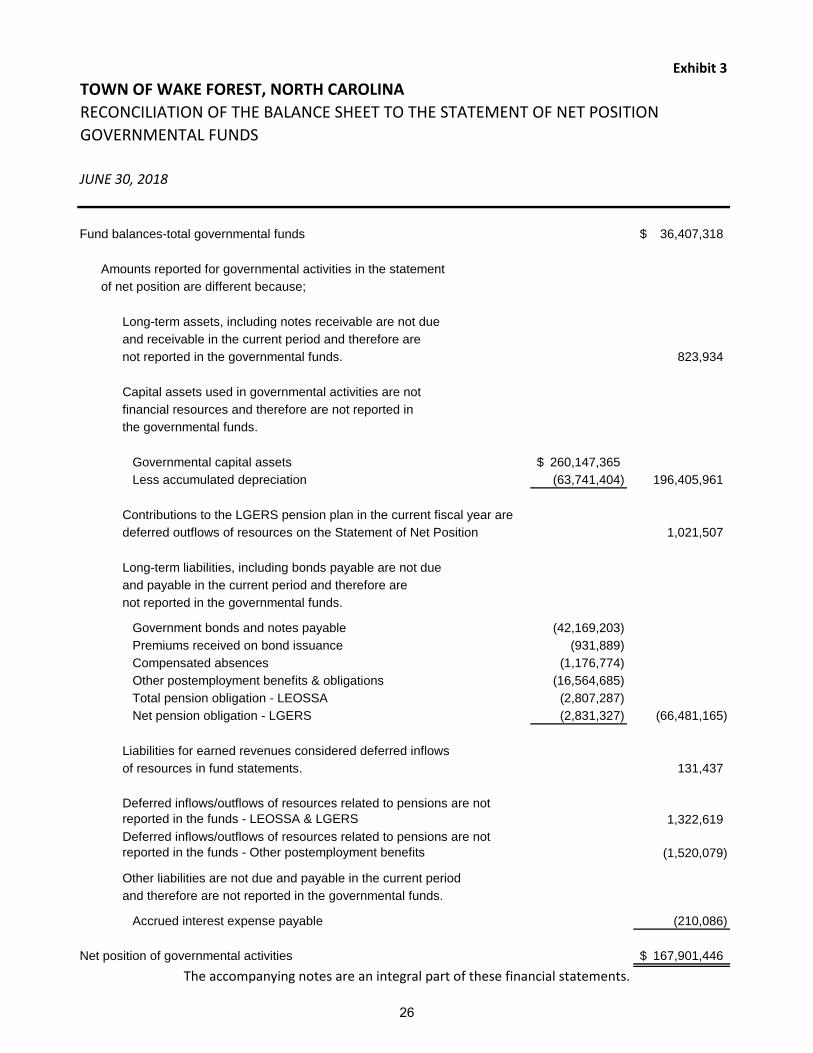
Exhibit 3
Fund balances-total governmental funds 36,407,318$
Amounts reported for governmental activities in the statementof net position are different because;
Long-term assets, including notes receivable are not dueand receivable in the current period and therefore arenot reported in the governmental funds. 823,934
Capital assets used in governmental activities are notfinancial resources and therefore are not reported inthe governmental funds.
Governmental capital assets 260,147,365$ Less accumulated depreciation (63,741,404) 196,405,961
Contributions to the LGERS pension plan in the current fiscal year aredeferred outflows of resources on the Statement of Net Position 1,021,507
Long-term liabilities, including bonds payable are not dueand payable in the current period and therefore arenot reported in the governmental funds.
Government bonds and notes payable (42,169,203) Premiums received on bond issuance (931,889) Compensated absences (1,176,774) Other postemployment benefits & obligations (16,564,685) Total pension obligation - LEOSSA (2,807,287) Net pension obligation - LGERS (2,831,327) (66,481,165)
Liabilities for earned revenues considered deferred inflowsof resources in fund statements. 131,437
Deferred inflows/outflows of resources related to pensions are not reported in the funds - LEOSSA & LGERS 1,322,619 Deferred inflows/outflows of resources related to pensions are not reported in the funds - Other postemployment benefits (1,520,079)
Other liabilities are not due and payable in the current periodand therefore are not reported in the governmental funds.
Accrued interest expense payable (210,086)
Net position of governmental activities 167,901,446$
TOWN OF WAKE FOREST, NORTH CAROLINA
RECONCILIATION OF THE BALANCE SHEET TO THE STATEMENT OF NET POSITION
GOVERNMENTAL FUNDS
JUNE 30, 2018
The accompanying notes are an integral part of these financial statements.
26
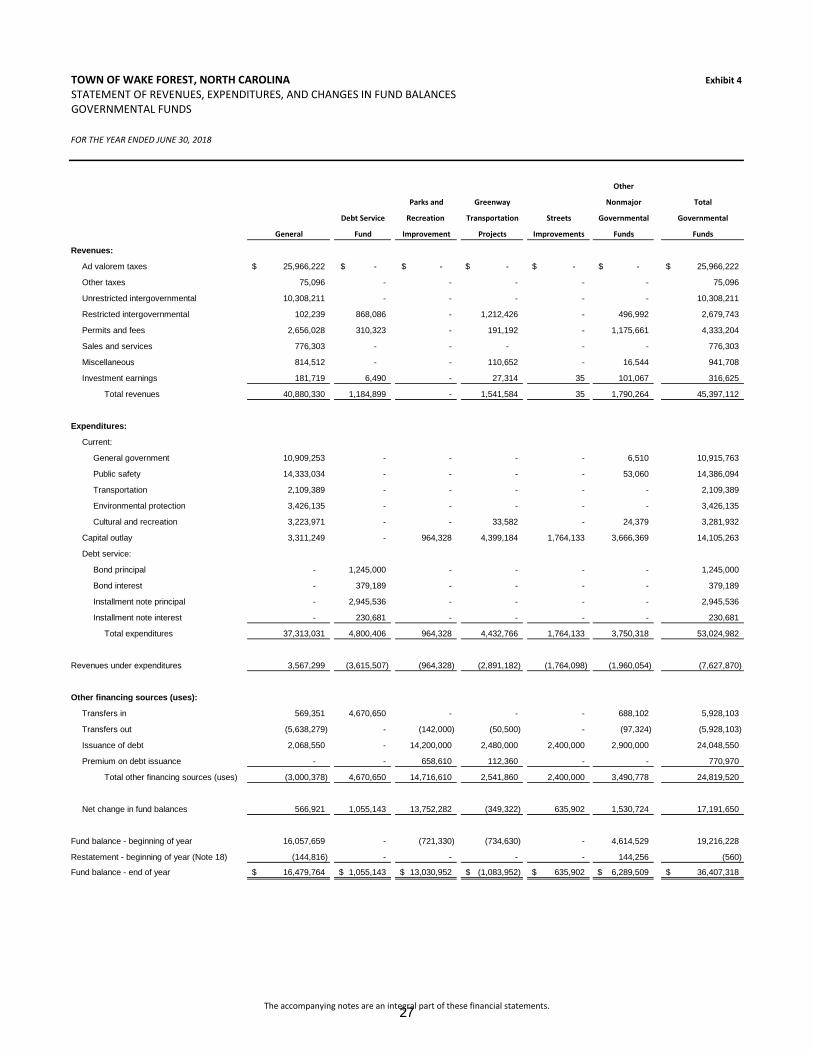
TOWN OF WAKE FOREST, NORTH CAROLINA Exhibit 4
Other
Parks and Greenway Nonmajor Total
Debt Service Recreation Transportation Streets Governmental Governmental
General Fund Improvement Projects Improvements Funds Funds
Revenues:
Ad valorem taxes 25,966,222$ -$ -$ -$ -$ -$ 25,966,222$
Other taxes 75,096 - - - - - 75,096
Unrestricted intergovernmental 10,308,211 - - - - - 10,308,211
Restricted intergovernmental 102,239 868,086 - 1,212,426 - 496,992 2,679,743
Permits and fees 2,656,028 310,323 - 191,192 - 1,175,661 4,333,204
Sales and services 776,303 - - - - - 776,303
Miscellaneous 814,512 - - 110,652 - 16,544 941,708
Investment earnings 181,719 6,490 - 27,314 35 101,067 316,625
Total revenues 40,880,330 1,184,899 - 1,541,584 35 1,790,264 45,397,112
Expenditures:
Current:
General government 10,909,253 - - - - 6,510 10,915,763
Public safety 14,333,034 - - - - 53,060 14,386,094
Transportation 2,109,389 - - - - - 2,109,389
Environmental protection 3,426,135 - - - - - 3,426,135
Cultural and recreation 3,223,971 - - 33,582 - 24,379 3,281,932
Capital outlay 3,311,249 - 964,328 4,399,184 1,764,133 3,666,369 14,105,263
Debt service:
Bond principal - 1,245,000 - - - - 1,245,000
Bond interest - 379,189 - - - - 379,189
Installment note principal - 2,945,536 - - - - 2,945,536
Installment note interest - 230,681 - - - - 230,681
Total expenditures 37,313,031 4,800,406 964,328 4,432,766 1,764,133 3,750,318 53,024,982
Revenues under expenditures 3,567,299 (3,615,507) (964,328) (2,891,182) (1,764,098) (1,960,054) (7,627,870)
Other financing sources (uses):
Transfers in 569,351 4,670,650 - - - 688,102 5,928,103
Transfers out (5,638,279) - (142,000) (50,500) - (97,324) (5,928,103)
Issuance of debt 2,068,550 - 14,200,000 2,480,000 2,400,000 2,900,000 24,048,550
Premium on debt issuance - - 658,610 112,360 - - 770,970
Total other financing sources (uses) (3,000,378) 4,670,650 14,716,610 2,541,860 2,400,000 3,490,778 24,819,520
Net change in fund balances 566,921 1,055,143 13,752,282 (349,322) 635,902 1,530,724 17,191,650
Fund balance - beginning of year 16,057,659 - (721,330) (734,630) - 4,614,529 19,216,228
Restatement - beginning of year (Note 18) (144,816) - - - - 144,256 (560)
Fund balance - end of year 16,479,764$ 1,055,143$ 13,030,952$ (1,083,952)$ 635,902$ 6,289,509$ 36,407,318$
STATEMENT OF REVENUES, EXPENDITURES, AND CHANGES IN FUND BALANCESGOVERNMENTAL FUNDS
FOR THE YEAR ENDED JUNE 30, 2018
The accompanying notes are an integral part of these financial statements.27
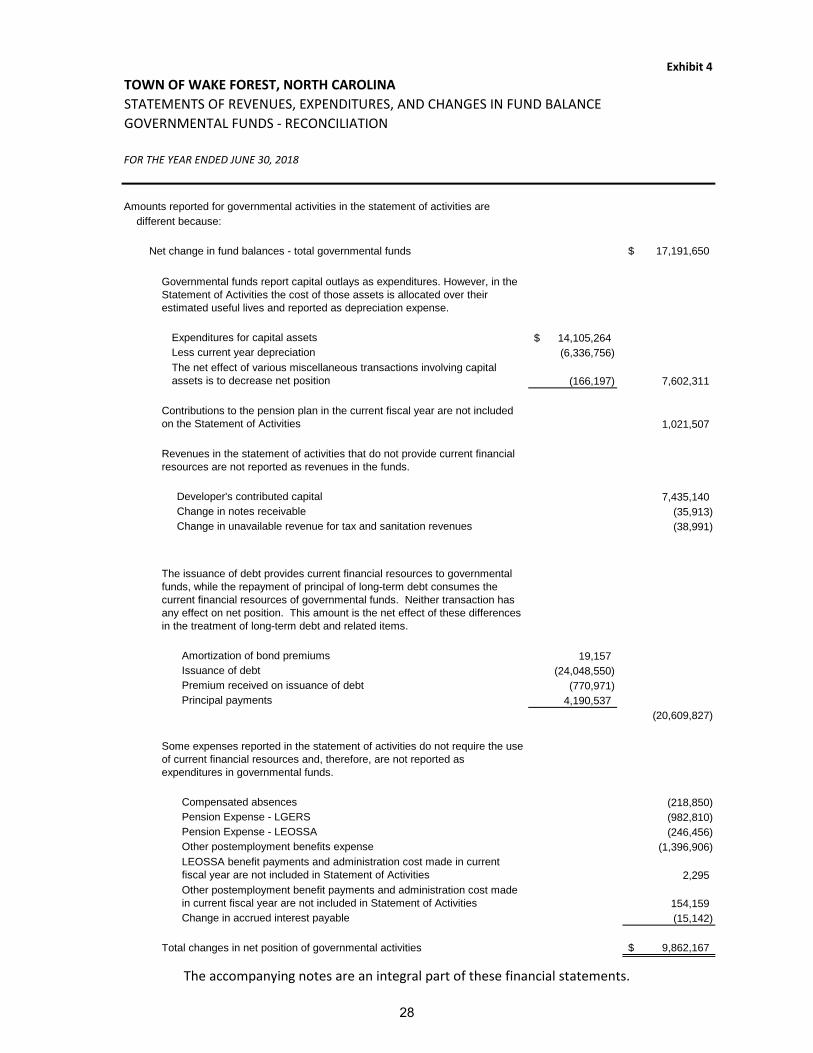
Exhibit 4
Amounts reported for governmental activities in the statement of activities aredifferent because:
Net change in fund balances - total governmental funds 17,191,650$
Governmental funds report capital outlays as expenditures. However, in the Statement of Activities the cost of those assets is allocated over their estimated useful lives and reported as depreciation expense.
Expenditures for capital assets 14,105,264$ Less current year depreciation (6,336,756) The net effect of various miscellaneous transactions involving capital assets is to decrease net position (166,197) 7,602,311
Contributions to the pension plan in the current fiscal year are not included on the Statement of Activities 1,021,507
Revenues in the statement of activities that do not provide current financial resources are not reported as revenues in the funds.
Developer's contributed capital 7,435,140 Change in notes receivable (35,913) Change in unavailable revenue for tax and sanitation revenues (38,991)
The issuance of debt provides current financial resources to governmental funds, while the repayment of principal of long-term debt consumes the current financial resources of governmental funds. Neither transaction has any effect on net position. This amount is the net effect of these differences in the treatment of long-term debt and related items.
Amortization of bond premiums 19,157 Issuance of debt (24,048,550) Premium received on issuance of debt (770,971) Principal payments 4,190,537
(20,609,827)
Some expenses reported in the statement of activities do not require the use of current financial resources and, therefore, are not reported as expenditures in governmental funds.
Compensated absences (218,850) Pension Expense - LGERS (982,810) Pension Expense - LEOSSA (246,456) Other postemployment benefits expense (1,396,906) LEOSSA benefit payments and administration cost made in current fiscal year are not included in Statement of Activities 2,295 Other postemployment benefit payments and administration cost made in current fiscal year are not included in Statement of Activities 154,159 Change in accrued interest payable (15,142)
Total changes in net position of governmental activities 9,862,167$
TOWN OF WAKE FOREST, NORTH CAROLINA
STATEMENTS OF REVENUES, EXPENDITURES, AND CHANGES IN FUND BALANCE
GOVERNMENTAL FUNDS - RECONCILIATION
FOR THE YEAR ENDED JUNE 30, 2018
The accompanying notes are an integral part of these financial statements.
28
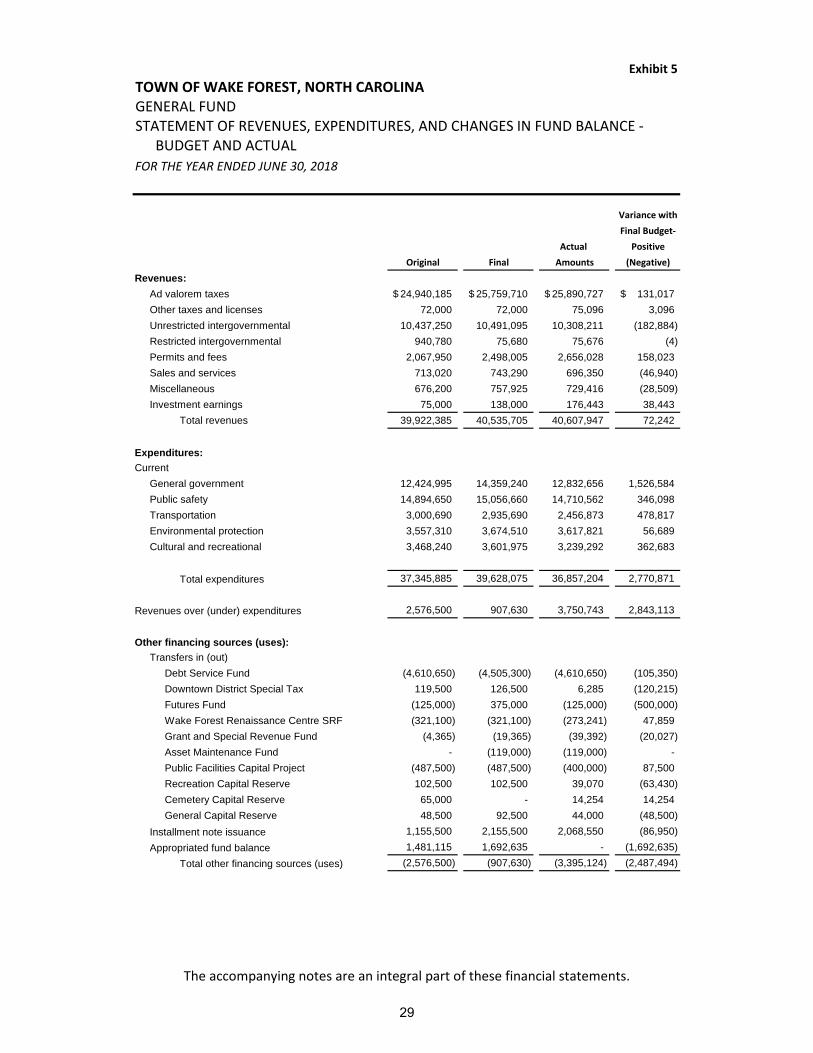
Exhibit 5
Variance with
Final Budget-
Actual Positive
Original Final Amounts (Negative)
Revenues:Ad valorem taxes 24,940,185$ 25,759,710$ 25,890,727$ 131,017$ Other taxes and licenses 72,000 72,000 75,096 3,096 Unrestricted intergovernmental 10,437,250 10,491,095 10,308,211 (182,884) Restricted intergovernmental 940,780 75,680 75,676 (4) Permits and fees 2,067,950 2,498,005 2,656,028 158,023 Sales and services 713,020 743,290 696,350 (46,940) Miscellaneous 676,200 757,925 * 729,416 (28,509) Investment earnings 75,000 138,000 176,443 38,443
Total revenues 39,922,385 40,535,705 40,607,947 72,242
Expenditures:Current
General government 12,424,995 14,359,240 12,832,656 1,526,584 Public safety 14,894,650 15,056,660 14,710,562 346,098 Transportation 3,000,690 2,935,690 2,456,873 478,817 Environmental protection 3,557,310 3,674,510 3,617,821 56,689 Cultural and recreational 3,468,240 3,601,975 3,239,292 362,683
Total expenditures 37,345,885 39,628,075 36,857,204 2,770,871
Revenues over (under) expenditures 2,576,500 907,630 3,750,743 2,843,113
Other financing sources (uses):Transfers in (out)
Debt Service Fund (4,610,650) (4,505,300) (4,610,650) (105,350) Downtown District Special Tax 119,500 126,500 6,285 (120,215) Futures Fund (125,000) 375,000 (125,000) (500,000) Wake Forest Renaissance Centre SRF (321,100) (321,100) (273,241) 47,859 Grant and Special Revenue Fund (4,365) (19,365) (39,392) (20,027) Asset Maintenance Fund - (119,000) (119,000) - Public Facilities Capital Project (487,500) (487,500) (400,000) 87,500 Recreation Capital Reserve 102,500 102,500 39,070 (63,430) Cemetery Capital Reserve 65,000 - 14,254 14,254 General Capital Reserve 48,500 92,500 44,000 (48,500)
Installment note issuance 1,155,500 2,155,500 2,068,550 (86,950) Appropriated fund balance 1,481,115 1,692,635 - (1,692,635)
Total other financing sources (uses) (2,576,500) (907,630) (3,395,124) (2,487,494)
TOWN OF WAKE FOREST, NORTH CAROLINAGENERAL FUNDSTATEMENT OF REVENUES, EXPENDITURES, AND CHANGES IN FUND BALANCE -
BUDGET AND ACTUAL
FOR THE YEAR ENDED JUNE 30, 2018
The accompanying notes are an integral part of these financial statements.
29
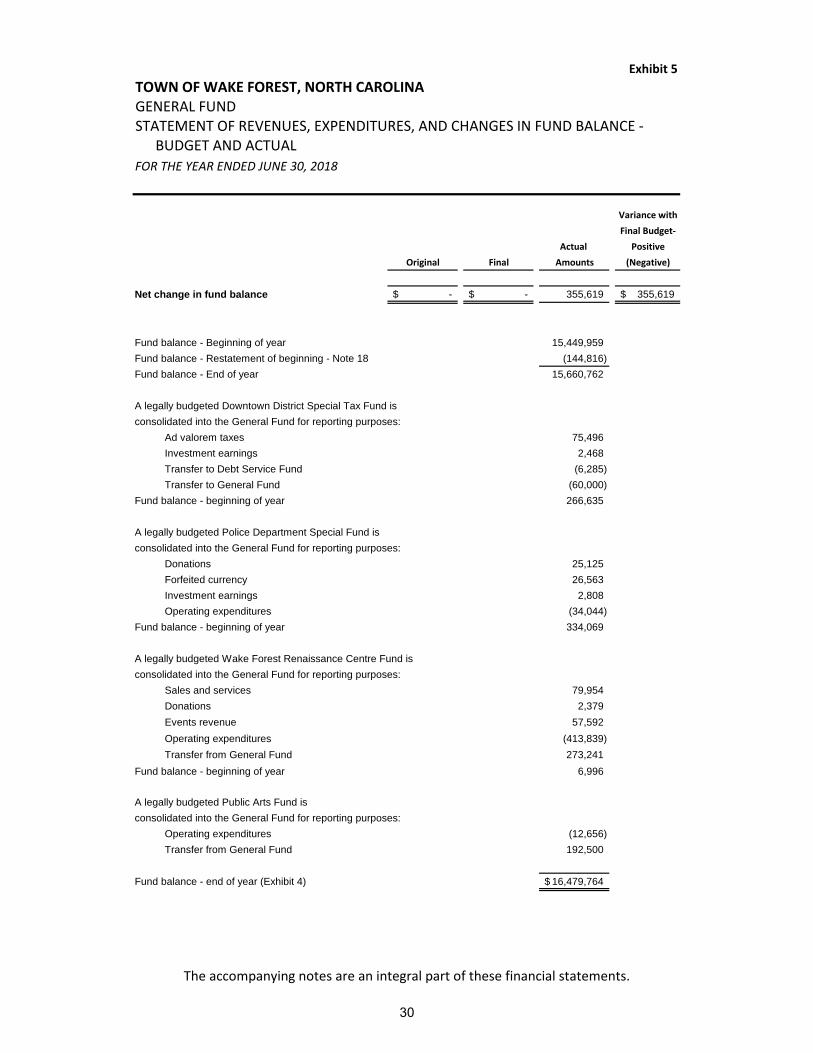
Exhibit 5
Variance with
Final Budget-
Actual Positive
Original Final Amounts (Negative)
TOWN OF WAKE FOREST, NORTH CAROLINAGENERAL FUNDSTATEMENT OF REVENUES, EXPENDITURES, AND CHANGES IN FUND BALANCE -
BUDGET AND ACTUAL
FOR THE YEAR ENDED JUNE 30, 2018
-$ -$ 355,619 355,619$
Fund balance - Beginning of year 15,449,959 Fund balance - Restatement of beginning - Note 18 (144,816) Fund balance - End of year 15,660,762
A legally budgeted Downtown District Special Tax Fund isconsolidated into the General Fund for reporting purposes:
Ad valorem taxes 75,496 Investment earnings 2,468 Transfer to Debt Service Fund (6,285) Transfer to General Fund (60,000)
Fund balance - beginning of year 266,635
A legally budgeted Police Department Special Fund isconsolidated into the General Fund for reporting purposes:
Donations 25,125 Forfeited currency 26,563 Investment earnings 2,808 Operating expenditures (34,044)
Fund balance - beginning of year 334,069
A legally budgeted Wake Forest Renaissance Centre Fund isconsolidated into the General Fund for reporting purposes:
Sales and services 79,954 Donations 2,379 Events revenue 57,592 Operating expenditures (413,839) Transfer from General Fund 273,241
Fund balance - beginning of year 6,996
A legally budgeted Public Arts Fund isconsolidated into the General Fund for reporting purposes:
Operating expenditures (12,656) Transfer from General Fund 192,500
Fund balance - end of year (Exhibit 4) 16,479,764$
Net change in fund balance
The accompanying notes are an integral part of these financial statements.
30
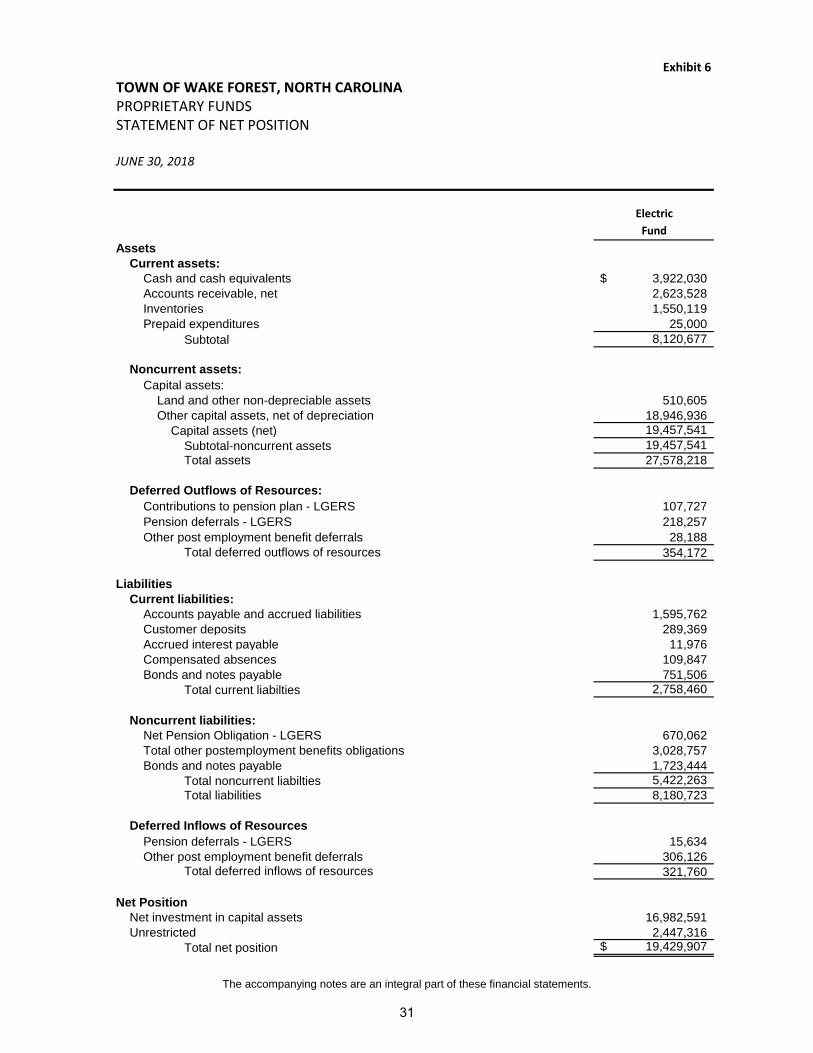
Exhibit 6
TOWN OF WAKE FOREST, NORTH CAROLINAPROPRIETARY FUNDSSTATEMENT OF NET POSITION
Electric
Fund
AssetsCurrent assets:
Cash and cash equivalents 3,922,030$ Accounts receivable, net 2,623,528 Inventories 1,550,119 Prepaid expenditures 25,000
Subtotal 8,120,677
Noncurrent assets:Capital assets:
Land and other non-depreciable assets 510,605 Other capital assets, net of depreciation 18,946,936
Capital assets (net) 19,457,541 Subtotal-noncurrent assets 19,457,541 Total assets 27,578,218
Deferred Outflows of Resources:Contributions to pension plan - LGERS 107,727 Pension deferrals - LGERS 218,257 Other post employment benefit deferrals 28,188
Total deferred outflows of resources 354,172
Liabilities Current liabilities:
Accounts payable and accrued liabilities 1,595,762 Customer deposits 289,369 Accrued interest payable 11,976 Compensated absences 109,847 Bonds and notes payable 751,506
Total current liabilties 2,758,460
Noncurrent liabilities:Net Pension Obligation - LGERS 670,062 Total other postemployment benefits obligations 3,028,757 Bonds and notes payable 1,723,444
Total noncurrent liabilties 5,422,263 Total liabilities 8,180,723
Deferred Inflows of ResourcesPension deferrals - LGERS 15,634 Other post employment benefit deferrals 306,126
Total deferred inflows of resources 321,760
Net PositionNet investment in capital assets 16,982,591 Unrestricted 2,447,316
Total net position 19,429,907$
JUNE 30, 2018
The accompanying notes are an integral part of these financial statements.
31
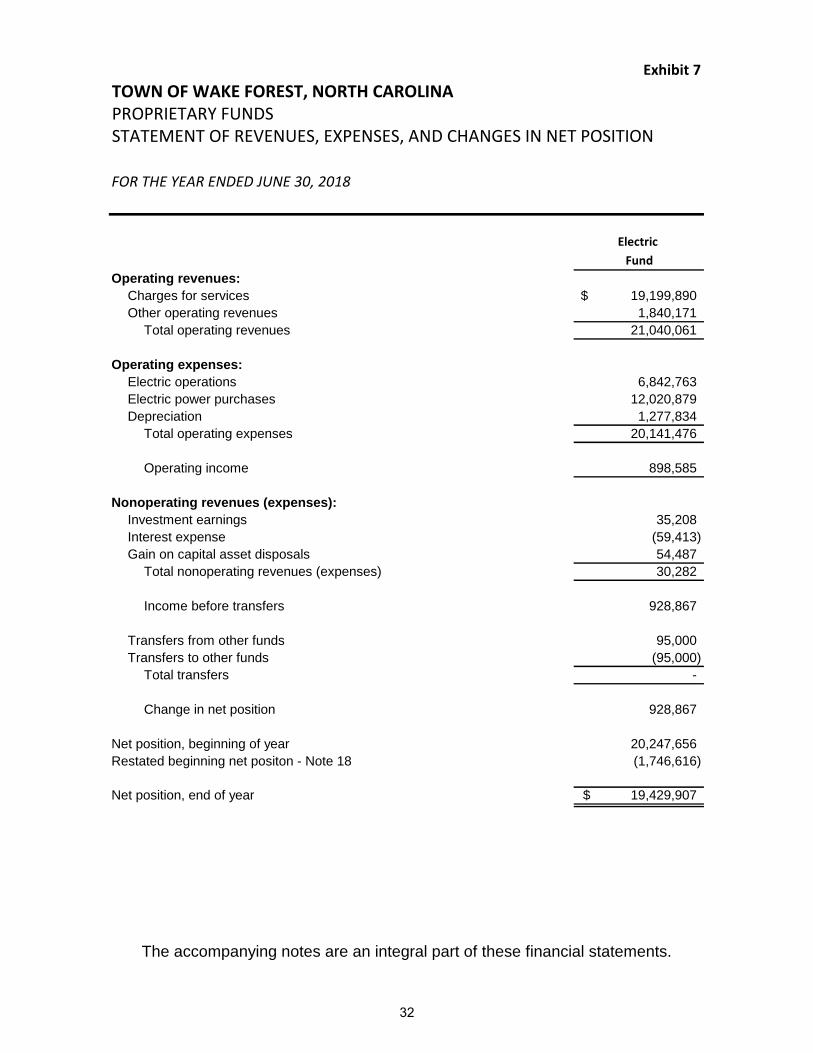
Exhibit 7
Electric
Fund
Operating revenues:Charges for services 19,199,890$ Other operating revenues 1,840,171
Total operating revenues 21,040,061
Operating expenses:Electric operations 6,842,763 Electric power purchases 12,020,879 Depreciation 1,277,834
Total operating expenses 20,141,476
Operating income 898,585
Nonoperating revenues (expenses):Investment earnings 35,208 Interest expense (59,413) Gain on capital asset disposals 54,487
Total nonoperating revenues (expenses) 30,282
Income before transfers 928,867
Transfers from other funds 95,000 Transfers to other funds (95,000)
Total transfers -
Change in net position 928,867
Net position, beginning of year 20,247,656 Restated beginning net positon - Note 18 (1,746,616)
Net position, end of year 19,429,907$
TOWN OF WAKE FOREST, NORTH CAROLINAPROPRIETARY FUNDSSTATEMENT OF REVENUES, EXPENSES, AND CHANGES IN NET POSITION
FOR THE YEAR ENDED JUNE 30, 2018
The accompanying notes are an integral part of these financial statements.
32
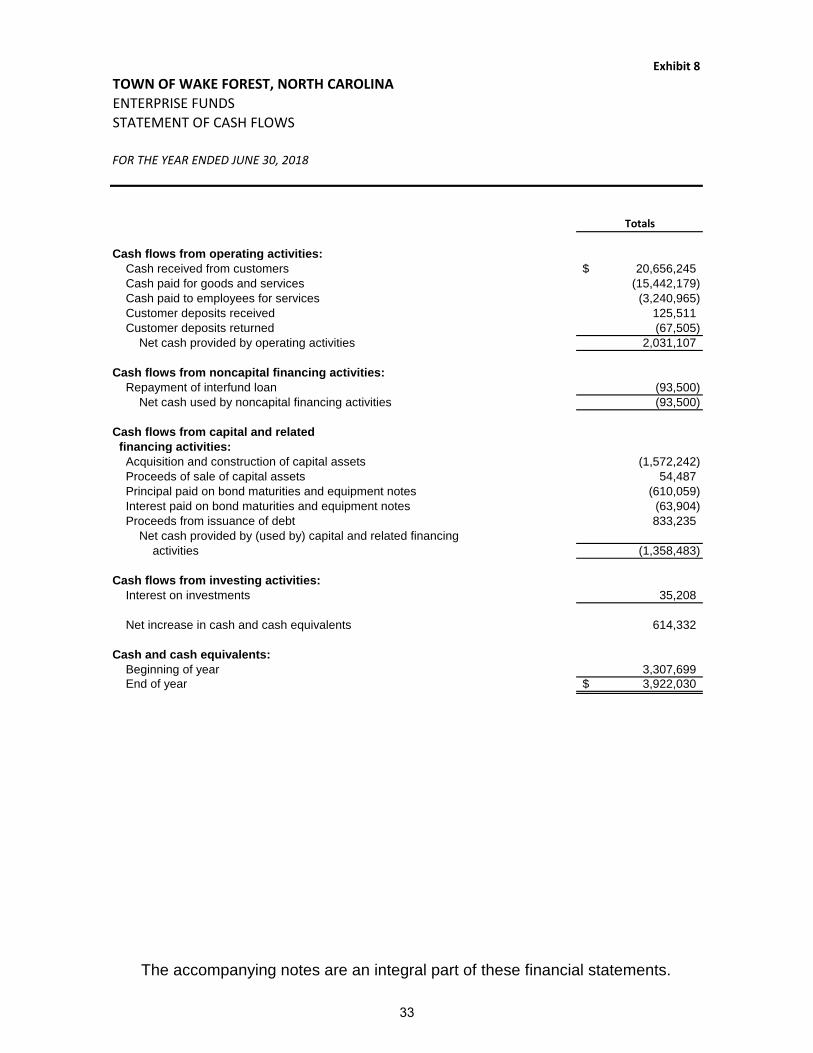
Exhibit 8
Totals
Cash flows from operating activities:Cash received from customers 20,656,245$ Cash paid for goods and services (15,442,179) Cash paid to employees for services (3,240,965) Customer deposits received 125,511 Customer deposits returned (67,505)
Net cash provided by operating activities 2,031,107
Cash flows from noncapital financing activities:Repayment of interfund loan (93,500)
Net cash used by noncapital financing activities (93,500)
Cash flows from capital and related financing activities:
Acquisition and construction of capital assets (1,572,242) Proceeds of sale of capital assets 54,487 Principal paid on bond maturities and equipment notes (610,059) Interest paid on bond maturities and equipment notes (63,904) Proceeds from issuance of debt 833,235
Net cash provided by (used by) capital and related financingactivities (1,358,483)
Cash flows from investing activities:Interest on investments 35,208
Net increase in cash and cash equivalents 614,332
Cash and cash equivalents:Beginning of year 3,307,699 End of year 3,922,030$
TOWN OF WAKE FOREST, NORTH CAROLINA
ENTERPRISE FUNDS
STATEMENT OF CASH FLOWS
FOR THE YEAR ENDED JUNE 30, 2018
The accompanying notes are an integral part of these financial statements.
33
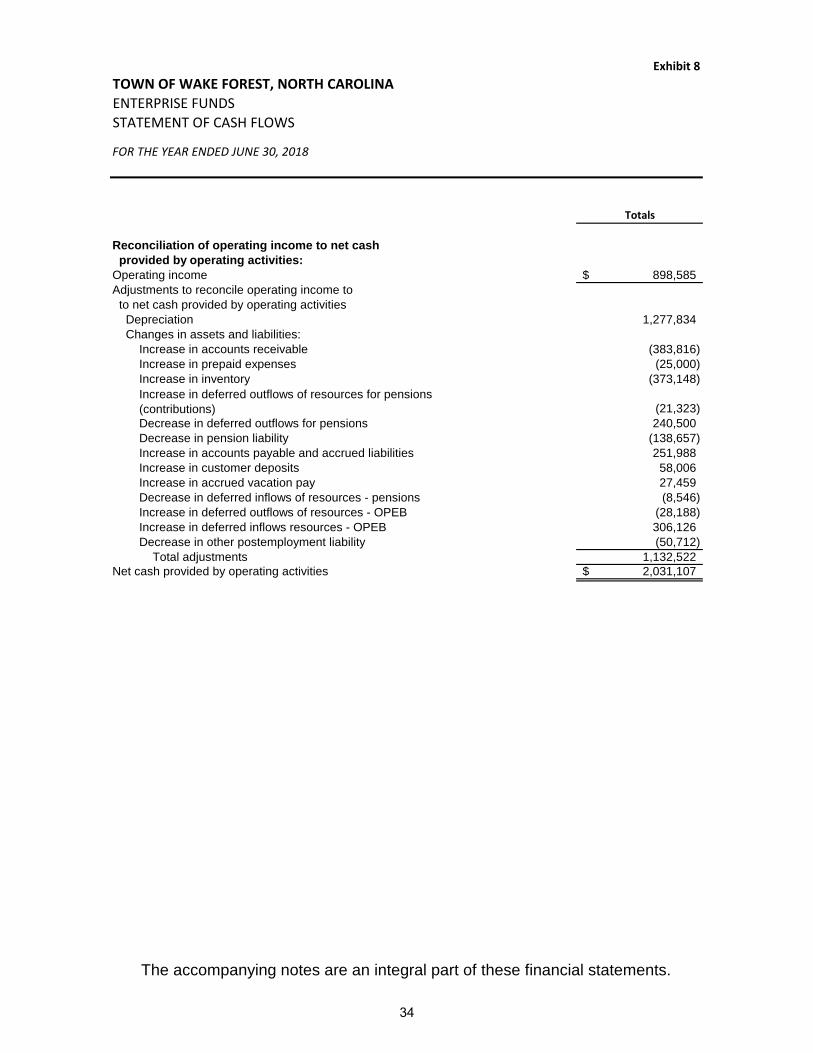
Exhibit 8
Totals
Reconciliation of operating income to net cash provided by operating activities:Operating income 898,585$ Adjustments to reconcile operating income to to net cash provided by operating activities
Depreciation 1,277,834 Changes in assets and liabilities:
Increase in accounts receivable (383,816) Increase in prepaid expenses (25,000) Increase in inventory (373,148)
(21,323) Decrease in deferred outflows for pensions 240,500 Decrease in pension liability (138,657) Increase in accounts payable and accrued liabilities 251,988 Increase in customer deposits 58,006 Increase in accrued vacation pay 27,459 Decrease in deferred inflows of resources - pensions (8,546) Increase in deferred outflows of resources - OPEB (28,188) Increase in deferred inflows resources - OPEB 306,126 Decrease in other postemployment liability (50,712)
Total adjustments 1,132,522 Net cash provided by operating activities 2,031,107$
Increase in deferred outflows of resources for pensions (contributions)
ENTERPRISE FUNDS
STATEMENT OF CASH FLOWS
FOR THE YEAR ENDED JUNE 30, 2018
TOWN OF WAKE FOREST, NORTH CAROLINA
The accompanying notes are an integral part of these financial statements.
34
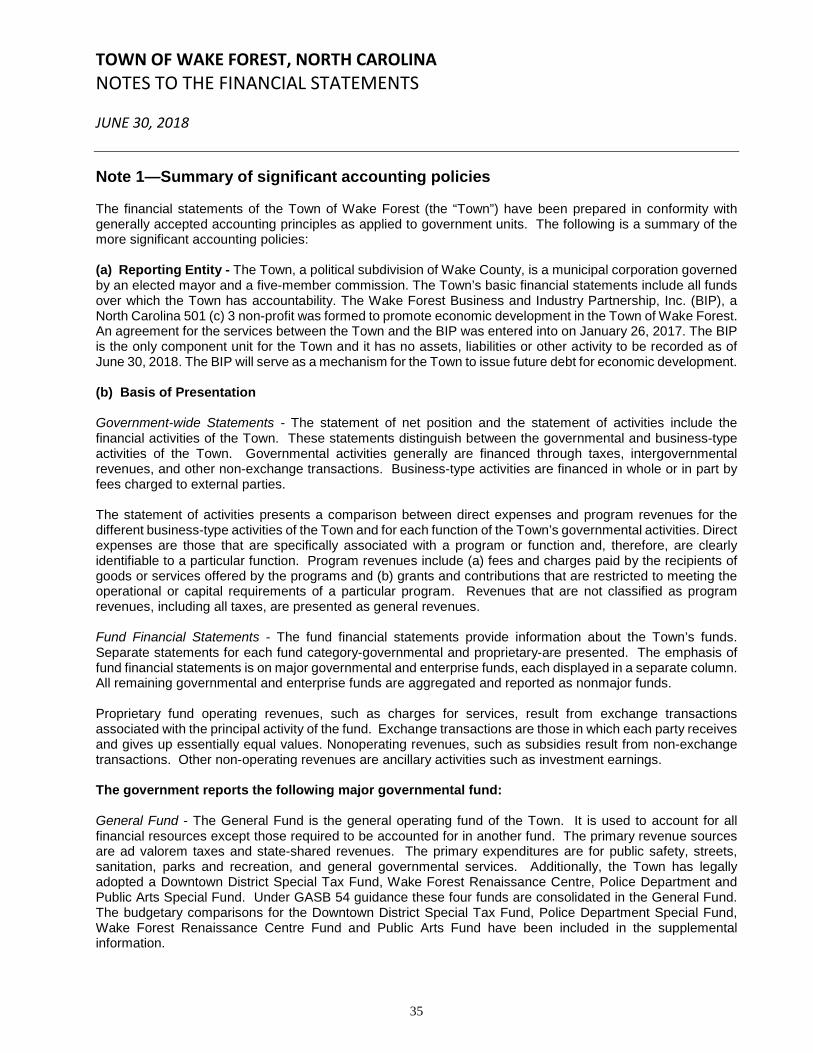
TOWN OF WAKE FOREST, NORTH CAROLINA NOTES TO THE FINANCIAL STATEMENTS JUNE 30, 2018
35
Note 1—Summary of significant accounting policies The financial statements of the Town of Wake Forest (the “Town”) have been prepared in conformity with generally accepted accounting principles as applied to government units. The following is a summary of the more significant accounting policies: (a) Reporting Entity - The Town, a political subdivision of Wake County, is a municipal corporation governed by an elected mayor and a five-member commission. The Town’s basic financial statements include all funds over which the Town has accountability. The Wake Forest Business and Industry Partnership, Inc. (BIP), a North Carolina 501 (c) 3 non-profit was formed to promote economic development in the Town of Wake Forest. An agreement for the services between the Town and the BIP was entered into on January 26, 2017. The BIP is the only component unit for the Town and it has no assets, liabilities or other activity to be recorded as of June 30, 2018. The BIP will serve as a mechanism for the Town to issue future debt for economic development. (b) Basis of Presentation Government-wide Statements - The statement of net position and the statement of activities include the financial activities of the Town. These statements distinguish between the governmental and business-type activities of the Town. Governmental activities generally are financed through taxes, intergovernmental revenues, and other non-exchange transactions. Business-type activities are financed in whole or in part by fees charged to external parties. The statement of activities presents a comparison between direct expenses and program revenues for the different business-type activities of the Town and for each function of the Town’s governmental activities. Direct expenses are those that are specifically associated with a program or function and, therefore, are clearly identifiable to a particular function. Program revenues include (a) fees and charges paid by the recipients of goods or services offered by the programs and (b) grants and contributions that are restricted to meeting the operational or capital requirements of a particular program. Revenues that are not classified as program revenues, including all taxes, are presented as general revenues. Fund Financial Statements - The fund financial statements provide information about the Town’s funds. Separate statements for each fund category-governmental and proprietary-are presented. The emphasis of fund financial statements is on major governmental and enterprise funds, each displayed in a separate column. All remaining governmental and enterprise funds are aggregated and reported as nonmajor funds. Proprietary fund operating revenues, such as charges for services, result from exchange transactions associated with the principal activity of the fund. Exchange transactions are those in which each party receives and gives up essentially equal values. Nonoperating revenues, such as subsidies result from non-exchange transactions. Other non-operating revenues are ancillary activities such as investment earnings. The government reports the following major governmental fund: General Fund - The General Fund is the general operating fund of the Town. It is used to account for all financial resources except those required to be accounted for in another fund. The primary revenue sources are ad valorem taxes and state-shared revenues. The primary expenditures are for public safety, streets, sanitation, parks and recreation, and general governmental services. Additionally, the Town has legally adopted a Downtown District Special Tax Fund, Wake Forest Renaissance Centre, Police Department and Public Arts Special Fund. Under GASB 54 guidance these four funds are consolidated in the General Fund. The budgetary comparisons for the Downtown District Special Tax Fund, Police Department Special Fund, Wake Forest Renaissance Centre Fund and Public Arts Fund have been included in the supplemental information.
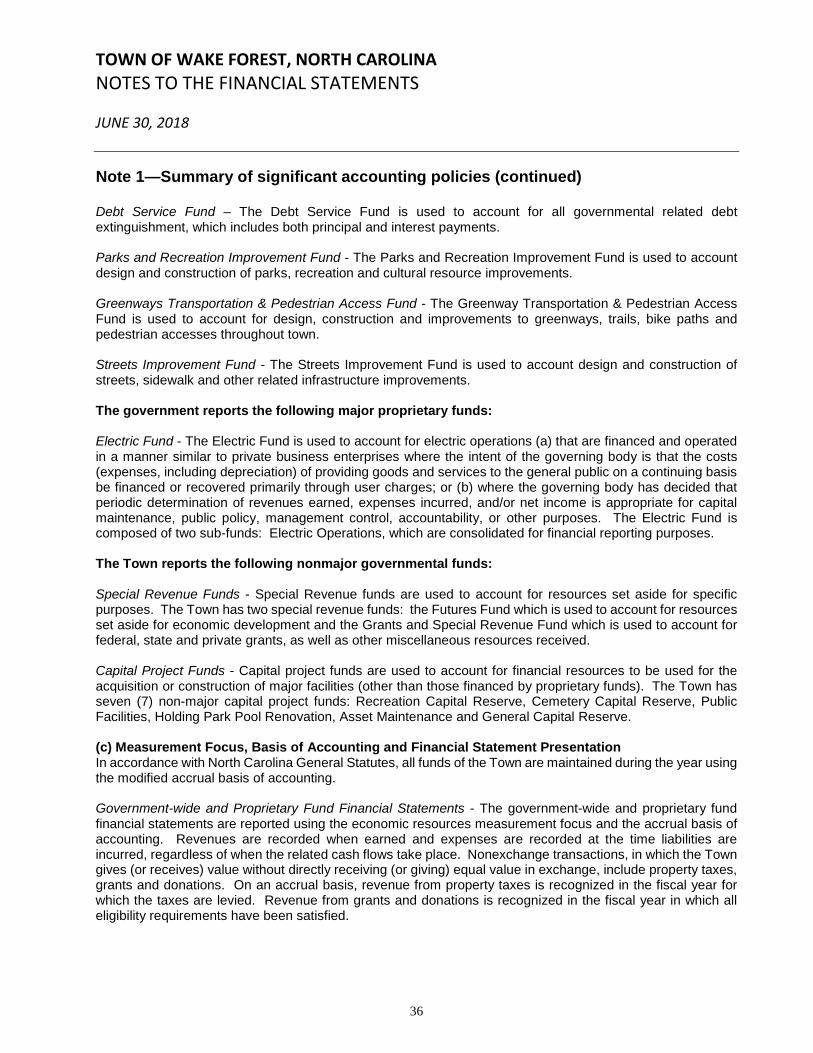
TOWN OF WAKE FOREST, NORTH CAROLINA NOTES TO THE FINANCIAL STATEMENTS JUNE 30, 2018
36
Note 1—Summary of significant accounting policies (continued) Debt Service Fund – The Debt Service Fund is used to account for all governmental related debt extinguishment, which includes both principal and interest payments. Parks and Recreation Improvement Fund - The Parks and Recreation Improvement Fund is used to account design and construction of parks, recreation and cultural resource improvements. Greenways Transportation & Pedestrian Access Fund - The Greenway Transportation & Pedestrian Access Fund is used to account for design, construction and improvements to greenways, trails, bike paths and pedestrian accesses throughout town. Streets Improvement Fund - The Streets Improvement Fund is used to account design and construction of streets, sidewalk and other related infrastructure improvements. The government reports the following major proprietary funds: Electric Fund - The Electric Fund is used to account for electric operations (a) that are financed and operated in a manner similar to private business enterprises where the intent of the governing body is that the costs (expenses, including depreciation) of providing goods and services to the general public on a continuing basis be financed or recovered primarily through user charges; or (b) where the governing body has decided that periodic determination of revenues earned, expenses incurred, and/or net income is appropriate for capital maintenance, public policy, management control, accountability, or other purposes. The Electric Fund is composed of two sub-funds: Electric Operations, which are consolidated for financial reporting purposes. The Town reports the following nonmajor governmental funds: Special Revenue Funds - Special Revenue funds are used to account for resources set aside for specific purposes. The Town has two special revenue funds: the Futures Fund which is used to account for resources set aside for economic development and the Grants and Special Revenue Fund which is used to account for federal, state and private grants, as well as other miscellaneous resources received. Capital Project Funds - Capital project funds are used to account for financial resources to be used for the acquisition or construction of major facilities (other than those financed by proprietary funds). The Town has seven (7) non-major capital project funds: Recreation Capital Reserve, Cemetery Capital Reserve, Public Facilities, Holding Park Pool Renovation, Asset Maintenance and General Capital Reserve. (c) Measurement Focus, Basis of Accounting and Financial Statement Presentation In accordance with North Carolina General Statutes, all funds of the Town are maintained during the year using the modified accrual basis of accounting. Government-wide and Proprietary Fund Financial Statements - The government-wide and proprietary fund financial statements are reported using the economic resources measurement focus and the accrual basis of accounting. Revenues are recorded when earned and expenses are recorded at the time liabilities are incurred, regardless of when the related cash flows take place. Nonexchange transactions, in which the Town gives (or receives) value without directly receiving (or giving) equal value in exchange, include property taxes, grants and donations. On an accrual basis, revenue from property taxes is recognized in the fiscal year for which the taxes are levied. Revenue from grants and donations is recognized in the fiscal year in which all eligibility requirements have been satisfied.
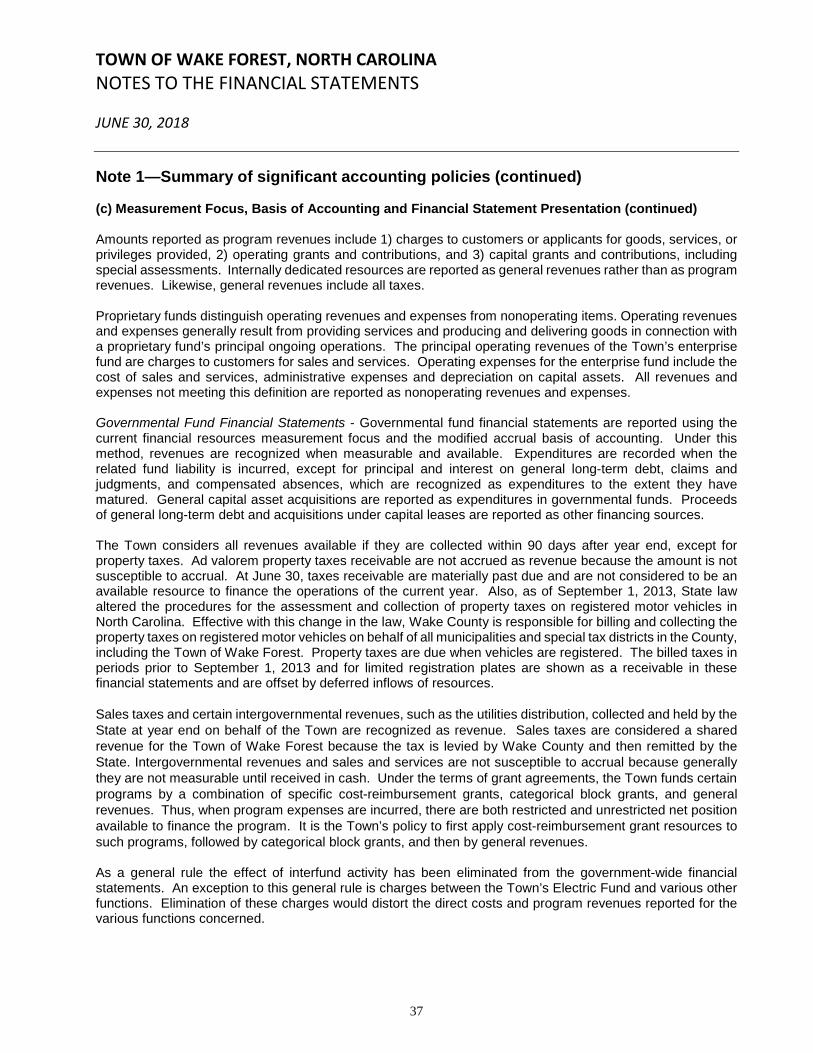
TOWN OF WAKE FOREST, NORTH CAROLINA NOTES TO THE FINANCIAL STATEMENTS JUNE 30, 2018
37
Note 1—Summary of significant accounting policies (continued) (c) Measurement Focus, Basis of Accounting and Financial Statement Presentation (continued) Amounts reported as program revenues include 1) charges to customers or applicants for goods, services, or privileges provided, 2) operating grants and contributions, and 3) capital grants and contributions, including special assessments. Internally dedicated resources are reported as general revenues rather than as program revenues. Likewise, general revenues include all taxes. Proprietary funds distinguish operating revenues and expenses from nonoperating items. Operating revenues and expenses generally result from providing services and producing and delivering goods in connection with a proprietary fund’s principal ongoing operations. The principal operating revenues of the Town’s enterprise fund are charges to customers for sales and services. Operating expenses for the enterprise fund include the cost of sales and services, administrative expenses and depreciation on capital assets. All revenues and expenses not meeting this definition are reported as nonoperating revenues and expenses. Governmental Fund Financial Statements - Governmental fund financial statements are reported using the current financial resources measurement focus and the modified accrual basis of accounting. Under this method, revenues are recognized when measurable and available. Expenditures are recorded when the related fund liability is incurred, except for principal and interest on general long-term debt, claims and judgments, and compensated absences, which are recognized as expenditures to the extent they have matured. General capital asset acquisitions are reported as expenditures in governmental funds. Proceeds of general long-term debt and acquisitions under capital leases are reported as other financing sources. The Town considers all revenues available if they are collected within 90 days after year end, except for property taxes. Ad valorem property taxes receivable are not accrued as revenue because the amount is not susceptible to accrual. At June 30, taxes receivable are materially past due and are not considered to be an available resource to finance the operations of the current year. Also, as of September 1, 2013, State law altered the procedures for the assessment and collection of property taxes on registered motor vehicles in North Carolina. Effective with this change in the law, Wake County is responsible for billing and collecting the property taxes on registered motor vehicles on behalf of all municipalities and special tax districts in the County, including the Town of Wake Forest. Property taxes are due when vehicles are registered. The billed taxes in periods prior to September 1, 2013 and for limited registration plates are shown as a receivable in these financial statements and are offset by deferred inflows of resources. Sales taxes and certain intergovernmental revenues, such as the utilities distribution, collected and held by the State at year end on behalf of the Town are recognized as revenue. Sales taxes are considered a shared revenue for the Town of Wake Forest because the tax is levied by Wake County and then remitted by the State. Intergovernmental revenues and sales and services are not susceptible to accrual because generally they are not measurable until received in cash. Under the terms of grant agreements, the Town funds certain programs by a combination of specific cost-reimbursement grants, categorical block grants, and general revenues. Thus, when program expenses are incurred, there are both restricted and unrestricted net position available to finance the program. It is the Town’s policy to first apply cost-reimbursement grant resources to such programs, followed by categorical block grants, and then by general revenues. As a general rule the effect of interfund activity has been eliminated from the government-wide financial statements. An exception to this general rule is charges between the Town’s Electric Fund and various other functions. Elimination of these charges would distort the direct costs and program revenues reported for the various functions concerned.
TOWN OF WAKE FOREST, NORTH CAROLINA NOTES TO THE FINANCIAL STATEMENTS JUNE 30, 2018
38
Note 1—Summary of significant accounting policies (continued) (d) Budgetary Data Budgets are adopted as required by North Carolina General Statutes. Annual budget ordinances are adopted for the general, special revenue and enterprise funds. All annual appropriations lapse at fiscal year-end. Project ordinances, which may cover more than one year, are adopted for the capital project and capital reserve funds. All budgets are prepared using the modified accrual basis of accounting, which is consistent with the accounting system used to record transactions. Supplemental appropriations that amend the total expenditures of any fund require an ordinance of the Board of Commissioners. The Town Manager is authorized by the budget ordinance to transfer appropriations between objects of expenditure within a functional area without limitation and without a report being required and may transfer appropriations up to $50,000 between functional areas within a fund with an official reporting of such transfers to the Board. Any interfund transfer not included in the original budget or any appropriation from a contingency account must be approved by the Board of Commissioners. During the year several immaterial amendments to the original budget were necessary. The budget ordinance must be adopted by July 1 of the fiscal year or the governing board must adopt an interim budget that covers that time until the annual ordinance can be adopted. (e) Assets, Liabilities, Deferred Outflows/Inflows of Resources, and Fund Equity Deposits and Investments - All deposits of the Town are made in board-designated official depositories and are secured as required by State law (G.S. 159-31). The Town may designate as an official depository any bank or savings and loan whose principal office is located in North Carolina. The Town may also establish time deposits in the form of NOW and SuperNOW accounts, money market accounts, and certificates of deposit. State law (G.S. 159-30(c)) authorizes the Town to invest in obligations of the United States or obligations fully guaranteed both as to principal and interest by the United States; obligations of the State of North Carolina; bonds and notes of any North Carolina local government or public authority; obligations of certain non-guaranteed federal agencies; certain high quality issues of commercial paper and banker’s acceptances; and the North Carolina Capital Management Trust (NCCMT). The Town’s investments are reported at fair value as determined by quoted market prices. The securities of the NCCMT government portfolio, a SEC-registered (2a-7) money market fund, are valued at fair value, which is the NCCMT’s share price. Cash and Cash Equivalents - The Town pools moneys from several funds to facilitate disbursement and investment and maximize investment income. Therefore, all cash and investments are essentially demand deposits and are considered cash and cash equivalents. Restricted Assets - The unexpended debt proceeds of the General Fund, Parks & Recreation Improvements Fund, as well as Greenways, Trails and Pedestrian Access issued by the Town are classified as restricted assets because their use is completely restricted to the purpose for which the debt was originally issued. Money in the Downtown District Special Tax Fund and the Police Department Special Fund is classified as restricted assets because its use is restricted to the Downtown District Special Tax Fund and the Police Department Special Fund per N.C. G.S. Chapter 159, Article 3. Funds in the Grants and Special Revenue Fund are restricted by the external and/or awarding agency for the specific purpose of the award. The fund restricted for Inspections are pursuant of NC General Assembly 2015 House Bill 255 which states all fees collected under the authority set forth shall be used for support of the administration and activities of the inspection department and no other purpose.
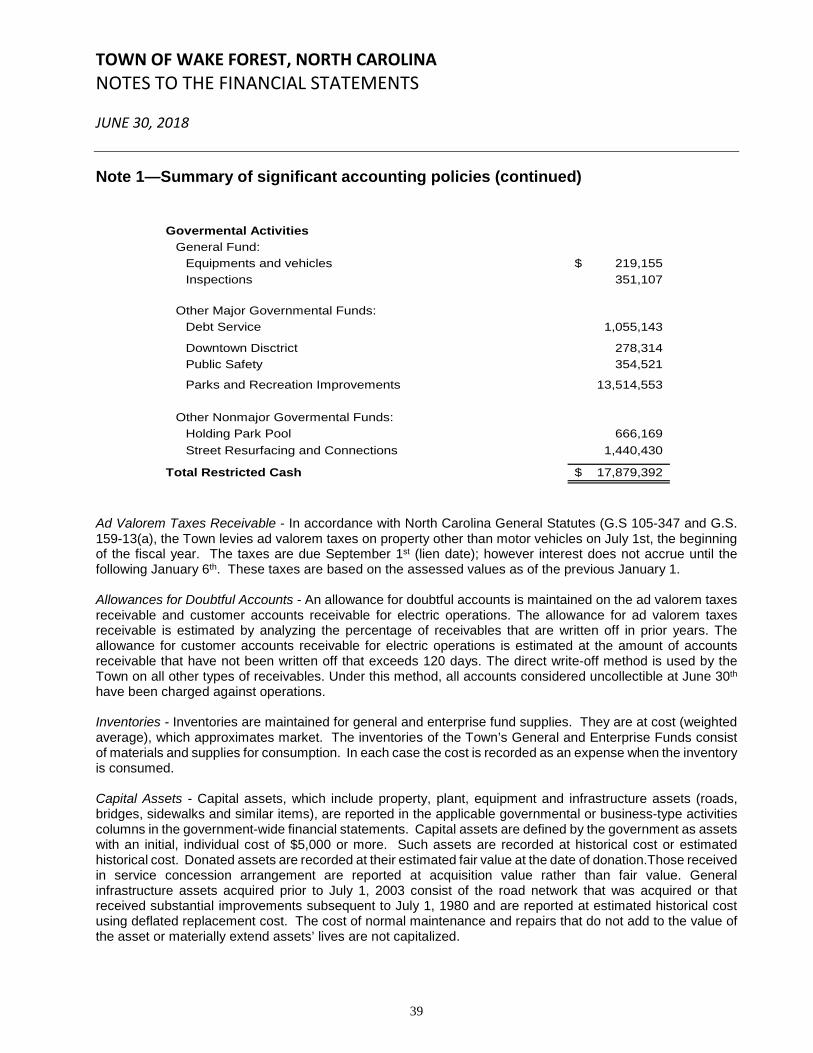
TOWN OF WAKE FOREST, NORTH CAROLINA NOTES TO THE FINANCIAL STATEMENTS JUNE 30, 2018
39
Note 1—Summary of significant accounting policies (continued)
Govermental Activities
General Fund:Equipments and vehicles 219,155$ Inspections 351,107
Other Major Governmental Funds:Debt Service 1,055,143
Downtown Disctrict 278,314 Public Safety 354,521
Parks and Recreation Improvements 13,514,553
Other Nonmajor Govermental Funds:Holding Park Pool 666,169 Street Resurfacing and Connections 1,440,430
Total Restricted Cash 17,879,392$
Ad Valorem Taxes Receivable - In accordance with North Carolina General Statutes (G.S 105-347 and G.S. 159-13(a), the Town levies ad valorem taxes on property other than motor vehicles on July 1st, the beginning of the fiscal year. The taxes are due September 1st (lien date); however interest does not accrue until the following January 6th. These taxes are based on the assessed values as of the previous January 1. Allowances for Doubtful Accounts - An allowance for doubtful accounts is maintained on the ad valorem taxes receivable and customer accounts receivable for electric operations. The allowance for ad valorem taxes receivable is estimated by analyzing the percentage of receivables that are written off in prior years. The allowance for customer accounts receivable for electric operations is estimated at the amount of accounts receivable that have not been written off that exceeds 120 days. The direct write-off method is used by the Town on all other types of receivables. Under this method, all accounts considered uncollectible at June 30th have been charged against operations. Inventories - Inventories are maintained for general and enterprise fund supplies. They are at cost (weighted average), which approximates market. The inventories of the Town’s General and Enterprise Funds consist of materials and supplies for consumption. In each case the cost is recorded as an expense when the inventory is consumed. Capital Assets - Capital assets, which include property, plant, equipment and infrastructure assets (roads, bridges, sidewalks and similar items), are reported in the applicable governmental or business-type activities columns in the government-wide financial statements. Capital assets are defined by the government as assets with an initial, individual cost of $5,000 or more. Such assets are recorded at historical cost or estimated historical cost. Donated assets are recorded at their estimated fair value at the date of donation.Those received in service concession arrangement are reported at acquisition value rather than fair value. General infrastructure assets acquired prior to July 1, 2003 consist of the road network that was acquired or that received substantial improvements subsequent to July 1, 1980 and are reported at estimated historical cost using deflated replacement cost. The cost of normal maintenance and repairs that do not add to the value of the asset or materially extend assets’ lives are not capitalized.
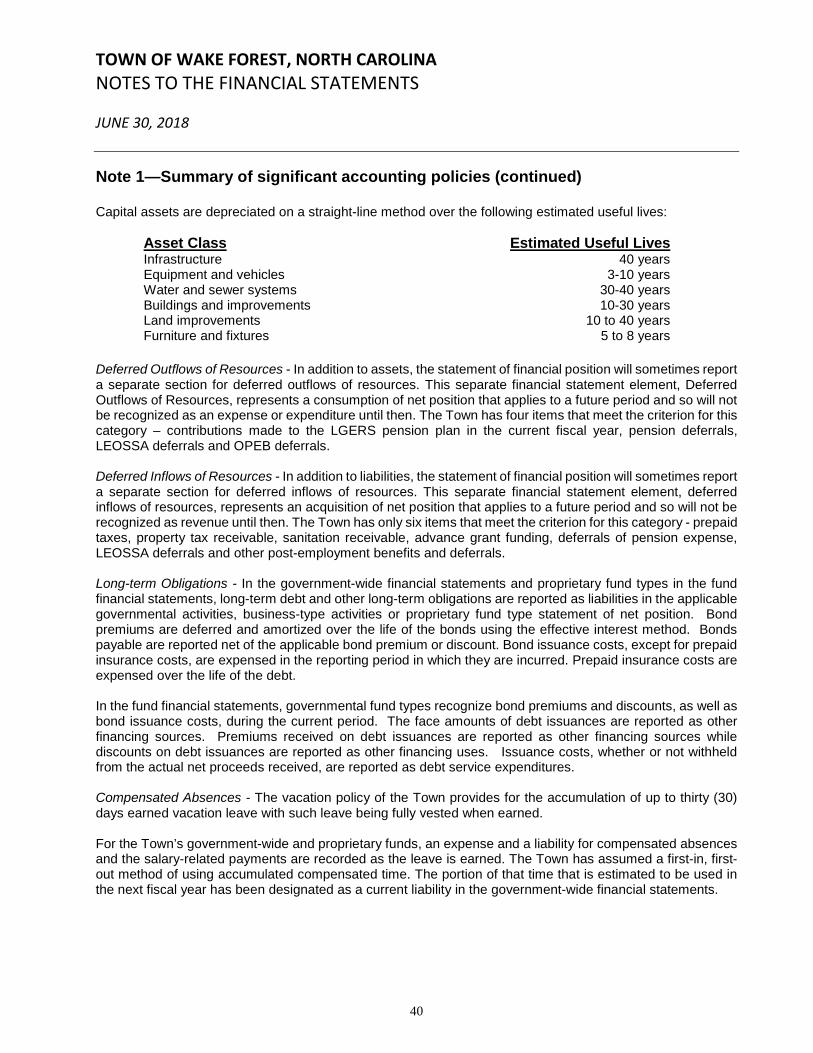
TOWN OF WAKE FOREST, NORTH CAROLINA NOTES TO THE FINANCIAL STATEMENTS JUNE 30, 2018
40
Note 1—Summary of significant accounting policies (continued) Capital assets are depreciated on a straight-line method over the following estimated useful lives:
Asset Class Estimated Useful Lives Infrastructure 40 years Equipment and vehicles 3-10 years Water and sewer systems 30-40 years Buildings and improvements 10-30 years Land improvements 10 to 40 years Furniture and fixtures 5 to 8 years
Deferred Outflows of Resources - In addition to assets, the statement of financial position will sometimes report a separate section for deferred outflows of resources. This separate financial statement element, Deferred Outflows of Resources, represents a consumption of net position that applies to a future period and so will not be recognized as an expense or expenditure until then. The Town has four items that meet the criterion for this category – contributions made to the LGERS pension plan in the current fiscal year, pension deferrals, LEOSSA deferrals and OPEB deferrals. Deferred Inflows of Resources - In addition to liabilities, the statement of financial position will sometimes report a separate section for deferred inflows of resources. This separate financial statement element, deferred inflows of resources, represents an acquisition of net position that applies to a future period and so will not be recognized as revenue until then. The Town has only six items that meet the criterion for this category - prepaid taxes, property tax receivable, sanitation receivable, advance grant funding, deferrals of pension expense, LEOSSA deferrals and other post-employment benefits and deferrals. Long-term Obligations - In the government-wide financial statements and proprietary fund types in the fund financial statements, long-term debt and other long-term obligations are reported as liabilities in the applicable governmental activities, business-type activities or proprietary fund type statement of net position. Bond premiums are deferred and amortized over the life of the bonds using the effective interest method. Bonds payable are reported net of the applicable bond premium or discount. Bond issuance costs, except for prepaid insurance costs, are expensed in the reporting period in which they are incurred. Prepaid insurance costs are expensed over the life of the debt. In the fund financial statements, governmental fund types recognize bond premiums and discounts, as well as bond issuance costs, during the current period. The face amounts of debt issuances are reported as other financing sources. Premiums received on debt issuances are reported as other financing sources while discounts on debt issuances are reported as other financing uses. Issuance costs, whether or not withheld from the actual net proceeds received, are reported as debt service expenditures. Compensated Absences - The vacation policy of the Town provides for the accumulation of up to thirty (30) days earned vacation leave with such leave being fully vested when earned. For the Town’s government-wide and proprietary funds, an expense and a liability for compensated absences and the salary-related payments are recorded as the leave is earned. The Town has assumed a first-in, first-out method of using accumulated compensated time. The portion of that time that is estimated to be used in the next fiscal year has been designated as a current liability in the government-wide financial statements.
TOWN OF WAKE FOREST, NORTH CAROLINA NOTES TO THE FINANCIAL STATEMENTS JUNE 30, 2018
41
Note 1—Summary of significant accounting policies (continued) The Town’s sick leave policy provides for unlimited accumulation of earned sick leave. Sick leave does not vest but any unused sick leave accumulated at the time of retirement may be used in the determination of length of service for retirement purposes. Since the Town has no obligation for the sick leave until it is actually taken, no provision has been made in the accompanying financial statements. Net Position/Fund Balances Net Position - Net position in government-wide and proprietary fund financial statements are classified as net investment in capital assets, restricted and unrestricted. Restricted net position represents constraints on resources that are either externally imposed by creditors, grantors, contributors, or laws or regulations of other governments or imposed by law through state statute. Fund Balances - In the governmental fund financial statements, fund balance is composed of five classifications designed to disclose the hierarchy of constraints placed on how fund balance can be spent. The governmental fund types classify fund balances as follows:
Nonspendable Fund Balance This classification includes amounts that cannot be spent because they are either (a) not in spendable form or (b) legally or contractually required to be maintained intact.
Inventories - portion of fund balance that is not an available resource because it represents the year-end balance of ending inventories, which are not spendable resources. Prepayments – portion of fund balance that is not an available resource because it represents the year-end balance of prepaid expenses, which are not spendable resources.
Restricted Fund Balance This classification includes amounts of fund balance restricted by or subject to externally enforceable legal restrictions, including, but not limited to creditors, grantors, contributors, or other governments through enabling legislation.
Restricted for Stabilization by State Statute - portion of fund balance that is restricted by State Statute [G.S. 159-8(a)]. Restricted for Inspection – portion of fund balance that is restricted by NC General Assembly 2015 House Bill 255. Restricted for Downtown District - portion of fund balance that is restricted by revenue source for certain downtown district expenditures. Restricted for Public Safety - portion of fund balance that is restricted by revenue source for certain public safety expenditures. Restricted for Parks & Recreation – portion of fund balance that is restricted by revenue source for Joyner Park, Northern Wake Senior Center and Holding Park Pool. Restricted for Equipment and Vehicles – portion of fund balance that is restricted by revenue source for certain rolling stock expenditures.
TOWN OF WAKE FOREST, NORTH CAROLINA NOTES TO THE FINANCIAL STATEMENTS JUNE 30, 2018
42
Note 1—Summary of significant accounting policies (continued) Restricted for Street and Sidewalk Improvements - portion of fund balance that is restricted by revenue source for street construction and maintenance. Restricted for Greenway Improvements - portion of fund balance that is restricted by revenue source for improvements to greenways. Restricted for Grants – portion of fund balance that is restricted revenue source for various grant award received which are restricted by external agency.
Committed Fund Balance This classification includes amounts of fund balance that can only be used for specific purposes imposed by majority vote by quorum of the Town’s Board of Commissioners, the highest level of decision making authority. Any changes or removal of specific purpose requires majority action by the Board either through board resolution or ordinance. The governing body approves the appropriation; however the budget ordinance authorizes the manager to modify the appropriations by resource or appropriation within funds up to $50,000.
The governing body can, by adoption of an ordinance prior to the end of the fiscal year, commit fund balance. Once adopted, the limitation imposed by the ordinance remains in place until similar action is taken (the adoption of another ordinance) to remove or revise the limitation.
Committed for economic development – portion of fund balance committed by the Board for future economic development projects.
Assigned Fund Balance This classification includes amounts of fund balance that reflect a government’s intended use of resources through authority delegated by the Town’s Board of Commissioners to the Town Manager or another member of the management team.
Assigned for subsequent year’s expenditures - portion of total fund balance that is appropriated in the next year’s budget that is not already classified in restricted or committed. Assigned for debt service – portion of fund balance that will be used to make future debt payments.
Assigned for recreation improvements - portion of fund balance that has been budgeted by the Board for recreation improvements.
Assigned for cemetery improvements - portion of fund balance that has been budgeted by the Board for cemetery improvements. Assigned for fire services – portion of fund balance that will be used for fire service related construction and equipment purchases. Assigned for roadway projects – portion of fund balance that is to be used for transportation related construction and improvements. Assigned for asset maintenance – portion of fund balance that will be used for improvements to town assets.
TOWN OF WAKE FOREST, NORTH CAROLINA NOTES TO THE FINANCIAL STATEMENTS JUNE 30, 2018
43
Note 1—Summary of significant accounting policies (continued)
Unassigned Fund Balance The portion of fund balance that has not been restricted, committed, or assigned to specific purposes or other funds. The General Fund is the only fund that reports a positive unassigned fund balance amount. In governmental funds other than the general fund, if expenditures incurred for specific purposes exceed the amounts that are restricted, committed or assigned to those purposes, it may be necessary to report a negative unassigned fund balance in that fund.
The Town has a revenue spending policy that provides guidance for programs with multiple revenue sources. The Chief Financial Officer will use resources in the following hierarchy: bond proceeds, federal funds, state funds, local non-Town funds, Town funds. For purposes of fund balance classification expenditures are to be spent from restricted fund balance first, followed in-order by committed fund balance, assigned fund balance and lastly unassigned fund balance. The Chief Financial Officer has the authority to deviate from this policy if it is in the best interest of the Town. The Town’s original fund balance policy adopted in September 2004 was amended in February 2016 and requires that the Town maintain an unassigned General Fund balance between 20 and 25 percent of General Fund expenditures and a total fund balance of at least 35 percent of General Fund expenditures. Amounts in excess of this minimum may be used for construction projects or major capital outlay when the Town wishes to avoid the issuance of debt, purchase of real property, emergency work after disasters or for maintaining a stable tax rate when economically dependent revenues (i.e. sales taxes) are less than budgeted amounts. (f) Pensions The Town participates in three cost-sharing, multi-employer, defined benefit pension plans that are administered by the State; the Local Government Employees’ Retirement System (LGERS) and the Law Enforcement Officers’ Special Separation Allowance (LEOSSA). For purposes of measuring the net pension asset, deferred outflows of resources and deferred inflows of resources related to pensions, and pension expense, information about the fiduciary net position of the LGERS and additions to/deductions from LGERS’ fiduciary net position have been determined on the same basis as they are reported by LGERS. For this purpose, plan member contributions are recognized in the period in which the contributions are due. The Town of Wake Forest’s employer contributions are recognized when due and the Town of Wake Forest has a legal requirement to provide the contributions. Benefits and refunds are recognized when due and payable in accordance with the terms of LGERS. Investments are reported at fair value. Note 2—Stewardship, compliance, and accountability Deficit in Fund Balance of Individual Fund – The Greenways, Trails and Pedestrian Access (GTP) Fund and Public Facilities Capital Project Fund had a deficit fund balance at June 30, 2018, in the amount of $1,083,952 and $46,357, respectively. These deficits are both for expenditures paid which are related to authorized but unissued debt. The Town’s anticipated plan for eliminating this deficit will be through future debt issuance. Note 3—Deposits and investments Deposits - All of the Town’s deposits are either insured or collateralized by using one of two methods. Under the Dedicated Method, all deposits exceeding the federal depository insurance coverage are collateralized with securities held by the Town’s agent in the Town’s name. Under the Pooling Method, which is a collateral pool, all uninsured deposits are collateralized with securities held by the State Treasurer’s agent in the name of the State Treasurer. Since the State Treasurer is acting in a fiduciary capacity for the Town, these deposits
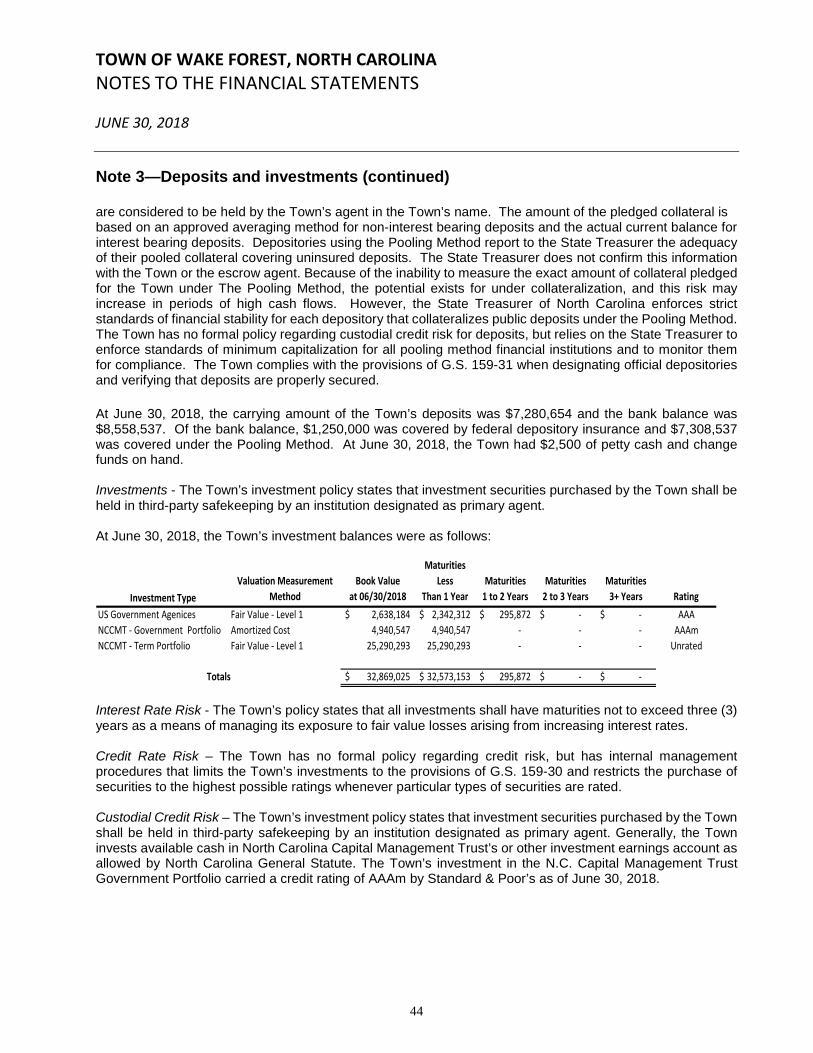
TOWN OF WAKE FOREST, NORTH CAROLINA NOTES TO THE FINANCIAL STATEMENTS JUNE 30, 2018
44
Note 3—Deposits and investments (continued) are considered to be held by the Town’s agent in the Town’s name. The amount of the pledged collateral is based on an approved averaging method for non-interest bearing deposits and the actual current balance for interest bearing deposits. Depositories using the Pooling Method report to the State Treasurer the adequacy of their pooled collateral covering uninsured deposits. The State Treasurer does not confirm this information with the Town or the escrow agent. Because of the inability to measure the exact amount of collateral pledged for the Town under The Pooling Method, the potential exists for under collateralization, and this risk may increase in periods of high cash flows. However, the State Treasurer of North Carolina enforces strict standards of financial stability for each depository that collateralizes public deposits under the Pooling Method. The Town has no formal policy regarding custodial credit risk for deposits, but relies on the State Treasurer to enforce standards of minimum capitalization for all pooling method financial institutions and to monitor them for compliance. The Town complies with the provisions of G.S. 159-31 when designating official depositories and verifying that deposits are properly secured. At June 30, 2018, the carrying amount of the Town’s deposits was $7,280,654 and the bank balance was $8,558,537. Of the bank balance, $1,250,000 was covered by federal depository insurance and $7,308,537 was covered under the Pooling Method. At June 30, 2018, the Town had $2,500 of petty cash and change funds on hand. Investments - The Town’s investment policy states that investment securities purchased by the Town shall be held in third-party safekeeping by an institution designated as primary agent. At June 30, 2018, the Town’s investment balances were as follows:
Investment TypeValuation Measurement
MethodBook Value
at 06/30/2018
Maturities Less
Than 1 YearMaturities
1 to 2 YearsMaturities
2 to 3 YearsMaturities 3+ Years Rating
US Government Agenices Fair Value - Level 1 2,638,184$ 2,342,312$ 295,872$ -$ -$ AAANCCMT - Government Portfolio Amortized Cost 4,940,547 4,940,547 - - - AAAmNCCMT - Term Portfolio Fair Value - Level 1 25,290,293 25,290,293 - - - Unrated
32,869,025$ 32,573,153$ 295,872$ -$ -$ Totals
Interest Rate Risk - The Town’s policy states that all investments shall have maturities not to exceed three (3) years as a means of managing its exposure to fair value losses arising from increasing interest rates. Credit Rate Risk – The Town has no formal policy regarding credit risk, but has internal management procedures that limits the Town’s investments to the provisions of G.S. 159-30 and restricts the purchase of securities to the highest possible ratings whenever particular types of securities are rated. Custodial Credit Risk – The Town’s investment policy states that investment securities purchased by the Town shall be held in third-party safekeeping by an institution designated as primary agent. Generally, the Town invests available cash in North Carolina Capital Management Trust’s or other investment earnings account as allowed by North Carolina General Statute. The Town’s investment in the N.C. Capital Management Trust Government Portfolio carried a credit rating of AAAm by Standard & Poor’s as of June 30, 2018.
TOWN OF WAKE FOREST, NORTH CAROLINA NOTES TO THE FINANCIAL STATEMENTS JUNE 30, 2018
45
Note 3—Deposits and investments (continued) All investments will be purchased “payment-versus-delivery” and if certificated will be held by the Chief Financial Officer in the name of the Town. All non-certificated investments will be held in book-entry form in the name of the Town with the Town’s third party custodian (safekeeping agent). The Town may deposit Town funds into: any Board approved official depository, if such funds are secured in accordance with NCGS-159 (31). Level of fair value hierarchy: Level 1 debt securities are valued using directly observable, quoted prices (unadjusted) in active markets for identical assets. Note 4—Receivables – allowance for doubtful accounts The amounts presented in the Statement of Net Position are net of allowance for doubtful accounts in the following amounts:
General Fund Allowance for uncollectible property taxes receivable 87,067$ Electric Fund Allowance for uncollectible customer receivables 10,546
*The remainder of the page was left blank intentionally
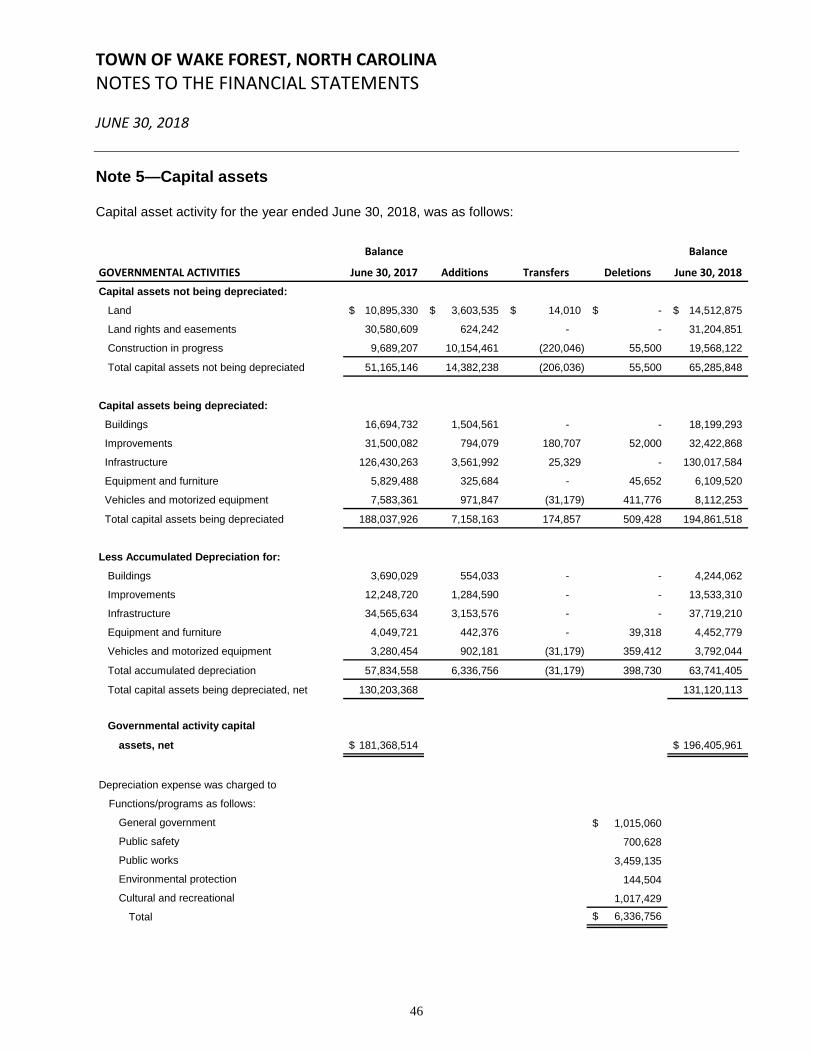
TOWN OF WAKE FOREST, NORTH CAROLINA NOTES TO THE FINANCIAL STATEMENTS JUNE 30, 2018
46
Note 5—Capital assets Capital asset activity for the year ended June 30, 2018, was as follows:
Balance Balance
GOVERNMENTAL ACTIVITIES June 30, 2017 Additions Transfers Deletions June 30, 2018Capital assets not being depreciated:
Land 10,895,330$ 3,603,535$ 14,010$ -$ 14,512,875$
Land rights and easements 30,580,609 624,242 - - 31,204,851
Construction in progress 9,689,207 10,154,461 (220,046) 55,500 19,568,122
Total capital assets not being depreciated 51,165,146 14,382,238 (206,036) 55,500 65,285,848
Capital assets being depreciated:
Buildings 16,694,732 1,504,561 - - 18,199,293
Improvements 31,500,082 794,079 180,707 52,000 32,422,868
Infrastructure 126,430,263 3,561,992 25,329 - 130,017,584
Equipment and furniture 5,829,488 325,684 - 45,652 6,109,520
Vehicles and motorized equipment 7,583,361 971,847 (31,179) 411,776 8,112,253
Total capital assets being depreciated 188,037,926 7,158,163 174,857 509,428 194,861,518
Less Accumulated Depreciation for:
Buildings 3,690,029 554,033 - - 4,244,062
Improvements 12,248,720 1,284,590 - - 13,533,310
Infrastructure 34,565,634 3,153,576 - - 37,719,210
Equipment and furniture 4,049,721 442,376 - 39,318 4,452,779
Vehicles and motorized equipment 3,280,454 902,181 (31,179) 359,412 3,792,044
Total accumulated depreciation 57,834,558 6,336,756 (31,179) 398,730 63,741,405
Total capital assets being depreciated, net 130,203,368 131,120,113
Governmental activity capital
assets, net 181,368,514$ 196,405,961$
Depreciation expense was charged to
Functions/programs as follows:
General government 1,015,060$
Public safety 700,628
Public works 3,459,135
Environmental protection 144,504
Cultural and recreational 1,017,429
Total 6,336,756$
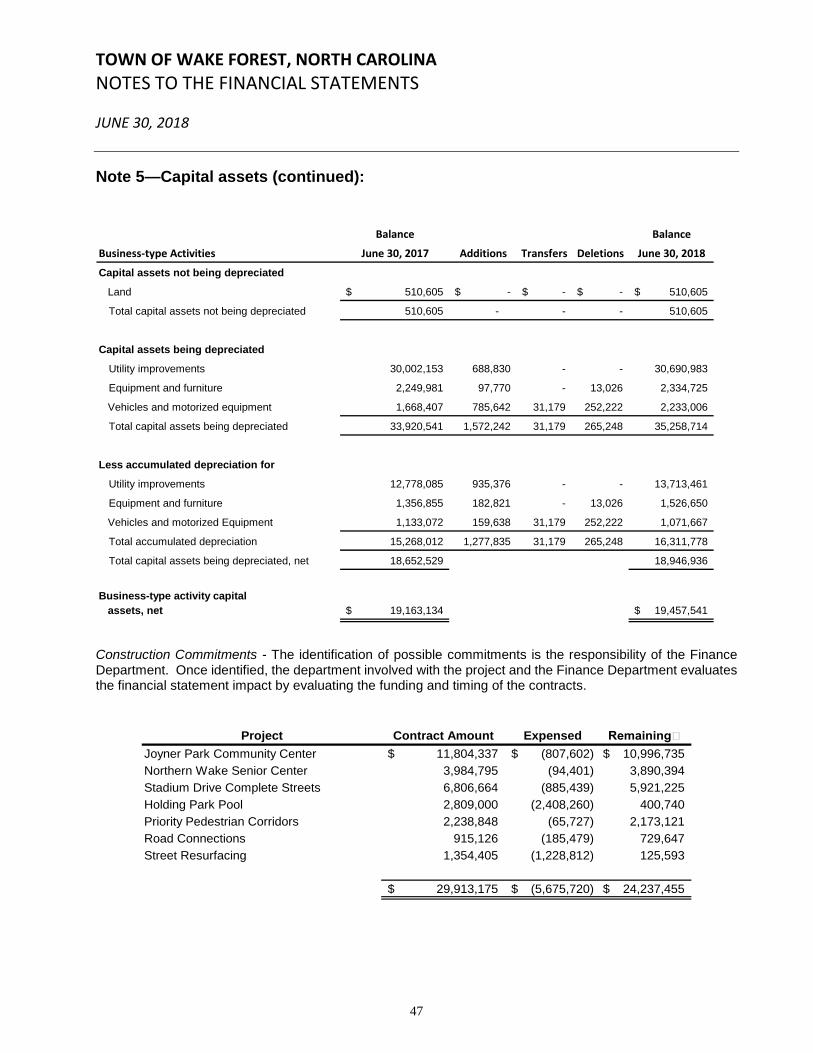
TOWN OF WAKE FOREST, NORTH CAROLINA NOTES TO THE FINANCIAL STATEMENTS JUNE 30, 2018
47
Note 5—Capital assets (continued):
Balance Balance
Business-type Activities June 30, 2017 Additions Transfers Deletions June 30, 2018
Capital assets not being depreciated
Land 510,605$ -$ -$ -$ 510,605$
Total capital assets not being depreciated 510,605 - - - 510,605
Capital assets being depreciated
Utility improvements 30,002,153 688,830 - - 30,690,983
Equipment and furniture 2,249,981 97,770 - 13,026 2,334,725
Vehicles and motorized equipment 1,668,407 785,642 31,179 252,222 2,233,006
Total capital assets being depreciated 33,920,541 1,572,242 31,179 265,248 35,258,714
Less accumulated depreciation for
Utility improvements 12,778,085 935,376 - - 13,713,461
Equipment and furniture 1,356,855 182,821 - 13,026 1,526,650
Vehicles and motorized Equipment 1,133,072 159,638 31,179 252,222 1,071,667
Total accumulated depreciation 15,268,012 1,277,835 31,179 265,248 16,311,778
Total capital assets being depreciated, net 18,652,529 18,946,936
Business-type activity capital assets, net 19,163,134$ 19,457,541$
Construction Commitments - The identification of possible commitments is the responsibility of the Finance Department. Once identified, the department involved with the project and the Finance Department evaluates the financial statement impact by evaluating the funding and timing of the contracts.
Project Contract Amount Expensed RemainingJoyner Park Community Center 11,804,337$ (807,602)$ 10,996,735$ Northern Wake Senior Center 3,984,795 (94,401) 3,890,394 Stadium Drive Complete Streets 6,806,664 (885,439) 5,921,225 Holding Park Pool 2,809,000 (2,408,260) 400,740 Priority Pedestrian Corridors 2,238,848 (65,727) 2,173,121 Road Connections 915,126 (185,479) 729,647 Street Resurfacing 1,354,405 (1,228,812) 125,593
29,913,175$ (5,675,720)$ 24,237,455$
TOWN OF WAKE FOREST, NORTH CAROLINA NOTES TO THE FINANCIAL STATEMENTS JUNE 30, 2018
48
Note 6—Pension plan obligations (a) Local Government Employees’ Retirement System
Plan Description - The Town is a participating employer in the statewide Local Governmental Employees’ Retirement System (LGERS), a cost-sharing multiple-employer defined benefit pension plan administered by the State of North Carolina. LGERS membership is comprised of general employees and local law enforcement officers (LEOs) of participating local governmental entities. Article 3 of G. S. Chapter 128 assigns the authority to establish and amend benefit provisions to the North Carolina General Assembly. Management of the plan is vested by the LGERS Board of Trustees, which consists of 13 members – nine appointed by the Governor, one appointed by the State Senate, one appointed by the State House of Representatives, and the State Treasurer and State Superintendent, who serve as ex-officio members. The Local Governmental Employee’s Retirement System is included in the Comprehensive Annual Financial Report (CAFR) for the State of North Carolina. The State’s CAFR includes financial statements and required supplementary information for LGERS. That report may be obtained by writing to the Office of the State Controller, 1410 Mail Service Center, Raleigh, North Carolina 27699-1410, or by calling (919) 981-5454 or at www.osc.nc.gov. Benefits Provided – LGERS provides retirement and survivor benefits. Retirement benefits are determined as 1.85% of the member’s average final compensation times the member’s years of creditable service. A member’s average final compensation is calculated as the average of a member’s four highest consecutive years of compensation. Plan members are eligible to retire with full retirement benefits at age 65 with five years of creditable service, at age 60 with 25 years of creditable service, or at any age with 30 years of creditable service. Plan members are eligible to retire with partial retirement benefits at age 50 with 20 years of creditable service or at age 60 with five years of creditable service. Survivor benefits are available to eligible beneficiaries of members who die while in active service or within 180 days of their last day of service and who have either completed 20 years of creditable service regardless of age or have completed five years of service and have reached age 60. Eligible beneficiaries may elect to receive a monthly Survivor’s Alternate Benefit for life or a return of the member’s contributions. The plan does not provide for automatic post-retirement benefit increases. Increases are contingent upon actuarial gains of the plan. LGERS plan members who are LEOs are eligible to retire with full retirement benefits at age 55 with five years of creditable service as an officer, or at any age with 30 years of creditable service. LEO plan members are eligible to retire with partial retirement benefits at age 50 with 15 years of creditable service as an officer. Survivor benefits are available to eligible beneficiaries of LEO members who die while in active service or within 180 days of their last day of service and who also have either completed 20 years of creditable service regardless of age, or have completed 15 years of service as a LEO and have reached age 50, or have completed five years of creditable service as a LEO and have reached age 55, or have completed 15 years of creditable service as a LEO if killed in the line of duty. Eligible beneficiaries may elect to receive a monthly Survivor’s Alternate Benefit for life or a return of the member’s contributions. Funding Policy – Contribution provisions are established by General Statute 128-30 and may be amended only by the North Carolina General Assembly. Town of Wake Forest employees are required to contribute six (6%) percent of their annual covered salary. The Town is required to contribute at an actuarially determined rate. For the Town, the current rate for employees not engaged in law enforcement and for law enforcement officers is 7.61% and 8.25%, respectively, of annual covered payroll. The contribution requirements of employees and of the Town are established and may be amended by the North Carolina General Assembly. The Town’s contributions to LGERS for the years ended June 30, 2018, 2017 and 2016 and were $1,129,234, $1,004,600 and $878,134, respectively. The contributions made by the Town equaled the required contributions for each year.
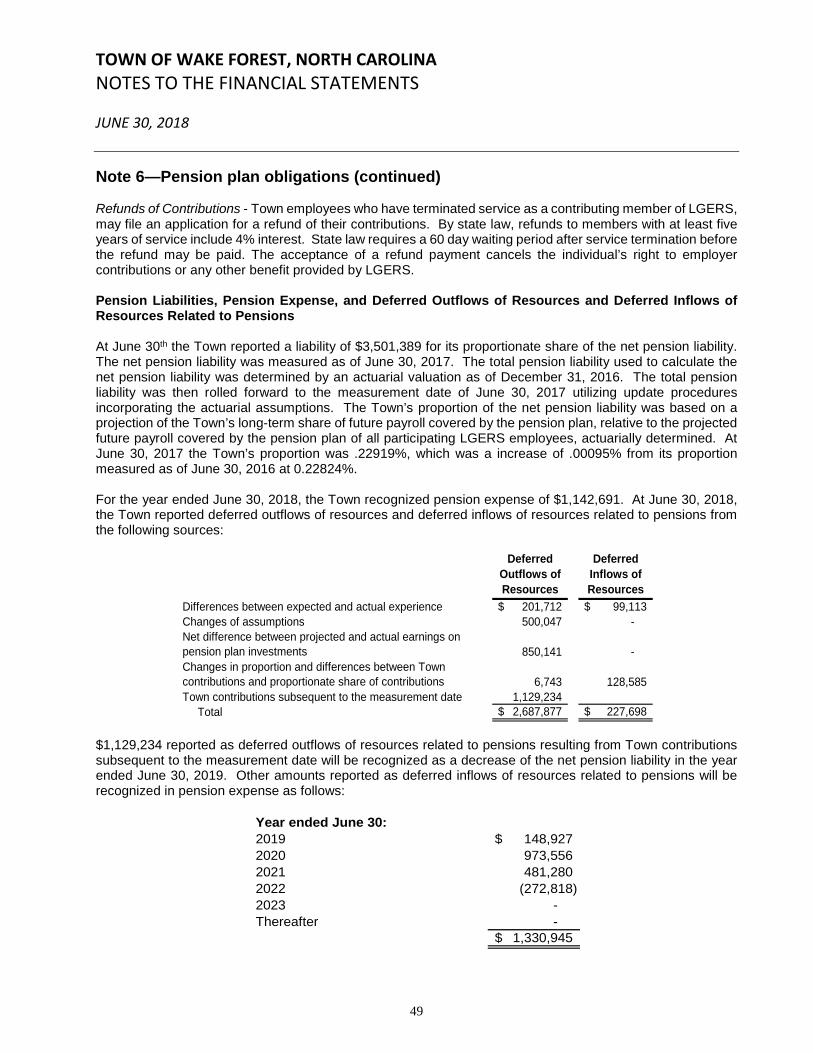
TOWN OF WAKE FOREST, NORTH CAROLINA NOTES TO THE FINANCIAL STATEMENTS JUNE 30, 2018
49
Note 6—Pension plan obligations (continued) Refunds of Contributions - Town employees who have terminated service as a contributing member of LGERS, may file an application for a refund of their contributions. By state law, refunds to members with at least five years of service include 4% interest. State law requires a 60 day waiting period after service termination before the refund may be paid. The acceptance of a refund payment cancels the individual’s right to employer contributions or any other benefit provided by LGERS. Pension Liabilities, Pension Expense, and Deferred Outflows of Resources and Deferred Inflows of Resources Related to Pensions At June 30th the Town reported a liability of $3,501,389 for its proportionate share of the net pension liability. The net pension liability was measured as of June 30, 2017. The total pension liability used to calculate the net pension liability was determined by an actuarial valuation as of December 31, 2016. The total pension liability was then rolled forward to the measurement date of June 30, 2017 utilizing update procedures incorporating the actuarial assumptions. The Town’s proportion of the net pension liability was based on a projection of the Town’s long-term share of future payroll covered by the pension plan, relative to the projected future payroll covered by the pension plan of all participating LGERS employees, actuarially determined. At June 30, 2017 the Town’s proportion was .22919%, which was a increase of .00095% from its proportion measured as of June 30, 2016 at 0.22824%. For the year ended June 30, 2018, the Town recognized pension expense of $1,142,691. At June 30, 2018, the Town reported deferred outflows of resources and deferred inflows of resources related to pensions from the following sources:
Deferred Outflows of Resources
Deferred Inflows of Resources
Differences between expected and actual experience 201,712$ 99,113$ Changes of assumptions 500,047 - Net difference between projected and actual earnings on pension plan investments 850,141 - Changes in proportion and differences between Town contributions and proportionate share of contributions 6,743 128,585 Town contributions subsequent to the measurement date 1,129,234
Total 2,687,877$ 227,698$
$1,129,234 reported as deferred outflows of resources related to pensions resulting from Town contributions subsequent to the measurement date will be recognized as a decrease of the net pension liability in the year ended June 30, 2019. Other amounts reported as deferred inflows of resources related to pensions will be recognized in pension expense as follows:
Year ended June 30:2019 148,927$ 2020 973,556 2021 481,280 2022 (272,818) 2023 - Thereafter -
1,330,945$
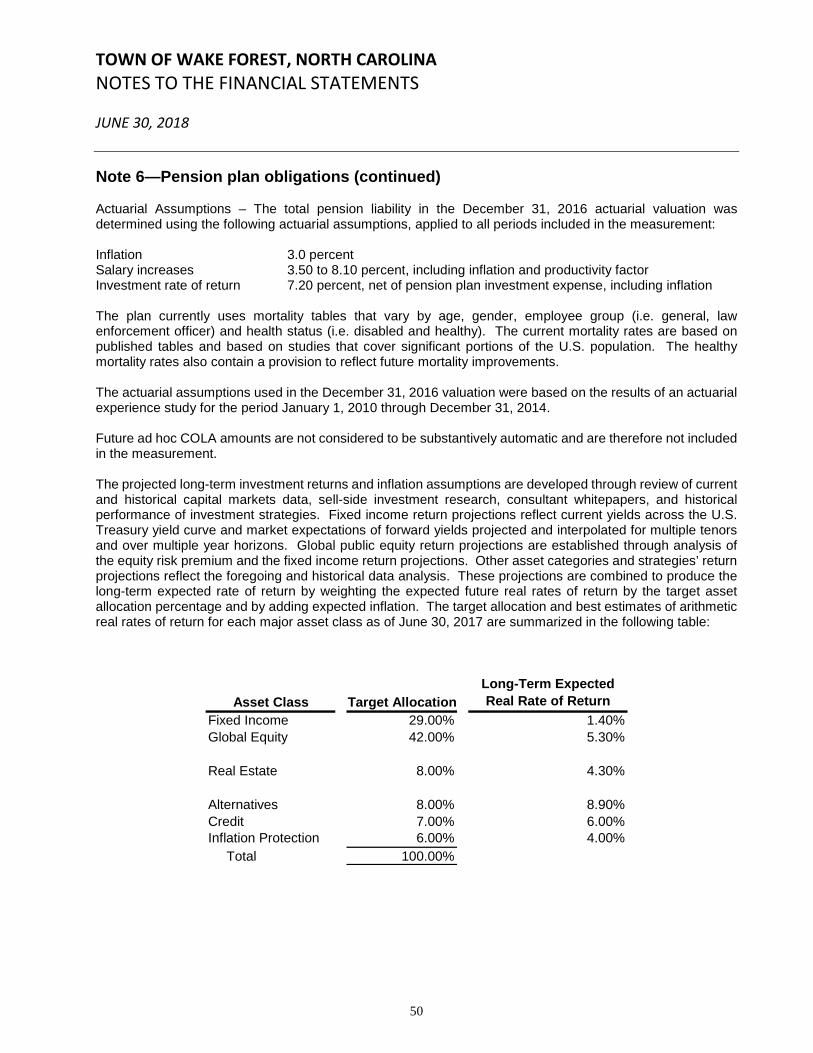
TOWN OF WAKE FOREST, NORTH CAROLINA NOTES TO THE FINANCIAL STATEMENTS JUNE 30, 2018
50
Note 6—Pension plan obligations (continued) Actuarial Assumptions – The total pension liability in the December 31, 2016 actuarial valuation was determined using the following actuarial assumptions, applied to all periods included in the measurement: Inflation 3.0 percent Salary increases 3.50 to 8.10 percent, including inflation and productivity factor Investment rate of return 7.20 percent, net of pension plan investment expense, including inflation The plan currently uses mortality tables that vary by age, gender, employee group (i.e. general, law enforcement officer) and health status (i.e. disabled and healthy). The current mortality rates are based on published tables and based on studies that cover significant portions of the U.S. population. The healthy mortality rates also contain a provision to reflect future mortality improvements. The actuarial assumptions used in the December 31, 2016 valuation were based on the results of an actuarial experience study for the period January 1, 2010 through December 31, 2014. Future ad hoc COLA amounts are not considered to be substantively automatic and are therefore not included in the measurement. The projected long-term investment returns and inflation assumptions are developed through review of current and historical capital markets data, sell-side investment research, consultant whitepapers, and historical performance of investment strategies. Fixed income return projections reflect current yields across the U.S. Treasury yield curve and market expectations of forward yields projected and interpolated for multiple tenors and over multiple year horizons. Global public equity return projections are established through analysis of the equity risk premium and the fixed income return projections. Other asset categories and strategies’ return projections reflect the foregoing and historical data analysis. These projections are combined to produce the long-term expected rate of return by weighting the expected future real rates of return by the target asset allocation percentage and by adding expected inflation. The target allocation and best estimates of arithmetic real rates of return for each major asset class as of June 30, 2017 are summarized in the following table:
Asset Class Target AllocationLong-Term ExpectedReal Rate of Return
Fixed Income 29.00% 1.40%Global Equity 42.00% 5.30%
Real Estate 8.00% 4.30%
Alternatives 8.00% 8.90%Credit 7.00% 6.00%Inflation Protection 6.00% 4.00%
Total 100.00%
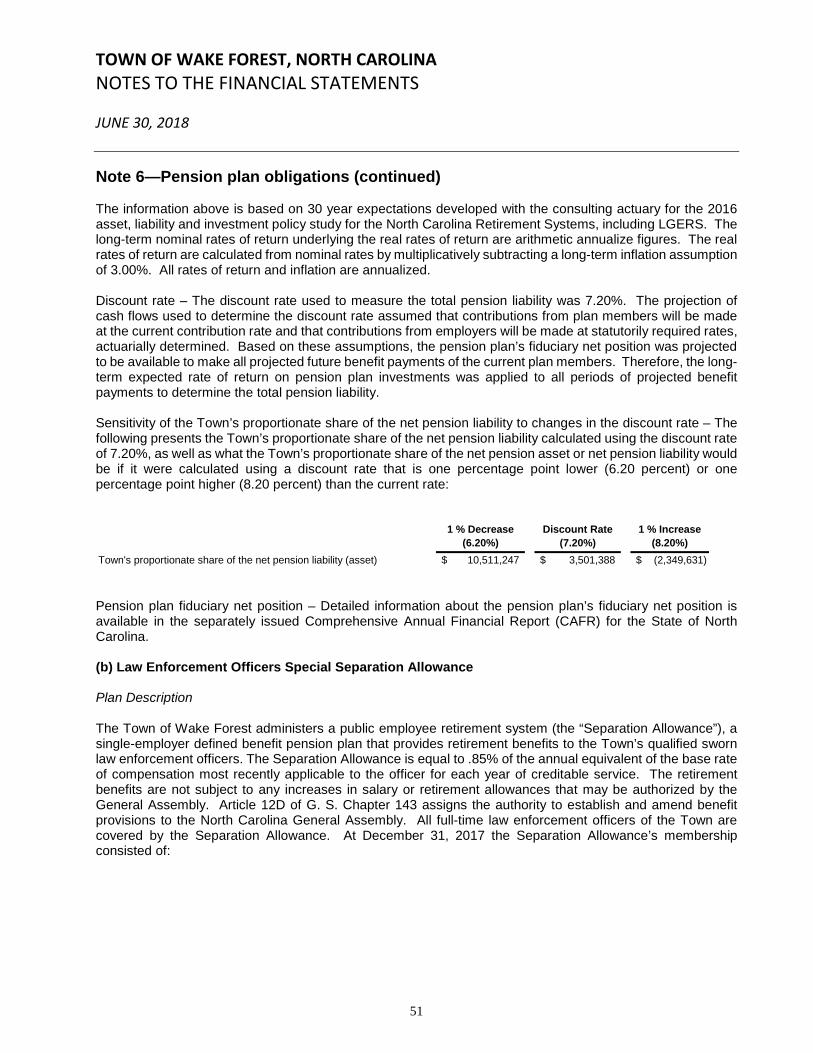
TOWN OF WAKE FOREST, NORTH CAROLINA NOTES TO THE FINANCIAL STATEMENTS JUNE 30, 2018
51
Note 6—Pension plan obligations (continued) The information above is based on 30 year expectations developed with the consulting actuary for the 2016 asset, liability and investment policy study for the North Carolina Retirement Systems, including LGERS. The long-term nominal rates of return underlying the real rates of return are arithmetic annualize figures. The real rates of return are calculated from nominal rates by multiplicatively subtracting a long-term inflation assumption of 3.00%. All rates of return and inflation are annualized. Discount rate – The discount rate used to measure the total pension liability was 7.20%. The projection of cash flows used to determine the discount rate assumed that contributions from plan members will be made at the current contribution rate and that contributions from employers will be made at statutorily required rates, actuarially determined. Based on these assumptions, the pension plan’s fiduciary net position was projected to be available to make all projected future benefit payments of the current plan members. Therefore, the long-term expected rate of return on pension plan investments was applied to all periods of projected benefit payments to determine the total pension liability. Sensitivity of the Town’s proportionate share of the net pension liability to changes in the discount rate – The following presents the Town’s proportionate share of the net pension liability calculated using the discount rate of 7.20%, as well as what the Town’s proportionate share of the net pension asset or net pension liability would be if it were calculated using a discount rate that is one percentage point lower (6.20 percent) or one percentage point higher (8.20 percent) than the current rate:
1 % Decrease(6.20%)
Discount Rate(7.20%)
1 % Increase(8.20%)
Town's proportionate share of the net pension liability (asset) 10,511,247$ 3,501,388$ (2,349,631)$ Pension plan fiduciary net position – Detailed information about the pension plan’s fiduciary net position is available in the separately issued Comprehensive Annual Financial Report (CAFR) for the State of North Carolina. (b) Law Enforcement Officers Special Separation Allowance Plan Description The Town of Wake Forest administers a public employee retirement system (the “Separation Allowance”), a single-employer defined benefit pension plan that provides retirement benefits to the Town’s qualified sworn law enforcement officers. The Separation Allowance is equal to .85% of the annual equivalent of the base rate of compensation most recently applicable to the officer for each year of creditable service. The retirement benefits are not subject to any increases in salary or retirement allowances that may be authorized by the General Assembly. Article 12D of G. S. Chapter 143 assigns the authority to establish and amend benefit provisions to the North Carolina General Assembly. All full-time law enforcement officers of the Town are covered by the Separation Allowance. At December 31, 2017 the Separation Allowance’s membership consisted of:
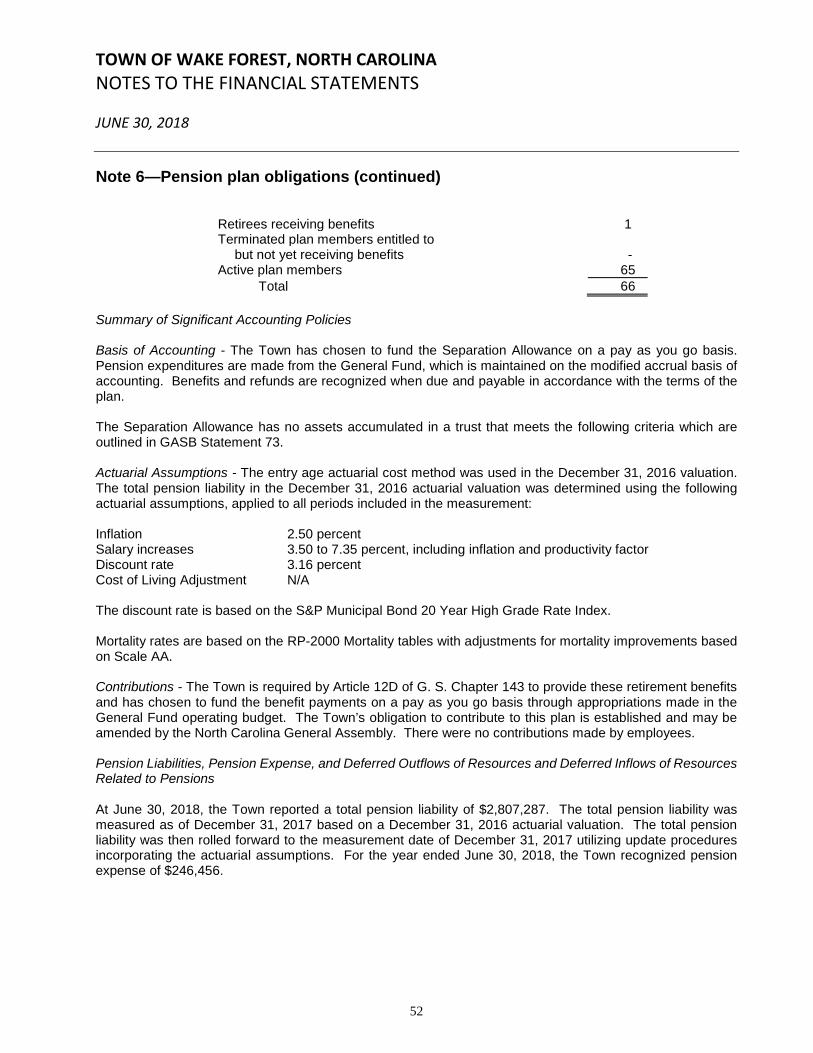
TOWN OF WAKE FOREST, NORTH CAROLINA NOTES TO THE FINANCIAL STATEMENTS JUNE 30, 2018
52
Note 6—Pension plan obligations (continued)
Retirees receiving benefits
1
Terminated plan members entitled to but not yet receiving benefits - Active plan members 65 Total 66
Summary of Significant Accounting Policies Basis of Accounting - The Town has chosen to fund the Separation Allowance on a pay as you go basis. Pension expenditures are made from the General Fund, which is maintained on the modified accrual basis of accounting. Benefits and refunds are recognized when due and payable in accordance with the terms of the plan. The Separation Allowance has no assets accumulated in a trust that meets the following criteria which are outlined in GASB Statement 73. Actuarial Assumptions - The entry age actuarial cost method was used in the December 31, 2016 valuation. The total pension liability in the December 31, 2016 actuarial valuation was determined using the following actuarial assumptions, applied to all periods included in the measurement: Inflation 2.50 percent Salary increases 3.50 to 7.35 percent, including inflation and productivity factor Discount rate 3.16 percent Cost of Living Adjustment N/A The discount rate is based on the S&P Municipal Bond 20 Year High Grade Rate Index. Mortality rates are based on the RP-2000 Mortality tables with adjustments for mortality improvements based on Scale AA. Contributions - The Town is required by Article 12D of G. S. Chapter 143 to provide these retirement benefits and has chosen to fund the benefit payments on a pay as you go basis through appropriations made in the General Fund operating budget. The Town’s obligation to contribute to this plan is established and may be amended by the North Carolina General Assembly. There were no contributions made by employees. Pension Liabilities, Pension Expense, and Deferred Outflows of Resources and Deferred Inflows of Resources Related to Pensions At June 30, 2018, the Town reported a total pension liability of $2,807,287. The total pension liability was measured as of December 31, 2017 based on a December 31, 2016 actuarial valuation. The total pension liability was then rolled forward to the measurement date of December 31, 2017 utilizing update procedures incorporating the actuarial assumptions. For the year ended June 30, 2018, the Town recognized pension expense of $246,456.
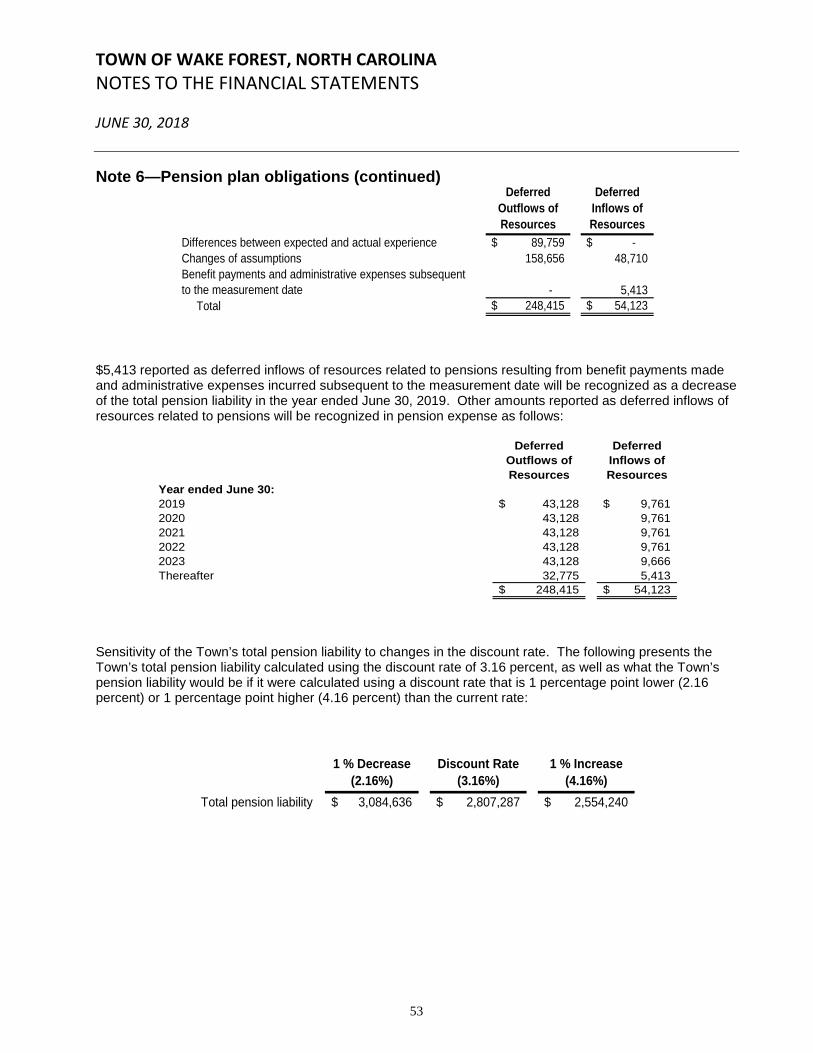
TOWN OF WAKE FOREST, NORTH CAROLINA NOTES TO THE FINANCIAL STATEMENTS JUNE 30, 2018
53
Note 6—Pension plan obligations (continued) Deferred
Outflows of Resources
Deferred Inflows of Resources
Differences between expected and actual experience 89,759$ -$ Changes of assumptions 158,656 48,710 Benefit payments and administrative expenses subsequent to the measurement date - 5,413
Total 248,415$ 54,123$
$5,413 reported as deferred inflows of resources related to pensions resulting from benefit payments made and administrative expenses incurred subsequent to the measurement date will be recognized as a decrease of the total pension liability in the year ended June 30, 2019. Other amounts reported as deferred inflows of resources related to pensions will be recognized in pension expense as follows:
Deferred Outflows of Resources
Deferred Inflows of Resources
Year ended June 30:2019 43,128$ 9,761$ 2020 43,128 9,761 2021 43,128 9,761 2022 43,128 9,761 2023 43,128 9,666 Thereafter 32,775 5,413
248,415$ 54,123$
Sensitivity of the Town’s total pension liability to changes in the discount rate. The following presents the Town’s total pension liability calculated using the discount rate of 3.16 percent, as well as what the Town’s pension liability would be if it were calculated using a discount rate that is 1 percentage point lower (2.16 percent) or 1 percentage point higher (4.16 percent) than the current rate:
1 % Decrease(2.16%)
Discount Rate(3.16%)
1 % Increase(4.16%)
Total pension liability 3,084,636$ 2,807,287$ 2,554,240$
TOWN OF WAKE FOREST, NORTH CAROLINA NOTES TO THE FINANCIAL STATEMENTS JUNE 30, 2018
54
Note 6—Pension plan obligations (continued)
Total Pension Liability as of December 31, 2016 2,307,794$ Changes for the year:
Service Cost 123,548 Interest on the total pension liability 88,992 Changes of benefit terms - Differences between expected and actual experience in the measurement of the total pension liability 105,342 Changes of assumptions or other inputs 186,201 Benefit payments (4,590) Other changes -
Net changes 499,493 Total Pension Liability as of December 31, 2017 2,807,287$
Schedule of Changes in Total Pension Liability Law Enforcement Officers' Special Separation Allowance
The plan currently uses mortality tables that vary by age and health status (i.e. disabled and healthy). The current mortality rates are based on published tables and based on studies that cover significant portions of the U.S. population. The healthy mortality rates also contain a provision to reflect future mortality improvements.
The actuarial assumptions used in the December 31, 2016 valuation were based on the results of an actuarial experience study for the period January 1, 2010 through December 31, 2014. Total Expense, Liabilities and Deferred Outflows and Inflows of Resources Related to Pensions Following is information related to the proportionate share and pension expense for all pension plans:
LGERS LEOSSA TotalPension Expense 1,142,691$ 246,456$ 1,389,147$ Pension Liability 3,501,388 2,807,287 6,308,675 Proportionate share of the net pension liability 0.22919% 100%
Deferred Outflows of ResourcesDifferences between expected and actual experience 201,712 89,759 291,471 Changes of assumptions 500,047 158,656 658,703 Net difference between projected and actual earnings on plan investments 850,141 - 850,141 Changes in proportion and differences between contributions and proportionate share of contributions 6,743 - 6,743 Benefit payments and administrative costs paid subsequent to the measurement date 1,129,234 4,590 1,133,824
Deferred Inflows of ResourcesDifferences between expected and actual experience 99,113 - 99,113 Changes of assumptions - 48,710 48,710 Net difference between projected and actual earnings on plan investments - - - Changes in proportion and differences between contributions and proportionate share of contributions 128,585 - 128,585 Benefit pyaments and administrative costs paid subsequent to the measurement date - 5,413 5,413
TOWN OF WAKE FOREST, NORTH CAROLINA NOTES TO THE FINANCIAL STATEMENTS JUNE 30, 2018
55
Note 6—Pension plan obligations (continued) (c) Supplemental Retirement Income Plan for Law Enforcement Officers Plan Description - The Town contributes to the Supplemental Retirement Income Plan (Plan), a defined contribution pension plan administered by the Department of State Treasurer and a Board of Trustees. The Plan provides retirement benefits to law enforcement officers employed by the Town. Article 5 of G. S. Chapter 135 assigns the authority to establish and amend benefit provisions to the North Carolina General Assembly. The Supplemental Retirement Income Plan for Law Enforcement Officers is included in the Comprehensive Annual Financial Report (CAFR) for the State of North Carolina. The State’s CAFR includes the pension trust fund financial statements for the Internal Revenue Code Section 401 (k) plan that includes the Supplemental Retirement Income Plan for Law Enforcement Officers. That report may be obtained by writing to the Office of the State controller, 1410 Mail Service Center, Raleigh, North Carolina 27699-1410, or by calling (919) 981-5454. Funding Policy - Article 12E of G. S. Chapter 143 requires the Town to contribute each month an amount equal to 5% of each officer’s salary, and all amounts contributed are vested immediately. The Law Enforcement Officers may also make voluntary contributions to the plan. Contributions for the year ended June 30, 2018 were $317,224, which consisted of $225,443 from the Town and $91,782 from the law enforcement officers. (d) Supplemental Retirement Income Plan for all Other Employees Plan Description - All other employees of the Town (excluding Law Enforcement Officers) are members of the Town’s 401(k) plan, a defined contribution pension plan as described above. Funding Policy - The Town contributes each month an amount equal to 5% of eligible employee’s salary, and all amounts contributed are vested immediately. Also, the employees may make voluntary contributions to the plan. Contributions for the year ended June 30, 2018 were $703,245, which consisted of $475,909 from the Town and $227,336 from employees. (e) Other Postemployment Benefit (OPEB) – Healthcare Benefits Plan Description - Under a Town resolution July 1, 2008, the Town provides healthcare benefits through the Healthcare Benefits Plan (HCB Plan) as a single-employer defined benefit plan to cover retirees of the Town who participate in the North Carolina Local Government Employees’ Retirement System (System) and have met certain service requirements with the Town. Employees hired after April 15, 2003 who have 20 or more years of continuous creditable service with the Town at the time of their retirement will receive full benefits; those with 15-19 years of continuous creditable service with the Town will receive one-half of the benefits. Employees hired prior to April 15, 2003 who have 15 or more years of service at retirement will receive full benefits; those with 5-14 years of service will receive one-half of the benefits. This resolution was amended on May 15, 2018 by the Town Board, employees hired on or after July 1, 2018 will no longer be eligible to receive this benefit. Also, the Town’s retirees can purchase coverage for their dependents at the Town’s group rates. The Town Board may amend the benefit provisions. A separate report was not issued for the plan.
TOWN OF WAKE FOREST, NORTH CAROLINA NOTES TO THE FINANCIAL STATEMENTS JUNE 30, 2018
56
Note 6—Pension plan obligations (continued)
Retired employees' years of creditable service - continuous Pre-April 15, 2003
After-April 15, 2003 but before July 1, 2018 After July 1, 2018
20+ years Full Benefits Full Benefits No Benefits
15 - 19 years Full Benefits Half Benefits No Benefits
5 - 14 years Half Benefits No Benefits No Benefits
up to 5 years No Benefits No Benefits No Benefits
Date Hired
Membership of the HCB Plan consisted of the following at June 30, 2017, the date of the latest actuarial valuation:
Law General Enforcement Employees Officers Retirees and dependents receiving benefits 33 4 Terminated plan members entitled to but not yet receiving benefits - - Active plan members 143 69 Total 176 73
Funding Policy - The Board of Commissioners established the contribution requirements of plan members and this may be amended by the Board. Employees pay $419 per month for dependent coverage and $969 per month for family coverage. The Town has chosen to fund the healthcare benefits on a pay as you go basis. Total OPEB Liability The Town’s total OPEB liability of $19,593,442 was measured as of June 30, 2017 and was determined by an actuarial valuation as of that date. Actuarial assumptions and other inputs. The total OPEB liability in the June 30, 2017 actuarial valuation was determined using the following actuarial assumptions and other inputs, applied to all periods included in the measurement unless otherwise specified: Inflation 2.50 percent Salary increases 3.50 to 7.75 percent, including inflation for General Employees 3.50 to 7.35 percent, including inflation for Law Enforcement Officers Discount rate 3.56 percent Healthcare cost trend rates Pre-medicare: 7.50 percent for 2017 decreasing to an ultimate rate of 5.00 percent by 2023 Medicare: 5.50 percent for 2017 decreasing to an ultimate rate of 5.00 percent by 2020
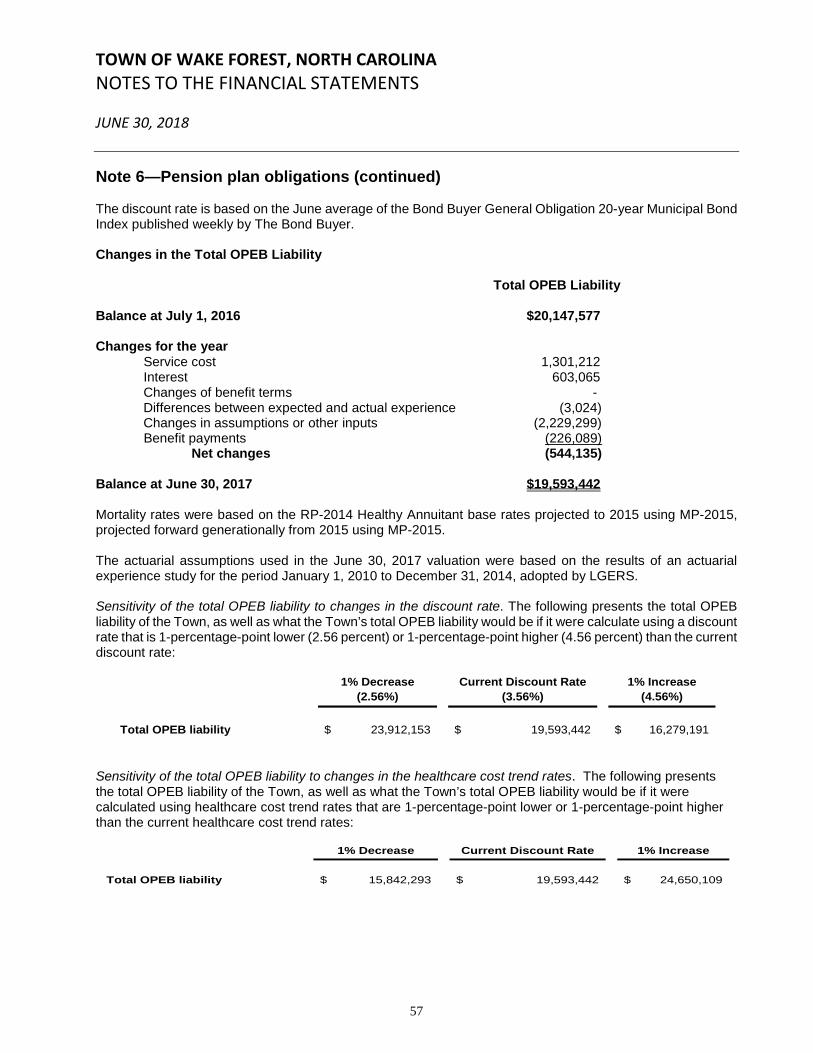
TOWN OF WAKE FOREST, NORTH CAROLINA NOTES TO THE FINANCIAL STATEMENTS JUNE 30, 2018
57
Note 6—Pension plan obligations (continued) The discount rate is based on the June average of the Bond Buyer General Obligation 20-year Municipal Bond Index published weekly by The Bond Buyer. Changes in the Total OPEB Liability Total OPEB Liability Balance at July 1, 2016 $20,147,577 Changes for the year Service cost 1,301,212 Interest 603,065 Changes of benefit terms - Differences between expected and actual experience (3,024) Changes in assumptions or other inputs (2,229,299) Benefit payments (226,089) Net changes (544,135) Balance at June 30, 2017 $19,593,442 Mortality rates were based on the RP-2014 Healthy Annuitant base rates projected to 2015 using MP-2015, projected forward generationally from 2015 using MP-2015. The actuarial assumptions used in the June 30, 2017 valuation were based on the results of an actuarial experience study for the period January 1, 2010 to December 31, 2014, adopted by LGERS. Sensitivity of the total OPEB liability to changes in the discount rate. The following presents the total OPEB liability of the Town, as well as what the Town’s total OPEB liability would be if it were calculate using a discount rate that is 1-percentage-point lower (2.56 percent) or 1-percentage-point higher (4.56 percent) than the current discount rate:
1% Decrease(2.56%)
Current Discount Rate(3.56%)
1% Increase(4.56%)
Total OPEB liability 23,912,153$ 19,593,442$ 16,279,191$
Sensitivity of the total OPEB liability to changes in the healthcare cost trend rates. The following presents the total OPEB liability of the Town, as well as what the Town’s total OPEB liability would be if it were calculated using healthcare cost trend rates that are 1-percentage-point lower or 1-percentage-point higher than the current healthcare cost trend rates:
1% Decrease Current Discount Rate 1% Increase
Total OPEB liability 15,842,293$ 19,593,442$ 24,650,109$
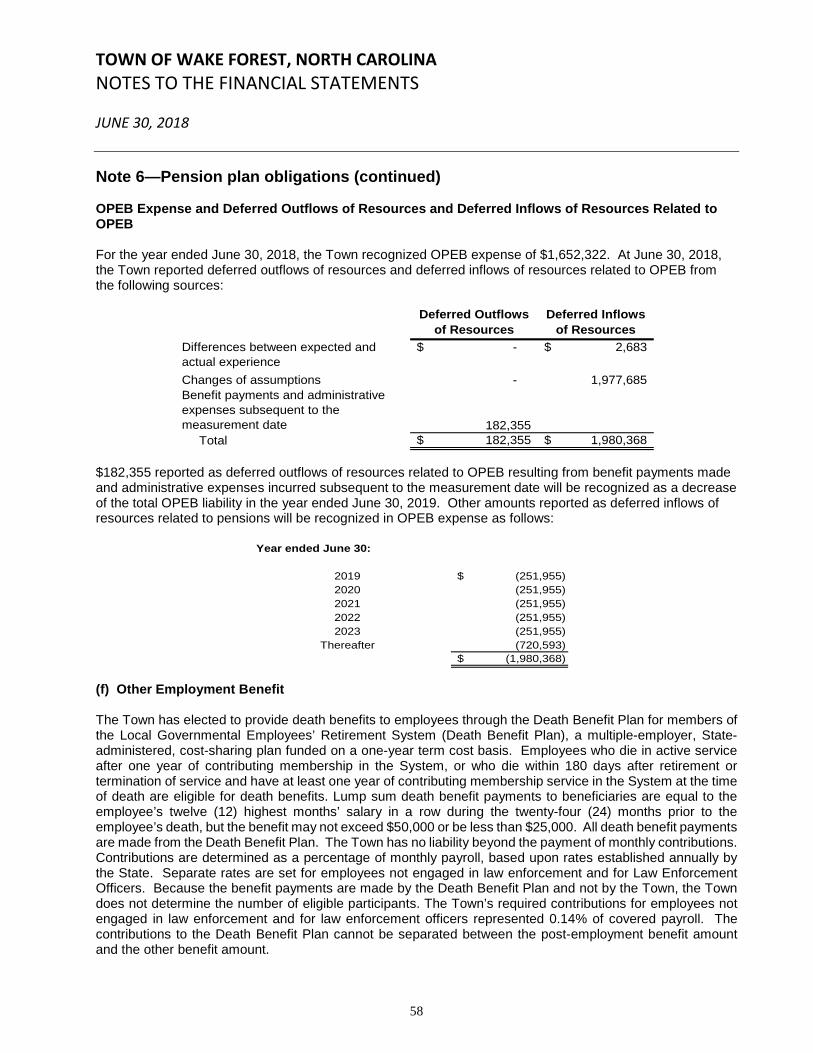
TOWN OF WAKE FOREST, NORTH CAROLINA NOTES TO THE FINANCIAL STATEMENTS JUNE 30, 2018
58
Note 6—Pension plan obligations (continued) OPEB Expense and Deferred Outflows of Resources and Deferred Inflows of Resources Related to OPEB For the year ended June 30, 2018, the Town recognized OPEB expense of $1,652,322. At June 30, 2018, the Town reported deferred outflows of resources and deferred inflows of resources related to OPEB from the following sources:
Deferred Outflows of Resources
Deferred Inflows of Resources
Differences between expected and actual experience
-$ 2,683$
Changes of assumptions - 1,977,685 Benefit payments and administrative expenses subsequent to the measurement date 182,355
Total 182,355$ 1,980,368$
$182,355 reported as deferred outflows of resources related to OPEB resulting from benefit payments made and administrative expenses incurred subsequent to the measurement date will be recognized as a decrease of the total OPEB liability in the year ended June 30, 2019. Other amounts reported as deferred inflows of resources related to pensions will be recognized in OPEB expense as follows:
Year ended June 30:
2019 (251,955)$ 2020 (251,955)2021 (251,955)2022 (251,955)2023 (251,955)
Thereafter (720,593)(1,980,368)$
(f) Other Employment Benefit The Town has elected to provide death benefits to employees through the Death Benefit Plan for members of the Local Governmental Employees’ Retirement System (Death Benefit Plan), a multiple-employer, State-administered, cost-sharing plan funded on a one-year term cost basis. Employees who die in active service after one year of contributing membership in the System, or who die within 180 days after retirement or termination of service and have at least one year of contributing membership service in the System at the time of death are eligible for death benefits. Lump sum death benefit payments to beneficiaries are equal to the employee’s twelve (12) highest months’ salary in a row during the twenty-four (24) months prior to the employee’s death, but the benefit may not exceed $50,000 or be less than $25,000. All death benefit payments are made from the Death Benefit Plan. The Town has no liability beyond the payment of monthly contributions. Contributions are determined as a percentage of monthly payroll, based upon rates established annually by the State. Separate rates are set for employees not engaged in law enforcement and for Law Enforcement Officers. Because the benefit payments are made by the Death Benefit Plan and not by the Town, the Town does not determine the number of eligible participants. The Town’s required contributions for employees not engaged in law enforcement and for law enforcement officers represented 0.14% of covered payroll. The contributions to the Death Benefit Plan cannot be separated between the post-employment benefit amount and the other benefit amount.
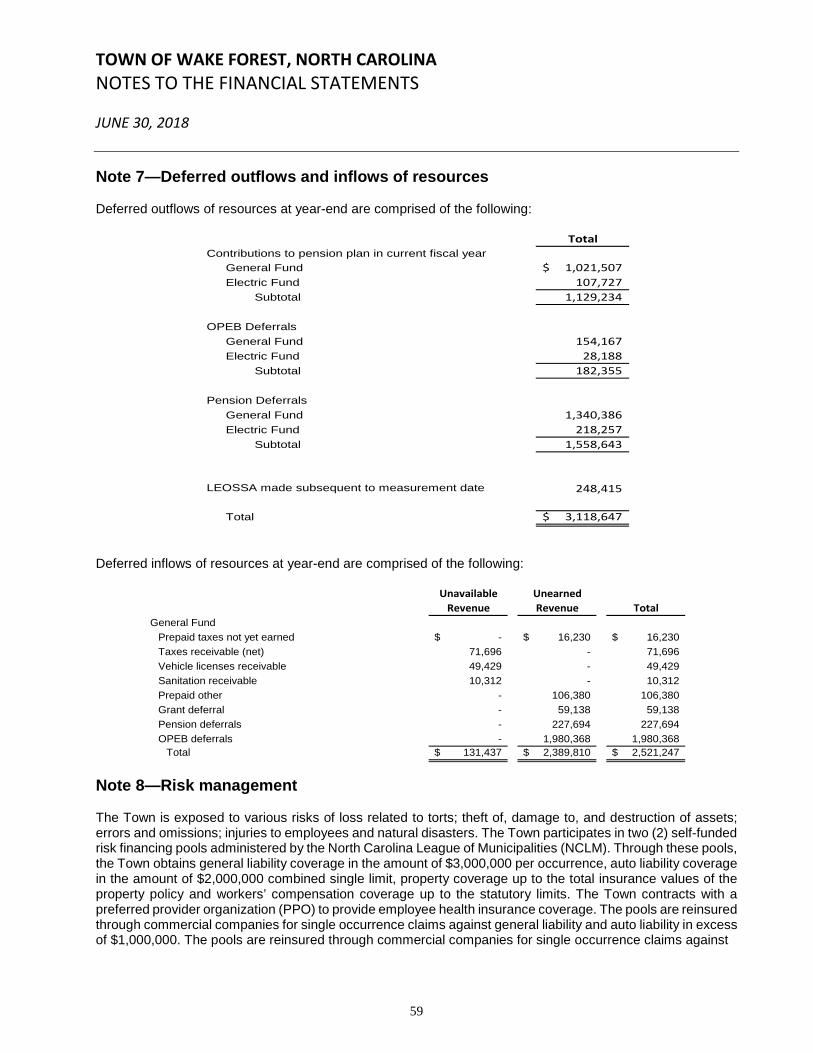
TOWN OF WAKE FOREST, NORTH CAROLINA NOTES TO THE FINANCIAL STATEMENTS JUNE 30, 2018
59
Note 7—Deferred outflows and inflows of resources Deferred outflows of resources at year-end are comprised of the following:
TotalContributions to pension plan in current fiscal year
General Fund 1,021,507$ Electric Fund 107,727
Subtotal 1,129,234
OPEB DeferralsGeneral Fund 154,167 Electric Fund 28,188
Subtotal 182,355
Pension DeferralsGeneral Fund 1,340,386 Electric Fund 218,257
Subtotal 1,558,643
LEOSSA made subsequent to measurement date 248,415
Total 3,118,647$
Deferred inflows of resources at year-end are comprised of the following:
Unavailable UnearnedRevenue Revenue Total
General FundPrepaid taxes not yet earned -$ 16,230$ 16,230$ Taxes receivable (net) 71,696 - 71,696 Vehicle licenses receivable 49,429 - 49,429 Sanitation receivable 10,312 - 10,312 Prepaid other - 106,380 106,380 Grant deferral - 59,138 59,138 Pension deferrals - 227,694 227,694 OPEB deferrals - 1,980,368 1,980,368
Total 131,437$ 2,389,810$ 2,521,247$
Note 8—Risk management The Town is exposed to various risks of loss related to torts; theft of, damage to, and destruction of assets; errors and omissions; injuries to employees and natural disasters. The Town participates in two (2) self-funded risk financing pools administered by the North Carolina League of Municipalities (NCLM). Through these pools, the Town obtains general liability coverage in the amount of $3,000,000 per occurrence, auto liability coverage in the amount of $2,000,000 combined single limit, property coverage up to the total insurance values of the property policy and workers’ compensation coverage up to the statutory limits. The Town contracts with a preferred provider organization (PPO) to provide employee health insurance coverage. The pools are reinsured through commercial companies for single occurrence claims against general liability and auto liability in excess of $1,000,000. The pools are reinsured through commercial companies for single occurrence claims against
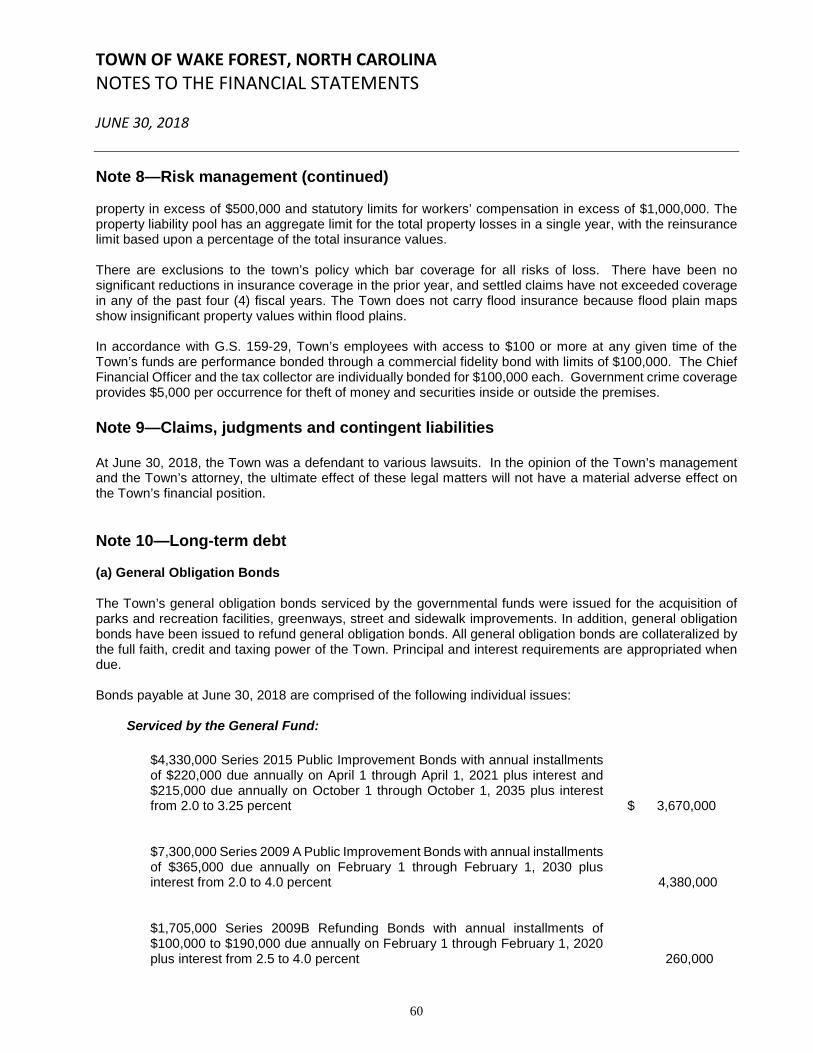
TOWN OF WAKE FOREST, NORTH CAROLINA NOTES TO THE FINANCIAL STATEMENTS JUNE 30, 2018
60
Note 8—Risk management (continued) property in excess of $500,000 and statutory limits for workers’ compensation in excess of $1,000,000. The property liability pool has an aggregate limit for the total property losses in a single year, with the reinsurance limit based upon a percentage of the total insurance values. There are exclusions to the town’s policy which bar coverage for all risks of loss. There have been no significant reductions in insurance coverage in the prior year, and settled claims have not exceeded coverage in any of the past four (4) fiscal years. The Town does not carry flood insurance because flood plain maps show insignificant property values within flood plains. In accordance with G.S. 159-29, Town’s employees with access to $100 or more at any given time of the Town’s funds are performance bonded through a commercial fidelity bond with limits of $100,000. The Chief Financial Officer and the tax collector are individually bonded for $100,000 each. Government crime coverage provides $5,000 per occurrence for theft of money and securities inside or outside the premises. Note 9—Claims, judgments and contingent liabilities At June 30, 2018, the Town was a defendant to various lawsuits. In the opinion of the Town’s management and the Town’s attorney, the ultimate effect of these legal matters will not have a material adverse effect on the Town’s financial position. Note 10—Long-term debt (a) General Obligation Bonds The Town’s general obligation bonds serviced by the governmental funds were issued for the acquisition of parks and recreation facilities, greenways, street and sidewalk improvements. In addition, general obligation bonds have been issued to refund general obligation bonds. All general obligation bonds are collateralized by the full faith, credit and taxing power of the Town. Principal and interest requirements are appropriated when due. Bonds payable at June 30, 2018 are comprised of the following individual issues: Serviced by the General Fund:
$4,330,000 Series 2015 Public Improvement Bonds with annual installments
of $220,000 due annually on April 1 through April 1, 2021 plus interest and $215,000 due annually on October 1 through October 1, 2035 plus interest from 2.0 to 3.25 percent $ 3,670,000
$7,300,000 Series 2009 A Public Improvement Bonds with annual installments of $365,000 due annually on February 1 through February 1, 2030 plus interest from 2.0 to 4.0 percent 4,380,000
$1,705,000 Series 2009B Refunding Bonds with annual installments of $100,000 to $190,000 due annually on February 1 through February 1, 2020 plus interest from 2.5 to 4.0 percent 260,000
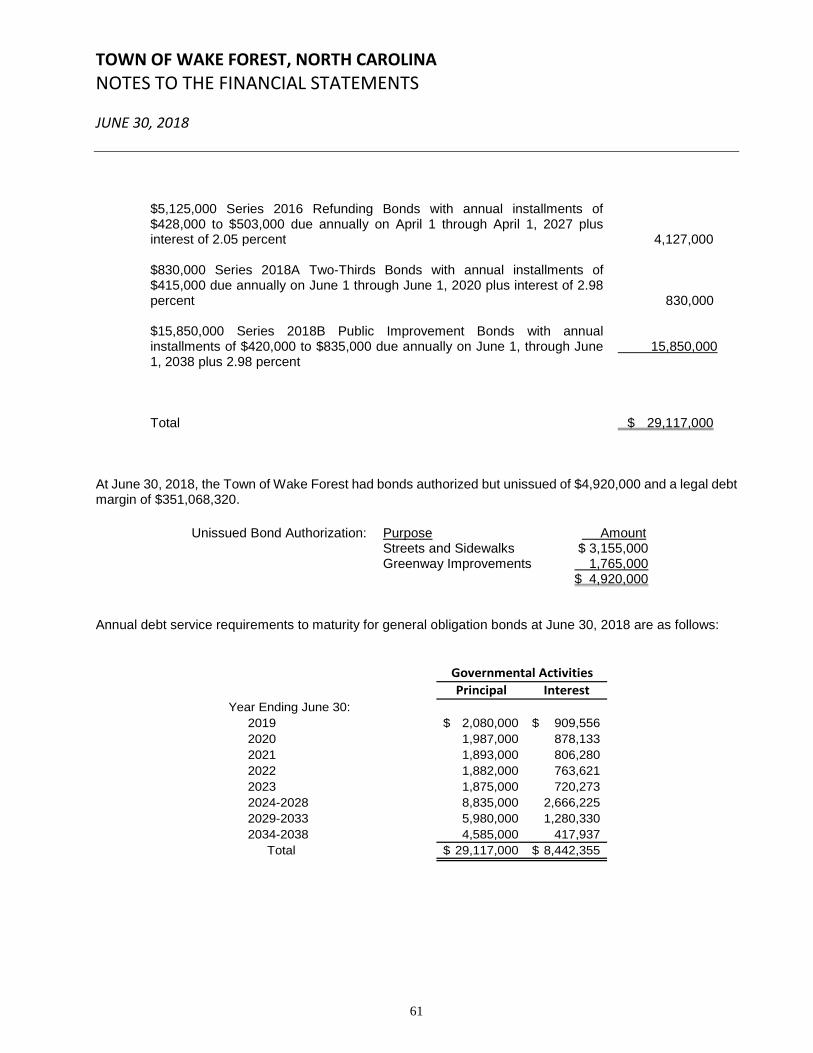
TOWN OF WAKE FOREST, NORTH CAROLINA NOTES TO THE FINANCIAL STATEMENTS JUNE 30, 2018
61
$5,125,000 Series 2016 Refunding Bonds with annual installments of $428,000 to $503,000 due annually on April 1 through April 1, 2027 plus interest of 2.05 percent 4,127,000
$830,000 Series 2018A Two-Thirds Bonds with annual installments of $415,000 due annually on June 1 through June 1, 2020 plus interest of 2.98 percent $15,850,000 Series 2018B Public Improvement Bonds with annual installments of $420,000 to $835,000 due annually on June 1, through June 1, 2038 plus 2.98 percent Total
830,000 15,850,000 $ 29,117,000
At June 30, 2018, the Town of Wake Forest had bonds authorized but unissued of $4,920,000 and a legal debt margin of $351,068,320.
Unissued Bond Authorization: Purpose Amount Streets and Sidewalks $ 3,155,000 Greenway Improvements 1,765,000 $ 4,920,000 Annual debt service requirements to maturity for general obligation bonds at June 30, 2018 are as follows:
Principal InterestYear Ending June 30:
2019 2,080,000$ 909,556$ 2020 1,987,000 878,133 2021 1,893,000 806,280 2022 1,882,000 763,621 2023 1,875,000 720,273 2024-2028 8,835,000 2,666,225 2029-2033 5,980,000 1,280,330 2034-2038 4,585,000 417,937
Total 29,117,000$ 8,442,355$
Governmental Activities
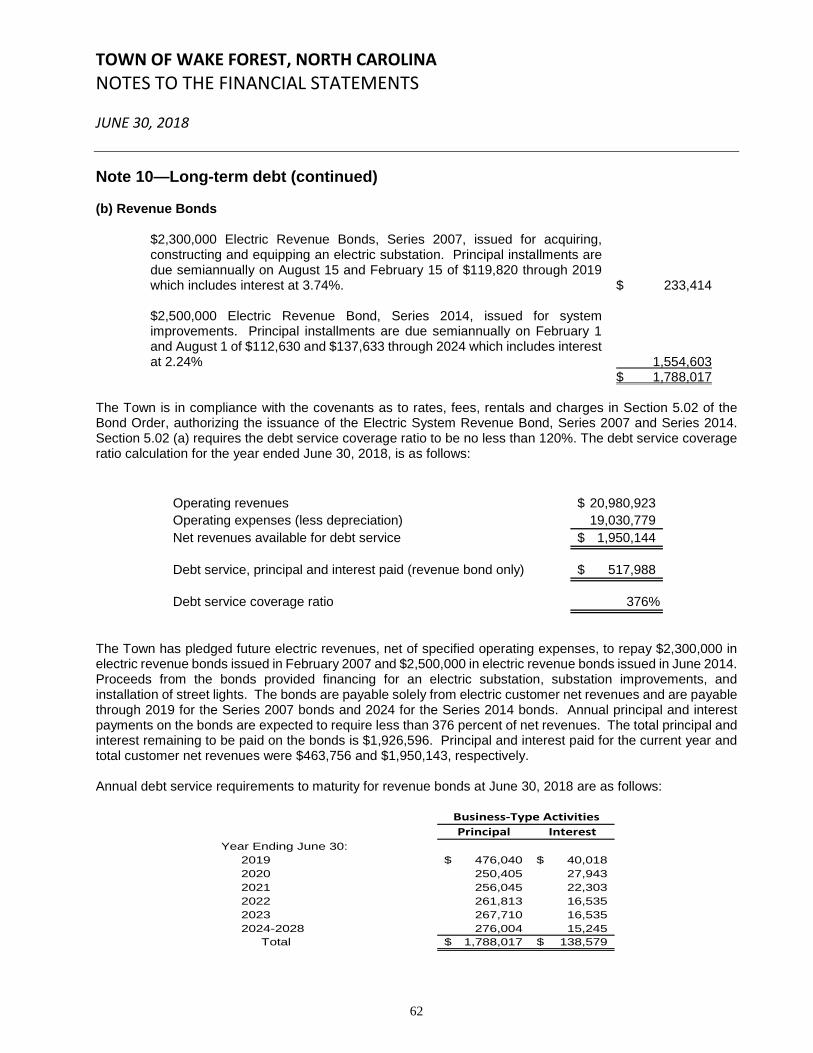
TOWN OF WAKE FOREST, NORTH CAROLINA NOTES TO THE FINANCIAL STATEMENTS JUNE 30, 2018
62
Note 10—Long-term debt (continued) (b) Revenue Bonds
$2,300,000 Electric Revenue Bonds, Series 2007, issued for acquiring, constructing and equipping an electric substation. Principal installments are due semiannually on August 15 and February 15 of $119,820 through 2019 which includes interest at 3.74%. $ 233,414
$2,500,000 Electric Revenue Bond, Series 2014, issued for system improvements. Principal installments are due semiannually on February 1 and August 1 of $112,630 and $137,633 through 2024 which includes interest at 2.24% 1,554,603
$ 1,788,017
The Town is in compliance with the covenants as to rates, fees, rentals and charges in Section 5.02 of the Bond Order, authorizing the issuance of the Electric System Revenue Bond, Series 2007 and Series 2014. Section 5.02 (a) requires the debt service coverage ratio to be no less than 120%. The debt service coverage ratio calculation for the year ended June 30, 2018, is as follows:
Operating revenues 20,980,923$ Operating expenses (less depreciation) 19,030,779 Net revenues available for debt service 1,950,144$
Debt service, principal and interest paid (revenue bond only) 517,988$
Debt service coverage ratio 376%
The Town has pledged future electric revenues, net of specified operating expenses, to repay $2,300,000 in electric revenue bonds issued in February 2007 and $2,500,000 in electric revenue bonds issued in June 2014. Proceeds from the bonds provided financing for an electric substation, substation improvements, and installation of street lights. The bonds are payable solely from electric customer net revenues and are payable through 2019 for the Series 2007 bonds and 2024 for the Series 2014 bonds. Annual principal and interest payments on the bonds are expected to require less than 376 percent of net revenues. The total principal and interest remaining to be paid on the bonds is $1,926,596. Principal and interest paid for the current year and total customer net revenues were $463,756 and $1,950,143, respectively. Annual debt service requirements to maturity for revenue bonds at June 30, 2018 are as follows:
Principal InterestYear Ending June 30:
2019 476,040$ 40,018$ 2020 250,405 27,943 2021 256,045 22,303 2022 261,813 16,535 2023 267,710 16,535 2024-2028 276,004 15,245
Total 1,788,017$ 138,579$
Business-Type Activities
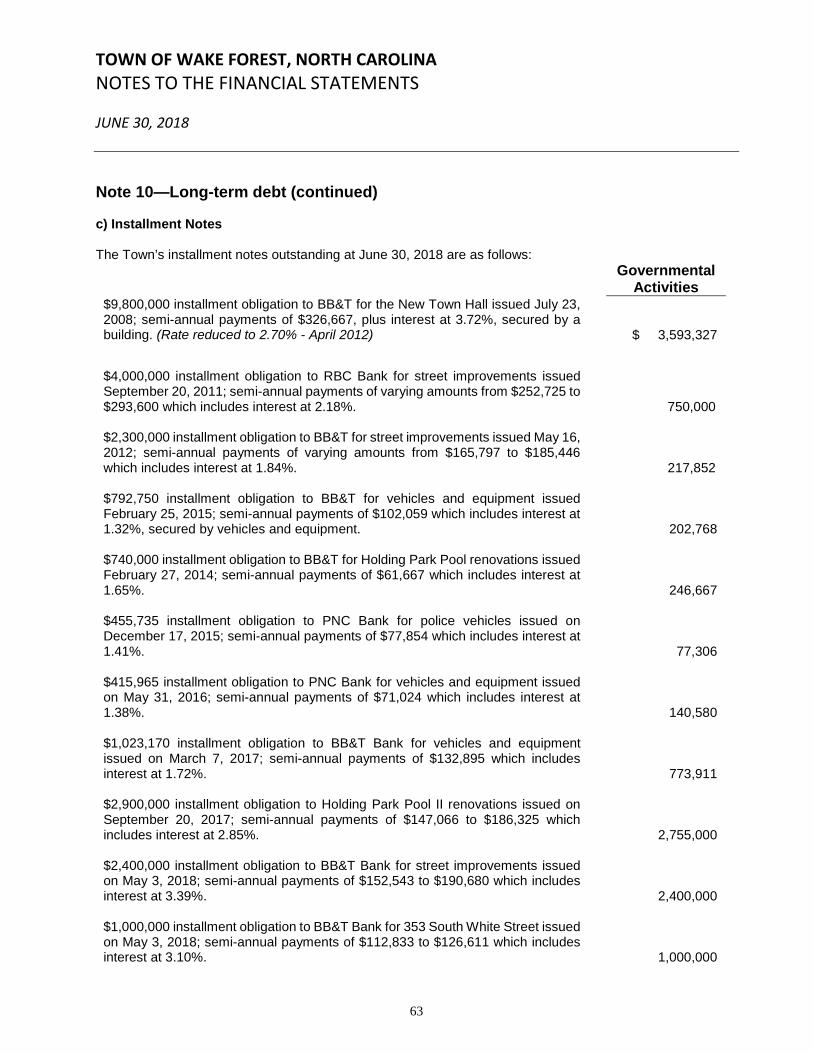
TOWN OF WAKE FOREST, NORTH CAROLINA NOTES TO THE FINANCIAL STATEMENTS JUNE 30, 2018
63
Note 10—Long-term debt (continued) c) Installment Notes The Town’s installment notes outstanding at June 30, 2018 are as follows:
Governmental
Activities $9,800,000 installment obligation to BB&T for the New Town Hall issued July 23, 2008; semi-annual payments of $326,667, plus interest at 3.72%, secured by a building. (Rate reduced to 2.70% - April 2012) $ 3,593,327
$4,000,000 installment obligation to RBC Bank for street improvements issued September 20, 2011; semi-annual payments of varying amounts from $252,725 to $293,600 which includes interest at 2.18%. 750,000 $2,300,000 installment obligation to BB&T for street improvements issued May 16, 2012; semi-annual payments of varying amounts from $165,797 to $185,446 which includes interest at 1.84%. 217,852 $792,750 installment obligation to BB&T for vehicles and equipment issued February 25, 2015; semi-annual payments of $102,059 which includes interest at 1.32%, secured by vehicles and equipment. 202,768 $740,000 installment obligation to BB&T for Holding Park Pool renovations issued February 27, 2014; semi-annual payments of $61,667 which includes interest at 1.65%. 246,667 $455,735 installment obligation to PNC Bank for police vehicles issued on December 17, 2015; semi-annual payments of $77,854 which includes interest at 1.41%. 77,306 $415,965 installment obligation to PNC Bank for vehicles and equipment issued on May 31, 2016; semi-annual payments of $71,024 which includes interest at 1.38%. 140,580 $1,023,170 installment obligation to BB&T Bank for vehicles and equipment issued on March 7, 2017; semi-annual payments of $132,895 which includes interest at 1.72%. 773,911 $2,900,000 installment obligation to Holding Park Pool II renovations issued on September 20, 2017; semi-annual payments of $147,066 to $186,325 which includes interest at 2.85%.
2,755,000
$2,400,000 installment obligation to BB&T Bank for street improvements issued on May 3, 2018; semi-annual payments of $152,543 to $190,680 which includes interest at 3.39%.
2,400,000
$1,000,000 installment obligation to BB&T Bank for 353 South White Street issued on May 3, 2018; semi-annual payments of $112,833 to $126,611 which includes interest at 3.10%.
1,000,000
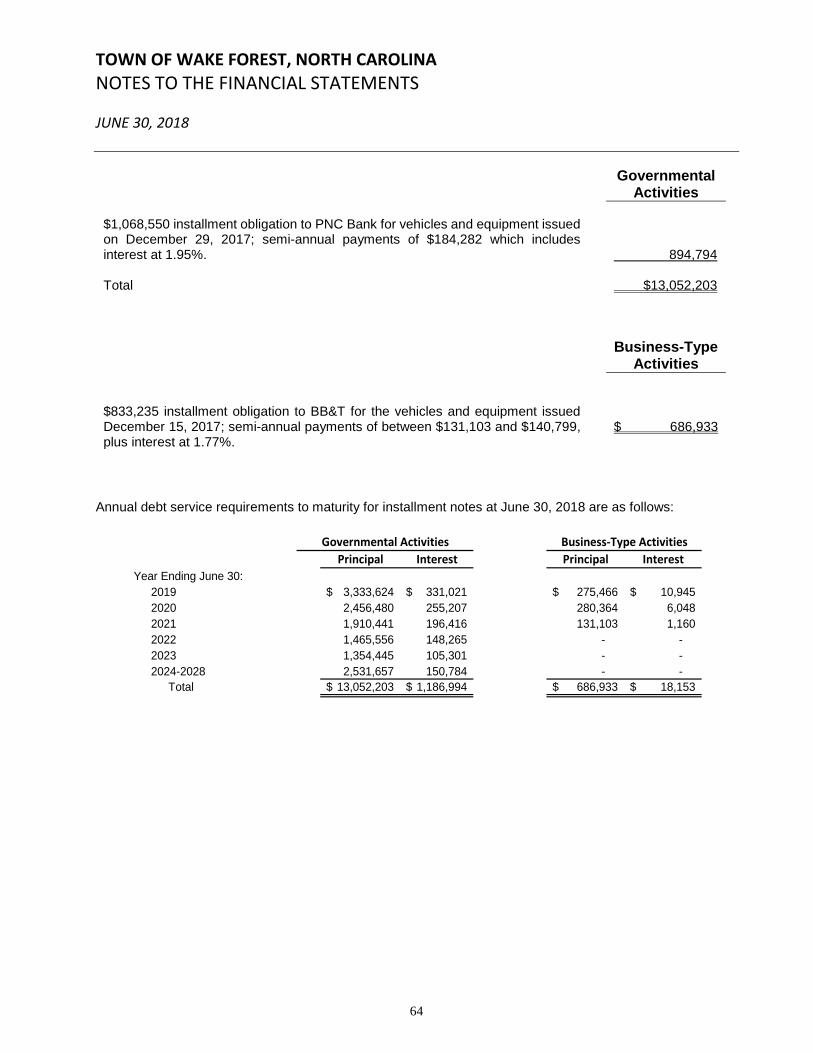
TOWN OF WAKE FOREST, NORTH CAROLINA NOTES TO THE FINANCIAL STATEMENTS JUNE 30, 2018
64
Governmental
Activities $1,068,550 installment obligation to PNC Bank for vehicles and equipment issued on December 29, 2017; semi-annual payments of $184,282 which includes interest at 1.95%. 894,794 Total $13,052,203
Business-Type
Activities
$833,235 installment obligation to BB&T for the vehicles and equipment issued December 15, 2017; semi-annual payments of between $131,103 and $140,799, plus interest at 1.77%.
$ 686,933
Annual debt service requirements to maturity for installment notes at June 30, 2018 are as follows:
Principal Interest Principal InterestYear Ending June 30:
2019 3,333,624$ 331,021$ 275,466$ 10,945$ 2020 2,456,480 255,207 280,364 6,048 2021 1,910,441 196,416 131,103 1,160 2022 1,465,556 148,265 - - 2023 1,354,445 105,301 - - 2024-2028 2,531,657 150,784 - -
Total 13,052,203$ 1,186,994$ 686,933$ 18,153$
Governmental Activities Business-Type Activities
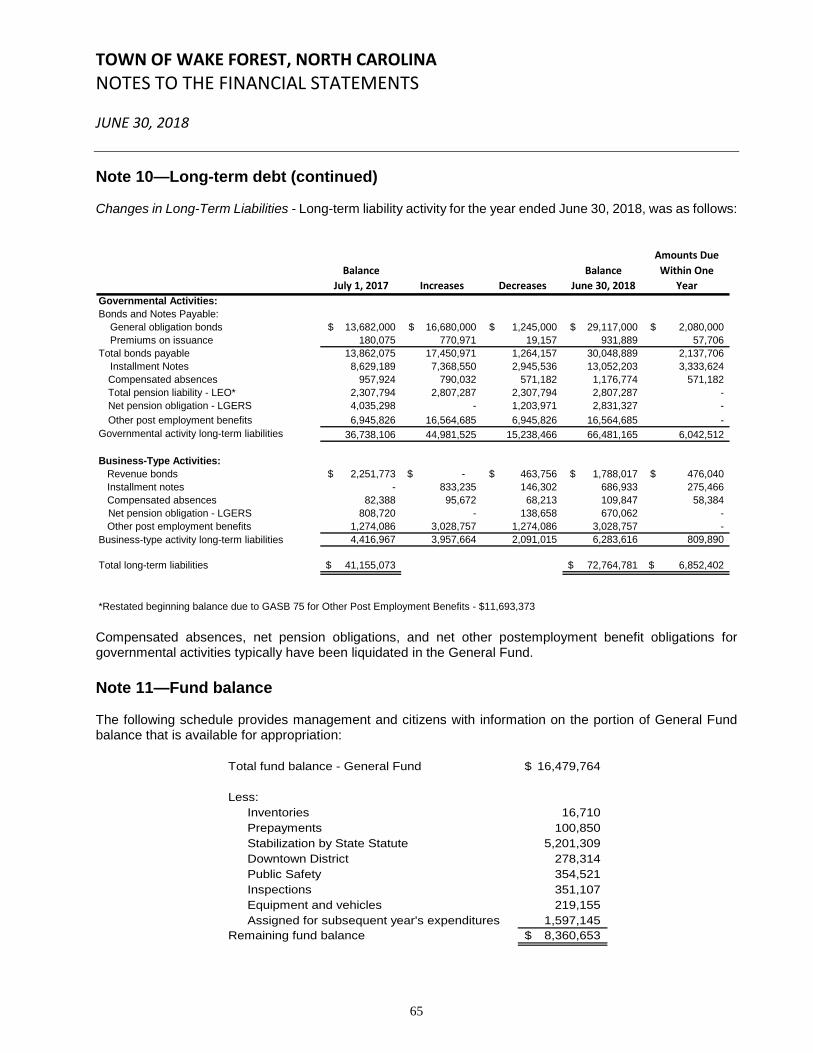
TOWN OF WAKE FOREST, NORTH CAROLINA NOTES TO THE FINANCIAL STATEMENTS JUNE 30, 2018
65
Note 10—Long-term debt (continued) Changes in Long-Term Liabilities - Long-term liability activity for the year ended June 30, 2018, was as follows:
Amounts DueBalance Balance Within One
July 1, 2017 Increases Decreases June 30, 2018 YearGovernmental Activities:Bonds and Notes Payable: General obligation bonds 13,682,000$ 16,680,000$ 1,245,000$ 29,117,000$ 2,080,000$ Premiums on issuance 180,075 770,971 19,157 931,889 57,706 Total bonds payable 13,862,075 17,450,971 1,264,157 30,048,889 2,137,706 Installment Notes 8,629,189 7,368,550 2,945,536 13,052,203 3,333,624
Compensated absences 957,924 790,032 571,182 1,176,774 571,182 Total pension liability - LEO* 2,307,794 2,807,287 2,307,794 2,807,287 - Net pension obligation - LGERS 4,035,298 - 1,203,971 2,831,327 - Other post employment benefits 6,945,826 16,564,685 6,945,826 16,564,685 -
Governmental activity long-term liabilities 36,738,106 44,981,525 15,238,466 66,481,165 6,042,512
Business-Type Activities: Revenue bonds 2,251,773$ -$ 463,756$ 1,788,017$ 476,040$ Installment notes - 833,235 146,302 686,933 275,466 Compensated absences 82,388 95,672 68,213 109,847 58,384
Net pension obligation - LGERS 808,720 - 138,658 670,062 - Other post employment benefits 1,274,086 3,028,757 1,274,086 3,028,757 - Business-type activity long-term liabilities 4,416,967 3,957,664 2,091,015 6,283,616 809,890
Total long-term liabilities 41,155,073$ 72,764,781$ 6,852,402$
*Restated beginning balance due to GASB 75 for Other Post Employment Benefits - $11,693,373 Compensated absences, net pension obligations, and net other postemployment benefit obligations for governmental activities typically have been liquidated in the General Fund. Note 11—Fund balance The following schedule provides management and citizens with information on the portion of General Fund balance that is available for appropriation:
Total fund balance - General Fund 16,479,764$
Less:Inventories 16,710 Prepayments 100,850 Stabilization by State Statute 5,201,309 Downtown District 278,314 Public Safety 354,521 Inspections 351,107 Equipment and vehicles 219,155 Assigned for subsequent year's expenditures 1,597,145
Remaining fund balance 8,360,653$
TOWN OF WAKE FOREST, NORTH CAROLINA NOTES TO THE FINANCIAL STATEMENTS JUNE 30, 2018
66
Note 11—Fund balance (continued) Outstanding encumbrances are amounts needed to pay any commitments related to purchase orders and contracts that remain unperformed at year-end. Encumbrances – General Fund $ 489,375 Capital Projects 1,196,354 Note 12—Interfund balances and transfers A summary of interfund transfers follows:
Police Downtown Department Parks & Cemetery Recreation General
General District Special Revenue Recreation GTP Capital Capital Capital TotalFund Special Tax Fund Improvement Fund Reserve Reserve Reserve Transfers In
Transfers In:
General Fund -$ 6,285$ -$ -$ -$ 14,254$ 39,070$ 44,000$ 103,609$
Debt Service Fund 4,610,650 60,000 - - - - - - 4,670,650 Wake Forest Renaissance Centre 273,241 - - - - - - - 273,241 Grants and Special Revenue 39,392 - 4,711 - - - - - 44,103 Public Arts - - - 142,000 50,500 - - - 192,500 Asset Maintenance 119,000 - - - - - - - 119,000 Futures Fund 125,000 - - - - - - - 125,000 Public Facilities Projects 400,000 - - - - - - - 400,000
Total Transfers Out 5,567,283$ 66,285$ 4,711$ 142,000$ 50,500$ 14,254$ 39,070$ 44,000$ 5,928,103$
Transfers Out
Transfers are used to move unrestricted revenues to finance various programs that the government must account for in other funds in accordance with budgetary authorizations, including amounts provided for matching funds for various grant programs. Balances advanced to/from other funds at June 30, 2018, consist of the following:
Amount500,000$
Receivable FundFutures Fund
Payable General Fund
The amounts payable to the Futures Fund relate to a loan made to the General Fund for the purchase of the Suntrust Building located at 353 South White Street for economic development purposes. The General Fund will pay this loan within seven (7) year plus interest at 3.10% beginning in FY 2019-2020. The interfund balances resulted from the time lag between the dates that (1) interfund goods and services are provided or reimbursable expenditures occur, (2) transactions are recorded in the accounting system, and (3) payments between funds are made.
TOWN OF WAKE FOREST, NORTH CAROLINA NOTES TO THE FINANCIAL STATEMENTS JUNE 30, 2018
67
Note 13—Jointly governed organization The Town is a member of the North Carolina Eastern Municipal Power Agency (the “Agency”). The Agency was formed to enable municipalities that own electric distribution systems to finance, construct, own, operate, and maintain generation and transmission facilities through the Agency. The Town receives power from the Agency and is contractually allocated a .7262% interest in the Agency, with the balance being shared by the thirty-two (32) other local governments. Each participating government appoints one commissioner to the Agency’s governing board. The Town is obligated to purchase all of its power supply requirements from the Agency. Except for the power supply purchase requirements, no local government participant has any obligation, entitlement, or residual interest. On July 31, 2015, the NCEMPA completed the sale of most of its electricity generating assets to Duke Energy. These proceeds were used to defease the NCEMPA’s outstanding revenue bonds. The NCEMPA entered into contractual agreements with its member cities and Duke Energy. Under these arrangements, the NCEMPA will supply wholesale power to its members and will purchase this power from Duke Energy. In addition to payments made for electric power, NCEMPA members will make payments for their share of the debt service on the NCEMPA’s new revenue bonds. The Town’s gross purchases of power for the fiscal year ended June 30, 2018 were $12,020,879. Note 14—Summary disclosure of significant contingencies Federal and State Assisted Programs - The Town has received proceeds from several federal and state grants. Periodic audits of these grants are required and certain costs may be questioned as not being appropriate expenditures of grant monies by the grantor agencies. Management believes that any required refunds will be immaterial. No provision has been made in the accompanying financial statements for the refund of grant monies. Note 15—Merger of water and sewer system with the City of Raleigh The Water and Sewer Utility System of the Town was transferred to the City of Raleigh effective July 1, 2005. Under the terms of the agreement, Raleigh assumed full responsibility for the provision of water and sewer services in Wake Forest, including responsibility for Wake Forest’s water and sewer utility systems and related equipment and property rights. Upon the transfer, Raleigh assumed immediate and sole duty and responsibility for financing, operating, maintaining, improving and expanding the water and sewer systems serving Wake Forest’s existing and future corporate limits and Urban Services Area. The Town transferred ownership of all facilities, property, land, equipment, financial assets, information and data subject to the agreement with Raleigh. At June 30, 2017 there was a fund balance deficit in the Water and Sewer Fund. This deficit was related to the City of Raleigh equity transfer. The deficit was closed out to the General Fund in the current fiscal year. Therefore, there is no balance sheet reported in the current year’s financial statement.
TOWN OF WAKE FOREST, NORTH CAROLINA NOTES TO THE FINANCIAL STATEMENTS JUNE 30, 2018
68
Note 16—Note receivable The Town entered into an agreement with the Wireless Research Center of North Carolina whereby the Town would advance loan funds to the Wireless Research Center up to $975,000 for the purpose of economic development. The loan funds are for the purpose of covering operating expenses during the startup period. As of June 30, 2018, the Town had advanced funding in the amount of $823,934. This loan agreement was modified in March 2016. Under the original terms of the loan, interest only payments began January 1, 2012 and continued on the first day of each calendar month thereafter until December 31, 2016 at such time the entire outstanding principal balance was due. The terms of the loan modification, interest at the rate of 2.5% per annum with the balance of the loan in December 2016 to convert to a 10 year balloon payment with a 20 year amortization. Accordingly, the amounts advanced at June 30, 2018 have been recorded as noncurrent assets in the government-wide financial statements. Note 17—Subsequent events The Town entered into an agreement on June 19, 2018 to purchase real property at 5031 Unicorn Drive for the purpose of relocating Wake Forest Power and other electric administrative personnel along with equipment and vehicles from the current location at 234 Friendship Chapel Road. Subsequent to June 30, 2018, the Town will be entering into an agreement with Regions Capital Advantage, Inc. for an amount not to exceed $3,500,000 to fund the acquisition of the property along with improvements. This is a ten year installment note with an interest rate of 2.94%. The Town closed on the property acquisition and installment purchase contract on October 18, 2018. The Town received a credit on the September 2018 wholesale power bill in the amount of $700,411.56 is a result of the change in delivery leased facilities for Wake Forest in the newly FERC filed Network Integration Transmission Service Agreement (NITSA) between Duke Energy Progress (DEP) and North Carolina Eastern Municipal Power Agency(NCEMPA). NCEMPA requested a refund from DEP of charges for delivery leased facilities that were billed under the previous NITSA related to facilities that had been removed from service within the 2015-2018 timeframe. Note 18—Change in Accounting Principles/Restatement Prior Period Adjustment During the fiscal year ended June 30, 2018, the Town determined that from the inception of the Futures Fund there were unrestricted revenues which were inadvertently recorded to the General Fund. The adjustment has no overall effect on the financial statements because, in accordance with GASB Statement 54, the Futures Fund is consolidated with the General Fund for reporting purposes. The adjustment to beginning fund balance was a $144,256 increase and decrease to the Futures Fund and General Fund, respectively. In addition, there was an immaterial adjustment to the General Fund in the amount of $560. Change in Accounting Principle The Town implemented Governmental Accounting Standards Board (GASB) No. Statement 75, Accounting and Financial Reporting for Postemployment Benefits Other Than Pensions, in the fiscal year ending June 30, 2018. The implementation of the statement required the Town to record beginning total OPEB liability and effects on net position of benefit payments and administrative expenses paid by the Town related to OPEB during the measurement period (fiscal year ending June 30, 2017). Beginning deferred outflows and inflows of resources associated with the implementation were excluded from the restatement. As a result, net position for the governmental activities decreased $9,896,757 and $1,746,616 for the business-type activities.
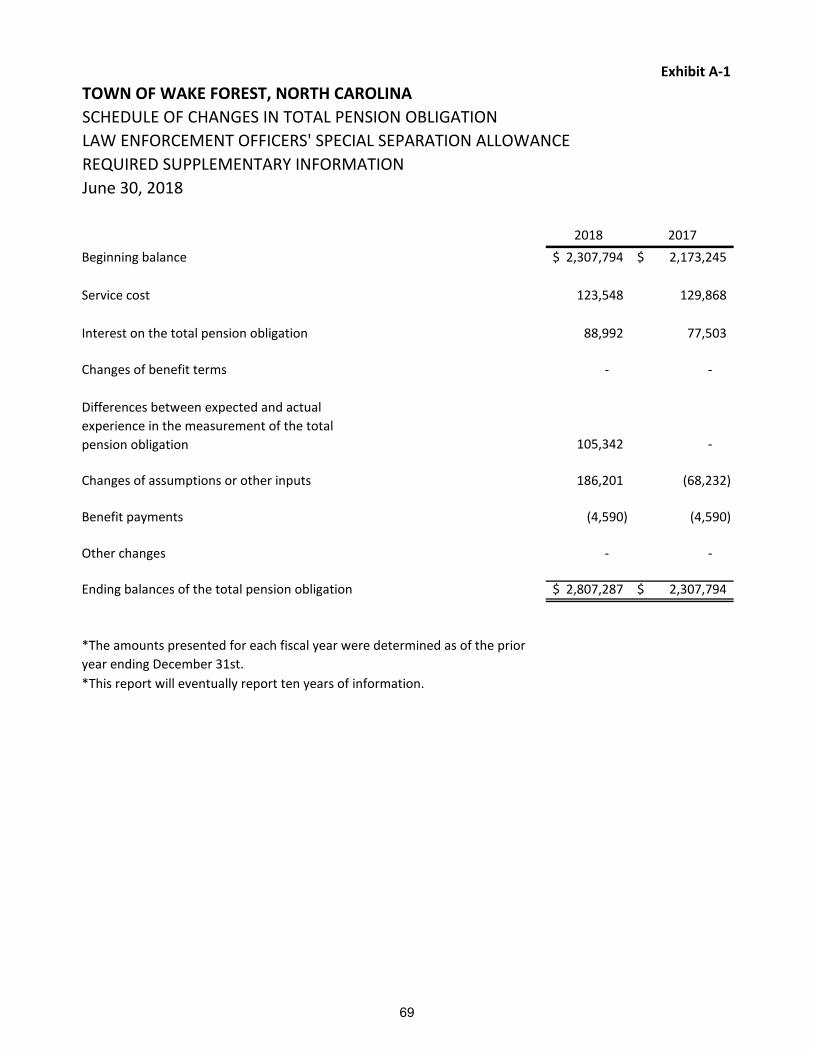
Exhibit A-1
SCHEDULE OF CHANGES IN TOTAL PENSION OBLIGATION
REQUIRED SUPPLEMENTARY INFORMATION
2018 2017
2,307,794$ 2,173,245$
123,548 129,868
88,992 77,503
Changes of benefit terms - -
105,342 -
186,201 (68,232)
(4,590) (4,590)
- -
2,807,287$ 2,307,794$
TOWN OF WAKE FOREST, NORTH CAROLINA
LAW ENFORCEMENT OFFICERS' SPECIAL SEPARATION ALLOWANCE
June 30, 2018
Beginning balance
Service cost
Ending balances of the total pension obligation
*This report will eventually report ten years of information.
*The amounts presented for each fiscal year were determined as of the prior
year ending December 31st.
Interest on the total pension obligation
Differences between expected and actual
experience in the measurement of the total
pension obligation
Changes of assumptions or other inputs
Benefit payments
Other changes
69
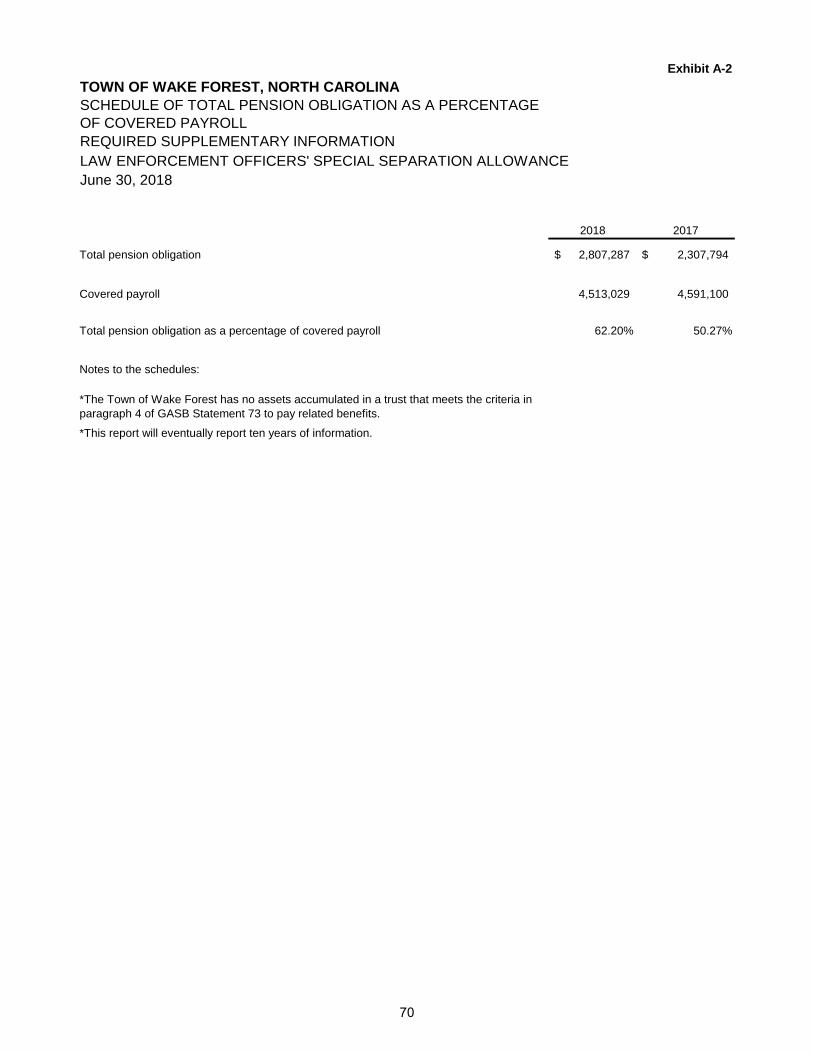
Exhibit A-2
June 30, 2018
2018 2017
Total pension obligation 2,807,287$ 2,307,794$
Covered payroll 4,513,029 4,591,100
Total pension obligation as a percentage of covered payroll 62.20% 50.27%
Notes to the schedules:
TOWN OF WAKE FOREST, NORTH CAROLINASCHEDULE OF TOTAL PENSION OBLIGATION AS A PERCENTAGE OF COVERED PAYROLL
*The Town of Wake Forest has no assets accumulated in a trust that meets the criteria in paragraph 4 of GASB Statement 73 to pay related benefits.
*This report will eventually report ten years of information.
REQUIRED SUPPLEMENTARY INFORMATIONLAW ENFORCEMENT OFFICERS' SPECIAL SEPARATION ALLOWANCE
70
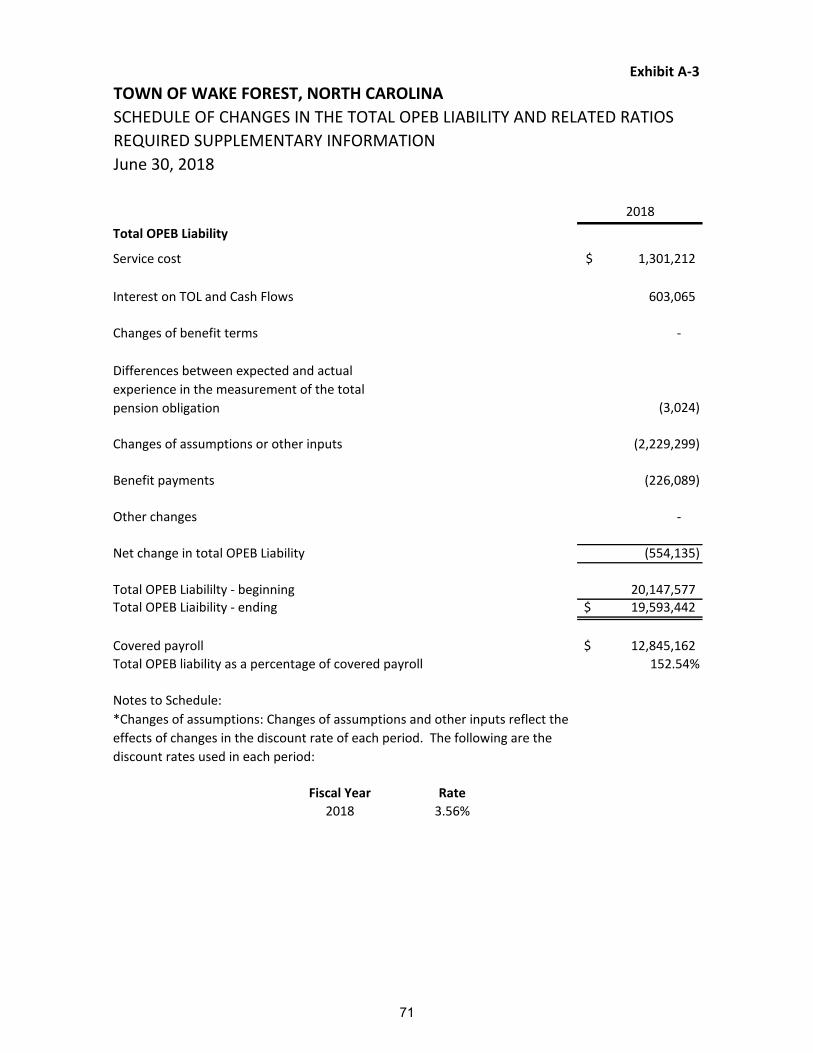
Exhibit A-3
REQUIRED SUPPLEMENTARY INFORMATION
2018
1,301,212$
603,065
Changes of benefit terms -
(3,024)
(2,229,299)
(226,089)
-
(554,135)
Total OPEB Liabililty - beginning 20,147,577 Total OPEB Liaibility - ending 19,593,442$
Covered payroll 12,845,162$
Total OPEB liability as a percentage of covered payroll 152.54%
Notes to Schedule:
Fiscal Year Rate
2018 3.56%
TOWN OF WAKE FOREST, NORTH CAROLINA
SCHEDULE OF CHANGES IN THE TOTAL OPEB LIABILITY AND RELATED RATIOS
June 30, 2018
Total OPEB Liability
Service cost
Interest on TOL and Cash Flows
Differences between expected and actual
experience in the measurement of the total
pension obligation
Changes of assumptions or other inputs
Benefit payments
Other changes
Net change in total OPEB Liability
*Changes of assumptions: Changes of assumptions and other inputs reflect the
effects of changes in the discount rate of each period. The following are the
discount rates used in each period:
71
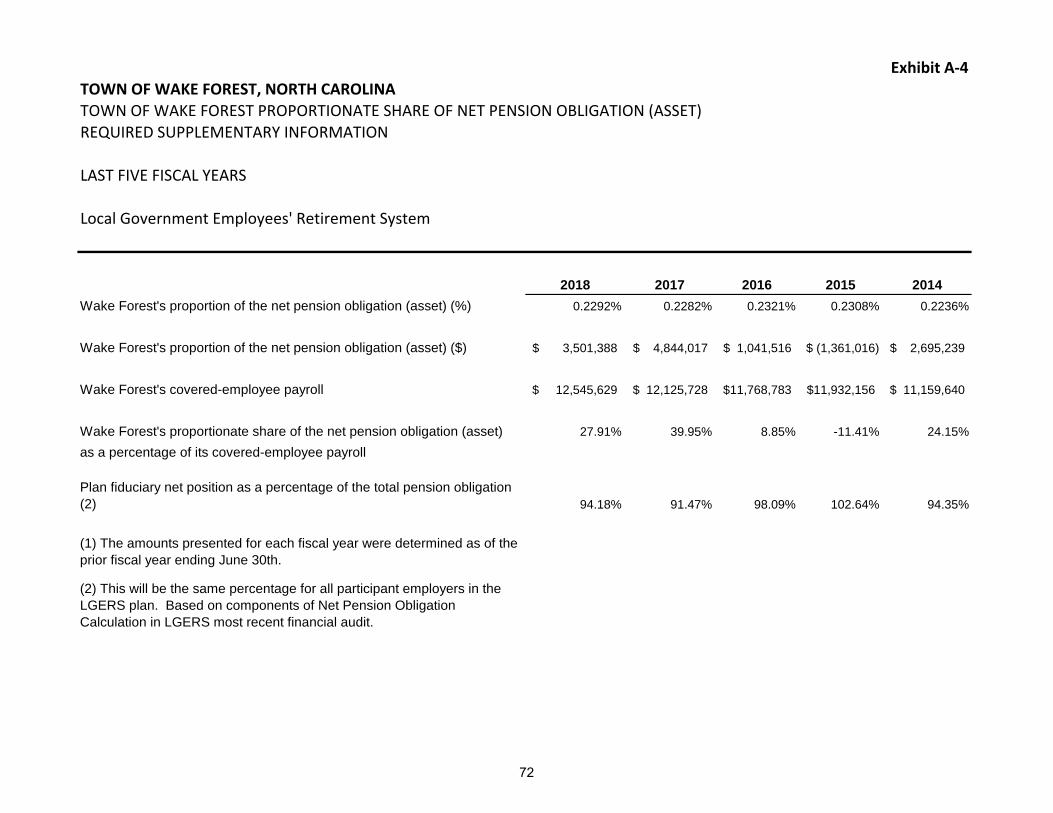
Exhibit A-4
2018 2017 2016 2015 2014Wake Forest's proportion of the net pension obligation (asset) (%) 0.2292% 0.2282% 0.2321% 0.2308% 0.2236%
Wake Forest's proportion of the net pension obligation (asset) ($) 3,501,388$ 4,844,017$ 1,041,516$ (1,361,016)$ 2,695,239$
Wake Forest's covered-employee payroll 12,545,629$ 12,125,728$ 11,768,783$ 11,932,156$ 11,159,640$
Wake Forest's proportionate share of the net pension obligation (asset) 27.91% 39.95% 8.85% -11.41% 24.15%
as a percentage of its covered-employee payroll
94.18% 91.47% 98.09% 102.64% 94.35%
TOWN OF WAKE FOREST PROPORTIONATE SHARE OF NET PENSION OBLIGATION (ASSET)
(1) The amounts presented for each fiscal year were determined as of the prior fiscal year ending June 30th.
(2) This will be the same percentage for all participant employers in the LGERS plan. Based on components of Net Pension Obligation Calculation in LGERS most recent financial audit.
TOWN OF WAKE FOREST, NORTH CAROLINA
REQUIRED SUPPLEMENTARY INFORMATION
LAST FIVE FISCAL YEARS
Local Government Employees' Retirement System
Plan fiduciary net position as a percentage of the total pension obligation (2)
72
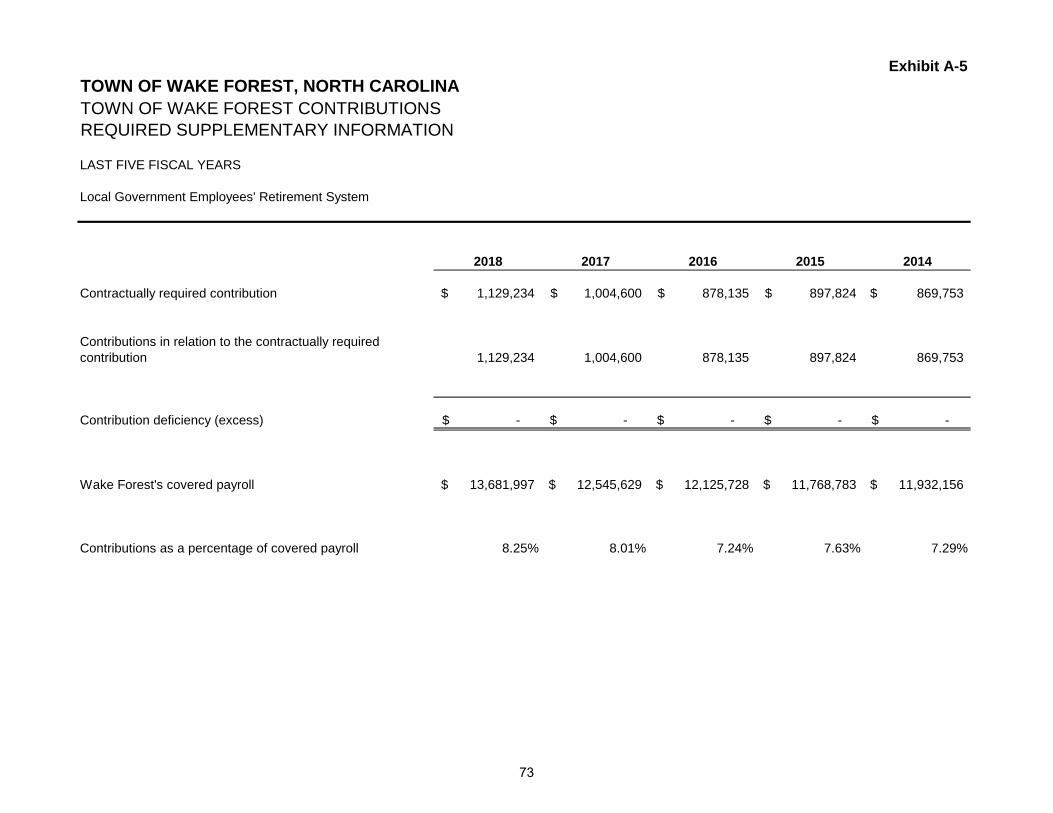
Exhibit A-5
2018 2017 2016 2015 2014
Contractually required contribution 1,129,234$ 1,004,600$ 878,135$ 897,824$ 869,753$
1,129,234 1,004,600 878,135 897,824 869,753
Contribution deficiency (excess) -$ -$ -$ -$ -$
Wake Forest's covered payroll 13,681,997$ 12,545,629$ 12,125,728$ 11,768,783$ 11,932,156$
Contributions as a percentage of covered payroll 8.25% 8.01% 7.24% 7.63% 7.29%
TOWN OF WAKE FOREST, NORTH CAROLINATOWN OF WAKE FOREST CONTRIBUTIONSREQUIRED SUPPLEMENTARY INFORMATION
LAST FIVE FISCAL YEARS
Local Government Employees' Retirement System
Contributions in relation to the contractually required contribution
73

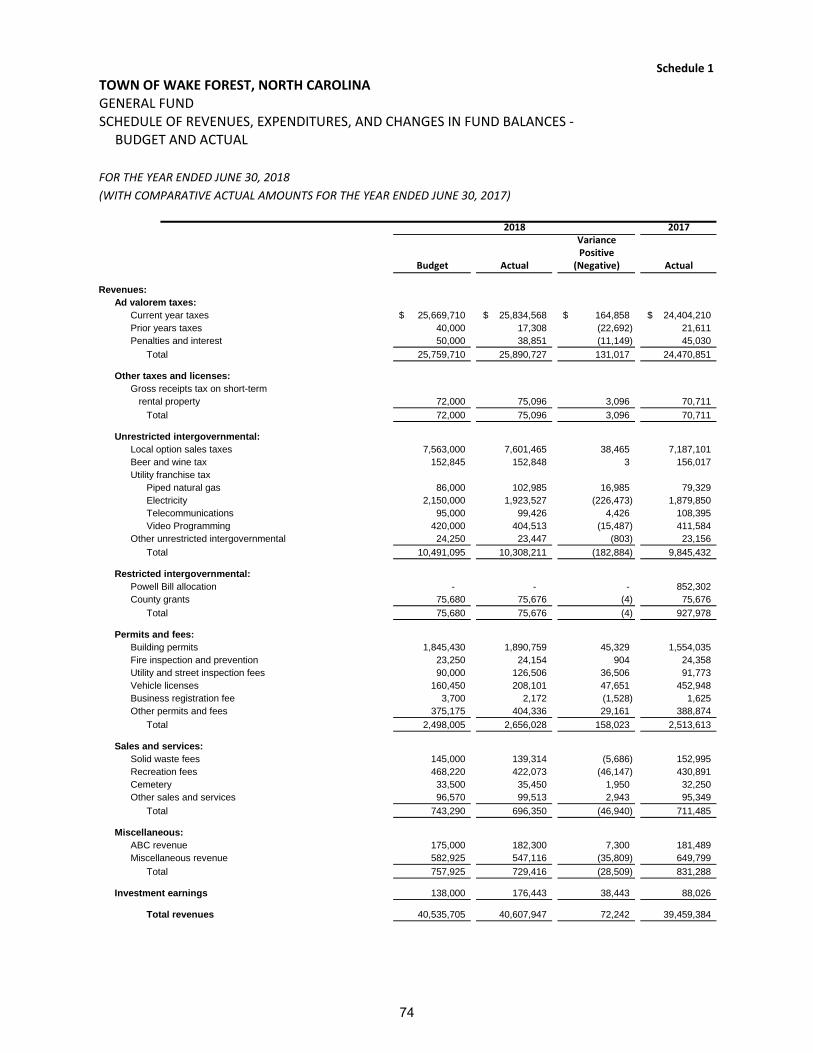
Schedule 1
TOWN OF WAKE FOREST, NORTH CAROLINAGENERAL FUNDSCHEDULE OF REVENUES, EXPENDITURES, AND CHANGES IN FUND BALANCES -
BUDGET AND ACTUAL
FOR THE YEAR ENDED JUNE 30, 2018
(WITH COMPARATIVE ACTUAL AMOUNTS FOR THE YEAR ENDED JUNE 30, 2017)
2017VariancePositive
Budget Actual (Negative) Actual
Revenues:Ad valorem taxes:
Current year taxes 25,669,710$ 25,834,568$ 164,858$ 24,404,210$ Prior years taxes 40,000 17,308 (22,692) 21,611Penalties and interest 50,000 38,851 (11,149) 45,030
Total 25,759,710 25,890,727 131,017 24,470,851
Other taxes and licenses:Gross receipts tax on short-term rental property 72,000 75,096 3,096 70,711
Total 72,000 75,096 3,096 70,711
Unrestricted intergovernmental:Local option sales taxes 7,563,000 7,601,465 38,465 7,187,101Beer and wine tax 152,845 152,848 3 156,017Utility franchise tax
Piped natural gas 86,000 102,985 16,985 79,329 Electricity 2,150,000 1,923,527 (226,473) 1,879,850 Telecommunications 95,000 99,426 4,426 108,395 Video Programming 420,000 404,513 (15,487) 411,584
Other unrestricted intergovernmental 24,250 23,447 (803) 23,156Total 10,491,095 10,308,211 (182,884) 9,845,432
Restricted intergovernmental:Powell Bill allocation - - - 852,302County grants 75,680 75,676 (4) 75,676
Total 75,680 75,676 (4) 927,978
Permits and fees:Building permits 1,845,430 1,890,759 45,329 1,554,035Fire inspection and prevention 23,250 24,154 904 24,358Utility and street inspection fees 90,000 126,506 36,506 91,773Vehicle licenses 160,450 208,101 47,651 452,948Business registration fee 3,700 2,172 (1,528) 1,625Other permits and fees 375,175 404,336 29,161 388,874
Total 2,498,005 2,656,028 158,023 2,513,613
Sales and services:Solid waste fees 145,000 139,314 (5,686) 152,995Recreation fees 468,220 422,073 (46,147) 430,891Cemetery 33,500 35,450 1,950 32,250Other sales and services 96,570 99,513 2,943 95,349
Total 743,290 696,350 (46,940) 711,485
Miscellaneous:ABC revenue 175,000 182,300 7,300 181,489 Miscellaneous revenue 582,925 547,116 (35,809) 649,799
Total 757,925 729,416 (28,509) 831,288
Investment earnings 138,000 176,443 38,443 88,026
Total revenues 40,535,705 40,607,947 72,242 39,459,384
2018
74
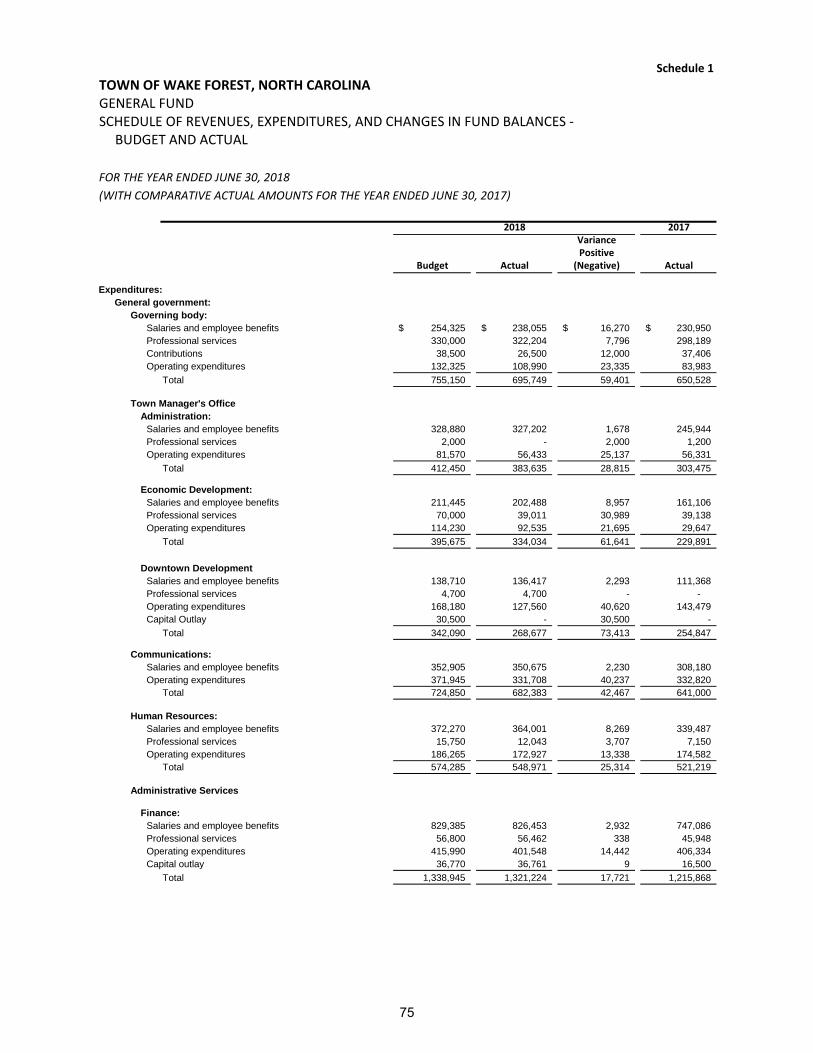
Schedule 1
TOWN OF WAKE FOREST, NORTH CAROLINAGENERAL FUNDSCHEDULE OF REVENUES, EXPENDITURES, AND CHANGES IN FUND BALANCES -
BUDGET AND ACTUAL
FOR THE YEAR ENDED JUNE 30, 2018
(WITH COMPARATIVE ACTUAL AMOUNTS FOR THE YEAR ENDED JUNE 30, 2017)
2017VariancePositive
Budget Actual (Negative) Actual
2018
Expenditures:General government:
Governing body:Salaries and employee benefits 254,325$ 238,055$ 16,270$ 230,950$ Professional services 330,000 322,204 7,796 298,189Contributions 38,500 26,500 12,000 37,406Operating expenditures 132,325 108,990 23,335 83,983
Total 755,150 695,749 59,401 650,528
Town Manager's OfficeAdministration:
Salaries and employee benefits 328,880 327,202 1,678 245,944Professional services 2,000 - 2,000 1,200 Operating expenditures 81,570 56,433 25,137 56,331
Total 412,450 383,635 28,815 303,475
Economic Development:Salaries and employee benefits 211,445 202,488 8,957 161,106 Professional services 70,000 39,011 30,989 39,138 Operating expenditures 114,230 92,535 21,695 29,647
Total 395,675 334,034 61,641 229,891
Downtown DevelopmentSalaries and employee benefits 138,710 136,417 2,293 111,368Professional services 4,700 4,700 - - Operating expenditures 168,180 127,560 40,620 143,479Capital Outlay 30,500 - 30,500 -
Total 342,090 268,677 73,413 254,847
Communications:Salaries and employee benefits 352,905 350,675 2,230 308,180Operating expenditures 371,945 331,708 40,237 332,820
Total 724,850 682,383 42,467 641,000
Human Resources:Salaries and employee benefits 372,270 364,001 8,269 339,487Professional services 15,750 12,043 3,707 7,150Operating expenditures 186,265 172,927 13,338 174,582
Total 574,285 548,971 25,314 521,219
Administrative Services
Finance:Salaries and employee benefits 829,385 826,453 2,932 747,086 Professional services 56,800 56,462 338 45,948Operating expenditures 415,990 401,548 14,442 406,334Capital outlay 36,770 36,761 9 16,500
Total 1,338,945 1,321,224 17,721 1,215,868
75
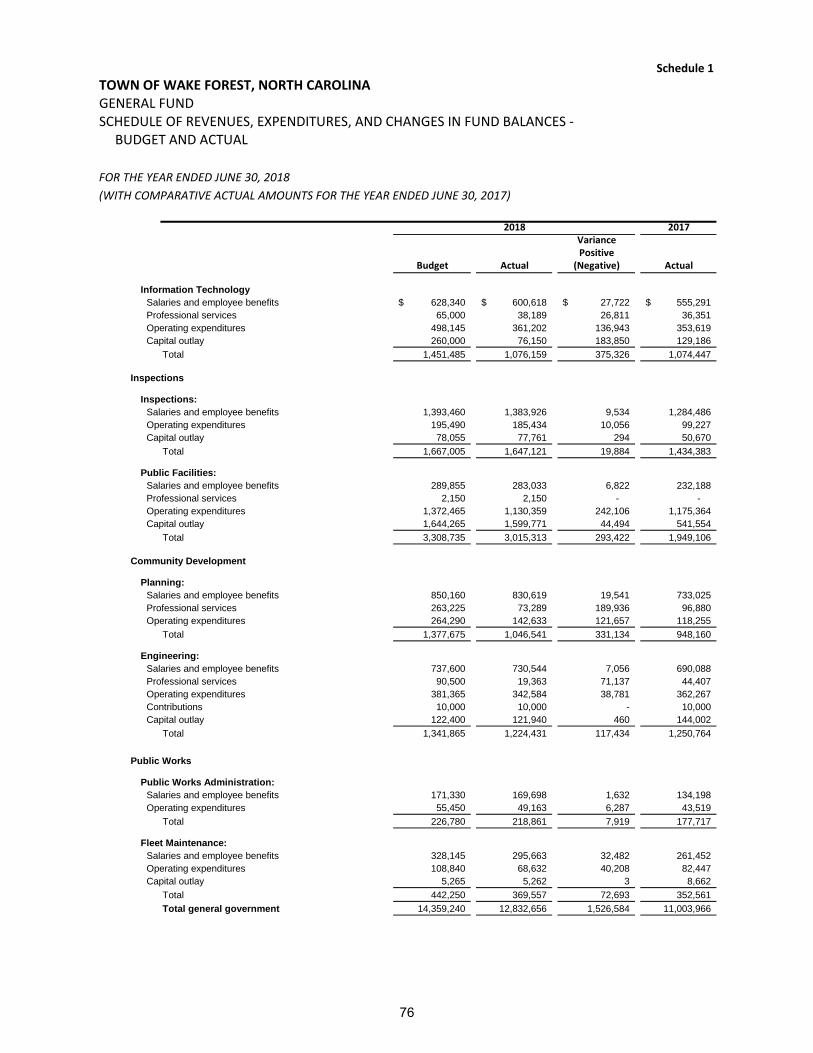
Schedule 1
TOWN OF WAKE FOREST, NORTH CAROLINAGENERAL FUNDSCHEDULE OF REVENUES, EXPENDITURES, AND CHANGES IN FUND BALANCES -
BUDGET AND ACTUAL
FOR THE YEAR ENDED JUNE 30, 2018
(WITH COMPARATIVE ACTUAL AMOUNTS FOR THE YEAR ENDED JUNE 30, 2017)
2017VariancePositive
Budget Actual (Negative) Actual
2018
Information Technology Salaries and employee benefits 628,340$ 600,618$ 27,722$ 555,291$ Professional services 65,000 38,189 26,811 36,351 Operating expenditures 498,145 361,202 136,943 353,619Capital outlay 260,000 76,150 183,850 129,186
Total 1,451,485 1,076,159 375,326 1,074,447
Inspections
Inspections:Salaries and employee benefits 1,393,460 1,383,926 9,534 1,284,486Operating expenditures 195,490 185,434 10,056 99,227Capital outlay 78,055 77,761 294 50,670
Total 1,667,005 1,647,121 19,884 1,434,383
Public Facilities:Salaries and employee benefits 289,855 283,033 6,822 232,188 Professional services 2,150 2,150 - - Operating expenditures 1,372,465 1,130,359 242,106 1,175,364Capital outlay 1,644,265 1,599,771 44,494 541,554
Total 3,308,735 3,015,313 293,422 1,949,106
Community Development
Planning:Salaries and employee benefits 850,160 830,619 19,541 733,025Professional services 263,225 73,289 189,936 96,880Operating expenditures 264,290 142,633 121,657 118,255
Total 1,377,675 1,046,541 331,134 948,160
Engineering:Salaries and employee benefits 737,600 730,544 7,056 690,088Professional services 90,500 19,363 71,137 44,407Operating expenditures 381,365 342,584 38,781 362,267Contributions 10,000 10,000 - 10,000 Capital outlay 122,400 121,940 460 144,002
Total 1,341,865 1,224,431 117,434 1,250,764
Public Works
Public Works Administration:Salaries and employee benefits 171,330 169,698 1,632 134,198 Operating expenditures 55,450 49,163 6,287 43,519
Total 226,780 218,861 7,919 177,717
Fleet Maintenance:Salaries and employee benefits 328,145 295,663 32,482 261,452 Operating expenditures 108,840 68,632 40,208 82,447Capital outlay 5,265 5,262 3 8,662
Total 442,250 369,557 72,693 352,561 Total general government 14,359,240 12,832,656 1,526,584 11,003,966
76
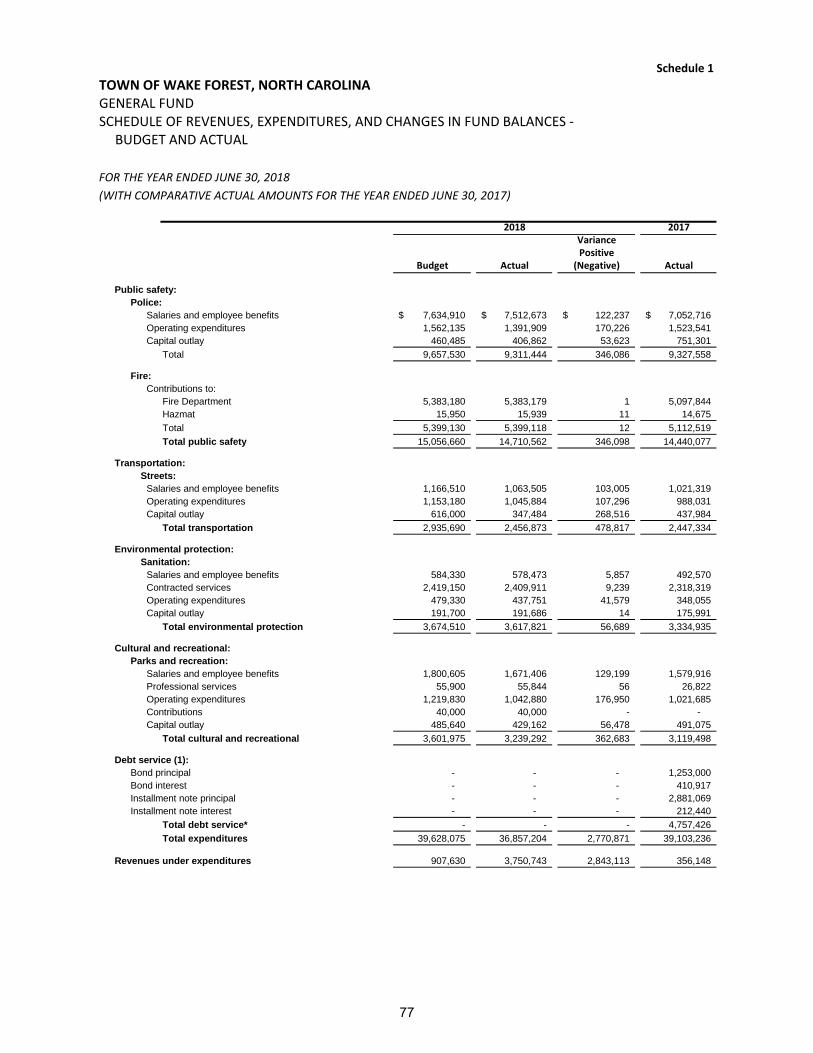
Schedule 1
TOWN OF WAKE FOREST, NORTH CAROLINAGENERAL FUNDSCHEDULE OF REVENUES, EXPENDITURES, AND CHANGES IN FUND BALANCES -
BUDGET AND ACTUAL
FOR THE YEAR ENDED JUNE 30, 2018
(WITH COMPARATIVE ACTUAL AMOUNTS FOR THE YEAR ENDED JUNE 30, 2017)
2017VariancePositive
Budget Actual (Negative) Actual
2018
Public safety:Police:
Salaries and employee benefits 7,634,910$ 7,512,673$ 122,237$ 7,052,716$ Operating expenditures 1,562,135 1,391,909 170,226 1,523,541Capital outlay 460,485 406,862 53,623 751,301
Total 9,657,530 9,311,444 346,086 9,327,558
Fire:Contributions to:
Fire Department 5,383,180 5,383,179 1 5,097,844Hazmat 15,950 15,939 11 14,675Total 5,399,130 5,399,118 12 5,112,519 Total public safety 15,056,660 14,710,562 346,098 14,440,077
Transportation:Streets:
Salaries and employee benefits 1,166,510 1,063,505 103,005 1,021,319Operating expenditures 1,153,180 1,045,884 107,296 988,031Capital outlay 616,000 347,484 268,516 437,984
Total transportation 2,935,690 2,456,873 478,817 2,447,334
Environmental protection:Sanitation:
Salaries and employee benefits 584,330 578,473 5,857 492,570Contracted services 2,419,150 2,409,911 9,239 2,318,319Operating expenditures 479,330 437,751 41,579 348,055Capital outlay 191,700 191,686 14 175,991
Total environmental protection 3,674,510 3,617,821 56,689 3,334,935
Cultural and recreational:Parks and recreation:
Salaries and employee benefits 1,800,605 1,671,406 129,199 1,579,916 Professional services 55,900 55,844 56 26,822Operating expenditures 1,219,830 1,042,880 176,950 1,021,685Contributions 40,000 40,000 - - Capital outlay 485,640 429,162 56,478 491,075
Total cultural and recreational 3,601,975 3,239,292 362,683 3,119,498
Debt service (1):Bond principal - - - 1,253,000 Bond interest - - - 410,917Installment note principal - - - 2,881,069Installment note interest - - - 212,440
Total debt service* - - - 4,757,426 Total expenditures 39,628,075 36,857,204 2,770,871 39,103,236
Revenues under expenditures 907,630 3,750,743 2,843,113 356,148
77
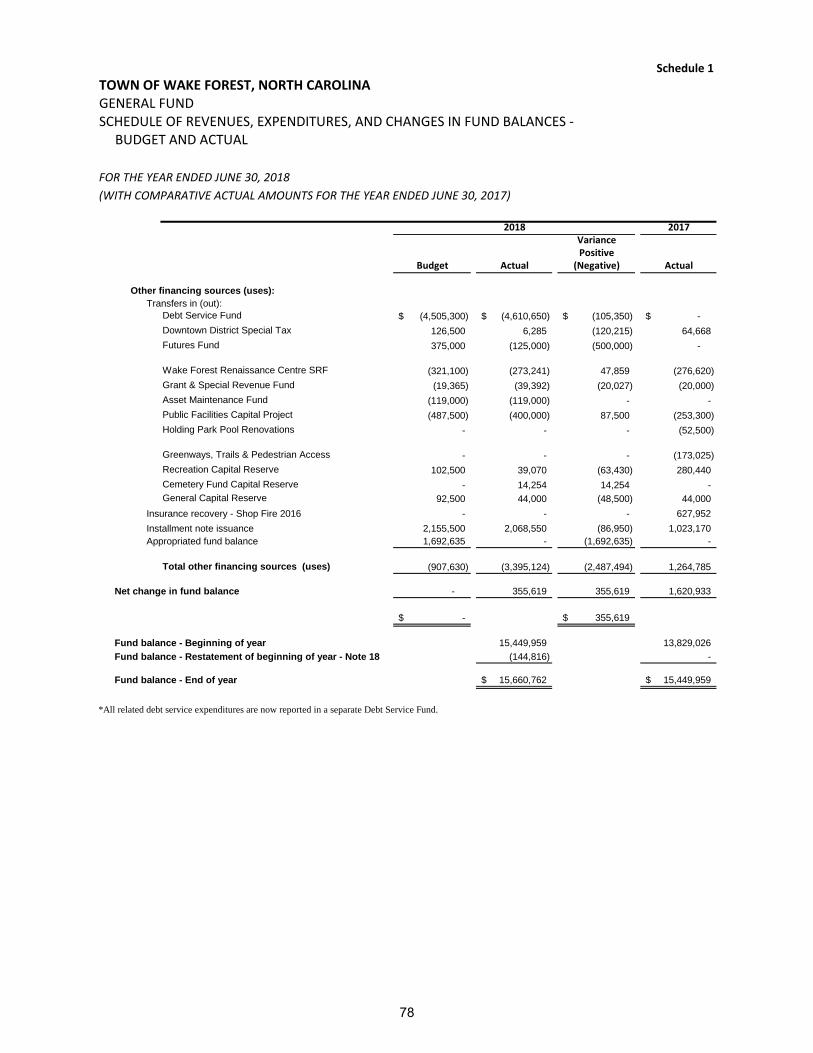
Schedule 1
TOWN OF WAKE FOREST, NORTH CAROLINAGENERAL FUNDSCHEDULE OF REVENUES, EXPENDITURES, AND CHANGES IN FUND BALANCES -
BUDGET AND ACTUAL
FOR THE YEAR ENDED JUNE 30, 2018
(WITH COMPARATIVE ACTUAL AMOUNTS FOR THE YEAR ENDED JUNE 30, 2017)
2017VariancePositive
Budget Actual (Negative) Actual
2018
Other financing sources (uses):Transfers in (out):
Debt Service Fund (4,505,300)$ (4,610,650)$ (105,350)$ -$ Downtown District Special Tax 126,500 6,285 (120,215) 64,668 Futures Fund 375,000 (125,000) (500,000) -
Wake Forest Renaissance Centre SRF (321,100) (273,241) 47,859 (276,620) Grant & Special Revenue Fund (19,365) (39,392) (20,027) (20,000) Asset Maintenance Fund (119,000) (119,000) - - Public Facilities Capital Project (487,500) (400,000) 87,500 (253,300) Holding Park Pool Renovations - - - (52,500)
Greenways, Trails & Pedestrian Access - - - (173,025) Recreation Capital Reserve 102,500 39,070 (63,430) 280,440 Cemetery Fund Capital Reserve - 14,254 14,254 - General Capital Reserve 92,500 44,000 (48,500) 44,000
Insurance recovery - Shop Fire 2016 - - - 627,952 Installment note issuance 2,155,500 2,068,550 (86,950) 1,023,170 Appropriated fund balance 1,692,635 - (1,692,635) -
Total other financing sources (uses) (907,630) (3,395,124) (2,487,494) 1,264,785
- 355,619 355,619 1,620,933
-$ 355,619$
Fund balance - Beginning of year 15,449,959 13,829,026 Fund balance - Restatement of beginning of year - Note 18 (144,816) -
Fund balance - End of year 15,660,762$ 15,449,959$
Net change in fund balance
*All related debt service expenditures are now reported in a separate Debt Service Fund.
78
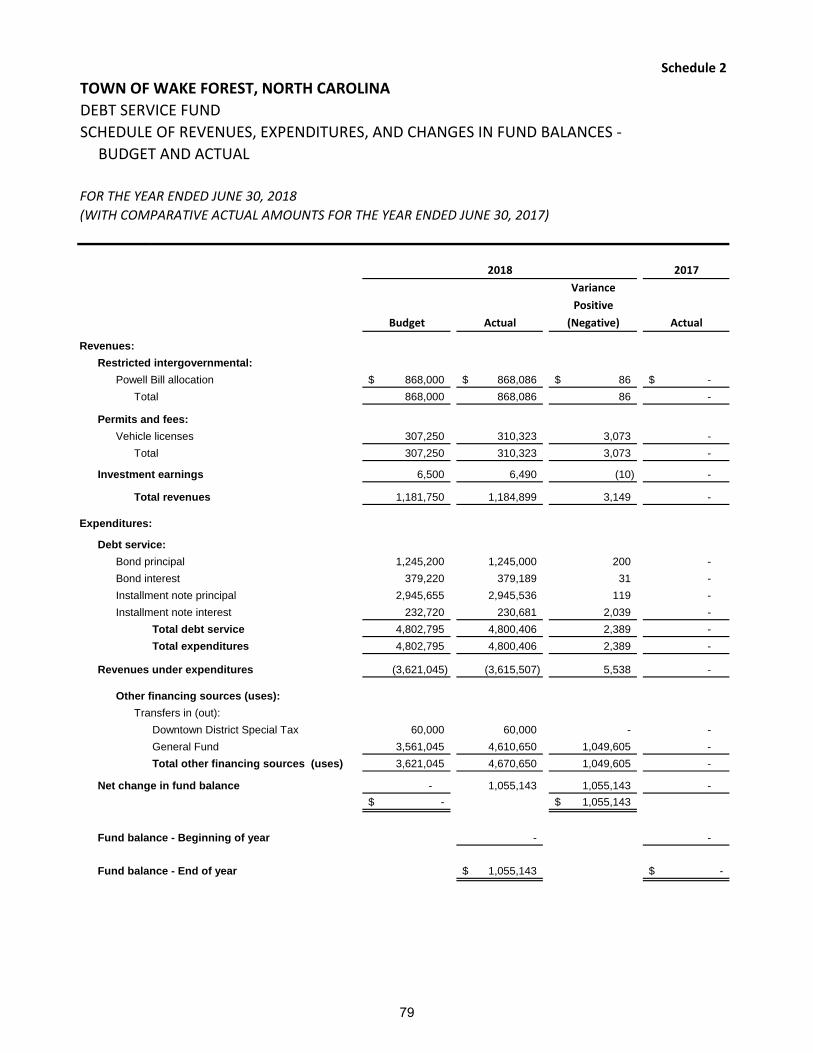
Schedule 2
TOWN OF WAKE FOREST, NORTH CAROLINA
DEBT SERVICE FUND
SCHEDULE OF REVENUES, EXPENDITURES, AND CHANGES IN FUND BALANCES -
BUDGET AND ACTUAL
FOR THE YEAR ENDED JUNE 30, 2018
(WITH COMPARATIVE ACTUAL AMOUNTS FOR THE YEAR ENDED JUNE 30, 2017)
2017
Variance
Positive
Budget Actual (Negative) Actual
Revenues:Restricted intergovernmental:
Powell Bill allocation 868,000$ 868,086$ 86$ -$ Total 868,000 868,086 86 -
Permits and fees:Vehicle licenses 307,250 310,323 3,073 -
Total 307,250 310,323 3,073 -
Investment earnings 6,500 6,490 (10) -
Total revenues 1,181,750 1,184,899 3,149 -
Expenditures:
Debt service:Bond principal 1,245,200 1,245,000 200 - Bond interest 379,220 379,189 31 - Installment note principal 2,945,655 2,945,536 119 - Installment note interest 232,720 230,681 2,039 -
Total debt service 4,802,795 4,800,406 2,389 - Total expenditures 4,802,795 4,800,406 2,389 -
Revenues under expenditures (3,621,045) (3,615,507) 5,538 -
Other financing sources (uses):Transfers in (out):
Downtown District Special Tax 60,000 60,000 - - General Fund 3,561,045 4,610,650 1,049,605 - Total other financing sources (uses) 3,621,045 4,670,650 1,049,605 -
- 1,055,143 1,055,143 - -$ 1,055,143$
Fund balance - Beginning of year - -
Fund balance - End of year 1,055,143$ -$
2018
Net change in fund balance
79
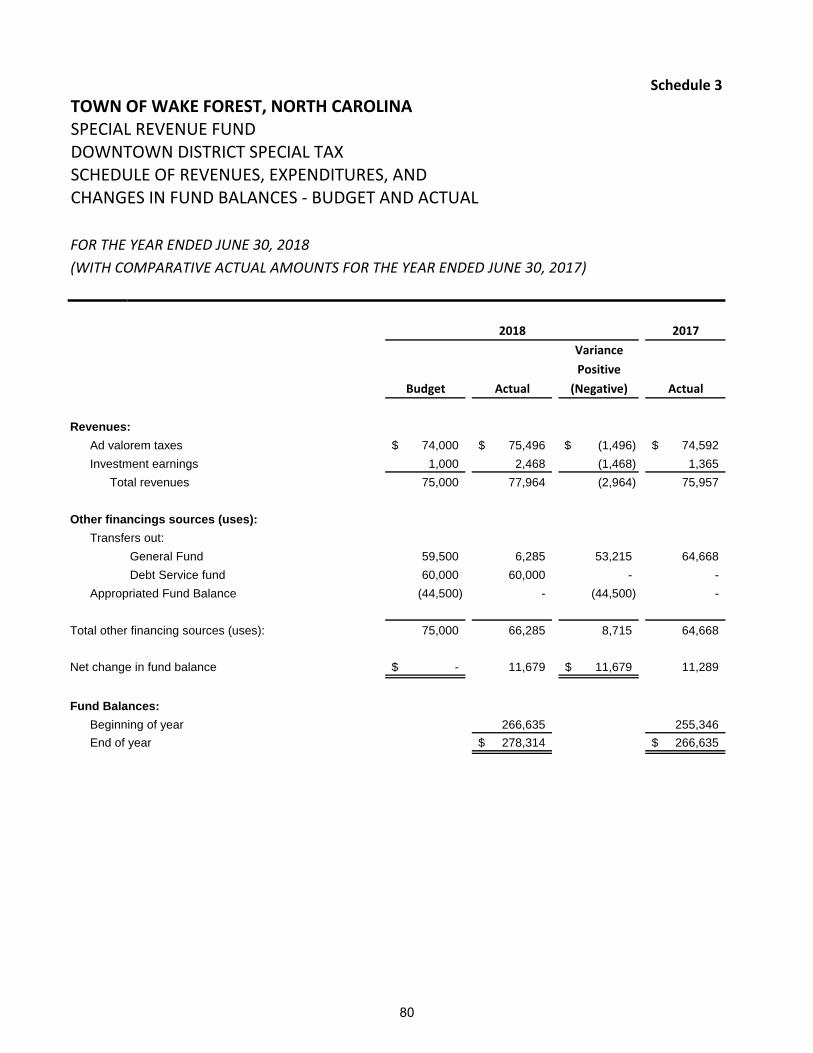
Schedule 3
(WITH COMPARATIVE ACTUAL AMOUNTS FOR THE YEAR ENDED JUNE 30, 2017)
2017
Variance
Positive
Budget Actual (Negative) Actual
Revenues:Ad valorem taxes 74,000$ 75,496$ (1,496)$ 74,592$ Investment earnings 1,000 2,468 (1,468) 1,365
Total revenues 75,000 77,964 (2,964) 75,957
Other financings sources (uses):Transfers out:
General Fund 59,500 6,285 53,215 64,668 Debt Service fund 60,000 60,000 - -
Appropriated Fund Balance (44,500) - (44,500) -
Total other financing sources (uses): 75,000 66,285 8,715 64,668
Net change in fund balance -$ 11,679 11,679$ 11,289
Fund Balances:Beginning of year 266,635 255,346
End of year 278,314$ 266,635$
FOR THE YEAR ENDED JUNE 30, 2018
2018
TOWN OF WAKE FOREST, NORTH CAROLINASPECIAL REVENUE FUNDDOWNTOWN DISTRICT SPECIAL TAXSCHEDULE OF REVENUES, EXPENDITURES, AND CHANGES IN FUND BALANCES - BUDGET AND ACTUAL
80
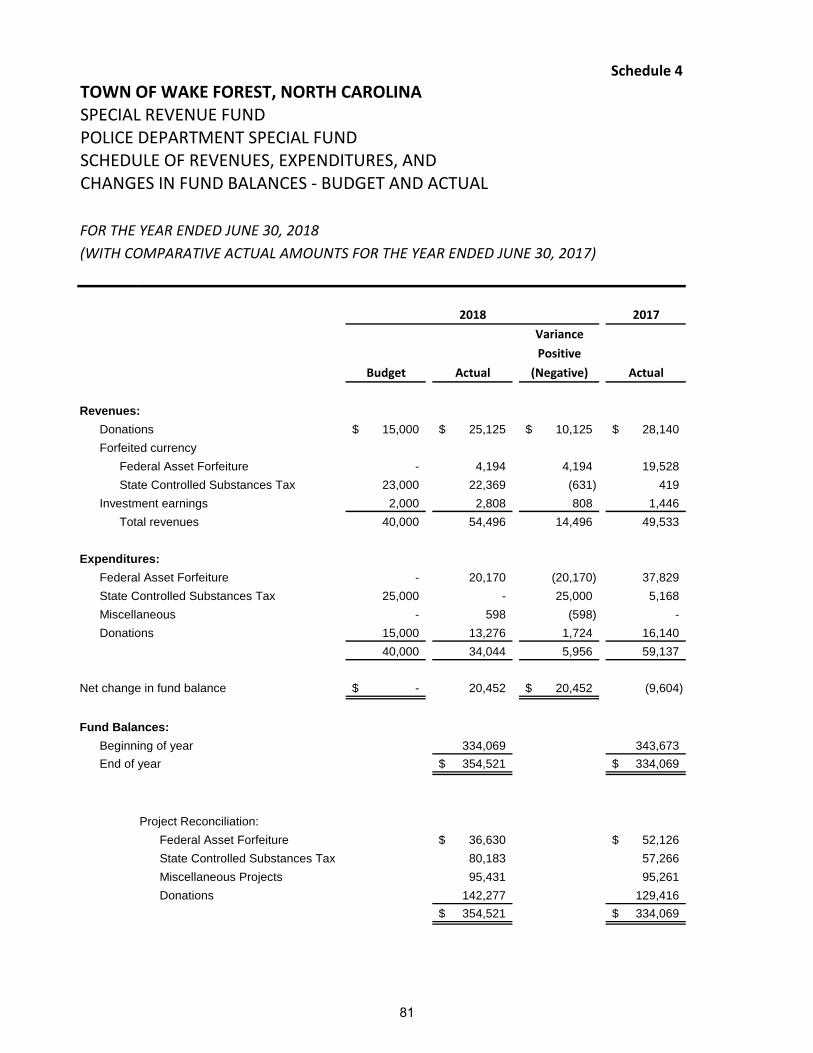
Schedule 4
(WITH COMPARATIVE ACTUAL AMOUNTS FOR THE YEAR ENDED JUNE 30, 2017)
2017
Variance
Positive
Budget Actual (Negative) Actual
Revenues:Donations 15,000$ 25,125$ 10,125$ 28,140$ Forfeited currency
Federal Asset Forfeiture - 4,194 4,194 19,528 State Controlled Substances Tax 23,000 22,369 (631) 419
Investment earnings 2,000 2,808 808 1,446 Total revenues 40,000 54,496 14,496 49,533
Expenditures:Federal Asset Forfeiture - 20,170 (20,170) 37,829 State Controlled Substances Tax 25,000 - 25,000 5,168 Miscellaneous - 598 (598) - Donations 15,000 13,276 1,724 16,140
40,000 34,044 5,956 59,137
Net change in fund balance -$ 20,452 20,452$ (9,604)
Fund Balances:Beginning of year 334,069 343,673
End of year 354,521$ 334,069$
Project Reconciliation:Federal Asset Forfeiture 36,630$ 52,126$ State Controlled Substances Tax 80,183 57,266 Miscellaneous Projects 95,431 95,261 Donations 142,277 129,416
354,521$ 334,069$
2018
TOWN OF WAKE FOREST, NORTH CAROLINASPECIAL REVENUE FUNDPOLICE DEPARTMENT SPECIAL FUNDSCHEDULE OF REVENUES, EXPENDITURES, ANDCHANGES IN FUND BALANCES - BUDGET AND ACTUAL
FOR THE YEAR ENDED JUNE 30, 2018
81
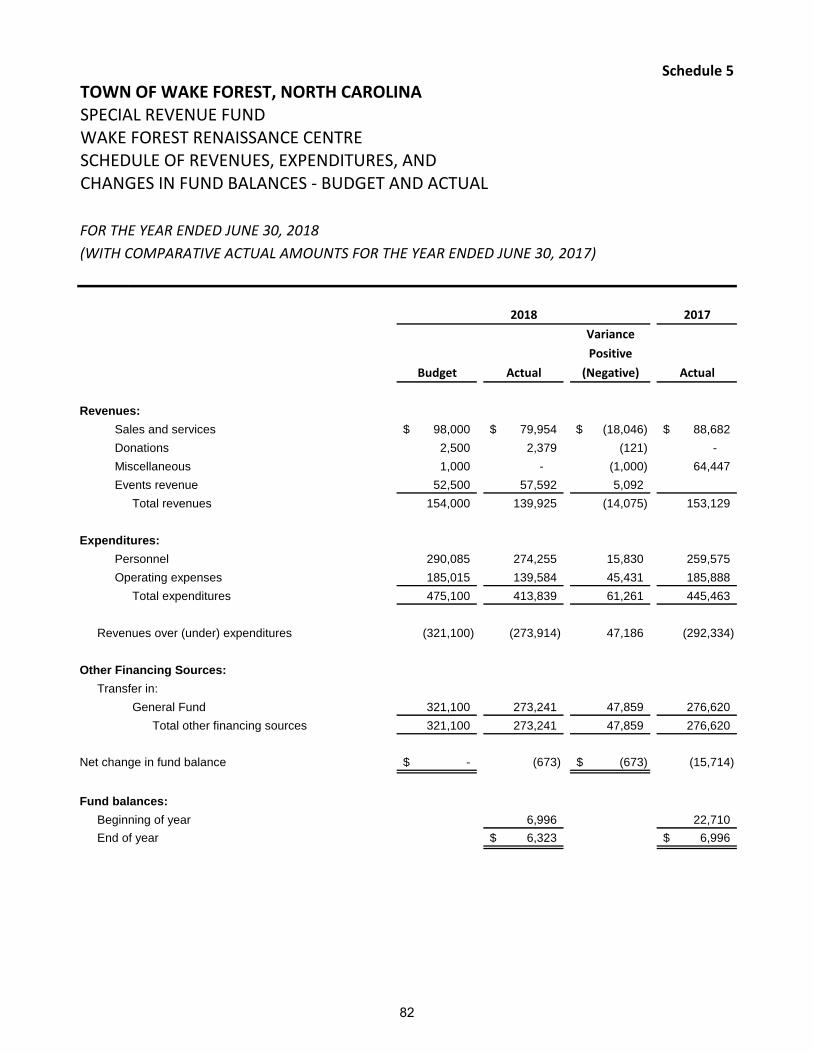
Schedule 5
(WITH COMPARATIVE ACTUAL AMOUNTS FOR THE YEAR ENDED JUNE 30, 2017)
2017
Variance
Positive
Budget Actual (Negative) Actual
Revenues:Sales and services 98,000$ 79,954$ (18,046)$ 88,682$ Donations 2,500 2,379 (121) - Miscellaneous 1,000 - (1,000) 64,447 Events revenue 52,500 57,592 5,092
Total revenues 154,000 139,925 (14,075) 153,129
Expenditures:Personnel 290,085 274,255 15,830 259,575 Operating expenses 185,015 139,584 45,431 185,888
Total expenditures 475,100 413,839 61,261 445,463
Revenues over (under) expenditures (321,100) (273,914) 47,186 (292,334)
Other Financing Sources:Transfer in: General Fund 321,100 273,241 47,859 276,620
Total other financing sources 321,100 273,241 47,859 276,620
Net change in fund balance -$ (673) (673)$ (15,714)
Fund balances:Beginning of year 6,996 22,710
End of year 6,323$ 6,996$
2018
TOWN OF WAKE FOREST, NORTH CAROLINASPECIAL REVENUE FUNDWAKE FOREST RENAISSANCE CENTRESCHEDULE OF REVENUES, EXPENDITURES, AND CHANGES IN FUND BALANCES - BUDGET AND ACTUAL
FOR THE YEAR ENDED JUNE 30, 2018
82
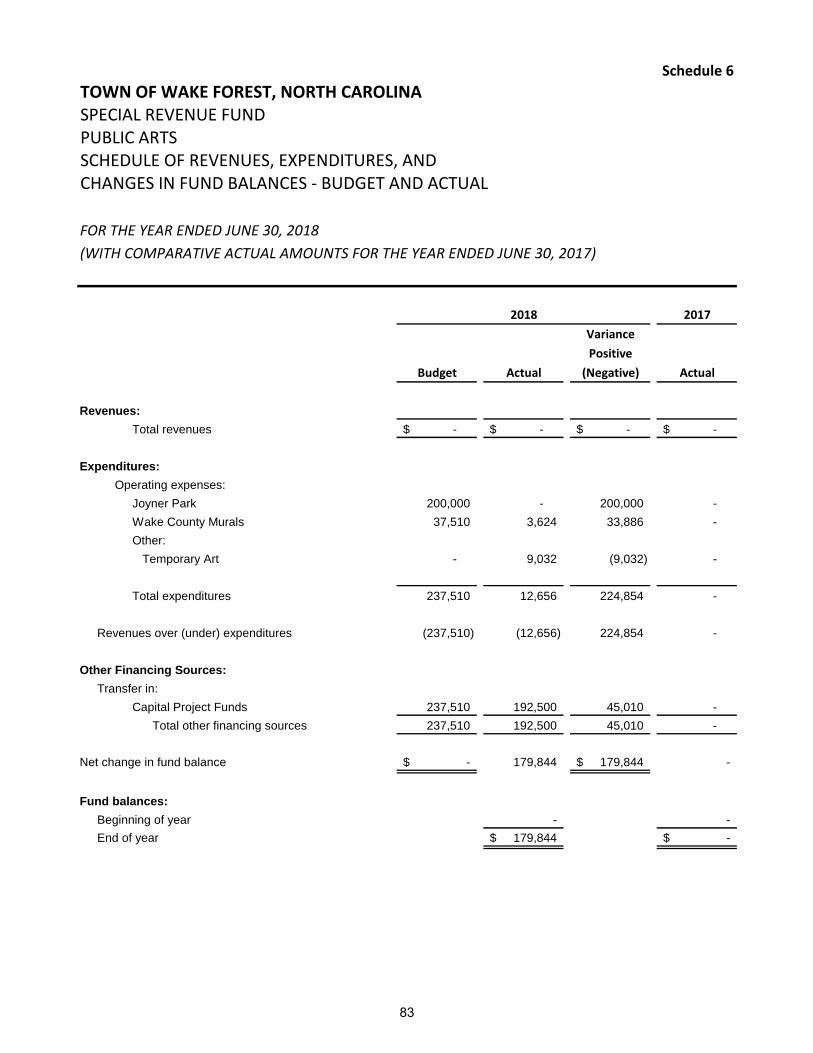
Schedule 6
(WITH COMPARATIVE ACTUAL AMOUNTS FOR THE YEAR ENDED JUNE 30, 2017)
2017
Variance
Positive
Budget Actual (Negative) Actual
Revenues:Total revenues -$ -$ -$ -$
Expenditures:Operating expenses:
Joyner Park 200,000 - 200,000 - Wake County Murals 37,510 3,624 33,886 - Other:
Temporary Art - 9,032 (9,032) -
Total expenditures 237,510 12,656 224,854 -
Revenues over (under) expenditures (237,510) (12,656) 224,854 -
Other Financing Sources:Transfer in: Capital Project Funds 237,510 192,500 45,010 -
Total other financing sources 237,510 192,500 45,010 -
Net change in fund balance -$ 179,844 179,844$ -
Fund balances:Beginning of year - -
End of year 179,844$ -$
2018
TOWN OF WAKE FOREST, NORTH CAROLINASPECIAL REVENUE FUNDPUBLIC ARTS SCHEDULE OF REVENUES, EXPENDITURES, AND CHANGES IN FUND BALANCES - BUDGET AND ACTUAL
FOR THE YEAR ENDED JUNE 30, 2018
83
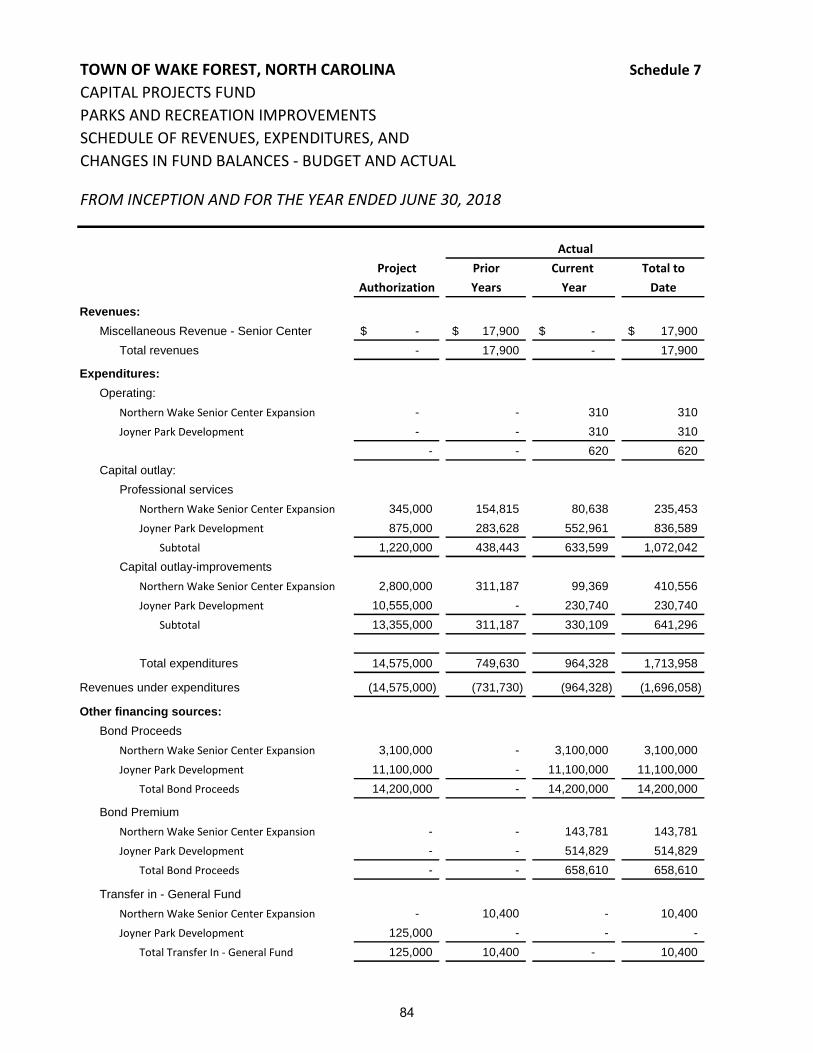
Schedule 7
Project Prior Current Total to
Authorization Years Year Date
Revenues:Miscellaneous Revenue - Senior Center -$ 17,900$ -$ 17,900$
Total revenues - 17,900 - 17,900
Expenditures:Operating:
Northern Wake Senior Center Expansion - - 310 310 Joyner Park Development - - 310 310
- - 620 620 Capital outlay:
Professional servicesNorthern Wake Senior Center Expansion 345,000 154,815 80,638 235,453 Joyner Park Development 875,000 283,628 552,961 836,589
Subtotal 1,220,000 438,443 633,599 1,072,042 Capital outlay-improvements
Northern Wake Senior Center Expansion 2,800,000 311,187 99,369 410,556 Joyner Park Development 10,555,000 - 230,740 230,740
Subtotal 13,355,000 311,187 330,109 641,296
Total expenditures 14,575,000 749,630 964,328 1,713,958
Revenues under expenditures (14,575,000) (731,730) (964,328) (1,696,058)
Other financing sources:Bond Proceeds
Northern Wake Senior Center Expansion 3,100,000 - 3,100,000 3,100,000 Joyner Park Development 11,100,000 - 11,100,000 11,100,000
Total Bond Proceeds 14,200,000 - 14,200,000 14,200,000
Bond PremiumNorthern Wake Senior Center Expansion - - 143,781 143,781 Joyner Park Development - - 514,829 514,829
Total Bond Proceeds - - 658,610 658,610
Transfer in - General FundNorthern Wake Senior Center Expansion - 10,400 - 10,400 Joyner Park Development 125,000 - - -
Total Transfer In - General Fund 125,000 10,400 - 10,400
TOWN OF WAKE FOREST, NORTH CAROLINA
Actual
CAPITAL PROJECTS FUND
PARKS AND RECREATION IMPROVEMENTS
SCHEDULE OF REVENUES, EXPENDITURES, AND
CHANGES IN FUND BALANCES - BUDGET AND ACTUAL
FROM INCEPTION AND FOR THE YEAR ENDED JUNE 30, 2018
84
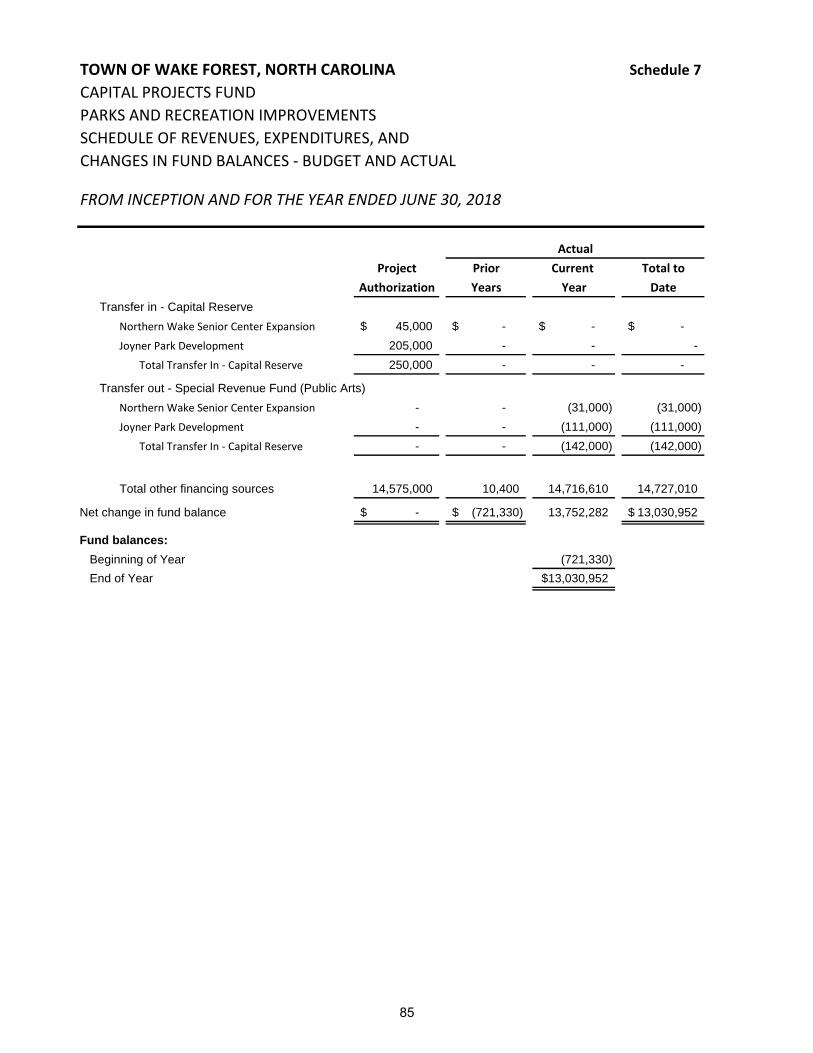
Schedule 7
Project Prior Current Total to
Authorization Years Year Date
TOWN OF WAKE FOREST, NORTH CAROLINA
Actual
CAPITAL PROJECTS FUND
PARKS AND RECREATION IMPROVEMENTS
SCHEDULE OF REVENUES, EXPENDITURES, AND
CHANGES IN FUND BALANCES - BUDGET AND ACTUAL
FROM INCEPTION AND FOR THE YEAR ENDED JUNE 30, 2018
Transfer in - Capital ReserveNorthern Wake Senior Center Expansion 45,000$ -$ -$ -$ Joyner Park Development 205,000 - - -
Total Transfer In - Capital Reserve 250,000 - - -
Transfer out - Special Revenue Fund (Public Arts)Northern Wake Senior Center Expansion - - (31,000) (31,000) Joyner Park Development - - (111,000) (111,000)
Total Transfer In - Capital Reserve - - (142,000) (142,000)
Total other financing sources 14,575,000 10,400 14,716,610 14,727,010
Net change in fund balance -$ (721,330)$ 13,752,282 13,030,952$
Fund balances: Beginning of Year (721,330) End of Year 13,030,952$
85
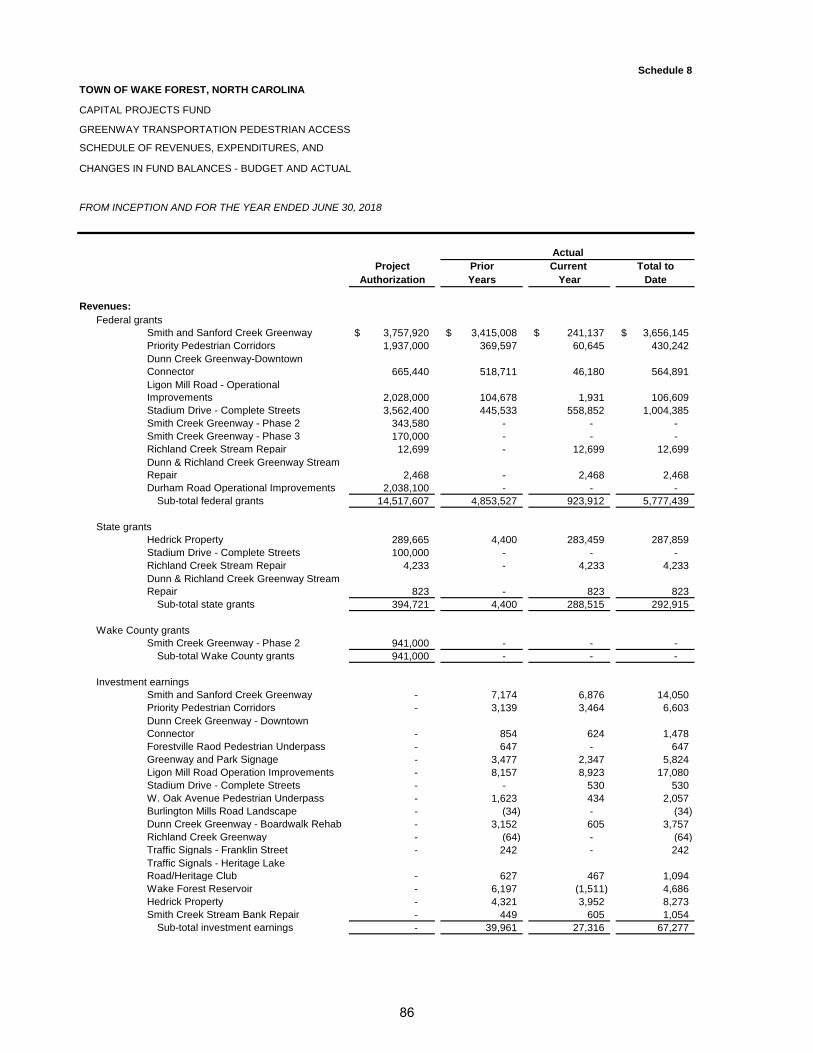
Schedule 8
TOWN OF WAKE FOREST, NORTH CAROLINA
CAPITAL PROJECTS FUND
GREENWAY TRANSPORTATION PEDESTRIAN ACCESS
SCHEDULE OF REVENUES, EXPENDITURES, AND
CHANGES IN FUND BALANCES - BUDGET AND ACTUAL
FROM INCEPTION AND FOR THE YEAR ENDED JUNE 30, 2018
Project Prior Current Total to Authorization Years Year Date
Revenues:Federal grants
Smith and Sanford Creek Greenway 3,757,920$ 3,415,008$ 241,137$ 3,656,145$ Priority Pedestrian Corridors 1,937,000 369,597 60,645 430,242 Dunn Creek Greenway-Downtown Connector 665,440 518,711 46,180 564,891 Ligon Mill Road - Operational Improvements 2,028,000 104,678 1,931 106,609 Stadium Drive - Complete Streets 3,562,400 445,533 558,852 1,004,385 Smith Creek Greenway - Phase 2 343,580 - - - Smith Creek Greenway - Phase 3 170,000 - - - Richland Creek Stream Repair 12,699 - 12,699 12,699 Dunn & Richland Creek Greenway Stream Repair 2,468 - 2,468 2,468 Durham Road Operational Improvements 2,038,100 - - -
Sub-total federal grants 14,517,607 4,853,527 923,912 5,777,439
State grantsHedrick Property 289,665 4,400 283,459 287,859 Stadium Drive - Complete Streets 100,000 - - - Richland Creek Stream Repair 4,233 - 4,233 4,233 Dunn & Richland Creek Greenway Stream Repair 823 - 823 823
Sub-total state grants 394,721 4,400 288,515 292,915
Wake County grantsSmith Creek Greenway - Phase 2 941,000 - - -
Sub-total Wake County grants 941,000 - - -
Investment earningsSmith and Sanford Creek Greenway - 7,174 6,876 14,050 Priority Pedestrian Corridors - 3,139 3,464 6,603 Dunn Creek Greenway - Downtown Connector - 854 624 1,478 Forestville Raod Pedestrian Underpass - 647 - 647 Greenway and Park Signage - 3,477 2,347 5,824 Ligon Mill Road Operation Improvements - 8,157 8,923 17,080 Stadium Drive - Complete Streets - - 530 530 W. Oak Avenue Pedestrian Underpass - 1,623 434 2,057 Burlington Mills Road Landscape - (34) - (34) Dunn Creek Greenway - Boardwalk Rehab - 3,152 605 3,757 Richland Creek Greenway - (64) - (64) Traffic Signals - Franklin Street - 242 - 242 Traffic Signals - Heritage Lake Road/Heritage Club - 627 467 1,094 Wake Forest Reservoir - 6,197 (1,511) 4,686 Hedrick Property - 4,321 3,952 8,273 Smith Creek Stream Bank Repair - 449 605 1,054
Sub-total investment earnings - 39,961 27,316 67,277
Actual
86
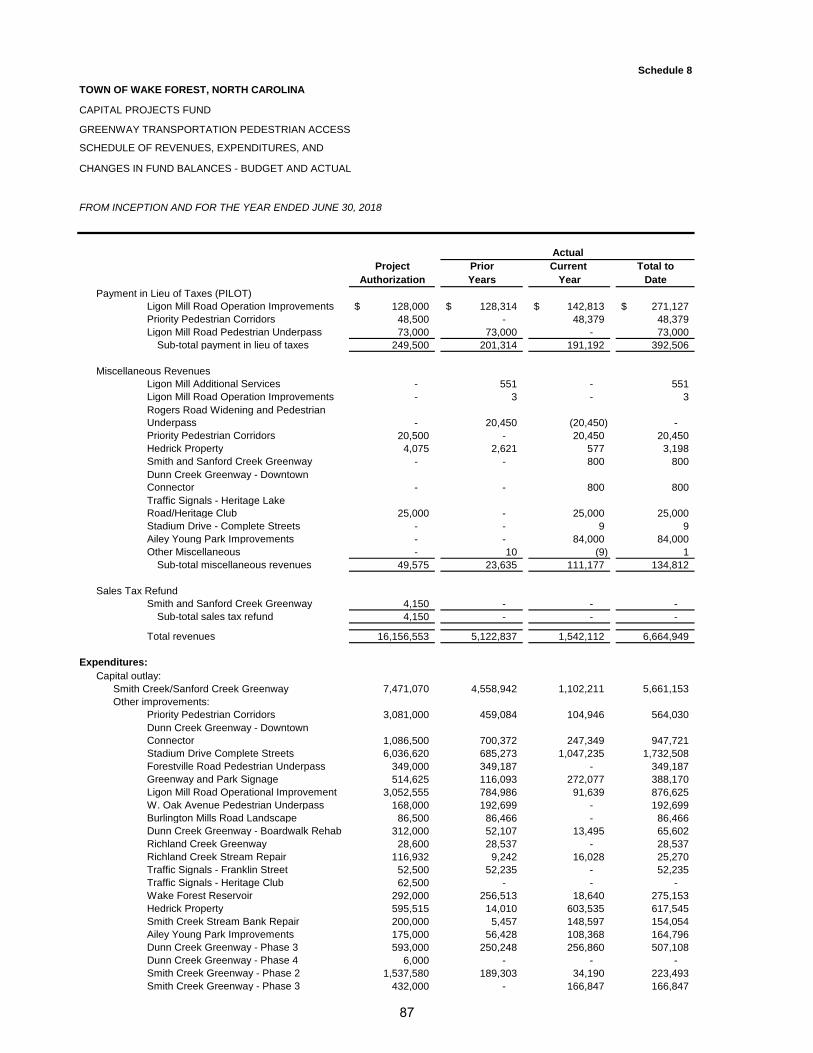
Schedule 8
TOWN OF WAKE FOREST, NORTH CAROLINA
CAPITAL PROJECTS FUND
GREENWAY TRANSPORTATION PEDESTRIAN ACCESS
SCHEDULE OF REVENUES, EXPENDITURES, AND
CHANGES IN FUND BALANCES - BUDGET AND ACTUAL
FROM INCEPTION AND FOR THE YEAR ENDED JUNE 30, 2018
Project Prior Current Total to Authorization Years Year Date
Actual
Payment in Lieu of Taxes (PILOT)Ligon Mill Road Operation Improvements 128,000$ 128,314$ 142,813$ 271,127$ Priority Pedestrian Corridors 48,500 - 48,379 48,379 Ligon Mill Road Pedestrian Underpass 73,000 73,000 - 73,000
Sub-total payment in lieu of taxes 249,500 201,314 191,192 392,506
Miscellaneous RevenuesLigon Mill Additional Services - 551 - 551 Ligon Mill Road Operation Improvements - 3 - 3 Rogers Road Widening and Pedestrian Underpass - 20,450 (20,450) - Priority Pedestrian Corridors 20,500 - 20,450 20,450 Hedrick Property 4,075 2,621 577 3,198 Smith and Sanford Creek Greenway - - 800 800 Dunn Creek Greenway - Downtown Connector - - 800 800 Traffic Signals - Heritage Lake Road/Heritage Club 25,000 - 25,000 25,000 Stadium Drive - Complete Streets - - 9 9 Ailey Young Park Improvements - - 84,000 84,000 Other Miscellaneous - 10 (9) 1
Sub-total miscellaneous revenues 49,575 23,635 111,177 134,812
Sales Tax RefundSmith and Sanford Creek Greenway 4,150 - - -
Sub-total sales tax refund 4,150 - - -
Total revenues 16,156,553 5,122,837 1,542,112 6,664,949
Expenditures:Capital outlay:
Smith Creek/Sanford Creek Greenway 7,471,070 4,558,942 1,102,211 5,661,153 Other improvements:
Priority Pedestrian Corridors 3,081,000 459,084 104,946 564,030 Dunn Creek Greenway - Downtown Connector 1,086,500 700,372 247,349 947,721 Stadium Drive Complete Streets 6,036,620 685,273 1,047,235 1,732,508 Forestville Road Pedestrian Underpass 349,000 349,187 - 349,187 Greenway and Park Signage 514,625 116,093 272,077 388,170 Ligon Mill Road Operational Improvement 3,052,555 784,986 91,639 876,625 W. Oak Avenue Pedestrian Underpass 168,000 192,699 - 192,699 Burlington Mills Road Landscape 86,500 86,466 - 86,466 Dunn Creek Greenway - Boardwalk Rehab 312,000 52,107 13,495 65,602 Richland Creek Greenway 28,600 28,537 - 28,537 Richland Creek Stream Repair 116,932 9,242 16,028 25,270 Traffic Signals - Franklin Street 52,500 52,235 - 52,235 Traffic Signals - Heritage Club 62,500 - - - Wake Forest Reservoir 292,000 256,513 18,640 275,153 Hedrick Property 595,515 14,010 603,535 617,545 Smith Creek Stream Bank Repair 200,000 5,457 148,597 154,054 Ailey Young Park Improvements 175,000 56,428 108,368 164,796 Dunn Creek Greenway - Phase 3 593,000 250,248 256,860 507,108 Dunn Creek Greenway - Phase 4 6,000 - - - Smith Creek Greenway - Phase 2 1,537,580 189,303 34,190 223,493 Smith Creek Greenway - Phase 3 432,000 - 166,847 166,847
87
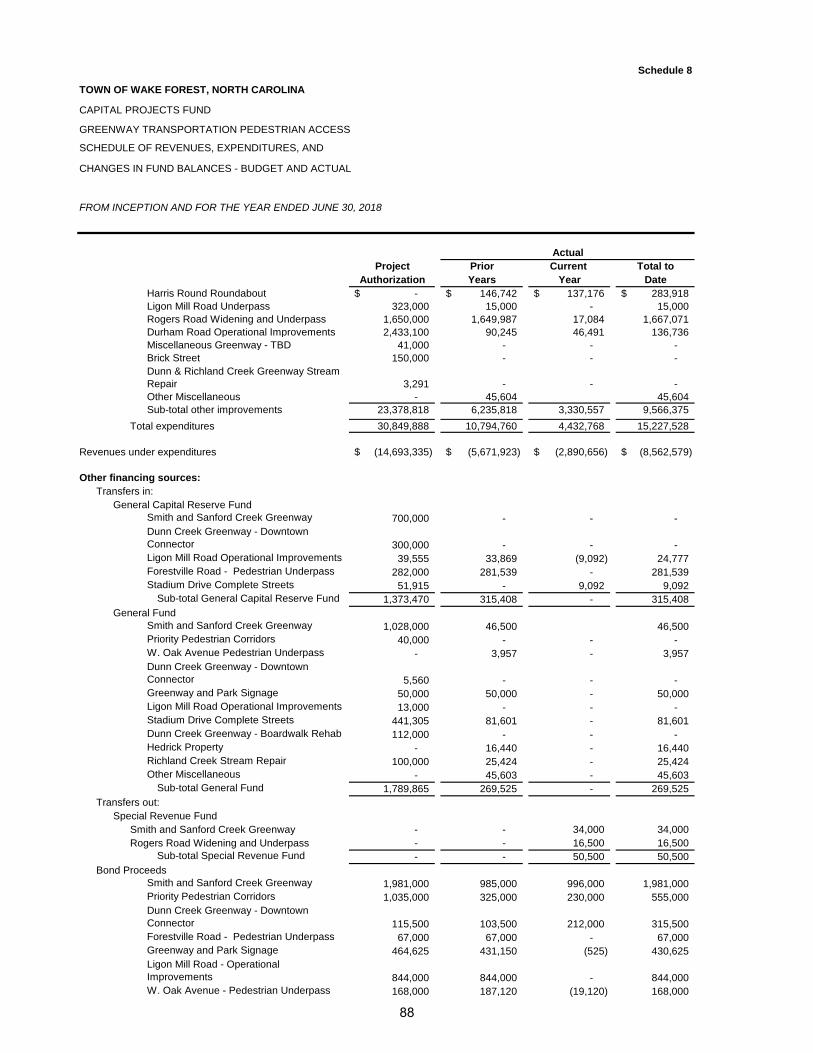
Schedule 8
TOWN OF WAKE FOREST, NORTH CAROLINA
CAPITAL PROJECTS FUND
GREENWAY TRANSPORTATION PEDESTRIAN ACCESS
SCHEDULE OF REVENUES, EXPENDITURES, AND
CHANGES IN FUND BALANCES - BUDGET AND ACTUAL
FROM INCEPTION AND FOR THE YEAR ENDED JUNE 30, 2018
Project Prior Current Total to Authorization Years Year Date
Actual
Harris Round Roundabout -$ 146,742$ 137,176$ 283,918$ Ligon Mill Road Underpass 323,000 15,000 - 15,000 Rogers Road Widening and Underpass 1,650,000 1,649,987 17,084 1,667,071 Durham Road Operational Improvements 2,433,100 90,245 46,491 136,736 Miscellaneous Greenway - TBD 41,000 - - - Brick Street 150,000 - - - Dunn & Richland Creek Greenway Stream Repair 3,291 - - - Other Miscellaneous - 45,604 45,604 Sub-total other improvements 23,378,818 6,235,818 3,330,557 9,566,375
Total expenditures 30,849,888 10,794,760 4,432,768 15,227,528
Revenues under expenditures (14,693,335)$ (5,671,923)$ (2,890,656)$ (8,562,579)$
Other financing sources:Transfers in: General Capital Reserve Fund
Smith and Sanford Creek Greenway 700,000 - - - Dunn Creek Greenway - Downtown Connector 300,000 - - - Ligon Mill Road Operational Improvements 39,555 33,869 (9,092) 24,777 Forestville Road - Pedestrian Underpass 282,000 281,539 - 281,539 Stadium Drive Complete Streets 51,915 - 9,092 9,092
Sub-total General Capital Reserve Fund 1,373,470 315,408 - 315,408 General Fund
Smith and Sanford Creek Greenway 1,028,000 46,500 46,500 Priority Pedestrian Corridors 40,000 - - - W. Oak Avenue Pedestrian Underpass - 3,957 - 3,957 Dunn Creek Greenway - Downtown Connector 5,560 - - - Greenway and Park Signage 50,000 50,000 - 50,000 Ligon Mill Road Operational Improvements 13,000 - - - Stadium Drive Complete Streets 441,305 81,601 - 81,601 Dunn Creek Greenway - Boardwalk Rehab 112,000 - - - Hedrick Property - 16,440 - 16,440 Richland Creek Stream Repair 100,000 25,424 - 25,424 Other Miscellaneous - 45,603 - 45,603
Sub-total General Fund 1,789,865 269,525 - 269,525 Transfers out: Special Revenue Fund
- - 34,000 34,000 - - 16,500 16,500
Sub-total Special Revenue Fund - - 50,500 50,500 Bond Proceeds
Smith and Sanford Creek Greenway 1,981,000 985,000 996,000 1,981,000 Priority Pedestrian Corridors 1,035,000 325,000 230,000 555,000 Dunn Creek Greenway - Downtown Connector 115,500 103,500 212,000 315,500 Forestville Road - Pedestrian Underpass 67,000 67,000 - 67,000 Greenway and Park Signage 464,625 431,150 (525) 430,625 Ligon Mill Road - Operational Improvements 844,000 844,000 - 844,000 W. Oak Avenue - Pedestrian Underpass 168,000 187,120 (19,120) 168,000
Smith and Sanford Creek GreenwayRogers Road Widening and Underpass
88

Schedule 8
TOWN OF WAKE FOREST, NORTH CAROLINA
CAPITAL PROJECTS FUND
GREENWAY TRANSPORTATION PEDESTRIAN ACCESS
SCHEDULE OF REVENUES, EXPENDITURES, AND
CHANGES IN FUND BALANCES - BUDGET AND ACTUAL
FROM INCEPTION AND FOR THE YEAR ENDED JUNE 30, 2018
Project Prior Current Total to Authorization Years Year Date
Actual
Dunn Creek Greenway - Boardwalk Rehab 200,000$ 200,000$ (200,000)$ -$ Traffic Signals - Franklin Street 52,500 51,993 - 51,993 Traffic Signals - Heritage Lake Road/Heritage Club
37,500 38,995 (988) 38,007
Wake Forest Reservoir 292,000 501,727 (209,727) 292,000 Richland Creek Greenway 28,600 28,600 - 28,600 Burlington Mills Road Landscape 86,500 86,500 - 86,500 Stadium Drive Complete Streets 1,881,000 - - - Hedrick Property 301,775 301,775 - 301,775 Smith Creek Stream Bank Repair 200,000 200,000 (200,000) - Dunn Creek Greenway - Phase 3 593,000 - - Dunn Creek Greenway - Phase 4 6,000 - - - Smith Creek Greenway - Phase 2 253,000 - - - Smith Creek Greenway - Phase 3 262,000 - - - Rogers Road Widening and Underpass 1,650,000 - 1,650,000 1,650,000 Ligon Mill Road Underpass 250,000 - - - Durham Road Operational Improvements 395,000 - - - Ailey Young Park Improvements 175,000 - - - Brick Street 150,000 - - - Miscellaneous Greenway - TBD 41,000 - - -
Sub-total Bonds Proceeds 11,530,000 4,352,360 2,457,640 6,810,000 Bond Proceeds - Premium
Smith and Sanford Creek Greenway - - 17,268 17,268 Priority Pedestrian Corridors - - 9,929 9,929 Dunn Creek Greenway - Downtown Connector - - 8,634 8,634 Traffic Signals - Heritage Lake/Heritage Club - - 984 984 W. Oak Avenue - Pedestrian Underpass - - 18,687 18,687 Wake Forest Reservoir - - 4,934 4,934 Rogers Road Widening and Underpass - - 33,570 33,570
Miscellaneous Sidewalks and Streets - TBD - - 40,188 40,188 Sub-total Bonds Proceeds Premium - - 134,194 134,194
Sub-total other financing sources 14,693,335 4,937,293 2,541,334 7,478,627 Less closed project budget -
Total other financing sources 14,693,335 4,937,293 2,541,334 7,478,627
Net change in fund balance -$ (734,630)$ (349,322) (1,083,952)$
Fund balances:Beginning of year (734,630)
End of year (1,083,952)$
89
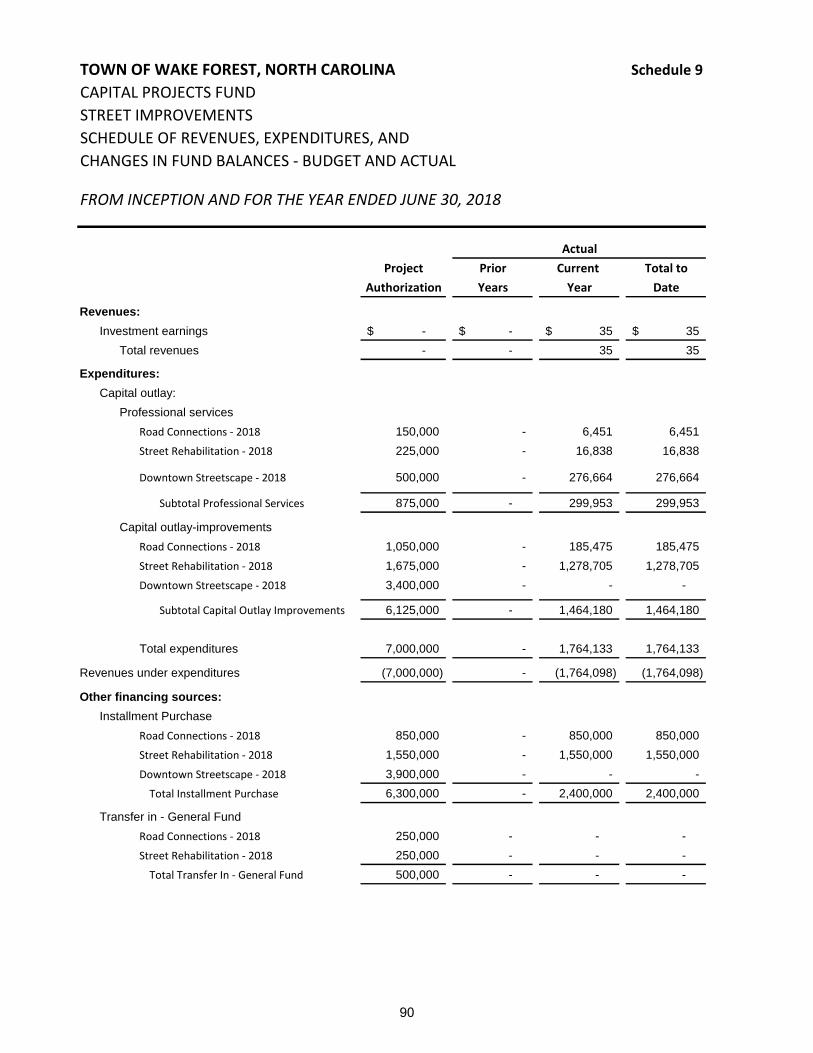
Schedule 9
Project Prior Current Total to
Authorization Years Year Date
Revenues:Investment earnings -$ -$ 35$ 35$
Total revenues - - 35 35
Expenditures:Capital outlay:
Professional servicesRoad Connections - 2018 150,000 - 6,451 6,451 Street Rehabilitation - 2018 225,000 - 16,838 16,838
Downtown Streetscape - 2018 500,000 - 276,664 276,664
Subtotal Professional Services 875,000 - 299,953 299,953
Capital outlay-improvementsRoad Connections - 2018 1,050,000 - 185,475 185,475 Street Rehabilitation - 2018 1,675,000 - 1,278,705 1,278,705 Downtown Streetscape - 2018 3,400,000 - - -
Subtotal Capital Outlay Improvements 6,125,000 - 1,464,180 1,464,180
Total expenditures 7,000,000 - 1,764,133 1,764,133
Revenues under expenditures (7,000,000) - (1,764,098) (1,764,098)
Other financing sources:Installment Purchase
Road Connections - 2018 850,000 - 850,000 850,000 Street Rehabilitation - 2018 1,550,000 - 1,550,000 1,550,000 Downtown Streetscape - 2018 3,900,000 - - -
Total Installment Purchase 6,300,000 - 2,400,000 2,400,000
Transfer in - General FundRoad Connections - 2018 250,000 - - - Street Rehabilitation - 2018 250,000 - - -
Total Transfer In - General Fund 500,000 - - -
Actual
TOWN OF WAKE FOREST, NORTH CAROLINA
CAPITAL PROJECTS FUND
STREET IMPROVEMENTS
SCHEDULE OF REVENUES, EXPENDITURES, AND
CHANGES IN FUND BALANCES - BUDGET AND ACTUAL
FROM INCEPTION AND FOR THE YEAR ENDED JUNE 30, 2018
90
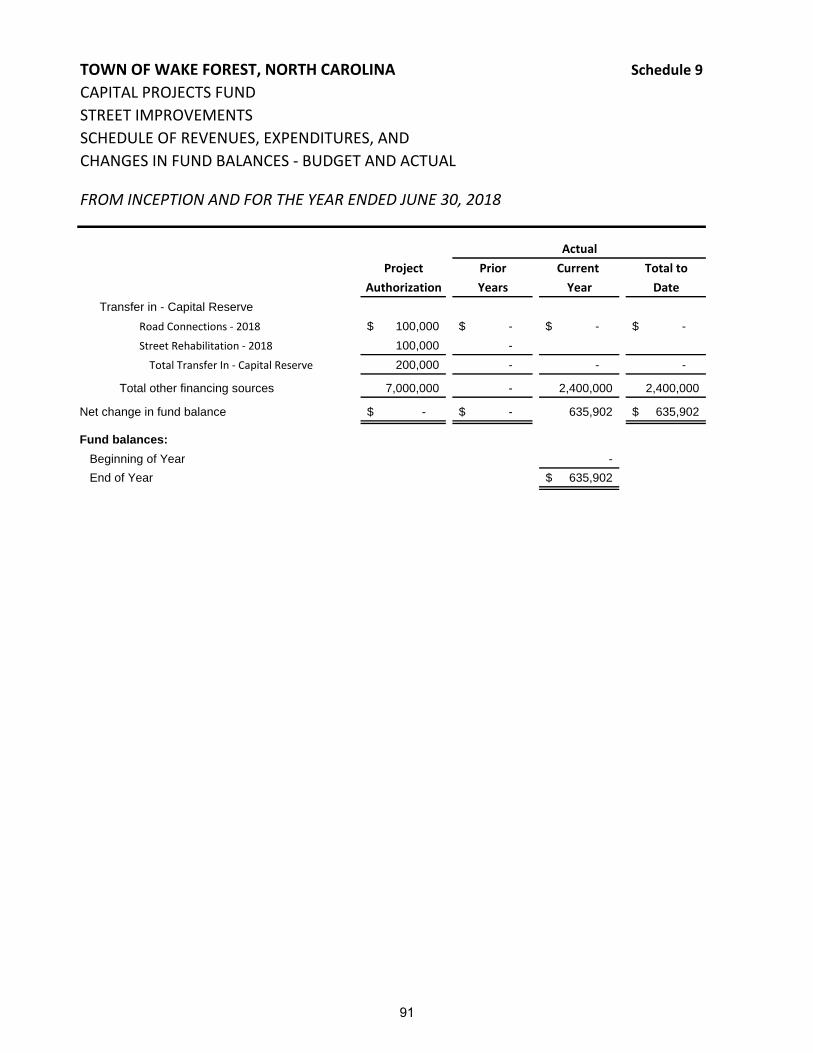
Schedule 9
Project Prior Current Total to
Authorization Years Year Date
Actual
TOWN OF WAKE FOREST, NORTH CAROLINA
CAPITAL PROJECTS FUND
STREET IMPROVEMENTS
SCHEDULE OF REVENUES, EXPENDITURES, AND
CHANGES IN FUND BALANCES - BUDGET AND ACTUAL
FROM INCEPTION AND FOR THE YEAR ENDED JUNE 30, 2018
Transfer in - Capital ReserveRoad Connections - 2018 100,000$ -$ -$ -$ Street Rehabilitation - 2018 100,000 -
Total Transfer In - Capital Reserve 200,000 - - -
Total other financing sources 7,000,000 - 2,400,000 2,400,000
Net change in fund balance -$ -$ 635,902 635,902$
Fund balances: Beginning of Year - End of Year 635,902$
91

Public Holding Recreation Cemetery
Asset Facilities Park Pool Capital Capital
Maintenance Projects Project Reserve Reserve
Assets
Cash and cash equivalents 18,257$ -$ -$ 2,227,677$ 56,046$
Restricted cash and cash equivalents - - 666,169 - - Due from other funds - - - - -
Accounts receivable 46,014 249,567 - - -
Total assets 64,271$ 249,567$ 666,169$ 2,227,677$ 56,046$
Liabilities
Accounts payable 14,323$ 327$ 356,109$ -$ -$
Due to other funds - 295,597 - - -
Total liabilities 14,323 295,924 356,109 - -
Deferred inflows
Grants - - - - -
Fund balances:
Restricted:
Public Safety - - - - -
Cultural & Recreation - - 310,060 - -
Committed:
Economic development - - - - -
Assigned:
Subsequent years expenditures - - - - -
Recreation improvements - - - 2,227,677 -
Cemetery improvements - - - - 56,046
Unassigned: 49,948 (46,357) - - -
Total fund balances 49,948 (46,357) 310,060 2,227,677 56,046
Total liabilities, deferred inflows
and fund balances 64,271$ 249,567$ 666,169$ 2,227,677$ 56,046$
TOWN OF WAKE FOREST, NORTH CAROLINANONMAJOR GOVERNMENTAL FUNDS
COMBINING BALANCE SHEET
JUNE 30, 2018
Capital Project Funds
92
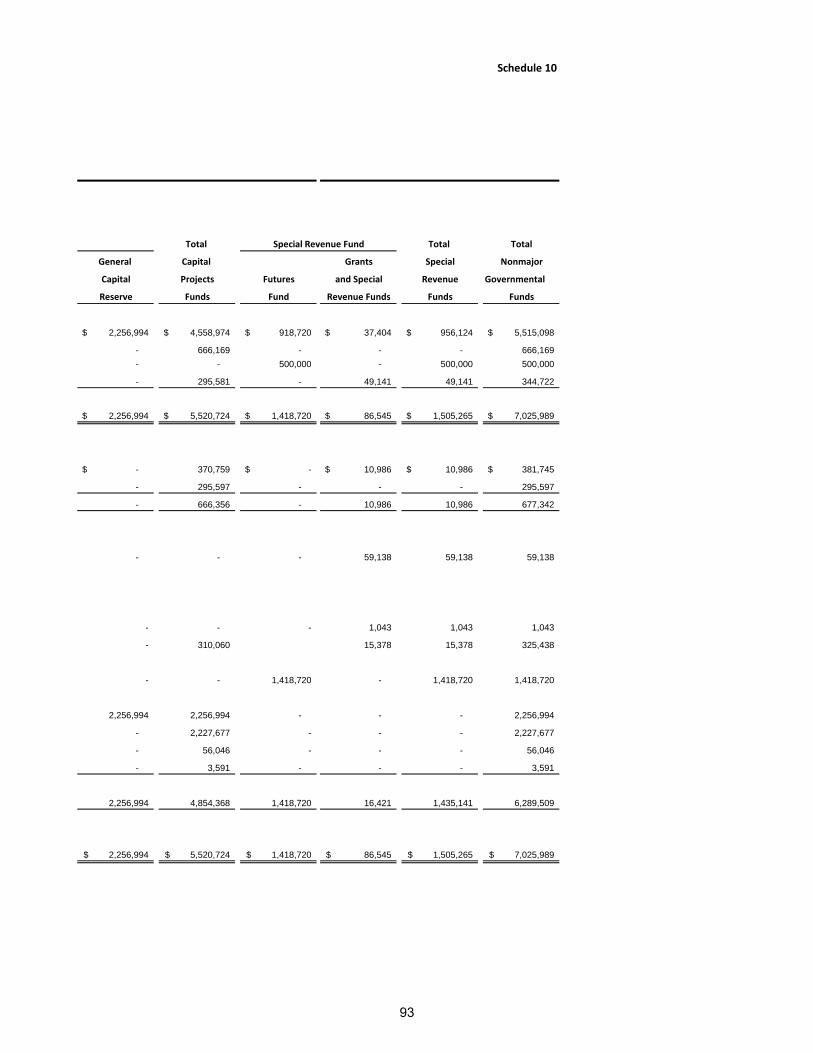
Schedule 10
Total Total Total
General Capital Grants Special Nonmajor
Capital Projects Futures and Special Revenue Governmental
Reserve Funds Fund Revenue Funds Funds Funds
2,256,994$ 4,558,974$ 918,720$ 37,404$ 956,124$ 5,515,098$
- 666,169 - - - 666,169 - - 500,000 - 500,000 500,000
- 295,581 - 49,141 49,141 344,722
2,256,994$ 5,520,724$ 1,418,720$ 86,545$ 1,505,265$ 7,025,989$
-$ 370,759 -$ 10,986$ 10,986$ 381,745$
- 295,597 - - - 295,597
- 666,356 - 10,986 10,986 677,342
- - - 59,138 59,138 59,138
- - - 1,043 1,043 1,043
- 310,060 15,378 15,378 325,438
- - 1,418,720 - 1,418,720 1,418,720
2,256,994 2,256,994 - - - 2,256,994
- 2,227,677 - - - 2,227,677
- 56,046 - - - 56,046
- 3,591 - - - 3,591
2,256,994 4,854,368 1,418,720 16,421 1,435,141 6,289,509
2,256,994$ 5,520,724$ 1,418,720$ 86,545$ 1,505,265$ 7,025,989$
TOWN OF WAKE FOREST, NORTH CAROLINANONMAJOR GOVERNMENTAL FUNDS
COMBINING BALANCE SHEET
JUNE 30, 2018
Special Revenue FundCapital Project Funds
93
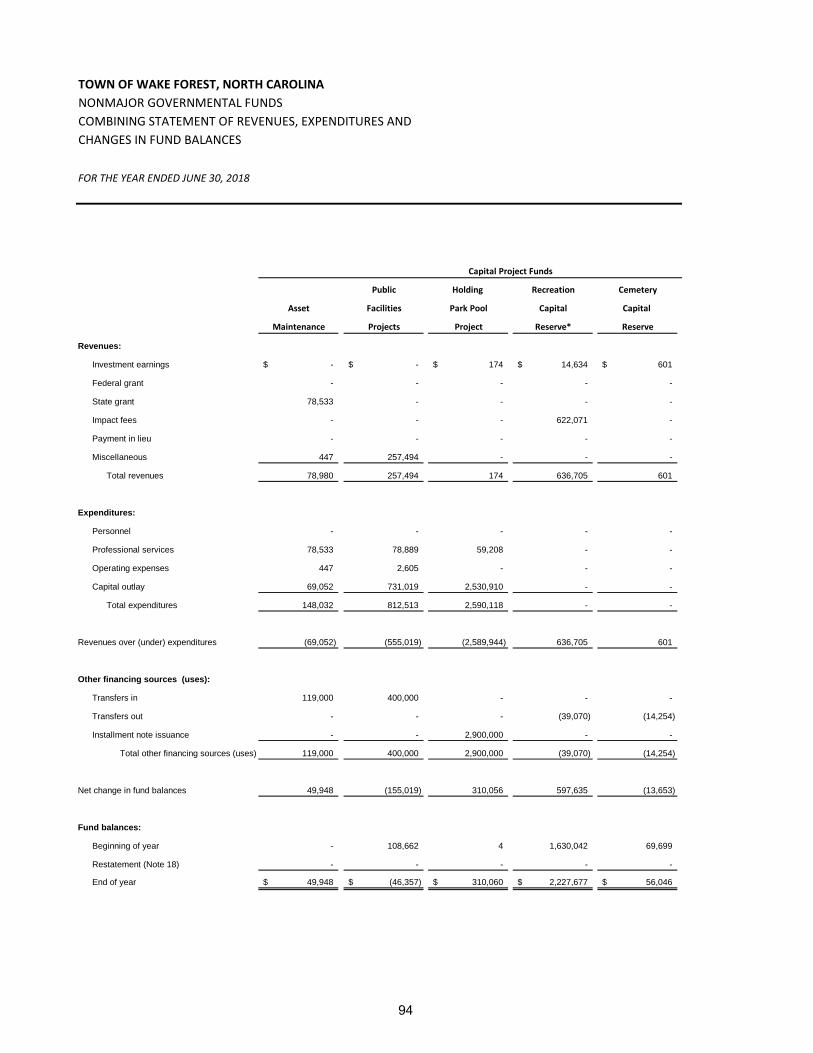
Public Holding Recreation Cemetery
Asset Facilities Park Pool Capital Capital
Maintenance Projects Project Reserve* Reserve
Revenues:
Investment earnings -$ -$ 174$ 14,634$ 601$
Federal grant - - - - -
State grant 78,533 - - - -
Impact fees - - - 622,071 -
Payment in lieu - - - - -
Miscellaneous 447 257,494 - - -
Total revenues 78,980 257,494 174 636,705 601
Expenditures:
Personnel - - - - -
Professional services 78,533 78,889 59,208 - -
Operating expenses 447 2,605 - - -
Capital outlay 69,052 731,019 2,530,910 - -
Total expenditures 148,032 812,513 2,590,118 - -
Revenues over (under) expenditures (69,052) (555,019) (2,589,944) 636,705 601
Other financing sources (uses):
Transfers in 119,000 400,000 - - -
Transfers out - - - (39,070) (14,254)
Installment note issuance - - 2,900,000 - -
Total other financing sources (uses) 119,000 400,000 2,900,000 (39,070) (14,254)
49,948 (155,019) 310,056 597,635 (13,653)
Fund balances:
Beginning of year - 108,662 4 1,630,042 69,699
Restatement (Note 18) - - - - -
End of year 49,948$ (46,357)$ 310,060$ 2,227,677$ 56,046$
Net change in fund balances
TOWN OF WAKE FOREST, NORTH CAROLINANONMAJOR GOVERNMENTAL FUNDSCOMBINING STATEMENT OF REVENUES, EXPENDITURES ANDCHANGES IN FUND BALANCES
FOR THE YEAR ENDED JUNE 30, 2018
Capital Project Funds
94
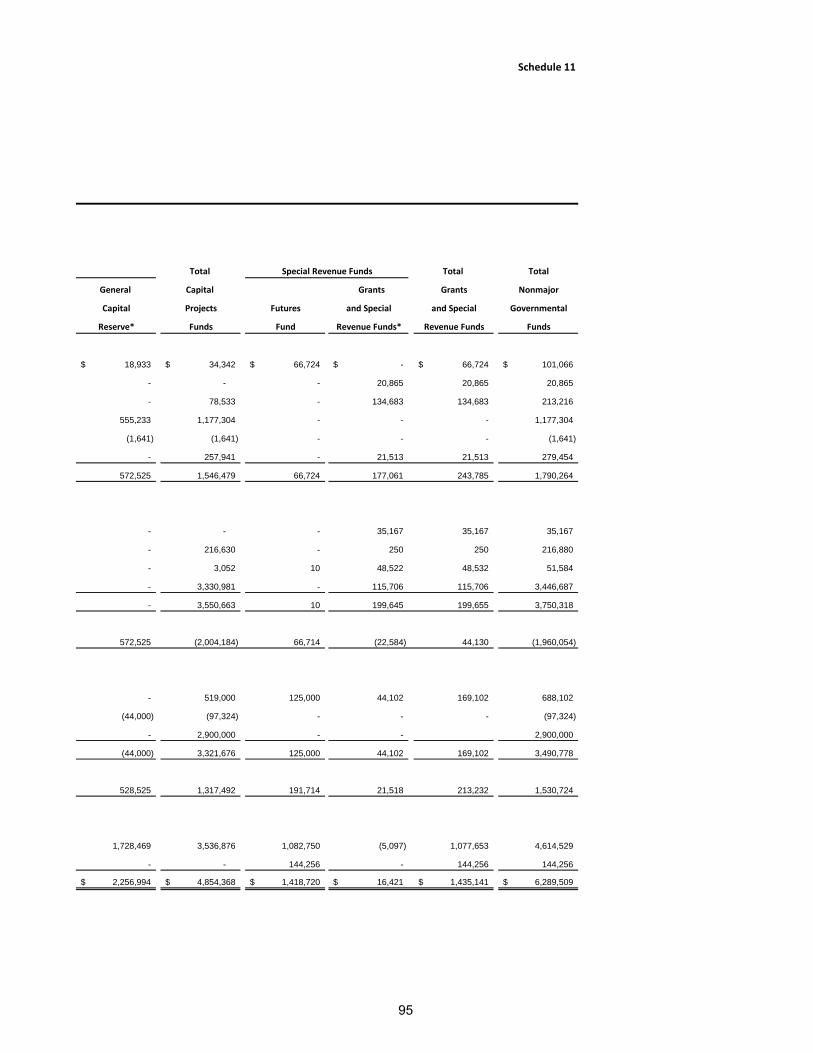
Schedule 11
Total Total Total
General Capital Grants Grants Nonmajor
Capital Projects Futures and Special and Special Governmental
Reserve* Funds Fund Revenue Funds* Revenue Funds Funds
18,933$ 34,342$ 66,724$ -$ 66,724$ 101,066$
- - - 20,865 20,865 20,865
- 78,533 - 134,683 134,683 213,216
555,233 1,177,304 - - - 1,177,304
(1,641) (1,641) - - - (1,641)
- 257,941 - 21,513 21,513 279,454
572,525 1,546,479 66,724 177,061 243,785 1,790,264
- - - 35,167 35,167 35,167
- 216,630 - 250 250 216,880
- 3,052 10 48,522 48,532 51,584
- 3,330,981 - 115,706 115,706 3,446,687
- 3,550,663 10 199,645 199,655 3,750,318
572,525 (2,004,184) 66,714 (22,584) 44,130 (1,960,054)
- 519,000 125,000 44,102 169,102 688,102
(44,000) (97,324) - - - (97,324)
- 2,900,000 - - 2,900,000
(44,000) 3,321,676 125,000 44,102 169,102 3,490,778
528,525 1,317,492 191,714 21,518 213,232 1,530,724
1,728,469 3,536,876 1,082,750 (5,097) 1,077,653 4,614,529
- - 144,256 - 144,256 144,256
2,256,994$ 4,854,368$ 1,418,720$ 16,421$ 1,435,141$ 6,289,509$
Special Revenue Funds
95
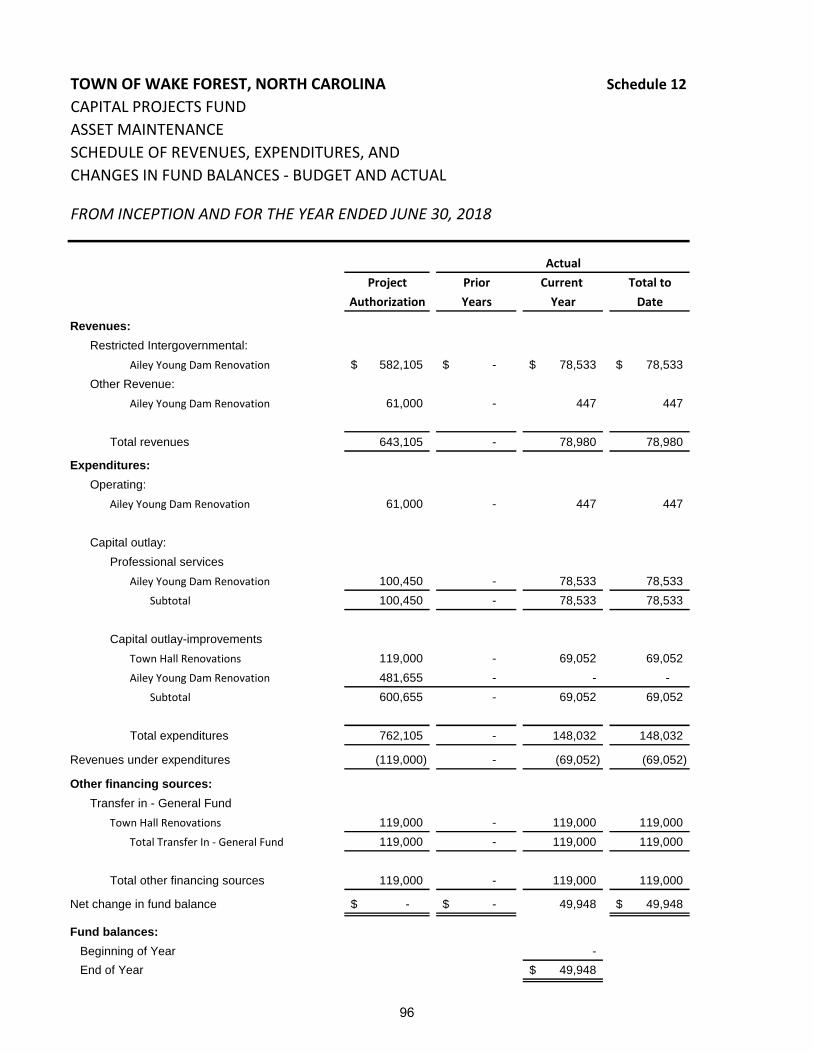
Schedule 12
Project Prior Current Total to
Authorization Years Year Date
Revenues:Restricted Intergovernmental:
Ailey Young Dam Renovation 582,105$ -$ 78,533$ 78,533$ Other Revenue:
Ailey Young Dam Renovation 61,000 - 447 447
Total revenues 643,105 - 78,980 78,980
Expenditures:Operating:
Ailey Young Dam Renovation 61,000 - 447 447
Capital outlay: Professional services
Ailey Young Dam Renovation 100,450 - 78,533 78,533 Subtotal 100,450 - 78,533 78,533
Capital outlay-improvementsTown Hall Renovations 119,000 - 69,052 69,052 Ailey Young Dam Renovation 481,655 - - -
Subtotal 600,655 - 69,052 69,052
Total expenditures 762,105 - 148,032 148,032
Revenues under expenditures (119,000) - (69,052) (69,052)
Other financing sources:Transfer in - General Fund
Town Hall Renovations 119,000 - 119,000 119,000 Total Transfer In - General Fund 119,000 - 119,000 119,000
Total other financing sources 119,000 - 119,000 119,000
Net change in fund balance -$ -$ 49,948 49,948$
Fund balances: Beginning of Year - End of Year 49,948$
Actual
TOWN OF WAKE FOREST, NORTH CAROLINA
CAPITAL PROJECTS FUND
ASSET MAINTENANCE
SCHEDULE OF REVENUES, EXPENDITURES, AND
CHANGES IN FUND BALANCES - BUDGET AND ACTUAL
FROM INCEPTION AND FOR THE YEAR ENDED JUNE 30, 2018
96

97
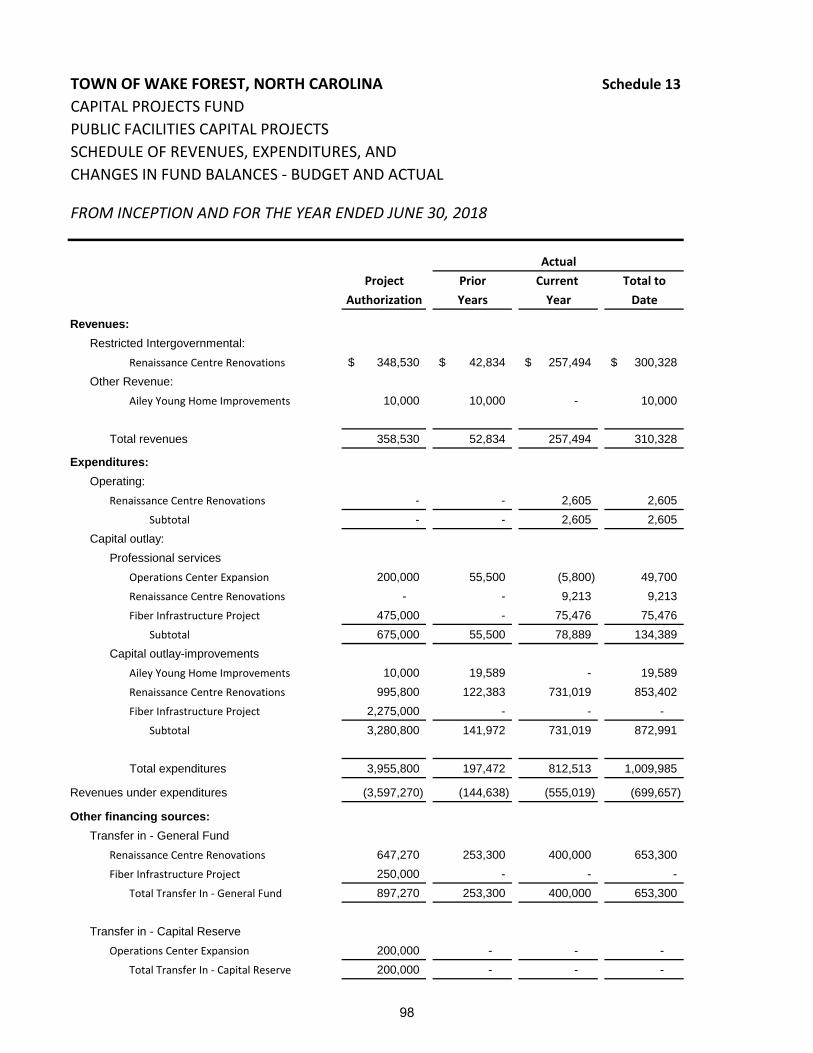
Schedule 13
Project Prior Current Total to
Authorization Years Year Date
Revenues:Restricted Intergovernmental:
Renaissance Centre Renovations 348,530$ 42,834$ 257,494$ 300,328$ Other Revenue:
Ailey Young Home Improvements 10,000 10,000 - 10,000
Total revenues 358,530 52,834 257,494 310,328
Expenditures:Operating:
Renaissance Centre Renovations - - 2,605 2,605 Subtotal - - 2,605 2,605
Capital outlay: Professional services
Operations Center Expansion 200,000 55,500 (5,800) 49,700 Renaissance Centre Renovations - - 9,213 9,213 Fiber Infrastructure Project 475,000 - 75,476 75,476
Subtotal 675,000 55,500 78,889 134,389 Capital outlay-improvements
Ailey Young Home Improvements 10,000 19,589 - 19,589 Renaissance Centre Renovations 995,800 122,383 731,019 853,402 Fiber Infrastructure Project 2,275,000 - - -
Subtotal 3,280,800 141,972 731,019 872,991
Total expenditures 3,955,800 197,472 812,513 1,009,985
Revenues under expenditures (3,597,270) (144,638) (555,019) (699,657)
Other financing sources:Transfer in - General Fund
Renaissance Centre Renovations 647,270 253,300 400,000 653,300 Fiber Infrastructure Project 250,000 - - -
Total Transfer In - General Fund 897,270 253,300 400,000 653,300
Transfer in - Capital ReserveOperations Center Expansion 200,000 - - -
Total Transfer In - Capital Reserve 200,000 - - -
Actual
TOWN OF WAKE FOREST, NORTH CAROLINA
CAPITAL PROJECTS FUND
PUBLIC FACILITIES CAPITAL PROJECTS
SCHEDULE OF REVENUES, EXPENDITURES, AND
CHANGES IN FUND BALANCES - BUDGET AND ACTUAL
FROM INCEPTION AND FOR THE YEAR ENDED JUNE 30, 2018
98
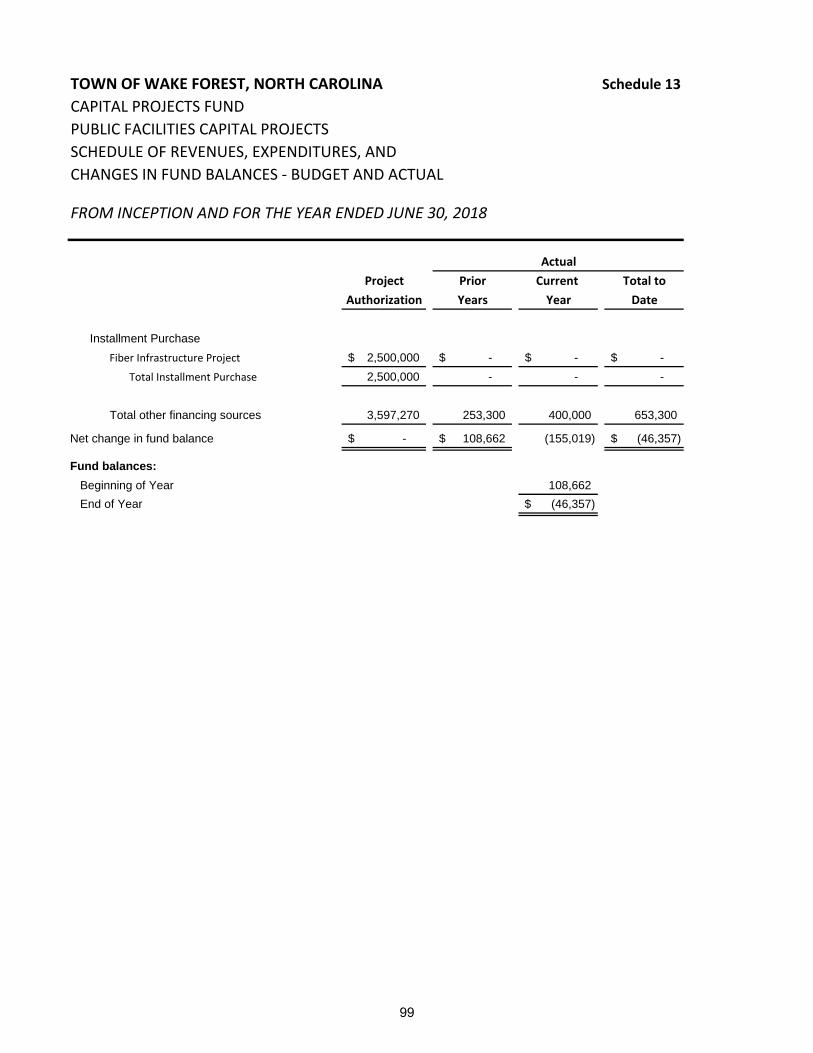
Schedule 13
Project Prior Current Total to
Authorization Years Year Date
Actual
TOWN OF WAKE FOREST, NORTH CAROLINA
CAPITAL PROJECTS FUND
PUBLIC FACILITIES CAPITAL PROJECTS
SCHEDULE OF REVENUES, EXPENDITURES, AND
CHANGES IN FUND BALANCES - BUDGET AND ACTUAL
FROM INCEPTION AND FOR THE YEAR ENDED JUNE 30, 2018
Installment PurchaseFiber Infrastructure Project 2,500,000$ -$ -$ -$
Total Installment Purchase 2,500,000 - - -
Total other financing sources 3,597,270 253,300 400,000 653,300
Net change in fund balance -$ 108,662$ (155,019) (46,357)$
Fund balances: Beginning of Year 108,662 End of Year (46,357)$
99
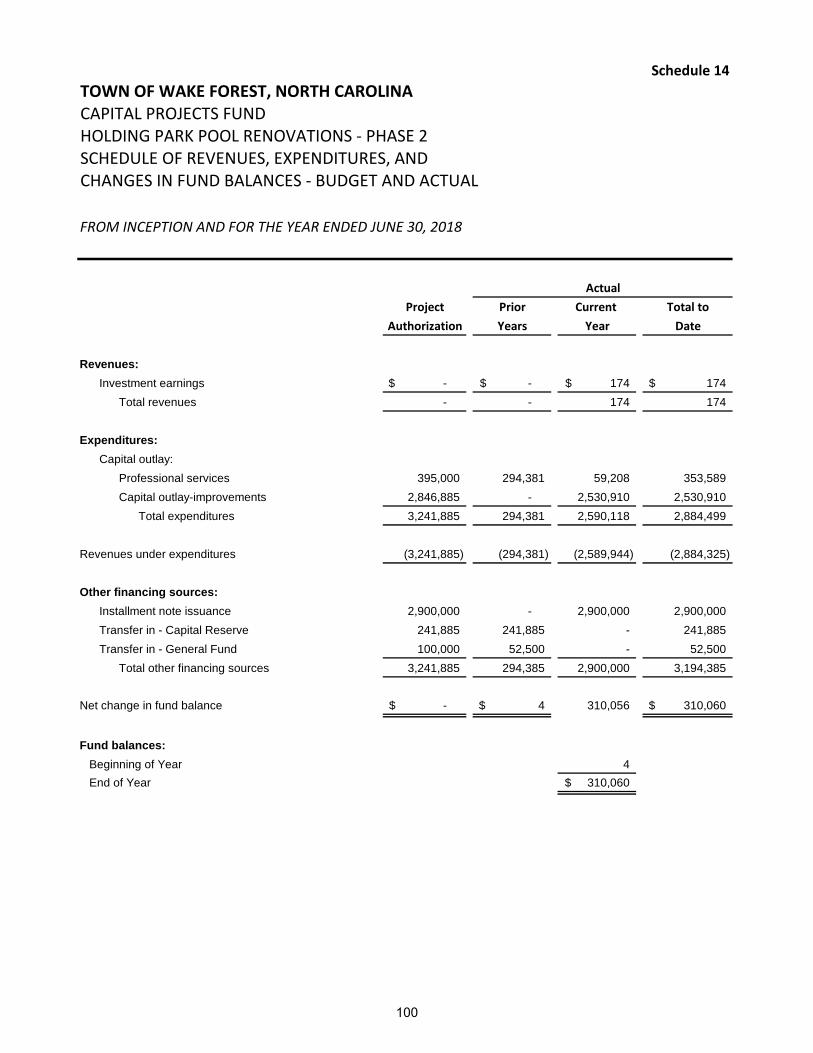
Schedule 14
Project Prior Current Total to
Authorization Years Year Date
Revenues:Investment earnings -$ -$ 174$ 174$
Total revenues - - 174 174
Expenditures:Capital outlay:
Professional services 395,000 294,381 59,208 353,589Capital outlay-improvements 2,846,885 - 2,530,910 2,530,910
Total expenditures 3,241,885 294,381 2,590,118 2,884,499
Revenues under expenditures (3,241,885) (294,381) (2,589,944) (2,884,325)
Other financing sources:Installment note issuance 2,900,000 - 2,900,000 2,900,000 Transfer in - Capital Reserve 241,885 241,885 - 241,885 Transfer in - General Fund 100,000 52,500 - 52,500
Total other financing sources 3,241,885 294,385 2,900,000 3,194,385
Net change in fund balance -$ 4$ 310,056 310,060$
Fund balances: Beginning of Year 4 End of Year 310,060$
Actual
TOWN OF WAKE FOREST, NORTH CAROLINACAPITAL PROJECTS FUNDHOLDING PARK POOL RENOVATIONS - PHASE 2SCHEDULE OF REVENUES, EXPENDITURES, ANDCHANGES IN FUND BALANCES - BUDGET AND ACTUAL
FROM INCEPTION AND FOR THE YEAR ENDED JUNE 30, 2018
100
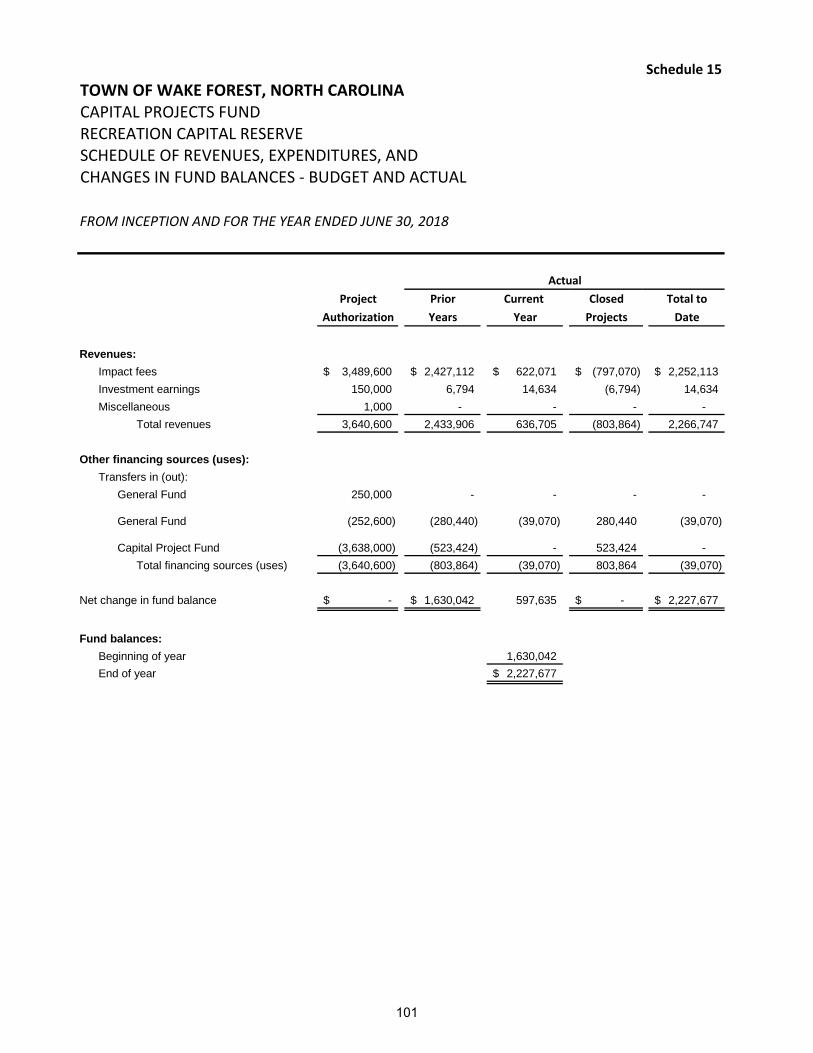
Schedule 15
TOWN OF WAKE FOREST, NORTH CAROLINACAPITAL PROJECTS FUNDRECREATION CAPITAL RESERVESCHEDULE OF REVENUES, EXPENDITURES, ANDCHANGES IN FUND BALANCES - BUDGET AND ACTUAL
FROM INCEPTION AND FOR THE YEAR ENDED JUNE 30, 2018
Actual
Project Prior Current Closed Total to
Authorization Years Year Projects Date
Revenues:Impact fees 3,489,600$ 2,427,112$ 622,071$ (797,070)$ 2,252,113$ Investment earnings 150,000 6,794 14,634 (6,794) 14,634 Miscellaneous 1,000 - - - -
Total revenues 3,640,600 2,433,906 636,705 (803,864) 2,266,747
Other financing sources (uses):Transfers in (out):
General Fund 250,000 - - - -
General Fund (252,600) (280,440) (39,070) 280,440 (39,070)
Capital Project Fund (3,638,000) (523,424) - 523,424 - Total financing sources (uses) (3,640,600) (803,864) (39,070) 803,864 (39,070)
Net change in fund balance -$ 1,630,042$ 597,635 -$ 2,227,677$
Fund balances:Beginning of year 1,630,042End of year 2,227,677$
101
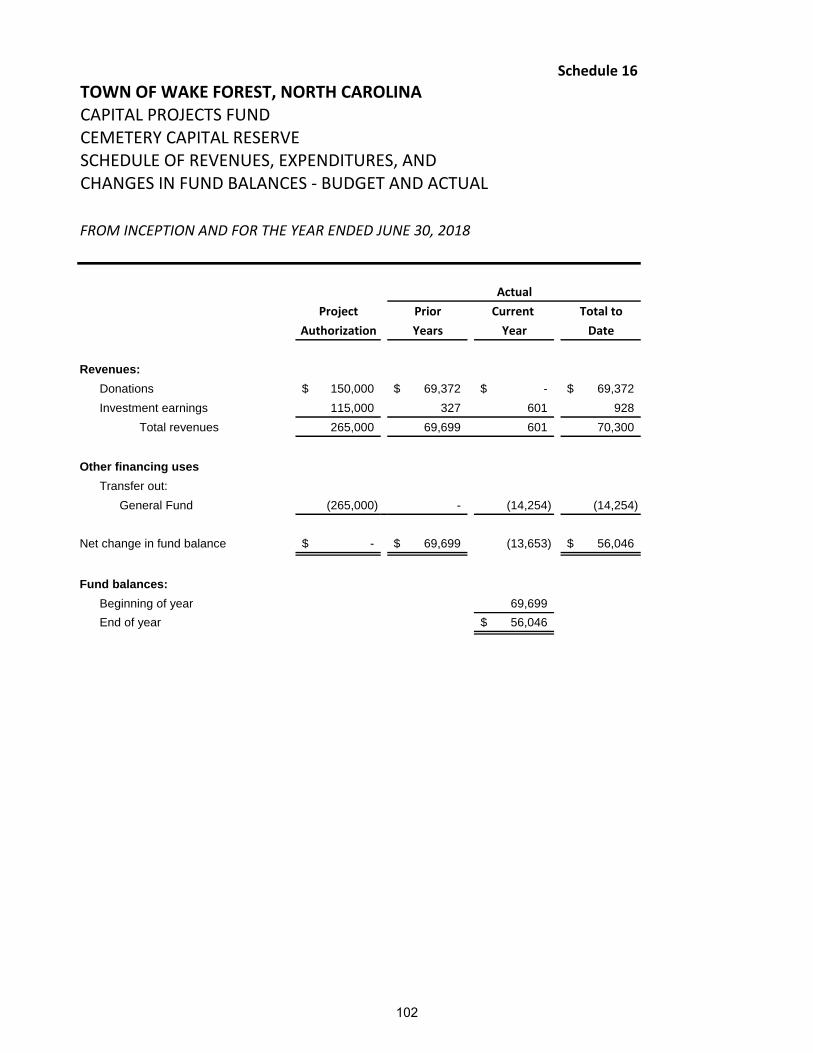
Schedule 16
TOWN OF WAKE FOREST, NORTH CAROLINACAPITAL PROJECTS FUNDCEMETERY CAPITAL RESERVESCHEDULE OF REVENUES, EXPENDITURES, ANDCHANGES IN FUND BALANCES - BUDGET AND ACTUAL
FROM INCEPTION AND FOR THE YEAR ENDED JUNE 30, 2018
Actual
Project Prior Current Total to
Authorization Years Year Date
Revenues:Donations 150,000$ 69,372$ -$ 69,372$ Investment earnings 115,000 327 601 928
Total revenues 265,000 69,699 601 70,300
Other financing uses Transfer out:
General Fund (265,000) - (14,254) (14,254)
Net change in fund balance -$ 69,699$ (13,653) 56,046$
Fund balances:Beginning of year 69,699End of year 56,046$
102
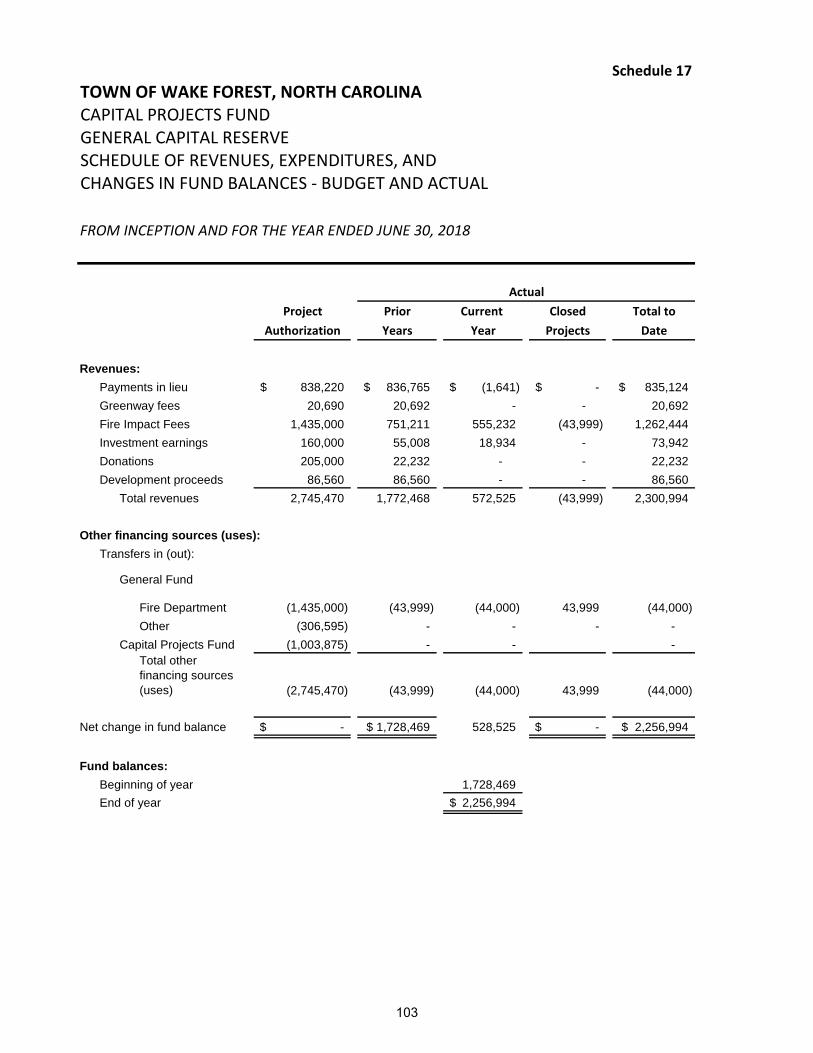
Schedule 17
TOWN OF WAKE FOREST, NORTH CAROLINACAPITAL PROJECTS FUNDGENERAL CAPITAL RESERVESCHEDULE OF REVENUES, EXPENDITURES, ANDCHANGES IN FUND BALANCES - BUDGET AND ACTUAL
FROM INCEPTION AND FOR THE YEAR ENDED JUNE 30, 2018
Project Prior Current Closed Total to
Authorization Years Year Projects Date
Revenues:Payments in lieu 838,220$ 836,765$ (1,641)$ -$ 835,124$ Greenway fees 20,690 20,692 - - 20,692Fire Impact Fees 1,435,000 751,211 555,232 (43,999) 1,262,444Investment earnings 160,000 55,008 18,934 - 73,942Donations 205,000 22,232 - - 22,232Development proceeds 86,560 86,560 - - 86,560
Total revenues 2,745,470 1,772,468 572,525 (43,999) 2,300,994
Other financing sources (uses):Transfers in (out):
General Fund
Fire Department (1,435,000) (43,999) (44,000) 43,999 (44,000) Other (306,595) - - - -
Capital Projects Fund (1,003,875) - - - Total other financing sources (uses) (2,745,470) (43,999) (44,000) 43,999 (44,000)
Net change in fund balance -$ 1,728,469$ 528,525 -$ 2,256,994$
Fund balances:Beginning of year 1,728,469 End of year 2,256,994$
Actual
103
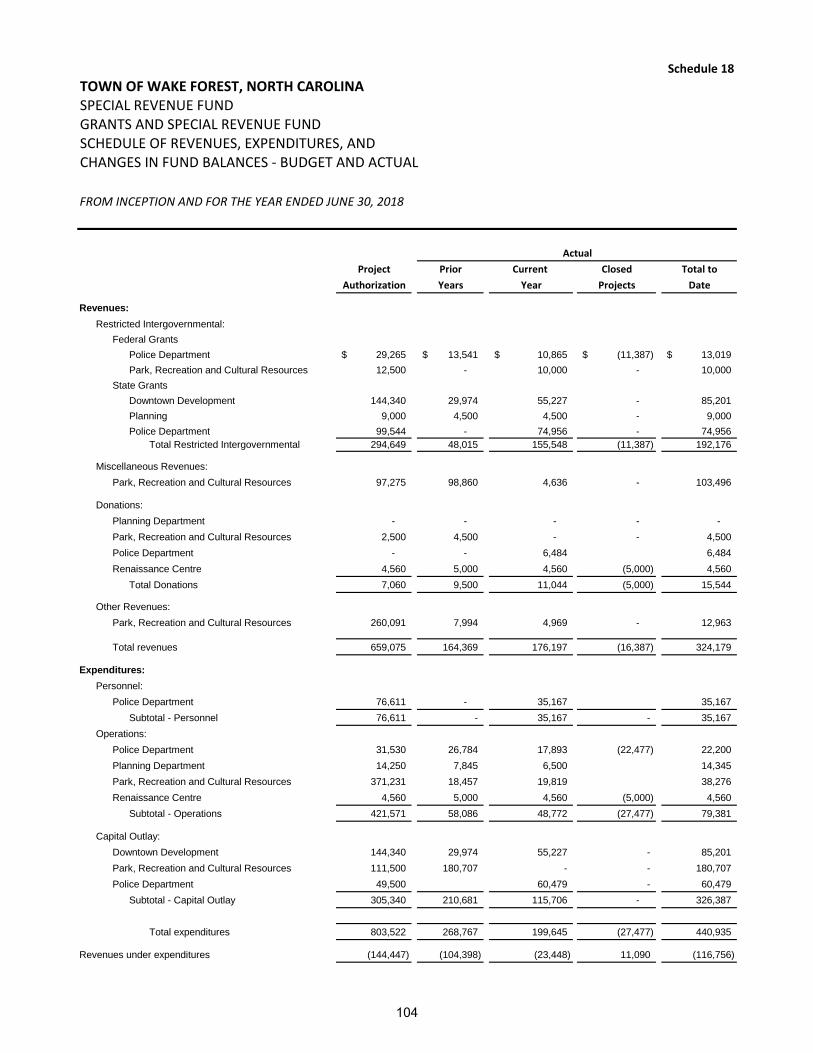
Schedule 18
Project Prior Current Closed Total to
Authorization Years Year Projects Date
Revenues:Restricted Intergovernmental:
Federal GrantsPolice Department 29,265$ 13,541$ 10,865$ (11,387)$ 13,019$ Park, Recreation and Cultural Resources 12,500 - 10,000 - 10,000
State GrantsDowntown Development 144,340 29,974 55,227 - 85,201 Planning 9,000 4,500 4,500 - 9,000 Police Department 99,544 - 74,956 - 74,956
Total Restricted Intergovernmental 294,649 48,015 155,548 (11,387) 192,176
Miscellaneous Revenues:Park, Recreation and Cultural Resources 97,275 98,860 4,636 - 103,496
Donations:Planning Department - - - - - Park, Recreation and Cultural Resources 2,500 4,500 - - 4,500 Police Department - - 6,484 6,484 Renaissance Centre 4,560 5,000 4,560 (5,000) 4,560
Total Donations 7,060 9,500 11,044 (5,000) 15,544
Other Revenues:Park, Recreation and Cultural Resources 260,091 7,994 4,969 - 12,963
Total revenues 659,075 164,369 176,197 (16,387) 324,179
Expenditures:Personnel:
Police Department 76,611 - 35,167 35,167 Subtotal - Personnel 76,611 - 35,167 - 35,167
Operations:Police Department 31,530 26,784 17,893 (22,477) 22,200 Planning Department 14,250 7,845 6,500 14,345 Park, Recreation and Cultural Resources 371,231 18,457 19,819 38,276 Renaissance Centre 4,560 5,000 4,560 (5,000) 4,560
Subtotal - Operations 421,571 58,086 48,772 (27,477) 79,381
Capital Outlay: Downtown Development 144,340 29,974 55,227 - 85,201 Park, Recreation and Cultural Resources 111,500 180,707 - - 180,707 Police Department 49,500 60,479 - 60,479
Subtotal - Capital Outlay 305,340 210,681 115,706 - 326,387
Total expenditures 803,522 268,767 199,645 (27,477) 440,935
Revenues under expenditures (144,447) (104,398) (23,448) 11,090 (116,756)
Actual
TOWN OF WAKE FOREST, NORTH CAROLINASPECIAL REVENUE FUNDGRANTS AND SPECIAL REVENUE FUNDSCHEDULE OF REVENUES, EXPENDITURES, ANDCHANGES IN FUND BALANCES - BUDGET AND ACTUAL
FROM INCEPTION AND FOR THE YEAR ENDED JUNE 30, 2018
104
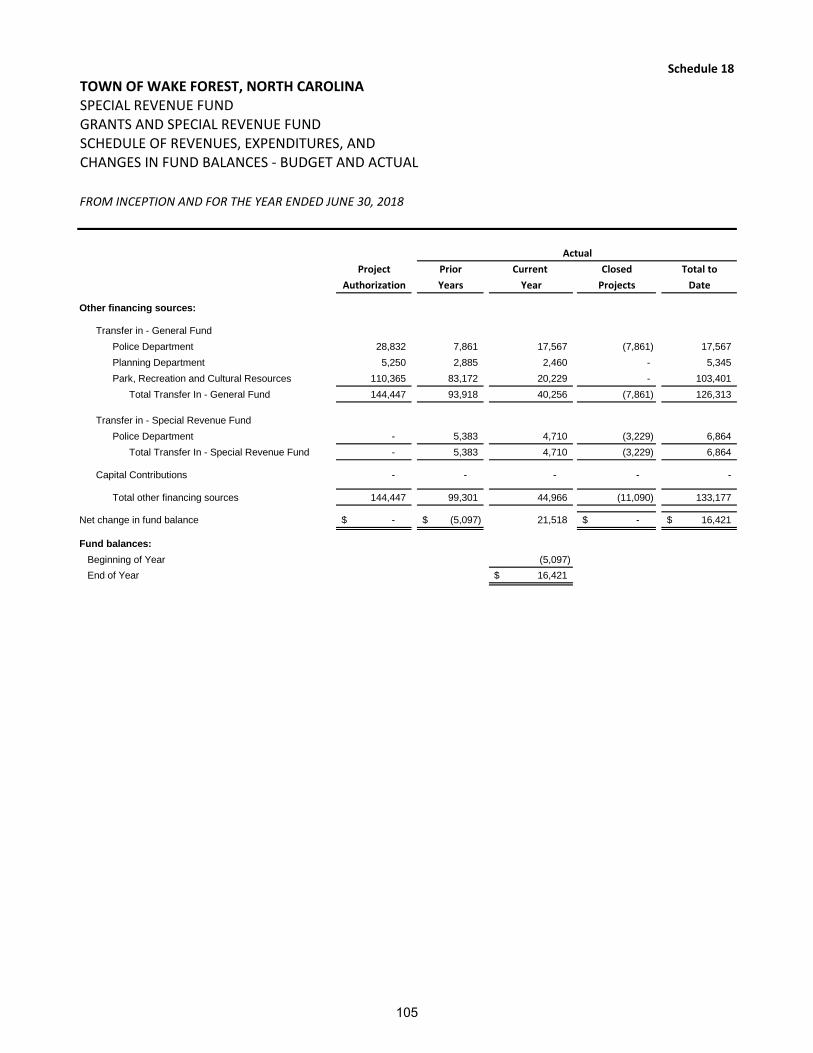
Schedule 18
Project Prior Current Closed Total to
Authorization Years Year Projects Date
Actual
TOWN OF WAKE FOREST, NORTH CAROLINASPECIAL REVENUE FUNDGRANTS AND SPECIAL REVENUE FUNDSCHEDULE OF REVENUES, EXPENDITURES, ANDCHANGES IN FUND BALANCES - BUDGET AND ACTUAL
FROM INCEPTION AND FOR THE YEAR ENDED JUNE 30, 2018
Other financing sources:
Transfer in - General FundPolice Department 28,832 7,861 17,567 (7,861) 17,567 Planning Department 5,250 2,885 2,460 - 5,345 Park, Recreation and Cultural Resources 110,365 83,172 20,229 - 103,401
Total Transfer In - General Fund 144,447 93,918 40,256 (7,861) 126,313
Transfer in - Special Revenue FundPolice Department - 5,383 4,710 (3,229) 6,864
Total Transfer In - Special Revenue Fund - 5,383 4,710 (3,229) 6,864
Capital Contributions - - - - -
Total other financing sources 144,447 99,301 44,966 (11,090) 133,177
Net change in fund balance -$ (5,097)$ 21,518 -$ 16,421$
Fund balances: Beginning of Year (5,097) End of Year 16,421$
105
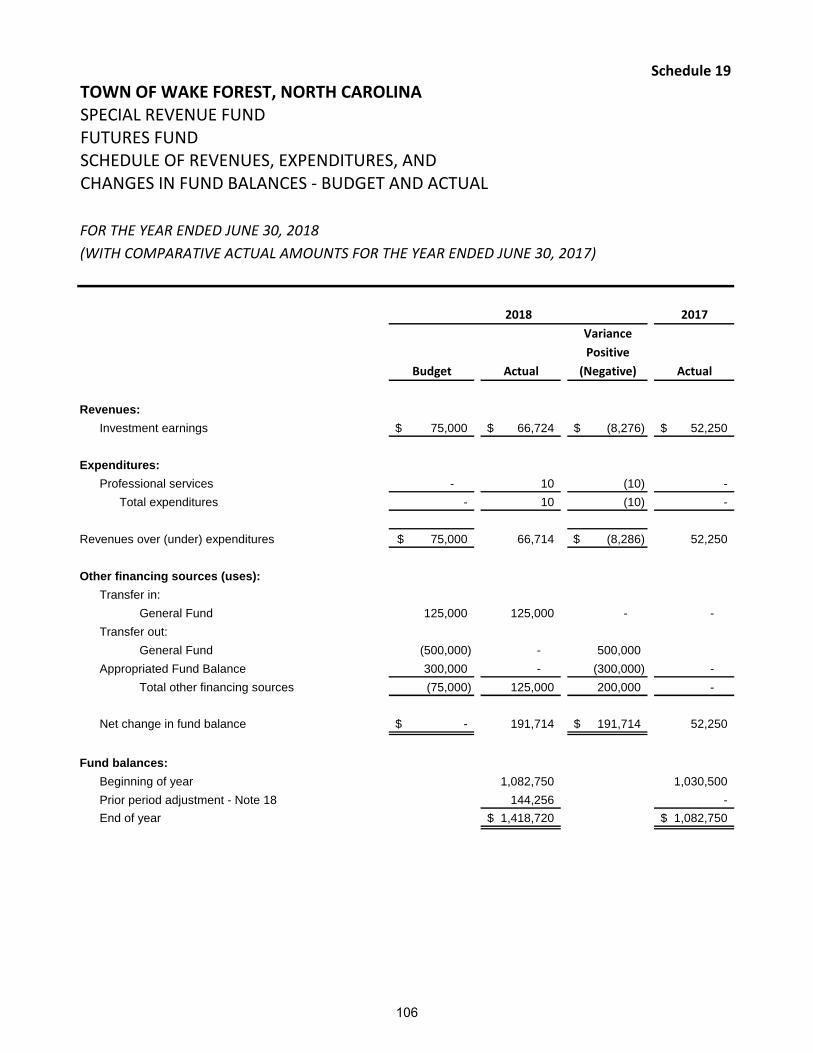
Schedule 19
TOWN OF WAKE FOREST, NORTH CAROLINA
SPECIAL REVENUE FUNDFUTURES FUNDSCHEDULE OF REVENUES, EXPENDITURES, ANDCHANGES IN FUND BALANCES - BUDGET AND ACTUAL
(WITH COMPARATIVE ACTUAL AMOUNTS FOR THE YEAR ENDED JUNE 30, 2017)
2017
Variance
Positive
Budget Actual (Negative) Actual
Revenues:Investment earnings 75,000$ 66,724$ (8,276)$ 52,250$
Expenditures:Professional services - 10 (10) -
Total expenditures - 10 (10) -
Revenues over (under) expenditures 75,000$ 66,714 (8,286)$ 52,250
Other financing sources (uses):Transfer in: General Fund 125,000 125,000 - - Transfer out:
General Fund (500,000) - 500,000 Appropriated Fund Balance 300,000 - (300,000) -
Total other financing sources (75,000) 125,000 200,000 -
Net change in fund balance -$ 191,714 191,714$ 52,250
Fund balances:Beginning of year 1,082,750 1,030,500 Prior period adjustment - Note 18 144,256 - End of year 1,418,720$ 1,082,750$
2018
FOR THE YEAR ENDED JUNE 30, 2018
106
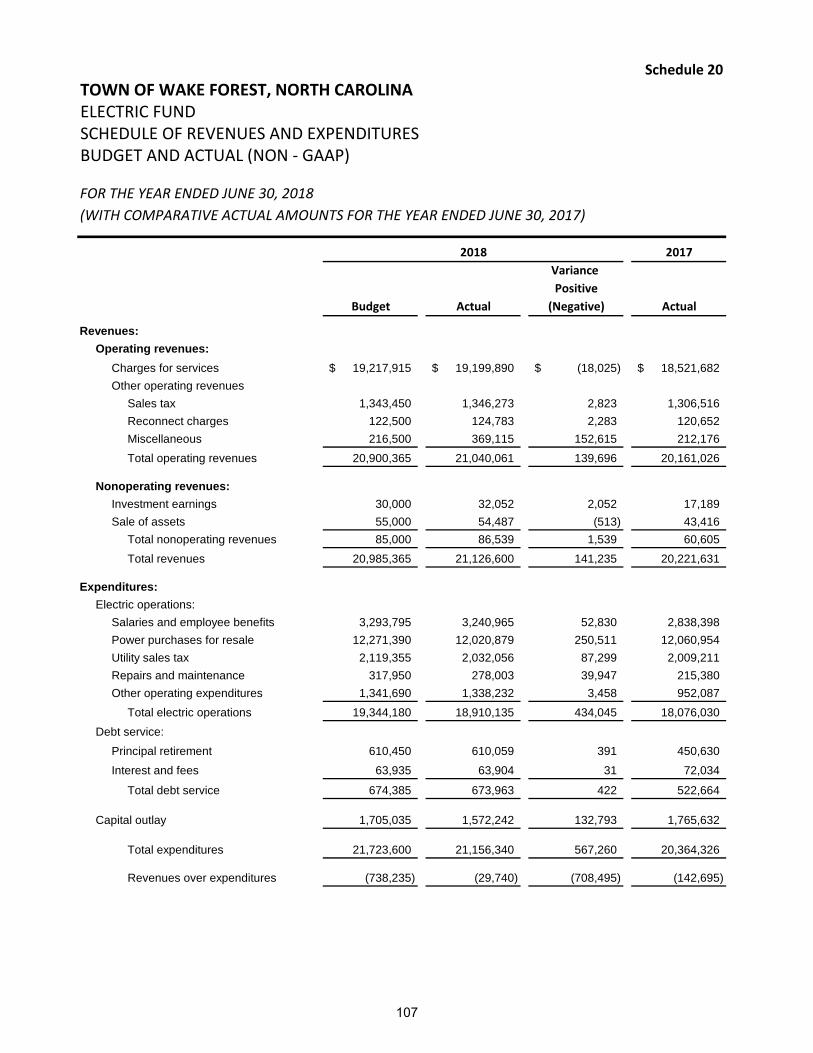
Schedule 20
FOR THE YEAR ENDED JUNE 30, 2018
2018 2017
Variance
Positive
Budget Actual (Negative) Actual
Revenues:Operating revenues:
Charges for services 19,217,915$ 19,199,890$ (18,025)$ 18,521,682$ Other operating revenues
Sales tax 1,343,450 1,346,273 2,823 1,306,516Reconnect charges 122,500 124,783 2,283 120,652Miscellaneous 216,500 369,115 152,615 212,176Total operating revenues 20,900,365 21,040,061 139,696 20,161,026
Nonoperating revenues:Investment earnings 30,000 32,052 2,052 17,189Sale of assets 55,000 54,487 (513) 43,416
Total nonoperating revenues 85,000 86,539 1,539 60,605 Total revenues 20,985,365 21,126,600 141,235 20,221,631
Expenditures:Electric operations:
Salaries and employee benefits 3,293,795 3,240,965 52,830 2,838,398Power purchases for resale 12,271,390 12,020,879 250,511 12,060,954Utility sales tax 2,119,355 2,032,056 87,299 2,009,211Repairs and maintenance 317,950 278,003 39,947 215,380Other operating expenditures 1,341,690 1,338,232 3,458 952,087
Total electric operations 19,344,180 18,910,135 434,045 18,076,030 Debt service:
Principal retirement 610,450 610,059 391 450,630 Interest and fees 63,935 63,904 31 72,034
Total debt service 674,385 673,963 422 522,664
Capital outlay 1,705,035 1,572,242 132,793 1,765,632
Total expenditures 21,723,600 21,156,340 567,260 20,364,326
Revenues over expenditures (738,235) (29,740) (708,495) (142,695)
(WITH COMPARATIVE ACTUAL AMOUNTS FOR THE YEAR ENDED JUNE 30, 2017)
TOWN OF WAKE FOREST, NORTH CAROLINAELECTRIC FUNDSCHEDULE OF REVENUES AND EXPENDITURESBUDGET AND ACTUAL (NON - GAAP)
107
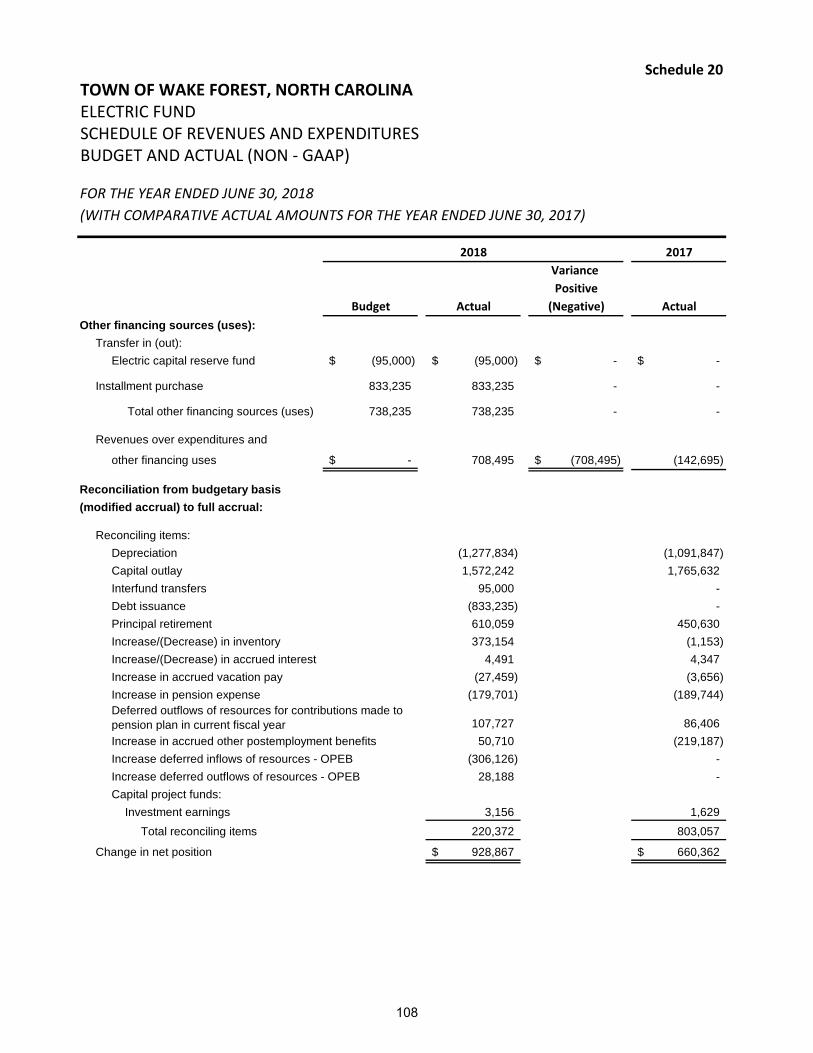
Schedule 20
FOR THE YEAR ENDED JUNE 30, 2018
2018 2017
Variance
Positive
Budget Actual (Negative) Actual
(WITH COMPARATIVE ACTUAL AMOUNTS FOR THE YEAR ENDED JUNE 30, 2017)
TOWN OF WAKE FOREST, NORTH CAROLINAELECTRIC FUNDSCHEDULE OF REVENUES AND EXPENDITURESBUDGET AND ACTUAL (NON - GAAP)
Other financing sources (uses):Transfer in (out):
Electric capital reserve fund (95,000)$ (95,000)$ -$ -$
Installment purchase 833,235 833,235 - -
Total other financing sources (uses) 738,235 738,235 - -
Revenues over expenditures and
other financing uses -$ 708,495 (708,495)$ (142,695)
Reconciliation from budgetary basis (modified accrual) to full accrual:
Reconciling items:Depreciation (1,277,834) (1,091,847) Capital outlay 1,572,242 1,765,632 Interfund transfers 95,000 - Debt issuance (833,235) - Principal retirement 610,059 450,630 Increase/(Decrease) in inventory 373,154 (1,153) Increase/(Decrease) in accrued interest 4,491 4,347 Increase in accrued vacation pay (27,459) (3,656) Increase in pension expense (179,701) (189,744)
107,727 86,406 50,710 (219,187)
(306,126) - 28,188 -
Capital project funds:Investment earnings 3,156 1,629
Total reconciling items 220,372 803,057
Change in net position 928,867$ 660,362$
Increase deferred outflows of resources - OPEB
Increase in accrued other postemployment benefits
Deferred outflows of resources for contributions made to pension plan in current fiscal year
Increase deferred inflows of resources - OPEB
108
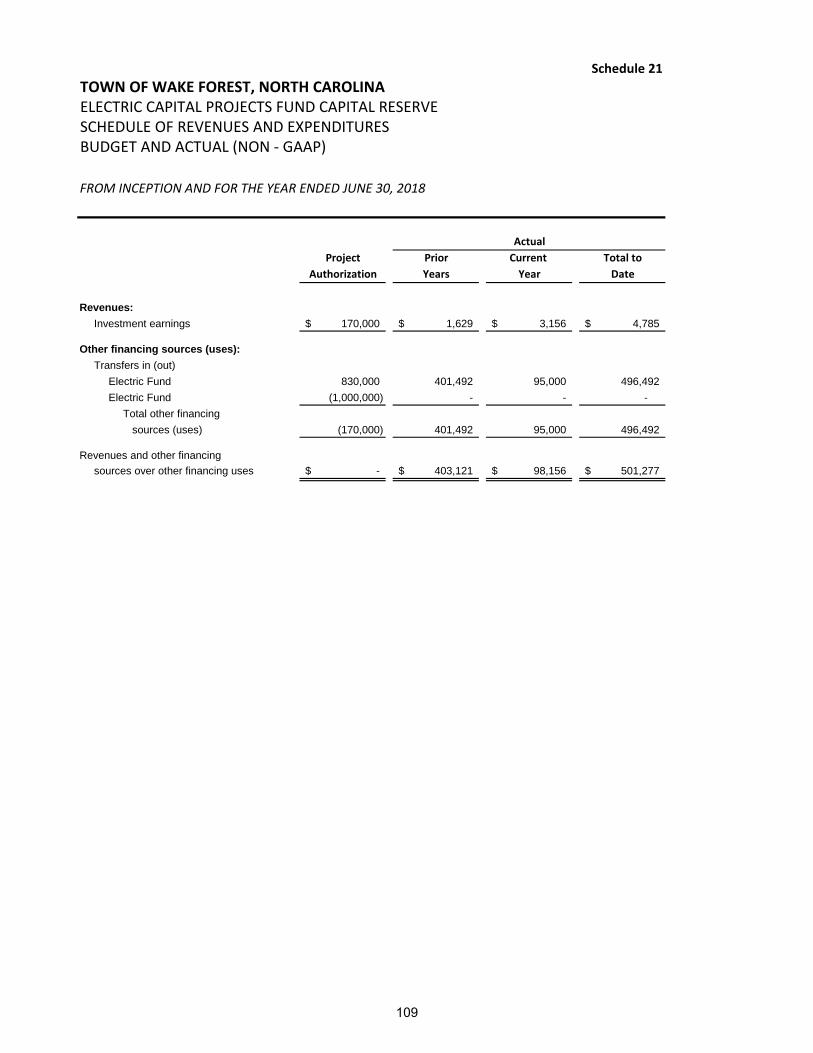
Schedule 21
TOWN OF WAKE FOREST, NORTH CAROLINAELECTRIC CAPITAL PROJECTS FUND CAPITAL RESERVESCHEDULE OF REVENUES AND EXPENDITURES
Actual
Project Prior Current Total to
Authorization Years Year Date
Revenues:Investment earnings 170,000$ 1,629$ 3,156$ 4,785$
Other financing sources (uses):Transfers in (out)
Electric Fund 830,000 401,492 95,000 496,492Electric Fund (1,000,000) - - -
Total other financing sources (uses) (170,000) 401,492 95,000 496,492
Revenues and other financingsources over other financing uses -$ 403,121$ 98,156$ 501,277$
FROM INCEPTION AND FOR THE YEAR ENDED JUNE 30, 2018
BUDGET AND ACTUAL (NON - GAAP)
109
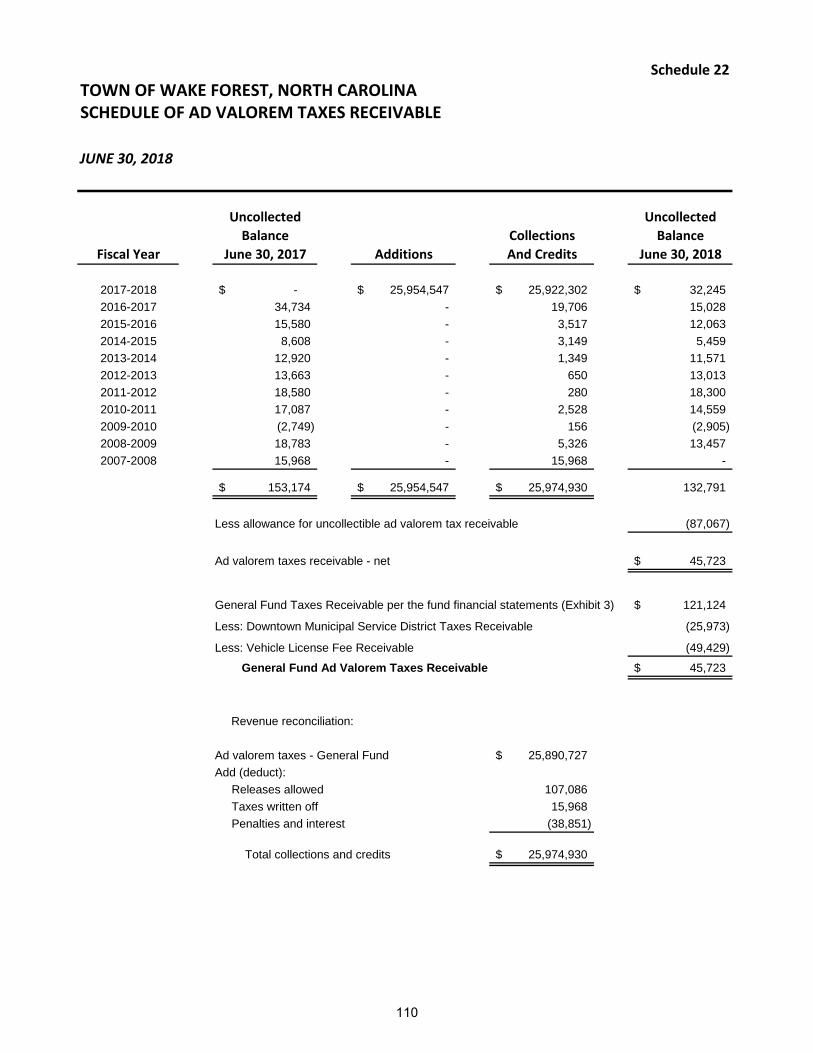
Schedule 22
TOWN OF WAKE FOREST, NORTH CAROLINASCHEDULE OF AD VALOREM TAXES RECEIVABLE
JUNE 30, 2018
Uncollected Uncollected
Balance Collections Balance
Fiscal Year June 30, 2017 Additions And Credits June 30, 2018
2017-2018 -$ 25,954,547$ 25,922,302$ 32,245$ 2016-2017 34,734 - 19,706 15,028 2015-2016 15,580 - 3,517 12,063 2014-2015 8,608 - 3,149 5,459 2013-2014 12,920 - 1,349 11,571 2012-2013 13,663 - 650 13,013 2011-2012 18,580 - 280 18,300 2010-2011 17,087 - 2,528 14,559 2009-2010 (2,749) - 156 (2,905) 2008-2009 18,783 - 5,326 13,457 2007-2008 15,968 - 15,968 -
153,174$ 25,954,547$ 25,974,930$ 132,791
Less allowance for uncollectible ad valorem tax receivable (87,067)
Ad valorem taxes receivable - net 45,723$
General Fund Taxes Receivable per the fund financial statements (Exhibit 3) 121,124$
Less: Downtown Municipal Service District Taxes Receivable (25,973)
Less: Vehicle License Fee Receivable (49,429)
General Fund Ad Valorem Taxes Receivable 45,723$
Revenue reconciliation:
Ad valorem taxes - General Fund 25,890,727$ Add (deduct): Releases allowed 107,086 Taxes written off 15,968 Penalties and interest (38,851)
Total collections and credits 25,974,930$
110

Schedule 23
TOWN OF WAKE FOREST, NORTH CAROLINAANALYSIS OF CURRENT TAX LEVYTOWN-WIDE LEVY
FOR THE FISCAL YEAR ENDED JUNE 30, 2018
Total Levy
Property
excluding
Town - Wide Registered Registered
Property Total Motor Motor
Valuation Rate Levy Vehicles Vehicles
Original levy:Property taxed at current year's rate 4,991,269,425$ 0.52 25,954,601$ 23,738,228$ 2,216,372$ Penalties - 21,481 21,481 -
Total 4,991,269,425 25,976,082 23,759,709 2,216,372
Discoveries: Prior year taxes - 50,877 50,852 25
Less: abatements (13,925,385) 0.52 (72,412) (66,195) (6,217)
Total property valuation 4,977,344,040$
Net levy 25,954,547 23,744,366 2,210,180
Less: uncollected taxes at June 30, 2018 32,245 24,246 7,999
Current year's taxes collected 25,922,302$ 23,720,120$ 2,202,181$
Current levy collection percentage 99.88% 99.90% 99.64%
111
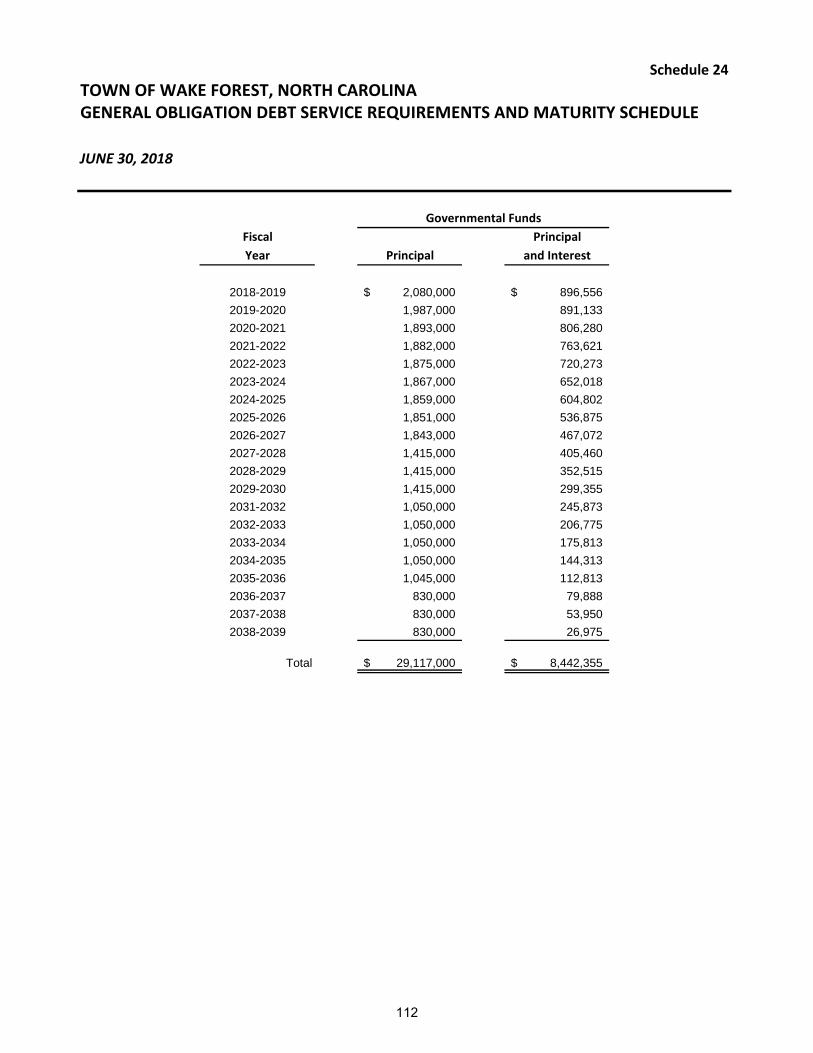
Schedule 24
TOWN OF WAKE FOREST, NORTH CAROLINAGENERAL OBLIGATION DEBT SERVICE REQUIREMENTS AND MATURITY SCHEDULE
JUNE 30, 2018
Governmental Funds
Fiscal Principal
Year Principal and Interest
2018-2019 2,080,000$ 896,556$ 2019-2020 1,987,000 891,133 2020-2021 1,893,000 806,280 2021-2022 1,882,000 763,621 2022-2023 1,875,000 720,273 2023-2024 1,867,000 652,018 2024-2025 1,859,000 604,802 2025-2026 1,851,000 536,875 2026-2027 1,843,000 467,072 2027-2028 1,415,000 405,460 2028-2029 1,415,000 352,515 2029-2030 1,415,000 299,355 2031-2032 1,050,000 245,873 2032-2033 1,050,000 206,775 2033-2034 1,050,000 175,813 2034-2035 1,050,000 144,313 2035-2036 1,045,000 112,813 2036-2037 830,000 79,888 2037-2038 830,000 53,950 2038-2039 830,000 26,975
Total 29,117,000$ 8,442,355$
112

113
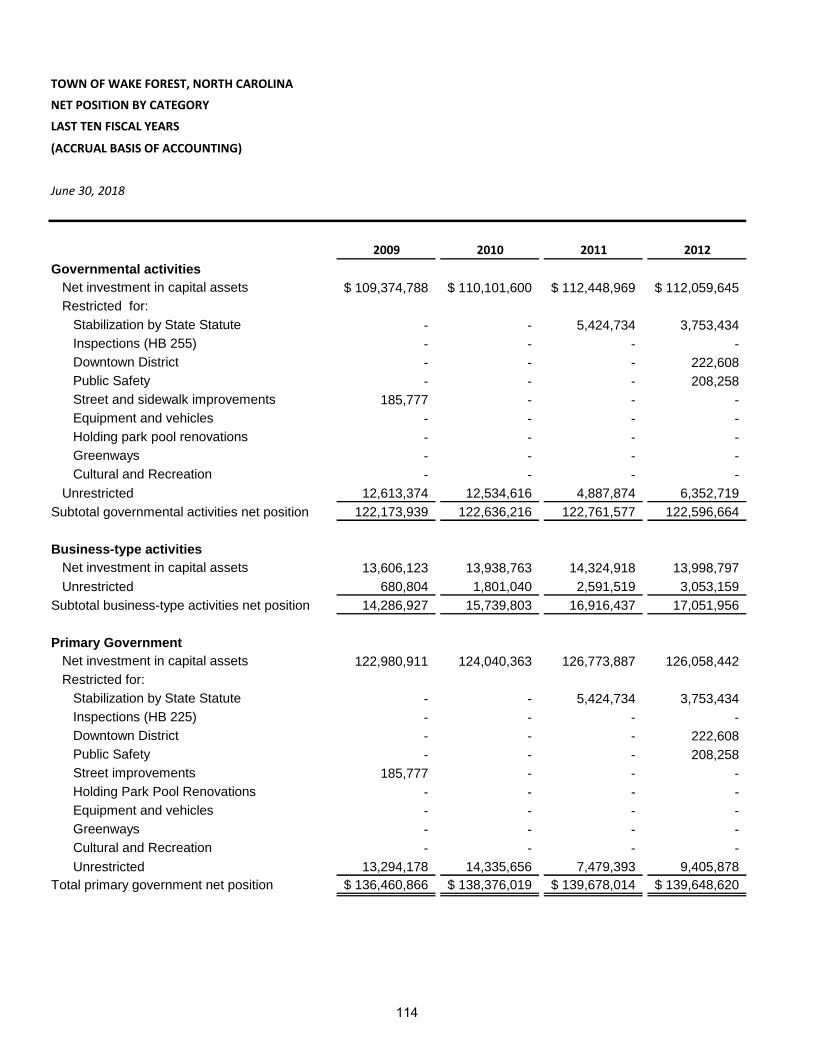
TOWN OF WAKE FOREST, NORTH CAROLINA
NET POSITION BY CATEGORY
LAST TEN FISCAL YEARS
(ACCRUAL BASIS OF ACCOUNTING)
2009 2010 2011 2012
Governmental activitiesNet investment in capital assets 109,374,788$ 110,101,600$ 112,448,969$ 112,059,645$ Restricted for:
Stabilization by State Statute - - 5,424,734 3,753,434 Inspections (HB 255) - - - - Downtown District - - - 222,608 Public Safety - - - 208,258 Street and sidewalk improvements 185,777 - - - Equipment and vehicles - - - - Holding park pool renovations - - - - Greenways - - - - Cultural and Recreation - - - -
Unrestricted 12,613,374 12,534,616 4,887,874 6,352,719 Subtotal governmental activities net position 122,173,939 122,636,216 122,761,577 122,596,664
Business-type activitiesNet investment in capital assets 13,606,123 13,938,763 14,324,918 13,998,797 Unrestricted 680,804 1,801,040 2,591,519 3,053,159
Subtotal business-type activities net position 14,286,927 15,739,803 16,916,437 17,051,956
Primary GovernmentNet investment in capital assets 122,980,911 124,040,363 126,773,887 126,058,442 Restricted for:
Stabilization by State Statute - - 5,424,734 3,753,434 Inspections (HB 225) - - - - Downtown District - - - 222,608 Public Safety - - - 208,258 Street improvements 185,777 - - - Holding Park Pool Renovations - - - - Equipment and vehicles - - - - Greenways - - - - Cultural and Recreation - - - - Unrestricted 13,294,178 14,335,656 7,479,393 9,405,878
Total primary government net position 136,460,866$ 138,376,019$ 139,678,014$ 139,648,620$
June 30, 2018
114
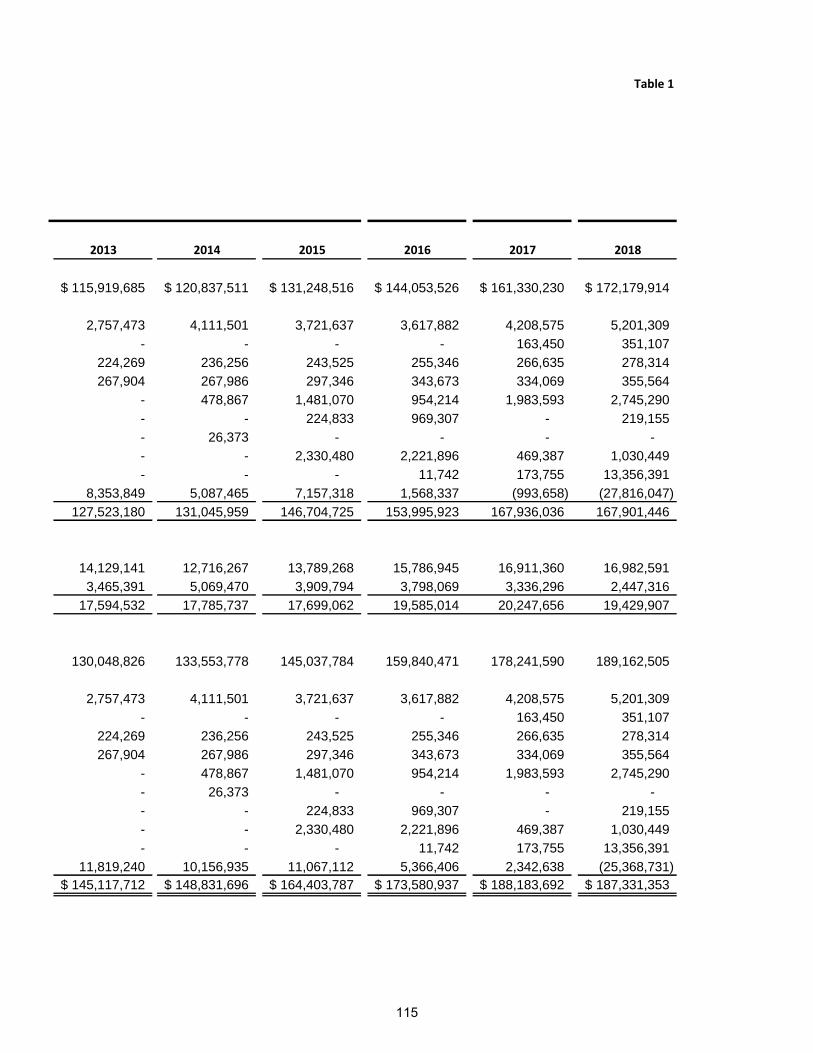
Table 1
2013 2014 2015 2016 2017 2018
115,919,685$ 120,837,511$ 131,248,516$ 144,053,526$ 161,330,230$ 172,179,914$
2,757,473 4,111,501 3,721,637 3,617,882 4,208,575 5,201,309 - - - - 163,450 351,107
224,269 236,256 243,525 255,346 266,635 278,314 267,904 267,986 297,346 343,673 334,069 355,564
- 478,867 1,481,070 954,214 1,983,593 2,745,290 - - 224,833 969,307 - 219,155 - 26,373 - - - - - - 2,330,480 2,221,896 469,387 1,030,449 - - - 11,742 173,755 13,356,391
8,353,849 5,087,465 7,157,318 1,568,337 (993,658) (27,816,047) 127,523,180 131,045,959 146,704,725 153,995,923 167,936,036 167,901,446
14,129,141 12,716,267 13,789,268 15,786,945 16,911,360 16,982,591 3,465,391 5,069,470 3,909,794 3,798,069 3,336,296 2,447,316
17,594,532 17,785,737 17,699,062 19,585,014 20,247,656 19,429,907
130,048,826 133,553,778 145,037,784 159,840,471 178,241,590 189,162,505
2,757,473 4,111,501 3,721,637 3,617,882 4,208,575 5,201,309 - - - - 163,450 351,107
224,269 236,256 243,525 255,346 266,635 278,314 267,904 267,986 297,346 343,673 334,069 355,564
- 478,867 1,481,070 954,214 1,983,593 2,745,290 - 26,373 - - - - - - 224,833 969,307 - 219,155 - - 2,330,480 2,221,896 469,387 1,030,449 - - - 11,742 173,755 13,356,391
11,819,240 10,156,935 11,067,112 5,366,406 2,342,638 (25,368,731) 145,117,712$ 148,831,696$ 164,403,787$ 173,580,937$ 188,183,692$ 187,331,353$
115
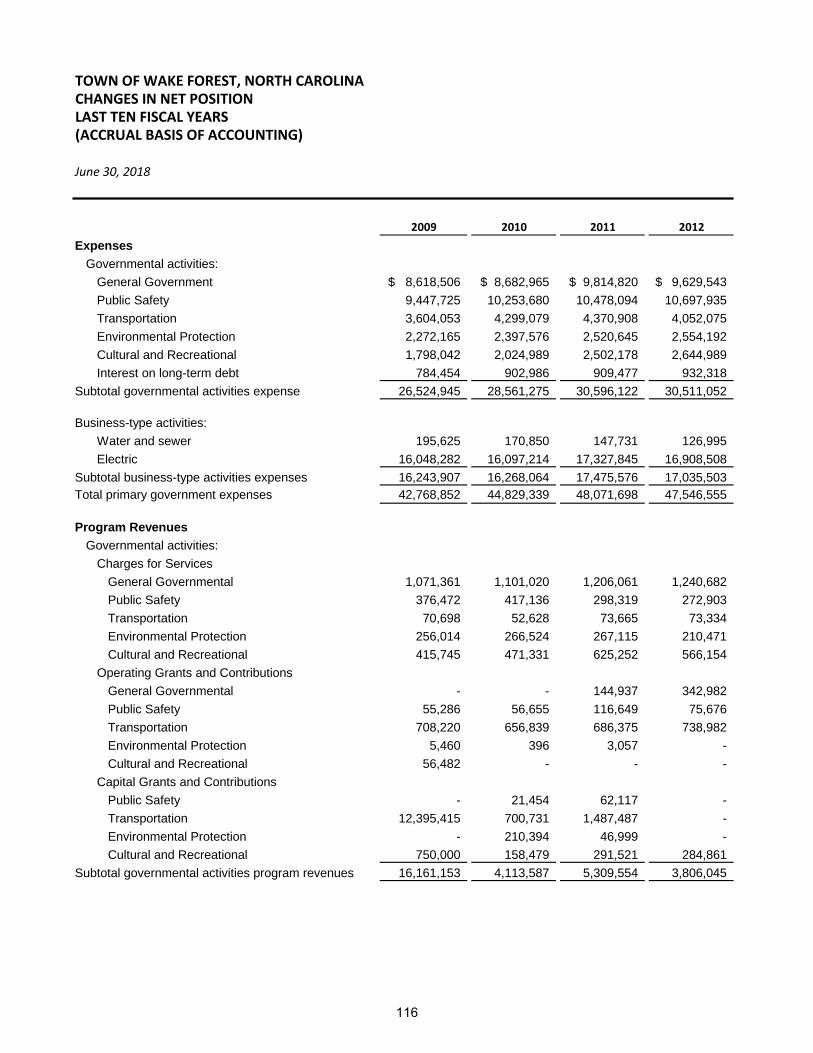
TOWN OF WAKE FOREST, NORTH CAROLINACHANGES IN NET POSITIONLAST TEN FISCAL YEARS(ACCRUAL BASIS OF ACCOUNTING)
June 30, 2018
2009 2010 2011 2012
ExpensesGovernmental activities:
General Government 8,618,506$ 8,682,965$ 9,814,820$ 9,629,543$ Public Safety 9,447,725 10,253,680 10,478,094 10,697,935 Transportation 3,604,053 4,299,079 4,370,908 4,052,075 Environmental Protection 2,272,165 2,397,576 2,520,645 2,554,192 Cultural and Recreational 1,798,042 2,024,989 2,502,178 2,644,989 Interest on long-term debt 784,454 902,986 909,477 932,318
Subtotal governmental activities expense 26,524,945 28,561,275 30,596,122 30,511,052
Business-type activities:Water and sewer 195,625 170,850 147,731 126,995 Electric 16,048,282 16,097,214 17,327,845 16,908,508
Subtotal business-type activities expenses 16,243,907 16,268,064 17,475,576 17,035,503 Total primary government expenses 42,768,852 44,829,339 48,071,698 47,546,555
Program RevenuesGovernmental activities:
Charges for ServicesGeneral Governmental 1,071,361 1,101,020 1,206,061 1,240,682 Public Safety 376,472 417,136 298,319 272,903 Transportation 70,698 52,628 73,665 73,334 Environmental Protection 256,014 266,524 267,115 210,471 Cultural and Recreational 415,745 471,331 625,252 566,154
Operating Grants and ContributionsGeneral Governmental - - 144,937 342,982 Public Safety 55,286 56,655 116,649 75,676 Transportation 708,220 656,839 686,375 738,982 Environmental Protection 5,460 396 3,057 - Cultural and Recreational 56,482 - - -
Capital Grants and ContributionsPublic Safety - 21,454 62,117 - Transportation 12,395,415 700,731 1,487,487 - Environmental Protection - 210,394 46,999 - Cultural and Recreational 750,000 158,479 291,521 284,861
Subtotal governmental activities program revenues 16,161,153 4,113,587 5,309,554 3,806,045
116
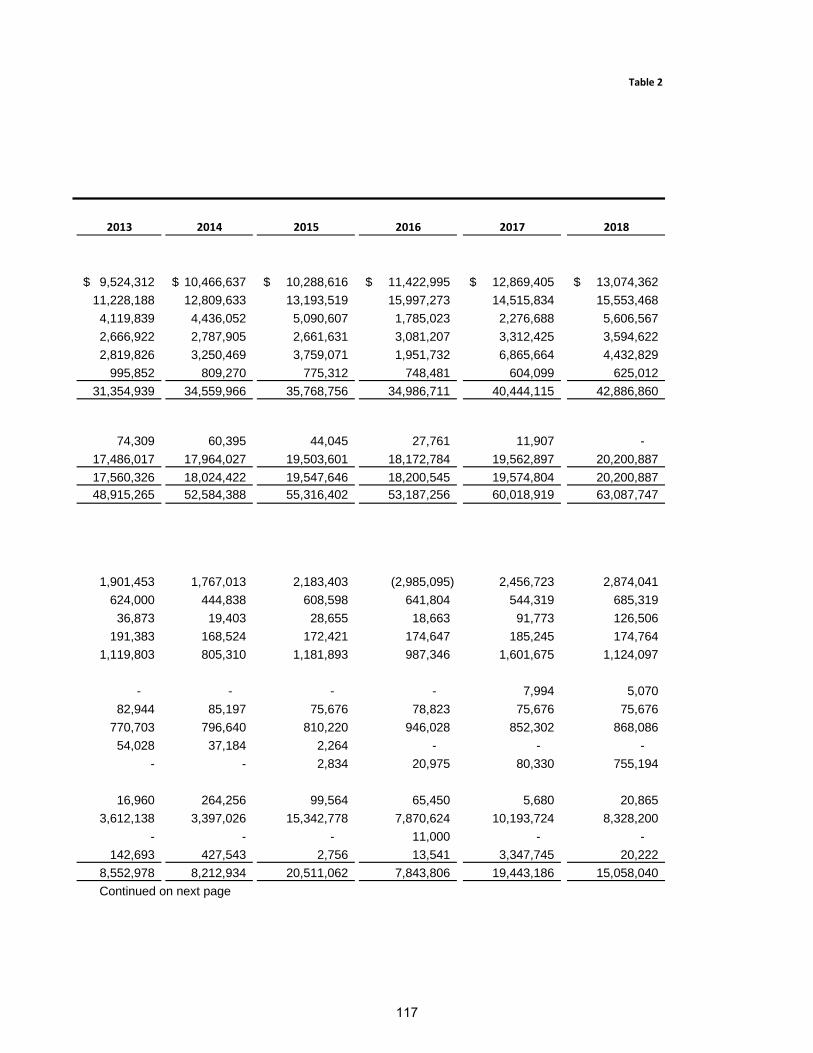
Table 2
2013 2014 2015 2016 2017 2018
9,524,312$ 10,466,637$ 10,288,616$ 11,422,995$ 12,869,405$ 13,074,362$ 11,228,188 12,809,633 13,193,519 15,997,273 14,515,834 15,553,468 4,119,839 4,436,052 5,090,607 1,785,023 2,276,688 5,606,567 2,666,922 2,787,905 2,661,631 3,081,207 3,312,425 3,594,622 2,819,826 3,250,469 3,759,071 1,951,732 6,865,664 4,432,829
995,852 809,270 775,312 748,481 604,099 625,012 31,354,939 34,559,966 35,768,756 34,986,711 40,444,115 42,886,860
74,309 60,395 44,045 27,761 11,907 - 17,486,017 17,964,027 19,503,601 18,172,784 19,562,897 20,200,887 17,560,326 18,024,422 19,547,646 18,200,545 19,574,804 20,200,887 48,915,265 52,584,388 55,316,402 53,187,256 60,018,919 63,087,747
1,901,453 1,767,013 2,183,403 (2,985,095) 2,456,723 2,874,041 624,000 444,838 608,598 641,804 544,319 685,319 36,873 19,403 28,655 18,663 91,773 126,506
191,383 168,524 172,421 174,647 185,245 174,764 1,119,803 805,310 1,181,893 987,346 1,601,675 1,124,097
- - - - 7,994 5,070 82,944 85,197 75,676 78,823 75,676 75,676
770,703 796,640 810,220 946,028 852,302 868,086 54,028 37,184 2,264 - - -
- - 2,834 20,975 80,330 755,194
16,960 264,256 99,564 65,450 5,680 20,865 3,612,138 3,397,026 15,342,778 7,870,624 10,193,724 8,328,200
- - - 11,000 - - 142,693 427,543 2,756 13,541 3,347,745 20,222
8,552,978 8,212,934 20,511,062 7,843,806 19,443,186 15,058,040 Continued on next page
117
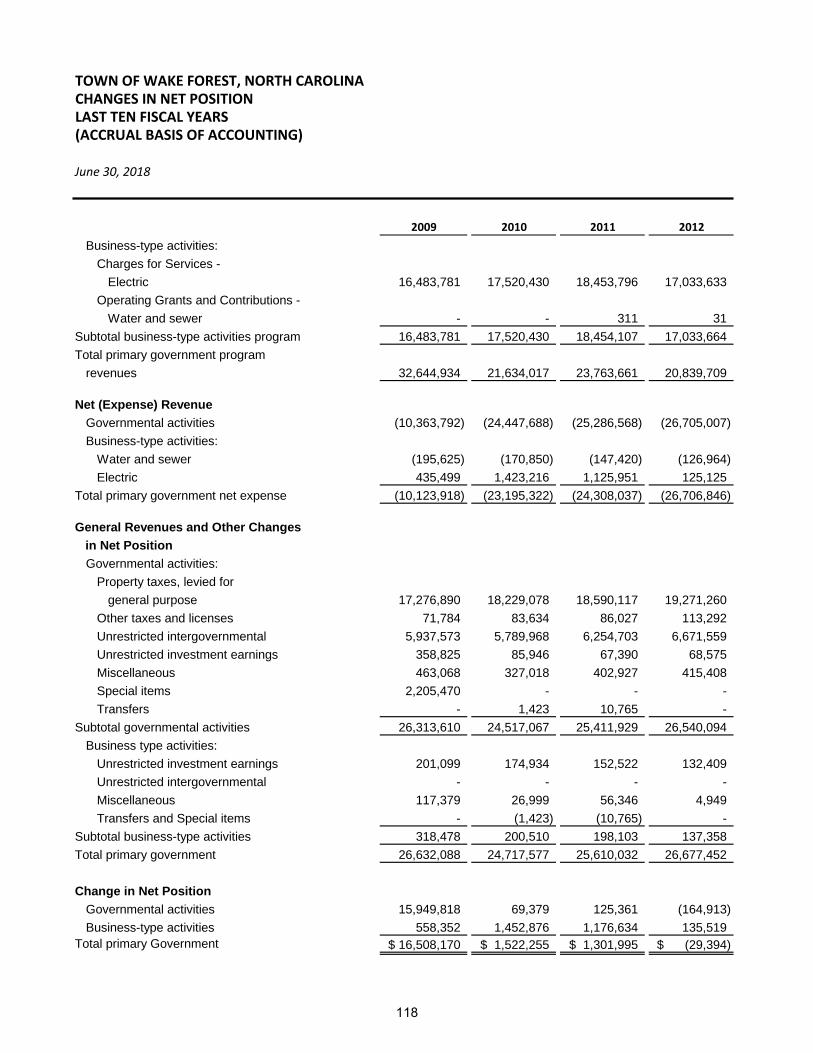
TOWN OF WAKE FOREST, NORTH CAROLINACHANGES IN NET POSITIONLAST TEN FISCAL YEARS(ACCRUAL BASIS OF ACCOUNTING)
June 30, 2018
2009 2010 2011 2012
Business-type activities:Charges for Services -
Electric 16,483,781 17,520,430 18,453,796 17,033,633 Operating Grants and Contributions -
Water and sewer - - 311 31 Subtotal business-type activities program 16,483,781 17,520,430 18,454,107 17,033,664 Total primary government program
revenues 32,644,934 21,634,017 23,763,661 20,839,709
Net (Expense) RevenueGovernmental activities (10,363,792) (24,447,688) (25,286,568) (26,705,007) Business-type activities:
Water and sewer (195,625) (170,850) (147,420) (126,964) Electric 435,499 1,423,216 1,125,951 125,125
Total primary government net expense (10,123,918) (23,195,322) (24,308,037) (26,706,846)
General Revenues and Other Changes in Net Position
Governmental activities:Property taxes, levied for
general purpose 17,276,890 18,229,078 18,590,117 19,271,260 Other taxes and licenses 71,784 83,634 86,027 113,292 Unrestricted intergovernmental 5,937,573 5,789,968 6,254,703 6,671,559 Unrestricted investment earnings 358,825 85,946 67,390 68,575 Miscellaneous 463,068 327,018 402,927 415,408 Special items 2,205,470 - - - Transfers - 1,423 10,765 -
Subtotal governmental activities 26,313,610 24,517,067 25,411,929 26,540,094 Business type activities:
Unrestricted investment earnings 201,099 174,934 152,522 132,409 Unrestricted intergovernmental - - - - Miscellaneous 117,379 26,999 56,346 4,949 Transfers and Special items - (1,423) (10,765) -
Subtotal business-type activities 318,478 200,510 198,103 137,358 Total primary government 26,632,088 24,717,577 25,610,032 26,677,452
Change in Net PositionGovernmental activities 15,949,818 69,379 125,361 (164,913) Business-type activities 558,352 1,452,876 1,176,634 135,519
Total primary Government 16,508,170$ 1,522,255$ 1,301,995$ (29,394)$
118
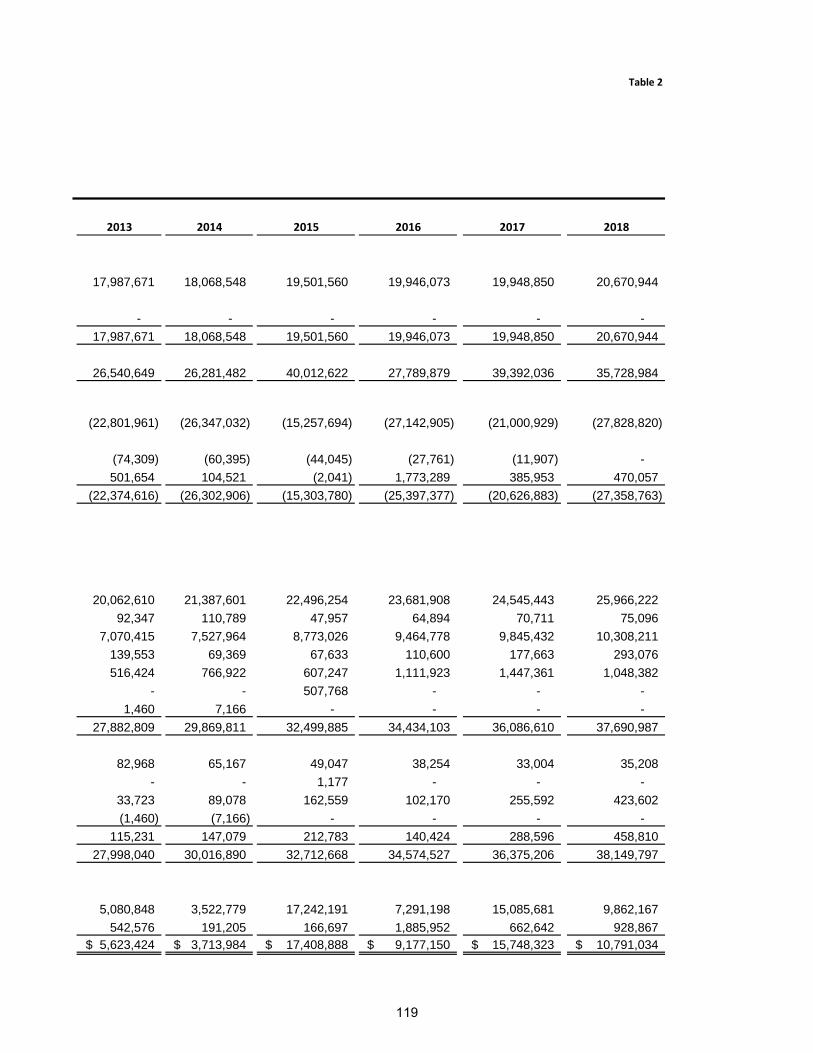
Table 2
2013 2014 2015 2016 2017 2018
17,987,671 18,068,548 19,501,560 19,946,073 19,948,850 20,670,944
- - - - - - 17,987,671 18,068,548 19,501,560 19,946,073 19,948,850 20,670,944
26,540,649 26,281,482 40,012,622 27,789,879 39,392,036 35,728,984
(22,801,961) (26,347,032) (15,257,694) (27,142,905) (21,000,929) (27,828,820)
(74,309) (60,395) (44,045) (27,761) (11,907) - 501,654 104,521 (2,041) 1,773,289 385,953 470,057
(22,374,616) (26,302,906) (15,303,780) (25,397,377) (20,626,883) (27,358,763)
20,062,610 21,387,601 22,496,254 23,681,908 24,545,443 25,966,222 92,347 110,789 47,957 64,894 70,711 75,096
7,070,415 7,527,964 8,773,026 9,464,778 9,845,432 10,308,211 139,553 69,369 67,633 110,600 177,663 293,076 516,424 766,922 607,247 1,111,923 1,447,361 1,048,382
- - 507,768 - - - 1,460 7,166 - - - -
27,882,809 29,869,811 32,499,885 34,434,103 36,086,610 37,690,987
82,968 65,167 49,047 38,254 33,004 35,208 - - 1,177 - - -
33,723 89,078 162,559 102,170 255,592 423,602 (1,460) (7,166) - - - -
115,231 147,079 212,783 140,424 288,596 458,810 27,998,040 30,016,890 32,712,668 34,574,527 36,375,206 38,149,797
5,080,848 3,522,779 17,242,191 7,291,198 15,085,681 9,862,167 542,576 191,205 166,697 1,885,952 662,642 928,867
5,623,424$ 3,713,984$ 17,408,888$ 9,177,150$ 15,748,323$ 10,791,034$
119
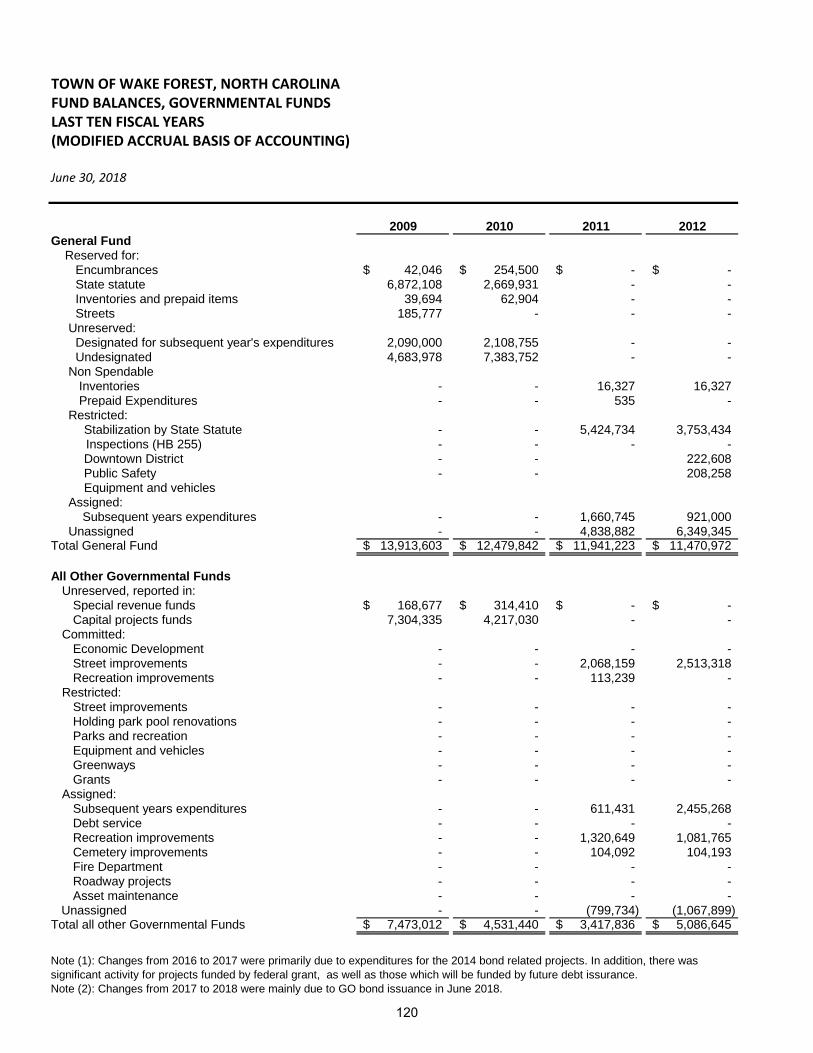
TOWN OF WAKE FOREST, NORTH CAROLINAFUND BALANCES, GOVERNMENTAL FUNDSLAST TEN FISCAL YEARS(MODIFIED ACCRUAL BASIS OF ACCOUNTING)
June 30, 2018
2009 2010 2011 2012General Fund Reserved for: Encumbrances 42,046$ 254,500$ -$ -$ State statute 6,872,108 2,669,931 - - Inventories and prepaid items 39,694 62,904 - - Streets 185,777 - - - Unreserved: Designated for subsequent year's expenditures 2,090,000 2,108,755 - - Undesignated 4,683,978 7,383,752 - - Non Spendable Inventories - - 16,327 16,327 Prepaid Expenditures - - 535 - Restricted:
Stabilization by State Statute - - 5,424,734 3,753,434 Inspections (HB 255) - - - -
Downtown District - - 222,608 Public Safety - - 208,258 Equipment and vehicles
Assigned: Subsequent years expenditures - - 1,660,745 921,000 Unassigned - - 4,838,882 6,349,345 Total General Fund 13,913,603$ 12,479,842$ 11,941,223$ 11,470,972$
All Other Governmental FundsUnreserved, reported in:
Special revenue funds 168,677$ 314,410$ -$ -$ Capital projects funds 7,304,335 4,217,030 - -
Committed:Economic Development - - - - Street improvements - - 2,068,159 2,513,318 Recreation improvements - - 113,239 -
Restricted:Street improvements - - - - Holding park pool renovations - - - - Parks and recreation - - - - Equipment and vehicles - - - - Greenways - - - - Grants - - - -
Assigned:Subsequent years expenditures - - 611,431 2,455,268 Debt service - - - - Recreation improvements - - 1,320,649 1,081,765 Cemetery improvements - - 104,092 104,193 Fire Department - - - - Roadway projects - - - - Asset maintenance - - - -
Unassigned - - (799,734) (1,067,899) Total all other Governmental Funds 7,473,012$ 4,531,440$ 3,417,836$ 5,086,645$
Note (1): Changes from 2016 to 2017 were primarily due to expenditures for the 2014 bond related projects. In addition, there was significant activity for projects funded by federal grant, as well as those which will be funded by future debt issurance. Note (2): Changes from 2017 to 2018 were mainly due to GO bond issuance in June 2018.
120
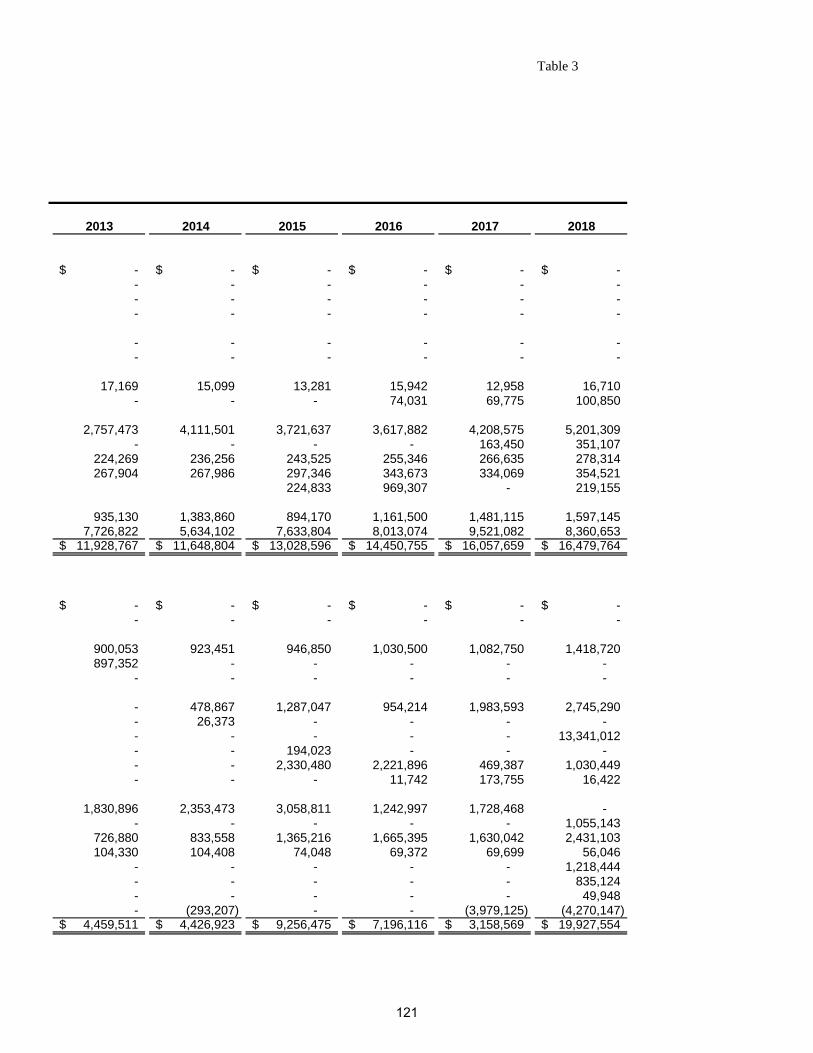
Table 3
2013 2014 2015 2016 2017 2018
-$ -$ -$ -$ -$ -$ - - - - - - - - - - - - - - - - - -
- - - - - - - - - - - -
17,169 15,099 13,281 15,942 12,958 16,710 - - - 74,031 69,775 100,850
2,757,473 4,111,501 3,721,637 3,617,882 4,208,575 5,201,309 - - - - 163,450 351,107
224,269 236,256 243,525 255,346 266,635 278,314 267,904 267,986 297,346 343,673 334,069 354,521
224,833 969,307 - 219,155
935,130 1,383,860 894,170 1,161,500 1,481,115 1,597,145 7,726,822 5,634,102 7,633,804 8,013,074 9,521,082 8,360,653
11,928,767$ 11,648,804$ 13,028,596$ 14,450,755$ 16,057,659$ 16,479,764$
-$ -$ -$ -$ -$ -$ - - - - - -
900,053 923,451 946,850 1,030,500 1,082,750 1,418,720 897,352 - - - - -
- - - - - -
- 478,867 1,287,047 954,214 1,983,593 2,745,290 - 26,373 - - - - - - - - - 13,341,012 - - 194,023 - - - - - 2,330,480 2,221,896 469,387 1,030,449 - - - 11,742 173,755 16,422
1,830,896 2,353,473 3,058,811 1,242,997 1,728,468 - - - - - - 1,055,143
726,880 833,558 1,365,216 1,665,395 1,630,042 2,431,103 104,330 104,408 74,048 69,372 69,699 56,046
- - - - - 1,218,444 - - - - - 835,124 - - - - - 49,948 - (293,207) - - (3,979,125) (4,270,147)
4,459,511$ 4,426,923$ 9,256,475$ 7,196,116$ 3,158,569$ 19,927,554$
121
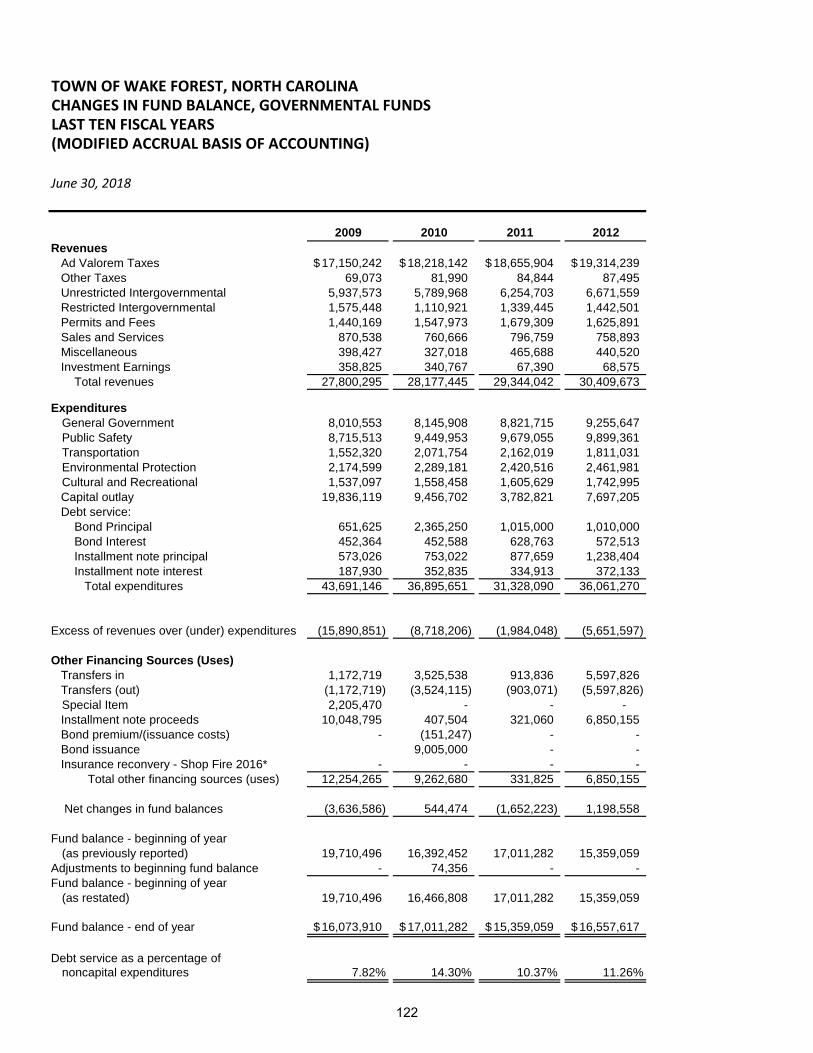
TOWN OF WAKE FOREST, NORTH CAROLINACHANGES IN FUND BALANCE, GOVERNMENTAL FUNDSLAST TEN FISCAL YEARS(MODIFIED ACCRUAL BASIS OF ACCOUNTING)
June 30, 2018
2009 2010 2011 2012Revenues Ad Valorem Taxes 17,150,242$ 18,218,142$ 18,655,904$ 19,314,239$ Other Taxes 69,073 81,990 84,844 87,495 Unrestricted Intergovernmental 5,937,573 5,789,968 6,254,703 6,671,559 Restricted Intergovernmental 1,575,448 1,110,921 1,339,445 1,442,501 Permits and Fees 1,440,169 1,547,973 1,679,309 1,625,891 Sales and Services 870,538 760,666 796,759 758,893 Miscellaneous 398,427 327,018 465,688 440,520 Investment Earnings 358,825 340,767 67,390 68,575 Total revenues 27,800,295 28,177,445 29,344,042 30,409,673
ExpendituresGeneral Government 8,010,553 8,145,908 8,821,715 9,255,647 Public Safety 8,715,513 9,449,953 9,679,055 9,899,361 Transportation 1,552,320 2,071,754 2,162,019 1,811,031 Environmental Protection 2,174,599 2,289,181 2,420,516 2,461,981 Cultural and Recreational 1,537,097 1,558,458 1,605,629 1,742,995
Capital outlay 19,836,119 9,456,702 3,782,821 7,697,205 Debt service: Bond Principal 651,625 2,365,250 1,015,000 1,010,000 Bond Interest 452,364 452,588 628,763 572,513 Installment note principal 573,026 753,022 877,659 1,238,404 Installment note interest 187,930 352,835 334,913 372,133 Total expenditures 43,691,146 36,895,651 31,328,090 36,061,270
Excess of revenues over (under) expenditures (15,890,851) (8,718,206) (1,984,048) (5,651,597)
Other Financing Sources (Uses) Transfers in 1,172,719 3,525,538 913,836 5,597,826 Transfers (out) (1,172,719) (3,524,115) (903,071) (5,597,826)
Special Item 2,205,470 - - - Installment note proceeds 10,048,795 407,504 321,060 6,850,155 Bond premium/(issuance costs) - (151,247) - - Bond issuance 9,005,000 - - Insurance reconvery - Shop Fire 2016* - - - - Total other financing sources (uses) 12,254,265 9,262,680 331,825 6,850,155
Net changes in fund balances (3,636,586) 544,474 (1,652,223) 1,198,558
Fund balance - beginning of year(as previously reported) 19,710,496 16,392,452 17,011,282 15,359,059
Adjustments to beginning fund balance - 74,356 - - Fund balance - beginning of year
(as restated) 19,710,496 16,466,808 17,011,282 15,359,059
Fund balance - end of year 16,073,910$ 17,011,282$ 15,359,059$ 16,557,617$
Debt service as a percentage ofnoncapital expenditures 7.82% 14.30% 10.37% 11.26%
122
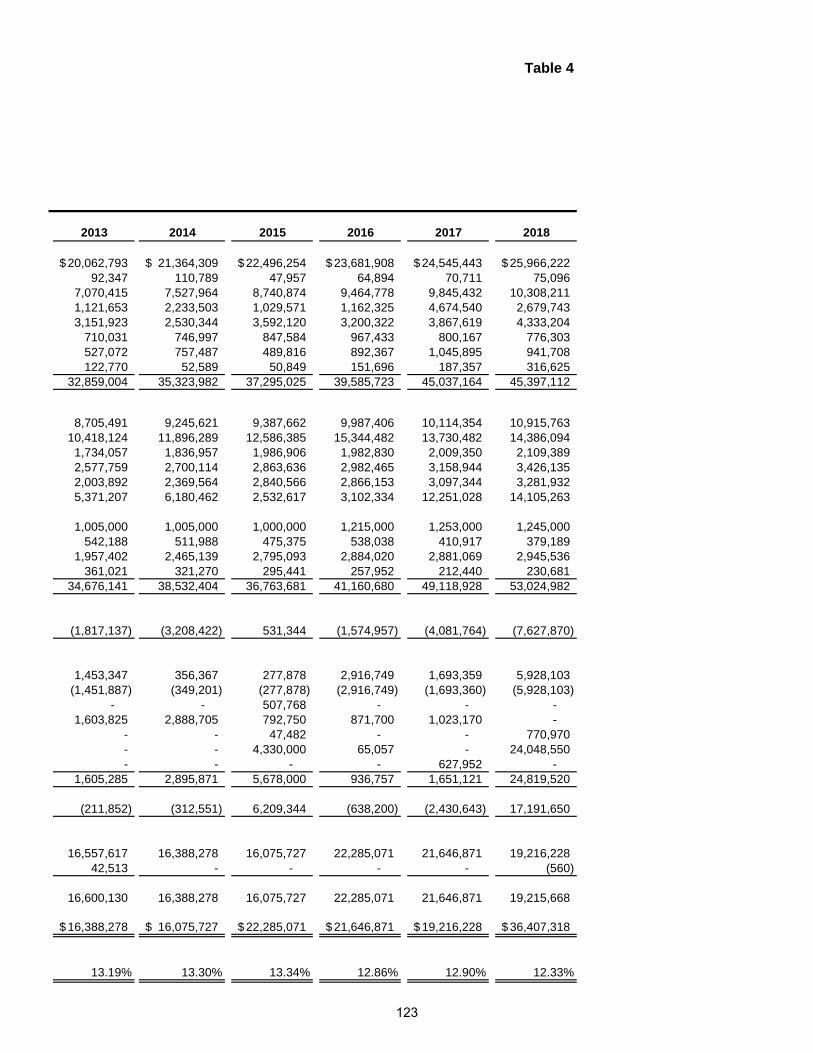
Table 4
2013 2014 2015 2016 2017 2018
20,062,793$ 21,364,309$ 22,496,254$ 23,681,908$ 24,545,443$ 25,966,222$ 92,347 110,789 47,957 64,894 70,711 75,096
7,070,415 7,527,964 8,740,874 9,464,778 9,845,432 10,308,211 1,121,653 2,233,503 1,029,571 1,162,325 4,674,540 2,679,743 3,151,923 2,530,344 3,592,120 3,200,322 3,867,619 4,333,204
710,031 746,997 847,584 967,433 800,167 776,303 527,072 757,487 489,816 892,367 1,045,895 941,708 122,770 52,589 50,849 151,696 187,357 316,625
32,859,004 35,323,982 37,295,025 39,585,723 45,037,164 45,397,112
8,705,491 9,245,621 9,387,662 9,987,406 10,114,354 10,915,763 10,418,124 11,896,289 12,586,385 15,344,482 13,730,482 14,386,094
1,734,057 1,836,957 1,986,906 1,982,830 2,009,350 2,109,389 2,577,759 2,700,114 2,863,636 2,982,465 3,158,944 3,426,135 2,003,892 2,369,564 2,840,566 2,866,153 3,097,344 3,281,932 5,371,207 6,180,462 2,532,617 3,102,334 12,251,028 14,105,263
1,005,000 1,005,000 1,000,000 1,215,000 1,253,000 1,245,000
542,188 511,988 475,375 538,038 410,917 379,189 1,957,402 2,465,139 2,795,093 2,884,020 2,881,069 2,945,536
361,021 321,270 295,441 257,952 212,440 230,681 34,676,141 38,532,404 36,763,681 41,160,680 49,118,928 53,024,982
(1,817,137) (3,208,422) 531,344 (1,574,957) (4,081,764) (7,627,870)
1,453,347 356,367 277,878 2,916,749 1,693,359 5,928,103 (1,451,887) (349,201) (277,878) (2,916,749) (1,693,360) (5,928,103)
- - 507,768 - - - 1,603,825 2,888,705 792,750 871,700 1,023,170 -
- - 47,482 - - 770,970 - - 4,330,000 65,057 - 24,048,550 - - - - 627,952 -
1,605,285 2,895,871 5,678,000 936,757 1,651,121 24,819,520
(211,852) (312,551) 6,209,344 (638,200) (2,430,643) 17,191,650
16,557,617 16,388,278 16,075,727 22,285,071 21,646,871 19,216,228 42,513 - - - - (560)
16,600,130 16,388,278 16,075,727 22,285,071 21,646,871 19,215,668
16,388,278$ 16,075,727$ 22,285,071$ 21,646,871$ 19,216,228$ 36,407,318$
13.19% 13.30% 13.34% 12.86% 12.90% 12.33%
123
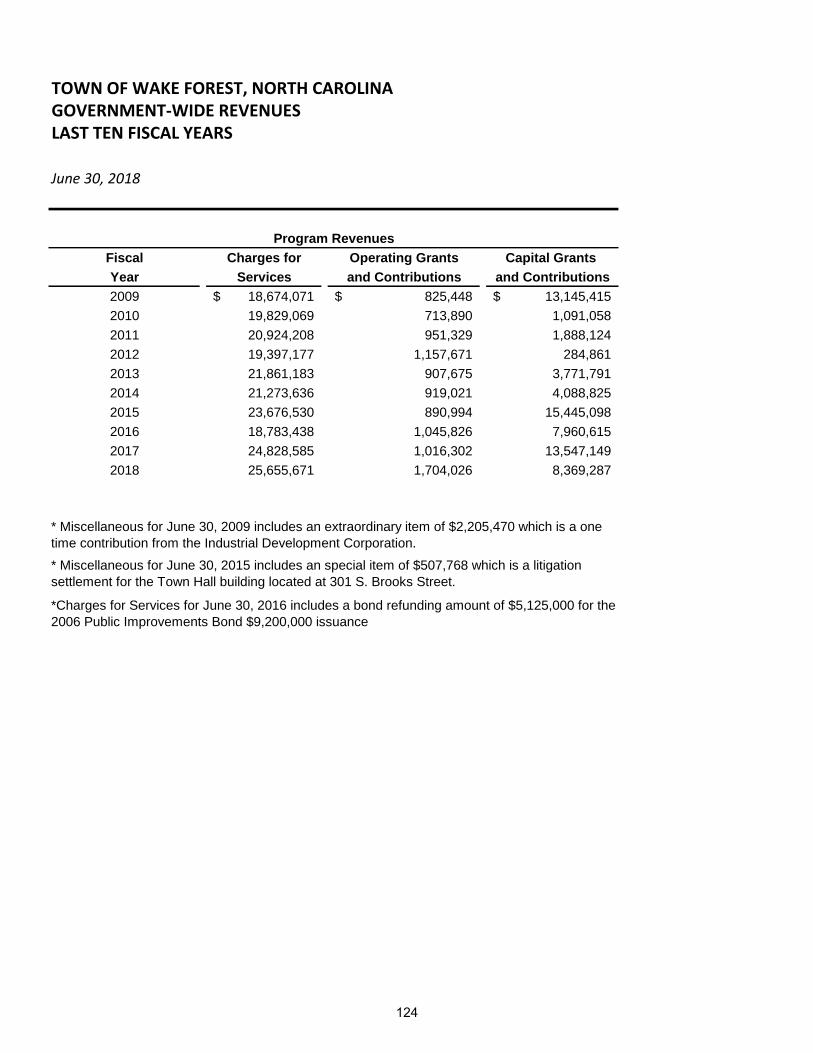
GOVERNMENT-WIDE REVENUESLAST TEN FISCAL YEARS
June 30, 2018
Program Revenues General RevenueFiscal Charges for Operating Grants Capital Grants Year Services and Contributions and Contributions2009 18,674,071$ 825,448$ 13,145,415$ 2010 19,829,069 713,890 1,091,058 2011 20,924,208 951,329 1,888,124 2012 19,397,177 1,157,671 284,861 2013 21,861,183 907,675 3,771,791 2014 21,273,636 919,021 4,088,825 2015 23,676,530 890,994 15,445,098 2016 18,783,438 1,045,826 7,960,615 2017 24,828,585 1,016,302 13,547,149 2018 25,655,671 1,704,026 8,369,287
TOWN OF WAKE FOREST, NORTH CAROLINA
* Miscellaneous for June 30, 2009 includes an extraordinary item of $2,205,470 which is a one time contribution from the Industrial Development Corporation.
* Miscellaneous for June 30, 2015 includes an special item of $507,768 which is a litigation settlement for the Town Hall building located at 301 S. Brooks Street.
*Charges for Services for June 30, 2016 includes a bond refunding amount of $5,125,000 for the 2006 Public Improvements Bond $9,200,000 issuance
124
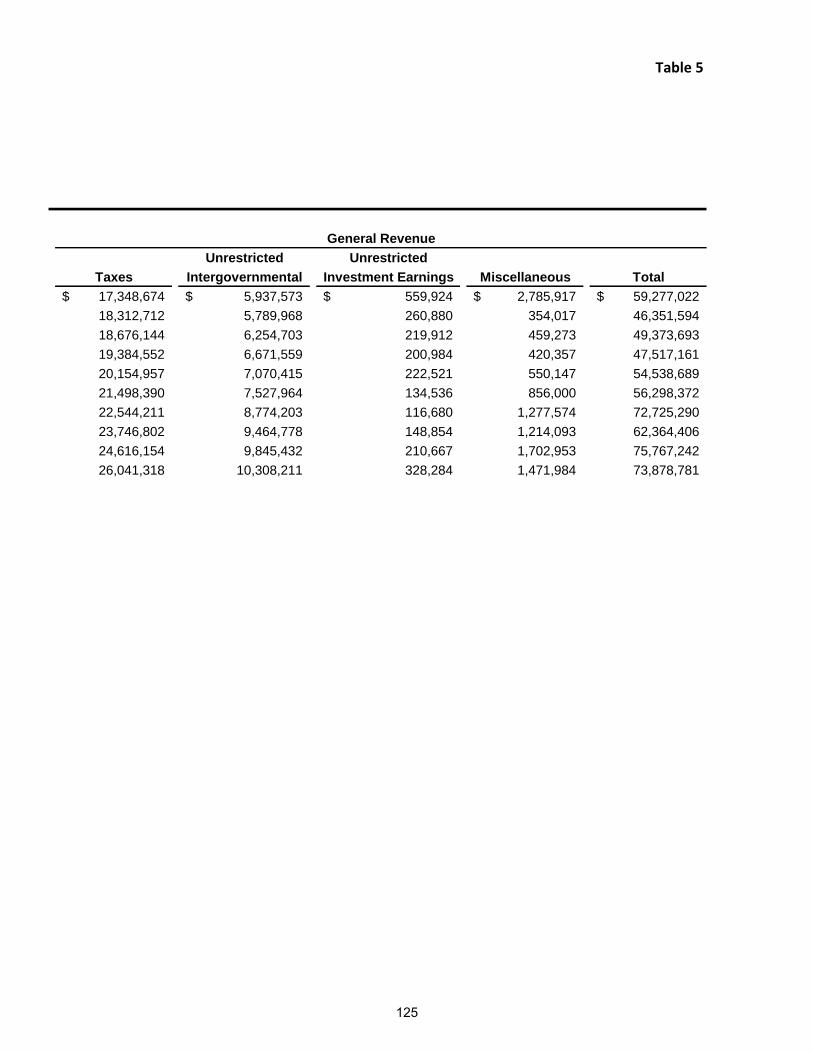
Table 5
General RevenueUnrestricted Unrestricted
Taxes Intergovernmental Investment Earnings Miscellaneous Total17,348,674$ 5,937,573$ 559,924$ 2,785,917$ 59,277,022$ 18,312,712 5,789,968 260,880 354,017 46,351,594 18,676,144 6,254,703 219,912 459,273 49,373,693 19,384,552 6,671,559 200,984 420,357 47,517,161 20,154,957 7,070,415 222,521 550,147 54,538,689 21,498,390 7,527,964 134,536 856,000 56,298,372 22,544,211 8,774,203 116,680 1,277,574 72,725,290 23,746,802 9,464,778 148,854 1,214,093 62,364,406 24,616,154 9,845,432 210,667 1,702,953 75,767,242 26,041,318 10,308,211 328,284 1,471,984 73,878,781
TOWN OF WAKE FOREST, NORTH CAROLINA
125
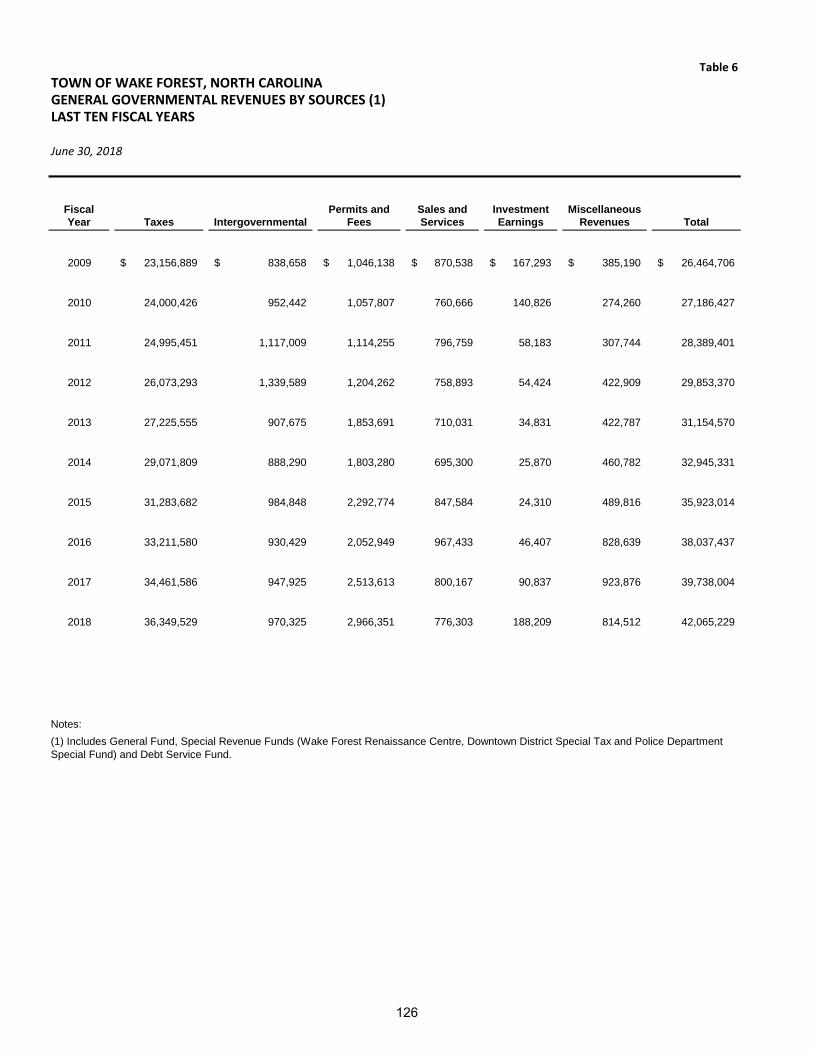
Table 6
Fiscal Permits and Sales and Investment Miscellaneous Year Taxes Intergovernmental Fees Services Earnings Revenues Total
2009 23,156,889$ 838,658$ 1,046,138$ 870,538$ 167,293$ 385,190$ 26,464,706$
2010 24,000,426 952,442 1,057,807 760,666 140,826 274,260 27,186,427
2011 24,995,451 1,117,009 1,114,255 796,759 58,183 307,744 28,389,401
2012 26,073,293 1,339,589 1,204,262 758,893 54,424 422,909 29,853,370
2013 27,225,555 907,675 1,853,691 710,031 34,831 422,787 31,154,570
2014 29,071,809 888,290 1,803,280 695,300 25,870 460,782 32,945,331
2015 31,283,682 984,848 2,292,774 847,584 24,310 489,816 35,923,014
2016 33,211,580 930,429 2,052,949 967,433 46,407 828,639 38,037,437
2017 34,461,586 947,925 2,513,613 800,167 90,837 923,876 39,738,004
2018 36,349,529 970,325 2,966,351 776,303 188,209 814,512 42,065,229
Notes:
TOWN OF WAKE FOREST, NORTH CAROLINAGENERAL GOVERNMENTAL REVENUES BY SOURCES (1)LAST TEN FISCAL YEARS
June 30, 2018
(1) Includes General Fund, Special Revenue Funds (Wake Forest Renaissance Centre, Downtown District Special Tax and Police Department Special Fund) and Debt Service Fund.
126
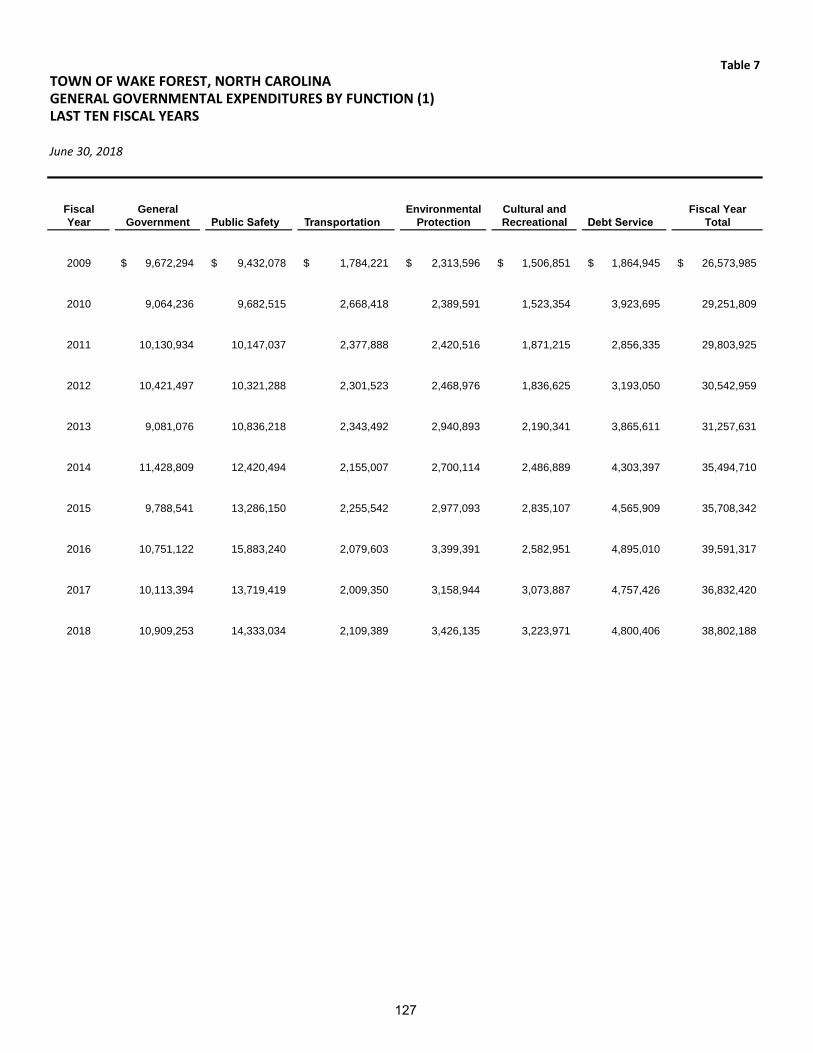
Table 7
Fiscal General Environmental Cultural and Fiscal YearYear Government Public Safety Transportation Protection Recreational Debt Service Total
2009 9,672,294$ 9,432,078$ 1,784,221$ 2,313,596$ 1,506,851$ 1,864,945$ 26,573,985$
2010 9,064,236 9,682,515 2,668,418 2,389,591 1,523,354 3,923,695 29,251,809
2011 10,130,934 10,147,037 2,377,888 2,420,516 1,871,215 2,856,335 29,803,925
2012 10,421,497 10,321,288 2,301,523 2,468,976 1,836,625 3,193,050 30,542,959
2013 9,081,076 10,836,218 2,343,492 2,940,893 2,190,341 3,865,611 31,257,631
2014 11,428,809 12,420,494 2,155,007 2,700,114 2,486,889 4,303,397 35,494,710
2015 9,788,541 13,286,150 2,255,542 2,977,093 2,835,107 4,565,909 35,708,342
2016 10,751,122 15,883,240 2,079,603 3,399,391 2,582,951 4,895,010 39,591,317
2017 10,113,394 13,719,419 2,009,350 3,158,944 3,073,887 4,757,426 36,832,420
2018 10,909,253 14,333,034 2,109,389 3,426,135 3,223,971 4,800,406 38,802,188
June 30, 2018
LAST TEN FISCAL YEARS
TOWN OF WAKE FOREST, NORTH CAROLINAGENERAL GOVERNMENTAL EXPENDITURES BY FUNCTION (1)
127
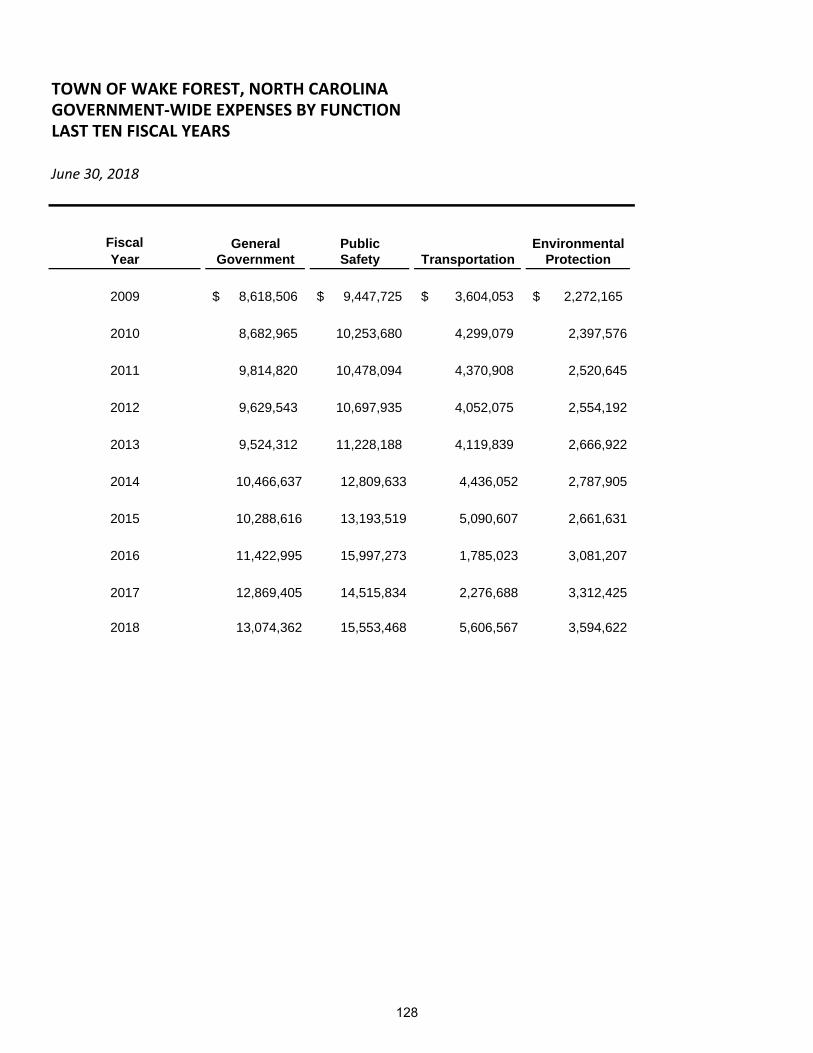
TOWN OF WAKE FOREST, NORTH CAROLINAGOVERNMENT-WIDE EXPENSES BY FUNCTION
June 30, 2018
Fiscal General Public EnvironmentalYear Government Safety Transportation Protection
2009 8,618,506$ 9,447,725$ 3,604,053$ 2,272,165$
2010 8,682,965 10,253,680 4,299,079 2,397,576
2011 9,814,820 10,478,094 4,370,908 2,520,645
2012 9,629,543 10,697,935 4,052,075 2,554,192
2013 9,524,312 11,228,188 4,119,839 2,666,922
2014 10,466,637 12,809,633 4,436,052 2,787,905
2015 10,288,616 13,193,519 5,090,607 2,661,631
2016 11,422,995 15,997,273 1,785,023 3,081,207
2017 12,869,405 14,515,834 2,276,688 3,312,425
2018 13,074,362 15,553,468 5,606,567 3,594,622
LAST TEN FISCAL YEARS
128
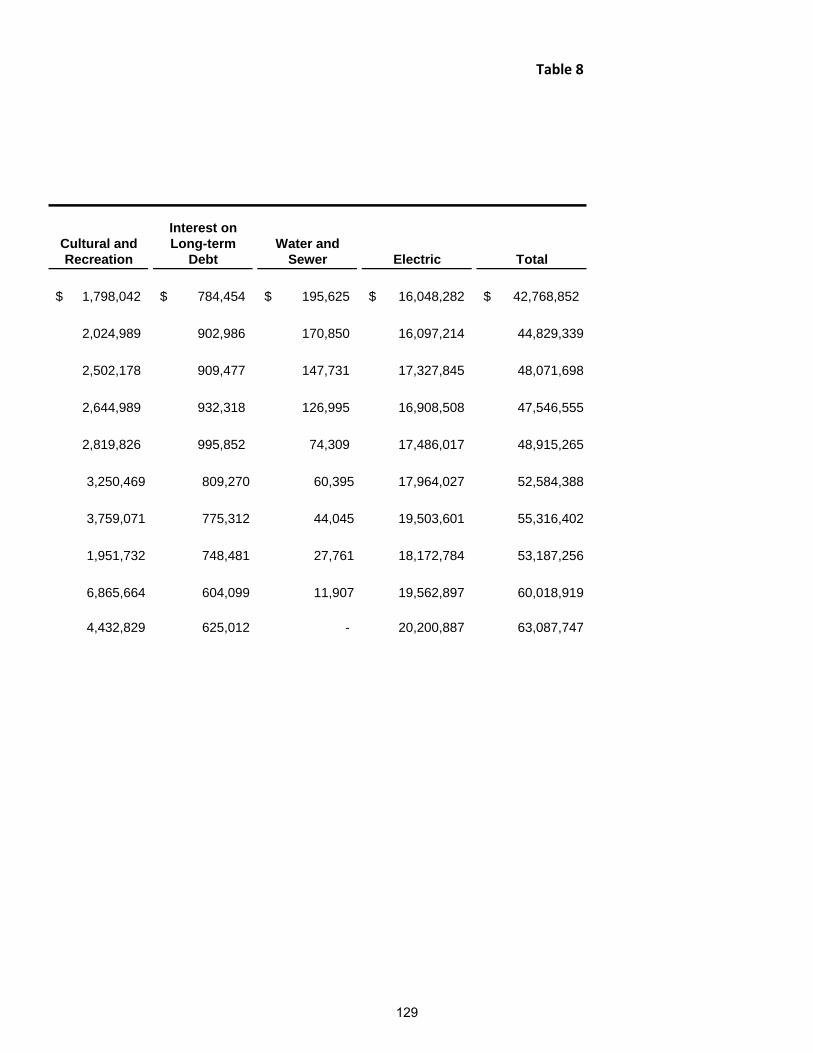
Table 8
Interest onCultural and Long-term Water andRecreation Debt Sewer Electric Total
1,798,042$ 784,454$ 195,625$ 16,048,282$ 42,768,852$
2,024,989 902,986 170,850 16,097,214 44,829,339
2,502,178 909,477 147,731 17,327,845 48,071,698
2,644,989 932,318 126,995 16,908,508 47,546,555
2,819,826 995,852 74,309 17,486,017 48,915,265
3,250,469 809,270 60,395 17,964,027 52,584,388
3,759,071 775,312 44,045 19,503,601 55,316,402
1,951,732 748,481 27,761 18,172,784 53,187,256
6,865,664 604,099 11,907 19,562,897 60,018,919
4,432,829 625,012 - 20,200,887 63,087,747
LAST TEN FISCAL YEARS
129
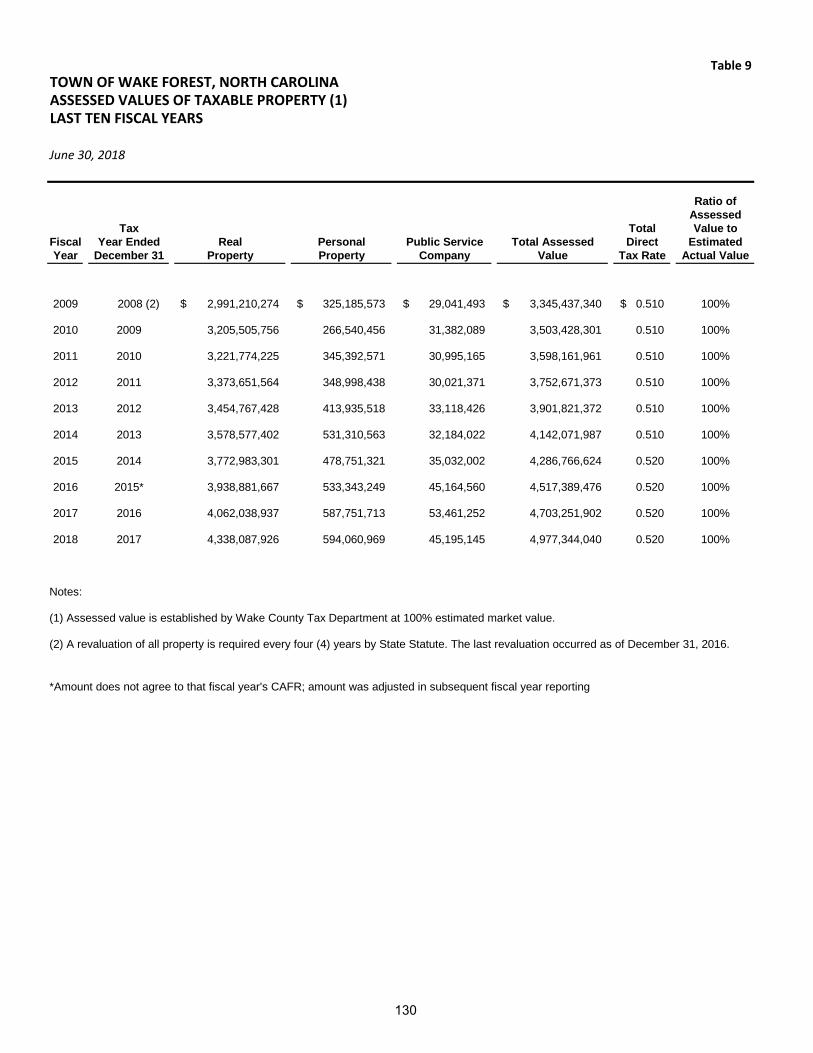
Table 9
LAST TEN FISCAL YEARS
Ratio ofAssessed
Tax Total Value toFiscal Year Ended Real Personal Public Service Total Assessed Direct EstimatedYear December 31 Property Property Company Value Tax Rate Actual Value
2009 2008 (2) 2,991,210,274$ 325,185,573$ 29,041,493$ 3,345,437,340$ 0.510$ 100%
2010 2009 3,205,505,756 266,540,456 31,382,089 3,503,428,301 0.510 100%
2011 2010 3,221,774,225 345,392,571 30,995,165 3,598,161,961 0.510 100%
2012 2011 3,373,651,564 348,998,438 30,021,371 3,752,671,373 0.510 100%
2013 2012 3,454,767,428 413,935,518 33,118,426 3,901,821,372 0.510 100%
2014 2013 3,578,577,402 531,310,563 32,184,022 4,142,071,987 0.510 100%
2015 2014 3,772,983,301 478,751,321 35,032,002 4,286,766,624 0.520 100%
2016 2015* 3,938,881,667 533,343,249 45,164,560 4,517,389,476 0.520 100%
2017 2016 4,062,038,937 587,751,713 53,461,252 4,703,251,902 0.520 100%
2018 2017 4,338,087,926 594,060,969 45,195,145 4,977,344,040 0.520 100%
Notes:
(1) Assessed value is established by Wake County Tax Department at 100% estimated market value.
(2) A revaluation of all property is required every four (4) years by State Statute. The last revaluation occurred as of December 31, 2016.
June 30, 2018
ASSESSED VALUES OF TAXABLE PROPERTY (1)TOWN OF WAKE FOREST, NORTH CAROLINA
*Amount does not agree to that fiscal year's CAFR; amount was adjusted in subsequent fiscal year reporting
130
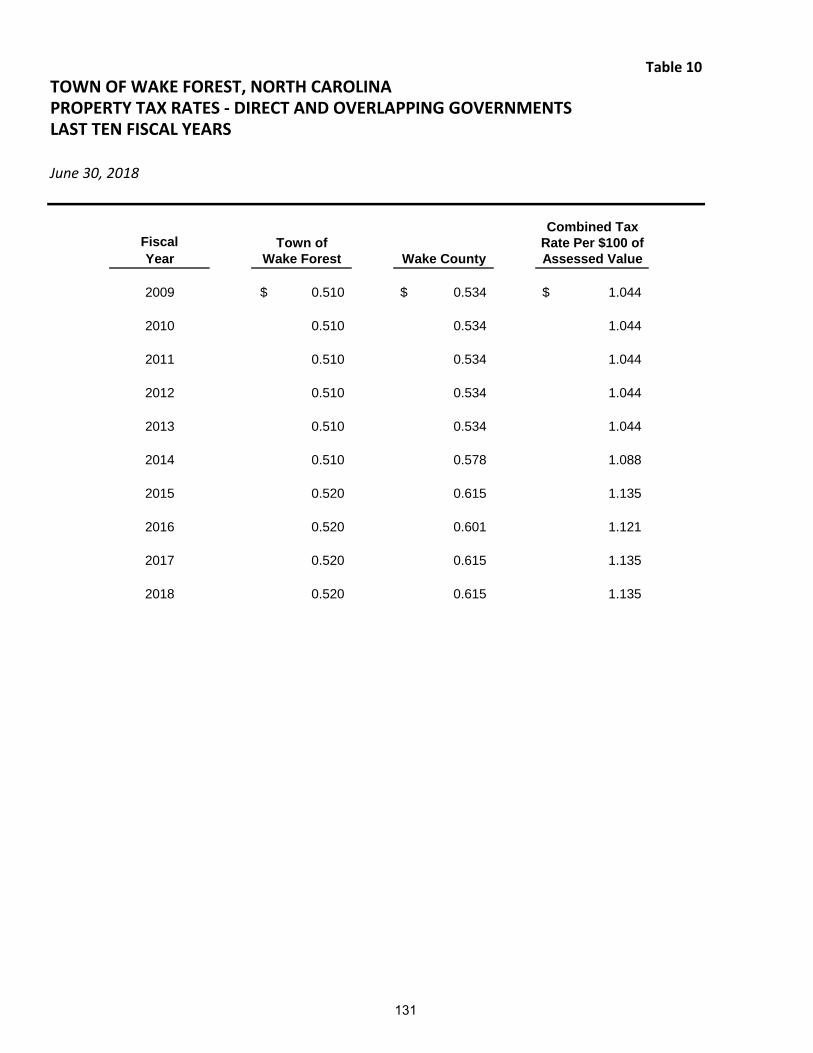
Table 10TOWN OF WAKE FOREST, NORTH CAROLINAPROPERTY TAX RATES - DIRECT AND OVERLAPPING GOVERNMENTSLAST TEN FISCAL YEARS
Combined TaxFiscal Town of Rate Per $100 ofYear Wake Forest Wake County Assessed Value
2009 0.510$ 0.534$ 1.044$
2010 0.510 0.534 1.044
2011 0.510 0.534 1.044
2012 0.510 0.534 1.044
2013 0.510 0.534 1.044
2014 0.510 0.578 1.088
2015 0.520 0.615 1.135
2016 0.520 0.601 1.121
2017 0.520 0.615 1.135
2018 0.520 0.615 1.135
June 30, 2018
131
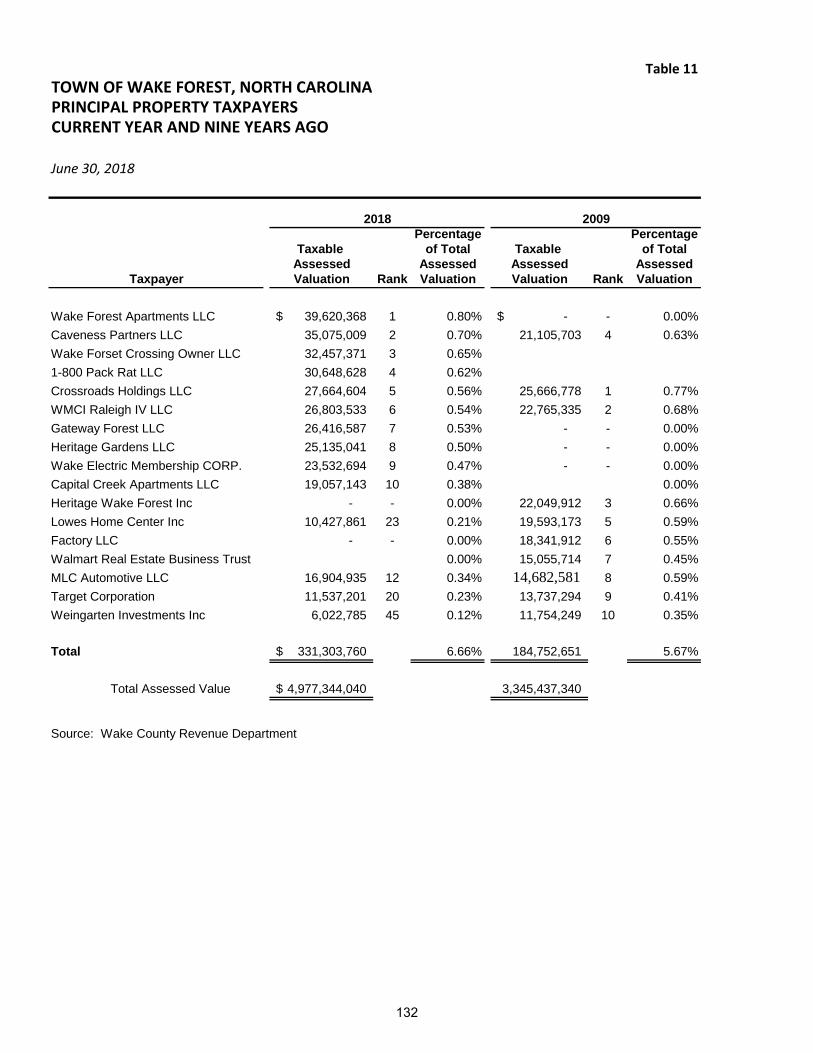
Table 11
TOWN OF WAKE FOREST, NORTH CAROLINAPRINCIPAL PROPERTY TAXPAYERSCURRENT YEAR AND NINE YEARS AGO
June 30, 2018
Percentage PercentageTaxable of Total Taxable of Total
Assessed Assessed Assessed AssessedTaxpayer Valuation Rank Valuation Valuation Rank Valuation
Wake Forest Apartments LLC 39,620,368$ 1 0.80% -$ - 0.00%Caveness Partners LLC 35,075,009 2 0.70% 21,105,703 4 0.63%Wake Forset Crossing Owner LLC 32,457,371 3 0.65%1-800 Pack Rat LLC 30,648,628 4 0.62%Crossroads Holdings LLC 27,664,604 5 0.56% 25,666,778 1 0.77%WMCI Raleigh IV LLC 26,803,533 6 0.54% 22,765,335 2 0.68%Gateway Forest LLC 26,416,587 7 0.53% - - 0.00%Heritage Gardens LLC 25,135,041 8 0.50% - - 0.00%Wake Electric Membership CORP. 23,532,694 9 0.47% - - 0.00%Capital Creek Apartments LLC 19,057,143 10 0.38% 0.00%Heritage Wake Forest Inc - - 0.00% 22,049,912 3 0.66%Lowes Home Center Inc 10,427,861 23 0.21% 19,593,173 5 0.59%Factory LLC - - 0.00% 18,341,912 6 0.55%Walmart Real Estate Business Trust 0.00% 15,055,714 7 0.45%MLC Automotive LLC 16,904,935 12 0.34% 14,682,581 8 0.59%Target Corporation 11,537,201 20 0.23% 13,737,294 9 0.41%Weingarten Investments Inc 6,022,785 45 0.12% 11,754,249 10 0.35%
Total 331,303,760$ 6.66% 184,752,651 5.67%
Total Assessed Value 4,977,344,040$ 3,345,437,340
Source: Wake County Revenue Department
2018 2009
132
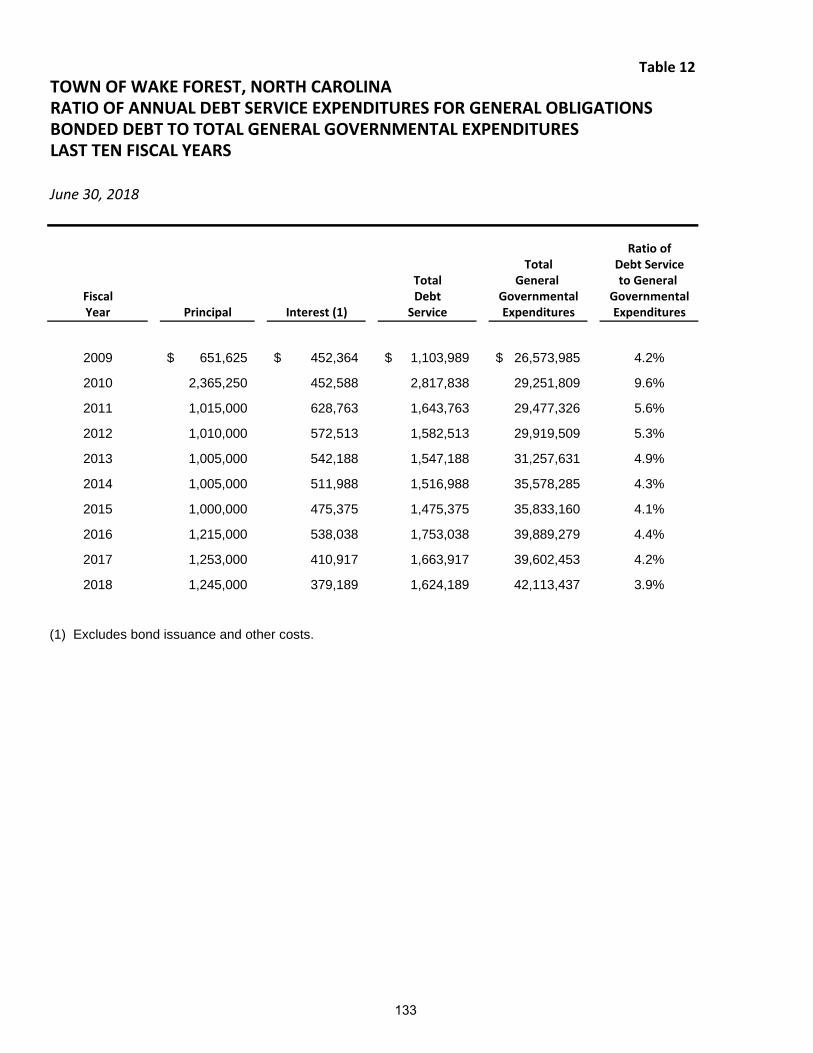
Table 12TOWN OF WAKE FOREST, NORTH CAROLINARATIO OF ANNUAL DEBT SERVICE EXPENDITURES FOR GENERAL OBLIGATIONSBONDED DEBT TO TOTAL GENERAL GOVERNMENTAL EXPENDITURESLAST TEN FISCAL YEARS
Ratio ofTotal Debt Service
Total General to General Fiscal Debt Governmental GovernmentalYear Principal Interest (1) Service Expenditures Expenditures
2009 651,625$ 452,364$ 1,103,989$ 26,573,985$ 4.2%
2010 2,365,250 452,588 2,817,838 29,251,809 9.6%
2011 1,015,000 628,763 1,643,763 29,477,326 5.6%
2012 1,010,000 572,513 1,582,513 29,919,509 5.3%
2013 1,005,000 542,188 1,547,188 31,257,631 4.9%
2014 1,005,000 511,988 1,516,988 35,578,285 4.3%
2015 1,000,000 475,375 1,475,375 35,833,160 4.1%
2016 1,215,000 538,038 1,753,038 39,889,279 4.4%
2017 1,253,000 410,917 1,663,917 39,602,453 4.2%
2018 1,245,000 379,189 1,624,189 42,113,437 3.9%
(1) Excludes bond issuance and other costs.
June 30, 2018
133
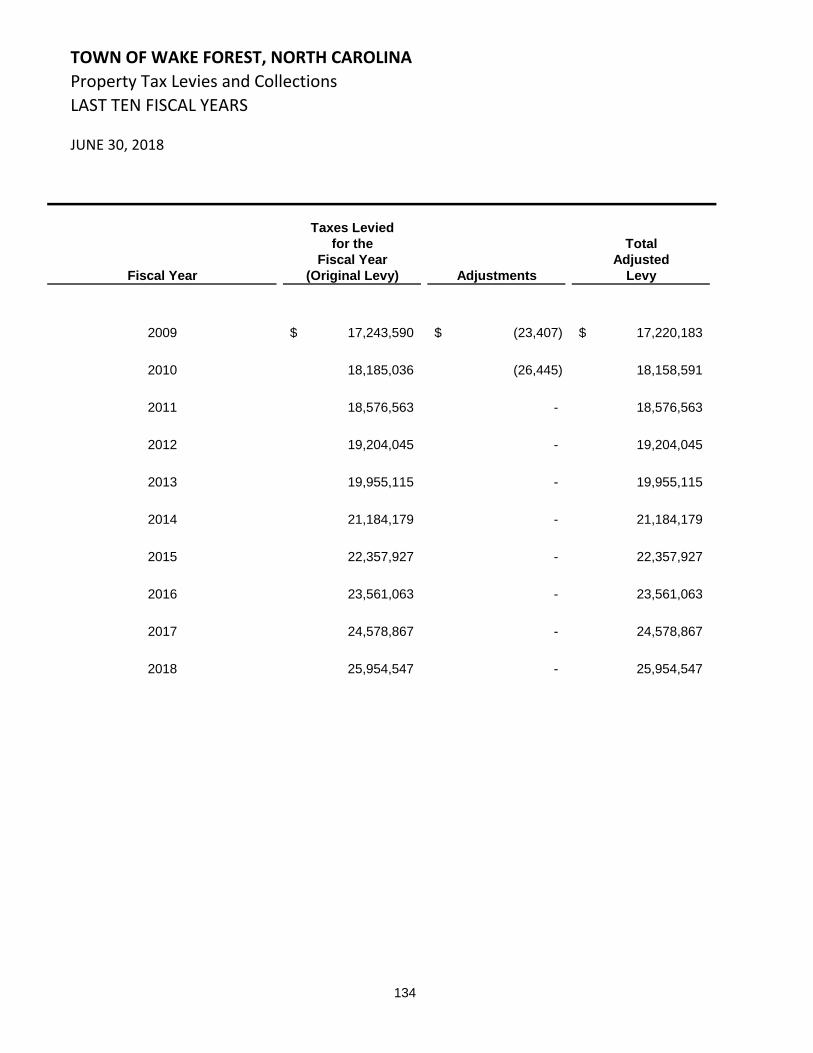
TOWN OF WAKE FOREST, NORTH CAROLINAProperty Tax Levies and CollectionsLAST TEN FISCAL YEARS
JUNE 30, 2018
134
Taxes Leviedfor the Total
Fiscal Year AdjustedFiscal Year (Original Levy) Adjustments Levy
2009 17,243,590$ (23,407)$ 17,220,183$
2010 18,185,036 (26,445) 18,158,591
2011 18,576,563 - 18,576,563
2012 19,204,045 - 19,204,045
2013 19,955,115 - 19,955,115
2014 21,184,179 - 21,184,179
2015 22,357,927 - 22,357,927
2016 23,561,063 - 23,561,063
2017 24,578,867 - 24,578,867
2018 25,954,547 - 25,954,547
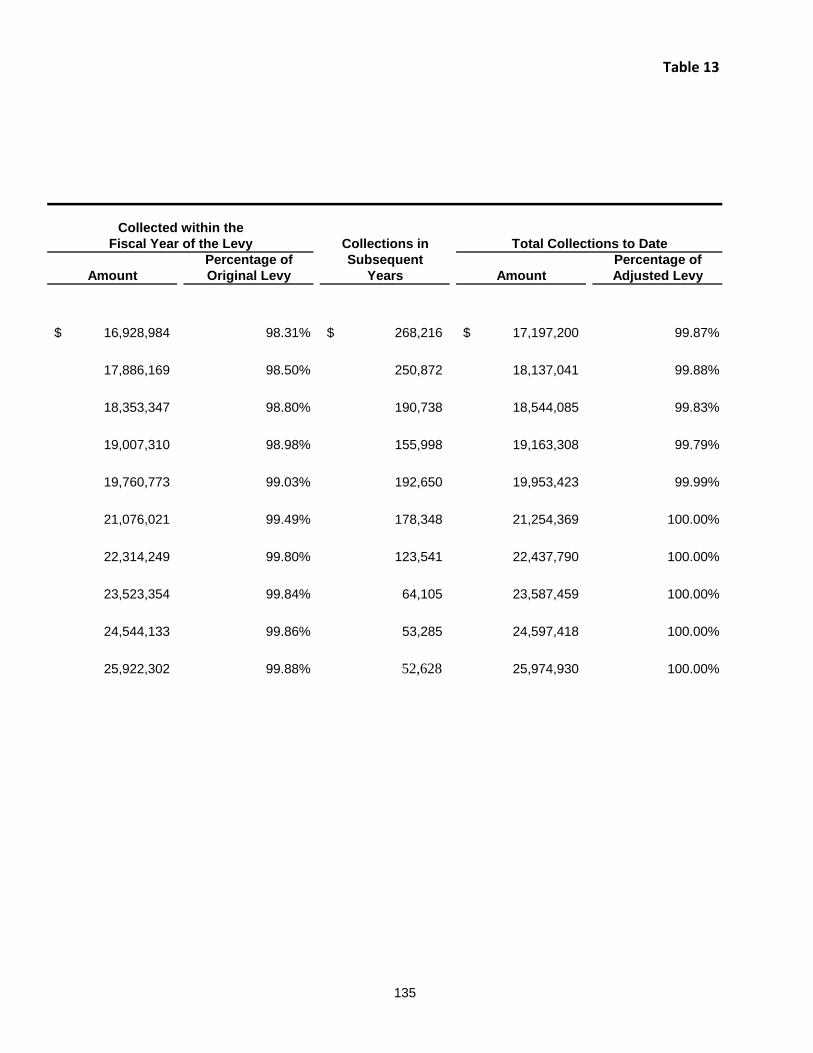
135
Table 13
Collections inPercentage of Subsequent Percentage of
Amount Original Levy Years Amount Adjusted Levy
16,928,984$ 98.31% 268,216$ 17,197,200$ 99.87%
17,886,169 98.50% 250,872 18,137,041 99.88%
18,353,347 98.80% 190,738 18,544,085 99.83%
19,007,310 98.98% 155,998 19,163,308 99.79%
19,760,773 99.03% 192,650 19,953,423 99.99%
21,076,021 99.49% 178,348 21,254,369 100.00%
22,314,249 99.80% 123,541 22,437,790 100.00%
23,523,354 99.84% 64,105 23,587,459 100.00%
24,544,133 99.86% 53,285 24,597,418 100.00%
25,922,302 99.88% 52,628 25,974,930 100.00%
Total Collections to DateCollected within the
Fiscal Year of the Levy
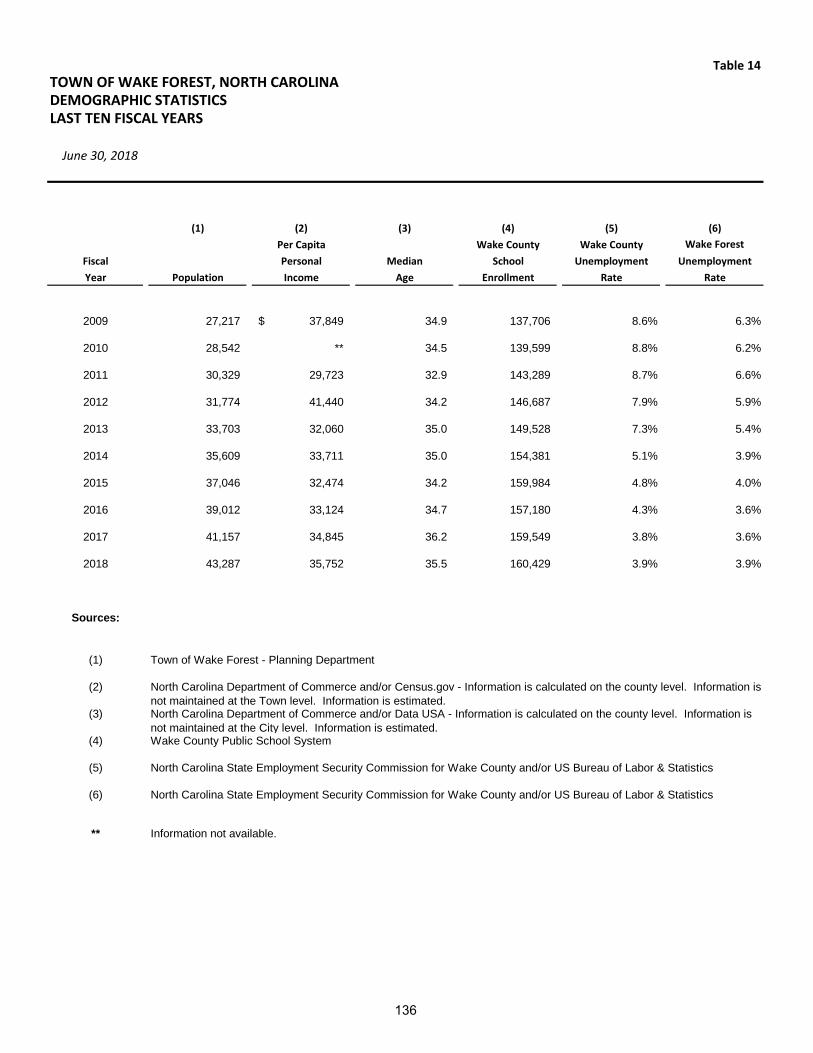
Table 14
June 30, 2018
(1) (2) (3) (4) (5) (6)Per Capita Wake County Wake County Wake Forest
Fiscal Personal Median School Unemployment UnemploymentYear Population Income Age Enrollment Rate Rate
2009 27,217 37,849$ 34.9 137,706 8.6% 6.3%
2010 28,542 ** 34.5 139,599 8.8% 6.2%
2011 30,329 29,723 32.9 143,289 8.7% 6.6%
2012 31,774 41,440 34.2 146,687 7.9% 5.9%
2013 33,703 32,060 35.0 149,528 7.3% 5.4%
2014 35,609 33,711 35.0 154,381 5.1% 3.9%
2015 37,046 32,474 34.2 159,984 4.8% 4.0%
2016 39,012 33,124 34.7 157,180 4.3% 3.6%
2017 41,157 34,845 36.2 159,549 3.8% 3.6%
2018 43,287 35,752 35.5 160,429 3.9% 3.9%
Sources:
(1)
(2)
(3)
(4)
(5)
(6)
**
TOWN OF WAKE FOREST, NORTH CAROLINADEMOGRAPHIC STATISTICS
Town of Wake Forest - Planning Department
LAST TEN FISCAL YEARS
North Carolina Department of Commerce and/or Census.gov - Information is calculated on the county level. Information is not maintained at the Town level. Information is estimated. North Carolina Department of Commerce and/or Data USA - Information is calculated on the county level. Information is not maintained at the City level. Information is estimated. Wake County Public School System
North Carolina State Employment Security Commission for Wake County and/or US Bureau of Labor & Statistics
North Carolina State Employment Security Commission for Wake County and/or US Bureau of Labor & Statistics
Information not available.
136
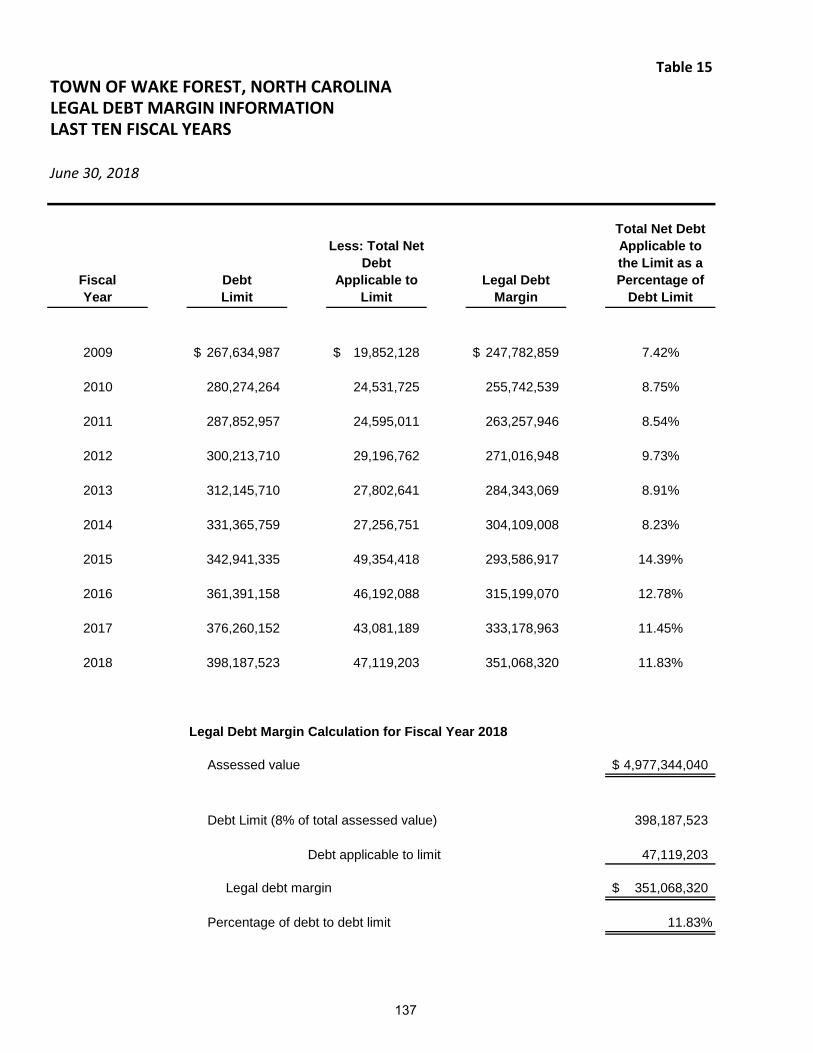
Table 15
LAST TEN FISCAL YEARS
Fiscal Year
Debt Limit
Less: Total Net Debt
Applicable to Limit
Legal Debt Margin
Total Net Debt Applicable to the Limit as a Percentage of
Debt Limit
2009 267,634,987$ 19,852,128$ 247,782,859$ 7.42%
2010 280,274,264 24,531,725 255,742,539 8.75%
2011 287,852,957 24,595,011 263,257,946 8.54%
2012 300,213,710 29,196,762 271,016,948 9.73%
2013 312,145,710 27,802,641 284,343,069 8.91%
2014 331,365,759 27,256,751 304,109,008 8.23%
2015 342,941,335 49,354,418 293,586,917 14.39%
2016 361,391,158 46,192,088 315,199,070 12.78%
2017 376,260,152 43,081,189 333,178,963 11.45%
2018 398,187,523 47,119,203 351,068,320 11.83%
Legal Debt Margin Calculation for Fiscal Year 2018
Assessed value 4,977,344,040$
Debt Limit (8% of total assessed value) 398,187,523
Debt applicable to limit 47,119,203
Legal debt margin 351,068,320$
Percentage of debt to debt limit 11.83%
TOWN OF WAKE FOREST, NORTH CAROLINALEGAL DEBT MARGIN INFORMATION
June 30, 2018
137

TOWN OF WAKE FOREST, NORTH CAROLINARATIO OF NET GENERAL BONDED DEBTTO ASSESSED VALUE AND NET BONDED DEBT PER CAPITALAST TEN FISCAL YEARS
JUNE 30, 2018
Debt PayableGross From
Fiscal (1) Bonded EnterpriseYear Population Assessed Value Debt Revenues
2009 27,217 3,345,437,340$ 10,220,000$ 69,750$
2010 28,542 3,503,428,301 16,790,000 -
2011 30,329 3,598,161,961 15,775,000 -
2012 31,774 3,752,671,373 14,765,000 -
2013 33,703 3,901,821,373 13,760,000 -
2014 35,609 4,142,071,987 12,942,690 -
2015 37,046 4,286,766,624 16,303,389 -
2016 39,012 4,517,389,476 15,134,232 -
2017* 41,157 4,703,251,902 13,862,075 -
2018 43,287 4,977,344,040 30,048,889 -
(1) Compiled by the Town of Wake Forest Planning Department*2017 figure is different than reported in previous year; this number should have included the bond premium also.
138
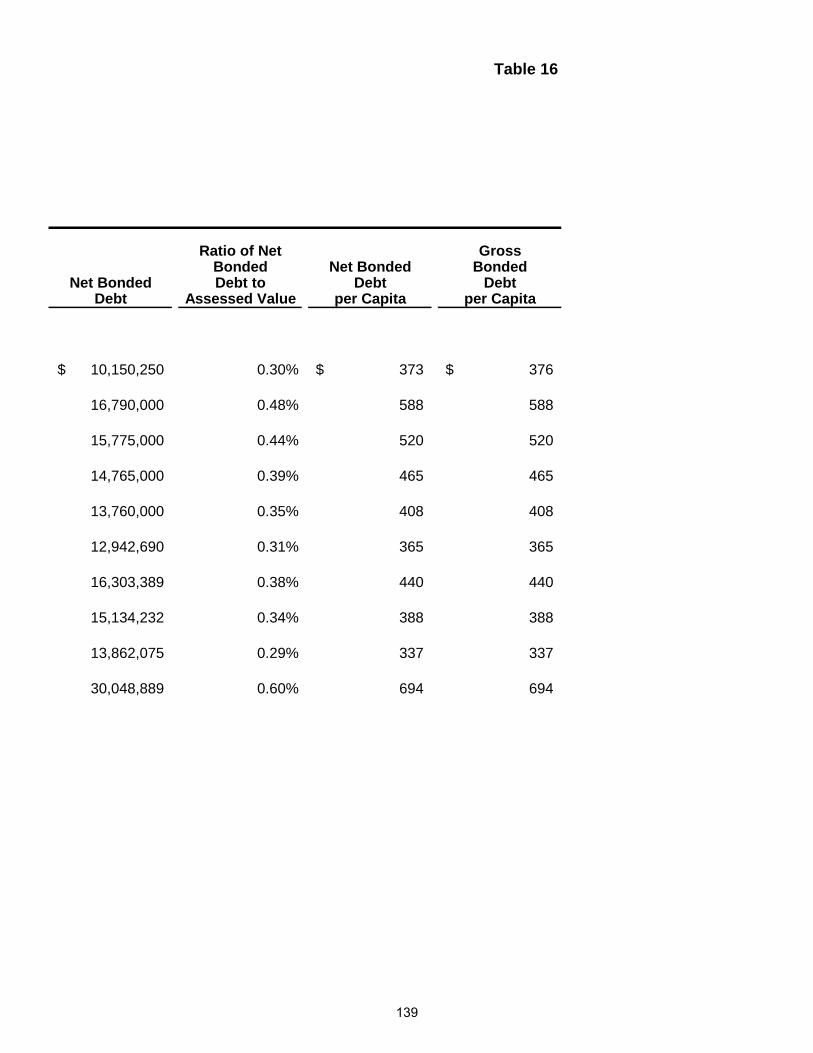
Table 16
Ratio of Net GrossBonded Net Bonded Bonded
Net Bonded Debt to Debt DebtDebt Assessed Value per Capita per Capita
10,150,250$ 0.30% 373$ 376$
16,790,000 0.48% 588 588
15,775,000 0.44% 520 520
14,765,000 0.39% 465 465
13,760,000 0.35% 408 408
12,942,690 0.31% 365 365
16,303,389 0.38% 440 440
15,134,232 0.34% 388 388
13,862,075 0.29% 337 337
30,048,889 0.60% 694 694
139
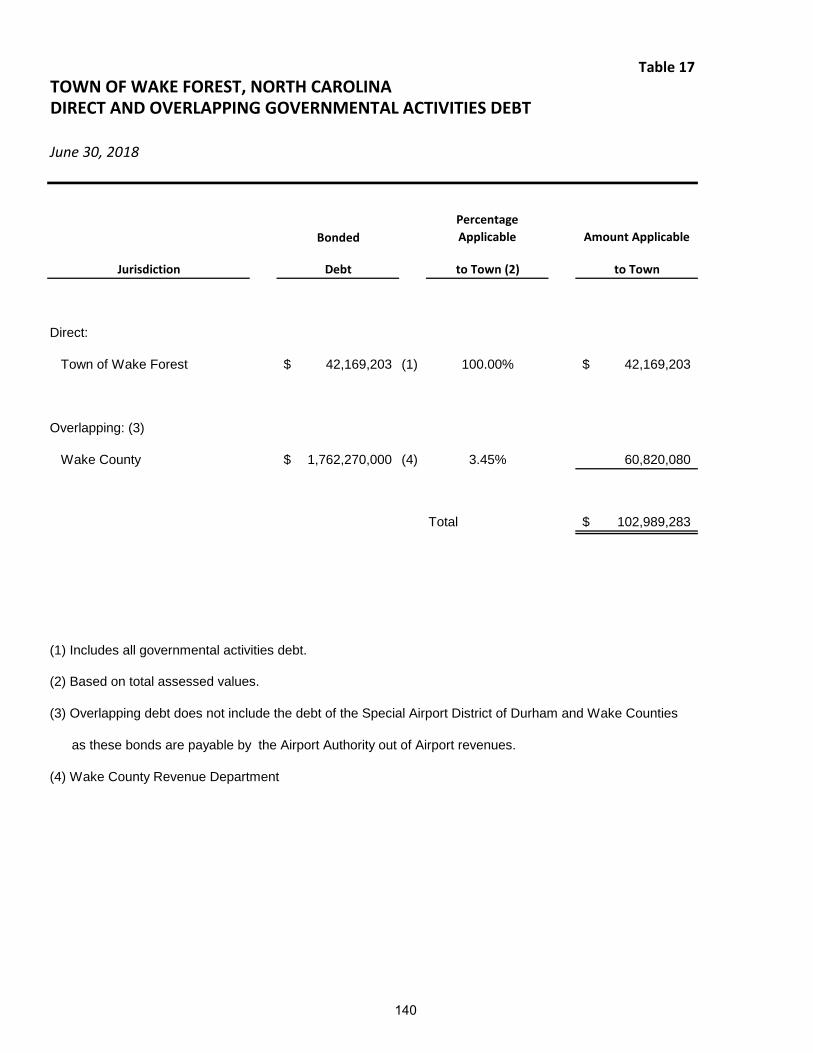
Table 17
June 30, 2018
BondedPercentage Applicable Amount Applicable
Jurisdiction Debt to Town (2) to Town
Direct:
Town of Wake Forest 42,169,203$ (1) 100.00% 42,169,203$
Overlapping: (3)
Wake County 1,762,270,000$ (4) 3.45% 60,820,080
Total 102,989,283$
(1) Includes all governmental activities debt.
(2) Based on total assessed values.
(3) Overlapping debt does not include the debt of the Special Airport District of Durham and Wake Counties
as these bonds are payable by the Airport Authority out of Airport revenues.
(4) Wake County Revenue Department
TOWN OF WAKE FOREST, NORTH CAROLINADIRECT AND OVERLAPPING GOVERNMENTAL ACTIVITIES DEBT
140
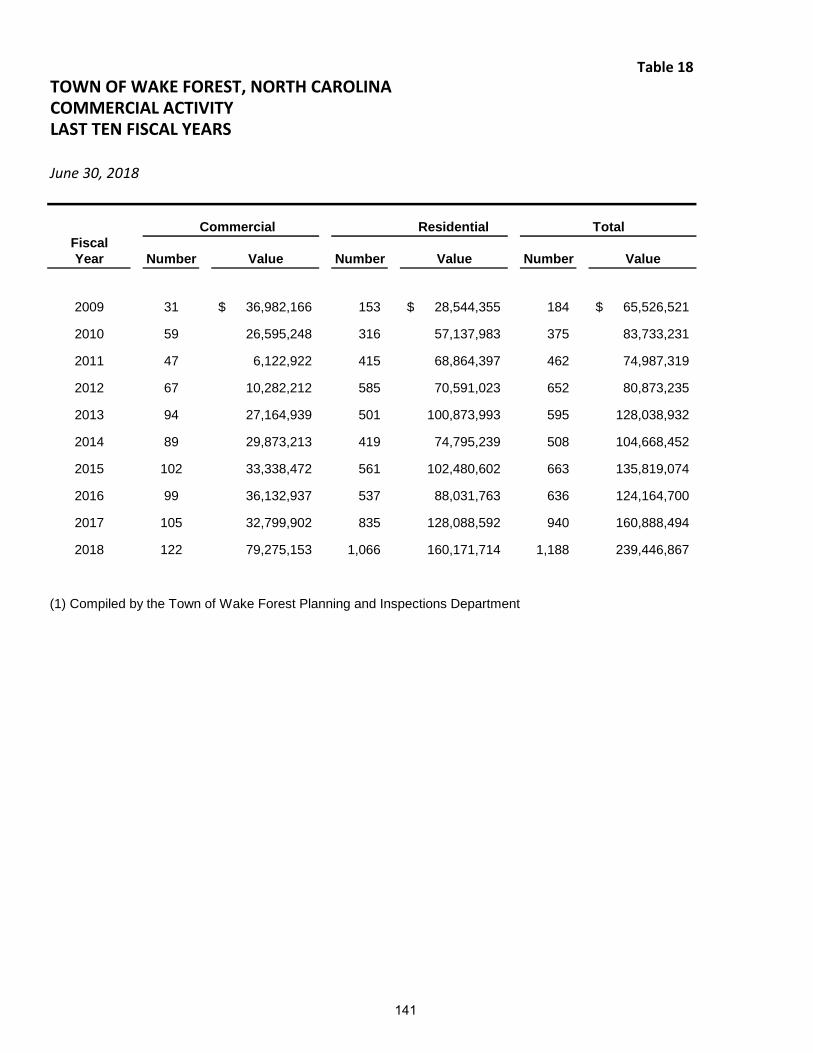
Table 18TOWN OF WAKE FOREST, NORTH CAROLINACOMMERCIAL ACTIVITYLAST TEN FISCAL YEARS
Commercial Residential TotalFiscalYear Number Value Number Value Number Value
2009 31 36,982,166$ 153 28,544,355$ 184 65,526,521$
2010 59 26,595,248 316 57,137,983 375 83,733,231
2011 47 6,122,922 415 68,864,397 462 74,987,319
2012 67 10,282,212 585 70,591,023 652 80,873,235
2013 94 27,164,939 501 100,873,993 595 128,038,932
2014 89 29,873,213 419 74,795,239 508 104,668,452
2015 102 33,338,472 561 102,480,602 663 135,819,074
2016 99 36,132,937 537 88,031,763 636 124,164,700
2017 105 32,799,902 835 128,088,592 940 160,888,494
2018 122 79,275,153 1,066 160,171,714 1,188 239,446,867
(1) Compiled by the Town of Wake Forest Planning and Inspections Department
June 30, 2018
141
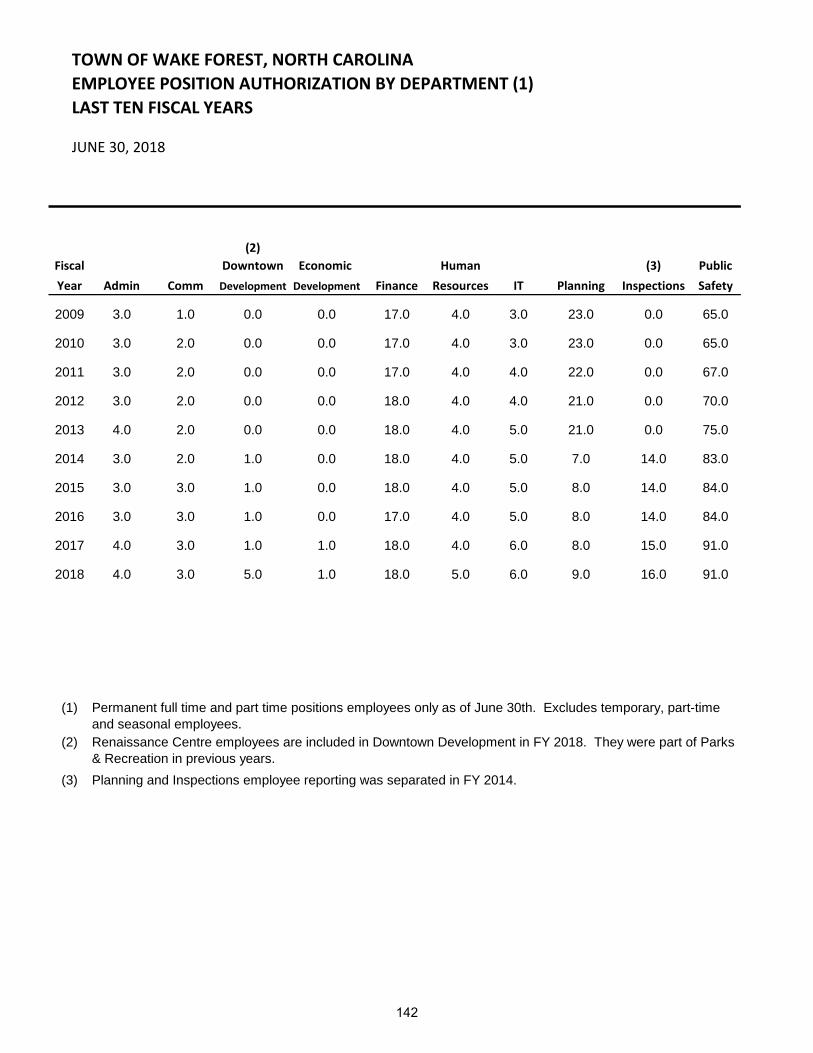
TOWN OF WAKE FOREST, NORTH CAROLINA
EMPLOYEE POSITION AUTHORIZATION BY DEPARTMENT (1)
LAST TEN FISCAL YEARS
JUNE 30, 2018
(2)
Fiscal Downtown Economic Human (3) Public
Year Admin Comm Development Development Finance Resources IT Planning Inspections Safety
2009 3.0 1.0 0.0 0.0 17.0 4.0 3.0 23.0 0.0 65.0
2010 3.0 2.0 0.0 0.0 17.0 4.0 3.0 23.0 0.0 65.0
2011 3.0 2.0 0.0 0.0 17.0 4.0 4.0 22.0 0.0 67.0
2012 3.0 2.0 0.0 0.0 18.0 4.0 4.0 21.0 0.0 70.0
2013 4.0 2.0 0.0 0.0 18.0 4.0 5.0 21.0 0.0 75.0
2014 3.0 2.0 1.0 0.0 18.0 4.0 5.0 7.0 14.0 83.0
2015 3.0 3.0 1.0 0.0 18.0 4.0 5.0 8.0 14.0 84.0
2016 3.0 3.0 1.0 0.0 17.0 4.0 5.0 8.0 14.0 84.0
2017 4.0 3.0 1.0 1.0 18.0 4.0 6.0 8.0 15.0 91.0
2018 4.0 3.0 5.0 1.0 18.0 5.0 6.0 9.0 16.0 91.0
(1)
(2)
(3) Planning and Inspections employee reporting was separated in FY 2014.
Permanent full time and part time positions employees only as of June 30th. Excludes temporary, part-time and seasonal employees. Renaissance Centre employees are included in Downtown Development in FY 2018. They were part of Parks & Recreation in previous years.
142
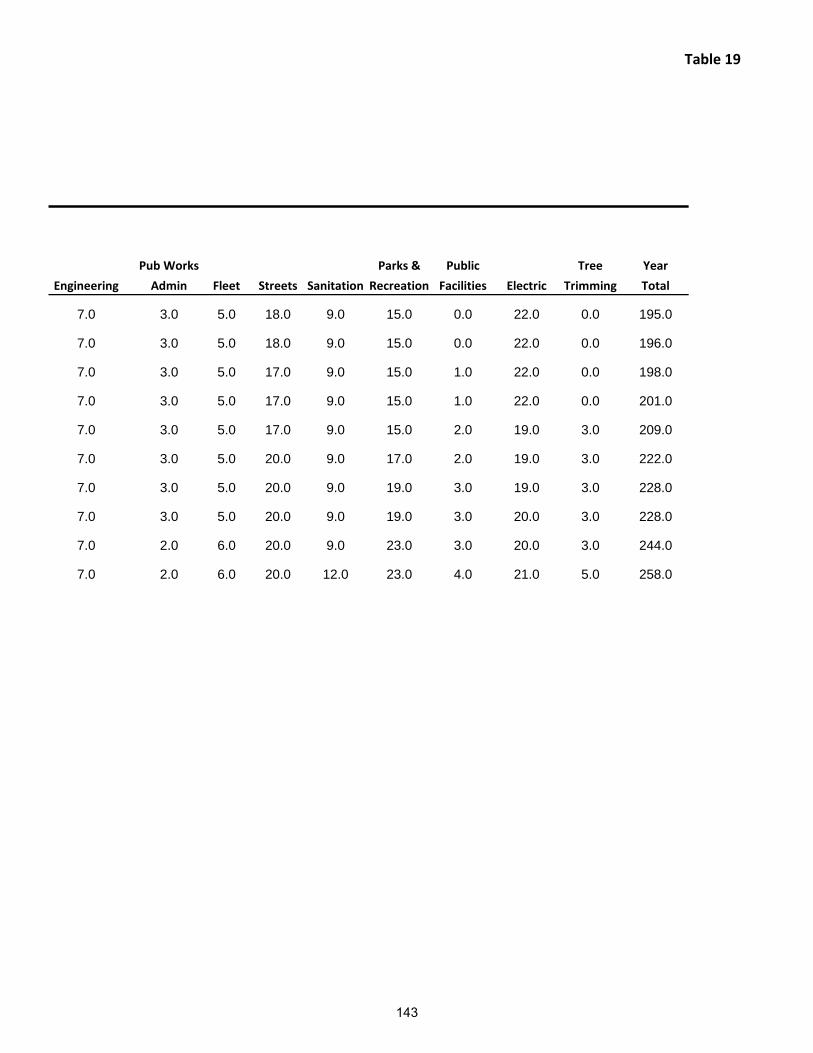
Table 19
Pub Works Parks & Public Tree Year
Engineering Admin Fleet Streets Sanitation Recreation Facilities Electric Trimming Total
7.0 3.0 5.0 18.0 9.0 15.0 0.0 22.0 0.0 195.0
7.0 3.0 5.0 18.0 9.0 15.0 0.0 22.0 0.0 196.0
7.0 3.0 5.0 17.0 9.0 15.0 1.0 22.0 0.0 198.0
7.0 3.0 5.0 17.0 9.0 15.0 1.0 22.0 0.0 201.0
7.0 3.0 5.0 17.0 9.0 15.0 2.0 19.0 3.0 209.0
7.0 3.0 5.0 20.0 9.0 17.0 2.0 19.0 3.0 222.0
7.0 3.0 5.0 20.0 9.0 19.0 3.0 19.0 3.0 228.0
7.0 3.0 5.0 20.0 9.0 19.0 3.0 20.0 3.0 228.0
7.0 2.0 6.0 20.0 9.0 23.0 3.0 20.0 3.0 244.0
7.0 2.0 6.0 20.0 12.0 23.0 4.0 21.0 5.0 258.0
143
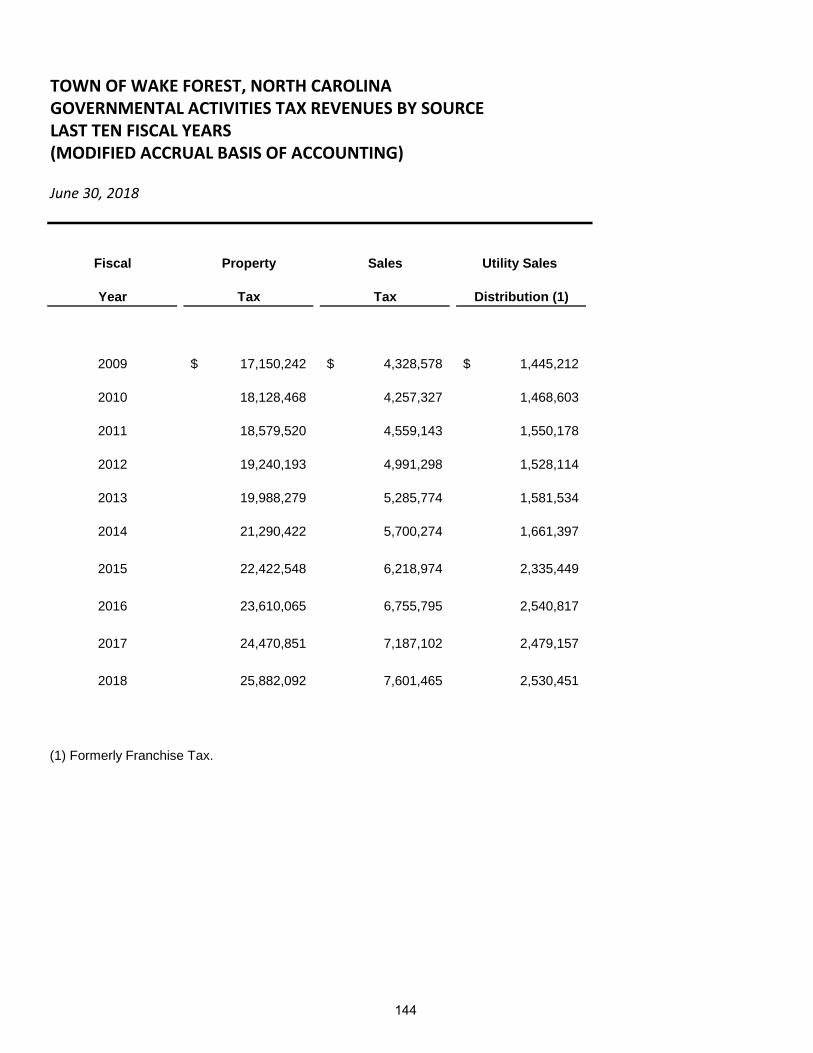
TOWN OF WAKE FOREST, NORTH CAROLINA
LAST TEN FISCAL YEARS(MODIFIED ACCRUAL BASIS OF ACCOUNTING)
June 30, 2018
Fiscal Property Sales Utility Sales
Year Tax Tax Distribution (1)
2009 17,150,242$ 4,328,578$ 1,445,212$
2010 18,128,468 4,257,327 1,468,603
2011 18,579,520 4,559,143 1,550,178
2012 19,240,193 4,991,298 1,528,114
2013 19,988,279 5,285,774 1,581,534
2014 21,290,422 5,700,274 1,661,397
2015 22,422,548 6,218,974 2,335,449
2016 23,610,065 6,755,795 2,540,817
2017 24,470,851 7,187,102 2,479,157
2018 25,882,092 7,601,465 2,530,451
(1) Formerly Franchise Tax.
GOVERNMENTAL ACTIVITIES TAX REVENUES BY SOURCE
144
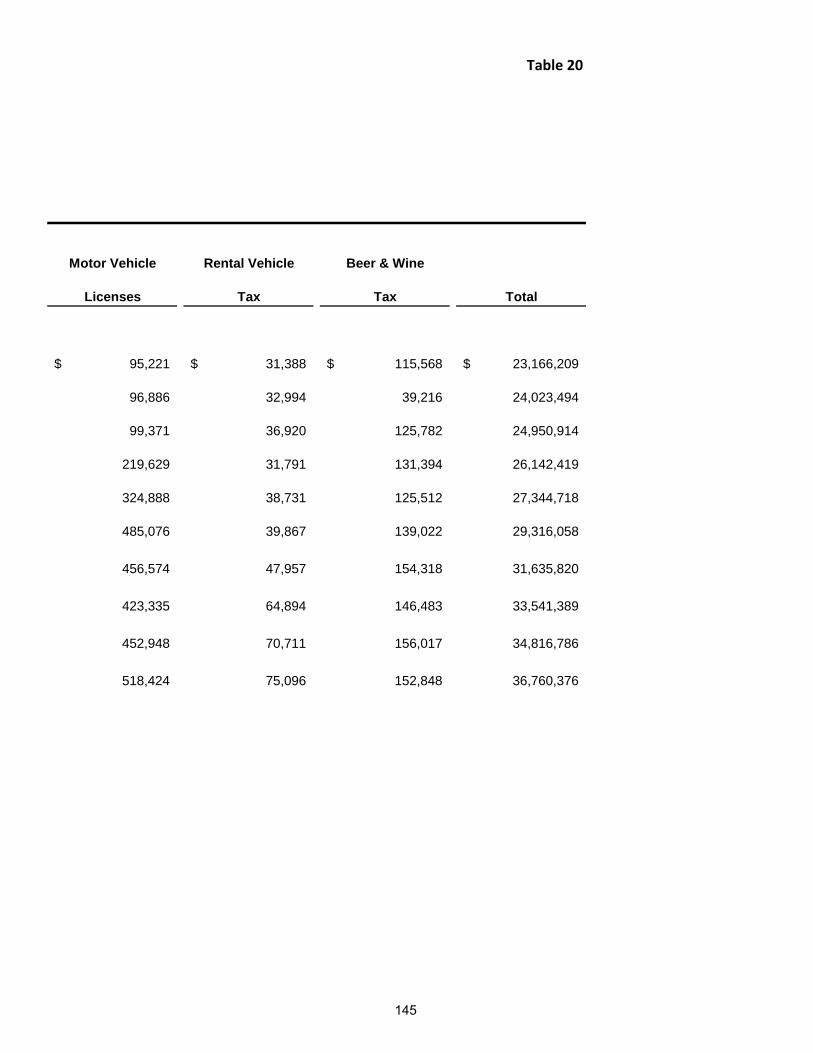
Table 20
Motor Vehicle Rental Vehicle Beer & Wine
Licenses Tax Tax Total
95,221$ 31,388$ 115,568$ 23,166,209$
96,886 32,994 39,216 24,023,494
99,371 36,920 125,782 24,950,914
219,629 31,791 131,394 26,142,419
324,888 38,731 125,512 27,344,718
485,076 39,867 139,022 29,316,058
456,574 47,957 154,318 31,635,820
423,335 64,894 146,483 33,541,389
452,948 70,711 156,017 34,816,786
518,424 75,096 152,848 36,760,376
145
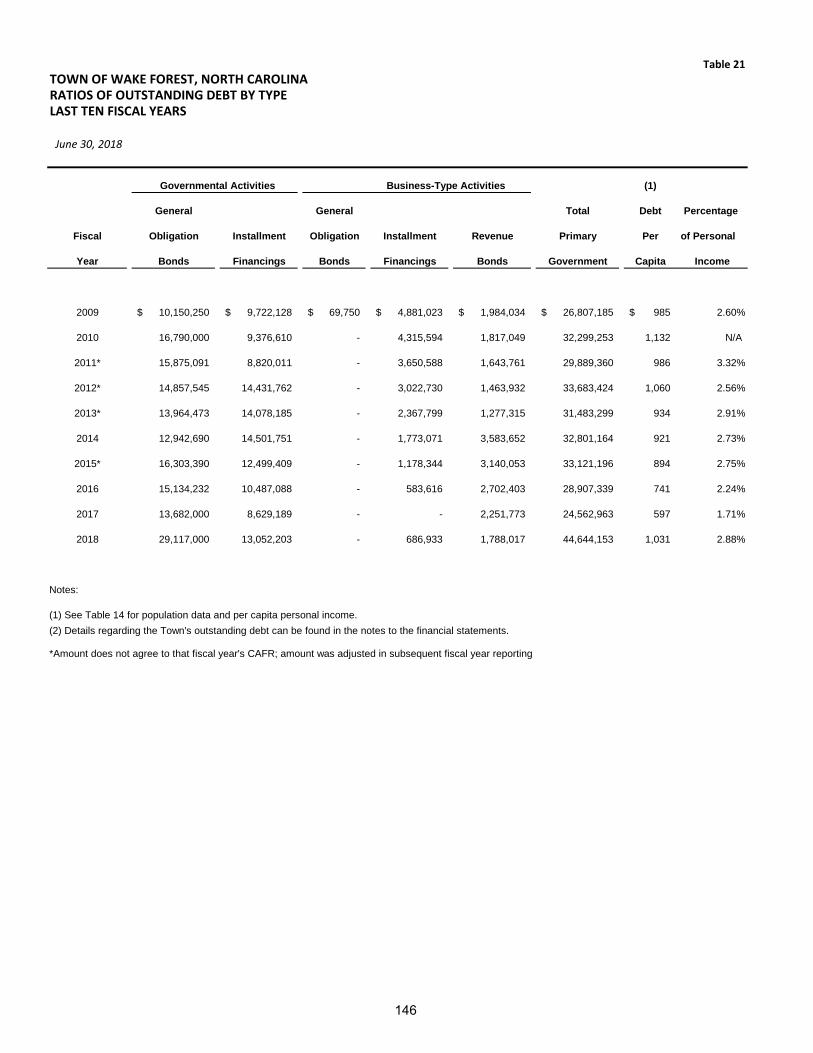
Table 21TOWN OF WAKE FOREST, NORTH CAROLINARATIOS OF OUTSTANDING DEBT BY TYPELAST TEN FISCAL YEARS
June 30, 2018
Governmental Activities (1)
General General Total Debt Percentage
Fiscal Obligation Installment Obligation Installment Revenue Primary Per of Personal
Year Bonds Financings Bonds Financings Bonds Government Capita Income
2009 10,150,250$ 9,722,128$ 69,750$ 4,881,023$ 1,984,034$ 26,807,185$ 985$ 2.60%
2010 16,790,000 9,376,610 - 4,315,594 1,817,049 32,299,253 1,132 N/A
2011* 15,875,091 8,820,011 - 3,650,588 1,643,761 29,889,360 986 3.32%
2012* 14,857,545 14,431,762 - 3,022,730 1,463,932 33,683,424 1,060 2.56%
2013* 13,964,473 14,078,185 - 2,367,799 1,277,315 31,483,299 934 2.91%
2014 12,942,690 14,501,751 - 1,773,071 3,583,652 32,801,164 921 2.73%
2015* 16,303,390 12,499,409 - 1,178,344 3,140,053 33,121,196 894 2.75%
2016 15,134,232 10,487,088 - 583,616 2,702,403 28,907,339 741 2.24%
2017 13,682,000 8,629,189 - - 2,251,773 24,562,963 597 1.71%
2018 29,117,000 13,052,203 - 686,933 1,788,017 44,644,153 1,031 2.88%
Notes:
(2) Details regarding the Town's outstanding debt can be found in the notes to the financial statements.
Business-Type Activities
(1) See Table 14 for population data and per capita personal income.
*Amount does not agree to that fiscal year's CAFR; amount was adjusted in subsequent fiscal year reporting
146
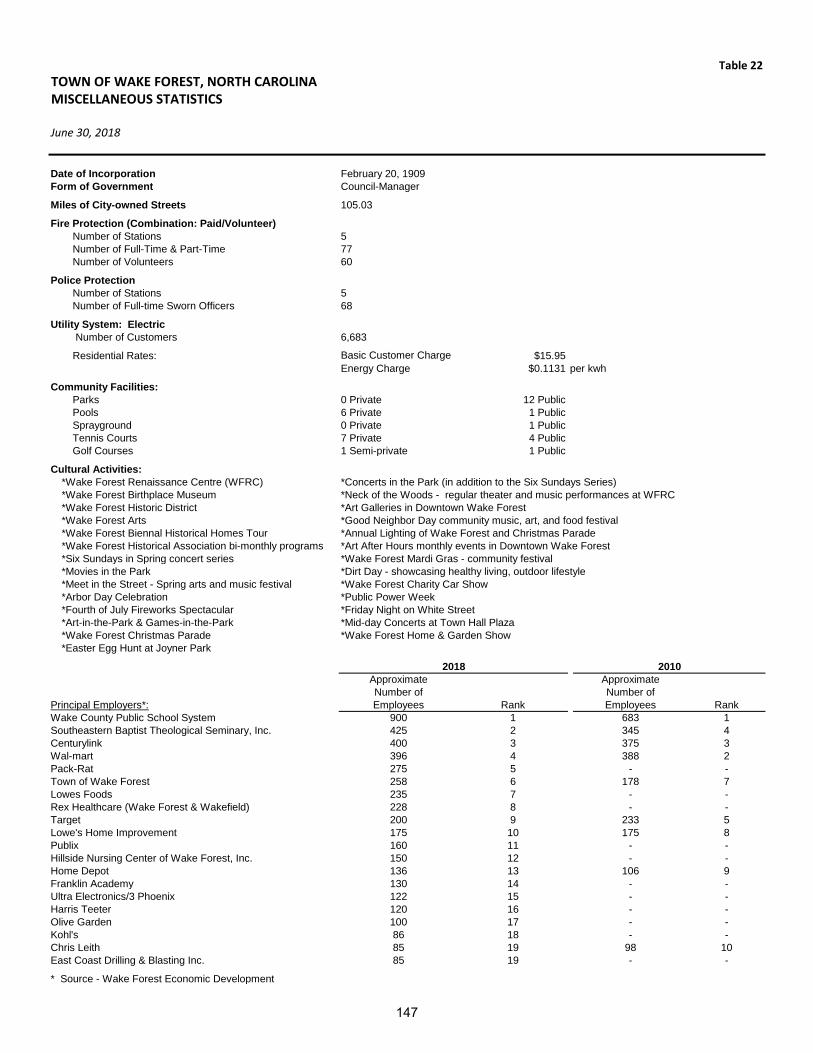
Table 22
TOWN OF WAKE FOREST, NORTH CAROLINAMISCELLANEOUS STATISTICS
June 30, 2018
Date of Incorporation February 20, 1909Form of Government Council-Manager
Miles of City-owned Streets 105.03
Fire Protection (Combination: Paid/Volunteer)Number of Stations 5Number of Full-Time & Part-Time 77Number of Volunteers 60
Police ProtectionNumber of Stations 5Number of Full-time Sworn Officers 68
Utility System: Electric Number of Customers 6,683
Residential Rates: Basic Customer Charge $15.95Energy Charge $0.1131 per kwh
Community Facilities:Parks 0 Private 12 PublicPools 6 Private 1 PublicSprayground 0 Private 1 PublicTennis Courts 7 Private 4 PublicGolf Courses 1 Semi-private 1 Public
Cultural Activities:*Wake Forest Renaissance Centre (WFRC)*Wake Forest Birthplace Museum*Wake Forest Historic District*Wake Forest Arts*Wake Forest Biennal Historical Homes Tour*Wake Forest Historical Association bi-monthly programs*Six Sundays in Spring concert series*Movies in the Park*Meet in the Street - Spring arts and music festival*Arbor Day Celebration *Public Power Week*Fourth of July Fireworks Spectacular *Friday Night on White Street *Art-in-the-Park & Games-in-the-Park *Mid-day Concerts at Town Hall Plaza*Wake Forest Christmas Parade *Wake Forest Home & Garden Show*Easter Egg Hunt at Joyner Park
Approximate ApproximateNumber of Number of
Principal Employers*: Employees Rank Employees RankWake County Public School System 900 1 683 1Southeastern Baptist Theological Seminary, Inc. 425 2 345 4Centurylink 400 3 375 3Wal-mart 396 4 388 2Pack-Rat 275 5 - -Town of Wake Forest 258 6 178 7Lowes Foods 235 7 - -Rex Healthcare (Wake Forest & Wakefield) 228 8 - -Target 200 9 233 5Lowe's Home Improvement 175 10 175 8Publix 160 11 - -Hillside Nursing Center of Wake Forest, Inc. 150 12 - -Home Depot 136 13 106 9Franklin Academy 130 14 - -Ultra Electronics/3 Phoenix 122 15 - -Harris Teeter 120 16 - -Olive Garden 100 17 - -Kohl's 86 18 - -Chris Leith 85 19 98 10East Coast Drilling & Blasting Inc. 85 19 - -
* Source - Wake Forest Economic Development
2018 2010
*Concerts in the Park (in addition to the Six Sundays Series)*Neck of the Woods - regular theater and music performances at WFRC*Art Galleries in Downtown Wake Forest*Good Neighbor Day community music, art, and food festival*Annual Lighting of Wake Forest and Christmas Parade*Art After Hours monthly events in Downtown Wake Forest*Wake Forest Mardi Gras - community festival*Dirt Day - showcasing healthy living, outdoor lifestyle*Wake Forest Charity Car Show
147

148
Report of Independent Auditor on Internal Control over Financial Reporting and on Compliance and Other Matters Based on an Audit of Financial Statements
Performed in Accordance with Government Auditing Standards To the Honorable Mayor Members of the Board of Commissioners Town of Wake Forest, North Carolina We have audited, in accordance with the auditing standards generally accepted in the United States of America and the standards applicable to financial audits contained in Government Auditing Standards issued by the Comptroller General of the United States, the financial statements of the governmental activities, the business-type activities, each major fund, and the aggregate remaining fund information of the Town of Wake Forest, North Carolina (the “Town”), as of and for the year ended June 30, 2018, and the related notes to the financial statements, which collectively comprise the Town’s basic financial statements, and have issued our report thereon dated October 25, 2018. Internal Control over Financial Reporting In planning and performing our audit of the basic financial statements, we considered the Town’s internal control over financial reporting (“internal control”) to determine the audit procedures that are appropriate in the circumstances for the purpose of expressing our opinions on the financial statements, but not for the purpose of expressing an opinion on the effectiveness of the Town’s internal control. Accordingly, we do not express an opinion on the effectiveness of the Town’s internal control. A deficiency in internal control exists when the design or operation of a control does not allow management or employees, in the normal course of performing their assigned functions, to prevent, or detect and correct, misstatements on a timely basis. A material weakness is a deficiency, or a combination of deficiencies, in internal control, such that there is a reasonable possibility that a material misstatement of the Town’s financial statements will not be prevented, or detected and corrected, on a timely basis. A significant deficiency is a deficiency, or a combination of deficiencies, in internal control that is less severe than a material weakness, yet important enough to merit attention by those charged with governance. Our consideration of internal control was for the limited purpose described in the first paragraph of this section and was not designed to identify all deficiencies in internal control that might be material weaknesses or significant deficiencies. Given these limitations, during our audit we did not identify any deficiencies in internal control that we consider to be material weaknesses. However, material weaknesses may exist that have not been identified. Compliance and Other Matters As part of obtaining reasonable assurance about whether the Town’s basic financial statements are free from material misstatement, we performed tests of its compliance with certain provisions of laws, regulations, contracts, and grant agreements, noncompliance with which could have a direct and material effect on the determination of financial statement amounts. However, providing an opinion on compliance with those provisions was not an objective of our audit and, accordingly, we do not express such an opinion. The results of our tests disclosed no instances of noncompliance or other matters that are required to be reported under Government Auditing Standards.
149
Purpose of this Report The purpose of this report is solely to describe the scope of our testing of internal control and compliance and the results of that testing, and not to provide an opinion on the effectiveness of the Town’s internal control or on compliance. This report is an integral part of an audit performed in accordance with Government Auditing Standards in considering the Town’s internal control and compliance. Accordingly, this communication is not suitable for any other purpose.
Raleigh, North Carolina October 25, 2018
150
Report of Independent Auditor on Compliance with Requirements Applicable for Each Major Federal Program and on Internal Control over Compliance in Accordance with OMB Uniform
Guidance and the State Single Audit Implementation Act To the Honorable Mayor Members of the Board of Commissioners Town of Wake Forest, North Carolina Report on Compliance for Each Major Federal Program We have audited the Town of Wake Forest, North Carolina’s (the “Town”) compliance with the types of compliance requirements described in the OMB Compliance Supplement and the Audit Manual for Governmental Auditors in North Carolina, issued by the Local Government Commission, that could have a direct and material effect on each of the Town’s major federal programs for the year ended June 30, 2018. The Town’s major federal programs are identified in the summary of auditor’s results section of the accompanying schedule of findings and questioned costs. Management’s Responsibility Management is responsible for compliance with the requirements of laws, regulations, contracts, and grants applicable to its federal programs. Auditor’s Responsibility Our responsibility is to express an opinion on compliance for each of the Town’s major federal programs based on our audit of the types of compliance requirements referred to above. We conducted our audit of compliance in accordance with auditing standards generally accepted in the United States of America; the standards applicable to financial audits contained in Government Auditing Standards, issued by the Comptroller General of the United States; and the audit requirements of Title 2 U.S. Code of Federal Regulations (CFR) Part 200, Uniform Administrative Requirements, Cost Principles, and Audit Requirements for Federal Awards (“Uniform Guidance”) and the State Single Audit Implementation Act. Those standards, the Uniform Guidance, and the State Single Audit Implementation Act require that we plan and perform the audit to obtain reasonable assurance about whether noncompliance with the types of compliance requirements referred to above that could have a direct and material effect on a major federal program occurred. An audit includes examining, on a test basis, evidence about the Town’s compliance with those requirements and performing such other procedures, as we considered necessary in the circumstances. We believe that our audit provides a reasonable basis for our opinion on compliance for each major federal program. However, our audit does not provide a legal determination of the Town’s compliance. Opinion on Each Major Federal Program In our opinion, the Town complied, in all material respects, with the types of compliance requirements referred to above that could have a direct and material effect on each of its major federal programs for the year ended June 30, 2018.
151
Report on Internal Control over Compliance Management of the Town is responsible for establishing and maintaining effective internal control over compliance with the types of compliance requirements referred to above. In planning and performing our audit of compliance, we considered the Town’s internal control over compliance with the types of requirements that could have a direct and material effect on a major federal program to determine the auditing procedures that are appropriate in the circumstances for the purpose of expressing our opinion on compliance for each major federal program and to test and report on internal control over compliance in accordance with the Uniform Guidance, but not for the purpose of expressing an opinion on the effectiveness of internal control over compliance. Accordingly, we do not express an opinion on the effectiveness of the Town’s internal control over compliance. A deficiency in internal control over compliance exists when the design or operation of a control over compliance does not allow management or employees, in the normal course of performing their assigned functions, to prevent, or detect and correct, noncompliance with a type of compliance requirement of a federal program on a timely basis. A material weakness in internal control over compliance is a deficiency, or a combination of deficiencies, in internal control over compliance, such that there is a reasonable possibility that material noncompliance with a type of compliance requirement of a federal program will not be prevented, or detected and corrected, on a timely basis. A significant deficiency in internal control over compliance is a deficiency, or combination of deficiencies, in internal control over compliance with a type of compliance requirement of a federal program that is less severe than a material weakness in internal control over compliance, yet important enough to merit attention by those charged with governance. Our consideration of internal control over compliance was for the limited purpose described in the first paragraph of this section and was not designed to identify all deficiencies in internal control over compliance that might be significant deficiencies or material weaknesses. We did not identify any deficiencies in internal control over compliance that we consider to be material weaknesses. However, material weaknesses may exist that have not been identified. Purpose of this Report The purpose of this report on internal control over compliance is solely to describe the scope of our testing of internal control over compliance and the results of that testing based on the requirements of the Uniform Guidance. Accordingly, this report is not suitable for any other purpose.
Raleigh, North Carolina October 25, 2018
152
Report of Independent Auditor on Compliance with Requirements Applicable for Each Major State Program and on Internal Control over Compliance in Accordance with
the Uniform Guidance and the State Single Audit Implementation Act To the Honorable Mayor Members of the Board of Commissioners Town of Wake Forest, North Carolina Report on Compliance for Each Major State Program We have audited the Town of Wake Forest, North Carolina’s (the “Town”) compliance with the types of compliance requirements described in the Audit Manual for Governmental Auditors in North Carolina, issued by the Local Government Commission that could have a direct and material effect on the Town’s major state program for the year ended June 30, 2018. The Town’s major state program is identified in the summary of auditor’s results section of the accompanying schedule of findings and questioned costs. Management’s Responsibility Management is responsible for compliance with the requirements of laws, regulations, contracts, and grants applicable to its state program. Auditor’s Responsibility Our responsibility is to express an opinion on compliance for the Town’s major state program based on our audit of the types of compliance requirements referred to above. We conducted our audit of compliance in accordance with auditing standards generally accepted in the United States of America; the standards applicable to financial audits contained in Government Auditing Standards, issued by the Comptroller General of the United States; and applicable sections of Title 2 U.S. Code of Federal Regulations (CFR) Part 200, Uniform Administrative Requirements, Cost Principles, and Audit Requirements for Federal Awards (“Uniform Guidance”) as described in the audit manual for Governmental Audits in North Carolina, and the State Single Audit Implementation Act. Those standards, the Uniform Guidance, and the State Single Audit Implementation Act require that we plan and perform the audit to obtain reasonable assurance about whether noncompliance with the types of compliance requirements referred to above that could have a direct and material effect on a major state program occurred. An audit includes examining, on a test basis, evidence about the Town’s compliance with those requirements and performing such other procedures as we considered necessary in the circumstances. We believe that our audit provides a reasonable basis for our opinion on compliance for the major state program. However, our audit does not provide a legal determination of the Town’s compliance. Opinion on Each Major State Program In our opinion, the Town complied, in all material respects, with the types of compliance requirements referred to above that could have a direct and material effect on its major state program for the year ended June 30, 2018.
153
Report on Internal Control over Compliance Management of the Town is responsible for establishing and maintaining effective internal control over compliance with the types of compliance requirements referred to above. In planning and performing our audit of compliance, we considered the Town’s internal control over compliance with the types of requirements that could have a direct and material effect on the major state program to determine the auditing procedures that are appropriate in the circumstances for the purpose of expressing an opinion on compliance for the major state program and to test and report on internal control over compliance in accordance with the Uniform Guidance, but not for the purpose of expressing an opinion on the effectiveness of internal control over compliance. Accordingly, we do not express an opinion on the effectiveness of the Town’s internal control over compliance. A deficiency in internal control over compliance exists when the design or operation of a control over compliance does not allow management or employees, in the normal course of performing their assigned functions, to prevent, or detect and correct, noncompliance with a type of compliance requirement of a state program on a timely basis. A material weakness in internal control over compliance is a deficiency, or combination of deficiencies, in internal control over compliance, such that there is a reasonable possibility that material noncompliance with a type of compliance requirement of a state program will not be prevented, or detected and corrected, on a timely basis. A significant deficiency in internal control over compliance is a deficiency, or a combination of deficiencies, in internal control over compliance with a type of compliance requirement of a state program that is less severe than a material weakness in internal control over compliance, yet important enough to merit attention by those charged with governance. Our consideration of internal control over compliance was for the limited purpose described in the first paragraph of this section and was not designed to identify all deficiencies in internal control over compliance that might be material weaknesses or significant deficiencies. We did not identify any deficiencies in internal control over compliance that we consider to be material weaknesses. However, material weaknesses may exist that have not been identified. Purpose of this Report The purpose of this report on internal control over compliance is solely to describe the scope of our testing of internal control over compliance and the results of that testing based on the requirements of Uniform Guidance. Accordingly, this report is not suitable for any other purpose.
Raleigh, North Carolina October 25, 2018
154
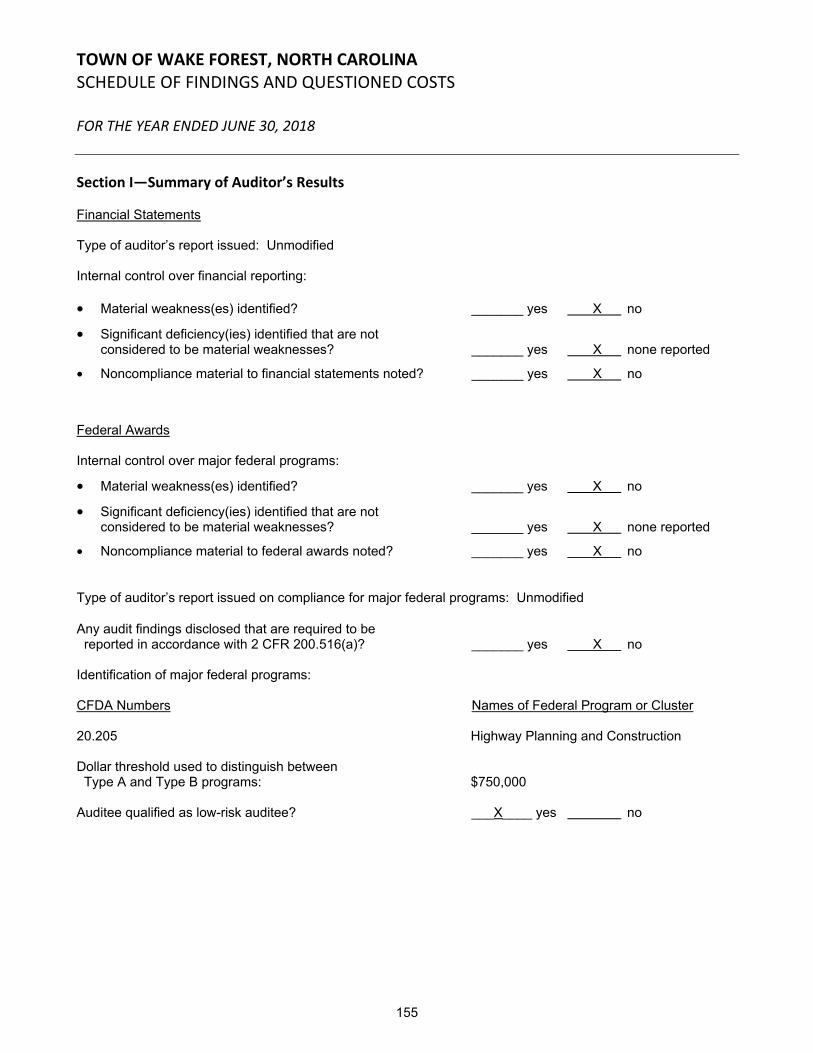
TOWN OF WAKE FOREST, NORTH CAROLINA SCHEDULE OF FINDINGS AND QUESTIONED COSTS FOR THE YEAR ENDED JUNE 30, 2018
Section I—Summary of Auditor’s Results Financial Statements Type of auditor’s report issued: Unmodified Internal control over financial reporting: • Material weakness(es) identified? _______ yes X no
• Significant deficiency(ies) identified that are not considered to be material weaknesses? _______ yes X none reported
• Noncompliance material to financial statements noted? _______ yes X no
Federal Awards Internal control over major federal programs:
• Material weakness(es) identified? _______ yes X no
• Significant deficiency(ies) identified that are not considered to be material weaknesses? _______ yes X none reported
• Noncompliance material to federal awards noted? _______ yes X no
Type of auditor’s report issued on compliance for major federal programs: Unmodified
Any audit findings disclosed that are required to be reported in accordance with 2 CFR 200.516(a)? _______ yes X no Identification of major federal programs: CFDA Numbers Names of Federal Program or Cluster 20.205 Highway Planning and Construction Dollar threshold used to distinguish between Type A and Type B programs: $750,000 Auditee qualified as low-risk auditee? ___X____ yes no
155
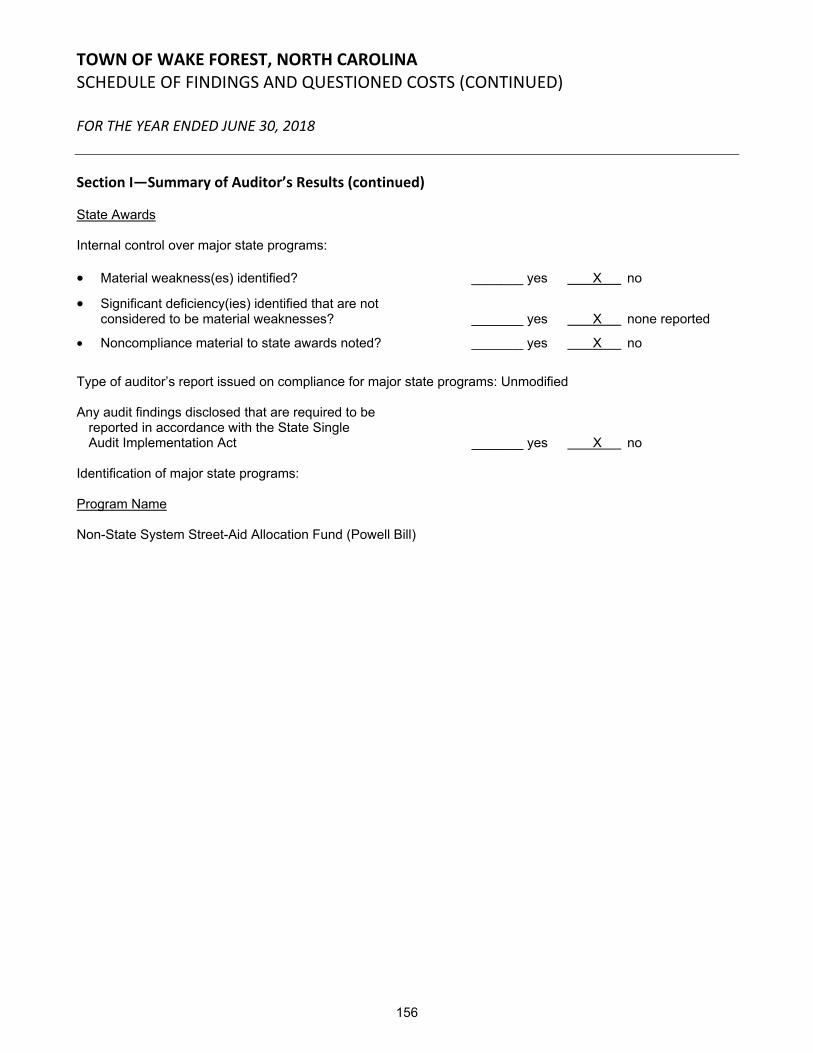
TOWN OF WAKE FOREST, NORTH CAROLINA SCHEDULE OF FINDINGS AND QUESTIONED COSTS (CONTINUED) FOR THE YEAR ENDED JUNE 30, 2018
Section I—Summary of Auditor’s Results (continued) State Awards Internal control over major state programs: • Material weakness(es) identified? _______ yes X no
• Significant deficiency(ies) identified that are not considered to be material weaknesses? _______ yes X none reported
• Noncompliance material to state awards noted? _______ yes X no
Type of auditor’s report issued on compliance for major state programs: Unmodified Any audit findings disclosed that are required to be reported in accordance with the State Single Audit Implementation Act _______ yes X no Identification of major state programs: Program Name Non-State System Street-Aid Allocation Fund (Powell Bill)
156
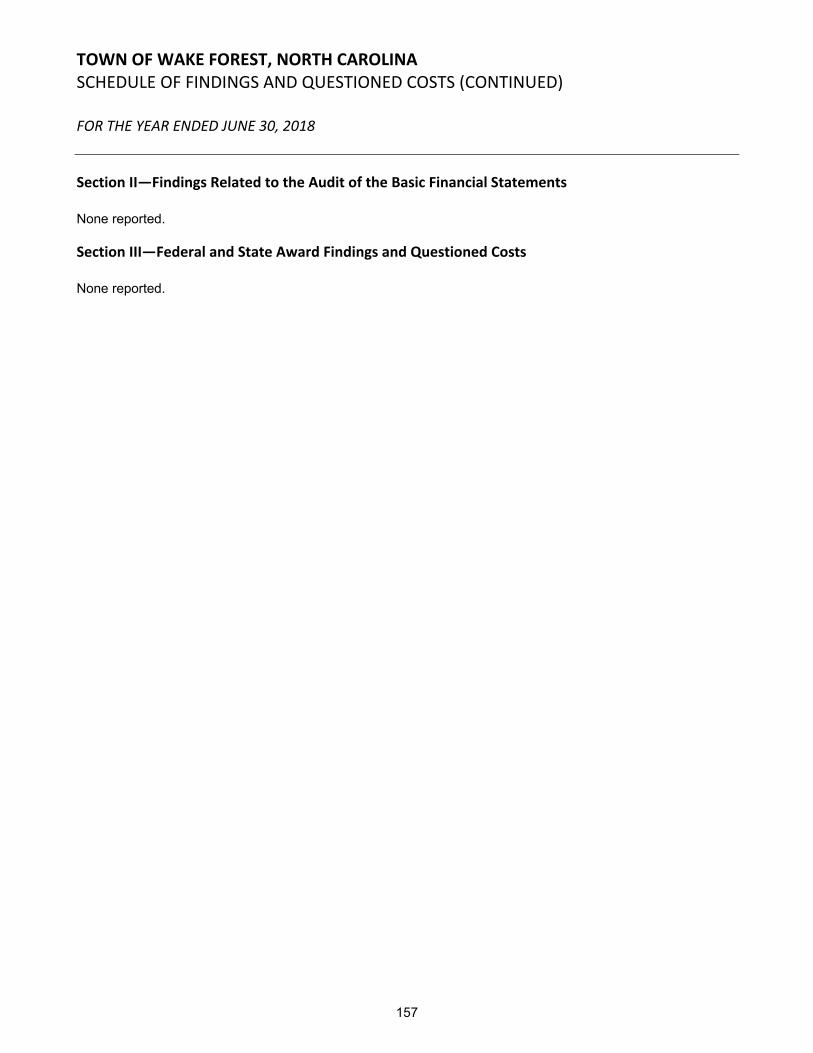
TOWN OF WAKE FOREST, NORTH CAROLINA SCHEDULE OF FINDINGS AND QUESTIONED COSTS (CONTINUED) FOR THE YEAR ENDED JUNE 30, 2018
Section II—Findings Related to the Audit of the Basic Financial Statements None reported. Section III—Federal and State Award Findings and Questioned Costs None reported.
157

TOWN OF WAKE FOREST, NORTH CAROLINA SCHEDULE OF PRIOR YEAR FINDINGS FOR THE YEAR ENDED JUNE 30, 2018
None noted.
158
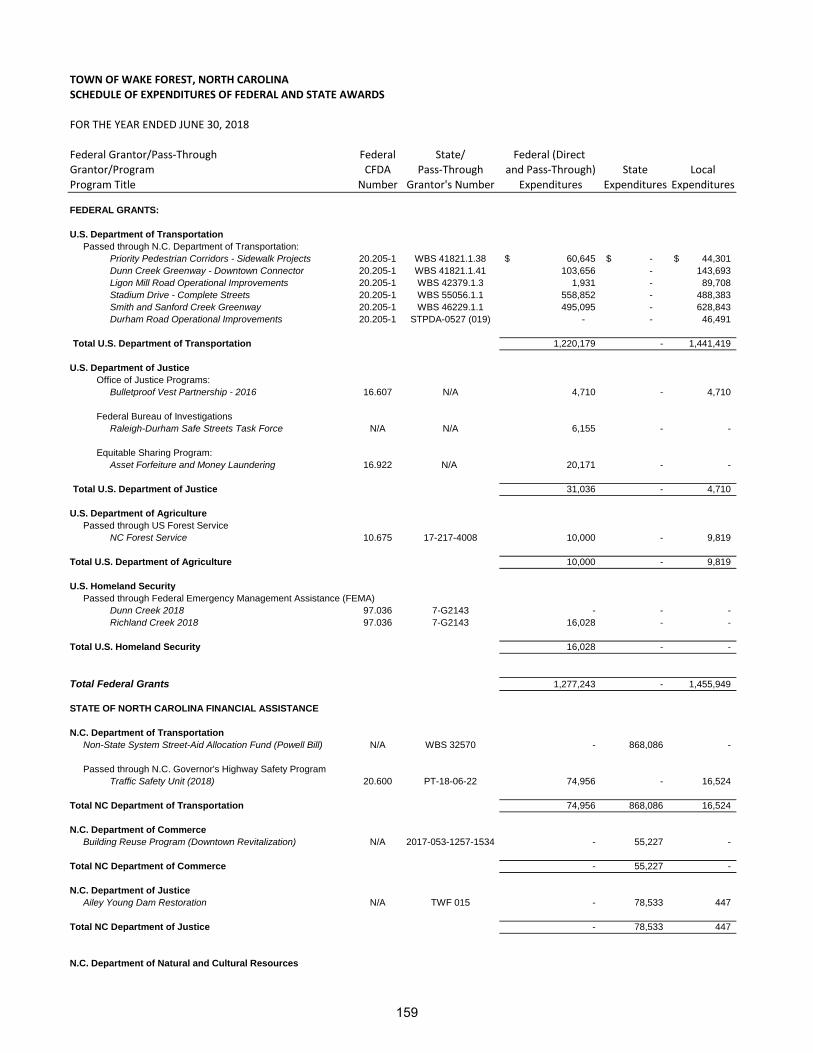
TOWN OF WAKE FOREST, NORTH CAROLINA
SCHEDULE OF EXPENDITURES OF FEDERAL AND STATE AWARDS
FOR THE YEAR ENDED JUNE 30, 2018
Federal Grantor/Pass-Through Federal State/ Federal (Direct
Grantor/Program CFDA Pass-Through and Pass-Through) State Local
Program Title Number Grantor's Number Expenditures Expenditures Expenditures
FEDERAL GRANTS:
U.S. Department of TransportationPassed through N.C. Department of Transportation:
Priority Pedestrian Corridors - Sidewalk Projects 20.205-1 WBS 41821.1.38 60,645$ -$ 44,301$ Dunn Creek Greenway - Downtown Connector 20.205-1 WBS 41821.1.41 103,656 - 143,693 Ligon Mill Road Operational Improvements 20.205-1 WBS 42379.1.3 1,931 - 89,708 Stadium Drive - Complete Streets 20.205-1 WBS 55056.1.1 558,852 - 488,383 Smith and Sanford Creek Greenway 20.205-1 WBS 46229.1.1 495,095 - 628,843 Durham Road Operational Improvements 20.205-1 STPDA-0527 (019) - - 46,491
Total U.S. Department of Transportation 1,220,179 - 1,441,419
U.S. Department of JusticeOffice of Justice Programs:
Bulletproof Vest Partnership - 2016 16.607 N/A 4,710 - 4,710
Federal Bureau of InvestigationsRaleigh-Durham Safe Streets Task Force N/A N/A 6,155 - -
Equitable Sharing Program:Asset Forfeiture and Money Laundering 16.922 N/A 20,171 - -
Total U.S. Department of Justice 31,036 - 4,710
U.S. Department of Agriculture
NC Forest Service 10.675 17-217-4008 10,000 - 9,819
Total U.S. Department of Agriculture 10,000 - 9,819
U.S. Homeland Security
Dunn Creek 2018 97.036 7-G2143 - - - Richland Creek 2018 97.036 7-G2143 16,028 - -
Total U.S. Homeland Security 16,028 - -
Total Federal Grants 1,277,243 - 1,455,949
N.C. Department of Transportation
Non-State System Street-Aid Allocation Fund (Powell Bill) N/A WBS 32570 - 868,086 -
Traffic Safety Unit (2018) 20.600 PT-18-06-22 74,956 - 16,524
Total NC Department of Transportation 74,956 868,086 16,524
N.C. Department of CommerceBuilding Reuse Program (Downtown Revitalization) N/A 2017-053-1257-1534 - 55,227 -
Total NC Department of Commerce - 55,227 -
N.C. Department of JusticeAiley Young Dam Restoration N/A TWF 015 - 78,533 447
Total NC Department of Justice - 78,533 447
N.C. Department of Natural and Cultural Resources
Passed through N.C. Governor's Highway Safety Program
Passed through Federal Emergency Management Assistance (FEMA)
Passed through US Forest Service
STATE OF NORTH CAROLINA FINANCIAL ASSISTANCE
159
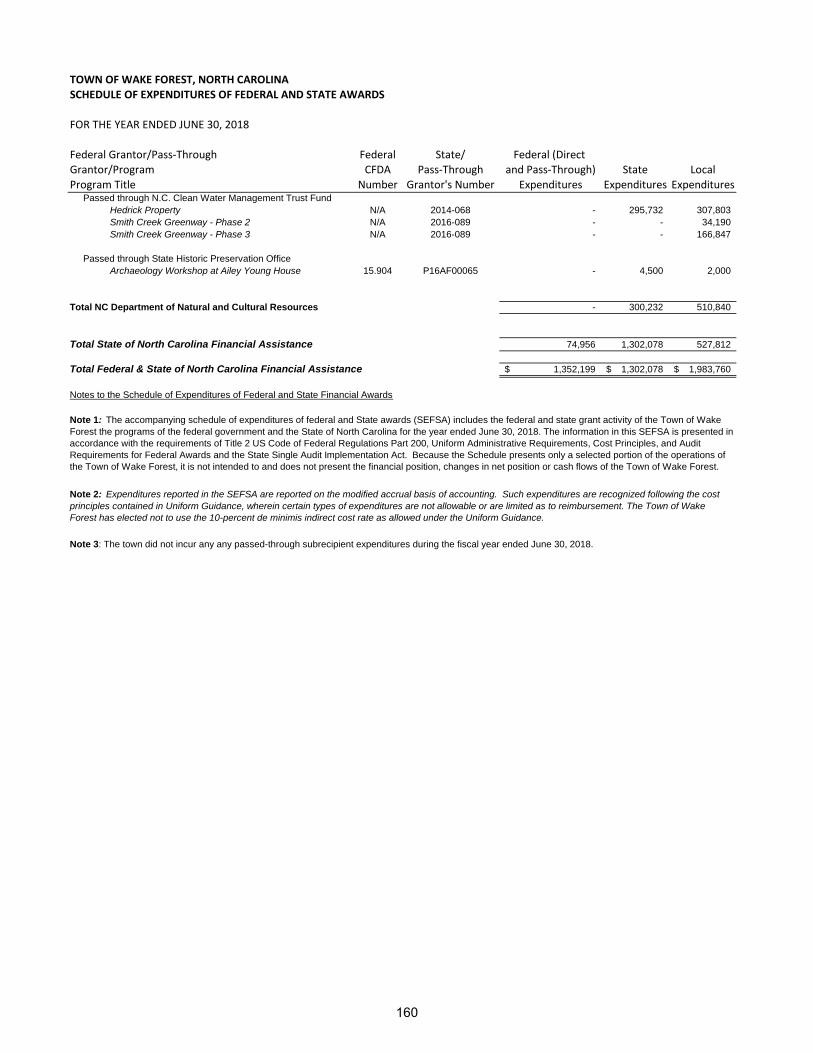
TOWN OF WAKE FOREST, NORTH CAROLINA
SCHEDULE OF EXPENDITURES OF FEDERAL AND STATE AWARDS
FOR THE YEAR ENDED JUNE 30, 2018
Federal Grantor/Pass-Through Federal State/ Federal (Direct
Grantor/Program CFDA Pass-Through and Pass-Through) State Local
Program Title Number Grantor's Number Expenditures Expenditures Expenditures
Hedrick Property N/A 2014-068 - 295,732 307,803 Smith Creek Greenway - Phase 2 N/A 2016-089 - - 34,190 Smith Creek Greenway - Phase 3 N/A 2016-089 - - 166,847
Archaeology Workshop at Ailey Young House 15.904 P16AF00065 - 4,500 2,000
Total NC Department of Natural and Cultural Resources - 300,232 510,840
Total State of North Carolina Financial Assistance 74,956 1,302,078 527,812
1,352,199$ 1,302,078$ 1,983,760$ Total Federal & State of North Carolina Financial Assistance
Notes to the Schedule of Expenditures of Federal and State Financial Awards
Note 1: The accompanying schedule of expenditures of federal and State awards (SEFSA) includes the federal and state grant activity of the Town of Wake Forest the programs of the federal government and the State of North Carolina for the year ended June 30, 2018. The information in this SEFSA is presented in accordance with the requirements of Title 2 US Code of Federal Regulations Part 200, Uniform Administrative Requirements, Cost Principles, and Audit Requirements for Federal Awards and the State Single Audit Implementation Act. Because the Schedule presents only a selected portion of the operations of the Town of Wake Forest, it is not intended to and does not present the financial position, changes in net position or cash flows of the Town of Wake Forest.
Note 2: Expenditures reported in the SEFSA are reported on the modified accrual basis of accounting. Such expenditures are recognized following the cost
principles contained in Uniform Guidance, wherein certain types of expenditures are not allowable or are limited as to reimbursement. The Town of Wake
Forest has elected not to use the 10-percent de minimis indirect cost rate as allowed under the Uniform Guidance.
Note 3: The town did not incur any any passed-through subrecipient expenditures during the fiscal year ended June 30, 2018.
Passed through N.C. Clean Water Management Trust Fund
Passed through State Historic Preservation Office
160
Copyright © 2022 FDOKUMEN