2016 Town Report - Town of Salem, NH
139
-
Upload
khangminh22 -
Category
Documents
-
view
0 -
download
0
Transcript of 2016 Town Report - Town of Salem, NH

ROCKINGHAM PARK 1906-2016
SALEM, NEW HAMPSHIRE ANNUAL REPORT2016

ABOUT THE COVER
Front Cover In 2016 Rockingham Park was sold and after 110 years (1906-2016) of a rich background in
Thoroughbred Racing, the property will soon enter a new phase in its history as it transforms into
the Tuscan Village.
The collage on the front cover is a collection of images from Rockingham Park over the years and
includes Rockingham Speedway in 1925, the Racetrack finish line in 1933, the Rockingham Racer
train, an artist rendering of the Grandstand in 1964, the Rockingham Fair Pennant from 1912,
Jockey Josiah Hampshire crossing the finish line on Knock Out Prospect Thoroughbred Race in
2002, famous Jockeys and track announcers, and the finish line pole taken in 2016, all featured in
this photomosaic by Robert Berthel.
The history of Rockingham Park will forever be remembered in Salem.
Commentary in part written by Robert Berthel
Back Cover Like a mighty Oak growing from a single acorn, the Salem Bike-Ped Corridor, coming from the
mind of a single bicycling enthusiast, has blossomed into reality with the opening of the first 1.2
mile section of trail. Connecting with Windham and Derry trails, the area now boasts over 9 miles
of paved trail.
Supported primarily with NH Department of Transportation funding, the local share of funds was
provided by a commitment from the dedicated members of the Friends of the Salem Bike-Ped
Corridor, without relying on taxpayer funds. Salem residents and businesses, primarily the
banking community, provided nearly a quarter million dollars to make the trail happen.
The next phase, reaching southward to link up with an earlier section, will bring the paved corridor
to the restored Salem Depot building on Main Street. Completion of construction for Phase 2 is
scheduled for mid-2018.
Well done, Salem. Together we have created a major recreational and alternative transportation
asset for generations to come.
Commentary written by Larry Belair
Special thanks to Robert Berthel for his assistance and expertise in designing this cover.

TOWN OF SALEM,
NEW HAMPSHIRE
The Gateway to New Hampshire
ANNUAL REPORT
For the Year 2016

i
Table of Contents
TOWN OFFICIALS .................................................................................................................................. 1
BOARD OF SELECTMEN ...................................................................................................................... 5
TOWN MANAGER .................................................................................................................................. 7
TOWN DEPARTMENTS
Assessing ..................................................................................................................................................... 11
Community Development ........................................................................................................................... 12
Planning Division .............................................................................................................................. 13
Community Services (Recreation and Senior Services Divisions).............................................................. 15
Finance Department .................................................................................................................................... 18
Fire Department ........................................................................................................................................... 19
Fire Prevention, Inspectional Services, Communications, Information Technology Divisions ........ 24
Fire Inspectional Services, Health Officer ......................................................................................... 26
Human Resources ........................................................................................................................................ 27
Human Services ........................................................................................................................................... 28
Municipal Services (Engineering, Public Works, Utilities Divisions) ........................................................ 29
Police Department ....................................................................................................................................... 41
Salem Community Television ..................................................................................................................... 44
Tax Collector ............................................................................................................................................... 45
Town Clerk .................................................................................................................................................. 46
BOARDS, COMMITTEES, AND COMMISSIONS
Budget Committee ...................................................................................................................................... 51
Conservation Commission........................................................................................................................... 52
Council on Aging ........................................................................................................................................ 53
Historic District Commission ...................................................................................................................... 55
Housing Authority ....................................................................................................................................... 56
Kelley Library Board of Trustees ............................................................................................................... 57
Kelley Library Director ............................................................................................................................... 58
Kelley Library Statistics .............................................................................................................................. 59
Museum Committee .................................................................................................................................... 60
Planning Board ............................................................................................................................................ 61

ii
Table of Contents
Supervisors of the Checklist ........................................................................................................................ 62
Trustees of the Trust Funds ......................................................................................................................... 63
Zoning Board of Adjustment ....................................................................................................................... 64
FINANCIAL REPORTS
Town Treasurer’s Report ............................................................................................................................. 67
Kelley Library Treasurer’s Report .............................................................................................................. 68
Independent Auditors’ Report ..................................................................................................................... 69
Balance Sheet (2015 Audited) ..................................................................................................................... 71
Statement of Revenues, Expenditures and Changes in Fund Balances (2015 Audited).............................. 72
Bank Balances by Fund by Account (2016 Unaudited) .............................................................................. 73
Schedule of Changes in Unassigned Fund Balance (2016 Unaudited) ....................................................... 74
Statement of Revenues, Expenditures & Changes in Fund Balances (2016 Unaudited) ............................ 75
Balance Sheet (2016 Unaudited) ................................................................................................................. 76
Statement of Revenue, Expenditures & Changes in Fund Balances – Budget & Actual (2016 Unaudited) 77
Capital Assets (2016 Unaudited) ................................................................................................................. 78
Statement of Town Debt (2016 Unaudited) ............................................................................................... 79
Tax Rate Computation and Assessed Valuation Trends ............................................................................. 80
Tax Rate Computations and Assessed Valuation Trends (5-Year Comparison Graph) .............................. 81
Tax Collector MS-61 Report ....................................................................................................................... 82
Trustees of the Trust Funds MS-9 Report ................................................................................................... 85
Trustees of the Trust Funds MS-10 Report ................................................................................................. 94
OTHER
2016 Town Meeting Results ........................................................................................................................ 99
2017 Town Meeting Warrant ...................................................................................................................... 107
2017 MS-737 (Budget of the Town) ........................................................................................................... 119
2017 Default Budget ................................................................................................................................... 128
Schedule of Town Holidays ........................................................................................................................ 133
Telephone Number Reference ..................................................................................................................... 134

Town Officials
Board of Selectmen 3-year terms
Elected terms expire in March
James S. Keller, Chair 2018
Everett P. McBride, Jr. Vice-Chair 2018
Michael J. Lyons, Secretary 2017
Lisa S. Withrow 2019
Arthur E. Barnes, III 2017
Budget Committee 3-year terms
Elected terms expire in March
Robert Bryant, Chair 2018
Paul Huard, Vice-Chair 2018
Steven Chartrain, Secretary 2019
D.J. Bettencourt 2019
Shannon Bettencourt 2017
Dane Hoover 2018
Thomas Plante 2017
Bernard Campbell, School Board Rep.
Michael Lyons, Selectmen Rep.
Michael Carney, School Board Rep. (Alt.)
Everett P. McBride, Selectmen Rep. (Alt.)
Conservation Commission 3-year terms
Appointed terms expire in April
Linda Harvey, Chair 2017
Stefanie Giallongo, Vice-Chair 2019
Ruth Tanner Isaks 2018
Thomas Campbell 2017
Regina Andler 2018
David Blake 2019
Vacancy, Alternate 2017
Darlene Eden, Alternate 2018
Everett P. McBride, Jr., Selectmen Rep.
Lisa S. Withrow, Selectmen Rep. (Alt.)
Council on Aging 3-year terms
Appointed terms expire in April
Russell Ingram, Chair 2017
Linda Cignoni, Vice-Chair/Treasurer 2018
David Thompson 2019
Robert Dennis 2019
Matthew Ferrara 2019
Paula McGillivray, Secretary 2017
Gary Schmottlach 2018
Lisa S. Withrow, Selectmen Rep.
Historic District Commission 3-year terms Appointed terms expire in April
Beverly Glynn 2017
Kathryn Burke 2019
Patricia Good 2018
Elizabeth Roth 2018
Edward Brooks III 2018
Arthur E. Barnes, Selectmen Rep.
Lisa S. Withrow, Selectmen Rep. (Alt.)
Housing Authority 5-year terms Appointed terms expire in April
Virginia Consoli, Chair 2021
Gwendolyn Brainerd, Vice-Chair 2018
Kenneth Akerley 2020
Frank Grzasko 2019
Georgette Smith 2017
Diane Kierstead, Executive Director
Kelley Library Trustees 3-year terms Elected terms expire in March
Kathleen Norton, Chair 2017
Cindy Jury, Vice-Chair 2018
Martin Isaks 2019
Alison Baker, Library Director
Museum Committee 3-year terms
Appointed terms expire in April
Jeffrey Barraclough, Chair 2018
Kathryn Burke 2019
Beverly Glynn 2017
Patricia Good 2018
Ann Leclair 2018
Dan Zavisza 2019
Arthur E. Barnes, Selectmen Rep.
Lisa S. Withrow, Selectmen Rep. (Alt.)
Planning Board Staggered terms Elected/Appointed terms expire in March
Alternates expire in April
Keith Belair, Chair 2018
Linda Harvey, Vice-Chair 2019
Paul J. Pelletier, Secretary 2018
Edward DeClercq 2019
Ron Belanger 2017
Laurel Redden 2017
Beverly Donovan, Alternate 2019
Robert Donahue, Alternate 2018
Robert Gibbs, Alternate 2017
Christopher Graham, Alternate 2017
James S. Keller, Selectmen Rep.
Lisa S. Withrow, Selectmen Rep.
Recreation Advisory Committee 3-year terms Appointed terms expire in April
Kevin Richard, Secretary 2017
Thomas Woelfel 2017
Richard Murray 2017
Patricia Good 2019
Patrick Hargreaves 2019
James KocZat 2018
Aaron Krukowski 2018
Joseph Sweeney 2018
Glen R. Yergeau 2018
Michael Carney, Jr., School Board Rep.
Everett McBride, Selectmen Rep.
James S. Keller, Selectmen Rep. (Alt.)
1

Town Officials
Supervisors of the Checklist 6-year terms
Elected terms expire in March
Melissa Sorcinelli, Chair 2018
Patricia Frydryck 2020
Sheila Murray 2022
Trustees of the Trust Funds 3-year terms
Elected term expires in March
Tom Linehan 2019
Susan Covey 2018
Russell Frydryck 2017
Zoning Board of Adjustment 3-year terms Elected terms expire in March
Bernard Campbell, Chair 2017
Michael Smith, Vice-Chair 2018
John Manning, Secretary 2018
Robert Uttley 2017
Bonnie Wright 2019
George D. Perry, Alternate 2017
Olga Guza, Alternate 2019
Kellie Annicelli, Alternate 2017
David L. Bruce, Alternate 2018
Thomas R. Raskow, Jr., Alternate 2019
Tax Collector 3- year elected term
Cheryl-Ann Bolouk March 2017
Town Clerk 3-year elected term
Susan Wall March 2017
Moderator 2-year elected term
Christopher Goodnow March 2018
Treasurer 3-year elected term
John Sytek March 2017
NH State Representatives - District 8
Terms End November 2018
Charles W. Morse, State Senator – District 22
Ronald Belanger
John Sytek
Robert Elliot
Fred Doucette
Betty Gay
John Manning
Arthur Barnes III
John Janigian
2

Board of Selectmen
and
Town Manager


BOARD OF SELECTMEN
Seated: Everett P. McBride, Jr., (Vice-Chair), James S. Keller (Chair), Lisa S. Withrow,
Standing: Arthur E. Barnes, III, Michael J. Lyons (Secretary)
I was once again honored to have been chosen as Chairman of the Board of Selectmen this year
and appreciated the Board’s cooperation in approaching our business in a new way.
2016 was a year of change within the ranks of the Board of Selectmen as we welcomed Lisa
Withrow to the Board in March. Unfortunately, that was followed shortly thereafter by a finding
that a member of the Board had violated one of the most sacrosanct laws we have and chose to
release confidential non-public information to the press illegally. After several months of
hearings and nearing a legal trial the Board of Selectmen accepted the member’s resignation. The
Board then conducted an open and public vetting process and selected former Fire Chief and
Selectman Arthur Barnes to the Board to fill the vacant seat. Once we had the Board fully
constituted we got down to business and began formulating our goals and commencing our very
detailed strategic planning discussions. The Board crafted a series of strategic goals that focused
on key areas that include our continued investment in our horizontal infrastructure, building
additional efficiencies and cost cutting solutions associated with delivering services to our
citizens and our town asset review and planning.
As the Board of Selectmen proceeded through our strategic planning sessions we committed to
continue our investment in our highly successful road program. We also emphasized our need to
move forward aggressively with a Sewer Master Plan to ensure that we resolve our infiltration
issues in conjunction with replacing and repairing our aging underground sewer network. In
addition, the Board encouraged our Economic Development Action Committee to proceed with
their efforts to create a plan to remediate and sell the former wastewater treatment plant. For the
first time in recent history, both the Police and Fire Departments were presented five-year
strategic plans to the Board describing each department’s equipment, staffing, technology and
other strategic needs as we move to the close of this decade.
5

BOARD OF SELECTMEN
In addition to our budget and strategic planning the Board and our Town Manager welcomed
additional new members to our Management Team including Finance Director Nicole McGee
and our new Community Development Director Andre Garron. As a result of diligence by both
town staff and the Board of Selectmen, Salem’s fiscal health is excellent and the Board continues
to successfully balance investment with affordability for our citizens and businesses. The
proposed 2017 budget, as recommended by the Budget Committee, reflects our sound and
conservative fiscal approach.
I want to thank both my fellow board members as well as town staff for their dedication, effort
and support over the past year.
Respectfully submitted,
James S. Keller, Chair
6
TOWN MANAGER
I am once again honored to deliver the Town Manager’s report for 2016. It was a busy and
productive year for the Town of Salem! Thanks to the passion and dedication of its employees,
volunteers, elected officials and residents, Salem continues to grow and prosper while remaining
an attractive and affordable community to live, work and play.
Locally, the economy continued to rebound from the doldrums of 2008 and is now showing sings
of new growth above pre-recession levels. The unemployment rate has dropped (3.8% as of
December) and wages begun to steadily increase. Commercial development and redevelopment
remained strong for the third year in a row, driving a surge in permit revenue and increased
demands on the Inspectional Services and Planning Divisions’ resources. Notably, during 2016
we saw plans go from concept to reality for a significant redevelopment of first fifty (50) acres of
the former Rockingham Park, and the same developer presented an exciting and transformative
concept for a mixed-use Tuscan Village on the remaining 120 acres. In addition to this commercial
resurgence, on the residential side we again saw significant growth to meet the rising demand to
live in one of, if not the most, dynamic towns in southern New Hampshire.
Increased assessed valuation from new development along with the Board of Selectmen’s steadfast
commitment to conservative budgeting has allowed Salem to continue to enjoy a stable, affordable
tax rate while addressing infrastructure needs to support growth of the tax base. In 2016 the Board
of Selectmen set an aggressive and ultimately successful agenda to keep Salem moving forward,
and looking toward 2017 it is my expectation that 2017 will be no different.
The proposed 2017 operating budget includes funds to provide the same high-quality services as
past years, with notable improvements to infrastructure planning and maintenance, while affecting
a .92% decrease in the tax rate. The fact that we were able to maintain, and in many cases improve
level of service with an essentially flat tax rate, all while dealing with escalating health care costs
and continued downshifting of costs to municipalities from the state, is a testament to the hard
work, collective experience, and collaborative attitude of Town staff, the Board of Selectmen and
the Budget Committee. Along with the steady tax rate, water and sewer rates will remain
unchanged for the sixth budget year while infrastructure improvements continue to occur
providing more relatability for both systems.
In closing, on behalf of all Town employees I would like to thank you, the residents of this special
community, for your continued support of the critical work that Town employees do. Last but by
no means least, I would be remiss if I didn’t also thank my Executive Assistant, Maureen Witley.
Maureen continues to be an invaluable resource to me, Town residents, and the Board of Selectmen
alike. Please feel free to contact the Town Manager’s Office either by e-mail at
[email protected] or phone at 603-890-2120 if we can be of any assistance to you.
Respectfully submitted,
Leon I. Goodwin III, Town Manager
7

Town
Departments


ASSESSING DEPARTMENT
The Assessor’s office continues to offer assessment data online at www.gis.vgsi.com/salemnh/.
This service has helped reduce traffic to our office while giving the public the opportunity of
doing research on our data base at their convenience.
In 2015 we hired KRT Appraisal to do our statistical update for the 2016 tax year. All properties
needed to be brought back to market value as required by state law. New values were effective
for the second billing in late October. The increase in the assessed value of the town is listed
below.
The major focus of new commercial construction over the next few years will take place at the
race track. This will be the largest project that the town has ever been involved with. This project
is expected to exceed 2.8 million sq. ft. of retail, office and residential development. Residential
sales and new construction remain strong with several new projects in the planning stages.
Our office offers programs for the elderly, blind, disabled and Veterans to help offset their
property tax bills. Homeowners must file by April 15 to receive the exemption or credit for that
tax year. Residents should feel free to call the Assessor’s office or visit our web site
http://www.townofsalemnh.org/assessing for information regarding these programs.
Respectfully submitted,
Normand Pelletier, Chief Assessor
Summary of Inventory
2015 2016
Land
Buildings
Utilities
Total Gross Valuation
Elderly Exemptions
Blind Exemptions
Disabled Exemptions
Total Net Valuation
Taxes before Exemptions
Minus Veterans Exemption
Net Property Tax Commitment
Tax Rate
Total Current Use Acreage
Total Taxable Properties
Total Exempt Properties
$ 1,633,890,072
$ 2,273,047,200
$ 64,238,000
$3 ,971,175,272
$ 21,614,000
$ 630,000
$ 457,500
$ 3,948,473,772
$ 84,301,756
$ 636,000
$ 83,665,756
$21.39
1,575.99
12,125
558
$ 1,687,108,740
$ 2,638,560,600
$ 86,890,200
$ 4,412,559,540
$ 18,770,200
$ 540,000
$ 429,000
$ 4,392,820,340
$ 89,537,652
$ 606,500
$ 88,931,152
$20.43
1577.71
12,109
571
11

COMMUNITY DEVELOPMENT DEPARTMENT
Mission: To provide information, technical expertise and services to the community to plan,
manage, and coordinate the natural, constructed, and economic environment of Salem in order to
provide a better quality of life for its citizens.
Operations: The Community Development Department provides support and managerial
oversight to the Planning Division. Please also review the Planning Division report for a complete
picture of the Community Development Department’s activities and responsibilities. The
Community Development Department staff consists of André Garron, Community Development
Director/Assistant Town Manager and Karri Makinen, Community Development Coordinator.
Projects: The following projects are managed or are assisted by the Community Development
Department and represent efforts to create new opportunities in a manner that minimizes local tax
dollar impact.
Wastewater Treatment Site: The former Wastewater Treatment Facility located on SARL Drive
sits on a 32-acre parcel of Town-owned land, offering a prime opportunity for redevelopment.
Bids were received at the end of 2016 for the demolition of some of the structures currently on the
site. Demolition will begin in early 2017. After the site has been cleared of structures and
remediated, plans will begin for redevelopment, potentially incorporating incentives such as New
Markets Tax Credits and Economic Revitalization Zone (ERZ) programs to maximize the revenues
to the Town from the sale of the property and incentives to develop and expand businesses within
the area.
Depot Intersection Reconstruction Project: This project is for planned transportation
improvements of the Depot Intersection including Broadway (Route 28) and Main Street (Route
97). The work will include traffic signal modifications and approach roadway widening to
improve safety and operations within the intersection. During 2016 work continued on planning
and design of the improvements to keep the project on schedule for construction to begin in 2019.
In 2017 funds are being requested for Salem’s share of the cost to purchase land needed to
construct the proposed intersection improvement.
Salem Bike-Ped Corridor (Rail Trail) Phase I: Following on the heels of prior projects, in 2016
the Town worked with its consultant, Vanasse Hangen Brustlin, Inc. (VHB), to design, engineer
and construct additional improvements to the northernmost 1.62 mile segment of the rail trail (1.18
miles in Salem and .44 miles in Windham), which will greatly enhance bicycle and pedestrian
transportation opportunities and connectivity with existing trails. The design and construction of
these improvements has been funded with a $1,328,649.00 Transportation Enhancements Grant
from NHDOT, with the required 25 percent local match for this project completely funded by
donations from the Friends of the Salem Bike-Ped Corridor and Impact Fees. The Town is grateful
for the Friends’ contribution, which helped achieve the goal that no taxpayer funds be used to
complete this project.
12

COMMUNITY DEVELOPMENT DEPARTMENT
Salem Bike-Ped Corridor (Rail Trail) Phase II: In late 2014 the Community Development
Department completed and submitted a Transportation Alternatives Program (TAP) Grant in the
amount of $408,000.00 to secure additional funding to design and construct approximately 3,000
additional feet of multi-use trail in Salem, stretching from Old Rockingham Road to Willow Street.
After review and ranking, this project was ranked the #2 priority in the state and was awarded the
full amount requested. As with the prior TE Grant, the Friends of Salem Bike-Ped Corridor have
pledged to provide the required 20 percent match so that no taxpayer funds will be used on the
project. The Town of Salem is working with our consultant, CMA Engineers, on the design portion
of this project. Phase II construction is slated to take place during the spring of 2018.
Respectfully submitted,
Andre L. Garron, AICP
Community Development Director/Assistant Town Manager
PLANNING DIVISION
The primary responsibility of the Planning Division is administering the Town’s land use controls,
including subdivision and site plan regulations and the zoning ordinance. This involves reviewing
plans and proposals to make sure they comply with various rules, helping applicants, reviewing
building permit applications, inspecting sites, answering questions from the public, and working
with other Town staff and consultants. We arrange Planning Board, Conservation Commission,
and Zoning Board of Adjustment meetings throughout the year, prepare agendas and information
packets, attend the meetings, and implement their decisions.
Our other major responsibility is long-range planning for the community. This involves updating
and implementing the Town’s Master Plan, adding or amending regulations to control land
development, preparing planning studies, and working on a variety of miscellaneous projects for
the betterment of the Town.
Planning Division highlights for 2016 include:
Coordinated 24 regular Planning Board meetings with 70 agenda items (up from 64 in 2015).
Large projects approved in 2016 include a car dealership on South Broadway, a cell phone
tower on Zion Hill Road, redevelopment of Sal’s Pizza on North Broadway, a new bank on
Main Street, a 27 lot subdivision on Bluff Street and Zion Hill Road, a 60-unit senior housing
project on Lawrence Road, and a 14-unit multi-family building on Sally Sweet’s Way. Prepare
8 amendments to the Zoning Ordinance, including legal notices and warrant/ballot articles and
set up public hearings. Coordinated review of Tuscan Village project (redevelopment of
Rockingham Park).
Coordinated 12 Conservation Commission meetings with 27 agenda items (up from 18 in
2015). Major projects include wetland impacts associated with Town road reconstructions, a
60-unit senior housing project on Lawrence Road, a drive-through coffee shop on No.
Broadway, a 6 lot subdivision on Bluff Street, and the redevelopment of Rockingham Park for
the Tuscan Village project. Assisted with acquisition of 101- acre parcel on Zion Hill Road
and grant applications.
13

COMMUNITY DEVELOPMENT DEPARTMENT
PLANNING DIVISION
Coordinated 14 Zoning Board of Adjustment meetings with 56 agenda items (same as 2015).
Organized training session with Town Attorney. Notable variance applications include 3
charitable gaming facilities, several aspects of the Tuscan Village project, expansion of a
landscaping business on Lawrence Road, and a used car dealership at the former State liquor
store.
Other highlights:
Collected about $600,000 in impact fees for roads, schools, recreation, and public safety.
Assisted Town Attorney with lawsuits. Worked with intern on Master Plan Update. Worked
with Senior Volunteer Jim Rand on archiving old reports and files. Reviewed requests to
purchase Town land. Worked on re-adoption of public safety impact fee.
We urge citizens to participate in planning for Salem’s future by reading the Master Plan and Land
Use Controls, attending meetings or watching them on Cable Channel 23 (meetings can also be
watched at www.sgc23.com), writing letters or email messages, visiting the Planning Office, and
viewing our web page at www.townofsalemnh.org.
Respectfully submitted,
Ross A. Moldoff, AICP, Planning Director
14

COMMUNITY SERVICES DEPARTMENT
RECREATION DIVISION
2016 was a great year for the Recreation Division of Community Services. With the changes in
2015 to Recreation and an addition of a part-time program coordinator, 2016 was the first year
we truly felt what those changes meant. In 2016 we continued to offer many of the programs we
have in the past, but also offered 23 new programs that a couple hundred more people
participated in. Another huge changes was that Recreation moved to the Ingram Senior Center in
September from the Town Hall. This enables the staff to work more efficiently as we are all in
one location.
In 2016 the voters approved adding money into the operating budget for the purpose of buying
an aeration system to circulate the water at Hedgehog Park. An aeration system will move the
water around which will help keep bacteria down and improve the water quality for fish and the
swimmers. Other improvements at Hedgehog included the demolition of one of the original
ramps of the skate-park and addition of a new one. Most people driving by would not notice the
difference, but if you have skated at the park in the last two years, I’m sure you would appreciate
the update. The Palmer School also received an update this summer. The historic building’s
floors were in rough shape and could not be sanded or re-finished as they were. We were able to
replace the flooring with flooring that was similar to the old.
The Recreation Department offered the following programs in 2016: adaptive basketball,
bowling, soccer, and track and field. They also offered archery, the fishing derby, Granite State
Track and Field (formerly Hershey Track and Field), our annual Halloween Party, holiday party,
many theatre trips, 7 sessions of karate, winter coloring contest, CPR/AED, NFL pick’em, old
school PE, the Palmer School program, ski & snowboard program at Pat’s Peak, summer fun
playground program, teen adventure camp, swimming lessons, and tennis lessons.
Some of the new programs offered in 2016 include a logo contest, coloring contest, flag football,
ultimate frisbee, field sports, trip to Laser Craze, assumed the responsibility for managing the
Community Gardens, adult sports, fall tennis lessons, trip to the Flume, deep sea fishing, family
sports, winter dodgeball, arena football, court sports, floor hockey, and many others.
The Recreation Department would be unable to do what it does if it weren’t for the help of its
many volunteers, businesses, and dedicated employees. We would be unable to run the adaptive
sports programs if it weren’t for the coaches and volunteers that help every week. Many
businesses and non-profits also assist the Recreation Department throughout the year with
sponsorships and donations to make programs more affordable including the Greater Salem, NH
Rotary Club that sponsors the Fishing Derby and Enterprise Bank, which sponsors the
Halloween Party. We appreciate their help. We also appreciate the new ideas and energy from
the Recreation Coordinator – Doug Cole. Finally, we need to thank Jeanine Bannon and
everything she does for the department and the community. As anyone knows that signs up for a
program or comes into the department with questions, she greets everyone with a smile. Thank
you.
Respectfully submitted,
Chris Dillon, Community Services Director
15

COMMUNITY SERVICES DEPARTMENT
SENIOR SERVICES DIVISION
Salem Senior Services is located in the Russell & Roberta Ingram Senior Center. The center,
located at 1 Sally Sweet’s Way, is open Monday thru Thursday from 8:30 to 4:30 and Fridays
from 8:30 to 3:30. Any resident 60 years of age or older is able to register to use the center and
all the activities located in the center, the trips run by the department, and satellite programs
around town. Registration is free for Salem residents.
Salem Senior Services kept busy in 2016 with the addition of programs, modifications in the
center itself, changes in responsibilities for staff, and trying to utilize the space at the center as
effectively as possible. Much of these items stem from the evolving change in merging
Recreation and Senior Services into Community Services. The Recreation Staff moved to the
Ingram Senior Center in September and in order to make space for the additional people, we
moved the thrift shop across the foyer, moved additional tables to the Salem room upstairs, and
moved the pool table into the foyer. Although some liked the privacy of having the pool table
upstairs, we have also seen increased usage with this move.
Some of the other changes in 2016 included adding an intercom system with the upstairs circuit,
providing a blood pressure cuff, started recycling throughout the center, new weights in the
exercise room, installed TV’s in various rooms to better communicate to our seniors, started
using the check in system through “myseniorcenter”, replaced our Tai Chi instructor, cleared out
the foyer of older furniture, sold some exercise equipment, and brought in a new massage
therapist and reflexology.
Some of the new programs added in 2016 include: cell phone help, Shaw’s delivery, Spanish
classes, FAD (Family-Anxiety-Downsizing), current events, French classes, sound off with our
Council on Aging members, lunch and learn, pen, paper, puzzle, bocce, afternoon Tai Chi class,
added another day of walking outdoors, sing along, corn hole, building Bones, Tai Ji Quan, Tai
Chi Self Defense, adult coloring, scat, massage, reflexology, and we began displaying our
members talents in a display case and paintings around the center.
On December 31, 2016 we had 2,611 residents and 344 non-residents registered at the center.
We also had 32 outdoor only non-residents registered at the center. Non-residents were required
to pay a $50 non-resident fee to join the center. In total, the center had 2,987 registered members
in 2016. This is just under a 1% increase over 2015. We processed 251 new Salem residents;
315 new registrations in total. 130 of our new members are in their 60’s, 132 are in their 70’s, 50
are in their 80’s, 3 are in their 90’s.
In addition to the amazing staff for Salem Senior Services, 171 volunteers completed just under
12,000 hours of volunteer work. This does not include random acts of kindness which occurs
daily around the center. We would be unable to run the programs, activities, and trips we offer if
it were not for these volunteers.
16

COMMUNITY SERVICES DEPARTMENT
SENIOR SERVICES DIVISION
We appreciate the giving spirit of so many. We also owe our sincere thanks to the Salem
Council on Aging for all their help. Together they raised over $50,000 this year! Please be sure
to also read the Council on Aging’s report elsewhere in this report.
We would like to recognize and thank all of the Salem Firefighters and their families that served
over 200 seniors a wonderful spaghetti lunch on December 12th. Unfortunately, the snow that
morning kept some away; those that attended the event had a great time. We were able to collect
487 lbs. of food and donated $175.00 to the local food pantry. It was truly impressive and
delicious.
I would also like thank Karen Bryant, Wendy Peters, and Hector Rivera for all they do for the
department, seniors, and the center. They are extremely dedicated and do everything they can to
help our seniors.
Last, but certainly not least, we want to thank all of the seniors who have been so gracious and
giving. We greatly appreciate your support and ideas. We look forward to delivering the quality
services and programming our seniors desire and deserve in the coming year.
Respectfully submitted,
Chris Dillon, Community Services Director
17

FINANCE DEPARTMENT
The Finance Department is comprised of many functions that interact with all departments
within the Town of Salem. These functions include accounts payable, accounts receivable,
payroll, purchasing and utility billing. This department manages the expenditures and revenues
of town funds, examines all department bills and payroll for accuracy, legality, and availability
of funds before payment. The Finance Department is responsible for development, preparation,
and control of the Town's budget in conjunction with the Town Manager and the individual
departments throughout the Town. The department is responsible for State reporting and
submission of necessary documents to set the municipal portion of the tax rate. This department
also oversees insurance matters.
It is the mission of the Finance Department to administer the financial resources of the Town in a
fair, accurate and professional manner to meet all areas of fiscal responsibility, including
compliance with federal, state and local laws and generally accepted accounting principles.
The municipal portion of the 2016 tax rate was set at $6.60. The 2016 tax rate was set at $20.43
per thousand. A revaluation occurred in 2016, property values were adjusted which lead to a
decrease in the tax rate.
Over this past year, the Town approved a $1,670,000 bond for water system improvements in the
Exit 2 Area. This bond is through the Drinking Water State Revolving Fund.
In 2016, the Finance Department gained a new payroll coordinator and a new Finance Director.
I am excited to serve as the Town’s new Finance Director. I served in a similar position in a
municipality in Massachusetts.
I would like to thank the employees of the Finance Department for their hard work this year.
They have gone above and beyond to transition me to this new position. Their hard work and
key attention to detail is in invaluable asset to the Town of Salem. They continue to work hard
to protect taxpayers’ assets.
Respectfully submitted,
Nicole McGee, Finance Director
18

FIRE DEPARTMENT
Greetings from the women and men of the Salem Fire Department!
It has been an incredibly busy year for the Salem Fire Department. We have undergone two
reorganizations, set records for the number of emergencies we responded to, and are looking
forward to a terrific future!
Operations Division:
Reorganization of the officer corps
Transitioned Deputy Fire Chief position to Director of EMS
Transitioned Firefighter/Mechanic to civilian mechanic
The Salem Fire Department underwent a major realignment in the beginning of 2016, enabling
our organization to be more effective while also saving money. We converted an existing
Deputy Chief position to a Director of Emergency Medical Services position. This position now
has the sole focus of overseeing the delivery of EMS to the community. This includes the
administrative management of our five ambulances and paramedic intercept vehicle; supplies
and equipment; licensure of the unit and its members; training and continuing education;
controlled substance oversight; quality assurance and control; ambulance billing and revenue;
and being a liaison between our receiving hospitals and the SFD. We also re-titled the Shift
Commander positions from Captain to Battalion Chief. This title is more commensurate with the
roles and responsibilities of a person in charge of leading a shift. Further, we re-titled the Station
Officers to Captains, again in an effort to be more in line with the national fire service model.
Finally, we converted the Firefighter/Mechanic position to a civilian mechanic. This member
now has the ability to focus solely on managing our fleet, rather than having to be a firefighter as
well.
Inspectional Services Division:
February, 2016 – Building and Health Departments merged into the
Fire Department from the Community Development Department
Another change the Fire Department underwent was merging with the Building and Health
Departments, and in doing so created an Inspectional Services Division within the Fire
Department. Fire Marshal Jeffrey Emanuelson was appointed by the Board of Selectmen as the
Chief Building Official, and all of the inspectors and administrative staff now report to Jeff. The
Fire Marshal has spent most of his Fire Department career administering and enforcing codes, so
these new duties are right in his wheelhouse.
19

FIRE DEPARTMENT
These changes could not have happened without the cooperation of the Board of Selectmen,
Town Manager, the three (3) unions involved (Professional Firefighters of Salem, Salem
Employees Association, and the Salem Public Administrators Association), as well as the
members themselves. I thank all involved for their hard work and faith that this was the right
thing to do.
Status of Apparatus:
Received a new ambulance and ordered a pumper for delivery in Spring, 2017
The community supported the Department procurement of a new ambulance and a new pumper
in 2016. While the ambulance is now in service serving the residents, the pumper is on order
with an anticipated delivery date of spring, 2017. We have been plagued with mechanical issues
in the recent past, so this new pumper will be a welcomed sight. It will replace a 22 year old
apparatus. We respectfully ask the community to support the purchase of another ambulance in
2017.
Impact of a Growing Community:
Since 1990:
o Emergency Responses increased by 79% with fewer line firefighters
o Equalized assessed evaluation has increased by 128%
($4.1 Billion, up from $1.8 Billion)
o 6.5 million square feet of building space has been added
o The over 55 population has increased by 12%
For a third consecutive year, Salem Fire responded to a record number of emergency incidents.
In 2016, we answered 5,258 calls for service, seeing a 2% increase over 2015. The chart below
shows the increase in activity we have handled since 2012.
4,609 4,556
4,9945,170 5,258
2012 2013 2014 2015 2016
Inci
den
ts
Year
SFD 5-Year Incident History
20

FIRE DEPARTMENT
Our community continues to grow, and the Fire Department needs to grow with it in order to
deliver the same level of service we currently provide. The Board of Selectmen charged us with
projecting our long-term service demands and needs earlier in the year, so in August we
presented those predictions and a plan to maintain the existing level of service the community
currently enjoys. Our projections for a 5 year “look-ahead” reveal an increase in emergency
incidents, perhaps as much as 20% due to the many projects that are being considered by the
Planning Board, not the least of which is the redevelopment of Rockingham Park and the
collateral development that will occur as a result. Additionally, we predict a significant increase
in demand on the Inspectional Services Division due to a corresponding rise in the number of
requests for plan reviews, permits, and inspections.
The Plan to Reduce Response Times:
Our Goal: Reaching 90% of emergency responses in 4 or fewer minutes
Our Current Situation: Only reaching 66% in 4 or fewer minutes
Two strategies to improve response times:
1. Gradually increase shift staffing
2. Build a west-side Fire/EMS Facility
The plan that was presented addresses one of the most important aspects of the delivery of
services: response time. A nationally recognized standard, National Fire Protection Association
Standard #1710 (Organization and Deployment of Fire Suppression, Emergency Medical
Operations, and Special Operations to the Public by Career Fire Departments) states that the first
arriving engine or ambulance reach an emergency scene in 4 or fewer minutes, 90% of the time.
We currently arrive in 4 or fewer minutes 66% of the time. In 2015, we arrived 67% of the
time. In 2014, it was 68% of the time. We are headed in the wrong direction.
There are two ways to impact response time: station location and capacity of available units. In
looking at station location, all of our services are delivered to the community via three (3)
facilities located on the east side of Route 28, even though a significant number of our
emergency incidents occur west of Route 28. Moving forward, it is the Department’s goal to
present station location studies to the Board of Selectmen and community at-large in order to
begin the process of identifying a suitable location for a new station that will help meet the
NFPA 1710 standard.
Capacity is another reason we’re not meeting NFPA 1710. In order to meet the demand of our
ever-increasing call volume, we need to increase the number of units we have available to
respond to emergencies. One variable that has a significant negative impact on capacity is the
frequency with which simultaneous incidents occur. A simultaneous call is a call for service that
is received when we are already out helping someone else. In 2016, we broke another record…
we registered simultaneous calls 45% of the time. Having additional staffed units available to
respond enables us to reach our customers without delay. It is also noteworthy to report that we
received mutual aid into Salem 121 times in 2016….also a record. This indicates we are
increasingly dependent on our mutual aid partners to respond into Salem and handle calls for
service.
21

FIRE DEPARTMENT
The plan we presented to the Board of Selectmen included gradually increasing staffing, using
the growth in tax revenue from development, to meet the demands of the ever-increasing call
volume. We further proposed to construct a Fire/EMS facility on the west-side of the
community, using a combination of the growth in tax revenue as well as public safety impact
fees. The Board of Selectmen concurred with this plan in principle.
The Substance Misuse Crisis:
127 overdoses (67% were Salem residents)
9 Deaths
61 Naloxone administrations
The substance misuse crisis is still front and center in our town. Salem saw 127 overdoses in
2016, with 9 deaths. Eighty-five of the 127 overdoses (67%) were Salem residents. We are
active participants in StandUp Salem, a grass-roots organization aimed at prevention, education,
treatment, and recovery from substance misuse. We were excited to participate in the first-ever
CPR/Narcan workshop in November, and we pledge to work tirelessly to end this plague.
2016 - By the Numbers:
5,258 emergency responses (new record)
45% simultaneous incidents (new record)
121 times mutual aid received (new record)
$701,241 fire loss
24 structural fires
63% of incidents medical; 37% of incidents fire
While we have experienced a record number of calls, we are fortunate to report that we had zero
fire deaths in 2016. This marks the 8th consecutive year without a fire or products of
combustion exposure death, our last being in 2008. Salem’s fire loss for 2016 was $701,241. We
had 3 civilians injured during fires, and 26 firefighters suffered injuries during the course of their
duties in 2016.
Personnel:
We had one member retire from the Salem Fire Department in 2016. We humbly thank her for
her faithful service to our community:
Mary E. Burnett, Badge #152 Appointed: 07-09-2001 Retired: 08-01-2016
The following former members passed away:
Warren P. Seckendorf, Captain, Badge #119 03-31-2016
Frank J. Cote, Call Firefighter 06-19-2016
Alice E. Campbell, Communications Supervisor 12-02-2016
22

FIRE DEPARTMENT
The following members were appointed in 2016:
John A. Stevens, Badge #212 of Plaistow, NH – Fire Mechanic 02-29-2016
Hassan M. Hussni, Badge #213 of Salem, NH – Probationary Firefighter 03-07-2016
Patrick C. Summers, Badge #214 of Mechanic Falls, ME – Probationary Firefighter 03-07-2016
Samuel Zannini Jr., Badge #221 of Atkinson, NH – Fulltime Inspector 03-14-2016
Jonathan T. Barker, Badge #215 of Amherst, NH – Probationary Firefighter 09-26-2016
Patrick R. Emanuelson, Badge #216 of Hudson, NH – Probationary Firefighter 09-26-2016
The following members were promoted in 2016:
Lawrence D. Best, Badge #163 from Captain to Assistant Fire Chief
Jeffrey S. Emanuelson, Badge #173 to the position of Chief Building Official
Jonathan C. Brackett, Badge #142 from Captain to Battalion Chief
Francis J. Enos, Badge #143 from Captain to Battalion Chief
Timothy J. Kenney, Badge #145 from Captain to Battalion Chief
Randall J. Young, Badge #146 from Captain to Battalion Chief
John W. Judson III, Badge #122 from Lieutenant to Captain
Stephen E. Coonrod, Badge #164 from Lieutenant to Captain
Craig J. Lemire, Badge #169 from Lieutenant to Captain
Brian H. Allard, Badge #176 to the position of Director of Emergency Medical Services
Nicolas J. St. Pierre, Badge #178 from Firefighter to Lieutenant
Timothy P. Sice, Badge #182 from Firefighter to Lieutenant
M. Jared Whalen, Badge #200 to the position of Emergency Medical Services Coordinator
I am extremely proud to be the leader of an organization that takes customer service and
professionalism so seriously. I would like to thank all of our members for their dedication to
duty, especially Assistant Chief Best, Fire Marshal Emanuelson, and Administrative Assistant
Betty Oldeman for their support and guidance. The officers and members of our organization
enjoy helping the citizens and visitors of our great community.
If you would like further information on our department, please visit our website at
www.townofsalemnh.org/firedepartment. To contact me, please e-mail me at
[email protected] or call my office at (603)-890-2217.
Yours in Fire and Life Safety,
Paul J. Parisi, Chief of Department
23
FIRE DEPARTMENT
FIRE PREVENTION BUREAU, INSPECTIONAL SERVICES,
COMMUNICATIONS, INFORMATION TECHNOLOGY DIVISIONS
I am pleased to submit to you the following as an annual report of the Fire Prevention Bureau,
Inspectional Services, Communications and Information Technology Divisions. 2016 was a year
of incredible change with the integration of the Health and Building Departments into Salem Fire
and creating the Inspectional Services Division. The new members of Salem Fire have embraced
the changes and are working daily to promote the mission and goals of Salem Fire. Also notable
is the warm reception from all of the members of Salem Fire to the newest members of our
family. This commitment and dedication from all of the members reminds me daily that we are
truly the best department hands down.
Some of the major highlights from 2016 are:
1) Our annual Fire Prevention Open House continues to be an extremely successful
community event attended by hundreds of families each year. 2016 was no exception.
2) Major accomplishments:
Transitioned the Building and Health Departments into the Fire Prevention
Bureau creating the Inspectional Services Division.
Completed the relocation of the Fire Prevention Bureau staff and equipment to
Town Hall.
Acquired and placed into service 4 inspectional services vehicles from SPD.
Implemented a Box Running Card system into the Red Alert CAD system.
Began the replacement of the aging MDT units with self-contained Surface Units.
Managed the expansion of the fiber optic plant to West Salem.
Installed and updated the Power Management System and UPS in the Fire Alarm
Office.
Acquired two classrooms at the Haigh School for secured file storage.
Beta tested the View Permits Inspection Module for roll out Jan 2017.
Maintain a proactive role in the redevelopment of the Rockingham Track
property.
Developed a fiber-optic conversion plan for Stations 2 and 3.
Managed several communications/construction projects for DPW/SPD.
Assisted in FCC relicensing for SPD.
3) Some of the statistical highlights for 2016 from the Inspectional Services Division are:
6751 Inspections conducted by the Inspectional Services Division.
4021 Permits were issued.
74 Violation notices were issued down from 126 in 2012.
472 Plans reviewed by the Fire Marshal
1028 Building Plans were reviewed by the Building Inspector
27 Complaint investigations.
126 Nuisance Investigations
24

FIRE DEPARTMENT
FIRE PREVENTION BUREAU, INSPECTIONAL SERVICES,
COMMUNICATIONS, INFORMATION TECHNOLOGY DIVISIONS
2016 highlights continued
46 Code Enforcement Complaint Investigations.
74 Fires and related incidents were investigated for origin and cause.
226 Hours of training were conducted.
$470,431 Permit Fees received (Building, Electric, Plumbing, Fire, Mech)
$334,427 Permit Fees waived (Town and School Projects)
$113,850 Radio Box Monitoring Fees Collected.
$53,205 Permit / License Fees (Health)
Looking ahead to 2016/2017 and beyond the Salem Fire Department will be asking for the
town’s support for several important projects critical to our operation. They are:
Seeking funding sources to help meet the technology needs of our department.
Seeking approval for additional staffing to meet the growing needs of the Inspectional
Services Division.
Completing the installation of the radio infrastructure replacement.
Full Implementation of the new Place of Assembly inspection program with the Battalion
Chiefs.
Present a plan to complete the upgrading of the mobile and portable radios.
Present a plan to add additional receiving sites to reduce the poor coverage areas of the
community.
Complete the installation of the mobile repeater in the Shift Commander’s vehicle.
Completing a comprehensive inspection of multi-family occupancies and other target
occupancies for fire and life safety.
Implementation of an on line component for the View Permits System.
In conclusion I would like to personally thank all Salem Fire Department members and their
continuing efforts in delivering the Fire Prevention / Community Preparedness message to the
community. I feel privileged to serve as Salem’s Fire Marshal/Chief Building Official and look
forward to continued success in 2017.
Respectfully Submitted:
Jeffrey S. Emanuelson
Jeffrey S. Emanuelson
Fire Marshal/Chief Building Official
25

FIRE DEPARTMENT
FIRE INSPECTIONAL SERVICES DIVISION HEALTH OFFICER
Licenses/Inspections/Food Safety Initiatives: The primary function of the Health Officer
involves the inspection and licensing of regulated facilities in Salem. These regulated facilities
include food establishments, body art facilities (tattoo & piercing), daycare centers and massage
therapy facilities. The major portion of the inspectional activities is devoted to food
establishments; this includes restaurants, school cafeterias, supermarkets and convenience stores.
Food samples are collected and tested monthly to assess food preparation procedures.
Complaints received by the Health Officer included nuisances such as improper storage of trash,
unsafe housing conditions, illegal dumping and odors. Beaches are inspected and tested during
the summer months to ensure safe swimming conditions.
Mosquito Control Program: The comprehensive mosquito control program was conducted for
the sixteenth straight year. Larvaciding (treatment of wet areas and catch basins) and surveillance
activities began in April and continued till October. Spraying occurred at the athletic fields prior
to the 4th of July events. No positive batches of mosquitoes were detected in Salem for West
Nile Virus or Eastern Equine Encephalitis in 2016.
Septic Systems/Wells: The part-time
contracted inspector assists the Health
Officer with the inspectional and plan
review duties. A total of 474 inspections
and plan reviews were conducted in
2016.
Groundwater Protection Program:
Businesses (PCS) that utilize hazardous
materials within the protected watershed
area around Canobie Lake are subject to
an inspection every three years. The
purpose of this program is to prevent a
contaminant release that could adversely
affect our drinking water.
Public Health Preparedness: Salem is
a member of a collaborative of ten municipalities, health & human service agencies and other
community partners involved in planning and training to deal with public health emergencies.
2016 Highlights:
No positive mosquitoes found for WNV or EEE.
Conducted 611 food safety inspections, collected 17 food samples for analysis.
Assisted NH Dept. of Environmental Services with water quality study of Captains Pond.
Respectfully submitted,
Brian A. Lockard, Health Officer
0
100
200
300
400
500
600
Number of Inspections 2016
Number ofInspections
Did You Know?
Physical activity, such as brisk walking, can help lower risk for
heart disease, stroke, type 2 diabetes, depression, and some
cancers.
26

HUMAN RESOURCES DEPARTMENT
During 2016 the Human Resources Department assisted with finalizing new collective
bargaining agreements for the SEA and SPAA Unions, which will be on the 2017 Town Meeting
Ballot. We continued to see more employees and retirees selecting the Town’s Health Savings
Account health insurance plan, which reduces costs by moving the Town to a Consumer Driven
Health Plan model. We found that the HSA plan reduced our overall health insurance renewal
rate for 2017, and we look forward to continuing to realize savings going forward. Despite the
uncertain health insurance market and regulatory landscape, the Town has taken steps to help
assure that it is well-positioned no matter what the future brings.
Throughout the year, the HR Department held on-site events to encourage employees and
retirees to take an active interest in their health. These events included a biometric screening fair
at which employees and retirees could learn their blood pressure, height, weight, blood sugar and
cholesterol levels and receive information on how to improve if needed and a flu vaccine clinic
open to employees, retirees and their families.
We continued our partnership with the Salem Farmers’ Market and Brookford Farm to bring
fresh seasonal vegetables to Town employees through the farm’s CSA program.
We welcome new employees joining us in 2016 and extend our best wishes to those who retired
during the year.
During 2016 we filed 67 first reports of injury with our Worker’s Compensation carrier, many of
which resulted in no loss of time or any medical treatment. This was a decline from 74 first
reports in 2015.
The Town’s Joint Loss Management Committee continued to focus on employee safety, and
undertook such tasks as ensuring that all AED machines are adequately supplied and have
working batteries.
We continued to focus on training employees to provide excellent customer service to all of
Salem’s residents and visitors.
We extend our thanks to our Human Resources volunteer, Bobbie, for all she does to help us
keep things running smoothly. We welcome the new HR Clerk, Robin, to our team.
Finally, we want to thank all of the Town’s staff for making Salem the great place it is to work.
We appreciate all that you do every day!
We look forward to a happy and healthy 2017.
Molly McKean Anne Fogarty
Human Resources Director Benefits Administrator/HR Assistant
Robin Lynch
Human Resources Clerk
27

HUMAN SERVICES DEPARTMENT
The Human Services Department provides financial assistance to Salem residents as defined by
NH State Statue RSA 165. Eligibility is based on need and determined each time a formal
request for assistance is made through the application process, based on guidelines adopted by
the Salem Board of Selectmen. Assistance is provided through vouchers or directly to vendors
for basic emergency needs such as food, fuel for heat, utilities, shelter costs, prescriptions (for
life threatening conditions) and other necessities. Referrals to other resources, such as State and
Federal Programs, food pantries, etc., are made before local tax dollars are utilized whenever
possible.
The Human Services Department information and General Assistance application page are
available on the Town of Salem web page at: www.townofsalemnh.org . This link is constantly
updated to include more referral contacts, information and on line applications. Our office is
located at 33 Geremonty Drive, Salem, NH (Bottom floor-side door). Our office hours are
Monday – Friday 8:30am-3:30pm, Call for General Assistance appointment at 603-890-2130.
In 2016, the Town provided $54,128 in direct assistance vouchers to individuals who had
insufficient income due to a job loss, an injury or disability. These Salem residents were assisted
with vouchers for basic necessities such as: food, fuel, medical assistance (for the uninsured),
emergency car repairs and rent. This rental category consists of regular rent, emergency shelter
costs, and eviction prevention money. In 2015, $50,000 was budgeted for this category but due
to lack of available rental housing only $24,125 was spent. Due to this downward trend, the
budget for rental assistance was reduced for upcoming 2017 to $40,000.
In 2016, the Human Services office has seen many positive things happening in terms of the
building of multiple community collaborations which includes local non-profit organizations,
state and municipal agencies, special service clubs, churches and caring individuals. This year
with everyone working together, our office was able to assist dozens of school children who
were supplied with free back packs, notebooks and supplies for Back to School as well as
donated gift cards for new school clothing. In addition, the Salem Knights of Columbus (Bishop
Peterson Council, 4442) has made our office one of their designated recipients of the “Coats for
Kids” Program and our office has been able to supply Salem children with hundreds of new
winter coats through this program. Thanks to extremely generous food donations, the area
churches and food pantries were able to help over 200 families with complete Thanksgiving
Baskets. Again this Christmas hundreds of families and individuals have signed up through the
Salem Christmas Fund for help with Christmas gifts.
AARP will once again conduct free 2016 Tax Preparation at sites in Salem: (to be announced)
go to their web site at www.nhtaxhelp.org for more information.
We also have many anonymous donors who call us and want to assist families in Salem so we
are able to create those links and the wonderful senior ladies of Greater Salem who knit hats,
scarves and mittens for the Human Services office to distribute.
Respectfully submitted,
Kathleen R. Walton, Director of Human Services (retired as of December 31, 2016)
Barbara Riley, Human Services Assistant
28

MUNICIPAL SERVICES DEPARTMENT
It is my honor to present this report on behalf of all the extremely hard working and dedicated staff
from the Municipal Services Department. The staff works together across the divisions and
sections as needed and takes pride in the work they do. Their efforts over the past year have allowed
for a smooth transition into a unified professional department.
Respectfully Submitted,
Roy E. Sorenson, Municipal Services Director
The Year 2016 marked the inaugural year for the Municipal Services Department which was the
result of a reorganization in late 2015. Engineering, Public Works, and Utilities were combined to
function together as one department with a mission to provide high quality essential municipal
services to the residents, businesses, and visitors to Salem in a professional, efficient, and cost
effective manner. The new department combined relative resources into an organizational structure
that improved and streamlined services that the residents of Salem have come to expect from each
respective department over the years. The staff is comprised of thirty six full time employees
including myself and three deputy directors that oversee an eleven million dollar operating budget
and large capital infrastructure projects among many other responsibilities.
One of the primary directives is communication that is consistent and collaborative
notwithstanding reducing duplication and improving efficiency. The departments work together to
establish a dynamic and responsible asset management and improvement program utilizing a GIS
(Geographic Information System) driven work order database program that will help the
community prosper well into the future. We will monitor our performance and develop goals and
objectives so that we may offer the best service possible to the community. Staff works together
on strategic and master planning so that capital improvements can be achieved in a timely and
feasible manner. We are committed to the residents of Salem and will continue to provide a level
of municipal service that everyone can be proud of. Please feel free to call us as Maureen Sullivan
– Administrative Assistant, is available to answers questions and/or requests so you may reach the
proper staff member.
29

MUNICIPAL SERVICES DEPARTMENT
ENGINEERING DIVISION
The Salem Engineering Division located at Town Hall is dedicated to providing high quality and
prompt engineering assistance to the Town’s residents, business community, Municipal Boards,
Commissions, and Committees, as well as other Town Departments. The Engineering Division
mission seeks to provide professional engineering services and cost effective engineering solutions
associated with the planning, design, construction, and administration of capital improvement
projects and the maintenance of Town infrastructure. The Engineering Division provides a variety
of functions and services related to municipal matters including permitting and subdivision/site
plan technical review.
This past September Dan Hudson, PE, became the Deputy Director – Engineering replacing Robert
Puff, PE who left Salem for another opportunity. Mr. Puff was an integral part in creating a
comprehensive road program and feasible capital improvement plan and will be missed. Jim
Brown - Senior Engineer and James Danis, PE – Capital Projects Engineer, are the full time staff
members.
With the reorganization the Engineering Division has become involved in major project work
across the department including water and sewer so work can be completed according to
specifications and done in a timely manner. Staff also worked diligently over the past year across
the department on RFP (Request for Proposals) and RFQ (Request for Qualifications) items to
procure the best vendors.
The Engineering Division was involved in the following major activities in 2016.
• Haverhill Road Reconstruction Project – Approximately 5,000 linear feet of Haverhill Road
was reconstructed from Atkinson Road to Christine Lane. Road work involved comprehensive
storm drain improvements, excavation of the old road bed, placement and compaction of new
foundation gravels, grading, and repaving. In
addition there were significant amounts of ledge
that was hammered and removed for proper
gradient. Another 1,500 linear feet of road to
Theodore Ave was added to the project because
of schedule and favorable pricing. All work was
completed by the end of November.
• Road Reconstruction Projects – The
neighborhood road reconstruction work was
completed early and under budget on Cornwell
Court, Windwood Terrace, Car-Mar Lane, and Walter Palmer Lane. Approximately 5,000 linear
feet of road reconstruction was reconstructed respectively among the roads. Work included
removal of the old pavement material, re-grading, and repaving of the road surface as well as storm
drain improvements.
30

MUNICIPAL SERVICES DEPARTMENT
ENGINEERING DIVISION
• Road Stabilization Project – Engineering and Public Works managed the annual Road
Stabilization work which involved mill and overlay of more than 25,000 linear feet of Town roads,
including Wheeler Avenue, Hooker Farm Road, Old Rockingham Road, Lake Shore Road,
Canobie Avenue, Taylor Street, and Merrill Avenue. In addition, schedule and favorable pricing
allowed for another 3,000 linear feet to be resurfaced on Hazelwood Drive and Scotland Avenue.
• South Shore Road – This project was put out to bid and awarded in March with construction
starting shortly thereafter in April. Work included installation of gravity and low pressure sanitary
sewer on South Shore Road, and portions of Northeastern Boulevard and Lake Shore Road. The
work involved road reconstruction of approximately 3,000 linear feet removing the old pavement
material, re-grading, and repaving of the road surface as well as storm drain improvements.
• Road Design Projects – A formal design was put together for the reconstruction of the
intersection of Haverhill Road and Klein Drive that will be constructed in 2017. Design work was
also completed for road reconstruction for the rest of Haverhill Road, Klein Drive, Parker Circle,
Woodland Avenue, Bradford Drive, and Stanley Brook Drive. Staff finalized design on
Commercial Drive which will be the first road to be done as part of the program guidelines to have
an industrial road included each year starting in 2017.
• Town Farm Road Bridge – Work involved removal of an existing 15 foot span concrete and
steel beam bridge over the Spicket River and
construction of a new pre-stressed concrete deck
beam bridge with a 42 foot span. Construction
commenced in August 2015 and was completed in
June 2016 on time and on budget. Work also
included reconstruction of approximately 700 linear
feet of Town Farm Road and 400 linear feet of Bluff
Street Extension. Work was conducted through the
NHDOT Municipally Managed Bridge Program, and
the Town was reimbursed 80 percent of participating construction costs by NHDOT State Aid
Bridge funds.
• Drainage Culvert Repair – Two major culvert repairs on South Broadway and Lazarus Way
were designed and put out to bid by staff in March 2016. A contract was administered and work
began during the summer and was finished on schedule and under budget by November.
• Old Rockingham Road Watermain Expansion/Replacement Project – The Engineering
Division working with the Utilities Division administered this project which included the
replacement/extension of a new 16 inch watermain to the Windham Town Line on North Policy
Street, extending north to Range Road, then east on Range Road to Old Rockingham Road, then
southerly on Old Rockingham Road to St Mary’s Lane. The project added approximately 4,100
linear feet of new watermain to the distribution system and was the second phase of the 2015
project. The new transmission line will help with pressure, redundancy, and water quality within
the distribution system.
31

MUNICIPAL SERVICES DEPARTMENT
ENGINEERING DIVISION
• Depot Intersection Project – This project, at the intersection of Routes 28 and 97, involves the
design of traffic signals and geometric modifications of both the intersection and the roadway
approaches in order to provide dedicated left turn lanes on the northbound and southbound sections
of Route 28. The project is being locally managed in conjunction with the NHDOT Municipal
Urban Program – Compact Area (MUPCA) with a preliminary design contract administered this
past year. Several planning meetings were held to begin the permitting process and set a schedule
for right of way, bidding, and construction.
• Road Committee and 10 Year Road Program – Myself and Dan Hudson, Deputy Director –
Engineering became new members of the Road Stabilization Committee along with Selectman
Mike Lyons. The committee periodically reviews and updates the 10 Year Road Program. The
most recently revised 10 Year Road Plan (for the period 2017 to 2026) was adopted by the Board
of Selectmen (BOS) on December 12, 2016. This serves as the sixth update of the 10 Year Plan
since its initial adoption by the Board on November 08, 2010.
• Road Inventory – Working with the Town’s consultant the Road Committee was directed by
the BOS to pursue an update of the Pavement Condition Index (PCI) for all roads one year ahead
of the scheduled five year update. This update was necessitated after many discussions of how best
to distribute and budget the work with industrial roads coming up for resurfacing once per year
starting in 2017.
• NPDES Phase II Small MS4 General Permit – In cooperation with the Division of Public
Works, the Engineering Division coordinates and oversees the preparation of annual stormwater
reports to the U. S. Environmental Protection Agency. The annual report documents the Town’s
progress with respect to various Stormwater objectives. This year the Town filed its Annual Report
for Permit Year 13. As part of the Town’s NPDES MS4 work, staff continues to work on updates
to the drainage system map, with a goal of providing more accurate stormwater mapping on the
Town GIS. This work is an extension of past efforts relative to inventory and assessment of the
Town drainage system.
• Underground Storage Tank Program – The Engineering Division coordinates an annual
program involving testing, monitoring, maintaining and reporting on Town operated underground
tanks used for the storage of heating fuel, gasoline and diesel products. The program seeks to
maintain compliance with State and Federal regulations and includes the monitoring, testing and
remediation of previous releases of petroleum products from underground storage tank systems.
• Subdivision and Site Plan Review – The Engineering Division performed technical review of
335 submissions related to subdivision and site plan projects. Among those were the conceptual
master plans for the Tuscan Village which will be for redevelopment of the former Rockingham
Park.
• Permits – The Engineering Division issued 242 permits for Street Openings, Sewer and Water
Connections, Driveways, and Gas Services. Engineering also participated in the review and sign
off on 793 Building Permit Applications and Certificates of Occupancy.
32

MUNICIPAL SERVICES DEPARTMENT
PUBLIC WORKS DIVISION
The Public Works Division (DPW) is located at 21 Cross Street and is dedicated to providing high
quality and prompt assistance to the Town’s residents, business community, visitors, as well as
other Town Departments. The primary function of the Division of Public Works is to provide
municipal services including but not limited to snow and ice removal, stormwater drainage, vehicle
fleet maintenance, facility management, improvement and maintenance of roads, sidewalks, and
public property as well as maintenance of parks and cemeteries. Public Works is the largest
Municipal Service Division comprised of four sections including Streets, Fleet, Solid Waste, and
Parks/Properties.
Dave Wholley, Deputy Director – DPW, oversees eighteen full time employees and directs day-
to-day operations along with Ted Puzniak – Chief Mechanic, Jon Graichen – Street Foreman, Joe
Feole – Street Foreman, Rich Houle – Parks/Properties Foreman, and Dave Cantor – Solid Waste
Foreman who manage the full time and seasonal staff. The hardworking dedicated staff are
available and provide municipal services when called including working nights, weekends, and
holidays as well as extended hours during emergency operations.
The Public Works Division was involved in the following major activities in 2016.
• Street Section – The mission of the Streets and Shops section is to effectively maintain the
towns roadway infrastructure for the safest possible travel while being cost conscience and
efficient. The largest responsibility of this section is to execute the town Winter Emergency
Operation Plan. Making sure that all 376 lane miles are clear of snow, ice and debris 24 hours a
day to the greatest extent possible to allow for the safe response of emergency agencies to move
about the community of Salem during emergencies is our greatest responsibility. Outside the
winter season this section performs the routine maintenance of the drainage system, roadside
mowing and brush clearing, pavement markings, street sweeping, street signs, pot hole patching,
turf management at all ball fields, parks and town buildings, litter control (4.35 tons in 2016),
traffic light signalization, 35 miles of sidewalk maintenance, grading 28 gravel roads twice
annually, hazardous tree removal and responding to work order calls from the general public. This
section also routinely assists other sections from within the division and department on other tasks
such as picking up leaves in the fall, burials, minor equipment repairs, water main breaks as well
as assisting with execution and completion of other large ongoing town infrastructure investments
within the road program and town capital projects. In addition to the foreman staff includes: Kelly
Demers, Darrell Bible, Geoff Benson, James Pacheco, Eric Becker, Brian Capone, Kyle Fox, Bill
Simone, Mike Stickney and Matt Waldron.
This past year was a below average winter with only 33 inches of snow following a record setting
year in 2015. There was a total of 7 plowable events for our Winter Emergency Operations
including treatment of the primary salt routes 22 times and the secondary routes 7 times with a
total of 4,300 tons of salt used. Most of the events were small in nature and drawn out involving
long hours of treating roads with salt but as usual staff answered the call and kept the roads safe
for the public. A new asphalt shingled roof was also put on the large building that houses the winter
salt.
33

MUNICIPAL SERVICES DEPARTMENT
PUBLIC WORKS DIVISION
There were over 900 work orders completed over the year predominately for maintenance
including the yearly programs such as street sweeping which was accomplished ahead of schedule
and allowed for all roadway markings to be painted in a timely manner. Our neighborhood roads
biennial catch basin cleaning program completed its second year which saw over 1900 catch basins
cleaned. Because of this staff was able to begin the arterial road program ahead of schedule with
some of the catch basins on South Broadway. Moreover staff also repaired 40 structures that had
become compromised or failed.
Public Works along with Engineering administered and managed the annual Road Stabilization
work which involved mill and overlay of more than 25,000 linear feet of Town roads, including
Wheeler Avenue, Hooker Farm Road, Old Rockingham Road, Lake Shore Road, Canobie Avenue,
Taylor Street, and Merrill Avenue. In addition, schedule and favorable pricing allowed for another
3,000 linear feet to be resurfaced on Hazelwood Drive and Scotland Avenue. Staff repaired
stormwater assets including headwalls, pipe, swales, and basins for the program.
The Streets staff invested four days of surveying, investigating, water jetting, cleaning, and
repairing of the drainage issues surrounding the Depot to get a better understanding of its
functionality and/or deficiencies and map the as built
conditions. In this effort we found three drain man
holes that were either buried or paved over. We
made necessary repairs and video recorded the 36”
main drain line running through from Scrub a Dub
car wash to the outfall behind the Dunkin Donuts in
the Depot. This work was driven by the upcoming
Depot Project which is slated for reconstruction in
2019.
Dave Wholley managed contracted services for two major culvert repairs on South Broadway and
Lazarus Way. The South Broadway repair involved replacement of a corrugated metal pipe arch
with associated earthwork and paving. A culvert was replaced on Lazarus Way which involved
two catch basin structures, headwalls, new drainpipe, associated earthwork, and berm and
pavement reconstruction.
The Streets Section also performed work at both the Fire and Police
stations to remove and repair compromised pavement. Parking spaces
were also constructed including restriping throughout the Police lot.
Staff also played a role assisting with the Rail Trail Project by cleaning
up road edges and proper signage that had to be relocated. This year’s
election season kept staff busy with setting up and breaking down of
polling stations and removal of illegally placed political roadside signs.
New banners celebrating our veterans were added in place of flags along
Veterans Parkway.
34

MUNICIPAL SERVICES DEPARTMENT
PUBLIC WORKS DIVISION
• Fleet Section - The mission of the Fleet Section is to properly maintain and inspect all town
vehicles for the Municipal Services Department and Town Hall vehicles in a cost efficient manner.
The responsibility this section is tasked with requires ensuring
that front line emergency response equipment stays up and
functioning during the course of town wide snow emergencies,
water main breaks and floods among other things. Some of the
more routine equipment maintenance plan requires this section to
ensure that all vehicles and equipment (60 plus) receive thorough
inspections at least once per year in accordance with the State of
NH Department of Transportation (DOT) specifications. Fleet
staff will also respond to vehicle/equipment breakdowns in the
field to ensure that downtime is kept to a minimum which helps
the department maximize project efficiencies. The Fleet section
manages the inventory including preventive maintenance, repairs,
deferment, and capital replacement. A large six wheel dump
truck, one ton dump truck, and a backhoe were procured and purchased to replace equipment
beyond its useful life. Among the staff are Chief Mechanic Ted Puzniak and Ryan Pike.
• Solid Waste Section - The mission of the Solid Waste is to provide oversight of the solid waste
received at the transfer station generated by the town’s residents, private haulers, and the operation
of the municipalities business and projects. The transfer station is designed to receive solid waste,
recyclables, brush, leaves, white goods, clean scrap metal, propane cylinders, electronic waste,
waste motor oil, CRT’s, and batteries. Foreman Dave Cantor monitors the operation including the
contracted services to assure that all visitors to the transfer station are permitted while providing
direction and guidance for the disposal of various items. In 2016 we collected 7,971 tons of solid
waste and 2,050 tons of recyclables – 20% recycling rate. Another 59 tons of E-waste was received
at the facility as well. The annual Household Hazardous Waste Day (HHWD) was held at the DPW
headquarters on September 10th with a turnout of 176 vehicles.
• Parks/Properties Section - The mission of the Parks and Properties section is to ensure all
public grounds, parks, play fields, buildings, historic structures, and cemeteries are open and safe
for use to the public year round; as well as, provide the highest level of professional interment
services at all the three cemeteries within the Town of Salem. This section is led by Foreman Rich
Houle along with Greg Minnon and Will Rock.
The primary function of this section is to perform professional burial services at the Town’s
cemeteries for the residents. Maintenance of these cemeteries is extremely time consuming for
preservation, lawn mowing and weed trimming, tree pruning, flower planting, Memorial and
Veterans Day ceremonies, snow plowing, leaf blowing/raking and responding to residents
concerns while enforcing cemetery ordinances and rules. This section also administers facility
oversight of the Town Hall, District Court House, Depot Train Station, Historic Buildings, Parks
35

MUNICIPAL SERVICES DEPARTMENT
PUBLIC WORKS DIVISION
Building and Pine Grove Cemetery for all maintenance issues including HVAC systems, lighting,
sidewalks, parking lots, lawns, irrigation systems, fire and burglary systems, cleaning, and general
upkeep. Maintenance of Michele Memorial Park, Hedgehog Park, Palmer School (field) and the
Linwood Avenue playground are also part of the operations with turf management, tennis courts,
and facility operating needs. Another important duty is management of election polling station set
up of which all DPW personnel are used. Staff also assists moving items for various charities
during the holidays, recreation supplies for camps, and files during year end.
This past year was an extremely busy season for staff with clean-up and re-loaming of the
cemeteries after a challenging winter.
Because of the Presidential election, staff
spent quite a bit of time setting up and
breaking down the polling stations across the
town and also helped remove illegally placed
political roadside signs. A new vinyl fence
was installed at the Mt. Pleasant Cemetery
and a Master Plan was explored for Pine
Grove Cemetery for 2017 to ensure the
longevity of space over the coming years.
Overall there were 74 burials and 51
cremations during the year and some
preservation work was performed on the headstones at the Salem Center Burying Ground.
UTILITIES DIVISION
The Utilities Division is located at 161 North Policy Street – Canobie Lake Water Treatment Plant
(WTP). Our mission is to work diligently to provide cost-effective reliable water and wastewater
distribution services to the customers. We are committed to customer service including providing
ample safe drinking water for domestic use and firefighting requirements that complies with all
state and federal water quality standards. Similarly we will ensure the most efficient waste system
including pump stations and force mains that collect and transport the Town’s wastewater to the
Greater Lawrence Sanitary District (GLSD). Utilities is committed to providing high quality
service while maintaining and evaluating our systems to ensure efficiency and reliability. The
Utilities Division is comprised of three sections: Distribution, Systems, and Meters.
The Town’s drinking water is supplied by Canobie Lake from the months of May through October
then transfers to Arlington Pond for the colder months or October through May. This past year
was challenging due to extreme drought conditions and heavy demand for water. Above normal
temperatures in June combined with the lack of precipitation (7 inch deficit) resulted in below
normal average water levels for Canobie Lake. The Board of Selectmen issued Mandatory Water
Restrictions effective July 10th after discussion and recommendation from Municipal Services.
Since instituting Mandatory Water Restrictions, the overall usage reduced by 0.50 million gallons
36

MUNICIPAL SERVICES DEPARTMENT
UTILITIES DIVISION
per day (MGD) on a consistent basis overall and by 0.70 MGD on even days per restrictions. The
drought continued through the summer months and year ultimately reaching a 12 inch precipitation
deficit. The restrictions helped maintain levels of Canobie that were
sustainable per the Town’s Water Management Plan and water
production dropped off to normal levels by October. The Town also
engaged the services of a consultant to begin a water supply study
that is being funded by NHDES and should be completed by April
2017.
Frank Giordano, Deputy Director – Utilities, oversees eleven full
time employees and directs day-to-day operations along with Glenn
Burton – Distribution Foreman, Ron Benjamin – Systems Foreman,
and Fred Wallace – Meter Foreman who manage the full time and
seasonal staff. The hardworking dedicated staff are available and
provide municipal service when called including working nights,
weekends, and holidays including extended hours during
emergency operations.
The Utilities Division was involved in the following major
activities in 2016.
• Distribution Section - Our mission is to provide safe,
accessible, reliable, and sufficient water supply to our customers as
we are the responsible custodian of the distribution system that
delivers a potable source for drinking but also ensures ample supply
for fire protection purposes.
This section services over 7,700 homes and businesses in Salem per the water distribution system.
Over 2.5 million gallons of drinking water per day on average flow from the water treatment plant
and is distributed through the town in its vast network of pipes. The infrastructure must be
operative at all times as it serves potable water to a significant portion of the town and provides
water for public safety and firefighting. The current infrastructure varies in pipe material and age
which can cause unexpected emergency breaks that will need to be fixed throughout its life. Major
improvements have been identified through a master plan that improve the network alleviating
water age, regulating pressure, and creating redundancy. Staff is responsible for the maintenance
and repair of over 140 miles of water main including 1,750 valves and 932 fire hydrants and also
provide technical review for new developments.
This section is led by Foreman Glenn Burton along with Ed Thompson and Rusty Gosselin. Mr.
Burton – 31 years, and Mr. Thompson – 15 years, each retired respectively during 2016. We wish
them well and thank them for their years of dedicated service as they will be missed.
37

MUNICIPAL SERVICES DEPARTMENT
UTILITIES DIVISION
Substantial effort was required to fulfill the “Dig Safe” law requirement with our locating and
marking water lines for over 1800 regular and 50 emergency Dig Safe requests. In 2016 emergency
water main repairs were made to 25 failures, 2 service leaks, and nonemergency repairs made to
96 shut off valves and 20 fire hydrants. Over 1000 hours were invested in the flushing, maintenance
and repair of hydrants. Improvement projects for 2016 included completion of the Old
Rockingham Road Watermain Expansion/Replacement Project. The new 16 inch main on Old
Rockingham Road was tied into the North Policy Street main back to the WTP. Work included 2
new fire hydrants and 5 water services along with gate valve boxes and road improvements.
The Howard Street Water Tank exterior was sandblasted and painted during 2016. This was a
complex job that required removal and relocation of extensive
cellular equipment from the four major carriers. Staff also supported
the Road Stabilization Program by providing relative services
during the 2016 construction and 2017 planning process. The staff
also worked with the Town water consultant on preliminary design
for new water main at the Depot and an additional 1 mile length
down South Broadway to Veterans Parkway. This stretch of water
main has been plagued by major breaks and was identified as failed
in the Pipe Integrity Study of 2015. Another major goal was
accomplished with the award of an asset management grant from
NH Department of Environmental Services (NHDES) that will
allow the distribution system to be updated in GIS and viewed via
mobile software by laptop to identify conditions in the field.
• Systems Section - As a utility service provider our mission is to operate, maintain, plan, and
develop the Town’s water and wastewater systems and ensure all work is performed in accordance
with State and Federal Permit Requirements and Regulations. We will responsibly treat, store, and
distribute water to meet the social, health, economic and environmental needs of the community
in a cost efficient manner. Similarly we will ensure that the wastewater system including pump
stations and force mains which collects and transports the Town’s wastewater to the GLSD is
sound and operating effectively. This section is led by Foreman Ron Benjamin along with Jay
VanAmburgh and Jeff Young. Maria Poor is the Chemist at the WTP which once again qualified
for NELAC (National Lab Accreditation) certification this year.
The Water Treatment Plant provides over 7,700 homes and businesses with water and produced
over 874 million gallons of water in 2016 with an average daily production of 2.4 million gallons.
The facility has the capacity to provide up to 6.0MGD and was designed and built to comply with
EPA's Safe Drinking Water Act and Surface Water Treatment Rule. In 2016 all State and Federal
Drinking Water standards were met or exceeded. All our required laboratory water testing was
within compliance with state and federal standards this past year. A public notice was required by
NHDES to be sent out after a late reporting of our October sampling. Along with the WTP, the
Utilities Division also operates and maintains two water booster stations and the Arlington Pond
38

MUNICIPAL SERVICES DEPARTMENT
UTILITIES DIVISION
Pump Station. Three dam locations are also monitored in order to maintain established levels in
their respective water bodies. Water supply is critical to the health and well-being of our
community and production of safe drinking water remains our number one concern.
As for the wastewater system, responsibilities include the maintenance and repair of the collection
system which is approximately 60 miles of piping, hundreds of manholes, and 10 pumping stations
located throughout the community. The sewer system delivers 5 million gallons of flow on an
average daily basis with peak hourly counts reaching 14.5 million gallons to the GLSD. The
collection system is maintained in the most practical manner to ensure service and reliability and
is monitored to identify illicit flows. There is a significant cost and reserved capacity for flow to
the GLSD so it is important that any and all deficiencies including inflow and infiltration (I/I) are
determined so a budget number for repair can be incorporated into capital planning.
Two major projects were performed in 2016 along with day-to-day operations: The Exit 2 Area
Water System Improvements and The Sewer
Master Plan Update. A new water booster station
was built and put on line on Commercial Drive that
will supply adequate water pressure to meet fire
codes to the commercial area by Exit 2 including
Manor Parkway, Commercial Drive, Industrial
Way, and Northwestern Boulevard. The Manor
Parkway station was also upgraded as part of the
project which was funded by a loan available
through the NHDES Clean Water Drinking
Program.
As part of the Sewer Master Plan Update the Town’s wastewater consultant was busy modeling
and investigating the sewer collection system to identify any deficiencies including restrictions
and I/I throughout the year. The update was brought about due to capacity limitations within some
of the main transmission lines and redevelopment. The initial findings identified significant
restrictions and overflow issues along the South Broadway stretch from the Depot to Cluff
Crossing and a contract for design was issued for improvements. The final report will be issued by
April 2017.
• Meters Section – Our mission is to ensure that all water meters and backflow devices are
functioning accurately and inspected in a timely fashion for our customers. A water meter is a
device that measures how much water you use and is similar to an electricity or gas meter. We use
readings from the meter to calculate how much to charge you for your water and sewerage usage
if applicable. This section is led by Foreman Fred Wallace along with Scott Witkowski, Pete
Parrino, and John Hackett.
The Meter section in the Utilities Division completed the final year of a 5 year meter replacement
program. With the completion of this project we have a much more accurate accounting of water
entering each property using new metering technology. The new system includes automatic meter
39

MUNICIPAL SERVICES DEPARTMENT
UTILITIES DIVISION
reading technology that will have labor time, prevent recording errors, minimize wear and tear on
vehicles, minimize the need for Town employees to access residents private property and
potentially allow water line leaks and/or excessive usage to be identified earlier by analysis of data
collected. We can also generate an hourly report for any customer showing use throughout the day.
The real time information will help the consumer with conservation by showing how much water
is used during specific times of the day so they may adjust daily routines such as lawn watering.
Along with the responsibilities of maintaining the meters, staff is also responsible for
administering the Cross Connection Prevention Program. Our certified testers completed the
inspection and testing of 1,378 backflow prevention assemblies. These devices are vital to the
protection of our water system from backflow. The term backflow means any unwanted flow of
used or non-potable water or substance from any domestic, industrial or institutional piping system
into the pure, potable water distribution system. To prevent backflow from occurring at the point
of a cross-connection a backflow prevention assembly must be installed. Our cross connection
control program is a structured and organized to inspect all devices in a timely manner eliminating
and containing any hazards that might enter our municipal potable water supply. This program is
implemented for public safety and enforced by local ordinance. The Utilities Division will
determine, as part of its granting of a water service, those sites which will require
a backflow prevention device. There must be an approved backflow prevention device installed
and inspected by staff at those designated sites prior to the water service being activated.
40

POLICE DEPARTMENT
In 2016 the Salem Police Department again dealt with a large number of Part A & B Crimes.
These serious criminal offenses, many of which are quite time consuming to investigate, are a
draw on our limited resources. They include drug cases, arsons, and felony-level thefts to name a
few; plus the court PC Hearings/appearances that result. Part A activity increased in areas, as
well as motor vehicle. Some administrative and minor cases appear to have gone down, but
lobby calls were up. Officers were tied up on the longer, more serious investigations and did not
have the time to participate in more undirected patrol functions - such as officer-initiated
activities like traffic stops, business checks, and to a limited degree, neighborhood patrols. We
had several officers out on extended injuries as well. Despite this, we continued to provide
adequate coverage for our neighborhoods, schools and businesses. Patrol call-driven activity
levels remained high; with some areas experiencing large increases and others seeing decreases.
In-custody arrests, though slightly lower, remain well above that of surrounding towns again this
year.
The most serious issue facing our community continues to be the alarming issue of drug
offenses. The 2016 year number appears to be lower, but in fact, it is not. These types of crimes
continue to bring with them other issues such as an increase in burglary, shoplifting and theft,
assault, gun-related criminal activity, overdoses and more. Unfortunately, our computer system
does not single drugs out when they are an additional offense/charge in an investigation, which
they often are. This leaves our statistics in this area artificially lower than what we actually deal
with. Though we have worked diligently to stem illegal drug crime in Salem; much of it
continues to come in from the larger cities in Massachusetts (dealers) and from northern NH
towns (buyers & dealers). The drug business also contributes to the issues of shoplifting and
thefts, and the attempted sales of stolen goods at Salem pawn shops. Salem PD has assisted
numerous other law enforcement agencies in making arrests of those individuals who come here
to fence stolen goods. Our illegal drug reduction efforts have also paid off for the town through
asset forfeiture awards, which have been used to purchase needed equipment for the agency at no
cost to the tax payer. By law, these purchases cannot be used to supplant items normally
purchased via our budget process. In the past thirteen years we have legally and judiciously used
over a million dollars in asset forfeiture funding to purchase non-budgeted items such as
specialty and staff vehicles, computers & software, training, defensive equipment, and more.
We will continue to effectively and efficiently use the resources allotted us to keep Salem a safe
and inviting community. Our involvement in community events has increased with the return of
the Community Services Unit. National Night Out will again return in 2017. Please also consider
participating in our 2017 Citizens Police Academy. The date of this event will be announced
during the summer of 2017. The Citizen Academy has given Salem residents a chance for totally
open discussion and review of how we operate as an agency. It is well-worth the time
investment.
Thank you for your support and encouragement.
Respectfully submitted,
Paul T. Donovan, Chief of Police
41

POLICE DEPARTMENT
2016 DEPARTMENT STATISTICS
PATROL DIVISION
Totals
Total Criminal Calls: 8,837
Total Non-Criminal Calls: 24,643
Total Calls for Service: 33,480
Total Lobby Calls: 13,414
Total Case #’s Assigned: 12,558
Motor Vehicle Stops: 13,962
Summonses Issued: 1,494
Warnings Issued 8,634
Motor Vehicle Accidents: Reported: 1,152 Investigated: 587
CRIME STATISTICS
Class A Offenses:
Arson: 02
Aggravated Assault: 30
Simple Assault: 210
Intimidation: 72
Bribery: 0
Burglary/Breaking and Entering: 71
Counterfeiting/Forgery: 82
Destruction/Damage/Vandalism: 204
Drug/Narcotic Offenses: 669
Embezzlement: 21
Extortion/Blackmail: 9
False Pretenses/Swindle/Confidence Games: 129
Credit Card/Automated Teller Machine: 153
Impersonation: 82
Welfare Fraud: 0
Wire Fraud: 2
Gambling Offenses: 0
Homicide, vehicular: 0
Kidnapping/Abduction: 5
Pocket-picking: 0
Purse Snatching: 1
Shoplifting/Willful Concealment: 488
Thefts from buildings: 85
Thefts from coin-operated machines: 0
Thefts from motor vehicles: 54
Theft of MV parts/Accessories: 17
All other larceny: 63
Motor Vehicle Theft: 29
Pornography/Obscene Material: 8
Prostitution Offenses: 11
Robbery: 39
Forcible Rape: 5
Forcible Sodomy: 1
Sexual Assault with an object: 0
Forcible Fondling: 13
Incest: 0
Statutory Rape: 0
Receiving stolen property: 113
Weapons Law violations: 13
Class B Offenses:
Bad Checks: 20
Curfew/Loitering/Vagrancy: 12
Disorderly Conduct: 92
Driving under the Influence: 272
Drunkeness: 78
Family Offenses, non-violent: 42
Liquor Law violations: 82
Peeping Tom: 0
Runaway: 2
Trespass of real property: 47
All other offenses: 983
Traffic, Town Ordinance Offenses: 619
TOTAL A & B CRIMES 4,930
TOTAL ARRESTS 2,086
Adult 1,834
Juvenile 252
42

POLICE DEPARTMENT
2016 DEPARTMENT STATISTICS
ADMINISTRATIVE STATISTICS
Pawn Slips: 25,109
Insurance Requests: 1,223
Parking Tickets: 172
Pistol Permits: 516
Alarm Permits: 142
Record Checks: 801
Subpoenas: 937
VIN 58
Fingerprinting 217
Discovery Packets: 457
Arraignments: 1,580
Trials: 628
PC Hearings: 622
Grand Jury Indictments: 348
Pre-Trial Conferences: 367
TOTAL STATISTICS
Total Calls for Service: 33,480
Dispatch Lobby Calls: 13,414
Administrative Statistics: 33,177
2016 TOTAL STATISTICS: 80,071
43

SALEM COMMUNITY TELEVISION
Salem Community Television began in 1971 with an agreement between Salem Cable TV and the
Town of Salem. In the 1980’s, a second channel was added to play Government and Public Access
programming. In 2005, The Salem Government Channel was created and is dedicated to air live
and pre-recorded coverage of Salem meetings. In 2016, SCTV celebrates its 45th year of serving
the Salem Community. The main office is located at the High School Media Center, 44 Geremonty
Drive in Salem and our telephone number is 603-893-7069 x5118. Staff members include: Tom
Giarrosso - Executive Director, Judy Day, Susan McLoughlin, Larry Seaman, and Aaron
Shamshoyan.
SCTV shares community media center space with Salem’s Learning Channel (SLC6) and students
enrolled in vocational television broadcast courses at Salem High School. The shared facilities
provide cost effective means and the support necessary for community members to express
themselves through the production and distribution of television programs.
All Salem residents and employees of Salem located organizations are eligible for training utilizing
SCTV equipment and services for non-commercial programming. SCTV is committed to the idea
that community and public access programming should serve the greater Salem community. The
public is invited to participate in the creation of these programs.
The Mission of Salem Community Television is to use cable television’s unique capabilities to
address the communications needs of individuals and organizations in Salem; to provide training
and resources to make use of this communication medium; to increase access to the educational,
cultural, political, municipal, and human service resources of the Town; to strengthen the ability
of Town organizations to serve residents by distributing information to the community; and to
provide local television programs and opportunities to create programming for residents of Salem.
In 2009, Town Meeting established a Revolving Fund under RSA 31:95-h for the purpose of
providing public, educational, and governmental programming (PEG) and designated 100 percent
of the revenue from cable franchise fees be used in support of the stations. This completed a 3-
year transition to integrate SCTV into of the Town of Salem.
SCTV also coordinates several web sites including sctv17.com, sgc23.com, salemchristmas.com,
salemondemand.com, and salemnhhistory.com in conjunction with the Salem Historical Society
and Salem Media Services. Over 2,000 programs are available as Video On Demand from your
internet browser, including local shows and government meetings since 2006. The channels are
also available to view as a live remote video stream over the internet, so Salem meetings can be
seen live with an internet connection. School Board meetings and other educational programming
can be found on ssdtv6.com.
Respectfully submitted,
Tom Giarrosso, Executive Director
44

TAX COLLECTOR
The office of the Tax Collector is responsible for collecting revenue for property, yield, current
use taxes and town utility fees. Other major departmental responsibilities include responding to
inquiries from banks, mortgage companies, attorney’s offices and the general public. All of
these transactions are handled in a courteous and timely manner.
On May 18, 2015, the on-line bill payment and paperless billing system for property taxes and
town utility (water/sewer) bills via our third party payer Invoice Cloud was launched. The
customer is now able to view and/or print their actual bill as well as have the option to pay on-
line and/or register as a permanent paperless customer. They can also make full or partial
payments anytime or schedule future payments, review their payment history and receive e-mail
notifications, reminders and receipt confirmations. The link is available on the home page of the
Town of Salem’s website; select the Online Payments button at the bottom of the page and
follow the instructions that appear on the screen. By using this on-line system, the Town of
Salem is able to accept electronic transfers for both property tax and town utility payments at no
additional cost to the customer.
The collection clerks work under the supervision and direction of both the Tax Collector and
Town Clerk. They are trained to register motor vehicles, accept payments for property tax and
town utility bills; recreation fees; building permits and other miscellaneous payments. I wish to
thank full-time clerks Jillian Skene and Rosie Daigle; along with part-time clerks Nicole Morse
and Cathy Brown for their hard work and dedication serving the public.
I wish to express my sincere thanks and appreciation to Deputy Tax Collector Donna Bergeron
for her dedicated assistance, dependability and accuracy in our record keeping.
Respectfully submitted,
Cheryl-Ann Bolouk, CTC, Tax Collector
45

TOWN CLERK
The total gross revenue for the Town Clerk’s office in 2016 was $6,387,606.50. This was an
increase of about $461,159.50 in revenue.
In May of 2012, the collection clerks were trained to be Municipal Agents. This means when
registering a motor vehicle, we can process both the Town and State portion for an additional
$3.00 agent fee per transaction. The Town Clerk’s office also offers motor vehicle renewals on
line (E-Reg) and dog renewals on line.
Clerks from both the Town Clerk’s office and the Tax Collector’s office are cross-trained to
perform most of the functions of both offices. The clerks register and title motor vehicles, issue
plates, license dogs, sell landfill permits, accept payments for property tax bills, water and sewer
bills, recreation fees, building permits and other miscellaneous collections. This “one stop
shopping” has worked very well for both the clerks and for the residents of Salem.
The full-time clerks in this office are Jillian Skene and Rosie Daigle. Nicole Morse and Cathy
Brown are our part-time clerks. I would like to thank all the clerks for their dedication and hard
work making the Collections Department a success; they are all assets to the Town of Salem.
These clerks work under the supervision and direction of both the Town Clerk and the Tax
Collector.
Kelly Dortona is my Deputy Town Clerk. Kelly and I continue to perform all other functions of
the Town Clerk which include marriage licenses, vital statistics, town records, voter registration
applications and information, elections, UCC terminations, State liens and attachments, dredge
and fill applications, pole permits, Article of Agreement (non-profit filings), oaths of office and
Sheriff’s writs. We also are available to help in the collections department when needed and
continue to do the bookkeeping duties of the Town Clerk’s office, which maintains an
accounting of its own revenue.
There were 17 resident marriages, 168 resident deaths and 36 resident births which took place in
NH in 2016. We have no record of any out of state vital events.
Respectfully submitted,
Susan Wall, Town Clerk
46

TOWN CLERK
RECEIPTS AND VITAL STATICS
Automobile Tax Permits $6,159,691.00
2016 (37,292)
Title Fees 16,514.00
Municipal Agent Fee 108,177.00
Marriage License Fees* 19,550.00
Certified Copy Fees** 40,340.00
Dog License Fees***
2016 (4,225) 26,662.50
Elections 389.00
Uniform Commercial Code & Other Liens 4,110.00
Collection Fees 1,062.00
Filing Fees 36.00
Recording Fees 0.00
Legal Fees - Dogs 11,075.00
Gross Receipts Remitted to the Treasurer $6,387,606.50
*Less Remittance to State of NH for Marriage License Fees - 16,684.00
**Less Remittance to State of NH for Certified Copy Fees - 16,900.00
(1280 copies @ $ 8.00 ea = $10,240.00)
(1332 copies @ $ 5.00 ea = $ 6,660.00)
***Less Remittance to State of NH for Dog License Fees - 2,112.50
(4,225) Licenses @ .50 ea. - $ 2,112.50
***Less Remittance to State of NH for Animal Population Control Fees - 7,552.00
(3,776) Licenses @ $2.00 ea - $ 7,552.00 ____________
Net Revenue to the Town $6,344,358.00
VITAL STATISTICS --2016
MARRIAGES Salem Residents -- Married in NH 17
BIRTHS Resident Births -- Born in NH 36
DEATHS
Salem Residents -- Died in NH 168
47

THIS PAGE INTENTIONALLY LEFT BLANK
48

Boards, Committees,
and
Commissions


BUDGET COMMITTEE
From October to December the Budget Committee reviews the Town and School budgets
recommending cuts or different approaches to reduce costs. In early January we review the
warrant articles from both sides of the street, open a public meeting, and then move them on to
the taxpayers for their approval.
The process this budget season was made easier by the work of both Town and School officials
whose diligence provided us with budgets with very little waste. On the 9th of February you will
have the opportunity to review the final budget and warrant articles for the School District. There
are three contracts that have been negotiated and can be reviewed from the floor of the meeting
for final taxpayer approval before moving to the March ballot. The large share of the increases in
the School budget was a combination of reductions in the State commitment to provide
retirement funding and the last bond for the High School renovation project.
From the Town, we know from past experience, the projected tax impact should be less once the
contracts are bid out. We should know more by the Town meeting on Feb 11th and adjustments
can be made from the floor of the meeting. Warrant articles from the Town include employee
contracts and their effort in the past to reduce healthcare costs finally seems to be taking hold.
I would like to thank my fellow committee members for all their questions, research, and
cooperation; it has been a pleasure to serve as your Chairman. To Superintendent of Schools, Dr.
Michael Delahanty, your staff and School Board should be commended for the tireless
commitment to the students, staff, and infrastructure in the District.
To Town Manager, Leon Goodwin, thanks for the communication prior to and during the budget
review; it was invaluable to the process. In the short time you have been here it would seem you
have earned the respect of staff and gained an appreciation for the Town and its’ residents.
Thanks to my fellow officers Paul Huard - Vice Chairman, Steven Chartrain – Secretary, Board
Members – Dane Hoover, Shannon Bettencourt, Tom Plante, David Bettencourt, and School
Board Representative Bernard Campbell and Selectman Representative Michael Lyons.
Respectfully submitted,
Robert Bryant 2016-2017 Chairman/Town Budget Committee
51

CONSERVATION COMMISSION
In 2016 the Conservation Commission held 12 regular meetings, site walks at 27 locations, and
6 non-public meetings. Projects reviewed by the Commission at its regular meetings included 16
applications for wetland filling, lakeside retaining wall replacements, and a prime wetland
re-delineation and 8 applications for Conditional Use Permits for proposed encroachment in
wetland setbacks or buffers. We also held workshops on the invasive Emerald Ash Borer insect,
the Natural Resources section of the Town’s Master Plan, the NH Wildlife Action Plan, the
Town Forest Rules, and the Commission’s Bylaws and Rules of Procedure.
The major highlight for 2016 was the acquisition of 133 additional acres of land on Bluff Street
and Zion Hill Road for the Salem Town Forest. The Commission purchased 101 acres from Mr.
Steve Hatem in May. Mr. Hatem donated an additional 32 acres to the Town. The Southeast
Land Trust (SELT) provided significant help to the Commission with this acquisition. The Town
bought the land for $750,000, of which $500,000 was paid at closing and $250,000 will be paid
over the next 2 years. This was a once-in-a-lifetime opportunity to substantially expand the
existing 200 acre Town Forest.
SELT helped the Town apply for grants totaling $330,000 from the NH Department of
Environmental Protection Aquatic Remedial Mitigation program and the NH Land and
Community Heritage Investment Program. These two awards will help the Commission pay for
the purchased acres plus develop a new management plan and new trail system for the expanded
Town Forest.
Other Commission activities in 2016 included trail system maintenance and offering several
guided walks in the Salem Town Forest; participating in Salemfest with educational materials;
adopting a proposed wetland mitigation priority list for local projects requiring mitigation;
sending a letter to the NH Fish and Game Department opposing bobcat hunting; and proposing a
zoning ordinance change for the 2017 Town Meeting ballot to change the conditional use
requirements for wetland setback and buffer encroachments
Some properties within Salem are taxed at a lower rate under the State’s current-use statute.
When properties are removed from current-use status because of development, the land owners
must pay a Land Use Change Tax. Town meeting voted to put all LUCT funds in the Town’s
Conservation Fund to manage and acquire additional conservation land. LUCT funds added in
2016 were $107,000. At year end the Conservation Fund balance was $94,000.
We express our tremendous gratitude to Lawrence Weil who stepped down from the
Commission. The Board of Selectmen appointed Regina Andler and David Blake to fill vacant
positions. At year end, one alternate member vacancy remains open.
Respectfully submitted,
Linda Harvey, Chair
52

COUNCIL ON AGING
The Salem Council on Aging (COA) consists of seven Salem residents appointed by the Board
of Selectmen. Their mission is to help insure Salem provides its older residents with the
opportunity to maintain self-sufficiency in their homes; acquaint them with local, county, state
and federal programs; increase their opportunities to interact in the community; and provide
them with a center which fosters mental, physical, social and nutritional well-being in a
wholesome environment.
2016 continued to be an exciting and busy year for the Council. As Chairman, I’d like our
citizens to realize just how great an impact the Councils’ efforts help our community. As you go
on to read more detail below, please keep in mind that all our efforts and contributions are saving
tax dollars. Many of the improvements we do for senior programming or to the Ingram Senior
Center most likely would go unrealized, as they are not provided for in the Senior Services
budget.
We want to thank ALL who have helped us in our fundraising efforts. We continue to actively
fundraise, solicit donations and seek grants, resulting in more than $50,000 for 2016. We
continued our commitment to volunteering our time as a designated charity for the Texas
Hold’em events at Rockingham Park until it closed. This effort raised $28,183. Since the track
has closed, the council is currently reviewing other fundraising options which we hope roll out in
2017.
As in the past, the ‘Off Broadway Thrift and Gift Shop’ continues to be a huge contributor to this
fund; in 2016 the thrift shop raised $15,006. Other major contributions include the donation of
$3,089 from the Bingo Group, $1,329 from the 45’s Card Group, $280 from the lobby donation
box, $217 from the Poker Group, $139 in appreciation of Reiki Treatments, and $198 from the
FanTan group. More than 45 other individuals gave very generous donations, such as memorials
in memory of a loved one or in appreciation of the good times and services they receive at our
center, totaling $1,560.
We expended more than $18,500 to help enhance and supplement the facility, programs and
services offered by Salem Senior Services. Some of our major expenditures included the annual
Volunteer Appreciation event, wiring for TV’s and a new TV to advertise events and activities,
moving and refelting the pool table, new tablecloths, file of life magnets, subsidizing coffee
purchased at the center, annual support contract with myseniorcenter.com, awards for the
Tournament Challenges held during the annual Anniversary Celebration event, entertainment
events, and several miscellaneous repairs, supplies and enhancements to the Ingram Senior
Center building. The largest single improvement the council supported this fall included
covering the cost of adding another door and reception area into the center for those coming to
the center to register for recreation activities.
The Council on Aging would like to thank Marie Gauvin, Ann Sheehy and Barbara Ferrero for
their commitment and hard work in creating a Tired & True Family Recipes Cookbook to help
raise additional funds. The book was created a couple years ago, but the last of the books were
sold in 2016. The total profit for the cookbooks was $3,449.25.
53

COUNCIL ON AGING
Salem Senior Services continues to grow and by year-end had more than 2,955 seniors regularly
participating in programs and activities. I wish to also commend the staff and all of the
volunteers for the great job they do each and every day to facilitate Salem having the best Senior
Center in New England! Please drop in and check us out when you’re in the neighborhood!
P.S. For your information, you should know your Senior Center is the envy of all the other
Senior Centers in the state of New Hampshire.
Respectfully submitted,
Russell Ingram, Chairman
54

HISTORIC DISTRICT COMMISSION
The Historic District Commission had a year that was exciting and also disheartening. The
fountain was reconnected after many years and with help of the Garden Club flowers were
planted and a lost plaque was found.
Hose House #2 was completely restored and the electrical, heating and air conditioning was
updated. Dr. Henry LaBranche, Howie Glynn, Dan Zavisza, Sue and Michael Covey, Phil
Cammarata, Chief Paul Parisi, Kevin Breen, Beth Roth and myself, worked diligently to
accomplish this task. We are all very proud of what has been accomplished. Brendon Nault, a
student a Woodbury School, created a display on the second floor of the Hose House exhibiting
various old and new techniques for firefighting.
The Woodbury History Club, under the supervision of Mrs. April Muraco, a teacher at the
school, researched several grave stones and straightened eight stones. The club hopes to return in
the spring to clean and preserve these very old grave sites. The History Club also made a
presentation about the background of the people that are buried at the “Old Burying Ground”.
The garden was extremely beautiful this year at the museum thanks to the hard work of Diane
Dube. Diane gave tender loving care to the plants during the drought this year. Along the Rail
Trail, there was a park bench placed at the Salem Depot Train Station for all to rest and enjoy on
their walks.
Many thanks to the Salem Lions Club for keeping a tradition of the Christmas Tree Lighting and
Nativity scene at the Town Common. This year was very special as the children from the Birches
Academy sang Christmas carols.
On a sad note, the Garden Club has disbanded after many years and they will be greatly missed.
The Rockingham Race track is also gone after more than one hundred years of operation. They
will be greatly missed as they had made significant contributions to the Town of Salem. It can
never be replaced. A special thanks to Ed Callahan and the track for hosting the Texas Hold’em
tournaments, with a portion of the proceeds being donated for the work in the district with no tax
implications to the residents of the town.
Respectfully submitted,
Beverly Glynn, Chairperson
Katheryn Burke, V. Chairperson
Beth Roth, Secretary
Pat Good, Member
Ed Brooks, Member
55

SALEM HOUSING AUTHORITY
Applications Continue to Stream In
The Housing Authority maintains a lengthy waiting list for the public housing program, and in
2016 our office received and processed nearly 100 new applications! Wait time continues to
average several years for applicants who seek occupancy at one of our three public housing sites:
Millville Arms (75 units), Telfer Circle (75 units), and Hilda Place (8 units). As mentioned in
previous reports, our public housing units are restricted to low-income elderly and/or disabled
households (head or co-head).
We were pleased to renew the lease with Greater Salem Caregivers once again this year. They
continue to utilize our office space at the Millville Arms complex and we have enjoyed having
them there! Additionally, the Senior Center was able to utilize our community room space at
Telfer Circle to put on a two-day training program that was well attended. We are grateful for
our ongoing association with the Lancaster School and for the events and activities that bring our
residents and the students together.
With funds from a HUD capital grant, the entire Telfer Circle complex (including all dwelling
units) received new locksets and a new, improved keying system for better safety and security.
The SHA updated its Emergency Plan this year with input from the Salem Fire and Police
departments. We were very grateful for their assistance! As always, we are thankful for the
positive relationship we share with the Town of Salem.
For more information about our public housing program or about our Downing Way rental
property (restricted to occupants age 62 or older), we welcome you to contact our office at 603-
893-6417.
Respectfully submitted,
Board of Commissioners
Virginia Consoli, Chairperson
Gwendolyn Brainerd, Vice-Chair
Georgette Smith
Frank Grzasko
Kenneth Akerley
Diane E. Kierstead, Executive Director
56

KELLEY LIBRARY TRUSTEES
The Kelley Library Trustees are proud to serve the community of Salem and the library employees.
We would like to thank the library staff and Director Alison Baker for their hard work in 2016.
At the beginning of the year Trustee Martha Breen completed her term of service. Martha's
contribution to the Board was immeasurable. Her wisdom, intellect and attention to detail will be
missed. To honor her dedication the small conference room on the ground floor will be remodeled
and named the Breen Meeting Room. In March Martin Isaks joined the team and now serves as
our Treasurer. We look forward to his contributions.
From September through November the Library participated in the Community Stories program.
This program included multiple libraries and was primarily funded by the New Hampshire
Humanities. The project focused on Tim O'Brien's Vietnam War novel The Things They Carried.
To support this program the Library hosted a number of events including films, book discussions
a program called Voices of Salem Veterans which highlighted veterans in our community.
Assistant Director Natalie Ducharme served as our liaison to the program and planned many of
the special events, we would like to thank her for a job well done.
Throughout the year the Trustees planned for the future. This included updates and revisions to
the Library's employee handbook and policy manual. With guidance from Director Alison Baker,
the Library now has to documents that better fit the needs of our employees and patrons.
Continuing with the theme of planning for the future, the Trustees focused on facility
improvements. The air conditioner unit in the Beshara Room was replaced and plans are underway
to replace the unit in the Children's Room. Throughout the year we spent time planning, evaluating
and assessing the cost of future building improvement projects.
Respectfully Submitted,
Kathleen Norton, Trustee
Cindy Jury, Vice Chair
Martin Isaks, Treasurer
57
KELLEY LIBRARY DIRECTOR
We at the Kelley Library continued to make the library space welcoming and ready to serve the
changing library needs of the community of Salem. Digital resources are now an integral part of
the collection of quality books, films and music and services. As always, we invite you to come
and see for yourself what’s new this year at your local library.
A new website was launched embracing the move from computers to hand held devices.
The website is readily usable over all digital products, and makes accessing the online and digital
products the Library offers easy.
The move away from Dewey to a more intuitive, word based (NATLAC) organization
continued for adult materials, with just a small portion left to complete. The change to NATLAC
has been seamless and embraced by library users. A NATLAC system has been started in the
Children’s Room to make accessing the right books easier. The Trustees used their funds to
purchase shelving for the children’ room to support this new model of organizing the Children’s
Room.
The programming offered by the Library was expanded. There are now 4 Book Groups:
Science Fiction/Fantasy, Non-fiction, Fiction, and True Crime. The Children’s Department
added a new kind of drop in program for babies: Play Date at the Library. These Monday drop
in programs feature a rotating array of developmental toys and an opportunity to provide fresh
challenges for babies in addition to social interactions. Monthly Lego programs, one series for
preschoolers and the other series for elementary, was added as well.
One aspect of the Library’s mission is to support imagination, exploration, and creativity.
The Children’s Room added a new Lego table (a donation from Barnes and Noble), several
sensory exploration tables, a new Thomas the Train table, and a Creation Station. The Creation
Station offers a changing selection of crafting and art supplies for elementary aged children to
create artwork. No directions, no preset ideas – just an opportunity to be imaginative.
Two AWE computers were added to the children’s room. These are computer systems
heavily loaded with a wide range of educational programs. The purchases included one focused
on preschoolers and one focused on early elementary aged children.
Generous donations continued in 2016, with a focus on items. The Library received
beautifully framed map of old Salem from an area businessman. Additionally, an original James
Christensen “Once Upon a Time”, was donated by a local couple. Both pieces of art are on
display near the Kelly Room. In the Kelly Room is a ship model of Capt. Cook’s HMS
Endeavor. The model was donated by the modeler himself, a local resident and master modeler.
And a lilac bush donated by a long time library user is thriving.
Did you know? You can create animated video, as well as edit music, video, and pictures using
one of several different software options on our public access computers?
Respectfully submitted,
Alison Baker, Director
58

REGISTERED USERS
Adult Cards 12,210
Children's Cards 1,895Total 13,105
New Registrations, 2016 1,249
RESOURCES AVAILABLE
Books 75,418
Audio: Books and Music 7,759
Video: DVD, Blu-Ray, Games 10,097
Other: Kindles, etc 21
Magazine and Newspapers: print copies 3,037
Magazines and Newspapers: Microfilm reels 1,621
Magazine and Newspapers: eResources 11,118
Downloadable: Audio and eBooks 51,321
Museum passes 19
Streaming media: Music and Film 3
eResources 24
Total 160,438
ITEMS CIRCULATED
Books: Adult 68,114
Books: Children's 57,565
Books: Young Adult 3,565
Magazines 5,100
Audio: Books and Music 16,157
Video: DVD, Blu-Ray, Games 52,498
Other: Kindles, etc 447
Museum Passes 885
Downloadable: Audiobooks 4,496
Downloadable: eBooks, eMagazines, eSources 9,842
eResources: Sessions 51,998
Streaming music and film: Sessions 396
Total 271,063
Items added, 2016 9,827
IN-HOUSE ACTIVITY
Adult Programs 83
Attendance 611
Children's and Teen Programs 187
Attendance 2,786
Meeting Room Reservations, community 320
Public Computer Sessions (23 computers) 11,262
Total visits 142,510
2016 KELLEY LIBRARY STATISTICS
"A Lifetime of Discovery and Enrichment"
59

MUSEUM COMMITTEE
The Salem Historical Museum consists of five buildings located in the Salem Center Historic
District: the Old Town Hall (built 1738), Alice Hall Memorial Library (built 1861), Schoolhouse
#5 (built 1873), Hose House #2 (built 1906) and the train station at the Salem Depot, which has
been totally renovated. Each building houses artifacts and displays relating to that building.
Donations of memorabilia and memories of Salem are much appreciated and can be made in the
donor’s names. The most recent restoration is the re-connection of the water fountain at the
intersection of School St. and Main St.
Volunteers are an intricate part of our success. Many volunteer faithfully giving much of their
time and energy to the maintenance, cataloging, guided tours and setting up of new displays for
public viewing. We have been fortunate to have many visitors from around the world tour the
buildings. They have been quite impressed with our exhibits. The most recent group from Egypt
enjoyed our history and also gave us a first-hand account of their lives. It is not only tourists that
enjoy our history but also many of the residents of Salem, including the school children and civic
groups that tour the buildings. Volunteers are always needed and appreciated.
The buildings are open from March to the first week of November, on Mondays from 2pm to
5pm. Additional openings and tours are available when requested by appointment. We just love
to show off the buildings.
This year’s programs are as follows:
March 14 Inside Russia today
April 11 Invasive Plant Species ID & control
May 9 Acadians & Cajuns
June 13 Mystery Hill
July 11 Canobie Lake Park
August 12 Field Trip to the Robert Frost Farm
September 12 Memories of the Salem Grange
October 10 All Aboard the Titanic
November 14 Isabella Stewart Gardiner, Part 2
All programs start at 7:00 pm and are free and open to the public. Please join us to help share
Salem’s history.
Respectfully submitted,
Beverly Glynn, Curator
60

PLANNING BOARD
It is my honor and privilege to provide a summary of the Salem Planning Board’s activities in
2016. The Board held 24 regular meetings with 70 agenda items.
As anticipated, we spent a fair amount of time working with the Tuscan Village, a multi-use,
town center project at the site of the former Rockingham Park. The beginning of the year saw
the conceptual plan for the initial 50 acre parcel as well as the subdivision for the future site of
Salem Ford. As the project size increased to 170 acres with the purchase of the balance of the
Rockingham site, the center of the project shifted south and the “North Village” took shape.
This portion has been further subdivided to accommodate 256 apartments, 100 townhomes and
26 acres of retail development. We eagerly anticipate the conceptual plans for the balance of the
site.
In addition to the Salem Ford dealership, we approved several commercial projects. These
include the redevelopment of Sal’s Pizza with an 18,000 square foot mixed use development, the
final approval of a new Cumberland Farms on South Broadway, Space Place, a 97,000 square
foot mini-storage facility and a cell tower on Zion Hill Road proposed by Verizon Wireless.
There were also several residential projects approved in 2016. The Stonebrook subdivision was
approved in three phases yielding 27 house lots and 132 acres added to the Town Forest. A 14
unit condominium project for Salem MOB was approved on Sally Sweet’s Way as was the 60-
unit DHB senior housing project on Lawrence Road.
The Board re-instated the Public Safety impact fee based on a report prepared by Bruce
Mayberry, the Town’s impact fee consultant.
I thank all of the members of the Board and Town staff for their dedication and work during
2016, as well as the professionalism of the applicants as they appeared before us.
Respectfully submitted,
Keith Belair, Chairman, Salem Planning Board
Major Projects Approved By Planning Board – 2016
Applicant Project Location Map/Lot
Salem Ford 38,500 sf car dealership So. Broadway 99-12507
Stonebrook 7 lot subdivision Zion Hill Rd./Bluff St. 47-6874
Verizon Wireless cell phone tower Zion Hill Rd. 26-6381
Space Place 97,500 sf self-storage Lowell Rd. 124-8842
So. Broadway Dev. used car dealership* So. Broadway 144-204
Stonebrook 6 lot subdivision Zion Hill Rd./Bluff St. 47-6874
Lupoli 18,000 sf mixed use project No. Broadway 89-1150
Ford Flower 3800 sf retail addition So. Broadway 99-825
J & S (Enterprise Bank) 6000 sf bank Main St. 89-1147
Tuscan Village conceptual master plan Central St. 98-12502
Salem MOB 14 unit multi-family bldg. Sally Sweet’s Way 91-7523
DHB Homes 60-unit senior housing project Lawrence Rd. 100-7913
Stonebrook 14 lot subdivision Zion Hill Rd. 47-12526
Aroma Joe’s 790 sf drive-through coffee shop No. Broadway 81-12453
*change of use within existing building
61

SUPERVISORS OF THE CHECKLIST
2016 was a very busy year for the Supervisors, as it is every year when there is a Presidential
Election. This past year we handled four elections: the Presidential Primary in February, the
Town election in March, the State Primary in September and the General Election in November.
Our duties include registering new voters, updating voter information (i.e. change of address or
name) and removing voters who have moved or are deceased. After each election, we are
responsible for reporting to the State how many people voted, registered and/or changed party
affiliation.
The total number of registrations processed by the Supervisors during 2016 was 3,608. Of this
number 1,395 were same day election registrations processed on November 8, 2016. As of
January 26, 2017, the total number of registered voters in the Town of Salem is 22,224. This
number is comprised of 8,544 undeclared voters, 5,996 democrats, 7,683 republicans and 1
Libertarian. As of January 2017, voters in the State of New Hampshire can choose to be
registered as Libertarian.
The Supervisors would like to remind everyone that a resident may check their registration status
at any time. The complete Voter Registration Checklist is updated periodically throughout the
year and a copy is always available at Town Hall and the KelleyLibrary. This checklist allows
you to verify your name, address and party affiliation as well as which polling location you
should go to cast your ballot. If any of the information is not correct, you may fill out a new
registration form at Town Hall during regular business hours or at any of the special sessions
held by the Supervisors. These sessions are mandated by the State of New Hampshire and are
held at various times throughout the year. Notices of these special sessions are always
publicized in the local newspapers, on the local government channel, and are posted at the Town
Hall. While New Hampshire does allow new registrations on election days, we highly
recommend that you ensure you are registered to vote prior to Election Day.
Respectfully submitted,
Melissa M. Sorcinelli
Patricia W. Frydryck
Sheila M. Murrary
62

TRUSTEES OF TRUST FUNDS
The Trustees of Trust Funds are comprised of three elected officials who are authorized by NH
State Statute (RSA 31:19-38-a) to administer various non-expendable trust funds created by gifts
and legacies to the Town. In accordance with their fiduciary duties, the Trustees seek to preserve
the capital of the funds. The Trustees also currently administer separate capital reserve funds
appropriated by Town Meeting.
The Trust funds are held to purchase library or educational material and scholarships. The
Capital Reserve Funds are appropriated for road improvements, school district improvements or
the purchase of capital equipment.
The Trustees disburse funds throughout the year as necessary from the capital reserve accounts
and disburse income annually to carry out the designated purposes of the non-expendable trusts.
Since 1994, the day-to-day management of these funds has been performed by Citizens Bank
Investment Services.
The New Hampshire Attorney General’s office states that:
1 } Trustees of the Trust Funds are the custodians of the Town's perpetual care funds, charitable
trusts, private donations and capital reserve/expendable trust funds. The Trustees of the Trust
Funds act in a fiduciary capacity and make decisions regarding expenditure from these funds
based on the wishes of the donor in the case of privately donated funds and release capital
reserve funds and expendable trust funds to the appropriate government officials upon request
and make the decisions on how these funds are to be invested, based upon the statutes and the
investment policy adopted by the Trustees.
2 } Authority to administer Town trust funds is vested solely in the Trustees and income
therefore cannot be turned over to the Selectmen for purposes contrary to the judgment of the
Trustees.
The Trustees wish to thank Tax Collector Cheryl-Ann Bolouk for volunteering to perform their
record keeping functions for the past twenty-six years.
If you have any questions or suggestions regarding the Trust Funds please contact the Trustees at
the Town Hall.
Respectfully submitted,
Thomas Linehan, Chairman
Susan Covey
Russell Frydryck
63

64
ZONING BOARD OF ADJUSTMENT
The Zoning Board of Adjustment derives its power to hear petitions, and grant relief, from the
New Hampshire Revised Statutes Annotated (RSA) and from the Town of Salem Zoning
Ordinance. The Zoning Board of Adjustment is a quasi-judicial board and hears cases brought
forth by property owners who seek relief from the strict terms of the Town of Salem zoning
requirements. Relief is granted by way of Variance as well as through Appeals of Administrative
Decisions made by Town officials.
The primary goal of the Board is to uphold the strict terms of the ordinance in a professional, polite
and courteous manner. Board members follow a strict set of criteria and use all applicable
ordinances, statutes, and case law when deciding each petition separately and on its own merits.
The Zoning Board of Adjustment meetings are held the first Tuesday of each month. The meetings
are televised and broadcast live on SCTV 23 and rerun throughout the month. The meeting can
also be viewed on the Town website at www.townofsalemnh.org or www.sgc23.org. The public
is invited and encouraged to attend the meetings.
The 2016 year was an interesting and difficult one for the Zoning Board. In what was, perhaps, the
most difficult issue the Board faced in many years, the Board met three times in September to
consider three requests for charitable gaming facilities before the decision was made.
This year, the Board heard fifty-three total applications, of which forty-seven were variance
applications. Thirty-three variance requests were granted, eight were denied, two were withdrawn
by the applicant, six were tabled and one continued. The Board granted two requests for Equitable
Waiver, and denied all four of the year’s rehearing requests.
As we begin 2017, I would like to thank Planning Director Ross Moldoff and Administrative
Secretary Lisa Wojtas for all their hard work in putting the applications together and helping to
keep the Board running smoothly and efficiently.
Respectfully submitted,
Bernard W. Campbell, Chairman
Zoning Board of Adjustment Petitions - 2016
2016 Total
Applications
Granted Denied Withdrawn Tabled Continued
Variance 47 33 8 2 6 1
Equitable Waiver 2 2 0 0 0 0
Re-hearing 4 0 4 0 0 0
Appeal of
Administrative Decision
0 0 0 0 0 0
Special Exception 0 0 0 0 0 0
Totals 53 35 12 2 6 1
Note: Multiple meetings took place in September.

Financial
Reports


TOWN TREASURER
The Treasurer has duties and responsibilities established by both statute and Town investment
policy. This policy is reviewed and approved annually by the Selectmen. The principal elements
of this policy require the liquidity and safety of Town funds and, consistent with these
constraints, maximizing the earnings on Town funds on deposit. This is the money collected in
property taxes and various fees, and held for use in paying the operating expenses of the town.
Liquidity means that the Town has sufficient cash on hand to meet its expenses, both current and
capital. Safety requires that Town funds are never at risk.
During 2016 the Federal Reserve made no significant changes to interest rates. These rates have
remained low as they have for many years. The intention and expectation were that these rates
would stimulate the economy. Thus the investment policy’s secondary goal of maximizing
interest income on Town moneys on deposit has remained challenging. These low interest rates
are beneficial for borrowers and home buyers, but do not provide much income for savers and
others with cash on hand.
Also in June, we welcomed a new Finance Director, Nicole McGee. As an experienced financial
officer, she has fit right in.
I include the following remarks for reference and for new readers to this space. RSA 41:29
provides in part that: “The town treasurer shall have custody of all moneys belonging to the
Town, and shall pay out the same only upon orders of the Selectmen.” However, essentially all
the financial dealings of the Town are handled by the Finance Department. Nonetheless, the
Town Treasurer, a part-time elected official, has specific tasks and responsibilities not handled
by it. This is due to both statute and Town practice.
The Financial Report section of this Town Report contains a comprehensive listing of town
revenues and expenses. Here I describe how the Town actually guarantees the safety of its funds.
Because Town balances generally exceed FDIC insurance limits, a collateralization procedure is
used. That is, our bank purchases US Government securities in the Town’s name for 102% of
current balances. The amounts on deposit are monitored and the collateralization is adjusted on a
weekly basis.
The Treasurer also has custody of impact fees. These are the fees assessed on new dwellings and
other structures for their impact on the community and are kept in an account separate from the
Town’s general fund. There are four such impact fees, viz. School, Recreation, Public Safety and
Roads. The activity in each of these accounts is summarized in the following table.
Impact Fee Number Balance Receipts Withdrawals Interest Balance
of Fees 12/31/2015 2016 2016 2016 12/31/2016
School 37 348,355 140,153 150,000 23 338,531
Recreation 36 97,583 34,378 0 7 131,968
Public Safety 82 247,972 261,883 2,610 26 507,271
Roads 50 434,896 226,914 150,012 32 511,830
As always, I thank Melanie Murray, Accounting and Budget Manager, who compiled the data
for this report with her usual expertise and unfailing good cheer.
Respectfully submitted,
John Sytek, Town Treasurer
67

Balance of cash on hand January 1, 2016
Cash on Hand 889.48
Checking Account 40,343.61
Certificate of Deposit 10,739.82
Brock Trust Fund 6,493.31
Madeleine L. Marois Trust Fund 3,268.17
Total Cash Balances 61,734.39
Income, 2016
Materials of Trade (fines & payments for lost/damaged items) 11,144.61
Trust Funds 2,014.42
Gifts 2,140.97
Book Sale 4,198.21
Vending 1,836.27
FAX 1,143.05
Non-Resident Registrations 561.00
Misc (sale of headphones, refunds, etc) 296.35
Grants 250.00
Interest 95.33
Total income: 23,680.21
Total Available Funds, 2016 85,414.60
Expenses, 2016
Museum Passes 4,570.00
Programming (Summer Reading, etc.) 1,664.74
Equipment and Furniture 5,138.35
Materials of Trade (books, etc) 2,382.63
Training 1,065.48
Memberships 150.00
Bank charges (returned checks) 37.00
Miscellaneous 35.99
Income given to town to offset budget 8,284.52
Total Expenses: 23,328.71
Balance 62,085.89
Cash Balances, December 31, 2016
Cash on Hand 889.48
Checking Account 41,009.23
Certificate of Deposit 10,782.91
Brock Trust Fund 7,632.54
Madeleine L. Marois Trust Fund 1,771.37
Total Cash Balances 62,085.53
KELLEY LIBRARY
BOARD OF TRUSTEES FUNDS
2016
68

69

70

The notes to the basic financial statements are an integral part of this statement.
71

The notes to the basic financial statements are an integral part of this statement.
72

Beginning EndingBalance Deposits Expenditures Balance
Citizens Bank - OperatingGeneral Fund 27,066,803 89,446,643 104,707,486 11,805,960 Sewer Fund 3,080,546 2,798,595 2,325,343 3,553,798 Water Fund 2,439,758 4,819,412 4,243,089 3,016,081 Outside Detail-Police (137,558) 1,555,603 1,376,673 41,372 SCTV Fund 718,107 438,281 438,173 718,215 Outside Detail-Fire 15,054 48,891 58,407 5,538 Recreation 126,894 70,318 67,983 129,229
Total 33,309,604 99,177,744 113,217,154 19,270,194
General Fund:
Bank of America-Ambulance 98,701 1,239,507 1,061,750 276,458
Capital Projects:
Citizens Bank 5,436,023 6,414,026 8,497,639 3,352,410
CDBG Grants:Citizens Bank 550 - - 550
Forfeiture and Seizure:
Citizens Bank 152,591 103,082 120,477 135,196
Trust:
Citizens Bank-Performance Escrow 1,759,216 967,337 560,410 2,166,143
Special Revenue Fund:
Citizens Bk-Conservation Comm. 309,946 250,713 535,606 25,052 Salem Co-op -Conservation Comm. 248,123 100,639 262,500 86,262
TOTAL 41,314,754$ 108,253,049$ 124,255,536$ 25,312,266$
Bank Balances by Fund by Account December 31, 2016 (unaudited)
Town of Salem, New Hampshire
73

Unassigned Fund Balance - January 1, 2016 8,466,191
2016 Summary: Current Year Revenues 41,559,050 Current Year Expenditures (41,476,172) Current Year Encumbered (1,120,660) Prior Year Unencumbered Funds 229,744 Net Revenue, Expenditure and Encumbrances (808,038)
Unassigned Fund Balance - December 31, 2016 7,658,153
Town of Salem, New HampshireGeneral Fund
Schedule of Changes in Unassigned Fund BalanceFor the Year Ended December 31, 2016
Unaudited
74

Gen
eral
Sew
erW
ater
Oth
erC
apit
alF
un
dF
un
dF
un
dG
over
nm
enta
l Fu
nd
sP
roje
cts
Fu
nd
Tot
alR
EV
EN
UE
ST
axes
28,6
18,3
35
-
-
154,
490
-
28,7
72,8
25
Inte
rgov
ern
men
tal
2,34
0,56
0
14
5,12
0
-
-
5,
349,
635
7,
835,
315
Lic
ense
s an
d p
erm
its
7,02
3,72
2
-
-
-
-
7,02
3,72
2
C
har
ges
for
serv
ices
3,28
5,88
5
2,
894,
856
3,
863,
793
1,67
9,14
3
-
11,7
23,6
77
Inve
stm
ent
earn
ings
31,4
42
1,73
0
1,28
1
1,
309
471
36,2
32
B
ond
pro
ceed
s-
-
1,
102,
084
-
-
1,
102,
084
Mis
cell
aneo
us
259,
107
15
4
67,2
53
550,
243
34
,000
91
0,75
7
Tot
al r
even
ues
41,5
59,0
50
3,04
1,86
0
5,03
4,41
1
2,
385,
185
5,38
4,10
6
57,4
04,6
12
Exp
end
itu
res
Cu
rren
t: G
ener
al g
over
nm
ent
6,65
3,22
4
-
-
48
9,89
2
-
7,
143,
116
Pu
bli
c sa
fety
21,0
57,0
36
-
-
1,63
5,02
3
-
22,6
92,0
59
San
itat
ion
938,
324
2,
623,
484
-
-
-
3,56
1,80
8
H
igh
way
an
d s
tree
ts3,
753,
760
-
-
-
-
3,
753,
760
Wat
er d
istr
ibu
tion
an
d t
reat
men
t-
-
2,
088,
550
-
-
2,
088,
550
Wel
fare
322,
878
-
-
-
-
322,
878
C
ult
ure
an
d r
ecre
atio
n1,
983,
290
-
-
67,1
90
-
2,
050,
480
Con
serv
atio
n-
-
-
76
0,60
6
-
76
0,60
6
Deb
t se
rvic
e: P
rin
cip
al
1,03
6,00
0
57
,600
67
1,40
0
-
-
1,
765,
000
In
tere
st
127,
140
9,
180
12
6,25
2
-
-
26
2,57
2
Cap
ital
ou
tlay
6,72
5,18
0
28
7,60
0
2,
407,
141
-
8,52
2,88
4
17,9
42,8
04
Tot
al e
xpen
dit
ure
s42
,596
,832
2,
977,
864
5,
293,
343
2,95
2,71
2
8,
522,
884
62
,343
,634
Exc
ess
(def
icie
ncy
) of
rev
enu
es
-
-
over
(u
nd
er)
exp
end
itu
res
(1,0
37,7
82)
63
,996
(2
58,9
32)
(567
,526
)
(3
,138
,778
)
(4
,939
,022
)
Net
ch
ange
in f
un
d b
alan
ces
(1,0
37,7
82)
63
,996
(2
58,9
32)
(567
,526
)
(3
,138
,778
)
(4
,939
,022
)
Fu
nd
bal
ance
s, b
egin
nin
g, a
s re
stat
ed9,
926,
992
3,69
6,73
5
3,33
3,23
3
1,
772,
085
5,12
0,95
5
23,8
50,0
00
Fu
nd
bal
ance
s, e
nd
ing
8,88
9,21
1
3,
760,
731
3,
074,
301
1,20
4,55
9
1,
982,
177
18
,910
,978
Tow
n o
f S
alem
, New
Ham
psh
ire
Sta
tem
ent
of R
even
ues
, Exp
end
itu
res
and
Ch
ange
s in
Fu
nd
Bal
ance
sG
over
nm
enta
l Fu
nd
s
Dec
emb
er 3
1, 2
016
(Un
aud
ited
)
75

Gen
eral
Sew
er
Wat
er
Oth
erC
apit
al P
roje
cts
Tru
stF
un
dF
un
dF
un
dG
over
nm
enta
l Fu
nd
sF
un
d&
Age
ncy
Tot
alA
SS
ET
SC
ash
an
d e
qu
ival
ents
29,1
02,6
39
3,58
2,81
2
2,98
7,06
7
1,13
1,56
4
3,
352,
410
2,16
6,14
3
42
,322
,635
Inve
stm
ents
34,1
43
-
-
-
-
-
34
,143
Rec
eiva
ble
s:
Pro
per
ty t
axes
2,83
6,99
9
-
-
-
-
-
2,
836,
999
Acc
oun
ts r
ecei
vab
le
557,
580
34
5,29
4
273,
323
27
6,30
6
-
-
1,
452,
503
In
terg
over
nm
enta
l64
,337
-
-
38
,500
211,
202
-
314,
039
S
pec
ial a
sses
smen
ts-
2,
439,
813
1,
727,
716
-
-
-
4,16
7,52
9
I
nte
rfu
nd
rec
eiva
ble
1,27
9,46
4
-
-
-
228,
461
-
1,50
7,92
5
Vol
un
tary
tax
lien
s15
5,33
4
-
-
-
-
-
15
5,33
4
T
ax li
en -
res
erve
for
un
coll
ecti
ble
(155
,334
)
-
-
-
-
-
(155
,334
)
Pre
pai
d e
xpen
ses
379,
903
-
-
-
-
-
379,
903
-
T
otal
ass
ets
34,2
55,0
65
6,36
7,91
9
4,98
8,10
5
1,44
6,37
0
3,
792,
073
2,16
6,14
3
53
,015
,677
LIA
BIL
ITIE
S-
Acc
oun
ts p
ayab
le38
1,72
7
39,4
47
115,
998
40
,402
221,
181
-
798,
755
Acc
rued
sal
arie
s an
d b
enef
its
419,
719
3,
178
10,8
54
10,9
09
-
-
444,
660
Con
trac
ts a
nd
ret
ain
age
pay
able
54,3
53
-
60,3
26
-
229,
149
-
343,
827
Du
e to
oth
ers
-
-
-
-
-
2,16
6,14
3
2,
166,
143
In
terg
over
nm
enta
l pay
able
23,2
14,7
35
-
-
187,
500
-
-
23,4
02,2
35
I
nte
rfu
nd
pay
able
150,
631
11
6,33
0
-
3,00
0
1,
359,
566
-
1,
629,
527
D
efer
red
rev
enu
e12
6,01
1
2,44
8,23
4
1,72
6,62
7
-
-
-
4,
300,
872
R
eser
ves
1,01
8,67
9
-
-
-
-
-
1,
018,
679
Tot
al li
abil
itie
s25
,365
,855
2,
607,
188
1,
913,
805
24
1,81
1
1,80
9,89
6
2,
166,
143
34,1
04,6
98
FU
ND
BA
LA
NC
ES
Res
tric
ted
for
:
Sp
ecia
l rev
enu
e fu
nd
s-
-
-
12
2,89
4
-
-
12
2,89
4
En
terp
rise
fu
nd
s-
1,
416,
039
74
6,29
8
-
-
-
2,
162,
336
C
omm
itte
d f
or:
E
ncu
mb
ran
ces
1,23
1,05
8
770,
935
1,
252,
944
14
1,57
2
1,18
7,72
8
-
4,58
4,23
6
S
pec
ial r
even
ue
fun
ds
-
-
-
940,
092
-
-
940,
092
C
apit
al p
roje
cts
-
-
-
-
794,
449
-
794,
449
Un
assi
gned
/un
rest
rict
ed7,
658,
153
1,
573,
757
1,
075,
059
-
-
-
10,3
06,9
69
Tot
al f
un
d b
alan
ces
8,88
9,21
1
3,76
0,73
1
3,07
4,30
1
1,20
4,55
9
1,
982,
177
-
18
,910
,978
Tot
al li
abil
itie
s an
d f
un
d b
alan
ces
34,2
55,0
65
6,36
7,91
9
4,98
8,10
5
1,44
6,37
0
3,
792,
073
2,16
6,14
3
53
,015
,677
Tow
n o
f S
alem
, New
Ham
psh
ire
Gov
ern
men
tal F
un
ds
Bal
ance
Sh
eet
Dec
emb
er 3
1, 2
016
(Un
aud
ited
)
76

Town of Salem, New HampshireStatement of Revenues, Expenditures, and Changes in Fund Balance
Budget and Actual (Non-GAAP Budgetary Basis)General Fund
For the Year Ended December 31, 2016Unaudited
VarianceFinal Favorable
Budget Actual (Unfavorable)Revenues and other sources Property taxes 28,052,174 28,486,014 433,840 Interest and penalties on taxes 135,000 132,321 (2,679) Licenses, permits and fees 6,861,400 7,023,722 162,322 Charges for services 2,943,864 3,285,885 342,021 Intergovernmental 2,563,232 2,340,560 (222,672) Investment income 21,000 31,442 10,442 Other financing sources 142,600 259,107 116,507 Use of fund balance 2,381,787 2,381,787 -
Total Revenues 43,101,057 43,940,837 839,780
Expenditures and other sources Current: General government 6,792,708 6,653,224 139,484 Public safety 21,243,390 21,057,036 186,354 Sanitation 922,891 938,324 (15,433) Highways and streets 3,976,585 3,753,760 222,825 Welfare 328,036 322,878 5,158 Culture and recreation 2,082,921 1,983,290 99,631
Debt service 1,163,141 1,163,140 1 Capital outlay 6,591,386 6,725,180 (133,794)
Total Expenditures 43,101,058 42,596,832 504,226
2016
77

Balance Balance12/31/2015 Additions Deductions 12/31/2016
Governmental activities:Capital assets not being depreciated:
Land 9,749,541 994,000 - 10,743,541 Land improvements 509,289 - - 509,289 Construction in progress 104,585 - 104,585 -
Total capital assets not being depreciated 10,363,415 994,000 104,585 11,252,830
DepreciableBuildings 7,655,861 - - 7,655,861 Machinery and equipment 8,211,542 257,950 - 8,469,492 Infrastructure 227,356,133 1,315,642 - 227,356,133 Vehicles 9,126,781 1,259,124 1,310,295 9,075,610
Total depreciable capital assets 252,350,317 2,832,716 1,310,295 252,557,096
Total capital assets 262,713,732 3,826,716 1,414,880 263,809,926
Accumulated depreciation:Buildings (4,146,093) (156,868) - (4,302,961) Machinery and equipment (4,429,858) (368,671) - (4,798,529) Vehicles (5,729,550) (550,200) 1,060,103 (5,219,647) Infrastructure (141,537,728) (8,279,643) - (149,817,371)
Total accumulated depreciation (155,843,229) (9,355,382) 1,060,103 (164,138,508)
Net Book Value, Capital Assets 106,870,503 (5,528,666) 2,474,983 99,671,418
Town of Salem, New Hampshire
Capital Assets
For the Year Ended December 31, 2016
Unaudited
78

Des
crip
tion
Yea
r Is
sued
Ori
gin
al O
bli
gati
onIn
tere
st R
ate
Fin
al P
aym
ent
Ou
tsta
nd
ing
Deb
t 12
/31/
15N
ew I
ssu
es 2
016
Red
uct
ion
s 20
16O
uts
tan
din
g D
ebt
12/3
1/16
Arl
ingt
on P
ipel
ine
1996
2,90
0,00
0
5.71
%20
1623
5,00
0
23
5,00
0
-
Can
obie
Wat
er /S
ewer
1998
1,17
0,35
4
4.92
%20
1825
5,00
0
80
,000
175,
000
Bla
ke
Roa
d W
ater
Pro
ject
2004
695,
900
4.41
%20
2431
5,00
0
35
,000
280,
000
Art
eria
l Roa
d B
ond
- N
orth
Mai
n S
t20
064,
000,
000
3.
75%
2016
400,
000
400,
000
-
Bri
dge
Rec
onst
ruct
ion
-Law
ren
ce R
oad
2009
2,39
4,50
0
2.02
%20
1995
0,00
0
24
0,00
0
710,
000
Bri
dge
Rec
onst
ruct
ion
-N M
ain
/Em
erso
n20
101,
297,
000
2.
62%
2020
645,
000
130,
000
51
5,00
0
Bri
dge
Rec
onst
ruct
ion
-Blu
ff S
tree
t/P
rovi
den
ce H
ill
2013
1,18
9,90
9
1.81
%20
2394
8,00
0
12
1,00
0
827,
000
Wat
er I
mp
rovm
ents
-Pon
d S
tree
t20
1369
2,09
1
1.
81%
2023
552,
000
69,0
00
48
3,00
0
Bri
dge
Rec
onst
ruct
ion
-Sh
ann
on R
oad
20
141,
418,
000
1.
70%
2024
1,27
0,00
0
145,
000
1,
125,
000
Wat
er D
isch
arge
Man
agem
ent
2014
1,07
5,00
0
1.70
%20
2496
5,00
0
11
0,00
0
855,
000
Wat
er I
mp
rove
men
t-N
orth
Pol
icy
2014
825,
000
1.70
%20
2474
0,00
0
85
,000
655,
000
Wat
er I
mp
rove
men
ts-N
orth
Pol
icy/
Old
Roc
kin
gham
2015
1,11
0,00
0
1.96
%20
251,
110,
000
11
5,00
0
995,
000
Tot
als
Tot
als
18,7
67,7
54
8,
385,
000
-
1,76
5,00
0
6,
620,
000
Tow
n o
f S
alem
, New
Ham
psh
ire
For
th
e Y
ear
En
din
g D
ecem
ber
31,
201
6S
tate
men
t of
Tow
n D
ebt
(Un
aud
ited
)
79

2012
2013
2014
2015
2016
Tot
al T
own
Ap
pro
pri
atio
ns
$41,
986,
816
$45,
045,
318
$51,
564,
063
$49,
573,
896
$50,
724,
197
Les
s R
even
ues
an
d C
red
its
(15,
917,
976)
(18,
935,
805)
(24,
833,
925)
(22,
490,
943)
(22,
923,
207)
Net
Tow
n A
pp
rop
riat
ion
s26
,068
,840
26,1
09,5
1326
,730
,138
27,0
82,9
5327
,800
,990
Net
Sch
ool T
ax A
sses
smen
t38
,465
,963
38,5
01,2
5139
,827
,779
42,0
42,6
3445
,781
,316
Sta
te E
du
cati
on T
axes
9,09
3,68
09,
188,
952
9,02
4,14
49,
448,
622
10,3
01,0
41C
oun
ty T
ax A
sses
smen
t4,
034,
902
4,00
1,15
04,
203,
001
4,58
8,48
74,
461,
348
Tot
al T
own
, Sch
ool a
nd
Cou
nty
77,6
63,3
8577
,800
,866
79,7
85,0
6283
,162
,696
88,3
44,6
95
Bu
sin
ess
Pro
fits
Tax
Rei
mb
urs
emen
t0
00
00
War
Ser
vice
Cre
dit
s68
8,50
067
1,00
065
2,00
063
6,00
060
6,50
0
Ove
rlay
267,
419
300,
000
363,
201
503,
060
586,
457
Pro
per
ty T
axes
to
be
Rai
sed
$78,
619,
304
$78,
771,
866
$80,
800,
263
$84,
301,
756
$89,
537,
652
Net
Ass
esse
d V
alu
atio
n$3
,827
,733
,752
$3,8
58,0
80,6
77$3
,893
,788
,592
$3,9
48,4
73,7
72(1)
$4,3
92,8
20,3
40
Tot
al T
ax R
ate
$20.
58$2
0.46
$20.
79$2
1.39
$20.
43
(1)
Rev
alu
atio
n o
ccu
rred
in 2
016
Tow
n o
f S
alem
, New
Ham
psh
ire
Tax
Rat
e C
omp
uta
tion
an
d A
sses
sed
Val
uat
ion
Tre
nd
s20
12-2
016
80

Tax Rate 5-Year Comparison
2012 20.58$ 2013 20.46$ 2014 20.79$ 2015 21.39$ 2016 20.43$
Assessed Valueation 5-Year Comparison
2012 3,827,733,752$ 2013 3,858,080,677$ 2014 3,893,788,592$ 2015 3,948,473,772$ 2016 4,392,820,340$
Town of Salem, New HampshireTax Rate Comparison and Assessed Valuation Trends (5-Year Comparison Chart)
2012-2016
$0.00
$5.00
$10.00
$15.00
$20.00
$25.00
2012 2013 2014 2015 2016
Tax Rate 5 Year Comparison
3,500,000,0003,600,000,0003,700,000,0003,800,000,0003,900,000,0004,000,000,0004,100,000,0004,200,000,0004,300,000,0004,400,000,0004,500,000,000
2012 2013 2014 2015 2016
Assessed Valuation 5 Year Comparison
81

TAX COLLECTOR'S REPORT
FOR THE MUNICIPALITY OF SALEM, NH YEAR ENDING DECEMBER 31, 2016 MS-61
***ON LEVIES OF ***Debits 2016 2015 2014 Prior
Uncollected Taxes Beginning of Year
Property Taxes #3110 xxxxxxxxxxxx 2,030,443.20
Resident Taxes #3180 xxxxxxxxxxxx
Land Use Change Taxes #3120 xxxxxxxxxxxx -
Yield Taxes #3185 xxxxxxxxxxxx
Excavation Tax #3187 xxxxxxxxxxxx
Other Taxes #3189 xxxxxxxxxxxx
Property Tax Credit Balance xxxxxxxxxxxx (35,425.64)
Taxes Committed This Year
Property Taxes #3110 88,948,468.00
Resident Taxes #3180
Land Use Change Taxes #3120 153,490.00
Yield Taxes #3185 324.56
Excavation Tax #3187
Other Taxes #3189
Overpayment Refunds
Property Taxes #3110 132,768.46
Resident Taxes #3180
Land Use Change Taxes #3120
Yield Taxes #3185
Excavation Tax #3187
Interest and Penalties
on Delinquent Taxes #3190 34,945.05 94,529.24
Interest and Penalties
on Resident Taxes #3190
Total Debits 89,269,996.07 2,089,546.80 - -
82

TAX COLLECTOR'S REPORT Page 2
FOR THE MUNICIPALITY OF SALEM, NH YEAR ENDING DECEMBER 31, 2016 MS-61
***ON LEVIES OF***
Credits 2016 2015 2014 Prior
Remitted to Treasurer
Property Taxes 86,876,235.82 1,142,341.94
Resident Taxes
Land Use Change Taxes 131,990.00 -
Yield Taxes 324.56 -
Interest (Include Lien Conversion) 34,945.05 94,529.24
Penalties
Excavation Tax
Other Taxes -
Conversion to Lien(Principal Only) 852,675.62
Discounts Allowed
Abatements Made
Property Taxes 44,271.00 -
Resident Taxes
Land Use Change Taxes
Yield Taxes
Excavation Tax
Other Taxes
Uncollected Taxes-End of Year #1080
Property Taxes 2,202,829.89
Resident Taxes
Land Use Change Taxes 21,500.00
Yield Taxes -
Excavation Tax
Other Taxes
Property Tax Credit Balance (42,100.25)
Total Credits 89,269,996.07 2,089,546.80
83

TAX COLLECTOR'S REPORT Page 3
FOR THE MUNICIPALITY OF SALEM, NH YEAR ENDING DECEMBER 31, 2016 MS-61
***ON LEVIES OF***
Summary of Debits 2015 2014 2013 Prior
Unredeemed Liens
Balance Beginning of Year 484,248.01 205,783.42 9,099.62
Liens Executed
During Fiscal Year 907,843.94
Interest & Costs
Collected After Lien Execution 22,770.06 70,490.07 60,719.76 2,664.99
Total Debits 930,614.00 554,738.08 266,503.18 11,764.61
Summary of Credits
Redemptions 432,056.01 271,016.25 186,380.27 3,680.31
Interest and Costs Collected #3190 22,770.06 70,490.07 60,719.76 2,664.99
(After Lien Execution)
Abatements of Unredeemed Liens 137.31 133.87 133.41 1,547.18
Liens Deeded to Municipality 4,144.40 4,030.87 3,968.91
Unredeemed Liens
Bal End of Year #1110 471,506.22 209,067.02 15,300.83 3,872.13
Total Credits 930,614.00 554,738.08 266,503.18 11,764.61
Under penalties of perjury, I declare that I have examined the information contained in this form and
to the best of my belief it is true, correct and complete.
Cheryl-Ann Bolouk, CTC, Tax Collector
84
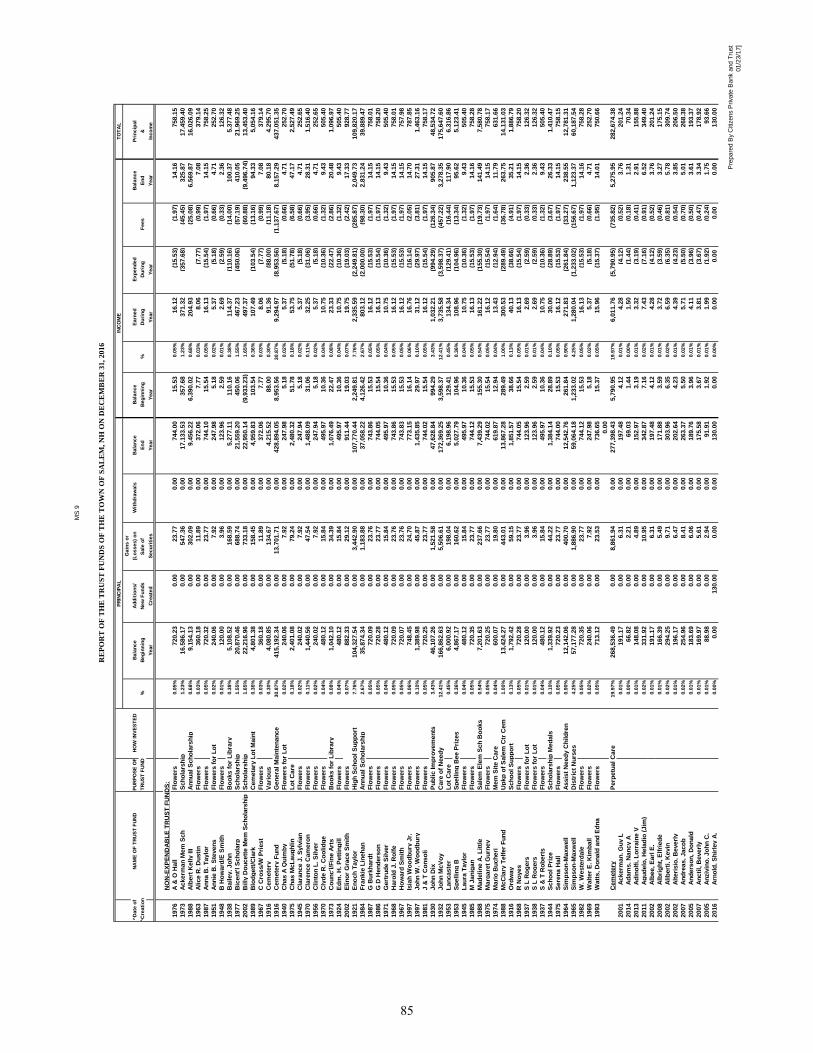
MS
9
RE
PO
RT
OF
TH
E T
RU
ST
FU
ND
S O
F T
HE
TO
WN
OF
SA
LE
M,
NH
ON
DE
CE
MB
ER
31
, 2
01
6
P
RIN
CIP
AL
IN
CO
ME
TO
TA
L
Ga
ins
or
^D
ate
of
NA
ME
OF
TR
US
T F
UN
DP
UR
PO
SE
OF
HO
W IN
VE
ST
ED
Ba
lan
ce
Ad
dit
ion
s/
(Lo
ss
es
) o
nW
ith
dra
wa
lsB
ala
nc
eB
ala
nc
eE
arn
ed
Ex
pe
nd
ed
Ba
lan
ce
Pri
nc
ipa
l
^C
rea
tio
nT
RU
ST
FU
ND
%B
eg
inn
ing
Ne
w F
un
ds
Sa
le o
f E
nd
Be
gin
nin
g%
Du
rin
gD
uri
ng
Fe
es
En
d&
Ye
ar
Cre
ate
dS
ec
uri
tie
sY
ea
rY
ea
rY
ea
rY
ea
rY
ea
rIn
co
me
NO
N-E
XP
EN
DA
BL
E T
RU
ST
FU
ND
S:
1976
A &
O H
all
Flo
wers
0.0
5%
720.2
30.0
023.7
70.0
0744.0
015.5
30
.05
%16.1
2(1
5.5
3)
(1.9
7)
14.1
6758.1
5
1973
Ackerm
an
Mem
Sch
Sch
ola
rsh
ip1
.23
%16,5
86.1
70.0
0547.3
60.0
017,1
33.5
3357.6
81
.23
%371.3
2(3
57.6
8)
(45.4
5)
325.8
717,4
59.4
0
1988
Alb
ert
Kelly III
An
nu
al S
ch
ola
rsh
ip0
.68
%9,1
54.1
30.0
0302.0
90.0
09,4
56.2
26,3
90.0
20
.68
%204.9
3(2
5.0
8)
6,5
69.8
716,0
26.0
9
1963
Alice R
. D
usti
nF
low
ers
0.0
3%
360.1
80.0
011.8
90.0
0372.0
67.7
70
.03
%8.0
6(7
.77)
(0.9
9)
7.0
8379.1
4
1987
An
na B
. T
aylo
rF
low
ers
0.0
5%
720.3
20.0
023.7
70.0
0744.1
015.5
40
.05
%16.1
3(1
5.5
4)
(1.9
7)
14.1
5758.2
5
1951
An
nie
B. S
teven
sF
low
ers
fo
r L
ot
0.0
2%
240.0
60.0
07.9
20.0
0247.9
85.1
80
.02
%5.3
7(5
.18)
(0.6
6)
4.7
1252.7
0
1948
B H
ow
ard
/E S
mit
hF
low
ers
0.0
1%
120.0
00.0
03.9
60.0
0123.9
62.5
90
.01
%2.6
9(2
.59)
(0.3
3)
2.3
6126.3
2
1938
Bailey, Jo
hn
Bo
oks f
or
Lib
rary
0.3
8%
5,1
08.5
20.0
0168.5
90.0
05,2
77.1
1110.1
60
.38
%114.3
7(1
10.1
6)
(14.0
0)
100.3
75,3
77.4
8
1977
Bic
en
t'l S
ch
ola
rpS
ch
ola
rsh
ip1
.55
%20,8
70.4
60.0
0688.7
40.0
021,5
59.2
0450.0
61
.55
%467.2
3(4
50.0
6)
(57.1
9)
410.0
521,9
69.2
5
2002
Billy
Do
ucett
e M
em
Sch
ola
rsh
ipS
ch
ola
rsh
ip1
.65
%22,2
16.9
60.0
0733.1
80.0
022,9
50.1
4(9
,933.2
3)
1.6
5%
497.3
7(6
0.8
8)
(9,4
96.7
4)
13,4
53.4
0
1989
Blo
dg
ett
/Cla
rkC
em
eta
ry L
ot
Main
t0
.36
%4,8
01.3
80.0
0158.4
50.0
04,9
59.8
3103.5
40
.36
%107.4
9(1
03.5
4)
(13.1
6)
94.3
35,0
54.1
6
1967
C C
ross/W
Pri
est
Flo
wers
0.0
3%
360.1
80.0
011.8
90.0
0372.0
67.7
70
.03
%8.0
6(7
.77)
(0.9
9)
7.0
8379.1
4
1916
Cem
ete
ryV
ari
ou
s0
.30
%4,0
80.8
50.0
0134.6
70.0
04,2
15.5
288.0
00
.30
%91.3
6(8
8.0
0)
(11.1
8)
80.1
84,2
95.7
0
1916
Cem
ete
ry F
un
dG
en
era
l M
ain
ten
an
ce
30
.87
%415,1
92.3
40.0
013,7
01.7
10.0
0428,8
94.0
58,9
53.5
63
0.8
7%
9,2
94.9
7(8
,953.5
6)
(1,1
37.6
7)
8,1
57.2
9437,0
51.3
5
1940
Ch
as A
Qu
imb
yF
low
ers
fo
r L
ot
0.0
2%
240.0
60.0
07.9
20.0
0247.9
85.1
80
.02
%5.3
7(5
.18)
(0.6
6)
4.7
1252.7
0
1975
Ch
as M
cL
au
gh
lin
Lo
t C
are
0.1
8%
2,4
01.0
80.0
079.2
40.0
02,4
80.3
251.7
80
.18
%53.7
5(5
1.7
8)
(6.5
8)
47.1
72,5
27.4
9
1945
Cla
ran
ce J
. S
ylv
ian
Flo
wers
0.0
2%
240.0
20.0
07.9
20.0
0247.9
45.1
80
.02
%5.3
7(5
.18)
(0.6
6)
4.7
1252.6
5
1970
Cla
ren
ce C
am
ero
nF
low
ers
0.1
1%
1,4
40.5
60.0
047.5
40.0
01,4
88.0
931.0
60
.11
%32.2
5(3
1.0
6)
(3.9
5)
28.3
11,5
16.4
0
1956
Clin
ton
L. S
ilver
Flo
wers
0.0
2%
240.0
20.0
07.9
20.0
0247.9
45.1
80
.02
%5.3
7(5
.18)
(0.6
6)
4.7
1252.6
5
1970
Cly
de R
. C
oo
lid
ge
Flo
wers
0.0
4%
480.1
20.0
015.8
40.0
0495.9
710.3
60
.04
%10.7
5(1
0.3
6)
(1.3
2)
9.4
3505.4
0
1973
Co
un
c'l/F
ine A
rts
Bo
oks f
or
Lib
rary
0.0
8%
1,0
42.1
00.0
034.3
90.0
01,0
76.4
922.4
70
.08
%23.3
3(2
2.4
7)
(2.8
6)
20.4
81,0
96.9
7
1924
Ed
m. H
. P
ett
ing
ill
Flo
wers
0.0
4%
480.1
20.0
015.8
40.0
0495.9
710.3
60
.04
%10.7
5(1
0.3
6)
(1.3
2)
9.4
3505.4
0
2002
Elin
or
Gra
ce S
mit
hF
low
ers
0.0
7%
882.3
30.0
029.1
20.0
0911.4
419.0
30
.07
%19.7
5(1
9.0
3)
(2.4
2)
17.3
3928.7
7
1921
En
och
Taylo
rH
igh
Sch
oo
l S
up
po
rt7
.76
%104,3
27.5
40.0
03,4
42.9
00.0
0107,7
70.4
42,2
49.8
17
.76
%2,3
35.5
9(2
,249.8
1)
(285.8
7)
2,0
49.7
3109,8
20.1
7
1984
Fra
nkie
Lin
eh
an
An
nu
al S
ch
ola
rsh
ip2
.67
%35,8
74.3
40.0
01,1
83.8
80.0
037,0
58.2
24,1
26.4
22
.67
%803.1
2(2
,000.0
0)
(98.3
0)
2,8
31.2
439,8
89.4
7
1987
G B
urk
hard
tF
low
ers
0.0
5%
720.0
90.0
023.7
60.0
0743.8
615.5
30
.05
%16.1
2(1
5.5
3)
(1.9
7)
14.1
5758.0
1
1986
G D
Hen
ders
on
Flo
wers
0.0
5%
720.2
80.0
023.7
70.0
0744.0
515.5
40
.05
%16.1
3(1
5.5
4)
(1.9
7)
14.1
5758.2
0
1971
Gert
rud
e S
ilver
Flo
wers
0.0
4%
480.1
20.0
015.8
40.0
0495.9
710.3
60
.04
%10.7
5(1
0.3
6)
(1.3
2)
9.4
3505.4
0
1968
Haro
ld J
. R
olf
eF
low
ers
0.0
5%
720.0
90.0
023.7
60.0
0743.8
615.5
30
.05
%16.1
2(1
5.5
3)
(1.9
7)
14.1
5758.0
1
1967
Ho
ward
Sm
ith
Flo
wers
0.0
5%
720.0
70.0
023.7
60.0
0743.8
315.5
30
.05
%16.1
2(1
5.5
3)
(1.9
7)
14.1
5757.9
8
1997
Isia
h W
oo
db
ury
Jr.
Flo
wers
0.0
6%
748.4
50.0
024.7
00.0
0773.1
516.1
40
.06
%16.7
6(1
6.1
4)
(2.0
5)
14.7
0787.8
5
1997
Jo
hn
W. W
oo
db
ury
Flo
wers
0.1
0%
1,3
89.9
80.0
045.8
70.0
01,4
35.8
529.9
70
.10
%31.1
2(2
9.9
7)
(3.8
1)
27.3
11,4
63.1
6
1981
J &
T C
on
so
liF
low
ers
0.0
5%
720.2
50.0
023.7
70.0
0744.0
215.5
40
.05
%16.1
2(1
5.5
4)
(1.9
7)
14.1
5758.1
7
1930
Jo
hn
Dix
Pu
blic Im
pro
vem
en
ts3
.43
%46,1
07.2
60.0
01,5
21.5
80.0
047,6
28.8
4994.2
93
.43
%1,0
32.2
1(9
94.2
9)
(126.3
4)
905.8
748,5
34.7
2
1932
Jo
hn
McV
oy
Care
of
Need
y1
2.4
1%
166,8
62.6
30.0
05,5
06.6
10.0
0172,3
69.2
53,5
98.3
71
2.4
1%
3,7
35.5
8(3
,598.3
7)
(457.2
2)
3,2
78.3
5175,6
47.6
0
1953
Lan
caste
rL
ot
Care
0.4
5%
6,0
00.9
20.0
0198.0
40.0
06,1
98.9
6129.4
10
.45
%134.3
4(1
29.4
1)
(16.4
4)
117.9
06,3
16.8
6
1953
Sp
ellin
g B
Sp
ellin
g B
ee P
rizes
0.3
6%
4,8
67.1
70.0
0160.6
20.0
05,0
27.7
9104.9
60
.36
%108.9
6(1
04.9
6)
(13.3
4)
95.6
25,1
23.4
1
1945
Lau
ra T
aylo
rF
low
ers
0.0
4%
480.1
20.0
015.8
40.0
0495.9
710.3
60
.04
%10.7
5(1
0.3
6)
(1.3
2)
9.4
3505.4
0
1985
M J
an
igan
Flo
wers
0.0
5%
720.3
50.0
023.7
70.0
0744.1
215.5
30
.05
%16.1
3(1
5.5
3)
(1.9
7)
14.1
6758.2
8
1988
Mad
elin
e A
. L
ittl
eS
ale
m E
lem
Sch
Bo
oks
0.5
4%
7,2
01.6
30.0
0237.6
60.0
07,4
39.2
9155.3
00
.54
%161.2
2(1
55.3
0)
(19.7
3)
141.4
97,5
80.7
8
1975
Marg
are
t G
urn
ey
Flo
wers
0.0
5%
720.2
50.0
023.7
70.0
0744.0
215.5
40
.05
%16.1
2(1
5.5
4)
(1.9
7)
14.1
5758.1
7
1974
Mari
o B
uch
eri
Mem
Sit
e C
are
0.0
4%
600.0
70.0
019.8
00.0
0619.8
712.9
40
.04
%13.4
3(1
2.9
4)
(1.6
4)
11.7
9631.6
6
1988
McC
lary
Telf
er
Fu
nd
Up
kp
of
Sale
m C
tr C
em
1.0
0%
13,4
24.2
70.0
0443.0
10.0
013,8
67.2
8289.4
91
.00
%300.5
3(2
89.4
9)
(36.7
8)
263.7
514,1
31.0
3
1916
Ord
way
Sch
oo
l S
up
po
rt0
.13
%1,7
92.4
20.0
059.1
50.0
01,8
51.5
738.6
60
.13
%40.1
3(3
8.6
6)
(4.9
1)
35.2
11,8
86.7
9
1968
R N
oyes
Flo
wers
0.0
5%
720.2
80.0
023.7
70.0
0744.0
515.5
40
.05
%16.1
3(1
5.5
4)
(1.9
7)
14.1
5758.2
0
1937
S L
Ro
gers
Flo
wers
fo
r L
ot
0.0
1%
120.0
00.0
03.9
60.0
0123.9
62.5
90
.01
%2.6
9(2
.59)
(0.3
3)
2.3
6126.3
2
1938
S L
Ro
gers
Flo
wers
fo
r L
ot
0.0
1%
120.0
00.0
03.9
60.0
0123.9
62.5
90
.01
%2.6
9(2
.59)
(0.3
3)
2.3
6126.3
2
1937
S &
T R
ob
ert
sF
low
ers
0.0
4%
480.1
20.0
015.8
40.0
0495.9
710.3
60
.04
%10.7
5(1
0.3
6)
(1.3
2)
9.4
3505.4
0
1944
Sch
oo
l P
rize
Sch
ola
rsh
ip M
ed
als
0.1
0%
1,3
39.9
20.0
044.2
20.0
01,3
84.1
428.8
90
.10
%30.0
0(2
8.8
9)
(3.6
7)
26.3
31,4
10.4
7
1975
Sere
na H
all
Flo
wers
0.0
5%
720.2
30.0
023.7
70.0
0744.0
015.5
30
.05
%16.1
2(1
5.5
3)
(1.9
7)
14.1
5758.1
5
1964
Sim
pso
n-M
axw
ell
Assis
t N
eed
y C
hild
ren
0.9
0%
12,1
42.0
60.0
0400.7
00.0
012,5
42.7
6261.8
40
.90
%271.8
3(2
61.8
4)
(33.2
7)
238.5
512,7
81.3
1
1965
Sim
pso
n-M
axw
ell
Dis
tric
t N
urs
es
4.2
5%
57,1
77.2
80.0
01,8
86.9
00.0
059,0
64.1
81,2
33.0
24
.25
%1,2
80.0
4(1
,233.0
2)
(156.6
7)
1,1
23.3
760,1
87.5
4
1982
W. W
este
rdale
Flo
wers
0.0
5%
720.3
50.0
023.7
70.0
0744.1
215.5
30
.05
%16.1
3(1
5.5
3)
(1.9
7)
14.1
6758.2
8
1969
Walt
er
E. K
imb
all
Flo
wers
0.0
2%
240.0
60.0
07.9
20.0
0247.9
85.1
80
.02
%5.3
7(5
.18)
(0.6
6)
4.7
1252.7
0
1993
Watt
s, D
on
ald
an
d E
dn
aF
low
ers
0.0
5%
713.1
20.0
023.5
30.0
0736.6
515.3
70
.05
%15.9
6(1
5.3
7)
(1.9
5)
14.0
1750.6
6
0.0
0
Cem
ete
ryP
erp
etu
al C
are
19
.97
%268,5
36.4
90.0
08,8
61.9
40.0
0277,3
98.4
35,7
90.9
51
9.9
7%
6,0
11.7
6(5
,790.9
5)
(735.8
2)
5,2
75.9
5282,6
74.3
8
2001
A
ckerm
an
, G
uy L
0
.01
%191.1
70.0
06.3
10.0
0197.4
84.1
20
.01
%4.2
8(4
.12)
(0.5
2)
3.7
6201.2
4
2014
A
dam
s, N
an
cy A
0
.00
%66.8
20.0
02.2
10.0
069.0
31.4
40
.00
%1.5
0(1
.44)
(0.1
8)
1.3
170.3
4
2013
A
din
olf
i, L
orr
ain
e V
0.0
1%
148.0
80.0
04.8
90.0
0152.9
73.1
90
.01
%3.3
2(3
.19)
(0.4
1)
2.9
1155.8
8
2011
A
gu
delo
, H
ela
dio
(Jim
)0
.02
%331.9
20.0
010.9
50.0
0342.8
77.1
60
.02
%7.4
3(7
.16)
(0.9
1)
6.5
2349.4
0
2002
A
lbee, E
arl
E.
0.0
1%
191.1
70.0
06.3
10.0
0197.4
84.1
20
.01
%4.2
8(4
.12)
(0.5
2)
3.7
6201.2
4
2008
A
lbri
gh
t, E
lfri
ed
e0
.01
%166.3
90.0
05.4
90.0
0171.8
83.5
90
.01
%3.7
2(3
.59)
(0.4
6)
3.2
7175.1
5
2002
A
lib
ert
i, K
evin
0.0
2%
294.2
50.0
09.7
10.0
0303.9
66.3
50
.02
%6.5
9(6
.35)
(0.8
1)
5.7
8309.7
4
2002
A
lteri
sio
, B
everl
y0
.01
%196.1
70.0
06.4
70.0
0202.6
44.2
30
.01
%4.3
9(4
.23)
(0.5
4)
3.8
5206.5
0
2007
A
nd
reas, Jaco
b0
.02
%254.9
60.0
08.4
10.0
0263.3
75.5
00
.02
%5.7
1(5
.50)
(0.7
0)
5.0
1268.3
8
2005
A
nd
ers
on
, D
on
ald
0.0
1%
183.6
90.0
06.0
60.0
0189.7
63.9
60
.01
%4.1
1(3
.96)
(0.5
0)
3.6
1193.3
7
2007
A
ncti
l, B
everl
y
0.0
1%
169.9
70.0
05.6
10.0
0175.5
83.6
70
.01
%3.8
1(3
.67)
(0.4
7)
3.3
4178.9
2
2005
A
nziv
ino
, Jo
hn
C.
0.0
1%
88.9
80.0
02.9
40.0
091.9
11.9
20
.01
%1.9
9(1
.92)
(0.2
4)
1.7
593.6
6
2016
A
rno
ld, S
hir
ley A
. 0
.00
%0.0
0130.0
00.0
00.0
0130.0
00.0
00
.00
%0.0
00.0
00.0
00.0
0130.0
0
Pre
pare
d B
y C
itiz
ens P
rivate
Bank a
nd T
rust
01/2
3/1
7]
85

MS
9
RE
PO
RT
OF
TH
E T
RU
ST
FU
ND
S O
F T
HE
TO
WN
OF
SA
LE
M,
NH
ON
DE
CE
MB
ER
31
, 2
01
6
P
RIN
CIP
AL
IN
CO
ME
TO
TA
L
Ga
ins
or
^D
ate
of
NA
ME
OF
TR
US
T F
UN
DP
UR
PO
SE
OF
HO
W IN
VE
ST
ED
Ba
lan
ce
Ad
dit
ion
s/
(Lo
ss
es
) o
nW
ith
dra
wa
lsB
ala
nc
eB
ala
nc
eE
arn
ed
Ex
pe
nd
ed
Ba
lan
ce
Pri
nc
ipa
l
^C
rea
tio
nT
RU
ST
FU
ND
%B
eg
inn
ing
Ne
w F
un
ds
Sa
le o
f E
nd
Be
gin
nin
g%
Du
rin
gD
uri
ng
Fe
es
En
d&
Ye
ar
Cre
ate
dS
ec
uri
tie
sY
ea
rY
ea
rY
ea
rY
ea
rY
ea
rIn
co
me
2014
A
zzari
to, S
alv
ato
re D
. 0
.01
%200.4
70.0
06.6
20.0
0207.0
94.3
20
.01
%4.4
9(4
.32)
(0.5
5)
3.9
4211.0
3
2003
B
ab
ikia
n, G
reg
ory
H0
.03
%392.3
40.0
012.9
50.0
0405.2
88.4
60
.03
%8.7
8(8
.46)
(1.0
8)
7.7
1412.9
9
2002
B
ailla
rgeo
n, A
ug
ust
0.0
3%
382.3
40.0
012.6
20.0
0394.9
68.2
50
.03
%8.5
6(8
.25)
(1.0
5)
7.5
1402.4
7
2015
B
ailla
rgeo
n, L
ou
is J
. 0
.01
%130.0
00.0
04.2
90.0
0134.2
90.0
00
.01
%2.9
10.0
0(0
.36)
2.5
5136.8
4
2016
B
alu
ko
nis
, V
incen
t J.
0.0
0%
0.0
0130.0
00.0
00.0
0130.0
00.0
00
.00
%0.0
00.0
00.0
00.0
0130.0
0
2002
B
am
ford
, M
ari
a E
. 0
.03
%382.3
40.0
012.6
20.0
0394.9
68.2
50
.03
%8.5
6(8
.25)
(1.0
5)
7.5
1402.4
7
2011
B
arb
ag
allo
, A
lexan
der
F.
0.0
1%
155.8
90.0
05.1
40.0
0161.0
43.3
60
.01
%3.4
9(3
.36)
(0.4
3)
3.0
6164.1
0
2008
B
arb
era
, V
incen
t 0
.02
%332.7
80.0
010.9
80.0
0343.7
67.1
80
.02
%7.4
5(7
.18)
(0.9
1)
6.5
4350.3
0
2008
B
arc
lay, Jo
hn
R.
0.0
2%
332.7
80.0
010.9
80.0
0343.7
67.1
80
.02
%7.4
5(7
.18)
(0.9
1)
6.5
4350.3
0
2004
B
ark
er,
Raym
on
d
0.0
2%
299.5
00.0
09.8
80.0
0309.3
86.4
60
.02
%6.7
0(6
.46)
(0.8
2)
5.8
8315.2
6
2009
B
ascio
, M
ich
ael
0.0
1%
85.9
20.0
02.8
40.0
088.7
51.8
50
.01
%1.9
2(1
.85)
(0.2
4)
1.6
990.4
4
2004
B
asti
en
, D
ori
s0
.01
%99.8
30.0
03.2
90.0
0103.1
32.1
50
.01
%2.2
3(2
.15)
(0.2
7)
1.9
6105.0
9
2010
B
att
a, G
eo
rge A
. 0
.01
%87.6
50.0
02.8
90.0
090.5
41.8
90
.01
%1.9
6(1
.89)
(0.2
4)
1.7
292.2
7
2015
B
eato
n, M
ela
nie
A.
0.0
1%
195.0
00.0
06.4
40.0
0201.4
40.0
00
.01
%4.3
70.0
0(0
.53)
3.8
3205.2
7
2012
B
eau
lieu
, M
ich
el C
. 0
.01
%74.0
40.0
02.4
40.0
076.4
81.6
00
.01
%1.6
6(1
.60)
(0.2
0)
1.4
577.9
4
2015
B
els
ky, P
ete
r J.
0.0
1%
130.0
00.0
04.2
90.0
0134.2
90.0
00
.01
%2.9
10.0
0(0
.36)
2.5
5136.8
4
2003
B
erg
ero
n, G
ilb
ert
0.0
1%
99.8
30.0
03.2
90.0
0103.1
32.1
50
.01
%2.2
3(2
.15)
(0.2
7)
1.9
6105.0
9
2007
B
ilo
deau
, D
avid
0.0
2%
332.7
80.0
010.9
80.0
0343.7
67.1
80
.02
%7.4
5(7
.18)
(0.9
1)
6.5
4350.3
0
2014
B
lain
e, D
en
nis
J.
0.0
0%
66.8
20.0
02.2
10.0
069.0
31.4
40
.00
%1.5
0(1
.44)
(0.1
8)
1.3
170.3
4
2003
B
lakesle
e, E
dw
ard
0.0
3%
392.3
40.0
012.9
50.0
0405.2
88.4
60
.03
%8.7
8(8
.46)
(1.0
8)
7.7
1412.9
9
2011
B
leakle
y, C
harl
es A
. 0
.01
%155.8
90.0
05.1
40.0
0161.0
43.3
60
.01
%3.4
9(3
.36)
(0.4
3)
3.0
6164.1
0
2013
B
lod
gett
, T
ho
mas G
0
.01
%74.0
40.0
02.4
40.0
076.4
81.6
00
.01
%1.6
6(1
.60)
(0.2
0)
1.4
577.9
4
2002
B
lou
in, E
arl
0
.01
%191.1
70.0
06.3
10.0
0197.4
84.1
20
.01
%4.2
8(4
.12)
(0.5
2)
3.7
6201.2
4
2010
B
od
en
, A
rth
ur
T., J
r.
0.0
1%
87.6
50.0
02.8
90.0
090.5
41.8
90
.01
%1.9
6(1
.89)
(0.2
4)
1.7
292.2
7
2011
B
ola
nd
, A
melia L
. 0
.02
%311.7
80.0
010.2
90.0
0322.0
76.7
20
.02
%6.9
8(6
.72)
(0.8
5)
6.1
3328.2
0
2010
B
on
an
no
, A
nd
rew
J.
0.0
1%
175.3
00.0
05.7
90.0
0181.0
93.7
80
.01
%3.9
2(3
.78)
(0.4
8)
3.4
4184.5
3
2011
B
org
es, A
lbert
0
.01
%165.9
60.0
05.4
80.0
0171.4
43.5
80
.01
%3.7
2(3
.58)
(0.4
5)
3.2
6174.7
0
2006
B
ou
rqu
e, Jam
es
0.0
1%
177.9
50.0
05.8
70.0
0183.8
33.8
40
.01
%3.9
8(3
.84)
(0.4
9)
3.5
0187.3
2
2008
B
ou
tin
, A
nn
ie L
. 0
.01
%166.3
90.0
05.4
90.0
0171.8
83.5
90
.01
%3.7
2(3
.59)
(0.4
6)
3.2
7175.1
5
2003
B
ou
tras, Z
elf
a
0.0
2%
299.5
00.0
09.8
80.0
0309.3
86.4
60
.02
%6.7
0(6
.46)
(0.8
2)
5.8
8315.2
6
2004
B
razil, R
ich
ard
0.0
1%
199.6
60.0
06.5
90.0
0206.2
54.3
10
.01
%4.4
7(4
.31)
(0.5
5)
3.9
2210.1
8
2015
B
reen
, R
ich
ard
J
0.0
2%
260.0
00.0
08.5
80.0
0268.5
80.0
00
.02
%5.8
20.0
0(0
.71)
5.1
1273.6
9
2011
B
rig
gs, N
orm
a J
. 0
.01
%82.9
80.0
02.7
40.0
085.7
21.7
90
.01
%1.8
6(1
.79)
(0.2
3)
1.6
387.3
5
2016
B
roth
ers
, A
iden
E.
0.0
0%
0.0
0130.0
00.0
00.0
0130.0
00.0
00
.00
%0.0
00.0
00.0
00.0
0130.0
0
2008
B
rou
sseau
, A
lph
on
ce
0.0
2%
249.5
80.0
08.2
40.0
0257.8
25.3
80
.02
%5.5
9(5
.38)
(0.6
8)
4.9
0262.7
2
2010
B
row
n, C
aro
l L
. 0
.01
%87.6
50.0
02.8
90.0
090.5
41.8
90
.01
%1.9
6(1
.89)
(0.2
4)
1.7
292.2
7
2016
B
row
n, M
ari
on
S.
0.0
0%
0.0
0130.0
00.0
00.0
0130.0
00.0
00
.00
%0.0
00.0
00.0
00.0
0130.0
0
2015
B
rucato
, T
ho
mas D
0
.00
%65.0
00.0
02.1
50.0
067.1
50.0
00
.00
%1.4
60.0
0(0
.18)
1.2
868.4
2
2002
B
run
elle, R
aym
on
d
0.0
3%
382.3
40.0
012.6
20.0
0394.9
68.2
50
.03
%8.5
6(8
.25)
(1.0
5)
7.5
1402.4
7
2005
B
ob
is, M
arc
L.
0.0
1%
177.9
50.0
05.8
70.0
0183.8
33.8
40
.01
%3.9
8(3
.84)
(0.4
9)
3.5
0187.3
2
2014
B
ou
rdela
ais
, H
en
ry A
0
.02
%267.3
00.0
08.8
20.0
0276.1
25.7
60
.02
%5.9
8(5
.76)
(0.7
3)
5.2
5281.3
7
2002
B
ou
dre
au
, T
ere
sa
0.0
1%
95.5
90.0
03.1
50.0
098.7
42.0
60
.01
%2.1
4(2
.06)
(0.2
6)
1.8
8100.6
2
2016
B
ou
rdela
is, K
are
n
0.0
0%
0.0
0195.0
00.0
00.0
0195.0
00.0
00
.00
%0.0
00.0
00.0
00.0
0195.0
0
2008
B
oyko
, P
au
lin
e
0.0
2%
332.7
80.0
010.9
80.0
0343.7
67.1
80
.02
%7.4
5(7
.18)
(0.9
1)
6.5
4350.3
0
2006
B
urn
ham
, L
ind
a0
.01
%169.9
70.0
05.6
10.0
0175.5
83.6
70
.01
%3.8
1(3
.67)
(0.4
7)
3.3
4178.9
2
2003
B
urr
is, E
ug
en
e0
.01
%199.6
60.0
06.5
90.0
0206.2
54.3
10
.01
%4.4
7(4
.31)
(0.5
5)
3.9
2210.1
8
2002
B
uscem
i, D
ora
0
.01
%191.1
70.0
06.3
10.0
0197.4
84.1
20
.01
%4.2
8(4
.12)
(0.5
2)
3.7
6201.2
4
2016
B
ure
sh
, W
illiam
0
.00
%0.0
065.0
00.0
00.0
065.0
00.0
00
.00
%0.0
00.0
00.0
00.0
065.0
0
2007
B
yth
ew
oo
d, D
oro
thy
0.0
1%
83.1
90.0
02.7
50.0
085.9
41.7
90
.01
%1.8
6(1
.79)
(0.2
3)
1.6
387.5
7
2011
C
allah
an
An
n M
0
.01
%82.9
80.0
02.7
40.0
085.7
21.7
90
.01
%1.8
6(1
.79)
(0.2
3)
1.6
387.3
5
2009
C
alm
a, M
ary
S.
0.0
3%
343.6
70.0
011.3
40.0
0355.0
17.4
10
.03
%7.6
9(7
.41)
(0.9
4)
6.7
5361.7
6
2004
C
am
pb
ell, W
illiam
0.0
3%
399.3
30.0
013.1
80.0
0412.5
18.6
10
.03
%8.9
4(8
.61)
(1.0
9)
7.8
5420.3
5
2008
C
am
po
s, C
arl
os S
r.
0.0
1%
166.3
90.0
05.4
90.0
0171.8
83.5
90
.01
%3.7
2(3
.59)
(0.4
6)
3.2
7175.1
5
2006
C
ap
ozzi, B
ruce
0.0
1%
177.9
50.0
05.8
70.0
0183.8
33.8
40
.01
%3.9
8(3
.84)
(0.4
9)
3.5
0187.3
2
2003
C
arn
ey, Jr.
, Jo
sep
h0
.03
%392.3
40.0
012.9
50.0
0405.2
88.4
60
.03
%8.7
8(8
.46)
(1.0
8)
7.7
1412.9
9
2014
C
aro
, Jo
hn
S.
0.0
1%
133.6
50.0
04.4
10.0
0138.0
62.8
80
.01
%2.9
9(2
.88)
(0.3
7)
2.6
3140.6
9
2014
C
aro
n F
lore
nce E
. 0
.01
%133.6
50.0
04.4
10.0
0138.0
62.8
80
.01
%2.9
9(2
.88)
(0.3
7)
2.6
3140.6
9
2004
C
arr
, R
aym
on
d
0.0
3%
399.3
30.0
013.1
80.0
0412.5
18.6
10
.03
%8.9
4(8
.61)
(1.0
9)
7.8
5420.3
5
2004
C
arr
oll, M
arg
are
t0
.01
%199.6
60.0
06.5
90.0
0206.2
54.3
10
.01
%4.4
7(4
.31)
(0.5
5)
3.9
2210.1
8
2013
C
arr
oll, P
au
l J
0.0
1%
148.0
80.0
04.8
90.0
0152.9
73.1
90
.01
%3.3
2(3
.19)
(0.4
1)
2.9
1155.8
8
2005
C
art
er,
Ed
na G
. 0
.01
%91.8
50.0
03.0
30.0
094.8
81.9
80
.01
%2.0
6(1
.98)
(0.2
5)
1.8
096.6
8
2008
C
asey, K
are
n
0.0
1%
166.3
90.0
05.4
90.0
0171.8
83.5
90
.01
%3.7
2(3
.59)
(0.4
6)
3.2
7175.1
5
2012
C
assaro
, N
ore
en
M.
0.0
1%
155.8
90.0
05.1
40.0
0161.0
43.3
60
.01
%3.4
9(3
.36)
(0.4
3)
3.0
6164.1
0
2016
C
astr
o, A
lexan
der
Z.
0.0
0%
0.0
0260.0
00.0
00.0
0260.0
00.0
00
.00
%0.0
00.0
00.0
00.0
0260.0
0
2002
C
ata
lfim
o, C
ath
eri
ne
0.0
3%
392.3
40.0
012.9
50.0
0405.2
88.4
60
.03
%8.7
8(8
.46)
(1.0
8)
7.7
1412.9
9
2007
C
ata
riu
s, C
aro
le
0.0
1%
169.9
70.0
05.6
10.0
0175.5
83.6
70
.01
%3.8
1(3
.67)
(0.4
7)
3.3
4178.9
2
2007
C
avan
au
gh
, Jo
hn
0.0
1%
169.9
70.0
05.6
10.0
0175.5
83.6
70
.01
%3.8
1(3
.67)
(0.4
7)
3.3
4178.9
2
2016
C
hah
an
ovic
h, M
elv
in
0.0
0%
0.0
065.0
00.0
00.0
065.0
00.0
00
.00
%0.0
00.0
00.0
00.0
065.0
0
2014
C
hap
ela
ine, P
au
l T
0
.02
%267.3
00.0
08.8
20.0
0276.1
25.7
60
.02
%5.9
8(5
.76)
(0.7
3)
5.2
5281.3
7
2003
C
harl
eb
ois
, D
avid
0.0
3%
392.3
40.0
012.9
50.0
0405.2
88.4
60
.03
%8.7
8(8
.46)
(1.0
8)
7.7
1412.9
9
2002
C
ho
rley, D
avid
0
.01
%191.1
70.0
06.3
10.0
0197.4
84.1
20
.01
%4.2
8(4
.12)
(0.5
2)
3.7
6201.2
4
Pre
pare
d B
y C
itiz
ens P
rivate
Bank a
nd T
rust
01/2
3/1
7]
86

MS
9
RE
PO
RT
OF
TH
E T
RU
ST
FU
ND
S O
F T
HE
TO
WN
OF
SA
LE
M,
NH
ON
DE
CE
MB
ER
31
, 2
01
6
P
RIN
CIP
AL
IN
CO
ME
TO
TA
L
Ga
ins
or
^D
ate
of
NA
ME
OF
TR
US
T F
UN
DP
UR
PO
SE
OF
HO
W IN
VE
ST
ED
Ba
lan
ce
Ad
dit
ion
s/
(Lo
ss
es
) o
nW
ith
dra
wa
lsB
ala
nc
eB
ala
nc
eE
arn
ed
Ex
pe
nd
ed
Ba
lan
ce
Pri
nc
ipa
l
^C
rea
tio
nT
RU
ST
FU
ND
%B
eg
inn
ing
Ne
w F
un
ds
Sa
le o
f E
nd
Be
gin
nin
g%
Du
rin
gD
uri
ng
Fe
es
En
d&
Ye
ar
Cre
ate
dS
ec
uri
tie
sY
ea
rY
ea
rY
ea
rY
ea
rY
ea
rIn
co
me
2010
C
hic
caro
ne, P
ete
r 0
.03
%350.6
10.0
011.5
70.0
0362.1
87.5
60
.03
%7.8
5(7
.56)
(0.9
6)
6.8
9369.0
6
2006
C
lift
on
, W
alt
er
S0
.01
%177.9
50.0
05.8
70.0
0183.8
33.8
40
.01
%3.9
8(3
.84)
(0.4
9)
3.5
0187.3
2
2007
C
oco
, H
ora
ce J
. 0
.02
%332.7
80.0
010.9
80.0
0343.7
67.1
80
.02
%7.4
5(7
.18)
(0.9
1)
6.5
4350.3
0
2006
C
on
ley, R
ich
ard
A.N
.0
.01
%88.9
80.0
02.9
40.0
091.9
11.9
20
.01
%1.9
9(1
.92)
(0.2
4)
1.7
593.6
6
2005
C
on
ners
, M
au
rice
0.0
1%
183.6
90.0
06.0
60.0
0189.7
63.9
60
.01
%4.1
1(3
.96)
(0.5
0)
3.6
1193.3
7
2005
C
on
nearn
ey, K
evin
0.0
2%
275.5
40.0
09.0
90.0
0284.6
35.9
40
.02
%6.1
7(5
.94)
(0.7
6)
5.4
1290.0
5
2011
C
oo
ney, P
atr
ick W
. 0
.01
%82.9
80.0
02.7
40.0
085.7
21.7
90
.01
%1.8
6(1
.79)
(0.2
3)
1.6
387.3
5
2014
C
oo
ney, R
ich
ard
T
0.0
0%
65.0
00.0
02.1
50.0
067.1
50.0
00
.00
%1.4
60.0
0(0
.18)
1.2
868.4
2
2010
C
ossett
e, S
an
dra
A.
0.0
2%
262.9
50.0
08.6
80.0
0271.6
35.6
70
.02
%5.8
9(5
.67)
(0.7
2)
5.1
7276.8
0
2004
C
oty
, B
ern
ard
W.
0.0
3%
399.3
30.0
013.1
80.0
0412.5
18.6
10
.03
%8.9
4(8
.61)
(1.0
9)
7.8
5420.3
5
2003
C
ou
ture
, D
ori
s0
.03
%392.3
40.0
012.9
50.0
0405.2
88.4
60
.03
%8.7
8(8
.46)
(1.0
8)
7.7
1412.9
9
2009
C
oville
, Jacq
uo
lin
e
0.0
1%
85.9
20.0
02.8
40.0
088.7
51.8
50
.01
%1.9
2(1
.85)
(0.2
4)
1.6
990.4
4
2003
C
ox, S
heila
0.0
3%
392.3
40.0
012.9
50.0
0405.2
88.4
60
.03
%8.7
8(8
.46)
(1.0
8)
7.7
1412.9
9
2006
C
ran
e, W
illiam
A.
0.0
1%
169.9
70.0
05.6
10.0
0175.5
83.6
70
.01
%3.8
1(3
.67)
(0.4
7)
3.3
4178.9
2
2010
C
ron
in, Jo
hn
F.
0.0
1%
175.3
00.0
05.7
90.0
0181.0
93.7
80
.01
%3.9
2(3
.78)
(0.4
8)
3.4
4184.5
3
2007
C
rote
au
, D
eb
ora
h
0.0
3%
339.9
40.0
011.2
20.0
0351.1
67.3
30
.03
%7.6
1(7
.33)
(0.9
3)
6.6
8357.8
4
2012
C
rote
au
, S
usan
E.
0.0
1%
77.9
50.0
02.5
70.0
080.5
21.6
80
.01
%1.7
4(1
.68)
(0.2
1)
1.5
382.0
5
2003
C
rum
ple
r, B
ett
y J
an
e0
.01
%196.1
70.0
06.4
70.0
0202.6
44.2
30
.01
%4.3
9(4
.23)
(0.5
4)
3.8
5206.5
0
2009
C
urr
an
, B
ren
da J
. 0
.01
%171.8
30.0
05.6
70.0
0177.5
03.7
10
.01
%3.8
5(3
.71)
(0.4
7)
3.3
8180.8
8
2016
C
utl
er,
Pau
l E
. 0
.00
%0.0
0130.0
00.0
00.0
0130.0
00.0
00
.00
%0.0
00.0
00.0
00.0
0130.0
0
2010
D
'Ag
ate
, Jo
hn
Ab
du
l 0
.03
%350.6
10.0
011.5
70.0
0362.1
87.5
60
.03
%7.8
5(7
.56)
(0.9
6)
6.8
9369.0
6
2013
D
'Arg
osti
no
, L
ucille
A
0.0
1%
74.0
40.0
02.4
40.0
076.4
81.6
00
.01
%1.6
6(1
.60)
(0.2
0)
1.4
577.9
4
2012
D
'Am
ico
, L
orr
ain
e L
. 0
.01
%148.0
80.0
04.8
90.0
0152.9
73.1
90
.01
%3.3
2(3
.19)
(0.4
1)
2.9
1155.8
8
2004
D
aw
so
n, B
arb
ara
0.0
1%
199.6
60.0
06.5
90.0
0206.2
54.3
10
.01
%4.4
7(4
.31)
(0.5
5)
3.9
2210.1
8
2004
D
aw
so
n, L
yn
ne
0.0
1%
199.6
60.0
06.5
90.0
0206.2
54.3
10
.01
%4.4
7(4
.31)
(0.5
5)
3.9
2210.1
8
2010
D
ay, S
tep
eh
en
R.
0.0
1%
87.6
50.0
02.8
90.0
090.5
41.8
90
.01
%1.9
6(1
.89)
(0.2
4)
1.7
292.2
7
2011
D
eA
mic
is, R
ob
ert
A.
0.0
1%
165.9
60.0
05.4
80.0
0171.4
43.5
80
.01
%3.7
2(3
.58)
(0.4
5)
3.2
6174.7
0
2004
D
eC
esare
, H
ele
n
0.0
1%
199.6
60.0
06.5
90.0
0206.2
54.3
10
.01
%4.4
7(4
.31)
(0.5
5)
3.9
2210.1
8
2003
D
ecker,
Nan
cy G
. 0
.02
%294.2
50.0
09.7
10.0
0303.9
66.3
50
.02
%6.5
9(6
.35)
(0.8
1)
5.7
8309.7
4
2011
D
ela
ney, N
orm
an
G.
0.0
1%
165.9
60.0
05.4
80.0
0171.4
43.5
80
.01
%3.7
2(3
.58)
(0.4
5)
3.2
6174.7
0
2013
D
elim
, R
oo
ney C
0
.01
%148.0
80.0
04.8
90.0
0152.9
73.1
90
.01
%3.3
2(3
.19)
(0.4
1)
2.9
1155.8
8
2002
D
ellacio
pp
a, D
avid
0
.01
%191.1
70.0
06.3
10.0
0197.4
84.1
20
.01
%4.2
8(4
.12)
(0.5
2)
3.7
6201.2
4
2001
D
elo
ge, Jean
0
.01
%191.1
70.0
06.3
10.0
0197.4
84.1
20
.01
%4.2
8(4
.12)
(0.5
2)
3.7
6201.2
4
2014
D
elu
ca, N
ico
le A
. 0
.00
%66.8
20.0
02.2
10.0
069.0
31.4
40
.00
%1.5
0(1
.44)
(0.1
8)
1.3
170.3
4
2003
D
em
ellia
, M
ich
ael
0.0
1%
199.6
60.0
06.5
90.0
0206.2
54.3
10
.01
%4.4
7(4
.31)
(0.5
5)
3.9
2210.1
8
2015
D
em
ers
, A
lfre
da W
. 0
.00
%65.0
00.0
02.1
50.0
067.1
50.0
00
.00
%1.4
60.0
0(0
.18)
1.2
868.4
2
2003
D
em
ers
, R
ud
olp
h0
.01
%98.0
80.0
03.2
40.0
0101.3
22.1
20
.01
%2.2
0(2
.12)
(0.2
7)
1.9
3103.2
5
2011
D
en
nis
, R
ob
ert
L.
0.0
1%
165.9
60.0
05.4
80.0
0171.4
43.5
80
.01
%3.7
2(3
.58)
(0.4
5)
3.2
6174.7
0
2010
D
eR
osa, P
hilip
A. S
r.
0.0
1%
165.9
60.0
05.4
80.0
0171.4
43.5
80
.01
%3.7
2(3
.58)
(0.4
5)
3.2
6174.7
0
2013
D
eS
an
tis, E
lla M
0
.01
%148.0
80.0
04.8
90.0
0152.9
73.1
90
.01
%3.3
2(3
.19)
(0.4
1)
2.9
1155.8
8
2005
D
esF
osses, G
lori
a0
.01
%183.6
90.0
06.0
60.0
0189.7
63.9
60
.01
%4.1
1(3
.96)
(0.5
0)
3.6
1193.3
7
2011
D
eS
ou
sa, A
big
ail
0.0
1%
155.8
90.0
05.1
40.0
0161.0
43.3
60
.01
%3.4
9(3
.36)
(0.4
3)
3.0
6164.1
0
2010
D
esm
an
ch
es, R
en
e
0.0
3%
350.6
10.0
011.5
70.0
0362.1
87.5
60
.03
%7.8
5(7
.56)
(0.9
6)
6.8
9369.0
6
2008
D
eV
ito
, S
tep
hen
D.
0.0
2%
332.7
80.0
010.9
80.0
0343.7
67.1
80
.02
%7.4
5(7
.18)
(0.9
1)
6.5
4350.3
0
2003
D
ew
, R
ob
ert
0
.01
%196.1
70.0
06.4
70.0
0202.6
44.2
30
.01
%4.3
9(4
.23)
(0.5
4)
3.8
5206.5
0
2014
D
ion
, A
my D
. 0
.00
%66.8
20.0
02.2
10.0
069.0
31.4
40
.00
%1.5
0(1
.44)
(0.1
8)
1.3
170.3
4
2011
D
on
ab
ed
ian
, D
an
iel
0.0
1%
165.9
60.0
05.4
80.0
0171.4
43.5
80
.01
%3.7
2(3
.58)
(0.4
5)
3.2
6174.7
0
2014
D
on
ah
ue, R
ich
ard
Art
hu
r 0
.00
%65.0
00.0
02.1
50.0
067.1
50.0
00
.00
%1.4
60.0
0(0
.18)
1.2
868.4
2
2006
D
on
ovan
, R
ita
0.0
1%
177.9
50.0
05.8
70.0
0183.8
33.8
40
.01
%3.9
8(3
.84)
(0.4
9)
3.5
0187.3
2
2012
D
ozib
rin
, T
heo
do
re
0.0
1%
155.8
90.0
05.1
40.0
0161.0
43.3
60
.01
%3.4
9(3
.36)
(0.4
3)
3.0
6164.1
0
2013
D
rag
o, R
ob
ert
F.
0.0
1%
148.0
80.0
04.8
90.0
0152.9
73.1
90
.01
%3.3
2(3
.19)
(0.4
1)
2.9
1155.8
8
2009
D
ub
e, R
ich
ard
0
.01
%175.3
00.0
05.7
90.0
0181.0
93.7
80
.01
%3.9
2(3
.78)
(0.4
8)
3.4
4184.5
3
2002
D
ub
reu
il, D
en
ise
0.0
1%
95.5
90.0
03.1
50.0
098.7
42.0
60
.01
%2.1
4(2
.06)
(0.2
6)
1.8
8100.6
2
2005
D
ub
ois
, Jo
hn
0.0
1%
183.6
90.0
06.0
60.0
0189.7
63.9
60
.01
%4.1
1(3
.96)
(0.5
0)
3.6
1193.3
7
2004
D
uff
y, T
hre
sa
0.0
1%
99.8
30.0
03.2
90.0
0103.1
32.1
50
.01
%2.2
3(2
.15)
(0.2
7)
1.9
6105.0
9
2005
D
ug
gan
, P
au
l 0
.03
%367.3
90.0
012.1
20.0
0379.5
17.9
20
.03
%8.2
2(7
.92)
(1.0
1)
7.2
2386.7
3
2014
D
um
on
t, J
osh
ua W
. 0
.01
%200.4
70.0
06.6
20.0
0207.0
94.3
20
.01
%4.4
9(4
.32)
(0.5
5)
3.9
4211.0
3
2012
D
um
och
el, R
eje
an
J.
0.0
1%
155.8
90.0
05.1
40.0
0161.0
43.3
60
.01
%3.4
9(3
.36)
(0.4
3)
3.0
6164.1
0
2002
D
un
aw
ay, Jam
es
0.0
1%
191.1
70.0
06.3
10.0
0197.4
84.1
20
.01
%4.2
8(4
.12)
(0.5
2)
3.7
6201.2
4
2014
D
up
uis
, F
red
eri
ck W
. S
r.
0.0
2%
267.3
00.0
08.8
20.0
0276.1
25.7
60
.02
%5.9
8(5
.76)
(0.7
3)
5.2
5281.3
7
2005
D
uvern
ay, B
ert
ran
d0
.01
%183.6
90.0
06.0
60.0
0189.7
63.9
60
.01
%4.1
1(3
.96)
(0.5
0)
3.6
1193.3
7
2007
D
ym
ek, D
ori
s0
.02
%249.5
80.0
08.2
40.0
0257.8
25.3
80
.02
%5.5
9(5
.38)
(0.6
8)
4.9
0262.7
2
2016
E
llio
t, F
ran
cis
P.
0.0
0%
0.0
065.0
00.0
00.0
065.0
00.0
00
.00
%0.0
00.0
00.0
00.0
065.0
0
2012
E
ng
lish
, D
ian
e L
. 0
.01
%77.9
50.0
02.5
70.0
080.5
21.6
80
.01
%1.7
4(1
.68)
(0.2
1)
1.5
382.0
5
2010
E
sp
inal, A
nd
rea L
. 0
.01
%87.6
50.0
02.8
90.0
090.5
41.8
90
.01
%1.9
6(1
.89)
(0.2
4)
1.7
292.2
7
2013
E
sp
ino
la, H
erm
an
J.
0.0
1%
148.0
80.0
04.8
90.0
0152.9
73.1
90
.01
%3.3
2(3
.19)
(0.4
1)
2.9
1155.8
8
2011
F
air
weath
er,
Eth
el M
0.0
1%
165.9
60.0
05.4
80.0
0171.4
43.5
80
.01
%3.7
2(3
.58)
(0.4
5)
3.2
6174.7
0
2010
F
allie
r, N
an
cy J
. 0
.01
%87.6
50.0
02.8
90.0
090.5
41.8
90
.01
%1.9
6(1
.89)
(0.2
4)
1.7
292.2
7
2012
F
arn
ell, B
rian
R.
0.0
2%
233.8
40.0
07.7
20.0
0241.5
55.0
40
.02
%5.2
3(5
.04)
(0.6
4)
4.5
9246.1
5
2002
F
arn
eth
, D
ou
gla
s
0.0
1%
95.5
90.0
03.1
50.0
098.7
42.0
60
.01
%2.1
4(2
.06)
(0.2
6)
1.8
8100.6
2
2007
F
au
ch
er,
Lu
cia
0
.02
%254.9
60.0
08.4
10.0
0263.3
75.5
00
.02
%5.7
1(5
.50)
(0.7
0)
5.0
1268.3
8
Pre
pare
d B
y C
itiz
ens P
rivate
Bank a
nd T
rust
01/2
3/1
7]
87

MS
9
RE
PO
RT
OF
TH
E T
RU
ST
FU
ND
S O
F T
HE
TO
WN
OF
SA
LE
M,
NH
ON
DE
CE
MB
ER
31
, 2
01
6
P
RIN
CIP
AL
IN
CO
ME
TO
TA
L
Ga
ins
or
^D
ate
of
NA
ME
OF
TR
US
T F
UN
DP
UR
PO
SE
OF
HO
W IN
VE
ST
ED
Ba
lan
ce
Ad
dit
ion
s/
(Lo
ss
es
) o
nW
ith
dra
wa
lsB
ala
nc
eB
ala
nc
eE
arn
ed
Ex
pe
nd
ed
Ba
lan
ce
Pri
nc
ipa
l
^C
rea
tio
nT
RU
ST
FU
ND
%B
eg
inn
ing
Ne
w F
un
ds
Sa
le o
f E
nd
Be
gin
nin
g%
Du
rin
gD
uri
ng
Fe
es
En
d&
Ye
ar
Cre
ate
dS
ec
uri
tie
sY
ea
rY
ea
rY
ea
rY
ea
rY
ea
rIn
co
me
2004
F
aw
cett
, W
alt
er
0.0
1%
199.6
60.0
06.5
90.0
0206.2
54.3
10
.01
%4.4
7(4
.31)
(0.5
5)
3.9
2210.1
8
2012
F
een
ey, G
ail F
. 0
.01
%155.8
90.0
05.1
40.0
0161.0
43.3
60
.01
%3.4
9(3
.36)
(0.4
3)
3.0
6164.1
0
2013
F
err
an
ti, Jo
sep
h
0.0
1%
74.0
40.0
02.4
40.0
076.4
81.6
00
.01
%1.6
6(1
.60)
(0.2
0)
1.4
577.9
4
2012
F
err
an
ti, M
ari
a E
. 0
.01
%148.0
80.0
04.8
90.0
0152.9
73.1
90
.01
%3.3
2(3
.19)
(0.4
1)
2.9
1155.8
8
2006
F
err
is, V
irg
inia
M.
0.0
3%
355.9
10.0
011.7
50.0
0367.6
57.6
80
.03
%7.9
7(7
.68)
(0.9
8)
6.9
9374.6
4
2006
F
ich
era
, P
hilip
D.
0.0
1%
177.9
50.0
05.8
70.0
0183.8
33.8
40
.01
%3.9
8(3
.84)
(0.4
9)
3.5
0187.3
2
2002
F
itto
n, R
uth
E.
0.0
3%
382.3
40.0
012.6
20.0
0394.9
68.2
50
.03
%8.5
6(8
.25)
(1.0
5)
7.5
1402.4
7
2006
F
itzg
era
ld, D
ian
e0
.03
%355.9
10.0
011.7
50.0
0367.6
57.6
80
.03
%7.9
7(7
.68)
(0.9
8)
6.9
9374.6
4
2007
F
lem
ing
, D
oro
thy
0.0
3%
339.9
40.0
011.2
20.0
0351.1
67.3
30
.03
%7.6
1(7
.33)
(0.9
3)
6.6
8357.8
4
2011
F
lessas, C
aro
l M
. 0
.01
%165.9
60.0
05.4
80.0
0171.4
43.5
80
.01
%3.7
2(3
.58)
(0.4
5)
3.2
6174.7
0
2014
F
lyn
n, Jan
ice R
0
.01
%133.6
50.0
04.4
10.0
0138.0
62.8
80
.01
%2.9
9(2
.88)
(0.3
7)
2.6
3140.6
9
2011
F
ord
, E
arl
F
0.0
1%
155.8
90.0
05.1
40.0
0161.0
43.3
60
.01
%3.4
9(3
.36)
(0.4
3)
3.0
6164.1
0
2005
F
ord
, Jo
an
0.0
1%
183.6
90.0
06.0
60.0
0189.7
63.9
60
.01
%4.1
1(3
.96)
(0.5
0)
3.6
1193.3
7
2002
F
ou
lds J
r., S
am
ual T
.N.
0.0
1%
191.1
70.0
06.3
10.0
0197.4
84.1
20
.01
%4.2
8(4
.12)
(0.5
2)
3.7
6201.2
4
2004
F
ow
ler,
Geo
rge
0.0
1%
199.6
60.0
06.5
90.0
0206.2
54.3
10
.01
%4.4
7(4
.31)
(0.5
5)
3.9
2210.1
8
2011
F
ox, Jam
es J
. 0
.02
%331.9
20.0
010.9
50.0
0342.8
77.1
60
.02
%7.4
3(7
.16)
(0.9
1)
6.5
2349.4
0
2013
F
raser,
Dean
G.
0.0
1%
148.0
80.0
04.8
90.0
0152.9
73.1
90
.01
%3.3
2(3
.19)
(0.4
1)
2.9
1155.8
8
2005
F
red
ett
e, Jo
sep
h
0.0
1%
183.6
90.0
06.0
60.0
0189.7
63.9
60
.01
%4.1
1(3
.96)
(0.5
0)
3.6
1193.3
7
2007
F
reit
as, M
ari
lyn
0.0
1%
169.9
70.0
05.6
10.0
0175.5
83.6
70
.01
%3.8
1(3
.67)
(0.4
7)
3.3
4178.9
2
2001
F
usco
, G
eo
rge C
0
.01
%191.1
70.0
06.3
10.0
0197.4
84.1
20
.01
%4.2
8(4
.12)
(0.5
2)
3.7
6201.2
4
2003
F
red
eri
ck, R
uth
A.
0.0
1%
199.6
60.0
06.5
90.0
0206.2
54.3
10
.01
%4.4
7(4
.31)
(0.5
5)
3.9
2210.1
8
2016
F
ucci, R
ich
ard
Jo
sep
h
0.0
0%
0.0
0130.0
00.0
00.0
0130.0
00.0
00
.00
%0.0
00.0
00.0
00.0
0130.0
0
2013
G
ag
no
n, B
ren
da
0.0
1%
200.4
70.0
06.6
20.0
0207.0
94.3
20
.01
%4.4
9(4
.32)
(0.5
5)
3.9
4211.0
3
2008
G
ag
no
n, G
ilm
an
J.
0.0
1%
166.3
90.0
05.4
90.0
0171.8
83.5
90
.01
%3.7
2(3
.59)
(0.4
6)
3.2
7175.1
5
2015
G
ale
, Jam
es J
. Jr.
0
.01
%130.0
00.0
04.2
90.0
0134.2
90.0
00
.01
%2.9
10.0
0(0
.36)
2.5
5136.8
4
2009
G
allag
her,
William
T.
0.0
1%
171.8
30.0
05.6
70.0
0177.5
03.7
10
.01
%3.8
5(3
.71)
(0.4
7)
3.3
8180.8
8
2007
G
allan
t, J
osep
h A
. 0
.01
%84.9
90.0
02.8
00.0
087.7
91.8
30
.01
%1.9
0(1
.83)
(0.2
3)
1.6
789.4
6
2002
G
allu
zzo
, D
avid
0
.03
%382.3
40.0
012.6
20.0
0394.9
68.2
50
.03
%8.5
6(8
.25)
(1.0
5)
7.5
1402.4
7
2008
G
ara
bed
ian
, C
aro
l, E
0
.03
%343.6
70.0
011.3
40.0
0355.0
17.4
10
.03
%7.6
9(7
.41)
(0.9
4)
6.7
5361.7
6
2005
G
ara
bed
ian
, C
aro
lyn
0.0
3%
367.3
90.0
012.1
20.0
0379.5
17.9
20
.03
%8.2
2(7
.92)
(1.0
1)
7.2
2386.7
3
2005
G
arc
ia, G
ilb
ert
0.0
1%
177.9
50.0
05.8
70.0
0183.8
33.8
40
.01
%3.9
8(3
.84)
(0.4
9)
3.5
0187.3
2
2009
G
ard
ella, D
ori
s T
0
.01
%171.8
30.0
05.6
70.0
0177.5
03.7
10
.01
%3.8
5(3
.71)
(0.4
7)
3.3
8180.8
8
2002
G
arv
ey, C
aro
l0
.01
%191.1
70.0
06.3
10.0
0197.4
84.1
20
.01
%4.2
8(4
.12)
(0.5
2)
3.7
6201.2
4
2002
G
arv
ey, C
harl
es
0.0
1%
191.1
70.0
06.3
10.0
0197.4
84.1
20
.01
%4.2
8(4
.12)
(0.5
2)
3.7
6201.2
4
2014
G
au
gh
an
, R
ob
ert
J. Jr.
0
.00
%66.8
20.0
02.2
10.0
069.0
31.4
40
.00
%1.5
0(1
.44)
(0.1
8)
1.3
170.3
4
2003
G
azd
a, R
ich
ard
J.
0.0
1%
196.1
70.0
06.4
70.0
0202.6
44.2
30
.01
%4.3
9(4
.23)
(0.5
4)
3.8
5206.5
0
2008
G
eary
, R
ich
ard
F.
0.0
1%
83.1
90.0
02.7
50.0
085.9
41.7
90
.01
%1.8
6(1
.79)
(0.2
3)
1.6
387.5
7
2016
G
en
dre
au
Jo
hn
A.
0.0
0%
0.0
0195.0
00.0
00.0
0195.0
00.0
00
.00
%0.0
00.0
00.0
00.0
0195.0
0
2006
G
en
tile
, W
illiam
0.0
3%
355.9
10.0
011.7
50.0
0367.6
57.6
80
.03
%7.9
7(7
.68)
(0.9
8)
6.9
9374.6
4
2004
G
eo
rge, E
rnest
J.
0.0
3%
367.3
90.0
012.1
20.0
0379.5
17.9
20
.03
%8.2
2(7
.92)
(1.0
1)
7.2
2386.7
3
2003
G
eo
rgia
na, K
ait
lin
Eliz
0.0
2%
294.2
50.0
09.7
10.0
0303.9
66.3
50
.02
%6.5
9(6
.35)
(0.8
1)
5.7
8309.7
4
2010
G
ilch
rist,
Bru
ce
0.0
1%
82.9
80.0
02.7
40.0
085.7
21.7
90
.01
%1.8
6(1
.79)
(0.2
3)
1.6
387.3
5
2004
G
ill, A
nn
0
.03
%367.3
90.0
012.1
20.0
0379.5
17.9
20
.03
%8.2
2(7
.92)
(1.0
1)
7.2
2386.7
3
2005
G
ill, J
ean
nett
e
0.0
1%
177.9
50.0
05.8
70.0
0183.8
33.8
40
.01
%3.9
8(3
.84)
(0.4
9)
3.5
0187.3
2
2008
G
ing
ues, D
ian
e M
. 0
.02
%332.7
80.0
010.9
80.0
0343.7
67.1
80
.02
%7.4
5(7
.18)
(0.9
1)
6.5
4350.3
0
2007
G
irard
, B
arb
ara
J.
0.0
1%
169.9
70.0
05.6
10.0
0175.5
83.6
70
.01
%3.8
1(3
.67)
(0.4
7)
3.3
4178.9
2
2005
G
irard
, Ju
liett
e0
.01
%88.9
80.0
02.9
40.0
091.9
11.9
20
.01
%1.9
9(1
.92)
(0.2
4)
1.7
593.6
6
2003
G
irag
osia
n, A
nth
on
y0
.01
%196.1
70.0
06.4
70.0
0202.6
44.2
30
.01
%4.3
9(4
.23)
(0.5
4)
3.8
5206.5
0
2015
G
iud
ice, T
ho
mas
0.0
1%
130.0
00.0
04.2
90.0
0134.2
90.0
00
.01
%2.9
10.0
0(0
.36)
2.5
5136.8
4
2012
G
iuff
rid
a, Jo
sep
h P
. 0
.01
%155.8
90.0
05.1
40.0
0161.0
43.3
60
.01
%3.4
9(3
.36)
(0.4
3)
3.0
6164.1
0
2006
G
iusti
, Jo
an
0
.01
%177.9
50.0
05.8
70.0
0183.8
33.8
40
.01
%3.9
8(3
.84)
(0.4
9)
3.5
0187.3
2
2002
G
osselin
, L
ore
tta M
. 0
.01
%196.1
70.0
06.4
70.0
0202.6
44.2
30
.01
%4.3
9(4
.23)
(0.5
4)
3.8
5206.5
0
2003
G
ou
ld, W
illiam
0.0
3%
392.3
40.0
012.9
50.0
0405.2
88.4
60
.03
%8.7
8(8
.46)
(1.0
8)
7.7
1412.9
9
2010
G
ote
rch
, W
alt
er
0.0
2%
331.9
20.0
010.9
50.0
0342.8
77.1
60
.02
%7.4
3(7
.16)
(0.9
1)
6.5
2349.4
0
2005
G
rassi, C
on
sta
nce
0.0
1%
183.6
90.0
06.0
60.0
0189.7
63.9
60
.01
%4.1
1(3
.96)
(0.5
0)
3.6
1193.3
7
2008
G
razia
ni, A
rth
ur
Jr.
0
.01
%166.3
90.0
05.4
90.0
0171.8
83.5
90
.01
%3.7
2(3
.59)
(0.4
6)
3.2
7175.1
5
2011
G
reen
, W
illiam
T
0.0
1%
82.9
80.0
02.7
40.0
085.7
21.7
90
.01
%1.8
6(1
.79)
(0.2
3)
1.6
387.3
5
2003
G
rover,
Ro
deri
ck
0.0
3%
392.3
40.0
012.9
50.0
0405.2
88.4
60
.03
%8.7
8(8
.46)
(1.0
8)
7.7
1412.9
9
2006
G
uccia
rdi, L
ee A
nn
0
.03
%339.9
40.0
011.2
20.0
0351.1
67.3
30
.03
%7.6
1(7
.33)
(0.9
3)
6.6
8357.8
4
2009
G
ueri
n, A
lfre
d L
. 0
.01
%175.3
00.0
05.7
90.0
0181.0
93.7
80
.01
%3.9
2(3
.78)
(0.4
8)
3.4
4184.5
3
2009
G
ug
lio
tta, F
ran
cis
0
.03
%343.6
70.0
011.3
40.0
0355.0
17.4
10
.03
%7.6
9(7
.41)
(0.9
4)
6.7
5361.7
6
2006
G
ug
lio
tta, G
len
do
lyn
0.0
1%
169.9
70.0
05.6
10.0
0175.5
83.6
70
.01
%3.8
1(3
.67)
(0.4
7)
3.3
4178.9
2
2012
G
uid
ry, D
ori
s M
. 0
.01
%77.9
50.0
02.5
70.0
080.5
21.6
80
.01
%1.7
4(1
.68)
(0.2
1)
1.5
382.0
5
2012
G
uilm
et,
Raym
on
d A
. 0
.01
%77.9
50.0
02.5
70.0
080.5
21.6
80
.01
%1.7
4(1
.68)
(0.2
1)
1.5
382.0
5
2014
G
uso
ski, S
an
dra
J
0.0
1%
130.0
00.0
04.2
90.0
0134.2
90.0
00
.01
%2.9
10.0
0(0
.36)
2.5
5136.8
4
2007
H
ab
ib, C
hri
sto
ph
er
0.0
1%
83.1
90.0
02.7
50.0
085.9
41.7
90
.01
%1.8
6(1
.79)
(0.2
3)
1.6
387.5
7
2001
H
ad
wah
, Ju
lia M
alo
ff0
.02
%286.7
60.0
09.4
60.0
0296.2
26.1
80
.02
%6.4
2(6
.18)
(0.7
9)
5.6
3301.8
5
2004
H
all, D
avid
H.
0.0
1%
199.6
60.0
06.5
90.0
0206.2
54.3
10
.01
%4.4
7(4
.31)
(0.5
5)
3.9
2210.1
8
2002
H
am
el Jr.
, C
harl
es
0.0
1%
95.5
90.0
03.1
50.0
098.7
42.0
60
.01
%2.1
4(2
.06)
(0.2
6)
1.8
8100.6
2
2006
H
am
el , D
oro
thy I
0.0
1%
177.9
50.0
05.8
70.0
0183.8
33.8
40
.01
%3.9
8(3
.84)
(0.4
9)
3.5
0187.3
2
2009
H
an
lon
, P
atr
icia
0
.01
%171.8
30.0
05.6
70.0
0177.5
03.7
10
.01
%3.8
5(3
.71)
(0.4
7)
3.3
8180.8
8
Pre
pare
d B
y C
itiz
ens P
rivate
Bank a
nd T
rust
01/2
3/1
7]
88

MS
9
RE
PO
RT
OF
TH
E T
RU
ST
FU
ND
S O
F T
HE
TO
WN
OF
SA
LE
M,
NH
ON
DE
CE
MB
ER
31
, 2
01
6
P
RIN
CIP
AL
IN
CO
ME
TO
TA
L
Ga
ins
or
^D
ate
of
NA
ME
OF
TR
US
T F
UN
DP
UR
PO
SE
OF
HO
W IN
VE
ST
ED
Ba
lan
ce
Ad
dit
ion
s/
(Lo
ss
es
) o
nW
ith
dra
wa
lsB
ala
nc
eB
ala
nc
eE
arn
ed
Ex
pe
nd
ed
Ba
lan
ce
Pri
nc
ipa
l
^C
rea
tio
nT
RU
ST
FU
ND
%B
eg
inn
ing
Ne
w F
un
ds
Sa
le o
f E
nd
Be
gin
nin
g%
Du
rin
gD
uri
ng
Fe
es
En
d&
Ye
ar
Cre
ate
dS
ec
uri
tie
sY
ea
rY
ea
rY
ea
rY
ea
rY
ea
rIn
co
me
2008
H
arl
ess, G
ord
on
0
.01
%83.1
90.0
02.7
50.0
085.9
41.7
90
.01
%1.8
6(1
.79)
(0.2
3)
1.6
387.5
7
2003
H
arr
iso
n, P
atr
ick
0.0
1%
98.0
80.0
03.2
40.0
0101.3
22.1
20
.01
%2.2
0(2
.12)
(0.2
7)
1.9
3103.2
5
2009
H
arv
ey, C
ath
eri
ne C
. 0
.03
%350.6
10.0
011.5
70.0
0362.1
87.5
60
.03
%7.8
5(7
.56)
(0.9
6)
6.8
9369.0
6
2014
H
ayn
es, L
ora
ine
0.0
0%
66.8
20.0
02.2
10.0
069.0
31.4
40
.00
%1.5
0(1
.44)
(0.1
8)
1.3
170.3
4
2010
H
eb
ert
, R
ola
nd
H.
0.0
1%
175.3
00.0
05.7
90.0
0181.0
93.7
80
.01
%3.9
2(3
.78)
(0.4
8)
3.4
4184.5
3
2013
H
en
ders
on
, P
au
l E
& M
arc
ia
0.0
1%
74.0
40.0
02.4
40.0
076.4
81.6
00
.01
%1.6
6(1
.60)
(0.2
0)
1.4
577.9
4
2012
H
em
bro
ug
h, M
uri
el M
. 0
.01
%77.9
50.0
02.5
70.0
080.5
21.6
80
.01
%1.7
4(1
.68)
(0.2
1)
1.5
382.0
5
2005
H
en
ders
on
, N
ob
le0
.01
%183.6
90.0
06.0
60.0
0189.7
63.9
60
.01
%4.1
1(3
.96)
(0.5
0)
3.6
1193.3
7
2006
H
ew
itt,
Tim
oth
y E
. 0
.01
%88.9
80.0
02.9
40.0
091.9
11.9
20
.01
%1.9
9(1
.92)
(0.2
4)
1.7
593.6
6
2011
H
eu
ser,
Vau
gh
nd
ella J
. 0
.01
%165.9
60.0
05.4
80.0
0171.4
43.5
80
.01
%3.7
2(3
.58)
(0.4
5)
3.2
6174.7
0
2002
H
ilb
erg
, E
lizab
eth
0.0
3%
392.3
40.0
012.9
50.0
0405.2
88.4
60
.03
%8.7
8(8
.46)
(1.0
8)
7.7
1412.9
9
2012
H
ill, E
ug
en
ia P
. 0
.01
%77.9
50.0
02.5
70.0
080.5
21.6
80
.01
%1.7
4(1
.68)
(0.2
1)
1.5
382.0
5
2010
H
ines, S
heila L
. 0
.03
%350.6
10.0
011.5
70.0
0362.1
87.5
60
.03
%7.8
5(7
.56)
(0.9
6)
6.8
9369.0
6
2002
H
ob
bs, M
eg
an
0.0
1%
196.1
70.0
06.4
70.0
0202.6
44.2
30
.01
%4.3
9(4
.23)
(0.5
4)
3.8
5206.5
0
2002
H
ockri
dg
e, Jo
an
0
.01
%191.1
70.0
06.3
10.0
0197.4
84.1
20
.01
%4.2
8(4
.12)
(0.5
2)
3.7
6201.2
4
2007
H
off
man
, G
eo
rge F
. 0
.02
%249.5
80.0
08.2
40.0
0257.8
25.3
80
.02
%5.5
9(5
.38)
(0.6
8)
4.9
0262.7
2
2012
H
og
an
, R
ob
ert
C.
0.0
1%
74.0
40.0
02.4
40.0
076.4
81.6
00
.01
%1.6
6(1
.60)
(0.2
0)
1.4
577.9
4
2010
H
oh
man
n, M
arg
are
t M
0
.02
%262.9
50.0
08.6
80.0
0271.6
35.6
70
.02
%5.8
9(5
.67)
(0.7
2)
5.1
7276.8
0
2012
H
ollan
d, D
on
na M
ari
e
0.0
1%
77.9
50.0
02.5
70.0
080.5
21.6
80
.01
%1.7
4(1
.68)
(0.2
1)
1.5
382.0
5
2009
H
om
sey, G
len
n M
. 0
.03
%350.6
10.0
011.5
70.0
0362.1
87.5
60
.03
%7.8
5(7
.56)
(0.9
6)
6.8
9369.0
6
2015
H
om
sey, S
am
uel F
. 0
.02
%260.0
00.0
08.5
80.0
0268.5
80.0
00
.02
%5.8
20.0
0(0
.71)
5.1
1273.6
9
2011
H
oo
n, Jacq
uelin
e M
. 0
.01
%155.8
90.0
05.1
40.0
0161.0
43.3
60
.01
%3.4
9(3
.36)
(0.4
3)
3.0
6164.1
0
2006
H
ow
ell, Jo
hn
J.
0.0
1%
169.9
70.0
05.6
10.0
0175.5
83.6
70
.01
%3.8
1(3
.67)
(0.4
7)
3.3
4178.9
2
2014
H
ueb
ner,
Alv
in E
. Jr.
0
.00
%65.0
00.0
02.1
50.0
067.1
50.0
00
.00
%1.4
60.0
0(0
.18)
1.2
868.4
2
2007
H
utc
hin
gs, Ju
dit
h
0.0
3%
339.9
40.0
011.2
20.0
0351.1
67.3
30
.03
%7.6
1(7
.33)
(0.9
3)
6.6
8357.8
4
2012
H
utc
hin
so
n, M
arg
are
t A
0
.01
%155.8
90.0
05.1
40.0
0161.0
43.3
60
.01
%3.4
9(3
.36)
(0.4
3)
3.0
6164.1
0
2005
Ich
ton
, Jo
sep
h0
.01
%183.6
90.0
06.0
60.0
0189.7
63.9
60
.01
%4.1
1(3
.96)
(0.5
0)
3.6
1193.3
7
2008
J
aq
ues, M
ari
e0
.01
%83.1
90.0
02.7
50.0
085.9
41.7
90
.01
%1.8
6(1
.79)
(0.2
3)
1.6
387.5
7
2004
J
en
dri
ck, Jam
es T
0.0
1%
183.6
90.0
06.0
60.0
0189.7
63.9
60
.01
%4.1
1(3
.96)
(0.5
0)
3.6
1193.3
7
2002
J
oh
nso
n, E
dw
in
0.0
1%
95.5
90.0
03.1
50.0
098.7
42.0
60
.01
%2.1
4(2
.06)
(0.2
6)
1.8
8100.6
2
2008
J
oh
nso
n, Jam
es L
. 0
.01
%171.8
30.0
05.6
70.0
0177.5
03.7
10
.01
%3.8
5(3
.71)
(0.4
7)
3.3
8180.8
8
2015
J
oh
nso
n, M
att
hew
P.
0.0
2%
260.0
00.0
08.5
80.0
0268.5
80.0
00
.02
%5.8
20.0
0(0
.71)
5.1
1273.6
9
2015
J
oh
nso
n, P
au
l O
. 0
.00
%65.0
00.0
02.1
50.0
067.1
50.0
00
.00
%1.4
60.0
0(0
.18)
1.2
868.4
2
2016
J
oh
nso
n, R
ob
ert
J.
0.0
0%
0.0
065.0
00.0
00.0
065.0
00.0
00
.00
%0.0
00.0
00.0
00.0
065.0
0
2016
J
ord
an
, Jan
elle S
. 0
.00
%0.0
065.0
00.0
00.0
065.0
00.0
00
.00
%0.0
00.0
00.0
00.0
065.0
0
2004
K
an
dre
s, C
harl
es
0.0
2%
275.5
40.0
09.0
90.0
0284.6
35.9
40
.02
%6.1
7(5
.94)
(0.7
6)
5.4
1290.0
5
2009
K
ara
mo
urt
op
ou
los, Jo
hn
0
.01
%175.3
00.0
05.7
90.0
0181.0
93.7
80
.01
%3.9
2(3
.78)
(0.4
8)
3.4
4184.5
3
2012
K
ate
r, R
on
ald
J.
0.0
1%
155.8
90.0
05.1
40.0
0161.0
43.3
60
.01
%3.4
9(3
.36)
(0.4
3)
3.0
6164.1
0
2002
K
au
fman
, E
dit
h
0.0
1%
191.1
70.0
06.3
10.0
0197.4
84.1
20
.01
%4.2
8(4
.12)
(0.5
2)
3.7
6201.2
4
2012
K
arl
, E
ric D
0
.02
%311.7
80.0
010.2
90.0
0322.0
76.7
20
.02
%6.9
8(6
.72)
(0.8
5)
6.1
3328.2
0
2007
K
eo
, Jim
0
.01
%169.9
70.0
05.6
10.0
0175.5
83.6
70
.01
%3.8
1(3
.67)
(0.4
7)
3.3
4178.9
2
2008
K
imb
all, H
aro
ld F
. 0
.01
%83.1
90.0
02.7
50.0
085.9
41.7
90
.01
%1.8
6(1
.79)
(0.2
3)
1.6
387.5
7
2007
K
ing
, M
ary
S.
0.0
1%
84.9
90.0
02.8
00.0
087.7
91.8
30
.01
%1.9
0(1
.83)
(0.2
3)
1.6
789.4
6
2015
K
inn
ey, P
atr
icia
R.
0.0
1%
130.0
00.0
04.2
90.0
0134.2
90.0
00
.01
%2.9
10.0
0(0
.36)
2.5
5136.8
4
2010
K
oza, B
arb
ara
J.
0.0
1%
175.3
00.0
05.7
90.0
0181.0
93.7
80
.01
%3.9
2(3
.78)
(0.4
8)
3.4
4184.5
3
2010
K
urg
an
, L
ois
S.
0.0
1%
87.6
50.0
02.8
90.0
090.5
41.8
90
.01
%1.9
6(1
.89)
(0.2
4)
1.7
292.2
7
2011
L
ai, M
an
Yip
0
.02
%331.9
20.0
010.9
50.0
0342.8
77.1
60
.02
%7.4
3(7
.16)
(0.9
1)
6.5
2349.4
0
2016
L
aC
arb
on
ara
, D
an
iel R
. 0
.00
%0.0
0130.0
00.0
00.0
0130.0
00.0
00
.00
%0.0
00.0
00.0
00.0
0130.0
0
2005
L
aF
on
tain
e, R
ich
ard
0.0
2%
266.9
30.0
08.8
10.0
0275.7
45.7
60
.02
%5.9
8(5
.76)
(0.7
3)
5.2
4280.9
8
2005
L
am
ph
ere
, L
orr
ain
e T
. 0
.01
%183.6
90.0
06.0
60.0
0189.7
63.9
60
.01
%4.1
1(3
.96)
(0.5
0)
3.6
1193.3
7
2003
L
an
dry
, R
aym
on
d I
0.0
1%
199.6
60.0
06.5
90.0
0206.2
54.3
10
.01
%4.4
7(4
.31)
(0.5
5)
3.9
2210.1
8
2004
L
an
dry
, W
ilfr
ed
A.
0.0
3%
367.3
90.0
012.1
20.0
0379.5
17.9
20
.03
%8.2
2(7
.92)
(1.0
1)
7.2
2386.7
3
2007
L
an
ou
ett
e, L
ion
el
0.0
1%
83.1
90.0
02.7
50.0
085.9
41.7
90
.01
%1.8
6(1
.79)
(0.2
3)
1.6
387.5
7
2011
L
aP
lan
te, Jo
hn
J.
0.0
1%
82.9
80.0
02.7
40.0
085.7
21.7
90
.01
%1.8
6(1
.79)
(0.2
3)
1.6
387.3
5
2008
L
aro
ch
e, Jo
an
0
.01
%83.1
90.0
02.7
50.0
085.9
41.7
90
.01
%1.8
6(1
.79)
(0.2
3)
1.6
387.5
7
2016
L
ars
en
, H
arr
y J
. Jr.
0
.00
%0.0
0130.0
00.0
00.0
0130.0
00.0
00
.00
%0.0
00.0
00.0
00.0
0130.0
0
2003
L
asp
ina, A
lfre
d J
. 0
.01
%98.0
80.0
03.2
40.0
0101.3
22.1
20
.01
%2.2
0(2
.12)
(0.2
7)
1.9
3103.2
5
2007
L
ayco
ck, B
eatr
ice
0.0
1%
169.9
70.0
05.6
10.0
0175.5
83.6
70
.01
%3.8
1(3
.67)
(0.4
7)
3.3
4178.9
2
2005
L
eam
y, B
ren
da
0.0
1%
183.6
90.0
06.0
60.0
0189.7
63.9
60
.01
%4.1
1(3
.96)
(0.5
0)
3.6
1193.3
7
2010
L
eary
, T
ho
mas F
. 0
.01
%87.6
50.0
02.8
90.0
090.5
41.8
90
.01
%1.9
6(1
.89)
(0.2
4)
1.7
292.2
7
2009
L
eB
lan
c, D
on
ald
S.
0.0
1%
175.3
00.0
05.7
90.0
0181.0
93.7
80
.01
%3.9
2(3
.78)
(0.4
8)
3.4
4184.5
3
2013
L
em
elin
, R
ich
ard
N
0.0
2%
296.1
60.0
09.7
70.0
0305.9
36.3
90
.02
%6.6
3(6
.39)
(0.8
1)
5.8
2311.7
5
2008
L
eo
ne, P
au
l J., S
r.
0.0
1%
166.3
90.0
05.4
90.0
0171.8
83.5
90
.01
%3.7
2(3
.59)
(0.4
6)
3.2
7175.1
5
2005
L
eri
ch
e, R
ob
ert
Sr.
0
.01
%183.6
90.0
06.0
60.0
0189.7
63.9
60
.01
%4.1
1(3
.96)
(0.5
0)
3.6
1193.3
7
2002
L
esn
itsky, G
eo
rge
0.0
3%
382.3
40.0
012.6
20.0
0394.9
68.2
50
.03
%8.5
6(8
.25)
(1.0
5)
7.5
1402.4
7
2002
L
eto
urn
eau
, R
en
e P
0
.01
%95.5
90.0
03.1
50.0
098.7
42.0
60
.01
%2.1
4(2
.06)
(0.2
6)
1.8
8100.6
2
2009
L
imo
san
i, M
ich
ael F
. 0
.01
%87.6
50.0
02.8
90.0
090.5
41.8
90
.01
%1.9
6(1
.89)
(0.2
4)
1.7
292.2
7
2016
L
inzett
o, S
alv
ato
r C
. 0
.00
%0.0
065.0
00.0
00.0
065.0
00.0
00
.00
%0.0
00.0
00.0
00.0
065.0
0
2012
L
ocke, R
ich
ard
M.
0.0
1%
74.0
40.0
02.4
40.0
076.4
81.6
00
.01
%1.6
6(1
.60)
(0.2
0)
1.4
577.9
4
2014
L
on
go
, P
atr
icia
A.
0.0
1%
133.6
50.0
04.4
10.0
0138.0
62.8
80
.01
%2.9
9(2
.88)
(0.3
7)
2.6
3140.6
9
2015
L
ord
, S
co
tt R
. 0
.00
%65.0
00.0
02.1
50.0
067.1
50.0
00
.00
%1.4
60.0
0(0
.18)
1.2
868.4
2
Pre
pare
d B
y C
itiz
ens P
rivate
Bank a
nd T
rust
01/2
3/1
7]
89

MS
9
RE
PO
RT
OF
TH
E T
RU
ST
FU
ND
S O
F T
HE
TO
WN
OF
SA
LE
M,
NH
ON
DE
CE
MB
ER
31
, 2
01
6
P
RIN
CIP
AL
IN
CO
ME
TO
TA
L
Ga
ins
or
^D
ate
of
NA
ME
OF
TR
US
T F
UN
DP
UR
PO
SE
OF
HO
W IN
VE
ST
ED
Ba
lan
ce
Ad
dit
ion
s/
(Lo
ss
es
) o
nW
ith
dra
wa
lsB
ala
nc
eB
ala
nc
eE
arn
ed
Ex
pe
nd
ed
Ba
lan
ce
Pri
nc
ipa
l
^C
rea
tio
nT
RU
ST
FU
ND
%B
eg
inn
ing
Ne
w F
un
ds
Sa
le o
f E
nd
Be
gin
nin
g%
Du
rin
gD
uri
ng
Fe
es
En
d&
Ye
ar
Cre
ate
dS
ec
uri
tie
sY
ea
rY
ea
rY
ea
rY
ea
rY
ea
rIn
co
me
2009
L
ore
nzo
, Jo
sep
h D
. 0
.01
%175.3
00.0
05.7
90.0
0181.0
93.7
80
.01
%3.9
2(3
.78)
(0.4
8)
3.4
4184.5
3
2010
L
ovejo
y, T
ho
mas G
.0
.01
%175.3
00.0
05.7
90.0
0181.0
93.7
80
.01
%3.9
2(3
.78)
(0.4
8)
3.4
4184.5
3
2011
L
un
d, M
ary
D.
0.0
1%
82.9
80.0
02.7
40.0
085.7
21.7
90
.01
%1.8
6(1
.79)
(0.2
3)
1.6
387.3
5
2007
L
un
d, N
an
cy L
0.0
3%
339.9
40.0
011.2
20.0
0351.1
67.3
30
.03
%7.6
1(7
.33)
(0.9
3)
6.6
8357.8
4
2002
L
uste
nb
erg
er,
No
reen
0
.01
%191.1
70.0
06.3
10.0
0197.4
84.1
20
.01
%4.2
8(4
.12)
(0.5
2)
3.7
6201.2
4
2005
L
ute
y, W
esle
y R
., S
r.
0.0
3%
367.3
90.0
012.1
20.0
0379.5
17.9
20
.03
%8.2
2(7
.92)
(1.0
1)
7.2
2386.7
3
2006
L
yn
ch
, D
an
ial A
. 0
.02
%266.9
30.0
08.8
10.0
0275.7
45.7
60
.02
%5.9
8(5
.76)
(0.7
3)
5.2
4280.9
8
2006
M
acD
on
ald
, C
olin
0.0
1%
177.9
50.0
05.8
70.0
0183.8
33.8
40
.01
%3.9
8(3
.84)
(0.4
9)
3.5
0187.3
2
2008
M
acD
on
ald
, W
illiam
0
.01
%166.3
90.0
05.4
90.0
0171.8
83.5
90
.01
%3.7
2(3
.59)
(0.4
6)
3.2
7175.1
5
2014
M
cC
art
hy, Jo
hn
W.
0.0
0%
66.8
20.0
02.2
10.0
069.0
31.4
40
.00
%1.5
0(1
.44)
(0.1
8)
1.3
170.3
4
2005
M
cN
am
ara
, T
ho
mas
0.0
1%
88.9
80.0
02.9
40.0
091.9
11.9
20
.01
%1.9
9(1
.92)
(0.2
4)
1.7
593.6
6
2001
M
acP
hee, B
arb
ara
J
0.0
1%
191.1
70.0
06.3
10.0
0197.4
84.1
20
.01
%4.2
8(4
.12)
(0.5
2)
3.7
6201.2
4
2014
M
ag
lio
, R
ob
ert
S.
0.0
0%
65.0
00.0
02.1
50.0
067.1
50.0
00
.00
%1.4
60.0
0(0
.18)
1.2
868.4
2
2009
M
ah
on
ey, E
neit
h
0.0
1%
171.8
30.0
05.6
70.0
0177.5
03.7
10
.01
%3.8
5(3
.71)
(0.4
7)
3.3
8180.8
8
2010
M
aille
, E
lizab
eth
0
.01
%175.3
00.0
05.7
90.0
0181.0
93.7
80
.01
%3.9
2(3
.78)
(0.4
8)
3.4
4184.5
3
2003
M
aker,
Jo
sep
h T
0.0
1%
196.1
70.0
06.4
70.0
0202.6
44.2
30
.01
%4.3
9(4
.23)
(0.5
4)
3.8
5206.5
0
2016
M
aker,
Jo
sep
h T
. Jr.
0
.00
%0.0
0130.0
00.0
00.0
0130.0
00.0
00
.00
%0.0
00.0
00.0
00.0
0130.0
0
2003
M
aker,
Ro
nald
R.
0.0
1%
196.1
70.0
06.4
70.0
0202.6
44.2
30
.01
%4.3
9(4
.23)
(0.5
4)
3.8
5206.5
0
2010
M
alo
ney, S
tep
hen
F.
0.0
2%
262.9
50.0
08.6
80.0
0271.6
35.6
70
.02
%5.8
9(5
.67)
(0.7
2)
5.1
7276.8
0
2007
M
an
du
ca, Jo
sep
h0
.01
%84.9
90.0
02.8
00.0
087.7
91.8
30
.01
%1.9
0(1
.83)
(0.2
3)
1.6
789.4
6
2012
M
an
ton
, R
ich
ard
B.
0.0
1%
155.8
90.0
05.1
40.0
0161.0
43.3
60
.01
%3.4
9(3
.36)
(0.4
3)
3.0
6164.1
0
2005
M
arc
hu
lait
is, W
ayn
e F
.0
.01
%91.8
50.0
03.0
30.0
094.8
81.9
80
.01
%2.0
6(1
.98)
(0.2
5)
1.8
096.6
8
2011
M
ari
n, C
hery
l 0
.02
%331.9
20.0
010.9
50.0
0342.8
77.1
60
.02
%7.4
3(7
.16)
(0.9
1)
6.5
2349.4
0
2008
M
ars
hall, N
orm
an
0
.03
%343.6
70.0
011.3
40.0
0355.0
17.4
10
.03
%7.6
9(7
.41)
(0.9
4)
6.7
5361.7
6
2012
M
assah
os, G
ail L
. 0
.01
%148.0
80.0
04.8
90.0
0152.9
73.1
90
.01
%3.3
2(3
.19)
(0.4
1)
2.9
1155.8
8
2002
M
ars
den
, L
ind
a
0.0
1%
95.5
90.0
03.1
50.0
098.7
42.0
60
.01
%2.1
4(2
.06)
(0.2
6)
1.8
8100.6
2
2010
M
art
in, C
lair
e L
. 0
.01
%175.3
00.0
05.7
90.0
0181.0
93.7
80
.01
%3.9
2(3
.78)
(0.4
8)
3.4
4184.5
3
2007
M
ath
on
, G
era
rd0
.01
%169.9
70.0
05.6
10.0
0175.5
83.6
70
.01
%3.8
1(3
.67)
(0.4
7)
3.3
4178.9
2
2011
M
aw
so
n, E
ileen
0
.01
%82.9
80.0
02.7
40.0
085.7
21.7
90
.01
%1.8
6(1
.79)
(0.2
3)
1.6
387.3
5
2014
M
aw
so
n, Jo
sep
h E
. 0
.02
%267.3
00.0
08.8
20.0
0276.1
25.7
60
.02
%5.9
8(5
.76)
(0.7
3)
5.2
5281.3
7
2010
M
cC
art
hy, R
ich
ard
E, D
r.
0.0
1%
175.3
00.0
05.7
90.0
0181.0
93.7
80
.01
%3.9
2(3
.78)
(0.4
8)
3.4
4184.5
3
2007
M
cC
ollig
an
, A
lice
0.0
1%
84.9
90.0
02.8
00.0
087.7
91.8
30
.01
%1.9
0(1
.83)
(0.2
3)
1.6
789.4
6
2004
M
cG
uir
e, E
dw
ard
0.0
1%
183.6
90.0
06.0
60.0
0189.7
63.9
60
.01
%4.1
1(3
.96)
(0.5
0)
3.6
1193.3
7
2006
M
cG
rath
, S
heila P
. 0
.01
%169.9
70.0
05.6
10.0
0175.5
83.6
70
.01
%3.8
1(3
.67)
(0.4
7)
3.3
4178.9
2
2003
M
cD
on
ou
gh
, T
ho
mas
0.0
1%
199.6
60.0
06.5
90.0
0206.2
54.3
10
.01
%4.4
7(4
.31)
(0.5
5)
3.9
2210.1
8
2011
M
cIn
nis
, G
eo
rge
0.0
1%
165.9
60.0
05.4
80.0
0171.4
43.5
80
.01
%3.7
2(3
.58)
(0.4
5)
3.2
6174.7
0
2011
M
cL
ean
, M
arl
en
a S
. 0
.02
%248.9
40.0
08.2
20.0
0257.1
65.3
70
.02
%5.5
7(5
.37)
(0.6
8)
4.8
9262.0
5
2011
M
eis
el, F
ran
k R
. Jr.
0
.01
%165.9
60.0
05.4
80.0
0171.4
43.5
80
.01
%3.7
2(3
.58)
(0.4
5)
3.2
6174.7
0
2008
M
ela
nso
n, Jo
sep
h S
. 0
.01
%166.3
90.0
05.4
90.0
0171.8
83.5
90
.01
%3.7
2(3
.59)
(0.4
6)
3.2
7175.1
5
2003
M
ere
dit
h, M
ich
ael
0.0
2%
294.2
50.0
09.7
10.0
0303.9
66.3
50
.02
%6.5
9(6
.35)
(0.8
1)
5.7
8309.7
4
2010
M
err
ow
, E
arl
K.
0.0
1%
165.9
60.0
05.4
80.0
0171.4
43.5
80
.01
%3.7
2(3
.58)
(0.4
5)
3.2
6174.7
0
2009
M
ich
als
ki, D
on
ald
C
0.0
1%
171.8
30.0
05.6
70.0
0177.5
03.7
10
.01
%3.8
5(3
.71)
(0.4
7)
3.3
8180.8
8
2009
M
ille
r, J
oan
T
0.0
1%
171.8
30.0
05.6
70.0
0177.5
03.7
10
.01
%3.8
5(3
.71)
(0.4
7)
3.3
8180.8
8
2002
M
ille
r, Y
vo
nn
e0
.01
%95.5
90.0
03.1
50.0
098.7
42.0
60
.01
%2.1
4(2
.06)
(0.2
6)
1.8
8100.6
2
2005
M
ille
y, K
are
n W
. 0
.01
%183.6
90.0
06.0
60.0
0189.7
63.9
60
.01
%4.1
1(3
.96)
(0.5
0)
3.6
1193.3
7
2010
M
inn
on
, Jean
E.
0.0
3%
350.6
10.0
011.5
70.0
0362.1
87.5
60
.03
%7.8
5(7
.56)
(0.9
6)
6.8
9369.0
6
2016
M
ob
ilia
, W
illiam
W. Jr.
0
.00
%0.0
065.0
00.0
00.0
065.0
00.0
00
.00
%0.0
00.0
00.0
00.0
065.0
0
2015
M
off
att
, S
hir
ley L
0
.00
%65.0
00.0
02.1
50.0
067.1
50.0
00
.00
%1.4
60.0
0(0
.18)
1.2
868.4
2
2003
M
on
ag
han
, D
oro
thy
0.0
1%
196.1
70.0
06.4
70.0
0202.6
44.2
30
.01
%4.3
9(4
.23)
(0.5
4)
3.8
5206.5
0
2015
M
on
tecalv
o, E
lain
e D
0
.01
%130.0
00.0
04.2
90.0
0134.2
90.0
00
.01
%2.9
10.0
0(0
.36)
2.5
5136.8
4
2011
M
on
ty, D
on
ald
L. Jr.
0
.01
%165.9
60.0
05.4
80.0
0171.4
43.5
80
.01
%3.7
2(3
.58)
(0.4
5)
3.2
6174.7
0
2011
M
oo
re, Jo
hn
C.
0.0
1%
155.8
90.0
05.1
40.0
0161.0
43.3
60
.01
%3.4
9(3
.36)
(0.4
3)
3.0
6164.1
0
2003
M
oo
reh
ou
se, T
ho
mas
0.0
1%
196.1
70.0
06.4
70.0
0202.6
44.2
30
.01
%4.3
9(4
.23)
(0.5
4)
3.8
5206.5
0
2007
M
oir
, N
ath
an
0
.01
%169.9
70.0
05.6
10.0
0175.5
83.6
70
.01
%3.8
1(3
.67)
(0.4
7)
3.3
4178.9
2
2011
M
ore
lle, A
melia P
. 0
.01
%165.9
60.0
05.4
80.0
0171.4
43.5
80
.01
%3.7
2(3
.58)
(0.4
5)
3.2
6174.7
0
2004
M
osq
ues, T
ho
mas
0.0
1%
199.6
60.0
06.5
90.0
0206.2
54.3
10
.01
%4.4
7(4
.31)
(0.5
5)
3.9
2210.1
8
2011
M
uir
, R
ich
ard
W.
0.0
1%
165.9
60.0
05.4
80.0
0171.4
43.5
80
.01
%3.7
2(3
.58)
(0.4
5)
3.2
6174.7
0
2003
M
un
ro, C
lair
e0
.01
%196.1
70.0
06.4
70.0
0202.6
44.2
30
.01
%4.3
9(4
.23)
(0.5
4)
3.8
5206.5
0
2015
M
un
roe, P
au
l R
. 0
.01
%130.0
00.0
04.2
90.0
0134.2
90.0
00
.01
%2.9
10.0
0(0
.36)
2.5
5136.8
4
2006
M
urp
hy, R
ob
ert
0.0
1%
169.9
70.0
05.6
10.0
0175.5
83.6
70
.01
%3.8
1(3
.67)
(0.4
7)
3.3
4178.9
2
2015
M
urr
ay, M
ich
ael G
. S
r.
0.0
0%
65.0
00.0
02.1
50.0
067.1
50.0
00
.00
%1.4
60.0
0(0
.18)
1.2
868.4
2
2004
M
urr
ay, R
ich
ard
0.0
1%
199.6
60.0
06.5
90.0
0206.2
54.3
10
.01
%4.4
7(4
.31)
(0.5
5)
3.9
2210.1
8
2014
N
ag
ri, R
ob
ert
J
0.0
1%
130.0
00.0
04.2
90.0
0134.2
90.0
00
.01
%2.9
10.0
0(0
.36)
2.5
5136.8
4
2012
N
aja
rian
Hra
ir
0.0
1%
148.0
80.0
04.8
90.0
0152.9
73.1
90
.01
%3.3
2(3
.19)
(0.4
1)
2.9
1155.8
8
2002
N
ari
nkevic
ius, W
alt
er
0.0
1%
191.1
70.0
06.3
10.0
0197.4
84.1
20
.01
%4.2
8(4
.12)
(0.5
2)
3.7
6201.2
4
2009
N
eu
hau
ser,
Marg
it
0.0
2%
257.7
50.0
08.5
10.0
0266.2
65.5
60
.02
%5.7
7(5
.56)
(0.7
1)
5.0
6271.3
2
2015
N
ew
ell, L
ind
a A
0
.01
%130.0
00.0
04.2
90.0
0134.2
90.0
00
.01
%2.9
10.0
0(0
.36)
2.5
5136.8
4
2014
N
ew
ton
, B
eatr
ice E
. 0
.01
%133.6
50.0
04.4
10.0
0138.0
62.8
80
.01
%2.9
9(2
.88)
(0.3
7)
2.6
3140.6
9
2014
N
isb
et,
Sh
aw
n T
0
.02
%267.3
00.0
08.8
20.0
0276.1
25.7
60
.02
%5.9
8(5
.76)
(0.7
3)
5.2
5281.3
7
2009
N
oo
nan
, C
yn
thia
D.
0.0
1%
171.8
30.0
05.6
70.0
0177.5
03.7
10
.01
%3.8
5(3
.71)
(0.4
7)
3.3
8180.8
8
2005
N
utt
er,
Haro
ld R
0.0
1%
183.6
90.0
06.0
60.0
0189.7
63.9
60
.01
%4.1
1(3
.96)
(0.5
0)
3.6
1193.3
7
Pre
pare
d B
y C
itiz
ens P
rivate
Bank a
nd T
rust
01/2
3/1
7]
90

MS
9
RE
PO
RT
OF
TH
E T
RU
ST
FU
ND
S O
F T
HE
TO
WN
OF
SA
LE
M,
NH
ON
DE
CE
MB
ER
31
, 2
01
6
P
RIN
CIP
AL
IN
CO
ME
TO
TA
L
Ga
ins
or
^D
ate
of
NA
ME
OF
TR
US
T F
UN
DP
UR
PO
SE
OF
HO
W IN
VE
ST
ED
Ba
lan
ce
Ad
dit
ion
s/
(Lo
ss
es
) o
nW
ith
dra
wa
lsB
ala
nc
eB
ala
nc
eE
arn
ed
Ex
pe
nd
ed
Ba
lan
ce
Pri
nc
ipa
l
^C
rea
tio
nT
RU
ST
FU
ND
%B
eg
inn
ing
Ne
w F
un
ds
Sa
le o
f E
nd
Be
gin
nin
g%
Du
rin
gD
uri
ng
Fe
es
En
d&
Ye
ar
Cre
ate
dS
ec
uri
tie
sY
ea
rY
ea
rY
ea
rY
ea
rY
ea
rIn
co
me
2006
O
'Co
nn
ell, M
ark
J.
0.0
1%
177.9
50.0
05.8
70.0
0183.8
33.8
40
.01
%3.9
8(3
.84)
(0.4
9)
3.5
0187.3
2
2016
O
'Co
nn
or,
Ro
bert
G.
0.0
0%
0.0
065.0
00.0
00.0
065.0
00.0
00
.00
%0.0
00.0
00.0
00.0
065.0
0
2002
O
'Cla
re, D
ore
en
0
.03
%382.3
40.0
012.6
20.0
0394.9
68.2
50
.03
%8.5
6(8
.25)
(1.0
5)
7.5
1402.4
7
2003
O
'Neill, T
here
sa
0.0
1%
196.1
70.0
06.4
70.0
0202.6
44.2
30
.01
%4.3
9(4
.23)
(0.5
4)
3.8
5206.5
0
2006
O
lds, D
avid
W.
0.0
1%
177.9
50.0
05.8
70.0
0183.8
33.8
40
.01
%3.9
8(3
.84)
(0.4
9)
3.5
0187.3
2
2010
O
lds, H
ow
ard
W.
0.0
3%
350.6
10.0
011.5
70.0
0362.1
87.5
60
.03
%7.8
5(7
.56)
(0.9
6)
6.8
9369.0
6
2009
O
livera
, Jo
sp
eh
J.
0.0
1%
85.9
20.0
02.8
40.0
088.7
51.8
50
.01
%1.9
2(1
.85)
(0.2
4)
1.6
990.4
4
2007
O
liveri
, R
ich
ard
P
0.0
2%
332.7
80.0
010.9
80.0
0343.7
67.1
80
.02
%7.4
5(7
.18)
(0.9
1)
6.5
4350.3
0
2015
O
lso
n, R
ob
ert
0
.01
%130.0
00.0
04.2
90.0
0134.2
90.0
00
.01
%2.9
10.0
0(0
.36)
2.5
5136.8
4
2002
O
uellett
e, P
atr
ick
0.0
1%
95.5
90.0
03.1
50.0
098.7
42.0
60
.01
%2.1
4(2
.06)
(0.2
6)
1.8
8100.6
2
2002
O
verk
a, S
an
dra
M.
0.0
3%
382.3
40.0
012.6
20.0
0394.9
68.2
50
.03
%8.5
6(8
.25)
(1.0
5)
7.5
1402.4
7
2002
P
ackard
, C
yn
thia
0
.03
%382.3
40.0
012.6
20.0
0394.9
68.2
50
.03
%8.5
6(8
.25)
(1.0
5)
7.5
1402.4
7
2014
P
ag
e, M
ert
on
W
0.0
1%
195.0
00.0
06.4
40.0
0201.4
40.0
00
.01
%4.3
70.0
0(0
.53)
3.8
3205.2
7
2006
P
alo
mb
i, J
oan
M.
0.0
1%
177.9
50.0
05.8
70.0
0183.8
33.8
40
.01
%3.9
8(3
.84)
(0.4
9)
3.5
0187.3
2
2012
P
an
dele
na, M
ich
ael P
. 0
.02
%311.7
80.0
010.2
90.0
0322.0
76.7
20
.02
%6.9
8(6
.72)
(0.8
5)
6.1
3328.2
0
2010
P
ap
pala
rdo
, M
ara
C.
0.0
1%
165.9
60.0
05.4
80.0
0171.4
43.5
80
.01
%3.7
2(3
.58)
(0.4
5)
3.2
6174.7
0
2007
P
arh
iala
, S
usan
0.0
1%
169.9
70.0
05.6
10.0
0175.5
83.6
70
.01
%3.8
1(3
.67)
(0.4
7)
3.3
4178.9
2
2007
P
ars
on
s, W
arr
en
0
.02
%254.9
60.0
08.4
10.0
0263.3
75.5
00
.02
%5.7
1(5
.50)
(0.7
0)
5.0
1268.3
8
2008
P
atn
od
e, G
eo
rge W
. 0
.01
%166.3
90.0
05.4
90.0
0171.8
83.5
90
.01
%3.7
2(3
.59)
(0.4
6)
3.2
7175.1
5
2007
P
att
i, J
osep
hin
e0
.03
%339.9
40.0
011.2
20.0
0351.1
67.3
30
.03
%7.6
1(7
.33)
(0.9
3)
6.6
8357.8
4
2010
P
au
lman
, H
erb
ert
F.
0.0
1%
175.3
00.0
05.7
90.0
0181.0
93.7
80
.01
%3.9
2(3
.78)
(0.4
8)
3.4
4184.5
3
2002
P
ere
dn
a, R
on
ald
0
.01
%191.1
70.0
06.3
10.0
0197.4
84.1
20
.01
%4.2
8(4
.12)
(0.5
2)
3.7
6201.2
4
2002
P
art
rid
ge, S
tuart
0.0
3%
382.3
40.0
012.6
20.0
0394.9
68.2
50
.03
%8.5
6(8
.25)
(1.0
5)
7.5
1402.4
7
2011
P
ere
ira, M
an
uel C
. 0
.01
%165.9
60.0
05.4
80.0
0171.4
43.5
80
.01
%3.7
2(3
.58)
(0.4
5)
3.2
6174.7
0
2010
P
ero
nt,
Cle
men
t E
. 0
.01
%87.6
50.0
02.8
90.0
090.5
41.8
90
.01
%1.9
6(1
.89)
(0.2
4)
1.7
292.2
7
2012
P
err
y, W
illiam
A III
0.0
1%
77.9
50.0
02.5
70.0
080.5
21.6
80
.01
%1.7
4(1
.68)
(0.2
1)
1.5
382.0
5
2006
P
ete
rs, R
ob
ert
J.
0.0
2%
266.9
30.0
08.8
10.0
0275.7
45.7
60
.02
%5.9
8(5
.76)
(0.7
3)
5.2
4280.9
8
2010
P
han
eu
f, K
ay E
. 0
.01
%175.3
00.0
05.7
90.0
0181.0
93.7
80
.01
%3.9
2(3
.78)
(0.4
8)
3.4
4184.5
3
2013
P
ott
er,
Caro
lyn
J
0.0
1%
74.0
40.0
02.4
40.0
076.4
81.6
00
.01
%1.6
6(1
.60)
(0.2
0)
1.4
577.9
4
2013
P
resco
tt, M
arg
are
t F
0
.02
%296.1
60.0
09.7
70.0
0305.9
36.3
90
.02
%6.6
3(6
.39)
(0.8
1)
5.8
2311.7
5
2005
P
revete
, A
nd
rew
0.0
1%
183.6
90.0
06.0
60.0
0189.7
63.9
60
.01
%4.1
1(3
.96)
(0.5
0)
3.6
1193.3
7
2003
P
riestl
ey, A
nn
e0
.04
%588.5
00.0
019.4
20.0
0607.9
312.6
90
.04
%13.1
7(1
2.6
9)
(1.6
1)
11.5
6619.4
9
2002
P
rou
lx, N
orm
an
d
0.0
3%
382.3
40.0
012.6
20.0
0394.9
68.2
50
.03
%8.5
6(8
.25)
(1.0
5)
7.5
1402.4
7
2011
P
roven
ch
er,
Jo
hn
J. Jr.
0
.01
%155.8
90.0
05.1
40.0
0161.0
43.3
60
.01
%3.4
9(3
.36)
(0.4
3)
3.0
6164.1
0
2004
P
ug
lia, G
era
ldin
e (
Ste
eves)
0.0
1%
199.6
60.0
06.5
90.0
0206.2
54.3
10
.01
%4.4
7(4
.31)
(0.5
5)
3.9
2210.1
8
2006
Q
ueen
an
, P
atr
icia
M.
0.0
1%
177.9
50.0
05.8
70.0
0183.8
33.8
40
.01
%3.9
8(3
.84)
(0.4
9)
3.5
0187.3
2
2009
Q
uin
n, W
illiam
M.
0.0
1%
171.8
30.0
05.6
70.0
0177.5
03.7
10
.01
%3.8
5(3
.71)
(0.4
7)
3.3
8180.8
8
2011
R
an
dall, C
harl
es R
. 0
.02
%331.9
20.0
010.9
50.0
0342.8
77.1
60
.02
%7.4
3(7
.16)
(0.9
1)
6.5
2349.4
0
2010
R
ay, C
assan
dra
R.
0.0
3%
350.6
10.0
011.5
70.0
0362.1
87.5
60
.03
%7.8
5(7
.56)
(0.9
6)
6.8
9369.0
6
2004
R
azzab
on
i, N
ap
ole
an
0.0
1%
199.6
60.0
06.5
90.0
0206.2
54.3
10
.01
%4.4
7(4
.31)
(0.5
5)
3.9
2210.1
8
2002
R
eid
, R
ich
ard
0.0
1%
95.5
90.0
03.1
50.0
098.7
42.0
60
.01
%2.1
4(2
.06)
(0.2
6)
1.8
8100.6
2
2002
R
eit
an
o, Jo
yce
0.0
3%
382.3
40.0
012.6
20.0
0394.9
68.2
50
.03
%8.5
6(8
.25)
(1.0
5)
7.5
1402.4
7
2005
R
ich
ard
so
n, R
od
ney
0.0
1%
183.6
90.0
06.0
60.0
0189.7
63.9
60
.01
%4.1
1(3
.96)
(0.5
0)
3.6
1193.3
7
2007
R
iley, Jo
hn
Sr.
0
.01
%169.9
70.0
05.6
10.0
0175.5
83.6
70
.01
%3.8
1(3
.67)
(0.4
7)
3.3
4178.9
2
2016
R
ho
des, Jam
es F
Dr.
0
.00
%0.0
0130.0
00.0
00.0
0130.0
00.0
00
.00
%0.0
00.0
00.0
00.0
0130.0
0
2002
R
ob
bin
s, G
rete
l0
.01
%95.5
90.0
03.1
50.0
098.7
42.0
60
.01
%2.1
4(2
.06)
(0.2
6)
1.8
8100.6
2
2016
R
ob
ich
au
rd, R
ich
ard
J.
0.0
0%
0.0
0130.0
00.0
00.0
0130.0
00.0
00
.00
%0.0
00.0
00.0
00.0
0130.0
0
2011
R
ob
into
n, M
ad
on
na M
0
.01
%82.9
80.0
02.7
40.0
085.7
21.7
90
.01
%1.8
6(1
.79)
(0.2
3)
1.6
387.3
5
2010
R
ou
ff, P
earl
M.
0.0
1%
82.9
80.0
02.7
40.0
085.7
21.7
90
.01
%1.8
6(1
.79)
(0.2
3)
1.6
387.3
5
2007
R
oyle
, M
ary
R.
0.0
1%
169.9
70.0
05.6
10.0
0175.5
83.6
70
.01
%3.8
1(3
.67)
(0.4
7)
3.3
4178.9
2
2008
R
uff
en
, T
ho
mas F
. 0
.04
%499.1
60.0
016.4
70.0
0515.6
410.7
60
.04
%11.1
7(1
0.7
6)
(1.3
7)
9.8
1525.4
4
2005
R
ub
ino
, Jo
sep
h0
.01
%183.6
90.0
06.0
60.0
0189.7
63.9
60
.01
%4.1
1(3
.96)
(0.5
0)
3.6
1193.3
7
2014
R
ufo
, Jo
hn
G. &
Marg
are
t T
0.0
0%
66.8
20.0
02.2
10.0
069.0
31.4
40
.00
%1.5
0(1
.44)
(0.1
8)
1.3
170.3
4
2003
R
up
pert
, Jo
hn
0
.03
%392.3
40.0
012.9
50.0
0405.2
88.4
60
.03
%8.7
8(8
.46)
(1.0
8)
7.7
1412.9
9
2004
S
aab
, K
ath
eri
ne
0.0
3%
367.3
90.0
012.1
20.0
0379.5
17.9
20
.03
%8.2
2(7
.92)
(1.0
1)
7.2
2386.7
3
2014
S
arc
ion
e, R
aym
on
d R
. 0
.00
%65.0
00.0
02.1
50.0
067.1
50.0
00
.00
%1.4
60.0
0(0
.18)
1.2
868.4
2
2006
S
am
aro
, K
are
n0
.01
%169.9
70.0
05.6
10.0
0175.5
83.6
70
.01
%3.8
1(3
.67)
(0.4
7)
3.3
4178.9
2
2008
S
am
bata
ro, M
ark
0
.01
%166.3
90.0
05.4
90.0
0171.8
83.5
90
.01
%3.7
2(3
.59)
(0.4
6)
3.2
7175.1
5
2016
S
am
bata
ro, P
au
l A
0
.00
%0.0
0130.0
00.0
00.0
0130.0
00.0
00
.00
%0.0
00.0
00.0
00.0
0130.0
0
2008
S
an
tag
ati
, K
evin
0
.03
%343.6
70.0
011.3
40.0
0355.0
17.4
10
.03
%7.6
9(7
.41)
(0.9
4)
6.7
5361.7
6
2014
S
an
tare
lli, P
ete
r J
0.0
1%
133.6
50.0
04.4
10.0
0138.0
62.8
80
.01
%2.9
9(2
.88)
(0.3
7)
2.6
3140.6
9
2014
S
an
tosu
osso
, M
ad
ely
n E
. 0
.01
%130.0
00.0
04.2
90.0
0134.2
90.0
00
.01
%2.9
10.0
0(0
.36)
2.5
5136.8
4
2012
S
ap
ien
za, D
an
iel R
. 0
.02
%311.7
80.0
010.2
90.0
0322.0
76.7
20
.02
%6.9
8(6
.72)
(0.8
5)
6.1
3328.2
0
2007
S
ap
och
ett
i, E
rnis
tin
e
0.0
1%
169.9
70.0
05.6
10.0
0175.5
83.6
70
.01
%3.8
1(3
.67)
(0.4
7)
3.3
4178.9
2
2007
S
avard
, C
aro
le0
.03
%339.9
40.0
011.2
20.0
0351.1
67.3
30
.03
%7.6
1(7
.33)
(0.9
3)
6.6
8357.8
4
2010
S
ayer,
Jam
es A
., J
r.
0.0
1%
87.6
50.0
02.8
90.0
090.5
41.8
90
.01
%1.9
6(1
.89)
(0.2
4)
1.7
292.2
7
2004
S
ch
ofi
eld
, T
ho
mas F
. 0
.01
%199.6
60.0
06.5
90.0
0206.2
54.3
10
.01
%4.4
7(4
.31)
(0.5
5)
3.9
2210.1
8
2010
S
ch
ofi
eld
, E
ric W
. 0
.01
%87.6
50.0
02.8
90.0
090.5
41.8
90
.01
%1.9
6(1
.89)
(0.2
4)
1.7
292.2
7
2009
S
ch
warz
en
berg
, F
ran
ces
0.0
1%
87.6
50.0
02.8
90.0
090.5
41.8
90
.01
%1.9
6(1
.89)
(0.2
4)
1.7
292.2
7
2016
S
cu
rto
, K
imb
erl
y A
. 0
.00
%0.0
065.0
00.0
00.0
065.0
00.0
00
.00
%0.0
00.0
00.0
00.0
065.0
0
2006
S
eale
, M
ari
lyn
0.0
1%
88.9
80.0
02.9
40.0
091.9
11.9
20
.01
%1.9
9(1
.92)
(0.2
4)
1.7
593.6
6
Pre
pare
d B
y C
itiz
ens P
rivate
Bank a
nd T
rust
01/2
3/1
7]
91

MS
9
RE
PO
RT
OF
TH
E T
RU
ST
FU
ND
S O
F T
HE
TO
WN
OF
SA
LE
M,
NH
ON
DE
CE
MB
ER
31
, 2
01
6
P
RIN
CIP
AL
IN
CO
ME
TO
TA
L
Ga
ins
or
^D
ate
of
NA
ME
OF
TR
US
T F
UN
DP
UR
PO
SE
OF
HO
W IN
VE
ST
ED
Ba
lan
ce
Ad
dit
ion
s/
(Lo
ss
es
) o
nW
ith
dra
wa
lsB
ala
nc
eB
ala
nc
eE
arn
ed
Ex
pe
nd
ed
Ba
lan
ce
Pri
nc
ipa
l
^C
rea
tio
nT
RU
ST
FU
ND
%B
eg
inn
ing
Ne
w F
un
ds
Sa
le o
f E
nd
Be
gin
nin
g%
Du
rin
gD
uri
ng
Fe
es
En
d&
Ye
ar
Cre
ate
dS
ec
uri
tie
sY
ea
rY
ea
rY
ea
rY
ea
rY
ea
rIn
co
me
2009
S
ears
, E
lmo
D.
0.0
1%
175.3
00.0
05.7
90.0
0181.0
93.7
80
.01
%3.9
2(3
.78)
(0.4
8)
3.4
4184.5
3
2015
S
ee, C
aro
l A
. 0
.02
%260.0
00.0
08.5
80.0
0268.5
80.0
00
.02
%5.8
20.0
0(0
.71)
5.1
1273.6
9
2010
S
elf
rid
ge, M
au
ra
0.0
1%
165.9
60.0
05.4
80.0
0171.4
43.5
80
.01
%3.7
2(3
.58)
(0.4
5)
3.2
6174.7
0
2007
S
eu
bert
, E
dw
ard
0
.01
%83.1
90.0
02.7
50.0
085.9
41.7
90
.01
%1.8
6(1
.79)
(0.2
3)
1.6
387.5
7
2005
S
ham
barg
er,
Pam
ela
0.0
1%
183.6
90.0
06.0
60.0
0189.7
63.9
60
.01
%4.1
1(3
.96)
(0.5
0)
3.6
1193.3
7
2003
S
heeh
an
, R
ob
ert
0.0
1%
98.0
80.0
03.2
40.0
0101.3
22.1
20
.01
%2.2
0(2
.12)
(0.2
7)
1.9
3103.2
5
2004
S
herm
an
, Jean
nett
e0
.01
%99.8
30.0
03.2
90.0
0103.1
32.1
50
.01
%2.2
3(2
.15)
(0.2
7)
1.9
6105.0
9
2008
S
ho
ukal, M
ich
ael J.
0.0
1%
171.8
30.0
05.6
70.0
0177.5
03.7
10
.01
%3.8
5(3
.71)
(0.4
7)
3.3
8180.8
8
2015
S
ilva, Jo
sh
ua J
. 0
.02
%260.0
00.0
08.5
80.0
0268.5
80.0
00
.02
%5.8
20.0
0(0
.71)
5.1
1273.6
9
2007
S
ilva, P
atr
icia
A.
0.0
1%
166.3
90.0
05.4
90.0
0171.8
83.5
90
.01
%3.7
2(3
.59)
(0.4
6)
3.2
7175.1
5
2012
S
mit
h, M
ari
an
na B
.0
.02
%296.1
60.0
09.7
70.0
0305.9
36.3
90
.02
%6.6
3(6
.39)
(0.8
1)
5.8
2311.7
5
2004
S
mit
h, R
ich
ard
J.
0.0
2%
299.5
00.0
09.8
80.0
0309.3
86.4
60
.02
%6.7
0(6
.46)
(0.8
2)
5.8
8315.2
6
2007
S
ou
sa, M
axw
ell C
0.0
3%
339.9
40.0
011.2
20.0
0351.1
67.3
30
.03
%7.6
1(7
.33)
(0.9
3)
6.6
8357.8
4
2006
S
ou
za, F
lore
nce
0.0
1%
169.9
70.0
05.6
10.0
0175.5
83.6
70
.01
%3.8
1(3
.67)
(0.4
7)
3.3
4178.9
2
2002
S
pen
cer,
Ralp
h0
.01
%191.1
70.0
06.3
10.0
0197.4
84.1
20
.01
%4.2
8(4
.12)
(0.5
2)
3.7
6201.2
4
2010
S
tan
ley, H
ou
le Ire
ne D
. 0
.03
%350.6
10.0
011.5
70.0
0362.1
87.5
60
.03
%7.8
5(7
.56)
(0.9
6)
6.8
9369.0
6
2001
S
teele
, G
eo
rge
0.0
1%
191.1
70.0
06.3
10.0
0197.4
84.1
20
.01
%4.2
8(4
.12)
(0.5
2)
3.7
6201.2
4
2009
S
tep
han
ian
, S
tep
hen
0
.01
%171.8
30.0
05.6
70.0
0177.5
03.7
10
.01
%3.8
5(3
.71)
(0.4
7)
3.3
8180.8
8
2012
S
teven
s, N
an
cy J
. 0
.01
%77.9
50.0
02.5
70.0
080.5
21.6
80
.01
%1.7
4(1
.68)
(0.2
1)
1.5
382.0
5
2011
S
teven
s, R
ob
ert
H.
0.0
1%
82.9
80.0
02.7
40.0
085.7
21.7
90
.01
%1.8
6(1
.79)
(0.2
3)
1.6
387.3
5
2011
S
tew
art
, D
avid
C
0.0
1%
82.9
80.0
02.7
40.0
085.7
21.7
90
.01
%1.8
6(1
.79)
(0.2
3)
1.6
387.3
5
2010
S
t. C
yr,
Dan
iel P
. 0
.01
%87.6
50.0
02.8
90.0
090.5
41.8
90
.01
%1.9
6(1
.89)
(0.2
4)
1.7
292.2
7
2007
S
t. J
ean
, P
hillip
0.0
1%
169.9
70.0
05.6
10.0
0175.5
83.6
70
.01
%3.8
1(3
.67)
(0.4
7)
3.3
4178.9
2
2007
S
t. J
ean
, R
og
er
J.
0.0
1%
169.9
70.0
05.6
10.0
0175.5
83.6
70
.01
%3.8
1(3
.67)
(0.4
7)
3.3
4178.9
2
2005
S
tocks, Jo
sep
h0
.03
%367.3
90.0
012.1
20.0
0379.5
17.9
20
.03
%8.2
2(7
.92)
(1.0
1)
7.2
2386.7
3
2011
S
too
dle
y, S
co
tt M
. 0
.01
%165.9
60.0
05.4
80.0
0171.4
43.5
80
.01
%3.7
2(3
.58)
(0.4
5)
3.2
6174.7
0
2008
S
top
yra
, F
ran
cis
0
.01
%83.1
90.0
02.7
50.0
085.9
41.7
90
.01
%1.8
6(1
.79)
(0.2
3)
1.6
387.5
7
2009
S
tuart
, R
ob
ert
0
.02
%257.7
50.0
08.5
10.0
0266.2
65.5
60
.02
%5.7
7(5
.56)
(0.7
1)
5.0
6271.3
2
2014
S
tys, C
hri
sti
ne M
. 0
.00
%65.0
00.0
02.1
50.0
067.1
50.0
00
.00
%1.4
60.0
0(0
.18)
1.2
868.4
2
2010
S
tys C
raig
M.
0.0
1%
165.9
60.0
05.4
80.0
0171.4
43.5
80
.01
%3.7
2(3
.58)
(0.4
5)
3.2
6174.7
0
2009
S
ulliv
an
, Jam
es
0.0
1%
85.9
20.0
02.8
40.0
088.7
51.8
50
.01
%1.9
2(1
.85)
(0.2
4)
1.6
990.4
4
2006
S
ulliv
an
, Jo
an
0.0
1%
177.9
50.0
05.8
70.0
0183.8
33.8
40
.01
%3.9
8(3
.84)
(0.4
9)
3.5
0187.3
2
2016
S
ulliv
an
, L
ind
a
0.0
0%
0.0
0195.0
00.0
00.0
0195.0
00.0
00
.00
%0.0
00.0
00.0
00.0
0195.0
0
2002
S
uszek, A
nn
M
0.0
3%
382.3
40.0
012.6
20.0
0394.9
68.2
50
.03
%8.5
6(8
.25)
(1.0
5)
7.5
1402.4
7
2013
S
weet,
Sh
aro
n M
. 0
.01
%74.0
40.0
02.4
40.0
076.4
81.6
00
.01
%1.6
6(1
.60)
(0.2
0)
1.4
577.9
4
2004
S
ylv
este
r, P
au
l 0
.01
%183.6
90.0
06.0
60.0
0189.7
63.9
60
.01
%4.1
1(3
.96)
(0.5
0)
3.6
1193.3
7
2006
T
aylo
r, A
nn
0.0
3%
355.9
10.0
011.7
50.0
0367.6
57.6
80
.03
%7.9
7(7
.68)
(0.9
8)
6.9
9374.6
4
2005
T
aylo
r, E
ileen
F.
0.0
1%
177.9
50.0
05.8
70.0
0183.8
33.8
40
.01
%3.9
8(3
.84)
(0.4
9)
3.5
0187.3
2
2013
T
ecce, L
uig
i 0
.01
%148.0
80.0
04.8
90.0
0152.9
73.1
90
.01
%3.3
2(3
.19)
(0.4
1)
2.9
1155.8
8
2007
T
eso
ro, K
ath
leen
0.0
3%
339.9
40.0
011.2
20.0
0351.1
67.3
30
.03
%7.6
1(7
.33)
(0.9
3)
6.6
8357.8
4
2001
T
heri
au
lt, B
lan
ch
e0
.01
%191.1
70.0
06.3
10.0
0197.4
84.1
20
.01
%4.2
8(4
.12)
(0.5
2)
3.7
6201.2
4
2001
T
hib
au
lt, W
illiam
F0
.01
%191.1
70.0
06.3
10.0
0197.4
84.1
20
.01
%4.2
8(4
.12)
(0.5
2)
3.7
6201.2
4
2005
T
ho
mas, D
oro
thy
0.0
1%
183.6
90.0
06.0
60.0
0189.7
63.9
60
.01
%4.1
1(3
.96)
(0.5
0)
3.6
1193.3
7
2003
T
ho
mp
so
n, M
ari
an
na
0.0
1%
196.1
70.0
06.4
70.0
0202.6
44.2
30
.01
%4.3
9(4
.23)
(0.5
4)
3.8
5206.5
0
2006
T
ho
mp
so
n, W
illiam
J.
0.0
2%
266.9
30.0
08.8
10.0
0275.7
45.7
60
.02
%5.9
8(5
.76)
(0.7
3)
5.2
4280.9
8
2016
T
ille
r, D
ori
s M
. 0
.00
%0.0
065.0
00.0
00.0
065.0
00.0
00
.00
%0.0
00.0
00.0
00.0
065.0
0
2002
T
itco
mb
, L
ucille
B0
.01
%191.1
70.0
06.3
10.0
0197.4
84.1
20
.01
%4.2
8(4
.12)
(0.5
2)
3.7
6201.2
4
2010
T
od
d, R
aym
on
d W
. 0
.01
%175.3
00.0
05.7
90.0
0181.0
93.7
80
.01
%3.9
2(3
.78)
(0.4
8)
3.4
4184.5
3
2002
T
om
asin
o, Jo
sep
h
0.0
1%
191.1
70.0
06.3
10.0
0197.4
84.1
20
.01
%4.2
8(4
.12)
(0.5
2)
3.7
6201.2
4
2002
T
okan
el, S
haw
n0
.01
%191.1
70.0
06.3
10.0
0197.4
84.1
20
.01
%4.2
8(4
.12)
(0.5
2)
3.7
6201.2
4
2015
T
ou
zet,
Am
eri
co
F.
0.0
1%
130.0
00.0
04.2
90.0
0134.2
90.0
00
.01
%2.9
10.0
0(0
.36)
2.5
5136.8
4
2002
T
ram
mell, M
ild
red
0
.01
%95.5
90.0
03.1
50.0
098.7
42.0
60
.01
%2.1
4(2
.06)
(0.2
6)
1.8
8100.6
2
2004
T
rep
an
ier,
Ken
neth
0.0
1%
91.8
50.0
03.0
30.0
094.8
81.9
80
.01
%2.0
6(1
.98)
(0.2
5)
1.8
096.6
8
2012
T
rou
t, R
ob
ert
T. Jr.
0
.01
%155.8
90.0
05.1
40.0
0161.0
43.3
60
.01
%3.4
9(3
.36)
(0.4
3)
3.0
6164.1
0
2013
T
rou
t, R
ob
in A
0
.01
%74.0
40.0
02.4
40.0
076.4
81.6
00
.01
%1.6
6(1
.60)
(0.2
0)
1.4
577.9
4
2001
T
urc
ott
e, Y
vo
nn
e
0.0
3%
382.3
40.0
012.6
20.0
0394.9
68.2
50
.03
%8.5
6(8
.25)
(1.0
5)
7.5
1402.4
7
2007
T
urn
er,
Ed
gar
0.0
1%
169.9
70.0
05.6
10.0
0175.5
83.6
70
.01
%3.8
1(3
.67)
(0.4
7)
3.3
4178.9
2
2015
V
ach
on
, S
usan
M.
0.0
0%
65.0
00.0
02.1
50.0
067.1
50.0
00
.00
%1.4
60.0
0(0
.18)
1.2
868.4
2
2016
V
ailla
nco
urt
, M
ich
elle M
. 0
.00
%0.0
0195.0
00.0
00.0
0195.0
00.0
00
.00
%0.0
00.0
00.0
00.0
0195.0
0
2006
V
alc
ou
rt, D
ian
e0
.03
%339.9
40.0
011.2
20.0
0351.1
67.3
30
.03
%7.6
1(7
.33)
(0.9
3)
6.6
8357.8
4
2009
V
ale
ncia
, T
aylo
r 0
.01
%85.9
20.0
02.8
40.0
088.7
51.8
50
.01
%1.9
2(1
.85)
(0.2
4)
1.6
990.4
4
2007
V
ale
nti
ne, W
illiam
0
.01
%169.9
70.0
05.6
10.0
0175.5
83.6
70
.01
%3.8
1(3
.67)
(0.4
7)
3.3
4178.9
2
2005
V
alley, W
allace
0.0
1%
183.6
90.0
06.0
60.0
0189.7
63.9
60
.01
%4.1
1(3
.96)
(0.5
0)
3.6
1193.3
7
2004
V
au
gh
an
, B
ob
by D
0.0
2%
299.5
00.0
09.8
80.0
0309.3
86.4
60
.02
%6.7
0(6
.46)
(0.8
2)
5.8
8315.2
6
2012
V
iel, R
uth
L.
0.0
1%
77.9
50.0
02.5
70.0
080.5
21.6
80
.01
%1.7
4(1
.68)
(0.2
1)
1.5
382.0
5
2010
W
ain
wri
gh
t, D
ori
s
0.0
1%
165.9
60.0
05.4
80.0
0171.4
43.5
80
.01
%3.7
2(3
.58)
(0.4
5)
3.2
6174.7
0
2006
W
ait
es, H
ele
n
0.0
2%
266.9
30.0
08.8
10.0
0275.7
45.7
60
.02
%5.9
8(5
.76)
(0.7
3)
5.2
4280.9
8
2014
W
ald
ron
, C
riag
J.
0.0
1%
133.6
50.0
04.4
10.0
0138.0
62.8
80
.01
%2.9
9(2
.88)
(0.3
7)
2.6
3140.6
9
2015
W
all, G
era
rd S
0
.01
%130.0
00.0
04.2
90.0
0134.2
90.0
00
.01
%2.9
10.0
0(0
.36)
2.5
5136.8
4
2004
W
allace, C
lift
on
0.0
1%
199.6
60.0
06.5
90.0
0206.2
54.3
10
.01
%4.4
7(4
.31)
(0.5
5)
3.9
2210.1
8
2004
W
allace, F
red
eri
ck
0.0
1%
199.6
60.0
06.5
90.0
0206.2
54.3
10
.01
%4.4
7(4
.31)
(0.5
5)
3.9
2210.1
8
2014
W
als
h, M
ilto
n J
. 0
.01
%133.6
50.0
04.4
10.0
0138.0
62.8
80
.01
%2.9
9(2
.88)
(0.3
7)
2.6
3140.6
9
Pre
pare
d B
y C
itiz
ens P
rivate
Bank a
nd T
rust
01/2
3/1
7]
92

MS
9
RE
PO
RT
OF
TH
E T
RU
ST
FU
ND
S O
F T
HE
TO
WN
OF
SA
LE
M,
NH
ON
DE
CE
MB
ER
31
, 2
01
6
P
RIN
CIP
AL
IN
CO
ME
TO
TA
L
Ga
ins
or
^D
ate
of
NA
ME
OF
TR
US
T F
UN
DP
UR
PO
SE
OF
HO
W IN
VE
ST
ED
Ba
lan
ce
Ad
dit
ion
s/
(Lo
ss
es
) o
nW
ith
dra
wa
lsB
ala
nc
eB
ala
nc
eE
arn
ed
Ex
pe
nd
ed
Ba
lan
ce
Pri
nc
ipa
l
^C
rea
tio
nT
RU
ST
FU
ND
%B
eg
inn
ing
Ne
w F
un
ds
Sa
le o
f E
nd
Be
gin
nin
g%
Du
rin
gD
uri
ng
Fe
es
En
d&
Ye
ar
Cre
ate
dS
ec
uri
tie
sY
ea
rY
ea
rY
ea
rY
ea
rY
ea
rIn
co
me
2016
W
als
h, W
illiam
E.
0.0
0%
0.0
0130.0
00.0
00.0
0130.0
00.0
00
.00
%0.0
00.0
00.0
00.0
0130.0
0
2004
W
are
, B
rian
0.0
3%
399.3
30.0
013.1
80.0
0412.5
18.6
10
.03
%8.9
4(8
.61)
(1.0
9)
7.8
5420.3
5
2005
W
ate
rho
use, W
illiam
0.0
3%
367.3
90.0
012.1
20.0
0379.5
17.9
20
.03
%8.2
2(7
.92)
(1.0
1)
7.2
2386.7
3
2005
W
atk
evit
ch
, Jo
hn
C.
0.0
1%
183.6
90.0
06.0
60.0
0189.7
63.9
60
.01
%4.1
1(3
.96)
(0.5
0)
3.6
1193.3
7
2013
W
eit
zm
an
, G
race M
0
.01
%148.0
80.0
04.8
90.0
0152.9
73.1
90
.01
%3.3
2(3
.19)
(0.4
1)
2.9
1155.8
8
2004
W
erm
er,
Id
a M
. 0
.02
%299.5
00.0
09.8
80.0
0309.3
86.4
60
.02
%6.7
0(6
.46)
(0.8
2)
5.8
8315.2
6
2006
W
est,
Ro
bert
E.
0.0
1%
169.9
70.0
05.6
10.0
0175.5
83.6
70
.01
%3.8
1(3
.67)
(0.4
7)
3.3
4178.9
2
2002
W
hit
e, E
vely
n
0.0
3%
382.3
40.0
012.6
20.0
0394.9
68.2
50
.03
%8.5
6(8
.25)
(1.0
5)
7.5
1402.4
7
2015
W
hit
en
eck, Ju
sti
n R
. 0
.02
%260.0
00.0
08.5
80.0
0268.5
80.0
00
.02
%5.8
20.0
0(0
.71)
5.1
1273.6
9
2009
W
hit
taker,
Han
nah
S.
0.0
1%
87.6
50.0
02.8
90.0
090.5
41.8
90
.01
%1.9
6(1
.89)
(0.2
4)
1.7
292.2
7
2011
W
iela
nd
, V
ale
rie E
lla
0.0
2%
311.7
80.0
010.2
90.0
0322.0
76.7
20
.02
%6.9
8(6
.72)
(0.8
5)
6.1
3328.2
0
2005
W
igg
in, A
rth
ur
0.0
1%
177.9
50.0
05.8
70.0
0183.8
33.8
40
.01
%3.9
8(3
.84)
(0.4
9)
3.5
0187.3
2
2006
W
illiam
s, Ir
en
e
0.0
1%
88.9
80.0
02.9
40.0
091.9
11.9
20
.01
%1.9
9(1
.92)
(0.2
4)
1.7
593.6
6
2015
W
illiam
s, Jake
0.0
0%
65.0
00.0
02.1
50.0
067.1
50.0
00
.00
%1.4
60.0
0(0
.18)
1.2
868.4
2
2008
W
illiam
s, R
ob
in L
0
.01
%171.8
30.0
05.6
70.0
0177.5
03.7
10
.01
%3.8
5(3
.71)
(0.4
7)
3.3
8180.8
8
2006
W
illis, K
ath
leen
0.0
1%
177.9
50.0
05.8
70.0
0183.8
33.8
40
.01
%3.9
8(3
.84)
(0.4
9)
3.5
0187.3
2
2014
W
ilso
n, P
au
l V
0
.01
%133.6
50.0
04.4
10.0
0138.0
62.8
80
.01
%2.9
9(2
.88)
(0.3
7)
2.6
3140.6
9
2015
W
itko
wski, G
eo
rge B
0
.01
%130.0
00.0
04.2
90.0
0134.2
90.0
00
.01
%2.9
10.0
0(0
.36)
2.5
5136.8
4
2009
W
rig
ht,
Walt
er
F.
0.0
3%
343.6
70.0
011.3
40.0
0355.0
17.4
10
.03
%7.6
9(7
.41)
(0.9
4)
6.7
5361.7
6
2001
Y
am
ou
t, A
dn
an
M
0.0
1%
95.5
90.0
03.1
50.0
098.7
42.0
60
.01
%2.1
4(2
.06)
(0.2
6)
1.8
8100.6
2
2011
Y
ett
er,
Caro
le A
. 0
.01
%155.8
90.0
05.1
40.0
0161.0
43.3
60
.01
%3.4
9(3
.36)
(0.4
3)
3.0
6164.1
0
2002
Y
eu
ng
, C
hu
en
Ch
i0
.02
%286.7
60.0
09.4
60.0
0296.2
26.1
80
.02
%6.4
2(6
.18)
(0.7
9)
5.6
3301.8
5
2013
Y
ork
, Ju
dit
h P
.
0.0
1%
148.0
80.0
04.8
90.0
0152.9
73.1
90
.01
%3.3
2(3
.19)
(0.4
1)
2.9
1155.8
8
2005
Y
ork
, P
ete
r0
.03
%367.3
90.0
012.1
20.0
0379.5
17.9
20
.03
%8.2
2(7
.92)
(1.0
1)
7.2
2386.7
3
2012
Y
un
es, M
art
in D
. 0
.01
%148.0
80.0
04.8
90.0
0152.9
73.1
90
.01
%3.3
2(3
.19)
(0.4
1)
2.9
1155.8
8
2005
Z
eyto
on
ian
, H
aig
0.0
1%
91.8
50.0
03.0
30.0
094.8
81.9
80
.01
%2.0
6(1
.98)
(0.2
5)
1.8
096.6
8
2016
Z
uko
wski, J
oh
n A
. 0
.00
%0.0
0195.0
00.0
00.0
0195.0
00.0
00
.00
%0.0
00.0
00.0
00.0
0195.0
0
TO
TA
L N
ON
-EX
PE
ND
AB
LE
FU
ND
S 3
053007143
100.0
0%
1,3
44,9
63.3
23,5
75.0
044,3
84.9
70.0
01,3
92,9
23.2
928,0
33.3
01
00
.00
%30,1
09.8
7(2
9,4
50.1
2)
(3,6
85.3
3)
25,0
07.7
21,4
17,9
31.0
1
LIB
RA
RY
TR
US
T F
UN
DS
2006
Kelley L
ibra
ry
100%
92,4
99.1
415,0
00.0
0107,4
99.1
40.0
01
00
%121.7
7121.7
7107,6
20.9
1
TO
TA
L L
IBR
AR
Y T
RU
ST
FU
ND
S92,4
99.1
415,0
00.0
00.0
00.0
0107,4
99.1
40.0
01.0
0121.7
70.0
00.0
0121.7
7107,6
20.9
1
EX
PE
ND
AB
LE
TR
US
T F
UN
DS
2007
SS
D A
thle
tic F
acilit
ies
4.0
4%
66,9
92.4
018,1
64.5
085,1
56.9
00.0
04
.0%
95.8
495.8
485,2
52.7
4
2008
Lan
caste
r F
un
d S
el D
isc
10.9
1%
181,0
36.5
0181,0
36.5
00.0
01
0.9
%205.7
4205.7
4181,2
42.2
4
2008
Hed
geh
og
Park
0.6
7%
11,1
50.6
711,1
50.6
70.0
00
.7%
12.6
612.6
611,1
63.3
3
2010
Sale
m D
ep
ot
Tra
in S
tati
on
3.0
2%
50,1
06.0
250,1
06.0
20.0
03
.0%
56.9
556.9
550,1
62.9
7
2014
Sale
m S
en
ior
Ho
usin
g
0.0
0%
1.0
01.0
00.0
00
.0%
0.0
01.0
0
2005
An
niv
ers
ary
Cele
bra
tio
n0.6
9%
11,4
63.4
011,4
63.4
00.0
00
.7%
13.0
313.0
311,4
76.4
3
1992
Dep
ot
Imp
rovem
en
t29.4
6%
488,8
15.1
075,7
04.5
7(2
1,6
11.5
4)
542,9
08.1
30.0
02
9.5
%585.9
9585.9
9543,4
94.1
2
1993
Perf
orm
ing
Art
s0.1
7%
2,7
87.8
3(1
,000.0
0)
1,7
87.8
30.0
00
.2%
3.0
83.0
81,7
90.9
1
1993
Seif
ert
Au
dit
ori
um
3.4
0%
56,3
46.0
01,1
00.0
057,4
46.0
00.0
03
.4%
65.2
665.2
657,5
11.2
6
1993
Str
ate
gic
Pla
n0.6
2%
10,3
41.5
910,3
41.5
90.0
00
.6%
11.7
511.7
510,3
53.3
4
1990
His
tori
c D
istr
ict
Main
ten
an
ce
0.1
7%
2,7
82.4
82,7
82.4
80.0
00
.2%
3.1
43.1
42,7
85.6
2
1990
Pelh
am
Ro
ad
0.3
7%
6,1
12.8
26,1
12.8
20.0
00
.4%
6.9
46.9
46,1
19.7
6
1994
Sid
ew
alk
0.5
2%
8,7
05.1
18,7
05.1
10.0
00
.5%
9.8
79.8
78,7
14.9
8
1995
Rte
28 R
oad
Im
pro
vem
en
t7.3
6%
122,1
49.7
4122,1
49.7
40.0
07
.4%
138.8
3138.8
3122,2
88.5
7
1998
Sn
ow
22.5
5%
374,1
44.9
2250,0
00.0
0(6
0,0
48.2
8)
564,0
96.6
40.0
02
2.6
%603.6
5603.6
5564,7
00.2
9
2001
Lan
d A
cq
uis
itio
n6.5
0%
107,8
89.5
5107,8
89.5
50.0
06
.5%
122.6
1122.6
1108,0
12.1
6
2001
Lan
d &
Heri
tag
e7.7
0%
127,7
85.4
8127,7
85.4
80.0
07
.7%
145.2
2145.2
2127,9
30.7
0
2005
Po
lice O
vert
ime E
xp
Tru
st
1.2
3%
20,4
22.4
120,4
22.4
10.0
01
.2%
23.2
123.2
120,4
45.6
2
2015
Sale
m H
ose H
ou
se N
o. 2
0.6
0%
10,0
00.1
715,0
00.0
025,0
00.1
70.0
00
.6%
20.3
720.3
725,0
20.5
4
TO
TA
L E
XP
EN
DA
BL
E T
RU
ST
FU
ND
S81%
1,6
59,0
33.1
9359,9
69.0
70.0
0(8
2,6
59.8
2)
1,9
36,3
42.4
40.0
09
9.4
0%
2,1
24.1
40.0
00.0
02,1
24.1
41,9
38,4
66.5
8
T
OT
AL
CO
MB
INE
D T
RU
ST
FU
ND
S
3,0
96,4
95.6
5378,5
44.0
744,3
84.9
7(8
2,6
59.8
2)
3,4
36,7
64.8
728,0
33.3
032,3
55.7
8(2
9,4
50.1
2)
(3,6
85.3
3)
27,2
53.6
33,4
64,0
18.5
0
CA
PIT
AL
RE
SE
RV
E F
UN
DS
1993
Sch
oo
l D
istr
ict
Reco
nstr
ucti
on
3.5
%29,6
42.6
029,6
42.6
00.0
03
.5%
33.6
833.6
829,6
76.2
8
1990
Pelh
am
Ro
ad
Im
pro
vem
en
t10.7
%91,3
93.7
291,3
93.7
20.0
01
0.7
%103.8
5103.8
591,4
97.5
7
1990
Ro
ad
Im
pro
vem
en
t81.7
%694,7
05.1
25,4
34,1
96.7
3(5
,134,5
04.0
0)
994,3
97.8
50.0
08
1.7
%782.7
1782.7
1995,1
80.5
6
1995
Sale
m R
evalu
ati
on
1.2
%9,8
12.4
39,8
12.4
30.0
01
.2%
11.1
411.1
49,8
23.5
7
1995
Sale
m R
ecre
ati
on
Lan
d2.5
%21,1
76.7
821,1
76.7
80.0
02
.5%
24.0
624.0
621,2
00.8
4
2010
Kelley L
ibra
ry B
uild
ing
Fu
nd
0.5
%3,9
84.8
03,9
84.8
00.0
00
.5%
4.5
04.5
03,9
89.3
0
TO
TA
L C
AP
ITA
L R
ES
ER
VE
S100%
850,7
15.4
55,4
34,1
96.7
30.0
0(5
,134,5
04.0
0)
1,1
50,4
08.1
80.0
01
00
.00
%959.9
40.0
0959.9
41,1
51,3
68.1
2
T
OT
AL
AL
L T
RU
ST
FU
ND
S
3,9
47,2
11.1
05,8
12,7
40.8
044,3
84.9
7(5
,217,1
63.8
2)
4,5
87,1
73.0
528,0
33.3
033,3
15.7
2(2
9,4
50.1
2)
(3,6
85.3
3)
28,2
13.5
74,6
15,3
86.6
2
Pre
pare
d B
y C
itiz
ens P
rivate
Bank a
nd T
rust
01/2
3/1
7]
93

MS
10
RE
PO
RT
OF
TH
E T
RU
ST
FU
ND
IN
VE
ST
ME
NT
S O
F T
HE
TO
WN
OF
SA
LE
M, N
H O
N D
EC
EM
BE
R 3
1, 2
01
6
H
OW
IN
VE
ST
ED
PR
INC
IPA
L I
NC
OM
ET
OT
AL
# S
ha
res
Bala
nce
Cap
ital
Pro
ceed
sB
ala
nce
Bala
nce
Incom
eE
xp
en
ded
Bala
nce
Pri
ncip
al
Be
gin
nin
g o
fU
nre
alize
d
En
d o
f Y
ea
r
or
DE
SC
RIP
TIO
N O
F P
RIN
CIP
AL
Begin
nin
gA
dd
itio
ns/
Book
Valu
e
Gain
sF
rom
En
dB
egin
nin
gD
uri
ng
Du
rin
gE
nd
&Y
ea
r F
air
G
ain
/Lo
ss
Fa
ir M
ark
et
Va
lue
Un
its
Year
Pu
rch
ase
sA
dju
stm
en
ts(L
oss
es)
Sale
sY
ear
Year
Year
Year
Year
Incom
eM
ark
et
Va
lue
NO
N-E
XP
EN
DA
BL
E F
UN
DS
Ca
sh
& C
as
h E
qu
iva
len
ts2
2,3
93
.45
53
,18
9.6
47
5,5
83
.09
27
,36
2.5
05
,94
4.7
8(3
,12
5.5
2)
30
,18
1.7
61
05
,76
4.8
54
9,7
55
.95
(0.0
0)
10
5,7
64
.85
25
,00
0B
ec
ton
Dic
kin
so
n
3.1
3%
du
e1
1/0
8/2
12
5,0
30
.75
25
,03
0.7
50
.00
78
1.2
6(7
81
.26
)0
.00
25
,03
0.7
52
5,2
10
.00
42
0.7
52
5,6
30
.75
0B
oe
ing
Co
. 3
.75
%d
ue
11
/20
/16
25
,25
5.0
0(2
55
.00
)(2
5,0
00
.00
)0
.00
0.0
09
37
.50
(93
7.5
0)
0.0
00
.00
25
,59
0.2
5(5
90
.25
)0
.00
25
,00
0C
olg
ate
Pa
lmo
liv
e
2.6
3%
du
e5
/1/2
01
72
5,1
24
.75
25
,12
4.7
50
.00
65
6.2
6(6
56
.26
)0
.00
25
,12
4.7
52
5,5
01
.00
(36
6.2
5)
25
,13
4.7
5
25
,00
0M
org
an
Sta
ne
ly
5.6
25
%d
ue
09
/23
/19
25
,76
2.7
52
5,7
62
.75
0.0
01
,40
6.2
6(1
,40
6.2
6)
0.0
02
5,7
62
.75
27
,59
0.0
0(4
91
.00
)2
7,0
99
.00
50
,00
0U
S T
rea
s N
ote
1
.37
5%
du
e0
6/3
0/2
30
.00
50
,03
1.2
55
0,0
31
.25
0.0
03
15
.72
(31
5.7
2)
0.0
05
0,0
31
.25
0.0
0(2
,53
5.2
5)
47
,49
6.0
0
50
,00
0U
S T
rea
s N
ote
1
.37
5%
du
e1
0/3
0/2
00
.00
50
,70
7.0
35
0,7
07
.03
0.0
0(1
41
.98
)1
41
.98
0.0
05
0,7
07
.03
0.0
0(1
,32
0.5
3)
49
,38
6.5
0
50
,00
0U
S T
rea
s N
ote
1
.62
5%
du
e1
1/1
5/2
20
.00
50
,95
8.9
85
0,9
58
.98
0.0
02
71
.57
(27
1.5
7)
0.0
05
0,9
58
.98
0.0
0(2
,29
8.9
8)
48
,66
0.0
0
0O
cc
ide
nta
l P
ete
Co
rp
1.7
50
%d
ue
02
/15
/17
24
,88
8.0
03
21
.19
(25
,20
9.1
9)
0.0
00
.00
31
5.9
7(3
15
.97
)0
.00
0.0
02
5,0
50
.00
15
9.1
90
.00
0C
olu
mb
ia In
co
me
Op
po
rtu
nit
ies
Z
0.0
00
.00
0.0
02
5.8
9(2
5.8
9)
0.0
00
.00
0.0
00
.00
0.0
0
23
5.0
iSh
are
s C
ore
S&
P 5
00
ET
F
56
,42
5.8
16
,44
4.5
1(2
4,9
84
.42
)3
7,8
85
.90
0.0
01
,37
2.8
9(1
,37
2.8
9)
0.0
03
7,8
85
.90
71
,70
4.5
06
,15
2.5
75
2,8
72
.65
0.0
iSh
are
s N
AS
DA
Q B
iote
ch
no
log
y E
TF
2,6
45
.34
2,9
57
.27
(5,6
02
.61
)0
.00
0.0
03
.06
(3.0
6)
0.0
00
.00
6,7
66
.60
(1,1
63
.99
)0
.00
2,4
78
.7J
PM
org
an
Dis
cip
lin
ed
Eq
uit
y In
stl
5
5,8
48
.78
55
,84
8.7
80
.00
88
6.5
1(8
86
.51
)0
.00
55
,84
8.7
85
4,2
34
.24
4,3
12
.96
58
,54
7.2
0
2,6
44
.8J
PM
org
an
Mo
rtg
ag
e B
ac
ke
d S
ec
Fd
3
0,0
25
.99
18
.26
30
,04
4.2
50
.00
82
4.7
1(8
24
.71
)0
.00
30
,04
4.2
52
9,6
82
.54
(19
3.1
4)
29
,48
9.4
0
0.0
Me
tro
po
lita
n W
es
t H
igh
YD
Bd
I #
51
40
.00
0.0
00
.00
29
.72
(29
.72
)0
.00
0.0
00
.00
0.0
00
.00
1,3
16
.8O
pp
en
he
ime
r In
tl G
row
th F
d
50
,00
0.0
05
0,0
00
.00
0.0
06
12
.04
(61
2.0
4)
0.0
05
0,0
00
.00
47
,26
0.9
9(1
,59
3.3
6)
45
,66
7.6
3
0.0
Pu
tna
m A
bs
olu
te R
etu
rn 7
00
Y
47
,42
0.5
9(7
,14
1.3
4)
(40
,27
9.2
5)
0.0
00
.00
0.0
00
.00
0.0
04
0,7
19
.86
(44
0.6
1)
0.0
0
24
5.0
Se
lec
t S
ec
tor
SP
DR
Ma
tls
12
,04
1.9
05
46
.73
(3,0
71
.65
)9
,51
6.9
80
.00
26
2.9
1(2
62
.91
)0
.00
9,5
16
.98
13
,46
0.2
01
,78
7.9
51
2,1
76
.50
25
0.0
Se
lec
t S
ec
tor
SP
DR
En
erg
y
5,6
04
.55
11
,27
6.6
21
6,8
81
.17
0.0
02
82
.50
(28
2.5
0)
0.0
01
6,8
81
.17
5,4
28
.80
2,1
24
.58
18
,83
0.0
0
35
5.0
SP
DR
S&
P M
idc
ap
40
0 E
FT
TR
5
7,1
40
.78
57
,14
0.7
80
.00
1,3
41
.83
(1,3
41
.83
)0
.00
57
,14
0.7
89
0,1
84
.20
16
,92
9.9
51
07
,11
4.1
5
2,2
06
.7T
Ro
we
Pri
ce
In
sti
t L
g C
p C
ore
Grw
5
0,9
56
.84
50
,95
6.8
40
.00
15
4.4
7(1
54
.47
)0
.00
50
,95
6.8
46
0,8
15
.38
52
9.6
06
1,3
44
.98
0.0
Te
mp
leto
n In
sti
tuti
on
al F
ore
ign
Eq
uit
y6
0,3
63
.30
(10
,36
5.0
8)
(49
,99
8.2
2)
0.0
00
.00
0.0
00
.00
0.0
05
4,6
76
.59
(4,6
78
.37
)0
.00
3,2
48
.2T
ran
sa
me
ric
a In
tern
ati
on
al E
qu
ity I
0.0
04
9,8
26
.00
13
9.3
04
9,9
65
.30
0.0
08
73
.74
(87
3.7
4)
0.0
04
9,9
65
.30
0.0
03
,50
8.8
05
3,3
34
.80
5,1
69
.2V
an
gu
ard
Ad
mir
al G
NM
A F
un
d #
53
65
2,7
63
.97
39
0.6
35
3,1
54
.60
0.0
01
,30
7.8
3(1
,30
7.8
3)
0.0
05
3,1
54
.60
54
,70
4.3
4(2
22
.63
)5
4,4
81
.71
7,4
97
.3V
an
gu
ard
In
ter
Te
rm F
d #
57
10
.00
75
,00
0.0
06
86
.14
75
,68
6.1
40
.00
80
0.9
4(8
00
.94
)0
.00
75
,68
6.1
40
.00
(2,7
26
.11
)7
2,2
73
.89
11
,27
4.4
Va
ng
ua
rd In
term
-Trm
Bd
In
dx
Ad
m #
53
14
22
4,8
09
.09
90
,00
0.0
01
1,3
47
.07
(19
9,4
96
.22
)1
26
,65
9.9
40
.00
5,4
47
.60
(5,4
47
.60
)0
.00
12
6,6
59
.94
22
8,8
91
.20
7,3
29
.80
12
6,7
24
.78
4,5
18
.8V
an
gu
ard
S/T
Bo
nd
In
de
x A
dm
#5
13
27
5,1
79
.24
15
0.2
8(2
5,0
00
.01
)5
0,3
29
.51
0.0
08
91
.04
(89
1.0
4)
0.0
05
0,3
29
.51
74
,60
7.6
63
39
.28
49
,94
6.9
3
0.0
Va
ng
ua
rd S
/T In
ve
stm
en
t-G
R A
dm
#5
39
25
,06
5.1
4(4
6.0
4)
(25
,01
9.1
0)
0.0
00
.00
24
3.0
7(2
43
.07
)0
.00
0.0
02
4,6
22
.71
39
6.3
90
.00
0A
bb
ott
La
bo
rato
rie
s4
,06
2.2
31
,31
6.7
9(5
,37
9.0
2)
0.0
00
.00
0.0
00
.00
0.0
05
,61
3.7
5(2
34
.73
)0
.00
50
Ac
ce
ntu
re P
LC
Ire
lan
d
7,7
83
.53
88
5.0
1(2
,83
0.8
9)
5,8
37
.65
0.0
02
00
.75
(20
0.7
5)
0.0
05
,83
7.6
51
0,4
50
.00
1,1
65
.64
8,7
84
.75
0A
CE
Ltd
6
,56
7.4
4(6
,56
7.4
4)
0.0
00
.00
0.0
00
.00
0.0
07
,59
5.2
5(1
,02
7.8
1)
0.0
0
35
Ac
uit
y B
ran
ds
In
c
0.0
09
,02
6.4
99
,02
6.4
90
.00
3.3
8(3
.38
)0
.00
9,0
26
.49
0.0
0(9
46
.39
)8
,08
0.1
0
85
Ad
ob
e S
ys
In
c
0.0
08
,75
2.0
08
,75
2.0
00
.00
0.0
00
.00
8,7
52
.00
0.0
0(1
.25
)8
,75
0.7
5
0A
dv
an
six
In
c.
0.0
03
0.1
62
.43
(32
.59
)0
.00
0.0
00
.00
0.0
00
.00
0.0
02
.43
0.0
0
10
0A
lig
n T
ec
hn
olo
gy In
c.
0.0
06
,16
1.3
16
,16
1.3
10
.00
0.0
00
.00
6,1
61
.31
0.0
03
,45
1.6
99
,61
3.0
0
12
Alp
ha
be
t In
c. C
om
Cl C
3
,54
8.5
53
,54
8.5
50
.00
0.0
00
.00
3,5
48
.55
9,1
06
.56
15
5.2
89
,26
1.8
4
15
Alp
ha
be
t In
c. N
PV
A
3,5
67
.32
2,3
62
.16
5,9
29
.48
0.0
00
.00
0.0
05
,92
9.4
89
,33
6.1
21
88
.47
11
,88
6.7
5
13
Am
azo
n C
om
In
c.
0.0
09
,71
2.8
79
,71
2.8
70
.00
0.0
00
.00
9,7
12
.87
0.0
03
5.4
49
,74
8.3
1
0A
me
ric
an
In
tl G
rou
p In
c.
9,8
42
.15
47
6.2
1(1
0,3
18
.36
)0
.00
0.0
05
7.6
0(5
7.6
0)
0.0
00
.00
11
,15
4.6
0(8
36
.24
)0
.00
65
Am
ge
n In
c.
4,6
47
.77
4,6
47
.77
0.0
02
60
.00
(26
0.0
0)
0.0
04
,64
7.7
71
0,5
51
.45
(1,0
47
.80
)9
,50
3.6
5
70
AO
N P
lc C
l A
0
.00
7,6
89
.91
7,6
89
.91
0.0
04
6.2
0(4
6.2
0)
0.0
07
,68
9.9
10
.00
11
7.1
97
,80
7.1
0
17
6A
pp
le In
c.
8,6
21
.31
8,6
21
.31
0.0
03
92
.48
(39
2.4
8)
0.0
08
,62
1.3
11
8,5
25
.76
1,8
58
.56
20
,38
4.3
2
17
5A
rch
er
Da
nie
ls M
idld
0
.00
7,8
11
.80
7,8
11
.80
0.0
00
.00
0.0
07
,81
1.8
00
.00
17
6.9
57
,98
8.7
5
15
0A
T &
T
4,7
24
.09
4,7
24
.09
0.0
02
88
.00
(28
8.0
0)
0.0
04
,72
4.0
95
,16
1.5
01
,21
8.0
06
,37
9.5
0
75
Av
ery
De
nn
iso
n C
orp
0
.00
5,7
43
.21
5,7
43
.21
0.0
06
1.5
0(6
1.5
0)
0.0
05
,74
3.2
10
.00
(47
6.7
1)
5,2
66
.50
0B
an
k o
f A
me
ric
a C
orp
ora
tio
n
3,9
48
.73
1,0
02
.48
(4,9
51
.21
)0
.00
0.0
03
4.5
0(3
4.5
0)
0.0
00
.00
5,8
06
.35
(85
5.1
4)
0.0
0
34
Ba
rd C
R In
c.
7,3
05
.27
2,2
02
.67
(5,3
68
.29
)4
,13
9.6
50
.00
48
.60
(48
.60
)0
.00
4,1
39
.65
11
,36
6.4
01
,64
0.3
37
,63
8.4
4
75
Be
rks
hir
e H
ath
aw
ay In
c. D
el C
l B
Ne
w
0.0
01
0,3
42
.68
10
,34
2.6
80
.00
0.0
00
.00
10
,34
2.6
80
.00
1,8
80
.82
12
,22
3.5
0
40
Bo
ein
g C
om
pa
ny
5,2
45
.41
59
6.0
3(2
,34
4.5
0)
3,4
96
.94
0.0
01
96
.20
(19
6.2
0)
0.0
03
,49
6.9
48
,67
5.4
0(1
03
.70
)6
,22
7.2
0
37
0B
os
ton
Sc
ien
tifi
c C
orp
7
,44
4.5
43
60
.80
(2,4
04
.40
)5
,40
0.9
40
.00
0.0
00
.00
5,4
00
.94
9,4
04
.40
1,0
03
.10
8,0
03
.10
80
Bri
sto
l-M
ye
rs S
qu
ibb
Co
. 0
.00
4,7
40
.30
4,7
40
.30
0.0
00
.00
0.0
04
,74
0.3
00
.00
(65
.10
)4
,67
5.2
0
0C
ha
rle
s S
ch
wa
b C
orp
Ne
w
4,5
83
.68
(16
5.4
9)
(4,4
18
.19
)0
.00
0.0
01
0.8
0(1
0.8
0)
0.0
00
.00
5,9
27
.40
(1,5
09
.21
)0
.00
65
Ch
ub
b L
imit
ed
0
.00
6,5
67
.44
6,5
67
.44
0.0
01
76
.80
(17
6.8
0)
0.0
06
,56
7.4
40
.00
2,0
20
.36
8,5
87
.80
55
Cin
tas
Co
rpo
rati
on
4
,73
1.7
43
,32
9.8
8(5
,58
3.0
9)
2,4
78
.53
0.0
07
3.1
5(7
3.1
5)
0.0
02
,47
8.5
39
,56
0.2
52
,37
8.6
46
,35
5.8
0
27
5C
isc
o S
ys
tem
s
7,0
43
.87
7,0
43
.87
0.0
02
72
.25
(27
2.2
5)
0.0
07
,04
3.8
77
,46
7.6
38
42
.87
8,3
10
.50
22
0C
itig
rou
p In
c.
8,3
87
.73
4,1
93
.69
12
,58
1.4
20
.00
63
.00
(63
.00
)0
.00
12
,58
1.4
27
,76
2.5
01
,11
8.4
11
3,0
74
.60
55
Clo
rox
Co
. 6
,06
1.7
66
,06
1.7
60
.00
17
2.7
0(1
72
.70
)0
.00
6,0
61
.76
6,9
75
.65
(37
4.5
5)
6,6
01
.10
12
0C
olg
ate
-Pa
lmo
liv
e C
o.
5,8
35
.18
5,8
35
.18
0.0
01
86
.00
(18
6.0
0)
0.0
05
,83
5.1
87
,99
4.4
0(1
41
.60
)7
,85
2.8
0
15
5C
om
ca
st
Co
rp N
ew
Cl A
9
,36
8.6
09
,36
8.6
00
.00
16
6.6
4(1
66
.64
)0
.00
9,3
68
.60
8,7
46
.65
1,9
56
.10
10
,70
2.7
5
15
5C
on
oc
oP
hillip
s6
,59
6.3
62
,36
7.0
88
,96
3.4
40
.00
13
0.0
0(1
30
.00
)0
.00
8,9
63
.44
4,9
02
.45
50
2.1
77
,77
1.7
0
0C
VS
He
alt
h C
orp
ora
tio
n
6,2
72
.61
5,0
11
.93
(11
,28
4.5
4)
0.0
00
.00
18
2.7
5(1
82
.75
)0
.00
0.0
01
2,7
10
.10
(1,4
25
.56
)0
.00
90
Da
na
he
r C
orp
8
,19
1.7
0(2
,01
2.3
0)
96
8.1
5(2
,69
8.3
8)
4,4
49
.17
0.0
06
8.1
3(6
8.1
3)
0.0
04
,44
9.1
71
1,6
10
.00
10
6.2
87
,00
5.6
0
0D
av
ita
He
alt
hc
are
Pa
rtn
ers
In
c.
6,4
19
.93
(38
1.2
5)
(6,0
38
.68
)0
.00
0.0
00
.00
0.0
00
.00
6,6
22
.45
(58
3.7
7)
0.0
0
50
Do
min
os
Piz
za
In
c.
5,7
58
.97
5,7
58
.97
0.0
07
6.0
0(7
6.0
0)
0.0
05
,75
8.9
75
,56
2.5
02
,39
9.5
07
,96
2.0
0
90
Du
ke
En
erg
y C
orp
Ne
w
6,6
16
.16
6,6
16
.16
0.0
03
02
.40
(30
2.4
0)
0.0
06
,61
6.1
66
,42
5.1
05
60
.70
6,9
85
.80
0E
li L
illy
& C
o.
8,4
28
.16
(88
0.6
9)
(7,5
47
.47
)0
.00
0.0
05
1.0
0(5
1.0
0)
0.0
00
.00
8,4
26
.00
(87
8.5
3)
0.0
0
70
Eq
uif
ax
In
c.
0.0
07
,68
7.7
87
,68
7.7
80
.00
69
.30
(69
.30
)0
.00
7,6
87
.78
0.0
05
88
.32
8,2
76
.10
69
Ex
xo
n M
ob
il C
orp
6,2
93
.72
2,3
08
.69
(5,2
36
.00
)3
,36
6.4
10
.00
38
4.4
2(3
84
.42
)0
.00
3,3
66
.41
10
,05
5.5
51
,40
8.3
96
,22
7.9
4
90
Fa
ce
Bo
ok
In
c.
0.0
09
,10
6.2
29
,10
6.2
20
.00
0.0
00
.00
9,1
06
.22
0.0
01
,24
8.2
81
0,3
54
.50
85
Fis
erv
In
c.
5,8
27
.68
5,8
27
.68
0.0
00
.00
0.0
05
,82
7.6
87
,77
4.1
01
,25
9.7
09
,03
3.8
0
0F
ort
ive
Co
rp
0.0
02
,01
2.3
01
,16
1.7
6(3
,17
4.0
6)
0.0
00
.00
0.0
00
.00
0.0
00
.00
1,1
61
.76
0.0
0
75
Ge
ne
ral D
yn
am
ics
6
,60
2.1
76
,60
2.1
70
.00
22
2.7
5(2
22
.75
)0
.00
6,6
02
.17
10
,30
2.0
02
,64
7.5
01
2,9
49
.50
Pre
pare
d B
y C
itizen
s P
riva
te B
an
k a
nd
Tru
st
01
/23
/20
17
94

MS
10
RE
PO
RT
OF
TH
E T
RU
ST
FU
ND
IN
VE
ST
ME
NT
S O
F T
HE
TO
WN
OF
SA
LE
M, N
H O
N D
EC
EM
BE
R 3
1, 2
01
6
H
OW
IN
VE
ST
ED
PR
INC
IPA
L I
NC
OM
ET
OT
AL
# S
ha
res
Bala
nce
Cap
ital
Pro
ceed
sB
ala
nce
Bala
nce
Incom
eE
xp
en
ded
Bala
nce
Pri
ncip
al
Be
gin
nin
g o
fU
nre
alize
d
En
d o
f Y
ea
r
or
DE
SC
RIP
TIO
N O
F P
RIN
CIP
AL
Begin
nin
gA
dd
itio
ns/
Book
Valu
e
Gain
sF
rom
En
dB
egin
nin
gD
uri
ng
Du
rin
gE
nd
&Y
ea
r F
air
G
ain
/Lo
ss
Fa
ir M
ark
et
Va
lue
Un
its
Year
Pu
rch
ase
sA
dju
stm
en
ts(L
oss
es)
Sale
sY
ear
Year
Year
Year
Year
Incom
eM
ark
et
Va
lue
19
2G
en
era
l E
lec
tric
Co
. 4
,88
1.6
84
,88
1.6
80
.00
23
8.7
4(2
38
.74
)0
.00
4,8
81
.68
5,9
80
.80
86
.40
6,0
67
.20
13
5G
en
era
l M
ills
In
c.
7,0
46
.86
7,0
46
.86
0.0
01
89
.00
(18
9.0
0)
0.0
07
,04
6.8
67
,78
4.1
05
54
.85
8,3
38
.95
0G
ile
ad
Sc
ien
ce
s In
c.
0.0
08
,25
5.4
9(2
,07
0.7
8)
(6,1
84
.71
)0
.00
0.0
07
9.9
0(7
9.9
0)
0.0
00
.00
0.0
0(2
,07
0.7
8)
0.0
0
11
5H
ain
Ce
les
tia
l G
rou
p In
c.
0.0
05
,60
8.5
05
,60
8.5
00
.00
0.0
00
.00
5,6
08
.50
0.0
0(1
,12
0.0
5)
4,4
88
.45
10
5H
arr
is C
orp
ora
tio
n
5,5
30
.90
3,6
86
.62
9,2
17
.52
0.0
01
62
.75
(16
2.7
5)
0.0
09
,21
7.5
26
,08
3.0
09
89
.73
10
,75
9.3
5
0H
CA
Ho
ldin
gs
In
c.
0.0
07
,29
6.3
0(6
89
.24
)(6
,60
7.0
6)
0.0
00
.00
0.0
00
.00
0.0
00
.00
(68
9.2
4)
0.0
0
45
Ho
me
De
po
t In
c.
0.0
01
1,2
09
.99
11
,20
9.9
90
.00
18
9.7
5(1
89
.75
)0
.00
11
,20
9.9
90
.00
18
6.8
11
1,3
96
.80
80
Ho
ne
yw
ell In
tl In
c.
5,6
58
.46
2,8
49
.20
8,5
07
.66
0.0
01
51
.39
(15
1.3
9)
0.0
08
,50
7.6
65
,69
6.3
57
22
.45
9,2
68
.00
60
Illin
ois
To
ol W
ork
s
0.0
05
,79
8.1
85
,79
8.1
80
.00
10
5.0
0(1
05
.00
)0
.00
5,7
98
.18
0.0
01
,54
9.4
27
,34
7.6
0
98
Jo
hn
so
n &
Jo
hn
so
n5
,82
2.7
62
,25
9.9
38
,08
2.6
90
.00
29
3.7
0(2
93
.70
)0
.00
8,0
82
.69
8,0
12
.16
1,0
18
.49
11
,29
0.5
8
22
0J
PM
org
an
Ch
as
e &
Co
. 7
,10
3.4
64
,35
8.3
61
1,4
61
.82
0.0
03
03
.60
(30
3.6
0)
0.0
01
1,4
61
.82
10
,89
4.9
53
,73
0.4
91
8,9
83
.80
53
Kim
be
rly C
lark
7
,36
8.0
81
57
.29
(1,9
46
.68
)5
,57
8.6
90
.00
25
4.8
0(2
54
.80
)0
.00
5,5
78
.69
8,9
11
.00
(91
5.9
6)
6,0
48
.36
13
0M
ars
h &
Mc
Le
nn
an
Co
mp
an
ies
7
,65
3.0
31
,15
0.1
3(3
,11
8.0
5)
5,6
85
.11
0.0
02
27
.50
(22
7.5
0)
0.0
05
,68
5.1
19
,70
3.7
52
,20
1.0
08
,78
6.7
0
0M
cG
raw
-Hill F
ina
nc
ial, In
c.
6,6
51
.16
(6,6
51
.16
)0
.00
0.0
02
5.2
0(2
5.2
0)
0.0
00
.00
6,9
00
.60
(24
9.4
4)
0.0
0
23
5M
icro
so
ft C
orp
9,3
47
.85
1,2
85
.23
(3,3
10
.59
)7
,32
2.4
90
.00
39
2.2
5(3
92
.25
)0
.00
7,3
22
.49
16
,64
4.0
01
,26
9.4
91
4,6
02
.90
0M
on
ste
r B
ev
era
ge
Co
rp N
ew
2
,89
3.3
41
,99
7.6
0(4
,89
0.9
4)
0.0
00
.00
0.0
00
.00
0.0
05
,95
8.4
0(1
,06
7.4
6)
0.0
0
75
Ne
xte
ra E
ne
rgy In
c. C
om
4
,48
3.1
34
,48
3.1
30
.00
26
1.0
0(2
61
.00
)0
.00
4,4
83
.13
7,7
91
.75
1,1
67
.75
8,9
59
.50
15
0N
ike
, In
c. C
las
ss
B
8,2
38
.08
1,0
08
.55
(3,0
68
.07
)6
,17
8.5
60
.00
11
2.0
0(1
12
.00
)0
.00
6,1
78
.56
12
,50
0.0
0(1
,80
7.4
3)
7,6
24
.50
0N
ob
le C
orp
Plc
3
,29
2.3
8(9
42
.71
)(2
,34
9.6
7)
0.0
00
.00
44
.20
(44
.20
)0
.00
0.0
02
,74
3.0
0(3
93
.33
)0
.00
0N
vid
ia C
orp
8
,60
4.1
73
,82
2.3
8(1
2,4
26
.55
)0
.00
0.0
00
.00
0.0
00
.00
13
,67
8.4
0(1
,25
1.8
5)
0.0
0
25
O R
eilly
Au
tom
oti
ve
In
c N
ew
8
,35
4.8
24
43
.55
(3,1
53
.22
)5
,64
5.1
50
.00
0.0
00
.00
5,6
45
.15
9,3
76
.54
73
6.9
36
,96
0.2
5
26
5P
att
ers
on
-UT
I E
ne
rgy In
c.
0.0
06
,70
9.8
16
,70
9.8
10
.00
3.8
0(3
.80
)0
.00
6,7
09
.81
0.0
04
23
.99
7,1
33
.80
90
Pe
ps
ico
In
c3
,73
2.7
53
,73
2.7
50
.00
26
1.9
2(2
61
.92
)0
.00
3,7
32
.75
8,9
92
.80
42
3.9
09
,41
6.7
0
0P
fize
r In
c.
4,6
50
.58
1,7
83
.79
(6,4
34
.37
)0
.00
0.0
02
44
.00
(24
4.0
0)
0.0
00
.00
6,7
78
.80
(34
4.4
3)
0.0
0
10
0P
NC
Fin
an
cia
l S
erv
ice
s G
rou
p
6,6
61
.71
6,6
61
.71
0.0
01
57
.00
(15
7.0
0)
0.0
06
,66
1.7
19
,53
1.0
02
,16
5.0
01
1,6
96
.00
18
5P
rin
cip
al F
inl G
rou
p In
c.
0.0
08
,19
9.3
18
,19
9.3
10
.00
15
5.4
0(1
55
.40
)0
.00
8,1
99
.31
0.0
02
,50
4.7
91
0,7
04
.10
0R
oc
kw
ell C
ollin
s In
c.
6,3
88
.77
1,1
65
.53
(7,5
54
.30
)0
.00
0.0
02
8.0
5(2
8.0
5)
0.0
00
.00
7,8
45
.50
(29
1.2
0)
0.0
0
70
S&
P G
lob
al In
c. C
om
0
.00
6,6
51
.16
6,6
51
.16
0.0
07
5.6
0(7
5.6
0)
0.0
06
,65
1.1
60
.00
87
6.6
47
,52
7.8
0
45
Sc
he
in H
en
ry In
c.
5,3
53
.14
5,3
53
.14
0.0
00
.00
0.0
05
,35
3.1
47
,11
8.5
5(2
91
.60
)6
,82
6.9
5
0T
E C
on
ne
cti
vit
y L
td
5,4
58
.62
1,7
78
.62
(7,2
37
.24
)0
.00
0.0
03
9.6
0(3
9.6
0)
0.0
00
.00
7,7
53
.20
(51
5.9
6)
0.0
0
18
0T
ex
as
In
str
um
en
ts In
c.
8,8
03
.41
8,8
03
.41
0.0
02
95
.20
(29
5.2
0)
0.0
08
,80
3.4
19
,86
5.8
03
,26
8.8
01
3,1
34
.60
45
Th
erm
o F
ish
er
Sc
ien
tifi
c In
c.
2,7
52
.06
2,7
52
.06
0.0
02
7.0
0(2
7.0
0)
0.0
02
,75
2.0
66
,38
3.2
5(3
3.7
5)
6,3
49
.50
70
Tim
e W
arn
er
Inc
. 8
,57
3.4
01
,22
2.6
5(5
,50
9.3
5)
4,2
86
.70
0.0
01
65
.03
(16
5.0
3)
0.0
04
,28
6.7
09
,05
3.8
03
,21
2.6
56
,75
7.1
0
12
0T
JX
Co
mp
an
ies
Ne
w
5,5
74
.02
1,3
42
.80
(2,6
01
.45
)4
,31
5.3
70
.00
13
5.2
5(1
35
.25
)0
.00
4,3
15
.37
10
,99
1.0
56
26
.00
9,0
15
.60
70
Un
ite
dH
ea
lth
Gro
up
In
c.
8,1
50
.85
8,1
50
.85
0.0
01
66
.25
(16
6.2
5)
0.0
08
,15
0.8
58
,23
4.8
02
,96
8.0
01
1,2
02
.80
10
5V
ale
ro E
ne
rgy C
orp
Ne
w
8,6
39
.67
(15
4.3
7)
(2,2
28
.99
)6
,25
6.3
10
.00
30
0.0
0(3
00
.00
)0
.00
6,2
56
.31
10
,25
2.9
5(8
50
.36
)7
,17
3.6
0
17
0V
eri
zo
n C
om
mu
nic
ati
on
s
4,7
82
.58
2,5
56
.03
7,3
38
.61
0.0
03
29
.83
(32
9.8
3)
0.0
07
,33
8.6
15
,54
6.4
09
72
.17
9,0
74
.60
16
0V
isa
In
c.
4,4
00
.09
2,3
44
.40
(3,2
24
.42
)3
,52
0.0
70
.00
10
4.8
0(1
04
.80
)0
.00
3,5
20
.07
15
,51
0.0
01
97
.62
12
,48
3.2
0
10
0W
as
te M
gm
t In
c. D
el
0.0
06
,39
8.2
66
,39
8.2
60
.00
41
.00
(41
.00
)0
.00
6,3
98
.26
0.0
06
92
.74
7,0
91
.00
0W
ells
Fa
rgo
& C
o. N
ew
6,7
62
.79
4,7
20
.36
(11
,48
3.1
5)
0.0
00
.00
23
8.9
7(2
38
.97
)0
.00
0.0
01
2,9
92
.04
(1,5
08
.89
)0
.00
0W
yn
dh
am
Wo
rld
wid
e C
orp
6
,94
4.1
46
16
.29
(7,5
60
.43
)0
.00
0.0
01
10
.00
(11
0.0
0)
0.0
00
.00
7,9
91
.50
(43
1.0
7)
0.0
0
To
tal N
on
-Ex
pe
nd
ab
le F
un
ds
1,3
45
,63
3.1
26
01
,90
3.1
60
.00
44
,37
1.3
9(6
04
,15
9.5
8)
1,3
87
,74
8.0
92
7,3
62
.50
35
,95
4.8
7(3
3,1
35
.61
)3
0,1
81
.76
1,4
17
,92
9.8
51
,58
1,5
29
.52
66
,66
9.4
51
,64
8,7
61
.81
Ca
pit
al R
es
erv
e F
un
ds
SC
HO
OL
DIS
TR
ICT
RE
CO
NS
TR
UC
TIO
N
C
as
h &
Ca
sh
Eq
uiv
ale
nts
29
,64
2.6
02
9,6
42
.60
0.0
03
3.6
83
3.6
82
9,6
76
.28
29
,64
2.6
00
.00
29
,67
6.2
8
PE
LH
AM
RO
AD
C
as
h &
Ca
sh
Eq
uiv
ale
nts
91
,39
3.7
29
1,3
93
.72
0.0
01
03
.85
10
3.8
59
1,4
97
.57
91
,39
3.7
2(0
.00
)9
1,4
97
.57
RO
AD
IM
PR
OV
EM
EN
T
C
as
h &
Ca
sh
Eq
uiv
ale
nts
69
4,7
05
.12
29
9,6
92
.73
99
4,3
97
.85
0.0
07
82
.71
78
2.7
19
95
,18
0.5
66
94
,70
5.1
20
.00
99
5,1
80
.56
SA
LE
M R
EV
AL
UA
TIO
N
C
as
h &
Ca
sh
Eq
uiv
ale
nts
9,8
12
.43
9,8
12
.43
0.0
01
1.1
41
1.1
49
,82
3.5
79
,81
2.4
30
.00
9,8
23
.57
SA
LE
M R
EC
RE
AT
ION
LA
ND
C
as
h &
Ca
sh
Eq
uiv
ale
nts
21
,17
6.7
82
1,1
76
.78
0.0
02
4.0
62
4.0
62
1,2
00
.84
21
,17
6.7
8(0
.00
)2
1,2
00
.84
KE
LL
EY
LIB
RA
RY
BU
ILD
ING
FU
ND
C
as
h &
Ca
sh
Eq
uiv
ale
nts
3,9
84
.80
3,9
84
.80
0.0
04
.50
4.5
03
,98
9.3
03
,98
4.8
00
.00
3,9
89
.30
To
tal C
ap
ita
l R
es
erv
e F
un
ds
85
0,7
15
.45
29
9,6
92
.73
0.0
00
.00
0.0
01
,15
0,4
08
.18
0.0
09
59
.94
0.0
09
59
.94
1,1
51
,36
8.1
28
50
,71
5.4
50
.00
1,1
51
,36
8.1
2
Lib
rary
Tru
st
Fu
nd
s
KE
LL
EY
LIB
RA
RY
TR
US
T F
UN
DS
C
as
h &
Ca
sh
Eq
uiv
ale
nts
92
,49
9.1
41
5,0
00
.00
10
7,4
99
.14
0.0
01
21
.77
12
1.7
71
07
,62
0.9
19
2,4
99
.14
(0.0
0)
10
7,6
20
.91
To
tal L
ibra
ry T
rus
t F
un
ds
92
,49
9.1
41
5,0
00
.00
0.0
00
.00
0.0
01
07
,49
9.1
40
.00
12
1.7
70
.00
12
1.7
71
07
,62
0.9
19
2,4
99
.14
(0.0
0)
10
7,6
20
.91
Pre
pare
d B
y C
itizen
s P
riva
te B
an
k a
nd
Tru
st
01
/23
/20
17
95

MS
10
RE
PO
RT
OF
TH
E T
RU
ST
FU
ND
IN
VE
ST
ME
NT
S O
F T
HE
TO
WN
OF
SA
LE
M, N
H O
N D
EC
EM
BE
R 3
1, 2
01
6
H
OW
IN
VE
ST
ED
PR
INC
IPA
L I
NC
OM
ET
OT
AL
# S
ha
res
Bala
nce
Cap
ital
Pro
ceed
sB
ala
nce
Bala
nce
Incom
eE
xp
en
ded
Bala
nce
Pri
ncip
al
Be
gin
nin
g o
fU
nre
alize
d
En
d o
f Y
ea
r
or
DE
SC
RIP
TIO
N O
F P
RIN
CIP
AL
Begin
nin
gA
dd
itio
ns/
Book
Valu
e
Gain
sF
rom
En
dB
egin
nin
gD
uri
ng
Du
rin
gE
nd
&Y
ea
r F
air
G
ain
/Lo
ss
Fa
ir M
ark
et
Va
lue
Un
its
Year
Pu
rch
ase
sA
dju
stm
en
ts(L
oss
es)
Sale
sY
ear
Year
Year
Year
Year
Incom
eM
ark
et
Va
lue
Ex
pe
nd
ab
le T
rus
t F
un
ds
SS
D A
TH
LE
TIC
FA
CIL
ITIE
S
C
as
h &
Ca
sh
Eq
uiv
ale
nts
6
6,9
92
.40
18
,16
4.5
08
5,1
56
.90
0.0
09
5.8
49
5.8
48
5,2
52
.74
66
,99
2.4
00
.00
85
,25
2.7
4
LA
NC
AS
TE
R F
UN
D S
EL
DIS
C
C
as
h &
Ca
sh
Eq
uiv
ale
nts
1
81
,03
6.5
01
81
,03
6.5
00
.00
20
5.7
42
05
.74
18
1,2
42
.24
18
1,0
36
.50
0.0
01
81
,24
2.2
4
HE
DG
EH
OG
PA
RK
C
as
h &
Ca
sh
Eq
uiv
ale
nts
1
1,1
50
.67
11
,15
0.6
70
.00
12
.66
12
.66
11
,16
3.3
31
1,1
50
.67
0.0
01
1,1
63
.33
SA
LE
M D
EP
OT
TR
AIN
ST
AT
ION
C
as
h &
Ca
sh
Eq
uiv
ale
nts
5
0,1
06
.02
50
,10
6.0
20
.00
56
.95
56
.95
50
,16
2.9
75
0,1
06
.02
(0.0
0)
50
,16
2.9
7
SA
LE
M S
EN
IOR
HO
US
ING
EX
P T
RU
ST
C
as
h &
Ca
sh
Eq
uiv
ale
nts
1
.00
1.0
00
.00
0.0
01
.00
1.0
00
.00
1.0
0
DE
PO
T IM
PR
OV
EM
EN
T
C
as
h &
Ca
sh
Eq
uiv
ale
nts
48
8,8
15
.10
54
,09
3.0
35
42
,90
8.1
30
.00
58
5.9
95
85
.99
54
3,4
94
.12
48
8,8
15
.10
0.0
05
43
,49
4.1
2
PE
RF
OR
MIN
G A
RT
S
C
as
h &
Ca
sh
Eq
uiv
ale
nts
2,7
87
.83
(1,0
00
.00
)1
,78
7.8
30
.00
3.0
83
.08
1,7
90
.91
2,7
87
.83
0.0
01
,79
0.9
1
SE
IFE
RT
AU
DIT
C
as
h &
Ca
sh
Eq
uiv
ale
nts
56
,34
6.0
01
,10
0.0
05
7,4
46
.00
0.0
06
5.2
66
5.2
65
7,5
11
.26
56
,34
6.0
00
.00
57
,51
1.2
6
ST
RA
TE
GIC
PL
AN
C
as
h &
Ca
sh
Eq
uiv
ale
nts
10
,34
1.5
91
0,3
41
.59
0.0
01
1.7
51
1.7
51
0,3
53
.34
10
,34
1.5
90
.00
10
,35
3.3
4
HIS
TO
RIC
AL
DIS
TR
ICT
C
as
h &
Ca
sh
Eq
uiv
ale
nts
2,7
82
.48
2,7
82
.48
0.0
03
.14
3.1
42
,78
5.6
22
,78
2.4
8(0
.00
)2
,78
5.6
2
PE
LH
AM
RO
AD
C
as
h &
Ca
sh
Eq
uiv
ale
nts
6,1
12
.82
6,1
12
.82
0.0
06
.94
6.9
46
,11
9.7
66
,11
2.8
20
.00
6,1
19
.76
SID
EW
AL
K
C
as
h &
Ca
sh
Eq
uiv
ale
nts
8,7
05
.11
8,7
05
.11
0.0
09
.87
9.8
78
,71
4.9
88
,70
5.1
10
.00
8,7
14
.98
RT
28
RO
AD
IM
PR
OV
EM
EN
T
C
as
h &
Ca
sh
Eq
uiv
ale
nts
12
2,1
49
.74
12
2,1
49
.74
0.0
01
38
.83
13
8.8
31
22
,28
8.5
71
22
,14
9.7
40
.00
12
2,2
88
.57
SN
OW
C
as
h &
Ca
sh
Eq
uiv
ale
nts
37
4,1
44
.92
18
9,9
51
.72
56
4,0
96
.64
0.0
06
03
.65
60
3.6
55
64
,70
0.2
93
74
,14
4.9
2(0
.00
)5
64
,70
0.2
9
LA
ND
AC
QU
ISIT
ION
C
as
h &
Ca
sh
Eq
uiv
ale
nts
10
7,8
89
.55
10
7,8
89
.55
0.0
01
22
.61
12
2.6
11
08
,01
2.1
61
07
,88
9.5
5(0
.00
)1
08
,01
2.1
6
LA
ND
AN
D H
ER
ITA
GE
C
as
h &
Ca
sh
Eq
uiv
ale
nts
12
7,7
85
.48
12
7,7
85
.48
0.0
01
45
.22
14
5.2
21
27
,93
0.7
01
27
,78
5.4
80
.00
12
7,9
30
.70
PO
LIC
E O
VE
RT
IME
EX
P T
RU
ST
C
as
h &
Ca
sh
Eq
uiv
ale
nts
20
,42
2.4
12
0,4
22
.41
0.0
02
3.2
12
3.2
12
0,4
45
.62
20
,42
2.4
1(0
.00
)2
0,4
45
.62
AN
NIV
ER
SA
RY
CE
LE
BR
AT
ION
C
as
h &
Ca
sh
Eq
uiv
ale
nts
11
,46
3.4
01
1,4
63
.40
0.0
01
3.0
31
3.0
31
1,4
76
.43
11
,46
3.4
0(0
.00
)1
1,4
76
.43
SA
LE
M H
OS
E H
OS
UE
NO
. 2
C
as
h &
Ca
sh
Eq
uiv
ale
nts
10
,00
0.1
71
5,0
00
.00
25
,00
0.1
70
.00
20
.37
20
.37
25
,02
0.5
41
0,0
00
.17
0.0
02
5,0
20
.54
TO
TA
L E
XP
EN
DA
BL
E T
RU
ST
FU
ND
S1
,65
9,0
33
.19
27
7,3
09
.25
0.0
00
.00
0.0
01
,93
6,3
42
.44
0.0
02
,12
4.1
40
.00
2,1
24
.14
1,9
38
,46
6.5
81
,65
9,0
33
.19
0.0
01
,93
8,4
66
.58
TO
TA
L A
LL
TR
US
T F
UN
DS
3,9
47
,88
0.9
01
,19
3,9
05
.14
0.0
04
4,3
71
.39
(60
4,1
59
.58
)4
,58
1,9
97
.85
27
,36
2.5
03
9,1
60
.72
(33
,13
5.6
1)
33
,38
7.6
14
,61
5,3
85
.46
4,1
83
,77
7.3
06
6,6
69
.45
4,8
46
,21
7.4
2
Pre
pare
d B
y C
itizen
s P
riva
te B
an
k a
nd
Tru
st
01
/23
/20
17
96

Results of 2016
Town Meeting


TOWN MEETING RESULTS–MARCH 8, 2016
Article 1: Election of Officers (bold italic print identifies winner)
One for Selectman (3 years)
Lisa Withrow Janine M. LaFauci
Paul Pelletier
Two for Budget Committee
(3 years)
D.J. Bettencourt
Steven Chartrain
Kenneth Tarara
Steven Goddu
Patrick McDougall
One for Budget Committee
(1 year)
Thomas Plante
Paul Welch
Two for Planning Board (3 years)
Linda Harvey
Ed DeClercq
1,611
529
702
1,245
1,211
821
807
646
1,353
1,113
1,996
1,658
One for Zoning Board of Adjustment
(3 years)
Bonnie Wright
One for Library Trustee (3 years)
Martin Isaks
One for Trustee of Trust Funds
(3 years)
Thomas Linehan
One for Moderator (2 years)
Christopher Goodnow
One for Supervisor of the Checklist
(6 years)
Sheila Murray
2,166
2,221
2,227
2,327
2,360
Article #2 – Revise Septic System Setback to Wetlands
Are you in favor of the adoption of Amendment No. 1, as proposed by the Planning Board,
toamend the Town Zoning Ordinance as follows: This amendment would revise the setback
requirement between septic systems and wetlands to match State requirements?
Passed on official ballot vote on March 8, 2016: Yes – 2,234 No - 630
Article #3 – Revise Impact Fee Ordinance
Are you in favor of the adoption of Amendment No. 2, as proposed by the Planning Board, to
amend the Town Zoning Ordinance as follows: This amendment would update the Impact Fee
Ordinance by referencing the most recent impact fee schedule adopted by the Planning Board?
Passed on official ballot vote on March 8, 2016: Yes – 1,815 No – 936
Article #4 – Allow Expansion of Certain Nonconforming Structures
Are you in favor of the adoption of Amendment No. 3, as proposed by the Planning Board, to
amend the Town Zoning Ordinance as follows: This amendment would allow existing structures
that do not meet current setbacks to expand provided there is no additional encroachment?
Passed on official ballot vote on March 8, 2016: Yes – 1,858 No - 943
99

TOWN MEETING RESULTS–MARCH 8, 2016
Article #5 – Allow Non-Commercial Keeping of Chickens
Are you in favor of the adoption of Amendment No. 4, as proposed by the Planning Board, to
amend the Town Zoning Ordinance as follows: This amendment would allow the non-commercial
keeping of up to six chickens on lots at least 1 acre in size in the Rural District provided certain
restrictions are met? Passed on official ballot vote on March 8, 2016: Yes – 1,976 No – 940
Article #6 – Adopt Business Innovation Overlay District
Are you in favor of the adoption of Amendment No. 5, as proposed by the Planning Board, to
amend the Town Zoning Ordinance and Zoning Map as follows: This amendment would
encourage growth industries and redevelopment of older properties in the commercial-industrial
areas near I-93 Exit 2 by allowing the Planning Board to vary restrictions on permitted uses,
dimensional and other restrictions, and parking requirements if certain criteria are met?
Passed on official ballot vote on March 8, 2016: Yes – 1,982 No - 887
Article 7: Water System Improvements - Exit 2 Area $1,670,000
Shall the Town vote to raise and appropriate the sum of One Million Six Hundred Seventy
Thousand Dollars ($1,670,000) (gross appropriation) for the purpose of performing water system
improvements in the Exit 2 Area. Work includes construction in the existing Manor Parkway
Booster Station and construction of a new booster station on the Commercial Drive area and to
cover the costs associated with obtaining a bond issue, and to authorize the issuance of not more
than $1,670,000 of bonds or notes in accordance with the provisions of the Municipal Finance Act
(RSA 33) and to authorize the Board of Selectmen to apply for, obtain and accept any and all
Federal, State or other Aid or other revenue source that may become available and take any and
all action necessary to carry out any vote hereunder or take any other action relative thereto,
including acquiring or conveying interests in real property necessary to complete this work?
Requires a 3/5 ballot vote. The anticipated first year Bond/SRF Loan payment is $194,305. Needed 1,7,53 for 3/5 vote to pass
Passed on official ballot vote on March 8, 2016: Yes – 1,763 No – 1,103
Article 8: 2016 Operating Budget $43,994,423
Shall the Town vote to raise and appropriate as an operating budget, not including appropriations
by special warrant articles and other appropriations voted separately, the amounts set forth on the
budget posted with the warrant or as amended by the vote of the first session, for the purposes set
forth therein, totaling $44,160,803? ($1,282,225 to come from unassigned fund balance as a
revenue offset). Should this article be defeated, the default budget shall be $40,471,914 which is
the same as last year, with certain adjustments required by previous action of the town or by law;
or the Board of Selectmen may hold one special meeting in accordance with RSA 40:13, X and
XVI to take up the issue of a revised budget only. Amended from $44,134,398 to $44,154,398
Amended from $44,154,398 to $44,160,803
Reduced by $159,307 per Article 9
Reduced by $7,073 per Article 10
Passed on official ballot vote on March 8, 2016: Yes – 1,711 No – 1,158
100

TOWN MEETING RESULTS–MARCH 8, 2016
Article 9: Salem Police Relief Collective Bargaining Agreement $0
Shall the Town vote to approve the cost items included in the collective bargaining agreement
reached between the Board of Selectmen and the members of the Salem Police Relief, which call
for the following changes to salaries and benefits at the current staffing level:
Fiscal Year Estimated Increase/Decrease Explanation
2016 ($159,307) Decrease 2.75% salary adjustment April 1, 2016
Savings in health insurance plans
Changes to uniform allowance
Changes to health insurance opt-out stipend
Changes to Shift Differential
Additional steps for various positions
2017 ($27,350) Decrease 2.75% salary adjustment April 1, 2017,
Savings in health insurance plans
Additional steps for various positions
2018 ($18,057) Decrease 2.75% salary adjustment April 1, 2018
Savings in health insurance plans
Additional steps for various positions
2019 ($49,879) Decrease 2.75% One-time bonus January 1, 2019
Additional steps for various positions
2020 ($76,344) Decrease 3 months savings in health insurance
and further to reduce the Town Operating Budget for Fiscal Year 2016 by $159,307, such sum
representing the anticipated decrease in salaries and benefits required by the new agreement from
what would be paid under the current agreement at current staffing levels? Passed on official ballot vote on March 8, 2016: Yes – 2,211 No – 692
Article 10: AFSCME Collective Bargaining Contract $0
Shall the Town vote to approve the cost items included in the collective bargaining agreement
reached between the Board of Selectmen and the members of the Salem Municipal Services
Department (formerly DPW) AFSCME Union which call for the following changes to salaries and
benefits at the current staffing level:
Fiscal Year Estimated Increase/Decrease Explanation
2016 ($7,073) Decrease 2.75% salary adjustment April 1, 2016
Savings in health insurance plans
Changes to uniform allowance
Changes in annual sick buy back
Changes to health insurance opt-out stipend
2017 ($79,468) Decrease 2.75% salary adjustment April 1, 2017
Savings in health insurance plans
2018 ($29,845) Decrease 3 months health insurance savings
and further to reduce the Town Operating Budget for Fiscal Year 2016 by $7,073, such sum
representing the anticipated decrease in salaries and benefits required by the new agreement from
what would be paid under the current agreement at current staffing levels? Passed on official ballot vote on March 8, 2016: Yes – 1,970 No – 889
101

TOWN MEETING RESULTS–MARCH 8, 2016
Article 11: 2016 Road Construction and Engineering Program $4,757,604
Shall the Town vote to raise and appropriate the sum of Four Million Seven Hundred Fifty-Seven
Thousand Six Hundred Four Dollars ($4,757,604) to be added to the Roadway Capital Reserve
Fund previously established in 1990 for the purpose of repair and/or reconstruction of existing
roads and associated drainage improvements, and engineering? These funds plus an additional
$138,450 will be expended from the Roadway Capital Reserve for the 2016 Road Construction
Program and further authorize the Board of Selectmen to accept any and all State Aid or other
revenue source that may become available for this work and to take any other action relative thereto
including acquiring or conveying interests in real property necessary to complete the work? The
funds will be used for the improvement, reconstruction, maintenance, crack sealing, and
engineering of roads as outlined in the 10-year road program. Passed on official ballot vote on March 8, 2016: Yes – 2,208 No – 726
Article 12: Winter Weather Operations $250,000
Shall the Town vote to raise and appropriate the sum of Two Hundred Fifty Thousand Dollars
($250,000) to be placed in the Snow Expendable Trust Fund previously established in 1998 for the
purpose of managing winter weather, including but not limited to plowing and removing snow,
sanding and chemically treating streets, and otherwise responding to hazardous road conditions
related to winter weather and to authorize the transfer of the December 31, 2015 General Fund
Unassigned Fund Balance in that amount for this purpose? Passed on official ballot vote on March 8, 2016: Yes – 2,316 No – 647
Article 13: Sale of Town Deeded Property $0
Shall the Town vote to authorize the Board of Selectmen to transfer tax liens and to convey any
real estate acquired by the town by Tax Collector’s deed. Such conveyance shall be by deed
following a public auction, or property may be sold by advertised sealed bids or may be otherwise
disposed of as justice may require, pursuant to RSA 80:80. This authorization will remain in effect
until rescinded by a vote of the municipal meeting. Passed on official ballot vote on March 8, 2016: Yes – 2,228 No – 609
Article 14: Amend 1996 Article 35 Authorize the Selectmen to Sell Town Land $0
Shall the Town vote to amend Article 35 approved at the 1996 Town Meeting to allow the Board
of Selectmen to sell town owned land pursuant to RSA 41:14(a) by increasing the threshold from
$10,000 to $30,000? Passed on official ballot vote on March 8, 2016: Yes – 2,152 No – 699
Article 15: Authorize the Sale of Town Owned Property $0
Shall the Town authorize the Board of Selectmen to sell property located at 9 Tiffany Road, Unit
10, known as Map 117, Lot 8951, Suffix 34 and property located at 10 Tiffany Road, Unit 9,
known as Map 117, Lot 8951, Suffix 45 on such terms and conditions as the Board of Selectmen
determine are in the best interest of the Town? Passed on official ballot vote on March 8, 2016: Yes – 2,328 No – 486
102

TOWN MEETING RESULTS–MARCH 8, 2016
Article 16: Funding of Kelley Library Employment Separation Trust Fund $15,000
By Petition: Shall the Town vote to raise and appropriate the sum of Fifteen Thousand Dollars
($15,000) be placed in the Kelley Library Employment Separation Benefits Expendable Trust
Fund previously established for the purpose of funding the buy-out of library employee benefits
upon separation of employment, and to authorize the transfer of the December 31, 2015 General
Fund Unassigned Fund Balance in that amount for this purpose? Passed on official ballot vote on March 8, 2016: Yes – 2,128 No – 767
Article 17: Funding of Kelley Library Employees Economic Benefits $18,669
By Petition: Shall the Town vote to raise and appropriate a sum of Eighteen Thousand Six
Hundred Sixty-Nine Dollars ($18,669), such sum representing the cost of increased economic
benefits for the employees of the Kelley Library, the amount being set by the cost of living increase
determined for other similar municipal employees and to authorize the transfer of the December
31, 2015 Unassigned Fund Balance in that amount for this purpose? Passed on official ballot vote on March 8, 2016: Yes – 2,105 No – 816
Article 18: Rockingham Community Action $15,000
By Petition: Shall the Town vote to raise and appropriate the sum of Fifteen Thousand Dollars
($15,000) for the purpose of funding Rockingham Community Action for its work in providing
fuel, utility, food, homeless and housing assistance, budgeting education and support to Salem
residents in crisis to move them toward self-sufficiency? Passed on official ballot vote on March 8, 2016: Yes – 1,841 No – 1,086
Article 19: Child and Family Services $3,500
By Petition: Shall the Town vote to raise and appropriate the sum of Three Thousand Five
Hundred Dollars ($3,500) for the purpose of supporting services provided to residents to access
counseling, family support services, and elder care services, without regard to income from Child
and Family Services. Child and Family Services provides accessible and affordable programs to
children, youth, and their families leading to stronger family connections, improved school
performance and better citizenship. From July 1, 2014 - May 31, 2015, one hundred seventeen
(117) Salem residents received 1,118 hours of free and reduced service valued at over $34,056
from Child and Family Services. These services protected children from abuse and neglect,
strengthened families, prevented out of home placements, insured that young women had the
comprehensive health care necessary to give birth to healthy babies and helped elder, frail and
disabled adults remain in their homes? Passed on official ballot vote on March 8, 2016: Yes – 1,934 No – 920
Article 20: Fight Big Money Politics and Restore Government $0
By Petition: Shall the Town vote to urge that the next President and Congress fight big money
politics and restore government of, and for the people by championing the We the People agenda:
1. Ban Super Pacs and overturn Citizens United
2. Expose secret donors and require full transparency
3. Ban bribes from big money lobbyists and governmental contractors
4. Establish small donor, citizen-funded elections
5. End gerrymandering and modernize voter registration
6. Close loopholes and enforce campaign finance laws Passed on official ballot vote on March 8, 2016: Yes – 1,850 No – 914
103

TOWN MEETING RESULTS–MARCH 8, 2016
Article 21: Reconstruction and Repair of Garabedian Drive $1
By Petition: Shall the Town vote to raise and appropriate the sum of One Dollar ($1) for the
purpose of reconstruction, reclamation and repair of Garabedian Drive? The work will be done in
strict conformance to the requirements of the Town's Engineering Department. Amended from $1,217,029 to $1.00
Passed on official ballot vote on March 8, 2016: Yes – 1,432 No – 1,339
Total appropriations passed $50,724,197.
This is a true copy of the results of the March 8, 2016 Ballot Vote.
Attest:
Susan M. Wall
Town clerk
104

2017 Town Meeting
Warrant


2017 WARRANT ARTICLES
TOWN OF SALEM, NEW HAMPSHIRE
To the inhabitants of the Town of Salem in the County of Rockingham and the State of New
Hampshire qualified to vote in Town affairs:
FIRST SESSION OF ANNUAL MEETING – DELIBERATIVE You are hereby notified to meet at Salem High School in said Salem on Saturday, February 11,
2017 at 9:00 a.m. The session shall consist of explanation, discussion and debate on warrant
articles 9 through 23. Warrant articles may be amended subject to the following limitations: (a)
warrant articles whose wording is prescribed by law shall not be amended, (b) warrant articles that
are amended shall be placed on the official ballot for a final vote on the main motion as amended,
and (c) no warrant article shall be amended to eliminate subject matter of the article.
SECOND SESSION OF ANNUAL MEETING – VOTING Voting on warrant article numbers 1 through 23 shall be conducted by official ballot to be held in
conjunction with Town Meeting voting on March 14, 2017. You are hereby notified to meet at
your respective polling places as follows:
District 1 Fisk School
District 2 Soule School
District 3 Barron School
District 4 Ingram Senior Center
District 6 North Salem School
The polls will open at 7:00 a.m. and will not close before 7:00 p.m.
Article 1: Choose All Necessary Town Officers for Ensuing Year
Zoning Amendments (new text in italics, deleted text in strikethrough):
Article 2: Allow Charitable Gaming as Permitted Use To see if the Town will vote to adopt Amendment #1, as proposed by the Planning Board, to amend
the Salem Zoning Ordinance as follows:
Add a new Section 490-501B(3)(j) as follows:
(j) Facilities offering games of chance for charitable organizations, as defined in RSA 287-D,
which are licensed by the State, provided such facilities are located in that portion of the
Commercial-Industrial B and C Districts to the east of Rt. 93 and also to the east of South and
North Policy Streets. The minimum gross floor area devoted to gaming activities shall be 4000
square feet.
107
MWitley
Typewritten Text
MWitley
Typewritten Text

2017 TOWN MEETING WARRANT
Article 3: Revise Accessory Apartment Requirements to Address State Law
To see if the Town will vote to adopt Amendment #2, as proposed by the Planning Board, to amend
the Salem Zoning Ordinance as follows:
Revise Section 490-801 Accessory Apartments to read as follows:
A. Accessory apartments are allowed in the Residential and Rural Districts all districts that permit
single family dwellings.
B. To increase housing alternatives while maintaining neighborhood aesthetics and quality, one
accessory apartment within a detached single-family dwelling shall be permitted, provided the
following conditions are met:
(1) Maximum of one accessory apartment per property single family dwelling.
(2) The property owner must occupy one of the two units.
(3) The exterior appearance and entrances of the dwelling shall be consistent with a single-family
residence.
(4) Only one two bedrooms is are permitted in the accessory apartment, and to qualify as an
accessory apartment under this section, the apartment may not exceed 750 square feet of floor
space. The limit of 750 square feet shall not apply to conversion of in-law apartments having a
permit as of December 28, 1988, provided they meet all other requirements of this section.
(5) Where municipal sewer service is not provided, the septic system shall meet New Hampshire
Water Supply and Pollution Control Division requirements for the combined use. Adequate
provisions for water supply and sewage disposal for the accessory unit shall be made in
accordance with RSA 485-A:38.
(6) Off-street parking shall be provided for at least four vehicles. Garage and "piggy-back" parking
is encouraged.
(7) The structure and lot shall not be converted to a condominium or any other form of legal
ownership distinct from the ownership of the existing single-family dwelling. Accessory apartment
use shall be recorded by deed addendum.
(8) An accessory apartment shall not be permitted in addition to an in-law apartment or a family
day-care center.
(9) Accessory apartments shall not be permitted in conjunction with variances from any
requirements of this section.
(10) (9) Variances from this section shall be contrary to the spirit and intent of this chapter.
(10) Detached accessory apartments are not allowed.
(11) An interior door shall be provided between the principal dwelling unit and the accessory
dwelling unit.
Add the following definition in Section 490-107
Accessory dwelling unit
A residential living unit that is within or attached to a single-family dwelling, and that provides
independent living facilities for one or more persons, including provisions for sleeping, eating,
cooking, and sanitation on the same parcel of land as the principal dwelling unit it accompanies.
108

2017 TOWN MEETING WARRANT
Article 4: Amend Senior Housing Overlay District
To see if the Town will vote to adopt Amendment #3, as proposed by the Planning Board, to amend
the Salem Zoning Ordinance as follows:
A. Revise Section 490-601F(3) to read as follows:
(a) Maximum allowable density shall be based on project location as follows:
[1] Commercial-Industrial Districts: 10 units per acre.
[2] Town Center District: eight units per acre.
[3] Residential Districts: four two units per acre.
[4] Business-Office Districts: four units per acre.
[5] Rural Districts: two one units per acre.
B. Amend Section 490-601F(4) as follows:
(4) Open space requirements. Land within the parcel or lot which is not specifically covered by
the buildings, roads, driveways, parking areas, or service areas, and not set aside as private yards,
patios, or gardens for residents shall qualify as open space. Private yards shall be considered to
encompass all property within 20 feet of the dwelling or building. Further, all open space shall be
unobstructed and open to the sky. Flagpoles, sculptures, benches, swimming pools, tennis courts,
atriums, trees, and similar objects shall not be considered obstructions. No more than 25% of the
minimum required open space may lie within a wetland. At least 50% of the required open space
must be undisturbed land that remains in its natural state. The size, dimension, character, and
location of open space shall be suitable to enable its enjoyment and use for conservation,
recreation, or agricultural purposes by residents of the community. Such restrictions regarding
open space shall be in a form and substance as the Planning Board may prescribe, and shall be
recorded in an instrument enforceable by the Town.
C. Revise Section 490-601H(5) to read as follows:
(5) At least 10% of the total dwelling units in all projects shall be dedicated as affordable to low-
income households, defined as being available at a cost of no more than 30% of gross household
income of households at or below 80% of the Lawrence, MA PMSA - NH Portion median income
as reported by the U.S. Department of Housing and Urban Development. As an alternative to
providing these units, the Planning Board may allow an applicant may to contribute a fee to a local
housing trust fund to be used for the development of affordable senior housing. The fee shall be
equivalent in value to the units which otherwise would have been provided within the
development, in accordance with a fee schedule adopted by the Salem Planning Board, and shall
be paid on a timetable approved by the Board.
109

2017 TOWN MEETING WARRANT
Article 5: Modify Large Scale Redevelopment Ordinance
To see if the Town will vote to adopt Amendment #4, as proposed by the Planning Board, to amend
the Salem Zoning Ordinance as follows:
A. Revise Section 490-710D(1)(b) and add a new subsection (i) to read as follows:
D. Criteria.
(1) The conceptual development plan shall meet the following criteria for redevelopment:
(b) Mitigating Addressing negative impacts on traffic, public utilities, municipal services, and
natural resources.
B. Revise Section 490-710B to read as follows:
B. The Planning Board may grant conditional use permits to vary the restrictions in Sections 490-
501B (permitted uses) and C (restrictions), and Section 490-701 (off-street parking and loading),
and Section 490-814 (phasing requirement for multi-family housing), consistent with the criteria
noted below. An applicant is not entitled to a conditional use permit, and the Planning Board may,
in its discretion, decline to grant such permit if the Board determines such permit is not justified
or warranted in accordance with the below criteria and the intent of this regulation. This provision
is adopted as an innovative land use control pursuant to RSA 674:21, II, and the Planning Board
is vested with sole authority to administer it and to grant the conditional use permits. All other
zoning regulations shall apply.
Article 6: Revise Conditional Use Permit for Wetlands
To see if the Town will vote to adopt Amendment #5, as proposed by the Planning Board, to amend
the Salem Zoning Ordinance as follows:
Revise Section 490-706I(1)(g) to read as follows
I. Conditional use permit.
(1) (g) There is Conservation Commission approval. A recommendation from the Conservation
Commission is submitted.
Article 7: Adopt 2015 NFPA 1 Uniform Fire Code and 2015 International Fire Code
To see if the Town will vote to adopt Amendment #6, as proposed by the Planning Board, to amend
the Salem Fire Prevention Code as follows:
Revise Chapter 260 of the Salem Code as follows:
260 -3 Change International Fire Code 2006 Edition to 2015 Edition.
Change NFPA 1 Uniform Fire Code 2006 Edition to 2015 Edition.
110

2017 TOWN MEETING WARRANT
Article 8: Adopt 2015 NFPA 101 Life Safety Code
To see if the Town will vote to adopt Amendment #7, as proposed by the Planning Board, to amend
the Salem Life Safety Code as follows:
Revise Chapter 314 of the Salem Code as follows:
314-2 Adoption of Standards to read: “NFPA 101Life Safety Code 2015 edition”
314-3 Amendments to code.
314.3 B Change reference from 3.3.27.3 to 3.3.36.3 Apartment Building
314.3.E Remove
314.3 F Renumber to E
BOND AND OTHER ARTICLES
Article 9: Depot Intersection Land Acquisition – Bond $3,127,150
Shall the Town vote to raise and appropriate the sum of Three Million One Hundred Twenty-Seven
Thousand One Hundred Fifty Dollars ($3,127,150) for land acquisition and related work required
for the reconstruction of the Depot intersection (Main Street / Broadway), to authorize the issuance
of not more than $3,127,150 of bonds or notes in accordance with the provisions of the Municipal
Finance Act (RSA 33), and to authorize the Board of Selectmen to apply for, obtain and accept
any and all Federal, State or other Aid or other revenue source that may become available and take
any and all action necessary to carry out any vote hereunder or take any other action relative
thereto, including acquiring or conveying interests in real property necessary to complete this
work? Requires a 3/5 ballot vote.
Recommendations: Board of Selectmen: With Budget Committee: With
Background: This article is requesting funding for land acquisition and related work (appraisals,
agent costs, business re-establishment, moving expenses) required for the Depot intersection
reconstruction. The anticipated maximum first year bond payment is $437,801. The intersection
reconstruction will add dedicated left-turn lanes on Broadway to improve safety and expand
intersection capacity. Seven properties will be acquired in whole, permanent easements will be
acquired on five properties, and temporary easements will be acquired as needed.
Originator: Board of Selectmen
Funding Source: Property Tax
Rate Impact: $0.00
111

2017 TOWN MEETING WARRANT
Article 10: Wastewater and Stormwater Asset Management Plan – SRF $60,000 Shall the Town vote to raise and appropriate the sum of Sixty Thousand Dollars ($60,000) (gross
appropriation) for the purpose of performing asset management for the Town’s wastewater and
stormwater collection system, to authorize the issuance of not more than Sixty Thousand Dollars
($60,000) of bonds or notes in accordance with the provisions of the Municipal Finance Act (RSA
33); and, further, to authorize the Selectmen to issue and negotiate such bonds or notes and to
determine the conditions and the rate of interest thereon; and, to further authorize the Selectmen
to offset a portion of said appropriation by applying for Clean Water State Revolving Funds
(CWSRF) it being understood that repayment of the loan funds may include up to 100% principal
forgiveness in the amount up to $60,000? Requires a 3/5 ballot vote.
Recommendations: Board of Selectmen: With Budget Committee: With
Background: This article funds the total anticipated cost of developing an asset management plan
for the Towns wastewater and stormwater collection systems. This plan will assist in determining
the condition of the existing infrastructure and establish a prioritization for any needed capital
improvements. All data gathered will be entered into the Town database and VUEWorks GIS work
order system. This loan qualifies for 100% principal forgiveness from the NHDES Clean Water
State Revolving Fund and has no tax rate impact.
Originator: Board of Selectmen
Funding Source: Water/Sewer DBA
Article 11: 2017 Road Construction and Engineering Program $3,785,332
Shall the Town vote to raise and appropriate the sum of Three Million Seven Hundred Eighty-Five
Three Hundred Thirty-Two Dollars ($3,785,332) to be added to the Roadway Capital Reserve
Fund previously established in 1990 for the purpose of repair and/or reconstruction of existing
roads and associated drainage improvements, and engineering? Shall the Town further authorize
the Board of Selectmen to accept any and all State Aid or other revenue source that may become
available for this work and to take any other action relative thereto including acquiring or
conveying interests in real property necessary to complete the work? The funds will be used for
the improvement, reconstruction, maintenance, crack sealing, and engineering of roads as outlined
in the 10-year road program.
Recommendations: Board of Selectmen: With Budget Committee: With
Background: Within the context of the 10-Year Road Program, capital road rehabilitation and
reconstruction continues towards a goal of improving overall road conditions within the Town.
Road Program priorities are generally guided by road condition and PCI (pavement condition
index) ratings, traffic volumes, and opportunities to coordinate road construction with other
projects. The majority of the funds are dedicated to construction, with a portion of the funds
being allocated to engineering design of other main roads. This overall approach enables the
Town to execute a well-coordinated construction project, and at the same time, prepare/maintain
a healthy backlog of design projects that will be ready for reconstruction in subsequent years.
Efforts will focus on all or part of the following streets:
112

2017 TOWN MEETING WARRANT
Road Reconstruction:
Haverhill Road – Theodore Avenue to 507’ East of North Main Street
Klein Drive - Haverhill Road to Atkinson Town Line
Parker Circle – North Main Street (North) to North Main Street (South)
Commercial Drive – Pelham Road to Industrial Way
Woodland Avenue – Grove Avenue to Dead End
Bradford Drive – School Street (East) to School Street (West)
Road Maintenance (Mill/Overlay):
Hampstead Road – Main Street to Liberty Street
Brookdale Road – North Policy Street to Lake Shore Road
Salem Street – Brady Avenue to Methuen Town Line
Clare Lane – North Main Street to Cul De Sac Loop
Equestrian Road – Wheeler Avenue to Remington Road
Off Marie Avenue – Marie Avenue to Dead End
Sullivan Court – Sullivan Avenue to Cul De Sac Loop
First Street – North Main Street to Sandy Beach Road
Leeside Drive – Crestwood Circle to Cul De Sac
Marie Avenue – Cross Street to Green Acre Drive
Marianna Road – Dyson Road to North Policy Road
Crack Seal:
Miscellaneous Locations
Originator: Board of Selectmen
Funding Source: Property Tax
Rate Impact: $0.85
Article 12: 2017 Operating Budget $44,479,297
Shall the Town vote to raise and appropriate as an operating budget, not including appropriations
by special warrant articles and other appropriations voted separately, the amounts set forth on the
budget posted with the warrant or as amended by the vote of the first session, for the purposes set
forth therein, totaling $44,479,297? ($1,453,000 to come from unassigned fund balance as a
revenue offset). Should this article be defeated, the default budget shall be $42,368,022 which is
the same as last year, with certain adjustments required by previous action of the town or by law;
or the Board of Selectmen may hold one special meeting in accordance with RSA 40:13, X and
XVI to take up the issue of a revised budget only.
Recommendations: Board of Selectmen: With Budget Committee: With
Background: This article provides funding for the recurring annual operating costs of providing
a broad range of public services to the community. Please review the financial report and
recommendations of the Budget Committee detailed in the warrant as shown on the MS-737 Form.
The operating budget is a "bottom line budget” by law in New Hampshire. Therefore, the final
vote taken on this article will be based on the aggregate appropriation.
Originator: Board of Selectmen
Funding Source: Property Tax Water Rate Sewer Rate
Rate Impact: $5.67 $3.45 $3.25
113

2017 TOWN MEETING WARRANT
Article 13: Salem Administrative and Technical Employees Union $77,231
Collective Bargaining Agreement
Shall the Town vote to approve the cost items included in the collective bargaining agreement
reached between the Board of Selectmen and the members of the State Employees Association of
NH (SEA), Local 1984, which call for the following changes to salaries and benefits at the current
staffing level:
Fiscal Year Estimated Increase/Decrease Explanation
2017 $77,231 Increase 1.90% salary adjustment April 1, 2017
Reduction of max sick accrual from 72 days
to 60 days
Addition of 10-year salary step
2018 $43,668 Increase 1.90% salary adjustment April 1, 2018
2019 $37,266 Increase 1.90% salary adjustment April 1, 2019
and further to raise and appropriate the sum of $77,231, such sum representing the anticipated
increase in salaries and benefits required by the new agreement from what would be paid under
the current agreement at current staffing levels?
Recommendations: Board of Selectmen: With Budget Committee: With
There are 27 full-time and 10 part-time members in this collective bargaining unit (“union”). This
is a three year contract. If this article is adopted by the voters the Town’s 2017 Operating Budget
will be increased by $77,231. In exchange for the salary adjustment, the union has agreed to
reduce individual member’s maximum sick accrual from 72 days to 60 days. The maximum
present value of the 12 day reduction of sick accrual is $74,830, while the onetime cost for this
buy down in 2017 is $29,162. This onetime buy down benefits the Town as under the current
contract the value of the additional 12 days of accrual would have continued to increase.
Permanently reducing the accrual maximum reduces the Town’s liability when members retire.
Additionally, the union has also agreed to eliminate the Point of Service (POS) health
plan, historically the most expensive plan offered by the Town, reducing the average health
insurance rate increase the Town expects to see in future years.
Originator: Board of Selectmen
Funding Source Property Tax
Rate Impact: $0.02
114

2017 TOWN MEETING WARRANT
Article 14: Salem Public Administrators Association Collective $38,103
Bargaining Agreement
Shall the Town vote to approve the cost items included in the collective bargaining agreement
reached between the Board of Selectmen and the members of the Salem Public Administrators
Association, which call for the following changes to salaries and benefits at the current staffing
level:
Fiscal Year Estimated Increase/Decrease Explanation
2017 $38,103 Increase 1.70% salary adjustment April 1, 2017
2018 $45,885 Increase 1.70% salary adjustment April 1, 2018
2019 $55,977 Increase 1.70% one-time bonus April 1, 2019
and further to raise and appropriate the sum of $38,103, such sum representing the anticipated
increase in salaries and benefits required by the new agreement from what would be paid under
the current agreement at current staffing levels?
Recommendations: Board of Selectmen: With Budget Committee: With
Background: There are 21 full-time members in this collective bargaining unit. This is a three year
contract. If this article is adopted by the voters the Town’s 2017 Operating Budget will be
increased by $38,103.
Originator: Board of Selectmen
Funding Source Property Tax
Rate Impact: $0.01
Article 15: Transfer Unassigned Fund Balance to Snow Expendable $45,342
Trust Fund
Shall the Town vote to raise and appropriate the sum of Forty-Five Thousand Three Hundred
Forty-Two Dollars ($45,342) to be placed in the Snow Expendable Trust Fund previously
established in 1998 for the purpose of managing winter weather, including but not limited to
plowing and removing snow, sanding and chemically treating streets, and otherwise responding to
hazardous road conditions related to winter weather and to authorize the transfer of the December
31, 2016 General Fund Unassigned Fund Balance in that amount for this purpose?
Recommendations: Board of Selectmen: With Budget Committee: With
Background: This article represents the unexpended funds in the general fund from the 2016
appropriation of $750,000 with actual expenditures to date for 2016 of $704,658. There is a
$750,000 appropriation in the 2017 Operating Budget.
Originator: Board of Selectmen
Funding Source Use of Fund Balance
115

2017 TOWN MEETING WARRANT
Article 16: Add Parcel and Conservation Easement to the Town Forest Shall the Town vote to expand the existing Salem Town Forest by designating additional parcels
on Zion Hill Road and Bluff Street totaling 137.5 acres, shown on Tax Map 47, Lots 6874 and
12526, and Tax Map 56, Lot 6890, as part of the Town Forest; and further, to authorize the Board
of Selectmen to convey a conservation easement to a qualified conservation organization and/or
governmental agency encompassing the entire Town Forest in order to permanently protect the
Town Forest from development while retaining the ability to use the Town Forest for forest
management, passive recreation, enhancement and maintenance of scenic value, wildlife habitat
and open space? The Town will still own the Town Forest, however, passage of this article is
required to accept approximately $330,000 in grant funds to offset the cost of purchasing 101 acres
of this additional land.
Recommendations: Board of Selectmen: With Budget Committee: N/A
Background: Salem’s Town Forest was established in 1983 by Warrant Article #16 and, at
approximately 200 acres in size, is one of the largest and most important environmental resource
areas in Salem. The Town Forest is managed by the Salem Conservation Commission. Over the
last year, the Commission worked to acquire an additional 137.5 acres to expand the Town Forest.
Town conservation funds and two grants paid for this acquisition. Both of the grants require that
the Town permanently conserve the Town Forest through a conservation easement. Approval of
this Article will designate the newly acquired parcels as part of the Town Forest and conserve the
entire Town Forest so it is available to our future generations to enjoy. A yes vote will have zero
(0) impact on taxes.
Originator: Board of Selectmen
Funding Source: No funding requested
Article 17: Amend Purpose of Snow Expendable Trust Fund Previously Established
in 1998.
Shall the Town vote to amend the purpose of the Snow Expendable Trust Fund established in 1998
to include expenditures for extraordinary costs associated with weather related emergencies. For
the purposes of this amendment, a weather related emergency shall mean any declared state of
emergency? Requires 2/3 ballot vote.
Recommendations: Board of Selectmen: With Budget Committee: N/A
Background: The Trustees of the Trust funds requested that the Board of Selectmen bring forth
an article to Town Meeting to amend the purpose of the Snow Expendable Trust fund established
in 1998 for winter weather operations. The amendment will allow for monies in the trust fund to
be used for other weather related emergencies including hurricanes, floods, etc. In order for
funds to be used for any other purpose than winter weather, a state of emergency must be declared
at the State or Federal level.
Originator: Board of Selectmen
Funding Source: No funding requested
116

2017 TOWN MEETING WARRANT
Article 18: Allow Printing of Trustee of Trust Funds Reports in Summary Form
Shall the Town vote to authorize the printing of the report of Trustees of Trust Funds in summary
form rather than in full detail in the Town report, as authorized by RSA 31:33,II?
Recommendations: Board of Selectmen: With Budget Committee: NA
Background: A recent amendment to NH RSA 31:33,II allows for the Town to print a summary
form of the MS 9 and MS 10 reports (which include details on the investments and funds overseen
by the Trustees) in the annual Town Report. Printing in a summary form will help reduce the cost
of printing the detail in the town report. Copies of the MS 9 and 10 are always available at the
Town Hall.
Originator: Board of Selectmen
Funding Source: No funding requested
Article 19: Designate #2, #6 & #8 Emery Road as Conservation Land
By Petition: Shall the Town vote, pursuant to RSA 80:80 (IV) to retain the following three (3)
parcels of land for public uses, and to further designate them as Conservation Land subject to the
jurisdiction of the Conservation Commission in accordance with RSA 36-4:
2 Emery Road, Map 70, Lot 4516
6 Emery Road, Map 70, Lot 4515
8 Emery Road, Map 70, Lot 4514
Recommendations: Board of Selectmen: Without Budget Committee: N/A
Originator: Petitioner
Funding Source: No funding requested
Article 20: Fund Rockingham Community Action $15,000
By Petition: Shall the Town vote to raise and appropriate the sum of Fifteen Thousand Dollars
($15,000) for the purpose of funding Rockingham Community Action for its work in providing
fuel, utility, food, homeless housing and assistance, budgeting education and support to Salem
residents in crisis to move them toward self-sufficiency?
Recommendations: Board of Selectmen: With Budget Committee: With
Originator: Petitioner
Funding Source: Property Tax
Rate Impact: <$0.01
Article 21: Fund Kelley Library Employees’ Economic Benefits $6,808
By Petition: Shall the Town vote to raise and appropriate the sum of Six Thousand Eight Hundred
Eight Dollars ($6,808), such sum representing the cost of a 1% increase in economic benefits for
the employees of the Kelley Library?
Recommendations: Board of Selectmen: With Budget Committee: With
Originator: Petitioner
Funding Source: Property Tax
Rate Impact: <$0.01
117

118
MWitley
Typewritten Text
MWitley
Typewritten Text
MWitley
Typewritten Text
MWitley
Typewritten Text
MWitley
Typewritten Text
MWitley
Typewritten Text
MWitley
Typewritten Text
MWitley
Typewritten Text
MWitley
Typewritten Text
MWitley
Typewritten Text
MWitley
Typewritten Text
MWitley
Typewritten Text
MWitley
Typewritten Text
MWitley
Typewritten Text
MWitley
Typewritten Text
MWitley
Typewritten Text
MWitley
Typewritten Text
MWitley
Typewritten Text
MWitley
Typewritten Text
MWitley
Typewritten Text
MWitley
Typewritten Text
119

Acco
unt
Code
Des
crip
tion
War
rant
Ar
ticle
#
Appr
opria
tions
Pr
ior Y
ear a
s Ap
prov
ed b
y D
RA
Actu
al
Expe
nditu
res
Prio
r Ye
ar
Sele
ctm
en's
Ap
prop
riatio
ns
Ensu
ing
FY
(Rec
omm
ende
d)
Sele
ctm
en's
Ap
prop
riatio
ns
Ensu
ing
FY (
Not
Re
com
men
ded)
Budg
et
Com
mitt
ee's
Ap
prop
riatio
ns
Ensu
ing
FY
(Rec
omm
ende
d)
Budg
et
Com
mitt
ee's
Ap
prop
riatio
ns
Ensu
ing
FY (
Not
Re
com
men
ded)
Gen
eral
Gov
ernm
ent
0000
-000
0Co
llect
ive B
arga
inin
g$0
$0$0
$0$0
$041
30-4
139
Exec
utive
12$3
75,8
66$3
54,3
64$3
50,3
89$0
$350
,341
$041
40-4
149
Elec
tion,
Reg
istra
tion,
and
Vita
l Sta
tistic
s12
$342
,429
$322
,445
$257
,242
$0$2
57,2
18$0
4150
-415
1Fi
nanc
ial A
dmin
istra
tion
12$1
,811
,020
$1,8
24,9
62$1
,856
,698
$0$1
,856
,281
$041
52Re
valu
atio
n of
Pro
perty
$0$0
$0$0
$0$0
4153
Lega
l Exp
ense
12$1
13,9
00$8
4,39
0$1
00,0
61$0
$100
,061
$041
55-4
159
Pers
onne
l Adm
inist
ratio
n12
$1,3
98,6
82$1
,281
,028
$1,4
99,5
98$0
$1,5
17,5
53$0
4191
-419
3Pl
anni
ng a
nd Z
onin
g12
$479
,576
$396
,057
$490
,507
$0$4
90,3
87$0
4194
Gene
ral G
over
nmen
t Bui
ldin
gs12
$203
,820
$206
,883
$223
,755
$0$2
23,7
55$0
4195
Cem
eter
ies
12$3
58,7
47$3
64,0
34$3
82,4
67$0
$382
,376
$041
96In
sura
nce
12$4
55,3
92$4
38,5
13$4
99,3
25$0
$499
,325
$041
97Ad
verti
sing
and
Regi
onal
Ass
ocia
tion
$0$0
$0$0
$0$0
4199
Othe
r Gen
eral
Gov
ernm
ent
12$1
,117
,149
$1,1
47,9
97$6
39,5
03$0
$639
,081
$0
Publ
ic S
afet
y42
10-4
214
Polic
e12
$10,
299,
253
$10,
276,
390
$10,
981,
120
$0$1
0,97
9,14
7$0
4215
-421
9Am
bula
nce
$0$0
$0$0
$0$0
4220
-422
9Fi
re12
$10,
703,
668
$10,
659,
446
$11,
054,
118
$0$1
1,05
2,35
3$0
4240
-424
9Bu
ildin
g In
spec
tion
12$4
11,6
85$3
99,6
74$7
24,6
35$0
$724
,489
$042
90-4
298
Emer
genc
y M
anag
emen
t$0
$0$0
$0$0
$042
99Ot
her (
Inclu
ding
Com
mun
icatio
ns)
$0$0
$0$0
$0$0
Airp
ort/
Avia
tion
Cent
er43
01-4
309
Airp
ort O
pera
tions
$0$0
$0$0
$0$0
Hig
hway
s an
d St
reet
s43
11Ad
min
istra
tion
12$4
69,9
88$4
73,7
46$5
08,2
97$0
$508
,225
$043
12Hi
ghw
ays
and
Stre
ets
12$2
,554
,256
$2,2
86,3
96$2
,552
,688
$0$2
,555
,268
$043
13Br
idge
s$0
$0$0
$0$0
$043
16St
reet
Lig
htin
g12
$591
,103
$552
,044
$598
,637
$0$5
98,6
37$0
4319
Othe
r$0
$0$0
$0$0
$0
App
ropr
iatio
ns
2 of
9M
S-7
37: S
alem
201
7
120

Acco
unt
Code
Des
crip
tion
War
rant
Ar
ticle
#
Appr
opria
tions
Pr
ior Y
ear a
s Ap
prov
ed b
y D
RA
Actu
al
Expe
nditu
res
Prio
r Ye
ar
Sele
ctm
en's
Ap
prop
riatio
ns
Ensu
ing
FY
(Rec
omm
ende
d)
Sele
ctm
en's
Ap
prop
riatio
ns
Ensu
ing
FY (
Not
Re
com
men
ded)
Budg
et
Com
mitt
ee's
Ap
prop
riatio
ns
Ensu
ing
FY
(Rec
omm
ende
d)
Budg
et
Com
mitt
ee's
Ap
prop
riatio
ns
Ensu
ing
FY (
Not
Re
com
men
ded)
Sani
tatio
n43
21Ad
min
istra
tion
$0$0
$0$0
$0$0
4323
Solid
Was
te C
olle
ctio
n$0
$0$0
$0$0
$043
24So
lid W
aste
Disp
osal
12$9
22,8
91$8
77,1
11$9
15,0
42$0
$915
,018
$043
25So
lid W
aste
Cle
anup
$0$0
$0$0
$0$0
4326
-432
9Se
wag
e Co
llect
ion,
Disp
osal
and
Oth
er12
$2,5
68,0
28$2
,858
,386
$3,3
47,2
15$0
$3,3
47,1
65$0
Wat
er D
istr
ibut
ion
and
Trea
tmen
t43
31Ad
min
istra
tion
12$1
,339
,566
$1,3
44,4
33$1
,468
,434
$0$1
,468
,161
$043
32W
ater
Ser
vices
12$2
,045
,546
$2,2
57,6
15$1
,608
,927
$0$1
,608
,927
$043
35-4
339
Wat
er T
reat
men
t, Co
nser
vatio
n an
d Ot
her
$0$0
$0$0
$0$0
Elec
tric
4351
-435
2Ad
min
istra
tion
and
Gene
ratio
n$0
$0$0
$0$0
$043
53Pu
rcha
se C
osts
$0$0
$0$0
$0$0
4354
Elec
tric
Equi
pmen
t Mai
nten
ance
$0$0
$0$0
$0$0
4359
Othe
r Ele
ctric
Cos
ts$0
$0$0
$0$0
$0
Hea
lth44
11Ad
min
istra
tion
$220
,511
$222
,352
$0$0
$0$0
4414
Pest
Con
trol
12$1
06,1
32$9
9,42
0$1
03,9
39$0
$103
,915
$044
15-4
419
Heal
th A
genc
ies,
Hos
pita
ls, a
nd O
ther
$0$0
$0$0
$0$0
Wel
fare
4441
-444
2Ad
min
istra
tion
and
Dire
ct A
ssist
ance
12$2
45,8
83$2
28,1
78$2
49,9
33$0
$249
,885
$044
44In
terg
over
nmen
tal W
elfa
re P
aym
ents
$0$0
$0$0
$0$0
4445
-444
9Ve
ndor
Pay
men
ts a
nd O
ther
12$1
00,6
53$8
1,65
3$1
03,8
00$0
$120
,800
$0
Cultu
re a
nd R
ecre
atio
n45
20-4
529
Park
s an
d Re
crea
tion
12$3
21,5
98$2
92,0
00$6
22,5
27$0
$622
,328
$045
50-4
559
Libra
ry12
$1,4
51,7
23$1
,404
,089
$1,5
09,8
84$0
$1,5
09,3
95$0
4583
Patri
otic
Purp
oses
12$2
6,97
5$2
3,79
7$2
8,69
4$0
$28,
694
$045
89Ot
her C
ultu
re a
nd R
ecre
atio
n$2
82,1
31$2
50,7
79$0
$0$0
$0
Cons
erva
tion
and
Dev
elop
men
t46
11-4
612
Adm
inist
ratio
n an
d Pu
rcha
sing
of N
atur
al
Reso
urce
s$0
$0$0
$0$0
$0
4619
Othe
r Con
serv
atio
n$0
$0$0
$0$0
$0
3 of
9M
S-7
37: S
alem
201
7
121

Acco
unt
Code
Des
crip
tion
War
rant
Ar
ticle
#
Appr
opria
tions
Pr
ior Y
ear a
s Ap
prov
ed b
y D
RA
Actu
al
Expe
nditu
res
Prio
r Ye
ar
Sele
ctm
en's
Ap
prop
riatio
ns
Ensu
ing
FY
(Rec
omm
ende
d)
Sele
ctm
en's
Ap
prop
riatio
ns
Ensu
ing
FY (
Not
Re
com
men
ded)
Budg
et
Com
mitt
ee's
Ap
prop
riatio
ns
Ensu
ing
FY
(Rec
omm
ende
d)
Budg
et
Com
mitt
ee's
Ap
prop
riatio
ns
Ensu
ing
FY (
Not
Re
com
men
ded)
4631
-463
2Re
deve
lopm
ent a
nd H
ousin
g$0
$0$0
$0$0
$046
51-4
659
Econ
omic
Deve
lopm
ent
$0$0
$0$0
$0$0
Deb
t Ser
vice
4711
Long
Ter
m B
onds
and
Not
es -
Prin
cipal
12$1
,039
,000
$1,0
36,0
00$6
36,0
00$0
$636
,000
$047
21Lo
ng T
erm
Bon
ds a
nd N
otes
- In
tere
st12
$124
,140
$127
,140
$95,
310
$0$9
5,31
0$0
4723
Tax
Antic
ipat
ion
Note
s - I
nter
est
12$1
$0$1
$0$1
$047
90-4
799
Othe
r Deb
t Ser
vice
$0$0
$0$0
$0$0
Capi
tal O
utla
y49
01La
nd$0
$0$0
$0$0
$049
02M
achi
nery
, Veh
icles
, and
Equ
ipm
ent
12$1
,550
,281
$1,5
22,4
30$1
,039
,201
$0$1
,039
,201
$049
03Bu
ildin
gs$0
$0$0
$0$0
$049
09Im
prov
emen
ts O
ther
than
Bui
ldin
gs$1
,670
,000
$1,6
52,5
07$0
$0$0
$0
Ope
ratin
g Tr
ansf
ers
Out
4912
To S
pecia
l Rev
enue
Fun
d$0
$0$0
$0$0
$049
13To
Cap
ital P
roje
cts
Fund
$0$0
$0$0
$0$0
4914
ATo
Pro
prie
tary
Fun
d - A
irpor
t$0
$0$0
$0$0
$049
14E
To P
ropr
ieta
ry F
und
- Ele
ctric
$0$0
$0$0
$0$0
4914
STo
Pro
prie
tary
Fun
d - S
ewer
$0$0
$0$0
$0$0
4914
WTo
Pro
prie
tary
Fun
d - W
ater
$0$0
$0$0
$0$0
4918
To N
on-E
xpen
dabl
e Tr
ust F
unds
$0$0
$0$0
$0$0
4919
To A
genc
y Fu
nds
$0$0
$0$0
$0$0
Tota
l Pro
pose
d Ap
prop
riatio
ns$4
5,70
1,59
3$4
5,34
6,25
9$4
4,44
7,94
7$0
$44,
479,
297
$0
4 of
9M
S-7
37: S
alem
201
7
122

Acco
unt
Code
Purp
ose
of A
ppro
pria
tion
War
rant
Ar
ticle
#
Appr
opria
tions
Pr
ior Y
ear a
s Ap
prov
ed b
y D
RA
Actu
al
Expe
nditu
res
Prio
r Yea
r
Sele
ctm
en's
Ap
prop
riatio
ns
Ensu
ing
FY
(Rec
omm
ende
d)
Sele
ctm
en's
Ap
prop
riatio
ns
Ensu
ing
FY (
Not
Re
com
men
ded)
Budg
et
Com
mitt
ee's
Ap
prop
riatio
ns
Ensu
ing
FY
(Rec
omm
ende
d)
Budg
et
Com
mitt
ee's
Ap
prop
riatio
ns
Ensu
ing
FY (
Not
Re
com
men
ded)
4917
To H
ealth
Mai
nten
ance
Tru
st F
unds
$0$0
$0$0
$0$0
4445
-444
9Ve
ndor
Pay
men
ts a
nd O
ther
20$0
$0$1
5,00
0$0
$15,
000
$0Pu
rpos
e:Ro
ckin
gham
Com
mun
ity A
ctio
n45
50-4
559
Libra
ry21
$0$0
$6,8
08$0
$6,8
08$0
Purp
ose:
Fund
ing
of K
elle
y Lib
rary
Em
ploy
ees'
Econ
omic
Bene
4550
-455
9Lib
rary
22$0
$0$1
3,50
0$0
$13,
500
$0Pu
rpos
e:Pa
intin
g of
the
Kelle
y Lib
rary
Ext
erio
r47
11Lo
ng T
erm
Bon
ds a
nd N
otes
- Pr
incip
al09
$0$0
$3,1
27,1
50$0
$3,1
27,1
50$0
Purp
ose:
Depo
t Lan
d Ac
quisi
tion
Bon
d47
11Lo
ng T
erm
Bon
ds a
nd N
otes
- Pr
incip
al10
$0$0
$60,
000
$0$6
0,00
0$0
Purp
ose:
Clea
n W
ater
Sta
te R
evol
ving
Loan
for A
sset
Man
agem
4915
To C
apita
l Res
erve
Fun
d11
$0$0
$4,5
00,3
32$0
$4,5
00,3
32$0
Purp
ose:
2017
Roa
d Co
nstru
ctio
n an
d En
gine
erin
g Pr
ogra
m49
16To
Exp
enda
ble
Trus
ts/F
iduc
iary
Fun
ds15
$0$0
$150
,000
$0$1
50,0
00$0
Purp
ose:
Tran
sfer
Una
ssig
ned
Fund
Bal
ance
to S
now
Exp
enda
blSp
ecia
l Art
icle
s Re
com
men
ded
$0$0
$7,8
72,7
90$0
$7,8
72,7
90$0
Acco
unt
Code
Purp
ose
of A
ppro
pria
tion
War
rant
Ar
ticle
#
Appr
opria
tions
Pr
ior Y
ear a
s Ap
prov
ed b
y D
RA
Actu
al
Expe
nditu
res
Prio
r Ye
ar
Sele
ctm
en's
Ap
prop
riatio
ns
Ensu
ing
FY
(Rec
omm
ende
d)
Sele
ctm
en's
Ap
prop
riatio
ns
Ensu
ing
FY (
Not
Re
com
men
ded)
Budg
et
Com
mitt
ee's
Ap
prop
riatio
ns
Ensu
ing
FY
(Rec
omm
ende
d)
Budg
et
Com
mitt
ee's
Ap
prop
riatio
ns
Ensu
ing
FY (
Not
Re
com
men
ded)
0000
-000
0Co
llect
ive B
arga
inin
g13
$0$0
$77,
231
$0$7
7,23
1$0
Purp
ose:
Sale
m A
dmin
istra
tive
and
Tech
nica
l Em
ploy
ees
Unio
n00
00-0
000
Colle
ctive
Bar
gain
ing
14$0
$0$3
8,10
3$0
$38,
103
$0Pu
rpos
e:Sa
lem
Pub
lic A
dmin
istra
tors
Ass
ocia
tion
Colle
ctive
Indi
vidu
al A
rtic
les
Reco
mm
ende
d$0
$0$1
15,3
34$0
$115
,334
$0
Spe
cial
War
rant
Art
icle
s
Indi
vidu
al W
arra
nt A
rtic
les
5 of
9M
S-7
37: S
alem
201
7
123

Acco
unt
Code
Purp
ose
of A
ppro
pria
tion
War
rant
Ar
ticle
#Ac
tual
Rev
enue
s Pr
ior Y
ear
Sele
ctm
en's
Est
imat
ed R
even
ues
Budg
et C
omm
ittee
's E
stim
ated
Re
venu
esTa
xes
3120
Land
Use
Cha
nge
Tax
- Gen
eral
Fun
d$0
$0$0
3180
Resid
ent T
ax$0
$0$0
3185
Yiel
d Ta
x12
$325
$1,0
00$1
,000
3186
Paym
ent i
n Lie
u of
Tax
es12
$52,
186
$65,
000
$65,
000
3187
Exca
vatio
n Ta
x$0
$0$0
3189
Othe
r Tax
es12
$11,
240
$8,0
00$8
,000
3190
Inte
rest
and
Pen
altie
s on
Del
inqu
ent T
axes
12$2
88,9
67$2
35,1
00$2
35,1
0099
91In
vent
ory
Pena
lties
$0$0
$0
Lice
nses
, Per
mits
, and
Fee
s32
10Bu
sines
s Lic
ense
s an
d Pe
rmits
12$1
29,7
05$5
0,25
0$5
0,25
032
20M
otor
Veh
icle
Perm
it Fe
es12
$6,2
52,5
91$5
,900
,000
$5,9
00,0
0032
30Bu
ildin
g Pe
rmits
12$4
32,5
87$6
86,0
00$6
86,0
0032
90Ot
her L
icens
es, P
erm
its, a
nd F
ees
12$2
75,5
62$2
46,2
94$2
46,2
9433
11-3
319
From
Fed
eral
Gov
ernm
ent
$0$0
$0
Stat
e So
urce
s33
51Sh
ared
Rev
enue
s$0
$0$0
3352
Mea
ls an
d Ro
oms
Tax
Dist
ribut
ion
12$1
,482
,718
$1,3
96,9
03$1
,396
,903
3353
High
way
Blo
ck G
rant
12$6
45,6
69$6
21,2
70$6
21,2
7033
54W
ater
Pol
lutio
n Gr
ant
$0$0
$033
55Ho
usin
g an
d Co
mm
unity
Dev
elop
men
t$0
$0$0
3356
Stat
e an
d Fe
dera
l For
est L
and
Reim
burs
emen
t$0
$0$0
3357
Floo
d Co
ntro
l Rei
mbu
rsem
ent
$0$0
$033
59Ot
her (
Inclu
ding
Rai
lroad
Tax
)$0
$0$0
3379
From
Oth
er G
over
nmen
ts12
$57,
954
$32,
840
$32,
840
Char
ges
for S
ervi
ces
3401
-340
6In
com
e fro
m D
epar
tmen
ts12
$2,3
29,2
10$2
,375
,044
$2,3
75,0
4434
09Ot
her C
harg
es$0
$0$0
Mis
cella
neou
s Re
venu
es35
01Sa
le o
f Mun
icipa
l Pro
perty
12$9
1,25
7$3
0,00
0$3
0,00
035
02In
tere
st o
n In
vest
men
ts12
$12,
204
$21,
000
$21,
000
Rev
enue
s
6 of
9M
S-7
37: S
alem
201
7
124

Acco
unt
Code
Purp
ose
of A
ppro
pria
tion
War
rant
Ar
ticle
#Ac
tual
Rev
enue
s Pr
ior Y
ear
Sele
ctm
en's
Est
imat
ed R
even
ues
Budg
et C
omm
ittee
's E
stim
ated
Re
venu
es35
03-3
509
Othe
r12
$783
,258
$868
,978
$868
,978
Inte
rfun
d O
pera
ting
Tran
sfer
s In
3912
From
Spe
cial R
even
ue F
unds
$0$0
$039
13Fr
om C
apita
l Pro
ject
s Fu
nds
$0$0
$039
14A
From
Ent
erpr
ise F
unds
: Airp
ort (
Offs
et)
$0$0
$039
14E
From
Ent
erpr
ise F
unds
: Ele
ctric
(Offs
et)
$0$0
$039
14O
From
Ent
erpr
ise F
unds
: Oth
er (O
ffset
)$0
$0$0
3914
SFr
om E
nter
prise
Fun
ds: S
ewer
(Offs
et)
12$2
,850
,342
$3,3
47,1
65$3
,347
,165
3914
WFr
om E
nter
prise
Fun
ds: W
ater
(Offs
et)
12$3
,928
,809
$3,0
77,0
88$3
,077
,088
3915
From
Cap
ital R
eser
ve F
unds
$100
,000
$0$0
3916
From
Tru
st a
nd F
iduc
iary
Fun
ds$4
5,78
2$0
$039
17Fr
om C
onse
rvat
ion
Fund
s$0
$0$0
Oth
er F
inan
cing
Sou
rces
3934
Proc
eeds
from
Lon
g Te
rm B
onds
and
Not
es 0
9, 1
0$1
,102
,084
$3,1
87,1
50$3
,187
,150
9998
Amou
nt V
oted
from
Fun
d Ba
lanc
e 1
5$1
,585
,894
$150
,000
$150
,000
9999
Fund
Bal
ance
to R
educ
e Ta
xes
12$8
15,8
93$1
,453
,000
$1,4
53,0
00To
tal E
stim
ated
Rev
enue
s an
d Cr
edits
$23,
274,
237
$23,
752,
082
$23,
752,
082
7 of
9M
S-7
37: S
alem
201
7
125

Bud
get S
umm
ary
Item
Prio
r Yea
r Ado
pted
Bud
get
Sele
ctm
en's
Rec
omm
ende
d Bu
dget
Budg
et C
omm
ittee
's
Reco
mm
ende
d Bu
dget
Oper
atin
g Bu
dget
App
ropr
iatio
ns R
ecom
men
ded
$44,
134,
398
$44,
447,
947
$44,
479,
297
Spec
ial W
arra
nt A
rticle
s Re
com
men
ded
$6,7
11,2
73$7
,872
,790
$7,8
72,7
90In
divid
ual W
arra
nt A
rticle
s Re
com
men
ded
$1$1
15,3
34$1
15,3
34TO
TAL
Appr
opria
tions
Rec
omm
ende
d$5
0,84
5,67
2$5
2,43
6,07
1$5
2,46
7,42
1Le
ss: A
mou
nt o
f Est
imat
ed R
even
ues
& Cr
edits
$22,
830,
248
$23,
752,
082
$23,
752,
082
Estim
ated
Am
ount
of T
axes
to b
e Ra
ised
$28,
015,
424
$28,
683,
989
$28,
715,
339
8 of
9M
S-7
37: S
alem
201
7
126

4. C
apita
l out
lays
fund
ed fr
om L
ong-
Term
Bon
ds &
Not
es$0
5. M
anda
tory
Ass
essm
ents
$06.
Tot
al E
xclu
sions
(Sum
of L
ines
2 th
roug
h 5
abov
e)$3
,918
,460
7. A
mou
nt R
ecom
men
ded,
Les
s Ex
clus
ions
(Lin
e 1
less
Lin
e 6)
$48,
548,
961
8. 1
0% o
f Am
ount
Rec
omm
ende
d, L
ess
Exclu
sions
(Lin
e 7
x 10
%)
$4,8
54,8
96
Colle
ctiv
e Ba
rgai
ning
Cos
t Ite
ms:
9. R
ecom
men
ded
Cost
Item
s (P
rior t
o M
eetin
g)$1
15,3
34
10. V
oted
Cos
t Ite
ms
(Vot
ed a
t Mee
ting)
$0
11. A
mou
nt v
oted
ove
r rec
omm
ende
d am
ount
(Diff
eren
ce o
f Lin
es 9
and
10)
$0
Man
dato
ry W
ater
& W
aste
Tre
atm
ent F
acili
ties
(RSA
32:
21):
12. A
mou
nt R
ecom
men
ded
(Prio
r to
Mee
ting)
$0
13. A
mou
nt V
oted
(Vot
ed a
t Mee
ting)
$0
14. A
mou
nt v
oted
ove
r rec
omm
ende
d am
ount
(Diff
eren
ce o
f Lin
es 1
2 an
d 13
)$0
15. B
ond
Ove
rrid
e (R
SA 3
2:18
-a),
Am
ount
Vot
ed$0
Max
imum
Allo
wab
le A
ppro
pria
tions
Vot
ed A
t Mee
ting:
(Lin
e 1
+ L
ine
8 +
Lin
e 11
+ L
ine
15)
$57,
322,
317
Bud
get C
omm
ittee
Sup
plem
enta
l Sch
edul
e
2. P
rincip
al: L
ong-
Term
Bon
ds &
Not
es47
11$3
,823
,150
$3,8
23,1
50$9
5,31
03.
Inte
rest
: Lon
g-Te
rm B
onds
& N
otes
4721
$95,
310
1. T
otal
Rec
omm
ende
d b
y Bu
dget
Com
mitt
ee$5
2,46
7,42
1Le
ss E
xclu
sion
s:
9 of
9M
S-7
37: S
alem
201
7
127

128

Account Code Purpose of AppropriationPrior Year
Adopted BudgetReductions or
IncreasesOne-Time
Appropriations Default BudgetGeneral Government
0000-0000 Collective Bargaining $0 $0 $0 $04130-4139 Executive $375,866 ($7,502) $0 $368,3644140-4149 Election, Registration, and Vital Statistics $342,429 ($10,892) ($75,445) $256,0924150-4151 Financial Administration $1,811,020 $15,164 ($3,472) $1,822,712
4152 Revaluation of Property $0 $0 $0 $04153 Legal Expense $113,900 $0 $0 $113,900
4155-4159 Personnel Administration $1,398,682 $59,037 $0 $1,457,7194191-4193 Planning and Zoning $479,576 ($16,210) ($8,559) $454,807
4194 General Government Buildings $203,820 $19,650 ($15,587) $207,8834195 Cemeteries $358,747 $3,116 ($24,747) $337,1164196 Insurance $455,392 $43,933 $0 $499,3254197 Advertising and Regional Association $0 $0 $0 $04199 Other General Government $1,117,149 $20,708 ($566,059) $571,798
Public Safety4210-4214 Police $10,299,253 $528,306 ($15,782) $10,811,7774215-4219 Ambulance $0 $0 $0 $04220-4229 Fire $10,703,668 $239,984 ($99,916) $10,843,7364240-4249 Building Inspection $411,685 $312,150 $0 $723,8354290-4298 Emergency Management $0 $0 $0 $0
4299 Other (Including Communications) $0 $0 $0 $0Airport/Aviation Center
4301-4309 Airport Operations $0 $0 $0 $0Highways and Streets
4311 Administration $469,988 $16,244 $0 $486,2324312 Highways and Streets $2,554,255 ($613) ($68,450) $2,485,1924313 Bridges $0 $0 $0 $04316 Street Lighting $591,103 ($9,003) $0 $582,1004319 Other $0 $0 $0 $0
Sanitation4321 Administration $0 $0 $0 $04323 Solid Waste Collection $0 $0 $0 $04324 Solid Waste Disposal $922,891 $4,161 ($12,585) $914,4674325 Solid Waste Cleanup $0 $0 $0 $0
4326-4329 Sewage Collection, Disposal and Other $2,568,028 $503,804 ($67,792) $3,004,040Water Distribution and Treatment
4331 Administration $1,339,566 $81,491 $0 $1,421,0574332 Water Services $2,045,546 ($233,980) ($659,427) $1,152,139
4335-4339 Water Treatment, Conservation and Other $0 $0 $0 $0Electric
4351-4352 Administration and Generation $0 $0 $0 $0
Default Budget: Salem 2017 2 of 5
New HampshireDepartment of
Revenue Administration
2017Default Budget
129

Account Code Purpose of AppropriationPrior Year
Adopted BudgetReductions or
IncreasesOne-Time
Appropriations Default Budget4353 Purchase Costs $0 $0 $0 $04354 Electric Equipment Maintenance $0 $0 $0 $04359 Other Electric Costs $0 $0 $0 $0
Health4411 Administration $220,511 ($220,511) $0 $04414 Pest Control $106,132 ($1,318) $0 $104,814
4415-4419 Health Agencies, Hospitals, and Other $0 $0 $0 $0Welfare
4441-4442 Administration and Direct Assistance $245,883 $8,550 $0 $254,4334444 Intergovernmental Welfare Payments $0 $0 $0 $0
4445-4449 Vendor Payments and Other $82,153 $0 $0 $82,153Culture and Recreation
4520-4529 Parks and Recreation $321,598 $278,018 ($20,000) $579,6164550-4559 Library $1,433,054 $72,675 ($22,909) $1,482,820
4583 Patriotic Purposes $26,975 $0 $0 $26,9754589 Other Culture and Recreation $282,131 ($282,131) $0 $0
Conservation and Development4611-4612 Administration and Purchasing of Natural
Resources$0 $0 $0 $0
4619 Other Conservation $0 $0 $0 $04631-4632 Redevelopment and Housing $0 $0 $0 $04651-4659 Economic Development $0 $0 $0 $0
Debt Service4711 Long Term Bonds and Notes - Principal $1,039,000 ($403,000) $0 $636,0004721 Long Term Bonds and Notes - Interest $124,140 ($28,830) $0 $95,3104723 Tax Anticipation Notes - Interest $1 $0 $0 $1
4790-4799 Other Debt Service $0 $0 $0 $0Capital Outlay
4901 Land $0 $0 $0 $04902 Machinery, Vehicles, and Equipment $1,550,281 ($32,708) ($925,964) $591,6094903 Buildings $0 $0 $0 $04909 Improvements Other than Buildings $0 $0 $0 $0
Operating Transfers Out4912 To Special Revenue Fund $0 $0 $0 $04913 To Capital Projects Fund $0 $0 $0 $04914A To Proprietary Fund - Airport $0 $0 $0 $04914E To Proprietary Fund - Electric $0 $0 $0 $04914S To Proprietary Fund - Sewer $0 $0 $0 $04914W To Proprietary Fund - Water $0 $0 $0 $04915 To Capital Reserve Fund $0 $0 $0 $04916 To Expendable Trusts/Fiduciary Funds $0 $0 $0 $0
Default Budget: Salem 2017 3 of 5
New HampshireDepartment of
Revenue Administration
2017Default Budget
130

Account Code Purpose of AppropriationPrior Year
Adopted BudgetReductions or
IncreasesOne-Time
Appropriations Default Budget4917 To Health Maintenance Trust Funds $0 $0 $0 $04918 To Non-Expendable Trust Funds $0 $0 $0 $04919 To Agency Funds $0 $0 $0 $0
Total Appropriations $43,994,423 $960,293 ($2,586,694) $42,368,022
Default Budget: Salem 2017 4 of 5
New HampshireDepartment of
Revenue Administration
2017Default Budget
131

Account Code Reason for Reductions/Increases or One-Time Appropriations4311 Salary and benefits4331 Salaries and benefits4411 Reorganization of Health Dept. under Inspectional Services
4441-4442 Salary and benefits4240-4249 Reorganization of Health dept. under inspectional services
4195 Fence replacement4140-4149 Reduction of number of election4130-4139 Salary and benefits4150-4151 IT managed services4220-4229 Salary and benefits. Facility repairs
4194 Utilities and insulation install in attic4312 Salt shed roof4196 Premium increase
4550-4559 Salaries and benefits4711 Bond ended in 20164902 Various one time expenditures in 2016 budget4589 Reorg of department. Moved to Parks and Recreation4199 Consulting/engineering projects
4520-4529 Reorg of department. Other Cult and Rec moved to this line item4155-4159 Health Insurance4191-4193 Salary and benefits4210-4214 Salary and benefits4326-4329 Salaries and benefits, GLSD charge, and remediation/demolition of former WWTP
4324 One time repairs to tailer4316 Utilities4332 Bond ended in 2016 and utilities
Default Budget: Salem 2017 5 of 5
New HampshireDepartment of
Revenue Administration
2017Default Budget
132

HOLIDAYS, MEETING SCHEDULE AND OFFICE HOURS
2017 TOWN HALL HOLIDAY SCHEDULE
HOLIDAY DATE
New Year’s Day
Civil Rights Day
President’s Day
Memorial Day
Independence Day
Labor Day
Columbus Day
Veterans’ Day
Thanksgiving Day
Day After Thanksgiving
Christmas Day
Monday, January 2, 2017
Monday, January 16, 2017
Monday, February 20, 2017
Monday, May 29, 2017
Tuesday, July 4, 2017
Monday, September 4, 2017
Monday, October 9, 2017
Friday, November 10, 2017
Thursday, November 23, 2017
Friday, November 24, 2017
Monday, December 25, 2017
BOARDS, COMMITTEES & COMMISSIONS MEETING SCHEDULES
BOARD/COMMITTEE/COMMISSION MEETING
SCHEDULE
TIME LOCATION
Board of Selectmen
Budget Committee
Conservation Commission
Council on Aging
Housing Authority
Planning Board
Recreation Advisory Committee
Zoning Board of Adjustment
1st, 2nd, and 4th Mondays
2nd and 4th Wednesday
1st Wednesday
3rd Friday
2nd Tuesday
2nd and 4th Tuesday
1st Wednesday
1st Tuesday
7:00pm
7:00pm
7:00pm
9:30am
5:00pm
7:00pm
7:00pm
7:00pm
Town Hall
Town Hall
Town Hall
Senior Center
Housing Authority
Town Hall
Town Hall
Town Hall
TOWN DEPARTMENTS OFFICE HOURS
TOWN OFFICE HOURS
Assessing Office
Community Development Department
Planning/Zoning
Fire/Inspectional Services
Building/Electrical Permitting
Building/Electrical Inspection
Plumbing/Gas Permitting/Inspection
Health Officer
Community Services (Recreation)
Community Services (Senior Center)
Finance Department
Human Resources Department
Human Services Department
Municipal Services (Engineering)
Municipal Services (Public Works)
Municipal Services (Utilities)
Municipal Services (Transfer Station)
Tax Collector’s Office
Town Clerk’s Office
Town Manager’s Office
Monday – Friday 8:30am–5:00pm
Monday – Friday 8:30am–5:00pm
Monday – Friday 8:30am–5:00pm
Monday– Friday 8:30-9:30am, 4:00pm–5:00pm
Monday – Friday (By Appointment)
Monday – Friday: Permitting: 8:30–9:30am & 4:00–5:00pm
Inspections 9:30am – 4:00pm (By Appt.)
Monday – Friday 8:30-9:30 a.m., 4:00-5:00pm (or by appt.)
Monday – Thursday 8:30am-4:30pm, Friday 8:30am-3:30pm
Monday – Thursday 8:30am-4:30pm, Friday 8:30am-3:30pm
Monday – Friday 8:30am–5:00pm
Monday – Friday 8:30am–5:00pm
Monday – Friday 8:30am–3:30pm (or by Appt.)
Monday – Friday 8:30am–5:00pm
Monday – Friday 7:00am-3:30pm
Monday – Friday 7:00am-3:30pm
Tuesday, Thursday Friday, Saturday - 7:00am–2:45pm
Wednesday, 7:00 am–6:45pm – Closed Sunday/Monday
Monday – Friday 8:30am–5:00pm
Monday – Thursday – 8:30am-4:30pm, Friday–8:30am–3:30pm
Monday – Friday 8:30am–5:00pm
133

REFERENCE
www.townofsalemnh.org
Town Hall
33 Geremonty Drive
Salem, NH 03079
Fire Department (Emergency Only) ....................................................................................................
911
Police Department (Emergency Only) ................................................................................................. 911
Emergency Management Center .......................................................................................................... 890-2210
DEPARTMENT NUMBERS:
General Information ............................................................................................................................ 890-2000
Town Manager/Board of Selectmen .................................................................................................... 890-2120
Assessing Department ......................................................................................................................... 890-2010
Animal Control ................................................................................................................................... 890-2390
Building Department (Permits & Inspections) .................................................................................... 890-2020
Community Development ................................................................................................................... 890-2086
Engineering Department ..................................................................................................................... 890-2033
Finance Department ............................................................................................................................ 890-2040
Fire Department (Non-Emergency) ..................................................................................................... 890-2200
Fire/Inspectional Services (Health Permits & Inspections) ................................................................. 890-2050
Fire/Inspectional Services (Building/Gas Permits & Inspections) ...................................................... 890-2020
Human Resources Department (Personnel) ......................................................................................... 890-2070
Human Services Department (Public Assistance) ............................................................................... 890-2130
Planning Department ........................................................................................................................... 890-2080
Police Department (Non-Emergency).................................................................................................. 893-1911
Municipal Services Department (Public Works Department/Highway) .............................................. 890-2150
Transfer Station (Solid Waste and Recycling) ..................................................................................... 890-2164
Water Treatment Plant ......................................................................................................................... 890-2171
Cemeteries & Parks ............................................................................................................................. 890-2180
Purchasing Department (Finance)........................................................................................................ 890-2090
Recreation Department (Community Services) ................................................................................... 890-2140
Senior Citizens Center (Senior Services/Community Services) .......................................................... 890-2190
Tax Collection...................................................................................................................................... 890-2100
Town Clerk .......................................................................................................................................... 890-2110
OTHER IMPORTANT NUMBERS:
Salem District Court ............................................................................................................................ 855-212-1234
Salem Housing Authority .................................................................................................................... 893-6417
Salem Kelley Library ........................................................................................................................... 898-7064
Salem Historic Museum ....................................................................................................................... 890-2280
134

Bike-Ped CorridorTown of Salem