Comprehensive Annual Financial Report - Lexington County School ...
221
LEXINGTON COUNTY SCHOOL DISTRICT ONE Lexington, South Carolina Fiscal Year ended June 30, 2019 Comprehensive Annual Financial Report
-
Upload
khangminh22 -
Category
Documents
-
view
0 -
download
0
Transcript of Comprehensive Annual Financial Report - Lexington County School ...

LEXINGTON COUNTY SCHOOL DISTRICT ONELexington, South Carolina
Fiscal Year ended June 30, 2019
Comprehensive Annual Financial Report

Comprehensive Annual Financial Report
of
Lexington County School District One
Lexington, South Carolina
For the Year Ended
June 30, 2019
Prepared By: The Office of Finance
Lexington County School District One

LEXINGTON COUNTY SCHOOL DISTRICT ONELEXINGTON, SOUTH CAROLINA
TABLE OF CONTENTS
FOR THE YEAR ENDED JUNE 30, 2019
Reference PageINTRODUCTORY SECTION
189101112
FINANCIAL SECTION1316
2829
Fund Financial Statements :30
Reconciliation of Governmental Funds Balance Sheet to the 33Statement of Net Position
34Governmental Funds
Reconciliation of the Governmental Funds Statement of Revenues, Expenditures, 36and Changes in Fund Balances to the Statement of Activities
Statement of Assets and Liabilities - Fiduciary Fund 37Notes to Financial Statements 38
Required Supplementary Information:Budgetary Comparison Schedule - General Fund
Schedule of Revenues, Expenditures, and Changes in Fund Balance-Budgets and Schedule A-1 76Actual
Pension Plan SchedulesSchedule of the District's Proportionate Share of the Net Pension 77
Liability - South Carolina Retirement SystemSchedule of the District's Contributions - South Carolina Retirement System 78Schedule of the District's Proportionate Share of the Net Pension 79
Liability - Police Officers Retirement SystemSchedule of the District's Contributions - Police Officers Retirement System 80
OPEB SchedulesSchedule of the District's Proportionate Share of the Net OPEB Liability 81Schedule of the District's OPEB Contributions 82
Supplementary Information:Combining and Individual Fund Schedules:General Fund
Schedule of Revenues, Expenditures and Changes in Fund Balance - Schedule A-2 86Revised Budget and Actual - General Fund
Special Revenue - Special Revenue FundsSchedule of Revenues, Expenditures and Changes in Fund Balance Schedule B-1 96Supplemental Listing of LEA Subfund Codes and Titles Schedule B-2 108Summary Schedule for Other Designated Restricted State Grants Schedule B-3 109
Special Revenue - Education Improvement ActCombining Schedule of Revenue, Expenditures and Changes in Fund Balance - Schedule B-4 110
All ProgramsSummary Schedule by Program Schedule B-5 116
Other ScheduleDetailed Schedule of Due to State Department of Education/Federal Government Schedule B-6 117
Special Revenue - Food Service FundSchedule of Revenues, Expenditures and Changes in Fund Balance Schedule B-7 118
i (Continued)
Certificate of Excellence in Financial Reporting
Independent Auditor's ReportManagement's Discussion and AnalysisBasic Financial Statements:
Letter of TransmittalLexington One Board of Trustees
Certificate of Achievement for Excellence in Financial Reporting
List of Principal OfficialsOrganizational Chart
Government-wide Financial Statements :Statement of Net PositionStatement of Activities
Balance Sheet – Governmental Funds
Statement of Revenues, Expenditures and Changes in Fund Balances -

LEXINGTON COUNTY SCHOOL DISTRICT ONELEXINGTON, SOUTH CAROLINA
TABLE OF CONTENTS
FOR THE YEAR ENDED JUNE 30, 2019
FINANCIAL SECTION (Continued) Supplementary Information: (Continued) Reference Page
Combining and Individual Fund Schedules: (Continued)
Debt Service FundsSchedule of Revenues, Expenditures and Changes in Fund Balances Schedule C-1 121
Capital Projects FundsSchedule of Revenues, Expenditures and Changes in Fund Balance Schedule D-1 125
Fiduciary FundSchedule of Changes in Assets and Liabilities Schedule F-1 128Schedule of Receipts, Disbursements and Changes in Due to Student Schedule F-2 129
OrganizationsSummary Schedule of Cash Receipts and Disbursements Schedule F-3 130
Location Reconciliation Schedule 131Other Schedules:
Summary Schedule of Cash Receipts and Disbursements -Carolina Springs Elementary School Schedule F-4 134
Summary Schedule of Cash Receipts and Disbursements -Carolina Springs Middle School Schedule F-5 135
Summary Schedule of Cash Receipts and Disbursements -Deerfield Elementary School Schedule F-6 136
Summary Schedule of Cash Receipts and Disbursements -Forts Pond Elementary School Schedule F-7 137
Summary Schedule of Cash Receipts and Disbursements -Gilbert Elementary School Schedule F-8 138
Summary Schedule of Cash Receipts and Disbursements -Gilbert High School Schedule F-9 139
Summary Schedule of Cash Receipts and Disbursements -Gilbert Middle School Schedule F-10 141
Summary Schedule of Cash Receipts and Disbursements -Gilbert Primary School Schedule F-11 143
Summary Schedule of Cash Receipts and Disbursements -Lake Murray Elementary School Schedule F-12 144
Summary Schedule of Cash Receipts and Disbursements -Lexington Technology Center Schedule F-13 145
Summary Schedule of Cash Receipts and Disbursements -Lexington Elementary School Schedule F-14 146
Summary Schedule of Cash Receipts and Disbursements -Lexington High School Schedule F-15 147
Summary Schedule of Cash Receipts and Disbursements -Lexington Middle School Schedule F-16 149
Summary Schedule of Cash Receipts and Disbursements -Meadow Glen Elementary School Schedule F-17 151
Summary Schedule of Cash Receipts and Disbursements -Meadow Glen Middle School Schedule F-18 152
Summary Schedule of Cash Receipts and Disbursements -Midway Elementary School Schedule F-19 153
Summary Schedule of Cash Receipts and Disbursements -New Providence Elementary School Schedule F-20 154
Summary Schedule of Cash Receipts and Disbursements -Oak Grove Elementary School Schedule F-21 155
Summary Schedule of Cash Receipts and Disbursements -Pelion Elementary School Schedule F-22 156
Summary Schedule of Cash Receipts and Disbursements -Pelion High School Schedule F-23 157
Summary Schedule of Cash Receipts and Disbursements -Pelion Middle School Schedule F-24 159
ii (Continued)

LEXINGTON COUNTY SCHOOL DISTRICT ONELEXINGTON, SOUTH CAROLINA
TABLE OF CONTENTS
FOR THE YEAR ENDED JUNE 30, 2019
FINANCIAL SECTION, Continued Reference Page(s)Other Schedules:(Continued)
Summary Schedule of Cash Receipts and Disbursements -Pleasant Hill Elementary School Schedule F-25 160
Summary Schedule of Cash Receipts and Disbursements -Pleasant Hill Middle School Schedule F-26 161
Summary Schedule of Cash Receipts and Disbursements -Red Bank Elementary School Schedule F-27 163
Summary Schedule of Cash Receipts and Disbursements -River Bluff High School Schedule F-28 164
Summary Schedule of Cash Receipts and Disbursements -Rocky Creek Elementary School Schedule F-29 166
Summary Schedule of Cash Receipts and Disbursements -Saxe Gotha Elementary School Schedule F-30 167
Summary Schedule of Cash Receipts and Disbursements -White Knoll Elementary School Schedule F-31 168
Summary Schedule of Cash Receipts and Disbursements -White Knoll High School Schedule F-32 169
Summary Schedule of Cash Receipts and Disbursements -White Knoll Middle School Schedule F-33 172
Schedule of General Obligation Bonds Outstanding 173Schedule of Lexington One School Facilities Corp. Installment 176
Purchase Revenue Bonds Outstanding
STATISTICAL SECTIONNet Position by Component Table 1 178Changes in Net Position Table 2 179Fund Balances of Governmental Funds Table 3 181Changes in Fund Balances of Governmental Funds Table 4 182Assessed Value and Estimated Actual Value of All Taxable Property Table 5 183Property Tax Rates – Direct and Overlapping Governments Table 6 184Principal Property Taxpayers Table 7 185Property Tax Levies and Collections Table 8 186Legal Debt Margin Information Table 9 187Ratios of Outstanding Debt by Type Table 10 188
Table 11 189Table 12 190Table 13 191Table 14 192Table 15 193Table 16 194Table 17 195Table 18 196
COMPLIANCE SECTIONSummary Schedule of Prior Audit Findings 203Schedule of Findings and Questioned Costs 204Schedule of Expenditures of Federal Awards 205Notes to the Schedule of Expenditures of Federal Awards 207
208Reporting and on Compliance and Other Matters Based on an Auditof Financial Statements Performed in Accordance with GovernmentAuditing Standards
Independent Auditor’s Report on Compliance for Each Major Program and 210on Internal Control Over Compliance Required by the Uniform Guidance
iii
Direct and Overlapping Governmental Activities DebtRatios of General Bonded Debt Outstanding
Demographic Statistics – Lexington CountyPrincipal Employers – Lexington County
Independent Auditor’s Report on Internal Control Over Financial
Employees by FunctionOperating StatisticsTeacher SalariesCapital Asset Statistics by School

INTRODUCTORYINTRODUCTORY

N
T
S
s
g
h
y
T
a
r
c
to
B
c
th
a
T
c
T
s
r
c
L
f
f
in
s
o
b
y
f
100 Tar
November 12, 2
To the Board o
State law requir
statements pres
generally accep
hereby issue th
year ended Jun
This report con
assumes full re
reasonable basi
comprehensive
o compile suff
Because the c
comprehensive
he financial sta
and belief, this
The comprehe
compliance. Th
The financial s
schedules, as w
report on these
capacity of the
Lexington Cou
firm of licensed
financial statem
ndependent au
statements; ass
overall financia
basis for rende
year ended Jun
first componen
rrar Springs Ro
2019
f Trustees and
res that all sch
sented in confo
pted auditing s
he comprehensi
e 30, 2019.
nsists of mana
sponsibility fo
is for making
internal contro
ficient reliable
cost of intern
framework of
atements will b
financial repor
ensive annual
he introductory
section include
well as required
e financial state
District. The f
unty School Di
d certified pub
ments of the
udit involved e
sessing the acc
al statement pre
ering an unmod
e 30, 2019, are
t of the financi
oad • P.O. Box
Citizens of Le
hool districts pu
formity with ge
standards by a
ive annual fina
agement’s repr
or the complete
these represen
ol framework t
information fo
al controls sh
f internal contr
be free from m
rt is complete a
financial repo
y section includ
es the basic fin
d supplementar
ements. The st
final section is
strict One’s fin
blic accountant
District for th
examining, on
counting princ
esentation. The
dified opinion
e fairly present
ial section of th
Lexington Cou 1869 • Lexing
exington Count
ublish within si
enerally accept
a firm of licen
ancial report of
resentations co
eness and reliab
ntations, manag
that is designed
or the preparati
hould not out
rols has been
material misstate
and reliable in
ort is presente
des the transmi
nancial statem
ry information
tatistical sectio
the compliance
nancial stateme
s. The goal of
he fiscal year
n a test basis,
ciples used and
e independent
that Lexingto
ted in conformi
his report.
unty School Disgton, SC 29071
ty School Distr
ix months of th
ted accounting
nsed certified p
f Lexington Co
oncerning the
bility of all of
gement of Lex
d both to prote
ion of the Dist
tweigh their b
designed to pr
ement. As man
all material re
ed here in fo
ittal letter, the
ments; the com
n. Also included
on reflects soci
e section.
ents have been
the independe
ended June 3
evidence supp
d significant e
auditor conclu
on County Sch
ity with GAAP
strict One 1-1869 • 803-8
rict One:
he close of eac
g principles (G
public account
ounty School D
finances of th
the informatio
xington County
ect the District
trict’s financial
benefits, Lexi
rovide reasona
nagement, we a
spects.
our sections: i
list of principa
mbining and ind
d in the financ
ial and econom
n audited by B
ent audit was to
30, 2019, are
porting the am
estimates mad
uded, based upo
hool District O
P. The indepen
821-1000 • ww
ch fiscal year a
GAAP) and au
tants. Pursuant
District One (t
he District. Co
on presented in
y School Distri
’s assets from
l statements in
ington County
able rather than
assert that, to th
introductory,
al officials and
dividual fund
cial section is t
mic data, finan
Burkett Burkett
o provide reaso
free of mate
mounts and dis
e by managem
on the audit, th
One’s financial
ndent auditor’s
ww.lexington1.
complete set o
dited in accord
t to that requir
the District) fo
nsequently, m
n this report. To
ict One has es
loss, theft or m
n conformity w
y School Dist
n absolute assu
he best of our
financial, stat
d the organizati
financial state
the independen
ncial trends and
& Burkett, CP
onable assuran
erial misstatem
sclosures in th
ment; and eval
hat there was a
statements for
report is prese
net
of financial
dance with
rement, we
or the fiscal
management
o provide a
tablished a
misuse, and
with GAAP.
trict One’s
urance that
knowledge
istical and
ional chart.
ements and
nt auditor’s
d the fiscal
PAs, PA, a
nce that the
ment. The
he financial
luating the
reasonable
r the fiscal
ented as the
1

The independent audit of the financial statements of Lexington County School District One was a part of a broader, federally
mandated “Single Audit” designed to meet the special needs of federal grantor agencies. The standards governing Single
Audit engagements require the independent auditor to report not only on the fair presentation of the financial statements, but
also on the audited government’s internal controls and compliance with legal requirements, with special emphasis on internal
controls and legal requirements involving the administration of federal awards. These reports are available in the compliance
section of this comprehensive annual financial report.
GAAP require that management provide a narrative introduction, overview, and analysis to accompany the basic financial
statements in the form of Management’s Discussion and Analysis (MD&A). This letter of transmittal is designed to
complement MD&A and should be read in conjunction with it. Lexington County School District One’s MD&A can be
found immediately following the report of the independent auditors.
Profile of Lexington County School District One
Lexington County School District One is widely recognized as a leader in education. The District was established in 1952 by
the consolidation of 23 existing school districts. The District is located in the central part of Lexington County, South
Carolina (the County), that is located in the north central section of the State. The District is bound on the north by Lake
Murray and the Saluda River, on the east by Lexington County School Districts Nos. 2 and 4 of the County, on the south by
the North Edisto River and on the west by Lexington County School District No. 3 of the County. The District encompasses a
land area of approximately 360 square miles. The District lies within the Metropolitan Statistical Area (“MSA”) of the City
of Columbia, capital of the state of South Carolina.
Lexington County School District One is governed by a seven-member Board of Trustees elected by the voters of the
District. Board members are elected to four-year terms. Regular board meetings are generally held on the third Tuesday of
each month and are open to the public. Guided by the policies of the Board of Trustees, the District provides a broad
spectrum of elementary and secondary programs to meet the needs of its diverse student population. These programs
complement each other to provide a total program that is comprehensive, highly cost-effective and meets the mission
statement of the District. The mission, stated as follows from the strategic plan, was developed by a committee of citizens
and school district personnel, and was adopted by the Lexington County School District One Board of Trustees.
In fiscal year 2018–2019 the District served 25,999 students, kindergarten through grade 12. The District anticipates growing
over 500 students in each of the next few years. The district currently offers programs in seventeen primary/elementary
schools, eight middle schools, five high schools, a technology center and an alternative-learning center. The programs offered
include but are not limited to: academically gifted and talented classes for students in grades three through twelve; a variety
The Vision
Empower each child to design the future.
The Mission
Our mission is to cultivate a caring community where ALL learners are extraordinary communicators, collaborators, creators
and critical thinkers.
2

of accelerated, honors level and Advanced Placement courses for qualifying students; an International Baccalaureate (IB)
diploma programme located at Lexington High School; an IB Middle Years Programme located at Lexington Middle School,
3-year-old preschool classes for children with developmental delays; child development classes that provide interventions for
4-year-old children to better prepare them for school; a full day 5-year-old kindergarten program; early intervention services
for students who need more instruction or re-teaching of basic skills in the areas of English language arts and mathematics;
special education programs for all students who meet the criteria for the thirteen recognized areas of disability; a community
learning center for middle and high school students who have displayed severe behavior or discipline problems; programs for
targeted students to reduce the potential for dropping out of school; career and technology courses for high school students at
their home school and through the Lexington Technology Center; and LexOne Virtual Learning, a virtual school sponsored
by the district. World language instruction in Spanish, French, German, Latin and Chinese is offered in schools across the
district. The partial immersion program serves six schools in Lexington District One in French, Spanish (grades 5K–G5),
Chinese (5K–G1) and German. All elementary students receive Spanish instruction daily in grades 3–5. In middle and high
school, students have the option of taking French, Spanish, German, Latin and/or Chinese. In addition, Lexington County
School District One continues to offer extensive professional learning related to effective teacher collaboration, use of
classroom assessments, student-centered coaching, critical friends training, blended learning, differentiation of instruction
and gradual release of responsibility to meet students’ individual needs. Technology is infused into the instructional program
in all schools (K–G12).
The annual budget for the general fund serves as the foundation for the District’s financial planning and control. All schools
and departments of Lexington County School District One are required to submit requests for appropriation to the district’s
management by the last day of February each year. The District’s management uses these requests as the starting point for
developing a proposed budget. The District’s management then prioritizes these requests and presents a proposed budget to
the Lexington County School District One Board of Trustees for study and review between April and June. The Board of
Trustees is required to hold public hearings on the proposed budget and to adopt a final budget by no later than June 30, the
close of the District’s fiscal year. The appropriated budget is prepared by function (e.g., student instruction), object (e.g.,
supplies), school and department (e.g., Lexington High School). School principals may request transfers of appropriations
within their school. Transfers of appropriations, however, require the special approval of the District’s superintendent and
must be reported to the District’s Board of Trustees for their review and acceptance. Budget-to-actual comparisons are
provided in this report for the general fund as noted in the table of contents as required supplementary information.
All funds of Lexington County School District One and its component units that are controlled by this governing body and
are considered to be the “reporting entity,” are included in this report. The Lexington County School District No. 1
Educational Foundation and Lexington One School Facilities, Corp. are blended component units of the District’s operations.
Since these are major funds, data from these units are shown in separate columns in the financial statement of the District.
The District does not have any component units that are discretely presented. The Lexington County School District No. 1
Educational Foundation and Lexington One School Facilities, Corp. are discussed further in the school district’s
Management’s Discussion and Analysis.
3

Factors Affecting Financial Condition
The information presented in the financial statements is perhaps best understood when it is considered from the broader
perspective of the specific environment within which Lexington County School District One operates.
Local Economy
The District currently enjoys a favorable economic environment and local indicators point to continued stability. Lexington
County School District One’s location within the Columbia Metropolitan Statistical Area (the “Columbia MSA”), which
consists of Lexington, Richland, Calhoun, Fairfield, Kershaw and Saluda counties with a 2010 population of 767,598, is
economically significant. As a suburban school district near the state’s capital city of Columbia, Lexington County School
District One serves as a key residential community on and around the shores of Lake Murray that continues to attract upscale
residential housing and associated commercial development.
Based on the U.S. Census, Lexington County School District One had a population in calendar year 2010 of 121,030, a 38
percent increase over the 2000 population of 87,547. The estimated population for fiscal year 2019 for Lexington County is
295,032. As the population continues to increase, the economy of the community continues to change from one traditionally
based on agriculture and manufacturing to an economy based upon retail business, service businesses, manufacturing and, to
a lesser extent, agriculture.
Located within the county are a number of major corporate enterprises that help to provide a stable economy for Lexington
County School District One. The larger enterprises include Michelin North America, Inc., Nephron Pharmaceuticals, UPS,
Walmart, Amazon, Dominion Energy, Mid-Carolina Electric Cooperative, Inc., Akebono Brake Corporation, Carolina Water
Service, CMC Steel, Flextronics America, LLC, Windstream SC Inc., Lullwater at Saluda Pointe LLC, Columbia
Farms/House of Raeford Farms, Inc., Southeastern Freight Lines, Republic National Distributing Co., DHL Global
Forwarding North America, General Information Services (GIS), Time Warner ENT, Prysmian Power Cables & Systems
USA, PBR Columbia, LLC, and others.
C.R. Jackson, a large site work and road improvement contractor, has announced plans to expand their operations and build a
new asphalt mixing plant in the Batesburg-Leesville Industrial Park. The new location for the company will officially serve
as the first project located within this Park. C.R. Jackson will invest approximately $5 million into this new venture and will
hire at least five (5) additional employees.
JUUL Labs, initially established to help adult smokers switch from combustible cigarettes, is anticipated to cause more than
$125 million to be invested in a new manufacturing facility at 375 Metropolitan Drive. This plant will assemble and package
JUUL products using advanced production techniques and is expected to aid in the creation of more than 500 jobs.
Ferrous Engineering and Tool, a newly formed expansion project created out of an existing industry in Lexington County, is
planning an investment of approximately $12,858,969 accompanied by the creation of at least 33 new jobs. The company
will focus primarily on designing, engineering and machining custom firearms components from raw materials using a
variety of CNC machines.
In 2017, the last year for which information was available, Lexington County’s per capita personal income was $44,497,
ranking it third among the 46 counties in the state in per capita personal income. The state and national per capita income for
4

this same period were $40,312 and $51,914, respectively. The unemployment rate for Lexington County for June 2019 was
3.0 percent, tied for second lowest in the state. For fiscal year 2019, according to the South Carolina Department of
Employment and Workforce, the average unemployment rate in the county was 2.78 percent. The state and national
unemployment rates for the same period were 3.5 and 3.7 percent, respectively. Lexington County’s labor force increased
from 148,210 in June 2018 to 150,622 in June 2019. The number of people employed increased from 143,500 in June 2018 to
146,056 in June 2019.
Lexington County School District One continues to grow at a rapid pace not only in enrollment, increasing by 488 students
over fiscal year 2018, but also in the estimated actual value of all property in the District. The estimated actual value from all
property increased to $11,907,331,739 as of June 2019 from $11,463,643,404 as of June 2018, an increase of 3.9 percent.
Long-term Financial Planning
During the recession, on February 25, 2009, Standard & Poor’s upgraded Lexington County School District One from an
‘A+’ to an ‘AA-’ bond rating citing the District’s “maintenance of a sound financial position and good financial management
policies and practices.” The report went on to say “The ‘AA-’ ICR reflects the District’s diversifying local economy
highlighted by good wealth and employment indicators; expanding tax base, which underlies the District’s consistently sound
financial operations; and maintenance of a strong financial position with growing reserve levels, due in part to the District’s
good financial management practices.” This rating was re-affirmed during 2013. On February 13, 2015, the District received
a second upgrade in its bond rating by Standard & Poor’s. Standard & Poor’s Ratings Services raised the District’s
underlying rating for general obligation debt one notch to AA from AA-, stating, “The upgrade reflects our opinion of the
district’s strong and consistent financial performance, including the maintenance of very strong general fund reserves at fiscal
year-end 2014.” Standard and Poor’s re-affirmed the AA rating in February 2019 when the District issued $54,525,000 in
General Obligation Refunding Bonds, Series 2019A (Series 2019A Refunding Issue). Moody’s Investors Service re-affirmed
the District’s enhanced rating of Aa1 and an underlying rating of Aa2 in September of 2013. Moody’s also re-affirmed its
Aa1 rating on the Series 2019A Refunding Issue. As evidenced by the financial statements contained in this report, capital
projects are one of the main areas of focus in financial planning. The District’s oldest buildings were constructed in 1932,
1952, 1953 and 1957, and have undergone major renovations. Other facilities were constructed from 1974 through 2015. A
complete listing of school sites with ages, square footage, capacity and enrollment can be found on Table 18 of the statistical
section of this report as referenced in the table of contents.
During fiscal year 2018, the District formed a Facilities Study Committee made up of 115 business leaders, community
members, parents, staff and students, which developed a five-year building plan that includes updated safety and security
systems in all district schools and facilities; three new schools to replace old schools and increase student capacity; two new
elementary schools needed to accommodate growth; renovations, additions and/or upgrades to 14 elementary schools, five
middle schools, five high schools, the District’s maintenance facility, technology center and community learning center; a
new transportation facility; and information technology equipment and furniture to create “Future-Ready Classrooms” at all
schools.
The committee considered a long-range growth analysis of the District’s attendance areas and a long-range facilities
improvement plan, both developed by outside consultants, as well as the overall needs of the district, class size, school size,
type of facility and other related aspects. This plan was presented to the District’s Board of Trustees for three readings. On
August 7, 2018, the Board of Trustees voted to pursue the $365 million five-year building plan through a referendum passed
5

by the District’s voters on November 6, 2018. The district has broken ground on two new school facilities and several other
renovation projects as part of the long-range facilities improvement plan.
Relevant Financial Policies
By policy, the District must maintain not less than seven percent of the total general fund budget as a fund balance from one
fiscal year to the next. The District has maintained that balance for the 2019 fiscal year at a rate of 20.51 percent.
Major Initiatives
The District employed an adaptive strategic planning process during fiscal year 2018 to design a new vision, mission and
goals for the next three years in order to react more quickly and with greater agility to changes taking place in the world, our
community, the District and our schools. The District’s new vision “Empower each student to design the future” gets to the
heart of the District’s work and is reinforced by the new mission, “Our mission is to cultivate a caring community where
ALL learners are extraordinary communicators, collaborators, creators and critical thinkers.” The mission and vision provide
direction for the District’s system commitments which are laid forth as follows: In Lexington County School District One, it
is our goal to prepare graduates who are accomplished in 21st century skills and serve as a learning center for the entire
community. We seek continuous improvement in overall achievement, such as achievement gaps, acceleration and the effects
of poverty, to accomplish this mission. Our aim is to maintain a strong graduation rate by providing students with skills they
will need to be successful in today’s world, including being proficient in multiple languages. The commitments follow:
1. All students, regardless of circumstances, advance on time, prepared to graduate and ready to enter college, the
military or industry with certification.
2. Teaching and learning develop power skills in all students.
3. Our schools are service-oriented centers of learning, committed to family and community partnerships.
4. Every adult will be equipped with the skills and resources necessary to advocate for and ensure the success of all
students.
The District completed Beechwood Middle School in the Lexington attendance area, which it financed through its 8 percent
debt. The school opened in August 2019 and the related debt will be paid off in March 2020.
The District began work on the five year building plan approved as part of the $365 million referendum passed by the
District’s voters on November 6, 2018. Safety and security updates were started, several renovations and upgrades were
started and several were completed by the end of the fiscal year. Ground was broken and construction started on two school
sites.
Awards and Acknowledgments
The Government Finance Officers Association (GFOA) awarded a Certificate of Achievement for Excellence in Financial
Reporting to Lexington County School District One for its comprehensive annual financial report (CAFR) for the fiscal year
ended June 30, 2018. This was the twenty-fourth consecutive year that the District has received this prestigious award. In
order to be awarded a Certificate of Achievement, the District published an easily readable and efficiently organized CAFR.
This report satisfied both GAAP and applicable legal requirements.
6

A
C
a
I
in
tw
f
W
a
T
o
d
a
r
R
J
C
O
A Certificate o
Certificate of A
another certific
In addition, the
n Financial Re
wenty-fifth co
financial report
We believe our
and we are subm
The preparation
of the entire st
department wh
acknowledge an
report.
Respectfully su
Jeffrey S. Salte
Chief Operation
Operations Div
f Achievement
Achievement P
cate.
e District was a
eporting for th
onsecutive year
ting issued by t
r current CAFR
mitting it to AS
n of this report
taff of the Fis
ho assisted in th
nd thank the o
ubmitted,
ers
ns Officer
vision
t is valid for a
Program’s requ
also awarded th
he comprehensi
r the District h
the Association
R continues to m
SBO to determ
t on a timely ba
scal Services D
he timely clos
other District d
period of one
uirements and
he Association
ive annual fina
has received th
n of School Bu
meet the Certif
mine its eligibili
asis could not h
Department. W
ing of the Dist
epartments for
year only. We
we are submi
of School Bus
ancial report fo
his award. This
usiness Official
ficate of Excel
ity for the awa
have been acco
We would like
trict’s financia
r their assistanc
Gregory D
Superinte
Lexington
e believe that th
itting it to the
siness Officials
for the fiscal ye
s award is the
ls Internationa
llence in Finan
ard.
omplished with
e to express ou
al records and
ce in the prese
D. Little, ED.D
endent
n County Scho
he current CAF
GFOA to det
s International
ear ended June
e highest form
al (ASBO).
ncial Reporting
hout the efficie
ur appreciation
the preparatio
entation and pr
D.
ool District One
FR continues t
termine its elig
Certificate of
e 30, 2018. Th
of recognition
program’s req
ent and dedicat
n to all memb
on of this repor
reparation of d
e
to meet the
gibility for
Excellence
his was the
n in school
quirements,
ed services
bers of the
rt. We also
data for this
7

Anne Marie GreenVice Chair
Dr. R. Kyle Guyton
Cynthia S. SmithChair
Dr. Brent M. PowersSecretary
Michael E. Anderson
Timothy F. Oswald
Jada B. Garris
Board of TrusteesLEXINGTON COUNTY SCHOOL DISTRICT ONE
8

Lexington County School District One List of Principal Officials
For the Year Ended June 30, 2019
Lexington County School District One Board of Trustees
Cynthia S. Smith, Chair
Anne Marie Green, Vice Chair
Dr. Brent Powers, Secretary
Michael E. Anderson, Member
Jada B. Garris, Member
Dr. R. Kyle Guyton, Member
Timothy F. Oswalt, Member
Lexington County School District One Senior Leadership Team
Gregory D. Little, Ed.D., Superintendent
John C. Butler, C.P.A., Chief Financial Officer
Jeffrey F. Caldwell, Chief Student Services Officer
Mary Beth Hill, Chief Communications Officer
Jeffrey S. Salters, Chief Operations Officer
Michael L. Stacey, Chief Human Resources Officer
Gloria J. Talley, Ed.D., Chief Academic Officer
9

Organizational ChartBoard of Trustees
Superintendent Educational Foundation
Chief Academic
Officer
Director Assessment/
Accountability
Director Secondary
Schools
Director Elementary
Schools
Director Special Services
Director School
Counseling and
Advisement
Chief Communications
Officer
Chief Financial Officer
Director Accounting
Controller
Director Business Services
Director Food
Services and Nutrition
Director Fiscal
Services
Director Procurement
Director Procurement,
Contracts, Bids
Chief Human Resources
Officer
Director Human
ResourcesDirector
Communications
Chief Operations
Officer
Chief Student Services Officer
Director of Athletics
Operations Program Manager
Director Online
Environments
Nursing and Health Services
Director
Enterprise Information Technology
Officer
Director Student Services
Director Transportation
Director Safety and Emergency
Services
Director Building
Maintenance/Facilities
School Principals and FOCUS, LTC, Leadership
Development and Continuous Improvement
Directors
10

11

The Certificate of Excellence in Financial Reporting
is presented to
Lexington County School District One
for its Comprehensive Annual Financial Report (CAFR)
for the Fiscal Year Ended June 30, 2018.
The CAFR meets the criteria established for
ASBO International’s Certificate of Excellence.
Tom Wohlleber, CSRM David J. Lewis
President Executive Director
12

FINANCIALFINANCIAL

13

14

15

LEXINGTON COUNTY SCHOOL DISTRICT ONE LEXINGTON, SOUTH CAROLINA
MANAGEMENT’S DISCUSSION AND ANALYSIS
FOR THE YEAR ENDED JUNE 30, 2019
The management of Lexington County School District One presents to the readers of these financial statements this discussion and analysis of the District’s financial activities for the fiscal year ended June 30, 2019. We encourage the reader to consider the information presented in this analysis in conjunction with additional information we have furnished in our letter of transmittal, in the financial statements and in the notes to these statements to enhance their understanding of the District’s financial performance.
FINANCIAL HIGHLIGHTS
o The liabilities and deferred inflows of resources of the Lexington County School District Oneexceeded its assets and deferred outflows of resources by $353,208,338 at June 30, 2019. Thegovernment’s net position decreased by $951,899.
o As of the close of the current fiscal year, the District’s governmental funds reported combined endingfund balances of $183,788,233, an increase of $47,245,259. Of this amount $48,019,991 isconsidered unassigned and available for spending.
o At the end of the current fiscal year, the general fund unassigned fund balance was $48,019,991 or18.4 percent of total general fund expenditures.
o The District’s governmental funds reported total revenues of $367,749,868 and total expenditures of$406,535,800. Of these amounts the District’s general fund reported revenues of $267,234,180 andexpenditures of $260,905,046. The District also reported transfers to and from other funds. For thegeneral fund, $9,272,983 was transferred in from other funds and $9,990,405 was transferred out toother funds.
o The District’s total capital assets, net of depreciation increased by $22,941,115. This increase ispredominately due to the increase in construction in progress which includes completion of theconstruction of a new middle school and the start of projects approved as part of the five year$365,000,000 bond referendum and building plan approved by Lexington County School District Onevoters on November 6, 2018. A full discussion of these projects can be found in the Capital Assetssection of this analysis.
o The District issued short-term General Obligation Bonds for $13,940,000 and a short-term GeneralObligation Bond Anticipation Note for $1,125,000. The District issued Series 2019A $54,525,000General Obligation Refunding Bonds to refund Series 2009A General Obligation Bonds. In April2019, the District issued 2019A General Obligation Bond Anticipation Notes of $85,000,000 as part ofthe 2018 Referendum Bonds. This issue was refinanced as part of the $165,000,000 2019B GeneralObligation Bonds issued in October 2019.
OVERVIEW OF THE FINANCIAL STATEMENTS
This discussion and analysis are intended to serve as an introduction to Lexington County School District One’s basic financial statements, which consist of three parts -- government-wide financial statements, fund financial statements, and notes to the financial statements. This report also contains supplementary and other information in addition to the basic financial statements.
Government-wide financial statements. The government-wide financial statements are designed to provide readers with a broad overview of the District’s overall financial status, in a manner similar to a private-sector business. This includes two kinds of statements, the Statement of Net Position and the Statement of Activities, which are described below.
The Statement of Net Position presents information on all the District’s assets, deferred outflows of resources, liabilities, and deferred inflows of resources with the difference reported as net position. Over time, increases or decreases in net position may serve as a useful indicator of whether the financial position of the District is improving or deteriorating.
16

LEXINGTON COUNTY SCHOOL DISTRICT ONE LEXINGTON, SOUTH CAROLINA MANAGEMENT’S DISCUSSION AND ANALYSIS FOR THE YEAR ENDED JUNE 30, 2019
The Statement of Activities presents information showing how the District’s net position changed during the most recent fiscal year. All changes in net position are reported as soon as the underlying event giving rise to the change occurs, regardless of the timing of related cash flows. Thus, revenues and expenses are reported in this statement for some items that will only result in cash flows in future fiscal periods (e.g., uncollected taxes and earned but unused compensated absences). The government-wide financial statements distinguish functions of the District that are principally supported by taxes and intergovernmental revenues (governmental activities) from other functions that are intended to recover all or a significant portion of their costs through user fees and charges (business-type activities). The governmental activities of the District include instruction, support services, community services and intergovernmental activities. The District does not have any business-type activities. The government-wide financial statements include not only the District itself (known as the primary government), but also component units. The component units include Lexington County School District One Educational Foundation and Lexington One School Facilities, Corp. (LOSF, Corp). Both are not-for-profit corporations for which the District is financially accountable. Both are considered “blended” component units and are reported as governmental activities of the district. The government-wide financial statements can be found as listed in the table of contents of this report. Fund financial statements. The remaining basic financial statements are fund financial statements that focus on individual parts of the District, reporting the District’s operations in more detail than the government-wide statements. A fund is a grouping of related accounts that is used to maintain control over resources that have been segregated for specific activities or objectives. The District, like other state and local governments, uses fund accounting to ensure and demonstrate compliance with finance-related requirements. All of the funds of the District can be divided into two categories: governmental funds and fiduciary funds. Governmental Funds. Governmental funds are used to account for essentially the same functions reported as governmental activities in the government-wide financial statements. However, unlike the government-wide financial statements, governmental fund financial statements focus on near-term inflows and outflows of spendable resources, as well as on balances of spendable resources available at the end of the fiscal year. Such information may be useful in evaluating a government’s near-term financing requirements. Because the focus of governmental funds is narrower than that of the government-wide financial statements, it is useful to compare the information presented for governmental funds with similar information presented for governmental activities in the government-wide financial statements. By doing so, readers may better understand the long-term impact of the government’s near-term financing decisions. Both the governmental fund balance sheet and the governmental fund statement of revenues, expenditures, and changes in fund balances provide a reconciliation to facilitate this comparison between governmental funds and governmental activities. The District maintains eight individual governmental funds. Information is presented separately in the governmental fund balance sheet and in the governmental fund statement of revenues, expenditures, and changes in fund balances for the general fund, special revenue fund, EIA fund, food service fund, debt service fund - District, debt service fund – LOSF, Corp., and capital projects fund all of which are considered to be major funds. The District accounts for the Lexington County School District One Educational Foundation. This is considered a permanent fund and is a major fund. The individual fund data for it are provided in a separate column. The basic governmental fund financial statements can be found as referenced in the table of contents of this report. The District adopts an annual appropriated budget for its general fund. A budgetary comparison schedule has been provided for the general fund to demonstrate compliance with this budget. This schedule can be found as referenced in the table of contents of this report.
17

LEXINGTON COUNTY SCHOOL DISTRICT ONE LEXINGTON, SOUTH CAROLINA MANAGEMENT’S DISCUSSION AND ANALYSIS FOR THE YEAR ENDED JUNE 30, 2019
Fiduciary funds. Fiduciary funds are used to account for resources held for the benefit of parties outside the government. Fiduciary funds are not reflected in the government-wide financial statements because the resources of those funds are not available to support the District’s own programs. The District is the trustee, or fiduciary, for the pupil activity of the schools and accounts for this activity in an agency fund. The basic fiduciary fund financial statement can be found as referenced in the table of contents of this report. Notes to the financial statements. The notes provide additional information that is essential to a full understanding of the data provided in the government-wide and fund financial statements. The notes to the financial statements can be found as referenced in the table of contents. Other information. In addition to the basic financial statements and accompanying notes, this report also presents certain required supplemental information that further supports the financial statements with a comparison of the District’s budget for the year and other supplementary information schedules required either by the State Department of Education, the certificate of achievement program of the Government Finance Officer’s Association, or the certificate of excellence program of the Association of School Business Officials. GOVERNMENT-WIDE FINANCIAL ANALYSIS As noted earlier, net position may serve over time as a useful indicator of a government’s financial position. In the case of the District, liabilities and deferred inflows of resources of the Lexington County School District One exceeded its assets and deferred outflows of resources by $353,208,338 at June 30, 2019. The District’s net position decreased from the previous year by $951,899. The District’s largest portion of net position is reflected in the net investment in capital assets. This equates to $198,169,631, and represents the land, buildings, improvements and equipment used by the District for the instruction and support of instruction of the District’s students. Therefore, these assets are not available for future spending. In addition, $11,961,352, of the District’s net position represents resources that are subject to external restrictions in the special revenue funds, the permanent fund and the debt service fund. At June 30, 2019, the District has a negative unrestricted net position of $563,339,321. This is a direct result of the adoption in Fiscal Year 2015 of GASB Statement No. 68 and No. 71 and the adoption of GASB Statement No. 75 in Fiscal Year 2018. GASB Statement No.68 and No. 71 requires governmental entities who participate in a cost-sharing multiple employer pension plan to recognize a liability. Each governmental entity must recognize its proportionate share of the net pension liability of that plan. Therefore, the District must recognize a net pension liability, deferred outflows of resources and deferred inflows of resources for its participation in the South Carolina Retirement System and the South Carolina Police Officers Retirement System. GASB Statement No. 75 requires each governmental entity that participates in a cost-sharing multiple employer plan to recognize a liability for its proportionate share of the net other postemployment benefits (OPEB) liability of that plan. The District must recognize a net OPEB liability and related deferred outflows and inflows of resources for its participation in the State Health Plan. As follows, Table I provides a summary of the District’s net position for fiscal years 2019 and 2018 and Table II shows the changes in net position for fiscal years 2019 and 2018.
18

LEXINGTON COUNTY SCHOOL DISTRICT ONE LEXINGTON, SOUTH CAROLINA MANAGEMENT’S DISCUSSION AND ANALYSIS FOR THE YEAR ENDED JUNE 30, 2019
Table I
Condensed Statement of Net Position
Fiscal Year 2019 Fiscal Year 2018
252,871,977$ 188,488,452$
616,738,692 593,797,577
869,610,669 782,286,029
71,578,845 76,089,312
564,607,822 506,874,299
357,651,532 358,255,942
Net OPEB Liability 278,819,922 265,078,337
68,176,925 54,911,671
1,269,256,201 1,185,120,249
25,141,651 25,511,531
198,169,631 192,330,571
11,961,352 8,374,119
(563,339,321) (552,961,129)
(353,208,338)$ (352,256,439)$
Net Position
Net investment in capital assets
Restricted
Unrestricted
Total net position
Total assets
Deferred Outflows of Resources
Liabilities
Long-term liabilities
Net Pension Liability
Other liabilities
Total liabilities
Deferred Inflows of Resources
Capital Assets
Governmental Activities
Assets
Current and other assets
Current and other assets increased due to an increase in cash and cash equivalents in capital projects. Liabilities increased due to an increase in net OPEB liability and general bonded debt.
19

LEXINGTON COUNTY SCHOOL DISTRICT ONE LEXINGTON, SOUTH CAROLINA MANAGEMENT’S DISCUSSION AND ANALYSIS FOR THE YEAR ENDED JUNE 30, 2019
Table II
Change in Net Position
Fiscal Year 2019 Fiscal Year 2018
Charges for services 5,665,880$ 5,618,992$
Operating grants & contributions 157,338,630 153,024,677
Property taxes 145,988,335 142,907,398
State Revenue in Lieu of Taxes 55,267,173 51,777,087
Other 4,408,115 3,504,026
Total Revenues 368,668,133 356,832,180
197,575,813 185,261,218
155,511,378 138,426,399
367,339 318,768
16,165,502 21,741,049
Total Expenses 369,620,032 345,747,434
(951,899) 11,084,746
(352,256,439) (89,117,585)
Cumulative Effect of GASB 75 Adoption - (274,223,600)
(353,208,338)$ (352,256,439)$
Net Position, July 1
Net Position, June 30
Expenses
Instruction
Support Services
Community Services
Interest & other charges
Increase/(Decrease) in net position
General Revenues:
Governmental Activities
Revenues
Program Revenues:
Property tax revenues increased due to an increase in general fund millage of 4.45 mills and an increase in assessed value. Property assessments increased a total of 3.57 percent. Also, state revenues grew due to an increase in allocations and also due to student growth which directly impacts the calculation of certain state allocations. The District’s expenses are primarily for instruction and support services that account for 53 percent and 42 percent of total governmental activities expenses, respectively. The instructional expenses predominantly account for salaries and benefits for teachers and instructional assistants. Support services expenses are mainly building renovations and additions, instructional support, maintenance, utilities, pupil transportation and food service salaries and benefits, contractual services and supplies. Instructional and Support Services expenses increased due to salary and fringe benefit increases.
20

LEXINGTON COUNTY SCHOOL DISTRICT ONE LEXINGTON, SOUTH CAROLINA MANAGEMENT’S DISCUSSION AND ANALYSIS FOR THE YEAR ENDED JUNE 30, 2019
Tables III and IV that follow illustrate the District’s Revenues by Source and Expenses by Function for fiscal year 2019.
Table III Revenues by Source
Governmental Activities
Table IV Program Expenses by Function
Governmental Activities
21

LEXINGTON COUNTY SCHOOL DISTRICT ONE LEXINGTON, SOUTH CAROLINA MANAGEMENT’S DISCUSSION AND ANALYSIS FOR THE YEAR ENDED JUNE 30, 2019
FINANCIAL ANALYSIS OF THE GOVERNMENT’S FUNDS As noted earlier, the District uses fund accounting to ensure and demonstrate compliance with finance-related legal requirements. Governmental Funds. The analysis of governmental funds serves the purpose of looking at what resources came into the funds, how they were spent and what is available for future expenditures. Such information is useful in assessing the District’s financing requirements. The District implemented GASB Statement No. 54 as of June 30, 2010. GASB Statement No. 54, Fund Balance Reporting and Governmental Fund Type Definitions leaves unchanged the total amount reported as fund balance, but it changes the categories and terminology used to describe its components. Therefore, the presentation of fund balance focuses on the extent to which the District is bound to honor constraints on specific purposes for which amounts in the fund can be spent. The fund balance categories are nonspendable, restricted, committed, assigned and unassigned. Nonspendable fund balance is the portion of net resources that cannot be spent because of their form or because they must remain intact (i.e. prepaid expenditures and inventories). Restricted fund balance is classified due to externally enforceable limitations on use as imposed by creditors, grantors, contributors, or laws (i.e. special revenues, debt service, and capital projects). Committed fund balance represents limitations set in place prior to the end of a fiscal year by the Board of Trustees in formal action. The assigned fund balance represents a limitation resulting from intended use. In this case, the District appropriated a portion of fund balance in the next year’s general fund budget. Unassigned fund balance may serve as a useful measure of a government’s residual net resources available. As of June 30, 2019, the District’s governmental funds reported a combined ending fund balance of $183,788,233. Approximately 26.1 percent, or $48,019,991, represents unassigned fund balance. The nonspendable portion was $1,376,650 or .7 percent; the restricted portion was $125,519,602 or 68.2 percent; and the assigned portion was $8,871,990 or 4.8 percent. The general fund is the chief operating fund of the District. The general fund unassigned fund balance represents 18.4 percent of total general fund expenditures. The District has a formally approved fund balance policy that sets a minimum of 7 percent of the District’s general fund budget to be held in fund balance. This equates to a total of $19,639,303. The District’s general fund balance increased $5,611,712 from fiscal year 2018. The District’s general fund revenues increased $9 million. Local property tax revenues accounted for $1.28 million of this increase due to an increase in assessments of 3.57 percent and a millage increase of 4.45 mills. The general fund revenue increase is also due to an increase of approximately $1.7 million in the state Education Finance Act (EFA) funding and approximately $2.75 million in state fringe benefits revenue allocation increase. EFA funding is based on a district’s average daily membership as well as a state base student cost. The District’s average daily membership increased 488 students and the final base student cost increased to $2,485 in fiscal year 2019 from $2,425 in fiscal year 2018 resulting in an increase in EFA revenue. Expenditures in the general fund were approximately $12.2 million greater than the prior year. This was a result of an increase in employees as well as salary increases to all employees and the mandated employer costs for insurance and retirement premium increases. The debt service fund-District had a total fund balance of $13,922,094 all of which is restricted for the payment of debt service. The debt service tax revenues grew by $1,341,961 or 2.85 percent from the previous fiscal year. This increase is due to an increase in property assessments. The issuance of debt related to this fund is discussed later in the Capital Assets and Debt Administration section of this management’s discussion and analysis. The debt service fund-LOSF, Corp. had a total fund balance of $0. The bonds have been refunded and therefore there are no longer reserve accounts to generate interest. All principal and interest payments are generated by the issuance of short-term debt annually.
22

LEXINGTON COUNTY SCHOOL DISTRICT ONE LEXINGTON, SOUTH CAROLINA MANAGEMENT’S DISCUSSION AND ANALYSIS FOR THE YEAR ENDED JUNE 30, 2019
The capital projects fund had a total fund balance of $109,346,245 at June 30, 2019, all of which is restricted for capital projects. The district’s capital projects fund balance increased by $41,194,399 from June 30, 2018. The District also transferred $8.5 million from the general fund for various capital needs. A discussion follows in the Capital Assets and Debt Administration section of this management’s discussion and analysis. The food service fund converted to a special revenue fund from a proprietary fund as of July 1, 2014. In fiscal year 2018, the district ended the year with a positive fund balance of $878,407. In fiscal year 2019, the district increased fund balance by $58,635 to $937,042. This increase in fund balance can be attributed to an increase in breakfast and lunch sales and an increase in the after school snack programs. This resulted in an increase in the USDA reimbursement. GENERAL FUND BUDGETARY HIGHLIGHTS The District’s general fund budget is prepared according to South Carolina law. The District did not amend the general fund budget for increases or decreases in total budget. The District made minor categorical budget amendments during the year to ensure that expenditures were charged to the proper account codes as required by the South Carolina Department of Education. Actual local revenue was under budget by approximately $1.5 million as a result of actual revenues for taxes being less than budget. Actual state revenues exceeded budget by approximately $5.4 million as actual state allocations were greater than originally anticipated by the District when the budget was prepared. The final amended budgeted expenditures of the District had a positive variance from the actual expenditures of $18.1 million. The District hired long-term substitutes to fill vacated positions which was a factor in actual expenditures being less than budget. The District also spent less on maintenance and operations than budgeted. The costs of utilities, repairs and maintenance, property insurance and natural gas were significantly less than budgeted. The District also transferred $8.5 million from the general fund to capital projects to fund certain capital expenditures. CAPITAL ASSET AND DEBT ADMINISTRATION Capital Assets. The District’s investment in capital assets at June 30, 2019 was $616,738,692, net of accumulated depreciation. This investment in assets includes land, buildings, improvements other than buildings, construction in progress, and equipment. The total increase from the prior year was $22,941,115 mostly due to the increase in construction in progress. This increase in construction in progress is attributed to the near completion of Beechwood Middle School and the start of construction on two school sites and other projects approved in the new five year building plan with a projected cost of $365,000,000. District voters approved a bond referendum on November 6, 2018 to fund this plan. The District also issued non-referendum short-term bonds for certain capital needs during the current year to fund renovations and repairs, the acquisition of school buses and acquisition of information technology and school safety equipment. There are a a few of projects still under way but near completion at June 30, 2019 from the Series 2016B. Projects underway from Series 2018 consist of information and technology and school safety equipment at various locations across the district.
23

LEXINGTON COUNTY SCHOOL DISTRICT ONE LEXINGTON, SOUTH CAROLINA
MANAGEMENT’S DISCUSSION AND ANALYSIS
FOR THE YEAR ENDED JUNE 30, 2019
Table V shows the District’s capital assets, net of accumulated depreciation, as of June 30, 2019 and 2018:
Table V Capital Assets, net of accumulated depreciation
FY 2019 FY 2018
Land 25,913,490$ 25,768,028$ Buildings 497,430,600 504,277,580 Improvements 39,778,642 32,135,418 Equipment 12,087,903 10,970,549 Construction in progress 41,528,057 20,646,002
Total 616,738,692$ 593,797,577$
Governmental Activities
Additional information on the District’s capital assets can be found in Note VI of this report. Information on the District’s commitments for capital expenditures can be found in Note XV of this report.
Long-term debt. At June 30, 2019, the District had total general obligation debt outstanding of $451,030,000. This is an increase of $55,995,000 or 14.2 percent from the prior fiscal year due to the general obligation debt payments combined with the issuance of $85,000,000 of bonds under the $365,000,000 Referendum approved by District voters on November 6, 2018. The general obligation bonds of the District’s debt are backed by the full faith and credit of the District as well as the State of South Carolina. The District also shows outstanding debt of $58,985,000 for the Installment Purchase Revenue Bonds. This is a decrease of 6.1 percent from the prior fiscal year due to scheduled principal payments. The District will annually sell general obligation bonds to make the installment payments on the LOSF, Corp. debt. Table VI outlines the District’s General Obligation Debt and Installment Purchase Revenue Bonds as of June 30, 2019 and 2018:
Table VI Outstanding Debt
2019 2018 Total Percent
General Obligation Bonds 451,030,000$ 395,035,000$ 55,995,000$ 14.2%
Installment Purchase Bonds 58,985,000 62,785,000 (3,800,000) -6.1%
Total 510,015,000$ 457,820,000$ 52,195,000$ 11.4%
Governmental Activities Increase (Decrease)
State law limits the amount of general obligation debt a school district may issue to 8 percent of its assessed value excluding assessment for fee in lieu of taxes plus assessed value of merchant’s inventory plus a percentage of the fee in lieu of taxes assessment based on the most recently received annual payment of fee in lieu of taxes. However, the District is allowed by the law to exceed the legal debt limit of 8 percent if the citizens of the District approve such additional debt through a district-wide referendum. The 8 percent debt limit for the District at June 30, 2019 was $48,247,095. There is $8,710,000 that is considered 8 percent debt outstanding and therefore the legal debt margin was $39,537,095 as of the end of fiscal year 2019.
24

LEXINGTON COUNTY SCHOOL DISTRICT ONE LEXINGTON, SOUTH CAROLINA
MANAGEMENT’S DISCUSSION AND ANALYSIS
FOR THE YEAR ENDED JUNE 30, 2019
The 8 percent debt outstanding at year end represents the general obligation debt outstanding of the Series 2017 bonds. The remaining general obligation debt outstanding represents debt authorized by a $118,000,000 bond referendum approved by voters on November 2, 2004, a $336,000,000 bond referendum approved by voters on November 4, 2008 and a $365,000,000 bond referendum approved by voters on November 6, 2018.
During fiscal year 2019 the District issued Series 2019A $54,525,000 General Obligation Refunding Bonds to refund Series 2009A General Obligation Build America Bonds.
Under the provisions of the American Recovery and Reinvestment Act of 2009, The District issued the Build America Bonds in Fiscal year 2010 for which the United States Government will pay directly to the District, after application, a 35 percent subsidy on each interest payment due in that fiscal year for the life of the bonds. The United States Government sequestered portions of the credit over the years to balance the budget. For the federal fiscal year ended 9/30/19 the sequestration rate was 6.2% and it will be 5.9% for the federal fiscal year beginning 10/1/2019. The Taxable Qualified School Construction Bonds were issued in fiscal years 2010 and 2011. These bonds were issued under the provisions of the State of South Carolina Federal Education Tax-Credit Bond Implementation Act of 2009. A refundable tax credit must be applied for each time an interest payment is due for these bonds. For both types of bonds, the District has reported interest at the gross amount on the financial statements. The interest subsidy received from the United States Government is reported as intergovernmental revenue in the financial statements.
Additional information on the District’s long-term debt can be found in Note X of the notes to the financial statements.
ECONOMIC FACTORS AND NEXT YEAR’S BUDGETS
The average unemployment rate for Lexington County was 2.78 percent for the fiscal year ended June 30, 2019. The average unemployment rate for the state was 3.35 percent and for the nation was 3.78 percent for the fiscal year ended June 30, 2019. The county unemployment rate for June 2019 was 3 percent which was less than the June 2018 rate of 3.1 percent. The unemployment rate for June 2019 was 3.5 percent for the state and 3.7 percent for the nation. Lexington County consistently has one of the lowest unemployment rates in the state of South Carolina. In June 2019, it was tied for the second lowest unemployment rate in the state.
The District’s general fund budget for fiscal year 2020 was approved by the Board of Trustees on June 25, 2019. This budget was approved for $295,123,749, an increase of $14,562,273 or 5.2 percent, from the previous year’s budget of $280,561,476.
CONTACTING THE DISTRICT’S FINANCIAL MANAGEMENT
This financial report is designed to provide our citizens, taxpayers, and other interested parties with a general overview of the District’s finances and to demonstrate the District’s accountability for the resources it receives. Questions concerning any of the information provided in this report or requests for additional financial information should be addressed to the Office of Finance, Lexington County School District One, P. O. Box 1869, Lexington, South Carolina 29071. In addition, this financial report may be found on the District’s website at http://www.lexington1.net.
25

(This page intentionally left blank)
26

BASIC FINANCIAL STATEMENTS
27

LEXINGTON, SOUTH CAROLINA
PRIMARY GOVERNMENTGovernmental
ActivitiesASSETS Cash and Cash Equivalents 106,513,270$ Cash and Cash Equivalents, Restricted 106,276,141 Cash and Investments Held By County Treasurer 14,937,865 Investments 3,103,285 Investments, Restricted 1,020,886 Property Taxes Receivable, Net 6,915,239 Accounts Receivable, Net 526,371 Due from Other Governments 12,117,522 Prepaid Items 1,266,650 Inventories 194,748 Capital Assets: Non-Depreciable 67,441,547 Depreciable, Net 549,297,145
TOTAL ASSETS 869,610,669
DEFERRED OUTFLOWS OF RESOURCES
Deferred Loss on Refunding 6,655,286 Deferred Pension Charges 47,528,485 Deferred OPEB Charges 17,395,074
TOTAL DEFERRED OUTFLOWS OF RESOURCES 71,578,845
LIABILITIES
Accounts Payable and Accrued Expenses 55,502,656 Accrued Interest Payable 6,792,388 Due to Other Governments 15,749 Short Term Bonds Payable 1,125,000 Unearned Revenue 4,741,132 Noncurrent Liabilities: Net Pension Liability 357,651,532 Net OPEB Liability 278,819,922 Due within One Year 114,812,274 Due in more than One Year 449,795,548
TOTAL LIABILITIES 1,269,256,201
DEFERRED INFLOWS OF RESOURCES Deferred Pension Credits 2,331,314 Deferred OPEB Credits 22,810,337
TOTAL DEFERRED INFLOWS OF RESOURCES 25,141,651
NET POSITION Net Investment in Capital Assets 198,169,631 Restricted for: Debt Service 9,600,089 Food Service 937,042 Permanent Fund - Nonexpendable 110,000 Permanent Fund - Expendable 1,314,221 Unrestricted (563,339,321)
TOTAL NET POSITION (353,208,338)$
LEXINGTON COUNTY SCHOOL DISTRICT ONE
STATEMENT OF NET POSITION
JUNE 30, 2019
The notes to the financial statements are an integral part of this statement.See accompanying independent auditor's report.
28

LEXINGTON, SOUTH CAROLINA
YEAR ENDED JUNE 30, 2019
NET (EXPENSE) REVENUEAND CHANGE
IN NET POSITION
Operating Primary GovernmentCharges for Grants and Governmental
PRIMARY GOVERNMENT: Expenses Services Contributions Activities
Governmental activities: Instruction 197,575,813$ 211,863 144,196,850 (53,167,100)$ Support Services 155,511,378 5,178,193 10,024,292 (140,308,894) Community Services 367,339 275,824 - (91,515) Interest and Other Charges 16,165,502 - 3,117,488 (13,048,014)
Total Governmental Activities 369,620,032 5,665,880 157,338,630 (206,615,522)
TOTAL PRIMARY GOVERNMENT 369,620,032$ 5,665,880 157,338,630 (206,615,522)$
GENERAL REVENUES:Property Taxes Levied for General Purposes 97,432,019 Property Taxes Levied for Debt Service 48,556,316 State Revenue in Lieu of Taxes for General Purposes 52,662,043 State Revenue in Lieu of Taxes for Debt Service 2,605,130 Unrestricted Investment Earnings 3,574,996 Miscellaneous 833,119
Total General Revenues 205,663,623
CHANGE IN NET POSITION (951,899)
NET POSITION, Beginning of Year (352,256,439)
NET POSITION, End of Year (353,208,338)$
FUNCTIONS/PROGRAMS:
LEXINGTON COUNTY SCHOOL DISTRICT ONE
STATEMENT OF ACTIVITIES
Program Revenues
The notes to the financial statements are an integral part of this statement.See accompanying independent auditor's report.
29

LEXINGTON COUNTY SCHOOL DISTRICT ONELEXINGTON, SOUTH CAROLINA
BALANCE SHEET
GOVERNMENTAL FUNDS
JUNE 30, 2019
SPECIALSPECIAL REVENUE -
GENERAL REVENUE EIAASSETS
Cash and cash equivalents 106,377,850$ - - Cash and cash equivalents, Restricted - - - Cash and Investments Held by County Treasurer - - - Investments 3,103,285 - - Investments, Restricted - - - Receivables, Net
Taxes 5,327,025 - - Accounts Receivable 287,202 298,013 -
Due From:County Treasurer 3,266,173 - - State Dept of Education 149,836 - - Other State Agencies 3,794,648 - - Federal Agencies - 3,915,467 - Other Funds - - 4,752,179
Prepaid Items 1,266,650 - - Inventories - - -
TOTAL ASSETS 123,572,669$ 4,213,480 4,752,179
LIABILITIES
Accounts Payable & Accrued Expenditures 1,200,783$ 248,927 86,462 Accrued Salaries & Benefits 33,921,577 1,484,516 908,549 Due To:
State Dept of Education - - 15,749 Other Funds 25,579,460 1,174,045 -
Short-term Bonds Payable - - - Unearned Revenue 99,825 689,561 3,741,419
TOTAL LIABILITIES 60,801,645 3,597,049 4,752,179
DEFERRED INFLOWS OF RESOURCES
Unavailable Revenue - Property Taxes 5,228,824 - -
TOTAL DEFERRED INFLOWS OF RESOURCES 5,228,824 - -
TOTAL LIABILITIES AND DEFERRED INFLOWS OF RESOURCES 66,030,469 3,597,049 4,752,179
FUND BALANCES:Fund Balances
Nonspendable:Prepaid Items 1,266,650 - - Permanent Fund Principal - - -
Restricted:Special Revenue (Food Service) - - - Debt Service - - - Capital Projects - - - Educational Foundation - - -
AssignedSpecial Revenue - 616,431 - FY 2020 Budget Appropriation 8,255,559 - -
Unassigned 48,019,991 - -
TOTAL FUND BALANCES 57,542,200 616,431 -
TOTAL LIABILITIES, DEFERRED INFLOWS OF RESOURCESAND FUND BALANCES 123,572,669$ 4,213,480 4,752,179
The accompanying notes to financial statements are an integral part of this exhibit.
30

SPECIAL DEBT DEBT TOTAL REVENUE - SERVICE - SERVICE - CAPITAL PERMANENT GOVERNMENTAL
FOOD SERVICE DISTRICT LOSF, Corp. PROJECTS FUND FUNDS
135,420 - - - - 106,513,270$ - - - 105,872,806 403,335 106,276,141 - 14,937,865 - - - 14,937,865 - - - - - 3,103,285 - - - - 1,020,886 1,020,886
- 1,588,214 - - - 6,915,239 (58,844) - - - - 526,371
- - - - - 3,266,173 - - - - - 149,836 - - - - - 3,794,648 - - - - - 3,915,467
1,724,628 - - 20,276,698 - 26,753,505 - - - - - 1,266,650
194,748 - - - - 194,748
1,995,952 16,526,079 - 126,149,504 1,424,221 278,634,084$
12,497 - - 16,803,259 - 18,351,928$ 836,086 - - - - 37,150,728
- - - - - 15,749 - - - - - 26,753,505 - 1,125,000 - - - 1,125,000
210,327 - - - - 4,741,132
1,058,910 1,125,000 - 16,803,259 - 88,138,042
- 1,478,985 - - - 6,707,809
- 1,478,985 - - - 6,707,809
1,058,910 2,603,985 - 16,803,259 - 94,845,851
- - - - - 1,266,650 - - - - 110,000 110,000
937,042 - - - - 937,042 - 13,922,094 - - - 13,922,094 - - - 109,346,245 - 109,346,245 - - - - 1,314,221 1,314,221
- - - - - 616,431 - - - - - 8,255,559 - - - - - 48,019,991
937,042 13,922,094 - 109,346,245 1,424,221 183,788,233
1,995,952 16,526,079 - 126,149,504 1,424,221 278,634,084$
31

(This page intentionally left blank)
32

LEXINGTON COUNTY SCHOOL DISTRICT ONELEXINGTON, SOUTH CAROLINA
RECONCILIATION OF THE GOVERNMENTAL FUNDS BALANCE SHEET TO THE STATEMENT OF NET POSITION
TOTAL FUND BALANCES - GOVERNMENTAL FUNDS 183,788,233$
Amounts reported for governmental activities in the statement of Net Position are different because:
Property Taxes Receivable will be collected in the future but are not available soon enough to pay for the current period's expenditures and therefore are unavailable in the funds 6,707,809
Capital assets used in governmental activities are not financial resources and thereforeare not reported as assets in governmental funds. The cost of assets was $758,100,410
and the accumulated depreciation was $164,302,833. 616,738,692
Deferred losses on refunding are amortized over the lives of the bonds; however, in governmental accounting, deferred losses on refunding are expenditures in the year they are incurred. The deferredlosses on refunding have been shown net of accumulated amortization expense. 6,655,286
The District's proportionate share of the net pension liability, deferred outflows of resources,and deferred inflows of resources related to its participation in the State pension plans are notrecorded in the governmental funds but are recoreded in the Statement of Net Position. (312,454,361)
The District's proportionate share of the net OPEB liability, deferred outflows of resources,and deferred inflows of resources related to its participation in the State insurance plans are notrecorded in the governmental funds but are recoreded in the Statement of Net Position. (284,235,185)
Accrued interest on the outstanding bonds in governmental accounting is not due and payabletherefore, not reported as a liability in the funds. (6,792,388)
Rebatable interest receivable is not a current financial resource and therefore is not reportedas an asset in the governmental funds. 991,398
Long-term obligations, including debt premiums and discounts, are not due and payable inthe current period and therefore are not reported as liabilities in the funds. Long-Termliabilities at year-end consist of:
Long-Term Debt (510,015,000) Long-Term Debt Premiums (24,555,592) Compensated Absences (30,037,230) (564,607,822)
TOTAL NET POSITION - GOVERNMENTAL ACTIVITIES (353,208,338)$
JUNE 30, 2019
The notes to the financial statements are an integral part of this statement.See accompanying independent auditor's report.
33

LEXINGTON COUNTY SCHOOL DISTRICT ONELEXINGTON, SOUTH CAROLINA
STATEMENT OF REVENUES, EXPENDITURES AND CHANGES IN FUND BALANCES
GOVERNMENTAL FUNDS
YEAR ENDED JUNE 30, 2019
SPECIALSPECIAL REVENUE -
GENERAL REVENUE EIAREVENUES
Local SourcesLocal Property Taxes 96,716,048$ - - Investment Earnings 1,959,550 - - Other Local Sources 1,381,349 1,205,912 -
State Sources 167,177,233 5,197,962 17,098,611 Federal Sources - 9,565,751 - Intergovernmental Revenue - 98,626 -
TOTAL REVENUE ALL SOURCES 267,234,180 16,068,251 17,098,611
EXPENDITURESCurrent:
Instruction 155,175,283 7,815,594 6,896,739 Support services 105,519,975 5,319,393 1,808,650 Community services - 63,967 -
Intergovernmental - 2,393,951 - Capital outlay 209,788 - 134,650 Debt service:
Principal Retirement - - - Interest and Fiscal Charges - - -
TOTAL EXPENDITURES 260,905,046 15,592,905 8,840,039
EXCESS (DEFICIENCY) OF REVENUES OVER(UNDER) EXPENDITURES 6,329,134 475,346 8,258,572
OTHER FINANCING SOURCES (USES)Payment to Refunded Bond Escrow Agent - - - Premium on Bonds Issued - - - Issuance of General/Special Obligation Bonds - - - Issuance of Refunding Bonds - - - Transfers In 9,272,983 - - Transfers Out (9,990,405) (466,390) (8,258,572)
TOTAL OTHER FINANCING SOURCES (USES) (717,422) (466,390) (8,258,572)
NET CHANGE IN FUND BALANCE 5,611,712 8,956 -
FUND BALANCE - BEGINNING OF YEAR 51,930,488 607,475 -
FUND BALANCE - END OF YEAR 57,542,200$ 616,431 -
The accompanying notes to financial statements are an integral part of this exhibit.
34

SPECIAL TOTALREVENUE- DEBT SERVICE - DEBT SERVICE - CAPITAL PERMANENT GOVERNMENTAL
FOOD SERVICE DISTRICT LOSF, CORP. PROJECTS FUND FUNDS
- 48,354,022 - - - 145,070,070$ 342 390,282 11,832 1,173,233 39,757 3,574,996
4,827,919 - - - 275,824 7,691,004 - 2,605,130 - - - 192,078,936
6,552,997 - - - - 16,118,748 - 3,117,488 - - - 3,216,114
11,381,258 54,466,922 11,832 1,173,233 315,581 367,749,868
- - - - - 169,887,616 12,232,272 - - 20,675,665 - 145,555,955
- - - - 303,372 367,339 - - - - - 2,393,951
25,500 - - 41,106,015 - 41,475,953
- 22,335,000 3,800,000 - - 26,135,000 - 18,437,015 2,282,971 - - 20,719,986
12,257,772 40,772,015 6,082,971 61,781,680 303,372 406,535,800
(876,514) 13,694,907 (6,071,139) (60,608,447) 12,209 (38,785,932)
- (61,195,000) - - - (61,195,000) - 7,090,041 - 611,150 - 7,701,191 - - - 85,000,000 - 85,000,000 - 54,525,000 - - - 54,525,000
1,483,170 - 6,082,971 16,191,696 - 33,030,820 (548,021) (13,755,600) (11,832) - - (33,030,820)
935,149 (13,335,559) 6,071,139 101,802,846 - 86,031,191
58,635 359,348 - 41,194,399 12,209 47,245,259
878,407 13,562,746 - 68,151,846 1,412,012 136,542,974
937,042 13,922,094 - 109,346,245 1,424,221 183,788,233$
35

LEXINGTON COUNTY SCHOOL DISTRICT ONELEXINGTON, SOUTH CAROLINA
RECONCILIATION OF THE GOVERNMENTAL FUNDS STATEMENT OF REVENUES, EXPENDITURES, ANDCHANGES IN FUND BALANCES TO THE STATEMENT OF ACTIVITIES
YEAR ENDED JUNE 30, 2019
TOTAL NET CHANGE IN FUND BALANCES - GOVERNMENTAL FUNDS 47,245,259$
Amounts reported for governmental activities in the Statement of Activities are different because of the following:
Revenues in the Statement of Activities that do not provide current financial resources are not reported as
revenues in the funds. This amount represents the change in unavailable property taxes for the year. 918,265
Repayment of bond principal is an expenditure in the governmental funds, but it reduces long-term liabilities
in the Statement of Net Position 26,135,000
Bond proceeds provide current financial resources in governmental funds, but issuing debt increases
liabilities in the Statement of Net Position. (139,525,000)
Payment to refunding debt escrow agent is an expenditure in the governmental funds, but the payment reduces
long-term liabilities in the Statement of Net Position. 61,195,000
Interest on long-term debt in the Statement of Activities differs from the amount reported in the governmental
funds because interest is recognized as an expenditure in the funds when it is due, and thus requires the use
of current financial resources. In the Statement of Activities, however, interest expense is recognized as the
interest accrues, regardless of when it is due. This amount is the net change in accrued interest this year. 2,977,651
Deferred losses on refunding are expenditures in the year they are incurred in governmental funds but are amortized
over the lives of the bonds in the Statement of Activities. This amount represents the amortization of deferred
losses for the year. (1,740,822)
Bond premiums are revenues the year they are received in governmental funds but are amortized over the
lives of the bonds in the Statement of Activities. This amount represents the difference between the premiums
received during the current year and the amortization of premiums. (4,360,632)
Interest on Build America Bonds and Qualified School Construction Bonds in the Statement of Activities
differs from the governmental fund because governmental funds recognize rebatable interest income only when
received. In the Statement of Activities, however, Interest income is recognized as it accrues. This amount
represents the change in accrued interest receivable for the year. (22,904)
Changes in the District's proportionate share of the net pension liability, deferred outflows of resources,
and deferred inflows of resources for the current year are not reported in the governmental funds but are
reported in the Statement of Activities. (11,511,786)
Changes in the District's proportionate share of the net OPEB liability, deferred outflows of resources,
and deferred inflows of resources for the current year are not reported in the governmental funds but are
reported in the Statement of Activities. (4,025,154)
Some expenses reported in the Statement of Activities do no require the use of current financial resources and
therefore are not reported as expenditures in the governmental funds. (1,177,891)
Governmental funds report capital asset additions as expenditures. However, in the Statement of Activities,
the cost of those assets is allocated over their estimated useful lives as depreciation expense. This is the
amount by which current year capital additions of $36,958,944 exceeded depreciation expense of $14,017,829. 22,941,115
CHANGE IN NET POSITION OF GOVERNMENTAL ACTIVITIES (951,899)$
The notes to the financial statements are an integral part of this statement.See accompanying independent auditor's report.
36

AGENCYASSETS
Cash on Deposit 3,694,576$
TOTAL ASSETS 3,694,576$
LIABILITIES
Accounts Payable 61,708$ Accrued Salaries and Benefits 74,869 Due to Student Organizations 3,557,999
TOTAL LIABILITIES 3,694,576$
JUNE 30, 2019
LEXINGTON COUNTY SCHOOL DISTRICT ONELEXINGTON, SOUTH CAROLINA
STATEMENT OF ASSETS AND LIABILITIES
FIDUCIARY FUND
The accompanying notes to financial statements are an integral part of this exhibit.
37

LEXINGTON COUNTY SCHOOL DISTRICT ONE LEXINGTON, SOUTH CAROLINA
NOTES TO FINANCIAL STATEMENTS
JUNE 30, 2019
I. Summary of Significant Accounting Policies
Lexington County School District One operates twenty-nine public schools, one alternative learning center and one technology center in a portion of Lexington County, South Carolina and encompasses the towns of Lexington, Gilbert and Pelion. The District provides a broad range of general and specialized elementary and secondary educational services and derives its local revenue from the tax base in these areas. In addition, the District receives funding from the State of South Carolina and the United States Federal Government and must comply with the related requirements of these funding source entities. The financial statements of the District have been prepared in conformity with accounting principles generally accepted in the United States of America (GAAP) as applied to governmental units. The Governmental Accounting Standards Board (GASB) is the accepted standard-setting body for establishing governmental accounting and financial reporting principles.
Reporting Entity
These financial statements present the District and its component units, entities for which the District is considered to be financially accountable. Blended component units, although legally separate entities, are, in substance, part of the District’s operations and so data from these units are combined with data of the primary government.
Blended Component Units:
1. Lexington One School Facilities, Corp. (LOSF, Corp.) is a not-for-profit 501(c)(3) organization incorporatedfor the specific charitable purpose of serving as a “support organization” for capital projects of the District. LOSF, Corp. board members are appointed by the Lexington County School District One Board of Trustees. Because LOSF, Corp. exclusively benefits the District, there is a financial burden on the District and the District has operational responsibility for the component unit, its financial information is blended with its financial information included in individual columns throughout the financial statements. Separate financial statements for LOSF, Corp. are not issued.
In prior years, LOSF, Corp. issued installment purchase revenue bonds to finance various capital projects of the District. The installment purchase revenue bonds are secured by lease agreements with the District and will be retired through lease payments from the District. The lease agreements constitute the imposition of a financial burden on the District and provide services entirely to the District. The substance of the leases is that of a capital lease agreement. The assets and debt are accounted for as though they are assets and debt of the lessee (the District).
2. Lexington County School District One Educational Foundation is a not-for-profit 501(c) (3) organizationincorporated for the specific charitable purpose of supporting the educational process in Lexington County School District One. The Lexington County School District One Board of Trustees approves all appointments of the members of the Foundation board, which is the governing authority for the Foundation. In addition, the District’s Chief Financial Officer approves all Foundation expenditures. Therefore, the District has the ability to significantly influence the operations of the Foundation. Additionally, upon dissolution of the Foundation, all net position will revert to the District, as well as, the Foundation’s services are provided entirely to the District. Its financial information is blended with that of the District in individual columns throughout the financial statements. Financial statements may be obtained by writing to the Executive Director of the Foundation at P.O. Box 1869, Lexington, SC, 29071.
Basis of Presentation Government-Wide Financial Statements
The Statement of Net Position and the Statement of Activities report information on all of the nonfiduciary activities of the District and its component units. For the most part, the effect of interfund activity has been removed from these statements. However, the interfund services provided and used are not eliminated in the consolidation process. Governmental activities, which normally are supported by taxes and intergovernmental revenues, are reported separately from business-type activities, which rely to a significant extent on fees and charges for support. The District does not have any business-type activities.
38

LEXINGTON COUNTY SCHOOL DISTRICT ONE LEXINGTON, SOUTH CAROLINA
NOTES TO FINANCIAL STATEMENTS
JUNE 30, 2019
Summary of Significant Accounting Policies (Continued) Basis of Presentation (Continued) Government-Wide Financial Statements (Continued)
The Statement of Activities demonstrates the degree to which the direct expenses of a given function or segment are offset by program revenues.
Direct expenses are those that are clearly identifiable with a specific function or segment. Program revenues include; 1) charges to customers or applicants who purchase, use, or directly benefit from goods, services or privileges provided by a given function or segment and 2) grants and contributions that are restricted to meeting the operational or capital requirements of a particular function or segment. Taxes and other items not properly included among program revenues are reported instead as general revenues. The comparison of direct expenses with program revenues identifies the extent to which each business segment or governmental function is self-financing or draws from the general revenues of the District. Certain indirect costs are included in the program expense reported for individual functions and activities.
The government-wide financial statements are reported using the economic resources measurement focus and the accrual basis of accounting, as are the fiduciary fund financial statements. Revenues are recorded when earned and expenses are recorded when a liability is incurred, regardless of the timing of related cash flows. Property taxes are recognized as revenues in the year for which they are levied. Grants and similar items are recognized as revenue as soon as all eligibility requirements imposed by the provider have been met.
The governmental fund financial statements are reported using the current financial resources measurement focus and the modified accrual basis of accounting. Revenues are recognized as soon as they are both measurable and available. Revenues are considered to be available when they are collectible within the current period or soon enough thereafter to pay liabilities of the current period.
For this purpose, the government considers revenues to be available if they are collected within 60 days of the end of the current fiscal period. Expenditures generally are recorded when a liability is incurred, as under accrual accounting. However, debt service expenditures, as well as expenditures related to compensated absences and claims and judgments, are recorded only when payment is due.
Property taxes, state allocations, grants, and interest associated with the current fiscal period are all considered to be susceptible to accrual and so have been recognized as revenues of the current fiscal period. All other revenue items are considered to be measurable and available only when cash is received by the government.
Fund financial statements report detailed information about the District. The focus of governmental financial statements is on major funds rather than reporting funds by type. Each major fund is presented in a separate column. Nonmajor funds are aggregated and presented in a single column. Fiduciary funds are reported by fund type. The accounts of the District are organized on the basis of funds. A fund is an independent fiscal and accounting entity with a self-balancing set of accounts. Fund accounting segregates funds according to their intended purpose and is used to aid management in demonstrating compliance with finance-related legal and contractual provisions. The minimum number of funds is maintained consistent with legal and managerial requirements.
The District has the following major funds and fund types:
Governmental Fund Types
Governmental funds are those through which most governmental functions of the District are financed. The acquisition, use and balances of the District’s expendable financial resources and the related liabilities (except those accounted for in agency funds) are accounted for through governmental funds. The District has the following major and nonmajor governmental fund types:
39

LEXINGTON COUNTY SCHOOL DISTRICT ONE LEXINGTON, SOUTH CAROLINA
NOTES TO FINANCIAL STATEMENTS
JUNE 30, 2019
Summary of Significant Accounting Policies (Continued) Basis of Presentation (Continued) Governmental Fund Types (Continued)
General Fund, a major fund - The General Fund is the primary operating fund of the District. It accounts for and reports all financial resources of the District not accounted for and reported in another fund. All general tax revenues and other receipts that are not allocated by law or contractual agreement to other funds are accounted for in the General Fund. General operating expenditures and the capital improvement costs that are not paid through other funds are paid from the General Fund. This is a budgeted fund, and any fund balance is considered a resource available for use.
Special Revenue Funds - Special Revenue Funds are used to account for and report the proceeds of specific revenue sources that are restricted or committed to expenditures for specific purposes other than debt service or capital projects. The District has three Special Revenue Funds:
1. The Special Revenues, a major fund, is used to account for financial resources provided by federal, state,and local projects and grants that are restricted, committed, or assigned for specific educational programs.Budgets are prepared on a per project basis, generally with approval of the funding source. These budgetsare not a part of the formal budget process approved by the board of trustees.
2. The Education Improvement Act (EIA) Fund, a major fund, is used to account for the revenue from theSouth Carolina Education Improvement Act of 1984, which is legally required by the state to be accountedfor as a specific revenue source. Budgets are prepared on a per project basis. These budgets are not a part ofthe formal budget process approved by the board of trustees.
3. The Food Service Fund, a major fund and an unbudgeted fund, is used to account for and report thefinancial resources received that are restricted for the cafeteria operations at school locations. Theseresources primarily consist of revenues received (a) from breakfast, lunch, and other food sales and (b)from the United States Department of Agriculture’s (“USDA”) approved school breakfast and lunchprograms. A budget is prepared annually but is not a part of the formal budget process approved by theboard of trustees.
Debt Service Fund – District, a major fund, is used to account for and report financial resources that are restricted, committed, or assigned to expenditures for principal and interest for the District.
Debt Service Fund – LOSF, Corp., a major fund, is used to account for and report financial resources that are restricted, committed, or assigned to expenditures for principal and interest for Lexington One School Facilities, Corp.
Capital Projects Fund, a major fund, is used to account for and report financial resources that are restricted, committed, or assigned to expenditures for capital outlays, including the acquisition or construction of capital facilities and other capital assets.
Permanent Fund – Lexington County School District One Foundation, a major fund, is used to account for and report financial resources that are restricted to the extent that only earnings, and not principal, may be used for purposes that support the District's programs, that is, for the benefit of the District.
Fiduciary Funds
Fiduciary funds are used to account for assets held by the government in a trustee capacity or as an agent on behalf of others, and include trust funds and agency funds. Fiduciary fund types include:
Agency Fund, an unbudgeted fund, accounts for the receipt and disbursement of monies to and from student activity organizations. These funds have no equity and do not include revenues and expenditures for general operation of the District. The Agency Fund is not included in the government wide financial statements.
40

LEXINGTON COUNTY SCHOOL DISTRICT ONE LEXINGTON, SOUTH CAROLINA
NOTES TO FINANCIAL STATEMENTS
JUNE 30, 2019
Summary of Significant Accounting Policies (Continued) Assets, Liabilities, Deferred Outflows/Inflows of Resources, and Fund Equity
Cash and Cash Equivalents
The District considers all highly liquid investments (including restricted assets) with original maturities of three months or less and investments of the cash management pool to be cash equivalents.
Investments
The District’s cash deposits and investment policy is designed to operate within existing statutes that authorize the District to invest in the following:
1. Obligations of the United States and agencies thereof;2. General obligations of the State of South Carolina or any of its political units;3. Savings and loan associations to the extent that the same are insured by an agency of the federal
government;4. Certificates of deposit and funds in deposit accounts with banking institutions provided that such
certificates and funds in deposit accounts are collaterally secured by securities of the type described in 1and 2 above, held by a third party as escrow agent, or custodian of a market value, not less than the amountof the certificates of funds in deposit accounts so secured, including interest; provided, however, suchcollateral shall not be required to the extent the same are insured by an agency of the federal government;
5. Collateralized repurchase agreements when collateralized by securities as set forth in 1 and 2 above andheld by the District or a third party as escrow agent or custodian; and,
6. South Carolina Pooled Investment Fund established and maintained by the State Treasurer.7. Cash and Investments held by the County Treasurer represent property taxes collected by the District’s
fiscal agent that have not been remitted to the District. The County Treasurer invests these funds ininvestments authorized by state statute.
All investments are reported at their fair values (which are normally determined by quoted market prices), with the exception of amounts invested in the South Carolina Pooled Investment Fund.
South Carolina Pooled Investment Fund (“Pool” or “LGIP”) investments are invested with the South Carolina State Treasurer’s Office, which established the South Carolina Pool pursuant to Section 6-6-10 of the South Carolina Code of Laws. The Pool is an investment trust fund, in which public monies in excess of current needs, which are under the custody of any city treasurer or any governing body or a political subdivision of the State, may be deposited. The Pool is a 2a 7-like pool which is not registered with the Securities and Exchange Commission (“SEC”) as an investment company, but has a policy that it will operate in a manner consistent with the SEC’s Rule 2a 7of the Investment Company Act of 1940.
In accordance with GASB Statement No. 31 “Accounting and Financial Reporting for Certain Investments for External Investment Pools”, investments are carried at fair value determined annually based upon quoted market prices. Accordingly, the Pool qualifies as a 2a 7-like pool and is reported at the net asset value per share (which approximates fair value).
The Permanent Fund - The Lexington County School District One Educational Foundation handles and is responsible for the investment of voluntary contributions and financial gifts given to it by private individuals or companies to benefit the District. The Foundation does not handle any public funds received by the District. The Foundation has developed its own investment guidelines that are broader in scope than the state mandated guidelines above. Investments in the Foundation’s portfolio are reviewed regularly by its board of directors. Investments of the Foundation are recorded at fair value.
41

LEXINGTON COUNTY SCHOOL DISTRICT ONE LEXINGTON, SOUTH CAROLINA
NOTES TO FINANCIAL STATEMENTS
JUNE 30, 2019
Summary of Significant Accounting Policies (Continued) Assets, Liabilities, Deferred Outflows/Inflows of Resources, and Fund Equity (Continued)
The Foundation investments are allocated to exchange-traded funds (ETF), closed-end mutual funds, and a certificate of deposit, with cash and cash equivalents minimized. At June 30, 2019, the percentage of investments in mutual funds was 73.89%, in a certificate of deposit was 23.96%, and in cash and cash equivalents was 2.15%.
Restricted Assets
The District establishes certain accounts for assets restricted for specific purposes, typically by outside parties or legal agreements. Certain bond indentures require the establishment of (i) maximum annual principal and interest payments, unless a surety bond was provided; (ii) the next succeeding principal and accrued interest payment; and (iii) bond proceeds to be used for construction purposes as required in the bond agreement. Also, assets of the Permanent Fund are classified as restricted assets because their use is restricted by donors and by the purpose for which they are collected.
Receivables and Payables
Transactions between funds that represent reimbursement arrangements outstanding at the end of the year are referred to as “due from other funds” or “due to other funds” on the fund financial statements. These amounts are eliminated in the governmental activities column of the Statement of Net Position.
All trade and property tax receivables are shown net of an allowance for uncollectible amounts.
Inventories and Prepaid Items
Materials and supplies are carried in an inventory account at cost on the first-in, first-out method of accounting and are subsequently charged to expense when used. Inventories consist of purchased food, supplies, and commodities received from the United States Department of Agriculture as of June 30, but not consumed. The value of commodities on hand at year-end is recorded at fair value as provided by the United States Department of Agriculture. Inventories are reported only in the Special Revenue Fund - Food Service.
Certain payments to vendors reflect costs applicable to future accounting periods and are recorded as prepaid items using the consumption method. A current asset for the prepaid amount is recorded at the time of the purchase and an expenditure is reported in the year in which the services are consumed.
Capital Assets
General capital assets generally result from expenditures in the governmental funds. These assets are reported in the governmental activities column of the government-wide Statement of Net Position but are not reported in the fund financial statements.
All capital assets are capitalized at cost and updated for additions and retirements during the year. Donated capital assets are recorded at estimated acquisition value (as estimated by the District) at the date of donation. The District maintains a capitalization threshold of $5,000 for furniture, equipment, vehicles, and textbooks, and $50,000 for land, buildings and improvements thereto. The costs of normal maintenance and repairs that do not add to the value of the assets or materially extend the life of the assets are not capitalized.
All reported capital assets except land and construction in progress are depreciated. Construction projects will begin being depreciated once they are complete, at which time the complete costs of the project are transferred to the appropriate capital asset category. Improvements are depreciated over the remaining useful lives of the related capital assets.
42

LEXINGTON COUNTY SCHOOL DISTRICT ONE LEXINGTON, SOUTH CAROLINA
NOTES TO FINANCIAL STATEMENTS
JUNE 30, 2019
Summary of Significant Accounting Policies (Continued) Assets, Liabilities, Deferred Outflows/Inflows of Resources, and Fund Equity (Continued)
Capital Assets (Continued)
Depreciation is computed using the straight-line method over the following useful lives:
Compensated Absences
It is the District’s policy to permit certain qualified employees to accumulate earned but unused annual leave. A maximum accrual of 135 days is allowed. Employees are paid for their accumulated days over the maximum amount at their rate of pay.
All full-time employees who separate from employment or retire from the District may receive payment for accumulated but unused annual leave which has been earned while employed in the District up to 66 2/3 percent of 135 day maximum, i.e., 90 days in the following manner.
A person with up to a maximum of 135 days of annual leave earned while employed in the District may receive payment for 66 2/3 percent of those days, i.e., payment for no more than 90 days, upon separation from employment.
Once an employee elects to receive his/her leave payment, he/she will not be able to transfer any annual leave days for which payment is received to another school district or eligible state agency.
In his/her lifetime, no employee will receive payment for more than 66 2/3 percent of 135 days of annual leave, i.e., 90 days, which has been earned and accumulated while in the employment of the District.
If an employee receives payment for days of annual leave earned and accumulated while in the employment of the District in an amount less than the maximum of 90 days, the employee may receive additional payments for leave accumulated to the extent that the payment does not exceed the lifetime aggregate maximum total of 90 days.
The District computes its compensated absences liability based on employees employed by the District at year end. The District takes the employee’s accumulated leave days and multiplies two-thirds of those days by the employee’s daily rate of compensation. The entire compensated absences liability is reported on the government-wide financial statements.
No liability has been recorded in the governmental fund financial statements, since compensated absences would only be reported in the governmental funds if they were still outstanding following an employee’s resignation or retirement. The District intends to fund the liability from future operations with assets that do not represent expendable available financial resources.
Description Governmental Activities Estimated Lives
Land Improvements 20 years
Buildings and Improvements 25-50 years
Furniture and Equipment 5-20 years
Vehicles 8 years
43

LEXINGTON COUNTY SCHOOL DISTRICT ONE LEXINGTON, SOUTH CAROLINA
NOTES TO FINANCIAL STATEMENTS
JUNE 30, 2019
Summary of Significant Accounting Policies (Continued) Assets, Liabilities, Deferred Outflows/Inflows of Resources, and Fund Equity (Continued)
Accrued Liabilities and Long-term Obligations
All payables, accrued liabilities and long-term obligations are reported on the government-wide financial statements regardless of whether they will be liquidated with current resources. However, claims and judgments, the non-current portion of capital leases, contractually required pension contributions and special termination benefits, and compensated absences that will be paid from governmental funds are reported as a liability in the fund financial statements only to the extent that they will be paid with current expendable, available, financial resources. In general, payments made within sixty days after year-end are considered to have been made with current available financial resources. Bonds and other long-term obligations that will be paid from governmental funds are not recognized as a liability in the fund financial statements until due.
For governmental funds, bond premiums and discounts are recognized during the current period. Bond proceeds are reported as another financing source. Issuance costs, even if withheld from actual net proceeds received, are reported as debt service expenditures.
Fund Balances
The District reports fund balance in accordance with GASB Statement No. 54, Fund Balance Reporting and Governmental Fund Type Definitions. This Statement defines five classifications of governmental fund balances: nonspendable, restricted, committed, assigned and unassigned. Where applicable, these classifications are presented on the face of the governmental fund balance sheet. The District’s highest level of decision-making authority is the Board of Trustees.
The District classifies fund balances as follows:
Nonspendable – This includes amounts that inherently cannot be spent either because it is not in spendable form (i.e. prepaid items, inventories, etc.) or because of legal or contractual requirements (i.e. principal amount of resources that are required to remain intact.)
Restricted – This includes amounts that have constraints placed on the use of resources externally imposed by creditors, grantors, or contributors.
Committed – This includes amounts that have constraints for specific purposes by the District itself, using its highest level of decision-making authority, which as noted above is the Board of Trustees. Constraints must remain in place unless removed in the same manner as imposed and must take place no later than the close of the fiscal year. In order for an amount to constitute a committed fund balance, the Board of Trustees during open session of a Board of Trustee meeting must approve an ordinance. In order for the fund balance commitment to be modified or rescinded, the Board of Trustees would have to change that in formal action, such as an ordinance, prior to the end of a fiscal year.
Assigned – This includes amounts that the District intends to use for specific purposes that are neither considered restricted nor committed and these assignments are made before the report issuance date. The intent to assign these balances can be expressed by the Board of Trustees or by an official or body to which the Board of Trustees delegates the authority. Through the Lexington County School District Board Policy BBD, the Board of Trustees delegates its executive powers to the District’s superintendent. The District reports assigned fund balance when it appropriates a portion of fund balance in the next fiscal year’s General Fund budget. The General Fund budget is approved each year in formal action taken by the Board of Trustees.
Unassigned – This includes amounts that do not qualify to be accounted for or reported in any of the other fund balance categories. These amounts are available for any purpose and the General Fund should be the only fund that reports a positive unassigned fund balance.
44

LEXINGTON COUNTY SCHOOL DISTRICT ONE LEXINGTON, SOUTH CAROLINA
NOTES TO FINANCIAL STATEMENTS
JUNE 30, 2019
Summary of Significant Accounting Policies (Continued) Assets, Liabilities, Deferred Outflows/Inflows of Resources, and Fund Equity (Continued)
Fund Balances (Continued)
The District applies restricted resources when an expenditure is incurred for the purposes for which both restricted and unrestricted net position are available. The District applies assigned, then unassigned fund balance. Committed resources can only be applied if the Board of Trustees takes formal action to release resources for incurring expenditures.
The Board of Trustees formally adopted a minimum fund balance policy of 7 percent of the General Fund budget. The General Fund budget for fiscal year 2019 was $280,561,495 of which 7 percent equals $19,639,305. This amount is included in the unassigned fund balance.
Deferred Outflows/Inflows of Resources
In addition to assets, the Statement of Net Position and the Balance Sheet will sometimes report a separate section for deferred outflows of resources. This separate financial statement element, deferred outflows of resources, represents a consumption of net position that applies to a future period(s) and so will not be recognized as an outflow of resources (expense/expenditure) until then. The District currently has three types of deferred outflows of resources: (1) The District reports deferred loss on refunding in its government-wide Statement of Net Position. Deferred loss on refunding, which is the difference between the reacquisition prices and the net carrying amounts of the defeased debt, is deferred and amortized over the life of the refunding bonds. Amortization of deferred loss on refunding is included in interest expense in the Statement of Activities. (2) The District reports deferred pension charges in its Statement of Net Position in connection with its participation in the South Carolina Retirement System and the South Carolina Police Officers Retirement System. These deferred pension charges are either (a) recognized in the subsequent period as a reduction of the net pension liability (which includes pension contributions made after the measurement date) or (b) amortized in a systematic and rational method as pension expense in future periods in accordance with GAAP. (3) The District reports deferred OPEB charges in its Statement of Net Position in connection with its participation in the South Carolina Retiree Health Insurance Trust Fund and the South Carolina Long-term Disability Insurance Trust Fund (“OPEB Trusts”). These deferred OPEB charges are either (a) recognized in the subsequent period as a reduction of the net OPEB liability (which includes OPEB contributions made after the measurement date) or (b) amortized in a systematic and rational method as OPEB expense in future periods in accordance with GAAP.
In addition to liabilities, the Statement of Net Position and the Balance Sheet will sometimes report a separate section for deferred inflows of resources. This separate financial statement element, deferred inflows of resources, represents an acquisition of net position that applies to a future period(s) and so will not be recognized as an inflow of resources (revenue) until that time. The District currently has three types of deferred inflows of resources: (1) The District reports unavailable revenue – property taxes only in the governmental funds Balance Sheet; it is deferred and recognized as an inflow of resources (property tax revenues) in the period the amounts become available. (2) The District reports deferred pension credits in its Statement of Net Position in connection with its participation in the South Carolina Retirement System and the South Carolina Police Officers Retirement System. These deferred pension credits are amortized in a systematic and rational method and recognized as a reduction of pension expense in future periods in accordance with GAAP. (3) The District reports deferred OPEB credits in its Statement of Net Position in connection with its participation in the OPEB Trusts. These deferred OPEB credits are amortized in a systematic and rational method and recognized as a reduction of OPEB expense in future periods in accordance with GAAP.
Net Position
Net position represents the difference between assets and deferred outflows of resources and liabilities and deferred inflows of resources in the Statement of Net Position. Net position is classified as net investment in capital assets; restricted; and unrestricted.
45

LEXINGTON COUNTY SCHOOL DISTRICT ONE LEXINGTON, SOUTH CAROLINA
NOTES TO FINANCIAL STATEMENTS
JUNE 30, 2019
Summary of Significant Accounting Policies (Continued) Assets, Liabilities, Deferred Outflows/Inflows of Resources, and Fund Equity (Continued)
Net Position (Continued)
Net investment in capital assets consists of capital assets, net of accumulated depreciation, reduced by the outstanding balances of any borrowings used for the acquisition, construction or improvement of those assets. Outstanding debt which has not been spent is included in the same net position component as the unspent proceeds.
Net position is reported as restricted when there are limitations imposed on their use either through enabling legislation or through external restrictions imposed by creditors, grantors, contributors, or laws or regulations of other governments.
Pensions
In government-wide financial statements, pensions are required to be recognized and disclosed using the accrual basis of accounting (see Note XI and the required supplementary information immediately following the notes to the financial statements for more information), regardless of the amount recognized as pension expenditures on the modified accrual basis of accounting. The District recognizes a net pension liability for each qualified pension plan in which it participates, which represents the excess of the total pension liability over the fiduciary net position of the qualified pension plan, or the District’s proportionate share thereof in the case of a cost-sharing multiple-employer plan, measured as of the District’s fiscal year-end. Changes in the net pension liability during the period are recorded as pension expense, or as deferred outflows or inflows of resources depending on the nature of the change, in the period incurred. Those changes in net pension liability that are recorded as deferred outflows or inflows of resources that arise from changes in actuarial assumptions or other inputs and differences between expected or actual experience are amortized over the weighted average remaining service life of all participants in the respective qualified pension plan and recorded as a component of pension expense beginning with the period in which they are incurred. Projected earnings on qualified pension plan investments are recognized as a component of pension expense. Differences between projected and actual investment earnings are reported as deferred outflows or inflows of resources and amortized as a component of pension expense on a closed basis over a five-year period beginning with the period in which the difference occurred.
Other Postemployment Benefits
In government-wide financial statements, other postemployment benefits are required to be recognized and disclosed using the accrual basis of accounting (see Note XII and the required supplementary information immediately following the notes to the financial statements for more information), regardless of the amount recognized as OPEB expenditures on the modified accrual basis of accounting. The District recognizes a net OPEB liability for each of the OPEB Trusts in which it participates, which represents the excess of the total OPEB liability over the fiduciary net position of the OPEB Trust, or the District’s proportionate share thereof in the case of a cost-sharing multiple-employer plan, measured as of the District’s fiscal year-end. Changes in the net OPEB liability during the period are recorded as OPEB expense, or as deferred outflows or inflows of resources depending on the nature of the change, in the period incurred. Those changes in net OPEB liability that are recorded as deferred outflows or inflows of resources that arise from changes in actuarial assumptions or other inputs and differences between expected or actual experience are amortized over the weighted average remaining service life of all participants in the respective OPEB Trust and recorded as a component of OPEB expense beginning with the period in which they are incurred. Projected earnings on OPEB Trust investments are recognized as a component of OPEB expense. Differences between projected and actual investment earnings are reported as deferred outflows or inflows of resources and amortized as a component of OPEB expense on a closed basis over a five-year period beginning with the period in which the difference occurred.
46

LEXINGTON COUNTY SCHOOL DISTRICT ONE LEXINGTON, SOUTH CAROLINA
NOTES TO FINANCIAL STATEMENTS
JUNE 30, 2019
Summary of Significant Accounting Policies (Continued) Assets, Liabilities, Deferred Outflows/Inflows of Resources, and Fund Equity (Continued)
Accounting Estimates
The preparation of financial statements in accordance with accounting principles generally accepted in the United States of America requires the District’s management to make estimates and assumptions. These estimates and assumptions affect the reported amounts of assets and deferred outflows and liabilities and deferred inflows and disclosure of these balances at the date of the financial statements and the reported amounts of revenue and expenses during the reporting period.
Actual results could differ from those estimates.
Fair Value
The fair value measurement and disclosure framework provides for a three-tier fair value hierarchy that gives highest priority to quoted prices in active markets for identical assets or liabilities (Level 1 measurements) and the lowest priority to unobservable inputs (Level 3 measurements). The three levels of the fair value hierarchy are described below:
Level 1 – Inputs to the valuation methodology are unadjusted quoted prices for identical assets or liabilities in active markets that the District can access at the measurement date.
Level 2 – Inputs to the valuation methodology, other than quoted prices included in Level 1, that are observable for an asset or liability either directly or indirectly and include:
Quoted prices for similar assets and liabilities in active markets. Quoted prices for identical or similar assets or liabilities in inactive markets. Inputs other than quoted market prices that are observable for the asset or liability. Inputs that are derived principally from or corroborated by observable market data by
correlation or other means.Level 3 – Inputs to the valuation methodology that are unobservable for an asset or liability and include:
Fair value is often based on developed models in which there are few, if any, observableinputs.
The asset’s or liability’s fair value measurement level within the fair value hierarchy is based on the lowest level of any input that is significant to the fair value measurement. Valuation techniques used should maximize the use of observable inputs and minimize the use of unobservable inputs.
The valuation methodologies described above may produce a fair value calculation that may not be indicative of future net realizable values or reflective of future fair values. The District believes that the valuation methods used are appropriate and consistent with GAAP. The use of different methodologies or assumptions to determine the fair value of certain financial instruments could result in a different fair value measurement at the reporting date. There have been no significant changes from the prior year in the methodologies used to measure fair value.
Budgetary Information
The Board of Trustees adopts a legal annual appropriated budget for the General Fund revenues and expenditures on the modified accrual basis of accounting which is consistent with GAAP each fiscal year. The budget is prepared, controlled, and amended at the revenue and expenditure object level. The District’s superintendent may authorize line item transfers in the General Fund budget that are subject to final review by the Board. Revisions to the budget were made throughout the year at the legal level of budgetary control. During the fiscal year, no additional appropriations to the General Fund budget were adopted. Unexpended appropriations lapse at fiscal year-end. Special Revenue Fund budgets are developed and controlled in conformance with the specific requirements of each grant or funding agency. These budgets are not legally adopted by the Board of Trustees. Both General and Special Revenue Fund budgets are used as a management control device during the year.
47

LEXINGTON COUNTY SCHOOL DISTRICT ONE LEXINGTON, SOUTH CAROLINA
NOTES TO FINANCIAL STATEMENTS
JUNE 30, 2019
Summary of Significant Accounting Policies (Continued) Budgetary Information (Continued)
The following procedures are followed in establishing the budgetary data reflected in the financial statements:
1. In the fall of the preceding year, the District begins its budget process for the next succeeding fiscal yearbeginning on July 1.
2. After the District’s budget committee reviews all requests and allocation requirements and related revenue,it presents a tentative proposed budget to the Superintendent for review and adjustment.
3. The Superintendent then presents a proposed budget to the Board of Trustees which reviews it in a series ofworkshops and makes any additions or deletions it deems necessary.
4. Prior to July 1, the budget is legally enacted through passage of a resolution by the Board.
Encumbrances
The appropriations of the General Fund of the District lapse at June 30 each year and the outstanding purchase orders, contracts, and other commitments must be renewed. Therefore, there are no commitments or assignments of the fund balances at year-end for encumbrances.
II. Cash and Investments
Custodial Credit Risk for Deposits: Custodial credit risk for deposits is the risk that, in the event of a bank failure, theDistrict’s deposits might not be recovered. The District does not have a deposit policy for custodial credit risk butfollows the investment policy statutes of the State of South Carolina. The State’s policy, by law, requires all banks orsavings and loan associations that receive public funds to secure the deposits by deposit insurance, surety bonds,collateral securities, or letters of credit to protect the State against any loss. As of June 30, 2019, none of the District’sbank balances of $15,500,612 (book balance of $12,556,659) were exposed to custodial credit risk.
Custodial Credit Risk for Investments: Custodial credit risk for investments is the risk that, in the event of a failure,the government will not be able to recover the value of its investments or collateral securities that are in possession of anoutside party. The District does not have an investment policy for custodial credit risk but follows the investment policystatutes of the State of South Carolina, as described above. As of June 30, 2019, none of the District’s investments wereexposed to custodial credit risk.
As of June 30, 2019, the District had the following investments:
Fair Value
Credit Fair
Investment Type Level Maturities Rating Value SC Local Government Investment Pool N/A Various Unrated $ 207,030,613 Open Ended Mutual Funds Level 1 Various Unrated 770,886 Certificate of Deposit N/A Various Unrated 250,000 Cash/Investments Held by County Treasurer Various Unrated 14,937,865 Total Investments $ 222,989,364
Credit Risk for Investments: Credit risk for investments is the risk that an issuer or other counterparty to an investment will not fulfill its obligations. The District does not have an investment policy for credit risk but follows the investment policy statutes of the State of South Carolina.
The Local Government Investment Pool (LGIP) is not rated. Further information may be obtained from the LGIP’s complete financial statements.
48

LEXINGTON COUNTY SCHOOL DISTRICT ONE LEXINGTON, SOUTH CAROLINA
NOTES TO FINANCIAL STATEMENTS
JUNE 30, 2019
Cash and Investments (Continued)
These financial statements may be obtained by writing to the following address:
Office of the State Treasurer Local Government Investment Pool Post Office Box 11778 Columbia, SC 29211
Interest Rate Risk: The District does not have a formal investment policy that limits investment maturities as a means of managing its exposure to fair value losses arising from increasing interest rates.
Concentration of Credit Risk for Investments: The District places no limit on the amount it may invest in any one issuer. Investments issued or explicitly guaranteed by the U.S. government and investments in mutual funds and external investment pools are excluded from this disclosure requirement.
The following table reconciles deposits and investments within the footnotes to the amounts in the Statement of Net Position:
Statement of Net Position:Unrestricted Assets:
Cash and Cash Equivalents 106,513,270$ Investments 3,103,285 Cash and Investments Held by County Treasurer 14,937,865
Restricted Assets:Cash and Cash Equivalents, Restricted 106,276,141 Investments 1,020,886
Statement of Assets and Liabilities - Fiduciary FundCash and Cash Equivalents 3,694,576
Total 235,546,023$
Deposits 12,556,659 Investments 222,989,364
235,546,023$
Financial Statements
Notes to Financial Statements
III. Property Taxes and Other Receivables
The County of Lexington, South Carolina is responsible for collecting and distributing property taxes in accordance withenabling state legislation. Property taxes attach as an enforceable lien on property as of March 15. Property taxes arelevied and billed on November 1 based on an assessed value of approximately $577.1 million at tax rates of 322.40 millsfor the General Fund and 85.3 mills for the debt service fund. These taxes are due and payable without penalty throughJanuary 15 of the next year. Penalties are added to taxes when paid after January 15 depending on the period of time thetax is delinquent.
49

LEXINGTON COUNTY SCHOOL DISTRICT ONE LEXINGTON, SOUTH CAROLINA
NOTES TO FINANCIAL STATEMENTS
JUNE 30, 2019
Property Taxes and Other Receivables (Continued)
Taxes receivable include an allowance for uncollectibles of $768,360 at June 30, 2019. Allowances for uncollectibles were not necessary for the other receivable accounts.
Governmental funds report unavailable revenue in connection with receivables for revenues that are not considered to be available to liquidate liabilities of the current period. Governmental funds also defer revenue recognition in connection with resources that have been received, but not yet earned. At June 30, 2019, the various components of unavailable revenue and unearned revenue reported in the governmental funds were as follows:
IV. Due from County Government
This represents the amount due from the Lexington County Treasurer for the amounts of property taxes and property taxrelief distributions that had been collected at June 30, but had not been remitted to the District.
V. Due from State Department of Education, Other State Agencies and Federal Government
This represents amounts due for state and federal revenues that had been earned as of June 30, 2019 but had not yet beenreceived.
VI. Capital Assets
A summary of changes in capital assets for the District is as follows:
Balance BalanceJuly 1, 2018 Additions Disposals Transfers July 1, 2019
Non-depreciable Assets:Land 25,768,028$ 145,462$ -$ -$ 25,913,490$ Construction in Process 20,646,002 34,646,292 (527,938) (13,236,299) 41,528,057
Total Non-depreciable 46,414,030 34,791,754 (527,938) (13,236,299) 67,441,547
Depreciable Assets:Buildings 640,871,401 - - 4,140,688 645,012,089 Improvements 42,335,987 - - 9,095,611 51,431,598 Equipment 28,478,992 2,784,244 (320,852) 30,942,384
Total Depreciable 711,686,380 2,784,244 (320,852) 13,236,299 727,386,071
Less Accumulated Depreciation for:Buildings (136,593,821) (10,987,668) - - (147,581,489) Improvements (10,200,569) (1,452,387) - - (11,652,956) Equipment (17,508,443) (1,577,774) 231,736 - (18,854,481)
Total Accumulated Depreciation (164,302,833) (14,017,829) 231,736 - (178,088,926)
Net Depreciable Capital Assets 547,383,547 (11,233,585) (89,116) 13,236,299 549,297,145
Governmental Activities Capital Assets, Net 593,797,577$ 23,558,169$ (617,054)$ -$ 616,738,692$
General Special Revenue Debt Service Fund Funds Fund Total
Unavailable Property Taxes $ 5,228,824 $ $ 1,478,985 $ 6,707,809 Unearned Revenue 99,825 4,641,307 4,741,132
Total $ 5,328,649 $ 4,641,307 $ 1,478,985 $ 11,448,941
50

LEXINGTON COUNTY SCHOOL DISTRICT ONE LEXINGTON, SOUTH CAROLINA
NOTES TO FINANCIAL STATEMENTS
JUNE 30, 2019
Capital Assets (Continued)
Depreciation expense was charged to functions/programs of the primary government as follows:
Governmental Activities: Instruction $ 10,906,884 Support Services 3,110,945
Total Depreciation Expense – governmental activities $ 14,017,829
VII. Interfund Receivables and Payables
Interfund balances at June 30, 2019 (all of which are expected to be paid or received within one year), consisted of thefollowing individual fund receivables and payables:
Fund Receivables Payables General Fund: Due from Special Revenue – Special Projects $ 1,174,045 Due to Special Revenue – EIA $ 4,752,179 Due to Special Revenue – Food Service 1,724,628
Due to Capital Projects 20,276,698 Total – General Fund 1,174,045 26,753,505
Special Revenue – Special Projects Due to General Fund 1,174,045
Special Revenue – EIA Due from General Fund 4,752,179
Special Revenue – Food Service Due from General Fund 1,724,628
Capital Projects Due from General Fund 20,276,698 Totals $ 27,927,550 $ 27,927,550
The General Fund receivable from Special Revenue – Special Projects is a result of General Fund cash being used to pay expenditures for this fund while the matching revenues are due from federal, state or local agencies. These funds will be collected in the subsequent fiscal year. The General Fund payable to Special Revenue – EIA is a result of revenues received and unearned, but recorded as cash in the General Fund. These funds will be expended in the subsequent fiscal year. The amounts payable to Special Revenue – Food Service and Capital Projects are a result of cash for these funds being held in the General Fund.
The Special Revenue – Special Projects payable to the General Fund is a result of revenues receivable from federal, state, and local agencies for matching expenditures that were paid using General Fund cash.
The Special Revenue – EIA receivable from the General Fund is a result of revenues received and unearned, but recorded as cash in the General Fund.
The Special Revenue – Food Service receivable from the General Fund is a result of cash for this fund being held in the General Fund.
The Capital Projects receivable from the General Fund is a result of cash for this fund being held in the General Fund.
51

LEXINGTON COUNTY SCHOOL DISTRICT ONE LEXINGTON, SOUTH CAROLINA
NOTES TO FINANCIAL STATEMENTS
JUNE 30, 2019
VIII. Transfers To and From
Transfers from and to other funds for the year ended June 30, 2019, consisted of the following:
Transfers To: Amount Transfers From: Amount
Special Revenue - Food Service 1,483,170$ Special Revenue - Special Projects 466,390$
Debt Service - LOSF, Corp 7,235 Special Revenue - EIA 8,258,572
Capital Projects 8,500,000 Special Revenue - Food Service 548,021
9,990,405 9,272,983
Transfers To: Amount Transfers From: Amount
General Fund 466,390
Transfers To: Amount Transfers From: Amount
General Fund 8,258,572
Transfers To: Amount Transfers From: Amount
General Fund 548,021 General Fund 1,483,170
Transfers To: Amount Transfers From: Amount
Debt Service - LOSF, Corp 6,075,736
Capital Projects 7,679,864
13,755,600
Transfers To: Amount Transfers From: Amount
Capital Projects 11,832 General Fund 7,235
Debt Service - District 6,075,736
6,082,971
Transfers To: Amount Transfers From: Amount
General Fund 8,500,000
Debt Service - District 7,679,864
Debt Service - LOSF, Corp 11,832
16,191,696 Total 33,030,820$ 33,030,820$
Capital Projects
Special Revenue - Food Service
General Fund
Special Revenue- Special Projects
Special Revenue- EIA
Debt Service - District
Debt Service - LOSF, Corp
52

LEXINGTON COUNTY SCHOOL DISTRICT ONE LEXINGTON, SOUTH CAROLINA
NOTES TO FINANCIAL STATEMENTS
JUNE 30, 2019
Transfers To and From (Continued)
Interfund transfers include funding allowed for indirect costs, required matches, and supplemental funding. The transfers for the year ended June 30, 2019, consisted of the following:
General Fund: Transfers to: The transfer to Special Revenue– Food Service represents an annual transfer made to fund benefits for food service employees as required by the South Carolina State Department of Education. Funds are transferred to the Debt Service – LOSF, Corp. in order to pay trustee fees. The transfer to Capital Projects represents a transfer to fund capital projects.
Transfers from: Funds transferred from Special Revenue – Special Projects and Special Revenues – Food Service were transferred to the General Fund for indirect costs for federal programs. Funds transferred from Special Revenue – EIA were transferred to cover the EIA teacher salary supplement paid by the General Fund and for the State of South Carolina’s Funding Flexibility provision.
Special Revenue – Special Projects: Transfers to: Funds transferred to the General Fund represent allowable indirect costs for federal programs.
Special Revenue – EIA: Transfers to: Funds were transferred to the General Fund to cover the cost of the EIA teacher salary supplement that was paid by the General Fund and for funds transferred under the State of South Carolina’s Funding Flexibility provision to offset state funding reductions. The District’s Board of Trustees approved the transfer under the Funding Flexibility as required by law.
Special Revenue – Food Service: Transfers to: Funds transferred to the General Fund represent allowable indirect costs for the federal food nutrition program.
Transfers from: Funds were transferred from the General Fund to fund benefits for food service employees as required by the South Carolina State Department of Education.
Debt Service – District: Transfers to: Funds were transferred to the Debt Service – LOSF, Corp. to account for the General Obligation Bonds issued by the District to satisfy the annual installment purchase revenue bonds principal and interest payment. Funds were transferred to Capital Projects for the portion of short-term bonds issued to finance certain capital improvements as approved by the Board of Trustees.
Debt Service – LOSF, Corp.: Transfers to: Funds transferred to the Capital Projects Fund represent a transfer of investment earnings to fund capital projects.
Transfers from: Funds were transferred from the General Fund for the payment of trustee fees due in the current year. Funds were transferred from Debt Service – District to satisfy the annual principal and interest payment due on the installment purchase revenue bonds.
53

LEXINGTON COUNTY SCHOOL DISTRICT ONE LEXINGTON, SOUTH CAROLINA
NOTES TO FINANCIAL STATEMENTS
JUNE 30, 2019
Transfers To and From (Continued)
Capital Projects: Transfers from: Funds were transferred from General Fund to fund the costs of capital projects. Funds were transferred from Debt Service – District for short-term bonds issued to finance certain capital improvements as approved by the Board of Trustees. Funds transferred from Debt Service – LOSF, Corp. represent a transfer of investment earnings to fund capitalprojects.
IX. Short-Term Obligations
Summary of Changes in Short-Term Debt Obligations:
Bonds Issued In October 2018, the District issued $13,940,000 in Series 2018 General Obligation Bonds, for the purpose of providing funds to pay the acquisition price payments in fiscal year 2019 (Installment Purchase Bonds) of LOSF, Corp., to provide funding for capital improvements as approved by the Board and to pay the costs of issuance of the bonds. In April 2019, the District issued a Series 2019B $1,125,000 General Obligation Bond Anticipation Note for the purpose of providing funds to pay the acquisition price payments in fiscal year 2019 (Installment Purchase Bonds) of LOSF, Corp., and to pay the costs of issuance of the Note.
X. Long-Term Obligations
Summary of Changes in Long-Term Debt Obligations:
Balance Balance July 1, 2018 Additions Deletions June 30, 2019 General Obligation Bond Anticipation Note, Series 2018 $ 1,198,000 $ - $ 1,198,000 $ - General Obligation Bond, Series 2018 - 13,940,000 13,940,000 - General Obligation Bond Anticipation Note, Series 2019B - 1,125,000 - 1,125,000
Total $ 1,198,000 $ 15,065,000 $ 15,138,000 $ 1,125,000
Balance Balance July 1, 2018 Additions Deletions June 30, 2019 General Obligations: General Obligation Bonds $ 395,035,000 $139,525,000 $ 83,530,000 $ 451,030,000 Installment Purchase Revenue Bonds 62,785,000 - 3,800,000 58,985,000
Subtotal 457,820,000 139,525,000 87,330,000 510,015,000 Bond Premiums 20,194,960 7,701,191 3,340,559 24,555,592 Net Bonded Indebtedness 478,014,960 147,226,191 90,670,559 534,570,592 Compensated Absences 28,859,339 3,515,165 2,337,274 30,037,230 Total $ 506,874,299 $150,741,356 $ 93,007,833 $ 564,607,822
54

LEXINGTON COUNTY SCHOOL DISTRICT ONE LEXINGTON, SOUTH CAROLINA
NOTES TO FINANCIAL STATEMENTS
JUNE 30, 2019
Long-Term Obligations (Continued)
Current Portion of Long-Term Debt Obligations: June 30, 2019 General Obligations: General Obligation Bonds $ 108,525,000 Installment Purchase Revenue Bonds 3,950,000
Subtotal 112,475,000 Compensated Absences 2,337,274 Total $ 114,812,274
In prior years, the District has used General Fund resources to liquidate Compensated Absences.
General Obligations
General obligations at June 30, 2019 consist of installment purchase revenue bonds and general obligation bonds payable. Of the General Obligation Bonds payable, the Series 2010 and Series 2011 bonds were issued as Taxable Qualified School Construction Bonds.
The Taxable Qualified School Construction Bonds were issued under the provisions of the State of South Carolina Federal Education Tax-Credit Bond Implementation Act of 2009. A refundable tax credit must be applied for each time an interest payment is due for these bonds. The District has reported interest expenditures at the gross amount. The interest subsidy and refundable tax credit received from the United States Government are reported as intergovernmental revenue.
Lexington One School Facilities, Corp. issued various Installment Purchase Revenue Bonds to finance various capital projects that were completed by the District between 2005 and 2011. The District is not a party to these bonds. The obligation to make installment payments does not represent or constitute a debt of, or a pledge of the faith and credit of the taxing power of the District; however, chances of non-appropriation are remote.
Bonds Issued
In February 2019, the School District issued $54,525,000 in Series 2019A General Obligation Refunding Bonds, receiving a premium of approximately $7,090,000, and incurring bond issuance costs of approximately $420,000. The School District placed the net proceeds of $61,195,000 into an irrevocable trust, which was used to pay the principal amount of the outstanding Series 2009A General Obligation Bonds maturing on February 1, 2020 through February 1, 2034. This refunding was undertaken to reduce total debt service payments over the next 15 years by approximately $13,433,000.
In April 2019, the School District issued $85,000,000 in Series 2019A General Obligation Bond Anticipation Notes, receiving a premium of $611,150, and incurring issuance costs of approximately $126,000. This issue was refinanced as a part of the School District’s issuance of $165,000,000 in Series 2019B General Obligation Bonds (see Note XVII). The refinancing meets the criteria in GASB Statement No. 62, which allows the School District to classify the $85,000,000 as long-term liabilities.
Defeased Debt Outstanding
At June 30, 2019, the District had defeased outstanding general obligation bonds that would otherwise be included in General Long-Term Obligations totaling $78,740,000. In October 2017, the District issued $82,910,000 in Series 2017B General Obligation Advanced Refunding Bonds, to refund $78,740,000 of the outstanding balance on the Series 2011C General Obligation Bonds. The District placed the net proceeds of $88,785,911 into an irrevocable trust for the purpose of generating resources for future debt service payments on the Series 2011C General Obligation Bonds. As of June 30, 2018, $78,740,000 is considered to be defeased until the bonds are called on February 1, 2022.
55

LEXINGTON COUNTY SCHOOL DISTRICT ONE LEXINGTON, SOUTH CAROLINA
NOTES TO FINANCIAL STATEMENTS
JUNE 30, 2019
Long-Term Obligations (Continued)
The following table outlines the debt outstanding at June 30, 2019:
Issue Date of Final Interest Amount Outstanding as of Debt Date Maturity Rates Issued June 30, 2019
General Obligation Bonds Series 2010 6/30/2010 4/1/2020 1.06% $ 10,000,000 $ 5,000,000 Series 2011 3/31/2011 2/1/2026 3.5%-5.0% 35,710,000 35,685,000 Series 2011C 10/25/2011 2/1/2036 2.0%-5.0% 110,115,000 12,700,000
Series 2013A 4/9/2013 3/1/2024 4.0%-5.0% 18,720,000 15,670,000 Series 2013B 10/8/2013 2/1/2038 3.0%-5.0% 85,180,000 83,905,000 Series 2015A 3/4/2015 2/1/2030 3.5%-5.0% 60,850,000 51,135,000
Series 2016 2/2/2016 2/1/2032 3.25%-5.0% 18,200,000 17,315,000 Series 2017 5/11/2017 3/1/2020 5.0% 29,400,000 8,710,000 Series 2017B 10/31/2017 2/1/2036 2.0%-5.0% 82,910,000 81,385,000
Series 2019A 2/1/2019 2/1/2034 3.0%-5.0% 54,525,000 54,525,000 Series 2019A BAN 4/30/2019 10/29/2019 3.0% 85,000,000 85,000,000 Installment Purchase Revenue Bonds Series 2013 7/2/2013 12/1/2030 4.0%-5.25% 35,350,000 26,660,000
Series 2015A 4/16/2015 12/1/2030 2.0%-5.0% 39,320,000 32,325,000
TOTAL $ 665,280,000 $ 510,015,000
The annual requirements to amortize the General Obligation Bonds outstanding at June 30, 2019, including interest payments of $131,994,332 are as follows:
Fiscal Year Ending June 30 Principal Interest Total 2020 $ 108,525,000 $ 16,668,397 $ 125,193,397 2021 16,585,000 14,201,148 30,786,148 2022 18,515,000 13,398,397 31,913,397 2023 20,570,000 12,472,648 33,042,648 2024 22,575,000 11,476,697 34,051,697
2025-2029 123,040,000 41,433,263 164,473,263 2030-2034 99,605,000 18,484,188 118,089,188 2035-2038 41,615,000 3,859,594 45,474,594
Total $ 451,030,000 $ 131,994,332 $ 583,024,332
The annual requirements to amortize the Installment Purchase Revenue Bonds at June 30, 2019, including interest payments of $13,700,283 are as follows:
Fiscal Year Ending June 30 Principal Interest Total 2020 $ 3,950,000 $ 2,122,084 $ 6,072,084 2021 4,105,000 1,961,935 6,066,935 2022 4,270,000 1,794,969 6,064,969 2023 4,440,000 1,620,864 6,060,864 2024 4,615,000 1,439,424 6,054,424
2025-2029 25,960,000 4,312,959 30,272,959 2030-2033 11,645,000 448,048 12,093,048
Total $ 58,985,000 $ 13,700,283 $ 72,685,283
56

LEXINGTON COUNTY SCHOOL DISTRICT ONE LEXINGTON, SOUTH CAROLINA
NOTES TO FINANCIAL STATEMENTS
JUNE 30, 2019
Long-Term Obligations (Continued)
The District has satisfied all sinking fund requirements. There is an annual debt service tax millage, currently 85.3 mills, to repay the General Obligation debt. Details on the Installment Purchase Revenue Bonds and General Obligation Bonds are presented as schedules.
Compensated Absences
The District estimates that the compensated absences amount to be considered as the current portion due within one year to be $2,337,274.
XI. Retirement Plans
The District participates in the State of South Carolina’s retirement plans, which are administered by the South CarolinaPublic Employee Benefit Authority (“PEBA”), which was created on July 1, 2012 and administers the various retirementsystems and retirement programs managed by its Retirement Division. PEBA has an 11-member Board of Directors(“PEBA Board”), appointed by the Governor and General Assembly leadership, which serves as co-trustee and co-fiduciary of the systems and the trust funds. By law, the State Fiscal Accountability Authority (“SFAA”), which consistsof five elected officials, also reviews certain PEBA Board decisions regarding the funding of the South CarolinaRetirement Systems (“Systems”) and serves as a co-trustee of the Systems in conducting that review.
The PEBA issues a Comprehensive Annual Financial Report (“CAFR”) containing financial statements and required supplementary information for the System’s Pension Trust Funds. The CAFR is publicly available through the Retirement Benefits’ link on the PEBA website at www.peba.sc.gov, or a copy may be obtained by submitting a request to PEBA, 202 Arbor Lake Drive, Columbia, SC 29223. The PEBA is considered a division of the primary government of the State of South Carolina and therefore, retirement trust fund financial information is also included in the comprehensive annual financial report of the state.
Plan Descriptions
The South Carolina Retirement System (“SCRS”), a cost–sharing multiple-employer defined benefit pension plan, wasestablished effective July 1, 1945, pursuant to the provisions of Section 9-1-20 of the South Carolina Code of Laws forthe purpose of providing retirement allowances and other benefits for employees of the state, its public school districts,and political subdivisions.
The State Optional Retirement Program (“State ORP”) is a defined contribution plan that is offered as an alternative tothe SCRS to certain newly hired state, public school, and higher education employees. State ORP participants direct theinvestment of their funds into a plan administered by one of four investment providers.
The South Carolina Police Officers Retirement System (“PORS”), a cost–sharing multiple-employer defined benefitpension plan, was established effective July 1, 1962, pursuant to the provisions of Section 9-11-20 of the South CarolinaCode of Laws for the purpose of providing retirement allowances and other benefits for police officers and firemen ofthe state and its political subdivisions.
Plan Membership
Membership requirements are prescribed in Title 9 of the South Carolina Code of Laws. A brief summary of therequirements under each system is presented below.
57

LEXINGTON COUNTY SCHOOL DISTRICT ONE LEXINGTON, SOUTH CAROLINA NOTES TO FINANCIAL STATEMENTS JUNE 30, 2019
Retirement Plans (Continued) Plan Membership (continued)
SCRS - Generally, all employees of covered employers are required to participate in and contribute to the system as a condition of employment. This plan covers general employees and teachers and individuals newly elected to the South Carolina General Assembly beginning with the November 2012 general election. An employee member of the system with an effective date of membership prior to July 1, 2012, is a Class Two member. An employee member of the system with an effective date of membership on or after July 1, 2012 is a Class Three member.
State ORP - As an alternative to membership in the SCRS, newly hired state, public school, and higher education employees and individuals newly elected to the S.C. General Assembly beginning with the November 2012 general election have the option to participate in the State ORP, which is a defined contribution plan. State ORP participants direct the investment of their funds into a plan administered by one of four investment providers. PEBA assumes no liability for State ORP benefits. Rather, the benefits are the liability of the investment providers. For this reason, State ORP programs are not part of the retirement systems’ trust funds for financial statement purposes. Employee and Employer contributions to the State ORP are at the same rates as the SCRS. A direct remittance is required from the employers to the member’s account with investment providers for the employee contribution and a portion of the employer contribution (5 percent). A direct remittance is also required to the SCRS for the remaining portion of the employer contribution and an incidental death benefit contribution, if applicable, which is retained by the SCRS. PORS - To be eligible for PORS membership, an employee must be required by the terms of his employment, by election or appointment, to preserve public order, protect life and property, and detect crimes in the state; to prevent and control property destruction by fire; or to serve as a peace officer employed by the Department of Corrections, the Department of Juvenile Justice, or the Department of Mental Health. Probate judges and coroners may elect membership in PORS. Magistrates are required to participate in PORS for service as a magistrate. PORS members, other than magistrates and probate judges, must also earn at least $2,000 per year and devote at least 1,600 hours per year to this work, unless exempted by statute. An employee member of the system with an effective date of membership prior to July 1, 2012, is a Class Two member. An employee member of the system with an effective date of membership on or after July 1, 2012, is a Class Three member.
Plan Benefits Benefit terms are prescribed in Title 9 of the South Carolina Code of Laws. PEBA does not have the authority to establish or amend benefit terms without a legislative change in the code of laws. Key elements of the benefit calculation include the benefit multiplier, years of service, and average final compensation. A brief summary of benefit terms for each system is presented below.
SCRS - A Class Two member who has separated from service with at least five or more years of earned service is eligible for a monthly pension at age 65 or with 28 years credited service regardless of age. A member may elect early retirement with reduced pension benefits payable at age 55 with 25 years of service credit. A Class Three member who has separated from service with at least eight or more years of earned service is eligible for a monthly pension upon satisfying the Rule of 90 requirement that the total of the member’s age and the member’s creditable service equals at least 90 years. Both Class Two and Class Three members are eligible to receive a reduced deferred annuity at age 60 if they satisfy the five- or eight-year earned service requirement, respectively. An incidental death benefit is also available to beneficiaries of active and retired members of employers who participate in the death benefit program.
58

LEXINGTON COUNTY SCHOOL DISTRICT ONE LEXINGTON, SOUTH CAROLINA NOTES TO FINANCIAL STATEMENTS JUNE 30, 2019
Retirement Plans (Continued) Plan Benefits (continued)
The annual retirement allowance of eligible retirees or their surviving annuitants is increased by the lesser of one percent or five hundred dollars every July 1. Only those annuitants in receipt of a benefit on July 1 of the preceding year are eligible to receive the increase. Members who retire under the early retirement provisions at age 55 with 25 years of service are not eligible for the benefit adjustment until the second July 1 after reaching age 60 or the second July 1 after the date they would have had 28 years of service credit had they not retired.
PORS - A Class Two member who has separated from service with at least five or more years of earned service is eligible for a monthly pension at age 55 or with 25 years of service regardless of age. A Class Three member who has separated from service with at least eight or more years of earned service is eligible for a monthly pension at age 55 or with 27 years of service regardless of age. Both Class Two and Class Three members are eligible to receive a deferred annuity at age 55 with five or eight years of earned service, respectively.
An incidental death benefit is also available to beneficiaries of active and retired members of employers who participate in the death benefit program. Accidental death benefits are also provided upon the death of an active member working for a covered employer whose death was a natural and proximate result of an injury incurred while in the performance of duty. The retirement allowance of eligible retirees or their surviving annuitants is increased by the lesser of one percent or five hundred dollars every July 1. Only those annuitants in receipt of a benefit on July 1 of the preceding year are eligible to receive the increase. Plan Contributions Contributions are prescribed in Title 9 of the South Carolina Code of Laws. The PEBA Board may increase the percentage rate in SCRS and PORS (“Plans”) employer and employee contribution rates on the basis of the actuarial valuations, but any such increase may not result in a differential between the employee and total employer contribution rate that exceeds 2.9 percent of earnable compensation for SCRS and 5 percent for PORS. An increase in the contribution rates adopted by the PEBA Board may not provide for an increase of more than one-half of one percent in any one year. If the scheduled employee and employer contributions provided in statute or the rates last adopted by the PEBA Board are insufficient to maintain a thirty year amortization schedule of the unfunded liabilities of the plans, the PEBA Board shall increase the contribution rates in equal percentage amounts for the employer and employee as necessary to maintain the thirty-year amortization period; this increase is not limited to one-half of one percent per year. If the most recent annual actuarial valuation of the Systems for funding purposes shows a ratio of the actuarial value of system assets to the actuarial accrued liability of the system (the funded ratio) that is equal to or greater than ninety percent, then the board, effective on the following July first, may decrease the then current contribution rates upon making a finding that the decrease will not result in a funded ratio of less than ninety percent. Any decrease in contribution rates must maintain the 2.9 and 5 percent differentials between the SCRS and PORS employer and employee contribution rates respectively. If contribution rates are decreased pursuant to this provision, and the most recent annual actuarial valuation of the system shows a funded ratio of less than ninety percent, then effective on the following July first, and annually thereafter as necessary, the board shall increase the then current contribution rates until a subsequent annual actuarial valuation of the system shows a funded ratio that is equal to or greater than 90 percent. The Retirement System Funding and Administration Act increases employer contribution rates to 13.56 percent for SCRS and 16.24 percent for PORS, effective July 1, 2017. It also removes the 2.9 percent and 5 percent differential and increases and establishes a ceiling on employee contribution rates at 9 percent and 9.75 percent for SCRS and PORS respectively. The employer contribution rates will continue to increase annually by 1 percent through July 1, 2022. The legislation’s ultimate scheduled employer rate is 18.56 percent for SCRS and 21.24 percent for PORS. The amortization period is scheduled to be reduced one year for each of the next 10 years to a twenty year amortization schedule. The recent pension reform legislation also changes the long term funded ratio requirement from ninety to eighty-five.
59

LEXINGTON COUNTY SCHOOL DISTRICT ONE LEXINGTON, SOUTH CAROLINA
NOTES TO FINANCIAL STATEMENTS
JUNE 30, 2019
Retirement Plans (Continued) Plan Contributions (Continued)
As noted earlier, both employees and the District are required to contribute to the Plans at rates established and as amended by the PEBA. The District’s contributions are actuarially determined but are communicated to and paid by the District as a percentage of the employees’ annual eligible compensation.
Required employer and employee contribution rates for the past three years are as follows:
The required contributions and percentages of amounts contributed by the District to the Plans for the past four years were as follows:
Eligible payrolls of the District covered under the Plans for the past four years were as follows:
2017 2018 2019 2017 2018 2019
Employer Contribution Rate:̂Retirement* 11.41% 13.41% 14.41% 13.84% 15.84% 16.84%Incidental Death Benefit 0.15% 0.15% 0.15% 0.20% 0.20% 0.20%Accidental Death Contributions 0.00% 0.00% 0.00% 0.20% 0.20% 0.20%
11.56% 13.56% 14.56% 14.24% 16.24% 17.24%
Employee Contribution Rate 8.66% 9.00% 9.00% 9.24% 9.75% 9.75%
^ Calculated on earnable compensation as defined in Title 9 of the South Carolina Code of Laws.* Of the rate for the State ORP Plan, 5% of earnable compensation must be remitted by the employer directly to the ORP vendor
to be allocated to the member's account with the remainder of the employer contribution remitted to the SCRS.
SCRS and State ORP Rates PORS Rates
Year EndedJune 30, Required % Contributed Required % Contributed Required % Contributed
2019 23,797,494$ 100% 1,201,327$ 100% 36,533$ 100%2018 21,203,846 100% 951,402 100% 34,325 100%2017 17,829,264 100% 1,215,146 100% 38,723 100%2016 16,350,272$ 100% 1,005,700$ 100% 41,295$ 100%
SCRS Contributions State ORP Contributions PORS Contributions
Year EndedJune 30,
2019201820172016
SCRS Payroll State ORP Payroll PORS Payroll Total Payroll
158,119,667 11,312,752 216,691 169,649,110 163,444,327$ 12,566,184$ 211,907$ 176,222,417$
154,232,391 10,511,642 271,932 165,015,965 147,832,482$ 9,093,129$ 300,545$ 157,226,156$
60

LEXINGTON COUNTY SCHOOL DISTRICT ONE LEXINGTON, SOUTH CAROLINA
NOTES TO FINANCIAL STATEMENTS
JUNE 30, 2019
Retirement Plans (Continued) Actuarial Assumptions and Methods
Actuarial valuations involve estimates of the reported amounts and assumptions about the probability of occurrence of events far into the future. Examples include assumptions about future employment, mortality, and future salary increases. Actuarial assumptions and methods used during the annual valuation process are subject to periodic revision, typically with an experience study, as actual results over an extended period of time are compared with past expectations and new estimates are made about the future. South Carolina state statute requires than an actuarial experience study be completed at least once in each five-year period. An experience report on the Systems was most recently issued as of July 1, 2015.
The June 30, 2018, total pension liability, net pension liability, and sensitivity information were determined by the consulting actuary, Gabriel, Roeder, Smith and Company (“GRS”) and are based on the July 1, 2017 actuarial valuations as adopted by the PEBA Board and the SFAA which utilized membership data as of July 1, 2017. The total pension liability was rolled-forward from the valuation date to the plans’ fiscal year ended June 30, 2018, using generally accepted actuarial principles. Information included in these notes are based on the certification provided by GRS.
The following table provides a summary of the actuarial assumptions and methods used in the July 1, 2015, valuations for the SCRS and PORS.
SCRS PORS
Actuarial Cost Method Entry Age Normal Entry Age NormalActuarial Assumptions:
Investment Rate of Return* 7.50% 7.50%Projected Salary Increases* 3.5% to 12.5% (varies by service) 4.0% to 10.0% (varies by service)Benefit Adjustments Lesser of 1% or $500 annually Lesser of 1% or $500 annually
* Includes inflation at 2.75%.
The post-retiree mortality assumption is dependent upon the member’s job category and gender. This assumption includes base rates which are automatically adjusted for future improvement in mortality using published Scale AA projected from the year 2000. Assumptions used in the July 1, 2015 valuations for the SCRS and PORS are as follows:
Former Job Class Males Females
Educators RP-2000 Males (with White Collar
adjustment) multiplied by 110% RP-2000 Females (with White Collar
adjustment) multiplied by 95%
General Employees and Members of the General
Assembly
RP-2000 Males multiplied by 100% RP-2000 Females multiplied by 90%
Public Safety and Firefighters
RP-2000 Males (with Blue Collar adjustment) multiplied by 115%
RP-2000 Females (with Blue Collar adjustment) multiplied by 115%
61

LEXINGTON COUNTY SCHOOL DISTRICT ONE LEXINGTON, SOUTH CAROLINA
NOTES TO FINANCIAL STATEMENTS
JUNE 30, 2019
Retirement Plans (Continued)
Long-term Expected Rate of Return
The long-term expected rate of return on pension plan investments is based upon 30 year capital market assumptions. The long-term expected rate of returns represent assumptions developed using an arithmetic building block approach primarily based on consensus expectations and market based inputs. Expected returns are net of investment fees.
The expected returns, along with the expected inflation rate, form the basis for the target asset allocation adopted at the beginning of the 2018 fiscal year. The long-term expected rate of return is produced by weighting the expected future real rates of return by the target allocation percentage and by adding expected inflation and is summarized in the table below. For actuarial purposes, the 7.25 percent assumed annual investment rate of return used in the calculation of the total pension liability includes a 5.00 percent real rate of return and a 2.25 percent inflation component.
Asset Class Target Asset
Allocation
Expected Arithmetic Real Rate of Return
Long Term Expected Portfolio
Real Rate of Return
Global Equity 47.0%Global Public Equity 33.0% 6.99% 2.31% Private Equity 9.0% 8.73% 0.79%Equity Options Strategies 5.0% 5.52% 0.28%
Real Assets 10.0%Real Estate (Private) 6.0% 3.54% 0.21% Real Estate (REITs) 2.0% 5.46% 0.11%Infrastructure 2.0% 5.09% 0.10%
Opportunistic 13.0%GTAA/Risk Parity 8.0% 3.75% 0.30% Hedge Funds (non-PA) 2.0% 3.45% 0.07%Other Opportunistic Strategies 3.0% 3.75% 0.11%
Diversified Credit 18.0%Mixed Credit 6.0% 3.05% 0.18% Emerging Markets Debt 5.0% 3.94% 0.20%Private Debt 7.0% 3.89% 0.27%
Conservative Fixed Income 12.0%Core Fixed Income 10.0% 0.94% 0.09% Cash and Short Duration (Net) 2.0% 0.34% 0.01%
Total Expected Real Return 100.0% 5.03% Inflation for Actuarial Purposes 2.25% Total Expected Nominal Return 7.28%
62

LEXINGTON COUNTY SCHOOL DISTRICT ONE LEXINGTON, SOUTH CAROLINA NOTES TO FINANCIAL STATEMENTS JUNE 30, 2019
Retirement Plans (Continued) Pension Liabilities, Pension Expense, and Deferred Outflows/Inflows of Resources Related to Pensions The net pension liability (“NPL”) is calculated separately for each system and represents that particular system’s total pension liability determined in accordance with GASB No. 67 less that System’s fiduciary net position. NPL totals, as of June 30, 2017 measurement date, for the SCRS and PORS are presented in the following table:
The total pension liability is calculated by the Systems’ actuary, and each plan’s fiduciary net position is reported in the Systems’ financial statements. The net pension liability is disclosed in accordance with the requirements of GASB No. 67 in the Systems’ notes to the financial statements and required supplementary information. Liability calculations performed by the Systems’ actuary for the purpose of satisfying the requirements of GASB Nos. 67 and 68 are not applicable for other purposes, such as determining the Plans’ funding requirements. At June 30, 2019, the District reported liabilities of approximately $357,207,000 and $444,000 for its proportionate share of the net pension liabilities for the SCRS and PORS (“Plans”), respectively. The net pension liabilities were measured as of June 30, 2018, and the total pension liabilities for the Plans used to calculate the net pension liabilities were determined based on the most recent actuarial valuation report as of July 1, 2017 that was projected forward to the measurement date. The District’s proportion of the net pension liabilities were based on a projection of the District’s long-term share of contributions to the Plans relative to the projected contributions of all participating South Carolina state and local governmental employers, actuarially determined. At the June 30, 2018 measurement date, the District’s SCRS proportion was 1.594191 percent, which was an increase of 0.005251 percent from its proportion measured as of June 30, 2017. At the June 30, 2018 measurement date, the District’s PORS proportion was 0.01567 percent, which was a decrease of 0.00477 percent from its proportion measured as of June 30, 2017. For the year ended June 30, 2019, the District recognized pension expense of approximately $36,533,000 and $14,000 for the SCRS and PORS, respectively, for a total pension expense of approximately $36,547,000. At June 30, 2019, the District reported deferred outflows of resources (deferred pension charges) and deferred inflows of resources (deferred pension credits) related to pensions from the following sources:
Total PensionSystem LiabilitySCRS 48,821,730,067$ PORS 7,403,972,673$
Plan Fiduciary NetEmployer's Net
Plan Fiduciary Pension Liability Percentage of the Total
Position as a
Pension Liability26,414,916,370$ 22,406,813,697$
Net Position (Asset)54.1%
4,570,430,247$ 2,833,542,426$ 61.7%
63

LEXINGTLEXINGT NOTES T JUNE 30,
RetiremenPension Li
Approximacontributioreduction o Other amo(deferred p
SCRSDifferencChangesNet DiffeChanges
and PrThe Scho
Total SCRS
PORSDifferencChangesNet DiffeChanges
and PrThe Scho
Total PORS
Total SCRS
TON COUNTTON, SOUTH
TO FINANCIA
2019
nt Plans (Contiabilities, Pens
ately $24,999,0ons subsequenof the net pensi
ounts reported pension credits
ces Between Exps in Assumptionerence Between s in Proportionatroportionate Shaool District's Co
S
ces Between Exps in Assumptionerence Between s in Proportionatroportionate Shaool District's Co
S
S and PORS
Y SCHOOL DH CAROLINA
AL STATEME
tinued) ion Expense, a
000 and $36,0t to the measion liabilities in
as deferred ou) related to the
xpected and Actuns
Projected and Ate Share and Diare of Total Planontributions Sub
xpected and Actuns
Projected and Ate Share and Diare of Total Planontributions Sub
De
DISTRICT ONA
ENTS
and Deferred O
000 that were rsurement date n the year ende
utflows of resoue SCRS and PO
ual Experience
Actual Earningsfferences Betwen Employer Conbsequent to the
ual Experience
Actual Earningsfferences Betwen Employer Conbsequent to the
escription
NE
Outflows/Inflow
reported as deto the SCRS
ed June 30, 202
urces (deferredORS will increa
s on Pension Plaeen Employer Contributions Measurement D
s on Pension Plaeen Employer Contributions Measurement D
ws of Resources
eferred outflowS and PORS, 20.
d pension charase (decrease)
an Investmentsontributions
Date
an Investmentsontributions
Date
s Related to Pe
ws of resourcesrespectively, w
rges) and deferpension expen
DeferreOutflowsResourc
644$ 14,171 5,674
1,950 24,998
47,440
13 29 8
36
88
47,528$
ensions (Contin
s related to thewill be recogn
rred inflows ofnse as follows:
ed Defes of Inflowces Resou
4,803 2,1$ 1,992 4,247
0,240 1 8,821
0,103 2,2
3,684 9,283 8,882
- 1 6,533
8,382 1
8,485 2,3$
nued)
e District’s nized as a
f resources
erredws ofurces
102,067- -
101,075-
203,142
- - -
128,172-
128,172
331,314
64

LEXINGTON COUNTY SCHOOL DISTRICT ONE LEXINGTON, SOUTH CAROLINA
NOTES TO FINANCIAL STATEMENTS
JUNE 30, 2019
Retirement Plans (Continued)
Discount Rate
The discount rate used to measure the total pension liability was 7.25 percent. The projection of cash flows used to determine the discount rate assumed that contributions from participating employers in SCRS and PORS will be made based on the actuarially determined rates based on provisions in the South Carolina Code of Laws. Based on those assumptions, the System’s fiduciary net position was projected to be available to make all the projected future benefit payments of current plan members. Therefore, the long-term expected rate of return on pension plan investments was applied to all periods of projected benefit payments to determine the total pension liability.
The following table presents the sensitivity of the District’s proportionate share of the net pension liability of the Plans to changes in the discount rate, calculated using the discount rate of 7.25 percent, as well as what it would be if it were calculated using a discount rate that is 1.00 percent lower (6.25 percent) or 1.00 percent higher (8.25 percent) than the current rate.
Plans Fiduciary Net Position
Detailed information regarding the fiduciary net position of the Plans administered by the PEBA is available in the separately issued CAFR containing financial statements and required supplementary information. The CAFR is publicly available through the Retirement Benefits’ link on the PEBA’s website at www.peba.sc.gov, or a copy may be obtained by submitting a request to PEBA, 202 Arbor Lake Drive, Columbia, SC 29223.
Payable to Plans
The District reported payables of approximately $4,186,000 and $6,000 to the PEBA as of June 30, 2018, representing required employer and employee contributions for the month of June 2019 for the SCRS and PORS, respectively. These amounts are included in Accrued Salaries and Benefits on the financial statements and were paid in July 2019.
XII. Other Postemployment Benefits
As previously discussed, PEBA is a state agency responsible for the administration and management of the State ofSouth Carolina’s employee insurance programs, other post-employment benefit trusts and retirement systems and is partof the State of South Carolina primary government. By law, the State Fiscal Accountability Authority (“SFFA”), whichconsists of five elected officials, also reviews certain PEBA Board decisions in administering the State Health Plan andOPEB.
PEBA issues audited financial statements and required supplementary information for the other post-employmentbenefits trusts (“OPEB Trusts”). This information is publicly available through the Insurance Benefits’ link on PEBA’swebsite at www.peba.sc.gov or a copy may be obtained by submitting a request to PEBA – Insurance Benefits, 202Arbor Lake Drive, Columbia, SC 29223. PEBA is considered a division of the primary government of the state of SouthCarolina, and therefore, the financial information of the Trust is also included in the comprehensive annual financialreport of the State.
The School District's proportionate share of thepension liability of the SCRS
The School District's proportionate share of thepension liability of the PORS
Total Pension Liability
1.00% Decrease Current Discount Rate(7.25%)
1.00% Increase(8.25%)
286,262,223$
317,487
286,579,710$
System
457,043,468$
598,738
456,444,730$ 357,207,405$
444,127
357,651,532$
(6.25%)
65

LEXINGTON COUNTY SCHOOL DISTRICT ONE LEXINGTON, SOUTH CAROLINA
NOTES TO FINANCIAL STATEMENTS
JUNE 30, 2019
Other Postemployment Benefits (Continued)
Plan Descriptions
The Other Post-Employment Benefits Trust Funds (OPEB Trusts), collectively refers to the South Carolina Retiree Health Insurance Trust Fund (SCRHITF) and the South Carolina Long-Term Disability Insurance Trust Fund (SCLTDITF), were established by the State of South Carolina as Act 195, which became effective on May 2008. The SCRHITF was created to fund and account for the employer costs of the State’s retiree health and dental plans. The SCLTDITF was created to fund and account for the employer costs of the State’s Basic Long-Term Disability Income Benefit Plan.
In accordance with Act 195, the OPEB Trusts are administered by the PEBA, Insurance Benefits and the State Treasurer is the custodian of the funds held in trust. The Board of Directors of PEBA has been designated as the Trustee.
The OPEB Trusts are cost-sharing multiple-employer defined benefit plans. Article 5 of the State Code of Laws defines the two plans and authorizes the Trustee to at any time adjust the plans, including its benefits and contributions, as necessary to insure the fiscal stability of the plans. In accordance with the South Carolina Code of Laws and the annual Appropriations Act, the State provides post-employment health and dental and long-term disability benefits to retired State and school district employees and their covered dependents.
Plan Benefits
The SCRHITF is a healthcare plan that covers retired employees of the State of South Carolina, including all agencies, and public school districts. The SCRHITF provides health and dental insurance benefits to eligible retirees. Generally, retirees are eligible for the health and dental benefits if they have established at least ten years of retirement service credit. For new hires beginning employment May 2, 2008 and after, retirees are eligible for benefits if they have established 25 years of service for 100% employer funding and 15-24 years of service for 50% employer funding.
The SCLTDITF is a long-term disability plan that covers employees of the State of South Carolina, including all agencies and public school districts and all participating local governmental entities. The SCLTDITF provides disability payments to eligible employees that have been approved for disability.
Plan Contributions and Funding Policies
Section 1-11-710 of the South Carolina Code of Laws of 1976, as amended, requires these postemployment and long-term disability benefits to be funded through annual appropriations by the General Assembly for active employees to the PEBA, Insurance Benefits and participating retirees to PEBA, except for the portion funded through the pension surcharge and provided from the other applicable sources of the PEBA, Insurance Benefits. For active employees who are not funded by State General Fund appropriations, participating employers are mandated by State statute to contribute at a rate assessed each year by the Department of Administration Executive Budget Office. The covered payroll surcharge for the years ended June 30, 2019 and 2018 were 6.05 percent and 5.50 percent, respectively.
The South Carolina Retirement System collects the monthly surcharge for all participating employers and remits it directly to the SCRHITF. Other sources of funding for the SCRHITF include mandatory transfers of accumulated PEBA, Insurance Benefits’ reserves and income generated from investments. Employer contributions also include the implicit subsidy, or age-related subsidy inherent in the healthcare premiums structure. The implicit subsidy represents a portion of the health care expenditures paid on behalf of the employer’s active employees. For purposes of GASB Statement No. 75, this expenditure on behalf of the active employee is reclassified as a retiree health care expenditure so that the employer’s contributions towards the plan reflect the underlying age-adjusted, retiree benefit costs.
BLTD benefits are funded through a person’s premium charged to State agencies, public school districts and other participating local governments. The monthly premium per active employee was $3.22 for the fiscal year ended June 30, 2019. The SCLTDITF premium is billed monthly by PEBA, Insurance Benefits and transferred monthly to the SCLTDITF. It is also funded through investment income.
66

LEXINGTON COUNTY SCHOOL DISTRICT ONE LEXINGTON, SOUTH CAROLINA
NOTES TO FINANCIAL STATEMENTS
JUNE 30, 2019
Other Postemployment Benefits (Continued)
Actuarial Assumptions and Methods
Actuarial valuations of an ongoing plan involve estimates of the value of reported amounts and assumptions about the probability of occurrence of events far into the future. Examples include assumptions about future employment, mortality, and the healthcare cost trend. Actuarially determined amounts are subject to continual revision as actual results are compared with past expectations and new estimates are made about the future.
Projections of benefits for financial reporting purposes are based on the substantive plans (as understood by the employer and plan participants) and include the types of benefits provided at the time the valuation and the historical pattern of sharing of benefit costs between the employer and plan members to that point. The actuarial methods and assumptions used include techniques that are designed to reduce the effects of short-term volatility in actuarial accrued liabilities and the actuarial value of assets, consistent with the long-term perspective of the calculations.
Additional information as of the latest actuarial valuation for SCRHITF:
Valuation Date: June 30, 2017
Actuarial Cost Method: Entry Age Normal
Inflation: 2.25%
Investment Rate of Return: 4.00%, net of OPEB Plan investment expense; including inflation
Single Discount Rate: 3.62% as of June 30, 2018
Demographic Assumptions: Based on the experience study performed for the South Carolina Retirement Systems for the 5-year period ending June 30, 2015
Mortality: For healthy retirees, the 2016 Public Retirees of South Carolina Mortality Table for Males and the 2016 Public Retirees of South Carolina Mortality Table for Females are used with fully generational mortality projections based on Scale AA from the year 2016. Multipliers are applied to the base tables based on gender and employment type.
Health Care Trend Rate: Initial trend starting at 6.75% and gradually decreasing to an ultimate trend rate of 4.15% over a period of 14 years
Aging Factors: Based on plan specific experience
Retiree Participation: 79% for retirees who are eligible for funded premiums
Notes: There were no benefit changes during the year. The discount rate changed from 3.59% as of June 30, 2017 to 3.62% as of June 30, 2018.
Additional information as of the latest actuarial valuation for SCLTDITF:
Valuation Date: June 30, 2017
Actuarial Cost Method: Entry Age Normal
Inflation: 2.25%
Investment Rate of Return: 4.00%, net of Plan investment expense; including inflation
Single Discount Rate: 3.91% as of June 30, 2018
Salary, Termination and Retirement Rates: Based on the experience study performed for the South Carolina Retirement Systems for the 5-year period ending June 30, 2015
Disability Incidence: The rates used in the valuation are based on the rates developed for the South Carolina
67

LEXINGTON COUNTY SCHOOL DISTRICT ONE LEXINGTON, SOUTH CAROLINA
NOTES TO FINANCIAL STATEMENTS
JUNE 30, 2019
Other Postemployment Benefits (Continued)
Actuarial Assumptions and Methods (continued)
Retirement Systems pension plans
Disability Recovery: For participants in payment, 1987 CGDT Group Disability; for active employees, 60% were assumed to recover after the first year and 92% were assumed to recover after the first two years
Offsets: 40% are assumed to be eligible for Social Security benefits; assumed percentage who will be eligible for a pension plan offset varies based on employee group
Notes: There were no benefit changes during the year. The discount rate changed from 3.87% as of June 30, 2017 to 3.91% as of June 30, 2018.
Long-Term Expected Rate of Return
The long-term expected rate of returns represent assumptions developed using an arithmetic building block approach primarily based on consensus expectations and market based inputs. The expected returns, along with the expected inflation rate, form the basis for the target asset allocation adopted at the beginning of the 2017 fiscal year. The long-term expected rate of return is produced by weighting the expected future real rates of return by the target allocation percentage and adding expected inflation. This information is summarized in the following table:
Asset Class Target Asset
Allocation
Expected Arithmetic Real Rate of Return
Allocation-Weighted Long-Term Expected
Real Rate of Return
U.S. Domestic Fixed Income 80.00% 2.09% 1.67% Cash 20.00% 0.84% 0.17% Total 100.00% 1.84% Expected Inflation 2.25%
Total Return 4.09%
Investment Return Assumption 4.00%
Discount Rate
A Single Discount Rate of 3.62% was used to measure the total OPEB liability for the SCRHITF. The accounting policy for this plan is to set the Single Discount Rate equal to the prevailing municipal bond rate. Due to the plan’s investment and funding policies, the difference between a blended discount rate and the municipal bond rate would be less than several basis points (several hundredths of one percent).
A Single Discount Rate of 3.91% was used to measure the total OPEB liability for the SCLTDITF. This Single Discount Rate was based on an expected rate of return on plan investments of 4.00% and a municipal bond rate of 3.62%. The projection of cash flows to determine this Single Discount Rate assumed that employer contributions will remain $38.64 per year for each covered active employee. Based on these assumptions, the plan’s Fiduciary Net Position and future contributions were sufficient to finance the benefit payments through the year 2037. As a result, the long-term expected rate of return on plan investments was applied to project benefit payments through the year 2037, and the municipal bond rate was applied to all benefit payments after that date.
68

LEXINGTON COUNTY SCHOOL DISTRICT ONE LEXINGTON, SOUTH CAROLINA NOTES TO FINANCIAL STATEMENTS JUNE 30, 2019
Other Postemployment Benefits (Continued) Discount Rate(continued) The following table presents the District’s proportionate share of the net OPEB liability of the SCRHITF calculated using a Single Discount Rate of 3.62 percent, as well as what the District’s proportionate share of the net OPEB liability of the SCRHITF would be if it were calculated using a Single Discount Rate that is one percent lower or one percent higher:
1.00% Decrease Current Discount 1.00% Increase(2.62%) Rate (3.62%) (4.62%)
328,416,984$ 278,769,274$ 238,749,288$
Sensitivity of the SCRHITF Net OPEB Liability to Changesin the Discount Rate
Regarding the sensitivity of the District’s proportionate share of the net OPEB liability of the SCRHITF to changes in the healthcare cost trend rates, the following table presents the District’s proportionate share of the net OPEB liability of the SCRHITF, calculated using the assumed trend rates as well as what the District’s proportionate share of the net OPEB liability of the SCRHITF would be using a trend rate that is one percent lower or one percent higher:
Current Healthcare1.00% Decrease Cost Trend Rate 1.00% Increase
229,382,105$ 278,769,274$ 342,617,737$
Sensitivity of the SCRHITF Net OPEB Liability to Changesin the Healthcare Cost Trend Rates
The following table presents the District’s proportionate share of the net OPEB liability of the SCLTDITF calculated using a Single Discount Rate of 3.91 percent, as well as what the District’s proportionate share of the net OPEB liability of the SCLTDITF would be if it were calculated using a Single Discount Rate that is one percent lower or one percent higher:
1.00% Decrease Current Discount 1.00% Increase(2.91%) Rate (3.91%) (4.91%)
75,694$ 50,648$ 26,205$
in the Discount RateSensitivity of the SCLTDITF Net OPEB Liability to Changes
69

LEXINGTON COUNTY SCHOOL DISTRICT ONE LEXINGTON, SOUTH CAROLINA
NOTES TO FINANCIAL STATEMENTS
JUNE 30, 2019
Other Postemployment Benefits (Continued)
Net OPEB Liability, OPEB Expense and Deferred Outflows/Inflows of Resources Related to OPEB
The Net OPEB Liability is calculated separately for each OPEB Trust Fund and represents that particular Trust’s total OPEB liability determined in accordance with GASB No. 74 less that Trust’s fiduciary net position. Net OPEB liability totals, as of June 30, 2018 measurement date, for the SCRS and PORS are presented in the following table:
The total OPEB liability is calculated by the Trusts’ actuary, and each Trust’s fiduciary net position is reported in the Trust’s financial statements. The net OPEB liability is disclosed in accordance with the requirements of GASB No. 74 in the Trusts’ notes to the financial statements and required supplementary information.
At June 30, 2019, the District reported liabilities of approximately $278,769,000 and $50,000 for its proportionate share of the net OPEB liabilities for the SCRHITF and SCLTDITF, respectively. The net OPEB liabilities were measured as of June 30, 2018, and the total OPEB liabilities for the OPEB Trusts used to calculate the net OPEB liabilities were determined based on the most recent actuarial valuation report as of July 1, 2017 that was projected forward to the measurement date. The District’s proportion of the net OPEB liabilities were based on an allocation of the District’s share of payroll-related contributions to the OPEB Trusts relative to the projected contributions of all participating South Carolina state and local governmental employers, actuarially determined. At the June 30, 2018 measurement date, the District’s SCRHITF proportion was 1.967239 percent, which was equal to its proportion measured as of June 30, 2017. At the June 30, 2018 measurement date, the District’s SCLTDITF proportion was 1.654508 percent, which was equal to its proportion measured as of June 30, 2017.
In accordance with part (b) of paragraph 69 of GASB Statement No. 75, participating employers should recognize revenue in an amount equal to the employer’s proportionate share of the change in the collective net OPEB liability arising from contributions to the OPEB plan during the measurement period from non-employer contributing entities for purposes other than the separate financing of specific liabilities to the OPEB plan. For the year ended June 30, 2018, the District recognized $2,103,936 of revenues from state sources and intergovernmental expenditures in the District’s special revenue funds.
For the year ended June 30, 2019, the District recognized OPEB expense of approximately $14,677,000 and $133,000 for the SCRHITF and SCLTDITF, respectively, for a total OPEB expense of approximately $14,810,000. At June 30, 2019, the District reported deferred outflows of resources (deferred OPEB charges) and deferred inflows of resources (deferred OPEB credits) related to OPEB from the following sources:
Total OPEBSystem Liability
SCRHITF 15,387,115,010$ SCLTDITF 39,261,091$
Plan Fiduciary Net
1,216,530,062$ 36,199,863$
14,170,584,948$ 3,061,228$
7.91%92.20%
Plan FiduciaryNet Position
Employer's Net
(Asset)OPEB Liability
OPEB LiabilityPercentage of the Total
Position as a
70

LEXINGTON COUNTY SCHOOL DISTRICT ONE LEXINGTON, SOUTH CAROLINA
NOTES TO FINANCIAL STATEMENTS
JUNE 30, 2019
Other Postemployment Benefits (Continued)
Net OPEB Liability, OPEB Expense and Deferred Outflows/Inflows of Resources Related to OPEB(continued)
Deferred DeferredOutflows of Inflows ofResources Resources
SCRHITFDifferences Between Expected and Actual Experience 4,176,090$ 97,131$ Changes in Assumptions - 22,700,229 Net Difference Between Projected and Actual Earnings on OPEB Plan Investments 1,068,910 - Changes in Proportionate Share and Differences Between Employer Contributions
and Proportionate Share of Total Plan Employer Contributions 1,336,131 3,184 The School District's Contributions Subsequent to the Measurement Date 10,661,456 -
Total SCRHITF 17,242,587 22,800,544
SCLTDITFDifferences Between Expected and Actual Experience 29,422 3,097 Changes in Assumptions - 3,300 Net Difference Between Projected and Actual Earnings on Pension Plan Investments - - Changes in Proportionate Share and Differences Between Employer Contributions
and Proportionate Share of Total Plan Employer Contributions - 3,396 The School District's Contributions Subsequent to the Measurement Date 123,065 -
Total SCLTDITF 152,487 9,793
Total SCRHITF and SCLTDITF 17,395,074$ 22,810,337$
Description
Approximately $10,661,000 and $123,000 that were reported as deferred outflows of resources related to the District’s contributions subsequent to the measurement date to the SCRHITF and SCLTDITF, respectively, will be recognized as a reduction of the net OPEB liabilities in the year ended June 30, 2020.
Other amounts reported as deferred outflows of resources (deferred OPEB charges) and deferred inflows of resources (deferred OPEB credits) related to the SCRHITF and SCLTDITF will increase (decrease) OPEB expense as follows:
Year EndedJune 30,
2020202120222023 (3,545) 2024 1,101
Thereafter
Total 16,219,413$ (19,629)$ 16,199,784$
3,113,506 (7,158) 3,106,348
241,577 4,289 245,866
3,224,424 3,410,450
SCLTDITF Total
3,113,506 (7,158) 3,106,348 3,113,506$ (7,158)$ 3,106,348$
3,227,969 3,409,349
SCRHITF
71

LEXINGTON COUNTY SCHOOL DISTRICT ONE LEXINGTON, SOUTH CAROLINA
NOTES TO FINANCIAL STATEMENTS
JUNE 30, 2019
XIII. Risk Management
The District is exposed to various risks of loss related to torts; theft of, damage to, and destruction of assets; errors andomissions; injuries to employees; and natural disasters. The District participates with other school districts in the SouthCarolina School Boards Insurance Trust/Workers’ Compensation Trust Fund and Property & Casualty Trust Funds(SCSBIT/WCTF– PCTF).
The SCSBIT/WCTF–PCTF is a public entity risk pool currently operating as a common risk management and insuranceprogram for 63 member school districts for worker’s compensation and 52 member school districts for property andcasualty. The District pays an annual premium for worker’s compensation insurance coverage and for property andcasualty coverage based upon the total payroll and other exposure factors of the District each plan year. TheSCSBIT/WCTF–PCTF is self-sustaining through member premium and deficiencies can be charged back to the memberdistricts should a fund deficit arise.
The District’s insurance coverage for all types of risk has not been significantly reduced from coverage in the prior year.The amounts of any District settlement have not exceeded the insurance coverage for the previous three fiscal years.
XIV. Contingent Liabilities
LitigationVarious claims and lawsuits are pending against the District. Although the outcome of these lawsuits is not presentlydeterminable, it is the opinion of the District’s counsel that resolution of these matters will not have a material adverseeffect on the financial condition of the District.
GrantsThe District participates in a number of federally assisted grant programs. These programs are subject to programcompliance audits by the grantors or their representatives. The amount of program expenditures which may bedisallowed by the granting agencies cannot be determined at this time although the District expects such amounts, if any,to be immaterial.
XV. Commitments
The District had six construction and renovation projects (Beechwood Middle School Site Package and Main Building,Lexington High School Reroofing and Asphalt, and construction at Centerville Elementary School and Pelion MiddleSchool) in various stages at the end of the fiscal year 2019. The District has entered into various contracts for theseprojects totaling $78 million of which $35.8 million had not been expended as of June 30, 2019.
72

LEXINGTON COUNTY SCHOOL DISTRICT ONE LEXINGTON, SOUTH CAROLINA
NOTES TO FINANCIAL STATEMENTS
JUNE 30, 2019
XVI. Tax Abatements
The District’s property tax revenues were reduced by $17,098,109 under agreements entered into by the County as ofJune 30, 2019. The State of South Carolina reimbursed the County $548,493 of these property tax revenues, which theCounty disbursed back to the District. See the chart below for further details:
XVII. Subsequent Events
On October 29, 2019, the District issued $165,000,000 in General Obligation Bonds, Series 2019B. The bonds wereissued as long-term obligations for the purpose of refinancing the Series 2019A General Obligation Bond AnticipationNotes (see Note X) and funding the construction and acquisition of capital assets as approved in the November 2018Bond Referendum.
On November 6, 2019, the District issued $9,750,000 in General Obligation Bonds, Series 2019C. The bonds wereissued as short-term obligations for the purpose of refinancing the Series 2019B Bond Anticipation Note, paying theInstallment Purchase Revenue Bonds and certain capital needs.
Fee-in-Lieu of Taxes Program (FILOT)Fee-in-Lieu of Tax and Special Source Revenue CreditProgram (FILOT + SSRC)Fee-in-Lieu of Tax and Infrastructure Program (FILOT + IP)Fee-in-Lieu of Tax, Special Source Revenue Credit andInfrastructure Program (FILOT + SSRC + IP)
Tax Abatement Program
Amount of TaxesAbated during the
Fiscal Year1,753,021$
3,830 4,655,362
8,991,050 17,098,109$
1,698,676
State of South CarolinaRevenue Reimbursement
Amount150,784$
305,534
88,345 548,493$
73

(This page intentionally left blank)
74

REQUIRED SUPPLEMENTARY INFORMATION
75

Schedule A-1
REQUIRED SUPPLEMENTARY INFORMATION - BUDGETARY COMPARISON SCHEDULE - GENERAL FUND
SCHEDULE OF REVENUES, EXPENDITURES, AND CHANGES IN FUND BALANCE -
YEAR ENDED JUNE 30, 2019
VARIANCEWITH FINAL
ORIGINAL FINAL ACTUAL BUDGETREVENUES
Local Sources:Taxes 100,239,214$ 100,239,214 96,716,048 (3,523,166) Investment Earnings 607,300 607,300 1,959,550 1,352,250 Other Local Sources 706,627 706,627 1,381,349 674,722
State Sources 161,766,542 161,766,543 167,177,233 5,410,690
TOTAL REVENUE ALL SOURCES 263,319,683 263,319,684 267,234,180 3,914,496
EXPENDITURES
Current:Instruction 162,045,948 162,560,544 155,175,283 7,385,261 Supporting Services 116,812,928 116,179,392 105,519,975 10,659,417
Capital Outlay 195,600 314,559 209,788 104,771
TOTAL EXPENDITURES 279,054,476 279,054,495 260,905,046 18,149,449
EXCESS (DEFICIENCY) OF REVENUES OVER EXPENDITURES (15,734,793) (15,734,811) 6,329,134 22,063,945
OTHER FINANCING SOURCES (USES)
Transfers In 8,241,793 8,241,793 9,272,983 1,031,190 Transfers Out (1,507,000) (1,507,000) (9,990,405) (8,483,405)
TOTAL OTHER FINANCING SOURCES (USES) 6,734,793 6,734,793 (717,422) (7,452,215)
NET CHANGE IN FUND BALANCE (9,000,000) (9,000,018) 5,611,712 14,611,730
FUND BALANCE - BEGINNING OF YEAR 51,930,488 51,930,488 51,930,488 -
FUND BALANCE - END OF YEAR 42,930,488$ 42,930,470$ 57,542,200 14,611,730$
Note: The budgets are presented on the modified accrual basis of accounting, which is consistent with accounting principles generallyaccepted in the United States of America.
Note: The School District's original and final budget reflected the use of appropriated fund balance of $9,000,018.
LEXINGTON COUNTY SCHOOL DISTRICT ONELEXINGTON, SOUTH CAROLINA
BUDGET TO ACTUAL
BUDGETED AMOUNTS
The accompanying notes to financial statements are an integral part of this exhibit.
76
$

REQUIRED SUPPLEMENTARY INFORMATION
SCHEDULE OF LEXINGTON COUNTY SCHOOL DISTRICT ONE'S PROPORTIONATE SHARE OF THE NET
LAST SIX FISCAL YEARS
2019 2018 2017 2016 2015 2014
Lexington County School District One's Proportion of theNet Pension Liability 1.594191% 1.588940% 1.579012% 1.580883% 1.555256% 1.555256%
Lexington County School District One's Proportionate Share of theNet Pension Liability 357,207,405$ 357,695,948$ 337,274,633 299,822,083 267,763,523$ 278,957,446$
Lexington County School District One's Covered Payroll 169,432,419$ 164,744,033$ 156,925,611 152,136,549 144,947,436$ 139,746,760$
Lexington County School District One's Proportionate Share of theNet Pension Liability as a Percentage of its Covered Payroll 210.83% 217.12% 214.93% 197.07% 184.73% 199.62%
Plan Fiduciary Net Position as a Percentage of the Total PensionLiability 54.105% 53.338% 52.906% 56.992% 59.919% 56.388%
Notes to Schedule:The amounts presented for each fiscal year were determined as of June 30th of the preceding year.Only six years of data were available; thus, only six years were presented.
LEXINGTON COUNTY SCHOOL DISTRICT ONELEXINGTON, SOUTH CAROLINA
PENSION LIABILITY - SOUTH CAROLINA RETIREMENT SYSTEM
Year Ended June 30,
The accompanying notes to financial statements are an integral part of this exhibit.
77

REQUIRED SUPPLEMENTARY INFORMATION
SCHEDULE OF LEXINGTON COUNTY SCHOOL DISTRICT ONE'S CONTRIBUTIONS
LAST SIX FISCAL YEARS
2019 2018 2017 2016 2015 2014
Contractually Required Contribution 23,552,327$ 21,203,846 18,518,828 16,901,316 16,158,971$ 14,966,882$
Contributions in Relation to the Contractually Required Contributions 23,552,327 21,203,846 18,518,828 16,901,316 16,158,971 14,966,882
Contribution Deficiency (Excess) -$ -$ - - - -
Lexington County School District One's Covered Payroll 176,010,510$ 169,432,419 164,744,033$ 156,925,611 152,136,549$ 144,947,436$
Contributions as a Percentage of Covered Payroll 13.38% 12.51% 11.24% 10.77% 10.62% 10.33%
Notes to Schedule:Only six years of data were available; thus, only six years were presented.
LEXINGTON COUNTY SCHOOL DISTRICT ONELEXINGTON, SOUTH CAROLINA
SOUTH CAROLINA RETIREMENT SYSTEM
Year Ended June 30,
The accompanying notes to financial statements are an integral part of this exhibit.
78

REQUIRED SUPPLEMENTARY INFORMATION
SCHEDULE OF LEXINGTON COUNTY SCHOOL DISTRICT ONE'S PROPORTIONATE SHARE OF THE NET
LAST SIX FISCAL YEARS
2019 2018 2017 2016 2015 2014
Lexington County School District One's Proportion of theNet Pension Liability 0.01567% 0.02044% 0.02358% 0.02372% 0.02418% 0.02418%
Lexington County School District One's Proportionate Share of theNet Pension Liability 444,127$ 559,994$ 598,101 516,998 462,928 501,265$
Lexington County School District One's Covered Payroll 216,691$ 271,932$ 300,545 293,873 291,643 215,649$
Lexington County School District One's Proportionate Share of theNet Pension Liability as a Percentage of its Covered Payroll 204.96% 205.93% 199.01% 175.93% 158.73% 232.44%
Plan Fiduciary Net Position as a Percentage of the Total PensionLiability 61.73% 60.94% 60.44% 64.57% 67.55% 62.98%
Notes to Schedule:The amounts presented for each fiscal year were determined as of June 30th of the preceding year.Only six years of data were available; thus, only six years were presented.
LEXINGTON COUNTY SCHOOL DISTRICT ONELEXINGTON, SOUTH CAROLINA
PENSION LIABILITY - POLICE OFFICERS RETIREMENT SYSTEM
Year Ended June 30,
The accompanying notes to financial statements are an integral part of this exhibit.
79

REQUIRED SUPPLEMENTARY INFORMATION
SCHEDULE OF LEXINGTON COUNTY SCHOOL DISTRICT ONE'S CONTRIBUTIONS
LAST SIX FISCAL YEARS
2019 2018 2017 2016 2015 2014
Contractually Required Contribution 35,685$ 34,325 38,723 41,295 39,408$ 37,343$
Contributions in Relation to the Contractually Required Contributions 35,685 34,325 38,723 41,295 39,408 37,343
Contribution Deficiency (Excess) -$ - - - -$ -$
Lexington County School District One's Covered Payroll 211,907$ 216,691 271,932 300,545 293,873$ 291,643$
Contributions as a Percentage of Covered Payroll 16.84% 15.84% 14.24% 13.74% 13.41% 12.80%
Notes to Schedule:Only six years of data were available; thus, only six years were presented.
LEXINGTON COUNTY SCHOOL DISTRICT ONELEXINGTON, SOUTH CAROLINA
POLICE OFFICERS RETIREMENT SYSTEM
Year Ended June 30,
The accompanying notes to financial statements are an integral part of this exhibit.
80

REQUIRED SUPPLEMENTARY INFORMATION
SCHEDULE OF LEXINGTON COUNTY SCHOOL DISTRICT ONE'S PROPORTIONATE SHARE OF THE NET
AND SOUTH CAROLINA LONG-TERM DISABILITY INSURANCE TRUST FUND (SCLTDITF)
LAST THREE FISCAL YEARS
2019 2018 2017
Lexington County School District One's Proportion of theNet OPEB Liability 1.967239% 1.956825% 1.956825%
Lexington County School District One's Proportionate Share of theNet OPEB Liability 278,769,274$ 265,048,741$ 283,125,787$
Lexington County School District One's Covered Payroll 169,649,110$ 165,015,965$ 156,925,611$
Lexington County School District One's Proportionate Share of theNet OPEB Liability as a Percentage of its Covered Payroll 164.32% 160.62% 180.42%
Plan Fiduciary Net Position as a Percentage of the Total OPEB Liability 7.906% 7.604% 7.604%
2019 2018 2017
Lexington County School District One's Proportion of theNet OPEB Liability 1.654508% 1.632471% 1.632471%
Lexington County School District One's Proportionate Share of theNet OPEB Liability 50,648$ 29,596$ 11,332$
Lexington County School District One's Covered Payroll 1 N/A N/A N/A
Lexington County School District One's Proportionate Share of theNet OPEB Liability as a Percentage of its Covered Payroll N/A N/A N/A
Plan Fiduciary Net Position as a Percentage of the Total OPEB Liability 92.203% 95.292% 95.292%
Notes to Schedule:1 Because contributions to the plan are not based on a measure of pay, covered payroll for the measurement period is not presented.
The amounts presented for each fiscal year were determined as of June 30th of the preceding year.Only three years of data were available; thus, only three years were presented.
Year Ended June 30,
SCLTDITFYear Ended June 30,
LEXINGTON COUNTY SCHOOL DISTRICT ONELEXINGTON, SOUTH CAROLINA
OPEB LIABILITY - SOUTH CAROLINA RETIREE HEALTH INSURANCE TRUST FUND (SCRHITF)
SCRHITF
The accompanying notes to financial statements are an integral part of this exhibit.
81

REQUIRED SUPPLEMENTARY INFORMATION
SCHEDULE OF LEXINGTON COUNTY SCHOOL DISTRICT ONE'S CONTRIBUTIONS
SOUTH CAROLINA LONG-TERM DISABILITY INSURANCE TRUST FUND (SCLTDITF)
LAST THREE FISCAL YEARS
2019 2018 2017
Contractually Required Contribution 10,661,456$ 9,330,701$ 8,795,351
Contributions in Relation to the Contractually Required Contributions 10,661,456 9,330,701 8,795,351
Contribution Deficiency (Excess) -$ -$ -
Lexington County School District One's Covered Payroll 176,222,417$ 169,649,110$ 165,015,965$
Contributions as a Percentage of Covered Payroll 6.05% 5.50% 5.33%
2019 2018 2017
Contractually Required Contribution 123,065$ 120,476$ 118,168
Contributions in Relation to the Contractually Required Contributions 123,065 120,476 118,168
Contribution Deficiency (Excess) -$ -$ -
Lexington County School District One's Covered Payroll 176,222,417$ 169,649,110$ 165,015,965$
Contributions as a Percentage of Covered Payroll 0.07% 0.07% 0.07%
Notes to Schedule:Only three years of data were available; thus, only three years were presented.
SCLTDITFYear Ended June 30,
Year Ended June 30,
LEXINGTON COUNTY SCHOOL DISTRICT ONELEXINGTON, SOUTH CAROLINA
SOUTH CAROLINA RETIREE HEALTH INSURANCE TRUST FUND (SCRHITF) AND
SCRHITF
The accompanying notes to financial statements are an integral part of this exhibit.
82

SUPPLEMENTARY INFORMATION
83

(This page intentionally left blank)
84

General Fund The General Fund accounts for all financial resources except those required to be accounted for in another fund. All property tax, intergovernmental revenues, and miscellaneous revenues are recorded in this fund, except amounts which are specifically collected to service debt or for which the School District collects other funds in a fiduciary capacity. Operational expenditures for general education, support services and other departments of the District are paid through the General Fund.
The following Schedule of Revenues, Expenditures, and Changes in Fund Balance - Revised Budget and Actual for the General Fund has been prepared in the format mandated by the South Carolina Department of Education. The account numbers shown on the schedule are also mandated by the South Carolina Department of Education.
85

SCHEDULE A-2
GENERAL FUND
REVISEDBUDGET ACTUAL VARIANCE
REVENUES
1000 Revenue from Local Sources: 1100 Taxes: 1110 Ad Valorem Taxes - Including Delinquent (Independent) 91,189,203$ 86,384,657 (4,804,546)$ 1140 Penalties and Interest on Taxes (Independent) 2,709,128 3,094,332 385,204 1190 Other Taxes (independent) 21,525 18,950 (2,575)
1200 Revenue from Local Governmental Units Other Than LEAs: 1280 Revenue in Lieu of Taxes (Independent and Dependent) 6,319,358 7,218,109 898,751
1300 Tuition: 1310 From Patrons for Regular Day School 24,876 169,209 144,333 1320 From Other LEAs for Regular Day School 7,259 42,654 35,395
1500 Earnings on Investments: 1510 Interest on Investments 607,300 1,959,550 1,352,250
1900 Other Revenue from Local Sources: 1910 Rentals 336,900 346,747 9,847 1950 Refund of Prior Year's Expenditures 1,396 3,416 2,020 1990 Miscellaneous Local Revenue: 1993 Receipt of Insurance Proceeds - 16,899 16,899 1999 Revenue from Other Local Sources 336,196 802,424 466,228
Total Revenue from Local Sources 101,553,141 100,056,947 (1,496,194)
3000 Revenue from State Sources: 3100 Restricted State Funding: 3130 Special Programs: 3131 Handicapped Transportation - 22,060 22,060 3132 Home Schooling (No Carryover Provision) - 621 621 3160 School Bus Driver's Salary (Includes Hazardous Condition 1,775,013 2,125,747 350,734 Transportation) 3161 EAA Bus Driver Salary and Fringe - 2,727 2,727 3162 Transportation Workers Compensation 96,241 97,939 1,698 3180 Fringe Benefits Employer Contributions (No Carryover Provision) 31,014,209 32,310,839 1,296,630 3181 Retiree Insurance (No Carryover Provision) 6,521,564 7,273,935 752,371 3199 Other Restricted State Grants - 676 676
3300 Education Finance Act: 3310 Full-Time Programs: 3311 Kindergarten 3,451,196 3,524,870 73,674 3312 Primary 10,254,535 10,322,244 67,709 3313 Elementary 18,405,530 18,697,806 292,276 3314 High School 3,844,842 3,655,542 (189,300) 3315 Trainable Mentally Handicapped 198,847 231,755 32,908 3316 Speech Handicapped (Part-time) 4,311,231 4,190,505 (120,726) 3317 Homebound 30,503$ 48,014 17,511$
(Continued)
FOR THE YEAR ENDED JUNE 30, 2019
LEXINGTON COUNTY SCHOOL DISTRICT ONELEXINGTON, SOUTH CAROLINA
SCHEDULE OF REVENUES, EXPENDITURES, AND CHANGES IN FUND BALANCE -REVISED BUDGET AND ACTUAL
86

SCHEDULE A-2
GENERAL FUND
REVISEDBUDGET ACTUAL VARIANCE
FOR THE YEAR ENDED JUNE 30, 2019
LEXINGTON COUNTY SCHOOL DISTRICT ONELEXINGTON, SOUTH CAROLINA
SCHEDULE OF REVENUES, EXPENDITURES, AND CHANGES IN FUND BALANCE -REVISED BUDGET AND ACTUAL
3320 Part-Time Programs: 3321 Emotionally Handicapped 142,486$ 214,113 71,627$ 3322 Educable Mentally Handicapped 238,457 124,935 (113,522) 3323 Learning Disabilities 5,231,121 5,770,303 539,182 3324 Hearing Handicapped 258,950 226,534 (32,416) 3325 Visually Handicapped 146,494 165,810 19,316 3326 Orthopedically Handicapped 78,540 82,926 4,386 3327 Vocational 12,950,629 13,584,286 633,657 3330 Other EFA Programs: 3331 Autism 1,974,846 2,210,521 235,675 3375 Education Foundation Supplement 770,115 - (770,115) 3392 NBC Excess - 129,510 129,510 3332 High Achieving Students 1,787,263 1,733,765 (53,498) 3334 Limited English Proficiency 504,498 514,453 9,955 3351 Academic Assistance 2,439,673 2,373,773 (65,900) 3352 Pupils in Poverty 4,644,568 4,770,614 126,046 3353 Dual Credit Enrollment 93,421 108,367 14,946
3800 State Revenue in Lieu of Taxes: 3810 Reimbursement for Local Residential Property Tax Relief (Tier 1) 8,055,568 8,055,568 - 3820 Homestead Exemption (Tier 2) 2,110,131 2,110,131 - 3825 Reimbursement for Property Tax Relief (Tier 3) 37,939,121 37,946,484 7,363 3830 Merchant's Inventory Tax 243,386 243,386 - 3840 Manufacturers Depreciation Reimbursement 315,517 2,273,313 1,957,796 3890 Other State Property Tax Revenues (Includes Motor Carrier 333,165 428,277 95,112
Vehicle Tax) 3900 Other State Revenue: 3993 PEBA on Behalf of Payment 1,604,883 1,604,884 1
Total Revenue from State Sources 161,766,543 167,177,233 5,410,690
TOTAL REVENUE ALL SOURCES 263,319,684 267,234,180 3,914,496
EXPENDITURES
100 Instruction:110 General Instruction:
111 Kindergarten Programs:100 Salaries 6,482,537 6,332,201 150,336 200 Employee Benefits 3,034,600 2,934,689 99,911 300 Purchased Services 8,827 8,828 (1) 400 Supplies and Materials 288,628 279,745 8,883
112 Primary Programs:100 Salaries 20,108,488 18,868,587 1,239,901 200 Employee Benefits 8,041,735 7,857,017 184,718 300 Purchased Services 71,487 49,477 22,010 400 Supplies and Materials 162,444$ 160,460 1,984$
(Continued)
87

SCHEDULE A-2
GENERAL FUND
REVISEDBUDGET ACTUAL VARIANCE
FOR THE YEAR ENDED JUNE 30, 2019
LEXINGTON COUNTY SCHOOL DISTRICT ONELEXINGTON, SOUTH CAROLINA
SCHEDULE OF REVENUES, EXPENDITURES, AND CHANGES IN FUND BALANCE -REVISED BUDGET AND ACTUAL
113 Elementary Programs:100 Salaries 31,921,736$ 30,276,522 1,645,214$ 200 Employee Benefits 12,721,860 12,289,860 432,000 300 Purchased Services 962,965 926,967 35,998 400 Supplies and Materials 1,289,841 945,955 343,886 500 Capital Outlay 28,000 - 28,000 600 Other Objects 2,500 1,466 1,034
114 High School Programs:100 Salaries 24,035,120 23,691,626 343,494 200 Employee Benefits 9,428,756 9,307,448 121,308 300 Purchased Services 800,980 793,047 7,933 400 Supplies and Materials 677,571 612,413 65,158 600 Other Objects 1,011,822 970,954 40,868
115 Career & Technology Education (Vocational) Programs:100 Salaries 4,867,537 4,595,337 272,200 200 Employee Benefits 1,934,057 1,906,645 27,412 300 Purchased Services - other than tuition 99,105 89,463 9,642 400 Supplies and Materials 132,382 127,502 4,880
116 Career & Tech. Education (Vocational) Programs - Middle School:100 Salaries 624,332 538,944 85,388 200 Employee Benefits 261,600 233,382 28,218 400 Supplies and Materials 21,950 19,855 2,095
120 Exceptional Programs:121 Educable Mentally Handicapped:
100 Salaries 819,033 749,868 69,165 200 Employee Benefits 327,997 320,534 7,463
122 Trainable Mentally Handicapped:100 Salaries 1,054,442 987,019 67,423 200 Employee Benefits 499,880 441,070 58,810
123 Orthopedically Handicapped:100 Salaries 39,322 27,009 12,313 200 Employee Benefits 20,755 19,346 1,409
124 Visually Handicapped:100 Salaries 146,475 146,330 145 200 Employee Benefits 63,373 63,227 146
125 Hearing Handicapped:100 Salaries 273,221 273,092 129 200 Employee Benefits 121,378 120,876 502
126 Speech Handicapped:100 Salaries 2,241,657 2,240,775 882 200 Employee Benefits 922,696 903,284 19,412 300 Purchased Services 167,297 167,296 1
127 Learning Disabilities:100 Salaries 6,781,816 6,058,888 722,928 200 Employee Benefits 2,780,691 2,561,748 218,943
128 Emotionally Handicapped:100 Salaries 846,839 793,730 53,109 200 Employee Benefits 356,246 356,204 42 300 Purchased Services 65,000$ 45,603 19,397$
(Continued)
88

SCHEDULE A-2
GENERAL FUND
REVISEDBUDGET ACTUAL VARIANCE
FOR THE YEAR ENDED JUNE 30, 2019
LEXINGTON COUNTY SCHOOL DISTRICT ONELEXINGTON, SOUTH CAROLINA
SCHEDULE OF REVENUES, EXPENDITURES, AND CHANGES IN FUND BALANCE -REVISED BUDGET AND ACTUAL
129 Consolidated Early Intervening Services (CEIS):100 Salaries 2,822,359$ 2,821,313 1,046$ 200 Employee Benefits 1,135,196 1,128,742 6,454
130 Pre-School Programs:132 Preschool Handicapped Itinerant (5-Yr. Olds):
100 Salaries 68,366 70,318 (1,952) 200 Employee Benefits 34,858 34,987 (129)
133 Preschool Handicapped Self-contained (5-Yr. Olds):100 Salaries 273,088 272,791 297 200 Employee Benefits 155,189 153,499 1,690
135 Preschool Handicapped Speech (3 & 4-Yr. Olds):100 Salaries 30,450 30,260 190 200 Employee Benefits 20,468 19,987 481
136 Preschool Handicapped Itinerant (3 & 4-Yr. Olds):100 Salaries 302,946 297,530 5,416 200 Employee Benefits 147,545 142,582 4,963
137 Preschool Handicapped Self-contained (3&4-Yr. Olds):100 Salaries 494,089 450,077 44,012 200 Employee Benefits 220,810 209,136 11,674
139 Early Childhood Development:100 Salaries 509,829 496,354 13,475 200 Employee Benefits 213,669 208,319 5,350 400 Supplies and Materials 17,000 8,642 8,358
140 Special Programs:141 Gifted and Talented - Academic:
100 Salaries 1,269,972 1,262,333 7,639 200 Employee Benefits 499,315 498,538 777 300 Purchased Services 64,052 47,956 16,096 400 Supplies and Materials 89,985 84,464 5,521 600 Other Objects 125,500 125,257 243
143 Advanced Placement:400 Supplies and Materials 10,000 7,839 2,161
144 International Baccalaureate:100 Salaries 241,385 213,248 28,137 200 Employee Benefits 88,325 82,353 5,972 300 Purchased Services 114,835 94,104 20,731 400 Supplies and Materials 25,027 14,946 10,081 600 Other Objects 34,040 34,220 (180)
145 Homebound:100 Salaries 345,376 325,498 19,878 200 Employee Benefits 120,241 116,265 3,976 300 Purchased Services 36,000 18,799 17,201
148 Gifted and Talented - Artistic:100 Salaries 34,739 22,556 12,183 200 Employee Benefits 9,661 6,289 3,372 300 Purchased Services 11,800 6,496 5,304 400 Supplies and Materials 16,425$ 7,355 9,070$
(Continued)
89

SCHEDULE A-2
GENERAL FUND
REVISEDBUDGET ACTUAL VARIANCE
FOR THE YEAR ENDED JUNE 30, 2019
LEXINGTON COUNTY SCHOOL DISTRICT ONELEXINGTON, SOUTH CAROLINA
SCHEDULE OF REVENUES, EXPENDITURES, AND CHANGES IN FUND BALANCE -REVISED BUDGET AND ACTUAL
149 Other Special Programs:100 Salaries 1,453,128$ 1,225,780 227,348$ 200 Employee Benefits 524,104 381,024 143,080
160 Other Exceptional Programs:161 Autism:
100 Salaries 1,122,141 1,006,973 115,168 200 Employee Benefits 467,868 424,875 42,993
162 Limited English Proficiency:100 Salaries 1,734,931 1,667,438 67,493 200 Employee Benefits 695,236 646,878 48,358
170 Summer School Programs:172 Elementary Summer School:
100 Salaries 10,300 11,137 (837) 200 Employee Benefits 2,365 3,127 (762) 300 Purchased Services - 300 (300)
175 Instructional Program Beyond the School Day:100 Salaries 208,180 174,772 33,408 200 Employee Benefits 57,893 48,409 9,484 300 Purchased Services 19,800 12,489 7,311 400 Supplies and Materials - 831 (831)
180 Adult/Continuing Educational Programs:181 Adult Basic Education Programs:
100 Salaries 65,351 66,632 (1,281)
200 Employee Benefits 23,181 23,500 (319) 182 Adult Secondary Education Programs:
100 Salaries 4,500 - 4,500 200 Employee Benefits 1,251 - 1,251
188 Parenting/Family Literacy:100 Salaries 51,423 52,000 (577) 200 Employee Benefits 15,374 21,778 (6,404)
Total Instruction 162,588,544 155,175,285 7,413,259
200 Support Services:210 Pupil Services:
211 Attendance and Social Work Services:100 Salaries 1,989,865 1,937,468 52,397 200 Employee Benefits 828,597 809,268 19,329 300 Purchased Services 67,250 67,373 (123) 400 Supplies and Materials 6,000 4,933 1,067 600 Other Objects 2,000 1,375 625
212 Guidance Services:100 Salaries 5,851,946 5,756,716 95,230 200 Employee Benefits 2,395,513 2,367,733 27,780 300 Purchased Services 17,829 13,355 4,474 400 Supplies and Materials 30,397$ 22,549 7,848$
(Continued)
90

SCHEDULE A-2
GENERAL FUND
REVISEDBUDGET ACTUAL VARIANCE
FOR THE YEAR ENDED JUNE 30, 2019
LEXINGTON COUNTY SCHOOL DISTRICT ONELEXINGTON, SOUTH CAROLINA
SCHEDULE OF REVENUES, EXPENDITURES, AND CHANGES IN FUND BALANCE -REVISED BUDGET AND ACTUAL
213 Health Services: 100 Salaries 1,797,926$ 1,670,578 127,348$ 200 Employee Benefits 779,044 778,131 913 300 Purchased Services 100,048 99,234 814 400 Supplies and Materials 62,353 59,763 2,590 600 Other Objects 1,080 348 732
214 Psychological Services:100 Salaries 1,737,052 1,611,118 125,934 200 Employee Benefits 752,497 621,990 130,507 300 Purchased Services 285,021 268,003 17,018
215 Exceptional Program Services:100 Salaries 1,118,556 1,077,838 40,718 200 Employee Benefits 424,448 426,406 (1,958) 300 Purchased Services 28,600 27,349 1,251
217 Career Specialist Service:200 Employee Benefits - 48,287 (48,287)
220 Instructional Staff Services:221 Improvement of Instruction - Curriculum Development:
100 Salaries 6,948,527 6,217,087 731,440 200 Employee Benefits 2,902,174 2,594,403 307,771 600 Other Objects 37,500 37,328 172
222 Educational Media Services:100 Salaries 2,500,519 2,415,340 85,179 200 Employee Benefits 1,128,362 1,083,630 44,732 300 Purchased Services 30,577 30,277 300 400 Supplies and Materials 271,788 180,218 91,570 600 Other Objects 50 - 50
223 Supervision of Special Projects:100 Salaries 45,481 45,481 - 200 Employee Benefits 18,863 18,959 (96)
224 Improvement of Instruction - In-service and Staff Training:100 Salaries 658,500 630,647 27,853 200 Employee Benefits 244,857 223,312 21,545 300 Purchased Services 999,117 836,261 162,856 400 Supplies and Materials 231,292 203,687 27,605 600 Other Objects 60,225 53,633 6,592
230 General Administration Services:231 Board of Education:
200 Employee Benefits 70,000 17,150 52,850 300 Purchased Services 523,000 500,911 22,089 400 Supplies and Materials 990 735 255 600 Other Objects 75,700 66,211 9,489
232 Office of the Superintendent:100 Salaries 332,499 330,374 2,125 200 Employee Benefits 157,571 157,344 227 300 Purchased Services 15,771 13,663 2,108 400 Supplies and Materials 6,000 6,617 (617) 600 Other Objects 18,850$ 9,120 9,730$
(Continued)
91

SCHEDULE A-2
GENERAL FUND
REVISEDBUDGET ACTUAL VARIANCE
FOR THE YEAR ENDED JUNE 30, 2019
LEXINGTON COUNTY SCHOOL DISTRICT ONELEXINGTON, SOUTH CAROLINA
SCHEDULE OF REVENUES, EXPENDITURES, AND CHANGES IN FUND BALANCE -REVISED BUDGET AND ACTUAL
233 School Administration:100 Salaries 12,044,952$ 11,873,210 171,742$ 200 Employee Benefits 4,598,383 4,474,552 123,831 300 Purchased Services 103,585 82,391 21,194 400 Supplies and Materials 64,878 49,779 15,099 600 Other Objects 30,908 30,009 899
250 Finance and Operations Services:252 Fiscal Services:
100 Salaries 3,034,803 2,946,553 88,250 200 Employee Benefits 1,146,492 1,110,742 35,750 300 Purchased Services 39,204 37,381 1,823 400 Supplies and Materials 38,205 28,247 9,958 600 Other Objects 24,341 23,113 1,228
254 Operation and Maintenance of Plant:100 Salaries 9,779,854 9,220,553 559,301 200 Employee Benefits 4,606,477 4,346,402 260,075 300 Purchased Services 12,089,055 9,664,980 2,424,075 400 Supplies and Materials 1,894,889 1,643,852 251,037 500 Capital Outlay 111,959 78,038 33,921 600 Other Objects 3,055 1,672 1,383
255 Student Transportation (State Mandated):100 Salaries 7,411,084 6,267,732 1,143,352 200 Employee Benefits 3,605,032 2,969,084 635,948 300 Purchased Services 623,700 549,169 74,531 400 Supplies and Materials 190,365 66,282 124,083 500 Capital Outlay 14,600 - 14,600 600 Other Objects 379,726 364,423 15,303
258 Security:100 Salaries 340,030 340,914 (884) 200 Employee Benefits 152,821 143,591 9,230 300 Purchased Services 2,053,442 1,777,094 276,348 400 Supplies and Materials 15,700 13,604 2,096 600 Other Objects 1,185 665 520
260 Central Support Services:262 Planning, Research, Development, and Evaluation:
100 Salaries 305,503 302,902 2,601 200 Employee Benefits 99,297 99,618 (321)
263 Information Services:100 Salaries 595,631 496,849 98,782 200 Employee Benefits 201,973 182,364 19,609 300 Purchased Services 280,264 117,571 162,693 400 Supplies and Materials 36,650 21,073 15,577 600 Other Objects 44,450 27,700 16,750
264 Staff Services:100 Salaries 1,648,919 1,339,562 309,357 200 Employee Benefits 1,004,398 453,989 550,409 300 Purchased Services 291,500 206,795 84,705 400 Supplies and Materials 54,830 47,883 6,947 600 Other Objects 1,483,405$ 1,481,178 2,227$
(Continued)
92

SCHEDULE A-2
GENERAL FUND
REVISEDBUDGET ACTUAL VARIANCE
FOR THE YEAR ENDED JUNE 30, 2019
LEXINGTON COUNTY SCHOOL DISTRICT ONELEXINGTON, SOUTH CAROLINA
SCHEDULE OF REVENUES, EXPENDITURES, AND CHANGES IN FUND BALANCE -REVISED BUDGET AND ACTUAL
266 Technology and Data Processing Services:100 Salaries 3,679,329$ 3,540,520 138,809$ 200 Employee Benefits 1,350,203 1,346,335 3,868 300 Purchased Services 4,315,079 3,680,413 634,666 400 Supplies and Materials 956,210 804,539 151,671 500 Capital Outlay 160,000 131,749 28,251 600 Other Objects 5,350 2,486 2,864
TOTAL SUPPORT SERVICES 116,465,951 105,729,761 10,736,190
TOTAL EXPENDITURES 279,054,495 260,905,046 18,149,449
OTHER FINANCING SOURCES (USES)
Interfund Transfers, From (To) Other Funds:
5220 Transfer from Special Revenue 20,000 - (20,000) 5230 Transfer from Special Revenue EIA Fund 7,876,083 8,258,572 382,489 5280 Transfer from Other Funds Indirect Costs 345,710 1,014,411 668,701
Interfund Transfers, From (To) Other Funds (Continued):423-710 Transfer to Debt Service Fund (7,000) (7,235) (235) 424-710 Transfer to Capital Projects Fund - (8,500,000) (8,500,000) 425-710 Transfer to Food Service Fund (1,500,000) (1,483,170) 16,830
TOTAL OTHER FINANCING SOURCES (USES) 6,734,793 (717,422) (7,452,215)
EXCESS (DEFICIENCY) OF REVENUES OVER EXPENDITURES (9,000,018) 5,611,712 14,611,730
FUND BALANCE, Beginning of the Year 51,930,488 51,930,488 -
FUND BALANCE, End of Year 42,930,470$ 57,542,200 14,611,730$
93

(This page intentionally left blank)
94

Special Revenue Funds To account for the operations of federal and state projects that are required to be accounted for in separate funds by the South Carolina State Department of Education.
Special Revenue – used to account for legally restricted federal, state, and local revenues with specific educational mandates.
Education Improvement Act – used to account for legally restricted state revenues appropriated by the State of South Carolina under the SC Education Improvement Act of 1984.
Food Service – used to account for all activities necessary to provide food services to the students of the district.
95

LEXINGTON COUNTY SCHOOL DISTRICT ONELEXINGTON, SOUTH CAROLINA
SPECIAL REVENUE FUNDS
SCHEDULE OF REVENUES, EXPENDITURES AND CHANGES IN FUND BALANCE
FOR THE YEAR ENDED JUNE 30, 2019
Title I IDEA(BA Projects) (CA Projects)
(201/202) (203/204)REVENUES
1000 Revenue from Local Sources:
1900 Other Revenue from Local Sources:1930 Special Needs Transportation - Medicaid -$ -1990 Miscellaneous Local Revenue:
1999 Revenue from Other Local Sources - -
Total Revenue from Local Sources - -
2000 Intergovernmental Revenue:
2300 Payments from Non-Profit Entities (for First Steps) - -
Total Intergovernmental Revenue - -
3000 Revenue from State Sources:
3100 Restricted State Funding:3110 Occupational Education:
3113 12-Month Agriculture Program - -3118 EEDA Career Specialists - -
3120 General Education:3127 Student Health and Fitness - PE Teachers - -
3130 Special Programs:3135 Reading Coaches - -3136 Student Health and Fitness - Nurses - -
3150 Adult Education: 3156 Adult Education - -
3190 Miscellaneous Restricted State Grants:3193 Education License Plates - -3199 Other Restricted State Grants - -
3600 Education Lottery Act Revenue:3670 School Safety - Facility and Infrastructure Safety Upgrades - -
3900 Other State Revenue:3994 PEBA Nonemployer Contribution - -3999 Revenue from Other State Sources - -
Total Revenue from State Sources - -
4000 Revenue from Federal Sources
4200 Occupational Education:4210 Perkins Aid, Title I- Career and Technical Education- Basic Grants to States - -
4300 Elementary and Secondary Education Act of 1965 (ESEA):4310 Title I, Basic State Grant Programs (Carryover Provision) 3,236,682 -4341 Language Instruction for Limited English Proficient
and Immigrant students, Title III (Carryover Provision) - -4343 McKinney-Vento Education for Homeless Children and Youth Program - -4351 Improving Teacher Quality (Carryover Provision) - -
4400 Adult Education:4410 Basic Adult Education -$ -
96

SCHEDULE B-1
OtherDesignated Other
Preschool Adult Restricted SpecialHandicapped CATE Education* State Revenue(CG Projects) (VA Projects) (EA/ED Projects) Grants* Programs*
(205/206) (207/208) (243) (900s) (200s/800s) Totals
- - - - 990,077 990,077$
- - - - 215,835 215,835
- - - - 1,205,912 1,205,912
- - - - 98,626 98,626
- - - - 98,626 98,626
- - - - 56,016 56,016 - - - 1,162,109 - 1,162,109
- - - 235,815 - 235,815
- - - 1,037,884 - 1,037,884 - - - 494,644 - 494,644
- - - 10,490 - 10,490
- - - 4,197 - 4,197 - - - - 2,941 2,941
- - - 60,000 - 60,000
- - - 2,103,936 - 2,103,936 - - - - 29,930 29,930
- - - 5,109,075 88,887 5,197,962
- 290,900 - - - 290,900
- - - - 214,520 3,451,202
- - - - 69,673 69,673 - - - - 49,784 49,784 - - - - 381,375 381,375
- - 125,919 - - 125,919$
(Continued)
97

LEXINGTON COUNTY SCHOOL DISTRICT ONELEXINGTON, SOUTH CAROLINA
SPECIAL REVENUE FUNDS
SCHEDULE OF REVENUES, EXPENDITURES AND CHANGES IN FUND BALANCE
FOR THE YEAR ENDED JUNE 30, 2019
Title I IDEA(BA Projects) (CA Projects)
(201/202) (203/204)
4500 Programs for Children with Disabilities:4510 Individuals with Disabilities Education Act (IDEA) (Carryover Provision) -$ 4,373,904
4520 Pre-School Grants for Children with Disabilities (IDEA) (Carryover Provision) - -
4900 Other Federal Sources:4924 21st Century Community Learning Center Program (Title IV, 21st Century Schools) - -4997 Title IV - SSAE - -4999 Revenue from Other Federal Sources - -
Total Revenue from Federal Sources 3,236,682 4,373,904
TOTAL REVENUE ALL SOURCES 3,236,682 4,373,904
EXPENDITURES
100 Instruction:110 General Instruction:
111 Kindergarten Programs:400 Supplies and Materials - -
112 Primary Programs:100 Salaries 511,338 -200 Employee Benefits 212,864 -300 Purchased Services 69,848 -400 Supplies and Materials 428,889 -
113 Elementary Programs:100 Salaries 134,967 -200 Employee Benefits 56,122 -300 Purchased Services 17,016 -400 Supplies and Materials 75,269 -600 Other Objects - -
114 High School Programs:100 Salaries - -200 Employee Benefits - -400 Supplies and Materials - -600 Other Objects - -
115 Career and Technology Education Program:100 Salaries - -200 Employee Benefits - -300 Purchased Services - Other than Tuition - -400 Supplies and Materials - -
116 CATE (Vocational) Programs - Middle Schools:100 Salaries - -200 Employee Benefits - -300 Purchased Services - -400 Supplies and Materials - -
120 Exceptional Programs121 Educable Mentally Handicapped:
100 Salaries - 264,813 200 Employee Benefits - 129,888 300 Purchased Services - 535 400 Supplies and Materials - 665
122 Trainable Mentally Handicapped:100 Salaries - 404,275 200 Employee Benefits - 222,672 400 Supplies and Materials -$ 449
98

SCHEDULE B-1
OtherDesignated Other
Preschool Adult Restricted SpecialHandicapped CATE Education* State Revenue(CG Projects) (VA Projects) (EA/ED Projects) Grants* Programs*
(205/206) (207/208) (243) (900s) (200s/800s) Totals
- - - - - 4,373,904$
215,090 - - - - 215,090
- - - - 336,735 336,735 - - - - 99,400 99,400 - - - - 171,769 171,769
215,090 290,900 125,919 - 1,323,256 9,565,751
215,090 290,900 125,919 5,109,075 2,716,681 16,068,251
- - - - 401 401
- - - 67,039 90,954 669,331 - - - 26,153 33,043 272,060 - - - - 3,426 73,274 - - - - 41,188 470,077
- - - 101,051 34,405 270,423 - - - 41,571 9,878 107,571 - - - - 5,850 22,866 - - - 4,197 80,173 159,639 - - - - 2,969 2,969
- - - - 105,927 105,927 - - - - 31,878 31,878 - - - - 2,989 2,989 - - - - 680 680
- 67,032 - - 113,753 180,785 - 31,600 - - 43,285 74,885 - 84,463 - - - 84,463 - 15,172 - - 13,487 28,659
- - - - 8,892 8,892 - - - 3,507 3,507 - 250 - - - 250 - 15,471 - - - 15,471
- - - - - 264,813 - - - - - 129,888 - - - - - 535 - - - - - 665
- - - - 2,321 406,596 - - - - 620 223,292 - - - - - 449$
(Continued)
99

LEXINGTON COUNTY SCHOOL DISTRICT ONELEXINGTON, SOUTH CAROLINA
SPECIAL REVENUE FUNDS
SCHEDULE OF REVENUES, EXPENDITURES AND CHANGES IN FUND BALANCE
FOR THE YEAR ENDED JUNE 30, 2019
Title I IDEA(BA Projects) (CA Projects)
(201/202) (203/204)
123 Orthopedically Handicapped100 Salaries -$ 17,018 200 Employee Benefits - 6,456
124 Visually Handicapped:100 Salaries - 229 200 Employee Benefits - 64 300 Purchased Services - 8,365 400 Supplies and Materials - 1,683
125 Hearing Handicapped:100 Salaries - 1,775 200 Employee Benefits - 498 300 Purchased Services - 9,376 400 Supplies and Materials - 11,326 600 Other Objects - 200
126 Speech Handicapped:100 Salaries - 13,134 200 Employee Benefits - 3,708 300 Purchased Services - 4,176 400 Supplies and Materials - 7,642 600 Other Objects - 450
127 Learning Disabilities:100 Salaries - 766,789 200 Employee Benefits - 380,080 300 Purchased Services - 45,659 400 Supplies and Materials - 67,678
128 Emotionally Handicapped:100 Salaries - 64,202 200 Employee Benefits - 25,685
129 Coordinated Early Intervening Services:100 Salaries 335,492 -200 Employee Benefits 130,144 -
130 Preschool Programs:132 Preschool Handicapped Itinerant(5 Yr. olds):
100 Salaries - 45,836 200 Employee Benefits - 20,261
133 Preschool Handicapped Self/Contained (5-Yr. Olds):100 Salaries - 112,014 200 Employee Benefits - 58,510
135 Preschool Handicapped Speech (3 & 4-Yr. Olds): 400 Supplies and Materials - -
136 Preschool Handicapped Itinerant (3 & 4-Yr. Olds):100 Salaries - -200 Employee Benefits - -
137 Preschool Handicapped Self-Containted (3 & 4-Yr. Olds):100 Salaries - 81,827 200 Employee Benefits - 42,158 400 Supplies and Materials - -
140 Special Programs149 Other Special Programs:
100 Salaries 14,330 -200 Employee Benefits 3,614$ -
100

SCHEDULE B-1
OtherDesignated Other
Preschool Adult Restricted SpecialHandicapped CATE Education* State Revenue(CG Projects) (VA Projects) (EA/ED Projects) Grants* Programs*
(205/206) (207/208) (243) (900s) (200s/800s) Totals
- - - - - 17,018$ - - - - - 6,456
- - - - 36,319 36,548 - - - - 13,932 13,996 - - - - - 8,365 - - - - - 1,683
- - - - - 1,775 - - - - - 498 - - - - - 9,376 - - - - 2,655 13,981 - - - - - 200
- - - - 48,191 61,325 - - - - 16,141 19,849 - - - - - 4,176 - - - - - 7,642 - - - - - 450
- - - - 66,292 833,081 - - - - 23,546 403,626 - - - - - 45,659 - - - - - 67,678
- - - - - 64,202 - - - - - 25,685
- - - - - 335,492 - - - - - 130,144
- - - - 24,924 70,760 - - - - 10,676 30,937
- - - - - 112,014 - - - - - 58,510
3,584 - - - - 3,584
21,730 - - - - 21,730 6,165 - - - - 6,165
23,064 - - - - 104,891 11,192 - - - - 53,350
5,630 - - - - 5,630
- - - - - 14,330 - - - - - 3,614$
(Continued)
101

LEXINGTON COUNTY SCHOOL DISTRICT ONELEXINGTON, SOUTH CAROLINA
SPECIAL REVENUE FUNDS
SCHEDULE OF REVENUES, EXPENDITURES AND CHANGES IN FUND BALANCE
FOR THE YEAR ENDED JUNE 30, 2019
Title I IDEA(BA Projects) (CA Projects)
(201/202) (203/204)
160 Other Exceptional Programs:161 Autism:
100 Salaries -$ 278,254 200 Employee Benefits - 154,815 300 Purchased Services - 10,876 400 Supplies and Materials - 1,746
162 Limited English Proficiency300 Purchased Services - -400 Supplies and Materials - -
170 Summer School Programs171 Primary Summer School:
100 Salaries 11,140 -200 Employee Benefits 3,148 -300 Purchased Services - -400 Supplies and Materials - -
172 Elementary School Summer School100 Salaries - -200 Employee Benefits - -300 Purchased Services - -400 Supplies and Materials - -
173 High School Summer School400 Supplies and Materials - -600 Other Objects - -
175 Instructional Programs Beyond Regular School Day:100 Salaries 69,121 -200 Employee Benefits 19,071 -300 Purchased Services - -400 Supplies and Materials 75 -
180 Adult/Continuing Educational Programs181 Adult Education Basic Program:
100 Salaries - -200 Employee Benefits - -
182 Adult Secondary Education Programs:100 Salaries - -200 Employee Benefits - -
183 Adult English Literacy:100 Salaries - -200 Employee Benefits - -400 Supplies and Materials - -
188 Parenting/Family Literacy:100 Salaries 187,504 -200 Employee Benefits 93,447 -300 Purchased Services 11,641 -400 Supplies and Materials 45,649 -600 Other Objects 4,604 -
Total Instruction 2,435,293 3,265,787
200 Support Services:210 Pupil Services:
212 Guidance Services:100 Salaries - -200 Employee Benefits - -300 Purchased Services - -400 Supplies and Materials -$ -
102

SCHEDULE B-1
OtherDesignated Other
Preschool Adult Restricted SpecialHandicapped CATE Education* State Revenue(CG Projects) (VA Projects) (EA/ED Projects) Grants* Programs*
(205/206) (207/208) (243) (900s) (200s/800s) Totals
- - - - 58,676 336,930$ - - - - 22,032 176,847 - - - - - 10,876 - - - - - 1,746
- - - - 6,425 6,425 - - - - 1,151 1,151
- - - - 9,305 20,445 - - - - 2,496 5,644 - - - - 2,168 2,168 - - - - 4,036 4,036
- - - - 27,833 27,833 - - - - 6,217 6,217 - - - - 2,500 2,500 - - - - 110,387 110,387
- - - - 881 881 - - - - 447 447
- - - - 140,307 209,428 - - - - 36,966 56,037 - - - - 22,015 22,015 - - - - 32,414 32,489
- - 8,000 - - 8,000 - - 2,260 - - 2,260
- - 29,431 - - 29,431 - - 6,951 - - 6,951
- - 54,091 - - 54,091 - - 15,206 - - 15,206 - - 3,756 - - 3,756
- - - - 65,768 253,272 - - - - 26,166 119,613 - - - - 2,130 13,771 - - - - 9,909 55,558 - - - - 6,924 11,528
71,365 213,988 119,695 240,011 1,469,455 7,815,594
- - - 284,353 - 284,353 - - - 108,122 - 108,122 - 2,478 - - - 2,478 - 2,659 - - - 2,659$
(Continued)
103

LEXINGTON COUNTY SCHOOL DISTRICT ONELEXINGTON, SOUTH CAROLINA
SPECIAL REVENUE FUNDS
SCHEDULE OF REVENUES, EXPENDITURES AND CHANGES IN FUND BALANCE
FOR THE YEAR ENDED JUNE 30, 2019
Title I IDEA(BA Projects) (CA Projects)
(201/202) (203/204)
213 Health Services:100 Salaries -$ 373 200 Employee Benefits - 105 300 Purchased Services - -400 Supplies and Materials - 17,241 600 Other Objects - -
214 Psychological:100 Salaries - 457 200 Employee Benefits - 129 300 Purchased Services - 10,863 400 Supplies and Materials - 16,301 600 Other Objects - 600
215 Exceptional Program Services:100 Salaries - 116,409 200 Employee Benefits - 43,977 300 Purchased Services - 9,007 400 Supplies and Materials - 16,314
217 Career Specialist Service:100 Salaries - -200 Employee Benefits - -
220 Instructional Staff Services:221 Improvement of Instruction - Curriculum Development:
100 Salaries 137,123 -200 Employee Benefits 62,642 -300 Purchased Services - -
222 Library & Media:400 Supplies and Materials - -
223 Supervision of Special Programs:100 Salaries 103,894 441,086 200 Employee Benefits 37,970 170,383 300 Purchased Services 2,241 13,207 400 Supplies and Materials 1,945 3,542 600 Other Objects - 694
224 Improvement of Instruction-Inservice Training:100 Salaries 12,800 4,838 200 Employee Benefits 3,278 1,362 300 Purchased Services 261,168 3,874 400 Supplies and Materials 14,001 164 600 Other Objects 748 1,043
250 Finance and Operations Services:251 Student Transportation (Federal/District Mandated):
100 Salaries 2,440 15,723 200 Employee Benefits 686 4,432 300 Purchased Services 465 -
252 Fiscal Services:100 Salaries - -200 Employee Benefits - -300 Purchased Services - -
254 Operations and Maintenance:100 Salaries - -200 Employee Benefits - -400 Supplies and Materials - -
258 Security:400 Supplies and Materials - -500 Capital Outlay -$ -
104

SCHEDULE B-1
OtherDesignated Other
Preschool Adult Restricted SpecialHandicapped CATE Education* State Revenue(CG Projects) (VA Projects) (EA/ED Projects) Grants* Programs*
(205/206) (207/208) (243) (900s) (200s/800s) Totals
- - - 350,569 18,143 369,085$ - - - 144,075 11,057 155,237 - - - - 89,015 89,015 - - - - - 17,241 - - - - - -
- - - - 78,574 79,031 - - - - 31,411 31,540 - - - - - 10,863 - - - - - 16,301 - - - - - 600
- - - - 39,924 156,333 - - - - 14,912 58,889 - - - - - 9,007 - - - - - 16,314
- - - 571,066 - 571,066 - - - 198,568 - 198,568
- - - 893,951 - 1,031,074 - - - 143,933 - 206,575 - 9,223 - - - 9,223
- - - - 299 299
97,475 - - - - 642,455 32,237 - - - - 240,590
3,381 - - 5,893 - 24,722 - - - - - 5,487 - - - - - 694
- - - - 112,691 130,329 - - - - 46,750 51,390 - 48,763 - - 166,924 480,729 - - - - - 14,165 - - - - 1,078 2,869
- - - - 62,960 81,123 - - - - 17,591 22,709 - - - - 48,823 49,288
- - - - 2,709 2,709 - - - - 756 756 - - - - 4,533 4,533
- - - - 2,193 2,193 - - - - 601 601 - - - 4,598 3,373 7,971
- - - 60,000 34,289 94,289 - - - - 33,918 33,918$
(Continued)
105

LEXINGTON COUNTY SCHOOL DISTRICT ONELEXINGTON, SOUTH CAROLINA
SPECIAL REVENUE FUNDS
SCHEDULE OF REVENUES, EXPENDITURES AND CHANGES IN FUND BALANCE
FOR THE YEAR ENDED JUNE 30, 2019
Title I IDEA(BA Projects) (CA Projects)
(201/202) (203/204)
270 Support Services - Pupil Activity 271 Pupil Services Activities 600 Other Objects -$ -
Total Support Services 641,401 892,124
300 Community Services:360 Welfare Services:
400 Supplies and Materials - -370 Non Public School Services:
400 Supplies and Materials - -390 Other Community Services:
100 Salaries - -200 Employee Benefits - -300 Purchased Services - -400 Supplies and Materials - -600 Other Objects - -
Total Community Services - -
410 Intergovernmental Expenditures:411 Payments to SDE:
720 Transits - -419 Payments from PEBA Nonemployer Contributions:
720 Transits - -
Total Intergovernmental Expenditures - -
TOTAL EXPENDITURES 3,076,694 4,157,911
OTHER FINANCING SOURCES (USES)
Interfund Transfers, From (To) Other Funds:431-791 Special Revenue Fund Indirect Costs
(Use Only for Transfer of Indirect Costs to General Fund) (159,988) (215,993)
TOTAL OTHER FINANCING SOURCES (USES) (159,988) (215,993)
EXCESS (DEFICIENCY) OF REVENUES OVER EXPENDITURES - -
FUND BALANCE, Beginning of Year - -
FUND BALANCE, End of Year -$ -
106

SCHEDULE B-1
OtherDesignated Other
Preschool Adult Restricted SpecialHandicapped CATE Education* State Revenue(CG Projects) (VA Projects) (EA/ED Projects) Grants* Programs*
(205/206) (207/208) (243) (900s) (200s/800s) Totals
- - - - 2,000 2,000$
133,093 63,123 - 2,765,128 824,524 5,319,393
- - - - 5,203 5,203
- - - - 3,661 3,661
- - - - 30,832 30,832 - - - - 7,321 7,321 - - - - 1,172 1,172 - - - - 8,876 8,876 - - - - 6,902 6,902
- - - - 63,967 63,967
- - - - 290,015 290,015
- - - 2,103,936 - 2,103,936
- - - 2,103,936 290,015 2,393,951
204,458 277,111 119,695 5,109,075 2,647,961 15,592,905
(10,632) (13,789) (6,224) - (59,764) (466,390)
(10,632) (13,789) (6,224) - (59,764) (466,390)
- - - - 8,956 8,956
- - - - 607,475 607,475
- - - - 616,431 616,431$
107

Schedule B-2
OTHER DESIGNATED RESTRICTED STATE GRANTS
91900 Education License Plates92800 EEDA Career Specialists93500 Reading Coaches93600 Student Health and Fitness - Nurses93700 Student Health and Fitness - PE Teachers95600 Adult Education97000 School Safety Infrastructure
OTHER SPECIAL REVENUE PROGRAMS
22100/22110 Title I - Neglected and Delinquent22400/22401 21st Century - PES22430/22431 21st Century - FPE22440/22441 21st Century - PMS
22450 21st Century - Summer Bridge Program - FPE22460 21st Century - Summer Bridge Program - FPE22470 21st Century - Summer Bridge Program - PMS22490 21st Century - Summer Bridge Program - PES
23200/23210 McKinney-Vento Homeless23220 McKinney-Vento Homeless Suppl23800 Title I Support24000 Title I Direct Stud Svcs26400 Language Instruction - Title III26700 Improving Teacher Quality26710 Improving Teacher Quality27100 Medicaid27210 ROTC - Army - PHS27220 ROTC - Air Force - LHS27230 ROTC - Navy - WKHS80010 MCEC Bright Ideas Grant80020 MCEC Bright Ideas Grant80030 MCEC Bright Ideas Grant80040 MCEC Bright Ideas Grant80050 MCEC Bright Ideas Grant81350 National FFA Grant81410 CDBG - Lexington County81500 SC Arts Commission Grant81600 Walmart Foundation81700 SCSBIT Risk Control Grant
81750/81751 Childrens Trust of SC Grant81900 Parenting - Rotary81910 Rotary Club of Lexington81920 United Way Reading Grant81950 NBT Manufacturing Camp Grant82000 Lexington Sertoma Club82060 Sertoma Community Grant82090 Gene Haas Foundation82091 Gene Haas Foundation82092 Gene Haas Foundation82120 SCHLHC Parenting82190 State Credit Union Grant82200 Reading Recovery Grant82600 DHEC Recycling Grants82630 Tobacco Free SD82850 AXA Scholarship Grant83000 Dollar General Grant83720 Target Field Trip Grant
83800/83810 Donors Choose83900 PMD State Supplement84200 Lowes Toolbox for Education86700 Youth Risk Behavior Survey87000 12 Month Agriculture
SPECIAL REVENUE FUND
LEXINGTON, SOUTH CAROLINALEXINGTON COUNTY SCHOOL DISTRICT ONE
SUPPLEMENTAL LISTING OF LEA SUBFUND CODES AND TITLES
YEAR ENDED JUNE 30, 2019
108

Schedule B-3
SpecialRevenue
Interfund Other Fund FundTransfers Transfers Unearned
Subfund Revenue Programs Revenues Expenditures In(Out) In(out) Revenue
91900 3193 Education License Plates 4,197$ 4,197 - - -$
92800 3118 EEDA Career Specialists 1,162,109 1,162,109 - - -
93500 3135 Reading Coaches 1,037,884 1,037,884 - - -
93600 3136 Student Health and Fitness - Nurses 494,644 494,644 - - -
93700 3127 Student Health and Fitness - PE Teachers 235,815 235,815 - - 185,258
95600 3156 Adult Education 10,490 10,490 - - 1,228
99400 3994 PEBA Nonemployer Contributions 2,103,936 2,103,936 - - -
97000 3670 School Safety Infrastructure 60,000 60,000 - - 115,000
5,109,075$ 5,109,075 - - 301,486$
Special Revenue
Totals
LEXINGTON COUNTY SCHOOL DISTRICT ONELEXINGTON, SOUTH CAROLINA
SPECIAL REVENUE FUND
SUMMARY SCHEDULE FOR OTHER DESIGNATED RESTRICTED STATE GRANTS
FOR THE YEAR ENDED JUNE 30, 2019
109

Schedule B-4
LEXINGTON COUNTY SCHOOL DISTRICT ONELEXINGTON, SOUTH CAROLINA
EDUCATION IMPROVEMENT ACT
SCHEDULE OF REVENUES, EXPENDITURES, AND CHANGES IN FUND BALANCE - ALL PROGRAMS
YEAR ENDED JUNE 30, 2019
ACTUAL
REVENUES
3000 Revenue from State Sources:3500 Education Improvement Act:
25,598$ 359,958
11,288 189,991 121,234
67,273 92,707 44,939
564,883 2,641,414
1,0772,132,474
710,867 6,852,790 1,405,782
312,512 196,491
63,807 6,518
553,575 51,093
506,194
3502 ADEPT3507 Aid to Districts-Technology3509 Arts in Education3511 Professional Development3518 Adoption List of Formative Assessment3519 Grade 10 Assessments3526 Refurbishment of K-8 Science Kits3528 Industry Certificates3529 Career and Technology Education3532 National Board Salary Supplement (No Carryover Provision)3533 Teacher of the Year Awards (No Carryover Provision)3538 Students at Risk of School Failure3540 Early Childhood Program (4K Programs Serving Four-Year-Old Children) 3550 Teacher Salary Increase (No Carryover Provision)3555 Teacher Salary Fringe (No Carryover Provision)3556 Adult Education3557 Summer Reading3558 Reading3571 State Priority School Revenue3577 Teacher Supplies (No Carryover Provision)3595 EEDA - Supplies and Materials3597 Aid to Districts3599 Other EIA 186,146
Total Revenue from State Sources 17,098,611
TOTAL REVENUE ALL SOURCES 17,098,611
EXPENDITURES
100 Instruction:110 General Instruction:
111 Kindergarten Programs:100 Salaries 93,219 200 Employee Benefits 26,071$
(Continued)
110

Schedule B-4
LEXINGTON COUNTY SCHOOL DISTRICT ONELEXINGTON, SOUTH CAROLINA
EDUCATION IMPROVEMENT ACT
SCHEDULE OF REVENUES, EXPENDITURES, AND CHANGES IN FUND BALANCE - ALL PROGRAMS
YEAR ENDED JUNE 30, 2019
ACTUAL
112 Primary Programs:100 Salaries 353,147$ 200 Employee Benefits 108,135 300 Purchased Services 757400 Supplies and Materials 43,250
113 Elementary Programs:100 Salaries 717,937 200 Employee Benefits 224,059 300 Purchased Services 165,178 400 Supplies and Materials 977,019
114 High School Programs:100 Salaries 512,880 200 Employee Benefits 143,297 300 Purchased Services 97,761 400 Supplies and Materials 3,545
115 Career and Technology Education Program:100 Salaries 77,500 200 Employee Benefits 21,557 300 Purchased Services - Other Than Tuition 42,378 400 Supplies and Materials 305,759 500 Capital Outlay 116,980 600 Other Objects 1,047
116 CATE Middle School Programs:400 Supplies and Materials 25,995 500 Capital Outlay 5,900
120 Exceptional Programs:121 Educable Mentally Handicapped:
100 Salaries 5,000200 Employee Benefits 1,396
122 Trainable Mentally Handicapped:100 Salaries 7,500200 Employee Benefits 2,075
124 Visually Handicapped:100 Salaries 7,500200 Employee Benefits 2,105
125 Hearing Handicapped:100 Salaries 15,000 200 Employee Benefits 4,170$
(Continued)
111

Schedule B-4
LEXINGTON COUNTY SCHOOL DISTRICT ONELEXINGTON, SOUTH CAROLINA
EDUCATION IMPROVEMENT ACT
SCHEDULE OF REVENUES, EXPENDITURES, AND CHANGES IN FUND BALANCE - ALL PROGRAMS
YEAR ENDED JUNE 30, 2019
ACTUAL
126 Speech Handicapped:100 Salaries 20,250$ 200 Employee Benefits 5,611
127 Learning Disabilities:100 Salaries 81,250 200 Employee Benefits 22,710
128 Emotionally Handicapped:100 Salaries 7,500200 Employee Benefits 2,071
129 Coordinated Early Intervening Services (CEIS):100 Salaries 675,318 200 Employee Benefits 284,461
130 Preschool Programs:132 Preschool Handicapped Self-Contained (5-Yr. Olds):
100 Salaries 7,066200 Employee Benefits 1,973
139 Early Childhood Programs:100 Salaries 850,879 200 Employee Benefits 395,504 300 Purchased Services 450 400 Supplies and Materials 102,486
140 Special Programs:141 Gifted and Talented:
100 Salaries 15,000 200 Employee Benefits 4,193
145 Homebound:100 Salaries 7,500200 Employee Benefits 2,094
149 Other Special Programs:100 Salaries 1,132200 Employee Benefits 208
160 Other Exceptional Programs:161 Autism:
100 Salaries 22,500 200 Employee Benefits 6,278
162 Limited English Proficiency:100 Salaries 27,500 200 Employee Benefits 7,681$
(Continued)
112

Schedule B-4
LEXINGTON COUNTY SCHOOL DISTRICT ONELEXINGTON, SOUTH CAROLINA
EDUCATION IMPROVEMENT ACT
SCHEDULE OF REVENUES, EXPENDITURES, AND CHANGES IN FUND BALANCE - ALL PROGRAMS
YEAR ENDED JUNE 30, 2019
ACTUAL
170 Summer School Programs:171 Primary Summer School:
100 Salaries 69,141$ 200 Employee Benefits 19,361 300 Purchased Services 478400 Supplies and Materials 64,871 600 Other Objects 973
172 Elementary Summer School:100 Salaries 18,614 200 Employee Benefits 5,438300 Purchased Services 550400 Supplies and Materials 1,500
180 Adult/Continuing Education Programs:181 Adult Basic Educational Programs:
100 Salaries 23,050 200 Employee Benefits 5,706
182 Adult Secondary Education Programs:100 Salaries 45,057 200 Employee Benefits 10,721 300 Purchased Services 4,251400 Supplies and Materials 17,841
183 Adult English Literacy100 Salaries 7,801200 Employee Benefits 2,205
188 Parenting/Family Literacy:100 Salaries 42,409 200 Employee Benefits 15,581 300 Purchased Services 4,339
Total Instruction 7,019,619
200 Support Services:210 Pupil Services:
212 Guidance Services:100 Salaries 90,000 200 Employee Benefits 25,037 300 Purchased Services 47,271 400 Supplies and Materials 3,381$
(Continued)
113

Schedule B-4
LEXINGTON COUNTY SCHOOL DISTRICT ONELEXINGTON, SOUTH CAROLINA
EDUCATION IMPROVEMENT ACT
SCHEDULE OF REVENUES, EXPENDITURES, AND CHANGES IN FUND BALANCE - ALL PROGRAMS
YEAR ENDED JUNE 30, 2019
ACTUAL
213 Health Services:100 Salaries 44,113$ 200 Employee Benefits 12,466
217 Career Specialist Services300 Purchased Services 441
220 Instructional Staff Services:221 Improvement of Instruction-Curriculum Development:
100 Salaries 340,046 200 Employee Benefits 358,616 300 Purchased Services 6,076400 Supplies and Materials 7,067
222 Library and Media:100 Salaries 45,000 200 Employee Benefits 12,541
223 Supervision of Special Programs:100 Salaries 155,852
200 Employee Benefits 55,448
300 Purchased Services 5,633
400 Supplies and Materials 3,580
224 Improvement of Instruction- Inservice and Staff Training:100 Salaries 96,675 200 Employee Benefits 36,399 300 Purchased Services 247,401 400 Supplies and Materials 19,041 600 Other Objects 90
250 Finance and Operations Services:255 Student Transportation (State Mandated):
100 Salaries 13,463 200 Employee Benefits 3,912300 Purchased Services 18,127
266 Technology and Data Processing Services:400 Supplies 160,974 500 Capital Outlay 11,770
Total Support Services 1,820,420
TOTAL EXPENDITURES 8,840,039$
(Continued)
114

Schedule B-4
LEXINGTON COUNTY SCHOOL DISTRICT ONELEXINGTON, SOUTH CAROLINA
EDUCATION IMPROVEMENT ACT
SCHEDULE OF REVENUES, EXPENDITURES, AND CHANGES IN FUND BALANCE - ALL PROGRAMS
YEAR ENDED JUNE 30, 2019
ACTUAL
OTHER FINANCING SOURCES (USES)
420-710 Transfer to General Fund (Exclude Indirect Costs) (8,258,572)$
TOTAL OTHER FINANCING SOURCES (USES) (8,258,572)
EXCESS (DEFICIENCY) OF REVENUES OVER EXPENDITURES -
FUND BALANCES, Beginning of the Year -
FUND BALANCES, End of Year -$
115

Schedule B-5
EIA Interfund Other Fund EIA FundTransfers Transfers Unearned
Program Revenues Expenditures In/(Out) In/(Out) Revenue
3500 Education Improvement Act:
3502 ADEPT 25,598$ 25,598 - - 25,936$ 3507 Aid to Districts-Technology 359,958 359,958 - - 10,641 3509 Arts in Education 11,288 11,288 - - - 3511 Professional Development 189,991 189,991 - - - 3518 Adoption List of Formative Assessment 121,234 121,234 - - 142,372 3519 Grade 10 Assesments 67,273 67,273 - - 66,123 3526 Refurbishment of K-8 Science Kits 92,707 92,707 - - 70,209 3528 Industry Certificates 44,939 44,939 - - 187,216 3529 Career and Technology Education 564,883 564,883 - - 164,709 3532 National Board Salary Supplement* 2,641,414 2,641,414 - - - 3533 Teacher of the Year Awards* 1,077 1,077 - - - 3538 Students at risk of School Failure 2,132,474 2,132,474 - - 1,939,302 3540 Early Childhood Program (4k Programs Serving
Four-Year-Old Children) 710,867 710,867 - - 263,971 3550 Teacher Salary Increase* 6,852,790 - - (6,852,790) - 3555 Teacher Salary Fringe* 1,405,782 - - (1,405,782) - 3556 Adult Education 312,512 312,512 - - 137,304 3557 Summer Reading 196,491 196,491 - - 168,733 3558 Reading 63,807 63,807 - - - 3571 State Priority School 6,518 6,518 - - 133,482 3577 Teacher Supplies* 553,575 553,575 - - - 3595 EEDA - Supplies and Materials 51,093 51,093 - - 39,032 3597 Aid to Districts 506,194 506,194 - - 357,242 3599 Other EIA 186,146 186,146 - - 35,147
Totals 17,098,611$ 8,840,039 - (8,258,572) 3,741,419$
*No carryover provision for Fiscal Year 2019
YEAR ENDED JUNE 30, 2019
LEXINGTON COUNTY SCHOOL DISTRICT ONELEXINGTON, SOUTH CAROLINA
EDUCATION IMPROVEMENT ACT
SUMMARY SCHEDULE BY PROGRAM
116

Schedule B-6LEXINGTON COUNTY SCHOOL DISTRICT ONE LEXINGTON, SOUTH CAROLINA
DETAILED SCHEDULE OF DUE TO STATE DEPARTMENT OF EDUCATION/FEDERAL GOVERNMENT
YEAR ENDED JUNE 30, 2019
Amount Due toState Department
of Education Status ofProject/Grant Revenue & or Federal Amount Due
Program Number Subfund Code Description Government to GrantorsOverpayment to the
Arts in Education N/A 3509/3090 District by the SDE 1,212$ N/AOverpayment to the
NBC Salary Supplement N/A 3532/332 District by the SDE 11,644 N/AOverpayment to the
Summer Reading Program N/A 3557/3572 District by the SDE 2,038 N/AOverpayment to the
EIA Other N/A 3599/3990 District by the SDE 855 N/A15,749$
117

Schedule B-7
LEXINGTON COUNTY SCHOOL DISTRICT ONELEXINGTON, SOUTH CAROLINA
FOOD SERVICE FUND
SCHEDULE OF REVENUES, EXPENDITURES AND CHANGES IN FUND BALANCE
YEAR ENDED JUNE 30, 2019
ACTUAL REVENUES
1000 Revenue from Local Sources:
1500 Earnings on Investments: 1510 Interest on Investments 342$
1600 Food Services: 1610 Lunch Sales to Pupils 2,792,268 1620 Breakfast Sales to Pupils 171,714 1630 Special Sales to Pupils 1,220,754 1640 Lunch Sales to Adults 195,108 1650 Breakfast Sales to Adults 15,118 1660 Special Sales to Adults 147,659
1900 Other Revenue from Local Sources: 1950 Refund of Prior Year's Expenditures (Include only if Expenditure Occurred Last Year 8,329 and the Refund This Year) 1999 Revenue from Other Local Sources 276,969
Total Revenue From Local Sources 4,828,261
4000 Revenue from Federal Sources:
4800 USDA Reimbursement: 4810 School Lunch and After School Snacks Program 4,266,205 4830 School Breakfast Program 1,540,850 4870 School Food Equipment Program 25,370 4880 Summer Feeding Programs (SFSP) 55,697
4900 Other Federal Sources: 4991 USDA Commodities (Food Distribution Program)(Carryover Provision) 664,875
Total Revenue from Federal Sources 6,552,997
TOTAL REVENUE ALL SOURCES 11,381,258
EXPENDITURES
256 Food Service: 100 Salaries 3,914,205 200 Employee Benefits 2,127,059 300 Purchased Services (Exclude Gas, Oil, Electricity, Other Heating Fuels, and Direct Purchased Services) 69,992 400 Supplies and Materials (Include Gas, Oil, Electricity, and Other Heating Fuels) 6,055,305 500 Capital Outlay 25,500 600 Other Objects 65,711
Total Food Service 12,257,772
TOTAL EXPENDITURES 12,257,772
OTHER FINANCING SOURCES (USES) Interfund Transfers, From (To) Other Funds:
5210 Transfer from General Fund (Excludes Indirect Costs) 1,483,170432-791 General Fund (Indirect Costs) (548,021)
TOTAL OTHER FINANCING SOURCES (USES) 935,149
EXCESS (DEFICIENCY) OF REVENUES OVER EXPENDITURES 58,635
FUND BALANCE, Beginning of Year 878,407
FUND BALANCE, End of Year 937,042$
118

Debt Service Funds The Debt Service Funds account for resources that will be used to service General Long-term Debt. The following schedule has been prepared in the format mandated by the South Carolina Department of Education. The account numbers shown on the schedule are also mandated by the South Carolina Department of Education.
119

(This page intentionally left blank)
120

Schedule C-1
YEAR ENDED JUNE 30, 2019
District LOSF, Corp.REVENUES1000 Revenue from Local Sources:
1100 Taxes:1110 Ad Valorem Taxes-Including Delinquent (Fiscally Independent LEA) 22,941,337$ -$ 1140 Penalties & Interest on Taxes (Independent) 665,628 - 1190 Other Taxes (Independent) 23,386,767 -
1200 Revenue in Lieu of Taxes:1280 Revenue in Lieu of Taxes (Dependent and Independent) 1,360,290 -
1500 Earnings on Investments:1510 Interest on Investments 390,282 11,832
Total Revenue from Local Sources 48,744,304 11,832
2000 Intergovernmental Revenue:2100 Payments from Other Governmental Units 3,117,488 -
Total Intergovernmental Revenue 3,117,488 -
3000 Revenue from State Sources:3800 State Revenue in Lieu of Taxes:
3820 Homestead Exemption 1,729,338 - 3830 Merchants' Inventory Tax 83,263 - 3840 Manufacturing Exemption 604,980 - 3890 Other State Property Tax Revenues (Includes Motor Carrier Vehicle Tax) 187,549 -
Total Revenue from State Sources 2,605,130 -
TOTAL REVENUE ALL SOURCES 54,466,922 11,832
EXPENDITURES:500 Debt Service:
610 Redemption of Principal 22,335,000 3,800,000 620 Interest 17,909,099 2,275,736 690 Other Objects (Includes Fees for Servicing Bonds) 527,916 7,235
Total Debt Service 40,772,015 6,082,971
TOTAL EXPENDITURES 40,772,015 6,082,971
OTHER FINANCING SOURCES (USES): 5110 Premium on Bonds Sold 7,090,041 - 5130 Issuance of Refunding Bonds 54,525,000 - 441-720 Payment to Refunded Debt Escrow Agent (61,195,000) -
Interfund Transfers, From (To) Other Funds:5210 Transfer from General Fund - 7,235 5240 Transfer from Debt Service - District Fund - 6,075,736 423-710 Transfer to Debt Service Fund - LOSF, Corp. Fund (6,075,736) - 424-710 Transfer to Capital Projects Fund (7,679,864) (11,832)
TOTAL OTHER FINANCING SOURCES (USES) (13,335,559) 6,071,139
EXCESS (DEFICIENCY) OF REVENUES OVER EXPENDITURES 359,348 -
FUND BALANCE, Beginning of Year 13,562,746 -
FUND BALANCE, End of Year 13,922,094$ -$
LEXINGTON COUNTY SCHOOL DISTRICT ONE LEXINGTON, SOUTH CAROLINA
DEBT SERVICE FUNDS
SCHEDULE OF REVENUES, EXPENDITURES, AND CHANGES IN FUND BALANCES
121

(This page intentionally left blank)
122

Capital Projects Fund The Capital Projects Fund accounts for financial resources to be used for the acquisition and construction of major capital facilities. The following schedule has been prepared in the format mandated by the South Carolina Department of Education. The account numbers shown on the schedule are also mandated by the South Carolina Department of Education.
123

(This page intentionally left blank)
124

Schedule D-1
ACTUALREVENUES
1000 Revenue from Local Sources1500 Earnings on Investments:
1510 Interest on Investments 1,173,233$
Total Revenue from Local Sources 1,173,233
TOTAL REVENUE ALL SOURCES 1,173,233
EXPENDITURES250 Finance and Operations
253 Facilities Acquisition & Construction: 100 Salaries 124,207 200 Employee Benefits 43,574
300 Purchased Services 366,399 400 Supplies and Materials 19,931,768 500 Capital Outlay
510 Land 147,227 520 Buildings 35,074,542 530 Improvements other than Buildings 3,531,420 541 Equipment 843,083 545 Technology Equipment and Software 278,981 550 Vehicles 1,230,762
600 Other Objects 209,717
Total Support Services 61,781,680
TOTAL EXPENDITURES 61,781,680
OTHER FINANCING SOURCES (USES) 5110 Premium on Bonds Sold 611,150 5120 Proceeds of General Obligation Bonds 85,000,000
Interfund Transfers From (To) Other Funds: 5210 Transfer from General Fund (Exclude Indirect Costs) 8,500,000 5240 Transfer from Debt Service - District 7,679,864 5240 Transfer from Debt Service - LOSF, Corp 11,832
TOTAL OTHER FINANCING SOURCES (USES) 101,802,846
EXCESS (DEFICIENCY) OF REVENUES OVER EXPENDITURES 41,194,399
FUND BALANCE, Beginning of Year 68,151,846
FUND BALANCE, End of Year 109,346,245$
YEAR ENDED JUNE 30, 2019
LEXINGTON COUNTY SCHOOL DISTRICT ONELEXINGTON, SOUTH CAROLINA
CAPITAL PROJECTS FUNDS
SCHEDULE OF REVENUES, EXPENDITURES AND CHANGES IN FUND BALANCE
125

(This page intentionally left blank)
126

Fiduciary Fund This fund accounts for collection and payment of pupil activity receipts and disbursements from and on behalf of the School District's students.
The following individual fund schedules have been prepared in the format mandated by the South Carolina Department of Education. The account numbers shown are also mandated by the South Carolina Department of Education.
127

LEXINGTON COUNTY SCHOOL DISTRICT ONE SCHEDULE F-1
Beginning EndingBalance Additions Deletions Balance
ASSETSCash on Deposit 3,484,889$ 9,601,136$ 9,391,449$ 3,694,576$
Total Assets 3,484,889$ 9,601,136$ 9,391,449$ 3,694,576$
LIABILITIESAccounts Payable 193,750$ -$ 132,042$ 61,708$ Accrued Salaries and Benefits 53,581 21,288 - 74,869 Due to Student Organizations 3,237,558 9,579,848 9,259,407 3,557,999
Total Liabilities 3,484,889$ 9,601,136$ 9,391,449$ 3,694,576$
LEXINGTON, SOUTH CAROLINA
PUPIL ACTIVITY FUND
STATEMENT OF CHANGES IN ASSETS AND LIABILITIES
FOR YEAR ENDED JUNE 30, 2019
128

LEXINGTON COUNTY SCHOOL DISTRICT ONE SCHEDULE F-2
PUPIL ACTIVITY FUND
RECEIPTS1700 Pupil Activities:
1710 Admissions 2,388,319$ 1740 Student Fees 1,789,229 1790 Other 5,402,300
Total Receipts - All Sources 9,579,848
DISBURSEMENTS190 Instructional Pupil Activity:
660 Pupil Activity 1,822,538
Total Instruction 1,822,538 270 Supporting Pupil Activity:
271 Pupil Service Activity660 Pupil Activity 7,436,869
Total Pupil Activity Expenditures 7,436,869
Total Disbursements 9,259,407
Excess (Deficiency) Receipts Over Disbursements 320,441
Due to Student Organizations - July 1, 2018 3,237,558
Due to Student Organizations - June 30, 2019 3,557,999$
LEXINGTON, SOUTH CAROLINA
SCHEDULE OF RECEIPTS, DISBURSEMENTS, AND CHANGE IN DUE TO
FOR YEAR ENDED JUNE 30, 2019
STUDENT ORGANIZATIONS
129

LEXINGTON COUNTY SCHOOL DISTRICT ONE SCHEDULE F-3
Beginning EndingSchool Balance Receipts Disbursements Balance
Carolina Springs Elementary School (13,586)$ 97,139$ 95,428$ (11,875)$ Carolina Springs Middle School 45,560 343,105 314,661 74,004 Deerfield Elementary School 27,751 76,617 105,274 (906) Forts Pond Elementary School 5,528 50,639 51,084 5,083 Gilbert Elementary School 57,528 94,709 94,175 58,062 Gilbert High School 268,232 677,880 691,602 254,510 Gilbert Middle School 11,737 260,014 251,673 20,078 Gilbert Primary School 17,559 64,340 71,495 10,404 Lake Murray Elementary School 101,631 103,084 116,884 87,831 Lexington Technology Center 186,584 356,443 329,492 213,535 Lexington Elementary School 39,041 85,758 88,733 36,066 Lexington High School 783,727 1,300,669 1,208,682 875,714 Lexington Middle School 82,249 364,188 310,301 136,136 Meadow Glen Elementary School 29,068 145,137 132,593 41,612 Meadow Glen Middle School 73,969 447,339 407,253 114,055 Midway Elementary School 77,294 248,555 265,690 60,159 New Providence Elementary School 29,422 143,318 147,975 24,765 Oak Grove Elementary School 34,080 60,681 79,955 14,806 Pelion Elementary School 21,894 61,796 53,810 29,880 Pelion High School 112,971 555,891 568,578 100,284 Pelion Middle School 20,752 156,215 183,791 (6,824) Pleasant Hill Elementary School 47,762 289,781 261,499 76,044 Pleasant Hill Middle School 281,249 663,445 632,909 311,785 Red Bank Elementary School (40,611) 81,370 105,665 (64,906) River Bluff High School 334,791 1,404,660 1,259,175 480,276 Rocky Creek Elementary School 27,910 92,544 101,398 19,056 Saxe Gotha Elementary School 68,707 74,026 75,922 66,811 White Knoll Elementary School 40,819 98,419 90,994 48,244 White Knoll High School 510,417 995,293 977,050 528,660 White Knoll Middle School (46,477) 186,793 185,666 (45,350) Total 3,237,558$ 9,579,848$ 9,259,407$ 3,557,999$
LEXINGTON, SOUTH CAROLINA
PUPIL ACTIVITY FUND
SUMMARY SCHEDULE OF CASH RECEIPTS AND DISBURSEMENTS
FOR YEAR ENDED JUNE 30, 2019
130

Location TotalI.D. Location Ed Level Cost Type Expenditures000 District Wide (Debt Service) Non-School Central $ 55,635,532 010 Central Services Non-School Central 64,708,443 011 Lexington High High School School 19,220,740 012 Lexington Elementary Elementary School 6,235,632 013 Gilbert High High School School 10,641,057 014 Gilbert Elementary Elementary School 6,430,091 015 Pelion High High School School 9,394,753 016 Pelion Elementary Elementary School 9,052,676 019 Rosenwald Community Learning Ctr Middle School 2,678,142 020 Lexington Middle Middle School 8,477,774 021 Lexington Technology Center Other School School 6,429,579 022 Oak Grove Elementary Elementary School 6,548,052 023 Saxe Gotha Elementary Elementary School 7,482,603 024 Red Bank Elementary Elementary School 7,307,038 025 White Knoll Elementary Elementary School 7,408,735 026 White Knoll Middle Middle School 7,602,737 027 White Knoll High School High School School 18,382,203 028 Midway Elementary Elementary School 9,245,529 029 Gilbert Middle Middle School 7,437,520 030 Pelion Middle School Elem/Middle School 6,796,495 031 Lake Murray Elementary Elementary School 6,913,724 032 Gilbert Primary School Elementary School 7,316,096 033 Virtual School High School School 94,483 034 Pleasant Hill Middle School Middle School 10,471,938 035 Pleasant Hill Elementary School Elementary School 7,311,808 037 Carolina Springs Middle School Middle School 8,008,829 038 Carolina Springs Elementary School Elementary School 6,799,679 039 Forts Pond Elementary School Elementary School 5,798,469 040 New Providence Elementary School Elementary School 6,094,760 041 Rocky Creek Elementary School Elementary School 6,332,040 042 Meadow Glen Elementary School Elementary School 7,610,920 043 Meadow Glen Middle School Middle School 8,994,916 044 River Bluff High School High School School 18,594,370 045 Deerfield Elementary School Elementary School 6,198,865 046 New Lexington Area Middle School Middle School 29,591,047 047 New Gilbert Area Elementary School Elementary School 2,545,293 048 New Pelion Area Middle School Middle School 874 051 New White Knoll Area Elementary School Elementary School 1,765
Total Expenditures/Expenses for all Funds $ 415,795,207
The above expenditures are reconciled to the District's financial Statements as follows:
General Fund $ 260,905,046 Special Revenue Fund 15,592,905 Special Revenue - EIA ` 8,840,039 Special Revenue - Food Service 12,257,772 Debt Service Fund - District 40,772,015 Debt Service Fund - LOSF, Corp. 6,082,971 Capital Projects Fund 61,781,680 Pupil Activity Fund 9,259,407 Permanent Fund 303,372
Total Expenditures/Expenses for all Funds $ 415,795,207
FOR THE YEAR ENDED JUNE 30, 2019
LEXINGTON COUNTY SCHOOL DISTRICT ONELEXINGTON, SOUTH CAROLINA
LOCATION RECONCILIATION SCHEDULE (REQUIRED)(FOR COGNIZANT AGENCY USE ONLY)
131

(This page intentionally left blank)
132

OTHER SCHEDULES
133

LEXINGTON COUNTY SCHOOL DISTRICT ONE SCHEDULE F-4
Description Beginning Balance Receipts Disbursements Ending Balance
1st Grade 461$ 4,064$ 4,525$ -$ 2nd Grade 114 1,464 1,578 - 3rd Grade 405 2,450 2,854 1 4th Grade (132) 8,676 8,544 - 5th Grade 529 6,855 7,383 1 Kindergarten 36 2,878 2,770 144 Technical Equip Ins Fees (11,747) - 3,968 (15,715) Band-Fees 28 - 28 - Eagles 1,959 950 2,602 307 Instruction Material Fees 3,119 14,914 14,220 3,813 Library Fees/Fines/Fairs 360 12,533 9,005 3,888 Orchestra/Strings-Fees 41 - 41 - State Textbooks-Lost 62 - 5 57 Go Fund Me 193 - - 193 Special Collections 1,265 2,971 3,531 705 Parent Support Organiz. 743 7,349 8,437 (345) Afterschool/Homehelp Ctr (18,716) 793 - (17,923) School Store 256 442 502 196 School Pictures 4,883 9,113 10,111 3,885 Yearbooks (198) 1,737 428 1,111 Faculty Funds 283 - - 283 Miscellaneous 400 3,682 1,267 2,815 Special Funds 564 3,004 1,727 1,841 Special Projects 110 6,997 5,345 1,762 Lunch Credits (580) 674 1,036 (942) Blowfish Awards 176 - 176 - Education Foundation - 137 95 42 Education Fd Books for Bucks 2 1,500 1,502 - Student Field Studies (207) 2,271 2,063 1 Dist Media Spec Fund 1,797 - - 1,797 Relay for Life 205 1,665 1,665 205 Ring Ceremony - 20 20 - Heart of Lexington Awards 3 - - 3 Total (13,586)$ 97,139$ 95,428$ (11,875)$
LEXINGTON, SOUTH CAROLINA
SUMMARY SCHEDULE OF CASH RECEIPTS AND DISBURSEMENTS - CAROLINA SPRINGS ELEMENTARY SCHOOL
FOR YEAR ENDED JUNE 30, 2019
134

LEXINGTON COUNTY SCHOOL DISTRICT ONE SCHEDULE F-5
Description Beginning Balance Receipts Disbursements Ending Balance
Technical Equip Ins Fees (43,869)$ 34,904$ 33,386$ (42,351)$ Art-Fees 361 1,748 1,063 1,046 Band-Fees 10,102 20,609 17,045 13,666 Books/Workbooks-Fees 169 - - 169 Chorus 5,065 13,577 10,873 7,769 Computer - Fees 629 1,366 1,598 397 Drama-Fees 2,045 2,772 2,228 2,589 Instruction Material Fees 1,746 20,155 19,729 2,172 Lab Fees 5,781 3,337 1,500 7,618 Library Fees/Fines/Fairs 1,491 4,763 5,121 1,133 Orchestra/Strings-Fees 2,820 17,021 15,740 4,101 Physical Education-Fees 7,173 7,228 4,816 9,585 State Textbooks-Lost 410 470 721 159 Music Fees 3,423 1,916 5,156 183 Music Theatre Fee - 5,677 2,460 3,217 Service Learning Fees (3) 549 - 546 ITE 851 - 352 499 Dance Fee 8,803 24,716 19,732 13,787 Journalism Fees 1 - - 1 ID Badges 1,305 2,733 2,849 1,189 Special Collections 5,189 5,799 7,850 3,138 Misc. Pupil Activity Fund 66 888 867 87 Icivics Fees 1,522 866 619 1,769 Cell Phone Fines (109) 109 - - Athletics 10,080 26,260 29,670 6,670 Cheerleaders-JV 5,828 14,791 7,785 12,834 FCA Club (15) 27 12 - Pep Club/Spirit Committee 7 - - 7 Student Council - Jr. - 31 - 31 Middle School Beta Club 262 560 433 389 Canteen Sales (222) 230 8 - Canteen Allocation 4,333 17,767 16,110 5,990 WP Rawl Mini Grant - 250 250 - School Pictures 2,326 6,090 2,167 6,249 Yearbooks 1,539 8,308 8,832 1,015 Faculty Funds 11 240 237 14 Miscellaneous 420 5,277 3,823 1,874 Special Funds 1,239 389 1,439 189 Special Projects 685 2,059 1,335 1,409 Project Unify Award 685 400 - 1,085 Lunch Credits (2,860) 3,485 4,900 (4,275) United Way 159 152 311 - Step Club 164 - 27 137 Archery Club 4,303 14,374 12,513 6,164 Robotics Club - 234 224 10 Education Foundation - 235 235 - Student Field Studies 561 70,126 69,708 979 Heart Of Lexington Awards 3 - 3 - Club-O-Chat 1,081 617 934 764 Total 45,560$ 343,105$ 314,661$ 74,004$
LEXINGTON, SOUTH CAROLINA
SUMMARY SCHEDULE OF CASH RECEIPTS AND DISBURSEMENTS - CAROLINA SPRINGS MIDDLE SCHOOL
FOR YEAR ENDED JUNE 30, 2019
135

LEXINGTON COUNTY SCHOOL DISTRICT ONE SCHEDULE F-6LEXINGTON, SOUTH CAROLINA
SUMMARY SCHEDULE OF CASH RECEIPTS AND DISBURSEMENTS - DEERFIELD ELEMENTARY SCHOOL
FOR YEAR ENDED JUNE 30, 2019
Description Beginning Balance Receipts Disbursements Ending
1st Grade (401)$ 1,998$ 1,655$ (58)$ 2nd Grade (19) 1,115 809 287 3rd Grade 227 531 1,213 (455) 4th Grade 131 5,578 5,911 (202) 5th Grade 55 3,593 2,925 723 Kindergarten - 3,841 3,841 - Technical Equip Ins Fees (20,184) - 22,935 (43,119) Band-Fees 139 - - 139 Eagles 889 820 178 1,531 Instruction Material Fees 7,942 15,745 14,104 9,583 Library Fees/Fines/Fairs 9,554 11,084 10,511 10,127 Orchestra/Strings-Fees 530 - - 530 Special Collections 17 1,348 410 955 Student Council-Junior 127 - - 127 Afterschool/Homehelp Ctr 15,602 12,550 23,372 4,780 School Store 671 400 594 477 Canteen 87 365 477 (25) School Pictures 4,269 7,275 4,052 7,492 Yearbooks 4,387 5,690 5,962 4,115 Miscellaneous 2 - - 2 Special Funds 110 1,107 1,769 (552) Special Projects 4,392 288 1,361 3,319 Lunch Credits (965) 965 929 (929) Michelin Awards - 44 16 28 Blowfish Awards 176 - - 176 Education Fd Bucks for Books 7 1,500 1,465 42 Student Field Studies 1 - - 1 Relay for Life 5 780 785 - Total 27,751$ 76,617$ 105,274$ (906)$
136

LEXINGTON COUNTY SCHOOL DISTRICT ONE SCHEDULE F-7LEXINGTON, SOUTH CAROLINA
SUMMARY SCHEDULE OF CASH RECEIPTS AND DISBURSEMENTS - FORTS POND ELEMENTARY SCHOOL
FOR YEAR ENDED JUNE 30, 2019
Description Beginning Balance Receipts Disbursements Ending Balance
1st Grade 287$ 433$ 413$ 307$ 2nd Grade 400 842 777 465 3rd Grade (135) 1,579 1,349 95 4th Grade 87 1,053 699 441 Kindergarten 1,457 3,190 3,291 1,356 Technical Equip Ins Fees (15,707) - 5,832 (21,539) Band-Fees 320 - - 320 Eagles 1,778 300 1,837 241 Instruction Material Fees 1,254 4,788 5,628 414 Library Fees/Fines/Fairs 4,210 6,818 7,749 3,279 Orchestra/Strings-Fees 560 - - 560 State Textbooks-Lost 171 18 112 77 State Textbooks-Damaged 29 - - 29 Special Collections (167) 860 334 359 Radius Fund - 4,000 909 3,091 School Store 24 - - 24 Canteen Sales 71 - - 71 WP Rawl Mini Grant (159) 750 666 (75) School Pictures 2,706 4,563 4,567 2,702 Yearbooks 1,558 2,060 1,606 2,012 Faculty Funds 816 368 359 825 Miscellaneous 249 1,063 1,033 279 Special Funds 550 673 492 731 Special Projects 791 617 59 1,349 Lunch Credits 1,483 991 459 2,015 Michelin Awards - 500 479 21 Blowfish Awards 176 40 219 (3) Education Foundation 55 275 275 55 Education Fd Bucks for Books 452 1,500 1,824 128 Student Field Studies 1,844 3,540 3,759 1,625 Disaster Relief 11 - - 11 Robotics Grant - 1,400 1,400 - Relay For Life 335 8,418 4,957 3,796 Literacy Fund 1 - - 1 Learning Commons Award 21 - - 21 Total 5,528$ 50,639$ 51,084$ 5,083$
137

LEXINGTON COUNTY SCHOOL DISTRICT ONE SCHEDULE F-8LEXINGTON, SOUTH CAROLINA
SUMMARY SCHEDULE OF CASH RECEIPTS AND DISBURSEMENTS - GILBERT ELEMENTARY SCHOOL
FOR YEAR ENDED JUNE 30, 2019
Description Beginning Balance Receipts Disbursements Ending Balance
3rd Grade 16$ 2,048$ 2,086$ (22)$ 4th Grade 1,675 5,351 5,107 1,919 5th Grade 4,487 11,350 8,362 7,475 Technical Equip Ins Fees (17,687) - 4,578 (22,265) Art-Fees 876 200 - 1,076 Chorus 39 779 624 194 Drama-Fees 26 - 26 - Eagles 3,233 2,042 1,111 4,164 Instruction Material Fees 10,107 14,819 13,406 11,520 Library Fees/Fines/Fairs 1,204 9,595 6,938 3,861 Orchestra/Strings-Fees 21 - - 21 Physical Ed - 243 190 53 State Textbooks-Lost 143 - - 143 State Textbooks-Damaged 210 - 114 96 Health 679 - - 679 Special Collections 6,374 4,244 2,076 8,542 Misc. Pupil Activity Fund 534 - - 534 Cell Phone Fines 15 - - 15 Equipment-Nonexpendable 29 - - 29 Just Say No 298 - 29 269 Afterschool/Homehelp Ctr 30 - 30 - Canteen Sales 773 - 41 732 School Pictures 12,263 7,662 16,006 3,919 Yearbooks 16,673 9,896 2,224 24,345 Guidance - 29 - 29 Faculty Funds 1 - - 1 Miscellaneous 2,374 - - 2,374 Special Funds 19 31 50 - Special Projects 11,664 20,137 24,206 7,595 Memorials 95 - 95 - Lunch Credits (452) 1,475 881 142 United Way - 30 - 30 Ed Fd Innovation Grant 61 - - 61 Blowfish Awards 176 - 176 - Education Foundation 7 1,850 1,857 - Student Book Club Orders 61 - 28 33 Disaster Relief 345 - - 345 Relay for Life 349 2,912 3,169 92 Heart Of Lexington Awards 21 - 21 - Learning Commons Award 343 - 343 - Recycling Program 446 16 401 61 Total 57,528$ 94,709$ 94,175$ 58,062$
138

LEXINGTON COUNTY SCHOOL DISTRICT ONE SCHEDULE F-9LEXINGTON, SOUTH CAROLINA
SUMMARY SCHEDULE OF CASH RECEIPTS AND DISBURSEMENTS - GILBERT HIGH SCHOOL
FOR YEAR ENDED JUNE 30, 2019
Description Beginning Balance Receipts Disbursements Ending Balance
11th Grade 2,033$ 7,953$ 8,779$ 1,207$ Technical Equip Ins Fees (22,592) 40,069 45,946 (28,469) Business Education 8,147 5,301 13,767 (319) Agriculture- Fees 1,795 800 1,003 1,592 Art-Fees 6,074 1,656 539 7,191 Band-Fees 851 536 990 397 Chorus 998 1,081 1,530 549 Computer - Fees 1,157 - - 1,157 Drama-Fees 1,290 198 190 1,298 Instruction Material Fees 18,446 40,262 18,731 39,977 Lab Fees 5,788 3,376 1,254 7,910 Library Fees/Fines/Fairs 2,403 1,162 693 2,872 Mechanical Drawing-Fees 1,581 746 1,101 1,226 Orchestra/Strings-Fees 1,307 1,766 992 2,081 Parking Fees 7,952 8,502 9,560 6,894 Physical Education-Fees 4,710 4,284 4,595 4,399 State Textbooks-Lost 735 183 801 117 Health 10,503 4,140 5,907 8,736 Service Learning Fees 3,132 670 601 3,201 Building Construct. Fees 763 761 161 1,363 Sports Medicine - Fees 525 190 193 522 ID Badges 847 1,755 2,742 (140) Back Pack Program 91 - - 91 Special Collections 3,347 8,919 6,718 5,548 Misc. Pupil Activity Fund - 1,256 1,498 (242) Cell Phone Fines 220 - - 220 Athletics 17,044 183,115 181,902 18,257 Beta Club-Senior 4,070 9,300 7,121 6,249 Cheerleaders-Varsity 21,333 34,185 37,409 18,109 DECA Club 2,093 - - 2,093 FCA Club 168 200 100 268 FFA Club 17,165 24,230 25,301 16,094 FTA Club/Teacher Cadets 181 500 244 437 French Club 5 - - 5 Minority Std. - 200 - 200 Jr. Drama Club 3,605 2,374 3,067 2,912 Pep Club/Spirit Committee 211 430 300 341 Science Club-Junior 2,120 350 291 2,179 Student Council - Senior 7,524 11,989 13,364 6,149
(Continued)
139

LEXINGTON COUNTY SCHOOL DISTRICT ONE SCHEDULE F-9LEXINGTON, SOUTH CAROLINA
SUMMARY SCHEDULE OF CASH RECEIPTS AND DISBURSEMENTS - GILBERT HIGH SCHOOL
FOR YEAR ENDED JUNE 30, 2019
Description Beginning Balance Receipts Disbursements Ending Balance
Chess Club 93$ -$ -$ 93$ Spanish Club 2,655 2,367 4,428 594 Tribe Time Junior Class 1,118 - - 1,118 Key Club 855 135 135 855 Foreign Language 16 - - 16 Recycling Club 942 - - 942 Canteen Sales 8,890 29,857 28,196 10,551 Graduation 389 577 571 395 School Pictures 2,250 1,794 556 3,488 Student Newspaper (48) - - (48) Yearbooks 7,408 31,318 28,493 10,233 Varsity Basketball Cheer. 140 - - 140 Department Funds 564 17 19 562 Faculty Funds 523 590 200 913 Miscellaneous (23) - - (23) Special Funds 46,962 1,284 25,886 22,360 Special Project-Athletics 23,777 112,362 97,673 38,466 Memorials 100 - - 100 Sears Class 1,542 5,254 5,525 1,271 Project Unify (32) - - (32) Health Occupations 5,878 14,312 16,567 3,623 Lunch Credits (929) 1,637 3,996 (3,288) Construction Cluster 1,439 1,150 604 1,985 Exped Learning - 491 - 491 International Club 183 50 233 - Booster Clubs 9,536 42,625 45,403 6,758 Dorm Room Grant - 1,499 1,143 356 Education Foundation - 155 155 - Student Field Studies (161) 504 288 55 Band Allocation 8,595 22,319 30,950 (36) School/Business Partnersh 1,692 613 - 2,305 Health Room/Nurse 149 - 38 111 Junior Achievement 981 - - 981 Athletic Camps 3 - - 3 Dance Team 260 112 242 130 Keisler Chorus Fund 68 - - 68 Teen Lead Projects - 182 391 (209) OCP Class Projects 3,882 3,237 2,520 4,599 CREW 913 1,000 - 1,913 Total 268,232$ 677,880$ 691,602$ 254,510$
140

LEXINGTON COUNTY SCHOOL DISTRICT ONE SCHEDULE F-10LEXINGTON, SOUTH CAROLINA
SUMMARY SCHEDULE OF CASH RECEIPTS AND DISBURSEMENTS - GILBERT MIDDLE SCHOOL
FOR YEAR ENDED JUNE 30, 2019
Description Beginning Balance Receipts Disbursements Ending Balance
Technical Equip Ins Fees (74,992)$ 27,564$ 40,928$ (88,356)$ Art-Fees 3,060 1,252 337 3,975 Band-Fees 3,121 7,561 7,021 3,661 Chorus 672 2,884 1,995 1,561 Computer - Fees 2,576 824 1,241 2,159 Drama-Fees 3,421 2,787 2,901 3,307 Home Economics-Fees 665 1,084 277 1,472 Instruction Material Fees (688) 11,907 7,812 3,407 Lab Fees 137 2,321 2,458 - Library Fees/Fines/Fairs 3,046 8,064 6,161 4,949 Locks-Fees 650 418 1,068 - Orchestra/Strings-Fees 2,595 3,372 3,799 2,168 Physical Education-Fees (1,775) 5,018 3,014 229 State Textbooks-Lost 3 - - 3 State Textbooks-Damaged 18 - - 18 Industrial Tech. Fees 55 - 13 42 Health 3,459 1,789 1,713 3,535 Music Fees 67 8 75 - Pro Team 2,094 266 265 2,095 Dance Fees (30) 444 273 141 Journalism Fees 1,200 80 - 1,280 Id Badges 1,470 1,689 1,072 2,087 Guitar Class (45) 506 340 121 Music With Technology 567 - 567 - Special Collections 144 - - 144 Misc. Pupil Activity Fund 12,717 42,256 39,534 15,439 Icivics Fees 3,848 1,220 3,211 1,857 Cell Phone Fines 150 - - 150 Athletics Dues/Fees 15,360 19,191 18,716 15,835 Beta Club-Junior 159 380 389 150 FCA Club (141) 650 393 116 Student Council-Junior 3,236 4,147 5,554 1,829 Canteen Sales 2,680 15,993 18,594 79 Walter P. Rawl Mini Grant 30 - - 30 School Pictures 4,170 2,716 3,388 3,498 Student Newspapers - - 16 (16) Yearbooks 4,928 12,668 11,209 6,387 Miscellaneous 256 886 804 338 Special Funds 2,806 7,503 7,797 2,512 Special Projects 5,236 4,475 5,910 3,801 Special Projects - Athletics - 1,324 377 947 B Team Cheerleaders (1,424) 11,899 8,903 1,572 Lunch Credits (1,466) 1,553 1,039 (952) Archery Club 5,246 30,711 21,510 14,447Robotics Club 317 - 312 5 Education Foundation - 359 359 -
(Continued)
141

LEXINGTON COUNTY SCHOOL DISTRICT ONE SCHEDULE F-10LEXINGTON, SOUTH CAROLINA
SUMMARY SCHEDULE OF CASH RECEIPTS AND DISBURSEMENTS - GILBERT MIDDLE SCHOOL
FOR YEAR ENDED JUNE 30, 2019
Description Beginning Balance Receipts Disbursements Ending BalanceStudent Field Studies 237$ 16,780$ 16,012$ 1,005$ LOCC 755 656 119 1,292 Sunshine Fund 2 - - 2 Robotics Grant - 725 733 (8) Relay For Life 255 2,038 2,000 293 Learning Commons Award 4 - - 4 Pageant Funds 886 2,046 1,464 1,468 Total 11,737$ 260,014$ 251,673$ 20,078$
142

LEXINGTON COUNTY SCHOOL DISTRICT ONE SCHEDULE F-11LEXINGTON, SOUTH CAROLINA
SUMMARY SCHEDULE OF CASH RECEIPTS AND DISBURSEMENTS - GILBERT PRIMARY SCHOOL
FOR YEAR ENDED JUNE 30, 2019
Description Beginning Balance Receipts Disbursements Ending Balance
Kindergarten 1,680$ 6,245$ 5,763$ 2,162$ Technical Equip Ins Fees (15,806) - 5,183 (20,989) Instruction Material Fees 11,087 8,514 9,940 9,661 Library Fees/Fines/Fairs 4,031 10,539 8,955 5,615 Special Collections 889 5,681 5,106 1,464 GPS Cares Fund 2,812 1,000 1,367 2,445 Canteen Sales 7 - 4 3 WP Rawl Mini Grant - 404 404 - School Pictures 5,085 4,941 7,393 2,633 Yearbooks 2,728 8,176 8,144 2,760 Faculty Funds 3 - - 3 Interest 47 - 47 - Miscellaneous 83 490 564 9 Special Funds 2,388 7,151 6,465 3,074 Special Projects 2,020 6,065 6,209 1,876 Memorials 36 - 30 6 Project Unify - 250 - 250 Lunch Credits (769) 769 764 (764) United Way 20 5 25 - Blowfish Awards 176 - 176 - Education Foundation - 203 203 - Education Fd Bucks for Books 15 2,050 2,035 30 Relay For Life 1,027 1,857 2,718 166 Total 17,559$ 64,340$ 71,495$ 10,404$
143

LEXINGTON COUNTY SCHOOL DISTRICT ONE SCHEDULE F-12LEXINGTON, SOUTH CAROLINA
SUMMARY SCHEDULE OF CASH RECEIPTS AND DISBURSEMENTS - LAKE MURRAY ELEMENTARY SCHOOL
FOR YEAR ENDED JUNE 30, 2019
Description Beginning Balance Receipts Disbursements Ending Balance
1st Grade -$ 337$ 337$ -$ 2nd Grade (750) 1,121 329 42 3rd Grade (162) 1,043 573 308 4th Grade (252) 1,030 302 476 5th Grade 4,546 8,305 11,638 1,213 Kindergarten 6,080 4,391 3,991 6,480 Tuition Based 4K - 4,750 - 4,750 Technical Equip Ins Fees (15,779) - 5,137 (20,916) Art Fees 250 - - 250 Eagles 2,282 2,105 3,500 887 Instruction Material Fees 19,284 15,786 15,408 19,662 Library Fees/Fines/Fairs 677 875 1,464 88 State Textbooks-Lost 119 - 10 109 Health 955 - 104 851 Special Collections (38) 490 159 293 Radius Fund - 1,000 - 1,000 Afterschool/Homehelp Ctr 34,740 35,160 41,115 28,785 School Store 2,652 1,537 1,569 2,620 School Pictures 32,911 10,073 12,221 30,763 Faculty Funds 1,061 490 1,358 193 Special Projects 7,807 8,239 9,984 6,062 Project Unify Award (7) 447 130 310 Lunch Credits (190) 574 399 (15) United Way - 361 361 - Nature Trail 1,626 - 1 1,625 Blowfish Awards 176 - 176 - Education Foundation - 334 334 - Education Fd Bucks for Books 5 1,500 1,498 7 Student Field Studies 73 279 333 19 Relay for Life - 2,851 2,851 - Leader In Me 3,565 6 1,602 1,969 Total 101,631$ 103,084$ 116,884$ 87,831$
144

LEXINGTON COUNTY SCHOOL DISTRICT ONE SCHEDULE F-13LEXINGTON, SOUTH CAROLINA
SUMMARY SCHEDULE OF CASH RECEIPTS AND DISBURSEMENTS - LEXINGTON TECHNOLOGY CENTER
FOR YEAR ENDED JUNE 30, 2019
Description Beginning Balance Receipts Disbursements Ending Balance
Adult Education 18,067$ 25,802$ 23,194$ 20,675$ Instruction Material Fees 65,688 84,729 81,682 68,735 State Textbooks-Lost 78 20 40 58 Culinary Arts 2,005 1,055 428 2,632 Special Collections 291 - - 291 Cell Phone Fines 135 - - 135 DECA Club 3,454 56,486 61,985 (2,045) FBLA Club 3,151 3,030 1,746 4,435 FFA Club 5,003 15,007 11,772 8,238 Nat'l Honor Society -Sr. 28 1,830 1,800 58 Vica 2,910 12,870 8,521 7,259 Lex 1 Summer Camp 3,579 1,950 603 4,926 Canteen Sales 6,889 25,945 22,782 10,052 Faculty Funds (22) - - (22) Miscellaneous 1,783 873 1,600 1,056 Special Projects 41,029 79,040 74,400 45,669 S.P.-Machine Tech. 1,001 40 - 1,041 Nephron Award (498) 9,000 8,501 1 Health Occupations 2,453 10,188 12,011 630 Parenting Center 20 - - 20 LTC Cares Fund 1,678 - - 1,678 Michelin Robotics - 2,000 1,989 11 Robotics Club 1,758 750 - 2,508 Education Foundation (500) 620 370 (250) Robotics Grant - 3,752 3,488 264 Adult Ed Computer Fund 18,281 7,190 - 25,471 Cosmetology 8,323 14,266 12,580 10,009 Total 186,584$ 356,443$ 329,492$ 213,535$
145

LEXINGTON COUNTY SCHOOL DISTRICT ONE SCHEDULE F-14LEXINGTON, SOUTH CAROLINA
SUMMARY SCHEDULE OF CASH RECEIPTS AND DISBURSEMENTS - LEXINGTON ELEMENTARY SCHOOL
FOR YEAR ENDED JUNE 30, 2019
Description Beginning Balance Receipts Disbursements Ending Balance
1st Grade 732$ 1,302$ 1,056$ 978$ 2nd Grade 768 2,007 2,419 356 3rd Grade 485 1,900 1,856 529 4th Grade 385 978 847 516 5th Grade 22 5,395 5,313 104 Kindergarten 2,270 3,846 4,141 1,975 Technical Equip Ins Fees (16,685) - 4,815 (21,500) Art-Fees 169 - - 169 Band-Fees 107 1,112 959 260 Books/Workbooks-Fees 186 23 - 209 Eagles 1,128 2,892 3,543 477 Instruction Material Fees 15,533 15,360 12,632 18,261 Library Fees/Fines/Fairs 8,959 13,737 9,161 13,535 Orchestra/Strings-Fees 20 - - 20 State Textbooks-Lost 289 - 27 262 State Textbooks-Damaged 222 - - 222 Special Collections 128 - 120 8 IB Program 603 670 1,273 - Parent Support Organiz. 593 1,574 2,030 137 Student Council - Junior 174 - 131 43 School Store 534 884 491 927 Recycling Club 187 - 87 100 Special Education - 1,135 1,135 - School Pictures 12,296 6,479 7,730 11,045 Yearbooks 6,386 4,740 6,134 4,992 Guidance Fund 364 - 322 42 Faculty Funds 72 579 603 48 Miscellaneous 585 40 518 107 Special Funds 249 1,120 690 679 Special Projects 83 739 123 699 Project Unify Award 319 697 817 199 Lunch Credits (111) 395 393 (109) Ed Fd Innovation Grant 412 5,630 6,041 1 Michelin Awards - 250 250 - Blowfish Awards 176 6 182 - Education Foundation 6 2,060 2,066 - Student Field Studies 373 1,787 2,100 60 School/Business Partnersh 556 397 952 1 Health Room/Nurse 5 - 5 - Relay For Life 78 7,756 7,503 331 Positive Behavior (PBIS) 383 268 268 383 Total 39,041$ 85,758$ $ 88,733$ 36,066$
146

LEXINGTON COUNTY SCHOOL DISTRICT ONE SCHEDULE F-15LEXINGTON, SOUTH CAROLINA
SUMMARY SCHEDULE OF CASH RECEIPTS AND DISBURSEMENTS - LEXINGTON HIGH SCHOOL
FOR YEAR ENDED JUNE 30, 2019
Description Beginning Balance Receipts Disbursements Ending Balance
12th Grade (176)$ 176$ -$ -$ Technical Equip Sales 3,295 - - 3,295 Technical Equip Ins Fees 270,409 91,323 58,492 303,240 ROTC - Fees 3,055 19,083 14,501 7,637 Art-Fees 2,977 6,254 4,597 4,634 Band-Fees 22,586 3,004 6,115 19,475 Books/Workbooks-Fees 40,062 5,684 340 45,406 Chorus 6,014 22,777 34,467 (5,676) Drama-Fees 8,033 21,283 20,590 8,726 Home Economics-Fees 1,675 6,382 5,105 2,952 Instruction Material Fees 31,652 25,264 44,919 11,997 Lab Fees 13,740 14,800 7,763 20,777 Library Fees/Fines/Fairs 5,696 1,717 383 7,030 Orchestra/Strings-Fees 16,827 6,219 6,722 16,324 Parking Fees 17,345 39,361 16,333 40,373 Physical Education-Fees 24,244 15,649 36,691 3,202 State Textbooks-Lost 7,875 - 1,196 6,679 Summer School-Fees 200 - - 200 State Textbooks - Damaged 6 - - 6 Service Learning Fees 1,943 - - 1,943 Dance Fees 770 1,302 846 1,226 ID Badges 7,376 5,082 1,517 10,941 Leadership 21 Fees 1,081 - - 1,081 FIT Program 1,343 400 1,245 498 Bass Fishing Club 1,000 8,146 6,296 2,850 Coffee Club 1,783 562 1,300 1,045 Misc. Pupil Activity Fund (3,240) 4,989 9,724 (7,975) Cell Phone Fines - 54 214 (160) Athletics (1,068) 413,575 345,179 67,328 Cheerleaders-JV 21,127 4,128 25,011 244 Cheerleaders-Varsity 18,635 72,907 75,346 16,196 FTA Club/Teacher Cadets 549 506 619 436 French Club 102 117 117 102 Jr. Classical League 313 - - 313 Nat'l Honor Society -Sr. 12,579 5,552 4,394 13,737 French Honor Society 156 600 266 490 Model UN 73 2,102 1,690 485 Student Council - Senior 223 3,548 3,028 743 Ping Pong 64 - 28 36 Arts and Crafts Club 475 330 282 523 Key Club 3,065 1,389 1,456 2,998 Debate Team - 240 219 21
(Continued)
147

LEXINGTON COUNTY SCHOOL DISTRICT ONE SCHEDULE F-15LEXINGTON, SOUTH CAROLINA
SUMMARY SCHEDULE OF CASH RECEIPTS AND DISBURSEMENTS - LEXINGTON HIGH SCHOOL
FOR YEAR ENDED JUNE 30, 2019
Description Beginning Balance Receipts Disbursements Ending Balance
Best Program -$ 14$ -$ 14$ Canteen Sales 10,214 52,802 33,371 29,645 School Pictures 1,076 - - 1,076 Yearbooks 27,112 26,810 42,242 11,680 German Club 345 - 495 (150) Best 3 Class 1,376 2,524 4,302 (402) Miscellaneous 10,943 46,448 46,731 10,660 Special Projects 150 - 149 1 Special Project-Athletics 93,623 230,197 207,078 116,742 Sears Class 15,570 7,775 6,044 17,301 Project Unify 27 - - 27 B Team Cheerleaders (24) - - (24) Young Republicans - 395 - 395 Lunch Credits 12,006 350 2,571 9,785 United Way - 60 60 - International Club - 2 - 2 Jr/Sr Prom 1,962 27,377 28,350 989 Italian Club 73 - - 73 Dorm Room Grant (230) 230 - - Be A Fan 1,710 2,065 2,608 1,167 Mock Trial Club 60 - - 60 Education Foundation 1,060 930 930 1,060 Instructional Fair 8,797 - - 8,797 LOCC 1,234 116 930 420 Band Allocation 1,193 27,100 30,297 (2,004) Helping Hand 112 - - 112 Athletic Camps 41,674 42,491 42,791 41,374 Dance Team 3,520 14,766 11,143 7,143 Virtual Enterprise Class 12 - - 12 Heart Of Lexington Awards 79 - - 79 Special Ed LD 4,324 6,765 6,294 4,795 Loyal Program 1,560 6,792 5,305 3,047 Learning Commons Award 25 - - 25 Spanish Nat Hn Society 280 155 - 435 Total 783,727$ 1,300,669$ 1,208,682$ 875,714$
148

LEXINGTON COUNTY SCHOOL DISTRICT ONE SCHEDULE F-16LEXINGTON, SOUTH CAROLINA
SUMMARY SCHEDULE OF CASH RECEIPTS AND DISBURSEMENTS - LEXINGTON MIDDLE SCHOOL
FOR YEAR ENDED JUNE 30, 2019
Description Beginning Balance Receipts Disbursements Ending Balance
6th Grade 702$ -$ 325$ 377$ 7th Grade 623 - - 623 8th Grade 383 17,115 16,786 712 World Art Fees 363 1,759 1,533 589 Technical Equip Ins Fees (37,916) 46,624 33,093 (24,385) CS Boot Camp - 1,270 - 1,270 Art-Fees 567 1,845 2,378 34 Band-Fees 719 24,536 19,467 5,788 Books/Workbooks-Fees 5,483 4,873 6,439 3,917 Chorus 11,787 13,552 11,624 13,715 Computer - Fees 3,791 28 1,238 2,581 Drama-Fees 13,134 27,119 14,243 26,010 Eagles 20 - - 20 Exploratory-Fees 1,521 20 273 1,268 Instruction Material Fees 3,021 6,687 5,670 4,038 Lab Fees 7,406 5,039 4,205 8,240 Language Arts Fee - 5,752 110 5,642 Library Fees/Fines/Fairs 8,794 4,666 9,682 3,778 Locks-Fees 145 22 287 (120) Orchestra/Strings-Fees 5,145 12,067 11,900 5,312 Physical Education-Fees 4,191 13,891 9,639 8,443 State Textbooks-Lost 5,628 86 691 5,023 State Textbooks-Damaged 57 - - 57 Industrial Tech. Fees 4,764 - 1,738 3,026 Global Conn Fee - 1,366 - 1,366 Service Learning Fees 2,817 - 96 2,721 Dance Fees 6,397 14,093 11,798 8,692 World Language Fee - 2,432 211 2,221 ID Badges 1,678 1,571 2,606 643 Outdoor Education 3,616 3,050 3,210 3,456 Special Collections 1,609 6,000 1,245 6,364 Cell Phone Fines (515) 884 369 - Athletics 7,514 40,877 33,011 15,380 Beta Club-Junior 1,754 3,152 3,686 1,220 Cheerleaders-JV 4,052 19,148 22,324 876 FCA Club 676 - 490 186 French Club 287 5,858 6,055 90 Student Council-Junior (215) 1,515 363 937 Arts and Crafts Club 452 - 305 147 Outdoor Club 803 72 - 875 Canteen Sales 1,106 19,338 18,235 2,209 School Pictures 3,790 4,602 7,493 899 Student Newspaper 223 144 - 367 Yearbooks (367) 25,976 20,866 4,743 Latin Club - 2,652 2,095 557 Club Sponsorship Stipends (15) 1,140 959 166
(Continued)
149

LEXINGTON COUNTY SCHOOL DISTRICT ONE SCHEDULE F-16LEXINGTON, SOUTH CAROLINA
SUMMARY SCHEDULE OF CASH RECEIPTS AND DISBURSEMENTS - LEXINGTON MIDDLE SCHOOL
FOR YEAR ENDED JUNE 30, 2019
Description Beginning Balance Receipts Disbursements Ending Balance
Miscellaneous 2,320$ 2,683$ 5,979$ (976)$ Special Funds 2,369 - - 2,369 Special Project-Athletics 147 2,076 1,090 1,133 Memorials 52 - - 52 Project Unify 205 2,103 1,414 894 Planet Earth Club 931 - - 931 Lunch Credits (330) 402 692 (620) United Way - 20 20 - Digital D Top - 1,691 483 1,208 School Theater 1 385 - 386 Owls Club 1 72 72 1 School Pageants - 6,107 6,002 105 Michelin Awards - 419 413 6 Michelin Robotics - 2,000 2,000 - Education Foundation - 358 358 - Robotics Grant - 1,250 1,250 - Relay For Life 371 3,197 3,000 568 Lex One Comm Coalition 192 604 790 6 Total 82,249$ 364,188$ 310,301$ 136,136$
150

LEXINGTON COUNTY SCHOOL DISTRICT ONE SCHEDULE F-17LEXINGTON, SOUTH CAROLINA
SUMMARY SCHEDULE OF CASH RECEIPTS AND DISBURSEMENTS - MEADOW GLEN ELEMENTARY SCHOOL
FOR YEAR ENDED JUNE 30, 2019
Description Beginning Balance Receipts Disbursements Ending Balance
Kindergarten -$ 5,166$ 5,166$ -$ Technical Equip Ins Fees (12,382) - 2,982 (15,364)Band-Fees 206 - 50 156Eagles 410 3,010 1,403 2,017Instruction Material Fees 8,933 23,368 19,756 12,545Library Fees/Fines/Fairs 8,293 19,378 21,489 6,182State Textbooks-Lost 82 49 94 37Special Collections 980 6,706 7,218 468Afterschool/Homehelp Ctr 15,145 26,848 23,169 18,824Afterschool Power Hour (1,180) 15,824 9,799 4,845Canteen Sales 131 1,987 1,812 306Walter P Rawl Mini-Grant 1 1,000 998 3School Pictures 4,735 17,612 16,801 5,546Yearbooks 1,079 5,850 5,103 1,826Faculty Projects 557 851 1,260 148Faculty Funds 494 1,600 904 1,190Miscellaneous - 535 287 248Special Funds 216 5,688 5,421 483Lunch Credits (721) 992 1,536 (1,265)Education Fd Innovation Grant 36 - - 36Michelin Awards - 500 487 13Blowfish Awards - 115 115 - Education Foundation - 365 365 - Education Fd Bucks for Books - 1,500 594 906Student Field Studies 1,645 3,452 3,151 1,946Relay For Life 386 2,741 2,611 516SC Early Childhood Project 22 - 22 - Total 29,068$ 145,137$ 132,593$ 41,612$
151

LEXINGTON COUNTY SCHOOL DISTRICT ONE SCHEDULE F-18LEXINGTON, SOUTH CAROLINA
SUMMARY SCHEDULE OF CASH RECEIPTS AND DISBURSEMENTS - MEADOW GLEN MIDDLE SCHOOL
FOR YEAR ENDED JUNE 30, 2019
Description Beginning Balance Receipts Disbursements Ending Balance
Technical Equip Ins Fees (9,010)$ 44,912$ 45,693$ (9,791)$ Art-Fees 331 4,837 3,859 1,309 Band-Fees 8,363 34,840 37,251 5,952 Chorus (1,426) 8,883 6,007 1,450 Digital Media Fee (365) 2,064 1,088 611 Drama-Fees 2,558 2,941 2,664 2,835 Instruction Material Fees 8,413 16,780 20,748 4,445 Lab Fees 5,402 3,834 4,995 4,241 Library Fees/Fines/Fairs 807 5,651 5,653 805 Orchestra/Strings-Fees 2,736 9,105 8,419 3,422 Physical Education-Fees 5,094 7,263 7,240 5,117 State Textbooks-Lost 103 203 354 (48) Grace Peace Sisterhood (577) 4,070 3,433 60 Dance Fees 6,088 10,487 9,105 7,470 Id Badges 1,711 1,546 507 2,750 Intro to Eng (Stems) 2,090 50 1,855 285 Chinese (44) 522 343 135 Misc. Pupil Activity Fund 37 1,500 1,439 98 Icivics Fees 3,775 1,696 2,542 2,929 Cell Phone Fines 158 - - 158 Athletics 9,208 35,555 29,075 15,688 Beta Club-Junior 516 1,232 1,368 380 FCA Club 399 120 392 127 French Club 1,528 687 - 2,215 Student Council-Junior 1,082 - 790 292 Spanish Club 2,553 951 117 3,387 Radius Fund - 4,187 1,154 3,033 Outdoor Club 2,734 19,115 15,357 6,492 Canteen Sales 979 19,543 22,914 (2,392) School Pictures 486 1,302 1,589 199 Yearbooks 1,743 12,420 855 13,308 Latin Club 1,070 773 426 1,417 Faculty Funds 244 - 271 (27) Miscellaneous 5,641 15,444 16,757 4,328 Special Projects-Athletics (32) - - (32) B Team Cheerleaders (3,649) 33,055 32,432 (3,026) Lunch Credits (162) 244 459 (377) School Theater 7,790 7,249 7,415 7,624 Archery Club 212 50,561 44,238 6,535 Robotics Club 3,597 17,011 13,909 6,699 Student Field Studies 1,227 47,830 47,510 1,547 Relay For Life 86 12,299 2,116 10,269 Lex One Comm Coalition (69) 499 419 11 Special Ed TMD 542 6,078 4,495 2,125 Total 73,969$ 447,339$ 407,253$ 114,055$
152

LEXINGTON COUNTY SCHOOL DISTRICT ONE SCHEDULE F-19LEXINGTON, SOUTH CAROLINA
SUMMARY SCHEDULE OF CASH RECEIPTS AND DISBURSEMENTS - MIDWAY ELEMENTARY SCHOOL
FOR YEAR ENDED JUNE 30, 2019
Description Beginning Balance Receipts Disbursements Ending Balance
1st Grade 435$ 387$ 778$ 44$ 2nd Grade 306 1,278 675 909 3rd Grade 1,193 699 614 1,278 4th Grade 2,017 7,884 9,790 111 5th Grade 241 759 1,234 (234) Kindergarten - 5,472 5,472 - Tuition Based 4K Program 5,000 117,650 102,449 20,201 Technical Equip Ins Fees (11,216) - 3,676 (14,892) Band-Fees 31 - - 31 Books/Workbooks-Fees 738 40 - 778 Eagles 1,184 3,050 3,934 300 Instruction Material Fees 5,188 23,426 27,895 719 Library Fees/Fines/Fairs 15,121 22,641 32,911 4,851 Orchestra/Strings-Fees 748 - - 748 State Textbooks-Lost 490 - - 490 Scholastic Books 5 25 - 30 Special Collections 750 1,884 - 2,634 Misc. Pupil Activity Fund 443 - - 443 Just Say No 202 - - 202 Parent Support Organiz. 27 - - 27 School Store 255 1,249 1,075 429 Book to The Future 306 - 21 285 Canteen Sales 182 - 55 127 School Pictures 16,766 13,381 21,482 8,665 Yearbooks 5,506 7,095 3,091 9,510 Department Funds 441 1,051 - 1,492 Faculty Funds 1,254 1,640 2,002 892 Interest 123 - - 123 Miscellaneous 25,009 17,494 31,736 10,767 Special Funds 893 1,165 46 2,012 Special Projects 1,173 624 580 1,217 Memorials 1,516 110 238 1,388 Project Unify - 200 - 200 Lunch Credits (202) 524 909 (587) United Way - 28 28 - Innovation Grant - 5,452 4,925 527 Blowfish Awards 176 - 176 - Education Foundation - 540 540 - Education Fd Books for Bucks - 1,500 1,493 7 Student Field Studies 446 1,704 1,444 706 Relay For Life 547 3,319 3,398 468 After School Program - 6,284 3,023 3,261 Total 77,294$ 248,555$ 265,690$ 60,159$
153

LEXINGTON COUNTY SCHOOL DISTRICT ONE SCHEDULE F-20LEXINGTON, SOUTH CAROLINA
SUMMARY SCHEDULE OF CASH RECEIPTS AND DISBURSEMENTS - NEW PROVIDENCE ELEMENTARY SCHOOL
FOR YEAR ENDED JUNE 30, 2019
Description Beginning Balance Receipts Disbursements Ending Balance1st Grade 477$ 3,003$ 3,122$ 358$ 2nd Grade 177 1,441 1,535 83 3rd Grade 212 3,876 3,340 748 4th Grade 105 7,184 6,159 1,130 5th Grade 558 13,370 11,099 2,829 Kindergarten 742 3,788 3,360 1,170 Technical Equip Ins Fees (7,360) - 1,807 (9,167) Drama - Fees 597 734 769 562 Eagles 1,863 2,120 1,944 2,039 Instruction Material Fees 7,622 14,542 19,758 2,406 Library Fees/Fines/Fairs 5,809 15,120 16,494 4,435 State Textbooks-Damaged 15 - - 15 Music Fees - 13,720 13,033 687 Dance Fees 135 525 660 - Special Collections 549 - - 549 Misc. Pupil Activity Fund 886 3,646 2,386 2,146 Beta Club - Junior 168 - - 168 Walter P. Rawl Mini Grant 159 250 409 - School Pictures 7,712 9,455 14,143 3,024 Special Projects 7,430 22,287 19,743 9,974 Project Unify 152 609 658 103 Lunch Credits (50) 69 - 19 United Way 203 139 - 342 Blowfish Awards 7 - - 7 Education Foundation - 491 491 - Education Fd Bucks for Books 29 1,500 1,493 36 Sunshine Fund 7 96 103 - Relay For Life 1,065 22,623 23,487 201 Birthday Book Club 153 2,730 1,982 901 Total 29,422$ 143,318$ 147,975$ 24,765$
154

LEXINGTON COUNTY SCHOOL DISTRICT ONE SCHEDULE F-21LEXINGTON, SOUTH CAROLINA
SUMMARY SCHEDULE OF CASH RECEIPTS AND DISBURSEMENTS - OAK GROVE ELEMENTARY SCHOOL
FOR YEAR ENDED JUNE 30, 2019
Description Beginning Balance Receipts Disbursements Ending Balance
1st Grade -$ 775$ 822$ (47)$ 2nd Grade - 1,048 214 834 3rd Grade - 1,356 1,356 - 4th Grade - 915 819 96 5th Grade - 1,800 1,435 365 Kindergarten 750 4,013 4,023 740 Technical Equip Ins Fees (6,304) - 15,361 (21,665) Band-Fees 322 - - 322 Eagles 2,575 810 627 2,758 Instruction Material Fees 7,603 12,356 11,176 8,783 Library Fees/Fines/Fairs 6,853 14,560 12,974 8,439 Orchestra/Strings-Fees 543 - - 543 State Textbooks-Lost 73 - 63 10 Special Collections - 344 321 23 School Pictures 16,002 14,159 21,597 8,564 Guidance Fund 3,868 1,000 617 4,251 Miscellaneous 859 238 - 1,097 Special Funds 464 487 183 768 Special Projects - 831 790 41 Lunch Credits (1,119) 1,214 1,676 (1,581) United Way 330 691 1,021 - Michelin Awards - 500 499 1 Blowfish Awards 176 - 176 - Education Foundation (20) 255 235 - Education Fd Bucks for Books 20 1,500 1,500 20 Student Field Studies - 879 970 (91) Sunshine Fund 987 700 1,198 489 Relay For Life 80 - - 80 Heart Of Lexington Awards 3 - - 3 Learning Commons Award 15 - - 15 Leader In Me - 250 302 (52) Total 34,080$ 60,681$ 79,955$ 14,806$
155

LEXINGTON COUNTY SCHOOL DISTRICT ONE SCHEDULE F-22LEXINGTON, SOUTH CAROLINA
SUMMARY SCHEDULE OF CASH RECEIPTS AND DISBURSEMENTS - PELION ELEMENTARY SCHOOL
FOR YEAR ENDED JUNE 30, 2019
Description Beginning Balance Receipts Disbursements Ending Balance
1st Grade 198$ 1,174$ 1,033$ 339$ 2nd Grade - 673 449 224 3rd Grade 136 1,176 986 326 4th Grade (145) 1,124 682 297 5th Grade - 100 - 100 Kindergarten 1,038 4,628 4,106 1,560 Technical Equip Ins Fees (13,247) - 5,212 (18,459) Band-Fees 149 - - 149 Books/Workbooks-Fees 61 - - 61 Chorus 421 1,526 1,461 486 Eagles 1,522 500 312 1,710 Instruction Material Fees 5,436 6,799 5,354 6,881 Library Fees/Fines/Fairs 1,152 7,611 6,306 2,457 Orchestra/Strings-Fees 310 - - 310 State Textbooks-Lost 462 - 36 426 Music Fees - 5 - 5 Parent Support Organiz. - 65 - 65 School Store 2,921 5,075 3,890 4,106 Canteen Sales 12 39 23 28 WP Rawl Mini Grant - 500 458 42 School Pictures 4,731 5,782 6,031 4,482 Yearbooks 5,301 6,121 5,005 6,417 Faculty Funds 1,555 1,240 1,077 1,718 Interest 75 - - 75 Miscellaneous 2,429 7,732 3,810 6,351 Special Funds 2,198 250 - 2,448 Special Projects 4,438 - - 4,438 Lunch Credits (254) 381 665 (538) United Way 30 5 5 30 Ed Fd Innovation Grant 2 - - 2 Michelin Grants - 351 318 33 Blowfish Awards 176 - 176 - Archery Club 269 5,169 2,673 2,765 Education Foundation 468 493 493 468 Ed Fnd Bucks/Books - 1,500 1,486 14 Relay For Life 50 1,777 1,763 64 Total 21,894$ 61,796$ 53,810$ 29,880$
156

LEXINGTON COUNTY SCHOOL DISTRICT ONE SCHEDULE F-23LEXINGTON, SOUTH CAROLINA
Description Beginning Balance Receipts Disbursements Ending Balance
11th Grade 5,961$ 12,445$ 13,397$ 5,009$ 12th Grade 514 918 1,123 309 Technical Equip Sales 1,350 25 - 1,375 Technical Equip Ins Fees (25,876) 23,386 44,692 (47,182) ROTC - Fees 9,247 11,535 8,504 12,278 Agriculture- Fees 926 20 407 539 Art-Fees 40 - 199 (159) Band-Fees 8,551 69,419 87,007 (9,037) Books/Workbooks-Fees 3,892 - 81 3,811 Chorus (4,145) 1,702 1,547 (3,990) Computer - Fees 4,025 - 63 3,962 Drama-Fees 829 - - 829 Instruction Material Fees 3,831 21,009 9,493 15,347 Lab Fees 5,546 12 3,519 2,039 Library Fees/Fines/Fairs 2,252 158 97 2,313 Mechanical Drawing-Fees 1,141 - 178 963 Orchestra/Strings-Fees 3,948 24,456 25,069 3,335 Parking Fees 5,137 5,484 3,921 6,700 Physical Education-Fees 851 8 851 8 State Textbooks-Lost 232 270 444 58 State Textbooks-Damaged 130 - 130 - Music Fees 306 - 306 - Health Occupation Fees 2,938 - 1,945 993 Building Construct. Fees 7,731 2,538 7,802 2,467 Sports Medicine Fees 685 89 1,270 (496) ID Badges 4,272 3,430 3,383 4,319 Broadcast Journalism 1,070 - 134 936 Culinary Arts 4,805 12,173 11,098 5,880 Intro to Eng (Stems) 999 650 650 999 Bass Fishing Club 150 1,973 1,234 889 Special Collections 4 30 - 34 Cell Phone Fines 494 - 396 98 Athletics 9,538 146,889 145,606 10,821 Beta Club-Senior 1,350 480 1,778 52 Bus Transportation Club 111 575 550 136 DECA Club 179 242 405 16 FCA Club 922 200 - 1,122 FFA Club 6,217 16,188 17,966 4,439 Jr. Drama Club 525 - - 525 Student Council - Senior 328 5,980 5,510 798 Chess Club 12 - - 12 Arts and Crafts Club 356 2,748 3,584 (480)
(Continued)
SUMMARY SCHEDULE OF CASH RECEIPTS AND DISBURSEMENTS - PELION HIGH SCHOOL
FOR YEAR ENDED JUNE 30, 2019
157

LEXINGTON COUNTY SCHOOL DISTRICT ONE SCHEDULE F-23LEXINGTON, SOUTH CAROLINA
Description Beginning Balance Receipts Disbursements Ending Balance
Key Club 339$ 552$ 600$ 291$ Best Program 16 20,153 16,571 3,598 Health Occup Student Assc 335 4,690 5,056 (31) Canteen Sales 13,057 21,261 29,573 4,745 Yearbooks (4,065) 14,463 1,819 8,579 Miscellaneous 246 12,137 4,643 7,740 Special Projects 1,959 - 143 1,816 Special Project-Athletics 20,357 50,178 51,085 19,450 Sears Class 6,228 1,600 5,305 2,523 Lunch Credits (1,370) 760 2,052 (2,662) TRI M Music 77 300 275 102 International Club 382 1,429 1,487 324 Booster Clubs 2,075 30,061 16,369 15,767 Dorm Room Grants 178 3,000 1,924 1,254 Education Foundation - 737 737 - LOCC 412 684 794 302 Band Allocation 566 24,721 20,912 4,375 Sunshine Fund 127 - - 127 Health Room/Nurse 207 - - 207 Relay For Life 452 1,881 2,263 70 Region 5 Activities 5 - - 5 Spanish National Honor Soc 14 2,252 2,363 (97) CREW - - 268 (268) Total 112,971$ 555,891$ 568,578$ 100,284$
SUMMARY SCHEDULE OF CASH RECEIPTS AND DISBURSEMENTS - PELION HIGH SCHOOL
FOR YEAR ENDED JUNE 30, 2019
158

LEXINGTON COUNTY SCHOOL DISTRICT ONE SCHEDULE F-24LEXINGTON, SOUTH CAROLINA
SUMMARY SCHEDULE OF CASH RECEIPTS AND DISBURSEMENTS - PELION MIDDLE SCHOOL
FOR YEAR ENDED JUNE 30, 2019
Description Beginning Balance Receipts Disbursements Ending Balance
6th Grade 1,324$ 3,369$ 4,516$ 177$ 7th Grade - 2,594 2,612 (18) 8th Grade 137 2,278 2,806 (391) Technical Equip Ins Fees (32,585) 25,923 48,264 (54,926) Agriculture Fee - 1,476 1,605 (129) Art-Fees 1,399 768 427 1,740 Band-Fees 4,424 11,748 13,236 2,936 Books/Workbooks-Fees 1,730 1,687 3,321 96 Chorus 3,462 6,910 6,457 3,915 Drama-Fees 585 745 50 1,280 Exploratory-Fees 1,823 536 143 2,216 Instruction Material Fees (742) 1,570 1,774 (946) Lab Fees 2,769 1,388 387 3,770 Library Fees/Fines/Fairs 1,000 2,148 1,263 1,885 Orchestra/Strings-Fees 1,198 5,633 5,303 1,528 Physical Education-Fees 1,912 1,670 1,612 1,970 State Textbooks-Lost 408 199 233 374 Industrial Tech. Fees 107 50 185 (28) Journalism Fees 302 160 310 152 Id Badges 1,728 3,506 4,300 934 Back Pack Program 628 2,703 1,635 1,696 Icivics Fee 503 6 389 120 Cell Phone Fines 15 - - 15 Athletics Dues/Fees 17,302 19,279 18,050 18,531 Beta Club-Junior 4,186 15,919 14,990 5,115 FFA Club - 4,056 2,732 1,324 Student Council-Junior 262 1,419 1,213 468 Canteen Sales 4,518 12,750 10,164 7,104 WP Rawl Mini Grant - 500 57 443 Yearbooks 2,621 3,363 4,021 1,963 Faculty Funds 454 - 112 342 Miscellaneous 464 6,054 3,733 2,785 Special Funds (50) 50 - - Special Project-Athletics 1,877 8,041 9,581 337 Lunch Credits 75 896 924 47 United Way - 130 130 - Michelin Awards - 133 133 - Archery Club - - 70 (70) Robotics Club 123 3,865 3,172 816 Education Foundation - 298 298 - Student Book Club Orders - 272 288 (16) Robotics Grant - 670 824 (154) Relay for Life - 1,453 1,453 - Leader in Me (3,207) - 11,018 (14,225) Total 20,752$ 156,215$ 183,791$ (6,824)$
159

LEXINGTON COUNTY SCHOOL DISTRICT ONE SCHEDULE F-25LEXINGTON, SOUTH CAROLINA
SUMMARY SCHEDULE OF CASH RECEIPTS AND DISBURSEMENTS - PLEASANT HILL ELEMENTARY SCHOOL
FOR YEAR ENDED JUNE 30, 2019
Description Beginning Balance Receipts Disbursements Ending Balance
Kindergarten -$ 4,769$ 4,733$ 36$ Tuition Based 4K 8,242 117,488 109,142 16,588Technical Equip Ins Fees (9,890) - 1,076 (10,966)Eagles 3,383 2,580 2,436 3,527Instruction Material Fees (360) 21,924 21,368 196Library Fees/Fines/Fairs 13,910 11,728 10,173 15,465State Textbooks-Lost 65 - 51 14State Textbooks-Damaged 8 - - 8Special Collections 291 210 - 501Misc. Pupil Activity Fund 291 1,282 754 819Immersion Camp - 9,225 - 9,225Radius Fund - 1,000 100 900Afterschool/Homehelp Ctr 11,567 31,009 30,212 12,364Lex 1 Summer Camp - 9,935 735 9,200School Store 350 491 144 697Canteen Sales - 1,120 1,120 - WP Rawl Mini Grant (1) - - (1)School Pictures 9,337 27,744 26,209 10,872Yearbooks 2,241 16,121 16,688 1,674Summer Programs 7,220 2,715 8,798 1,137Faculty Projects 88 51 51 88Department Funds 52 - - 52Faculty Funds 53 2,263 2,348 (32)Miscellaneous 267 4,756 2,591 2,432Special Funds 138 4,079 3,631 586Special Projects 498 1,675 1,592 581Memorials - 450 246 204Lunch Credits (698) 1,485 2,547 (1,760)United Way 114 - - 114Education Fd Innovation Grant - 5,053 5,053 - Michelin Awards - 250 242 8Blowfish Awards 162 - 162 - Education Foundation - 1,456 1,456 - Education Fd Bucks for Books 1 1,500 1,478 23Student Field Studies (173) 7,036 5,853 1,010Relay For Life 10 386 - 396Math Club 596 - 510 86Total 47,762$ 289,781$ 261,499$ 76,044$
160

LEXINGTON COUNTY SCHOOL DISTRICT ONE SCHEDULE F-26LEXINGTON, SOUTH CAROLINA
SUMMARY SCHEDULE OF CASH RECEIPTS AND DISBURSEMENTS - PLEASANT HILL MIDDLE SCHOOL
FOR YEAR ENDED JUNE 30, 2019
Description Beginning Balance Receipts Disbursements Ending Balance
Technical Equip Ins Fees 90,025$ 68,170$ 35,159$ 123,036$ Art-Fees 20 4,816 4,851 (15) Band-Fees 15,617 22,663 24,468 13,812 Books/Workbooks-Fees 4,151 - 94 4,057 Chorus 3,326 13,616 9,642 7,300 Computer - Fees 1,908 1,936 57 3,787 Drama-Fees 6,311 3,856 1,414 8,753 Eagles 25 - - 25 Exploratory-Fees 4,826 3,488 2,440 5,874 Instruction Material Fees 10,750 39,671 41,595 8,826 Lab Fees 15,875 5,808 8,084 13,599 Library Fees/Fines/Fairs 1,048 8,626 8,731 943 Orchestra/Strings-Fees 4,346 69,001 69,021 4,326 Physical Education-Fees 1,741 9,759 5,643 5,857 State Textbooks-Lost 2,190 719 1,061 1,848 State Textbooks-Damaged 702 - - 702 Industrial Tech. Fees 1,029 - 988 41 Music Fees 10,568 17,343 17,521 10,390 Service Learning Fees 3,887 1,944 1,144 4,687 Pro Team 327 150 418 59 Dance Fees 1,765 20,599 23,826 (1,462) Id Badges 2,460 3,322 922 4,860 Project Adventure Fees 794 315 131 978 Misc. Pupil Activity Fund 3,862 15,192 15,166 3,888 Cell Phone Fines 165 - - 165 Athletics 12,199 13,883 14,961 11,121 Beta Club-Junior 331 4,383 4,218 496 French Club 2,104 543 216 2,431 Student Council-Junior 890 1,044 770 1,164 Spanish Club 2,460 1,260 - 3,720 School Store 380 - - 380 Special Education 2,229 2,437 3,251 1,415 Canteen Sales 2,218 21,787 21,898 2,107 Walter P Rawl Mini Grant - 250 241 9 School Pictures 6,566 8,429 9,914 5,081 Yearbooks 6,391 29,783 29,597 6,577 Latin Club 576 84 - 660 German Club 2,313 375 - 2,688 Guidance Fund - 3,000 555 2,445 Lighthouse Team - 604 220 384 Faculty Funds 972 643 407 1,208 Special Projects 3,235 63,223 65,165 1,293 Special Project-Athletics 4,603 27,941 28,724 3,820 Project Unify 1 - - 1 B Team Cheerleaders 17,596 19,846 24,610 12,832 Lunch Credits (1,333) 1,632 3,029 (2,730) United Way 20 20 20 20
(Continued)
161

LEXINGTON COUNTY SCHOOL DISTRICT ONE SCHEDULE F-26LEXINGTON, SOUTH CAROLINA
SUMMARY SCHEDULE OF CASH RECEIPTS AND DISBURSEMENTS - PLEASANT HILL MIDDLE SCHOOL
FOR YEAR ENDED JUNE 30, 2019
Description Beginning Balance Receipts Disbursements Ending Balance
Race Team 190$ -$ -$ 190$ School Pageants 10,000 13,031 9,874 13,157Cougar Carnival 6,425 17,055 17,304 6,176 Archery Club - 3,737 2,616 1,121 Robotics Club 2,952 2,470 2,092 3,330 Education Foundation - 324 324 - Student Field Studies (1,542) 60,892 62,845 (3,495) LOCC - 1,088 683 405 WEB Program 6,494 24,361 28,830 2,025 Robiotics Grant - 1,447 1,250 197 Relay For Life 1,815 5,398 3,084 4,129 Dance Team 3,446 21,481 23,835 1,092 Total 281,249$ 663,445$ 632,909$ 311,785$
162

LEXINGTON COUNTY SCHOOL DISTRICT ONE SCHEDULE F-27LEXINGTON, SOUTH CAROLINA
SUMMARY SCHEDULE OF CASH RECEIPTS AND DISBURSEMENTS - RED BANK ELEMENTARY SCHOOL
FOR YEAR ENDED JUNE 30, 2019
Description Beginning Balance Receipts Disbursements Ending Balance
1st Grade -$ 1,779$ 2,112$ (333)$ 2nd Grade - 1,563 1,512 51 3rd Grade - 646 681 (35) 4th Grade 490 2,100 2,590 - 5th Grade (411) 2,826 2,134 281 Kindergarten 335 2,550 2,888 (3) Technical Equip Ins Fees (41,196) - 23,434 (64,630) Band-Fees (250) 278 - 28 Instruction Material Fees (9) 9,626 11,212 (1,595) Library Fees/Fines/Fairs 123 9,962 8,633 1,452 Orchestra/Strings-Fees 36 - - 36 State Textbooks-Lost 105 - 18 87 Special Collections 1,465 4,987 4,959 1,493 Just Say No 141 950 1,189 (98) Radius Fund - 4,000 2,345 1,655 Afterschool/Homehelp Ctr 2,137 13,863 16,725 (725) Make Your Mark 8 - - 8 Canteen Sales (12) 448 377 59 Walter P Rawl Mini Grant 5 - - 5 School Pictures 2,553 5,641 6,413 1,781 Yearbooks (107) 4,125 3,125 893 Faculty Funds (169) 573 318 86 Miscellaneous 824 - 764 60 Special Funds 99 - 78 21 Special Projects 952 1,059 1,742 269 Project Unify 172 - - 172 Lunch Credits (404) 657 632 (379) Sunshine Club 31 1,316 370 977 Innovation Grant 43 5,500 4,425 1,118 Michelin Awards - 277 277 - Blowfish Awards 54 - 54 - Education Fd Bucks for Books - 1,500 1,468 32 Relay For Life 100 5,144 5,190 54 Heart Of Lexington Awards 4 - - 4 Afterschool Program (7,730) - - (7,730) Total (40,611)$ 81,370$ 105,665$ (64,906)$
163

LEXINGTON COUNTY SCHOOL DISTRICT ONE SCHEDULE F-28LEXINGTON, SOUTH CAROLINA
SUMMARY SCHEDULE OF CASH RECEIPTS AND DISBURSEMENTS - RIVER BLUFF HIGH SCHOOL
FOR YEAR ENDED JUNE 30, 2019
Description Beginning Balance Receipts Disbursements Ending Balance
12th Grade 2,690$ 2,753$ 2,778$ 2,665$ Gator Town 16,181 52,683 50,351 18,513 Technical Equip Ins Fees 206,539 60,901 63,646 203,794 Business Education 23,687 17,147 5,572 35,262 Art-Fees 5,561 4,880 2,924 7,517 Band-Fees 3,768 3,190 4,194 2,764 Chorus 7,848 2,718 5,504 5,062 Drama-Fees 13,670 7,782 8,451 13,001 Instruction Material Fees 32,422 148,574 113,109 67,887 Lab Fees 26,579 26,234 20,580 32,233 Library Fees/Fines/Fairs 4,900 924 3,279 2,545 Orchestra/Strings-Fees 5,228 1,900 450 6,678 Parking Fees 7,462 24,623 25,513 6,572 Physical Education-Fees 6,673 11,035 4,276 13,432 State Textbooks-Lost 113 470 583 - State Textbooks-Damaged 27 337 - 364 Health Science Inst Fees 3,802 17,727 7,932 13,597 National Art Honor Society 230 475 509 196 ID/S PMD Class 371 245 432 184 Dance Fees 1,759 1,820 2,455 1,124 ID Badges 5,934 5,434 4,380 6,988 Photography 3,723 3,353 2,657 4,419 FIT Program 1,881 365 1,478 768 Chinese - 1,200 1,125 75 Bass Fishing Club - 1,475 374 1,101 Misc. Pupil Activity Fund (96,217) - - (96,217) Cell Phone Fines 573 - 125 448 Athletics 84,987 232,109 243,410 73,686 Beta Club-Senior 3,096 4,620 4,733 2,983 DECA Club (5,678) 62,745 57,307 (240) FCA Club 477 167 59 585 Law/Global Policy CTR 1,290 6,238 7,592 (64) Nat'l Honor Society -Sr. 8,752 13,116 9,791 12,077 Pep Club/Spirit - 540 310 230 Student Council - Senior 10,977 14,018 4,174 20,821 Chemistry Club - 135 - 135 Key Club 267 81 81 267 Outdoor Club 480 - - 480 Teacher Cadets 620 1,293 823 1,090 PSAT/ACT/SAT Tests - 9,846 8,254 1,592 Health Occup Student Assc 8,992 18,061 16,947 10,106 Canteen Sales 16,773 60,533 58,195 19,111 Walter P Rawl Mini Grant 279 497 594 182 Yearbooks 6,433 47,042 47,959 5,516 German Club 2,651 1,600 1,589 2,662 Faculty Funds 5,877 5,078 3,598 7,357
(Continued)
164

LEXINGTON COUNTY SCHOOL DISTRICT ONE SCHEDULE F-28LEXINGTON, SOUTH CAROLINA
SUMMARY SCHEDULE OF CASH RECEIPTS AND DISBURSEMENTS - RIVER BLUFF HIGH SCHOOL
FOR YEAR ENDED JUNE 30, 2019
Description Beginning Balance Receipts Disbursements Ending Balance
Miscellaneous 3,075$ 7,465$ 10,540$ -$ Special Projects (228,221) 17,500 2,796 (213,517) Special Project-Athletics 118,689 234,875 209,864 143,700 Sears Class - 4,912 768 4,144 Lunch Credits 3,001 3,112 2,092 4,021 Autism - 386 115 271 Juniorette Club 573 97 44 626 Junior/Senior Prom 7,993 32,750 33,907 6,836 Bowling Club 267 550 550 267 Dorm Room Grants 1,420 - 1,492 (72) Golden Gate Club - 340 - 340 Michelin Robotics - 2,147 2,146 1 Mock Trial Club 183 - 150 33 Robotics Club - 4,464 4,267 197 Education Foundation - 1,343 1,343 - Student Field Studies 1,339 4,642 4,985 996 ID/M-TMD Class Project 1,439 2,383 2,175 1,647 LOCC - 227 189 38 Band Allocation (32,539) 85,993 66,921 (13,467) Sunshine Fund 649 5,354 1,999 4,004 Robotics Grant - 4,198 4,198 - Relay For Life 563 111 674 - Athletic Camps 19,148 76,429 68,737 26,840 OCP Class Projects 1,616 16,367 17,891 92 Spanish Nat Honor Society 1,743 4,584 4,571 1,756 CREW 2,176 18,467 18,668 1,975 Total 334,791$ 1,404,660$ 1,259,175$ 480,276$
165

LEXINGTON COUNTY SCHOOL DISTRICT ONE SCHEDULE F-29LEXINGTON, SOUTH CAROLINA
SUMMARY SCHEDULE OF CASH RECEIPTS AND DISBURSEMENTS - ROCKY CREEK ELEMENTARY SCHOOL
FOR YEAR ENDED JUNE 30, 2019
Description Beginning Balance Receipts Disbursements Ending Balance
Kindergarten 83$ 4,044$ 4,117$ 10$ Technical Equip Ins Fees (14,947) - 2,793 (17,740)Art-Fees 97 - - 97Band-Fees 40 - - 40Eagles 1,699 1,390 2,720 369Instruction Material Fees 9,643 22,844 30,630 1,857Library Fees/Fines/Fairs 531 253 139 645Orchestra/Strings-Fees 43 - - 43State Textbooks-Lost 69 38 107 - Health 62 - 62 - Special Collections 4,811 10,416 8,615 6,612Radius Fund - 3,021 770 2,251Afterschool/Homehelp Ctr 12,462 9,950 14,770 7,642School Pictures 7,371 4,025 10,208 1,188Faculty Funds 854 515 660 709Special Projects 2,873 26,310 16,900 12,283Lunch Credits (86) 493 760 (353)United Way - 112 - 112Innovation Grant - 4,964 3,774 1,190Michelin Awards - 257 257 - Blowfish Awards 176 - 175 1Education Foundation - 769 769 - Education Fd Bucks for Books 2,000 1,742 1,656 2,086Health Room/Nurse 7 - - 7Relay For Life - 1,397 1,397 - Learning Commons Award 122 4 119 7Total 27,910$ 92,544$ 101,398$ 19,056$
166

LEXINGTON COUNTY SCHOOL DISTRICT ONE SCHEDULE F-30LEXINGTON, SOUTH CAROLINA
SUMMARY SCHEDULE OF CASH RECEIPTS AND DISBURSEMENTS - SAXE GOTHA ELEMENTARY SCHOOL
FOR YEAR ENDED JUNE 30, 2019
Description Beginning Balance Receipts Disbursements Ending Balance
1st Grade 588$ 1,741$ 1,911$ 418$ 2nd Grade 229 1,652 1,880 1 3rd Grade 2,683 1,030 1,090 2,623 4th Grade 88 1,610 1,760 (62) 5th Grade 3,368 8,354 8,342 3,380 Kindergarten 3,013 4,541 3,189 4,365 Technical Equip Ins Fees (14,393) - 3,673 (18,066) Art-Fees 778 - - 778 Band-Fees 148 - - 148 Eagles 321 550 107 764 Instruction Material Fees 12,405 6,886 4,121 15,170 Library Fees/Fines/Fairs 1,669 10,505 12,117 57 Orchestra/Strings-Fees 465 - - 465 State Textbooks-Lost 268 - - 268 State Textbooks-Damaged 29 - - 29 Special Collections 365 524 - 889 Radius Fund - 4,000 - 4,000 Canteen Sales 29 1,989 2,005 13 Walter P Rawl Mini Grant 6 212 209 9 School Pictures 9,933 5,703 4,509 11,127 Yearbooks 10,327 3,808 5,143 8,992 Department Funds 38 - - 38 Faculty Funds 2,448 - - 2,448 Miscellaneous 317 613 452 478 Special Funds 139 465 307 297 Special Projects 24,122 8,371 11,270 21,223 Project Unify 300 - - 300 Lunch Credits (130) 367 758 (521) Innovation Grant 1 - - 1 Michelin Awards - 1,366 1,322 44 Blowfish Awards 176 40 176 40 Bob Parker Memorial Fund 4,490 - 34 4,456 Education Foundation - 389 389 - Education Fd Books for Bucks - 1,500 1,500 - Student Field Studies 715 1,584 1,668 631 Health Room/Nurse 35 - - 35 Relay For Life 162 6,226 6,380 8 Heart Of Lexington Awards 4 - - 4 Leader In Me 3,571 - 1,610 1,961
68,707$ 74,026$ 75,922$ 66,811$
167
Total

LEXINGTON COUNTY SCHOOL DISTRICT ONE SCHEDULE F-31LEXINGTON, SOUTH CAROLINA
SUMMARY SCHEDULE OF CASH RECEIPTS AND DISBURSEMENTS - WHITE KNOLL ELEMENTARY SCHOOL
FOR YEAR ENDED JUNE 30, 2019
Description Beginning Balance Receipts Disbursements Ending Balance
1st Grade 367$ 1,833$ 1,876$ 324$ 2nd Grade (347) 4,388 4,758 (717) 3rd Grade 2,200 1,005 1,759 1,446 4th Grade 353 1,882 1,587 648 5th Grade 459 6,512 7,458 (487) Kindergarten - 4,977 4,977 - Technical Equip Ins Fees (7,505) - 1,900 (9,405) Band-Fees 404 17 217 204 Books/Workbooks-Fees 90 - - 90 Eagles 3,131 1,220 1,475 2,876 Instruction Material Fees 1,180 12,688 5,155 8,713 Library Fees/Fines/Fairs 848 12,805 8,048 5,605 Orchestra/Strings-Fees (78) 78 - - State Textbooks-Lost 117 - 81 36 Special Collections 3,168 13,036 3,395 12,809 Afterschool/Homehelp Ctr 12,268 8,302 14,103 6,467 School Store (209) 209 - - Angel Account - 3,000 761 2,239 Canteen Sales 387 - 387 - School Pictures 12,428 3,718 13,414 2,732 Yearbooks 4,315 3,814 1,808 6,321 Faculty Funds (342) 342 - - Miscellaneous 1,742 220 1,490 472 Special Funds 3,529 4,721 4,599 3,651 Special Projects 345 - 272 73 Lunch Credits (670) 1,493 1,737 (914) United Way 330 186 186 330 Sunshine Club 1,547 2,631 2,932 1,246 Ed Fd Innovation Grant - 4,725 4,000 725 Michelin Awards - 449 449 - Blowfish Awards 176 - 176 - Education Foundation - 394 394 - Education Fd Bucks for Books 198 1,500 1,600 98 Student Book Club Orders 99 - - 99 School/Business Partners - 60 - 60 Relay For Life - 2,214 - 2,214 Learning Commons Award 289 - - 289 Total 40,819$ 98,419$ 90,994$ 48,244$
168

LEXINGTON COUNTY SCHOOL DISTRICT ONE SCHEDULE F-32LEXINGTON, SOUTH CAROLINA
Description Beginning Balance Receipts Disbursements Ending Balance
9th Grade 570$ -$ 40$ 530$ 10th Grade 546 177 90 633 11th Grade 645 - - 645 12th Grade 1,257 1,094 2,287 64 Technical Equip Sales 3,115 553 50 3,618 Technical Equip Ins Fees 182,846 61,704 67,512 177,038 ROTC - Fees (379) 2,824 517 1,928 Art-Fees 4,113 5,451 3,781 5,783 Band-Fees 779 5,636 4,379 2,036 Books/Workbooks-Fees 509 - - 509 Chorus 8,844 3,224 1,356 10,712 Computer - Fees 15,382 15,030 11,684 18,728 Drama-Fees 1,422 18,255 15,562 4,115 Home Economics-Fees 296 57 - 353 Instruction Material Fees 3,615 40,230 23,146 20,699 Lab Fees 1,979 8,411 7,172 3,218 Library Fees/Fines/Fairs 2,191 1,017 1,757 1,451 Orchestra/Strings-Fees 2,060 4,495 3,137 3,418 Parking Fees 9,480 8,676 12,528 5,628 Physical Education-Fees 6,034 8,719 7,250 7,503 State Textbooks-Lost 195 386 196 385 State Textbooks-Damaged 20 25 20 25 Music Fees 801 - - 801 National Art Honor Society 265 167 395 37 Health Occupation Fees 14,392 10,216 7,405 17,203 Journalism Fees 562 7,064 5,324 2,302 Sports Medicine - Fees 324 517 560 281 ID Badges 4,983 2,446 8,539 (1,110) Drafting -Fees 4,284 3,123 1,535 5,872 Guitar Class 990 1,958 2,597 351 Public Health Center Fees 14,191 17,858 20,971 11,078 Project Adventure Fees 1,684 140 - 1,824 Leadership 21 Fees 11,125 2,261 1,353 12,033 Scorers Table Fund (15,772) - - (15,772) Percussion Instr Fund (9,802) - - (9,802) Bass Fishing Club (239) 1,302 503 560 Power Group 39 - 39 - Coffee Club 144 3,277 3,065 356 Icivics Fees 1,491 - - 1,491
(Continued)
SUMMARY SCHEDULE OF CASH RECEIPTS AND DISBURSEMENTS - WHITE KNOLL HIGH SCHOOL
FOR YEAR ENDED JUNE 30, 2019
169

LEXINGTON COUNTY SCHOOL DISTRICT ONE SCHEDULE F-32LEXINGTON, SOUTH CAROLINA
Description Beginning Balance Receipts Disbursements Ending Balance
Cell Phone Fines 1,873$ -$ 1,873$ -$ Athletics (53,086) 211,129 204,663 (46,620) Beta Club-Senior 1,301 1,390 1,628 1,063 Computer Club - 342 342 - Cheerleaders-Varsity - - 119 (119) DECA Club 3,156 9,230 5,800 6,586 DECA SBE 144 - 144 - FBLA Club 681 - 681 - Skills USA 703 3,869 1,572 3,000 FCA Club 2,014 2,580 2,450 2,144 French Club 30 - 30 - Minority Std 94 - 94 - Nat'l Honor Society -Sr. 4,849 4,321 2,478 6,692 Student Council - Senior 1,610 1,716 1,783 1,543 Chess Club 222 - - 222 Spanish Club 209 80 85 204 Key Club 166 210 376 - Radius Fund - 5,000 732 4,268 Outdoor Club 773 495 224 1,044 Teacher Cadets 303 951 1,195 59 Debate Team 11 - 11 - PSAT/ACT/SAT Test - 2,054 1,656 398 NTHS 342 542 580 304 Canteen Sales 24,642 56,693 76,644 4,691 WP Rawl Mini Grant - 500 500 - Graduation 145 - - 145 School Pictures - 2,223 - 2,223 Womens Ambassadors 146 - - 146 Student Newspapers (1,227) 1,227 - - Yearbooks 1,431 26,886 4,455 23,862 Latin Club 149 - - 149 German Club 134 - - 134 Wolfpack Fund 391 491 - 882 Faculty Funds 399 485 - 884 Foundations 113 - 113 - Miscellaneous 5,448 85 - 5,533 Special Funds 4,478 2,189 1,085 5,582 Special Projects 2,298 17,290 17,458 2,130 Special Project-Athletics 149,606 185,987 220,366 115,227 Sears Class 5,402 5,457 7,643 3,216 Project Unity - 2,150 815 1,335 Health Occupations 2,864 11,289 7,475 6,678 Literary Magazine 54 - 54 - Lunch Credits (1,258) 3,054 3,346 (1,550) Digital Dtop Printing 24,643 70,748 76,472 18,919 Print Shop 3,688 24,239 27,506 421 Mentor Program 34 699 815 (82) Green Steps School 111 - - 111
(Continued)
SUMMARY SCHEDULE OF CASH RECEIPTS AND DISBURSEMENTS - WHITE KNOLL HIGH SCHOOL
FOR YEAR ENDED JUNE 30, 2019
170

LEXINGTON COUNTY SCHOOL DISTRICT ONE SCHEDULE F-32LEXINGTON, SOUTH CAROLINA
Description Beginning Balance Receipts Disbursements Ending Balance
She Wolf English Club -$ 130$ 17$ 113$ Junior/Senior Prom 10,106 21,380 14,992 16,494 Gospel Choir 2 - 2 - Booster Clubs 1,150 590 2,681 (941) Step Club (787) 1,144 317 40 Dorm Room Grant 54 2,700 2,700 54 Michelin Awards - 220 213 7 Future Educators of America 626 - - 626 Michelin Robotics - 2,000 285 1,715 Archery Club 6,168 13,886 10,416 9,638 Robotics Club 1,378 200 462 1,116 Ed Foundation - 360 360 - Student Field Studies 1,265 8,669 9,298 636 TMD Class Project 2,403 4,117 2,835 3,685 LOCC 994 475 255 1,214 Band Allocation 3,877 20,500 19,252 5,125 Latin Dance Club 168 - 168 - Robotics Grant - 3,752 1,102 2,650 Science Olympiad (86) 159 100 (27) Relay For Life 683 4,363 1,689 3,357 Ring Ceremony 520 550 384 686 Athletic Camps 10,690 2,726 7,499 5,917 ROTC Unit Support 2,149 1,122 2,033 1,238 Teen Lead Service Project 4 - 4 - Special Ed TMD 4,344 8,070 6,007 6,407 Coffee House 500 154 - 654 Learning Commons Award 8 1 8 1 Te Paic Projects 40 - 40 - OCP Class Projects 94 6,131 5,918 307 Total 510,417$ 995,293$ 977,050$ 528,660$
FOR YEAR ENDED JUNE 30, 2019
SUMMARY SCHEDULE OF CASH RECEIPTS AND DISBURSEMENTS - WHITE KNOLL HIGH SCHOOL
171

LEXINGTON COUNTY SCHOOL DISTRICT ONE SCHEDULE F-33LEXINGTON, SOUTH CAROLINA
SUMMARY SCHEDULE OF CASH RECEIPTS AND DISBURSEMENTS - WHITE KNOLL MIDDLE SCHOOL
FOR YEAR ENDED JUNE 30, 2019
Description Beginning Balance Receipts Disbursements Ending Balance
6th Grade 240$ -$ 397$ (157)$ Technical Equip Sales 400 - - 400 Technical Equip Ins Fees (108,694) 32,229 42,790 (119,255) Art-Fees 238 1,207 1,525 (80) Band-Fees 1,543 674 797 1,420 Books/Workbooks-Fees 4,771 4,917 5,717 3,971 Chorus 2,403 7,102 7,183 2,322 Computer - Fees 1,483 1,130 1,901 712 Drama-Fees 956 2,751 2,064 1,643 Eagles 88 - 88 - Home Economics-Fees 794 1,067 1,158 703 Instruction Material Fees 834 2,314 3,132 16 Lab Fees 2,843 2,727 1,860 3,710 Library Fees/Fines/Fairs 4,101 3,322 5,543 1,880 Orchestra/Strings-Fees 4,357 1,246 1,890 3,713 Physical Education-Fees 4,663 9,529 8,643 5,549 State Textbooks-Lost 653 190 726 117 State Textbooks-Damaged 205 216 - 421 Industrial Tech. Fees 1,020 - 183 837 Dance Fees 121 1,657 1,485 293 Journalism Fees 725 72 79 718 Id Badges 2,814 5,998 7,639 1,173 Music With Technology 1,402 1,049 2,430 21 Special Collections 321 - - 321 Misc. Pupil Activity Fund 273 3,000 534 2,739 Icivics Fees 257 - - 257 Athletics 8,700 28,178 27,012 9,866 FBLA Club 5 - - 5 Student Council-Junior 2,688 3,551 3,635 2,604 Spanish Club 1,000 50 1,175 (125) Canteen Sales 811 15,077 13,490 2,398 School Pictures - 1,930 1,122 808 Yearbooks 50 11,090 169 10,971 Destination Imagination 23 - - 23 Faculty Funds 94 485 476 103 Interest 162 - - 162 Miscellaneous 3,008 2,860 1,662 4,206 Special Funds 4,807 17,823 15,755 6,875 Special Projects 885 5,537 5,503 919 Lunch Credits (744) 744 6,016 (6,016) United Way 229 172 172 229 Michelin Awards - 475 140 335 Michelin Robotics - 2,000 1,993 7 Archery Club 564 7,807 3,171 5,200 Robotics Club 70 - 70 - Education Foundation - 577 577 - Student Book Club Orders 5 - - 5 LOCC - 475 208 267 Robotics Grant - 1,700 1,450 250 Relay For Life 2,301 3,332 3,461 2,172 Literacy Fd - 503 591 (88) MS Choral Clinic - 30 - 30 Learning Commons Award 54 - 54 - Total (46,477)$ 186,793$ 185,666$ (45,350)$
172

LEXINGTON COUNTY SCHOOL DISTRICT ONELEXINGTON, SOUTH CAROLINA
SCHEDULE OF GENERAL OBLIGATION BONDS OUTSTANDING
JUNE 30, 2019Principal
Fiscal Year Outstanding, Outstanding,Bond Issue Maturity July 1, 2018 Issued Refunded Paid June 30, 2019
2009A Issue 2019 2,285,000$ 2020 2,430,0002021 2,590,0002022 2,760,0002023 2,940,0002024 3,210,0002025 3,430,0002026 3,665,0002027 3,920,0002028 4,185,0002029 4,480,0002030 4,795,0002031 5,130,0002032 5,490,0002033 5,880,0002034 6,290,000 63,480,000$ -$ 61,195,000$ 2,285,000$ -$
2010 Issue 2019 4,975,0002020 5,000,000 9,975,000 4,975,000 5,000,000
2011 Issue 201920202021202220232024 5,685,000 2025 14,500,000 2026 15,500,000 35,685,000 35,685,000
2011C Issue 201920202021 5,900,0002022 6,800,000 12,700,000 12,700,000
2013A Issue 2019 2,945,000$ 2020 3,215,0002021 3,500,0002022 4,090,0002023 4,445,0002024 420,000 18,615,000$ 2,945,000$ 15,670,000$
(Continued)
173

LEXINGTON COUNTY SCHOOL DISTRICT ONE
LEXINGTON, SOUTH CAROLINA
SCHEDULE OF GENERAL OBLIGATION BONDS OUTSTANDING
JUNE 30, 2019
Principal
Fiscal Year Outstanding, Outstanding,
Bond Issue Maturity July 1, 2018 Issued Refunded Paid June 30, 20192013B Issue 2019
2020 1,050,000$ 2021 1,325,0002022 1,500,0002023 1,525,0002024 1,550,0002025 1,500,0002026 1,575,0002027 4,810,0002028 5,060,0002029 5,290,0002030 5,505,0002031 5,730,000 2032 5,965,0002033 6,210,0002034 6,475,0002035 6,745,0002036 7,035,0002037 7,360,0002038 7,695,000 83,905,000$ 83,905,000$
2015A Series 2019 3,055,0002020 2,695,0002021 2,390,0002022 2,080,0002023 1,730,0002024 1,325,0002025 830,0002026 250,0002027 9,650,0002028 9,840,0002029 10,060,0002030 10,285,000 54,190,000 3,055,000 51,135,000
2016 Series 2019 885,000$ 2020 930,0002021 980,0002022 1,030,0002023 1,085,0002024 1,130,0002025 1,165,0002026 1,270,0002027 1,475,0002028 1,545,0002029 1,590,0002030 1,650,0002031 1,705,0002032 1,760,000 18,200,000$ 885,000$ 17,315,000$
(Continued)
174

LEXINGTON COUNTY SCHOOL DISTRICT ONELEXINGTON, SOUTH CAROLINA
SCHEDULE OF GENERAL OBLIGATION BONDS OUTSTANDING
JUNE 30, 2019Principal
Fiscal Year Outstanding, Outstanding,Bond Issue Maturity July 1, 2018 Issued Refunded Paid June 30, 2019
2017 Series 2019 8,140,000$ 2020 8,710,000 16,850,000$ 8,140,000 8,710,000$
2017B Series 2019 50,000 2020 55,000 2021 450,000 2022 790,000 2023 9,360,000 2024 9,750,000 2025 2,370,000 2026 1,875,000 2027 4,930,000 2028 5,120,000 2029 5,250,000 2030 5,390,000 2031 5,555,000 2032 5,725,000 2033 5,900,000 2034 6,085,000 2035 6,285,000 2036 6,495,000 81,435,000 50,000 81,385,000
2019A Series 2019 - 2020 1,870,000 2021 2,040,000 2022 2,225,000 2023 2,425,000 2024 2,715,000 2025 2,955,000 2026 3,215,000 2027 3,500,000 2028 3,795,000 2029 4,120,000 2030 4,460,000 2031 4,815,000 2032 5,145,000 2033 5,450,000 2034 5,795,000 - 54,525,000 54,525,000
Series 2019A BAN 20192020 85,000,000 - 85,000,000 85,000,000
395,035,000$ 139,525,000$ 61,195,000$ 22,335,000$ 451,030,000$
175

LEXINGTON COUNTY SCHOOL DISTRICT ONELEXINGTON, SOUTH CAROLINA
INSTALLMENT PURCHASE REVENUE BONDS OUTSTANDING
JUNE 30, 2019
PrincipalFiscal Year Outstanding, Outstanding,
Bond Issue Maturity July 1, 2018 Issued Refunded Paid June 30, 2019
2013 Issue 2019 1,840,000 2020 1,890,000 2021 1,945,000 2022 2,000,000 2023 2,060,000 2024 2,120,000 2025 2,180,000 2026 2,245,000 2027 2,305,000 2028 2,375,000 2029 2,440,000 2030 2,515,000 2031 2,585,000 28,500,000$ 1,840,000$ 26,660,000$
2015 Issue 2019 1,960,000 2020 2,060,000 2021 2,160,000 2022 2,270,000 2023 2,380,000 2024 2,495,000 2025 2,620,000 2026 2,750,000 2027 2,890,000 2028 3,030,000 2029 3,125,000 2030 3,220,000 2031 3,325,000 34,285,000 1,960,000 32,325,000
62,785,000$ -$ -$ 3,800,000$ 58,985,000$
SCHEDULE OF LEXINGTON ONE SCHOOL FACILITIES, CORP.
176

STATISTICALSTATISTICAL

STATISTICAL SECTION
This section of the Lexington County School District One Comprehensive Annual Financial Report presents detailed trend and other information as a context for understanding what the information in the basic financial statements, notes to the financial statements, required supplementary information and other supplementary information says about Lexington County School District One’s overall financial health.
Page Financial Trends 178
These schedules contain trend information to help the reader understand how the government’s financial performance and well-being have changed over time.
Revenue Capacity 182 These schedules contain information to help the reader access Lexington County School District One’s most significant local revenue source, the property tax.
Debt Capacity 187 These schedules present information to help the reader assess the affordability of Lexington County School District One’s current level of outstanding debt and the District’s ability to issue additional debt in the future.
Demographic and Economic Information 191 These schedules offer demographic and economic indicators to help the reader understand the environment within which Lexington County School District One’s financial activities take place.
Operating Information 194 These schedules contain service and infrastructure data to help the reader understand how the information in Lexington County School District One’s financial report relates to the services the District provides and the activities it performs.
177

Lex
ingt
on C
oun
ty S
choo
l Dis
tric
t O
ne
Tab
le 1
Lex
ingt
on, S
outh
Car
olin
a
Net
Pos
itio
n b
y C
omp
onen
t
Las
t T
en F
isca
l Yea
rs (
A)
(Acc
rual
Bas
is o
f A
ccou
nti
ng)
2010
2011
2012
2013
2014
2015
1,2
2016
2017
2018
320
19 3
Net
inve
stm
ent
in c
apit
al a
sset
s13
1,97
0,67
1$
14
6,02
5,00
8$
14
2,43
1,11
5$
144,
811,
919
$
142,
714,
423
$
137,
869,
432
$
145,
379,
211
$
159,
318,
035
$
19
2,33
0,57
1$
19
8,16
9,63
1$
Res
tric
ted
17,9
78,7
79
19
,176
,906
21,6
66,4
02
21
,113
,861
18,6
55,2
13
10
,262
,344
13
,281
,759
17,2
02,6
05
8,37
4,11
9
11,9
61,3
52
Un
rest
rict
ed10
,874
,673
5,55
3,65
7
12,6
53,2
69
14
,763
,608
14,4
67,4
85
(2
54,1
19,5
22)
(258
,420
,112
)
(265
,638
,225
)
(5
52,9
61,1
29)
(5
63,3
39,3
21)
160,
824,
123
$
170,
755,
571
$
176,
750,
786
$ 18
0,68
9,38
8$
17
5,83
7,12
1$
(1
05,9
87,7
46)
$
(99,
759,
142)
$
(89,
117,
585)
$
(3
52,2
56,4
39)
$ (3
53,2
08,3
38)
$
Net
inve
stm
ent
in c
apit
al a
sset
s1,
789,
361
$
1,
832,
185
$
1,
912,
730
$
2,
184,
335
$
2,
392,
682
$
-
$
-$
-$
-
$
-
$
Un
rest
rict
ed1,
173,
506
1,
928,
113
1,
801,
852
66
3,23
4
(1
,487
,189
)
-
--
- -
2,96
2,86
7$
3,76
0,29
8$
3,71
4,58
2$
2,84
7,56
9$
905,
493
$
-$
-
$-
$
-$
-$
Net
inve
stm
ent
in c
apit
al a
sset
s13
3,76
0,03
2$
14
7,85
7,19
3$
14
4,34
3,84
5$
146,
996,
254
$
145,
107,
105
$
137,
869,
432
$
145,
379,
211
$
159,
318,
035
$
19
2,33
0,57
1$
19
8,16
9,63
1$
Res
tric
ted
17,9
78,7
79
19
,176
,906
21,6
66,4
02
21
,113
,861
18,6
55,2
13
10
,262
,344
13
,281
,759
17,2
02,6
05
8,37
4,11
9
11,9
61,3
52
Un
rest
rict
ed12
,048
,179
7,48
1,77
0
14,4
55,1
21
15
,426
,842
12,9
80,2
96
(2
54,1
19,5
22)
(258
,420
,112
)
(265
,638
,225
)
(5
52,9
61,1
29)
(5
63,3
39,3
21)
163,
786,
990
$
174,
515,
869
$
180,
465,
368
$ 18
3,53
6,95
7$
17
6,74
2,61
4$
(1
05,9
87,7
46)
$
(99,
759,
142)
$
(89,
117,
585)
$
(3
52,2
56,4
39)
$ (3
53,2
08,3
38)
$
Sou
rce:
Dis
tric
t Com
preh
ensi
ve A
nnua
l Fin
anci
al R
epor
ts.
Not
e: W
ith
the
Impl
emen
tati
on o
f G
AS
B S
tate
men
t No.
63
for
Fis
cal Y
ear
2013
, the
term
inol
ogy
of N
et P
osit
ion
is u
sed
inst
ead
of N
et A
sset
s.1
- A
t the
beg
inni
ng o
f F
isca
l Yea
r 20
15, t
he D
istr
ict c
onve
rted
Foo
d S
ervi
ce f
rom
a P
ropr
ieta
ry F
und
to a
Spe
cial
Rev
enue
Fun
d.2
- In
Fis
cal Y
ear
2015
, the
Dis
tric
t im
plem
ente
d G
AS
B S
tate
men
ts N
os. 6
8 an
d 71
. 3
- A
t the
beg
inni
ng o
f F
isca
l Yea
r 20
18, t
he D
istr
ict i
mpl
emen
ted
GA
SB
Sta
tem
ent N
o. 7
5.
Fis
cal Y
ears
Gov
ern
men
tal A
ctiv
itie
s
Bu
sin
ess-
typ
e ac
tivi
ties
Pri
mar
y G
over
nm
ent
Tot
al p
rim
ary
gove
rnm
ent
net
pos
itio
n
Tot
al g
over
nm
enta
l act
ivit
ies
net
pos
itio
n
Tot
al b
usi
nes
s-ty
pe
acti
viti
es n
et p
osit
ion

Lex
ingt
on C
ount
y Sc
hool
Dis
tric
t One
Tab
le 2
Lex
ingt
on, S
outh
Car
olin
a
Cha
nges
in N
et P
ositi
on
Las
t Ten
Fis
cal Y
ears
(A)
(Acc
rual
Bas
is o
f Acc
ount
ing)
2010
2011
2012
2013
2014
2015
1,2
2016
120
17 1
2018
1,3
2019
1, 3
Exp
ense
sG
over
nmen
tal a
ctiv
ities
:In
stru
ctio
n12
7,25
7,28
1$
12
6,91
5,50
3$
13
2,38
3,76
9$
13
8,40
7,67
8$
14
8,58
7,18
8$
15
3,01
8,70
8$
16
0,94
0,45
6$
17
2,38
1,10
7$
18
5,26
1,21
8$
19
7,57
5,81
3$
Su
ppor
t ser
vice
s76
,106
,830
77,9
20,0
53
83,0
09,2
71
85,6
71,0
63
92,2
69,3
36
137,
525,
474
116,
444,
588
124,
543,
929
138,
426,
399
155,
511,
378
Com
mun
ity se
rvic
es36
8,14
5
40
1,95
6
27
9,27
5
24
1,40
1
30
9,42
5
315,
574
25
1,84
9
224,
795
31
8,76
8
367,
339
In
terg
over
nmen
tal
19,3
79
-
-
-
3,34
7
-
-
-
In
tere
st a
nd o
ther
cha
rges
13,7
20,9
43
17
,529
,274
20
,206
,851
24
,030
,876
24
,214
,695
22
,457
,096
20
,953
,913
20
,287
,202
21
,741
,049
16
,165
,502
T
otal
gov
ernm
enta
l act
iviti
es e
xpen
ses
217,
472,
578
222,
766,
786
235,
879,
166
248,
351,
018
265,
383,
991
313,
316,
852
298,
590,
806
317,
437,
033
345,
747,
434
369,
620,
032
Bus
ines
s-ty
pe a
ctiv
ities
Food
serv
ice
10,8
40,5
32
11
,065
,339
11
,886
,094
12
,840
,104
14
,177
,548
-
-
-
-
T
otal
bus
ines
s-ty
pe a
ctiv
ities
exp
ense
s10
,840
,532
11,0
65,3
39
11,8
86,0
94
12,8
40,1
04
14,1
77,5
48
-
-
-
-
-
Tot
al p
rim
ary
gove
rnm
ent e
xpen
ses
228,
313,
110
$
233,
832,
125
$
247,
765,
260
$
261,
191,
122
$
279,
561,
539
$
313,
316,
852
$
298,
590,
806
$
317,
437,
033
$
345,
747,
434
$
369,
620,
032
$
Prog
ram
Rev
enue
sG
over
nmen
tal a
ctiv
ities
:C
harg
es fo
r se
rvic
es:
Inst
ruct
ion
143,
713
$
210,
036
$
190,
923
$
180,
802
$
178,
162
$
20
4,16
3$
181,
571
$
16
0,61
9$
184,
355
$
21
1,86
3$
Supp
ort s
ervi
ces
294,
523
289,
338
258,
254
303,
094
381,
429
6,
187,
497
5,55
1,46
7
5,
070,
160
5,13
2,33
0
5,
178,
193
Com
mun
ity se
rvic
es26
4,93
5
39
1,30
2
31
0,92
8
37
2,26
7
45
4,54
4
-
-
-
302,
307
27
5,82
4
Inte
rgov
ernm
enta
l-
-
-
-
-
-
-
-
-
-
O
pera
ting
gran
ts a
nd c
ontr
ibut
ions
94,9
63,1
89
93
,533
,079
98
,129
,612
10
6,51
3,68
3
10
9,43
7,57
4
12
7,98
2,05
6
12
9,34
5,07
7
14
0,60
5,03
3
15
3,02
4,67
7
15
7,33
8,63
0
95
,666
,360
94,4
23,7
55
98,8
89,7
17
107,
369,
846
110,
451,
709
134,
373,
716
135,
078,
115
145,
835,
812
158,
643,
669
163,
004,
510
Bus
ines
s-ty
pe a
ctiv
ities
:C
harg
es fo
r se
rvic
es:
Food
serv
ice
6,22
4,62
6
5,98
8,27
5
6,07
9,37
0
5,65
6,73
2
5,58
8,45
5
-
-
-
-
-
O
pera
ting
gran
ts a
nd c
ontr
ibut
ions
3,93
7,54
6
5,19
4,60
8
4,94
4,24
0
5,17
9,76
8
5,55
5,69
3
-
-
-
-
-
C
apita
l gra
nts a
nd c
ontr
ibut
ions
-
-
-
-
-
-
-
-
-
-
10,1
62,1
72
11
,182
,883
11
,023
,610
10
,836
,500
11
,144
,148
-
-
-
-
-
10
5,82
8,53
2$
10
5,60
6,63
8$
10
9,91
3,32
7$
11
8,20
6,34
6$
12
1,59
5,85
7$
13
4,37
3,71
6$
13
5,07
8,11
5$
14
5,83
5,81
2$
15
8,64
3,66
9$
16
3,00
4,51
0$
(C
ontin
ued)
Fisc
al Y
ears
Tot
al p
rim
ary
gove
rnm
ent p
rogr
am r
even
ues
Tot
al g
over
nmen
tal a
ctiv
ities
pro
gram
rev
enue
s
Tot
al b
usin
ess-
type
act
iviti
es p
rogr
am r
even
ues

Lex
ingt
on C
ount
y Sc
hool
Dis
tric
t One
Tab
le 2
Lex
ingt
on, S
outh
Car
olin
a
Cha
nges
in N
et P
ositi
on
Las
t Ten
Fis
cal Y
ears
(A)
(Acc
rual
Bas
is o
f Acc
ount
ing)
2010
2011
2012
2013
2014
2015
1,2
2016
120
17 1
2018
1,3
2019
1, 3
Net
(exp
ense
)/rev
enue
(121
,806
,218
)$
(128
,343
,031
)$
(1
36,9
89,4
49)
$
(140
,981
,172
)$
(1
54,9
32,2
82)
$
(178
,943
,136
)$
(1
63,5
12,6
91)
$
(171
,601
,221
)$
(1
87,1
03,7
65)
$
(206
,615
,522
)$
B
usin
ess-
type
act
iviti
es(6
78,3
60)
117,
544
(862
,484
)
(2
,003
,604
)
(3,0
33,4
00)
-
-
-
-
-
(1
22,4
84,5
78)
$
(1
28,2
25,4
87)
$
(137
,851
,933
)$
(1
42,9
84,7
76)
$
(157
,965
,682
)$
(1
78,9
43,1
36)
$
(163
,512
,691
)$
(1
71,6
01,2
21)
$
(187
,103
,765
)$
(2
06,6
15,5
22)
$
Gen
eral
Rev
enue
s and
Oth
er C
hang
es in
Net
Pos
ition
Gen
eral
Pur
pose
s56
,821
,842
$
60,9
77,7
19$
64,1
20,6
44$
65,1
33,3
13$
71,2
65,2
67$
75,8
86,2
46$
83,1
64,8
99$
89,4
58,6
92$
95,7
84,7
21$
97,4
32,0
19$
Deb
t Ser
vice
29,6
84,5
03
31
,977
,458
32
,691
,615
32
,970
,582
34
,466
,380
35
,783
,922
36
,593
,521
41
,687
,070
47
,122
,677
48
,556
,316
44
,560
,712
44,7
23,9
45
45,6
06,6
70
46,3
16,3
82
47,1
04,2
41
47,8
10,5
68
48,7
03,8
46
49,2
64,8
37
51,7
77,0
87
55,2
67,1
73
836,
030
705,
424
730,
231
997,
429
347,
694
65
4,19
0
479,
503
1,
043,
216
2,26
7,08
7
3,
574,
996
192,
311
568,
996
651,
768
638,
357
349,
636
53
2,33
6
799,
526
78
8,96
3
1,23
6,93
9
83
3,11
9
(284
,764
)
(6
79,0
63)
(816
,264
)
(1
,136
,289
)
(1,0
89,9
51)
-
-
-
-
-
13
1,81
0,63
4
13
8,27
4,47
9
14
2,98
4,66
4
14
4,91
9,77
4
15
2,44
3,26
7
16
0,66
7,26
2
16
9,74
1,29
5
18
2,24
2,77
8
19
8,18
8,51
1
20
5,66
3,62
3
B
usin
ess-
type
act
iviti
es1,
230
82
4
504
30
2
1,37
3
-
-
-
-
-
28
4,76
4
67
9,06
3
81
6,26
4
1,
136,
289
1,
089,
951
-
-
-
-
-
285,
994
679,
887
816,
768
1,13
6,59
1
1,09
1,32
4
-
-
-
-
-
13
2,09
6,62
8$
13
8,95
4,36
6$
14
3,80
1,43
2$
14
6,05
6,36
5$
15
3,53
4,59
1$
16
0,66
7,26
2$
16
9,74
1,29
5$
18
2,24
2,77
8$
19
8,18
8,51
1$
20
5,66
3,62
3$
Cha
nge
in N
et P
ositi
on10
,004
,416
$
9,93
1,44
8$
5,99
5,21
5$
3,93
8,60
2$
(2,4
89,0
15)
$
(1
8,27
5,87
4)$
6,
228,
604
$
10,6
41,5
57$
11,0
84,7
46$
(951
,899
)$
B
usin
ess-
type
act
iviti
es(3
92,3
66)
797,
431
(45,
716)
(8
67,0
13)
(1,9
42,0
76)
-
-
-
-
-
T
otal
pri
mar
y go
vern
men
t9,
612,
050
$
10
,728
,879
$
5,
949,
499
$
3,
071,
589
$
(4
,431
,091
)$
(18,
275,
874)
$
6,22
8,60
4$
10
,641
,557
$
11
,084
,746
$
(9
51,8
99)
$
Sour
ce: D
istric
t Com
preh
ensiv
e A
nnua
l Fin
anci
al R
epor
ts.
Not
e: W
ith th
e Im
plem
enta
tion
of G
ASB
Sta
tem
ent N
o. 6
3 as
for F
iscal
Yea
r 201
3, th
e te
rmin
olog
y of
Net
Pos
ition
is u
sed
inst
ead
of N
et A
sset
s.1
- At t
he b
egin
ning
of F
iscal
Yea
r 201
5, th
e D
istric
t con
verte
d Fo
od S
ervi
ce fr
om a
Pro
prie
tary
Fun
d to
a S
peci
al R
even
ue F
und.
2 - I
n Fi
scal
Yea
r 201
5, th
e D
istric
t Im
plem
ente
d G
ASB
Sta
tem
ent N
os. 6
8 an
d 71
.3
- At t
he b
egin
ning
of F
iscal
Yea
r 201
8, th
e D
istric
t im
plem
ente
d G
ASB
Sta
tem
ent N
o. 7
5.
Fisc
al Y
ears
Mis
cella
neou
s rev
enue
Gov
ernm
enta
l act
iviti
es
Gov
ernm
enta
l act
iviti
es
Tot
al p
rim
ary
gove
rnm
ent p
rogr
am n
et e
xpen
se
Fede
ral a
nd st
ate
aid
not r
estr
icte
d fo
r sp
ecifi
c pu
rpos
es
Prop
erty
taxe
s Lev
ied
for:
Gov
ernm
enta
l act
iviti
es
Unr
estr
icte
d in
vest
men
t ear
ning
sT
rans
fers
Tot
al b
usin
ess-
type
act
iviti
esT
otal
pri
mar
y go
vern
men
t
Tot
al g
over
nmen
tal a
ctiv
ities
Tra
nsfe
rs
Unr
estr
icte
d in
vest
men
t ear
ning
s

Lexi
ngto
n C
ount
y Sc
hool
Dist
rict
One
Tabl
e 3
Le
ton,
Sou
th C
arol
ina
Fund
Bal
ance
s of G
over
nmen
tal F
unds
Last
Ten
Fisc
al Y
ears
(Mod
ified
Acc
rual
Bas
is of
Acc
ount
ing)
2010
2011
2012
2013
2014
2015
120
16 1
2017
120
18 1
2019
1
Res
erve
d-
$
-
$
-
$
-$
-$
-$
-$
-
$
-
$
-
$
U
nres
erve
d-
-
-
-
-
-
-
-
-
-
N
onsp
enda
ble
2,55
3,10
8
3,66
0,33
1
965,
521
4,33
7,66
2
1,07
6,32
8
1,07
2,55
8
5,27
8,19
9
1,
086,
508
1,
162,
629
1,
266,
650
C
omm
itted
11,3
15,5
29
11
,668
,054
12
,371
,356
13,3
15,4
06
-
-
-
-
-
-
Ass
igne
d5,
000,
000
4,
900,
000
6,
000,
000
8,
000,
000
9,
000,
000
7,
000,
000
7,
256,
709
7,77
7,14
8
9,00
0,00
0
8,25
5,55
9
Una
ssig
ned
8,91
6,56
1
8,01
3,74
0
12,8
68,8
71
9,
308,
840
26
,331
,731
28,3
32,9
67
27,1
44,8
21
36,2
17,8
55
41
,767
,859
48,0
19,9
91
27,7
85,1
98$
28
,242
,125
$
32,2
05,7
48$
34
,961
,908
$
36,4
08,0
59$
36
,405
,525
$
39
,679
,729
$
45
,081
,511
$
51,9
30,4
88$
57
,542
,200
$
Res
erve
d-
$
-
$
-
$
-$
-$
-$
-$
-
$
-
$
-
$
U
nres
erve
d, r
epor
ted
in:
Perm
anen
t Fun
d-
-
-
-
-
-
-
-
-
-
Non
spen
dabl
e-
13
0,00
0
13
0,00
0
13
0,00
0
13
0,00
0
31
3,24
5
45
8,71
6
346,
585
110,
000
110,
000
Res
tric
ted
97,8
07,3
49
59
,579
,949
95
,094
,229
36,5
84,2
68
84
,045
,793
63,2
02,7
31
61,2
40,8
03
101,
182,
246
83,8
95,0
11
12
5,51
9,60
2
A
ssig
ned
-
-
-
-
-
10
0,00
0
10
4,32
5
210,
985
607,
475
616,
431
Una
ssig
ned
45,3
28
-
-
-
-
(1
,853
,299
)
(1,0
89,2
25)
(41,
363)
-
-
97,8
52,6
77$
59
,709
,949
$
95,2
24,2
29$
36
,714
,268
$
84,1
75,7
93$
61
,762
,677
$
60
,714
,619
$
10
1,69
8,45
3$
84
,612
,486
$
126,
246,
033
$
Sour
ce: D
istric
t Com
preh
ensiv
e A
nnua
l Fin
anci
al R
epor
ts.
Not
e: G
ASB
54
Impl
emen
ted
Fisc
al Y
ear 2
010.
Fisc
al Y
ear 2
009
Resta
ted.
1
- At t
he b
egin
ning
of F
iscal
Yea
r 201
5, th
e D
istric
t con
verte
d Fo
od S
ervi
ce fr
om a
Pro
prie
tary
Fun
d to
a S
peci
al R
even
ue F
und.
Fisc
al Y
ears
Gen
eral
Fun
d
Tota
l Gen
eral
Fun
d
All
othe
r go
vern
men
tal f
unds
Tota
l all
othe
r go
vern
men
tal f
unds

Lex
ingt
on C
ount
y Sc
hool
Dis
tric
t One
Tab
le 4
Lex
ingt
on, S
outh
Car
olin
a
Cha
nges
in F
und
Bal
ance
s of G
over
nmen
tal F
unds
Las
t Ten
Fis
cal Y
ears
(Mod
ified
Acc
rual
Bas
is o
f Acc
ount
ing)
2010
2011
2012
2013
2014
2015
120
16 1
2017
120
18 1
2019
1
Loc
al S
ourc
es89
,060
,426
$
95
,518
,218
$
99
,175
,179
$
103,
106,
022
$
107,
594,
750
$
123,
764,
554
$
129,
139,
062
$
138,
806,
923
$
15
2,97
0,12
7$
156,
336,
070
$
In
terg
over
nmen
tal
807,
603
2,
045,
036
3,57
4,17
5
3,
834,
951
3,51
2,65
2
3,
521,
940
3,
549,
727
3,
504,
494
3,
491,
381
3,21
6,11
4
Stat
e So
urce
s11
9,60
3,37
8
120,
172,
403
13
0,61
6,71
0
140,
736,
719
144,
773,
108
152,
478,
528
156,
507,
389
169,
757,
288
18
3,53
2,18
4
192,
078,
936
Fe
dera
l Sou
rces
18,1
84,8
35
15,1
68,0
83
8,73
9,05
7
7,
031,
878
7,53
4,25
1
14
,853
,030
16
,450
,896
15
,301
,925
16,3
71,6
27
16,1
18,7
48
22
7,65
6,24
2$
232,
903,
740
$
24
2,10
5,12
1$
254,
709,
570
$
263,
414,
761
$
294,
618,
052
$
305,
647,
074
$
327,
370,
630
$
35
6,36
5,31
9$
367,
749,
868
$
Cur
rent
:In
stru
ctio
n11
8,34
9,57
4
115,
385,
154
11
9,14
8,67
7
126,
841,
951
132,
173,
834
140,
974,
046
145,
704,
224
152,
103,
711
16
1,56
9,17
6
169,
887,
616
Su
ppor
t Ser
vice
s72
,104
,817
72
,164
,793
76
,447
,465
82,1
39,0
01
87,6
18,5
19
124,
780,
547
110,
628,
792
116,
239,
074
12
5,38
7,24
7
145,
555,
955
C
omm
unity
Ser
vice
s36
8,14
5
401,
956
27
9,27
5
241,
401
30
9,42
5
315,
574
250,
414
221,
795
318,
768
36
7,33
9
In
terg
over
nmen
tal
19,3
79
-
-
-
3,
347
206,
378
223,
395
172,
637
1,76
3,11
8
2,
393,
951
D
ebt S
ervi
cePr
inci
pal
45,2
85,0
00
26,3
20,0
00
23,4
80,0
00
13
,975
,000
13
,790
,000
12
,220
,000
14
,125
,000
15
,310
,000
30,7
25,0
00
26,1
35,0
00
In
tere
st13
,666
,756
15
,942
,843
18
,353
,745
21,8
90,3
27
21,4
81,1
31
23,4
80,2
93
22,2
91,1
39
21,7
88,4
84
21
,383
,028
20
,719
,986
Paym
ent t
o R
efun
ded
Deb
t Esc
row
Age
nt-
-
-
-
-
4,
266,
306
-
-
-
Oth
er O
bjec
ts67
7,98
5
330,
521
66
7,11
1
251,
464
52
0,70
6
-
-
-
-
Cap
ital O
utla
y35
,187
,801
84
,622
,720
91
,221
,734
64,0
87,0
26
39,7
61,1
51
10,0
52,4
91
10,4
02,3
42
6,46
5,23
6
25,8
36,1
23
41,4
75,9
53
28
5,65
9,45
7$
315,
167,
987
$
32
9,59
8,00
7$
309,
426,
170
$
295,
658,
113
$
316,
295,
635
$
303,
625,
306
$
312,
300,
937
$
36
6,98
2,46
0$
406,
535,
800
$
(58,
003,
215)
$
(8
2,26
4,24
7)$
(87,
492,
886)
$
(5
4,71
6,60
0)$
(32,
243,
352)
$
(2
1,67
7,58
3)$
2,
021,
768
$
15
,069
,693
$
(10,
617,
141)
$
(3
8,78
5,93
2)$
Prem
ium
on
Bon
ds Is
sued
759,
176
40
2,50
9
11,0
72,0
53
4,
464,
118
129,
088
8,
774,
424
2,
361,
524
1,
915,
923
6,
256,
062
7,70
1,19
1
Issu
ance
of G
ener
al O
blig
atio
n B
onds
111,
100,
000
44
,855
,000
11
6,71
5,00
0
-
85,1
80,0
00
-
-
29,4
00,0
00
85
,000
,000
Issu
ance
of R
efun
ding
Bon
ds-
-
-
18
,720
,000
35
,350
,000
10
0,17
0,00
0
18
,200
,000
-
82,9
10,0
00
54,5
25,0
00
Pa
ymen
t to
Ref
unde
d D
ebt E
scro
w A
gent
-
-
-
(23,
085,
030)
(3
8,41
8,10
9)
(108
,195
,302
)
(20,
357,
146)
-
(8
8,78
5,91
1)
(61,
195,
000)
Tra
nsfe
rs In
17,5
96,6
70
19,7
00,9
06
15,2
30,4
44
19
,485
,374
15
,515
,520
22
,225
,076
20
,477
,483
27
,889
,536
31,0
27,6
84
33,0
30,8
20
T
rans
fers
Out
(17,
881,
434)
(2
0,37
9,96
9)
(16,
046,
708)
(2
0,62
1,66
3)
(16,
605,
471)
(2
2,22
5,07
6)
(2
0,47
7,48
3)
(2
7,88
9,53
6)
(3
1,02
7,68
4)
(33,
030,
820)
111,
574,
412
$
44
,578
,446
$
12
6,97
0,78
9$
(1,0
37,2
01)
$
81
,151
,028
$
74
9,12
2$
20
4,37
8$
31
,315
,923
$
380,
151
$
86
,031
,191
$
53,5
71,1
97$
(37,
685,
801)
$
39
,477
,903
$
(55,
753,
801)
$
48
, 907
,676
$
(2
0,92
8,46
1)$
2,
226,
146
$
46
,385
,616
$
(10,
236,
990)
$
47
,245
,259
$
22.2
%14
.9%
16.5
%15
.6%
14.9
%12
.5%
12.4
%12
.1%
15.3
%12
.7%
Sour
ce:
Dist
rict C
ompr
ehen
sive
Ann
ual F
inan
cial
Rep
orts
1 - A
t the
beg
inni
ng o
f Fisc
al Y
ear 2
015,
the
Dist
rict c
onve
rted
Food
Ser
vice
from
a P
ropr
ieta
ry F
und
to a
Spe
cial
Rev
enue
Fun
d.
Tot
al R
even
ues
Rev
enue
s
Deb
t Ser
vice
as a
Per
cent
age
of N
onca
pita
l Exp
endi
ture
s
Tot
al E
xpen
ditu
res
Exc
ess o
f Rev
enue
s ove
r (u
nder
) exp
endi
ture
s
Oth
er F
inan
cing
Sou
rces
(Use
s)
Tot
al O
ther
Fin
anci
ng S
ourc
es (U
ses)
Exp
endi
ture
s
Net
Cha
nge
in F
und
Bal
ance
s

Lex
ingt
on C
ount
y Sc
hool
Dis
tric
t One
Tab
le 5
Lex
ingt
on, S
outh
Car
olin
a
Ass
esse
d V
alue
and
Est
imat
ed A
ctua
l Val
ue o
f All
Tax
able
Pro
pert
y
Las
t Ten
Fis
cal Y
ears
Tot
alA
sses
sed
Tot
alT
otal
Dir
ect
Val
ue a
s a
Fisc
alT
axR
esid
entia
l C
omm
eric
al
Mot
orA
sses
sed
Est
imat
ed A
ctua
lT
ax R
ate
Perc
enta
ge o
f Y
ear
Yea
rPr
oper
tyPr
oper
ty1
Veh
icle
sO
ther
Val
ueV
alue
(Mill
age)
Act
ual V
alue
2010
2009
301,
292,
540
25,5
13,8
60
51,2
09,6
50
57,8
71,2
50
435,
887,
300
8,
400,
237,
915
32
1.16
5.
19%
2011
2010
331,
632,
520
26,4
50,5
30
47,7
96,6
30
60,9
05,6
60
466,
785,
340
9,
125,
132,
150
32
6.70
5.
12%
2012
2011
340,
002,
640
26,6
85,3
50
50,5
61,9
00
61,6
21,0
77
478,
870,
967
9,
331,
513,
260
33
1.70
5.
13%
2013
2012
346,
870,
740
25,7
45,7
90
55,2
16,6
60
60,5
30,9
70
488,
364,
160
9,
549,
481,
436
33
1.20
5.
11%
2014
2013
354,
259,
000
26,8
84,3
80
61,0
60,3
30
62,8
16,1
00
505,
019,
810
9,
861,
863,
861
34
2.76
5.
12%
2015
2014
363,
888,
240
34,0
20,8
60
65,9
37,2
80
60,5
20,3
10
524,
366,
690
10
,298
,143
,984
349.
51
5.09
%
2016
2015
371,
638,
220
39,0
00,7
90
72,7
20,5
30
67,0
61,2
10
550,
420,
750
10
,683
,984
,950
369.
37
5.15
%
2017
2016
382,
996,
800
40,5
33,2
10
73,8
76,4
50
71,4
07,0
80
568,
813,
540
11
,060
,393
,996
384.
29
5.14
%
2018
2017
398,
387,
520
40,7
03,5
60
75,2
91,3
60
75,6
06,7
30
589,
989,
170
11
,463
,643
,404
403.
25
5.15
%
2019
2018
414,
772,
980
42,3
37,7
80
72,7
16,5
50
81,7
86,9
00
611,
614,
210
11
,907
,331
,739
407.
70
5.14
%
Not
e: 1
I ncl
udes
fee
in li
eu o
f tax
es.
Prop
erty
val
ues w
ere
re-a
sses
sed
in F
isca
l Yea
r 201
1 an
d 20
16.
Sour
ce:
Lexi
ngto
n C
ount
y A
udito
r's O
ffic
e - U
naud
ited.
Rea
l Pro
pert
y P
erso
nal P
rope
rty

Lex
ingt
on C
oun
ty S
choo
l Dis
tric
t O
ne
Tab
le 6
Lex
ingt
on, S
outh
Car
olin
a
Pro
per
ty T
ax R
ates
- D
irec
t an
d O
verl
app
ing
Gov
ern
men
ts
Las
t T
en F
isca
l Yea
rs
Tot
alM
idla
nd
sD
irec
t an
dF
isca
lT
axO
per
atin
gD
ebt
Ser
vice
Tot
alL
exin
gton
Rec
reat
ion
Tec
hn
ical
Riv
erb
ank
sO
verl
app
ing
Tow
n o
f C
ity
of
Tow
n o
fT
own
of
Tow
n o
fT
own
of
Yea
rY
ear
Mil
lage
1M
illa
geM
illa
geC
oun
tyD
istr
ict
Col
lege
Zoo
Rat
esS
pri
ngd
ale
Cay
ceG
ilb
ert
Lex
ingt
onP
elio
nS
um
mit
2010
2009
247.
660
73.5
0032
1.16
089
.745
15.5
994.
452
1.78
843
2.74
459
.700
46.0
005.
000
36.2
3817
.600
6.10
0
2011
2010
254.
900
71.8
0032
6.70
086
.467
15.4
354.
303
1.77
543
4.68
057
.700
41.2
505.
000
35.1
4017
.600
6.10
0
2012
2011
259.
900
71.8
0033
1.70
088
.253
16.0
154.
374
1.79
344
2.13
557
.700
46.9
305.
000
35.1
4017
.600
6.10
0
2013
2012
259.
900
71.3
0033
1.20
090
.759
15.7
354.
374
1.79
344
3.86
157
.700
43.2
705.
000
35.1
4017
.600
6.10
0
2014
2013
271.
460
71.3
0034
2.76
094
.296
15.7
354.
374
1.89
345
9.05
857
.700
44.1
705.
000
35.1
4018
.000
6.10
0
2015
2014
278.
210
71.3
0034
9.51
094
.746
16.7
354.
374
2.39
346
7.75
857
.700
44.1
705.
000
35.1
4018
.000
6.10
0
2016
2015
298.
070
71.3
0036
9.37
094
.441
16.0
024.
353
2.08
848
6.25
457
.700
45.3
605.
000
35.1
4018
.000
6.10
0
2017
2016
305.
990
78.3
0038
4.29
094
.973
16.2
224.
353
2.08
850
1.92
657
.700
45.3
605.
000
34.2
9018
.000
6.10
0
2018
2017
317.
950
85.3
0040
3.25
094
.689
16.1
024.
353
2.08
852
0.48
257
.700
47.6
905.
000
34.2
9018
.000
6.10
0
2019
2018
322.
400
85.3
0040
7.70
097
.160
15.9
024.
353
2.08
852
7.20
357
.700
49.6
905.
000
34.2
9018
.300
6.10
0
Not
es:
1 -
Ope
rati
ng m
illa
ge in
clud
es th
e L
ease
Pur
chas
e m
illa
ge s
ince
it is
levi
ed in
the
gene
ral f
und
inst
ead
of th
e de
bt s
ervi
ce f
und.
Sou
rce:
Lex
ingt
on C
ount
y A
udit
or's
Off
ice
- U
naud
ited
.
Ad
dit
ion
al M
illa
ges
-M
un
icip
alit
ies
Lex
ingt
on C
oun
ty S
choo
l Dis
tric
t O
ne
Ove
rlap
pin
g R
ates

Lex
ingt
on C
ount
y Sc
hool
Dist
rict
One
Tab
le 7
Lex
ingt
on, S
outh
Car
olin
a
Prin
cipa
l Pro
pert
y T
axpa
yers
Cur
rent
Yea
r an
d N
ine
Yea
rs A
go
Perc
ent o
f Pe
rcen
t of
Ass
esse
d V
alue
Ass
esse
d V
alue
Ass
esse
d T
axes
to
Tot
alA
sses
sed
Tax
es
to T
otal
Tax
paye
rV
alue
Paid
Ran
kA
sses
sed
Val
ueV
alue
Paid
Ran
kA
sses
sed
Val
ue
SCA
NA
* 31
,452
,440
$
16
,058
,406
$
1
5.14
%21
,697
,830
$
8,31
8,19
3$
1
4.98
%
Mic
helin
Nor
th A
mer
ica
Inc*
29,9
84,1
60
10,4
74,9
11
2
4.
90%
16,6
36,8
70
4,
890,
072
2
3.
82%
Mid
-Car
olin
a E
lect
ric
Coo
p.5,
226,
180
2,65
1,33
8
3
0.
85%
4,43
0,01
0
1,83
4,84
0
3
1.02
%
Ake
bono
Bra
ke C
orpo
ratio
n*5,
776,
600
2,16
1,38
9
4
0.
94%
Tim
e W
arne
r C
able
Sou
thea
st2,
347,
430
1,19
1,81
5
5
0.
38%
2,12
3,26
0
879,
732
5
0.49
%
Car
olin
a W
ater
Ser
vice
Inc.
2,
253,
110
1,14
5,09
9
6
0.
37%
Flex
tron
ics A
mer
ica
LL
C *
2,21
1,92
0
79
1,10
6
7
0.36
%2,
081,
120
63
1,17
0
6
0.
48%
Ape
x T
ool G
roup
LL
C*1
1,63
5,01
0
74
9,20
7
8
0.27
%
CH
P C
olum
bia
SC O
wne
r L
LC
1,
290,
090
680,
683
9
0.
21%
Wal
mar
t Sto
res E
ast L
P 1,
338,
090
675,
102
10
0.22
%
PBR
Col
umbi
a, L
LC
3,
306,
210
1,
012,
170
4
0.
76%
Tin
Inc.
1,66
9,41
0
601,
609
7
0.38
%
Low
e's H
ome
Cen
ters
Inc.
1,28
5,93
0
542,
879
8
0.30
%
Pella
Cor
pora
tion*
1,39
9,89
0
534,
584
9
0.32
%
Prys
mia
n C
omm
unic
atio
ns C
able
s*1,
563,
120
52
2,73
4
10
0.
36%
83,5
15,0
30$
36,5
79,0
56$
13.6
5%56
,193
,650
$
19,7
67,9
83$
12
.89%
* In
clud
es F
ee in
Lie
u of
Tax
esSo
urce
: Lex
ingt
on C
ount
y A
udito
r's O
ffic
e - U
naud
ited.
(1) F
orm
erly
-Coo
per T
ools
Fisc
al Y
ear
2019
Fisc
al Y
ear
2010
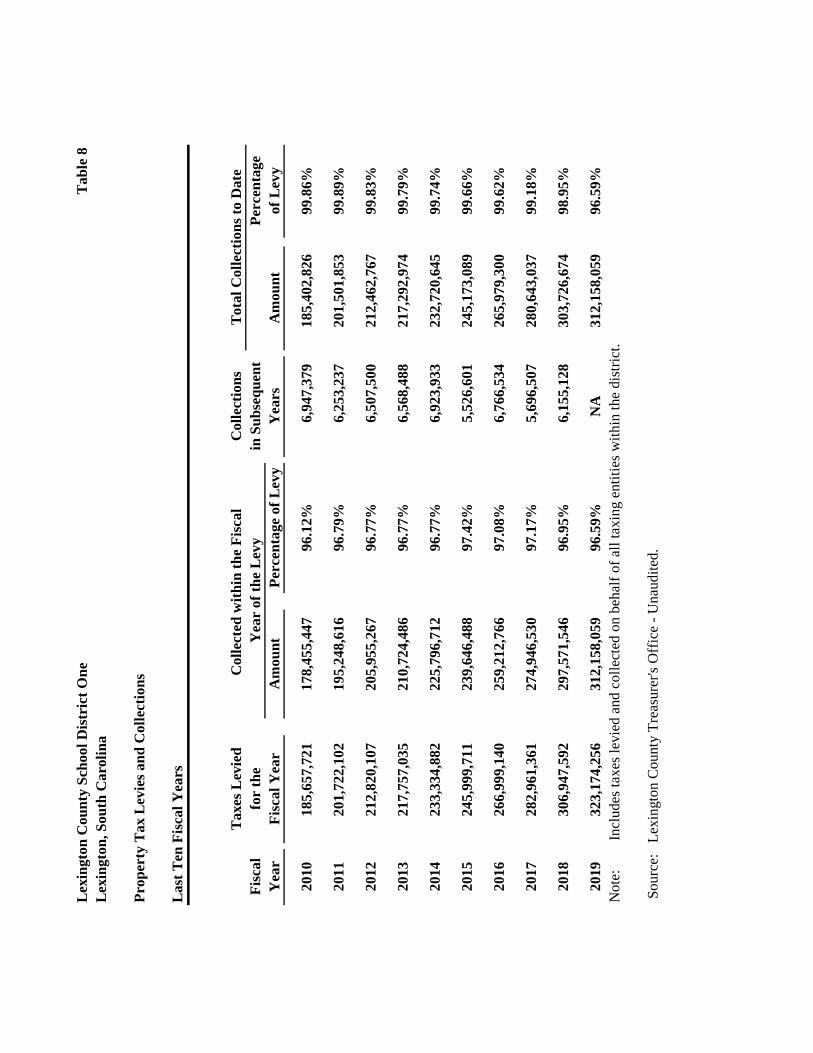
Lex
ingt
on C
ount
y Sc
hool
Dis
tric
t One
Tab
le 8
Lex
ingt
on, S
outh
Car
olin
a
Prop
erty
Tax
Lev
ies a
nd C
olle
ctio
ns
Las
t Ten
Fis
cal Y
ears
Tax
es L
evie
dC
olle
ctio
nsFi
scal
for
the
in S
ubse
quen
tPe
rcen
tage
Yea
rFi
scal
Yea
rA
mou
ntPe
rcen
tage
of L
evy
Yea
rsA
mou
ntof
Lev
y
2010
185,
657,
721
178,
455,
447
96.1
2%6,
947,
379
18
5,40
2,82
6
99
.86%
2011
201,
722,
102
195,
248,
616
96.7
9%6,
253,
237
20
1,50
1,85
3
99
.89%
2012
212,
820,
107
205,
955,
267
96.7
7%6,
507,
500
21
2,46
2,76
7
99
.83%
2013
217,
757,
035
210,
724,
486
96.7
7%6,
568,
488
21
7,29
2,97
4
99
.79%
2014
233,
334,
882
225,
796,
712
96.7
7%6,
923,
933
23
2,72
0,64
5
99
.74%
2015
245,
999,
711
239,
646,
488
97.4
2%5,
526,
601
24
5,17
3,08
9
99
.66%
2016
266,
999,
140
259,
212,
766
97.0
8%6,
766,
534
26
5,97
9,30
0
99
.62%
2017
282,
961,
361
274,
946,
530
97.1
7%5,
696,
507
28
0,64
3,03
7
99
.18%
2018
306,
947,
592
297,
571,
546
96.9
5%6,
155,
128
30
3,72
6,67
4
98
.95%
2019
323,
174,
256
312,
158,
059
96.5
9%N
A31
2,15
8,05
9
96
.59%
Not
e:
Incl
udes
taxe
s lev
ied
and
colle
cted
on
beha
lf of
all
taxi
ng e
ntiti
es w
ithin
the
dist
rict.
Sou
rce:
Le
ton
Cou
nty
Trea
sure
r's O
ffic
e - U
naud
ited.
Col
lect
ed w
ithin
the
Fisc
al
Yea
r of
the
Lev
yT
otal
Col
lect
ions
to D
ate

Lex
ingt
on C
ount
y S
choo
l Dis
tric
t O
neT
able
9
Lex
ingt
on, S
outh
Car
olin
a
Leg
al D
ebt
Mar
gin
Info
rmat
ion
Las
t T
en F
isca
l Yea
rs
2010
2011
2012
2013
2014
2015
2016
2017
2018
2019
Deb
t L
imit
34,3
67,0
17$
36
,875
,898
$
37
,771
,282
$
38,7
49,7
91$
40
,031
,809
$
41,3
94,7
65$
41
,452
,783
$
44,9
91,3
08$
46
,583
,801
$
48,2
47,0
95$
Tot
al N
et D
ebt
Ap
pli
cab
le t
o D
ebt
Lim
it26
5,00
0
160,
000
65,0
00
-
-
-
-
29
,400
,000
16,8
50,0
00
8,
710,
000
L
egal
Deb
t M
argi
n34
,102
,017
$
36,7
15,8
98$
37,7
06,2
82$
38
,749
,791
$
40,0
31,8
09$
41
,394
,765
$
41,4
52,7
83$
15
,591
,308
$
29,7
33,8
01$
39
,537
,095
$
Tot
al N
et D
ebt
Ap
pli
cab
le t
o D
ebt
Lim
it
a
s a
Per
cent
age
of D
ebt
Lim
it0.
8%0.
4%0.
2%0.
0%0.
0%0.
0%0.
0%65
.3%
36.2
%18
.1%
Ass
esse
d V
alue
61
1,61
4,21
0$
Les
s: A
sses
smen
t fo
r F
ee in
Lie
u of
Tax
es(3
4,56
1,53
0)
Mer
chan
t's
Inve
ntor
y 1,
960,
970
Fee
in L
ieu
of T
ax P
rop
erty
Ap
pli
cab
le t
o D
ebt
Lim
it C
alcu
atio
n (N
ote
2)24
,075
,042
T
otal
Ass
esse
d V
alue
All
owab
le f
or C
omp
utat
ion
of D
ebt
Lim
it60
3,08
8,69
2$
Con
stit
utio
nal D
ebt
Lim
it
(8%
of
tota
l ass
esse
d v
alue
)48
,247
,095
$
Deb
t A
pp
lica
ble
to
Deb
t L
imit
:
Gen
eral
Ob
liga
tion
Bon
ds
Out
stan
din
g45
1,03
0,00
0L
ess:
Gen
eral
Ob
liga
tion
Bon
ds
Out
stan
din
g N
ot
Sub
ject
to
Deb
t L
imit
(442
,320
,000
)
Tot
al N
et D
ebt
Ap
pli
cab
le t
o D
ebt
Lim
it8,
710,
000
Leg
al D
ebt
Mar
gin
39,5
37,0
95$
Unaudited
Sour
ce:
Ass
esse
d V
alue
s ar
e ob
tain
ed f
rom
the
Lex
ingt
on C
ount
y A
udit
or's
Off
ice.
Not
e2:
Stat
utes
auth
oriz
ing
the
paym
ent
offe
esin
lieu
ofta
xes
prov
ide
that
prop
erty
from
whi
chsu
chfe
esar
ede
rive
dm
aybe
incl
uded
inth
eca
lcul
atio
nof
debt
limit
.T
hese
stat
utes
prov
ide
form
ulae
whe
reby
the
asse
ssed
valu
efo
rde
btlim
itpu
rpos
esof
prop
erty
subj
ect
toa
fee
inlie
uof
taxe
sis
dete
rmin
ed,b
ased
upon
the
mos
tre
cent
lyre
ceiv
edan
nual
paym
ents
inlie
uof
taxe
sre
ceiv
edby
apa
rtic
ular
taxi
ngen
tity
.B
ased
upon
info
rmat
ion
rece
ived
from
the
Lex
ingt
onC
ount
yA
udit
or,
in20
19pr
oper
tysu
bjec
tto
fees
inlie
uof
taxe
spr
ovid
esth
eD
istr
ict
wit
hap
prox
imat
ely
$1,9
26,0
03 i
n de
bt li
mit
cap
acit
y.
NO
TE
1:A
rtic
leX
,Sec
tion
15of
the
Con
stit
utio
nof
the
Stat
eof
Sout
hC
arol
ina,
1895
,as
amen
ded
(the
"Con
stit
utio
n"),
empo
wer
sea
chsc
hool
dist
rict
ofth
eSt
ate
toin
cur
gene
ralo
blig
atio
nde
btin
such
term
san
dco
ndit
ions
asth
eG
ener
alA
ssem
bly
shal
lpre
scri
beby
law
.A
fter
Nov
embe
r30
,198
2,ea
chsc
hool
dist
rict
may
incu
rge
nera
lobl
igat
ion
debt
,w
itho
utan
elec
tion
and
upon
such
term
san
dco
ndit
ions
asth
eG
ener
alA
ssem
bly
may
pres
crib
e,in
anam
ount
not
exce
edin
g8%
ofth
eas
sess
edva
lue
ofal
lta
xabl
epr
oper
tyof
such
scho
oldi
stri
ct.
Bon
ded
inde
bted
ness
exis
ting
onN
ovem
ber
30,
1982
,an
dth
ebo
nded
inde
bted
ness
auth
oriz
edby
am
ajor
ity
vote
ofth
equ
alif
ied
elec
tors
ofth
esc
hool
dist
rict
voti
ngin
are
fere
ndum
will
not
beco
nsid
ered
in t
he c
ompu
tati
on o
f th
e 8%
lim
itat
ion.
Leg
al D
ebt
Mar
gin
Cal
cula
tion
for
Fis
cal Y
ear
2019
Fis
cal Y
ear

Lex
ingt
on C
oun
ty S
choo
l Dis
tric
t O
ne
Tab
le 1
0L
exin
gton
, Sou
th C
arol
ina
Rat
ios
of O
uts
tan
din
g D
ebt
By
Typ
e
Las
t T
en F
isca
l Yea
rs Gen
eral
Inst
allm
ent
Tot
al
Per
cen
tage
Fis
cal
Ob
liga
tion
Cer
tifi
cate
s of
Pu
rch
ase
Bon
d
Pri
mar
yof
Per
son
alP
er
Yea
rB
ond
sP
arti
cip
atio
nR
even
ue
Bon
ds
Pre
miu
ms
Gov
ern
men
tIn
com
e2C
apit
a2
2010
243,
555,
000
1,23
5,00
0
89,2
15,0
00
4,
774,
681
33
8,77
9,68
1
37
32%
2,86
9
2011
265,
775,
000
-
86,7
65,0
00
4,
821,
057
35
7,36
1,05
7
37
99%
2,95
3
2012
361,
580,
000
-
84,1
95,0
00
15
,037
,441
460,
812,
441
4578
%3,
717
2013
349,
515,
000
-
81,4
90,0
00
18
,279
,944
449,
284,
944
4324
%3,
540
2014
422,
555,
000
-
80,6
30,0
00
16
,010
,560
519,
195,
560
4678
%3,
997
2015
412,
210,
000
-
73,0
30,0
00
22
,017
,731
507,
257,
731
4310
%3,
819
2016
400,
315,
000
-
69,9
70,0
00
22
,584
,495
492,
869,
495
4020
%3,
630
2017
417,
935,
000
-
66,4
40,0
00
22
,660
,975
507,
035,
975
3921
%3,
655
2018
395,
035,
000
-
62,7
85,0
00
20
,194
,960
478,
014,
960
Un
avai
lab
le3,
374
2019
451,
030,
000
-
58,9
85,0
00
24
,555
,592
534,
570,
592
Un
avai
lab
le3,
645
Not
e: 1
Det
ails
reg
ardi
ng th
e D
istr
ict's
out
stan
ding
deb
t can
be
foun
d in
the
note
s to
the
fina
ncia
l sta
tem
ents
. In
form
atio
n is
com
pile
d fr
om
Dis
tric
t Com
preh
ensi
ve A
nnua
l Fin
anci
al R
epor
ts
Not
e: 2
Per
sona
l Inc
ome
and
Est
imat
ed P
opul
atio
n ca
n be
fou
nd o
n th
e ta
ble
for
Dem
ogra
phic
and
Eco
nom
ic S
tati
stic
s.
Gov
ern
men
tal A
ctiv
itie
s1

Lex
ingt
on C
ount
y Sc
hool
Dis
tric
t One
Tab
le 1
1L
exin
gton
, Sou
th C
arol
ina
Rat
ios o
f Gen
eral
Bon
ded
Deb
t Out
stan
ding
Las
t Ten
Fis
cal Y
ears
Perc
ent o
fG
ener
alL
ess:
Am
ount
sE
stim
ated
Fisc
alO
blig
atio
nA
vaila
ble
inA
ctua
l Tax
able
Per
Yea
rB
onds
1D
ebt S
ervi
ce F
und4
Tot
alV
alue
of P
rope
rty2
Cap
ita3
2010
243,
555,
000
9,
504,
435
23
4,05
0,56
5
2.
79%
1,98
2
2011
265,
775,
000
10
,466
,629
25
5,30
8,37
1
2.
80%
2,10
9
2012
361,
580,
000
12
,764
,253
34
8,81
5,74
7
3.
74%
2,81
3
2013
349,
515,
000
12
,008
,867
33
7,50
6,13
3
3.
53%
2,65
9
2014
422,
555,
000
13
,616
,698
40
8,93
8,30
2
4.
15%
3,14
9
2015
412,
210,
000
15
,800
,057
39
6,40
9,94
3
3.
85%
2,98
4
2016
400,
315,
000
17
,485
,141
38
2,82
9,85
9
3.
58%
2,81
9
2017
417,
935,
000
20
,895
,130
39
7,03
9,87
0
3.
59%
2,86
2
2018
395,
035,
000
13
,562
,746
38
1,47
2,25
4
3.
33%
2,69
2
2019
451,
030,
000
13
,922
,094
43
7,10
7,90
6
3.
81%
2,98
0
Not
es:
1D
etai
ls re
gard
ing
the
dist
rict's
out
stan
ding
deb
t and
rela
ted
prem
ium
s can
be
foun
d in
the
note
s to
the
finan
cial
stat
emen
ts.
2Se
e th
e Sc
hedu
le o
f Ass
esse
d V
alue
and
Est
imat
ed A
ctua
l Val
ue o
f Tax
able
Pro
perty
.3
Popu
latio
n da
ta c
an b
e fo
und
on th
e Sc
hedu
le o
f Dem
ogra
phic
and
Eco
nom
ic S
tatis
tics.
4Th
e am
ount
show
n re
flect
s the
fund
bal
ance
in th
e D
istri
ct D
ebt S
ervi
ce F
und
and
the
amou
nt re
stric
ted
for p
aym
ent o
f pr
inci
pal u
sed
in th
e ca
lcul
atio
n of
net
bon
ded
debt
due
to th
e am
ount
on
the
gove
rnm
ent-w
ide
stat
emen
t inc
ludi
ng th
e LO
SF, C
orp.
Deb
t Ser
vice
fund
bal
ance
, una
vaila
ble
reve
nues
rela
ted
to D
istri
ct D
ebt S
ervi
ce p
rope
rty ta
xes,
accr
ued
inte
rest
, and
inte
rest
subs
idie
s rec
eiva
ble.

Lex
ingt
on C
ount
y Sc
hool
Dis
tric
t One
Tab
le 1
2L
exin
gton
, Sou
th C
arol
ina
Dir
ect a
nd O
verl
appi
ng G
over
nmen
tal A
ctiv
ities
Deb
t
As o
f Jun
e 30
, 201
9
Gov
ernm
enta
l Pe
rcen
tE
stim
ated
Sha
reA
ctiv
ities
App
licab
leof
Ove
rlap
ping
Deb
t Out
stan
ding
to D
istr
ict2
Deb
tD
ebt R
epai
d w
ith P
rope
rty
Tax
es:
Lex
ingt
on C
ount
y30
,793
,373
$
46
.22%
14,2
32,6
97$
L
exin
gton
Cou
nty
Rec
reat
ion
Com
mis
sion
26,3
20,0
00
61.0
6%16
,070
,992
Tow
n of
Lex
ingt
on1,
215,
000
100.
00%
1,21
5,00
0
Riv
erba
nks Z
oo1
29,2
75,0
00
20.5
1%6,
004,
763
T
otal
Ove
rlap
ping
87,6
03,3
73$
37,5
23,4
52$
Lex
ingt
on C
ount
y Sc
hool
Dis
tric
t One
and
its b
lend
ed c
ompo
nent
uni
ts d
irec
t deb
t53
4,57
0,59
2$
Tot
al D
irec
t & O
verl
appi
ng D
ebt
572,
094,
044
$
Not
es:
1Pe
rcen
tage
for R
iver
bank
s Zoo
is c
ompu
ted
by c
ombi
ning
tota
l ass
esse
d va
lues
of L
exin
gton
and
Ric
hlan
d C
ount
ies.
2 Sour
ces:
***
Lexi
ngto
n C
ount
y A
udito
r - In
clud
es A
sses
smen
t for
FIL
OT
Paym
ents
Gov
ernm
enta
l Uni
t
The
per
cent
age
of o
verla
ppin
g de
bt a
pplic
able
is e
stim
ated
usi
ng ta
xabl
e as
sess
ed p
rope
rty v
alue
s. A
pplic
able
perc
enta
ges w
ere
com
pute
d by
div
idin
g th
e di
stric
t's a
sses
sed
valu
e by
the
asse
ssed
val
ue o
f the
app
licab
le
gove
rnm
enta
l uni
t.
Lexi
ngto
n C
ount
y A
udito
r's O
ffic
e, L
exin
gton
Cou
nty
Trea
sure
r's O
ffic
e, R
ichl
and
Cou
nty
Aud
itor's
Off
ice,
Riv
erba
nks Z
oo, a
nd T
own
of L
exin
gton
.

Lex
ingt
on C
ount
y Sc
hool
Dis
tric
t One
Tab
le 1
3L
exin
gton
, Sou
th C
arol
ina
Dem
ogra
phic
Sta
tistic
s - L
exin
gton
Cou
nty
Las
t Ten
Fis
cal Y
ears Sc
hool
Dis
tric
tC
ount
yPe
r C
apita
Fisc
alE
stim
ated
Est
imat
edPe
rson
alPe
rson
alSc
hool
Une
mpl
oym
ent
Yea
rPo
pula
tion1
Popu
latio
n1In
com
e2In
com
e2E
nrol
lmen
t3R
ate4
2010
118,
079
255,
607
9,07
7,81
5
34,4
56
51,8
338.
41%
2011
121,
030
262,
391
9,40
5,98
1
35,2
11
52,0
637.
88%
2012
123,
981
267,
129
10,0
65,5
76
37
,224
52
,255
7.42
%
2013
126,
932
270,
406
10,3
90,4
09
37
,956
52
,714
6.49
%
2014
129,
883
273,
752
11,0
97,5
82
39
,935
53
,315
5.05
%
2015
132,
834
277,
888
11,7
70,4
38
41
,764
54
,053
5.30
%
2016
135,
795
281,
833
12,2
61,5
18
42
,843
54
,713
4.61
%
2017
138,
736
286,
196
12,9
32,7
58
44
,497
55
,551
3.68
%
2018
141,
687
290,
642
Una
vaila
ble
Una
vaila
ble
55,9
693.
41%
2019
146,
675
295,
032
Una
vaila
ble
Una
vaila
ble
56,5
943.
35%
Dat
a So
urce
s:1
U.S
. Cen
sus B
urea
u, 2
010
Cen
sus
2U
.S. D
epar
tmen
t of C
omm
erce
, Bur
eau
of E
cono
mic
Ana
lysi
s, Le
ton
Cou
nty.
3SC
Dep
artm
ent o
f Edu
catio
n - 1
35-D
ay A
vera
ge D
aily
Mem
bers
hip
Rep
ort.
The
Cou
nty
of L
exin
gton
has
5 sc
hool
dis
trict
s.4
SC D
epar
tmen
t of E
mpl
oym
ent a
nd W
orkf
orce
. Ave
rage
s are
on
a fis
cal y
ear b
asis
, com
pute
d fr
om th
e m
onth
ly p
ress
rele
ases
.
Una
udite
d

Lex
ingt
on C
oun
ty S
choo
l Dis
tric
t O
ne
Tab
le 1
4L
exin
gton
, Sou
th C
arol
ina
Pri
nci
pal
Em
plo
yers
- L
exin
gton
Cou
nty
Cu
rren
t Y
ear
and
Nin
e Y
ears
Ago
Per
cen
tage
of
Per
cen
tage
of
Nu
mb
er o
f T
otal
Cou
nty
Nu
mb
er o
f T
otal
Cou
nty
Em
plo
yer
Em
plo
yees
Ran
kE
mp
loym
ent 2
Em
plo
yees
Ran
kE
mp
loym
ent2
Dom
inio
n E
ner
gy3,
066
1
2.
10%
Am
azon
.com
Fu
lfil
lmen
t C
ente
r2,
400
2
1.
64%
Mic
hel
in N
orth
Am
eric
a In
c.2,
080
3
1.
42%
1,75
0
2
1.43
%W
al-m
art
Sto
res,
In
c.2,
013
4
1.
38%
1,80
0
1
1.47
%
Nep
hro
n P
har
mac
euti
cals
1,00
0
5
0.68
%
Un
ited
Par
cel S
ervi
ce96
8
6
0.
66%
1,00
0
5
0.82
%
Wal
ter
P. R
awl &
Son
s In
c.90
0
7
0.
62%
Ak
ebon
o B
rak
e C
orp
orat
ion
766
8
0.52
%
Gen
eral
In
form
atio
n S
ervi
ces
700
9
0.48
%
Sou
thea
ster
n F
reig
ht
Lin
es58
7
10
0.40
%
Am
ick
Far
ms
1,20
0
3
0.98
%
SC
AN
A1,
000
4
0.
82%
Bab
cock
Cen
ter
750
6
0.61
%
Fle
xtro
nic
s 360
0
7
0.
49%
Arm
stro
ng
Air
Con
dit
ion
ing
Inc.
500
8
0.41
%
Col
um
bia
Far
ms/
Hou
se o
f R
aefo
rd42
5
9
0.
35%
Har
sco
Rai
l40
0
10
0.33
%
Tot
al14
,480
9.
90%
9,42
5
7.71
%
Not
e: (
A)
Exc
lude
s S
choo
l Dis
tric
t and
Cou
nty
Em
ploy
ees
Dat
a S
ourc
es:
1 Cen
tral
Sou
th C
arol
ina
All
ianc
e2 S
C D
epar
tmen
t of
Em
ploy
men
t and
Wor
kfor
ce3 F
orm
erly
- S
olec
tron
2019
120
10

Lex
ingt
on C
ount
y Sc
hool
Dist
rict
One
Tab
le 1
5L
exin
gton
, Sou
th C
arol
ina
Em
ploy
ees b
y Fu
nctio
n
Las
t Ten
Fisc
al Y
ears
2010
2011
220
12 2
2013
220
14 2
2015
220
16 2
2017
220
18 2
2019
2
Tea
cher
s1,
531.
00
1,
504.
00
1,
540.
00
1,
561.
00
1,
619.
00
1,
680.
00
1,
692.
00
1,
745.
00
1,76
0.00
1,
805.
00
Oth
er37
4.00
36
0.00
39
3.00
41
9.00
43
0.00
44
4.00
44
4.00
45
1.00
475.
00
50
5.00
Tea
cher
s116
8.00
16
5.00
16
7.00
17
9.00
18
4.00
20
4.00
20
3.00
20
5.00
192.
00
19
0.00
Oth
er93
2.00
1,
150.
00
1,
194.
00
1,
244.
00
1,
329.
00
1,
368.
00
1,
323.
00
1,
313.
00
1,32
0.00
1,
336.
00
3,00
5.00
3,17
9.00
3,29
4.00
3,40
3.00
3,56
2.00
3,69
6.00
3,66
2.00
3,71
4.00
3,
747.
00
3,83
6.00
1Te
ache
rs fo
r sup
port
serv
ices
incl
ude
Med
ia S
peci
alist
s, Sc
hool
Cou
nsel
ors,
Tech
nolo
gy In
tegr
atio
n Sp
ecia
lists,
and
Sch
ool P
sych
olog
ists.
2Pr
ior t
o 20
11 B
us d
river
s are
not
incl
uded
in th
is sc
hedu
le.
Sour
ce: D
istric
t Rec
ords
Fisc
al Y
ears
Func
tion
Inst
ruct
ion
Supp
ort S
ervi
ces
Tot
al

Lex
ingt
on C
ount
y Sc
hool
Dis
tric
t One
Tab
le 1
6L
exin
gton
, Sou
th C
arol
ina
Ope
ratin
g St
atis
tics
Las
t Ten
Fis
cal Y
ears
Perc
enta
geof
Stu
dent
sR
ecei
ving
Pupi
lPu
pil/
Free
or
Fisc
alE
nrol
lmen
tO
pera
ting
Cos
t per
Perc
enta
geC
ost p
erPe
rcen
tage
Tea
chin
gT
each
erR
educ
edY
ear
135-
Day
AD
M1
Exe
nditu
res2
Pupi
lC
hang
eE
xpen
ses
Pupi
lC
hang
eSt
aff3
Rat
ioL
unch
2010
21,7
5619
0,84
1,91
5
8,
772
1.
70%
203,
751,
635
9,36
5
1.72
%1,
531
14
.2
36%
2011
22,0
9718
7,95
1,90
3
8,
506
-3
.03%
205,
237,
512
9,28
8
-0.8
3%1,
504
14
.7
38%
2012
22,3
6719
5,87
5,41
7
8,
757
2.
96%
215,
672,
315
9,64
2
3.82
%1,
540
14
.5
39%
2013
22,9
3520
9,22
2,35
3
9,
122
4.
17%
229,
019,
251
9,98
6
3.56
%1,
561
14
.7
38%
2014
23,3
6322
0,10
5,12
5
9,
421
3.
27%
241,
169,
296
10,3
23
3.38
%1,
619
14
.4
39%
201
5 423
,953
266,
276,
545
11,1
17
18
.00%
290,
859,
758
12,1
43
17.6
3%1,
680
14
.3
39%
2016
24,4
1825
6,80
6,82
5
10
,517
-5.3
9%27
7,63
6,89
3
11
,370
-6
.36%
1,69
2
14.4
38
%
2017
24,8
9626
8,73
7,21
7
10
,794
2.64
%29
7,14
9,83
1
11
,936
4.
97%
1,74
5
14.3
37
%
2018
25,5
1128
9,03
8,30
9
11
,330
4.96
%32
4,00
6,38
5
12
,700
6.
41%
1,76
0
14.5
36
%
2019
25,9
9931
8,20
4,86
4
12
,239
8.03
%35
3,45
4,53
0
13
,595
7.
04%
1,80
5
14.4
34
%
Not
es: 1
Ave
rage
Dai
ly M
embe
rshi
p. I
nclu
des K
inde
rgar
ten
thro
ugh
Gra
de 1
2.2 3 4
Sour
ce:
Fina
ncia
l dat
a is
ext
ract
ed fr
om th
e D
istri
ct C
ompr
ehen
sive
Ann
ual F
inan
cial
Rep
orts
. O
ther
dat
a ha
s bee
n ga
ther
ed fr
om v
ario
us d
epar
tmen
ts w
ithin
the
dist
rict.
Una
udite
d
Ope
ratin
g Ex
pend
iture
s are
tota
l exp
endi
ture
s in
the
gove
rnm
enta
l fun
d le
ss c
apita
l out
lay
and
all d
ebt s
ervi
ce e
xpen
ditu
res.
Mod
ified
Acc
rual
Bas
is o
f Acc
ount
ing
Acc
rual
Bas
is o
f Acc
ount
ing
Doe
s not
incl
ude
Med
ia S
peci
alis
t, G
uida
nce
Cou
nsel
ors,
Tech
nolo
gy In
tegr
atio
n Sp
ecia
lists
, or S
choo
l Psy
chol
ogis
ts.
The
Dis
trict
con
verte
d Fo
od S
ervi
ce fr
om a
Pro
prie
tary
Fun
d to
a S
peci
al R
even
ue F
und
on Ju
ly 1
, 201
4

Lex
ingt
on C
ount
y Sc
hool
Dis
tric
t One
T
able
17
Lex
ingt
on, S
outh
Car
olin
a
Tea
cher
Sal
arie
s
Las
t Ten
Fis
cal Y
ears
Min
imum
Max
imum
Dis
tric
tSt
ate
Sout
heas
tern
Fisc
al Y
ear
Sala
ry1
Sala
ry1
Ave
rage
Sal
ary1,
2A
vera
ge S
alar
y2,3
Ave
rage
Sal
ary2,
3
2010
31,4
95
72
,070
49,9
64
47,5
08
47
,560
2011
30,7
57
72
,070
47,6
54
47
,050
48,0
68
2012
30,7
57
72
,070
47,4
02
47
,428
47,7
84
2013
31,3
72
73
,511
47,3
52
48
,375
48,3
58
2014
31,3
72
73
,511
47,3
63
48
,340
48,8
92
2015
31,6
86
72
,246
47,8
21
48
,892
49,2
23
2016
32,1
61
74
,988
48,8
46
49
,796
50,2
39
2017
32,8
04
76
,488
50,1
43
51
,495
50,1
27
2018
33,1
32
77
,253
51,0
80
51
,966
50,7
56
2019
35,9
91
81
,950
51,3
21
52
,152
51,8
54
Sour
ces:
1D
istri
ct R
ecor
ds2
SC D
epar
tmen
t of E
duca
tion
3SC
Rev
enue
and
Fis
cal A
ffai
rs O
ffic
e
Una
udite
d

Lex
ing
ton
Co
un
ty S
cho
ol
Dis
tric
t O
ne
Ta
ble
18
Lex
ing
ton
, S
ou
th C
aro
lin
a
Ca
pit
al
Ass
et S
tati
stic
s B
y S
cho
ol
La
st T
en F
isca
l Y
ears
Sch
oo
l2
01
02
01
12
01
22
01
32
01
42
01
52
01
62
01
72
01
82
01
9
Pri
ma
ry S
cho
ol
G
ilb
ert
Pri
mar
y 2
B
uil
t 1
98
0
S
qu
are
Fee
t1
16
,32
0
11
6,3
20
11
6,3
20
11
6,3
20
11
6,3
20
11
6,3
20
11
6,3
20
11
6,3
20
11
6,3
20
11
6,3
20
C
apac
ity
86
0
86
0
86
0
86
0
86
0
86
0
86
0
86
0
89
0
89
0
E
nro
llm
ent
72
3
70
3
66
7
66
3
68
2
69
0
67
5
64
7
63
3
67
2
%
of
Cap
acit
y U
sed
84
%8
2%
78
%7
7%
79
%8
0%
78
%7
5%
71
%7
6%
Ele
men
tary
Sch
oo
ls
L
exin
gto
n E
lem
enta
ry 2
B
uil
t 1
98
5
S
qu
are
Fee
t1
09
,78
3
10
9,7
83
10
9,7
83
10
9,7
83
10
9,7
83
10
9,7
83
10
9,7
83
10
9,7
83
10
9,7
83
10
9,7
83
C
apac
ity
90
2
90
2
90
2
90
2
90
2
90
2
90
2
90
2
90
0
90
0
E
nro
llm
ent
74
0
70
4
65
2
66
1
67
0
65
8
64
1
65
2
60
9
60
3
%
of
Cap
acit
y U
sed
82
%7
8%
72
%7
3%
74
%7
3%
71
%7
2%
68
%6
7%
G
ilb
ert
Ele
men
tary
B
uil
t 1
93
2
S
qu
are
Fee
t1
20
,67
1
12
0,8
31
12
0,8
31
12
0,8
31
12
0,8
31
12
0,8
31
12
0,8
31
12
0,8
31
12
0,8
31
12
0,8
31
C
apac
ity
74
0
74
0
74
0
74
0
74
0
74
0
74
0
74
0
74
0
74
0
E
nro
llm
ent
64
5
67
7
67
1
71
8
68
5
68
1
67
6
69
8
74
5
74
5
%
of
Cap
acit
y U
sed
87
%9
1%
91
%9
7%
93
%9
2%
91
%9
4%
10
1%
10
1%
P
elio
n E
lem
enta
ry 2
B
uil
t 1
98
0
S
qu
are
Fee
t1
23
,85
9
12
3,8
59
12
3,8
59
12
3,8
59
12
3,8
59
12
3,8
59
12
3,8
59
12
3,8
59
12
3,8
59
12
3,8
59
C
apac
ity
90
9
90
9
90
9
90
9
90
9
90
9
90
9
90
9
89
0
89
0
E
nro
llm
ent
53
4
53
8
51
3
53
8
53
6
57
0
56
3
57
3
56
6
56
4
%
of
Cap
acit
y U
sed
59
%5
9%
56
%5
9%
59
%6
3%
62
%6
3%
64
%6
3%
O
ak G
rove
Ele
men
tary
2
B
uil
t 1
97
4
S
qu
are
Fee
t8
5,6
06
85
,60
6
85
,60
6
85
,60
6
85
,60
6
85
,60
6
85
,60
6
85
,60
6
85
,60
6
85
,60
6
C
apac
ity
60
8
60
8
60
8
60
8
60
8
60
8
60
8
60
8
56
0
56
0
E
nro
llm
ent
62
4
65
1
60
2
59
8
61
5
64
5
65
2
64
8
62
8
65
7
%
of
Cap
acit
y U
sed
10
3%
10
7%
99
%9
8%
10
1%
10
6%
10
7%
10
7%
11
2%
11
7%
(Con
tin
ued
)

Lex
ing
ton
Co
un
ty S
cho
ol
Dis
tric
t O
ne
Ta
ble
18
Lex
ing
ton
, S
ou
th C
aro
lin
a
Ca
pit
al
Ass
et S
tati
stic
s B
y S
cho
ol
La
st T
en F
isca
l Y
ears
Sch
oo
l2
01
02
01
12
01
22
01
32
01
42
01
52
01
62
01
72
01
82
01
9
Ele
men
tary
Sch
oo
ls (
con
tin
ued
)
P
leas
ant
Hil
l E
lem
enta
ry 2
B
uil
t 2
00
6
S
qu
are
Fee
t8
6,0
08
86
,00
8
86
,00
8
86
,00
8
86
,00
8
86
,00
8
86
,00
8
86
,00
8
86
,00
8
86
,00
8
C
apac
ity
80
0
80
0
80
0
80
0
80
0
80
0
80
0
80
0
68
0
68
0
E
nro
llm
ent
97
5
83
0
87
6
90
5
94
5
83
4
82
3
85
6
91
6
93
7
%
of
Cap
acit
y U
sed
12
2%
10
4%
11
0%
11
3%
11
8%
10
4%
10
3%
10
7%
13
5%
13
8%
S
axe
Goth
a E
lem
enta
ry 2
B
uil
t 1
99
2
S
qu
are
Fee
t1
02
,42
8
10
2,4
28
10
2,4
28
10
2,4
28
10
2,4
28
10
2,4
28
10
2,4
28
10
2,4
28
10
2,4
28
10
2,4
28
C
apac
ity
87
1
87
1
87
1
87
1
87
1
87
1
87
1
87
1
86
0
86
0
E
nro
llm
ent
76
8
74
9
58
9
61
4
62
4
63
8
62
8
67
0
67
6
68
4
%
of
Cap
acit
y U
sed
88
%8
6%
68
%7
0%
72
%7
3%
72
%7
7%
79
%8
0%
R
ed B
ank E
lem
enta
ry 2
B
uil
t 1
98
0
S
qu
are
Fee
t9
8,8
77
98
,87
7
98
,87
7
98
,87
7
98
,87
7
98
,87
7
98
,87
7
98
,87
7
98
,87
7
98
,87
7
C
apac
ity
79
2
79
2
79
2
79
2
79
2
79
2
79
2
79
2
77
0
77
0
E
nro
llm
ent
59
1
60
2
64
0
64
1
62
1
55
9
54
5
53
5
54
7
53
7
%
of
Cap
acit
y U
sed
75
%7
6%
81
%8
1%
78
%7
1%
69
%6
8%
71
%7
0%
W
hit
e K
noll
Ele
men
tary
2
B
uil
t 1
99
0
S
qu
are
Fee
t9
9,6
54
99
,65
4
99
,65
4
99
,65
4
99
,65
4
99
,65
4
99
,65
4
99
,65
4
99
,65
4
99
,65
4
C
apac
ity
89
4
89
4
89
4
89
4
89
4
89
4
89
4
89
4
82
0
82
0
E
nro
llm
ent
76
2
74
8
71
6
71
9
69
8
70
3
71
9
75
1
71
2
67
7
%
of
Cap
acit
y U
sed
85
%8
4%
80
%8
0%
78
%7
9%
80
%8
4%
87
%8
3%
M
idw
ay E
lem
enta
ry 2
B
uil
t 1
99
4
S
qu
are
Fee
t1
05
,66
6
10
5,6
66
10
5,6
66
10
5,6
66
10
5,6
66
10
5,6
66
10
5,6
66
10
5,6
66
10
5,6
66
10
5,6
66
C
apac
ity
94
8
94
8
94
8
94
8
94
8
94
8
94
8
94
8
90
0
90
0
E
nro
llm
ent
86
6
1,0
41
79
8
75
9
76
2
75
9
76
7
79
7
87
6
93
2
%
of
Cap
acit
y U
sed
91
%1
10
%8
4%
80
%8
0%
80
%8
1%
84
%9
7%
10
4%
(Con
tin
ued
)

Lex
ing
ton
Co
un
ty S
cho
ol
Dis
tric
t O
ne
Ta
ble
18
Lex
ing
ton
, S
ou
th C
aro
lin
a
Ca
pit
al
Ass
et S
tati
stic
s B
y S
cho
ol
La
st T
en F
isca
l Y
ears
Sch
oo
l2
01
02
01
12
01
22
01
32
01
42
01
52
01
62
01
72
01
82
00
19
Ele
men
tary
Sch
oo
ls (
con
tin
ued
)
L
ake
Mu
rray
Ele
men
tary
2
B
uil
t 1
99
9
S
qu
are
Fee
t1
14
,61
3
11
4,6
13
11
4,6
13
11
4,6
13
11
4,6
13
11
4,6
13
11
4,6
13
11
4,6
13
11
4,6
13
11
4,6
13
C
apac
ity
98
8
98
8
98
8
98
8
98
8
98
8
98
8
98
8
99
0
99
0
E
nro
llm
ent
1,0
24
62
2
61
2
59
8
59
1
57
0
60
6
65
4
69
4
69
5
%
of
Cap
acit
y U
sed
10
4%
63
%6
2%
61
%6
0%
58
%6
1%
66
%7
0%
70
%
C
aroli
na
Sp
rin
gs
Ele
men
tary
2
B
uil
t 2
00
7
S
qu
are
Fee
t8
8,1
87
88
,18
7
88
,18
7
88
,18
7
88
,18
7
88
,18
7
88
,18
7
88
,18
7
88
,18
7
88
,18
7
C
apac
ity
80
0
80
0
80
0
80
0
80
0
80
0
80
0
80
0
68
0
68
0
E
nro
llm
ent
83
5
85
9
87
7
93
0
93
2
69
7
73
4
73
1
77
1
76
4
%
of
Cap
acit
y U
sed
10
4%
10
7%
11
0%
11
6%
11
7%
87
%9
2%
91
%1
13
%1
12
%
F
ort
s P
on
d E
lem
enta
ry 2
B
uil
t 2
00
8
S
qu
are
Fee
t8
1,3
43
81
,34
3
81
,34
3
81
,34
3
81
,34
3
81
,34
3
81
,34
3
81
,34
3
81
,34
3
81
,34
3
C
apac
ity
60
0
60
0
60
0
60
0
60
0
60
0
60
0
60
0
57
0
57
0
E
nro
llm
ent
51
8
50
3
49
2
50
7
52
7
54
6
56
6
55
6
51
3
55
0
%
of
Cap
acit
y U
sed
86
%8
4%
82
%8
5%
88
%9
1%
94
%9
3%
90
%9
6%
N
ew P
rovid
ence
Ele
men
tary
2
B
uil
t 2
00
8
S
qu
are
Fee
t8
8,7
66
88
,76
6
88
,76
6
88
,76
6
88
,76
6
88
,76
6
88
,76
6
88
,76
6
88
,76
6
88
,76
6
C
apac
ity
80
0
80
0
80
0
80
0
80
0
80
0
80
0
80
0
68
0
68
0
E
nro
llm
ent
53
9
58
1
57
4
58
4
57
5
59
0
54
9
55
3
64
4
67
3
%
of
Cap
acit
y U
sed
67
%7
3%
72
%7
3%
72
%7
4%
69
%6
9%
95
%9
9%
R
ock
y C
reek
Ele
men
tary
B
uil
t 2
01
0
S
qu
are
Fee
t1
16
,90
5
11
6,9
05
11
6,9
05
11
6,9
05
11
6,9
05
11
6,9
05
11
6,9
05
11
6,9
05
11
6,9
05
C
apac
ity
80
0
80
0
80
0
80
0
80
0
80
0
80
0
80
08
00
E
nro
llm
ent
54
5
58
6
57
5
59
2
64
6
66
4
64
5
71
2
69
9
%
of
Cap
acit
y U
sed
68
%7
3%
72
%7
4%
81
%8
3%
81
%8
9%
87
%
(Con
tin
ued
)

Lex
ing
ton
Co
un
ty S
cho
ol
Dis
tric
t O
ne
Ta
ble
18
Lex
ing
ton
, S
ou
th C
aro
lin
a
Ca
pit
al
Ass
et S
tati
stic
s B
y S
cho
ol
La
st T
en F
isca
l Y
ears
Sch
oo
l2
01
02
01
12
01
22
01
32
01
42
01
52
01
62
01
72
01
82
01
9
Ele
men
tary
Sch
oo
ls (
con
tin
ued
)
M
ead
ow
Gle
n E
lem
enta
ry 2
B
uil
t 2
01
2
S
qu
are
Fee
t1
24
,82
9
12
4,8
29
12
4,8
29
12
4,8
29
12
4,8
29
12
4,8
29
12
4,8
29
12
4,8
29
C
apac
ity
60
06
00
60
06
00
60
06
00
80
08
00
E
nro
llm
ent
55
27
39
84
39
13
97
91
03
49
30
90
5
%
of
Cap
acit
y U
sed
92
%1
23
%1
41
%1
52
%1
63
%1
72
%1
16
%1
13
%
D
eerf
ield
Ele
men
tary
B
uil
t 2
01
4
S
qu
are
Fee
t1
32
,61
11
32
,61
11
32
,61
11
32
,61
11
32
,61
1
C
apac
ity
80
08
00
80
08
00
80
0
E
nro
llm
ent
47
35
53
62
16
50
69
0
%
of
Cap
acit
y U
sed
59
%6
9%
78
%8
1%
86
%
Mid
dle
Sch
oo
ls
L
exin
gto
n M
idd
le 2
B
uil
t 1
95
7
S
qu
are
Fee
t1
89
,66
8
18
9,6
68
18
9,6
68
18
9,6
68
18
9,6
68
18
9,6
68
18
9,6
68
18
9,6
68
18
9,6
68
18
9,6
68
C
apac
ity
1,2
84
1,2
84
1,2
84
1,2
84
1,2
84
1,2
84
1,2
84
1,2
84
1,2
80
1,2
80
E
nro
llm
ent
1,1
65
1,4
17
1,3
99
83
0
79
7
81
8
83
3
84
4
94
9
99
5
%
of
Cap
acit
y U
sed
91
%1
10
%1
09
%6
5%
62
%6
4%
65
%6
6%
74
%7
8%
W
hit
e K
noll
Mid
dle
2
B
uil
t 1
99
1
S
qu
are
Fee
t1
59
,19
0
15
9,1
90
15
9,1
90
15
9,1
90
15
9,1
90
15
9,1
90
15
9,1
90
15
9,1
90
15
9,1
90
15
9,1
90
C
apac
ity
1,0
40
1,0
40
1,0
40
1,0
40
1,0
40
1,0
40
1,0
40
1,0
40
1,0
10
1,0
10
E
nro
llm
ent
80
1
78
8
76
7
76
9
75
0
74
6
76
4
77
9
77
2
79
3
%
of
Cap
acit
y U
sed
77
%7
6%
74
%7
4%
72
%7
2%
73
%7
5%
76
%7
9%
(Con
tin
ued
)

Lex
ing
ton
Co
un
ty S
cho
ol
Dis
tric
t O
ne
Ta
ble
18
Lex
ing
ton
, S
ou
th C
aro
lin
a
Ca
pit
al
Ass
et S
tati
stic
s B
y S
cho
ol
La
st T
en F
isca
l Y
ears
Sch
oo
l2
01
02
01
12
01
22
01
32
01
42
01
52
01
62
01
72
01
82
01
9
Mid
dle
Sch
oo
ls (
con
tin
ued
)
Gil
ber
t M
idd
le 2
Bu
ilt
19
93
Sq
uar
e F
eet
12
1,6
53
12
1,6
53
12
1,6
53
12
1,6
53
12
1,6
53
12
1,6
53
12
1,6
53
12
1,6
53
12
1,6
53
12
1,6
53
Cap
acit
y7
95
7
95
7
95
7
95
7
95
7
95
7
95
7
95
8
00
8
00
En
roll
men
t6
98
7
27
7
07
7
17
7
37
7
26
7
63
7
39
7
69
7
68
% o
f C
apac
ity U
sed
88
%9
1%
89
%9
0%
93
%9
1%
96
%9
3%
96
%9
6%
Pel
ion
Mid
dle
2
Bu
ilt
19
52
Sq
uar
e F
eet
12
6,5
51
12
7,4
90
12
8,1
36
14
6,1
96
14
6,1
96
14
6,1
96
14
6,1
96
14
6,1
96
14
6,1
96
14
6,1
96
Cap
acit
y7
48
7
48
7
48
7
48
7
48
7
48
7
48
7
48
7
30
7
30
En
roll
men
t6
05
6
25
6
05
5
83
5
39
5
43
5
53
5
30
5
80
5
76
%
of
Cap
acit
y U
sed
81
%8
4%
81
%7
8%
72
%7
3%
74
%7
1%
79
%7
9%
Ple
asan
t H
ill
Mid
dle
2
Bu
ilt
20
06
Sq
uar
e F
eet
14
7,6
29
14
7,6
29
14
7,6
29
14
7,6
29
14
7,6
29
14
7,6
29
14
7,6
29
14
7,6
29
14
7,6
29
14
7,6
29
Cap
acit
y1
,00
0
1,0
00
1,0
00
1,0
00
1,0
00
1,0
00
1,0
00
1,0
00
87
0
87
0
En
roll
men
t1
,04
6
1,0
70
1,1
09
1,0
24
1,0
14
1,0
55
1,1
04
1,1
28
1,1
96
1,2
06
% o
f C
apac
ity U
sed
10
5%
10
7%
11
1%
10
2%
10
1%
10
6%
11
0%
11
3%
13
7%
13
9%
Car
oli
na
Sp
rin
gs
Mid
dle
2
Bu
ilt
20
07
Sq
uar
e F
eet
14
2,3
63
14
2,3
63
14
2,3
63
14
2,3
63
14
2,3
63
14
2,3
63
14
2,3
63
14
2,3
63
14
2,3
63
14
2,3
63
Cap
acit
y1
,00
0
1,0
00
1,0
00
1,0
00
1,0
00
1,0
00
1,0
00
1,0
00
78
0
78
0
En
roll
men
t7
02
75
97
65
76
97
86
80
78
16
81
68
72
93
4
% o
f C
apac
ity U
sed
70
%7
6%
77
%7
7%
79
%8
1%
82
%8
2%
11
2%
12
0%
Mea
dow
Gle
n M
idd
le 2
Bu
ilt
20
12
Sq
uar
e F
eet
18
5,9
57
18
5,9
57
18
5,9
57
18
5,9
57
18
5,9
57
18
5,9
57
18
5,9
57
Cap
acit
y8
00
8
00
8
00
8
00
8
00
1
,00
0
1,0
00
En
roll
men
t7
81
9
22
1
,05
5
1,0
92
1,1
80
1,0
81
1,0
34
% o
f C
apac
ity U
sed
98
%1
15
%1
32
%1
37
%1
48
%1
08
%1
03
%
(Con
tin
ued
)

Lex
ing
ton
Co
un
ty S
cho
ol
Dis
tric
t O
ne
Ta
ble
18
Lex
ing
ton
, S
ou
th C
aro
lin
a
Ca
pit
al
Ass
et S
tati
stic
s B
y S
cho
ol
La
st T
en F
isca
l Y
ears
Sch
oo
l2
01
02
01
12
01
22
01
32
01
42
01
52
01
62
01
72
01
82
01
9
Hig
h S
cho
ols
L
exin
gto
n H
igh
2
B
uil
t 1
97
8
S
qu
are
Fee
t4
69
,42
3
46
9,8
39
46
9,8
39
46
9,8
39
46
9,8
39
46
9,8
39
47
2,7
33
47
2,7
33
47
2,7
33
47
2,7
33
C
apac
ity
2,4
56
2,4
56
2,4
56
2,4
56
2,4
56
2,4
56
2,4
56
2,4
56
2,1
20
2,1
20
E
nro
llm
ent
2,7
28
2,8
41
3,0
78
3,1
61
1,8
70
1,7
16
1,7
81
1,8
40
1,9
25
2,0
81
%
of
Cap
acit
y U
sed
11
1%
11
6%
12
5%
12
9%
76
%7
0%
73
%7
5%
91
%9
8%
G
ilb
ert
Hig
h 2
B
uil
t 2
00
2
S
qu
are
Fee
t2
47
,30
7
24
7,3
07
24
7,3
07
26
2,3
74
26
2,3
74
26
2,3
74
25
8,8
86
25
8,8
86
25
8,8
86
25
8,8
86
C
apac
ity
1,1
07
1,1
07
1,1
07
1,1
07
1,1
07
1,1
07
1,1
07
1,1
07
1,1
10
1,1
10
E
nro
llm
ent
92
1
90
2
93
4
89
9
91
6
91
3
89
4
94
1
95
0
1,0
07
%
of
Cap
acit
y U
sed
83
%8
1%
84
%8
1%
83
%8
2%
81
%8
5%
86
%9
1%
P
elio
n H
igh
2
B
uil
t 2
00
1
S
qu
are
Fee
t2
23
,13
9
24
0,5
67
24
0,5
67
24
0,5
67
24
0,5
67
24
0,5
67
24
4,3
68
24
4,3
68
24
4,3
68
24
4,3
68
C
apac
ity
99
0
1,1
40
1,1
40
1,1
40
1,1
40
1,1
40
1,1
40
1,1
40
99
0
99
0
E
nro
llm
ent
75
4
71
1
69
2
73
8
74
5
74
3
72
4
68
8
67
0
68
1
%
of
Cap
acit
y U
sed
76
%6
2%
61
%6
5%
65
%6
5%
64
%6
0%
68
%6
9%
W
hit
e K
noll
Hig
h 2
B
uil
t 2
00
0
S
qu
are
Fee
t4
09
,45
5
42
6,9
78
42
6,9
78
42
6,9
78
42
6,9
78
42
6,9
78
42
6,9
78
42
6,9
78
42
6,9
78
42
6,9
78
C
apac
ity
1,7
27
1,8
27
1,8
27
1,8
27
1,8
27
1,8
27
1,8
27
1,8
27
1,8
30
1,8
30
E
nro
llm
ent
1,9
10
1,9
03
1,8
94
1,9
16
1,9
22
1,9
17
1,8
93
1,8
54
1,8
96
1,9
21
%
of
Cap
acit
y U
sed
11
1%
10
4%
10
4%
10
5%
10
5%
10
5%
10
4%
10
1%
10
4%
10
5%
R
iver
Blu
ff H
igh
B
uil
t 2
01
4
S
qu
are
Fee
t5
45
,17
9
56
0,0
41
56
0,0
41
56
0,0
41
56
0,0
41
56
0,0
41
C
apac
ity
2,0
00
2,0
00
2,0
00
2,0
00
2,0
00
2,0
00
E
nro
llm
ent
14
66
17
57
18
62
19
34
20
42
20
33
%
of
Cap
acit
y U
sed
73
%8
8%
93
%9
7%
10
2%
10
2%
(Con
tin
ued
)

Lex
ing
ton
Co
un
ty S
cho
ol
Dis
tric
t O
ne
Ta
ble
18
Lex
ing
ton
, S
ou
th C
aro
lin
a
Ca
pit
al
Ass
et S
tati
stic
s B
y S
cho
ol
La
st T
en F
isca
l Y
ears
Sch
oo
l2
01
02
01
12
01
22
01
32
01
42
01
52
01
62
01
72
01
82
01
9
Oth
er
L
exin
gto
n T
ech
nolo
gy C
ente
r
B
uil
t 1
97
4
S
qu
are
Fee
t1
33
,52
6
15
3,9
76
15
3,9
76
15
3,9
76
15
3,9
76
15
3,9
76
15
3,9
76
15
3,9
76
15
3,9
76
15
3,9
76
C
apac
ity
61
8
76
2
76
2
76
2
76
2
76
2
76
2
76
2
76
2
76
2
E
nro
llm
ent
62
0
62
0
62
0
62
0
62
0
62
0
62
0
62
0
62
0
62
0
%
of
Cap
acit
y U
sed
10
0%
81
%8
1%
81
%8
1%
81
%8
1%
81
%8
1%
81
%
R
ose
nw
ald
Com
mu
nit
y L
earn
ing C
ente
r (A
du
lt E
du
cati
on
al S
ervic
es)
1
B
uil
t 1
95
3
S
qu
are
Fee
t4
8,0
56
48
,05
6
48
,05
6
48
,05
6
48
,05
6
48
,05
6
48
,05
6
48
,05
6
48
,05
6
48
,05
6
C
apac
ity
20
0
20
0
20
0
20
0
20
0
20
0
20
0
20
0
20
0
20
0
E
nro
llm
ent
28
1
14
0
14
0
14
0
14
0
14
0
14
0
14
0
14
0
14
0
%
of
Cap
acit
y U
sed
14
1%
70
%7
0%
70
%7
0%
70
%7
0%
70
%7
0%
70
%
NO
TE
S:
Un
aud
ited
2 -
In
Fis
cal
Yea
r 2
01
8, th
e D
istr
ict
adju
sted
cer
tain
bu
ild
ing c
apac
itie
s b
ased
on
th
e re
sult
s of
a lo
ng-r
ange
gro
wth
an
alysi
s st
ud
y c
on
du
cted
by a
n i
nd
epen
den
t en
gin
eeri
ng a
nd
c
on
sult
ing f
irm
an
d a
lon
g-r
ange
faci
liti
es i
mp
rovem
ent
pla
n c
on
du
cted
by a
con
stru
ctio
n m
anag
emen
t fi
rm.
Sou
rce:
Dat
a h
as b
een
gat
her
ed f
rom
var
iou
s d
epar
tmen
ts w
ith
in t
he
dis
tric
t.
1 -
At
the
end
of
Fis
cal
Yea
r 2
01
0, th
e b
uil
din
g p
revio
usl
y c
alle
d L
exin
gto
n I
nte
rmed
iate
Sch
ool
was
rep
urp
ose
d t
o h
ou
se t
he
Alt
ern
ativ
e E
du
cati
on
al S
ervic
es
a
nd
sev
eral
Dis
tric
t d
epar
tmen
ts. T
he
bu
ild
ing h
as b
een
ren
amed
as
the
Rose
nw
ald
Com
mu
nit
y L
earn
ing C
ente
r.
3 -
A B
on
d R
efer
end
um
was
pas
sed
in
Novem
ber
20
18
. T
his
res
ult
ed i
n v
ote
r ap
pro
val
for
5 n
ew s
chools
an
d a
dd
itio
ns
and
ren
ovat
ion
s to
36
ex
isti
ng s
chools
an
d f
acil
itie
s.

COMPLIANCECOMPLIANCE

YEAR ENDED JUNE 30, 2019
There were no prior year audit findings.
LEXINGTON COUNTY SCHOOL DISTRICT ONE LEXINGTON, SOUTH CAROLINA
SUMMARY SCHEDULE OF PRIOR AUDIT FINDINGS
203

YEAR ENDED JUNE 30, 2019
Section I - Summary of the Auditor's Results
Financial Statements
Type of auditor's report issued: Unmodified
Internal control over financial reporting:
Material weakness(es) identified? Yes X No Significant deficiency(ies) identified that are not considered to be material weaknesses? Yes X None Reported Noncompliance material to financial statements noted? Yes X None Reported
Federal Awards
Internal control over major programs:
Material weakness(es) identified? Yes X No Significant deficiency(ies) identified that are not considered to be material weaknesses? Yes X None Reported
Type of auditor's report issued on compliance for major programs: Unmodified
Any audit findings disclosed that are required to be reported in accordance with 2 CFR 200.516(a)? Yes X No
Identification of major programs:
CFDA Number(s) Name of Federal Program or Cluster84.027/84.173A Special Education Centers
Dollar threshold used to distinguish between type A and type B programs: 750,000$
Auditee qualified as low-risk auditee? X Yes No
Section II - Findings - Current Year Financial Statement Audit
No matters to report.
Section III - Findings and Questioned Costs - Major Federal Awards Programs Audit
No matters to report.
LEXINGTON COUNTY SCHOOL DISTRICT ONE LEXINGTON, SOUTH CAROLINA
SCHEDULE OF FINDINGS AND QUESTIONED COSTS
204

LEXINGTON COUNTY SCHOOL DISTRICT ONE LEXINGTON, SOUTH CAROLINA
YEAR ENDED JUNE 30, 2019
LEA Federal Pass-ThroughSubfund CFDA Grantor's Number Federal Grantor/Pass Through Grantor/Program Title Number Number Expenditures
U.S. DEPARTMENT OF EDUCATION
Passed-Through S.C. Department of Education:24300 Adult Education - State Grant Programs 84.002 2018-19 Adult Education Federal 125,919$
Total Adult Education - State Grant Programs 125,919
Title I Part A Cluster:20200 Title I Grants to Local Educational Agencies 84.010A 19 Title I - Regular 3,236,682 22100 Title I Neglected and Delinquent 84.010A 19 Title I N& D 2,88822110 Title I Neglected and Delinquent 84.010A 19 Title I N& D 10,14623800 Title I Grants to Local Educational Agencies 84.010A 19 Title I Support 94,54924000 Title I Grants to Local Educational Agencies 84.010A 19 Title I Direct Student Services 106,937
Total Title I Part A Cluster 3,451,202
Special Education Cluster (IDEA):20330 Special Education - Grants to States (Extended School Year) 84.027A N/A 45,188 *20400 Special Education - Grants to States (Special Ed IDEA) 84.027A 19 IDEA 3,262,070 *20410 Special Education - Grants to States (Special Ed IDEA) 84.027A 19 IDEA Supplemental 1,047,089 *20420 Special Education - Grants to States (Special Ed IDEA) 84.027A 19 IDEA Carryover 19,556 *20500 Special Education - Preschool Grants 84.173A 19 IDEA Preschool 201,604 *20510 Special Education - Preschool Grants 84.173A 18 IDEA Preschool 13,487 *
Total Special Education Cluster (IDEA) 4,588,994
20800 CATE (subprogram 01 Integration) 84.048 19 CATE 66,44420810 CATE (subprogram 02 WBL Activities) 84.048 19 CATE 1,51220880 CATE (subprogram 03 Technology Training) 84.048 19 CATE 20,82220790 CATE (subprogram 04 Professional Development) 84.048 19 CATE 48,76320780 CATE (subprogram 06 Initiate/Improve Programs) 84.048 19 CATE 10,07020760 CATE (subprogram 08 Special Populations) 84.048 19 CATE 28,89420720 CATE (subprogram 09 Career Guidance) 84.048 19 CATE 5,13720750 CATE (subprogram 10 Student Organizations) 84.048 19 CATE 82,05420710 CATE (subprogram 15 Administration) 84.048 19 CATE 13,56020740 CATE (subprogram 17 Innovative Initiatives 84.048 19 CATE 7,500
20891-2 CATE 18 Federal Carryover 84.048 18 CATE 6,144Total CATE 290,900
21000 Student Support and Academic Enrichment Grants 84.424A 19 Title IV 99,400Total Student Support and Academic Enrichment Grants 99,400
22400 Twenty-First Century Community Learning Centers 84.287C 19 21stCCLC - PES 117,98922401 Twenty-First Century Community Learning Centers 84.287C 18 21stCCLC - PES 4822420 Twenty-First Century Community Learning Centers 84.287C 19 21stCCLC Bridge - PES 2,80922430 Twenty-First Century Community Learning Centers 84.287C 19 21stCCLC - FPE 91,87222431 Twenty-First Century Community Learning Centers 84.287C 18 21stCCLC - FPE 20222440 Twenty-First Century Community Learning Centers 84.287C 19 21stCCLC - PMS 70,38222441 Twenty-First Century Community Learning Centers 84.287C 18 21stCCLC - PMS 1,29922450 Twenty-First Century Community Learning Centers 84.287C 19 21CCLC Bridge - FPE 12,20022460 Twenty-First Century Community Learning Centers 84.287C 18 21CCLC Bridge - FPE 3,39622470 Twenty-First Century Community Learning Centers 84.287C 19 21CCLC Bridge - PMS 23,92522490 Twenty-First Century Community Learning Centers 84.287C 19 21CCLC Bridge - PES 12,613
Total Twenty-First Century Community Learning Centers 336,735
23200 Education for Homeless Children and Youth 84.196A 19 McKinney-Vento Homeless 26,64423210 Education for Homeless Children and Youth 84.196A 19 McKinney-Vento Homeless 3,99323220 Education for Homeless Children and Youth 84.196A 19 McKinney-Vento Homeless Supplement 19,147
Total Education for Homeless Children and Youth 49,784
26400 English Language Acquisition Grants 84.365A 19 English Language Acquisition - Title III 69,673Total English Language Acquisition 69,673
26700 Improving Teacher Quality State Grants 84.367 19 Title II Improving Teacher Quality 212,01526710 Improving Teacher Quality State Grants 84.367 18 Title II Improving Teacher Quality 169,360
Total Improving Teacher Quality 381,375
Total U.S. Department of Education 9,393,982$
(Continued)
SCHEDULE OF EXPENDITURES OF FEDERAL AWARDS
205

LEXINGTON COUNTY SCHOOL DISTRICT ONE LEXINGTON, SOUTH CAROLINA
YEAR ENDED JUNE 30, 2019
LEA Federal Pass-ThroughSubfund CFDA Grantor's Number Federal Grantor/Pass Through Grantor/Program Title Number Number Expenditures
U.S. DEPARTMENT OF AGRICULTUREPassed-Through South Carolina Department of Education:
Child Nutrition Cluster:Non-Cash Assistance (Commodities):
60000 School Lunch Program 10.555 N/A 664,875$ Cash Assistance:
60000 School Breakfast Program 10.553 N/A 1,540,850 60000 School Lunch Program 10.555 N/A 4,266,205 60000 Summer Feeding Program 10.559 N/A 55,69760020 School Food Service Equipment Grant 10.579 19 School Food Equipment Grant 25,370
Cash Assistance Subtotal 5,888,122
Total U.S. Department of Agriculture 6,552,997
U.S. DEPARTMENT OF DEFENSEDirect Assistance:
27210-27230 ROTC 12.000 N/A 137,806
Total U.S. Department of Defense 137,806
U.S. DEPARTMENT OF HOUSING AND URBAN DEVELOPMENTPassed-Through Lexington County:
81410 Community Development Block Grant 14.218 N/A 32,603
Total U.S. Department of Housing and Urban Development 32,603
U.S. DEPARTMENT OF HEALTH AND HUMAN SERVICES CDCPassed-Through South Carolina Department of Education:
86700 Cooperative Agreements to Promote Adolescent Health 93.079 19 Youth Risk Behavior Survey 1,360
Total U.S. Department of Defense 1,360
Total Federal Expenditures 16,118,748$
* Denotes Major Programs
Note: There were no federal awards disbursed to subrecipients in the year ended June 30, 2019
See accompanying notes to the schedule of expenditures of federal awards
SCHEDULE OF EXPENDITURES OF FEDERAL AWARDS
206

LEXINGTON COUNTY SCHOOL DISTRICT ONELEXINGTON, SOUTH CAROLINA
NOTES TO THE SCHEDULE OF EXPENDITURES OF FEDERAL AWARDS
YEAR ENDED JUNE 30, 2019
A. - General
The accompanying Schedule of Expenditures of Federal Awards (the "Schedule") presents the activity of all federal awardprograms of Lexington County School District One, South Carolina (the "District") for the year ended June 30, 2019. Allfederal awards received directly from the federal agencies, as well as those passed through other government agencies, areincluded on the schedule.
B. - Basis of Accounting
The accompanying Schedule is presented using the modified accrual basis of accounting, which is described in Note I to theDistrict's financial statements.
C. - Relationship to Financial Statements
Federal award expenditures are reported in the District's financial statements as expenditures in the Special Revenue Funds.
D. - Relationship to Federal Financial Reports
Amounts reported in the accompanying schedule agree with the amounts reported in the related federal financial reportsexcept for timing differences relating to expenditures made subsequent to the filing of federal financial reports.
E. - Indirect Costs
The District elected not to use the di minimis indirect cost rate of 10%.
207

208

209

210

211

(This page intentionally left blank)
212