COMPREHENSIVE PLAN - Attleboro, MA
152
COMPREHENSIVE PLAN CITY OF ATTLEBORO, MASSACHUSETTS PREPARED BY: CITY OF ATTLEBORO, MAYOR’S COMPREHENSIVE PLAN STEERING COMMITTEE WITH ASSISTANCE FROM THE: PLANNING BOARD DEPARTMENT OF PLANNING AND DEVELOPMENT AND COMMUNITY OPPORTUNITIES GROUP, INC. BOSTON, MASSACHUSETTS ________________________________ ADOPTED BY THE MUNICIPAL COUNCIL ON JUNE 5, 2012
-
Upload
khangminh22 -
Category
Documents
-
view
5 -
download
0
Transcript of COMPREHENSIVE PLAN - Attleboro, MA

COMPREHENSIVE PLAN
CITY OF
ATTLEBORO, MASSACHUSETTS
PREPARED BY:
CITY OF ATTLEBORO, MAYOR’S COMPREHENSIVE PLAN STEERING COMMITTEE
WITH ASSISTANCE FROM THE: PLANNING BOARD
DEPARTMENT OF PLANNING AND DEVELOPMENT AND
COMMUNITY OPPORTUNITIES GROUP, INC. BOSTON, MASSACHUSETTS
________________________________
ADOPTED BY THE MUNICIPAL COUNCIL ON
JUNE 5, 2012

TABLE OF CONTENTS
CITY OF ATTLEBORO COMPREHENSIVE PLAN i
TABLE OF CONTENTS
Preface ........................................................................................................................................................... iii Adoption......................................................................................................................................................... iii Acknowledgments......................................................................................................................................... iv
I. INTRODUCTION..................................................................................................................................1 I.A. Purpose of the Comprehensive Plan..............................................................................................1 I.B. Statutory Requirements ...................................................................................................................1 I.C. Review of Past Plans, Studies, and Implementations..................................................................2 I.D. Structure of the Comprehensive Plan............................................................................................2
I.E. How to Use this Plan........................................................................................................................3
II. THE PROCESS: HOW THIS PLAN WAS CREATED......................................................................4
II.A. Comprehensive Plan Steering Committee ....................................................................................4
II.B. Committee and Subcommittee Meetings ......................................................................................4
II.C. Steering Committee Assignments ..................................................................................................4
II.D. Community Workshops ..................................................................................................................5
II.E. Public Opinion Questionnaire/Research and Interviews............................................................5
II.F. Final Compilation.............................................................................................................................5
III. LOOKING BACK: A SHORT HISTORY OF OUR CITY..................................................................6
IV. TRENDS, CHALLENGES, AND OPPORTUNITIES........................................................................8
IV.A. Population Characteristics ..............................................................................................................8
IV.B. Land Use..........................................................................................................................................19
IV.C. Housing and Neighborhoods .......................................................................................................28
IV.D. Economic Development.................................................................................................................41
IV.E. Transportation ................................................................................................................................52
IV.F. Environmental Resources..............................................................................................................65
IV.G. Open Space, Cultural Resources, and Historic Preservation....................................................76
IV.H. Municipal Facilities and Services .................................................................................................91
V. LOOKING AHEAD: A VISION OF A FUTURE ATTLEBORO....................................................98
VI. GOALS, POLICIES, AND PROPOSALS ........................................................................................101
VI.A. Creating City–Wide Goals, Policies, and Proposals ................................................................101
VI.B. Zoning and Land Use ..................................................................................................................104
VI.C. Neighborhoods .............................................................................................................................107
VI.D. Transportation ..............................................................................................................................110
VI.E. Economic Development...............................................................................................................114
VI.F. Central Business District..............................................................................................................116
VI.G. Housing..........................................................................................................................................120
VI.H. Environmental Resources, Open Space, and Historic Preservation......................................122
VI.I. Public Safety..................................................................................................................................127
VI.J. Municipal Facilities ......................................................................................................................129

TABLE OF CONTENTS
CITY OF ATTLEBORO COMPREHENSIVE PLAN ii
VI.K. School System ...............................................................................................................................131
VI.L. Social Services ...............................................................................................................................133
VII. IMPLEMENTATION PLAN............................................................................................................135
VII.A. Introduction...................................................................................................................................135
VII.B. Implementation Table..................................................................................................................135
VII.C. Comprehensive Plan Assessment and Updates.......................................................................135
BIBLIOGRAPHY..............................................................................................................................................136

PREFACE
CITY OF ATTLEBORO COMPREHENSIVE PLAN iii
Preface
A comprehensive plan is the highest, most complex, and most difficult form of city planning.
Conceptually and analytically, it encompasses the principal elements of the city that determine its
current activities and future development. It is planning for the city as a whole, rather than for one or
several of its constituent functions such as water supply and distribution, police and fire protection,
vehicular and pedestrian traffic, economic development, or any one of the many particular functions
of municipal government. There are many elements ranging from tangible components such as
housing, parks, schools, and public utilities to the intangible components such as political, legal, and
zoning powers that shape and constrain municipal activities. Comprehensive city planning seeks to
understand this complexity in order to enable municipal leaders and administrators, as well as civic
leaders, to take the necessary actions to improve and effectively shape the future.
Adoption
The City of Attleboro COMPREHENSIVE PLAN was approved by the Mayor’s Comprehensive Plan
Steering Committee on September 26, 2011, by the Attleboro Planning Board on December 5, 2011,
and subsequently adopted by a unanimous vote of the Attleboro Municipal Council on June 5, 2012.
This document is a policy statement that establishes long–term goals and provides a shared vision
aimed at unified and coordinated development for the City of Attleboro. The long–range policies
within the plan serve as the framework for future development, outlining the specific goals for the
City for the next 20 years. The plan is also to be used to guide the location, development, and
maintenance of the City’s many facilities and services. As such, the COMPREHENSIVE PLAN is one of
the main policy tools of the City’s Administration, Municipal Council, Planning Board, Zoning Board
of Appeals, the Department of Planning and Development, as well as a number of other City boards
and departments. The COMPREHENSIVE PLAN is a product of extensive data collection and analysis as
well as public opinion research. The COMPREHENSIVE PLAN may be viewed on the City’s web–site site
in PDF format at <www.cityofattleboro.us>.

ACKNOWLEDGMENTS
CITY OF ATTLEBORO COMPREHENSIVE PLAN iv
Acknowledgments
The Mayor’s Office established a thirteen–member community advisory committee—the Mayor’s
Comprehensive Plan Steering Committee—which consisted of volunteers who represented the
elements of the Attleboro community. The Steering Committee’s charge was to work on the
preparation of this document with municipal staff and to scrutinize the master planning process,
which included extensive public opinion research, data collection, and analysis. The Steering
Committee established eleven subcommittees, each chaired by a member of the Steering Committee.
Members of the subcommittees were recruited through direct invitation and open solicitation of
volunteers. The Steering Committee reviewed progress on the COMPREHENSIVE PLAN and provided
invaluable direction in its development. A more detailed discussion of the Mayor’s Comprehensive
Plan Steering Committee and the subcommittees is presented in Section II, “The Process: How this
Plan was Created.”
MAYOR’S COMPREHENSIVE PLAN STEERING COMMITTEE
Robert Duffin, Co–Chair
Roberta Wuilleumier, Co–Chair
Charlie Adler Roy Belcher
Robert Cassidy* Jason Gittle
Marcia Lindstrom Larre Nelson Lisa Nelson Ellen Parker Rich Renoni
Debora Doona Scott Michael Scott
*We note with sadness the death in September 2008 of Robert Cassidy who contributed his considerable knowledge, experience,
and enthusiasm to the preparation of this Comprehensive Plan.

ACKNOWLEDGMENTS
CITY OF ATTLEBORO COMPREHENSIVE PLAN v
MAYOR’S COMPREHENSIVE PLAN SUBCOMMITTEE MEMBERSHIP
Christine Allcock David McKee Mary Baker Jane Merkle Kelly Benson Keith Merkle Donna Bellerose Anne Messier Wayne Bellerose Kerri O’Donnell Norma Brewster Michael O’Donnell Bill Bowles Christopher O’Neil Barbara Brown Sandy Parsons Jeff Brownell Sean Perry Fran Carl David Puhl Gerald Chase James Purcell Peter Clark Sara Quinn Tony Concu Tom Rafferty Jeff Cook Jon Rallo Judy Corbett Robyn Rallo Bill Crowley Joan Raulino Nancy Daday Kent Richards Frank D’Agostino Jackie Romaniecki Cliff Danue Margaret Ross Marcus Evans Jonathon Rozek David Farmer Phil Rozek Joy Fife Ed Santarpio Robert Fife Sethu Sekhar Ann Friedman Bob Sharkey Elizabeth Fuller Eve Sharkey Louis Germaine Tracey Sirvano Dan Goulet Don Smyth Meg Goulet Bruce Stachura Sally Hamilton Theodore Trowbridge Katherine Honey Melissa Tucker Brian Kirby Andy Viens Allen Knowles Erik Volk Joseph Krofta Glen Weidner Sherie Lemire Tom Welch Carol Levis Kurt Wheaton Pamm MacEachern Megan Witherelle David McGee Christine Woods Catherine McGuiness Nancy Young

INTRODUCTION
CITY OF ATTLEBORO COMPREHENSIVE PLAN 1
I. INTRODUCTION
I.A. Purpose of the Comprehensive Plan The purpose of a comprehensive plan is to provide a coherent set of policy and development
recommendations that reflect public consensus around a set of priorities for the future. City policies
are continuously being shaped by many forces and many stakeholders:
City elections are a forum for policy debate. Citizens weigh in with their policy preferences by
voting for the candidates of their choice and, sometimes, by answering ballot questions.
Although it may not always be easy to interpret the wishes of the electorate, the Mayor and the
Municipal Council must do so to the best of their ability in the exercise of their powers and
duties under the City Charter.
The Planning Board (an appointed body in Attleboro) continuously guides development as it
interprets land use laws, develops regulations, and reviews land use proposals. Other City
departments and boards must perform similarly in other areas.
The City does not exist in isolation, but must react and adapt state and national policies, as well
as market forces.
The COMPREHENSIVE PLAN provides an opportunity to review existing municipal policies, physical
conditions, and development trends. It involves stakeholders and covers a wide range of topics. A
comprehensive planning process recognizes the deep interrelationships between policy categories
and the necessity of making trade–offs. The need to develop affordable housing, for example, may
come into conflict with the desire to conserve open space, and so these two policy areas can only be
reconciled when viewed within a comprehensive framework.
I.B. Statutory Requirements The City Charter stipulates that several key planning activities be carried out on a regular basis.
Article 6, §3 requires the City to plan five years in advance for all capital improvements and to
update its plans annually. And the entirety of Article 8 is devoted to the maintenance and
implementation of the COMPREHENSIVE PLAN.
The Planning Board is responsible for creating and updating the COMPREHENSIVE PLAN. All
modifications are submitted by the Mayor to the Municipal Council, which must hold a public
hearing and then, “by resolution adopt the same with or without amendment.”
According to the City Charter, the COMPREHENSIVE PLAN, “shall serve as a guide to all future actions
by the Municipal Council concerning land use and development regulations, urban renewal
programs, and expenditures for capital improvements.” The City Charter requires consultation with
the Planning Board before action by the Municipal Council.
In Massachusetts, state law (MGL CH. 41, §81D) requires that municipalities complete a
comprehensive plan. Plan elements must include analysis and discussion of the following: goals and
policies, land use, housing, economic development, natural and cultural resources, open space and
recreation, services and facilities, circulation, and a program for implementation.

INTRODUCTION
CITY OF ATTLEBORO COMPREHENSIVE PLAN 2
I.C. Review of Past Plans, Studies, and Implementations Although the Attleboro Comprehensive Plan is updated on a regular basis by the Planning Board and
the Municipal Council, there is a need from time to time to conduct a thorough review of its content.
As a rule of thumb, these periodic reviews should occur every ten years and should include wide–
reaching stakeholder participation. This Plan encompasses just such a review. Attleboro’s previous COMPREHENSIVE PLAN was adopted in November 1990. The 1990 plan guided
the City through a period of rapid growth, and many of the planʹs recommendations were
implemented. Of particular note is a heightened level of activity in recent years to achieve two key policy objectives
from the 1990 Comprehensive Plan:
Economic Base Policy 3: Plan for a new industrial park.
Economic Base Policy 5: Strengthen the Central Business District by encouraging new
commercial enterprises to locate there and by encouraging appropriate development and/or
redevelopment. Challenged in its ability to accommodate the rapid rate of growth occurring within its borders in the
1990s, the City considered a major re–write of its COMPREHENSIVE PLAN as early as 2000, but it was
decided that two other preparatory, planning efforts should be undertaken first. The first step was a
land use and growth management study, completed in June 2000, completed by Communities
Opportunities Group, Inc., in coordination with City planning staff and a citizens’ panel appointed
by Mayor Judith Robbins. Citizen input was gathered at public forums held on May 3 and May 10,
2000. As stated in the final report, CITY OF ATTLEBORO LAND USE GROWTH MANAGEMENT STUDY, JUNE
2000, the City conducted the study, “to analyze its land use patterns and future development
potential, explore ways to balance the community’s economic, natural resource and fiscal needs, and
set the stage for a new comprehensive plan.” The City also had a pressing need to do a major re–write
of its 1994 open space and recreation plan. Mayor Robbins appointed a fifteen member citizens’
committee to conduct this task in June 2000. A lengthy survey was distributed and 1,200 citizens
responded. A public forum held on October 30, 2001 generated additional public input. The final
report was completed in October 2002 entitled, CITY OF ATTLEBORO OPEN SPACE AND RECREATION
PLAN. With the groundwork established, it was now time to address the COMPREHENSIVE PLAN. A
Comprehensive Plan Steering Committee, consisting of volunteer residents with a range of interests
and experience, was appointed and began work on January 28, 2003 with the guidance and technical
assistance of Gary Ayrassian, Director of Planning and Development, and his staff.
I.D. Structure of the Comprehensive Plan Section I provides an orientation to the Comprehensive Plan.
Section II describes in detail how this Comprehensive Plan was created, with particular emphasis
on the ways in which various stakeholders—which included City officials and department heads,
representatives of various public and private agencies, and the public—had input into the
process
Section III presents a short history of Attleboro.

INTRODUCTION
CITY OF ATTLEBORO COMPREHENSIVE PLAN 3
Section IV provides an analysis of statistical data that conveys a ʺsnapshotʺ of where the City
stands today. The section is broken down into subsections focusing on specific policy areas. Each
subsection includes existing conditions and local and regional trends. Subsections include a
discussion of key issues, challenges, and opportunities and propose recommendations for the
City to consider when formulating the plan goals.
The vision described in Section V paints a picture of what our City might be like in the year 2030
if all of the goals and objectives described in this plan were to be achieved.
Section VI sets out in detail the goals and objectives of the COMPREHENSIVE PLAN, in eleven
subsections corresponding to the eleven citizen subcommittees which drafted them.
Section VII provides an Implementation Plan for proposed goals and objectives. The activities in
the Implementation Plan are prioritized and the responsible party for each activity is identified.
I.E. How to Use this Plan This plan is meant to be used by both decision makers and engaged citizens. The goals and objectives
are organized into eleven policy areas. It is the hope of the Steering Committee that all who act within
these policy areas will refer to and be influenced by this plan. For example, in the Social Services
policy area, we hope that this plan will be considered by elected and appointed officials responsible
for this area, by private agencies that operate in the City, and by individual citizens who have an
interest in this area. Wherever possible, we have indicated who should be responsible for
implementing each recommendation in this plan. The responsibilities may be assigned to particular
City departments or boards, or to elected officials. However, in many cases there is nothing to
prevent a concerned citizen from taking the initiative to press for implementation of a
recommendation, by writing a letter, speaking at a public hearing, or organizing a group of
volunteers to advocate on behalf of the recommendation.

THE PROCESS: HOW THIS PLAN WAS CREATED
CITY OF ATTLEBORO COMPREHENSIVE PLAN 4
II. THE PROCESS: HOW THIS PLAN WAS CREATED
II.A. Comprehensive Plan Steering Committee The Mayor’s Comprehensive Plan Steering Committee consisted of thirteen volunteer residents who
were appointed by the Mayor. The 76 subcommittee members were recruited through direct
invitation and open solicitation of volunteers such as at the three public forums that were held at
Wamsutta Middle School. Each member of the Steering Committee gave hundreds of hours of time in
writing, shaping, and guiding the preparation of this plan. The Steering Committee employed an
extensive public participation process in the development of this COMPREHENSIVE PLAN. An essential
step, and a fundamental building block, in the process of developing a thorough and effective
COMPREHENSIVE PLAN are public input and participation. Typically this input is obtained through a
variety of methods including public meetings, charrettes, and various survey techniques. In order to
obtain public opinion data from a representative sample of Attleboro residents, the Comprehensive
Plan Steering Committee led a series of public forums, evening meetings, subcommittee meetings,
and an extensive public opinion survey. Working together with the City’s planning staff, the
Comprehensive Plan Steering Committee conducted a series of carefully designed exercises to obtain
public input for the plan.
II.B. Committee and Subcommittee Meetings The Steering Committee, led by Co–Chairs Robert Duffin and Roberta Wuilleumier, held 52 evening
meetings where committee members discussed goal setting, performed land use policy analysis,
conducted research, and reviewed the work conducted by each of the eleven subcommittees. In
addition, the eleven subcommittees of the Steering Committee held an additional combined total of
163 subcommittee evening meetings during which time they discussed and refined topical goals,
policies, and proposals tailored specifically for each subcommittee. A total of 215 meetings were held.
II.C. Steering Committee Assignments The Steering Committee formed eleven subcommittees. Each subcommittee was chaired by a member
of the Steering Committee and was charged with developing goals, policies, and proposals for its
section based on the public forums, data analysis, and the public opinion survey. Ronald Merigold
and Terry Edwards were among the original members appointed to the Comprehensive Plan Steering
Committee when the project first began. Mr. Merigold initially chaired the Zoning and Land Use
Subcommittee, and Mr. Edwards initially chaired the Transportation Subcommittee. Subcommittee Chair
Central Business District Larre Nelson
Conservation/Environment/ Charlie Adler
Historic Preservation
Economic Base Roy Belcher
Housing Robert Cassidy
Municipal Facilities Michael Scott
Neighborhoods Ellen Parker
Public Safety Lisa Nelson
Schools Rich Renoni
Social Services Marcia Lindstrom
Transportation Debora Doona Scott
Zoning and Land Use Jason Gittle

THE PROCESS: HOW THIS PLAN WAS CREATED
CITY OF ATTLEBORO COMPREHENSIVE PLAN 5
II.D. Community Workshops
The Steering Committee conducted a series of three public forums at Wamsutta Middle School. These
forums addressed specific components of the COMPREHENSIVE PLAN such as housing and
neighborhoods, economic development and the downtown, transportation, and environmental
issues. The Southeast Regional Planning and Economic Development District (SRPEDD) facilitated
these planning forums with the Steering Committee and the City’s planning staff to begin to develop
a vision for the future of the City of Attleboro. Dozens of community leaders and residents
participated in these three public forums.
II.E. Public Opinion Questionnaire/Research and Interviews
In addition to the 218 meetings held by the Steering Committee and the subcommittees, a public
opinion survey was also implemented. Remarkably, seven thousand questionnaires were returned to
the Steering Committee, all of which were processed and tabulated. Also, all of the Steering
Committee members conducted numerous interviews of municipal department heads and middle
management personnel. On several occasions, department heads attended subcommittee meetings.
II.F. Final Compilation
The City’s Planning Department staff and Community Opportunities Group, Inc. researched and
wrote the policy analysis in the initial chapters of the COMPREHENSIVE PLAN. Subcommittee
volunteers drafted the goals and objectives, which were then edited and revised by the Steering
Committee together with the City’s Director of Planning and Development during committee
meeting. Volunteer and professional groups communicated extensively with each other, reviewed
each other’s work, and reviewed input from the public workshops and the survey. Near the end of
the process and after the goals and objectives were finalized, the Steering Committee wrote the Vision
Statement. Community Opportunities Group, Inc. prepared the Implementation Plan, and the
Steering Committee reviewed and approved it.

LOOKING BACK: A SHORT HISTORY OF OUR CITY
CITY OF ATTLEBORO COMPREHENSIVE PLAN 6
III. LOOKING BACK: A SHORT HISTORY OF OUR CITY With its initial roots forming in the mid–1600s with the purchase of land from the Wampanoag
people, Attleboro grew from a rural, agricultural settlement into one of New England’s
manufacturing centers. However, over the last several decades, Attleboro has lost much of its
manufacturing base due to migration of jobs outside the area. Today, the City continues to evolve
both as an employment center and as a residential community.
In its early years, major settlements took form in the
North Washington–Smith Street area of North
Attleborough and in West Attleboro, also known as
Oldtown. East Attleborough (currently Downtown
Attleboro) took its form at the junction of the main routes
from Boston to Bristol and from Plymouth to Providence.
It became the center of the Second Parish and expanded
rapidly when the Boston–Providence railroad line was
constructed through its center in 1836. Soon, the Town of
Attleborough grew so large that people began to discuss
dividing it. In 1887, following several years of debate, the
Town was divided, and North Attleborough was incorporated as a separate municipality. The
Town’s division was the only major change in Attleboroʹs government until it became a City in 1914,
when it received its City Charter, elected its first mayor, and modernized the spelling of its name.
Attleboro was the site of many historically significant events. The Woodcock house built on the Olde
Bay Road (now US Route 1) by John Woodcock, was a well–known meeting point and tavern during
the Indian and Revolutionary Wars and one of several fortifications extending from Boston to Rhode
Island. The settlement suffered during the Indian or King Phillip’s war (from 1675–1676) as the
natural meadowlands that the settlers had valued for the North Purchase created exposed farms that
were especially susceptible to Indian attacks. Later, during the Revolutionary War period, residents
of Attleboro participated actively in framing the Massachusetts Constitution. Approximately six
hundred men served in the militia and the Continental army out of a population of about two
thousand.
In the early 1700s, Attleboro’s institutional presence began with the construction of its first minister’s
house. For several years after its incorporation, Attleboro did not have a settled pastor, parsonage, or
meetinghouse. Since there were only about thirty families scattered over a wide area, infrequent town
meetings in private homes were almost the only occasions in which the whole population came
together. In 1704, at a town meeting, the populace made the first decisions toward building a
ministerʹs house. Within the ensuing three years, a minister was chosen and a parsonage and
meetinghouse were built on Old Post Road in Oldtown. Later, in 1743 a second parish was
established in East Attleboro.
Originally, churches in New England were organized by towns, and there were few religious
differences within a single town. However, as the population increased and years passed, the State
Legislature set town boundaries on a territorial basis and various denominations appeared. Attleboro
was no exception, and from the late 1700s, its religious diversity grew. The Baptist denomination

LOOKING BACK: A SHORT HISTORY OF OUR CITY
CITY OF ATTLEBORO COMPREHENSIVE PLAN 7
entered Attleboro in 1769 when a Congregational society dating from 1747 voted to change
denominations. The First Universalist Society, organized in 1816, erected its first meetinghouse on the
Olde Post Road near the original Congregational Church. The Grace Episcopal Church first held
services in 1858, while the Centenary Methodist Episcopal Church was organized in 1866. St. Mary’s
Roman Catholic Parish originated in Pawtucket, Rhode Island in 1850, and in 1883, St. Johnʹs Parish
was formed from the Attleboro area of St. Maryʹs Parish. St. Stephenʹs Church was built in Dodgeville
around 1878 to serve the growing community around the Dodgeville and Hebronville mills. The
Jewish congregation Agudas Achim was formed in 1911.
In the early years of the Attleboro settlements, organized education was scarce and erratic. As early
as 1680, people attempted to establish a school at Seekonk Cove. Yet it was not until 1718, when the
population in Attleboro reached about five hundred, that a town school was successfully established.
Fifty years later, state legislation authorized towns to organize school districts of fifty to one hundred
families for instruction in English, Latin, and Greek. The town divided into five districts in 1745, and
the school moved from one district to the next. Students in each district received six months of
education every two years. In the early 1800s, a school committee was chosen to select textbooks and
the town was divided into eighteen districts. The first superintendent of schools was selected in 1883.
During this period, two high schools were planned, one on High Street in North Attleborough and
one on Peck and Bank Streets in East Attleboro. By l884, the latter was open, offering classical,
general, and English courses and stayed in use until 1939, first as a high school and later as an
elementary school.
Industrial life started early in Attleboro when in 1787 Isaac Draper established a tannery. In 1801,
Major Ebenezer Tyler began to manufacture print cloth and started Attleboro’s textile industry.
Nehemiah Dodge purchased the textile mill from Tyler in 1819 and the Dodges soon became very
influential in the community. The opening of the Boston–Providence Railroad line in 1836 greatly
motivated the town’s industrial and commercial development. Several manufacturing industries
located in Attleboro, producing textiles, optical goods, paper, machinery, pressed steel, and
automobile accessories. In the 1900s, several jewelry manufacturers located in Attleboro and the City
became known for jewelry manufacturing.
In the mid–twentieth century, Attleboro began to transform from a manufacturing center to a City
with suburban outskirts. Attleboro had a dense central core and agricultural land spreading outward
from its center. The railroad connected the City’s manufacturing outlets to markets elsewhere. During
the 1950s, agriculture began to decline in Massachusetts and farmland became more valuable for
residential development. With connections to major highways and a location close to the Providence
and Boston job markets, Attleboro became a target for new growth. In the 1960s and again in the
1980s, Attleboro experienced periods of high residential growth and the City further moved away
from its manufacturing history.
Today, vacant commercial and industrial buildings provide a glimpse of the City’s past while also
suggesting redevelopment opportunities for its future. At all levels, City is working to adapt to local
and national economic changes through targeted revitalization and investment in its assets—making
Attleboro, once again, a healthy and vibrant City.

POPULATION CHARACTERISTICS
CITY OF ATTLEBORO COMPREHENSIVE PLAN 8
IV. TRENDS, CHALLENGES AND OPPORTUNITIES
IV.A. Population Characteristics
Existing Conditions
Population
Attleboro occupies a gateway location at the Massachusetts–Rhode Island border in northern Bristol
County. Its setting is important because Attleboro’s population characteristics reflect a mix of the
small towns, suburbs, and cities that surround it.1 A small City with deep roots as a regional
manufacturing center, Attleboro is home to a predominantly white, working–class population of
43,398.2 With a population density of 1,557.5 people per square mile, Attleboro is denser than most
nearby communities. However, Attleboro is still small compared to a majority of the
Commonwealth’s cities, and there is tremendous diversity within its residential development pattern
that is not captured in the
City’s overall population
density statistic. Many of
Attleboro’s residential
neighborhoods have been
developed at a more
suburban than urban
intensity: single–family and
two–family homes comprise
well over half of all housing
units in the City. This unique
mix of urban and suburban
housing influences the
makeup of its population, for
a community’s housing
options have an indelible
impact on the size,
composition, and wealth of its
households. Because the
City’s urban residential urban
fabric is diverse, so is its
population.
1 The Attleboro region includes Attleboro and its adjacent communities – North Attleborough, Mansfield,
Norton, Rehoboth and Seekonk, MA, and Cumberland and Pawtucket, RI – as well as Central Falls, East
Providence, and Providence, RI.
2 Claritas, Inc., “Demographic Snapshot Report,” 2007, Site Reports. For comparison, the Bureau of the Census
estimates Attleboro’s present population at 43,283. Source: U.S. Department of Commerce, Bureau of the Census,
Population Division, “Population Estimates 2006: States, Counties and County Subdivisions,” online at
<www.census.gov/popest/estimates.php>.
Table 4A–1. Population Density
Population Density/Sq. Mi.
Total Land Area (mi.2)
1990 2000 2007 Estimated
2020 Projected
ATTLEBORO 27.51 1,395.2 1,529.2 1,577.5 1,751.0
Mansfield 20.46 809.8 1,095.5 1,124.7 1,528.7
N. Attleborough 18.64 1,343.2 1,456.2 1,421.9 1,725.8
Norton 28.71 496.9 628.2 682.7 824.7
Rehoboth 46.50 186.2 218.8 237.2 243.3
Seekonk 18.32 712.1 732.8 767.8 682.6
Central Falls 1.20 14,697.5 15,773.3 15,785.8 16,779.2
Cumberland 26.80 1083.5 1,188.1 1,298.8 1,299.2
East Providence 13.40 3,759.7 3,633.4 3,679.2 3,526.6
Pawtucket 8.70 8,349.9 8,386.0 8,434.5 8,511.8
Providence 18.50 8,688.0 9,384.8 9,617.5 9,952.1
Sources: Claritas, Inc.; MassDOR; ri.gov/towns; 1990 Census STF1, Table P001; 2000 Census, SF1, Table P1; MISER, Population Projections to 2020–Middle Series, "age_sex_mcd_county_state.xls"; Rhode Island Statewide Planning Program, "Rhode Island Population Projections", August 2004, p.9.

NORTON
NORTH ATTLEBOROUGH
REHOBOTH
MANSFIELD
SEEKONK
PLAINVILLE
County Stree
t
Park Street
Sout h Main Street
Tremont StreetWashi
ngton
Street
Hickory Road
Pleasant Street
Elm Street
North Main Stree t
West Stre et
Landry Avenue
Newport Avenue
North Avenue
Anaw
an Street
Maple Street
West Main Street
South
Washi
ngton
Street
Highland Avenue
Thatcher Street
Central
Avenu
e
Lathro
p Road
Man sf ie ld Avenue
Holden Street Old Colony Road
Emory Street
John Bryson Scott Boulevard
South Avenue
Forest Street
Woodland Avenue
Olive Street
North
Wash
ington
Street
Hoppin Hill Road
Commonwealth Avenue
Oakhill Avenue
South
Washi
ngton
Street
West Street
South
Washi
ngton
Street
Central Avenue
§̈¦95
§̈¦295
§̈¦95
§̈¦295
£¤1
£¤1
£¤1
!(1A
!(1A
UV152
UV118
UV123
UV120
UV140
!(1A
!(1A
!(1A
!(1A
!(1A
0 0.3 0.6 Miles.
Sources: MassGIS, City of Attleboro
ATTLEBORO COMPREHENSIVE PLAN
Prepared by: Community Opportunities Group, Inc.
August 2011
POPULATIONDENSITY BYCENSUS TRACT
LEGENDMajor Roads
Limited Access HighwayMulti-lane Hwy, not limited accessOther Numbered HighwayMajor Road, Collector
Total population/acre0.402 - 1.0871.088 - 1.6741.675 - 2.4922.493 - 4.9604.961 - 13.532

POPULATION CHARACTERISTICS
CITY OF ATTLEBORO COMPREHENSIVE PLAN 9
Although Attleboro began to industrialize within
a decade of the American Revolution, the urban
form that defines Downtown Attleboro today was
kindled by the opening of rail service in the mid–
nineteenth century. Access to water and the
advent of rail made Attleboro a magnet for
industrial growth, which in turn spawned the
construction of housing for mill workers in
downtown–area neighborhoods. By the turn of the
century, Attleboro had transformed from a rural
economic node to a major employment center
with a large inventory of “walk–to–work”
housing.3 While its economic base has changed,
Attleboro remains a place where people can live
and work. In fact, Attleboro has a larger
percentage of locally employed residents than any
neighboring city or town.4
Age of Population
Attleboro’s declining public school enrollments
parallel national changes in population age due to
the aging of the “Baby Boomers”(persons born
during the postwar years, 1946–1964) and the
maturation of their children, known
euphemistically as “Echo Boomers,” born
between 1982 and 1995. Today, 73 percent of the
City’s population is 21 and over and nearly 13
percent is 65 and over, while the age cohort of 45–
54 progresses toward retirement. In contrast,
people between 18 and 24 represent a fairly small
proportion of Attleboro’s population, about 7.5
percent. The median age of Attleboro’s
population is 38 years. However, young citizens
make up a larger share of the City’s population
than that of nearly every neighboring community
except Norton, where Wheaton College students
contribute to the total population and influence
the town’s age distribution profile. Attleboro has
approximately 7,670 school–age children (5–17),
3 City of Attleboro, Open Space and Recreation Plan (October 2002), 9–10.
4 Bureau of the Census, Census 2000, Summary File 3 Table P29, online at American FactFinder
<www.census.gov/home/saff>.
Table 4A–2. Population
Total Population
1990 2000 2007 (Estimated)
ATTLEBORO 38,383 42,068 43,398 Mansfield 16,568 22,414 23,012
N. Attleborough 25,038 27,143 26,505
Norton 14,265 18,036 19,599
Rehoboth 8,656 10,172 11,031
Seekonk 13,046 13,425 14,067
Central Falls 17,637 18,928 18,943
Cumberland 29,038 31,840 34,808
East Providence 50,380 48,688 49,301
Pawtucket 72,644 72,958 73,380
Providence 160,728 173,618 177,924
Sources: Claritas, Inc.; 1990 Census STF1, Table P001; 2000 Census, SF1, Table P1.
19902000
20072020
0
5,000
10,000
15,000
20,000
25,000
30,000
35,000
40,000
45,000
50,000
Figure 4A-1. Attleboro Population by Age, 1990-2007
Source: 1990 Census, Census 2000, Claritas, Inc., MISER.
65+ Years 4,629 5,422 5,498 7,617
18-64 Years 24,076 25,972 27,488 28,924
Under 18 9,678 10,674 10,412 11,629
1990 2000 2007 2020

POPULATION CHARACTERISTICS
CITY OF ATTLEBORO COMPREHENSIVE PLAN 10
representing nearly 18 percent of its current population.5
Cultural Diversity
Attleboro’s industrial roots and the national origins of earlier generations that flocked to the City for
jobs contribute to the racial and economic characteristics of its people today. Slightly more than 88
percent of the City’s population is white, and most of its white population includes people of French,
French Canadian, English, Irish, Portuguese, and Italian descent. African Americans along with
Asians from Cambodia and India make up 45 percent of Attleboro’s racial minorities. In addition, the
City has a small (just over 2,500 persons) but growing Hispanic population composed primarily of
people from Puerto Rico and Guatemala.6 Since 1990, Attleboro’s racial minority population has
almost tripled, from a population of fewer than two thousand in 1990 to almost five thousand people
today.7 In addition, people with Hispanic heritage currently represent almost six percent of the total
population.
Table 4A–3. Population by Race and Hispanic/Latino
White Racial Minority Hispanic
Number % Total Population
Number % Total Population
Number % Total Population
ATTLEBORO 38,400 88.5% 4,998 11.5% 2,578 5.9%
Mansfield 21,268 92.4% 1,744 7.6% 458 2.0%
N. Attleborough 25,034 94.5% 1,471 5.5% 513 1.9%
Norton 17,693 90.3% 1,906 9.7% 270 1.4%
Rehoboth 10,724 97.2% 307 2.8% 66 0.6%
Seekonk 13,505 96.0% 562 4.0% 157 1.1%
Central Falls 9,394 49.6% 9,549 50.4% 10,936 57.7%
Cumberland 33,339 95.8% 1,469 4.2% 908 2.6%
East Providence 41,512 84.2% 7,789 15.8% 1,092 2.2%
Pawtucket 50,647 69.0% 22,733 31.0% 13,566 18.5%
Providence 85,360 48.0% 92,564 52.0% 68,237 38.4%
Region Total 346,876 70.5% 145,092 29.5% 98,781 20.1%
Source: Claritas, Inc., "Demographic Snapshot Reports," 2007.
Approximately 9 percent of the City’s total population is foreign–born, and nearly one–fourth of the
foreign–born population arrived in the United States after 1990. Even though Attleboro has less racial
diversity than the state as a whole, the presence of so many nationalities and new immigrants makes
Attleboro culturally and linguistically diverse, with 13 percent of its population over the age of five
speaking a language other than English at home. The presence of new foreign–born populations can
5 Department of Education, “Long–Term Trends in PK–12 Enrollments by Grade, 1988–2007” Statistical
Comparisons, online at <http://finance1.doe.mass.edu/statistics/>, and “Demographic Snapshot Report.”
6 Claritas, Inc., “Demographic Snapshot Report,” and Census 2000, Summary File 1 Tables P7, P8, and PCT 11.
7 1990 Census, Summary Tape File 1, Tables P001, P006, P008; and Claritas, Inc., “Demographic Snapshot
Report.”

POPULATION CHARACTERISTICS
CITY OF ATTLEBORO COMPREHENSIVE PLAN 11
be seen not only in federal census records,
but also the City’s schools: for 14.3 percent of
Attleboro’s K–12 students, English is not
their native language.8
Labor Force
A community’s civilian labor force includes
employed people as well unemployed that
are looking for work. Attleboro’s labor force
has grown in size from 19,917 people in 1990
to 22,914 people in 2000 to over 24,000
people in 2007.9 Today, approximately 70
percent of the population over 16 years of
age is either employed or looking for work.
In 2000, a large percentage of the labor force,
76.8 percent worked for private, for–profit
businesses, 9.1 percent in the public sector,
8.4 percent for private, non–profit employers
and a mere 5.1 percent as self–employed
people. Twenty–five percent worked in the manufacturing industry, 19 percent were employed in
the education, health and social services industries, and 12 percent were employed in the retail trade
industry.10
Educational Attainment
Over 20 percent of Attleboro’s residents over 18 years of age have not completed high school and 31
percent ended their formal education when they received their high school diploma.11 These statistics
place the educational level of Attleboro’s adult population well below that of the state as a whole and
all of the surrounding communities in Massachusetts.
As a result, the types of employment opportunities available to Attleboro’s labor force involve jobs
that do not require a high level of education. Just over 25 percent of the City’s employed population
works in the manufacturing industry, which has historically offered jobs that require less formal
education but pay good wages. However, today residents who once were able to attain a well–paying
manufacturing job in the City with limited education, now face an employment market trending
away from their strengths. A very small percentage of Attleboro’s labor force works in growing and
well–paying industries as they usually require college or advanced degrees such as, education, health
8 “Demographic Snapshot Report,” Census 2000, Summary File 3 Tables P19 and P22, and Massachusetts
Department of Education, “Attleboro Public Schools,” School Profile Series, online at
<http://profiles.doe.mass.edu/>.
9 1990 Census, Summary Tape File 3, Table P078; Census 2000, Summary File 3, Table P49.
10 Census 2000, Summary File 3, Tables P43, P49 and P51; Commonwealth of Massachusetts, Department of
Revenue, “Labor Force and Unemployment Data,” Municipal Data Bank at <www.dls.state.ma.us/mdm.htm>,
citing Executive Office of Labor and Workforce Development.
11 Census 2000, Summary File 3 Tables PCT25.
Table 4A–4. Characteristics of Foreign–Born Population
Foreign–Born
% Naturalized
% Arrived
Since 1990 ATTLEBORO 3,745 52.5% 23.2%
Mansfield 894 59.7% 29.6%
N. Attleborough 1,183 63.9% 23.3%
Norton 642 56.4% 16.2%
Rehoboth 462 75.3% 5.2%
Seekonk 1,015 70.6% 6.9%
Central Falls 6,645 31.0% 48.9%
Cumberland 2,964 67.9% 19.6%
East Providence 7,769 60.2% 19.7%
Pawtucket 17,036 44.6% 35.8%
Providence 43,947 34.4% 45.4%
Source: Bureau of the Census, Census 2000, Summary File 3 Tables P22, P23.

POPULATION CHARACTERISTICS
CITY OF ATTLEBORO COMPREHENSIVE PLAN 12
care, professional, scientific, and management industries. The City’s low level of educational
attainment makes it difficult for residents to compete for high–wage jobs and this, in turn, correlates
with its relatively low household incomes. This dynamic also impacts the City’s overall economic
development potential. A survey of developers and site location specialists cited Attleboro’s lower
than average number of residents with a high school or higher education as a “very important” or
“important” concern when looking at the City’s market potential from a regional perspective.12
Table 4A–5. Educational Attainment
# of Residents with only a High School Diploma
# of Residents with a College
Degree
1990 2000 2007 (estimated)
1990 to 2007
1990 2000 2007 (estimated)
1990 to 2007
ATTLEBORO 7,982 9,124 9,453 18.4% 7,002 9,232 9,775 39.6%
Mansfield 2,946 3,523 3,511 19.2% 4,299 7,270 5,760 34.0%
N. Attleborough 5,254 4,658 4,557 –13.3% 5,414 7,688 7,091 31.0%
Norton 2,921 3,086 3,324 13.8% 2,662 4,365 4,596 72.7%
Rehoboth 1,865 2,075 2,292 22.9% 1,672 2,742 2,608 56.0%
Seekonk 2,747 2,914 3,052 11.1% 2,770 3,180 3,286 18.6%
Central Falls, RI 3,113 3,160 3,265 4.9% 1,015 1,036 2,004 97.4%
Cumberland, RI 5,965 6,059 6,455 8.2% 6,242 8,444 8,348 33.7%
E. Providence, RI 11,078 10,125 10,420 –5.9% 7,440 8,242 10,411 39.9%
Pawtucket, RI 14,684 14,439 14,848 1.1% 8,945 10,083 13,496 50.9%
Providence, RI 23,512 22,167 23,911 1.7% 24,362 27,947 29,589 21.5%
Source: 1990 Census, STF3, Table P057; Census 2000, SF3, Table P37; Claritas, Inc., "Demographic Snapshot Reports,” 2007.
Yet, Attleboro is changing as more of its population seeks higher education. In 1990, just over 7,000
residents of Attleboro had college degrees (Associates degree or above). In 2007, estimates indicate
that almost 10,000 people were college graduates—a 40 percent increase.13 During the same time,
fewer people dropped out of high school and more were successful in attaining their high school
diploma. Bristol Community College and Bridgewater State University, both located in Attleboro,
provide opportunities for residents to seek higher education locally. The growth and development of
programs at these schools has the potential to help reduce the gap between resident educational
attainment levels and the higher levels of education required for service–sector jobs.
Households & Families
Just about everyone in Attleboro is a member of household, or a housekeeping unit composed of one
or more people occupying the same dwelling unit. There are 16,770 households in Attleboro.14 Of this
12 “City of Attleboro Self–Assessment Survey.” Northeastern University Center for Urban and Regional Policy,
2003.
13 1990 Census, Summary Tape File 3, Table P057; Claritas, Inc., ʺDemographic Snapshot Reports, 2007ʺ. 14 Claritas, Inc., “Demographic Snapshot Reports.”

POPULATION CHARACTERISTICS
CITY OF ATTLEBORO COMPREHENSIVE PLAN 13
total, nearly 70 percent are families: households of two or more people related by blood, marriage,
partnership, or adoption. Less than two percent of Attleboro’s population consists of people living in
group quarters, a federal census term for non–household residents. In Attleboro, the vast majority of
the group–quarters population includes nursing home patients and adults with disabilities living in
state–run or privately operated group homes.
For overall distribution of household and family types, Attleboro is similar to the state and Bristol
County and noticeably unlike most of its neighboring communities on either side of the state line.
About 48 percent of the City’s families (and 35 percent of its households) have dependent children
under 18, and married couples account for 79 percent of Attleboro’s families. 15
Table 4A–6. Household Characteristics
Number Percent
Households One–Person Households
Families Married Couples
One–Person Households
Families Married Couples
ATTLEBORO 16,771 4,429 11,416 9,003 26.4% 68.1% 53.7%
Mansfield 8,105 1,703 5,969 5,039 21.0% 73.6% 62.2%
N. Attleborough 10,350 2,701 7,115 5,819 26.1% 68.7% 56.2%
Norton 6,465 1,265 4,913 3,995 19.6% 76.0% 61.8%
Rehoboth 3,897 592 3,166 2,748 15.2% 81.2% 70.5%
Seekonk 5,175 940 4,114 3,470 18.2% 79.5% 67.1%
Central Falls 6,577 1,889 4,258 2,378 28.7% 64.7% 36.2%
Cumberland 13,553 3,168 10,000 8,348 23.4% 73.8% 61.6%
East Providence 21,217 7,196 13,201 9,758 33.9% 62.2% 46.0%
Pawtucket 30,458 10,018 18,696 11,993 32.9% 61.4% 39.4%
Providence 63,231 20,520 36,452 19,894 32.5% 57.6% 31.5%
Source: Claritas, Inc., “Demographic Snapshot Report,” 2007.
Table 4A–7. Household Growth
One–Person Households
Families
Married Couples
Households Number Percent Number Percent Number Percent
ATTLEBORO
1990 14,180 3,277 23.1% 10,152 71.6% 8,157 57.5%
2000 16,019 4,117 25.7% 10,921 68.2% 8,582 53.6%
2007 16,771 4,429 26.4% 11,416 68.1% 9,003 53.7%
Source: 1990 Census, Summary Tape File 1, Tables P018, P026, P027; Census 2000, Summary File 1, Tables P15, P21, P26, P34; Claritas, Inc., “Demographic Snapshot Report,” 2007.
15 1990, STF1, Tables P018, H017, H017A; Census 2000, SF1, Tables P17, P19, P26; Claritas, Inc., “Demographic
Snapshot Reports.”

POPULATION CHARACTERISTICS
CITY OF ATTLEBORO COMPREHENSIVE PLAN 14
Since 1990, there has been a decline in the number of households with dependent children under 18.
It is expected that this trend will continue as the “Baby Boom” generation and their children age,
resulting in an increase in empty nester, single–person, and childless households.
Household Size
Attleboro’s mix of households reflects the make–up of its housing inventory. The City has a relatively
large number of both apartments and traditional homes in family–oriented neighborhoods, and so its
average household size of 2.54 people is somewhat smaller than that of the neighboring towns.
More than 41 percent of Attleboro’s households (and 60 percent of its families) consist of three or
more people, yet 80 percent of its non–family households are single people living alone.16 These
statistics are similar to those of the state, although one–person households are more common in
Attleboro than the Commonwealth as a whole.
Table 4A–8. Household Size and Composition
Number Percent
Average Household
Size
Households with 3+ People
Households with
Children <18
Households with 3+ People
Households with
Children <18
ATTLEBORO 2.54 6,981 5,948 41.6% 35.5%
Mansfield 2.83 4,249 3,776 52.4% 46.6%
N. Attleborough 2.55 4,432 3,876 42.8% 37.4%
Norton 2.78 3,273 2,864 50.6% 44.3%
Rehoboth 2.83 1,980 1,589 50.8% 40.8%
Seekonk 2.72 2,491 1,986 48.1% 38.4%
Central Falls 2.78 3,162 2,783 48.1% 42.3%
Cumberland 2.55 5,765 4,740 42.5% 35.0%
East Providence 2.28 7,398 6,197 34.9% 29.2%
Pawtucket 2.38 11,441 10,087 37.6% 33.1%
Providence 2.58 26,231 22,790 41.5% 36.0%
Source: Claritas, Inc., “Demographic Snapshot Report,” 2007.
On average, Attleboro has fewer children per family than Mansfield, Norton or North Attleborough,
and more children per family than most of the region’s cities. These characteristics are, in part, a
function of differences in housing stock. Attleboro offers a broader mix of housing and more variety
in neighborhood settings than most of its Massachusetts neighbors. Because it provides opportunities
for people seeking to “buy up” from the region’s cities to suburbs, it has a somewhat larger
percentage of young family and non–family households.
16 Claritas, Inc., “Demographic Quick Facts Report,” and Census 2000, Summary File 1 Tables P17 and P28.

POPULATION CHARACTERISTICS
CITY OF ATTLEBORO COMPREHENSIVE PLAN 15
Household Wealth
Attleboro’s median household income is
currently estimated at $62,722, the fifth lowest
median household income in the region. The
City’s median family income is
approximately $11,907 higher than that of
Attleboro’s median household income –
$74,629.17
Elderly households, female–headed
households, and non–family households tend
to have lower incomes than families. Seven
percent of Attleboro households live in
poverty, with elderly households (those 65
years and older) comprising the majority of
these households.18 Only 432 of Attleboro’s
11,416 (3.7 percent) families live in poverty, 45
percent of which are female heads of
households, and 71 percent of which include
a child.19 In 2000, elderly households
comprised over 30 percent of all households
living below the poverty level, mainly elderly
women living alone or with non–family members. 20
Improvement in the household and family income of Attleboro residents in the future is likely.
Attleboro’s median household income has risen slightly faster than the statewide incomes between
1990 and 2000, exhibiting a 27.9 percent increase to the statewide 26.8 percent.21 Income estimates for
2007 show that this positive trend has continued. The number of families living below the poverty
level has remained virtually stagnant since 2000 at 3.8 percent.22 This steady rise in income levels is
an indication that the City’s population may be benefiting from a growing skill base and an increase
in educational attainment. If this trend continues, Attleboro residents will fare better in the post–
industrial economy and the City will stand a better chance at being competitive within the regional
economy.
17 Claritas, Inc., “Demographic Snapshot Report.”
18 Census 2000, Summary File 3, Tables P55 and P56.
19 Claritas, Inc. “Demographic Snapshot Report.”
20 Census 2000, Summary File 3, Tables P92.
21 Census 1990, Summary File 3, Table P080A and Census 2000, Summary File 3, Table P53.
22 Claritas, Inc., “Demographic Snapshot Report, Attleboro, Massachusetts” Site Reports Series.
Table 4A–9. Income Characteristics
Median Household
Median Family
Per Capita
ATTLEBORO $62,722 $74,629 $28,266
Mansfield $83,939 $96,904 $34,403
N. Attleborough $72,182 $89,326 $33,327
Norton $83,593 $91,887 $30,726
Rehoboth $83,673 $94,900 $36,175
Seekonk $69,571 $78,888 $30,725
Central Falls $26,675 $33,045 $12,306
Cumberland $66,181 $79,381 $32,341
East Providence $47,313 $60,356 $24,571
Pawtucket $38,255 $47,480 $20,369
Providence $31,125 $37,465 $17,667
Source: Claritas, Inc., “Demographic Snapshot Report,” 2007.

POPULATION CHARACTERISTICS
CITY OF ATTLEBORO COMPREHENSIVE PLAN 16
In addition to investment in training and
education, the economic well–being of Attleboro
residents may also be positively affected by the
proposed extension of the commuter rail system
to New Bedford and Fall River. Expanded rail
access would provide access to higher paying
jobs in the Metro Boston area, as well as present
incentives for Boston–area workers to relocate to
the southeast region for its comparatively
affordable housing.
Sources of Income
Most households in Attleboro (82.3 percent)
receive income from wage–paying or salaried
positions, while 4,919 households receive Social
Security, supplemental security, or public
assistance income. Just over six thousand
households receive interest, dividends, or rental
income. Over the past two decades there has
been a slight increase in the percent of
households with retirement incomes, which
reflects the City’s growing elderly population. This does not come as a surprise. Between 1980 and
2000, the number of children began trending downward and the number of senior citizens started to
climb. As the older population continues to increase, the reported sources of income for Attleboro
residents will shift accordingly. The proportion of
households receiving income from a wage–paying or
salaried position will undoubtedly fall from its 82.3
percent, while the number of households receiving Social
Security and retirement income will rise. 23
Attleboro’s self–employed population is relatively small:
today, only 1,379 households report self–employment
income. However, the true number of self–employed
people is difficult to determine. Between 1990 and 2000,
the number of households with income from self–
employment increased slightly,24 but during this same
time households with self–employment income declined
as a proportion of the total population.
Earnings
Median earnings for men in Attleboro are $35,891, nearly $14,000 more than the median earnings for
women, $22,022. This gap in earnings relates to the types of jobs held by men and women in
23 Census 2000, Summary File 3, Tables P59, P60, P61, P62, P63 and P64.
24 1990 Census, Summary Tape File 3, Table P091; Census 2000, Summary File 3, Table P60.
Table 4A–10. Attleboro Sources of Income
Households
1990 2000
Wage or Salary 81.1% 82.4%
Self–Employment 9.3% 8.6%
Social Security 24.6% 24.3%
Supplemental Security N/A 4.1%
Public Assistance 7.4% 2.3%
Retirement 12.5% 13.9%
Source: 1990 Census, STF 3, Tables P090–096; 2000 Census, SF3, Tables P59–65
$36,631
$43,248
$16,806
$50,807
$59,112
$28,014
$62,722
$74,629
$-
$10,000
$20,000
$30,000
$40,000
$50,000
$60,000
$70,000
$80,000
1990 2000 2007
Figure 4A-2. Attleboro Income Growth, 1990-2007 Source: Claritas, Inc., "Demographic Snapshot Reports
Median Household Income Median Family IncomeMedian Non-Family Income

POPULATION CHARACTERISTICS
CITY OF ATTLEBORO COMPREHENSIVE PLAN 17
Attleboro’s labor force. Typically, men in Attleboro work in industries such as manufacturing and
construction, while women tend to work in education and health services. While these industries
offer both low– and high–paying jobs, the educational attainment levels of Attleboro’s population
suggest that many of the City’s adult workers hold positions with salaries on the lower end of the pay
scale. Although not all of the City’s labor force works in Attleboro, typical wages paid by local
employers helps to explain the gender gap in earnings. Manufacturing and construction jobs based in
Attleboro typically pay average weekly wages of $1,033 and $1,002 respectively. However, local jobs
in education and health services pay a significantly lower average weekly wage of $786.25
Citywide, aggregate earnings increased nearly $800,000,000 between 1990 and 2000. This growth over
ten years brought Attleboro’s share of the state aggregate earnings from 0.38 to 0.60 percent.26 While
the increase is indicative of growth, it still represents a small share of the overall earnings across the
state for a city of Attleboro’s size.
Local & Regional Trends
Local Trends
Attleboro’s population has grown steadily since 1990 and is projected to grow through 2020 to 50,094
persons.27 The City’s population has become more diverse: today’s residents represent multiple races
and ethnicities.
Attleboro’s older age cohorts are growing and this trend will continue in the near future. Between
1990 and 2007, the number of persons over sixty–five years increased to 18.8 percent.28 This age
cohort will continue to grow, and, according to population projections, by 2020 over one–third of
Attleboro’s population will be sixty–five years and older.
While Attleboro’s population has increased overall over the last two decades, the number of
households has risen even more. Since 1990, the number of households grew 18 percent; population
increased 13 percent during the same time. In the last two decades, Attleboro’s proportion of single–
person households increased to make up almost 25 percent of all households in the City. During the
same period, the number of families and married–couples declined as a proportion of the City’s total
households.29
Consistent with national and state trends, Attleboro has experienced a decline in household size over
the last several decades. Today, single–person and childless households make up 61 percent of all
25 Census 2000, Summary File 3 Table P85; Executive Office of Labor and Workforce Development, ES–202,
Economic Data Programs, <www.detma.org>, and Community Opportunities Group, Inc.
26 Census 1990, Summary File 3, Table P085 and Census 2000, Summary File 3, Table P67.
27 Southeastern Regional Planning and Economic Development District, ʺQuick Stats 2007ʺ.
28 1990 Census, Summary Tape File 1, Table P11, Census 2000, Summary File 1, Table P12, Claritas, Inc.,
“Demographic Snapshot Report”.
29 1990 Census, Summary Tape File 1, Tables P018, P026, P027; Census 2000, Summary File 1, Tables P15, P21,
P26, P34; Claritas, Inc.

POPULATION CHARACTERISTICS
CITY OF ATTLEBORO COMPREHENSIVE PLAN 18
households in Attleboro, while households with three or more people comprise just over 40 percent
of the City’s households.30 Projections prepared by SRPEDD indicate that the average household size
will continue to decline through 2025, primarily due to the increase of single–person and empty–
nester households due to aging Baby Boomers.31
Regional Trends
Located in a high–growth region of the state, Attleboro is
an urban center surrounded by suburban communities.
While many of the region’s trends affect Attleboro, the
City’s demographics and housing stock are unique in
several respects.
Attleboro has experienced less significant population
growth over the last two decades than neighboring
communities. While, Attleboro’s growth at 13 percent is
impressive, several surrounding suburbs experienced
growth rates as high as 40 percent between 1990 and 2007.32
Attleboro’s relatively built–out urban fabric limits the
City’s growth potential, a condition not present in the
surrounding suburbs.
Attleboro and the region will continue to see continued
growth in racial minority population and older age cohorts,
although to varying degrees. Since 1990, all communities in the region experienced growth among
racial minorities. Today, Attleboro has the highest proportion of minority and Hispanic persons
compared to surrounding Massachusetts communities. However, the region as a whole has a
considerably higher proportion of minority persons than Attleboro alone, with most of the region’s
minority population living in the larger cities of Central Falls and Providence.
Older age cohorts will continue to grow at the local, regional, and state levels for the near future. The
median age of Attleboro’s population in 2007 was 38.1 years.33 Most surrounding communities in the
region have populations with median ages that are within one year of Attleboro’s median age or
older. But other communities—such as Mansfield, Norton, Central Falls, and Providence—have
younger median ages. When compared with the region as a whole, Attleboro has one of the largest
senior populations.
30 Census 2000, Summary File 1, Tables P26 and P34.
31 Southeastern Regional Planning and Economic Development District, “Regional Transportation Plan, 2003”,
Chapter 2, p. 3.
32 1990 Census STF1, Table P001; 2000 Census, SF1, Table P1, Claritas, Inc., ʺDemographic Snapshot Report.”
33 Claritas, Inc. ʺDemographic Snapshot Report.”
Table 4A–11. Median Age and Elderly Persons
Median Age
Population over 65
ATTLEBORO 38.1 12.7%
Mansfield 35.5 6.4%
N. Attleborough 37.4 10.0%
Norton 35.0 8.3%
Rehoboth 40.8 10.7%
Seekonk 40.9 13.4%
Central Falls 31.5 10.3%
Cumberland 40.5 15.3%
East Providence 40.9 18.0%
Pawtucket 36.5 13.7%
Providence 29.6 9.5%
Source: Claritas, Inc. "Demographic Snapshot Report," 2007.

LAND USE
CITY OF ATTLEBORO COMPREHENSIVE PLAN 19
IV.B. Land Use
Existing Conditions
Land Use Pattern
Like many small industrial cities,
Attleboro has had to face the
decline of industry and movement
of jobs away from the City. At the
same time, development booms in
the mid to late 20th century have
resulted in sprawling
neighborhoods and commercial
areas. While Attleboro has
retained the structure of its
downtown core and residential
villages, residential development
is widespread in the City and
density varies from area to area.
Attleboro is a pleasant and livable
small city, and it is critical to the
City’s character that land uses
remain diverse.
While industry still is present in
the City, since 1971, residential
uses have become more
prominent. Between 1971 and 1999
(the year for which the most recent
data is available), the number of
acres of industrial land increased 30 percent. During this same period, the number of residential acres
increased 41 percent and commercial acreage increased 38 percent. As indicated in Table 4B–2.,
between 1971 and 1999 Attleboro lost half of its agricultural land. In addition, the City lost 10 percent
of forest and over one–quarter of its open land. Today, roughly one–third of Attleboro’s land area is
used for residential purposes and three percent is used for industrial purposes.34
Development spreads outward from the Central Business District where Route 118, Route 123, and
Route 152 converge. South Attleboro is another high–density area through which US Route 1 runs
north to south.
34 MassGIS, “Land Use Statistics Summary Statistics, August 2007,”
<http://www.mass.gov/mgis/landuse_stats.htm>.
Table 4B–1. Attleboro Land Use
Category 1999 Acres % of Total Land Area
Total Land Area 17,814.8
Agriculture (total) 498.5 2.8%
Forest 7,477.5 42.0%
Open Land 777.1 4.4%
Recreation (total) 441.9 2.5%
Urban uses (total) 7,629.7 42.8%
Commercial 395.4 2.2%
Industrial 572.1 3.2%
Mining 58.6 0.3%
Public or transitional 409.4 2.3%
Multi–family residential 147.5 0.8%
High density residential 512.8 2.9%
Medium density residential 3,818.7 21.4%
Low density residential 1,081.3 6.1%
Transportation 560.9 3.1%
Waste Disposal 73.0 0.4%
Water (total) 990.1 5.6% Source: Mass GIS, Land Use Statistics, 2007.

LAND USE
CITY OF ATTLEBORO COMPREHENSIVE PLAN 20
Table 4B–2. Attleboro Land Use
Category 1971 Acres 1985 Acres 1999 Acres % Change 1971
to 1999
Total Land Area 17,814.8 17,814.8 17,814.8
Agriculture (total) 1,094.2 1,012.6 498.5 –54.4%
Cropland 898.7 810.8 390.4 –56.6%
Pasture 177.6 183.8 86.6 –51.3%
Perennial 17.9 17.9 21.6 20.5%
Forest 8,361.7 7,881.1 7,477.5 –10.6%
Open Land 1,052.9 1,048.4 777.1 –26.2%
Recreation (total) 370.8 405.4 441.9 19.2%
Participation recreation 361.6 391.5 428.0 18.4%
Spectator recreation 9.2 3.9 3.9 –58.0%
Water recreation 0.0 10.1 10.1 N/A
Urban uses (total) 5,944.0 6,465.7 7,629.7 28.4%
Commercial 286.2 319.8 395.4 38.2%
Industrial 439.1 532.4 572.1 30.3%
Mining 217.8 179.1 58.6 –73.1%
Public or transitional 458.1 454.4 409.4 –10.6%
Multi–family residential 51.0 92.7 147.5 189.4%
High density residential 401.7 471.1 512.8 27.6%
Medium density residential 2,831.7 3,060.8 3,818.7 34.9%
Low density residential 654.7 699.5 1,081.3 65.2%
Transportation 533.3 550.2 560.9 5.2%
Waste Disposal 70.4 105.7 73.0 3.7%
Water (total) 991.3 1,001.7 990.1 –0.1%
Fresh wetland 538.4 528.5 508.3 –5.6%
Open water 452.9 473.2 481.8 6.4% Source: Mass GIS, Land Use Statistics, 2007
Residential
Attleboro’s densest residential development is located in and around downtown and in South
Attleboro. Single–family housing is spread throughout the City in “village” neighborhoods and in
late 20th century subdivisions while multi–family housing is located primarily in the central business
district and in South Attleboro. Like many communities in the northeast, neighborhoods have
replaced agricultural fields. An analysis of build–out potential in 2000 revealed the capacity to develop another 5,314 acres of
residential land.35 This is inclusive of all residential zoning districts. The vast majority of this acreage
(5,131 acres) is located in the Single Residential zoning districts in the moderate and low–density
35 Executive Office of Environmental Affairs, “EOEA Buildout for Vision 2020,” June 2000.

County Street
Park Street
South Main Str
ee
t
Tremont Street
Washington Street
Hickory Road
Pleasant Street
Elm
Street
North M
ain Street
W
est Str
eet
Landry Ave
nue
Newport
Avenu
e
North Avenue
Maple Street
South Washington Street
Highland Avenue
Thatcher Street
West Main
Stree
t
Anaw
an Stree
t
Lathrop Road
Holden Street Old Colony Road
Central Avenue
South Aven
ue
Forest Street
Olive Street
North W
ashington Street
John Bryson Scott Boulevard
Commonwealth Avenue
Oakhill Avenue
Robert F Toner Boulevard
Park Street
West Str
eetSouth Washington Street
South Washington Street
§̈¦95
§̈¦295
§̈¦95
tu1
tu1
tu1
!(1A
!(1A
UV152
UV118
UV123
UV120
UV140
UV118
!(1A
!(1A
!(1A
!(1A
!(1A
0 0.3 0.6 Miles
.
ATTLEBORO COMPREHENSIVE PLAN
Prepared by:
Community Opportunities Group, Inc.
August 2011
LAND USE
LegendForest
Brushland/Successional
Open Land
Water
Forested Wetland
Non-Forested Wetland
Salt Water Wetland
Saltwater Sandy Beach
Cranberry Bog
" " " " " " " "
" " " " " " " "
" " " " " " " "
" " " " " " " "
Orchard
" " " " " " " "
" " " " " " " "
" " " " " " " "
" " " " " " " "
Nursery
Cropland
Pasture
E E E E
E E E E Cemetery
Ø Ø Ø Ø Ø
Ø Ø Ø Ø Ø
Ø Ø Ø Ø Ø
Golf Course
Participation Recreation
Spectator Recreation
ÙÙÙÙÙÙÙÙÙÙÙÙÙÙÙÙÙÙÙÙ
Water-Based Recreation
ÙÙÙÙÙÙÙÙÙÙÙÙÙÙÙ
Marina
! ! ! ! ! ! ! !
! ! ! ! ! ! ! !
! ! ! ! ! ! ! !
! ! ! ! ! ! ! !
! ! ! ! ! ! !
! ! ! ! ! ! !
! ! ! ! ! ! !
Multi-Family Residential
! ! ! ! ! ! ! ! !
! ! ! ! ! ! ! ! !
! ! ! ! ! ! ! ! !
! ! ! ! ! ! ! ! !
! ! ! ! ! ! ! ! !
High Density Residential
! ! ! ! !
! ! ! ! !
! ! ! !
! ! ! !
! ! ! !
Medium Density Residential
! ! ! !
! ! ! !
Low Density Residential
! ! ! Very Low Density Residential
Transitional
Urban Public/Institutional
Commercial
Industrial
Transportation
Powerline/Utility
Mining
Waste Disposal
################################
Junkyard

ATTLEBORO
NORTON
NORTH ATTLEBOROUGH
REHOBOTH
MANSFIELD
SEEKONK
PAWTUCKET
County Street
Park Street
South Main Str
eet
Tremont Street
Washington Street
Pleasant Street
Hickory Road
Elm
Street
North M
ain Street
W
est Str
eet
Ne
wport
Avenu
e
Landry Ave
nue
North Avenue
West Main
Street
Maple Street
Ana
wan
St
reet
South Washington Street
Highland Avenue
Thatcher Street
Central Avenue
Man
sfield Avenue
Lathrop Road
Holden Street Old Colony Road
John Bryson Scott Boulevard
South Aven
ue
Forest Street
Olive Street
North W
ashington Street
Woodland Av
enue
Hoppin Hill Road
Commonwealth Avenue
Oakhill Avenue
South Washington Street
West Str
eet
South Washington Street
Central Avenue
§̈¦95
§̈¦295
§̈¦95
tu1
tu1
tu1
!(1A
!(1A
UV152
UV118
UV123
UV120
UV140
UV118
!(1A
!(1A
!(1A
!(1A
!(1A
00.080.16 Miles
.
Sources: MassGIS, City of Attleboro
ATTLEBORO
COMPREHENSIVE PLAN
Prepared by:
Community Opportunities Group, Inc.
August 2011
LegendAttleboro_Commercial_Properties
COMMERCIALCORRIDORS
Route 1, Route 1A, Route 95 Triangle
Route 123
Route 152
Downtown Attleboro

LAND USE
CITY OF ATTLEBORO COMPREHENSIVE PLAN 21
sections of Attleboro. The balance (approximately 183 acres) is located in the General Residential
zoning districts, primarily in the areas surrounding downtown and west of US Route 1 in South
Attleboro. Commercial
In Attleboro today, 650.5 acres of land are assessed
as commercial property, or 3.6 percent of the City’s
total land area. Virtually all of the land (93 percent)
is already developed. The City has only 18.8 acres
of developable commercial land, 11.3 acres of
potentially developable land and 12.8 acres
classified as undevelopable. Just over 55 percent
(358.8 acres) of Attleboro’s commercial land has
been developed by retail businesses, including
automotive retail trade. This makes sense
considering that retail trade is Attleboro’s third largest industry, with average monthly employment
of more than 2,100 people. The second largest use of commercial land is for warehouses and
distribution facilities, accounting for 133.7 acres or 20.6 percent of all commercial land in Attleboro.36 Attleboro has four primary commercial corridors:
A) US Route 1, Route 1A, Interstate 95 Triangle
US Route 1 in Attleboro, locally known as Washington Street, runs perpendicular to Interstate 95. The
Route contains several medium sized commercial businesses and restaurants. A 1.8 mile segment of
US Route 1A (locally known as Newport Avenue) runs from southern Attleboro on the Rhode Island
border intersecting with Interstate 95 and eventually merging with US Route 1. Much like US Route
1, the western side of US Route 1A consists mainly of commercial businesses and restaurants only
smaller in size than those located on US Route 1. Both US Route 1 and US Route 1A intersect with
Interstate 95, creating an area known as the Interstate 95 triangle. This area is very important to
Attleboro because it provides the City with multiple highway access points for commuters and also
many economic benefits, including employment and commerce opportunities for residents.
B) Route 123
Route 123 runs from southwest Attleboro through the downtown and continues east into Norton,
intersecting with US Route 1, US Route 1A and Interstate 95. It has several fast–food restaurants and
small commercial businesses, and serves as a main roadway to the Attleboro Corporate Campus – a
major industrial compound that supports some of the City’s largest employers, including Sensata
Technologies (formerly Texas Instruments Sensors & Controls). Also located on Route 123 are
residential areas as well as Capron Park Zoo, a large public park with a playground, picnic areas, and
a zoo.
C) Route 152
Route 152 runs north from southern Attleboro at the Seekonk border through the City into North
Attleborough. The land uses along Route 152 vary from residential to dense commercial areas. The
northern and southern sections of Route 152 tend to be more rural and open, with small “mom and
36 City of Attleboro Assessor’s Parcel Database, 28 August 2007.

LAND USE
CITY OF ATTLEBORO COMPREHENSIVE PLAN 22
pop” businesses and residential developments. More densely developed commercial areas can be
found along the section of Route 152 that runs through downtown Attleboro. The City of Attleboro’s
Public Library is also located on Route 152.
D) Route 118, Downtown
Downtown Attleboro includes a mix of office, retail, industrial, and residential properties. While there are vacant storefronts and underutilized buildings in the downtown, the City of Attleboro has kept its focus and as a result has made good progress on revitalizing this important area through a multi–pronged approach including: (1) adoption of a Downtown Urban Renewal Plan and investment in public facilities such as development of the Intermodal Transportation Center project and the Ten Mile River Riverfront Restoration project between Wall Street and Olive Street, (2) establishment of an express Registry of Motor Vehicles, (3) establishment of a satellite Registry of Deeds; (4) investment in the downtown’s physical infrastructure, including streetscape improvements; and (5) investing CDBG funds in the downtown for small business development and job growth. In addition, in 2002, the City passed a “downtown cluster” ordinance encouraging higher density residential development in the downtown.37
In 2006, the City, the Attleboro Redevelopment Authority, and the Massachusetts Office for
Commonwealth Development worked with two consultants, Goody Clancy and Vanasse Hangen
Brustlin, to complete a downtown urban renewal plan entitled ADVANCING DOWNTOWN ATTLEBORO:
DOWNTOWN DEVELOPMENT PLAN AND IMPLEMENTATION STRATEGY. The plan’s goal is to rehabilitate
the following downtown areas: the Downtown Commercial District, the Union Street District, and the
Riverfront District. It calls for developing and redeveloping key downtown parcels, constructing an
intermodal transportation center, creating downtown residential development, making roadway
improvements, providing improved public access and use of the Ten Mile River, and enhancing
public parking facilities to serve downtown businesses.38
For its part, the City has concentrated on the transportation component of this plan, including
development of the Intermodal Transportation Center (ITC) and streetscape improvements.
Complementing this effort, the City’s Office of Community Development (OCD) has targeted its
CDBG allocation on a storefront revitalization program in the downtown area. To date, the OCD has
provided assistance to four restaurants and other small businesses.39
Industrial
Approximately 6.1 percent of Attleboro’s total land area is assessed for industrial use, 81 percent of
which is developed. The manufacturing industry is Attleboro’s largest employer and also the largest
occupant of industrially zoned land. Manufacturing firms occupy a total of 506.6 acres of the City’s
industrial land inventory, or nearly 50 percent of all assessed industrial land. 40 Attleboro has two
industrial zones: its generic “industrial” zone and the “industrial business park” (IBP) zone. The
industrial zone allows all types of industry while the IBP zone encourages light industrial and office
uses and does not allow heavy industry.
37 Gary Ayrassian, interview, August 31, 2010.
38 Goody Clancy and Vanasse Hangen Brustlin, Inc., Advancing Downtown Attleboro: Downtown Development
Plan and Implementation Strategy, 8 December 2006.
39 Salvador Pina (Community Development Director, City of Attleboro, MA), interview by Community
Opportunities Group, Inc., August 31, 2010.
40 City of Attleboro Assessor’s Parcel Data, 28 August 2007

LAND USE
CITY OF ATTLEBORO COMPREHENSIVE PLAN 23
The Industrial Business Park (IBP) zone is located near the intersection of County and Tiffany Streets
and comprises 175 acres. The City has been making progress toward the development of this park
with the installation of infrastructure including roadways, sidewalks, and utilities. The Attleboro
Redevelopment Authority (ARA) owns the land and is working with City staff to market and sell
parcels to companies. The first occupant is in the midst of constructing a 30,000 square foot building.
There is additional interest in the property, and the City is currently in negotiation with other
potential property owners. The IBP is an MGL CH. 43D Priority Development Site for the City and
has been designated a Growth District by the State. These designations enable to the City to receive
technical assistance and possible grant funding. 41
Public Facilities, Parks, and Recreation
Attleboro has several parks and recreation facilities. Some are under the management of the City’s
Recreation Department and Department of Parks and Forestry while others are managed by the
School Department. In total, City departments manage 180 acres of parks, fields, and recreation areas.
Uses range from playgrounds and basketball courts to a riverwalk and a zoo. (See the Open Space
element for more detail on the City’s parks and facilities.)
Existing Zoning
Like most municipalities in the U.S., Attleboro’s primary tool for regulating development is its
zoning ordinance. Originally adopted in February 1942 and amended many times since, the City’s
ordinance includes use, dimensional, design, and other requirements, as well as the City’s zoning
map, which divides Attleboro into thirteen zoning districts. The zoning districts are grouped in four
land use categories:
Single–Family Residential: SR–A, SR–B, SR–C, SR–D, and SR–E
General Residential: GR–A, GR–B, and GR–C
Business Districts: Central Business (CB), General Business (GB), and Planned Highway Business
(PHB)
Industrial Districts: Industrial (I), Industrial Business Park (IBP)
These are conventional use districts: areas designated for specific classes of use. Attleboro also has
two overlay districts, one to protect water resources and the other to prevent development from
interfering with the natural functioning of flood plains. When property lies within a use district and
an overlay district, it is subject to the requirements of both zones.
Residential Zoning. Although it may seem unusual to have five single–family residence zoning
districts, Attleboro’s zoning recognizes that each part of the City has evolved in a unique way. Some
areas have a well–established urban form while others have a more suburban feel. To maintain its
diverse land use pattern, preserve its urban mix of housing and control future growth, Attleboro has
zoned for small–lot, single–family development in portions of South Attleboro and the
41 Gary Ayrassian, interview, August 31, 2010.

LAND USE
CITY OF ATTLEBORO COMPREHENSIVE PLAN 24
neighborhoods near downtown, moderate–density housing along the major roadways, and larger
single–family lots on the outskirts of the City, with two–family and multi–family development
allowed near the commercial center. To some extent, the City’s residential zoning corresponds to the
kind of development that existed in 1942, when Attleboro adopted its first zoning ordinance. As a
result, the boundaries of areas that currently allow small single–family house lots, two–family homes
or multi–family uses correspond with Attleboro’s older residential areas.
Over half of the City’s total area lies within the Single Residence–D and Single Residence–E zoning
districts, which have the largest minimum lot area requirements of all five single–family zoning
districts. Attleboro’s second largest zoning district, Single Residence–D, covers most of Attleboro’s
eastern side, the areas bordering Manchester Reservoir and along the North Attleborough boundary,
and the lower end of County Street. Single Residence–E applies to an area of roughly 300 acres
bordering Locust Street and South Main Street. In the single–family zoning districts, Attleboro
provides for both conventional development plans and special permits to build open space
residential developments (OSRD), which can include single–family homes arranged in clusters with a
proportion of the site set–aside as open space as well as planned unit residential developments
(PURD), which can include clusters of single–family homes and townhouse buildings again with a
proportion of the site set–aside as open space.
Commercial Zoning. Slightly more than 5 percent of the land in Attleboro (954 acres) is zoned for
commercial development. Much like the continuum of residential zoning districts, Attleboro’s
business zoning districts encourage different types of development by location. The zoning in
Downtown Attleboro – Central Business – is perhaps the City’s most interesting and innovative.
Here, Attleboro allows not only a liberal complement of business uses, but also mixed–use buildings
with upper–story residential units by right and multi–family buildings with ground–floor housing by
special permit. In addition, the density regulations for Downtown Attleboro work to encourage
market–driven development by allowing the kinds of building height, bulk, and “street presence”
that enable older buildings to thrive in central business zoning district. The 86–acre Central Business
zoning district’s boundaries encompass Attleboro’s historic commercial center at the convergence of
Park Street, County Street, and North and South Main Streets. In contrast, the linear General Business zoning district along US Route 1 offers few opportunities to
develop housing, requires larger lots and imposes more restrictions on the overall size of commercial
buildings. These rules help to differentiate General Business zoning district from Downtown
Attleboro, yet they also contribute to lower commercial property values. Moreover, the General
Business zoning district is the only area zoned for adult uses. Finally, Attleboro created the Planned
Highway Business zoning district around the three major highway interchanges—I–295 and I–95, I–
95 and Route 123, and I–95 and US Route 1A—and along the west side of US Route 1A, in order to
designate places for large shopping centers and regional retail. In area (630 acres), the Planned
Highway Business zoning district stands out as Attleboro’s largest commercial zone and the sixth
largest of all thirteen zoning districts. Industrial Zoning. It is not surprising to find that Attleboro has set aside a considerable amount of
land for industrial uses. The City has 1,400 acres of industrially zoned land, or about 1.5 industrial
acres for every one commercial acre. Major industrial nodes exist along the railroad tracks peripheral
to Downtown Attleboro, in South Attleboro, and between Interstate 95 and Route 152 just south of
the City’s geographic center.

LAND USE
CITY OF ATTLEBORO COMPREHENSIVE PLAN 25
Development Trends
Attleboro is a city that grew from farmland. In the early days of its formation, Attleboro’s land was
valued for its agricultural promise. Later, the City’s rivers and transportation network supported
early industries, such as textiles and paper, and later metalwork, including jewelry making.
Attleboro once included the land areas known today as North Attleborough and Cumberland, Rhode
Island. In Attleboro, development occurred along main transportation routes, what are today’s Route
118, Route 123, and Route 152, as well as US Route 1 in South Attleboro. Corridors of development
spawned from the City’s center at the convergence of these roads. The addition of the railroad in 1836
further encouraged development, and industry situated itself along the rail corridor. Development
occurred along South Main Street and mill villages were created at Hebronville, Dodgeville, and
Mechanicsville. Development continued along transportation lines into the 20th century.
In the mid 20th century, Attleboro’s development
took on more structure with the City’s adoption of
its ZONING ORDINANCE in 1942 and the RULE AND
REGULATIONS GOVERNING THE SUBDIVISION OF
LAND in 1954. These regulations laid out land
development so that there would be a variety of
lot sizes, setbacks, and housing types. The City
created distinctions between residential areas and
commercial and industrial uses of land. Similar
development patterns continued into the latter
half of the century. While there was some
development in the urban core, much growth
occurred in the City’s outlying areas and along US Route 1 and US Route 1A.42
Regional Trends
The development of Southeastern Massachusetts mirrors that of Attleboro. The region’s economy
(and land pattern) developed from a marine and agrarian base prior to 1800, evolved into industry in
the 1800s, and began an industrial decline in the early– to mid–1900s. Transportation improvements
in the latter half of the 20th century make the south coast more accessible and attractive for residential
growth and property development. While the recent economic downturn has slowed this growth, the
area is ripe for development.43
Most recently, the eventual expansion of the commuter rail to New Bedford has prompted the region
to think about its development patterns and future growth. Towns and cities that are likely to be
affected are exploring Transit–Oriented Development (TOD) to maximize the potential of rail stops.
TOD involves integrating complementary uses such as housing, transportation and commercial
42 Attleboro Open Space and Recreation Plan, June 2002, 11.
43 The Woods Hole Research Center, “Critical Mass: Land Use Change in Southeastern Massachusetts,”
<http://www.whrc.org/resources/publications/pdf/StoneetalWHRC.06.pdf>.

LAND USE
CITY OF ATTLEBORO COMPREHENSIVE PLAN 26
development to create nodes of activity and efficient land use. Freetown, Fall River and New Bedford
are all considering how the new stations will affect their communities.44
The addition of the South Coast rail line will make this area of the state more accessible to people
who may chose to live in Southeastern Massachusetts, but work in the Boston area. As a result, the
rail line will likely stimulate even more development in this area. It will be important for
communities to understand how the development of the line may affect them, both positively and
negatively. While it is likely that the MBTA will extend the line to New Bedford through the existing
Stoughton line, Attleboro, as one of the region’s cities may be able to capitalize on regional growth
and attention.
A second transportation initiative that will affect the region is the improvement of interchanges along
Interstate 95. The Massachusetts Department of Transportation (DOT) has completed a study of
traffic patterns along this highly traveled north–south route and has concluded that there are several
interchanges that need to be reconstructed to handle higher traffic volume.45
Buildout Analysis
In 2000, the then Executive Office of Environmental and Economic Affairs (EOEA) sponsored
completion of a build out analysis for each of the state’s 351 towns and cities. To estimate build out
statistics, regional planning agencies analyzed local zoning to determine how municipalities would
develop according to their own rules. The analysis considered undeveloped land and recognized
protected areas. In addition to estimating the number of housing units and population size at “built
out,” planners estimated the impacts on municipal infrastructure systems.46 Table 4B–3 shows the
buildout statistics for Attleboro.
Table 4B–3. Attleboro Summary Buildout Statistics (Additional Buildout Impacts)
Developable Land Area Excluding Wetlands (Sq. Ft.) 291,249,259 Total Additional Dwelling Units 12,628 Commercial/Industrial Buildable Floor Area 8,428,584 Additional Residential Water Use (GPD) 2,718,092 Commercial/Industrial Water Use (GPD) 629,550 Additional Municipal Solid Waste 18,592 Additional Non–Recyclable Solid Waste 13,221 Additional Students 7,046 Additional Population 36,241 New Roads (Miles) 158
Source: EOEA, “Attleboro Buildout Final.xls,” 2000.
44 Jim Hadfield (Transportation Planning Manager, SRPEDD), interview by Community Opportunities Group,
Inc., October 14, 2010.
45 Ibid.
46 MA EOEA, “Buildout Maps and Analyses,” <http://commpres.env.state.ma.us/content/buildout.asp>.

LAND USE
CITY OF ATTLEBORO COMPREHENSIVE PLAN 27
Issues, Challenges, and Opportunities
As the MBTA expands rail service into Southeastern Massachusetts and the Boston job market
becomes more accessible, people will seek to live there and the region will likely experience
different types of development pressures. Maintaining the City’s housing affordability will be
one concern. Traffic congestion and strain on resources may be another.
As the City of Attleboro continues to grow, conservation of open space and natural resources will
become more critical. The City can use regulations and acquisition of land to ensure that open
space is preserved and natural resources protected. The City can encourage use of OSRD and
other cluster ordinances to conserve open space and minimize the amount of needed
infrastructure.
Economic development in Attleboro is one of the City’s major concerns. The City would like to
encourage business development in desired areas, specifically downtown and in designated
industrial areas.
Recommendations
Attleboro is currently in the process of revising its OSRD and PURD zoning to expand incentives
for developers. In addition, the City should review the existing zoning ordinance to determine if
there are other zoning tools the City may employ to conserve open space and protect natural
resources. (See Goal 1, Policy 1 and Goal 12, Policy 3.)
Institute design review for development proposals. Establish criteria for review to meet City’s
“smart growth” objectives. Encourage developers to create alternative transportation networks
such as walking paths, bicycle paths, or lanes. (See Goal 9, Policy 9, Goal 3, Policy 2, and Goal 7,
Policy 3.)
Examine zoning provisions in business zones and revise dimensional requirements to reduce
sprawl. Require developers to link to alternative transportation networks. (See Goal 12, Policy 5,
Goal 13, Policy 1, and Goal 3, Policy 2.)
Consider an inclusionary zoning ordinance or overlay district to encourage development of
affordable housing. (See Goal 11, Policy 3.)
Encourage developers to construct different types of housing. Rehabilitate existing housing stock
to maintain housing diversity and affordability. (See Goal 11.)
Market areas where the City would like to focus business and industrial development. Actively
recruit businesses to locate in these areas. (See Goal 9, Policy 1.)
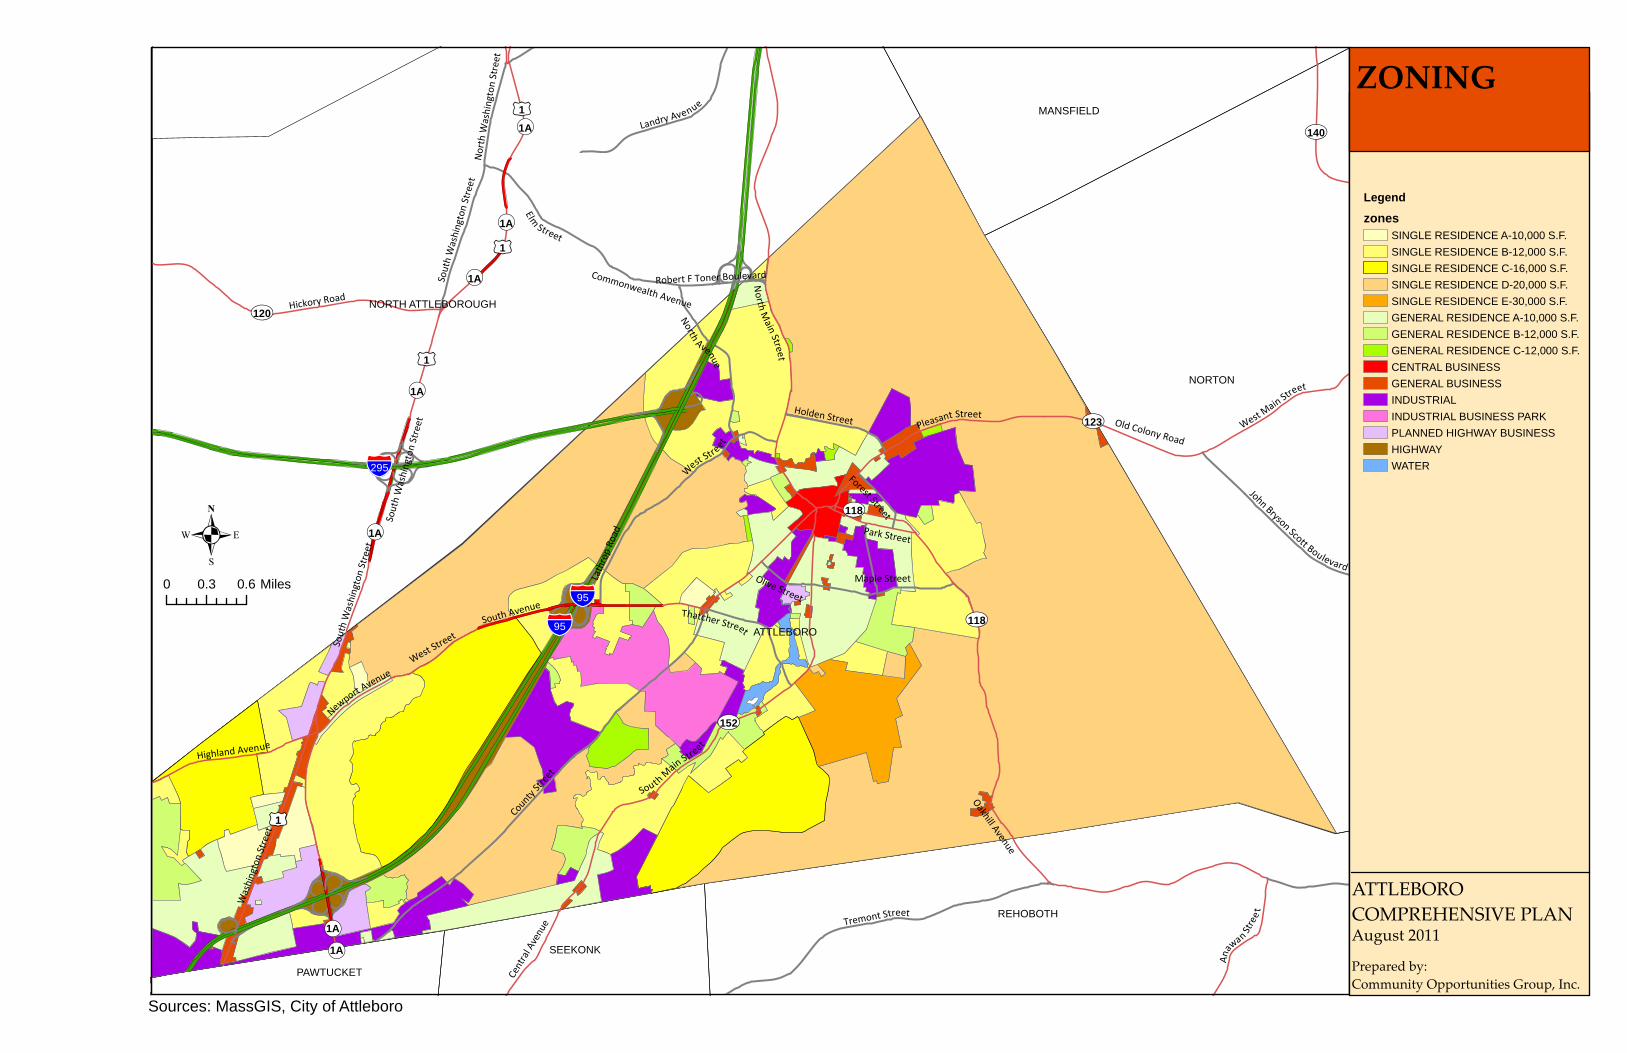
ATTLEBORO
NORTON
NORTH ATTLEBOROUGH
REHOBOTH
MANSFIELD
SEEKONK
PAWTUCKET
County Street
Park Street
South Main Str
eet
Tremont Street
Washington Street
Hickory Road
Pleasant Street
Elm
Street
North M
ain Street
W
est Str
eet
Landry Ave
nue
Newport
Avenu
e
North Avenue
Maple Street
South Washington Street
Highland Avenue
Thatcher Street
West Main
Street
Anaw
an
Stree
t
Lathrop Road
Holden Street Old Colony Road
Central Avenue
South Aven
ue
Forest Street
North W
ashington Street
Olive Street
John Bryson Scott Boulevard
Commonwealth Avenue
Oakhill Avenue
Robert F Toner Boulevard
West Str
eetSouth Washington Street
South Washington Street
§̈¦95
§̈¦295
§̈¦95
tu1
tu1
tu1
tu1
!(1A
!(1A
UV152
UV118
UV123
UV120
UV140
UV118
!(1A
!(1A
!(1A
!(1A
!(1A
0 0.3 0.6 Miles
.
Sources: MassGIS, City of Attleboro
ATTLEBORO
COMPREHENSIVE PLAN
Prepared by:
Community Opportunities Group, Inc.
August 2011
ZONING
Legend
zonesSINGLE RESIDENCE A-10,000 S.F.
SINGLE RESIDENCE B-12,000 S.F.
SINGLE RESIDENCE C-16,000 S.F.
SINGLE RESIDENCE D-20,000 S.F.
SINGLE RESIDENCE E-30,000 S.F.
GENERAL RESIDENCE A-10,000 S.F.
GENERAL RESIDENCE B-12,000 S.F.
GENERAL RESIDENCE C-12,000 S.F.
CENTRAL BUSINESS
GENERAL BUSINESS
INDUSTRIAL
INDUSTRIAL BUSINESS PARK
PLANNED HIGHWAY BUSINESS
HIGHWAY
WATER

HOUSING & NEIGHBORHOODS
CITY OF ATTLEBORO COMPREHENSIVE PLAN 28
IV.C. Housing & Neighborhoods
Existing Conditions
Types of Housing
Attleboro has approximately 17,325 housing units that include a broad mix of housing types, sizes
and price ranges. Since 1990, approximately 2,300 new units have been added to Attleboro’s housing
stock. As evidenced by the types of building
permits recently applied for and issued, single–
family homes make up a large percentage of the
market in Attleboro and the number of single–
family properties appears to be growing. Between
1990 and 2007, more single–family units were
built than other unit types. During this time, the
number of single–family homes as a proportion of
total housing units increased from 52 to 57
percent.47 Not surprisingly, the estimated
distribution of homeowners and renters has
shifted somewhat since 2000, with homeowners
making up some 64.3 percent of all households,
up from 63.8 percent in 2000.48
Although single–family homes constitute a majority of all housing in Attleboro, the City has a
noteworthy inventory of two–family and multi–family residences. The most significant
concentrations of small, two– to four–family dwellings can be found in Downtown Attleboro and
South Attleboro, where more than half of the units were built prior to 1939. According to Census
2000, about 9.6 percent of all housing units in Attleboro are in mid–sized structures with five to 19
units. These structures exist City–wide, but the largest number of units in mid–sized multi–family
structures (429) exists in south central Attleboro (Census Tract 6318) while the neighborhoods east of
Rte. 118, bordered by the MBTA rail to the north (Census Tract 6317) have the smallest number (119).
Units in large 20+ unit buildings represent about 5.4 percent of the City’s total housing inventory.49
Single–family home development between 1990 and 2007 accounted for the majority of new housing
units in Attleboro. However, units located in large complexes (50+ units) and mobile home units also
increased slightly as a proportion of Attleboro’s housing stock during this time. Other housing types
(two–families, 3–19 unit properties, and 20–49 unit properties) either stayed level or increased or
declined slightly.50
47 1990 Census, Summary File 1, Table H041, Census 2000, Summary File 3, Table H30, Claritas, Inc.
ʺDemographic Snapshot Reportʺ.
48 “Demographic Snapshot Report,” Census 2000, Summary File 1 Table H3, and Attleboro Assessor’s Parcel
Database (FY07).
49 Census 2000, Summary File 3, Table H30.
50 Ibid.

HOUSING & NEIGHBORHOODS
CITY OF ATTLEBORO COMPREHENSIVE PLAN 29
In addition to single–family homes, in the last two decades Attleboro has seen significant increases in
mobile home development. The number of mobile home units in Attleboro increased by almost 20
percent between 1990 and 2007.51 In 2007, Attleboro had 806 mobile homes, occupied primarily by
“over–55” or senior households. The mobile home inventory includes 468 units in four trailer parks in
South Attleboro, most located on or near the City’s southern
border with Rhode Island. One trailer park with 172 mobile
homes is located near Briggs Corner on the Rehoboth border
while another 97 units are located in north–central Attleboro.
Nearly all of the City’s mobile homes are owner–occupied,
with renters occupying only 28 units (4.1 percent).52
Age of Housing Stock
The age of a community’s housing stock reveals its
development history and sheds light on potential housing
needs. According to Census 2000, nearly half of Attleboro’s
housing units were built before 1960. The largest
concentration of older units can be found in downtown
neighborhoods, where over 70 percent of the housing stock is
more than fifty years old.53 Although not always the case,
older homes often have higher maintenance and repair costs
and may indicate the presence of hazardous materials such as
lead–based paint and asbestos.
51 1990 Census, Summary File 1, Table H041, Census 2000, Summary File 3, Table H30, Claritas, Inc.,
ʺDemographic Snapshot Reportʺ.
52 Census 2000, Summary File 3, Tables H32 and HCT4; “Demographic Snapshot Report.”
53 Census 2000, Summary File 3, H36.
Table 4C–1. Number of Housing Units in Structure
Number of Units in Structure
1,
detached
1,
attached
2
3 to 19
20 to 49
50 or more
Mobile home
Boat, RV, van, etc.
ATTLEBORO
1990 7,445 401 1,838 3,868 140 502 682 169
2000 8,678 611 1,869 3,745 167 728 746 10
2007 9,238 632 1,920 3,812 167 739 806 11
% Change 1990–2007
24.1% 57.6% 4.5% –1.4% 19.3% 47.2% 18.2% –93.5%
Source: 1990 Census, Summary File 1, Table H041, Census 2000, Summary File 3, Table H30, Claritas, Inc. "Demographic Snapshot Report."
Table 4C–2. Age of Housing Stock
ATTLEBORO Occupied Units
Built 1999 to March 2000 162
Built 1995 to 1998 1,000
Built 1990 to 1994 1,015
Built 1980 to 1989 2,185
Built 1970 to 1979 2,236
Built 1960 to 1969 2,079
Built 1950 to 1959 1,844
Built 1940 to 1949 1,134
Built 1939 or earlier 4,899
Source: Census 2000, Summary File 3, Table H34.

HOUSING & NEIGHBORHOODS
CITY OF ATTLEBORO COMPREHENSIVE PLAN 30
New housing construction is constantly reshaping Attleboro’s housing profile. The construction of
new units since 2000 is gradually reducing the proportion of older units within the City and giving
rise to new neighborhoods. In 2000, Census Tract 6312, located to the west of Downtown, had the
highest concentration of new housing: 20.5 percent of all housing units were built since 1990, while
Census Tract 6311 (South Attleboro, west of the Seven Mile River) had the largest number of new
units, 523. Today, units built since 1990 represent 18.9 percent of the City’s housing stock.54
The location of new housing development is further reflected in the median age of building
structures in different sections of the City. While the median year that downtown residential
structures were built is 1940, as reported by the Census Bureau, in south central Attleboro (Census
Tract 6318), the median year of construction is 1978.55
Neighborhood Character
Attleboro’s housing characteristics and the density of residential development vary by location, with
Downtown Attleboro being the most densely settled part of the City. At an average of more than six
units per acre, downtown’s housing density significantly exceeds that of other parts of Attleboro.
Downtown also has the most diverse housing stock with approximately 70 percent of units located in
multi–family structures and comparatively low owner occupancy rates in relation to other Attleboro
neighborhoods. The section of County Street that heads into Downtown Attleboro is also developed
at a higher than average density of just over two units per acre, followed by South Attleboro, with 1.5
units per acre. Overall, Attleboro’s residential development pattern is characterized by an average
density of 0.95 units per acre.56
In contrast, eastern Attleboro has both a high proportion of single–family dwellings and
correspondingly high rates of owner–occupancy. West central Attleboro also has a high proportion of
single–family homes and one of the City’s highest rates of owner–occupancy.
Table 4C–3. Housing Characteristics by Location
CT 6311 CT 6312 CT 6313 CT 6314 CT 6315 CT 6316 CT 6317 CT 6318
Housing Units 3,082 2,356 1,920 1,175 1,113 1,512 2,145 2,716
Owner–occupied 76.9% 75.0% 63.2% 19.1% 54.1% 43.1% 78.8% 62.8%
Renter–occupied 23.1% 25.0% 36.8% 80.9% 45.9% 56.9% 21.2% 37.2%
Single–family units 68.8% 75.0% 62.0% 10.0% 46.9% 32.0% 77.2% 61.1%
Multi–family units 31.2% 25.0% 38.0% 90.0% 53.1% 68.0% 22.8% 38.9%
Median year structure built
1968 1966 1959 1940– 1940– 1940– 1968 1978
Median housing value for owner–occupied units
$131,800 $161,000 $158,300 $128,300 $130,800 $120,400 $159,500 $152,300
Source: Census 2000, Summary File 1, Table P1, P7, P12, P15, P17; Summary File 3, Tables H30, H35, H85.
54 Census 2000, Summary File 3, H34; Claritas Demographic Estimates 2007.
55 Census 2000, Summary File 3, H35.
56 MassGIS, “Census 2000 Census Tracts” (2003), <http://www.mass.gov/mgis/census2000.htm>, and Community
Opportunities Group, Inc.

HOUSING & NEIGHBORHOODS
CITY OF ATTLEBORO COMPREHENSIVE PLAN 31
Recent housing development has occurred primarily outside of downtown Attleboro. Given the
predominance of single–family construction between 1990 and 2007, and the larger lot sizes needed
for this type of construction, this is not surprising. However, while considerable development has
occurred in outlying areas of the City, specifically the west and southeast areas, very little housing
development occurred downtown.
Table 4C–4. Housing Units and Tenure
1990 2000 1990–2000
Housing Units
Owner occupied (%)
Renter occupied (%)
Housing Units
Owner occupied (%)
Renter occupied (%)
Housing Unit Growth
ATTLEBORO 14,180 61.3% 38.7% 16,019 63.8% 36.2% 13.0%
Mansfield 5,940 66.3% 33.7% 7,942 71.7% 28.3% 33.7%
N. Attleborough 9,235 66.3% 33.7% 10,391 68.5% 31.5% 12.5%
Norton 4,641 77.2% 22.8% 5,872 82.3% 17.7% 26.5%
Rehoboth 2,870 88.6% 11.4% 3,523 89.3% 10.7% 22.8%
Seekonk 4,482 88.1% 11.9% 4,843 88.8% 11.2% 8.1%
Central Falls 6,643 23.7% 76.3% 6,696 21.8% 78.2% 0.8%
Cumberland 10,764 75.5% 24.5% 12,198 76.7% 23.3% 13.3%
East Providence 19,950 60.3% 39.7% 20,530 59.0% 41.0% 2.9%
Pawtucket 29,711 45.8% 54.2% 30,047 44.4% 55.6% 1.1%
Providence 58,905 36.2% 63.8% 62,389 34.6% 65.4% 5.9% Source: 1990 Census, Summary Tape File 1, Table H003, 2000 Census, Summary File 3, H36.
Tenure
Most Attleboro households own their own home and the number of owners is increasing. Today 65
percent of households own the home they live in, up from 61 percent in 1990.57 Conversely, there are
fewer renter households in Attleboro than in the past. This does not reflect a loss of rental housing,
but rather the recent increase in construction of single–family homes. Yet, renter–occupied units
increased by almost 500 units between 1990 and 2000.58
The City’s rental units tend to be smaller and older than its owner–occupied units, as is the case
nearly everywhere. For example, Census 2000 statistics show that Attleboro’s owner–occupied units
include an average of 6.3 rooms per unit while its rental units have an average of just over four rooms
per unit. These size differences largely reflect the types of housing units occupied by homeowners
and renters as 76 percent of the City’s homeowners live in single–family detached homes.59 In
57 1990 Census, Summary Tape File 1, Table H003, 2000 Census, Summary File 3, H36; Claritas, Inc.,
“Demographic Snapshot Report”.
58 1990 Census, Summary Tape File 1, Table H003, 2000 Census, Summary File 3, H36.
59 American Community Survey, 2006–2008 3–Year Estimates, Table 25032.

HOUSING & NEIGHBORHOODS
CITY OF ATTLEBORO COMPREHENSIVE PLAN 32
addition, the median year of construction for owner–occupied units is 1965, but for renter–occupied
units, it is 1954.60 As stated above, unit tenure varies in Attleboro’s different neighborhoods. While there are high levels
of renter–occupancy in the downtown, the reverse is true for other areas of the City. The eastern side
of the City has the most owner–occupied housing in the City as almost 79 percent of units are owner–
occupied. South Attleboro and west central Attleboro also have comparatively high levels of owner–
occupancy. In contrast, in northern as well as in the south central sections of the City, only about 60
percent of homes are occupied by owners, and renters reside in approximately 40 percent of housing
units.61
Housing Costs
Attleboro has not been immune to the rising cost of housing experienced throughout Eastern
Massachusetts in the last decade. Since 1990, the median price for a single–family dwelling increased
134 percent from $130,500 to $318,000 in 2006, the peak of recent sales.62 Since 2006, prices have
adjusted lower reflecting the turbulence in the housing and credit markets. Condominium sale prices also increased dramatically between 1990 and 2006. The median sales price
for condominiums was $95,900 in 1990 and rose to $231,450 by 2006, an increase of 141 percent. The
number of condominiums sold during this time
also increased steadily, from 27 in 1990 to 146 in
2006.63 Since 2006, condominiums have lost
value and turnover has declined sharply. It is fairly easy to track housing sales through
Banker & Tradesmen, but rental housing costs
are more difficult to analyze due to a limited
amount of verifiable data. In 2000, the Census
reported Attleboro’s median gross rent at $610,
up from $538 in 1990.64 More recently, however,
HUD conducted an area–wide Random Digit
Dialing (RDD) survey in 2005 as part of the
process for determining Section 8 Fair Market
Rents (FMRs) in the economic statistical area that
includes Attleboro.65 The RDD survey found
60 Census 2000, Summary File 3, H27; Census 2000, Summary File 3, H36 and H37; Census 2000, Summary File 3,
H32.
61 Census 2000, Summary File 3, H30.
62 The Warren Group, “Town Stats.”
63 The Warren Group, “Town Stats.”
64 1990 Census, Summary Tape File 3, Table H043A; Census 2000, Summary File 3, Table H63.
65 HUD surveyed the Providence–Fall River RI–MA Metro FMR Area, which includes Attleboro, Fall River,
North Attleborough, Rehoboth, Seekonk, Somerset, Swansea, and Westport, MA; and all of Rhode Island except
Middletown, Portsmouth, Hopkinton, New Shoreham, Westerly and Newport.
Table 4C–5. Recent Housing Growth by Location
Housing Units
ATTLEBORO 1990 2000 % Change
CT 6311 2,767 3,162 14.3%
CT 6312 2,026 2,413 19.1%
CT 6313 1,923 1,964 2.1%
CT 6314 1,246 1,245 –0.1%
CT 6315 1,108 1,152 4.0%
CT 6316 1,547 1,596 3.2%
CT 6317 1,840 2,244 22.0%
CT 6318 2,588 2,778 7.3%
Source: 1990 Census, Summary Tape File 1, Table H001, Census 2000, Summary File 1, Table H1. Note: Shading indicates downtown census tracts.

HOUSING & NEIGHBORHOODS
CITY OF ATTLEBORO COMPREHENSIVE PLAN 33
that the 50th percentile rent for the
Providence–Fall River RI–MA Metro
FMR Area was $966. Today, an
informal survey of apartments listed
for rent in Attleboro indicates that
one–bedroom units rent in the $600
to $700 range, two–bedroom units at
approximately $900, and three–
bedroom units at $1,100.66
Affordable Housing
The Massachusetts Department of
Housing and Community
Development (DHCD) maintains the
state’s official roster of affordable
housing, the MGL CH. 40B
Subsidized Housing Inventory.
DHCD’s list matters because when affordable housing constitutes 10 percent or more of a
community’s total housing inventory, as reported in the most recent federal census, local officials
have discretion to approve or deny permits to build new affordable housing. To qualify for the
Subsidized Housing Inventory, housing units must be sold at prices affordable to low– or moderate–
income homebuyers or be located within a rental development in which at least 25 percent of the
apartments are affordable to low– or moderate–income tenants. In addition, the affordable prices and
rents have to be preserved over time through a deed restriction. Attleboro currently has 1,198 units
on the Subsidized Housing Inventory, or 7.25 percent of the City’s Census 2000 housing count. The
1,198 units include five affordable homeownership units and 1,193 rental units, and nearly all of the
rental units are affordable to low– income or moderate–income people.67
Attleboro’s affordable housing stock is comprised of privately–owned units, public housing, and
units targeted to specific populations, such as group homes. It also contains 146 units set aside for
people with disabilities, and 385 low– or moderate–income units and 19 market–rate units in
developments financed by MassHousing.68
Increasing the supply of affordable housing is important, but it also is critical to preserve existing
affordable units by renegotiating the affordability terms of “expiring use” properties. These are
developments in which the affordability restriction is set to expire on a specific date. In Attleboro, the
MassHousing financed developments and others have term–limited affordability restrictions that
66 Classified Ads, The Sun Chronicle, September 9, 2010,
http://www.thesunchronicle.com/admarket/real_estate_for_rent/apartments/.
67 DHCD, “Chapter 40B Subsidized Housing Inventory: Attleboro,” issued to Community Opportunities Group,
Inc., 16 January 2007.
68 DHCD, “Chapter 40B Subsidized Housing Inventory: Attleboro”; Citizen’s Housing and Planning Association
(CHAPA), “Expiring Use Database,” at<http://www.chapa.org>, and Orion Realty and Christopher Heights,
interviews by Community Opportunities Group, Inc.
Table 4C–6. Attleboro Home Sales, 2000–2006
Single–Family Condominium # Sales Median Price # Sales Median Price
2010* 180 $232,500 39 $175,000 2009 287 $252,500 60 $185,000 2008 277 $264,000 63 $200,000 2007 338 $300,000 114 $216,000 2006 389 $318,000 135 $230,000 2005 502 $317,000 153 $205,000 2004 509 $305,000 116 $209,950 2003 498 $265,000 84 $185,500 2002 460 $234,000 76 $164,000 2001 523 $191,000 105 $141,630 2000 462 $168,565 101 $108,000
Source: The Warren Group, "Town Stats", <www.thewarrengroup.com>.
*Figures are from January to July 2010.

HOUSING & NEIGHBORHOODS
CITY OF ATTLEBORO COMPREHENSIVE PLAN 34
could make them ineligible for listing on the Subsidized Housing Inventory in the future.69 However,
each property must be reviewed individually to determine if the restrictions are likely to expire.
Under a recent state court decision, some expiring use properties may have to remain affordable even
if the owners want to convert their projects to market–rate housing.70 Attleboro recently lost some
units from its affordable homeownership inventory due to expiration of the affordability restriction.
These units were funded through the Community Development Inc. First–Time Homebuyer
Program.
City Responses: Actions and Programs
Improvements to Existing Homes
The Attleboro Community Development Office currently offers the following housing preservation
programs which provide housing assistance to low– and moderate–income homeowners:
Rehabilitation Program: The Attleboro Rehabilitation Program offers grants/loans for housing rehabilitation projects to multi–unit property owners who are income eligible and/or who are
willing to create affordable housing units for low– and moderate–income residents. The program
provides financial assistance for energy improvements, lead and asbestos abatement, and to
correct code violations.
Emergency Repair Program: The Emergency Repair Program provides emergency grants to assist
Attleboro residents with housing rehabilitation issues that are of an immediate threat to health
and safety (such as roof repair, ramp installation, furnace replacement, and window
replacement).
Senior Emergency Repairs: The Senior Emergency Repair Program provides emergency grants to
assist senior citizens with housing rehabilitation issues that are of an immediate threat to health
and safety (such as roof repair, ramp installation, furnace replacement, and window
replacement). This program is funded privately, and in cooperation with the Council on Aging.
Projects are limited to $1,000 or less; approximately $2,000 is spent on an annual basis.
Federal HOME Funds. In addition to programs operated through the Attleboro Community
Development Office, the Greater Attleboro/Taunton HOME Consortium offers funds for single–
family and non–profit housing rehabilitation assistance, construction of new affordable housing
units, and down payment assistance to first–time homebuyers on a regional basis. Since its
inception in 2004, the Consortium has funded rehabilitation of sixteen single–family and non–
profit housing units, forty new affordable housing units, and nine first time home buyers in
Attleboro.71
69 CHAPA, “Expiring Use Database,” and “Chapter 40B Subsidized Housing Inventory: Attleboro.”
70 In Zoning Board of Appeals of Wellesley v. Ardemore Apartments Limited Partnership (2002), the
Massachusetts Supreme Judicial Court held that if affordable housing is developed under Chapter 40B and the
comprehensive permit decision does not specify a time period for the affordability restriction, the units must
remain affordable as long as the development does not comply with local zoning requirements.
71 Greater Attleboro/Taunton HOME Consortium, Community Development Office staff, interview by
Community Opportunities Group, Inc., 17 June 2008.

HOUSING & NEIGHBORHOODS
CITY OF ATTLEBORO COMPREHENSIVE PLAN 35
Table 4C–7. Subsidized Housing Inventory and Affordable Units
Unknown (Family or
Elderly)
Family
Elderly/
HP
Total
Affordable
Market
Units
Affordability
Expires
Attleboro Housing Authority
Hillcrest Oaks 91 Perpetuity
Martin Street 15 Perpetuity
Scattered Site Duplexes 6 Perpetuity
Elderly/HP units Perpetuity
Brookside 75 Perpetuity
Maple Terrace 72 Perpetuity
Oakhurst 71 Perpetuity
Oakhurst 42 Perpetuity
River Court 59 Perpetuity
TOTAL AHA UNITS 112 319 431
Handicap Program Units
Ch. 689–2 91 George Street 8 8 Perpetuity
DMR units (group homes) 114 114 Perpetuity
DMH units (group homes) 24 24 Perpetuity
Total HP Program Units 146 146
MHFA Financed Projects:
Gardner Terrace 92 2015
Hebronville Mill Phase I 52 2015
Hillcrest Village 81 19 2017
Hope Gardens 160 2011
TOTAL MHFA Fin Proj: 52 81 252 385 19
Other Privately Financed Rental Properties
17 Peck St 2 2 8 Perpetuity
20 Star Lane 1 1 3 Perpetuity
Hebronville Mill Phase II 83 83 2015
School/Pine/Maple 6 6 25 2016
Merritt Place 1 1 2 2017
Christopher Heights 41 41 40 2050
Total Other PrivFinRental 3 90 41 134 78
Est. Affordable Rentals 55 283 768 1,096 97
Inventory: Tot Rental Units 1,193
Affordable Owner Units
Water View Condos 2 2 Perpetuity
CDI FTHB Program 3 3 2020
Total Ownership Units 5 5 Source: Massachusetts Department of Housing and Community Development, Chapter 40B Subsidized Housing Inventory, September 2, 2010.

HOUSING & NEIGHBORHOODS
CITY OF ATTLEBORO COMPREHENSIVE PLAN 36
Making Existing Housing Affordable
The Attleboro Housing Authority (AHA) administers the City’s Section 8 Vouchers/Certificates, to
assist low–income and very low– income renters. The Authority administers 54 regular Section 8
Vouchers and thirty–five Section 8 Vouchers under the Mainstream Housing Program for Disabled
Persons/Families. AHA is also the administering agency for the Massachusetts Rental Voucher
Program (MRVP). Although this program no longer issues new rental vouchers, existing vouchers
have continued to be renewed by the Massachusetts legislature. The AHA administers forty–two
MRVP vouchers.
New Affordable Housing Development
The Greater Attleboro/Taunton HOME Consortium provides funding for affordable housing
developments on a regional basis. One Attleboro project, the redevelopment of the former Bliss
Elementary School on Park Street, which created 42 affordable rental units, received HOME funds
from the Consortium in 2006. The City also recently received a substantial Neighborhood
Stabilization Program 3 grant (NSP3) from DHCD, which will be administered by Community
Development Office and used to assist in the creation of affordable rental units or homeownership
units. Some of the affordable units created under this program must be set–aside for households
earning ≤50% of the median household income of the Providence–Fall River PMSA.
Local and Regional Trends
The recent credit crisis and
economic downturn has had
widespread effects on the
housing markets nationwide. It
seems no City has been
immune to its impacts—
foreclosure, vacancy, and
frequently, homelessness. The
collapse of the housing market
has left many families looking
for new homes in the rental
market putting additional
strain on one of the highest–
priced markets in the nation.
Overcrowding has become an issue as families double and triple up. Vacant homes are vandalized
and decrease neighboring property values. Cities are left with a housing stock that, in the best of
times, was difficult to preserve. Now, deteriorating structures present real and urgent health and
safety risks. A housing market that seemed to have a limitless upward trend has collapsed. People
have lost their homes and, often, their potential for gaining wealth.
Table 4C–8. Median Sale Prices
Single–Family Condominium
2006 2009 2006 2009 ATTLEBORO $318,000 $252,500 $230,000 $185,000 Mansfield $422,000 $345,000 $207,000 $200,000 N. Attleborough $364,750 $321,500 $194,000 $160,000 Norton $357,400 $272,500 $335,000 $222,900 Rehoboth $372,500 $295,000 $392,070 n/a Seekonk $340,000 $270,000 $205,000 n/a Central Falls $82,500 $202,500 $157,825 $192,500 Cumberland $305,500 $235,804 $249,500 $215,000 East Providence $250,000 $195,000 $215,500 $175,000 Pawtucket $234,000 $150,000 $200,000 $143,000 Providence $225,000 $105,000 $233,750 $169,000 Source: The Warren Group, "Town Stats.”

HOUSING & NEIGHBORHOODS
CITY OF ATTLEBORO COMPREHENSIVE PLAN 37
Yet, it is unlikely that the market downturn of recent years will have a lasting impact on housing
affordability in Massachusetts and the Attleboro region. While, home prices have dropped,
eventually they will rise again and new pressures will develop. Today, it is the rental market that is
strained as displaced homeowners seek housing. Vacancies are low and prices high, presenting a
somewhat different housing affordability crisis in Massachusetts.
Historically, the smaller size and older age of Attleboro’s housing units compared to the surrounding
region have benefited young families, empty nesters, and the elderly—households that are often
priced out of adjacent towns. In a region experiencing dramatic growth in older age cohorts that is
expected to continue for several years forward, Attleboro’s smaller housing stock is an asset.
Households looking to downsize have options in Attleboro. Furthermore, while the housing market
has slowed considerably over the last few years, housing costs in the region remain unaffordable for
many new homebuyers. Attleboro’s modest and older housing stock is also more affordable than
housing in surrounding communities, making the City an attractive location for first–time
homebuyers and young families looking to purchase a starter home. As illustrated in Table 4C–8, at
the market’s peak, Attleboro’s median single–family home price was $318,000, higher than the
median prices in the region’s Rhode Island communities, but less than the median prices for other
Massachusetts towns. Despite declines in value, this relationship remains true in 2009. 72
While Attleboro’s housing is relatively affordable compared to much of the state, and home prices
have declined, the region’s housing costs are still a concern. In general, over the last several years,
housing prices in Southeastern
Massachusetts have risen. Sale
prices of single–family homes in
most of the communities in the
Attleboro region increased over
90 percent between 2000 and
2006.73 (Note: 2000 sales data is
unavailable for Rehoboth,
Seekonk and Central Falls.)
Housing prices have not yet
rebounded, but it is expected
that they will. Furthermore, the
limited production of units in the
latter part of the decade may
strain supply and further drive
prices up.
Even prior to the economic downturn, housing production was declining in Attleboro. In 2000, the
City issued 182 residential building permits. In 2005, this figure had fallen to 99 and in 2009, only 38
permits were issued.74 During this time, many other communities in the region also experienced
72 The Warren Group, ʺTown Statsʺ, <www.thewarrengroup.com>.
73 Ibid.
74 City of Attleboro, Building Department.
Table 4C–9. Subsidized Housing Inventory
2000 Census Year Round Housing Units
Total Develop–ment Units
Total SHI Units
Percent SHI Units
Attleboro 16,519 1,198 1,198 7.3%
Mansfield 8,083 980 934 11.6%
N. Attleborough 10,600 293 293 2.8%
Norton 5,942 723 413 7.0%
Rehoboth 3,588 108 36 1.0%
Seekonk 4,927 82 82 1.7%
Region Total 49,659 3,384 2,956 6.0%
State Total 2,526,963 270,682 242,976 9.6%
Source: Department of Housing and Community Development Chapter 40B Subsidized Housing Inventory (SHI) as of April 1, 2010.

HOUSING & NEIGHBORHOODS
CITY OF ATTLEBORO COMPREHENSIVE PLAN 38
declining or level housing production. However, of these communities, Attleboro had the sharpest
decline.75 Statewide, there were declines in single–family home production, while multi–family
development increased steadily between 2000 and 2006.76 In 2007, both single–family and multi–
family housing production began to wane statewide.
Attleboro supplies the greatest absolute number of
subsidized housing units of Massachusetts towns
included in the region. In total, there are just under
3,000 subsidized housing units in the Attleboro region.
Almost, 1,000 of these are in Mansfield, the region’s
greatest contributor to affordable housing on a percent
of total housing stock basis.77
Recent Building Permits
The City issues residential building permits for new
construction and for remodeling/additions to existing
housing. Sometimes a building permit does not result
in a new or remodeled housing unit, but fluctuations
and trends in housing production can generally be
traced through building permit activity. Between 1990
and 1999, the Attleboro building department issued
permits for an average of 134 units per year. During
this time, almost 90 percent of permits issued annually
were for single–family homes. In 2005, the Attleboro
Building Department issued permits for 151 new
housing units. By 2007, production dropped markedly and the Building Department issued only 56
permits for 76 units. Since then, the City has issued even fewer permits, mostly for single–family
homes.78
Between 2000 and 2006, the City issued an average of 162 permits annually, 68 percent of which for
single–family homes. In 2006, the Attleboro Building Department issued permits for 115 new housing
units. A third of these units (38) were single–family dwellings, 34 units were in two– and three–
family dwellings and 43 units were in 4+ unit buildings. The 56 permits issued in 2007 included 44
single–family homes, 20 units in 2–3 unit buildings, and 9 units in 4+ unit buildings. Comparatively,
in 2009, Attleboro issued a total of 38 permits: 34 single–families, one two–family, two three–families,
and one six–family.79
75 U.S. Census Bureau, Building Permits Database.
76 HUD User, SOCDS Building Permits Database.
77 Massachusetts Department of Housing and Community Development Chapter 40B Subsidized Housing
Inventory (SHI) as of December 3, 2007, located at <www.mass.gov/dhcd>.
78 Attleboro Building Department, “Building Permits by Month and Year,” Attleboro Building Department,
interview by Community Opportunities Group, Inc., 1 October 2007 and Attleboro Department of Planning and
Development, August 31, 2010.
79 Ibid.
2000
2002
2004
2006
2008
2010
*
0
200
400
600
800
1000
1200
1400
Figure 4C-1: Number of Dwelling Units PermittedSource: SOCDS Building Permits Database
Attleboro Region

HOUSING & NEIGHBORHOODS
CITY OF ATTLEBORO COMPREHENSIVE PLAN 39
New Home Purchases
In the first half of the decade, Attleboro
maintained relatively level single–family home
sales, averaging 478 transactions annually.
Condominium sales also increased and totaled
153 transactions in 2005. The median selling
price of both single–family homes and
condominiums in Attleboro increased steadily
and peaked in 2006. However, in 2007,
Attleboro’s housing market began to reflect the
stresses in the credit market and the economy.
By 2009, single–family home values had dropped 20 percent and condominiums almost 10 percent.80
The housing price increase of the early part of the decade partially can be attributed to the
characteristics of recent housing development. Housing constructed since 2000 is larger and more
expensive than Attleboro’s older housing stock. Attleboro homes built prior to 1970 have an average
of 1,420 square feet of living space, while homes constructed since 2000 average 2,144 square feet.81
An analysis of single–family sales between 2000 and 2006 further illustrates the higher values of new
homes in Attleboro. Of course, several factors contribute to the selling price of property, including
location, condition, age, size, and amenities, but the difference between the median single–family sale
price between 2000 and 2006 on properties built prior to 1980 and built after 2000 exceeds $120,000.82
Issues, Challenges, and Opportunities Attleboro has a diverse housing stock, providing owners and renters a range of choice in housing
style and affordability. Some of Attleboro’s housing is old and in poor condition. Given the age of
the structures, the presence of lead–based paint is also an issue. Maintaining a quality housing
stock and preservation of housing affordability are ongoing issues in Attleboro.
Attleboro’s downtown was once a center for commerce, services, and living. The City would like
to revitalize this area and restore its vibrancy. The creation of housing in Downtown Attleboro is
one tool for revitalization and complements the City’s economic development efforts and
transportation improvements, especially the ITC.
The foreclosure crisis has affected Attleboro, as it has in many other small cities nationwide.
While some private developers are rehabilitating foreclosed properties, these efforts may not be
enough. Currently, there number of vacant properties and displaced families as a result of this
crisis.
80 Ibid.
81 City of Attleboro, Assessor’s Office, Parcel Database.
82 Ibid.

HOUSING & NEIGHBORHOODS
CITY OF ATTLEBORO COMPREHENSIVE PLAN 40
Housing is the largest land use in Attleboro, and so residential development patterns have great
impact on the City’s formation, infrastructure, public services, open space and natural resources.
Thoughtful development of Attleboro’s remaining land is critical to minimize the impacts of
future growth and to conserve financial and physical resources.
Recommendations
Attleboro has developed around its centers of commerce and industry. The City should continue
efforts to revitalize the downtown area and promote the City’s higher density neighborhoods to
encourage village living. (See Goal 10.)
Encourage rehabilitation of modestly sized housing and multi–unit properties to offer diverse
and affordable housing choices. (See Goal 11, Policy 1.)
Consider programs to mitigate the effects of foreclosure. Specifically, the City should use CDBG
funds to assist lower–income households by rehabilitating property and offering resources and
financial assistance to property owners faced with foreclosure.
Look for ways to maintain diversity in the housing stock through regulation and incentives.
Eventually, the foreclosure crisis will pass, yet one of Attleboro’s great assets is the diversity and
relative affordability of its housing stock. Development pressures in Southeastern Massachusetts
will likely increase with the introduction of the commuter rail to New Bedford and transportation
improvements to Interstate 95. (See Goal 11.)

ECONOMIC DEVELOPMENT
CITY OF ATTLEBORO COMPREHENSIVE PLAN 41
IV.D. Economic Development
Existing Conditions
Attleboro has a strong history as an employment center for the manufacturing industry in New
England, and in the past, Attleboro’s labor force and employment base complemented each other.
Residents with modest education levels and job skills were often able to find employment locally.
Today, Attleboro’s residents are
seeking higher education as the
local market shifts towards a more
service–based economy.
Employment and Wages
While Attleboro has nearly 1,100
employer establishments, the mix of
establishments primarily includes
industries such as manufacturing,
construction, trade and
transportation: sectors typically
classified as blue collar industries.
These sectors generally do not
require a high level of education or
highly specialized skills.
Since 1990, there has been a decline in the proportion of Attleboro residents working in the
manufacturing and retail industries. In 1990, of Attleboro’s 19,917 employed residents aged 16 years
or older, 33 percent worked in the manufacturing industry, 16 percent in retail trade, and 14 percent
in health or education services.83 Ten years later, only 25 percent of the labor force worked in
manufacturing and 12 percent in retail trade.84 However, the percent of people working in health and
education increased to 19 percent. Today, estimates indicate that these figures have fallen across all
three of these sectors.
Since 2000, the percentage of the labor force
working in private, for–profit businesses has
fallen from 76.8 to 73.9 percent, and the labor
force in private, non–profit employment fell
from 8.4 percent to 8.1 percent. Public sector
employment has remained a constant 9.1 percent
of the labor force, as has self–employment
representing a mere 5.1 percent of the labor
force.
83 1990 Census, Summary Tape File 3, Table P077. 84 Census 2000, Summary File 3, Tables P43, P49 and P51.
Table 4D–1. Attleboro Employment by Industry
Percent of Labor Force
1990 2000 2006–2008 Manufacturing 32.9% 25.2% 22.7%
Retail Trade 15.5% 12.0% 10.9%
Health & Education 13.8% 18.9% 14.0%
Source: 1990 Census, STF3, Table P077; Census 2000, SF3, Table P49; ACS 2006–2008 Three Year Estimates.
0 50 100 150 200 250
Construction
Manufacturing
Trade, Transportation & Utilities
Information
Financial Activities
Professional & Business Services
Education & Health Services
Leisure & Hospitality
Other Services
Figure 4D-1: Attleboro Employment EstablishmentsSource: MA Department of Labor and Workforce Development

ECONOMIC DEVELOPMENT
CITY OF ATTLEBORO COMPREHENSIVE PLAN 42
Employment Base
Manufacturing and Education and Health Services are the City’s largest employment sectors,
employing on average 3,524 persons and 4,562 persons, respectively. While the number of
manufacturing jobs has declined in recent years, from almost 8,000 in 2001 to under 4,000 in 2009,
manufacturing jobs still comprise over 25 percent of the City’s employment base and manufacturing–
based businesses make up over one–third of Attleboro’s largest employers, for example those that
have at least 100 employees. There are thirteen manufacturing businesses in this category, and four of
them manufacture jewelry.85
Since, 2001, Attleboro’s Education and Health Services employment base has grown modestly from
4,079 jobs in 2001 to 4,561 jobs in 2009. Sturdy Memorial Hospital is a major employer in this sector,
employing 1,727 people.86 Major educational institutions in the City include Bristol Community
College, Bridgewater State University, and Amego. The presence of these institutions directly benefits
the residents of Attleboro with employment opportunities and services.
In contrast, both the total number of establishments and overall employment in industries such as
professional and business services and financial activities are comparatively low in Attleboro.
Attleboro has less than 1,500 jobs in these sectors, comprising only 8.4 percent of the employment
85 Massachusetts Department of Labor and Workforce Development, ES–202, Economic Data Programs,
<www.detma.org>, and Community Opportunities Group, Inc.
86 City of Attleboro, General Obligation Bond Prospectus, June 15, 2010.
Table 4D–2. Attleboro Average Monthly Employment
Average Monthly Employment
2001 2002 2003 2004 2005 2006 2007 2008 2009*
Construction 718 756 777 803 859 851 820 732 649
Manufacturing 7,932 6,903 6,622 6,377 5,902 5,453 5,283 4,651 3,524 Trade, Transportation & Utilities 3,284 3,137 3,017 3,159 2,885 2,903 2,887 2,854 2,639
Information 272 271 268 259 257 248 252 250 257
Financial Activities 328 345 372 365 369 366 369 356 303 Professional & Business Services 2,098 1,858 1,411 1,480 1,377 1,329 1,329 1,151 1,027
Education & Health Services 4,079 4,119 4,300 4,216 4,387 4,228 4,368 4,598 4,561
Leisure & Hospitality 1,834 1,961 1,954 2,008 1,992 2,113 2,166 2,091 2,224
Other Services 577 576 580 611 624 718 743 736 713
Public Administration 516 483 435 431 436 430 448 455 n/a
Goods–Producing Domain 8,661 7,668 7,406 7,182 6,763 6,305 6,104 5,382 4,173
Service–Providing Domain 12,988 12,750 12,338 12,528 12,326 12,333 12,561 12,489 12,065
Total, All Industries 21,649 20,418 19,744 19,710 19,089 18,639 18,664 17,872 16,238 Source: Massachusetts Department of Labor and Workforce Development, ES–202, Economic Data Programs, <www.detma.org>, and Community Opportunities Group, Inc.
*2009 estimate based on 3rd quarter data

ECONOMIC DEVELOPMENT
CITY OF ATTLEBORO COMPREHENSIVE PLAN 43
base. 87 Employment in industries such as professional and business services and financial activities is
lower in Attleboro than might be expected for a city of its size. These industries require a highly
educated and broadly skilled workforce. Several businesses associated with these sectors are located
in surrounding communities.
Table 4D–3. Attleboro Employment by Industry
July to September 2009
Description Number of
Establishments
Average Monthly
Employment Average
Weekly Wage
Total, All Industries 1,063 16,238 $742
Goods–Producing Domain 219 4,173 $1,004
Construction 116 649 $1,048
23 – Construction 116 649 $1,048
Manufacturing 103 3,524 $996
31–33 – Manufacturing 103 3,524 $996
DUR – Durable Goods Manufacturing 85 3,198 $1,004
NONDUR – Non–Durable Goods Manufacturing 18 326 $910
Service–Providing Domain 844 12,065 $652
Trade, Transportation and Utilities 220 2,639 $633
42 – Wholesale Trade 57 482 $1,192
44–45 – Retail Trade 139 2,027 $481
48–49 – Transportation and Warehousing 23 115 $825
Information 10 255 $636
51 – Information 10 255 $636
Financial Activities 63 303 $901
52 – Finance and Insurance 36 198 $963
53 – Real Estate and Rental and Leasing 27 105 $785
Professional and Business Services 139 1,060 $848
54 – Professional and Technical Services 84 293 $922
56 – Administrative and Waste Services 49 382 $663
Education and Health Services 138 4,562 $780
62 – Health Care and Social Assistance 124 3,777 $837
Leisure and Hospitality 98 2,175 $308
71 – Arts, Entertainment, and Recreation 13 210 $407
72 – Accommodation and Food Services 85 1,965 $297
Other Services 163 735 $324
81 – Other Services, Ex. Public Admin 163 735 $324 Source: MA Department of Labor and Workforce Development, ES–202, Third Quarter 2009.
87 Ibid.

ECONOMIC DEVELOPMENT
CITY OF ATTLEBORO COMPREHENSIVE PLAN 44
Table 4D–4. Largest Employers in Attleboro, other than the City of Attleboro
Company Name Nature of Business Employees
Sturdy Memorial Hospital Medical Facility 1,727
Sensata Tech Controls 1,200
Stern–Leach Manufacturing 800
Robbins Company Manufacturing 710
Cookson Group Manufacturing 644
Hallmark Sweet Manufacturing (Jewelry) 499
Jostens, Inc. Manufacturing (Jewelry) 480
Community Visiting Nurses Agency Nursing Services 300
Morins Diner, Inc. Restaurant & Catering 280
Life Care Center of Attleboro Nursing Homes 190 Source: City of Attleboro, General Obligation Bond Prospectus, June 15, 2010; Attleboro Chamber of Commerce, March 2010.
Data from 2001 to the present
illustrates several trends within the
Attleboro employment base. Overall,
the number of jobs in both the goods
and the services domains decreased
from 21,649 jobs in 2001 to an
estimated 16,238 jobs in 2009 — a 25
percent decline. However, some of
Attleboro’s industries have not
experienced the same level of
decline, nor is it likely that this
decline will continue. Between 2001
and the second quarter of 2007,
construction and financial activities
increased by 6.9 percent and 10.1
percent, respectively, and education
and health services increased 6.2 percent. The leisure and hospitality industry also grew 13.5 percent.
Industries showing the greatest decline between 2001 and 2007 include manufacturing (31.9 percent),
trade, and transportation. Utilities declined 11.8 percent, and professional and business services fell
37.8 percent.88
88 Massachusetts Department of Labor and Workforce Development, ES–202, Economic Data Programs,
<www.detma.org>, and Community Opportunities Group, Inc.
0
5,000
10,000
15,000
20,000
25,000
2001 2002 2003 2004 2005 2006 2007 2008 2009*
Figure 4D-2. Attleboro Average Monthly EmploymentSource: MA Dept. of Labor and Workforce Development, ES-202.
*Partial year data
Goods-Producing Domain Service-Providing Domain

ECONOMIC DEVELOPMENT
CITY OF ATTLEBORO COMPREHENSIVE PLAN 45
Attleboro’s employment base is not
expected to undergo major change
between the present conditions and
2030. It will be difficult for Attleboro
to capitalize on growth trends in
information technology, healthcare
and professional services given the
general education level and skills of
its workforce. However, Attleboro
should experience some growth in
retail, as well as trade and services
employment which is expected to
grow on a regional basis.
Between 2001 and 2004, trades
surpassed manufacturing in total
employment regionally. In the same
period, almost twice as many people
were employed in services than
manufacturing.89
Small– to mid–sized businesses have
gained prominence in Attleboro.
Although the City’s total
employment figures have declined
25 percent between 2001 and 2009,
the number of employers in Attleboro increased 6 percent, indicating a shift away from businesses
that employ a large number of people, for example large industry and, notably, manufacturing.
During this same period, wages have also increased by roughly 17.6 percent, consistent with the
trend towards service jobs.90
Table 4D–5. Attleboro Wages, Employment and Employers
2001 2002 2003 2004 2005 2006 2007 2008 2009*
Average Weekly Wage $631 $636 $683 $715 $732 $775 $792 $819 $742 Average Monthly Employment 21,649 20,418 19,744 19,710 19,089 18,639 18,664 17,872 16,238 Number of Employers 1,002 1,040 1,049 1,087 1,078 1,093 1,088 1,057 1,063 Source: Massachusetts Department of Labor and Workforce Development, ES–202, Economic Data Programs. *2009 estimate based on 3rd quarter data
89 SRPEDD Comprehensive Economic Development Strategy, Ch. II–7, 2006.
90 Massachusetts Department of Labor and Workforce Development, ES–202, Economic Data Programs,
<www.detma.org>, and Community Opportunities Group, Inc.
0%
20%
40%
60%
80%
100%
% E
mpl
oym
ent
Bas
e
2001 2002 2003 2004 2005 2006 2007*
Figure 4D-3. Employment Base Reallocation, 2000-2007Source: MA DOL, ES-202, Economic Data Programs and COG, Inc.
*2007 estimate based on 1st and 2nd quarter data
Construction Manufacturing
Trade, Transportation and Utilities Information
Financial Activities Professional and Business Services
Education and Health Services Leisure and Hospitality
Other Services Public Administration

ECONOMIC DEVELOPMENT
CITY OF ATTLEBORO COMPREHENSIVE PLAN 46
Unemployment
Between 1990 and 2000, Attleboro’s
unemployment rate dropped from 6.9 to
3.7 percent.91 The City’s unemployment
rate in 2000 was consistent with the rates of
most communities in the region and
comfortably below the statewide rate of 4.6
percent.92 However, by the end of the
decade these figures had changed
dramatically. While in 2005 Attleboro’s
unemployment rate was 5.4 percent, due to
the economic recession by the end of 2009,
it was 10.4 percent.
Table 4D–6. Labor Force Estimates by City And Town, First Quarter 2010
Unemployment Rate
Labor Force Employed Unemployed 1Q 2010 1Q 2009
Attleboro 24,396 21,545 2,851 11.70% 10.50%
Mansfield 12,931 11,909 1,022 7.90% 7.40%
North Attleborough 16,443 14,616 1,827 11.10% 9.80%
Norton 10,710 9,614 1,095 10.20% 8.50%
Rehoboth 6,874 6,079 795 11.60% 10.00%
Seekonk 7,600 6,666 934 12.30% 10.30%
Bristol County Workforce Area 200,664 174,755 25,909 12.90% 11.30%
Massachusetts 3,463,467 3,121,333 342,133 9.90% 8.20% Source: MA Department of Workforce Development, Regional LMI Profile: Annual Profile for Bristol County Workforce Area, May 2010, "Labor Force Estimates by City and Town," p. 17.
Note: Data is not seasonally adjusted.
Journey to Work
Journey to Work data published by the Census Bureau indicate that in 1990, 7,554 Attleboro
residents, or 39 percent of the labor force, worked in the City.93 By 2000, the number of residents
working in the City had declined to 6,696, or 31 percent of the labor force. In 2000, 28 percent of the
labor force worked in one of the surrounding communities of North Attleborough, Mansfield,
Norton, Rehoboth and Seekonk in Massachusetts, and Central Falls, Cumberland, East Providence
and Pawtucket in Rhode Island. According to Census 2000, only 6.3 percent of Attleboro’s labor force
91 1990 Census, Summary Tape File 3, Table P070; Census 2000, Summary File 3, Table P43.
92 Census 2000, Summary File 3 Table P43.
93 U.S. Census Bureau, 1990 County–to–County Worker Flow Files online at <www.census.gov>.
2001 2002 2003 2004 2005 2006 2007*
State
Attleboro
$0
$200
$400
$600
$800
$1,000
$1,200
Figure 4D-4. Average Weekly Wage, 2001-2007
Source: MA Department of Revenue, ES-202

ECONOMIC DEVELOPMENT
CITY OF ATTLEBORO COMPREHENSIVE PLAN 47
commutes to Boston for work, and an even smaller percentage (3.7 percent) commutes to
Providence.94 Nearly 74 percent of Attleboro’s residents have daily commutes of 34 minutes or less,
which is consistent with the fact that a majority of its labor force works locally or in a nearby
community.
While most people are employed nearby, the migration of jobs away from Attleboro has resulted in
increased commute times for many City residents. Between 1990 and 2000, the number of people
commuting thirty–five minutes or more to work increased by almost 2,000 people, from 17 percent of
the labor force to 24 percent.95 Today, a small percentage of residents commute more than 90 minutes,
and only 1.9 percent work at home.
Several major public works and construction projects planned for the region may help to mitigate the
effects of increased automobile traffic on the region and create more jobs for Attleboro.
Improvements to Interstate 95 and roadway reconstruction, such as Route 152 as well as the US Route
1A Bridge/Interstate 95, should improve traffic flow.96 ARA’s Industrial Business Park expects to add
jobs to the City, and the construction of the ITC and parking facility will also offer local employment
opportunities.
Commercial Base
Attleboro has four commercial centers or corridors: (1) the US
Route 1, US Route 1A, Interstate 95 triangle; (2) the Route 123
corridor; (3) the Route 152 corridor, and (4) downtown
Attleboro. These commercial areas support small and medium
sized businesses including restaurants, services and retailers.
In some areas, residences are interspersed with businesses. The
density of commercial activity varies from “mom and pop”
businesses along the more rural Route 152 to intense uses
downtown.
Attleboro’s commercial base includes office space as well as
retail enterprise. Nielsen Claritas collects data that indicates
whether there is a retail opportunity gap or surplus within a
specified area. In the area including and surrounding
Downtown Attleboro (based on one, three and five mile radii
from 77 Park Street), there is potential for additional retail development to support existing demand.
Specifically, within a one–mile radius of downtown, there is an excess demand for grocery and
beverage stores, health and personal care stores, and restaurants and drinking places. When the
radius is expanded to five miles, there is unmet demand for most types of retail business.97
94 Census 2000, “MCD/County to MCD/County Worker Flow Files,” Special Tabulation Series, Census 2000
Gateway, online at <www.census.gov>.
95 1990 Census, Summary Tape File 3, Table P050; Census 2000, Summary File 3, Table P31.
96 Jim Hadfield (Transportation Planning Manager, SRPEDD) interview by Community Opportunities Group,
Inc., October 15, 2010; Comprehensive Economic Development Strategy, 2007, 47.
97 Claritas Nielsen, “RMP Opportunity Gap – Retail Stores,” <http://www.claritas.com/sitereports/Default.jsp>.

ECONOMIC DEVELOPMENT
CITY OF ATTLEBORO COMPREHENSIVE PLAN 48
In South Attleboro, another of Attleboro’s commercial centers, within a one mile radius of the
intersection of Robinson Avenue and Brown Street retail demand outweighs supply for most types of
stores and services. The same is true for the area defined by a five–mile radius. (Note: A one–mile
radius captures all of South Attleboro, areas defined by three and five mile radii are located outside
of Attleboro.)98
Industrial Base
As described in other sections of this plan, Attleboro has a rich industrial history. Today, Attleboro’s
economy is still rooted in this industrial base despite declines in manufacturing and shifting toward a
service–based economy. Six percent of the City’s land area is zoned for industrial use and 81 percent
of it is developed.99
The City is currently developing the Industrial Business Park (IBP) located at County and Tiffany
Streets. The site encompasses 175 acres, but only eighty acres are developable due to wetlands and
other constraints. The IBP will host light industrial and office businesses. The first occupant is
constructing a 30,000 square foot building and the City is negotiating with other businesses to locate
at the IBP.
In addition to the IBP, Attleboro also has what is called the Attleboro Corporate Campus, which is
where Texas Instruments was once located. The Attleboro Corporate Campus is located off Route 123
(Pleasant Street) on the eastern side of Attleboro. The development is near capacity and hosts a wide
range of industrial uses as well as institutional uses.100
Educational & Health Care Institutions
Attleboro is fortunate to have Bristol Community
College and Bridgewater State University located in
the City. Bristol Community College offers 173
courses and advanced degree programs in several
areas with a focus on career preparation.101 The
Attleboro campus of Bristol Community College has
grown to enroll approximately 1,300 students over
the last several years.102 Bridgewater State University
offers four–year degrees programs in partnership
with Bristol Community College, expanding area
residents’ access to higher education. Furthermore,
the presence of these schools in Attleboro offers
opportunities for employment for people with
various skill levels.
98 Ibid.
99 Attleboro Assessor’s Database.
100 RKG Associates, Market Analysis for Development of the Attleboro Industrial Business Park, (Revised Draft
July 23, 2010), 26.
101 Bristol Community College website, <http://www.bristolcc.edu>.
102 Ayrassian, email message to Community Opportunities Group, Inc., June 28, 2011.

ECONOMIC DEVELOPMENT
CITY OF ATTLEBORO COMPREHENSIVE PLAN 49
Founded in 1913, Sturdy Memorial Hospital is an acute care hospital located in Downtown Attleboro.
The hospital employs 1,727 people and provides a wide range of medical care and treatments. The
hospital has many community partnerships, and in addition to offering on–site medical care,
sponsors community events throughout the year.103 Sturdy Memorial is an invaluable asset to the
City as a service–provider and as an employer.
Arts and Culture
The presence of arts and culture is regarded as integral to Attleboro’s identity. There are several
cultural institutions in the City including the Attleboro Arts Museum, Women at Work Museum,
Attleboro Area Industrial Museum, Triboro Youth Theatre, and the National Shrine of Our Lady of
LaSalette. People come to Attleboro to visit the Capron Park and Zoo and attend performances by the
Attleboro Community Theatre and the Triboro Youth Theatre.
Furthermore, Attleboro celebrates its arts, culture, and local business with the Expo for the Senses, an
annual festival held during the summer. The festival is held downtown and invites local artists,
shopkeepers and professionals to display their wares and services.
Local and Regional Trends
Southeastern Massachusetts is one of the fastest growing regions in the state. In the SRPEDD region
population growth has outpaced the state since 1970, and this rate of growth is projected to continue.
While there has been some growth in the region’s urban centers, the percent of the urban population
as a part of the total region has declined.
Major transportation projects will greatly influence the region’s growth, including the proposed
South Coast Rail extension of the MBTA’s Commuter Rail line. Currently, under design, one option
for the future rail line involves an extension through Attleboro. This is one of three alternatives to
connect New Bedford and Fall River with downtown Boston. Construction of the commuter rail
extension will attract new, higher–income residents from outside of the region and will promote
economic growth in the region. An influx of higher–income residents could spawn the growth of the
retail/services industries as well as investment in small business.
Looking forward, between 2005 and 2030, SRPEDD estimates that the regional population will grow
25 percent and regional employment will grow 24 percent. However, this growth will primarily
occur in the region’s suburban communities. While the suburbs experience dramatic growth, urban
centers in the region,104 including Attleboro, Fall River, New Bedford, and Taunton, will likely
experience continued decline in their share of the overall population from 48 to 43 percent.105
SRPEDD projects that the employment share of the region’s four main urban centers will decline
from 52 to 45 percent between 2000 and 2030, and employment growth will occur in suburban
103 Sturdy Memorial Hospital website, <http://www.sturdymemorial.org>.
104 The southeast region of Massachusetts is defined by the towns of Plainville, Mansfield, Norton, Raynham, and
Middleborough to the north, Carver and Wareham to the east, the Rhode Island border to the west and Buzzards
Bay to the south.
105 SRPEDD, 2003 Regional Transportation Plan, Chapter 2, Pages 2, 4, and 7.

ECONOMIC DEVELOPMENT
CITY OF ATTLEBORO COMPREHENSIVE PLAN 50
communities.106 Communities such as Mansfield, Norton, North Attleborough, Raynham, Taunton,
and Middleborough will likely see their employment figures rise by over three thousand jobs during
this time.107
National employment trends point to an aging labor force, declines in participation rates, a
continuing shift away from manufacturing and trend toward employment growth in service
industries including information technology, healthcare, childcare, and professional services.
Analyses completed by SRPEDD indicate that Southeastern Massachusetts will closely follow these
national trends.108 The decline of manufacturing in the region will slow as the “cumulative effects of
nearly three–quarters of a century of ‘de–industrialization’ [that] produced an acute employment
shock in the region” over the previous 20–25 years tempers.109 While the fields of information
technology and high–tech manufacturing should continue their steady rise throughout the region,
industries such as professional services, healthcare, and child–care services are likely to experience
the greatest growth on a regional basis.110 Recent changes in the region’s employment base highlights
this shift.
Issues, Challenges, and Opportunities Economic development is a pressing issue for the City of Attleboro and the City is working
diligently to retain current business and bring new business to the City. Although the Office of
Economic Development has been established under the Mayor’s Office, there is no City office or
position working exclusively on this effort.
As one of New England’s former manufacturing centers, Attleboro’s workforce has been skilled
in the production and manufacture of goods. Services, technology, and healthcare are growing
industries and require different skills and higher levels of education.
US Route 1 in South Attleboro bisects the City in its western corner. Along US Route 1 are retail
and other commercial establishments that draw heavy car traffic and are fronted by large parking
lots. The stretch of Route 1 that runs through Attleboro is visually unappealing and chaotic, and
creates a physical barrier between South Attleboro and the rest of the City.
The City is fortunate to have an existing network of infrastructure, public transportation (bus and
train service), and access to Interstate 95. Attleboro is close to Providence, its economic base and
universities, and within one hour’s distance from the Boston metro area. Furthermore, Attleboro
has a unique history and cultural presence that contribute to the attractiveness of the City as a
place to live.
Once a center of commercial and industrial activity, Attleboro’s downtown is currently
underutilized. Many storefronts are vacant and retail and services are limited. The City continues
to work toward the economic revitalization of this area.
106 SRPEDD, 2003 Transportation Plan, Chapter 3 “Socio–Economic Projections,” Page 12.
107 SRPEDD, 2003 Transportation Plan, Chapter 3 “Socio–Economic Projections,” Page 11.
108 SRPEDD, 2003 Transportation Plan, Chapter 3 “Socio–Economic Projections,” Page 10.
109 UMass–Dartmouth Center for Policy Analysis. Economic History of the Massachusetts South Coast.
110 SRPEDD, 2003 Transportation Plan, Chapter 3 “Socio–Economic Projections,” Page 8.

ECONOMIC DEVELOPMENT
CITY OF ATTLEBORO COMPREHENSIVE PLAN 51
Given Attleboro’s industrial past, it is not surprising that there are several brownfields where
factories and other industrial uses once were. Several sites are clean and are currently used for
multiple purposes. However, this is a real and current issue for the City as it looks to redevelop
some of these areas.
Attleboro is home to several non–profit organizations, including those in the healthcare industry.
The organizations are tax–exempt and while the City benefits from the many jobs and the market
they provide to “spin–off,” or secondary businesses, such as lunch spots, convenience stores and
copy centers, this benefit may be offset by the loss of tax revenue.
Recommendations
Create an Economic Development Coordinator position at the municipal staff level to guide the
City’s economic development efforts. The coordinator would work to draw business to Attleboro,
provide support to existing businesses, and act as a liaison between the City and business
community. The coordinator could link City departments, including the Community
Development Department, Mayor’s office and others working to promote economic revitalization
in the City.
The City should work with South Attleboro neighborhoods to develop a revitalization plan for
US Route 1 with the intent of making it more attractive and less of a physical barrier.
The City should work with Downtown businesses to promote downtown and draw people into
the downtown area. Furthermore, the City should work with local institutions, including
educational institutions, to locate in the vicinity of the Central Business District. (See Goal 10
Policies 3, 9, and 11.)
The City should continue to invest in business and industrial development in designated areas
(IBP). (See Goal 9, Policies 7, 8, 13, and 14.)
The City should explore whether the loss of tax revenue from the presence of several non–profit
organizations offsets the benefits from the jobs they provide and support to secondary businesses
and services.

TRANSPORTATION
CITY OF ATTLEBORO COMPREHENSIVE PLAN 52
IV.E. Transportation
Existing Conditions
The City of Attleboro is well served by a range
of transportation options. With its downtown
center the hub of several major routes and
with major interstate highways within City
limits or close by, Attleboro’s existing road
network offers both local and regional access
for visitors and residents alike. While the
majority of travelers on Attleboro’s road
network use private vehicles, the City is also
served by a local and regional bus system. In
addition, commuter rail stations in Downtown
Attleboro and South Attleboro provide
another transit option for people who do not
own or wish to use their own cars.
Transportation and Land Use
A road network not only determines the level of mobility and accessibility of a place, it also has a
close relationship with—and in many cases is a determining factor of—a community’s land use
pattern. Telling the story of the evolution of Attleboro’s transportation infrastructure is virtually the
same as telling the story of its overall development pattern. The first phase of Attleboro’s development relied on its waterways, with early tanneries and mills
locating along the banks of the Ten Mile River around the turn of the eighteenth century. Later, the
focus of industry shifted from waterways to roads with businesses locating in what would become
the downtown, around the junction of major roadways from Boston to Southeastern Massachusetts
and from Plymouth to Providence.111 In 1836, the Boston–Providence Railroad arrived, anchoring
Attleboro’s identity as an industrial urban center.112 This process established the land use and
transportation pattern still evident in Downtown Attleboro today: major roadways (now Route 118,
Route 123, and Route 152) and rail radiating from a dense, urban core. Over time, another residential center formed in South Attleboro and commercial development
proliferated along and between US Route 1 and US Route 1A. Until the 1960s, Attleboro consisted of
these two distinct areas, separated by farmland and open space and connected by Route 123. The
arrival of Interstate Highways in the 1960s (together with zoning decisions made by the City in the
1970s and early 1980s) facilitated the development of large tracts of Attleboro’s open land.
Neighborhoods of first single–family and later multi–family homes developed to the south and
southeast of the downtown area. Since the 1970s, these areas have continued to develop along with
pockets of single–family homes west of Interstate 95.113
111 City of Attleboro, Open Space and Recreation Plan (2002), 10.
112 Community Opportunities Group, Inc. Land Use Growth Management Study, (2000), 9.
113 Ibid.
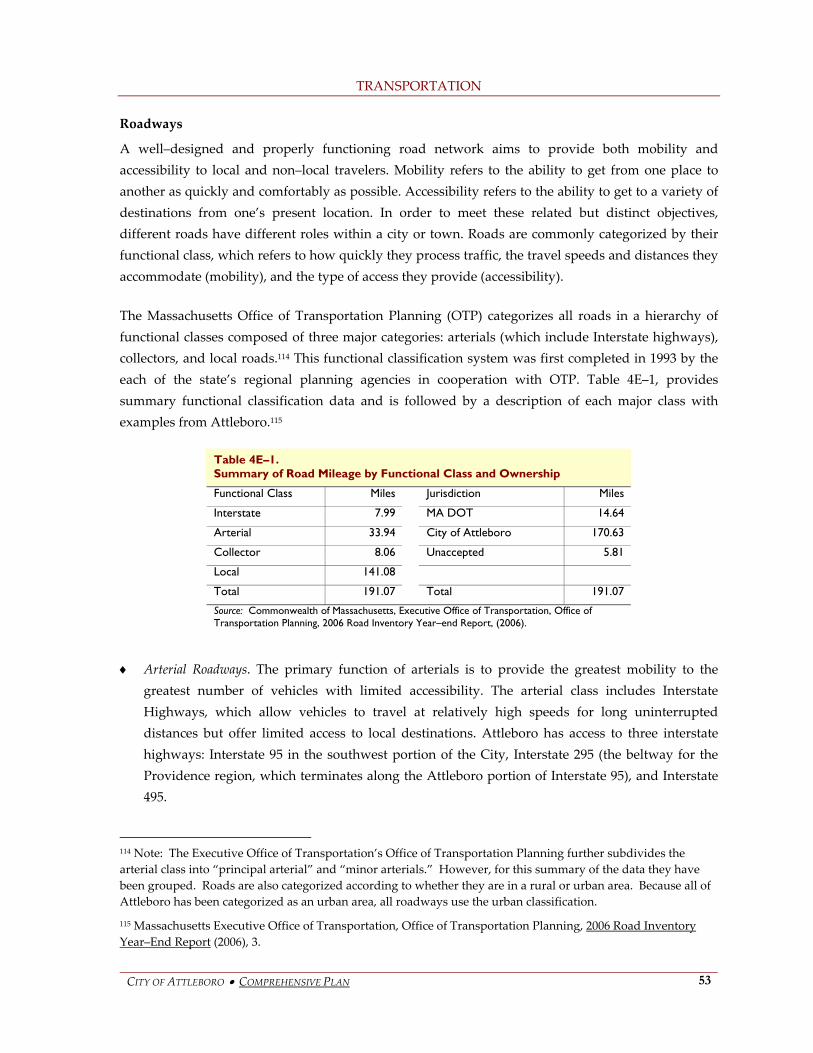
TRANSPORTATION
CITY OF ATTLEBORO COMPREHENSIVE PLAN 53
Roadways
A well–designed and properly functioning road network aims to provide both mobility and
accessibility to local and non–local travelers. Mobility refers to the ability to get from one place to
another as quickly and comfortably as possible. Accessibility refers to the ability to get to a variety of
destinations from one’s present location. In order to meet these related but distinct objectives,
different roads have different roles within a city or town. Roads are commonly categorized by their
functional class, which refers to how quickly they process traffic, the travel speeds and distances they
accommodate (mobility), and the type of access they provide (accessibility).
The Massachusetts Office of Transportation Planning (OTP) categorizes all roads in a hierarchy of
functional classes composed of three major categories: arterials (which include Interstate highways),
collectors, and local roads.114 This functional classification system was first completed in 1993 by the
each of the state’s regional planning agencies in cooperation with OTP. Table 4E–1, provides
summary functional classification data and is followed by a description of each major class with
examples from Attleboro.115
Table 4E–1. Summary of Road Mileage by Functional Class and Ownership
Functional Class Miles Jurisdiction Miles
Interstate 7.99 MA DOT 14.64
Arterial 33.94 City of Attleboro 170.63
Collector 8.06 Unaccepted 5.81
Local 141.08
Total 191.07 Total 191.07
Source: Commonwealth of Massachusetts, Executive Office of Transportation, Office of Transportation Planning, 2006 Road Inventory Year–end Report, (2006).
Arterial Roadways. The primary function of arterials is to provide the greatest mobility to the
greatest number of vehicles with limited accessibility. The arterial class includes Interstate
Highways, which allow vehicles to travel at relatively high speeds for long uninterrupted
distances but offer limited access to local destinations. Attleboro has access to three interstate
highways: Interstate 95 in the southwest portion of the City, Interstate 295 (the beltway for the
Providence region, which terminates along the Attleboro portion of Interstate 95), and Interstate
495.
114 Note: The Executive Office of Transportation’s Office of Transportation Planning further subdivides the
arterial class into “principal arterial” and “minor arterials.” However, for this summary of the data they have
been grouped. Roads are also categorized according to whether they are in a rural or urban area. Because all of
Attleboro has been categorized as an urban area, all roadways use the urban classification.
115 Massachusetts Executive Office of Transportation, Office of Transportation Planning, 2006 Road Inventory
Year–End Report (2006), 3.

TRANSPORTATION
CITY OF ATTLEBORO COMPREHENSIVE PLAN 54
In addition to Interstates, Attleboro is also well served by a network of other arterial roads
including Route 118, Route 123, and Route 152, all of which converge in Attleboro’s downtown.
Route 123 is also a route from Downtown to South Attleboro, where it intersects with Route 1
and 1A. Together with the Interstates, these roads comprise 22 percent of Attleboro’s total road
mileage.
Collector Roads. Collectors provide some level of both mobility and access by collecting traffic
from smaller local roads and funneling it onto arterials. In Attleboro, they account for a relatively
small percentage (4 percent) of the City’s total road mileage. Pike Avenue, Rocklawn Avenue,
and Robinson Avenue; Brown Street, Collins Street, Tiffany Street, May Street, Bacon Street, and
Bishop Street; a portion of West Street and Adamsdale Road function as collector roadways.
Local Roads. All roads not classified as Arterial or Collector fall into the category of local roads. The primary purpose of local roads is to provide access to local destinations with little emphasis
on mobility. Local roads comprise the majority (74 percent) of Attleboro’s centerline road miles.
Most of the roads in Attleboro are owned and controlled by the City. The Massachusetts Department
of Transportation (DOT) owns small sections of collector and local roads, and a more substantial
percentage of the City’s arterials. About three percent of the Attleboro’s roads are unaccepted ways,
including roads open for public use but not formally accepted by the Municipal Council, as well as
private ways.
Planned Roadway Projects
As part of its capital improvements program, the City proposes, plans, and tracks reconstruction and
new construction of Attleboro’s roadways. The CAPITAL IMPROVEMENTS PROGRAM for fiscal year
2011–2015 includes the following projects:
Reconstruction of Route 152 (North Main Street), which will be completed in two phases:
Phase I was completed in Fall 2009 and reconstructed North Main Street from Toner
Boulevard to Holcott Drive.
Phase II was completed in Summer 2011 and reconstructed North Main Street from Holcott
Drive to Claflin Street.116
Street Resurfacing Program: This program has been implemented continuously since 1986 and is
operated with Chapter 90 funds. Each year, the Mayor and Department of Public Works generate
a list of streets chosen from a previously designated area to be resurfaced. Planning for the
program typically is conducted for five–year time horizons through the fiscal year CAPITAL
IMPROVEMENTS PROGRAM.117
116 Capital Improvements, Program, Fiscal Years 2011–2015, 63, 95; Gary Ayrassian (Director of Planning and
Development, Attleboro, MA) interview by Community Opportunities Group, Inc., December 10, 2007.
117 Gary Ayrassian, December 10, 2007.

TRANSPORTATION
CITY OF ATTLEBORO COMPREHENSIVE PLAN 55
In addition to the projects listed above, the City has completed roadway improvements on Tiffany
Street between Interstate 95 and County Street. The project is part of the construction for the
Industrial Business Park and includes new sidewalks and pavement to accommodate increased
vehicle and truckloads.118
Bridges
Attleboro’s CAPITAL IMPROVEMENTS PROGRAM also includes the design and construction status of
Attleboro’s bridges. Those listed in the fiscal year 2011–2015 CIP include:
County Street Bridge replacement over the Massachusetts Bay Transportation Authority (MBTA)
railroad tracks: Construction was completed in June 2011.
Olive Street Bridge replacement over MBTA/Amtrak railroad tracks: This project started
construction in Spring 2012 and is expected to be completed in 2013.
North Main Street Bridge replacement over the Bungay River (this project will replace the
original bridge which dates to 1930): Construction was completed in June 2012.
Olive Street Bridge replacement over MBTA/Amtrak
Design of the Bank Street Bridge over the Bungay River: Design for this project will begin in
August 2012.
Pitas Avenue Bridge design: Funds have been requested for design. 119
In addition to the City’s CAPITAL IMPROVEMENTS PROGRAM, the condition, as well as the planning and
construction status, of Attleboro’s bridges is reported in the Southeast Regional Planning and
Economic Development District’s (SRPEDD) REGIONAL TRANSPORTATION PLAN. The REGIONAL
TRANSPORTATION PLAN distinguishes inadequate bridges in terms of whether they are structurally
deficient or functionally obsolete. A bridge is structurally deficient if the bridge deck, pavement, or
supporting structure fails to meet the requisite standards.120 Of the 59 structurally deficient bridges
identified in SPREDD communities, three are located in Attleboro. However, one of these (the
Thacher Street bridge above the MBTA/Amtrak railroad) underwent reconstruction in 2007.121
Functionally obsolete bridges have inadequate width and/or vertical clearance. These bridges do not
warrant as urgent attention as structurally deficient bridges, but they are nevertheless important to
monitor, especially if used as an evacuation route. Of the 94 functionally obsolete bridges identified
in the SRPEDD 2007 REGIONAL TRANSPORTATION PLAN, fifteen are located in Attleboro. Four of the 94
identified bridges are scheduled for or are undergoing improvements.122
118 John Clover (DPW Superintendent, City of Attleboro) interview by Community Opportunities Group, Inc.,
October 19, 2010.
119 Capital Improvements, Program, Fiscal Years 2011–2015, 63–64, 95; Gary Ayrassian, August 31, 2010.
120 Southeast Regional Planning and Economic Development District. 2007 Regional Transportation Plan, (2007),
7–1.
121 Ibid, 7–3,4.
122 Ibid, 7–6–10.

TRANSPORTATION
CITY OF ATTLEBORO COMPREHENSIVE PLAN 56
Public Transportation
Attleboro is fortunate to have a wide range of transportation alternatives to private auto use
including commuter rail, regional bus service, and airports nearby.
Bus Service
The Greater Attleboro–Taunton Regional Transit Authority (GATRA) provides local and regional
public transportation for Attleboro. Operating in twenty–three member communities, GATRA
provides local fixed route bus service, inter–city bus service, paratransit, Medicaid and Human
Services transport, and commuter rail connection service. Five fixed routes provide transportation
between Attleboro and neighboring communities, including North Attleborough, Plainville, Seekonk,
Norton, and Taunton.123 Annually, approximately 250,000 people ride GATRA buses.124
Rail Service
Attleboro is home to two Massachusetts Bay Transportation Authority (MBTA) Commuter Rail
stations: one in Downtown Attleboro and the other in South Attleboro. Located on the MBTA’s
Providence/Stoughton Line, the commuter rail offers service to major regional destinations such as
Boston (approximately 45 minutes from Downtown Attleboro) and Providence (approximately 20
minutes from Downtown Attleboro).
Parking capacity is an issue at both
commuter rail stations. At the Downtown
Attleboro station, there are 780 formal
parking spaces125 and 200 spaces on private
property. The SRPEDD 2007 RTP reports
that, when last studied in 1999, these spaces
were 96 percent full by 9:00 a.m. The City is
constructing an Intermodal Transportation
Center (ITC) in the downtown as part of the
Downtown Development Plan. One of the
objectives of the ITC will be to add parking
for commuters.126 At the South Attleboro
station, there are 567 formal parking spaces
with informal parking providing another
195 spaces. 127 The total parking supply (762 spaces) reaches capacity by 7:15 a.m. each weekday.
GATRA is currently awaiting a commitment from the MBTA to match federal funds for the
development of an expanded parking facility for the South Attleboro station.
123 Greater Attleboro–Taunton Regional Transit Authority, <www.gatra.org/>.
124 Ayrassian, 31 August 2010.
125 Massachusetts Bay Transportation Authority, <www.mbta.com>.
126 SRPEDD, Regional Transportation Plan (2007), 5–22 to 5–23 passim.
127 Massachusetts Bay Transportation Authority, <www.mbta.com>.

TRANSPORTATION
CITY OF ATTLEBORO COMPREHENSIVE PLAN 57
Air Service
Attleboro is served by two nearby commercial airports: Logan International Airport in Boston
(approximately 42 miles away) and T.F. Green International Airport in Warwick, Rhode Island
(approximately 20 miles away).
Pedestrian and Bicycle Accommodation
Proposed Pedestrian Improvements
With an historic downtown core and substantial swaths of older, residential neighborhoods,
Attleboro holds great potential as a walkable community. However, in some areas, insufficient and/or
poorly maintained pedestrian infrastructure makes walking difficult and potentially unsafe.
Attleboro roadways with documented or potential pedestrian issues are identified in the SRPEDD
2007 REGIONAL TRANSPORTATION PLAN and are summarized in Table 4E–2.
Attleboro has installed new sidewalks on Park Street and improved street lighting to try to address
the pedestrian dangers of the street.128 In addition, the City’s current Sidewalk Reconstruction
Program continues to improve walking conditions along all Attleboro streets. The program is similar
to the Street Resurfacing Program in that it began in 1986 and is implemented annually. The Mayor,
together with the Department of Public Works and Schools Department, generate a list of sidewalks
requiring reconstruction and/or streets that require new sidewalk construction. Like the Street
Resurfacing Program, the Sidewalk Reconstruction Program is operated with Chapter 90 funds.
Table 4E–2. Roadways with Pedestrian Issues
Road Name/Intersection Roadway Characteristics
Park Street (Union to County) Urban corridor, high pedestrian crash history
Dexter Street (S. Main to Oakdale) Incomplete/no sidewalks, close to 2+ destinations, pedestrian crash history
Newport Ave (Park Circle to Barrows) Incomplete/no sidewalks, close to 2+ destinations, pedestrian crash history
Oakhill Ave (Lee Street to Rehoboth) and Park Street to Steere Street
Incomplete/no sidewalks, close to 2+ destinations
Route 1 – Washington Street (Newport Avenue to North Attleborough)
Incomplete/no sidewalks, close to 2+ destinations (Mass DOT jurisdiction)
Source: Southeastern Regional Planning and Economic Development District, 2007 Regional Transportation Plan, (2007), 22–24; John Clover, October 19, 2010.
With the planned construction of the ITC and overall revitalization and redevelopment goals,
Downtown Attleboro constitutes a particular area of focus with regard to pedestrian issues. These
issues were discussed in ADVANCING DOWNTOWN ATTLEBORO: DOWNTOWN DEVELOPMENT PLAN AND
IMPLEMENTATION STRATEGY, which was produced to coordinate planning for the proposed ITC with
overall downtown redevelopment.129 Recommendations to promote pedestrian safety and
128 John Clover, October 19, 2010.
129 Goody, Clancy & Associates. Advancing Downtown Attleboro, (Dec 2006), 22, 37.

TRANSPORTATION
CITY OF ATTLEBORO COMPREHENSIVE PLAN 58
convenience included installing additional crosswalk improvements throughout the downtown,
enhancing sidewalks over the three downtown rail overpasses, and making general improvements to
sidewalks in both residential and commercial areas.
Planned bicycle projects
Two bike routes have been designated by the City and Bike Attleboro. The routes are marked with
signage and striping on the roadway. The first route is 3.2 miles long and includes Rome Boulevard,
Rathbun Willard Drive, Dennis Street, Mechanic Street, Riverbank Road, Watson Avenue, Hodges
Street, Water Street, West Street, and North Avenue. The second route is 7.2 miles and includes South
Main Street, Thurber Avenue, Oak Hill Avenue, Locust Street, Thacher Street, County Street and
Tiffany Street.130 Aside from these local projects, there is an opportunity for Attleboro to connect to
the following regional bikeways: 131
Mansfield Bike Path, connecting by way of Thacher Street, Lamb Street, South Main Street,
Maple Street, Park Street, Bishop Street, Pike Street, Peckham Street, Union Road, South
Worcester Street, and West Main Street in Norton.
Blackstone River Bikeway and the Ten Mile River Greenway, connecting by way of County
Street, Central Ave/Newman Avenue (into Seekonk), and Brook Street (into Rhode Island).
Critical Traffic Areas
The Southeastern Regional Planning and Economic Development District (SRPEDD) is the regional planning agency for Attleboro. Every three years SRPEDD publishes a REGIONAL TRANSPORTATION
PLAN (RTP), which identifies congestion issues for each municipality within the Southeastern Massachusetts Municipal Planning Organization. The most recent iteration of the RTP, completed in 2007, identifies the following congestion issues in Attleboro:132
North Main Street (Route 152) at Holden Street, Intersection: This intersection was first identified as a
congestion problem in 1985. Various solutions were considered, including construction of a new connector road between Route 123 and Route 152. The City is now addressing this issue through a two–phase widening and reconstruction project for North Main Street. Phase I is complete. It widened and reconstructed North Main Street from Toner Boulevard to Holcott Drive. Phase II is substantially complete. It slightly widened and reconstructed North Main Street from Holcott Drive to Claflin Street.133
Pleasant Street (Route 123) at Starkey Street, Intersection: This intersection (essentially the other end of Holden Street) functions as a connector between North Main Street and Pleasant Street and
becomes extremely congested as vehicles attempt to bypass the Central Business District. Further
study of the issue has been recommended.
130 Goody, Clancy & Associates. Advancing Downtown Attleboro, (Dec 2006), 22, 37; and Gary Ayrassian,
interview, Community Opportunities Group, Inc., 31 August 2010.
131 Ibid, 12–16.
132 SRPEDD, Regional Transportation Plan (2007), 5–4 to 5–23 passim.
133 City of Attleboro, Capital Improvements Program, Fiscal Years 2008–2012 (2007), 58, 88; Gary Ayrassian,
interview, Community Opportunities Group, Inc., 10 December 2007.

TRANSPORTATION
CITY OF ATTLEBORO COMPREHENSIVE PLAN 59
South Avenue (Route 123) at Tiffany Street: Due to existing congestion along the Route 123 corridor adjacent to Interstate 95 and the Industrial Business Park, the City is making modifications to
Tiffany Street. The project is intended to both enable Tiffany Street to function as the primary
access road connecting to Interstate 95 and to reduce congestion along Route 123.
North Main Street (Route 152) and Toner Boulevard at Interstate 95 Interchange: Toner Boulevard is a road segment connecting the on–ramps and off–ramps of Interstate 95 at Exit 5 to North Main
Street (Route 152). The intersections at each of these ramps are severely congested. A series of
short–term intersection improvements have been recommended and are awaiting
implementation.
West Street (Route 123) and Newport Avenue/Orr Street, Intersection: This intersection exhibits high levels of congestion at peak periods and requires further study.
In addition to problems along local and state routes, Interstate 95 from the Attleboro/Rhode Island
State line to its interchange with Interstate 93 has also been identified as having congestion issues.
Massachusetts Department of Transportation has completed the first phase of planning for
improvements along this stretch of highway. Proposed improvements include a full range of
alternatives (interchange, highway and non–highway improvements, and multi–modal options).134
Local and Regional Trends
Commute Patterns
As one of the region’s urban centers, Attleboro is both a source of and destination for commuter
traffic. Almost one–third of employed residents work in the City, while the majority of Attleboro’s
jobs are filled by persons residing outside the City. By
far, most people commuting to, from or within
Attleboro travel by car. However, data indicates that
the number of people relying on public transit and
other alternative modes of transportation to get to
work is slowly growing.
Commuting From and Within Attleboro
Attleboro’s employed residents travel both locally and
regionally for work. A relatively large number of
Attleboro residents (31.1 percent in 2000) commute
within the City, making it the most popular destination
for workers. Another nearby destination—North
Attleborough—accounts for the second–highest
number of Attleboro commuters, with about 7.6
percent of the City’s employed labor force traveling
there daily.
134 Keith Ferguson/GateHouse News Service, “Study eyes I–95 fixes,” The Dedham Transcript, January 3, 2010,
http://www.dailynewstranscript.com/news/x1671990979/Study–eyes–I–95–fixes.
Table 4E–3. Attleboro Commute Destinations
Destination Number of Attleboro Workers
Attleboro 6,696
North Attleborough 1,638
Boston 1,357
Mansfield 882
Providence, RI 802
Pawtucket, RI 559
Norwood 525
Foxborough 490
Taunton 431
Franklin 388
Norton 367
Source: Census 2000, Journey to Work (MCD/County to MCD/County Worker Flow Files)

TRANSPORTATION
CITY OF ATTLEBORO COMPREHENSIVE PLAN 60
Interstate 95 provides access to larger, regional employment centers such as Boston and Providence,
Rhode Island, with 6.3 percent and 3.7 percent of the City’s workforce commuting there respectively.
In 2000, 415 Attleboro residents worked at home, a 13.4 percent increase from 1990. Other top
commuter destinations include Mansfield, Pawtucket (Rhode Island), Norwood, Foxboro, Taunton,
Franklin, and Norton.135
In Attleboro, as in most small urban or
suburban communities, driving alone is the
most common means of transportation for
commuting. Between 1990 and 2000, the
percentage of commuters who drove alone
increased slightly while the percentage of
those who carpooled decreased slightly. In
2000, about 5.4 percent of commuters used
public transportation, a slight increase from
4.3 percent in 1990 with the majority of those
riders (77 percent in 2000) using the MBTA
commuter rail. The number of people who
walk to work dropped by half between 1990
and 2000, according to Census data.136
Furthermore, 2010 estimates for this data
indicate that as a proportion of the labor force,
3 percent fewer Attleboro residents drive
alone to work than in 2000 and approximately 3 percent more people ride public transportation. The
number of people who bicycle to work almost doubled, totaling 78 people in 2010. More people work
from home, an increase of 19 percent from 2000.137
The average travel time to work for Attleboro residents in 2000 was 27 minutes, a six minute increase
from the average in 1990.138 In 1990, the majority of Attleboro commuters spent 10 to 14 minutes
commuting, while in 2000 the most common commute time was between 15 and 19 minutes. In
general, the number of Attleboro workers with shorter commute times (under 25 minutes) decreased
between 1990 and 2000 and the number with longer commute times (over 25 minutes) increased. The
135 U.S. Bureau of the Census, 2000, MCD/County t o MCD/County Worker Flow Files,
<http://www.census.gov/population/www/socdemo/journey.html>, [accessed 19 Oct 2007].
136 U.S. Bureau of the Census, 1990 Census, Summary File 3, “P49: Means of Transportation to Work,” and
Census2000, Summary File 3, “P30: Means of Transportation to Work,” American Fact Finder at
http://factfinder.census.gov/, [accessed 19 Oct 2007]. Note: The dramatic drop between 1990 and 2000 data
suggest the possibility that these figures are a product of data collection error, rather than a reflection of actual
commuter patterns.
137 Nielsen Claritas, “Demographic Snapshot 2010 Report,” Site Reports.
138 U.S. Bureau of the Census, 1990 Census Summary File 3, “P051: Aggregate Travel Time to Work,” and 2000
Census Summary File 3, “P33: Aggregate Travel Time to Work,” American Fact Finder at
<http://factifinder.census.gov/”, [accessed 19 Oct 2007].
Table 4E–4. Means of Transportation to Work
Number of Attleboro Workers
1990 2000
Car, truck, or van: 17,479 19,475
Drove alone 15,245 17,276
Carpooled 2,234 2,199
Public transportation 829 1,131
Motorcycle 26 21
Bicycle 32 39
Walked 704 351
Other means 78 108
Worked at home 366 415
Total commuting 19,148 21,125
Source: U.S. Bureau of the Census, Census 1990, SF 3, Table P049; Census 2000, SF3, Table P30.

TRANSPORTATION
CITY OF ATTLEBORO COMPREHENSIVE PLAN 61
most dramatic change between 1990 and 2000 was the number of people traveling over ninety
minutes to work, which increased 262 percent between 1990 and 2000.139
Estimates for 2010 travel times to work for
Attleboro residents indicate a general
increase in all commute time groupings
since 2000, with percent changes ranging
from 1.7 to 20.9 percent. The greatest
increase is in people traveling 45 to 59
minutes to work. It is important to note,
however, that these numbers are a function
of estimated population changes. They
demonstrate percentage changes in travel
time groupings if current trends were to continue, without taking into account the affect of other
variables that may affect commute times.140
Figure 4E-1. Percent Change in Travel Time to Work, 1990-2000
Source: Bureau of the Census 1990, SF3 Table P050; Census 2000, SF3 Table P31
-0.5 0 0.5 1 1.5 2 2.5 3
Less than 5 minutes
5 to 9 minutes
10 to 14 minutes
15 to 19 minutes
20 to 24 minutes
25 to 29 minutes
30 to 34 minutes
35 to 39 minutes
40 to 44 minutes
45 to 59 minutes
60 to 89 minutes
90 or more minutes
139 For purposes of comparison, the number of Attleboro commuters overall increased 10% between 1990 and
2000.
140 Nielsen Claritas, “Demographic Snapshot 2010 Report.”
Table 4E–5. Actual and Estimated* Travel Time to Work
1990 2000 2010*
Less than 15 Minutes 6,866 6,321 6,429
15 – 29 Minutes 7,051 7,319 7,302
30 – 44 Minutes 2,821 3,462 3,750
45 – 59 Minutes 1,196 1,772 2,143
60 or more Minutes 1,214 2,251 2,369
Source: Bureau of the Census 1990, SF3 Table P050; Census 2000, SF3 Table P31; Claritas, Inc. Pop–facts: Demographic Snapshot 2010 Report.

TRANSPORTATION
CITY OF ATTLEBORO COMPREHENSIVE PLAN 62
Commuting to Attleboro
As one of the region’s largest employment centers, Attleboro
is itself a commute destination for residents in other cities
and towns. The largest percentage (9.3 percent) of commuters
to Attleboro (excluding Attleboro residents) comes from
Pawtucket, Rhode Island. Other Rhode Island municipalities
send significant numbers of workers to Attleboro, including
Cumberland, Providence, and East Providence. In
Massachusetts, the top residences for Attleboro workers
other than Attleboro are the nearby communities of North
Attleborough and Taunton (sending 6.6 and 4.3 percent of
Attleboro’s workers respectively), and Fall River, Norton,
Seekonk, and Rehoboth, each sending between 2.4 to 2.7
percent of the City’s workers.141
Transportation Infrastructure
Planned transit and roadway projects not only facilitate
travel within Attleboro but also support the economic vitality
of the City. Attleboro will gain prominence as a regional
transportation hub through the development of the ITC. This center, with complementary pedestrian
improvements, will stimulate revitalization efforts downtown while responding to increased demand
for public transit. Furthermore, Attleboro is creating bicycle routes and improving its roadway and
bridge infrastructure.
Planned Transit Projects
Attleboro’s ITC will be located on the current site of the Downtown Attleboro MBTA commuter rail
parking lot. The centerpiece of a comprehensive redevelopment planning effort led by the Attleboro
Redevelopment Authority (ARA), the ITC is a response to several trends and issues affecting existing
transit facilities:
A seven percent increase in ridership on the Attleboro/Providence MBTA line between
February 2001 and February 2005142 and subsequent increase in demand for commuter
parking spaces.
Near–capacity status of the Downtown Attleboro station parking lots. According to a 1999
study, the station’s 970–space parking lot was 96 percent full by 9:00 a.m.143
Downtown congestion problems and delays associated with peak–period access to the
existing commuter parking.144
Lack of integration between existing transit service, particularly the Great Attleboro Taunton
Regional Transit Authority (GATRA) and the MBTA.
141 U.S. Bureau of the Census, 2000, MCD/County to MCD/County Worker Flow Files.
142 Ibid, 10–2.
143 Southeast Regional Planning and Economic Development District. 2007 Regional Transportation Plan, (2007),
5–23.
144 Goody, Clancy & Associates. Advancing Downtown Attleboro, (Dec 2006), 22.
Table 4E–6. Workforce Place of Residence
City or Town Count
ATTLEBORO 6,696
Pawtucket 1,936
N. Attleborough 1,369
Cumberland 719
Providence 612
Norton 569
Seekonk 537
Rehoboth 507
East Providence 486
Central Falls 382
Mansfield 215
Source: Census 2000, MCD/County to MCD/County Worker Flow Files and Community Opportunities Group, Inc.

TRANSPORTATION
CITY OF ATTLEBORO COMPREHENSIVE PLAN 63
The ITC will include a structure with at least 1,050 total public commuter parking spaces (an increase
of approximately 400 spaces), a new GATRA terminal, and pedestrian–friendly streetscape
improvements.145
In order to meet demand for transit services while the ITC is under planning and construction,
GATRA has obtained funds to make the following improvements:146
Renovation of the existing station building.
Expansion of the existing surface lot west of the MBTA railroad tracks by 100–200 parking
spaces.
Existing commuter parking lot redesign, including an additional point of egress and
improved site safety.
The City has made progress with development of the ITC with the clearing of the site and completion
of the layout of the first phase. Currently, the project design is under final review, awaiting approval
and release of funds from the Federal Transit Administration. The riverfront restoration and
streetscape improvement components of the development are currently being designed.147
Issues, Challenges, and Opportunities
Attleboro has an extensive network of transportation infrastructure, but one that has grown and
expanded over time. Therefore, maintenance of existing infrastructure, periodic upgrades, and
safety improvements are of critical importance in the City.
Attleboro is currently developing the ITC and pursuing economic revitalization of the City.
Economic development and transportation go hand–in–hand, and Attleboro has access to major
roadways, rail lines and public transportation. Attleboro has an opportunity to benefit from its
transportation network and use it to promote economic revitalization.
Currently, there are areas of traffic congestion in the City. As Attleboro grows and draws more
business to the City, traffic will increase.
Attleboro is fortunate to offer access to public transportation to its residents. In addition, people
are looking for alternative modes of transport, such as bicycling and walking. The City will need
to respond to this interest and expand its transportation network.
Attleboro is fortunate to have a close relationship with its regional planning agency, SRPEDD.
SRPEDD conducts transportation planning and prepares the TRANSPORTATION IMPROVEMENT
PLAN (TIP) for Southeastern Massachusetts. As many transportation issues are regionally based,
SRPEDD’s active approach to transportation planning has direct impact on Attleboro.
145 Ibid, 31.
146 Southeast Regional Planning and Economic Development District. 2007 Regional Transportation Plan, (2007),
10–10.
147 Ayrassian, August 31, 2010.

TRANSPORTATION
CITY OF ATTLEBORO COMPREHENSIVE PLAN 64
Recommendations
The City should continue to prioritize and plan for roadway infrastructure improvements
through its CAPITAL IMPROVEMENTS PROGRAM. (See Goal 8, Policy 2.)
In an effort to take advantage of the benefits of transit–oriented development, the City should
support and encourage housing development in the downtown area with financial and other
incentives. For downtown revitalization, the City will need to create linkages between the ITC,
housing, retail, services, and arts and culture. (See Goal 10, Policies 4 and 9.)
Attleboro should continue to work with SRPEDD to address regional transportation issues and
planning efforts. (See Goal 8, Policy 1.)
The City should look for ways to link modes of public transportation, creating a multi–modal
transportation network. The City should assess all new development and substantial
redevelopment projects for their ability to contribute to an alternative transportation network
that includes bike lanes, walking paths, and sidewalks. (See Goal 3, Policy 2, and Goal 7, Policy
3.)

ENVIRONMENTAL RESOURCES
CITY OF ATTLEBORO COMPREHENSIVE PLAN 65
IV.F. Environmental Resources148
Existing Conditions
Topography, Geology & Soils
The topography of Southeastern Massachusetts and the Rhode Island region is predominantly
influenced by historic glacial activity. As the area’s glacial ice retreated, melting water left behind
distinct landscape features including glacial ridges, eskers, and outwash plains. These landforms
create topography of level terrain with gently rolling hills characteristic of the region.
As is typical in the region, Attleboro’s landscape is relatively level with elevations ranging between
100 and 140 feet above sea level. There are, however, three hills within the City with elevations
greater than 200 feet: Oak Hill (266 feet), Walnut Grove Hill (253 feet), and Ides Hill (260 feet). Both
Walnut Grove Hill and Ides Hill are comprised of bedrock with a number of exposed ledge
outcroppings and slopes greater than 15 percent. In contrast, Oak Hill consists of unconsolidated
material comprised of boulders, gravels, and sand. Attleboro’s lowlands are dominated by forested
river basins with level topography and vast areas of wetlands.
The geology of Attleboro includes three types of primary bedrock formations: Rhode Island; Dighton;
and Wamsutta. The Rhode Island formation is the most common and is composed of a slightly
metamorphosed conglomerate consisting of sandstone and shale. The Dighton formation, a slightly
metamorphosed conglomerate of shale, mudstone, siltstone, and sandstone, is found primarily along
the southern side of South Avenue between County Street and Interstate 95. The Wamsutta formation
is largely found in locations along the City’s border with North Attleborough extending from the
Highland Avenue area to North Main Street. The Wamsutta formation is considered unique to the
area and is distinguished by its red colored shale and sandstone. In the Walnut Grove Hill area the
formation includes volcanic agglomerates of balsitic and “red” felsite.
Soil profiles in Attleboro range from poorly drained soils with high organic matter content located
within the river valleys to well drained mineral soils consisting primarily of sands and gravels in the
City’s upland areas. The composition of soils in Attleboro was influenced predominantly by historic
glacial activity. These soils are categorized as either glacial till or glacial outwash. Other soil types
common to Attleboro have been influenced by wetlands and river systems and are high in organic
matter. Below is a discussion of the soils in Attleboro associated with these three categories:
Glacial Till consists of unsorted, non–stratified glacial drift consisting of clays, silt, sand, and
boulders transported and deposited by glacial ice. Soils associated with glacial till include
Paxton and Charlton soils found primarily on glacial ridges located in the areas of Highland
Avenue, Walnut Grove Hill, Ides Hill, Locust Street, and Manchester Reservoir. Each of these
areas is characterized by bedrock outcrops and may have slopes greater than 15 percent. Other
soils associated with glacial till include Woodbridge, Ridgebury, and Whitman. These soil
148 Unless otherwise noted, all information contained in this chapter is from the Attleboro Planning Board and
the Attleboro 2009 Open Space and Recreation Plan.

ENVIRONMENTAL RESOURCES
CITY OF ATTLEBORO COMPREHENSIVE PLAN 66
types are located in varying degrees throughout the Attleboro area. Whitman soils, consisting
of a loamy till material, is often used for agricultural purposes and is usually found in
depressions and drainways with slopes of less than three percent. In Attleboro, these soils are
found in the areas of Richardson Avenue, Read Street and lower County Street.
Glacial Outwash Plains consist predominantly of sorted and stratified areas of gravel, sand
and silt deposited by melt water which flowed from retreating glacial ice. Glacial outwash is
commonly found in valleys on landforms known as outwash terraces, eskers, kame terraces,
outwash fans, or deltas. Soils associated with glacier outwash are the most common types
found in Attleboro. Hinkley and Windsor soils are examples of glacial outwash soils found
throughout Attleboro. These soils are commonly utilized for sand and gravel mining
operations such as those found along Read Street, lower County Street, Handy Street and
Thurber Avenue. Other types of glacial outwash soils found in scattered locations throughout
Attleboro are Deerfield and Wareham soils.
Organic and Hydric soils are soils that contain a high organic matter content comprised
mainly of decomposing vegetative materials and are often saturated with water. These soils are
poorly to very poorly drained, and are most often found within depressions and low areas.
Medisaprist soils are the most common type of organic soils found in Attleboro. These soils are
low–lying soils with organic material that range from sixteen inches to more than ten feet of
thickness. The water table is commonly located near or at the ground surface for more than
nine months of the year in these areas. Medisaprist soils are found along river basins and
wetlands such as the Bungay River basin, the Seven Mile River basin, Chartley Brook, and the
Locust Valley area.
Vegetation
Attleboro’s vegetative community is typical to the inland Southeastern Massachusetts area. In the
City’s suburban areas, vegetation is dominated by forest communities interspersed with open fields
and meadows. The predominant forest cover consists of northern hardwoods including upland oaks
and red maple. Nearly all forested areas were cleared at some point in the past for farming or
commercial purposes, thus eliminating virgin timber stands. In more urban areas of the City,
vegetation includes ornamental trees and shrubs planted along roadways and throughout parks and
house lots. These plantings are valued for aesthetic and recreational purposes. They are also
important for screening less desirable views, reducing noise, and abating pollution.
The forested landscape in Attleboro is dominated by two distinct and diverse communities: upland
areas dominated by mixed–oak forests and lower wetland areas dominated by red maple swamps. A
typical upland oak forest consists of a mixture of oak and other tree species in the overstory,
including black oak, white oak, scarlet oak, and red oak. Other tree species typically occur in lesser
numbers mixed with the oaks, including hickory, pine, ash, beech, and maple. These forests typically
support a shrub layer consisting of tree saplings and woody shrubs, such as low–bush blueberry,
huckleberry, witch–hazel, green briar, sassafras, and sheep laurel. Herbaceous plants in these forests
typically include princess pine, teaberry, and various ferns.

ENVIRONMENTAL RESOURCES
CITY OF ATTLEBORO COMPREHENSIVE PLAN 67
Forested wetlands are characterized by saturated or
inundated soils with trees as the dominant cover vegetation.
The dominant tree species in most of Attleboro’s forested
wetlands is the red maple. Other tree species can also be
found in the canopy of these areas including swamp white
oak, tupelo, yellow birch, white ash, green ash, and hemlock.
These wetland areas typically support a diverse shrub layer
including tree saplings or woody shrubs such as red maple,
black alder, high–bush blueberry, sweet pepperbush,
spicebush, arrow–wood, silky dogwood, winterberry, swamp
azalea, green brier, and poison ivy. In addition to the tree and
shrub layers, these forested wetlands often have an herb
layer that includes skunk cabbage, cinnamon fern, sensitive
fern, various club mosses, and sphagnum moss.
Attleboro is home to two unique vegetation communities
considered Priority Sites for rare species by the
Massachusetts Division of Fisheries and Wildlife, Natural Heritage and Endangered Species Program
(NHESP)‘s Massachusetts Natural Heritage Atlas. These communities are also mapped as Exemplary
Natural Communities.
The Coastal Atlantic White Cedar Swamp, located within a portion of the Bungay River floodplain north
of Holden Street and west of Lindsey Street, is one of only twenty remaining in the
Commonwealth.149 This 32.2–acre area is located almost entirely within city–owned land, including
the Bungay River Conservation Area. This community is characterized by a dense, primarily
evergreen, canopy mixed with red maples, a dense shrub layer, and an extensive herbaceous layer.
The Rich Mesic Forest, a forest community dominated by sugar maple and basswood trees located
southwest of Manchester Pond Reservoir, is one of only a few remaining Rich Mesic Forests located
in the eastern part of the state. The moist soils of this area readily decompose fallen leaves and
provide ideal growing conditions for early spring wildflowers, which bloom before new leaf growth
blocks out the sun. The area is characterized by a unique topography of bedrock ridges and
outcroppings consisting of “red rocks” of the Wamsutta Formation. These ridges are separated by
low areas consisting of rich soil and vegetation. Populations of two Massachusetts Threatened
herbaceous plant species have been identified within the Rich Mesic Forest community in Attleboro.
These plants include the largest population of Tiny–flowered Buttercup (Ranunculus micranthus)
found in the state as well as a large population of Pale Green Orchis (Platanthera flava var. herbiola).
Both of these plant species depend upon the unique geology and soil conditions of the Rich Mesic
Forest.
Other significant natural communities in Attleboro include the Hemlock Swamp area, which extends
into the southeastern corner of Attleboro and into portions of the Towns of Norton and Rehoboth.
This area includes a vast wetland community characterized by dense stands of hemlock and spruce
149 Massachusetts Division of Fisheries and Wildlife, Natural Heritage and Endangered Species Program
(NHESP)

ENVIRONMENTAL RESOURCES
CITY OF ATTLEBORO COMPREHENSIVE PLAN 68
trees. The American Holly tree can also be found in great numbers in this area, which has been found
to be its most inland and nearly its most northern occurrence in Massachusetts.
Another significant natural community is a green ash/swamp white oak/red maple swamp complex
identified within a portion of the Locust Valley area. This natural community was identified in a
report entitled A PRELIMINARY ECOLOGICAL ASSESSMENT OF CITY OF ATTLEBORO LAND IN THE LOCUST
VALLEY prepared in January 2000. This wetland plant community was found to be significant, as it is
not dominated by either red maple or eastern hemlock trees like most forested swamps in this area of
Southeastern Massachusetts. Instead, this diverse community is dominated by green ash trees with
an abundance of swamp white oak trees interspersed. The area is important as it provides a diversity
of plant communities and habitat types. While the majority of the community is located on private
property, portions of this community extend into City–owned land.
Fisheries and Wildlife
Attleboro is home to an abundant variety of resident, breeding,
and/or migratory wildlife populations. The City’s forested
upland and wetland areas support populations of a wide variety
of wildlife common to eastern forests. In addition, the City’s vast
acreage of surface water and wetlands accommodate aquatic
species, as well as breeding and feeding sites for a variety of
terrestrial wildlife species. In addition to more common wildlife
species, several animal species listed on the Massachusetts List of
Endangered, Threatened, and Special Concern Species have been
identified in Attleboro. These include one amphibian—the
Jefferson Salamander (Ambystoma jeffersonianum); one reptile—
the Eastern Box Turtle (Terrapene Carolina); and one
invertebrate—the Purple Tiger Beetle (Cicindela purpurea); all of
which are listed as Species of Special Concern.
In an effort to protect the habitat of wetland–dependent wildlife
species, the NHESP has designated five locations within
Attleboro as Estimated Habitats of Rare Wildlife. The largest designated habitat is a two hundred–
acre area found in the northeastern portion of Attleboro, roughly bound by Robison Avenue to the
South, Lindsey Street and a National Grid power line right of way to the west. This area also extends
into portions of Mansfield, North Attleborough and Norton. Another of designated habitat is found
within the vast Locust Valley area of the City. Measuring several hundred acres in size, this habitat is
found within the area roughly bounded by Maple Street, Locust Street, Park Street, Handy Street, and
Oak Hill Avenue. The third designated area is found to the south and west of Manchester Pond
Reservoir and is roughly bounded by the reservoir, Rocklawn Avenue, and South Avenue. Two
smaller designated areas are located in the southwest corner of the City in the Sweeden’s Swamp
area.
NHESP has also certified the presence of 38 vernal pools in Attleboro. Vernal pools are temporary
seasonal bodies of water that provide critical habitat for many vertebrate and invertebrate wildlife
species. While the pools typically fill with spring rains and snowmelt and dry out during the summer
months, many persist throughout the year. Vernal pools are a unique and increasingly vulnerable
Table 4F–1. Major Waterbodies
Water Body Acreage
Manchester Pond 253.8
Orr’s Pond 59.6
Dodgeville Pond 52.9
Chartley Pond 30.1
Hebronville Pond 24.0
Mechanic’s Pond 19.0
Luther Reservoir 16.5
Cooper’s Pond 13.2
Cranberry Pond 12.4
Farmer’s Pond 10.0
Butterfly Pond 8.5
Lake Como 8.1 Source: Attleboro Open Space & Recreation Plan, 2009.

ENVIRONMENTAL RESOURCES
CITY OF ATTLEBORO COMPREHENSIVE PLAN 69
type of wetland that is home to many species of wildlife, some of which are entirely dependent on
these pools for their survival. Several amphibian species rely on these temporary, fish free, wetlands
for breeding. In addition, these habitats are also important resources for many species of birds,
mammals, reptiles, and other amphibians. In addition to the 38 vernal pools certified by NHESP,
Attleboro is home to numerous other pools that have yet to be certified, known as “potential vernal
pools”. Aerial photographic surveys conducted by NHESP have identified 343 potential vernal pools
within the City. The LOCAL WETLANDS PROTECTION ORDINANCE protects potential vernal pools and
certified vernal pools equally. NHESP recently introduced a unique data layer that identifies BioMap Core Habitat areas within
Massachusetts. Core Habitats are the most viable habitat for rare species and natural communities in
Massachusetts. The City of Attleboro has three Core Habitat areas identified within its limits. A very
large habitat in the Locust Valley section of Attleboro provides a valuable wildlife corridor as it
connects rich upland forest communities, vernal pools, and forested wetlands. This core habitat is
unique in its close proximity to the developed downtown of Attleboro and provides a unique
opportunity for recreation and enjoyment of the City’s residents. Additionally, the rich Mesic Forest
in the Manchester Reservoir area and lands adjacent to the Bungay River have also been identified as
Core Habitats. These areas provide an important and unique wildlife corridor within the City.
Water Resources
Watersheds
Watersheds, also known as drainage basins, are
divisions of the land surface into sections from which
water drains to a common point or water body. The
U.S. Geological Survey Water Resources Division
(USGS) divides Massachusetts into 27 watersheds
according to the state’s major rivers.150 While the
majority of Attleboro is located within the Ten Mile
River watershed, smaller areas of the City are located
within the watersheds of the Taunton River, the
Blackstone River and Mount Hope/Narragansett Bay.
Attleboro is also located within several sub–
watersheds, including the Bungay River and Seven
Mile River sub–watersheds. Surface Water
Ponds and Lakes
Approximately 508.1 acres in Attleboro are covered
by surface water. Some of these waterbodies, such as
Hebronville Pond and Dodgeville Pond, are
impoundments created to service industrial mills
along their banks. Others, such as Manchester Pond and Orr’s Pond, serve the City’s water supply.
Table 4F–1 lists the major waterbodies in the City and their surface area acreage. Several of the City’s
ponds are compromised by water pollution and nuisance aquatic vegetation.
150 U.S. Geological Survey, Massachusetts–Rhode Island Water Science Center at
<http://ma.water.usgs.gov/basins>.

ATTLEBORO
NORTON
REHOBOTH
NORTH ATTLEBOROUGH
SEEKONK
PAWTUCKET
MANSFIELD
CENTRAL FALLS
Sources: MassGIS, City of Attleboro
ATTLEBORO
COMPREHENSIVE PLAN
Prepared by:
Community Opportunities Group, Inc.
August 2011
WETLAND &
WATER
RESOURCES
LegendZONE A
ZONE B
Water Supply Watershed
WetlandsCoastal & Tidal Waters
Marsh, Swamp, Bog
OPEN WATER
Forested Wetland
Aquifer
0 0.4 0.8 Miles
.

ENVIRONMENTAL RESOURCES
CITY OF ATTLEBORO COMPREHENSIVE PLAN 70
Rivers and Streams
The City of Attleboro contains some 39.8 linear miles of rivers and streams. The major rivers are the
Ten Mile River, the Bungay River, and the Seven Mile River. The Ten Mile River flows southerly,
from its headwaters in Plainville, through the Town of North Attleborough, the center of the City of
Attleboro, and the Town of Seekonk before emptying into the Seekonk River in East Providence,
Rhode Island. Over eight miles of this 14.5–mile river are located in Attleboro. The majority of land
uses adjacent to the Ten Mile River are urban, consisting of commercial, industrial, and residential
development. There are, however, many undeveloped open spaces along the river corridor including
forested wetland and recreational areas. The Ten Mile River is designated by the Massachusetts
Department of Environmental Protection (DEP) Surface Water Quality Standards as a Class B
waterway, intended to be suitable as habitat for fish, other aquatic life, and wildlife, for primary and
secondary contact recreation, and for irrigation, other agricultural uses, and compatible industrial
cooling and process uses.
In Attleboro, the majority of the Bungay River’s three miles are bordered by expansive wetlands and
floodplain, including a unique Coastal Atlantic White Cedar Swamp community. The City of
Attleboro has made great strides in recent years to protect the river and bordering natural
communities by acquiring nearly three hundred acres of land along the Bungay River for permanent
protection as open space in its natural state. The lower reach of the Bungay River, between Bank
Street and Water Street, flows through an urban area of the City located just north of downtown. The
Bungay River is designated by DEP as a Class B waterway.
The Seven Mile River originates in North Attleborough and flows southerly for approximately two
miles through areas of residential and commercial development located along the US Route 1
corridor to the Attleboro border. Once it enters Attleboro, it flows through Luther Reservoir before
entering Orr’s Pond Reservoir, which serves as a surface water withdrawal point for the city’s public
water supply. The City’s Water Department manages several hundred acres of land in this northern
portion of the watershed for the purpose of protecting the City’s drinking supply. This upper reach of
the Seven Mile River is designated by DEP as a Class A waterway, intended to serve as a source of
public drinking water. Downstream of Orr’s Pond, the Seven Mile River flows parallel to Newport
Avenue where it is bordered by a wide floodplain and wetlands and is designated a Class B
waterway. Wetlands
Nearly 21 percent, or approximately 5.7 square miles, of Attleboro’s total land area is composed of
wetlands. A vital part of the City’s water resources, wetlands provide habitat and food for aquatic
and terrestrial wildlife and act as conduits for the movement of water from one area to another.
Wetlands serve as temporary storage areas for water, filtering out pollution, providing containment
for floodwaters, and allowing the filtered water to be recharged to groundwater.
The Attleboro Conservation Commission administers the Massachusetts Wetlands Protection Act
(MGL Ch. 131 §40), which prohibits impacts to wetland resource areas including rivers, streams,
brooks, ponds, lakes, vegetated wetlands, banks, floodplains, and vernal pools, and provides for a
regulatory 100–foot buffer zone around most wetland areas. The Massachusetts WETLANDS
PROTECTION ACT prohibits the removal, dredging, filling, or alteration of wetland resource area
without first applying to the local Conservation Commission and the state DEP for a permit (Order of
Conditions).

ENVIRONMENTAL RESOURCES
CITY OF ATTLEBORO COMPREHENSIVE PLAN 71
Attleboro’s LOCAL WETLANDS PROTECTION ORDINANCE adds further protection within the geographic
limits of the WETLANDS PROTECT ACT (MGL CH. 131, §40). Specifically, the ordinance protects any vegetated freshwater wetlands, marshes, wet meadows, bogs, swamps, vernal pools, banks,
reservoirs, lakes, ponds of any size, rivers, streams, creeks, beaches, lands under water bodies, lands
subject to flooding or inundation by groundwater or surface water, and lands within 25 feet of any of
these resource areas whether or not they border water bodies. The ordinance allows local review of
proposals within the designated resource areas to ensure that proper erosion and sediment control is
undertaken and that water quality, rare species habitat, agriculture, aquaculture, and recreation
values are protected. Attleboro’s LOCAL WETLANDS PROTECTION ORDINANCE requires a separate
application for a permit from the City for work impacting wetlands.
Aquifers and Water Supply
In 1995, the MADEP mandated that the City provide its water supply from surface sources, rather
than groundwater, due to elevated levels of iron and manganese in the City’s wells. Furthermore, the
City’s wells could not keep up with demand. Currently, there are three active surface water sources
in the Attleboro water supply system: Manchester Reservoir and Orr’s Pond, both located in
Attleboro, and the Wading River, located in Mansfield.
The City of Attleboro currently utilizes the Manchester Reservoir as the main drinking water source
for the City. The Bungay River watershed is considered a future drinking water supply source. There
is a large, high–yield aquifer in the southwestern portion of the City, in the vicinity of Sweeden’s
Swamp. Additionally, several medium–yield aquifers are located in Attleboro, including one adjacent
to Manchester Reservoir and in Hemlock Swamp in southeastern Attleboro.
In 2010, demand averaged 3.5 million gallons per day in winter and 6.75 million gallons per day in
summer.151 The Water Department attributes recent declines in water usage to an increase in water
rates, leak detection programs, 100 percent metering of water, loss of manufacturing in the City,
conservation measures, and water saving devices.
The City is currently undertaking and planning for several large–scale projects to improve water
quality and pressure, including:
Cleaning and lining 13,000 feet of 12–foot water main in South Main Street that dates back to
1894–1896;
Construction of a pipeline to transfer water from Luther Reservoir and Manchester Reservoir
directly to the Water Treatment Plant, bypassing the Seven Mile River during times of
drought to prevent the loss of millions of gallons of water during periods of low
precipitation; and
Replacement of an undersized water main between the Water Treatment Facility and South
Attleboro to improve water pressure and fire fighting capacity.
151 Attleboro Water Department website, “Quick Facts,” < http://www.cityofattleboro.us/water/quickfacts.htm>.

ENVIRONMENTAL RESOURCES
CITY OF ATTLEBORO COMPREHENSIVE PLAN 72
Areas of Critical Environmental Concern
Although the City of Attleboro has long advocated for protection of its natural resources, it is not
without its environmental problems. Present and historic development patterns have affected natural
systems in a variety of ways. Historically, human growth and development in the City was
concentrated in central villages. These villages were primarily located along river corridors, where
the water was harnessed by mills for power. Outlying areas were utilized for agriculture and later for
wood production. As the City has grown, its population has spread from the central villages and
areas of commerce to locations that were formerly more rural in nature. This growth and
development pattern has had a variety of impacts on the natural systems of the community.
Rivers: The Ten Mile River, as well as several other rivers and streams in the City, have been
impacted both from historic industrial usage, as well as from present day land uses within
watersheds. Segments of the Ten Mile River and the Bungay River have been channelized and
dams constructed on these rivers and also the Seven Mile River. These dams concentrate river
sediments, block fish migration, and may exacerbate flooding, while channelization results in
the alteration of a river’s banks and nearby riparian habitat.
Roadway Runoff and Nonpoint Source Discharges: Storm water drainage structures—both
public and private—located throughout the City discharge untreated runoff directly into rivers,
streams, and wetlands. These discharges are the primary source of pollution to waterways and
contribute to an increase in nutrient and chemical contamination. This contamination stems
from surrounding land uses such as commercial and industrial facilities, as well as automobiles
and winter roadway treatments. Increased sedimentation of waterways and water bodies
contribute to shallow water depths, algae blooms, emergent plant growth, and poor aesthetics.
To address these issues, Attleboro adopted a local STORMWATER MANAGEMENT ORDINANCE in
2008.
Habitat Fragmentation and Loss: Development of traditional rural areas has resulted in a loss
of forest and open field habitat. Increased fragmentation of these habitats may result in the
creation of ecologically isolated “islands” that may not be capable of supporting a diversity of
wildlife species. The City should review its unprotected open space parcels, particularly within
its ecologically sensitive areas, to determine potential habitat connections and take steps to
acquire or otherwise protect these landscapes from future development.
Historic Industrial Development (Brownfields): Attleboro’s history as a center of industrial
development has resulted in the presence of several potential brownfields in the City, which at
present may be abandoned or under utilized. A number of these properties may contain soil
and/or groundwater contamination resulting from past commercial/industrial land uses. Many
of these sites are now clean and used for other purposes.
Unlined Landfills: Inactive solid waste landfills in the City likely contribute to soil and
groundwater contamination. At least three inactive landfills are located in Attleboro: off
Peckham Street, Holden Street, and Bishop Street. These landfills have been, or are currently
undergoing, investigation by the Massachusetts Department of Environmental Protection.

ENVIRONMENTAL RESOURCES
CITY OF ATTLEBORO COMPREHENSIVE PLAN 73
Invasive Species: The introduction of non–native plant and animal species—either deliberately
or accidentally—is a region–wide problem. While some non–native species are relatively
benign, others are considered invasive as they may out–compete native species and may
overrun local habitats thus reducing biodiversity. Obvious examples of invasive plant species
in Attleboro include populations of purple loosestrife, common reed, and shining buckthorn in
wetland areas; and norway maple, japanese knotweed, japanese barberry, and common
buckthorn in upland areas. Examples of non–native invasive animal species found in Attleboro
include established populations of mute swans found on many of the City’s ponds, and several
common fish species found in its waterways.
Human/Animal Encounters: Expansion into traditionally undeveloped landscapes has resulted
in both the displacement of wildlife species and the increase in populations of species which
more easily adapt to human activity. This combination can lead to several potential conflicts
and health/safety concerns for people, such as an increase in the number of roadway collisions
and more exposure to diseases such as rabies or lyme disease each of which are common
concerns in Attleboro.
Ecologically Sensitive Areas
Attleboro is home to a diverse collection of natural and cultural resources. These resources contribute
to the community’s quality of life and provide a variety of habitat needs and recreational
opportunities. Several areas of the City are considered ecologically sensitive as they contain unique
natural communities or diverse and/or threatened wildlife population. These areas may be sensitive
to changes in soil conditions, hydrology, and vegetation cover, and changes in these characteristics,
may prevent the areas from supporting the diversity of plant and animal species that are unique to
their location. Below is a list of areas considered ecologically sensitive and the type of ecological
resources that may be found there:
Manchester Pond Reservoir Area: The Manchester Pond Reservoir area is a watershed area for
Attleboro’s drinking water supply. The upper segment of the Seven Mile River flows through this
area and is classified by DEP as an Outstanding Resource Water and Class A watercourse. The area
also contains a Rich Mesic Forest community, which is considered by NHESP to be an Exemplary
Natural Community. Portions of the area also contain a unique topography considered by NHESP to
be rare across Massachusetts. This topography consists of bedrock ridges and outcroppings of “red
rocks” of the Wamsutta Formation. Portions of the area are also mapped by NHESP as a Priority Site
for rare wildlife species as it contains two threatened plant species (Tiny–flowered Buttercup and Pale
Green Orchis) and at least one animal Species of Special Concern (Spotted Turtle). Two vernal pools
have been certified and several potential vernal pools have been mapped in the area.
Bungay River Basin: The Bungay River Basin consists of a broad riparian wetland that includes a
Coastal Atlantic White Cedar Swamp community. This community is considered by NHESP to be an
Exemplary Natural Community and a Priority Site for rare species. The basin is a former and
potential future source of drinking water for the City. Five vernal pools have been certified and
several potential vernal pools have been mapped in the area.

ENVIRONMENTAL RESOURCES
CITY OF ATTLEBORO COMPREHENSIVE PLAN 74
Locust Valley and Oak Hill Area: The Locust Valley and Oak Hill area contains a relatively large tract of
contiguous forest habitat including upland oak forest, red maple swamp, and a relatively unusual
green ash/swamp white oak/red maple swamp complex. The Spotted Turtle has been identified in the
area. Eleven vernal pools have been certified and several potential vernal pools have been mapped in
the area.
Chartley Brook and Chartley Pond Area: The Chartley Brook and Chartley Pond Area contains a broad
forested riparian corridor consisting primarily of a red maple swamp community. Chartley Pond
consists of a mix of open water and emergent marsh habitats. Several potential vernal pools have
been mapped in the area.
Hemlock Swamp: The Hemlock Swamp area consists of a vast wetland community dominated by
dense stands of hemlock and spruce trees. This area also reportedly includes the most inland
occurrence of the American Holly tree in Massachusetts. At least one animal Species of Special
Concern (Spotted Turtle) has been observed in the area. Several potential vernal pools have been
mapped in the area.
Sweedens Swamp: Sweedens Swamp consists of a large red maple swamp complex interspersed with
open marsh habitat. The Spotted Turtle has been documented in this area, and several potential
vernal pools have been mapped. The area provides important natural habitat within an otherwise
urban landscape.
Local and Regional Trends
Sustainability
Communities in Massachusetts and throughout the region have begun to identify sustainability as a
vital community concern. Many communities have become members of the International Council for
Local Environmental Initiatives (ICLEI)/Local Governments for Sustainability, an association of
national, regional, and local government organizations that have made a commitment to sustainable
development. ICLEI provides technical consulting, training, and information resources to support
local government in the creation and implementation of a sustainable development plan. Attleboro
participates on SRPEDD’s Council on Sustainability. The Council brings together regional entities to
coordinate and strategize around issues such as using resources wisely, creating efficiencies, and
preservation of the environment. Some communities have also created local Environmental
Coordinator positions to promote community environmental initiatives such as recycling, energy and
water conservation, and wildlife management.
Another growing trend is public awareness of global climate change. Anthropogenic forcing of
climate change can potentially be ameliorated by decisions made today, such as reducing
consumption of fossil fuels, and maintaining forests and naturally vegetated areas. Attleboro’s
Master Plan can present choices that may help respond to climate change, such as the preservation of
open space, encouraging public transportation, bicycles, and pedestrian–friendly land development
rather than the continued growth of roads and reliance on automobiles and the development of
environmentally sensitive (“green”) municipal buildings and landscapes.

ENVIRONMENTAL RESOURCES
CITY OF ATTLEBORO COMPREHENSIVE PLAN 75
Green Communities, Buildings, and Infrastructure
Today, communities are more careful to conserve resources and construct new infrastructure in
environmentally sensitive ways. Cities and towns are looking at ways to build “green infrastructure,”
networks of natural areas and open spaces that enhance the environment and its resources. There is a
growing awareness of the need to integrate care and enjoyment of the environment into personal, as
well as civic, life.152
Smart Growth
In Massachusetts, the idea of “smart growth” has taken hold and drives many decisions at the state
and local level. The State has established ten Sustainable Development Principles to support the
concept of smart growth—being deliberate about development choices, reusing existing buildings
and maximizing potential of existing infrastructure. The Commonwealth set in motion several
initiatives to support smart growth such as, MGL CH. 40R, Transit Oriented Development, and the
Green Communities Initiative.
Issues, Challenges & Opportunities Like many communities, Attleboro is concerned about water conservation and protection of its
water quality. The City has two water resource protection districts that regulate the uses of land and
buildings that may potentially pollute or otherwise damage water resources, including the
sources of current and future water supply for the City of Attleboro and the surrounding area.
One district is located in the northern corner of the City (Bungay River WRPD) and the second in
the southwest area around Manchester Pond (Orr’s Pond WRPD).
Stormwater management continues to be an issue in Attleboro. The City adopted the
STORMWATER MANAGEMENT ORDINANCE in 2008 to establish minimum requirements and
procedures to control the adverse effects of stormwater runoff and illicit connections and
discharges to the municipal storm drain system.
Attleboro will continue to grow in future years. It is a given that this growth will impact natural
resources, but Attleboro has a measure of control over the negative impacts of growth. By
promoting higher density development, infill in developed areas, utilization of existing
infrastructure, and aggressively preserving open space, the City may minimize some of the
effects of development on the natural environment.
Recommendations The City should continue to regulate seasonal use of water and promote water conservation
awareness through efforts such as public forums and distribution of informational literature in
addition to conservation tips available on the City’s website.
Attleboro could also promote conservation initiatives by employing water conservation methods
such as the use of drought–resistant and low–water–use plantings and appropriate landscape
maintenance care. (See Goal 13, Policy 1.)
Attleboro could also serve as a model for environmentally sensitive design by developing water–
efficient landscape design on some of its public landscapes. (See Goal 8, Policy 2.)
152 United States Environmental Protection Agency, “Green Communities,”
<http://www.epa.gov/greenkit/basicinformation.htm>.

OPEN SPACE, CULTURAL RESOURCES & HISTORIC PRESERVATION
CITY OF ATTLEBORO COMPREHENSIVE PLAN 76
IV.G. Open Space, Cultural Resources, and Historic
Preservation153
Existing Conditions
Open Space Resources
Open space in the City of Attleboro
consists of active recreation land,
parkland, and “open space in its
natural state,” which includes
properties that are either
undeveloped or include significant
areas of undeveloped open land.
Open space in the City is composed
of both municipally owned land
under several jurisdictions
including the City’s Conservation
Commission, the Department of
Parks and Forestry, the Recreation
Department, Water Department,
Wastewater Department, as well as
land that is owned by non–profit
conservation groups. In addition,
3,000 acres of undeveloped land in
the City is privately owned. It must
be noted that only land that is
designated City conservation land,
held by a non–profit conservation
organization, or is subject to a
conservation restriction should be
considered permanently protected
from future development.
Conservation Commission
Properties owned by the City and
placed under the stewardship of
the Conservation Commission are protected in perpetuity as “open space in its natural state.” The
City acquires property, either by purchase or by donation, for protection as conservation land if the
land is determined to possess ecologically significant characteristics and/or it is located within an area
identified for protection in City planning documents. Property under the stewardship of the
153 Unless otherwise noted, all information contained in this chapter is from the Attleboro Planning Board and
the Attleboro 2009 Open Space and Recreation Plan.
Table 4G–1. Conservation Commission Properties
Property Location Approx. Acreage
Thurber Avenue / Nichol Avenue 4
South Main Street off Fuller Avenue 6
Richardson Street at Dodgeville Pond 1 Bungay River Area: off Bank Street, Holden Street, Hope Street Extension, Lindsey Street, and Wamsutta Road
270
Farmer’s Pond 11
Pitas Avenue 23
Pike Avenue / Preston Road 12 Chartley Brook Area: off Pike Avenue, Eisenhower Street, Cottonwood Lane, Peckham Street, and Wilmarth Street
291
East of Lindsey Street at Attleboro/Mansfield Line 39
Hemlock Swamp Area: off Slater Street 62
Teaberry Lane 3
Bishop Street/Bishop Farms Subdivision 41
Off of Slater Street and Woodstock Road 15 St. James Place and Kensington Road/Victoria Estates Subdivision
8
Slater Street at Norton Line 18
Richardson Avenue 21
Slater Street/Slater Woods Estates, Phase III Subdivision 25
Wamsutta Road 7
County Street/Leawood Estate Subdivision 3
Total Acreage 860
Source: Attleboro Open Space & Recreation Plan, July 2009.

ATTLEBORO
NORTON
REHOBOTH
NORTH ATTLEBOROUGH
SEEKONK
PAWTUCKET
MANSFIELD
CENTRAL FALLS
County Street
Park StreetSou
th
Main Str
eet
Tremont Street
Washington Street
Hickory Road
Pleasant Street
Elm
Street
North M
ain Street
Anaw
an Str
eet
West
Stre
et
West Main
Street
New
po
rt Av
enue
North Avenue
Maple Street
South Washington Street
Highland Avenue
Landry A
venue
Woodland Av
enue
Central Avenue
Lathrop Road
Man
sf ield Avenue
Holden Street Old Colony Road
Emory Street
Pine Street
John Bryson Scott Boulevard
South Aven
ue
Forest Street
Olive Street
Commonwealth Avenue
Oakhill Avenue
South Washington Street
West Str
eet
South Washington Street
Central Avenue
§̈¦95
§̈¦295
§̈¦95
tu1
tu1
tu1
tu1
!(1A
!(1A
UV152
UV118
UV123
UV120
UV140
!(1A
!(1A
!(1A
!(1A
0 0.3 0.6 Miles
.
Sources: MassGIS, City of Attleboro
ATTLEBORO
COMPREHENSIVE PLAN
Prepared by:
Community Opportunities Group, Inc.
August 2011
PARKS &
TRAILS
LegendPark & Recreation Areas
Trails
Pond, River

OPEN SPACE, CULTURAL RESOURCES & HISTORIC PRESERVATION
CITY OF ATTLEBORO COMPREHENSIVE PLAN 77
Conservation Commission currently totals approximately 860 acres and consists of areas ranging in
size from approximately one acre to over one hundred acres. The largest tracts of contiguously
protected parcels are located in the Chartley Brook area east of Pike Avenue and in the Bungay River
area east and north of Bank Street. While many of the individual parcels within these areas contain
wetlands and are not easily accessible, there are several areas where public access is available and
recreational opportunities are abundant.
Over the years, Attleboro has seen the development of PURDs and OSRDs through the City’s ZONING
ORDINANCE. These provisions encourage developers to protect open space when developing land for
residential use by allowing reduced lot sizes and clustered site design by special permit in return for
a minimum open space “set–aside” of twenty–five percent of the total land tract. These parcels of
open space must be protected though either a conservation restriction or through donation to the
Conservation Commission. Table 4G–1 lists the properties owned and managed by the Conservation
Commission and includes a number of properties obtained through these special developments.
Water Department
Attleboro’s Water Department owns
approximately 1,147 acres of land and surface
water impoundments within Attleboro’s
corporate boundaries, as well as additional
properties surrounding reservoirs and/or
pumping facilities in North Attleborough,
Mansfield, and Foxboro. The majority of the
Department’s property is managed as open
space in its natural state for the protection of
the City’s drinking water supply. In
Attleboro, the more significant properties
managed by the Water Department include Manchester Pond Reservoir, Luther Reservoir, and Orr’s
Pond Reservoir. It is the City’s policy that land managed by the Water Department only be used for
purposes that are compatible with water supply protection goals. Therefore, other than management
activities, public usage and access is limited to walking, fishing, and other passive recreational
activities.
Non–Profit Groups
Two private non–profit groups, the Attleboro Land Trust and the Massachusetts Audubon Society,
currently own properties within Attleboro that are protected as “open space in its natural state.” The
Attleboro Land Trust owns nine properties totaling approximately 265 acres. The Massachusetts
Audubon Society owns one property consisting of approximately 43 acres.
Table 4G–2. Water Department Properties
Property Location Approximate Acreage
Luther Reservoir Area 57
Orr’s Pond Reservoir Area 367
Manchester Pond Reservoir Area 483
Ides Hill Water Tanks Area 75
Oak Hill Water Tank Area 50
Holden Street Well Area 13
Pond Street Wastewater Treatment Plant Area 102
Total Acreage 1,147
Source: Attleboro Open Space & Recreation Plan, July 2009.

OPEN SPACE, CULTURAL RESOURCES & HISTORIC PRESERVATION
CITY OF ATTLEBORO COMPREHENSIVE PLAN 78
Table 4G–3. Non–Profit Open Space Properties
Property Owner
Location
Approximate Acreage
Name
Attleboro Land Trust Watson Avenue and Riverbank Road
4 “Larson Woodland” at Mechanics Pond
Attleboro Land Trust Hope Avenue 48.5 Anthony Lawrence Wildlife Preserve
Attleboro Land Trust Woodland Lane 0.6 Woodland Lane property
Attleboro Land Trust Woodland Lane 19.4 Phil and Ginny Leach Wildlife Sanctuary
Attleboro Land Trust Division Street 14.9 Uriah's Marsh property
Attleboro Land Trust Oak Hill Avenue 2.8 Veno Property
Attleboro Land Trust Richardson Avenue 48 Nickerson Walking Woods Preserve
Attleboro Land Trust Steere Street 20.3 Capital Development property
Attleboro Land Trust Steere Street 32 Vaughan Memorial Forest
Attleboro Land Trust Steere Street 77 Colman Reservation Massachusetts Audubon Society
1417 Park Street 42.5 Oak Knoll Wildlife Sanctuary
Total Acreage 310
Source: Attleboro Open Space & Recreation Plan, July 2009.
Unprotected Open Space
Unprotected “large” tracts of land, by far, constitute the greatest acreage of “open space in its natural
state” within the City. These parcels include both public and private properties in which most or all
of the land is undeveloped. The amount of land in this category is also continuously changing as
individual properties are developed, sold, or subdivided. For purposes of discussion, this group of
properties has been separated into three categories: (1) publicly owned land, (2) privately owned
land, and (3) privately owned parcels that have been placed within a tax incentive program to
encourage the preservation of open space.
Publicly Owned Land
Publicly owned, unprotected open space
parcels consist of property owned by the City
of Attleboro that has not been placed under
the stewardship of a particular City
department or has not otherwise received
protection as open space by deed restriction or
regulation. An inventory of these properties
identified over thirty parcels of land totaling
nearly 300 acres. These parcels measure in size
from one acre to over 115 acres. This list
includes two parcels located in the Locust
Valley area that total nearly 150 acres.

OPEN SPACE, CULTURAL RESOURCES & HISTORIC PRESERVATION
CITY OF ATTLEBORO COMPREHENSIVE PLAN 79
Privately Owned Land
Privately owned unprotected large vacant
parcels consist of undeveloped land owned
by private individuals or organizations and
are not protected as open space by deed
restriction or otherwise. These lands
collectively account for the largest amount
of open space in the City. An inventory of
these properties revealed nearly 100 parcels
of land measuring in size from four acres to
over 200 acres and totaling nearly 3,000
acres.
Chapter 61, 61A, and 61B Land
Currently, there are eighteen properties,
totaling 766 acres, enrolled in tax incentive
programs under MGL CH. 61, CH.61A, or
CH.61B. These programs are intended to
encourage property owners to manage
their land for forestry, agriculture, and
recreational use, respectively, by providing
reductions in local real estate taxes. Should
a property owner decide to remove land
that has been designated under MGL CH.
61, CH. 61A, or CH.61B. or sell the land for
development, the City has a 120–day right–
of–first–refusal to purchase the property.
City Assessor’s records indicate that
approximately 78 acres of undeveloped
woodlands are enrolled in the MGL CH. 61
program, approximately 301 acres of
farmlands are
Table 4G–4. Large Tracts of Unprotected City–Owned Properties
Property Location Approximate Acreage
Brown Street 3.7
Nichol Avenue 8.8
Thacher Street 4.5
South Main Street at Dodgeville Pond 1.2
Snell Street 11
Roy Avenue 2.5
Roy Avenue 11.7
Steere Street 7
Camp Street 5
Wilmarth Street 4.4
Oakhill Avenue 7 Autumn Lane / Chartley Brook Lane / Eisenhower Street 7.5
Locust Valley 147
Doral Avenue 1.5
East of Lindsey Street at Mansfield Line 1.3
Park Street 2.3
Hillside Avenue and Eddy Street 5.2
Pike Avenue/ Broadway Street 4
Pike Avenue 21.5
Peckham Street 20.3
Total Acreage 277.4
Source: Attleboro Open Space & Recreation Plan, July 2009.
Table 4G–5. Municipal Parks
Property Name Location Approximate Acreage
Facilities
Angel Park Park Street 0.5 Tot Lot Playground
Balfour Riverwalk Park County Street 3.1 Tot lot playgrounds, skating rink, skatepark, volleyball court, walking path, horseshoe pits, picnic tables
Blackinton Park North Main Street 4.5 Fishing, walking path
Capron Park County Street 40 Capron Park Zoo, Sweet Memorial Forest, tot lot playground, softball field, open grassy fields, picnic area
Veteran’s Memorial Common
Pleasant Street 1.3 Walking paths, memorials
Total Acreage 49.4
Source: Attleboro Open Space & Recreation Plan, July 2009.

OPEN SPACE, CULTURAL RESOURCES & HISTORIC PRESERVATION
CITY OF ATTLEBORO COMPREHENSIVE PLAN 80
enrolled in the MGL CH. 61A program, and approximately 406 acres of land are enrolled in the
Chapter 61B program, including the 118–acre Highland Country Club, the 143–acre Stone E. Lea Golf
Course, and the 136–acre Locust Valley Country Club.
Recreation Resources
Municipal Parks
The City maintains several parks and active recreation facilities that are managed by either the
Recreation Department or the Department of Parks and Forestry. Parks range in size from the one–
half–acre Angel Park, with its grass recreation field and children’s playground, to the forty–acre
Capron Park, the City’s hallmark property. Table 4G–5 lists properties managed by the Department
of Parks and Forestry.
Table 4G–6. Municipal Recreational Facilities
Property Name Location Approximate Acreage
Facilities
Briggs Pool and Playground Parker Street 1.3 Wading pool and bathhouse, playground, two basketball courts, street hockey court
Como Picnic Area May Street 8.4 Picnic area and lake access
Conley Playground Newport Avenue 0.9 Playground, basketball court Tilda A. Stone Recreation Area (a.k.a. Dodgeville Playground)
South Main Street 8.5 Swimming pool and bathhouse, three soccer fields, softball field, tennis courts, playground, basketball court
Finberg Field Park Street 14.6 Four baseball fields, two basketball courts, four tennis courts, two playgrounds, exercise area, walking/jogging trail, picnic area
Hayward Field & Walsh Field North Avenue 13.8 Two baseball fields, two football fields, playground
Spatcher Pool* North Avenue 5.3 Swimming pool
Horton Field Starkey Avenue 2.5 Softball field, basketball court, playground
Nickerson Playground Snell Street 4.6
Softball field, little league baseball field, street hockey court, basketball court, multi–function shelter, skateboard park, playground, horseshoe pits
Ousley Field (a.k.a. Hebronville Park)
South Main Street 3.7 Softball field
Poncin–Hewitt Fields Oak Hill Avenue 28.6 Two soccer fields, four little league baseball fields, tot lot, basketball court, walking/jogging path
South Attleboro Veterans Memorial Playground (a.k.a. Lee’s Pond Recreation Area )
Gardner Avenue 11.5
Softball field, three little league fields, three basketball courts, football area, four horseshoe courts, skatepark, playground, swimming pool and bathhouse, walking/jogging trail, fishing pond
Attleboro Recreation Center 81 Pine Street 0.4
Former National Guard Armory. Indoor recreational facilities include: an open gymnasium equipped for basketball, soccer, volleyball, a nautilus room, a boxing ring, and game room
Total Acreage 104.1
Source: Attleboro Open Space & Recreation Plan, July 2009. * Note: The Spatcher Pool property is owned by the Commonwealth of Massachusetts and managed by the City of Attleboro.

OPEN SPACE, CULTURAL RESOURCES & HISTORIC PRESERVATION
CITY OF ATTLEBORO COMPREHENSIVE PLAN 81
Municipal Recreation Facilities
In recent years, the City has emphasized the development of active recreation fields. These efforts
have resulted in the successful development of recreation facilities at the City’s two newer middle
schools, the construction of the Poncin–Hewitt Fields located off Oakhill Avenue, and the
reconstruction of the Fred E. Briggs Playground swimming pool in 2004.
While most City–owned park and recreation lands and facilities are afforded only limited protection
under Article 97 of the Articles of Amendment to the Constitution of Massachusetts, several parcels
are protected through deed restrictions as a condition of state and federal grant funds used to acquire
and/or develop the facility. To satisfy the restriction, the property must remain open to the public for
park and recreational uses in perpetuity. Examples of properties with this type of additional
restriction include Lee’s Pond, Nickerson Field, the Balfour Riverwalk Park, and Poncin–Hewitt
Fields.
Table 4G–7. School Department Recreational Facilities
Property Name Location Approximate Acreage
Facilities
Attleboro High School Rathbun Willard Drive 17.1
Varsity baseball field, varsity football field, field hockey field, practice football field, two varsity softball fields, eight tennis courts, outdoor basketball court, handball courts
Brennan Middle School Rathbun Willard Drive 29.1 Baseball field, two soccer fields, basketball court, woodland trails
Coelho Middle School Brown Street 16.6 Baseball field, football field, three softball fields
Hill Roberts Elementary School
Roy Avenue 7.5 Three little league baseball fields, one baseball field, outdoor basketball court, playground
Hyman Fine Elementary School
Oak Hill Avenue 32 Two little league fields, playground
Studley Elementary School Rathbun Willard Drive 1.3 Practice softball field, playground Peter Thacher Elementary School
James Street 2.4 Two little league fields
Wamsutta Elementary School Locust Street 16.7 Two softball fields, outdoor basketball court
Willett Elementary School Riverbank Road 8.6 Softball field, little league baseball field, soccer field, playground
Total Acreage 131.1
Source: Attleboro Open Space & Recreation Plan, July 2009.
Private Recreation Facilities
In addition to the many public recreation facilities, there are also several private recreation facilities
in Attleboro, including four golf courses, a private swim/tennis club, and several smaller recreation
areas owned by private organizations. Table 4G–8 contains a list of private recreational facilities
located within Attleboro.

OPEN SPACE, CULTURAL RESOURCES & HISTORIC PRESERVATION
CITY OF ATTLEBORO COMPREHENSIVE PLAN 82
Table 4G–8. Private Recreational Facilities
Property Name Location Approximate Acreage
Facilities
Atlantic Golf Center Newport Avenue 40.7 Nine hole par 3 golf course, driving range
Bearcroft Swim Club Pike Avenue 20 Four swimming pools, eight tennis courts
Bishop Feehan High School Holcott Drive 46
Baseball field, football field, two softball fields, soccer field, practice football field, six tennis courts, outdoor track,
Elks Lodge South Main Street 14 Six horseshoe pits, picnic area
Highland Country Club Mechanics Street 97 Nine hole golf course
Locust Valley Country Club Locust Street 135 Nine hole golf course
Stone–E–Lea Golf Course County Street 143 Eighteen hole Golf Course
YMCA Forest Street 2 Walking/jogging trail
Total Acreage 500.8
Source: Attleboro Open Space & Recreation Plan, July 2009; Ayrassian, June 2011.
Cultural & Historic Resources
Attleboro is home to a number of organizations and museums that promote the arts in the
community and preserve the City’s rich heritage. Primarily concentrated in the downtown area, these
resources reflect the City’s varied history and contribute to its sense of place. Below is a list of
significant cultural resources:
Attleboro Area Industrial Museum (AAIM) was incorporated on July 4, 1975 as the City of
Attleboro’s Bicentennial project. Its mission is to collect and preserve the artifacts,
photographs, documents, publications, tools, and machinery that relate to the industrial
history of the Attleboro area; and to act as a resource center for research and education of the
general public. The AAIM conducts the annual “History to Go” educational program in June
for third grade students in Attleboro.154 The museum is housed downtown at 42 Union Street
in the former Attleboro Refining Company, which specialized in the refining of gold, silver,
and copper byproducts. The building itself is considered to be the most important object in
the Museum’s collection.
Founded in 1923, the Attleboro Arts Museum has evolved into an impressive community–
based arts organization that has become a cultural anchor for the City. Moved to its current
location on Park Street in 1994, the museum offers educational classes, changing exhibitions,
and many special events that bring life to the downtown.
Attleboro Community Theatre is a non–profit organization established in 1957 with the mission
of providing cultural enrichment to the Attleboro area through the theatre arts. The theatre,
154 http://www.industrialmuseum.com/history–to–go.html

OPEN SPACE, CULTURAL RESOURCES & HISTORIC PRESERVATION
CITY OF ATTLEBORO COMPREHENSIVE PLAN 83
which has performed in several locations, produced family entertainment and children’s
shows. The group has also engaged in community outreach efforts, participating in disaster
readiness drills for area Fire Departments; working in conjunction with the Attleboro Police
Department to create and produce a workshop for City youngsters; offering performances for
disadvantaged groups; and helping in many local fundraising efforts.
Triboro Youth Theatre was founded in 1996 and offers children from age four to eighteen with
the opportunity to participate in the performing arts through acting, musical and speech
training, creative movement, and dance. The Theatre also introduced children to off–stage
aspects of production such as stage management, set construction, costume design, and
publicity.
Attleboro Public Library serves as a learning and educational center, providing access to
resources and services for the information, recreation, intellectual development, and
enrichment of the Attleboro community and its members.
Capron Park and Zoo is a forty–acre park that includes beautifully landscaped lawns, historic
monuments, woodlands, a playground and concession stands. The zoo provides educational
and recreational activities dedicated to the understanding of animals from all over the world.
Women at Work Museum was established in October 2003 as a site to honor the achievements
of women throughout history and around the world, by providing educational programs that
promote leadership, economic independence, and expertise in math, science, engineering,
and technology for people of all ages.
A community’s historic resources are physical reminders of its
past. In Attleboro, these historic sites, buildings, structures,
objects, and landscapes represent the City’s Native American
past as well as its more recent social, architectural, and
industrial history. These resources are located throughout the
community and include scattered Native American
archeological sites as well as historic seventeenth, eighteenth,
and early nineteenth Century cemeteries, parks, churches,
schoolhouses, dwellings, and mill complexes.
Historic Resource Inventory
Documenting a community’s historic resources through a
historic resource survey forms the basis of historic
preservation planning at the local level. According to the
Massachusetts Historical Commission’s MACRIS database,
Attleboro has documented 691 resources on historic inventory
forms. While the majority of these resources are historic
buildings, the City has also documented its burial grounds as well as several objects, structures, and
areas.155 Attleboro also participated in the Massachusetts Department of Conservation and
155 Massachusetts Historical Commission, Massachusetts Cultural Resource Information System (MACRIS),
<http://www.mhc–macris.net>.

OPEN SPACE, CULTURAL RESOURCES & HISTORIC PRESERVATION
CITY OF ATTLEBORO COMPREHENSIVE PLAN 84
Recreation’s Heritage Landscape Inventory Program as part of the Pilot Program in Southeastern
Massachusetts. The report completed for Attleboro identified significant and threatened heritage
landscapes in the community and made recommendations for their protection.
National Register of Historic Places
The National Register of Historic Places is the official federal list of cultural resources worthy of
preservation. The resources include districts, sites, buildings, structures and objects that have been
determined to be significant in American history, architecture, archaeology, engineering and culture.
Properties listed on the National Register automatically qualify for listing on the State Register of
Historic Places. Listing on the National Register does not provide absolute protection for historic
resources. However, any application for federal or state funds or permits for a property listed on the
National or State Register triggers a review by MHC for negative or adverse impacts.
According to the Massachusetts Historical Commission’s State Register of Historic Places, Attleboro has
two districts listed on the National Register of Historic Places (NRDIS) and nine individually listed
properties (NRIND). One additional property, the Knoll C. Archaeological Site, has been determined
eligible for listing on the National Register but has not been formally designated (NRDOE).
Table 4G–9. Properties Listed on the State Register of Historic Places
Historic Name156 Address Designation Date of
Designation Number of properties
Blackinton Houses and Park District
North Main Street NRDIS 4/20/1979 7
Capron House 42 North Avenue NRIND 7/21/1978 1
East Attleboro Academy 28 Sanford Street NRIND 4/4/1985 1
Hebronville Mill Historic District
Knight Ave., Read and Phillip Sts
NRDIS 5/17/1984 38
Knoll C Archaeological Site NRDOE 10/15/1984 1
Makepeace, D.E. Company 46 Pine Street NRIND 7/18/1985 1
Northbound Railroad Station
1 Mill Street
NRIND 1/5/1989 1
Robinson, Capt. Joel House 111 Rocklawn Avenue
NRIND 11/20/1978 1
Sadler, Herbert Austin House
574 Newport Avenue
NRIND 10/21/1982 1
Southbound Railroad Station
3 Mill Street NRIND 1/5/1989 1
U.S. Post Office (former) – Attleboro Main Branch
75 Park Street
NRIND 10/19/1979 1
Source: State Register of Historic Places 2009, Massachusetts Historical Commission
NRIND – National Register Individual Property
NRDIS – National Register District
NRDOE – Determined eligible for listing on the National Register but not formally designated

OPEN SPACE, CULTURAL RESOURCES & HISTORIC PRESERVATION
CITY OF ATTLEBORO COMPREHENSIVE PLAN 85
Preservation Ordinances
The City enacted a Demolition Delay Ordinance in 2003 that required a 45–day (which was extended
to 90–days in 2011; See page 88) waiting period before a building or structure can be demolished.157
All buildings and structures, regardless of age or historic designation, are subject to this ordinance,
unless a determination is made by the Attleboro Historical Commission that the building is not
historically significant. Unlike demolition delay ordinances adopted by other communities in the
Commonwealth, Attleboro’s regulations are primarily a notification service due to the short length of
the delay period. Most communities adopt regulations with a significantly longer delay period in
order to allow the local commission time to work with the property owner to identify alternatives to
demolition or appropriate mitigation. However, in all demolition delay regulations, a property owner
can demolish the building after the delay period expires.
Attleboro Historical Commission
The Attleboro Historical Commission is the municipal board dedicated to the preservation of the
City’s historic resources. The Commission is responsible for administering the City’s demolition
delay ordinance and undertakes local preservation advocacy efforts, including an annual
Preservation Awards program158 In 2003, the Commission produced a self–guided walking tour
booklet, the Historical Site Guide of Attleboro, which identifies forty–seven historical properties in the
City. These sites are grouped in six different “clusters” and each listing is accompanied by a brief
description.
A comprehensive listing of historically significant sites compiled by the Attleboro Historical
Commission is included in Table 4G–10.
Table 4G–10. Historical Sites in Attleboro
Historical Site Location Description
First Jewelry Shop Site South Main Street Site of the first jewelry shop in Attleboro ca. 1830.
Bolkum’s Tavern Site South Main Street Site of former inn and meeting house. Organization site for the 'Washington Rifle Corps in 1815.
First Post Office Emory Street Location of first post office in East Attleborough.
Bates Opera House Park & North Main Streets The original Bates Opera House built in 1866 was demolished by fire. The last show was performed in 1952.
Union Hall Railroad Avenue Built in the early 1850's. Home of Murray Universalist Church in 1875 and St. John’s Church in 1883.
*Old Post Office Park Street Attleboro Main Branch constructed in 1916.
Militia Training Field Behind Old Post Office Washington Rifle Corps and Attleboro Militia between 1815–1841.
Old Kirk Yard Burial Ground Bank Street Located behind the 2nd Congregational Church on rear of Park Street. The Reverend Peter Thacher is buried there.
National Guard Armory Pine Street Massachusetts National Guard. Built 1910.
Attleboro Public Library North Main Street Historical Exhibits. Built in 1907
Old Peck House Elizabeth Street One of the oldest houses in Attleboro (Ca 1723)

OPEN SPACE, CULTURAL RESOURCES & HISTORIC PRESERVATION
CITY OF ATTLEBORO COMPREHENSIVE PLAN 86
Table 4G–10. Historical Sites in Attleboro
Historical Site Location Description Old Peck Family Yard Burial Ground
North Main Street Burial ground of the Peck Family. Hezerkiah Peck buried in 1723.
*Blackinton Houses and Park Historic District
North Main Street Blackinton houses and park. Site of Colonel Willard Blackinton's loom shuttle factory in 1827.
Woodlawn Cemetery North Main Street Graves moved here from the Old Kirk Yard.
Bolkcom Burial Yard North Main Street Moved to North Purchase Cemetery when Route 95 was constructed.
Capron Park County Street Public park designed in 1901.
Tingley Stone Mill Site West Street From 1723 to the middle of 1800's the Tingley family of stone cutters conducted their business here.
Newell Cemetery West Street The Oldest burial ground in the City Est. in 1715.
Training Field Newport Ave. Training ground for Minute Men of 1775.
Barrows Tavern Site Newport Ave. Tavern no longer at site. Once 3 buildings.
Toll House Mendon Road Built in 1732. Mendon road was the first town road and only toll.
Solomon Family Burial Yard Solomon Street Family of Dr. Solomon buried here.
Bishop Forge Site Pike Avenue Guns manufactured here for use in the American Revolution and War of 1812
Follett Family Burial Yard Pike Avenue Members of early Follett family are buried here.
Coombs Burial Yard Pike Avenue Single grave in burial yard.
Thayer Family Burial Yard Wilmarth Street Members of Thayer family buried here.
LaSalette Seminary Park Street Built in 1900, designed by Olsten Mayo Hagins. Burned and demolished in 2000.
First School House South Main Street Moved to present location in 1824.
*First Parsonage South Main Street Built in 1822 as parsonage for the East Parish Church. Demolished
First Ministers House South Main Street Built in 1750 by Reverend Peter Thacher.
Dodgeville Mill Village South Main Street Textile mill established in 1809 along Ten Mile River.
Dodge Island Cemetery South Main Sweet Members of the Dodge Family are buried here on island in Dodgeville Pond.
Hillside Cemetery South Main Street Burial ground of Capt. Joel Robinson and others who fought in the Revolution.
*Hebron Mill Village Knight Avenue Textile mill established in 1812 along Ten Mile River.
Hebron Methodist Church South Main Street Built in 1883, it is the oldest standing church in Attleboro.
*Capron House North Avenue Ca 1740. First house in Attleboro placed on National Register. Owned by Caprons for over 200 years.
*East Attleboro Academy Sanford Street Only remaining building from original village. Opened in 1842 as private academy for higher education
*Makepeace, D.E. Company Pine Street
Built in 1900 to house business started in 1885. Specialized in plating processing and fabricated precision metals. In 1930 was largest jewelry manufacturer of its type in the world.

OPEN SPACE, CULTURAL RESOURCES & HISTORIC PRESERVATION
CITY OF ATTLEBORO COMPREHENSIVE PLAN 87
Table 4G–10. Historical Sites in Attleboro
Historical Site Location Description
*Capt. Joel Robinson House Rocklawn Avenue Built in 1790. Robinson was a farmer and housewright who fought in the Revolution.
*Herbert Sadler House Newport Avenue
Built in 1906 by Herbert Sadler a jewelry manufacturer. Building has distinctive architecture with lots of stained glass and grand entrance hall.
*Southbound Railroad Station Mill Street Built in 1908. Used as train station until 1970. Rehabilitated into office building.
*Northbound Railroad Station Mill Street Built in 1906. Still in use as train station. Made of granite and brick with terra cota roof
House of First Mayor North Main Street Built in 1907. Owned by Mayor Harold Sweet. Colonial revival style.
Wisconsin Glacial Rock #1 and #2 Thacher and South Main Streets
Exposed bedrock outcropping showing visible scouring from Wisconsin Glacier Ice 25,000 years ago.
Source: Attleboro Planning Department. * Site listed on the National Register of Historic Places.
Local and Regional Trends
Of the seven towns within Attleboro’s direct region, Attleboro has one of the lowest percentages of
protected open space. Only Rehoboth and Seekonk have lower percentages. This emphasizes the fact
that while a significant portion of Attleboro remains as undeveloped land, only a fraction of this land
is permanently protected from future development.
While Attleboro has adopted only one
preservation–related tool in its efforts to
protect its historic resources, this is not
unusual for the region. Many of the
communities around Attleboro also have few
preservation bylaws or regulations (See Table
4G–12 below) in place. By pooling regional
resources, the AHC and its counterparts
nearby could work collaboratively with the
Massachusetts Historic Commission and the
statewide non–profit preservation organization, Preservation Massachusetts (Preservation MASS), to
facilitate discussions, conduct preservation forums, and form technical assistance relationships that
help small volunteer groups carry out complicated preservation projects.
However, Attleboro is the only community in its region that has a demolition delay ordinance with a
delay period less than six months. In fact, many communities in the Commonwealth have extended
Table 4G–11. Protected Open Space
Town Protected Open Space
Mansfield 15.85%
Norton 15.80%
Taunton 15.31 %
North Attleborough 10.84%
Attleboro 10.67%
Rehoboth 3.96%
Seekonk 7.87% Source: MassGIS, “Permanently Protected Open Space by Community,” updated February 23, 2010159

OPEN SPACE, CULTURAL RESOURCES & HISTORIC PRESERVATION
CITY OF ATTLEBORO COMPREHENSIVE PLAN 88
their delay periods to twelve months and even to eighteen months in order to provide adequate time
to undertake the sometimes arduous process of working with property owners to find alternatives to
demolition. In December 2010, the Attleboro Historical Commission petitioned the Municipal Council
to extend the duration to twelve months. In 2011, the Municipal Council voted to extend the delay to
90 (calendar) days.
Table 4G–12. Preservation Bylaws/Ordinances by Community
Town Community Preservation Act
Demolition Delay Bylaw/ Ordinance
Local Historic Districts
Scenic Roads Bylaw/ Ordinances
National Register Districts
Attleboro No Yes – 45 days No No Yes
Mansfield No No No Yes No*
North Attleborough
No Yes – 6 months No No Yes
Norton No No Yes Yes Yes
Rehoboth Yes No No Yes Yes
Seekonk Yes No No No No*
Taunton No Yes – 6 months Yes No Yes
Source: Preservation Through Bylaws and Ordinances Draft March 11, 2009, Massachusetts Historical Commission
* NRIND only
Issues, Challenges & Opportunities
Open Space Resources
Much of Attleboro’s vital open space remains unprotected. The City has a large amount of
privately owned, unprotected open space. While some of these parcels are temporarily protected
through MGL CH. 61 designation, the City has only a 120–day period in which to acquire these
properties should they become available. Without a proactive effort to approach property owners
before a property is offered for sale, the City will always be in reactionary mode.
Attleboro would have an opportunity to raise funds for purchase of open space and protection of
its historic resources if it adopted the Community Preservation Act (CPA).
Recreation Resources
Attleboro has many opportunities for active recreation through both municipal and privately
owned recreation facilities and programs. The City must continue to ensure that these
opportunities are diverse, properly maintained, and available to all residents.
Upgrades are needed at City recreation facilities, especially at fields outside of the School
Department’s jurisdiction.
The City’s OSRP recognizes the need for upgrades at many of the City’s playgrounds to make
them safe to all people and accessible for persons with disabilities.
The City has many great natural resources that are underutilized. The City may want to expand
its trail network, bike paths, and boat ramps.

OPEN SPACE, CULTURAL RESOURCES & HISTORIC PRESERVATION
CITY OF ATTLEBORO COMPREHENSIVE PLAN 89
Protection of Historic Resources
Attleboro has many historic resources, but few regulations to protect them. The City’s
demolition–delay ordinance allows for a 120 day delay before demolition. This is essentially
ineffective as it does not provide enough time for local boards to act to prevent demolition.
The City does not have any local historic districts under MGL CH. 40C or other tools, such as
Architectural Preservation Districts, in effect to protect its historic resources.
While Attleboro has pursued National Register designations in the past, these efforts have
focused on individual properties not districts.
Recommendations
Preserve Attleboro’s Open Space
The Conservation Commission should review the list of unprotected City–owned parcels and
assess their value for conservation purposes. Parcels that are determined to have value for
conservation purposes should be transferred to the Conservation Commission for stewardship.
(See Goal 12, Policies 6 and 7. See also the 2009 OPEN SPACE AND RECREATION PLAN)
The Assessor’s Office and Treasurer’s Office should adopt policies and procedures to review tax
title land for possible protection as open space prior to offering them for sale at auction. (See Goal
12, Policy 6. See also the 2009 OPEN SPACE AND RECREATION PLAN)
The City of Attleboro should focus its land acquisition and protection efforts on those areas of the
City identified as ecologically sensitive or containing endangered species habitat. (See the 2009
OPEN SPACE AND RECREATION PLAN)
Expand Opportunities for Active and Passive Recreation
The City of Attleboro should continue to improve and expand its inventory of recreation
facilities, including improved access for those with disabilities. (See the 2009 OPEN SPACE AND
RECREATION PLAN)
The City should provide adequate
maintenance resources for its recreational
facilities, including necessary personnel,
tools, and equipment to properly
maintain facilities. These efforts may
include the installation of irrigation where
necessary at all playing fields, fund and
implement an annual field maintenance
plan, replace and repair fields where
necessary, improve drainage systems
where necessary, and continue program
to replace fencing at park and recreation
facilities, as needed. (See the 2009 OPEN
SPACE AND RECREATION PLAN)

OPEN SPACE, CULTURAL RESOURCES & HISTORIC PRESERVATION
CITY OF ATTLEBORO COMPREHENSIVE PLAN 90
The City should continue its policy of upgrading and expanding recreational facilities to meet the
needs of its citizens. (See the 2009 OPEN SPACE AND RECREATION PLAN.)
The City should continue to improve and expand its trail system, mapping these trails and
identifying parcels that could provide critical links for a city–wide trail system. The City should
also encourage the creation, maintenance, and expansion of recreational trails on all appropriate
City–owned properties. (See Goal 16, Policy 5. See also the 2009 OPEN SPACE AND RECREATION
PLAN)
Preserve Attleboro’s Historic and Cultural Resources
Consider adopting ordinances to encourage the preservation of historic areas. These could
include: (See Goal 4, Goal 12, Policy 3, and Goal 14.)
Adopt the provisions of MGL CH. 40C legislation to create local historic districts at
Dodgeville, Hebronville, Blackinton Park, and Capron Park,
Amend the City’s current demolition delay ordinance to extend the delay period from 45
days to twelve months for structures more than 75 years old.
Adopt a scenic roadways ordinance under the Scenic Roads Act (MGL CH. 41, §15C and
designate scenic roads for review.
Develop maintenance and management plans for the City’s historic burial grounds, such as an
“Adopt a Cemetery” program.
Promote Downtown Attleboro as a cultural destination center. (See Goal 10, Policy 1.)
Review the Heritage Landscape Inventory Report completed by the Massachusetts Department
of Conservation and Recreation to determine the continued relevance of recommendations
established for Attleboro.
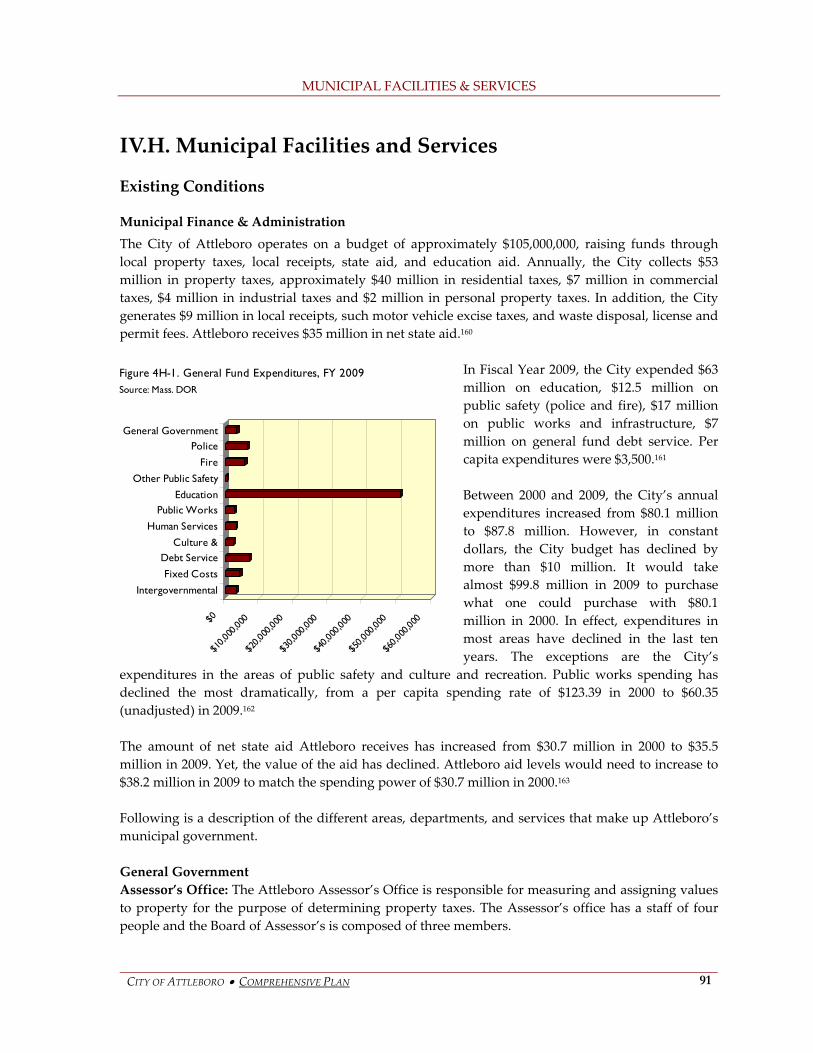
MUNICIPAL FACILITIES & SERVICES
CITY OF ATTLEBORO COMPREHENSIVE PLAN 91
IV.H. Municipal Facilities and Services
Existing Conditions
Municipal Finance & Administration
The City of Attleboro operates on a budget of approximately $105,000,000, raising funds through
local property taxes, local receipts, state aid, and education aid. Annually, the City collects $53
million in property taxes, approximately $40 million in residential taxes, $7 million in commercial
taxes, $4 million in industrial taxes and $2 million in personal property taxes. In addition, the City
generates $9 million in local receipts, such motor vehicle excise taxes, and waste disposal, license and
permit fees. Attleboro receives $35 million in net state aid.160
In Fiscal Year 2009, the City expended $63
million on education, $12.5 million on
public safety (police and fire), $17 million
on public works and infrastructure, $7
million on general fund debt service. Per
capita expenditures were $3,500.161
Between 2000 and 2009, the City’s annual
expenditures increased from $80.1 million
to $87.8 million. However, in constant
dollars, the City budget has declined by
more than $10 million. It would take
almost $99.8 million in 2009 to purchase
what one could purchase with $80.1
million in 2000. In effect, expenditures in
most areas have declined in the last ten
years. The exceptions are the City’s
expenditures in the areas of public safety and culture and recreation. Public works spending has
declined the most dramatically, from a per capita spending rate of $123.39 in 2000 to $60.35
(unadjusted) in 2009.162
The amount of net state aid Attleboro receives has increased from $30.7 million in 2000 to $35.5
million in 2009. Yet, the value of the aid has declined. Attleboro aid levels would need to increase to
$38.2 million in 2009 to match the spending power of $30.7 million in 2000.163
Following is a description of the different areas, departments, and services that make up Attleboro’s
municipal government.
General Government
Assessor’s Office: The Attleboro Assessor’s Office is responsible for measuring and assigning values
to property for the purpose of determining property taxes. The Assessor’s office has a staff of four
people and the Board of Assessor’s is composed of three members.
$0
$10,0
00,00
0
$20,0
00,00
0
$30,0
00,00
0
$40,0
00,00
0
$50,0
00,00
0
$60,0
00,00
0
General GovernmentPolice
Fire
Other Public Safety
EducationPublic Works
Human Services
Culture &Debt Service
Fixed Costs
Intergovernmental
Figure 4H-1. General Fund Expenditures, FY 2009Source: Mass. DOR

MUNICIPAL FACILITIES & SERVICES
CITY OF ATTLEBORO COMPREHENSIVE PLAN 92
City Collector: The City Collector collects personal property and real estate taxes as well as motor
vehicle excise taxes, and utility bills such as water and sewer charges.
Mayor’s Office: The City of Attleboro has a Mayor–Municipal Council form of government. The
Mayor of Attleboro works with the Municipal Council, municipal departments, and numerous
Boards, Commission, and agencies to govern the City. The Mayor’s term of service is two years.
Municipal Council: Attleboro elects an eleven–person Municipal Council, which serves as the City’s
legislative branch of government. Six Council members are elected at the ward level and each
represents one of six Wards in Attleboro and
five Council members are elected at–large
who all represent the entire City. Within the
Council are ten committees that discuss and
recommend legislation (i.e., ordinances) and
policy to the larger Council and Mayor.
Public Safety (Police and Fire): The
Attleboro Police Station is located at 12
Union Street next to City Hall. The Police
Department is staffed by 78 officers
including: one police chief, eight detectives,
eight sergeants, five lieutenants, and one
captain, and 55 patrol officers. In addition,
the department has nine E911 tele–communicators and four civilian employees. The department
handles emergency calls and operates several programs including youth drug prevention and crime
prevention programs.164 The Police Station is twenty–six years old and the City is initiating a needs
assessment for future upgrades to the station.165 Attleboro has four fire stations located throughout the City. Fire Department headquarters is located
on Union Street, the South Station on Newport Avenue, Twin Village Station on South Main Street,
and Briggs Corner Station is located at the intersection of Park and Steere Streets. The City’s fire
equipment includes seven engines, two ladder trucks, five rescue vehicles, two brush trucks and six
general vehicles. The Fire Department has 83 staff people including one fire chief, four deputy fire
chiefs, thirteen captains and sixty–five firefighters. Firefighters rotate on twenty–four–hour shifts.166 The Union Street station is in need of renovation or replacement. Costing between $2.5 and $5
million, the upgrade of this station is identified as an urgent need in the City’s CAPITAL
IMPROVEMENTS PROGRAM. In addition, the Fire Department needs to replace several of its emergency
vehicles.167
Land Use and Planning
Building Department: The Building Department is responsible for overseeing construction and
inspection buildings as well as zoning enforcement. The department issues building permits for new
construction and renovations to existing properties. The department also enforces the local and state
building codes. The Building Department staff is composed of building, wiring, gas, plumbing and
mechanical inspectors, and administrative staff. The Building Inspector also enforces the City’s
ZONING ORDINANCE.

MUNICIPAL FACILITIES & SERVICES
CITY OF ATTLEBORO COMPREHENSIVE PLAN 93
Community Development: The Community Development Office operates under the Department of
Planning and Development and is responsible for developing, managing, and implementing the
City’s Community Development Block Grant entitlement program. The department administers
assistance programs targeted at economic development, affordable housing development and
rehabilitation, and social services.
Planning Department: The Planning Department is responsible for overseeing overall land use
planning for the City including the preparation and updating of the OPEN SPACE AND RECREATION
PLAN, the COMPREHENSIVE PLAN, and the annual CAPITAL IMPROVEMENTS PROGRAM, as well as
granting writing and preparing technical reports. The department also provides staff to the
Conservation Commission, Planning Board, and Zoning Board of Appeals on land use permits and
development for the City. The department works with aforementioned Boards and Commission to
develop new regulations and policies to ensure the appropriate physical development of the City.
Conservation Commission: The Conservation Commission is a permitting authority and works to
protect and preserve the City’s natural resources. The Commission reviews proposed construction
near wetland areas and other natural resources such as floodplains and vernal pools. The
Commission, aside from its permitting role, is also active in developing plans to conserve and
manage the City’s open space.
Municipal Facilities and Infrastructure
Attleboro City Hall: Attleboro City Hall is
located in Downtown Attleboro and is part of
a government complex that includes the Police
Station, Registry of Deeds, and the Registry of
Motor Vehicles. Most of the City’s government
offices are located in City Hall and 64 City staff
work there. City offices occupied the building
in 1985, and the building is fully accessible.
Attleboro Public Library: The Attleboro Public
Library is located in Downtown Attleboro.
Built in 1907, the library has been renovated
and expanded many times. Today, the library
contains approximately 40,000 square feet of area. The last major renovations to the library were
completed in the early 1990s. At a cost of $1.9 million, these renovations added space and made
improvements to the building’s accessibility.168
Recreation and Parks: The City has several recreation areas and parks and offers programs through
its Recreation Department. The Recreation Department maintains the City’s sports fields, recreation
areas and pools and operates the Attleboro Youth Center and the Frederic M. Bartek Recreation
Center. A listing of the City–operated facilities is included in the Open Space chapter. The
department also manages and runs the City’s recreational programs which range from summer
camps to sports tournaments.169

MUNICIPAL FACILITIES & SERVICES
CITY OF ATTLEBORO COMPREHENSIVE PLAN 94
Department of Public Works: The Department of Public Works, which has a staff of twenty–one,
maintains the City’s roadways, sidewalks, stormwater system, and traffic signage. In addition, the
DPW oversees the construction and reconstruction of the City’s roadways and bridges, often in
partnership with state and federal agencies. The DPW maintains an estimated 3,730 storm water
catch basins. The department cleans catch basins regularly throughout the year using a truck
mounted “clam shell” device. In addition, a contracted “vactor” truck is hired as needed to remove
accumulated sediments from drainage structures when it is determined that City–owned equipment
is inadequate to remove the material. Residuals are properly disposed of as cover in a permitted
City–owned landfill. The DPW cleans some 500–plus catch basins per year, removing more than 350
tons of sand and debris. In addition, the DPW maintains storm water management system
components, such as detention basins, throughout the City as problems arise.
Water Department: The Water Department manages and upgrades Attleboro’s municipal water
system, which serves nearly the entire City. The City maintains 218 miles of water mains and 1,923
fire hydrants. Orr’s Pond Reservoir provides the City’s drinking water. Water is treated by the
Russell F. Tennant Water Treatment Plant, which has a daily treatment capacity of up to twelve
million gallons of water. The Wading River Pumping Station in neighboring Mansfield also acts as an
auxiliary water source for the City.
Wastewater Department: The Wastewater Department manages and upgrades Attleboro extensive
municipal sewer system that provides service to approximately 65–70 percent of the households in
the City. The system includes nearly eighty miles of sewer pipeline and a wastewater treatment plant
that treats 1.6 billon gallons of wastewater annually, receiving a daily average flow of 4.0 million
gallons. Approximately 2,000 tons of sludge solids residuals go to the sludge landfill annually. The
City recently upgraded its Wastewater Treatment Plant to eliminate the hazardous chlorine and
sulfur dioxide gases and replace them with much safer chlorine and sodium bisulfite liquid
chemicals. In addition, the City completed a Comprehensive Wastewater Management Plan in
December 2011.
Municipal Services
Council on Aging: The Council on Aging operates the City’s Reverend Gordon N. Larson Senior
Center and offers a wide variety of programming to Attleboro residents of age 60 years and older.
The Senior Center offers guidance on health and nutritional issues, exercise classes, entertainment,
trips, and transportation. The Senior Center serves lunch daily.
Health Department: The Attleboro Health Department disseminates information about local health
issues and concerns to the public, as well as conducts inspections related to food service, septic
systems, and other health–related housing concerns.

MUNICIPAL FACILITIES & SERVICES
CITY OF ATTLEBORO COMPREHENSIVE PLAN 95
Veterans Department: The Veteran’s
Department offers support to the City’s
veterans and assists them in identifying
and applying for state and federal
benefits.
Youth Commission: The Attleboro
Youth Commission provides a forum
by which City youth are able to
participate in local government. Youth
commissioners represent the needs of
the City’s youth to the municipal
government.
Public Schools
Attleboro’s public schools serve 5,933
students district wide. The City has six
elementary schools, three middle
schools, and one high school. The
elementary schools run from
kindergarten through fourth grade,
middle schools from fifth to eighth
grade, and the high school from ninth
to twelfth grade. Attleboro employs
384 teachers and there is a student to
teacher ratio of 15.5 to 1. The City
spent $10,878 per pupil in 2008, while
the average spent statewide was
$12,453.170
In recent years, Attleboro has had
declining enrollments in the school
system. The school department does
not have concerns about building
capacities, and does not have a need to construct additional school buildings at this time.171 However,
many of the school buildings require capital improvements. These improvements range from
incidental to major upgrades. Examples of the work required include work to ventilation and heating
systems, painting, window replacement, and site improvements. The high school, in particular,
requires major capital improvements including replacing the heating system, installing new
information technology infrastructure, and replacing the track.172
In addition to its public schools, Attleboro also hosts several private schools. Bishop Feehan High
School serves grades nine through twelve and enrolls 1,000 students.173 Dayspring Christian in South
Attleboro offers education from kindergarten through eighth grade, and Grace Baptist Christian
Academy offers programs from Pre–K through twelfth grade. St. John the Evangelist runs from
kindergarten through eighth grade.174
Table 4H–1. Public Schools
School Grades 2009–2010 Enrollment
Early Learning Center Pre–K, K 157
Elementary schools K, 1, 2, 3, 4
A. Irving Studley 432
Hill–Roberts 475
Hyman Fine 429
Peter Thatcher 463
Thomas E. Willett 398
Middle Schools 5, 6, 7, 8
Cyril K. Brennan 582
Robert J. Coehlo 656
Wamsutta 585
Attleboro High School 9, 10, 11, 12 1,756
District enrollment 5,933
Average classroom size 20.1 Source: MA Department of Education.
5,7005,8005,9006,0006,1006,2006,3006,400
2004-
2005
2005-
2006
2006-
2007
2007-
2008
2008-
2009
2009-
2010
Figure 4H-2. Enrollment in Attleboro Public Schools
Source: MA Department of Education

MUNICIPAL FACILITIES & SERVICES
CITY OF ATTLEBORO COMPREHENSIVE PLAN 96
Local and Regional Trends
Municipalities across the state are faced with the persistent challenge of maintaining services with
less money. Declines in local aid have affected many cities and towns and, as described above,
Attleboro is no different. In Attleboro, declining amounts of state aid has converged with an increase
in assessments from the state. This has exacerbated the issues faced locally. Diminished property
values and general economic decline have weakened the City’s ability to raise revenue. At the same
time, energy costs to operate municipal facilities and the cost of health care for employees and
retirees have grown dramatically. Over the last several years, although Attleboro has had to make
difficult choices, the City has been able to reduce its operating expenditures to balance the budget yet
without cutting or reducing municipal services.
At the same time that shrinking budgets challenge municipalities, cities and towns are being called
upon to increase their awareness and action toward sustainable development and eco–sensitivity.
SRPEDD sponsors a Council on Sustainability for Southeastern Massachusetts. Established in 2009,
the Council’s goal is to bring regional entities together to maximize efficiencies and coordinate efforts
to promote resourcefulness and environmental sustainability. The Council meets regularly as a whole
and, in addition, there are five working groups that meet to discuss local and regional efforts to
address issues related to economic development, energy, food and agriculture, transportation and
natural resources.175
Issues, Challenges & Opportunities
Like communities throughout Massachusetts, Attleboro must find ways to manage a declining
budget while meeting the service needs of its residents. In recent years, the City has worked with
department heads to cut annual departmental operating budgets and instituted unpaid furlough
days for personnel in an effort to balance the budget without cutting or reducing municipal
services. The economic recession has reduced the amount of revenue the City can raise, and state
assessments have increased while aid has declined.
Eventually the economy will rebound and development in Attleboro will begin again. In
addition, the expansion of the commuter rail to New Bedford and improvements to Interstate 95
may increase development pressure in Attleboro. The City will need to accommodate this new
growth, providing services to the new residents and businesses it will bring.
With or without a tight budget, maintaining and upgrading municipal buildings and facilities is a
major challenge for local government. Attleboro conducts capital improvements planning process
each year to ensure that it facilities receive the upgrades that they need. Yet, the City is capable of
only so many improvements each year.
Given Attleboro’s manufacturing history, it is a challenge to align the skill set of its labor force
with many service–oriented jobs today. The Attleboro Public Schools and the City are challenged
to provide education to its students that will prepare them for work in the changing economy.

MUNICIPAL FACILITIES & SERVICES
CITY OF ATTLEBORO COMPREHENSIVE PLAN 97
Recommendations
The City should continue to conduct capital planning annually.
Periodically, Attleboro should review what municipal services it provides and how it provides
them. The City should assess the demand for services, identify potential efficiencies, and how it
might need to modify services to meet the changing needs of the City’s population. (See Goal 16
and Goal 18, Policy 1.)
The City should create linkages between municipal government and local and regional social
service providers to form a network of services to its residents. The City should target resources
to Attleboro’s most vulnerable populations: elderly persons, persons with disabilities, children,
and youth. (See Goal 18.)
The City should continue to invest in its school system and encourage the school department to
look for new and creative ways to ensure the curriculum is current and relevant in today’s
economy. (See Goal 17.)

LOOKING AHEAD: A VISION OF A FUTURE ATTLEBORO
CITY OF ATTLEBORO COMPREHENSIVE PLAN 98
V. LOOKING AHEAD: A VISION OF A FUTURE
ATTLEBORO
V.A. Vision Statement
We, the people of the City of Attleboro, through our locally elected officials and our own active
involvement, and guided by our City Charter, ordinances, and regulations, have the power to shape
the day–to–day environment in which we all live, work, and play in the City we call home.
Recognizing our rights and responsibilities for collectively determining our common future, we have
prepared this 2012 COMPREHENSIVE PLAN to:
Document the work of the many citizens and stakeholders who have contributed their
ideas, opinions, and energies to this planning effort;
Guide City officials as they carry out their duties over a planning horizon of at least two
decades;
Provide a framework for continued community involvement and consensus–building
around policy issues faced by local government;
Set goals that embody our highest shared aspirations; and
Make practical recommendations to achieve those goals.
In this vision statement we recognize that: (1) the powers of government are limited, (2) while local
communities have a degree of independence, cities and towns are not immune from conditions in
neighboring communities, the region, the Commonwealth, the nation, or the world at large, and (3)
we cannot foresee what events may transpire in the future to confound our best–laid plans.
Nevertheless, we envision the following description of a desirable future Attleboro, based on a
synthesis of global and regional trends, local strengths and weaknesses, potential threats and
opportunities, and community wishes and needs.
The Internet will continue to revolutionize the way we communicate and the way we learn.
Although education is highly valued by Attleboro citizens now, it will be even more highly
valued in the future, both for its own sake in enabling personal fulfillment, and as a necessity in
attaining good jobs. Although the funding mechanisms and delivery systems may change, there
will be more robust support for early childhood, elementary, and secondary education in
Attleboro in 2030. Furthermore, the importance of lifelong education will be paramount, and
there will be an array of opportunities for citizens of all ages to create and share knowledge.
Globalization will continue to level the playing field in markets for goods and services that can be
transferred electronically, including information, financial, and educational services. On the other
hand, material goods, such as food, clothing, and building materials, will travel shorter distances
as energy prices increase. Local and regional industries will provide locally produced goods to
replace imported products, putting people to work, helping to reduce the nationʹs trade
imbalance, and increasing local economic resiliency.

LOOKING AHEAD: A VISION OF A FUTURE ATTLEBORO
CITY OF ATTLEBORO COMPREHENSIVE PLAN 99
Electronics, jewelry making, and metals fabrication and refining will still be represented in the
Cityʹs industrial economy in 2030. At the same time, the tradition of educational excellence,
innovation, and entrepreneurship that is rooted in Attleboro, and in other historic mill towns
throughout New England, will find a new global niche. Research and development, perhaps with
a manufacturing component, in a high tech field such as renewable energy, will generate
economic activity, employing local people and serving distant markets.
As a result of the information revolution, fewer residents will commute out of town in 2030.
Many residents will telecommute to their place of work without leaving Attleboro. Others will
work in the Cityʹs industrial parks, which will be built out to full capacity. New transportation
and delivery services will emerge, based on Internet–enabled business models, to allow families
to meet their transportation needs with less reliance on private automobiles.
The City of Attleboro will experience a resurgence of economic activity in the downtown, due to
the stimulus of increased population density and the availability of public transit. Restaurants
and other retail businesses will occupy street level spaces, while upper floors will house Internet–
enabled businesses. The City will also play a growing role as a cultural center, with museums,
performing arts venues, and the Capron Park Zoo drawing visitors from surrounding towns.
Attleboro neighborhoods will grow in both diversity and cohesiveness. Neighborhood
associations will bring residents together to explore common interests, as well as to promote
safety and security. Walkable neighborhoods will be highly valued. These will be neighborhoods
in which the sidewalks are paved and a corner grocery and public park are within a ten–minute
walk.
City officials will play a leadership role in issues that require regional cooperation and planning,
such as transportation. An increasing number of public transit options will be available,
particularly from the downtown, including frequent service to Providence and T.F. Green
Airport.
Economic growth and proactive social policies at the federal and state level will result in a
reduction in the numbers of homeless and working poor. This, combined with adequate funding,
will enable local social services agencies to adequately meet client needs.
The water and the air in Attleboro will be cleaner in 2030 than they are now. Increased water
demand due to growth and development will be offset by more widespread water conservation
practices. Air quality will improve as measures to reduce greenhouse gas emissions are widely
adopted.
Green spaces will be highly valued for their visual appeal, contribution to clean air and water,
and ability to provide for active and passive recreation. The Ten Mile River will be walkable and
navigable over much of its length, including the downtown, where several sidewalk cafes will
overlook the river.

LOOKING AHEAD: A VISION OF A FUTURE ATTLEBORO
CITY OF ATTLEBORO COMPREHENSIVE PLAN 100
Due to a major shift in land development policies and techniques, a significant amount of
privately owned, residentially zoned, undeveloped land in the City will still be undeveloped in
2030. Most development over the next twenty years will occur in the downtown, existing
neighborhoods, and in land zoned for general business along main traffic arteries. Growth will be
accommodated by making better use of existing structures and of vacant lots in built–up areas.
Every building that is of historic significance in 2010 will still be standing in 2030, preserving the
historic character of the City. The exteriors of new buildings in the downtown will harmonize
with the older buildings. With the benefit of grants and other incentives, new public buildings
will incorporate green building design principles, including low energy consumption, renewable
energy generation, waste minimization, and the use of renewable and non–toxic materials.
Municipal adoption of total–cost–of–ownership financial planning techniques will result in better
maintenance of all assets under the stewardship of local government.
In summary, we envision in 2030 an Attleboro that is globally connected, with a strong local
economy; a vibrant urban center, in harmony with thriving residential neighborhoods; and a place
where natural and historic resources are valued as an irreplaceable legacy to be passed on to future
generations.

GOALS, POLICIES & PROPOSALS
CITY OF ATTLEBORO COMPREHENSIVE PLAN 101
VI. GOALS, POLICIES AND PROPOSALS
VI.A. Creating City–Wide Goals, Policies, and Proposals
As part of the comprehensive planning process, a City outlines goals to achieve during the course of
the plan and objectives to define mechanisms to achieve the goals. Goals should be realistic, yet push
the City to move in a direction that focuses its efforts. It is important that the City have the capacity
or the ability to develop capacity to achieve its goals. Goals should relate to the City’s vision for its
future and provide a framework for realizing the vision.
In the course of Attleboro’s planning process, each subcommittee developed goals, policies and
proposals for the applicable subject area. To this end, the subcommittees were informed by input
received through public participation, distillation of technical data and personal knowledge and
experience related to Attleboro. The goals and objectives of the following planning subject areas are
included in the plan:
Zoning & Land Use
Neighborhoods
Transportation
Economic Development
Central Business District
Housing
Environmental Resources, Open Space and Historic Preservation
Public Safety
Municipal Facilities
School System
Social Services
While goals are organized by a primary subject area, they often relate to more than one of the other
elements of the plan. For example, housing goals may relate to land use/zoning and historic
preservation. The table on the following pages identifies each of the goals under its primary element,
but also identifies any related elements illustrating the interrelatedness of not only the goals, but the
elements of the plan.
While by its very nature good planning incorporates objectives that support environmental
sustainability, certain policies in this plan directly work to foster a greater level of eco–sensitivity in
Attleboro. These policies are identified with a small globe icon in the left margin, “”.

GOALS, POLICIES & PROPOSALS
Attleboro Comprehensive Plan –102–
Topic Area Goals Also relates to:
Goal 1: Continue efforts to protect open space through land acquisition, or
conservation restrictions, or through other means such as land development
regulations.
Environmental Resources & Open
Space
Goal 2: Provide a mix of housing by striving to achieve the state goal of at least
ten percent of the City housing stock in affordable housing and median
housing.
Housing
Zoning & Land Use
Goal 3: Reduce sprawl and the attendant traffic congestion and air pollution
within Attleboro by developing infrastructure that facilitates getting places
other than by car.
Transportation
Neighborhoods Goal 4: To preserve the character and integrity of our neighborhoods.
Goal 5: To ensure that the future needs of our neighborhoods are adequately
served with municipal services and facilities, affordable housing, and
neighborhood planning. Encourage planning and zoning be changed to ensure
the future needs of the population.
Goal 6: To ensure that our neighborhoods are a safe place for residents to live
and raise children. We recognize that there is a growing population of older
citizens and providing a level of safety and passive recreation for all residents
is a priority.
Municipal Facilities, Housing,
Zoning, Public Safety, Open Space,
Historic Preservation
Transportation Goal 7: Provide transportation systems and services to meet the needs of
residents employing safe, logical, and user–friendly practices.
Goal 8: Support the design and construction of transportation improvement
projects. Ensure that the all modes of transportation are safe and that traffic
moves safely and efficiently.
Economic Development, Land Use
& Zoning
Economic Development Goal 9: Encourage economic development growth to increase and expand the
City’s tax and employment base.
Municipal Facilities, School
System, Land Use & Zoning
Central Business District Goal 10: Promote and advance a downtown improvement program that fosters
an inviting “place” in which people can live, work, play, and dine.
Economic Development,
Municipal Facilities,
Transportation
Housing Goal 11: To provide opportunities that will create adequate housing to meet
the needs for all residents of the City.
Neighborhoods, Land Use &
Zoning

GOALS, POLICIES & PROPOSALS
Attleboro Comprehensive Plan –103–
Topic Area Goals Also relates to:
Goal 12: To conserve open space and direct development to targeted areas
with existing infrastructure.
Land Use & Zoning
Goal 13: To ensure a clean and healthy environment for present and future
generations by minimizing pollution and degradation of air, land, and water
resources, and, where possible, reversing damage to such resources.
Land Use & Zoning, Economic
Development, Transportation
Environmental
Resources, Open Space
and Historic
Preservation
Goal 14: Preserve and protect historic resources. Neighborhoods
Public Safety Goal 15: To promote a municipality that is safe, secure, and healthy for its
residents and collaborates/teams with state and federal agencies and
neighboring communities in preventing and responding to threats to public
safety.
Municipal Facilities
Municipal Facilities Goal 16: Continue to upgrade municipal facilities thorough a planning process
to sustain adequate and economically efficient municipal assets and service
levels. Develop a municipal facilities service program based on population
growth and demand.
Public Safety
School System Goal 17: To provide the necessary resources, financial and otherwise, to
support the educational programs established by the Superintendent of
Schools and the School Committee.
Municipal Facilities
Social Services Goal 18: Support municipal agencies and independent private organizations
that provide social service programs to a diverse, changing and growing
population, with special emphasis on expanding programs that work with
families to improve their standard of living. Where possible, coordination
amongst municipal agencies and independent private organizations that
provide social service programs and referrals should be encouraged.
Housing

GOALS, POLICIES & PROPOSALS
CITY OF ATTLEBORO COMPREHENSIVE PLAN 104
VI.B. Zoning & Land Use
Overview of Attleboro Zoning Districts
The major tools that communities use to manage land use are comprehensive planning, zoning
ordinances, subdivision regulations, and growth management policies. Zoning designates permitted
uses of land based on mapped zones, separating one set of land uses from another. Zoning may be
use–based (regulating the uses to which land may be put), or it may regulate building height, lot
coverage, and similar characteristics, or some combination of the two. Urban zones fall into one of
five major categories: residential, mixed residential–commercial, commercial, industrial, or
institutional (i.e., governmental facilities or places of worship). Zoning regulations are land use
regulations and policies that implement community goals, preserve community resources, and
protect community character, while guiding new development. Attleboro has thirteen zoning districts that fall into the following land use categories: single–family
residential, general residential, business districts and industrial districts. In addition to its
conventional use districts, Attleboro has two water resource protection overlay districts (Orr’s Pond
and Bungay River), which provide additional protections to the City’s natural water resources.
Properties in the overlay districts are subject to both the underlying zoning and the overlay zoning.
Attleboro’s conventional use districts are:
Single‐Family Residential zoning districts: SR–A, SR–B, SR–C, SR–D, and SR–E
General Residential zoning districts: GR–A, GR–B, and GR–C
Business zoning districts: Central Business (CB), General Business (GB), and Planned
Highway Business (PHB)
Industrial zoning districts: Industrial (I), Industrial Business Park (IBP)
Attleboro’s residential zoning reflects the City’s development pattern and evolution over time.
Residential zones in and near downtown allow higher density housing than zones located on the
outskirts of the City. Attleboro’s single–family zones also include provisions to build open–space
residential developments and planned unit developments.
The predominant land use in Attleboro is residential. Thirty percent of the City’s land area is
residentially developed. Housing density ranges from six units per acre in Downtown Attleboro to
1.5 units per acre in South Attleboro. Citywide, the average housing density is 0.95 units per acre.
Attleboro’s commercial zoning includes the Central Business (CB) district, the General Business (GB)
district and the Planned Highway Business (PHB) district. The downtown district (CB) allows for a
variety of intensive uses, including exclusively retail business uses, service and finance industries,
institutions, mixed–use buildings, and multi–family housing. The City’s General Business zoning
district encourages primarily commercial uses and a wider variety of commercial uses on larger lots
as compared to the downtown district. The Planned Highway Business zoning districts are centered
around interchanges with Interstate 95 and along the west side of US Route 1A. This zoning district is
designed to allow large shopping centers and regional retail uses.

GOALS, POLICIES & PROPOSALS
CITY OF ATTLEBORO COMPREHENSIVE PLAN 105
Today, 3.6 percent of the City’s land area is in commercial use and 93 percent of the commercially
zoned land is developed. Attleboro has four primary commercial corridors:
US Route 1, Route 1A, Interstate 95 Triangle: Medium sized commercial businesses and
restaurants.
Route 123: Fast–food restaurants and small commercial businesses; main roadway to
Attleboro’s Industrial Business Park; Capron Park Zoo.
Route 152: Small “mom and pop” businesses, residential, and dense commercial.
Downtown: Mix of office, retail, industrial and residential properties. Attleboro’s industrial zoning districts are located along the railroad tracks near downtown, in South
Attleboro and between Interstate 95 and Route 152, south of the City’s geographic center. The
industrial districts allow for general industrial operations as well as office, research, and
development uses.
Approximately 6.1 percent of Attleboro’s total land area is assessed for industrial use, 81 percent of
which is developed. Manufacturing firms occupy most of Attleboro’s industrial land. Zoning & Land Use Goals
GOAL 1
Continue efforts to protect open space through land acquisition, or conservation restrictions, or
through other means such as land development regulations. Permanently protect at least 50
percent of the City’s remaining undeveloped open space.
Policy 1: Increase the amount of land conserved under the Open Space Residential Development
(OSRD) and Planned Unit Residential Development (PURD) zoning provisions.
Proposals
Increase use of the above ordinances, by requiring OSRD or PURD plan submittal in
addition to a conventional plan, and have the planning board recommend (or require) its
preference.
Increase the potential amount of conserved land and provide more flexibility in the
design by further reducing the minimum lot size under the OSRD ordinance from 12,000
square feet to 10,000 square feet.
For the OSRD ordinance, increase the minimum area of the tract to be preserved from 25
percent to 30 percent. Allow a density bonus of 5 percent more house lots than would be
allowed in a conventional subdivision if 40 percent of the tract is preserved. Allow a
bonus of 10 percent more house lots if 50 percent of the tract is preserved.
For both OSRD and PURD, require that the portion of the subdivision to be preserved as
conservation land be conveyed to either the City or a non–profit organization whose
principal purpose is the conservation of open space. If conveyed to a non–profit
organization, a conservation restriction in favor of the City should be recorded in
accordance with MGL CH. 184, §31 and §32. Require that a bond be posted until such
conveyances and restrictions are recorded.

GOALS, POLICIES & PROPOSALS
CITY OF ATTLEBORO COMPREHENSIVE PLAN 106
All land preserved under the OSRD and PURD ordinances should be protected as open
space in its natural state, allowing for passive recreation, but not active recreation. In
keeping with the goal of protecting wildlife habitat, preserved land should be compact in
layout and, if possible, contiguous with other conservation parcels. In specifying
conditions for the use of the preserved land, the planning board should be authorized to
grant waivers allowing the following uses:
As neighborhood parks or neighborhood playgrounds, up to a limit of one–half acre
or 10 percent of the preserved land, whichever is greater.
As pedestrian trails, connecting to other neighborhoods or preserved areas.
As neighborhood commons, encircled partially or completely by house lots and/or
roads.
As farmland for the practice of sustainable agriculture.
As forest land in which selective cutting of timber is practiced according to principles
of sustainable forestry.
GOAL 2
Provide a mix of housing by striving to achieve the state goal of at least 10 percent of the City
housing stock in affordable housing (targeted to households with incomes at or below 80 percent
of the median family income), as well as offer housing to households with incomes between 80
percent and 120 percent of the median household income.
Policy 1: Develop mechanisms to attract developers to construct or reuse housing to provide
affordable and median–income housing.
Proposals
Adopt incentive zoning provisions to increase underlying housing density.
GOAL 3
Reduce sprawl and the attendant traffic congestion and air pollution within Attleboro by
developing infrastructure which facilitates getting places other than by car.
Policy 1: Increase opportunity for people to be able to walk to their work or daily shopping
needs.
Proposals
Encourage development of neighborhood stores. Guidelines for design and development
may require provisions such as: special permits, location requirements (e.g. half–mile
radius), dimensional requirements such as maximum height (e.g. single–story) and
square footage, and design considerations (e.g. no illumination).
Policy 2: Develop and implement design codes that physically encourage pedestrian and other
alternative forms of transportation.
Proposals
Adopt regulations that require the construction of bike paths and parking as well as
school and public transit bus stop shelters in new developments.
Adopt “traffic calming” street design standards to help control traffic speed.

GOALS, POLICIES & PROPOSALS
CITY OF ATTLEBORO COMPREHENSIVE PLAN 107
Policy 3: Maintain and increase congenial streetscapes throughout the City that encourage
pedestrian traffic and maintain neighborhood feel.
Proposals
Adopt building and landscape architectural design codes (similar to the APA’s
Traditional Neighborhood Development guidelines) such as a signage ordinance,
reduced street setbacks, staggered facades, and landscaped sidewalks.
Reduce the requisite number of off–street parking stalls for retail business.
Policy 4: Encourage connectivity between subdivisions where possible. Whenever possible, new
developments should connect to surrounding developments to create a secondary street network.
Developments could also connect by way of foot or bike path to allow alternate means of
transportation.
VI.C. Neighborhoods
Attleboro is a City composed of several neighborhoods, and each with its own defining
characteristics, assets, and needs. Neighborhoods are geographic sub–areas within a City that may be
defined by tradition, period development, or subdivision patterns. Neighborhood boundaries may
include major streets or other physical features. It used to be that neighborhoods were self–contained;
people lived, worked, and played in their neighborhood. Today, people are more mobile and traverse
neighborhood boundaries routinely. Attleboro’s neighborhoods are in various stages of development. They can be described as
established and stable, established and redeveloping, developing, and new. In this plan, the
following neighborhoods are identified and discussed: Dodgeville, Hebronville, Mortgage Hill, South
Attleboro Village, Lonicut, Briggs Corner, East Side, and Downtown. The table below identifies
Attleboro neighborhoods and gives a brief description of their boundaries, characteristics, assets and
needs. Neighborhood Description
Dodgeville Boundary: Lamb Street to South Main Street, South Main Street to Camp Street,
Camp Street to the rail tracks to Lamb Street, including properties on both sides
of South Main Street that is located within this general area.
Characteristics: Mill Houses, single family, general residence, with some duplexes
Major assets: Dodgeville Mill, Tilda B. Stone Playground, and Twin Village Pool,
St. Stephens Church, Three grave yards, and the Dodge Island Cemetery
Needs: Historic District status for Mill House area
Hebronville Boundary: Thurber Avenue beginning at South Main Street to Oak Hill Avenue,
then westerly on Oakhill to the Seekonk Town line following said line to
terminating point near Rhode Island line, then northwesterly on the Rhode Island
line to County Street, then northeasterly to southerly side of County Street, the
Brook at the southeasterly corner of the Attleboro City Home property, then
southeasterly over a hypothetical line to the point of origin in South main street.
Characteristics: Mill Houses, more condo and apartments as opposed to single–
family homes
Major assets: Hebronville Mill, WWII Memorial, Ousley Field, Sewer treatment
Plant, Animal Control Center, Willow Tree Farm, Teknor Apex

GOALS, POLICIES & PROPOSALS
CITY OF ATTLEBORO COMPREHENSIVE PLAN 108
Neighborhood Description
Needs: None specific
Mortgage Hill
Boundary Lines: North Main Street, bound on the left side by Lincoln, Ashton, and
Payson Street, and on the right by Veery, Upland, and Bank Street
Characteristics: Early 1930s home, first homes in City with mortgages. Single–
family homes.
Major Assets: All areas have sidewalk
Needs: None specific
South Attleboro
Village
Boundary Lines: Newport Avenue from the North Attleborough town line
through the Intersection to US Route 1A. Newport continuing to the Pawtucket
Line
Characteristics: Once the center of Attleboro, it is comprised of 1700 period homes.
Mill homes, high volume of traffic, commercial business area.
Major Assets: Fire Station, Newell Burying Ground
Needs: Library, Pedestrian–friendly traffic calming techniques concerns for US
Route 1 and US Route 1A, especially coming out of side streets, Police substation
Lonicut
Boundary Lines: Borders Thacher Street, (includes Linden, Prairie Avenue, Alder
Street) on the north side to the railroad tracks to County Street.
People using the area as a cut through to go to work at the Dodgeville mills
derived the name Lonely Cut. It was a quiet area with sagebrush. Over time its
name was transformed from Lonely Cut to Lonicut
Characteristics: Small lots, well manicured lawns. It was once multi–cultural,
being made up of French, Italian, and Portuguese, but has become a primarily
Portuguese community
Major Assets: Glacier Rock, Holy Ghost Church, Father Sullivan’s Field, and
Barbeques
Needs: None specific
Briggs Corner
Boundary: The boundaries of this neighborhood include either side of Park Street
from approximately the LaSalette Shrine and Oak Knoll Sanctuary south to
Oakhill Avenue, and approximately a distance of 1,000 feet west and south from
the intersection of Park Street and Oakhill Avenue.
Major Assets: Hyman Fine School, Fire Station, LaSalette Shrine, Oak Knoll
Sanctuary, Briggs Corner Restaurant
Needs: None specific
East Side
Boundary: The boundaries of this neighborhood include Maynard Street to the
north, to Falmouth Street, to O’Neil Boulevard, south along Speedway Brook, to
South Main Street, north along South Main Street to Capron Street.
Characteristics: Multi–family dwellings. Properties have transitioned over the
years from being primarily owned and occupied by families to being owned by
absentee landlords. Recently, owner–occupancy has increased.
Major Assets: Briggs Pool and Playground, Recreation Center,: Peter Thacher,
Sturdy Memorial Hospital Auditorium & Fields at Peter Thacher School,
Needs: More programs & longer hours at recreation center – Briggs pool repair,
more Block Grant money allocated to the East Side, sidewalks need repairing,
litter is a problem

GOALS, POLICIES & PROPOSALS
CITY OF ATTLEBORO COMPREHENSIVE PLAN 109
Neighborhood Description
Downtown
Boundary: The boundaries of this neighborhood include the area generally bound
by Dean Street, Morey Street, Mill Street, Wall Street, County Street, Riverbank
Road, and North Main Street.
Major Assets: City Hall, Sturdy Memorial Hospital, YMCA, Art/Industrial/Women
at Work Museums, DAR House, Blackinton Inn, Knobby Crafters, Balfour River
walk, Jewelry Outlet, Churches, Library, Express Motor Vehicles Registry,
Registry of Deeds
Needs: Vision for the future; encourage redevelopment; employment housing and
food, place where people can live, work and play, streetscape program needs to
continue, ITC program needs to continue, additional parking. Signage for
existing parking areas
Neighborhood Goals
GOAL 4
To preserve the character and integrity of our neighborhoods.
Policy 1: Promote the preservation and protection of historic resources in neighborhoods.
Proposals
Amend City ordinances to increase the delay period for demolition permits and require
public notice.
Policy 2: Preserve the historic integrity of neighborhoods.
Proposals
Amend City ordinances to establish a Historic District Commission to promote the
creation of historic districts under MGL CH. 40C (such as Dodgeville, Hebronville, and
Blackinton Park).
Pursue a concerted local program through the Historical Commission to encourage the
placement of qualifying buildings and properties on the appropriate state or federal
Historic Register.
Encourage the use of Community Development Block Grant (CDBG) monies to help
improve neighborhoods. These funds are especially needed in the Downtown and the
East Side neighborhood.
GOAL 5
To ensure that the future needs of our neighborhoods are adequately served with municipal
services and facilities, affordable housing, and neighborhood planning. Encourage planning and
zoning be changed to ensure the future needs of the population.
Policy 1: Foster awareness of neighborhoods and get residents involved in government through,
for example, telecasting all municipal meetings.

GOALS, POLICIES & PROPOSALS
CITY OF ATTLEBORO COMPREHENSIVE PLAN 110
Proposals
Encourage neighborhood residents to participate in development, improvement,
municipal service, and zoning decisions that affect them.
Encourage local City officials to strengthen ordinances and policies to preserve the
integrity of the neighborhoods.
GOAL 6
To ensure that our neighborhoods are a safe place for residents to live and raise children. We
recognize that there is a growing population of older citizens, and providing a level of safety and
passive recreation for all residents is a priority.
Policy 1: To inform people of the assets of community and neighborhoods.
Proposals
Encourage the creation of informational packages for each neighborhood.
Encourage the use of signage in neighborhoods to depict, portray, and illustrate their
local history.
Policy 2: Strengthen and promote neighborhood safety.
Proposals
Prioritize expanding the sidewalk construction program to include areas that are in
disrepair, unsafe, and pose a public safety hazard.
Increase police patrols in neighborhoods and in outlying areas.
Continue to pursue state and federal grant resources to reinstate police bicycle patrols
and foot patrols.
Policy 3: Improve, expand and maintain existing recreational facilities and expand neighborhood
programs for both youth and seniors.
Proposals
Expand programs and hours at the recreation center for youth and integrate programs
geared toward residents in their 50s and older adults.
Expand the variety of recreation programs at all neighborhood facilities for older adults,
as needed.
Continue maintenance of recreational facilities in neighborhoods.
Allocate time at all municipal recreational facilities for non–organized, non–league use of
fields.
VI.D. Transportation
The coordination of transportation with the principles and practices of land use planning and
development is crucial. At a minimum, the coordination of land use and transportation requires that
local, regional, state, and federal officials assess and evaluate how land use decisions affect
transportation systems and how they can increase viable options for people to access opportunities,

GOALS, POLICIES & PROPOSALS
CITY OF ATTLEBORO COMPREHENSIVE PLAN 111
goods, services, and other resources to improve the quality of their lives. In turn, we must be aware
of the effects that existing and future transportation systems may have on land use development
demand, choices, and patterns. Integrating land use and transportation is one facet of “smart
growth”. These shared principles and strategies intend to preserve and even enhance valued natural
and cultural resources and facilitate “healthy,” sustainable communities and neighborhoods. Smart
growth fosters a balanced mix of uses (including housing, educational, employment, recreational,
retail, and service opportunities) and recognizes the importance of spatial or geographic proximity.
Attleboro’s transportation network is extensive and includes state and federal roadways, public
transit (bus and rail), bicycle and pedestrian infrastructure. As Attleboro is a regional employment
center and offers public transit connections to Boston and other locations, there is a substantial
amount of commuter traffic that travels into and through Attleboro. Such traffic, generated by
Attleboro residents and residents of surrounding towns, puts growing demands on the City’s
transportation infrastructure.
In response to these demands, the City has started planning for the Intermodal Transportation Center
(ITC) that will be located downtown and will be a regional transportation hub servicing both the
MBTA Commuter Rail and GATRA bus service. In addition to the ITC, Attleboro also has plans to
improve roadway and bridge infrastructure through its CAPITAL IMPROVEMENTS PROGRAM and to
continue to maintain and upgrade the its sidewalk systems, as well as construct new sidewalks
through its annual Sidewalk Reconstruction Program.
Transportation Goals
GOAL 7
Provide transportation systems and services to meet the needs of residents employing safe,
logical, and user–friendly practices.
Policy 1: Formulate a system–wide approach to mitigating traffic and transportation issues to
improve traffic safety conditions, congestion, and flow.
Proposals
Identify the Pleasant Street (Route 123) corridor as a high priority corridor for the City.
Improve the circulation flow on Pleasant Street by investigating reconstruction
alternatives for traffic circulation.
Study east–west traffic demand across the City. Coordinate proposed improvement
projects (Holden Street, West Street) to address this and other area wide traffic issues.
Install signs and signalization when warranted. This will require traffic studies and
analysis to prevent the installation of stop signs and traffic signals in inappropriate
locations.
Utilize police enforcement tools on local roads to reduce speed violations and other
traffic violations at locations that are deemed safety concerns. Consider developing a
Traffic Division. Utilize new technology as appropriate.

GOALS, POLICIES & PROPOSALS
CITY OF ATTLEBORO COMPREHENSIVE PLAN 112
Policy 2: Utilize Context Sensitive Design (CSD) techniques and establish standard City details
for future improvements, as needed.
Proposals
Stress written notification to community members for public meetings and input during
conceptual hearings. Ensure that a City representative is present at all such public
meetings.
Provide clear written notification of value, compensation processes, and property
acquisition timeframe to project abutters when land takings appear to be necessary.
Consider residents’ concerns in relation to the proximity of proposed projects in the City.
Emphasize the need for public participation and public meetings to address new
transportation projects through the Traffic Study Commission.
Policy 3: Encourage utilization of public transportation to reduce use of vehicles and emissions.
Proposals
Promote public transportation (MBTA, GATRA) where it is needed and/or would help
ease traffic congestion.
Encourage walking and bicycling as primary modes of travel, where possible. Promote
recreational transportation such as river canoeing, bicycling, walking, and jogging.
GOAL 8
Support the design and construction of transportation improvement projects. Ensure that all
modes of transportation are safe and that traffic moves safely and efficiently.
Policy 1: Participate actively in planning with regional, state, and federal authorities to ensure
that any changes or improvements will benefit Attleboro.
Proposals
Leverage funding opportunities for required improvements.
Encourage City, regional, State and Federal proposals for transportation projects that
would enhance the Attleboro’s transportation infrastructure and roadway safety.
Encourage City officials to communicate and coordinate the City’s plan with those of
adjacent communities and regional plans.
Encourage safety measures with MBTA and Amtrak, including possible patrols and
additional fencing, as needed.
Expedite current projects:
Design and construction of Riverfront Drive connecting Wall Street and Olive Street
adjacent to the MBTA commuter parking lot on Wall Street
Route 152 improvements – Phase III construction of the Route 152 improvements
upon the completion of Phase II

GOALS, POLICIES & PROPOSALS
CITY OF ATTLEBORO COMPREHENSIVE PLAN 113
Policy 2: Maintain and systematically improve the condition of the City’s road system.
Proposals
Develop a City road improvement/management program to prioritize road
improvements and assist in the development of the CAPITAL IMPROVEMENTS PROGRAM for
transportation.
Apply for federal transportation enhancement funds through the Massachusetts
Department of Transportation to design and construct alternative transportation systems,
such as bicycle corridors along the Ten Mile River, Bungay River, and the Seven Mile
River.
Increase the frequency of street–sweeping and measures to clean catch basins and storm
drains to reduce flooding and improve the City’s stormwater management system.
Purchase a vactor truck.
Make the safety and convenience of both pedestrians and motorists a priority when
planning improvements.
Promote use of xeriscaping (maintenance free landscaping), especially along sidewalks to
create green spaces.
Expedite current projects:
Construction of the Olive Bridge
Realignment of Wall Street (from the Ten Mile River Bridge to South Main Street)
Policy 3: Encourage private and public stewardship of City roadway infrastructure.
Proposals
Establish a systematic annual maintenance program. Utilize GIS software mapping
equipment to map City infrastructure for maintenance program, and develop a City
Pavement Management System (PMS), as well as similar programs for stormwater
drainage and other City infrastructure systems.
Consider performing a cost/benefit analysis to determine the feasibility and cost savings
of outsourcing the performance of maintenance activities.
Create the position of, and hire, a City Engineer.
Policy 4: Encourage developers to undertake reasonable infrastructure upgrades and
improvements such as to the municipal water, sewer, and storm drain systems, as necessary,
when the need for such upgrades and improvements is directly related to proposed new
developments during construction throughout the City.
Proposals
Amend City ordinances and establish a nexus between land development regulations to
provide for a linked sidewalk system and green corridors throughout the City’s
neighborhoods and outlying areas.
Require the installation of underground utilities.
Require the installation of granite curbing.

GOALS, POLICIES & PROPOSALS
CITY OF ATTLEBORO COMPREHENSIVE PLAN 114
Policy 5: Encourage City truck route planning.
Proposals
Investigate a new route to reroute trucks in and around the Central Business District.
Consider designating truck delivery times to off peak hours.
Clearly mark truck routes for unknowledgeable drivers and post warnings for low
bridges.
Formally consider truck access when constructing future improvements.
Utilize CDL Traffic Enforcement Truck Team.
Policy 6: Provide sufficient on–street and off–street parking spaces as well as appropriate and
aesthetically appealing signage to identify the location of the parking spaces.
Proposals
Amend City ordinances and the ZONING ORDINANCE as necessary.
Expand public parking garage located on Sanford Street.
Continue to pursue the development of a new parking garage as part of the Intermodal
Transit Center project on Wall Street.
VI.E. Economic Development
A city’s economic development contributes to the overall health of the community in multiple ways.
With a vibrant employment base, residents have opportunities for career and financial growth and do
not need to travel for routine items and
services. Commercial and industrial properties
are also an important source of tax revenue for
the City.
Manufacturing and Education and Health
Services are the City’s largest employment
sectors, employing over 8,000 people
collectively. While manufacturing jobs have
declined in recent years, this industry still
comprises 25 percent of the City’s employment
base. Many of Attleboro’s largest employers
are manufacturing–based businesses,
including a number of jewelry manufacturers.
Other leading employment sectors include
retail trade and the accommodation and food services industry. Approximately 25,000 people
comprise Attleboro’s labor force; 31 percent work in Attleboro.
While not its sole commercial center, Attleboro’s downtown gives the City a sense of place and
activity. Completion of the ITC will complement economic development efforts in the downtown by
drawing additional people into downtown.

GOALS, POLICIES & PROPOSALS
CITY OF ATTLEBORO COMPREHENSIVE PLAN 115
Economic Development Goals
GOAL 9
Encourage economic development growth to increase and expand the City’s tax and employment
base.
Overall Policies
Policy 1: Develop and implement an active marketing program designed to promote the City, to
attract and retain businesses, and to ensure the City’s ability to expand and diversify its economy.
Proposals
Explore the reactivation of the municipal economic development agencies such as the
Industrial Development Corporation (IDC) and the Economic Development and
Industrial Corporation (EDIC).
Explore the feasibility of an economic development strategy for attracting businesses in
“clusters” of similar or related industries to support and complement each other and
build a supportive environment for growth and development.
Promote incentives to attract companies with highly skilled and well–paying
employment opportunities.
Policy 2: Encourage and foster a concerted joint effort between City government and private
business enterprises to form an organization that creates and implements a capital financing
grant/loan pool program and other capital financing alternatives, traditional and non–traditional,
that reinforce a wide variety of economic development objectives. These objectives include
encouraging private investment by reducing risk, generating new wealth, nurturing small and
startup businesses, and creating more employment opportunities for residents. The goal of this
organization is to fill private financing gaps with public support to make otherwise unviable
projects financially viable.
Proposals
Establish an Economic Development Revolving Loan Fund to offer venture capital, risk
capital, and a revolving loan pool.
Promote the Economic Development Incentive Program Board and the Tax Increment
Financing tax abatement program to attract and retain business.
Policy 3: Develop and implement an aggressive program to identify and clean–up “brownfields”
sites in order to return them to a productive state.
Policy 4: Sustain a business climate that promotes orderly economic growth and development.
Policy 5: Promote coordination among local and state institutions including economic
development organizations, employment boards and training agencies, technological colleges
and vocational schools, colleges and universities and the business community to continue to
foster a top–tier and adaptive workforce.

GOALS, POLICIES & PROPOSALS
CITY OF ATTLEBORO COMPREHENSIVE PLAN 116
Policy 6: Continue to initiate new business opportunities and development as well as encourage
private investment and business growth by the City serving as an applicant, in partnership with
businesses, for state and federal grants and loans such as Public Works Economic Development
Grants (PWED), Community Development Action Grants (CDAG), BEDIs, EDIs, and other such
forms of financial assistance.
Commercial & Industrial Base
Policy 7: Continue to support the development of the Industrial Business Park.
Policy 8: Modernize and reinvest in the existing industrial park on lower County Street through a
phased infrastructure improvements program.
Proposals
Improve roadway network conditions, improve intersection conditions at County Street
and Franklin McKay Drive and at County Street and Frank Mossberg Drive, upgrade and
improve signage, street lighting, sidewalk and telecommunication systems.
Develop and implement a scheduled maintenance plan.
Plan and incorporate a recreational exercise trail throughout the industrial park and
explore the possibility of connecting the trail to the Industrial Business Park.
Policy 9: Encourage high quality design in expansion and renovation of existing facilities through
the adoption of design standards.
Policy 10: Encourage environmentally sound commercial and industrial (re)development through
the adoption of “green” standards such as LEED, supporting and encouraging “brownfields”
clean–up and re–use opportunities, and promoting related financial assistance programs.
Policy 11: Encourage redevelopment of vacant and underutilized commercial and industrial
properties.
Policy 12: Continue to upgrade, improve, and modernize the City’s infrastructure such as
roadways, sewerage, water, drainage systems, and related systems, as necessary, to ensure that
existing and future commercial and industrial areas are adequately serviced to attract new
business investment.
Policy 13: Strengthen the ability of older industrial areas, such as the Northwest Industrial Park,
O’Neil Boulevard, and John Williams Street, to support new and expanded business activity.
Policy 14: Continue to explore sites for future industrial development.
VI.F. Central Business District
Although the downtown does not necessarily reflect the overall economic health of the City, it is
important symbolically, creating a first impression for anyone coming to Attleboro to live, shop, or
do business. Historically, downtowns were populated by retail enterprises that provided a full range

GOALS, POLICIES & PROPOSALS
CITY OF ATTLEBORO COMPREHENSIVE PLAN 117
of everyday consumer goods. Over the past few decades, downtowns have been abandoned by the
retail trade in favor of roadside shopping centers, big box stores, and malls. Service–oriented
businesses occupy some of the vacant storefronts, but others often remain empty.
Attleboroʹs downtown is formally defined as the Central Business District (CBD). As one of the City’s
zoning districts, the CBD and its boundaries are defined on the Cityʹs zoning map. Because of the
importance of the downtown to the vitality of the City, this COMPREHENSIVE PLAN addresses the
needs of the CBD with a distinct subcommittee and policy area, rather than including it under
Economic Base, as was done in the 1990 COMPREHENSIVE PLAN. However, the CBD subcommittee and
Economic Base subcommittee met jointly to address areas of common interest.
At the public forums there was a consensus among participants that they would like to see all
storefronts in the downtown filled. In the forum on March 20, 2004, “a depressed downtown” was
cited as the City’s number one weakness. However, many of the participants subscribed to the view
that the downtown “can be improved’ and that more housing downtown was part of the solution.
The CBD subcommittee agreed that the current policy of promoting “mixed–residential and mixed–
use development” in the downtown through appropriate zoning regulations should continue. This
policy essentially allows residential uses on upper floors by right, and on first floors by special
permit, in areas which otherwise would be restricted to offices, stores, and restaurants. This policy is
in keeping with the theme of “live, work, and play” in which one could live self–sufficiently in the
CBD within walking distance of opportunities for both work and leisure activity.
Some programs already underway to improve the downtown include:
Streetscape Improvement Program. Under this program, downtown sidewalks are being
rebuilt, crosswalks are being redesigned to minimize crossing distances for pedestrians,
and historically styled street lights are being installed.
Downtown Urban Renewal and Revitalization Plan. This plan, coordinated by the
Attleboro Redevelopment Authority (ARA), involves the development of the ITC — a
parking garage, a transit bus loop for GATRA, a connector road between Wall Street and
Olive Street, new surface parking areas, and mixed–use development in the general area
now occupied by the MBTA train station parking area and the City’s Public Works
Highway yard on Wall Street.
While there was strong support on the CBD subcommittee for existing programs, the subcommittee felt that the City needs to be more aggressive in stimulating storefront business activity in the downtown.
Central Business District Goals
GOAL 10
Promote and advance a downtown improvement program that fosters an inviting “place” in
which people can live, work, play, and dine.
Policy 1: Make Downtown Attleboro a destination that is vibrant, thriving, and livable.

GOALS, POLICIES & PROPOSALS
CITY OF ATTLEBORO COMPREHENSIVE PLAN 118
Proposals
Promote and encourage overlapping activities and uses, including employment and
business, shopping, residential, public transportation, civic, social, entertainment, and
cultural.
Make the most of the Downtown’s natural beauty, such as the Ten Mile River, and
provide access for a wide variety of public uses.
Plan for year–round special events and seasonal theme events (e.g. museum events, X–
games and concerts at the Balfour Riverwalk, summer and fall markets, winter festivals,
the annual Expo for the Senses) to encourage residents to enjoy the downtown.
Encourage development of pedestrian–friendly streets, squares, and public green spaces.
Connect Downtown Attleboro with surrounding neighborhoods with greenways, trails,
and bicycle paths.
Encourage a variety of uses at street level that are lively and visible.
Improve traffic circulation and signalization while maintaining sensitivity to a business
and pedestrian–oriented downtown.
Develop memorable entrances.
Enliven public buildings and spaces through access and activities.
Policy 2: Seek and invest resources to stimulate and encourage commercial development and
light industrial development in the downtown.
Proposals
Explore and implement a range of incentives, whether financial, promotional, or
statutory, that will stimulate commercial investment, light industrial development and
job creation in the downtown.
Encourage a variety of commercial, retail, and service–industry uses in the downtown.
Explore opportunities to create a niche retail theme.
Encourage the establishment of multiple dining establishments.
Policy 3: Pursue and encourage the location of higher education facilities in the downtown to
stimulate a wide range of activities in the Central Business District, as well as to encourage
greater utilization of the downtown commuter rail station.
Policy 4: Continue to support and encourage transit oriented development and the
implementation of the 2007 Downtown Urban Renewal Plan.
Proposals
Support and pursue financial resources to ensure the successful implementation of
successive phases of the Downtown Urban Renewal Plan.

GOALS, POLICIES & PROPOSALS
CITY OF ATTLEBORO COMPREHENSIVE PLAN 119
Encourage excellence in urban design and sensitivity to pedestrian scale and interest
throughout the downtown in the construction, renovation, and rehabilitation of
buildings, streets, pedestrian ways, and open space.
Encourage redevelopment and new construction that promotes, complements, and is
respectful of the positive qualities and attributes of Downtown’s identity, historic
fabric and natural surroundings.
Policy 5: Continue to support and encourage the implementation of the downtown Streetscape
Improvements beautification program.
Proposals
Pedestrian improvements and amenities, such as well–designed and placed benches,
trash receptacles, crosswalks, kiosks, public art, landscape features, signage and
directional graphics, should utilize high quality and durable materials that emanate
comfort, accessibility, and aesthetics.
Promote a pedestrian–friendly walking environment throughout the downtown, which
provides comfort, convenience, and safety, high quality sidewalks and crosswalks, and
connection to squares and public places.
Develop and implement a maintenance schedule.
Policy 6: Prepare and implement an on–street / off–street parking plan that evaluates and
addresses current and future parking needs of the downtown.
Proposals
Provide “super convenient” retail parking.
Provide long–term, short–term, and free parking where appropriate.
Locate parking structures conveniently and unobtrusively.
Place signage and directional graphics in visible and convenient locations throughout
Downtown to clearly guide motorists.
Accommodate commuter parking in the downtown associated with the rail station in
such a manner so to complement the needs of the Central Business District.
Expand the parking facilities of the Reverend Gordon N. Larson Senior Center.
Prepare and implement a parking management plan.
Policy 7: Promote partnerships, such as among the YMCA, the Recreation Department, and other
such public and private entities, that advance recreational and health–conscious activities to
engage children, young adults, adults, and senior citizens in the downtown.
Policy 8: Promote the City’s façade improvement program that is funded with Community
Development Block Grant funds and administered by the Community Development Office.
Policy 9: Encourage a concerted joint effort between City government and private business
enterprises to form an organization to create and implement a capital financing grant/loan pool
program and other capital financing alternatives, both traditional and non–traditional. The

GOALS, POLICIES & PROPOSALS
CITY OF ATTLEBORO COMPREHENSIVE PLAN 120
organization would work to reinforce a wide variety of economic development, housing, and
public amenity objectives specifically for Downtown Attleboro, such as, encouraging private
investment by reducing risk, generating new wealth, nurturing entrepreneurial and business
opportunities, and creating jobs, housing, and public/green spaces. The goal of this organization
would be to fill private financing gaps with public support to make otherwise unviable projects
financially viable.
Policy 10: Explore the creation of a “downtown director” or ombudsman position as a
coordinator/facilitator dedicated solely to interdepartmental and inter–agency coordination of
downtown–related activities. The position should be broad–based in expertise with a direct
reporting relationship to the Mayor.
Policy 11: Promote partnerships for fair representation of the varied interests of Downtown
Attleboro and to further advance current strides and accomplishments of downtown
revitalization efforts by encouraging participation and collaboration among City residents,
corporate–citizens, business leaders, civic and neighborhood organizations, elected officials,
governmental and quasi–government entities.
Policy 12: Evaluate and modify, if necessary, the boundaries of the Central Business zoning
district to ensure that it reflects the character of today’s downtown and that of our future
downtown predicated on the long–term goals contained herein.
VI.G. Housing
Often a municipality’s predominant land use, housing is critical to the physical and socioeconomic
structure of a community. The housing stock not only defines what a town or City looks like, but also
who lives there; diverse housing units result in a diverse population. This is true in Attleboro. While
recent new development has resulted in construction of primarily single–family homes, the City has a
noteworthy inventory of two–family and multi–family residences. Today, single–family homes
comprise 57 percent of Attleboro’s units; 10 percent of Attleboro’s housing units are in buildings with
five to nineteen units.
Attleboro’s history is reflected in its housing development pattern. The residential housing stock
downtown is more likely to include two–family and multi–family properties than outlying areas of
the City. Once a thriving manufacturing center, housing developed around factory sites. As one
moved further from downtown, residential lots grew larger and housing density declined. This
remains true today: most of Attleboro’s recent single–family development has occurred in less–
developed sections of the City, specifically in the west and southeast.
As Attleboro looks to the future, the City will face several housing challenges:
How to meet the dynamic housing needs of its residents;
How to preserve the existing housing stock and ensure units are safe and affordable;
How to ensure new housing complements the City’s existing inventory and is developed
sensitively.

GOALS, POLICIES & PROPOSALS
CITY OF ATTLEBORO COMPREHENSIVE PLAN 121
Housing Goals
GOAL 11
To provide opportunities that will create adequate housing to meet the needs for all City
residents..
Policy 1: Encourage the construction of a variety of housing types to meet the identified needs of
the City’s residents.
Proposal
Encourage public/private participation, such as with the programs of the Massachusetts
Housing Partnership, for the creation and retention of affordable housing.
Develop a Needs Assessment and an affordable housing action plan that identifies
priority need areas.
Encourage the reuse and rehabilitation of abandoned or underutilized housing stock,
surplus municipal buildings, and abandoned industrial buildings.
Consider establishing an affordable housing task force to work with the Community
Development Office and developers to develop housing under the Commonwealth’s
Local Initiative Program (LIP).
Policy 2: Sustain and improve, as needed, the condition and appearance of city–owned/public
housing.
Policy 3: Consider the adoption of ordinances and other techniques that permit a more flexible
use of housing and to assist residents to remain in their home.
Proposals
Consider the adoption of an “accessory apartments” ordinance.
Consider the adoption of an “inclusionary zoning” ordinance.
Policy 4: Continue to direct and concentrate federal Community Development Block Grant funds
and HOME Investment Partnership funds to the municipal housing rehabilitation program and
to the creation of affordable housing.
Policy 5: Proactively plan and develop (either through conversion of existing units or new
construction) affordable housing in a manner consistent with smart growth principles and
compatible with adjacent land uses.
Policy 6: Consider the establishment of a new residential zoning district that allows a small lot
size (i.e., 5,000—7,000 square feet) to encourage the construction of smaller, “starter” dwellings as
a means to generate affordable housing for residents.
Policy 7: Encourage and support private, non–profit, entities to create affordable housing through
vehicles such as a community land trust.
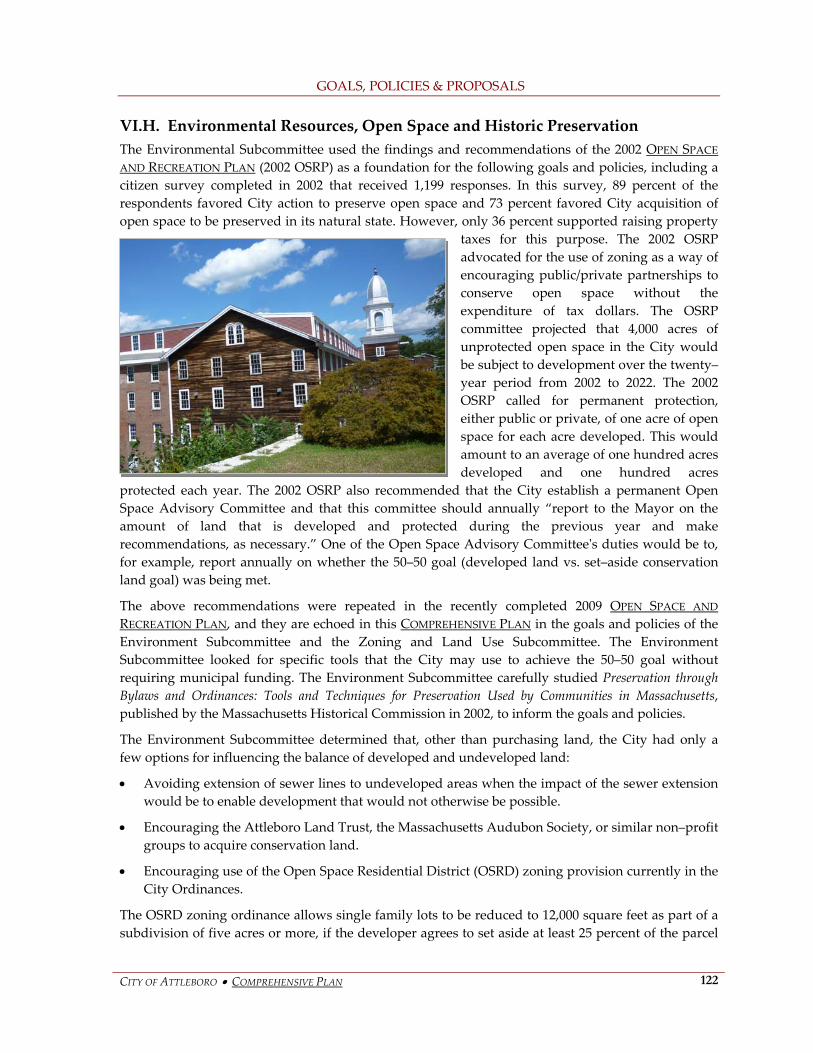
GOALS, POLICIES & PROPOSALS
CITY OF ATTLEBORO COMPREHENSIVE PLAN 122
VI.H. Environmental Resources, Open Space and Historic Preservation
The Environmental Subcommittee used the findings and recommendations of the 2002 OPEN SPACE
AND RECREATION PLAN (2002 OSRP) as a foundation for the following goals and policies, including a
citizen survey completed in 2002 that received 1,199 responses. In this survey, 89 percent of the
respondents favored City action to preserve open space and 73 percent favored City acquisition of
open space to be preserved in its natural state. However, only 36 percent supported raising property
taxes for this purpose. The 2002 OSRP
advocated for the use of zoning as a way of
encouraging public/private partnerships to
conserve open space without the
expenditure of tax dollars. The OSRP
committee projected that 4,000 acres of
unprotected open space in the City would
be subject to development over the twenty–
year period from 2002 to 2022. The 2002
OSRP called for permanent protection,
either public or private, of one acre of open
space for each acre developed. This would
amount to an average of one hundred acres
developed and one hundred acres
protected each year. The 2002 OSRP also recommended that the City establish a permanent Open
Space Advisory Committee and that this committee should annually “report to the Mayor on the
amount of land that is developed and protected during the previous year and make
recommendations, as necessary.” One of the Open Space Advisory Committeeʹs duties would be to,
for example, report annually on whether the 50–50 goal (developed land vs. set–aside conservation
land goal) was being met.
The above recommendations were repeated in the recently completed 2009 OPEN SPACE AND
RECREATION PLAN, and they are echoed in this COMPREHENSIVE PLAN in the goals and policies of the
Environment Subcommittee and the Zoning and Land Use Subcommittee. The Environment
Subcommittee looked for specific tools that the City may use to achieve the 50–50 goal without
requiring municipal funding. The Environment Subcommittee carefully studied Preservation through
Bylaws and Ordinances: Tools and Techniques for Preservation Used by Communities in Massachusetts,
published by the Massachusetts Historical Commission in 2002, to inform the goals and policies.
The Environment Subcommittee determined that, other than purchasing land, the City had only a
few options for influencing the balance of developed and undeveloped land:
Avoiding extension of sewer lines to undeveloped areas when the impact of the sewer extension
would be to enable development that would not otherwise be possible.
Encouraging the Attleboro Land Trust, the Massachusetts Audubon Society, or similar non–profit
groups to acquire conservation land.
Encouraging use of the Open Space Residential District (OSRD) zoning provision currently in the
City Ordinances.
The OSRD zoning ordinance allows single family lots to be reduced to 12,000 square feet as part of a
subdivision of five acres or more, if the developer agrees to set aside at least 25 percent of the parcel

GOALS, POLICIES & PROPOSALS
CITY OF ATTLEBORO COMPREHENSIVE PLAN 123
for conservation. The OSRD must be approved under special permit by the Planning Board, and the
developer is not entitled to any more lots than would be allowed under a conventional subdivision.
The ordinance was adopted many years ago, but is rarely used. The authors of the CITY OF
ATTLEBORO LAND USE GROWTH MANAGEMENT STUDY (2000) recommended that the OSRD ordinance
be re–examined to ʺmake these projects attractive to developers and at the same time increase the
level of public benefit (open space) that cluster housing can yield.ʺ The single most important step
that the City can take to promote land conservation is to make the OSRD ordinance more workable
and effective. Measures to achieve this are in Zoning and Land Use Goal 1, Policy 1. Additional
measures are in Goal 12. In Goal 13, the Environment Subcommittee made a number of
recommendations to protect natural resources in the City for the benefit of current and future
generations. The recommendations were made in response to a number of concerns, including:
pollution of ground water and rivers
the spread of invasive species
air pollution
light pollution of the nighttime sky
In the 2002 OSRP survey, 79 percent of the respondents said they believed that, ʺit is important for the
City to preserve landscapes, places, and/or buildings of historical or architectural interest.ʺ The
Environment Subcommittee responded to this need in Goal 14 by recommending a scenic roads
ordinance, strengthening of the demolition delay ordinance, legislation to allow the creation of
historic preservation districts in the City, and support for the work of the Attleboro Historical
Commission.
Preservation of historic resources. The cultural fabric of Attleboro includes both natural features and
historic structures that remind us of our rich history as a community. The following goals and
policies advocate protection of these resources.
Environmental Resource, Open Space, and Historic Preservation Goals
GOAL 12
To conserve open space and direct development to targeted areas with existing infrastructure.
Policy 1: Increase the amount of land conserved under the Open Space Residential Development
(OSRD) and Planned Unit Residential Development (PURD) zoning provisions. (See “Proposals”
under Goal 1/Policy 1 in Zoning and Land Use.)
Policy 2: Recognize that sewer expansion may negatively impact the environment by (1) opening
up more land for development, (2) reducing groundwater replenishment, and (3) causing off–
road sewer lines to be built in previously undisturbed areas.
Proposals
Require the Wastewater Department to reassess and modify existing sewer expansion
plans in light of the environmental impacts.
Rather than extending development into unsewered areas, encourage development in
areas already served by existing sewer systems.

GOALS, POLICIES & PROPOSALS
CITY OF ATTLEBORO COMPREHENSIVE PLAN 124
Policy 3: Preserve the character of Attleboro’s rural areas and encourage the preservation of
scenic views.
Proposals
Adopt a scenic roads ordinance under the Scenic Roads Act (MGL CH. 41 §15C) that
would require a public hearing prior to any work that would involve the removal or
altering of trees, stonewalls, or any other historic asset, within public rights of way.
Consider the adoption of “backlot zoning” or an overlay district where appropriate to
preserve scenic roadside views.
Policy 4: Adopt growth management measures, so that growth does not outpace the ability of
City government to provide and maintain an adequate level of municipal facilities and services.
Encourage growth and increased density in developed areas with under–utilized infrastructure
and encourage conservation in undeveloped areas.
Proposals
Adopt zoning to allow for cottage–style development, i.e. neighborhoods of smaller,
more affordable single–family homes on reduced lot sizes, in General Residence zoning
districts.
Encourage “brownfield” cleanup for redevelopment purposes to reduce pressure to build
on undeveloped land.
Policy 6: Promote public awareness about the need to preserve open space in its natural state.
Proposals
Create a standing Open Space Advisory Committee to advise the Mayor and the
Municipal Council regarding open space issues and actions, and to implement the action
items contained in the most recent OPEN SPACE AND RECREATION PLAN.
The Open Space Advisory Committee should conduct periodic public awareness
campaigns to show residents that Attleboro’s resources are worth preserving with such
tools as brochure mailings and newspaper articles. Encourage conservation programs
that promote the beautification of the City.
Policy 7: Protect and preserve large unprotected tracts of land in their natural state for passive
recreation, wildlife areas, City forest sites and watersheds.
Proposal
Place city–owned land at Locust Valley (Assessorʹs Map #176 Lot #1 – 115 acres,
Assessorʹs Map #181 Lot #1 – 32 acres) under the jurisdiction of the Conservation
Commission.
Encourage implementation of MGL CH. 61 (forests), MGL CH. 61a (agriculture), MGL
CH. 61b (private recreation) programs.
Acquire and protect large unprotected tracts of land and placed under protected status,
with an emphasis on land opportunities that adjoin or provide corridors between priority
areas such as the Bungay River, Manchester Reservoir, Locust Valley, and Chartley
Brook.
Policy 8: Protect large unprotected tracts of land for active recreational purposes.

GOALS, POLICIES & PROPOSALS
CITY OF ATTLEBORO COMPREHENSIVE PLAN 125
GOAL 13
To ensure a clean and healthy environment for present and future generations by minimizing
pollution and degradation of air, land, and water resources, and, where possible, reversing
damage to such resources.
Policy 1: Modify local regulations to strengthen ground and surface water protection.
Proposals
Modify zoning requirements and subdivision regulations to encourage less lawn area
and less impermeable surface area in new residential developments in order to reduce
non–point source pollution from lawn chemicals and reduce water usage. Discourage
large paved surfaces (in keeping with Low Impact Development policy guidelines) to
increase groundwater recharge.
Reduce parking lot requirements for commercial zoning, with a corresponding increase
in landscaping requirements. Encourage use of permeable parking surfaces to allow
groundwater recharge.
To conserve water, to curb the spread of invasive species, and to help sustain native plant
and animal species, require the use of native plant species in the landscaping of
residential, commercial, and municipal developments.
Promote native aquatic species (both plant and animal) and take steps to monitor,
control, and remove invasive aquatic species from rivers and streams.
Provide an unobstructed floodway in all watercourses by requiring the removal of all
unnecessary obstructions.
Policy 2: Manage water resources to maximize their public benefit through potential uses as
transportation corridors and recreational assets.
Proposals
Require all new bridge designs over navigable waterways to allow sufficient clearance
for passage by canoe and other light water craft.
Policy 3: Encourage City government to adopt best management practices for ground and surface
water protection in areas under municipal jurisdiction.
Proposals
Minimize toxic herbicide and pesticide applications on all city–owned or controlled land,
according to accepted Integrated Pest Management standards.
Complete street sweeping operations on roadways within 1,000 feet of all watercourses
by April 15. Avoid dumping plowed snow within one hundred feet of any watercourse.
Store road sand and salt indoors in a manner that prevents any runoff from the storage
piles and establish “No Storage” zones in sensitive areas.
Remove pavement along embankments of rivers and streams to improve environmental
quality.
GOALS, POLICIES & PROPOSALS
CITY OF ATTLEBORO COMPREHENSIVE PLAN 126
The City should promote water conservation awareness through efforts such as public
forums and distribution of informational literature in addition to conservation tips
available on the City’s website.
Policy 4: Encourage City government to adopt best management practices to improve air quality
in all areas of the City.
Proposals
Expand School Department busing services and encourage the use of public
transportation to decrease traffic congestion and air pollution caused by private vehicles.
Adopt a program to replace municipal vehicles and light trucks with vehicles powered
by alternative fuels or hybrid fuel systems.
Policy 5: Enact ordinances and zoning requirements to improve environmental quality.
Proposals
Require fully shielded lighting fixtures for all newly installed and renovated outdoor
lighting on commercial, industrial, and municipal properties to prevent light pollution of
the nighttime sky.
Adopt a sign ordinance to limit the visual blight of commercial signage.
Increase requirements for landscaped and buffer zones between businesses and homes.
GOAL 14
Preserve and protect Attleboro’s historic resources.
Policy 1: Provide adequate funding and assistance to the Attleboro Historical Commission.
Proposals
Support the Commission in the creation of an historic preservation plan. The plan should
include:
A comprehensive inventory of historic resources including documents, records, and
artifacts.
Community education programs to promote the value of historic preservation.
Identification of properties appropriate for listing on the historic register.
Policy 2: Protect historic buildings, scenic vistas, and landscapes.
Proposals
Create a Heritage tree inventory, referencing national standards.
Protect the City’s historic structures, such as Academy Building.
Assist the local preservation society and other civic/neighborhood groups in their efforts
to promote historic preservation.
Review the Heritage Landscape Inventory Report completed by the Massachusetts
Department of Conservation and Recreation to determine the continued relevance of
recommendations established for Attleboro.
Policy 3: Adopt provisions of Community Preservation Act (CPA) to provide funding for historic
preservation programs.

GOALS, POLICIES & PROPOSALS
CITY OF ATTLEBORO COMPREHENSIVE PLAN 127
VI.I. Public Safety
In the survey conducted by the Comprehensive Plan Steering Committee, respondents ranked public
safety as second among ten City priorities. Achieving a safe, secure, and healthy City requires
planning, organization, and assignment of resources for the prevention of threats, and an effective,
coordinated response to those threats if they should materialize. All City departments must organize
to operate under “normal” and “emergency” conditions.
The modern realities of terrorism, industrial accidents, or new forms of infectious disease must be
accommodated within the constraints imposed by financial, personnel, training, and equipment
limitations. Therefore it is necessary to plan and organize for an escalating, systematic, and multi–
level response depending on the nature of the threat.
In order to address the policy area of public safety in a comprehensive way, the Public Safety
Subcommittee interviewed a number of City department heads. The subcommittee began by
interviewing Mr. Bob MacDonald, Deputy Director of Civil Defense. He provided an overview of the
role of Civil Defense/Emergency Management in the City of Attleboro. Topics covered included the
identification of federal, state, and local agencies which coordinate with City efforts during an
emergency, the current state of preparedness within the City, and some of the shortfalls which are
due, in most part, to lack of available funding.
The Police Chief, Fire Chief, Water Superintendent, Wastewater Superintendent, Public Works
Superintendent, and the Health Agent were also interviewed by members of the subcommittee.
Public Safety Goals
GOAL 15
To promote a municipality that is safe, secure, and healthy for its residents and
collaborates/teams with state and federal agencies and neighboring communities in preventing
and responding to threats to public safety.
Policy 1: Provide adequate staffing, facilities, equipment, and training to support public safety
during normal and emergency conditions.
Proposals
Review and update the “schedule” for the planned replacement/upgrading of equipment
necessary to adequately support public safety during normal and emergency conditions.
Adopt a financial methodology for setting aside money each year to be used to
replace/upgrade equipment as outlined in the “schedule.”

GOALS, POLICIES & PROPOSALS
CITY OF ATTLEBORO COMPREHENSIVE PLAN 128
Periodically evaluate fire and police staffing needs, and amend the ordinance as needed,
to provide adequate public safety for the community.
Provide public safety facilities to meet the space needs and technological requirements
necessary to support current and future operational needs.
Incorporate Federal and State Homeland Security and Emergency Services requirements
for the City. Consider purchase of Mobile Command Unit.
Provide adequate training and cross–training for police officers, firefighters, and staff.
Pursue federal and state grant sources to help fund the implementation of the goals and
policies of public safety.
Policy 2: Maintain a Class 4 or better rating for the Fire Department.
Proposals
Maintain a maximum response time for emergencies.
Promote specialized training to police and fire personnel to properly and effectively
handle various situations.
Maintain effective emergency water supply systems throughout the City.
Policy 3: Provide an updated comprehensive Emergency Response Plan.
Proposals
Periodically review and update the existing Emergency Response Plan for each
department in the City.
Periodically evaluate emergency response staffing needs, and amend the ordinance as
needed, to provide adequate public safety for the community.
Provide public emergency response facilities that meet the space needs and technological
requirements necessary to support current and future operational needs.
Correlate the EMS system with the national alert system.
Develop a sheltering plan.
Provide an emergency generator for the Emergency Operations Center.
Ensure adequate support for implementing the Emergency Response Plan.
Provide a back–up incident command center.
Policy 4: Improve communications systems regarding emergency preparedness.
Proposals
Establish a modern alert system for communicating information to specific areas of the
City as well as to the entire City as a whole
Provide adequate means of communication technologies to facilitate and support
departmental and interdepartmental communication capabilities.
Incorporate the Geographic Information System within the City’s communication
infrastructure.

GOALS, POLICIES & PROPOSALS
CITY OF ATTLEBORO COMPREHENSIVE PLAN 129
Policy 5: Provide adequate emergency training sessions within all departments.
Proposals
Hold quarterly meetings, which include the planning group and the Director of
Emergency Management.
Provide regular interdepartmental training
exercises and cross–training within
municipal departments, utilizing
appropriate outside resources in training
exercises, including Sturdy Memorial
Hospital, Amtrak, FEMA, MEMA,
Homeland Security, FBI, ATF, State Police
and any other agencies deemed appropriate.
Policy 6: Establish a volunteer citizens’ corps to be
activated in times of emergency as a community
emergency response team.
VI.J. Municipal Facilities
In order to build, grow, and sustain our municipal infrastructure and deliver improved municipal
services to residents and business sectors, Attleboro must build on the capital works throughout the
City. Capital works encompass a wide range of municipal infrastructure and are necessary to build
long–term economic growth of the City; to do so, the City must deliver strong municipal services and
meet infrastructure demands. Attleboro residents depend on the City’s many municipal services and facilities, from public sewer
and the water supply to accessible and modern buildings. Today, maintaining municipal facilities is a
constant challenge for cities and towns with limited resources and growing demands. The following
goals stress the importance of focusing growth in areas that already have solid municipal
infrastructure and keeping abreast of maintenance and capital demands.
In addition to the concerns that evolved into specific goals and policies, the Municipal Facilities
Subcommittee identified the following areas of consideration:
Evaluate the City’s building space, manpower, and vehicle needs;
Design new municipal buildings to have multiple purposes over their duration;
Conduct park planning, giving special consideration to neighborhood parks; and
Anticipate development and evaluate its possible impacts on a comprehensive, citywide
basis in order to inform planning to meet residents’ needs.

GOALS, POLICIES & PROPOSALS
CITY OF ATTLEBORO COMPREHENSIVE PLAN 130
Municipal Facilities Goals
GOAL 16
Continue to upgrade municipal facilities through a planning process to sustain adequate and
economically efficient municipal assets and service levels. Develop a municipal facilities service
program based on population growth and demand.
Policy 1: Establish a maintenance plan for existing and new facilities that will maximize the
longevity and effectiveness of all municipal assets in a cost–effective manner.
Proposals
Develop life–cycle costs on all municipal assets to maintain adequate replacement
reserves.
Establish timetable of periodic maintenance and replacement costs and incorporate
expenses into long–term budget.
Encourage development in areas of the City already serviced by municipal facilities with
available capacities.
Policy 2: Provide a high quality water supply system for present and anticipated future needs.
Proposals
Protect the municipal water supply.
Ensure water treatment and supply is managed to comply with all state and federal
guidelines.
Follow industry Best Management Practices policy for all water treatment and supply
facilities.
Adopt more stringent development and land use restrictions within areas near the City’s
two water resource protection districts.
Upgrade and expand the municipal water supply, as needed. Encourage development to
loop watermains.
Adopt water conservation methods and techniques.
Policy 3: Provide a high quality wastewater collection and treatment system with an emphasis on
limiting negative environmental impact.
Proposals
Comply with all state and federal guidelines for the collection and treatment of
wastewater.
Follow industry Best Management Practices policy for all wastewater collection and
treatment facilities.
Upgrade municipal sewer lines, as needed.
Upgrade and expand the wastewater treatment facility, as needed.
Encourage the use of advanced septic systems that employ denitrofication and
disinfection technologies to protect surface and groundwater.

GOALS, POLICIES & PROPOSALS
CITY OF ATTLEBORO COMPREHENSIVE PLAN 131
Policy 4: Maintain safe roadways and sidewalks. (See policies and proposals in under
Transportation.)
Policy 5: Improve and expand the City’s park and recreation system.
Proposals
Develop a maintenance program that establishes funding needs to ensure high
maintenance standards.
Encourage “natural state” environments within parks.
Include educational information regarding the benefits of a clean environment.
Encourage partnerships with various environmental organizations.
Develop a network of walking/biking/hiking trails linked to areas of interest throughout
the City.
Policy 6: Provide cost–effective and environmentally sound and sustainable solid waste
management practices.
Proposals
Encourage cost–effective solid waste management and disposal options.
Establish a trash reduction program.
Encourage recycling through education and public awareness.
VI.K. School System
Education occurs in many forms, for many purposes, and through many institutions. Examples
include early childhood education, kindergarten through to twelfth grade, two–year colleges, four–
year colleges and universities, graduate and professional education, adult education and job training.
Therefore, education policy can directly affect the education people engage in at all ages. Examples of
areas subject to debate in education policy include school size, class size, school choice, school
privatization, teacher education and certification, teacher pay, teaching methods, curricular content,
graduation requirements, school infrastructure investment, and the values that schools are expected
to uphold and model.
Attleboro recognizes the importance of a strong educational system, not only to provide
opportunities to its residents, but also to reinforce opportunities for the City’s economic
development. The City’s school department maintains five elementary schools (Kindergarten through
fourth grade), three middle schools (fifth through eighth grades), and one high school. The education
levels of the local labor force influence business owners’ decisions regarding where to locate. In the
past, Attleboro was known as a regional manufacturing center and the labor force and industry
complemented each other. Today, industry shifts require a labor force with higher levels of education
and specialized job skills. In light of this, the following goals stress the importance of investment in
education.

GOALS, POLICIES & PROPOSALS
CITY OF ATTLEBORO COMPREHENSIVE PLAN 132
School System Goals
GOAL 17
To provide the necessary resources, financial and otherwise, to support the educational programs
established by the Superintendent of Schools and the School Committee.
Policy 1: Ensure funding stability, curricula stability, and quality in the public education system.
Proposals
Explore all potential avenues to increase funding, including grants, tax increases, tax
overrides, debt exclusions, or formation of an educational foundation.
Adopt policy to maintain consistency and stability in school curricula from year to year.
Provide a high quality public education system by keeping pace with programmatic and
personnel needs.
Expand/upgrade school space to keep pace with need.
Policy 2: Ensure the long–term viability of secondary education programming and facilities in
order to respond to changing demands of the economy.
Proposals
Continue to maintain a Comprehensive High School.
Explore the inclusion of smaller academy types of programming in the Comprehensive
High School.
Immediately hire a consultant to work with City officials and residents to prepare a
programmatic and physical “needs assessment” for the High School.
Determine whether to pursue construction of a new high school or to undertake a
complete overhaul/renovation of the existing High School based on the “needs
assessment.”
Policy 3: Improve cooperation and communication among the Mayor, Municipal Council, School
Committee, and School Superintendent.
Proposals
Develop a system of communication between the Finance Committee of both the School
Committee and the Municipal Council during the preparation of the School
Department’s budget.
Involve the School Committee more actively in the development of the School
Department budget.
Reinstate the Mayor as a voting member of the School Committee.
Ensure all state and federal monies allocated to the School Department go directly to
student services.
Policy 4: Develop a top–of–the–line Career and Technical Education (CTE) program.
Proposals
Encourage the School Administration to offer CTE programs that meet job market needs
and career tracks.

GOALS, POLICIES & PROPOSALS
CITY OF ATTLEBORO COMPREHENSIVE PLAN 133
Upgrade CTE programs and equipment to qualify and be eligible for additional state and
federal funding.
Ensure that CTE programs have up–to–date curricula and equipment.
Explore the creation of a tuition–based post–secondary CTE curriculum at the High
School.
Policy 5: Ensure that all school buildings and infrastructure are maintained at highest possible
levels.
Proposal
Pursue all potential avenues of revenue to adequately fund maintenance of facilities.
VI.L. Social Services
Social services are crucial to advance the greater good by identifying community needs and working
with key stakeholders on issues affecting the health and welfare of the City’s residents. High quality
public services are essential to improve the qualify
of life of residents who require such services, to
create opportunities for prosperity, to respond to
changing needs, and to create and maintain living
conditions that are conducive to human welfare.
An extension of the City’s municipal services, social
service provision in Attleboro is essential to the
health and well–being of its residents. Attleboro has
a diverse population with service needs that reflect
this diversity. Attleboro has an ethnically and
racially diverse population as 12 percent of residents
are non–white, 9 percent are foreign–born, and 13 percent speak a language other than English at
home. Thirteen percent of Attleboro’s population is over 65 years of age and the proportion of the
older population will grow for the foreseeable future as the “baby boom” generation ages.
The City offers social services through the Council on Aging, Veterans Department, Health
Department and Community Development Office. In addition, several non–profit organizations
provide a variety of services to the community.
Social Service Goals
GOAL 18
Support municipal agencies and independent private organizations that provide social service
programs to a diverse, changing, and growing population with special emphasis on expanding
programs that work with families to improve their standard of living. Where possible,

GOALS, POLICIES & PROPOSALS
CITY OF ATTLEBORO COMPREHENSIVE PLAN 134
coordination amongst municipal agencies and independent private organizations that provide
social service programs and referrals should be encouraged.
Policy 1: Support and encourage programs for City’s general population.
Proposals
Support public/private collaboration to initiate new programs and services that benefit
the general welfare of the residents such as physical fitness programs, health screenings,
and crises support services.
Promote the initiatives offered by the Substance Abuse Committee.
Promote private investment in affordable housing and social service program initiatives
by utilizing CDBG funds and HOME Partnership Investment Program Funds.
Encourage and support the United Way and the Homeless Management Information
System.
Support the 211 Emergency Line for Social Services.
Policy 2: Support and encourage programs for the City’s elderly population.
Proposals
Ensure that the programs of the Council on Aging meet the housing, assisted living,
health and social needs of the elderly population.
Policy 3: Support and encourage programs for mentally and physically handicapped persons.
Proposals
Support independent private organizations that provide services for mentally and
physically handicapped persons.
Charge the Council on Disabilities to study the needs of the City’s mentally handicapped
population and increase the scope of its charter if a tangible need arises.
Policy 4: Support and encourage programs for the City’s youth.
Proposals
Promote and expand social and recreational programs for at–risk youths.
Evaluate the transportation needs of the City’s children to access social and recreational
services and adopt an implementation strategy to address identified needs.
Re–institute dental screenings for students in the public school system and make
affordable dental/oral care and preventative dental programs available for people who
need them.

IMPLEMENTATION PLAN
CITY OF ATTLEBORO COMPREHENSIVE PLAN 135
VII. IMPLEMENTATION PLAN
VII.A. Introduction
Perhaps the most critical element of a comprehensive plan is its Implementation Plan. The
Implementation Plan provides a strategy for achieving the City’s vision and goals; and it outlines
concrete initiatives the City may take, who is responsible, and when they should happen.
The following table is the City of Attleboro’s Implementation Plan for this COMPREHENSIVE PLAN. It
was developed based on the many goals and policies established by the Comprehensive Plan Steering
Committee and is responsive to issues identified in each of the COMPREHENSIVE PLAN’S elements.
VII.B. Implementation Table
The table outlining the implementation plan follows this section.
VII.C. Comprehensive Plan Assessment and Updates
Annual Departmental Assessments
The COMPREHENSIVE PLAN and the city planning process need to be flexible in order to permit and
sustain changes in priorities as well as changes in the City’s future fiscal posture. This plan endeavors
to provide the necessary information and insight to help municipal leaders and officials guide the
City and its residents effectively and efficiently into the future. To this end, the COMPREHENSIVE PLAN
needs to be revisited on an annual basis to assess whether municipal officials are working towards
and taking the actions promulgated by the goals, policies, and proposals outlined in this plan.
Comprehensive Plan Updates
The Attleboro Planning Board, pursuant to the City’s Charter and MGL CH. 41 §81D, should reassess
this COMPREHENSIVE PLAN at five–year intervals to update it as needed, including statistics, goals or
policies stemming from local, regional, state, or national developments, accomplishment of goals, and
more. This will ensure the long–term effectiveness and relevancy of this most important city planning
document.
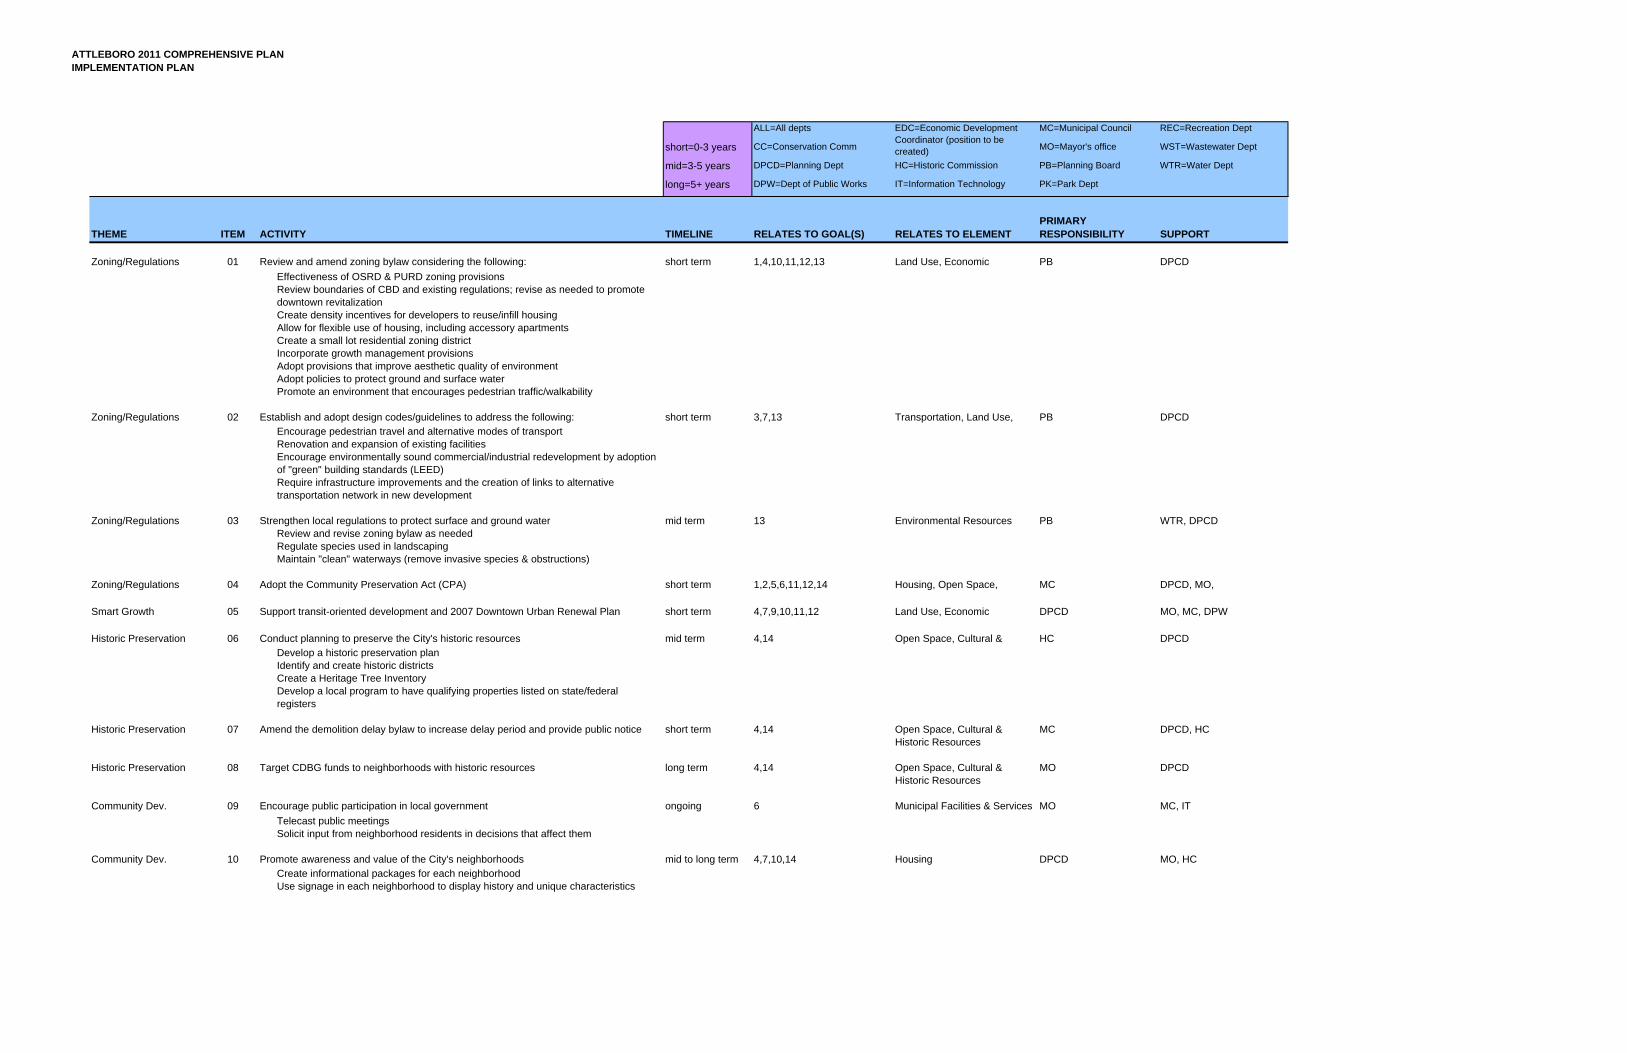
ATTLEBORO 2011 COMPREHENSIVE PLANIMPLEMENTATION PLAN
ALL=All depts MC=Municipal Council REC=Recreation Dept
short=0-3 years CC=Conservation Comm MO=Mayor's office WST=Wastewater Dept
mid=3-5 years DPCD=Planning Dept HC=Historic Commission PB=Planning Board WTR=Water Dept
long=5+ years DPW=Dept of Public Works IT=Information Technology PK=Park Dept
THEME ITEM ACTIVITY TIMELINE RELATES TO GOAL(S) RELATES TO ELEMENTPRIMARY RESPONSIBILITY SUPPORT
Zoning/Regulations 01 Review and amend zoning bylaw considering the following: short term 1,4,10,11,12,13 Land Use, Economic PB DPCD
Effectiveness of OSRD & PURD zoning provisionsReview boundaries of CBD and existing regulations; revise as needed to promote downtown revitalizationCreate density incentives for developers to reuse/infill housingAllow for flexible use of housing, including accessory apartmentsCreate a small lot residential zoning district Incorporate growth management provisionsAdopt provisions that improve aesthetic quality of environmentAdopt policies to protect ground and surface waterPromote an environment that encourages pedestrian traffic/walkability
Zoning/Regulations 02 Establish and adopt design codes/guidelines to address the following: short term 3,7,13 Transportation, Land Use, PB DPCDEncourage pedestrian travel and alternative modes of transportRenovation and expansion of existing facilitiesEncourage environmentally sound commercial/industrial redevelopment by adoption of "green" building standards (LEED)Require infrastructure improvements and the creation of links to alternative transportation network in new development
Zoning/Regulations 03 Strengthen local regulations to protect surface and ground water mid term 13 Environmental Resources PB WTR, DPCDReview and revise zoning bylaw as neededRegulate species used in landscapingMaintain "clean" waterways (remove invasive species & obstructions)
Zoning/Regulations 04 Adopt the Community Preservation Act (CPA) short term 1,2,5,6,11,12,14 Housing, Open Space, MC DPCD, MO,
Smart Growth 05 Support transit-oriented development and 2007 Downtown Urban Renewal Plan short term 4,7,9,10,11,12 Land Use, Economic DPCD MO, MC, DPW
Historic Preservation 06 Conduct planning to preserve the City's historic resources mid term 4,14 Open Space, Cultural & HC DPCDDevelop a historic preservation planIdentify and create historic districtsCreate a Heritage Tree InventoryDevelop a local program to have qualifying properties listed on state/federal registers
Historic Preservation 07 Amend the demolition delay bylaw to increase delay period and provide public notice short term 4,14 Open Space, Cultural & Historic Resources
MC DPCD, HC
Historic Preservation 08 Target CDBG funds to neighborhoods with historic resources long term 4,14 Open Space, Cultural & Historic Resources
MO DPCD
Community Dev. 09 Encourage public participation in local government ongoing 6 Municipal Facilities & Services MO MC, IT
Telecast public meetingsSolicit input from neighborhood residents in decisions that affect them
Community Dev. 10 Promote awareness and value of the City's neighborhoods mid to long term 4,7,10,14 Housing DPCD MO, HCCreate informational packages for each neighborhoodUse signage in each neighborhood to display history and unique characteristics
EDC=Economic Development Coordinator (position to be created)

ATTLEBORO 2011 COMPREHENSIVE PLANIMPLEMENTATION PLAN
THEME ITEM ACTIVITY TIMELINE RELATES TO GOAL(S) RELATES TO ELEMENTPRIMARY RESPONSIBILITY SUPPORT
Community Dev. 11 Improve, maintain and expand existing recreational facilities and programs, including parks and open space.
ongoing 6,15,16 Municipal Facilities & Services, Open Space, Cultural &
PK, REC DPW
Expand programs for youth and eldersPartner with other existing recreational organizations (e.g. YMCA) to expand recreational opportunities within the City.Develop a maintenance and improvement plan for the city's parks.
Infrastructure 12 Assess transportation infrastructure citywide and develop a capital improvements and maintenance plan.
short term 3,7,8,16 Transportation DPW DPCD
Infrastructure 13 Continue capital investment in the city's wastewater treatment system. ongoing 13,17 Municipal Facilities & Services, WST MO, MC
Economic Dev. 14 Invest in infrastructure planning and construction, including parking and installation of utilities to support economic development in the city.
ongoing 8,9 Economic Development DPW DPCD, MO, MC
Environmental 15 Conduct planning for an eco-friendly Attleboro. mid term 1,3,12,13 Environmental Resources, DPCD CC, PB
Consider publicity campaign to promote alternative transportationUtilize and protect natural resources and open spaceDevelop environmentally responsible policies (e.g. no sewer expansion)
Municipal Facilities 16 Continue annual capital improvements program. ongoing 5,8,9,15,16,17 Municipal Facilities & Services DPCD ALL
Consider maintenance planning for municipal assets, including public housing
Economic Dev. 17 Establish a revolving loan fund to assist small businesses in downtown Attleboro. mid term 9,10 Economic Development DPCD MO, MC
Economic Dev. 18 Create an Economic Development Coordinator position at the municipal level. short term 9,10 Economic Development MO MCResponsibilities include: working with downtown businesses and overseeing economic development in other areas of the city, seeking funding, including grants and loans, to invest in infrastructure and promote buisness environment
Economic Dev. 19 Continue the Community Development Department's façade improvement program. ongoing 9,10 Economic Development DPCD MO, MC
Economic Dev. 20 Create opportunities for industrial development. long term 9 Economic Development DPCD MO, MC, PBClean up brownfieldsLook for new sites for development
Economic Dev. 21 Create policies that promote and support economic development in Attleboro. mid term 9,10 Economic Development EDC MO, MCDevelop a marketing plan and strategy for the downtown that includes recommendations for how the city may create financial incentives or tap financial resources to support downtown developmentCreate a "downtown association" comprised of business and property owners, residents, neighborhood organizations, service providers and government to represent the varied downtown interests
Municipal Facilities 22 Invest in the Attleboro Public Schools. ongoing 17 Municipal Facilities & Services MO MC
Community Dev. 23 Sponsor a working group with representatives from municipal, non-profit and for-profit service providers to create a network of services and opportunities for collaboration.
short term 18 Municipal Facilities & Services, Housing
MO DPCD

BIBLIOGRAPHY
CITY OF ATTLEBORO COMPREHENSIVE PLAN 136
BIBLIOGRAPHY
Attleboro Area Industrial Museum. http://www.industrialmuseum.com/history–to–go.html.
Attleboro Capital Improvements Program, Fiscal Years 2011–2015.
Attleboro Comprehensive Plan, 1990.
Attleboro Fire Department. http://www.cityofattleboro.us/firedepartment.
Attleboro Historical Commission.
http://www.cityofattleboro.us/historicalcommission/ordinances.htm.
Attleboro Open Space and Recreation Plan, 2002.
Attleboro Open Space and Recreation Plan, 2009.
Attleboro Police Department. http://www.attleboropolice.org.
Attleboro Recreation Department. http://www.cityofattleboro.us/rec.
Attleboro Water Department. “Quick Facts,” http://www.cityofattleboro.us/water/quickfacts.htm.
Bishop Feehan High School. “At a Glance.” http://www.bishopfeehan.com.
Citizen’s Housing and Planning Association (CHAPA). Expiring Use Database.”
http://www.chapa.org.
City of Attleboro. Assessor’s Parcel Database. (28 August 2007).
Claritas Nielsen, Inc. Site Reports. http://www.claritas.com.
Community Opportunities Group, Inc. Land Use Growth Management Study, June 2000.
Ferguson, Keith. “Study Eyes I–95 fixes.” The Dedham Transcript, January 3, 2010,
http://www.dailynewstranscript.com/news/x1671990979/Study–eyes–I–95–fixes.
Goody Clancy and Vanasse Hangen Brustlin, Inc. Advancing Downtown Attleboro: Downtown
Development Plan and Implementation Strategy.
Massachusetts Department of Education. Statistical Comparisons. “Long–Term Trends in PK–12
Enrollments by Grade, 1988–2007.” http://finance1.doe.mass.edu/statistics/.
Massachusetts Department of Housing and Community Development. Chapter 40B Subsidized
Housing Inventory.

BIBLIOGRAPHY
CITY OF ATTLEBORO COMPREHENSIVE PLAN 137
Massachusetts Department of Labor and Workforce Development. ES–202 Economic Data Programs.
http://detma.org.
Massachusetts Department of Revenue. U.S. Bureau of Labor and Statistics. “Inflation Calculator.”
http://data.bls.gov/cgi–bin/cpicalc.pl.
Massachusetts Division of Fisheries and Wildlife. Natural Heritage and Endangered Species Program
(NHESP). http://www.mass.gov/dfwele/dfw/nhesp/nhesp.htm.
Massachusetts Executive Office of Environmental Affairs. EOEA Buildout for Vision 2020, June 2000.
Massachusetts Executive Office of Transportation. Office of Transportation Planning. 2006 Road
Inventory Year–End Report.
MassGIS. Census 2000 Census Tracts (2003). http://www.mass.gov/mgis/census2000.htm/.
MassGIS. Land Use Summary Statistics, August 2007. http://www.mass.gov/mgis/landuse_stats.htm/.
MassGIS. Permanently Protected Open Space by Community.
http://commpres.env.state.ma.us/publications/MapGallery/permos_list.pdf.
Massachusetts Historical Commission. Massachusetts Cultural Resource Information System
(MACRIS). http://www.mhc–macris.net.
Massachusetts Historical Commission, State Register of Historic Places 2009.
Massachusetts Historical Commission, Preservation Through By–Laws and Ordinances, May 2000
Northeastern University. Center for Urban and Regional Policy. City of Attleboro Self–Assessment
Survey.
RKG Associates. Market Analysis for Development of the Attleboro Industrial Business Park.
Southeastern Massachusetts Council on Sustainability. http://councilonsustainability.org/index.php.
Southeastern Regional Planning and Economic Development District. Comprehensive Economic
Development Strategy.
Southeastern Regional Planning and Economic Development District, ʺQuick Stats 2007ʺ.
Southeastern Regional Planning and Economic Development District. Regional Transportation Plan,
2003.
The Sun Chronicle. “Classified Ads (9 September 2010).”
http://www.thesunchronicle.com/admarket/real_estate_for_rent/apartments/.

BIBLIOGRAPHY
CITY OF ATTLEBORO COMPREHENSIVE PLAN 138
The Warren Group. Town Stats. http://www.thewarrengroup.com.
The Woods Hole Research Center. “Critical Mass: Land Use Change in Southeastern Massachusetts.”
http://www.whrc.org/resources/publications/pdf/StoneetalWHRC.06.pdf.
UMass–Dartmouth Center for Policy Analysis. Economic History of the Massachusetts South Coast.
University of Massachusetts. Massachusetts Institute of Social and Economic Research (MISER).
Population Projections 2010 and 2020. http://www.umass.edu/miser/population/miserproj.html/.
U.S. Bureau of the Census. 1990 Census Summary Tape File 1 and 3. Detailed Tables. American FactFinder.
http://www.census.gov/home/saff/.
U.S. Bureau of the Census. 1990 County–to–County Worker Flow Files. http://www.census.gov.
U.S. Bureau of the Census. American Community Survey. 2006–2008 3–Year Estimates. Detailed Tables.
American FactFinder. http://www.census.gov/home/saff/.
U.S. Bureau of the Census. Census 2000 Gateway. Special Tabulation Series.
MCD/County to MCD/County Worker Flow Files. http://www.census.gov.
U.S. Bureau of the Census. Census 2000 Summary File 1 and 3. Detailed Tables. American FactFinder.
http://www.census.gov/home/saff/.
U.S. Bureau of the Census. Population Division. “Population Estimates 2006: States, Counties and
County Subdivisions.” http://www.census.gov/popest/estimates.php/.
U.S. Department of Housing and Urban Development. HUD User. SOCDS Building Permits
Database. http://socds.huduser.org.
U.S. Environmental Protection Agency. “Green Communities,”
http://www.epa.gov/greenkit/basicinformation.htm.
U.S. Geological Survey. Massachusetts–Rhode Island Water Science Center. “Major Drainage Basins.”
http://ma.water.usgs.gov/basins.