city of rockport - comprehensive plan 2022-2042
227
-
Upload
khangminh22 -
Category
Documents
-
view
0 -
download
0
Transcript of city of rockport - comprehensive plan 2022-2042


CITY OF ROCKPORTCOMPREHENSIVE PLAN 2022-2042

FOREWORD | iii
INTRODUCTION
The City of Rockport is a resilient community dedicated to sustainable growth and attracting businesses to the area. Rockport is a charming town that offers a close-knit community feel and is a popular tourist destination for marine recreation, fairs, and exhibitions throughout the year. Founded in 1871, the City of Rockport aims to continue growing economically and sustainably. The Comprehensive Plan 2022-2042 is designed to guide the city of Rockport for its future growth.
WHAT IS A COMPREHENSIVE PLAN?
Planning for the future is essential for responsible growth. The city should be a safe and pleasant place for people to reside in. We want to mold our cities into a place that provides economic opportunities and treats all its citizens fairly. The Rockport Comprehensive Plan provides a vision of growth for the City of Rockport and identifies strategies to accomplish them.
The plan is a road map between community aspirations and implementation. All of the suggestions for future projects & actions laid out in the plan are intended to be pursued by the city staff to enact in the real-world. Certain projects could have a direct impact on individual neighborhoods or a broader impact on the whole community. However, the Comprehensive Plan is not a zoning regulation, and it does not affect existing approved zoning. It provides guidance for making changes or developing new regulations based on the identified vision, goals and objectives.
THE FISCAL AND PHILOSOPHICAL BASIS FOR PLANNING
There are many decisions to consider when designing a responsible plan for future growth. There must be a plan for fiscal sustainability as well as a plan for community involvement and a vision that is well articulated. The Comprehensive Plan for the City of Rockport serves this purpose by:
• Encouraging fiscally sound decisions;
• Seek input from the residents of Rockport;
• To provide consideration for the preservation of the character of the City of Rockport and what decisions best fit its needs.
PLANNING PROCESS
Rockport Comprehensive Plan 2022-2042 provides a guide for the future growth of the city. This document was developed and prepared by Texas Target Communities(TxTC) at Texas A&M University in partnership with the City of Rockport, Texas Sea Grant, Texas A&M University - Corpus Christi, Texas A&M University - School of Law and Texas Tech University. A citizen committee also guided development of the document and came from various community interests and backgrounds such as history, the arts, downtown, business, minority, and environment. The plan also integrates input from attendees to four public meetings on August 16, 2018; November 15, 2018, March 7, 2018, and April 25, 2019. The plan integrates recommendations from six other plans that involve the city: City of Rockport Comprehensive Plan (1999), A Vision for Rockport: A Master Plan for the Heritage District and Downtown Rockport (2006), Rockport Heritage District Zoning Overlay Code (2014), Aransas County Long Term Recovery Plan and Report (2018), Aransas County Multi-Jurisdictional Hazard Mitigation Action Plan (2017), Aransas County Multi-Jurisdictional Floodplain Management Plan (2017).

iv | FOREWORD
AGREEMENT BETWEEN CITY AND TxTC
In the summer of 2018, one year after Hurricane Harvey, the City of Rockport and Texas Target Communities partnered to create a task force to represent the community. The task force played an integral role in the planning process, contributing to the thoughts, desires, and opinions of community members - as well as their enthusiasm about Rockport’s future. The result of this collaboration is the City of Rockport Comprehensive Plan 2022-2042 which is the official policy guide for the community’s growth over the next twenty years.
BACKGROUND OF TxTC
The Texas Target Communities program was initiated in 1993 by the Department of Landscape Architecture and Urban Planning at Texas A&M University. This program selects small communities from the state of Texas and provide residents with valuable assistance in planning. At the same time, it serves as a “real world” learning laboratory for graduate students. Students can gain valuable planning experience while the targeted community receives the assistance it needs to can make a positive difference in the quality of urban life for its residents. Communities are chosen for participation in the program based on demonstrated need and their commitment to the planning process.
HOW TO USE THE COMPREHENSIVE PLAN
Rockport Comprehensive Plan 2022-2042 is a fully-developed planning document that can provide guidance for a variety of urban development activities. As such, it may be used to:
• Communicate the overarching vision;
• Guide development approvals by representatives such as elected officials and the planning board;
• Serve as a basis for land-use regulations such as zoning, subdivision regulations, building codes, etc.;
• Inform and support capital improvement plans.
THE STRUCTURE AND DEVELOPMENT OF THE PLAN
The guiding principles for this planning process were Rockport’s vision statement and its corresponding goals, which were crafted by the task force. The goals focus on factors of growth and development including public participation, development considerations, transportation, community facilities, economic development, parks, and housing and social vulnerability. Next, three alternative scenarios were developed as possible strategies Rockport could adapt to meet its goals. The task force expressed strong support for some of the key characteristics from two scenarios, which were then combined to form the preferred Future Land Use Plan.
Chapter 1 presents the background and history of Rockport and its residents and Chapter 2 tells the story of its vision. Chapters 3 through 8 of this document outline the goals, objectives, and policies of the preferred Plan. Each chapter explores the issues and opportunities of each plan component that will serve as the building blocks for it to be implemented. All the issues and threats are addressed with recommendations and proposed solutions, which are supported by maps and other analytical tools. Finally, Chapter 9 outlines the policies, timeline of actions, funding sources, and responsible parties. Additionally, this chapter includes funding programs and resources for implementing the recommendations of this plan.

FOREWORD | v
Special thanks to the team for their contribution and time to work on this project:
City Council
Patrick Rios, Mayor
J.D. Villa, Mayor Pro Tem
Rusty Day/Michael Saski, Ward 1
Warren Hassinger/Bob Cunningham, Ward 3
Barbara Gurtner, Ward 4
City Staff
Kevin Carruth, City Manager
Mike Donoho, Director of Building & Development
Amanda Torres, Community Planner
Mary Bellinger, Building Department Administration
Monica Cowen, Planning Technician
Vicki Pitluk, Community Relations
Art Smith, Assistant Director of Public Works
Ryan Picarazzi, Street Department Supervisor
Planning & Zoning Commission
Ruth Davis, Chair
Maynard Green, Vice Chair
Diana Severino-Saxon, Secretary
Kent Howard
Kim Hesley
Dudley McDaniel
Warren Hassinger
Comprehensive Plan Advisory Committee
Patty Albin
Nancy Bolting
Elizabeth Brundrett
Monica Burdette
Sylvia Combs
Christine Hale
Michelle Simmons
Beverly Trifonidis
Suzanne Villa
Barbara Gurtner, City Council Liaison
Vicki Pitluk, City Public Relations
Dudley McDaniel/Kim Hesley, Planning & Zoning Commission Liaison
Ginger Easton-Smith, AgriLife Extension Agent
Other StakeholdersKeith Barrett, Aransas County Navigation District Harbor Master
Kim Foutz, Long Term Recovery Team/Economic & Housing Development
David Reid, County Engineer
John Storthman , Project Manager and Long Term Recovery Team

vi | FOREWORD
PLANNING TEAM
John Cooper, Director, Texas Target Communities
Jaimie Masterson, Associate Director, Texas Target Communities
Jeewasmi Thapa, Program Coordinator, Texas Target Communities
Craig Rotter, Executive Director, Texas Rural Leadership Program
Ashley Bennis, Planning Specialist, Texas Sea Grant
Kate de Gennaro, Planning Specialist, Texas Sea Grant
Matthew Malecha,Postdoctoral Research Associate, Institute for Sustainable Communities
Siyu Yu,Lecturer and Postdoctoral Researcher
Applied Planning I and Plan Implementation: Master of Urban Planning, TAMU
Shannon Van Zandt
Tara Goddard
Phil Lasley
Forrest Williams
MJ Biazar
Michael Gerke
Chenyu Haung
Maria Martinez
Soheil Sameti
Paige Strunk
Nan Wang
Applied Transportation Studio: Master of Urban Planning, TAMU
Bill Eisele Xiaoqiang Kong
Soheil Sameti
Bhavya Sontineni
Faculty:
Faculty:
Students:
Students:
Texas Target Communities Interns
Madeline Patton
Smruti Parab
Samina Limkhedawala
Sanju Maharjan
Emily Tedford

FOREWORD | vii
Landscape Design IV Studio: Bachelor of Landscape Architecture, TAMU
Capstone: Master of Public Administration, TAMU-CORPUS CHRISTI
Jenna-Kaya Charles
Katherine Comeaux
Gabriel Cuellar
Shida Dusman
Justin Guajardo
Alberto Arenas
Kathryn Baczewski
Lexi Brandt
Andrew Calabrese
Angelica Chaparro
Chris Davila
Nathan Dedear
DB Douglas
Blair Ferrel
Michael Finley
Megan Fletcher
Adriana Hernandez
Elizabeth Hornick
Malinali Jimenez
Alex Juarez
Paige Kolupski
Leo Lopez
Clint McClellen
Cameron Monsavaiz
Allison Parks
Sara Prybutok
Milton Rico
Augustine Salazar
Lauren Schulze
Andrew Sikes
Emma Simpson
Jorge Toriz
Nancy Valenzuela
Madison Wavra
Rachel Wooten
Faculty:
Faculty:
Students:
Students:
Ken Hurst
Ryun Jung Lee
Beth Rauhaus Cynthia Ramos
Liz Romo
Marina Saenz
Richard Schreiber
Claire Snyder
Natural Resources System Capstone : TAMU School of Law
Philip Bedford
Alexis Long
Thomas Long
Gabriel Eckstein Erin Milliken
Lauren Thomas
Alexis Yelvington
Faculty: Students:

viii | FOREWORD
Regional Planning Studio: Landscape Architecture, TEXAS TECH UNIVERSITY
Melissa Currie Mario Carranza
Brandon Berend
Elizabeth Lane
Grant Huber
Grayson Borchardt
Jake Owen
Connor Jones
Oscar Flores
Jimmy Rosenkranz
Chris Rhinehart
Cody McCord
Faculty: Students:
Tyler Smith
Alec Sawtelle
Matthew Walls
Cuauhtemoc Zaragoza
Grayson Borchardt
Temo Cuauhtemoc
Christopher Perez
Arturo Villalba
Samantha Stec
Andrew Castilleja
Matthew Hoffman
American Planning Association Community Planning Assistance Team (CPAT)
Carol Barrett, FAICP, Team Leader
Eugene Aleci, AICP, AIA, RA
Richard Amore, AICP
Eugene Henry, AICP, CFM
Kerrie Tyndall
Ryan Scherzinger, AICP

FOREWORD | ix
TABLE OF CONTENTS
1. INTRODUCTION
1.1. Overview
1.2. Hurricane Harvey Impact
1.3. History
1.4. Population Density
1.5. Population Growth
1.6. Gender & Age Distribution
1.7. Race Distribution
1.8. Projections
1.9. Education
1.10. Poverty
2. PLAN PROCESS
2.1. Getting Started
2.2. Envisioning the Future
2.3. Meeting Schedule
2.4. Goals & Objectives
3. DEVELOPMENT
3.1. Overview
3.2. Existing Land Use
3.3. Scenario Planning
3.4. Recommendations
3.5. References
4. HOUSING
4.1. Overview
4.2. Conditions Before the Storm
4.3. Hazard Impacts on Housing
4.4. Recommendations
4.5. References
2
3
3
5
5
5
5
7
8
9
12
16
17
29
32
33
36
37
54
56
60
60
61
66

x | FOREWORD
5. TRANSPORTATION
5.1. Overview
5.2. Conditions Before the Storm
5.3. Recommendations
5.4. References
6. ECONOMY
6.1. Overview
6.2. Conditions Before the Storm
6.3. Impact of Hurricane Harvey
6.4. Recommendations
6.5. References
7. ENVIRONMENT
7.1. Overview
7.2. Conditions Before the Storm
7.3. Recommendations
7.4. References
8. FACILITIES
8.1. Overview
8.2. Conditions Before the Storm
8.3. Recommendations
8.4. References
9. IMPLEMENTATION
9.1. Prioritize & Implement
9.2. Implementation Table
9.3. Funding
68
69
79
92
106
107
121
126
128
128
143
148
150
153
192
94
94
99
101
104

FOREWORD | xi
LIST OF ACRONYMS
KEY WORDSAccessory Dwelling Units AUDsAnnual Average Daily Traffic AADTCommunity Rating System CRSConditional Use Permit District CUPCrime Prevention Through Environmental Design CPTEDDiameter at Breast Height DBHEndangered Species Act ESAExtraterritorial Jurisdiction ETJGreen Infrastructure GIGreen Infrastructure Flexible MOdel GIFModGreen Infrastructure Wizard GIWizHotel Occupancy Tax HOTIntelligent Transportation System ITSLow Impact Development LIDMulti-family Housing MFNational Oceanic & Atmospheric Administration NOAANational Stormwater Calculator SWCNeighborhood Electric Vehicle NEVNorth American Industry Classification System NAICSOpportunity Zone OZPlanned Unit Development District PUDRecreational Vehicle RVRockport Heritage District Zoning Overlay Code RHDZORockport Heritage District RHDSingle-family Housing SFStormwater Management Model SWMMTax Increment Financing TIFTax Increment Reinvestment Zone TIRZTransfer of Development Rights TDRTransportation Demand Management TDMVisualizing Ecosystems for Land Management Assessment Model VELMAWatershed Management Optimization Support Tool WMOST
NETWORK OF PLANS & OTHER PLANNING DOCUMENTSA Vision for Rockport: Master Plan for the Heritage District & Down-town Rockport HDMPAransas County Long Term Recovery Plan and Report LTRPAransas County Multi-Jurisdictional Floodplain Management Plan MFMPAransas County Multi-Jurisdictional Hazard Mitigation Plan MHMPHazard Mitigation Action Plan HMAPPlan Integration for Resilience Scorecard PIRSRegionally Coordinated Transportation Plan for The Coastal Bend RCTPTCBRockport Heritage Zoning Overlay Code HDZORecovery Planning Assistance Team Report - American Planning Asso-ciation RPATState of Community Report SOC

xii | FOREWORD
ACTION LEADERSAransas County ACAransas Pathways APAransas County Appraisal District ACADAransas County Health Department ACHDAransas County Historical Society ACHSAransas County ISD ACISDAransas County Long Term Recovery Team ACLTRTAransas County Navigation District ACNDAransas County Independent School District AISDAgri-Life Extension Office ALEOAransas National Wildlife Refuge ANWRAransas Pathways APBay Education Center BECBuilding and Development Department BDZoning Board of Adjustments BOABusinesses and Stakeholders BUSCity Council CCCity Engineer CECity Manager CMComprehensive Plan Task Force CPTFCity Staff CSDowntown Heritage Task Force DTFEconomic Development Corporation EDCEnvironmental Protection Agency EPAFederal Emergency Management Agency FEMAFair Housing Board FHAFinance Department FIThe City of Fulton FLTNFulton Mansion FMHuman Resources Department HRUS Department of Housing and Urban Development HUDKeep Aransas County Beautiful KACBLeadership in Energy and Environmental Design LEEDLong Term Recovery LTRMunicipal Court MCParks Board PBParks and Leisure Department PLProperty Owner POPublic Works Department PWPlanning & Zoning Commission P&ZRockport Center for the Arts RCARockport Cultural Arts District RCADRockport Community Members RCMRockport-Fulton Chamber of Commerce R-FCCRockport Police Department RPDRockport Volunteer Fire Department RVFDTexas Commission on Environmental Quality TCEQTexas Department of Housing & Community Affairs TDHCATexas State Affordable Housing Corporation TSAHCTree and Landscape Committee TLCTexas Maritime Museum TMMTexas Parks & Wildlife Department TPWDTexas Sea Grant TSG

FOREWORD | xiii
Texas Water Development Board TWDBThe State of Texas TXTexas Department of Transportation TxDOTU.S. Coast Guard Auxiliary UCGAUnited States USUtilities UTYMCA Development Committee YMCA
OTHER DEPARTMENTS, ORGANIZATIONS, PARTNERS, & PROGRAMSAll Children Begin Learning in a Christian Environment Learn-ing Center ABCAmerican Planning Association APACoastal Bend Bays & Estuaries Program CBBEPCommunity Development Institute CDICommunity Planning Assistance Team CPATFish & Wildlife Service FWSFriends of Aransas & Matagorda Island FAMIInsurance Institute for Business & Home Safety IBHSInstitute for Sustainable Communities IfSCInsurance Services Organization ISOInternational Ecotourism Society TIESKeep America Beautiful KABMission-Aransas National Estuarine Research Reserve NERRNational Flood Insurance Program NFIPNational Resources Conservation Service NRCSRegional Transportation Authority RTARural Economic Assistance League REALSan Patricio Municipal Water District SPMWDScience On a Sphere© SOSSmall Business Administration SBASystem-Wide Monitoring Program SWMPSystem-Wide Monitoring Program SWMPTexas A&M University TAMUTexas A&M University - Corpus Christi TAMU-CCTexas General Land Office GLOTexas Main Street Program TMSPTexas Rural Leadership Program TRLPTexas Target Communities TxTCTexas Tech University TTUTexas Workforce Commission TWCUrban Land Institute ULIUS Department of Agriculture USDAUniversity of Texas UTUniversity of Texas Marine Science Institute UTMSI

xiv | FOREWORD
FUNDING SOURCES & PROGRAMSBicycle Friendly Program BFCBuilding Neighborhood Capacity Program BNCPCapital Improvement Program CIPCoastal Bend Disaster Recovery Group CB-DRGCommunity Development Block Grant - Disaster Recovery CDBG-DRCommunity Development Block Grant Program for Rural Texas TxCDBGCommunity Development Block Grants CDBGCommunity Disaster Loan CDLCommunity Outdoor Outreach Program CO-OPFlood Mitigation Assistance FMAGovernor’s Community Achievement Awards GCAAHazard Mitigation Grant Program HMGPHighway Safety Improvement Program HSIPHistoric Revitalization Subgrant Program HRSPHousing Preservation Grants HPGLandowner Incentive Program LIPLow-income Housing Tax Credit LIHTCMuseum Assessment Program MAPNeighborhood Stabilization Program NSPRebuild Texas Fund RTFRecreational Trails Program RTPSmart Growth Implementation Assistance SGIAState Water Implementation Fund for Texas SWIFTSurface Transportation Block Grants Program STBGTexas Water Development Fund DFundTexas Windstorm Insurance Association TWIAWalk Friendly Community WFC

INTRODUCTION | 1
INTRODUCTION1

2 | CHAPTER 1
OVERVIEW
R ockport, Texas, the county seat of Aransas County, is a charming town located in the Texas Coastal Bend Region. Rockport is adjacent to the Town of Fulton, and together, they are referred to as the Rockport-Fulton community. The city is
about 30 miles northeast of Corpus Christi and about 160 miles southeast of San Antonio. Much like its neighboring cities, the city’s unique geography and location make Rockport ideal for outdoor activities such as boating, fishing, and bird watching. It l ies on the Live Oak Peninsula and takes up a total of 15 square miles and sits just seven feet above sea level. The population of Rockport has been steadily growing over the last several decades and is currently estimated to be around 10,000 people. The city may be small in size, but it has a lot to offer. Figure 1.1 shows the location of Rockport in Aransas County within the state of Texas.
Figure 1.1: Location of Rockport, TX

INTRODUCTION | 3
HURRICANE HARVEY IMPACT
Due to its coastal location, the City of Rock-port is susceptible to hurricanes and flooding. In 2017, the city was hit by Hurricane Harvey and has since focused on recovering, rebuilding, and planning for resilience. Harvey made landfall as a major hurricane at an intensity of a Catego-ry 4 storm with winds exceeding 130 mph. The hurricane made landfall on the barrier island of San Jose then made its way near Rockport and Fulton. Rockport undertook extensive damages; FEMA records indicate more than 1,500 struc-tures were damaged. Although much of the damage across the peninsula was due to high-speed winds and rain, the northwest side of the peninsula also saw damage due to storm surge coming from Copano Bay.
Nearly three years later, Rockport is still recov-ering from the damages. The Chamber of Com-merce says that about 80% of businesses have reopened since Harvey. According to city offi-cials, Rockport’s population is down 20% since Harvey made landfall. The city is working on rebuilding and recovering housing and busi-nesses to bring back the residents who are still displaced. In June 2018, Texas General Land Office awarded Rockport with $6.5 million in federal recovery money that the city will use to tackle this issue.
HISTORY
Rockport’s history has been impacted by storms, war, and economic highs and lows. The city was founded in 1867 after the Civil War, but it was not incorporated as a city until May 2, 1871, after the Special Act of the Texas Charter. The economy relied on the cattle industry which played an important factor in establishing Rock-port’s prominence. However, after the establish-ment of the San Antonio and Aransas Pass rail-road into the city, the cattle industry declined. With the establishment of railroads, Rockport began to expand, and new development brought an influx of new residents and businesses.
Rockport’s first Chamber of Commerce was es-tablished in 1912 after a significant economic
decline. In the midst of regaining its economy, Rockport was hit by a hurricane in 1919. The city took no time in rebuilding, and along with the reconstruction, the City of Rockport devel-oped the shrimping industry that was responsi-ble for the 1940’s economic boom. As it contin-ued to grow, the city focused on preserving its wildlife and culture. The community maintains their wildlife refuges, hosts countless festivals and programs that represent the area’s culture, and preserves historical sites. In efforts to build their community, the city became recognized as one with a coastal charm that attracts tourists to enjoy fishing, swimming, bird watching, wild-life refuges, and festivals held in historic sites.
Figure 1.2: Governor Greg Abbott’s visit to Rock-port after Hurricane Harvey in August of 2017Source: The Rockport Pilot 1
Figure 1.3: Historical Photo of the S.A. & A.P. DepotSource: The History Center for Aransas County

4 | CHAPTER 1
Figure 1.4: Timeline of Rockport’s HistorySource: Texas A& M University Landscape Architecture Student Presentation
Local Historical Groups
Aransas County Historical Commission: “The purpose of the Commission is to serve as the gov-erning and coordination body for preservation of Aransas County’s historic cultural resources consistent with the statewide preservation plan of the Texas Historical Commission, including the protection, recording, interpretation and acquisition of prehistoric and historic structures/sites. The Aransas County Historical Commission will also promote to the public an appreciation of local and state history.” http://www.aransascountytx.gov/historiccomm/
Aransas County Historical Society: In 1985, the Society was founded with the goal of identifying, protecting, recording, and interpreting historic and prehistoric information and artifacts related to the unique environment of the county. They work to make the history of Aransas County ac-cessible to the public and encourage the appreciation of history in the area. (http://achs1985.org)
Fulton Mansion State Historic Site: Visitors to the Fulton Mansion can get a glimpse into late 1800s life of an affluent Texas family. The site is operated by the Texas Historical Commission, but is currently out of operation due to Hurricane Harvey.(https://www.thc.texas.gov/historic-sites/fulton-mansion-state-historic-site)
The History Center for Aransas County: The Center works to preserve, showcase, and celebrate the history of Aransas County through public exhibits, workshops, and celebrations. (https://www.thehistorycenterforaransascounty.org)
The Texas Maritime Museum: The Museum first opened its doors in 1989 with the goal of exciting and educating the public about the history and artifacts of Texas Maritime. It provides a variety of programs for all ages through the collection, preservation, and interpretation of historical items, recounty maritime history, and different exhibits to spark public interest. (https://www.texasmaritimemuseum.org)

INTRODUCTION | 5
POPULATION DENSITY
Rockport is a well-established coastal commu-nity. As of 2016, the population density was 728 people per square mile which is 15.01% increase from the population density of 633 people per square mile in 2010. Rockport has a higher population density in comparison to the rest of Aransas County and the State. Other ma-jor cities affecting the demographic patterns of Rockport are Fulton, Aransas Pass, and Corpus Christi.
POPULATION GROWTH
Historically, the population growth for Rock-port has been slower than the county’s popu-lation growth. The growth rate for the city has been irregular throughout history. In the 1940’s and the 1990’s, Rockport saw their largest growth 51.7% and 45.3% respectively. The only two decades of population decline happened in the two decades directly preceding the great-est growth years. The 1930’s saw a decrease of 26.2%, while the 1980’s population decreased by 5%. The population growth comparison con-cerning the county is illustrated in Figure 1.5.
GENDER AND AGE DISTRIBUTION
The female-to-male ratio has been increasing continually in Rockport. According to the 2010 Census, 51.73% of the population was female while males made up 48.27%.
The age distribution for 2010 reflects the same patterns seen by the County. The population distribution for 2016 are slightly lopsided for certain age groups; this is most notable in fe-males aged 50 to 54. Observing the population from the data, it can be concluded that the young to early middle age working class, i.e., 25 to 34 years of age, has a lesser population in 2016 when compared to 2010. There is a sharp increase in the group corresponding to people between the ages of 50 to 54 years, especially males (Figure 1.4).
RACE DISTRIBUTION
Race distribution is used to help understand the culture and roots of a given population. It also helps in ensuring representation, equitable ac-cess, and appropriate distribution of resources within the community. The racial composition of Rockport in the 2000’s indicates the pop-
Figure 1.5: Population Growth ComparisonSource: Texas Almanac, Forstall, and U.S. Census Bureau

6 | CHAPTER 1
Figure 1.4: Age-Sex Pyramid (2010)Source: U.S Census Bureau, Table QT-P14
ulation was comprised mostly of people who identified as White alone (74.03%). The second largest racial group identified was the Hispan-ic or Latino population (19.50%), followed by Asians (3.60%). Other racial groups were pres-ent in small shares of the total population (Fig-ure 1.5).
Since 2010, the Hispanic and Black or African American shares of the total population have in-creased. None of the other represented groups increased to the extent that each of these did.
The most recent data shows the White popula-tion still makes up the majority of the popula-tion with 67.05%, while the Hispanic popula-tion has grown considerably to 24.58% (Figure 1.5). The recent shift suggests that the commu-nity is diversifying and therefore needs to look into how to actively involve all community members as stakeholders for future planning processes.
Figure 1.7 Rockport residents celebrating their new home after being destroyed by Hurricane HarveySource: The Rockport Pilot 1

INTRODUCTION | 7
PROJECTIONS
The Texas State Demographer’s Office publishes population projections based on different sce-narios. The smallest geographic area for which these projections are available are counties. With Rockport being the largest city in the county it is expected to follow similar trends to the coun-ty. The Zero Migration Scenario “assumes that
Figure 1.5: Race DistributionSource: U.S. Census Bureau, Table P0045 , Table P96, and Table B030027
YearTexas Water Development Board Texas State Demographer’s Office (Aransas County)
Rockport Aransas No Migration 0.5 Migration 1.0 Migration
2010 8,766 23,158 - - -2020 9,260 24,463 22,926 24,550 26,0412030 9,460 24,991 22,325 25,123 27,5582040 9,440 24,937 21,732 25,096 27,2962050 9,503 25,102 21,648 25,204 26,276
Source: Texas Water Development Board8 ,9and Texas State Demographer10
Table 1.1. Published Population Projections
in-migration and out-migration are equal (no net migration),” resulting in growth only through natural causes (births and deaths). This scenario creates the lowest population projection. The 100% Migration Scenario assumes the trends that occurred through-out the 2000 to 2010 decade will continue

8 | CHAPTER 1
in future decades. This scenario has the highest projection estimates but is unlikely as the period from 2000 to 2010 saw rapid growth in many areas of the State. It is unlikely that these trends will remain the same in future decades mostly due to natural disasters and the impact Hurri-cane Harvey had on the community. The Texas Water Development Board publishes popula-tion projections at the city level. The 2016 pop-ulation of Rockport is an estimated 10,197 peo-ple. In Table1.1, the Board forecasts that there will be 9,260 people in the city by the year of 2020. As previously stated, the estimated pop-ulation is higher than their projection, meaning that there would have to be a significant decline in population to reach the projection and this is unlikely to happen.
For all the following sections regarding projec-tions, the 2016 estimated population is taken as the base unless otherwise stated. The following subsections attempt to inform how the projec-tions appear across age, gender, race, and geog-raphy.
Subject TotalPercent-
agePopulation 3 years and over enrolled in school
1797 100.0%
Nursery school, preschool 105 5.8%Kindergarten to 12th grade
1337 74.4%
College, undergraduate 345 19.2Graduate, professional school
10 0.6%
Source: U.S. Census Bureau, Table S140111
Table 1.2: School Enrollment
EDUCATION
In 2016, the student population of Rockport was 3,394 students, which is 17.62% of the to-tal population as seen in Table 1.2.
A large share of the population aged 25 and above in Rockport has attained some level of college or are high school graduates; 35.4% of the population has acquired an associate’s degree or higher levels of education (Figure 1.6).
Figure 1.9 Rockport-Fulton High School football game in October 2018Source: The Rockport Pilot1

INTRODUCTION | 9
Figure 1.6: Educational Attainment 25 years old and OverSource: U.S. Census Bureau, Table S150112
POVERTY
Analyzing poverty helps to increase under-standing of the socio-economic standing of a community. About 16.3% of the population is identified as living in conditions of poverty in Rockport. The Census Bureau provides data using ratios that compare the income levels of people or families with their poverty threshold:
• A household income above 100% of their pov-erty threshold is considered “above the poverty level.”
• Income above 100% but below 125% of pov-erty is considered “near poverty.”
• Households with incomes at or below 100% are considered “in poverty.”
• Household incomes below 50% of their pov-erty threshold are considered to be in “severe” or “deep poverty.”
Poverty is seen to be lacking the means to fulfill the basic needs of your family. About 8% (809 people) of the total population in Rockport are suffering from deep poverty.

10 | CHAPTER 1
References
1Arseal, T. B. (2017, January 10). Fulton Mansion State Historic Site & Education Center.Retrieved from http://www.wwnrockport.com/2011/08/fulton-mansion-state-historic-site.html2Forstall, Richard L., Population of States and Counties of the United States: 1790 to 1990, Department of Commerce, U.S Bureau of Census Population Division https://www.census.gov/population/www/censusdata/PopulationofStatesand-CountiesoftheUnitedStates1790-1990.pdf3United States and Texas Population 1850- 2016, Texas State Libraries and Archives Commission Website,U.S. Bureau of the Census, Washington, DC, last modified February 8, 2017, retrieved on May 28, 2018, https://www.tsl.texas.gov/ref/abouttx/census.html4United States Census Bureau, ACS 5-Year Estimates, 2016, Table QT-P1, Age Groups and Sex: 2010, https://factfinder.census.gov/bkmk/table/1.0/en/DEC/10_SF1/QTP1/1600000US4834220|1600000US4862804?slice=-GEO~1600000US48628045United States Census Bureau, Decennial Census, 2010, Table P004, Hispanic or Latino, or not Hispanic or Latino by Race, https://factfinder.census.gov/bkmk/table/1.0/en/DEC/00_SF1/P004/1600000US4862804 6United States Census Bureau, Decennial Census, 2010, Table P9, Hispanic or Latino, or not Hispanic or Latino by Race, https://factfinder.census.gov/bkmk/table/1.0/en/DEC/10_SF1/P9/1600000US4862804 7United States Census Bureau, ACS 5-Year Estimates, 2016, Table B03002, Hispanic or Latino by Race, https://factfind-er.census.gov/bkmk/table/1.0/en/ACS/16_5YR/B03002/1600000US48628048Texas Water Development Board, 2016 Regional Water Plan, Population Projections for 2020-2070, https://2017.texasstatewaterplan.org/entity/9509Texas Water Development Board, 2021 Regional Water Plan, Population Projections for 2020-2070, http://www2.twdb.texas.gov/ReportServerExt/Pages/ReportViewer.aspx?%2fProjections%2f2022+Reports%2fpop_County_search&rs:Com-mand=Render10Texas Demographic Center, Population Projection Tool, 2014 Texas Population Projections by Migration Scenario Data Tool, http://txsdc.utsa.edu/Data/TPEPP/Projections/Tool?fid=E65F2620EE074C79B1F9F9F2CA9B95B011United States Census Bureau, ACS 5-Year Estimates, 2016, Table S1401, School Enrollment, https://factfinder.census.gov/bkmk/table/1.0/en/ACS/16_5YR/S1401/1600000US4862804 12United States Census Bureau, ACS 5-Year Estimates, 2016, Table S1501, Educational Attainment, https://factfinder.census.gov/bkmk/table/1.0/en/ACS/16_5YR/S1501/0400000US48|0500000US48007|1600000US4862804

PLAN DEVELOPMENT | 11
PLAN PROCESS2

12 | CHAPTER 2
GETTING STARTED
P articipatory planning is the foundation of Rockport’s Comprehensive Plan. Because the plan impacts every member of the community, it was essential for the city to actively involve the whole community at every stage. Ac-
tive participation ensures that residents are not only informed and understand the plan, but also influence actions that will shape the future of their city. Au-thentic public participation allows the community to identify and express needs and desires in an open constructive format. Throughout the planning process, stakeholders worked to create a community vision, define goals, and develop principles and action steps. The purpose of this chapter is to thoroughly explain the participatory planning process, which util ized the seven-phased inclusive plan-making process (Masterson et al. 2014) as shown in Figure 2.1.
Figure 2.1: Comprehensive Plan Making Process

PLAN DEVELOPMENT | 13
UNDERSTANDING ROCKPORT
As a first step, the planning team collected information for a State of Community Report (SOC) from May to July 2019. This report gathers data from a wide variety of sources to identify current conditions, trends, and patterns. It includes an assessment of population characteristics, economic conditions, land use, transportation, housing conditions, community facilities, and environmental conditions.
The first community meeting was held in Rockport Service Center on August 16, 2018. Community members reviewed and verified the SOC as a fact base for the plan while also expressing concern that the SOC did not accurately represent the community at its’ current status after Hurricane Harvey. Further, the attendees participated in an exercise discussing the community’s wishlist. This meeting initiated the process of combining local wisdom and technical knowledge to plan for the future of Rockport.
KICK-OFF MEETING
The Comprehensive Plan Kickoff Meeting took place on August 16, 2018. The purpose of this meeting was to introduce the planning team to the community, explain the planning process, and present the State of Community Report.
In this meeting, the attendees participated in several activities to generate things they need and desire for the community. Because this was a meeting that was open to the public, the team was able to gain a lot of information about Rockport and what the community desired. Participants included Historical Society members, business owners, Rockport citizens, government officials, and those with a desire to see their community improved. The Wish List Activity gathered information about what the community wanted in regards to safety, jobs, neighborhood issues, necessities, transportation and amenities.
Figure 2.3: Task Force members participating in a community asset activity
Figure 2.2: Wish List Activity at the Kickoff Meeting.
The partners involved in the planning process include the following:
• Texas Sea Grant • Texas Rural Leadership Program• Texas A&M University College of • Architecture• Texas A&M University School of
Law: natural resource law students developed a natural resource policy guidebook
• Texas A&M University-Corpus Christi’s Master of Public Administration: students conducted a youth survey asking local high school students for input in the Comprehensive Plan
• Texas Tech University: landscape architecture students designed green infrastructure projects
• American Planning Association

14 | CHAPTER 2
Figure 2.4 Planning Process CategoriesSource: Developed from Texas Rural Leadership Pro-gram Presentation on September 20, 2018
ASSEMBLING THE TASK FORCE
City staff reached out to community members to assemble a planning task force. The task force represents various communities within the greater community, guides the development of the plan by representing the hopes and desires of Rockport residents and acts as a conduit for information and communication with the community. The goals of the task force are:
• To establish and affirm a community-wide vision for the future of the city,
• To identify community assets, strengths, and opportunities for expansion or growth
• To determine goals and priorities for the topics within the comprehensive plan: Growth and development, economic development, community facilities and infrastructure, transportation, parks and recreation, and housing.
PREPARING THE TASK FORCE
Interested committee members were invited to the first task force meeting on September 20, 2018. Each task force member introduced themselves, explained their connection to Rockport and expressed their priorities and interests. TTC presented the planning process and laid out the roles and responsibilities of the committee. The members committed to participating in scheduled meetings to guide the development of the plan. Further, they agreed upon the following ground rules for effective discussions during these meetings:
• Explore alternative viewpoints.• Share all relevant information. • Use specific examples and agree on what
important words mean.• Combine advocacy and inquiry - express
your points of view, share your reasoning and intent and invite others to inquire into your comments.
• Jointly agree on next steps and ways to test disagreements.
• Discuss undiscussable issues that are relevant to the group’s tasks but that the group members believe they cannot discuss openly in the group without some negative consequences.
To prepare the task force for the year-long planning process, TTC partnered with the Texas Rural Leadership Program (TRLP) at Texas A&M. Craig Rotter from TRLP led the conversation on leadership, appreciative inquiry, and assets. Instead of focusing on weaknesses and deficiencies, the task force was encouraged to focus on strengths and potentials. Members were instructed to write down community assets under seven different categories seen in Figure 2.4.
A follow-up meeting was held on October 15, 2018 to build on the community wishlist and the identified assets. Three emerging topics, including Diverse Culture and Art, Responsible Growth, and Coastal Charm, were highlighted in the discussions. The task force split up into groups to identify assets associated with each topic. Additionally, the task force recognized the need to address issues of diversity, inclusion, accessibility, and affordability in the future planning process.

PLAN DEVELOPMENT | 15
SUBCOMMITTEE ON INCLUSION
Many task force members expressed concern over the lack of representation of some community groups. Five task force members volunteered to be a part of the inclusion subcommittee to brainstorm strategies and outreach methods for including as many diverse voices as possible. The committee met on October 19, 2018 and identified underrepresented and underserved communities within the community. The most highlighted faction included the youth population, Vietnamese population, Hispanic population, and religious-affiliated groups. The committee brainstormed engagement strategies and delegated tasks to reach these groups. These strategies were used for each of the public meetings.
Table 2.1 Emerging Themes in Rockport
Diverse Culture and Art Responsible Growth Coastal Charm
FocusStrengthening the existing art and culture in Rockport
Growing responsibly to create resilient future
Protecting the natural resources in Rockport
Assets
• Churches and faith based organizations
• Historical center and society
• Civic organizations• Downtown/heritage
district• Festivals• Tourism• Sense of community
• Strong building codes• Long-term recovery
plan• Aransas County
Navigation District• Proximity to other
cities• Existing tree ordinance• Engaged citizens
• Wildlife• Wetlands• Texas Maritime
Museum• Environmental
organizations• Aransas pathways• Fishing community• Park• Live Oak Trees
Figure 2.5: Culture and Art feedback and questions activity
Figure 2.6: Responsible Growth feedback and ques-tions activity
Figure 2.7: Coastal Charm feedback and questions activity
COMMUNITY OUTREACH
As part of the efforts to be more inclusionary, many different avenues were explored to get the word out. The local media, including television stations and the newspaper, posted press releases to announce each public meeting, and community pages on social media were effective in this day and age of technology.
Alternatively, locally stationed Texas A&M staff took outreach a step further and passed out flyers, in English and Spanish, to popular public areas in order to capture a diverse representation of Rockport residents. Academic institutions, government offices, senior living communities, and religious institutions were all targeted for flyer distribution.

16 | CHAPTER 2
Figure 2.8: Public meetings flyer in Spanish
“Rockport is a friendly, culturally diverse and economically vibrant
community that embraces the arts and humanities
and preserves the best of small town life on the water,
including health, beauty, comfort, and safety.”
Recognizing that not everyone can make it to a public meeting to voice their opinion, a wide range of tools were used to solicit feedback. Online surveys, as well as paper surveys were distributed in various locations. Informational materials and comment boxes were placed at the Rockport Service Center to provide multiple opportunities for engagement. Some task force members went door-to-door to bring in more folks to the planning process.
ENVISIONING THE FUTURE
The public meeting held in the Rockport High School on November 2018 received around 100 attendees. The objective of the meeting was to understand the community’s values and establish a vision. Participants split up into groups to discuss the different topics, which were generated based on previous public meeting discussions.
The meeting participants were asked to review the existing vision statement created by the city in 2017. The planning team wanted public input to revise the statement so that a new vision statement that reflects the current conditions, needs, and wishes of the community could be crafted.
Figure 2.9: Community members at the public meeting

PLAN DEVELOPMENT | 17
Meeting Objectives Meeting Activities
08/16
/18
Public Kickoff Meeting @ Rockport Service Center
• Introduce Texas Target Communities
• Explain planning process• Present State of Community
(SOC) report
Mapping - Show us where you live;Post It notes - What makes you proud to be a Rockport resident?Poster - Wishlist for your home, necessities, accessibility, activities
09/2
0/18 Task Force Meeting
@ Rockport Service Center
• Explain the role of the Task Force and ground rules
• Introduce Texas Rural Leadership Program
Document assets in the community
10/15
/18
Task Force Meeting @ Rockport Service Center
• Introduce and explain plan themes
Poster sessions to document assets and questions regarding each theme
11/11
/18
Comprehensive Planning Themes Public Meeting @ Rockport-Fulton High School
• Summarize what has been done so far
• Explain community vision• Present themes and input already
gathered
Poster & Mapping sessions to establish a comprehensive list of community wants and potential locations
01/0
9-10
/19
Task Force Downtown Focus Meeting @ Rockport Service Center
• Explain university courses/student involvement for spring semester
• Present themes and highlights from public meeting
• Explain APA-CPAT project
Discuss and document main downtown issues. Stakeholders include Diane Probst, Downtown Merchants, Navigation District, Cultural Arts District
01/2
4-25
/19
TAMU-DFW Law class meetings @ Rockport Service Center
• Gather community information on issues
Interview stakeholders: City Building and Development Director, County Long Term Recovery Team, Navigation District Director, Permitting Manager, County Engineer, Local Resident
02/0
7/19
Task Force Transportation Focus Meeting @ Rockport Service Center
• Review previous Mayor’s Vision Statement, receive feedback
• Introduce Transportation Class and students’ objectives
Discuss and map focus areas and mark issues and opportunities on printed maps for various transportation mode
03/0
7/19
Scenarios Public Meeting @ Aquarium Education Center
• Present overview of Vision Statement, Planning Scenarios and Draft Transportation Plan
Document public feedback on an scenarios and transportation map
04/2
5/19
Booth @Rockport-Fulton Chamber of Commerce Business Expo.
• Discuss the Comprehensive Plan focus areas and the elements of each focus area
Explain the planning process and the reccomendations
04/2
5/19
Draft Comprehensive Plan Public Meeting @ Aransas County Navigation District Offices
• Explain most supported Planning Scenario
• Poster presentation of the Comprehensive Plan focus areas and the elements of each focus area
Participants respond to the final recommendations, providing comments and feedback for each focus area
06/16
/19 Implementation Actions Discussion @ Rockport Service Center
• Discuss implementation table• Discuss Future Land Use Map
Discuss the implementation steps, responsible parties and timeline
Table 2.2 Comprehensive Planning Meeting Schedule

18 | CHAPTER 2
Figure 2.11: Culture and Art Feedback Figure 2.12: Coastal Charm Feedback
New strategies were piloted during this meeting, including setting up a kids corner for children to interact with and learn while their parents participated in the public meeting activities. Approximately 10 children accompanied their parents to the community meeting on November
Figure 2.10: Drawings made by children of their desires for the community
11, 2018. The focus for their activity was to engage the younger population and ask them what they like about where they live and what they want. Drawings made by the children at this meeting are seen in Figure 2.10.

PLAN DEVELOPMENT | 19
INVOLVING HIGH SCHOOL STUDENTS
The high school students were given a hand-out questionnaire as well as posed the questions verbally. An audio recorder was used to capture the students’ answers; however, the most helpful feedback came from the hand-outs. The students most valued Rockport’s sense of community and natural resources. The positive aspects of the community were the small-town community feel and the willingness to support one another during times of need. They expressed the need to improve job opportunities, affordable housing, and sources of entertainment for younger populations. Many students expressed their desire for recognition within the community, they want their voices to be heard. The students were well-informed and actively engaged in the conversation. Their feedback was enlightening, well thought out, and carefully considered while putting the plan together.
“My favorite thing about the Rockport community is that it ’s strong and
grows stronger when times get hard.”
- Rockport-Fulton High School Student
Themes from student survey:• Small community• Family• Entertainment• Environment• Economic issues
Traits of Rockport:• Selflessness• Support• Small-town community
A major theme throughout the Comprehensive Plan update was the idea of inclusion. The task force felt it was really important to include as many different people as possible so the plan could be representative of the whole community and not just a few. A graduate level Public Administration class from Texas A&M University-Corpus Christi wanted to take that idea further and incorporate high school students into the planning process as part of their civic engagement research project. The Public Administration class looked into public engagement by surveying 150 high school students at Rockport-Fulton High School. In February of 2019, students from a Public Administration Capstone Course at Texas A&M University - Corpus Christi visited an advanced level high school U.S. Economics and Government class to elicit feedback about student’s perceptions of Rockport and concerns for their future. The high school students were asked the following questions to gather information about what is important to the younger populations:
1. What do you value most about Rockport? 2. What is your favorite thing about Rockport?3. What improvements would you like to see
in Rockport? 4. What would keep you in Rockport?5. What are some specific concerns you have
for the future of Rockport? 6. In your opinion is Rockport an inclusive
environment?

20 | CHAPTER 2
TRANSPORTATION PLANNING
While students in the Plan Implementation course were focused on the aspects of the comprehensive plan, the transportation class considered thoroughfare planning, functional classifications, traffic analysis, public works considerations, and transportation funding opportunities. After building the foundation of values and creating a vision to guide future planning, additional meetings were held to explore specific topic areas of the plan. On February 7, 2019, the task force were invited to discuss transportation issues and opportunities to understand the local needs and context. The task force mapped points of interest, service gaps, and dangerous intersections in the transportation network. Ultimately the work the students created is included in the Transportation chapter of the comprehensive plan, providing a much deeper dive into transportation aspects for the city to consider as they develop and grow.
EXPLORING LOW IMPACT DEVELOP-MENT
In August of 2018, Dr. Melissa Currie, a professor of the TTU Regional Planning Studio at Texas Tech University, reached out to Amanda Torres to discuss the impacts of Hurricane Harvey on the community and what this meant for regional trends and potential for growth. On October 5, 2018, students from the Texas Tech Regional Planning Studio visited Rockport with the goal of creating Low Impact Design guidelines for the city to address stormwater drainage and flooding issues.
Low Impact Development (LID) is a principle of design with the goal of decreasing “ecological destruction” during development. The purpose of this principle is to provide as many opportunities as possible for water to be soaked up into the ground to reduce the chances of flooding and drainage issues.
The LID plan proposes several examples for the intersection of water management and the environment and public engagement. It focuses on environmental elements that include
protecting habitat, preservation of wetlands, and maintain a healthy coastal system. They identified several opportunities for community growth, including the implementation of a living shoreline, stormwater management via existing wetlands, the proposition of constructed wetlands, identification of potential areas for growth, and a focus on ecotourism. Some of the recommendations from the LID plan has been included in the Development Consideration Chapter of the Comprehensive Plan.
DOWNTOWN ROCKPORT1
Downtown Rockport is the city’s cultural, historic, and economic hub. This area was drastically impacted by the hurricane and is the focus of many recovery efforts. However, this particular area already had issues with frequent flooding long before Harvey made landfall. Issues and needs of the area were discussed during the meeting on January 9, 2019. A Community Planning Assistance Team (CPAT - which is later referred to as RPAT) conducted a preliminary site visit and attended this meeting to explain their goals and plans for downtown revitalization, resilience, and recovery. The focus of CPAT’s study is the heart of downtown, the Austin Street Corridor.
Rockport is the recipient of one of the APA Foundation’s 2018 Disaster Recovery Grants for a Recovery Planning Assistance Team to create a more resilient Downtown Rockport. It supports the post-Hurricane Harvey recovery and combines efforts with this Comprehensive Plan.
1 American Planning Association (2018) Creating Great communities for All: Rockport, Texas. Retrieved October 31, 2018, from https://www.planning.org/communityassistance/teams/rockport/

PLAN DEVELOPMENT | 21
To capitalize on existing knowledge base, many community groups were a part of the January 9-10 and May 20-24 meetings, including:
• City Staff • City Council and Mayor Rios• Planning Commission• Retired City Staff• Consulting City Engineer• Chamber of Commerce• Downtown Merchants• Center for the Arts• Navigation District• Texas Sea Grant• Local Realtor• Texas A&M University
During this meeting, the community’s downtown merchants discussed their wants and needs, what fits and what doesn’t fit. The merchants expressed their desire for overall beautification of downtown and the flooding issue. They want to see vacant lots cleaned up, green spaces maintained, and improved lighting. After walking through the city and gathering data and information from residents, the team presented three key concepts or focus areas for downtown improvement.
• Flood Mitigation and Resilience: In acknowledging Rockport’s risk of coastal flooding as the primary flood type risk due to its location, they discussed opportunities in reducing threats, community assets, and what is at risk.
• Economic Resilience: The team saw several opportunities for economic impact - development of businesses, land, and workforce, collaboration, and flood mitigation.
• Downtown Design and Vitality: Several themes emerged during discussion and data gathering - connecting places, enhancing the experience, understanding Rockport’s heritage, telling the story through marketing, signage and wayfinding, and celebrating the arts.
INVESTIGATING LEGAL TOOLS
Many of Texas’ coastal communities have little to no capacity for planning, risk assessment and, mitigation, and very rarely have the financial means to hire consultants. Rockport is no exception to this, as a community of close to 10,000 people recently reeling from a devastating storm. The legal needs of communities have increased since Hurricane Harvey, but providing legal assistance was not a service offered by Texas Target Communities. As part of a new partnership between TTC and Texas A&M School of Law, a capstone class focused on Natural Resources Systems visited Rockport to understand how the community is exploring legal tools, policies, and related mechanisms that could help avoid or minimize the negative effects of natural hazards. The course comprised of seven law students and resulted in a guide about Legal Mechanisms for Mitigating Flood Impacts in Texas Coastal Communities. The guide outlined natural hazards the community deals with, defines land use tools, and provided case studies.
On January 24, 2019, law students spent the day in Rockport meeting with municipal representatives and other community stakeholders while also visiting vulnerable sites. They assessed existing local, state, and national rules and regulations and investigated legal tools and mechanisms used by other similarly situated communities. They sought to gain an understanding of the scope of these tools and mechanisms and the extent to which they can be utilized; and formulated alternative and model ordinances and other legal mechanisms that could be considered by decision-makers in the region.

22 | CHAPTER 2
DESIGNING THE LANDSCAPE
On March 1st, students from an undergraduate landscape architecture class visited the City of Rockport and met with stakeholders from Aransas County Navigation District, Center for the Arts, Cultural Arts District, and Keep Aransas County Beautiful. The goal of the 3rd year studio class was to create urban design strategies for the downtown area.
It is unusual for so many different courses to come together in one community, but the timing could not have been more perfect. Each course offered a different perspective on what it means to achieve whole community resilience and have added invaluable knowledge and suggestions to make this comprehensive plan even better.
SCENARIO PLANNING
In March 2019, the planning team presented three scenarios representing various concepts. Each of the scenarios took into consideration each focus area discussed in the Comprehensive Plan. The three scenarios presented were Business as Usual, Coastal Buzz, and Growing Outward. Participants went up to each poster, placing sticker dots along oppose-support spectrums for each scenario. This activity allowed residents to consider different scenarios and decided which were most or least favored by the community. These scenarios and the Future Land Use Plan are fully described in Chapter 3.
Business as Usual: Showed the way future development in Rockport would look by using the current standards.
Coastal Buzz: Showed development primar-ily in or near downtown.Some elements were added from this scenario in the future land use map
Growing Outward: Showed development primarily along the Bypass, while incorporating other areas into the city. Some elements were added from this scenario in the future land use map.
Figure 2.13: Planning team presentation of Sce-nario Planning at the meeting on March 7, 2019
Figure 2.14: Scenario Meeting activity

PLAN DEVELOPMENT | 23
PLAN INTEGRATION FOR RESILIENCE
As the comprehensive plan development process entered its final stage, an additional technical analysis was performed in an effort to further reduce vulnerability to hazards and build a more resilient Rockport. The Plan Integration for Resilience Scorecard (PIRS) method of ‘spatial plan evaluation’, developed by a team of researchers at Texas A&M University’s Institute for Sustainable Communities (IfSC), can help enhance community resilience by helping coordinate planning efforts and integrate hazard mitigation throughout a community’s ‘network of plans’ -- the collection of documents that guide its development and management.
Rockport’s draft comprehensive plan was evaluated, along with other city- and county-level documents that influence planning and management in the community, to understand how the policies and guidance are likely to affect vulnerability to flooding. The results were recorded in the scorecard and subsequently used to suggest ‘adjustments’ that might improve coordination among the plans toward reducing vulnerability and strengthening resilience. This effort was guided by the 2019 version of the Plan Integration for Resilience Scorecard Guidebook, which may be found online at:
http://mitigationguide.org/wp-content/uploads/2018/03/Guidebook-2019.03-Update-v1.pdf.
The following maps visualize the resilience principles of policies across different districts.
The following “Network of Plans” in Rockport were evaluated in the process:
Aransas County Long Term Recovery Plan and Report (2018)
Aransas County Multi-Jurisdictional Hazard Mitigation Action Plan (2017)
Aransas County Multi-Jurisdictional Floodplain Management Plan (2017)
A Vision for Rockport: Master Plan for the Heritage District & Downtown Rockport (2006)
Rockport Heritage District Zoning Overlay Code (2014 update)
Recovery Planning Assistance Team Report (2019)
Throughout the plan, the icons (seen above) indicate alignment with policy best practices across the “network of plans.”
Figure 2.15: Plan Integration for Resilience Scorecard
RPAT
HDZO
HDMP
MFMP
MHMP
LTRP

24 | CHAPTER 2
To align with development and reconstruction during recovery from Hurricane Harvey, the planning team evaluated the LTRP. For the most part, the LTRP has policies that reduce vulnerability to hazards. Policies within the downtown district (district 9) should be adjusted or reconsidered within the LTRP to ensure long-term recovery efforts infuse floodproofing and other principles of resilience. The following policies are best practices within the LTRP:
• Provide needed infrastructure in key areas (eg. drainage improvements in Heritage District) to encourage redevelopment.
Figure 2.16: Aransas County Long Term Recovery Plan and Report Policy Scores by District Hazard Zones
(LTRP 50)• Little Bay Restoration- Little Bay receives
storm water runoff from 11 storm drain inlets and Tule Creek. The proposed project will reduce the threat of coastal erosion and flooding to new and existing businesses and infrastructure. (LTRP 99)
• Fulton Beach Road Restoration- This project proposes construction of up to 4 miles of breakwaters by creating a “Living Breakwater Reef” system at the convergence of Copano Bay with Aransas Bay. (LTRP 100)

PLAN DEVELOPMENT | 25
• Create a countywide wetlands preservation plan (MHMP 17-5)
• Incorporate higher floodplain management standards into City of Rockport comprehensive plan update. (MFMP 62)
• Evaluate list of repetitive loss properties for opportunities to partner with property owners regarding potential mitigation actions. (MFMP 64)
• Evaluate areas in the floodplain viable for open space preservation. (MFMP 65)
The hazard mitigation plan and floodplain management plan are two obvious plans the city should align with to reduce disaster vulnerability. These plans has policies focused on resilience throughout. Some best practice policies within the MHMP and MFMP include:
• Review and update zoning regulations to reduce population density in areas vulnerable to hazards (MHMP 17-44)
• Design and conduct an engineering study to address flooding in downtown Rockport (MHMP 17-40)
Figure 2.17: Aransas County Multi-jurisdictional Floodplain Management Plan Policy Scores by District Hazard Zone

26 | CHAPTER 2
The HDMP and HDZO focus policies around the Heritage District and downtown. Because of this, many policies within the documents may in fact exacerbate disaster vulnerability. The planning team recommends adjusting policies to ensure resilience principles are embedded throughout. The following are policies which demonstrate best practices of resilience within the HDMP and HDZO:
Figure 2.19: Aransas County Multi-jurisdictional Hazard Mitigation Action Plan Policy Scores by District Hazard Zone
• Replace bulkhead at Heritage District (HDMP)
• Dry Floodproofing: Within the Waterfront and Austin Corridor overlay districts, entrances located on the building’s primary facade shall be at the sidewalk level. Dry Floodproofing shall be the preferred method used to protect the space inside the building below the Base Floor Elevation. (HDZO)

PLAN DEVELOPMENT | 27
Figure 2.20: Heritage District and Downtown Master Plan Policy Scores by District Hazard Zone

28 | CHAPTER 2
Figure 2.21: Heritage District Overlay Code Policy Scores by District Hazard Zone

PLAN DEVELOPMENT | 29
GOALS AND OBJECTIVES
During several planning workshops of visioning and strategizing, residents identified plan themes, and developed goals that aim to address their present needs and provide sustainable benefits for the future growth of the city. Each topic area has goals and objectives that work together to transform Rockport into a stronger, more connected community.
The following themes are the guiding principles for the plan:
• Create a sense of belonging/community outreach• Increase representation of marginalized populations• Partnerships between elderly and youth• Youth and multi-family programs/activities and
participatory planningInclusive Community
• Building resilience• Fortified Standards• Infrastructure• Renewable energy
Responsible Growth
• Recreational mobility options• Medical facilities and senior care facilities• Housing affordability• Maintain small town feel with Mom & Pop shops
Connected Rockport
• Increase diversity of economy• Strong workforce• Promote tourism
Strong Economy
• Arts and entertainment for all• Night life for youth, young adults, and families• Activities for residents and visitors of all ages
Diverse Culture and Art
• Promote conservation and protection of natural resources and environment, including the flora and fauna
• Affordable activities and spaces for public engagement with the water
Coastal Charm

30 | CHAPTER 2
Goal 3.1 Achieve a more inclusive land use plan and comprehensive zoning ordinance by providing land uses that preserve the integrity of Rockport’s Community Character
Goal 3.2 Guide the future growth of the city according to the community’s vision
Goal 3.3 Establish development regulations to reduce hazard exposure within the city
Goal 4.1. Expand the Availability of Quality Housing to Meet the Needs of a Diverse Population &; Build Strong Neighborhoods to Enhance Community Character
Goal 4.2. Build Resilient Homes, Maintain Safe Neighborhoods, and Enhance Community Character
Goal 5.1 Provide Safe and Efficient Roadway network
Goal 5.2 Develop an annual maintenance and inventory for the transportation system
Goal 5.3 Implement Complete Street policies in the multi-modal network to enhance safety and connectivity
Goal 6.1 Develop a diverse and resilient economy
Goal 6.2 Establish strategies and programs to foster a skilled workforce.
Goal 6.3 Support existing economic assets
Goal 7.1 Preserve & Protect the Threatened Animals and Sensitive Natural Resources of Live Oak Peninsula, the Little Bay Estuary, Aransas Bay & Gulf of Mexico
Goal 7.2 Prepare the City for Disasters that Could Adversely Affect the Health, Safety, & General Welfare of Residents & Visitors
Goal 7.3 Maximize environmental and economic benefits of ecotourism industry.
Goal 8.1 Ensure that All Infrastructure Elements meet existing & projected demands in a manner that will minimize environmental impacts
Goal 8.2 Promote the peninsula’s heritage and encourage the preservation and revitalization of the historic resources for the educational, cultural and economic benefit of all
Table 2.3 The following are goals that will serve the public interest of the city
The following Chapters describe the existing conditions, recommendations, goals and objectives for development, transportation, economy, housing, and community facilities.

3DEVELOPMENT

32 | CHAPTER 3
OVERVIEW
L and use planning is central to creating an efficient, equitable, safe, and sus-tainable community. The City of Rockport aims to enhance development and land use practices to better respond to growing challenges posed by ex-
treme weather events and a changing climate. Rockport is committed to protect-ing the properties and lives of the residents and seeks to explore strategies that could help avoid or minimize the negative impacts of hazards on the community.
This chapter describes the community’s vision for the future of Rockport and guides the future development by explaining land-use policies and development priorities. The chapter articulates how and where development may occur. How-ever, this plan doesn’t establish zoning regulations or district boundaries.
The future land use map provides guidance for rezoning decisions and updates to development regulations regarding the community’s future growth and char-acter. It is not a zoning map. It is a conceptual map, depicting the community vision and future planning objectives.
“A comprehensive plan shall not constitute zoning regulations or establish zoning district
boundaries.”

DEVELOPMENT | 33
EXISTING LAND USE
Land use planning involves the arrangement of land to ensure the compatibility of different land uses. The existing land use inventory, which classifies different types of land use activities, is an important means of identifying current con-ditions and trends.
Zoning is one of the most common land use regulations used to control and direct the de-velopment of property within the city limits. The City of Rockport adopted its first zoning ordinances in 1996 as an effort to reduce traffic congestion, increase safety against fire and oth-er dangers, promote health and public welfare, provide adequate light and air, and prevent the overcrowding of land. It also works to facilitate the adequate provision of transportation, wa-ter, sewer, schools, parks, and other public re-quirements. Since then, these ordinances have been updated periodically. The current code of ordinances was updated in October 2018. The Rockport Heritage District Zoning Overlay Code was adopted in February 2012.
The current zoning ordinance contains fourteen districts that fall into general categories of resi-dential, commercial, and industrial district (see Table 3.1). Table 3.1 shows the breakdown of the zoning categories which coordinates with a zoning map (Figure 3.1). While the particular zone does not directly define the land use of that lot, it does play a major role in the current land use that is seen in Rockport. Table 3.2 shows the current land use based on the zoning map (Fig-ure 3.2) and Aransas County Appraisal District parcel data.
Zoning Districts
DefinitionArea
(acres)
ResidentialR-1 1st Single-Family Dwelling
District6830.3
R-2 2nd Single Family Dwell-ing District
511.3
R-2B Zero Lot Line Single-Fami-ly District
17.3
R-2M Manufactured Housing District
122.7
R-3 Duplex Dwelling District 9.1R-4 1st Multi-Family Dwelling
District19.4
R-5 2nd Multi-Family Dwelling District
166.0
R-6 Hotel/Motel District 132.4R-7 Residential and Office
District18.4
Commercial/ BusinessB-1 General Business District 946.5B-2 Central Business District 9.2IndustrialI-1 Light Industrial District 174.7I-2 Heavy Industrial District 61.7OthersP.U.D Planned Unit Develop-
ment District104.5
C.U.P Conditional Use Permit District
157.7
Table 3.1: City of Rockport Zoning Districts
Category Area (Acres)
Single Family 2345.49Manufactured Homes 54.17Multi-Family 39.96Commercial 394.19Public/Institutional 122.80Hotel/Motel 29.39Industrial 10.53RV Parks 46.53Open Space 159.60Undeveloped Land 2333.82
Table 3.2: City of Rockport Existing Land Use

34 | CHAPTER 3
Figure 3.1: Zoning Districts in Rockport

DEVELOPMENT | 35
Figure 3.2: Land Use Map

36 | CHAPTER 3
SCENARIO PLANNING
To better plan for the future, scenario planning is used to envision possible outcomes by consid-ering the full range of emerging conditions and uncertainties. The goal is to identify elements that are preferred and needed for the develop-ment of the community. This process began by reviewing current patterns, projected forecasts, and influential factors to develop three plausible potential futures.
SCENARIO 1- “BUSINESS AS USUAL”
The “Business as Usual” scenario represents how the City of Rockport will develop and grow if existing regulations do not change in the next 30 years. This scenario focuses on preserving the existing development pattern and scenario shows the development according to the current policies, regulations, and practices.
Key Takeaways
• Reflects the current land use practices in Rockport by enforcing the existing land use regulations.
• Increases single family residential develop-ment, but lacks a range of housing options.
• Expands commercial and residential devel-opment along Highway 35 Bypass.
• Increases commercial development around the downtown area.
• Preserves existing neighborhoods, as there are no major changes to current develop-ment patterns.
• Increases buildings in the floodplain. • Increases impervious land cover and loss of
existing wetlands.
SCENARIO 2- “COASTAL BUZZ”
The “Coastal Buzz” scenario represents how growth may occur if development is centered around the Downtown Heritage District in the next 30 years. This scenario will likely affect the tourism industry in Rockport as the focus is to provide more economic opportunities related to tourism and recreation with the goal of creating a “Coastal Charm City.”
SCENARIO 3- “GROWING OUTWARD”
The “Growing Outward” scenario focuses on de-velopment around the Highway 35 Bypass. This scenario represents a more “resilient Rockport” by driving development away from the coastline of the city and bringing more inland develop-ment. The purpose of this scenario is to allow the Bypass to drive development in the city and to create a safer and more resilient communi-ty. This scenario also shows what the city could look like if the un-annexed areas in the center of the city were to be annexed and incorporated in the future.
Key Takeaways
• Directs development inland and away from the floodplain.
• Encourages design standards to incorporate a “small town feel”.
• Increases parks and open space around the city near the edges of the peninsula, to pro-vide more mitigation and protection efforts from coastal hazards and flooding.
• Protects wetlands and environmentally sen-sitive areas.
• Increases commercial development along major corridors.
Key Takeaways
• Increases density in the downtown area where the majority of economic growth will occur.
• Increase residential development in the Downtown Heritage District, and lower density in areas outside the downtown dis-trict.
• Conserves more open space due to limited development on the currently vacant land and increased infill/redevelopment.
• Increases development in the floodplain, in-creasing the need to protect the Downtown Heritage District and future coastal devel-opment.

DEVELOPMENT | 37
Figure 3.7: Open space
Figure 3.4: Multi-family residencesPicture Courtesy: Emily Tedford
Figure 3.6: Industrial Facility
Figure 3.3: Single-family residence Picture Courtesy: Emily Tedford
Figure 3.5: Commercial development
Each of the three scenarios prioritizes different community values and embraces a unique over-all feel. These scenarios were presented to Rock-port residents at a public meeting for feedback and altered to produce the final future land use map.
PUBLIC FEEDBACK
Sustainable growth and responsible develop-ment are important to the residents, which begin with protection from natural disasters. Because Rockport is susceptible to hazards and sea level rise, the community hopes to see measures tak-en to protect community facilities, homes, and residents. The community supports the preser-vation of open space and wetlands for stormwa-ter mitigation. It is important to the communi-ty to restore and rebuild Rockport to be more sustainable and resilient through building codes and ordinances, sea level consideration, and over all community protection.
RECOMMENDATIONS
FUTURE LAND USE
Because this Comprehensive Plan is meant to be oriented toward the future of Rockport, future land use provides a visual guide to the future de-velopment and growth of the city. Future land use bring together elements of the comprehen-sive plan such as economic development, hous-ing, community facilities, environment, and transportation.
The future land use map (Figure 3.8) was devel-oped based on the feedback that was received during the scenario planning public meetings and other public feedback period. The goal is to provide accommodations to suit the needs of the current and future citizens of Rockport. The information in this chapter captures the city’s policies regarding how and where Rockport will grow and change for years to come. This com-munity vision is conceptualized in a future land use map with different districts. However, the future land use map is not a zoning map and doesn’t establish the zoning district boundaries.

38 | CHAPTER 3
Figure 3.8: Future Land Use Map
“A comprehensive plan shall not constitute zoning regulations or establish zoning district boundaries.”

DEVELOPMENT | 39
Park where appropriate based on existing sur-rounding development and land uses. City Staff and City Council will need to evaluate the ap-propriateness of an R-8 rezone request.
CONSERVATION SUBDIVISION AND ENVIRONMENTAL CORRIDORS
The City will explore conservation subdivision and environmental corridor district to protect environmentally sensitive areas. It is recom-mended that the City consider doing a corridor study for Highway 35 Bypass and develop an environmental corridor district. Similarly, the City will also consider a conservation sub-division. The difference between traditional subdivisions and conservation subdivisions is seen in Figure 3.13. Conservation subdivisions are residential subdivisions with design tech-niques that reserve at least half of the buildable land area to “undivided, permanently protected open space.” Conservation subdivision design helps communities protect vulnerable natural and cultural areas without reducing residential densities. These designs secure more land for wildlife habitats, filter and retain stormwater runoff, and maintain the natural environment. Developers can link open space areas to the adjacent subdivisions, creating a network of environmental corridors.
There are several steps that must be taken in or-der to implement these designs. First, the com-munity must identify the features and resources it wants to protect from future development to maximize environmental benefits. Community members have expressed a desire to protect the floodplain, wetlands, live oak trees, and ground-water recharge areas.
Based on the conservation priorities, the zoning and subdivision regulations must be updated to specify permissible locations for conservation subdivisions and set standards for the new de-velopment in regards to percentage of the land that is being protected, lot sizes, frontage de-signs, setbacks, and street widths. Additionally, the regulations need to specify the methods for protecting the open spaces, maintenance and ownership. Lastly, the City needs to promote the benefits of conservation subdivision design
RV PARKS
Due to its brand as a popular tourist destination and proximity to large industries to the south of the city, Rockport is an attractive city to develop recreational vehicle (RV) parks. The develop-ment of RV parks are regulated as a Conditional Use within the City zoning ordinance. Condi-tions outlined within this section dictate very basic regulations for a park. Community mem-bers have expressed concern about the locations where these parks have chosen to develop, the landscape and screening required of the parks, and the availability of adequate utilities at these locations. These expressed elements of concerns can be incorporated into the current ordinance to strengthen requirements and have these re-flect community vision.
The plan also suggests considering adding provisions for RV Parks specifically in the “Multi-Family Residential,” and “Commercial” areas, while not fully providing an entitlement to place an RV Park anywhere in those land districts but rather adding a caveat to allow RV
Land Districts
Single Family Residential
A location where the lots contain a stand-alone structure with its own lot intended for one fam-ily.
Multi-Family Residential
A location where the lots contain multiple sepa-rate housing units for residential use. It can con-tain one or several buildings, usually an apart-ment or condominium.
Commercial
A location that is intended for use by for-profit businesses. Examples of this kind of use are of-fice complexes or shopping malls.
Industrial
A type of land use intended for warehouse, in-dustrial, storage use.
Open Space
Any open piece of land that is undeveloped and accessible to the public.

40 | CHAPTER 3
and the process of implementing it. Educa-tion and assistance to developers and commu-nity members not only increase the chances of conservation designs but also help support the community’s vision for development and land conservation.
ANNEXATION
Annexation is a land use management tool au-thorized by state law that cities can utilize to reg-ulate properties within an area that is adjacent in a certain radius from its city limits called the “extraterritorial jurisdiction” or ETJ. The Texas Local Government Code defines the location of the extraterritorial jurisdiction of a municipality dependent on its population. Because Rockport is a city with a population between 5,000 to 24,999 inhabitants, its ETJ radius is one mile. The 2017 and 2019 Texas Legislative Sessions have modified the rules dictating how munic-ipalities can annex per Chapter 43 of the Tex-as Local Government Code. The city will need to be cognizant of the changes that occurred in these sessions, along with any legislation that will be passed in future sessions.
The City of Rockport most recently annexed land in 2016 and 2017, incorporating land along Market Street (FM 1069), Pearl Street (FM 2165), and State Highway 35 Bypass. These series of annexations have left two areas surrounded by the city limits that have yet to be incorporated into the city. At time of publi-cation, there are no plans to annex any further within the extraterritorial jurisdiction. Once annexed, the city zoning ordinance requires that any newly annexed land gets zoned into the most restrictive, least dense zoning category which is R-1 1st Single-Family Dwelling Dis-trict. The most recent annexation has caused staff to consider re-evaluating that policy to one that would better consider the land uses existing in a proposed annexation area.
DOWNTOWN HERITAGE DISTRICT
The downtown areas of cities often define the heart and character of an entire community. Streets are lined with historic buildings of yes-teryear, and citizens want to preserve the area’s cultural significance. Some cities choose to go through the process of getting their downtown areas designated for its cultural and/or historic significance. Such designations include Cultural Arts Districts or Main Street Program through the state, or the National Register of Historic Places. In 2016, downtown Rockport was des-ignated as a State Cultural Arts District by the Texas Commission on the Arts.
A downtown heritage district is an area of a city that contains older buildings which are consid-ered to be valuable because of the history or the architecture of the buildings but may not have yet gone through the process of being recog-nized as historically significant by a state or fed-eral agency. These areas receive legal protection from certain kinds of development. Cities often develop a set of development standards and re-strictions to maintain character and history.
The City of Rockport adopted the 2006 Down-town Master Plan to enhance, revitalize, and di-versify businesses in Downtown Rockport. The vision was for Downtown to be a destination point, be charming and friendly, walkable, have thriving businesses and economy, and have an unobstructed waterfront view. The master plan serves as the foundation for the planning and de-cisions of the downtown and heritage districts. The goals and expectations of development in the Downtown and Heritage District later be-came the basis for the 2014 Rockport Heritage District Zoning Overlay Code (RHDZO). The primary purpose for the RHDZO is to im-plement the Design Goals noted in the 2006 Master Plan. Buildings and structures should reflect the coastal heritage of the peninsula with unique style and character through awnings and landscaping, signage, murals and art, and other unique design characteristics.

DEVELOPMENT | 41
Figure 3.9: Conservation DesignSource: Randall Arendt
Figure 3.10: Downtown Heritage District OverlaySource: Rockport Heritage District Overlay Code

42 | CHAPTER 3
PLAN INTEGRATION
TEXAS MAIN STREET PROGRAMTexas Main Street Program (TMSP) was created by the Texas Historical Commis-sion 1980 with the goal of revitalizing and improving economic health of historic resources with the help of local commu-nities. Their mission is “to provide tech-nical expertise, education, resources and support to designated Main Street communities. Utilizing our individual and collective skills, we shall guide our desig-nated programs in effectively preserving and revitalizing their historic downtowns and commercial neighborhood districts in accord with the National Main Street Four Point Approach™ of organization, design, economic vitality and promotion.” Their approach to downtown revitalization is four fold:
• Organization• Promotion• Design• Economic Vitality
There are 88 official Texas Main Street communities across texas with popula-tions ranging from less than 2,000 to more than 300,000. These communities have been able to improve their economies, add more jobs, and improve their overall environment.
Specific codes and standards for development were established in the RHDZO that promote public welfare, enhance implementation, promote walk-able development, and promote the goals and ob-jectives of the city’s Comprehensive Plan and 2006 Heritage District Master Plan. Character districts within the Rockport Heritage District (RHD) en-ables development standards for functional and aesthetic design that reflect the vision of each area.
RHD’s Character Districts (Figure 3.10): • Austin Street Corridor• Waterfront District• Neighborhood District• Arterial District• Civic Core District• Harbor Destination
Another important purpose of the RHDZO is to encourage historic preservation. Revitalization is a high priority, but it is vital to protect and promote the character and history of Rockport. RHD revi-talization will help in supporting economic devel-opment through job creation and making the area more appealing for future investors and visitors. Like other parts of municipal regulatory authori-ty, the 2019 state legislative session curtailed how cities can regulate what types of building materials can be used on the facades of structures. This is a major element with the RHDZO and may require staff to make subsequent amendments to the code in order to be compliant with the state’s ruling.
In May 2019, a Community Planning Assistance Team with the American Planning Association conducted a week-long site visit and made recom-mendations specific to downtown Rockport. Rec-ommendations fell under three categories—flood mitigation and resilience, economic resilience, and downtown design and vitality. A full definitive re-port of the team’s recommendations should be re-leased in February 2020.
RPAT
DESIGN GUIDELINEThe adopted Design Guidelines in the pre-vious Comprehensive Plan have been valu-able to Rockport citizens and the City to guide new development in the communi-ty. The plan recommends reviewing and updating the Design Guidelines to match the current needs of the community.

DEVELOPMENT | 43
PLAN INTEGRATION
URBAN LAND INSTITUTE (ULI) PRINCIPLES FOR REBUILDING DOWNTOWN
1. Great Streets Need Great Champions. Someone to initiate the process, fight to ensure it is done right, and follow through to completion. The champion can be a group or an individ-ual.
2. It Takes Vision. The vision must be shared and face the tough questions up front, making sure everyone understands the realities of the situation, and setting goals that are attain-able.
3. Think Residential. Successful retail depends on successful residential neighborhoods.
4. Honor the Pedestrian. The first goal for a neighborhood shopping street should be to satisfy the aspirations and enhance the lifestyles of a neighborhood’s residents. And, cautions the ULI, don’t let traffic engineers rule the streets.
5. Parking is Power. Recognize that parking needs will usually be less along neighborhood shopping streets than in suburban shopping centers. Set lower parking requirements.
6. Merchandise and Lease Proactively. To achieve higher sales, rents, and land values, landlords along the street need to band together and work with the public sector to merchandise and lease their street in a coordinated and mutually supportive way.
7. Make it Happen. Communities should be willing to use both carrots and sticks to convince landowners, developers, and retailers that the revitalization efforts are in their interests.
8. Be Clean, Safe and Friendly. If a neighborhood shopping street is clean, safe, and friendly, customers will be drawn to their favorite shops even though the street as a whole may still be in transition.
9. Extend Day into Night. Identify, plan for, and tap multiple markets to generate income throughout the day and into the night.
10. Manage for Change. Rebuilding a neighborhood retail street is a long reinvestment process and market realities will undoubtedly continue to change throughout the ongoing life of the street. One-shot or formulaic projects will fail.
RPAT

44 | CHAPTER 3
FLOODPLAIN MANAGEMENT
The city’s building codes and ordinances guide and regulate construction in floodplains. The Special Flood Hazard Area is the zone that FEMA designates as the 100-year floodplain or, an area that has a 1% chance of flooding an-nually (Zones A and AE). The coastal edges of the east and west sides of the Live Oak Penin-sula are in the “A” or “AE” zone. The 500-year floodplain designation can better be explained as an area having a 2% chance of flooding an-nually (Zones B and X). The central portion of the peninsula is in the “B and X” and “C and X” zones which are the areas with minimal flood risk. Figure 3.11 displays the Flood Hazard Ar-eas within and around the City of Rockport.
To help reduce the impact of flooding of pri-vate and public structures, Rockport is partic-ipating in the National Flood Insurance Pro-gram (NFIP). The purpose of the program is to provide affordable flood insurance to property owners while encouraging communities to uti-lize flood mitigation strategies, such as adopting minimum building and development standards. In order to participate in the program, the city is required to enforce the adopted floodplain regulations based on the Flood Insurance Rate Maps.
The City adopted a freeboard requirement in 2016 as a way to alleviate risk of flood waters invading homes. The freeboard is the distance from the lowest livable floor of a property to the base flood elevation. Rockport requires at least 18 inches of freeboard. Many of the structures that were 50% or more damaged by Hurricane Harvey are now required to come into compli-ance with new floodplain regulations. Elevating a structure to this higher freeboard standard reduces risk of future flooding and reduces the cost of flood insurance as outlined in the Na-tional Flood Insurance Program.
As part of this effort to inspire communities to make themselves less vulnerable, the Communi-ty Rating System (CRS) was introduced to en-courage communities to exceed the minimum
NFIP requirements in exchange for monetary incentives. The CRS uses a class rating system from 1 to 9 with the goal being to reach a lower class rating for maximum incentives. Currently the City of Rockport is at a class 7 but is actively looking to incorporate activities that would help achieve a higher class rating. The CRS Coordi-nator’s Manual identifies six categories of flood-plain management activities that can increase a community’s resilience to flooding and improve their overall score.
CRS Activity Categories are as follows:
• Preventive• Property Protection• Natural Resource Protection • Emergency Services• Structural Projects• Public Information
The CRS recognizes, encourages, and rewards community and state activities that go beyond the minimum standards required by the NFIP.
HAZARD MITIGATION PLAN
Aransas County adopted the Multi-Jurisdic-tional Hazard Mitigation Action Plan (HMAP) in October 2017. The county-wide plan focus-es on reducing future losses by analyzing haz-ard risk and identifying mitigation strategies. The plan establishes five overall goals and lists mitigation actions for each jurisdiction. For ef-fective integration of hazard mitigation in local planning, the comprehensive plan aims to align with the goals and actions of the HMAP.
HMAP goals for Aransas County are:
• Protect public health and safety. • Protect new and existing properties. • Build and support partnerships to enhance
mitigation to continuously become less vul-nerable to hazards.
• Leverage outside funds for investment in hazards mitigation.
• Increase the understanding of residents for the need for mitigation and steps they can take to protect people and properties.

DEVELOPMENT | 45
Figure 3.11: Special Flood Hazard Areas in Rockport

46 | CHAPTER 3
HIGH TIDE FLOODING
High tide flooding, often referred to as “nuisance” flooding, occurs at high tide on a calm, sunny day causing costly public inconvenience. Coastal communities are at a greater risk of nuisance flooding because of rising sea levels, land subsidence, and loss of natural barriers. According to the National Oceanic and Atmospheric Administration (NOAA), the number of high-tide flood days is expected to increase and hit record highs in the coming years. NOAA projections indicate up to 15 high-tide flood days in 2030 in Rockport.
The NOAA Inundation Dashboard is an online tool coastal communities and decision makers can use to prepare for and manage flood events. It includes real-time water level information, 48-hour forecasts of water levels, storm surge and historic flooding information.
Figure 3.12: High Tide Flood EventsSource: oceanservice.noaa.gov
GUIDELINES FOR NEW DEVELOPMENT OR REDEVELOPMENT
Avoid new development in flood-prone areas and within floodplains.
Floodplains allow for overflow of water bodies when extreme rain events occur and provide an impoundment area while water levels recede. The city will avoid any new development in these areas to protect lives and properties. Parks, recreational, or sports uses with minimal struc-tures are compatible with floodplains.Reduce
Impervious Land Cover
To avoid flooding and preserve water quality, it is recommended that a limit is placed on the amount of impervious cover on land. Impervi-ous cover is any surface that cannot absorb and
As Rockport continues to recover and grow, the preservation of natural landscapes becomes increasingly important. The city is exploring Green Infrastructure (GI) and Low Impact De-velopment (LID) practices to mitigate the effects of future disruptions. Green infrastructure in-cludes measures that mimic natural processes to store, reuse, or reduce stormwater. Low Impact Development is land development that mimics natural processes for managing stormwater on site while still achieving water protection goals. The focus on GI and LID is an intentional strat-egy to address local flooding and drainage issues.
The following guidelines have been developed for new development and redevelopment of un-derused areas.

DEVELOPMENT | 47
filter water, like roofs and roadways. When road-ways and parking lots are constructed, especially in areas that have lower elevation, it becomes in-creasingly difficult to mitigate water collection and runoff. For this reason, it is important to preserve existing green spaces or develop new ones in the form of parks and nature areas. Re-ducing the amount of impervious surface is a key strategy in LID for managing stormwater. This can be achieved by:
• Paving less, reducing lane widths and reduc-ing impervious footprints
• Make use of existing infrastructure by rede-veloping infill sites or greyfields
Consider fill restriction
Fill is earthen material, like gravel, dirt, or sand, which is brought in during development to level or elevate the land. Fill can cause issues in the floodplain because it can reduce its holding ca-pacity, which further increases the risk of flood-ing in existing development. One way to reduce flood risk is to implement a zero net fill require-ment in which new fill is offset by removing ex-isting fill from another area of the floodplain. Additionally, a “no-rise” requirement can help with flood risk by ensuring that fill does not re-duce floodplain carrying capacity.
Manage water where it falls
Flooding is often the result of increased run-off from large amounts of impervious surfaces and upstream development. To mitigate urban flooding and the impacts of stormwater runoff, the city should consider design strategies at sev-eral scales:
Design for small rain events (first ½” of rain-fall or first flush)
• Direct downspouts to planter boxes, vege-tated areas, rain gardens, etc.
• Direct runoff from paved areas to planted/vegetated areas
• Encourage xeric landscape design• Plant trees along streets and in medians
Design for moderate rain events (1/2 to 1-1/2” of rainfall)
• Retain natural landscapes where possible
Design for large rain events (1-1/2” to 3” of rainfall)• Use larger bio retention areas and rain gar-
dens• Vegetated swales with long flow paths
to maximize the time runoff is conveyed through the swale
Design for extreme events (3” or more of rainfall)• Combined flood measures – i.e. the “sponge
city” approach• Protect and restore riparian buffers along
rivers, streams, wetlands, and coastlines• Protect and restore wetlands, both those
naturally occurring and “constructed.”• Increase vegetative cover in urban, subur-
ban, or rural/agricultural areas.• Increase the urban canopy by planting street
trees and rwequiring all new development to comply with landscape requirements
MAPPING TOOL
The Texas Sustainable Coastal Initiative developed tools to allows users to query data and make maps based on different development scenarios and help com-munities make future decisions on sus-tainable growth while balancing other priorities. Users are able to answer the research questions on where growth will occur along the coast and the impact of such growth. The tool includes three In-ternet-based decision support systems that help users identify critical issues. Each of the three atlases listed below provide information about environmen-tal degradation, natural hazard risks, and changes in land use patterns.
1. Texas Atlas2. Texas Coastal Communities Atlas3. Hurricane Evacuation Study

48 | CHAPTER 3
WATER INFRASTRUCTURE IMPROVEMENT ACT
The Water Infrastructure Improvement Act (H.R. 7279) was enacted in January 2019 (WIIA) to promote green infrastructure to meet water quality standards. The Federal Water Pollution Con-trol Act, also known as the Clean Water Act (CWA), was amended to permit local communities to develop a plan integrating wastewater and stormwater management to reduce economic bur-dens and protect water quality. Communities now have the freedom to develop an Integrated Plan (IP) that can be incorporated into their CWA permit. The Act permits the implementation of green infrastructure and projects to naturally reclaim, recycle, or reuse water by planting trees and restoring wetlands, rather than building a new water treatment plant.
Site-Level Techniques for Implement-ing GI and LID
The City of Rockport can encourage scalable techniques for implementing GI and LID on new sites or the redevelopment or existing sites. The practice of dispersed, small site applications addresses most rain events with an emphasis on managing the initial surface runoff of a rain-storm.
Paving Applications
• Porous pavements – a system used for sur-face paving that includes a subsurface gravel infiltration bed. The porous paving material (asphalt, concrete, or pavers) allows water to infiltrate through it and continue down through the gravel bed. This option can be used to detain runoff, thus saving land, and is particularly useful in urban redevelop-ment projects.
• Selective curb treatment – eliminating curbs along the edges of paved areas or roads al-lows runoff to be directed into adjacent bioswales or rain gardens to provide water for vegetation. Alternatively, flat (ribbon) curb edges or curb cuts can be used to ac-complish the same purpose.
Landscape Application
• Bioretention Areas – also called rain gar-dens – are shallow depressions that capture runoff. They are planted with a variety of trees, shrubs, and perennials that mimic up-per canopy, middle story, and ground floor conditions. Native or native-adapted plants
that are able to withstand both drought and flood conditions and that possess the ability to form a dense root layer to cleanse pol-lutants from runoff should be chosen. Rain gardens can be used in residential lawns, in medians, along roadways, or in other areas adjacent to impervious surfaces.
• Bioswales – used to convey runoff from paved areas to retention ponds. The use of bioswales to connect a series of rain gardens creates a green network effective at reducing the quantity and velocity of runoff, increas-ing the time runoff is in a swale to allow for greater infiltration, and enhancing water quality.
• Subsurface infiltration beds – a uniformly open-graded aggregate bed under a vegetat-ed or paved surface. Provide for storage and infiltration of runoff and are especially use-ful for athletic fields and parking areas. May be sloped in hilly or terraced areas.
• Tree trenches – a linear feature typically found along streets and sidewalks where runoff can be directed. These planted strips promote the health of street trees, espe-cially when combined with structural soils designed to allow tree roots to penetrate more deeply than the compacted subsurface found beneath pavement.
• Street Bump-Outs – an extension of curbs that creates a widened landscape space to capture street runoff. Most effective when used at intersections, which increases their size and ability to handle more water. Can be used in a retrofitting strategy for “green-ing” urban areas and traffic calming.

DEVELOPMENT | 49
LOW IMPACT DESIGN SUGGESTIONS
Several groups of Texas A&M and Texas Tech students worked in their classes to create design and infrastructure presentations with suggestions for Rockport. The goal for these presentations were to help with the community’s resilience, diversity, accessibility, and sustainability. The fig-ures below show some of the street design suggestions that would not only beautify Downtown Rockport, but also increase resilience. Some of these suggestions focus on several downtown streets (Austin St., Magnolia St., and Wharf St.). They include the addition of bike lanes and side-walks, redesigning street slopes to direct water and improve drainage, implementing bioswale features and permeable land cover, and improving beautification with pavers and plant features.

50 | CHAPTER 3

DEVELOPMENT | 51
RESOURCE: GREEN INFRASTRUCTURE MODELING TOOLKIT
The Environmental Protection Agency (EPA) put together the Green Infrastructure Modeling Toolkit of cost effective and resilient tools to help communities green infrastructure implementa-tion make decisions for stormwater management.
Storm Water Management Model (SWMM)SWMM software is used for large-scale planning, analysis, and design related to water runoff, sewer systems, and other drainage systems. It helps users determine the effectiveness of man-aging runoff.
National Stormwater Calculator (SWC)SWC software application allows users to estimate annual stormwater runoff amounts from spe-cific U.S. locations on the basis of soil conditions, land cover, and rainfall records. Site developers can use SWC to determine how well stormwater retention target can be met with and without green infrastructure.
Green Infrastructure Wizard (GIWiz)GIWiz is an interactive online application that gives users customized reports with EPA tools and resources based on the community’s objective. The user can find tools and resources for com-munity specific projects, and ideas. There is also an option to explore different categories and attributes to help the user find exactly what they want.
Watershed Management Optimization Support Tool (WMOST)WMOST is a software that helps facilitate integrated water management by allowing water re-source managers and city planners screen a wide range of practices for cost-effectiveness and environmental and economic stability.
Visualizing Ecosystems for Land Management Assessment (VELMA) ModelRegional planners and land managers can use VELMA to assess the effectiveness of natural and engineered green infrastructure management practices (riparian buffers, cover crops, and con-structed wetlands).
Green Infrastructure Flexible Model (GIFMod)GIFMod is a tool used to evaluate urban stormwater and agricultural green infrastructure practic-es. Users can build models of green infrastructure practices to make predictions about hydraulic and water quality performance under different weather scenarios.
PLAN INTEGRATION
TAX ABATEMENTS
Provide tax abatement for property owners undertaking flood improvements. A tax increment reinvestment zone (TIRZ) would be used to encourage new development and growth through funding of critical infrastructure needs within the district and the waterfront. The TIRZ should mirror the boundary of the overall Heritage District including the waterfront to ensure that growth from areas likely to develop sooner can be captured to fund necessary infrastructure.
RPAT

52 | CHAPTER 3
PLAN INTEGRATION
STORMWATER MITIGATION
Short Term Recommendations1. Create rain gardens and bioswales within higher and lower areas of Austin and Magnolia
Streets.
- Encourage private property owners to incorporate green infrastructure if possible.
2. Examine the two conveyance pipes to the bay in this area using a camera system to verify pipes (following Hurricane Harvey) remain fully functional.
- If any segments are not fully functional, request a study to determine the feasibility of bringing the system into full performance.
3. Examine and test areas of the drainage system for accumulation of sand and silt and verify that the outlet points into the bay are clear and free of growth.
- If there is any accumulation, a city street sweeper may be used periodically to clear accu-mulation between periodic vacuuming of the system.
4. Examine the functionality of backflow prevention devices on outlet points for the stormwa-ter drains into the bay.
Long Term Recommendations1. Examine the drainage system prior to future development.
- New development requests could be conditioned for floodplain management purposes through the land development approval process to ensure the functionality of convey-ance systems with respect to potential added impacts that may be mitigated by an ap-plicant.
- This would be supported through the city’s planning process to ensure the floodplain management program meets the needs of new development within the Special Flood Hazard Area and to ensure new development does not aggravate the current flooding conditions.
2. Review repetitive-loss properties to identify potential acquisitions that may be made to as-sist in reducing flooding within the sub-basin (Austin Street and the Heritage District).
PLAN INTEGRATION
POTENTIAL MITIGATION
For merchants or property owners with structures that cannot be structurally retrofitted pur-suant to code, a second possible course of action is the potential to dry floodproof for a lesser amount of flood protection. One example includes small shields placed at doorways to minimize flooding into the building following a concurrent heavy rain event and high tide. The team recom-mends the city work with downtown merchants to hire a structural engineer to identify the best manner to install smaller systems to work effectively with the older structures.
• Solar energy and other renewable energy alternatives,• Infrastructure improvements on Austin and Magnolia Streets that account for sea-level rise,• Retrofitting and/or updating drainage, sewage, and electric to accommodate redevelop-
ment and new development.
RPAT
RPAT

DEVELOPMENT | 53
PLAN INTEGRATION
A GREEN VISION FOR DOWNTOWN
Consistent with the city’s comprehensive plan, considerations for a more resilient future in the long term may include the following with reconstruction and new development:
• Solar energy and other renewable energy alternatives,
• Infrastructure improvements on Austin and Magnolia Streets that account for sea-level rise
• Retrofitting and/or updating drainage, sewage and electric to accommodate redevelopment and new development.
The city and the Navigation District are looking to further promote and develop a walkway that will share not only new development, but also allow for foot traffic to experience the bay while also having access to Austin Street and areas to the east and west. To the east is the existing park, Festival Grounds, beach, and a host of other areas of interactions. To the west is a small shoreline that is currently experiencing erosion and is uninviting. The team witnessed the inunda-tion of the road continuing further west along the shore during the wind-driven high tide. There are considerations for mitigating erosion that may be in addition to those already discussed with merchants, the community through the planning process, and government entities such as the planning commission and city staff.
The boardwalk could be designed to incorporate points of interest with a living shoreline, espe-cially around any existing or future stormwater discharge areas. Strategically placed gathering points should allow access from the boardwalk to Austin Street. A living shoreline may include sea grasses, reefs, and different formations or connections with the bay and the Austin Street area. The shoreline may also serve to provide small habitats and should be designed to assist with stormwater runoff water quality. In addition to illustrating the relationship to natural systems, it will serve as a parallel priority in mitigating erosion for supporting stormwater and future infra-structure along the shore.
Integrating bioswales and rain gardens will help control loose soil and sedimentation in down-town Rockport.
Strategic placement will greatly assist with mitigation, but also contributes to the overall aes-thetics of Austin Street and the Heritage District.
Market Street ends at Water Street, which is also the entry to the Navigation District’s sea wall. The sea wall helps protect the Navigation District’s property, including the marina. As an area of erosion, riprap is in place, which is not the most inviting, but many still come there to enjoy views of the bay. The area needs protection due to a drainage outfall. This is another good area for a living shoreline, as discussed above. A natural area that filters stormwater runoff and acts as an erosion control system could also serve as an observation area to view the water, experience sunrises, and enjoy wildlife. A launch for kayaks and canoes may also be possible.
Consult the full CPAT report for specific design recommendations.
RPAT

54 | CHAPTER 3
REFERENCES
1 Texas Historical Commission, About the Texas Main Street Program, (2020), Retrieved from https://www.thc.texas.gov/preserve/projects-and-programs/texas-main-street/about-texas-main-street-program
2 Rockport Heritage District Overlay Code, (2006), Retrieved from https://www.cityofrockport.com/DocumentCenter/View/13179/Rockport-Heritage-District-Overlay-code-final-?bidId=
3 Beyard, Michael D., Michael Pawlukiewicz, and Alex Bond. (2003) Ten Principles for Rebuilding Neighborhood Retail. Washington, D.C.: ULI–the rban Land Institute. Retrieved from http://uli.org/wp-content/uploads/ULI-Documents/TP_NeighborhoodRetail.ashx_.pdf
4 National Ocean Service, Coastal Inundation Dashboard, Accessed on November 23rd, 2018 at https://tidesandcurrents.noaa.gov/inundationdb/
5 National Ocean Service, What is high tide flooding?, (2018), Retrieved from https://oceanservice.noaa.gov/facts/nui-sance-flooding.html
6 National Ocean Service, Coastal Inundation Dashboard, Accessed on November 23rd, 2018 at https://tidesandcurrents.noaa.gov/inundationdb/
7 Texas A&M University, Texas Sustainable Coastal Initiative, Retrieved from http://coastalatlas.arch.tamu.edu
8 Environmental Protection Agency, (2018) Green Infrastructure Modeling Toolkit, Retrieved from https://www.epa.gov/water-research/green-infrastructure-modeling-toolkit

4 HOUSING

56 | CHAPTER 4
OVERVIEW
A s Rockport continues to grow, emphasis is placed on improving current housing op-tions and development of new housing. For individual neighborhoods to thrive, there must be quality housing options to meet the needs of diverse populations, lifestyles,
and income levels. This chapter examines existing housing types, values, affordability, and household characteristics. Additionally, the chapter describes recommendations to expand quality housing, meet the needs of the community, and maintain a safe environment for all.
CONDITIONS BEFORE THE STORM
HOUSEHOLD COMPOSITION
Rockport is made up of a diverse range of people that require different types of housing struc-tures, prices, neighborhood facilities, and infrastructure. In 2016, the U.S. Census Bureau esti-mated that 3,857 households lived in Rockport. Of total households, 59.58% are married-couple households, while 57.60% and 50.14% are in Aransas County and Texas respectively. In addition, this city contains 158 male-led households, 269 female-led households; 949 households are in-dividuals living alone, and 183 other households are individuals not living alone, but not related (Figure 4.1). These percentages indicate a lower number of single parents in Rockport than Texas and Aransas County.1

HOUSING | 57
Figure 4.1: Household TypesSource: U.S. Census Bureau
Figure 4.2: Housing TypesSource: U.S. Census Bureau
HOUSING TYPES
Rockport and the surrounding coastal areas are known for secondary/vacation homes, mobile/manufactured homes, and RV parks due to the availability of year-round recreational activities. An estimated 65.08% (4,238 out of 6,512) of homes in Rockport are “single family” (i.e. 1-unit, detached structures) which will include some of the secondary/vacation units (Figure 10). Other secondary/vacation units will be in-cluded in “multi-family” structures. Rockport has a higher percentage of mobile housing units than Texas.2 Figure 4.2 exhibits and compares housing unit types against the County and the State.
Figure 4.4: Oaks Garden Apartments in RockportSource: www.apartments.com
Figure 4.5: Circle W RV Ranch in Rockport,Source: www.tripadvisor.com
Figure 4.3: Single Family Home in Rockport, TXSource: www.zillow.com

58 | CHAPTER 4
RESIDENTIAL ZONING DISTRICTS
The size of housing units is determined by the different residential districts, which are desig-nated on the city’s zoning map. In Rockport, single family districts with low density have a minimum living area of 800 square feet. The minimum living area size for other single family districts is 600 square feet; the minimum living area size for multi-family districts is 500 square feet per unit. The maximum height for build-ings is 35 feet, with only one multi-family dis-trict allowance for 45 feet. The size and height of buildings will be significant if the city considers amending the zoning map to provide for a great-er variety of housing types.
Housing density shows the number of dwell-ing units situated on a particular lot or district. Higher density provides easier access to public transportation and community facilities like shops and neighborhood parks, while lower density allows single family homes to sit on larg-er lots, putting more distance between homes. Most residential districts are zoned to have a minimum lot size of 7000 square feet, but two districts are zoned for lower density. Lot sizes and density will also be important when consid-ering changes to the zoning map and increasing the variety of housing types.
Figure 4.6: Vacancy StatusSource: U.S Census Bureau
OCCUPANCY VS. VACANCY
Vacancy status assists in determining housing demand and is used to create a comprehensive overview of the housing market. In 2016, the vacancy rate of housing units in Rockport was 40.8% (up from 32.4% in 2010) which is com-parable to the County but is about 30% higher than the State (Figure 4.7).3 Figure 4.8 shows recreational and seasonal housing represents the majority of vacant housing (over 65%). While it is understandable that a coastal community like Rockport would have a significant number of recreational and seasonal units, the continuing development of these units drives up housing and land prices and challenges the development of affordable units for year-round residents.
HOUSING PRICES AND AFFORDABILITY
The comparison of household income to hous-ing costs determines housing affordability. Ac-cording to the U.S Department of Housing and Urban Development (HUD), a household pay-ing 30% or more of its income for housing cost is categorized as living in an unaffordable home. In the U.S., renter-occupied housing units com-monly cost 30% or more of the total income

HOUSING | 59
of the household. A large portion of US house-holds earning less than $20,000 annually, pay 30% or more of their income for housing fees (84.29% for owners and 86.52% for renters).
In Rockport, for households with annual in-come of $20,000 to $49,999, renter-occupied households experience more housing cost bur-den than owners (Figure 4.9 and Figure 4.10). Thus, offering more affordable rental units, in addition to owned units, can mitigate economic pressure and improve the quality of life of resi-dents.4
There are five apartment complexes in Rockport that set rent based on income of the tenant, giving low-income residents the opportunity to spend a fixed 30% of their income on rent.5
• Fifty Oaks Apartments• Saltgrass Landing• Linden Oaks (Retirement Community)• Bay of Aransas Gardens• Sea Mist Townhomes
SPECIAL HOUSING
It is important to have housing for residents who have special circumstances, such as the elderly and people with long term health care needs. There is an interest in nursing homes, adult day cares, and rehabilitation centers because most of the Rockport population falls between the ages of 45-54 and 65-84. Within Rockport, there are 3 nursing, rehabilitation, and/or retirement centers: Gulf Pointe Plaza, Gulf Pointe Village, and Rockport Nursing and Rehabilitation Cen-ter (formerly Oak Crest Nursing and Rehab). Rockport Coastal Care Center Inc. was de-stroyed during Hurricane Harvey and will not reopen.
Figure 4.8: Owner Occupied Housing CostSource: U.S Census Bureau
Figure 4.9: Renter Occupied Housing CostSource: U.S Census Bureau
Figure 4.7: Occupancy RatesSource: U.S Census Bureau

60 | CHAPTER 4
HAZARD IMPACTS PUBLIC FEEDBACK
Rockport, like many communities in Texas, suffered a great deal of devastation because of Hurricane Harvey. As a result, 94% of homes in Rockport experienced some level of damage while 30% of homes were destroyed entirely. According to FEMA statistics, 780,000 Texans were forced to evacuate their homes. Nearly 42,000 of evacuees went to stay in nearly 700 different temporary shelters. Many people could not return home after the hurricane due to the costs associated with repairing or rebuild-ing their homes, or due to the lack of alternate housing. This can be referred to as displacement. Often when people are forced to take up new housing and jobs in a different community, their temporary displacement becomes permanent. Rockport lost nearly 20% of its population due to displacement. The pre-existing condition in Rockport - a lack of affordable and low-income housing, including rental units - was exacerbat-ed by Harvey for two reasons. Many of these housing units were the hardest hit during the storm, and they are less profitable to rebuild af-ter the storm.6
The availability of affordable or “workforce” housing greatly impacts other conditions in Rockport. The city’s economy has been largely dependent on the tourism industry, restaurants, and retail shops. When the workforce that sup-ports these businesses cannot return to their homes, and thus their jobs, the economy of the whole city slows down and suffers. Many busi-nesses have not been able to operate regular busi-ness hours, and some have not been able to re-open, since the storm. Similarly, when there are less residents living in a community, there is less contribution to the tax base and governmental operations suffer (e.g. schools, the police force, and the public works/building department). In order for the city at large to sustain itself and grow in the aftermath of Harvey, Rockport must provide a variety of housing that accommodates all incomes and household types.
For Rockport to continue growing, it is import-ant to provide adequate and affordable housing for its diverse residents from all walks of life. The lack of affordable housing is a major concern for residents. Citizens want more diverse housing options for everyone, from families with chil-dren to single adults to senior citizens. It is im-portant to residents to encourage a welcoming and respectful atmosphere for people of differ-ent cultures and ethnicities. The public desires to have more support resources for the under-served such as women’s shelters and/or homeless shelters.
Additionally, residents care about promoting workforce housing with strong building stan-dards to withstand natural hazards. Since Hur-ricane Harvey destroyed many homes in Rock-port, the local government is facing population reduction and issues of homelessness. Therefore, promoting housing affordability is a priority in the revitalization of Rockport. Improving build-ing resistance against storm surge, strong winds and flooding, is also important to reduce the risk and prevent losses for future development.
Figure 4.10: Aerial photo of the damage sustained of the Salt Grass Landing ApartmentsSource: Courtney Sacco and Matt Woolbright7

HOUSING | 61
RECOMMENDATIONS
EXPAND HOUSING VARIETY
In order to provide housing for a variety of income levels, the construction of single family homes can be supported by different means. To utilize current land, public infrastructure, and vacant lots efficiently, the language in the existing ordinances should be amended to allow for smaller homes on infill lots and accessory dwelling units. Partnerships with organizations such as Habitat for Humanity, Coastal Bend Disaster Recovery Group and other non-profit and faith-based organizations need to be continued. Additionally, the city can increase housing density in undeveloped or redeveloping areas by providing financial incentives for developers, such as tax abatements and waived permit fees. To assess future employee housing needs and create partnerships for housing developments, the city can reach out to companies that are expanding in communities south of Rockport.
Expanding housing opportunities for low- and middle-income households will strength-en neighborhoods and meet future demands. Said expansions should provide more flexible housing options with small lots, duplexes, and multi-family units. However, in order to accom-plish this flexibility, the city needs to amend its land use and zoning maps, specifically adding inclusionary zoning. Further incentives can be provided to developers in order to encourage the construction of affordable housing units in new developments. Rockport can continue to apply for and prioritize state and federal funding for repairs, rebuilds, and maintenance to workforce and low income housing, in coordination with the Aransas County Long Term Recovery Plan. By partnering with the Texas Department of Housing and Community Affairs (TDHCA) and the Texas State Affordable Housing Corpo-ration (TSAHC), Rockport can also hold public meetings to educate low income residents about homeownership programs (such as My First Texas Home) and home buying tips.
PLAN INTEGRATION
INFILLEncourage potential infill and/or redevelopment tracts [residential, commercial]
Texas Department of Housing and Commu-nity Affairs (TDHCA) is a state agency that is responsible for homeownership, affordable rental housing, community and energy as-sistance programs, and activities in primarily low-income communities.
Texas State Affordable Housing Corporation (TSAHC) gives down payment assistance to homeowners, provides assistance to devel-opers to build affordable housing, and helps prevent foreclosure.
HDMP
PLAN INTEGRATION
HOUSING VARIETYPursue housing in Downtown.
To the extent possible, small scale developments such as duplexes, triplexes, and quad-plexes should be used to replace mobile homes and RV parks that have been used as permanent housing.
LTRP

62 | CHAPTER 4
RESILIENT HOMES, SAFE NEIGHBORHOODS AND ENHANCED COMMUNITY CHARACTER
In light of the impacts of Hurricane Harvey, resilient building standards will be integral to Rockport’s housing plan. A new focus should be placed on educating and encouraging home-owners, contractors, and builders to use stronger building codes, such as the latest International Building Codes. Rockport should continue to partner with Smart Home America’s for Lunch-N-Learns to educate people on FORTIFIED standards as well. Minimum building codes, in-cluding freeboard elevation, need to be enforced during rebuilds, renovations, and new construc-tion. Furthermore, flood mitigation techniques need to be taught to homeowners, specifically to protect their property without adversely affect-ing their neighbors.
The city plans to create new avenues to improve conditions on household and neighborhood levels. By researching and establishing building maintenance codes, the city can provide mini-mum requirements for equipment, light, venti-lation, heating, sanitation and hazard safety. To further improve existing neighborhoods, events like “Neighborhood Makeover” can provide op-portunities for residents, city staff and volunteers to clean up and maintain the overall character of their neighborhoods. Efforts for neighborhood improvements can be coordinated with and conducted through the Aransas County Long Term Recovery Plan.
PLAN INTEGRATION
MITIGATION
The community intends to very actively pursue floodproofing and mitigation for residential and commercial properties.
FORTIFIED STANDARDS8
FORTIFIED is a building method created by the Insurance Institute for Business & Home Safety (IIBHS) that strength-ens homes and businesses against se-vere weather which reduces the risk of property damage and financial loss. These standards are stronger than most building codes and are cost effective, consistent and well-defined. There are three levels to the FORTIFIED standards: Bronze, Silver and Gold
• Bronze Level helps homes withstand wind and keep water out by keeping the roof securely attached.
• Silver Level includes the Bronze Level improvements in addition to strengthening of all openings, win-dows, doors, etc.
• Gold Level adds to Bronze and Silver requirements, ensuring the structure is tied together. It provides a contin-uous load path connections which keeps the roof connected to the walls, walls connected to the floor and the entire home tied to the foun-dation.
Not only do the FORTIFIED Standards protect structures and keep them stand-ing strong, but they also increase the value of homes and businesses. These standards have been scientifically tested and widely accepted on national, state and local levels. It is important to keep in mind that these methods can be applied during new construction or in phases as home- and business-owners remodel their structures.
LTRP

HOUSING | 63
PLAN INTEGRATION
WORKFORCE HOUSINGIncrease supply of permanent workforce and affordable housing.• The existence of an Opportunity Zone south of the downtown area may provide opportuni-
ties for a developer to create more affordable housing options. The Opportunity Zone pro-gram could be used to attract needed investment to the area.
Allowing for Increased Density by Right• The city should consider amending the zoning ordinance in the district to allow for more
residential development near the downtown.• To meet the need for more affordable service worker housing, adjustments to the zoning
code will also be required. Right now, the smallest unit that can be built is 500 square feet. But zoning that would allow smaller micro units could allow for more units/acre.
• Reducing minimum lot sizes of 2,200 square feet per unit could also allow for higher density construction that is more economically efficient for workforce housing developers .
Figure 4.11: Comparison of an elevated home to an unelevated home after Hurricane HarveyPicture Courtesy: Kate de Gennaro
RPAT

64 | CHAPTER 4
CASE STUDY - AFFORDABLE HOUSING : AUSTIN, TX 9,10
The site of the former Robert Mueller Municipal Airport on the east side of Austin has been trans-formed into a sustainably planned community. The vision of the community was to attract busi-nesses, and establish mixed-income housing. Upon the airport’s closure in 1999, the plans began for a new community consisting of a variety of housing, commercial properties and multi-use green spaces. Today, the community has a similar focus of housing affordability, sustainable en-vironment, economic development and community engagement.
The development includes single-family homes as well as apartment complexes to meet the needs of a diverse community. To ensure housing affordability, the development reserves 25% of total units for households below the median family income (MFI) - for sale units are priced for households at or below 80% MFI and rental units are priced for households at or below 60% MFI.
ADDITIONAL HOUSING DEVELOPMENT STRATEGIES
High Density Zoning or Density Bonuses require or encourage developers to include more units within a given area. Increasing density in low risk areas can draw development out of hazardous zones. Increasing density can also increase accessibility in areas where there are community fa-cilities and amenities such as stores, schools, parks, and medical centers.
Inclusionary Zoning or Policies require or encourage a percentage of affordable units within res-idential developments. The developments are commonly made up of multi-family units, but can also be for single-family units. The goal is to provide the same quality of housing and the same amenities to a variety of income levels and to eliminate the stigma associated with segregated “low income” or “affordable” developments.
Accessory Dwelling Units (ADUs) are typically smaller units constructed on lots with a larger primary housing unit, but the accessory unit can also be included in the primary structure. Most zoning ordinances restrict property owners from renting out accessory units. Communities that wish to accommodate more density, affordability, and rental units should include specific lan-guage in their ordinances for ADUs.
Tax Incentives or Abatements are exemptions, reductions, or delays in tax payments for de-velopers. They can be granted when the property is purchased or while it is being developed. The developer benefits financially, but the city specifies how the incentives relate to increasing housing unit density or affordability.

HOUSING | 65
CASE STUDY - COTTAGE HOUSING ORDINANCE: KIRKLAND, WA11
Kirkland is an affluent, lakefront suburb outside Seattle. It is similar to Rockport in that it has a small-town feel and appreciation for quality of life. Changes in demographics and a slowing real estate market have caused cities like Kirkland to come up with ways to increase housing supply and offer residents more housing options. Kirkland’s solution is a Cottage Housing Ordinance which promotes affordable housing by encouraging smaller homes.
Cottage housing is a grouping of small, single-family homes that are clustered around a common area. These homes provide the privacy and benefits of single-family housing along with the low-er cost and maintenance of other housing options. The arrangement of cottages encourages a strong sense of community within the development.
Danielson Grove is featured in the demonstration program and well-received by focus groups, citizens and developers. Danielson Grove is known for its architecture, design and green building standards. The cottages are modestly sized, with one to one-and-a-half stories and 1-3 bedrooms, but the open floor plans and windows cause the interior to look bigger. This development holds 16 homes on private lots and one communal outdoor space. The exteriors of the cottages have distinguishable design features that provide character to the development, but fit in with sur-rounding areas.
To ensure affordability and opportunity for all income levels, a certain number of homes must be economically accessible to households earning 82-100% of the county’s median income. The cottages give first time home-owners, singles and empty-nesters the opportunity to purchase homes when fewer single-family options exist.
Figure 4.12: A view of a cottage housing communitySource: Ericksen Cottages, Bainbridge Island, WA
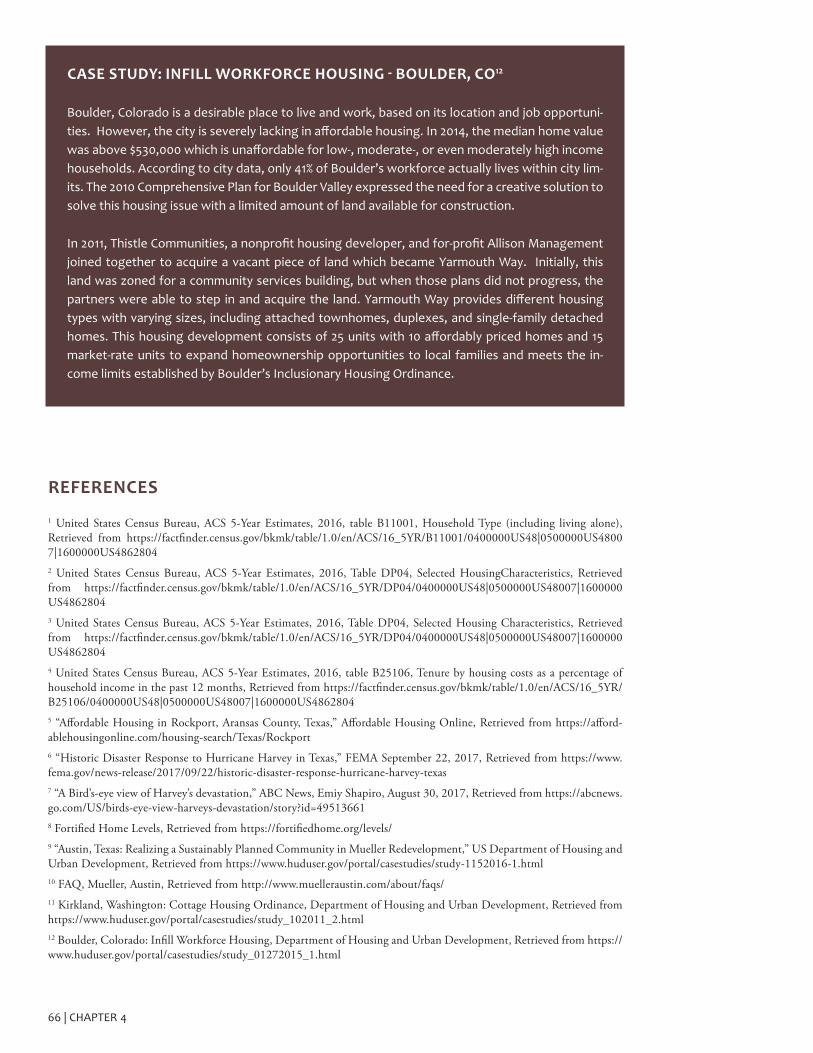
66 | CHAPTER 4
CASE STUDY: INFILL WORKFORCE HOUSING - BOULDER, CO12
Boulder, Colorado is a desirable place to live and work, based on its location and job opportuni-ties. However, the city is severely lacking in affordable housing. In 2014, the median home value was above $530,000 which is unaffordable for low-, moderate-, or even moderately high income households. According to city data, only 41% of Boulder’s workforce actually lives within city lim-its. The 2010 Comprehensive Plan for Boulder Valley expressed the need for a creative solution to solve this housing issue with a limited amount of land available for construction.
In 2011, Thistle Communities, a nonprofit housing developer, and for-profit Allison Management joined together to acquire a vacant piece of land which became Yarmouth Way. Initially, this land was zoned for a community services building, but when those plans did not progress, the partners were able to step in and acquire the land. Yarmouth Way provides different housing types with varying sizes, including attached townhomes, duplexes, and single-family detached homes. This housing development consists of 25 units with 10 affordably priced homes and 15 market-rate units to expand homeownership opportunities to local families and meets the in-come limits established by Boulder’s Inclusionary Housing Ordinance.
REFERENCES
1 United States Census Bureau, ACS 5-Year Estimates, 2016, table B11001, Household Type (including living alone), Retrieved from https://factfinder.census.gov/bkmk/table/1.0/en/ACS/16_5YR/B11001/0400000US48|0500000US48007|1600000US4862804 2 United States Census Bureau, ACS 5-Year Estimates, 2016, Table DP04, Selected HousingCharacteristics, Retrieved from https://factfinder.census.gov/bkmk/table/1.0/en/ACS/16_5YR/DP04/0400000US48|0500000US48007|1600000US4862804 3 United States Census Bureau, ACS 5-Year Estimates, 2016, Table DP04, Selected Housing Characteristics, Retrieved from https://factfinder.census.gov/bkmk/table/1.0/en/ACS/16_5YR/DP04/0400000US48|0500000US48007|1600000US4862804 4 United States Census Bureau, ACS 5-Year Estimates, 2016, table B25106, Tenure by housing costs as a percentage of household income in the past 12 months, Retrieved from https://factfinder.census.gov/bkmk/table/1.0/en/ACS/16_5YR/B25106/0400000US48|0500000US48007|1600000US4862804 5 “Affordable Housing in Rockport, Aransas County, Texas,” Affordable Housing Online, Retrieved from https://afford-ablehousingonline.com/housing-search/Texas/Rockport 6 “Historic Disaster Response to Hurricane Harvey in Texas,” FEMA September 22, 2017, Retrieved from https://www.fema.gov/news-release/2017/09/22/historic-disaster-response-hurricane-harvey-texas 7 “A Bird’s-eye view of Harvey’s devastation,” ABC News, Emiy Shapiro, August 30, 2017, Retrieved from https://abcnews.go.com/US/birds-eye-view-harveys-devastation/story?id=49513661 8 Fortified Home Levels, Retrieved from https://fortifiedhome.org/levels/9 “Austin, Texas: Realizing a Sustainably Planned Community in Mueller Redevelopment,” US Department of Housing and Urban Development, Retrieved from https://www.huduser.gov/portal/casestudies/study-1152016-1.html 10 FAQ, Mueller, Austin, Retrieved from http://www.muelleraustin.com/about/faqs/ 11 Kirkland, Washington: Cottage Housing Ordinance, Department of Housing and Urban Development, Retrieved from https://www.huduser.gov/portal/casestudies/study_102011_2.html 12 Boulder, Colorado: Infill Workforce Housing, Department of Housing and Urban Development, Retrieved from https://www.huduser.gov/portal/casestudies/study_01272015_1.html

TRANSPORTATION5

68 | CHAPTER 5
OVERVIEW
T he City of Rockport encompasses a State Highway (SH) 35 and a county airport. SH 35 passes through the center of the city, carrying the main thoroughfare traffic. Passenger vehicles commuting to Corpus Christi or
Houston compose a large volume of traffic.
While there is heavy auto-dependence, many residents and visitors prefer walk-ing to nearby destinations. The ecotourism industry and environmentally mind-ed setting of the community facil itate multi-modal connectivity. This chapter provides existing transportation conditions along with recommendations to en-hance transportation services for residents and visitors of Rockport. The trans-portation plan focuses on developing a sustainable system by which all modes of travel benefits. The recommendations include strategies for promoting biking, walking, and public transit. This chapter highlights areas of concern, and pres-ents innovative ideas for enhancing the existing conditions.

TRANSPORTATION | 69
The transportation system analysis includes traffic volume and related data analysis, alter-nate modes, and identification of a thorough-fare plan. Studying these elements provides solutions to challenges in the transportation system. This section provides information on annual average daily traffic, crash frequency and severity, the existing thoroughfare plan, and the existing bicycle lanes and sidewalks.
ROADWAY NETWORK
The City of Rockport transportation network encompasses local streets in a grid pattern and major roads used for higher mobility to other parts of the city, as well as commuting to sur-rounding cities. SH 35, FM 2165, and FM 3036 improve mobility throughout the com-munity (see Figure 5.3). There is no clear clas-sification of roads to date. Therefore, the future thoroughfare plan identifies classifications of the roads. The City should follow the standards of these classifications.
MODES OF COMMUTE
Most trips made by Rockport residents are made by automobile, 81.5% of residents drive alone, while 5.2% carpool and 0.4% use motorcycles, bicycles, or other means. In comparison, this indicates a slightly higher percentage of individ-uals to neither Aransas County nor Texas State who drive alone, carpool, or use a taxicab. Com-muters in Rockport have an average travel time of 15.5 minutes.
ANNUAL AVERAGE DAILY TRAFFIC
It is crucial to identify transportation issues to satisfy the needs of the growing community in Rockport. Annual Average Daily Traffic (AADT) data for 2018 was provided by TxDOT. Figure 5.6 shows these traffic volumes. It shows that the traffic volume on SH 35 and part of Busi-ness SH 35 are highest among all roadways in
Figure 5.2: Copano Bay BridgeSource: static.tti.tamu.edu
Figure 5.1: Austin St., Rockport, TxPicture Courtesy: Richard Amore
Rockport. With this relatively high AADT, the major part of SH 35 and part of Business SH 35 from Prairie Road to Corpus Christi Street are critical roads in Rockport. High volume roads always require more maintenance. The north part of SH 35, which is away from the city lim-its, has an AADT of 300 to 600. The south part of Business SH 35 starts from Corpus Christi Street to further south and falls into the 300 to 600 AADT range. Figure 5.6 also shows Market Street, Church Street, and conjunction of SH 35 and Business SH 35 which have 100 to 300 AADT (TxDOT, 2018).
CONDITIONS BEFORE THE STORM

70 | CHAPTER 5
Figure 5.3: Roadways in Rockport

TRANSPORTATION | 71
ROADWAY CLASSIFICATION SYSTEM
The traditional classification model provides a list of design standards and a base from which we can evaluate current conditions and future improvements and expansions. This method has also been adopted by the Texas Department of Transportation (TxDOT), and therefore it is often re-quired when applying for federal grants. The classification is defined by the following hierarchy:
• Principal arterial (freeway and other): Movement-focused (high mobility, limited access)
• Minor arterial: Connects principal arterials (moderate mobility, limited access)
• Collectors: Connects local streets to arterials (moderate mobility, moderate access)
• Local roads and streets: Access-focused (limited mobility, high access)
PRINCIPAL ARTERIAL
The main goal of principal arterial roads is to provide connection between all freeways crossing the County and lower-level roads. Roads classified as principal arterial are characterized by their high traffic volume and speed. They are responsible for carrying a major part of the traffic that enters and exits the County, including special freight.
MINOR ARTERIAL
Minor arterial roads are also responsible for carrying a large portion of traffic and providing con-nection between freeways and lower level roads. Roadways classified in this category are differ-ent from major arterial mostly because they are designed to support local traffic and land access. Yet, due to their high levels of speed and traffic volume, minor arterials should not allow direct access to local neighborhoods and highly dense regions.
MAJOR COLLECTOR
Major collector roadways are responsible for taking traffic from local roads and connecting them to arterial roads. They are supportive of traffic circulation and land access, especially in more rural environments. Hence, major collectors operate at medium speeds and are highly signalized.
MINOR COLLECTOR
Minor collectors provide the same function as major collectors, with more emphasis on access and generally with lower speed levels. Minor collectors are also shorter in length and have inter-sections more closely spaced.
LOCAL ROADS
Local roads are responsible for connecting traffic to their final destination. They offer the lowest level of mobility and provide direct access to adjacent land. Due to their design characteristics, local roads should carry no through traffic movement nor should they be used for bus routes.

72 | CHAPTER 5
Figure 5.4: SH 35 - Principal ArterialSource: Google maps
Figure 5.5: West Market St. - Major Collector-Source: Google maps
Figure 5.6: Rockport AADT Rates

TRANSPORTATION | 73
MEANS OF TRANSPORTATION
Highways
The transportation network in Rockport con-tains one state highway, farm-to-market roads, park roads, and arterials (Figure 5.8). State Highway 35 runs along the center of the city—it also serves as the main collector of traffic. On the north section of Rockport, the state highway becomes a bridge that connects the Live Oak Peninsula to the Lamar Peninsula.
Railroads
There are no railroads that pass directly through the City of Rockport. However, a branch of the Union Pacific Railroad passes through Aransas Pass, just beyond the south of the Rockport city limits.
Airports
The City of Rockport contains one airport with-in its city limits. The following airports are avail-able to Rockport residents (Figure 5.9):
• Aransas County Airport: a public and gen-eral aviation airport. Located on the north-side of Rockport, approximately 12-minute drive away from the center of Rockport.
• Corpus Christi International Airport: com-mercial service, primary, and non-hub air-port located in Corpus Christi. Approxi-mately 40-minute drive from Rockport.
• Kalt Ranch Airport: private use airport. Ap-proximately 24-minute drive from the cen-ter of Rockport.
• Hunt Airport: Privately owned, public use airport in Portland. Approximately 29-min-ute drive from Rockport.
• Mustang Beach Airport: city-operated facil-ity located in Port Aransas. Approximately 54-minute drive from Rockport.
• McCampbell-Porter Airport: coun-ty-owned, public use airport in Ingleside. Approximately 20-minute drive from Rock-port.
Sea Ports
The City of Rockport has two harbors: Rock-port Harbor-located near Downtown Rock-port, and Cove Harbor. The Rockport Harbor offers public restroom facilities, private transit, laundry facilities, numerous hotels/motels, and restaurants within walking distance. The harbor offers other attractions such as the Aquarium at Rockport Harbor, Maritime Museum, Rockport Center for the Arts, Rockport/Fulton Chamber of Commerce, and Women’s Club of Rockport.2
Cove Harbor offers restroom facilities, cleaning stations, reclamation station and boat ramps. It is located on the south of the city and the banks of Aransas Bay.
CRASH FREQUENCY
This analysis investigates the number of crashes in Rockport from 2015 to 2018. The Texas De-partment of Transportation (TxDOT) collects data every year on crash rates. Between 2015 and 2018, Rockport experienced, on average, 165.25 crashes on its roadways. In comparison to the neighboring cities, Fulton had an aver-age of 17 crashes, Corpus Christi had 7,470.25, and Aransas Pass had 134. Corpus Christi is much bigger with a higher population and vis-itor rate, so it is expected that there would be more crashes. Figure 5.7 “heatmap” identifies six different colors: white, yellow, orange, red, purple, and blue. White represents no crashes during that time period and the blue areas rep-resent the highest crash frequency in the city. The north part of Business SH 35, intersection of N. Pearl Street and E. Liberty Street in the downtown area and the turning point of SH 35, which intersects with FM 3036 have relatively higher number of crashes in Rockport. The fre-quency of the crashes is correlated with volumes and the complexity of the geometric characteris-tics of the roads. However, further analysis that considers the severity of the crash, the number of crashes per million vehicles and comparison with other similar intersections is required.1

74 | CHAPTER 5
Figure 5.7: Crash Frequency Heatmap

TRANSPORTATION | 75
Figure 5.8: Transportation Map of the City
Figure 5.9: Airports near Rockport

76 | CHAPTER 5
PUBLIC TRANSIT SYSTEMS
The City of Rockport does not possess its own public transportation system. However, the fol-lowing services are available through adjacent municipalities, Aransas County, and the Region:
• Fulton Trolley: Air-conditioned trolley that visits local businesses in the Town of Fulton and Downtown Rockport.
• Valley Transit Bus: full-service bus company serving South Central Texas and Northern Mexico with more than 50 daily schedules, as well as connections to nationwide travel on Greyhound Lines. This bus line makes two stops per day in Rockport, once in the North and once in the South.
• Jordan & Jordan Bus Charters: Charter Bus Company. Provides itineraries, travelers in-surance, and tours to its customers.
• Aransas County Public Transportation: A local curb-to-curb service within the Rock-port-Fulton area to Corpus Christi and Portland. Services are available to the public from 8am – 5pm Monday through Friday.
• Taxi Companies: Gulf Coast Taxi & Shut-tle Service and City Cab (24-hour) provide service in Rockport and surrounding areas.
Regionally Coordinated Transportation Plan
The Regionally Coordinated Transportation Plan for The Coastal Bend (RCTPTCB) was ap-proved on February 15, 2017 by the stakeholder steering committee of the planning region 20. The plan aims at collaborating effort involving dozens of stakeholders from all 11 counties of the Coastal Bend. The participating counties
comprise Aransas, Bee, Brooks, Duval, Jim Wells, Kennedy, Kleberg, Live Oak, Nueces, Re-fugio, and San Patricio. The plan provides a de-tailed analysis of resources, needs, gaps, explores integration with other plans, identifies methods for sustaining implementation, provides vision, goals, and objects and concludes with ongoing performance measurements.3 The plan’s mission statement is “equal access to public transporta-tion”.4
The goals for the RCTPTCB for improving equal access are:1. Establish and maintain strategic, efficient,
and integrated transportation services.2. Provide a variety of transportation services
to improve mobility and options for riders.3. Pursue long-term financial resources to pro-
vide affordable transportation services.4. Extend operating hours and days of the
week.5. Improve public awareness of available ser-
vices.6. Coordinate for residents’ mobility needs to
destinations outside the region.
Transportation for Health Services
Rural Economic Assistance League (R.E.A.L) is a non-profit organization with a mission to provide safe, caring, and quality communi-ty-centered services for the elderly, people with disabilities, and the public. It serves 11 southern counties in Texas, including Aransas, and pro-vides transportation services to people who need medical related visits, day-care, job interviews, and child care.5

TRANSPORTATION | 77
PUBLIC FEEDBACK
Access to safe and affordable transportation is important to the success of a city. While many people commute via their own vehicles, there is also a need for public transportation to fre-quently accessed places. Feedback shows the public’s desire to have more options for trans-portation and connections between parking and walkways.
Accessible public transportation is important for handicapped residents and visitors to medical facilities as well as parks and shops. There is a specific need for transport to and from medical facilities between Rockport and Corpus Christi; residents recommend a bus line between Rock-port and Corpus Christi for medical services.
Safety is of prime focus for the transportation system of Rockport. Residents desire connected parking with walkways and areas where kids can safely bike, blade, and skateboard.
CHALLENGES
This section explores the challenges raised by residents and the task force members. To in-crease safety of motorists, task force members identified the intersections and nodes with high-er perceived risks. In Figure 5.12, these spots are identified, further explanation is provided in Ta-ble 5.1. For many of these nodes, a proper road design is a potential solution. The intersection of FM 3036 with SH 35 is one candidate for road design improvements and alignment.
Figure 5.10: North Wood Street
Table 5.1: Description of risk areas identified by the community
Figure 5.11: Eighteenth Street
ID Description Suggestion1 Hazardous traffic
nodeRoundabout
2 Unclear and haz-ardous node
Traffic control de-vices and improved road design
3 Turning left and right is hazardous
Traffic control device
4 Hazardous for cyclists and pe-destrians
Traffic control device
5 Hazardous traffic node
Improved road alignment
6 Hazardous traffic node
Traffic control de-vice or roundabout
7 Confusing node Traffic control de-vice or roundabout
8 Intersection of SH 35 with Bypass road is hazardous
Traffic control device
9 Hazardous inter-section
Traffic control device
10 Quality of an-nexed road
Maintenance
11 Design Issue Traffic control de-vices and improved road design

78 | CHAPTER 5
Figure 5.12: Community Identified High Risk Traffic Nodes

TRANSPORTATION | 79
RECOMMENDATIONS
With the population projected to increase by only approximately 240 persons by 2050, the traffic volume is expected to remain about the same. In compliance with public demand and the desired future, the plan recommends thor-oughfare plan, expansion of sidewalks and bicy-cle routes, and a regional approach to serve the public transportation needs of the community.
SAFE AND EFFICIENT ROADWAY NETWORK
To maintain and enhance public safety, Rock-port needs to redesign critical roads and inter-sections to mitigate geometric and operational improvements. The City should maintain reg-ular communication with TxDOT, the county transportation agencies and local transportation stakeholders to update project needs and prog-ress.
In areas of the city where crash severity is high, speed, traffic, and crash studies need to be con-ducted to analyze traffic flow, issues, and pro-mote the safety of travelers. Some things to im-plement near residential areas and community facilities are low-speed zones, speed bumps, chicanes, and diversions. Additionally, the city needs to provide adequate lighting, visibility, and wayfinding signage along major thorough-fares adjacent to commercial developments and public facilities. To ensure quality and standard of the roads that get annexed, the City needs to coordinate street design standards with the County. Functional classification of roads need to be updated based on the future thoroughfare plan.
FUTURE THOROUGHFARE PLAN
Thoroughfare planning plays a crucial role in public safety since it defines standards for road width, sidewalks, bicycle paths, and speed. It includes functional classification of roads. The TxDOT functional classification of roads shows how different routes contrib-ute to mobility and accessibility. The thor-oughfare plan for Rockport encompasses mi-nor arterial, major collector, minor collector, and local roads. The arterial roads provides good mobility and is expected to have a good level of service. Collectors and local routes improve accessibility to publicly-used areas. Shared lanes and sidewalks cannot be a part of arterial roads. Collectors need moderate rate of movement and accessibility. Adopting a multi- modal connection helps to reduce the traffic volume. Similarly, local roads need lower speed limits and adequate side-walk space. Figure 5.16 shows the recommended thoroughfare plan in Rockport based on the TxDOT statewide planning map. SH 35 and Business SH 35 are two minor arterials. Market Street, Pearl Street, Church Street, FM 1069, SH-188, and a few others are ma-jor collectors. 12th Street, 10th Street, and a few others are classified as minor collectors.
All the improvements to the existing roads and new construction should ensure multi-modal connectivity. Figure 5.15, 5.16, 5.17. illustrate the cross sections required for road-way based on its functional classification of minor arterial and major and minor collec-tor.

80 | CHAPTER 5
Figure 5.14: Proposed Thoroughfare plan

TRANSPORTATION | 81
MAINTENANCE AND NETWORK INVENTORY
The City of Rockport should continue updat-ing and utilizing its road maintenance schedule. The schedule should have an annually updated inventory of all the existing transportation fa-cilities including, travelway, roadside, shoulders, sidewalks, bike lanes, drainage facilities, light-ing, and traffic control devices. Funds need to be budgeted to continue updating and implement-ing the street maintenance schedule for con-ducting repairs and rehabilitation of roadways.
Figure 5.15: Minor Arterial Cross Section
Figure 5.16: Major Collector Cross Section
Figure 5.17: Minor Collector Cross Section
Historically, the city has worked with the city engineer to rate the streets in three catego-ries based on needs for maintenance, repair and reconstruction. Streets with base failure require a cost benefit analysis to determine reconstruction needs.
The existing maintenance schedule can be expanded further by documenting the in-formation collected about roads and other

82 | CHAPTER 5
Table 5.2: Format for Road Evaluation
Road Name
Functional Class
Paving Materials
Length
(ft.)
Width
(ft.)
Area
(Sq. ft)
Ownership Estimated Repair
Cost ($)
Total Main-tenance Cost ($)
Name Minor Arterial
Asphalt 100 10 1000.0 TxDOT 0.0 0.0
Facility Name Location Current Condition Estimated Repair Cost
Total Maintenance Cost
Road Sign Intersection of FM3036
Left turn sign needs repair
0.0 0.0
Table 5.3: Format for Road Evaluation
Material Estimated Cost Pros Cons Cost SourceAsphalt Paving
$3-$4 per sq.ft($3.5/sq. ft can be used)
• Even Surface• Long Lifespan• Sleek Appear-
ance• Lasts 12-35 years
• Needs frequent seal coating to prevent cracks and pot holes
• Costly• Requires maintenance
once in every 2-5 years• Cracks and holes
should be repaired as soon as possible
• Gets damaged during extreme hot condi-tions
https://www.homeadvisor.com/cost/outdoor-liv-ing/install-as-phalt-paving/
Chip Seal Pavement
$15,000 per mile($2.84 per sq.ft can be used)
• Best alternative for asphalt
• Rapid install-ment
• Relatively dura-ble
• Easy mainte-nance
• Competitive pricing
• Forms ruts and sink holes
• Hard to maintain the appearance and smoothness
• Creates lightweight dust, debris and dirt which can be carried by air flow
• Neighborhood needs frequent cleaning to remove dust
• Not very feasible for bicycle riding and walking
https://www.homeadvisor.com/cost/outdoor
Table 5.4: Sample Estimated Cost and Characteristics of Materials
facilities in the format of Table 5.2 and Table 5.3 respectively. Based on the existing condi-tion and available funding, the priority of the maintenance schedule and the method to per-form the maintenance can be chosen. Table 5.4 shows sample estimated costs and characteristics
for selected materials. This type of data can in-form maintenance decisions. Further, the City can use the travel way, roadside and traffic con-trol and Intelligent Transportation System (ITS) devices maintenance categories shown in Table 5.5, Table 5.6 and Table 5.7 respectively.

TRANSPORTATION | 83
Table 5.5: Travel Way Maintenance Categories
Table 5.6: Roadside Maintenance Categories
Routine Maintenance Preventive Maintenance Major MaintenancePavement related work involv-ing restoration of pavement serviceability which involves re-condition, rebuild, level up and overlay of the pavement sur-face. This includes, but not lim-ited to; pavement repair, crack seal, bituminous level ups with light overlays to restore rideabil-ity (Overlays not to exveed total average depth of 2”), addition-al base to restore ridability and seal costs.
Pavement related work per-formed to prevent major dete-rioration of the pavement. Work normally includes, but not llimit-ed to bituminous level ups to re-store rideabililty, light overlays (Overlays not to exceed total average depth of 2”) seal coats, crack sealing, and micro-surfac-ing. Preparatory works Milling, repairs or level-ups may also be performed under preventive maintenance.
Pavement related work to strengthen the pavement for existing and future traffic. Work includes restoration of pave-ment serviceability of roadway. This includes but is not limited to: recondition and stabilize base and subgrade, add base, level up, overlays and seal coats. Pavement widening can be con-sidered as major maintenance if its performed to solve a mainte-nance issue.
Routine MaintenancePreventive Mainte-
nanceMajor Mainte-
nanceAll work to maintain sides of roadway including but not limited to: maintenance and operation of picnic spots, rest areas, removal of litter, mowing, trees, and bush trimming, repair and upgrade guard rails and extrude terminals, re-pair slides and side slopes, placing topsoil, sod, shrubs, etc., to re-establish proper grade and vegetative cover, landscaping, removal or treatment of roadside hazards, installation and maintenance of environmental protection devices, and mitigation of spills/ hazardous materials.
None None
Table 5.7: Traffic Control ITS Devices Maintenance
Routine Maintenance Preventive Maintenance Major MaintenanceInstallation, repair and replace-ment of signs, delineators, illu-mination, signals, and related appurternances; installation and replacement of stripping, pave-ment graphics, raised pavement markings rumble strips; mainte-nance of traffic control cabinets and the corresponding appurte-nances.
Replacement of raised pave-ment markings, pavement graphics, striping, and rumble strips may be performed in con-junction with a resurfacing oper-ation.
Installation of new signal sys-tems to upgrade outdated sig-nal designs.

84 | CHAPTER 5
Complete Street policies are one way for the city to ensure safe access to alternate modes of transportation. Residents of Rockport requested for safer sidewalks and bicycle routes for seniors and children. Rockport should look into grants that fund sidewalks and other multi-modal transportation paths such as the TxDOT Safe Route to School grant. Further, the city should require developers to build sidewalks as part of new development.
The city should ensure that the multimodal net-work is maintained by annually updating the maintenance schedule. Appropriate signage and painted lines on the roadways can help assist travelers and pedestrians and reduce conflicts. Provision of adequate sidewalks and crosswalks improves pedestrian mobility and safety. Figure 5.18 shows the recommended sidewalks that connect downtown to other activity centers and publicly-used facilities in the community.
COMPLETE STREETS
Complete Streets are designed to ensure the safety and convenience for residents and visitors of all ages and abilities. The provision of sidewalks, crosswalks, and bike paths are part of Complete Street policies. According to the 2010 Future of Transportation National Survey, 66% of Americans want more transportation op-tions because they want the freedom to choose how they get around. These proj-ects do not have to be accomplished all at once, but they can be accomplished along with routine maintenance.
Complete Streets help ensure the safety and accessibility of those who no longer drive and rely on the opportunity to walk or bike to their destinations safely. Due to the higher percentage of aging popu-lations in Rockport, it is important for the city to provide adequate sidewalks and secured bike lanes. According to surveys, 47% of older Americans feel it is unsafe for them to cross major streets near their home. Complete Street policies ensure that streets are planned, designed, con-structed, and maintained to provide safe and convenient access.
HIKE AND BIKE PATHS
For a popular tourist destination like Rockport, tourists might rely on bikes to reach their desti-nations. In such cases, providing more bicycle paths is beneficial to visitors as well as residents, resulting in a more accessibility and safety. To expand the hiking and biking facilities in Rock-port, the city should work with Aransas Path-ways and other partners to develop a hiking and biking trail master plan. Aransas Pathways has identified different levels of easements for pe-destrians and cyclists.The trails and bicycle paths should be developed with adequate signage. The recommended bicycle paths are according to the public feedback and the existing paths as iden-tified by the Aransas Pathways (Figure 5.19). Rockport residents also expressed the desire to expand the golf cart usage. However, golf carts can only be used in areas permitted by the state law and city ordinance.
ECOTOURISM
The thriving ecotourism industry of Rock-port demands a multi-modal transpor-tation network. Therefore, more bike routes, bus stops, sidewalks and golf cart routes fulfill residents’ and visitors’ desires. Having multi-modal connectivity will increase accessibility to public spaces as well as promoting equity in serving the community. This improvement can invite more visitors to the city and increase rev-enues.
COMPLETE STREET POLICIES IN THE MULTI-MODAL NETWORK

TRANSPORTATION | 85
Figure 5.18: Recommended Sidewalks

86 | CHAPTER 5
Figure 5.19: Recommended Bicycle Paths

TRANSPORTATION | 87
REQUIREMENTS OF OPERATING GOLF CARTS AND NEV - CITY ORDINANCE ARTICLE VI
Golf carts and neighborhood electric vehicles (NEV) are permitted within city limits, but drivers must be aware of certain laws and restrictions in order to ensure the safety of drivers and pedes-trians. Drivers of golf carts and NEVs must comply with state and local laws.
Permitted areas of operation within city limits are in master planned communities and neighbor-hoods, public or private beaches, and roadways for which the speed limit does not exceed 35 miles per hour. Golf carts and NEVs are only permitted for use during the daytime and not more than two miles from the location it is usually parked and for transportation to or from a golf course.
Operation of these slower moving vehicles are prohibited on the State Highway System including Farm to Market Roads, regardless of the speed limit. Additionally, golf carts and NEVs are not to be driven on sidewalks or hike and bike trails within the corporate boundaries of the city.
The city has set up certain requirements for the operation of these vehicles. Golf carts and NEVs are subject to yearly state inspection, like any other motor vehicle, and the inspection sticker must be attached to the rear of the vehicle. As with any other motor vehicle, operators must be covered by insurance and have a valid driver’s licence. The city added additional requirements to ensure safety. The vehicle must have:• Headlamps• Tail lamps• Reflectors• Parking brake• Mirrors• Turn signals• A “slow moving vehicle” reflective triangle attached to the rear• Seat belts• A flag on a six-foot pole attached to the rear of the vehicle• All equipment must be verified and inspected by the Rockport Police Department
These requirements and expectations have been implemented to ensure public safety and create an accessible environment for all residents and visitors.

88 | CHAPTER 5
REGIONAL TRANSPORTATION AUTHORITY (RTA)
The RTA provides transportation services for Corpus Christi and the surrounding areas of Rob-stown/Calallen, Downtown/North Beach, and Flour Bluff/Padre Island on the “B”. The Corpus Christi RTA will soon provide transportation for residents in Aransas Pass and Ingleside to their workplaces in Port Aransas. The new stops will be located near HEB stores in Aransas Pass and Ingleside and will cost just 75 cents to ride the “B”.
CASE STUDY - SHARED-USE STREETS: 2ND STREET - LONG BEACH, CA6
Long Beach is a coastal city in Southern California. It is a popular tourist destination due to its proximity to the ocean and access to restaurants and other amenities. 2nd Street is a Major Ar-terial street for the city, specifically the Belmont Shore. In the past, cyclists rode their bikes on the sidewalks rather than in the street because this street lacked the space for an adequate bike lane. 2nd Street was a four-lane roadway divided by a median with parking lanes along the curbs. In 2009, as part of the Bike Long Beach project, the City began plans for implementing sharrow bicycle markings in the outer travel lanes to increase accessibility and safety for cyclists and draw attention to drivers. After the three day construction, they saw a steady increase in cyclist use of the shared lanes.
During a three-day 2010 Usage Report, they reported an increase of over 400 more cyclists using the green lanes and a decrease of over 100 cyclists using the sidewalks. In the first 12 months af-ter the green lanes’ inception, the facility usage doubled. However, studies have found that the increased cyclists have not caused increased traffic congestion.
The implementation of the green lanes, “Bikes in Lane” signs, and decorative bike racks have encouraged more cyclists to commute in this area due to cyclist awareness and safety. It is im-portant to recognize the key benefits of this street. Local businesses have reported that they have seen an increase in consumers coming by bicycle after implementation of the shared lanes. Additionally, the increase in cyclists will provide for a healthier environment and community.
PUBLIC TRANSPORTATION
During community meetings, residents raised the need for public transportation to improve accessibility. The City of Rockport should evalu-ate a more robust, regional approach to serve the public transportation needs of the community. To encourage visitors and residents to use alter-native travel modes, Rockport should work with Fulton to fully implement the trolley service.
The task force members have identified bus routes close to publicly used centers such as churches, schools, downtown, and some com-mercial uses, which can be implemented in the future. The recommended timeline for imple-mentation of public transportation is by 10 to 15 years. Figure 5.20 represents the suggested bus route.

TRANSPORTATION | 89
Figure 5.20: Suggested Bus Routes

90 | CHAPTER 5
TRANSPORTATION DEMAND MANAGEMENT
Transportation demand management (TDM) is a set of strategies to encourage residents to use all the transportation options to maximize trav-eler choices. TDM strategies include providing information and incentives to increase rideshar-ing, walking, and biking. The city should con-sider encouraging ride-sharing programs, and providing informational resources on the city website and through other marketing materials.
PLAN INTEGRATION
SIDEWALKS, BIKE LANES, AND PEDESTRIAN SAFETYSidewalks are the most fundamental element of the walking network. They provide a dedicated space for pedestrian travel that is safe, comfortable, and accessible. The team recommends im-proving and expanding sidewalks in downtown Rockport including:
• Austin Street: Expand and fill in the gaps of sidewalks north along Austin Street along the east and west side of the street, fronting Veteran’s Park, connecting to the former HEB gro-cery site, and to the Rockport-Fulton Chamber of Commerce.
• East Concho Street: Expand sidewalks along both sides of the street to connect to the future city hall and courthouse site (downtown anchor site) to Austin Street.
• Veterans Memorial Drive/Seabreeze Drive: Expand and fill in the voids for sidewalks along both sides of the street, connect the Chamber, Veterans Park, the Festival Grounds, and Rockport Beach to Austin Street and downtown.
• Bike Lanes: Provide on-street bicycle lanes along Austin Street connecting to the Festival Grounds, Veterans Park, Rockport Beach, and to the Aransas Pathways biking trails.
Rockport may want to consider a bike sharing program to encourage the use of bike lanes, de-crease motor vehicle traffic, and provide more recreation options. Many different models exist. The city should conduct research to select the appropriate model and company.
• Conduct a pedestrian/bicycle plan (scoping study) for Austin Street and Downtown Rock-port to identify gaps, destinations, alignments, and costs of the bicycle and pedestrian infra-structure improvements.
• Systematically construct sidewalks and bike lanes along Austin Street, first filling in the gaps, and then expanding sidewalks and bike lanes to connect downtown to the beach and city hall/courthouse property.
TRAFFIC CALMING AND INTERSECTION IMPROVEMENTS• Restripe crosswalk stripes on Austin Street to improve visibility of crosswalk. Add public art
murals on crosswalks.
• Implement intersection improvements, including crosswalk treatments, improved bulb-outs, including brick pavers/stamped concrete, raised intersections, street trees, and light-ing. Intersection and crosswalk improvements should be made in close coordination with new public or private development (i.e. the opening of the Arts Center).
To minimize excessive traffic and allow more consumer parking availability, incentivize busi-nesses to encourage employees to use alternative transportation options. Rockport can develop recommended shared-lanes to promote pub-lic accessibility and provide a more convenient connection to Fulton. The city should consider learning about initiating quarterly bicycle and pedestrian counts, using the National Bicycle and Pedestrian Documentation project method-ology to assist with planning improvements and inform funding requests.
RPAT

TRANSPORTATION | 91
PLAN INTEGRATION
STREET TREES AND LANDSCAPING• Develop a Tree Master Plan to use as a framework to help guide tree planting within public
and private property. A tree inventory of the community would be a useful project to begin the master plan effort.
• Provide strategic tree plantings along Austin Street, at key intersections, on vacant lots, and along the streetscape to provide shade, visual appeal, and help capture stormwater. Plant-ing trees downtown is possible through using urban forestry best practices and close coordi-nation with underground utilities and Rockport’s public works department.
The city should consult an arborist or other landscaping professional to understand tree and plant selection that helps reduce the need for and costs of maintenance.
IMPROVE LIGHTING DOWNTOWN• Encourage (and financially support/incentivize) businesses to leave porch/facade lights and
window display lights on in the evening hours.
• Provide mini-grants to businesses to add building facade and awning lighting to illuminate the sidewalks at night.
• Incorporate pedestrian scale lighting into future streetscape engineering and design plans along the Austin Street corridor.
• Construct pedestrian scale lighting along the east and west sides of Austin Street along the sidewalks connecting to Veterans Memorial Park and Market Street.
RESILIENCE AND GREEN STREETS• Develop a Tree Master Plan and GI Plan to use as a framework to help guide tree planting
within public and private property.
• Retrofit bulb-outs and provide strategic live oak tree plantings along Austin Street, at key intersections, on vacant lots, and along the streetscape to provide shade, visual appeal, and help absorb stormwater.
RPAT

92 | CHAPTER 5
REFERENCES
1 Texas Department of Transportation, Crash Statistics, 2014-2018, Retrieved from http://ftp.dot.state.tx.us/pub/txdot-in-fo/trf/crash_statistics/2015/14.pdf, http://ftp.dot.state.tx.us/pub/txdot-info/trf/crash_statistics/2016/14.pdf, http://ftp.dot.state.tx.us/pub/txdot-info/trf/crash_statistics/2017/14.pdf, http://ftp.dot.state.tx.us/pub/txdot-info/trf/crash_statis-tics/2018/14.pdf 2 “Rockport Harbor”. Aransas County Navigation District. Retrieved from http://www.acnd.org/facilities/har-bors-rates/2-uncategorised/13-rkpt-hbr-rates3 “Regionally Coordinated Transportation Plan for the Coastal Bend 2017-2021”. Transportation Coordination Network of the Coastal Bend, Feb. 15. 2017. Retrieved from https://www.ccrta.org/wpcontent/uploads/2017/03/Final-CB-Region-ally-Coordinated-Plan-2017-20211.pdf 4 “Regionally Coordinated Transportation Plan for the Coastal Bend 2017-2021”. Transportation Coordination Network of the Coastal Bend, Feb. 15. 2017. Retrieved from https://www.ccrta.org/wpcontent/uploads/2017/03/Final-CB-Region-ally-Coordinated-Plan-2017-20211.pdf 5 “Rural Economic Assistance League Inc.” Retrieved from: http://realinc.org/ 6 City of Long Beach, Dept. of Public Works, Roadway Improvements, Retrieved From https://nacto.org/wp-content/uploads/2011/02/SecondStreetSharrowsandGreenLane_sharedlanemarking_longbeach.pdf

6 ECONOMY

94 | CHAPTER 6
OVERVIEW
C ollectively speaking, Rockport’s economy took a big hit due to Hurricane Harvey. However, the economy is recovering with a promising future for development. Economic development should capitalize on the city’s
historic strengths and cultural identity, including tourism and the arts. The local government plays an important role in attracting business investments, maintaining and expanding the city’s labor force, and helping the local economy thrive.
This chapter begins with the economic characteristics of the city in relation to the county and state, in order to get a better understanding of the conditions before Hurricane Harvey. The economic analysis describes local industries, employment, and income. The impacts of the hurricane and current conditions will also be addressed. Finally, recommendations will be presented to support the future economy of Rockport.
CONDITIONS BEFORE THE STORM
ECONOMIC GROWTH
The city experienced significant economic growth over the last decade. From 2005 to 2015, the number of jobs in Rockport increased 45.18%, from 2,853 to 4,143. This growth rate is slightly higher than both Aransas County (33.23%) and Texas (25.62%).

ECONOMY | 95
Figure 6.1: Local Business in Downtown Rockport.Picture Courtesy: Emily Tedford
Figure 6.2: Local Business in Rockport. Picture Courtesy: Emily Tedford
From 2005 to 2015, the fastest growing industries were:
1. Educational Services with 261 added jobs and a 3.2% increase in the employment share;
2. Mining, Quarrying, and Oil and Gas Extraction with 206 added jobs and a 3.6% increase in the employment share; and
3. Health Care and Social Assistance, with 141 added jobs but no change in the employment share.
Meanwhile, Rockport lost 15 jobs in Wholesale Trade, with a 0.4% decrease in the employment share, and lost 12 jobs in Transportation and Warehousing, with a 0.6% decrease in the employment share. The overall change in the number of jobs indicates that the economy in Rockport generally grew from 2005 to 2015. Table 6.1 shows changes in total number of jobs in Rockport from 2005 to 2015.
NAIC Industry Sector 2015 2005Absolute Change
Educational Services 546 285 261Mining, Quarrying, and Oil and Gas Extraction 332 126 206Health Care and Social Assistance 455 314 141Other Services (excluding Public Administration) 219 96 123Public Administration 268 156 112Accomodation and Food Services 710 598 112Professional, Scientific, and Technical Services 216 134 82Retail Trade 683 614 69Arts, Entertainment, and Recreation 124 65 59Administration & Support, Waste Management & Remediation 95 48 47Agriculture, Forestry, Fishing and Hunting 27 0 27Information 60 34 26Manufacturing 65 40 25Finance and Insurance 122 102 20Real Estate and Rental and Leasing 75 59 16Construction 123 122 1Management of Companies and Enterprises 0 0 0Utilities 0 11 -11Transportation and Warehousing 12 24 -12Wholesale Trade 10 25 -15Total 4,142 2,853 1,289
Table 6.1: Total Number of Jobs by Industry in Rockport, 2005-2015
Source: OnTheMap Application, 2005, 2015

96 | CHAPTER 6
Table 6.2: Income Overview in Rockport, Aransas County, Texas, and the United States, 2015
Source: U.S. Census Bureau, 2015, Table DP03
HOUSEHOLD INCOME
In 2015, the median household income in Rockport was $47,865 per year 73, a 7.6% increase from $44,487 per year in 2010. The median household income in Rockport is lower than Texas ($53,207), and the U.S. ($53,889) but higher than the median household income of Aransas County ($41,690). Table 6.2 compares family, household, and per capita incomes between Rockport, Aransas County, Texas, and the United States.
Rockport Aransas County Texas United
States
Median Family Income
59,098 51,267 62,717 66,011
Median Household Income
47,865 41,690 53,207 53,889
Per Capita Income
26,776 28,472 26,999 28,930
UNEMPLOYMENT AND LABOR FORCE
In 2015, 46.6% (3,731) of the 8,006 Rockport residents 16 years and older were not in the labor force, yet most of these residents are of retirement age. This number is about 10% higher than the county (35.06%), state (35.27%), and nation (36.35%). Figure 6.3 shows the employment status for residents 16 years and older for Rockport in 2015.
The unemployment rate is defined as the share of the population 16 and over in the civilian labor force who are jobless. In 2015, Rockport had an unemployment rate of 6.4%, which is slightly lower than Aransas County, Texas, and the nation. Figure 6.3 compares employment statistics of individuals over 16 in the civilian labor force for Rockport, Aransas County, Texas, and the United States.
MAJOR EMPLOYERS AND INDUSTRIES
The top ten major employers, having the highest number of employees, in the Rockport-Fulton area include the Aransas County School District, retail stores (Walmart and H.E.B), government entities (the City of Rockport, Aransas County, and the State of Texas), the medical services industry (including Care Regional Medical Center, Gulf Pointe Plaza), and Wood Group (an oilfield/industrial company). Table 6.3 shows major employers in Rockport-Fulton area.
Figure 6.3: Employment Status (Population 15 years and Older in Labor Force)Source: U.S. Census Bureau, 2015, Table DP03
Employer Industry Employees
Aransas County I.S.D. Education 521
Walmart Retail 250Care Regional Medical Center* Hospital 210
H.E.B. Retail Grocer 185Wood Group Production Services*
Oilfield & Industrial 181
Aransas County Government 175City of Rockport Government 130State of Texas Government 107Gulf Pointe Plaza Health Service 93Rockport Coastal Care Center Health Service 75
Table 6.3: Major Employers in the Rockport-Fulton Areas
Source: Rockport-Fulton Chamber of Commerce

ECONOMY | 97
In 2015, 4,142 people held a primary job in Rockport. The industry sectors with the largest absolute number of employees were:
• Accommodation and Food Services with 710 employees (17.1% of total jobs),
• Retail Trade with 683 employees (16.5% of total jobs),
• Educational Services with 546 employees (13.2% of total jobs), and
• Health Care and Social Assistance with 455 (11% of the total jobs).
The National Oceanic and Atmospheric Administration (NOAA) generates economic reports for coastal counties throughout the United States. The data focuses on six economic sectors that are dependent upon oceans, the Gulf of Mexico, or the Great Lakes, depending on where the counties are located. NOAA calls this “Ocean Economy,” and the six economic sectors which are: living resources, marine construction, ship and boat building, marine transportation, offshore mineral extraction, and tourism and recreation. The ocean-related industry is significant in Rockport, providing 24% of the total share of economy and 1,539 job positions.
Employment share by industry offers an efficient way to identify local economy drivers. It provides insight into the region’s workforce, the strengths and weaknesses of the local economy, and potential available job opportunities.
Rockport has a higher share of workers than both Aransas County and Texas in the following industries:
• Accommodation and Food Services,• Mining, Quarrying, and Oil and Gas
Extraction• Retail Trade
On the other hand, Rockport has less employment share in:
• Administration Support, Waste Management, and Remediation
• Construction• Professional, Scientific, and Technical
Services• Transportation and Warehousing• Wholesale Trade
Figure 6.4 shows the employment share of North American Industry Classification System (NAICS) industry sectors in Rockport, Aransas County, and the State of Texas in 2015.
ECOTOURISM
Ecotourism, as defined by Megan Epler Wood, the co-founder of The International Ecotourism Society, is “responsible travel to natural areas that conserves the environment and improves the well-being of local people.”1 Ecotourism is not simply a visitor enjoying activities related to the natural environment; the activities must make a positive impact on both the ecology and economy of a given destination.
Although Rockport has fostered the conservation and protection of its natural resources, these actions are becoming even more fundamental in the city’s ability to remain eco-friendly and sustain its economic development. Because of Rockport’s coastal location and moderate climate, there are many year-round opportunities for sport fishing, kayaking, bird-watching, hiking, and camping for visitors and residents alike. Not only can these ecotourism activities help the environment through education (as discussed in the following chapter), they also provide economic benefits to Rockport’s citizens. These benefits are affiliated with job opportunities and complementary businesses, such as restaurants, hotels, and stores.

98 | CHAPTER 6
Figure 6.4: NAICS Industry Sectors by Employment Share in Rockport, Aransas County, and Texas, 2015Source: OnTheMap Application, 2015

ECONOMY | 99
IMPACT OF HURRICANE HARVEY
In addition to the physical damages, Hurricane Harvey impacted the economy of the entire Texas coast through business disruptions and loss of productive activities. Business disruption and production loss could be related to displaced employees, cutbacks in the hours of operation, unusable facilities, and the interdependency of industries. Due to Rockport’s housing shortage in the aftermath of the storm, many local businesses suffered from a reduced workforce and had to cutback on hours of operation. Some businesses still experience these conditions.
Also due to Rockport’s dependency on the tourism industry, the city’s economy was negatively impacted by the physical damage to several tourism sites. The Aquarium, the Big Blue
Crab sculpture, and the Beach Bandshell were destroyed and have yet to be rebuilt. The Paws & Taws Convention Center and the Fulton Pier were heavily damaged and and torn down. The Rockport Center for the Arts building had severe damage, and eventually reopened in a new location. The Texas Maritime Museum and the Fulton Mansion had roof damage. Furthermore, the damages sustained by numerous hotels disrupted the number of tourists that could visit the city and support businesses that were not otherwise physically damaged. Because of the damage to these and other local tourist venues, Rockport estimates a loss of about $100 million annually in tourism revenue until the community is fully restored.
CHAMBER OF COMMERCE - “HARVEY, WE WON”
Since Hurricane Harvey struck, local businesses in Rockport have worked to rebuild and reopen with the help of many community organizations and leaders. In the past two years, the Chamber of Commerce has helped hundreds of businesses celebrate their grand re-openings.
Figure 6.6: “Harvey, We Won” ribbon cutting at the Rockport Center for the Arts, August 2018
Figure 6.5: “Harvey, We Won” ribbon cutting at the Sears re-opening, August 2019Source: Rockport-Fulton Chamber of Commerce

100 | CHAPTER 6
PUBLIC FEEDBACK
In order for the economy to flourish, development and the environment need to be balanced in Rockport. Local business is very important to the economy in Rockport, hence more policies that influence developing private firms or train people about professional skills should be generated. The basis of the economy, however, is tourism, so the community hopes to see more opportunities for small businesses and investments to be developed. One thing that is important to the community is the reopening of the Aquarium. It was destroyed during Hurricane Harvey and was subsequently closed. However because it was the fourth largest tourist attraction in the county, it would bring in a great deal of tourism dollars to the city.
The community wants more entertainment and activities to meet the local and tourist demand (e.g. restaurants, muti-use sports venues, shopping center). Considering the external economic situation, Rockport should encourage more local businesses and industries. There is a need for business and technical training for those outside the workforce to find work opportunities.
ECONOMIC DEVELOPMENT CORPORATION2,3
In the aftermath of Hurricane Harvey, the Aransas County Long Term Recovery Plan was developed for the county and the jurisdictions within the county. Through the groups working on that recovery plan, an Economic Development Corporation and a Local Government Corporation are in the process of being established. These two corporations will actually act as a “one stop shop” for business attraction, expansion, and retention in the region. However, each corporation has different legal responsibilities regarding donations, federal and state grants, and public-private partnerships. Many activities will build upon what the Chamber of Commerce has been doing historically for the region. Bylaws, budgets, and public meetings will be provided to ensure transparency.
Figure 6.7: Downtown Rockport storefrontPicture Courtesy: Emily Tedford

ECONOMY | 101
RECOMMENDATIONS
DIVERSE AND RESILIENT ECONOMY
Rockport needs to support sound economic growth and promote operational efficiency. Partnerships with other local jurisdictions and the proposed Economic Development Corporation will provide a “one stop shop” for prospective businesses and provide resources for existing businesses. The city should create tax incentives and enhance infrastructure to attract target industries to the area and to assist local businesses. The city can also further its partnership with the Chamber of Commerce to pursue new economic growth strategies and maintain successful ones. To bring business to Rockport’s Opportunity Zones, the city should assist collaboration between investors and entrepreneurs.
Despite the acute impacts from Hurricane Harvey, tourism and ecotourism will remain important industries for Rockport. Improvements to infrastructure, signage, and safety in key areas would encourage waterfront development and increase the use of public spaces and trail systems for tourists, Winter Texans, and year-round residents. A variety of development strategies, such as multimodal transportation, and small area plans, can serve the tourism industry while maintaining community character. The city should re-evaluate its use of Hotel Occupancy Taxes to meet current tourism needs. To maximize the presence of seasonal tourists and Winter Texans, the city should emphasize the advantages of coordinated business hours and activities in the downtown areas. Public relations campaigns (i.e. “Find Yourself in Rockport-Fulton”) can also be expanded by focusing on social media and regional tourist websites.
In light of Hurricane Harvey, Rockport has realized that it needs to diversify its economy and not rely so heavily on tourism. New industry sectors that complement Rockport’s existing businesses should be considered,
particularly along the 35 Bypass. Because the city is also known for its cultural arts district, businesses that deal with art-handling, framing, and graphics may be suitable. Outdoor activity supply companies would be fitting, as they relate to tourism, but are not dependent on the local environment and weather conditions. Nevertheless, any new industry sector should be “clean” and not create negative impacts on the surrounding ecosystems and wildlife habitats. Other potential low impact industries involve electronics and information processing.
ECONOMIC DEVELOPMENT POLICIES AND INCENTIVES
Tax Increment Financing (TIF) or Tax Increment Reinvestment Zone (TIRZ) are similar methods of using tax revenues for redevelopment. The methods start with the local government designating an area that is expected to accrue more tax revenue after redevelopment. The local government then borrows money from another entity or sells bonds to make improvements to the area (e.g. installing utilities and other infrastructure, purchasing properties, and demolishing or enhancing structures). After private development occurs in the area, and tax revenue increases to anticipated levels, the amount over the pre-development taxes pays off the loans or bonds.
Tax Abatement exempts a property owner from all or part of their property taxes as they develop/redevelop and the property value increases. The property owner and taxing entity agree on the length of contract, the conditions for improving the property, and the ultimate use of the property.

102 | CHAPTER 6
FOSTER A SKILLED WORKFORCE
As the workforce grows over time, with new or returning residents, marketing strategies and recruitment sessions should be developed to connect existing companies to potential employees. The city and the Economic Development Corporation (EDC) should identify new target industries and generate a stronger demand for workers. An assessment of the strengths and weaknesses in the existing workforce can help the city and the EDC establish professional training programs to advance local skill sets. Partnerships with the Coastal Bend Workforce Solutions, Del Mar College (in Corpus Christi), and other universities and organizations can create job fairs and seminars to encourage entrepreneurship and coach people on business trends, resumes, and interviews. Furthermore, it is important to get young people involved in the workforce, so mentorship and internship programs should be developed for high school and college students. Opportunities could be offered by the local government, nonprofits, and businesses. The City should support training and trade-specific licensing for the local unskilled workforce on building codes, including windstorm requirements.
SUPPORT EXISTING ASSETS
To retain and boost existing businesses, the city and the proposed EDC need to support small businesses. A business needs assessment should be conducted, as identified in the Aransas County Long Term Recovery Plan, in order to facilitate more business re-openings and a return to normal business hours. The Heritage District Overlay Code could be reassessed and updated. The EDC and the Chamber of Commerce should arrange professional assistance for businesses to cultivate their merchandising and websites. Special events, like the Rockport Business Expo, could be organized for the downtown or cultural arts district. Additional media campaigns, building on the “Find Yourself in Rockport-Fulton” campaign, should be developed to communicate specific, current information and that small businesses are open.
ECONOMIC DEVELOPMENT POLICIES AND INCENTIVES
Hotel Occupancy Tax (HOT)4 are room rental taxes required by a city, county, or state. HOT taxes are applied to rooms that are rented out for less than 30 days in hotels and motels, bed-and-breakfasts, apartments, condos, houses, etc. Two rates are paid by the customer, a state tax and a local tax. The local rate (7% in Rockport) is solely used to enhance and promote tourism venues, events, and related operations. The state rate (6% in Texas) flows directly to the Comptroller’s Office, but has been returned to certain communities on occasion for similar tourism purposes.
Opportunity Zones are low income census tracts and economically-distressed communities, that are nominated by state governors and certified by the US Department of the Treasury to encourage economic development and job creation. The program offers several tax incentives for investments in an Opportunity Fund that contributes to development in the zone. The investor receives tax deferrals or exclusions, depending on how long they leave their capital gain in the fund or if they make new gains from development in the zone.

ECONOMY | 103
PLAN INTEGRATION
TAX INCREMENT REINVESTMENT ZONERockport should assist businesses in being better prepared for future flood events and storms and more rapid recovery through development of educational resources. Rockport and downtown advocates should help to prepare area businesses for future flooding and or storm damage in advance of storms, aiming to minimize businesws interruption and/or losses and thus speeding up subsequent recovery. Informational materials should be disseminated to businesses throughout the community to help them prepare financially as well as structurally to weather-related threats. The city needs to encourage businesses to be eco-friendly and assist them in being better prepared for future flood events & storms & more rapid recovery through development of educational resources.
CASE STUDY: ECONOMIC REVITALIZATION - DOUGLAS, GA
Douglas is a small town in Coffee County, Georgia with a population of about 12,000. Up until the 1950s, the economy was driven by agriculture, but over time the Douglas-Coffee County Economic Development Authority sought to diversify. After some initial successes with the manufacturing industry, jobs declined in the early 2000s.
Cooperation among the city, county, business community, education institutions and civic leaders has been the basis for Douglas’ economic development strategy. In addition to bringing in manufacturing jobs, the city has focused on small and local businesses. Leaders in the community recognized that development of small business would support a more diverse economy and provide services that could attract industrial employers as well.
In the late 1980s, a Main Street Program was initiated and aimed to preserve the heritage and improve the aesthetics of Douglas’ downtown area. Through a series of grants and matching funds, storefronts were restored and improved, and a streetscape project added trees, landscaping, lighting, and sidewalks with decorative brickwork. These improvements made the downtown area a community gathering place and spurred a “Second Saturday” market for artists, farmers, and other vendors. In 2007, when the city’s comprehensive plan was updated, the plan included strategies to continue improvements, a mix of businesses, and redevelop vacant lots. Between 1995 and 2012, the vacancy rate in downtown dropped from 25% to 6%.
In 2002, a new director of entrepreneur and small business development, within the Chamber of Commerce, initiated a document outlining permitting and zoning processes, tax policies, business loans, and other resources. Additionally, the Chamber began offering programs for new business owners by connecting them with experienced business owners, providing training for workplace and community leadership skills, and encouraging community members to shop locally by giving discounts.
In 2004, Douglas and Coffee County were the first community in Georgia to be recognized by the state for its strategies and commitment to support local entrepreneurs. The decisions of the city and county to improve the economic environment for businesses and consumers helped Douglas become a more welcoming place for entrepreneurs and created nearly 800 new jobs.
RPAT

104 | CHAPTER 6
CASE STUDY: DOWNTOWN REVITALIZATION - MOUNT MORRIS, NY
Mount Morris, New York is a small village south of Rochester in Livingston County with a population of 2,929. Historically, its economy was driven by farming, commercial agriculture, and milling. The local farms and businesses were able to ship goods directly to markets via the Genesee Valley Canal and, later, a new rail line. Yet, the village and many surrounding communities fell into decline when manufacturing jobs left the area. In the 1970s, a new expressway and competition from big box stores also drew attention away from downtown Mount Morris and left storefronts empty and falling into disrepair.
The Livingston County Development Group (LCDG) stepped in to help revitalize the economy. The group supported small businesses, encouraged entrepreneurship, and promoted downtown revitalization. LCDG began to provide instruction, technical assistance, relocation services, and a loan fund for start-ups or expansion expenses. They subsidized rent, put together a catalog of downtown businesses, and advertised the community to developers with the hopes of bringing in investments.
Greg O’Connell, a developer and a graduate of State University of New York (SUNY) - Geneseo found Mount Morris to be a significant investment opportunity. He spent over $2 million on purchasing and restoring 20 downtown buildings. He provided lower rent for businesses to help them get a head start and, in exchange, requested more dynamic downtown activities such as longer hours one night a week. Renting out second story apartments also gave O’Connell a return on his investment.
Mount Morris worked to get the whole community involved in the downtown revitalization efforts, so it took advantage of its proximity to SUNY-Geneseo. By enlisting O’Connell’s alma mater, the students helped with projects related to beautification and event publicity. O’Connell created and funded the position of Main Street Manager for which a SUNY student works to coordinate advertising and social media for downtown businesses.
The efforts of O’Connell and other community leaders have brought downtown Mount Morris back to life by filling vacant storefronts with new businesses such as a cafe and bakery, a barbershop, and antiques dealer. In 2010, the village received a “Restore NY” grant to preserve and repurpose an old downtown theater building. Some business owners have been successful enough to open new establishments as well.
REFERENCES1 “About TIES,” The International Ecotourism Society, Retrieved from https://ecotourism.org/ties-overview/ 2 “Why Do We Need An EDC? Why Do We Need It Now?” Diane Probst, May 6, 2019. Retrieved from https://rfcocpresidentsblog.wordpress.com/2019/05/06/why-do-we-need-an-edc-why-do-we-need-it-now/3 “Economic Development - Frequently Asked Questions,” Retrieved From https://docs.google.com/document/d/e/2PACX-1vRo-kVZSj6mwjg9oUKDxYspMIvOQNvlJY9g4kOFlwY1TSBxvqg-qWPPslmfBF9oduWH7JPhMqkUbaWW/pub 4 “Hotel Motel Tax,” City of Rockport, Retrieved from https://www.cityofrockport.com/634/Hotel-Motel-Tax

ENVIRONMENT7

106 | CHAPTER 7
OVERVIEW
T he City of Rockport resides on the Live Oak Peninsula, a mostly rural region that has very unique ecosystems that contribute to its economic development and sense of place. Rockport encompasses a total area of 15.0 square miles, of which 10.7 square
miles is land and 4.3 square miles is water.1 The abundance of coastline makes for a variety of unique coastal ecosystems that are not found anywhere else. Outdoor recreational activities are a common pastime for locals tourists.
The first industries of the region incorporated the natural environment, centering on fishing, boat building, and tourism. The generally mild weather created an ideal environment for out-door recreation and industry. Though fishing and shrimping are no longer the main economic drivers on the Live Oak Peninsula, the water is still the focus for most residents. This region is home to the Windswept Oak, an icon for Rockport, productive wetlands and estuaries, multi-ple bay systems, and important critical habitats for threatened and endangered species.
It was clear through the public outreach and feedback process of the comprehensive plan update that Rockport residents rank conservation and protecting natural environmentally sensitive areas as high priorities. This also includes enhancing resilience by identifying wildlife habitat corridors, promoting mitigation options, particularly natural mitigation strategies, and encouraging disaster preparedness through public outreach and education. Numerous threat-ened and endangered species call this region home which alone draws in thousands of tourists every year.
Due to Rockport’s location on the water and its proximity to the Gulf, the city is very suscepti-ble to floods and tropical storms. Hurricane Harvey is the most recent disaster in 2017, but the area has had frequent confrontations with natural disasters that threaten public safety and economic security. On top of that, the region has struggled with localized water quality and drainage issues.
The following chapter will highlight the existing natural conditions in Rockport, go into detail about threats, highlight public feedback, and outline recommendations for the future.

ENVIRONMENT | 107
WILDLIFE AND CONSERVATION
The City of Rockport is located on a peninsu-la surrounded by Copano Bay to the northwest and Aransas Bay to the south. Along with those essential ecosystem features, Rockport also has two bodies of water that create nooks along the shore, Little Bay and Salt Lake. Due to these naturally occurring features, the peninsula is home to a variety of habitats comprised of many different species of birds, fish, and amphibians.
Wildlife
Aransas County is located at a pinch point, a location where species of migrating birds pass through on their journeys from north to south. Figure 7.4 displays North and South America Migration Patterns for many bird species in the Spring and Fall. As can be seen following the Central Flyway (purple), Rockport’s location guarantees a variety of avian visitors every year. Rockport has been able to protect important ecosystems and provide a habitat for millions of migrating birds, such as geese, ducks, and song-birds.2 The migrating birds bring in numerous tourists year-round, which helps boost the city’s economy. Other major species in the region in-clude, alligators, fiddler crabs, spoonbills, and sea turtles.3 Spoonbills prefer the bays, marshes, and estuaries since these shallow waters allow for easy access to fish.4 The Lightning Whelk, and the Texas State Shell has been found frequent-ly and holds cultural significance. The shell was valued for its design and used for religious cere-monies and as a practical tool.5
CONDITIONS BEFORE THE STORM
In 1973, the U.S. government implement-ed a piece of key legislation, the Endan-gered Species Act (ESA). Under the ESA, species that are vulnerable to extinction are listed as either endangered or threat-ened. The purpose of the Act is to pro-vide financial assistance to conservation efforts in order to help states maintain environmental programs. This legislation establishes a “framework to conserve and protect endangered and threatened species and their habitats” on an inter-national and domestic scale. The Fish and Wildlife Service (FWS) keeps records of endangered and threatened species which include birds, insects, fish, reptiles, mammals, crustaceans, flowers, grasses, and trees. In Rockport, there are several species that are listed as endangered or threatened or proposed threatened by the FWS. The most well-known endan-gered species that nest in Aransas Coun-ty is the Whooping Crane.
Figure 7.1 Lightning Whelk Source: photo by Jarek Tuszynski on Wikipedia
Threatened and Endangered Species
Due to ecological changes, Rockport has experi-enced significant degradation in species richness and habitat. The greatest threats include power lines, illegal hunting, loss of land, and chemical spills. Knowledge about these species helps with future development plans to reduce and con-trol possible negative impacts on vegetation and wildlife in the region.

108 | CHAPTER 7
Figure 7.4: North and South America Bird Migration PatternsSource: Boreal Songbird Initiative
Figure 7.2: Whooping CranesSource: texasstandard.org
Figure 7.3: Northern Aplomado FalconSource: allaboutbirds.org
According to the ESA, endangered species are defined as species that are “in danger of extinc-tion within the foreseeable future throughout all or a specific portion of its range,” and threat-ened species are “those animals and plants likely to become endangered within the foreseeable future throughout all or a specific portion of its range.” So far, the Piping Plover is the only ani-mal in Aransas County that is listed Threatened. Animals within the County that are listed en-dangered include the following:6
• Northern Aplomado Falcon• Ocelot• Whooping Crane• Leatherback Sea Turtle• Atlantic Hawksbill Sea Turtle• Golden-Cheeked Warbler• Kemp’s Ridley Sea Turtle

ENVIRONMENT | 109
Critical Habitats and Disturbances
The ESA defines a Critical Habitat as a specific geographic area containing many features es-sential to the conservation of an endangered or threatened species that may require special man-agement and protection.7
To minimize the influence of human activities, critical habitats and ecosystems are managed through conservation areas. The Aransas Na-tional Wildlife Refuge supports a diverse com-munity of species, some of which are considered endangered or threatened. Migrating birds are attracted to the mild temperature and abun-dance of food the refuge has to offer during the winter.8 The Wildlife refuge provides reha-bilitation efforts for vulnerable species and are critical habitats for fostering the life of species. The Whooping Crane is one of North America’s rarest birds; only three populations exist today. Therefore, the 22,500 acres of Refuge in Aransas County is imperative for their survival.9
Little Bay is a small, semi-enclosed estuary located in the center of Rockport and next to the city’s fair grounds. This ecosystem is extremely valuable as it provides the city with flood protection, filters unwanted nutrients and contaminants from larger sources of water, provides a habitat for species and is a major nursery area for many commercially and recreationally important fish. However, there are many concerns regarding the health and vitality of the Bay, in order for it to continue to foster its intended environmental functions.
Figure 7.7: Little Bay Estuary, Rockport, TxSource: Aransas County Navigation District
Figure 7.5: Rockport Demo Bird Garden Source: www.shinebeautifully.me
Figure 7.6: Rockport WetlandsSource: www.shinebeautifully.me

110 | CHAPTER 7
Vegetation
Rockport is the largest city in Aransas County and falls into the Gulf Coast Prairie and Marsh region. This ecological region experiences oce-anic impact from severe wind and rain. Accord-ing to Texas Parks and Wildlife, the primary vegetation coverage of Rockport includes bushes and marshes, with some special vegetation and plants.10 Short rooted plants, commonly found in this area and ecological region, can be found among the side of open waters. Table 7.1 pro-vides a list of plants grown in this area.11
Trees Wildflowers Vines Grasses Wildflowers
American Beauty-berry
Beach Evening Primosa
Carolina Jessa-mine
Big Blue Stem Prickly-Pear Cactus
American Elm Cardinal Flower Coral Honeysuckle Bushy Bluestem Spanish DaggerButtonbush Coral Bean Cross-Vine Eastern Gamma
GrassEastern Red Cedar Gulf Coast Penste-
monMay-Pop Gulf Cordgrass
Flame Leaf Sumac Indian Paintbrush Muscadine Grape Inland Sea-oatsLantana Lance-Leaf Core-
opsisPipevine Sugarcane Plume
GrassLoblolly Pine Meadow Pink Trumpet CreeperRed Buckeye Scarlet SageRed Mulberry Showy Evening
PrimroseShort-Leaf Pine Spider LilyShrubs Turk’s CapShumard Red OakSouthern Live OakSugarberryWater OakWax MyrtleWillow OakYaupon
Table 7.1: Plant Species in Coastal Gulf Prairies
Source: Texas Parks and Wildlife, 201612
Figure 7.8: Rockport Demo Bird Garden & Tule Marsh EastSource: www.shinebeautifully.me

ENVIRONMENT | 111
Conservation Efforts
Throughout Aransas County, there are initiatives to protect and conserve these endangered and threatened species and their habitats. A prime example of Rockport’s conservation effort is the work done to protect the Whooping Crane, in part, through the establishment of the Aransas National Wildlife Refuge, which is the only known area in the United States that Whooping Cranes come to mate.
The Whooping Crane is a highly sought after by bird watchers due to its rarity; this species alone draws in tourists from around the nation and has created a market for Whooping Crane relat-ed tours and festivals. There is only one self-sus-taining population that survives in the wild and spends the winter (November – March) on the Texas Gulf. Unfortunately, impacts from the changing climate are altering migratory patterns and increasing drought, putting the Whooping Crane’s future generations in jeopardy. As of the 2017-2018 winter season, 505 Whooping Cranes were counted in the area, which is 16 more than what was recorded the previous year. The Whooping Crane is following a trend of im-provements and it is these conservation efforts that will keep them from extinction.
Experiments, monitoring efforts, and manage-ment practices occur in this critical habitat to further understand the status of the species and prevent further population losses. Experiments, such as the one shown in the picture of decoys being placed on the reef, help to test the accu-racy of the aerial counting method used to de-termine how many Whooping Cranes there are each migratory year.
Figure 7.9: Whooping Crane Decoys being placed on Oyster ReefsSource: www.naturetourism.tamu.edu
A recently completed partnership project be-tween Texas A&M Corpus Christi and the Coastal Bend Bays and Estuary Program (CB-BEP) was Bacterial Source Tracking in Little Bay. This project was initiated in response to stakeholder concerns of elevated levels of entero-cocci in Little Bay. The main objectives were to conduct an analysis of historical data in the Bay, monitor enterococci concentrations for seven months, and determine probable sources of fe-cal pollution. The project recommended future Best Management Practice efforts to hopefully alleviate future events. More information can be found on the publication website for the CB-BEP.13 In 2012, the CBBEP also worked with Aransas County on Tule Lake wetland resto-ration efforts.
There are several other conservation organiza-tions that serve Rockport and the surrounding areas; for example, Aransas Bird and Nature Club, International Crane Foundation and Mis-sion-Aransas National Estuarine Research Re-serve (NERR) through the University of Texas Marine Science Institute (UTMSI).

112 | CHAPTER 7
WATER QUALITY AND DEMAND
Wetlands
Wetlands located along the coast contain a rich abundance of wildlife and nutrients. The com-position of this ecosystem provides a habitable place for numerous birds, fish, and amphibians, which is why wetlands are often referred to as the “cradle of life.” Wetlands not only foster breeding and feeding areas for wildlife but can also help mitigate flooding. Wetlands have the natural ability to manage extensive rainfall by storing flood waters and reducing the speed of streamflow. This results in reduced peak flows, allowing for the rate and volume of flood waters to penetrate the soils and minimize inland ef-fects as well as erosion. This process diminishes the strain of flood events on life and property. They mimic the absorption qualities of a sponge, therefore assessing the usefulness of wetlands is to measure their ability to naturally hold excess water and slowly release it.
The major types of wetlands include estuarine and marine, freshwater emergent, and freshwa-ter ponds, as seen in Figure 7.9. However, as development increases and human activities be-come more prominent in the area, wetlands be-come more susceptible to harmful contaminants that ultimately impact the wildlife inhabiting the area and the quality of water for city use.
The economy of Rockport thrives on activi-ties related to its wetlands; such as commercial fishing, shrimping, birdwatching, sport fishing, kayaking, and boating.14 These activities provide an economic base for the city and influences tourism numbers. Water management pro-grams, such as the one mentioned in the water demand section, helps to ensure the quality of water remains at healthy levels.
Watersheds and Aquifers
Underground aquifers provide the region with the potential to harvest groundwater. The aqui-fers recharge from rivers, lakes, and wetlands by seeping through its permeable layers.17 Water conservation practices help fill out the aquifers artificially. High water demand, combined with extended periods of low precipitation and the inability of aquifers to recharge can lead to water depletion and, eventually, regional drought.18
Communities often regulate the extraction and use of water resources for non-essential activities to conserve water and ensure availability. Rock-port belongs to Groundwater Management Area 15, which consists of 13 counties.19 Figure 7.10 shows the major aquifers in Texas and indicates that Rockport is part of the Gulf Coast Aquifer (denoted in yellow on the map).
Figure 7.10: Major Aquifers of TexasSource: Texas Water Development Board20

ENVIRONMENT | 113
Figure 7.11: Wetland Types in Rockport, TexasSource: U.S. Fish and Wildlife Service, 201815

114 | CHAPTER 7
BAY EDUCATION CENTER
In 2010, the Bay Education Center (BEC), a free to the public education and outreach center, to bring awareness to the importance of wetlands and conserving natural habitats. The main pur-pose of the center is to highlight the ecological and economic importance of the Mission-Aransas Estuary through engaging and interactive exhibits.
The BEC is a partnership between the Aransas County Navigation District (ACND), which donated the land for the center, the City of Rockport, the Mission-Aransas NERR, the University of Texas, Marine Science Institute (UTMSI), the Texas General Land Office (GLO), and the National Oceanic and Atmospheric Administration (NOAA). Construction of the BEC was made possible by Reserve funds received through a NOAA grant, GLO granted funds, and City funds. NOAA grants provided funding for the Visitor Center exhibits and Science On a Sphere© (SOS).
Unfortunately, The Center was damaged extensively by Hurricane Harvey and has since been closed. The Aransas County Navigation District commissioners recently approved an interlocal agreement with the UTMSI to help get the insurance money ready for repairs to begin. The agree-ment sets a maximum cost of $475,000 for the repairs. The Aransas County Navigation District and the University of Texas at Austin are partners in the BEC, with UT serving as the managing partner of the Mission-Aransas NERR. The BEC is set to re-open by the time the Comprehensive Plan updates are adopted.
One example of a program the BEC organized each year was the Wetlands Week for elementary students across the region. Reserve educators have presented programs for Wetlands Week at the Bay Education Center each October for the last six years. Wetlands Week was initially funded through a grant that Martha McLeod, a fifth grade science lab instructor with Fulton Learning Center, received from the Aransas County ISD Education Foundation and the support of com-munity organizations and volunteers has allowed this valuable, annual project to continue. Ad-ditionally, the BEC is home of Bay Talks which featured lunch hour talks on Fridays about various environmental and ecosystem topics.16
Figure 7.12: Bay Education Center suffered damage in Hurricane HarveySource: missionaransas.org

ENVIRONMENT | 115
Water Quality
Water quality refers to the chemical, physical, and biological characteristics of water with re-spect to its usability for particular purposes such as drinking and recreation. Rockport and other coastal communities have access to freshwater and saltwater ecosystems. These communities rely on local aquatic ecosystem for many recre-ational and commercial activities such as fishing, swimming, boating, and bird watching. In order for those activities to be possible, the water qual-ity level must be sustained. Vegetation and soil act as natural filters that remove pollutants from water, so the city focuses on maintaining the in-tegrity of these natural flood barriers.
New development in the city and increasing amount of impervious land results in more runoff pollution affecting Little Bay. Monitor-ing programs have since then been conducted to try and understand the status of the Bay and its health trends over time. The Mission-Aransas National Estuarine Research Reserve (NERR) manages the water quality station located in Little Bay, which measures the Bay’s quality based on temperature, salinity, and dissolved oxygen. The System-Wide Monitoring Program (SWMP) at the Mission-Aransas NERR is used to monitor water quality and weather indica-tors, biological monitoring, and mapping of Re-serve habitats and watersheds. Two of their five monitoring stations are located near Rockport in Aransas Bay and Copano Bay West. Each sta-tion measures temperature, salinity, dissolved oxygen, depth, pH, turbidity, and chlorophyll/algal biomass. Nutrients, such as nitrates and phosphates, are monitored at the bay stations on a monthly basis and diel monthly samples are collected at the Port Aransas Ship Channel. Figure 7.14 shows the different sampling loca-tions around Rockport.
On top of monitoring efforts, volunteers are also vital for improving the health of the ecosystem. The City of Rockport’s committee for Water Quality Issues initially spearheaded an exciting new water quality monitoring project in Little Bay, Rockport, Texas. This project is designed to monitor spatial and temporal variations in sa-linity and turbidity, which are two of the factors known to impact seagrass growth and reproduc-tion. Volunteers from Rockport and Port Aran-sas were provided training, so they can collect consistent water quality data using various types of sampling equipment around Little Bay.
The Bay itself is connected to Aransas Bay through two outlets and serves as the primary recipient of stormwater drainage for the City of Rockport from Tule Creek, at least 11 storm outfalls and runoff from the adjacent neighbor-hood, Key Allegro. The abundance of the sea-grass community, mostly made up of Halodule wrightii, has been steadily declining. The com-munity reached out the Mission-Aransas NERR and University of Texas Marine Science to try and find a source of this decline. Dr. Kenneth Dunton and Christopher Wilson from the Uni-versity wrote up a report in 2010 of their find-ings and can be found on the Mission-Aransas NERR website.
The availability of water and its quality largely depends on the naturally occurring systems in the region, e.g., the watersheds and aquifers.21
The bodies of surface water belonging to wa-tershed regions all converge and drain to one outlet.22 Along the coast, the rivers and streams converge into coastal basins made up of estu-aries and bays. Rockport is in the Copano Bay Watershed and the Aransas Bay Watershed, while also receiving the influence of several oth-er watersheds around it.

116 | CHAPTER 7
The Texas Water Development Board publishes the estimated water demand for all the coun-ties and cities in Texas. Figure 7.13 illustrates the Municipal Water Demand projections from 2020-2070 for Rockport.
Rockport’s population is expected to grow at a slow rate, therefore the supply of water tends to dwindle. The water demand provided by the Texas Water Development Board highlights this projection trend. Even though the city is not expecting exponential growth, there is still a de-mand for well-managed water resources. Rock-port’s treated water supply comes from the San Patricio Municipal Water District (SPMWD), who provides water to community water sys-tems and other industrial customers.23 The city’s contract with SPMWD requires the city to fol-low SPMWD’s plan.24
Figure 7.14: Sampling locations around Tule Creek and Little BaySource: Google Earth
Figure 7.13: Water Demand in Rockport, TexasSource: Texas Water Development Board, 201825
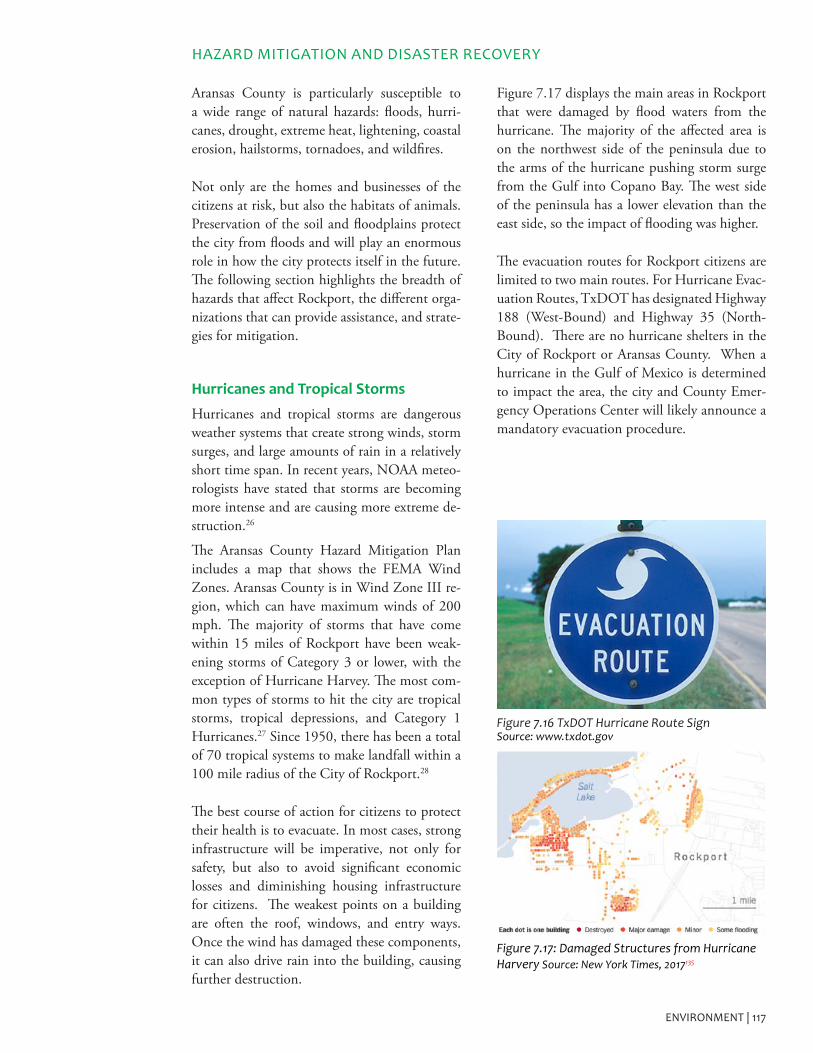
ENVIRONMENT | 117
Aransas County is particularly susceptible to a wide range of natural hazards: floods, hurri-canes, drought, extreme heat, lightening, coastal erosion, hailstorms, tornadoes, and wildfires.
Not only are the homes and businesses of the citizens at risk, but also the habitats of animals. Preservation of the soil and floodplains protect the city from floods and will play an enormous role in how the city protects itself in the future. The following section highlights the breadth of hazards that affect Rockport, the different orga-nizations that can provide assistance, and strate-gies for mitigation.
Hurricanes and Tropical Storms
Hurricanes and tropical storms are dangerous weather systems that create strong winds, storm surges, and large amounts of rain in a relatively short time span. In recent years, NOAA meteo-rologists have stated that storms are becoming more intense and are causing more extreme de-struction.26
The Aransas County Hazard Mitigation Plan includes a map that shows the FEMA Wind Zones. Aransas County is in Wind Zone III re-gion, which can have maximum winds of 200 mph. The majority of storms that have come within 15 miles of Rockport have been weak-ening storms of Category 3 or lower, with the exception of Hurricane Harvey. The most com-mon types of storms to hit the city are tropical storms, tropical depressions, and Category 1 Hurricanes.27 Since 1950, there has been a total of 70 tropical systems to make landfall within a 100 mile radius of the City of Rockport.28
The best course of action for citizens to protect their health is to evacuate. In most cases, strong infrastructure will be imperative, not only for safety, but also to avoid significant economic losses and diminishing housing infrastructure for citizens. The weakest points on a building are often the roof, windows, and entry ways. Once the wind has damaged these components, it can also drive rain into the building, causing further destruction.
HAZARD MITIGATION AND DISASTER RECOVERY
Figure 7.17 displays the main areas in Rockport that were damaged by flood waters from the hurricane. The majority of the affected area is on the northwest side of the peninsula due to the arms of the hurricane pushing storm surge from the Gulf into Copano Bay. The west side of the peninsula has a lower elevation than the east side, so the impact of flooding was higher.
The evacuation routes for Rockport citizens are limited to two main routes. For Hurricane Evac-uation Routes, TxDOT has designated Highway 188 (West-Bound) and Highway 35 (North-Bound). There are no hurricane shelters in the City of Rockport or Aransas County. When a hurricane in the Gulf of Mexico is determined to impact the area, the city and County Emer-gency Operations Center will likely announce a mandatory evacuation procedure.
Figure 7.17: Damaged Structures from Hurricane Harvery Source: New York Times, 2017135
Figure 7.16 TxDOT Hurricane Route SignSource: www.txdot.gov

118 | CHAPTER 7
Coastal Erosion
Coastal erosion is an increasing threat to many cities around the world, but Rockport in partic-ular is facing more direct exposure to the Gulf of Mexico due to tropical systems eroding the barrier islands that protect the mainland. Both Rockport and Fulton are highly vulnerable to coastal erosion and the peninsula is more likely to experience more erosion along the bay’s coast-line in the future.
The northwest side of the peninsula has many wetlands, marshes, and critical habitats as stated in the previous section. The city and surround-ing area has a large migratory bird population that can potentially be impacted. Table 7.2 identifies the types and causes of coastal erosion.
Sea Level Rise and Subsidence
The Texas coast is experiencing a high rate of relative sea level rise caused by both vertical sub-sidence and eustatic sea level rise. Subsidence can be attributed to many different factors such as land compaction, aquifer drawdown, and de-clining fluid pressures in subsurface hydrocar-bon reservoirs.26 The contributions to sea level rise range from a warming climate, leading to a warming and expanding ocean as well as melt-ing ice caps. It is understood across the country that all coastal communities should consider the future of their coastlines when contemplating new development and mitigating for natural di-sasters.
Floods
In recent years, localized flooding has become a significant hazard for communities like Rock-port.31 From 1997 – 2017, there were a total of 21 flash floods reported in Rockport. The total amount of property damages that have accrued over the course of the past 20 years is $1,850,000.32
Human ImpactsAgent Examples
Transportation Boat WakesAltered Water Circulation
Coastal Construction
Sediment Deprivation (Bluff Retention)Coastal Structures (Jetties, Groins, Seawalls)
River Modification
Control and Diversion (Dams, Levees)
Fluid Extraction Water, Oil, Gas, Sulfur
Climate Alteration
Global Warming and Ocean ExpansionIncreased Frequency and Storm Intensity
Excavation
Dredging (Canals, Pipelines, Drainage)Mineral Extraction (Sand, Shell, Heavy Mines)
Wetland De-struction
Pollutant DischargeTrafficFailed ReclamationBurning
Natural ImpactsAgent Examples
ErosionWaves/CurrentsStormsLandslides
Sediment Re-duction
Climate ChangeStream AvulsionSource Depletion
Submergence Land SubsidenceSea-level Rise
Wetland Deteri-oration
HerbivoryFreezesFiresSaltwater Intrusion
Table 7.2: Coastal Erosion Causes and Examples
Source: Aransas County Multi-Jurisdictional Hazard Mitigation Action Plan - Section 11 Page 2.

ENVIRONMENT | 119
Other Common Hazards
Drought, extreme heat, tornadoes, hailstorms, wildfires, winter storms, and earthquakes are other types of hazards that can impact Rock-port’s environment. These hazards are listed in the Aransas County Multi-Jurisdictional Hazard Mitigation Plan as medium to low risk events.33
All of these hazards have the potential to affect Rockport; however, looking at the historical data, they are not as likely to affect the city on an annual basis.
For more information about these hazards please refer to the Aransas County Multi-Jurisdictional Hazard Mitigation Plan. The plan dives into more detail about all the hazards mentioned in-cluding; what they are, where they can occur, the potential vulnerable populations, and eco-nomic impacts they might endure.34
Disaster Recovery Organizations
Within and around Aransas County there are several organizations that provide assistance to residents and businesses that have been impact-ed by natural disasters. Some of the organiza-tions include:
All Hands and Hearts - Through volunteer and community engagement, this group works to help families recover from natural disasters. The group commits to working in a given area for three years. They opened two programs in Texas after Hurricane Harvey: one in Houston and one in the Coastal Bend. The volunteers that comprise this group come from all over the region, and, in the event of a disaster, they have been able to draw volunteer groups from all over the country. In addition to helping rebuild, they have training programs for people who are inter-ested in construction.
Coastal Bend Disaster Recovery Group (CB-DRG) - This group was established in 2015 as a volunteer-based coalition to help areas and residents within the Coastal Bend counties (Aransas, Bee, Brooks, Duval, Jim Wells, Kene-dy, Kleberg, Live Oak, Nueces, Refugio and San Patricio). The organization focuses on coordi-
nating long-term disaster recovery through repairing and rebuilding homes, fundraising and raising awareness for current and future disasters.
In addition to these three non-governmen-tal organizations, there are several state-level and federal organizations that can provide financial assistance and mitigation planning assistance to Texas communities and individ-ual homeowners.
Community Development Block Grant - Disaster Recovery (CDBG-DR) - is ad-ministered by the Texas General Land Of-fice (GLO), but the funding comes from the CDBG-DR. The GLO creates a state-wide action plan after a disaster has been declared, accepts public comment on the plan and then HUD must approve the plan. CDBG-DR funds and projects generally support fair and affordable housing, infra-structure upgrades and economic develop-ment. Rockport and the surrounding area received DBG-DR funds for several projects, outlined in the Aransas County Long Term Recovery Report, after Hurricane Harvey.
Habitat for Humanity - Habitat for Hu-manity has had a presence in Aransas Coun-ty for 17 years. They are 100% volunteer run with the exception of the Executive Director that was recently brought on with funding from a 3-year grant. The group’s involvement in disaster recovery developed in the last 10 years and operates with 100% donations to help residents get into and own a home. Families and individuals in need of afford-able housing can apply for homeownership and, depending on their eligibility, may be selected to participate through a Sweat Eq-uity Program.

120 | CHAPTER 7
Hazard Mitigation Grant Program (HMGP) - is organized by the Federal Emergency Man-agement Agency (FEMA) but is locally adminis-tered by the Texas Division of Emergency Man-agement (TDEM). Hazard Mitigation in theory is implemented before a disaster, in order to reduce the risk from hazards. However, commu-nities can receive recovery funding if they have developed a Hazard Mitigation Plan. Rockport is included in the Aransas County Multi-Juris-dictional Hazard Mitigation Plan. Hazard miti-gation projects can be structural (e.g., levees and floodwalls) or non-structural (e.g., protecting wetlands and land use planning).
Rebuild Texas Fund (RTF) - The Rebuild Texas Fund is a collaborative project from the Michael & Susan Dell Foundation and the OneStar Foundation, with the support of thousands of corporate and individual donors. RTF helps in the rebuilding and restoration of disaster affect-ed cities in Texas.The funds will be fully allocat-ed by July 2019. Rockport is using RTF to con-struct the Memorial Park Fitness Courts with a total project amount of $149,451.
Small Business Administration (SBA) Recov-ery Loan - After Aransas County was presiden-tially declared a “disaster area” from Hurricane Harvey, many impacted small businesses and homeowners may have become eligible for SBA loans. If their insurance policies and assistance from FEMA did not cover everything, they could apply for this loan to rebuild and recover from physical damage and economic losses.
Texas Water Development Board (TWDB) - provides financial, technical and planning as-sistance to communities that participate in the National Flood Insurance Program. Examples of projects are: early warning systems, relocating residents, elevating buildings and other struc-tural flood mitigation measures. The TWDB website also has tips for homeowners before, during and after disasters.
Texas Windstorm Insurance Association (TWIA) - TWIA provides essential property insurance policies and services to eligible Texas properties in the gulf-coast area for windstorm and hail storm events.
PUBLIC FEEDBACK
Residents of Rockport aspire to maintain the city’s unique environment and small-town at-mosphere. The community values the protec-tion of natural resources and wildlife for the purposes of overall conservation efforts and pro-tection from natural disasters. Residents wish to see the extension of pathways and connections to green spaces, so that those areas can be more easily accessed and enjoyed but individuals of all socio-economic status and physical ability. Due to Rockport location on the coast and its’ risk for hurricanes and floods, it is important to the community that coastal barrier protection is increased and wetlands are preserved for flood mitigation purposes.

ENVIRONMENT | 121
RECOMMENDATIONS
NATURAL RESOURCE PRESERVATION AND PROTECTION
Public feedback highlighted the need for the city to work on improving connectivity of open spaces to expand wildlife corridors and conserve natural habitats. The city should encourage pub-lic participation in the Texas Wildscapes certi-fication program offered by the TPWD. This program restores and conserves habitats by pro-viding expertise on the design and maintenance of habitable land for wildlife and threatened species. Additionally, the city should look into options to amend the zoning ordinance to in-clude a conservation overlay, or other land use regulations to ensure critical habitats are pro-tected.
To ensure the Whooping Crane’s survival, wild-life protection areas are necessary. The 22,500 acres of the Aransas National Wildlife Refuge acts as a rehabilitation ground for vulnera-ble species and is considered a critical habitat. A critical habitat is an area that is essential for the conservation of a species and requires spe-cial management and protection. To help with the conservation and protection of Whooping Cranes, management and monitoring practices are therefore needed to combat this issue. Addi-tionally, the city should continue working with organizations such as the Aransas Bird and Na-ture Club and International Crane Foundation to identify critical habitats and ecological corri-dors to be conserved and maintained.
The protection of natural resources, habitats, trees and plants is just as important to the city as the is preservation of animals. The Tree Ordi-nance needs to be reviewed and revised to ensure that it is meeting its intended goals. It should include a goal for percentage cover of cano-py and language about protecting understory vegetation. The City of Rockport is focused on the protection of certain trees which add to the character and charm of the city. The Code of Or-dinances Section 106-4 defines protected trees as any tree that is on private or public property and has a trunk that is six inches (18.75-inch
circumference) or larger measured at Diameter at Breast Height (DBH). Clear regulations and expectations for the preservation of trees within Rockport are outlined in the city’s Code of Or-dinances.
In addition to the protection of critical habitats, a wetland preservation plan throughout the city, especially along the bypass, could be encouraged and implemented by Environmental Services of the Public Works Department. A staff member should be designated to oversee the implemen-tation of the plan and organize maintenance ef-forts with involved stakeholders. The city should create long term strategies and conservation tools such as: a conservation overlay zone, trans-fer and purchase of development rights, wetland banking, revitalization and restoration incentive programs. An implementation table of outlined strategies and tools should be used to organize funding sources and uphold accountability as-pect.
PLAN INTEGRATION
TREE REQUIREMENTPlan recommendation on the revision of the Tree Ordinance is aligned with Policy 8.2.1 street tree requirements and 8.2.5 turf and groundcover of the HDZO.
PLAN INTEGRATION
TREE MASTER PLAN AND GI PLANDevelop a Tree Master Plan and GI Plan to use as a framework to help guide tree planting within public and private property. Provide strategic tree plantings along Austin Street, at key intersections, on vacant lots, and along the streetscape to provide shade, visual appeal, and help capture stormwater.
HDZO
RPAT

122 | CHAPTER 7
All bay systems within Rockport need to be monitored and protected from runoff pollution and unwanted nutrients that would otherwise disturb the ecosystems natural state. Continue to support the efforts of the Mission-Aransas NERR’s program Little Bay Report Card to monitor and compare water quality in Little Bay. The Mission-Aransas NERR wanted to contin-ue to monitor the bay and compare its health with other bays so they established a report card aspect to measure water quality through temperature, salinity, dissolved oxygen, tur-bidity and chlorophyll. The measurements are compared with Aransas Bay as a control as it is generally regarded as a “healthy” bay with good water quality and healthy habitats. Education-al seminars and volunteer programs that cover techniques to reduce impact on water quality, review signs of poor water quality and steps to prevent illness should be provided. The city needs to ensure compliance with governmental regulations on wastewater disposal and runoff contaminants and implement an enforcement program to maintain healthy water quality.
To enhance the management of flood waters and quality of water, the city should increase the use of green infrastructure practices throughout the city. Rockport should encourage public-private partnerships to help with funding sources, the design and functionality of projects, as well as implementation. The Housing and Urban De-velopment Federal Department’s Community Development Block grant could also be a source of funding for green infrastructure projects. Building incentives can be provided to encour-age developers to incorporate low impact design techniques throughout their projects and con-sider using strategies to manage rainwater onsite to reduce negative side effects of runoff. Devel-opers should also be incentivized to promote the connection of identified ecological corridors and avoid building in those areas.
WINDSWEPT LIVE OAK TREES
Windswept Live Oak trees are protect-ed under the Code of Ordinances due to their uniqueness to the city. Any live Oak Tree is considered “windswept” when there is a definite south-east to north-west lean because of Rockport’s southeasterly winds. These trees add to the character and beauty of the city, so specific focus and protection is needed. Such trees are not to be removed without permission from the Tree and Landscape Committee. This is of utmost importance during development and construction as clear-cutting of land or removal of trees is not allowed without specific authoriza-tion. If authorization is given to remove a tree, one of equal or greater height is to be planted as a replacement. The goal for this is to maintain the natural resourc-es and character of the city. Another thing for the city to consider is including language about protecting understory plants in order to protect the trunk of the tree and maintain biodiversity. The concrete language in the Tree Ordinance is very important for the protection of trees that are not designated for remov-al, especially those Windswept Live Oaks, during development.
Figure 7.18: Windswept OaksPicture Courtesy: Kate de Gennaro

ENVIRONMENT | 123
DISASTER PREPARATION AND COMMUNITY PROTECTION
PLAN INTEGRATION
MITIGATIONEvaluate best mitigation solution (i.e. buyouts, reconstruction) for repetitive loss properties. Evaluate list of repetitive loss properties for opportunities to partner with property owners regarding potential mitigation actions.
Water retention methods need to be supported and managed throughout the city. The planning team recommends that Rockport amends the code of ordinances to include a land use tool, Transfer of Development Rights (TDR), to en-sure wetlands ability to function and retain wa-ter. Sending areas should be established and out-lined in the conservation management plan in places that have been identified as environmen-tally sensitive areas, critical habitats and wet-lands providing flood mitigation functions. The lands need to be managed and protected proper-ly so that the environmentally sensitive areas are preserved. The city needs to utilize tools such as a conservation easement or mitigation banking program so that conservation goals are achieved.
Directly coordinate with the Aransas County Navigation District to come up with strategies to strengthen the coastal shoreline to protect Rockport’s residents and infrastructure from powerful storm surge. Coastal erosion can be mitigated through the construction of an arti-ficial reef and marsh vegetation plantings; both will provide protection, filtration services and stabilization. Strengthening the coastal shoreline will protect Rockport’s residents and infrastruc-ture from powerful storm surge.
The Fulton Beach Road Project is a good mod-el for future shoreline stabilization projects in Rockport. The city should continue striving to protect their shores by reaching out to non-profits and advocacy groups for voluntary aid to help construct the artificial reef. Another ex-ample to use in the design and implementation of the erosion protection projects is the project along Shell Ridge Road, which is being fund-ed by FEMA 404 mitigation dollars. The city should continue reaching out to nonprofits and advocacy groups for voluntary aid. Funding for construction and implementation can come from sources such as the FEMA Hazard Miti-gation Grant, the Housing and Urban Develop-ment Community Development Block Grant Program for Disaster Recovery, and RESTORE
WETLAND MITIGATION
Wetland Mitigation is the practice of off-setting unavoidable impacts to aquatic resources at one site by restoring and/or enhancing wetlands on another site in the same or adjacent watershed.35 The Wetland Mitigation Banking Pro-gram came out of the 2014 Farm Bill and can be a great strategy for conserving essential habitat. This approach uses a market-based system to restore/enhance wetlands in one place to compensate for unavoidable impacts to wetlands in an-other place. The process requires the re-placement of all lost wetland functions, values and acres. Wetland Banking has been used in Georgia, Illinois, Iowa, Mich-igan, Missouri, Minnesota, Nebraska, North & South Dakota and Ohio.36
Act Buckets. Regular community meetings con-ducted by local emergency managers and miti-gation experts need to be held regularly to cover disaster preparedness and recovery efforts. The city’s media methods and other marketing tools should be utilized and enhanced to promote ed-ucational meetings, seminars, tool sets etc. and encourage citizen engagement and outreach.
MHMP
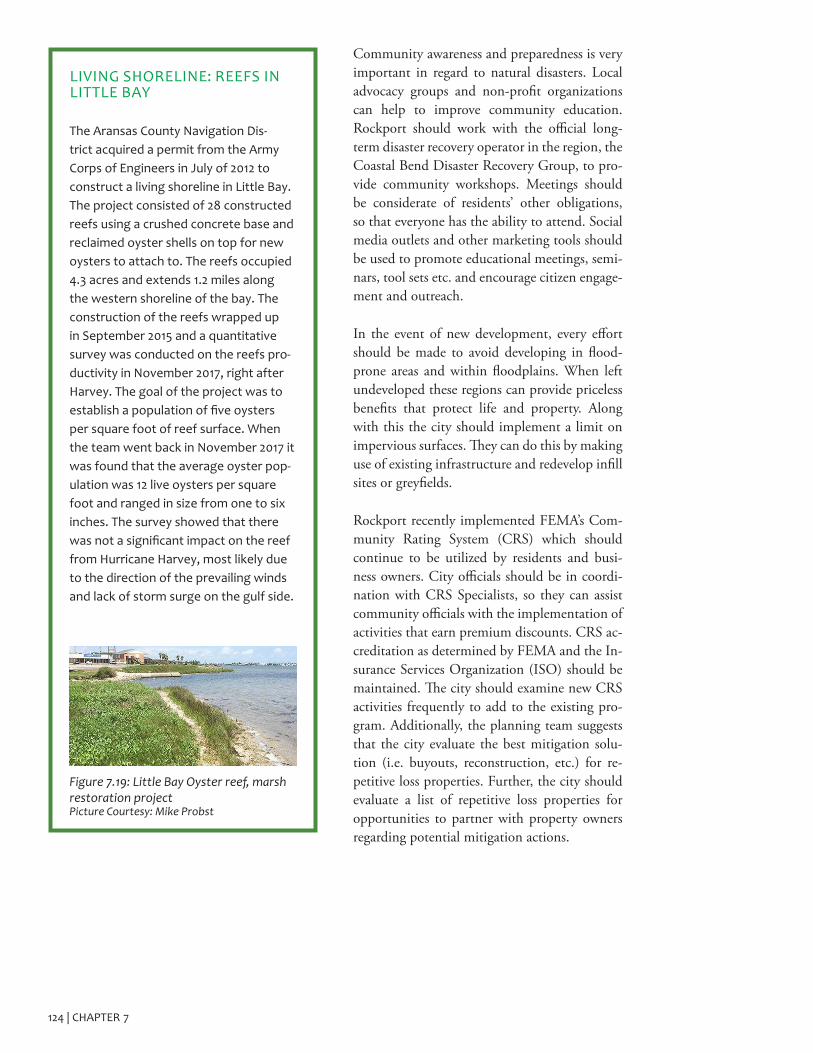
124 | CHAPTER 7
Figure 7.19: Little Bay Oyster reef, marsh restoration projectPicture Courtesy: Mike Probst
LIVING SHORELINE: REEFS IN LITTLE BAY
The Aransas County Navigation Dis-trict acquired a permit from the Army Corps of Engineers in July of 2012 to construct a living shoreline in Little Bay. The project consisted of 28 constructed reefs using a crushed concrete base and reclaimed oyster shells on top for new oysters to attach to. The reefs occupied 4.3 acres and extends 1.2 miles along the western shoreline of the bay. The construction of the reefs wrapped up in September 2015 and a quantitative survey was conducted on the reefs pro-ductivity in November 2017, right after Harvey. The goal of the project was to establish a population of five oysters per square foot of reef surface. When the team went back in November 2017 it was found that the average oyster pop-ulation was 12 live oysters per square foot and ranged in size from one to six inches. The survey showed that there was not a significant impact on the reef from Hurricane Harvey, most likely due to the direction of the prevailing winds and lack of storm surge on the gulf side.
Community awareness and preparedness is very important in regard to natural disasters. Local advocacy groups and non-profit organizations can help to improve community education. Rockport should work with the official long-term disaster recovery operator in the region, the Coastal Bend Disaster Recovery Group, to pro-vide community workshops. Meetings should be considerate of residents’ other obligations, so that everyone has the ability to attend. Social media outlets and other marketing tools should be used to promote educational meetings, semi-nars, tool sets etc. and encourage citizen engage-ment and outreach.
In the event of new development, every effort should be made to avoid developing in flood-prone areas and within floodplains. When left undeveloped these regions can provide priceless benefits that protect life and property. Along with this the city should implement a limit on impervious surfaces. They can do this by making use of existing infrastructure and redevelop infill sites or greyfields.
Rockport recently implemented FEMA’s Com-munity Rating System (CRS) which should continue to be utilized by residents and busi-ness owners. City officials should be in coordi-nation with CRS Specialists, so they can assist community officials with the implementation of activities that earn premium discounts. CRS ac-creditation as determined by FEMA and the In-surance Services Organization (ISO) should be maintained. The city should examine new CRS activities frequently to add to the existing pro-gram. Additionally, the planning team suggests that the city evaluate the best mitigation solu-tion (i.e. buyouts, reconstruction, etc.) for re-petitive loss properties. Further, the city should evaluate a list of repetitive loss properties for opportunities to partner with property owners regarding potential mitigation actions.

ENVIRONMENT | 125
MAXIMIZE BENEFITS OF ECOTOURISM INDUSTRY
In Rockport there are many environmentally conscious tours that visitors and locals alike can enjoy. Rockport Kayak, for example, offers Kay-ak eco-tours where guests can get an up-close-and-personal view of many different marine an-imals without disturbing their habitats. Aransas Pathways was created out of a desire to maintain natural areas around the county and encourage residents and visitors to experience all that Rock-port and Fulton have to offer from birding and historical tours to kayaking and hiking. They have continually invested in clean-up efforts and seek funding to expand and connect the existing trail network. The city should continue working with Aransas Pathways to maintain the natural environment.The key to a successful ec-otourism industry and an environmentally sus-tainable community is education. By educating the community on conservation through raising awareness, communities can reduce the impact of tourism on their local ecosystem and increase environmental and economic benefits.
Flood-related education in coastal communities is becoming increasingly important. For coastal cities like Rockport, it is especially important to educate the community on the causes of flood-ing and the impact individuals have on the en-vironment with the goal of helping them make environmentally conscious decisions. An envi-ronmentally-minded community and flourish-ing ecotourism industry helps protect the eco-system which, in turn, protects the community from floods.
The planning team encourages the protection of assets related to ecotourism and the assistance of businesses and tourist attractions to evalu-ate ecological footprint. Rockport should work with the chamber of commerce and environ-mental groups to educate local businesses on the importance of environmentally-friendly practic-es, such as recycling, water and energy conserva-tion, and reducing the use of plastics.
Environmental education programs are an im-portant part of the protection of the environ-ment while encouraging a thriving ecotourism industry. The city needs to enhance community education programs for ecologically conscious tourism and lifestyles.
Because of Rockport’s geography and topogra-phy, it is often a destination for vacationers. The city has a thriving ecotourism industry due to its many offerings of outdoor recreation. The International Ecotourism Society (TIES) de-fines ecotourism as “responsible travel to natural areas that conserves the environment, sustains the well-being of the local people and involves interpretation and education.”29 The goal of ecotourism is to maximize environmental and economic benefits while minimizing ecological damage and disruption.
Texas Parks and Wildlife has a specific focus on nature-based tourism. Nature-based tourism comes in many forms. Whether it is kayaking through canals and marshes or biking and walk-ing through nature trails and wildlife reserves, tourists can experience nature through low-im-pact, ecologically sound activities.

126 | CHAPTER 7
REFERENCES
1 City of Rockport State of the Community Report. 2016. 2 Wildscapes: Plant Guidance by Ecoregion. (n.d.). Retrieved October 31, 2018, from https://tpwd.texas.gov/huntwild/wild/wildlife_diversity/wildscapes/ecoregions/3 Ibid4 T. (n.d.). Coastal Wetlands Species FactSheet Set. Retrieved October 31, 2018, from https://tpwd.texas.gov/publications/pwdpubs/media/pwd_lf_k0700_0849.pdf5 Ibid6 T. (n.d.). Texas Ecoregions, Descriptions and List of Endangered, Threatened and Species of Concern for each Ecoregion. Retrieved October 31, 2018, from http://www.taleofchipilo.com/pdf/2013/instructionalresources/otherresources/TexasEcoregionsInformation.pdf7 Davison, V. (n.d.). Critical Habitat | Sacramento Fish & Wildlife Office. Retrieved October 31, 2018, from https://www.fws.gov/sacramento/es/Critical-Habitat/8 Coastal Wetlands Species Fact Sheet Set. (n.d.). Retrieved October 31, 2018, from https://tpwd.texas.gov/publications/pwdpubs/me-dia/pwd_lf_k0700_0849.pdf9 Ibid10 Plant Guidance by Ecoregions. (n.d.). Retrieved October 31, 2018, from https://tpwd.texas.gov/huntwild/wild/wildlife_diversity/wildscapes/ecoregions/ecoregion_2.phtml11 Ibid12 Ibid 13 Coastal Bend Bays and Estuary Program. (n.d.). Publications. Retrieved from http://www.cbbep.org/publications2/14 City of Rockport State of the Community Report. 2016. 15 Wildlife Service, & National Standards and Support Team. (n.d.). Download Seamless Wetlands Data. Retrieved October 31, 2018, from https://www.fws.gov/wetlands/data/data-download.html16 Mission-Aransas National Estuarine Research Reserve. (n.d.). Bay Education Center. Retrieved from https://missionaransas.org/bay-education-center17 Rosen, R. (n.d.). Aquifers and Springs. Retrieved October 31, 2018, from https://texasaquaticscience.org/aquifers-springs-aquat-ic-science-texas/18 Ibid19 Groundwater Management Area 15. (n.d.). Retrieved October 31, 2018, from http://www.twdb.texas.gov/groundwater/manage-ment_areas/gma15.asp20 Texas Water Development Board. Retrieved October 31, 2018, from http://www.twdb.texas.gov/groundwater/aquifer/major.asp21 CITY OF ROCKPORT - Texas Sea Grant. (2016). Retrieved October 31, 2018, from http://texasseagrant.org/assets/uploads/re-sources/16-202_RockportStateOfCommunityReport.pdf22 Ibid23 Gonzales, P. (2018, October 14). San Patricio Municipal Water District gets flooded with awards. Retrieved October 31, 2018, from https://www.mysoutex.com/san_patricio_county/news/features/san-patricio-municipal-water-district-gets-flooded-with-awards/arti-cle_613962d8-cd95-11e8-8132-8fb2219f1e9d.html24 Water Conservation and Drought Emergency Plan. (n.d.). Retrieved October 31, 2018, from http://www.cityofrockport.com/494/Water-Plan25 Population and Water Demand Projections. (n.d.). Retrieved October 31, 2018, from http://www.twdb.texas.gov/waterplanning/data/projections/index.asp26 “What is a Hurricane?” National Ocean Service. Retrieved from https://oceanservice.noaa.gov/facts/hurricane.html27 Aransas County Multi-Jurisdiction Hazard Mitigation Action Plan. City of Rockport. http://www.cityofrockport.com/ArchiveCenter/ViewFile/Item/268628 Historical Hurricane Tacks. NOAA. https://coast.noaa.gov/hurricanes/29 Aransas County Multi-Jurisdictional Hazard Mitigation Action Plan - Section 11 Page 2. https://pubs.usgs.gov/of/2003/of03-337/landloss.pdf30 Land subsidence in Houston correlated with flooding from Hurricane Harvey. Miller, Megan Shirzaei, Manoochehr. Remote Sensing of Environment, volume 225, May 2019. https://doi.org/10.1016/j.rse.2019.03.022 31 “Flood Zones”. The Federal Emergency Management Agency. Retrieved from https://www.fema.gov/flood-zones32 Storm Events Database. NOAA, National Center for Environmental Information. Retrieved from https://www.ncdc.noaa.gov/stormevents/33 Aransas County Multi-Jurisdiction Hazard Mitigation Action Plan. City of Rockport. Section 17.http://www.cityofrockport.com/ArchiveCenter/ViewFile/Item/268634 Ibid35 Taking Mitigation to the Bank. Alan Wood. Dec 2018. Forest Landowners Magazine. https://americanforestmanagement.com/about-us/news/taking-mitigation-to-the-bank-mitigation-credits-offer-a-lucrative-upside-for-forest-landowners-who-have-the-requisite-proper-ty-patience-and-openness-to-conservation/6436 News Release from USDA. 2016. https://www.nrcs.usda.gov/wps/portal/nrcs/detail/?navtype=SUBNAVIGA-TION&ss=161029&cid=NRCSEPRD1264419&navid=105100000000000&pnavid=105000000000000&position=News&t-type=detail

8 F AC I L I T I E S

OVERVIEW
T he City of Rockport aims to maintain excellent quality of life by providing for residents’ and visitors’ basic needs, recreational areas, and a safe environment. As the city grows and attracts new residents and businesses, the services and facilities will play a major
part in the success and further development of Rockport. This chapter provides an inventory of the current community and governmental facilities.
The existing facilities are followed by in-depth recommendations for the existing and future community facility demands through the promotion and preservation of the historic resourc-es and cultural identity of the city.
CONDITIONS BEFORE THE STORM
SCHOOLS
Aransas County Independent School District serves five communities including Rockport and consists of 5 public schools and one private school. Public schools include Rockport-Ful-ton High School, Rockport-Fulton Middle School, Fulton Learning Center, Little Bay Primary School, and Live Oak Learning Center. All schools in Rockport, except Little Bay Primary School and Live Oak 1-3 Learning Center, met the standards of Texas Education Agency for Account-ability Rating in 2017.1

FACILITIES | 129
The private and learning centers in Rockport include:
• Sacred Heart Elementary School: Pre-Kind-er, Kindergarten, and First through fifth grades. The school was founded in 1981 and has a total body of 153 students.
• All Children Begin Learning in a Christian Environment (ABC) Learning Center: The non-profit corporation organized in 1976 for the purpose of providing educational programs for preschool age children within a Christian environment in preparation for public/private school.
Table 8.1 shows Rockport public schools by student enrollment and Accountability Rating in 2017 and Figure 8.2 shows the location of the public and private schools in Rockport.
There are two Community Development Insti-tute (CDI) Head Start locations within the City of Rockport. Head Start is a federal program that provides tools to enhance social, emotional, language and literacy development to low-in-come children up to the age of five. The CDI Head Start Rockport serves low- income disad-vantaged, pre-school children and their fami-lies.2 There are two CDI Head Start Rockport locations within the City of Rockport.
Table 8.1 Public Schools by Student Enrollment and Accountability Rating in Rockport, TX, 2017
School Name Grade Span StudentsAccountability
Rating 2017
Little Bay Primary School EE-PK 343Improvement
Required
Live Oak 1-3 Learning Center
1-3 788Improvement
Required
Fulton 4-5 Learning Center 4-5 492 Met Standard
Rockport- Fulton Middle School
6-8 777 Met Standard
Rockport-Fulton High School
9-12 987 Met Standard
Source: Texas Education Agency, Accountability Rating, 2017
The Aransas County ISD Education Founda-tion is a nonprofit organization3 committed to advancing education excellence in Aransas County, including the schools located within Rockport city limits.4 The foundation has sup-ported over $1 million in funds to the Rockport community through scholarships, grants, and an endowment.5 The funds are used to enhance the educational programs in campuses through-out the county. This program has been an asset to the community’s education and has assisted in making Aransas County the progressive edu-cational leader within the Coastal Bend.
HEALTHCARE SERVICES
It is important that all residents have convenient access to health clinics, acute care, and emergen-cy services. The following are the regional and local medical services that are available to Rock-port residents. Prior to the hurricane, Allegiance Ambulance, Code3ER, Rockport Urgent Care Center, and Care Regional Medical Center in Aransas Pass provided emergency and urgent care for Aransas County.

130 | CHAPTER 8
Figure 8.1: Rockport Public Schools

FACILITIES | 131
Regional Medical Services
Christus Spohn Health System provides medical services throughout the Coastal Bend. The sys-tem consists of six hospital campuses, six family health centers, and a variety of other services. Christus Spohn does not have any facilities in Rockport; however, there is one Family Medi-cine location in Portland.
Care Regional Medical Center is located in Aransas Pass and provides a variety of emer-gency to specialty services. It has 75 beds, 80 physicians, and 200 employees. This structure serviced the entire peninsula, about 90,000 peo-ple,7 but was severely damaged in the storm and has since been closed with no concrete plans for reopening. This has left a significant void in the community further exacerbating poor access to health care services.
The Coastal Plains Community MHMR is lo-cated in Portland, Texas about 20 miles south of Rockport. The facility provides mental health services and programs for those with intellec-tual and developmental disabilities. There are two mental health clinics in Rockport, Aransas County Mental Health Clinic and the Rockport Clinic Youth and Family Service Center.
Allegiance Ambulance provides three vehicles for EMS and 911 calls in Aransas County.
Rockport Medical Services
Rockport Urgent Care is managed by Twin Fountains Medical Center. In addition to ur-gent care, it offers basic services such as physi-cals, x-rays, pediatrics, and vaccinations/immu-nizations. The center closed indefinitely on May 29, 2019.
Rockport has three facilities that serve as nursing homes, adult day care centers, and rehabilitation units: Gulf Pointe Plaza, Rockport Coastal Care Center Inc., and Oak Crest Nursing Center.
MICRO HOSPITAL PROPOSITION
After Hurricane Harvey, Rockport and the surrounding cities were left with a deficit in emergency medical facilities. In June 2019, Aransas County commissioners and city officials met to discuss the potential for a new hospital facility in Aransas Coun-ty like no other medical facility in the coun-ty.
The proposed facility is a micro-hospital that will fulfill the need for emergency and acute-care medical services. Micro-hospi-tals are small-scale inpatient facilities with between eight and fifteen short stay beds. These facilities can provide many of the same services as a full-scale hospital but are much less expensive to run.
The county has formed an agreement be-tween the county and Texas A&M College of Medicine and other governmental enti-ties and paid the fees to initiate a study, supporting the establishment of this new medical facility. Funding is said to come from the Community Development Block Grant - Disaster Recovery (CDBG-DR).
http://bit.ly/2yNXyo7

132 | CHAPTER 8
Medical Facilities TypeRockport Urgent Care Emergency care
faciltiesCoastal Medical Clinic Medical clinic and labMedical Beaches Medical clinic and labCorpus Christi Heart Clinic
Rockport Medical Clinic
MCCI Medical Gulf Side
Medical Clinic
Health Care Profes-sional Equipment Services
Medical Clinic
Liugao Health Medical ClinicRockport Physical Medicine PA
Medical Clinic
Premier Sleep Disor-der Center
Medical Clinic
Rockport Pediatrics Medical ClinicDiabetes Cardiovascu-lar of Rockport, PLCC
Medical Office
Humpal Physical Therapy
Physical Therapists
Interna Medicine Associates
Hospitalist
Live Oak Family Med-icine
Primary/Family Medi-cal Clinic
Table 8.2: Rockport Medical FacilitiesFour companies provide hospice and home health services: AIM Hospice, Cornerstone Home Health, Harbor Hospice, and Sea Crest Home Health. Table 8.2 shows medical facilities available in Rockport.
GOVERNMENTAL INFRASTRUCTURE
Governmental facilities in the City of Rockport include the city hall, which, as of the comple-tion of this Comprehensive Plan, has been de-molished, Rockport Service Center, a public library, Aransas County Appraisal District and the county courthouse. In 1956, the Woman’s Club of Aransas County established the Aransas Public Library. Before Hurricane Harvey, Aran-sas County Courthouse was located in the south region of Rockport since 1956.8
After Hurricane Harvey, some government fa-cilities were left in a bad shape and had to re-locate. Currently the courthouse is located in a strip mall at the corner of Henderson St. and Highway 35, but construction for the new loca-tion is underway on or within a short distance of where the old courthouse stood. This new lo-cation will be known as The Downtown Anchor Project and will soon be home to the courthouse and city hall complex. The Anchor Project is a joint venture between the City of Rockport and Aransas County and it is a major step toward recovery and reconstruction of the government facilities that were lost to the hurricane. The new facility will include the Aransas County Court-house, Rockport City Hall, and public meet-ing spaces. The estimated cost of the project is around $16.4 million for the county and $8.4 million for the city.
In addition to the devastation of the courthouse many other government facilities experienced damage and a slow down in services. The Aran-sas County Appraisal District and Rockport City Hall also sustained damage. Rockport Post Offices took a hit and operated with reduced services following the storm.

FACILITIES | 133
POLICE AND FIRE SERVICES
To keep its residents safe, the city has a police department and fire department that is com-prised of four fire stations. The Rockport Vol-unteer Fire Department is a nonprofit organi-zation that serves Rockport and consists of four fire stations. Since 1855, the Fire Department has served as an organization independent from the City of Rockport; however, the department receives annual funding through the city’s “Gen-eral Fund.” The stations comply with the Texas Commission on Fire Safety Protection and fi-nancial procedures. The organization is provided funding through the City of Rockport’s General Fund, Aransas County, and the Rural Volunteer Fire Department Assessment Program.
The organization is made up of approximately 50 volunteers who do an impressive job with providing aid for the community. The city en-courages residents to volunteer if they are will-
Figure 8.2: Map of Critical Facilities in Rockport, TX
ing and able to go through the mandatory train-ing and assist this organization.
The City of Rockport adopted the 2006 edition of the International Fire Code, which prohib-its the burning of brush, trash, or other rubbish within the city limits without the expressed per-mission of the Fire Marshal.
The Rockport Police Department conducts a variety of monitoring activities throughout the community including motor, tactical bike pa-trols and water safety. The department includes a “Criminal Investigation Division” which re-views and investigates reports of felony and misdemeanor criminal acts. This department also prepares for cases for prosecution with the U.S. District, County and City Attorneys’ of-fices. Rockport’s critical facilities can be seen in Figure 8.2.

134 | CHAPTER 8
WATER, WASTEWATER, AND PUBLIC WORKS
Rockport’s Public Works department is in charge of maintaining the streets, infrastructure, drainage, natural gas, environmental services, building maintenance, and water storage and distribution. The San Patricio Municipal Water District (SPMWD) was created in 1951 by the Texas Legislature. San Patricio purchases and treats untreated water from the City of Corpus Christi. The City of Rockport then purchas-es this water supply from the SPMWD.9 The Rockport Public Works Water Storage and Dis-tribution Department services maintains over 9,000 water connections and over 100 miles of waterlines.10 The department maintains two pump stations, four ground water storage tanks, one wastewater treatment plant, and three ele-vated tower storage tanks.
The wastewater collection and treatment de-partment maintains over 4,000 sanitary sewer connections and over 60 miles of sanitary sewer lines. The department performs daily inspec-tions, cleaning, and maintenance of 40 sanitary sewer lift stations.11
The City of Rockport has a Master Drainage Plan that includes a prioritized list of drainage improvement projects. Following Hurricanes Ike and Dolly, the city received $2 million dol-lars in disaster relief funds to complete two of the Master Drainage Plan projects that helped to ensure water is flushed offshore rather than being allowed to sit in developed areas.12 After Hurricane Harvey, Aransas County complet-ed a Long Term Recovery Plan with assistance from Texas Sea Grant and prioritized a number of drainage improvement projects to alleviate flooding in different regions of the County.
PARKS
Rockport has twelve parks totaling an area of about 200 acres which includes (Figure 8.3):
• Publicly-owned local, state, and national parks
• School parks with a joint-use agreement with the local government
• Privately-owned parks managed for full public use.
The City of Rockport maintains several city parks, school parks, and sport fields. The Com-munity Aquatic Park is collectively funded by the City of Rockport, Town of Fulton, and Aransas County. The Aquatic Park consists of a skate park, a multipurpose, a competition, and a recreational pool that are accessible year-round. The pools offers eight lanes in a 25-yard pool with a diving area, a whale-shaped children’s pool with slides and a bathhouse. Adjacent to the Aquatic Park is a skate park, playground, and two nature trails.
Memorial Park is Rockport’s largest park totaling over 100 acres, including recreational facilities, athletic fields, exercise stations, birding sites, a dog park, and picnic facilities. Additionally, the Park includes 1.65 miles of paved Hike and Bike trails and a ¾ mile Nature trail with interpretive signs and rest benches.13
Recently, the Memorial Park Ball Fields under-went renovations after the hurricane destroyed the old playing fields. The renovations conclud-ed in March 2019. The city continues to push efforts to better the community and ensure allo-cation of resources from the city Annual Budget.

FACILITIES | 135
Figure 8.3: Existing Parks, Schools, and Facilities in Rockport, TXSource: City of Rockport

136 | CHAPTER 8
Other city parks include the Tule Creek Hike and Bike Trail, Compass Rose Park, Zacha-ry Taylor Arboretum Park, Mathis Park, Bent Oaks Rookery Park, Spencer Park, Magnolia Park, Tule Park, Pride Park, Wetland Pod/Demo Garden, and Water Street Hike and Bike Trail.
Rockport Beach is a major attraction for resi-dents and tourists alike. The land adjacent to Aransas Bay offers a lot of activities for people to enjoy such as fishing, birding, a pavilion that can be rented out and a 800’ fishing pier to name a few.
Aransas County and the Cities of Rockport and Fulton have many unique and beautiful natural resources anyone can enjoy. Aransas Pathways works to maintain the natural environment and provides opportunities for birding, tours, kaya-king, and hiking.
Goose Island State Park is located north of the city near the community of Lamar and com-prises of an island and mainland park contain-ing some of the oldest trees in the region. Tex-as Parks and Wildlife maintain the park and, though they do not recommend swimming due to the terrain, concrete bulkhead and oyster reef restoration activity, there are plenty of ways to enjoy the space including hiking, camping, fishing, boating and birding. The state park is tucked away in a neighborhood but still com-prises of 101 campsites with water and electric-ity, restroom and shower facilities, a 1,620-foot long fishing pier, a regular boat launch, a kayak/canoe launch and a fish cleaning station.14
Figure 8.5: Memorial Park trailsSource: www.tripadvisor.com
Figure 8.4: Memorial ParkSource: www.tripadvisor.com
Figure 8.6: Compass Rose ParkSource: www.rockport-fulton.org
Figure 8.7: Zachary Taylor Arboretum ParkSource: www.tripadvisor.com

FACILITIES | 137
ARTS AND CULTURE
Rockport Cultural Arts District
Located in Downtown Rockport, the Cultural Arts District is home to many galleries, restau-rants and shops that reflect the culture and val-ues of the city. The purpose of this area is not only to enhance the economy of Rockport, but also enhance public spaces and to preserve and encourage cultural understanding and appreci-ation.
Throughout the year, residents and visitors can count on a full schedule of cultural and arts events in and around the Cultural Arts District, from art camps for kids to open markets, and festivals.
The Rockport Center for the Arts (RCA)
The Center is a hub for the Arts in the beautiful coastal Rockport-Fulton area, and 2019 marks the 50th Anniversary of the Center in Rockport. The original location was severely damaged by Hurricane Harvey, but the new temporary facil-ity is now open. After Harvey, the community joined together to rebuild and get the Center back up and running. Less than a month after the hurricane, the youth programs were back and just two months later, RCA hosted its an-nual Film Festival. Because of the damage sus-tained during the hurricane, Rockport is plan-ning to rebuild and expand the RCA facilities.
RCA has a goal of encouraging cultural tourism in Rockport, so throughout the year, the RCA hosts 10 exhibits a year featuring both local and visiting artists, events, workshops and classes for all ages, sculpture garden, and much more.
Rockport Art Loop
The Rockport Art Loop was initiated in 2019 as the newest cultural activity in Rockport. Nine Saturdays a year, the Austin Street corri-dor features seven simultaneous gallery open-ings to give residents and visitors the oppor-tunity to walk around and experience as many galleries as they desire.
Figure 8.8: Rockport Center for the ArtsPic Courtesy: Emily Tedford
In addition to the RCA, participating Art Loop Galleries include:
• Anita Diebel Studio• Yellow Rose Gallery• The Gallery at Latitude 28° 02’ Restaurant• Coast Modern• Wind Way Gallery• The Gallery Collection at Maison• Estelle Stair Gallery• John Martell Photography• Stan Irvin Unique Clay Works
Figure 8.9: Public Art in the Downtown Picture Courtesy: Emily Tedford

138 | CHAPTER 8
Rockport Art Festival
What began as a way to stimulate the arts econ-omy has grown to become a major summertime event with over 120 artists presenting their work to the over 10,000 festival attendees. In addition to artist presentations, visitors can enjoy the gift shop, the kids’ tent, and a big, central tent which houses food, drinks, live music, and air condi-tioning to give attendees a break from the Texas summer heat. Proceeds from the Art Festival go back to the RCA in order to continue providing its year-round free and low cost programs.
Art Educator Days
Every year, RCA hosts art educators from across South and Central Texas to come together and learn new ideas and strategies for their class-rooms. They are able to collaborate and learn from one another to develop new skills, ex-change lesson plans, and build relationships with others in their field.
Rockport Clay Expo
The annual Clay Expo takes place every Febru-ary and hosts dozens of potters to exhibit and sell their work. Attendees can visit with the art-ists and learn about their work during an hourly demonstration. In addition, each artist donates a piece of their pottery for a Silent Auction.
Rockport Film Festival
The Film Festival takes place during the first weekend in November each year. It begins with a Red Carpet Event the Thursday before and screens films all day Friday and Saturday. The Festival has six categories of independent films that are made by filmmakers from the U.S. and abroad: documentary feature, fiction feature, documentary short, fiction short, an-imated short, and student film. The Rockport Film Festival provides residents and visitors with a unique and innovative event during what is typically an off-season for tourism.
Figure 8.10: Rites of Spring by Kent UlbergSource: Rockport Art Center
Figure 8.11: Spirit Columns by Jesus Bautista MorolesSource: Rockport Art Center

FACILITIES | 139
Classes & Workshops
RCA offers hands-on classes and workshops in many mediums, from painting and drawing to jewelry and metalwork and mediums that are not typically seen in Rockport.
Artist-In-Residence Program - The program in-vites artists to Rockport for a month long stay to get out of their normal environments and ob-ligations. RCA has had artists from Massachu-setts, Pennsylvania, North Carolina, Kentucky, California, and Holland. The visiting artist ex-hibits their work in the RCA’s main gallery, and teaches free workshops for high schoolers and the community.
Penny Redmon Visiting Lecturer Series - The Series began in 2016 and brings up to four art-ists from outside the community to the RCA. Visiting artists present their work through pub-lic talks and hands-on workshops for members. The program promotes highly accomplished art-ists and introduce the community to their style and media.
Sculpture Garden
The Sculpture Garden was opened in 2000 after the dedication of its first permanent sculpture by Kent Ullberg, Rites of Spring. Since then, the garden has expanded to include works from many other local and visiting artists. Before he passed unexpectedly in 2015, Jesus Bautista Moroles lived and worked in Rockport. Three of his massive, granite sculptures are located in the sculpture alongside dozens of others. While some of the sculptures sustained damage during Hurricane Harvey, none were lost. In August 2018, a complete beautification of the Garden was completed for the enjoyment of residents and visitors.
COMMUNITY EVENTS
Throughout the year, the Rockport communi-ty is host to a variety of events. Several of the events are described below and are just the be-ginning of the fun that brings the community together year after year.
C.A.D Kite Festival
Every spring, the Rockport Cultural Arts Dis-trict hosts the annual Kite Festival at the festi-val grounds. This event features professional kite-flying demonstrations, kiteboarders in the ski basin, food vendors, and live music. The Fes-tival is a great, family-friendly event for residents and visitors alike to come and enjoy the spring-time weather and have fun.
Crawfish Boil
To celebrate Memorial Day and support great local cause, the Coastal Bend Troop Support, Inc. hosts the annual Crawfish Boil as a tribute to Active Military and local Veterans and raise money for care packages. It hosts many different vendors, auctions, and drawings to benefit the organization.
Figure 8.12: Office of the Rockport PilotPic Courtesy: Emily Tedford
Although it has been restructured and re-named a number of times, The Rockport Pilot newspaper has been Rockport and Fulton’s source for news since 1868.
THE ROCKPORT PILOT

140 | CHAPTER 8
Figure 8.14: Vendors and shoppers at a Rock-port-Fulton Market DaySource: fultonmarketdays.com
Figure 8.13: Kite Demonstration at the FestivalSource: Rockport Chamber of Commerce
Festival of Food and WineThe Festival of Food and Wine is an annual event hosted by the Texas Maritime Museum that brings wine, food, and fun together for an exciting event. The Festival provides over 75 va-rieties of wine, craft beer, local cuisine, vendors, and live music.
Gospel Music FestivalThe Gospel Music Festival began back in 1994 as a concert hosted by “Rockport’s Gospel Force” police quartet. It has since grown to a full weekend festival. Because of Hurricane Harvey, the 2018 festival was cancelled, but they were able to come back in 2019 and are planning for the upcoming year. The family-friendly festival takes place at First Baptist Church and wel-comes everyone to attend. They bring in music artists from all over the country to perform. Market DaysOn the third Saturday and Sunday of every month, the Rockport-Fulton Market is open for artists, crafters, and resellers to come together and sell their products. During Market Days, visitors and residents come to shop, enjoy the live music, and have some great food.
Nautical Flea MarketIn 2019, The Rockport Yacht Club hosted its 19th Annual Nautical Flea Market. The Market offers a wide variety of nautical-themed items for sale. Vendors bring many handmade and used nautical items relating to fishing, sailing, powerboating, and more. This event is an hom-age to Rockport’s seafaring history and has been very popular over the years. In addition to the many vendor booths, the Market also provides several food trucks for guests to enjoy.
Whooping Crane StrutThe Whooping Crane Strut has taken place ev-ery year for the past 31 years which includes a 2-mile walk, a 5k run, and a 10k run. The funds raised by the races go to the Friends of Aransas and Matagorda Island (FAMI) “Water for Wild-life” fund to provide fresh water for Whooping Cranes and other wildlife on the Aransas Na-tional Wildlife Refuge.
Figure 8.15: Whooping Crane Strut mascot Super WhooperSource: Aransas National Wildlife Refuge

FACILITIES | 141
HURRICANE HARVEY IMPACT
Hurricane Harvey spared no mercy on Rock-port’s community facilities. Over 1,000 of Rockport’s structures were destroyed by the hurricane, 2,261 were majorly damaged, and 3,000 were minimally damaged. Such destruc-tion requires the city to put together a plan to rebuild and restore those structures, so the city can get up and running again. As of April 2019, about 93% of Rockport’s businesses, churches and organizations, and facilities are open, with more slated to open in the coming months and years.
Some of the educational facilities were impacted by Hurricane Harvey which caused a decrease in student enrollment by as much as 500 students or about 15%. Overall, Aransas County ISD facilities sustained more than $55 million in damages. The damage from the hurricane lead to the permanent closure of Little Bay Primary School. The property has been sold to the Rock-port Land Trust.
Figure 8.16: Hurricane Harvey’s destruction of the Heritage DistrictPicture Courtesy: Kate de Gennaro
Figure 8.17: The Aquarium at Rockport Harbor after Hurricane HarveyPicture Courtesy: Kate de Gennaro
Rockport Center for the ArtsThe plan for the expansion of the Center for the Arts will include a main arts building with classrooms, exhibit spaces, multipurpose rooms, and a kitchen. The second building will be dedicated to performance and cine-matic arts and a convention space for busi-ness meetings. This dedicated center will be designed to uphold Rockport’s character to draw in visitors and residents alike.
This expansion is projected to bring in an es-timated 114,500 visitors a year. The project was funded through an Economic Develop-ment Administration Grant.
Rockport Beach PavilionsThe beach pavillions experienced a great deal of damage from the hurricane. and have since been renovated and are now open for the public.
Additionally, Rockport Beach is undergoing a makeover. Cabanas and barbecue pits are being replaced and more palapas are being added along the beach. A children’s play-ground is being donated by the Lions Club along with benches. More sand is being add-ed to the beach for visitors and residents to enjoy.
Figure 8.19: RCA Renovation Source: Dykema Architects.INC
Figure 8.18: Rockport Beach PavilionsSource: www.tripadvisor.com
The City of Rockport and other stakeholders have over $50 million in public projects on the following projects.
THE FUTURE OF COMMUNITY FACILITIES

142 | CHAPTER 8
THE FUTURE OF COMMUNITY FACILITIES
Aquarium at Rockport HarborThe Aquarium is being rebuilt with the fund-ing by insurance proceeds and federal public assistance dollars. This is an important proj-ect as the Aquarium is a big part of Rock-port’s tourism industry and provides activi-ties for low income families.
Downtown Anchor ProjectThe Downtown Anchor Project will be the governmental hub of Rockport and will house City Hall, the Courthouse, and public meeting spaces. The new site will be next to the location of the former Aransas County Courthouse and county jail and offices.
Figure 8.20: Aquarium at Rockport Harbor Source: mnkcusa.blogspot.com
Figure 8.21: Downtown Anchor Project LayoutSource: www.virtualbx.com
PUBLIC FEEDBACK
As Rockport continues to grow, residents will require and desire places for recreational activ-ities. Parks provide quality-of-life and can im-pact whether residents and businesses move to a community. Residents that participated in the public outreach meetings, identified the need for many different types of community facilities and engagement programs to fit the makeup of the families and individuals that live here. For example, Rockport lacks entertainment facili-ties for all ages and income levels since the lo-cal movie theater shut its doors in 2017. Many residents commented on the need for public re-strooms in more heavily trafficked public areas. They desire things like an amphitheater for con-certs, arcades, trampoline parks, a movie theater and a bowling alley. The Rockport Aquarium is of primary concern for the community as it is a center for education and tourism. Currently, the Aquarium is closed, but the desire to see it rebuilt and open once again is strong.
Public feedback shows that there is a com-munity-wide desire for multi-use facilities or a community center to house youth and kids programs and other community events.
Residents indicated the maintenance and preservation of Rockport’s history, charm and culture as a high priority. They expressed the desire for investment in arts and cul-tural centers. They suggest different ideas for events like arts and writers festivals and murals/public art displays in the heritage dis-trict.

FACILITIES | 143
RECOMMENDATIONS
EFFICIENT INFRASTRUCTURE
Investments in public parks and spaces to in-crease the number of recreational facilities will better meet the needs of future and current residents. The city should leverage funding for park maintenance and green infrastructure proj-ects. It is recommended that the city adopts a trail dedication ordinance that requires land dedication (or fee-in-lieu) for trails, parks, and improvements. This ordinance needs to require developers to dedicate and construct trails or to invest in public spaces. The planning team rec-ommends that the city identifies possible corri-dors to further expand and connect the existing trail network in Rockport. For example, the land at the crossroad of Bypass 35 and 3036 could be acquired and turned into a trail.
Utility easements are recommended to con-nect parks and open spaces (Aransas Pathways) throughout Rockport by developing an im-plementation plan that encourages utility and drainage easements.
The city needs to increase the number of public facilities to meet the needs of current and future residents of all ages. The planning team recom-mends that the city collaborates with Aransas County ISD to provide neighborhood parks by considering keeping school playgrounds open after hours for the use of residents in neighbor-hoods near schools. The city should also partner with the Nature Conservancy to identify park-land and open space in the floodplain that can be suitable and acquired for wildlife habitat, floodplain mitigation, or wetland banking. It is encouraged to have public offices and activity centers near residential areas in the downtown and bypass areas to promote convenience and accessibility. A partnership with the Parks & Leisure Services Board is recommended to rec-ognize recreational opportunities in Rockport.
Rockport should enforce strict building codes on community facilities and civic buildings. Further, the city should continue to complete capital improvement projects that have been identified to build resilience.
PLAN INTEGRATION
OPEN SPACE IN FLOODPLAINEvaluate areas in the floodplain viable for open space preservation
PLAN INTEGRATION
RESILIENT FACILITIESEnsure for community facilities and civic buildings are fortified and enforce building to strict building codes.
PLAN INTEGRATION
CAPITAL IMPROVEMENT PROJECTS• Fund drainage projects that were
modeled in the 2016 Drainage Master Plan Modeling Report
• Design and conduct an engineering study to address flooding in downtown Rockport
• Repair outfalls of pump station that pump into Aransas Bay
• Build City Hall to withstand future flood events
• Little Bay Hydraulic Restoration - remove sediment from the bay and use it for nourishment and habitat restoration projects.
MFMP
HDMP
MFMP

144 | CHAPTER 8
Improvements, promotion, and economic re-structuring in Rockport is important for down-town heritage revitalization. The city should explore the possibility of using tax increment financing or other funding mechanisms in the historic downtown to redevelop and bring new life into the area.
As a community that reveres the arts and its nat-ural beauty, art and beautification in the parks, open spaces, and Historical Downtown is highly recommended. The Cultural Arts District and the Center for the Arts can help in the establish-ment of a public art grant program that encour-ages public art installations and strategic place-making activities throughout the city.
Encourage residents to help with park beautifi-cation through volunteer programs that also in-clude a socialization aspect. This can achieve the goal of enhancing the parks while also building community support and gathering their input on what they want to see in public spaces and parks. Local businesses and groups can get in-volved with the creation of an “adopt-a-park” model, mirrored after the “adopt-a-highway” model, and market to local businesses to get buy-in for beautification initiatives.
To attract future investments and visitors, the city needs to enhance and maintain the char-acter and resilience of the community. The city should create a Branding/Wayfinding Design Manual and signs to execute common charac-ter elements for public facilities, beach facilities, parks, and private sector buildings as old ones are rebuilt and new ones are constructed. Strong relationships, city beautification and the com-munity’s sense of place can be maintained and enhanced through programs like “Keep Aransas County Beautiful” and “Aransas Pathways” and organizations like Texas A&M Agrilife County Extension. Evaluate and amend the Heritage District Zoning Overlay Code with the goal of preserving and enhancing the strip. Various funding sources can be explored and considered for infrastructure and community improve-ments of historic and cultural assets.
During the outreach portion of the compre-hensive plan update, emphasis from commu-nity members was placed on the city’s need to maintain historical and cultural heritage of the region to preserve its unique character and to encourage community members in prioritiz-ing conservation in the future. The city should continue supporting and promoting events and workshops about the culture and history of Rockport. The city can promote its history and culture through an agritourism plan that highlights the significant impacts from the civil war, the cattle industry and the presence of the chamber of commerce. Aransas Pathways would be an ideal organization to collaborate with on this effort.
Work with entities such as 4-H club, Agrilife Extension, and the Aransas County Indepen-dent School District to increase the amount of education and related programs for the youth to engage them in community development at a young age. Based on feedback, the planning team suggests establishing a systematic approach to identifying and focusing resources to further foster education and youth programs. For exam-ple, the city’s Environmental Services program can assist in facilitating education and engage-ment activities with the natural environment to educate local youth on the importance of the environments’ place in the community. During a public meeting at the Agrilife extension office in May, resident participants expressed the im-portance of Agrilife in fostering youth education and outreach and feel that this organizations’ contribution to the community is invaluable, and in order to ensure their services continue, the organization should seek out more collab-orative opportunities with the city, county and independent school district. These programs can take place at a centrally located, easily accessible public community facility. A preferable location for the center will be near the high school and middle school.
PROMOTE AND PROTECT THE HERITAGE AND CULTURE OF ROCKPORT

FACILITIES | 145
CASE STUDY: PUBLIC RESTROOMS IN THE DOWNTOWN
The Portland Loo was first installed in the Old Town Chinatown neighborhood of Portland in 2008. Since then, dozens of free-standing restrooms have been installed around Portland, ad-dressing the problem of public safety in public restrooms.
The modern and durable design is easily maintained and sustainably built. Its design discourages criminal activity by coating the walls with a graffiti proof coating. The slats on the walls provide privacy for users while allowing law enforcement to monitor activity. The free-standing stalls are built with Crime Prevention Through Environmental Design (CPTED) standards by placing them in visible areas with open sight lines.
These facilities are installed in areas that are heavily trafficked in order to provide service to a variety of people from shoppers to beach goers and special event attendees. The walls can even be wrapped in vinyl to show artwork or advertisements.
Other cities around the country are following suit, and several Texas cities are giving the Portland Loo a shot. In 2017, Galveston installed their first Portland Loo as part of the city’s beautification project. San Antonio installed their second Portland Loo in 2018 after the city saw improvements in criminal activity and public sanitation. In Austin, some temporary public restrooms are being tested before installing Portland’s model.
Support resources for public restrooms can be found through the World Toilet Organization (WTO) and PHLUSH (Public Hygiene Lets Us Stay Human).
Figure 8.22: The Portland Loo Source: portlandloo.com

146 | CHAPTER 8
PLAN INTEGRATION
AMENITIES AND BEAUTIFICATION Activate Austin Street daily by providing movable tables, chairs, and umbrellas. Moveable fur-niture provides maximum flexibility by allowing users to sit alone, in groups, in sun or in shade. If there are concerns of theft, chairs and tables can be secured with long locked cables that still allow portability within a certain distance. Ideally, the tables and chairs would only be secured overnight to ensure maximum flexibility.
Develop and provide public restrooms in any public park improvements, marina and waterfront development, and public buildings downtown. Explore creative mechanism to develop public restrooms downtown to serve visitors and residents alike
Consider setting aside funding for public artwork and programming. Explore developing a one percent-for-art-ordinance in Rockport. A “one percent for the arts” program specifies that one percent of eligible city capital improvement project and private development funds be set aside for the commission, purchase, and installation of artworks, including art related events and cre-ative placemaking in the Cultural Arts District and Downtown Rockport.
CASE STUDY: COMMUNITY AND PARK BEAUTIFICATION
Given the community’s desire for the arts and youth involvement, the city can put forth a volun-teer program dedicated to art installations and murals around Rockport. Great examples of such programs can be seen in Seattle, Washington and in San Francisco, California.
Urban Artwork is a non-profit organization that was founded in Seattle with the mission to “cre-ate public art that empowers the young people and transform communities.” The program was started as an effort to clean up the trash and graffiti in the industrial zone with the help of at risk-youth volunteers as a strategy to keep them out of trouble. Today the program has had a big impact in its community and provides an after school mural program, summer youth program, young curators program, and a mural intern/apprentice program. The programs not only teach the youth about art, but also instill in them a sense of responsibility by allowing them to plan, build solid relationships, and earn money for the time they spend creating large scale public art pieces.
The program in San Francisco is called Precita Eyes Muralists. The organization is “committed to enriching communities through collaborative murals that celebrate culture, unity, history, and nature.” The individuals that run the organization focus on collaboration and dedication to de-veloping the individuality of each community with which they work. The organization not only produces murals, but also provides educational programs and festivals and gets involved in other programs such as community gardens.
Both programs are great examples of volunteer programs that can assist in beautifying the city and assisting in the maintenance of parks and public spaces. By working off of the efforts of Agrilife County Extension agents and their 4H program, the city can pilot a volunteer program that can engage the youth and the rest of the community in the arts and the history of Rockport.
RPAT

FACILITIES | 147
Figure 8.24: Mock-up of Rockport ParkSource: www.nrpa.org
POCKET PARKS
Downtown areas often have vacant lots that can decrease appeal. Pocket parks are a small-scale solution for open or unused spaces, providing an opportunity for community beautification and recreation. These parks are not usually larger than ¼ of an acre in urban areas surrounded by buildings or houses. They provide safe, inviting spaces for community members for small event space, play areas for kids, relaxing and meeting friends, or even taking lunch breaks during work. Open spaces can be filled with programming that enhance social and economic income (Ex. Food Truck Park).
Over the last decade, Austin, Texas has seen new pocket parks popping up or being revitalized throughout the city. Now, there are 20 parks that provide quaint neighborhood getaways rather than citywide attractions. In the pocket parks, residents and visitors can take advantage of the small-scale green space, picnic areas, splash pads, play spaces for kids, and sport courts. Reno-vation and construction projects of the pocket parks are planned by the city’s Parks Department and with input from community members. Community involvement and neighborhood improve-ments have made Austin’s many pocket parks into popular tourist and resident destinations.
During Rockport’s meeting with the CPAT Team in May of 2019, the planning team presented dif-ferent ideas for downtown design and vitality improvements. With the goal of creating linkages and gathering spaces and enhancing the experience of Downtown Rockport. Based off of Texas A&M Landscape Architecture student presentations, the CPAT team suggested the implementa-tion of pocket parks within Downtown Rockport in the unused open spaces in the area to fulfill needs for social meeting areas, public art showcases, environmental learning opportunities, and play spaces for children. In their presentation, they provided example illustrations, generated by a Texas A&M Landscape Architecture student, of locations and what the pocket parks can look like in Downtown Rockport.

148 | CHAPTER 8
REFERENCES
1Texas Education Agency, 2017 Accountability List by Campus. Retrieved fromhttps://rptsvr1.tea.texas.gov/perfreport/account/2017/srch.html?srch=C
2Welcome to Benefits.Gov. Benefits.Gov. Accessed September 5, 2019, https://www.benefits.gov/benefit/616
3Aransas County ISD Education Foundation. Accessed September 5, 2019, https://www.acedfoundation.org/about/
4Aransas County ISD Education Foundation. Accessed September 5, 2019, https://www.acedfoundation.org/about/
5Aransas County ISD Education Foundation. Accessed September 5, 2019, https://www.acedfoundation.org/about/
6Alvarado, Beatriz. Aransas County ISD’s post-Harvey comeback includes new trees. August 28, 2018. Retrieved from https://www.caller.com/story/news/education/2018/08/28/aransas-county-isds-post-harvey-comeback-includes-new-trees/1089695002/
7Alanis, Taylor. Aransas Pass still without a hospital. January 23, 2018. Retrieved from, https://www.kiiitv.com/article/news/local/aransas-pass-still-without-a-hospital/503-511041791
8Aransas County Courthouse, Rockport, Texas. All About Texas Cities, Towns, Counties, History, Legends, Syndicated Columns, Trips, Photos, Vintage Maps. Accessed September 5, 2019, http://www.texasescapes.com/TexasGulfCoast-Towns/Rockport-Texas-Aransas-County-Courthouse.htm
9Water Conservation and Drought Emergency Plan, Rockport, TX. Rockport, TX - Official Website. Accessed September 5, 2019, https://www.cityofrockport.com/494/Water-Plan
10Water Storage & Distribution Department, Rockport, TX. Rockport, TX - Official Website. Accessed September 5, 2019, https://www.cityofrockport.com/81/Water-Department
11Water Storage & Distribution Department, Rockport, TX. Rockport, TX - Official Website. Accessed September 5, 2019, https://www.cityofrockport.com/82/Water-Department
12Texas Sea Grant. State of Community Report. City of Rockport, TX. Summer 2016.
13Rockport Parks, Rockport, TX. Rockport, TX - Official Website. Accessed September 5, 2019, https://www.cityofrock-port.com/116/Area-Parks.
14Goose Island State Park — Texas Parks & Wildlife Department. Accessed September 5, 2019, http://www.tpwd.texas.gov/state-parks/goose-island

IMPLEMENTATION9

150 | CHAPTER 9
PRIORITIZE & IMPLEMENT
R ockport’s vision statement is: “Rockport is a friendly, culturally diverse, and economically vibrant community that respects its history and embraces the arts and humanities while preserving the best of small town life on the water, including health, beauty, comfort and safety.” The Compre-
hensive Plan and its goals, objectives, and action items are a reflection of that vision. In order to fulfill that promise to the community, implementation must be a thoughtful, organized process. These strat-egies and policies are meant to align with the needs, opportunities, and existing initiatives.
The items in this chapter are not just a list of ‘to-dos’, they are an outline for the process that requires various leaders and coordination within the community to achieve the goals and objectives to make the community the best it can be.
The Comprehensive Plan is meant to be a ‘living document’ that is visited regularly. The Implementation Table specifies recommended policy changes, goals, objectives and actions, along with an annotated timeline with responsible parties involved. It also identifies potential opportunities to finance imple-mentation of actions or projects, outlining potential grant opportunities. Comprehensive Plans are liv-ing documents that need ongoing evaluation and monitoring to ensure the relevance and effectiveness for the city.

IMPLEMENTATION | 151
PLAN MAINTENANCE
Stakeholders and those responsible for certain action items should continue to ensure that their action items are being fulfilled in order to con-tinue to be an asset to the community’s needs. The city can amend the Comprehensive Plan in order to respond to changes in conditions or needs of the community, to improve or clarify content, or to incorporate other documents or plans. To help evaluate Rockport’s progress, an agreed upon time frame is needed. The Imple-mentation Table contains information regarding the suggested time frame for each of the Action Steps, separated into four categories:
1. Short-term: 0 - 5 years2. Medium-term: 5 - 10 years 3. Long-term: 10 - 20 years4. Continuous (“On-going”)
ACTION TYPE
Capital Project Program: The Capital Project Action Type means there will be a significant investment in order to achieve the action item. These are projects that help maintain or improve a city asset. Capital projects should be included in the capital improvement program (CIP) and should include infrastructure, drainage improve-ments, parks facilities, public buildings, etc.
Regulation or Standard: Regulations or stan-dards refer to the local policies that can be ad-opted as a part of development regulations and other County and City standards.
Partnership or Collaboration: Action steps that require additional partners or coordination with other agencies, organizations, or compa-nies. Developing relationships with other part-ners within the community and surrounding communities will yield more connections and resilience.
More Targeted Planning: This Action Type re-fers to actions that are related to additional stud-ies, plans, reports, etc. Typically these studies are needed for a more detailed analysis of conditions or more specific solutions.
ACTION LEADERS
To achieve the goal of building a better Rock-port community, the following is a list of pre-sumable action leaders corresponding to certain action items. This would help Rockport author-ities to maintain transparency and create con-sistency across all associated departments and organizations.
Entities are classified as follows:
AC: Aransas County
AP: Aransas Pathways
ACAD: Aransas County Appraisal District
ACHD: Aransas County Health Department
ACHS: Aransas County Historical Society
ACISD: Aransas County ISD
ACLTRT: Aransas County Long Term Recovery Team
ACND: Aransas County Navigation District
AISD: Aransas County Independent School District
ALEO: Agri-Life Extension Office
ANWR: Aransas National Wildlife Refuge
AP: Aransas Pathways
BD: Building and Development Department
BOA: Zoning Board of Adjustments
BUS: Businesses and Stakeholders
CC: City Council
CE: City Engineer
CM: City Manager
CPTF: Comprehensive Plan Task Force

152 | CHAPTER 9
PLAN INTEGRATION FOR RESILIENCE SCORECARD
To ensure the comprehensive plan integrates with other planning documents that influence development, the following “network of plans” indicate the policies that are aligned across plans, as described in Chapter 2. Within the implementation table, the city can discern the relevance and applicability of policies. The acro-nyms for the “network of plans” include:
• Aransas County Long Term Recovery Plan and Report (2018): LTRP
• Aransas County Multi-Jurisdictional Haz-ard Mitigation Action Plan (2017): MHMP
• Aransas County Multi-Jurisdictional Flood-plain Management Plan (2017): MFMP
• A Vision for Rockport: A Master Plan for the Heritage District and Downtown Rock-port (2006): HDMP
• Rockport Heritage District Zoning Overlay Code (2014 update): HDZO
• Recovery Planning Assistance Team: RPAT
CS: City Staff
DTF: Downtown Heritage Task Force
EDC: Economic Development Corporation
EM: Emergency Manager
EPA: Environmental Protection Agency
FEMA: Federal Emergency Management Agency
FHA: Fair Housing Board
FI: Finance Department
FLTN: The City of Fulton
FM: Fulton Mansion
HR: Human Resources Department
HUD: Housing and Urban Development
KACB: Keep Aransas County Beautiful
LEED: Leadership in Energy and Environmen-tal Design
LTR: Long Term Recovery
MC: Municipal Court
PB: Parks Board
PL: Parks and Leisure Department
PO: Property Owner
PW: Public Works Department
P&Z: Planning & Zoning Commission
RCA: Rockport Center for the Arts
RCAD: Rockport Cultural Arts District
RCM: Rockport Community Members
R-FCC: Rockport-Fulton Chamber of Com-merce
RPD: Rockport Police Department
RVFD: Rockport Volunteer Fire Department
TCEQ: Texas Commission on Environmental Quality
TDHCA: Texas Department of Housing & Community Affairs
TSAHC: Texas State Affordable Housing Cor-poration
TLC: Tree and Landscape Committee
TMM: Texas Maritime Museum
TPWD: Texas Parks & Wildlife
TSG: Texas Sea Grant
TWDB: Texas Water Development Board
TX: The State of Texas
TxDOT: Texas Department of Transportation
UCGA: U.S. Coast Guard Auxiliary
UT: Utilities
YMCA: YMCA Development Committee

IMPLEM
ENTATIO
N | 153
Development Consideration
Plan
Inte
grat
ion
On-
Goi
ng
Shor
t-Ter
m
Mid
-Ter
m
Long
-Ter
m
Capi
tal P
roje
ct
Prog
ram
Regu
latio
n or
Sta
ndar
d
Part
ners
hip
or C
olla
bora
tion
Mor
e Ta
rget
ed P
lann
ing
Objective Action Notes Timeframe Action TypeAction Leaders
Other Partners
Funding
Goal 3.1 Achieve a more inclusive land use plan and comprehensive zoning ordinance by providing land uses that preserve the integrity of Rockport’s Community Character
Objective 3.1.1. Provide for a Balance of Land Uses & Associated Regulations to Enhance Quality of Life
Action 3.1.1.1. Revise and amend the Zoning Ordinance in accordance with the recommendations indicated in this plan.
X XCS; CC; P&Z
CPTF; RCM In-House
Action 3.1.1.2. Monitor and report the plan progress to City Council and Planning and Zoning Commission an-nually.
X XCS; CC; P&Z
CPTF; RCM In-House
Action 3.1.1.3. Conduct a thorough review and potential revision of the plan every 5 years. X X
CS; CC; P&Z
CPTF; RCM; Consultant
City Budgeted Funds; Community Develop-ment Block Grants (CDBG)
Action 3.1.1.4. Encourage develop-ment in areas that are served by existing municipal services and in-frastructure and outside the Special Flood Hazard Area. X X X
CS; CC; P&Z
CPTF; RCM Community Develop-ment Block Grants (CDBG), Distressed Cities Technical Assis-tance, Flood Mitiga-tion Assistance (FMA) Grant Program, Capacity Building for Sustainable Commu-nities
Action 3.1.1.5 Adopt and implement the preferred land use scenario as to help grow Rockport to the desired place over the next several decades.
X XCS; CC; P&Z
CPTF; RCM In-House
Action 3.1.1.6 Revise and update ordi-nances pretaining to RV Park. X X X CS; CC;
P&Z CPTF; RCM In-House
Action 3.1.1.6 Review and update the existing design guidelines. X X X CS; CC;
P&ZCPTF; RCM In-House

154 | CHAPTER 9
Development Consideration
Plan
Inte
grat
ion
On-
Goi
ng
Shor
t-Ter
m
Mid
-Ter
m
Long
-Ter
m
Capi
tal P
roje
ct
Prog
ram
Regu
latio
n or
Sta
ndar
d
Part
ners
hip
or C
olla
bora
tion
Mor
e Ta
rget
ed P
lann
ing
Objective Action Notes Timeframe Action TypeAction Leaders
Other Partners
Funding
Goal 3.2 Guide the future growth of the city according to the community’s vision
Objective 3.2.1. Develop land use regulations for the implementation of the future land use map.
Action 3.2.1.1 Explore the option of creating a conservation subdivision and environmental corridors to pro-tect environmentally sensitive areas.
MFMP; MHMP
X X X
CS; CC; P&Z
CPTF; RCM In-House; Commu-nity Development Block Grants (CDBG), Distressed Cities Technical Assistance, Flood Mitigation As-sistance (FMA) Grant Program, WaterS-MART Cooperative Watershed Manage-ment Program Phase I Grants, Capacity Building for Sustain-able Communities, The Conservation Fund
Action 3.2.1.2 Provide Infrastructure and Financial Assistance (through Development Agreements) to Target Areas for Private Developers building SF and MF Housing (some of this may be geared towards homeowners, through developer or builder-initiat-ed programs)
LTRP
X X X
CS; CC; P&Z
CPTF; RCM; EDC
Building Neigh-borhood Capacity Program (BCNP), Capacity Building for Sustainable Com-munities, Commu-nity Development Block Grant (CDBG), Multi-Family Housing Loan Guarantees
Action 3.2.1.3 Examine the drainage system prior to future development. X X X CS; CC;
P&ZCPTF; RCM In-House
Action 3.2.1.3 Consider developing a corridor plan for Highway 35 Bypass. X X X CS: PW;
CCCPTF; RCM In-House

IMPLEM
ENTATIO
N | 155
Development Consideration
Plan
Inte
grat
ion
On-
Goi
ng
Shor
t-Ter
m
Mid
-Ter
m
Long
-Ter
m
Capi
tal P
roje
ct
Prog
ram
Regu
latio
n or
Sta
ndar
d
Part
ners
hip
or C
olla
bora
tion
Mor
e Ta
rget
ed P
lann
ing
Objective Action Notes Timeframe Action TypeAction Leaders
Other Partners
Funding
Objective 3.2.2. Devel-op an annexation plan to annex properties based on the future expansion needs of the city and the prospects of development within the city’s extraterritori-al jurisdiction.
Action 3.2.2.1 Re-evaluate zoning pol-icy for newly annexed lands. X X X CS; CC;
P&ZCPTF; RCM In-House
Action 3.2.2.2 Zone newly annexed land into the most restrictive, least dense zoning category, R-1 1st Sin-gle-Family Dwelling District. X X
CS; CC; P&Z
In-House
Objective 3.2.3. De-velop a plan for the increased development and protection of the Heritage District.
Action 3.2.3.1. Evaluate and amend the Heritage District Zoning Overlay Code (HDZO) to preserve and en-hance the area
HDZO
X X X
CS; CC; P&Z
CPTF; RCM Community Develop-ment Block Grants (CDBG), Cool & Connected Program, Community Resto-ration and Resiliency Fund, Texas Main Street Program
Action 3.2.3.2 Consider developing a partnership with the Texas Main Street Program.
RPAT
X X
CS; CC; P&Z
CPTF; RCM Community Resto-ration and Resiliency Fund, Keep America Beautiful’s Com-munity Restoration and Resiliency Fund, Texas Main Street Program
Action 3.2.3.3 Follow the codes and development standards and restric-tions within the HDZO to maintain the character and history of the downtown district.
HDZO
X X
CS; CC; P&Z
CPTF; RCM Community Resto-ration and Resiliency Fund, Community Development Block Grants (CDBG), Smart Growth Implementa-tion Assistance (SGIA) program, Historic Re-vitalization Subgrant Program (HRSP)

156 | CHAPTER 9
Development Consideration
Plan
Inte
grat
ion
On-
Goi
ng
Shor
t-Ter
m
Mid
-Ter
m
Long
-Ter
m
Capi
tal P
roje
ct
Prog
ram
Regu
latio
n or
Sta
ndar
d
Part
ners
hip
or C
olla
bora
tion
Mor
e Ta
rget
ed P
lann
ing
Objective Action Notes Timeframe Action TypeAction Leaders
Other Partners
Funding
Action 3.2.3.4 Implement Urban Land Institute principles for rebuilding downtown
RPATX X X
CS; CC; P&Z
CPTF; RCM Smart Growth Imple-mentation Assistance (SGIA) program
Action 3.2.3.5 Review and implement the recommendations from the RPAT team regarding flood mitigation and resilience, economic resilience, and downtown design and vitality.
RPAT
X X X X
CS; CC; P&Z
CPTF; RCM; RCAD; BUS; COC
NOAA Coastal Resilience Grants Program, Smart Growth Implementa-tion Assistance (SGIA) program, Community Development Block Grants (CDBG)
Objective 3.2.3. Con-tinue to promote the Tourism industry, while also carefully main-taining the cultural Heritage
Action 3.2.3.1. Utilize a variety of de-velopment incentives that promote the tourism industry, yet maintain the community character within Rockport and the surrounding areas.
X X X
CS; R-FCC CC; CPTF; RCM
Community Develop-ment Block Grants (CDBG), Cool & Connected Program, Community Resto-ration and Resiliency Fund
Goal 3.3 Establish development regulations to reduce hazard exposure within the city.
Objective 3.3.1. Actively persue floodproofing and hazard mitigation for residential and com-mercial properties.
Action 3.3.1.1 Continue participating in the National Flood Insurance Pro-gram (NFIP) and enforce adopted floodplain regulations based on the Flood Insurance Rate Maps.
MHMP MFMP
X X X X
CS; CC Flood Mitigation As-sistance (FMA) Grant Program, NOAA Coastal Resilience Grants Program, Smart Growth Imple-mentation Assistance (SGIA) program

IMPLEM
ENTATIO
N | 157
Development Consideration
Plan
Inte
grat
ion
On-
Goi
ng
Shor
t-Ter
m
Mid
-Ter
m
Long
-Ter
m
Capi
tal P
roje
ct
Prog
ram
Regu
latio
n or
Sta
ndar
d
Part
ners
hip
or C
olla
bora
tion
Mor
e Ta
rget
ed P
lann
ing
Objective Action Notes Timeframe Action TypeAction Leaders
Other Partners
Funding
Action 3.3.1.2 Continue implementing the freeboard requirements to alle-viate further risk of flood damage to homes and businesses.
MHMP; MFMP
X X
CS; CC NOAA Coastal Resilience Grants Program, Smart Growth Implementa-tion Assistance (SGIA) program, Distressed Cities Technical Assis-tance
Action 3.3.1.3 Incorporate activities outlined in the CRS Coordinator’s Manual that would help achieve a higher class rating.
MHMP; MFMP
X X X
CS; CC NOAA Coastal Resilience Grants Program, Smart Growth Implementa-tion Assistance (SGIA) program, Distressed Cities Technical Assis-tance
Action 3.3.1.4 Ensure the city is fol-lowing the guidelines set in the Aran-sas County Multi-Jurisdictional Haz-ard Mitigation Action Plan.
MHMP
X X
CS; CC NOAA Coastal Resilience Grants Pro-gram, Flood Mitiga-tion Assistance (FMA) Grant Program
Action 3.3.1.5 Utilize the Inundation Dashboard created by NOAA to pre-pare for and manage flood events. X X
CS; CC NOAA Coastal Resilience Grants Pro-gram, Flood Mitiga-tion Assistance (FMA) Grant Program
Action 3.3.1.6 Review repetitive-loss properties to identify potential acqui-sitions that may be made to assist in reducing flooding within the sub-ba-sin (Austin Street and the Heritage District).
RPAT
X X
CS; CC Flood Mitigation As-sistance (FMA) Grant Program, NOAA Coastal Resilience Grants Program, Smart Growth Imple-mentation Assistance (SGIA) program

158 | CHAPTER 9
Development Consideration
Plan
Inte
grat
ion
On-
Goi
ng
Shor
t-Ter
m
Mid
-Ter
m
Long
-Ter
m
Capi
tal P
roje
ct
Prog
ram
Regu
latio
n or
Sta
ndar
d
Part
ners
hip
or C
olla
bora
tion
Mor
e Ta
rget
ed P
lann
ing
Objective Action Notes Timeframe Action TypeAction Leaders
Other Partners
Funding
Action 3.3.1.7 Provide tax abatement for property owners undertaking flood improvements.
RPAT
X X
CS; CC Housing Preserva-tion & Revitalization Demonstration Loans & Grants, Single Family Home Repairs (Section 504)
Action 3.3.1.8 Consider using the solar energy and other renewable energy alternatives, infrastructure improvements on Austin and Magno-lia Streets that account for sea-level rise, and retrofitting and/or updating drainage, sewage and electric to ac-commodate redevelopment and new development.
RPAT
X X X
CS; PW; UT; CC
Capacity Building for Sustainable Commu-nities
Action 3.3.1.9 Examine the two con-veyance pipes to the bay in this area using a camera system to verify pipes (following Hurricane Harvey) remain fully functional
RPAT
X X X
CS; PW; CC
Flood Mitigation As-sistance (FMA) Grant Program, NOAA Coastal Resilience Grants Program, Smart Growth Imple-mentation Assistance (SGIA) program
Action 3.3.1.10 Examine and test ar-eas of the drainage system for accu-mulation of sand and silt and verify that the outlet points into the bay are clear and free of growth.
RPAT
X X X
CS; PW; CC
Flood Mitigation As-sistance (FMA) Grant Program, NOAA Coastal Resilience Grants Program, Smart Growth Imple-mentation Assistance (SGIA) program
Action 3.3.1.11 Examine the function-ality of backflow prevention devices on the outlet points for the stormwa-ter drains into the bay.
RPATX X X
CS; PW; CC
WaterSMART Cooper-ative Watershed Man-agement Program Phase I Grants

IMPLEM
ENTATIO
N | 159
Development Consideration
Plan
Inte
grat
ion
On-
Goi
ng
Shor
t-Ter
m
Mid
-Ter
m
Long
-Ter
m
Capi
tal P
roje
ct
Prog
ram
Regu
latio
n or
Sta
ndar
d
Part
ners
hip
or C
olla
bora
tion
Mor
e Ta
rget
ed P
lann
ing
Objective Action Notes Timeframe Action TypeAction Leaders
Other Partners
Funding
Action 3.3.1.12 Evaluate and adopt a No Adverse Impact policy to City floodplain ordinance to help contain drainage on residential lots.
X X XCS; PW; CC
Objective 3.3.3. Imple-ment low-impact de-velopment techniques to manage stormwater runoff
Action 3.3.3.1 Explore Green Infra-structure (GI) and Low Impact Devel-opment (LID) practices to mitigate the effects of future disruptions. X X
CS; CC Smart Growth Imple-mentation Assistance (SGIA) program, Capacity Building for Sustainable Commu-nities
Action 3.3.3.2 Create rain gardens and bioswales within both the high-er and the lowest areas of Austin and Magnolia Streets.
RPAT
X X
CS; CC RCAD; BUS; PO
Smart Growth Imple-mentation Assistance (SGIA) program, Com-munity Restoration and Resiliency Fund
“Action 3.3.3.3 Utilize the Green In-frastructure Modeling Toolkit pro-vided by the EPA to help implement green infrastructure and make deci-sions for stormwater management.” X X
CS; CC PW Flood Mitigation As-sistance (FMA) Grant Program, NOAA Coastal Resilience Grants Program, Smart Growth Imple-mentation Assistance (SGIA) program
Action 3.3.3.4 Consult full RPAT re-port for specific design recommenda-tions on creating “A Green Vision for Downtown.”
RPAT
X X
CS; CC PW Flood Mitigation As-sistance (FMA) Grant Program, NOAA Coastal Resilience Grants Program, Smart Growth Imple-mentation Assistance (SGIA) program, Com-munity Restoration and Resiliency Fund

160 | CHAPTER 9
Housing
Plan
Inte
grat
ion
On-
Goi
ng
Shor
t-Ter
m
Mid
-Ter
m
Long
-Ter
m
Capi
tal P
roje
ct
Prog
ram
Regu
latio
n or
Sta
ndar
d
Part
ners
hip
or C
olla
bora
tion
Mor
e Ta
rget
ed P
lann
ing
Objectives Action Notes Timeframe Action TypeAction
LeadersOther
PartnersFunding
Goal 4.1 Expand the Variety of Housing to Meet the Needs of a Diverse Population and Encourage the Return of Hurricane-displaced Residents
Objective 4.1.1 Support Single Family (SF) home construction for a vari-ety of income levels
Action 4.1.1.1 Amend language in existing ordinance(s) to allow for smaller homes on infill lots (except in SFHA)
HDMP; LTRP X X
CS Choice Neighborhoods Planning Grants, Single Family Home Repairs (Section 504)
Action 4.1.1.2 Continue to partner with Habitat for Humanity, Coastal Bend Disaster Recovery Group, other non-profit and faith-based organiza-tions
LTRP
X X
CS Choice Neighborhoods Planning Grants, Single Family Home Repairs (Section 504)
Action 4.1.1.3 Provide financial in-centives for developers to increase housing density in undeveloped areas (such as tax abatements and waived permit fees) (except in SFHA)
X X
CS; EDC; CC
Choice Neighborhoods Planning Grants, Single Family Home Repairs (Section 504)
Action 4.1.1.4 Reach out to companies that are expanding in communities south of Rockport to assess future employee housing needs and create partnerships for housing develop-ments.
X X X
CS; EDC; CC
Choice Neighborhoods Planning Grants, Single Family Home Repairs (Section 504)
Objective 4.1.2. Expand housing opportunities for low- and middle-in-come households
Action 4.1.2.1 Amend landuse/zon-ing to allow flexible housing options such as small lots, accessory dwelling units, duplexes, and multi-family units in areas for redevelopment and new development
X X
CS; P&Z; CC
Community Devel-opment Block Grant (CDBG), Capacity Building for Commu-nity Development and Affordable Housing Grants

IMPLEM
ENTATIO
N | 161
Housing
Plan
Inte
grat
ion
On-
Goi
ng
Shor
t-Ter
m
Mid
-Ter
m
Long
-Ter
m
Capi
tal P
roje
ct
Prog
ram
Regu
latio
n or
Sta
ndar
d
Part
ners
hip
or C
olla
bora
tion
Mor
e Ta
rget
ed P
lann
ing
Objectives Action Notes Timeframe Action TypeAction
LeadersOther
PartnersFunding
Action 4.1.2.2 Implement inclusionary zoning or financial incentives for de-velopers to build affordable housing (affordable units can be a percentage of their overall development or a sep-arate development) (except in SFHA)
LTRP
X X
CS; P&Z; CC
EDC Community Devel-opment Block Grant (CDBG), Capacity Building for Commu-nity Development and Affordable Housing Grants
Action 4.1.2.3 Identify areas that would benefit from providing greater accessibility to community facilities and amenities.
LTRPX X
CS; P&Z; CC
Choice Neighborhoods Planning Grants, Com-munity Development Block Grant (CDBG)
Action 4.1.2.4 Continue to apply for and prioritize state and federal fund-ing for repairs, rebuilds, and mainte-nance to workforce and low income housing. Coordinate with the Aransas County Long Term Recovery Plan
LTRP
X X X
CS;ACLTRT
TDHCA, GLO, HUD, USDA
Housing Preserva-tion & Revitalization Demonstration Loans & Grants, Commu-nity Development Block Grant (CDBG), Single Family Home Repairs (Section 504), Low-Income Housing Tax Credit (LIHTC), Housing Preserva-tion & Revitalization Demonstration Loans & Grants, Capacity Building for Commu-nity Development and Affordable Housing Grants , Public Hous-ing Agency’s Hous-ing Choice Voucher program

162 | CHAPTER 9
Housing
Plan
Inte
grat
ion
On-
Goi
ng
Shor
t-Ter
m
Mid
-Ter
m
Long
-Ter
m
Capi
tal P
roje
ct
Prog
ram
Regu
latio
n or
Sta
ndar
d
Part
ners
hip
or C
olla
bora
tion
Mor
e Ta
rget
ed P
lann
ing
Objectives Action Notes Timeframe Action TypeAction
LeadersOther
PartnersFunding
Action 4.1.2.5 Partner with Texas De-partment of Housing and Commu-nity Affairs (TDHCA) and the Texas State Affordable Housing Corpora-tion (TSAHC) to hold public meet-ings where residents can learn about homeownership programs (such as My First Texas Home) and home buy-ing tips.
X X
CS TDHCA; TSAHC
Building Neighbor-hood Capacity Pro-gram (BCNP), Capacity Building for Commu-nity Development and Affordable Housing Grants,
Action 4.1.2.6 Increase supply of per-manent workforce and affordable housing.
RPAT
X X
CS; P&Z; CC; EDC
PO; HUD Low Income Housing Tax Credit (4%/9%), Low-Income Housing Tax Credit (LIHTC), Multi-family (Rental Housing) Develop-ment Program
Goal 4.2. Build Resilient Homes, Maintain Safe Neighborhoods, and Enhance Community Character
Objective 4.2.1. Improve building standards for all homeowners
Action 4.2.1.1 Educate/encourage homeowners, contractors, and build-ers to use stronger building codes, such as the latest International Build-ing Codes. Continue to partner with SmartHomeAmerica for Lunch-N-Learns for FORTIFIED standards.
LTRP
X X X
CS SmartHo-meAmer-ica, IBHS, TDHCA
Building Neighbor-hood Capacity Pro-gram (BCNP), Capacity Building for Commu-nity Development and Affordable Housing Grants, Housing Pres-ervation Grants (HPG), Capacity Building for Sustainable Commu-nities
Action 4.2.1.2 Enforce city’s minimum building codes (including freeboard elevation) during rebuilds, renova-tions, and new construction
X XCS Choice Neighborhoods
Implementation Pro-gram, Housing Preser-vation Grants (HPG)

IMPLEM
ENTATIO
N | 163
Housing
Plan
Inte
grat
ion
On-
Goi
ng
Shor
t-Ter
m
Mid
-Ter
m
Long
-Ter
m
Capi
tal P
roje
ct
Prog
ram
Regu
latio
n or
Sta
ndar
d
Part
ners
hip
or C
olla
bora
tion
Mor
e Ta
rget
ed P
lann
ing
Objectives Action Notes Timeframe Action TypeAction
LeadersOther
PartnersFunding
Action 4.2.1.3 Educate homeowners on techniques to mitigate flooding on their own property/in their yard, with-out adversely affecting their neigh-bors.
X X X
CS CFMs in the area
Landowner Incentive Program (LIP)
Objective 4.2.2. Create new avenues to im-prove conditions on household and neigh-borhood levels
Action 4.2.2.1 Research and establish building maintenance codes, which provide minimum requirements for equipment, light, ventilation, heating, sanitation, and hazard safety
X X X
CS; CE Capacity Building for Sustainable Communi-ties, Housing Preserva-tion Grants (HPG)
Action 4.2.2.2 Facilitate “Neighbor-hood Makeover” events where res-idents, city staff, and volunteers can clean up and maintain the overall character of their neighborhoods. Coordinate with any efforts conduct-ed through the Aransas County Long Term Recovery Plan.
LTRP
X X X X
CS; CE; ACLTRT
Choice Neighborhoods Planning Grants & Implementation Pro-gram, Neighborhood Stabilization Program (NSP), Community Impact Grants, Keep America Beautiful’s Community Resto-ration and Resiliency Fund

164 | CHAPTER 9
Transportation
Plan
Inte
grat
ion
On-
Goi
ng
Shor
t-Ter
m
Mid
-Ter
m
Long
-Ter
m
Capi
tal P
roje
ct
Prog
ram
Regu
latio
n or
Sta
ndar
d
Part
ners
hip
or C
olla
bora
tion
Mor
e Ta
rget
ed P
lann
ing
Objective Action Notes Timeframe Action TypeAction Leaders
Other Partners
Funding
Goal 5.1 Provide Safe and Efficient Roadway network
Objective 5.1.1 Redesign critical roads and inter-sections to mitigate geometric and opera-tional improvements.
Action 5.1.1.1. Maintain regular com-munications with city and county transportation agencies and local transportation stakeholders to up-date project needs list and progress.
X X X
CS; PW; CC
CS: PW Surface Transportation Block Grant Program (STBG)
Action 5.1.1.2. Prioritize listed chal-lenges and problem areas.
X X X
CS: PW AC; TxDOT INVEST 1.0 Imple-mentation Projects, The Highway Safety Improvement Program (HSIP)
Action 5.1.1.3. Implement low-speed zones, speed bumps, chicanes, and diversions in residential areas around community facilities.
X X X CS: PW ACThe Highway Safety Improvement Program (HSIP)
Action 5.1.1.4. Provide adequate light-ing, visibility, and wayfinding signage along major thoroughfares adjacent to commercial developments and community facilities.
X X X
CS: PW AC; TxDOT BUILD Discretionary Grants, The National Complete Streets Coalition
Action 5.1.1.5. Update the functional classification of roads based on the future thoroughfare plan.
X XCS: PW Surface Transportation
Block Grant Program (STBG)
Action 5.1.1.6 Coordinate street de-sign standards with the County to en-sure the quality and standard of the roads that get annexed.
X X X
CS: PW AC The National Complete Streets Coalition, Surface Transportation Block Grant Program (STBG)
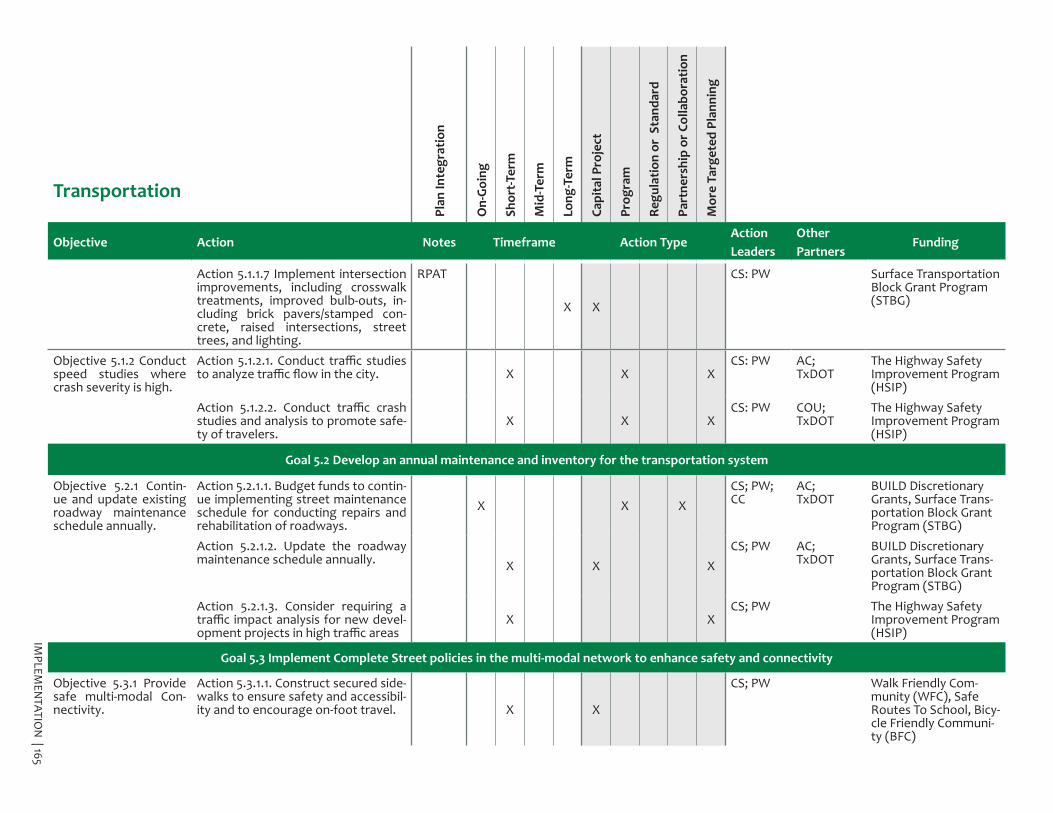
IMPLEM
ENTATIO
N | 165
Transportation
Plan
Inte
grat
ion
On-
Goi
ng
Shor
t-Ter
m
Mid
-Ter
m
Long
-Ter
m
Capi
tal P
roje
ct
Prog
ram
Regu
latio
n or
Sta
ndar
d
Part
ners
hip
or C
olla
bora
tion
Mor
e Ta
rget
ed P
lann
ing
Objective Action Notes Timeframe Action TypeAction Leaders
Other Partners
Funding
Action 5.1.1.7 Implement intersection improvements, including crosswalk treatments, improved bulb-outs, in-cluding brick pavers/stamped con-crete, raised intersections, street trees, and lighting.
RPAT
X X
CS: PW Surface Transportation Block Grant Program (STBG)
Objective 5.1.2 Conduct speed studies where crash severity is high.
Action 5.1.2.1. Conduct traffic studies to analyze traffic flow in the city. X X X
CS: PW AC; TxDOT
The Highway Safety Improvement Program (HSIP)
Action 5.1.2.2. Conduct traffic crash studies and analysis to promote safe-ty of travelers.
X X XCS: PW COU;
TxDOTThe Highway Safety Improvement Program (HSIP)
Goal 5.2 Develop an annual maintenance and inventory for the transportation system
Objective 5.2.1 Contin-ue and update existing roadway maintenance schedule annually.
Action 5.2.1.1. Budget funds to contin-ue implementing street maintenance schedule for conducting repairs and rehabilitation of roadways.
X X XCS; PW; CC
AC; TxDOT
BUILD Discretionary Grants, Surface Trans-portation Block Grant Program (STBG)
Action 5.2.1.2. Update the roadway maintenance schedule annually. X X X
CS; PW AC; TxDOT
BUILD Discretionary Grants, Surface Trans-portation Block Grant Program (STBG)
Action 5.2.1.3. Consider requiring a traffic impact analysis for new devel-opment projects in high traffic areas
X XCS; PW The Highway Safety
Improvement Program (HSIP)
Goal 5.3 Implement Complete Street policies in the multi-modal network to enhance safety and connectivity
Objective 5.3.1 Provide safe multi-modal Con-nectivity.
Action 5.3.1.1. Construct secured side-walks to ensure safety and accessibil-ity and to encourage on-foot travel. X X
CS; PW Walk Friendly Com-munity (WFC), Safe Routes To School, Bicy-cle Friendly Communi-ty (BFC)

166 | CHAPTER 9
Transportation
Plan
Inte
grat
ion
On-
Goi
ng
Shor
t-Ter
m
Mid
-Ter
m
Long
-Ter
m
Capi
tal P
roje
ct
Prog
ram
Regu
latio
n or
Sta
ndar
d
Part
ners
hip
or C
olla
bora
tion
Mor
e Ta
rget
ed P
lann
ing
Objective Action Notes Timeframe Action TypeAction Leaders
Other Partners
Funding
Action 5.3.1.2 Construct sidewalks and bike lanes along Austin Street, first filling in the gaps, and then ex-panding sidewalks and bike lanes to connect downtown to the beach and city hall/courthouse property.
RPAT
X X
CS; PW TxDOT Bicycle Friendly Com-munity (BFC) Program, Walk Friendly Commu-nity (WFC)
Action 5.3.1.3 Improve and expand sidewalks in downtown (Austin St., East Concho St., Veterans memorial Dr./Deabreeze Dr.) and add bike lanes along Austin St.
RPAT
X X
CS; PW TxDOT Walk Friendly Commu-nity (WFC), Surface Transportation Block Grant Program (STBG)
Action 5.3.1.4 Restripe crosswalk stripes on Austin Street to improve visibility of crosswalk. Add public art murals on crosswalks
RPATX X
CS; PW TxDOT Surface Transportation Block Grant Program (STBG)
Action 5.3.1.5 Conduct a pedestrian/bicycle plan (scoping study) for Aus-tin Street and Downtown Rockport to identify gaps, destinations, align-ments, and costs of the bicycle and pedestrian infrastructure improve-ments.
RPAT
X X
CS; PW Bicycle Friendly Com-munity (BFC) Program, Walk Friendly Commu-nity (WFC), Pedestrian and Bicycle Safety Program
Action 5.3.1.6. Fully implement the trolley service.
X X X X
CS; CC BUILD Discretionary Grants, Grants for Rural Areas to Support Public Transportation- 5311
Action 5.3.1.7 Evaluate a more robust, regional approach to serving the pub-lic transportation needs of the com-munity X X X
CS; CC AC; TxDOT
Grants for Rural Areas to Support Public Transportation- 5311, Surface Transportation Block Grant Program (STBG)

IMPLEM
ENTATIO
N | 167
Transportation
Plan
Inte
grat
ion
On-
Goi
ng
Shor
t-Ter
m
Mid
-Ter
m
Long
-Ter
m
Capi
tal P
roje
ct
Prog
ram
Regu
latio
n or
Sta
ndar
d
Part
ners
hip
or C
olla
bora
tion
Mor
e Ta
rget
ed P
lann
ing
Objective Action Notes Timeframe Action TypeAction Leaders
Other Partners
Funding
Action 5.3.1.8. Provide appropriate signage and painted lines on the multi-modal network facilities to as-sist travelers and reduce conflicts.
X X XAC; CC; CS
TxDOT BUILD Discretionary Grants, The National Complete Streets Coalition
Action 5.3.1.9 Consider grants that fund sidewalks and other multi-modal transportation paths such as the Safe Route to School grant (TxDOT) X X X X
CS; PW Pedestrian and Bicycle Safety Program, Bicy-cle Friendly Commu-nity (BFC) Program, Safe Routes To School, BUILD Discretionary Grants
Action 5.3.1.10 Require developers to build sidewalks as part of new devel-opment.
X X X XCS; PW Walk Friendly Commu-
nity (WFC)
Action 5.3.1.11 Work with Aransas Pathways and other partners to de-velop a hiking/biking trail master plan. X X X
CS; PW AC Recreational Trail Grants, Rivers, Trails and Conservation Assistance (15.921)
Objective 5.3.2 Iden-tify a regular mainte-nance schedule for a multi-modal network.
Action 5.3.2.1. Provide a maintenance schedule for the multi-modal net-work.
X X XCS; PW The Highway Safety
Improvement Program (HSIP)
Action 5.3.2.2. Update the multi-mod-al maintenance schedule annually. X X X
CS; PW AC; TxDOT
Surface Transportation Block Grant Program (STBG)
Objective 5.3.3 Reduce vehicle miles traveled through Travel Demand Management strate-gies.
Action 5.3.3.1. Consider developing ride-sharing programs and providing informational resources on the City of Rockport website and through other City marketing materials.
X X X X
CS; PW AC; BUS; R-FCC; EDC
Transportation for Elderly Persons and Persons with Disabil-ities

168 | CHAPTER 9
Transportation
Plan
Inte
grat
ion
On-
Goi
ng
Shor
t-Ter
m
Mid
-Ter
m
Long
-Ter
m
Capi
tal P
roje
ct
Prog
ram
Regu
latio
n or
Sta
ndar
d
Part
ners
hip
or C
olla
bora
tion
Mor
e Ta
rget
ed P
lann
ing
Objective Action Notes Timeframe Action TypeAction Leaders
Other Partners
Funding
Action 5.3.3.2. Incentivize businesses to encourage employees to use alter-native transportation options. X X X
CS R-FCC; EDC; AC
Bicycle Friendly Com-munity (BFC) Program, Governor’s Community Achievement Awards (GCAA), Walk Friendly Community (WFC)
Action 5.3.3.3. Develop recommend-ed shared-lanes to promote public accessibility as well as connect Rock-port to Fulton. X X X
CS; PW; AC
TxDOT; FLTN
Bicycle Friendly Com-munity (BFC) Program, Governor’s Community Achievement Awards (GCAA), Walk Friendly Community (WFC), Cool & Connected Program
Action 5.3.3.4. Learn about initiat-ing quarterly bicycle and pedestrian counts, using the National Bicycle and Pedestrian Documentation project methodology to assist with planning improvements and inform funding re-quests.
X X X
CS; PW AC; TxDOT
Pedestrian and Bicycle Safety Program, Bicy-cle Friendly Communi-ty (BFC) Program

IMPLEM
ENTATIO
N | 169
Economic Development
Plan
Inte
grat
ion
On-
Goi
ng
Shor
t-Ter
m
Mid
-Ter
m
Long
-Ter
m
Capi
tal P
roje
ct
Prog
ram
Regu
latio
n or
Sta
ndar
d
Part
ners
hip
or C
olla
bora
tion
Mor
e Ta
rget
ed P
lann
ing
Objective Action Notes Timeframe Action TypeAction
LeadersOther
PartnersFunding
Goal 6.1 Develop a diverse and resilient economy
"Objective 6.1.1. Sup-port Sound Economic Growth & Promote Op-erational Efficiency”
Action 6.1.1.1. Continue to partner with other local jurisdictions and the new Economic Development Corpo-ration to retain local businesses and provide a "one stop shop" for pro-spective businesses.
X X X X
CS; EDC; AC
BUS In-House; Strong Cities, Strong Com-munities Visioning Challenge
Action 6.1.1.2. Create economic devel-opment incentives to amplify existing businesses, and attract new busi-nesses/industries (e.g. tax increment financing, tax abatement, infrastruc-ture expansion).
X X X X
CS; EDC; COC
CC; AC; ACND; FLTN
In-House; Community Advantage Program, Rural Business Devel-opment Grants, Rural Business Opportunity Grants (RBOG)
Action 6.1.1.3. Continue to support and partner with the Chamber of Commerce on their economic devel-opment activities.
X XCS EDC; COC In-House; Rural Busi-
ness Development Grants
Action 6.1.1.4. Establish a tax incre-ment reinvestment zone to overlay the downtown district.
HDMP; RPAT X X X
CS EDC; COC Tax Increment Financ-ing
Action 6.1.1.5. Assist businesses in be-ing better prepared for future flood events and storms and more rapid recovery through development of ed-ucational resources.
RPAT
X X X X
CS EDC; COC; BUS
In-House; Pre-Disaster Mitigation Program
Action 6.1.1.6. Support eco-friendly businesses by encouraging reduction of water and energy consumption, re-cycling, and using less plastics.
RPAT X X X X
CS EDC; COC; BUS
REAP Grants
Action 6.1.1.7. Encourage infill com-mercial development in downtown. X X X
CS EDC; COC; BUS
In-House; Community Development Block Grants (CDBG)
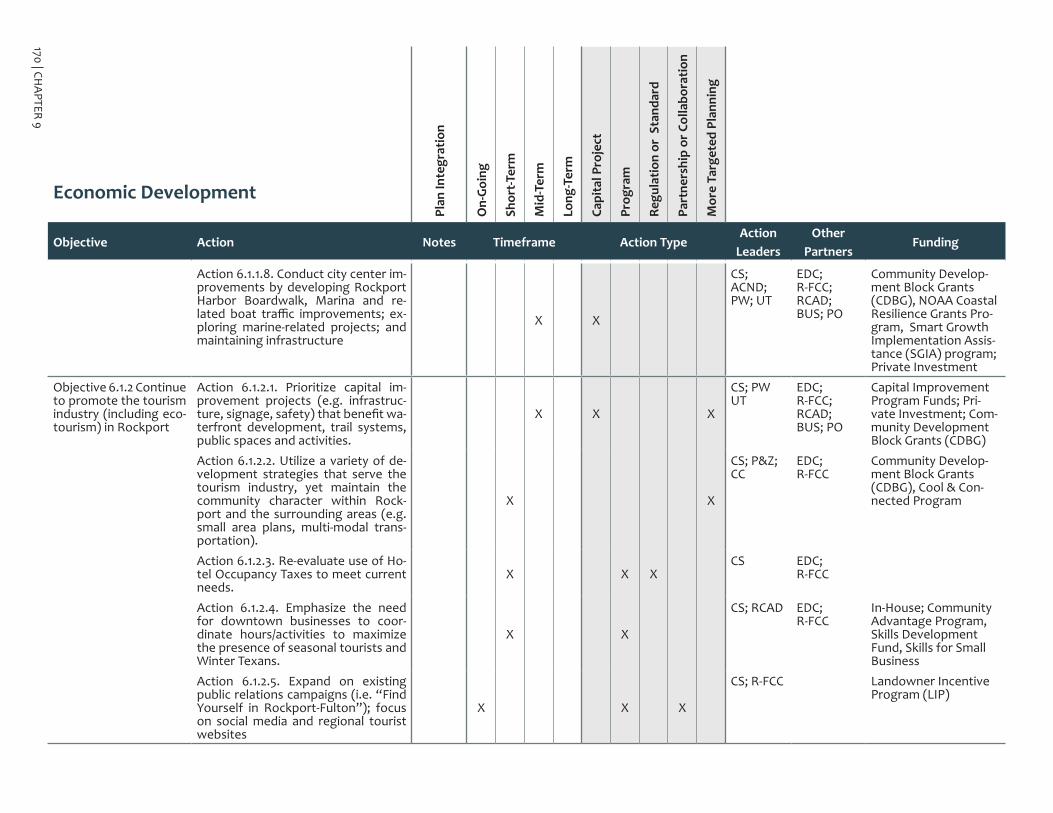
170 | CHAPTER 9
Economic Development
Plan
Inte
grat
ion
On-
Goi
ng
Shor
t-Ter
m
Mid
-Ter
m
Long
-Ter
m
Capi
tal P
roje
ct
Prog
ram
Regu
latio
n or
Sta
ndar
d
Part
ners
hip
or C
olla
bora
tion
Mor
e Ta
rget
ed P
lann
ing
Objective Action Notes Timeframe Action TypeAction
LeadersOther
PartnersFunding
Action 6.1.1.8. Conduct city center im-provements by developing Rockport Harbor Boardwalk, Marina and re-lated boat traffic improvements; ex-ploring marine-related projects; and maintaining infrastructure
X X
CS; ACND; PW; UT
EDC; R-FCC; RCAD; BUS; PO
Community Develop-ment Block Grants (CDBG), NOAA Coastal Resilience Grants Pro-gram, Smart Growth Implementation Assis-tance (SGIA) program; Private Investment
Objective 6.1.2 Continue to promote the tourism industry (including eco-tourism) in Rockport
Action 6.1.2.1. Prioritize capital im-provement projects (e.g. infrastruc-ture, signage, safety) that benefit wa-terfront development, trail systems, public spaces and activities.
X X X
CS; PW UT
EDC; R-FCC; RCAD; BUS; PO
Capital Improvement Program Funds; Pri-vate Investment; Com-munity Development Block Grants (CDBG)
Action 6.1.2.2. Utilize a variety of de-velopment strategies that serve the tourism industry, yet maintain the community character within Rock-port and the surrounding areas (e.g. small area plans, multi-modal trans-portation).
X X
CS; P&Z; CC
EDC; R-FCC
Community Develop-ment Block Grants (CDBG), Cool & Con-nected Program
Action 6.1.2.3. Re-evaluate use of Ho-tel Occupancy Taxes to meet current needs.
X X XCS EDC;
R-FCC
Action 6.1.2.4. Emphasize the need for downtown businesses to coor-dinate hours/activities to maximize the presence of seasonal tourists and Winter Texans.
X X
CS; RCAD EDC; R-FCC
In-House; Community Advantage Program, Skills Development Fund, Skills for Small Business
Action 6.1.2.5. Expand on existing public relations campaigns (i.e. “Find Yourself in Rockport-Fulton”); focus on social media and regional tourist websites
X X X
CS; R-FCC Landowner Incentive Program (LIP)

IMPLEM
ENTATIO
N | 171
Economic Development
Plan
Inte
grat
ion
On-
Goi
ng
Shor
t-Ter
m
Mid
-Ter
m
Long
-Ter
m
Capi
tal P
roje
ct
Prog
ram
Regu
latio
n or
Sta
ndar
d
Part
ners
hip
or C
olla
bora
tion
Mor
e Ta
rget
ed P
lann
ing
Objective Action Notes Timeframe Action TypeAction
LeadersOther
PartnersFunding
Objective 6.1.3. Con-sider new industry sec-tors that are suitable to Rockport’s character and conditions, partic-ularly along the 35 By-pass
Action 6.1.3.1. Focus on new indus-tries (e.g. outdoor activity supply companies, graphic designers, art handlers) that coordinate with Rock-port’s existing businesses.
X X X
CS; EDC R-FCC Community Advan-tage Program, Rural Business Opportunity Grants (RBOG), Small Business Administra-tion Loan programs
Action 6.1.3.2. Establish industries that minimize environmental impacts (e.g. electronic engineering, comput-er science, information processing). X X X X
CS; EDC R-FCC; BUS
Community Advan-tage Program, Rural Business Opportunity Grants (RBOG), Small Business Administra-tion Loan programs
Objective 6.1.4 Improve lighting and environ-ment in the downtown district to attract visi-tors and improve visibil-ity and ensure safety.
Action 6.1.4.1 Encourage (and finan-cially support/incentivize) businesses to leave porch/facade lights and win-dow display lights on in the evening hours.
RPAT
X X
CS; BUS RCAD; R-FCC; EDC
Tax Increment Financ-ing, Cool & Connected Program
Action 6.1.4.2 Provide mini-grants to businesses to add building facade and awning lighting to illuminate the side-walks at night.
RPATX X X
CS; RCAD R-FCC; EDC; BUS
Tax Increment Financ-ing, Cool & Connected Program
Action 6.1.4.3 Incorporate pedestrian scale lighting into future streetscape engineering and design plans along the Austin Street corridor.
RPATX X
CS; PW RCAD; R-FCC; EDC
Cool & Connected Program
Action 6.1.4.4 Construct pedestrian scale lighting along the east and west sides of Austin Street along the side-walks connecting to Veterans Memo-rial Park and Market Street.
X X
CS; PW RCAD; R-FCC; EDC
Tax Increment Financ-ing, Cool & Connected Program

172 | CHAPTER 9
Economic Development
Plan
Inte
grat
ion
On-
Goi
ng
Shor
t-Ter
m
Mid
-Ter
m
Long
-Ter
m
Capi
tal P
roje
ct
Prog
ram
Regu
latio
n or
Sta
ndar
d
Part
ners
hip
or C
olla
bora
tion
Mor
e Ta
rget
ed P
lann
ing
Objective Action Notes Timeframe Action TypeAction
LeadersOther
PartnersFunding
Action 6.1.4.5 Retrofit bulb-outs and provide strategic live oak tree plant-ings along Austin Street, at key inter-sections, on vacant lots, and along the streetscape to provide shade, visual appeal, and help absorb storm-water.
RPAT
X X
CS; PW; PARKS
RCAD; R-FCC;EDC
Surface Transportation Block Grant Program (STBG)
Action 6.1.4.6 Work with downtown merchants to hire a structural engi-neer to identify the best manner to install smaller systems to work effec-tively with the older structures.
RPAT
X X X X
CS; PW RCAD; BUS; PO
Community Develop-ment Block Grants (CDBG) , Tax Incre-ment Financing, Cool & Connected Program
Goal 6.2 Establish strategies and programs to foster a skilled workforce.
Objective 6.2.1 Support workforce recruitment
Action 6.2.1.1. Work with Economic Development Corporation to identify target industries that would generate a demand for workforce members.
X X XCS; EDC; ACISD
R-FCC;BUS
In-House; Texas Work-force Commission’s Skill Development Program
Action 6.2.1.2. Develop marketing strategies and recruitment sessions to connect existing companies to new or returning workers. X X X
CS; EDC; R-FCC
In-House; Community Advantage Program, Skills for Small Busi-ness, Jobs & Education for Texans (JET) Grant Program
Objective 6.2.2 Address workforce needs and development by offer-ing professional train-ings
Action 6.2.2.1. Assess strengths and weaknesses in existing workforce and develop professional training programs to advance skill sets. X X X X
CS; EDC R-FCC;BUS
In-House; High De-mand Job Training Program, Jobs & Edu-cation for Texans (JET) Grant Program, Skills for Small Business

IMPLEM
ENTATIO
N | 173
Economic Development
Plan
Inte
grat
ion
On-
Goi
ng
Shor
t-Ter
m
Mid
-Ter
m
Long
-Ter
m
Capi
tal P
roje
ct
Prog
ram
Regu
latio
n or
Sta
ndar
d
Part
ners
hip
or C
olla
bora
tion
Mor
e Ta
rget
ed P
lann
ing
Objective Action Notes Timeframe Action TypeAction
LeadersOther
PartnersFunding
Action 6.2.2.2. Partner with local agencies or universities to establish a program to facilitate entrepreneur-ship.
X X XCS; EDC; R-FCC
TAMUCC In-House; Texas Work-force Commission’s Skill Development Program
Action 6.2.2.3. Partner with the Coast-al Bend Workforce Solutions (CBWS), Del Mar College (in Corpus Christi - DMC), Texas A&M University - Corpus Christi (TAMUCC) and other organiza-tions to boost readiness of the local workforce with resume and interview workshops, job fairs and trend aware-ness.
X X X
CS; EDC; R-FCC
CBWS; DMC; TA-MUCC
Jobs & Education for Texans (JET) Grant Program
Action 6.2.2.4. Create mentorship programs for high school students by providing internship opportunities with the local government, nonprof-its, and businesses
X X X
CS; EDC; ACISD
The Aransas County ISD Education Foun-dation
Action 6.2.2.45 Support training and trade-specific licensing for the lo-cal unskilled workforce on building codes, including windstorm require-ments.
X X X X
CS; EDC; ACISD

174 | CHAPTER 9
Economic Development
Plan
Inte
grat
ion
On-
Goi
ng
Shor
t-Ter
m
Mid
-Ter
m
Long
-Ter
m
Capi
tal P
roje
ct
Prog
ram
Regu
latio
n or
Sta
ndar
d
Part
ners
hip
or C
olla
bora
tion
Mor
e Ta
rget
ed P
lann
ing
Objective Action Notes Timeframe Action TypeAction
LeadersOther
PartnersFunding
Goal 6.3 Support existing economic assets.
Objective 6.3.1. Support small business reten-tion and expansion
Action 6.3.1.1. Conduct business needs assessment to facilitate more business re-openings. Coordinate with efforts from the Aransas County Long Term Recovery Plan.
X X
CS; R-FCC
COC; BUS; TAMUCC
Community Advantage Program, Skills for Small Business
Action 6.3.1.2. Reassess and update the Heritage District Overlay Code
LTRP;HDZO X X X
CS; CC; P&Z
In-House; Community Development Block Grants (CDBG)
Action 6.3.1.3. Connect small busi-nesses with professional assistance to help cultivate business merchan-dising, websites, and special events.
X X X
CS; R-FCC EDC; BUS Community Advantage Program, Skills for Small Business, Small Business Administra-tion Loan programs
Action 6.3.1.4. Collaborate with the Chamber of Commerce for “open for business” messaging and commu-nicate specific, current information. Media campaigns should build on the “Find Yourself in Rockport-Fulton” campaign.
X X
CS;R-FCC BUS; FLTN; AC
Strong Cities, Strong Communities Visioning Challenge, Skills for Small Business

IMPLEM
ENTATIO
N | 175
Environment
Plan
Inte
grat
ion
On-
Goi
ng
Shor
t-Ter
m
Mid
-Ter
m
Long
-Ter
m
Capi
tal P
roje
ct
Prog
ram
Regu
latio
n or
Sta
ndar
d
Part
ners
hip
or C
olla
bora
tion
Mor
e Ta
rget
ed P
lann
ing
Objective Action Notes Timeframe Action TypeAction
LeadersOther
PartnersFunding
Goal 7.1 Preserve & Protect the Threatened Animals and Sensitive Natural Resources of Live Oak Peninsula, the Little Bay Estuary, Aransas Bay & Gulf of Mexico
Objective 7.1.1. Improve the connectivity of open spaces to expand wildlife corridors and conserve natural habi-tats.
Action 7.1.1.1. Encourage participation in the Texas Wildscapes certification program offered by the TPWD on the design and maintenance of habitable land for wildlife and threatened spe-cies.
X X
CS; PR; CC
TPWD; AC; FLTN
In-House; Cooperative Endangered Species Conservation Fund/Section 6 Grants, The Conservation Fund
Action 7.1.1.2. Look into options to amend the zoning ordinance to in-clude a conservation overlay, or other land use regulations to ensure critical habitats are protected. Get advice from residents on areas of concerns. Prioritize those in SFHA.
MFMP
X X
CS; PR; P&Z; CC
In-House; Cooperative Endangered Species Conservation Fund/Section 6 Grants, The Conservation Fund
Action 7.1.1.3. Work with wildlife spe-cialists and environmental organiza-tions/non-profits such as, the Interna-tional Crane Foundation of Rockport, the Aransas Bird and Nature Club, and Aransas First to identify critical habi-tats and ecological corridors to be conserved and maintained (prioritiz-ing those in SFHA).
X X X
CS; PR TPWD; TNC; AC; FLTN; ACND
Cooperative Endan-gered Species Conser-vation Fund/Section 6 Grants, The Conserva-tion Fund
Action 7.1.1.4. Revise and update the tree ordinance to include a goal for % cover of canopy and include language about protecting understory vegeta-tion. (how to calculate percentage of canopy and/or open space).
HDZO
X X X X
CS; CC; TLC
PR Community & Re-covery Tree Planting Grants
Action 7.1.1.5 Develop a Tree Master Plan and GI Plan to use as a frame-work to help guide tree planting with-in public and private property.
RPATX X X X
CS; CC; TLC
PR; PW Community & Re-covery Tree Planting Grants

176 | CHAPTER 9
Environment
Plan
Inte
grat
ion
On-
Goi
ng
Shor
t-Ter
m
Mid
-Ter
m
Long
-Ter
m
Capi
tal P
roje
ct
Prog
ram
Regu
latio
n or
Sta
ndar
d
Part
ners
hip
or C
olla
bora
tion
Mor
e Ta
rget
ed P
lann
ing
Objective Action Notes Timeframe Action TypeAction
LeadersOther
PartnersFunding
Action 7.1.1.6 Provide strategic tree plantings along Austin Street, at key intersections, on vacant lots, and along the streetscape to provide shade, visual appeal, and help cap-ture stormwater.
RPAT
X X X X
CS; CC; TLC
PR; PW Capital Improvement Funds; Community & Recovery Tree Planting Grants, Smart Growth Implementation Assis-tance (SGIA) program
Objective 7.1.2. Encour-age wetland preserva-tion throughout the city, especially along the bypass.
Action 7.1.2.1 Designate a staff mem-ber of the Environment Services of the Public Works Department to oversee the implementation of the conservation management plan. X X
CS; CC; PW
PR; TPWD; AC; FLTN; RCM
Cooperative Endan-gered Species Conser-vation Fund/Section 6 Grants, Resilient Communities Program, Rivers, Trails and Con-servation Assistance (15.921), The Conserva-tion Fund
Action 7.1.2.2. Develop long term strategies and conservation tools such as: a conservation overlay zone, wetland buffers, set backs, transfer and purchase of development rights, wetland banking, revitalization and restoration incentive programs. Prior-itize areas in SFHA.
MFMP
X X X X
CS; PW; CC
In-House; WaterS-MART Cooperative Watershed Manage-ment Program Phase I Grants
Objective 7.1.3. Monitor and protect all bay sys-tems within Rockport city limits from runoff pollution and unwant-ed nutrients that would otherwise disturb the ecosystems natural state.
Action 7.1.3.1 Continue to partner with NGOs such as Coastal Bend Bays & Es-tuaries Program and Mission-Aransas NERR’s report card program to con-duct regular water quality testing of Little Bay.
X X X X
CS; PW; PR: CC
TPWD; AC; FLTN; RCM
Water and Environ-mental Programs

IMPLEM
ENTATIO
N | 177
Environment
Plan
Inte
grat
ion
On-
Goi
ng
Shor
t-Ter
m
Mid
-Ter
m
Long
-Ter
m
Capi
tal P
roje
ct
Prog
ram
Regu
latio
n or
Sta
ndar
d
Part
ners
hip
or C
olla
bora
tion
Mor
e Ta
rget
ed P
lann
ing
Objective Action Notes Timeframe Action TypeAction
LeadersOther
PartnersFunding
Action 7.1.3.2. Provide educational seminars and volunteer programs that cover techniques to reduce im-pact on water quality, reviews signs of poor water quality and steps to prevent illness.
MFMP
X X
CS; PW TPWD; KACB; AC; FLTN; RCM; TWDB; TCEQ; EPA
In-House; Environ-mental Education (EE) Grants, Environmental Literacy Program
Action 7.1.3.3. Ensure compliance with governmental regulation on wastewater disposal, runoff contam-inants and nutrients, and implement an enforcement program to maintain healthy water quality.
X X X X
CS; PW; CC
TPWD; KACB; AC; FLTN; RCM; TWDB; TCEQ; EPA
“In-House; Texas Water Development Fund (DFund), Water and Environmental Programs, State Water Implementation Fund for Texas (SWIFT)”
Objective 7.1.4. In-crease the use of green infrastructure practices throughout the city to enhance the manage-ment of flood waters and quality of water.
Action 7.1.4.1. Encourage public-pri-vate partnerships to help with funding sources, the design and functionality of projects, as well as implementation. The Housing and Urban Development Federal Depart-ment’s Community Development Block grant could provide funding for green infrastructure projects. Priori-tize areas in SFHA.
X X X
CS; PW TPWD; KACB; RCM; TWDB; TCEQ; EPA; LEED; HUD;
Community Develop-ment Block Grants (CDBG)
Action 7.1.4.2. Provide building in-centives that encourage developers to incorporate low impact design techniques throughout their projects city wide. Developers should also be incentivized to promote the connec-tion of identified ecological corridors, hydrologically important locations winthin Rockport and ETJ and avoid building in those areas.
MFMP
X X X
CS; PW; CC
TPWD; KACB; RCM; TWDB; TCEQ; EPA; LEED; HUD;
Landowner Incentive Program (LIP)

178 | CHAPTER 9
Environment
Plan
Inte
grat
ion
On-
Goi
ng
Shor
t-Ter
m
Mid
-Ter
m
Long
-Ter
m
Capi
tal P
roje
ct
Prog
ram
Regu
latio
n or
Sta
ndar
d
Part
ners
hip
or C
olla
bora
tion
Mor
e Ta
rget
ed P
lann
ing
Objective Action Notes Timeframe Action TypeAction
LeadersOther
PartnersFunding
Goal 7.2 Prepare the City for Disasters that Could Adversely Affect the Health, Safety & General Welfare of Residents & Visitors
Objective 7.2.1. Support and manage natural wa-ter retention methods throughout the city.
Action 7.2.1.1. Amend the city’s code of ordinances to include the land use tool, Transfer of Development Rights (TDR) to ensure wetlands ability to provide water retention functions.
X X
CS; PW; CC
TPWD; KACB; RCM; TWDB; TCEQ; EPA; FEMA
Wetlands Reserve Program
Action 7.2.1.2. Ensure that lands are managed and protected properly so that environmentally significant areas are preserved. Utilize tools such as a conservation easement or mitigation banking program so that conserva-tion goals are achieved. Prioritize ar-eas in the SFHA.
MFMP
X X X
CS; PW; CC
FEMA Flood Mitiga-tion Assistance (FMA) Grants
Objective 7.2.2. Direct-ly coordinate with the Aransas County Naviga-tion District to generate strategies to strength-en the coastal shoreline to protect Rockport’s residents and infra-structure from power-ful storm surge.
Action 7.2.2.1. Mitigate coastal ero-sion through the construction of an artificial reef. The breakwater reef provides the coast with erosion pro-tection, filtration services and sta-bilization by the implementation of marsh vegetation plantings.
MFMP
X X X
CS; CC; ACND
AC; FEMA; TGLO
Coastal Erosion Plan-ning & Response Act, Coastal Management Program, Water and Environmental Pro-grams, Wetlands Re-serve Program, NOAA Coastal Resilience Grants Program

IMPLEM
ENTATIO
N | 179
Environment
Plan
Inte
grat
ion
On-
Goi
ng
Shor
t-Ter
m
Mid
-Ter
m
Long
-Ter
m
Capi
tal P
roje
ct
Prog
ram
Regu
latio
n or
Sta
ndar
d
Part
ners
hip
or C
olla
bora
tion
Mor
e Ta
rget
ed P
lann
ing
Objective Action Notes Timeframe Action TypeAction
LeadersOther
PartnersFunding
Objective 7.2.3. Partner with local advocacy groups and non-prof-it organizations to improve education, awareness and access to resources about natural and manmade disasters and the recov-ery process.
Action 7.2.3.1. Continue to hold peri-odic educational community meet-ings conducted by local emergency managers and mitigation experts that cover disaster preparedness and recovery efforts.
MFMP; MHMP
X X X
CS; PW; CC
TPWD; KACB; AC; R-FCC; FLTN; RCM; TWDB; TCEQ; EPA; FEMA
Environmental Edu-cation (EE) Grants, Environmental Literacy Program
Action 7.2.3.2. Utilize and enhance the city’s media methods and other mar-keting tools to promote educational meetings, seminars, tool sets etc. and encourage citizen engagement and outreach.
MFMP; MHMP
X X
CS; PW; CC
COU; FLTN; ACND; AC
Community Outdoor Outreach Program (CO-OP) Grants
Objective 7.2.4. Encour-age the city to partner with higher education entities to maintain the CRS (FEMA’s Commu-nity Rating System) for the residents and busi-ness owners of Rock-port.
Action 7.2.4.1. Encourage city officials and Disaster Recovery Teams to at-tend free CRS informational cours-es (a series of webinars is offered throughout the year) to become aware of the potential program.
MFMP; MHMP
X X X X
CS; PW; CC;
AC; FLTN In-House; Community Development Block Grant Disaster Recov-ery (CDBG-DR), Public Assistance Grant Program, Pre-Disaster Mitigation Program, Community Disaster Loan (CDL) Program, NOAA Coastal Resil-ience Grants Program

180 | CHAPTER 9
Environment
Plan
Inte
grat
ion
On-
Goi
ng
Shor
t-Ter
m
Mid
-Ter
m
Long
-Ter
m
Capi
tal P
roje
ct
Prog
ram
Regu
latio
n or
Sta
ndar
d
Part
ners
hip
or C
olla
bora
tion
Mor
e Ta
rget
ed P
lann
ing
Objective Action Notes Timeframe Action TypeAction
LeadersOther
PartnersFunding
Action 7.2.4.2. City officials should be in coordination with CRS Specialists, so that they can assist community of-ficials with the implementation of ac-tivities that earn premium discounts.
MFMP; MHMP
X X X X
CS Community Devel-opment Block Grant Disaster Recovery (CD-BG-DR), Public Assis-tance Grant Program, Pre-Disaster Mitigation Program, Community Disaster Loan (CDL) Program, NOAA Coast-al Resilience Grants Program
Action 7.2.4.3. Maintain CRS accred-itation as determined by FEMA and ISO (Insurance Services Organiza-tion).
MFMP; MHMP
X X X
CS; PW PO Community Devel-opment Block Grant Disaster Recovery (CD-BG-DR), Public Assis-tance Grant Program, Pre-Disaster Mitigation Program, Community Disaster Loan (CDL) Program, NOAA Coast-al Resilience Grants Program
Action 7.2.4.4. Examine new CRS ac-tivities to add to the existing activities that the City is doing.
MFMP; MHMP
X X X
CS CC Community Devel-opment Block Grant Disaster Recovery (CD-BG-DR), Public Assis-tance Grant Program, Pre-Disaster Mitigation Program, Community Disaster Loan (CDL) Program, NOAA Coast-al Resilience Grants Program

IMPLEM
ENTATIO
N | 181
Environment
Plan
Inte
grat
ion
On-
Goi
ng
Shor
t-Ter
m
Mid
-Ter
m
Long
-Ter
m
Capi
tal P
roje
ct
Prog
ram
Regu
latio
n or
Sta
ndar
d
Part
ners
hip
or C
olla
bora
tion
Mor
e Ta
rget
ed P
lann
ing
Objective Action Notes Timeframe Action TypeAction
LeadersOther
PartnersFunding
Action 7.2.4.5. Evaluate best miti-gation solution (i.e. buyouts, recon-struction) for repetitive loss proper-ties.
MFMP; MHMP
X X X
CS AC; FTLN Flood Mitigation Assis-tance (FMA) Grants, Pre-Disaster Mitigation Program, Hazard Miti-gation Grant Program
Action 7.2.4.6. Evaluate list of repeti-tive loss properties for opportunities to partner with property owners re-garding potential mitigation actions.
MFMP; MHMP
X X X
CS AC; FTLN Flood Mitigation Assis-tance (FMA) Grants, Pre-Disaster Mitigation Program, Hazard Miti-gation Grant Program
Objective 7.2.5. Ensure better community com-pliance with the NFIP regulations by building local capacity.
Action 7.2.5.1. Set up cloud backup services for storing information ao-but housing inventory in SFHAs, per-mit records, appraisal information, and other critical local informtin for substantial damage on properties lo-cated in SFHAs.
X X
Action 7.2.5.2. Use Substantial Dam-age Estimator (SDE) software effec-tively to keep track of an inventory of structures in SFHAs and request FEMA assistance with DAs.
X
Action 7.2.5.3. Develop partnerships between local planning staff mem-bers and floodplain administrators (with GIS capabilities) and county tax assessor officials to develop a more streamlined market values and assist with damage assessments.
X X
CS, CM EM, ACAD Community Devel-opment Block Grant Disaster Recovery (CD-BG-DR), Public Assis-tance Grant Program, Pre-Disaster Mitigation Program, Community Disaster Loan (CDL) Program, NOAA Coast-al Resilience Grants Program

182 | CHAPTER 9
Environment
Plan
Inte
grat
ion
On-
Goi
ng
Shor
t-Ter
m
Mid
-Ter
m
Long
-Ter
m
Capi
tal P
roje
ct
Prog
ram
Regu
latio
n or
Sta
ndar
d
Part
ners
hip
or C
olla
bora
tion
Mor
e Ta
rget
ed P
lann
ing
Objective Action Notes Timeframe Action TypeAction
LeadersOther
PartnersFunding
Action 7.2.5.4. Evaluate current per-mitting, plan review, and recordkeep-ing process to ensure that there will be consistent, equitable, and defend-able floodplain management/devel-opment records.
X XCS EM
Action 7.2.5.5. Provide elected offi-cials with training on how to maintain a clear and realistic message about post-disaster mitigation options with community residents in ways that do not undermine substantial damage activities.
X XCS, EM CC
Action 7.2.5.6. Develop partnerships with non-profits, universities, exten-sion programs and other non-federal partners that have the ability to col-lect, analyze and display spatial data quickly, and that can support local mapping, planning and engagement efforts during DAs and SDD activities.
X X
CS
Action 7.2.5.7. Ensure emergency re-sponse protocols include provisions that state that GIS community plan-ning staff, tax assessors and flood-plain management administrators are present (or have direct access to) the Emergency Operations Center during disaster.
X X
CS, EM ACAD

IMPLEM
ENTATIO
N | 183
Environment
Plan
Inte
grat
ion
On-
Goi
ng
Shor
t-Ter
m
Mid
-Ter
m
Long
-Ter
m
Capi
tal P
roje
ct
Prog
ram
Regu
latio
n or
Sta
ndar
d
Part
ners
hip
or C
olla
bora
tion
Mor
e Ta
rget
ed P
lann
ing
Objective Action Notes Timeframe Action TypeAction
LeadersOther
PartnersFunding
Action 7.2.5.8. Develop mutual-aid agreements (with county govern-ments, regions, non-profit organiza-tions and other agencies and groups) that benefit DAs and SD activities, enabling disaster mitigation and re-covery.
X X
CS AC, FLTN, ACND
Action 7.2.5.9. Work with and use the FEMA and TWDB Community Assis-tance Contact as a resource to assist with compliance of the NFIP.
X X
CS TWDB, FEMA
Goal 7.3 Maximize environmental and economic benefits of ecotourism industry.
Objective 7.3.1. Pro-tect assets related to ecotourism and assist businesses and tourist attractions to evaluate ecological footprint.
Action 7.3.1.1. Work with the Cham-ber of Commerce and environmental groups to educate local businesses on the importance of environmen-tally-friendly practices, such as recy-cling, water and energy conservation, and reducing the use of plastics.
X X
CS; PW; R-FCC
BUS; KACB Outdoor Recreation Grants, Texas Water Development Fund (DFund), Recreation Grants, Boating Access Grants, Community Outdoor Outreach Pro-gram (CO-OP) Grants
Action 7.3.1.2. Continue working with Aransas Pathways to maintain the natural environment. X X
CS; AC Rivers, Trails and Con-servation Assistance (15.921), The Conserva-tion Fund

184 | CHAPTER 9
Environment
Plan
Inte
grat
ion
On-
Goi
ng
Shor
t-Ter
m
Mid
-Ter
m
Long
-Ter
m
Capi
tal P
roje
ct
Prog
ram
Regu
latio
n or
Sta
ndar
d
Part
ners
hip
or C
olla
bora
tion
Mor
e Ta
rget
ed P
lann
ing
Objective Action Notes Timeframe Action TypeAction
LeadersOther
PartnersFunding
Objective 7.3.2. Encour-age environmental and flood-related educa-tion.
Action 7.3.2.1. Enhance community education programs to raise aware-ness about flood risks and maintain-ing ecologically conscious tourism and lifestyles.
MFMP
X X
CS; ACISD “Recreation Grants, Outdoor Recreation Grants, Smart Growth Implementation Assistance (SGIA) pro-gram, Environmental Education (EE) Grants, Environmental Literacy Program, Community Outdoor Outreach Pro-gram (CO-OP) Grants”

IMPLEM
ENTATIO
N | 185
Community Facilities
Plan
Inte
grat
ion
On-
Goi
ng
Shor
t-Ter
m
Mid
-Ter
m
Long
-Ter
m
Capi
tal P
roje
ct
Prog
ram
Regu
latio
n or
Sta
ndar
d
Part
ners
hip
or C
olla
bora
tion
Mor
e Ta
rget
ed P
lann
ing
Objective Action Notes Timeframe Action TypeAction
LeadersOther Part-
nersFunding
Goal 8.1 Ensure that All Infrastructure Elements meet existing & projected demands in a manner that will minimize environmental impacts
Objective 8.1.1. Invest in city wide public parks and public spaces to increase the number of recreational facilities to better meet the needs of current and future residents.
Action 8.1.1.1. Partner and collaborate within different city departments to leverage funding and effort for park maintenance and green infrastruc-ture projects, priorotizing areas in SFHA.
MFMP
X X
CS; PW; PR
CC; CM; AC; FLTN; ACND
Community Facilities Direct Loan & Grant Program
Action 8.1.1.2. Adopt a parkland trail dedication ordinance that requires land dedication (or fee-in-lieu) for trails, parks and improvements, pri-oritizing areas in SFHA. The ordinance should also require developers to dedicate and construct trails or to in-vest in existing public spaces.
X X X
CS; PW; PR
CC Rivers, Trails and Con-servation Assistance (15.921), Recreational Trails Program (RTP), Recreational Trail Grants
Action 8.1.1.3. Identify possible corri-dors to further expand and connect the existing trail network in Rockport. For example, acquiring the land at the crossroad of Bypass 35 and 3036 to turn into a trail.
X
CS; PR AC Rivers, Trails and Con-servation Assistance (15.921), Recreational Trails Program (RTP), Recreational Trail Grants
Objective 8.1.2. Use utility easements to connect parks and open spaces (Aransas Pathways) throughout Rockport.
Action 8.1.2.1 Develop an implementa-tion plan to use the utility and drain-age easements to connect parks and open spaces. X X X
CS; PW; PR
Wetlands Reserve Program

186 | CHAPTER 9
Community Facilities
Plan
Inte
grat
ion
On-
Goi
ng
Shor
t-Ter
m
Mid
-Ter
m
Long
-Ter
m
Capi
tal P
roje
ct
Prog
ram
Regu
latio
n or
Sta
ndar
d
Part
ners
hip
or C
olla
bora
tion
Mor
e Ta
rget
ed P
lann
ing
Objective Action Notes Timeframe Action TypeAction
LeadersOther Part-
nersFunding
Objective 8.1.3. In-crease the amount of public facilities to meet the needs of current and future residents, including facilities for people of all ages.
Action 8.1.3.1. Collaborate with the Aransas County ISD to provide neigh-borhood parks by considering keep-ing school playgrounds open after hours for the use of residents in sur-rounding neighborhoods.
X X X
PW; PL; BD; ACISD; CS
PB; AC; CC; CM; RCA; RCM; TLC
Community Impact Grants, Local Park Grant Program
Action 8.1.3.2. Partner with the Na-ture Conservancy to identify and ac-quire parkland and open space in the floodplain that can be suitable and acquired for wildlife habitat, flood-plain mitigation or wetland banking. (MFMP: Evaluate areas in the flood-plain viable for open space preserva-tion.)
MFMP
X X X
CS AC; TNC The Conservation Fund, Wetlands Re-serve Program, Water and Environmental Programs
Action 8.1.3.3. Public offices and ac-tivities center are encouraged to be located nearby residential areas in the downtown and bypass areas, for more convenient and accessible com-munity facilities.
X X
CC AC Community Facilities Direct Loan & Grant Program, Rural LISC - Community Facilities Fund
Action 8.1.3.4. Work with the Parks & Leisure Services Board to recognize recreational opportunities. X X
CS; PR Recreation Grants, Outdoor Recreation Grants, Local Park Grant Program
Action 8.1.3.5. Investigate grant op-portunities for property buyouts, open space preservation, or other flood mitigation measures. (65)
MFMP
X
CS FEMA Flood Mitiga-tion Assistance (FMA) Grants, Pre-Disaster Mitigation Program, Community Resto-ration and Resiliency Fund

IMPLEM
ENTATIO
N | 187
Community Facilities
Plan
Inte
grat
ion
On-
Goi
ng
Shor
t-Ter
m
Mid
-Ter
m
Long
-Ter
m
Capi
tal P
roje
ct
Prog
ram
Regu
latio
n or
Sta
ndar
d
Part
ners
hip
or C
olla
bora
tion
Mor
e Ta
rget
ed P
lann
ing
Objective Action Notes Timeframe Action TypeAction
LeadersOther Part-
nersFunding
Action 8.3.1.6 Ensure community fa-cilities and civic buildings are fortified and enforce building to higher build-ing codes.
HDMP
X X X
CS CC: AC “Community Facilities Direct Loan & Grant Program, Community Development Block Grants (CDBG), Com-munity Restoration and Resiliency Fund, Smart Growth Imple-mentation Assistance (SGIA) program, Resilient Communities Program”
Objective 8.1.4 Com-plete capital improve-ment projects already identified by the City
Action 8.1.4.1. Fund drainage projects that were modeled in the 2016 Drain-age Master Plan Modeling Report
MFMP;MHMP X X
CS; PW; CC
Water and Environ-mental Programs
Action 8.1.4.2. Design and conduct an engineering study to address flood-ing in downtown Rockport (17-40)
MFMPX X X
CS; CE; PW
CC Flood Mitigation As-sistance (FMA) Grant Program, Pre-Disaster Mitigation Program
Action 8.1.4.3. Each jurisdiction will continue ongoing maintenance of drainage pipes, culverts, and swales until the county-wide master plan is approved and implementation can begin.
MFMP
X X X
CS; PW AC; FLTN Community Facilities Direct Loan & Grant Program, Keep Ameri-ca Beautiful’s Commu-nity Restoration and Resiliency Fund
Action 8.1.4.4. Repair outfalls of pump station that pump into Aransas Bay
MFMP
X X
CS; PW; CE
Community Facilities Direct Loan & Grant Program, Keep Ameri-ca Beautiful’s Commu-nity Restoration and Resiliency Fund
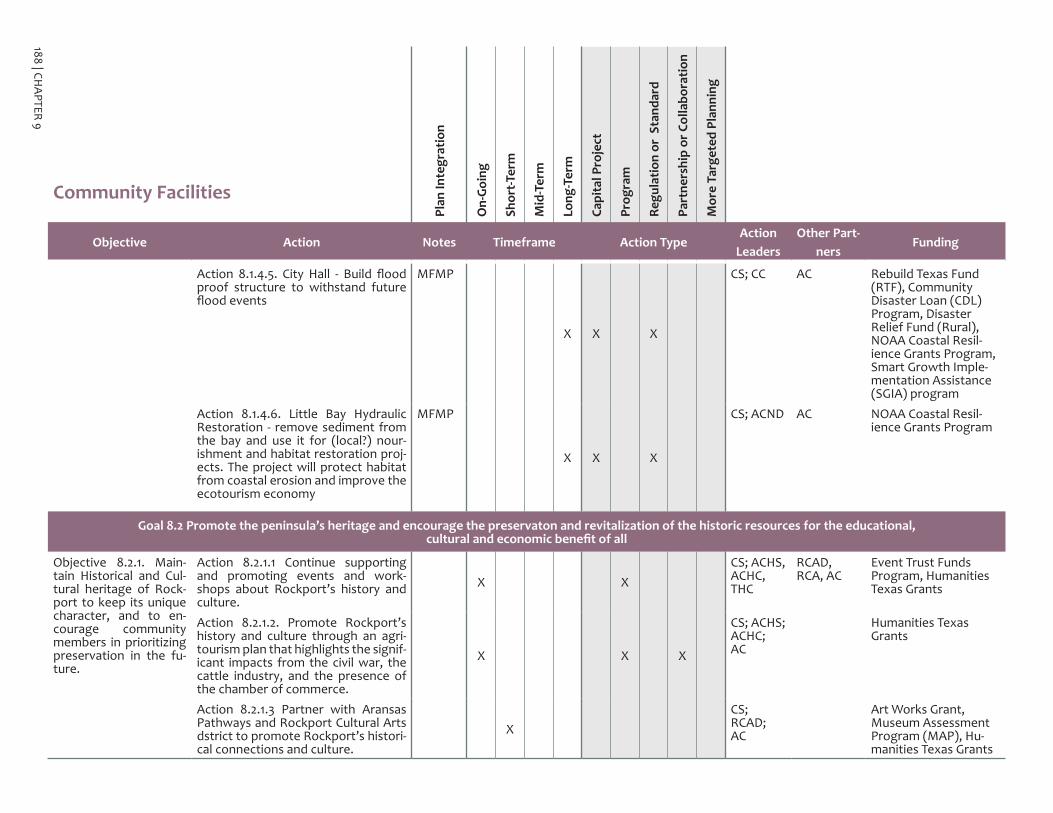
188 | CHAPTER 9
Community Facilities
Plan
Inte
grat
ion
On-
Goi
ng
Shor
t-Ter
m
Mid
-Ter
m
Long
-Ter
m
Capi
tal P
roje
ct
Prog
ram
Regu
latio
n or
Sta
ndar
d
Part
ners
hip
or C
olla
bora
tion
Mor
e Ta
rget
ed P
lann
ing
Objective Action Notes Timeframe Action TypeAction
LeadersOther Part-
nersFunding
Action 8.1.4.5. City Hall - Build flood proof structure to withstand future flood events
MFMP
X X X
CS; CC AC Rebuild Texas Fund (RTF), Community Disaster Loan (CDL) Program, Disaster Relief Fund (Rural), NOAA Coastal Resil-ience Grants Program, Smart Growth Imple-mentation Assistance (SGIA) program
Action 8.1.4.6. Little Bay Hydraulic Restoration - remove sediment from the bay and use it for (local?) nour-ishment and habitat restoration proj-ects. The project will protect habitat from coastal erosion and improve the ecotourism economy
MFMP
X X X
CS; ACND AC NOAA Coastal Resil-ience Grants Program
Goal 8.2 Promote the peninsula’s heritage and encourage the preservaton and revitalization of the historic resources for the educational, cultural and economic benefit of all
Objective 8.2.1. Main-tain Historical and Cul-tural heritage of Rock-port to keep its unique character, and to en-courage community members in prioritizing preservation in the fu-ture.
Action 8.2.1.1 Continue supporting and promoting events and work-shops about Rockport’s history and culture.
X XCS; ACHS, ACHC, THC
RCAD, RCA, AC
Event Trust Funds Program, Humanities Texas Grants
Action 8.2.1.2. Promote Rockport’s history and culture through an agri-tourism plan that highlights the signif-icant impacts from the civil war, the cattle industry, and the presence of the chamber of commerce.
X X X
CS; ACHS; ACHC; AC
Humanities Texas Grants
Action 8.2.1.3 Partner with Aransas Pathways and Rockport Cultural Arts dstrict to promote Rockport’s histori-cal connections and culture.
XCS; RCAD; AC
Art Works Grant, Museum Assessment Program (MAP), Hu-manities Texas Grants

IMPLEM
ENTATIO
N | 189
Community Facilities
Plan
Inte
grat
ion
On-
Goi
ng
Shor
t-Ter
m
Mid
-Ter
m
Long
-Ter
m
Capi
tal P
roje
ct
Prog
ram
Regu
latio
n or
Sta
ndar
d
Part
ners
hip
or C
olla
bora
tion
Mor
e Ta
rget
ed P
lann
ing
Objective Action Notes Timeframe Action TypeAction
LeadersOther Part-
nersFunding
Objective 8.2.2. Work with entities such as 4-H club and the Aran-sas County Indepen-dent School District to increase the amount of education and related programs for the youth to engage them in com-munity development at a young age
Action 8.2.2.1. Establish a systematic approach to identifying and focusing resources for education and youth programs.
X X X
ACISD; AgriLife
In-House; Bee Grant Program, The Aransas County ISD Education Foundation, Garden Grant Program
Action 8.2.2.2. Facilitate education and engagement programs about the environment via the City’s Envi-ronmental Services department that educates youth on the role of the en-vironment in the community.
X X X
CS; PW; ACISD
In-House; Environ-mental Education (EE) Grants, Environmental Literacy Program, Event Trust Funds Program
Action 8.2.2.3. Invest in building a multi-purpose community facility cen-ter, open to the public, that will in-clude recreational activities. Prefera-ble location for center will be near the major high school and middle school.
X
CS; CC Community Facilities Direct Loan & Grant Program, Rural LISC - Community Facilities Fund
Objective 8.2.3. Down-town Heritage Re-vitalization through improvements, pro-motion, and economic restructuring that is ap-propriate for Rockport.
Action 8.2.3.1 Explore the possibility of using tax increment financing or other funding mechanisms in the his-toric downtown to redevelop and im-prove the area.
X X X X
CS; CC RCAD; RCA; BUS; R-FCC; EDC; COU; ACND; ACISD
Federal Historic Preservation Tax Incentives, Historic Re-vitalization Subgrant Program (HRSP)
Objective 8.2.4. In-crease of Art and Beau-tification in the parks, open spaces and Histor-ical Downtown.
Action 8.2.4.1 Work with the Cultural Arts District and the Center for the Arts to establish a public art grant program that encourages public art installations and strategic placemak-ing activities throughout the city.
X X
CS; RCAD; RCA
Art Works Grant

190 | CHAPTER 9
Community Facilities
Plan
Inte
grat
ion
On-
Goi
ng
Shor
t-Ter
m
Mid
-Ter
m
Long
-Ter
m
Capi
tal P
roje
ct
Prog
ram
Regu
latio
n or
Sta
ndar
d
Part
ners
hip
or C
olla
bora
tion
Mor
e Ta
rget
ed P
lann
ing
Objective Action Notes Timeframe Action TypeAction
LeadersOther Part-
nersFunding
Action 8.2.4.2 Collaborate with volun-teer programs to engage residents in beautifying parks. Social events could be used to draw in a larger crowds and gather more feedback from the community on what they want to see for their public open spaces.
X X
CS; PL KACB Keep America Beauti-ful’s Community Res-toration and Resiliency Fund, Community Impact Grants
Action 8.2.4.3. Create an “adopt-a-park’ model and market to local busi-nesses to get buy-in for beautification initiatives. Could be mirrored after the “adopt-a-highway” model.
X X
CS; PL Keep America Beauti-ful’s Community Res-toration and Resiliency Fund, Community Impact Grants
Action 8.2.4.4. Pedestrian links to Residential districts (4-2)
HDMPRPAT X CS; PW
CCWalk Friendly Commu-nity (WFC)
Action 8.2.4.5. North Street Pocket Park (4-2)
HDMPRPAT X X CS; PR Local Park Grant Pro-
gramObjective 8.2.5. En-hance the sense of place and maintain community character to attract future invest-ments and visitors.
Action 8.2.5.1. Create a Branding/Way-finding Design Manual to execute common themes/branding for public facilities, beach facilities, parks, and private sector buildings as they are rebuilt and newly built.
X X X
CS R-FCC Local Park Grant Pro-gram
Action 8.2.5.2. Maintain strong re-lations with “Keep Aransas County Beautiful,” Texas A&M Agrilife Coun-ty Extension, and “Aransas Path-ways” to assist in beautifying the city and enhance sense of place and link up existing trails.
X X
CS KACB; AgriLife; AC
Keep America Beauti-ful’s Community Res-toration and Resiliency Fund

IMPLEM
ENTATIO
N | 191
Community Facilities
Plan
Inte
grat
ion
On-
Goi
ng
Shor
t-Ter
m
Mid
-Ter
m
Long
-Ter
m
Capi
tal P
roje
ct
Prog
ram
Regu
latio
n or
Sta
ndar
d
Part
ners
hip
or C
olla
bora
tion
Mor
e Ta
rget
ed P
lann
ing
Objective Action Notes Timeframe Action TypeAction
LeadersOther Part-
nersFunding
Action 8.2.5.3. Evaluate and amend the Heritage District Zoning Overlay Code to preserve and enhance the area
RPAT
X X
CS; P&Z; CC
HOPE VI Main Street Program, Federal His-toric Preservation Tax Incentives, Community Facilities Direct Loan & Grant Program,
Action 8.2.5.4. Explore various fund-ing sources for infrastructure and community improvements in Histor-ic Districts and around other historic and cultural assets.
X X X
CS; ACHS; ACHC
Community Facilities Direct Loan & Grant Program, Humanities Texas Grants, HOPE VI Main Street Pro-gram, Federal Historic Preservation Tax Incentives, Preser-vation Technology and Training Grants, Historic Revitalization Subgrant Program (HRSP), Rural LISC - Community Facilities Fund

192 | CHAPTER 9
FUNDING & RESOURCES
Many funding sources, both internal and external, are available to help the city accomplish its goals. Internal resources refer to taxes and fees to support the action item. External resources are numer- ous, and may also include public-private partnerships with external partners such as developers. The Funding column in the Implementation Table table provides suggestions for fund-ing sources or grants for each action item.
CH. 3 - DEVELOPMENT
Community Development Block Grants (CDBG) • Grantor: U.S. Department of Housing and Urban Development • Purpose: Formula grants for local governments to carry out community and economic development activities. • Eligibility: State allocated Limitations: Apportioned to the States by a formula More Information: http://www.reconnectingamerica.org/resource-center/federal-grant-opportunities/
Community Disaster Loan (CDL) Program• Grantor: FEMA• Purpose: Provides operational funding to help local governments that have incurred a significant loss in revenue, due to major disaster.• Eligibility: Local Governments• Funding limitations: max loan of $5,000,000• Deadline: RollingMore information: https://www.fema.gov/media-library/assets/documents/176527
Cool & Connected Program• Grantor: EPA• Cool & Connected is a planning assistance program that helps community members develop strategies and an action plan for using
broadband to create walkable, connected, economically vibrant main streets and small town neighborhoods that improve human health and the environment. Communities can combine broadband service with other local assets such as cultural and recreational amenities to attract investment and people, including young people, and diversify local economies.
More information: https://www.epa.gov/smartgrowth/cool-connected
Community Restoration and Resiliency Fund• Grantor: Keep America Beautiful (KAB)• Purpose: provides immediate and long-term support for initial and ongoing cleanup efforts and helps rebuild vital public spaces: parks,
greenways, community gateways, Main Street/downtown areas, open spaces and more.• Eligibility: KAB certified affiliates.More Information: https://www.kab.org/resources/community-restoration-and-resiliency-fund
Disaster Relief Fund (Rural)• Grantor: Texas Department of Agriculture• Purpose: Cities and counties may apply following a disaster declaration or for qualifying urgent infrastructure needs.• Eligibility: Non-entitlement cities under 50,000 in population and non-entitlement counties that have a non-metropolitan population
under 200,000 and are not eligible for direct CDBG funding from HUD may apply for funding through any of the Texas CDBG pro-grams.
• Limitations: $50,000-350,000, official disaster status declaration• Deadline: Rolling More information: http://www.texasagriculture.gov/GrantsServices/RuralEconomicDevelopment/RuralCommunityDevelopmentBlock-Grant(CDBG)/DisasterRelief.aspx
Distressed Cities Technical Assistance• Grantor: HUD• Purpose: To build the administrative capacity of smaller distressed communities recently impacted by a natural disaster. The focus of this
TA includes financial management, economic development, and disaster recovery planning.

IMPLEMENTATION | 193
• Eligibility: Eligibility is three-fold• Distressed Community: unemployment rate of 9% or more over the past 3 years; poverty rate of 20% or more among individuals not
enrolled in higher education; population decline of 5% or more between the 2010 Decennial Census and the most recent ACS 5-year Estimates
• Impacted by Natural Disaster: community in a county that experienced a Presidentially declared disaster from 2015 onward• Population Size: less than 40,000More Information: https://www.hudexchange.info/programs/distressed-cities/
Flood Mitigation Assistance (FMA) Grant Program• Grantor: FEMA• Purpose: FMA provides funding to states, territories, federally-recognized tribes and local communities for projects and planning that re-
duces or eliminates long-term risk of flood damage to structures insured under the NFIP. FMA funding is also available for management costs. Funding is appropriated by Congress annually.
• Eligibility: Individual homeowners, business, and private nonprofits may apply for funding through eligible subapplicants (federally-rec-ognized tribes, state agencies, private HMGP nonprofits, tribal agencies, and local governments/communities). Generally, local commu-nities will sponsor applications on behalf of homeowners and then submit the applications to their State. All FMA grant applications must be submitted to FEMA by a state, territory, or federally-recognized tribe.
More information: https://www.fema.gov/flood-mitigation-assistance-grant-program
Flood Mitigation Assistance (FMA) Grants• Grantor: Texas Water Development Board (TWDB)• Purpose: The Flood Mitigation Assistance (FMA) program provides grants to assist communities in implementing measures to reduce or
eliminate the long-term risk of flood damage to buildings, manufactured homes, and other structures insurable under the NFIP.• Funding Limitations: The Texas Water Development Fund helps fund wastewater and flood control projects.More information at http://www.fema.gov/flood-mitigation-assistance-grant-program
NOAA Coastal Resilience Grants Program• Grantor: NOAA• Purpose: funds projects that are helping coastal communities and ecosystems prepare for and recover from extreme weather events, cli-
mate hazards, and changing ocean conditions. More Information: https://coast.noaa.gov/resilience-grant/
Smart Growth Implementation Assistance (SGIA) program• Grantor: Environmental Protection Agency• Purpose: focuses on complex or cutting-edge issues, such as stormwater management, code revision, transit-oriented development, af-
fordable housing, infill development, corridor planning, green building, and climate change.• Eligibility: Tribes, states, regions, local governments, as well as nonprofits that have a partnership with a government entity.• Limitations: Applicants can submit proposals under 4 categories: community resilience to disasters, job creation, the role of manufac-
tured homes in sustainable neighborhood design or medical and social service facilities siting.• Deadline: RollingMore Information: http://www2.epa.gov/smartgrowth/smart-growth-implementation-assistance
REAP Grants• Grantor: USDA• Purpose: Providing grants of up to $20,000, the Rural Energy for America Program helps farmers and small rural businesses obtain and
install renewable energy systems. Recipients may also use the grant to make improvements to existing energy efficiency systems. Agricul-tural producers must demonstrate that at least half of their gross income comes from agribusiness and show they can pay for at least 75 percent of the project to qualify.
• Eligibility: Small businesses must be in an area OTHER THAN a city or town with a population of greater than 50,000 inhabitants and the urbanized area of that city or town. Agricultural producers with at least 50 percent of their gross income coming from agricultural operations.
More information: https://www.rd.usda.gov/programs-services/rural-energy-america-program-renewable-energy-systems-energy-efficiency
Urgent Need Fund (Rural)• Grantor: Texas Department of Agriculture• Purpose: Grants that will restore rural infrastructure whose sudden failure poses an imminent threat to life or health.

194 | CHAPTER 9
• Eligibility: Non-entitlement cities under 50,000 in population and non-entitlement counties that have a non-metropolitan population under 200,000 and are not eligible for direct CDBG funding from HUD may apply for funding through any of the Texas CDBG pro-grams.
• Limitations: $25,000-250,000, requires assessment.• Deadline: Applications are accepted by invitation. More information: http://www.texasagriculture.gov/GrantsServices/RuralEconomicDevelopment/RuralCommunityDevelopmentBlock-Grant(CDBG)/UrgentNeedFund.aspx
WaterSMART Cooperative Watershed Management Program Phase I Grants• Grantor: Department of the Interior - Bureau of Reclamation• Purpose: 50/50 cost share funding to irrigation and water districts, tribes, states and other entities with water or power delivery authority.
Projects conserve and use water more efficiently; increase the production of hydropower; mitigate conflict risk in areas at a high risk of future water conflict; and accomplish other benefits that contribute to water supply reliability in the western United States. Projects are selected through a competitive process and the focus is on projects that can be completed within two or three years.
• Eligibility: an applicant eligible for funding under this FOA is a state, Indian tribes, irrigation districts, water district, or other organiza-tions with water or power delivery authority.
• Applicants must also be located in the western United States or Territories as identified in the Reclamation Act of June 17, 1902, as amended and supplemented; specifically: Alaska, Arizona, California, Colorado, Hawaii, Idaho, Kansas, Montana, Nebraska, Nevada, New Mexico, North Dakota, Oklahoma, Oregon, South Dakota, Texas, Utah, Washington, Wyoming, American Samoa, Guam, the Northern Mariana Islands, and the Virgin Islands.
More Information: https://www.usbr.gov/watersmart/weeg/index.html
CH. 4 - HOUSING
Building Neighborhood Capacity Program (BCNP)• Grantor: U.S. Department of Housing and Urban Development• Purpose: offer training and technical assistance (TTA) to begin or sustain the process of revitalization, guided by comprehensive neigh-
borhood revitalization plans, in concert with relevant local and state plans and planning processes.• Eligibility: Five neighborhoods selected. Nonprofit organizations, faith-based and community organizations, institutions of higher learn-
ing, and for-profit organizations (commercial) with significant experience in supporting neighborhood and community development through training and technical assistance. For-profit organizations must agree to forgo any profit or management fee.
• Limitations: Up to $2 millionMore Information: http://www.cssp.org/community/neighborhood-investment/place-based-initiatives/building-neighborhood-capacity
Capacity Building for Community Development and Affordable Housing Grants• Grantor: U.S. Department of Housing and Urban Development• Purpose: for intermediary organizations to assist HUD in providing technical assistance to community development corporations and
community housing development organizations to carry out community development and affordable housing activities that benefit low-income families.
• Eligibility: Community development financing institutions (CDFIs)• Limitations: $49.4 million• Deadline: RollingMore Information: http://portal.hud.gov/hudportal/HUD?src=/hudprograms/capacitybuilding
Capacity Building for Sustainable Communities• Grantor: Environmental Protection Agency• Purpose: Funding for intermediary organizations who will assist HUD in providing technical assistance to communities engaged in
planning efforts built around integrating housing, land use, transportation,and other issues.• Eligibility: nonprofit organization, a local or state public agency, a for-profit organization, a nationally recognized and accredited Uni-
versity or College; or any combination of the aforementioned entities as a Capacity Building Team to combine their skills and offer a coordinated program.
• Limitations: $5.65 million, max amount $ 1 million. Primary support will be given to recipients of Sustainable Communities and Brownfield Area Wide Planning grants.

IMPLEMENTATION | 195
More Information: http://portal.hud.gov/hudportal/HUD?src=/program_offices/economic_resilience/capacity-building
Choice Neighborhoods Implementation Program• Grantor: U.S. Department of Housing and Urban Development• Purpose: to revitalize severely distressed public and/or HUD-assisted multifamily housing in distressed neighborhoods into viable,
mixed-income communities with access to well-functioning services, high quality educational programs, public transportation, and jobs.• Eligibility:Public housing authorities (PHAs), local governments, nonprofits, tribal entities and for-profit developers that apply jointly
with a public entity.• Limitations: Public housing authorities (PHAs), local governments, nonprofits, tribal entities and for-profit developers that apply jointly
with a public entity. Preferred Sustainability Applicants receive an additional two bonus points.More Information: https://www.hud.gov/program_offices/public_indian_housing/programs/ph/cn/grants
Choice Neighborhoods Planning Grants• Grantor: U.S. Department of Housing and Urban Development• Purpose: to revitalize severely distressed public and/or HUD-assisted multifamily housing in distressed neighborhoods into viable,
mixed-income communities with access to well-functioning services, high quality educational programs, public transportation, and jobs.• Eligibility: Public housing authorities, local governments, nonprofits, and for-profit developers that apply jointly with a public entity.
Preferred Sustainability Applicants receive an additional two bonus points.• Deadlines: Annual More Information: https://www.hud.gov/program_offices/public_indian_housing/programs/ph/cn/planninggrants
Community Development Block Grant (CDBG)• Grantor: U.S. Department of Housing and Urban Development (HUD).• Purpose: Provides communities with resources to address a wide range of unique community development needs. Assists urban, suburban
and rural communities to improve housing and living conditions and expand economic opportunities for low- and moderate-income persons.
• Eligibility: States and local governments.• Limitations: Apportioned to States and local governments by a formula• Deadline: Annually apportionedMore Information: http://portal.hud.gov/hudportal/HUD?src=/program_offices/comm_planning/communitydevelopment/programs
Community Development Block Grant (TxCDBG) Program for Rural Texas • Grantor: Texas Department of Agriculture• Purpose: develop viable communities by providing decent housing and suitable living environments, and expanding economic opportu-
nities principally for persons of low- to moderate-income.• Eligibility: non-entitlement cities and counties whose populations are less than 50,000 and 200,000 respectively, and are not participat-
ing or designated as eligible to participate in the entitlement portion of the federal Community Development Block Grant Program.• Limitations: Population 50,000 city and 200,000 county.• Deadline: Annually Apportioned.More information: http://www.texasagriculture.gov/GrantsServices/RuralEconomicDevelopment/RuralCommunityDevelopmentBlock-Grant(CDBG).aspx
Housing Preservation Grants (HPG)• Grantor: U.S. Department of Agriculture Rural Development• Purpose: provides grants to sponsoring organizations for the repair or rehabilitation of housing owned or occupied by low- and very-low-
income rural citizens.• Eligibility: Most State and local governmental entities, nonprofit organizations, Federally Recognized Tribes. Individual homeowners are
not eligible. Rural areas and towns with 20,000 or fewer people.• Limitations: USDA will award a total of $15,888,420 in Housing Preservation Grant Program funding for the repair and rehabilitation
of rural housing units.• Deadline: RollingMore information: https://flh.fhwa.dot.gov/programs/erfo/

196 | CHAPTER 9
Housing Preservation & Revitalization Demonstration Loans & Grants• Grantor: U.S. Department of Agriculture• Purpose: provide affordable multi-family rental housing • Eligibility: for very low-, low-, and moderate-income families; the elderly; and persons with disabilities.• Deadline: RollingMore Information: http://www.rd.usda.gov/programs-services/housing-preservation-revitalization-demonstration-loans-grants
Low Income Housing Tax Credit (4%)• Grantor: HUD• Purpose: Generate equity capital for the construction and rehabilitation of affordable rental housing.• Eligibility: Determined by state housing finance agency• If the projects involve acquisition and substantial rehabilitation expenditures, and are funded with Tax-Exempt Bonds only qualify for
4%.• Deadline: Rolling Application• More information: https://tdhca.state.tx.us/multifamily/housing-tax-credits-4pct/index.htm
Low Income Housing Tax Credit (9%)• Grantor: Department of the Treasury• Purpose: Generate equity capital for the construction and rehabilitation of affordable rental housing.• Eligibility: Determined by state housing finance agency• 9% LIHTC are possible if the projects are not funded by federal Tax-Exempt Bonds, and meet the other basic qualifications of LIHTC.• Deadline: Rolling ApplicationMore information: http://www.tdhca.state.tx.us/multifamily/housing-tax-credits-9pct/
Low-Income Housing Tax Credit (LIHTC)• Grantor: U.S. Treasury Department via the Internal Revenue Code• Purpose: directing private capital toward the development and preservation of affordable rental housing for low-income households.• Eligibility: Private for-profit and nonprofit developers. Tenants earning up to 60% of the area median family income (AMFI), which
varies by area. • Deadline: RollingMore information can be found at http://www.huduser.org/portal/datasets/lihtc.html
Multi-family (Rental Housing) Development Program• Grantor: provides funding to units of General Local Governments, Public Housing Authorities, nonprofits, and for-profit entities to-
wards the new construction or rehabilitation of affordable multifamily rental developments. • Eligibility: Development funds are awarded on a first-come, first-served basis through an application process. • Deadline: RollingMore information: http://www.tdhca.state.tx.us/multifamily/home/index.htm
Multi-Family Housing Loan Guarantees• Grantor: U.S. Department of Agriculture• Purpose: to increase the supply of moderately-priced housing in rural areas• Eligibility: be a U.S. citizen(s) or legal resident(s), a U.S. owned corporation, a limited liability corporation (LLC) or a partnership in
which the principals are U.S. citizens or permanent legal residents.• Limitations: The maximum loan to value is 90% for for-profit entities and 97% for non-profit entities.More Information: http://www.rd.usda.gov/programs-services/multi-family-housing-loanguarantees
Multifamily Mortgage Revenue Bond Program • Grantor: Texas Bond Review Board and the Texas Department of Housing and Community Affairs (TDHCA)• Purpose: issues mortgage revenue bonds to finance loans• Eligibility: qualified nonprofit organizations and for-profit developers. • Limitations: developers financed through this program are subject to set-aside restrictions for low-income tenants and persons with spe-
cial needs, tenant services, maximum rent limitations and other requirements.

IMPLEMENTATION | 197
• Deadline: RollingMore information: http://www.tdhca.state.tx.us/multifamily/bond/index.htm
Neighborhood Stabilization Program (NSP)• Grantor: U.S. Department of Housing and Urban Development• Purpose: to stabilize communities that have suffered from foreclosures and abandonment by providing funds to purchase and redevelop
distressed residential properties.• Eligibility: States, territories and local governments• Limitations: VariesMore Information: https://www.hudexchange.info/programs/nsp/
Planning Capacity Building Fund (Rural)• Grantor: Texas Department of Agriculture• Purpose: Grants for local public facility and housing planning activities.• Eligibility: non-entitlement cities and counties whose populations are less than 50,000 and 200,000 respectively, and are not participat-
ing or designated as eligible to participate in the entitlement portion of the federal Community Development Block Grant Program.• Limitations: $55,000 and competitive application processMore information: http://www.texasagriculture.gov/GrantsServices/RuralEconomicDevelopment/RuralCommunityDevelopment-Block-Grant(CDBG)/PlanningandCapacityBuildingFund.aspx
Public Housing Agency’s Housing Choice Voucher program • Grantor: U.S. Department of Housing and Urban Development• Purpose: Allows a very low-income family to receive a housing voucher. The family must pay 30% of its monthly adjusted gross income
for rent and utilities. • Eligibility: very low-income families.• Limitations: Housing Authorities may establish local preferences for selecting applicants from its waiting list.• Deadline: RollingMore information: https://www.hud.gov/program_offices/public_indian_housing/programs/hcv/about/fact_sheet
SBA Disaster Loan Assistance (Home and Personal Property Loans)• Grantor: U.S. Small Business Administration• Purpose: If you are in a declared disaster area and have experienced damage to your home or personal property, you may be eligible for
financial assistance from the SBA — even if you do not own a business. As a homeowner, renter and/or personal property owner, you may apply to the SBA for a loan to help you recover from a disaster.
• Eligibility: Secondary homes or vacation properties are not eligible for these loans. However, qualified rental properties may be eligible for assistance under the SBA business disaster loan program.
• Loan amount: Homeowners may apply for up to $200,000 to replace or repair their primary residence. Renters and homeowners may borrow up to $40,000 to replace or repair personal property — such as clothing, furniture, cars and appliances — damaged or destroyed in a disaster.
• Deadline: Rolling More information: https://disasterloan.sba.gov/ela/Information/HomePersonalPropertyLoans
Single Family Home Repairs (Section 504)• Grantor: U.S. Department of Agriculture (USDA) & Rural Development• Purpose: provide loans to very-low-income homeowners to repair, improve, or modernize their homes or grants to elderly very-low-in-
come homeowners to remove health and safety hazards.• Eligibility: Rural areas with populations up to 10,000 if located in a MSA or up to 20,000 if not in an MSA.Limitations: up to $7,500-27,500 loans and grants, 20 year repayment, very-low-income applicants or elderly persons age 62 or older.
More information: http://www.rd.usda.gov/programs-services/single-family-housing-repairloans-
Section 202 - Supportive Housing for the Elderly• Grantor: U.S. Department of Housing and Urban Development\• Purpose: Provide capital advances to finance the construction, rehabilitation or acquisition of properties that will serve as supportive
housing for very low-income elderly persons.• Eligibility: Private nonprofit organizations and nonprofit consumer cooperatives• Limitations: $371 millionMore Information: http://www.reconnectingamerica.org/resource-center/federal-grant-opportunities/
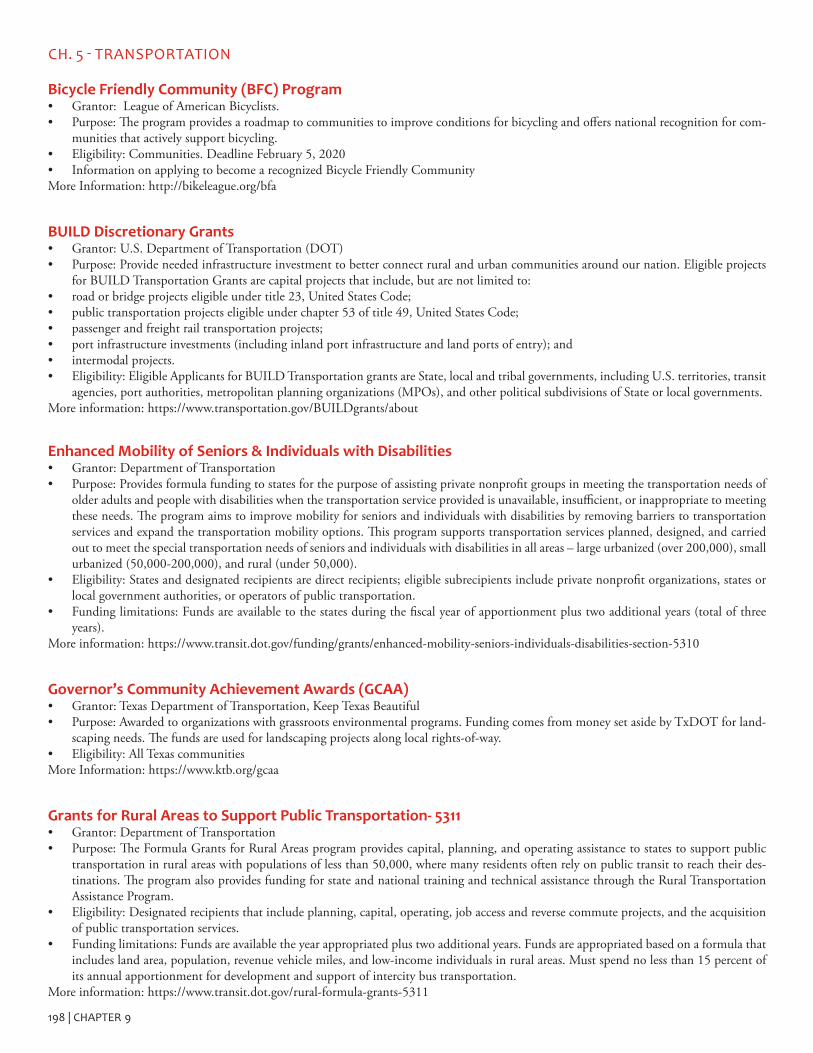
198 | CHAPTER 9
CH. 5 - TRANSPORTATION
Bicycle Friendly Community (BFC) Program• Grantor: League of American Bicyclists. • Purpose: The program provides a roadmap to communities to improve conditions for bicycling and offers national recognition for com-
munities that actively support bicycling. • Eligibility: Communities. Deadline February 5, 2020• Information on applying to become a recognized Bicycle Friendly CommunityMore Information: http://bikeleague.org/bfa
BUILD Discretionary Grants• Grantor: U.S. Department of Transportation (DOT)• Purpose: Provide needed infrastructure investment to better connect rural and urban communities around our nation. Eligible projects
for BUILD Transportation Grants are capital projects that include, but are not limited to:• road or bridge projects eligible under title 23, United States Code;• public transportation projects eligible under chapter 53 of title 49, United States Code;• passenger and freight rail transportation projects;• port infrastructure investments (including inland port infrastructure and land ports of entry); and• intermodal projects.• Eligibility: Eligible Applicants for BUILD Transportation grants are State, local and tribal governments, including U.S. territories, transit
agencies, port authorities, metropolitan planning organizations (MPOs), and other political subdivisions of State or local governments.More information: https://www.transportation.gov/BUILDgrants/about
Enhanced Mobility of Seniors & Individuals with Disabilities• Grantor: Department of Transportation • Purpose: Provides formula funding to states for the purpose of assisting private nonprofit groups in meeting the transportation needs of
older adults and people with disabilities when the transportation service provided is unavailable, insufficient, or inappropriate to meeting these needs. The program aims to improve mobility for seniors and individuals with disabilities by removing barriers to transportation services and expand the transportation mobility options. This program supports transportation services planned, designed, and carried out to meet the special transportation needs of seniors and individuals with disabilities in all areas – large urbanized (over 200,000), small urbanized (50,000-200,000), and rural (under 50,000).
• Eligibility: States and designated recipients are direct recipients; eligible subrecipients include private nonprofit organizations, states or local government authorities, or operators of public transportation.
• Funding limitations: Funds are available to the states during the fiscal year of apportionment plus two additional years (total of three years).
More information: https://www.transit.dot.gov/funding/grants/enhanced-mobility-seniors-individuals-disabilities-section-5310
Governor’s Community Achievement Awards (GCAA)• Grantor: Texas Department of Transportation, Keep Texas Beautiful• Purpose: Awarded to organizations with grassroots environmental programs. Funding comes from money set aside by TxDOT for land-
scaping needs. The funds are used for landscaping projects along local rights-of-way.• Eligibility: All Texas communitiesMore Information: https://www.ktb.org/gcaa
Grants for Rural Areas to Support Public Transportation- 5311• Grantor: Department of Transportation • Purpose: The Formula Grants for Rural Areas program provides capital, planning, and operating assistance to states to support public
transportation in rural areas with populations of less than 50,000, where many residents often rely on public transit to reach their des-tinations. The program also provides funding for state and national training and technical assistance through the Rural Transportation Assistance Program.
• Eligibility: Designated recipients that include planning, capital, operating, job access and reverse commute projects, and the acquisition of public transportation services.
• Funding limitations: Funds are available the year appropriated plus two additional years. Funds are appropriated based on a formula that includes land area, population, revenue vehicle miles, and low-income individuals in rural areas. Must spend no less than 15 percent of its annual apportionment for development and support of intercity bus transportation.
More information: https://www.transit.dot.gov/rural-formula-grants-5311

IMPLEMENTATION | 199
INVEST 1.0 Implementation Projects• Grantor: Department of Transportation• Purpose: to evaluate the sustainability of transportation systems• Eligibility: State DOTs, MPOs and other transportation agencies• Limitations: Multiple awards between $25,000 to $150,000More Information: http://www.reconnectingamerica.org/resource-center/federal-grant-opportunities/
National Scenic Byways• Grantor: Department of Transportation• Purpose: improvement to a scenic byway that will enhance access to an area for the purpose of recreation; development of tourist infor-
mation to the public (such as biking info and maps on scenic byways).• Eligibility: State DOTs and Indian Tribes• Limitations: Livability is a criteria that will be used in the consideration of projects.More Information: http://www.reconnectingamerica.org/resource-center/federal-grant-opportunities/
The Highway Safety Improvement Program (HSIP) • Grantor: U.S. Department of Transportation Federal Highway Administration.• Purpose: The goal is to achieve a significant reduction in traffic fatalities and serious injuries on all public roads.• Limitations: The HSIP requires states to develop and implement a Strategic Highway Safety Plan (SHSP). $2.407 bnMore Information: https://www.fhwa.dot.gov/map21/funding.cfm
The National Complete Streets Coalition• Grantor: Smart Growth America• Purpose: promoting the design and operation of road-ways to provide safe, comfortable, and convenient access for all users, from motor-
ists to bicyclists and pedestrians of all ages and abilities.More Information: http://www.smartgrowthamerica.org/complete-streets
Pedestrian and Bicycle Safety Program
• Grantor: Department of Transportation• Purpose: Conduct research and develop guidelines, tools and safety countermeasures to reduce pedestrian and bicycle fatalities.• Eligibility: State/MPO allocatedMore Information: http://www.reconnectingamerica.org/resource-center/federal-grant-opportunities/
Recreational Trail Grants• Grantor: Texas Parks and Wildlife Department• Purpose: TPWD administers the National Recreational Trails Fund in Texas under the approval of the Federal Highway Administration
(FHWA). This federally funded program receives its funding from a portion of federal gas taxes paid on fuel used in non-highway recre-ational vehicles.
• Eligibility: Funds can be spent on both motorized and non-motorized recreational trail projects such as the construction of new recre-ational trails, to improve existing trails, to develop trailheads or trailside facilities, and to acquire trail corridors.
• Limitations: The grants can be up to 80% of project cost with a maximum of $200,000 for non-motorized trail grants and currently there is not a maximum amount for motorized trail grants (call 512-389-8224 for motorized trail grant funding availability).
More information: https://tpwd.texas.gov/business/grants/recreation-grants/recreational-trails-grants;
Recreational Trails Program (RTP)• Grantor: Department of Transportation’s Federal Highway Administration (FHWA)• Purpose: provides funds to the States to develop and maintain recreational trails and trail-related facilities for both non motorized and
motorized recreational trail usesMore Information: https://www.fhwa.dot.gov/environment/recreational_trails/

200 | CHAPTER 9
Safe Routes To School • Grantor: Department of Transportation • Purpose: The Program’s objectives are 1) to enable and encourage children in grades K-8, including those with disabilities, to walk and
bicycle to school; 2) to make bicycling and walking to school a safer and more appealing transportation alternative, thereby encouraging a healthy and active lifestyle from an early age; and 3) to facilitate the planning, development, and implementation of projects and activities that will improve safety and reduce traffic, fuel consumption, and air pollution in the vicinity of schools.
• Eligibility: Eligible applicants for infrastructure projects include state agencies and political subdivisions (a city or county within the State of Texas). Applications should present a unified solution for improving the safety of pedestrian or bicycle routes to schools within a community and may involve more than one partner.
• Funding limitations: Safe Routes to School is a 100 percent federally funded cost-reimbursement program managed through the Texas Department of Transportation (TxDOT), Traffic Operations Division (TRF). Projects are funded through a statewide competitive pro-cess with funds limited to those authorized in the SRTS program. Cost-reimbursement means that sponsors will front the cost of the project and will be reimbursed through various stages of the project. In some cases, there will be no up-front funds required from the applicant.
More information: http://ftp.dot.state.tx.us/pub/txdot-info/ptn/programs/tasa-2017/2019-program-guide.pdf
Surface Transportation Block Grant Program (STBG) • Grantor: Department of Transportation • Purpose: The Surface Transportation Block Grant program (STBG) provides flexible funding that may be used by States and localities for
projects to preserve and improve the conditions and performance on any Federal-aid highway, bridge and tunnel projects on any public road, pedestrian and bicycle infrastructure, and transit capital projects, including intercity bus terminals.
• Eligibility: State, local, and tribal governments, including U.S. territories, transit agencies, port authorities, metropolitan planning orga-nizations (MPOs), and other political subdivisions of State or local governments.
More information: https://www.fhwa.dot.gov/specialfunding/stp/
Transportation for Elderly Persons and Persons with Disabilities• Grantor: Department of Transportation• Purpose: provides formula funding to States for the purpose of assisting private nonprofit groups in meeting the transportation needs
of the elderly and persons with disabilities when the service provided is unavailable, insufficient/inappropriate to meeting these needs.• Eligibility: States are direct recipients. Eligible sub recipients are private non-profit organizations, governmental authorities where no
non-profit organizations are available to provide service and governmental authorities approve to coordinate services• Limitations: State allocatedMore Information: http://www.reconnectingamerica.org/resource-center/federal-grant-opportunities/
Walk Friendly Community (WFC) • Grantor: U.S. Department of Transportation Federal Highway Administration.• Purpose: helps to promote safe walking environments in cities. • Eligibility: Individual cities and towns. Applications due June 15 and December 15.• Limitations: By applying will receive specific suggestions and resources on how to make needed changes for pedestrian safety. More Information: http://walkfriendly.org/
CH. 6 - ECONOMY
Community Advantage Program• Grantor: U.S. Small Business Administration• Purpose: Loans are primarily designed for newer, veteran-owned, and underserved businesses that have difficulty securing traditional
financing and can benefit from management and technical assistance.• Eligibility: small businesses• Max loan amount: $ 250,000• Interest rate: prime + 6%• Terms: up to 25 years of real estate, 10 years for equipment and working capital• Guarantee: 75 to 90%
IMPLEMENTATION | 201
More information: https://fitsmallbusiness.com/sba-community-advantage-loan-program/
Economically Distressed Areas Program• Grantor: Texas Water Development Board (TWDB)• Purpose: This program provides financial assistance for water and wastewater services in economically distressed areas where present fa-
cilities are inadequate to meet residents’ minimal needs. The program also includes measures to prevent future substandard development.• Eligibility: Projects must be located in an area that was established as a residential subdivision as of June 1, 2005, median household in-
come less than 75% of the median state household income, has an inadequate water supply or sewer services to meet minimal residential needs and a lack of financial resources to provide water supply or sewer services to satisfy those needs. All political subdivisions, including cities, counties, water districts, and nonprofit water supply corporations, are eligible to apply for funds. The applicant, or its designee, must be capable of maintaining and operating the completed system.
• Funding limitations: Financial support is in the form of grant or combination of a grant and a loan. The program does not fund ongoing operation and maintenance expenses, nor does it fund new development.
• Deadline: Rolling More information: http://www.twdb.texas.gov/financial/programs/EDAP/
High Demand Job Training Program• Grantor: Texas Workforce Commission (TWC)• Purpose: to provide high-demand occupational job training in local workforce areas; to support Boards in partnering with local EDCs
that use their local economic development sales taxes for high-demand job training.• Eligibility: Local Workforce Development Board• Limitations: one million dollars. Funds will be available through August 30, 2020.More information: https://twc.texas.gov/high-demand-job-training-program
Jobs & Education for Texans (JET) Grant Program• Grantor: Texas Workforce Commission (TWC)• Purpose: provides grants to eligible educational institutions to defray the start-up costs associated with developing career and technical
education programs; Supports new, emerging industries or high-demand occupations; Offers new or expanded dual credit career and technical educational opportunities in public high schools.
• Eligibility: Public community, state or technical colleges; Independent school districts (ISD) entered into a partnership with a public community, state or technical college
• Limitations: $10 million each biennium. Rolling Applications.More information: https://twc.texas.gov/partners/jobs-education-texans-jet-grant-program
Rural Business Development Grants • Grantor: USDA• Purpose: The RBEG program provides grants for rural projects that finance and facilitate the development of small and emerging rural
businesses help fund distance learning networks, and help fund employment related adult education programs.• Eligibility: Rural public entities (towns, communities, State agencies, and authorities), Indian tribes and rural private non-profit corpo-
rations are eligible to apply for funding.• Limitations: Generally grants range $10,000 up to $500,000.• Deadline: April (annually) More Information: http://www.rd.usda.gov/programs-services/rural-business-development-grants
Rural Business Opportunity Grants (RBOG)• Grantor: USDA• Purpose: promotes sustainable economic development in rural communities with exceptional needs through provision of training and
technical assistance.• Eligibility: Rural public bodies, rural nonprofit corporations, rural Indian tribes, and cooperatives with primarily rural members.• Limitations: The maximum grant for a project serving a single state is $50,000. The maximum grant for a project serving two or more
states is $150,000.More Information: http://www.usda.gov/wps/portal/usda/usdahome?contentid=kyf_grants_rd2_content.html

202 | CHAPTER 9
SBA Disaster Loan Assistance (Business Physical Disaster Loans)• Grantor: U.S. Small Business Administration• Purpose: If you are in a declared disaster area and have experienced damage to your business, you may be eligible for financial assistance
from the SBA. Businesses of any size and most private nonprofit organizations may apply to the SBA for a loan to recover after a disaster. These loan proceeds may be used for the repair or replacement of Real property, Machinery, Equipment, Fixtures, Inventory and Lease-hold improvements.
• Eligibility: A business of any size or most private nonprofit organizations that are located in a declared disaster area and has incurred damage during the disaster may apply for a loan to help replace damaged property or restore its pre-disaster condition.
• Loan amount: up to $2 million to qualified businesses or most private nonprofit organizations.More information: https://disasterloan.sba.gov/ela/Information/BusinessPhysicalLoans
Skills Development Fund
Texas Workforce Commission (TWC)• Purpose: To assist Texas public community and technical colleges to finance customized job training for their local businesses. A business,
a consortium of businesses, or trade union identifies a training need, and then partners with a public Community or Technical college to fill its specific needs. Businesses work with college partners to submit proposals, develop curricula and conduct training. The Skills Development Fund pays for the training, the college administers the grant, and businesses create new jobs and improve the skills of their current workers.
• Eligibility: Businesses and trade unions must partner with an eligible applicant in order to be considered for Skills Development Fund grants. Eligible applicants are public community or technical colleges, the Texas Engineering Extension Service or a community-based organization working in partnership with one of these institutions.
More information: https://twc.texas.gov/partners/skills-development-fund
Skills for Small Business• Grantor: Texas Workforce Commission (TWC)• Purpose: supports businesses with fewer than 100 employees, emphasizes training for new workers, and helps upgrade the skills of in-
cumbent workers.• Eligibility: small businesses• Limitations: funds tuition and fees up to $1,800 per newly hired employee and up to $900 per incumbent employee. An individual
employee can participate once per 12-month period. Funding for training is for full-time employees.More information: https://twc.texas.gov/programs/skills-small-business-program-overview
Small Business Administration Loan programs • Grantor: U.S. Small Business Administration• Purpose: works with lenders to provide loans to small businesses. The agency doesn’t lend money directly to small business owners. In-
stead, it sets guidelines for loans made by its partnering lenders, community development organizations, and micro-lending institutions. General Small Business Loans, Microloan Program, Real Estate & Equipment Loans, and Disaster Loans.
• Eligibility: small businessesMore information: http://www.sba.gov/loanprograms
Strong Cities, Strong Communities Visioning Challenge• Grantor: EDA & HUD• Purpose: support the development and implementation of comprehensive economic development strategic plans.• Eligibility: Cities• Limitations: $6 million total; $1 million will be awarded to six total citiesMore Information: http://www.eda.gov/challenges/sc2challenge/
Tax Increment Financing• Grantor: Texas Comptroller of Public Accounts• Purpose: Tax increment financing is a tool that local governments can use to publicly finance needed structural improvements and en-
hanced infrastructure within a defined area.• Eligibility: Only a city or county may initiate tax increment financing . Tax increment financing requires the governing body of a city to
create a Tax Increment Reinvestment Zone (TIRZ). The governing body of a city by ordinance may: designate a contiguous or noncon-tiguous geographic area (a) within the corporate limits of a municipality; (b) in the extraterritorial jurisdiction of the municipality, or (c) in both to be a reinvestment zone. The designation of an area that is wholly or partly located in the extraterritorial jurisdiction of a

IMPLEMENTATION | 203
municipality is not affected by a subsequent annexation of real property in the reinvestment zone by the municipality.More information: https://comptroller.texas.gov/economy/local/ch311/
Texas Workforce Commission’s Skill Development Program • Grantor: Texas Workforce Commission through Texas Legislature• Purpose: provides grants to community and technical colleges to provide customized job training programs for businesses who want to
train new workers or upgrade the skills of their existing workforce.• Eligibility: A business, a consortium of businesses, or trade union identifies a training need, and then partners with a public community
or technical college.• Limitations: Texas Administrative Code, Title 40, Part 20, Chapter 803 and Texas Labor Code, Chapter 303.More Information: http://www.twc.state.tx.us/partners/skills-development-fund
CH. 7 - ENVIRONMENT
Boating Access Grants• Grantor: Texas Parks and Wildlife Department• Purpose: For the construction of public boat ramp facilities throughout Texas.• Eligibility: Local government sponsors must make an application, provide the land, provide access to the proposed boat ramp, supply
25% of the development costs, and accept operation and maintenance responsibilities for a minimum 25-year period.• Limitations: This grant program provides 75% matching grant funds. These funds are allocated annually through the federal Sport Fish
Restoration Act. • Deadlines: October 1, 2020More information: https://tpwd.texas.gov/business/grants/recreation-grants/boating-access
Community Development Block Grant Disaster Recovery (CDBG-DR)• Grantor: U.S. Department of Housing and Urban Development • Purpose: to help cities, counties, and States recover from Presidentially declared disasters, especially in low-income areas, subject to avail-
ability of supplemental appropriations. It serves to address job losses, impacts on tax revenues, and impact to business.• Eligibility: cities, counties and States.• Limitations: $4.383 billion for Texas• Deadline: RollingMore information: https://www.hudexchange.info/programs/cdbg-dr/
Community Outdoor Outreach Program (CO-OP) Grants• Grantor: Texas Parks and Wildlife Department• Purpose: The CO-OP grant helps to introduce under-served populations to the services, programs, and sites of Texas Parks & Wildlife
Department.• Eligibility: Grants are awarded to non-profit organizations, schools, municipalities, counties, cities, and other tax-exempt groups.• Limitations: This is not a land acquisition or construction grant; this is only for programs. • Deadline: December 4, 2020More information: https://tpwd.texas.gov/business/grants/recreation-grants/community-outdoor-outreach-program-co-op-grants
Community & Recovery Tree Planting Grants• Grantor: Keep America Beautiful (KAB)• Purpose: reducing levels of carbon dioxide (CO2) and greenhouse gas emissions through strategic plantings; emphasizing the importance
of native trees; or planting fruit trees to produce fruit for local consumption, planting trees that have a greater likelihood of withstanding disasters ( e.g., roots hold soil and prevent erosion, lessen runoff to mitigate flooding).
• Eligibility: KAB certified affiliates.• Limitations: $5,000• Deadline: October 22, 2020More Information: https://www.kab.org/resources/community-grants

204 | CHAPTER 9
Cooperative Endangered Species Conservation Fund/Section 6 Grants• Grantor: Fish & Wildlife Service• Purpose: provides grants to states and territories to participate in a wide array of voluntary conservation projects for candidate, proposed,
and listed species. The program provides funding to states and territories for species and habitat conservation actions on non-federal lands.
• Eligibility: States and territories must contribute a minimum non-federal match of 25 percent of the estimated program costs of approved projects, or 10 percent when two or more states or territories implement a joint project. A state or territory must currently have, or enter into a cooperative agreement with the Secretary of the Interior to receive grants. Most states and territories have entered into these agree-ments for both plant and animal species.
More information: https://www.fws.gov/endangered/grants/
Environmental Education (EE) Grants• Grantor: EPA• Purpose: To support environmental education projects that promote environmental awareness and stewardship and help provide people
with the skills to take responsible actions to protect the environment. The grant program provides financial support for projects that design, demonstrate and/or disseminate environmental education practices, methods, or techniques.
• Eligibility: Applicants must represent one of the following types of organizations to be eligible for an environmental education grant: - local education agency - state education or environmental agency - college or university - non-profit organization as described in section 501(c)(3) of the Internal Revenue Code - noncommercial educational broadcasting entity - tribal education agency (which includes schools and community colleges controlled by an Indian tribe, band, or nation and which
are recognized as eligible for special programs and services provided by the United States to Indians because of their status as In-dians and which are not administered by the Bureau of Indian Education.)
- Applicant organizations must be located in the United States or territories and the majority of the educational activities must take place in the United States; or in the United States and Canada or Mexico; or in the U.S. Territories.
More Information: https://www.epa.gov/education/environmental-education-ee-grants
Environmental Literacy Program• Grantor: NOAA• Purpose: A competitive funding opportunity for projects designed to build environmental literacy of K-12 students and the public so
they are knowledgeable of the ways in which their community can become more resilient to extreme weather and/or other environmental hazards, and become involved in achieving that resilience.
More Information: https://www.noaa.gov/office-education/elp/grants
FEMA Flood Mitigation Assistance (FMA) Grants• Grantor: Texas Water Development Board (TWDB)• Purpose: The Flood Mitigation Assistance (FMA) program provides grants to assist communities in implementing measures to reduce
or eliminate the long-term risk of flood damage to buildings, manufactured homes, and other structures insurable under the National Flood Insurance Program (NFIP).
• Eligibility: Political subdivision (including any Indian or authorized tribal or native organization) that has zoning and building code jurisdiction over a particular area having special flood hazards and is participating in the NFIP.
• Funding Limitations: FEMA may contribute up to 75 percent of the total eligible costs. At least 25 percent of the total eligible costs must be provided by a nonfederal source.
More information at http://www.fema.gov/flood-mitigation-assistance-grant-program
Landowner Incentive Program (LIP)• Grantor: Texas Parks and Wildlife Department (TPWD)• Purpose: The program offers project cost-sharing for projects that positively impact the valuable riparian areas and watershed in Texas.
Projects showing the greatest benefit to targeted watersheds will receive priority as do projects offering long-term protection, long-term monitoring and greater than the required minimum landowner contribution.
• Eligibility: Eligible parties include private, non-federal landowners wishing to enact good conservation practices on their lands in targeted eco-regions. Targeted eco-regions may change from year to year.
• Funding limitations: Contracts will require a minimum of 25% landowner contribution (in-kind labor, materials, monetary, etc.).• Deadline: Rolling application

IMPLEMENTATION | 205
More information: http://www.tpwd.state.tx.us/landwater/land/private/lip
Public Assistance Grant Program
• Grantor: FEMA• Purpose: to support communities’ recovery from major disasters by providing them with grant assistance for debris removal, life-saving
emergency protective measures, and restoring public infrastructure.• Eligibility: Local Governments, states, tribes, territories and certain private nonprofit organization• Limitations: The federal share of assistance is not less than 75 percent of the eligible cost. The Recipient determines how the non-federal
share (up to 25 percent) is split with the sub-recipients (i.e. eligible applicants).• Deadline: RollingMore information: https://www.fema.gov/public-assistance-local-state-tribal-and-non-profit
Pre-Disaster Mitigation Program• Grantor: Federal Emergency Management Agency (FEMA)• Purpose: This program assists local governments in implementing cost-effective hazard mitigation activities that complement a compre-
hensive mitigation program. • Eligibility: In order to be eligible the city must be in good standing with the National Flood Insurance Program. • Funding Limitations: This grant should be used for hazard planning activities but cannot be used for major flood control projects, warn-
ing systems, engineering designs, feasibility studies not integral to proposed projects, generators not integral to a proposed project, phased or partial projects, flood studies or mapping, or response and communication equipment.
More information at http://www.fema.gov/pre-disaster-mitigation-grant-program
Hazard Mitigation Grant Program• Grantor: FEMA• Purpose: provides grants to states and local governments to implement long-term hazard mitigation measures after a Major Disaster
Declaration.• Eligibility: state, territorial, and local governments, Federally-recognized tribes or tribal organizations, and certain nonprofit organiza-
tions. Individual homeowners and businesses may not apply directly to the program; however, a community may apply on their behalf.• Deadline: The applicant must submit all HMGP sub applications to FEMA within 12 months of the date of the Presidential Major
Disaster Declaration.More information: https://www.fema.gov/hazard-mitigation-grant-program-guide-state/local-governments
National Trails Training Partnership• Grantor: American Trails and NTTP• Purpose: for planning, building, designing, funding, managing, enhancing, and supporting trails, greenways, and blue ways.More information: http://www.americantrails.org/resources/funding/
National Trails Training Partnership• Grantor: Bureau of Land Management’s Watchable Wildlife for Youth and Families• Purpose: offers workshops and webinars on successful trail development and implementation.More Information: http://www.americantrails.org/nttp/
Outdoor Recreation Grants• Grantor: Texas Parks and Wildlife Department• Purpose: This grant provides 50% matching grant funds to acquire and develop parkland or to renovate existing public recreation areas.• Eligibility: For municipalities, counties, MUDs and other local units of government with populations less than 500,000. Eligible spon-
sors include cities, counties, MUDs, river authorities, and other special districts. • Limitations: Projects must be completed within three years of approval. The master plans submission deadline is at least 60 days prior to
the application deadline. • Deadline: December 4, 2020More information: For complete information on this grant, please download the Outdoor Recreation Grant Application; http://www.nps.gov/lwcf/index.htm

206 | CHAPTER 9
Rebuild Texas Fund (RTF)• Gantor: Michael & Susan Dell Foundation and the OneStar Foundation, with the support of thousands of corporate and individual
donors.• Purpose: Helps in the rebuilding and restoration of disaster affected cities in Texas. More Information: https://www.rebuildtx.org/faq/
Recreation Grants• Grantor: Texas Parks and Wildlife Department• Purpose: This grant was created to meet recreation needs. The grant provides 50% matching grant funds to eligible municipalities and
counties. Funds must be used for development or acquisition of parkland.• Eligibility: Must be a small Texas community with a population of 20,000 and under. Eligible projects include ball fields, boating, fishing,
and hunting facilities, picnic facilities, playgrounds, swimming pools, trails, camping facilities, beautification, restoration, gardens, sports courts and support facilities.
• Deadline: December 4, 2020More information: https://tpwd.texas.gov/business/grants/recreation-grants
Recreational Trail Grants• Grantor: Texas Parks and Wildlife Department• Purpose: TPWD administers the National Recreational Trails Fund in Texas under the approval of the Federal Highway Administration
(FHWA). This federally funded program receives its funding from a portion of federal gas taxes paid on fuel used in non-highway recre-ational vehicles.
• Eligibility: Funds can be spent on both motorized and non-motorized recreational trail projects such as the construction of new recre-ational trails, to improve existing trails, to develop trailheads or trailside facilities, and to acquire trail corridors.
• Limitations: The grants can be up to 80% of project cost with a maximum of $200,000 for non-motorized trail grants and currently there is not a maximum amount for motorized trail grants (call 512-389-8224 for motorized trail grant funding availability).
More information: https://tpwd.texas.gov/business/grants/recreation-grants/recreational-trails-grants;
Recreational Trails Program (RTP)• Grantor: Department of Transportation’s Federal Highway Administration (FHWA)• Purpose: provides funds to the States to develop and maintain recreational trails and trail-related facilities for both non motorized and
motorized recreational trail usesMore Information: https://www.fhwa.dot.gov/environment/recreational_trails/
Resilient Communities Program• Grantor: Wells Fargo and National Fish and Wildlife Foundation• Carrie Clingan (Director) [email protected]• Purpose: Grant - “Grants will be offered once a year to support priority projects in the states and communities associated with Wells Fargo
operations. Additional priorities and funding guidelines may be found within the program’s Request for Proposals.”• Eligibility: Eligible applicants include non-profit 501(c) organizations, local governments, Indian tribes.• Funding Limitations: $200,000 to $500,000• The ratio of matching funds offered is one criterion considered during the review process and projects that meet or exceed a 1:1 match
ratio will be more competitive.• Deadline: November 1, 2020Websites:
1. Description of Resilient Communities Program- https://www.nfwf.org/resilientcommunities/Pages/home.aspx2. Request for Proposal Information- https://www.nfwf.org/resilientcommunities/Pages/2019rfp.aspx
Rivers, Trails and Conservation Assistance (15.921)• Grantor: Department of the Interior• Purpose: will help create local, regional and state networks of parks, rivers, trails, greenways and open spaces by collaborating with com-
munity partners and National Park areas in every state. • Eligibility: Private nonprofit organizations and Federal, State and local government agencies. Private nonprofit organizations and Federal,
State and local government agencies. Not applicable. OMB Circular No. A-87 applies to this program• Limitations: Range $3,000 to $237,000; Average $45,000.More Information: https://www.cfda.gov/index?s=program&mode=form&tab=core&id=0eb58e82a9a678d4d621062e2ea27978

IMPLEMENTATION | 207
State Water Implementation Fund for Texas (SWIFT)• Grantor: Texas Water Development Board (TWDB)• Purpose: This program helps communities to develop cost-effective water supplies by providing low-interest loans, extended repayment
terms, deferral of loan repayments, and incremental repurchase terms.• Eligibility: Any political subdivision or nonprofit water supply corporation with a project included in the most recently adopted state
water plan.• Funding limitations: Financial support is in the form of a variety of loans and is available twice a year. A priority rating process applies.
Grants are not available.• Deadline: September 27, 2020More information: http://www.twdb.texas.gov/financial/programs/SWIFT/index.asp
Texas Citizen Planner, Local Coastal Planning in the wake of Hurricane CountyFunding Source(s): Coastal Management Program (CMP), Texas Agrilife Extension Service
Texas Water Development Fund (DFund)• Grantor: Texas Water Development Board (TWDB)• Purpose: This program enables the TWDB to fund projects with multiple purposes (e.g., water and wastewater) in one loan.• Eligibility: Political subdivisions (cities, counties, districts, and river authorities) and nonprofit water supply corporations.• Funding limitations: Loans offered. • Deadline: Rolling applicationMore information: http://www.twdb.texas.gov/financial/programs/TWDF/index.asp
Texas Windstorm Insurance Association (TWIA) TWIA provides essential property insurance policies and services to eligible Texas properties in the gulf-coast area for windstorm and hail storm events.
The Conservation Fund• Grantor: “A nonprofit organization that operates with an entrepreneurial culture”• Reggie Hall (Director) [email protected] 703-908-5825• Purpose: Conservation Loan - to conserve America’s legacy of land and water resources• Eligibility: Non‐profit, municipal and tribal organizations in good standing• Funding Limitations:• Minimum Loan Amount: $200,000 (extraordinary exceptions considered).• Interest: Contact for current rate.• Term: Minimum of 90 days and a maximum of 3 years (extraordinary exceptions considered). If a loan is needed for less than 90 days,
90 days’ worth of interest will be due at maturity.• Payment Schedule: To be negotiated.More information: https://www.conservationfund.org/images/resources/Conservation_Loans_Program.pdf
Wetlands Reserve Program• Grantor: Natural Resources Conservation Service (NRCS)• Purpose: Provides technical and financial support to landowners with their wetland restoration efforts. The programs aims to offer land-
owners the opportunity to protect, restore, and enhance wetlands on their property.• Eligibility: Lands that are eligible under this program include: wetlands farmed under natural conditions; farmed wetlands; prior convert-
ed cropland, farmed wetland pasture; certain lands that have the potential to become a wetland as a result of flooding; rangeland, pasture, or forest production lands where the hydrology has been significantly degraded and can be restored; riparian areas which link protected wetlands; lands adjacent to protected wetlands that contribute significantly to wetland functions and values; and wetlands previously restored under a local, state, or federal Program that need long-term protection.
• Funding limitations: For permanent easements, 100% of the easement value and 100% of the restoration costs will be funded. For 30-year easements, 75% of the easement value and up to 75% of the restoration costs are funded. For an agreement to restore wetlands with-out an easement, up to 75% of the restoration costs will be funded. A 30-year contract is available for tribal land and funding allocation is up to 75% of the restoration costs.
More information: http://www.nrcs.usda.gov/wps/portal/nrcs/main/national/programs/easements/wetlands

208 | CHAPTER 9
Water and Environmental Programs• Grantor: United States Department of Agriculture (USDA)• Purpose: This program provides financial assistance for drinking water, sanitary sewer, solid waste and storm drainage facilities in rural
areas and cities and towns of 10,000 or less. Technical assistance and training is also available to assist rural communities with their water, wastewater, and solid waste problems.
• Eligibility: Public bodies, non-profit organizations and recognized Indian Tribes• Funding limitations: Financial assistance is provided in various ways including direct or guaranteed loans, grants, technical assistance,
research and educational materials. Different amounts of assistance exist depending on the project type and financial tool the participant is seeking.
• Deadline: Rolling More information: https://www.rd.usda.gov/programs-services/all-programs/water-environmental-programs
CH. 8 - FACILITIES
Art Works Grant• Grantor: National Endowment for the Arts• Purpose: Project-based funding that supports public engagement with, and access to, various forms of excellent art across the nation, the
creation of art that meets the highest standards of excellence, learning in the arts at all stages of life, and the integration of the arts into the fabric of community life
• Eligibility: Nonprofit, tax-exempt 501(c)(3), U.S. organizations; units of state or local government; or federally recognized tribal com-munities or tribes may apply. Applicants may be arts organizations, local arts agencies, arts service organizations, local education agencies (school districts), and other organizations that can help advance the goals of the National Endowment for the Arts.
• Funding: Matching grants generally will range from $10,000 to $100,000. No grants will be made below $10,000. Grants of $100,000 or more will be made only in rare instances, and only for projects that we determine demonstrate exceptional national or regional signif-icance and impact.
More information: https://www.arts.gov/grants-organizations/art-works/grant-program-description
The Aransas County ISD Education Foundation • Grantor: The Education Foundation• Purpose: To support programs that go beyond what public funds can provide in order to directly enhance students’ knowledge, thinking
skills, and career preparation in creative, innovative ways.More Information: https://www.acedfoundation.org/grants-education-foundation.html
Bee Grant Program• Grantor: Whole Kids Foundation in partnership with The Bee Cause Project• Purpose: Allows for schools and non-profit organizations to receive support for educational bee hives, so students can observe bees up
close and learn about the vital role these pollinators play in our food system.• Eligibility: K-12 Schools or Non-Profit Organizations in U.S./Canada• Grant Value: $2,000More Information: https://www.wholekidsfoundation.org/programs/honey-bee-hive-grant
Community Impact Grants• Grantor: The Home Depot Foundation• Purpose: Grants are given in the form of The Home Depot gift cards for the purchase of tools, materials, or services and are required to
be completed within six months of approval date.• Eligibility: 501c designated organizations (recognized and in good standing with the IRS for a minimum of one year) and tax-exempt
public service agencies in the U.S. that are using the power of volunteers to improve the community. More information: https://corporate.homedepot.com/grants/community-impact-grants
Community Facilities Direct Loan & Grant Program• Grantor: U.S. Department of Agriculture• Purpose: assist in the development of essential community facilities in rural areas and towns.• Eligibility: public entities such as municipalities, counties, and special-purpose districts, as well as non-profit corporations and tribal

IMPLEMENTATION | 209
governments. Towns of up to 20,000 in population. • Limitations: Development Financing, Construction• Deadline: Open More information: https://www.rd.usda.gov/programs-services/community-facilities-direct-loan-grant-program
Event Trust Funds Program• Grantor: Texas Economic Development Division• Purpose: Event-specific trust funds created to help pay for qualified expenses associated with an event, to which both the state and ap-
plicant must contribute.• Eligibility: A municipality, county, or non-profit local organizing committee endorsed by a Texas municipality or county which has been
selected to host a qualified event, if the event location in that Texas municipality or county. • Limitations: Applicants must contribute $1 in local tax gains for every $6.25 the state contributes to the fund. • Deadline: RollingMore information: https://gov.texas.gov/business/page/event-trust-funds-program
Farmers Market Promotion Program• Grantor: U.S. Department of Agriculture • Purpose: to increase domestic consumption of, and access to, locally and regionally produced agricultural products, and to develop new
market opportunities for farm and ranch operations serving local markets by developing, improving, expanding, and providing outreach, training, and technical assistance to, or assisting in the development, improvement, and expansion of, domestic farmers markets, roadside stands, community-supported agriculture programs, agritourism activities, and other direct producer-to-consumer market opportunities.
• Eligibility: June 2020 Agricultural businesses, Agricultural cooperatives, Community Supported Agriculture (CSA) networks, CSA asso-ciations, Economic development corporations, Local governments, Nonprofit corporations, Producer networks, Producer associations, Public benefit corporations, Regional farmers’ market authorities and Tribal governments
More Information: https://www.ams.usda.gov/services/grants/fmpp
Federal Historic Preservation Tax Incentives • Grantor: National Park Services• Purpose: encourage private sector investment in the rehabilitation and re-use of historic buildings. The community revitalization program
is one of the nation’s most successful and cost-effective community revitalization programs. • Limitations: a 20% tax credit for the certified rehabilitation of certified historic structures; a 10% tax credit for the rehabilitation of
non-historic, non-residential buildings built before 1936.More information: http://www.nps.gov/tps/tax-incentives.htm
Garden Grant Program• Grantor: Whole Kids Foundation• Purpose: Turn outdoor spaces into powerful hands-on learning gardens that connect kids with food, spark their curiosity and support
classroom curriculum.• Eligibility: K-12 Schools or Non-Profit Organizations in U.S./Canada• Grant Value: $2,000More Information: https://www.wholekidsfoundation.org/programs/school-gardens-grant
Historic Revitalization Subgrant Program (HRSP)• Grantor: National Parks Service• Purpose: supports the rehabilitation of historic properties and fosters economic development of rural communities. This program funds
physical preservation projects for historic sites, including architectural and engineering services through subgrants to communities deter-mined rural by the US Bureau of the Census.
• Eligibility: Eligible properties must be listed in the National Register of Historic Places or determined eligible for listing at the National, State, or local level of significance and located within rural (non-urban) communities with populations less than 50,000. States, Tribes, Certified Local Governments, and non-profits will apply for funding that will in turn be subgranted to rural communities in their juris-dictions.
More information: https://www.nps.gov/orgs/1623/historic-revitalization-subgrant-program.htm
HOPE VI Main Street Program• Grantor: U.S. Department of Housing and Urban Development• Purpose: Small community grants to assist with downtown revitalization of a historic or traditional central business district by replacing

210 | CHAPTER 9
unused commercial space with affordable housing units.• Eligibility: Local governments with populations of 50,000 or less that currently have less than 100 public housing units• Limitations: $500,000, max grant $500,000 (only one awardee)• Deadline: July 30. 2020More Information: https://www.hud.gov/program_offices/public_indian_housing/programs/ph/hope6/grants/mainstreet
Humanities Texas Grants• Grantor: Humanities Texas• Purpose: Enable communities throughout the state to develop programs of local interest promoting heritage, culture, and education. To
support a wide range of public programs: lectures, panel discussions, and conferences; teacher institutes; reading- and film-discussion groups; interpretive exhibits; television and radio programming; film production; and interactive multimedia programming.
• Eligibility: Nonprofit organizations and state and local governmental entities• More Information: https://www.humanitiestexas.org/grants • Keep America Beautiful’s Community Restoration and Resiliency Fund• Grantor: Keep America Beautiful• Purpose: Benefits Keep America Beautiful Affiliates that serve communities directly affected by natural and environmental disasters.
The fund provides immediate and long-term support for initial and ongoing cleanup efforts and helps rebuild vital public spaces: parks, greenways, community gateways, Main Street/downtown areas, open spaces and more.
• Eligibility: Must be a Keep America Beautiful Affiliate• Deadline: RollingMore information: https://www.kab.org/resources/community-grants
Local Historic Property Tax Incentives• Grantor: U.S. Department of the Interior• According to the Texas Property Code Section 11.24, “Historic Sites grants the governing body of a taxing unit the authority to exempt
from taxation part or all of the assessed value of a structure and the land necessary for access to the structure if the structure is a Recorded Texas Historical Landmark or designated as historically significant and in need of tax relief to encourage its preservation.” Thus, commu-nities that do not currently have historic tax incentives programs should consider adopting them as permitted by Texas law.
Local Park Grant Program• Grantor: Texas Parks and Wildlife• Purpose: The Local Park Grant Program consists of 5 individual programs that assist local units of government with the acquisition and/
or development of public recreation areas and facilities throughout the State of Texas. The Program provides 50% matching grants on a reimbursement basis to eligible applicants. Once funded, all grant assisted sites must be dedicated as parkland in perpetuity, properly maintained and open to the public.
• Eligibility: Eligible applicants include political subdivisions of the State of Texas legally responsible for providing public recreation ser-vices to their citizens. This includes cities, counties, river authorities, municipal utility districts, and other special districts.
More information: https://tpwd.texas.gov/business/grants/recreation-grants/about-local-parks-grants
Museum Assessment Program (MAP)• Grantor: American Alliance of Museums & Institute of Museum and Library Services• Purpose: Help museums assess their strengths and weaknesses, and plan for the future. A MAP assessment requires members of the
museum staff and governing authority to complete a self-study. After completion of the self-study, a site visit is conducted by one or more museum professionals, who tour the museum and meet with staff, governing officials, and volunteers. The reviewers work with the museum and MAP staff to produce a report evaluating the museum’s operations, making recommendations, and suggesting resources.
More information: https://www.aam-us.org/programs/accreditation-excellence-programs/museum-assessment-program-map/
Preservation Technology and Training Grants• Grantor: U.S. Department of the Interior• Purpose: provides funding for innovative research that develops new technologies or adapt existing technologies to preserve cultural
resources. Grant recipients undertake innovative research and produce technical reports which respond to national needs in the field of historic preservation.
• Eligibility: federal agencies, states, tribes, local governments, and non-profit organizations.• Funding Limitation: Up to $30,000More information: https://www.ncptt.nps.gov/grants/preservation-technology-and-training-grants/

IMPLEMENTATION | 211
Rural LISC - Community Facilities Fund• Grantor: National Center for Mobility Management• Purpose: to provide capital to help develop and improve essential community facilities in rural areas. Rural LISC utilizes this fund to
provide permanent and construction-to-permanent financing for rural community facilities, including health care centers, hospitals, educational facilities, and other nonprofit and public facilities in rural communities with populations under 20,000.
• Eligibility: Nonprofits or public entities• Limitations: $100,000 - $8,000,000. • Deadline: Assigned every two years. 2021More information: https://nationalcenterformobilitymanagement.org/challenge-2019/
ADDITIONAL GLO/FEMA FUNDING SOURCES
2015 Floods State Mitigation Competition• Allocation: $46M | Min: $3M - Max: $10M• Eligibility: 2015 Counties | Cities, Counties, Tribes, COGs
2016 Floods State Mitigation Competition• Allocation: $1.5M | Min: $3M - Max: $10M• Eligibility: 2016 Counties | Cities, Counties, Tribes, COGs
Hurricane Harvey State Mitigation Competition• Allocation: $2.14B | Min: $3M - Max: $100M• Purpose: provide funds for mitigation projects to address risk in the Hurricane Harvey impacted areas. • Eligibility: Harvey Counties | Cities, Counties, Tribes, COGs, State, S.P. Districts
Regional Mitigation Program (COG MODs)• Allocation: $500M | Min: $1M - Max: Determined by Local MOD• Purpose: councils of government (COG) impacted by Hurricane Harvey will develop a method of distribution (MOD) to allocate funds
to local units of government and Indian tribes.• Eligibility: Harvey Counties | Cities, Counties, Tribes
Hazard Mitigation Grant Program (HMGP): Supplemental• Allocation: $170M | Max: $170M• Grantor: Texas Division of Emergency Management• Purpose: Provide funds CDBG-MIT eligible HMGP projects submitted to TDEM after Hurricane Harvey but, due to program over-
subscription, remain unfunded.• Eligibility: Harvey Counties | FEMA HMGP Eligible Applicants
Coastal Resiliency Program• Allocation: $100M | Max: $60M• Purpose: Funds Tier 1 projects identified in the Texas Coastal Resiliency Master Plan that mitigate coastal risks through green and gray
infrastructure and nonstructural measures.• Eligibility: Harvey Counties | Cities, Counties, State, NGOs, Districts Authorities
Housing Oversubscription Supplemental• Allocation: $400M | Max: See Action Plan• Purpose: Addresses oversubscription in the Hurricane Harvey Homeowner Assistance Program of eligible applicants that have been wait-
listed. Hurricane Harvey damage homes will be reconstructed with mitigation measures, such as elevation.• Eligibility: Harvey Counties | State Run
Resilient Home Program• Allocation: $100M | Max: See Action Plan• Purpose: Reconstruct Hurricane Harvey damaged single-family homes with homes that meet additional resilience and mitigation stan-
dards. Waitlisted homeowners in the oversubscribed Hurricane Harvey Homeowner Assistance Program will be eligible.• Eligible: Harvey Counties | State Run

212 | CHAPTER 9
Hazard Mitigation Plans• Allocation: $30M | Max: $300,000• Grantor: General Land Office (GLO) & TDEM• Purpose: a GLO partnership with TDEM will contribute to the development of an enhanced State Hazard Mitigation Plan and fund the
development of Local Hazard Mitigation Action Plans (LHMAP) for entities located in the CDBG-MIT eligible counties.• Eligibility: 2015,2016 Harvey Counties | TDEM, HMGP Eligible Entities
Resilient Communities Program • Allocation: $100M | Max: $300,000• Purpose: funds for the development, adoption, and implementation of resilient building codes, flood damage prevention ordinances,
zoning ordinances, land use and comprehensive plans, and public service activities for cities, counties and Indian tribes located in the CDBG-MIT eligible counties.
• Eligibility: 2015,2016 Harvey Counties | Cities, Counties, Tribes, COGs
Regional and State Planning• Allocation: $214.9M • Grantor: GLO• Purpose: provides funding for regional and state planning studies and tools that work to reduce risk and impacts of future disasters.• Eligibility: 2015,2016 Harvey CountiesMore information: https://recovery.texas.gov/local-government/programs/local-regional-state-planning/index.html
Flood Protection Grant Program• Grantor: State’s Research and Planning Fund • Purpose: Provides up to 50% state financial assistance to political subdivisions to conduct feasibility studies for an entire watershed to
evaluate both structural and nonstructural solutions to flood hazards within the watershed, planning for or implementation of Flood Early Warning System(s); or planning for or implementing a Flood Response Plan.
More information: http://www.twdb.texas.gov/flood/grant/index.asp
For more information on these funding sources, visit: https://www.glo.texas.gov/the-glo/news/press-releases/2019/december/texas-glo-hosting-public-hearings-for-4-billion-in-mitigation-funds.html

IMPLEMENTATION | 213