COMPREHENSIVE ANNUAL FINANCIAL ... - EMMA.MSRB.org.
336
City of San Antonio, Texas COMPREHENSIVE ANNUAL FINANCIAL REPORT FISCAL YEAR ENDED SEPTEMBER 30, 2010
-
Upload
khangminh22 -
Category
Documents
-
view
0 -
download
0
Transcript of COMPREHENSIVE ANNUAL FINANCIAL ... - EMMA.MSRB.org.

City of San Antonio, Texas
COMPREHENSIVEANNUAL
FINANCIAL REPORTFISCAL YEAR ENDED SEPTEMBER 30, 2010

CITY OF SAN ANTONIO, TEXAS Comprehensive Annual Financial Report For Fiscal Year-Ended September 30, 2010
Prepared by: DEPARTMENT OF FINANCE
Ben Gorzell Jr., CPA Chief Financial Officer Troy Elliott, CPA Assistant Director Melanie Seale, CPA Controller Juanita Carabajal, CPA Disbursement and Receivables Administrator Elizabeth Drouillard, CPA Financial Reporting Manager Jay Blackwell Financial Reporting Manager
Financial Reporting Gloria Alvarado Karen Atta Carlos Beechner Jacqueline Bennett, CPA Denise Fuller Mary Hammer Randalyn Harlan Joseph Kobilka, CPA Victoria Roeder Curtis Ruder, CPA Patrice Wallace With Assistance From: Financial Services Margaret Villegas, Assistant Director Cappi Arriola, Financial Management Administrator Gary Johnson, Tax Assessor Administrator Mary Gomez, Financial Manager Mike Martinez, Collections Manager Accounting Services Veronica Carrillo, Fiscal Administrator Tom Schmidt, General Ledger Manager Kay Grant, Accounts Payable Manager Fred Mendoza, Payroll Manager Public Utilities Jeff Pullin, Public Utilities Manager

City of San Antonio, Texas
Introductory Section

CITY OF SAN ANTONIO, TEXAS
Comprehensive Annual Financial Report Table of Contents Year-Ended September 30, 2010
INTRODUCTORY SECTION Title Page Table of Contents Letter of Transmittal __________________________________________________________________________i-xv Certificate of Achievement for Excellence in Financial Reporting _____________________________________ xvi Organizational Chart___________________________________________________________________________xvii List of Principal Officials ______________________________________________________________________ xviii FINANCIAL SECTION Independent Auditors' Report Management’s Discussion and Analysis (Required Supplementary Information) (Unaudited) ______________1 Basic Financial Statements: Government-wide Financial Statements: Statement of Net Assets____________________________________________________________________14 Statement of Activities ____________________________________________________________________15 Fund Financial Statements: Governmental Funds Financial Statements: Balance Sheet _________________________________________________________________________16 Reconciliation of the Governmental Funds Balance Sheet to the Statement of Net Assets __________17 Statement of Revenues, Expenditures, and Changes in Fund Balances___________________________18 Reconciliation of the Governmental Funds Statement of Revenues, Expenditures, and Changes in Fund Balances to the Statement of Activities _______________________________19 Proprietary Funds Financial Statements: Statement of Net Assets _________________________________________________________________20 Statement of Revenues, Expenses, and Changes in Fund Net Assets_____________________________21 Statement of Cash Flows ________________________________________________________________22 Fiduciary Funds Financial Statements: Statement of Fiduciary Net Assets_________________________________________________________23 Statement of Changes in Fiduciary Net Assets _______________________________________________24 Discretely Presented Component Units Financial Statements: Statement of Net Assets _________________________________________________________________25 Statement of Activities __________________________________________________________________26 Notes to Financial Statements ________________________________________________________________27 Required Supplementary Information Other Than MD&A (Unaudited): General Fund: Budgetary Comparison Schedule ____________________________________________________________159 Pension and Postemployment Schedules: Schedules of Funding Progress______________________________________________________________160

CITY OF SAN ANTONIO, TEXAS
Comprehensive Annual Financial Report Table of Contents Year-Ended September 30, 2010 Combining Financial Statements and Schedules: Nonmajor Governmental Funds: Combining Balance Sheet__________________________________________________________________164 Combining Statement of Revenues, Expenditures, and Changes in Fund Balances ___________________165 Special Revenue Funds: Combining Balance Sheet – Special Revenue _______________________________________________166 Combining Statement of Revenues, Expenditures, and Changes in Fund Balances – Special Revenue ___________________________________________________________________167 Combining Balance Sheet - Grants________________________________________________________168 Combining Statement of Revenues, Expenditures, and Changes in Fund Balances - Grants _________169 Combining Balance Sheet – Other Special Revenue _________________________________________170 Combining Statement of Revenues, Expenditures, and Changes in Fund Balances – Other Special Revenue ______________________________________________________________171 Combining Balance Sheet – Blended Component Units _______________________________________172 Combining Statement of Revenues, Expenditures, and Changes in Fund Balances – Blended Component Units ____________________________________________________________173 Capital Projects Funds: Combining Balance Sheet – Capital Projects _______________________________________________174 Combining Statement of Revenues, Expenditures, and Changes in Fund Balances – Capital Projects ____________________________________________________________________175 Combining Balance Sheet – General Obligation Bonds________________________________________176 Combining Statement of Revenues, Expenditures, and Changes in Fund Balances – General Obligation Bonds ____________________________________________________________177 Combining Balance Sheet – Certificates of Obligation Bonds __________________________________178 Combining Statement of Revenues, Expenditures, and Changes in Fund Balances – Certificates of Obligation Bonds _______________________________________________________179 Combining Balance Sheet – Other Capital Projects __________________________________________180 Combining Statement of Revenues, Expenditures, and Changes in Fund Balances – Other Capital Projects ______________________________________________________________181 Permanent Funds: Combining Balance Sheet – Permanent ___________________________________________________182 Combining Schedule of Revenues, Expenditures, and Changes in Fund Balances – Permanent ________________________________________________________________________183 Supplementary Budget and Actual Schedules for Legally Adopted Funds: General Fund ______________________________________________________________________184 Debt Service Fund __________________________________________________________________190 Special Revenue Funds_______________________________________________________________191 Permanent Fund - San Jose Burial Park _________________________________________________215 Nonmajor Enterprise Funds: Combining Balance Sheet__________________________________________________________________216 Combining Statement of Revenues, Expenses, and Changes in Fund Net Assets _____________________217 Combining Statement of Cash Flows_________________________________________________________218

CITY OF SAN ANTONIO, TEXAS
Comprehensive Annual Financial Report Table of Contents Year-Ended September 30, 2010 Combining Financial Statements and Schedules (Continued): Internal Service Funds: Combining Statement of Net Assets ______________________________________________________219 Combining Statement of Revenues, Expenses, and Changes in Fund Net Assets __________________220 Combining Statement of Cash Flows ______________________________________________________221 Fiduciary Funds: Fire and Police Pension and Health Care Funds: Combining Statement of Fiduciary Net Assets____________________________________________222 Combining Statement of Changes in Fiduciary Net Assets __________________________________223 Agency Funds: Combining Balance Sheet ____________________________________________________________224 Combining Statement of Changes in Assets and Liabilities _________________________________225 Nonmajor Component Units: Combining Statement of Net Assets _________________________________________________________228 Combining Statement of Activities __________________________________________________________229 Capital Assets Used in the Operation of Governmental Funds: Schedule of Capital Assets by Source ________________________________________________________230 Schedule of Capital Assets by Function and Activity____________________________________________231 Schedule of Changes in Capital Assets by Function and Activity __________________________________232 STATISTICAL SECTION (UNAUDITED) Financial Trends: Net Assets by Component, Last Nine Fiscal Years ______________________________________________ 233 Changes in Net Assets, Last Nine Fiscal Years _________________________________________________ 234 Fund Balances, Governmental Funds, Last Nine Fiscal Years_____________________________________ 235 Changes in Fund Balances, Governmental Funds, Last Nine Fiscal Years ___________________________ 236 Tax Revenues by Source, Governmental Funds, Last Ten Fiscal Years _____________________________ 237 Revenue Capacity: Assessed Value and Actual Value of Taxable Property, Last Ten Fiscal Years _______________________ 238 Direct and Overlapping Property Tax Rates, Last Ten Fiscal Years________________________________ 239 Principal Property Tax Payers, Current Year and Nine Years Ago _________________________________ 240 Property Tax Levies and Collections, Last Ten Fiscal Years______________________________________ 241 Taxable Sales by Category, Last Eight Calendar Years __________________________________________ 242 Direct and Overlapping Sales and Use Tax Rates, Last Ten Fiscal Years____________________________ 243 Debt Capacity: Ratios of Outstanding Debt by Type, Last Nine Fiscal Years _____________________________________ 244 Ratios of General Bonded Debt Outstanding, Last Nine Fiscal Years_______________________________ 245 Direct and Overlapping Governmental Activities Debt as of September 30, 2010____________________ 246 Legal Debt Margin Information, Last Nine Fiscal Years__________________________________________ 247 Pledged-Revenue Coverage, Last Nine Fiscal Years ____________________________________________ 248

CITY OF SAN ANTONIO, TEXAS
Comprehensive Annual Financial Report Table of Contents Year-Ended September 30, 2010 Demographic and Economic Information: Demographic and Economic Statistics, Last Ten Calendar Years__________________________________ 251 Principal Employers, Current Year and Ten Years Ago __________________________________________ 252 Operating Information: Full-Time Equivalent City Government Employees by Function/Program, Last Ten Fiscal Years _______ 253 Operating Indicators by Function/Program, Last Ten Fiscal Years ________________________________ 254 Capital Asset Statistics by Function/Program, Last Ten Fiscal Years ______________________________ 255

City of San Antonio, Texas
Letter of Transmittal


- ii -
CITY SERVICES (Continued) The City provides a vast array of municipal services. The full range of services provided to its constituents includes ongoing programs to provide health, welfare, art, cultural, and recreational services; maintenance and construction of streets and drainage; public safety through police and fire protection; and urban redevelopment and housing. The City also considers the promotion of convention and tourism and participation in economic development programs as high priorities. The funding sources from which these services are provided include ad valorem, sales and use, and hotel occupancy tax receipts; grants; user fees; bond proceeds; tax increment financing; and other sources. The City continues to support recreational improvements that enhance citizens’ quality of life and recreation and fitness opportunities. Over 10 miles of linear greenway walking and biking trails were completed in fiscal year 2010. A total of 22 miles of trails have been constructed through two voter-approved sales tax initiatives, with an additional 14 miles in development. The City has twenty-six entities that are legally separate, but are considered part of the City’s operations and therefore are included in its annual financial statements. Fifteen of these entities are blended component units of the City, while the other eleven entities are discretely presented. For additional details on each of these entities and the basis for their respective presentation in our financial report, please refer to the Financial Section, entitled, Summary of Significant Accounting Policies, Reporting Entity.
ECONOMIC CONDITIONS AND OUTLOOK
As a community, San Antonio has positioned itself for long-term growth and prosperity by successfully following a strategy to diversify its economy and improve quality of life for all citizens. The City’s economic strategy focuses on further development of major industries, including domestic and international trade, convention and tourism, medical and health care, government employment, manufacturing, information security, financial services, aerospace, finance and insurance, oil and gas refining, and the military. The City is undertaking ongoing infrastructure improvements, neighborhood revitalization and workforce development initiatives, as well as providing assistance to businesses of all sizes. In February 2010, the City passed the Inner City Reinvestment and Infill Policy to further support balanced and sustainable development throughout San Antonio’s inner-city and southern sectors which include Port San Antonio and Brooks City-Base. Both government and citizens are actively committed to increasing the caliber of educational and economic opportunities, expanding arts and leisure choices, revitalizing older neighborhoods, and planning for overall growth in the City. The City’s cultural and geographic proximity to Mexico provides favorable conditions for international business relations. Also enhancing San Antonio’s business appeal is the high quality of life the City offers and a cost-of-living that is below the national average. In addition to the favorable economic climate, excellent weather conditions year round help encourage and enhance the operation of many of San Antonio’s most important industries. Economic indicators tell the story of a resilient 2010 for San Antonio, one exemplifying the comparative stability of the local economy as it out performed comparable cities impacted by the national recession. According to research performed by the Brookings Institution, San Antonio is one of the 20 strongest performing metropolitan areas (metros) out of the 100 largest metros with at least 500,000 residents. The Brookings Metropolitan Policy Program issues the quarterly series, MetroMonitor, which provides an understanding of how the current economic recession has ‘affected America’s metropolitan economies’. The Brookings MetroMonitor measures overall metropolitan performance as an aggregate of four measures: percent employment change, percent unemployment rate change, percent Gross Metropolitan Product (GMP) change and percent change in Housing Price Index (HPI). The September 2010 report, which examined data throughout the 2nd quarter of calendar year 2010, showed San Antonio and Austin were the only two metros that were classified in the top twenty (strongest performers) on all four indicators of overall performance. All other metros classified as one of the twenty strongest metros in the United States all demonstrated one or more categories that were “second strongest” or “middle.” As of the 2nd quarter of 2010, the 100 largest metros in the United States continue to struggle to regain pre-recession employment levels. San Antonio was among the top cities that suffered a less-severe decline in overall employment. From San Antonio’s pre-recession peak employment quarter to the 2nd quarter of 2010, San Antonio ranked 6th among the top 100 metros with a change of -2.2%.

- iii -
ECONOMIC CONDITIONS AND OUTLOOK (Continued) San Antonio was among several metros that experienced relatively low unemployment rates in comparison to the respective state and the national average. In September 2010, San Antonio’s seasonally adjusted unemployment rate was 7.1%, compared to the State’s rate of 8.1% and the national rate of 9.6%. All metros experienced a rise in unemployment rates through the on-set of the recession in 2007 but among the 100 metros, San Antonio ranked 13th in the nation, demonstrating one of the smallest increases in unemployment from June 2007 to June 2010 at 3.1%. In addition to employment and unemployment data, Gross Metropolitan Product (GMP) is a valuable measure of the total value of goods and services produced within a metro area. When measuring the percentage change in GMP from San Antonio’s pre-recession peak quarter to the 2nd quarter of 2010, San Antonio ranked 6th with an increase of 4.9%. San Antonio’s housing market registered a relatively small negative impact as a result of the national housing bubble. According to the September 2010 Multiple Listing Service report by the San Antonio Board of REALTORS®, the average price for a single-family residential home year-to-date rose to $184,276, a 1.0% increase when compared to a year ago. The number of sales was up by 3.0% year-to-date, though the median price of a home dipped slightly to $149,100, a 1.0% decrease when compared to a year ago. Additionally, lender-owned properties accounted for only 12.0% of the sold single-family residential properties. This low number, especially when compared to other parts of the country, further emphasizes the stability of the San Antonio market. San Antonio’s resilient economy was fueled by several targeted industry projects in fiscal year 2010. The City utilized a combination of tax abatements, grant and loan agreements, impact fee waivers, and nominations for State project designations that assisted in enticing the following businesses to move to or remain in San Antonio: Toyota On August 27, 2009, Toyota officially announced it would relocate production of the Tacoma pickup from its plant in Fremont, California to the state-of-the-art manufacturing facility in San Antonio by the summer of 2010. On January 21, 2010, City Council approved two resolutions nominating Toyota Motor Manufacturing Texas, Inc. (TMMTX) for two State Enterprise Zone project designations to support the expansion of $20.0 million in machinery and equipment from the former manufacturing plant in Fremont, California and to expand the truck manufacturing capability in parts stamping and plastics operations. Both of these designations were approved by the State on September 22, 2010. On October 29, 2010, the City provided TMMTX with a 100.0% abatement of ad valorem taxes over 10 years on approximately $100.0 million in personal property improvements, inventory and supplies related to the addition of Tacoma truck production and 1,000 new jobs at the TMMTX manufacturing site in San Antonio. Production of the Toyota Tacoma began at the site in July 2010, bringing the total of Toyota jobs up to over 2,800. InCube City Council approved an Economic Development Program Grant Agreement on June 17, 2010 with the newly established San Antonio Economic Development Corporation (SAEDC) in support of InCube Labs to establish a life-science business incubator in San Antonio. City Council also authorized SAEDC to enter into an Economic Development Agreement with InCube for the purpose of supporting this project. City and community partners are committing funding in the amount of $10.0 million for InCube over 5 years. InCube was founded in 1995 by Mir Imran, a prolific healthcare entrepreneur, inventor and builder of life-science companies. The mission of InCube Labs, currently based in San Jose, CA, is to create therapeutic innovations that radically improve patient outcomes. InCube began operations in their new laboratory facility in District 8 in November 2010. On September 28, 2010, the Governor announced that three InCube companies (Corhythm, Neurolink and Fe3) will receive a total of $9.2 million from the State’s Emerging Technology Fund. Based on this funding, InCube relocated these three early stage companies to San Antonio prior to January 31, 2011.

- iv -
ECONOMIC CONDITIONS AND OUTLOOK (Continued) Additional entities that the City was able to retain or entice to move to San Antonio include:
• Washington Mutual/JP Morgan Chase (WAMU) – Retaining 2,500 former WAMU jobs after Chase acquired WAMU;
• SA Aerospace – Retaining 570 employees and adding 100 new jobs;
• Site B Data Services, Inc. – Investing $3.7 million and creating 20 jobs over the next 5 years paying
$25,000- $85,000 annually plus benefits;
• Corporate Office Properties Trust (COPT) – Capital investment of $50.0 million to the National Security Agency - Texas (NSAT) site and creating 30 jobs; COPT also owns 100 acres adjacent to NSAT and has plans to develop up to three business parks;
• Nationwide Insurance – Retaining 932 existing jobs and creating 838 new jobs by the end of 2013;
Investing $75.0 million for Phase II construction of a corporate campus over the next 2 years;
• TX Solar I, LLC – Creating 100 green jobs during the construction and operation phases of the solar generation facility; capital investment of approximately $41.0 million in real and personal property;
• Allstate Insurance Company – Adding 598 full-time jobs in San Antonio;
• Kelly Aviation Center, L.P. – Investing $20.0 million and retaining 476 aerospace jobs;
• Kohl’s – Creating 1,065 new jobs within the first 3 years, with average salaries of $30,000 after
training;
• Holt CAT – Investing between $8.6 and $10.0 million and will result in the retention of 500 full-time jobs on the Eastside;
• Vanguard Health Systems – Investing approximately $85.0 million to construct a new, state of the art
medical facility; retain 500 jobs from existing Baptist Health Care facilities with average annual wages of $48,290; and
• Glazer’s Wholesale Drug Company – Capital investment of a $26.0 million new Leadership in Energy and
Environmental Design (LEED) certified warehouse, distribution and sales/marketing facility; retaining 125 existing jobs and creating 100 new jobs.
In addition to the targeted industry projects, the following are further details regarding factors affecting the business climate and local economy for the City of San Antonio: Base-Realignment and Closure (BRAC) and Fort Sam Houston One of the most significant events in San Antonio’s recent economic history is the 2005 Base Realignment and Closure (BRAC). BRAC will have a major positive impact on military medicine in San Antonio resulting in $3.1 billion in construction and the addition of 12,500 jobs in San Antonio by 2011. This is up from the $1.6 billion in construction and 11,500 personnel projected in 2007. Currently, all U.S. Army combat medic training is conducted at Fort Sam Houston. As a result of BRAC 2005, all military combat medic training – Army, Air Force, Navy, Marines and Coast Guard – will be undertaken at the new Medical Education and Training Campus at Fort Sam Houston. The San Antonio Military Medical Center (SAMMC) has been established as a result of the 2005 BRAC and combines the Level 1 Trauma elements of Wilford Hall and BAMC. Wilford Hall has been renamed SAMMC-South and BAMC has been renamed SAMMC-North. SAMMC-North is doubling its Level 1 trauma missions from SAMMC-South. SAMMC-South is an outpatient only facility that has received outpatient missions from SAMMC-North and will be replaced by the Lackland Ambulatory Care Center. The Care Center is scheduled for completion in 2013. This $486.0 million care Center will provide world-class medical care for the community.

- v -
ECONOMIC CONDITIONS AND OUTLOOK (Continued) Base-Realignment and Closure (BRAC) and Fort Sam Houston (Continued) In addition, San Antonio will receive new medical research missions. The U.S. Army Institute for Surgical Research located next to BAMC will double in size as a result of new BRAC missions and will be renamed the Joint Center of Excellence for Battlefield Health and Trauma. The new mission will continue its cutting edge research in the areas of robotics, prosthetics and regenerative medicine. As a result of BRAC, San Antonio will become a leader in military medical training, education and research. Port San Antonio Port San Antonio (the Port) is a multimodal logistics platform and aerospace complex occupying the 1,900 acre site of the former Kelly Air Force Base, which closed in 2001 by BRAC. Thanks to a decade of redevelopment efforts to put the property to new best uses, today the Port is home to 76 tenants, including aerospace, logistics and military organizations. The Port is the single largest commercial property management and leasing firm in the region. In 2010, the employers at the Port and construction activity at the site had a $4.2 billion regional economic impact reflecting 14,000 direct and 11,000 indirect jobs. This represents significant increases since 2007, when the employment base at the Port was 8,500 direct and 8,600 indirect jobs with an annual economic impact of $3.3 billion. Fourteen of Port San Antonio’s customers are aerospace companies, including industry leaders Boeing, Lockheed Martin, StandardAero, Chromalloy, Gore Design Completions and Pratt & Whitney. Of the 14,000 direct workers at the Port, 4,300 are employed in the aerospace sector. Port San Antonio reached important milestones in fiscal year 2010, positioning it and its customers for further growth as an important economic engine for the region. Efforts to upgrade a 450,000 square foot facility, known as Building 171, continued in 2010 to accommodate a dozen Air Force agency headquarters and 3,000 personnel relocating to Port San Antonio in 2011—a project of over $100.0 million led by the Port. The arrival of the agencies is creating new opportunities for the region as contractors and vendors require space to be close to their military customers. Accordingly, the Port also began marketing a 45-acre site near Building 171, known as Lindbergh Park, to developers interested in creating up to 1 million square feet of force-protected office space. In 2010, Port San Antonio also completed a $10.0 million upgrade to a former World War II era warehouse, which now comprises 85,000 square feet of modern office space. The building allowed ACS, A Xerox Company and a Port customer since 2000, to relocate from a 45,000 square-foot space it previously occupied into its new facility as it adds 400 workers in 2010-2011. Other Port milestones included beginning work on the extension of 36th Street—a $40.0 million project made possible through $15.0 million in federal stimulus funds provided by the Metropolitan Planning Organization and whose partners also include the City, CPS Energy, SAWS and the Texas Department of Transportation. The City-led project will extend 36th Street into the Port for 1.7 miles as a four-lane divided thoroughfare. Upon completion in 2012, the project will improve access to the Port and open 150 acres adjacent to Kelly Field to the development of new air-served facilities to accommodate the region’s growth of aerospace and logistics industries. As part of Port San Antonio’s vision to transform the property to new uses, upgrades and new buildings are being developed to the highest environmental standards. In 2010 Port San Antonio’s own headquarters offices at 907 Billy Mitchell became the first LEED certified building on the property and the first LEED-Gold certified commercial interior in San Antonio.

- vi -
ECONOMIC CONDITIONS AND OUTLOOK (Continued) Port San Antonio (Continued) In 2010 the Port was recognized nationally for its innovative redevelopment strategies when it received the Redevelopment Community of the Year Award—the top honor provided by the Association of Defense Communities. In October, the Port earned ISO 9001:2008 certification from the International Organization for Standardization. The certification reflects the set of practices implemented by the Port to ensure effective processes within the organization that are independently verified and consistently monitored and improved upon as it serves a growing number of customers. Brooks City-Base Brooks City-Base (BC-B) continues to foster the development of its business and technology center on the south side of San Antonio through its aggressive business attraction and retention efforts. Recognized as one of the most innovative economic development projects in the United States, BC-B is a 1,246 acre campus with approximately 350 acres available for immediate development. BC-B was recognized by Expansion Solutions Magazine as one of the “Nation’s Top Five Emerging Biotech Centers” in 2009. The Brooks Development Authority (BDA) initiated its national sales effort by hosting the first Site Selectors Event in Chicago to promote BC-B as a prime site for business location and expansion to top-level site selection companies. Later in the year, the BDA participated in a major site selection event in Fort Myers, Florida. In addition, the BDA Board of Directors approved a national print and online advertising campaign that launched in 2009. The campaign incorporates testimonial advertisements promoting the business climate and commercial real estate assets at BC-B. The International Economic Development Council (IEDC) recognized the BDA as an Accredited Economic Development Organization, one of twenty-four “best practices” economic development organizations in the United States. BC-B completed Phase I of the three-part expansion roadway that will eventually stretch South New Braunfels Avenue from Southeast Military Drive to Interstate Loop 410. The $8.9 million Phase I extended the avenue from Southeast Military Drive to Sidney Brooks. It included the design of street, drainage, detention ponds, traffic signals, water, recycled water, irrigation, and sanitary sewers. Integral parts of the project were landscape, irrigation, and design for the new gateway entry, which will serve as a signature piece to the BC-B campus. Significant modifications to the Southeast Military intersection were made to accommodate new traffic signals and turn lanes. The BC-B also began Phase II of the South New Braunfels Avenue extension by completing its civil engineering design and selecting its contractor. The $11.0 million project, which is expected to be completed in 2011, will also include the design of two traffic-signal intersections, underground dry utility conduit, street, drainage, detention, water and recycled water. By finishing the civil engineering design and selecting a contractor, the BDA began the first of three phases that will extend Inner Circle Road from Research Plaza to South New Braunfels Avenue. Phase I will extend a three-lane collector street and provide all infrastructures for future development of the Mission Trails Baptist Hospital project. This initial phase will begin at Research Plaza and extend in a northwest arch to Building 538’s parking area at BC-B. The Bexar County 381 Grant will reimburse the BDA for the three-phased $3.3 million Inner Circle Road project. The BDA entered into an agreement with Transwestern, a national real estate brokerage firm, to market commercial real estate opportunities at BC-B. The company was awarded a contract to provide leasing services of existing buildings as the Air Force vacates and to seek developers and tenants for ground leases, land sales, and build-to-suit opportunities. The BDA also contracted with The NRP Group, LLC, a national real estate property manager and builder, to market and lease the 160 single family homes on the BC-B campus, which until recently were available only to residents affiliated with Brooks Air Force Base and the BDA.

- vii -
ECONOMIC CONDITIONS AND OUTLOOK (Continued) Aerospace Industry Development San Antonio International Airport (SAT) has 21 airlines (10 mainline and 11 regional) providing non-stop flights to a total of 32 destinations, which do not include seasonal charter flights to Mexico available during the spring and summer. During fiscal year 2010, SAT experienced an increase in enplaned passengers despite weak economic conditions. At final count, 3,990,447 people were enplaned in fiscal year 2010, an increase of 55,963 (or 1.4%) over fiscal year 2009. On March 30, 2010, SAT completed and opened the new two-tiered roadway system intended to service existing and future terminals. On November 9, 2010, the first flights departed from Terminal B. This milestone marks the completion of the major Airport Expansion Program that was initiated as part of the 1998 Master Plan. Also completed in time for the Terminal B Opening, were the Central Utility Plant and Phase 1 of the Consolidated Baggage Handling System. As of November 9, 2010, Terminal 1 was renamed Terminal A. Terminal 2 will be demolished in 2011. ST Aerospace San Antonio (ST), currently leases over two million square feet of ground space/hanger space at SAT and specializes in commercial maintenance, repair and overhaul (MRO) work on large aircraft, including Delta Air Lines and United Parcel Service. In 2010, ST expanded its MRO operations by investing $16.5 million in the construction of a new 100,000 square foot maintenance hangar that includes warehouse and office space. ST currently employs 1,100 workers. With the new hangar's construction being completed in December 2010, ST is in the process of hiring an additional 150 employees. Stinson Municipal Airport (Stinson) is at an occupancy rate of 100.0% and has a tenant waiting list for airport facilities. New tenant hangars have been constructed in 2010 to accommodate the growing demand for private aircraft storage facilities. A runway extension project was initiated in 2009, along with other infrastructure improvements. The added runway length will aid in attracting larger private and corporate aircraft to Stinson Airport, as well as allow for the growth of existing tenants and new business developments. International Trade and Outlook As part of International and Economic Development Department’s ongoing efforts to focus on core functions, the City’s “international” functions fit into two distinctive services: “International Relations” which encompasses Protocol and Sister City development including the Casas San Antonio Program, and “International Business Development” which focuses on attracting foreign direct investment and assisting local companies to expand into foreign markets. This redesign is a natural evolution focused on providing a greater impact in job creation and investment, driven by focused performance measures.
The International Relations Office (IRO) develops and maintains foreign relations for the City of San Antonio fostering partnerships that increase global visibility, cultural understanding and economic growth. In fiscal year 2010 IRO provided support to the City Council’s China Initiative by organizing and staffing a 70 plus member delegation of local leaders to celebrate San Antonio Days at the USA Pavilion and to attend the Shanghai World Expo as the first U.S. city delegation. While there, Mayor Castro signed Friendship City Agreements with the Cities of Suzhou and Wuxi to develop research, business, education, medical and technical exchanges. In addition to organizing travel abroad, the IRO hosted visits from four Chinese cities as a direct result of San Antonio’s overtures to them before and during the Shanghai World Expo. In fiscal 2010, International Business Development led the 10th Annual San Antonio Export Leaders Program in partnership with the UTSA International Trade Center, US Foreign Commercial Service, Hispanic Chamber of Commerce and other business development stakeholders. The annual program helped empower 10 San Antonio companies sell their products and services to foreign markets, including two trade missions to Mexico and Spain. The International Business Development also conducted the first "Expand your Business to San Antonio" seminar to promote foreign direct investment to San Antonio. The seminar resulted in over 180 attendees that translated to 30 new clients for the speakers within a month.

- viii -
ECONOMIC CONDITIONS AND OUTLOOK (Continued) International Trade and Outlook (Continued) As of August 31, 2010, the North American Development Bank (NADB) is participating in the development and financing of 148 environmental infrastructure projects, with approximately $1.2 billion in loans and grants. These projects are estimated to cost a total of $3.2 billion to build and will benefit an estimated 12.7 million border residents throughout the 10 states that comprise the U.S. – Mexico border region. San Antonio continues to develop itself as an Inland Port for imports and exports with Mexico, Latin America, India, Germany, China, Japan, Spain, and other regions of the world. This is accomplished through transportation, manufacturing and logistics facilities; professional services and value-added services involved in processing, marketing and moving freight within the South Texas Region. Over the past 16 years, the City led the nation by establishing three commercial trade offices in Mexico’s principal cities and in Tokyo, Japan; which has generated over $263.0 million in bilateral trade. For 26 years, the IRO’s trade representative in Japan has attracted multi-million dollar operations to San Antonio including Toyota and its 24 suppliers, Takata Seat Belt, Sony Corporation, MyCom International, Hyatt Hill Country Resort (a major Japanese investment joint venture), Colin Medical Equipment, and Higuchi. The trade representative continues to promote Japanese investment in San Antonio by conducting trade missions to cities throughout Japan. Community Development Community development projects continue to play an important role in San Antonio’s economic success. Targeted redevelopment, neighborhood revitalization and smart growth strategies are shaping the way San Antonio is growing and its citizens are living. The City initiated efforts to redevelop portions of the community and influence development of new areas with the adoption of the ICRIP. It promotes growth and development in the heart of the City, specifically in areas that are currently served by public infrastructure and transit, but underserved by residential and commercial real estate markets. It is the intent of this policy to coordinate public initiatives within targeted areas in order to stimulate private investment in walkable urban communities that are the building blocks of a sustainable region. In 2009, San Antonio continued its progress to becoming the first major Texas city to possess both a University of Texas and a Texas A&M University degree granting campus when Texas A&M University-San Antonio was designated a stand-alone university. In May 2010, ground was broken to construct the first building on the almost 700-acre site campus which is scheduled to open the fall of 2011 with an estimated 3,500 students. Leveraging the economic momentum surrounding the Toyota manufacturing plant and Texas A&M University-San Antonio campus, and adopting the Heritage South Sector Plan, City South Management Authority (CSMA) continues to foster economic growth and sustainable development in the far South Side. Hospitality Industry The City’s diversified economy includes a significant sector relating to the hospitality industry. A study prepared by Richard V. Butler, Ph.D. and Mary E. Stefl, Ph.D., both professors at Trinity University, found that in 2008 the hospitality industry had an economic impact of nearly $11.0 billion. The estimated annual payroll for the industry in 2008 was $1.99 billion, and the industry employed more than 106,311 workers. San Antonio’s hospitality industry attracted 25.0 million visitors in 2008, and 11.1 million were overnight leisure visitors, placing San Antonio as one of the top leisure destinations in Texas. This industry contributed more than $153.4 million in taxes and fees to the City, and more than $286.4 million to all local governments combined. San Antonio continues to rank high as a top leisure and convention/group meeting destination. Recent initiatives contributing to this success are the City’s new brand image, the JW Marriott San Antonio Hill Country Resort and Spa, the River Walk Expansion Project (Museum Reach Expansion completed in May 2009; Mission Reach to be completed in 2013), and events like the Rock ‘n’ Roll Marathon held in November 2010. San Antonio, perched at the southern edge of the Texas Hill Country, also puts the fun of exploring the countryside

- ix -
ECONOMIC CONDITIONS AND OUTLOOK (Continued) Hospitality Industry (Continued) and its small towns just a short drive away. The Texas Hill Country is a burgeoning region of championship golf resorts, culinary treats and vineyards. The list of attractions in the San Antonio area includes, among many others, the Alamo (and other sites of historic significance), River Walk and two major theme parks (SeaWorld San Antonio and Six Flags Fiesta Texas). San Antonio is also one of the top convention cities in the country, and the opening of the 1,003-room Grand Hyatt Hotel along with the 1,002-room JW Marriot will allow the City to host more and larger conventions and meetings in the years to come. The City continues to be proactive in attracting convention business through its management practices and marketing efforts. According to Smith Travel, in 2009, the City’s overall performance (City Level) for hotel occupancy decreased by 11.5%, hotel room supply increased by 6.0%. Average daily rate (ADR) decreased by 10.6%; revenue per available room (REVPAR) decreased 20.9%; and total room nights sold in the destination decreased by 6.2%. However in 2010, from January through October 2010, hotel occupancy increased by 4.3% while room supply increased by 4.1%. Room nights sold increased by 8.6%, ADR decreased by 2.1% and REVPAR increased by 2.0%. Overall, for San Antonio, the first ten months of 2010, hotel revenue increased by 6.3% over the same period last year. Convention, Sports and Entertainment Facilities The City’s vibrant hospitality industry is significantly dependant on having high-quality facilities to host conventions, meetings, and major sporting events. The Convention, Sports, and Entertainment Facilities Department (CSEF) encompasses the Henry B. Gonzalez Convention Center (including the Lila Cockrell Theatre), the Alamodome, and the Municipal Auditorium. In the past year, more than 622,000 visitors attended 304 events held at the Henry B. Gonzalez Convention Center and Municipal Auditorium. In July 2010, the Convention Center and Alamodome hosted the largest convention in San Antonio history - the 75th annual Alcoholics Anonymous Convention with more than 55,000 attendees from around the world. Other significant conventions include the National League of Cities, Dish Network, GameStop, American Telemedicine Association, and the National Cattlemen’s Beef Association. The City also hosted the 2010 NCAA Women’s Final Four Basketball Championship tournament with more than 14,000 out-of-town visitors. Ancillary events of the tournament included the NCAA Tourney Town and the Women’s Basketball Coaches Association convention. The total economic impact of the Women’s Final Four and related activities was approximately $20.0 million. The Alamodome experienced one of its most successful years since 2002, hosting more than 1,151,000 visitors over 148 event days. Events with significant economic impact to the City included the 2010 Valero Alamo Bowl featured Michigan State vs. Texas Tech. More than 64,000 fans attended, generating a direct economic impact of $27.5 million for the City. The Dallas Cowboys Training Camp returned to the Alamodome for the fifth time since 2002. Attendance exceeded 200,000 fans, including a Cowboys camp single-practice record 19,437 on opening day and had an estimated economic impact of $10.0 million. In May 2010, the George Strait Concert set an all-time concert attendance record at the Alamodome with 55,266 fans. New events held at the Alamodome included the Valero MS150 Bike Ride, Notre Dame vs. Washington St. Football Game, Tour of Texas Power League Volleyball Qualifier, Univision La Mafia Concert, Top Rank Boxing, and the Fall Home & Garden Show. The CSEF Department completed Phase I of an exterior upgrade to the convention center façade, creating a new formal entry and pedestrian plaza at a cost of $3.8 million. The all-new Lonesome Dove Room was completed at a cost of $2.0 million, and the Lila Cockrell Theatre renovation remained on schedule for completion in December 2010 at a cost of more than $26.0 million. More than $1.8 million in capital improvements were made to the Alamodome, including the renovation of the Plaza level restrooms, replacement of Plaza and Club level concession stand equipment, and renovations to the Sports Club. These upgrades will assist the City in enticing future, high profile clients, and improve fan’s experiences with state-of-the-art technology. The City was also able to recover over $11.0 million in capital improvement-related rebates via the State’s Sporting Event Trust Legislation for the year.

- x -
ECONOMIC CONDITIONS AND OUTLOOK (Continued) Convention, Sports and Entertainment Facilities (Continued) A convention facilities development study was conducted by the Populous Group which included a short-term facility and capital equipment improvement plan, and a long-term convention center complex development strategy recommendation. The study also includes recommendations for customer service enhancements and revenue enhancement opportunities throughout the convention center. The Henry B. Gonzalez Convention Center was awarded the Association Meetings INNER CIRCLE AWARD for 2009, being recognized as one of the top 15 convention centers in the nation for exemplary levels of unsurpassed quality service in the meetings and hospitality industry. Downtown Development Projects City Council approved several economic development grants for center city projects that total $6.8 million for the Steel House Lofts, 1221 Broadway, and Can Plan Apartments. These projects represent a total investment of $84.4 million and will add 549 housing units to the center city. In August 2009, City Council created the HemisFair Park Area Redevelopment Corporation to assist with planning and redeveloping HemisFair Park and its surrounding area. On May 6, 2010, the HemisFair Park Area Redevelopment Corporation (HPARC) issued a request for qualifications for the HemisFair Area Master Plan. HPARC received 21 proposals, and after a through review and interview process, Johnson Fain Inc. out of Los Angeles was the recommended firm. The firm was awarded a contract in September 2010 and has begun the research and public input process. The master plan will be complete in Fall 2011. Additionally, Council executed a capital funding agreement in the amount of $3.3 million with HPARC for the use of 2007 General Obligation Park and Recreation Improvement Bond funds and 2008 Certificates of Obligation. On January 21, 2010, City Council passed a resolution of support for the creation of the Centro Partnership and authorized staff to proceed with the incorporation of the Centro Partnership and its next steps. The Centro Partnership is a public private partnership that oversees and facilitates development and revitalization in the center city. Since January 2010, public and private sector leaders worked together to establish and implement the purpose of the Centro Partnership. In July 2010, the Certificate of Formation that creates the 501(c)6 was filed. Mayor Julian Castro, Judge Nelson Wolff, Don Frost of Frost Bank, and Jack Spector of Hixon Properties, served as incorporators of the Centro Partnership. In August 2010, the City entered into a Memorandum of Understanding with the Centro Partnership that defines the initial responsibilities of Centro, commits initial funding of $20,000 for administrative services for Centro, and determines the size and composition of the permanent board. The full board is expected to include 30 individuals and will spend the majority of fiscal year 2011 finalizing its governance structure and leadership, creating a mission, and initiating a vision process for downtown. American Recovery and Reinvestment Act President Obama signed the American Recovery and Reinvestment Act (ARRA) into law on February 17, 2009. The American Recovery and Reinvestment Act of 2009 will provide a nationwide total of $787.0 billion in spending and tax cuts. The funding is temporary, intended to preserve and create jobs, and make investments in infrastructure, energy and science, unemployment assistance, and State and local stabilization. In order to take full advantage of the funding opportunities and additional services that may be provided to the City of San Antonio as a result of the American Recovery and Reinvestment Act, City staff has worked closely with City Council to strategize and align specific City Council ranked projects to individual Federal and State agency funded programs. The strategies developed address formula and grants funding opportunities available to the City and serve as the guiding plan for submission of applications and acceptance upon award of stimulus funds by the City. City Council adopted the Funding Strategy for City Council Prioritized Federal Economic Stimulus Projects on March 5, 2009 and amended on April 9, 2009 to reflect additional energy efficiency-related stimulus dollars. This Funding Strategy Plan serves as the guide in the City’s submittal of “applications” and acceptance upon award of stimulus funds.

- xi -
ECONOMIC CONDITIONS AND OUTLOOK (Continued) American Recovery and Reinvestment Act (Continued) As of February 2011, the City has been awarded over $134.0 million in ARRA grants. These grants will fund public safety, street projects, various child care programs, energy efficiency programs, and homeless assistance. In fiscal year 2010, enhancements to City services for the San Antonio Police Department included the addition of 50 new police officers funded in large part from the Community Oriented Policing Services (COPS) grant award under ARRA. A reserve of over $1.2 million was set aside to partially prefund the costs of the new officers in fiscal year 2013 when the stimulus funds are exhausted. Green Operations The City launched multiple programs through ARRA funding received from the US Department of Energy. A $12.4 million Weatherization Assistance Program called “Casa Verde SA” began in the 2nd quarter of fiscal year 2010 and is on track to complete weatherization services to approximately 2,400 low income residential units by September 2011. The program’s field operations are managed by CPS Energy. Other programs and projects funded under a $12.9 million Energy Efficiency and Conservation Block Grant include a 245kW solar installation at the International Airport; outfitting Airport police cruisers with auxiliary power units that reduce fuel use; lighting retrofits of downtown parking garages and water retrofits to over 40 municipal facilities; initiation of a bicycle media safety campaign, bike master plan update, bike signage and parking, and a bike share station to be operational in March 2011. In fiscal year 2011, two ARRA grants from the State Energy Conservation Office and a $10.0 million award from the US Department of Energy are in the obligation process. New solar installations, conversion of plug-in vehicles, and innovative financing and services for building retrofits are in progress. Auditing over 100 City facilities for energy upgrades has been completed and retrofit work using ARRA funds and State Energy Office loan funds are being conducted. Over $600,000 of annual energy savings will be realized through the upgrade. Several Green ordinances passed by City Council took effect in 2010 with at least one that will take effect during fiscal year 2011. Safe passing and Bicycle Lights Safety Ordinances took effect immediately. Both are geared toward bicycle safety. A Green Fleet Acquisition Policy approval resulted in adding over 80 hybrid light sedans to the City’s fleet during FY 2010 and will guide upcoming acquisitions. A Green Events Ordinance taking effect in January 2011 will reduce environmental impacts from large public events. The SAFD was awarded $7.3 million from FEMA for the construction of two Fire Stations, under ARRA. These Fire Stations (No. 50 and 51) will meet certain design and construction standards to be certified by the U.S. Green Building Council’s LEED program. The new Animal Care Services offices have also been presented to the U.S. Green Building Council for LEED certification, which is expected in fiscal year 2011. The Parks and Recreation Department initiated a pilot recycling program at one highly visited large urban park. Based on the pilot’s success, the program will be expanded into additional parks and linear greenway trailheads in 2011. It will result in recycling being offered at approximately 30.0% of park acres available to the public. The City has embarked on an ambitious tree planting initiative that will see 9,000 trees planted in City parks by May 2011. The campaign will extend to the community with volunteer tree plantings, tree giveaways and a tree rebate program in conjunction with CPS Energy. The campaign features the planting of trees in more than 80 City parks. Some parks will receive as many as 300 or more new trees. The initiative is one component to the City’s long term goal of increasing the tree canopy from 38.0% to 40.0%. The City installed 118 solar-powered parking pay stations for both on-street use and surface parking lots. The pay stations improve customer service by communicating in multiple languages, accepting credit/debit cards and providing a receipt for every transaction.

- xii -
ECONOMIC CONDITIONS AND OUTLOOK (Continued) Green Operations (Continued) The City also completed a lighting retrofit at three parking garages for more efficient electrical usage, including Central Library Garage, St. Mary’s Garage and Marina Garage. The City partnered with San Antonio Water System (SAWS) to complete a water conservation project for HemisFair Park’s trademark fountains. Prior to the conservation project, river gravel water from the area was diverted from the basement of the adjacent Convention Center and then discharged into the storm drain. Construction of a wet well and pipeline allows the collection and transport of the water, which is used as make-up water for the HemisFair fountains. The project conserves almost 37 million gallons of water each year, which is enough to serve about 400 families. In addition, the City saves almost $220,000 in utility and treatment costs per year. SA 2020 SA 2020 is a four-to-six month community-wide visioning process that asks the question ‘What do we want San Antonio to look like in the year 2020?’ The process launched on September 25, 2010 with four to six community forums to obtain public input. The aim of SA 2020 is to develop a long-range plan that includes specific, achievable goals to make San Antonio one of America’s great cities by 2020. The meetings covered educational attainment, transportation, economic development, revitalizing the urban core, sustainability, and teen pregnancy among other items.
FINANCIAL INFORMATION Accounting System and Budgetary Control The management of the City is responsible for establishing a system of internal controls that are designed to provide reasonable assurance that assets are protected from loss, theft, or misuse. The City’s accounting system supports the internal controls and procedures, which provide reliable financial records for preparing financial statements in conformity with U.S. generally accepted accounting principles. The internal control structure provides reasonable assurance that the City’s assets are safeguarded as well as the reliability of financial records for preparing financial statements. The concept of reasonable assurance first recognizes that the cost of a control should not exceed the benefits likely to be derived. Secondarily, the evaluation of costs and benefits require estimates and judgments by management. Budgetary compliance is a significant tool for managing and controlling governmental activities, as well as ensuring conformance with the City’s budgetary limits and specifications. The objective of budgetary controls is to ensure compliance with legal provisions embodied in the annual appropriated budget approved by City Council. Levels of budgetary control, that is the levels at which expenditures cannot legally exceed appropriated amounts, are established by department within individual funds. The City utilizes an encumbrance system of accounting as one mechanism to accomplish effective budgetary control. Encumbered amounts lapse at year-end and are generally appropriated as part of the following year’s budget. Another budgetary control is the monthly revenue and expenditure reports detailing budget and actual balances with variances that are generated and reviewed by the Office of Management and Budget, Finance and the City Manager’s Office prior to submission to City Council. As part of the annual review and close-out process, City Council will approve desired budget adjustments and carryforwards for the next fiscal year. The City further implemented availability budget controls within its system of record for capital projects and grants. The system warns when cumulative expenditures are within 75.0% of total budget. The system will not allow the processing of non-payroll transactions over budget. Each year the City prepares a five-year financial forecast (Forecast) prior to the adoption of the annual operating budget. The Forecast is a financial and budgetary planning tool that provides a current and long-range assessment of financial conditions and costs for City services. The Forecast includes the identification of service delivery policy issues that will be encountered in the next five years and that will have a fiscal impact upon the City’s program of services. The Forecast also examines the local and national economic conditions that have an impact on the City’s economy and ultimately, its budget.

- xiii -
FINANCIAL INFORMATION (Continued) Accounting System and Budgetary Control (Continued) The Forecast serves as a foundation for development of the proposed budget by projecting revenues and anticipated expenditures under a defined set of assumptions. The Forecast enables the City Council and staff to identify financial issues in sufficient time to develop a proactive strategy in order to address emerging strategic issues. After obtaining the priorities of City Council, as well as conducting reviews of each City department, the proposed City budget is presented to City Council. The proposed budget represents the City staff’s professional recommendation on how to utilize revenues and expenditures in order to achieve a balanced budget, while optimizing City service deliveries. After obtaining public input on the proposed budget, a balanced plan is adopted. The City’s budget incorporates a strategy to maintain the financial reserves at 9.0%. The establishment and maintenance of appropriate reserves within the General Fund is critical to prudent financial management and provides budgetary flexibility for unexpected events, financial emergencies, and the unusual fluctuation in revenue-expenditure patterns. As part of the City’s sound financial planning, the City Council adopted a leaner 2010 budget through scrutinizing of positions, programs, and departmental costs. The City also established an enhanced process for reviewing and justifying the need to fill vacant positions, and continued its delayed hiring of staff for those justified vacant positions. These proactive actions assisted the City in retaining surplus fund balance to take into the fiscal year 2011 budget. The City also employs a comprehensive multi-year, long-term capital improvement planning program that is updated annually. Debt management is a major component of the financial planning model which incorporates projected financing needs for infrastructure development that is consistent with the City’s growth while at the same time measuring and assessing the cost and timing of each debt issuance. In fiscal year 2009, the City of San Antonio received the highest possible bond rating from Standard & Poor's Rating Services. This rating was based on the City's “maintenance of strong financial reserves and continued diversification of the local economy.” Over the long term, the improved rating will save San Antonio and its residents millions as a result of lower interest rates on the bonds the City sells. In fiscal year 2010, San Antonio achieved a triple-triple, with three national credit-rating agencies awarding the City ‘AAA’ status, the highest bond rating a city can receive. San Antonio is one of only two cities with a population of more than a million to receive a ‘AAA’ rating, and the only city to receive the optimum mark from all three major agencies: Fitch, Moody's, and Standard & Poor's. As demonstrated by the statements and schedules in the Financial Section of this report, the City continues to meet its responsibility for sound financial management.
Fiscal Management Debt Administration The City utilizes a comprehensive debt management financial planning program, which is updated annually and is a major component of the City’s financial planning. The model projects financing needs, measuring and assessing the cost and timing of each debt issuance. It involves comprehensive financial analysis, which utilizes computer modeling, and incorporates variables such as interest rate sensitivity, assessed value changes, annexations, and current ad valorem tax collection rates. Use of this financial management tool has assisted the City in meeting its financing needs by facilitating timely and thorough planning, which has allowed the City to capitalize on market opportunities.

- xiv -
FINANCIAL INFORMATION (Continued)
Fiscal Management (Continued) Transparency The City actively pursues transparency of its operations. The status of voter approved $550.0 million bond projects is available for public view on the City’s website. The City additionally created a website for public view of its strategy, funding and Council actions associated with the Federal Economic Stimulus (ARRA). At the end of fiscal year 2010, the City streamlined its website for user friendly access to the City’s budget documents, quarter and annual reports, and check register. The City continues to assess ways to provide the public with a more transparent government.
OTHER INFORMATION
Independent Audit State statutes require that an annual audit by an independent certified public accountant be conducted. The City selected the accounting firm Grant Thornton, LLP. In addition to meeting the requirements set forth in state statutes, the audit was also designed to meet the requirements of the Single Audit Act Amendments of 1996, OMB Circular A-133, Audit of State and Local Government and Nonprofit Organizations and State of Texas Single Audit Circular. The Independent Auditors’ Report on the basic financial statements, Managements Discussion and Analysis (MD&A) (required supplementary information), required disclosures, and schedules are included in the Financial Section of this CAFR. The Independent Auditors’ Report, along with other required reports and schedules mandated by the Single Audit Act Amendments of 1996, and OMB Circular A-133, and the State of Texas Single Audit Circular are in a separate document.
Awards The Government Finance Officers Association of the United States and Canada (GFOA) awarded a Certificate of Achievement for Excellence in Financial Reporting to the City for its CAFR for the fiscal year-ended September 30, 2009. This was the 34th consecutive year that the government has achieved this prestigious award. In order to be awarded a Certificate of Achievement, a government must publish an easily readable and efficiently organized CAFR. This report satisfies both U.S. generally accepted accounting principles and applicable legal requirements. A Certificate of Achievement is valid for a period of one year only. We believe that our current CAFR continues to meet the Certificate of Achievement Program’s requirements and we are submitting it to the GFOA to determine its eligibility for another certificate. The Office of Management and Budget received the Annual Distinguished Budget Award from the Government Finance Officers Association, recognizing outstanding achievement in preparation of the 2010 Operating and Capital Budget. Development Services was accredited by International Accreditation Service (IAS). IAS is a nonprofit, public benefit corporation and a subsidiary of the International Code Council. The IAS accreditation program provides a trusted, independent assessment and verification that a building inspection department is operating at the highest legal, ethical and technical standard. San Antonio is the largest City to receive this distinguished award with only twelve other building departments in the United States and Canada having this accreditation. Receiving this award highlights the City’s commitment to make San Antonio a great City for business expansion or relocation. The Comptroller of Public Accounts has awarded the City with a “Gold” Circle Award for the City’s transparency efforts in the Texas Comptroller Leadership Circle program. The Gold level highlights those entities that set the bar with their transparency.

- xv -
OTHER INFORMATION (Continued)
Acknowledgements
The preparation of the City of San Antonio, Texas Comprehensive Annual Financial Report for the fiscal year ended September 30, 2010, was made possible by the dedication and hard work of the Finance Department, particularly the staff of the Accounting Division, Financial Reporting Section. Each member of the department has my sincere appreciation for their contributions to the preparation of this document. In closing, please accept my sincere gratitude to the Mayor and City Council, City Manager, Deputy City Managers, Assistant City Managers, and their staff, for their continued support.
Respectfully submitted,
Ben Gorzell Jr., CPA Chief Financial Officer

- xvi -

Comprehensive Annual Financial Report Year-Ended September 30, 2010
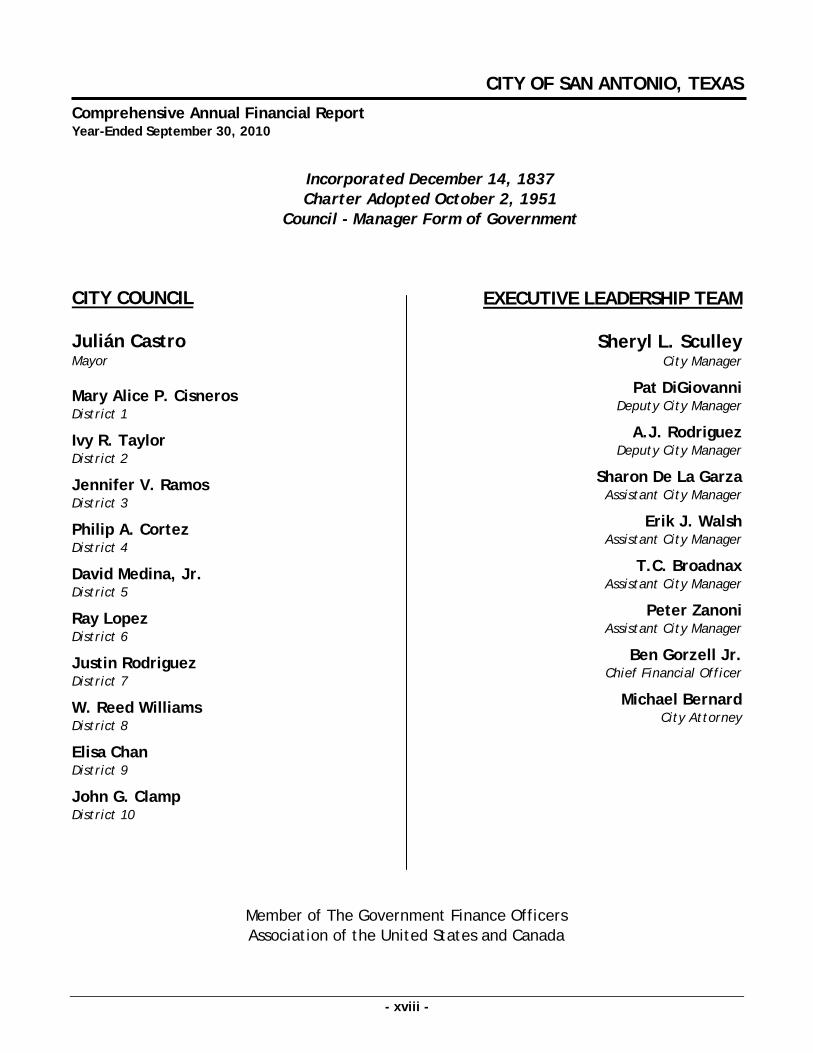
CITY COUNCIL Julián Castro Mayor Mary Alice P. Cisneros District 1
Ivy R. Taylor District 2
Jennifer V. Ramos District 3
Philip A. Cortez District 4
David Medina, Jr. District 5
Ray Lopez District 6
Justin Rodriguez District 7
W. Reed Williams District 8
Elisa Chan District 9
John G. Clamp District 10
CITY OF SAN ANTONIO, TEXAS
Incorporated December 14, 1837 Charter Adopted October 2, 1951
Council - Manager Form of Government
EXECUTIVE LEADERSHIP TEAM
Sheryl L. Sculley
City Manager
Pat DiGiovanni Deputy City Manager
A.J. Rodriguez Deputy City Manager
Sharon De La Garza Assistant City Manager
Erik J. Walsh Assistant City Manager
T.C. Broadnax Assistant City Manager
Peter Zanoni Assistant City Manager
Ben Gorzell Jr. Chief Financial Officer
Michael Bernard City Attorney
Member of The Government Finance Officers Association of the United States and Canada
- xviii -

City of San Antonio, Texas
Financial Section

City of San Antonio, Texas
Independent Auditors’ Report


City of San Antonio, Texas
Management’s Discussion and Analysis (Required Supplementary Information) (Unaudited)

City of San Antonio, Texas - 1 - Amounts are expressed in thousands
MANAGEMENT’S DISCUSSION AND ANALYSIS The City of San Antonio (City) presents the following discussion and analysis of the City’s financial performance during the fiscal year-ended September 30, 2010. This discussion and analysis is intended to assist readers in focusing on significant financial issues and changes in the City’s financial position, and identifying any significant variances from the adopted budget. We encourage readers to consider the information presented here in conjunction with additional information that we have furnished in our letter of transmittal and the financial statements provided in this report. All amounts, unless otherwise indicated, are expressed in thousands of dollars. Financial Highlights
• The assets of the City exceeded its liabilities by $2,878,843 (net assets). Of this amount, $163,807 (unrestricted net assets) may be used to meet the government’s ongoing obligations to citizens and creditors.
• As of the end of the current fiscal year, the City’s governmental funds reported combined ending fund balances of $958,721, an increase of $12,386 compared to the fiscal year 2009 restated fund balance. The total unreserved fund balance of $506,575 is available for spending at the government’s discretion. Of this amount, $106,747 is designated and $399,828 is undesignated fund balance.
• At the end of the current fiscal year, unreserved fund balance for the General Fund was $199,110 or 24.4% of the total General Fund expenditures.
Overview of the Financial Statements This discussion and analysis is intended to serve as the introduction to the City of San Antonio’s basic financial statements, which have three components: 1) government-wide financial statements, 2) fund financial statements, and 3) notes to the financial statements. Government-wide Financial Statements The government-wide financial statements are designed to provide readers with a broad overview of the City’s finances, in a manner similar to private-sector business financial presentation. The statement of net assets is a presentation of the City’s assets and liabilities, including capital and infrastructure assets, and long-term liabilities. This statement reports the difference between assets and liabilities as net assets. Over time, increases or decreases in net assets may help determine or help indicate whether the financial position of the City is improving or deteriorating. The statement of activities presents information showing how the government’s net assets changed during the fiscal year. Changes in net assets are recorded when the underlying event giving rise to the change occurs regardless of the timing of the cash flows. Therefore, revenues and expenses reported in this statement for some items will not result in cash flows until future fiscal periods (e.g., uncollected taxes and earned but unused vacation leave). Both of the government-wide financial statements distinguish functions of the City that are principally supported by taxes and intergovernmental revenues (governmental activities) from other functions that are intended to recover all or a significant portion of their costs through user fees or charges (business-type activities). Governmental activities include general government, public safety, public works, sanitation, health services, culture and recreation, convention and tourism, urban redevelopment and housing, welfare, and economic development and opportunity. The business-type activities of the City include the airport system, parking system, and solid waste management. In addition, the basic financial statements provide information regarding the City’s legally separate discretely presented component units. Component unit financial information is reported separately from the primary government in the government-wide financial statements.

City of San Antonio, Texas - 2 - Amounts are expressed in thousands
Fund Financial Statements The accounts of the City are organized on the basis of funds, each of which is considered a separate accounting entity. Government resources are allocated to and accounted for in individual funds based upon the purposes for which they are to be spent and the means by which spending activities are controlled. Fund financial statements are used to present financial information detailing resources that have been identified for specific activities. The focus of the fund financial statements is on the City’s major funds, although nonmajor funds are also presented in aggregate and further detailed in the supplementary statements. The City uses fund accounting to ensure and demonstrate compliance with requirements placed on resources. Funds are divided into three categories: governmental, proprietary, and fiduciary. Fund financial statements allow the City to present information regarding fiduciary funds, since they are not reported in the government-wide financial statements. Governmental Funds - Governmental funds are used for essentially the same functions reported in the governmental activities in the government-wide financial statements. However, unlike the government-wide statement, governmental fund financial statements focus on the near-term inflows and outflows of spendable resources, as well as on balances of spendable resources available at the end of the fiscal year. Such information may be useful in evaluating a government’s near-term financing requirements. As the focus of governmental funds is narrower than that of the government-wide financial statements, it is useful to compare the information presented in the governmental funds with similar information presented for governmental activities in the government-wide financial statements. By doing so, readers may better understand the long-term impact of the government’s near-term financing decisions. Both the governmental fund balance sheet and the governmental fund statement of revenues, expenditures, and changes in fund balances provide a reconciliation to facilitate this comparison between governmental fund and governmental activities. The City maintains five individual governmental fund types for financial reporting purposes. The governmental fund types are General Fund, Special Revenue Funds, Capital Projects Funds, Debt Service Funds, and Permanent Funds. Information is presented separately in the governmental fund balance sheet and in the governmental fund statement of revenues, expenditures, and changes in fund balances for the General Fund, Categorical Grant-In Aid, Debt Service Fund, and the 2007 General Obligation Bonds Fund all of which are considered to be major funds. Data from the other funds are combined into a single, aggregated presentation labeled “Nonmajor Governmental Funds.” Individual fund data for each nonmajor governmental fund is provided in the form of combining statements elsewhere in this report. Proprietary Funds - The City maintains two types of proprietary funds. Enterprise funds are used to report the functions presented in business-type activities in the government-wide financial statements. The City uses enterprise funds to account for its Airport System, Parking System, and Solid Waste Management Funds. Internal Service Funds are used to accumulate and allocate costs internally among the City’s various functions, including, self-insurance programs, other internal services, and information technology services. The services provided by these funds predominantly support the governmental rather than the business-type functions. They have been included within the governmental activities in the government-wide financial statements and are reported alongside the enterprise funds in the fund financial statements. Information is presented separately in the proprietary funds statement of net assets and in the proprietary funds statement of revenues, expenses, and changes in fund net assets for the Airport System Fund, which is considered to be a major fund. The Internal Service Funds are combined into a single aggregated presentation in the proprietary fund financial statements. Data from the other enterprise funds are combined into a single, aggregated presentation labeled “Nonmajor Enterprise Funds.” Individual fund data for each nonmajor enterprise fund and each internal service fund are provided in the form of respective combining statements elsewhere in this report. Fiduciary Funds - Fiduciary funds are used to account for resources held for the benefit of parties outside the primary government. Fiduciary funds are not reflected in the government-wide financial statements as the resources of those funds are not available to support the City’s programs and operations. With the exception of agency funds, the accounting for fiduciary funds is much like that used for the proprietary funds.

City of San Antonio, Texas - 3 - Amounts are expressed in thousands
Notes to the financial statements - The notes provide additional information that is essential to a full understanding of the data provided in the government-wide and fund financial statements. Other information - In addition to the basic financial statements and the accompanying notes, this report also presents the required supplementary information of (a) the City’s General Fund budgetary comparison schedule that demonstrates compliance with its budget, and (b) schedules of funding progress related to pension and postemployment plans. The Debt Service Fund, various Special Revenue Funds and specific Permanent Fund budgets, which are legally adopted on an annual basis, are also included in the CAFR as supplementary schedules within the Combining Financial Statements and Schedules. Government-Wide Financial Statement Analysis The following tables, graphs and analysis discuss the financial position and changes to the financial position for the City as a whole as of and for the year-ended September 30, 2010.
2010 2009 2010 2009 2010 2009Current and Other Assets 1,473,273$ 1,247,871$ 227,481$ 245,770$ 1,700,754$ 1,493,641$ Capital Assets 3,637,655 3,519,907 627,007 540,223 4,264,662 4,060,130
Total Assets 5,110,928 4,767,778 854,488 785,993 5,965,416 5,553,771
Current and Other Liabilities 400,852 390,096 52,789 51,399 453,641 441,495 Long-term Liabilities 2,183,125 1,880,285 449,807 404,840 2,632,932 2,285,125
Total Liabilities 2,583,977 2,270,381 502,596 456,239 3,086,573 2,726,620
Net Assets:Investments in Capital Assets,
Net of Related Debt 2,241,952 2,200,616 270,226 260,679 2,512,178 2,461,295 Restricted 124,300 128,727 78,558 66,099 202,858 194,826 Unrestricted 160,699 168,054 3,108 2,976 163,807 171,030
Total Net Assets (as restated) 2,526,951$ 2,497,397$ 351,892$ 329,754$ 2,878,843$ 2,827,151$
Net AssetsYear-Ended September 30, 2010
(With Comparative Totals for September 30, 2009)
GovernmentalActivities
Business-TypeActivities
TotalPrimary Government
For the year-ended September 30, 2010, total assets exceeded liabilities by $2,878,843. The largest portion of the City’s net assets, $2,512,178 (87.3%) represents its investment in capital assets less any related debt used to acquire those assets that are still outstanding, and includes assets such as land, infrastructure, improvements, buildings, machinery and equipment, and intangibles. Capital assets are used to provide services to the citizens of San Antonio and are not available for further spending. Although the City’s investment in capital assets is reported net of related debt, the resources needed to repay the debt must be provided from other sources, as capital assets cannot be used to liquidate liabilities. Of the total net assets, $202,858, 7.0%, represents resources that are subject to external restrictions on how they may be used. The remaining $163,807, 5.7%, represents unrestricted net assets, which can be used to meet the government’s ongoing obligations to citizens and creditors.

City of San Antonio, Texas - 4 - Amounts are expressed in thousands
2010 2009 2010 2009 2010 2009Revenues:
Program Revenues:Charges for Services 175,868$ 176,136$ 160,892$ 152,170$ 336,760$ 328,306$ Operating Grants and Contributions 258,714 206,356 258,714 206,356 Capital Grants and Contributions 98,362 81,114 40,156 31,115 138,518 112,229
General Revenues:Property Taxes 406,579 407,183 406,579 407,183 Other Taxes 328,928 323,467 328,928 323,467 Revenues from Utilities 293,114 275,993 293,114 275,993 Investment Earnings 6,959 17,500 823 4,769 7,782 22,269 Miscellaneous 25,181 24,017 480 464 25,661 24,481
Total Revenues 1,593,705 1,511,766 202,351 188,518 1,796,056 1,700,284
Expenses:Primary Government:
Governmental Activities:General Government 117,505 92,415 117,505 92,415 Public Safety 545,228 497,274 545,228 497,274 Public Works 221,612 212,256 221,612 212,256 Sanitation 8,385 3,953 8,385 3,953 Health Services 104,667 92,351 104,667 92,351 Culture and Recreation 143,122 145,386 143,122 145,386 Convention and Tourism 26,437 42,512 26,437 42,512 Urban Redevelopment and Housing 44,447 45,533 44,447 45,533 Welfare 177,817 162,956 177,817 162,956 Economic Development and Opportunity 106,766 23,260 106,766 23,260 Interest on Long-Term Debt, Net 70,945 75,108 70,945 75,108
Business-Type Activities:Airport System 83,240 81,229 83,240 81,229 Parking System 9,135 8,984 9,135 8,984 Solid Waste Management 85,058 88,900 85,058 88,900
Total Expenses 1,566,931 1,393,004 177,433 179,113 1,744,364 1,572,117 Change in Net Assets
Before Transfers and Special Items 26,774 118,762 24,918 9,405 51,692 128,167 Special Items 4,528 4,528 Transfers 2,780 498 (2,780) (498) Net Change in Net Assets 29,554 119,260 22,138 13,435 51,692 132,695
Beginning, Net Assets (as restated) 2,497,397 2,378,137 329,754 316,319 2,827,151 2,694,456
Ending, Net Assets (as restated) 2,526,951$ 2,497,397$ 351,892$ 329,754$ 2,878,843$ 2,827,151$
City of San Antonio, TexasChanges in Net Assets
Year-Ended September 30, 2010(With Comparative Totals for September 30, 2009)
ActivitiesBusiness-Type
ActivitiesTotal PrimaryGovernment
Governmental
The City’s total revenues were $1,796,056 for fiscal year-ended September 30, 2010. Revenues from governmental activities totaled $1,593,705 and revenues from business-type activities totaled $202,351. General revenues represented 59.1% of the City’s total revenue, while program revenues provided 40.9% of revenue received in fiscal year 2010. Expenses for the City totaled $1,744,364. Governmental activity expenses totaled $1,566,931, or 89.8% of total expenses.

City of San Antonio, Texas - 5 - Amounts are expressed in thousands
Governmental Activities
Governmental ActivitiesProgram Revenues and Expenses
$0 $100,000
$200,000
$300,000
$400,000
$500,000
General Government
Public Safety
Public Works
Sanitation
Health Services
Culture & Rec.
Conv. & Tourism
Urban Redev. &
Welfare
Econ. Dev. & Opp.
Interest, Net
Revenues Expenses
Governmental ActivitiesRevenues by Source
18.4%
20.7%
11.0%16.2%
6.2%25.5%
1.6%0.4%
Charges for Services
Operating Grants and Contributions
Capital Grants and Contributions
Property Taxes
Other Taxes
Revenues from Utilities
Investment Earnings
Miscellaneous
Governmental Activities increased the City’s net assets by $29,554. The reason for the change is as follows:
• Grants and Contributions revenues increased by $69,606 primarily due to 1) the increase in American Reinvestment and Recovery Act (ARRA) grant awards and spending mainly related to Department of Energy and Department of Health Services’ grants; 2) $17,636 received from the State of Texas for the State’s rebate program, which provides municipalities the opportunity to obtain reimbursement for eligible expenses related to hosting and attracting high-visibility, high-tax impact events to the state of Texas that could otherwise take place outside of the state; and 3) $2,500 contribution to the San Antonio Economic Development Corporation to start its operations.
• Although net taxable assessed values increased from $72,541 in fiscal year 2009 to $72,743 in fiscal year 2010, revenues from Property Taxes decreased by $604 due to 1) a 0.145% decrease in the City’s direct rate; and 2) increased successful property tax appeals filed by constituents and local businesses. The direct rate was reduced as part of a package deal of United Health System’s taking over a number of City clinics in 2008.
• Other Taxes increased by $5,461 due to a slight upturn in the economy and increase in overall tourism for the City. The improvement of the economy resulted in an increase in tourism, along with an increase in convention business and caused Hotel Occupancy Taxes and Sales and Use Taxes to increase by $934, and $1,729, respectively, from the prior year.
• CPS Energy revenues increased by $18,043 due to a 2% increase in electric sales and a 23% increase in natural gas prices from the prior year. Revenues from SAWS revenues decreased by $922 due to decreased sales resulting from a wetter than normal summer season, which decreased water usage.
• Investment Earnings decreased by $10,541 due to a significant decrease in yields within the market during the fiscal year and lower cash and investment holdings as a result of lower average investment balances.
• General Government expenses were higher by $25,090 from fiscal year 2009 primarily due to 1) $17,179 in assets that did not meet the threshold to be capitalized; and an increase of $2,756 for building maintenance costs.

City of San Antonio, Texas - 6 - Amounts are expressed in thousands
• Public Safety expenses increased by $47,954 from the prior fiscal year due to 1) $23,002 of expenses associated with police and fire accrued leave, increased obligations for post-employment benefits and overtime; 2) $2,795 of new costs for 50 additional officers hired due to the COPS Hiring Grant received in 2010; and 3) $3,042 of increased insurance claim assessments charged to the departments based on the volume and severity of prior year incidents.
• Expenses for Health Services increases by $12,316 primarily due to 1) the City expending the Public Health Emergency Response Grant received in fiscal year 2010; and 2) purchasing $7,832 in assets that did not meet the threshold to be capitalized.
• Convention and Tourism’s reduction of $16,075 was due to a change in function for reporting the Convention Center Hotel Finance Corporation’s $17,578 in fiscal year 2009 expenses. The Convention Center completed its construction of the Grand Hyatt Hotel in fiscal year 2009. Expenses incurred in fiscal year 2010 related to the construction of the Hotel’s condominiums which are more appropriately designated as economic development.
• Welfare increased $14,861 from fiscal year 2009 primarily due to 1) the various awards of grants associated with ARRA. As the awards increased, so too did the various expenses matched or covered by the General Fund.
• Economic Development and Opportunity expenses increased $83,506 from fiscal year 2009 primarily due to a change in function for reporting fiscal year 2010 expenses in the amount of $56,425 related to the Convention Center Hotel Finance Corporation, as noted above under Convention and Tourism. The City also recognized $16,260 and $6,655 of expenses in fiscal year 2010 which were related to the HUD 108 Loan Program and the City’s Tax Increment Reinvestment Zones, respectively.
Business-Type Activities Program revenues for the City’s Business-Type Activities totaled $201,048, which is $17,763 higher than the previous fiscal year. The remaining revenues were a result of investment earnings and other miscellaneous items. Expenses for Business-Type Activities were $177,433 compared to prior year’s expenses of $179,113.
Business-Type ActivitiesExpenses and Revenues
$0 $20,000
$40,000
$60,000
$80,000
$100,000
$120,000
Airport System
Parking System
Solid WasteManagement
Revenues Expenses
Business-Type ActivitiesRevenues by Source
19.8%0.3%
0.4%
79.5%
Charges for Services
Investment Earnings
Miscellaneous
Capital Grants & Contributions

City of San Antonio, Texas - 7 - Amounts are expressed in thousands
Business-Type Activities increased the City’s net assets by $22,138, primarily because of the following:
• Charges for Services increased by $8,722 primarily due to an increase in passenger travel through San Antonio International Airport, resulting in $1,953 more in Airport Systems revenues; Solid waste fees increasing by $6,625, mainly due to an increase in commodity prices paid by recycling centers for the City’s recycling.
• A $9,041 increase in Capital Grants and Contributions was primarily attributed to a $7,060 increase in grant funded capital project expenses related to the Airport’s ongoing expansion project, as well as an increase of $1,399 in passenger facility charge revenues due to increased passenger travel at San Antonio International Airport.
• Investment Earnings decreased by $3,946, due to a significant decrease in yields within the market during the fiscal year and lower cash and investment holdings as a result of lower average investment balances.
• Airport System expenses increased by $2,011 primarily due to increased contractual services and commodities at both San Antonio International and Stinson Airports.
• Solid Waste Management expenses decreased by $3,842, due to the implementation of the automated garbage collection services, which was completed in fiscal year 2010.
Financial Analysis of Governmental Funds Activities of the Primary Government’s General Fund, Special Revenue Funds, Debt Service Fund, and Capital Projects Funds are considered general government functions. The General Fund is the City’s general operating fund. Special Revenue Funds are used to account for the proceeds of specific revenue sources that are legally restricted as to expenditures. The Debt Service Fund is used to account for financial activity related to the City’s general bonded indebtedness, as well as other long-term obligations. The Capital Projects Funds are used to account for financial activity related to the City indebtedness for Capital Projects, other agency contributions and the operating activities of those projects. Revenues from taxes increased by $4,857, which is primarily attributable to: (1) a $604 decrease in property tax and related penalties and interest revenues in the General Fund, (2) a $1,326 increase in sales and use tax revenues in the General Fund, (3) a $375 decrease in property tax and related penalties and interest revenues in the Debt Service Fund, (4) a $934 increase in occupancy taxes and related penalties and interest revenues in the Nonmajor Governmental Funds, and (5) a $67 decrease in property tax revenue in the Tax Increment Reinvestment Zone Fund. The decreases in property taxes are a result of a slight decrease in property valuation; while the increase in sales and use taxes and occupancy taxes are results of an upswing in the economy and increased activity associated with tourism and convention business. The total fund balance of the General Fund at year-end was $229,636, an increase of $23,129 from the total fund balance of $206,507 in fiscal year 2009. The total unreserved General Fund balance for fiscal year 2010 is $199,110, which represents $97,762 in designated and $101,348 in undesignated fund balances. The undesignated fund balance, which represents amounts available for additional appropriations in the General Fund at the end of the fiscal year, increased by $1,040 from the previous year’s balance, while the City’s financial reserves also increased $679 in fiscal year 2010. This reserve, which is recorded in the designated unreserved balance, will be utilized for unforeseen operational or capital requirements, extraordinary occurrences such as natural disasters or other similar events, to assist the City in managing fluctuations in available General Fund resources and to stabilize the budget. The total fund balance of the Debt Service Fund at year-end was $109,083, a decrease of $3,841 from the total fund balance of $112,924 in fiscal year 2009. The entire fund balance is reserved for payment of debt service. The Categorical Grant-In Aid Fund has a total deficit fund balance of $4,397 as a result of providing additional program services to the community beyond what monies were provided by grantor agencies. The uncollectible amounts were incorporated into the City’s annual budget process to be funded over five years of which the City has two years remaining to fund.

City of San Antonio, Texas - 8 - Amounts are expressed in thousands
The total fund balance of the 2007 General Obligation Bonds at year-end was $238,321, an increase of $141,207 from the total fund balance of $97,114 in fiscal year 2009. The voters approved a $550,000 bond for City improvements in fiscal year 2007. The City issued debt of $200,350 related to that bond during the current fiscal year. General Fund Budgetary Highlights
Changes in original budget appropriations to the final amended budget appropriations resulted in a net $20,150 increase in appropriations. This increase can be summarized by the following:
• General Government had a $10,998 decrease. Indirect cost reimbursements from other funds caused a $9,360 decrease. Budget carryforwards caused a $3,046 increase, while ordinance and analyst adjustments accounted for a decrease of $4,705.
• Of the $3,408 increase in Public Works, $3,273 consisted of budget carryforwards while the remaining $135 increase consisted of budget adjustments.
• Of the $3,450 increase in Welfare, $3,628 consisted of budget carryforwards while the remaining $178 decrease consisted of budget adjustments.
• The $18,296 increase in Transfers to Other Funds consisted of $3,218 of budget carryforwards, $8,172 in budget adjustments related to Public Works projects since the Streets and Drainage Fund had been incorporated into the General Fund in fiscal year 2010, and $6,794 of other budget adjustments.
Final budgeted appropriations for the General Fund were $907,206, while actual expenditures on a budgetary basis were $896,861 creating a positive variance of $10,345. Significant variances are as follows:
• General Government had a $4,035 positive variance. The City budgeted the retiree payouts in the General Government function while actual payouts are charged across all functions. Salary reserves represented $8,500 in fiscal year 2010. Public Safety typically receives 70% of these funds. Further savings were achieved across departments as a result of hiring being delayed during the fiscal year.
• Public Safety had a $2,061 positive variance due to savings in the implementation of the Computer Aided Dispatch program.
• Public Works had a $1,104 positive variance due to lower than expected spending on building improvement materials.
Original Final ActualBudget Budget Results
General Government 97,975$ 86,977$ 82,942$ Public Safety 506,841 507,106 505,045 Public Works 41,933 45,341 44,237 Health Services 71,862 74,782 73,898
Sanitation 3,163 3,385 3,212 Culture and Recreation 75,447 77,655 76,983 Welfare 39,177 42,627 41,142 Economic Development
and Opportunity 2,459 2,838 2,907 Transfers to Other Funds 48,199 66,495 66,495
Total 887,056$ 907,206$ 896,861$
Variances in Budget Appropriations(Budgetary Basis)
General Fund

City of San Antonio, Texas - 9 - Amounts are expressed in thousands
The following charts provide a comparison of the City’s budget appropriations.
$-
$100
,000
$200
,000
$300
,000
$400
,000
$500
,000
$600
,000
General Government
Public Safety
Public Works
Health Services
Sanitation
Welfare
Cult & Rec
Eco Dev & Opp
Trsf to Other Funds
Budget Appropriations by FunctionOriginal Budget/Final Budget/Actual - General Fund
Original Budget Final Budget Actual Results
Financial Analysis of Proprietary Funds Activities of the Primary Government’s Airport System, Parking System, and Solid Waste Funds are considered proprietary funds. The Airport System handles operations at both the San Antonio International Airport and Stinson Municipal Airport. The Parking System handles operations of the City’s parking garages and lots. Solid Waste Management handles trash collection operations, recycling, and the activities of the City’s landfills. Financial analysis for the proprietary funds is on the same basis as the business-type activities. See further analysis on the funds’ operations at pages 6 and 7. Capital Assets The City’s investment in capital assets for its governmental and business-type activities as of September 30, 2010 amounts to $4,264,662 (net of accumulated depreciation). This investment in capital assets includes land, other non-depreciable assets, buildings, improvements, infrastructure, machinery and equipment, intangible assets and construction in progress. The net increase in the City’s investment in capital assets for the current fiscal year was $204,532, which comprises an $117,748 increase in governmental activities and an $86,784 increase in business-type activities.

City of San Antonio, Texas - 10 - Amounts are expressed in thousands
2010 2009 2010 2009 2010 2009Land 1,364,427$ 1,430,280$ 14,340$ 14,341$ 1,378,767$ 1,444,621$ Other Non-Depreciable Assets 500 500 500 500 Non-Depreciable Intangible Assets 81,809 81,809 Depreciable Intangible Assets 109 109 Buildings 454,437 457,223 139,334 139,042 593,771 596,265 Improvements 273,450 232,070 131,495 136,343 404,945 368,413 Infrastructure 819,559 852,026 819,559 852,026 Machinery and Equipment 163,595 159,451 23,454 23,299 187,049 182,750 Construction in Progress 479,769 388,357 318,384 227,198 798,153 615,555
Total 3,637,655$ 3,519,907$ 627,007$ 540,223$ 4,264,662$ 4,060,130$
GovernmentalActivities
Total PrimaryGovernment
Business-TypeActivities
During fiscal year 2010, the City transferred $129,789 of construction in progress to depreciable asset classes for various completed projects of buildings, improvements, infrastructure, and machinery and equipment. The following schedule provides a summary of the City’s capital assets:
$1,378,767
$500
$81,809
$109
$593,771
$404,945
$819,559
$187,049
$798,153
$0
$200,000
$400,000
$600,000
$800,000
$1,000,000
$1,200,000
$1,400,000
Governmental and Business-Type Activities
For Fiscal Year 2010
Total Capital Assets $4,264,662 Land
Other Non-DepreciableAssetsNon_Depreciable IntangibleAssetsDepreciable IntangibleAssetsBuildings
Improvements
Infrastructure
Machinery and Equipment
Construction in Progress
Governmental Business-TypeActivities Activities Total
Beginning Balance 5,566,633$ 737,244$ 6,303,877$ Additions 270,213 107,715 377,928 Deletions (29,864) (6,592) (36,456) Accumulated Depreciation (2,169,327) (211,360) (2,380,687) Ending Balance 3,637,655$ 627,007$ 4,264,662$
Change in Capital AssetsSeptember 30, 2010

City of San Antonio, Texas - 11 - Amounts are expressed in thousands
The following charts provide a summary of the ending balances of capital assets for both the current and prior fiscal years:
$3,637,655
$3,519,907
$3,400,000
$3,500,000
$3,600,000
$3,700,000
Governmental Activities
Total Capital Assets
Fiscal Year End 2010 Fiscal Year End 2009
$627,007
$540,223
$450,000$500,000$550,000$600,000$650,000
Business-Type Activities
Total Capital Assets
Fiscal Year End 2010 Fiscal Year End 2009
Additional information on the City’s capital assets can be found in Note 4, Capital Assets. Debt Administration Long-Term Debt At the end of the current fiscal year, the City had a total of $2,236,689 in bonds, certificates, tax notes and commercial paper outstanding, an increase of 5.3% over last year. Additional information on the City’s long-term debt, including descriptions of the new issues, can be found in Note 6, Long-Term Debt and Note 7, Commercial Paper Programs.

City of San Antonio, Texas - 12 - Amounts are expressed in thousands
2010 2009Bonds Payable:
General Obligation Bonds 912,900$ 731,270$ Tax-Exempt Certificates of Obligation 303,635 348,235 Taxable Certificates of Obligation 80 155 Tax Notes 28,860 48,095 Commercial Paper 14,370 25,805 Revenue Bonds 557,387 570,252 Capital Appreciation Bonds (CAB) 20,077 18,812
Total 1,837,309$ 1,742,624$
2010 2009Bonds Payable:
General Obligation Bonds 18,220$ 18,480$ Tax-Exempt Certificates of Obligation 2,135 2,715 Tax Notes 34,500 Revenue Bonds 344,525 360,380
Total 399,380$ 381,575$
September 30, 2010 and 2009
Governmental Activities
Business-Type Activities
Governmental Activities In 2010, the City issued additional indebtedness for a total of $413,180. The $413,180 was composed of $356,060 in general obligation bonds, $38,375 in certificates of obligations, $9,655 in tax notes, and $9,090 in revenue bonds. In March 2010, the City issued $156,255 in General Improvement Refunding Bonds, Series 2010, of which $545 funded Solid Waste Management projects. The general obligation bonds were issued to refund certain obligations of the City (Refunded Obligations). In March 2010, the City issued $9,090 in Municipal Facilities Corporation Lease Revenue Refunding Bonds, Series 2010. The Bonds were issued to refund certain municipal facilities corporation bonds. In July 2010, the City issued the following: $8,800 in General Improvement Bonds, Series 2010A, $191,550 in General Improvement Bonds, Taxable Series 2010B (Direct Subsidy – Build America Bonds), and $38,375 in Combination Tax and Revenue Certificates of Obligation, Series 2010. The General Improvement Bonds, Series 2010A were issued to finance improvements to parks, recreation, and open space and athletics. The General Improvement Bonds, Taxable Series 2010B were issued to finance improvements to streets, bridges and sidewalks, drainage, and libraries. The Combination Tax and Revenue Certificates of Obligation, Series 2010 were issued to provide funds for making permanent public improvements and for other public purposes. The Tax Notes, Series 2010A were issued to provide funds for computer and information technology systems. Business-Type Activities In March 2010, the City issued $34,500 in Tax Notes, Series 2010. The Notes were issued to provide interim financing to fund capital improvements at the San Antonio International Airport. In March 2010, $545 of the $156,255 General Improvement Refunding Bonds, Series 2010 was allocated to Solid Waste Management.

City of San Antonio, Texas - 13 - Amounts are expressed in thousands
Standard & Poor’s, Moody’s, and Fitch’s underlying rating for City obligations during fiscal year 2010 were as follows:
Standard& Poor's Moody's Fitch
General Obligation/Certificates of Obligation/Tax Notes AAA Aaa AAAHotel Occupancy Tax Bonds (Prior Lien) A+ Aa2 AA-Hotel Occupancy Tax Bonds (Subordinate Lien - Long Term) A+ Aa3 A+Hotel Occupancy Tax Bonds (Variable Rate - Short Term) A+ Aa3 A+Hotel Occupancy Tax Notes 1
Airport System A+ A1 A+Aiport PFC A- A2 AMunicipal Drainage Utility System Revenue Bonds AA+ Aa2 AASales Tax Revenue Commercial Paper Notes 2 A-1+ P-1 F1+
Private Placement - Not Rated
1 The Hotel Occupancy Tax Notes were no longer outstanding as of August 15, 2010. 2 The ratings assigned to the Sales Tax Revenue Commercial Paper Notes are based upon the credit rating of the Letter of Credit provider and no application for an underlying rating on the Notes was submitted. The Constitution of the State of Texas and the City Charter limit the amount of debt the City may incur. For more information related to these limits see Note 6, Long-Term Debt. The total gross assessed valuation for the fiscal year-ended 2010 was $84,481,611, which provides a debt ceiling of $8,448,161. Currently Known Facts On May 20, 2010, the City Council approved the City's collective bargaining agreement with the San Antonio Police Officer's Association (SAPOA), which is effective from October 1, 2009 to September 30, 2014. The projected fiscal impact of the four year agreement is $62,900. The collective bargaining agreement with the International Association of Fire Fighters Local 624 (Local 624) expired September 30, 2009. The collective bargaining agreement contained an evergreen clause through September 30, 2019. Efforts to negotiate a new four-year agreement with the Local 624 began in January, 2010. To date, no agreement has been reached with the Local 624 and fire services to the public continue to be provided under the evergreen clause. For more information on other currently known facts, please see Note 18, Subsequent Events. Requests for Information This financial report is designed to provide a general overview of the City’s position for those with an interest in the government’s finances. Questions concerning any of the information provided in this report or requests for additional financial information should be addressed to the Finance Department, P.O. Box 839966, San Antonio, TX 78283-3966.

CITY OF SAN ANTONIO, TEXAS Comprehensive Annual Financial Report Year-Ended September 30, 2010

City of San Antonio, Texas
Basic Financial Statements

Statement of Net Assets
GOVERNMENTAL BUSINESS-TYPE COMPONENTACTIVITIES ACTIVITIES TOTAL UNITS
Current Assets:Cash and Cash Equivalents 30,368$ 2,935$ 33,303$ 353,512$Securities Lending Collateral 51,065 5,766 56,831 31,815Investments 336,365 33,670 370,035 241,316Receivables, Net 105,564 9,803 115,367 276,004Due from:
Fiduciary Funds 509 509 Other Governmental Agencies 16,421 16,421 9,458
Internal Balances 2,550 (2,550) Materials and Supplies, at Cost 6,396 623 7,019 157,105Prepaid Expenses 1,281 17 1,298 98,663Other Assets 1,360Deposits 213 213Restricted Assets:
Cash and Cash Equivalents 82,996 17,077 100,073 156,793Securities Lending Collateral 74,717 15,902 90,619Investments 630,495 134,232 764,727 1,096,838Receivables, Net 88,175 2,155 90,330 3,696Prepaid Expenses 16 16 Deposits 1 1Due from: Other Governmental Agencies 10,172 6 10,178
Materials and Supplies, at Cost 17 17Total Current Assets 1,437,321 219,636 1,656,957 2,426,560Noncurrent Assets:
Capital Assets:Non Depreciable 1,926,505 332,724 2,259,229 2,734,472Depreciable, Net 1,711,150 294,283 2,005,433 7,784,436
Assets Held for Resale 448Receivables, Net 4,128Prepaid Expenses 976,579Net OPEB Asset 38,694Other Noncurrent Assets 90,621Unamortized Bond Issuance Costs 35,952 7,845 43,797 19,407
Total Noncurrent Assets 3,673,607 634,852 4,308,459 11,648,785Total Assets 5,110,928 854,488 5,965,416 14,075,345
Current Liabilities:Accounts Payable and Other Current Liabilities 119,798 12,282 132,080 444,191Unearned Revenue 8,987 456 9,443 2,992Securities Lending Obligation 51,065 5,766 56,831 31,815Accrued Interest 2 15 17 Due to:
Other Governmental Agencies 723 723 1,782Restricted Liabilities:
Accounts Payable and Other Current Liabilities 61,322 13,556 74,878 28,956Unearned Revenue 64,549 64,549Securities Lending Obligation 74,717 15,902 90,619Accrued Interest 15,245 4,812 20,057 26,210Arbitrage Liability PayableDue to:
Other Governmental Agencies 4,444 4,444Total Current Liabilities 400,852 52,789 453,641 535,946Noncurrent Liabilities:
Due Within One Year 172,865 26,962 199,827 292,042Due in More Than One Year 2,010,260 422,845 2,433,105 8,034,392
Total Noncurrent Liabilities 2,183,125 449,807 2,632,932 8,326,434Total Liabilities 2,583,977 502,596 3,086,573 8,862,380
Invested in Capital Assets, Net of Related Debt 2,241,952 270,226 2,512,178 4,294,171Restricted for:
Debt Service 103,363 31,025 134,388 31,633Capital Projects 3,987 47,533 51,520 336,954Operating and Other Reserves 76,128Perpetual Care:
Expendable 12,148 12,148 2,972Nonexpendable 4,802 4,802
Unrestricted 160,699 3,108 163,807 471,107Total Net Assets 2,526,951$ 351,892$ 2,878,843$ 5,212,965$
Assets:
Liabilities:
Net Assets:
CITY OF SAN ANTONIO, TEXAS
As of September 30, 2010(In Thousands)
PRIMARY GOVERNMENT
The accompanying notes are an integral part of these basic financial statements.
- 14 - Amounts are expressed in thousands

Statement of ActivitiesFor the Year-Ended September 30, 2010
OPERATING CAPITALCHARGES FOR GRANTS AND GRANTS AND
EXPENSES SERVICES CONTRIBUTIONS CONTRIBUTIONS
Primary Government:Governmental Activities:
General Government 117,505$ 21,565$ 1,052$ 504$Public Safety 545,228 10,157 14,684 6,436Public Works 221,612 53,723 16,446 24,708Sanitation 8,385 397 6,837Health Services 104,667 31,595 21,471 1,069Culture and Recreation 143,122 33,791 4,307 506Convention and Tourism 26,437 1,262 20,782 16Urban Redevelopment and Housing 44,447 20,724 25,201 2,517Welfare 177,817 72 138,402 213Economic Development and Opportunity 106,766 2,582 9,532 62,393Amortization of Bond Related Costs (7,346)Interest on Long-Term Debt 78,291
Total Governmental Activities 1,566,931 175,868 258,714 98,362
Business-Type Activities:Airport System 83,240 63,717 39,574Parking System 9,135 9,287Solid Waste Management 85,058 87,888 582
Total Business-Type Activities 177,433 160,892 40,156
Total Primary Government 1,744,364$ 336,760$ 258,714$ 138,518$
Discretely Presented Component Units:CPS Energy 1,955,115$ 1,930,875$ -$ 38,991$San Antonio Water System 387,576 369,053 66,771Brooks Development Authority 13,552 17,119 3,334City South Management Authority 170Main Plaza Conservancy 649 30 580Municipal Golf Association - San Antonio 8,022 7,853 386Port Authority of San Antonio 44,106 41,409 2,914SA Energy Acquisition Corporation 53,942 53,042San Antonio Development Agency 453 57San Antonio Housing Trust Foundation, Inc. 872 108 588
Total Component Units 2,464,457$ 2,419,546$ 4,082$ 109,482$
General Revenues:Taxes:
PropertyGeneral Sales and Use Selective Sales and Use Gross Receipts Business OccupancyPenalties and Interest on Delinquent Taxes
Revenues from UtilitiesInvestment EarningsMiscellaneous
Adjustment for STP Pension CostTransfers, net
Total General Revenues, Special Items, and Transfers
Change in Net AssetsNet Assets - Beginning of Fiscal Year (as restated)
Net Assets - End of Fiscal Year
FUNCTION/PROGRAM ACTIVITIES
PROGRAM REVENUES
CITY OF SAN ANTONIO, TEXAS
(In Thousands)
The accompanying notes are an integral part of these basic financial statements.
- 15 - Amounts are expressed in thousands
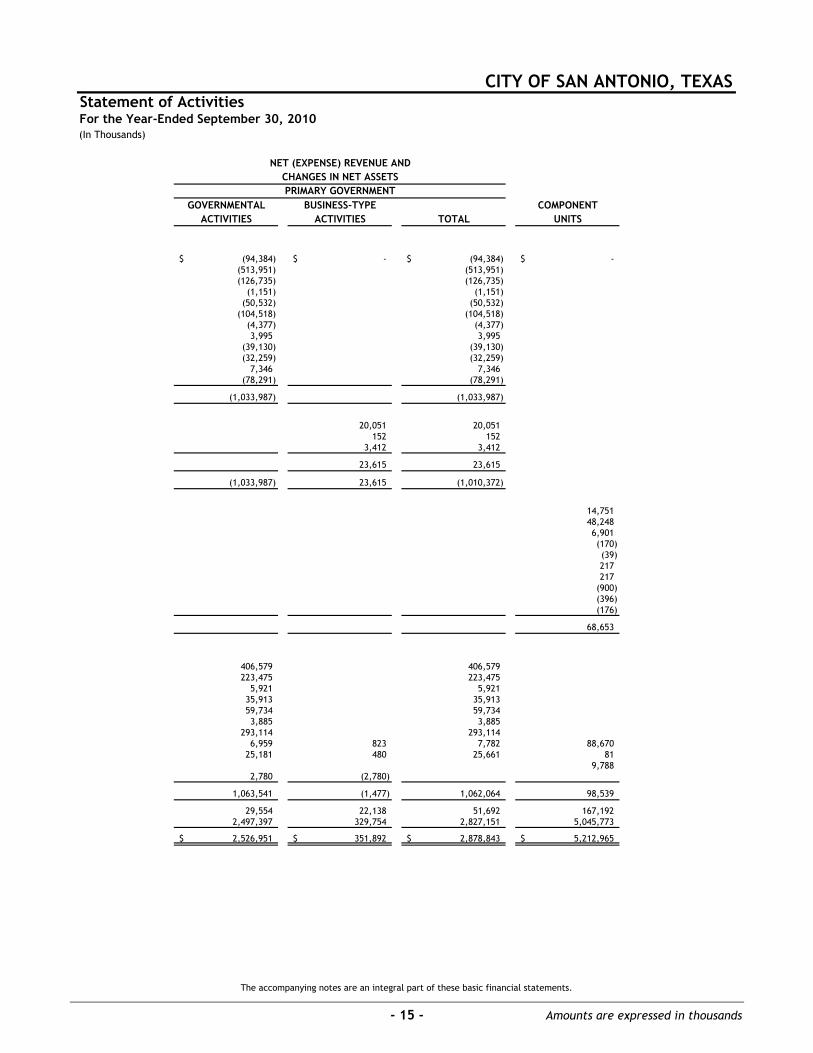
Statement of Activities
GOVERNMENTAL BUSINESS-TYPE COMPONENTACTIVITIES ACTIVITIES TOTAL UNITS
(94,384)$ -$ (94,384)$ -$(513,951) (513,951)(126,735) (126,735)
(1,151) (1,151)(50,532) (50,532)
(104,518) (104,518)(4,377) (4,377)3,995 3,995
(39,130) (39,130)(32,259) (32,259)
7,346 7,346(78,291) (78,291)
(1,033,987) (1,033,987)
20,051 20,051152 152
3,412 3,412
23,615 23,615
(1,033,987) 23,615 (1,010,372)
14,75148,2486,901(170)(39)217217
(900)(396)(176)
68,653
406,579 406,579223,475 223,475
5,921 5,92135,913 35,91359,734 59,7343,885 3,885
293,114 293,1146,959 823 7,782 88,670
25,181 480 25,661 819,788
2,780 (2,780)
1,063,541 (1,477) 1,062,064 98,539
29,554 22,138 51,692 167,1922,497,397 329,754 2,827,151 5,045,773
2,526,951$ 351,892$ 2,878,843$ 5,212,965$
NET (EXPENSE) REVENUE ANDCHANGES IN NET ASSETSPRIMARY GOVERNMENT
For the Year-Ended September 30, 2010(In Thousands)
CITY OF SAN ANTONIO, TEXAS
The accompanying notes are an integral part of these basic financial statements.
- 15 - Amounts are expressed in thousands

Balance SheetGovernmental Funds
CATEGORICAL NONMAJOR TOTAL DEBT GRANT-IN GOVERNMENTAL GOVERNMENTAL
GENERAL SERVICE AID FUNDS FUNDS
Cash and Cash Equivalents 11,989$ -$ -$ -$ 8,593$ 20,582$Securities Lending Collateral 21,717 12,286 34,003Investments 138,496 83,197 221,693Receivables, Net 94,984 8,437 103,421Materials and Supplies, at Cost 4,610 470 5,080Deposits 75 75Prepaid Expenditures 110 110Due from:
Other Funds 43,436 761 44,197Other Governmental Agencies, Net 3,494 12,853 16,347
Restricted Assets:Cash and Cash Equivalents 23,762 924 18,013 40,297 82,996Securities Lending Collateral 1,873 31,410 41,434 74,717Investments 85,734 12,592 211,120 321,049 630,495Receivables, Net 7,391 25,545 21 55,218 88,175Materials and Supplies, at Cost 17 17Deposits 1 1Prepaid Expenditures 16 16Due from:
Other Funds 481 3,252 9,200 11,041 23,974Other Governmental Agencies, Net 10,172 10,172
Total Assets 318,726$ 117,368$ 44,203$ 269,764$ 606,010$ 1,356,071$
Liabilities:Vouchers Payable 8,328$ -$ -$ -$ 4,775$ 13,103$Accounts Payable - Other 6,292 7,464 13,756Accrued Payroll 20,252 3,019 23,271Accrued Leave Payable 11,477 935 12,412Deferred Revenue 19,287 19,287Securities Lending Obligation 21,717 12,286 34,003Due To:
Other Funds 1,737 11,663 13,400Other Governmental Agencies 12 12
Restricted Liabilities:Vouchers Payable 6,236 3 29,865 36,104Accounts Payable - Other 47 3,056 18,111 21,214Accrued Payroll 1,070 505 1,575Accrued Leave Payable 21 21Deferred Revenue 6,737 4,129 60,420 71,286Securities Lending Obligation 1,873 31,410 41,434 74,717Amounts Held in Trust 2,429 2,429Due to:
Other Funds 1,501 30,661 30 24,124 56,316Other Governmental Agencies 1,575 2,869 4,444
Total Liabilities 89,090 8,285 48,600 31,443 219,932 397,350
Fund Balances:Reserved:
Reserved for Encumbrances 25,916 311,848 337,764Reserved for Materials and Supplies 4,610 17 470 5,097Reserved for Deposits 76 76Reserved for Prepaid Expenditures 126 126Reserved for Debt Service 109,083 109,083
Unreserved:Designated: General 97,762 97,762Designated: Special Revenue 4,183 4,183Designated: Permanent 4,802 4,802Undesignated: General 101,348 101,348Undesignated: Special Revenue (4,414) 100,460 96,046Undesignated: Capital Projects 238,321 (48,035) 190,286Undesignated: Permanent 12,148 12,148
Total Fund Balances 229,636 109,083 (4,397) 238,321 386,078 958,721
Total Liabilities and Fund Balances 318,726$ 117,368$ 44,203$ 269,764$ 606,010$ 1,356,071$
CITY OF SAN ANTONIO, TEXAS
2007 GENERAL
As of September 30, 2010(In Thousands)
MAJOR FUNDS
Assets:
Liabilities and Fund Balances:
BONDSOBLIGATION
The accompanying notes are an integral part of these basic financial statements.
- 16 - Amounts are expressed in thousands
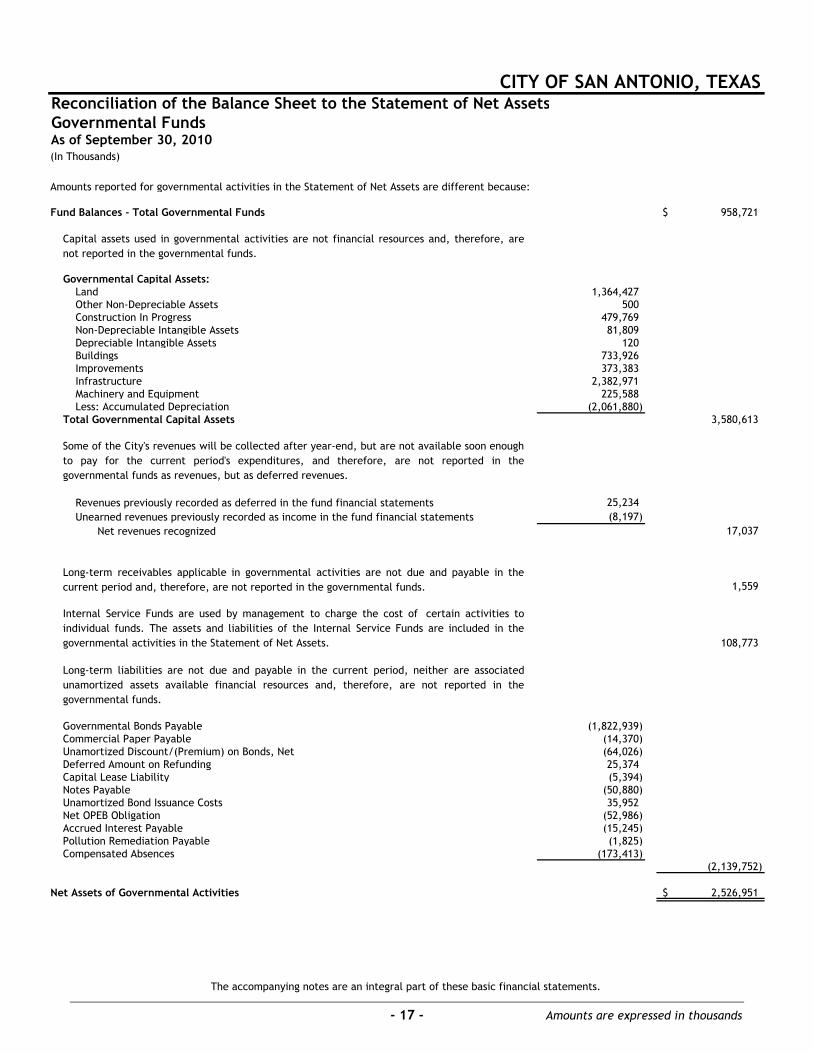
Reconciliation of the Balance Sheet to the Statement of Net AssetsGovernmental Funds
(In Thousands)
Amounts reported for governmental activities in the Statement of Net Assets are different because:
Fund Balances - Total Governmental Funds 958,721$
Governmental Capital Assets:Land 1,364,427Other Non-Depreciable Assets 500Construction In Progress 479,769Non-Depreciable Intangible Assets 81,809Depreciable Intangible Assets 120Buildings 733,926Improvements 373,383Infrastructure 2,382,971Machinery and Equipment 225,588Less: Accumulated Depreciation (2,061,880)
Total Governmental Capital Assets 3,580,613
Revenues previously recorded as deferred in the fund financial statements 25,234Unearned revenues previously recorded as income in the fund financial statements (8,197)
Net revenues recognized 17,037
1,559
108,773
Governmental Bonds Payable (1,822,939)Commercial Paper Payable (14,370)Unamortized Discount/(Premium) on Bonds, Net (64,026)Deferred Amount on Refunding 25,374Capital Lease Liability (5,394)Notes Payable (50,880)Unamortized Bond Issuance Costs 35,952Net OPEB Obligation (52,986)Accrued Interest Payable (15,245)Pollution Remediation Payable (1,825)Compensated Absences (173,413)
(2,139,752)
Net Assets of Governmental Activities 2,526,951$
Long-term liabilities are not due and payable in the current period, neither are associatedunamortized assets available financial resources and, therefore, are not reported in thegovernmental funds.
CITY OF SAN ANTONIO, TEXAS
As of September 30, 2010
Capital assets used in governmental activities are not financial resources and, therefore, arenot reported in the governmental funds.
Some of the City's revenues will be collected after year-end, but are not available soon enoughto pay for the current period's expenditures, and therefore, are not reported in thegovernmental funds as revenues, but as deferred revenues.
Long-term receivables applicable in governmental activities are not due and payable in thecurrent period and, therefore, are not reported in the governmental funds.
Internal Service Funds are used by management to charge the cost of certain activities toindividual funds. The assets and liabilities of the Internal Service Funds are included in thegovernmental activities in the Statement of Net Assets.
The accompanying notes are an integral part of these basic financial statements.
- 17 - Amounts are expressed in thousands

Statement of Revenues, Expenditures, and Changes in Fund BalancesGovernmental Funds
CATEGORICAL 2007 GENERAL NONMAJOR TOTALDEBT GRANT-IN OBLIGATION GOVERNMENTAL GOVERNMENTAL
GENERAL SERVICE AID BONDS FUNDS FUNDSRevenues:
Taxes:Property 246,864$ 147,685$ -$ -$ 10,217$ 404,766$General Sales and Use 188,741 34,734 223,475Selective Sales and Use 5,921 5,921Gross Receipts Business 35,913 35,913Occupancy 59,734 59,734Penalties and Interest on Delinquent Taxes 2,336 1,393 156 3,885
Licenses and Permits 7,769 7,769Intergovernmental 7,768 154,096 107,451 269,315Revenues from Utilities 292,726 292,726Charges for Services 45,850 192 98,251 144,293Fines and Forfeits 11,506 11,506Miscellaneous 10,267 384 2,583 21,159 34,393Investment Earnings 1,832 843 8 552 3,148 6,383Contributions 16,581 66,960 83,541
Total Revenues 857,493 150,305 173,460 552 401,810 1,583,620Expenditures:
Current:General Government 81,117 1,807 1,077 77 7,976 92,054Public Safety 501,630 14,426 6,926 522,982Public Works 42,518 17,524 54,285 114,327Health Services 73,343 21,226 1,773 96,342Sanitation 3,138 166 5,292 8,596Welfare 38,453 117,911 20,597 176,961Culture and Recreation 73,884 1,865 47,453 123,202Convention and Tourism 21,240 21,240Urban Redevelopment and Housing 1,375 40,311 41,686Economic Development and Opportunity 2,607 195 103,843 106,645
Capital Projects 287,722 287,722Debt Service:
Principal Retirement 147,085 5,520 152,605Interest 60,886 14,728 75,614Issuance Costs 1,303 1,651 564 3,518
Total Expenditures 816,690 211,081 175,765 1,728 618,230 1,823,494Excess (Deficiency) of Revenues
Over (Under) Expenditures 40,803 (60,776) (2,305) (1,176) (216,420) (239,874)Other Financing Sources (Uses):
Issuance of Long-Term Debt 155,710 200,350 57,120 413,180Payments to Refunded Bond Escrow Agent (176,569) (8,939) (185,508)Premium/(Discount) on Long-Term Debt 20,685 1,301 5,694 27,680Transfers In 36,581 57,122 8,925 258,880 361,508Transfers Out (54,255) (13) (4,295) (59,268) (246,769) (364,600)
Total Other Financing Sources (Uses) (17,674) 56,935 4,630 142,383 65,986 252,260Net Change in Fund Balances 23,129 (3,841) 2,325 141,207 (150,434) 12,386Fund Balances, October 1 (as restated) 206,507 112,924 (6,722) 97,114 536,512 946,335
Fund Balances, September 30 229,636$ 109,083$ (4,397)$ 238,321 386,078$ 958,721$
CITY OF SAN ANTONIO, TEXAS
(In Thousands)Year-Ended September 30, 2010
MAJOR FUNDS
The accompanying notes are an integral part of these basic financial statements.
- 18 - Amounts are expressed in thousands

Reconciliation of the Statement of Revenues, Expenditures, and Changes inFund Balances of Governmental Funds to the Statement of Activities
Amounts reported for governmental activities in the Statement of Activities are different because:
Net change in Fund Balances - Total Governmental Funds 12,386$
Expenditures for Capital Assets 253,936 Pollution Remediation Capitalization 417Less: Current Year Depreciation (117,779) Less: Current Year Deletions (10,430) 126,144
6,236
Bond, Note and Loan Amounts Issued (413,180) (Premium)/Discount on Long-term Debt (27,680) Bond Issuance Costs 3,518 Payments to Escrow Agent 185,508 Amortization of Bond Premiums/Discounts, Deferred Charges, and Cost of Issuance, Net 7,346 Principal Payments 152,605 (91,883)
Interest Expense (2,680) Compensated Absences (1,192) Net OPEB Obligation (16,438) Pollution Remediation (504)Principal Amounts on Leases and Notes 4,792 Arbitrage 182 (15,840)
(7,489)
Change in Net Assets of Governmental Activities 29,554$
CITY OF SAN ANTONIO, TEXAS
The issuance of long-term debt (e.g. bonds, notes and loans) provides current financial resources togovernmental funds, while the repayment of the principal of long-term debt consumes the currentfinancial resources of governmental funds. Neither transaction, however, has any effect on net assets.Also, governmental funds report the effect of issuance costs, premiums, discounts and similar itemswhen debt is first issued. This amount is the net effect of these differences in the treatment of long-term debt and related items.
Internal Service Funds are used by management to charge the cost of certain activities to individualfunds. The net (expense) of the internal service funds is reported with governmental activities.
Governmental funds report capital outlays as expenditures. However, in the Statement of Activities,the cost of those assets is allocated over their estimated useful lives and reported as depreciationexpense. This is the amount by which capital outlays exceed depreciation in the current period.
Revenues in the Statement of Activities that do not provide current financial resources are notreported as revenues in the funds.
(In Thousands)Year-Ended September 30, 2010
The following expenses reported in the Statement of Activities do not require the use of current financial resources and, therefore, are not reported as expenditures in governmental funds:
The accompanying notes are an integral part of these basic financial statements.
- 19 - Amounts are expressed in thousands

Statement of Net AssetsProprietary Funds
GOVERNMENTALACTIVITIES
NONMAJOR INTERNALAIRPORT ENTERPRISE SERVICESYSTEM FUNDS TOTAL FUNDS
Current Assets:Unrestricted Assets:
Cash and Cash Equivalents 1,635$ 1,300$ 2,935$ 9,786$Securities Lending Collateral 2,723 3,043 5,766 17,062Investments 18,304 15,366 33,670 114,672Receivables, Net:
Accounts 997 348 1,345 561Accrued Interest 2 2 4 10Accrued Revenue 1,738 6,716 8,454 13
Due from:Other Funds 235 1,406 1,641 1,349Other Governmental Agencies, Net 74
Materials and Supplies, at Cost 540 83 623 1,316Prepaid Expenses 17 17 1,171Deposits 138
Total Unrestricted Assets 26,191 28,264 54,455 146,152 Restricted Assets:
Debt Service Accounts: Cash and Cash Equivalents 7,533 762 8,295 Securities Lending Collateral 789 789 Investments 21,350 6,209 27,559 Receivables-Accrued Interest 1 1 Due From Other Funds 28 28
Construction Accounts: Cash and Cash Equivalents 4,151 52 4,203 Securities Lending Collateral 7,795 90 7,885 Investments 52,396 607 53,003 Receivables-Accrued Interest 5 5 Due From Other Funds 185 185
Other Restricted Assets: Cash and Cash Equivalents 18 18 Securities Lending Collateral 32 32 Investments 215 215 Due From Other Governmental Agencies, Net 6 6
Improvement and Contingency Accounts: Cash and Cash Equivalents 3,622 939 4,561 Securities Lending Collateral 6,315 881 7,196 Investments 42,445 11,010 53,455 Accrued Revenue 2,141 2,141 Receivables-Accrued Interest 6 2 8 Due From Other Funds 806 806
Total Restricted Assets 149,021 21,370 170,391
Total Current Assets 175,212 49,634 224,846 146,152Noncurrent Assets:
Capital Assets:Land 5,322 9,018 14,340 Buildings 200,673 25,347 226,020 178Improvements 225,666 10,457 236,123 244Machinery and Equipment 14,603 28,897 43,500 164,067Construction in Progress 317,647 737 318,384
Total Capital Assets 763,911 74,456 838,367 164,489Less: Accumulated Depreciation 190,700 20,660 211,360 107,447
Net Capital Assets 573,211 53,796 627,007 57,042Unamortized Bond Issuance Costs 7,444 401 7,845
Total Noncurrent Assets 580,655 54,197 634,852 57,042
Total Assets 755,867$ 103,831$ 859,698$ 203,194$
As of September 30, 2010
CITY OF SAN ANTONIO, TEXAS
(In Thousands)BUSINESS-TYPE ACTIVITIES
ENTERPRISE FUNDS
Assets:
The accompanying notes are an integral part of these basic financial statements.
- 20 - Amounts are expressed in thousands

Statement of Net AssetsProprietary Funds
GOVERNMENTALACTIVITIES
NONMAJOR INTERNALAIRPORT ENTERPRISE SERVICESYSTEM FUNDS TOTAL FUNDS
Current Liabilities:Payable from Current Unrestricted Assets:
Vouchers Payable 660$ 1,440$ 2,100$ 7,317$Accounts Payable-Other 5,423 2,307 7,730 3,532Claims Payable 57,094Accrued Payroll 1,126 1,326 2,452 1,725Accrued Interest 15 15 2Current Portion of Accrued Leave Payable 372 340 712 453Due to Other Governmental Agencies 711Securities Lending Obligation 2,723 3,043 5,766 17,062Unearned Revenue 456 456 Current Portion of Capital Lease Liability 7,688 7,688 103Current Portion of Accrued Landfill Postclosure Costs 177 177 Due to Other Funds 806 328 1,134 735
Total Payable from Current Unrestricted Assets 11,566 16,664 28,230 88,734Payable from Restricted Assets:
Vouchers Payable 13,526 6 13,532 Accrued Interest 4,631 181 4,812 Securities Lending Obligation 14,142 1,760 15,902 Current Portion of Bonds, Certificates and Notes 17,210 935 18,145 Due to Other Funds 77 9 86 Current Portion of Unamortized Premium/(Discount) 916 50 966 Current Portion of Deferred Amount on Refunding (546) (180) (726) Other Payables 22 2 24
Total Payable from Restricted Assets 49,978 2,763 52,741
Total Current Liabilities 61,544 19,427 80,971 88,734Noncurrent Liabilities:
Bonds, Certificates and Notes 361,815 19,420 381,235 Unamortized Premium/(Discount) 7,954 247 8,201 Deferred Amount on Refunding (1,065) (1,732) (2,797) Accrued Leave Payable 1,858 1,699 3,557 2,262Capital Lease Liability 17,927 17,927 299Net OPEB Obligation 5,370 6,772 12,142 7,116Pollution Remediation Liability 700 700 Accrued Landfill Postclosure Costs 1,880 1,880
Total Noncurrent Liabilities 376,632 46,213 422,845 9,677
Total Liabilities 438,176 65,640 503,816 98,411
Invested In Capital Assets, Net of Related Debt 243,474 26,752 270,226 56,640Restricted:
Debt Service 24,241 6,784 31,025 Capital Projects 35,595 11,938 47,533
Unrestricted 14,381 (7,283) 7,098 48,143
Total Net Assets 317,691$ 38,191$ 355,882$ 104,783$
(3,990)
Net assets of business-type activities. 351,892$
Net Assets:
Adjustment to reflect the consolidation of internal service fund activities related to enterprise funds.
Liabilities:
As of September 30, 2010(In Thousands)
BUSINESS-TYPE ACTIVITIESENTERPRISE FUNDS
CITY OF SAN ANTONIO, TEXAS
The accompanying notes are an integral part of these basic financial statements.
- 20 - Amounts are expressed in thousands

Statement of Revenues, Expenses, and Changes in Fund Net AssetsProprietary Funds
GOVERNMENTALACTIVITIES
NONMAJOR INTERNALAIRPORT ENTERPRISE SERVICESYSTEM FUNDS TOTAL FUNDS
Operating Revenues:Charges for Services 63,717$ 96,819$ 160,536$ 227,656$
Total Operating Revenues 63,717 96,819 160,536 227,656
Operating Expenses:Personal Services 28,706 34,547 63,253 39,650Contractual Services 18,841 25,769 44,610 41,466Commodities 1,690 9,463 11,153 2,373Materials 20,198Claims 107,958Other 6,065 16,580 22,645 13,949Depreciation 10,659 4,034 14,693 21,342
Total Operating Expenses 65,961 90,393 156,354 246,936
Operating Income (Loss) (2,244) 6,426 4,182 (19,280)
Nonoperating Revenues (Expenses):Investment Earnings 699 124 823 552Other Nonoperating Revenue 16,939 480 17,419 1,657Gain (Loss) on Sale of Capital Assets (458) 356 (102) 1,319Interest and Debt Expense (15,153) (1,985) (17,138) (17)Other Nonoperating Expense (747) (293) (1,040) (35)
Total Nonoperating Revenues (Expenses) 1,280 (1,318) (38) 3,476
Change in Net Assets Before Contributionsand Transfers (964) 5,108 4,144 (15,804)
Capital Contributions 22,635 582 23,217
Transfers In (Out):Transfers In 580 580 9,897Transfers Out (394) (2,966) (3,360) (4,025)
Total Transfers In (Out) (394) (2,386) (2,780) 5,872
Change In Net Assets 21,277 3,304 24,581 (9,932)
Net Assets - October 1 296,414 34,887 114,715
Net Assets - September 30 317,691$ 38,191$ 104,783$
Adjustment to reflect the consolidation of internal service fund activities related to enterprise funds. (2,443)
Change in Net Assets of Business-Type Activities. 22,138$
BUSINESS-TYPE ACTIVITIESENTERPRISE FUNDS
CITY OF SAN ANTONIO, TEXAS
Year-Ended September 30, 2010(In Thousands)
The accompanying notes are an integral part of these basic financial statements.
- 21 - Amounts are expressed in thousands

CITY OF SAN ANTONIO, TEXAS Comprehensive Annual Financial Report Year-Ended September 30, 2010

Stat
emen
t of
Cas
h Fl
ows
Prop
riet
ary
Fund
s
(In
Thou
sand
s)
GO
VERN
MEN
TAL
ACT
IVIT
IES
NO
NM
AJO
RIN
TERN
AL
AIR
PORT
ENTE
RPRI
SESE
RVIC
ESY
STEM
FUN
DS
TOTA
LSFU
ND
SCa
sh F
low
s fr
om O
pera
ting
Act
ivit
ies:
Cash
Rec
eive
d fr
om C
usto
mer
s64
,386
$96
,566
$16
0,95
2$
227,
831
$Ca
sh P
a ym
ents
to
Supp
liers
for
Goo
ds a
nd S
ervi
ces
(23,
132)
(52,
171)
(75,
303)
(177
,160
)Ca
sh P
aym
ents
to
Empl
oyee
s fo
r Se
rvic
e(2
7,09
4)(3
2,32
8)(5
9,42
2)(3
7,40
5)Ca
sh R
ecei
ved
from
Oth
er N
onop
erat
ing
Reve
nues
16,9
3948
017
,419
1,65
7
Net
Cas
h Pr
ovid
ed b
y O
pera
ting
Act
ivit
ies
31,0
9912
,547
43,6
4614
,923
Cash
Flo
ws
from
Non
capi
tal F
inan
cing
Act
ivit
ies:
Tran
sfer
s In
fro
m O
ther
Fun
ds58
058
09,
897
Tran
sfer
s O
ut t
o O
ther
Fun
ds(3
94)
(2,9
66)
(3,3
60)
(4,0
25)
Due
to
Oth
er F
unds
(1,9
61)
(3,5
75)
(5,5
36)
587
Due
fro
m O
ther
Fun
ds2,
381
9,69
712
,078
184
Net
Cas
h Pr
ovid
ed b
y N
on-C
apit
al F
inan
cing
Act
ivit
ies
263,
736
3,76
26,
643
Cash
Flo
ws
from
Cap
ital
and
Rel
ated
Fin
anci
ng A
ctiv
itie
s:Co
ntri
bute
d Ca
pita
l22
,635
582
23,2
17Ac
quis
itio
ns a
nd C
onst
ruct
ion
of C
apit
al A
sset
s(9
8,69
1)(1
,736
)(1
00,4
27)
(15,
860)
Proc
eeds
fro
m Is
suan
ce o
f Lo
ng-T
erm
Deb
t34
,500
545
35,0
45Pr
ocee
ds f
rom
Issu
ance
of
Not
es a
nd L
ease
s6,
324
6,32
4Pr
inci
pal P
aym
ents
or
Refu
ndin
gs o
n Lo
ng-T
erm
Deb
t(1
5,85
5)(1
,385
)(1
7,24
0)In
tere
st a
nd F
ees
Paid
on
Long
-Ter
m D
ebt
(15,
420)
(1,1
28)
(16,
548)
Inte
rest
Pai
d on
Not
es a
nd L
ease
s(9
04)
(904
)(1
5)Pr
inci
pal P
aym
ents
on
Not
es a
nd L
ease
s(6
,544
)(6
,544
)(2
24)
Proc
eeds
fro
m S
ale
of A
sset
s12
719
4,23
3
Net
Cas
h (U
sed
for)
Cap
ital
and
Rel
ated
Fin
anci
ng A
ctiv
itie
s(7
2,81
9)(4
,239
)(7
7,05
8)(1
1,86
6)
Cash
Flo
ws
from
Inve
stin
g A
ctiv
itie
s:Pu
rcha
ses
of In
vest
men
t Se
curi
ties
(182
,503
)(4
1,48
3)(2
23,9
86)
(139
,459
)M
atur
ity
of In
vest
men
t Se
curi
ties
221,
939
30,6
5125
2,59
013
1,04
5Pu
rcha
ses
of In
vest
men
ts f
or S
ecur
itie
s Le
ndin
g(1
6,86
5)(4
,803
)(2
1,66
8)(1
7,06
2)Pr
ocee
ds f
rom
Cas
h Co
llect
ed f
or S
ecur
itie
s Le
ndin
g Ca
sh C
olla
tera
l16
,865
4,80
321
,668
17,0
62In
vest
men
ts E
arni
n gs
693
119
812
510
Net
Cas
h Pr
ovid
ed b
y (U
sed
for)
Inve
stin
g A
ctiv
itie
s40
,129
(10,
713)
29,4
16(7
,904
)
Net
Incr
ease
(D
ecre
ase)
in C
ash
and
Cash
Equ
ival
ents
(1,5
65)
1,33
1(2
34)
1,79
6
Cash
and
Cas
h Eq
uiva
lent
s, O
ctob
er 1
18,5
241,
722
20,2
467,
990
Cash
and
Cas
h Eq
uiva
lent
s, S
epte
mbe
r 30
16,9
59$
3,05
3$
20,0
12$
9,78
6$
CITY
OF
SAN
AN
TON
IO,
TEXA
S
Year
-End
ed S
epte
mbe
r 30
, 20
10
BUSI
NES
S-TY
PE A
CTIV
ITIE
SEN
TERP
RISE
FU
ND
S
The
acco
mpa
nyin
g no
tes
are
an in
tegr
al p
art
of t
hese
bas
ic f
inan
cial
sta
tem
ents
.
- 22 - Amounts are expressed in thousands

Stat
emen
t of
Cas
h Fl
ows
Prop
riet
ary
Fund
s
(In
Thou
sand
s)
GO
VERN
MEN
TAL
ACT
IVIT
IES
NO
NM
AJO
RIN
TERN
AL
AIR
PORT
ENTE
RPRI
SESE
RVIC
E SY
STEM
FUN
DS
TOTA
LSFU
ND
S
Reco
ncili
atio
n of
Ope
rati
ng In
com
e (L
oss)
to
Net
Cas
hPr
ovid
ed b
y O
pera
ting
Act
ivit
ies:
Ope
rati
ng In
com
e (L
oss)
(2,2
44)
$6,
426
$4,
182
$(1
9,28
0)$
Ad j
ustm
ents
to
Reco
ncile
Ope
rati
ng In
com
e (L
oss)
to N
et C
ash
Prov
ided
by
Ope
rati
ng A
ctiv
itie
s:D
e pre
ciat
ion
10,6
594,
034
14,6
9321
,342
Oth
er N
ono p
erat
ing
Reve
nues
16,9
3948
017
,419
1,65
7Ch
ange
s in
Ass
ets
and
Liab
iliti
es:
(Inc
reas
e) D
ecre
ase
in A
ccou
nts
Rece
ivab
le1,
959
(211
)1,
748
213
(Inc
reas
e) in
Acc
rued
Rev
enue
s(7
95)
(92)
(887
)(3
)(I
ncre
ase)
Dec
reas
e in
Due
fro
m O
ther
Gov
ernm
enta
l Age
ncie
s38
38(3
5)(I
ncre
ase)
Dec
reas
e in
Mat
eria
ls a
nd S
uppl
ies
1215
27(9
1)(I
ncre
ase)
Dec
reas
e in
Pre
paid
Exp
ense
s5
5(1
48)
Dec
reas
e in
Dep
osit
s50
50In
crea
se(D
ecre
ase)
in V
ouch
ers
Paya
ble
3,23
1(5
)3,
226
2,49
6In
crea
se in
Cla
ims
Paya
ble
6,05
2In
crea
se(D
ecre
ase)
in A
ccou
nts
Paya
ble
- O
ther
21
6(7
3)14
347
8In
crea
se in
Acc
rued
Pa y
roll
108
212
320
108
(Dec
reas
e) in
Acc
rued
Lea
ve P
ayab
le(8
)(1
13)
(121
)(8
9)(D
ecre
ase)
in L
andf
ill P
ostc
losu
re L
iabi
lity
(296
)(2
96)
Incr
ease
in N
et O
PEB
Obl
igat
ion
1,51
22,
120
3,63
22,
223
(Dec
reas
e) in
Une
arne
d Re
venu
e(5
33)
(533
)
Net
Cas
h Pr
ovid
ed b
y O
pera
ting
Act
ivit
ies
31,0
99$
12,5
47$
43,6
46$
14,9
23$
Non
cash
Inve
stin
g, C
apit
al a
nd F
inan
cing
Act
ivit
ies
Acqu
isit
ions
and
Con
stru
ctio
n of
Cap
ital
Ass
ets
from
Deb
t Pr
ocee
ds-
$1,
171
$1,
171
$-
$
Year
-End
ed S
epte
mbe
r 30
, 20
10
CITY
OF
SAN
AN
TON
IO,
TEXA
S
BUSI
NES
S-TY
PE A
CTIV
ITIE
SEN
TERP
RISE
FU
ND
S
The
acco
mpa
nyin
g no
tes
are
an in
tegr
al p
art
of t
hese
bas
ic f
inan
cial
sta
tem
ents
.
- 22 - Amounts are expressed in thousands

Statement of Fiduciary Net Assets/Balance SheetFiduciary Funds
(In Thousands)
FIRE AND PRIVATE PURPOSEPOLICE TRUST FUND -
PENSION AND SAN ANTONIOHEALTH CARE LITERACY AGENCY
FUNDS PROGRAM FUNDS
Current Assets:Cash and Cash Equivalents 75,203$ 2$ 1,507$Security Lending Collateral 118,325 3 1,398Investments:
Common Stock 828,540U.S. Government Securities 88,870 22 8,790Corporate Bonds 434,308Hedge Funds 265,923Real Estate 163,929Alternative 245,622
Receivables:Accounts 7,762 270Accrued Interest 5,800Accrued Revenue 3,500
Total Current Assets 2,237,782 27 11,965
Capital Assets:Machinery and Equipment 132Buildings 767
Total Capital Assets 899 Less: Accumulated Depreciation 428
Net Capital Assets 471
Total Assets 2,238,253$ 27$ 11,965$
Vouchers Payable 2,883$ -$ 45$Accounts Payable - Other 9,112 10,013Claims Payable 2,961Accrued Payroll 161Due to Other Funds 509Securities Lending Obligation 118,325 3 1,398
Total Liabilities 133,442 3 11,965$
Held in Trust for Pension Benefitsand Other Purposes 2,104,811$ 24$
CITY OF SAN ANTONIO, TEXAS
Net Assets:
Assets:
Liabilities:
As of September 30, 2010
The accompanying notes are an integral part of these basic financial statements.
- 23 - Amounts are expressed in thousands

Statement of Changes in Fiduciary Net AssetsFiduciary Funds
(In Thousands)
FIRE AND PRIVATE PURPOSEPOLICE TRUST FUND -
PENSION AND SAN ANTONIOHEALTH CARE LITERACY
FUNDS PROGRAMAdditions:
Contributions:Employer 86,763$ -$Employee 43,436
Total Contributions 130,199
Investment Earnings:Net Increase in Fair Value of Investments 138,692Real Estate Income, Net 1,364Interest and Dividends 33,518Securities Lending 2,105Other Income 436
Total Investment Earnings 176,115Less Investment Expenses:
Investment Management Fees and Custodian Fees (9,955)Securities Lending Expenses:
Borrower Rebates (28)Lending Fees (125)
Net Investment Earnings 166,007
Total Additions 296,206
Deductions:Benefits 127,693Refunds of Contributions 871Administrative Expense 3,753
Total Deductions 132,317
Change in Net Assets 163,889
Net Assets - October 1 1,940,922 24
Net Assets - September 30 2,104,811$ 24$
CITY OF SAN ANTONIO, TEXAS
Year-Ended September 30, 2010
The accompanying notes are an integral part of these basic financial statements.
- 24 - Amounts are expressed in thousands

Statement of Net AssetsDiscretely Presented Component Units
(In Thousands)
SAN ANTONIO NONMAJORCPS WATER COMPONENT
ENERGY SYSTEM UNITS TOTAL
Current Assets:Unrestricted Assets:
Cash and Cash Equivalents 298,818$ 32,138$ 22,556$ 353,512$Cash Collateral from Securities Lending 31,815 31,815Investments 102,996 137,879 441 241,316Receivables, Net:
Notes 7,518 7,518Accounts 202,060 41,580 6,157 249,797Accrued Interest 17,660 997 32 18,689
Materials and Supplies, at Cost 151,014 5,932 159 157,105Due from Other Governmental Agencies 9,458 9,458Prepaid Expenses 61,796 2,499 34,368 98,663Other Assets 1,360 1,360
Total Unrestricted Assets 866,159 221,025 82,049 1,169,233 Restricted Assets:
Debt Service Accounts:Cash and Cash Equivalents 3,210 19,448 22,658Investments 37,010 7,445 44,455Receivables - Accrued Interest 96 96
Capital Projects Accounts:Cash and Cash Equivalents 13,913 96,331 110,244Investments 73,707 183,083 256,790Receivables - Accrued Interest 29 29
Ordinance Accounts:Investments 331,608 331,608Receivables - Accrued Interest 1,604 1,604
Other Restricted Accounts:Cash and Cash Equivalents 21,979 3 1,909 23,891Investments 373,777 90,208 463,985Receivables - Accrued Interest 1,967 1,967
Total Restricted Assets 821,794 406,635 28,898 1,257,327Total Current Assets 1,687,953 627,660 110,947 2,426,560Noncurrent Assets:
Capital Assets:Land 107,150 78,814 40,010 225,974Infrastructure 56,993 56,993Buildings 241,151 241,151Utility Plant in Service 8,697,358 3,503,761 12,201,119Machinery and Equipment 146,858 8,307 155,165Construction in Progress 1,893,686 427,971 29,749 2,351,406Other Intangible Assets 157,092 157,092Nuclear Fuel 643,545 643,545
Total Capital Assets 11,341,739 4,314,496 376,210 16,032,445Less: Accumulated Depreciation 4,277,546 1,140,232 95,759 5,513,537Assets Held for Resale 448 448
Net Capital Assets 7,064,193 3,174,264 280,899 10,519,356Other Noncurrent Assets:
Receivables 4,128 4,128Prepaid Expenses 417,234 559,345 976,579Net OPEB Asset 38,694 38,694Other Noncurrent Assets 54,303 36,318 90,621Unamortized Bond Issuance Costs 19,407 19,407
Total Noncurrent Assets 7,574,424 3,193,671 880,690 11,648,785
Total Assets 9,262,377$ 3,821,331$ 991,637$ 14,075,345$
CITY OF SAN ANTONIO, TEXAS
As of September 30, 2010
Assets:
The accompanying notes are an integral part of these basic financial statements.
- 25 - Amounts are expressed in thousands

Statement of Net AssetsDiscretely Presented Component Units
(In Thousands)
SAN ANTONIO NONMAJORCPS WATER COMPONENT
ENERGY SYSTEM UNITS TOTAL
Current Liabilities:Payable from Current Unrestricted Assets:
Accounts Payable and Other Current Liabilities 401,945$ 32,634$ 9,612$ 444,191$Securities Lending Obligation 31,815 31,815Unearned Revenue 2,992 2,992Due to Other Governmental Agencies 1,782 1,782Current Portion of Long-term Lease/Notes Payable 3,358 3,358Current Portion of Deferred Lease/Leaseback 22,561 22,561Current Portion of Other Payables 27,950 4,785 8,207 40,942
Total Payable from Current Unrestricted Assets 484,271 37,419 25,951 547,641
Payable from Restricted Assets:Accrued Bond and Certificate Interest 9,499 16,711 26,210Current Portion of Bonds and Certificates 162,235 38,590 21,756 222,581Current Portion of Commercial Paper 2,600 2,600Other Payables 28,956 28,956
Total Payable from Restricted Assets 162,235 79,645 38,467 280,347
Total Current Liabilities 646,506 117,064 64,418 827,988
Noncurrent Liabilities:Bonds and Certificates (Net of Current Portion) 3,981,260 1,721,110 633,889 6,336,259Commercial Paper (Net of Current Portion) 350,000 171,050 521,050Unamortized Premium/(Discount) on Bonds and Certificates 137,332 6,873 34,366 178,571Deferred Amount on Refunding (61,308) (22,884) (84,192)Long-Term Lease/Notes Payable (Net of Current Portion) 41,761 41,761Deferred Lease/Leaseback (Net of Current Portion) 475,651 475,651Net OPEB Obligation (Net of Current Portion) 47,093 47,093Other Payables (Net of Current Portion) 513,786 2,417 1,996 518,199
Total Noncurrent Liabilities 5,396,721 1,925,659 712,012 8,034,392
Total Liabilities 6,043,227 2,042,723 776,430 8,862,380
Invested in Capital Assets, Net of Related Debt 2,585,351 1,521,466 187,354 4,294,171Restricted for:
Debt Service 3,210 27,511 912 31,633Capital Projects 335,202 1,752 336,954Operating and Other Reserves 76,128 76,128Perpetual Care:
Expendable 2,972 2,972Unrestricted 295,387 153,503 22,217 471,107
Total Net Assets 3,219,150$ 1,778,608$ 215,207$ 5,212,965$
Liabilities:
Net Assets:
As of September 30, 2010
CITY OF SAN ANTONIO, TEXAS
The accompanying notes are an integral part of these basic financial statements.
- 25 - Amounts are expressed in thousands

Statement of ActivitiesDiscretely Presented Component Units
(In Thousands)
OPERATING CAPITALCHARGES FOR GRANTS AND GRANTS AND
EXPENSES SERVICES CONTRIBUTIONS CONTRIBUTIONS
CPS Energy 1,955,115$ 1,930,875$ -$ 38,991$
San Antonio Water System 387,576 369,053 66,771
Nonmajor Component Units 121,766 119,618 4,082 3,720
Total 2,464,457$ 2,419,546$ 4,082$ 109,482$
General Revenues:Investment EarningsMiscellaneous
Adjustment for STP Pension Cost
Total General Revenues and Special Items
Change in Net AssetsNet Assets - Beginning of Fiscal Year (as restated)
Net Assets - End of Fiscal Year
PROGRAM REVENUES
Year-Ended September 30, 2010
CITY OF SAN ANTONIO, TEXAS
The accompanying notes are an integral part of these basic financial statements.
- 26 - Amounts are expressed in thousands

Statement of ActivitiesDiscretely Presented Component Units
(In Thousands)
SAN ANTONIO NONMAJORCPS WATER COMPONENT
ENERGY SYSTEM UNITS TOTALS
14,751$ -$ -$ 14,751$
48,248 48,248
5,654 5,654
14,751 48,248 5,654 68,653
83,060 4,511 1,099 88,67081 81
9,788 9,788
92,848 4,511 1,180 98,539
107,599 52,759 6,834 167,1923,111,551 1,725,849 208,373 5,045,773
3,219,150$ 1,778,608$ 215,207$ 5,212,965$
CITY OF SAN ANTONIO, TEXAS
NET (EXPENSE) REVENUEAND CHANGES IN NET ASSETS
Year-Ended September 30, 2010
The accompanying notes are an integral part of these basic financial statements.
- 26 - Amounts are expressed in thousands

CITY OF SAN ANTONIO, TEXAS Comprehensive Annual Financial Report Year-Ended September 30, 2010
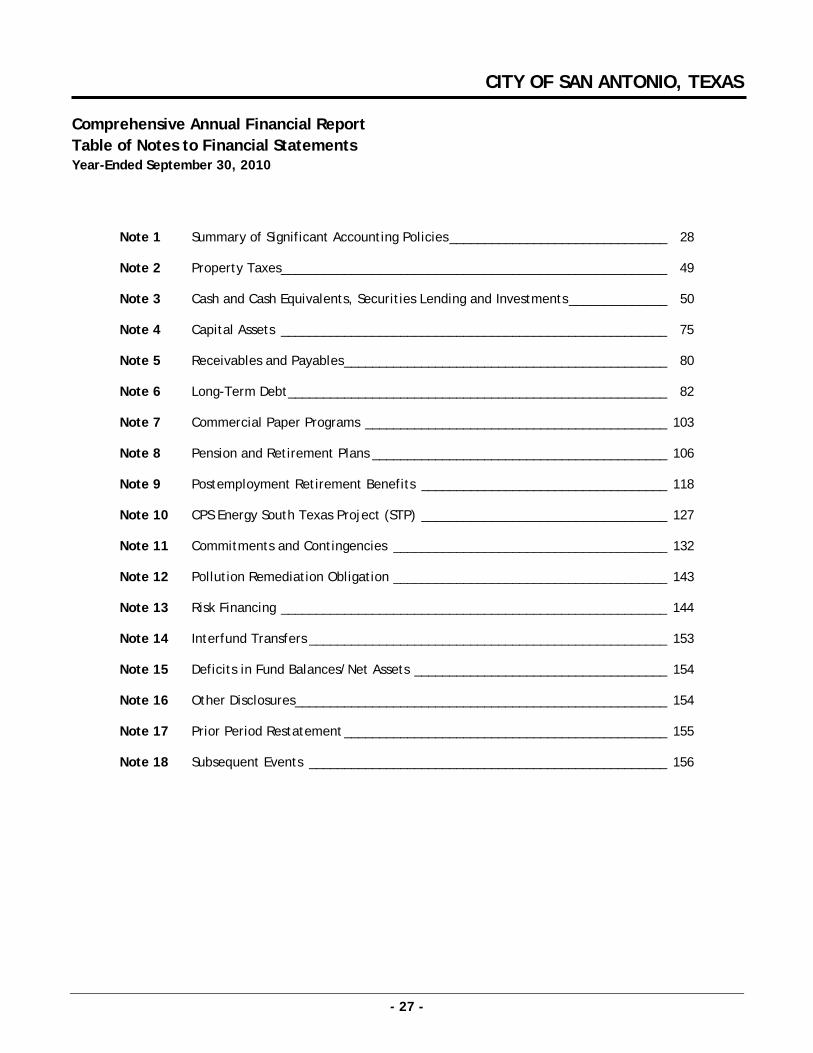
CITY OF SAN ANTONIO, TEXAS
- 27 - Amounts are expressed in thousands
Comprehensive Annual Financial Report Table of Notes to Financial Statements Year-Ended September 30, 2010
Note 1 Summary of Significant Accounting Policies_______________________________ 28 Note 2 Property Taxes_______________________________________________________ 49 Note 3 Cash and Cash Equivalents, Securities Lending and Investments______________ 50 Note 4 Capital Assets _______________________________________________________ 75 Note 5 Receivables and Payables______________________________________________ 80 Note 6 Long-Term Debt______________________________________________________ 82 Note 7 Commercial Paper Programs ___________________________________________ 103 Note 8 Pension and Retirement Plans __________________________________________ 106 Note 9 Postemployment Retirement Benefits ___________________________________ 118 Note 10 CPS Energy South Texas Project (STP) ___________________________________ 127 Note 11 Commitments and Contingencies _______________________________________ 132 Note 12 Pollution Remediation Obligation _______________________________________ 143 Note 13 Risk Financing _______________________________________________________ 144 Note 14 Interfund Transfers ___________________________________________________ 153 Note 15 Deficits in Fund Balances/Net Assets ____________________________________ 154 Note 16 Other Disclosures_____________________________________________________ 154 Note 17 Prior Period Restatement______________________________________________ 155 Note 18 Subsequent Events ___________________________________________________ 156

CITY OF SAN ANTONIO, TEXAS
- 28 - Amounts are expressed in thousands
Note 1 Summary of Significant Accounting Policies The financial statements of the City of San Antonio (the City) have been prepared in conformity with U.S. generally accepted accounting principles (GAAP) for local governmental units. The Governmental Accounting Standards Board (GASB) is the accepted body for establishing governmental accounting and financial reporting standards. The following is a summary of significant accounting policies of the City. Reporting Entity In the evaluation of how to define the City for financial reporting purposes, management considered all potential component units. The decision to include a potential component unit in the reporting entity was made by applying the criteria set forth in GASB Statement No. 14, The Financial Reporting Entity, as amended by GASB Statement No. 39, Determining Whether Certain Organizations Are Component Units—an amendment of GASB Statement No. 14. The underlying concept of the financial reporting entity is that elected officials are "accountable" to their constituents for their actions. One of the objectives of this concept is to provide users of governmental financial statements with a basis for assessing the accountability of those elected officials. The financial reporting entity consists of: (a) the primary government (in these financial statements the primary government is the City), (b) component units, which are legally separate organizations for which the City is financially accountable or the services rendered by the component unit are provided entirely or almost entirely to the City (blended), and (c) component units, the nature and significance of their relationship with the City is such that exclusion from the reporting entity’s financial statements would be misleading or incomplete (discretely presented). Using the criteria of GASB Statements No. 14 and No. 39 outlined below, potential component units were evaluated for inclusion in or exclusion from the reporting entity, whether the organizations were financially accountable or not, and were further evaluated for financial statement presentation. Based on their individual relationships with the City, some component unit financial statements were blended as though they are part of the City and others were discretely presented. The following criteria (as set forth in GASB Statements No. 14 and No. 39) were used in the evaluation of potential component units of the City:
1) Legally separate 2) Financial accountability a) Appointment of a voting majority b) Imposition of will c) Financial benefit to or burden on the City d) Fiscal dependency 3) The relationship with the City is such that exclusion would cause these financial statements to be
misleading or incomplete 4) Service rendered by the potential component unit is provided entirely or almost entirely to the City 5) The City or its component units, are entitled to, or have the ability to access the majority of the
resources received or held by the separate organization The criteria outlined above were excerpted from GASB Statements No. 14 and No. 39. For a more detailed explanation of the criteria established by the Statements, the reader is referred to the Codification of Governmental Accounting and Financial Reporting Standards, as of June 30, 2009, published by GASB, Section-2600. GASB Statement No. 39 further clarifies that a “not for profit” may not be financially accountable to the City, but may be considered a component unit based on the nature and significance of its relationship with the City. Predicated upon the application of the criteria outlined above, the following is a brief overview of component units included in the reporting entity.
CITY OF SAN ANTONIO, TEXAS
- 29 - Amounts are expressed in thousands
Note 1 Summary of Significant Accounting Policies (Continued) Blended Component Units The relationships among the following component units and the City meet the criteria, as set forth in GASB Statements No. 14 and No. 39, for inclusion in the reporting entity and are such that the financial statements are blended with those of the City. As set forth in GASB Statement No. 34, Basic Financial Statements—and Management's Discussion and Analysis—for State and Local Governments, the City excludes fiduciary funds and component units that are fiduciary in nature from the government-wide financial statements. The City’s component units that are fiduciary in nature are the San Antonio Fire and Police Pension Fund and the San Antonio Fire and Police Retiree Health Care Fund. These component units are presented in the Statements of Fiduciary Net Assets and Changes in Fiduciary Net Assets. Following is a brief description of the City’s blended component units:
Convention Center Hotel Finance Corporation
111 Soledad St., 5th Floor San Antonio, TX 78205
Contact: Ben Gorzell Jr. Telephone No. (210) 207-4478
The Convention Center Hotel Finance Corporation (CCHFC) was established in fiscal year 2005 in accordance with state laws for the purposes of, and to act on behalf of the City in local economic development to stimulate business and commercial activity in the City. The CCHFC is governed by a board of directors, which is comprised of the City Council of San Antonio.
Empowerment Zone
Development Corporation P.O. Box 839966
San Antonio, Texas 78283-3966 Contact: Pat DiGiovanni
Telephone No. (210) 207-6912
The Empowerment Zone Development Corporation (EZDC) was established in fiscal year 2004 in accordance with state laws for the purposes of, and to act on behalf of the City in local economic development to stimulate business and commercial activity in the City. The EZDC is governed by a board of directors, which is comprised of the City Council of San Antonio.
San Antonio Fire and Police
Pension Fund 311 Roosevelt
San Antonio, Texas 78210-2700 Contact: Warren Schott
Telephone No. (210) 534-3262
The San Antonio Fire and Police Pension Fund (Pension Fund) is a single employer defined benefit plan established in accordance with state law. The Pension Fund is administered by a nine-member board of trustees, including two members of the City Council of San Antonio, and the Mayor or his appointee. The City and Pension Fund participants are obligated to make all contributions to the Pension Fund in accordance with rates established by state laws. Benefit levels are also set by state laws. Services rendered by the Pension Fund are exclusively for the benefit of eligible firefighters and police officers, upon retirement.
San Antonio Fire and Police Retiree Health Care Fund
300 Convent Street, Suite 2500 San Antonio, Texas 78205-3716
Contact: James Bounds Telephone No. (210) 220-1385
The City of San Antonio Firefighters’ and Police Officers’ Retiree Prefunded Group Health Plan was created in October 1989, in accordance with the provisions of the City’s contracts with the local fire and police unions, respectively, to provide postemployment health care benefits to uniformed employees who retired on or after October 1, 1989. Pursuant to the passage of Senate Bill 1568 in 1997, a separate and distinct statutory trust, the Fire and Police Retiree Health Care Fund (Health Fund), was created to provide these postemployment health care benefits for eligible uniformed employees of the City. The Health Fund is administered by a nine-member board of trustees, including two members of the City Council of San Antonio and the Mayor or his appointee, and is funded primarily by contributions from the City and contributions made by active employees and retirees on behalf of their dependents. Contribution rates and benefits are established pursuant to legislation enacted by the State with the Health Care Fund Board’s ability to modify benefits within certain parameters.

CITY OF SAN ANTONIO, TEXAS
- 30 - Amounts are expressed in thousands
Note 1 Summary of Significant Accounting Policies (Continued) Blended Component Units (Continued)
San Antonio Health Facilities Development Corporation
P.O. Box 839966 San Antonio, Texas 78283-3966
Contact: Rene Dominguez Telephone No. (210) 207-3900
The City of San Antonio Health Facilities Development Corporation (HFDC) was established by Ordinance No. 55400, dated June 3, 1982, in accordance with state laws for the purposes of, and to act on behalf of the City as, a health facilities development corporation under the Texas Health Facilities Development Act of 1981. The HFDC is authorized to issue tax-exempt health facility revenue bonds, for which the City is not obligated in any manner, to finance health related projects in support of the promotion, expansion, and improvement of health facilities. The City Council of San Antonio comprises the board of directors that govern HFDC.
San Antonio Housing Trust
Finance Corporation P.O. Box 15915
San Antonio, Texas 78212 Contact: John Kenny
Telephone No. (210) 735-2772
The San Antonio Housing Trust Finance Corporation (SAHTFC) was established in fiscal year 1997 under the Texas Housing Finance Corporations Act (the Act), in accordance with state laws for the purposes of, and to act on behalf of the City in, carrying out the purposes of the Act, including the issuance of single family and multi-family revenue bonds. SAHTFC is managed by a five-member board of directors, which is appointed by the City Council of San Antonio.
San Antonio Industrial
Development Authority P.O. Box 839966
San Antonio, Texas 78283-3966 Contact: Rene Dominguez
Telephone No. (210) 207-3900
The City of San Antonio Industrial Development Authority (IDA) was established by Resolution No. 79-48-100 dated October 11, 1979, in accordance with state laws for the purposes of benefiting and accomplishing public purposes of, and to act on behalf of the City as, an industrial development corporation under the Development Corporation Act of 1979. The IDA is authorized to issue tax-exempt industrial revenue bonds, for which the City is not obligated in any manner, to finance qualified projects, which may further the promotion and development of commercial, industrial, and manufacturing enterprises to advance and encourage employment and public welfare. The IDA is governed by a board of directors, which is comprised of the City Council of San Antonio.
San Antonio Public Library
Foundation 625 Shook
San Antonio, Texas 78212 Contact: Kaye Lenox
Telephone No. (210) 225-4728
The San Antonio Public Library Foundation was created in 1983 to emphasize the important role the private sector has in helping to enhance Library resources and services. The Library Foundation works to raise funds from several sources, including individuals, corporations and charitable foundations for the sole benefit of the Library and to raise awareness of reading. The City’s library board of trustees’ Chairman and two additional members of the library’s board of trustees are members of the 100+ member Foundation Board. The Foundation is a self-governing agency, as such the City has no control over the board of trustees or how the funds are expended. Additionally, as a self-governing agency, the City has no access to the Foundation’s funds. The purpose of the Foundation is exclusively to support the San Antonio Public Library System and to increase the awareness and use of the Library through financial support and programmatic efforts.
San Antonio Texas Municipal
Facilities Corporation 111 Soledad St., 5th Floor
San Antonio, TX 78205 Contact: Ben Gorzell Jr.
Telephone No. (210) 207-4478
The San Antonio Texas Municipal Facilities Corporation (TMFC) was established in fiscal year 2001 in accordance with state laws for the purposes of, and to act on behalf of the City in, acquiring, constructing, equipping, financing, operating, and maintaining land and other municipal facilities for the City. The TMFC is governed by a board of directors, which is comprised of the City Council of San Antonio.

CITY OF SAN ANTONIO, TEXAS
- 31 - Amounts are expressed in thousands
Note 1 Summary of Significant Accounting Policies (Continued) Blended Component Units (Continued)
Starbright Industrial Development
Corporation 111 Soledad St., 5th Floor
San Antonio, TX 78205 Contact: Ben Gorzell Jr.
Telephone No. (210) 207-4478
The Starbright Industrial Development Corporation (SIDC) was established in fiscal year 2003 in accordance with state laws for the purposes of, and to act on behalf of the City in, the promotion and development of commercial, industrial, and manufacturing enterprises, to advance and encourage employment and public welfare, including but not limited to the acquisition of land. The SIDC is governed by a board of directors, which is comprised of the City Council of San Antonio.
HemisFair Park Area
Redevelopment Corporation Office of the City Manager
100 Military Plaza San Antonio, Texas 78205
Contact: Lori Houston Telephone No. (210) 207-2129
The HemisFair Park Area Redevelopment Corporation (HPARC) was established in fiscal year 2009 in accordance with state laws for the purposes of, and to act on behalf of the City in, assisting with acquiring property, planning, developing, constructing, managing and financing projects within HemisFair Park and its surrounding area in order to promote economic development, employment, and to stimulate business, housing, tourism, and commercial activity within the City. The HPARC is governed by eleven members approved by City Council. As HPARC had no activity through September 30, an audit is not deemed necessary in fiscal year 2010.
San Antonio Education Facilities Corporation
P.O. Box 839966 San Antonio, Texas 78283-3966
Contact: Rene Dominguez Telephone No. (210) 207-3900
City of San Antonio Higher Education Authority (SAHEA) was established in 1984, in accordance with state laws for the purpose of aiding nonprofit institutions of higher education in providing educational, housing, and other related facilities in accordance with, and subject to the provisions of Section 53.35 (b) Texas Education Code, all to be done on behalf of the City and its duly constituted authority and instrumentality. In 2001, the SAHEA changed its name to San Antonio Education Facilities Corporation (SAEFC). The Code authorizes SAEFC to issue revenue bonds for these purposes on behalf of the City. These bonds are not obligations of the City. SAEFC is governed by an eleven-member board of directors appointed by the City Council of San Antonio for two-year terms. Board members are subject to removal by the City Council for cause, or at will, and the City reserves the right to terminate and dissolve SAEFC at any time.
Westside Development
Corporation 2300 W. Commerce, Ste 207
San Antonio, Texas 78207-3839 Contact: Ramon Flores
Telephone No. (210) 207-8204
Westside Development Corporation (WDC) was established in fiscal year 2006 in accordance with state laws for the purposes of promoting economic development and redevelopment opportunities in the west side of San Antonio. WDC seeks to generate new capital investment, create more, higher paying jobs, and reduce the poverty level in the area. In addition, WDC functions as a land development corporation that has the power to buy, sell, and accept land as a nonprofit without the restrictions placed upon a municipality. WDC is governed by a board of directors nominated by a City Council committee and appointed by the City Council of San Antonio. Representatives of key stakeholders and Westside advocates are the policy-setting oversight authority for WDC, comprised of 17 members.
(The remainder of this page left blank intentionally)

CITY OF SAN ANTONIO, TEXAS
- 32 - Amounts are expressed in thousands
Note 1 Summary of Significant Accounting Policies (Continued) Blended Component Units (Continued)
San Antonio Economic Development Corporation
P.O. Box 839966 San Antonio, Texas 78283-3966
Contact: Rene Dominguez Telephone No. (210) 207-3900
The San Antonio Economic Development Corporation (SAEDC) was established in fiscal year 2010 as a nonprofit corporation to promote, assist, and enhance economic development activities for the City. SAEDC was organized for the purposes of undertaking any statute-authorized projects to benefit and accomplish the public purpose of promoting economic development in the City. The affairs of SAEDC are managed by a Board of Directors appointed by the City Council of San Antonio. City Council may remove a director at any time without cause. SAEDC's budget is not effective until adopted by City Council.
San Antonio Housing Trust Public Facility Corporation
P.O. Box 15915 San Antonio, Texas 78212
Contact: John Kenny Telephone No. (210) 735-2772
San Antonio Housing Trust Public Facility Corporation (SAHTPFC) was established in fiscal year 2010 as a nonprofit corporation, organized for the purpose of assisting the City in financing, refinancing, or providing public facilities. SAHTPFC was created to provide a tool to develop affordable housing. SAHTPFC enables housing resources to be better coordinated and directed to accomplish the City’s revitalization goals, and gives the City another tool to establish housing in downtown and other areas targeted for development. SAHTPFC’s Board of Directors is appointed by the City Council of San Antonio, and consists of five City Council members.
The blended component unit with a different fiscal year-end from the City is the San Antonio Public Library Foundation with a fiscal year-end of December 31st. It is management’s belief that to exclude essential disclosures from the City’s financial statements as they pertain to Pension Fund and Health Fund would be misleading. Therefore, relevant disclosures have been included in the City’s financial statements. The City noted that HFDC, IDA, SAHEA and WDC did not complete audits of their fiscal year 2010 activities in time for the City to include in its financial statements. It is management’s belief that the exclusion of these component units’ statements does not materially misrepresent the City’s financial statements. The City restated beginning fund balance/net assets for these component units as included in Note 17, Prior Period Restatement. Discretely Presented Component Units The relationship among the following component units and the City is such that they meet the criteria, as set forth in GASB Statements No. 14 and No. 39, for inclusion in the reporting entity as discretely presented component units.
Brooks Development Authority 1 B.D.A. Crossing, Ste 100
Brooks City-Base, Texas 78235-5355
Contact: Bart Sanchez Telephone No. (210) 678-3306
The Brooks Development Authority (BDA) is a special district and political subdivision of the State of Texas. It was established on September 27, 2001, as a defense base development authority in accordance with state laws for the purposes of, and to act on behalf of the City in, improving mission effectiveness, reducing the cost of providing quality installation support through improved capital asset management, and promoting economic development for Brooks Air Force Base and in the surrounding community. An eleven-member board of directors appointed by the City Council of San Antonio governs the BDA for two-year terms and oversees the Brooks Technology and Business Park in support of the Brooks City-Base Project. The City’s ability to impose its will on this organization is through City Council having the power to remove board members.

CITY OF SAN ANTONIO, TEXAS
- 33 - Amounts are expressed in thousands
Note 1 Summary of Significant Accounting Policies (Continued) Discretely Presented Component Units (Continued)
City South Management Authority
P.O. Box 839966 San Antonio, Texas 78283
Contact: Jesus Garza Telephone No. (210) 207-7950
City South Management Authority (CSMA) is a political subdivision of the State of Texas established at the request of the City for the purposes of supporting economic development, creating sustainable communities, and promoting the unique historical, cultural and environmental assets of the City’s southern edge. CSMA was established by the City in 2005, with a fifteen-member board; six appointed by the City, six by Bexar County, and three appointed collectively by Southwest, East Central, and Southside Independent School Districts. The issuance of bonds or notes must be approved by the City Council of San Antonio.
CPS Energy
P.O. Box 1771 San Antonio, Texas 78296-1771
Contact: Gary W. Gold Telephone No. (210) 353-2523
CPS Energy, a municipally owned utility, provides electricity and natural gas to San Antonio and the surrounding areas. CPS Energy is governed by a board of trustees, which is comprised of four members appointed by the City Council of San Antonio and has the City’s Mayor as an ex-officio member. The user rates for services and charges and the issuance of bonds are approved by the City Council.
Main Plaza Conservancy 111 Soledad, Suite 825
San Antonio Texas 78205 Contact: Jane Pauley-Flores
Telephone No. (210) 225-9800
Main Plaza Conservancy (MPC), a nonprofit organization that provides the management of Main Plaza, was incorporated in October 2007. MPC operates and maintains Main Plaza in coordination with the City and Bexar County to develop and implement a strategy to increase awareness of the historical and cultural significance of Main Plaza, and to organize cultural and artistic events at Main Plaza for the benefit of the citizens, residents and visitors of San Antonio. MPC is governed by an eleven-member board of directors, with one representative from the City and one representative from Bexar County. MPC must obtain written permission from the City Manager or designee on such items including security guidelines, charges for admittance, improvements and changes to Main Plaza, and debt issuances.
Municipal Golf Association –
San Antonio 2315 Avenue B
San Antonio, Texas 78215 Contact: James E. Roschek
Telephone No. (210) 298-5999
Municipal Golf Association – San Antonio (MGA-SA) was established in fiscal year 2007 in accordance with state laws for the purposes of, and to act on behalf of the City in, operating and promoting the City’s municipal golf facilities. MGA-SA is governed by a fifteen member board of directors, which is comprised of seven members selected by MGA-SA according to the approved process contained in its by-laws; two ex-officio member positions from City staff who are appointed by the City Manager; and six members appointed by the City Council of San Antonio.
(The remainder of this page left blank intentionally)

CITY OF SAN ANTONIO, TEXAS
- 34 - Amounts are expressed in thousands
Note 1 Summary of Significant Accounting Policies (Continued) Discretely Presented Component Units (Continued)
Port Authority of San Antonio dba Port San Antonio 907 Billy Mitchell Blvd
San Antonio, Texas 78226 Contact: Dan Ferris
Telephone No. (210) 362-7821
Greater Kelly Development Corporation (GKDC) was established in 1996 as a local development authority on an interim basis under the Development Corporation Act of 1979 for the development and redevelopment of Kelly Air Force Base (Kelly). In November 1999, the City established the Greater Kelly Development Authority (GKDA) as the successor-in-interest to the GKDC pursuant to the newly enacted Senate Bill 655. In accordance with the Act, the GKDA has the powers previously enjoyed by the GKDC, while at the same time clarifying such powers and preserving the property tax-exempt status of prior commercial tenants at Kelly. In 2006, GKDA changed its name to Port Authority of San Antonio dba Port San Antonio (the Port). The Port is a special district and political subdivision of the State of Texas and was established for the purpose of monitoring the proposed closing of Kelly; conducting comprehensive studies of all issues related to the closure, conversion, redevelopment, and future use of Kelly; reviewing all options relative to the most appropriate uses of Kelly and the surrounding area; formulating and adopting a comprehensive plan for the conversion and redevelopment of Kelly and submitting such plan to the appropriate agency or agencies of the federal government; and implementing such plan as it relates to Kelly and the surrounding area. The Port is governed by an eleven-member board of directors, appointed by the City Council of San Antonio. The City Council also has the ability to remove appointed members of the organization’s governing board at will. The Port is authorized to issue bonds to finance any project as permitted by state laws. These bonds are not obligations of the City.
Urban Renewal Agency of the City of San Antonio dba San
Antonio Development Agency Center City Development-
City of San Antonio 1400 S. Flores
San Antonio, Texas 78204 Contact: Adil A. Elgaili
Telephone No. (210) 207-7527
The Urban Renewal Agency of the City of San Antonio dba San Antonio Development Agency (SADA) was created under the provisions of the Urban Renewal Law of the State of Texas. SADA is responsible for implementing the City’s Urban Renewal Program and may designate for urban renewal in such areas as it deems advisable, subject to approval by the City Council of San Antonio. SADA receives a majority of its operating funds from the sale of land owned by the entity. SADA is governed by a seven-member board of commissioners appointed by the City Council.
SA Energy Acquisition Public
Facility Corporation P.O. Box 1771
San Antonio, Texas 78296-1771 Contact: Gary W. Gold
Telephone No. (210) 353-2523
SA Energy Acquisition Public Facility Corporation (SAEAPFC) was established in 2007, in accordance with state laws for the purposes of, and to act on behalf of the City in, the financing and acquisition of electric energy and power, oil, gas, coal and other liquid, gaseous or solid hydrocarbon fuels for the electric and gas systems of the City. SAEAPFC is governed by a seven-member board of directors appointed by the City Council of San Antonio for two-year terms. Board members are subject to removal by the City Council for cause, or at will.
(The remainder of this page left blank intentionally)
CITY OF SAN ANTONIO, TEXAS
- 35 - Amounts are expressed in thousands
Note 1 Summary of Significant Accounting Policies (Continued) Discretely Presented Component Units (Continued)
San Antonio Housing Trust Foundation, Inc. P.O. Box 15915
San Antonio, Texas 78212 Contact: John Kenny
Telephone No. (210) 735-2772
San Antonio Housing Trust Foundation, Inc. (SAHTF) is a nonprofit entity incorporated in 1990 under the laws of the State of Texas. SAHTF was organized for the purposes of supporting charitable, educational, and scientific undertakings, and specifically for providing housing for low- and middle-income families, promoting public health, safety, convenience, and welfare, revitalizing neighborhoods and the downtown area through appropriate housing activities, and to provide administrative and other support for the operations of the City of San Antonio Housing Trust Fund, a Permanent Fund of the City. SAHTF is governed by an eleven-member board of directors appointed by the City Council of San Antonio. SAHTF administers the San Antonio Housing Trust Finance Corporation. The City has the ability to appoint, hire, reassign, or dismiss those persons responsible for the day-to-day operations of the SAHTF as it authorizes a contract for the administration and management of the operations on an annual basis.
San Antonio Water System
P.O. Box 2449 San Antonio, Texas 78298-2449
Contact: Doug Evanson Telephone No. (210) 233-3803
On May 19, 1992, the consolidation of water systems, agencies and activities into one institution through a refunding of the then outstanding water and sewer bonds of the former City Water Board, Alamo Water Conservation and Re-Use District, and the City’s Sewer and Stormwater System, resulted in the creation of the San Antonio Water System (SAWS). The City Council of San Antonio determined that the interests of the citizens and the customers would best be served by placing authority for management and control of SAWS, as consolidated, with a board of trustees. This board of trustees includes the City’s Mayor as an ex-officio member, along with six members appointed by the City Council for four-year staggered terms. The rates for user charges and bond issuance authorizations are approved by the City Council.
San Antonio Housing Trust
Reinvestment Corp. P.O. Box 15915
San Antonio, Texas 78212 Contact: John Kenny
Telephone No. (210) 735-2772
San Antonio Housing Trust Reinvestment Corporation (SAHTRC) was created to act as a duly constituted authority of the City and is authorized by the City Council of San Antonio to aid, assist, and act on behalf of the City to promote for the common good and general welfare of reinvestment zones. As SAHTRC had no activity through September 30, an audit is not deemed necessary in fiscal year 2010.
Essential disclosures related to the above mentioned discretely presented and blended component units are included in the complete financial statements of each of the individual component units. These statements may be obtained at the respective entity’s administrative office. It is management’s belief that to exclude essential disclosures from the City’s financial statements as they pertain to CPS Energy and SAWS would be misleading. CPS Energy and SAWS have been identified as major discretely presented component units as they both relate to total component units and to the primary government. Therefore, relevant disclosures have been included in the City’s financial statements. Discretely presented component units with different fiscal year-ends from the City are CPS Energy and SAEAPFC with fiscal year-ends of January 31st and SAWS with a fiscal year-end of December 31st.

CITY OF SAN ANTONIO, TEXAS
- 36 - Amounts are expressed in thousands
Note 1 Summary of Significant Accounting Policies (Continued) Related Organizations The City Council of San Antonio appoints members to the board of commissioners for the San Antonio Housing Authority (SAHA) and a majority of the board of directors for Keep San Antonio Beautiful, Inc. However, the City’s accountability for these entities does not extend beyond making appointments to their boards, and the coordination and approval of strategic plans, for SAHA. Basic Financial Statements - GASB Statement No. 34 Government-Wide and Fund Financial Statements - The basic financial statements include three components: (1) government-wide financial statements, (2) fund financial statements, and (3) notes to the financial statements. The government-wide financial statements report information on all nonfiduciary activities of the primary government and its component units. MD&A introduces the basic financial statements and provides an analytical overview of the City’s financial activities. Additionally, for the most part, the effect of interfund activity has been removed from the statements. The Statement of Net Assets - Reflects both short-term and long-term assets and liabilities. In the government-wide Statement of Net Assets, governmental activities are reported separately from business-type activities. Governmental activities are supported by taxes and intergovernmental revenues, whereas business-type activities are normally supported by user fees and charges for services. Long-term assets, such as capital assets and unamortized bond issuance costs, and long-term obligations, such as debt, are now reported in the governmental activities. The components of net assets are presented in three separate components: (1) invested in capital assets, net of related debt, (2) restricted, and (3) unrestricted. Interfund receivables and payables within governmental and business-type activities have been eliminated in the government-wide Statement of Net Assets, which minimizes the duplication of assets and liabilities within the governmental and business-type activities. The net amount of interfund transfers between governmental, proprietary and fiduciary funds is the balance reported in the Statement of Net Assets. Component units are also reported in the Statement of Net Assets. The Statement of Activities - Reflects both the gross and net cost format. The net cost (by function or business-type activity) is usually covered by general revenues (property tax, sales and use tax, revenues from utilities, etc.). Direct (gross) expenses of a given function or segment are offset by charges for services, and operating and capital grants and contributions. Program revenues must be directly associated with the function of program activity. The presentation allows users to determine which functions are self-supporting and which rely on the tax base in order to complete their mission. Internal Service Fund balances, whether positive or negative, have been eliminated against the expenses and program revenues shown in the governmental and business-type activities of the Statement of Activities. A reconciliation detailing the change in net assets between the government-wide financial statements and the fund financial statements is presented separately for governmental funds. In order to achieve a break-even result in the Internal Service Fund activity, differences in the basis of accounting and reclassifications are allocated back to user departments. These allocations are reflected in the government-wide statements. Any residual amounts of the Internal Service Funds are reported in the governmental activity column. The proprietary funds have a reconciliation presented in the proprietary funds’ Statement of Net Assets and Statement of Revenues, Expenses, and Changes in Fund Net Assets related to the Internal Service Fund allocation.
(The remainder of this page left blank intentionally)

CITY OF SAN ANTONIO, TEXAS
- 37 - Amounts are expressed in thousands
Note 1 Summary of Significant Accounting Policies (Continued) Fund Accounting The accounts of the City are organized on the basis of funds, each of which is considered a separate accounting entity. The operations of each fund are accounted for with a separate set of self-balancing accounts that comprise its assets and other debits, liabilities, fund balances and other credits, revenues and expenditures, or expenses, as appropriate. Government resources are allocated to and accounted for in individual funds based upon the purposes for which they are to be spent and the means by which spending activities are controlled. The City has three types of funds: governmental, proprietary, and fiduciary. The fund financial statements provide more detailed information about the City’s most significant funds, but not on the City as a whole. Major governmental and enterprise funds are reported separately in the fund financial statements. Nonmajor funds are aggregated in the fund financial statements and independently presented in the combining statements. The criteria used to determine if a governmental or enterprise fund should be reported as a major fund are as follows: the total assets, liabilities, revenues or expenditures/expenses of that governmental or enterprise fund are at least 10.0% of the corresponding element total for all funds of that category or type (that is, total governmental or total enterprise funds), and the same element that met the 10.0% criterion above in the governmental or enterprise fund is at least 5.0% of the corresponding element total for all governmental and enterprise funds combined. The following is a brief description of the major governmental funds that are each presented in a separate column in the fund financial statements:
• The General Fund is always presented as a major fund. • The Debt Service Fund accounts for the accumulation of resources for, and the payment of, general
long-term debt principal, interest, and related costs, except those that are accounted for in enterprise funds.
• The Categorical Grant-In-Aid Fund, a special revenue fund, accounts for the receipt and disbursement of all federal and state grants, except for Community Development Block Grants, HUD 108 loans, HOME Investment Partnership Grants, and the American Recovery and Reinvestment Act Grants.
• The 2007 General Obligation Bonds Fund, a capital projects fund, accounts for the receipt and disbursement of $550,000 in bond sales for physical infrastructure development and improvement projects approved by a bond election held on May 12, 2007. These projects were within five areas: streets and pedestrian, drainage improvements, parks and recreation, library and public health.
The following is a brief description of the major enterprise fund that is presented separately in the fund financial statements:
• The Airport System accounts for the operation of the San Antonio International Airport and Stinson Municipal Airport. Financing for the Airport System operations is provided by user fees.
Governmental Funds General Fund is the primary operating fund for the City, which accounts for all financial resources of the general government, except those required to be accounted for in another fund. Special Revenue Funds are used to account for the proceeds of specific revenue sources (other than private-purpose trusts and major capital projects) that are legally restricted to expenditures for specified purposes. Debt Service Fund is used to account for the accumulation of resources for, and the payment of, general long-term debt principal, interest, and related costs. Capital Projects Funds are used to account for the financial resources to be used for the acquisition or construction of major capital facilities (other than those financed by enterprise funds and trust funds).

CITY OF SAN ANTONIO, TEXAS
- 38 - Amounts are expressed in thousands
Note 1 Summary of Significant Accounting Policies (Continued) Fund Accounting (Continued) Permanent Funds are used to report resources that are legally restricted to the extent that only earnings, and not principal, may be used for purposes that support the reporting government’s programs - that is, for the benefit of the government or its citizenry. The governmental funds that have legally adopted budgets are the General Fund, Debt Service Fund, Special Revenue Funds (excluding HOME Program, Categorical Grant-In-Aid, HUD 108 Loan Program, Community Development Program, American Recovery and Reinvestment Act, and most Community Services Funds), and San Jose Burial Park Fund. Proprietary Funds Enterprise Funds are used to account for operations that are financed and operated in a manner similar to private business enterprises, where the intent of the governing body is that the expenses (including depreciation) of providing goods or services to the general public on a continuing basis should be financed or recovered primarily through user charges. Internal Service Funds are used to account for the financing of goods or services provided by one department or agency to other departments or agencies of the City, or to other governmental units, on a cost-reimbursement basis. The City's self-insurance programs, data processing programs, and other internal service programs are accounted for in these funds. Fiduciary Funds Trust and Agency Funds are used to account for assets held by the City in a trustee capacity or as an agent for individuals, private organizations, other governmental units, or other funds. These include Pension Trust and Retiree Health Care Trust, which account for resources for pension fund and health care benefits for the City's firefighters and police officers. The Private Purpose Trust Fund includes reporting on funds restricted for the City's literacy programs. The Agency Funds account for the City's sales and use tax to be remitted to the State of Texas, various fees for other governmental entities, unclaimed property, and holds various deposits. Pension Trust, Retiree Health Care Trust, and the Private Purpose Trust Fund are accounted for in essentially the same manner as proprietary funds since capital maintenance is critical. Agency Funds are custodial in nature (assets equal liabilities) and do not involve the measurement of results of operations. Measurement Focus and Basis of Accounting Primary Government (City) The government-wide financial statements present information about the City as a whole. Government-wide financial statements exclude both fiduciary funds and fiduciary component units. The Statement of Net Assets and the Statement of Activities are reported using the economic resources measurement focus and the accrual basis of accounting. Revenues are recorded when earned and expenses are recorded when a liability is incurred, regardless of the timing of related cash flows. The City recognizes revenue from property taxes in the period for which they were levied. Property taxes receivable includes taxes due and amounts expected to be collected within 60 days after the year-end, along with related interest and penalties. For additional disclosure related to property taxes see Note 2, Property Tax. Other taxes and fees are recognized as revenue in the year they are earned. Revenues from grants and similar items are recognized in the fiscal year the qualifying expenditures are made and all other eligibility requirements have been satisfied.

CITY OF SAN ANTONIO, TEXAS
- 39 - Amounts are expressed in thousands
Note 1 Summary of Significant Accounting Policies (Continued) Measurement Focus and Basis of Accounting (Continued) Primary Government (City) (Continued) Program revenues are presented in the government-wide Statement of Activities. The City reports program revenues in three categories: (1) charges for services, (2) operating grants and contributions, and (3) capital grants and contributions. Further descriptions of these three categories follow. They are presented separately as a reduction of the total expense to arrive at the net expense of each functional activity. Program revenues are revenues generated by transactions with outside parties who purchase, use, or directly benefit from a program. They also include amounts such as grants and contributions received from outside parties that restrict the use of those funds to specific programs. 1) Charges for services are revenues generated by those who purchase goods or services from the City.
Examples of charges for services include airport landing fees, solid waste collection and disposal fees, vacant lot clean up, and food establishment licenses. Fines and forfeitures, license and permits and intergovernmental revenues as reported in the General Fund are also reported under charges for services.
2) Operating grants and contributions are those revenues that are restricted in the way they may be spent for operations of a particular program.
3) Capital grants and contributions are also restricted revenues; the funds may only be spent to purchase or build capital assets for specified programs.
All governmental funds are accounted for using the current financial resources measurement focus and the modified accrual basis of accounting. This means that only current assets and current liabilities are generally included in their balance sheets and revenues are recognized in the accounting period in which they become available and measurable. “Available” means collectible within the current period, or soon enough thereafter, to be used to pay liabilities of the current period. Revenues from property taxes, sales and use taxes, occupancy taxes, gross receipts taxes, municipal court fines and fees, licenses, revenues from utilities, investment earnings, and charges for services are recorded on the modified accrual basis of accounting, and therefore, are considered susceptible to accrual. The City’s availability period is no more than 60 days beyond the end of the fiscal year. When collections are delayed beyond the normal time of receipt due to unusual circumstances, the amounts involved are still recognized as revenues of the current period. Grant revenues are recognized when reimbursable expenditures are made and all other eligibility requirements imposed by the provider have been met. Grant funds received in advance and delinquent property taxes are recorded as deferred revenue until earned and available. Gross receipts and sales and use taxes are considered available when received by intermediary collecting governments, and are recognized at that time. Anticipated refunds of such taxes are recorded as liabilities and reductions of revenue when they are measurable and their validity seems certain. Expenditures are recognized in the accounting period in which the fund liability is incurred; however, accrued leave, debt service expenditures, claims and judgments, arbitrage rebates, postemployment obligations, and pollution remediation are recorded only when the liability is matured. The reported fund balance (net current assets) for each fund is considered a measure of "current financial resources." Governmental fund operating statements present increases (revenues and other financing sources) and decreases (expenditures and other financing uses) in net current assets. Accordingly, they are said to present a summary of sources and uses of "current financial resources" during the period. Special reporting treatments are applied to governmental fund materials and supplies, prepaid expenditures, and deposits to indicate that they do not represent "current financial resources," since they do not represent net current assets. Such amounts are generally offset by fund balance reserve accounts.

CITY OF SAN ANTONIO, TEXAS
- 40 - Amounts are expressed in thousands
Note 1 Summary of Significant Accounting Policies (Continued) Measurement Focus and Basis of Accounting (Continued) Primary Government (City) (Continued) Proprietary, Pension, Private Purpose Trust, Health Funds, and governmental and business-type activities are accounted for using the accrual basis of accounting. Their revenues are recognized when they are earned, and their expenses and related liabilities, including claims, judgments, and accrued leave, are recognized when they are incurred. These funds are accounted for on a cost of services or "economic resources" measurement focus. Consequently, all assets and all liabilities (whether current or noncurrent) associated with their activity are included in their balance sheets. The reported proprietary fund net assets are segregated into three components: (1) invested in capital assets, net of related debt, (2) restricted, and (3) unrestricted net assets. Proprietary fund type operating statements present increases (revenues) and decreases (expenses) in net assets. Proprietary funds report both operating and nonoperating revenues and expenses in the Statement of Revenues, Expenses, and Changes in Fund Net Assets. The City defines operating revenues as those receipts generated by a specified program offering either a good or service. For example, parking garage and street lot fees are operating revenues of the Parking System Fund. This definition is consistent with GASB Statement No. 9, Reporting Cash Flows of Proprietary and Nonexpendable Trust Funds and Governmental Entities That Use Proprietary Fund Accounting, which defines operating receipts as cash receipts from customers and other cash receipts that do not result from transactions defined as capital and related financing, noncapital financing or investing activities. Operating expenses include personal services, contractual services, commodities, other expenses (such as insurance), and depreciation. Revenues and expenses not fitting the above definitions are considered nonoperating. The City’s proprietary funds, Pension, private purpose trust and Health Funds and business-type activities, as well as its discretely presented component units, apply all applicable GASB Statements as well as FASB Statements and Interpretations, APB Opinions, and ARBs issued on or before November 30, 1989, in accordance with GASB Statement No. 20, Accounting and Financial Reporting for Proprietary Funds and Other Governmental Entities That Use Proprietary Fund Accounting. CPS Energy CPS Energy’s operating revenue includes receipts from energy sales and miscellaneous revenue related to the operation of electric and gas systems. CPS Energy revenues are recorded when earned. Customers’ meters are read and bills are prepared monthly based on billing cycles. Rate schedules include adjustment clauses that permit recovery of electric and gas fuel costs. CPS Energy has used historical information from the relative prior fiscal years as partial bases to estimate and record earned revenue not yet billed. This process has involved an extrapolation of customer usage over the days since the last meter read through the last day of the monthly period. Also included in unbilled revenue are the over/under-recoveries of electric and gas fuel costs and regulatory assessments. CPS Energy’s electric fuel cost adjustment clause also permits recovery of regulatory assessments. Specifically beginning in March 2000, CPS Energy began recovering assessments from the Public Utility Commission of Texas (PUCT) for transmission access charges, and from the Texas Independent System Operator, also known as the Electric Reliability Council of Texas (ERCOT), for its operating costs and other charges applicable to CPS Energy as a wholesale provider of power to other utilities. Miscellaneous revenue includes late payment fees, rental income, jobbing and contract work, and ancillary services. Operating expenses are recorded as incurred and include those costs that result from the ongoing operations of the electric and gas systems.

CITY OF SAN ANTONIO, TEXAS
- 41 - Amounts are expressed in thousands
Note 1 Summary of Significant Accounting Policies (Continued) Measurement Focus and Basis of Accounting (Continued) CPS Energy (Continued) Nonoperating revenue consists primarily of investment income, including fair market value adjustments. The amortization of net gains from the lease/leaseback of J.K. Spruce Unit 1 is also included. Certain miscellaneous income amounts from renting general property and providing various services are also recorded as nonoperating revenue when they are not directly identified with the electric or gas systems. These amounts for fiscal year 2010 were recorded net of expenses. In fiscal year 2009, CPS Energy changed its method of accounting for the Decommissioning Trusts. Under the new method, a pro rata share of total decommissioning costs (as determined by the most recent cost study) has been recognized as a liability. In subsequent years, annual decommissioning expense and an increase in the liability will reflect the effects of inflation and an additional year of plant usage. Additionally, due to requirements under the Code of Federal Regulations governing nuclear decommissioning trust funds, guidance under FAS 71, Accounting for the Effects of Certain Types of Regulation, has been followed. Under this guidance, the zero fund net assets approach to accounting for the Decommissioning Trusts has been retained. In accordance with FAS 71, the cumulative effect of activity in the Trusts has been recorded as a regulatory liability reported on the balance sheet as net costs refundable through future rates since any excess funds are payable to customers. Going forward, prolonged unfavorable economic conditions could result in the assets of the Trusts being less than the estimated decommissioning liability. In that case, instead of an excess as currently exists, there would be a deficit that would be reported as net costs recoverable through future rates. This amount would be receivable from customers. Current-year activity in the Decommissioning Trusts has been reported in the nonoperating income (expense) section of the Statement of Revenues, Expenses and Changes in Fund Net Assets as net costs recoverable (refundable) through future rates. There was no impact to fund net assets as a result of this change in accounting method. To more accurately reflect funding methodology, the Allowance for Funds Used During Construction (AFUDC) rate was modified effective for fiscal year 2010 to include both a debt and an equity component. The new blended rate is composed of 50.0% equity and 50.0% debt based on construction funding forecasts for fiscal year 2010. Both the investment rate as well as the debt rate will continue to be reviewed quarterly to determine if any adjustments are necessary. Projects costing more than $100,000 use alternate AFUDC rates, which reflect the method by which they are funded. San Antonio Water System (SAWS) SAWS revenues are recorded when earned. Customers’ meters are read and bills are prepared monthly based on billing cycles. SAWS uses historical information to estimate and record earned revenue not yet billed. SAWS’ principal operating revenues are charges to customers for water supply, water delivery, wastewater, and chilled water and steam services. Operating expenses include the cost of service, administrative expenses, and depreciation on capital assets. All revenues and expenses not meeting this definition are reported as nonoperating revenues and expenses. Nonoperating revenues consist primarily of interest income earned on investments, including the changes in fair value of investments. Nonoperating expenses consist primarily of interest expense, amortization of debt related costs, sales of capital assets and payments to the City.

CITY OF SAN ANTONIO, TEXAS
- 42 - Amounts are expressed in thousands
Note 1 Summary of Significant Accounting Policies (Continued) Current Year GASB Statement Implementations In fiscal year 2010, the City implemented the following GASB Statements: GASB Statement No. 51, Accounting and Financial Reporting for Intangible Assets, establishes consistent guidance on recognition of intangible assets. The Statement requires that an intangible asset be recognized in the Statement of Net Assets only if it is considered identifiable. This Statement also establishes a specified-conditions approach to recognizing intangible assets that are internally generated. Effectively, outlays associated with the development of such assets should not begin to be capitalized until certain criteria are met. Outlays incurred prior to meeting these criteria should be expensed as incurred. This Statement also establishes guidance specific to intangible assets related to amortization. It provides guidance on determining the useful life of intangible assets when the length of their life is limited by contractual or legal provisions, and if there are no factors that limit the useful life of an intangible asset, it is considered to have an indefinite useful life. It is the determination of the City that implementation of GASB Statement No. 51 did not materially impact the City’s Financial Statements as the City’s right of ways and internally generated systems have traditionally been recorded in construction in progress (CIP) and capitalized and depreciated, where deemed appropriate, upon the project’s completion. The City did not restate beginning balances for implementation of this Statement due to immateriality of the $398 reduction to CIP. All indefinite life right of ways were previously recorded in non-depreciable assets (Land), and transferred to nondepreciable intangible assets as part of this implementation. GASB Statement No. 53, Accounting and Financial Reporting for Derivative Instruments, is intended to improve how state and local governments recognize, measure, and disclose information about derivative instruments in their financial statements. The Statement specifically requires governments to measure most derivative instruments at fair value in their financial statements. The guidance in this Statement also addresses hedge accounting requirements. The requirements for this Statement are effective for fiscal periods beginning after June 15, 2009. It is the determination of the City that implementation of GASB Statement No. 53 did not impact the City’s financial statements since the City does not invest in or use derivative instruments, but did impact certain of the City’s component units. GASB Statement No. 58, Accounting and Financial Reporting for Chapter 9 Bankruptcies, is intended to provide accounting and financial reporting guidance for governments that have petitioned for protection from creditors by filing for bankruptcy under Chapter 9 of the United Statements Bankruptcy Code. It is the determination of the City that requirements of GASB Statement No. 58 are not applicable to the City of San Antonio. Future GASB Statement Implementations GASB Statement No. 54, Fund Balance Reporting and Governmental Fund Type Definitions, enhances the usefulness of fund balance information by providing clearer fund balance classifications that can be more consistently applied and by clarifying the existing governmental fund type definitions. The Statement establishes fund balance classifications that comprise a hierarchy based primarily on the extent to which a government is bound to observe constraints imposed upon the use of the resources reported in governmental funds. The requirements for this Statement are effective for fiscal periods beginning after June 15, 2010. The City will implement this Statement in fiscal year 2011. GASB Statement No. 57, OPEB Measurements by Agent Employees and Agent Multiple-Employer Plans, is intended to address issues related to the use of the alternative measurement method and the frequency and timing of measurements by employers that participate in agency multiple-employer other postemployment benefit (OPEB) plans (that is, agent employers). The requirements for this Statement are effective for fiscal periods beginning after June 15, 2011. The City will implement this Statement in fiscal year 2012.

CITY OF SAN ANTONIO, TEXAS
- 43 - Amounts are expressed in thousands
Note 1 Summary of Significant Accounting Policies (Continued) Future GASB Statement Implementations (Continued) GASB Statement No. 59, Financial Instruments Omnibus, updates and improves existing standards regarding financial reporting and disclosure requirements of certain financial instruments and external investment pools for which significant issues have been identified in practice. The requirements of this Statement will improve financial reporting by providing more complete information, by improving consistency of measurements, and by providing clarifications of existing standards. This Statement provides for amendments to the National Council on Governmental Accounting Statement 4, Accounting and Financial Reporting Principles for Claims and Judgments and Compensated Absences; GASB Statements No. 25, Financial Reporting for Defined Benefit Pension Plans and Note Disclosures for Defined Contribution Plans, and No. 43, Financial Reporting for Postemployment Benefit Plans Other Than Pension Plans; GASB Statement No. 31, Accounting and Financial Reporting for Certain Investments and for External Investment Pools; and GASB Statement No. 40, Deposit and Investment Risk Disclosures. The City will implement this Statement in fiscal year 2011. GASB Statement No. 60, Accounting and Financial Reporting for Service Concession Arrangements, improves financial reporting by addressing issues related to service concession arrangements (SCAs). The requirements of this Statement improve financial reporting by establishing recognition, measurement, and disclosure requirements for SCAs for both transferors and governmental operators, requiring governments to account for and report SCAs in the same manner, which improves the comparability of financial statements. The requirements of this Statement are effective for fiscal periods beginning after December 15, 2011. The City will implement this Statement in fiscal year 2013. GASB Statement No. 61, The Financial Reporting Entity: Omnibus – an amendment of GASB Statements No. 14 and No. 34, improves financial reporting for a governmental financial reporting entity. The requirements of this Statement result in financial reporting entity financial statements being more relevant by improving guidance for including, presenting, and disclosing information about component units and equity interest transactions of a financial reporting entity. This Statement provides amendments to Statement No. 14, The Financial Reporting Entity, and Statement No. 34, Basic Financial Statements – and Management’s Discussion and Analysis – for State and Local Governments. The requirements of this Statement are effective for fiscal periods beginning after June 15, 2012. The City will implement this Statement in fiscal year 2013. GASB Statement No. 62, Codification of Accounting and Financial Reporting Guidance Contained in Pre-November 30, 1989 FASB and AICPA Pronouncements, improves financial reporting by contributing to the GASB’s efforts to codify all sources of generally accepted accounting principles for state and local governments so that they derive from a single source. This requirement will bring the authoritative accounting and financial reporting literature together in one place. This Statement will eliminate the need for financial statement preparers and auditors to determine which FASB and AICPA pronouncement provisions apply to state and local governments, resulting in more consistent application of applicable guidance. The requirements of this Statement are effective for fiscal periods beginning after December 15, 2011. The City will implement this Statement in fiscal year 2013. The City has not fully determined the effects that implementation of Statements No. 54, No. 57, No. 59, No. 60, No. 61 and No. 62 will have on the City’s financial statements. Cash and Cash Equivalents and Investments The City's investment practices are governed by state statutes and by the City’s own Investment Policy. City cash is required to be deposited in FDIC-insured banks located within the State of Texas. A pooled cash and investment strategy is utilized, which enables the City to have one central depository. Investments are pooled into two primary categories: operating funds and debt service funds. The balances in these funds are invested in an aggregate or pooled amount, with principal and interest income distributed to each respective fund on a pro rata basis. In addition, the City may purchase certain investments with the available balance of a specific fund for the sole benefit of such fund. As of September 30, 2010, the City’s investment portfolio did not contain any derivative or alternative investment products, nor was it leveraged in any way, except as noted in the Fire and Police Pension Fund and Fire and Police Retiree Health Care Fund. For a listing of authorized investments, see Note 3, Cash and Cash Equivalents and Investments.
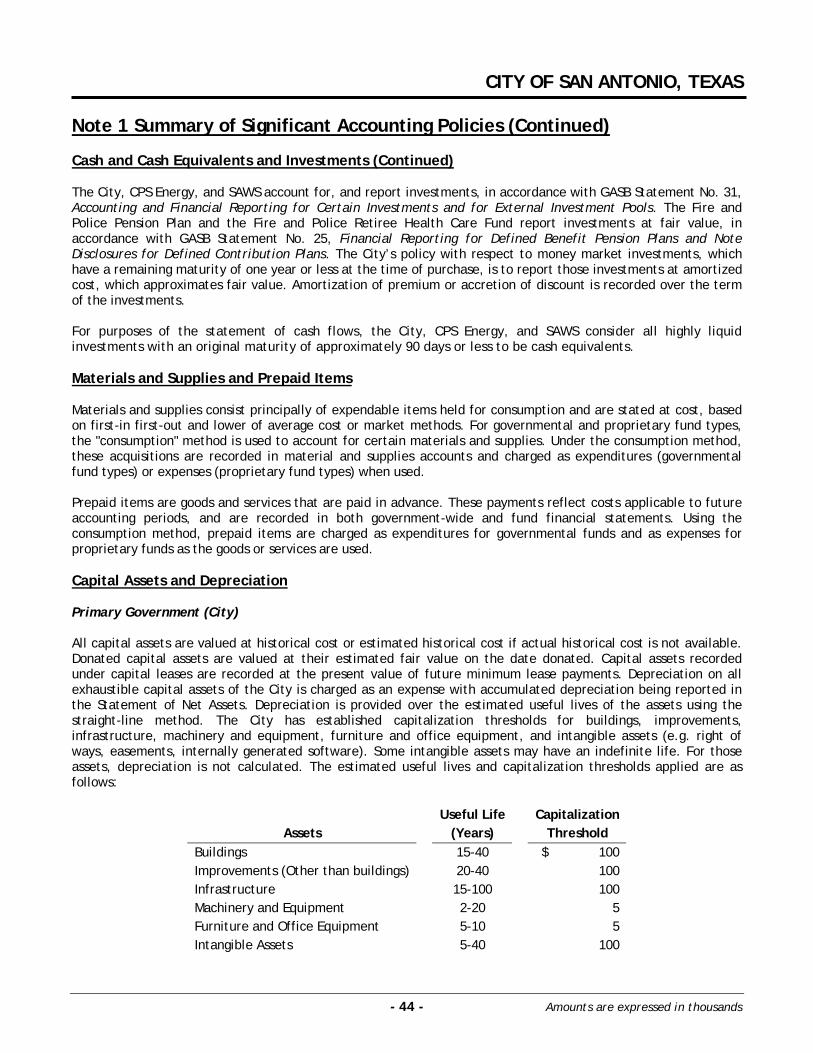
CITY OF SAN ANTONIO, TEXAS
- 44 - Amounts are expressed in thousands
Note 1 Summary of Significant Accounting Policies (Continued) Cash and Cash Equivalents and Investments (Continued) The City, CPS Energy, and SAWS account for, and report investments, in accordance with GASB Statement No. 31, Accounting and Financial Reporting for Certain Investments and for External Investment Pools. The Fire and Police Pension Plan and the Fire and Police Retiree Health Care Fund report investments at fair value, in accordance with GASB Statement No. 25, Financial Reporting for Defined Benefit Pension Plans and Note Disclosures for Defined Contribution Plans. The City’s policy with respect to money market investments, which have a remaining maturity of one year or less at the time of purchase, is to report those investments at amortized cost, which approximates fair value. Amortization of premium or accretion of discount is recorded over the term of the investments. For purposes of the statement of cash flows, the City, CPS Energy, and SAWS consider all highly liquid investments with an original maturity of approximately 90 days or less to be cash equivalents. Materials and Supplies and Prepaid Items Materials and supplies consist principally of expendable items held for consumption and are stated at cost, based on first-in first-out and lower of average cost or market methods. For governmental and proprietary fund types, the "consumption" method is used to account for certain materials and supplies. Under the consumption method, these acquisitions are recorded in material and supplies accounts and charged as expenditures (governmental fund types) or expenses (proprietary fund types) when used. Prepaid items are goods and services that are paid in advance. These payments reflect costs applicable to future accounting periods, and are recorded in both government-wide and fund financial statements. Using the consumption method, prepaid items are charged as expenditures for governmental funds and as expenses for proprietary funds as the goods or services are used. Capital Assets and Depreciation Primary Government (City) All capital assets are valued at historical cost or estimated historical cost if actual historical cost is not available. Donated capital assets are valued at their estimated fair value on the date donated. Capital assets recorded under capital leases are recorded at the present value of future minimum lease payments. Depreciation on all exhaustible capital assets of the City is charged as an expense with accumulated depreciation being reported in the Statement of Net Assets. Depreciation is provided over the estimated useful lives of the assets using the straight-line method. The City has established capitalization thresholds for buildings, improvements, infrastructure, machinery and equipment, furniture and office equipment, and intangible assets (e.g. right of ways, easements, internally generated software). Some intangible assets may have an indefinite life. For those assets, depreciation is not calculated. The estimated useful lives and capitalization thresholds applied are as follows:
Useful Life Capitalization Assets (Years) Threshold
Buildings 15-40 $ 100 Improvements (Other than buildings) 20-40 100 Infrastructure 15-100 100 Machinery and Equipment 2-20 5 Furniture and Office Equipment 5-10 5 Intangible Assets 5-40 100

CITY OF SAN ANTONIO, TEXAS
- 45 - Amounts are expressed in thousands
Note 1 Summary of Significant Accounting Policies (Continued) Capital Assets and Depreciation (Continued) CPS Energy The costs of additions and replacements of assets identified as major components or property units are capitalized. Maintenance and replacements of minor items are charged to operating expenses. Except for certain assets that may become impaired, the cost of depreciable plant retired, plus removal costs and less salvage, is charged to accumulated depreciation. Per the financial reporting requirements of GASB Statement No. 42, Accounting and Financial Reporting for Impairment of Capital Assets and for Insurance Recoveries, any losses associated with capital asset impairments will be charged to operations, not to accumulated depreciation. The CPS Energy’s utility plant is stated at the cost of construction, including expenses for contracted services; direct equipment, material and labor; indirect costs, including general engineering, labor, equipment and material overheads; and an allowance for funds used during construction (AFUDC), which represents capitalized interest. CPS Energy computes AFUDC using rates that approximate the cost of borrowed funds measured as the investment rate for other funds used for construction. Noncash AFUDC is applied to projects estimated to require 30 days or more to complete. Proceeds from customers to partially fund construction expenditures are reported in the Statements of Revenues, Expenses and Changes in Fund Net Assets as increases in fund net assets in accordance with the requirements of GASB Statement No. 33, Accounting and Financial Reporting for Nonexchange Transactions. Except for nuclear fuel, which is amortized over units of production, CPS Energy computes depreciation using the straight-line method over the estimated service lives of the depreciable property according to asset type. Total depreciation as a percent of total depreciable assets, excluding nuclear fuel, was 3.3% for fiscal year 2010. The estimated useful lives of capital assets were as follows:
Buildings and structures 20-60 years Systems and improvements: Generation 18-60 years Transmission and distribution 20-55 years Gas 50-65 years Machinery and equipment 4-30 years Lignite mineral rights and other 20-40 years Nuclear fuel Units of Production
Capitalization thresholds contained in CPS Energy’s capitalization policy for fiscal year 2010 were as follows:
Land, land improvements and certain easements Capitalize All Buildings and building improvements $ 10 Computer software - purchased 10 Computer software – internally developed 100 Computer software – enhancements/upgrades 100 Computer hardware 3 All other assets 3

CITY OF SAN ANTONIO, TEXAS
- 46 - Amounts are expressed in thousands
Note 1 Summary of Significant Accounting Policies (Continued) Capital Assets and Depreciation (Continued) San Antonio Water System (SAWS) SAWS’ capital assets in service are capitalized when the unit cost is greater than or equal to $5. Utility plant additions are recorded at cost, which includes materials, labor, overhead, and interest capitalized during construction. Overhead consists of internal costs that are clearly related to the acquisition of capital assets. Assets acquired through capital leases are recorded on the cost basis and included in utility plant in service. Assets acquired through contributions, such as those from developers, are recorded at estimated fair market value at date of donation. Maintenance, repairs, and minor renewals are charged to operating expense; major plant replacements are capitalized. Capital assets are depreciated and property under capital lease is amortized on the straight-line method. This method is applied to all individual assets except distribution mains. Groups of mains are depreciated on the straight-line method using rates estimated to fully depreciate the costs of the asset group over their estimated average useful lives. Intangible assets, including water rights, which are considered to have indefinite useful lives, are not amortized but are periodically reviewed for potential impairment. The following table shows an estimated average of useful lives used in providing for depreciation of capital assets:
Structures and improvements 25-50 years Pumping and purification equipment 10-50 years Distribution and transmission system 25-50 years Collection system 50 years Treatment facilities 25 years Equipment and machinery 5-20 years Furniture and fixtures 3-10 years Computer equipment 5 years Software 3-10 years
General Bonded Debt Service The ad valorem tax rate is allocated each year between the General Fund and the Debt Service Fund. Amounts estimated to be required for debt service on general bonded debt are provided by allocated property taxes, investment earnings within the Debt Service Fund, and transfers from other funds. Accrued Leave Primary Government (City) In the governmental fund financial statements, the City accrues annual leave and associated employee related costs when matured (payable from available resources) for both civilian and uniformed employees. The matured portion of the City’s compensatory time is also accrued annually for both civilian and uniformed employees. In addition, the City accrues the matured portion of its uniformed employees’ accrued sick leave, holiday, and bonus pay. For governmental fund types, the matured current portion of the liability resulting from the accrual of these leave liabilities is recorded in the respective governmental fund and reported in the fund financial statements, while the entire vested liability is reported in the government-wide financials. The current and long-term portions of the liability related to proprietary fund types are accounted for in the respective proprietary funds.

CITY OF SAN ANTONIO, TEXAS
- 47 - Amounts are expressed in thousands
Note 1 Summary of Significant Accounting Policies (Continued) Accrued Leave (Continued) CPS Energy Employees earn vacation benefits based upon their employment status and years of service. San Antonio Water System (SAWS) It is SAWS’ policy to accrue employee vacation pay as earned as well as the employer portion of Social Security taxes and required pension contributions related to the accrued vacation pay. Sick leave is not accrued as a terminating employee is not paid for accumulated sick leave. Insurance Activity for the City’s self-insurance programs is recorded in the Internal Service Funds. Assets and obligations related to property and casualty liability, employee health benefits, workers’ compensation, unemployment compensation, and employee wellness are included. The City is insured for property loss on a primary basis through Great American Insurance Company of New York. Excess liability coverage for casualty losses is provided by Star Insurance Company. Related liabilities are accrued based on the City’s estimates of the aggregate liability for claims made and claims incurred but not reported prior to the end of the fiscal year. The City determines and accrues loss liabilities based on an actuarial assessment of historical claim data and industry trends performed annually. The City also provides employee health insurance, which includes a pro rata share of retiree health benefits, Workers’ Compensation, and unemployment benefits under its self-insurance programs. The City is a member of the Texas Municipal League Workers’ Compensation Joint Insurance Fund, and uses this fund as a mechanism for administering Workers’ Compensation claims that occurred prior to September 30, 1986. Workers’ Compensation claims that occurred after October 1, 1986 are administered by third-party administrators. In addition, as of September 30, 2010, the City has excess Workers’ Compensation coverage through Star Insurance Company. The City records all Workers’ Compensation loss contingencies, including claims incurred but not reported. The City determines and accrues Workers’ Compensation liabilities based on an actuarial assessment of historical claim data and industry trends performed annually. Employee and retiree health benefit liabilities are determined and accrued based upon the City’s estimates of aggregate liabilities for unpaid benefits utilizing claim lag data from the City’s third party administrator (TPA). The City additionally determines and accrues postemployment liabilities based on an actuarial assessment of historical claim data performed bi-annually and reviewed annually. Current year unpaid benefit liabilities for retirees are netted against the postemployment liability as additional contributions. Regarding unemployment compensation, the City is subject to the State of Texas Employment Commission Act. Under this act, the City’s method for providing unemployment compensation is to reimburse the State for claims paid by the State. All insurance carriers providing coverage for the City are required to possess an A.M. Best Company rating of A- or better; where A- denotes “Excellent.” A.M. Best is an industry recognized rating service for insurance companies. For a more detailed explanation of the City’s self-insurance programs, see Note 13, Risk Financing.
(The remainder of this page left blank intentionally)

CITY OF SAN ANTONIO, TEXAS
- 48 - Amounts are expressed in thousands
Note 1 Summary of Significant Accounting Policies (Continued) Fund Equity Reservations of fund equity represent amounts that are not appropriable or are legally segregated for a specific purpose. Designations of fund equity represent tentative plans identified by management and are subject to change. Designations are utilized in the City’s governmental funds for amounts that have been designated for subsequent years’ expenditures and amounts allocated to making future improvements and replacements. Such designations are reflected on the fund financial statements. Allocation of Indirect Expenses The City recovers indirect costs in the General Fund through the application of departmental indirect cost rates. These rates are developed and documented in the City’s departmental indirect cost rate plan. In this plan, each department is classified by function. Indirect costs are budgeted by department and are used as a basis for the City’s actual indirect cost allocation. Base rates are then applied to actual indirect costs recovered and indirect costs are reclassified to reduce general government expenditures. For fiscal year 2010, general government expenditures were reduced by $9,360, resulting in increased expenditures/expenses in other governmental functions and in business-type activities in the amounts of $6,940 and $2,420, respectively. Long-Term Obligations In the government-wide and proprietary fund financial statements, long-term debt and other long-term obligations are reported as liabilities in the Statement of Net Assets. Bond premiums and discounts are amortized over the life of the debt. Debt refundings (carrying value of the debt net of any unamortized costs of the old debt) are deferred and amortized over the shorter of the life of the original bonds or the life of the refunding bonds. In the fund financial statements, governmental fund types recognize bond premiums and discounts during the current period. The face amount of debt issued is reported as other financing sources. Premiums received on debt issuances are reported as other financing sources while discounts are reported as other financing uses. Bond Issuance Costs In the government-wide and proprietary fund financial statements, bond issuance costs are reported as assets in the Statement of Net Assets and amortized over the life of the debt. In the fund financial statements, governmental fund types recognize bond issuance costs during the current period as expenditures of the funds in which proceeds of debt issuances are recorded. Elimination of Internal Activity Elimination of internal activity, particularly related to Internal Service Fund transactions, is needed to make the transition from governmental funds to government-wide activities. The overriding objective in eliminating the effects of Internal Service Fund activity is to adjust the internal charges to cause a break-even result. Eliminating the effect of Internal Service Fund activity requires the City to look back and adjust the Internal Service Funds’ internal charges. Net income derived from Internal Service Fund activity would cause a pro rata reduction in the charges made to the participating funds/functions. Conversely, an Internal Service Fund net loss would require a pro rata increase in the amounts charged to the participating funds/functions. Therefore, eliminations made to the Statement of Activities remove the doubling up effect of Internal Service Fund activity. The residual internal balances between the governmental and business–type activities are reported in the Statement of Net Assets and the internal balance amounts that exist within the governmental funds or within business-type funds are eliminated. The City reports Internal Service Fund balances in both governmental and business-type activities, based on the pro rata share of the amounts charged to the participating funds/functions.

CITY OF SAN ANTONIO, TEXAS
- 49 - Amounts are expressed in thousands
Note 1 Summary of Significant Accounting Policies (Continued) Elimination of Internal Activity (Continued) The City has three Internal Service Funds: Other Internal Services, Information Technology Services, and Self-Insurance Funds. Other Internal Services and Information Technology Services charge user fees for requested goods or services. Building maintenance, a component of the Other Internal Services Fund, charges are based on the space occupied by departments. Information Technology Services also charges a monthly amount based on the number of personnel positions in each department. Through the tracking of these charges to the applicable departments, the net income or loss is allocated back to the user department, based on actual charges incurred. The Self-Insurance Funds generate their revenues through fixed assessments charged to the various funds each year, as well as, a pro rata user fee charged to employees. The Employee Benefits Fund additionally generates revenue through a pro rata user fee charged to retirees. The net income or loss generated by the Self-Insurance Funds is allocated back, based on the same allocation by which the revenues are received over time. Application of Restricted and Unrestricted Net Assets The City may receive funding from an organization whose expenditures are restricted to certain allowable costs. In situations where both restricted and unrestricted net assets are expended to cover allowable expenses, the City will first expend the restricted net assets and cover additional costs with unrestricted net assets. The City reserves the right to selectively defer the use of restricted assets. Unreserved Designated Fund Balance The designated fund balances from the governmental funds balance sheet are composed of the following:
• The General Fund has designated unreserved fund balances of $5,289 for budgeted carryforwards, $547 for special projects, $79,837 reserve for revenue loss, $11,954 for Public, Educational and Government Access Funding (PEG) revenues, $112 for the Streets Endowment Funds, and $23 for Human Development Services Funds.
• Special Revenue Funds designated fund balance consists of a reservation of $4,183 in Hotel Occupancy Taxes received for the Grand Hyatt (Convention Center Hotel) that are pledged to cover debt repayments.
• Permanent Funds designated fund balance consists of a reservation from the sale of burial lots within the San Jose Burial Park Fund of $2,366, the endowment for the San Antonio Public Library Foundation of $1,920, and the endowment for the Boza Becica Fund of $516.
Reclassifications During the City's annual review of its Component Units, two entities (SAEFC and WDC) had changes in their management or involvement with the City's Council that resulted in their reclassification from Discretely Presented to Blended.
Note 2 Property Taxes Property taxes are levied and due upon receipt on October 1, attached as an enforceable lien on property as of January 1, and become delinquent the following February 1. Property tax billing and collections are performed via an inter-local agreement with the Bexar County Tax Assessor/Collector's Office. The City is permitted by the Municipal Finance Law of the State of Texas to levy taxes up to $2.50 per $100 of taxable valuation (please note amounts are not reflected in thousands). The tax rate approved by City ordinance for the fiscal year-ended September 30, 2010, was $0.56569 per $100 taxable valuation, which means that the City has a tax margin of $1.93431 per $100 taxable valuation (please note that tax rate amounts are not reflected in thousands). This could raise an additional $1,407,079 per year based on the net taxable valuation of $72,743,219 before the limit is reached.

CITY OF SAN ANTONIO, TEXAS
- 50 - Amounts are expressed in thousands
Note 2 Property Taxes (Continued) The City has approved a “TIF Manual” for the utilization of Tax Increment Financing (TIF) and the creation of Tax Increment Reinvestment Zones (TIRZ) pursuant to Chapter 311 of the Texas Tax Code, as amended. Since 1998, the City has utilized TIF as a vehicle to fund in whole or in part eligible capital costs for public infrastructure related to economic development, commercial, and residential projects. As of September 30, 2010, there are 24 existing TIRZ with a total taxable captured value of $1,226,990. For fiscal year 2010, this total taxable captured value produced $6,488 in tax increment revenues for use by the City to fund capital costs of certain public infrastructure improvements in the TIRZ. The existing TIRZ have terms ranging from 13 years to 30 years which are anticipated to expire starting in fiscal year 2014 through fiscal year 2038. It is estimated that the City will contribute approximately $695,250 in tax increment revenues in aggregate over the life of these TIRZ projects. The existing TIRZ are referred to as the Rosedale, Highland Heights, Mission Del Lago, Brookside, Houston Street, Stablewood Farms, Inner City, Plaza Fortuna, Lackland Hills, Sky Harbor, North East Crossing, Brooks City Base, Mission Creek, Hallie Heights, Heather Cove, Ridge Stone, Palo Alto Trails, Hunters Pond, Rosillo Ranch, River North, Verano Projects, Westside, Midtown, and Mission Drive-In.
Note 3 Cash and Cash Equivalents, Securities Lending and Investments Summary of Cash and Cash Equivalents, Securities Lending and Investments A summary of cash and cash equivalents, securities lending and investments for the primary government (City), Fire and Police Pension Fund, Fire and Police Retiree Health Care Fund, CPS Energy, and SAWS are presented below as of each entity’s respective fiscal year. The information is provided in order to facilitate reconciliation between the Statement of Net Assets and the following note disclosures:
Fire and Fire and PolicePolice Retiree Health CPS
City 1 Pension Fund 2 Care Fund 2 Energy 3 SAWS 4
Unrestricted:Cash and Cash Equivalents 33,303$ 65,684$ 9,519$ 298,818$ 32,138$ Security Lending Collateral 56,831 112,290 6,035 31,815 Investments 370,035 1,850,877 176,315 102,996 137,879
Total Unrestricted 460,169 2,028,851 191,869 433,629 170,017 Restricted:
Cash and Cash Equivalents 101,582 39,102 96,334 Security Lending Collateral 92,020 Investments 773,539 779,092 310,301
Total Restricted 967,141 - - 818,194 406,635 Total Cash and Cash Equivalents,
Securities Lending and Investments 1,427,310$ 2,028,851$ 191,869$ 1,251,823$ 576,652$
1
2
3 For the fiscal year ended January 31, 2010.
4 For the fiscal year ended December 31, 2009.
Totals from Statement of Net Assets
Private Purpose Trust and Agency Funds, City South Management Authority and San Antonio Development Agency's cash,security lending collateral and investments are included in the City's pooled cash, security lending collateral andinvestments but are not available for City activities and are excluded from the primary government's Statement of NetAssets. The Private Purpose Trust and Agency assets are presented above as Restricted Cash and Cash Equivalents of $1,509,Security Lending Collateral of $1,401 and Investments of $8,812. The other entities' assets are presented in the DiscretelyPresented Component Unit's Statement of Net Assets.
The Fire and Police Pension Fund and the Fire and Police Retiree Health Care Fund are separately issued fiduciarycomponent units and are excluded from the primary government's Statement of Net Assets.

CITY OF SAN ANTONIO, TEXAS
- 51 - Amounts are expressed in thousands
Note 3 Cash and Cash Equivalents, Securities Lending and Investments (Continued) Summary of Cash and Cash Equivalents, Securities Lending and Investments (Continued)
Fire and Fire and PolicePolice Retiree Health CPS
City Pension Fund Care Fund Energy SAWSDeposits with Financial Institutions 38,003$ 196$ 34$ 1,989$ 56,884$ Investments with Original Maturities
of Less than Ninety Days 95,150 65,488 9,485 335,842 71,558 Cash with Other Financial Agents 1,556 Petty Cash Funds 96 89 Cash on Hand 80 30
Total Cash and Cash Equivalents 134,885$ 65,684$ 9,519$ 337,920$ 128,472$
Summary of Cash and Cash Equivalents
Fire and Fire and PolicePolice Retiree Health CPS
City Pension Fund Care Fund Energy SAWSU.S. Treasury, Government Agencies,
and Money Market Mutual Funds 1,235,381$ 152,373$ 9,485$ 977,851$ 519,738$ Repurchase Agreements 1,154
Fixed Income Securities 1 657
Equity Securities 1 1,532
Corporate Bonds 431,594 2,714 61,646 Foreign Bonds 4,255 Government & Agency Notes 1,945 Common Stock 787,274 26,458 174,178 Real Estate 138,959 24,970 Hedge Funds 227,750 38,173 International Equities - Common Stock 14,808 Alternative Investment 178,375 67,247
Total Investments 1,238,724 1,916,325 185,800 1,217,930 519,738 Less: Investments with original maturities Less: of Less than Ninety Days included in Less: Cash and Cash Equivalents (95,150) (65,448) (9,485) (335,842) (71,558)
Total 1,143,574$ 1,850,877$ 176,315$ 882,088$ 448,180$
1
Summary of Investments
These investments are reported under a blended component unit (San Antonio Public Library Foundation). As the Foundation
is a self-governing agency the City has no control over or rights to the Foundation's investments. Further breakout of these
investments was not attainable.
(The remainder of this page left blank intentionally)

CITY OF SAN ANTONIO, TEXAS
- 52 - Amounts are expressed in thousands
Note 3 Cash and Cash Equivalents, Securities Lending and Investments (Continued) Primary Government (City) City monies are deposited in demand accounts at the City’s depository. The City utilizes a pooled cash and investment strategy with each fund’s cash balance and pro rata shares of highly liquid investments, including U.S. Treasury securities, U.S. government agency securities, and repurchase agreements with original maturities of ninety days or less, summarized by fund type and included in the combined Statement of Net Assets as cash and cash equivalents. Overdrafts, which result from a fund overdrawing its share of pooled cash, are reported as interfund payables by the overdrawn fund and as interfund receivables of either the General Fund or another fund within a similar purpose. The City’s investment portfolio is managed in accordance with the Texas Public Funds Investment Act, as amended, and its own Investment Policy. Authorized investments include demand accounts, certificates of deposit, obligations of the U.S. Treasury and U.S. government agencies, commercial paper, and repurchase agreements. The City maintains in its investment portfolio U.S. Treasury securities and U.S. government agency securities with original maturities greater than ninety days. Each fund’s pro rata share of these investments with original maturities greater than ninety days is combined with similar nonpooled securities (i.e., securities purchased and held for specific funds), including U.S. Treasury securities and U.S. government agency securities, and are reported as investments in the combined Statement of Net Assets, as of September 30, 2010. The City accounts for and reports investments in accordance with GASB Statement No. 31, Accounting and Financial Reporting for Certain Investments and for External Investment Pools. The City’s policy with respect to money market investments that have a remaining maturity of one year or less at the time of purchase is to report these investments at amortized cost. Amortized cost approximates fair value for these investments. The increase in fair value for investments of the City with a remaining maturity of greater than one year at the time of purchase was $294 for the year-ended September 30, 2010. The City does not participate in external investment pools. In accordance with GASB Statement No. 40, Deposit and Investment Risk Exposure, the following table and narrative addresses the interest rate risk exposure by investment type, using the weighted average maturity (WAM) method, custodial credit risk, interest rate risk, credit risk, and concentration of credit risk. The City does not hold any foreign securities; therefore, foreign currency risk is not applicable. A summary of the City’s cash and cash equivalents is provided at the beginning of Note 3, with a comparison to the Statement of Net Assets and Statement of Fiduciary Net Assets.
Carrying 1 Fair 1
Amount Value Allocation 2 Rating 3 WAMU.S. Government Agency Securities 947,968$ 948,092$ 76.5% AAA/A-1+ .44 yearsU.S. Treasuries 193,122 193,293 15.6% N/A .49 yearsMoney Market Mutual Fund 93,996 93,996 7.6% AAA 1 dayFixed Income Securities 4 657 657 0.1%Equity Securities 4 1,532 1,532 0.1%Repurchase Agreement 1,154 1,154 0.1% N/A 1 day
Total City Investments 1,238,429$ 1,238,724$ 100.0%1
2 The allocation is based on fair value.3 Standard & Poors.4
City Investments
The Carrying Amount and Fair Value include investments for the Starbright Industrial Development Corporation, Texas Municipal
Facilities Corporation, Convention Center Hotel Finance Corporation, and San Antonio Public Library Foundation, which total $16,472.
These investments are reported under a blended component unit (San Antonio Public Library Foundation). As the Foundation is a self-
governing agency the City has no control over or rights to the Foundation's investments. Further breakout of these investments,
ratings and WAM were not attainable.

CITY OF SAN ANTONIO, TEXAS
- 53 - Amounts are expressed in thousands
Note 3 Cash and Cash Equivalents, Securities Lending and Investments (Continued) Primary Government (City) (Continued) Custodial Credit Risk (Deposits) - Collateral pledged for demand accounts and certificates of deposit is required to be held in the City's name in the custody of a third-party institution that customarily provides such custodial services at 102.0% of all deposits not covered by federal deposit insurance. Obligations that may be pledged as collateral are obligations of the U.S. government and its agencies and obligations of the State and its municipalities, school districts, and district corporations. Written custodial agreements are required which provide, among other things, that the collateral securities are held separate from the assets of the custodial banks. The City periodically determines that the collateral has a market value adequate to cover the deposits (not less than 102.0% of the deposit amount) and that the collateral has been segregated either physically or by book entry. At fiscal year-end, cash deposits for the City were entirely collateralized by the City’s depository with securities consisting of U.S. government and its agencies or U.S. government guaranteed obligations held in book entry form by the Federal Reserve Bank in the City’s name. Custodial Credit Risk (Investments) - The City’s investment securities are held at the City’s depository bank’s third-party custodian, The Bank of New York Mellon, in the depository bank’s name “as a custodian for the City”. Assets pledged as collateral must generally be a type of security specifically authorized to be held as a direct investment; must be held by an independent third party; and must be pledged in the name of the City. Interest Rate Risk - The City manages exposure to value losses resulting from rising interest rates by limiting the investment portfolio’s weighted-average maturity to five years. Per the City’s Investment Policy, investments are diversified across issuers and maturity dates so that fewer funds will be subject to interest rate risk occurrence at any given time. In addition, the City generally follows a laddered approach to investing, whereby blocks of roughly the same increments are invested at similarly increased maturity lengths. This approach provides security that all investments will not become due at one particularly advantageous or disadvantageous period of time, thereby spreading the risk. Weighted-average maturity is defined as the weighted-average time to the return of a dollar of principal. It is used as an estimate of the interest rate risk of a fixed income investment. The City invests in money market mutual funds with 100.0% overnight liquidity. Additionally, the City has entered into several repurchase agreements with 100.0% overnight liquidity for investment of certain bond proceeds. Credit Risk – The City’s Investment Policy requires the purchase of securities that are of the highest credit quality, based on current ratings provided by nationally recognized credit rating agencies. The City deems investments in U.S. Treasury securities and U.S. government agency securities that are guaranteed to be without credit risk. Investments in other debt securities will consist of securities rated ‘A’ or better by at least two nationally recognized rating agencies. As of September 30, 2010, the City’s investment portfolio, with the exception of the repurchase agreement and the money market mutual fund investments, consisted only of U.S. Treasury securities and U.S. government agency securities. Investments in U.S. government agency securities, including Federal Home Loan Mortgage Corporation, Federal National Mortgage Association, Federal Home Loan Bank, and Federal Agricultural Mortgage Corporation, were rated ‘AAA’ (Long-term) and ‘A-1+’ (Short-term) by Standard & Poor’s. The investments in the money market funds were rated ‘AAA’ by Standard & Poor’s, and all repurchase agreements were greater than 100.0% collateralized with U.S. government agency securities. The City manages its exposure to credit risk by limiting its fixed income investments to a rating of ’A’ or better. Concentration of Credit Risk - Although the City’s Investment Policy does not limit the amount of the portfolio invested in any one U.S. government agency, the City manages exposure to concentration of credit risk through diversification. As of September 30, 2010, the U.S. government agency’s 76.5% securities allocation was as follows: Federal National Mortgage Association 29.4%, Federal Home Loan Mortgage Corporation 35.9%, Federal Home Loan Bank 2.9%, and Federal Agricultural Mortgage Corporation 8.3%.

CITY OF SAN ANTONIO, TEXAS
- 54 - Amounts are expressed in thousands
Note 3 Cash and Cash Equivalents, Securities Lending and Investments (Continued) Primary Government (City) (Continued) Securities Lending – The City engages in securities lending transactions under a contract with its lending agent, Frost National Bank, which became effective on April 1, 2010. Authority to engage in these transactions is authorized under the Texas Public Funds Investment Act (“the Act”) and the City’s Investment Policy. The City has authorized Frost National Bank to loan up to 75.0% of the par value of its investments in the Pooled Operating Funds Portfolio, consisting of agency and treasury securities, in securities lending transactions for fiscal year 2010. GASB Statement No. 28, Accounting and Financial Reporting for Securities Lending Transactions, provides guidance for reporting and disclosing securities lending transactions. This guidance includes reporting certain securities lending collateral on the Balance Sheet as an asset, with a corresponding liability for the obligation to repay the collateral. In securities lending transactions, the City, through its lending agent, transfers securities to approved borrowers in exchange for collateral and simultaneously agrees to return the collateral for the same securities in the future. Cash collateral received from borrowers may be invested in ‘AAA’-rated money market mutual funds or investments that adhere to the Act and the City's Investment Policy. The liquidity provided by the money market mutual funds allows for the easy return of collateral upon termination of a security loan. As of September 30, 2010, all cash collateral was invested in next day money market funds. Securities lending income is earned if the investment returns on the cash collateral exceeds the rebate paid to borrowers of the securities. The income is then split with the lending agent to cover its fees based on a contractually negotiated rate (70.0% allocated to the City and 30.0% allocated to Frost National Bank). In the event that the investment income of the cash collateral does not provide a return that exceeds the rebate or if the investment incurs a loss of principal, the payment to the borrower would come from the City and the lending agent based on the negotiated rate split. Loans that are collateralized with securities generate income when the borrower pays a loan premium for the securities borrowed. This income is split at the same rate as the earnings for cash collateral. The collateral pledged to the City for the loaned securities is held by the lending agent or the tri-party bank. These securities are not available to the City for selling or pledging unless the borrower is in default of the loan. All collateral received is required to have a fair value of 102.0% of the loaned securities. Securities are marked to market daily and additional cash or securities are required from the borrower if the fair value of the collateral falls below 102.0%. Cash collateral is reported on the Balance Sheet as an asset, with a corresponding liability for the obligation to repay the cash collateral. Noncash collateral for securities lending activities is not recorded as an asset because it remains under the control of the transferor, except in the event of default. In the event of default, where the borrower is unable to return the securities borrowed, the City has authorized the lending agent to seize the borrower’s collateral. The collateral would then be used to replace the borrowed securities where possible. Due to some market conditions, it is possible that the original securities may not be able to be replaced. The lending agent has indemnified the City from any loss due to borrower default in the event the collateral is insufficient to replace the securities. At September 30, 2010, the City had no credit risk exposure to borrowers because the amount of collateral held by the City exceeded the amount of the securities loaned to the borrowers. There were no violations of legal or contractual provisions nor were there any borrower or lending agent default losses related to securities lending in fiscal year 2010.

CITY OF SAN ANTONIO, TEXAS
- 55 - Amounts are expressed in thousands
Note 3 Cash and Cash Equivalents, Securities Lending and Investments (Continued) Primary Government (City) (Continued) At September 30, 2010, there was a total of $745,463 in securities, or 74.4% of the par value of the City’s Pooled Operating Funds Portfolio was on loan. In exchange, the City received $148,851 in cash collateral and $612,506 in securities collateral, or 102.1% of the market value of the corresponding securities loaned. Income generated from securities lending transactions, net of rebates to borrowers of $99, amounted to $716 in fiscal year 2010, of which 30.0% was paid as fees to the lending agent totaling $215. Fire and Police Pension Fund Investments of the Fire and Police Pension Fund (Pension Fund), a blended component unit, are administered by the Fire and Police Pension Fund board of trustees. Investments of the Pension Fund are reported at fair value and include corporate bonds; common stock; U.S. Treasury securities; U.S. government agency securities; notes, mortgages, hedge funds and contracts; and real estate. Equity and fixed income securities traded on national or international exchanges are valued at the last reported sales price at current exchange rates. Notes, mortgages, and contracts are valued on the basis of future principal and interest payments discounted at prevailing interest rates. The fair value of real estate investments is based on independent appraisals and on the equity position of real estate partnerships in which the Pension Fund has invested. Investments in private equity and others that do not have an established market are reported at estimated fair value using discounted expected future cash flows at rates that are adjusted for the amount of expected risk and valuations of comparable assets with ascertainable market values. Investment income is recognized as earned. Net appreciation/(depreciation) in fair value of investments includes gains and losses that are being recognized based on the change in the market value of the investments, but have not been realized because the assets have not been sold or exchanged as of the balance sheet date. The Pension Fund’s assets are invested as authorized by Texas state law. The fair value of the Pension Fund’s cash and investments are $2,028,851. A summary of the Pension Fund’s cash, cash equivalents, and investments can be found at the beginning of Note 3. Credit Risk - Using Standard and Poor’s rating system for fixed income securities as of September 30, 2010, 29.0% of the Pension Fund’s bonds were rated ‘AAA’, 3.0% were rated ‘AA’, 8.0% were rated ‘A’, 14.0% were rated ‘BBB’, 15.0% were rated ‘BB’, 19.0% were rated ‘B’, 3.0% were rated ‘CCC’, and 9.0% were unrated or not rated. Custodial Credit Risk - For an investment, custodial credit risk is the risk that, in the event of the failure of the counterparty, the Pension Fund will not be able to recover the value of its investments or collateral securities that are in the possession of the outside party. As of September 30, 2010, the Pension Fund had cash deposits held by investment managers in the amount of $457 that were uninsured and uncollateralized.
(The remainder of this page left blank intentionally)

CITY OF SAN ANTONIO, TEXAS
- 56 - Amounts are expressed in thousands
Note 3 Cash and Cash Equivalents, Securities Lending and Investments (Continued) Primary Government (City) (Continued) Fire and Police Pension Fund (Continued) Interest Rate Risk - Only the fixed income securities of the Pension Fund are subject to interest rate risk due to the possibility that prevailing interest rates could change before the securities reach maturity. Securities that are subject to interest rate risk as of September 30, 2010 amount to $516,045 and have a weighted-average maturity (WAM) of 8.88 years. Securities that are subject to interest rate risk are shown in the following table.
Weighted-Average
Investment Type Fair Value Maturity WAM (Years)Corporate Bonds 89,939$ 10.40Government Agencies 12,730 7.44Government Bonds 66,434 10.47Index Linked Government Bonds 2,383 2.55Mortage-backed securities 98,563 3.85Corporate Convertible Bonds 558 8.64Municipal/Provincial bonds 5,377 27.44Non-Government Backed C.M.O.s 25,995 16.40Bank Loans 2,181 3.60Golden Tree* 64,095 9.70Ashmore* 34,466 11.22Ashmore LFC* 36,921 3.10Wellington Emerging Market Debt* 76,403 10.00
Total Interest Rate Sensitive Securities 516,045$
*Wellington Asset Management, Ashmore and Ashmore LCF are commingled fundsinvested in emerging market debt and report their weighted average maturities (WAM)for the portfolio. GoldenTree is a commingled fund invested in high-yield corporatebonds, and they also report their WAM for the portfolio.
Foreign Currency Risk - The Pension Fund’s investments include investments in equities, bonds, and cash in foreign currency denominations. Equities denominated in foreign currencies as of September 30, 2010 amounted to $307,329 in equities, $159,481 in bonds and $28,999 in cash. Detailed as follows:
(The remainder of this page left blank intentionally)

CITY OF SAN ANTONIO, TEXAS
- 57 - Amounts are expressed in thousands
Note 3 Cash and Cash Equivalents, Securities Lending and Investments (Continued) Primary Government (City) (Continued) Fire and Police Pension Fund (Continued)
Country Equities Bonds Cash TotalArgentine Peso 36$ 1,479$ -$ 1,515$ Australian Dollar 10,274 12,730 11 23,015 Bermuda Dollar 72 72 Brazilian Real 10,547 8,556 19,103 Canadian Dollar 6,137 7,859 13,996 Swiss Franc 14,689 44 14,733 Chinese Renminbi 6,894 576 2,498 9,968 Chilean Peso 1,504 2,303 3,807 Colombian Peso - 4,140 4,140 Czech Republic Krona 1,620 3,053 4,673 Danish Krone 2,570 21 2,591 Egyptian Pound - 1,532 1,532 European Union 72,397 1,453 430 74,280 British Pound 41,347 6,619 13,880 61,846 Hong Kong Dollar 16,633 1 16,634 Hungarian Forint 4 6,388 6,392 Indonesian Rupiah 855 7,247 8,102 Israeli New Shekel 1,216 1,200 2,416 Indian Rupee 9,415 3,435 12,850 Japanese Yen 43,572 (1) 43,571 South Korean Won 16,154 7,272 23,426 Kazakhstan Tenge - 1,330 1,330 Cayman Dollar 22 3,929 3,951 Mexican Peso 5,160 7,947 13,107 Morocco Dirham 116 116 Malaysian Ringgit 2,651 7,839 10,490 Norwegian Krone 2,218 5,767 7,985 New Zealand Dollar 52 4,858 1,464 6,374 Pakistani Rupe 325 325 Panamanian Balboa 5 5 Peruvian Nuevo Sol 727 727 Philippine Peso 14 4,130 4,144 Polish Zloty 2,115 13,006 15,121 Romanian Leu 1,337 1,337 Russian Ruble 3,119 2,661 5,780 Swedish Krona 4,457 6,501 10,958 Singapore Dollar 3,880 5,949 34 9,863 Thai Baht 5,712 2,031 7,743 Turkey New Lira 4,229 5,443 4,850 14,522 Taiwan Dollar 10,846 1,373 12,219 Ukrainian Hyvnia 1,427 1,427 UAE Dirham 2,854 2,854 Uruguay Peso 1,906 1,906 Venezuelan Bolivar 1,696 1,696 South African Rand 6,472 6,695 13,167
307,329$ 159,481$ 28,999$ 495,809$
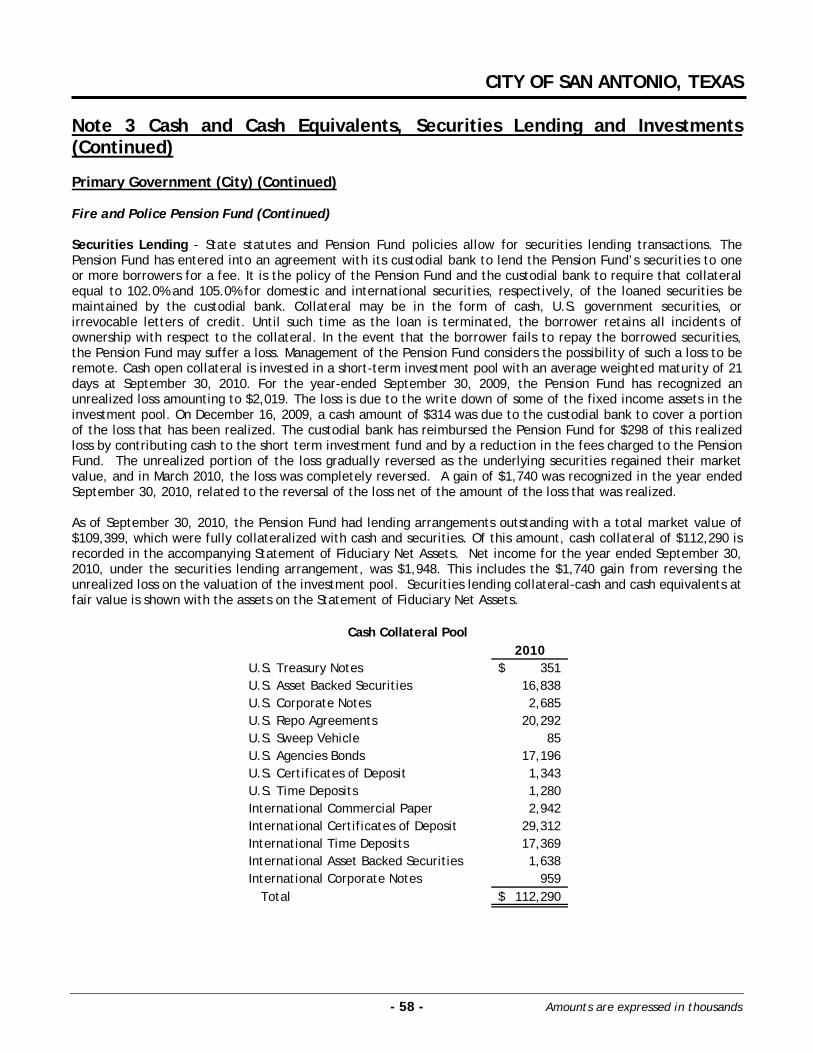
CITY OF SAN ANTONIO, TEXAS
- 58 - Amounts are expressed in thousands
Note 3 Cash and Cash Equivalents, Securities Lending and Investments (Continued) Primary Government (City) (Continued) Fire and Police Pension Fund (Continued) Securities Lending - State statutes and Pension Fund policies allow for securities lending transactions. The Pension Fund has entered into an agreement with its custodial bank to lend the Pension Fund’s securities to one or more borrowers for a fee. It is the policy of the Pension Fund and the custodial bank to require that collateral equal to 102.0% and 105.0% for domestic and international securities, respectively, of the loaned securities be maintained by the custodial bank. Collateral may be in the form of cash, U.S. government securities, or irrevocable letters of credit. Until such time as the loan is terminated, the borrower retains all incidents of ownership with respect to the collateral. In the event that the borrower fails to repay the borrowed securities, the Pension Fund may suffer a loss. Management of the Pension Fund considers the possibility of such a loss to be remote. Cash open collateral is invested in a short-term investment pool with an average weighted maturity of 21 days at September 30, 2010. For the year-ended September 30, 2009, the Pension Fund has recognized an unrealized loss amounting to $2,019. The loss is due to the write down of some of the fixed income assets in the investment pool. On December 16, 2009, a cash amount of $314 was due to the custodial bank to cover a portion of the loss that has been realized. The custodial bank has reimbursed the Pension Fund for $298 of this realized loss by contributing cash to the short term investment fund and by a reduction in the fees charged to the Pension Fund. The unrealized portion of the loss gradually reversed as the underlying securities regained their market value, and in March 2010, the loss was completely reversed. A gain of $1,740 was recognized in the year ended September 30, 2010, related to the reversal of the loss net of the amount of the loss that was realized. As of September 30, 2010, the Pension Fund had lending arrangements outstanding with a total market value of $109,399, which were fully collateralized with cash and securities. Of this amount, cash collateral of $112,290 is recorded in the accompanying Statement of Fiduciary Net Assets. Net income for the year ended September 30, 2010, under the securities lending arrangement, was $1,948. This includes the $1,740 gain from reversing the unrealized loss on the valuation of the investment pool. Securities lending collateral-cash and cash equivalents at fair value is shown with the assets on the Statement of Fiduciary Net Assets.
2010U.S. Treasury Notes 351$ U.S. Asset Backed Securities 16,838 U.S. Corporate Notes 2,685 U.S. Repo Agreements 20,292 U.S. Sweep Vehicle 85 U.S. Agencies Bonds 17,196 U.S. Certificates of Deposit 1,343 U.S. Time Deposits 1,280 International Commercial Paper 2,942 International Certificates of Deposit 29,312 International Time Deposits 17,369 International Asset Backed Securities 1,638 International Corporate Notes 959
Total 112,290$
Cash Collateral Pool

CITY OF SAN ANTONIO, TEXAS
- 59 - Amounts are expressed in thousands
Note 3 Cash and Cash Equivalents, Securities Lending and Investments (Continued) Primary Government (City) (Continued) Fire and Police Pension Fund (Continued) Derivatives and Structured Investments - The Pension Fund has only limited involvement with derivatives and other structured financial instruments. The Pension Fund’s investment philosophy regarding the use of derivatives and other structured financial instruments is to use derivatives to replicate exposures to equity or fixed income securities. The fair value of structured financial instruments held by the Pension Fund at September 30, 2010, was approximately $14,939, in commercial mortgage obligations and is included with investments in the Statement of Fiduciary Net Assets. The Pension Fund also invests in hedge funds which may employ the use of derivatives to reduce volatility. The Pension Fund’s total investment in hedge funds was $227,750 as of September 30, 2010. As of September 30, 2010, the fund held currency forward contracts as follows:
Market ValueReceivable/
Currency (Payable) Maturity DateAustrialian Dollars (7,273)$ 10/29/2010British Pound 13,819 12/3/2010Chinese Yuan 2,499 1/21/2011New Zealand Dollar 1,463 12/7/2010Norwegian Krone 5,751 10/12/2010Turkish Lira 4,845 10/12/2010U.S. Dollars (9,536) 10/12/2010U.S. Dollars 39 10/22/2010U.S. Dollars 7,229 10/29/2010U.S. Dollars (13,608) 12/3/2010U.S. Dollars (1,402) 12/7/2010U.S. Dollars (2,506) 1/21/2011
Total 1,320$
2010
Fire and Police Retiree Health Care Fund The Fire and Police Retiree Health Care Fund (Health Care Fund) board of trustees administers investments of the Fire and Police Retiree Health Care Fund, a blended component unit. Investments are reported at fair value. Short-term investments are reported at amortized cost, which approximates fair value. Securities traded on national or international exchanges are valued at the last reported sales price at current exchange rates. Investments that do not have an established market value are reported at estimated fair value. Alternative investments are substantially held in the form of nonmarketable limited partnerships interests, private real estate investment trusts, and open-ended hedge funds. These investments are subject to the terms of the respective partnerships’ or other types of governing documents which may limit the Health Care Fund’s withdrawal to specified times and conditions and restrict the transferability of the Health Care Fund’s interest. The fair valuation of these investments is based on net asset values as set by the partnerships’ fund managers or general partners. These net asset values may differ from the value that would have been used had a ready market for the investments existed. Such differences could be material.

CITY OF SAN ANTONIO, TEXAS
- 60 - Amounts are expressed in thousands
Note 3 Cash and Cash Equivalents, Securities Lending and Investments (Continued) Primary Government (City) (Continued) Fire and Police Retiree Health Care Fund (Continued) All investment income, including changes in the fair value of investments, is reported as additions in the Statement of Changes in Fiduciary Net Assets. The Health Care Fund’s assets are invested as authorized by the Investment Policy. The Health Care Fund utilizes an investment consultant that makes recommendations to the Health Care Fund as to the appropriate target portfolio weightings among the major asset classes (e.g. stocks, mutual funds, limited liability partnerships, cash, etc.) within the Health Care Fund. Additionally, the Health Care Fund has hired certain investment managers to exercise full discretionary authority as to all buy, hold, and sell decisions for each security under management, subject to the guidelines as defined in the Investment Policy. All of the Health Care Fund’s assets are held by a custodial bank, Frost National Bank of San Antonio, Texas. Investments authorized by the Health Care Fund’s Investment Policy include U.S. equities, including common stocks, securities convertible into common stock, and open or closed end mutual funds; international equity; certain fixed income assets such as corporate bonds and certificates of deposit; commercial paper; private equity; and alternative investments, including real estate, absolute return hedge funds, and natural resources. The cash portion of the Health Care Fund will be invested in a short-term investment fund administered by the custodian bank, a money market mutual fund. The fair value of the Health Care Fund’s cash and investments at September 30, 2010 is $176,315. A summary of the Health Care Fund’s cash, cash equivalents, and investments can be found at the beginning of Note 3. Custodial Credit Risk (Deposits) - The Health Care Fund’s deposits that are held with Frost Bank in non-interest bearing demand accounts are covered under the new FDIC Transaction Account Guarantee Program. Under this program, through December 31, 2010, all non-interest bearing transaction accounts are fully guaranteed by the FDIC for the entire amount in the account. Coverage under this program is in addition to and separate from the coverage available under the FDIC’s general deposit rules. It does not appear that deposits the Health Care Fund holds in demand accounts are exposed to custodial credit risk as of September 30, 2010. The Health Care Fund does not have deposit or investment policies related to custodial credit risk as of September 30, 2010. The Health Care Fund is aware of these risks and monitors such risks, if any, as part of its day-to-day operations and through its daily dealings with the custodian bank. Custodial Credit Risk (Investments) - The custodial credit risk for investments is the risk that, in the event of failure of the counterparty to an investment transaction, a government will not be able to recover the value of its investment or collateral securities that are in the possession of an outside party. At September 30, 2010, the Health Care Fund’s commercial paper, government and agency notes, corporate bonds, and common stock investments are held at Frost National Bank’s third-party custodian, Bank of New York. Since the investments are maintained separately from the bank’s assets, in the event of failure of the bank, the investments held in trust would not be affected. Credit Risk – In accordance with the Health Care Fund’s Investment Policy, investments in money market mutual funds and commercial paper must be rated at least ‘A-2’ by Standard and Poor’s (S & P) and fixed income assets, which includes government and agency notes and corporate bonds, must have an average rating of ‘A’. The Health Care Fund’s investments ratings from S & P was ‘AAAm’ for money market mutual funds; ‘A-1’ to ‘A-2’ for commercial paper; ‘NR’ to ‘AAA’ for government and agency notes, and ‘BBB+’ to ‘AAA’ for corporate bonds.

CITY OF SAN ANTONIO, TEXAS
- 61 - Amounts are expressed in thousands
Note 3 Cash and Cash Equivalents, Securities Lending and Investments (Continued) Primary Government (City) (Continued) Fire and Police Retiree Health Care Fund (Continued) Concentration of Credit Risk - The Health Care Fund’s Investment Policy regarding concentration of credit risk for equities states that no more than 5.0% of any investment manager’s portfolio at cost and 8.0% at the market value shall be invested in the securities of any one company. Regarding fixed-income assets, no more than 10.0% of an investment manager’s bond portfolio at cost shall be invested in the securities of any one issuer. The policy further states there shall be no such limit on U.S. government securities, U.S. agency securities or government -sponsored entities, U.S. agency mortgage-backed securities, or other sovereign issues rated ‘AAA’ or ‘Aaa’. At year-end, the Health Care Fund did not have any investments in any one issuer that represented 5.0% or more of total investments. Interest Rate Risk – As a means of limiting its exposure to fair value losses arising from rising interest rates, the Health Care Fund’s Investment Policy limits the maturities of money market mutual funds to two years at time of purchase. For fixed income assets, which includes government and agency notes and corporate bonds, the Investment Policy limits their maturities to market value weighted average effective duration, adjusted for expected life and call provision, which cannot be plus or minus 25.0% of the benchmark’s effective duration. The weighted average maturity in days for the Health Care Fund’s investments are 10 to 38 days for money market mutual funds; 1 to 8 days for commercial paper; 22 to 39 days for government and agency notes; and 5 to 304 days for corporate bonds. Securities Lending – The Health Care Fund participates in a securities lending program as a means to augment income. The program is operated in accordance with a contract between the Health Care Fund and its custodian bank, Frost National Bank, and compliance with State statutes and Health Care Fund policies. Securities are lent to select borrowers for a fee. It is the policy of the Health Care Fund and the custodian bank to require that collateral equal 100.0% of the loaned security’s market value plus accrued interest for domestic government or agency securities loaned, and 102.0% of the loaned security’s market value plus accrued interest for approved, domestic nongovernment or agency securities loaned be maintained by the custodial bank. Collateral may be in the form of cash, U.S. government securities, or irrevocable letters of credit. Until such time as the loan is terminated, the borrower retains all incidents of ownership with respect to the collateral. In the event the borrower fails to repay the borrowed securities when due and the value of the collateral is insufficient to replace the borrowed securities, the Health Care Fund may suffer a loss. Management of the Health Care Fund considers the possibility of such a loss to be remote. At September 30, 2010, the Health Care Fund was not exposed to credit risk to borrowers because the amounts owed to borrowers exceeded the amount the borrowers owed. There were no violations of legal or contractual provisions nor were there any borrower or lending agent default losses in fiscal year 2010. At September 30, 2010, there was a total of $5,890 in securities out on loan to borrowers. In exchange, the Health Care Fund received $6,035 in securities collateral invested in open-ended money market type mutual funds, or 103.0% of the market value of the corresponding securities loaned. Subscribed Capital Commitments - As of September 30, 2010, the Fund had non-binding commitments to invest capital in sixteen investment companies under investment capital subscription agreements. These commitments are subject to periodic calls from the investment companies. The amount of this investment capital committed under the subscription agreements totaled to $70,946. As of September 30, 2010, $17,751 of this total had been called.

CITY OF SAN ANTONIO, TEXAS
- 62 - Amounts are expressed in thousands
Note 3 Cash and Cash Equivalents, Securities Lending and Investments (Continued) CPS Energy CPS Energy’s investments with a maturity date within one year of the purchase date are reported at amortized cost, which approximates fair value. Amortization of premium and accretion of discount are recorded over the terms of the investments that mature within one year. CPS Energy’s investments with a maturity date of one year or longer from the purchase date are accounted for using fair value. As available, fair values are determined by using generally accepted financial reporting services, publications, and broker and dealer information. The specific identification method is used to determine costs in computing gains or losses on sales of securities. CPS Energy reports all investments of the Decommissioning Trusts at fair market value. Restricted funds are generally for uses other than current operations. They are designated by law, ordinance or contract and are often used to acquire or construct noncurrent assets. Restricted funds consist primarily of unspent bond or commercial paper proceeds, debt service required for the New Series Bonds, Junior Lien Obligations and Tax-Exempt Commercial Paper, and funds for future construction or contingencies. This category also includes customer assistance programs where proceeds are received from outside parties, as well as, the assets of the Decommissioning Trusts. The Repair and Replacement Account is restricted in accordance with CPS Energy’s bond ordinances. In compliance with a bond ordinance, CPS Energy’s board of trustees authorized that a portion of the Repair and Replacement Account be designated for converting overhead electric facilities to underground (also referred to as the Overhead Conversion Fund). CPS Energy’s cash deposits at January 31, 2010 were entirely insured by federal depository insurance or collateralized by banks. For deposits that were collateralized, the securities were U.S. government, U.S. government agency, or U.S. government-guaranteed obligations held in book entry form by the Federal Reserve Bank of New York in CPS Energy’s name. Since the assets in the Decommissioning Trusts are restricted for use only for decommissioning at some future date, securities lending cash collateral has been treated as long-term and thus has been classified as an investment in the Decommissioning Trusts. Consistent with other investments in the Decommissioning Trusts, securities lending cash collateral is shown separately on the table that lists investments by type in the Decommissioning Trust section of this Note.
(The remainder of this page left blank intentionally)

CITY OF SAN ANTONIO, TEXAS
- 63 - Amounts are expressed in thousands
Note 3 Cash and Cash Equivalents, Securities Lending and Investments (Continued) CPS Energy (Continued)
January 31,2010
Cash and cash equivalentsPetty cash funds on hand 89$
Deposits with financial institutionsUnrestricted CPS Energy deposits 1,497 Restricted CPS Energy deposits
Debt service 333 Project Warm 159
Investments with original maturities of less than 90 daysCPS Energy unrestricted (current) 297,232 CPS Energy restricted (noncurrent) 24,304 Decommissioning Trusts - restricted (noncurrent) 14,306
Total cash and cash equivalents 337,920 CPS Energy - securities lending cash collateral 31,815 Total cash, cash equivalents and
securities lending cash collateral 369,735$
Cash, Cash Equivalents andSecurities Lending Cash Collateral
CPS Energy’s cash, cash equivalents and investments can be separated in the following manner: • Those directly managed by CPS Energy, and • Those managed through the Decommissioning Trusts. For financial reporting purposes, cash, cash equivalents and investments managed directly by CPS Energy have been consistently measured as of the end of the fiscal year. The Decommissioning Trusts are reported on a calendar-year basis.
(The remainder of this page left blank intentionally)

CITY OF SAN ANTONIO, TEXAS
- 64 - Amounts are expressed in thousands
Note 3 Cash and Cash Equivalents, Securities Lending and Investments (Continued) CPS Energy (Continued)
January 31, 2010
Cash and cash equivalentsCPS Energy unrestricted and restricted 323,614$ Decommissioning Trusts - restricted 14,306
Total cash and cash equivalents 337,920 Gross investments - current and noncurrent
CPS Energy - unrestricted and restricted 829,847 Decommissioning Trusts - restricted 388,083
Total gross investments 1,217,930 Investments with original maturities of less than
90 days also included in cash equivalentsCPS Energy unrestricted and restricted (321,536) Decommissioning Trusts - restricted (14,306)
Total investments also included in cash equivalents (335,842) Net current and noncurrent investments 882,088
Total cash, cash equivalents and investments 1,220,008$
Summary of Cash and Cash Equivalents,Along with Current and Noncurrent Investments
CPS Energy’s investments and the investments held in the Decommissioning Trusts are subject to the rules and regulations of the Public Funds Investment Act (PFIA). The PFIA regulates what types of investments can be made, requires written investment policies, mandates training requirements of investment officers, requires internal management reports to be produced at least quarterly, and provides for the selection of authorized brokers. In September 2005, the Texas legislature passed a law to allow the decommissioning trust funds for municipally owned nuclear power plants to hold investments authorized by Subtitle B, Title 9, of the Property Code (i.e., corporate bonds and equities such as common stocks). CPS Energy’s allowable investments are defined by CPS Energy Board Resolution, CPS Energy Investment Policy, bond ordinances, Tax-Exempt Commercial Paper (TECP) Ordinance and state law. These investments are subject to market risk, and their market value will vary as interest rates fluctuate. All CPS Energy direct investments are held in trust custodial funds by an independent bank. CPS Energy’s investments in the Decommissioning Trusts are held by an independent trustee. Investments are limited to those defined by CPS Energy Board Resolution, the South Texas Project Decommissioning Trust Investment Policy, the Investment Strategy Committee, the Trust Agreements and state law. Allowable investments for the Decommissioning Trusts include those directly permissible for CPS Energy, as well as equities and corporate bonds (including international securities traded in U.S. dollars and on U.S. stock exchanges). Specifically, starting in September 2005, in accordance with the applicable amended investment policies, total investments can include a maximum of 60.0% equity securities.
(The remainder of this page left blank intentionally)
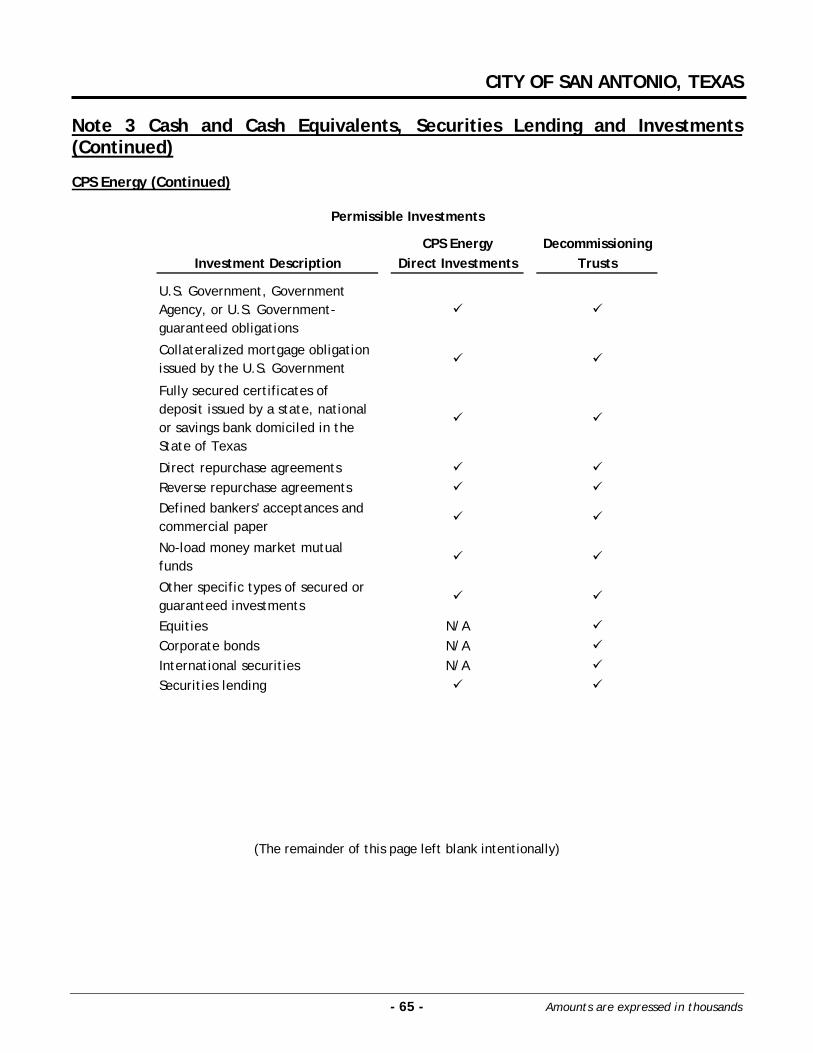
CITY OF SAN ANTONIO, TEXAS
- 65 - Amounts are expressed in thousands
Note 3 Cash and Cash Equivalents, Securities Lending and Investments (Continued) CPS Energy (Continued)
CPS Energy DecommissioningInvestment Description Direct Investments Trusts
U.S. Government, Government Agency, or U.S. Government-guaranteed obligations
Collateralized mortgage obligation issued by the U.S. Government
Fully secured certificates of deposit issued by a state, national or savings bank domiciled in the State of Texas
Direct repurchase agreementsReverse repurchase agreementsDefined bankers' acceptances and commercial paper
No-load money market mutual funds
Other specific types of secured or guaranteed investmentsEquities N/ACorporate bonds N/AInternational securities N/ASecurities lending
Permissible Investments
(The remainder of this page left blank intentionally)
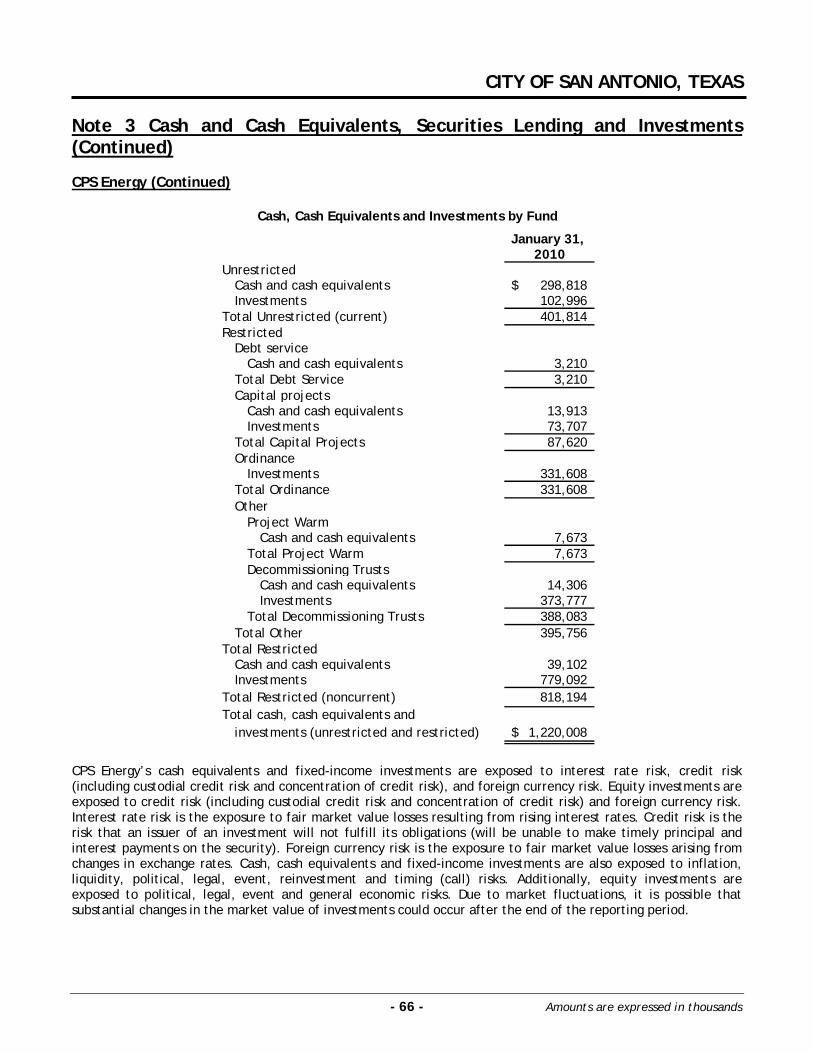
CITY OF SAN ANTONIO, TEXAS
- 66 - Amounts are expressed in thousands
Note 3 Cash and Cash Equivalents, Securities Lending and Investments (Continued) CPS Energy (Continued)
January 31, 2010
UnrestrictedCash and cash equivalents 298,818$ Investments 102,996
Total Unrestricted (current) 401,814 Restricted
Debt serviceCash and cash equivalents 3,210
Total Debt Service 3,210 Capital projects
Cash and cash equivalents 13,913 Investments 73,707
Total Capital Projects 87,620 Ordinance
Investments 331,608 Total Ordinance 331,608 Other
Project WarmCash and cash equivalents 7,673
Total Project Warm 7,673 Decommissioning Trusts
Cash and cash equivalents 14,306 Investments 373,777
Total Decommissioning Trusts 388,083 Total Other 395,756
Total RestrictedCash and cash equivalents 39,102 Investments 779,092
Total Restricted (noncurrent) 818,194 Total cash, cash equivalents and
investments (unrestricted and restricted) 1,220,008$
Cash, Cash Equivalents and Investments by Fund
CPS Energy’s cash equivalents and fixed-income investments are exposed to interest rate risk, credit risk (including custodial credit risk and concentration of credit risk), and foreign currency risk. Equity investments are exposed to credit risk (including custodial credit risk and concentration of credit risk) and foreign currency risk. Interest rate risk is the exposure to fair market value losses resulting from rising interest rates. Credit risk is the risk that an issuer of an investment will not fulfill its obligations (will be unable to make timely principal and interest payments on the security). Foreign currency risk is the exposure to fair market value losses arising from changes in exchange rates. Cash, cash equivalents and fixed-income investments are also exposed to inflation, liquidity, political, legal, event, reinvestment and timing (call) risks. Additionally, equity investments are exposed to political, legal, event and general economic risks. Due to market fluctuations, it is possible that substantial changes in the market value of investments could occur after the end of the reporting period.

CITY OF SAN ANTONIO, TEXAS
- 67 - Amounts are expressed in thousands
Note 3 Cash and Cash Equivalents, Securities Lending and Investments (Continued) CPS Energy (Continued) CPS Energy’s investments and the investments in the Decommissioning Trusts are managed with a conservative focus. The investment policies are structured to ensure compliance with bond ordinances, the PFIA, the Public Funds Collateral Act, the NRC, the PUCT, other applicable state statutes, and CPS Energy board of trustee resolutions relating to investments. CPS Energy identifies and manages risks by following an appropriate investment oversight strategy, establishing and monitoring compliance with investment policies and procedures, and continually monitoring prudent controls over risks.
January 31,2010
CPS Energy investmentsU.S. Treasury, Government Agencies and
money market funds 829,847$ Decommissioning Trusts
U.S. Treasury, Government Agencies andmoney market funds 148,004
Corporate bonds 61,646 Foreign bonds 4,255
Subtotal 213,905 Common stock 174,178
Total Decommissioning Trusts 388,083 Grand total - all investments 1,217,930$
Summary of Investments by Organizational Structure and Type
Effective September 1, 2005, as a result of a change in Texas law, the investment policies of the Decommissioning Trusts were revised to allow for investment in additional types of securities, such as corporate bonds and equity securities. The policies provide guidelines to ensure all funds are invested in authorized securities in order to earn a reasonable return. The primary emphasis is placed on long-term growth commensurate with the need to preserve the value of the assets and, at the time funds are needed for decommissioning costs, on liquidity. The investment policies continue to follow the “prudent person” concept. In accordance with GASB Statement No. 40, additional disclosures have been provided in this note that address investment exposure to interest rate risk, credit risk (including custodial credit risk and concentration of credit risk), and foreign currency risk, as applicable. The disclosure requirements of this Statement do not apply to equity securities since they are not directly or immediately exposed to these risks. CPS Energy and the Decommissioning Trusts do not have custodial credit risk, as all investments are held either by an independent trustee or bank and are in CPS Energy’s or the Decommissioning Trusts’ names. CPS Energy Investments – In accordance with GASB Statement No. 40, the following tables address credit risk (including custodial credit risk and concentration of credit risk) and interest rate risk exposure by investment type using the weighted-average maturity (WAM) method. Since CPS Energy does not hold foreign instruments in its direct investments (those held by CPS Energy), foreign currency risk is not applicable. Interest Rate Risk – In accordance with its investment policy, CPS Energy manages exposure to fair market value losses resulting from rising interest rates by limiting the portfolio’s WAM to two years or less. WAM is defined as the weighted-average time to return a dollar of principal. It is used as an estimate of the interest rate risk of a fixed-income investment. CPS Energy invests the cash collateral received from securities lending and other funds in money market mutual funds that have no fixed maturities. Accordingly, a WAM in terms of years for money market mutual funds is not applicable.

CITY OF SAN ANTONIO, TEXAS
- 68 - Amounts are expressed in thousands
Note 3 Cash and Cash Equivalents, Securities Lending and Investments (Continued) CPS Energy (Continued) Concentration of Credit Risk – In accordance with its investment policy, CPS Energy manages exposure to concentration of credit risk through diversification and by limiting its investment in each federal agency to 50.0% and its investment in any other issuer of debt securities to 5.0% of the total fixed-income portfolio. Additionally, certificates of deposit are limited to 50.0% per issuer.
Weighted-Carrying Market Average
Investment Type Value Value Allocation Maturity (Years)U.S. Agencies:
Federal Home Loan Mortgage Corp. 124,228$ 124,228$ 15.0% 3.9Federal National Mortgage Assn. 95,467 95,467 11.5% 4.0Federal Home Loan Bank 147,419 147,461 17.8% 0.7Federal Farm Credit Bank 7,551 7,551 0.9% 2.4Municipal bonds 20,645 20,645 2.5% 1.3
Certificates of Deposit 113,000 113,000 13.6% 0.4Money Market Mutual Funds 321,537 321,537 38.7% 0.0
Total Fixed-Income Investments 829,847 829,889 100.0% 2.1Cash Collateral - Securities Lending 31,815 31,815 Total Fixed-Income Portfolio 861,662$ 861,704$
Credit Risk – In accordance with its investment policy, CPS Energy manages exposure to credit risk by limiting its fixed-income investments to a credit rating of ‘A’ or better. As of January 31, 2010, CPS Energy held no direct investments with a credit rating below ‘Aa’.
Carrying MarketCredit Rating Value Value Allocation
AAA 733,725$ 733,767$ 85.2%Aaa 200 200 0.0%AA 13,664 13,664 1.6%Aa 1,073 1,073 0.1%Certicates of Deposits (not rated) 113,000 113,000 13.1%
Total Fixed-Income Investments 861,662$ 861,704$ 100.0%
Decommissioning Trust Investments – As mentioned above, the Decommissioning Trust report their assets on a calendar-year basis; therefore, the tables in this section are as of December 31. These tables address interest rate risk exposure by investment type, credit risk, concentration of credit risk and foreign currency risk. All investments held by the Decommissioning Trusts are long-term in nature and are recorded at market value. Interest Rate Risk – Generally, the long-term nature of the liabilities and the limited need for daily operating liquidity allow interim fluctuations in market value to occur without jeopardizing the ultimate value of the assets. Where long-term securities are held, the interim market value of assets can be sensitive to changes in interest rates. As the general level of interest rates moves up and down, the interim market value of longer-maturity bonds may change substantially.

CITY OF SAN ANTONIO, TEXAS
- 69 - Amounts are expressed in thousands
Note 3 Cash and Cash Equivalents, Securities Lending and Investments (Continued) CPS Energy (Continued) To mitigate this interest rate risk, a limitation is placed on the duration of the fixed-income portfolio. Weighted-average duration is defined as the weighted-average time to return a dollar of principal and interest and also incorporates potential changes in the timing of principal and interest return that may occur as a result of changes in interest rates. It makes assumptions regarding the most likely timing and amounts of variable cash flows and is used as an estimate of the interest rate risk of a fixed-income investment – especially those with payment terms dependent on market interest rates. The overall portfolio duration should not deviate from the weighted-average duration of the Investment Strategy Committee’s specified fixed-income index by more than +/- 1.5 years. The Investment Strategy Committee’s fixed-income index is based on the Barclays Capital Aggregate Index, which is 4.4 for 2009. Concentration of Credit Risk – In accordance with the investment policy, exposure to concentration of credit risk is managed through diversification and by limiting investments in each government-sponsored entity to 30.0% and investments in any nongovernment-sponsored issuer to 5.0% of the total fixed-income portfolio (excluding cash collateral from securities lending). At December 31, 2009, total nongovernment-sponsored (corporate and foreign) issuers amounted to 41.6% of the 28% Decommissioning Trust and 18.2% of the 12% Decommissioning Trust. The following tables list the fixed-income investment holdings by type:
Weighted- Weighted-Average Average
Market Duration Market DurationValue Allocation (Years) Value Allocation (Years)
U.S. Treasuries 8,349$ 5.9% 3.8 7,788$ 19.6% 6.8U.S. Agencies:
Federal National Mortgage Assn. 32,318 22.9% 2.7 9,429 23.7% 3.3Federal Home Loan Mortgage Corp. 16,312 11.6% 3.0 6,289 15.8% 3.4Small Business Administration 4,581 3.3% 6.1Government National Mortgage Assn. 2,003 1.4% 3.5 2,867 7.2% 6.8
Municipal Bonds - Texas 624 0.4% 4.9 2,026 5.1% 6.3Municipal Bonds - Other States 5,951 4.2% 9.5 2,159 5.4% 3.2Corporate Bonds 54,417 38.6% 6.0 7,229 18.1% 5.6Foreign Bonds 4,255 3.0% 6.0 - AIM Money Market 12,287 8.7% 0.0 2,019 5.1%
Total Fixed-income Investments 141,097$ 100.0% 4.8 39,806$ 100.0% 4.9
Cash Collateral - Securities Lending 20,407 12,595
Total Portfolio 161,504$ 52,401$
Investment Type
28% Interest 12% Interest
Credit Risk – In accordance with the investment policy, exposure to credit risk is managed by limiting all fixed-income investments to a credit rating of ‘BBB-’ or better from at least two nationally recognized credit rating agencies. If a security’s rating falls below the minimum investment grade rating of ‘BBB-’ after it has been purchased, the investment policy allows investment managers to continue to hold the security as long as the total fair value of securities rated below investment grade does not exceed 5.0% of the total fixed-income portfolio.

CITY OF SAN ANTONIO, TEXAS
- 70 - Amounts are expressed in thousands
Note 3 Cash and Cash Equivalents, Securities Lending and Investments (Continued) CPS Energy (Continued) The following table lists the fixed-income investment holdings by credit rating:
Market Value Allocation Market Value AllocationU.S. Treasuries 8,349$ 5.2% 7,788$ 14.9%AAA 100,280 62.1% 35,724 68.2%Aaa 1,215 0.8%AA+ 1,414 0.9% 1,393 2.6%AA 1,198 0.7% 522 1.0%Aa2 296 0.2%AA- 3,095 1.9% 538 1.0%Aa3 78 0.1%A+ 2,347 1.5% 526 1.0%A 10,539 6.5% 2,859 5.4%A- 8,916 5.5% 1,401 2.7%A3 150 0.1%BBB+ 5,131 3.2% 925 1.8%BBB 10,321 6.4% 725 1.4%BBB- 5,025 3.1%BB 1,681 1.0%B 57 0.0%B- 39 0.0%CCC 471 0.3%D 71 0.0%Not rated 831 0.5%
Total Fixed-income Portfolio 161,504$ 100.0% 52,401$ 100.0%
Credit Rating28% Interest 12% Interest
Foreign Currency Risk – With the exception of dedicated foreign-equity portfolios, all investments authorized for purchase by the Decommissioning Trusts are U.S. dollars. This reduces the potential foreign currency risk exposure to the portfolio. Total foreign bonds outstanding amounted to $4,255 as of December 31, 2009. In accordance with the investment policy, investments in international portfolios are limited to international commingled funds and Exchange Traded Funds that are diversified across countries and industries. The international portfolio will be limited to 20.0% of the total equity portfolio. At December 31, 2009, total foreign equity securities amounted to 14.6% of the 28% Trust’s equity portfolio. There were no foreign equity securities held by the 12% Trust at December 31, 2009. Securities Lending – CPS Energy and the Decommissioning Trusts engage in securities lending transactions under a contract with their lending agent, Frost National Bank. Authority to engage in these transactions is granted under each entity’s Investment Policy. The entities are authorized to loan up to 100.0% of their investments in securities lending transactions. GASB Statement No. 28, Accounting and Financial Reporting for Securities Lending Transactions, provides guidance for entities reporting and disclosing securities lending transactions. This guidance includes reporting certain securities lending collateral on the Balance Sheet as an asset, with a corresponding liability for the obligation to repay the collateral.

CITY OF SAN ANTONIO, TEXAS
- 71 - Amounts are expressed in thousands
Note 3 Cash and Cash Equivalents, Securities Lending and Investments (Continued) CPS Energy (Continued) In securities lending transactions, CPS Energy and the Decommissioning Trusts, through their lending agent, transfer securities to brokers/dealers in exchange for collateral and simultaneously agree to return the collateral for the same securities in the future. Cash collateral received from the borrower is invested entirely in money market mutual funds. The liquidity provided by the money market mutual funds allows for the easy return of collateral at the termination of a security loan. Lending income is earned if the returns on the cash collateral invested exceed the rebate paid to borrowers of the securities. The income is then shared with the lending agent to cover its fees based on a contractually negotiated rate split. However, if the investment of the cash collateral does not provide a return exceeding the rebate or if the investment incurs a loss of principal, part of the payment to the borrower would come from CPS Energy’s or the Decommissioning Trusts’ resources and the lending agent based on the rate split. Loans that are collateralized with securities generate income when the borrower pays a loan premium for the securities loaned. This income is split at the same ratio as the earnings for cash collateral. The collateral pledged to CPS Energy or the Decommissioning Trusts for the loaned securities is held by the lending agent. These securities are not available to CPS Energy or the Decommissioning Trusts for selling or pledging unless the borrower is in default of the loan. Any collateral received is required to have a fair value of 102.0% of the loaned securities. Securities are marked to market daily and additional cash or securities are required from the borrower if the market value of the collateral falls below 100.0%. Cash collateral is reported on the Balance Sheet as an asset, with a corresponding liability for the obligation to repay the cash collateral. Noncash collateral for securities lending activities is not recorded as an asset because it remains under the control of the transferor, except in the event of default. In the event of default, where the borrower is unable to return the securities loaned, CPS Energy and the Decommissioning Trusts have authorized the lending agent to seize the collateral held. The collateral would then be used to replace the borrowed securities where possible. Due to some market conditions, it is possible that the original securities may not be able to be replaced. The lending agent has indemnified CPS Energy and the Decommissioning Trusts from any loss due to borrower default in the event the collateral is not sufficient to replace the securities. At January 31, 2010, neither CPS Energy nor the Decommissioning Trusts had any credit risk exposure to borrowers because the amounts CPS Energy and the Decommissioning Trusts owed to borrowers exceeded the amounts the borrowers owed. There were no violations of legal or contractual provisions nor were there any borrower or lending agent default losses related to securities lending in fiscal year 2010. Direct Investments – At January 31, 2010, there was a total of $181,330 in securities, or 21.8% of CPS Energy’s direct investments, out on loan to brokers/dealers. In exchange, CPS Energy received $31,815 in cash collateral and $153,491 in securities collateral, or 102.2% of the market value of the corresponding securities loaned. Income generated from securities lending transactions amounted to $922 in fiscal year 2010, of which 30.0% was paid as fees to the lending agent totaling $277. Decommissioning Trusts – For the 28% Decommissioning Trust at December 31, 2009, there was a total of $20,284 in securities, or 7.6% of the Decommissioning Trust’s investments, out on loan to brokers/dealers. In exchange, the Trust received $20,407 in cash collateral and $464 in securities collateral, or a total of 102.9% of the market value of the corresponding securities loaned. Income generated from securities lending transactions for the Decommissioning Trust amounted to $67 in calendar year 2009, of which 30.0% was paid as fees to the lending agent totaling $20.

CITY OF SAN ANTONIO, TEXAS
- 72 - Amounts are expressed in thousands
Note 3 Cash and Cash Equivalents, Securities Lending and Investments (Continued) CPS Energy (Continued) For the 12% Decommissioning Trust at December 31, 2009, there was a total of $13,000 in securities, or 14.5% of the Decommissioning Trust’s investments, out on loan to brokers/dealers. In exchange, the Trust received $12,595 in cash collateral and $830 in securities collateral, or a total of 102.9% of the market value of the corresponding securities loaned. Income generated from securities lending transactions for this Decommissioning Trust amounted to $27 in calendar year 2009, of which 30.0% was paid as fees to the lending agent totaling $8. San Antonio Water System (SAWS) SAWS is permitted by City Ordinance No. 75686, SAWS’ Investment Policy and Texas state law, to invest in direct obligations of the U.S. or its agencies and instrumentalities. Other allowable investments include direct obligations of the State of Texas or its agencies and instrumentalities; secured certificates of deposit issued by depository institutions that have their main office or a branch office in the State of Texas; defined bankers acceptances and commercial paper; collateralized direct repurchase agreements, reverse repurchase agreements; no-load money market mutual funds; investment pools; and other types of secured or guaranteed investments. These investments are subject to market risk, interest rate risk, and credit risk, which may affect the value at which these investments are recorded. Investments other than money market investments are reported at fair value. Under the provisions of GASB Statement No. 31, money market investments, including U.S. Treasury and agency obligations, with a remaining maturity at time of purchase of one year or less are reported at cost. A summary of SAWS cash, cash equivalents, and investments can be found at the beginning of Note 3. Custodial Credit Risk (Deposit) - All funds are deposited in demand and savings accounts or certificates of deposit at Frost National Bank, SAWS’ general depository bank. The general depository agreement with the bank does not require SAWS to maintain an average monthly balance. As required by state law, all deposits are fully collateralized and/or are covered by federal depository insurance. At December 31, 2009, the collateral pledged is being held by the Federal Reserve Bank of Boston under SAWS’ name so SAWS incurs no custodial credit risk. As of December 31, 2009, the bank balance of demand and savings account was $16,770 and the reported amount was $12,914 which included $30 of cash on hand, and certificates of deposits totaled $44,000. Custodial Credit Risk (Investment) - All investments, with the exception of those held in escrow, are securities issued by Agencies of the United States and are held in safekeeping by SAWS’ depository bank, Frost National Bank and registered as accounts of SAWS. Funds held in escrow are Money Market Funds managed by Frost National Bank or Wells Fargo Bank and are invested in securities issued by the U.S. government or by U.S. Agencies. As of December 31, 2009, SAWS had the following investments and maturities:
Investment Type 90 Days or Less 91 to 180 181 to 365Greater than 365
Fair Value Reported
U.S. Agency Discount Notes 89,993$ 145,423$ 31,022$ -$ 266,438$ 266,428$
U.S. Agency Coupon Notes 45,677 53,134 49,707 33,221 181,739 181,751
Money Market Funds:
Frost National Bank 17,021 17,021 17,021
Wells Fargo Bank 54,538 54,538 54,538
207,229$ 198,557$ 80,729$ 33,221$ 519,736$ 519,738$
Percentage of Portfolio 39.9% 38.2% 15.5% 6.4% 100.0%
Investments Maturities (in Days)

CITY OF SAN ANTONIO, TEXAS
- 73 - Amounts are expressed in thousands
Note 3 Cash and Cash Equivalents, Securities Lending and Investments (Continued) San Antonio Water System (SAWS) (Continued) Interest Rate Risk - As a means of limiting its exposure to fair value losses due to rising interest rates, SAWS’ investment policy limits its investment maturities to no more than five years. As indicated in the table above, 93.6% of SAWS’ investment portfolio is invested in maturities less than one year. Credit Risk – In accordance with its investment policies, SAWS manages exposure to credit risk by limiting its investments in obligations of other states and cities to those with a credit rating of ‘A’ or better. Additionally, any investments in commercial paper require a rating of at least ‘A-1’ or ‘P-1’. As of December 31, 2009, SAWS held no direct investments with a credit rating below ‘AAA’.
Carrying Value Market Value Allocation Investment Policy Limit
AAA 519,738$ 519,736$ 100.0% Max. = 100.0%Total Portfolio 519,738$ 519,736$ 100.0%
Credit Rating
December 31, 2009
Concentration of Credit Risk - SAWS’ investment policy does not limit the amount it may invest in U.S. Treasury securities, government-guaranteed securities, or government-sponsored entity securities. However, in order to manage its exposure to credit risk, SAWS’ investment policy does limit the amount that can be invested in any one government-sponsored issuer to no more than 50.0% of the total investment portfolio, and no more than 5.0% of the total investment portfolio on any non-government issuer unless it is fully collateralized. As of December 31, 2009, SAWS has invested more than 5.0% of its investments in the following government-sponsored entities in the form of discount or coupon notes: 25.0% in Federal Home Loan Bank, 26.0% in Federal National Mortgage Association, and 26.0% in Federal Home Loan Mortgage Corporation.
(The remainder of this page left blank intentionally)

CITY OF SAN ANTONIO, TEXAS
- 74 - Amounts are expressed in thousands
Note 3 Cash and Cash Equivalents, Securities Lending and Investments (Continued) San Antonio Water System (SAWS) (Continued) The following is a reconciliation of deposits and investments disclosed in the note to the amounts presented for cash and cash equivalents and investments in the balance sheet for 2009:
December 31,2009
Reported amounts in note for:Deposits, including certificates of deposit 56,914$ Investments 519,738
Total Deposits and Investments 576,652$
Totals for Balance Sheet:Cash and Cash Equivalents:
Unrestricted cash and cash equivalents 32,138$ Restricted cash and cash equivalents:
Capital Projects Accounts 96,331 Other Restricted Accounts:
Reserve Fund 3 Total Cash and Cash Equivalents 128,472$
Investments:Unrestricted current investments 137,879$ Restricted current investments:
Debt Service Accounts 37,010 Capital Project Accounts 20,762 Other Restricted Accounts:
Operating reserve 34,649 Customer deposits 8,194
Total Other Restricted Accounts 42,843 Total Current Investments 238,494$
Restricted noncurrent investments:Capital Project Accounts 162,321$ Other Restricted Accounts:
Reserve Fund 47,365
Total Cash, Cash Equivalents and Investments 576,652$
(The remainder of this page left blank intentionally)
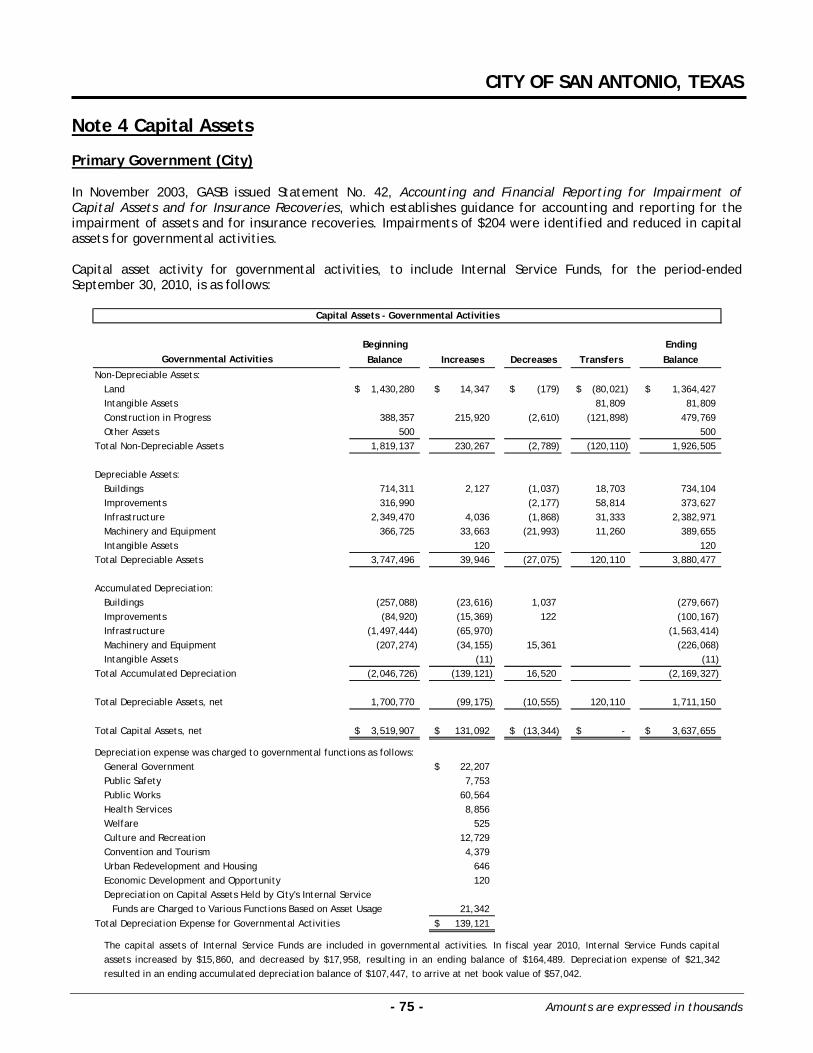
CITY OF SAN ANTONIO, TEXAS
- 75 - Amounts are expressed in thousands
Note 4 Capital Assets Primary Government (City) In November 2003, GASB issued Statement No. 42, Accounting and Financial Reporting for Impairment of Capital Assets and for Insurance Recoveries, which establishes guidance for accounting and reporting for the impairment of assets and for insurance recoveries. Impairments of $204 were identified and reduced in capital assets for governmental activities. Capital asset activity for governmental activities, to include Internal Service Funds, for the period-ended September 30, 2010, is as follows:
Beginning Ending
Balance Increases Decreases Transfers Balance
Non-Depreciable Assets:Land 1,430,280$ 14,347$ (179)$ (80,021)$ 1,364,427$ Intangible Assets 81,809 81,809 Construction in Progress 388,357 215,920 (2,610) (121,898) 479,769 Other Assets 500 500
Total Non-Depreciable Assets 1,819,137 230,267 (2,789) (120,110) 1,926,505
Depreciable Assets:Buildings 714,311 2,127 (1,037) 18,703 734,104 Improvements 316,990 (2,177) 58,814 373,627 Infrastructure 2,349,470 4,036 (1,868) 31,333 2,382,971 Machinery and Equipment 366,725 33,663 (21,993) 11,260 389,655 Intangible Assets 120 120
Total Depreciable Assets 3,747,496 39,946 (27,075) 120,110 3,880,477
Accumulated Depreciation:Buildings (257,088) (23,616) 1,037 (279,667) Improvements (84,920) (15,369) 122 (100,167) Infrastructure (1,497,444) (65,970) (1,563,414) Machinery and Equipment (207,274) (34,155) 15,361 (226,068) Intangible Assets (11) (11)
Total Accumulated Depreciation (2,046,726) (139,121) 16,520 (2,169,327)
Total Depreciable Assets, net 1,700,770 (99,175) (10,555) 120,110 1,711,150
Total Capital Assets, net 3,519,907$ 131,092$ (13,344)$ -$ 3,637,655$
Depreciation expense was charged to governmental functions as follows:General Government 22,207$ Public Safety 7,753 Public Works 60,564 Health Services 8,856 Welfare 525 Culture and Recreation 12,729 Convention and Tourism 4,379 Urban Redevelopment and Housing 646 Economic Development and Opportunity 120 Depreciation on Capital Assets Held by City's Internal Service
Funds are Charged to Various Functions Based on Asset Usage 21,342 Total Depreciation Expense for Governmental Activities 139,121$
Capital Assets - Governmental Activities
Governmental Activities
The capital assets of Internal Service Funds are included in governmental activities. In fiscal year 2010, Internal Service Funds capitalassets increased by $15,860, and decreased by $17,958, resulting in an ending balance of $164,489. Depreciation expense of $21,342resulted in an ending accumulated depreciation balance of $107,447, to arrive at net book value of $57,042.

CITY OF SAN ANTONIO, TEXAS
- 76 - Amounts are expressed in thousands
Note 4 Capital Assets (Continued) Primary Government (City) (Continued) The City capitalizes interest incurred on construction projects, in accordance with Statement of Accounting Standards No. 62, Special Reports, issued by the Financial Accounting Standards Board. In fiscal year 2010, the City capitalized construction period interest for the Airport System in the amount of $3,736. Capital asset activity for business-type activities for the year-ended September 30, 2010, is as follows:
Beginning EndingBalance Increases Decreases Transfers Balance
Non-Depreciable Assets:Land:
Airport System 5,323$ 4$ (5)$ -$ 5,322$ Nonmajor Enterprise Funds 9,018 9,018
Total Land 14,341 4 (5) 14,340 Construction in Progress:
Airport System 226,186 97,687 (138) (6,088) 317,647 Nonmajor Enterprise Funds 1,012 1,528 (1,803) 737
Total Construction in Progress 227,198 99,215 (138) (7,891) 318,384 Total Non-Depreciable Assets 241,539 99,219 (143) (7,891) 332,724 Depreciable Assets:
Buildings:Airport System 195,802 (459) 5,330 200,673 Nonmajor Enterprise Funds 24,566 419 362 25,347
Total Buildings 220,368 419 (459) 5,692 226,020 Improvements:
Airport System 225,281 5,255 (5,628) 758 225,666 Nonmajor Enterprise Funds 10,140 317 10,457
Total Improvements 235,421 5,572 (5,628) 758 236,123 Machinery and Equipment:
Airport System 13,304 1,511 (212) 14,603 Nonmajor Enterprise Funds 26,612 994 (150) 1,441 28,897
Total Machinery and Equipment 39,916 2,505 (362) 1,441 43,500 Total Depreciable Assets 495,705 8,496 (6,449) 7,891 505,643 Accumulated Depreciation:
Buildings:Airport System (73,170) (4,664) (77,834) Nonmajor Enterprise Funds (8,156) (696) (8,852)
Total Buildings (81,326) (5,360) (86,686) Improvements:
Airport System (96,876) (5,052) (101,928) Nonmajor Enterprise Funds (2,202) (498) (2,700)
Total Improvements (99,078) (5,550) (104,628) Machinery and Equipment:
Airport System (10,201) (943) 206 (10,938) Nonmajor Enterprise Funds (6,416) (2,840) 148 (9,108)
Total Machinery and Equipment (16,617) (3,783) 354 (20,046) Total Accumulated Depreciation (197,021) (14,693) 354 (211,360) Total Depreciable Assets, net 298,684 (6,197) (6,095) 7,891 294,283 Total Capital Assets, net 540,223$ 93,022$ (6,238)$ -$ 627,007$
Capital Assets - Business-Type Activities

CITY OF SAN ANTONIO, TEXAS
- 77 - Amounts are expressed in thousands
Note 4 Capital Assets (Continued) CPS Energy CPS Energy’s plant-in service includes seven power plants, which are solely owned and operated by CPS Energy. In total, the plants have 19 generating units—three of which are coal-fired and 16 of which are gas-fired. The following is a list of plants and relative generating units:
Generating GeneratingUnits Type Plant Units Type
J.T. Deely 2 Coal V.H. Brauning 3 GasJ.K. Spruce 1 Coal W.B. Tuttle * 4 * GasArthur von Rosenberg 1 Gas Leon Creek 6 GasO.W. Sommers 2 Gas
*
Plant
Included as a part of the 16 gas generating units are W.B. Tuttle Unit 2, which is currently not available for use, and W.B. Tuttle Units 1,3 and 4, which were mothballed in FY 2010. All W.B. Tuttle units are fully depreciated.
Construction on J.K. Spruce Unit 2 (Spruce 2) was started on March 21, 2006, with plans for commercial operation in fiscal year 2011. Spruce 2, a 750-megawatt unit, will be the largest of the coal units at Calavaras Lake and will be equipped with current emissions-control technology. Construction of the V.H. Braunig (VHB) peaking units project began on September 10, 2008, and commercial operations is expected to begin in fiscal year 2011. The peaking units will provide an additional 186 megawatts of capacity to the CPS Energy generation portfolio to meet customer demand during periods of peak load. Other notable capital assets in electric and gas plant include a fleet of rail cars, a transmission network for the movement of electric power from the generating stations to substations, and the electric and gas distribution systems. Included in the general plant are: the Energy Management Center; the main office complex; the construction and customer service centers; the Villita Assembly Building; and a fleet of automobiles, trucks, and work equipment. Impairments – No capital asset impairments were identified for fiscal year 2010. Investment in STP – STP is currently a two-unit nuclear power plant located in Matagorda County, Texas. It is maintained and operated by the STP Nuclear Operating Company (STPNOC), a nonprofit Texas corporation special-purpose entity. It is financed and controlled by the owners – CPS Energy; the City of Austin; and NRG South Texas LLP, a wholly owned subsidiary of NRG Energy, Inc. CPS Energy’s 40% interest in STP Units 1 and 2 is included in plant assets. See Note 10 for more information on CPS Energy’s South Texas Project. On October 29, 2007, the CPS Energy board of trustees approved a resolution enabling CPS Energy to participate in development activities related to new nuclear generation units to be constructed in Bay City, Texas, on a site where Units 1 and 2 currently operate. These generation units are referred to as STP Units 3 and 4. At January 31, 2010, CPS Energy held a 50.0% interest in the development. As a result of a litigation settlement with Nuclear Innovation North America, Inc. (NINA), CPS Energy’s partner in the project, CPS Energy’s ownership in STP Units 3 and 4 was reduced from 50.0% to 7.6% effective March 1, 2010. Project costs to date of $380,000 are included in construction-in-progress. For more detailed information on project development and legal issues associated with STP Units 3 and 4, see Note 10.
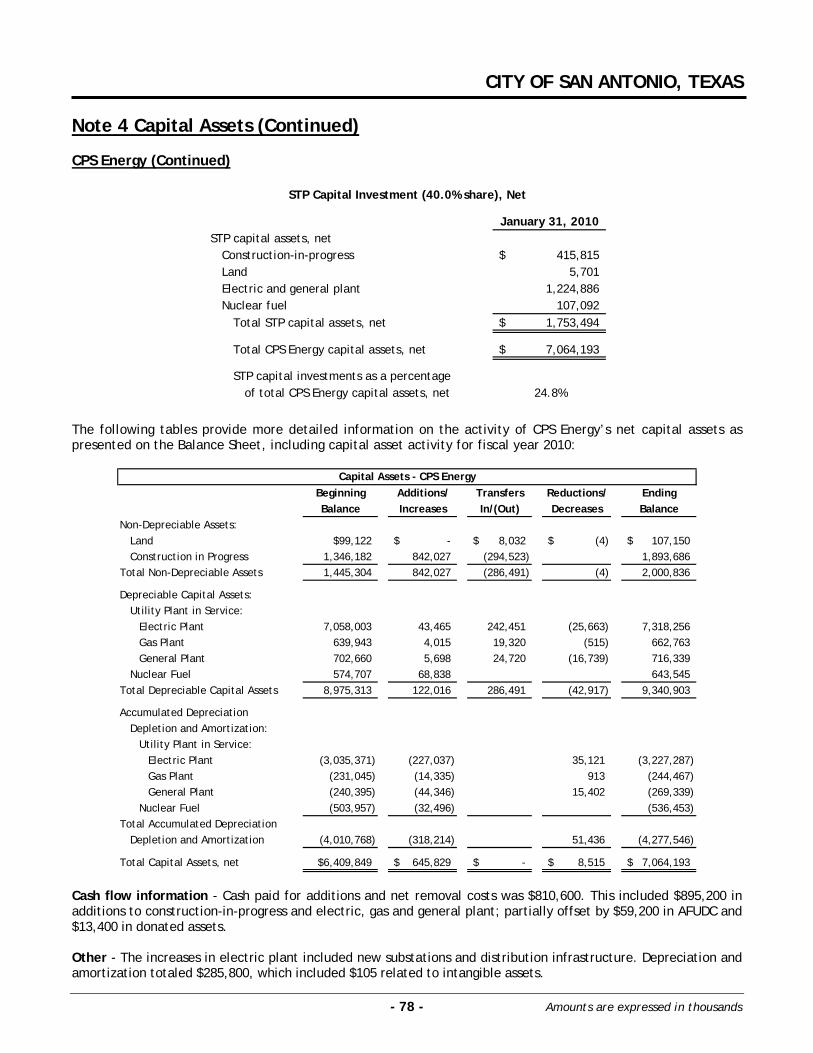
CITY OF SAN ANTONIO, TEXAS
- 78 - Amounts are expressed in thousands
Note 4 Capital Assets (Continued) CPS Energy (Continued)
January 31, 2010STP capital assets, net
Construction-in-progress 415,815$ Land 5,701 Electric and general plant 1,224,886 Nuclear fuel 107,092
Total STP capital assets, net 1,753,494$
Total CPS Energy capital assets, net 7,064,193$
STP capital investments as a percentageof total CPS Energy capital assets, net 24.8%
STP Capital Investment (40.0% share), Net
The following tables provide more detailed information on the activity of CPS Energy’s net capital assets as presented on the Balance Sheet, including capital asset activity for fiscal year 2010:
Beginning Additions/ Transfers Reductions/ EndingBalance Increases In/(Out) Decreases Balance
Non-Depreciable Assets:Land $99,122 -$ 8,032$ (4)$ 107,150$ Construction in Progress 1,346,182 842,027 (294,523) 1,893,686
Total Non-Depreciable Assets 1,445,304 842,027 (286,491) (4) 2,000,836
Depreciable Capital Assets:Utility Plant in Service:
Electric Plant 7,058,003 43,465 242,451 (25,663) 7,318,256 Gas Plant 639,943 4,015 19,320 (515) 662,763 General Plant 702,660 5,698 24,720 (16,739) 716,339
Nuclear Fuel 574,707 68,838 643,545 Total Depreciable Capital Assets 8,975,313 122,016 286,491 (42,917) 9,340,903
Accumulated DepreciationDepletion and Amortization:
Utility Plant in Service:Electric Plant (3,035,371) (227,037) 35,121 (3,227,287) Gas Plant (231,045) (14,335) 913 (244,467) General Plant (240,395) (44,346) 15,402 (269,339)
Nuclear Fuel (503,957) (32,496) (536,453) Total Accumulated Depreciation
Depletion and Amortization (4,010,768) (318,214) 51,436 (4,277,546)
Total Capital Assets, net $6,409,849 645,829$ -$ 8,515$ 7,064,193$
Capital Assets - CPS Energy
Cash flow information - Cash paid for additions and net removal costs was $810,600. This included $895,200 in additions to construction-in-progress and electric, gas and general plant; partially offset by $59,200 in AFUDC and $13,400 in donated assets. Other - The increases in electric plant included new substations and distribution infrastructure. Depreciation and amortization totaled $285,800, which included $105 related to intangible assets.

CITY OF SAN ANTONIO, TEXAS
- 79 - Amounts are expressed in thousands
Note 4 Capital Assets (Continued) San Antonio Water System (SAWS) SAWS’ interest on debt proceeds used to finance utility plant additions is capitalized as part of the cost of capital assets. For the year-ended December 31, 2009, interest capitalized was $9,953. Capital asset activity for SAWS is as follows:
Beginning EndingBalance Increases Transfers Decreases Balance
Non-Depreciable Assets:Land:
Land 78,572$ -$ 242$ -$ 78,814$ Acquisition of Water Rights 104,056 52,648 156,704
Other Intangible Assets 365 23 388 Construction in Progress 372,607 281,532 (225,479) 689 427,971
Total Non-Depreciable Assets 555,600 281,555 (172,589) 689 663,877
Depreciable Assets:Utility Plant in Service:
Structures and Improvements 415,477 117 28,407 1 444,000 Pumping and Purification 122,793 155 3,286 126,234 Distribution and Transmission System 1,434,989 737 75,406 2,585 1,508,547 Treatment Facilities 1,365,247 63,668 3,935 1,424,980
Machinery and Equipment:Machinery and Equipment 102,758 10,241 (99) 10,276 102,624 Furniture and Fixtures 5,048 5,048 Computer Equipment 18,409 2,000 1,915 873 21,451 Software 17,587 142 6 17,735
Total Depreciable Assets 3,482,308 13,392 172,589 17,670 3,650,619
Accumulated Depreciation:Utility Plant in Service:
Structures and Improvements (90,901) (9,058) (1) (99,958) Pumping and Purification (24,137) (3,046) (27,183) Distribution and Transmission System (381,333) (32,988) (1,987) (412,334) Treatment Facilities (492,819) (30,615) (3,935) (519,499)
Machinery and Equipment:Machinery and Equipment (53,668) (6,933) (10,271) (50,330) Furniture and Fixtures (3,624) (264) (3,888) Computer Equipment (13,910) (2,039) (827) (15,122) Software (10,326) (1,592) (11,918)
Total Accumulated Depreciation (1,070,718) (86,535) (17,021) (1,140,232)
Total Depreciable Assets, net 2,411,590 (73,143) 172,589 649 2,510,387
Total Capital Assets, net 2,967,190$ 208,412$ -$ 1,338$ 3,174,264$
Capital Assets - San Antonio Water System

CITY OF SAN ANTONIO, TEXAS
- 80 - Amounts are expressed in thousands
Note 5 Receivables and Payables Primary Government (City) Disaggregation of Receivables Net receivables at September 30, 2010 are as follows:
Notes and Accrued Total NetAccounts Taxes Loans Interest Other Receivables
Governmental Activities 130,781$ 25,547$ 37,058$ 235$ 118$ 193,739$
Business-Type Activities:Airport System 4,876$ -$ -$ 13$ -$ 4,889$ Nonmajor Enterprise Funds 7,064 5 7,069
Total Business-Type Activities 11,940$ -$ -$ 18$ -$ 11,958$
The receivable balances for Governmental Activities have been reduced by estimated allowances for doubtful accounts of $58,672 against customer, other governmental agencies and other receivables, and $4,711 against property and occupancy taxes. The receivable balances for Business-Type Activities have been reduced by estimated allowances for doubtful accounts of $265 against customer and other receivables. The only receivables not expected to be collected within one year are $37,034 of notes and loans receivables, net of allowance for doubtful accounts, related to General Government, Urban Redevelopment and Housing and Economic Development and Opportunity. These notes and loans have a corresponding deferred revenue balance recorded within the respective funds. Disaggregation of Payables Payables at September 30, 2010 are as follows:
Accrued TotalAccounts Payroll Other Payables
Governmental Activities 154,549$ 26,571$ -$ 181,120$
Business-Type Activities:Airport System 19,609$ 1,126$ 22$ 20,757$ Nonmajor Enterprise Funds 3,753 1,326 2 5,081
Total Business-Type Activities 23,362$ 2,452$ 24$ 25,838$
Interfund Receivable and Payable Balances As of September 30, 2010, the interfund receivable and payable balances represent short-term loans resulting from (1) timing differences between the dates that transactions are recorded in the accounting system and (2) short-term borrowings at year-end. Of the $43,436 due from other funds in the General Fund, $42,404 is a result of overdraws of pooled cash. Except for internal loans from the Other Internal Service Fund of $648 and $257 to the Nonmajor Governmental Fund and General Fund, respectively, all interfund balances are expected to be paid within one year. See Note 6 Long-Term Debt, for additional information regarding the internal loans.

CITY OF SAN ANTONIO, TEXAS
- 81 - Amounts are expressed in thousands
Note 5 Receivables and Payables (Continued) Primary Government (City) (Continued)
Interfund Receivable and Payable Balances (Continued) The following is a summary of interfund receivables and payables for the City as of September 30, 2010:
Due from Other Funds Due To Other FundsGeneral Fund:
Debt Service Fund 1,500$ -$ Categorical Grant In-Aid 30,605 524 2007 General Obligation Bonds 30 Airport System Fund 77 Nonmajor Governmental Funds 10,275 432 Nonmajor Enterprise Funds 101 315 Internal Service Funds 339 466 Fiduciary Funds 509
Total General Fund 43,436 1,737 Debt Service Fund:
General Fund 1,500 Nonmajor Governmental Funds 477 Nonmajor Enterprise Fund 4 1
Total Debt Service Fund 481 1,501 Categorical Grant In-Aid:
General Fund 524 30,605 Nonmajor Governmental Funds 2,706 53 Internal Service Funds 22 3
Total Categorical Grant In-Aid 3,252 30,661 2007 General Obligation Bonds:
General Fund 30 Nonmajor Governmental Funds 9,200
Total 2007 General Obligation Bonds 9,200 30 Airport System Fund:
General Fund 77 Airport System Fund 806 806 Internal Service Funds 235 Nonmajor Governmental Funds 185
Total Airport System Fund 1,226 883 Nonmajor Governmental Funds:
General Fund 432 10,275 Debt Service Fund 477 Categorical Grant In-Aid 53 2,706 2007 General Obligation Bonds 9,200 Airport System Fund 185 Nonmajor Governmental Funds 11,178 11,178 Nonmajor Enterprise Funds 1,118 Internal Service Funds 139 648
Total Nonmajor Governmental Funds 11,802 35,787 Nonmajor Enterprise Funds:
General Fund 315 101 Debt Service Fund 1 4 Nonmajor Governmental Funds 1,118 Internal Service Funds 232
Total Nonmajor Enterprise Funds 1,434 337 Internal Service Funds:
General Fund 466 339 Categorical Grant In-Aid 3 22 Airport System Fund 235 Nonmajor Governmental Funds 648 139 Nonmajor Enterprise Funds 232
Total Internal Service Funds 1,349 735 Fiduciary Funds:
General Fund 509 Total Fiduciary Funds - 509
Total 72,180$ 72,180$
Summary Table of Interfund Receivables and PayablesAs of September 30, 2010

CITY OF SAN ANTONIO, TEXAS
- 82 - Amounts are expressed in thousands
Note 5 Receivables and Payables (Continued) CPS Energy Disaggregation of Receivables - Net customer accounts receivable as of January 31, 2010, included $40,069 for unbilled revenue receivables and $161,991 for billed utility services. Interest and other receivables included $2,699 for regulatory-related receivables, $1,456 for interest receivables and $13,505 for other miscellaneous receivables. Disaggregation of Payables - At January 31, 2010, accounts payable and accrued liabilities included $296,929 related to standard operating supplier and vendor payables, including fuels payable; $26,167 for employee-related payables; and $78,849 for other miscellaneous payables and accrued liabilities. San Antonio Water System (SAWS) Accounts Receivable – Accounts receivable, net of allowance for uncollectible accounts are broken down by core business as follows:
December 31,2009
Water Delivery 12,043$ Water Supply 12,843 Wastewater 15,387 Chilled Water and Steam 1,307
41,580$
Included within the receivables above are unbilled revenue receivables of $16,987 at December 31, 2009. Note 6 Long-Term Debt Primary Government (City) Governmental Activity Long-Term Debt The City’s debt management and on-going capital improvement financing for infrastructure and “quality of life” purposes resulted in the issuance of additional indebtedness during fiscal year 2010: On March 23, 2010, the City issued $156,255 in General Improvement Refunding Bonds, Series 2010 to refund certain obligations of the City (Refunded Obligations). Solid Waste Management was allocated $545 from the Refunded Obligations. The Governmental Activities’ share of the net proceeds from the sale of the General Improvement Refunding Bonds, Series 2010, which included a premium of $20,685, were applied, together with a cash contribution of $1,500 from the City, to fund an escrow account for the redemption, discharge, and defeasance of the refunded obligations. As a result of converting the debt, the City will realize a total decrease of $9,265 in debt service payments and total deferred charges of $13,147. Through this defeasance, the City obtained an economic gain (difference between the present values of the debt service payments on the old and new debt plus the City’s cash contribution) of $7,591. The Bonds have maturities ranging from 2011 to 2023, with interest rates ranging from 2.0% to 5.0%. On July 13, 2010, the City issued the following: $8,800 in General Improvements Bonds, Series 2010A, $191,550 in General Improvement Bonds, Taxable Series 2010B (Direct Subsidy – Build America Bonds), and $38,375 in Combination Tax and Revenue Certificates of Obligation, Series 2010.

CITY OF SAN ANTONIO, TEXAS
- 83 - Amounts are expressed in thousands
Note 6 Long-Term Debt (Continued) Primary Government (City) (Continued) Governmental Activity Long-Term Debt (Continued) The General Improvement Bonds, Series 2010A were issued to finance improvements to parks, recreation, and open space and athletics. The Bonds have maturities ranging from 2019 to 2020, with interest rates of 5.0%. The General Improvement Bonds, Taxable Series 2010B (Direct Subsidy – Build America Bonds) were issued to finance improvements to streets, bridges and sidewalks, drainage, and libraries. The Bonds have maturities ranging from 2020 to 2040, with interest rates ranging from 4.314% to 6.038%. The Combination Tax and Revenue Certificates of Obligation, Series 2010 were issued to provide funds for making permanent public improvements and for other public purposes, including police and fire improvements, municipal facilities improvements, park and recreation improvements, street improvements, drainage improvements, riverwalk improvements, library improvements, and golf course improvements. The Certificates have maturities ranging from 2014 to 2019, with interest rates ranging from 4.0% to 5.0%. On July 13, 2010, the City issued $9,655 in Tax Notes, Series 2010A. The Notes were issued to provide funds for computer and information technology systems. The Notes have maturities ranging from 2011 to 2013, with interest rates ranging from 2.0% to 4.0%. On March 31, 2010, Municipal Facilities Corporation issued $9,090 in Municipal Facilities Corporation Lease Revenue Refunding Bonds, Series 2010 (Development & Business Services Center Project). The Bonds were issued to refund certain Municipal Facilities Corporation bonds in order to lower the overall annual debt service requirements of the Corporation and the lease payments made by Municipal Facilities Corporation. The net proceeds from the sale of the Municipal Facilities Corporation Lease Revenue Refunding Bonds, Series 2010, which included a premium of $33, were applied to fund an escrow account for the redemption, discharge, and defeasance of the refunded obligations. As a result of converting the debt, Municipal Facilities Corporation will realize a total decrease of $599 in debt service payments and total deferred charges of $633. Through this defeasance, Municipal Facilities Corporation obtained an economic gain (difference between the present values of the debt service payments on the old and new debt) of $530. The 2010 Refunding Bonds have maturities ranging from 2010 to 2020, with interest rates ranging from 1.00% to 3.25%. The City of San Antonio’s General Obligation, Certificates of Obligation, and Tax Notes are pledged by ad-valorem taxes levied upon all taxable property located within the City, within the limitations prescribed by law. The Certificates of Obligations are additionally secured by a lien on and pledge of certain pledged revenues of the City’s municipal parks system not to exceed $1 during the entire period the Certificates of Obligation or interest thereon remains outstanding in order to permit the Certificates of Obligation to be sold for cash. The Hotel Occupancy Tax Revenue Bonds are secured by Hotel Occupancy Tax (HOT) currently levied at 9.0% of which 7.0% is designated as “General HOT” and 2.0% is designated as the “Expansion HOT”. The General HOT is comprised of the pledged 1.75% HOT and the pledged 5.25% HOT. The Series 1996 HOT Bonds are secured by prior liens on revenues from the General HOT and a lien on the revenues from the Expansion HOT. The 2004A, 2006, and the 2008 HOT Bonds are secured by subordinate liens on revenues from the General HOT. The 2008 HOT Bonds are additionally supported by an irrevocable direct-pay Letter of Credit dated as of July 8, 2010 issued by Wells Fargo Bank, National Association, whom also serves as the remarketing agent. The Letter of Credit agreement will expire July 11, 2012. As of September 30, 2010, there have been no borrowings under the Letter of Credit. The 2008 HOT Bonds were issued as variable-rate bonds and as such have interest rates set on a weekly basis.

CITY OF SAN ANTONIO, TEXAS
- 84 - Amounts are expressed in thousands
Note 6 Long-Term Debt (Continued) Primary Government (City) (Continued) Governmental Activity Long-Term Debt (Continued) The Municipal Drainage Utility System Revenue Bonds are secured by a lien on Stormwater revenues. The Municipal Facilities Corporation Lease Revenue Bonds are paid by annually appropriated lease payments made by the City which equal the annual debt service on the Bonds. The Starbright Industrial Development Corporation Contract Revenue Bonds are secured with a pledge of utility revenue received by the City from CPS Energy. The Convention Center Hotel Finance Corporation Contract Revenue Empowerment Zone Bonds are secured by net operating revenues to be received from the Convention Center Hotel operations. In the event the net operating revenues are insufficient to pay all debt service, City tax revenues will be pledged in the following order of priority: first, from the Convention Center Hotel State HOT revenues; second, from Convention Center Hotel State sales tax revenues; third, from Convention Center Hotel 7.0% local HOT revenues; and fourth, from available Expansion HOT revenues on a subordinate basis. Prior Years’ Defeased Debt In prior years, the City advance refunded, prior to maturity, certain general obligation bonds, revenue bonds, certificates of obligation and tax notes. The refunding bonds were utilized to purchase securities, which are direct obligations of the United States of America (the Purchase Securities). The Purchased Securities plus cash were deposited into irrevocable escrow accounts in amounts scheduled to mature in principal amounts that, when added to interest earned on the Purchased Securities plus remaining balances in the escrow fund, are fully sufficient to make timely payment on the principal, premium if any, and interest scheduled to come due on the refunded obligations. The refunded obligations represent a legal defeasance and are no longer a liability of the City; therefore, they are not included in the City’s financial statements. On September 30, 2010, $287,710 of previously defeased bonds was outstanding.
(The remainder of this page left blank intentionally)

CITY OF SAN ANTONIO, TEXAS
- 85 - Amounts are expressed in thousands
Note 6 Long-Term Debt (Continued) Primary Government (City) (Continued) Governmental Activity Long-Term Debt (Continued) The following table is a summary of changes for the year-ended September 30, 2010 for governmental activity debt:
Final Balance Additions Deletions BalanceOriginal Principal Interest Outstanding During During OutstandingAmount Payment Rates (%) October 1, 2009 Year Year September 30, 2010
General Obligation Bonds:Series 1998 Refunding 30,855$ 2018 4.500-5.000 3,180$ -$ 3,180$ -$ Series 1998A Refunding 49,110 2019 4.000-5.250 14,605 14,605 Series 1999 12,000 2020 5.375-6.000 1,170 1,170 Series 2000 27,565 2020 4.500-5.000 4,170 4,170 Series 2000A 15,615 2021 5.250-5.375 3,035 2,300 735 Series 2001 84,945 2022 3.000-5.250 2,565 385 2,180 Series 2002 Forward Refunding 251,280 2013 4.000-5.250 93,170 37,210 55,960 Series 2002 55,850 2023 2.000-5.500 24,100 16,895 7,205 Series 2003 40,905 2014 2.750-5.000 17,155 1,140 16,015 Series 2003A 56,515 2016 2.000-5.000 43,020 4,940 38,080 Series 2004 33,570 2024 2.375-4.750 30,655 16,160 14,495 Series 2005 116,170 2025 3.500-5.250 116,170 15,335 100,835 Series 2006 Forward Refunding 33,090 2016 5.250-5.500 30,690 2,550 28,140 Series 2006 Refunding 169,785 2026 3.500-5.000 159,160 26,985 132,175 Series 2007 Refunding 121,220 2028 4.000-5.000 113,365 27,405 85,960 Series 2008 75,060 2028 4.000-5.500 75,060 75,060 Series 2010 Refunding 155,710 2023 2.000-5.000 155,710 155,710 Series 2010A 8,800 2020 5.000 8,800 8,800 Series 2010B BABs 191,550 2040 4.314-6.038 191,550 191,550
Total General Obligation Bonds 1,529,595$ 731,270$ 356,060$ 174,430$ 912,900$ Tax-Exempt Certificates of Obligation:
Series 1998 4,315$ 2018 4.600-5.000 360$ -$ 360$ -$ Series 1998A 36,535 2019 4.000-5.250 6,065 6,065 Series 1999 4,230 2020 5.750-6.000 410 410 Series 2000 8,490 2020 4.500-4.625 1,280 1,280 Series 2000A 8,810 2021 5.250-5.375 1,710 1,295 415 Series 2000C 6,415 2020 5.000-5.500 4,925 4,925 Series 2001 65,195 2014 4.000-5.250 26,580 20,120 6,460 Series 2002 69,930 2023 3.000-5.500 40,410 23,570 16,840 Series 2004 29,525 2024 2.000-5.000 23,580 3,440 20,140 Series 2005 10,535 2025 4.000-5.250 10,535 10,535 Series 2006 72,755 2026 3.500-4.375 65,200 2,705 62,495 Series 2007 104,255 2028 4.000-5.000 85,010 15,930 69,080 Series 2008 85,005 2028 3.500-5.500 82,170 2,875 79,295 Series 2010 38,375 2019 4.000-5.000 38,375 38,375
Total Tax-Exempt Certificates of Obligation 544,370$ 348,235$ 38,375$ 82,975$ 303,635$ Taxable Certificates of Obligation:
Series 2000B 1,755$ 2021 7.450-7.550 155$ -$ 75$ 80$ Total Taxable Certificates of Obligation 1,755$ 155$ -$ 75$ 80$ Tax Notes:
Series 2007A 21,270$ 2012 4.000-5.000 13,715$ -$ 4,380$ 9,335$ Series 2008 15,320 2013 3.500-5.000 12,905 3,035 9,870 Series 2009 30,100 2010 1.840-2.610 21,475 21,475 Series 2010A 9,655 2013 2.000-4.000 9,655 9,655
Total Tax Notes 76,345$ 48,095$ 9,655$ 28,890$ 28,860$ Revenue Bonds:
Series 1996 Hotel Occupancy Tax 1 182,012$ 2017 4.500-6.200 18,112$ -$ -$ 18,112$
Series 2004A Hotel Occupancy Tax 10,390 2029 5.000 10,390 10,390 Series 2006 Hotel Occupancy Tax Ref 72,620 2026 4.000-4.500 71,320 265 71,055 Series 2007 Hotel Occupancy Tax Note 5,500 2010 4.042 5,500 5,500 Series 2008 Hotel Occupancy Tax Ref 135,000 2034 Variable 131,000 1,500 129,500 Series 2003 Municipal Drainage 44,150 2028 2.000-5.000 37,395 1,280 36,115 Series 2005 Municipal Drainage 61,060 2030 3.500-5.250 55,535 1,515 54,020 Series 2001 Municipal Facility Corp 14,465 2020 3.370-5.200 9,780 9,055 725 Series 2010 Municipal Facility Corp Ref 9,090 2020 1.000-3.250 9,090 125 8,965 Convention Series 2005A 129,930 2039 4.750-5.000 129,930 129,930 Convention Series 2005B 78,215 2028 4.500-5.310 78,215 2,150 76,065 Starbright Industrial Development Corp. 24,685 2033 2.180-5.110 23,075 565 22,510
Total Revenue Bonds 767,117$ 570,252$ 9,090$ 21,955$ 557,387$ Total 2,919,182$ 1,698,007$ 413,180$ 308,325$ 1,802,862$
1
Issue
Governmental Activity Long-Term Debt
A portion of the Hotel Occupancy Tax Revenue Bonds Series 1996 was sold as Capital Appreciation Bonds (CABS). Interest on the CABS accrete from date of delivery and will
be payable only at maturity or redemption. Interest accreted through Fiscal Year 2010 has resulted in an increase of $20,077 in revenue bonds payable. This increase is
reflected in the combined Statement of Net Assets but is not shown in the above table.
Time of Original Issuance

CITY OF SAN ANTONIO, TEXAS
- 86 - Amounts are expressed in thousands
Note 6 Long-Term Debt (Continued) Primary Government (City) (Continued) Governmental Activity Long-Term Debt (Continued) Annual Requirements The annual requirement to amortize all general obligation bonds, certificates of obligation, tax notes, and all revenue bonds outstanding as of September 30, 2010 are as follows:
DirectPrincipal Interest Subsidy Principal Interest Principal Interest Principal Interest
72,780$ 46,377$ (4,017)$ 26,625$ 13,687$ 10,855$ 1,155$ 10,197$ 26,508$ 60,465 42,225 (3,825) 21,360 12,486 11,290 715 10,744 26,177 68,620 39,159 (3,825) 18,470 11,655 6,715 303 11,101 25,837 56,045 35,970 (3,825) 24,985 10,906 11,395 25,476 43,070 33,243 (3,825) 28,480 9,791 11,415 25,083
224,275 133,888 (19,127) 79,060 34,141 83,780 117,478 187,505 79,581 (17,652) 70,515 18,106 120,420 93,272 89,985 45,117 (14,191) 34,220 3,079 131,055 61,425 49,815 27,461 (9,611) 112,140 29,526 60,340 11,210 (3,923) 55,140 7,056
912,900$ 494,231$ (83,821)$ 303,715$ 113,851$ 28,860$ 2,173$ 557,387$ 437,838$
Principal and Interest Requirements
Year EndingSeptember 30,
2011
Tax Notes Revenue BondsGeneral
2031-2035
Obligation
20122013
Obligation Bonds
2036-2040Total
Certificates of
2021-20252026-2030
2016-202020152014
In May 2007, the citizens authorized the City to sell $550,000 in debt for the 2007-2012 Municipal Bond Program. The program included 151 projects designed to improve and enhance existing, as well as acquire or construct, new local streets, bridges, sidewalks, drainage facilities, parks, athletic facilities, libraries, and public health centers. The Bonds are categorized in five areas: Streets, Bridges and Sidewalks Improvements; Drainage Improvements; Parks, Recreation, Open Space, and Athletics Improvements; Library Improvements; and Public Health Facilities Improvements. The Bonds are pledged with and will be repaid from ad valorem tax revenue the City collects on an annual basis. The Bonds authorized but unissued as of September 30, 2010 are as follows:
Amount Bonds Previously Bonds AuthorizedPurpose Authorized Issued but Unissued
Streets, Bridges, and Sidewalks 306,998$ 199,449$ 107,549$ Drainage 152,052 97,532 54,520 Parks, Recreation, Open Space, and Athletics 79,125 78,187 938 Library 11,025 11,025 Public Health Facilities 800 800
550,000$ 386,993$ 163,007$
5/12/2007
5/12/2007
5/12/20075/12/2007
Authorized but Unissued General Obligation DebtAuthorization
Date
5/12/2007
Total
(The remainder of this page left blank intentionally)

CITY OF SAN ANTONIO, TEXAS
- 87 - Amounts are expressed in thousands
Note 6 Long-Term Debt (Continued) Primary Government (City) (Continued) Governmental Activity Long-Term Debt (Continued) Debt Limitation The amount of debt that the City may incur is limited by City Charter and by the Constitution of the State of Texas. The City Charter establishes a limitation on the general obligation debt supported by ad valorem taxes to an amount not to exceed 10.0% of the total assessed valuation. The total assessed valuation for the fiscal year 2010 was $84,481,611, which provides a debt ceiling of $8,448,161. The total outstanding debt that is secured by an ad valorem tax pledge is $1,300,330 including $54,855 that is reported in business-type activities. The Constitution of the State of Texas provides that the ad valorem taxes levied by the City for debt service and maintenance and operation purposes shall not exceed $2.50 for each hundred dollars of assessed valuation of taxable property. There is no limitation within the $2.50 rate for interest and sinking fund purposes; however, it is the policy of the Attorney General of the State of Texas to prohibit the issuance of debt by a city if such issuance produces debt service requirements that exceed the amount that can be paid from $1.50 tax rate calculated at 90.0% collections (please note that dollar figures in this paragraph are not reflected in thousands). Interfund Borrowings In certain instances, after an evaluation of project/purchase funding requirements, it has been determined that some funds or operations may require temporary financing. As an alternative to the issuance of external debt to finance those projects/purchases, the City has authorized internal temporary financing from available cash balances in the Internal Service Equipment Replacement Fund (Other Internal Service Fund) to meet those needs. In May 2008, a loan was authorized from the City’s Other Internal Service Fund to the City’s Tax Increment Reinvestment Zone to finance the purchase of the draft River North Master Plan, in an amount not to exceed $650. The principal amount of the loan was $648, with quarterly interest to be calculated at the City’s pooled investment portfolio rate. The City’s average rate for the year ended September 30, 2010, was 0.5%, resulting in interest of $3. Repayment of the principal and interest on this loan will occur as funding is available from the revenues of the TIRZ. The following is a summary of changes in the loan for the year-ended September 30, 2010:
Balance BalanceOctober 1, 2009 Additions Reductions September 30, 2010
648$ -$ -$ 648$
(The remainder of this page left blank intentionally)

CITY OF SAN ANTONIO, TEXAS
- 88 - Amounts are expressed in thousands
Note 6 Long-Term Debt (Continued) Primary Government (City) (Continued) Governmental Activity Long-Term Debt (Continued) In June 2009, a loan in the amount of $460 was authorized for a period of not more than two years from the City’s Other Internal Service Fund to the General Fund to finance the City’s participation in an interagency agreement with the San Antonio Water System to implement a water efficiency project at the HemisFair Fountain. Upon completion of the project, the City was eligible for a one-time rebate, subject to SAWS Board approval. In January 2010, the City received a rebate of $182. This rebate will be used to reimburse the loan from the Other Internal Service Fund along with the annual utility savings that will be realized in the Downtown Operations Department Operating Budget (General Fund) by reducing the Fountain’s need to use SAWS water. The HemisFair Fountain uses an estimated 36,000 gallons of water each year which equates to an annual estimated cost of $130 to the Downtown Operations Department (General Fund). These savings will be transferred to the Other Internal Service Fund with interest as needed to reimburse the Fund for its loan for the capital project. The following is a summary of changes in the loan for the year ended September 30, 2010:
Balance BalanceOctober 1, 2009 Additions Reductions September 30, 2010
460$ -$ 203$ 257$
Leases The City leases property and equipment from others. Leased property having elements of ownership are recorded in the government-wide financial statements. The related obligations, in amounts equal to the present value of minimum lease payments payable during the remaining term of the leases, are also recorded in the government-wide financial statements. Other leased property, not having elements of ownership, are classified as operating leases. Both capital and operating lease payments are recorded as expenditures when matured in the governmental fund financial statements. Total expenditures for operating leases for the fiscal year-ended September 30, 2010 were approximately $7,636. The City has entered into various lease purchase agreements for the acquisition of printers and related components, fire fighting gear, self-contained breathing apparatus, a mainframe computer, various fire trucks and parts, electrocardiograms, an inventory theft detection system, and hybrid vehicles. These lease agreements qualify as capital leases for accounting purposes and have been recorded at the present value of their future minimum lease payments as of the date of inception. Payments on each of the lease purchases will be made from budgeted annual appropriations to be approved by the City Council. The assets acquired through capital leases for governmental activities are as follows:
Machinery and Equipment 38,423$ Less: Accumulated Depreciation (21,290)
Total 17,133$

CITY OF SAN ANTONIO, TEXAS
- 89 - Amounts are expressed in thousands
Note 6 Long-Term Debt (Continued) Primary Government (City) (Continued) Governmental Activity Long-Term Debt (Continued) As of September 30, 2010, the City had future minimum lease payments under capital and operating leases with a remaining term in excess of one year for governmental activities as follows:
Capital OperatingLeases Leases Total
Fiscal Year Ending September 30:2011 3,621$ 7,267$ 10,888$ 2012 1,437 6,755 8,192 2013 699 5,349 6,048 2014 281 3,175 3,456 2015 2,029 2,029
2016-2020 7,308 7,308 2021-2025 1,413 1,413 2026-After 412 412
Future Minimum Lease Payments 6,038 33,708$ 39,746$ Less: Interest (242)
Present Value of Future Minimum Lease Payments 5,796 Less: Current Portion (3,467)
Capital Lease, Net of Current Portion 2,329$
Business-Type Activity Long-Term Debt Business-Type Activity long-term debt applies to those City operations that relate to business and quasi-business activities where net income and capital maintenance are measured (Enterprise Funds). Long-term debt, which is to be repaid from enterprise fund resources, is reported in the respective proprietary fund. The long-term indebtedness of the City’s Enterprise Funds is presented in the discussion that follows. Airport System – The Airport System includes the City of San Antonio International Airport and Stinson Municipal Airport and all land, buildings, structures, equipment, and facilities pertaining thereto. The Airport System’s long-term debt consists of Airport System Revenue Improvement Bonds (GAR) and Passenger Facility Charge and Subordinate Lien Bonds (PFC). GAR Bonds are payable from and secured solely by an irrevocable first lien on and pledge of the gross revenues of the Airport System. Gross revenues of the Airport System include all revenues of any nature derived from contracts or use agreements with airlines and other users of the Airport System and its facilities. PFC Bonds are payable from and secured by an irrevocable first lien on and pledge of the PFC revenues and a first lien on and pledge of the subordinate net revenues. On March 18, 2010, the City issued $34,500 in Tax Notes, Series 2010. The Notes were issued to provide interim financing to fund $15,250 in General Airport capital improvements and $19,250 in PFC eligible capital improvements at the San Antonio International Airport. The Notes mature in 2011 and have an interest rate of 0.6%. While the Notes are secured by ad valorem taxes, no property taxes will be utilized to pay the debt service on the Notes and the Notes will be refunded through the issuances of GAR and PFC Bonds planned for fiscal year 2011. Parking System – The Parking System operation includes the ownership and operation of parking facilities, parking lots, parking meters, and retail/office space. Long-term debt is allocated to the Parking System on a pro rata basis from proceeds received from the issuance of taxable general obligation debt and is paid from revenues derived from the operation of the Parking System. The allocated debt is secured by an ad valorem tax pledge.

CITY OF SAN ANTONIO, TEXAS
- 90 - Amounts are expressed in thousands
Note 6 Long-Term Debt (Continued) Primary Government (City) (Continued) Business-Type Activity Long-Term Debt (Continued) Solid Waste Management – Solid Waste Management was established on a financially self-supporting basis in 1988. Revenues are received from garbage collection fees which are utilized to pay operating costs and indebtedness. Long-term debt is allocated to Solid Waste Management on a pro rata basis from proceeds received from the issuance of general obligation and certificates of obligation debt for Solid Waste Management related improvements and is paid from revenues derived from the operation of Solid Waste Management. The allocated debt is secured by an ad valorem tax pledge. On March 23, 2010, $545 of the $156,255 General Improvement Refunding Bonds, Series 2010 was allocated to Solid Waste Management. The net proceeds for the allocated portion of the bonds from the sale of the General Improvement Refunding Bonds, Series 2010, which included a premium of $72, were applied to fund an escrow account for the redemption, discharge, and defeasance of the refunded obligations. As a result of converting the debt, the City will realize a total decrease of $37 in debt service payments and total deferred charges of $44. Through this defeasance, the City obtained an economic gain (difference between the present values of the debt service payments on the old and new debt plus the City’s cash contribution) of $23. The allocated Bonds have maturities ranging from 2018 to 2021, with interest rates ranging from 2.0% to 5.0%. Capitalized Interest Costs - Interest costs incurred on revenue bonds and other borrowing totaled $18,890 for the Airport System. For fiscal year 2010, the amount of $3,736 was capitalized for the Airport System and included as an addition to construction in progress. Interest costs for nonmajor enterprise funds were not capitalized as there was no construction in progress in these funds during fiscal year 2010. Prior Years’ Defeased Debt In prior years, the City advance refunded, prior to maturity, certain revenue bonds. The refunding bonds were utilized to purchase securities, which are direct obligations of the United States of America (the Purchased Securities). The Purchased Securities plus cash were deposited into irrevocable escrow accounts in amount scheduled to mature in principal amounts that, when added to interest earned on the Purchase Securities plus remaining balances in the escrow fund, are fully sufficient to make timely payment on the principal, premium if any, and interest scheduled to come due on the refunded obligations. The refunded obligations represent a legal defeasance and are no longer a liability of the City; therefore, they are not included in the City’s financial statements. On September 30, 2010, $18,435 of previously defeased bonds was outstanding.
(The remainder of this page left blank intentionally)

CITY OF SAN ANTONIO, TEXAS
- 91 - Amounts are expressed in thousands
Note 6 Long-Term Debt (Continued) Primary Government (City) (Continued) Business-Type Activity Long-Term Debt (Continued) The following table is a summary of changes in debt obligations for the fiscal year ended September 30, 2010:
Original Amount
Final Principal Payment
Interest Rates (%)
Balance Outstanding October 1,
2009Additions
During YearDeletions
During Year
Balance Outstanding September 30, 2010
Airport System:Revenue Bonds:
Series 2001 17,795$ 2016 5.375 17,795$ -$ -$ 17,795$ Series 2002 92,470 2027 5.000-5.750 85,450 2,410 83,040 Series 2002 PFC 37,575 2027 4.000-5.750 31,400 1,040 30,360 Series 2003 Refunding 50,230 2013 5.500-6.000 23,525 5,380 18,145 Series 2005 PFC 38,085 2030 3.375-5.250 34,590 955 33,635 Series 2006 17,850 2014 5.000 14,095 2,410 11,685 Series 2007 82,400 2032 4.950-5.250 82,400 1,965 80,435 Series 2007 PFC 74,860 2032 5.000-5.250 71,125 1,695 69,430
Tax NotesSeries 2010 34,500 2011 0.600 34,500 34,500
Subtotal 445,765$ 360,380$ 34,500$ 15,855$ 379,025$
Parking System:General Obligation Bonds:
Series 2004 Refunding 13,245$ 2016 2.800-4.650 7,455$ -$ 700$ 6,755$ Series 2008 Refunding 10,120 2024 5.820-6.570 10,120 10,120
Subtotal 23,365$ 17,575$ -$ 700$ 16,875$
Solid Waste Management:General Obligation Bonds:
Series 2006 Refunding 1,000$ 2026 3.500-5.000 905$ -$ 105$ 800$ Series 2010 Refunding 545 2021 2.000-5.000 545 545
Certificate of Obligations:Series 2006 400 2026 3.500-5.000 365 15 350 Series 2007 2,500 2028 4.000-5.000 2,350 565 1,785
Subtotal 4,445$ 3,620$ 545$ 685$ 3,480$ Total 473,575$ 381,575$ 35,045$ 17,240$ 399,380$
Issues
Business-type Activity Long-Term Debt
The annual requirements to amortize long-term debt for the City’s Enterprise Funds related to general obligation bonds, certificates of obligation, tax notes, and revenue bonds outstanding at September 30, 2010 are as follows:
Year EndingSept. 30: Principal Interest Total Principal Interest Total Principal Interest Total
2011 17,210$ 18,158$ 35,368$ 800$ 901$ 1,701$ 135$ 164$ 299$ 2012 52,625 17,541 70,166 1,175 862 2,037 140 157 297 2013 19,135 16,226 35,361 1,300 810 2,110 145 151 296 2014 17,170 15,168 32,338 1,480 750 2,230 150 145 295 2015 18,265 14,259 32,524 1,000 694 1,694 165 137 302
2016-2020 72,625 58,139 130,764 5,465 2,773 8,238 925 549 1,474 2021-2025 84,440 38,610 123,050 5,655 934 6,589 1,180 303 1,483 2026-2030 76,120 15,919 92,039 640 53 693 2031-2035 21,435 1,665 23,100
Total 379,025$ 195,685$ 574,710$ 16,875$ 7,724$ 24,599$ 3,480$ 1,659$ 5,139$
Airport System Parking SystemPrincipal and Interest Requirements
Solid Waste Management

CITY OF SAN ANTONIO, TEXAS
- 92 - Amounts are expressed in thousands
Note 6 Long-Term Debt (Continued) Primary Government (City) (Continued) Business-Type Activity Long-Term Debt (Continued) Leases The City has entered into various lease purchase agreements for the acquisitions of refuse collection containers, refuse collections trucks, brush grappler trucks, and brush tractor/trailer combinations. These lease agreements qualify as capital leases for accounting purposes and have been recorded at the present value of their future minimum lease payments as of the date of inception. Payments on each of the lease purchases will be made from budgeted annual appropriations to be approved by the City Council. While the garbage containers meet the criteria for capital lease recognition these items were expensed during the current year as their individual costs were below the City’s capitalization threshold. The assets acquired through capital leases for business-type activities are as follows:
Machinery and Equipment 23,893$ Less: Accumulated Depreciation (5,781)
Total 18,112$
As of September 30, 2010, the City had future minimum payments under capital and operating leases with a remaining term in excess of one year for business-type activities as follows:
Capital OperatingLeases Leases Total
Fiscal Year Ending September 30, 2011 8,467$ 318$ 8,785$ 2012 5,776 18 5,794 2013 4,671 4,671 2014 3,422 3,422 2015 3,374 3,374
2016-2017 2,071 2,071 Future Minimum Lease Payments 27,781 336$ 28,117$
Less: Interest (2,166) Present Value of Future Minimum Lease Payments 25,615
Less: Current Portion (7,688) Capital Leases, Net of Current Portion 17,927$
(The remainder of this page left blank intentionally)

CITY OF SAN ANTONIO, TEXAS
- 93 - Amounts are expressed in thousands
Note 6 Long-Term Debt (Continued) Primary Government (City) (Continued) Governmental and Business-Type Activities Long-Term Debt Long-term obligations and amounts due within one year:
Beginning Ending Due WithinBalance Increases Decreases Balance One Year
Governmental Activities:Bonds Payable:
General Obligation Bonds 731,270$ 356,060$ (174,430)$ 912,900$ 72,780$ Tax-Exempt Certificates of Obligation 348,235 38,375 (82,975) 303,635 26,545 Taxable Certificates of Obligation 155 (75) 80 80 Tax Notes 48,095 9,655 (28,890) 28,860 10,855 Revenue Bonds 570,252 9,090 (21,955) 557,387 10,197
Gross Bonds Payable 1,698,007 413,180 (308,325) 1,802,862 120,457 Unamortized (Discount) / Premium 46,566 27,680 (10,220) 64,026 7,462 Deferred Amount on Refunding (14,038) (13,780) 2,444 (25,374) (1,919)
Net Bonds Payable 1,730,535 427,080 (316,101) 1,841,514 126,000 Total Commercial Paper 1 25,805 (11,435) 14,370 Other Payables:
Accrued Arbitrage Rebate Payable 3 182 (182) - Capital Lease Liability 10,567 (4,771) 5,796 3,467 Accrued Leave Payable 184,080 4,751 (270) 188,561 41,788 Notes Payable 53,355 (2,475) 50,880 2,000 Pollution Remediation Liability 4 904 1,529 (608) 1,825 Net OPEB Obligation 2 41,441 18,661 60,102
Total Other Payables 290,529 24,941 (8,306) 307,164 47,255 Total Governmental Activities
Long-Term Liabilities 2,046,869$ 452,021$ (335,842)$ 2,163,048$ 173,255$
Business-Type Activities:Bonds Payable:
General Obligation Bonds 18,480$ 545$ (805)$ 18,220$ 835$ Tax-Exempt Certificates of Obligation 2,715 (580) 2,135 100 Tax Notes 34,500 34,500 Revenue Bonds 360,380 (15,855) 344,525 17,210
Gross Bonds Payable 381,575 35,045 (17,240) 399,380 18,145 Unamortized (Discount) / Premium 10,185 94 (1,112) 9,167 966 Deferred Amount on Refunding (4,206) (44) 729 (3,521) (726)
Net Bonds Payable 387,554 35,095 (17,623) 405,026 18,385 Capital Lease Liability 24,664 7,495 (6,544) 25,615 7,688 Accrued Landfill Postclosure Costs 3 2,353 (296) 2,057 177 Pollution Remediation Liability 4 700 700 Net OPEB Obligation 2 8,510 3,632 12,142 Accrued Leave Payable 4,390 (121) 4,269 712
Total Other Payables 40,617 11,127 (6,961) 44,783 8,577 Total Business-Type Activities
Long-Term Liabilities 428,171$ 46,222$ (24,584)$ 449,809$ 26,962$
1 See Note 7, Commercial Paper Programs for a description of the commercial paper program.
2 See Note 9, Postemployment Retirement Benefits for a description of the postemployment program.
3 See Note 11, Commitments and Contingencies for a description of the Arbitrage and Landfill Postclosure Care Costs.
4 See Note 12, Pollution Remediation Obligation for a description of the Pollution Remediation Liability.
NOTE: The accreted interest through fiscal year 2010 has resulted in an increase of $20,077 in Hotel Occupancy Tax Revenue Bondspayable in governmental activities. The accreted interest in the amount of $20,077 is reflected on the governmental fund combinedstatement but is not reflected in this table.

CITY OF SAN ANTONIO, TEXAS
- 94 - Amounts are expressed in thousands
Note 6 Long-Term Debt (Continued) Primary Government (City) (Continued) Governmental and Business-Type Activities Long-Term Debt (Continued) Accrued Leave The following is a summary of accrued leave for the year-ended September 30, 2010:
Short-Term Short-Term Total Fund Type Available Remaining Short-Term Long-Term Total
Governmental Funds 12,433$ 28,902$ 41,335$ 144,511$ 185,846$ Internal Service Funds 453 453 2,262 2,715
Total Governmental Activities 12,433$ 29,355$ 41,788$ 146,773$ 188,561$
Governmental Activities
The General Fund accounts for approximately 65.0% of the City’s employees; therefore, most of the accrued leave liability has been liquidated from the General Fund. When a City employee terminates, the fund that their salary was charged to throughout the year will be the same fund that will pay their accrued leave.
Fund Short-Term Long-Term TotalAirport System 372$ 1,858$ 2,230$ Nonmajor Enterprise Funds 340 1,699 2,039
Total Business-Type Activities 712$ 3,557$ 4,269$
Business-Type Activities
Conduit Debt Obligations The City facilitates the issuance of bonds to enable the San Antonio Industrial Development Authority, Health Facilities Development Corporation and the Education Facilities Corporation (formerly known as Higher Education Authority), component units of the City, to provide financial assistance to various entities for the acquisition, construction, or renovation of facilities deemed to be in the public interest. The bonds are secured by the property financed and are payable solely from payments received on the underlying mortgage loans. Upon repayment of the bonds, ownership of the acquired property transfers to the entity served by the bond issuance. As of September 30, 2010, the aggregate principal amounts payable are as follows: seven series of Education Facility Revenue Bonds in the amount of $113,174; and one series of Empowerment Zone Development Revenue Bonds in the amount of $12,800. The City also facilitates the issuance of tax-exempt revenue bonds to enable the San Antonio Housing Finance Corporation to provide financing of residential developments for persons of low and moderate income. The bonds are secured by the property financed and are payable solely from, and secured by, a pledge of rental receipts. As of September 30, 2010, 29 series of tax-exempt revenue bonds were outstanding, with an aggregate principal amount payable of $265,139 and an aggregate principal amount issued of $223,802. To provide for the acquisition and construction of certain airport facilities, the City has issued Special Airport Facilities Revenue Refunding Bonds, Series 1995. The bond is payable pursuant to lease agreements, which stipulate that various commercial entities are obligated to pay amounts to a third-party trustee in lieu of lease payments to the City. These payments are sufficient to pay for the principal, premium, interest, and purchase price of the bond when they become due. The aggregate principal amount outstanding for the Special Airport Facilities Revenue Refunding Bonds, Series 1995 at September 30, 2010 was $3,000.

CITY OF SAN ANTONIO, TEXAS
- 95 - Amounts are expressed in thousands
Note 6 Long-Term Debt (Continued) Primary Government (City) (Continued) Governmental and Business-Type Activities Long-Term Debt (Continued) The City entered into an agreement with the Port to fund renovations at the Port, in the amount of $20,000. The Department of Housing and Urban Development (HUD) provides the funding for the loan through a Section 108 Loan. The loan is secured by pledged Port revenues and property and is payable solely from payments received by the Port. As of September 30, 2010, the aggregate amount of the outstanding loan totaled $12,155. The City has authorized San Antonio Housing Trust Finance Corporation to issue single family and multi-family mortgage revenue bonds used to provide affordable housing to the City of San Antonio. The bonds are payable solely out of the revenues and receipts derived from any residential development or home mortgage financed by the bonds. As of September 30, 2010, the amount of conduit debt was $49,188. The City also facilitates the issuance of tax-exempt revenue bonds for SA Energy Acquisition Public Facility Corporation (SAEAPFC) to enter into long-term prepaid purchases of natural gas. SAEAPFC in turn, sells contracted volumes of the prepaid gas to CPS Energy on a monthly basis at a discounted rate, which is passed on to CPS Energy’s gas customers through reduced utility costs. The bonds are secured by the gas supplier and are payable primarily from the contracted volume sales and associated gas swap payments. As of September 30, 2010, SAEAPFC issued one series of tax-exempt revenue bonds with an aggregate principal amount outstanding of $587,940. Neither the City, the State of Texas, nor any political subdivision of the State of Texas, is obligated in any manner for repayment of the aforementioned bonds, loans or leases. Accordingly, the bonds, loans, and leases are not reported as liabilities in the accompanying financial statements. CPS Energy To support its long-term capital financing needs, CPS Energy uses several types of debt instruments. As of January 31, 2010 these included fixed-rate and variable-rate bonds, as well as commercial paper. Relative to the bond instruments, provisions may be included that allow for refunding after specified time periods during the bond term. Current refundings involve issuing new debt (refunding bonds) to redeem existing debt (refunded bonds) that can be called within 90 days of issuing the refunding bonds. Advance refunding of bonds involves issuing new debt to redeem existing debt that cannot be called within 90 days of issuing the refunding bonds. In these circumstances, the refunding bond proceeds are irrevocably escrowed with a third party. These proceeds, and income thereon, are used to pay the debt service on the refunded bonds until the refunded bonds can be called. Refunding bonds are generally issued to achieve debt service savings. Subject to applicable timing restrictions that may prevent early payoff, CPS Energy also has the option to defease or extinguish debt with cash. A bond defeasance occurs when cash is placed in an irrevocable trust to be used solely for satisfying scheduled payments of both interest and principal of the defeased debt, which fully discharges the bond issuer’s obligation. At the time of an extinguishment with cash, since the issuer no longer has the legal obligation, the defeased debt is removed from the balance sheets, the related unamortized costs are expensed and the gain or loss is immediately recognized. For current and advance refundings, the difference between the reacquisition price and the net carrying amount of the old debt is deferred and reported as a deduction or addition to the new debt liability. The deferred amount is amortized as a component of interest expense over the shorter remaining life of the refunding or the refunded debt.

CITY OF SAN ANTONIO, TEXAS
- 96 - Amounts are expressed in thousands
Note 6 Long-Term Debt (Continued) CPS Energy (Continued) On January 20, 2009, CPE Energy’s board of trustees authorized the establishment of a flexible rate revolving note program to provide additional liquidity in support of the Systems. Under the program, CPS Energy can issue taxable or tax-exempt notes with individual maturities of one year or less at fixed or variable interest rates in an aggregate principal amount at any one time outstanding not to exceed $100,000. The program became effective on April 28, 2009, and authorizes the issuance of such notes through November 1, 2028. There were no outstanding notes under this program as of January 31, 2010. As of January 31, 2010, the bond ordinances for New Series Bonds issued on and after February 1, 1994 contained, among others, the following provisions: Revenue deposited in CPS Energy’s General Account shall be pledged and appropriated to be used in the following priority for: • Maintenance and operating expenses of CPS Energy; • Payments of the New Series Bonds; • Payment of Prior Lien Bonds, including Junior Lien Obligations; • Payment of the Notes and the Credit Agreement (as defined in the ordinance authorizing Commercial Paper); • Payment of any Inferior Lien Obligations issued, which are inferior in lien to the New Series Bonds, the Prior
Lien Bonds and the Notes and Credit Agreement; • An annual amount equal to 6.0% of the gross revenue of CPS Energy to be deposited in the Repair and
Replacement Account; • Cash payments and benefits to the General Fund of the City not to exceed 14.0% of the gross revenue of CPS
Energy; and • Any remaining net revenues of CPS Energy in the General Account to the Repair and Replacement Account,
which is used to partially fund construction costs. The maximum amount in cash to be transferred or credited to the City’s General Fund from the net revenues of CPS Energy during any fiscal year shall not exceed 14.0% of the gross revenues of CPS Energy, less the value of gas and electric services of CPS Energy used by the City for municipal purposes and the amounts expended during the fiscal year for additions to the street lighting system and other authorized exclusions. The percentage of gross revenues of CPS Energy to be paid over, or credited to, the City’s General Fund each fiscal year shall be determined (within the 14.0% limitation) by the governing body of the City. The net revenues of CPS Energy are pledged to the payment of principal of and interest on the New Series Bonds, which are classified as Senior Lien Obligations. All New Series Bonds and the interest thereon shall have a first lien upon the net revenues of CPS Energy. The Junior Lien, Variable-Rate Demand Obligation (VRDO) bonds are debt instruments of the City payable solely from, and equally and ratably secured by, a junior lien on and pledge of the net revenues of CPS Energy, subject and subordinate to liens and pledges securing the outstanding Senior Lien Obligations and any additional Senior Lien Obligations hereafter issued, and superior to the pledge and lien securing the currently outstanding Commercial Paper Obligations, all as fully set forth in the ordinances authorizing the issuance of the Junior Lien Obligations as noted below: The City agrees that it will at all times maintain rates and charges for the sale of electric energy, gas, or other services furnished, provided, and supplied by CPS Energy to the City and all other consumers, which shall be reasonable and nondiscriminatory and which will produce income and revenues sufficient to pay: • All operation and maintenance expenses, depreciation, replacement and betterment expenses, and other
costs as may be required by Chapter 1502 of the Texas Government code, as amended;

CITY OF SAN ANTONIO, TEXAS
- 97 - Amounts are expressed in thousands
Note 6 Long-Term Debt (Continued) CPS Energy (Continued) • The interest on, and principal of, all Parity Bonds, as defined in the New Series Bond Ordinances, as and when
the same shall become due, and for the establishment and maintenance of the funds and accounts created for the payment and security of the Parity Bonds;
• The interest on, and principal of, the Prior Lien Bonds, including the Junior Lien Obligations and any additional Junior Lien Obligations hereafter issued (all as defined in the New Series Bond Ordinances), as and when the same shall become due, and for the establishment and maintenance of the funds and accounts created for the payment and security of the Junior Lien Obligations and any additional Junior Lien Obligations;
• To the extent the same are reasonably anticipated to be paid with available revenues (as defined in the Ordinance authorizing the Commercial Paper), the interest on and principal of all Notes (as defined in said Ordinance), and the Credit Agreement (as defined in said Ordinance); and
• Any legal debt or obligation of CPS Energy as and when the same shall become due. As of January 31, 2010, the Tax-Exempt Commercial Paper (TECP) Ordinance contains, among others, the following provisions: To secure the payment of TECP principal and interest, a pledge is made of: • Proceeds from:
− The sale of bonds and additional notes issued for such purposes, and − The sale of TECP;
• Loans under and pursuant to the revolving credit agreement; and • The net revenues of CPS Energy, after payment on New Series Bond requirements and Prior Lien Bond
Obligations. Revenue Bonds On March 12, 2009, CPS Energy issued $442,005 of New Series 2009A Revenue Refunding Bonds. The true interest cost for this issue, which has maturities that extend from 2015 to 2034, was 4.9%. The bond proceeds, including the premium associated with the bonds, were used on March 13, 2009 to refund $450,000 of outstanding TECP obligations. The American Recovery and Reinvestment Act of 2009 provided authority for the issuance of Build America Bonds (BABs), which are issuable in calendar years 2009 and 2010, limited to new money capital expenditures, and only issued as taxable bonds. The BABs also permit the issuer (or the bondholder) to receive a subsidy payment equal to 35.0% of the bond’s interest directly from the U.S. Department of the Treasury. On June 12, 2009, CPS Energy issued $375,000 of taxable New Series 2009C Revenue Direct Subsidy BABs. The true interest cost for this issue, which has maturities that extend from 2033 to 2039, was 3.9%. The total BABs subsidy received in fiscal year 2010 was $5,000. Total bond proceeds are primarily being used to fund generation and electric distribution construction projects. At one point, CPS Energy contemplated issuing a portion of the 2009C instruments as nontaxable bonds. These would have been 2009B Revenue Bonds (2009B Bonds). Since the effective interest rate and investor interest were more favorable for BABs, the 2009B Bonds were not pursued. On July 30, 2009, CPS Energy issued $207,940 of tax exempt New Series 2009D Revenue Refunding Bonds. The true interest cost for this issue, which has maturities that extend from 2017 to 2021, was 3.7%. On September 1, 2009, the escrowed proceeds, including the premium associated with the bonds, were used to refund $227,660 par value of the remaining New Series 1998A Bonds. This refunding transaction resulted in a net present value debt service savings of $14,800, or 6.5% of the par amount of the bonds being refunded.

CITY OF SAN ANTONIO, TEXAS
- 98 - Amounts are expressed in thousands
Note 6 Long-Term Debt (Continued) CPS Energy (Continued) Revenue Bonds (Continued)
Weighted-AverageYield on Outstanding January 31,
Maturities Bonds at January 31, 2010 2010Tax Exempt New Series Bonds, 1994A-2009D; 2011-2034 4.8% 3,366,495$ Taxable new series bonds 2009C, 2033-2039 3.9% 375,000
Total 4.6% 3,741,495 Tax Exempt Variable-Rate Series Bonds, 2003-2004, 2024-2033 402,000
Total Long-Term Revenue Bonds Outstanding 4,143,495 Less: Current Maturities of Bonds 162,235
Total Revenue Bonds Outstanding, Net of Current Maturities 3,981,260$
CPS Energy Revenue Bond Summary
As of January 31, 2010, principal and interest amounts due for all revenue bonds outstanding for each of the next five years and thereafter to maturity are:
DirectYear Principal Interest Subsidy Total2011 162,235$ 197,855$ (7,855)$ 352,235$ 2012 176,190 189,476 (7,855) 357,811 2013 173,925 180,519 (7,855) 346,589 2014 184,255 171,335 (7,855) 347,735 2015 157,035 161,584 (7,855) 310,764
2016-2020 863,970 684,623 (39,277) 1,509,316 2021-2025 1,185,445 449,965 (39,277) 1,596,133 2026-2030 496,965 238,727 (39,277) 696,415 2031-2035 476,333 135,727 (37,803) 574,257 2036-2039 267,142 40,734 (14,257) 293,619
Totals 4,143,495$ 2,450,545$ (209,166)$ 6,384,874$
CPS EnergyPrincipal and Interest Requirements
The above table includes Senior Lien and Junior Lien bonds. Interest on the Senior Lien bonds is based upon the stated coupon rates of each series of bonds outstanding. The direct subsidy associated with the New Series 2009C BABs has been presented in a separate column. CPS Energy has taken the position that the BABs direct subsidy should be deducted when calculating total debt service. The 2003 Junior Lien bonds were issued as variable-rate bonds and as such have interest rates that reset on a weekly basis. On December 1, 2007, the 2004 Junior Lien bonds were remarketed for a three-year term at an interest rate of 3.6%. This interest rate will remain in effect until the next interest reset date of December 1, 2010. The total interest amounts for all revenue bonds outstanding included a blended interest rate of 1.5% for the 2003 and 2004 Junior Lien Bonds.

CITY OF SAN ANTONIO, TEXAS
- 99 - Amounts are expressed in thousands
Note 6 Long-Term Debt (Continued) CPS Energy (Continued) Revenue Bonds (Continued) The interest rate term mode for the Junior Lien Revenue bonds, or any portion thereof, may be converted to a different mode, or to an auction rate or term rate with an interest rate period of different duration, at the direction of the City. Following such a conversion, the Junior Lien Revenue bonds, or portion thereof, will bear interest at the corresponding daily rate, weekly rate, auction rate, commercial paper rate, term rate, or fixed rate. The turmoil in the capital markets has had a minimal impact on CPS Energy’s variable-rate debt. Initially, rates increased during a two-month period at the onset of the financial crisis, but have since decreased and stabilized. CPS Energy continues to monitor the markets on a daily basis and is in close communication with its remarketing agents, financial advisors and bond counsel.
Balance BalanceFinal Interest Outstanding Additions Decreases Outstanding
Original Principal Rates February 1, During During January 31,Amount Payment (%) 2009 Year Year 2010
Revenue and Refunding Bonds:1994A Tax Exempt 684,700$ 2012 5.008 68,965$ -$ -$ 68,965$ 1998A Tax Exempt 785,515 2021 4.918 227,660 227,660 2000A Tax Exempt 170,770 2010 5.374 2,490 2,490 2001 Tax Exempt 115,280 2011 3.843 38,135 25,710 12,425 2002 Tax Exempt 436,090 2017 4.055 406,610 45,030 361,580 2002 Tax Exempt 140,615 2015 4.751 10,525 10,525 2003 Tax Exempt Junior Lien 250,000 2033 Variable 250,000 250,000 2003A Tax Exempt 93,935 2014 3.675 81,550 310 81,240 2003 Tax Exempt 350,490 2013 3.081 144,785 25,835 118,950 2004 Tax Exempt Junion Lien 160,000 2027 Variable 152,000 152,000 2005 Tax Exempt 294,625 2020 4.381 294,625 294,625 2005 Tax Exempt 240,675 2025 4.683 240,675 240,675 2005A Tax Exempt 197,335 2025 4.571 197,335 197,335 2006A Tax Exempt 384,185 2025 4.555 371,515 13,290 358,225 2006B Tax Exempt 128,845 2021 3.974 112,670 8,540 104,130 2007 Tax Exempt 46,195 2018 4.159 46,195 46,195 2007 Tax Exempt 403,215 2032 4.575 403,215 403,215 2008 Tax Exempt 287,935 2032 4.582 287,935 287,935 2008A Tax Exempt 158,030 2016 3.736 158,030 27,500 130,530 2009A Tax Exempt 442,005 2034 4.863 442,005 442,005 2009C Taxable 375,000 2039 3.944 375,000 375,000 2009D Tax Exempt 207,940 2021 3.720 207,940 207,940
3,494,915 1,024,945 376,365 4,143,495
Bonds Outstanding:Bond Current Maturities (148,705) (13,530) (162,235) Bond (Discount)/Premium 124,408 33,975 21,051 137,332 Bond Reacquisition Costs (76,497) (11,889) (27,078) (61,308) Revenue Bonds, Net 3,394,121 1,033,501 370,338 4,057,284 Tax Exempt Commercial Paper (TECP) Variable 450,000 350,000 450,000 350,000
Total Long-Term Debt, Net 3,844,121$ 1,383,501$ 820,338$ 4,407,284$
Long-Term Debt Activity
Issue
Accrued Leave As of January 31, 2010 the accruals for employee vested benefits were $15,500. These accruals are reported under Accounts Payable and Other Current Liabilities.

CITY OF SAN ANTONIO, TEXAS
- 100 - Amounts are expressed in thousands
Note 6 Long-Term Debt (Continued)
San Antonio Water System (SAWS) On April 30, 1992, the City Council approved the consolidation of City owned utilities related to water including the water, wastewater, and water reuse systems as the San Antonio Water System. The System – SAWS has been defined in City Ordinance No. 75686 as all properties, facilities and plants currently owned, operated, and maintained by the City and/or the board of trustees, for the supply, treatment, transmission and distribution of treated potable water, chilled water and steam, for the collection and treatment of wastewater and for water reuse, together with all future extensions, improvements, purchases, repairs, replacements and additions thereto, and any other projects and programs of SAWS provided, however, that the City retains the right to incorporate a stormwater system as provided by the Texas Local Government Code. Funds Flow – City Ordinance No. 75686 requires that gross revenues of SAWS be applied in sequence to (1) payment of current maintenance and operating expenses including a two-month reserve amount based upon the budgeted amount of maintenance and operating expenses for the current fiscal year; (2) Debt Service Fund requirements of Senior Lien Obligations; (3) Reserve Fund requirements of Senior Lien Obligations; (4) Interest and Sinking Fund and Reserve Fund requirements of Junior Lien Obligations; (5) Interest and Sinking Fund and Reserve Fund requirements of Subordinate Lien Obligations; (6) payment of amounts required on Inferior Lien Obligations; and (7) transfers to the City’s General Fund and to the Renewal and Replacement Fund. Reuse Contract – SAWS has a contract with CPS Energy, the City-owned electricity and gas utility, for the provision of reuse water. According to City Ordinance No. 75686, the revenues derived from the contract have been restricted in use to only reuse activities and are excluded from gross revenue for purposes of calculating any transfers to the City’s General Fund. No Free Service – City Ordinance No. 75686 also provides for no free services except for municipal firefighting purposes. Revenue Bonds On February 12, 2009, SAWS issued $163,755 City of San Antonio, Texas Water System Revenue and Refunding Bonds, Series 2009. The proceeds from the sale of the bonds were used to (i) finance capital improvement projects, (ii) refund $143,000 in outstanding commercial paper notes, and (iii) pay the cost of issuance. The bonds are collateralized, together with other currently outstanding Senior Lien Obligations, solely by a lien on a pledge of net revenues. On December 10, 2009, SAWS issued $12,250 City of San Antonio, Texas Water System Revenue Bonds, Series 2009A. The proceeds from the sale of the bonds were used to (i) finance capital improvement projects, and (ii) pay the cost of issuance. The bonds are collateralized, together with other currently outstanding Senior Lien Obligations, solely by a lien on a pledge of net revenues.
(The remainder of this page left blank intentionally)

CITY OF SAN ANTONIO, TEXAS
- 101 - Amounts are expressed in thousands
Note 6 Long-Term Debt (Continued) San Antonio Water System (SAWS) (Continued) Revenue Bonds (Continued) On December 10, 2009, SAWS issued $102,750 City of San Antonio, Texas Water System Revenue Bonds, Taxable Series 2009B (Direct Subsidy – Build America Bonds) (the Series 2009B Bonds). The proceeds from the sale of the bonds were used to (i) finance capital improvement projects, and (ii) pay the cost of issuance. The Series 2009B Bonds qualify for and were designated as Build America Bonds under and pursuant to the authority provided for in the American Recovery and Reinvestment Act of 2009 (the Stimulus Act). In connection with the issuance of the Series 2009B Bonds, and as permitted in the Stimulus Act, SAWS elected an option (which election is irrevocable pursuant to the provisions of the Stimulus Act) permitting it to receive directly from the United States Department of the Treasury (the Treasury) a subsidy payment equal to 35.0% of the taxable interest it pays on the Series 2009B Bonds (the Tax Credit). SAWS has provided for the Tax Credit to be delivered from the Treasury directly to the paying agent/registrar of the Series 2009B Bonds solely for the use to reduce the amount of the regularly scheduled debt service payment on the Series 2009B Bonds that SAWS is required to make. The Tax Credit is a general revenue of SAWS and is not directly pledged to the payment of the Series 2009B Bonds, however, SAWS anticipates that the entirety of the Tax Credit, as a result of the direct deposit from the Treasury to the paying agent/registrar will be available solely to off-set the scheduled debt service payment requirements attributable to the Series 2009B Bonds. The bonds are collateralized, together with other currently outstanding Senior Lien Obligations, solely by a lien on a pledge of net revenues. On December 30, 2009, SAWS issued $54,300 City of San Antonio, Texas Water System Junior Lien Revenue Bonds, Series 2009 through the Texas Water Development Board. The bonds were sold under the State Revolving Fund (SRF) Program. The proceeds from the sale of the bonds were used to (i) finance capital improvement projects which qualify under the Texas Water Development Board program, and (ii) pay the cost of issuance. The bonds are secured together with other currently outstanding Junior Lien Obligations solely by a lien on a pledge of net revenues and are subordinate to outstanding Senior Lien Obligations. On December 30, 2009, SAWS issued $35,000 City of San Antonio, Texas Water System Junior Lien Revenue and Refunding Bonds, Series 2009A (the Junior Lien Series 2009A Bonds) through the Texas Water Development Board. The bonds were sold under the Water Infrastructure Fund Loan Program (the WIF). The proceeds from the sale of the bonds were used to (i) finance the planning and design of the Brackish Groundwater Desalination Project, (ii) refund $12,000 in outstanding commercial paper notes, and (iii) pay the cost of issuance. Loans through the WIF are offered at a subsidized interest rate which is 2.0% below the Texas Water Development Board’s cost of funds, with a repayment period of 20 years. In order to advance projects which have significant development lead times, a portion of the WIF is available specifically for planning and design of projects (WIF Deferred), which offers an additional subsidy of deferring all interest and principal payments for up to 10 years, or until the end of the construction of the project, whichever is sooner. Interest is not charged by the Texas Water Development Board during the deferral period and the loan is amortized over the remaining life of the bond with a maximum maturity of 20 years. The Junior Lien Series 2009A Bonds were issued under the WIF Deferred option with amortization of principal and interest to begin in 2015 with a final maturity of 2029. The interest rates range from 0.6% to 2.8%, with an overall effective rate of 1.4% taking into account the deferral period. The bonds are collateralized, together with other currently outstanding Junior Lien Obligations, solely by a lien on a pledge of net revenues and are subordinate to outstanding Senior Lien Obligations. Senior Lien Water System Revenue Bonds, comprised of Series 2001, Series 2002, Series 2002-A, Series 2004, Series 2005, Series 2007, Series 2009, Series 2009A, and Series 2009B outstanding in the amount of $1,395,665 at December 31, 2009, are collateralized by a senior lien and pledge of the gross revenues of SAWS after deducting and paying the current expenses of operation and maintenance of SAWS and maintaining a two-month operating reserve for such expenses. Interest rates range from 2.5% to 6.3%.

CITY OF SAN ANTONIO, TEXAS
- 102 - Amounts are expressed in thousands
Note 6 Long-Term Debt (Continued) San Antonio Water System (SAWS) (Continued)
Revenue Bonds (Continued) Junior Lien Water System Revenue Bonds, comprised of Series 1999, Series 1999-A, Series 2001, Series 2001-A, Series 2002, Series 2002-A, Series 2003, Series 2004, Series 2004-A, Series 2007, Series 2007A, Series 2008, Series 2008A, Series 2009, and Series 2009A outstanding in the amount of $364,035 at December 31, 2009, are collateralized by a junior lien and pledge of the gross revenues of SAWS after deducting the current expenses of operation and maintenance of SAWS, maintaining a two-month operating reserve for such expenses, and paying debt service on senior lien debt. Interest rates range from 0.3% to 4.4%.
The following summarizes transactions of the Revenue Bonds for the year-ended December 31, 2009:
Beginning EndingBalance Balance Due Within
Jan. 1, 2009 Additions Reductions Dec. 31, 2009 One YearBonds Payable 1,427,525$ 368,055$ 35,880$ 1,759,700$ 38,590$ Deferred Amounts for Issuance (Discounts)/Premiums/(Losses) (19,343) 3,345$ 13 (16,011) Total Bonds payable, Net 1,408,182$ 371,400$ 35,893$ 1,743,689$ 38,590$
The following table shows the annual debt service requirements on SAWS’ debt obligations for each of the next five years and then in five year increments:
Year Ended Interest Federal Net InterestDecember 31, Principal Expense Subsidy Interest Principal Expense
2010 21,685$ 68,313$ (1,772)$ 66,541$ 16,905$ 10,770$ 2011 22,360 67,753 (1,904) 65,849 17,135 10,550 2012 23,365 66,746 (1,904) 64,842 17,615 10,068 2013 24,410 65,620 (1,904) 63,716 18,210 9,543 2014 25,635 64,374 (1,904) 62,470 18,790 8,978
2015-2019 154,460 300,186 (9,052) 291,134 113,170 38,046 2020-2024 254,515 249,354 (7,803) 241,551 74,725 22,401 2025-2029 302,695 175,807 (6,052) 169,755 40,265 13,311 2030-2034 228,545 113,782 (3,967) 109,815 22,475 7,786 2035-2039 295,455 47,153 (1,430) 45,723 24,745 2,504
2040 42,540 1,064 1,064 Total 1,395,665$ 1,220,152$ (37,692)$ 1,182,460$ 364,035$ 133,957$
Annual Debt Service RequirementsRevenue and Refunding Bonds
Junior LienSenior Lien
(The remainder of this page left blank intentionally)

CITY OF SAN ANTONIO, TEXAS
- 103 - Amounts are expressed in thousands
Note 6 Long-Term Debt (Continued) San Antonio Water System (SAWS) (Continued) Debt Covenants – SAWS is required to comply with various provisions included in the ordinances which authorized the bond issuances. SAWS is in compliance with all significant provisions of the ordinances. Defeasance of Debt – In current and prior years, SAWS defeased certain revenue bonds by placing revenues or proceeds of new bond issues in an irrevocable trust to provide for all future debt service payments on the old bonds. Accordingly, the trust accounts’ assets and liabilities for the defeased bonds are not included in SAWS’ financial statements. At December 31, 2009, $44,605 of bonds outstanding were considered defeased. Accrued Vacation Payable – SAWS records an accrual for vacation payable for all full-time employees and pays unused vacation hours available at the end of employment with the final paycheck. These accruals are reported under Other Payables.
Liability LiabilityBalance at Balance at Estimated
Beginning of Current-Year End of Due WithinFiscal Year Accruals Payments Fiscal Year One Year
Year EndedDecember 31, 2009 6,328$ 5,659$ (4,785)$ 7,202$ 4,785$
Note 7 Commercial Paper Programs Primary Government (City) In May 2007, the City adopted an ordinance authorizing the issuance of up to $50,000 in Sales Tax Revenue Commercial Paper Notes, Series A. Proceeds from the sale of the Commercial Paper Notes are to provide funds to acquire property for a conservation easement or open-space preservation program with the intent of protecting water in the Edwards Aquifer as contemplated by the “Edwards Aquifer Protection Venue Project” (authorized at an election held on May 7, 2005). As of September 30, 2010, $14,370 of Commercial Paper Notes are outstanding with various maturities ranging from 1 to 270 days. The Commercial Paper Notes are supported by an irrevocable direct-pay Letter of Credit dated as of May 23, 2007 issued by Bank of America, N.A. The role of the Letter of Credit provider is to assure the timely payment of principal and interest on the Commercial Paper Notes at maturity. The Letter of Credit provider has issued its irrevocable, direct-pay Letter of Credit for the account of the City and for the benefit of the issuing and paying agent on behalf of the note holders. The dealer for the Commercial Paper Notes is Ramirez & Co., Inc. as of July 1, 2008 and the issuing and paying agent is Wells Fargo, N.A. The Letter of Credit in an amount equal to $53,699 enables the City to pay at maturity the principal amount of the Commercial Paper Notes plus up to 270 days interest, at an assumed interest rate of 10.0% per year; provided however that none of the Commercial Paper Notes shall mature later than August 1, 2017. Under the terms of the Letter of Credit, the City may borrow up to an aggregate amount not to exceed $50,000 for the purpose of paying principal due under the Commercial Paper Notes. The Letter of Credit agreement will expire April 30, 2012, unless previously terminated or extended. As of September 30, 2010, there have been no borrowings under the Letter of Credit. The Commercial Paper Notes have been classified as long-term in accordance with the refinancing terms of the revolving credit agreement included in the Letter of Credit. The Commercial Paper Notes are secured by and payable from a pledge of and lien on two-thirds of one-eighth of one percent (1/8 of 1.0%) sales and use tax in an amount not to exceed $90,000.

CITY OF SAN ANTONIO, TEXAS
- 104 - Amounts are expressed in thousands
Note 7 Commercial Paper Programs (Continued)
Primary Government (City) (Continued)
Balance BalanceOutstanding Outstanding
Issue October 1, 2009 Additions Deletions September 30, 2010Series A (2007) 25,805$ -$ (11,435)$ 14,370$
CPS Energy In 1988, the City Council adopted an ordinance authorizing the issuance of up to $300,000 in TECP. This ordinance, as amended in June 1997, provides for funding to assist in the financing of eligible projects in an aggregate amount not to exceed $450,000. Eligible projects include fuel acquisition, capital improvements to the utility systems, and refinancing or refunding any outstanding obligations which are secured by and payable from a lien and/or a pledge of net revenues of CPS Energy. The program’s scheduled maximum maturities cannot extend beyond November 1, 2028. The TECP has been classified as long-term in accordance with the refinancing terms under a revolving credit agreement with a consortium of banks, which supports the commercial paper. Under the terms of the amended revolving credit agreement, effective September 6, 2007, CPS Energy may borrow up to an aggregate amount not to exceed $450,000 for the purpose of paying principal due under the TECP. On September 6, 2007, the revolving credit agreement was extended until November 1, 2012. At January 31, 2010, there was no amount outstanding under the agreement. Further, there have been no borrowings under the agreement since inception. On March 12, 2009, CPS Energy issued $442,000 of New Series 2009A Revenue Refunding Bonds to refund $450,000 of outstanding TECP. On March 16, 2009, CPS Energy issued $260,000 of TECP. On November 24 and December 29, 2009, CPS Energy issued $30,000 and $40,000 of TECP, respectively. All proceeds were used to fund generation and distribution construction projects. On January 28, 2010, CPS Energy issued an additional $20,000 of TECP, which was used to remediate debt. The current outstanding TECP balance as of January 31, 2010, was $350,000. Of the total TECP outstanding at January 31, 2010, $130,000 was used to fund the development of STP Units 3 and 4. The TECP is secured by the net revenues of CPS Energy. Such pledge of net revenues is subordinate and inferior to the pledge securing payment of existing New Series Bonds and Junior Lien Obligations.
TECP Outstanding 350,000$ TECP New Money Issues 350,000 Weighted Average Interest Rate of Outstanding TECP 0.3%Average Life of Outstanding TECP (Approximate Number of Days) 93
San Antonio Water System (SAWS) SAWS maintains a commercial paper program that is used to provide funds for the interim financing of a portion of its capital improvements. The City Council of the City of San Antonio has authorized the commercial paper program in an amount of $500,000. Notes payable under the program cannot exceed maturities of 270 days.

CITY OF SAN ANTONIO, TEXAS
- 105 - Amounts are expressed in thousands
Note 7 Commercial Paper Programs (Continued) San Antonio Water System (SAWS) (Continued) The City has covenanted in the ordinance authorizing the commercial paper program (the Note Ordinance) to maintain at all times credit facilities with banks or other financial institutions which would provide available borrowing capacity sufficient to pay the principal of the commercial paper program. The credit facility is maintained under the terms of a revolving credit agreement. Pursuant to the most recent amendment to the revolving credit agreement, the capacity of the revolving credit agreement has been reduced to $300,000. The issuance of commercial paper is further supported by the following agreements and related participants:
• Dealer Agreements with Goldman, Sachs & Co., J.P. Morgan Securities Inc., and Ramirez & Co., Inc. • Revolving Credit Agreement with Bank of America, N.A. and State Street Bank and Trust Company • Issuing and Paying Agency Agreement with The Bank of New York Mellon Trust Company, N.A.
The borrowings under the commercial paper program are equally and ratably secured by and are payable from (i) the proceeds from the sale of bonds or additional borrowing under the commercial paper program and (ii) borrowing under and pursuant to the revolving credit agreement. Commercial paper notes of $173,650 are outstanding as of December 31, 2009. Of this balance, $109,130 relates to the refunding of the Series 2003 Bonds while the remaining $64,520 proceeds were used solely for financing of capital improvements. Interest rates on the notes outstanding at December 31, 2009 range from 0.2% to 0.4% and maturities range from 16 to 126 days. The outstanding notes had an average rate of 0.3% and averaged 96 days to maturity. SAWS intends to reissue maturing commercial paper, in accordance with the terms of the revolving credit agreement, and ultimately refund such maturities with proceeds from the issuance of long-term revenue bonds. Consistent with this intent, SAWS has classified nearly all outstanding commercial paper notes as long-term debt. In accordance with the amortization schedule of the interest rate swap agreement discussed in Note 6, SAWS intends to redeem $2,600 of commercial paper in 2010. Therefore, this portion of the commercial paper is classified as a current liability. The following summarizes transactions of the program for the year-ended December 31, 2009.
Beginning Balance Ending BalanceJanuary 1, 2009 Additions Reductions December 31, 2009
Tax Exempt CommercialPaper Notes 261,115$ 70,000$ 157,465$ 173,650$
(The remainder of this page left blank intentionally)

CITY OF SAN ANTONIO, TEXAS
- 106 - Amounts are expressed in thousands
Note 8 Pension and Retirement Plans Primary Government (City) General Plan Information The City of San Antonio, SAWS, and CPS Energy participate in several contributory retirement plans. These are funded plans covering substantially all full-time employees. Payroll and contribution information as of the year-end for each entity is presented as follows:
Covered Employee Employer TotalTitle Type of Plan Payroll Contribution Contribution Contribution
City Fire and Police Single EmployerPension Plan Defined Benefit
Plan 259,904$ 34,849$ 64,498$ 99,347$
Texas Municipal NontraditionalRetirement HybridSystem (TMRS) - Defined BenefitCivilian Agent Plan 258,932$ 15,544$ 32,338$ 47,882$
Component Units:
SAWS 1 Texas Nontraditional
Municipal HybridRetirement Defined BenefitSystem (TMRS) Agent Plan 81,821$ 2,553$ 4,275$ 6,828$
1 SAWSRP Single
Contract EmployerDefined BenefitPlan 82,923$ -$ 6,035$ 6,035$
CPS Energy 2 CPS All Single
Employee Plan EmployerDefined BenefitPlan 219,716$ 11,212$ 23,732$ 34,944$
1
2 Fiscal year ended January 31, 2010
Contributory Pension and Retirement Plans
Entity
Plan year ended December 31, 2009
(The remainder of this page left blank intentionally)

CITY OF SAN ANTONIO, TEXAS
- 107 - Amounts are expressed in thousands
Note 8 Pension and Retirement Plans (Continued) Primary Government (City) (Continued) Fire and Police Pension Plan The Pension Fund is a single-employer defined benefit retirement plan established in accordance with the laws of the State of Texas. The governing document for the Pension Fund is found in Vernon’s Texas Civil Statutes, Article 6243o. The pension law governing the Pension Fund was amended on October 1, 2009. The Pension Fund is administered by a nine-member board of trustees (Board), which includes two City Council members, the mayor or his appointee, two police officers, two fire fighters, and two retirees. The Pension Fund meets the criteria of a “fiduciary fund” of the City of San Antonio as established by Governmental Accounting Financial and Reporting Standards and is therefore included in the City’s financial statements as a pension trust fund. A more complete description of the Plan is provided in the summary plan description. At September 30, 2010, membership of the Pension Fund consisted of:
2010Retirees and beneficiaries receiving benefits 2,085Active participants 3,807
Total 5,892
Currently, the Pension Fund provides retirement benefits to eligible employees of the fire and police departments of the City who have served for 20 years or more. Employees who terminate prior to accumulating 20 years of service may apply to receive a refund of their contributions. Upon application for a service retirement pension from the Pension Fund, retiring employees are entitled to a retirement annuity computed based on the average of the employee’s total salary, excluding overtime pay, for the highest three years of the last five years. The retirement annuity computation (Annuity Computation) for employees retiring after September 30, 2009 is 2.3% of such average for each of the first 20 years served, plus 5.0% of the member’s average total salary for each of the next seven years, plus 0.5% of the member’s average total salary for each of the next three years of service, with fractional years of service prorated based on full months served as a contributing member. In making the computation for a year, the year is considered to begin on the first day a contribution is made. A retirement annuity under this subsection may not exceed, as of the date of retirement, 87.5% of the member’s average total salary. The minimum monthly pension provided to a member or the member’s beneficiaries is $1,850 (please note figure not reflected in thousands). If there is more than one beneficiary, the minimum pension is divided between them.
There is a provision for the Backwards Deferred Retirement Option Plan (BackDROP), which, as of October 1, 2007, permits retiring members who had actual service credit of at least 20 years and one month to elect to receive a lump-sum payment for a number of full months of service elected by the member that does not exceed the lesser of the number of months of service credit the member had in excess of 20 years or 48 months and a reduced annuity payment. As of October 1, 2009, the maximum BackDROP period is increased to 60 months. For purposes of a BackDROP benefit calculation, the participant’s salary beyond 34 years of service is used to determine the participant’s average salary.
There is also a provision for a thirteenth and fourteenth pension check. At the end of each fiscal year, the Board may authorize the disbursement of a thirteenth monthly pension check if the yield on the Pension Fund’s investments exceeds the actuarial projections for the preceding five year period by at least 100 basis points. In the same way, the Board may authorize a fourteenth monthly pension check if the yield on the Pension Fund’s investments exceeds the actuarial projections for the preceding five year period by at least 300 basis points. The thirteenth and fourteenth pension checks are paid to each retiree and beneficiary receiving a pension at the end of the fiscal year and are in an amount equal to the pension check paid in the last month of the preceding fiscal year of the Pension Fund (retirees/beneficiaries with less than one year of benefits will receive a prorated check, and no check will be paid to members who retired after the end of the fiscal year). Authorization for one year does not obligate the Board to authorize a thirteenth and fourteenth check for any other year. The Pension Fund did not meet the criteria for the thirteenth and fourteenth checks for the year ended September 30, 2010.
CITY OF SAN ANTONIO, TEXAS
- 108 - Amounts are expressed in thousands
Note 8 Pension and Retirement Plans (Continued) Primary Government (City) (Continued) Fire and Police Pension Plan (Continued) The Pension Fund also provides benefits when service is terminated by reason of death or disability. The employee's beneficiary or the employee shall be entitled to one-half of the average of the employee’s total salary, excluding overtime pay, or vested benefit as is provided in the computation of normal retirement benefits, whichever is higher. If a member dies after retiring, spouses or beneficiaries who were married to or dependents of the member at the time of retirement receive the same annuity paid to the member as of the date of the member’s death up to the maximum benefit. The maximum benefit for surviving spouses and dependent children is equal to a 27-year service pension. As of October 1, 2009, the allocation of death benefits between a surviving spouse and the dependent children of a member is 75.0% to the spouse and 25.0% to the children. The spousal death benefit for a spouse who married a retiree after retirement and at least five years prior to the date of the retiree’s death is the same as a spouse who married a member prior to retirement. At October 1, 2009 amendments establish a 55-year-old minimum age for marriage-after-retirement spouses to begin receiving annuity payments for those that qualify for such annuity payments. As of October 1, 2009, the spousal death benefit for a spouse who married a retiree after retirement, and less than five years prior to the date of the retiree’s death, was $15,000 (please note figure not reflected in thousands). The Pension Fund provides a disability annuity equal to 87.5% of average total salary, if the member suffers a catastrophic injury. A catastrophic injury is described as an irreparable physical bodily injury suffered during the performance of high-risk line of duty activities, when the injury results in the individual being unable to obtain any sort of employment sufficient to generate income above the poverty level. The surviving spouse of an active member may elect to receive benefits in the form of a lump-sum payment and reduced annuity, similar to a BackDROP election made by a retiring member. The maximum service credit allowed in determining the spousal BackDROP lump-sum is 30 years. The estate of an active member who dies and does not leave a beneficiary will receive either 10 times the amount of an annuity computed according to the Annuity Computation mentioned above using the deceased member’s service credit and average total salary as of the date of death or the deceased member’s contributions that were picked up by the City. The estate of a retired member who dies and does not leave a beneficiary will receive a lump-sum benefit equal to 10 times the amount of the annuity awarded by the Board effective on the retiree’s date of retirement, less any retirement or disability annuity and any lump-sum payments paid to the retiree. The Pension Fund also provides benefits when an eligible member is killed in the line of duty. The member’s surviving spouse and dependent children are entitled to a total pension equal to the member’s base salary at the time of death. Another important provision of the Pension Fund is the Cost of Living Adjustment (COLA). The COLA is based on the Consumer Price Index for all Urban Consumers – U.S. City Average (CPI) as published by the Bureau of Labor Statistics. Members whose retirement, disability, or death occurred before August 30, 1971, receive an increase equal to 100.0% of the increase in the CPI. Members whose retirement, disability, or death occurred after August 30, 1971, but before October 1, 1997, receive an increase equal to 100.0% of the increase in the CPI up to 8.0% and 75.0% of the increase in the CPI in excess of 8.0%. Members whose retirement, disability, or death occurred after October 1, 1997 receive an increase equal to 75.0% of the increase in the CPI. On October 1, 2007, a special cost of living increase of $200 per month (please note figure not reflected in thousands) was awarded to members who retired prior to October 1, 1989 or their beneficiaries. If there is more than one beneficiary, the special COLA is divided between them. The cost of living increase is awarded prior to determining the minimum monthly pension. Beginning October 1, 2009, the COLA for members who retired between October 1, 1997 and September 30, 1999, is increased to 100.0% of the increase in CPI up to 8.0% and 75.0% of the increase in the CPI in excess of 8.0%.

CITY OF SAN ANTONIO, TEXAS
- 109 - Amounts are expressed in thousands
Note 8 Pension and Retirement Plans (Continued) Primary Government (City) (Continued) Fire and Police Pension Plan (Continued) Beginning October 1, 2009, the Pension Fund has a provision that allows the fire chief and police chief to opt out of membership in the Pension Fund. The Pension Fund’s contribution requirements are established and funded in accordance with Texas state statues and are not actuarially determined. The City was required to contribute 24.6% of salary, excluding overtime pay, in 2010. The employee contribution rate was 12.3% in 2010. New fire fighters and police officers are immediately eligible for membership after they receive state certification and complete all other requirements. The new member contributes to the Pension Fund upon becoming eligible. As part of the amendments effective October 1, 2009, from October 1, 2009 to December 31, 2009, members who served probationary time prior to becoming a member were allowed to elect to purchase service credit for that time. If the member elected to purchase the service credit, the member was responsible for paying 3 times the member’s contribution rate that would have been due during the probationary period, with interest calculated from the time of the probation until the amount was paid. The annual required contributions for fiscal year 2010 were determined as part of the October 2009 actuarial valuations, using the entry-age actuarial cost method. The actuarial assumptions included (a) an 8.0% investment rate of return and (b) a projected annual salary increase of 4.3%. Both (a) and (b) include inflation components of 4.3%. The actuarial value of assets was determined using techniques that smooth the effects of short-term volatility in the market value of investments over a five year period. The unfunded actuarial liability is being amortized as a level percentage of projected payroll on an open basis. The remaining amortization period at October 1, 2009 was 10.4 years which, as reported under GASB guidelines, does not consider the assumption of payroll growth rate. The amounts of the actuarial value of assets represent estimates based upon the assumptions described above. Changes in those assumptions will result in changes in such estimates in the future. The amounts of benefits ultimately to be paid could differ materially from the current estimates. Contributions for the year-ended September 30, 2010 were as follows:
Percentage ofCovered Payroll
Employer 64,498$ 24.6%Employee 32,249 12.3%
Total 96,747
Purchase of Service Credit 2,600 99,347$
2010
Another guideline adopted by the Board is that any decrease in the years to full funding resulting from modifications of actuarial assumptions may form the basis for recommending legislative benefits enhancements, except for any modification of the Inflation Rate Assumption regarding the amount of the rate that would reduce such rate below 4.3%. This policy reflects the current statement of Board policy and may be changed at any time by the current Pension Board or any future Board.
CITY OF SAN ANTONIO, TEXAS
- 110 - Amounts are expressed in thousands
Note 8 Pension and Retirement Plans (Continued) Primary Government (City) (Continued) Fire and Police Pension Plan (Continued) The Board of the Pension Fund has historically recommended changes to benefits provided by the governing statute controlling the Fund that are actuarially prudent, keeping in mind the goal of reducing the unfunded liability of the Pension Fund over time. The Legislative Program has worked by soliciting the input of all affected interest groups and the advice of external professionals to reach agreement on a package of benefits that is actuarially prudent. The Board reaffirms this commitment to a program of prudent legislative changes that result in greater retirement security for its members while at the same time moving towards full funding from an actuarial perspective. To evidence this policy, the Board adopted several guidelines for determining whether to recommend legislative amendments in the future. Two highlights of these guidelines include utilizing external actuarial analysis to determine the years to full funding based on reports as of October 1 every two years, commencing with the 2005 Actuarial Valuation Report, adjusted to include the 2007 Legislative Package. The actuarial cost of benefits enhancements recommended by the Board will not exceed 50.0% of any actuarial improvements, as measured by the years to full funding in any two year cycle. Any improvements in years to full funding not used for legislative benefit changes in any two year cycle may be banked for future benefits in subsequent two year cycles. The City of San Antonio is responsible for funding the deficiency, if any, between the amount available to pay all retirement annuities and other benefits owed by the Pension Fund and the amount required to pay such benefits. The Pension Fund issues a publicly available financial report that includes financial statements and required supplemental information. That report may be obtained by writing to the Fire and Police Pension Fund of San Antonio, 311 Roosevelt, San Antonio, Texas 78210-2700 or by calling (210) 534-3262. Texas Municipal Retirement System (TMRS) The City provides benefits for all eligible employees (excluding firefighters and police officers) through a nontraditional, joint contributory, hybrid defined benefit plan in the TMRS. The TMRS is a statewide agent multiple-employer public employee retirement system created by law in 1948 to provide retirement and disability benefits to City employees. TMRS as of December 31, 2009, is the agent for 837 participating entities. It is the opinion of the TMRS management that the plans in TMRS are substantially defined benefit plans, but they have elected to provide additional voluntary disclosure to help foster a better understanding of some of the nontraditional characteristics of the TMRS plan. At its December 4, 2009 meeting, TMRS Board of Trustees adopted actuarial assumptions to be used in the actuarial valuation for the year ended December 31, 2009. A summary of actuarial assumptions and methods definitions can be found later in this note. Since its inception, TMRS has used the traditional Unit Credit actuarial funding method. This method accounts for liability accrued as of the valuation date but does not project the potential future liability of provisions adopted by a participating government. Two-thirds of the governments participating in TMRS have adopted the Updated Service Credit and Annuity Increases provisions on an annually repeating basis. These provisions are considered to be “committed” benefits (or likely to be guaranteed); as such, for the December 31, 2007 valuation, TMRS’ Board has adopted the Projected Unit Credit (PUC) actuarial funding method, which facilitates advance funding for future updated service credits and annuity increases that are adopted on an annually repeating basis.

CITY OF SAN ANTONIO, TEXAS
- 111 - Amounts are expressed in thousands
Note 8 Pension and Retirement Plans (Continued) Primary Government (City) (Continued) Texas Municipal Retirement System (TMRS) (Continued) In addition, the Board also adopted a change in the amortization period from a 25-year “open” to a 25-year “closed” period. TMRS Board of Trustee rules provide that, whenever a change in actuarial assumptions or methods results in a contribution rate increase in an amount greater than 0.5%, the amortization period may be increased up to 30 years, unless a participating government requests that the period remain at 25 years. For governments with repeating features, these changes will likely result initially in higher required contributions and lower funded ratios. To assist in this transition to higher rates, the Board also approved an eight-year phase-in period, which will allow governments the opportunity to increase their contributions gradually (approximately 12.5% each year) to their full rate (or their required contribution rate). The actuarial valuation for year-ended December 31, 2009 resulted in an $187,969 unfunded actuarial accrued liability utilizing the adopted actuarial assumption and changed funding method. The projected calendar year 2011 contribution rate under a 29-year amortization period for the City was estimated by TMRS to be 12.4%. However, under the phase-in option the rate would be not applicable for calendar year 2011. During fiscal year 2008, the City created a work plan to review and address the changes made by TMRS, obtained a voting seat on the TMRS Board, and conducted six focus groups with employees and retirees asking input via a survey on their TMRS benefits and priorities. The survey results provided valuable input as the City continues to evaluate its options. The City also contracted with a legal firm to provide legal advice and assistance on TMRS and other pension related issues. The legal firm engaged an actuarial firm to evaluate the assumptions and results of TMRS’ report, to provide a historical performance analysis of the funds within TMRS, and will assist in exploring viable pension alternatives. A task force of current employees and retirees was formed to provide input regarding the work to be completed by this actuarial firm. As approved by City Council, the annual repeating COLA applied towards retirees’ accounts were turned off in the fiscal year 2010 budget. This resulted in a reduction in the City’s contribution rate from a phased in rate of 13.9% to 12.3%. Ad hoc COLAs remain available to retirees subject to certain retroactive requirements. The City is continuing to evaluate additional options in coordination with the task force of current employees and retirees. Benefits depend upon the sum of the employee's contributions to the TMRS plan, with interest, and the City-financed monetary credits, with interest. At the date the TMRS plan began, the City granted monetary credits for service rendered before the TMRS plan began of a theoretical amount equal to two times what would have been contributed by the employee, with interest, prior to establishment of the TMRS plan. Monetary credits for service since the TMRS plan began are a percentage of the employee's accumulated contributions. In addition, the City may grant, as often as annually, another type of monetary credit referred to as an updated service credit. This is a theoretical amount which, when added to the employee's accumulated contributions and the monetary credits for service since the TMRS plan began, would be the total monetary credits and employee contributions accumulated with interest if the current employee contribution rate and City matching percentage had always been in existence and if the employee's salary had always been the average salary for the last three years that are one year before the effective date. At retirement, the benefit is calculated as if the sum of the employee's accumulated contributions with interest and the City-financed monetary credits with interest were used to purchase an annuity. Members are eligible to retire upon attaining the normal retirement age of 60 and above with 5 or more years of service, or with 20 years of service regardless of age. The TMRS plan also provides death and disability benefits. A member is vested after five years, but must leave accumulated contributions in the TMRS plan. If a member withdraws the contributions with interest, the member would not be entitled to the City-financed monetary credits, even if vested.

CITY OF SAN ANTONIO, TEXAS
- 112 - Amounts are expressed in thousands
Note 8 Pension and Retirement Plans (Continued) Primary Government (City) (Continued) Texas Municipal Retirement System (TMRS) (Continued) TMRS provisions and contribution requirements are adopted by the governing body of the City within the options available in the state statutes governing TMRS and within the actuarial constraints contained in the statutes. Contribution requirements are actuarially determined by TMRS’ actuary (see summary of TMRS Actuarial Assumptions and Methods at the end of Note 8). The contribution rate for the City's employees is 6.0% and the matching percent was 12.4% for calendar year 2009, both as adopted by the governing body of the City (see summary of contribution information at the beginning of Note 8.) Under the state law governing TMRS, the employer's contribution rates are annually determined by the actuary, using the Projected Unit Credit actuarial cost method. This rate consists of the normal cost contribution rate and the prior service contribution rate, both of which are calculated to be a level percentage of payroll from year to year. The normal cost contribution rate finances the portion of an active member’s projected benefit allocated annually; the prior service contribution rate amortized the unfunded (overfunded) actuarial liability (asset) over the applicable period for the City. Both the normal cost and prior service contribution rates includes recognition of the projected impact of annually repeating benefits, such as Updated Service Credits and Annuity Increases. The normal cost contribution finances the currently accruing monetary credits due to the City matching percentage, which are the obligation of the City as of an employee’s retirement date, not at the time the employee’s contributions are made. The normal cost contribution rate is the actuarially determined percentage of payroll necessary to satisfy the obligation of the City to each employee at the time the employee’s retirement becomes effective. The prior service contribution rate amortizes the unfunded actuarial liability over the remainder of the plan’s 29-year amortization period. When the City periodically adopts updated service credits and increases annuities in effect, the increased unfunded actuarial liability is being amortized over a new 29-year period. Currently, the unfunded actuarial liability is amortized over a constant 29-year period as a level percentage of payroll. Contributions are made monthly by both the employees and the City. All current year required contributions of the employees and the City were made to TMRS. Due to the fact that the City requires the contribution rates in advance for budget purposes, there is a one-year lag between the actuarial valuation that is the basis for the rate and the calendar year when the rate goes into effect. The required schedule of funding progress follows immediately the notes to the financial statements, and they present multi-year trend information regarding the actuarial value of plan assets relative to the actuarial liability for benefits. TMRS issues a publicly available financial report that includes financial information and required supplementary information for TMRS; the report also provides detailed explanations of the contributions, benefits, and actuarial methods and assumptions used related to participating municipalities. The report may be obtained by writing to the TMRS, P.O. Box 149153, Austin, Texas 78714-9153 or by calling (800) 924-8677. In addition, the report is available on TMRS’ website at www.TMRS.com. San Antonio Water System (SAWS) SAWS’ retirement program includes benefits provided by the Texas Municipal Retirement System (TMRS), the San Antonio Water System Retirement Plan, the San Antonio Water System Deferred Compensation Plan, and Social Security. The following information related to the TMRS was prepared as of December 31, 2008, while the information related to the San Antonio Water System Retirement Plan has been prepared as of January 1, 2009. Texas Municipal Retirement System (TMRS) SAWS provides pension benefits for all of its eligible employees through a nontraditional, joint contributory, hybrid defined benefit plan in the state-wide TMRS, one of more than 833 administered by TMRS, an agent multiple-employer public employee retirement system.

CITY OF SAN ANTONIO, TEXAS
- 113 - Amounts are expressed in thousands
Note 8 Pension and Retirement Plans (Continued) San Antonio Water System (SAWS) (Continued) Texas Municipal Retirement System (TMRS) (Continued) Benefits depend upon the sum of the employee’s contributions to the plan, with interest, and SAWS financed monetary credits, with interest. At retirement, the benefit is calculated as if the sum of the employee’s accumulated contributions with interest and the employer-financed monetary credits with interest were used to purchase an annuity. Members can retire at age 60 and above with 5 or more years of services or with 20 years of service regardless of age. A member is vested after 5 years. The plan provisions are adopted by SAWS within the options available and actuarial constraints in the state statutes governing TMRS. Under the state law governing TMRS, SAWS is required to contribute at an actuarially determined rate. These rates are provided on an annual basis, following the completion of the actuarial valuation. There is a delay in the valuation and when the rate becomes effective – for example the 2009 contribution rate is based on the December 31, 2007 valuation results. If a change in plan provisions is adopted by SAWS’ Board of Trustees, the contribution rate can change. Beginning with the December 31, 2007 actuarial valuation, a change was made in the funding method and the amortization period used in the valuation. To assist in this transition to higher rates, TMRS approved an eight-year phase-in period, which allows governments the opportunity to increase their contributions gradually (approximately 12.5% each year) to their full rate (or their required contribution rate). SAWS elected to transition the increase in its contribution rate over the eight-year phase-in period. As a result of these changes, SAWS’ actuarially required contribution for 2009 was 5.0% while the phased-in rate of 2009 was 3.8% of salary. The current contribution rate for employees is 3.0% of salary.
2009Employer Contribution 4,275$
Employee Contribution 2,553$
Employer Contribution Rate 5.0%
TMRSSchedule of Contributions
San Antonio Water System Retirement Plan (SAWSRP) The San Antonio Water System Retirement Plan (SAWSRP) is a single-employer defined benefit pension plan controlled by the provisions of Ordinance No. 75686, which serves as a supplement to TMRS and Social Security benefits. SAWSRP is governed by SAWS, which may amend plan provisions and which is responsible for the management of plan assets. SAWS has delegated the authority to manage certain plan assets and administer the payment of benefits to Principal Financial Group. SAWS provides supplemental pension benefits for all persons customarily employed at least 20 hours per week and five months per year through this defined benefit pension plan. Employees are eligible to participate in SAWSRP on January 1 of the calendar year following date of hire. A member does not vest in this plan until completion of five years of service. Covered employees are eligible to retire upon attaining the normal retirement age of 65. An employee may elect early retirement, with reduced benefits, upon attainment of:
• Twenty years of vesting service regardless of age, or • Five years of vesting service and at least age 60.

CITY OF SAN ANTONIO, TEXAS
- 114 - Amounts are expressed in thousands
Note 8 Pension and Retirement Plans (Continued) San Antonio Water System (SAWS) (Continued) San Antonio Water System Retirement Plan (SAWSRP) (Continued) The normal retirement benefit is based upon two factors: average compensation and years of vesting service. Average compensation is defined as the monthly average of total compensation received for the three consecutive years ending December 31st, out of the last ten compensation years prior to normal retirement date, which gives the highest average. The normal retirement benefit under the Principal Financial Group contract is equal to the following:
• 1.2% of the average compensation, times years of credited service not in excess of 25 years, plus • 0.8% of the average compensation, times years of credited service in excess of 25 years but not in excess
of 35 years, plus • 0.4% of the average compensation, times years of credited service in excess of 35 years.
Upon retirement, an employee must select from one of seven alternative payment plans. Each payment plan provides for monthly payments as long as the retired employee lives. The options available address how plan benefits are to be distributed to the designated beneficiary of the retired employee. The program also provides death and disability benefits. An employee is automatically 100.0% vested upon attainment of age 65 or upon becoming totally and permanently disabled. The pension plan’s unallocated insurance contracts are valued at contract value. Contract value represents contributions made under the contract, plus interest at the contract rate, less funds used to purchase annuities or pay administrative expenses charged by Principal Financial Group (PFG). Funds under the contract that have been allocated and applied to purchase annuities are excluded from the pension plan’s assets. The pension plan’s unallocated separate accounts are valued at fair value. The plan’s funding policy provides for actuarially determined periodic contributions so that sufficient assets will be available to pay benefits when due. Contribution requirements are established and may be amended by SAWS. Active members are not required to contribute to the plan. Any obligation with respect to SAWSRP shall be paid by SAWS. A summary of the actuarial assumptions utilized in determining SAWS’ contribution requirements is as follows:
Actuarial Cost Method Entry Age Normal - FrozenInitial Liability Period
Amortization Method Level DollarRemaining Amortization Period 28 Years - Closed PeriodAsset Valuation Method Smoothed Market Value (4 years)Investment Rate of Return 8.0%Inflation Rate NoneSalary Scale Table S-5 from the Actuary's
Pension Handbook plus 3.4%Cost of Living Adjustments None
SAWSRP Actuarial Assumptions

CITY OF SAN ANTONIO, TEXAS
- 115 - Amounts are expressed in thousands
Note 8 Pension and Retirement Plans (Continued) San Antonio Water System (SAWS) (Continued) San Antonio Water System Retirement Plan (SAWSRP) (Continued) The Pension Fund issues a publicly available financial report that includes financial statements and required supplemental information. That report may be obtained by writing to Principal Financial Group at:
711 High Street Des Moines, Iowa 50392
Telephone: (800) 986-3343 Website: www.principal.com
San Antonio Water System Deferred Compensation Plan (SAWSDCP) SAWS has a deferred compensation plan for its employees, created in accordance with Internal Revenue Code Section 457. SAWSDCP, available to all regular employees, permits them to defer a portion of their salary until future years. The compensation deferred under this plan is not available to employees until termination, retirement, death, or qualifying unforeseeable emergency. Participation in SAWSDCP is voluntary, and SAWS does not make any contributions. SAWS has no liability for losses under SAWSDCP, but does have the usual fiduciary responsibilities of a plan sponsor. CPS Energy All Employee Plan The CPS Energy Pension Plan is a self-administered, single-employer, defined-benefit contributory pension plan (Plan) covering substantially all employees who have completed one year of service. It is an unconsolidated entity within which normal retirement is age 65; however, early retirement is available with 25 years of benefit service, as well as to those employees who are ages 55 or older with at least ten years of benefit service. Retirement benefits are based on length of service and compensation, and benefits are reduced for retirement before age 55 with 25 years or more of benefit service or before age 62 with less than 25 years of service. The plan is sponsored by and may be amended at any time by CPS Energy, acting by and through an Oversight Committee, which includes the General Manager and CEO, the Chief Financial Officer and the Audit Committee Chair of CPS Energy’s board of trustees. Its assets are segregated from CPS Energy’s assets and are separately managed by an Administrative Committee whose members are appointed by the Oversight Committee. The Plan reports results on a calendar-year basis, and the separately audited financial statements, which contain historical trend information, may be obtained by contacting Benefit Trust Administration at CPS Energy. Plan net assets had a market value of $973,700 at December 31, 2009. In addition to the defined-benefit pension plan, CPS Energy has two Restoration Plans that were effective as of January 1, 1998, which supplement benefits paid from the Pension Plan due to federal tax restrictions on benefit amounts. The benefits due under those Restoration Plans have been paid annually by CPS Energy. Employees who retired prior to 1983 receive annuity payments from an insurance carrier, as well as some benefits directly from CPS Energy. The costs for the benefits directly received from CPS Energy were $120 for fiscal year 2010. These costs were recorded when paid.

CITY OF SAN ANTONIO, TEXAS
- 116 - Amounts are expressed in thousands
Note 8 Pension and Retirement Plans (Continued) CPS Energy (Continued) All Employee Plan (Continued) Funding Policy – The current policy of CPS Energy is to establish funding levels, considering annual actuarial valuations and recommendations of the Administrative Committee, using both employee and employer contributions. Generally, participating employees contribute 5.0% of their total compensation and are normally fully vested in CPS Energy’s contribution after completing seven years of credited service or upon reaching age 40. Employee contributions commence with the effective date of participation and continue until normal or early retirement, completion of 44 years of benefit service, or termination of employment. The employee contribution interest crediting rate was 8.0% for fiscal year 2010. The balance of Plan contributions is the responsibility of CPS Energy, giving consideration to actuarial information, budget controls, legal requirements, compliance, and industry and/or community norms. For fiscal year 2009, the amount to be funded was established using a general target near the 20-year funding contribution level as determined by the Plan’s actuary. CPS Energy’s contributions in relation to the annual required contribution (ARC) amounted to 10.8% of covered payroll in fiscal year 2010. Annual Pension Cost and Net Pension Obligation – CPS Energy’s annual pension cost (APC) and net pension obligation (NPO) for fiscal year 2010 is presented at the end of this note. The NPO may be either positive, reflecting a liability, or negative, reflecting an asset. The term net pension obligation, as used in this Note, refers to either situation. Funded Status and Funding Progress – The funded status of the Plan as of February 1, 2009 valuation date is noted at the end of this note. The schedule of funding progress, presented as required supplementary information, presents multi-year trend information that shows whether the actuarial value of Plan assets is increasing or decreasing over time relative to the actuarial accrued liability for benefits. Actuarial Methods and Assumptions – Beginning with the 2008 Plan year, the cost method was revised to project January 1 data to February 1 of the next calendar year based on assumptions. Actuarial valuation methods used for the February 1, 2009 valuation included (a) the five-year smoothed market for asset valuation, (b) the projected unit credit for the actuarial accrued liability, and (c) the twenty year level dollar open for amortization of pension service costs. Significant actuarial assumptions used for the February 1, 2009, actuarial valuation included (a) a rate of return on the investment of present and future assets of 8.0%, (b) projected salary increases averaging 5.8%, and (c) post retirement cost-of-living increases of 1.8%. The projected salary increases included an inflation rate of 3.5%.
(The remainder of this page left blank intentionally)

CITY OF SAN ANTONIO, TEXAS
- 117 - Amounts are expressed in thousands
Note 8 Pension and Retirement Plans (Continued) Three-Year Trend Information Trend information compares the annual required contribution to annual pension cost and the resultant net pension obligation, as required by GASB Statement No. 27.
Annual Interest on Annual Net Pension Net Pension PercentageRequired Net Pension Adjustment Pension Contributions Increase Obligation at Obligation of
Fiscal Contribution Obligation To Cost In Relation to (Decrease) Beginning at End ARCYear (ARC) (NPO) ARC (APC) ARC in NPO of Year of Year Contributed
Fire and Police 2008 58,101$ -$ -$ 58,101$ (58,101)$ -$ -$ -$ 100.0%Pension Plan City 2009 62,071 62,071 (62,071) 100.0%of San Antonio 2010 64,498 64,498 (64,498) 100.0%
TMRS - 2008 30,538$ -$ -$ 30,538$ (30,538)$ -$ -$ -$ 100.0%City of 2009 33,510 33,510 (33,510) 100.0%San Antonio 2010 32,338 32,338 (32,338) 100.0%
CPS All 2008 20,868$ -$ -$ 20,868$ (22,841)$ (1,973)$ -$ (1,973)$ 109.5%Employee Plan 1 2009 20,561 (164) 193 20,590 (20,561) 29 (1,973) (1,944) 99.9%
2010 23,468 (156) 191 23,503 (23,732) (229) (1,944) (2,173) 101.0%
TMRS - 2007 2,386$ -$ -$ 2,386$ (2,386)$ -$ -$ -$ 100.0%SAWS 2 2008 2,600 2,600 (2,600) 100.0%
2009 4,275 4,275 (4,275) 1,066 1,066 100.0%
SAWRP - 2007 4,710$ -$ -$ 4,710$ (4,710)$ -$ -$ -$ 100.0%SAWS 2 2008 4,891 4,891 (4,891) 100.0%
2009 6,035 6,035 (6,035) 100.0%1 Fiscal year-ended January 31, 20102 Plan year-ended December 31, 2009
Three-Year Trend Information
Pension Plan
City of Fire and Police San Antonio SAWS SAWSPension Plan 1 TMRS 2 TMRS SAWSRP CPS Energy
Actuarial value of plan assets (a) 2,166,924$ 515,884$ 68,756$ 77,365$ 1,145,029$ Actuarial accrued liability (b) 2,442,620 703,853 107,311 112,263 1,169,302 Unfunded actuarial accrued liability
(funding excess) (b) - (a) 275,696$ 187,969$ 38,555$ 34,898$ 24,273$ Funded ratio (a) / (b) 88.7% 73.3% 64.1% 68.9% 97.9%Covered payroll (c) 269,359$ 258,932$ 81,821$ 82,923$ 219,716$ Unfunded actuarial accrued liability
(funding excess) as a percentageof covered payroll ([(b) - (a)] / (c)) 102.4% 72.6% 47.1% 42.1% 11.0%
1 Covered payroll presented in this table is as of 10/31/20092 Covered payroll presented in this table is as of 12/31/2009
Funded Status and Funding Progress
(The remainder of this page left blank intentionally)

CITY OF SAN ANTONIO, TEXAS
- 118 - Amounts are expressed in thousands
Note 8 Pension and Retirement Plans (Continued) Significant TMRS Actuarial Assumptions and Methods Significant assumptions used in the actuarial valuation of December 31, 2009, by the Texas Municipal Retirement System’s (TMRS) actuary are provided in the following table for both the City and SAWS:
Actuarial Cost Method Projected Unit CreditAmortization Method Level Percent of PayrollRemaining Amortization Period - SAWS 28 Years - Closed PeriodRemaining Amortization Period - City 28 Years - Closed PeriodAsset Valuation Method Amortization CostInvestment Return - City 7.5%Investment Return - SAWS 8.0%Projected Salary Increases Varies by Age and ServiceIncludes Inflation At 3.0%Cost of Living Adjustments 0.0%
TMRS Actuarial Assumptions and Methods
Note 9 Postemployment Retirement Benefits Primary Government (City)
Plan Description - In addition to the pension benefits discussed in Note 8, Pension and Retirement Plans, the City provides most retired employees with certain health benefits under two postemployment benefit programs. Pursuant to Governmental Accounting Standards Board (“GASB”) Statement No. 45, the City is required to account for and disclose its other postemployment liability for these programs. GASB Statement No. 45 became applicable to the City in Fiscal Year 2008 and the City continues to actively review each of these programs having actuarial valuations performed for these programs as required. The first of the two programs is a health insurance plan, which provides benefits for nonuniformed City retirees and for pre-October 1, 1989 uniformed (fire and police) retirees who are not eligible for Medicare. The program compromises 4 self-funded PPO health plans currently administered by United Healthcare. These plans may be amended at any time with approval from the City Council. This program is funded on a pay-as-you-go basis with an aggregate sharing of premium costs based on the following targets: 67.0% by the City and 33.0% by the retiree for those retirees hired prior to October 2007, 50.0% for retirees hired on or after October 2007 with 10+ years of service to City of San Antonio and 100.0% for retirees hired on or after October 2007 with 5-9 years of City of San Antonio service. Currently, there are 5,744 active civilian employees who may become eligible in the future. Employees may become eligible to participate in this Program based on eligibility for participation in the TMRS Pension Plan and their number of years of service to City of San Antonio. Under the TMRS Pension Plan, employees may retire at age 60 and above with five or more years of service or with 20 years of service regardless of age. Retiree medical benefits continue for the life of the retiree and their surviving eligible dependents that were covered at the time of the employee’s retirement. Nonuniformed City employees who qualify for a disability pension under TMRS rules are also eligible to receive the retiree medical benefit under this plan. As of September 30, 2010, there were 551 retirees participating in this program. The second program with 837 participating retirees is available to eligible retirees who have Medicare coverage. All retirees and dependents are required to apply for and maintain Medicare Part A & B coverage once they reach age 65 or otherwise become eligible for Medicare. Of the current 837 participating Medicare retirees, 280 participate in a fully insured Medicare Advantage HMO and the remaining 557 participate in a fully insured Medicare Supplement. This program may be amended at any time by the City Council. An additional 90 retirees participate in CitiMed which is a self-funded health plan administered by United Healthcare.

CITY OF SAN ANTONIO, TEXAS
- 119 - Amounts are expressed in thousands
Note 9 Postemployment Retirement Benefits (Continued) Primary Government (City) (Continued) With the adoption of the fiscal year 2008 Budget, additional changes were made to this retirement health plan. For all non-uniformed employees beginning employment on or after October 1, 2007, a revised schedule for sharing of the costs on a pay-as-you-go basis is effective. The revised schedule is as follows: (1) Employees who separate from the City with less than five years of service are not eligible to participate in the Program; (2) Employees who separate with at least five years of service but less than 10 years of service are eligible to participate in the Program but without City subsidy; and (3) Employees who separate from employment with 10 years of service or more will pay for 50.0% of the pay-as-you-go contributions to the Program and the City will contribute 50.0%. The ability to participate in the Program remains based on eligibility for the TMRS Pension Plan. Please note that the number of employees, retirees, and deductible amounts in the above are not expressed in thousands. Funding Policy - The cost of the program is reviewed annually, and the costs of medical claims are funded jointly by the City and retirees on a pay-as-you-go basis, based on the allocations described above. For retirees, total program expenses were $9,468 of which $7,468 were medical claims. For the year-ended September 30, 2010, total contributions were as follows:
City 6,090$ Retiree Premiums 3,378
Total Contributions 9,468$
Total Contributions
No contributions were made in fiscal year 2010 to prefund benefits. The Medicare Prescription Drug Improvement and Modernization Act of 2003, which was effective January 1, 2006, established prescription drug coverage for Medicare beneficiaries known as Medicare Part D. One of the provisions of Medicare Part D entitled the health plan to receive retiree drug subsidy payments from the federal government to offset pharmacy claims paid by the health plan on behalf of certain plan participants. As of September 30, 2010, the City received $534 in payments. In accordance with GASB Technical Bulletin 2006-01, Accounting and Financial Reporting by Employers for Payments from the Federal Government Pursuant to the Retiree Drug Subsidy Provisions of Medicare Part D, future projected payments from the federal government have not been used to lessen total projected obligations under the City’s plan. Annual OPEB Cost and Net OPEB Obligation - For the fiscal year-ended September 30, 2010, the City’s annual postemployment benefits other than pension (OPEB) cost was not equal to its annual required contribution (ARC) to the plan. The City’s annual OPEB cost is calculated based on the ARC of the employer, an amount actuarially determined in accordance with GASB Statement No. 45. The ARC represents a level of funding that if paid on an ongoing basis, is projected to cover normal cost each year and amortize any unfunded actuarial balance over thirty years. The City will not be fully funding the ARC at this time. The City will continue to fund OPEB on a pay-as-you-go basis. Actuarial Methods and Assumptions – Actuarial valuations of an ongoing plan involve estimates of the value of reported amounts and assumptions about the probability of occurrence of events far into the future. Examples include assumptions about future employment, mortality, and the healthcare cost trend. Amounts determined regarding the funded status of the plan and the annual required contributions of the employer are subject to continual revision as actual results are compared with past expectations and new estimates are made about the future. Projections of benefits for financial reporting purposes are based on the substantive plan (the plan as understood by the employer and the plan members) and include the types of benefits provided at the time of each valuation and the historical pattern of sharing of benefit costs between the City and plan members to that point. The actuarial methods and assumptions used include techniques that are designed to reduce the effects of short-term volatility in actuarial accrued liabilities and the actuarial value of assets, consistent with the long-term perspective of the calculations. The table below details the actuarial methods and assumptions for the City’s OPEB calculation for the fiscal year-ended September 30, 2010:

CITY OF SAN ANTONIO, TEXAS
- 120 - Amounts are expressed in thousands
Note 9 Postemployment Retirement Benefits (Continued) Primary Government (City) (Continued)
Actuarial Valuation Date 1/1/2009Actuarial Cost Method Projected Unit CreditAmortization Method Level Dollar, OpenRemaining Amortization Period 30 yearsAsset Valuation Method N/AActuarial Assumptions:
Investment Rate of Return 3.00%Projected Salary Increase N/AHealthcare Inflation Rate - Medical 10% initial (2009)
5% ultimate (2014)Healthcare Inflation Rate - Presription 12% initial (2009)
5% ultimate (2016)
Assumptions
Below are the health care cost trend assumptions used for the City’s January 1, 2010 actuarial study for the fiscal year-ended September 30, 2010.
Year Medical Prescription Drugs
2010 9.0% 11.0%2011 8.0% 10.0%2012 7.0% 9.0%2013 6.0% 8.0%2014 5.0% 7.0%2015 5.0% 6.0%2016+ 5.0% 5.0%
City's Health Care Cost Trend Assumptions
The City’s retiree participation rate is estimated to be at 60.0%. This estimate is based on evaluation of City retiree’s enrolled in the City’s retiree plan, versus those enrolled in TMRS. Numerous City retirees are former military, or are able to obtain healthcare through spouses insurance, etc. Fire and Police Retiree Health Care Fund Plan Description - The second postemployment benefit program of the City the Fire and Police Retiree Health Care Fund, San Antonio (Health Care Fund) is a Texas statutory retirement health trust for firefighters and police officers of the City. The trust holds assets and liabilities of the City’s Fire and Police Retiree Health Care Plan (Plan). This Plan is a single-employer defined benefit postemployment health care plan that was created in October 1989 in accordance with provisions established by contract with the local fire and police unions to provide postemployment health care benefits to police officers and firefighters of the City of San Antonio retiring after September 30, 1989. Authority to establish and amend the plan’s postemployment health care benefits is based on such contracts and the Texas Legislature enacts regulations that control the operation of the Fund. The statutory trust is governed by a board of trustees that meets on a monthly basis. The board consists of nine members: the Mayor or his appointee; two members of the City Council; one retired and two active duty police officers; and one retired and two active duty firefighters. The Health Care Fund board has the ability to modify benefits within certain parameters. The City is the only participating employer in the Plan.

CITY OF SAN ANTONIO, TEXAS
- 121 - Amounts are expressed in thousands
Note 9 Postemployment Retirement Benefits (Continued) Primary Government (City) (Continued) Fire and Police Retiree Health Care Fund (Continued) WEB-TPA Employer Services, LLC serves as the third party administrator for the Health Care Fund. Additional administrative services were provided to the Health Care Fund by PTRX, Inc. during fiscal year 2010. Contributions - Since its inception, the Health Care Fund has been funded primarily by contributions from the City and City active firefighters and police officers, as part of the compensation for services rendered by the union members, and by contributions made by retirees for their dependents. Effective October 1, 2007, the board implemented state-mandated changes to increase contributions from the Plan’s single employer, the City, and plan members in order to reduce actuarially determined funding deficits and ensure the existence of the Fund for future retired firefighters and police officers. The increased contributions were initiated to take effect over a span of years through October 2011. The state-mandated changes also called for a decrease in the level of benefits. The contribution amounts for each fiscal year, beginning October 1, 2007, are based on statutory contribution rates and on the average member salary expected for that fiscal year, which is to be determined by the Health Care Fund’s actuary. For the years ending September 30, 2010, 2011, and years thereafter, the specified employee contribution rates were 3.4%, 4.1% and 4.7%, respectively. The City’s contributions will be set at 9.4% of the specified wage base. The table below summarizes the actuary’s determinations of the contribution amount for the fiscal year-ended September 30, 2010:
Biweekly Contributions:Active Fire and Police Members $82.76City of San Antonio for Each Member $228.80
$179.80
Dependent Children $157.35
Monthly Contributions for Each Retiree withUnder 30 Years of Service who Retires afterOctober 1, 2007
Total contributions by active firefighters and police officers were $8,055 for the year ended September 30, 2010. Membership in the Plan consisted of the following at September 30, 2010:
Retirees and Beneficiaries Receiving Benefits 2,884 Active Plan Members 3,785
Total Membership 6,669
Funding Status and Funding Progress - Actuarial valuations of an ongoing plan involve estimates of the value of reported amounts and assumptions about the probability of occurrence of events far into the future. Examples include assumptions about future employment, mortality and the health care cost trend. Actuarially determined amounts are subject to continual revision as actual results are compared with past expectations and new estimates are made about the future. The schedules of funding progress, presented as required supplementary information following the notes to the financial statements, present multi-year trend information about whether the actuarial values of the plan assets are increasing or decreasing over time relative to the actuarial accrued liabilities for benefits.

CITY OF SAN ANTONIO, TEXAS
- 122 - Amounts are expressed in thousands
Note 9 Postemployment Retirement Benefits (Continued) Primary Government (City) (Continued) Fire and Police Retiree Health Care Fund (Continued) The accompanying schedules of employer contributions present trend information about the amounts contributed to the plan by the City in comparison to the ARC, an amount that is actuarially determined in accordance with the parameters of GASB Statement No. 43. The ARC represents a level of funding that, if paid on an ongoing basis, is projected to cover normal cost for each year and amortize any unfunded actuarial liabilities (or funding excess) over a period not to exceed thirty years. Projections of benefits for financial reporting purposes are based on the substantive plan (the plan as understood by the employer and plan members) and include the types of benefits provided at the time of each valuation and the historical pattern of sharing of benefit costs between the employer and plan members to that point. The actuarial methods and assumptions used include techniques that are designed to reduce the effects of short-term volatility in actuarial accrued liabilities and the actuarial value of assets, consistent with the long-term perspective of the calculations. Additional information as of the latest actuarial valuations follows:
Valuation Date 10/1/2009Actuarial Cost Method Entry AgeAmortization Method Level Percentage of Pay, OpenRemaining Amortization Period Open, 30 YearsAsset Valuation Method 5-Year Adjusted Market Rate
Actuarial Assumptions:Investment Rate of Return Net of Expense 8.0%Annual Inflation Rate 4.0%Projected Annual Salary Increases 4.5% to 15.0%Health Care Cost Rate Trend: 8.0% Initial
5.5% UltimateAnnual Payroll Growth Rate 4.0%
Assumptions
CPS Energy CPS Energy provides certain health, life insurance and disability income benefits for employees. Additionally, most CPS Energy employees are also eligible for these benefits upon retirement from CPS Energy. Assets of the plans are held in three separate, single-employer contributory plans: • City Public Service of San Antonio Group Health Plan (Health Plan) – a contributory group health plan that
provides health, dental and vision benefits. • City Public Service of San Antonio Group Life Insurance Plan (Life Plan) – a contributory plan that provides life
insurance benefits. • City Public Service of San Antonio Group Disability Plan (Disability Plan) – an employer funded plan that
provides disability income benefits. The Employee Benefit Plans may be amended at any time by CPS Energy, acting by and through an Oversight Committee, which includes the General Manager and CEO, the Chief Financial Officer and the Audit Committee Chair of the Board.

CITY OF SAN ANTONIO, TEXAS
- 123 - Amounts are expressed in thousands
Note 9 Postemployment Retirement Benefits (Continued) CPS Energy (Continued) The Employee Benefit Plans’ assets are segregated from CPS Energy’s assets and are separately managed by an Administrative Committee whose members are appointed by the Oversight Committee. These plans report results on a calendar-year basis and issue separately audited financial statements that may be obtained by contacting Employee Services at CPS Energy. Funding Policy – The funding requirements for both the Plan participants and the employer are established by and may be amended by CPS Energy. Funding is based on projected pay-as-you-go financing requirements, with an additional amount to prefund benefits as determined annually by CPS Energy. Retired employees contribute to the Health Plan in varying amounts depending upon an equity formula that considers age and years of service. Individuals who retired before February 1, 1993, contribute a base rate plus 2¼% of the difference between that amount and the aggregate rate for each year that the sum of age and service is less than 95. Those who retired on or after February 1, 1993, contribute a base rate plus a percentage of the CPS Energy contribution, based on the number of years of service, if they retired with less than 35 years of service. Retirees and covered dependents contributed $4,100 in fiscal year 2010. CPS Energy’s contributions in relation to the ARC for the Health Plan amounted to 6.3% of covered payroll in fiscal year 2010. The Medicare Prescription Drug Improvement and Modernization Act of 2003, which was effective January 1, 2006, established prescription drug coverage for Medicare beneficiaries known as Medicare Part D. One of the provisions of Medicare Part D entitled the Health Plan to receive retiree drug subsidy payments from the federal government to offset pharmacy claims paid by the Health Plan on behalf of certain Plan participants. These payments totaled $646 for fiscal year 2010. In accordance with GASB Technical Bulletin 2006-01, Accounting and Financial Reporting by Employers for Payments from the Federal Government Pursuant to the Retiree Drug Subsidy Provisions of Medicare Part D, future projected payments from the federal government have not been used to lessen total projected obligations under CPS Energy’s Plan. Employees who retired prior to February 1, 1993, contribute to the Life Plan at a rate of $0.1 per $1,000 of insurance per month on amounts in excess of $20,000 plus 2¼% of the difference between that amount and the aggregate rate for retiree coverage for each year the sum of retirement age and service is less than 95. Those who retired on or after February 1, 1993, contribute $0.1 per $1,000 of insurance per month on amounts in excess of $20,000 plus a percentage of the CPS Energy contribution, based on number of years of service, if they retired with less than 35 years of service. Retirees and covered dependents contributed $228 in fiscal year 2010 for their life insurance benefits. CPS Energy’s contributions in relation to the ARC for the Life Plan amounted to 0.1% of covered payroll in fiscal year 2010. The Disability Plan is funded completely by CPS Energy. CPS Energy’s contributions in relation to the ARC were 0.3% of covered payroll in fiscal year 2010. Annual OPEB Cost and Net OPEB Obligation – CPS Energy’s annual OPEB cost is calculated based on the ARC of the employer, an amount actuarially determined in accordance with the parameters of GASB Statement No. 43. The ARC represents a level of funding that, if paid on an ongoing basis, is projected to cover normal cost each year and amortize any unfunded actuarial liabilities (or funding excess) over a period not to exceed 30 years. The annual OPEB cost consists of the ARC, interest on the net OPEB obligation and adjustments to the ARC for the Health, Life and Disability Plans. The annual OPEB cost was $8,800 for fiscal year 2009. The net OPEB obligation may be either positive, reflecting a liability, or negative, reflecting an asset. The term net OPEB obligation, as used in this Note, refers to either situation.

CITY OF SAN ANTONIO, TEXAS
- 124 - Amounts are expressed in thousands
Note 9 Postemployment Retirement Benefits (Continued) CPS Energy (Continued) CPS Energy has selected the aggregate cost method for determining Life and Disability Plan funding amounts. Since this method does not identify or separately amortize unfunded actuarial liabilities, information about the funded status and funding progress has been prepared using the entry age actuarial cost method, which approximates the funding progress of the plans. Actuarial Methods and Assumptions – Actuarial valuations of ongoing plans involve estimates of the value of reported amounts and assumptions about the probability of occurrence of events far into the future. Examples include assumptions about future employment, mortality and the healthcare cost trend. Amounts determined regarding the funded status of the plans and the annual required contributions of the employer are subject to continued revision as actual results are compared with past expectations and new estimates are made about the future. The schedules of funding progress, presented as required supplementary information, present multiyear trend information that shows whether the actuarial value of Plan assets is increasing or decreasing over time relative to the actuarial accrued liabilities for benefits. For the Health Plan, the actuarial cost method used was the projected unit credit actuarial cost method. For the Life and Disability Plans, the aggregate actuarial cost method was used to determine the cost of benefits. Since this method does not identify or separately amortize unfunded actuarial liabilities, information about funded status and funding progress was prepared using the entry age actuarial cost method, which is intended to approximate the funding progress of the Plans. The amortization method used for all three Plans was the level dollar open method. Effective with the January 1, 2007, valuation, CPS Energy elected to establish an amortization period of 20 years to be used for actuarial valuations for the current and future periods. The asset valuation method used for all three Plans was the five-year smoothed market valuation method. Beginning with the 2008 plan year, the cost method was revised to project January 1 data to February 1 of the next calendar year based on assumptions. Significant actuarial assumptions used in the calculations for the February 1, 2009 valuation included (a) a rate of return on the investment of present and future assets of 8.0% for the Health, Life and Disability Plans, (b) a Consumer Price Index increase of 4.0% for the Disability Plan, (c) projected salary increases for the Health Plan ranging from 4.1% to 10.5% depending on age for base and other salaries and an inflation rate for salary increases of 3.5% for the Life and Disability Plans, and (d) medical cost increases projected at 8.5% for 2009 decreasing to 5.5% in 2016 and thereafter. San Antonio Water System (SAWS) SAWS provides certain healthcare and life insurance benefits for eligible retirees, their spouses, and their dependents through a single-employer defined benefit plan administered by SAWS. The authority to establish and amend the OPEB provisions is vested in the SAWS Board of Trustees. By State law, any employee that retires under either the TMRS or SAWS retirement plans is eligible, at the time of retirement, to obtain health insurance benefits similar to those offered to active SAWS employees. Contributions made by retirees for health insurance benefits vary based on retirement date, years of service and the health care options selected. Retirees can purchase coverage for their spouse at SAWS’ group rates. After age 65, healthcare benefits under the plan are supplemental to Medicare benefits. The following is the participant summary as of January 1, 2009 (the most recent actuarial valuation date):
Active employees 1,548 Retired employees 625 Spouses of retired employees 448
Total 2,621

CITY OF SAN ANTONIO, TEXAS
- 125 - Amounts are expressed in thousands
Note 9 Postemployment Retirement Benefits (Continued) San Antonio Water System (SAWS) (Continued) Funding Policy – The contribution requirements of plan members and SAWS are established and may be amended by the SAWS Board of Trustees. To date, SAWS has funded all obligations arising under these plans on a pay-as-you-go basis. Going forward, SAWS’ required contribution will be based on a projected pay-as-you-go financing requirement, with an additional amount, if any, to prefund benefits as determined annually by SAWS’ Board of Trustees. SAWS is currently evaluating ways to phase-in full funding of the actuarially determined annual required contribution. Plan members’ required contributions vary depending on the health plan selected by the retiree as well as the number of years of service at the time of retirement. For the year-ended December 31, 2009, SAWS’ contribution to the plan equaled the current premiums of $5,884, while plan members receiving benefits contributed $296 through their required contribution. No contributions were made in 2009 to prefund benefits. Annual OPEB Cost and Net OPEB Obligation – For the year-ended December 31, 2009, SAWS’ annual OPEB cost is calculated based on the annual required contributions (ARC). Actuarial Methods and Assumptions – Actuarial valuations of an ongoing plan involve estimates of the value of reported amounts and assumptions about the probability of occurrence of events far into the future. Since no portion of SAWS’ OPEB obligation has been funded in a separate trust as of December 31, 2009, SAWS does not issue a separate financial report for its OPEB plan. In the January 1, 2009 actuarial valuation, the projected unit credit funding method was used. The investment return assumption used in the calculation of the AAL was 4¾%, which is a blended rate of the estimated long-term investment return on the investments that are expected to be used to finance the payment of benefits. The investment return assumes SAWS will phase-in fully funding the annual required contribution over the years. There is not an inflation rate projected for this actuarial valuation. As of December 31, 2009, the UAAL is being amortized as a level dollar amount over a 28 year closed period.
(The remainder of this page left blank intentionally)
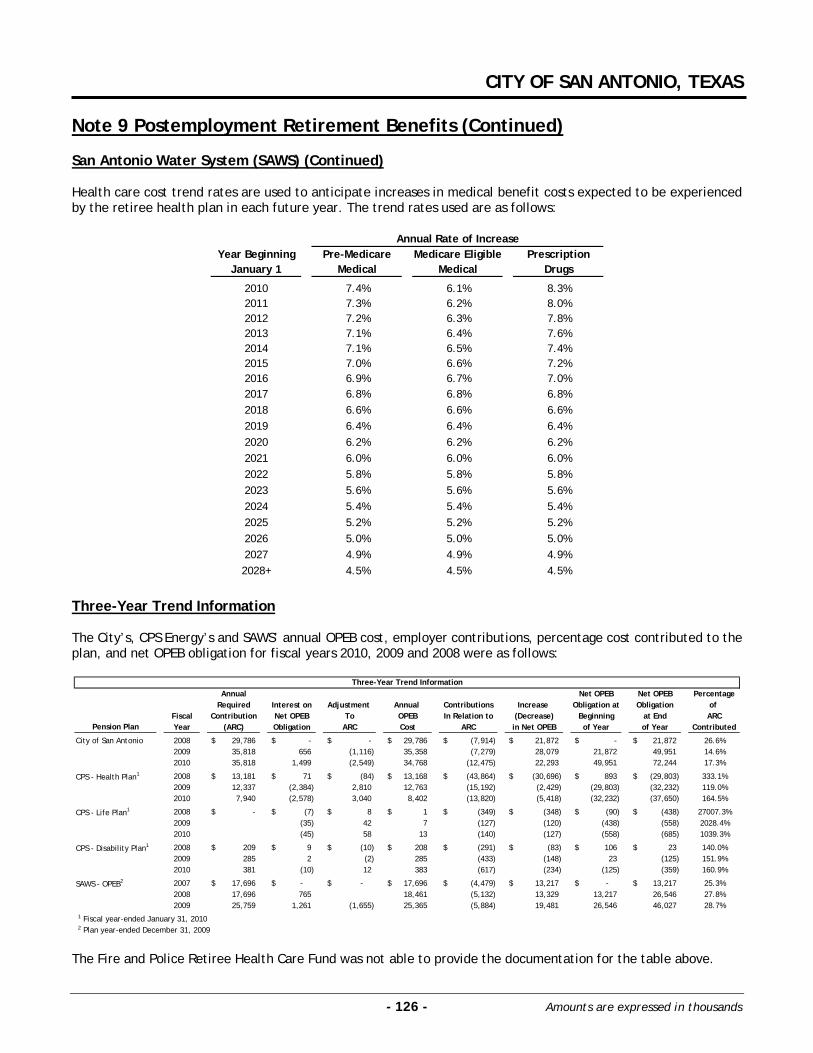
CITY OF SAN ANTONIO, TEXAS
- 126 - Amounts are expressed in thousands
Note 9 Postemployment Retirement Benefits (Continued) San Antonio Water System (SAWS) (Continued) Health care cost trend rates are used to anticipate increases in medical benefit costs expected to be experienced by the retiree health plan in each future year. The trend rates used are as follows:
Year Beginning Pre-Medicare Medicare Eligible PrescriptionJanuary 1 Medical Medical Drugs
2010 7.4% 6.1% 8.3%2011 7.3% 6.2% 8.0%2012 7.2% 6.3% 7.8%2013 7.1% 6.4% 7.6%2014 7.1% 6.5% 7.4%2015 7.0% 6.6% 7.2%2016 6.9% 6.7% 7.0%2017 6.8% 6.8% 6.8%2018 6.6% 6.6% 6.6%2019 6.4% 6.4% 6.4%2020 6.2% 6.2% 6.2%2021 6.0% 6.0% 6.0%2022 5.8% 5.8% 5.8%2023 5.6% 5.6% 5.6%2024 5.4% 5.4% 5.4%2025 5.2% 5.2% 5.2%2026 5.0% 5.0% 5.0%2027 4.9% 4.9% 4.9%2028+ 4.5% 4.5% 4.5%
Annual Rate of Increase
Three-Year Trend Information The City’s, CPS Energy’s and SAWS’ annual OPEB cost, employer contributions, percentage cost contributed to the plan, and net OPEB obligation for fiscal years 2010, 2009 and 2008 were as follows:
Annual Net OPEB Net OPEB PercentageRequired Interest on Adjustment Annual Contributions Increase Obligation at Obligation of
Fiscal Contribution Net OPEB To OPEB In Relation to (Decrease) Beginning at End ARCYear (ARC) Obligation ARC Cost ARC in Net OPEB of Year of Year Contributed
City of San Antonio 2008 29,786$ -$ -$ 29,786$ (7,914)$ 21,872$ -$ 21,872$ 26.6%2009 35,818 656 (1,116) 35,358 (7,279) 28,079 21,872 49,951 14.6%2010 35,818 1,499 (2,549) 34,768 (12,475) 22,293 49,951 72,244 17.3%
CPS - Health Plan1 2008 13,181$ 71$ (84)$ 13,168$ (43,864)$ (30,696)$ 893$ (29,803)$ 333.1%2009 12,337 (2,384) 2,810 12,763 (15,192) (2,429) (29,803) (32,232) 119.0%2010 7,940 (2,578) 3,040 8,402 (13,820) (5,418) (32,232) (37,650) 164.5%
CPS - Life Plan1 2008 -$ (7)$ 8$ 1$ (349)$ (348)$ (90)$ (438)$ 27007.3%2009 (35) 42 7 (127) (120) (438) (558) 2028.4%2010 (45) 58 13 (140) (127) (558) (685) 1039.3%
CPS - Disability Plan1 2008 209$ 9$ (10)$ 208$ (291)$ (83)$ 106$ 23$ 140.0%2009 285 2 (2) 285 (433) (148) 23 (125) 151.9%2010 381 (10) 12 383 (617) (234) (125) (359) 160.9%
SAWS - OPEB2 2007 17,696$ -$ -$ 17,696$ (4,479)$ 13,217$ -$ 13,217$ 25.3%2008 17,696 765 18,461 (5,132) 13,329 13,217 26,546 27.8%2009 25,759 1,261 (1,655) 25,365 (5,884) 19,481 26,546 46,027 28.7%
1 Fiscal year-ended January 31, 20102 Plan year-ended December 31, 2009
Three-Year Trend Information
Pension Plan
The Fire and Police Retiree Health Care Fund was not able to provide the documentation for the table above.

CITY OF SAN ANTONIO, TEXAS
- 127 - Amounts are expressed in thousands
Note 9 Postemployment Retirement Benefits (Continued) Three-Year Trend Information (Continued) The City’s, Fire and Police Health Care Fund, SAWS’ and CPS Energy’s funded status for the most recent year are as follows:
Fire and PoliceCity of Health Care CPS Energy CPS Energy CPS Energy
San Antonio Fund SAWS Health Plan Life Plan Disability Plan
Actuarial value of plan assets (a) -$ 200,329$ -$ 204,246$ 49,614$ 3,763$ Actuarial accrued liability (b) 342,018 549,466 297,259 219,364 35,491 6,575 Unfunded actuarial accrued liability
(funding excess) (b) - (a) 342,018$ 349,137$ 297,259$ 15,118$ (14,123)$ 2,812$ Funded ratio (a) / (b) 0.0% 36.5% 0.0% 93.1% 139.8% 57.2%Covered payroll (c) 259,224$ 236,372$ 75,270$ 219,716$ 198,669$ 198,669$ Unfunded actuarial accrued liability
(funding excess) as a percentageof covered payroll ([(b) - (a)] / (c)) 131.9% 147.7% 394.9% 6.9% -7.1% 1.4%
Funded Status and Funding Progress
Pension Plan
Note 10 CPS Energy South Texas Project (STP) Joint Operations Units 1 and 2 – CPS Energy is one of three participants in STP, a two-unit nuclear power plant with each unit having a nominal output of approximately 1,350 megawatts. The units, along with their support facilities and administrative offices, are located on a 12,220-acre site in Matagorda County, Texas. In-service dates for STP were August 1988 for Unit 1 and June 1989 for Unit 2. The other participants in STP Units 1 and 2 are NRG South Texas LLP, a wholly owned subsidiary of NRG Energy, Inc. (NRG) and the City of Austin. Effective November 17, 1997, the Participation Agreement among the owners of STP was amended and restated. At that time, the STPNOC, a Texas nonprofit, nonmember corporation created by the participants, assumed responsibility as the licensed operator of STP. The participants share costs in proportion to ownership interests, including all liabilities and expenses of STPNOC. STPNOC is financed and controlled by the owners pursuant to an operating agreement among the owners and STPNOC. Currently, a four-member board of directors governs STPNOC, with each owner appointing one member to serve with STPNOC’s chief executive officer. CPS Energy amortizes its share of nuclear fuel for STP to fuel expense on a units-of-production method. Under the Nuclear Waste Policy Act of 1982, the federal government assumed responsibility for the permanent disposal of spent nuclear fuel. CPS Energy is charged a fee for disposal of spent nuclear fuel, which is based upon CPS Energy’s share of STP generation that is available for sale to CPS Energy customers. This charge is included in fuel expense monthly. CPS Energy’s 40.0% ownership in STP Units 1 and 2 represents approximately 1,080 megawatts of total plan capacity. See Note 4, Capital Assets for more information about CPS Energy’s capital investments in STP. Units 3 and 4 Project – On June 28, 2006, NRG announced plans to construct two additional reactors (“STP Units 3 and 4”) at the current two-unit STP site. With this addition, energy production at that site is projected to increase by approximately 2,700 megawatts. In July 2006, in response to NRG’s announcement, CPS Energy formed a cross-functional task force of more than 30 in-house staff from various disciplines and external consultants who conducted an extensive feasibility study comparing the proposed development of new nuclear plants against CPS Energy’s alternatives for other sources of baseload generation (Feasibility Study). The initial results of the Feasibility Study were reported to the Board in early 2007, and an ongoing due diligence team was established to monitor project developments and make additional recommendations regarding CPS Energy’s potential participation in STP Units 3 and 4.

CITY OF SAN ANTONIO, TEXAS
- 128 - Amounts are expressed in thousands
Note 10 CPS Energy South Texas Project (STP) (Continued) Joint Operations (Continued) In September 2007, NRG and CPS Energy signed the South Texas Project Supplemental Agreement (Supplemental Agreement) under which CPS Energy elected to participate in the development of STP Units 3 and 4 pursuant to the terms of the participation agreement among the STP owners and agreed to potentially own up to 50% of STP Units 3 and 4. The Supplemental Agreement provided for CPS Energy to reimburse NRG for its pro rata share, based on its ownership percentage, of initial project costs incurred and to pay its pro rata share of future development costs. The Boards of CPS Energy and NRG subsequently approved the Supplemental Agreement, which was effective on October 29, 2007. CPS Energy’s adoption of its resolution to participate in the initial development of STP Units 3 and 4 did not constitute a commitment to make the complete investment in the proposed construction and operation of new nuclear units at STP. Also in September 2007, STPNOC, on behalf of CPS Energy and NRG, filed with the NRC a combined construction and operating license application (COLA) to build and operate STP Units 3 and 4. This COLA was the first complete application for new commercial nuclear units to be filed with the NRC in nearly 30 years. On November 29, 2007, the NRC announced it had accepted the COLA for review. On March 26, 2008, NRG announced the formation of Nuclear Innovation North America, LLC (NINA). NRG has an 88.0% ownership interest in NINA, while Toshiba Corporation (Toshiba) owns the remaining 12.0%. Upon the formation of NINA, NRG contributed its 50.0% ownership of, and its development rights to, STP Units 3 and 4 to NINA. As a result, NINA is now CPS Energy’s partner for the co-development of STP Units 3 and 4. On September 24, 2008, STPNOC, on behalf of CPS Energy and NINA, filed with the NRC an updated COLA naming Toshiba as the provider of STP Units 3 and 4. On February 10, 2009, the NRC issued a schedule for completing its review of the COLA. The NRC expects to issue the final Safety Evaluation Report in September 2011. Receipt of the NRC-approved combined operating license is a condition precedent to starting significant project construction. Also in September 2008, CPS Energy filed a Phase I application for a Department of Energy (“DOE”) loan guarantee related to its portion of the estimated project costs. Following the DOE’s evaluation of all Phase I applications, the DOE ranked the project third out of a field of fourteen nuclear loan guarantee project applications that were submitted. Subsequently, the DOE narrowed the list of nuclear project candidates for DOE loan guarantees to four projects, including STP Units 3 and 4. On November 5, 2008, STPNOC and the DOE executed a Standard Contract in which the DOE undertook the obligation to provide for permanent disposal of used nuclear fuel from the proposed STP Units 3 and 4 project. On January 20, 2009, the Board authorized CPS Energy to work with STPNOC to enter into an engineering, procurement and construction (EPC) agreement with Toshiba for STP Units 3 and 4. The EPC agreement did not commit CPS Energy to build the new nuclear units. Instead, it enabled CPS Energy to lock in favorable terms and conditions with the contractor prior to a final construction decision once the NRC issues a license for the project. The agreement was subsequently signed by all parties on February 24, 2009. On October 13, 2009, the Board approved selection of STP Units 3 and 4 as the next baseload generation resource and approved a request for $400,000 in bonds to support the project. However, amid reports that CPS Energy had knowledge that costs of the project might be significantly higher than previously reported, the City Council’s vote on the bonds was postponed. This higher project cost estimate prompted the San Antonio City Council to reevaluate CPS Energy’s stake in the project and members of CPS Energy’s management to engage in negotiations with representatives from Toshiba Corporation in November 2009.

CITY OF SAN ANTONIO, TEXAS
- 129 - Amounts are expressed in thousands
Note 10 CPS Energy South Texas Project (STP) (Continued) Joint Operations (Continued) Following the postponement of the City Council’s vote, the Board undertook an investigation to determine whether CPS Energy’s management had knowledge of an increase in the preliminary cost estimate for STP Units 3 and 4 and why that information was not previously communicated to the Board. The results of this investigation were reported to the Board in late 2009 and, based on the report, the Board adopted a resolution finding that there was a failure of the communication from certain members of CPS Energy executive management to the Board and the City Council regarding a revised cost estimate that was publicly disclosed in October 2009. The investigation report also concluded that there was no malicious intent on the part of any member of the management team in connection with the failure of the communication. Further, the report found that no member of management instructed any other employee to conceal or withhold any information from the Board and that lack of information flowing to the Board was, at worst, due to a difference of opinion about what information should be deemed material and deserving of the Board’s attention. While the project’s cost controversy was being investigated, CPS Energy explored all its options regarding participation in or withdrawal from the project. On December 6, 2009, CPS Energy filed a petition in Bexar County district court to clarify the roles and obligations of CPS Energy and NINA to define the rights of both parties should either decide to withdraw from the project. NRG escalated the litigation when it sued CPS Energy and claimed CPS Energy should forfeit all investment to date and lose all value in the project’s land and water rights. CPS Energy amended its petition on December 23, 2009, and raised significant issues concerning misconduct by NRG and NINA. CPS Energy specified actual and exemplary damages of $32,000,000. On February 17, 2010, CPS Energy and NINA announced that a proposed settlement had been reached that ended the parties’ legal disagreement and allowed the proposed expansion of STP Units 3 and 4 to proceed. As a result of the settlement, CPS Energy’s ownership stake in STP Units 3 and 4 was reduced from 50.0% to 7.6%, while NINA and Toshiba Corporation retained 92.4% ownership. NINA will pay all development costs incurred after January 31, 2010. CPS Energy has withdrawn its pending application for a DOE loan guarantee and will support the NINA loan guarantee applications. In addition to receiving a higher ownership interest (due to the reduction in CPS Energy’s ownership level to 7.6% which approximates CPS Energy’s expenditures on the project through January 31, 2010), NINA also agreed to pay CPS Energy $80,000, in two $40,000 payments, conditional on their loan guarantees being approved by the DOE. NINA also agreed to make a contribution of $10,000 over a four-year period to the Residential Energy Assistance Partnership, which provides emergency bill payment assistance to low-income customers in San Antonio and Bexar County. The settlement agreement was finalized on March 1, 2010. CPS Energy’s project costs to date of $380,000 for development of STP Units 3 and 4 are included in construction-in-progress. Nuclear Insurance The Price-Anderson Act is a comprehensive statutory arrangement for providing limitations on liability and governmental indemnities with respect to nuclear accidents or events. The maximum amount that each licensee may be assessed following a nuclear incident at any insured facility is $100,600, subject to adjustment for inflation, for the number o f operating nuclear units and for each licensed reactor, payable at $10,000 per year per reactor for each nuclear incident. CPS Energy and each of the other participants of STP are subject to such assessments, which will be borne on the basis of their respective ownership interests. For purposes of these assessments, STP has two licensed reactors. The participants have purchased the maximum limits of nuclear liability insurance, as required by law, and have executed indemnification agreements with the NRC in accordance with the financial protection requirements of the Price-Anderson Act. A Master Worker Nuclear Liability policy, with a maximum limit of $300,000 for the nuclear industry as a whole, provides protection from nuclear-related claims. NRC regulations require licensees of nuclear power plants to obtain on-site property damage insurance in a minimum amount of approximately $1,100,000. NRC regulations also require that the proceeds from this insurance be used first to ensure that the licensed reactor is in a safe and stable condition so as to prevent any significant risk to the public health or safety, and then to complete any decontamination operations that may be ordered by the NRC. Any funds remaining would then be available for covering direct losses to property.

CITY OF SAN ANTONIO, TEXAS
- 130 - Amounts are expressed in thousands
Note 10 CPS Energy South Texas Project (STP) (Continued) Nuclear Insurance (Continued) The owners of STP Units 1 and 2 currently maintain approximately $2,800,000 of nuclear property insurance, which is above the legally required amount of $1,100,000. The $2,800,000 of nuclear property insurance consists of $500,000 in primary property damage insurance and $2,300,000 of excess property damage insurance, both subject to a retrospective assessment being paid by all members of Nuclear Electric Insurance Limited (NEIL). A retrospective assessment could occur if property losses, as a result of an accident at any nuclear plant insured by NEIL, exceed the accumulated funds available to NEIL. Nuclear Decommissioning CPS Energy, together with the other owners of STP Units 1 and 2, files a certificate of financial assurance with the Nuclear Regulatory Commission (NRC) for the decommissioning of the nuclear power plant every two years or upon transfer of ownership. The certificate assures that CPS Energy and the other owners meet the minimum decommissioning funding requirements mandated by the NRC. The STP owners agreed in the financial assurance plan that their estimate of decommissioning costs would be reviewed and updated periodically. The most recent cost study conducted by the owners in March 2008 showed that CPS Energy’s share of decommissioning costs was $386,300 in 2007 dollars. Included in the cost study was a 10.0% contingency component as required to comply with the PUCT. Based on the level of funds accumulated in the 28.0% Decommissioning Trust and an analysis of this cost study, CPS Energy determined that no further decommissioning contributions will be required to be deposited into the Decommissioning Trust. In 1991, CPS Energy started accumulating the decommissioning funds for their original 28.0% portion in an external trust in accordance with the NRC regulations. The 28% Decommissioning Trust’s assets and related liabilities are included in CPS Energy’s financial statements as a component unit. Excess or deficient funds related to the 28% Trust will be received from or distributed to CPS Energy’s ratepayers after decommissioning is complete. In conjunction with the acquisition of the additional 12.0% interest in STP in May 2005, CPS Energy also assumed control of a relative portion of the Decommissioning Trust previously established by the prior owner, American Electric Power (AEP). This is referred to as the 12% Decommissioning Trust, and its assets and related liabilities are also included in CPS Energy’s financial statements as a component unit. Subject to PUCT approval as requested in the future, excess or deficient funds related to the 12% Trust will be received from or distributed to AEP customers after decommissioning is complete. CPS Energy has determined that some decommissioning activities will be required prior to shutdown of STP Units 1 and 2 at the end of the plant’s life. Since the NRC prohibits any spending out of the Decommissioning Trusts for other than administrative expenses prior to shutdown, CPS Energy established a preshutdown account to fund decommissioning expenses incurred prior to shutdown. Contributions to fund preshutdown decommissioning costs for CPS Energy’s 28.0% ownership in STP amounted to $2,200 in fiscal year 2010. Preshutdown decommissioning expenses for the 28.0% ownership totaled $270 for fiscal year 2010. For the 12.0% ownership, preshutdown costs were funded by AEP’s ratepayers; preshutdown decommissioning expenses for this ownership totaled $116 for fiscal year 2010. Excluding securities lending collateral, as of December 31, 2009, CPS Energy had accumulated approximately $266,800 in the 28% Trust. Total funds are allocated to decommissioning costs, spent fuel management and site restoration. Based on the most recent annual calculation of financial assurance required by the NRC, the 28% Trust funds allocated to decommissioning costs totaled $153,900, which exceeded the calculated financial assurance amount of $107,700 at December 31, 2008.

CITY OF SAN ANTONIO, TEXAS
- 131 - Amounts are expressed in thousands
Note 10 CPS Energy South Texas Project (STP) (Continued) Nuclear Decommissioning (Continued) The March 2008 cost study estimated decommissioning costs for the 12.0% ownership in STP Units 1 and 2 at $165,600 million in 2007 dollars. Excluding securities lending cash collateral, as of December 31, 2009, approximately $90,300 had been accumulated in the 12% Trust. Total funds are allocated to decommissioning costs, spent fuel management and site restoration. Based on the most recent annual calculation of financial assurance required by the NRC, the 12% Trust funds allocated to decommissioning costs totaled $54,400, which exceeded the calculated financial assurance amount of $46,100 at December 31, 2008. In fiscal year 2009, CPS Energy changed its method of accounting for the Decommissioning Trusts. Under the new method, a pro rata share of total decommissioning costs (as determined by the March 2008 cost study) has been recognized as a liability. In subsequent years, annual decommissioning expense and an increase in the liability will reflect the effects of inflation and an additional year of plant usage. Additionally, guidance under FASB Statement 71, Accounting for the Effects of Certain Types of Regulation, will be followed to retain the zero fund net assets approach to accounting for the Decommissioning Trusts. There was no impact to fund net assets as a result of this change in accounting method. Both Decommissioning Trusts have separate calendar-year financial statements, which are separately audited and can be obtained by contacting the Controller at CPS Energy. STP Pension Plan and Other Postretirement Benefits STP maintains a noncontributory defined-benefit pension plan covering most employees. Retirement benefits are based on length of service and compensation. Plan assets are invested in various equity and fixed-income securities. Contributions totaling $11,300 were made in fiscal year 2009, of which $10,500 related to the 2009 plan year, while $800 related to plan year 2008. A final contribution of $448 for plan year 2009 will be required to be made by September 15, 2010, in order to meet minimum funding requirements of the Internal Revenue Code. In September 2006, the FASB issued Statement No. 158, Employers’ Accounting for Defined Benefit Pension and Other Postretirement Plans – An Amendment of FASB Statements No. 87, 88, 106 and 132(R). FASB Statement No. 158 required STP, as the sponsor of a plan, to (a) recognize on its balance sheet as an asset the plan’s overfunded status or as a liability the plan’s underfunded status, (b) measure the plan’s assets and obligations as of the end of the calendar year, and (c) recognize changes in the funded status of the plans in the year in which changes occur. Additional minimum liabilities are also derecognized upon adoption of the new standard. FAS No. 158 required STP to recognize additional liabilities and eliminate the intangible asset related to certain of its qualified and nonqualified plans. The effect of the defined benefit funding obligations to CPS Energy was $(9,788) for fiscal year 2010 and was reflected as a reduction in Other Changes in Fund Net Assets on the Statements of Revenues, Expenses and Changes in Fund Net Assets. Employees whose pension benefits exceed $230 for the 2008 Employee Retirement Income Security Act limitations are covered by a supplementary nonqualified, unfunded pension plan, which is provided for by charges to operations sufficient to meet the projected benefit obligation. The accruals for the cost of that plan are based on substantially the same actuarial methods and economics as the noncontributory defined-benefit pension plan. STPNOC approved a change to the pension plan, effective January 1, 2007, to preclude the eligibility of employees hired after December 31, 2006, in the plan. Employees hired after this date will receive enhanced matching contributions under the STP Nuclear Operating Company Savings Plan. STP also maintains a defined-benefit postretirement plan that provides medical, dental and life insurance benefits for substantially all retirees and eligible dependents. The cost of these benefits is recognized in the project statements during an employee’s active working career. STP has a trust to partially meet the obligations of the plan.

CITY OF SAN ANTONIO, TEXAS
- 132 - Amounts are expressed in thousands
Note 10 CPS Energy South Texas Project (STP) (Continued) STP Pension Plan and Other Postretirement Benefits (Continued) The owners of STP, including CPS Energy, share in all plan costs in the same proportion as their respective ownership percentages.
Pension Benefits Other BenefitsChange in benefit obligation:
Benefit Obligation - Beginning 240,915$ 70,701$ Service Cost 9,675 5,839 Interest Cost 14,336 4,151 Actuarial Loss (2,331) (953) Benefits Paid (3,350) (2,748)
Benefit Obligation - Ending 259,245 76,990
Change in Plan Assets:Fair Value of Plan Assets - Beginning 132,279 8,706 Actual Return on Plan Assets 21,593 1,511 Employer Contributions 11,323 2,196 Benefits Paid (3,350) (2,748)
Fair Value of Plan Assets - Ending 161,845 9,665
Funded Status - Ending (97,400) (67,325) Unrecognized Net Actuarial Loss 79,835 23,798 Unrecognized Prior Service Cost 6,752 (12,023) Unrecognized Transition Obligation 251
Net Amount Recognized (10,813) (55,299) Accrued Benefit Cost (10,813)$ (55,299)$
Weighted-average Assumptions:Discount Rate 6.0% 6.0%Expected Return on Plan Assets 8.0% 8.0%Rate of Compensation Increase 3.0% 3.0%
Schedule of Funding Status (RSI-Unaudited)Calendar Year 2009
Note 11 Commitments and Contingencies Primary Government (City) Grants The City has received significant financial assistance from federal and state agencies in the form of grants. The disbursement of funds received under these programs generally requires compliance with terms and conditions specified in the grant agreements and are subject to audit by the grantor agencies. Any disallowed claims resulting from such audits could become a liability of the General Fund or other applicable funds. However, in the opinion of management, liabilities resulting from disallowed claims, if any, will not have a materially adverse effect on the City's financial position at September 30, 2010. Grants awarded by federal, state, and other governmental agencies but not yet earned as of September 30, 2010 were $61,998.

CITY OF SAN ANTONIO, TEXAS
- 133 - Amounts are expressed in thousands
Note 11 Commitments and Contingencies (Continued) Primary Government (City) (Continued) Capital Improvement Program The City will be undertaking various capital improvements during fiscal year 2011. The estimated cost of these improvements is $711,036, which consist of the following:
Function/Program FY 2011
General GovernmentInformation Technology 18,145$ Municipal Facilites 46,705 Other Facilities 6,561
Total General Government 71,411$
Public Health & SafetyDrainage 101,600$ Fire Protection 27,435 Law Enforcement 88,296
Total Public Health & Safety 217,331$
Recreation & CultureLibraries 17,539$ Municipal Facilites 30,749 Parks 64,246
Total Recreation & Culture 112,534$
TransportationAir Transportation 98,576$ Street 211,184
Total Transportation 309,760$
Total Capital Plan 711,036$
These projects are scheduled to be funded with a combination of grants, contributions from others, bonds, certificates, notes and other designated City resources. Litigation The City is a party to various lawsuits alleging personal and property damages, wrongful death, breach of contract, property tax assessment disputes, environmental matters, class actions, employment claims and cases. The estimated liability, including an actuarially determined amount of incurred but not reported claims, is recorded in the Insurance Reserve Fund in the amount of $23,135. The City estimates the amounts of unsettled claims under its self-insurance program and believes that the self-insurance reserves recorded in the Insurance Reserve Fund are adequate to cover losses for which the City may be liable. Whether additional claims or revisions to estimates required for settlement on existing claims could have a material effect on the general purpose financial statements cannot be determined.

CITY OF SAN ANTONIO, TEXAS
- 134 - Amounts are expressed in thousands
Note 11 Commitments and Contingencies (Continued) Primary Government (City) (Continued) Litigation (Continued) Kopplow Development, Inc. v. City of San Antonio. Plaintiff contends that the construction of a regional storm water detention facility was an inverse condemnation of its property by increasing the flood plain elevation on its property. The City also filed a statutory condemnation to acquire an easement involving Plaintiff's property to construct and maintain part of the facility. This matter was tried in July 2008, but the City’s motion for new trial was granted. After a retrial, the jury awarded approximately $600 to Plaintiff for the inverse condemnation and statutory condemnation. The City and Plaintiff appealed. The Fourth Court of Appeals recently issued its opinion affirming the trial court’s ruling awarding Kopplow $5 as compensation for the land taken, but reversed the other portion of the judgment for the remainder of the damages. Kopplow’s motion for rehearing was denied on December 29, 2010. The City anticipates Kopplow will appeal this matter to the Texas Supreme Court. Shawn Rosenbaum, et. al. v. City of San Antonio, et. al. Plaintiff's decedent, Diane Rosenbaum, was operating her motorized wheelchair, crossing a parking area where she allegedly was struck by a City vehicle. Ms. Rosenbaum later died, allegedly as a result of this incident. Discovery is on-going. Damages in this matter are capped by the Texas Tort Claims Act at $250. A trial date has not been set. Daniel Thomas, et. al. v. City of San Antonio, et. al. Plaintiffs' decedent was involved in two vehicle accidents in a short period of time and fled the scene of the second one on foot. After decedent refused commands to stop and drop his weapon, and in fear for their safety, the officers shot and killed the decedent. Plaintiffs filed suit in Federal Court against the City and the officers in their individual capacities. Discovery is on-going. If liability is determined, damages could be in excess of $250. Chacon, et. al. v. City of San Antonio, et. al. Plaintiffs are land owners who own property in an area that had been part of a limited purpose annexation by the City. The area was deannexed in March 2008 and City South Management Authority ("CSMA") took over responsibility for planning and zoning pursuant to State statute. Plaintiffs filed suit in Federal Court challenging both the City and CSMA's authority to enact and enforce zoning and planning regulations, alleging that these restrictions have devalued their property by limiting their ability to develop it. Under the City’s Indemnification Ordinance, the City has provided a defense for CSMA. On cross-motions for Summary Judgment, the Court dismissed most of Plaintiffs’ claims, but retained their claim of violations of Texas Government Code Chapter 2007. Plaintiffs seek damages in excess of $4,000. Galvan, et al. v. City of San Antonio, et al. Plaintiffs filed suit for wrongful death under State and Federal laws related to the death of Sergio Galvan. During the course of an arrest, decedent became violent and, in response, the defendant officers used taser guns to subdue him. Decedent became unresponsive and was later pronounced dead. The trial court granted summary judgment in favor of all defendants in November 2008. Plaintiffs have appealed the judgment with respect to the defendant officers to the Fifth Circuit Court of Appeals. The Fifth Circuit affirmed the judgment in favor of the Defendants in June 2010. During the pendency of that suit, a second lawsuit was filed by different family members of the decedent, in State District Court. That matter was removed to Federal Court. The Court requested briefing on why the second suit should not be dismissed in light of the Fifth Circuit opinion in the first case. The Court’s decision is pending. If the matter is not dismissed and plaintiffs are successful, damages could be in excess of $250. Smith, et al. v. Ybarra, et al. Plaintiffs’ decedent was killed in a motor vehicle accident. Plaintiffs filed suit against the driver of the vehicle involved, as well as the City. As to the City, plaintiffs contend that paramedics did not render medical aid to decedent based on their mistaken belief that she was already dead. Damages are capped at $250. Wissmann v. City of San Antonio. Plaintiff was involved in a motor vehicle accident with a SAPD cruiser and filed suit for injuries allegedly sustained in the accident. This case is covered by the Texas Tort Claims Act. If liability is determined, damages are capped at $250. This case is set for trial on May 2, 2011.

CITY OF SAN ANTONIO, TEXAS
- 135 - Amounts are expressed in thousands
Note 11 Commitments and Contingencies (Continued) Primary Government (City) (Continued) Litigation (Continued) KGME, Incorporated v. City of San Antonio. Plaintiff entered into a contract with the City to provide construction services. The parties determined that work on portions of the contract had become impracticable and further work would cease. Plaintiff sued for Breach of Contract and Violations of the Prompt Payment Act. Damages could exceed $250. The City filed a plea to the jurisdiction, which was denied by the Court. The Fourth Court of Appeals issued its opinion on February 16, 2011, affirming the trial court’s denial of the City’s Plea to the Jurisdiction. The City is currently assessing whether to continue the appeal process or return to the trial court for further litigation on this matter. Vasquez, et al. v. City of San Antonio Police Department. Plaintiffs were involved in a motor vehicle accident while pursued by SAPD officers. Plaintiff filed suit on her behalf and on behalf of her minor child for injuries allegedly sustained in the accident. This case is covered by the Texas Torts Claims Act. If liability is determined, damages are capped at $250. This case is set for trial on July 11, 2011. David Ash v. City of San Antonio. Plaintiff struck a City vehicle from behind. Plaintiff claims he could not see that the City vehicle was stopping because of the dust cloud kicked up by the truck. This case was tried to a jury in September 2009 and Plaintiff was awarded damages of approximately $190. The Fourth Court of Appeals issued its opinion on February 9, 2011. The Court found that some of the damages awarded by the jury were not supported by the evidence. They encouraged the parties to agree to a remittitur of the award to an amount of approximately $94 or the matter will be returned to the trial court for a new trial. The parties are still assessing their options. Valemas, Inc. v City of San Antonio. The City contracted with Plaintiff for construction work associated with the Brackenridge Park Rehabilitation Project. The City refused to pay the Plaintiff the balance of the contract due to delays in completion. Plaintiff contends that the delays were due to actions of the City and filed suit to recover the balance of the contract. Damages could be in excess of $250. This matter is to be set for mediation in April, 2011 and set for trial in October, 2011. L. Payne Constructors v City of San Antonio. The City contracted with Plaintiff for construction work associated with the Clark Avenue/Fair Avenue project. Plaintiff filed suit for breach of contract alleging the City caused delays and increased costs through change orders. Plaintiffs have sued for damages in excess of $500. This matter has been recently filed and discovery is just beginning. Sayani v City of San Antonio and City South Management Authority. Plaintiff contended that City and City South Management Authority effected a taking of his property by allegedly improperly imposing zoning restrictions on his property without performing a takings analysis. Plaintiff sought damages in loss of value to his property in an amount of approximately $1,500. This matter was settled in October, 2010 for $500 payable to the Plaintiff by the City. Rosemary Flammia v City of San Antonio. Plaintiff initially filed an Equal Employment Opportunity Commission (EEOC) complaint alleging discrimination based on gender and race based on not being appointed as Assistant Chief. She amended her complaint on several occasions and also asserted claims of retaliation based on her prior EEOC filings. This matter settled in October, 2010 for $249.
(The remainder of this page left blank intentionally)

CITY OF SAN ANTONIO, TEXAS
- 136 - Amounts are expressed in thousands
Note 11 Commitments and Contingencies (Continued) Primary Government (City) (Continued) Arbitrage The City has issued certain tax-exempt obligations that are subject to Internal Revenue Service (IRS) arbitrage regulations. Noncompliance with these regulations, which pertain to the utilization and investment of proceeds, can result in penalties, including the loss of the tax-exempt status of the applicable obligations retroactive to the date of original issuance. In addition, the IRS requires that interest income earned on proceeds in excess of the arbitrage rate on applicable obligations be rebated to the federal government. The City monitors its bond proceeds in relation to arbitrage regulations, and “arbitrage rebate” is estimated and recorded in the government-wide and proprietary financial statements when susceptible to accrual, and in the governmental fund type when matured. As of September 30, 2010, the City has no arbitrage liability for its governmental or proprietary funds. Leases The City leases City-owned property to others consisting of buildings, real property, and parking spaces. Costs of specific leased components are not readily determinable. The Airport System’s revenue is net Ground Abatement Credits and Building Improvement Credits allowed to lessees per signed contracts. Total rental revenue on operating leases for the fiscal year-ended September 30, 2010 was $28,738. As of September 30, 2010, the leases provide for the following future minimum rentals:
Governmental Airport ParkingActivities System System Total
Fiscal year ending September 30:2011 7,364$ 16,089$ 100$ 23,553$ 2012 6,217 15,346 100 21,663 2013 5,744 11,804 100 17,648 2014 5,200 4,022 100 9,322 2015 4,833 3,810 100 8,743
2016-2020 9,152 15,046 500 24,698 2021-2025 4,874 9,066 500 14,440 2026-2030 2,517 5,393 100 8,010 2031-2035 693 979 1,672 2036-After 734 734
Future Minimum Lease Rentals 47,328$ 81,555$ 1,600$ 130,483$
Lease Revenues
Landfill Postclosure Care Costs In October 1993, the City Council approved closure of the Nelson Gardens Landfill, which immediately stopped accepting solid waste. Subsequent to landfill closure, federal and state laws required the City to incur certain postclosure care costs over a period of 30 years. As of September 30, 1994, the City estimated these costs for postclosure of the Nelson Gardens Landfill at $3,825. The estimate was based on estimated costs for installation of a leachate and groundwater collection system, installation of a methane recovery system, geotechnical and environmental engineering services, and monitoring and maintaining the facility for a 30-year period. In accordance with GASB Statement No. 18, Accounting for Municipal Solid Waste Landfill Closure and Postclosure Care Cost, the estimated postclosure cost of $3,825 for the Nelson Gardens Landfill was recorded as a liability and expensed in the Solid Waste Management Fund in fiscal year 1994. This cost is an estimate and is subject to changes resulting from inflation/deflation, advances in technology, or changes in applicable laws or regulations. Each fiscal year, the City performs an annual re-evaluation of the postclosure care costs associated with the Nelson Gardens Landfill. The annual re-evaluation conducted for the fiscal year-ended September 30, 2010 resulted in an estimated postclosure care liability for the Nelson Gardens Landfill of $2,057. This represents a decrease of $296 from the prior fiscal year for expenditures incurred for geotechnical and environmental engineering services.

CITY OF SAN ANTONIO, TEXAS
- 137 - Amounts are expressed in thousands
Note 11 Commitments and Contingencies (Continued) Primary Government (City) (Continued) Texas Commission on Environmental Quality (TCEQ) Financial Assurance The City is required under the provision of the Texas Administrative Code to provide financial assurance to the Texas Commission on Environmental Quality (TCEQ) related to the closure of municipal solid waste operations including, but not limited to, storage, collection, handling, transportation, processing, and disposal of municipal solid waste. As such, financial assurance is required to ensure that funds are available, when needed, to meet costs associated with the closure of the City’s North East Transfer Station. As of September 30, 2001, the permit for the North East Transfer Station has been transferred from the City, and the new permitee has provided adequate financial assurance and assumes all liabilities for this facility. Additionally, financial assurance is required to demonstrate financial responsibility for underground storage petroleum facilities. Based on the number of underground petroleum storage tanks, the City is required to provide $1,000 of financial assurance related to the underground storage facilities. Brooks City-Base – Electric and Gas Utilities The Brooks City-Base Project is a collaborative effort between the U.S. Air Force (the Air Force) and the City designed to retain the Air Force missions and jobs at Brooks Air Force Base, improve mission effectiveness, assist in reducing operating costs, and promote and enhance economic development at Brooks City-Base. On July 22, 2002, the land and improvements were transferred to the Brooks Development Authority (BDA) for the purpose of creating the Brooks Technology and Business Park, a facility that will foster the development of key targeted industries. The Air Force is currently the Park’s anchor tenant and is leasing back facilities to perform its missions. In fiscal year 2003, CPS Energy entered into a 20-year agreement with Brooks Development Authority (BDA) to upgrade the electric and gas utility systems located within the Brooks City-Base. CPS Energy and BDA have each committed to invest $6,300 ($4,200 in year 2002 dollars, which accumulates interest at the rate of 3.7% compounded annually) to upgrade the infrastructure at that location. BDA is required to pay its annual minimum payment from its available operating revenues. If BDA’s operating revenues cannot cover the annual minimum payment, then, as BDA’s obligation is backed by the City, the City will fund the obligation for that fiscal year. Obligations for fiscal year 2010 were fully funded through BDA operating revenues. BDA’s obligations are additionally reduced annually, in accordance with contract terms, for economic development that benefits CPS Energy’s electric and gas systems at the Brooks City-Base. To the extent that the capital renewals and upgrades do not total $12,600 by September 2022, BDA’s and CPS Energy’s committed investments each will be reduced equally. To date, CPS Energy has invested $5,100 and BDA has invested, net of annual interest, $4,200. BDA has fully funded its commitment. CPS Energy Litigation In the normal course of business, CPS Energy is involved in legal proceedings related to alleged personal and property damages, breach of contract, condemnation appeals, and discrimination cases. In addition, CPS Energy’s power generation activities and other utility operations are subject to extensive state and federal environmental regulation. In the opinion of CPS Energy’s management, the outcome of such proceedings will not have a material adverse effect on the financial position or results of operations of CPS Energy.

CITY OF SAN ANTONIO, TEXAS
- 138 - Amounts are expressed in thousands
Note 11 Commitments and Contingencies (Continued) CPS Energy (Continued) Leases Capital Leases - CPS Energy has one capital lease arrangement for the use of computer servers, associated software and maintenance of the hardware and software. The four year lease began in fiscal year 2007 and will end in fiscal year 2011. As of January 31, 2010, there were no future lease payments associated with this capital lease. The value of the assets acquired through capital leases at January 31, 2010, was as follows:
January 31, 2010
Equipment 2,723$ Accumulated Depreciation (2,159)
Net book value 564$
Operating Leases – CPS Energy has entered into operating lease agreements to secure the usage of natural gas storage facilities, land, a building, office space, parking lot space and engineering equipment. The lease of the building contains a lease payment escalation clause whereby the minimum monthly lease payments will increase by $3 per month beginning in the sixth year of the lease. Additionally, the building lease contains an option to purchase the facility before the end of the third year of the lease. The leases for the parking lot space contain a provision for a slight escalation in the monthly payment amount in the second and third years of the lease. As of January 31, 2010, the future minimum lease payments for noncancelable operating leases with terms in excess of one year were as follows:
Operating LeaseYear Ended January 31, Payments
2011 5,192$ 2012 2,329 2013 499 2014 365
Total future minimum lease payments 8,385$
CPS Energy’s minimum lease payments for all operating leases for which CPS Energy was the lessee amounted to $6,300 in fiscal year 2010. There were no contingent lease or sublease payments in fiscal year 2010. CPS Energy has entered into operating lease agreements allowing cable and telecommunication companies to attach telephone, cable and fiber-optic lines to CPS Energy’s electric poles. Operating leases also exist between CPS Energy and telecommunication companies allowing the companies to attach communication equipment to CPS Energy’s communication towers. Additionally, CPS Energy has three operating leases for the use of land that CPS Energy owns. The majority of the operating leases pertaining to the use of CPS Energy’s communication towers contain a provision for contingent lease receipts that will equal the lesser of a 15.0% increase in the prior five-year lease payment or the percentage increase in the Consumer Price Index over the same five-year period. Furthermore, the three land leases also contain a provision for contingent lease receipts based on the Consumer Price Index.

CITY OF SAN ANTONIO, TEXAS
- 139 - Amounts are expressed in thousands
Note 11 Commitments and Contingencies (Continued) CPS Energy (Continued) Leases (Continued) As of January 31, 2010, the future minimum lease receipts for noncancelable operating leases with terms in excess of one year were as follows:
Operating LeaseYear Ended January 31, Receipts
2011 2,188$ 2012 2,180 2013 2,101 2014 1,566 2015 590
Later years 2,407 Total future minimum lease payments 11,032$
CPS Energy’s minimum lease receipts for all operating leases for which CPS Energy was the lessor amounted to $8,600 in fiscal year 2010. Contingent lease receipts amounted to $553 for fiscal year 2010. There were no sublease receipts in fiscal year 2010. Lease/Leaseback - In June 2000, CPS Energy entered into a lease/leaseback transaction with an affiliate of Exelon involving CPS Energy’s Spruce 1 coal-fired electric generating unit. The transaction included a lease for a term of approximately 65 years in combination with a leaseback of the facility by CPS Energy for approximately 32 years. CPS Energy retains fee simple title to, and operating control of, the facility and retains all revenues generated from sales of electricity produced from the facility. CPS Energy received the appraised fair value of the unit, $725,000, which is being amortized over 381 months, or approximately 32 years. The transaction expenses and leaseback costs of $628,300 were recorded as prepaid items in 2001 and are being amortized over 381 months, or approximately 32 years. CPS Energy has the option to cancel the leaseback after it expires by making a payment to Exelon’s affiliate. CPS Energy entered into a collateralization payment-undertaking agreement that will generate amounts sufficient to fund the cancellation option. CPS Energy’s net benefits associated with the transaction were approximately $88,000. The City was paid $12,300 in accordance with the provisions of the New Series Bond Ordinance that permit 14.0% of this net benefit to be distributed. The distribution was recorded as a prepayment in 2001 and is being amortized over 381 months, or approximately 32 years. As a result, net proceeds from the transaction of approximately $75,700 are being reported over the 32-year leaseback term. In fiscal year 2010, the net amount recorded as income by CPS Energy was $2,800. Other Purchase and construction commitments amounted to approximately $2,400,000 at January 31, 2010. This amount includes provisions for natural gas purchases expected through June 2027; the actual amount to be paid will depend upon CPS Energy’s actual requirements during the contract period and the price of gas. Also included are provisions for coal purchases through December 2021 and for coal transportation through December 2014. CPS Energy also has other purchase commitments totaling $2,800,000. This amount includes provisions for wind power through May 2030, solar power through December 2040, landfill power through December 2020, and raw uranium associated with STP fabrication and conversion services needed for refueling through May 2026.

CITY OF SAN ANTONIO, TEXAS
- 140 - Amounts are expressed in thousands
Note 11 Commitments and Contingencies (Continued) CPS Energy (Continued) Other (Continued) On January 20, 2009, the Board approved a policy statement on sustainability. The basis of the policy is to affirm that CPS Energy’s strategic direction centers on transforming from a company focused on providing low-cost power from traditional generation sources to a company providing competitively priced power from a variety of sources. To be sustainable, CPS Energy has to balance its financial viability, environmental commitments and social responsibility as a community-owned provider. Further, the objective of sustainable energy development is to meet current needs without compromising the ability of future generations to meet their needs. A total of $5,700,000 has been committed over the next 12 years in the areas of renewable energy, energy efficiency and conservation, transition to a smart grid, compliance with state energy conservation mandates, energy research and environmental improvements. In October 2008, CPS Energy agreed to an amendment with Calaveras Power Partners, L.P. under which CPS Energy is obligated to make a payment of $10,000 if the milestones and progress are achieved per the amendment. CPS Energy has paid $7,400 of this amount to date. During fiscal year 2008, CPS Energy entered into a Natural Gas Supply Agreement with the SA Energy Acquisition Public Facility Corporation (PFC), a component unit of the City, to purchase, to the extent of its gas utility requirements, all natural gas to be delivered under a Prepaid Natural Gas Sales Agreement. Under the Prepaid Natural Gas Sales Agreement between the PFC and a third-party gas supplier, the PFC has prepaid the cost of a specified supply of natural gas to be delivered over 20 years. CPS Energy’s 20-year commitment under the Natural Gas Supply Agreement is included in the aforementioned $2,400,000 purchase and construction commitments amount. In December 2007, CPS Energy and Exelon Generation Company LLC (Exelon) signed an agreement granting CPS Energy an option to participate in a possible joint investment in a nuclear-powered electric generation facility in Southeast Texas (the Exelon Project). Preliminary plans indicate that the Exelon Project would be located in Victoria County, Texas, and would involve the development of two Economic Simplified Boiling Water Reactors (ESBWR), nominally rated at 1,520 megawatts each. Under this agreement, CPS Energy has the option to acquire between 25.0% and a 40.0% ownership in the Exelon Project. Exelon submitted the COLA for the Exelon Project to the NRC on September 3, 2008. On October 30, 2008, the NRC accepted the application for a detailed review. Exelon announced on November 24, 2008, that they intended to select an alternate technology, other than the ESBWR, for the Exelon Project. Subsequently on December 18, 2008, the NRC placed the review of Exelon’s COLA on hold. On March 27, 2009, Exelon announced that it had selected Hitachi’s Advanced Boiling Water Reactor design for the Exelon Project, and that it planned to revise the COLA and its DOE loan guarantee application accordingly. The Exelon Project failed to qualify for the initial round of DOE loan guarantees. Exelon has delayed development of the Exelon Project but will continue to pursue an Early Site Permit for the Victoria County location. The parties are in discussions to execute a new agreement, with a possible change in ownership percentage. Exelon has not notified CPS Energy of any intention to terminate the agreement or to abandon the project. In fiscal year 2003, CPS Energy entered into a 20-year agreement with Brooks Development Authority (BDA) to upgrade the electric and gas utility systems located within the Brooks City-Base. CPS Energy and BDA have each committed to invest $6,300 ($4,200 in year 2002 dollars, which accumulates interest at the rate of 3.7% compounded annually) to upgrade the infrastructure at that location. BDA is required to pay its annual minimum payment from its available operating revenues. If BDA’s operating revenues cannot cover the annual minimum payment, then, as BDA’s obligation is backed by the City, the City will fund the obligation for that fiscal year. Obligations for fiscal year 2010 were fully funded through BDA operating revenues. BDA’s obligations are additionally reduced annually, in accordance with contract terms, for economic development that benefits CPS Energy’s electric and gas systems at the Brooks City-Base. To the extent that the capital renewals and upgrades do not total $12,600 by September 2022, BDA’s and CPS Energy’s committed investments each will be reduced equally. To date, CPS Energy has invested $5,100 and BDA has invested, net of annual interest, $4,200. BDA has fully funded its commitment.

CITY OF SAN ANTONIO, TEXAS
- 141 - Amounts are expressed in thousands
Note 11 Commitments and Contingencies (Continued) CPS Energy (Continued) Save for Tomorrow Energy Program (“STEP”) During fiscal year 2009, CPS Energy committed to spending $849,000 over the next 12 years on energy efficiency and conservation through STEP. Annually, the first $8,000 of STEP expenses will be funded through the base rate and will be reported as CPS Energy operation and maintenance (O&M) expenses. STEP expenses over the initial $8,000 per year will be recovered or funded through the fuel adjustment factor in the year after they are incurred and have been independently validated. These STEP recoveries will be deferred as STEP net costs recoverable through future rates in accordance with guidance provided by FAS 71, Accounting for the Effects of Certain Types of Regulation. This guidance requires that certain costs be capitalized as a regulatory asset until they are recovered through future rates. As a result, there is no impact to net income from the STEP expenses over the initial $8,000. San Antonio Water System (SAWS) Litigation SAWS is the subject of various claims and potential litigation, which arise in the ordinary course of its operations. Management, in consultation with legal counsel, makes an estimate of potential costs that are expected to be paid in the future as a result of known claims and potential litigation and records this estimate as a contingent liability. The amount of such contingent liability totaled $5,504 at December 31, 2009. While the exact amount of any potential liability that may arise from these claims and potential litigation is indeterminable, management believes that the amounts recorded are a reasonable estimate. During 2007, the Environmental Protection Agency Region 6 (EPA) informed SAWS that the agency intended to institute an enforcement action based on reported sewer overflows related to the operation of SAWS’ wastewater treatment plants and collection system under SAWS’ Texas Pollutant Discharge Elimination System (TPDES) permits. The EPA has alleged that certain aspects of SAWS’ operations constitute violations of the Clean Water Act. SAWS is vigorously defending these claims while also pursuing settlement negotiations with EPA and the Department of Justice (DOJ). These settlement discussions may result in SAWS, EPA and DOJ entering a civil Consent Decree to resolve the EPA’s allegations. Such a Consent Decree may impose injunctive relief in the form of required capital construction projects, increased operational costs and civil penalties. During 2009, SAWS continued settlement discussions with DOJ, which included examining a variety of proposed actions that would help prevent sewer overflows in the future. To address what SAWS believes to be the leading cause of sewer overflows, SAWS expanded its sewer line cleaning activities in 2009. As the settlement negotiations with DOJ continue to be in a preliminary stage, the range of cost of any injunctive relief can not be reasonably estimated. The Lower Colorado River Authority-San Antonio Water System (LCRA-SAWS) Water Project was conceived to develop and make available up to 150,000 acre feet per year of surface water supplies for San Antonio in 2025 while firming up water supplies in the Colorado River Basin. In 2002, SAWS and LCRA executed a Definitive Agreement outlining SAWS’ and LCRA’s obligations. The agreement called for a multi-year study period, at the end of which both SAWS and LCRA were to determine whether or not to proceed with implementation of the project. Finalization of studies and obtaining appropriate permits for the project were expected to be completed between 2013 and 2015 (figures in this paragraph are not in thousands). SAWS has expensed $39,300 in study period costs through December 31, 2009. Under the terms of the 2002 Definitive Agreement with LCRA, SAWS is entitled to receive a reimbursement from LCRA of approximately one-half of those study period costs in the event the agreement is terminated by SAWS.

CITY OF SAN ANTONIO, TEXAS
- 142 - Amounts are expressed in thousands
Note 11 Commitments and Contingencies (Continued) San Antonio Water System (SAWS) (Continued) Litigation (Continued) Throughout the study period, SAWS and LCRA evaluated the project’s viability on an ongoing basis. In December 2008, the LCRA Board of Directors adopted several water supply planning guidance resolutions which led to a conclusion by LCRA that there would be no firm water supply available to San Antonio from the planned project. In May 2009, SAWS’ Board of Trustees declared LCRA in breach of the 2002 Definitive Agreement between the parties. The parties unsuccessfully conducted formal mediation in August 2009 and SAWS filed suit against LCRA. In September 2009, LCRA filed a plea asserting full or partial governmental immunity from suit. Other As of December 31, 2009, SAWS has entered into various water leases to obtain rights to pump water from the Edwards Aquifer. The term of these agreements vary, with some expiring as early as 2010 and others continuing until 2019. Some of the leases include price escalations and the average annual cost per acre foot ranges from $134 to $165 (these figures not in thousands). The future commitments under these leases are as follows:
2010 2011 2012 2013 2014 ThereafterLease obligations 5,551$ 5,904$ 5,138$ 2,760$ 1,860$ 6,399$ Lease obligations (acre feet) 42 39 33 19 13 41
SAWS has various commitments relating to the production of water supplies. A summary of these commitments is provided below. As with any estimates, the actual amounts paid could differ materially.
2010 2011 2012 2013 2014 ThereafterFirm purchased water obligations 4,351$ 4,246$ 4,318$ 4,390$ 4,462$ 122,844$ Firm purchased water obligations (acre feet) 6 6 6 6 6 101 Variable purchased water obligations 3,743$ 3,217$ 3,165$ 2,789$ 2,469$ 66,021$ Variable purchased water obligations (acre feet) 5 4 4 3 3 66
SAWS’ firm and variable purchased water obligations relate to the contractual commitments made in connection with SAWS’ wholesale water contracts with Guadalupe Blanco River Authority (GBRA) and two wholesale agreements for the supply of raw water from the Trinity Aquifer. All water provided under these contracts is subject to availability. Under the contract with GBRA, SAWS will receive between 4,000 and 11,000 acre feet of water annually during the years 2010-2037 at prices ranging from $890 to approximately $1,523 per acre foot. SAWS has an option to extend this contract until 2077 under new payment terms (figures in this paragraph are not in thousands). In 2000, SAWS entered into a wholesale contract with the Massah Development Corporation to deliver raw water from the Lower Glen Rose/Cow Creek formations of the Trinity Aquifer in northern Bexar County. SAWS determined the sustainable yield of the project to be 4,685 acre feet. Under this contract, SAWS is required to take or pay for 50.0% of the determined sustainable yield of the project, or 2,343 acre feet annually. In 2010, SAWS and Massah Development Corporation negotiated a new Water Supply Agreement for a term of 15 years beginning July 1, 2010. The minimum Take of Pay for the contract is 100 acre feet per month or 1,200 acre feet per year. The negotiated price is $550 per acre foot with an escalator based on the Producers Price Index. SAWS has an option at the end of the primary term to extend the contract for 10 years. (Figures in this paragraph are not in thousands).

CITY OF SAN ANTONIO, TEXAS
- 143 - Amounts are expressed in thousands
Note 11 Commitments and Contingencies (Continued) San Antonio Water System (SAWS) (Continued) Other (Continued) In 2006, SAWS renegotiated the terms of a contract with Sneckner Partners, Ltd. to supply raw water from the Trinity Aquifer. Under this contract, SAWS is required to take or pay for 1,500 acre feet annually at a minimum annual cost of $225 per acre foot through 2020 (these figures not in thousands). SAWS has an option to extend the contract through 2026, if it desires. As part of this contract, SAWS agreed to make payments quarterly for any residential customers within a defined, currently undeveloped geographical area that begin taking water service from SAWS. While it is impossible to estimate the exact amount of any potential future payments associated with this provision of the agreement, management estimates of this potential contingent liability are less than $5,000. SAWS has entered into various agreements to pump water from the Carrizo aquifers. SAWS makes minimum water payments under the terms of these agreements until such time as SAWS’ pending permit application to pump water from the Carrizo Aquifer has been approved and the necessary infrastructure to produce and transport the water has been completed. At December 31, 2009, SAWS is committed to make payments under only three of these agreements. Minimum water payments are required under these three agreements through 2029 even if no water is produced. The remaining agreements are currently subject to cancellation by SAWS. The table below summarizes both the required minimum water payments under the three agreements that cannot be cancelled as well as the projected additional payments under all agreements assuming that none are cancelled and water production begins in 2013.
2010 2011 2012 2013 2014 ThereafterRequired minimum water payments 178$ 183$ 198$ 204$ 210$ 6,170$ Projected additional payments 265$ 402$ 417$ 746$ 768$ 14,372$ Produced water (acre feet) 12 12 175
SAWS is also committed under various contracts for completion of construction or acquisition of utility plant totaling approximately $288,000 as of December 31, 2009. Funding of this amount will come from excess revenues, contributions from developers, restricted assets and available commercial paper capacity.
Note 12 Pollution Remediation Obligation Primary Government (City) The City implemented the provisions of GASB Statement No. 49, Accounting and Financial Reporting for Pollution Remediation Obligations, in fiscal year 2009. The general nature of existing pollution that has been identified on City property is consistent with City operations of acquiring properties for infrastructure and improvement development. Under most circumstances, the triggering event relevant to the City is the voluntary commencement of activities to clean up the pollution. Costs were estimated using the expected cash flow technique prescribed under GASB Statement No. 49 utilizing information provided by the City’s respective departments which included previous knowledge of clean-up costs, existing contracts, etc. Depending on the length of time it takes the City to remediate the pollution, costs may be different from that estimated below as a result of market rate changes, improvements to technology, etc.
Balance at Balance at 10/1/2009 Additions Deletions 9/30/2010
Governmental Activities:Liabilities 904$ 1,529$ (608)$ 1,825$ Construction in Progress 788 1,038 (621) 1,205
Business-Type Activities:Liabilities 700$ -$ -$ 700$

CITY OF SAN ANTONIO, TEXAS
- 144 - Amounts are expressed in thousands
Note 12 Pollution Remediation Obligation (Continued) Primary Government (City) (Continued) The Governmental Activities’ liabilities were a result of cost estimates to clean existing pollution found on land acquired by the City’s Capital Improvement Management Services and Parks Departments for the construction of streets and drainage and parks, respectively. Any net changes in the Governmental Activities pollution liability that was not capitalized under Construction in Progress was expensed under the City’s public works activities. The Business-Type Activities’ liability was a result of cost estimates to clean existing pollution found on land acquired by the Airport System for the construction of airport structures. As the City acquired this property in the early 1940s, the liability did not meet the criteria to be capitalized, and as such was expensed in fiscal year 2009. There have been no changes regarding this obligation in fiscal year 2010. The City does not foresee receiving any recoveries from third parties for the costs associated with cleaning up these pollution obligations. CPS Energy GASB Statement No. 49, Accounting and Financial Reporting for Pollution Remediation Obligations, requires that a liability be recognized for expected outlays for cleaning up existing pollution when certain triggering events occur. The general nature of existing pollution that has been identified at CPS Energy sites is consistent with that experienced within the electric and gas utilities industry. Under most circumstances, the triggering event most relevant to CPS Energy is the voluntary commencement of activities to clean up pollution. Under the Federal Energy Regulatory Commission guidance, reserves have been established for dismantling and closure costs. In fiscal year 2008, in preparation for implementation of GASB Statement No. 49, a portion of those reserves were reclassified to remediation and dismantling reserve accounts reported on the balance sheet within other liabilities and deferred credits. When a triggering event occurs, those reserves will be reclassified as a pollution remediation liability also reported within other liabilities and deferred credits. The pollution remediation liability was $888 as of January 31, 2010. Costs were estimated using the expected cash flow technique prescribed under GASB Statement No. 49 utilizing information provided by CPS Energy’s environmental staff and consultants. FY 2009 beginning balances were not restated as a result of the implementation of GASB Statement No. 49 due to immateriality. San Antonio Water System (SAWS) SAWS had no material pollution remediation liabilities at December 31, 2009.
Note 13 Risk Financing Primary Government (City) Property and Casualty Liability At September 30, 2010, the City maintains excess liability insurance coverage through Star Insurance Company. The policy provides general liability, law enforcement legal liability, public official’s liability, employee benefits liability, and workers’ compensation excess liability coverage. The City utilizes a third-party administrator to adjust its claims. Great American Insurance Company provides coverage for the City’s real property and contents. Obligations for claims under these programs are accrued in the City's Self-Insurance Reserve Fund based on the City's estimates of the aggregate liability for claims made and claims incurred but not reported. The departments are assessed contributions to cover expenditures. There were no significant reductions in insurance coverage. Claims settlements have not exceeded insurance coverage limits for the past four years.

CITY OF SAN ANTONIO, TEXAS
- 145 - Amounts are expressed in thousands
Note 13 Risk Financing (Continued) Primary Government (City) (Continued) Workers’ Compensation As of September 30, 2010, the City maintains excess workers’ compensation insurance coverage through Star Insurance Company. The policy provides coverage for claims by or on behalf of injured workers where the total liability exceeds the City’s self-insured retention of $500. The City utilizes a third-party administrator to adjust its claims. Obligations for claims under these programs are accrued in the City’s Self-Insurance Reserve Fund, Enterprise Funds and Convention Visitors Facility Fund based on the City’s estimates of the aggregate liability for claims made and claims incurred but not reported. The departments are assessed contributions to cover expenditures. There were no significant reductions in insurance coverage. Claims settlements have not exceeded insurance coverage limits for the past four years. Employee Health Benefits The City offers employees and their eligible dependents a comprehensive employee benefits program including medical, dental, vision and basic and supplemental life insurance. Employees may also participate in healthcare or dependent care spending accounts through our Section 125 Cafeteria Plan. The City’s health and dental programs are self-funded. Obligations for benefits are accrued in the City's Employee Health Benefits Insurance Fund based upon the City's estimates of the aggregate liability for unpaid benefits. Retiree Health Benefits The City offers medical coverage for its retirees and their dependents. The City offers both self insured and fully insured plans to participating retirees who retire from the TMRS Pension Plan immediately following retirement from the City. Self Funded obligations for benefits are accrued in the City’s Retiree Health Benefits Insurance Fund based upon the City’s estimates of the aggregate liability for unpaid benefits. The City additionally, determined and accrued OPEB liabilities based on an actuarial assessment of historical self funded claims data performed bi-annually and reviewed annually. Current year unpaid benefit liabilities for retirees are netted against the OPEB liability as additional contributions. Unemployment Compensation Program The Unemployment Compensation Program provides a central account for payment of unemployment compensation claims. As of the fiscal year-end, claims were being administered externally and are paid to the Texas Workforce Commission on a reimbursement basis. All costs incurred are recorded on a claim paid basis in the City's Employee Health Benefits Insurance Fund. Extended Sick Leave Program The Extended Sick Leave Program is used to pay benefits associated with the City's employee long-term disability plan. Benefits are administered by the City. Actual costs are incurred when extended leave is taken. The Extended Sick Leave Program is currently administered out of the City’s Employee Health Benefits Insurance Fund. Employee Wellness Program The Employee Wellness Program is designed to mitigate future health and productivity loss costs by creating awareness of health risks and providing education about healthy lifestyle choices. In 2008, the City opened the COSA Health and Wellness Center in partnership with Gonzaba Medical Group. The Center is available exclusively to provide primary and occupational medicine to active employees. Additionally, the City provides every employee and members of their household an Employee Assistance Program to assist employees with basic situational and behavioral counseling, as well as, financial counseling and legal referral services. The Employee Wellness Program is managed out of the Employee Health Benefits Fund.

CITY OF SAN ANTONIO, TEXAS
- 146 - Amounts are expressed in thousands
Note 13 Risk Financing (Continued) Primary Government (City) (Continued) Claims Liability The liability for the Employee Health Benefits Program is based on the estimated aggregate amount outstanding at the statement of net assets date for unpaid benefits. Liabilities for the Insurance Reserve and Workers’ Compensation Programs are reported when it is probable that a loss has occurred as of the statement of net assets date, and the amount of the loss can be reasonably estimated. These liabilities include allocable loss adjustment expenses, specific incremental claim adjustment expenses such as the cost of outside legal counsel, and a provision for claims that have been incurred but not reported (IBNR). Unallocated claim adjustment expenses have not been included in the calculation of the outstanding claims liability, as management of the City feels it would not be practical or cost beneficial. In addition, based on the difficulty in determining a basis for estimating potential recoveries and the immateriality of prior amounts, no provision for subrogation or salvage has been included in the calculation of the claims liability. The claims liability reported in the accompanying financial statements for both the Insurance Reserve and Workers’ Compensation Programs is based on a 3.0% discount rate. The following is a summary of changes in claims liability for the City’s Insurance Reserve, Employee Health Benefits, and Workers’ Compensation Programs Funds for the year-ended September 30, 2010:
October 1, Estimates Claims Payments September 30, Insurance Reserve:
Fiscal Year 2009 19,435$ (938)$ 5,286$ (5,286)$ 18,497$ Fiscal Year 2010 18,497 4,638 4,031 (4,031) 23,135
Employee Health Benefits: 1
Fiscal Year 2009 9,611$ (957)$ 75,077$ (75,077)$ 8,654$ Fiscal Year 2010 8,654 (289) 85,058 (85,058) 8,365
Workers' Compensation: 2
Fiscal Year 2009 24,547$ 1,670$ 11,778$ (11,778)$ 26,217$ Fiscal Year 2010 26,217 1,703 12,270 (12,270) 27,920
1
2
Fund
The Workers' Compensation Liability Balance of $27,920 is comprised of $25,594 recorded in the Workers'Compensation Fund, and the remaining liability of $2,326 recorded in the enterprise funds.
FY10 fund financial claims expense reflects an additional $548 in Unemployment Claims that are not shownabove.
CPS Energy CPS Energy is exposed to various risks of loss including, but not limited to, those related to torts, theft or destruction of assets, errors and omissions, and natural disasters. CPS Energy maintains property and liability insurance programs that combine self-insurance with commercial insurance policies to cover major risks. The property insurance program provides $4,700,000 of replacement-value coverage for property and boiler machinery loss, including comprehensive automobile coverage, fire damage coverage for construction equipment, and valuable papers coverage. The deductible for the property insurance policy is $5,000 per occurrence with a secondary deductible of $1,000 per occurrence applicable to non-power-plant and non-substation property locations. The liability insurance program includes:
• $100,000 of excess general liability coverage over a retention amount of $2,000; • $25,000 of fiduciary liability coverage; • $100,000 of employment practice liability coverage; and • Other property and liability insurance coverage, which includes commercial crime, employee travel,
event insurance.

CITY OF SAN ANTONIO, TEXAS
- 147 - Amounts are expressed in thousands
Note 13 Risk Financing (Continued) CPS Energy (Continued) CPS Energy also manages its own workers’ compensation program. Additionally, to support this program, $35,000 of excess workers’ compensation coverage over a retention amount of $2,000 is maintained. No claims settlements exceeded insurance coverage in the last three fiscal years. Actuarial studies are performed periodically to assess and determine the adequacy of insurance reserve retentions. Actuarial valuations include nonincremental claims expenses. An actuarial study was performed during the third quarter of fiscal year 2010. In the table below, the remaining balance under the property reserves column at January 31, 2010, relates to estimated obligations for the clean up, closure, and post-closure care requirements of CPS Energy’s landfills. CPS Energy has seven landfill sites, four of which are at full capacity. The estimates for landfill liability are based upon capacity to date and are subject to change due to inflation or deflation, as well as new developments in technology, applicable laws or regulations. Under CPS Energy’s reserve program, all claims are recorded against the reserve.
Liability Claims Claims LiabilityFebruary 1, Adjustments Payments January 31,
Property Reserves:Fiscal Year 2009 3,671$ (566)$ -$ 3,105$ Fiscal Year 2010 3,105 799 3,904
Employee and Public Liability Claims:Fiscal Year 2009 8,231$ 6,658$ (4,586)$ 10,303$ Fiscal Year 2010 10,303 4,314 (4,254) 10,363
Schedule of Changes in Claims Liability
Fund
Counterparty Risk – CPS Energy is exposed to counterparty risk associated with various transactions primarily related to debt, investments, a lease/leaseback transaction and wholesale power. Counterparty risk is the risk that a counterparty will fail to meet its obligations in accordance with the terms and conditions of its contract with CPS Energy. CPS Energy has policies and practices in place to ensure the solvency of counterparties is assessed accurately, monitored regularly and managed actively through its Enterprise Risk Management Division.
Hedging – The 1999 Texas utility deregulation legislation, Senate Bill 7, contained provisions modifying the Texas Public Funds Investment Act to allow municipal utilities the ability to purchase and sell energy-related financial instruments in order to hedge or mitigate the effect of market price fluctuations of natural gas, fuel oil, and electric energy. In 2002, CPS Energy began hedging its exposure to changes in natural gas prices, with the goal of controlling fuel costs to native load customers and stabilizing the expected cash flows associated with wholesale power transactions. In fiscal year 2010, CPS Energy implemented GASB Statement No. 53, Accounting and Financial Reporting for Derivative Instruments, which addresses recognition, measurement and disclosures related to derivative instruments. CPS Energy does not use derivative instruments for speculative purposes. The only derivative instruments entered into are for the purposes of risk mitigation; therefore, these instruments are considered potential hedging derivative instruments under GASB Statement No. 53. On January 20, 2009, the CPS Energy board of trustees reaffirmed the Energy Price Risk Management Policy, which sets forth the guidelines for the purchase and sale of certain financial instruments and certain physical products, collectively defined as hedge instruments. The essential goal of the Energy Price Risk Management Policy is to provide a framework for the operation of a fuel and energy price hedging program to better manage CPS Energy’s risk exposures in order to stabilize pricing and costs for the benefit of CPS Energy and its customers.

CITY OF SAN ANTONIO, TEXAS
- 148 - Amounts are expressed in thousands
Note 13 Risk Financing (Continued) CPS Energy (Continued) In accordance with the requirements of GASB Statement No. 53, all fuel hedges are reported on the Balance Sheet at fair value. The fair value of option contracts is determined using New York Mercantile Exchange (NYMEX) closing settlement prices as of the last day of the reporting period. For futures and basis swap contracts, the fair value is calculated by deriving the difference between the closing futures prices on the last day of the reporting period and the futures or basis swap purchase prices at the time the positions were established, less applicable commissions. All potential hedging derivative instruments were evaluated for effectiveness at January 31, 2010, and were determined to be effective in substantially offsetting the changes in cash flows of the hedgeable items. The instruments were categorized into two broad groups for purposes of this testing. In one category, hedges utilize only NYMEX natural gas futures and options that are priced based on the underlying Henry Hub natural gas price, while the physical gas is typically purchased at prices based on either the Western Area Hub Association (WAHA) or the Houston Ship Channel (HSC). Therefore, effectiveness testing was based on the extent of correlation between the first of the month index prices of natural gas at each of these locations and the settlement price at Henry Hub. The correlation coefficient was established at the critical term to be evaluated, with 0.8944 established as the minimum standard tolerated. The testing, based on two different location hubs (WAHA and HSC), demonstrated a substantial offset in the fair values, as evidenced by their calculated R values, 0.9664 and 0.9961, respectively, indicating that the changes in cash flows substantially offset the changes in cash flows of the hedgeable item. Additionally, the substantive characteristics of the hedge have been considered, and the evaluation of this effectiveness measure has been sufficiently completed and documented such that a different evaluator, using the same method and assumptions, would reach substantially similar results. In the second category, hedges utilize both NYMEX natural gas futures and their associated location basis. The effectiveness of these hedges was tested using a quantitative method similar to the synthetic instrument method prescribed by GASB Statement No. 53, with the combination of the hedging instrument and the hedged expected transaction substantively resulting in a hedged fixed price for natural gas. The method requires that the hedged fixed price fall within a range of 90.0% to 111.0% of the confirmed price. Effectiveness testing demonstrated that the hedged price was fixed within the tolerable range, thus demonstrating that the variable cash flows of the hedged instrument substantially offset the variable cash flows of the hedgeable item to create a synthetic price that is effectively fixed. Additionally, the substantive characteristics of the hedge have been considered, and the evaluation of this effectiveness measure has been sufficiently completed and documented such that a different evaluator, using the same method and assumptions, would reach substantially similar results. As of January 31, 2010, the total fair value of outstanding hedge instruments was a net liability of $5,520. Fuel hedging instruments with a fair value of $(5,520) are reported as a current liability and classified on the Balance Sheet as a component of accounts payable and accrued liabilities. Long-term fuel hedging instruments with a fair value of $6 are reported as a noncurrent asset and classified as a component of noncurrent and other assets. Additionally, long-term fuel hedges with a fair value of $(31) are reported as a noncurrent liability and classified as a component of other liabilities and deferred credits. Consistent with hedge accounting treatment required for derivative instruments that are determined to be effective in offsetting changes in the cash flows of the hedged item, changes in fair value are reported as deferred (inflows) outflows of resources on the Balance Sheet until the contract expiration that occurs in conjunction with the hedged expected fuel purchase transaction. When fuel hedging contracts expire, at the time the purchase transactions occur, the deferred balance is recorded as an adjustment to fuel expense. The current deferred (inflows) outflows of resources related to fuel hedges totaled $6,400 at January 31, 2010. These amounts are reported on the Balance Sheet as current assets and are classified as a component of prepayments, deferred and other current assets. The noncurrent deferred (inflows) outflows of resources totaled $376 at January 31, 2010. These amounts are reported on the Balance Sheet as noncurrent assets and are classified as a component of other deferred costs.

CITY OF SAN ANTONIO, TEXAS
- 149 - Amounts are expressed in thousands
Note 13 Risk Financing (Continued) CPS Energy (Continued) In fiscal year 2010, some hedging derivative instruments were terminated early, causing them to be ineffective under GASB Statement No. 53. Accordingly, losses from the closed positions were recorded as a decrease in investment income of $2,100. Following is information related to CPS Energy’s outstanding fuel hedging derivative instruments:
Changes inType of Transaction Duration Volumes in MMBTU Fair Value Fair Value
Long Call Mar 2010 - Jul 2011 4,750,000 1,308$ (1,388)$ Long Put Mar 2010 - Jul 2010 980,000 66 (58) Short Put Mar 2010 - Jul 2011 4,320,000 (1,468) 61 Long NG Futures Mar 2010 - Dec 2010 5,510,000 (5,960) (1,881) Long Basis Swap Feb 2010 - Dec 2010 3,475,000 534 527
(5,520)$ (2,739)$
Fuel Derivative Transactions as of January 31, 2010
In the event purchased options are allowed to expire, the related premiums paid to acquire those options will be lost. When a short position is established and options are sold, premiums are received and an obligation to honor the terms of the option contract, if exercised, is created. The decision to exercise the options or let them expire rests with the purchasing party. Futures contracts represent a firm obligation to buy or sell the underlying asset. If held to expiration, the contract holder must take delivery of, or deliver, the underlying asset at the established contract price. Basis swap contracts represent a financial obligation to buy or sell the underlying delivery point basis. If held to expiration, the financial difference determined by mark-to-market valuation must be settled on a cash basis. Only if expressly requested in advance may an exchange for physical assets take place. Preassigned Congestion Rights - In the normal course of business, CPS Energy acquires Preassigned Congestion Rights (PCRs) and Transmission Congestion Rights (TCRs) as a hedge against unexpected congestion costs. The TCRs are purchased at auction, annually and monthly, at market value. Municipally owned utilities are granted the right to purchase PCRs annually at 15.0% of the cost of TCRs. This low initial investment is an indication of the leverage characteristic of derivatives. Additionally, PCRs exhibit the other two characteristics of derivatives as defined by GASB Statement No. 53 (settlement factors and net settlement). Therefore, PCRs are reported at fair value on the Balance Sheet in accordance with GASB Statement No. 53, with fair value determined by the cost of annual TCRs purchased at the same time. The effectiveness of these hedges is satisfied utilizing the "consistent critical terms method" prescribed under GASB Statement No. 53, whereby the forward contract is for the same quantity of the hedgeable item (one Megawatt per PCR) and covers the same time (15-minute intervals over the course of a month) and location (a specified directional constraint). When combined with the hedgeable item (congestion cost), the contract value is zero since the reference rate of the contract is consistent with the rate of the hedgeable item. PCRs had a market value of $2,554 at January 31, 2010. These hedging derivative instruments were reported as current assets and classified as a component of prepayments, deferred and other current assets. The deferred (inflows) outflows of resources related to PCRs was $(2,200) at January 31, 2010. These balances are reported on the Balance Sheet as noncurrent liabilities and are classified as a component of accounts payable and accrued liabilities.
Purchase Date Direction MWhs Fair Value CostDecember 11, 2009 North to West 8,760 52$ 8$ December 11, 2009 North to South 8,760 2,502 375
2,554$ 383$
Preassigned Congestion Rights as of January 31, 2010

CITY OF SAN ANTONIO, TEXAS
- 150 - Amounts are expressed in thousands
Note 13 Risk Financing (Continued) CPS Energy (Continued)
Credit Risk - The fuel hedging contracts expose CPS Energy to a minimal amount of credit risk. In the event of default or nonperformance by brokers or NYMEX, the operations of CPS Energy could be materially affected. However, CPS Energy does not expect the brokerages to fail in meeting their obligations given their high credit rating and the strict and deep credit requirements upheld by NYMEX, of which these brokerage firms are members. Termination Risk - All of CPS Energy's fuel hedges are exchange-traded instruments; therefore, the risk of termination is greatly reduced by the strict rules and guidelines established by NYMEX, which is governed by the Commodity Futures Trade Commission. Basis Risk - CPS Energy is exposed to basis risk on its fuel hedges because the expected commodity purchases being hedged will price based on a pricing point (HSC or WAHA) different than that at which the contracts are expected to settle (Henry Hub). For January 2010, the HSC price was $5.83 per MMBtu, the WAHA price was $5.71 per MMBtu, and the Henry Hub price was $5.81 per MMBtu. San Antonio Water System (SAWS) Risk Management SAWS is exposed to various risks of loss related to torts; theft of, damage to, and destruction of assets; errors and omissions; injuries to employees; and natural disasters. SAWS is self-administered and self-insured for the first $500 of each workers’ compensation, general liability, automobile liability and public official’s liability claim and for the first $250 for each pollution remediation, legal liability and commercial property claim. Claims that exceed the self-insured retention limit are covered through SAWS’ comprehensive commercial insurance program. For the year-ended December 31, 2009, there were no reductions in insurance coverage from the previous year and there were no new claims incurred during the period that exceeded the self-insured retention limit. Settled claims have never exceeded the insurance coverage in any year. SAWS has recorded accrued claims liability in the amount of $5,504 as of December 31, 2009, which is reported as a current liability. The claims liability, including incurred but not reported claims, is based on the estimated ultimate cost of settling the claims. Changes in the liability amount for the last two fiscal years were as follows:
Balance at Balance at EstimatedBeginning of Fiscal Claims and Claims End of Due Within
Year Ended Year Adjustments Payments Fiscal Year One YearDec. 31, 2009 5,401$ 2,050$ (1,947)$ 5,504$ 5,504$
Dec. 31, 2008 5,312$ 2,276$ (2,187)$ 5,401$ 5,401$
San Antonio Water SystemSchedule of Changes in Claims Liability
Even though the effective date of implementing GASB Statement No. 53, Accounting and Financial Reporting for Derivative Instruments, allowed SAWS to adopt the Statement in fiscal year 2010, as SAWS is a component unit of the City, it was required to implement GASB Statement No. 53 in fiscal year 2009 for inclusion in the City’s fiscal year 2010 CAFR. SAWS did not implement GASB Statement No. 53 in fiscal year 2009. The swaps noted below were prepared in compliance with pre-GASB Statement No. 53 requirements.

CITY OF SAN ANTONIO, TEXAS
- 151 - Amounts are expressed in thousands
Note 13 Risk Financing (Continued) San Antonio Water System (SAWS) (Continued) Pay-Fixed, Receive-Variable Interest Rate Swap - On March 27, 2003, SAWS entered into an interest rate swap agreement in connection with its City of San Antonio, Texas Water System Subordinate Lien Revenue and Refunding Bonds, Series 2003-A and 2003-B (the Series 2003 Bonds) issued in a variable interest rate mode. The Series 2003 Bonds were issued to provide funds for the SAWS’ Capital Improvement Program and to refund certain outstanding commercial paper notes. The swap was used to hedge interest rates on the Series 2003 Bonds to a synthetic fixed rate that produced a lower expected interest rate cost than traditional long-term fixed rate bonds. At the time of issuance, the principal and interest payments on the Series 2003 Bonds were insured by a financial guaranty insurance policy issued by MBIA Insurance Corporation (MBIA). In August 2008, SAWS issued a Notice of Partial Redemption for $110,615 of the outstanding principal amount of $111,615 of the Series 2003 Bonds due to continued unfavorable market conditions relating to the ratings downgrade of MBIA, resulting in significantly higher variable rates of interest being paid on the Series 2003 Bonds. This partial redemption was effected with commercial paper notes, leaving $1,000 of the Series 2003 Bonds outstanding. In May 2009, SAWS redeemed $20 of the Series 2003 Bonds and $2,465 of commercial paper notes according to the amortization schedule of the Series 2003 Bonds and the swap. In June 2009, SAWS issued a Notice of Partial Redemption for the remaining $980 of Series 2003 Bonds outstanding with commercial paper notes. At December 31, 2009, the interest rate swap serves to hedge $109,130 of commercial paper notes. Upon the maturity of the commercial paper notes, SAWS intends to reissue commercial paper in amounts matching the notional amounts and amortization schedule of the swap. There was no economic gain or loss as a result of this refunding since the debt service requirements of the commercial paper are expected to closely match the debt service requirements of the refunded debt. Terms – The swap agreement contains scheduled reductions to the outstanding notional amounts that are expected to follow the original scheduled reductions in the Series 2003 Bonds. The Series 2003 Bonds were issued on March 27, 2003, with a principal amount of $122,500. The swap agreement matures on May 1, 2033. At the time the swap was entered into, the counterparty was Bear Stearns Financial Products, Inc. (Bear Stearns FPI), with the index for the variable rate leg of the SWAP being the Securities Industry and Financial Markets Association (SIFMA) Municipal Swap Index. In March 2008, JP Morgan Chase & Co. announced its acquisition of The Bear Stearns Companies, Inc., the parent of Bear Stearns FPI. The transaction closed on May 30, 2008. JP Morgan Chase has guaranteed the trading obligations of Bear Stearns and its subsidiaries. Effective June 16, 2009, the swap agreement was amended between SAWS, JP Morgan Chase & Co. , and MBIA to provide for JP Morgan Chase Bank N.A. to become the swap counterparty and allow for the remaining $980 of outstanding Series 2003 Bonds to be redeemed with commercial paper notes, while maintaining the swap agreement as an obligation to all parties. The amendment provides for the conditional release of MBIA’s swap insurance policy upon the occurrence of certain future events. The combination of commercial paper notes and a floating-to-fixed swap creates a synthetic fixed-rate of 4.2%. The synthetic fixed-rate protects against the potential of rising interest rates. Fair Value - The swap had a negative fair value as of December 31, 2009 of approximately $10,600. This value was calculated using the zero-coupon method. This method calculates the future net settlement payments required by the swap, assuming that the current forward rates implied by the yield curve correctly anticipate future spot interest rates. These net payments are then discounted using the spot rates implied by the current yield curve for hypothetical zero-coupon bonds due on the date of each future net settlement on the swap. Credit Risk - As of December 31, 2009, SAWS was not exposed to credit risk on its outstanding swap because the swap had a negative fair value. However, should interest rates change and the fair value of the swap become positive, SAWS would be exposed to credit risk in the amount of the swap’s fair value. The swap counterparty, JP Morgan Chase Bank, N.A. was rated “AA-” by Fitch Ratings and Standard & Poor’s and “Aa1” by Moody’s Investors Service as of December 31, 2009. The amended swap agreement contains a credit support annex which will become effective upon the release of MBIA from the swap insurance policy. Collateralization would be required by either party should the fair market value of the swap reach applicable thresholds as stated in the amended swap agreement.

CITY OF SAN ANTONIO, TEXAS
- 152 - Amounts are expressed in thousands
Note 13 Risk Financing (Continued) San Antonio Water System (SAWS) (Continued) Basis Risk - SAWS is exposed to basis risk to the extent that the interest payments on its hedged commercial paper notes do not match the variable-rate payments received on the associated swap. SAWS attempts to mitigate this risk by (a) matching the outstanding hedged commercial paper notes associated with the redemption of the variable-rate debt to the notional amount and amortization schedule of the swap and (b) selecting an index for the variable-rate leg of the swap that is reasonably expected to closely match the interest rate on the hedged commercial paper notes. Termination Risk - SAWS may terminate the swap at any time for any reason. JP Morgan Chase may terminate the swap if SAWS fails to perform under the terms of the agreement. The ongoing payment obligations under the swap are insured as provided for in the swap amendment and JP Morgan Chase cannot terminate as long as the insurer does not fail to perform. Also, if at the time of the termination the swap has a negative fair value, SAWS would be liable to the counterparty for a payment equal to the swap’s fair value. Market-access Risk – SAWS is subject to market-access risk as $109,130 of variable-rate debt hedged by the swap is outstanding commercial paper notes with current maturities less than 87 days. As previously noted, SAWS intends to reissue commercial paper in amounts matching the notional amounts and amortization schedule of the swap. Swap Payments and Associated Debt - As of December 31, 2009, debt service requirements of the hedged commercial paper notes and net swap payments, assuming current interest rates remain the same, are detailed in the following table. As rates vary, variable-rate interest payments and net swap payments will vary. Principal payments assume that commercial paper will be repaid in accordance with the amortization schedule of the swap.
Interest Paid Interest RateYear Principal on Debt Swap, Net Total2010 2,600$ 297$ 4,221$ 7,118$ 2011 2,720 289 4,115 7,124 2012 2,840 282 4,005 7,127 2013 2,970 274 3,891 7,135 2014 3,105 265 3,770 7,140
2015-2019 17,780 1,185 16,845 35,810 2020-2024 22,220 908 12,902 36,030 2025-2029 27,770 561 7,974 36,305 2030-2033 27,125 142 2,014 29,281
Total 109,130$ 4,203$ 59,737$ 173,070$
Pay-Fixed, Receive-Variable Interest Rate SwapEstimated Debt Service Requirements of Variable-Rate
Debt Outstanding and Net Swap Payments
(The remainder of this page left blank intentionally)

CITY OF SAN ANTONIO, TEXAS
- 153 - Amounts are expressed in thousands
Note 14 Interfund Transfers The following is a summary of interfund transfers for the City for the year-ended September 30, 2010:
Transfers From Transfers ToOther Funds Other Funds
General Fund:Airport System Fund 193$ -$ Categorical Grant-In Aid 22 6,649 Internal Service Funds 7,650 Nonmajor Governmental Funds 35,072 39,376 Nonmajor Enterprise Funds 1,294 580
Total General Fund 36,581 54,255
Debt Service Fund:Nonmajor Governmental Funds 57,122 13
Total Debt Service Fund 57,122 13
Categorical Grant-In Aid:General Fund 6,649 22 Nonmajor Governmental Funds 2,276 4,273
Total Categorical Grant-In Aid 8,925 4,295
2007 General Obligation Bonds:Nonmajor Governmental Funds 59,268
Total 2007 General Obligation Bonds 59,268
Airport System Fund:General Fund 193 Internal Service Funds 169 Nonmajor Governmental Funds 32
Total Airport System Fund 394
Internal Service Funds:General Fund 7,650 Airport System Fund 169 Internal Service Funds 535 535 Nonmajor Governmental Funds 971 3,490 Nonmajor Enterprise Funds 572
Total Internal Service Funds 9,897 4,025
Nonmajor Governmental Funds:General Fund 39,376 35,072 Debt Service Fund 13 57,122 Categorical Grant-In Aid 4,273 2,276 2007 General Obligation Bonds 59,268 Airport System Fund 32 Internal Service Funds 3,490 971 Nonmajor Governmental Funds 151,328 151,328 Nonmajor Enterprise Funds 1,100
Total Nonmajor Governmental Funds 258,880 246,769
Nonmajor Enterprise Funds:General Fund 580 1,294 Internal Service Funds 572 Nonmajor Governmental Funds 1,100
Total Nonmajor Enterprise Funds 580 2,966 Total 371,985$ 371,985$
Summary Table of Interfund TransfersYear-Ended September 30, 2010

CITY OF SAN ANTONIO, TEXAS
- 154 - Amounts are expressed in thousands
Note 14 Interfund Transfers (Continued) Transfers are made to use unrestricted revenues collected in the General Fund to finance various programs accounted for in other funds. These transfers are in the form of operating subsidies, grant matches, and funding for capital projects. In addition, transfers are routinely made from other funds to fund debt service payments and for other restricted purposes. All transfers are in accordance with budgetary authorizations.
Note 15 Deficits in Fund Balances / Net Assets Special Revenue Funds As of September 30, 2010, deficit fund balances are reported in the Categorical Grant-in-Aid Fund and Community Development Program Fund in the amounts of $4,397 and $1,105. The deficit fund balance in Categorical Grant-in-Aid is a result of providing additional program services to the community beyond what monies were provided by grantor agencies. The uncollectible amounts were incorporated into the City’s annual budget process to be funded over five years of which the City has two years remaining to fund. The deficit balance in the Community Development Program Fund is a result of utilizing grant monies for activities that were determined not to benefit the mission/purpose of the grant. The City has created an obligation to reimburse the grantor and will incorporate this deficit into the annual budget process to fund. Capital Projects Funds As of September 30, 2010, deficit fund balances are reported in the General Obligation Project Fund, Certificates of Obligation Project Fund, and Improvement Projects in the amounts of $24,550, $7,062, and $6,370, respectively. The deficit balances in these work effort funds are a result of a one year reimbursement clause allowing departments to spend up to one year in advance of bonds being sold and proceeds transferred in to fund the work efforts. Another contribution to this deficit is the timing of invoices billed to third party contributors. The deficits will be addressed by identifying the appropriate funding source and transferring funds from a bond authorization (when sold), operating funds, grants, and/or by billing and collecting contributions from third party contributors. Internal Service Funds As of September 30, 2010, the Workers Compensation Program had deficit net assets of $1,111. The deficit balance was a result of higher than expected claims activity and associated actuarially determined accruals that were more than the amount considered in the annual Workers Compensation assessment. The City will fund the deficit by revising the future assessment charged to various City funds over the course of the next three years.
Note 16 Other Disclosures Donor Restricted Endowment The City has five Permanent Funds: the San Jose Burial Park Fund, the Carver Cultural Center Endowment Fund, the San Antonio Housing Trust Fund, the William C. Morris Endowment Fund, and the Boza Becica Endowment Fund. The City is only allowed to spend interest proceeds generated from the principal amount for each of these funds. The net assets from these endowment funds are classified as restricted net assets and are reported in the government-wide financial statements. The San Jose Burial Park Fund generated $10 in investment earnings to be expended for specified purposes. Chapter 713 of the Texas Health and Safety Code governs what expenditures the City may incur when spending the interest income. Per Chapter 713, the revenue can be spent for the maintenance and care of the graves, lots, and burial places, and to beautify the entire cemetery. The principal amount of this fund is increased each year by sales of lots from the San Jose Cemetery. The principal is required to be retained in perpetuity.

CITY OF SAN ANTONIO, TEXAS
- 155 - Amounts are expressed in thousands
Note 16 Other Disclosures (Continued) Donor Restricted Endowment (Continued) The Carver Cultural Center Endowment Fund generated $2 in investment earnings. These earnings can be used for the Carver Community Cultural Center’s operating program, or reinvestment expenses (as detailed in the grant agreement). This fund is managed in accordance with the Uniform Prudent Management of Institutional Funds Act, which is codified as Section 163.001 in the Texas Property Code. The principal portion of the fund came from a one-time grant from the National Endowment for the Arts. The San Antonio Housing Trust Fund generated $106 in investment earnings. These earnings may be disbursed to projects with particular emphasis on housing programs as grants or secured loans. All distributions or disbursements of San Antonio Housing Trust shall be made for the primary purpose of providing additional and continuing housing opportunities for low and moderate income families. This trust shall at all times be governed, regulated, and administered in all respects under the laws of the State of Texas. The William C. Morris Endowment Fund generated $1 in investment earnings. These earnings are used on an annual basis to enhance the City Library’s Educational Programming and Services for Children. The earnings of the funds will be expended in accordance with the spending policy of the Library’s board of directors or trustees. The Boza Becica Endowment Fund generated $2 in investment earnings. These earnings will be used for the acquisition of books and materials for the San Antonio Public Library in accordance with the terms and conditions of the Last Will and Testament of Boza Becica. The principal is required to be retained in perpetuity.
Note 17 Prior Period Restatement Discretely Presented Component Units During fiscal year 2010, San Antonio Development Agency’s management performed a more in-depth analysis of the existing property (land and building inventory records). Based on additional information discovered by management, it was determined various properties that are actually owned by the City or others were recorded by SADA in error. Thus, an adjustment for $496 has been made to restate (decrease) beginning net assets and land and building inventory as of September 30, 2009. In addition, San Antonio Local Development Company Inc. dba South Texas Business Fund dissolved its operations effective August 2010. As the entity did not exist at the City’s fiscal year-end, it no longer qualified as a component unit and its beginning net assets of $4,822 were removed from the City’s financial statements. Blended Component Units The City was unable to obtain fiscal year 2010 financial statements for four of its component units that were presented in the prior year. The City feels the removal of these component units would not materially misstate the CAFR. The City reduced its beginning fund balances as noted below:
Fund Balance
Nonmajor Governmental Funds - Blended Component Units:San Antonio Health Facilities Development Corportation 7$ San Antonio Industrial Development Authority 15 San Antonio Education Facilities Corporation 43 Westside Development Corporation 26
91$

CITY OF SAN ANTONIO, TEXAS
- 156 - Amounts are expressed in thousands
Note 18 Subsequent Events Primary Government (City) Governmental and Business-Type Activities Long-Term Debt In the May 7, 2005 Election, the voters authorized the imposition of a sales and use tax at the rate of one-eighth of one percent (1/8 of 1.0%) for the purpose of financing an Edwards Aquifer Protection Venue Project and a Parks Development and Expansion Venue Project. That one-eighth of one percent (1/8 of 1.0%) sales and use tax is expected to be fully collected by the end of August 2011. On November 2, 2010, the voters of the City elected to establish the Edwards Aquifer Protection Venue Project and the Parks Development and Expansion Venue Project, and extend the sales and use tax rate of one-eighth of one percent (1/8 of 1.0%) for the purpose of financing the Venue Projects, in an amount not to exceed $90,000 for the Edwards Aquifer Protection Venue Project and $45,000 for the Parks Development and Expansion Venue Project. The one-eighth of one percent (1/8 of 1.0%) sales and use tax approved by the voters in this most recent election will take effect immediately after the collection authorized in the 2005 Election. On December 21, 2010, the City issued $42,220 in Airport System Revenue Improvement and Refunding Bonds, Series 2010A, $20,885 in Airport System Revenue Refunding Bonds, Taxable Series 2010B, and $37,335 in Passenger Facility Charge and Subordinate Lien Airport System Revenue Improvement and Refunding Bonds, Series 2010 for the purpose of funding the Capital Improvement Plan for the Airport System as well as refunding certain outstanding Airport debt. The Tax-Exempt GAR Bonds and the PFC Bonds refunded $34,500 of Tax Notes, Series 2010 which were utilized as interim financing to allow the Airport expansion program as well as other planned Airport capital improvements to move forward without delay prior to this issuance. Additionally, certain Airport bonds are being refunded to effectuate a restructuring of the Airport’s existing debt service. Fire and Police Pension Fund The Pension Fund had their actuarial study as of October 1, 2010 completed and issued in January 2011. The results of the study include a decrease in the Fund’s Unfunded Actuarially Accrued Liability (UAAL) from $275,696 as of October 1, 2009 to $231,075 and a decrease in the years to amortize the UAAL from 10.4 years to 9.1 years as a level percent of payroll. As is the case with most public pension plans, the Pension Fund has incurred substantial investment losses due to financial market conditions. The actuarial valuation includes a five-year smoothed market approach for the value of assets which provides for asset gains or losses to be smoothed over a five-year period. As such, under this approach, the Fund’s investment returns as of September 30, 2010 have been smoothed which results in the deferral of $328,575 in investment losses. These investment losses will be recognized in future year’s actuarial valuations to the extent they are not offset by recognition of investment gains above the Fund’s assumed investment return of 7.8% or other actuarial gains. Contribution rates for the members of the Pension Plan and the City are established under Texas state statutes and do not change with the results of the annual actuarial valuations. Staff of the Pension Fund and the City will continue to monitor the situation closely. Please see Note 8, Pension and Retirement Plans for more information on the Fire and Police Pension Plan.
(The remainder of this page left blank intentionally)

CITY OF SAN ANTONIO, TEXAS
- 157 - Amounts are expressed in thousands
Note 18 Subsequent Events (Continued) CPS Energy Rates are set by the CPS Energy Board of Trustees and approved by City Council. On February 18, 2010, the City Council unanimously approved a 7.5% increase in CPS Energy’s electric base rates and an 8.5% increase in its natural gas base rates, which became effective March 1, 2010. Long-Term Debt On March 23, 2010, CPS Energy issued $380,000 of taxable New Series 2010A Revenue Direct Subsidy BABs. The true interest cost for this issue, which has two term bonds maturing in 2041, was 3.8%. Total bond proceeds are primarily being used to fund generation and electric distribution construction projects. On November 4, 2010, CPS Energy issued $300,000 of Junior Lien Taxable Series 2010A Revenue Direct Subsidy BABs and $200,000 of Junior Lien Taxable Series 2010B Revenue Refunding Direct Subsidy BABs. The true interest cost for the 2010A issue, which has a term bond maturing in 2041, was 3.8%. Total bond proceeds are being used to fund general system improvements. The true interest cost for the 2010B issue, which has a term bond maturing in 2037, was 4.1%. On November 5, 2010, proceeds from the 2010B issue were used to refund $200,000 of outstanding TECP obligations. Flexible Rate Revolving Note In FY 2010, the San Antonio City Council adopted an ordinance authorizing the establishment of the Flexible Rate Revolving Note (“FRRN”) Private Placement Program. This ordinance provides for funding to assist in the interim financing of eligible projects in an aggregate amount not to exceed $100,000. Eligible projects include the acquisition or construction of improvements, additions, or extensions for the Systems, including capital assets and facilities incident and related to the operation, maintenance, and administration of fuel acquisition and development and facilities for the transportation thereof; capital improvements to the Systems; and refinancing or refunding any outstanding obligations secured by the net revenues of the Systems; or with respect to the payment of any obligation of the Systems pursuant to any credit. Under the program, maturity dates cannot extend beyond November 1, 2028. On May 10, 2010, CPS Energy drew $25,200 on the taxable Flexible Rate Revolving Note, Series A. On May 11, 2010, the proceeds from the note, along with cash, were used to defease $25,700 in principal amounts of the allocable portion of the debt associated with the common facilities of STP Units 3 and 4. The outstanding FRRN balance at October 31, 2010, was $25,200. The FRRN has been classified as short-term in accordance with the financing terms under the Note Purchase Agreements, which support the Program Notes. Under the terms of the two current Note Purchase Agreements, $75,000 of the credit facility is taxable and secured by collateral pledged in the form of investments. The remaining $25,000 of the credit facility is tax-exempt and secured by an inferior lien obligation with a pledge of net revenues. Such pledge of net revenues is subordinate and inferior to the pledge securing payment of New Series Bonds, Junior Lien Obligations and TECP. Both the current taxable and tax-exempt Note Purchase Agreements expire on December 31, 2011.
(The remainder of this page left blank intentionally)

CITY OF SAN ANTONIO, TEXAS
- 158 - Amounts are expressed in thousands
Note 18 Subsequent Events (Continued) San Antonio Water System (SAWS) Long-Term Debt On March 4, 2010, SAWS issued $59,145 City of San Antonio, Texas Water System Junior Lien Revenue and Refunding Bonds, Series 2010. The proceeds from the sale of the bonds were used to (i) refund $38,130 City of San Antonio, Texas Water System Junior Lien Revenue and Refunding Bonds, Series 1999 (the 1999 Junior Lien Bonds), (ii) refund $25,070 City of San Antonio, Texas Water System Junior Lien Revenue Bonds, Series 1999-A (the 1999-A Junior Lien Bonds), and (iii) pay the cost of issuance. The refunding of the 1999 Junior Lien Bonds and the 1999-A Junior Lien Bonds resulted in a reduction of SAWS’ total debt service payments over the next ten years of approximately $4,900 and SAWS obtained an economic gain (difference between the present value of the old and new debt service payments) of approximately $4,300. The bonds are secured together with other currently outstanding Junior Lien Obligations solely by a lien on the pledge of net revenues and are subordinate to outstanding Senior Lien Obligations. On February 1, 2010, the District Judge in the 200th Judicial District Court of Travis County, Texas granted LCRA’s plea asserting full or partial governmental immunity from suit and dismissed SAWS’ law suit discussed in Note 11. On February 17, 2010, SAWS’ filed an appeal to the Court of Appeals for the Third Appellate District of Texas in Austin, Texas. Following a decision by the Court of Appeals, either party may further appeal to the Supreme Court of Texas. However, consideration by the Supreme Court is discretionary with the Court and may be refused. Resolution of the appeal on the issue of governmental immunity is expected to take from two to five years, although the time is very difficult to predict. On November 23, 2010, SAWS issued $110,000 City of San Antonio, Texas Water System Revenue Bonds, Taxable Series 2010B (Direct Subsidy – Build America Bonds) (the “Series 2010B Bonds”). The proceeds from the sale of the bonds were used to (i) finance capital improvement projects, and (ii) pay the cost of issuance. The Series 2010B Bonds qualify for and were designated as Build America Bonds under and pursuant to the authority provided for in the American Recovery and Reinvestment Act of 2009 (the “Stimulus Act”). In connection with the issuance of the Series 2010B Bonds, and as permitted in the Stimulus Act, SAWS elected an option (which election is irrevocable pursuant to the provisions of the Stimulus Act) permitting it to receive directly from the United States Department of the Treasury (the “Treasury”) a subsidy payment equal to 35.0% of the taxable interest it pays on the Series 2010B Bonds (the “Tax Credit”). SAWS has provided for the Tax Credit to be delivered from the Treasury directly to the paying agent/registrar of the Series 2010B Bonds solely for the use to reduce the amount of the regularly scheduled debt service payment on the Series 2010B Bonds that SAWS is required to make. The Tax Credit is a general revenue of SAWS and is not directly pledged to the payment of the Series 2010B Bonds, however, SAWS anticipates that the entirety of the Tax Credit, as a result of the direct deposit from the Treasury to the paying agent/registrar will be available solely to off-set the scheduled debt service payment requirements attributable to the Series 2010B Bonds. The bonds are collateralized, together with other currently outstanding Senior Lien Obligations, solely by a lien on a pledge of net revenues. On December 14, 2010, SAWS issued $17,930 City of San Antonio, Texas Water System Junior Lien Revenue and Refunding Bonds, Series 2010A through the Texas Water Development Board. The bonds were sold under the State Revolving Fund (SRF) Program. The proceeds from the sale of the bonds were used to (i) finance capital improvement projects which qualify under the Texas Water Development Board program, (ii) refund $3,400 in outstanding commercial paper notes, and (iii) pay the cost of issuance. The bonds are secured together with other currently outstanding Junior Lien Obligations solely by a lien on a pledge of net revenues and are subordinate to outstanding Senior Lien Obligations.

City of San Antonio, Texas
Required Supplementary Information Other Than MD&A (Unaudited)

Budgetary Comparison ScheduleGeneral Fund
VARIANCE WITHBUDGETARY FINAL BUDGET
BASIS POSITIVEORIGINAL FINAL ACTUAL (NEGATIVE)
Taxes 473,681$ 472,161$ 479,775$ 7,614$Licenses and Permits 7,036 6,939 7,769 830Intergovernmental 6,543 6,212 7,768 1,556Revenues from Utilities 261,208 282,485 292,726 10,241Charges for Services 43,031 44,333 45,850 1,517Fines and Forfeits 14,157 14,139 11,506 (2,633)Investment Earnings 2,174 1,034 1,832 798Miscellaneous 8,364 9,555 10,267 712Transfers from Other Funds 27,955 36,581 36,581
Amounts Available for Appropriation 844,149 873,439 894,074 20,635Charges to Appropriations (Outflows):
General Government 97,975 86,977 82,942 4,035Public Safety 506,841 507,106 505,045 2,061Public Works 41,933 45,341 44,237 1,104Health Services 71,862 74,782 73,898 884Sanitation 3,163 3,385 3,212 173Culture and Recreation 75,447 77,655 76,983 672Welfare 39,177 42,627 41,142 1,485Economic Development and Opportunity 2,459 2,838 2,907 (69)Transfers to Other Funds 48,199 66,495 66,495
Total Charges to Appropriations: 887,056 907,206 896,861 10,345Surplus (Deficiency) of Resources Over (Under)
Charges to Appropriations (42,907) (33,767) (2,787) 30,980Fund Balance Allocation 42,907 33,767 2,787 (30,980)Excess (Deficiency) of Resources Over (Under)
Charges to Appropriations -$ -$ -$ -$
Explanation of Differences between Budgetary Inflows and Outflows and GAAP Revenues and ExpendituresSources/Inflows of Resources:
Actual amounts (budgetary basis) "available for appropriation" from the budgetarycomparison schedule 894,074$
Differences - budget to GAAP:Transfers from other funds are inflows of budgetary resources but are not revenues
for financial reporting purposes (36,581)Total revenues as reported on the statement of revenues, expenditures, and changes
in fund balances - governmental funds 857,493$Uses/Outflows of Resources:
Actual amounts (budgetary basis) "total charges to appropriations" from the budgetarycomparison schedule 896,861$
Differences - budget to GAAP:Encumbrances for supplies, equipment, and services ordered but not received are reported in the
year the orders are placed for budgetary purposes, but in the year the supplies, equipment andservices are received for financial reporting purposes (25,916)
Transfers to other funds are outflows of budgetary resources but are not expendituresfor financial reporting purposes (54,255)
Total expenditures as reported on the statement of revenues, expenditures, and changesin fund balances - governmental funds 816,690$
General Fund Budgetary Information
The City noted budget violations within the Economic Development and Opportunity function. However, as sufficient fund balance covered individualfunctional excesses this was not deemed to be a material violation.
CITY OF SAN ANTONIO, TEXAS
Year-Ended September 30, 2010
The City prepares an annual budget for the General Fund on a budgetary basis, which is consistent with generally accepted accounting principles. Theannual budgetary data reported for the General Fund represents the original appropriation ordinance and amendments thereto as adopted by the CityCouncil, adjusted for encumbrances outstanding at the beginning of the fiscal year. All annual appropriations lapse at fiscal year-end.
The City Charter establishes requirements for the adoption of budgets and budgetary control. Under provisions of the Charter, expenditures of each Cityfunction within individual funds cannot legally exceed the final budget approved by the City Council. Amendments to line items within a departmentalbudget may be initiated by Department Directors.
Resources (Inflows):
(In Thousands)
BUDGETED AMOUNTS
2010
(unaudited - see accompanying auditors' report)
- 159 - Amounts are expressed in thousands

CITY OF SAN ANTONIO, TEXAS Comprehensive Annual Financial Report Year-Ended September 30, 2010

City of San Antonio, Texas
Pension and Postemployment Schedules
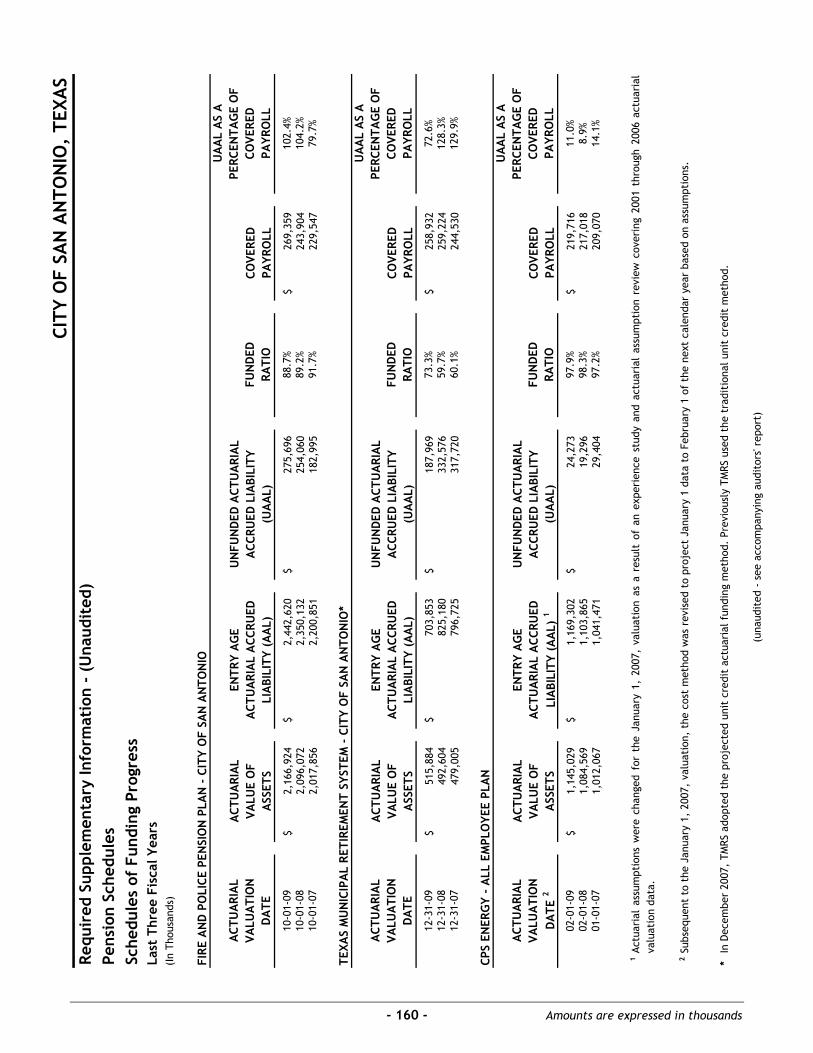
Requ
ired
Sup
plem
enta
ry In
form
atio
n -
(Una
udit
ed)
Pens
ion
Sche
dule
sSc
hedu
les
of F
undi
ng P
rogr
ess
FIRE
AN
D P
OLI
CE P
ENSI
ON
PLA
N -
CIT
Y O
F SA
N A
NTO
NIO
ACT
UA
RIA
LEN
TRY
AG
EU
NFU
ND
ED A
CTU
ARI
AL
VALU
E O
FA
CTU
ARI
AL
ACC
RUED
ACC
RUED
LIA
BILI
TYCO
VERE
DA
SSET
SLI
ABI
LITY
(A
AL)
(UA
AL)
PAYR
OLL
2,16
6,92
4$
2,44
2,62
0$
275,
696
$26
9,35
9$
2,09
6,07
22,
350,
132
254,
060
243,
904
2,01
7,85
62,
200,
851
182,
995
229,
547
TEXA
S M
UN
ICIP
AL
RETI
REM
ENT
SYST
EM -
CIT
Y O
F SA
N A
NTO
NIO
*
ACT
UA
RIA
LEN
TRY
AG
EU
NFU
ND
ED A
CTU
ARI
AL
VALU
E O
FA
CTU
ARI
AL
ACC
RUED
ACC
RUED
LIA
BILI
TYCO
VERE
DA
SSET
SLI
ABI
LITY
(A
AL)
(UA
AL)
PAYR
OLL
515,
884
$
703,
853
$18
7,96
9$
258,
932
$49
2,60
482
5,18
033
2,57
625
9,22
447
9,00
579
6,72
531
7,72
024
4,53
0
CPS
ENER
GY
- A
LL E
MPL
OYE
E PL
AN
ACT
UA
RIA
LEN
TRY
AG
EU
NFU
ND
ED A
CTU
ARI
AL
VALU
E O
FA
CTU
ARI
AL
ACC
RUED
ACC
RUED
LIA
BILI
TYCO
VERE
DA
SSET
SLI
ABI
LITY
(AA
L)1
(UA
AL)
PAYR
OLL
1,14
5,02
9$
1,16
9,30
2$
24,2
73$
219,
716
$1,
084,
569
1,10
3,86
519
,296
217,
018
1,01
2,06
71,
041,
471
29,4
0420
9,07
0
1 2 *In
Dec
embe
r 20
07,
TMRS
ado
pted
the
pro
ject
ed u
nit
cred
it a
ctua
rial
fun
ding
met
hod.
Pre
viou
sly
TMRS
use
d th
e tr
adit
iona
l uni
t cr
edit
met
hod.
CITY
OF
SAN
AN
TON
IO,
TEXA
S
PAYR
OLL
FUN
DED
RATI
O
UA
AL
AS
A
Last
Thr
ee F
isca
l Yea
rs
DA
TEVA
LUA
TIO
NA
CTU
ARI
AL
(In
Thou
sand
s)
UA
AL
AS
AA
CTU
ARI
AL
Actu
aria
las
sum
ptio
nsw
ere
chan
ged
for
the
Janu
ary
1,20
07,
valu
atio
nas
are
sult
ofan
expe
rien
cest
udy
and
actu
aria
las
sum
ptio
nre
view
cove
ring
2001
thro
ugh
2006
actu
aria
lva
luat
ion
data
.
RATI
OPA
YRO
LL
12-3
1-08
59.7
%12
8.3%
DA
TE
COVE
RED
PERC
ENTA
GE
OF
10-0
1-07
89.2
%91
.7%
10-0
1-08
104.
2%79
.7%
10-0
1-09
88.7
%
12-3
1-07
60.1
%12
9.9%
PERC
ENTA
GE
OF
VALU
ATI
ON
FUN
DED
COVE
RED
UA
AL
AS
AA
CTU
ARI
AL
PERC
ENTA
GE
OF
VALU
ATI
ON
FUN
DED
COVE
RED
PAYR
OLL
02-0
1-08
98.3
%8.
9%
DA
TE2
RATI
O
02-0
1-09
97.9
%11
.0%
102.
4%
12-3
1-09
73.3
%72
.6%
Subs
eque
nt t
o th
e Ja
nuar
y 1,
200
7, v
alua
tion
, th
e co
st m
etho
d w
as r
evis
ed t
o pr
ojec
t Ja
nuar
y 1
data
to
Febr
uary
1 o
f th
e ne
xt c
alen
dar
year
bas
ed o
n as
sum
ptio
ns.
01-0
1-07
97.2
%14
.1%
(una
udit
ed -
see
acc
ompa
nyin
g au
dito
rs' r
epor
t)
- 160 - Amounts are expressed in thousands

Requ
ired
Sup
plem
enta
ry In
form
atio
n -
(Una
udit
ed)
Pens
ion
Sche
dule
sSc
hedu
les
of F
undi
ng P
rogr
ess
SAN
AN
TON
IO W
ATE
R SY
STEM
- T
MRS
ACT
UA
RIA
LEN
TRY
AG
EU
NFU
ND
ED A
CTU
ARI
AL
VALU
E O
FA
CTU
ARI
AL
ACC
RUED
ACC
RUED
LIA
BILI
TYCO
VERE
DA
SSET
SLI
ABI
LITY
(A
AL)
(UA
AL)
PAYR
OLL
$68,
756
$107
,311
$38,
555
$81,
821
63,6
7496
,539
32,8
6574
,448
62,0
2390
,776
28,7
5368
,412
SAN
AN
TON
IO W
ATE
R SY
STEM
- S
AW
SRP
ACT
UA
RIA
LEN
TRY
AG
EU
NFU
ND
ED A
CTU
ARI
AL
VALU
E O
FA
CTU
ARI
AL
ACC
RUED
ACC
RUED
LIA
BILI
TYCO
VERE
DA
SSET
SLI
ABI
LITY
(A
AL)
(UA
AL)
PAYR
OLL
$77,
365
$112
,263
$34,
898
$82,
923
74,6
1199
,144
24,5
3370
,252
73,7
7781
,587
7,81
066
,996
CITY
OF
SAN
AN
TON
IO,
TEXA
S
Last
Thr
ee F
isca
l Yea
rs
UA
AL
AS
APE
RCEN
TAG
E O
F
(In
Thou
sand
s)
ACT
UA
RIA
LVA
LUA
TIO
NRA
TIO
PAYR
OLL
FUN
DED
COVE
RED
DA
TE
12-3
1-09
64.1
%47
.1%
12-3
1-07
68.3
%42
.0%
12-3
1-08
66.0
%44
.1%
UA
AL
AS
APE
RCEN
TAG
E O
FFU
ND
EDCO
VERE
DA
CTU
ARI
AL
VALU
ATI
ON
RATI
OPA
YRO
LL
01-0
1-09
75.3
%34
.9%
DA
TE
01-0
1-10
68.9
%42
.1%
01-0
1-08
90.4
%11
.7%
(una
udit
ed -
see
acc
ompa
nyin
g au
dito
rs' r
epor
t)
- 161 - Amounts are expressed in thousands

Requ
ired
Sup
plem
enta
ry In
form
atio
n -
(Una
udit
ed)
Post
empl
oym
ent
Sche
dule
sSc
hedu
les
of F
undi
ng P
rogr
ess
CPS
ENER
GY
- H
EALT
H P
LAN ACT
UA
RIA
LU
NFU
ND
ED A
CTU
ARI
AL
VALU
E O
FA
CTU
ARI
AL
ACC
RUED
ACC
RUED
LIA
BILI
TYCO
VERE
DA
SSET
SLI
ABI
LITY
(AA
L)2
(UA
AL)
PAYR
OLL
204,
246
$
219,
364
$15
,118
$21
9,71
6$
194,
876
247,
283
52,4
0721
7,01
815
0,81
822
0,69
169
,873
209,
070
CPS
ENER
GY
- D
ISA
BILI
TY P
LAN
ACT
UA
RIA
LU
NFU
ND
ED A
CTU
ARI
AL
VALU
E O
FA
CTU
ARI
AL
ACC
RUED
ACC
RUED
LIA
BILI
TYCO
VERE
DA
SSET
SLI
ABI
LITY
(A
AL)
(
UA
AL)
3PA
YRO
LL
3,76
3$
6,57
5$
2,81
2$
198,
669
$3,
734
5,71
21,
978
185,
090
3,92
5
5,21
11,
286
177,
558
CPS
ENER
GY
- LI
FE P
LAN
ACT
UA
RIA
LU
NFU
ND
ED A
CTU
ARI
AL
VALU
E O
FA
CTU
ARI
AL
ACC
RUED
ACC
RUED
LIA
BILI
TYCO
VERE
DA
SSET
SLI
ABI
LITY
(A
AL)
(
UA
AL)
3PA
YRO
LL
49,6
14$
35,4
91$
(14,
123)
$19
8,66
9$
49,0
9833
,024
(16,
074)
185,
090
47,8
0931
,219
(16,
590)
177,
558
1 2 3
Subs
eque
nt t
o th
e Ja
nuar
y 1,
200
7 va
luat
ion,
the
cos
t m
etho
d w
as r
evis
ed t
o pr
ojec
t Ja
nuar
y 1
data
to
Febr
uary
1 o
f th
e ne
xt c
alen
dar
year
bas
ed o
n as
sum
ptio
ns
The
AAL
cons
iste
dof
the
liabi
lity
for
both
reti
red
empl
oyee
san
dac
tive
empl
oyee
s.Th
eAA
Lfo
rre
tire
dem
ploy
ees
was
$87,
900
for
Febr
uary
1,20
09;
$94,
200
for
Febr
uary
1,20
08;
and
$97,
900
for
Janu
ary
1, 2
007.
CPS
Ener
gyha
sse
lect
edth
eag
greg
ate
cost
met
hod
for
dete
rmin
ing
Dis
abili
tyan
dLi
fePl
ans'
fund
ing
amou
nts.
Sinc
eth
ism
etho
ddo
esno
tid
enti
fyor
sepa
rate
lyam
orti
zeun
fund
ed
actu
aria
llia
bilit
ies,
info
rmat
ion
abou
tth
efu
nded
stat
usan
dfu
ndin
gpr
ogre
ssha
sbe
enpr
epar
edus
ing
the
entr
yag
eac
tuar
ial
cost
met
hod,
whi
chap
prox
imat
esth
efu
ndin
gpr
ogre
ss
of t
he P
lan.
RATI
OPA
YRO
LL
01-0
1-07
148.
7%(8
.7)%
DA
TE 1
(9.3
)%02
-01-
0815
3.1%
UA
AL
AS
APE
RCEN
TAG
E O
FVA
LUA
TIO
NFU
ND
EDCO
VERE
DA
CTU
ARI
AL
75.3
%0.
7%
FUN
DED
COVE
RED
DA
TE 1
RATI
OPA
YRO
LLVA
LUA
TIO
N
UA
AL
AS
AA
CTU
ARI
AL
PERC
ENTA
GE
OF
01-0
1-07
68.3
%33
.4%
RATI
OPA
YRO
LL
02-0
1-08
78.8
%24
.1%
DA
TE 1
02-0
1-09
93.1
%6.
9%
CITY
OF
SAN
AN
TON
IO,
TEXA
S
Last
Thr
ee F
isca
l Yea
rs
UA
AL
AS
APE
RCEN
TAG
E O
F
(In
Thou
sand
s)
FUN
DED
COVE
RED
ACT
UA
RIA
LVA
LUA
TIO
N
02-0
1-09
57.2
%1.
4%
02-0
1-09
139.
8%(7
.1)%
01-0
1-07
65.4
%1.
1%02
-01-
08
(una
udit
ed -
see
acc
ompa
nyin
g au
dito
rs' r
epor
t)
- 162 - Amounts are expressed in thousands

Requ
ired
Sup
plem
enta
ry In
form
atio
n -
(Una
udit
ed)
Post
empl
oym
ent
Sche
dule
sSc
hedu
les
of F
undi
ng P
rogr
ess
CITY
OF
SAN
AN
TON
IO R
ETIR
EE H
EALT
H B
ENEF
ITS
FUN
D
ACT
UA
RIA
LU
NFU
ND
ED A
CTU
ARI
AL
VALU
E O
FA
CTU
ARI
AL
ACC
RUED
ACC
RUED
LIA
BILI
TYCO
VERE
DA
SSET
SLI
ABI
LITY
(A
AL)
(U
AA
L)PA
YRO
LL
-$
34
2,01
8$
342,
018
$25
9,22
4$
258,
428
258,
428
231,
262
FIRE
AN
D P
OLI
CE R
ETIR
EE H
EALT
H C
ARE
FU
ND
ACT
UA
RIA
LU
NFU
ND
ED A
CTU
ARI
AL
VALU
E O
FA
CTU
ARI
AL
ACC
RUED
ACC
RUED
LIA
BILI
TYCO
VERE
DA
SSET
SLI
ABI
LITY
(A
AL)
(U
AA
L)PA
YRO
LL
200,
329
$
549,
466
$34
9,13
7$
236,
372
$20
8,38
456
1,03
535
2,65
122
6,70
718
8,14
751
3,48
432
5,33
721
3,44
6
SAN
AN
TON
IO W
ATE
R SY
STEM
- O
PEB
PLA
N
ACT
UA
RIA
LEN
TRY
AG
EU
NFU
ND
ED A
CTU
ARI
AL
VALU
E O
FA
CTU
ARI
AL
ACC
RUED
ACC
RUED
LIA
BILI
TYCO
VERE
DA
SSET
SLI
ABI
LITY
(A
AL)
(UA
AL)
PAYR
OLL
-$
29
7,25
9$
297,
259
$75
,270
$20
0,08
320
0,08
369
,288
1Ci
ty w
ill p
erfo
rm a
ctua
rial
stu
dies
bi-
annu
ally
and
rev
iew
ann
ually
ass
umpt
ions
and
cha
nges
in p
lan
desi
gn t
o co
mpu
te O
PEB
liabi
lity
for
the
Reti
ree
Hea
lth
Bene
fits
Fun
d.
2
0.0%
394.
9%01
-01-
09
COVE
RED
PAYR
OLL
DA
TE2
RATI
O
COVE
RED
DA
TE1
RATI
OPA
YRO
LL
CITY
OF
SAN
AN
TON
IO,
TEXA
S
Last
Thr
ee F
isca
l Yea
rs(I
n Th
ousa
nds)
UA
AL
AS
A
UA
AL
AS
AA
CTU
ARI
AL
PERC
ENTA
GE
OF
VALU
ATI
ON
FUN
DED
01-0
1-09
0.0%
131.
9%
VALU
ATI
ON
FUN
DED
UA
AL
AS
AA
CTU
ARI
AL
PERC
ENTA
GE
OF
0.0%
111.
7%01
-01-
06
36.5
%14
7.7%
PERC
ENTA
GE
OF
VALU
ATI
ON
FUN
DED
COVE
RED
ACT
UA
RIA
L
152.
4%10
-01-
0736
.6%
PAYR
OLL
10-0
1-08
37.1
%15
5.5%
DA
TERA
TIO
10-0
1-09
SAW
S w
ill p
erfo
rm a
ctua
rial
stu
dies
bi-
annu
ally
and
rev
iew
ann
ually
ass
umpt
ions
and
cha
nges
in p
lan
desi
gn t
o co
mpu
te O
PEB
liabi
lity.
01-0
1-07
288.
8%0.
0%
- 163 - Amounts are expressed in thousands

City of San Antonio, Texas
Combining Financial Statements and Schedules

City of San Antonio, Texas
Nonmajor Governmental Funds

Combining Balance SheetNonmajor Governmental Funds
(In Thousands)TOTAL
SPECIAL CAPITAL NONMAJORREVENUE PROJECTS PERMANENT GOVERNMENTAL
FUNDS FUNDS FUNDS FUNDSAssets:
Cash and Cash Equivalents 8,593$ -$ -$ 8,593$Securities Lending Collateral 12,286 12,286Investments 83,197 83,197Receivables, Net 1,795 1,795Accrued Interest 6 6Accrued Revenue 6,636 6,636Due from:
Other Funds 761 761Other Governmental Agencies 12,853 12,853
Materials and Supplies, at Cost 470 470Deposits 75 75Prepaid Expenditures 110 110Restricted Assets:
Cash and Cash Equivalents 20,929 18,998 370 40,297Securities Lending Collateral 8,855 31,933 646 41,434Investments 84,238 222,126 14,685 321,049Receivables, Net 53,166 1,043 54,209Accrued Interest 1 23 42 66Accrued Revenue 943 943Prepaid Expenditures 16 16Deposits 1 1Due from:
Other Funds 5,337 5,704 11,041Other Governmental Agencies 10,172 10,172
Total Assets 300,268$ 289,999$ 15,743$ 606,010$Liabilities and Fund Balances:
Liabilities:Vouchers Payable 4,775$ -$ -$ 4,775$Accounts Payable - Other 7,464 7,464Accrued Payroll 3,019 3,019Accrued Leave Payable 935 935Securities Lending Obligation 12,286 12,286Due to:
Other Funds 11,663 11,663Other Governmental Agencies 12 12
Restricted Liabilities:Vouchers Payable 3,584 26,281 29,865Accounts Payable - Other 2,068 15,996 47 18,111Accrued Payroll 442 48 15 505Accrued Leave Payable 16 5 21Deferred Revenue 57,869 2,551 60,420Securities Lending Obligation 8,855 31,933 646 41,434Amounts Held in Trust 2,429 2,429Due to:
Other Funds 7,815 16,309 24,124Other Governmental Agencies 2,869 2,869
Total Liabilities 126,101 93,118 713 219,932Fund Balances:
Reserved:Reserved for Encumbrances 66,932 244,916 311,848Reserved for Materials and Supplies 470 470Reserved for Deposits 76 76Reserved for Prepaid Expenditures 126 126
Unreserved:Designated - Special Revenue 4,183 4,183Designated - Permanent 1,920 2,882 4,802Undesignated - Special Revenue 100,460 100,460Undesignated - Capital Projects (48,035) (48,035)Undesignated - Permanent 12,148 12,148
Total Fund Balances 174,167 196,881 15,030 386,078
Total Liabilities and Fund Balances 300,268$ 289,999$ 15,743$ 606,010$
CITY OF SAN ANTONIO, TEXAS
As of September 30, 2010
- 164 - Amounts are expressed in thousands

Combining Statement of Revenues, Expenditures, and Changes in Fund BalancesNonmajor Governmental Funds
(In Thousands)
TOTALSPECIAL CAPITAL NONMAJORREVENUE PROJECTS PERMANENT GOVERNMENTAL
FUNDS FUNDS FUNDS FUNDSRevenues:
Taxes:Property 10,217$ -$ -$ 10,217$General Sales and Use 34,734 34,734Occupancy 59,734 59,734Penalties and Interest on Delinquent Taxes 156 156
Intergovernmental 87,603 19,848 107,451Charges for Services 97,736 515 98,251Miscellaneous 20,643 368 148 21,159Investment Earnings 1,744 1,283 121 3,148Contributions 66,960 66,960
Total Revenues 379,527 21,499 784 401,810
Expenditures:Current:
General Government 7,862 114 7,976Public Safety 6,926 6,926Public Works 54,285 54,285Health Services 1,773 1,773Sanitation 5,292 5,292Welfare 20,597 20,597Culture and Recreation 46,922 531 47,453Convention and Tourism 21,240 21,240Urban Redevelopment and Housing 40,062 249 40,311Economic Development and Opportunity 103,843 103,843
Capital Projects 287,722 287,722Debt Service:
Principal Retirement 5,520 5,520Interest 14,728 14,728Issuance Costs 171 393 564
Total Expenditures 329,221 288,229 780 618,230
Excess (Deficiency) of RevenueOver (Under) Expenditures 50,306 (266,730) 4 (216,420)
Other Financing Sources (Uses):Issuance of Long-Term Debt 9,090 48,030 57,120Payments to Refunded Bond Escrow Agent (8,939) (8,939)Premium on Long-Term Debt 33 5,661 5,694Transfers In 17,193 241,587 100 258,880Transfers Out (139,399) (107,366) (4) (246,769)
Total Other Financing Sources (Uses) (122,022) 187,912 96 65,986
Net Change in Fund Balances (71,716) (78,818) 100 (150,434)
Fund Balances, October 1 (as restated) 245,883 275,699 14,930 536,512
Fund Balances, September 30 174,167$ 196,881$ 15,030$ 386,078$
CITY OF SAN ANTONIO, TEXAS
Year-Ended September 30, 2010
- 165 - Amounts are expressed in thousands

City of San Antonio, Texas
Special Revenue Funds
GRANTS
AMERICAN RECOVERY REINVESTMENT ACT – to accept, receipt, disburse federal funds designated as part of the American Recovery Reinvstment Act.
COMMUNITY DEVELOPMENT PROGRAM – to accept, receipt and disburse federal funds designated for Community Development Block Grants’ Programs.
CONFISCATED PROPERTY - to account for receipts and disbursement of funds confiscated by law enforcement officers within the City of San Antonio, Texas.
HOME PROGRAM - to accept, receipt and disburse federal funds designated for HOME Investment Partnership Programs.
HUD 108 LOAN PROGRAM - to accept, receipt and disburse federal funds designed to finance various HUD eligible capital improvements within the City.
OTHER SPECIAL REVENUES ADVANCED TRANSPORATION DISTRICT – to account for revenues and expenditures associated with the administration and project delivery of the Advanced Transportation District Program (ATD).
CAPITAL IMPROVEMENTS MANAGEMENT SERVICES (CIMS) – to account for revenues and expenditures associated with the administration and delivery of capital improvement projects.
CAPITAL IMPROVEMENT RESERVE - to account for the financing of special capital improvements designated by the City Council. Financing is derived from the sale of excess City land and from investment earnings on prior CPS Energy nonbudgeted sales to other utilities. Amounts are transferred to the Capital Improvement Projects Fund for construction purposes.
COMMUNITY AND VISITOR FACILITIES – to account for revenues and expenditures generated from Convention and Tourism activities relating to the promotion of City of San Antonio owned facilities to be used for conventions, community and entertainment venues.
COMMUNITY SERVICES - to account for funds that provide various services to the community, such as health, housing, education, safety, employment, golfing, and economic development. Animal Care Services was transferred to General Fund effective October 1, 2009.
PLANNING AND DEVELOPMENT SERVICES – to account for revenues and expenditures associated with the operation and maintenance of City development service activities.
TAX INCREMENT REINVESTMENT ZONE - to account for all revenues and expenditures associated with the operations of Tax Increment Reinvestment Zones (TIRZ) and the Tax Increment Financing Fund (TIF).

City of San Antonio, Texas
Special Revenue Funds (Continued)
OTHER SPECIAL REVENUES (CONTINUED) HOTEL/MOTEL 2% REVENUE - to account for funds derived from and capital improvement activity relating to the additional 2.0% Municipal Hotel/Motel Occupancy Tax.
INTERNATIONAL CENTER – to account for revenues and the general maintenance of the International Center. Financing is provided by charges for rent, common area maintenance of the facility, and a prior contribution from the General Fund.
JOB TRAINING, NEIGHBORHOOD REVITALIZATION, AND ECONOMIC DEVELOPMENT – to account for the proceeds and related investment earnings realized from the lease-lease back of CPS Energy. The proceeds will be used to fund better jobs, neighborhood revitalization, technology accelerator initiative, and capital improvement programs.
PARKS DEVELOPMENT AND EXPANSION - to account for the additional ⅛ cent sales tax that funds the purchase and maintenance of new parkland in the Edwards Aquifer Recharge Zones, as well as linear parks along Leon Creek and Salado Creek.
STORMWATER OPERATIONS - to account for the administrative and operational activities of the Stormwater Program. Financing is provided by a stormwater fee.
RIGHT OF WAYS – to account for funds used in the maintenance and improvement of right of ways. Financing is provided by street resurfacing charges. Street Operations transferred to General Fund effective October 1, 2009.
BLENDED COMPONENT UNITS
CONVENTION CENTER HOTEL FINANCE CORPORATION – was established in accordance with state laws for the purpose of, and to act on behalf of the City in local economic development to stimulate business and commercial activity in the City.
SAN ANTONIO HOUSING TRUST FINANCE CORPORATION - was established in accordance with state laws for the purpose of acting on behalf of the City, to carry out the purposes of the Texas Housing Finance Corporations Act. SAN ANTONIO PUBLIC LIBRARY FOUNDATION – was established to bring back the important role of the private sector in helping to enhance Library resources and services.
STARBRIGHT INDUSTRIAL DEVELOPMENT CORPORATION – to account for the purchase of the project site for the Toyota plant and finance other costs of the project site including site preparation and a training facility as provided in the Project Starbright Agreement. Financing was derived from the prior sale of City of San Antonio, Texas Starbright Industrial Development Corporation Contract Revenue Bonds.

City of San Antonio, Texas
Special Revenue Funds (Continued)
BLENDED COMPONENT UNITS (CONTINUED) SAN ANTONIO TEXAS MUNICIPAL FACILITIES CORPORATION – to account for the financing for the acquisition and construction of a One Stop Development Services Center for the City of San Antonio, Texas. Financing was derived from the prior sale of City of San Antonio, Texas Municipal Facilities Corporation Lease Revenue Bonds.
SAN ANTONIO ECONOMIC DEVELOPMENT CORPORATION – was established to promote, assist, and enhance economic development activities for the City.
SAN ANTONIO HOUSING TRUST PUBLIC FACILITY CORPORATION – was established to assist the City in financing, refinancing, or providing public facilities. The Corporation was to provide a tool to develop affordable housing.
EMPOWERMENT ZONE DEVELOPMENT CORPORATION – was established in accordance with state laws for the purpose of, and to act on behalf of the City in local economic development to stimulate business and commercial activity in the City.

Combining Balance SheetNonmajor Governmental Funds - Special Revenue FundsAs of September 30, 2010(In Thousands)
TOTALOTHER BLENDED NONMAJORSPECIAL COMPONENT SPECIAL
GRANTS REVENUES UNITS REVENUE FUNDSAssets:
Cash and Cash Equivalents -$ 8,593$ -$ 8,593$Securities Lending Collateral 12,286 12,286Investments 83,197 83,197Receivables, Net 1,795 1,795Accrued Interest 6 6Accrued Revenue 6,636 6,636Due from:
Other Funds 761 761Other Governmental Agencies 12,853 12,853
Materials and Supplies, at Cost 470 470Deposits 75 75Prepaid Expenditures 110 110Restricted Assets:
Cash and Cash Equivalents 658 4,422 15,849 20,929Securities Lending Collateral 1,145 7,710 8,855Investments 30,222 51,827 2,189 84,238Receivables, Net 47,172 5,994 53,166Accrued Interest 1 1Accrued Revenue 943 943Prepaid Expenditures 16 16Deposits 1 1Due from:
Other Funds 64 5,273 5,337Total Assets 79,262$ 202,952$ 18,054$ 300,268$Liabilities and Fund Balances:
Liabilities:Vouchers Payable -$ 4,775$ -$ 4,775$Accounts Payable - Other 7,464 7,464Accrued Payroll 3,019 3,019Accrued Leave Payable 935 935Securities Lending Obligation 12,286 12,286Due to:
Other Funds 11,663 11,663Other Governmental Agencies 12 12
Restricted Liabilities:Vouchers Payable 3,143 441 3,584Accounts Payable - Other 1,729 339 2,068Accrued Payroll 373 69 442Accrued Leave Payable 16 16Deferred Revenue 57,869 57,869Securities Lending Obligation 1,145 7,710 8,855Amounts Held in Trust 2,429 2,429Due to:
Other Funds 7,167 648 7,815Other Governmental Agencies 2,869 2,869
Total Liabilities 74,295 49,377 2,429 126,101Fund Balances:
Reserved:Reserved for Encumbrances 27 66,905 66,932Reserved for Materials and Supplies 470 470Reserved for Deposits 1 75 76Reserved for Prepaid Expenditures 110 16 126
Unreserved:Designated - Special Revenue 4,183 4,183Designated - Permanent 1,920 1,920Undesignated - Special Revenue 4,939 81,832 13,689 100,460Undesignated - Capital Projects
Total Fund Balances 4,967 153,575 15,625 174,167Total Liabilities and Fund Balances 79,262$ 202,952$ 18,054$ 300,268$
CITY OF SAN ANTONIO, TEXAS
- 166 - Amounts are expressed in thousands

Combining Statement of Revenues, Expenditures, and Changes in Fund BalancesNonmajor Governmental Funds - Special Revenue Funds
(In Thousands)
TOTALOTHER BLENDED NONMAJORSPECIAL COMPONENT SPECIAL
GRANTS REVENUES UNITS REVENUE FUNDSRevenues:
Taxes:Property -$ 10,217$ -$ 10,217$General Sales and Use 34,734 34,734Occupancy 59,734 59,734Penalties and Interest on Delinquent Taxes 156 156
Intergovernmental 65,944 21,620 39 87,603Charges for Services 349 97,292 95 97,736Miscellaneous 11,599 7,030 2,014 20,643Investment Earnings 222 1,006 516 1,744Contributions 748 66,212 66,960
Total Revenues 78,862 231,789 68,876 379,527
Expenditures:Current:
General Government 554 7,308 7,862Public Safety 6,533 393 6,926Public Works 7,841 46,444 54,285Health Services 1,741 32 1,773Sanitation 5,292 5,292Welfare 20,067 530 20,597Culture and Recreation 1,181 44,475 1,266 46,922Convention and Tourism 21,240 21,240Urban Redevelopment and Housing 21,972 17,942 148 40,062Economic Development and Opportunity 21,804 23,810 58,229 103,843
Debt Service:Principal Retirement 1,895 3,625 5,520Interest 2,817 11,911 14,728Issuance Costs 171 171
Total Expenditures 91,697 162,174 75,350 329,221
Excess (Deficiency) of RevenueOver (Under) Expenditures (12,835) 69,615 (6,474) 50,306
Other Financing Sources (Uses):Long-Term Debt Issued 9,090 9,090Payments to Refunded Bond Escrow Agent (8,939) (8,939)Premium on Long-Term Debt 33 33Transfers In 1,176 14,845 1,172 17,193Transfers Out (12,688) (126,711) (139,399)
Total Other Financing Sources (Uses) (11,512) (111,866) 1,356 (122,022)
Net Change in Fund Balances (24,347) (42,251) (5,118) (71,716)
Fund Balances, October 1 (as restated) 29,314 195,826 20,743 245,883
Fund Balances, September 30 4,967$ 153,575$ 15,625$ 174,167$
CITY OF SAN ANTONIO, TEXAS
Year-Ended September 30, 2010
- 167 - Amounts are expressed in thousands

Combining Balance SheetNonmajor Governmental Funds - GrantsAs of September 30, 2010(In Thousands)
AMERICANRECOVERY COMMUNITY HUD 108 TOTAL
REINVESTMENT DEVELOPMENT CONFISCATED HOME LOAN NONMAJORACT PROGRAM PROPERTY PROGRAM PROGRAM GRANTS
Assets:Restricted Assets:
Cash and Cash Equivalents 20$ 39$ 402$ 108$ 89$ 658$Securities Lending Collateral 34 68 699 188 156 1,145Investments 229 1,524 4,701 1,263 22,505 30,222Receivables, Net 9,296 15,188 22,688 47,172Deposits 1 1Due from:
Other Funds 4 10 50 64
Total Assets 9,584$ 16,829$ 5,802$ 24,247$ 22,800$ 79,262$
Liabilities and Fund Balances:Liabilities:
Restricted Liabilities:Vouchers Payable 2,328$ 607$ 61$ 147$ -$ 3,143$Accounts Payable - Other 886 540 8 295 1,729Accrued Payroll 173 168 11 21 373Deferred Revenue 33 14,409 23,596 19,831 57,869Securities Lending Obligaton 34 68 699 188 156 1,145Due to:
Other Funds 6,130 1,037 7,167Other Governmental Agencies 1,105 12 1,752 2,869
Total Liabilities 9,584 17,934 791 24,247 21,739 74,295
Fund Balances:Reserved:
Reserved for Encumbrances 27 27Reserved for Deposits 1 1
Unreserved:Undesignated - Special Revenue (1) (1,105) 4,984 1,061 4,939
Total Fund Balances (1,105) 5,011 1,061 4,967
Total Liabilities and Fund Balances 9,584$ 16,829$ 5,802$ 24,247$ 22,800$ 79,262$
CITY OF SAN ANTONIO, TEXAS
- 168 - Amounts are expressed in thousands

Combining Statement of Revenues, Expenditures, and Changes in Fund BalancesNonmajor Governmental Funds - GrantsYear-Ended September 30, 2010(In Thousands)
AMERICANRECOVERY COMMUNITY HUD 108 TOTAL
REINVESTMENT DEVELOPMENT CONFISCATED HOME LOAN NONMAJORACT PROGRAM PROPERTY PROGRAM PROGRAM GRANTS
Revenues:Intergovernmental 48,858$ 8,008$ -$ 9,078$ -$ 65,944$Charges for Services 349 349Miscellaneous 83 552 3,769 878 6,317 11,599Investment Earnings 4 155 16 47 222Contributions 385 363 748
Total Revenues 49,330 9,427 3,785 9,956 6,364 78,862
Expenditures:Current:
General Government 269 285 554Public Safety 5,195 87 1,251 6,533Public Works 6,987 854 7,841Health Services 824 917 1,741Sanitation 5,292 5,292Welfare 19,876 191 20,067Culture and Recreation 1,181 1,181Urban Redevelopment and Housing 7,906 4,110 9,956 21,972Economic Development and Opportunity 21,804 21,804
Debt Service:Principal Retirement 1,895 1,895Interest 2,817 2,817
Total Expenditures 46,349 7,625 1,251 9,956 26,516 91,697
Excess (Deficiency) of RevenueOver (Under) Expenditures 2,981 1,802 2,534 (20,152) (12,835)
Other Financing Sources (Uses):Transfers In 1,027 4 145 1,176Transfers Out (4,008) (2,911) (954) (4,815) (12,688)
Total Other Financing Sources (Uses) (2,981) (2,907) (954) (4,670) (11,512)
Net Change in Fund Balances (1,105) 1,580 (24,822) (24,347)
Fund Balances, October 1 3,431 25,883 29,314
Fund Balances, September 30 -$ (1,105)$ 5,011$ -$ 1,061$ 4,967$
CITY OF SAN ANTONIO, TEXAS
- 169 - Amounts are expressed in thousands

CITY OF SAN ANTONIO, TEXAS Comprehensive Annual Financial Report Year-Ended September 30, 2010

Combining Balance SheetNonmajor Governmental Funds - Other Special Revenues
(In Thousands)
CAPITALADVANCED IMPROVEMENTS CAPITAL COMMUNITY PLANNING AND
TRANSPORTATION MANAGEMENT IMPROVEMENT AND VISITOR COMMUNITY DEVELOPMENTDISTRICT SERVICES RESERVE FACILITIES SERVICES SERVICES
Assets:Cash and Cash Equivalents -$ 81$ 375$ 1,890$ 2,763$ 373$Securities Lending Collateral 141 654 3,261 2,575 211Investments 948 4,395 21,922 17,305 2,034Receivables, Net 2 459 874 72Accrued Interest 1 2 Accrued Revenue 3,782 100 Due From:
Other Funds 329 17 170 24Other Governmental Agencies 12,579 274
Materials and Supplies, at Cost 273 53 Deposits 75 Prepaid Expenditures 110Restricted Assets:
Cash and Cash Equivalents 853 Securities Lending Collateral 1,488 Investments 10,000 Receivables, Net 1,858 Accrued Interest Accrued RevenueDue From:
Other Funds
Total Assets 14,199$ 1,501$ 5,424$ 44,294$ 24,191$ 2,714$
Liabilities and Fund Balances:Liabilities:
Vouchers Payable -$ 41$ -$ 3,269$ 802$ 14$Accounts Payable - Other 142 3,940 2,072 1,059Accrued Payroll 617 947 220 591Accrued Leave Payable 196 317 20 202Securities Lending Obligation 141 654 3,261 2,575 211Due To:
Other Funds 318 5,255 6,082 Other Governmental Agencies 12
Restricted Liabilities:Vouchers Payable 13Accounts Payable - Other Accrued Payroll 55 Accrued Leave Payable 14Securities Lending Obligation 1,488Due To:
Other Funds
Total Liabilities 1,570 1,455 654 16,989 11,771 2,089
Fund Balances:Reserved:
Reserved for Encumbrances 4,643 46 106 6,313 6,000 40Reserved for Materials and Supplies 273 53 Reserved for Deposits 75Reserved for Prepaid Expenditures 110
Unreserved: Designated - Special Revenue 4,183 Undesignated - Special Revenue 7,986 4,664 16,426 6,292 585
Total Fund Balances 12,629 46 4,770 27,305 12,420 625
Total Liabilities and Fund Balances 14,199$ 1,501$ 5,424$ 44,294$ 24,191$ 2,714$
As of September 30, 2010
CITY OF SAN ANTONIO, TEXAS
- 170 - Amounts are expressed in thousands

Combining Balance SheetNonmajor Governmental Funds - Other Special RevenuesAs of September 30, 2010(In Thousands)
JOB TRAINING, TOTALTAX NEIGHBORHOOD PARKS OTHER
INCREMENT REVITALIZATION, DEVELOPMENT NONMAJORREINVESTMENT HOTEL/MOTEL INTERNATIONAL AND ECONOMIC AND STORMWATER RIGHT OF SPECIAL
ZONE 2% REVENUE CENTER DEVELOPMENT EXPANSION OPERATIONS WAYS REVENUES
-$ -$ 149$ 122$ -$ 2,764$ 76$ 8,593$ 261 213 4,837 133 12,286 1,752 1,433 32,515 893 83,197 26 362 1,795 3 6 2,754 6,636
221 761 12,853 144 470 75
110
444 1,049 2,076 4,422774 1,828 3,620 7,710
5,203 12,291 24,333 51,82790 84 3,962 5,994
1 1943 943
18 5,255 5,273
6,529$ 21,451$ 2,188$ 1,768$ 33,991$ 43,238$ 1,464$ 202,952$
-$ -$ 14$ -$ -$ 628$ 7$ 4,775$ 1 204 46 7,464 6 595 43 3,019 187 13 935 261 213 4,837 133 12,286 8 11,663 12
428 441239 100 33914 692 16
774 1,828 3,620 7,710
648 648
2,105 1,928 282 213 3,620 6,459 242 49,377
333 650 17 233 26,136 22,353 35 66,905 144 470
75110
4,183
4,091 18,873 1,889 1,322 4,235 14,282 1,187 81,832
4,424 19,523 1,906 1,555 30,371 36,779 1,222 153,575
6,529$ 21,451$ 2,188$ 1,768$ 33,991$ 43,238$ 1,464$ 202,952$
CITY OF SAN ANTONIO, TEXAS
- 170 - Amounts are expressed in thousands

Combining Statement of Revenues, Expenditures, and Changes in Fund BalancesNonmajor Governmental Funds - Other Special Revenues
(In Thousands)
CAPITALADVANCED IMPROVEMENTS CAPITAL COMMUNITY PLANNING AND
TRANSPORTATION MANAGEMENT IMPROVEMENT AND VISITOR COMMUNITY DEVELOPMENTDISTRICT SERVICES RESERVE FACILITIES SERVICES SERVICES
Revenues:Taxes:
Property -$ -$ -$ -$ -$ -$General Sales and Use 11,077 Occupancy 46,460Penalties and Interest on Delinquent Taxes 121
Intergovernmental 20,782 838Charges for Services 10,901 16,489 7,372 20,336Miscellaneous 1,031 4,810 1,067Investment Earnings 46 1 23 159 308 6
Total Revenues 11,123 10,902 23 85,042 13,328 21,409
Expenditures:Current:
General Government 2 1,953 5,350Public Safety 393Public Works 2,051 15,022 45Health Services 32Welfare 530Culture and Recreation 40,323 3,577Convention and Tourism 19,458Urban Redevelopment and Housing 17,942Economic Development and Opportunity 433 912 10,653
Total Expenditures 2,051 15,455 2 62,646 20,580 17,942
Excess (Deficiency) of RevenueOver (Under) Expenditures 9,072 (4,553) 21 22,396 (7,252) 3,467
Other Financing Sources (Uses):Transfers In 500 4,664 425 2,645 1,584Transfers Out (7,920) (88) (21,236) (3,583) (4,333)
Total Other Financing Sources (Uses) (7,420) 4,576 (20,811) (938) (2,749)
Net Change in Fund Balances 1,652 23 21 1,585 (8,190) 718
Fund Balances, October 1 10,977 23 4,749 25,720 20,610 (93)
Fund Balances, September 30 12,629$ 46$ 4,770$ 27,305$ 12,420$ 625$
Year-Ended September 30, 2010
CITY OF SAN ANTONIO, TEXAS
- 171 - Amounts are expressed in thousands

Combining Statement of Revenues, Expenditures, and Changes in Fund BalancesNonmajor Governmental Funds - Other Special RevenuesYear-Ended September 30, 2010(In Thousands)
JOB TRAINING, TOTALTAX NEIGHBORHOOD PARKS OTHER
INCREMENT REVITALIZATION, DEVELOPMENT NONMAJORREINVESTMENT HOTEL/MOTEL INTERNATIONAL AND ECONOMIC AND STORMWATER RIGHT OF SPECIAL
ZONE 2% REVENUE CENTER DEVELOPMENT EXPANSION OPERATIONS WAYS REVENUES
10,217$ -$ -$ -$ -$ -$ -$ 10,217$ 23,657 34,734 13,274 59,734 35 156 21,620 1,262 39,128 1,804 97,292
16 1 7 98 7,03046 90 9 6 144 165 3 1,006
10,279 13,400 1,278 6 23,801 39,391 1,807 231,789
3 7,308 393 27,836 1,490 46,444 32 530 575 44,475 612 1,170 21,240 17,942
11,812 23,810
11,815 612 1,170 575 27,836 1,490 162,174
(1,536) 12,788 108 6 23,226 11,555 317 69,615
12 4,015 1,000 14,845(989) (15,360) (191) (50) (27,543) (12,063) (33,355) (126,711)
(977) (11,345) (191) (50) (27,543) (11,063) (33,355) (111,866)
(2,513) 1,443 (83) (44) (4,317) 492 (33,038) (42,251)
6,937 18,080 1,989 1,599 34,688 36,287 34,260 195,826
4,424$ 19,523$ 1,906$ 1,555$ 30,371$ 36,779$ 1,222$ 153,575$
CITY OF SAN ANTONIO, TEXAS
- 171 - Amounts are expressed in thousands

Com
bini
ng B
alan
ce S
heet
Non
maj
or G
over
nmen
tal F
unds
- B
lend
ed C
ompo
nent
Uni
tsA
s of
Sep
tem
ber
30,
2010
(In
Thou
sand
s)
SAN
AN
TON
IOSA
N A
NTO
NIO
SAN
AN
TON
IOTO
TAL
CON
VEN
TIO
NH
OU
SIN
GSA
N A
NTO
NIO
STA
RBRI
GH
TTE
XAS
SAN
AN
TON
IOH
OU
SIN
GEM
POW
ERM
ENT
NO
NM
AJO
RCE
NTE
R H
OTE
LTR
UST
PUBL
ICIN
DU
STRI
AL
MU
NIC
IPA
LEC
ON
OM
ICTR
UST
PU
BLIC
ZON
EBL
END
EDFI
NA
NCE
FIN
AN
CELI
BRA
RYD
EVEL
OPM
ENT
FACI
LITI
ESD
EVEL
OPM
ENT
FACI
LITI
ESD
EVEL
OPM
ENT
COM
PON
ENT
CORP
.CO
RP.
FOU
ND
ATI
ON
CORP
.CO
RP.
CORP
.CO
RP.
CORP
.U
NIT
SA
sset
s:Re
stri
cted
Ass
ets:
Cash
and
Cas
h E q
uiva
lent
s13
,155
$
333
$46
7$
524
$60
4$
700
$56
$10
$15
,849
$In
vest
men
ts2,
189
2,18
9Pr
epai
d Ex
pend
itur
es2
14
16
Tota
l Ass
ets
13,1
55$
33
3$
2,65
6$
526
$61
8$
700
$56
$10
$18
,054
$
Liab
iliti
es a
nd F
und
Bala
nces
:Li
abili
ties
:Re
stri
cted
Lia
bilit
ies:
Amou
nts
Hel
d in
Tru
st2,
429
$
-
$-
$-
$-
$
-
$-
$-
$2,
429
$
Tota
l Lia
bilit
ies
2,42
9
2,42
9
Fund
Bal
ance
s:Re
serv
ed:
Rese
rved
for
Pre
paid
Exp
endi
ture
s2
14
16U
nres
erve
d:D
esi g
nate
d -
Perm
anen
t1,
920
1,92
0U
ndes
igna
ted
- Sp
ecia
l Rev
enue
10,7
26
33
373
652
460
4
700
5610
13,6
89U
ndes
igna
ted
- Ca
pita
l Pro
ject
s
Tota
l Fun
d Ba
lanc
es10
,726
333
2,65
652
661
8
700
5610
15,6
25
Tota
l Lia
bilit
ies
and
Fund
Bal
ance
s13
,155
$
333
$2,
656
$52
6$
618
$
70
0$
56$
10$
18,0
54$
CITY
OF
SAN
AN
TON
IO,
TEXA
S
- 172 - Amounts are expressed in thousands

Com
bini
ng S
tate
men
t of
Rev
enue
s, E
xpen
ditu
res,
and
Cha
nges
in F
und
Bala
nces
Non
maj
or G
over
nmen
tal F
unds
- B
lend
ed C
ompo
nent
Uni
tsYe
ar-E
nded
Sep
tem
ber
30,
2010
(In
Thou
sand
s)
SAN
AN
TON
IOSA
N A
NTO
NIO
SAN
AN
TON
IOTO
TAL
CON
VEN
TIO
NH
OU
SIN
GSA
N A
NTO
NIO
STA
RBRI
GH
TTE
XAS
SAN
AN
TON
IOH
OU
SIN
GEM
POW
ERM
ENT
NO
NM
AJO
RCE
NTE
R H
OTE
LTR
UST
PUBL
ICIN
DU
STRI
AL
MU
NIC
IPA
LEC
ON
OM
ICTR
UST
PU
BLIC
ZON
EBL
END
EDFI
NA
NCE
FIN
AN
CELI
BRA
RYD
EVEL
OPM
ENT
FACI
LITI
ESD
EVEL
OPM
ENT
FACI
LITI
ESD
EVEL
OPM
ENT
COM
PON
ENT
CORP
.CO
RP.
FOU
ND
ATI
ON
CORP
.CO
RP.
CORP
.CO
RP.
CORP
.U
NIT
SRe
venu
es:
Inte
rgov
ernm
enta
l-
$-
$-
$-
$
-
$-
$39
$39
$Ch
arge
s fo
r Se
rvic
es20
7595
Mis
cella
neou
s35
31,
661
2,01
4In
vest
men
t Ea
rnin
gs1
493
22
516
Cont
ribu
tion
s62
,393
1,30
92,
500
1066
,212
Tota
l Rev
enue
s62
,394
35
31,
822
1,66
122
2,
500
7549
68,8
76
Expe
ndit
ures
:Cu
rren
t:Cu
ltur
e an
d Re
crea
tion
1,26
61,
266
Urb
an R
edev
elop
men
t an
d H
ousi
ng90
1939
148
Econ
omic
Dev
elop
men
t an
d O
ppor
tuni
ty56
,425
22
1,80
058
,229
Deb
t Se
rvic
e:Pr
inci
pal R
etir
emen
t2,
150
9056
582
0
3,62
5In
tere
st10
,442
1,09
637
3
11,9
11Is
suan
ce C
osts
171
17
1
Tota
l Exp
endi
ture
s69
,017
18
01,
266
1,66
31,
366
1,80
019
3975
,350
Exce
ss(D
efic
ienc
y) o
f Re
venu
eO
ver
(Und
er)
Expe
ndit
ures
(6,6
23)
173
556
(2)
(1,3
44)
700
5610
(6,4
74)
Oth
er F
inan
cing
Sou
rces
(U
ses)
:Lo
ng-T
erm
Deb
t Is
sued
9,09
09,
090
Paym
ents
to
Refu
nded
Bon
d Es
crow
Age
nt(8
,939
)(8
,939
)Pr
emiu
m o
n Lo
ng-T
erm
Deb
t33
33
Tran
sfer
s In
1,17
21,
172
Tota
l Oth
er F
inan
cing
Sou
rces
(U
ses)
1,35
61,
356
Net
Cha
n ge
in F
und
Bala
nces
(6,6
23)
173
556
(2)
12
700
5610
(5,1
18)
Fund
Bal
ance
s, O
ctob
er 1
(as
res
tate
d)17
,349
160
2,10
052
860
6
20,7
43
Fund
Bal
ance
s, S
epte
mbe
r 30
10,7
26$
333
$2,
656
$52
6$
618
$
70
0$
56$
10$
15,6
25$
CITY
OF
SAN
AN
TON
IO,
TEXA
S
- 173 - Amounts are expressed in thousands

CITY OF SAN ANTONIO, TEXAS Comprehensive Annual Financial Report Year-Ended September 30, 2010

City of San Antonio, Texas
Capital Projects Funds
GENERAL OBLIGATION BONDS
GENERAL OBLIGATION BONDS - to account for financial resources to be used for the acquisition or construction of major capital facilities, such as drainage and library improvements, excluding those financed by proprietary-type funds and trust funds. Financing is derived by the sale of General Obligation Bonds.
PRE-1999 GENERAL OBLIGATION BONDS - consist of six bond elections from 1980 to 1994 held on January 26, 1980, April 2, 1983, April 6, 1985, November 3, 1987, May 6, 1989, and May 7, 1994, respectively, for development and improvement projects. These six bond elections covered projects within seven areas: libraries, fire protection, crime prevention, parks, San Antonio River flood control, drainage and flood control, and street, bridge and related improvements.
1999 GENERAL OBLIGATION BONDS – a bond election held on May 1, 1999 approved $140.2 million in physical infrastructure development and improvement projects. These projects were within six areas: streets and pedestrian, drainage improvements, flood control with park improvements, parks and recreation, library system and public safety.
2003 GENERAL OBLIGATION BONDS – a bond election held on November 4, 2003 approved $115.0 million in physical infrastructure development and improvement projects. These projects were within five areas: streets and pedestrian, drainage improvements, library improvements, parks and recreation and public safety.
GENERAL OBLIGATION PROJECT FUND – to account for the acquisition or construction of major capital facilities such as streets, drainage, library and park improvements, where funding is primarily derived from the sale of General Obligation Bonds.
CERTIFICATES OF OBLIGATION
CERTIFICATES OF OBLIGATION - to account for permanent public improvements and/or construction of municipal facilities, streets, drainage, and emergency fire protection projects. Financing is derived from the sale of Certificates of Obligation.
PRE-2006 CERTIFICATES OF OBLIGATION – consists of Certificates of Obligation sold between the years of 1985 to 2005 for construction of municipal facilities, library, streets, drainage, parks, police, and emergency fire protection projects.

City of San Antonio, Texas
Capital Projects Funds (Continued)
CERTIFICATES OF OBLIGATION (CONTINUED)
2006 CERTIFICATES OF OBLIGATION – consists of Certificates of Obligation sold in 2006 for construction of municipal facilities, library, streets, drainage, parks, police, and emergency fire protection projects.
2007 CERTIFICATES OF OBLIGATION - consists of Certificates of Obligation sold in 2007 for construction of municipal facilities, library, streets, drainage, parks, police, and emergency fire protection projects.
2008 CERTIFICATES OF OBLIGATION – consists of Certificates of Obligation sold in 2008 for construction of municipal facilities, library, streets, drainage, parks, police and emergency fire protection projects.
2010 CERTIFICATES OF OBLIGATION – consists of Certificates of Obligation sold in 2010 for construction of municipal facilities, library, streets, drainage, parks, police and emergency fire protection projects.
CERTIFICATES OF OBLIGATION PROJECT FUND – to account for the acquisition or construction of major capital facilities such as streets, drainage, library and park improvements, where funding is primarily derived from the sale of Certificates of Obligation.
OTHER CAPITAL PROJECTS
CONVENTION CENTER EXPANSION - to account for financial resources to be used in the Convention Center Expansion Project. Financing is derived from a 2.0% Hotel/Motel tax, and proceeds from the sale of debt.
EDWARDS AQUIFER PROTECTION VENUE – to account for the acquisition and development of land in the Edwards Aquifer Recharge Zones. Financing is derived from a 1/8 cent sales tax approved by voters on May 7, 2007 and a portion from the sale of sales tax revenue commercial paper notes.
IMPROVEMENT PROJECTS - to account for special capital improvements designated by City Council. Financing is derived from contributions from other funds.
RESIDUAL CAPITAL PROJECTS – to account for residual investment earnings generated from Pre-1999 General Obligation Bonds and Pre-2006 Certificates of Obligation project fundings. These residual earnings will primarily be used for the debt service of the 2008 Tax Notes, and to fund specific municipal facilities and street projects.

City of San Antonio, Texas
Capital Projects Funds (Continued)
OTHER CAPITAL PROJECTS (CONTINUED)
MUNICIPAL DRAINAGE UTILITY SYSTEM – to account for financial resources to be used to finance the costs of drainage improvements, including the acquisition, construction and repair of structures, equipment and facilities for the City’s Municipal Drainage Utility System. Financing is derived from the prior sale of City of San Antonio, Texas Municipal Drainage Utility System Revenue Bonds.
PARKS DEVELOPMENT AND EXPANSION – to account for the acquisition and development of new parkland in the Edwards Aquifer Recharge Zones, as well as linear parks along Leon Creek and Salado Creek. Financing is derived from a 1/8 cent sales tax approved by voters on May 6, 2000 and a portion from the prior sale of sales tax revenue commercial paper notes.
TAX NOTES – to account for capital projects where funding is derived from the sale of short-term notes.

Combining Balance SheetNonmajor Governmental Funds - Capital ProjectsAs of September 30, 2010(In Thousands)
GENERAL CERTIFICATES OTHER TOTALOBLIGATION OF CAPITAL CAPITAL
BONDS OBLIGATION PROJECTS PROJECTSAssets:
Restricted Assets:Cash and Cash Equivalents 1,274$ 11,682$ 6,042$ 18,998$Securities Lending Collateral 2,099 20,371 9,463 31,933Investments 14,112 136,933 71,081 222,126Receivables, Net 288 755 1,043Accrued Interest 2 14 7 23Due from:
Other Funds 107 5,389 208 5,704Other Governmental Agencies 3,822 3,244 3,106 10,172
Total Assets 21,416$ 177,921$ 90,662$ 289,999$
Liabilities and Fund Balances:Liabilities:
Restricted Liabilities: Vouchers Payable 8,657$ 5,150$ 12,474$ 26,281$Accounts Payable - Other 7,825 3,660 4,511 15,996Accrued Payroll 4 44 48Deferred Revenue 646 1,646 259 2,551Securities Lending Obligation 2,099 20,371 9,463 31,933Due to:
Other Funds 11,739 4,114 456 16,309
Total Liabilities 30,970 34,941 27,207 93,118
Fund Balances:Reserved:
Reserved for Encumbrances 152,300 50,618 41,998 244,916Unreserved:
Undesignated - Capital Projects (161,854) 92,362 21,457 (48,035)
Total Fund Balances (9,554) 142,980 63,455 196,881
Total Liabilities and Fund Balances 21,416$ 177,921$ 90,662$ 289,999$
CITY OF SAN ANTONIO, TEXAS
- 174 - Amounts are expressed in thousands

Combining Statement of Revenues, Expenditures, and Changes in Fund BalancesNonmajor Governmental Funds - Capital Projects
(In Thousands)
GENERAL CERTIFICATES OTHER TOTALOBLIGATION OF CAPITAL CAPITAL
BONDS OBLIGATION PROJECTS PROJECTSRevenues:
Intergovernmental 7,894$ 7,617$ 4,337$ 19,848$Miscellaneous 339 27 2 368Investment Earnings 76 702 505 1,283
Total Revenues 8,309 8,346 4,844 21,499
Expenditures:Current:
General Government 5 71 38 114Capital Projects 89,849 79,482 118,391 287,722Debt Service:
Issuance Costs 301 92 393
Total Expenditures 89,854 79,854 118,521 288,229
(Deficiency) of Revenue(Under) Expenditures (81,545) (71,508) (113,677) (266,730)
Other Financing Sources (Uses): Issuance of Long-Term Debt 38,375 9,655 48,030Premium on Long-Term Debt 5,223 438 5,661Transfers In 71,325 70,386 99,876 241,587Transfers Out (3,267) (57,348) (46,751) (107,366)
Total Other Financing Sources (Uses) 68,058 56,636 63,218 187,912
Net Change in Fund Balances (13,487) (14,872) (50,459) (78,818)
Fund Balances, October 1 3,933 157,852 113,914 275,699
Fund Balances, September 30 (9,554)$ 142,980$ 63,455$ 196,881$
CITY OF SAN ANTONIO, TEXAS
Year-Ended September 30, 2010
- 175 - Amounts are expressed in thousands

Combining Balance SheetNonmajor Governmental Funds - General Obligation BondsAs of September 30, 2010(In Thousands)
PRE-1999 1999 2003 GENERAL TOTALGENERAL GENERAL GENERAL OBLIGATION GENERAL
OBLIGATION OBLIGATION OBLIGATION PROJECT OBLIGATIONBONDS BONDS BONDS FUND BONDS
Assets:Restricted Assets:
Cash and Cash Equivalents 19$ 234$ 938$ 83$ 1,274$Securities Lending Collateral 34 408 1,636 21 2,099Investments 226 2,745 10,997 144 14,112Accrued Interest 2 2Due from:
Other Funds 107 107Other Governmental Agencies 9 3,813 3,822
Total Assets 288$ 3,387$ 13,573$ 4,168$ 21,416$
Liabilities and Fund Balances:Liabilities:
Restricted Liabilities:Vouchers Payable 158$ -$ 14$ 8,485$ 8,657$Accounts Payable - Other 7,825 7,825Accrued Payroll 4 4Deferred Revenue 646 646Securities Lending Obligation 34 408 1,636 21 2,099Due to:
Other Funds 1 1 11,737 11,739
Total Liabilities 192 409 1,651 28,718 30,970
Fund Balances:Reserved:
Reserved for Encumbrances 152,300 152,300Unreserved:
Undesignated - Capital Projects 96 2,978 11,922 (176,850) (161,854)
Total Fund Balances 96 2,978 11,922 (24,550) (9,554)
Total Liabilities and Fund Balances 288$ 3,387$ 13,573$ 4,168$ 21,416$
CITY OF SAN ANTONIO, TEXAS
- 176 - Amounts are expressed in thousands

Combining Statement of Revenues, Expenditures, and Changes in Fund BalancesNonmajor Governmental Funds - General Obligation BondsYear-Ended September 30, 2010(In Thousands)
PRE-1999 1999 2003 GENERAL TOTALGENERAL GENERAL GENERAL OBLIGATION GENERAL
OBLIGATION OBLIGATION OBLIGATION PROJECT OBLIGATIONBONDS BONDS BONDS FUND BONDS
Revenues:Intergovernmental -$ 526$ -$ 7,368$ 7,894$Miscellaneous 48 291 339Investment Earnings 1 17 58 76
Total Revenues 49 543 58 7,659 8,309
Expenditures:Current:
General Government 1 4 5Capital Projects 18 632 54 89,145 89,849
Total Expenditures 18 633 58 89,145 89,854
Excess (Deficiency) of RevenueOver (Under) Expenditures 31 (90) (81,486) (81,545)
Other Financing Sources (Uses):Transfers In 348 70,977 71,325Transfers Out (2,278) (989) (3,267)
Total Other Financing Sources (Uses) (1,930) (989) 70,977 68,058
Net Change in Fund Balances 31 (2,020) (989) (10,509) (13,487)
Fund Balances, October 1 65 4,998 12,911 (14,041) 3,933
Fund Balances, September 30 96$ 2,978$ 11,922$ (24,550)$ (9,554)$
CITY OF SAN ANTONIO, TEXAS
- 177 - Amounts are expressed in thousands

Com
bini
ng B
alan
ce S
heet
Non
maj
or G
over
nmen
tal F
unds
- C
erti
fica
tes
of O
blig
atio
nA
s of
Sep
tem
ber
30,
2010
(In
Thou
sand
s)
PRE-
2006
2006
2007
2008
2010
CERT
IFIC
ATE
STO
TAL
CERT
IFIC
ATE
SCE
RTIF
ICA
TES
CERT
IFIC
ATE
SCE
RTIF
ICA
TES
CERT
IFIC
ATE
SO
FCE
RTIF
ICA
TES
OF
OF
OF
OF
OF
OBL
IGA
TIO
NO
FO
BLIG
ATI
ON
OBL
IGA
TIO
NO
BLIG
ATI
ON
OBL
IGA
TIO
NO
BLIG
ATI
ON
PRO
JECT
FU
ND
OBL
IGA
TIO
NA
sset
s:Re
stri
cted
Ass
ets:
Cash
and
Cas
h Eq
uiva
lent
s36
0$
1,73
0$
2,85
8$
3,65
1$
3,07
9$
4$
11,6
82$
Secu
riti
es L
endi
ng C
olla
tera
l62
83,
017
4,98
46,
367
5,36
87
20,3
71In
vest
men
ts4,
222
20,2
8133
,499
42,7
98
36
,083
5013
6,93
3Re
ceiv
able
s, N
et28
828
8Ac
crue
d In
tere
st1
23
44
14D
ue f
rom
:O
ther
Fun
ds2,
816
2,57
35,
389
Oth
er G
over
nmen
tal A
genc
ies
3,24
43,
244
Tota
l Ass
ets
5,21
1$
25,0
30$
44,1
60$
52,8
20$
44,5
34$
6,16
6$
177,
921
$
Liab
iliti
es a
nd F
und
Bala
nces
:Li
abili
ties
:Re
stri
cted
Lia
bilit
ies:
Vouc
hers
Pay
able
73$
-$
-$
-$
-$
5,07
7$
5,15
0$
Acco
unts
Pay
able
- O
ther
33,
657
3,66
0D
efer
red
Reve
nue
1,64
61,
646
Secu
riti
es L
endi
ng O
blig
atio
n62
83,
017
4,98
46,
367
5,36
87
20,3
71D
ue t
o:O
ther
Fun
ds3
51,
250
132
2,84
14,
114
Tota
l Lia
bilit
ies
704
3,02
26,
237
6,38
05,
370
13,2
2834
,941
Fund
Bal
ance
s:Re
serv
ed:
Rese
rved
for
Enc
umbr
ance
s46
250
,156
50,6
18U
nres
erve
d:U
ndes
igna
ted
- Ca
pita
l Pro
ject
s4,
507
21,5
4637
,923
46,4
40
39
,164
(57,
218)
92,3
62
Tota
l Fun
d Ba
lanc
es4,
507
22,0
0837
,923
46,4
40
39
,164
(7,0
62)
142,
980
Tota
l Lia
bilit
ies
and
Fund
Bal
ance
s5,
211
$25
,030
$44
,160
$52
,820
$
44
,534
$6,
166
$17
7,92
1$
CITY
OF
SAN
AN
TON
IO,
TEXA
S
- 178 - Amounts are expressed in thousands

Com
bini
ng S
tate
men
t of
Rev
enue
s, E
xpen
ditu
res,
and
Cha
nges
in F
und
Bala
nces
Non
maj
or G
over
nmen
tal F
unds
- C
erti
fica
tes
of O
blig
atio
nYe
ar-E
nded
Sep
tem
ber
30,
2010
(In
Thou
sand
s)
PRE-
2006
2006
2007
2008
2010
CERT
IFIC
ATE
STO
TAL
CERT
IFIC
ATE
SCE
RTIF
ICA
TES
CERT
IFIC
ATE
SCE
RTIF
ICA
TES
CERT
IFIC
ATE
SO
FCE
RTIF
ICA
TES
OF
OF
OF
OF
OF
OBL
IGA
TIO
NO
FO
BLIG
ATI
ON
OBL
IGA
TIO
NO
BLIG
ATI
ON
OBL
IGA
TIO
NO
BLIG
ATI
ON
PRO
JECT
FU
ND
OBL
IGA
TIO
NRe
venu
es:
Inte
rgov
ernm
enta
l-
$-
$-
$-
$-
$7,
617
$7,
617
$M
isce
llane
ous
189
27In
vest
men
t Ea
rnin
gs34
127
211
288
4270
2
Tota
l Rev
enue
s52
127
211
288
427,
626
8,34
6
Expe
ndit
ures
:Cu
rren
t:G
ener
al G
over
nmen
t2
1221
297
71Ca
pita
l Pro
ject
s27
79,4
5579
,482
Deb
t Se
rvic
e:Is
suan
ce C
osts
301
301
Tota
l Exp
endi
ture
s29
1221
2930
879
,455
79,8
54
Exce
ss(D
efic
ienc
y) o
f Re
venu
eO
ver
(Und
er)
Expe
ndit
ures
2311
519
025
9(2
66)
(71,
829)
(71,
508)
Oth
er F
inan
cing
Sou
rces
(U
ses)
:Is
suan
ce o
f Lo
n g-T
erm
Deb
t38
,375
38,3
75Pr
emiu
m o
n Lo
ng-T
erm
Deb
t5,
223
5,22
3Tr
ansf
ers
In14
237
70,1
3570
,386
Tran
sfer
s O
ut(5
,432
)(9
,483
)(1
2,44
5)(2
5,32
0)
(4,1
68)
(500
)(5
7,34
8)
Tota
l Oth
er F
inan
cing
Sou
rces
(U
ses)
(5,4
18)
(9,4
83)
(12,
208)
(25,
320)
39
,430
69,6
3556
,636
Net
Cha
nge
in F
und
Bala
nces
(5,3
95)
(9,3
68)
(12,
018)
(25,
061)
39
,164
(2,1
94)
(14,
872)
Fund
Bal
ance
s, O
ctob
er 1
9,90
231
,376
49,9
4171
,501
(4
,868
)15
7,85
2
Fund
Bal
ance
s, S
epte
mbe
r 30
4,50
7$
22,0
08$
37,9
23$
46,4
40$
39
,164
$(7
,062
)$
142,
980
$
CITY
OF
SAN
AN
TON
IO,
TEXA
S
- 179 - Amounts are expressed in thousands

Com
bini
ng B
alan
ce S
heet
Non
maj
or G
over
nmen
tal F
unds
- O
ther
Cap
ital
Pro
ject
sA
s of
Sep
tem
ber
30,
2010
(In
Thou
sand
s)
EDW
ARD
SM
UN
ICIP
AL
PARK
STO
TAL
CON
VEN
TIO
NA
QU
IFER
RESI
DU
AL
DRA
INA
GE
DEV
ELO
PMEN
TO
THER
CEN
TER
PRO
TECT
ION
IMPR
OVE
MEN
TCA
PITA
LU
TILI
TYA
ND
TAX
CAPI
TAL
EXPA
NSI
ON
VEN
UE
PRO
JECT
SPR
OJE
CTS
SYST
EMEX
PAN
SIO
NN
OTE
SPR
OJE
CTS
Ass
ets:
Rest
rict
ed A
sset
s:Ca
sh a
nd C
ash
Equi
vale
nts
1,15
2$
1
$29
6$
23$
1,96
9$
16$
2,58
5$
6,04
2$
Secu
riti
es L
endi
ng C
olla
tera
l2,
009
251
640
3,43
528
3,43
39,
463
Inve
stm
ent s
13,5
03
153,
470
270
23,0
8718
930
,547
71,0
81Re
ceiv
able
s, N
e t75
5
75
5Ac
crue
d In
tere
st2
23
7D
ue f
rom
:O
ther
Fun
ds1
207
208
Oth
er G
over
nmen
tal A
genc
ies
1,50
4
1,
602
3,10
6
Tota
l Ass
ets
16,6
66$
18$
6,54
2$
333
$30
,302
$23
3$
36,5
68$
90,6
62$
Liab
iliti
es a
nd F
und
Bala
nces
:Li
abili
ties
:Re
stri
cted
Lia
bilit
ies:
Vouc
hers
Pay
able
3,05
3$
-
$7,
375
$3
$2,
042
$-
$1
$12
,474
$Ac
coun
ts P
ayab
le -
Oth
er2
4,50
6
3
4,51
1Ac
crue
d Pa
yrol
l44
44D
efer
red
Reve
nue
259
259
Secu
riti
es L
endi
ng O
blig
atio
n2,
009
251
640
3,43
528
3,43
39,
463
Due
to:
Oth
er F
unds
1221
2
22
39
456
Tota
l Lia
bilit
ies
5,07
6
2
12,9
1243
5,70
028
3,44
627
,20 7
Fund
Bal
ance
s:Re
serv
ed:
Rese
rved
for
Enc
umbr
ance
s3,
257
32,7
90
5,
951
41,9
98U
nres
erve
d:
U
ndes
igna
ted
- Ca
pita
l Pro
ject
s8,
333
16(3
9,16
0)29
018
,651
205
33,1
2221
,45 7
Tota
l Fun
d Ba
lanc
es11
,590
16
(6,3
70)
290
24,6
0220
533
,122
63,4
55
Tota
l Lia
bilit
ies
and
Fund
Bal
ance
s16
,666
$
18
$6,
542
$33
3$
30,3
02$
233
$36
,568
$90
,662
$
CITY
OF
SAN
AN
TON
IO,
TEXA
S
- 180 - Amounts are expressed in thousands

Com
bini
ng S
tate
men
t of
Rev
enue
s, E
xpen
ditu
res,
and
Cha
nges
in F
und
Bala
nces
Non
maj
or G
over
nmen
tal F
unds
- O
ther
Cap
ital
Pro
ject
sYe
ar-E
nded
Sep
tem
ber
30,
2010
(In
Thou
sand
s)
EDW
ARD
SM
UN
ICIP
AL
PARK
STO
TAL
CON
VEN
TIO
NA
QU
IFER
RESI
DU
AL
DRA
INA
GE
DEV
ELO
PMEN
TO
THER
CEN
TER
PRO
TECT
ION
IMPR
OVE
MEN
TCA
PITA
LU
TILI
TYA
ND
TAX
CAPI
TAL
EXPA
NSI
ON
VEN
UE
PRO
JECT
SPR
OJE
CTS
SYST
EMEX
PAN
SIO
NN
OTE
SPR
OJE
CTS
Reve
nues
:In
terg
over
nmen
tal
-$
-$
2,13
4$
-$
2,20
3$
-$
-$
4,33
7$
Mis
cella
neou
s2
2In
vest
men
t Ea
rnin
g s12
9
55
121
200
505
Tota
l Rev
enue
s12
9
2,
134
552,
324
220
04,
844
Expe
ndit
ures
:Cu
rren
t:G
ener
al G
over
nmen
t6
725
38Ca
pita
l Pro
ject
s35
,646
375
,658
57,
079
118,
391
Deb
t Se
rvic
e:Is
suan
ce C
osts
9292
Tota
l Exp
endi
ture
s35
,652
375
,658
57,
086
117
118,
521
Exce
ss(D
efic
ienc
y) o
f Re
venu
eO
ver
(Und
er)
Expe
ndit
ures
(35,
523)
(3)
(73,
524)
50(4
,762
)2
83(1
13,6
77)
Oth
er F
inan
cing
Sou
rces
(U
ses)
:Is
suan
ce o
f Lo
ng-T
erm
Deb
t9,
655
9,65
5Pr
emiu
m o
n Lo
ng-T
erm
Deb
t43
843
8Tr
ansf
ers
In11
,938
71,0
6 44,
535
12,3
3999
,876
Tran
sfer
s O
u t(2
2,17
1)(4
71)
(502
)(2
3,60
7)(4
6,75
1)
Tota
l Oth
er F
inan
cing
Sou
rces
(U
ses)
11,9
38
71
,064
(22,
171)
4,06
4(5
02)
(1,1
75)
63,2
18
Net
Cha
nge
in F
und
Bala
nces
(23,
585)
(3)
(2,4
60)
(22,
121)
(698
)(5
00)
(1,0
92)
(50,
459)
Fund
Bal
ance
s, O
ctob
er 1
35,1
75
19
(3,9
10)
22,4
1125
,300
705
34,2
1 411
3,91
4
Fund
Bal
ance
s, S
epte
mbe
r 30
11,5
90$
16
$(6
,370
)$
290
$24
,602
$20
5$
33,1
22$
63,4
55$
CITY
OF
SAN
AN
TON
IO,
TEXA
S
- 181 - Amounts are expressed in thousands
City of San Antonio, Texas
Permanent Funds
CARVER CULTURAL CENTER ENDOWMENT- to account for matching funds held by the City of San Antonio and grant funds previously awarded by the National Endowment for the Arts.
SAN ANTONIO HOUSING TRUST – to account for funds utilized in programs administered by the San Antonio Housing Trust Foundation. Financing is provided from investment earnings that were designated from the sale of Roger’s Cable System.
SAN JOSE BURIAL PARK - to account for operation of the City's burial park. Financing for operations is provided by user fees and investment earnings. The principal portion is required to be retained in the Fund’s Corpus.
WILLIAM C. MORRIS ENDOWMENT – to account for funds donated to the City of San Antonio by the estate of William C. Morris for the purpose of developing and sustaining the San Antonio Public Library’s programs for children.
BOZA BECICA ENDOWMENT – to account for funds donated to the City of San Antonio by the estate of Boza Becica for the purpose of developing and sustaining the San Antonio Public Library’s material purchases.

Combining Balance SheetNonmajor Governmental Funds - Permanent
(In Thousands)
CARVERCULTURAL SAN ANTONIO SAN JOSE WILLIAM C. BOZA TOTAL
CENTER HOUSING BURIAL MORRIS BECICA PERMANENTENDOWMENT TRUST PARK ENDOWMENT ENDOWMENT FUNDS
Assets:Restricted Assets:
Cash and Cash Equivalents 31$ 86$ 188$ 25$ 40$ 370$Securities Lending Collateral 54 150 328 43 71 646Investments 366 11,352 2,201 290 476 14,685Accrued Interest 42 42
Total Assets 451$ 11,630$ 2,717$ 358$ 587$ 15,743$
Liabilities and Fund Balances:Liabilities:
Restricted Liabilities:Accounts Payable - Other -$ 43$ 3$ 1$ -$ 47$Accrued Payroll 15 15Accrued Leave Payable 5 5Securities Lending Obligation 54 150 328 43 71 646
Total Liabilities 54 193 351 44 71 713
Fund Balances:Unreserved:
Designated - Permanent 2,366 516 2,882Undesignated - Permanent 397 11,437 314 12,148
Total Fund Balances 397 11,437 2,366 314 516 15,030
Total Liabilities and Fund Balances 451$ 11,630$ 2,717$ 358$ 587$ 15,743$
As of September 30, 2010
CITY OF SAN ANTONIO, TEXAS
- 182 - Amounts are expressed in thousands

Combining Statement of Revenues, Expenditures, and Changes in Fund BalancesNonmajor Governmental Funds - Permanent
(In Thousands)
CARVERCULTURAL SAN ANTONIO SAN JOSE WILLIAM C. BOZA TOTAL
CENTER HOUSING BURIAL MORRIS BECICA PERMANENTENDOWMENT TRUST PARK ENDOWMENT ENDOWMENT FUNDS
Revenues:Charges for Services -$ -$ 515$ -$ -$ 515$Miscellaneous 147 1 148Investment Earnings 2 106 10 1 2 121
Total Revenues 2 253 526 1 2 784
Expenditures:Current:
Culture and Recreation 1 521 9 531Urban Redevelopment and Housing 249 249
Total Expenditures 1 249 521 9 780
Excess (Deficiency) of RevenuesOver (Under) Expenditures 1 4 5 (8) 2 4
Other Financing Sources (Uses):Transfers In 100 100Transfers Out (4) (4)
Total Other Financing Source (Uses): 96 96
Net Change in Fund Balances 1 4 101 (8) 2 100
Fund Balances, October 1 396 11,433 2,265 322 514 14,930
Fund Balances, September 30 397$ 11,437$ 2,366$ 314$ 516$ 15,030$
Year-Ended September 30, 2010
CITY OF SAN ANTONIO, TEXAS
- 183 - Amounts are expressed in thousands

City of San Antonio, Texas
Supplementary Budget and Actual Schedules for Legally Adopted Funds GENERAL FUND
DEBT SERVICE FUND
SPECIAL REVENUE FUNDS: Advanced Transportation District Capital Improvement Reserve Capital Improvements Management Services Community and Visitor Facilities Confiscated Property Planning and Development Services Hotel/Motel Tax 2% Revenue International Center Job Training, Neighborhood Revitalization, and Economic Development Parks Development and Expansion – 2005 and 2000 Venue Projects Right of Ways Stormwater Operations Tax Increment Financing Community Service Funds: Child Safety Economic Development Incentive Golf Course Operating and Maintenance Juvenile Case Manager
Municipal Court Security Municipal Court Technology Visitor Information Center and City Store South Texas Business Starbright Industrial Development Corporation Tree Canopy Investment Tree Preservation Mitigation
PERMANENT FUND: San Jose Burial Park

Schedules of Revenues, Expenditures, Encumbrances, and Changes in Fund BalancesBudget and Actual (Budgetary Basis)General Fund
VARIANCE -FINAL POSITIVE
BUDGET ACTUAL (NEGATIVE)
Taxes 472,161$ 479,775$ 7,614$Licenses and Permits 6,939 7,769 830Intergovernmental 6,212 7,768 1,556Revenues from Utilities 282,485 292,726 10,241Charges for Services 44,333 45,850 1,517Fines and Forfeits 14,139 11,506 (2,633)Investment Earnings 1,034 1,832 798Miscellaneous 9,555 10,267 712
Total Revenues 836,858 857,493 20,635
Expenditures:General Government 86,977 82,942 4,035Public Safety 507,106 505,045 2,061Public Works 45,341 44,237 1,104Health Services 74,782 73,898 884Sanitation 3,385 3,212 173Welfare 42,627 41,142 1,485Culture and Recreation 77,655 76,983 672Economic Development and Opportunity 2,838 2,907 (69)
Total Expenditures 840,711 830,366 10,345
Excess (Deficiency) of Revenues Over (Under) Expenditures (3,853) 27,127 30,980
Other Financing Sources (Uses):Transfers In 36,581 36,581Transfers Out (66,495) (66,495)
Total Other Financing Sources (Uses) (29,914) (29,914)
(Deficiency) of Revenues and Other Financing Sources(Under) Expenditures and Other Financing (Uses) (33,767) (2,787) 30,980$
Fund Balances, October 1 206,507 206,507
Add Encumbrances 25,916
Fund Balances, September 30 172,740$ 229,636$
CITY OF SAN ANTONIO, TEXAS
Revenues:
(In Thousands)
2010
Year-Ended September 30, 2010
- 184 - Amounts are expressed in thousands

Schedule of Revenues Compared to BudgetBudget and Actual (Budgetary Basis)General Fund
VARIANCE -FINAL POSITIVE
BUDGET ACTUAL (NEGATIVE)
Taxes:Property:
Current 245,076$ 244,378$ (698)$Delinquent 2,407 2,486 79
General Sales and Use:City Sales 186,591 188,741 2,150
Selective Sales and Use:Alcoholic Beverages 5,517 5,921 404
Gross Receipts Business:Telecommunication Access Lines Fees 16,432 20,704 4,272Cablevision Franchise 12,895 14,058 1,163Bingo 889 944 55Other 204 207 3
Penalties and Interest on Delinquent Taxes 2,150 2,336 186
Total Taxes 472,161 479,775 7,614
Licenses and Permits:Alcoholic Beverages Licenses 416 487 71Health Licenses 3,456 4,321 865Amusement Licenses 150 138 (12)Professional and Occupational Licenses 2,064 2,073 9Animal Licenses 127 93 (34)Street Permits 726 657 (69)
Total Licenses and Permits 6,939 7,769 830
Intergovernmental:Library Aid from Bexar County 3,521 3,520 (1)Park Reservation Services 39 39Bexar County - Child Support 51 51Magistration and Detention - Bexar 1,158 1,154 (4)EMS Contributions 260 260Health Aid from Bexar County 1,133 1,162 29SAWS Reimbursement to Streets 1,233 1,233VIA Contributions 295 295Hotel/Motel Tax Collection Fee 50 54 4
Total Intergovernmental 6,212 7,768 1,556
Revenues from Utilities:CPS Energy 273,310 283,502 10,192San Antonio Water System 9,175 9,224 49
Total Revenues from Utilities 282,485 292,726 10,241
(Continued)
CITY OF SAN ANTONIO, TEXAS
(In Thousands)
2010
Year-Ended September 30, 2010
Revenues:
- 185 - Amounts are expressed in thousands

Schedule of Revenues Compared to BudgetBudget and Actual (Budgetary Basis)General Fund
VARIANCE -FINAL POSITIVE
BUDGET ACTUAL (NEGATIVE)Charges for Services:
4,675$ 3,840$ (835)$
Police Department 6,936 7,592 656Fire Department 756 809 53
Abatement of Nuisances 342 397 55Health 20,426 21,488 1,062Culture and Recreation:
Tower of the Americas 465 463 (2)Hemisphere Plaza 138 138La Villita 421 447 26Recreation Fees 1,012 1,066 54Concessions in Other Parks 61 60 (1)River Boats 5,293 5,331 38Governor's Palace 391 443 52Swimming Pools 119 139 20Community Centers 491 495 4Library 901 1,054 153Market Square - Markets and Warehouses 1,348 1,374 26Cemeteries 85 95 10Miscellaneous Recreation Revenue 611 619 8
Total Charges for Services 44,333 45,850 1,517
Fines and Forfeits:Municipal Court Fines 14,139 11,506 (2,633)
Investment Earnings:Interest 1,034 1,832 798
Miscellaneous:Sales 3,566 3,454 (112)Recovery of Expenditures 3,098 3,529 431Interfund Charges 1,688 1,948 260Rents, Leases, and Concessions 750 650 (100)Other 453 686 233
Total Miscellaneous 9,555 10,267 712
Total Revenues 836,858$ 857,493$ 20,635$
(End of Statement)
2010
Sanitation:
Public Safety:General Government
CITY OF SAN ANTONIO, TEXAS
(In Thousands)Year-Ended September 30, 2010
- 186 - Amounts are expressed in thousands

Schedule of Expenditures Compared to Budget Budget and Actual (Budgetary Basis)General Fund
VARIANCE -FINAL POSITIVE
BUDGET ACTUAL (NEGATIVE)
General Government:Legislative:
Personal Services 6,500$ 6,679$ (179)$Contractual Services 1,422 951 471Commodities 510 276 234Other Expenditures 2,899 2,888 11
Total Legislative 11,331 10,794 537
Judicial:Personal Services 10,606 10,008 598Contractual Services 668 2,197 (1,529)Commodities 158 192 (34)Other Expenditures 1,518 1,518Capital Outlay 10 (10)
Total Judicial 12,950 12,407 543
Executive:Personal Services 33,307 33,630 (323)Contractual Services 20,881 17,090 3,791Commodities 3,057 3,329 (272)Other Expenditures 5,431 4,901 530Capital Outlay 20 791 (771)
Total Executive 62,696 59,741 2,955
Total General Government 86,977 82,942 4,035
Public Safety:Police:
Personal Services 249,045 248,631 414Contractual Services 7,633 8,137 (504)Commodities 1,725 1,415 310Other Expenditures 16,845 16,611 234Capital Outlay 96 (96)
Total Police 275,248 274,890 358
Fire:Personal Services 132,708 130,854 1,854Contractual Services 3,215 2,783 432Commodities 2,554 3,272 (718)Other Expenditures 14,454 15,006 (552)Capital Outlay 2,210 2,206 4
Total Fire 155,141 154,121 1,020
(Continued)
CITY OF SAN ANTONIO, TEXAS
(In Thousands)
2010
Year-Ended September 30, 2010
Expenditures:
- 187 - Amounts are expressed in thousands

Schedule of Expenditures Compared to Budget Budget and Actual (Budgetary Basis)General Fund
VARIANCE -FINAL POSITIVE
BUDGET ACTUAL (NEGATIVE)Public Safety (Continued):
Building Inspection and Regulations:Personal Services 290$ 279$ 11$Contractual Services 7 5 2Commodities 3 3Other Expenditures 29 29
Total Building Inspection and Regulations 329 316 13
Administration:Personal Services 15,088 16,173 (1,085)Contractual Services 2,150 1,914 236Commodities 1,262 720 542Other Expenditures 7,580 7,550 30
Total Administration 26,080 26,357 (277)
Other Protection:Personal Services 26,809 27,366 (557)Contractual Services 6,118 5,154 964Commodities 3,685 3,416 269Other Expenditures 13,696 13,276 420Capital Outlay 149 (149)
Total Other Protection 50,308 49,361 947
Total Public Safety 507,106 505,045 2,061
Public Works:Streets:
Personal Services 11,509 11,363 146Contractual Services 2,905 3,612 (707)Commodities 12,423 10,409 2,014Other Expenditures 6,524 6,454 70Capital Outlay 48 (48)
Total Streets 33,361 31,886 1,475
Lighting:Contractual Services 90 90Commodities 11,890 12,351 (461)
Total Lighting 11,980 12,351 (371)
Total Public Works 45,341 44,237 1,104
(Continued)
2010
CITY OF SAN ANTONIO, TEXAS
Year-Ended September 30, 2010(In Thousands)
- 188 - Amounts are expressed in thousands

Schedule of Expenditures Compared to Budget Budget and Actual (Budgetary Basis)General Fund
VARIANCE -FINAL POSITIVE
BUDGET ACTUAL (NEGATIVE)Health Services:
Personal Services 55,902$ 55,041$ 861$Contractual Services 8,108 7,467 641Commodities 3,130 3,608 (478)Other Expenditures 7,455 7,499 (44)Capital Outlay 187 283 (96)
Total Health Services 74,782 73,898 884
Sanitation:Personal Services 2,512 2,403 109Contractual Services 170 173 (3)Commodities 161 81 80Other Expenditures 542 545 (3)Capital Outlay 10 (10)
Total Sanitation 3,385 3,212 173
Welfare:Personal Services 14,152 14,364 (212)Contractual Services 20,153 19,318 835Commodities 1,188 826 362Other Expenditures 7,103 6,407 696Capital Outlay 31 227 (196)
Total Welfare 42,627 41,142 1,485
Culture and Recreation:Libraries:
Personal Services 18,535 17,759 776Contractual Services 3,243 3,440 (197)Commodities 3,908 3,830 78Other Expenditures 3,974 3,912 62
Total Libraries 29,660 28,941 719
Parks:Personal Services 27,574 26,209 1,365Contractual Services 7,082 8,229 (1,147)Commodities 3,971 4,448 (477)Other Expenditures 9,347 8,721 626Capital Outlay 21 435 (414)
Total Parks 47,995 48,042 (47)
Total Culture and Recreation 77,655 76,983 672
Economic Development and Opportunity:Personal Services 2,024 1,907 117Contractual Services 648 566 82Commodities 44 40 4Other Expenditures 122 394 (272)
Total Economic Development and Opportunity 2,838 2,907 (69)
Total Expenditures 840,711$ 830,366$ 10,345$
(End of Statement)
2010
CITY OF SAN ANTONIO, TEXAS
Year-Ended September 30, 2010(In Thousands)
- 189 - Amounts are expressed in thousands

Schedule of Revenues, Expenditures, Encumbrances, and Changes in Fund BalancesBudget and Actual (Budgetary Basis)Debt Service Fund
VARIANCE -FINAL POSITIVE
BUDGET ACTUAL (NEGATIVE)
Taxes:Current 145,979$ 146,205$ 226$Delinquent 1,581 1,480 (101)Penalties and Interest on Delinquent Taxes 1,218 1,393 175
Investment Earnings 2,013 843 (1,170)Miscellaneous 384 384
Total Revenues 150,791 150,305 (486)
Expenditures:General Government:
Contractual Services 16 1,807 (1,791)Debt Service:
Principal Retirement 121,820 147,085 (25,265)Interest 60,102 60,886 (784)Issuance Costs 1,303 (1,303)
Total Expenditures 181,938 211,081 (29,143)
(Deficiency) of Revenues (Under) Expenditures (31,147) (60,776) (29,629)
Other Financing Sources (Uses):Issuance of Long-Term Debt 155,710 155,710Premium/(Discount) on Long-Term Debt 20,685 20,685Payments to Refunded Bond Escrow Agent (176,569) (176,569)Transfers In 28,198 57,122 28,924Transfers Out (13) (13)
Total Other Financing Sources (Uses) 28,198 56,935 28,737
(Deficiency) of Revenues and Other Financing Sources(Under) Expenditures and Other Financing (Uses) (2,949) (3,841) (892)$
Fund Balances, October 1 112,924 112,924
Fund Balances, September 30 109,975$ 109,083$
The City noted budget violations of excess expenditures, and transfers out over appropriations. As there was sufficient actual revenues or fundbalances to cover these excesses, the City does not deem these violations to be material.
2010
Revenues:
CITY OF SAN ANTONIO, TEXAS
(In Thousands)Year-Ended September 30, 2010
- 190 - Amounts are expressed in thousands

Schedule of Revenues, Expenditures, Encumbrances, and Changes in Fund BalancesBudget and Actual (Budgetary Basis)Special Revenue FundsAdvanced Transportation District
VARIANCE -FINAL POSITIVE
BUDGET ACTUAL (NEGATIVE)
General Sales and Use:City Sales Tax 10,885$ 11,077$ 192$
Investment Earnings 119 46 (73)
Total Revenues 11,004 11,123 119
Expenditures:Public Works:
Personal Services 1,384 1,348 36Contractual Services 264 371 (107)Commodities 71 37 34Other Expenditures 261 297 (36)
Total Expenditures 1,980 2,053 (73)
Excess of Revenues Over Expenditures 9,024 9,070 46
Other Financing Sources (Uses):Transfers In 500 500Transfers Out (29,355) (12,561) 16,794
Total Other Financing Sources (Uses) (29,355) (12,061) 17,294
(Deficiency) of Revenues and Other Financing Sources (Under) Expenditures and Other Financing (Uses) (20,331) (2,991) 17,340$
Fund Balances, October 1 10,977 10,977
Add Encumbrances 4,643
Fund Balances, September 30 (9,354)$ 12,629$
2010
Revenues:
CITY OF SAN ANTONIO, TEXAS
(In Thousands)Year-Ended September 30, 2010
- 191 - Amounts are expressed in thousands

Schedule of Revenues, Expenditures, Encumbrances, and Changes in Fund BalancesBudget and Actual (Budgetary Basis)Special Revenue FundsCapital Improvement Reserve
VARIANCE -FINAL POSITIVE
BUDGET ACTUAL (NEGATIVE)
Investment Earnings -$ 23$ 23$
Total Revenues 23 23
Expenditures:General Government:
Other Expenses 2 (2)
Total Expenditures 2 (2)
Excess of Revenues Over Expenditures 21 21
Other Financing (Uses):Transfers Out (106) (106)
Total Other Financing (Uses) (106) (106)
(Deficiency) of Revenues (Under) Expenditures and Other Financing (Uses) (106) (85) 21$
Fund Balances, October 1 4,749 4,749
Add Encumbrances 106
Fund Balances, September 30 4,643$ 4,770$
The City noted budget violations of excess expenditures, and encumbrances over appropriations. As there was sufficient actual revenues or fundbalances to cover these excesses, the City does not deem these violations to be material.
2010
Revenues:
CITY OF SAN ANTONIO, TEXAS
(In Thousands)Year-Ended September 30, 2010
- 192 - Amounts are expressed in thousands

Schedule of Revenues, Expenditures, Encumbrances, and Changes in Fund BalancesBudget and Actual (Budgetary Basis)Special Revenue FundsCapital Improvements Management Services
VARIANCE -FINAL POSITIVE
BUDGET ACTUAL (NEGATIVE)
Charges for Services 11,033$ 10,901$ (132)$Investment Earnings 1 1
Total Revenues 11,033 10,902 (131)
Expenditures:Public Works:
Personal Services 12,829 12,899 (70)Contractual Services 841 466 375Commodities 249 201 48Other Expenditures 1,458 1,500 (42)
Total Public Works 15,377 15,066 311
Economic Development and Opportunity:Personal Services 387 368 19Contractual Services 46 5 41Commodities 10 1 9Other Expenditures 66 61 5
Total Economic Development and Opportunity 509 435 74
Total Expenditures 15,886 15,501 385
(Deficiency) of Revenues (Under) Expenditures (4,853) (4,599) 254
Other Financing Sources (Uses):Transfers In 4,654 4,664 10Transfers Out (88) (88)
Total Other Financing Sources (Uses) 4,566 4,576 10
(Deficiency) of Revenues and Other Financing Sources (Under) Expenditures and Other Financing (Uses) (287) (23) 264$
Fund Balances, October 1 23 23
Add Encumbrances 46
Fund Balances, September 30 (264)$ 46$
Revenues:
CITY OF SAN ANTONIO, TEXAS
(In Thousands)
2010
Year-Ended September 30, 2010
- 193 - Amounts are expressed in thousands

Schedule of Revenues, Expenditures, Encumbrances, and Changes in Fund BalancesBudget and Actual (Budgetary Basis)Special Revenue FundsCommunity and Visitor Facilities
(In Thousands)VARIANCE -
FINAL POSITIVEBUDGET ACTUAL (NEGATIVE)
Taxes:Occupancy 47,883$ 46,460$ (1,423)$Penalties and Interest on Delinquent Taxes 78 121 43
Intergovernmental 20,782 20,782Charges for Services 16,620 16,489 (131)Investment Earnings 30 159 129Miscellaneous 867 1,031 164
Total Revenues 65,478 85,042 19,564Expenditures:
General Government:Contractual Service 2,294 1,942 352Other Expenditures 11 (11)
Total General Government 2,294 1,953 341Cultural and Recreation:
Arts and Cultural Affairs:Personal Services 940 885 55Contractual Services 999 969 30Commodities 13 11 2Other Expenditures 50 51 (1)
Total Arts and Cultural Affairs 2,002 1,916 86Convention Facilities:
Personal Services 16,529 15,933 596Contractual Services 3,721 3,481 240Commodities 928 855 73Other Expenditures 11,593 10,668 925
Total Convention Facilities 32,771 30,937 1,834Nondepartmental:
Personal Services 282 202 80Contractual Services 2,372 1,757 615Commodities 2 2Other Expenditures 10 12 (2)
Total Nondepartmental 2,666 1,971 695Contributions to Other Agencies 5,864 6,093 (229)
Total Cultural and Recreation 43,303 40,917 2,386Convention and Tourism:
Convention and Visitors Bureau:Personal Services 6,914 7,455 (541)Contractual Services 12,012 11,677 335Commodities 343 279 64Other Expenditures 589 600 (11)
Total Convention and Tourism 19,858 20,011 (153)Economic Development and Opportunity:
Personal Services 484 447 37Contractual Services 448 386 62Commodities 47 40 7Other Expenditures 30 39 (9)
Total Economic Development and Opportunity 1,009 912 97
Total Expenditures 66,464 63,793 2,671
Excess (Deficiency) of Revenues Over (Under) Expenditures (986) 21,249 22,235
Other Financing Sources (Uses):Transfers In 1,068 425 (643)Transfers Out (19,849) (26,443) (6,594)
Total Other Financing Sources (Uses) (18,781) (26,018) (7,237)
(Deficiency) of Revenues and Other Financing Sources (Under) Expenditures and Other Financing (Uses) (19,767) (4,769) 14,998$
Fund Balances, October 1 25,720 25,720
Add Encumbrances 6,354
Fund Balances, September 30 5,953$ 27,305$
CITY OF SAN ANTONIO, TEXAS
Year-Ended September 30, 2010
Note: Includes revenues and expenditures generated from Convention and Tourism activities relating to the promotion of City of San Antonio owned facilities tobe used for conventions, community and entertainment venues; the marketing and promotion of San Antonio through the Convention and Visitors Bureau andsupport for arts and cultural organizations in the Office of Cultural Affairs and International Affairs.
2010
Revenues:
The City noted budget violations of excess transfers out, and encumbrances over appropriations. As there was sufficient actual revenues or fund balances tocover these excesses, the City does not deem these violations to be material.
- 194 - Amounts are expressed in thousands
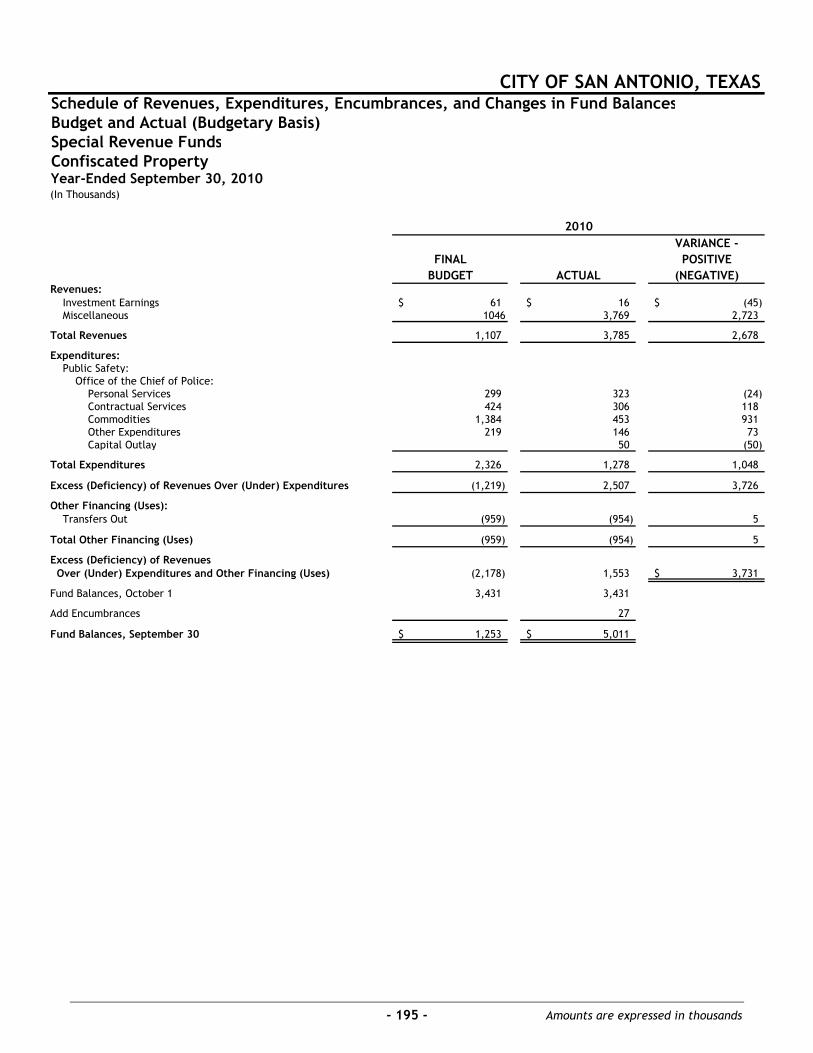
Schedule of Revenues, Expenditures, Encumbrances, and Changes in Fund BalancesBudget and Actual (Budgetary Basis)Special Revenue FundsConfiscated Property
VARIANCE -FINAL POSITIVE
BUDGET ACTUAL (NEGATIVE)
Investment Earnings 61$ 16$ (45)$Miscellaneous 1046 3,769 2,723
Total Revenues 1,107 3,785 2,678
Expenditures:Public Safety:
Office of the Chief of Police:Personal Services 299 323 (24)Contractual Services 424 306 118Commodities 1,384 453 931Other Expenditures 219 146 73Capital Outlay 50 (50)
Total Expenditures 2,326 1,278 1,048
Excess (Deficiency) of Revenues Over (Under) Expenditures (1,219) 2,507 3,726
Other Financing (Uses):Transfers Out (959) (954) 5
Total Other Financing (Uses) (959) (954) 5
Excess (Deficiency) of Revenues Over (Under) Expenditures and Other Financing (Uses) (2,178) 1,553 3,731$
Fund Balances, October 1 3,431 3,431
Add Encumbrances 27
Fund Balances, September 30 1,253$ 5,011$
2010
Revenues:
CITY OF SAN ANTONIO, TEXAS
(In Thousands)Year-Ended September 30, 2010
- 195 - Amounts are expressed in thousands

Schedule of Revenues, Expenditures, Encumbrances, and Changes in Fund BalancesBudget and Actual (Budgetary Basis)Special Revenue FundsPlanning and Development Services
VARIANCE -FINAL POSITIVE
BUDGET ACTUAL (NEGATIVE)
Charges for Services 22,522$ 20,336$ (2,186)$Investment Earnings 6 6Miscellaneous 281 1,067 786
Total Revenues 22,803 21,409 (1,394)
Expenditures:Urban Redevelopment and Housing:
Development Services:Personal Services 13,556 13,662 (106)Contractual Services 810 703 107Commodities 180 123 57Other Expenditures 2,836 2,862 (26)
Total Development Services 17,382 17,350 32
Office of Historic Preservation:Personal Services 619 561 58Contractual Services 31 22 9Commodities 10 5 5Other Expenditures 43 44 (1)
Total Office of Historic Preservation 703 632 71
Total Expenditures 18,085 17,982 103
Excess of Revenues Over Expenditures 4,718 3,427 (1,291)
Other Financing Sources (Uses):Transfers In 1,584 1,584 Transfers Out (4,340) (4,333) 7
Total Other Financing Sources (Uses) (2,756) (2,749) 7
Excess of Revenues and Other Financing Sources Over Expenditures and Other Financing (Uses) 1,962 678 (1,284)$
Fund Balances, October 1 (93) (93)
Add Encumbrances 40
Fund Balances, September 30 1,869$ 625$
Revenues:
2010
CITY OF SAN ANTONIO, TEXAS
(In Thousands)Year-Ended September 30, 2010
- 196 - Amounts are expressed in thousands

Schedule of Revenues, Expenditures, Encumbrances, and Changes in Fund BalancesBudget and Actual (Budgetary Basis)Special Revenue FundsHotel/Motel 2% Revenue
VARIANCE -FINAL POSITIVE
BUDGET ACTUAL (NEGATIVE)
Taxes:Occupancy 15,229$ 13,274$ (1,955)$Penalties and Interest on Delinquent Taxes 22 35 13
Investment Earnings 10 90 80Miscellaneous 1 1
Total Revenues 15,261 13,400 (1,861)
Expenditures:Convention and Tourism:
Contractual Service 625 725 (100)Other Expenditures 90 (90)
Total Convention and Tourism 625 815 (190)Total Expenditures 625 815 (190)
Excess of Revenues Over Expenditures 14,636 12,585 (2,051)
Other Financing Sources (Uses):Transfer In 4,015 4,015Transfers Out (18,538) (15,807) 2,731
Total Other Financing Sources (Uses) (18,538) (11,792) 6,746
Excess (Deficiency) of Revenues and Other Financing Sources Over (Under) Expenditures and Other Financing (Uses) (3,902) 793 4,695$
Fund Balances, October 1 18,080 18,080
Add Encumbrances 650
Fund Balances, September 30 14,178$ 19,523$
2010
Revenues:
CITY OF SAN ANTONIO, TEXAS
(In Thousands)Year-Ended September 30, 2010
- 197 - Amounts are expressed in thousands

Schedule of Revenues, Expenditures, Encumbrances, and Changes in Fund BalancesBudget and Actual (Budgetary Basis)Special Revenue FundsInternational Center
VARIANCE -FINAL POSITIVE
BUDGET ACTUAL (NEGATIVE)
Charges for Services 1,275$ 1,262$ (13)$Investment Earnings 4 9 5Miscellaneous 7 7
Total Revenues 1,279 1,278 (1)
Expenditures:Convention and Tourism:
Personal Services 138 153 (15)Contractual Services 163 140 23Commodities 42 42 Other Expenditures 854 841 13
Total Expenditures 1,197 1,176 21
Excess of Revenues Over Expenditures 82 102 20
Other Financing (Uses):Transfers Out (202) (202)
Total Other Financing (Uses) (202) (202)
(Deficiency) of Revenues (Under) Expenditures and Other Financing (Uses) (120) (100) 20$
Fund Balances, October 1 1,989 1,989
Add Encumbrances 17
Fund Balances, September 30 1,869$ 1,906$
2010
Revenues:
CITY OF SAN ANTONIO, TEXAS
(In Thousands)Year-Ended September 30, 2010
- 198 - Amounts are expressed in thousands

Schedule of Revenues, Expenditures, Encumbrances, and Changes in Fund BalancesBudget and Actual (Budgetary Basis)Special Revenue FundsJob Training, Neighborhood Revitalization, and Economic Development
VARIANCE -FINAL POSITIVE
BUDGET ACTUAL (NEGATIVE)
Investment Earnings -$ 6$ 6$
Total Revenues 6 6
Excess of Revenues Over Expenditures 6 6
Other Financing (Uses):Transfers Out (283) (283)
Total Other Financing (Uses) (283) (283)
(Deficiency) of Revenues (Under) Expenditures and Other Financing (Uses) (283) (277) 6$
Fund Balances, October 1 1,599 1,599
Add Encumbrances 233
Fund Balances, September 30 1,316$ 1,555$
2010
Revenues:
CITY OF SAN ANTONIO, TEXAS
(In Thousands)Year-Ended September 30, 2010
- 199 - Amounts are expressed in thousands
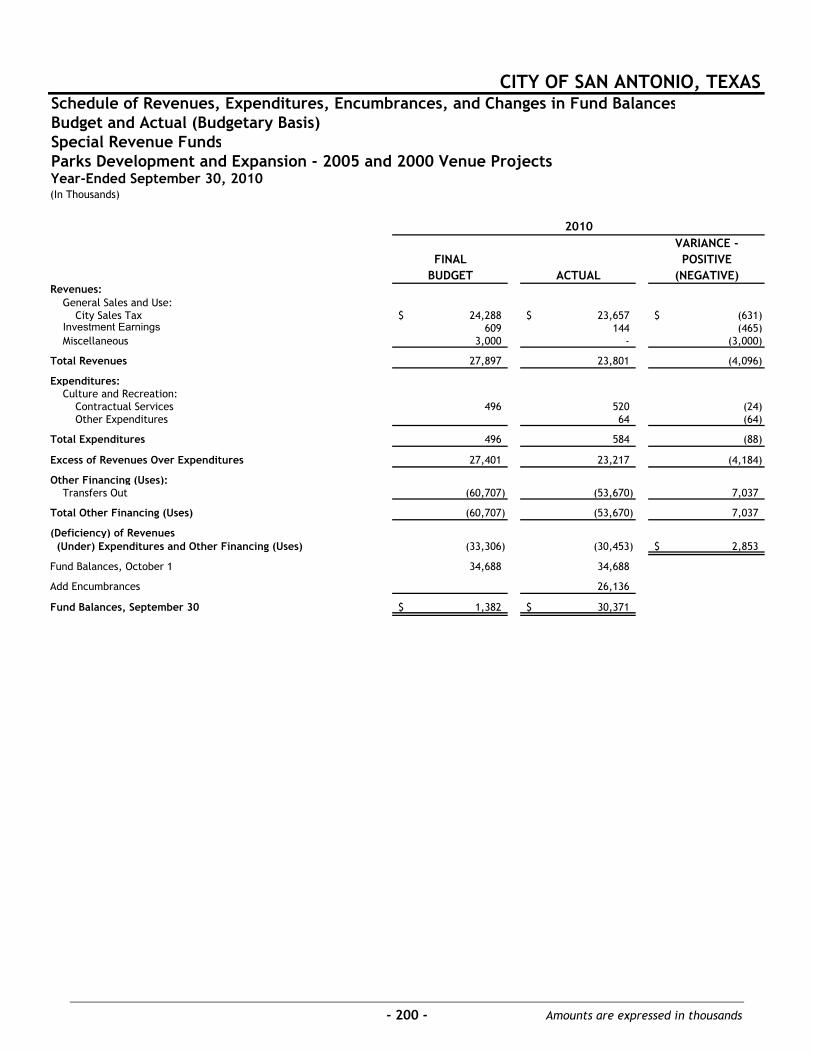
Schedule of Revenues, Expenditures, Encumbrances, and Changes in Fund BalancesBudget and Actual (Budgetary Basis)Special Revenue FundsParks Development and Expansion - 2005 and 2000 Venue Projects
VARIANCE -FINAL POSITIVE
BUDGET ACTUAL (NEGATIVE)
General Sales and Use:City Sales Tax 24,288$ 23,657$ (631)$
Investment Earnings 609 144 (465)Miscellaneous 3,000 - (3,000)
Total Revenues 27,897 23,801 (4,096)
Expenditures:Culture and Recreation:
Contractual Services 496 520 (24)Other Expenditures 64 (64)
Total Expenditures 496 584 (88)
Excess of Revenues Over Expenditures 27,401 23,217 (4,184)
Other Financing (Uses):Transfers Out (60,707) (53,670) 7,037
Total Other Financing (Uses) (60,707) (53,670) 7,037
(Deficiency) of Revenues (Under) Expenditures and Other Financing (Uses) (33,306) (30,453) 2,853$
Fund Balances, October 1 34,688 34,688
Add Encumbrances 26,136
Fund Balances, September 30 1,382$ 30,371$
2010
Revenues:
CITY OF SAN ANTONIO, TEXAS
(In Thousands)Year-Ended September 30, 2010
- 200 - Amounts are expressed in thousands

Schedule of Revenues, Expenditures, Encumbrances, and Changes in Fund BalancesBudget and Actual (Budgetary Basis)Special Revenue FundsRight of Ways
VARIANCE -FINAL POSITIVE
BUDGET ACTUAL (NEGATIVE)
Charges for Services 1,266$ 1,804$ 538$Investment Earnings 3 3
Total Revenues 1,266 1,807 541
Expenditures:Public Works:
Streets and Roadways:Personal Services 1,071 1,126 (55)Contractual Services 131 159 (28)Commodities 23 15 8Other Expenditures 229 225 4
Total Public Works 1,454 1,525 (71)
Total Expenditures 1,454 1,525 (71)
Excess (Deficiency) of Revenues Over (Under) Expenditures (188) 282 470
Other Financing (Uses):Transfers Out (33,355) (33,355)
Total Other Financing (Uses) (33,355) (33,355)
(Deficiency) of Revenues (Under) Expenditures and Other Financing (Uses) (33,543) (33,073) 470$
Fund Balances, October 1 34,260 34,260
Add Encumbrances 35
Fund Balances, September 30 717$ 1,222$
The City noted budget violations of excess expenditures, and encumbrances over appropriations. As there was sufficient actual revenues or fundbalances to cover these excesses, the City does not deem these violations to be material.
2010
Revenues:
CITY OF SAN ANTONIO, TEXAS
(In Thousands)Year-Ended September 30, 2010
- 201 - Amounts are expressed in thousands

Schedule of Revenues, Expenditures, Encumbrances, and Changes in Fund BalancesBudget and Actual (Budgetary Basis)Special Revenue FundsStormwater Operations
VARIANCE -FINAL POSITIVE
BUDGET ACTUAL (NEGATIVE)
Charges for Services 39,374$ 39,128$ (246)$Investment Earnings 338 165 (173)Miscellaneous 98 98
Total Revenues 39,712 39,391 (321)Expenditures:
Public Works:Administration:
Personal Services 1,058 1,061 (3)Contractual Services 3,928 3,831 97Commodities 181 266 (85)Other Expenditures 166 174 (8)Capital Outlay 83 (83)
Total Administration 5,333 5,415 (82)Vegetation Control:
Personal Services 2,597 2,766 (169)Contractual Services 2,289 648 1,641Commodities 599 449 150Other Expenditures 887 973 (86)Capital Outlay 47 269 (222)
Total Vegetation Control 6,419 5,105 1,314River Maintenance:
Personal Services 4,579 5,380 (801)Contractual Services 990 811 179Commodities 550 655 (105)Other Expenditures 2,102 2,139 (37)Capital Outlay 89 (89)
Total River Maintenance 8,221 9,074 (853)Street Sweeping:
Personal Services 2,366 2,390 (24)Contractual Services 540 654 (114)Commodities 301 332 (31)Other Expenditures 1,084 1,062 22
Total Street Sweeping 4,291 4,438 (147)Tunnel Maintenance:
Personal Services 1,370 1,321 49Contractual Services 423 297 126Commodities 435 351 84Other Expenditures 447 484 (37)Capital Outlay 72 (72)
Total Tunnel Maintenance 2,675 2,525 150Design Engineering:
Personal Services 1,466 1,463 3Contractual Services 417 201 216Commodities 11 14 (3)Other Expenditures 143 138 5Capital Outlay 65 (65)
Total Design Engineering 2,037 1,881 156
Total Expenditures 28,976 28,438 538
Excess of Revenues Over Expenditures 10,736 10,953 217
Other Financing Sources (Uses):Transfers In 1,000 1,000 Transfers Out (33,492) (33,814) (322)
Total Other Financing Sources (Uses) (32,492) (32,814) (322)
(Deficiency) of Revenues and Other Financing Sources (Under) Expenditures and Other Financing (Uses) (21,756) (21,861) (105)$
Fund Balances, October 1 36,287 36,287
Add Encumbrances 22,353
Fund Balances, September 30 14,531$ 36,779$
2010
Revenues:
CITY OF SAN ANTONIO, TEXAS
(In Thousands)Year-Ended September 30, 2010
- 202 - Amounts are expressed in thousands

Schedule of Revenues, Expenditures, Encumbrances, and Changes in Fund BalancesBudget and Actual (Budgetary Basis)Special Revenue FundsTax Increment Financing
VARIANCE -FINAL POSITIVE
BUDGET ACTUAL (NEGATIVE)
Charges for Services:Administrative Fee 560$ 125$ (435)$Processing Fee 62 (62)
Investment Earnings 1 1Miscellaneous 16 16
Total Revenues 622 142 (480)
Expenditures:Economic Development and Opportunity:
Personal Services 470 333 137Contractual Services 23 5 18Commodities 7 32 (25)Other Expenditures 34 35 (1)Capital Outlay 2 (2)
Total Expenditures 534 407 127
Excess (Deficiency) of Revenues Over (Under) Expenditures 88 (265) (353)
Other Financing (Uses):Transfers Out (76) (67) 9
Total Other Financing (Uses) (76) (67) 9
Excess (Deficiency) of Revenues Over (Under) Expenditures and Other Financing (Uses) 12 (332) (344)$
Fund Balances, October 1 381 381
Add Encumbrances 28
Fund Balances, September 30 393$ 77$
This fund is incorporated within the Tax Increment Reinvestment Zone reporting unit.
2010
Revenues:
CITY OF SAN ANTONIO, TEXAS
(In Thousands)Year-Ended September 30, 2010
- 203 - Amounts are expressed in thousands

Schedule of Revenues, Expenditures, Encumbrances, and Changes in Fund BalancesBudget and Actual (Budgetary Basis)Special Revenue FundsCommunity Service Funds - Child Safety
VARIANCE -FINAL POSITIVE
BUDGET ACTUAL (NEGATIVE)
Charges for Services:Parking Fines 191$ 177$ (14)$Moving Violations 251 270 19
Intergovernmental 1,533 1,544 11Investment Earnings 1 1
Total Revenues 1,975 1,992 17
Expenditures:General Government:
Personal Services 1,593 1,324 269Contractual Services 3 9 (6)Commodities 39 28 11Other Expenditures 311 474 (163)
Total Expenditures 1,946 1,835 111
Excess of Revenues Over Expenditures 29 157 128
Other Financing (Uses):Transfers Out (377) (377)
(Deficiency) of Revenues (Under) Expenditures and Other Financing (Uses) (348) (220) 128$
Fund Balances, October 1 384 384
Fund Balances, September 30 36$ 164$
2010
Revenues:
CITY OF SAN ANTONIO, TEXAS
(In Thousands)Year-Ended September 30, 2010
- 204 - Amounts are expressed in thousands

Schedule of Revenues, Expenditures, Encumbrances, and Changes in Fund BalancesBudget and Actual (Budgetary Basis)Special Revenue FundsCommunity Service Funds - Economic Development Incentive
VARIANCE -FINAL POSITIVE
BUDGET ACTUAL (NEGATIVE)
Investment Earnings 46$ 25$ (21)$Miscellaneous 183 1,139 956
Total Revenues 229 1,164 935
Expenditures:Economic Development and Opportunity:
Contractual Services 5,723 8,784 (3,061)Other Expenditures 2 (2)
Total Expenditures 5,723 8,786 (3,063)
(Deficiency) of Revenues (Under) Expenditures (5,494) (7,622) (2,128)
(Deficiency) of Revenues (Under) Expenditures (5,494) (7,622) (2,128)$
Fund Balances, October 1 6,518 6,518
Add Encumbrances 3,475
Fund Balances, September 30 1,024$ 2,371$
The City noted budget violations of excess expenditures, and encumbrances over appropriations. As there was sufficient actual revenues or fundbalances to cover these excesses, the City does not deem these violations to be material.
Revenues:
CITY OF SAN ANTONIO, TEXAS
(In Thousands)
2010
Year-Ended September 30, 2010
- 205 - Amounts are expressed in thousands

Schedule of Revenues, Expenditures, Encumbrances, and Changes in Fund BalancesBudget and Actual (Budgetary Basis)Special Revenue FundsCommunity Services Funds - Golf Course Operating and Maintenance
VARIANCE -FINAL POSITIVE
BUDGET ACTUAL (NEGATIVE)
Miscellaneous 1,071$ 686$ (385)$
Total Revenues 1,071 686 (385)
Expenditures:Culture and Recreation:
Other Expenditures 610 585 25
Total Expenditures 610 585 25
Excess of Revenues Over Expenditures 461 101 (360)
Other Financing (Uses):Transfers Out (18) (18)
Total Other Financing (Uses) (18) (18)
Excess of Revenues Over Expenditures and Other Financing (Uses) 461 83 (378)$
Fund Balances, October 1 (2,337) (2,337)
Fund Balances, September 30 (1,876)$ (2,254)$
2010
Revenues:
CITY OF SAN ANTONIO, TEXAS
(In Thousands)Year-Ended September 30, 2010
- 206 - Amounts are expressed in thousands

Schedule of Revenues, Expenditures, Encumbrances, and Changes in Fund BalancesBudget and Actual (Budgetary Basis)Special Revenue FundsCommunity Service Funds - Juvenile Case Manager
VARIANCE -FINAL POSITIVE
BUDGET ACTUAL (NEGATIVE)
Charges for Services:Juvenile Case Manager Fee 655$ 529$ (126)$
Investment Earnings 1 1
Total Revenues 655 530 (125)
Expenditures:General Government:
Personal Services 293 361 (68)Contractual Services 3 (3)Other Expenditures 20 20 Capital Outlay 45 45
Total Expenditures 358 384 (26)
Excess of Revenues Over Expenditures 297 146 (151)
Other Financing Sources:Transfers In 65 65
Total Other Financing Sources 65 65
Excess of Revenues and Other Financing Sources Over Expenditures 362 211 (151)$
Fund Balances, October 1
Fund Balances, September 30 362$ 211$
The City noted budget violations of excess expenditures over appropriations. As there was sufficient actual revenues or fund balances to cover theseexcesses, the City does not deem these violations to be material.
Revenues:
CITY OF SAN ANTONIO, TEXAS
(In Thousands)
2010
Year-Ended September 30, 2010
- 207 - Amounts are expressed in thousands

Schedule of Revenues, Expenditures, Encumbrances, and Changes in Fund BalancesBudget and Actual (Budgetary Basis)Special Revenue FundsCommunity Service Funds - Municipal Court Security
VARIANCE -FINAL POSITIVE
BUDGET ACTUAL (NEGATIVE)
Charges for Services:Building Security 439$ 493$ 54$
Investment Earnings 1 1
Total Revenues 439 494 55
Expenditures:General Government:
Personal Services 343 361 (18)Contractual Services 111 208 (97)Commodities 8 3 5Other Expenditures 29 32 (3)Capital Outlay 284 163 121
Total Expenditures 775 767 8
(Deficiency) of Revenues (Under) Expenditures (336) (273) 63
Other Financing Sources (Uses):Transfers In 153 153 Transfers Out (4) (4)
Total Other Financing Sources (Uses) 149 149
(Deficiency) of Revenues and Other Financing Sources (Under) Expenditures and Other Financing (Uses) (187) (124) 63$
Fund Balances, October 1 191 191
Add Encumbrances 15
Fund Balances, September 30 4$ 82$
CITY OF SAN ANTONIO, TEXAS
(In Thousands)
2010
Revenues:
Year-Ended September 30, 2010
- 208 - Amounts are expressed in thousands

Schedule of Revenues, Expenditures, Encumbrances, and Changes in Fund BalancesBudget and Actual (Budgetary Basis)Special Revenue FundsCommunity Service Funds - Municipal Court Technology
VARIANCE -FINAL POSITIVE
BUDGET ACTUAL (NEGATIVE)
Charges for Services:Technology Improvements 585$ 656$ 71$
Investment Earnings 8 8
Total Revenues 585 664 79
Expenditures:General Government:
Personal Services 69 8 61Contractual Services 615 380 235Commodities 1 (1)Other Expenditures 4 15 (11)Capital Outlay 56 (56)
Total Expenditures 688 460 228
Excess (Deficiency) of Revenues Over (Under) Expenditures (103) 204 307
Other Financing (Uses):Transfers Out (1,130) (1,130)
Total Other Financing (Uses) (1,130) (1,130)
(Deficiency) of Revenues (Under) Expenditures and Other Financing (Uses) (1,233) (926) 307$
Fund Balances, October 1 1,554 1,554
Add Encumbrances 1,140
Fund Balances, September 30 321$ 1,768$
2010
Revenues:
CITY OF SAN ANTONIO, TEXAS
(In Thousands)Year-Ended September 30, 2010
- 209 - Amounts are expressed in thousands

Schedule of Revenues, Expenditures, Encumbrances, and Changes in Fund BalancesBudget and Actual (Budgetary Basis)Special Revenue FundsCommunity Service Funds - Visitor Information Center and City Store
VARIANCE -FINAL POSITIVE
BUDGET ACTUAL (NEGATIVE)
Charges for Services 310$ 332$ 22$Investment Earnings 3 (3)
Total Revenues 313 332 19
Expenditures:General Government:
Personal Services 280 287 (7)Contractual Services 34 18 16Commodities 139 159 (20)Other Expenditures 87 87Capital Outlay 1 1
Total Expenditures 541 551 (10)
(Deficiency) of Revenues (Under) Expenditures (228) (219) 9
Other Financing Sources (Uses):Transfers In 200 200Transfers Out (15) (18) (3)
Total Other Financing Sources (Uses) (15) 182 197
(Deficiency) of Revenues and Other Financing Sources (Under) Expenditures and Other Financing (Uses) (243) (37) 206$
Fund Balances, October 1 115 115
Fund Balances, September 30 (128)$ 78$
The City noted budget violations of excess expenditures, and transfers out over appropriations. As there was sufficient actual revenues or fundbalances to cover these excesses, the City does not deem these violations to be material.
2010
Revenues:
CITY OF SAN ANTONIO, TEXAS
(In Thousands)Year-Ended September 30, 2010
- 210 - Amounts are expressed in thousands

Schedule of Revenues, Expenditures, Encumbrances, and Changes in Fund BalancesBudget and Actual (Budgetary Basis)Special Revenue FundsCommunity Service Funds - South Texas Business
VARIANCE -FINAL POSITIVE
BUDGET ACTUAL (NEGATIVE)
Intergovernmental:Contributions from Other Agencies (STBF) 781$ 445$ (336)$
Total Revenues 781 445 (336)
Expenditures:Economic Development and Opportunity:
Personal Services 547 350 197Contractual Services 23 2 21Commodities 7 1 6Other Expenditures 32 32 Capital Outlay 7 (7)
Total Expenditures 609 392 217
Excess of Revenues Over Expenditures 172 53 (119)
Other Financing (Uses):Transfers Out (17) (20) (3)
Total Other Financing (Uses) (17) (20) (3)
Excess of Revenues Over Expenditures and Other Financing (Uses) 155 33 (122)$
Fund Balances, October 1 (59) (59)
Fund Balances, September 30 96$ (26)$
This fund is separate and distinct from the component unit.
Revenues:
CITY OF SAN ANTONIO, TEXAS
(In Thousands)
2010
Year-Ended September 30, 2010
- 211 - Amounts are expressed in thousands

Schedule of Revenues, Expenditures, Encumbrances, and Changes in Fund BalancesBudget and Actual (Budgetary Basis)Special Revenue FundsCommunity Service Funds - Starbright Industrial Development Corporation
VARIANCE -FINAL POSITIVE
BUDGET ACTUAL (NEGATIVE)
Investment Earnings -$ 1$ 1$
Total Revenues 1 1
Expenditures:Economic Development and Opportunity:
Other Expenditures 1,663 1,662 1
Total Expenditures 1,663 1,662 1
(Deficiency) of Revenues (Under) Expenditures (1,663) (1,661) 2
Other Financing Sources:Transfers In 1,662 1,662
Total Other Financing Sources 1,662 1,662
Excess (Deficiency) of Revenues and Other Financing Sources Over (Under) Expenditures (1) 1 2$
Fund Balances, October 1 105 105
Fund Balances, September 30 104$ 106$
Revenues:
CITY OF SAN ANTONIO, TEXAS
(In Thousands)
2010
Year-Ended September 30, 2010
In fiscal year 2005-2006, the Starbright Industrial Development Corporation Fund was established to account for the proceeds from CPS Energy to beused to repay the debt service associated with the Toyota plant land purchase. This fund is separate and distinct from the component unit.
- 212 - Amounts are expressed in thousands

Schedule of Revenues, Expenditures, Encumbrances, and Changes in Fund BalancesBudget and Actual (Budgetary Basis)Special Revenue FundsCommunity Service Funds - Tree Canopy Investment
VARIANCE -FINAL POSITIVE
BUDGET ACTUAL (NEGATIVE)
Charges for Services:Canopy Fee - Residential 68$ 93$ 25$Canopy Fee - Commercial 124 90 (34)
Investment Earnings 3 3
Total Revenues 195 186 (9)
Expenditures:Culture and Recreation:
Contractual Services 1 (1)Commodities 840 231 609Other Expenditures 4 4
Total Expenditures 844 236 608
(Deficiency) of Revenues (Under) Expenditures (649) (50) 599
Other Financing (Uses):Transfers Out (109) (109)
Total Other Financing (Uses) (109) (109)
(Deficiency) of Revenues (Under) Expenditures and Other Financing (Uses) (758) (159) 599$
Fund Balances, October 1 515 515
Add Encumbrances 143
Fund Balances, September 30 (243)$ 499$
Revenues:
CITY OF SAN ANTONIO, TEXAS
(In Thousands)
2010
Year-Ended September 30, 2010
- 213 - Amounts are expressed in thousands

Schedule of Revenues, Expenditures, Encumbrances, and Changes in Fund BalancesBudget and Actual (Budgetary Basis)Special Revenue FundsCommunity Service Funds - Tree Preservation Mitigation
VARIANCE -FINAL POSITIVE
BUDGET ACTUAL (NEGATIVE)
Charges for Services:Tree Mitigation Fee 422$ 163$ (259)$
Investment Earnings 23 6 (17)
Total Revenues 445 169 (276)
Expenditures:Culture and Recreation:
Personal Services 118 107 11Contractual Services 649 278 371Commodities 641 461 180Other Expenditures 22 23 (1)Capital Outlay 265 228 37
Total Expenditures 1,695 1,097 598
(Deficiency) of Revenues (Under) Expenditures (1,250) (928) 322
Other Financing (Uses):Transfers Out (18) (26) (8)
Total Other Financing (Uses) (18) (26) (8)
(Deficiency) of Revenues (Under) Expenditures and Other Financing (Uses) (1,268) (954) 314$
Fund Balances, October 1 1,602 1,602
Add Encumbrances 357
Fund Balances, September 30 334$ 1,005$
2010
Revenues:
CITY OF SAN ANTONIO, TEXAS
(In Thousands)Year-Ended September 30, 2010
- 214 - Amounts are expressed in thousands

Schedule of Revenues, Expenditures, Encumbrances, and Changes in Fund BalancesBudget and Actual (Budgetary Basis)Permanent FundSan Jose Burial Park
VARIANCE -FINAL POSITIVE
BUDGET ACTUAL (NEGATIVE)
Charges for Services:Sales 410$ 515$ 105$
Investment Earnings 22 10 (12)Miscellaneous 1 1
Total Revenues 432 526 94
Expenditures:Culture and Recreation:
Personal Services 387 363 24Contractual Services 11 34 (23)Commodities 12 24 (12)Other Expenditures 104 100 4
Total Expenditures 514 521 (7)
Excess (Deficiency) of Revenues Over (Under) Expenditures (82) 5 87
Other Financing Sources (Uses):Transfers In 100 100Transfers Out (4) (4)
Total Other Financing Sources (Uses) 96 96
Excess of Revenues and Other Financing Sources Over Expenditures and Other Financing (Uses) 14 101 87$
Fund Balances, October 1 2,265 2,265
Fund Balances, September 30 2,279$ 2,366$
The City noted budget violations of excess expenditures over appropriations. As there was sufficient actual revenues or fund balances to coverthese excesses, the City does not deem these violations to be material.
2010
Revenues:
CITY OF SAN ANTONIO, TEXAS
(In Thousands)Year-Ended September 30, 2010
- 215 - Amounts are expressed in thousands

City of San Antonio, Texas
Nonmajor Enterprise Funds SOLID WASTE MANAGEMENT – accounts for the recording of all revenues and expenses associated with the operation and maintenance of the City’s solid waste and environmental management programs, required debt service for outstanding bonds, and construction and management of Solid Waste Management’s assets.
PARKING SYSTEM – accounts for recording of all revenues and expenses associated with the operation and maintenance of the City’s parking structures and parking lots, required debt service for outstanding bonds, and construction and management of the Parking System’s assets.

CITY OF SAN ANTONIO, TEXAS Comprehensive Annual Financial Report Year-Ended September 30, 2010

Combining Statement of Net AssetsNonmajor Enterprise Funds
(In Thousands)
TOTALNONMAJOR
SOLID WASTE PARKING ENTERPRISEMANAGEMENT SYSTEM FUNDS
Current Assets:Unrestricted Assets:
Cash and Cash Equivalents 1,183$ 117$ 1,300$Securities Lending Collateral 2,836 207 3,043Investments 13,978 1,388 15,366Receivables, Net:
Accounts 251 97 348Accrued Interest 2 2Accrued Revenue 6,704 12 6,716
Due From Other Funds 1,091 315 1,406Materials and Supplies, at Cost 83 83
Total Unrestricted Assets 26,045 2,219 28,264
Restricted Assets:Debt Service Accounts:
Cash and Cash Equivalents 21 741 762Securities Lending Collateral 789 789Investments 58 6,151 6,209Receivables-Accrued Interest 1 1Due From Other Funds 28 28
Construction Accounts:Cash and Cash Equivalents 51 1 52Securities Lending Collateral 89 1 90Investments 601 6 607
Improvement and Contingency Accounts:Cash and Cash Equivalents 434 505 939Securities Lending Collateral 881 881Investments 5,086 5,924 11,010Receivables-Accrued Interest 1 1 2
Total Restricted Assets 6,369 15,001 21,370
Total Current Assets 32,414 17,220 49,634
Noncurrent Assets:Capital Assets:
Land 893 8,125 9,018Buildings 757 24,590 25,347Improvements 6,870 3,587 10,457Machinery and Equipment 27,326 1,571 28,897Construction in Progress 737 737
Total Capital Assets 35,846 38,610 74,456Less: Accumulated Depreciation 10,216 10,444 20,660
Net Capital Assets 25,630 28,166 53,796Unamortized Debt Expense 41 360 401
Total Noncurrent Assets 25,671 28,526 54,197
Total Assets 58,085$ 45,746$ 103,831$
CITY OF SAN ANTONIO, TEXAS
As of September 30, 2010
Assets:
- 216 - Amounts are expressed in thousands
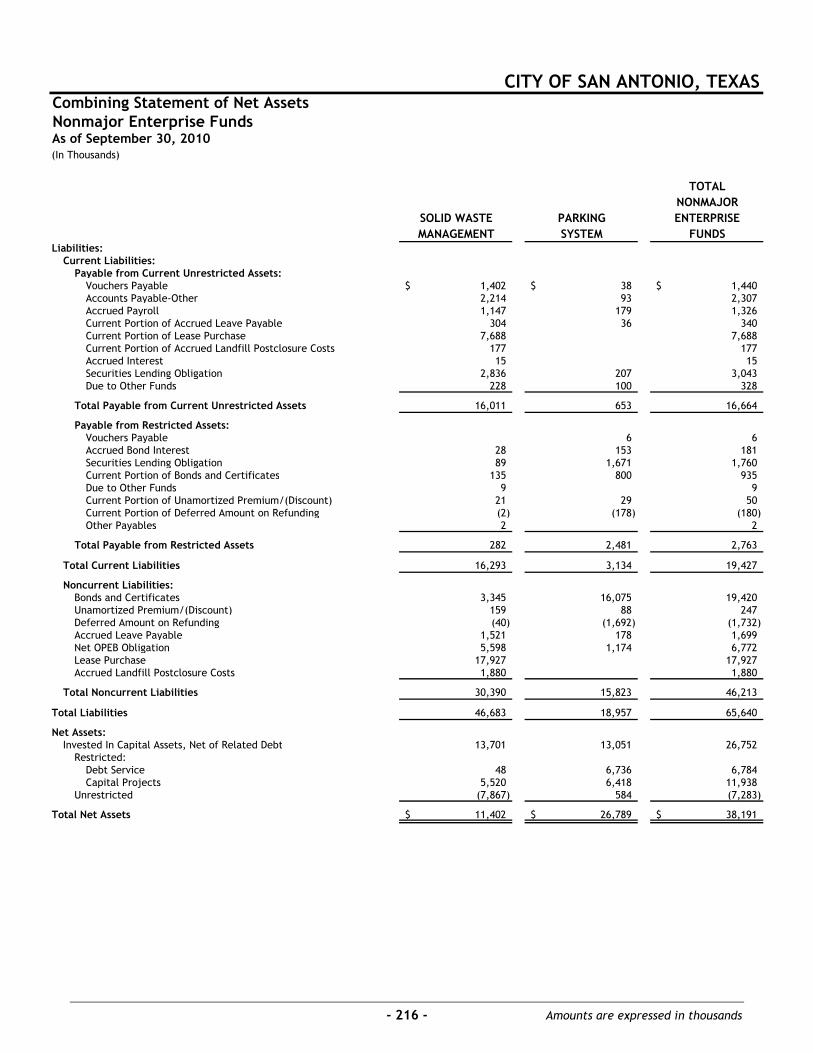
Combining Statement of Net AssetsNonmajor Enterprise Funds
(In Thousands)
TOTALNONMAJOR
SOLID WASTE PARKING ENTERPRISEMANAGEMENT SYSTEM FUNDS
Liabilities:Current Liabilities:
Payable from Current Unrestricted Assets:Vouchers Payable 1,402$ 38$ 1,440$Accounts Payable-Other 2,214 93 2,307Accrued Payroll 1,147 179 1,326Current Portion of Accrued Leave Payable 304 36 340Current Portion of Lease Purchase 7,688 7,688Current Portion of Accrued Landfill Postclosure Costs 177 177Accrued Interest 15 15Securities Lending Obligation 2,836 207 3,043Due to Other Funds 228 100 328
Total Payable from Current Unrestricted Assets 16,011 653 16,664
Payable from Restricted Assets:Vouchers Payable 6 6Accrued Bond Interest 28 153 181Securities Lending Obligation 89 1,671 1,760Current Portion of Bonds and Certificates 135 800 935Due to Other Funds 9 9Current Portion of Unamortized Premium/(Discount) 21 29 50Current Portion of Deferred Amount on Refunding (2) (178) (180)Other Payables 2 2
Total Payable from Restricted Assets 282 2,481 2,763
Total Current Liabilities 16,293 3,134 19,427
Noncurrent Liabilities:Bonds and Certificates 3,345 16,075 19,420Unamortized Premium/(Discount) 159 88 247Deferred Amount on Refunding (40) (1,692) (1,732)Accrued Leave Payable 1,521 178 1,699Net OPEB Obligation 5,598 1,174 6,772Lease Purchase 17,927 17,927Accrued Landfill Postclosure Costs 1,880 1,880
Total Noncurrent Liabilities 30,390 15,823 46,213
Total Liabilities 46,683 18,957 65,640
Net Assets:Invested In Capital Assets, Net of Related Debt 13,701 13,051 26,752
Restricted:Debt Service 48 6,736 6,784Capital Projects 5,520 6,418 11,938
Unrestricted (7,867) 584 (7,283)
Total Net Assets 11,402$ 26,789$ 38,191$
As of September 30, 2010
CITY OF SAN ANTONIO, TEXAS
- 216 - Amounts are expressed in thousands

Combining Statement of Revenues, Expenses, and Changes in Net AssetsNonmajor Enterprise Funds
(In Thousands)
TOTALNONMAJOR
SOLID WASTE PARKING ENTERPRISEMANAGEMENT SYSTEM FUNDS
Operating Revenues:Charges for Services 87,782$ 9,037$ 96,819$
Total Operating Revenues 87,782 9,037 96,819
Operating Expenses:Personal Services 29,622 4,925 34,547Contractual Services 25,342 427 25,769Commodities 9,360 103 9,463Other 15,260 1,320 16,580Depreciation 3,120 914 4,034
Total Operating Expenses 82,704 7,689 90,393
Operating Income 5,078 1,348 6,426
Nonoperating Revenues (Expenses):Investment Earnings 57 67 124Other Nonoperating Revenue 473 7 480Gain on Sale of Fixed Assets 106 250 356Interest and Debt Expense (1,058) (927) (1,985)Other Nonoperating Expense (22) (271) (293)
Total Nonoperating Revenues (Expenses) (444) (874) (1,318)
Change in Net Assets Before Transfers 4,634 474 5,108
Capital Contributions 582 582
Transfers In (Out):Transfers In 138 442 580Transfers Out (2,393) (573) (2,966)
Total Transfers In (Out) (2,255) (131) (2,386)
Change In Net Assets 2,961 343 3,304
Net Assets - October 1 8,441 26,446 34,887
Net Assets - September 30 11,402$ 26,789$ 38,191$
CITY OF SAN ANTONIO, TEXAS
Year-Ended September 30, 2010
- 217 - Amounts are expressed in thousands

Combining Statement of Cash FlowsNonmajor Enterprise Funds
(In Thousands)
TOTALNONMAJOR
SOLID WASTE PARKING ENTERPRISEMANAGEMENT FACILITIES FUNDS
Cash Flows from Operating Activities:Cash Received from Customers 87,519$ 9,047$ 96,566$Cash Payments to Suppliers for Goods and Services (50,002) (2,169) (52,171)Cash Payments to Employees for Service (27,767) (4,561) (32,328)Cash Received from Other Nonoperating Revenues 473 7 480
Net Cash Provided by Operating Activities 10,223 2,324 12,547
Cash Flows from Non-Capital Financing Activities:Transfers In from Other Funds 138 442 580Transfers Out to Other Funds (2,393) (573) (2,966)Due to Other Funds (3,607) 32 (3,575)Due from Other Funds 9,944 (247) 9,697
Net Cash Provided by (Used for) Non-Capital Financing Activities 4,082 (346) 3,736
Cash Flows from Capital and Related Financing Activities:Contributed Capital 582 582Acquisitions and Construction of Capital Assets (211) (1,525) (1,736)Proceeds from the Issuance of Long-Term Debt 545 545Proceeds from Issuance of Notes and Leases 6,324 6,324Principal Payments or Refundings on Long-Term Debt (685) (700) (1,385)Interest and Fees Paid on Long-Term Debt (149) (979) (1,128)Interest Paid on Notes and Leases (904) (904)Principal Payments on Notes and Leases (6,544) (6,544)Proceeds from Sale of Assets 7 7
Net Cash (Used for) Capital and Related Financing Activities (1,035) (3,204) (4,239)
Cash Flows from Investing Activities:Purchases of Investment Securities (24,023) (17,460) (41,483)Maturity of Investment Securities 12,172 18,479 30,651Purchases of Investments for Securities Lending (2,925) (1,878) (4,803)Proceeds from Cash Collected for Securities Lending Cash Collateral 2,925 1,878 4,803Investments Earnings 54 65 119
Net Cash Provided by (Used for) Investing Activities (11,797) 1,084 (10,713)
Net Increase (Decrease) in Cash and Cash Equivalents 1,473 (142) 1,331
Cash and Cash Equivalents, October 1 216 1,506 1,722
Cash and Cash Equivalents, September 30 1,689$ 1,364$ 3,053$
Reconciliation of Operating Income to Net CashProvided by Operating Activities
Operating Income 5,078$ 1,348$ 6,426$Adjustments to Reconcile Operating Income
to Net Cash Provided by Operating Activities:Depreciation 3,120 914 4,034Other Nonoperating Revenues 473 7 480Changes in Assets and Liabilities:
(Increase) in Accounts Receivable (183) (28) (211)(Increase) in Accrued Revenue (80) (12) (92)Decrease in Materials and Supplies 12 3 15Decrease in Deposits 50 50Increase (Decrease) in Vouchers Payable 290 (295) (5)(Decrease) in Accounts Payable - Other (46) (27) (73)Increase in Accrued Payroll 203 9 212(Decrease) in Accrued Leave Payable (88) (25) (113)(Decrease) in Landfill Postclosure Liability (296) (296)Increase in Net OPEB Obligation 1,740 380 2,120
Net Cash Provided by Operating Activities 10,223$ 2,324$ 12,547$
Noncash Investing, Capital and Financing Activities:Acquisitions and Construction of Capital Assets
from Debt Proceeds 1,171$ -$ 1,171$
CITY OF SAN ANTONIO, TEXAS
Year-Ended September 30, 2010
- 218 - Amounts are expressed in thousands

CITY OF SAN ANTONIO, TEXAS Comprehensive Annual Financial Report Year-Ended September 30, 2010

City of San Antonio, Texas
Internal Service Funds SELF-INSURANCE PROGRAMS - to account for Self-Insurance Programs including funds for the administration of all tort claims against the City and for the operation of the City’s employee benefit programs. Included in the Self-Insurance Programs are the Insurance Reserve Program, Employee Health Benefits Program, Workers’ Compensation Program, and Employee Wellness Program.
INFORMATION SERVICES - to account for financing of goods or services provided to other departments or agencies in the field of data processing, programming, and communication services.
OTHER INTERNAL SERVICES - to account for financing of goods or services (other than data processing and programming) provided to other departments or agencies. This fund has the following divisions: Central Stores, Motor Pool, Automotive Repair, Temporary Services and Building Maintenance and Repairs. Reserves for Equipment Renewal and Replacement are recorded by charges to the user departments.

Com
bini
ng S
tate
men
t of
Net
Ass
ets
Inte
rnal
Ser
vice
Fun
ds
(In
Thou
sand
s)
EMPL
OYE
EO
THER
TOTA
LH
EALT
HEM
PLO
YEE
INSU
RAN
CEW
ORK
ERS'
INFO
RMA
TIO
NIN
TERN
AL
INTE
RNA
LBE
NEF
ITS
WEL
LNES
SRE
SERV
ECO
MPE
NSA
TIO
NSE
RVIC
ESSE
RVIC
ESSE
RVIC
E FU
ND
SA
sset
s:Cu
rren
t A
sset
s:
Cash
and
Cas
h E q
uiva
lent
s1,
814
$-
$1,
964
$1,
960
$
920
$3,
128
$9,
786
$Se
curi
ties
Len
ding
Col
late
ral
3,17
13,
426
3,41
8
1,60
55,
442
17,0
62In
vest
men
ts21
,311
23,0
2122
,974
10
,791
36,5
7511
4,67
2Re
ceiv
able
s, N
et:
Acco
unts
3310
518
561
Accr
ued
Inte
rest
22
24
10Ac
crue
d Re
venu
e13
13D
ue F
rom
:O
ther
Fun
ds8
1,34
11,
349
Oth
er G
over
nmen
tal A
genc
ies,
Net
674
374
Mat
eria
ls a
nd S
uppl
ies,
at
Cost
331,
283
1,31
6Pr
epai
d Ex
pens
es82
217
917
01,
171
Dep
osit
s10
236
138
Tota
l Cur
rent
Ass
ets
26,5
0029
,235
28,5
73
13,5
4048
,304
146,
152
Capi
tal A
sset
s:Bu
ildin
gs20
158
178
Impr
ovem
ents
244
244
Mac
hine
ry a
nd E
quip
men
t15
464
441
5,73
415
7,67
416
4,06
7To
tal C
apit
al A
sset
s15
464
441
5,75
415
8,07
616
4,48
9Le
ss:
Accu
mul
ated
Dep
reci
atio
n15
464
441
5,69
410
1,09
410
7,44
7
Net
Cap
ital
Ass
ets
6056
,982
57,0
42
Tota
l Ass
ets
26,5
0029
,235
28,5
73
13,6
0010
5,28
620
3,19
4
Liab
iliti
es:
Curr
ent
Liab
iliti
es:
Vouc
hers
Pay
able
932
393
1,61
14,
732
7,31
7Ac
coun
ts P
ayab
le -
Oth
er1,
443
179
121
941
848
3,53
2Cl
aim
s Pa
yabl
e8,
365
23,1
3525
,594
57,0
94Ac
crue
d Pa
yrol
l63
7175
829
687
1,72
5Ac
crue
d In
tere
st P
ayab
le2
2Cu
rren
t Po
rtio
n of
Acc
rued
Lea
ve P
ayab
le11
914
247
172
453
Due
to
Oth
er G
over
nmen
tal A
genc
ies
711
711
Secu
riti
es L
endi
ng O
blig
atio
n3,
171
3,42
63,
418
1,
605
5,44
217
,062
Curr
ent
Port
ion
of L
ease
Pur
chas
e 10
310
3D
ue t
o O
ther
Fun
ds56
139
252
288
735
Tota
l Cur
rent
Lia
bilit
ies
14,0
4126
,859
29,3
64
6,19
612
,274
88,7
34
Non
curr
ent
Liab
iliti
es:
Accr
ued
Leav
e Pa
yabl
e 55
4369
1,23
785
82,
262
Leas
e Pu
rcha
se
299
299
Net
OPE
B O
blig
atio
n26
321
725
12,
702
3,68
37,
116
Tota
l Non
curr
ent
Liab
iliti
e s31
826
032
03,
939
4,84
09,
677
Tota
l Lia
bilit
ies
14,3
5927
,119
29,6
84
10,1
3517
,114
98,4
11
Net
Ass
ets:
Inve
sted
in C
apit
al A
sset
s, N
et o
f Re
late
d D
ebt
6056
,580
56,6
40U
nres
tric
ted
12,1
412,
116
(1,1
11)
3,
405
31,5
9248
,143
Tota
l Net
Ass
ets
12,1
41$
-$
2,11
6$
(1,1
11)
$
3,46
5$
88,1
72$
104,
783
$
As
of S
epte
mbe
r 30
, 20
10
SELF
-IN
SURA
NCE
PRO
GRA
MS
CITY
OF
SAN
AN
TON
IO,
TEXA
S
- 219 - Amounts are expressed in thousands

Com
bini
ng S
tate
men
t of
Rev
enue
s, E
xpen
ses,
and
Cha
nges
in F
und
Net
Ass
ets
Inte
rnal
Ser
vice
Fun
dsYe
ar-E
nded
Sep
tem
ber
30,
2010
(In
Thou
sand
s)
EMPL
OYE
EO
THER
TOTA
LH
EALT
HEM
PLO
YEE
INSU
RAN
CEW
ORK
ERS'
INFO
RMA
TIO
NIN
TERN
AL
INTE
RNA
LBE
NEF
ITS
WEL
LNES
SRE
SERV
ECO
MPE
NSA
TIO
NSE
RVIC
ESSE
RVIC
ESSE
RVIC
E FU
ND
SO
pera
ting
Rev
enue
s:Ch
arge
s fo
r Se
rvic
es88
,632
$-
$10
,883
$13
,766
$40
,092
$74
,283
$22
7,65
6$
Tota
l Ope
rati
ng R
even
ues
88,6
3210
,883
13,7
6640
,092
74,2
8322
7,65
6
Ope
rati
ng E
xpen
ses:
Pers
onal
Ser
vice
s1,
486
1,48
81,
595
18,3
8516
,696
39,6
50Co
ntra
ctua
l Ser
vice
s12
,953
1,05
11,
695
16,3
359,
432
41,4
66Co
mm
odit
ies
2918
4163
41,
651
2,37
3M
ater
ials
6820
,130
20,1
98Cl
aim
s85
,316
8,66
913
,973
107,
958
Oth
e r98
1,83
036
75,
322
6,33
213
,949
Dep
reci
atio
n48
520
,857
21,3
42
Tota
l Ope
rati
ng E
xpen
ses
99,8
8213
,056
17,6
7141
,229
75,0
9824
6,93
6
Ope
rati
ng (
Loss
)(1
1,25
0)(2
,173
)(3
,905
)(1
,137
)(8
15)
(19,
280)
Non
o per
atin
g Re
venu
es (
Expe
nses
):In
vest
men
t Ea
rnin
gs13
111
212
243
144
552
Oth
er N
onop
erat
ing
Reve
nue
502
230
379
291
255
1,65
7O
ther
Non
oper
atin
g Ex
pens
e(8
)(7
)(7
)(3
)(1
0)(3
5)G
ain
on S
ale
of C
apit
al A
sset
s1,
319
1,31
9In
tere
st a
nd D
ebt
Expe
nse
(2)
(15)
(17)
Tota
l Non
oper
atin
g Re
venu
es (
Expe
nses
)62
533
549
432
91,
693
3,47
6
Chan
ge in
Net
Ass
ets
Befo
re T
rans
fers
(10,
625)
(1,8
38)
(3,4
11)
(808
)87
8(1
5,80
4)
Tran
sfer
s In
(O
ut):
Tran
sfer
s In
4,03
485
4,69
31,
085
9,89
7Tr
ansf
ers
Out
(29)
(27)
(102
)(2
1)(3
,508
)(3
38)
(4,0
25)
Tota
l Tra
nsfe
rs In
(O
ut)
4,00
5(2
7)(1
02)
641,
185
747
5,87
2
Chan
ge in
Net
Ass
ets
(6,6
20)
(27)
(1,9
40)
(3,3
47)
377
1,62
5(9
,932
)
Net
Ass
ets
- O
ctob
er 1
18,7
6127
4,05
62,
236
3,08
886
,547
114,
715
Net
Ass
ets
- Se
ptem
ber
3012
,141
$-
$2,
116
$(1
,111
)$
3,46
5$
88,1
72$
104,
783
$
SELF
-IN
SURA
NCE
PRO
GRA
MS
CITY
OF
SAN
AN
TON
IO,
TEXA
S
- 220 - Amounts are expressed in thousands

Com
bini
ng S
tate
men
t of
Cas
h Fl
ows
Inte
rnal
Ser
vice
Fun
ds
(In
Thou
sand
s)
EMPL
OYE
EO
THER
TOTA
LH
EALT
HEM
PLO
YEE
INSU
RAN
CEW
ORK
ERS'
INFO
RMA
TIO
NIN
TERN
AL
INTE
RNA
LBE
NEF
ITS
WEL
LNES
SRE
SERV
ECO
MPE
NSA
TIO
NSE
RVIC
ESSE
RVIC
ESSE
RVIC
E FU
ND
SCa
sh F
low
s fr
om O
pera
ting
Act
ivit
ies:
Cash
Rec
eive
d fr
om C
usto
mer
s88
,583
$10
,884
$13
,762
$40
,112
$74
,490
$22
7,83
1$
Cash
Pay
men
ts t
o Su
pplie
rs f
or G
oods
and
Ser
vice
s(9
7,98
3)(6
,900
)(1
4,40
2)(2
1,11
7)(3
6,75
8)(1
77,1
60)
Cash
Pay
men
ts t
o Em
ploy
ees
for
Serv
ice
(1,3
94)
3(1
,418
)(1
,485
)(1
7,56
2)(1
5,54
9)(3
7,40
5)Ca
sh R
ecei
ved
from
Oth
er N
onop
erat
ing
Reve
nues
502
230
379
291
255
1,65
7
Net
Cas
h Pr
ovid
ed b
y (U
sed
for)
Ope
rati
ng A
ctiv
itie
s(1
0,29
2)3
2,79
6(1
,746
)1,
724
22,4
3814
,923
Cash
Flo
ws
from
Non
capi
tal F
inan
cing
Act
ivit
ies:
Tran
sfer
s In
fro
m O
ther
Fun
ds4,
034
854,
693
1,08
59,
897
Tran
sfer
s O
ut t
o O
ther
Fun
ds(2
9)(2
7)(1
02)
(21)
(3,5
08)
(338
)(4
,025
)D
ue T
o O
ther
Fun
ds52
139
115
281
587
Due
Fro
m O
ther
Fun
ds19
76
104
(15)
184
Net
Cas
h Pr
ovid
ed b
y (U
sed
for)
Non
capi
tal F
inan
cing
Act
ivit
ies
4,07
6(2
7)(2
6)
20
31,
404
1,01
36,
643
Cash
Flo
ws
from
Ca p
ital
and
Rel
ated
Fin
anci
ng A
ctiv
itie
s:Ac
quis
itio
ns a
nd C
onst
ruct
ion
of C
apit
al A
sset
s(1
5,86
0)(1
5,86
0)Pr
inci
pal P
aym
ents
on
Not
es a
nd L
ease
s(1
24)
(100
)(2
24)
Inte
rest
Pai
d on
Not
es a
nd L
ease
s(2
)(1
3)(1
5)Pr
ocee
ds f
rom
Sal
e of
Ass
ets
4,23
34,
233
Net
Cas
h (U
sed
for)
Cap
ital
and
Rel
ated
Fin
anci
ng A
ctiv
itie
s
(1
26)
(11,
740)
(11,
866)
Cash
Flo
ws
from
Inve
stin
g A
ctiv
itie
s:Pu
rcha
ses
of In
vest
men
t Se
curi
ties
(25,
921)
(27,
994)
(27,
939)
(13,
124)
(44,
481)
(139
,459
)M
atur
ity
of In
vest
men
t Se
curi
ties
31,6
8225
,538
29,4
5610
,383
33,9
8613
1,04
5Pu
rcha
ses
of In
vest
men
ts f
or S
ecur
itie
s Le
ndin
g(3
,171
)(3
,426
)(3
,418
)(1
,605
)(5
,442
)(1
7,06
2)Pr
ocee
ds f
rom
Cas
h Co
llect
ed f
or S
ecur
itie
s Le
ndin
g Ca
sh C
olla
tera
l3,
171
3,42
63,
418
1,60
55,
442
17,0
62In
vest
men
t Ea
rnin
gs12
210
3
11
440
131
510
Net
Cas
h Pr
ovid
ed b
y (U
sed
for)
Inve
stin
g A
ctiv
itie
s5,
883
(2,3
53)
1,63
1(2
,701
)(1
0,36
4)(7
,904
)
Net
Incr
ease
(D
ecre
ase)
in C
ash
and
Cash
Equ
ival
ents
(333
)(2
4)41
7
88
301
1,34
71,
796
Cash
and
Cas
h E q
uiva
lent
s, O
ctob
er 1
2,14
724
1,54
71,
872
619
1,78
17,
990
Cash
and
Cas
h E q
uiva
lent
s, S
epte
mbe
r 30
1,81
4$
-$
1,96
4$
1,96
0$
920
$3,
128
$9,
786
$
Reco
ncili
atio
n of
Ope
rati
ng(L
oss)
to
Net
Cas
hPr
ovid
ed b
y(U
sed
for)
Ope
rati
ng A
ctiv
itie
s:O
pera
ting
(Los
s)(1
1,25
0)$
-$
(2,1
73)
$(3
,905
)$
(1,1
37)
$(8
15)
$(1
9,28
0)$
Adj
ustm
ents
to
Reco
ncile
Ope
rati
ng In
com
e(L
oss)
to N
et C
ash
Prov
ided
by
(Use
d fo
r) O
pera
ting
Act
ivit
ies:
Dep
reci
atio
n48
520
,857
21,3
42O
ther
Non
oper
atin
g Re
venu
es50
223
0
37
929
125
51,
657
Chan
ges
in A
sset
s an
d Li
abili
ties
:(I
ncre
ase)
Dec
reas
e in
Acc
ount
s Re
ceiv
able
111
(9
)21
021
3(I
ncre
ase)
in A
ccru
ed R
even
ue(3
)(3
)(I
ncre
ase)
Dec
reas
e in
Due
fro
m O
ther
Gov
ernm
enta
l Age
ncie
s(6
0)(4
)29
(35)
(Inc
reas
e) D
ecre
ase
in M
ater
ials
and
Sup
plie
s69
(160
)(9
1)(I
ncre
ase)
Dec
reas
e in
Pre
paid
Exp
ense
s3
22
(15)
(158
)(1
48)
Incr
ease
(Dec
reas
e) in
Vou
cher
s Pa
yabl
e89
8(1
3)
(8
3)94
375
12,
496
Incr
ease
(Dec
reas
e) in
Cla
ims
Paya
ble
(289
)4,
638
1,70
36,
052
Incr
ease
(Dec
reas
e) in
Acc
ount
s Pa
yabl
e -
Oth
er
(196
)21
69
388
196
478
Incr
ease
in A
ccru
ed P
ayro
ll2
10
1222
6210
8In
crea
se(D
ecre
ase)
in A
ccru
ed L
eave
Pay
able
(6)
(6)
13
(86)
(4)
(89)
Incr
ease
in N
et O
PEB
Obl
igat
ion
9666
85
887
1,08
92,
223
Net
Cas
h Pr
ovid
ed b
y (U
sed
for)
Ope
rati
ng A
ctiv
itie
s(1
0,29
2)$
3$
2,79
6$
(1,7
46)
$1,
724
$22
,438
$14
,923
$
Year
-End
ed S
epte
mbe
r 30
, 20
10
SELF
-IN
SURA
NCE
PRO
GRA
MS
CITY
OF
SAN
AN
TON
IO,
TEXA
S
- 221 - Amounts are expressed in thousands

CITY OF SAN ANTONIO, TEXAS Comprehensive Annual Financial Report Year-Ended September 30, 2010

City of San Antonio, Texas
Fiduciary Funds Trust funds are used to account for assets held by the government in a trustee capacity. Agency funds are used to account for assets held by the government as an agent for individuals, private organizations, other governments and/or funds.
FIRE AND POLICE PENSION AND HEALTH CARE FUNDS - to account for resources of the pension and health care funds established for the City’s firefighters and police officers, as provided for under state law and the respective collective bargaining agreements:
FIRE AND POLICE PENSION FUND - to account for collection and payment of funds for the pension fund established for the City’s firefighters and police officers, as provided for under state law.
FIRE AND POLICE RETIREE HEALTH CARE FUND - to account for the collection and payment of funds for health care benefits of the City’s firefighters and police officers who retired after October 1, 1989, as provided for under state law and the respective collective bargaining agreements.
AGENCY FUNDS - to account for funds which are custodial in nature and for which the City is acting as an agent. The City has established the following agency funds based upon the above definition:
BEXAR COUNTY HOTEL/MOTEL TAX COLLECTIONS FUND – to account for the collection and payment to Bexar County for certain hotel occupancy taxes.
CRIMINAL JUSTICE PLANNING FUND – to account for the collection and payment to the State of Texas for Law Enforcement Fees collected.
CVB HOUSING BUREAU FUND – to account for individual hotel reservation deposits maintained by Convention & Visitors Bureau staff for confirmed City-wide conventions.
DEPOSIT FUND - to account for the collection and payment of cash deposits held by the City pending the outcome of bids on contracts.
EVIDENTIARY CASH FUND – to account for cash impounded by the San Antonio Police Department pending the outcome of legal proceedings.
LESSEES’ SPECIAL EVENTS LIABILITY INSURANCE FUND – to account for funds utilized for the purchase of insurance coverage on special events. Financing is provided by contributions from lessees.
MUNICIPAL COURT CASH BOND FUND – to account for the collection and payment of Court Cash Bonds held by the City pending the outcome of court cases.
SPECIAL EVENTS SECURITY TRUST FUND – to account for collection and payment of funds pertaining to security provided at events held on City property. Financing is provided by users.
STATE SALES TAX FUND – to account for the collection and payment to the State of Texas for sales tax collected.

City of San Antonio, Texas
Fiduciary Funds (continued) UNCLAIMED PROPERTY FUND - to account for the collection and administration of unclaimed property in accordance with the Texas Property Code - Title 6.
VIA TICKET SALES – to account for the collection and payment for bus pass proceeds to VIA Metropolitan Transport.

Combining Statement of Fiduciary Net AssetsFire and Police Pension and Health Care Funds
(In Thousands)
FIRE AND TOTAL FIREFIRE AND POLICE RETIREE AND POLICEPOLICE HEALTH CARE PENSION AND
PENSION FUND FUND HEALTH CARE FUNDS
Current Assets:Cash and Cash Equivalents 65,684$ 9,519$ 75,203$Security Lending Collateral 112,290 6,035 118,325Investments:
Common Stock 787,274 41,266 828,540U.S. Government Securities 86,925 1,945 88,870Corporate Bonds 431,594 2,714 434,308Hedge Funds 227,750 38,173 265,923Real Estate 138,959 24,970 163,929Alternative 178,375 67,247 245,622
Receivables:Accounts 7,762 7,762Accrued Interest 5,712 88 5,800Accrued Revenue 3,481 19 3,500
Total Current Assets 2,045,806 191,976 2,237,782
Capital Assets:Machinery and Equipment 132 132Buildings 767 767
Total Capital Assets 899 899Less: Accumulated Depreciation 428 428
Net Capital Assets 471 471
Total Assets 2,046,277 191,976 2,238,253
Vouchers Payable 2,767 116 2,883Accounts Payable - Other 9,112 9,112Claims Payable 2,961 2,961Accrued Payroll 134 27 161Securities Lending Obligation 112,290 6,035 118,325
Total Liabilities 124,303 9,139 133,442
Held in Trust for Pension Benefitsand Other Purposes 1,921,974$ 182,837$ 2,104,811$
Net Assets:
CITY OF SAN ANTONIO, TEXAS
As of September 30, 2010
Assets:
Liabilities:
- 222 - Amounts are expressed in thousands

Combining Statement of Changes in Fiduciary Net AssetsFire and Police Pension and Health Care Funds
(In Thousands)
FIRE AND TOTAL FIREFIRE AND POLICE RETIREE AND POLICEPOLICE HEALTH CARE PENSION AND
PENSION FUND FUND HEALTH CARE FUNDSAdditions:
Contributions:Employer 64,498$ 22,265$ 86,763$Employee 34,849 8,587 43,436
Total Contributions 99,347 30,852 130,199
Investment Earnings:Net Increase in Fair Value of Investments 128,828 9,864 138,692Real Estate Income, net 1,364 1,364Interest and Dividends 32,905 613 33,518Securities Lending 2,088 17 2,105Other Income 358 78 436
Total Investment Earnings 165,543 10,572 176,115Less: Investment Expenses:
Investment Management Fees and Custodian Fees (9,402) (553) (9,955)Securities Lending Expenses:
Borrower Rebates (28) (28)Lending Fees (112) (13) (125)
Net Investment Earnings 156,001 10,006 166,007
Total Additions 255,348 40,858 296,206
Deductions:Benefits 105,769 21,924 127,693Refunds of Contributions 871 871Administrative Expenses 2,172 1,581 3,753
Total Deductions 108,812 23,505 132,317
Change in Net Assets 146,536 17,353 163,889
Net Assets - October 1 1,775,438 165,484 1,940,922
Net Assets - September 30 1,921,974$ 182,837$ 2,104,811$
CITY OF SAN ANTONIO, TEXAS
Year-Ended September 30, 2010
- 223 - Amounts are expressed in thousands

Com
bini
ng B
alan
ce S
heet
Age
ncy
Fund
s
(In
Thou
sand
s)
CASH
AN
D
SECU
RITI
ESCA
SHLE
ND
ING
ACC
OU
NTS
TOTA
LEQ
UIV
ALE
NTS
COLL
ATE
RAL
INVE
STM
ENTS
RECE
IVA
BLE
ASS
ETS
Fund
s:Be
xar
Coun
ty H
otel
/Mot
el T
ax C
olle
ctio
ns F
und
954
$-
$
-$
75$
1,02
9$
Crim
inal
Jus
tice
Pla
nnin
g Fu
nd32
156
03,
766
14,
648
CVB
Hou
sing
Bur
eau
Fund
11
79
Dep
osit
Fun
d44
02,
342
12,
783
Evid
enti
ary
Cash
Fun
d13
123
01,
547
1,90
8Le
ssee
s' Sp
ecia
l Eve
nts
Liab
ility
Insu
ranc
e Fu
nd1
1 8
10M
unic
ipal
Cou
rt C
ash
Bond
Fun
d30
52 35
143
3Sp
ecia
l Eve
nts
Secu
rity
Tru
st F
und
116
716
8St
ate
Sale
s Ta
x Fu
nd16
24 16
420
4U
ncla
imed
Pro
pert
y Fu
nd49
85 57
370
7VI
A Ti
cket
Sal
es3
5 32
2666
Tota
l1,
507
$1,
398
$8,
790
$27
0$
11,9
65$
SECU
RITI
ESA
CCO
UN
TSD
UE
TOVO
UCH
ERS
LEN
DIN
GPA
YABL
EO
THER
TOTA
LPA
YABL
EO
BLIG
ATI
ON
OTH
ERFU
ND
SLI
ABI
LITI
ESFu
nds:
Bexa
r Co
unty
Hot
el/M
otel
Tax
Col
lect
ions
Fun
d-
$-
$
1,02
9$
-$
1,02
9$
Crim
inal
Jus
tice
Pla
nnin
g Fu
nd56
04,
088
4,64
8CV
B H
ousi
ng B
urea
u Fu
nd1
89
Dep
osit
Fun
d44
02,
343
2,78
3Ev
iden
tiar
y Ca
sh F
und
230
1,67
81,
908
Less
ees'
Spec
ial E
vent
s Li
abili
ty In
sura
nce
Fund
1 9
10M
unic
ipal
Cou
rt C
ash
Bond
Fun
d52
381
433
Spec
ial E
vent
s Se
curi
ty T
rust
Fun
d45
(386
)50
916
8St
ate
Sale
s Ta
x Fu
nd24
180
204
Unc
laim
ed P
rope
rty
Fund
85 62
270
7VI
A Ti
cket
Sal
es5
6166
Tota
l45
$1,
398
$10
,013
$50
9$
11,9
65$
ASS
ETS
LIA
BILI
TIES
CITY
OF
SAN
AN
TON
IO,
TEXA
S
As
of S
epte
mbe
r 30
, 20
10
- 224 - Amounts are expressed in thousands
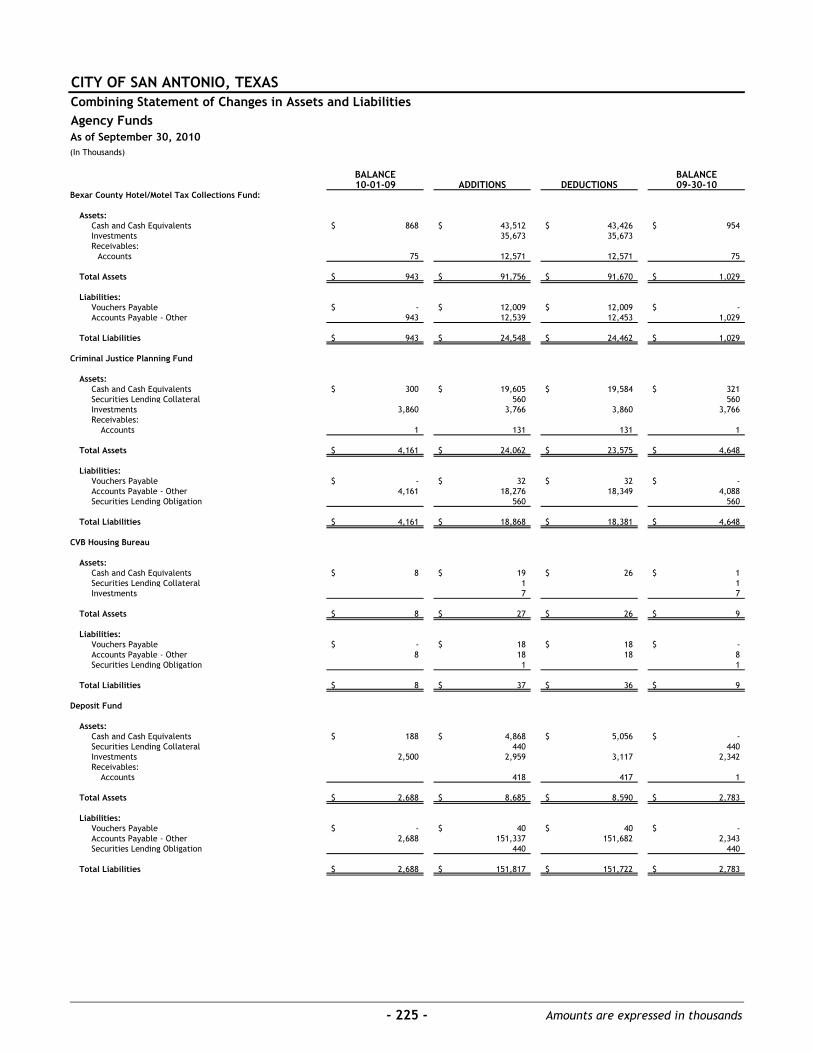
CITY OF SAN ANTONIO, TEXASCombining Statement of Changes in Assets and LiabilitiesAgency Funds
(In Thousands)
BALANCE BALANCE10-01-09 ADDITIONS DEDUCTIONS 09-30-10
Bexar County Hotel/Motel Tax Collections Fund:
Assets:Cash and Cash Equivalents 868$ 43,512$ 43,426$ 954$Investments 35,673 35,673 Receivables:
Accounts 75 12,571 12,571 75
Total Assets 943$ 91,756$ 91,670$ 1,029$
Liabilities:Vouchers Payable -$ 12,009$ 12,009$ -$Accounts Payable - Other 943 12,539 12,453 1,029
Total Liabilities 943$ 24,548$ 24,462$ 1,029$
Criminal Justice Planning Fund
Assets:Cash and Cash Equivalents 300$ 19,605$ 19,584$ 321$Securities Lending Collateral 560 560Investments 3,860 3,766 3,860 3,766Receivables:
Accounts 1 131 131 1
Total Assets 4,161$ 24,062$ 23,575$ 4,648$
Liabilities:Vouchers Payable -$ 32$ 32$ -$Accounts Payable - Other 4,161 18,276 18,349 4,088Securities Lending Obligation 560 560
Total Liabilities 4,161$ 18,868$ 18,381$ 4,648$
CVB Housing Bureau
Assets:Cash and Cash Equivalents 8$ 19$ 26$ 1$Securities Lending Collateral 1 1Investments 7 7
Total Assets 8$ 27$ 26$ 9$
Liabilities:Vouchers Payable -$ 18$ 18$ -$Accounts Payable - Other 8 18 18 8Securities Lending Obligation 1 1
Total Liabilities 8$ 37$ 36$ 9$
Deposit Fund
Assets:Cash and Cash Equivalents 188$ 4,868$ 5,056$ -$Securities Lending Collateral 440 440Investments 2,500 2,959 3,117 2,342Receivables:
Accounts 418 417 1
Total Assets 2,688$ 8,685$ 8,590$ 2,783$
Liabilities:Vouchers Payable -$ 40$ 40$ -$Accounts Payable - Other 2,688 151,337 151,682 2,343Securities Lending Obligation 440 440
Total Liabilities 2,688$ 151,817$ 151,722$ 2,783$
As of September 30, 2010
- 225 - Amounts are expressed in thousands

CITY OF SAN ANTONIO, TEXASCombining Statement of Changes in Assets and LiabilitiesAgency Funds
(In Thousands)
BALANCE BALANCE10-01-09 ADDITIONS DEDUCTIONS 09-30-10
As of September 30, 2010
Evidentiary Cash Fund
Assets:Cash and Cash Equivalents 131$ 5,394$ 5,394$ 131$Securities Lending Collateral 230 230Investments 1,669 4,732 4,854 1,547Receivables:
Accrued Interest 1 12 13
Total Assets 1,801$ 10,368$ 10,261$ 1,908$
Liabilities:Vouchers Payable -$ -$ -$ -$Accounts Payable - Other 1,801 69 192 1,678Securities Lending Obligation 230 230
Total Liabilities 1,801$ 299$ 192$ 1,908$
Lessee's Special Event Liability Insurance
Assets:Cash and Cash Equivalents 9$ 32$ 40$ 1$Securities Lending Collateral 1 1Investments 8 8Receivables:
Accounts 11 11
Total Assets 9$ 52$ 51$ 10$
Liabilities:Vouchers Payable -$ 26$ 26$ -$Accounts Payable - Other 9 31 31 9Securities Lending Obligation 1 1
Total Liabilities 9$ 58$ 57$ 10$
Municipal Court Cash Bond Fund
Assets:Cash and Cash Equivalents 24$ 653$ 647$ 30$Securities Lending Collateral 52 52Investments 321 351 321 351Receivables:
Accounts 1 1
Total Assets 345$ 1,057$ 969$ 433$
Liabilities:Vouchers Payable -$ -$ -$ -$Accounts Payable - Other 345 472 436 381Securities Lending Obligation 52 52
Total Liabilities 345$ 524$ 436$ 433$
Special Events Security Trust Fund
Assets:Cash and Cash Equivalents -$ 3,156$ 3,155$ 1$Receivables:
Accounts 201 3,043 3,077 167
Total Assets 201$ 6,199$ 6,232$ 168$
Liabilities:Vouchers Payable 45$ -$ -$ 45$Accounts Payable - Other (380) 3,451 3,457 (386)Due To Other Funds 536 509 536 509
Total Liabilities 201$ 3,960$ 3,993$ 168$
- 226 - Amounts are expressed in thousands

CITY OF SAN ANTONIO, TEXASCombining Statement of Changes in Assets and LiabilitiesAgency Funds
(In Thousands)
BALANCE BALANCE10-01-09 ADDITIONS DEDUCTIONS 09-30-10
As of September 30, 2010
State Sales Tax Fund
Assets:Cash and Cash Equivalents 76$ 9,282$ 9,342$ 16$Securities Lending Collateral 24 24Investments 164 164Receivables:
Accounts 6 6
Total Assets 82$ 9,470$ 9,348$ 204$
Liabilities:Accounts Payable - Other 82$ 9,053$ 8,955$ 180$Securities Lending Obligation 24 24
Total Liabilities 82$ 9,077$ 8,955$ 204$
Unclaimed Property Fund
Assets:Cash and Cash Equivalents 517$ 1,600$ 2,068$ 49$Securities Lending Collateral 85 85Investments 1,754 1,181 573
Total Assets 517$ 3,439$ 3,249$ 707$
Liabilities:Vouchers Payable -$ 124$ 124$ -$Accounts Payable - Other 517 281 176 622Securities Lending Obligation 85 85
Total Liabilities 517$ 490$ 300$ 707$
VIA Ticket Sales
Assets:Cash and Cash Equivalents 32$ 316$ 345$ 3$Securities Lending Collateral 5 5Investments 35,705 35,673 32Receivables:
Accounts 38 462 474 26
Total Assets 70$ 36,488$ 36,492$ 66$
Liabilities:Vouchers Payable -$ 218$ 218$ -$Accounts Payable - Other 70 369 378 61Securities Lending Obligation 5 5Due From Other Funds 36 36
Total Liabilities 70$ 628$ 632$ 66$
Total All Agency Funds
Assets:Cash and Cash Equivalents 2,153$ 88,437$ 89,083$ 1,507$Securities Lending Collateral 1,398 1,398Investments 8,350 85,119 84,679 8,790Receivables:
Accounts 321 16,637 16,688 270Accrued Interest 1 12 13
Total Assets 10,825$ 191,603$ 190,463$ 11,965$
Liabilities:Vouchers Payable 45$ 12,467$ 12,467$ 45$Accounts Payable - Other 10,244 195,896 196,127 10,013Securities Lending Obligation 1,398 1,398Due To Other Funds 536 545 572 509
Total Liabilities 10,825$ 210,306$ 209,166$ 11,965$
(end of statement)
- 227 - Amounts are expressed in thousands
City of San Antonio, Texas
Nonmajor Component Units As set forth in GASB Statement No. 14, The Financial Reporting Entity, and as amended by GASB Statement No. 39, Determining Whether Certain Organizations are Component Units - an amendment to GASB Statement No. 14, component units, which by the nature and significance of their relationship with the City is such that their exclusion from the reporting entity’s financial statements would be misleading or incomplete, and are presented discretely with the City’s financial statements.
The City has determined that the following component units meet the criteria for discrete presentation as set forth in GASB Statement No. 14, as amended by GASB Statement No. 39:
BROOKS DEVELOPMENT AUTHORITY (BDA) – was designated to improve mission effectiveness, reduce the cost of providing quality installation support, and promote economic development on Brooks Air Force Base and in the surrounding community. Dedicated funds will provide basic municipal services at the base while continuing to develop it as a technology and business park.
CITY SOUTH MANAGEMENT AUTHORITY (CSMA) – was established for supporting economic development, creating sustainable communities, and promoting the unique historical, cultural and environmental assets of the City’s southern edge.
MAIN PLAZA CONSERVANCY (MPA) – was established to operate and maintain Main Plaza in coordination with the City and Bexar County. MPA develops and implements strategies to increase awareness of the historical and cultural significance of Main Plaza and to organize cultural and artistic events at Main Plaza for the benefit of the citizens, residents and visitors of San Antonio.
MUNICIPAL GOLF ASSOCIATION – SAN ANTONIO (MGA-SA) – was established for the purpose of, and to act on behalf of the City in, operating and promoting the City of San Antonio municipal golf facilities.
PORT AUTHORITY OF SAN ANTONIO (THE PORT) – was established for the purpose of monitoring the proposed closing of Kelly Air Force Base (Kelly) and formulating and adopting a comprehensive plan for the conversion and redevelopment of Kelly. The Port is authorized to issue bonds to finance related projects. These bonds are not obligations of the City.
SA ENERGY ACQUISITION PUBLIC FACILITY CORPORATION – was established for the purpose of, and to act on behalf of the City in, the financing and acquisition of electric energy and power, oil, gas, coal and other liquid, gaseous or solid hydrocarbon fuels for the electric and gas systems of the City of San Antonio.
SAN ANTONIO DEVELOPMENT AGENCY (SADA) - SADA is responsible for implementing the City’s Urban Renewal Program. A majority of the financing is provided from the sale of existing properties.

City of San Antonio, Texas
Nonmajor Component Units (Continued) SAN ANTONIO HOUSING TRUST FOUNDATION INC. (SAHTF) - is a nonprofit corporation established in 1990 for the purpose of supporting charitable, educational, and scientific undertakings, specifically for providing housing for low- to middle-income families. In addition, SAHTF provides administrative and other support for the operations of the San Antonio Housing Trust Fund, a Permanent Fund of the City.

Com
bini
ng S
tate
men
t of
Net
Ass
ets
Non
maj
or D
iscr
etel
y Pr
esen
ted
Com
pone
nt U
nits
(In
Thou
sand
s)M
UN
ICIP
AL
PORT
SAN
AN
TON
IOTO
TAL
BRO
OKS
CITY
SO
UTH
MA
ING
OLF
AU
THO
RITY
SA E
NER
GY
SAN
AN
TON
IOH
OU
SIN
G T
RUST
NO
NM
AJO
RD
EVEL
OPM
ENT
MA
NA
GEM
ENT
PLA
ZAA
SSO
CIA
TIO
NO
FA
CQU
ISIT
ION
DEV
ELO
PMEN
TFO
UN
DA
TIO
NCO
MPO
NEN
TA
UTH
ORI
TYA
UTH
ORI
TYCO
NSE
RVA
NCY
SAN
AN
TON
IOSA
N A
NTO
NIO
CORP
ORA
TIO
NA
GEN
CYIN
C.U
NIT
SA
sset
s:Cu
rren
t A
sset
s:
Unr
estr
icte
d A
sset
s:Ca
sh a
nd C
ash
Equi
vale
nts
12,8
68$
-$
126
$40
3$
7,52
5$
23
0$
494
$91
0$
22,5
56$
Inve
stm
ent s
441
441
Rece
ivab
les,
Net
:N
otes
4,00
43,
514
7,51
8Ac
coun
t s15
227
5,62
729
754
6,15
7Ac
crue
d In
tere
s t32
32M
ater
ials
and
Sup
plie
s, a
t Co
st52
107
159
Due
fro
m O
ther
Gov
ernm
enta
l Age
ncie
s4,
756
4,70
29,
458
Prep
aid
Expe
nses
280
54
34,0
7934
,368
Oth
er A
sset
s1
176
1,15
825
1,36
0To
tal U
nres
tric
ted
Ass
ets
18,1
4013
271
717
,389
39
,936
791
4,94
482
,049
Rest
rict
ed A
sset
s:D
ebt
Serv
ice
Acco
unts
:Ca
sh a
nd C
ash
Equi
vale
nts
912
18
,536
19,4
48In
vest
men
t s7,
445
7,44
5Ac
crue
d In
tere
s t96
96O
ther
Res
tric
ted
Acco
unts
:Ca
sh a
nd C
ash
Equi
vale
nts
1,90
91,
909
Tota
l Res
tric
ted
Ass
ets
2,82
1
26,0
7728
,898
Tota
l Cur
rent
Ass
ets
18,1
4013
271
720
,210
66
,013
791
4,94
411
0,94
7N
oncu
rren
t A
sset
s:Ca
pita
l Ass
ets:
Land
4,58
635
,424
40,0
10In
fras
truc
tur e
15,3
4441
,649
56,9
93Bu
ildin
gs74
,759
565
153
165,
674
241,
151
Mac
hine
ry a
nd E
quip
men
t2,
075
92,
200
3,96
261
8,30
7Co
nstr
ucti
on in
Pro
gres
s21
,563
259
7,92
729
,749
Tota
l Cap
ital
Ass
ets
118,
327
574
2,61
225
4,63
661
376,
210
Less
: Ac
cum
ulat
ed D
epre
ciat
ion
37,7
9930
412
57,4
5959
95,7
59As
sets
Hel
d fo
r Re
sale
448
448
Net
Ca p
ital A
sset
s80
,528
544
2,20
019
7,17
744
82
280,
899
Oth
er N
oncu
rren
t A
sset
s:Re
ceiv
able
s4,
128
4,12
8Pr
epai
d Ex
pens
es55
9,34
555
9,34
5O
ther
Non
curr
ent
Asse
t s2,
009
34
,309
36,3
18To
tal O
ther
Non
curr
ent A
sset
s6,
137
59
3,65
459
9,79
1To
tal N
oncu
rren
t A
sset
s80
,528
544
2,20
020
3,31
4
593,
654
448
288
0,69
0To
tal A
sset
s98
,668
-67
62,
917
223,
524
65
9,66
71,
239
4,94
699
1,63
7
Liab
iliti
es:
Curr
ent
Liab
iliti
es:
Paya
ble
from
Cur
rent
Unr
estr
icte
d A
sset
s:Ac
coun
ts P
a yab
le a
nd O
ther
Cur
rent
Lia
bilit
ies
1,69
3-
2360
07,
227
31
299
9,61
2U
near
ned
Reve
nue s
2,47
01
500
21
2,99
2D
ue t
o O
ther
Gov
ernm
enta
l Age
ncie
s1,
261
3 31
919
91,
782
Curr
ent
Port
ion
of L
ong-
term
Lea
se/N
otes
Pay
abl e
450
784
2,06
2
161
3,35
8Cu
rren
t Po
rtio
n of
Oth
er P
ayab
les
3,02
45,
183
8,20
7To
tal P
ayab
le f
rom
Cur
rent
Unr
estr
icte
d A
sset
s7,
637
1,26
124
1,38
414
,975
31
370
269
25,9
51Pa
yabl
e fr
om R
estr
icte
d A
sset
s:A
ccru
ed B
onds
Inte
rest
341
16
,370
16,7
11Cu
rren
t Po
rtio
n of
Bon
ds P
ayab
l e79
6
20,9
6021
,756
Tota
l Pay
able
fro
m R
estr
icte
d A
sset
s1,
137
37
,330
38,4
67To
tal C
urre
nt L
iabi
litie
s7,
637
1,26
124
1,38
416
,112
37
,361
370
269
64,4
18N
oncu
rren
t Li
abili
ties
:Lo
ng-t
erm
Lea
se/N
otes
Pay
able
(N
et o
f Cu
rren
t Po
rtio
n )13
,126
1,15
927
,444
32
41,7
61O
ther
Pay
able
s (N
et o
f Cu
rren
t Po
rtio
n )10
51,
891
1,99
6Bo
nds
Paya
ble
(Net
of
Curr
ent
Port
ion )
45,9
49
587,
940
633,
889
Una
mor
tize
d Pr
emiu
m/(
Dis
coun
t) o
n Bo
nds
34,3
6634
,366
Tota
l Non
curr
ent
Liab
iliti
es13
,231
1,15
975
,284
62
2,30
632
712,
012
Tota
l Lia
bilit
ies
20,8
681,
261
242,
543
91,3
96
659,
667
402
269
776,
430
Net
Ass
ets:
Inve
sted
in C
apit
al A
sset
s, N
et o
f Re
late
d D
ebt
62,2
1654
455
712
4,03
52
187,
354
Rest
rict
ed f
or:
Deb
t Se
rvic
e91
291
2Ca
pita
l Pro
ject
s1,
752
1,75
2Pe
rpet
ual C
are:
Expe
ndab
le2,
972
2,97
2U
nres
tric
ted
15,5
84(1
,261
)10
8(1
83)
5,42
9
837
1,70
322
,217
Tota
l Net
Ass
ets
77,8
00$
(1,2
61)
$65
2$
374
$13
2,12
8$
-
$83
7$
4,67
7$
215,
207
$
As
of S
epte
mbe
r 30
, 20
10
CITY
OF
SAN
AN
TON
IO,
TEXA
S
- 228 - Amounts are expressed in thousands

Combining Statement of ActivitiesNonmajor Discretely Presented Component UnitsYear-Ended September 30, 2010(In Thousands)
CHARGES OPERATING CAPITAL BROOKS CITY SOUTHFOR GRANTS AND GRANTS AND DEVELOPMENT MANAGEMENT
EXPENSES SERVICES CONTRIBUTIONS CONTRIBUTIONS AUTHORITY AUTHORITY
Brooks Development AuthorityEconomic Development and Opportunity 13,552$ 17,119$ -$ 3,334$ 6,901$ -$
City South Management AuthorityEconomic Development and Opportunity 170 (170)
Main Plaza ConservancyCulture and Recreation 649 30 580
Municipal Golf Association - San AntonioCulture and Recreation 8,022 7,853 386
Port Authority of San AntonioEconomic Development and Opportunity 44,106 41,409 2,914
SA Energy Acquisition CorporationWelfare 53,942 53,042
San Antonio Development AgencyUrban Redevelopment and Housing 453 57
San Antonio Housing Trust Foundation, Inc.Urban Redevelopment and Housing 872 108 588
Total 121,766$ 119,618$ 4,082$ 3,720$ 6,901 (170)
General Revenues:Investment Earnings 20Miscellaneous 40
Total General Revenues 60
Change in Net Assets 6,961 (170)Net Assets - Beginning of Fiscal Year (as restated) 70,839 (1,091)
Net Assets - End of Fiscal Year 77,800$ (1,261)$
CITY OF SAN ANTONIO, TEXAS
FUNCTION/PROGRAM ACTIVITIES
PROGRAM REVENUESNET (EXPENSE) REVENUE AND
CHANGES IN NET ASSETS
- 229 - Amounts are expressed in thousands

Combining Statement of ActivitiesNonmajor Discretely Presented Component UnitsYear-Ended September 30, 2010(In Thousands)
MUNICIPAL PORT SAN ANTONIO TOTALMAIN GOLF AUTHORITY SA ENERGY SAN ANTONIO HOUSING TRUST NONMAJOR
PLAZA ASSOCIATION OF ACQUISITION DEVELOPMENT FOUNDATION COMPONENTCONSERVANCY SAN ANTONIO SAN ANTONIO CORPORATION AGENCY INC. UNITS
-$ -$ -$ -$ -$ -$ 6,901$
(170)
(39) (39)
217 217
217 217
(900) (900)
(396) (396)
(176) (176)
(39) 217 217 (900) (396) (176) 5,654
98 900 1 80 1,09937 3 1 81
37 98 900 4 81 1,180
(2) 217 315 (392) (95) 6,834654 157 131,813 1,229 4,772 208,373
652$ 374$ 132,128$ -$ 837$ 4,677$ 215,207$
NET (EXPENSE) REVENUE AND CHANGES IN NET ASSETS
CITY OF SAN ANTONIO, TEXAS
- 229 - Amounts are expressed in thousands

CITY OF SAN ANTONIO, TEXAS Comprehensive Annual Financial Report Year-Ended September 30, 2010

City of San Antonio, Texas
Capital Assets Used in the Operation of Governmental Funds

Capital Assets Used in the Operation of Governmental FundsSchedule of Capital Assets by Source1
(In Thousands)
2010
Land 1,364,427$Other Non-Depreciable Assets 500Non-Depreciable Intangible Assets 81,809Depreciable Intangible Assets 120Buildings 733,926Improvements 373,383Infrastructures 2,382,971Machinery and Equipment 225,588Construction in Progress 479,769
Total Governmental Funds Capital Assets 5,642,493$
Investment in Governmental Funds Capital Assets by Source:Current Revenue 2,212,101$General Obligation Bonds and Certificates of Obligation 2,821,606Special Revenue Bonds 15Federal and State Grants 577,121Special Assessments 1,008Trusts 118Private Citizens' Contribution 24,695San Antonio Fair, Inc. 4,542San Antonio Public Library Foundation 1,287
Total Investment in Governmental Funds Capital Assets by Source 5,642,493$
1 This schedule presents only the capital asset balances related to governmental funds. Accordingly, the capital assets reported in internal
service funds are excluded from the above amounts. Generally, the capital assets of internal service funds are included as governmental
activities in the Statement of Net Assets.
CITY OF SAN ANTONIO, TEXAS
As of September 30, 2010
Governmental Funds Capital Assets:
- 230 - Amounts are expressed in thousands
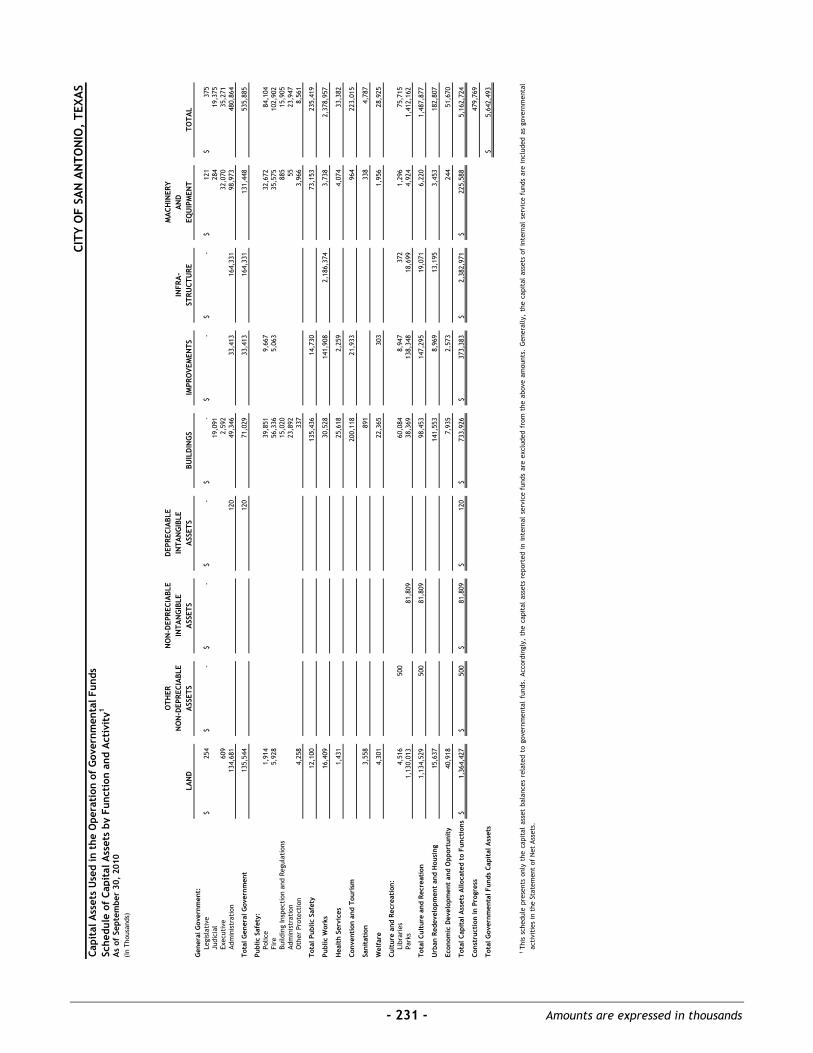
Capi
tal A
sset
s U
sed
in t
he O
pera
tion
of
Gov
ernm
enta
l Fun
dsSc
hedu
le o
f Ca
pita
l Ass
ets
by F
unct
ion
and
Act
ivit
y1
(In
Thou
sand
s)
OTH
ERN
ON
-DEP
RECI
ABL
ED
EPRE
CIA
BLE
MA
CHIN
ERY
NO
N-D
EPRE
CIA
BLE
INTA
NG
IBLE
INTA
NG
IBLE
INFR
A-
AN
DLA
ND
ASS
ETS
ASS
ETS
ASS
ETS
BUIL
DIN
GS
IMPR
OVE
MEN
TSST
RUCT
URE
EQU
IPM
ENT
TOTA
L
Legi
slat
ive
254
$
-$
-$
-$
-$
-$
-$
121
$37
5$
Judi
cial
19,0
9128
419
,375
Exec
utiv
e60
92,
592
32,0
7035
,271
Adm
inis
trat
ion
134,
681
120
49,3
4633
,413
164,
331
98,9
7348
0,86
4
Tota
l Gen
eral
Gov
ernm
ent
135,
544
12
071
,029
33,4
1316
4,33
113
1,44
853
5,88
5
Publ
ic S
afet
y:Po
lice
1,91
439
,851
9,66
732
,672
84,1
04Fi
re5,
928
56,3
365,
063
35,5
7510
2,90
2Bu
ildin
g In
spec
tion
and
Reg
ulat
ions
15,0
2088
515
,905
Adm
inis
trat
ion
23,8
9255
23,9
47O
ther
Pro
tect
ion
4,25
833
73,
966
8,56
1
Tota
l Pub
lic S
afet
y12
,100
13
5,43
614
,730
73,1
5323
5,41
9
Publ
ic W
orks
16,4
0930
,528
141,
908
2,18
6,37
43,
738
2,37
8,95
7
Hea
lth
Serv
ices
1,43
125
,618
2,25
94,
074
33,3
82
Conv
enti
on a
nd T
ouri
sm20
0,11
821
,933
964
223,
015
Sani
tati
on3,
558
891
338
4,78
7
Wel
fare
4,30
122
,365
303
1,95
628
,925
Cult
ure
and
Recr
eati
on:
Libr
arie
s4,
516
500
60,0
848,
947
372
1,29
675
,715
Park
s1,
130,
013
81,8
0938
,369
138,
348
18,6
994,
924
1,41
2,16
2
Tota
l Cul
ture
and
Rec
reat
ion
1,13
4,52
950
081
,809
98,4
5314
7,29
519
,071
6,22
01,
487,
877
Urb
an R
edev
elop
men
t an
d H
ousi
ng15
,637
141,
553
8,96
913
,195
3,45
318
2,80
7
Econ
omic
Dev
elop
men
t an
d O
ppor
tuni
t y40
,918
7,93
52,
573
244
51,6
70
Tota
l Cap
ital
Ass
ets
Allo
cate
d to
Fun
ctio
ns1,
364,
427
$
50
0$
81,8
09$
120
$73
3,92
6$
37
3,38
3$
2,38
2,97
1$
225,
588
$5,
162,
724
Cons
truc
tion
in P
rogr
ess
479,
769
Tota
l Gov
ernm
enta
l Fun
ds C
apit
al A
sset
s5,
642,
493
$
1Th
issc
hedu
lepr
esen
tson
lyth
eca
pita
las
set
bala
nces
rela
ted
togo
vern
men
tal
fund
s.Ac
cord
ingl
y,th
eca
pita
las
sets
repo
rted
inin
tern
alse
rvic
efu
nds
are
excl
uded
from
the
abov
eam
ount
s.G
ener
ally
,th
eca
pita
las
sets
ofin
tern
alse
rvic
efu
nds
are
incl
uded
asgo
vern
men
tal
acti
viti
es in
the
Sta
tem
ent
of N
et A
sset
s.
CITY
OF
SAN
AN
TON
IO,
TEXA
S
As
of S
epte
mbe
r 30
, 20
10
Gen
eral
Gov
ernm
ent:
- 231 - Amounts are expressed in thousands

Capital Assets Used in the Operation of Governmental FundsSchedule of Changes in Capital Assets by Function and Activity1
(In Thousands)
GOVERNMENTALGOVERNMENTAL FUNDS
FUNDS CAPITAL ASSETS10-01-09 ADDITIONS DEDUCTIONS 09-30-10
Function and Activity:General Government:
Legislative 375$ -$ -$ 375$Judicial 19,375 19,375Executive 35,271 35,271Administration 458,660 29,760 7,556 480,864
Total General Government 513,681 29,760 7,556 535,885
Public Safety:Police 83,552 699 147 84,104Fire 97,090 6,140 328 102,902Building Inspection and Regulations 15,905 15,905Administration 23,947 23,947Other Protection 8,561 8,561
Total Public Safety 229,055 6,839 475 235,419
Public Works 2,302,802 76,417 262 2,378,957
Health Services 31,856 1,537 11 33,382
Convention and Tourism 223,476 440 901 223,015
Sanitation 4,787 4,787
Welfare 14,909 14,016 28,925
Culture and Recreation:Libraries 75,715 75,715Parks 1,382,635 29,587 60 1,412,162
Total Culture and Recreation 1,458,350 29,587 60 1,487,877
Urban Redevelopment and Housing 181,523 1,315 31 182,807
Economic Development and Opportunity 51,250 420 51,670
Construction in Progress 388,357 215,920 124,508 479,769
Total Governmental Funds Capital Assets 5,400,046$ 376,251$ 133,804$ 5,642,493$
1
CITY OF SAN ANTONIO, TEXAS
This schedule presents only the capital asset balances related to governmental funds. Accordingly, the capital assets reported in internal servicefunds are excluded from the above amounts. Generally, the capital assets of internal service funds are included as governmental activities inthe Statement of Net Assets.
Year-Ended September 30, 2010
- 232 - Amounts are expressed in thousands

CITY OF SAN ANTONIO, TEXAS Comprehensive Annual Financial Report Year-Ended September 30, 2010

City of San Antonio, Texas
Statistical Section (Unaudited)
Sources: Unless otherwise noted, the information in these schedules are derived from the comprehensive annual financial reports for the relevant year. The City implemented GASB Statement No. 34 in 2002; schedules presenting government-wide information include information beginning in that year.

City of San Antonio, Texas
Financial Trends
These schedules contain trend information to help the reader understand how the City’s financial performance and well-being have changed over time.

Stat
isti
cal D
ata
Net
Ass
ets
by C
ompo
nent
(acc
rual
bas
is o
f ac
coun
ting
)(I
n Th
ousa
nds)
2002
2003
2004
2005
2006
(Res
tate
d)20
07(R
esta
ted)
2008
2009
2010
Gov
ernm
enta
l Act
ivit
ies:
Inve
sted
in C
apit
al A
sset
s, n
et o
f re
late
d de
bt2,
036,
269
$2,
079,
719
$2,
118,
418
$2,
042,
288
$1,
984,
942
$2,
024,
576
$2,
092,
623
$2,
200,
616
$2,
241,
952
$Re
stri
cted
109,
693
92,5
2489
,867
101,
253
105,
024
120,
591
122,
537
128,
727
124,
300
Unr
estr
icte
d11
0,59
112
5,74
899
,659
133,
052
181,
484
184,
154
162,
997
168,
054
160,
699
Tota
l Gov
ernm
enta
l Act
ivit
ies,
net
ass
ets
2,25
6,55
3$
2,29
7,99
1$
2,30
7,94
4$
2,27
6,59
3$
2,27
1,45
0$
2,32
9,32
1$
2,37
8,15
7$
2,49
7,39
7$
2,52
6,95
1$
Busi
ness
-Typ
e A
ctiv
itie
s:In
vest
ed in
Ca p
ital
Ass
ets,
net
of
rela
ted
debt
152,
261
$15
6,56
7$
197,
929
$21
2,71
5$
216,
459
$20
1,84
6$
208,
894
$26
0,67
9$
270,
226
$Re
stri
cted
52,0
7756
,489
23,7
2026
,636
27,7
0061
,559
76,1
7866
,099
78,5
58U
nres
tric
ted
6,02
17,
735
5,97
11,
719
7,24
0
23,0
1031
,247
2,97
63,
108
Tota
l Bus
ines
s-Ty
pe A
ctiv
itie
s, n
et a
sset
s21
0,35
9$
220,
791
$22
7,62
0$
241,
070
$25
1,39
9$
286,
415
$31
6,31
9$
329,
754
$35
1,89
2$
Prim
ary
Gov
ernm
ent:
Inve
sted
in C
a pit
al A
sset
s, n
et o
f re
late
d de
bt2,
188,
530
$2,
236,
286
$2,
316,
347
$2,
255,
003
$2,
201,
401
$2,
226,
422
$2,
301,
517
$2,
461,
295
$2,
512,
178
$Re
stri
cted
161,
770
149,
013
113,
587
127,
889
132,
724
182,
150
198,
715
194,
826
202,
858
Unr
estr
icte
d11
6,61
213
3,48
310
5,63
013
4,77
118
8,72
420
7,16
419
4,24
417
1,05
216
3,80
7
Tota
l Pri
mar
y G
over
nmen
t, n
et a
sset
s2,
466,
912
$2,
518,
782
$2,
535,
564
$2,
517,
663
$2,
522,
849
$2,
615,
736
$2,
694,
476
$2,
827,
173
$2,
878,
843
$
CITY
OF
SAN
AN
TON
IO,
TEXA
S
Last
Nin
e Fi
scal
Yea
rs
Fisc
al Y
ear
- 233 - Amounts are expressed in thousands

Statistical DataChanges in Net Assets
(accrual basis of accounting)(In Thousands)
2002 2003 2004 20052006
(Restated)2007
(Restated)2008 2009 2010
Expenses:Governmental Activities:
General Government 77,887$ 67,034$ 63,610$ 80,018$ 83,719$ 118,881$ 109,850$ 92,415$ 117,505$Public Safety 414,382 378,316 428,607 428,582 424,058 456,375 529,762 497,274 545,228Public Works 131,010 128,374 116,629 149,476 226,849 143,172 220,267 212,256 221,612Sanitation 7,909 7,102 2,787 2,731 3,112 2,878 3,000 3,953 8,385Transportation Health Services 78,662 84,239 82,233 89,011 87,283 91,432 90,443 92,351 104,667Environmental Protection and Control 194 298 36 Culture and Recreation 76,400 77,434 80,051 84,555 90,337 128,450 142,537 145,386 143,122Convention and Tourism 49,754 51,141 50,100 48,364 126,802 155,285 69,734 42,512 26,437Conservation 15 2 146Urban Redevelopment and Housing 17,038 28,653 23,981 29,764 21,766 20,575 39,700 45,533 44,447Welfare 133,818 133,455 116,701 131,840 134,554 153,704 168,585 162,956 177,817Economic Development and Opportunity 27,322 19,847 21,277 60,461 12,159 19,167 22,479 23,260 106,766Commercial Paper Fees 13 84Interest on Long-term Debt, Net 54,628 54,490 55,855 70,655 65,960 48,114 71,103 75,108 70,945
Total Governmental Activities Expenses 1,069,032 1,030,467 1,041,867 1,175,459 1,276,745 1,338,033 1,467,460 1,393,004 1,566,931
Business-Type Activities:Airport System 41,941 45,164 49,427 46,868 78,083 64,482 80,505 81,229 83,240Parking System 8,693 7,523 6,264 8,413 9,234 8,525 10,382 8,984 9,135Environmental Services 48,223 48,252 51,227 54,703 61,318 68,072 82,002 88,900 85,058
Total Business-Type Activities Expenses 98,857 100,939 106,918 109,984 148,635 141,079 172,889 179,113 177,433
Total Primary Government Expenses 1,167,889$ 1,131,406$ 1,148,785$ 1,285,443$ 1,425,380$ 1,479,112$ 1,640,349$ 1,572,117$ 1,744,364$
Program Revenues:Governmental Activities:
Charges for Services:General Government 47,835$ 48,963$ 57,203$ 57,660$ 62,286$ 45,307$ 45,757$ 29,323$ 21,565$Public Safety 18,897 17,166 7,172 7,861 9,046 9,059 9,536 9,026 10,157Public Works 22,062 26,208 28,271 34,201 36,969 39,090 46,970 50,266 53,723Sanitation 268 5 397Health Services 14,438 17,917 17,924 10,252 15,852 24,401 22,792 26,518 31,595Culture and Recreation 10,817 10,134 9,411 19,583 18,947 26,277 40,549 34,483 33,791Convention and Tourism 18,148 14,067 13,268 14,740 19,640 19,067 1,278 1,308 1,262Urban Redevelopment and Housing 116 217 126 1 2 22,949 20,724Welfare 230 207 327 341 19 192 122 72Economic Development and Opportunity 1,394 1,340 243 2,485 2,562 1,971 2,026 2,141 2,582
Operating Grants and Contributions 183,849 190,746 168,120 198,185 179,917 186,381 198,736 206,356 258,714Capital Grants and Contributions 16,400 51,189 16,614 8,256 29,050 57,891 49,577 81,114 98,362
Total Governmental Activities Program Revenues 334,070 378,053 318,443 353,550 374,736 409,732 417,420 463,606 532,944
Business-Type Activities:Charges for Services:
Airport System 40,119 43,051 43,701 45,791 50,058 53,115 63,944 61,764 63,717Parking System 7,978 8,455 9,647 10,325 10,276 10,236 10,988 9,143 9,287Environmental Services 46,717 49,492 50,391 51,753 60,090 70,080 81,988 81,263 87,888
Operating Grants and Contributions 5,040 Capital Grants and Contributions 3,865 27 2,223 18,079 23,188 36,987 31,115 40,156
Total Business-Type Activities Program Revenues 99,854 104,863 103,766 110,092 138,503 156,619 193,907 183,285 201,048
Total Primary Government Program Revenues 433,924$ 482,916$ 422,209$ 463,642$ 513,239$ 566,351$ 611,327$ 646,891$ 733,992$
CITY OF SAN ANTONIO, TEXAS
Last Nine Fiscal Years
Fiscal Year
- 234 - Amounts are expressed in thousands

Statistical DataChanges in Net Assets
(accrual basis of accounting)(In Thousands)
2002 2003 2004 20052006
(Restated)2007
(Restated)2008 2009 2010
Net (Expense) Revenue:Governmental Activities (734,962)$ (652,414)$ (723,424)$ (821,909)$ (902,009)$ (928,301)$ (1,050,040)$ (929,398)$ (1,033,987)$Business-Type Activities 997 3,924 (3,152) 108 (10,132) 15,540 21,018 4,172 23,615
Total Primary Government Net Expense (733,965)$ (648,490)$ (726,576)$ (821,801)$ (912,141)$ (912,761)$ (1,029,022)$ (925,226)$ (1,010,372)$
General Revenues and Other Changesin Net Assets:Governmental Activities:
Taxes:Property Taxes 225,740$ 236,947$ 257,514$ 269,138$ 276,728$ 326,342$ 379,457$ 407,183$ 406,579$General Sales and Use Taxes 157,593 156,322 162,383 167,332 210,141 224,480 232,348 221,746 223,475Selective Sales and Use Taxes 3,628 3,863 4,189 4,473 4,932 5,308 5,712 5,741 5,921Gross Receipts Business Taxes 22,518 22,128 22,787 26,274 30,415 30,236 31,705 33,396 35,913Occupancy Taxes 45,007 44,633 46,343 51,726 58,678 63,878 68,414 58,800 59,734Penalties and Interest on
Delinquent Taxes 5,105 5,063 2,998 3,434 3,851 4,088 3,797 3,784 3,885Revenues from Utilities 171,632 210,854 196,793 222,162 256,541 257,687 304,545 275,993 293,114Investment Earnings 13,081 8,536 7,189 19,931 38,386 54,027 39,463 17,500 6,959Miscellaneous 12,269 (1,639) 28,542 22,431 16,173 26,530 30,299 24,017 25,181Gain on Sale of Capital Assets 1,703 542 611 1,507Special Items 8,320 Capital Contributions 481 1,115 1,585 Transfers, net 2,072 5,488 2,443 2,150 1,021 (6,404) (5,184) 498 2,780
Total Governmental Activities 660,829 693,852 733,377 790,558 896,866 986,172 1,098,876 1,048,658 1,063,541
Business-Type Activities:Investment Earnings 3,291 2,551 2,046 5,434 10,023 11,099 12,010 4,769 823Miscellaneous 7,610 9,406 10,378 9,962 589 1,973 12 464 480Gain on Sale of Capital Assets 50 39 96Special Items 10,870 (8,320) 4,528Transfers, net (2,072) (5,488) (2,443) (2,150) (1,021) 6,404 5,184 (498) (2,780)
Total Business-Type Activities 8,879 6,508 9,981 13,342 20,461 19,476 8,886 9,263 (1,477)
Total Primary Government 669,708$ 700,360$ 743,358$ 803,900$ 917,327$ 1,005,648$ 1,107,762$ 1,057,921$ 1,062,064$
Change in Net Assets:Governmental Activities (74,133)$ 41,438$ 9,953$ (31,351)$ (5,143)$ 57,871$ 48,836$ 119,260$ 29,554$Business-Type Activities 9,876 10,432 6,829 13,450 10,329 35,016 29,904 13,435 22,138
Total Primary Government (64,257)$ 51,870$ 16,782$ (17,901)$ 5,186$ 92,887$ 78,740$ 132,695$ 51,692$
Fiscal Year
Last Nine Fiscal Years
CITY OF SAN ANTONIO, TEXAS
- 234 - Amounts are expressed in thousands
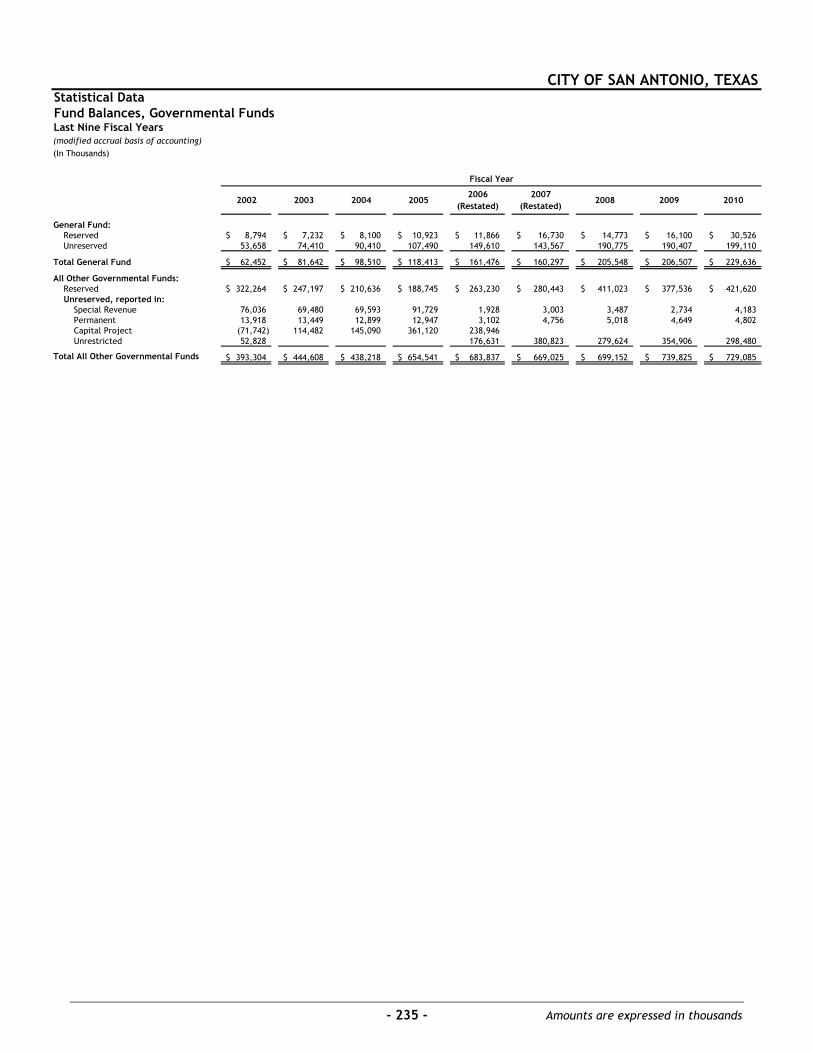
Statistical DataFund Balances, Governmental Funds
(modified accrual basis of accounting)(In Thousands)
2002 2003 2004 20052006
(Restated)2007
(Restated)2008 2009 2010
General Fund:Reserved 8,794$ 7,232$ 8,100$ 10,923$ 11,866$ 16,730$ 14,773$ 16,100$ 30,526$Unreserved 53,658 74,410 90,410 107,490 149,610 143,567 190,775 190,407 199,110
Total General Fund 62,452$ 81,642$ 98,510$ 118,413$ 161,476$ 160,297$ 205,548$ 206,507$ 229,636$
All Other Governmental Funds:Reserved 322,264$ 247,197$ 210,636$ 188,745$ 263,230$ 280,443$ 411,023$ 377,536$ 421,620$Unreserved, reported in:
Special Revenue 76,036 69,480 69,593 91,729 1,928 3,003 3,487 2,734 4,183Permanent 13,918 13,449 12,899 12,947 3,102 4,756 5,018 4,649 4,802Capital Project (71,742) 114,482 145,090 361,120 238,946Unrestricted 52,828 176,631 380,823 279,624 354,906 298,480
393,304$ 444,608$ 438,218$ 654,541$ 683,837$ 669,025$ 699,152$ 739,825$ 729,085$
CITY OF SAN ANTONIO, TEXAS
Last Nine Fiscal Years
Total All Other Governmental Funds
Fiscal Year
- 235 - Amounts are expressed in thousands

Statistical DataChanges in Fund Balances, Governmental Funds
(modified accrual basis of accounting)(In Thousands)
2002 2003 2004 2005 2006 2007 2008 2009 2010Revenues:
Taxes 462,933$ 473,466$ 500,494$ 524,720$ 597,379$ 653,427$ 718,860$ 729,808$ 733,694$Licenses and Permits 13,302 13,912 17,026 20,716 19,765 6,927 7,756 7,090 7,769Intergovernmental 186,828 186,812 181,717 190,251 192,285 202,667 221,943 229,476 269,315Revenues from Utilities 171,234 210,466 196,405 221,775 256,368 257,687 304,158 275,605 292,726Charges for Services 84,573 88,040 93,809 107,264 120,541 136,950 148,981 143,526 144,293Fines and Forfeits 10,829 11,282 11,713 12,025 10,948 15,114 12,249 13,111 11,506Miscellaneous 23,887 49,897 34,326 26,848 27,305 24,498 29,471 30,631 34,393Contributions 19,871 29,744 15,053 30,359 83,541In-Kind Contributions1 14,504 19,887 10,407 24,872 15,617 13,786 16,222 13,273Investment Earnings 12,056 7,937 6,896 18,544 35,830 50,050 35,412 15,696 6,383
Total Revenues 980,146 1,061,699 1,052,793 1,147,015 1,295,909 1,390,850 1,510,105 1,488,575 1,583,620
Expenditures:General Government 64,833 64,177 59,601 69,332 80,672 114,968 117,853 85,651 92,054Public Safety 364,240 375,090 391,950 419,634 440,231 450,664 472,904 501,560 522,982Public Works 67,129 68,351 65,205 85,940 119,697 101,433 121,023 103,127 114,327Health Services 76,542 83,608 79,843 88,533 86,258 92,350 90,086 90,615 96,342Sanitation 56,916 55,775 57,491 63,116 70,509 2,824 4,372 3,764 8,596Welfare 133,160 134,019 115,614 131,012 137,711 153,877 166,263 162,411 176,961Culture and Recreation 74,985 74,289 74,343 79,586 87,136 85,522 132,750 127,830 123,202Convention and Tourism 49,764 51,452 48,188 48,315 87,509 60,288 20,053 20,930 21,240Conservation 63 2Urban Redevelopment and Housing 17,469 23,766 23,904 25,557 17,538 14,028 20,008 43,700 41,686Economic Development and Opportunity 25,908 20,044 20,234 16,337 11,678 24,821 14,637 20,307 106,645Capital Projects 117,937 130,755 130,981 146,850 115,229 345,047 319,663 313,944 287,722Debt Service:
Principal Retirement 66,295 66,650 72,410 57,581 61,865 81,835 99,385 113,316 152,605Interest 49,092 50,929 52,558 60,202 71,848 57,190 77,271 79,723 75,614Bond Escrow Agent 2,118 5Arbitrage Expenditure 42Issuance Costs 1,656 1,206 2,061 1,027 429 3,557 2,467 1,630 3,518
Total Expenditures 1,165,989 1,202,229 1,194,383 1,293,024 1,388,315 1,588,446 1,658,735 1,668,508 1,823,494
(Deficiency) of Revenues (Under) Expenditures (185,843) (140,530) (141,590) (146,009) (92,406) (197,596) (148,630) (179,933) (239,874)
Other Financing Sources (Uses):Issuance of Long-Term Debt 390,050 271,010 186,591 192,329 70,690 382,060 381,745 205,485 413,180Payments to Refunded Bond Escrow Agent (257,467) (131,410) (99,526) (93,163) (34,927) (210,643) (170,737) (185,508)Issuance of Notes and Loans 3,374 210,607 63,218 10,966 2,799 1,768Redemption of General Commercial Paper (15,000)Issuance of Commercial Paper 4,000 6,500 15,305Premium/(Discount) on Long-Term Debt 19,548 17,275 9,488 12,904 2,251 7,139 12,014 3,034 27,680Release of Enterprise Fund Obligations 9,645 Debt Transfer to Enterprise Fund (11,045) Transfers In 163,819 186,385 181,557 159,821 228,041 335,090 341,227 411,807 361,508Transfers Out (161,544) (184,879) (181,123) (160,611) (231,290) (350,275) (348,140) (415,809) (364,600)
Total Other Financing Sources (Uses) 142,780 158,381 96,987 321,887 97,983 178,337 224,008 221,590 252,260
Net Change in Fund Balances (43,063)$ 17,851$ (44,603)$ 175,878$ 5,577$ (19,259)$ 75,378$ 41,657$ 12,386$
Debt Service as a Percentage of Noncapital Expenditures 11.0% 11.1% 11.9% 9.9% 10.7% 10.3% 12.4% 13.9% 14.5%
1 In-Kind Contributions was combined under Contributions in fiscal year 2010
CITY OF SAN ANTONIO, TEXAS
Last Nine Fiscal Years
Fiscal Year
- 236 - Amounts are expressed in thousands

Stat
isti
cal D
ata
Tax
Reve
nues
by
Sour
ce,
Gov
ernm
enta
l Fun
dsLa
st T
en F
isca
l Yea
rs(m
odif
ied
accr
ual
basi
s of
acc
ount
ing)
(In
Thou
sand
s)
$12
5,53
3
$
136,
811
$-
$3,
427
$24
,198
$1,
410
$29
1,37
922
7,59
9
15
7,59
345
,007
3,62
926
,042
3,06
446
2,93
423
9,21
4
15
6,32
344
,633
3,86
326
,364
3,06
947
3,46
625
8,26
1
16
2,38
346
,343
4,18
926
,550
2,71
350
0,43
927
1,49
0
16
7,33
251
,717
4,47
326
,274
3,43
452
4,72
028
9,34
8
21
0,14
158
,672
4,93
230
,823
3,46
459
7,38
032
5,81
1
22
4,48
063
,892
5,30
830
,236
3,70
165
3,42
837
6,88
4
23
2,34
868
,414
5,71
231
,705
3,79
771
8,86
040
6,34
1
22
1,74
658
,800
5,74
133
,396
3,78
472
9,80
840
4,76
6
22
3,47
559
,734
5,92
135
,913
3,88
573
3,69
4
Chan
ge:
2001
- 2
010
3
1 2 3Sh
ows
the
chan
ge b
etw
een
year
s 20
02 -
201
0.
4
CITY
OF
SAN
AN
TON
IO,
TEXA
S
Pena
ltie
s an
dFi
scal
Hot
el/M
otel
Alc
ohol
icBu
sine
ssIn
tere
st a
ndYe
arPr
oper
ty1
Sale
s an
d U
se 2
Occ
upan
cyBe
vera
ge T
axTa
xJu
dgm
ents
Tota
l
2001
4 200
2 4
2003
2004
2005
2006
2007
2008
222.
4%
2010
2009
Com
men
cing
inFi
scal
Year
2002
,re
venu
esw
ere
adju
sted
tore
flec
tth
eG
ener
alG
over
nmen
tam
ount
s,w
hich
incl
ude
the
Gen
eral
Fund
,Sp
ecia
lRe
venu
eFu
nds
and
the
Deb
tSe
rvic
e Fu
nd.
175.
5%15
1.8%
The
City
had
mai
ntai
ned
the
prop
erty
tax
rate
ata
curr
ent
tax
rate
from
2002
to20
07,
and
was
able
tore
duce
the
prop
erty
tax
rate
in20
08be
caus
eof
grow
thin
prop
erty
tax
valu
es(s
eeAs
sess
edVa
lue
and
Actu
alVa
lue
ofTa
xabl
ePr
oper
ty).
The
City
has
also
rece
ived
mor
ere
sour
ces
beca
use
ofim
prov
emen
tsin
colle
ctio
nra
tes
(see
Prop
erty
Tax
Levi
esan
d Co
llect
ions
).
Sale
san
dU
seta
xre
venu
esin
crea
sed
inth
epa
stte
nye
ars
due
toa
com
bina
tion
ofra
tein
crea
ses
(see
Dir
ect
and
Ove
rlap
ping
Sale
san
dU
seTa
xRa
tes)
,gr
owth
inta
xabl
ere
tail
sale
s (s
ee T
axab
le S
ales
by
Cate
gory
), a
nd s
ever
al le
gisl
ativ
e m
easu
res
to b
road
en t
he s
ales
and
use
tax
bas
e.
63.3
%32
.7%
72.8
%48
.4%
- 237 - Amounts are expressed in thousands

City of San Antonio, Texas
Revenue Capacity
These schedules contain information to help the reader assess the factors affecting the City’s ability to generate its property and sales and use taxes.

Statistical DataAssessed Value and Actual Value of Taxable PropertyLast Ten Fiscal Years(In Thousands)
TotalLess: Total Taxable Direct
Residential Commercial Industrial Other Tax-Exempt Assessed TaxProperty Property Property Property Property 1 Value Rate
$20,906,401 $15,773,750 $1,084,482 $2,622,171 $4,353,483 $36,033,321 0.5823,042,260 17,035,420 1,116,657 2,926,198 4,532,951 39,587,584 0.5825,034,364 17,043,717 1,427,232 2,815,483 4,785,249 41,535,547 0.5826,981,363 18,327,001 1,516,160 2,898,762 5,140,147 44,583,139 0.5828,522,603 19,030,656 1,509,281 2,761,668 5,342,234 46,481,974 0.5830,761,632 20,736,858 1,654,272 3,598,145 6,881,952 49,868,955 0.5835,144,958 23,195,079 1,728,928 4,964,661 8,265,925 56,767,701 0.5840,002,580 27,919,043 2,751,798 5,792,563 10,511,117 65,954,867 0.5742,379,588 30,763,686 2,735,402 7,973,642 11,311,176 72,541,142 0.5741,874,227 32,060,323 2,515,645 8,031,416 11,738,392 72,743,219 0.57
Source: Bexar Appraisal District
1
2010
Tax-exempt property deductions include deductions of residential homestead exemptions and exemptions granted to persons 65 years of ageand older and disabled veterans. In addition, other exemptions include historic properties, tax phase-ins, freeport, and transitional housing.
2001
200620072008
20022003
2009
20042005
CITY OF SAN ANTONIO, TEXAS
FiscalYear
Ended
- 238 - Amounts are expressed in thousands

Stat
isti
cal D
ata
Dir
ect
and
Ove
rlap
ping
Pro
pert
y Ta
x Ra
tes
Last
Ten
Fis
cal Y
ears
(rat
e pe
r $1
00 o
f as
sess
ed v
alue
)
Deb
tA
lam
oU
nive
rsit
ySa
n A
nton
ioA
lam
o Ea
stFi
scal
Tax
Gen
eral
Serv
ice
Tota
l Co
mm
unit
yBe
xar
Hea
lth
Rive
rH
eigh
ts
Cent
ral
Year
Roll
Fund
Fund
sD
irec
tCo
llege
Coun
tySy
stem
Aut
hori
tyIS
DIS
D
2001
2000
0.35
0790
0.22
9000
0.57
9790
0.10
6900
0.33
9458
0.24
3869
1.60
0000
1.61
0000
2002
2001
0.35
4540
0.22
4000
0.57
8540
0.10
4600
0.32
0756
0.24
3869
1.63
0000
1.68
0000
2003
2002
0.36
2040
0.21
6500
0.57
8540
0.10
7100
0.31
7571
0.24
3869
0.01
6425
1.63
0000
1.68
0000
2004
2003
0.36
7040
0.21
1500
0.57
8540
0.10
7050
0.32
0952
0.24
3869
0.01
6425
1.62
9600
1.68
0000
2005
2004
0.36
7040
0.21
1500
0.57
8540
0.10
7050
0.31
8471
0.24
3869
0.01
6425
1.62
9600
1.68
0000
2006
2005
0.36
7040
0.21
1500
0.57
8540
0.10
7050
0.31
8471
0.24
3869
0.01
6425
1.65
6600
1.68
0000
2007
2006
0.36
7040
0.21
1500
0.57
8540
0.13
7050
0.31
4147
0.24
3869
0.01
6425
1.48
6600
1.52
0000
2008
2007
0.36
0800
0.21
1500
0.57
2300
0.13
4550
0.32
6866
0.23
7408
0.01
5951
1.15
6600
1.19
0000
2009
2008
0.35
5640
0.21
1500
0.56
7140
0.13
5855
0.32
6866
0.26
6235
0.01
5951
1.16
2000
1.31
9500
2010
2009
0.35
4190
0.21
1500
0.56
5690
0.13
5855
0.32
6866
0.27
6235
0.01
5951
1.16
8000
1.31
9500
Fisc
alTa
xEd
gew
ood
Har
land
ale
Juds
onN
orth
east
Nor
thsi
deSa
n A
nton
ioSo
mer
set
Sout
h Sa
nSo
uths
ide
Sout
hwes
tYe
arRo
llIS
DIS
DIS
DIS
DIS
DIS
DIS
DA
nton
io IS
DIS
DIS
D
2001
2000
1.55
8800
1.67
8000
1.65
0000
1.80
0000
1.67
4100
1.72
2000
1.61
9007
1.62
0000
1.61
7900
2002
2001
1.63
0000
1.75
6000
1.67
6000
1.75
1500
1.73
7500
1.72
2000
1.62
9500
1.62
0000
1.61
6800
2003
2002
1.57
4000
1.75
6000
1.77
6000
1.76
4000
1.76
2500
1.72
2000
1.72
9690
1.72
0000
1.67
5800
2004
2003
1.62
7300
1.75
6000
1.77
6000
1.74
4000
1.76
2500
1.72
2000
1.68
5000
1.71
7590
1.72
0000
1.66
5200
2005
2004
1.73
4500
1.75
6000
1.77
6000
1.79
4000
1.76
2500
1.72
2000
1.68
5000
1.73
8300
1.72
0000
1.64
2200
2006
2005
1.72
2200
1.75
6000
1.77
6000
1.79
4000
1.77
5000
1.72
0000
1.68
5000
1.84
0000
1.72
0000
1.61
8800
2007
2006
1.61
0000
1.70
0000
1.63
6000
1.66
9000
1.59
2500
1.57
9700
1.53
6700
1.71
0000
1.69
0000
1.49
6000
2008
2007
1.40
5000
1.34
9000
1.41
0000
1.40
2900
1.26
2500
1.24
9700
1.19
4000
1.44
5000
1.36
0000
1.19
5000
2009
2008
1.40
5000
1.47
9000
1.46
3000
1.40
2900
1.33
7500
1.24
9700
1.22
8000
1.43
3800
1.36
8990
1.24
3200
2010
2009
1.42
0000
1.60
4800
1.46
3000
1.40
2900
1.36
5500
1.27
9700
1.28
9000
1.45
4900
1.36
8990
1.25
6100
Sour
ce:
Bexa
r Co
unt y
Tax
Off
ice,
Bex
ar A
ppra
isal
Dis
tric
t, a
nd In
depe
nden
t Sc
hool
Dis
tric
ts.
City
Dir
ect
Rate
sO
verl
appi
ng R
ates
Ove
rlap
ping
Rat
es
CITY
OF
SAN
AN
TON
IO,
TEXA
S
- 239 - Amounts are expressed in thousands

Stat
isti
cal D
ata
Prin
cipa
l Pro
pert
y Ta
x Pa
yers
Curr
ent
Year
and
Nin
e Ye
ars
Ago
(In
Thou
sand
s)
Taxa
ble
Taxa
ble
Ass
esse
dA
sses
sed
Taxp
ayer
Valu
eVa
lue
H.E
. Bu
tt G
roce
ry S
tore
s80
8,89
8$
343,
763
$To
yota
Mot
or M
anuf
actu
ring
Tex
as41
4,40
7VH
S Sa
n An
toni
o Pa
rtne
rs L
P38
8,97
0M
etho
dist
Hea
lthc
are
S yst
em38
6,37
613
8,65
0H
yatt
Reg
ency
Hot
els
362,
530
Wal
-Mar
t St
ores
, In
c.33
9,49
311
3,82
4U
nite
d Se
rvic
es A
utom
obile
Ass
ocia
tion
334,
538
317,
186
Mar
riot
t Co
r por
atio
n30
2,13
213
3,03
5AT
&T
298,
481
507,
716
La C
ante
ra R
etai
l LTD
Par
tner
shi p
263,
640
VLSI
Tec
hnol
o gy,
Inc.
196,
398
Sim
on P
rope
rty
Trus
t (T
exas
)13
1,56
1Pr
o per
ty T
rust
of
Amer
ica
118,
351
Nor
th S
tar
Mal
l10
1,61
4
Tota
l3,
899,
465
$2,
102,
098
$
Sour
ce:
Cit y
of
San
Anto
nio
2010
2001
5.36
%7.
16%
8 100.
40%
0.35
%
0.45
%
0.45
%
1.73
%0.
47%
0.67
%
1.08
%0.
47%
1 7
0.36
%0.
41%
5 439
0.53
%0.
50%
0.46
%
4 5 76 1091 3
21.
11%
0.53
%2
0.57
%
Perc
enta
geof
Tot
al C
ity
Ass
esse
d
Perc
enta
geof
Tot
al C
ity
Taxa
ble
1.17
%
Valu
eA
sses
sed
Taxa
ble
CITY
OF
SAN
AN
TON
IO,
TEXA
S
60.
39%
80.
42%
Rank
Valu
eRa
nk
- 240 - Amounts are expressed in thousands

Statistical DataProperty Tax Levies and CollectionsLast Ten Fiscal Years(In Thousands)
Fiscal Taxes Levied CollectionsYear for the in Subsequent
Ended Fiscal Year 1 Amount Years 2 Amount
2001 208,918$ 204,502$ 2,957$ 207,459$ 2002 229,030 223,943 3,373 227,3162003 240,300 234,956 3,504 238,4602004 257,931 252,678 4,180 256,8582005 268,917 264,392 5,256 269,6482006 288,512 283,982 5,366 289,3482007 326,326 321,203 4,035 325,2382008 372,823 366,888 5,001 371,8892009 405,010 398,119 3,520 401,6392010 405,896 397,356 3,189 400,545
1 Taxes levied, less the over-65 and disabled tax freeze amount.2 Penalty, judgments, and interest on judgments are excluded.3 Subsequent collections include dollars collected from prior years' tax levies.
97.90% 98.68%
Collected within theFiscal Year of the Levy Total Collections to Date
98.41% 99.75%98.43% 99.67%98.43% 100.29%98.32% 100.27%97.96% 99.58%97.78% 99.23%97.78% 99.25%
98.30% 99.17%
CITY OF SAN ANTONIO, TEXAS
Percentage
of Levy 3of Levy
97.89% 99.30%
Percentage
- 241 - Amounts are expressed in thousands

Stat
isti
cal D
ata
Taxa
ble
Sale
s by
Cat
egor
yLa
st E
ight
Cal
enda
r Ye
ars
(In
Thou
sand
s)
2002
2003
2004
2005
2006
2007
2008
2009
Mot
or V
ehic
le a
nd P
arts
Dea
lers
3,39
2,13
2$
3,52
6,26
0$
3,68
2,53
9$
4,53
0,84
0$
4,27
9,47
4$
4,74
1,29
7$
4,25
5,87
9$
3,74
8,52
0$
Furn
itur
e an
d H
ome
Furn
ishi
n gs
Stor
es41
6,46
541
8,16
645
1,64
455
8,90
063
2,72
262
3,58
058
7,03
354
3,87
1El
ectr
onic
s an
d A p
plia
nce
Stor
es67
7,12
871
4,20
279
5,61
792
2,76
61,
092,
875
1,10
5,40
993
3,28
486
9,48
9Bu
ildin
g M
ater
ial a
nd G
arde
n Eq
uipm
ent
and
Supp
lies
Dea
lers
904,
441
937,
670
997,
618
1,07
1,33
91,
184,
707
1,18
4,07
71,
179,
431
1,14
4,48
7Fo
od a
nd B
ever
a ge
Stor
es 3
2,11
0,66
8
2,22
6,81
92,
416,
103
2,55
3,20
32,
744,
361
2,94
7,32
43,
233,
292
3,29
6,73
5H
ealt
h an
d Pe
rson
al C
are
Stor
es91
2,56
396
8,32
11,
191,
515
1,52
1,13
51,
729,
193
1,95
2,44
91,
895,
026
1,26
5,43
1G
asol
ine
Stat
ions
890,
299
930,
089
1,08
7,28
11,
270,
710
1,48
2,68
81,
553,
859
1,68
4,07
71,
312,
607
Clot
hin g
and
Clo
thin
g Ac
cess
orie
s St
ores
486
5,42
985
7,20
591
6,00
393
9,40
31,
042,
774
1,08
3,05
71,
083,
856
1,01
1,98
7S p
orti
ng G
oods
, H
obby
, Bo
ok a
nd M
usic
Sto
res
432,
260
425,
368
415,
861
437,
902
390,
546
405,
698
528,
716
542,
502
Gen
eral
Mer
chan
dise
Sto
res
2,07
9,08
7
2,07
3,19
22,
204,
383
2,55
4,98
22,
884,
279
3,14
2,86
23,
229,
483
3,17
3,00
1M
isce
llane
ous
Stor
e Re
taile
rs73
2,06
972
6,64
974
1,20
578
9,07
184
6,86
298
2,13
081
8,76
777
4,87
5N
onst
ore
Reta
ilers
89,4
5378
,664
90,3
9386
,138
81,6
0210
7,40
711
4,53
498
,354
Food
Ser
vice
s an
d D
rink
ing
Plac
es1,
838,
573
1,
875,
393
2,04
8,17
92,
228,
510
2,37
1,14
22,
530,
543
2,65
3,76
89,
640,
952
Tota
l15
,340
,567
$
15,7
57,9
98$
17,0
38,3
41$
19,4
64,8
99$
20,7
63,2
25$
22,3
59,6
92$
22,1
97,1
46$
27,4
22,8
11$
Cit y
Dir
ect
Sale
s Ta
x Ra
te1.
125%
41.
000%
41.
000%
41.
000%
41.
125%
51.
125%
51.
125%
51.
125%
5
Sour
ce:
Texa
s Co
mpt
rolle
r of
Pub
lic A
ccou
nts
1Ca
lend
ar Y
ear
2010
info
rmat
ion
will
not
be
avai
labl
e un
til M
ay o
f 20
11.
2 3G
ener
al g
roce
ry it
ems
are
not
taxa
ble;
the
sal
es a
nd u
se t
ax a
pplie
s on
ly t
o pr
epar
ed f
ood
item
s an
d no
nfoo
d it
ems.
4Cl
othi
ng u
nder
$10
0 is
exe
mpt
dur
ing
the
sale
s an
d us
e ta
x ho
liday
in A
ugus
t.
5Pr
opos
itio
n2
-Pa
rks
Dev
elop
men
tan
dEx
pans
ion
Venu
ePr
ojec
tin
crea
sed
sale
san
dus
eta
x.Th
ista
xw
asad
ded
for
acqu
isit
ion
ofop
ensp
ace
and
linea
rpa
rks
alon
gth
eLe
onan
d
Sala
do C
reek
s, M
edin
a an
d Sa
n An
toni
o Ri
vers
and
impr
ovem
ents
and
add
itio
ns t
o th
e M
unic
ipal
Par
ks a
nd R
ecre
atio
n Sy
stem
.
In 2
007
the
Stat
e of
Tex
as c
onve
rted
rep
orts
fro
m S
IC t
o N
AICS
cla
ssif
icat
ions
. Th
e co
nver
sion
pro
cess
onl
y co
vers
the
yea
rs 2
002
to p
rese
nt.
Cale
ndar
Yea
r 1
2
CITY
OF
SAN
AN
TON
IO,
TEXA
S
- 242 - Amounts are expressed in thousands
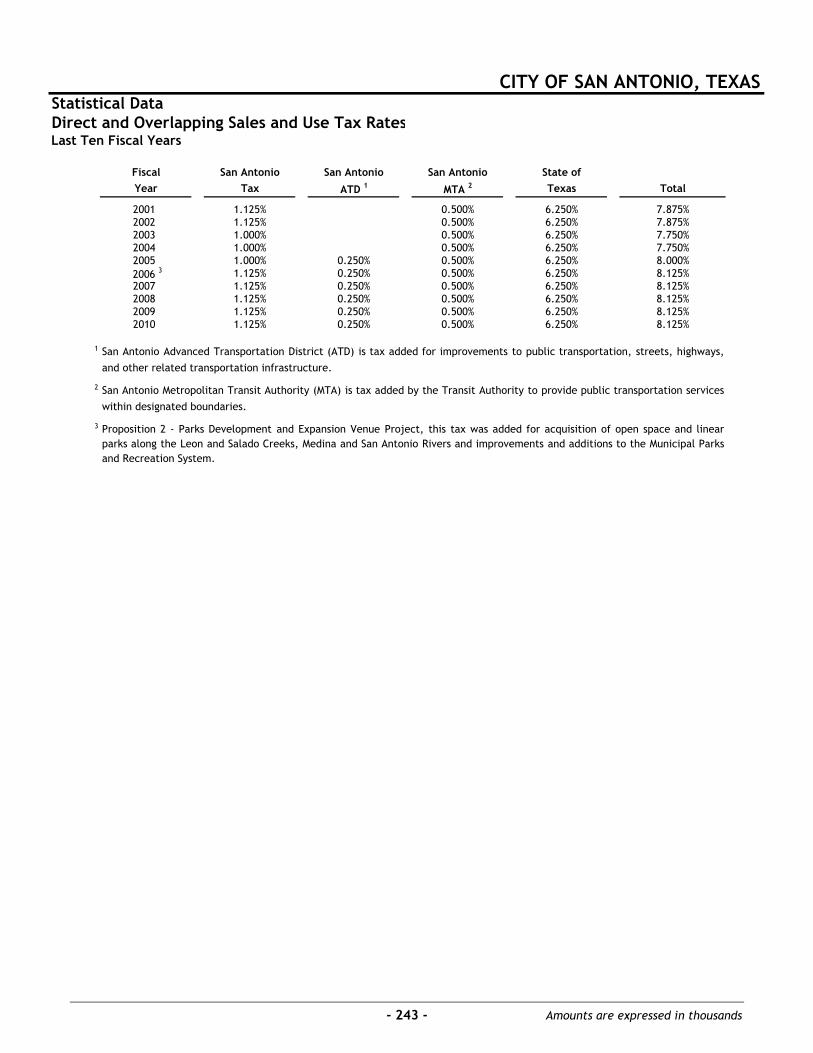
Statistical DataDirect and Overlapping Sales and Use Tax RatesLast Ten Fiscal Years
1
2
3
2008 1.125% 0.250%
Proposition 2 - Parks Development and Expansion Venue Project, this tax was added for acquisition of open space and linearparks along the Leon and Salado Creeks, Medina and San Antonio Rivers and improvements and additions to the Municipal Parksand Recreation System.
San Antonio Metropolitan Transit Authority (MTA) is tax added by the Transit Authority to provide public transportation services
within designated boundaries.
6.250%0.250%1.125% 8.125%
1.125%
Tax
6.250%6.250%6.250%6.250%
8.000%8.125%
7.875%7.875%
0.500%
6.250%0.500%
7.750%7.750%
0.500%1.125%1.000%1.000%
0.500%0.500%
2001
0.250%
San AntonioYear
200220032004
1.000% 0.250%
Fiscal
ATD 1
2009
San Antonio Advanced Transportation District (ATD) is tax added for improvements to public transportation, streets, highways,
and other related transportation infrastructure.
2010
CITY OF SAN ANTONIO, TEXAS
San Antonio
MTA 2
State ofTexas Total
San Antonio
6.250%200542006 3
2007 0.250%1.125%1.125% 0.500% 6.250%
0.500%
8.125%
8.125%1.125% 0.250% 0.500% 6.250%
0.500% 6.250% 8.125%0.500%
- 243 - Amounts are expressed in thousands

City of San Antonio, Texas
Debt Capacity
These schedules present information to help the reader assess the affordability of the City’s current levels of outstanding debt and the City’s ability to issue additional debt in the future.

Stat
isti
cal D
ata
Rati
os o
f O
utst
andi
ng D
ebt
by T
ype
Last
Nin
e Fi
scal
Yea
rs(d
olla
rs in
tho
usan
ds,
exce
pt p
er c
apit
a)
Acc
rued
Gen
eral
Tax-
Exem
ptTa
x-Ex
empt
Taxa
ble
Una
mor
tize
dD
efer
red
Arb
itra
ge
Fisc
alO
blig
atio
nCo
mm
erci
alCe
rtif
icat
esCe
rtif
icat
esTa
xRe
venu
e(D
isco
unt)
/A
mou
nt o
nRe
bate
Capi
tal
Com
pens
ated
Not
esO
ther
Year
Bond
sPa
per
of O
blig
atio
nof
Obl
igat
ion
Not
esBo
nds
Prem
ium
Refu
ndin
gPa
yabl
eLe
ases
Abs
ence
sPa
yabl
ePa
yabl
es
2002
669,
473
$
20,8
00$
14
5,40
5$
9,
780
$-
$17
9,39
3$
18,6
7 4$
(556
)$
1,58
0$
8,
297
$11
4,09
4$
-$
-$
2003
666,
983
10,5
00
196,
280
5,
165
-23
4,91
833
,836
(7,9
13)
1,34
4
9,79
611
5,82
620
0 465
5,14
1
21
4,47
0
4,58
026
4,69
740
,343
(15,
863)
968
7,12
612
1,53
620
0565
8,45
0
19
4,67
5
6,85
055
6,15
249
,799
(13,
839)
1,68
8
7,23
212
8,65
31,
369
2006
623,
075
183,
455
6,
170
37,6
0055
1,76
748
,189
(8,5
98)
1,36
9
10,2
6714
1,40
658
,005
8,00
320
0766
7,28
0
4,
000
21
8,18
5
290
60,0
0055
4,37
282
,099
(17,
283)
828
14,4
6515
6,79
656
,171
4,61
920
0871
7,27
5
10
,500
29
1,38
0
225
17,9
2557
8,41
239
,991
(10,
287)
501
12,6
8520
3,61
754
,958
2,31
520
0973
1,27
0
25
,805
34
8,23
5
155
48,0
9557
0,25
246
,566
(14,
038)
182
10,5
6718
4,08
053
,355
2010
912,
900
14,3
70
303,
635
80
28,8
6055
7,38
764
,026
(25,
374)
5,79
618
8,56
150
,880
Oth
erCa
pita
lA
ccru
ed
Gen
eral
Tax-
Exem
ptU
nam
orti
zed
Def
erre
dO
ther
Paya
bles
Leas
esA
rbit
rage
Tota
lPe
rcen
tage
Fisc
alO
blig
atio
nRe
venu
eCe
rtif
icat
es
Tax
(Dis
coun
t)/
Am
ount
on
Paya
bles
Non
maj
orN
onm
ajor
Com
pens
ated
Reba
tePr
imar
yof
Per
sona
l Pe
r
Year
Bond
sBo
nds
of O
blig
atio
nN
otes
Prem
ium
Refu
ndin
gA
viat
ion
Fund
sFu
nds
Abs
ence
sPa
yabl
eG
over
nmen
tIn
com
e1
Capi
ta1
2002
12,8
55$
255,
180
$
91
5$
-
$91
7$
(528
)$
649
$1,
498
$67
7$
1,72
3$
-
$1,
440,
826
$6.
02%
1,16
120
0312
,475
25
0,26
5
135
3,
545
(5,1
51)
1,59
51,
418
543
1,95
51,
533,
515
6.08
%1,
214
2004
13,2
45
242,
855
1,
984
(5,6
85)
3,08
41,
570
406
1,97
41,
552,
431
6.40
%1,
214
2005
12,1
15
272,
100
3,
012
(5,0
53)
1,56
51,
037
263
2,00
21,
878,
070
7.40
%1,
446
2006
261,
885
3,
813
(3,3
90)
168
1,01
111
53,
158
301,
927,
498
7.25
%1,
457
200 7
251,
370
9,
843
(2,9
37)
242
1,48
22,
678
38
,667
136
2,10
3,30
38.
06%
1,60
320
089,
495
39
5,69
5
2,80
5
5,25
1(2
,953
)7
2,03
814
,946
4,
113
82,
350,
902
8.50
%1,
769
2009
18,4
80
360,
380
2,
715
10
,185
(4,2
06)
2,35
324
,664
4,
390
2,42
3,48
58.
43%
1,80
820
1018
,220
34
4,52
5
2,13
5
34,5
009,
167
(3,5
21)
2,05
725
,615
4,
269
2,53
8,08
88.
98%
1,92
4
Not
e:D
etai
ls r
egar
ding
the
Cit
y's
outs
tand
ing
debt
can
be
foun
d in
the
Not
es t
o th
e Fi
nanc
ial S
tate
men
ts.
Info
rmat
ion
is p
rovi
ded
for
the
year
s si
nce
the
impl
emen
tati
on o
f G
ASB
Stat
emen
t N
o. 3
4
1 See
Dem
ogra
phic
and
Eco
nom
ic S
tati
stic
s fo
r pe
rson
al in
com
e an
d po
pula
tion
dat
a. T
hese
rat
ios
are
calc
ulat
ed u
sing
pers
onal
inco
me
and
popu
lati
on f
or t
he p
rior
cal
enda
r ye
ar.
CITY
OF
SAN
AN
TON
IO,
TEXA
S
Gov
ernm
enta
l Act
ivit
ies
Busi
ness
-Typ
e A
ctiv
itie
s
- 244 - Amounts are expressed in thousands

Statistical DataRatios of General Bonded Debt OutstandingLast Nine Fiscal Years(dollars in thousands, except per capita)
GeneralFiscal Obligation Certificates of Tax PerYear Bonds Obligation Notes Total Capita 2
2002 669,473$ 155,185$ -$ 824,658$ 664.462003 666,983 201,445 868,428 687.702004 655,141 219,050 874,191 683.872005 658,450 201,525 859,975 661.932006 623,075 189,625 37,600 850,300 642.752007 667,280 218,475 60,000 945,755 720.692008 717,275 291,605 17,925 1,026,805 772.622009 731,270 348,390 48,095 1,127,755 841.262010 912,900 303,715 28,860 1,245,475 943.90
GeneralFiscal Obligation Certificates of Tax PerYear Bonds Obligation Notes Total Capita 2
2002 12,855$ 915$ -$ 13,770$ 11.092003 12,475 135 12,610 9.992004 13,245 13,245 10.362005 12,115 12,115 9.322006 0.002007 0.002008 9,495 2,805 12,300 9.262009 18,480 2,715 21,195 15.812010 18,220 2,135 34,500 54,855 41.57
1 See Assessed Value and Actual Value of Taxable Property for property value data.2 Population data can be found in Demographic and Economic Statistics.3 Charges for services data related solely to the Parking System for year 2002-2007.4 In fiscal year 2008, Environmental Services' charges for services data were incorporated herein.
5 In fiscal year 2010, Airport System's charges for services data were incorporated herein.
1.55%
25.98%
Value of
Property 1
2.09%
Services 3 4 5
148.84%118.06%
1.71%
2.08%
CITY OF SAN ANTONIO, TEXAS
Percentage ofGovernmental Activities
Note: Details regarding the City's outstanding debt can be found in the Notes to the Financial Statements. Information is
provided for the years since the implementation of GASB Statement No. 34.
1.71%
1.56%1.67%
1.85%
Actual Taxable
1.96%
Business-Type ActivitiesPercentage ofCharges for
172.23%
34.17%
117.06%0.00%0.00%13.26%
- 245 - Amounts are expressed in thousands

Statistical DataDirect and Overlapping Governmental Activities Debt
(In Thousands)
EstimatedShares of
Debt OverlappingOutstanding Debt
Governmental Unit:
Debt Repaid with Property Taxes:Alamo Community College Bonds 583,703$ 75.72% 441,980$Bexar County Bonds 807,893 74.24% 599,780San Antonio River Authority Bonds 38,429 96.13% 36,942University Health System 756,499 75.14% 568,433Alamo Heights Independent School District Bonds 99,807 48.35% 48,257East Central Independent School District Bonds 82,242 51.23% 42,133Edgewood Independent School District Bonds 96,892 100.00% 96,892Harlandale Independent School District Bonds 205,051 100.00% 205,051Judson Independent School District Bonds 393,857 30.36% 119,575Northeast Independent School District Bonds 1,216,082 85.25% 1,036,710Northside Independent School District Bonds 1,452,654 78.18% 1,135,685San Antonio Independent School District Bonds 407,894 99.21% 404,672Somerset Independent School District Bonds 36,550 1.77% 647South San Antonio Independent School District Bonds 191,229 100.00% 191,229Southside Independent School District Bonds 59,945 31.15% 18,673Southwest Independent School District Bonds 123,139 55.56% 68,416
Total Debt Repaid with Property Taxes 5,015,075$
Other Debt:Municipal Facilities Corporation Bonds 9,690$Municipal Drainage Utility Revenue Bonds 90,135Starbright Industrial Development Corporation Bonds 22,510Convention Center Hotel Finance Corporation Bonds 205,995HOT Bonds 229,057HUD 108 Loans 49,975Capital Leases (Master Lease Agreements) 5,796
Total Other Debt 613,158$
City Direct Debt, net with Sinking and Self-Supporting 1,199,721
Total Direct and Overlapping Debt 6,827,954$
1 For debt repaid with property taxes, the percentage of overlapping debt applicable is estimated using assessed property values. Applicablepercentages were estimated by determining the portion of another governmental unit's taxable assessed value that is within the City'sboundaries and dividing it by each unit's total taxable assessed value.
Note: Overlapping governments are those that coincide, at least in part, with the geographic boundaries of the City. This schedule estimates theportion of the outstanding debt of those overlapping governments that is borne by the residents and businesses of San Antonio. This processrecognizes that, when considering the City's ability to issue and repay long-term debt, the entire debt burden borne by the residents andbusinesses should be taken into account. However, this does not imply that every taxpayer is a resident, and therefore responsible for repayingthe debt, of each overlapping government.
Sources: Assessed value data used to estimate applicable percentages provided by the districts. Debt outstanding data provided by each
overlapping government.
CITY OF SAN ANTONIO, TEXAS
As of September 30, 2010
Applicable 1
PercentageEstimated
- 246 - Amounts are expressed in thousands

Stat
isti
cal D
ata
Lega
l Deb
t M
argi
n In
form
atio
nLa
st N
ine
Fisc
al Y
ears
(In
Thou
sand
s)
Asse
ssed
Val
ue84
,481
,611
$D
ebt
Lim
it (
10.0
% of
Ass
esse
d Va
lue)
8,44
8,16
1D
ebt
Appl
icab
le t
o Li
mit
:To
tal B
onde
d D
ebt
1,30
0,33
0Le
ss:
Self
-Su p
port
ing
Deb
t:(6
0,59
0)D
ebt
Supp
lem
ente
d by
Oth
er S
ourc
esLe
ss:
Asse
ts A
vaila
ble
for
Paym
ent
of
Prin
cipa
l In:
Deb
t Se
rvic
e Fu
nd(8
0,25
8)
Tota
l Net
Deb
t Ap
plic
able
to
Lim
it1,
159,
482
Lega
l Deb
t M
argi
n7,
288,
679
$
2003
2004
2005
2006
2007
2008
2009
2010
Deb
t Li
mit
$4,
412,
054
4,63
2,07
9$
4,97
2,32
9$
5,18
2,42
1$
5,67
5,09
1$
6,50
3,36
3$
7,64
6,59
8$
8,38
5,23
2$
8,44
8,16
1$
Tota
l Net
Deb
tA p
plic
able
to
Lim
it75
2,84
680
1,96
680
9,34
291
9,22
391
3,97
287
9,53
891
7,86
598
6,43
71,
159,
482
Lega
l Deb
t M
argi
n$
3,65
9,20
83,
830,
113
$4,
162,
987
$4,
263,
198
$4,
761,
119
$5,
623,
825
$6,
728,
733
$7,
398,
795
$7,
288,
679
$To
tal N
et D
ebt
A ppl
icab
le t
oth
e Li
mit
as
a Pe
rcen
tage
of D
ebt
Lim
it17
.1%
17.3
%16
.3%
17.7
%16
.1%
13.5
%12
.0%
11.8
%13
.7%
CITY
OF
SAN
AN
TON
IO,
TEXA
S
Lega
l Deb
t M
argi
n Ca
lcul
atio
n fo
r Fi
scal
Yea
r 20
10
Fisc
al Y
ear
2002
Not
e: C
ity
Char
ter
and
the
Cons
titu
tion
of
the
Stat
e of
Tex
as s
ets
limit
s of
bon
d in
debt
edne
ss a
t 10
.0%
of a
sses
sed
valu
atio
n.
- 247 - Amounts are expressed in thousands

Stat
isti
cal D
ata
Pled
ged-
Reve
nue
Cove
rage
Last
Nin
e Fi
scal
Yea
rs(I
n Th
ousa
nds)
Hot
elN
etO
ccup
ancy
Reve
nues
Tax
Prin
cipa
lIn
tere
stCo
vera
geof
Hot
elPr
inci
pal
Inte
rest
Cove
rage
35,0
05$
1,38
0$
8,82
1$
3.43
-$
-$
-$
0.00
34,7
15
2,04
58,
756
3.21
0.00
36,0
44
2,78
57,
168
3.62
0.00
40,2
66
800
9,92
63.
751,
073
0.00
45,6
34
1,37
59,
910
4.04
10,4
420.
0049
,711
3,
100
8,86
54.
1510
,442
0.00
53,2
11
245
6,96
07.
3910
,442
0.00
45,7
33
4,25
55,
539
4.67
10,4
420.
0046
,460
7,
265
4,19
94.
052,
150
10,4
420.
00
Mun
icip
alD
rain
age
Uti
lity
Pled
ged
Syst
em R
even
uePr
inci
pal
Inte
rest
Cove
rage
Reve
nue
Prin
cipa
lIn
tere
stCo
vera
ge
-$
-
$-
$-
165,
118
$
-
$-
$-
21,1
90
487
43.5
120
4,01
7
15
51,
316.
2423
,067
1,
035
1,93
97.
7618
9,50
6
1,
138
166.
5326
,382
1,
065
2,92
66.
6121
3,38
4
1,
138
187.
5127
,758
2,
410
4,89
63.
8024
6,08
4
1,
138
216.
2429
,540
2,
495
4,81
14.
0424
8,54
0
52
51,
138
149.
4533
,485
2,
590
4,71
94.
5829
3,79
6
53
51,
126
176.
8836
,306
2,
685
4,61
74.
9726
5,51
2
55
01,
113
159.
6636
,972
2,
795
4,50
75.
0628
3,50
2
56
51,
097
170.
58
1Te
xas
Conv
enti
on C
ente
r H
otel
Fin
ance
inte
rest
for
FY
2005
-200
7 ha
s be
en c
apit
aliz
ed.
2
2009
CITY
OF
SAN
AN
TON
IO,
TEXA
S
Fisc
alYe
ar
Fisc
al
2003
2004
2005
2006
(Con
tinu
ed)
Deb
t Se
rvic
e
The
bond
sar
ese
cure
dby
alie
non
and
are
paya
ble
from
the
follo
win
gso
urce
sof
reve
nue
(in
the
orde
rof
prio
rity
give
n):
firs
t,th
ePl
edge
dH
otel
Ope
rati
ngRe
venu
esw
hich
are
the
net
reve
nues
deri
ved
from
the
Hot
elth
atre
mai
naf
ter
mak
ing
nece
ssar
ym
onth
lyes
crow
paym
ents
for
prop
erty
taxe
s;in
sura
nce
prem
ium
s;an
dfu
rnit
ure,
fixt
ures
,an
deq
uipm
ent
repl
acem
ents
;se
cond
,th
eSt
ate
Hot
elO
ccup
ancy
Tax
colle
cted
atth
eH
otel
;th
ird,
the
Stat
eSa
les
Tax
colle
cted
atth
eH
otel
;fo
urth
,th
eH
otel
spec
ific
Gen
eral
Hot
elO
ccup
ancy
Tax
(7.0
% H
OT)
; an
d fi
fth,
the
Exp
ansi
on H
otel
Occ
upan
cy T
ax r
even
ues
colle
cted
Cit
ywid
e (2
.0%
HO
T).
2004
2003
2002
2005
2006
Hot
el O
ccup
ancy
Tax
Rev
enue
Bon
dsTe
xas
Conv
enti
on C
ente
r H
otel
Fin
ance
1 2
Mun
icip
al D
rain
age
Uti
lity
Syst
em
Deb
t Se
rvic
e
Star
brig
ht In
dust
rial
Dev
elop
men
t Co
rpor
atio
n
2002
Deb
t Se
rvic
e
Deb
t Se
rvic
eYe
ar
2008
2007
2009
2010
2007
2008
2010
Not
e:D
etai
lsre
gard
ing
the
City
'sou
tsta
ndin
gde
btca
nbe
foun
din
the
Not
esto
the
Fina
ncia
lSt
atem
ents
.O
pera
ting
expe
nses
dono
tin
clud
ein
tere
st,
depr
ecia
tion
,or
amor
tiza
tion
expe
nses
.
- 248 - Amounts are expressed in thousands

Stat
isti
cal D
ata
Pled
ged-
Reve
nue
Cove
rage
Last
Nin
e Fi
scal
Yea
rs(I
n Th
ousa
nds)
Air
port
Syst
emRe
venu
esPr
inci
pal
Inte
rest
Cove
rage
47,4
16$
5,08
0$
8,36
2$
3.53
46,5
44
5,56
010
,100
2.97
48,2
15
6,20
510
,137
2.95
52,4
04
7,54
59,
866
3.01
60,7
74
7,91
09,
526
3.49
65,4
87
8,24
58,
749
3.85
65,9
35
8,31
011
,466
3.33
61,3
53
9,66
512
,456
2.77
63,8
78
5,38
011
,770
3.72
Park
ing
Syst
emRe
venu
esPr
inci
pal
Inte
rest
Cove
rage
7,99
5$
-$
1,36
7$
5.85
8,47
2
1,36
76.
2011
,219
40
01,
367
6.35
10,3
49
450
1,34
75.
7611
,160
60
01,
325
5.80
10,2
63
620
1,29
55.
3611
,173
66
01,
264
5.81
1In
FY
2009
the
Cit
y de
feas
ed it
s Pa
rkin
g Sy
stem
Ser
ies
2000
Rev
enue
Bon
ds.
The
out
stan
ding
deb
t is
not
ple
dged
wit
h re
venu
es o
f th
e Pa
rkin
g Sy
stem
.
2010
2004
2005
2006
2007
Fisc
al
Deb
t Se
rvic
e
Air
port
Sys
tem
(Con
tinu
ed)
Deb
t Se
rvic
e
2004
Year
2003
2005
2006
2007
2009
2002
Park
ing
Syst
em
200
8 1
2002
Not
e:D
etai
lsre
gard
ing
the
City
'sou
tsta
ndin
gde
btca
nbe
foun
din
the
Not
esto
the
Fina
ncia
lSt
atem
ents
.O
pera
ting
expe
nses
dono
tin
clud
ein
tere
st,
depr
ecia
tion
,or
amor
tiza
tion
expe
nses
.
CITY
OF
SAN
AN
TON
IO,
TEXA
S
Fisc
al
2008
Year
2003
- 249 - Amounts are expressed in thousands

Stat
isti
cal D
ata
Pled
ged-
Reve
nue
Cove
rage
Last
Nin
e Fi
scal
Yea
rs(i
n th
ousa
nds)
PFC
Less
:N
etBe
ginn
ing
PFC
PFC
Ava
ilabl
eFu
nd B
alan
ceRe
venu
esEx
pens
esRe
venu
ePr
inci
pal
Inte
rest
Cove
rage
-$
6,
306
$-
$6,
306
$-
$65
0$
9.70
4,99
8
8,90
2
52
8
13,3
72
775
1,
952
4.90
10,7
16
8,90
525
19,5
9680
51,
921
7.19
16,9
08
9,97
81,
174
25,7
1284
5
2,28
28.
2220
,960
10
,839
1,13
330
,666
1,70
5
3,
719
5.65
26,2
93
12,6
781,
576
37,3
951,
775
3,65
16.
8931
,601
17
,115
16,6
9232
,024
3,96
5
6,
128
3.17
32,0
24
16,0
3513
,216
34,8
433,
535
7,22
23.
2434
,843
16
,757
(567
)52
,167
3,69
0
7,
066
4.85
2010
2008
2007
PFC
Ope
rati
ons
2003
2005
2004
Year
Deb
t Se
rvic
eFi
scal
2006
(End
of
Stat
emen
t)
Not
e:D
etai
lsre
gard
ing
the
City
'sou
tsta
ndin
gde
btca
nbe
foun
din
the
Not
esto
the
Fina
ncia
lSt
atem
ents
.O
pera
ting
expe
nses
dono
tin
clud
ein
tere
st,
depr
ecia
tion
,or
amor
tiza
tion
expe
nses
.
CITY
OF
SAN
AN
TON
IO,
TEXA
S
2002
2009
- 250 - Amounts are expressed in thousands

CITY OF SAN ANTONIO, TEXAS Comprehensive Annual Financial Report Year-Ended September 30, 2010

City of San Antonio, Texas
Demographic and Economic Information
These schedules offer demographic and economic indicators to help the reader understand the environment within which the City’s financial activities take place and to help make comparisons over time and with other governments.

Statistical DataDemographic and Economic StatisticsLast Ten Calendar Years
PersonalIncome Per Capita
(thousands PersonalYear Population of dollars) Income
2001 1,226,250 24,770,250$ 20,200$2002 1,241,100 23,953,230 19,3002003 1,262,800 25,205,488 19,9602004 1,278,300 24,248,073 18,9692005 1,299,200 25,386,368 19,5402006 1,322,900 26,603,519 20,1102007 1,312,286 26,093,495 19,8842008 1,328,984 27,653,499 20,8082009 1,340,549 28,750,754 21,4472010 1,319,492 28,260,879 21,418
32.6 296,328 6.1%
Median SchoolAge Enrollment
267,184270,025
UnemploymentRate
4.1%5.1%
295,673
275,796273,560
32.531.832.032.232.2 279,756
Sources: Population, personal income, per capita income, median age, school enrollment, and education level information provided by the
Planning Department, City of San Antonio, Texas. Unemployment rate provided by the Texas Workforce Commission.
Note: Population, median age, and education level information are based on surveys conducted during the last quarter of the calendar year.
Personal income information is a total for the year. Unemployment rate information is an adjusted yearly average. School enrollment is based on
the census at the start of the school year.
5.2%5.2%4.4%3.9%32.6
33.2
32.8
387,343 6.7%32.1
CITY OF SAN ANTONIO, TEXAS
283,393
5.5%
5.0%291,873
- 251 - Amounts are expressed in thousands

Statistical DataPrincipal EmployersCurrent Year and Nine Years Ago
Lackland Air Force BaseFort Sam HoustonH.E.B. Food StoresUnited Services Automobile AssociationNorthside Independent School DistrictRandolph Air Force BaseCity of San AntonioNorth East Independent School DistrictSan Antonio Independent School DistrictMethodist Health Care SystemSBC Communications (A T & T)San Antonio Air Logistics CenterBaptist Health Systems
Total
1
2
4.30%
CITY OF SAN ANTONIO, TEXAS
Employer
Percentage
0.97%0.89%
5,631
13,657 2
7,180 67
1.85%
0.67%10,223 8
1.55%
1.25%
12,597 51.47%
Percent based on an Employment Estimate of 814,900 of Non-Farm jobs in the San Antonio-New Braunfels, TX Metropolitan Statistical Area as ofJanuary 2010. Figure provided by the Texas Workforce Commission.
10 0.88%
2.08%1.79%
8
4
97,154
Source: Economic Development Division, City of San Antonio, Texas, Greater San Antonio Chamber of Commerce, Economic Development
Foundation, and U.S. Census Bureau American FactFinder 2009 Data.
Percent based on an Employment Estimate of 737,700 of Non-Farm jobs in the San Antonio-New Braunfels, TX Metropolitan Statistical Area as ofJanuary 2001. Figure provided by the Texas Workforce Commission.
5 1.05%0.95%
19.14% 11.96%
7,720
156,010
7,714
88,236
of Total CityEmployees Rank Employment 1 Employees
35,026 1
17,664 3
11,944
28,082
6
2
14,589
of Total CityRank Employment 2
3.45%
2010
1.18%8,711
2.17%15,358 1
4,918
4
10
2001
3
Percentage
9 0.76%
1.68%11,017 7 1.35% 12,393
0.82%
6,600
6,068
- 252 - Amounts are expressed in thousands

City of San Antonio, Texas
Operating Information
These schedules contain information about the City’s operations and resources to help the reader understand how the City’s financial information relates to the services the City provides and the activities it performs.

Stat
isti
cal D
ata
Full-
Tim
e Eq
uiva
lent
Cit
y G
over
nmen
t Em
ploy
ees
by F
unct
ion/
Prog
ram
2001
2002
2003
2004
2005
2006
2007
2008
2009
2010
Func
tion
/Pro
gram
:M
a yor
and
Cou
ncil
1616
1717
1817
1817
1717
Cit y
Man
ager
1415
1312
1213
2422
1717
Adm
inis
trat
ive
Serv
ices
1,7
185
Alam
odom
e8
4851
6148
4846
Anim
al C
are
Serv
ices
577
8310
010
410
8As
set
Man
a gem
ent
220
2021
127
128
212
212
Avia
tion
Uni
form
ed O
ffic
ers
2627
2727
2828
2828
2730
Avia
tion
Civ
ilian
Em
ploy
ees
342
342
340
354
342
360
382
417
424
415
Capi
tal I
mpr
ovem
ents
Man
agem
ent
Serv
ices
(CI
MS)
137
183
196
Cit y
Att
orne
y11
286
8685
9093
9210
810
410
4Ci
t y A
udit
or27
227
2419
1325
2322
22Ci
t y C
lerk
1816
1519
1820
2224
2420
Code
Com
plia
nce
490
105
105
101
103
Com
mun
icat
ions
and
Pub
lic A
ffai
rs 6
68
89
8Co
mm
unit
y In
itia
tive
s48
545
840
539
435
733
133
133
531
927
8Co
ntra
ct S
ervi
ces
1, 2
1015
Conv
enti
on a
nd V
isit
ors
Bure
au90
8574
7067
6775
8690
86Co
nven
tion
Fac
iliti
es 8
246
296
278
254
243
252
Conv
enti
on,
Spor
ts a
nd E
nter
tain
men
t Fa
cilit
ies
827
630
829
828
0Cu
ltur
al A
ffai
rs8
1011
1110
911
1212
11Cu
stom
er S
ervi
ces/
311
S yst
em32
3845
4951
5852
6262
56D
evel
o pm
ent
Serv
ices
155
168
195
194
204
219
244
217
220
200
Dow
ntow
n O
pera
tion
s67
174
174
160
Econ
omic
and
Em
ploy
men
t D
evel
opm
ent
3233
3236
3437
3738
3533
Exte
rnal
Rel
atio
ns 6
1012
1313
13Fi
nanc
e/Pu
blic
Uti
litie
s96
113
100
7477
7187
9187
82Fi
refi
ghte
rs a
nd E
MS
1361
1376
1413
1421
1414
1435
1450
1448
1533
1568
Fire
De p
artm
ent
Civi
lian
Empl
oyee
s12
412
710
210
011
095
114
103
133
159
Flee
t M
aint
enan
ce a
nd O
pera
tion
s7
182
155
161
147
Gra
nts
Mon
itor
ing
and
Adm
inis
trat
ion
2022
2125
Hea
lth
564
365
762
161
960
251
048
336
536
536
0H
ousi
n g a
nd C
omm
unit
y D
evel
opm
ent
425
2925
2425
23H
uman
Res
ourc
es
4958
5671
6967
7791
8573
Info
rmat
ion
Tech
nolo
gy S
ervi
ces
165
170
186
219
225
212
196
208
218
214
Inte
r gov
ernm
enta
l Rel
atio
ns 6
45
55
5In
tern
atio
nal A
ffai
rs13
1112
1212
1210
1010
8Li
brar
y28
629
127
328
129
431
131
533
633
130
0M
unic
i pal
Cou
rt17
718
117
616
716
917
416
415
616
617
4N
eigh
borh
ood
Acti
on 4
3040
4547
49H
ousi
n g a
nd N
eigh
borh
ood
Serv
ices
415
315
616
717
315
4N
on D
e par
tmen
tal
425
2022
2119
2135
2436
Off
ice
of M
ana g
emen
t an
d Bu
dget
15
3134
1617
1714
1418
17Pa
rks
and
Recr
eati
on87
685
982
280
381
781
270
362
464
661
7Pl
anni
n g a
nd C
omm
unit
y D
evel
opm
ent
4242
4036
3533
4036
00
Polic
e O
ffic
ers
1949
1998
1995
1988
1964
1988
2031
2078
2186
2229
Polic
e D
e par
tmen
t Ci
vilia
n Em
ploy
ees
585
554
534
527
545
562
552
523
638
599
Publ
ic W
orks
314
4897
899
888
886
175
074
064
763
661
0Pu
rcha
sin g
119
919
018
118
418
0Pu
rcha
sing
and
Con
trac
t Se
rvic
es 2
, 7
814
713
113
6So
lid W
aste
Man
agem
ent
352
151
753
451
251
546
846
045
245
5S p
ecia
l Pro
ject
s15
11
Tota
l9,
873
10,0
519,
895
9,87
99,
799
9,80
69,
823
9,83
710
,160
10,0
09So
urce
: Ci
t y o
f Sa
n An
toni
o, T
exas
. Fi
gure
s ac
coun
t fo
r ac
tual
em
ploy
men
tpo
siti
ons
fille
d.1 In
FY
2006
the
Pur
chas
ing
and
Cont
ract
Ser
vice
s D
epar
tmen
ts w
ere
com
bine
d to
for
m t
he A
dmin
istr
ativ
e Se
rvic
es D
epar
tmen
t.2 T
he C
ontr
act
Serv
ices
Dep
artm
ent
bega
n as
a d
ivis
ion
of A
sset
Man
agem
ent
in F
Y 20
01.
In F
Y 20
04,
they
bec
ame
thei
r ow
n se
para
te d
epar
tmen
t an
d in
FY
2008
the
y w
ere
mov
ed in
to P
urch
asin
g an
d Co
ntra
ct S
ervi
ces.
3 Pri
or t
o FY
200
2 th
e En
viro
nmen
tal S
ervi
ces
Dep
artm
ent
was
a p
art
of P
ublic
Wor
ks a
s th
e En
terp
rise
Sol
id W
aste
Fun
d. In
FY
2008
the
dep
artm
ent's
nam
e w
as c
hang
ed t
o So
lid W
aste
Man
agem
ent.
4 In F
Y 20
06 t
he N
eigh
borh
ood
Acti
on a
nd C
ode
Com
plia
nce
Dep
artm
ents
wer
e co
mbi
ned
then
in F
Y 20
07 t
his
com
bine
d w
ith
Hou
sing
to
form
the
Hou
sing
and
Nei
ghbo
rhoo
d Se
rvic
es D
epar
tmen
t.5 P
rior
to
FY 2
006
Anim
al C
are
Serv
ices
was
par
t of
the
Hea
lth
Dep
artm
ent.
6 Dur
ing
FY 2
006
the
Exte
rnal
Rel
atio
ns D
epar
tmen
t di
vide
d to
for
m t
he In
terg
over
nmen
tal R
elat
ions
and
the
Com
mun
icat
ions
and
Pub
lic A
ffai
rs D
epar
tmen
ts.
7In
FY
2007
Adm
inis
trat
ive
Serv
ices
was
div
ided
into
tw
o ne
w d
epar
tmen
ts.
Form
ing
the
Flee
t M
aint
enan
ce a
nd O
pera
tion
s an
d Pu
rcha
sing
and
Con
trac
t Se
rvic
es D
epar
tmen
ts.
8 In F
Y 20
07 A
lam
odom
e an
d Co
nven
tion
Fac
iliti
es w
ere
com
bine
d to
for
m t
he C
onve
ntio
n, S
port
s an
d En
tert
ainm
ent
Faci
litie
s D
epar
tmen
t.
Last
Ten
Fis
cal Y
ears
Full-
tim
e Eq
uiva
lent
Em
ploy
ees
as o
f Se
ptem
ber
30
CITY
OF
SAN
AN
TON
IO,
TEXA
S
- 253 - Amounts are expressed in thousands

Stat
isti
cal D
ata
Ope
rati
ng In
dica
tors
by
Func
tion
/Pro
gram
2001
2002
2003
2004
2005
2006
2007
2008
2009
2010
Func
tion
/Pro
gram
:
Polic
e:Ph
ysic
al A
rres
ts 1
77,8
4677
,506
81,5
1783
,254
82,1
5880
,794
75,5
1688
,078
123,
038
186,
181
Park
ing
Viol
atio
ns91
,174
104,
833
104,
968
86,1
2811
1,86
393
,888
104,
309
110,
670
81,4
8076
,142
Traf
fic
Viol
atio
ns23
2,82
026
4,39
025
6,58
827
4,15
227
1,65
522
2,32
620
0,37
123
6,79
226
6,86
625
4,01
1Fi
re: Em
erge
ncy
Resp
onse
s66
,735
67,6
7768
,441
73,4
7284
,573
89,4
2690
,389
100,
104
101,
421
104,
253
Fire
Res
pons
es8,
688
8,39
38,
420
7,72
88,
370
9,71
97,
292
5,30
54,
839
2,39
0In
s pec
tion
s13
,604
14,1
2515
,243
15,4
8516
,223
16,6
1219
,986
24,7
1823
,149
22,4
59So
lid W
aste
:Re
fuse
Col
lect
ed (
tons
per
day)
1,60
21,
675
1,70
31,
697
1,69
01,
709
1,81
81,
842
1,69
81,
376
Rec y
clab
les
Colle
cted
(to
nspe
r da
y)10
096
9492
9810
014
921
728
547
8O
ther
Pub
lic W
orks
:St
reet
Res
urfa
cin g
(mile
s)20
5.05
177.
8415
7.50
159.
2512
8.46
115.
4614
0.09
185.
3145
3.20
423.
00Po
thol
es R
e pai
red
6,59
16,
380
12,3
7924
,467
27,2
9417
,290
23,7
2412
,919
12,1
2042
,240
Park
s an
d Re
crea
tion
:At
hlet
ic F
ield
Per
mit
s Is
sued
2,
001
2,25
32,
076
2,30
61,
854
1,95
51,
674
1,62
81,
939
1,94
5Co
mm
unit
y Ce
nter
Res
erva
tion
s 2,
727
2,80
23,
103
3,37
23,
027
2,80
53,
079
2,19
02,
220
1,93
0Li
brar
y:Vo
lum
es in
Col
lect
ion
1,98
2,57
71,
935,
036
1,85
2,22
11,
842,
579
1,97
0,66
12,
155,
843
2,09
1,73
52,
164,
172
2,18
8,21
92,
241,
491
Volu
mes
in C
ircu
lati
on4,
586,
483
4,86
5,80
45,
275,
268
5,86
1,62
45,
876,
331
6,03
0,77
75,
935,
818
6,37
4,10
96,
616,
776
6,60
1,17
5W
ater
:Cu
stom
ers
294,
286
297,
661
300,
742
306,
363
315,
000
325,
944
336,
434
344,
168
348,
834
352,
059
Wat
er M
ain
Brea
ks
1,66
5n/
a1,
395
1,48
01,
305
2,57
73,
073
1,39
22,
594
3,21
2Av
era g
e D
aily
Con
sum
ptio
n(m
illio
ns o
f ga
llons
)14
8.5
172.
214
4.3
149.
414
3.7
172.
218
1.6
169.
219
4.9
181.
4M
axim
um D
ail y
Con
sum
ptio
n(m
illio
ns o
f ga
llons
)27
0.4
274.
022
9.5
303.
219
6.5
278.
126
9.0
224.
029
9.1
243.
5W
aste
wat
er:
Amou
nt T
reat
ed P
eak
Da y
(mill
ions
of
gallo
ns)
264.
017
5.0
30.0
201.
029
7.0
212.
016
9.0
294.
017
4.0
194.
0
Sour
ces:
Var
ious
Cit
y de
part
men
ts a
nd S
an A
nton
io W
ater
Sys
tem
.1 C
ity
Clas
s "C
" of
fens
es.
Fisc
al Y
ear
Last
Ten
Fis
cal Y
ears
CITY
OF
SAN
AN
TON
IO,
TEXA
S
- 254 - Amounts are expressed in thousands

Stat
isti
cal D
ata
Capi
tal A
sset
Sta
tist
ics
by F
unct
ion/
Prog
ram
Func
tion
/Pro
gram
:
Polic
e:St
atio
nsSu
b-St
atio
nsM
arke
d Pa
trol
Uni
tsFi
re: Fire
Sta
tion
sSo
lid W
aste
:G
arba
ge T
ruck
sRe
c ycl
ing
Truc
ks 3
Dua
l Pur
pose
Col
lect
ion
Vehi
cles
312
0O
ther
Pub
lic W
orks
:St
reet
s(m
iles)
13,
953
Hi g
hway
s(m
iles)
191
1St
reet
light
sTr
affi
c Si
gnal
sPa
rks
and
Recr
eati
on:
Acre
age
Play
grou
nds
Base
ball/
Soft
ball
Dia
mon
dsSo
ccer
/Foo
tbal
l Fie
lds
Gol
f Co
urse
s6
66
66
66
66
6Sw
imm
ing
Pool
s23
2323
2423
2424
2425
27Co
mm
unit
y Ce
nter
sW
ater
:W
ater
Mai
ns (
mile
s)Fi
re H
ydra
nts
Stor
age
Capa
city
(mill
ions
of
gallo
ns)
Was
tew
ater
:Se
wer
Mai
ns (
mile
s)2
Stor
m S
ewer
s (m
iles)
Perm
itte
d Tr
eatm
ent
Capa
city
(mill
ions
of
gallo
ns)
Sour
ces:
Var
ious
Cit
y de
part
men
ts,
CPS
Ener
gy,
TxD
OT,
and
San
Ant
onio
Wat
er S
yste
m.
1 Fig
ures
ava
ilabl
e on
ly f
or t
he la
st s
ix f
isca
l yea
rs.
2In
FY20
07th
eEn
viro
nmen
talS
ervi
ces
Dep
artm
ent
chan
ged
its
nam
eto
Solid
Was
teM
anag
emen
t2Pr
ior
to 2
004,
the
mile
s of
sew
er m
ain
in p
lace
wer
e es
tim
ated
. U
tiliz
ing
GPS
tra
ckin
g, m
ore
accu
rate
dat
a w
as o
btai
ned
and
mai
ntai
ned
star
ting
in 2
004.
2In
FY20
07th
eEn
viro
nmen
talS
ervi
ces
Dep
artm
ent
chan
ged
its
nam
eto
Solid
Was
teM
anag
emen
t3Th
e re
cycl
e on
ly v
ehic
les
have
bee
n re
mov
ed f
rom
the
fle
et.
CO
SA h
as p
urch
ased
dua
l pur
pose
veh
icle
s, w
hich
ser
ve b
oth
as g
arba
ge a
nd r
ecyc
le c
olle
ctio
n ve
hicl
es.
CITY
OF
SAN
AN
TON
IO,
TEXA
S
498.
0
223.
5
4,86
626
,599
166.
2
5,08
5
129 93 30
1,04
679
,468
1,28
8
14,2
82
2010
1 668
0 50 49-
4,06
4
498.
0
223.
5
4,80
225
,955
165.
0
5,00
1
151
129 93 31
1,00
477
,674
1,22
6
14,2
4150 224 23
4,01
8
2009
1 666
8
Last
Ten
Fis
cal Y
ears
Fisc
al Y
ear
2001
2002
2003
2004
2005
2006
2007
2008
11
11
11
11
66
66
66
544
544
551
554
554
555
66
4848
5048
4949
50
559
580
3735
46
4,02
2
5050
50
110
13,8
9814
,463
15,6
00
110
11,2
52 9910
0
58
3,98
14,
018
1,09
01,
111
1,12
11,
139
1,15
365
,111
65,0
271,
197
911
75,4
901,
004
76,6
9664
,848
1,06
763
,620
142.
0
4,60
72626
2525
2529
29
18,9
14
62
498.
0
4,52
54,
673
23,9
6425
,004
112 62116
498.
0
223.
5
4,40
423
,212
4,32
422
,691
161.
5
4,53
3
4,25
122
,117
145.
0
5,08
849
8.0
223.
5
166.
016
4.0
498.
049
8.0
4,73
9
223.
522
3.5
223.
5
4,16
221
,463
4,07
64,
032
20,8
1520
,44025
144.
714
9.7
121.
2
4,84
54,
892
4,96
737
7.6
383.
238
3.7
223.
522
3.5
223.
5
59
64,5
27 110
111 61
61
64,6
78 115
111 61
113
16,1
5111
911
2
1,18
0
131
111
18,3
84
911
16,6
60
5046
114
112 62
4,87
7
147
193
131
133
129
137
131
50
- 255 - Amounts are expressed in thousands

CITY OF SAN ANTONIO, TEXAS Comprehensive Annual Financial Report Year-Ended September 30, 2010