Comprehensive Annual Financial Report fiscal year ended ...
169
County of San Diego, California Comprehensive Annual Financial Report fiscal year ended June 30, 2011 For the
-
Upload
khangminh22 -
Category
Documents
-
view
0 -
download
0
Transcript of Comprehensive Annual Financial Report fiscal year ended ...
County of San Diego, CaliforniaComprehensive Annual
Financial Report
fiscal year ended June 30, 2011
For the

Cover & title page photo credits:Brenda Linskey/Shutterstock.com (beach in La Jolla)JustASC/Shutterstock.com (grape vines in Escondido)Curtis Kautzer/Shutterstock.com (Indian Head at sun up in Anza Borrego)JustASC/Shutterstock.com (hot air balloons)
Walter F. EkardChief Administrative Officer
Compiled under the direction of
Donald F. SteuerChief Financial Officer
Tracy M. SandovalAuditor and Controller
County of San Diego, CaliforniaComprehensive Annual Financial ReportFor the fiscal year ended June 30, 2011
Greg CoxDianne JacobPam Slater-PriceRon RobertsBill Horn
District 1District 2District 3District 4District 5
Board of Supervisors

ii
Contents
Comprehensive Annual Financial Report for the Year Ended June 30, 2011 ~ County of San Diego
Introductory SectionLetter of Transmittal.................................................1GFOA Certificate of Achievement ...........................13Board of Supervisors...............................................14Organizational Chart...............................................15Other Elected and Appointed Officials ....................16
Financial SectionIndependent Auditor’s Report ................................17Management’s Discussion and Analysis ..................19Basic Financial Statements......................................33
Government-wide Financial Statements:Statement of Net Assets................................................................34Statement of Activities ..................................................................35
Fund Financial Statements:Balance Sheet - Governmental Funds ...........................................37Reconciliation of the Governmental Funds Balance Sheet to the Government-wide Statement of Net Assets ..........38
Statement of Revenues, Expenditures, and Changes in Fund Balances - Governmental Funds ..................................................39
Reconciliation of the Statement of Revenues, Expenditures, and Changes in Fund Balances of Governmental Funds to the Statement of Activities ................................................................40
Statement of Net Assets - Proprietary Funds................................41Statement of Revenues, Expenses, and Changes in Fund Net Assets - Proprietary Funds ....................................................42
Statement of Cash Flows - Proprietary Funds ...............................43Statement of Fiduciary Net Assets - Fiduciary Funds ....................44Statement of Changes in Fiduciary Net Assets - Fiduciary Funds..45
Contents - Notes to the Financial Statements ............................46Notes to the Financial Statements..............................................47
Required Supplementary Information ....................81Schedule of Revenues, Expenditures, and Changes in Fund Balance - Budget and Actual:General Fund.................................................................................82Public Safety Fund .........................................................................85Tobacco Endowment Fund............................................................86Notes to Required Supplementary Information - Budgetary Information..................................................................................87
Combining and Individual Fund Information and Other Supplementary Information................................89
Combining Balance Sheet:Nonmajor Governmental Funds....................................................93 Special Revenue Funds ...............................................................94 Debt Service Funds .....................................................................97 Capital Projects Funds ................................................................98
Combining Statement of Revenues, Expenditures, and Changes in Fund Balances:Nonmajor Governmental Funds....................................................99 Special Revenue Funds ............................................................. 100 Debt Service Funds ................................................................... 103 Capital Projects Funds .............................................................. 104
Schedule of Revenues, Expenditures, and Changes in Fund Balance - Budget and Actual: Air Pollution Fund ....................................................................... 105Asset Forfeiture Program Fund................................................... 106County Library Fund.................................................................... 107County Service District Funds ..................................................... 108Edgemoor Development Fund .................................................... 111Flood Control District Fund ......................................................... 112Housing Authority Fund .............................................................. 113Housing and Community Development Fund ............................. 114In Home Supportive Services Public Authority Fund .................. 115Inactive Wastesites Fund ............................................................ 116Inmate Welfare Program Fund ................................................... 117Lighting Maintenance District Fund ............................................ 118Other Special Districts Funds ...................................................... 119Park Land Dedication Fund ......................................................... 120Redevelopment Agency Fund ..................................................... 121Road Fund ................................................................................... 122
Combining Financial Statements - Nonmajor Enterprise Funds .............................. 123Combining Statement of Net Assets ........................................... 124Combining Statement of Revenues, Expenses, and Changes in Fund Net Assets ...................................................... 125
Combining Statement of Cash Flows .......................................... 126Combining Financial Statements -
Internal Service Funds....................................... 127Combining Statement of Net Assets ........................................... 128Combining Statement of Revenues, Expenses, and Changes in Fund Net Assets ...................................................... 130
Combining Statement of Cash Flows .......................................... 132Combining Financial Statements -
Investment Trust Funds .................................... 135Combining Statement of Fiduciary Net Assets............................ 136Combining Statement of Changes in Fiduciary Net Assets ......... 137
Combining Financial Statements - Agency Funds.................................................... 139Combining Statement of Changes in Assets and Liabilities......... 140
Statistical SectionIntroduction ................................................................................ 141Net Assets by Component........................................................... 142Changes in Net Assets ................................................................. 143Fund Balances Governmental Funds........................................... 145Changes in Fund Balances Governmental Funds ........................ 146Assessed Value of Taxable Property ........................................... 147Property Tax Rates - Direct and Overlapping Governments ....... 148Principal Property Taxpayers ...................................................... 149Property Tax Levies and Collections............................................ 150Ratios of Outstanding Debt by Type ........................................... 151Ratios of General Bonded Debt Outstanding.............................. 152Legal Debt Margin Information................................................... 153Pledged-Revenue Coverage ........................................................ 154Demographic and Economic Statistics ........................................ 155Principal Employers..................................................................... 156Full-time Equivalent County Government Employees by Function................................................................................ 157
Operating Indicators by Function................................................ 158Capital Asset Statistics by Function............................................. 159

1
County of San Diego ~ Comprehensive Annual Financial Report for the Year Ended June 30, 2011
Letter of Transmittal
Introductory Section
Letter of Transmittal
November 17, 2011
To the honorable members of the Board of Supervisors and the Citizens of San Diego County:
The Comprehensive Annual Financial Report (CAFR) of theCounty of San Diego (County) for the fiscal year ended June 30,2011, is hereby submitted in compliance with Sections 25250 and25253 of the Government Code of the State of California.
Management assumes full responsibility for the completenessand reliability of the information contained in this report, basedupon a comprehensive internal control framework it establishedfor this purpose. Because the cost of internal control should notexceed anticipated benefits, the objective is to providereasonable, rather than absolute, assurance that the financialstatements are free of any material misstatements.
Macias Gini & O’Connell LLP, Certified Public Accountants, haveissued an unqualified (“clean”) opinion on the County of SanDiego’s financial statements for the year ended June 30, 2011.The independent auditor’s report is located at the front of thefinancial section of this report.
Management’s discussion and analysis (MD&A) immediatelyfollows the independent auditor’s report and provides anarrative introduction, overview, and analysis of the financialstatements. MD&A complements this letter of transmittal andshould be read in conjunction with it.
County ProfileSan Diego County is the southernmost major metropolitan areain the State of California and covers 4,261 square miles,extending 75 miles along the Pacific Coast from Mexico toOrange County, and inland 75 miles to Imperial County along theinternational border shared with Mexico. Riverside and Orangecounties form the northern boundary. The County enjoys a widevariety of climate and terrain, from coastal plains and fertileinland valleys to mountain ranges and the Anza-Borrego Desertin the east. The Cleveland National Forest occupies much of theinterior portion of the County. The climate is equable in thecoastal and valley regions where most of the population andresources are located. The average annual rainfall in the coastalareas is 10 inches, so the County is highly dependent on importedwater.
In March 2011, the U.S. Census Bureau estimated the County'spopulation for 2010 to be 3,095,313 an increase of 10.0% fromthe 2000 figure of 2,813,833. The State of California Departmentof Finance released population data incorporating the 2010Census counts as the benchmark, and the County's populationfor January 1, 2011 was estimated to be 3,118,876. San Diego isthe second largest county by population in California behind LosAngeles County. There are 18 incorporated cities in the County;of them, the City of San Diego is the largest, with a population ofapproximately 1,311,882; and Del Mar is the smallest, with apopulation of approximately 4,187. In addition, the Tijuana,Mexico, metropolitan area with an estimated population ofapproximately 1,751,430 according to the 2010 census, is asubstantial urban neighbor with a shared border, workforce, andeconomy.
The racial and ethnic composition of the County is as diverse asits geography. The regional population for 2030 is forecasted tobe 3.9 million according to the San Diego Association ofGovernments' (SANDAG's) 2050 Regional Growth Forecastreleased in February 2010. SANDAG projects that in 2030 SanDiego's population breakdown will be 41.9% White, 37.0%Hispanic, 11.4% Asian and Pacific Islander, 5.4% AfricanAmerican, 3.5% two or more races, and 0.8% in all other groups.A significant growth in the Hispanic population is seen in thisprojection.
County Government, Economy and Outlook
County GovernmentSan Diego became one of California's original 27 counties onFebruary 18, 1850, shortly after California became the 31st Statein the Union. The County functions under a charter adopted in1933, as subsequently amended from time to time. A five-member Board of Supervisors elected to four-year terms indistrict, nonpartisan elections governs the County. Each boardmember is limited to no more than two terms and must reside inthe district from which he or she is elected. The Board of
2
Letter of Transmittal
Comprehensive Annual Financial Report for the Year Ended June 30, 2011 ~ County of San Diego
Supervisors sets priorities for the County and oversees mostCounty departments and programs and approves their budgets.Per California Government Code Section 23005, the County mayexercise its powers only through the Board of Supervisors orthrough agents and officers acting under the authority of theBoard or authority conferred by law. The Board of Supervisorsappoints the following officers: the Chief Administrative Officer(CAO), the County Counsel, the Probation Officer and the Clerk ofthe Board of Supervisors. The Chief Administrative Officerappoints the Chief Financial Officer, the Auditor and Controllerand all other appointive officers. The CAO assists the Board ofSupervisors in coordinating the function and operations of theCounty; is responsible for carrying out all of the Board's policydecisions that pertain to the functions assigned to that officer;and supervises the expenditures of all departments. Electedofficials head the offices of the Assessor/ Recorder/ County Clerk,District Attorney, Sheriff and Treasurer-Tax Collector.
The State Legislature has granted each county the powernecessary to provide for the health and well-being of itsresidents. The County provides a full range of public services toresidents, including law enforcement, detention and correction,emergency response services, health and sanitation, parks andrecreation, libraries and roads. The County also serves as adelivery channel for many State services, such as foster care,public health care and elections. These services are provided byfive business Groups (Public Safety, the Health and HumanServices Agency, Land Use and Environment, Community Servicesand Finance and General Government), each headed by aGeneral Manager [Deputy Chief Administrative Officer (DCAO)]who reports to the CAO.
Economy and OutlookThe U.S. economy suffered through a very deep recessionbeginning in December 2007 and ending in June 2009 accordingto the National Bureau of Economic Research (NBER). Therecession lasted approximately 18 months making it the longestrecession since 1929. The economic events of September andOctober, 2008, in particular, have had far reaching and long-termimpacts on the financial markets in the U.S and around the world.
On July 29, 2011, the Bureau of Economic Analysis (BEA) releasedrevised data for 2008 through 2010 that indicated that the recentrecession was deeper than previously thought and that the levelof real gross domestic product (GDP) had not yet attained its pre-recession peak by the second quarter of 2011. In 2010, real GDPincreased by 3.0% in contrast to a decrease of 3.5% in 2009.According to the second estimate released by the Bureau ofEconomic Analysis, the U.S. economy increased at an annual rateof 1.0% in the second quarter of 2011.
The forecast for 2011 depicts a real GDP increase of 1.5% from2010. Real GDP growth is expected to continue in 2012.
Minutes from the Federal Open Market Committee meeting onAugust 9, 2011, indicated that the pace of the economic recoveryremained slow in recent months and that labor marketconditions continued to be weak. Overall, consumer price
inflation moderated in recent months, and measures of long-runinflation expectations remained stable. Private non-farmemployment rose at a considerably slower pace in June and Julythan earlier in the year, and employment in state and localgovernments continued to trend lower. The unemployment rateedged up since the beginning of the year, and long-durationunemployment remained very high. Activity in the housingmarket continued to be depressed, held down by the largeinventory of foreclosed or distressed properties on the marketand by weak demand in an environment of uncertainty aboutfuture home prices and tight underwriting standards.Manufacturing production was unchanged in June. Supply chaindisruptions associated with the earthquake in Japan continued tohinder production at motor vehicle manufacturers and the firmsthat supply them. However, supply chain disruptions areexpected to ease, and motor vehicle assembly schedules calledfor a substantial step-up in production. Real consumer spendingwas nearly unchanged in the second quarter of 2011. Motorvehicle purchases have rebounded somewhat in July as suppliesimproved. Labor earnings rose in the second quarter, butincreases in consumer prices offset much of the gain in nominalincome.
Some significant risks facing the U.S. economy in 2011 includepossible effects of spillovers from the lack of a credible plan foran orderly resolution of the sovereign debt crisis in Europe'speriphery (Source: Moody's Economy.com - Global Outlook:Trying Times for the Recovery August 31, 2011), the continuedweakness in the housing market, weak labor market conditions,weakness in consumer spending, and uncertainty surroundingthe outlook for economic growth (Source: Minutes from theFederal Open Market Committee meeting on August 9, 2011).The Federal Open Market Committee agreed to keep the targetrange for the federal funds rate at 0 or ¼ percent and to statethat economic conditions warrant exceptionally low levels for thefederal funds rate at least through mid-2013.
Like the national outlook, California’s economy has felt theimpact of the worst recession since the Great Depression.California's economic performance was mixed through early2011, with most industry sectors growing again while a fewcontinued in the doldrums (Source: Los Angeles County EconomicDevelopment Corporation - The Kyser Center for EconomicResearch: 2011-12 Economic Forecast and Industry Outlook, Mid-Year Update). Retail sales continued to recover some of thelosses incurred in 2008-2009, while tourism was up across theboard. The state's high tech sector is booming, and capital isflowing into the industry once again. Activity at the state's portsincreased at double digit rates in 2010 and early 2011. Sometypes of state and local government tax revenues turned up inline with renewed growth in incomes and sales. Monthlyunemployment in 2010 remained above 12.0% with a December2010 unemployment rate of 12.3%. In 2011, the averageunemployment rate over the first seven months was 12.1% witha July 2011 unemployment rate of 12.4%. Real personal incomegrew by 1.7%, and taxable sales were estimated to grow by 1.8%in 2010 (final taxable sales figures will not be available until early

3
Letter of Transmittal
County of San Diego ~ Comprehensive Annual Financial Report for the Year Ended June 30, 2011
2012). Consumer spending continues to be impacted by thiseconomic volatility. California's economy is starting to recoverfrom the steep 2008-2009 recession. Unemployment is stillextremely high, and many business firms are reluctant to hireuntil they are certain that better times will be long-lasting.Nonfarm employment is projected to grow by 1.1% in 2011 and0.6% in 2012. In 2011, real personal income is expected to growby 2.3% and taxable sales are predicted to increase by 1.7%.More improvement is expected in 2012.
San Diego certainly shared the pain of the recession along withthe rest of Southern California. Increasing prices in commodities,including gasoline prices, are anticipated to place stress on theregion. However, tourists are coming back, and many of theCounty's biggest industries are on the mend (Source: Los AngelesCounty Economic Development Corporation - The Kyser Centerfor Economic Research: 2011-12 Economic Forecast and IndustryOutlook, Mid-Year Update). Unemployment in the region in 2010averaged 10.5%, and was lower than the 2010 median of 11.25%for the 10 largest counties in the State. In 2011, the averageunemployment rate over the first seven months was 10.2% witha July 2011 unemployment rate of 10.5%. Another indicator ofeconomic health is County taxable sales. Taxable sales started todecline overall in the County in 2007 and that trend continued in2008 and 2009. The annual figures on taxable sales for 2010 arenot yet available from the California State Board of Equalization,but sales tax revenues in 2010 have shown a gradualimprovement, which suggests that taxable sales in San DiegoCounty, similar to predictions for California as a whole, endedbetter in 2010. This improvement is expected to continue in 2011and 2012.
The state of the economy plays a significant role in the County'sability to provide core services and the mix of other servicessought by the public. For example, there continues to be anincreased demand for public assistance, while at the same timethe State and local resources available to fund those services arenot able to keep pace with the demand. The real estate marketslump has impacted the County's general purpose revenue (GPR),although GPR is expected to increase marginally in fiscal year2012 from fiscal year 2011. General purpose revenue is reliedupon to fund local services where no other funding is available,as well as to fund the County's share of costs for services that areprovided in partnership with the State and federal government.The State of California has been severely impacted by therecession while also struggling with budget imbalances. In fiscalyear 2012, the State of California's adopted budget also realignedvarious criminal justice, mental health and social serviceprograms, representing a long term change in state and countyresponsibilities.
County management continues to evaluate and respond to thechanging economic environment and its impact on the cost andthe demand for County services. Specific actions are detailed inthe fiscal year 2012 Adopted Operational Plan which can beaccessed at http://www.sdcounty.ca.gov/auditor/opplan/adoptedlist.html.
County’s Economic BaseThe County's economic base consists of a significantmanufacturing presence (e.g. energy storage, cyber-security, andclean tech), a large tourist industry attracted by the favorableclimate of the region, a considerable defense-related presence,and the region is a thriving hub for biotech andtelecommunications industries. Highlights of Countyemployment as of July 2011 are listed below:• Non-agricultural, industry employment totaled 1,240,200
jobs. This represents a gain of 27,300 jobs from theunadjusted July 2010 employment figures.
• The services industry, including information, professional andbusiness services, education and health services, leisure andhospitality, and other services, constitutes the largestemployment sector and accounted for approximately 48.8%of non-agricultural employment, with a total of 605,700employed.
• The wholesale and retail trade industries were the secondlargest non-government sector, comprising approximately13.7% of non-agricultural employment totaling 170,400 jobs.
• Government accounted for approximately 17.7% of non-agricultural employment (219,700). San Diego's militarypresence contributes to this significant component.
• Manufacturing accounted for an additional 7.5% of non-agricultural employment (92,400).
• The construction sector is greatly influenced by the generalhealth of the economy, and in particular, population andhousing growth. Construction employment, which accountedfor 4.4% of total non-agricultural employment or 54,500 jobs,was down 4,400 jobs from the unadjusted July 2010employment figures. The continued low but improving levelof residential building permits and continued relatively highlevel of foreclosures combined with the marginally decliningmedian home prices are expected to continue to adverselyimpact construction jobs through the end of 2011 and into2012.
• The financial sector, including finance, insurance, real estateand related employment, represents 5.5% of non-agricultureemployment (68,800). Financial activities experienced anincrease of 900 jobs from the unadjusted employment figuresfor July 2010.
• Transportation, Warehousing and Public Utilities accounts for2.3% of non-agricultural employment (28,300).
• Agriculture and mining accounted for approximately 0.7% oftotal employment.
• Self-employed, household domestic workers andmiscellaneous other categories not captured in industryemployment represents approximately 11.5% or 162,200 oftotal employment (1,412,100). This category experienced adecrease of 24,400 jobs from the unadjusted employmentfigures for July 2010.
• The San Diego County region experienced a net job gain of3,200 from the July 2010 unadjusted employment figure of1,408,900 (representing civilian labor force data by place of

4
Letter of Transmittal
Comprehensive Annual Financial Report for the Year Ended June 30, 2011 ~ County of San Diego
residence including self-employed, household domesticworkers, unpaid family workers and workers on strike) to theJuly 2011 level of 1,412,100. This compares to a decrease of5,700 jobs the previous year. The County has been in themidst of significant volatility. San Diego's index of leadingeconomic indicators has trended higher since April 2009,despite recent weakness, indicating gradual economicimprovement overall. While the pace of the economicrecovery has remained slow, 2012 should see continued signsof improvement for the region.
County revenues that are affected by the state of the localeconomy include property taxes, sales taxes, and charges forservices. Key factors impacting these revenues include realestate activity and consumer spending which are in turn greatlyinfluenced by interest rates and employment levels. Althoughshort and long-term interest rates are low by historicalstandards, there seems to be a general view that the pace ofeconomic recovery at the national, state and local levels will begradual.
An impact of the overall housing market decline is animprovement in the California Association of Realtors index forfirst-time buyers throughout California. Based on the CaliforniaAssociation of Realtors' First Time Buyer Housing AffordabilityIndex, San Diego's housing affordability index, (the percentage ofhouseholds that can afford to purchase an entry-level home)stood at 64% in June 2011. This is a slight improvement from 62%in December 2010, 57% in December 2009 and 2008, significantlyup from 33% in December 2007, and 27% in December 2006. Thisindex is based on an adjustable rate mortgage and assumes a10% down payment and a first-time buyer purchase of a homeequal to 85% of the prevailing median price. The improvement inthe percentage of households that could afford to buy an entry-level home in San Diego was based on the market-driven drop inentry-level priced homes, the corresponding adjustment to themonthly payment needed (including taxes and insurance), and anadjustment to the qualifying income level for the lower pricedentry-level homes.
Sources: State of California Department of Finance, U.S. CensusBureau, San Diego Association of Governments (SANDAG) - SanDiego's Regional Planning Agency, the State of CaliforniaEmployment Development Department, and the CaliforniaAssociation of Realtors.
General Management SystemThe County's General Management System (GMS) is theframework that establishes and guides the management ofCounty operations and service delivery to residents, businessesand visitors. The County sets goals, prioritizes the use ofresources, evaluates performance, ensures cooperation andrecognizes accomplishments in a structured and coordinatedway. By doing so, the County of San Diego moves away from thenegative image of “red tape” and “government bureaucracy” intoan organization that values and implements efficiency,innovation and fiscal discipline and one that provides focused,meaningful services to improve lives and benefit the community.
At the heart of the GMS are five overlapping components whichensure that the County asks and answers crucial questions:
Strategic Planning asks: Where do we want to go? The StrategicPlan looks ahead five years to anticipate significant needs,challenges and risks that are likely to develop and sets goals forthe future. Long-range strategic planning requires assessing bothwhere the County is and where it wants to be.
Operational Planning asks: How do we get there from here?Operational Planning allocates resources to specific programsand services that support the County's long-term goals asarticulated in the Strategic Plan over the next two fiscal years.This includes adoption of an annual budget and approval inprinciple of a second year spending plan.
Monitoring and Control asks: How is our performance?Monitoring and Control shows whether the County is on track toachieve its goals. The County evaluates its progress at regularintervals and makes necessary adjustments. Progress isevaluated monthly, quarterly and annually.
Functional Threading asks: Are we working together? Althoughthe County is divided into distinct groups, departments anddivisions for operational purposes, the County has many criticalfunctions and goals that cross these organizational lines.Functional threading ensures coordination throughout theorganization to pursue shared goals, solve problems, maximizeefficiency and exchange information.
Motivation, Rewards and Recognition asks: Are we encouragingexcellence? County employees must embrace the GMSdisciplines. This requires setting clear expectations, providingincentives, evaluating performance and recognizing those whomeet or exceed expectations. Motivation, Rewards andRecognition encourages individual and group excellence. TheOperational Incentive Plans, Departmental Excellence Goals, theDo-It-Better-By-Suggestion (DIBBS) program and departmentrecognition programs are the primary ways the Countyrecognizes employees and encourages excellent performance.
The five GMS components form an annual cycle that is renewedeach fiscal year with review of the Strategic Plan anddevelopment of a new Operational Plan.
Strategic and Operational Planning (Budgetary) ProcessAs noted above, a five-year Strategic Plan is updated annually toprovide long-term direction to County managers and staff. Eachfiscal year a two-year Operational Plan is prepared and detailseach department's strategic objectives and the resourcesrequired to achieve them. The Operational Plan is monitoredregularly and is linked to the GMS system of rewards andrecognition. Pursuant to Government Code 29000 et seq., Statelaw allows the Board of Supervisors to formally adopt only thefirst year of the Operational Plan as the County's budget. Statelaw permits modifications to the adopted budget during the yearwith approval by the Board of Supervisors or in certain instances,by the Chief Financial Officer. The Chief Administrative Officer
5
Letter of Transmittal
County of San Diego ~ Comprehensive Annual Financial Report for the Year Ended June 30, 2011
reviews the status of the County's performance against thebudget in a quarterly status report to the Board of Supervisors.
Financial (Budgetary) PoliciesGovernment Code Sections 29000 through 30200 provide thestatutory requirements pertaining to the form and content of theCounty's Budget. Government Code Section 29009 requires abalanced budget in the proposed and final budgets, defined as“funding sources shall equal the financing uses”.
County Charter Section 703 establishes the Chief AdministrativeOfficer as responsible for all Group/Agencies and theirdepartments (except departments with elected officials asdepartment heads) and for supervising the expenditures of alldepartments and reporting to the Board of Supervisors onwhether specific expenditures are necessary.
County Administrative Code Article VII establishes thecomponents and timeline for the budget process and establishesthe Chief Administrative Officer as responsible for budgetestimates and submitting recommendations to the Board ofSupervisors.
The County has the following financial policies that serve asguidelines for the budget process
Board of Supervisors PoliciesA-136 Use of County of San Diego General Management Systemfor Administration of County Operations: Establishes the GeneralManagement System (GMS) as the formal guide for theadministration of County departments, programs and services,and ensures that all County departments and offices operate incompliance with the GMS.
B-29 Fees, Grants, Revenue Contract: Provides a methodologyand procedure to encourage County departments to recover fullcost for services whenever possible.
B-71 Fund Balance and Reserves: Establishes guidelines regardingthe use of fund balance and the maintenance of reserves in orderto protect the fiscal health and stability of the County.Expenditures for services are subject to fluctuations in demandand revenues are influenced by changes in the economy and byState and federal regulations. This policy ensures the County isprepared for unforeseen events by establishing and maintainingprudent levels of fund balance and reserves.
M-13 Legislative Policy: State-Mandated Local Program Costs:Calls on the State and Federal Legislature to encourage equitablereimbursement of mandated local program costs.
M-26 Legislative Policy: Governance and Financing of LocalAgencies: Calls on the Legislature to redress inequitable Statefunding formulas.
Administrative Manual0030-01 Procedure for Fees, Grants and Revenue Contracts forServices Provided to Agencies or Individuals Outside the Countyof San Diego Organization: Establishes a procedure within theframework of Board of Supervisors Policy B-29, to serve as
guidance in the process of recovering full costs for servicesprovided to agencies or individuals outside the County of SanDiego organization under grants or contracts or for which feesmay be charged.
0030-06 State Mandated Cost Recovery: Establishes guidelines toattempt full recovery of all State mandated costs resulting fromchaptered legislation and executive orders.
0030-14 Use of One-Time Revenues: One-time revenue will beappropriated only for one-time expenditures such as capitalprojects or equipment, not to ongoing programs.
0030-22 Revenue Management - Auditor and Controller & ChiefAdministrative Responsibilities: Chief Financial Officer/Auditorand Controller and Chief Administrative Officer are responsiblefor reviewing and evaluating revenues from all sources in orderto maximize these revenues within legal provisions and toinstitute internal controls and systems to be used bydepartments to estimate, claim, and collect revenues.
Strategic Initiatives and AchievementsThe inability of State government to develop a viable long-termsolution to its budget imbalance remains a risk to funding andstability of County programs, since State aid is the primary sourceof County revenues.
Notwithstanding, County government continues to follow themap of the Strategic Plan developed within the discipline of theGMS to maintain core County services within available revenues,as well as to re-shape the County's organizational structure andimplement additional efficiencies, new technologies and newways of working that enable County workers to quickly identifyand adapt to changing public needs or program realities. TheStrategic Initiatives focus on what the County will do to serve thepublic and change over time as public needs, desires andpriorities change. The County's strategic Initiatives are: • Kids - Improve opportunities for children and families.• The Environment - Manage the region’s natural resources to
protect quality of life and support economic development.• Safe and Livable Communities - Promote safe and livable
communities.
The Strategic Plan also includes Required Disciplines that addressthe County's internal priorities. The Required Disciplines are thefoundation the County organization must establish to accomplishour public service goals efficiently and effectively. They set thestandards for continued operational excellence the County iscommitted to achieving. These Required Disciplines are:• Fiscal Stability• Customer Satisfaction• Regional Leadership• Skilled, Adaptable and Diverse Workforce• Essential Infrastructure• Accountability/Transparency & Ethical Conduct• Continuous Improvement• Information Technology

6
Letter of Transmittal
Comprehensive Annual Financial Report for the Year Ended June 30, 2011 ~ County of San Diego
Within the structure of the two-year operational planningprocess, the County plans for and attains interim progress towardachievement of the Strategic Initiatives. Some of the highlightsover the last year were:
Kids: Improve Opportunities for Children and Families• The County continued to improve health and health care,
helping children and the adults that care for them, bylaunching the County's Strategy Agenda for Health, “Live Well,San Diego!,” to improve services through four overarchingstrategies - changing the culture within, supporting healthychoices, pursuing policy changes for a healthy environment,and building a better service delivery system that isinnovative and outcome-driven, emphasizing quality,efficiency, cost savings, and large-scale population-basedimprovements. Examples of this include:• Implemented additional pathways to eligibility for public
assistance through online applications, 2-1-1 San Diego,and video interviewing resulting in increased enrollment of21,863 (for a total two-year increase of 52,333) childrenand seniors in CalFresh (formerly Food Stamps), achievingthree-year Nutritional Security Plan goal to enroll 50,000children and seniors one year early.
• Integrated CalFresh application assistance andprescreening at 12 Earned Income Tax Credit sites.
• Partnered with San Diego Unified School District topromote CalFresh as a healthy, nutrition assistanceprogram for low-income families.
• Implemented In-Home Supportive Services (IHSS) reformrecommendations, including program integrity case reviewsand unannounced home visits to protect taxpayer dollars andensure appropriate level of care for consumers.
• Integrated Welfare-to-Work, Refugee Employment Servicesand Child Care under one contract to align programs andprovide a one-stop service that promotes self-sufficiency.
• Maximized compliance with child support orders bypromoting, enabling and ensuring payment for families.Informed and educated the community about child supportservices through proactive media relations and communityoutreach.
• Provided rehabilitative services to youth in custody to preparethem for success in the community.
• Improved safety for children and their families in school areasby repainting and re-marking crosswalks and roadway legendsadjacent to all 116 public school locations throughout theunincorporated areas of the county, keeping children safefrom traffic around their schools and providing safe routes toschool.
• Assisted 140 low-income families by providing rentalassistance in a program that combines rental assistance forhomeless veterans with case management and clinicalservices provided by the US Department of Veterans' Affairs.
The Environment: Manage the Region's Natural Resources to Protect Quality of Life and Support Economic Development• Inspected 8,462 priority emission sources to ensure
compliance with air pollution control standards. (Priorityemission sources include all Air Pollution Control Districtpermitted operations such as gas stations, auto body shops,dry cleaners and power plants.)
• Installed three photovoltaic systems at existing facilities toreduce County reliance on fossil fuels and reduce annualoperating costs, delivering a positive return on investment.
• Upgraded one park facility with artificial turf to conservewater resources, to reduce overall maintenance and toprovide state of the art playing fields for year-round sportsprograms.
• Protected local watersheds:• Conducted 166 presentations on watersheds and water
quality to high school students at 90% of unincorporatedCounty public high schools - as a long-term strategy forachieving positive behavioral changes.
• Conducted 594 site investigations. These investigationsprovide crucial data for understanding the condition ofreceiving waters in all eight watersheds and how they areimpacted by discharges from unincorporated communities.
• Preserved and enhanced the quality of life for Countyresidents by implementing habitat conservation programssuch as the Multiple Species Conservation Program (MSCP)and the Special Area Management Plan (SAMP), whichstreamlined the development process and helped createviable permanent open space preserves.
Safe and Livable Communities: Promote Safe and Livable CommunitiesAddressed core law enforcement and public safety needs andimplemented community-based initiatives to improve publicsafety.• Worked collaboratively with criminal justice partners to
expand the Local Reentry Program aimed at providingindividualized rehabilitative programming to those in localcustody. Collaborated with the Superior Court, CaliforniaDepartment of Corrections and Rehabilitation to implement aReentry Court to provide supervision and rehabilitation torecidivist felony offenders. Collaborated to develop andimplement a reentry program for female offenders reenteringthe community after incarceration in Las Colinas DetentionFacility.
• Participated in multi-agency operations including gangoperations, truancy sweeps, probation and parole sweeps andsobriety checkpoints.
• Successfully secured and removed an extremely dangerousresidential structure contaminated with explosives andhazardous chemicals, bringing together law enforcement,emergency management, air quality, transportation and

7
Letter of Transmittal
County of San Diego ~ Comprehensive Annual Financial Report for the Year Ended June 30, 2011
hazardous material experts to destroy unstable chemicals andexplosives through a controlled burn, and to remove debris,clean the soil and ensure the safety of the neighborhood, thesurrounding community and the region.
• Continued to enhance emergency preparedness for theregion and protected residents from wildfire and othernatural disasters:• Implemented Step II of the County's Fire and Life Safety
Reorganization Report, which includes the merging of thefive County Service Areas into the San Diego County FireAuthority - CSA 135.
• Mitigated fire fuel hazards and maintained fire safe zonesin 24 park facilities through continued implementation ofvegetation management practices.
• Improved regional leadership of the administrativefunctions and land use planning services related to fire andemergency medical services, while maintaining localoperational control for fire and emergency medicalresponse.
• Continued to collaborate with fire service entities toimprove fire protection and emergency response byproviding ongoing funding for existing contracts and muchneeded resources to rural communities, such as responseapparatus and centralized dispatch.
• Awarded construction contracts for seven CapitalImprovement Projects that improve traffic flow and provideenhanced safety.
• Maintained the planned schedule of library operations with89,296 hours open and promoted lifelong learning throughadult literacy programs attended by 62,000 library patrons.
• Achieved the goal of 0% euthanasia of any healthy, friendlyanimal by reuniting animals with their owner or throughadoption.
Certificate of AchievementThe Government Finance Officers Association of the UnitedStates and Canada (GFOA) awarded a Certificate of Achievementfor Excellence in Financial Reporting to the County for itscomprehensive annual financial report (CAFR) for the fiscal yearended June 30, 2010. In order to be awarded a Certificate ofAchievement, a government must publish an easily readable andefficiently organized CAFR. This report must satisfy bothgenerally accepted accounting principles and applicable legalrequirements.
A Certificate of Achievement is valid for a period of one year only.We believe that our current comprehensive annual financialreport continues to meet the Certificate of AchievementProgram's requirements and we are submitting it to the GFOA todetermine its eligibility for another certificate.
Other Awards and Recognitions Even with the continued financial and environmental challengesin Fiscal Year 2011, the County was recognized for many activitiesthat highlight progress in the Strategic Plan Initiatives. TheCounty of San Diego works hard to maintain its standing as a bestpractices organization, offering programs that improve the livesof San Diego County residents in ways that are relevant andmeasurable. The County is proud that its leadership in theseareas has been recognized for the following:• The County of San Diego won national recognition and the
second highest number of awards in the county by theNational Association of Counties (NACo). Twenty-eightprograms received Achievement Awards for excellence in2011. The award-winning programs operate within all fiveCounty business groups and include programs that servechildren, youth and seniors, as well as those that promoteenvironmental protection, public safety and efficient,effective county administration. Programs receiving awardsincluded:• Camp Connect San Diego - a public-private partnership
program designed to bring together siblings who havebeen separated by their placement in the foster caresystem.
• Teens Go Green: Mental Health Life Skills Program - aprogram that provides life skills to help prepare teenagerswith emotional challenges or mental illnesses foradulthood. Through an innovative gardening project, theyouth worked with chefs and gardeners to achieve healthyresults they could see through the vegetables that grew.
• Girls Only - a gender-specific preventative program thatpromotes self-esteem and motivation, in order to developlife skills and keep girls who are at risk out of the influenceof gangs and drugs, and inspire them to further theireducation.
• Families as Partners - a Child Welfare Services programdesigned to protect children and ensure they can remainsafely in their homes by partnering with community andfamilial support systems to achieve identified goals.
• Homelessness Prevention and Rapid Re-housing ProgramDesign - through partnership with the U.S. Department ofHousing and Urban Development, this program addressesthe needs of local school districts that serve families withhousing subsidies. The program stabilized 137 families andensured that 257 children remained in school.
• In-Home Supportive Services (IHSS) Reform - Implementedreform recommendations for this state-mandated programadministered by counties, including program integrity casereviews and unannounced home visits to protect taxpayerdollars and ensure appropriate level of care for consumers.
• Prescription Drug Abuse Task Force and CollaborativeAction Plan - promotes coordinated efforts by federal,state and local partners throughout the region, and

8
Letter of Transmittal
Comprehensive Annual Financial Report for the Year Ended June 30, 2011 ~ County of San Diego
provides the public with a clear description of howprescription drug abuse among teens and young adults willbe addressed to prevent the related issues from escalating.
• San Diego Air Pollution Control District's ComplianceInspection Videos - an innovative tool to provideassistance, training and education to the regulatedfacilities to prevent non-compliance and promote self-inspections to ensure ongoing compliance.
• Water Conservation Landscape Ordinance - a newlandscape conservation ordinance that includes aLandscape Design Manual that gives the County greateroversight when builders prepare landscape plans andwater budgets.
• Energy Saving Adventures (ESA) Program - a program thatsupports community needs in the areas of energyefficiency and sustainability through resourceconservation.
• Water Efficiency Program - a program developed to reducewater consumption and sewer discharge, and theirassociated costs at County facilities. This program hasproduced an annual water savings of 150 million gallons,with an associated cost savings of $1.1 million.
• HOPE (Helping Other Pursue Excellence) - a local reentryresource program designed to gather and shareinformation on service providers, etc. with inmatesreleased or recently released from local jail custody. Theprogram is run by Americorps VISTA (Volunteers in Serviceto America) and staff at the San Diego County DistrictAttorney's Office.
• Blueprint for Recovery: Comprehensive Services forHomeless Mentally Ill - a multi-facetted approach toprovide this vulnerable population with permanenthousing, the necessary supportive services and a stigma-busting campaign.
• Responsible Pet Ownership Program - The Department ofAnimal Services, the San Diego City Attorney and the SanDiego County District Attorney developed an educationalResponsible Pet Ownership program to reduce recidivismof animal law violators. The program also promotes acooperative relationship with animal owners, while savingtaxpayers' money.
• Veterans' Internship Program Work Experience Option - aprogram that provides paid work experience to veteranspursuing a career in County government and enables themto effectively compete for regular County jobs oremployment with other agencies.
• Emergency Management Augmentation Program - TheOffice of Emergency Services (OES) developed a localprogram to utilize trained Probation Officers to augmentOES staff in the County's Emergency Operations Centerduring emergencies. This lessens the County's reliance onmutual aid, while strengthening its ability to manage large,complex emergencies and disasters.
• Partner/Sponsor Cross-Promotions - a program thattargets arts and community-based organizations in supportof library programs and events, offering mutual benefitand connections for increased collaboration.
• Safe and Livable Communities: Ground-in CenterlineRumble Strips on Rural Roadways - a program to installground-in centerline rumble strips along mountain andother rural roads to reduce the number of collisionsinvolving motorcycles that cross the centerline. Thisresulted in a 30% decrease in collisions on PalomarMountain.
• Tip the Scale to Reduce Drug Abuse and Increase PublicSafety - a large-scale, multi-agency collaborative effort totackle the County's pervasive drug problem. The programOperation Tip the Scale encourages treatment for criminalsand holding substance abusers accountable for their legalcourt orders, thus creating healthier and saferneighborhoods.
• Accountability and Transparency of ARRA Funds -To ensurecompliance and promote accountability and transparencyregarding funding from the American Recovery andReinvestment Act (ARRA), a taskforce was established toproactively address such issues as grant accountability,contract management, the prevention of fraud, waste, andabuse and reporting requirements.
• San Diego County Probation Department LeadershipAcademy - a program to empower supervisors andmanagers to improve service delivery with implementationof evidence based programs and supervision techniques toadult felony probationers, with the goal of reducingrecidivism among adult probationers.
• Improved Administration of County Pool InvestmentStrategy - The County Treasurer's Office improved theadministration of the San Diego County Pool's investmentstrategy during the credit crisis and the State budgetchallenges, through enhanced monitoring of creditmarkets, restrictions of corporate exposure, utilization ofFederal liquidity programs, and shortening of the Pool'sduration.
• Electronic Classification Activity Request (eCAR) TrackingSystem - The Department of Human Resources, whichreceives an average of 350 internal classification requestsper year, developed an electronic Tracking System thatallows departments to utilize an electronic “Smart Form”to submit a variety of classification requests. This hasgreatly reduced the content error rate and the amount ofpaper used.
• Sheriff's Management Academy - a Peace OfficerStandards and Training (POST) certified training programfor the levels of Lieutenant and higher within the Sheriff'sDepartment on topics from contracts to leadership skills.

9
Letter of Transmittal
County of San Diego ~ Comprehensive Annual Financial Report for the Year Ended June 30, 2011
• Contract Services Direct Billing Program - a programdeveloped by the Department of General Services toprovide client departments with actual and timely billingwith a direct correlation to the provided service (e.g.,trash, etc.).
• Treasurer-Tax Collector Workflow Prioritization Matrix - atool to manage daily priorities and provide a high level ofcustomer service within existing resources.
• San Diego Multiple Agency Public Safety System - aprogram that consists of a Government 2.0 designedGeographical Information Systems (GIS) project that allowsthe newly reorganized County Volunteer Fire Departmentsto jointly maintain their critical infrastructure and theircommunity information in a Web-based mapping and dataediting application.
• Transcending to be a Government Without Walls -continued implementation of a program that evaluatesand identifies areas within departments where alternativework schedules or locations would benefit departmentbusiness needs, reduce vehicle fuel and maintenancecosts, and increase efficiency and productivity.
• For the ninth consecutive year, the Government FinanceOfficers Association (GFOA) of the United States and Canadarecognized the County with the Distinguished BudgetPresentation Award for the Adopted Operational Plan FiscalYears 2010-11 & 2011-12. This award is a significantachievement for the County as it reflects the organizationscommitment to maintaining the highest standards ofgovernmental budgeting.
• The San Diego County Taxpayers Association presented theCounty of San Diego an It's about Time Award Winner for theresource saving Electricity Procurement Strategy program.Since 2008, the County has reduced electricity costs by morethan $3 million by locking in current market pricing ratherthan using fixed rates for energy. This strategy is possible dueto energy market deregulation that happened in the mid-90s,and is utilized by numerous private businesses. Though thisprocurement strategy has admittedly been long-available, theCounty's swift movements to adopt it in response to sharpincreases in natural gas prices in 2008 ultimately savedtaxpayers millions.
• The Department of Purchasing and Contracting received itstenth consecutive Achievement of Excellence in Procurementaward from the National Purchasing Institute recognizingorganizational excellence in public procurement. The Countyof San Diego is one of only 38 government agencies inCalifornia and one of only 34 counties in the United States toreceive this award. The award's criteria measures innovation,professionalism, e-procurement, productivity and leadershipattributes of the procurement function.
• The County won national recognition for its award-winningWorkforce Academy for Youth (WAY). Generations United, anational membership organization focused on improving the
lives of children, youth and older people throughintergenerational strategies, programs and public policies,named the Workforce Academy a Program of Distinction.
• The National Child Support Enforcement Association honoredthe Department of Child Support Services with the 2010Excellence Award for Program Awareness based on theireffective use of media relations and public outreach indissemination of child support program information andpublic awareness. The department was also honored by theCalifornia Child Support Director's Association with the 2010Outstanding Program Award, in recognition of thedepartment's quality services to the community.
• The County Operations Center (COC) won the 2011 Energy All-Star Award for best government/nonprofit building from theCalifornia Center for Sustainable Energy for the numerousgreen features in the design, including heat-reflective roofing,a large solar-electrical system and water-saving plumbingsystems and landscaping.
• The Women's Transportation Seminar selected CountyAirports for their Annual Award for Innovative TransportationSolutions for the McClellan-Palomar Airport TerminalRedevelopment Project. The terminal was built withconsideration of energy and environmental design criteriaand sustainable design principles.
• The District Attorney Computer and Technology Crime High-Tech (C.A.T.C.H.) Response Team was honored by the SanDiego Business Journal's 1st Annual Cyber Security Awards.C.A.T.C.H. apprehends and prosecutes criminals who usetechnology to prey on citizens in our region.
• The Department of Parks and Recreation won three 2011National Association of County Park and Recreation Officials(NACPRO) Awards. The award-winning projects involvedimprovements to the Sweetwater Campground, waterconservation improvements at County Parks and restorationof the Bancroft Rock House.
• The San Diego Housing Federation honored the Departmentof Housing and Community Development with an Award ofMerit as “Housing Project of the Year” in the Rehabilitationcategory for Outstanding Government Agencies for the 34thStreet Apartments project which provides housingopportunities for persons with HIV/AIDS.
• The San Diego County Library received a “Library of the Year”Special Mention honor from Library Journal and Gale CengageLearning received this honor for innovation, excellence, andfor being a library system that features the service philosophyand dedication to community that signifies a Library of theYear.
• The Department of Public Works received Public WorksProject of the Year Award for the renovation of the runway atMcClellan-Palomar Airport from PublicCEO, an onlinemagazine for California Cities and Counties. A 5,000 foot longrunway was resurfaced with a 23" thick layer of asphalt andconcrete. Old asphalt that was torn up in the constructionprocess was recycled for the runway's new layer.
10
Letter of Transmittal
Comprehensive Annual Financial Report for the Year Ended June 30, 2011 ~ County of San Diego
• The Department of Housing and Urban Development LosAngeles Office of Public Housing awarded the Department ofHousing and Community Development with the “Up and UpCampaign” award for Achievement in Housing ChoiceVoucher Utilization for their hard work and best practices thatultimately increase the number of families served under theHousing Choice Voucher Program.
• The Department of Parks and Recreation won an Award ofExcellence from the California Parks and Recreation Societyfor the planning and design of Clemmens Lane Park. The parkincludes a soccer field, volleyball court, two play structuresand picnic area.
• The National Association of Area Agencies on Aging awardedAging and Independence Services with two of nine nationalAging Innovation Awards for the “TEAM San Diego” projectand the “Workforce Academy for Youth” program. TEAM SanDiego works with health and social service providers tocoordinate needs in those areas for aging and disabledpopulations. The Workforce Academy for Youth is anintergenerational program that pairs youth with senior lifeskills coaches who support their future employment goals.
• The Institute of Transportation Engineers - San Diego Sectionawarded Transportation Project of the Year to theDepartment of Public Works for using High-Risk Rural Roadfunds to install rumble strips on South Grade Road at PalomarMountain to reduce collisions. The rumble strips make theroad bumpy and loud when tires cross the center line. Sinceinstallation of the strips, collisions have reduced dramatically.
• Health Care Communications presented Behavioral HealthServices with the Gold Award for their “Network of Care”website, which provides local information on behavioralhealth as part of a national network system.
• Guajome Regional Park was named Best of Family Attractions- Oceanside California by UpTake.com based on customerreviews and expert ratings from across the Web.
• The video “Green It Up: Watershed Protection” won an EmmyAward at the 35th Annual National Academy of TelevisionArts and Sciences, Pacific Southwest Chapter Awardsceremony. The County won six other Emmy Awards in variouscategories. The awards recognized the “Oxy Abuse Kills”public service announcement series; “Water Babies”, a storyabout the benefits of water safety training for toddlers, and“Tsunamis: Know What To Do!”, an animated educationalvideo designed for children.
• The Government and Finance Officers Association (GFOA)recognized the County's Management Controls Initiative(MCI) with an honorary mention in its 2010 Awards forExcellence in Government Finance. This Countywide initiativeprovides a framework for identifying and mitigating risk toensure key business objectives that provide public value willbe achieved.
• The Department of Planning and Land Use won a first placeaward for Best Practices from the San Diego Chapter of theAmerican Planning Association for the department's cellulartowers and wireless facilities permitting process. Thereengineering of the cellular facility permit process decreasedthe average processing time from 18 months to 7 ½ months, a60% reduction, and decreased the backlog of cellular projectsby 65%.
• The District Attorney's office received an Achievement Awardfrom the national Center for Digital Government for computeranimated courtroom exhibits. The award honored theinnovation, efficiency and functionality of 3-D computeranimations which are used by prosecutors to presentevidence during trials.
• The San Diego and Imperial Counties Chapter of the AmericanPublic Works Association presented an Honor Award to theCounty for its handling of the Camp West Fork Demolition andRestoration project. Twenty-one structures on 19.5 acres ofleased U.S. Forest land were demolished and restored to anatural, pre-development condition. In addition, the projectwas completed under budget by more than $2 million.
• The new Fallbrook Branch Library received two more awards -the Magic of Design Build award from the Design-BuildInstitute of America Western Pacific Region for the teamwork,innovation and problem solving that took place throughoutthe project; and a Civic Project Award from the AmericanConcrete Institute for innovative use of concrete in a publicbuilding with a Visual Garden wall and a Poet's Patio wall.
• The California County Information Services DirectorsAssociation awarded an Innovation Award in theCollaboration Category for a paperless system used byProbation, County juvenile justice partners and Countyattorneys in Juvenile Court hearings.
• The County's Popular Annual Financial Report (PAFR) earnedthe Award for Outstanding Achievement in Popular AnnualFinancial Reporting from the Government Finance OfficersAssociation. The PAFR is designed to make the County'sfinancial results more readable for a broader audience.
• The California Counties Facilities Services Associationpresented the County of San Diego the “2010 Award ofExcellence” for agencies who demonstrate facilitiesexcellence through best practices, process innovation, staffdevelopment, automation, energy program improvementsand customer service.
• The Department of Agriculture, Weights and Measuresreceived an award from Accela, Inc. for OutstandingAchievements in Mobile Inspections. This mobile technologyplaces inspectors in the field nearly 100% of the time, whicheliminates transit time from office to field, improvescustomer service, boosts productivity and reduces fuel andmaintenance costs.

11
Letter of Transmittal
County of San Diego ~ Comprehensive Annual Financial Report for the Year Ended June 30, 2011
AcknowledgmentsWe would like to express our appreciation to the accounting staffof County departments and the staff of the Auditor andController's department whose coordination, dedication andprofessionalism are responsible for the preparation of thisreport. We would also like to thank Macias Gini & O’Connell LLPfor their professional support in the preparation of the CAFR.
Lastly, we thank the members of the Board of Supervisors, theChief Administrative Officer, Group/Agency General Managersand their staff for using sound business practices whileconducting the financial operations of the County.
Respectfully,
TRACY M. SANDOVALAuditor and Controller
DONALD F. STEUERChief Financial Officer

12

13
County of San Diego ~ Comprehensive Annual Financial Report for the Year Ended June 30, 2011
GFOA Certificate of Achievement

14
Comprehensive Annual Financial Report for the Year Ended June 30, 2011 ~ County of San Diego
Board of Supervisors
District 4Vice-Chairman
District 1 District 2 District 3 District 5Chairman
Note: This map reflects the Supervisorial district boundaries as of June 30, 2011.

15
County of San Diego ~ Comprehensive Annual Financial Report for the Year Ended June 30, 2011
Organizational Chart
Citizens of San Diego County
Board of Supervisors
Chief Administrative Officer
Land Use & Environmental Group
Community Services Group
Health & Human Services Agency
Finance & General Government GroupPublic Safety Group
Executive Office Regional Operations Executive Office
District Attorney
Sheriff
Child Support
Citizens� Law Enforcement Review
Board
Executive Office
Animal Services
County Library
General Services
Housing & Community Development
Purchasing & Contracting
Redevelopment Agency
Agriculture, Weights & Measures
Air Pollution Control District
Environmental Health
Farm & Home Advisor
Parks & Recreation
Strategic Planning & Operational Support
Aging & Independence Services
Behavioral Health Services
Child Welfare Services
Public Health Services
Executive Office
Assessor/Recorder/County Clerk
Treasurer - Tax Collector
Auditor & Controller
County Technology Office
Civil Service Commission
Clerk of the Board of Supervisors
Emergency Services
Medical Examiner
Probation Department
Public Defender
Public Administrator/ Public Guardian
Administrative Support
San Diego County Fire Authority
Planning & Land Use
Public Works Registrar of Voters County Communications Office
County Counsel
Grand Jury
Human Resources

16
Comprehensive Annual Financial Report for the Year Ended June 30, 2011 ~ County of San Diego
Chief Administrative OfficeChief Administrative Officer Walter F. EkardAssistant Chief Administrative Officer Helen N. Robbins-Meyer
Elected OfficialsAssessor/Recorder/County Clerk Ernest DronenburgDistrict Attorney Bonnie DumanisTreasurer/Tax Collector Dan McAllisterSheriff Bill Gore
General ManagersDCAO/General Manager Community Services Group Mikel D. HaasChief Financial Officer/General Manager Finance & General Government Group Donald F. SteuerAgency Director/General Manager Health & Human Services Agency Nick MacchioneDCAO/General Manager Land Use & Environment Group Sarah AghassiDCAO/General Manager Public Safety Group Ray Fernandez
Department HeadsAgriculture, Weights & Measures Robert AtkinsAir Pollution Control District Bob KardAnimal Services Dawn DanielsonAuditor & Controller Tracy SandovalChief of Staff Janice GrahamChild Support Services Jeff GrissomCivil Service Commission Patt ZamaryClerk of the Board of Supervisors Thomas J. PastuszkaCommunications Office Michael WorkmanCounty Counsel Tom MontgomeryCounty Technology Office W. Harold Tuck, Jr.Emergency Services Ron LaneEnvironmental Health Jack MillerFarm & Home Advisor Carl Bell*General Services April HeinzeAging & Independent Services/Health & Human Services Agency (HHSA)-East Region Pamela B. SmithHHSA-Central & South Regions Rene SantiagoHHSA-North Regions Donna HandPublic Health Services Wilma Wooten, M.D.Child Welfare Services Debra Zanders-WillisBehavioral Health Services Jennifer SchafferHousing & Community Development David EstrellaHuman Resources Carlos ArauzInternal Affairs Joe CorderoLibrary Jose AponteMedical Examiner Glenn WagnerParks & Recreation Brian AlbrightPlanning & Land Use Eric GibsonProbation Mack JenkinsPublic Defender Henry C. CokerPublic Works Rich CromptonPurchasing & Contracting Winston F. McCollRegistrar of Voters Deborah SeilerStrategy & Intergovernmental Affairs Geoff Patnoe
*Acting
Other Elected and Appointed Officials


17
County of San Diego ~ Comprehensive Annual Financial Report for the Year Ended June 30, 2011
Financial Section
Independent Auditor’s Report
Independent Auditor’s Report
INDEPENDENT AUDITOR’S REPORT
Board of Supervisors County of San Diego, California
We have audited the accompanying financial statements of the governmental activities, the business-type activities, the discretely presented component unit, each major fund, and the aggregate remaining fund information of the County of San Diego, California (County), as of and for the year ended June 30, 2011, which collectively comprise the County’s basic financial statements as listed in the table of contents. These financial statements are the responsibility of the County’s management. Our responsibility is to express opinions on these financial statements based on our audit. We did not audit the financial statements of the First 5 Commission of San Diego (Commission), the discretely presented component unit, as of and for the year ended June 30, 2011. Those financial statements were audited by other auditors whose report thereon has been furnished to us, and our opinion, insofar as it relates to the amounts included for the Commission is based on the report of the other auditors.
We conducted our audit in accordance with auditing standards generally accepted in the United States of America and the standards applicable to financial audits contained in Government Auditing Standards,issued by the Comptroller General of the United States. Those standards require that we plan and perform the audit to obtain reasonable assurance about whether the financial statements are free of material misstatement. An audit includes consideration of internal control over financial reporting as a basis for designing audit procedures that are appropriate in the circumstances, but not for the purpose of expressing an opinion on the effectiveness of the County’s internal control over financial reporting. Accordingly, we express no such opinion. An audit also includes examining, on a test basis, evidence supporting the amounts and disclosures in the financial statements, assessing the accounting principles used and significant estimates made by management, as well as evaluating the overall financial statement presentation. We believe that our audit and the report of the other auditors provide a reasonable basis for our opinions.
In our opinion, the financial statements referred to above present fairly, in all material respects, the respective financial position of the governmental activities, the business-type activities, the discretely presented component unit, each major fund, and the aggregate remaining fund information of the County as of June 30, 2011, and the respective changes in financial position and, where applicable, cash flows thereof for the year then ended in conformity with accounting principles generally accepted in the United States of America.
As discussed in Note 31 to the financial statements, the County adopted the provisions of Governmental Accounting Standards Board Statement No. 54, Fund Balance Reporting and Governmental Fund Type Definitions.
In accordance with Government Auditing Standards, we have also issued our report dated November 17, 2011, on our consideration of the County’s internal control over financial reporting and on our tests of its compliance with certain provisions of laws, regulations, contracts, and grant agreements and other matters. The purpose of that report is to describe the scope of our testing of internal control over financial reporting and compliance and the results of that testing, and not to provide an opinion on internal control over financial reporting or on compliance. That report is an integral part of an audit performed in accordance with Government Auditing Standards and should be considered in assessing the results of our audit.

Independent Auditor’s Report
18
Comprehensive Annual Financial Report for the Year Ended June 30, 2011 ~ County of San Diego
Accounting principles generally accepted in the United States of America require that management’s discussion and analysis and the schedule of revenues, expenditures, and changes in fund balance – budget and actual for the General Fund, Public Safety and Tobacco Endowment special revenue funds as listed in the table of contents, be presented to supplement the basic financial statements. Such information, although not a part of the basic financial statements, is required by the Governmental Accounting Standards Board, who considers it to be an essential part of financial reporting for placing the basic financial statements in an appropriate operational, economic, or historical context. We have applied certain limited procedures to the required supplementary information in accordance with auditing standards generally accepted in the United States of America, which consisted of inquiries of management about the methods of preparing the information and comparing the information for consistency with management’s responses to our inquiries, the basic financial statements, and other knowledge we obtained during our audit of the basic financial statements. We do not express an opinion or provide any assurance on the information because the limited procedures do not provide us with sufficient evidence to express an opinion or provide any assurance.
Our audit was conducted for the purpose of forming opinions on the financial statements that collectively comprise the County’s basic financial statements. The accompanying introductory section, the combining and individual fund information and other supplementary information section, and statistical section are presented for purposes of additional analysis and are not a required part of the basic financial statements. The combining and individual fund information and other supplementary information section is the responsibility of management and was derived from and relates directly to the underlying accounting and other records used to prepare the financial statements. The information has been subjected to the auditing procedures applied in the audit of the basic financial statements and certain additional procedures, including comparing and reconciling such information directly to the underlying accounting and other records used to prepare the financial statements or to the financial statements themselves, and other additional procedures in accordance with auditing standards generally accepted in the United States of America. In our opinion, the information is fairly stated in all material respects in relation to the basic financial statements taken as a whole. The introductory and statistical sections have not been subjected to the auditing procedures applied by us and the other auditors in the audit of the basic financial statements and, accordingly, we express no opinion or provide any assurance on them.
San Diego, California November 17, 2011
19
County of San Diego ~ Comprehensive Annual Financial Report for the Year Ended June 30, 2011
This section of the County of San Diego's (County)Comprehensive Annual Financial Report provides a narrativeoverview and analysis of the basic financial activities of theCounty as of and for the year ended June 30, 2011.
The intent of the information presented here, in conjunction withthe Letter of Transmittal is to provide the reader with a clearerpicture of the County's overall financial status. Unless otherwiseindicated, all amounts in this section are expressed in thousandsof dollars.
Financial Highlights• The assets of the County exceeded liabilities at the close of
the fiscal year 2011 by $3.82 billion (net assets). Of thisamount, $2.84 billion is invested in capital assets, net ofrelated debt; $530 million is restricted for specific purposes(restricted net assets); and the remaining portion representsunrestricted net assets of $454 million.
• Total net assets increased by $193.2 million. Forgovernmental activities, capital assets and current and otherassets increased by $87.9 million and $99.8 million,respectively, while other liabilities increased by $36.9 million,offset by a $41.6 million decrease in long-term liabilities. Forbusiness-type activities, capital assets and current and otherassets decreased by $1.8 million and $3.9 million,respectively, while long-term and other liabilities decreasedby $6.5 million.
• General revenues for governmental activities were $1.05billion. Of this amount, property taxes and property taxes inlieu of vehicle license fees accounted for $884 million or 84%;while other taxes, sales and uses taxes, investment earningsand other general revenues accounted for $165 million or16%.
• Program revenues for governmental activities were $2.73billion. Of this amount, $2.21 billion or 81% was attributableto operating grants and contributions while charges forservices accounted for $488 million or 18%.
• The total expenses for governmental activities were $3.58billion. Public assistance accounted for $1.19 billion or 33%,while public protection accounted for $1.13 billion or 32% ofthis amount. Additionally, health and sanitation accounted for$722 million or 20%.
Overview of the Financial StatementsThis discussion and analysis is intended to serve as anintroduction to the County's basic financial statements. TheCounty's basic financial statements comprise three components:1) Government-wide financial statements 2) Fund financialstatements, and 3) Notes to the basic financial statements.Required supplementary information is included in addition tothe basic financial statements.
The Government-wide financial statements are designed toprovide readers with a broad overview of County finances, in amanner similar to a private-sector business.
The Statement of Net Assets presents information on all Countyassets and liabilities, with the difference between the tworeported as net assets. Over time, increases or decreases in netassets may serve as a useful indicator of whether the financialposition of the County is improving or deteriorating.
The Statement of Activities presents information showing howthe County's net assets changed during the most recent fiscalyear. All changes in net assets are reported as soon as theunderlying event giving rise to the change occurs, regardless ofthe timing of related cash flows. Thus, revenue and expenses arereported in this statement for some items that will result in cashflows in future fiscal periods (e.g., uncollected taxes and earnedbut unused vacation leave).
Both of the aforementioned government-wide financialstatements distinguish functions of the County that areprincipally supported by taxes and intergovernmental revenues(governmental activities) from other functions that are intendedto recover all or a significant portion of their costs through userfees and charges (business-type activities). The governmentalactivities of the County include general government, publicprotection, public ways and facilities, health and sanitation,public assistance, education and recreation and cultural. Thebusiness-type activities of the County include airport operations,sanitation districts and wastewater management.
Management’s Discussion and Analysis

20
Comprehensive Annual Financial Report for the Year Ended June 30, 2011 ~ County of San Diego
Management’s Discussion and Analysis
Fund financial statements are groupings of related accounts thatare used to maintain control over resources that have beensegregated for specific activities or objectives. The County, likeother state and local governments, uses fund accounting toensure and demonstrate compliance with finance-related legalrequirements. All of the funds of the County can be divided intothree categories: governmental funds, proprietary funds andfiduciary funds.
Governmental funds are used to account for essentially the samefunctions reported as governmental activities in the government-wide financial statements. However, unlike the government-widefinancial statements, governmental funds financial statementsfocus on near-term inflows and outflows of spendable resources,as well as on balances of spendable resources available at theend of the fiscal year. Such information may be useful inevaluating a county's near-term financing requirements.
Because the focus of governmental funds is narrower than thatof the government-wide financial statements, it is useful tocompare the information presented for governmental funds withsimilar information presented for governmental activities in thegovernment-wide financial statements. By doing so, readers maybetter understand the long-term impact of the government'snear-term financing decisions. Both the governmental fundsbalance sheet and the governmental funds statement ofrevenues, expenditures and changes in fund balances provide areconciliation to facilitate this comparison betweengovernmental funds and governmental activities.
The County maintains individual governmental funds.Information is presented separately in the governmental fundsbalance sheet and in the governmental funds statement ofrevenues, expenditures and changes in fund balances for theGeneral Fund, Public Safety Special Revenue Fund and theTobacco Endowment Special Revenue Fund, all of which areconsidered to be major funds. Data from the other governmentalfunds are combined into a single, aggregated presentation.Individual fund data for each of these nonmajor governmentalfunds is provided in the combining and individual fundinformation and other supplementary information section in thisreport.
Proprietary funds are generally used to account for services forwhich the County charges customers - either outside customers,or internal departments of the County. Proprietary funds provide
the same type of information as the government-wide financialstatements, only in more detail. The County maintains thefollowing types of proprietary funds:
Enterprise funds are used to report the same functions presentedas business-type activities in the government-wide financialstatements. The County uses enterprise funds to account forairport operations, sanitation services and wastewatermanagement. These nonmajor enterprise funds are combinedand aggregated. Individual fund data for each nonmajorenterprise fund is provided in the combining and individual fundinformation and other supplementary information section in thisreport.
Internal service funds are an accounting device used toaccumulate and allocate costs internally among the County'svarious functions. Internal service funds are used to account forthe financing of public works and communications equipment;the financing of materials and supplies (purchasing); for start upservices for new and existing county service districts; for theCounty's public liability and employee benefits activities; thefinancing of fleet services; for facilities management activities;for the financing of information technology services; and for thefinancing of clothing and personal sundry items for personsinstitutionalized at various County facilities. Because all of theseservices predominantly benefit governmental rather thanbusiness-type functions, they have been included withingovernmental activities in the government-wide financialstatements.
The County's internal service funds are combined into a single,aggregated presentation in the proprietary funds financialstatements. Individual fund data for the internal service funds isprovided in the form of combining statements in the combiningand individual fund information and other supplementaryinformation section in this report.
Fiduciary funds are used to account for resources held for thebenefit of parties outside the government. Fiduciary funds arenot reflected in the government-wide financial statementsbecause the resources of these funds are not available to supportthe County's own programs. The accounting used for fiduciaryfunds is much like that used for proprietary funds.
Notes to the basic financial statements provide additionalinformation that is essential to a full understanding of the dataprovided in the government-wide and fund financial statements.
The illustration below depicts the required components of the basic financial statements.
SummaryGovernment-wide Statements
Fund Financial Statements
DetailNotes to the Basic
Financial Statements

Management’s Discussion and Analysis
21
County of San Diego ~ Comprehensive Annual Financial Report for the Year Ended June 30, 2011
Required supplementary information (RSI) is also presented. Itprovides budgetary comparisons for the General Fund, PublicSafety Special Revenue Fund and the Tobacco EndowmentSpecial Revenue Fund (all major funds) in separate Schedules ofRevenues, Expenditures, and Changes in Fund Balance - Budgetand Actual.
Combining financial statements/schedules and supplementaryinformation section of this report presents combining andindividual fund statements and schedules referred to earlier thatprovide information for nonmajor governmental funds,enterprise funds, internal service funds and fiduciary funds andare presented immediately following the requiredsupplementary information section of this report.
Government-wide Financial AnalysisTable 1
Analysis of Net AssetsNet assets may serve over time as a useful indicator of a government's financial position. In the case of the County, assets exceededliabilities by $3.82 billion at the close of fiscal year 2011 an increase of $193.2 million or 5.3% over fiscal year 2010. This included anincrease of $115 million in the County’s restricted and unrestricted net assets (a 13% increase over fiscal year 2010) and an increase of$79 million in capital assets, net of related debt (a 3% increase over fiscal year 2010).
The aforementioned increase of $193.2 million in net assets was composed of the following changes in total assets and liabilities: Total assets increased by $182 million. This included an increase of $96 million in current and other assets and an $86 million
increase in capital assets. The $96 million increase in current and other assets was primarily attributable to an increase in cash andinvestments (including restricted and unrestricted cash and investments with fiscal agents) of $79 million, an increase of $66 mil-lion in receivables, net (excluding property taxes), a $46 million decrease in property taxes receivables, net, and a $3 milliondecrease in other assets. The $79 million increase in cash is principally due to the $66 million increase in receivables, net (exclud-ing property taxes), a $46 million decrease in property taxes receivables, net, a $16 million decrease in accounts payable, a $3 mil-lion increase in accrued payroll, a $44 million increase in unearned revenue (explained below), all of which have the net effect ofincreasing cash; and also includes a $21 million increase due to a new highway user tax revenue source (streets and highways codesection 2103), a $14 million increase in Proposition 172 monies; and, $33 million in other sundry cash related activities. The $66million increase in receivables, net is principally due to an increase of $70 million in amounts due from other governments, coupledwith a $4 million increase in loans receivable, offset by an $8 million decrease in other accounts receivables. The $46 milliondecrease in property taxes receivables, net was principally attributable to a decrease in delinquent secured taxes. The increase incapital assets was due in part to $51.6 million of construction costs for the County Operations Center Phase 1A and donated assetsof $12 million.
Total liabilities decreased by $11 million. This included an increase in other liabilities of $31 million and a decrease in long-term lia-bilities of $42 million. The increase in other liabilities of $31 million was primarily due to a $44 million increase in unearned revenuedue to the result of delays in securing contracts related to the Mental Health Services Act, coupled with a $16 million decrease inaccounts payable ($38 million vendors, offset by $22 million due to other government agencies), and a $3 million increase inaccrued payroll. The decrease of $42 million in long-term liabilities was mainly due to a $57 million decrease in long-term debt (seeLong-Term Liabilities discussion), coupled with a net $15 million increase in other long-term liabilities (including a $17 millionincrease in claims and judgments offset by a $2 million decrease in compensated absences).
Net AssetsJune 30, 2011 and 2010 (In Thousands)
Governmental Activities Business-Type Activities Total2011 2010 2011 2010 2011 2010
ASSETSCurrent and other assets $ 3,089,529 2,989,720 91,194 95,076 3,180,723 3,084,796Capital assets 3,056,863 2,968,953 164,834 166,654 3,221,697 3,135,607Total assets 6,146,392 5,958,673 256,028 261,730 6,402,420 6,220,403
LIABILITIESLong-term liabilities 2,073,708 2,115,347 1,994 2,269 2,075,702 2,117,616Other liabilities 502,471 465,533 1,164 7,362 503,635 472,895Total liabilities 2,576,179 2,580,880 3,158 9,631 2,579,337 2,590,511
NET ASSETSInvested in capital assets, net of related debt 2,675,240 2,595,105 163,268 164,845 2,838,508 2,759,950Restricted 529,808 247,585 529,808 247,585Unrestricted 365,165 535,103 89,602 87,254 454,767 622,357Total net assets $ 3,570,213 3,377,793 252,870 252,099 3,823,083 3,629,892
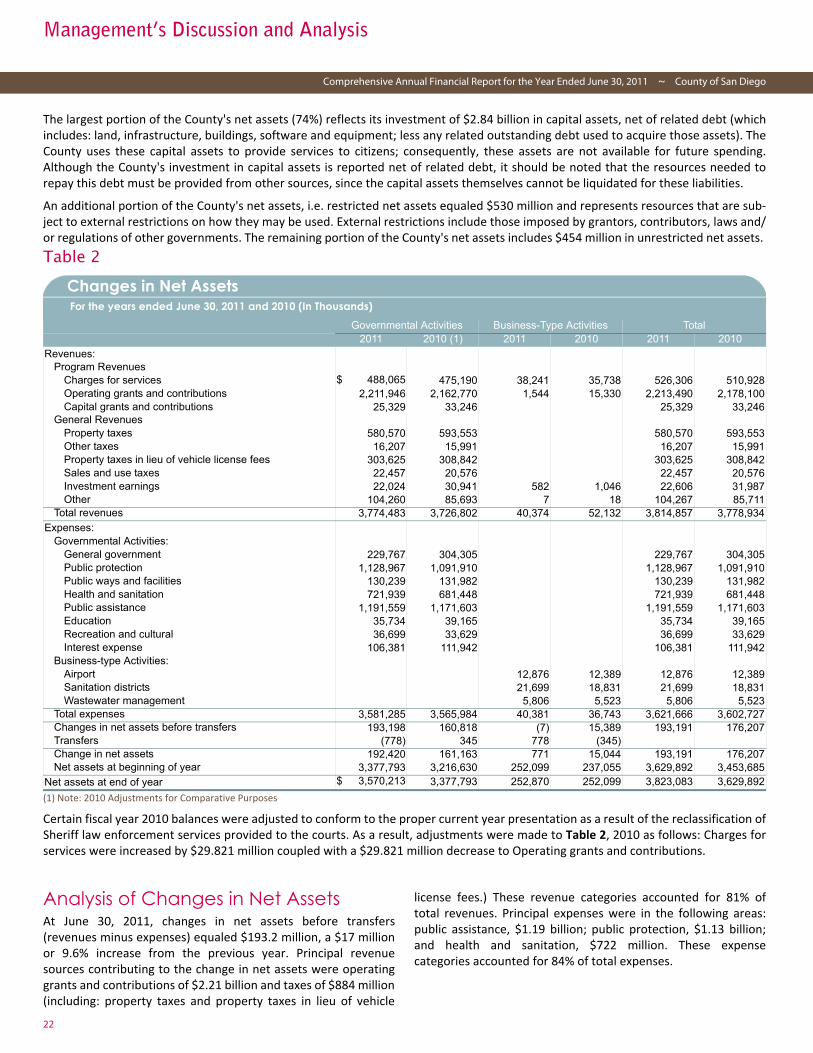
22
Comprehensive Annual Financial Report for the Year Ended June 30, 2011 ~ County of San Diego
Management’s Discussion and Analysis
The largest portion of the County's net assets (74%) reflects its investment of $2.84 billion in capital assets, net of related debt (whichincludes: land, infrastructure, buildings, software and equipment; less any related outstanding debt used to acquire those assets). TheCounty uses these capital assets to provide services to citizens; consequently, these assets are not available for future spending.Although the County's investment in capital assets is reported net of related debt, it should be noted that the resources needed torepay this debt must be provided from other sources, since the capital assets themselves cannot be liquidated for these liabilities.
An additional portion of the County's net assets, i.e. restricted net assets equaled $530 million and represents resources that are sub-ject to external restrictions on how they may be used. External restrictions include those imposed by grantors, contributors, laws and/or regulations of other governments. The remaining portion of the County's net assets includes $454 million in unrestricted net assets. Table 2
(1) Note: 2010 Adjustments for Comparative Purposes
Certain fiscal year 2010 balances were adjusted to conform to the proper current year presentation as a result of the reclassification ofSheriff law enforcement services provided to the courts. As a result, adjustments were made to Table 2, 2010 as follows: Charges forservices were increased by $29.821 million coupled with a $29.821 million decrease to Operating grants and contributions.
Analysis of Changes in Net AssetsAt June 30, 2011, changes in net assets before transfers(revenues minus expenses) equaled $193.2 million, a $17 millionor 9.6% increase from the previous year. Principal revenuesources contributing to the change in net assets were operatinggrants and contributions of $2.21 billion and taxes of $884 million(including: property taxes and property taxes in lieu of vehicle
license fees.) These revenue categories accounted for 81% oftotal revenues. Principal expenses were in the following areas:public assistance, $1.19 billion; public protection, $1.13 billion;and health and sanitation, $722 million. These expensecategories accounted for 84% of total expenses.
Changes in Net Assets For the years ended June 30, 2011 and 2010 (In Thousands)
Governmental Activities Business-Type Activities Total2011 2010 (1) 2011 2010 2011 2010
Revenues:Program Revenues
Charges for services $ 488,065 475,190 38,241 35,738 526,306 510,928Operating grants and contributions 2,211,946 2,162,770 1,544 15,330 2,213,490 2,178,100Capital grants and contributions 25,329 33,246 25,329 33,246
General Revenues Property taxes 580,570 593,553 580,570 593,553Other taxes 16,207 15,991 16,207 15,991Property taxes in lieu of vehicle license fees 303,625 308,842 303,625 308,842Sales and use taxes 22,457 20,576 22,457 20,576Investment earnings 22,024 30,941 582 1,046 22,606 31,987Other 104,260 85,693 7 18 104,267 85,711
Total revenues 3,774,483 3,726,802 40,374 52,132 3,814,857 3,778,934Expenses:
Governmental Activities: General government 229,767 304,305 229,767 304,305Public protection 1,128,967 1,091,910 1,128,967 1,091,910Public ways and facilities 130,239 131,982 130,239 131,982Health and sanitation 721,939 681,448 721,939 681,448Public assistance 1,191,559 1,171,603 1,191,559 1,171,603Education 35,734 39,165 35,734 39,165Recreation and cultural 36,699 33,629 36,699 33,629Interest expense 106,381 111,942 106,381 111,942
Business-type Activities: Airport 12,876 12,389 12,876 12,389Sanitation districts 21,699 18,831 21,699 18,831Wastewater management 5,806 5,523 5,806 5,523
Total expenses 3,581,285 3,565,984 40,381 36,743 3,621,666 3,602,727Changes in net assets before transfers 193,198 160,818 (7) 15,389 193,191 176,207Transfers (778) 345 778 (345) Change in net assets 192,420 161,163 771 15,044 193,191 176,207Net assets at beginning of year 3,377,793 3,216,630 252,099 237,055 3,629,892 3,453,685
Net assets at end of year $ 3,570,213 3,377,793 252,870 252,099 3,823,083 3,629,892

Management’s Discussion and Analysis
23
County of San Diego ~ Comprehensive Annual Financial Report for the Year Ended June 30, 2011
Governmental activitiesAt the end of fiscal year 2011, total revenues for thegovernmental activities were $3.77 billion, while total expenseswere $3.58 billion. Governmental activities increased theCounty's net assets by $192.4 million, accounting for 99% of thetotal increase in net assets (Business-type activities accountedfor the remaining 1%, $.8 million).
Expenses:
Total expenses for governmental activities were $3.58 billion, anincrease of $15 million or .4% ($21 million increase in functionalexpenses and $6 million decrease in interest expense). Publicassistance was the largest functional expense (33%), followed bypublic protection (32%) and health and sanitation (20%).
As noted below, the $21 million increase in functional expenseswas made up of an $80 million decrease and $101 million inincreases:
The $80 million decrease in functional expenses was mainly dueto the decrease in the loss on disposal of assets as compared tofiscal year 2010, principally due to the fiscal year 2010 transfer ofvarious court facilities from the County to the State. Senate Bill1732, Court Facilities Legislation, the Trial Court Facility Act, andAssembly Bill 1491, Court Facilities Transfer Deadline Extension,provided for the transfer of the responsibility and in someinstances, the title deed, from the County to the State to provide
necessary and suitable court facilities. This transfer resulted inthe removal of these buildings from the County's financialrecords. County financial responsibility for facility maintenancecosts for courts' space will continue as a statutorily requiredCounty facility payment.
The $101 million increase in functional expenses consisted of:• $29 million in overall salaries and benefit costs due to a two
percent negotiated wage increase for most employees infiscal year 2010-11;
• $60 million in contracted services increases of $18 million invarious health related contracts, $16 million for theimplementation of the Oracle Financial system and relatedconsulting services, $10 million in fire protection servicescontracts, $9 million in CalWorks contracts providingtemporary financial assistance and employment focusedservices to families with minor children who have income andproperty below the State maximum limits for their family size,$9 million in mental health related contracts, $2 million inservices for inmate welfare service contracts; offset by a $4million decrease in contracted services for housing andcommunity development;
• $4 million in other operating expenses for institutionalservices;
• $4 million in materials; and• $4 million in utilities expenses.
Expenses Program Revenues
Generalgovernment
Publicprotection
Public waysand facilities
Health andsanitation
Publicassistance
Education Recreationand cultural
Interestexpense
0
1,000,000
1,500,000
Chart 1Expenses and
Program Revenues - Governmental
Activities(In Thousands)

24
Comprehensive Annual Financial Report for the Year Ended June 30, 2011 ~ County of San Diego
Management’s Discussion and Analysis
Revenues:Total revenues for governmental activities were $3.77 billion, anincrease of 1.3% or $48 million from the previous year. Thisincrease consisted of increases in program revenue of $54 millioncoupled with a $6 million decrease in general revenues asfollows:
The $54 million increase in program revenue was chiefly due toincreases of $121 million and decreases of $67 million notedbelow:
Increases in program revenues of $121 million were principallycomposed of the following: • $24 million in operating grants and contributions resulting
from an increase in federal case counts for the CalWORKsprogram;
• $18 million in operating grants and contributions forProposition 63 Mental Health Services Act state aid;
• $16 million in operating grants and contributions from thefollowing federal programs: $7 million in Special EducationGrants to States, (passed through to the County), $5 million inHomeland Security Grant Program, $2 million in ImmunizationGrants, and, $2 million in Special Programs for the Aging TitleIII, Part B Grants for Supportive Services and Senior Centers;
• $16 million increase in operating grants and contributionsfrom federal health and human services substance abuseprevention and treatment revenue;
• $14 million in operating grants and contributions for stateProposition 172 revenues;
• $11 million in operating grants and contributions as a result ofSouthwest Border Prosecution Initiative federal funding;
• $11 million in operating grants and contributions resultingfrom federal health care coverage initiative revenue;
• $9 million in operating grants and contributions as a result ofstate aid reimbursement senate bill 90 revenues; and,
• $2 million in charges for services consisting ofreimbursements to the County for Sheriff’s law enforcementservices provided to the courts.
Decreases in program revenue of $67 million were attributableto:• $31 million in operating grants and contributions for State
Proposition 1B revenues;• $14 million in operating grants and contributions for federal
Short Doyle Medi-cal revenues due to lower clientenrollment;
• $12 million in operating grants and contributions from Statetransportation 1/2% sales taxes; and,
• $10 million in capital grants and contributions primarilyconsisting of donated assets.
General revenues decreased overall by approximately $6 million.This decrease was the result of increases of $21 million anddecreases of $27 million noted below.
Increases in general revenues of $21 million were mainly due tothe following:• $19 million increase in other revenue primarily due to: $6
million for additional treatment costs not funded by theFederal Individuals with Disabilities Education Act (IDEA), paiddirectly by the San Diego County Office of Education, $5million of Firestorm 2007 insurance proceeds used toreimburse costs associated with the capital renewal of SanPasqual Academy following the fires in 2007. (This moneyhelped to fund 30 buildings on the campus includingresidence facilities and administrative facilities and relatedinfrastructure such as roads), $5 million of new funding forthe defense of indigent criminal cases administered by CountyCounsel, and $3 million in donations for the renovation of theSan Diego Downtown Law Library, and,
• $2 million increase in sales and use taxes.
Charges for services: 13%
Sales and use taxes: 1%
Operating grants and contributions: 59%
Capital grants and contributions: 1% Property taxes in lieu of vehicle license fees: 8%
Property taxes: 15%
Other: 2%
Investment earnings: 1%Chart 2
Revenues by Source - Governmental Activities
(As a Percent)

Management’s Discussion and Analysis
25
County of San Diego ~ Comprehensive Annual Financial Report for the Year Ended June 30, 2011
Decreases in general revenues of $27 million were primarily dueto the following:• $13 million decrease in property taxes due in part to a 1.7%
decrease in secured assessed values;• $9 million decrease in investment earnings due to the 37%
decrease in annualized interest rates earned by the CountyTreasury Pool; and,
• $5 million in decrease in property taxes in lieu of vehiclelicense fees.
The County's governmental activities rely on several sources ofrevenue to finance ongoing operations. As shown in Chart 2,operating grants and contributions of $2.21 billion accounted for59%, the largest share of this revenue. These monies are receivedfrom parties outside the County and are generally restricted toone or more specific programs. Examples of operating grants andcontributions include State and Federal revenue for publicassistance programs and health and sanitation programs.
Property taxes and property taxes in lieu of vehicle license feesare not shown by program, but are effectively used to supportprogram activities county-wide. Combined, these generalrevenues equaled $884 million and accounted for 23% ofgovernmental activities. Additionally, charges for services were$488 million and accounted for 13% of revenues applicable togovernmental activities.
Other factors concerning the finances of the County's majorgovernmental funds are discussed in the governmental fundssection of the “Financial Analysis of County’s Funds.”
Business-type Activities: Business-type activities, which are exclusively comprised ofenterprise funds, are intended to recover all or a significantportion of their costs through user fees and charges. As shown inChart 3, charges for services represent $38 million or 95%, while
operating grants and contributions ($1.5 million) and investmentearnings ($0.5 million) represent 4% and 1% of total revenuesrespectively.
Net assets of business-type activities increased by $.8 million or0.3%. This net increase primarily included the following:• $1.8 million decrease in capital assets principally due to the
completion of various airport projects and improvements,resulting in a corresponding increase in accumulateddepreciation;
• $3.9 million decrease in current and other assets due to: i) a$7 million decrease in airport receivables, chiefly as a result ofaid received from the Federal Aviation Administration forimprovements to the McClellan-Palomar airport; and, ii) a $4million increase in pooled cash and investments; and
• $6.5 million decrease in long-term and other liabilities,principally due to decreases in accounts payable.
Financial Analysis of County FundsThe County uses fund accounting to demonstrate and ensurecompliance with finance-related legal requirements.
Governmental Funds: The focus of the County's governmental funds is to provideinformation on near-term inflows, outflows, and balances ofresources that are available for spending. Such information isuseful in assessing the County's financing requirements. Inparticular, unassigned fund balance may serve as a usefulmeasure of a government's net resources available for spendingat the end of the fiscal year. Types of major governmental fundsreported by the County include the General Fund, the PublicSafety Special Revenue Fund and the Tobacco EndowmentSpecial Revenue Fund. Nonmajor governmental funds includespecial revenue funds, debt service funds, and capital projectsfunds.
At June 30, 2011, the County's governmental funds hadcombined ending fund balances of $2.24 billion, an increase of$48.8 million in comparison to the prior fiscal year. Of the totalJune 30, 2011 amount, $612.81 million constituted unassignedfund balance, which is available for spending at the County'sdiscretion. $40.6 million of fund balance is assigned, $982.7million is committed, $587.7 is restricted, and $16.4 million isnonspendable. (Please refer to Note 1 in the notes to thefinancial statements for more details regarding fund balanceclassifications.)
Governmental revenues overall totaled $3.74 billion representinga 1% increase. Governmental expenditures totaled $3.69 billion,a 1.3% decrease from the fiscal year ended June 30, 2010.
General Fund:The General Fund is the chief operating fund of the County. Atthe end of fiscal year 2011, its unassigned fund balance was$612.81 million, while total fund balance was $1.39 billion, anincrease of $174 million from fiscal year 2010.
4%
1%
95%
Chargesfor services
Operating grantsand contributions
Investmentearnings
Chart 3 Revenues By Source - Business-type Activities
(As a Percent)

26
Comprehensive Annual Financial Report for the Year Ended June 30, 2011 ~ County of San Diego
Management’s Discussion and Analysis
This $174 million increase in fund balance was composed of $265million in increases and $91 million in decreases as follows:
Increases to fund balance of $265 million were composed of:• $55 million decrease in pension obligation bond payments
charged to departments attributable to a decrease in pensionobligation bond required debt service payments;
• $50 million one-time transfer to the General Fund to close outthe remaining activities of the Housing and CommunityDevelopment Fund. (The Housing and CommunityDevelopment Fund is no longer in operation);
• $25 million increase in federal grant revenues as follows: $7million in Special Education Grants to States (passed throughto the County), $5 million in Home Investment PartnershipsProgram, $5 million in Special Programs for the Aging Title III,Part C Nutrition Services, $5 million in Homeland SecurityGrant Program, and, $3 million in Community DevelopmentBlock Grants/Entitlement Grants;
• $24 million decrease in transfers out attributable to one-timefiscal year 2010 pay down of 2008B variable rate PensionObligation Bonds;
• $24 million increase in CalWorks program revenues; • $18 million increase in Proposition 63 Mental Health Services
Act state aid; • $16 million increase in federal health and human services
substance abuse prevention and treatment revenue;• $11 million increase in federal health care coverage initiative
revenue;• $11 million increase in federal Southwest Border Prosecution
Initiative program revenues;• $9 million increase in state aid reimbursement senate bill 90
revenues;• $6 million increase in other revenue is related to the
additional mental treatment cost reimbursement paid by theSan Diego County Office of Education;
• $6 million increase in Medi-Cal reimbursements due to anincrease in Medi-Cal eligible patients along with an increase inSupplemental Plan Amendment revenue accruals;
• $5 million increase in recording fees; and, • $5 million decrease in capital outlay expenditures.
Decreases to fund balance of $91 million were composed of:• $62 million increase in contracted services expenditures
made up of: $18 million increase in various health relatedcontracts, $16 million for the implementation of the OracleFinancial system and related consulting services, $10 millionin fire protection services contracts, $9 million in mentalhealth related contracts, and, $9 million in CalWorkscontracts providing temporary financial assistance andemployment focused services to families with minor childrenwho have income and property below State maximum limitsfor their family size; and
• $29 million increase in overall salaries and benefits due to atwo percent negotiated wage increase for most employees infiscal year 2010-11.
Public Safety Special Revenue Fund:
This fund was established to account for Proposition 172 half-cent sales taxes collected and apportioned to the County by theState Board of Equalization to fund public safety activities. PerGovernment Code Section 30052, a “maintenance of effort” (pre-Proposition (Prop) 172 public safety funding level) must bemaintained by the County to comply with the statute's spendingrequirements. In accordance with the Code, funds are allocatedto the Sheriff, District Attorney and Probation departments.Transfers-out of this fund subsidize the following types of publicsafety activities: juvenile detention services; facilitiesmaintenance and support; capital projects, equipment and otherone-time expenditures; on-going technology initiatives; andvarious region-wide services.
As of June 30, 2011, the total (restricted) fund balance in thePublic Safety Special Revenue Fund was $21.7 million, a $16.9million increase from the previous fiscal year. This increase wasmainly due to a $13.4 million increase in Prop 172 revenues dueto improvements in the local economy; offset by a $2.3 milliondecrease in transfers of these monies to the General Fund infiscal year 2011.
Tobacco Endowment Special Revenue Fund:
This special revenue fund is used to account for the $411 millionthe County received from the Tobacco Asset SecuritizationCorporation (Corporation) related to the sale of 25 years oftobacco settlement revenue in fiscal year 2002; and an additional$123 million the County received from the Corporation resultingfrom the issuance of the San Diego County Tobacco AssetSecuritization Corporation refunding bonds in fiscal year 2006. Atthe end of fiscal year 2011, fund balance was $393 million, adecrease of $19.7 million from fiscal year 2010, principally due toinvestment income of $4.7 million offset by $24.2 million intransfers out to the General Fund for the support of healthrelated program expenditures.
Other Governmental Funds:
Other governmental funds consist of nonmajor funds, whichinclude special revenue funds, debt service funds, and capitalproject funds. Individual fund data for each of these nonmajorgovernmental funds is provided in the combining and individualfund information and other supplementary information sectionin this report.
As of the end of fiscal year 2011, the fund balances of the othergovernmental funds totaled $432 million, a net decrease of $123million from the prior year. This $123 million net decreaseconsisted of $9.5 million in increases, offset by decreases of$132.5 million as follows:
$9.5 million increase to Other Governmental Funds' fundbalance:• $5.5 million increase in the Capital Outlay Fund's fund balance
chiefly attributable to a $13 million net increase in moniestransferred in from the General Fund to fund various capitalprojects consisting of a $10 million increase in various capital

Management’s Discussion and Analysis
27
County of San Diego ~ Comprehensive Annual Financial Report for the Year Ended June 30, 2011
outlay projects' funding, a $7 million increase in multiplespecies conservation program funding offset by $3 million and$1 million decreases in justice facility project and libraryproject funding, respectively; coupled with an overall $8million increase in capital project capital outlay expenditures.
• $4 million increase to the Road Fund's fund balance due tothe introduction of a new $21 million highway user taxrevenue source (streets and highways code section 2103), thedecrease of $11 million in capital outlay expenditures due tothe project close out of Valley Center North and major Rightof Way acquisitions for South Santa Fe during fiscal year 2010,a decrease of $2 million in operating transfers outattributable to a decline in charges to departments forpension obligation bond payments due to a reduction inpension obligation bond required debt service payments, anincrease of $2 million on sale of capital assets, offset by thedecrease of $32 million in Proposition 1B monies.
$132.5 million decrease to Other Governmental Funds' fundbalance:• $50 million decrease to the Housing and Community
Development Special Revenue Fund's fund balance due to theone-time $50 million transfer to the General Fund to close outthe remaining activities of the Housing and CommunityDevelopment Fund. The Housing and CommunityDevelopment Fund is no longer in operation.
• $10 million decrease to the Edgemoor Development Fund'sfund balance principally attributable to a $9 million transferout to reimburse the General Fund for annual Edgemoorfacility debt service payments.
• $64 million decrease to the San Diego Regional BuildingAuthority Capital Projects Fund's fund balance mainly due to$54.5 million incurred in capital outlay expenditures relatedto the ongoing construction of the County Operations Center;coupled with a $9.5 million incurred in minor equipmentexpenditures.
• $8.5 million decrease to the San Diego Regional BuildingAuthority Debt Service Fund's fund balance chiefly due toactivities associated with the issuance of the 2011Metropolitan Transit System Towers Refunding Certificates ofParticipation including a $22 million payment to the refundedbond escrow agent, offset by a $19.3 million in refundingbonds issued, and a $1.2 million issuance premium; coupledwith a $7 million payment of debt related interest.
Proprietary Funds:The County's proprietary funds provide the same type ofinformation found in the government-wide financial statements,but in more detail. The nonmajor enterprise funds and theinternal service funds are combined into single, aggregatedpresentations in the proprietary fund financial statements.Individual proprietary fund data is presented in the combiningfinancial statements/schedules and supplemental informationsection of this report.
Enterprise Funds:
See previous discussion above regarding Business-type activities.
Internal Service Funds:
Net Assets of the internal service funds (ISF) totaled $103 million,a net decrease of $10 million from the prior year. This $10 millionnet decrease consisted of $7 million in increases, offset bydecreases of $17 million as follows:
$7 million increases to internal service funds’ net assets:• $3 million increase in Facilities Management Fund's net assets
mainly attributable to a $7.4 million decrease in operatingrevenue coupled with a decrease in operating expenses offsetby a $1.15 increase in grants, a $400 thousand increase incapital contributions and an $800 thousand increase intransfers out.
• $3 million increase in Information Technology Fund's netassets chiefly due to transfers in from the General Fund forvarious information technology activities.
• $1 million increase in Fleet Services Fund's net assets chieflydue to transfers in from the General Fund for various fleetservices activities.
$17 million decreases to internal service funds’ net assets:• $9 million decrease Employee Benefits Fund's net assets due
to a $6 million increase in claims and judgments coupled witha $3 million decrease in charges for services.
• $8 million decrease in Public Liability Fund's net assets mainlydue to a $10 million increase in claims and judgments offsetby a $1 million decrease in operating revenues.
Fiduciary Funds:The County maintains fiduciary funds for the assets of theInvestment Trust Funds and the Agency Funds.
Investment Trust Funds:
These funds were established for the purpose of reportingpooled and specific investments. The Investment Trust Funds’net assets totaled $3.43 billion, an increase of $285 million, fromthe previous year. This increase was substantially due tocontributions to investments of $6.123 billion coupled withinvestment earnings of $19 million, offset by distributions frominvestments of $5.857 billion.
Agency Funds:
Agency funds maintain assets held in an agent capacity for othergovernments, organizations and individuals. These assets do notsupport the County's programs or services. Any portion of theagency funds' assets held at fiscal year end for other Countyfunds are reported in those funds rather than in the agencyfunds.
28
Comprehensive Annual Financial Report for the Year Ended June 30, 2011 ~ County of San Diego
Management’s Discussion and Analysis
General Fund Budgetary HighlightsThe County's final budget differs from the original budget (seeNotes to required supplementary information) in that it containssupplemental appropriations approved during the fiscal year forvarious programs and projects, as well as transfers ofappropriations, budget corrections, re-budgets, and accountreclassifications. For the fiscal year ended June 30, 2011 netexpenditure appropriations increased by $36.3 million andappropriations for transfers-out decreased by $2.3 million for anet increase of $34 million.
Appropriation changes of note to the original budget were thefollowing: • $12.4 million appropriation increase in the Housing and
Community Development General Fund Department. Thefunctions of the Housing and Community Development (HCD)Special Revenue Fund were transferred to the HCD GeneralFund department resulting in the dissolution of the HCDSpecial Revenue fund.
• $9.7 million of appropriations were cancelled in the Office ofthe Public Defender due to the loss of funding from the Stateof California Administrative Office of the Courts to provideDependency Representation services.
• $9.1 million in various departments including Office ofEmergency Services, Sheriff Department, Health and HumanServices Agency, Department of Planning and Land Use,Department of General Services for emergency planning, thecontinued development of a disaster preparedness exerciseprogram, equipment purchases, regional projects and grantadministration due to the award of a Homeland SecurityGrant.
• $8.8 million in the Sheriff Department to increasecoordination and enhance local law enforcement presencealong the border based on grant funds from the federalDepartment of Homeland Security.
• $3.5 million for the Sheriff's Rancho San Diego Station capitalproject based on Public Safety Group's Fund Balanceavailable. The new Rancho Sand Diego Sheriff Station will belocated on a vacant County owned parcel and will beapproximately 20,000- 25,000 square feet.
Actual revenues fell short of the final budgeted amounts by$113.7 million, while actual expenditures were less than thebudgeted amount by $472.0 million. The combination of therevenue and expenditure shortfalls resulted in a revenue/expenditure operating variance of $358.3 million. Other financingsources and uses of funds resulted in a net sources versus usesvariance from budget of $345.5 million and there was novariance in the increase to the nonspendable inventories. Thesecombined amounts resulted in a variance in the net change infund balance of $703.8 million.
Highlights of actual expenditures compared to final budgetedamounts are as follows:
Salaries and Benefits:
The final budget over expenditure variance across all functions inthis category was $62.7 million. A significant portion of thesesavings were in the Public Safety Group and the Health andHuman Services Agency but also in the Land Use andEnvironment Group, Community Services Group and Finance andGeneral Government Group from lower than budgeted salariesand employee benefit costs due to staff turnover anddepartment management of vacancies.
Health and Human Services Agency Programs:
Funded by a combination of State, federal, and County revenues,most Health and Human Services Agency programs are carriedout in the functional areas of health and sanitation and publicassistance, with final budget over expenditure variances of $60.1million and $79.6 million, respectively. Overall, theseexpenditure variances primarily resulted from a lower demandfor services than budgeted levels in the following areas:• Un-awarded Mental Health Services Act and Alcohol and Drug
Services contracts;• Lower than anticipated growth trends in In-Home Supportive
Services Individual Provider costs;• Lower than anticipated service levels in Early Periodic
Screening, Diagnosis and Treatment and MediCal;• State funding reductions in contracts for Immunization
services; and,• Bio-terrorism emergency appropriation savings.
Delayed expenditures:
Many County projects, such as maintenance and informationtechnology, take place over more than one fiscal year. However,at inception they are budgeted at full expected cost, resulting inbudgeted over expenditure variances that are rebudgeted in thenew fiscal year. For example:• A positive expenditure variance of approximately $41.3
million due to delays in the Integrated Property Tax Systemprocurement process.
• Department of Public Works rebudgeted $5.4 million of one-time funding for the Woodside Avenue Drainage project inthe community of Lakeside. These funds will be used forconstruction costs for culvert installation.
Management and Contingency Appropriations:
The County annually sets up management and contingencyappropriations based on both ongoing general purpose revenuesand prior years' fund balance for a variety of one-time capital andoperating expenditures as well as potential emergencies.Unexpended Management and Contingency Reserveappropriations resulted in budget over actual variances of $29.2million and $20 million, respectively. Note that the ManagementReserves are included within various functional activities.
Management’s Discussion and Analysis
29
County of San Diego ~ Comprehensive Annual Financial Report for the Year Ended June 30, 2011
Capital Assets and CommitmentsCapital AssetsAt June 30, 2011, the County's capital assets for bothgovernmental and business-type activities were $3.06 billion and$165 million, respectively, net of accumulated depreciation/amortization. Investment in capital assets includes land,construction in progress, buildings and improvements,infrastructure (including roads, bridges, flood channels, andtraffic signals), equipment, software and easements. Significantincreases to capital assets in fiscal year 2011 included:
Governmental Activities:• $51.6 million towards construction at the County Operations
Center Phase 1A. Total project costs are estimated at $179.5million.
• $40.2 million towards the construction and improvement ofCounty maintained roads, bridges and other road relatedinfrastructure.
• $19.8 million towards construction at the County OperationsCenter Phase 1B. Total project costs are estimated at $119.8million
• 17.9 million towards the construction of variousmiscellaneous capital outlay fund projects
• $9.2 million towards various land acquisitions.• $9.1 million in land donations• $6.1 million towards the construction of the Medical
Examiner Building at the County Operation Center in KearnyMesa. Total project costs are estimated at $68.7 million.
• $5.9 million towards park improvements• $5.8 million towards the construction of the Ramona Branch
Library. Total project costs are estimated at $12.1 million• $4.4 million towards construction of the San Pasqual
Academy Residences. Total project costs are estimated at$9.1 million.
• $3.9 million towards development of various softwareapplications.
• $3.4 million towards the construction of the Fallbrook BranchLibrary. Total project costs are estimated at $10.6 million.
• $2.4 million towards purchase of software licenses.• $2 million in infrastructure donated by developers.
Business-type Activities:• $2.6 million towards improvements at various Sanitation
Districts.
For government-wide financial statement presentation,governmental funds depreciable capital assets are depreciatedfrom the acquisition date to the end of the current fiscal year.Governmental funds financial statements record capital assetpurchases as expenditures.
Capital Commitments:As of June 30, 2011, capital commitments included the following:
Governmental Activities:• $100.6 million for the construction of: the County Operations
Center, South Santa Fe Ave., roadway assets replacements,San Pasqual Academy Housing, Women’s Detention Facility,Spring Valley traffic Signal, Jamacha Boulevard, and purchaseof license agreements and upgrade of Oracle EnterpriseResources.
Business-type Activities:• $750 thousand for construction of Rancho Del Campo
Wastewater.
(Please refer to Note 7 in the notes to the financial statementsfor more details concerning capital assets and capitalcommitments.)
Long-Term LiabilitiesGovernmental Activities:
At June 30, 2011, the County’s governmental activities hadoutstanding long-term liabilities of $2.07 billion.
Of this amount, approximately $1.82 billion pertained to long-term debt outstanding. Principal debt issuances included: $841million in taxable pension obligation bonds; $575 million inTobacco Settlement Asset-Backed Bonds; and $392 million incertificates of participation (COPs) and lease revenue bonds(LRBs).
Other long-term liabilities included $136 million in claims andjudgments; $98 million in compensated absences; $20 million forlandfill closure and postclosure costs and $212 thousand incapital leases.
During fiscal year 2011, the County's total principal amount ofCOPs and lease revenue bonds, other bonds, and loans forgovernmental activities decreased by $56.631 million.
The $56.631 million decrease was due to the following increasesand decreases:
Increases to debt were $33.631 million and included:• $19.260 million of fixed rate serial certificates of participation
issued by the San Diego Regional Building Authority toadvance refund $22.115 million of outstanding 2001Metropolitan Transit System Towers Refunding Certificates ofParticipation;
• $655 thousand of California Energy Conservation loans; • $4.320 million of principal was accreted (added) to the
outstanding Tobacco Settlement Asset-Backed Bonds' CapitalAppreciation Bonds principal balances outstanding;
• $3.591 million of principal was accreted (added) to theoutstanding Taxable Pension Obligation Bonds’ principalbalances outstanding; and,
• $5.805 million due to the effects of arbitrage, unamortizedissuance premiums, unamortized issuance discounts, andunamortized deferred amounts on refundings.

30
Comprehensive Annual Financial Report for the Year Ended June 30, 2011 ~ County of San Diego
Management’s Discussion and Analysis
Decreases to debt were $90.262 million and included:• $22.115 to advance refund the outstanding 2001
Metropolitan Transit System Towers Refunding Certificates ofParticipation referred to above; and,
• $68.147 million in principal debt service payments.
Business-type Activities:
Long-term liabilities for business-type activities totaled $1.994million and consisted of $1.566 million for capital loans and $428thousand for compensated absences.
Long-term liabilities for business-type activities decreased by$275 thousand. This was due to a combination of $243 thousandin debt service payments on capital loans and a net decrease of$32 thousand in compensated absences.
(Please refer to Notes 13 through 15 in the notes to the financialstatements for more details concerning long-term debt; changesin long-term liabilities; and funds used to liquidate liabilities.)
Credit RatingsThe County's issuer and credit ratings on its bonded program areas follows:
Table 3
The County's ratings on its lease financings and its pensionobligation bonds were reaffirmed in 2011. While Standard andPoor's affirmed its ratings on the County's remaining outstandingdebt, and AAA County issuer credit rating, it lowered its ratingson the outstanding subordinate obligations of the TobaccoSecuritization Authority of Southern California: TobaccoSettlement Asset-Backed Bonds (TSAB) - Series 2006B FirstSubordinate (BBB- to BB-), TSAB Series C Second Subordinate(BB+ to B+) and TSAB Series 2006D Third Subordinate (BB- to B-).
In reaffirming the County's ratings, all three rating agenciesreferenced the County's strong financial management practicesin the face of economic challenges. In its analysis dated July 19,2011, Moody's Investors Service states, “the County's long-termratings are based on its sizable tax base and residentsocioeconomic profile. The County's economy has experiencedchallenges in the recent recession but nonetheless remains largeand diverse. The County's ratings also incorporate its soundfinancial position and strong, conservative financialmanagement.”
Economic Factors and Next Year's Budget and Rates• The fiscal year 2012 General Fund adopted budget utilizes as
funding sources for one-time expenditures $210.1 million outof $612.814 million in unassigned fund balance and $5.9million out of $514.739 million committed fund balance.
• The fiscal year 2012 General Fund adopted budget containstotal appropriations of $3.74 billion. This is an increase of $3.8million or 0.1% from the fiscal year 2011 General Fundadopted budget. A number of risk factors continue to betracked closely: the state of the economy, which is sufferingfrom high unemployment, a struggling real estate market andconsumer spending weakness, and the State of California'sprojected budget imbalances for fiscal years 2013, 2014 andbeyond.
• The U.S. economy's revised Gross Domestic Product (GDP) for2010 showed an increase of 3.0% compared to a decline of3.5% in 2009, a 0.3% decline in 2008 after a 1.9% gain in 2007.GDP is expected to grow in 2011, with a current growthprojection of 1.5%, and GDP growth for 2012 is forecasted tobe 1.4%.
• California's economy has been negatively impacted by thesame financial market, housing and real estate, employmentand personal income trends experienced at the national level.In 2010, key indicators of California's economy showed mixedresults. Payroll employment declined by 1.4%, real personalincome improved by 1.7%, and adjusted taxable sales isestimated to have grown by 1.8%. California's 2011 economyis expected to show continued gradual improvement withpayroll employment expected to improve by 1.1%, realpersonal income is expected to increase by 2.3%, and taxablesales is expected to increase by 1.7%.
• The State's budget outlook continues to be strained, with theslow pace of economic recovery contributing significantly tothe ongoing structural imbalance between revenues andexpenditures. In fiscal year 2012, the State of California'sadopted budget also realigned various criminal justice, mentalhealth and social service programs, representing a long termchange in state and county responsibilities.
• San Diego certainly shared the pain of the recession alongwith the rest of Southern California. 2011 continues to beanother unsettled year for our region's economy withunemployment still above 10%. San Diego's index of leadingeconomic indicators has trended higher since April 2009,despite recent weakness, indicating gradual economic
Credit Ratings
Moody'sStandard &
Poor's FitchIssuer Rating Aa1 AAA AAACertificates of Participation San Diego Capital Asset Leasing Corporation (SANCAL)
Aa3 AA+ AA+
Certificates of Participation San Diego Regional Building Authority (SDRBA) Metropolitan Transit System Towers
Aa3 AA+ AA+
Lease Revenue Bonds SDRBA County Operations Center 1A
Aa3 AA+ AA+
Refunding Lease Revenue Bonds SDRBA San Miguel
A1 not rated not rated
Pension Obligation Bonds Aa2 AA+ AA+Tobacco Settlement Asset-Backed Bonds - Series 2006A (Senior)
Baa3 BBB not rated
Tobacco Settlement Asset-Backed Bonds - Series 2006B (First Subordinate)
not rated BB- not rated
Tobacco Settlement Asset-Backed Bonds - Series 2006C (Second Subordinate)
not rated B+ not rated
Tobacco Settlement Asset-Backed Bonds - Series 2006D (Third Subordinate)
not rated B- not rated
County Redevelopment Agency Bonds
not rated not rated not rated

Management’s Discussion and Analysis
31
County of San Diego ~ Comprehensive Annual Financial Report for the Year Ended June 30, 2011
improvement overall. While the pace of the economicrecovery has remained slow, 2012 should see continued signsof improvement for the region.
• The state of the economy plays a significant role in theCounty's ability to provide core services and the mix of otherservices sought by the public. There continues to be anincreased demand for public assistance, while at the sametime the State and local resources available to fund thoseservices are not able to keep pace with the demand. The realestate market slump has continued to impact the County'sgeneral purpose revenue (GPR), although GPR is expected toincrease marginally in fiscal year 2012 from fiscal year 2011.GPR is relied upon to fund local discretionary services, as wellas to fund the County's share of costs for services that areprovided in partnership with the State and federalgovernment.
As discussed below, the County's GPR is projected to increase by1.1% (with budgeted revenue of $964.4 million in fiscal year 2012compared to $954.4 million budgeted in fiscal year 2011). • The largest source of general purpose revenue is property
taxes ($505.8 million budgeted in fiscal year 2012),representing 52.4% of the total. For the last eleven years,property tax growth has been high (6.1% average annualgrowth) due to the County's overall stable economy andhealthy real estate market. In 2012, property taxes arebudgeted to increase by $8.2 million, or 1.7%, from the 2011budget. The budgeted property tax revenue factors in thecurrent soft commercial and residential real estate conditionsas evidenced by the continued low but improving level ofbuilding permits; marginally declining median price of homes;the continued relatively high level of foreclosures; and thegradual improvement in total deeds recorded. Currentproperty taxes consist of three components: current securedproperty taxes, current supplemental property taxes, andcurrent unsecured property taxes.
• The budgeted amount of current secured property taxrevenues ($487.1 million) assumes a net local assessedsecured property value decline of 0.5% from the actual localassessed secured property value figure for 2011, and makescertain assumptions regarding the County's share ofcountywide property tax revenues, the delinquency rate, andthe amount of tax roll corrections and refunds on prior yearassessments. The actual change in the net local assessedsecured property value was better than assumed for the fiscalyear 2012 budget, increasing by 0.5%. Consequently, theactual current secured property tax revenues in fiscal year2012 will likely come in higher than budget. In fiscal year2013, the projected amount of revenues from currentsecured property taxes assumes no growth in local assessedsecured property values.
• Current supplemental property taxes ($1.9 million budgetedin fiscal year 2012) are derived from net increases to the taxroll from either new construction or changes in ownershipthat occur subsequent to the January 1 lien date and are,therefore, more difficult to predict. The slowdown in new
construction and the decline in real estate prices have beenacutely felt in supplemental property tax revenues. In manychange of ownership transactions, instead of a propertyowner being billed for an additional amount of property taxbecause the value of the property after the transaction ishigher than the value as of the lien date, the property ownerreceives a refund because the value is lower than it was onthe lien date. In fiscal year 2006, supplemental refundscountywide totaled $4.0 million. They increased to $6.2million in fiscal year 2007, increased to $15.0 million in 2008,and increased again to $38.3 million in 2009. Supplementalrefunds exceeded $21.6 million in fiscal year 2010 anddropped to $15.3 million in 2011. They are anticipated todecline gradually in fiscal year 2012. Current supplementalproperty tax revenues were $29.5 million in fiscal year 2006.They dropped to $23.4 million in fiscal year 2007, to $14.0million in fiscal year 2008, to $2.4 million in 2009, and to $1.9million in 2010. In fiscal year 2011, current supplementalproperty tax revenues were $3.9 million. The AdoptedOperational Plan assumes that this weakness will continuethrough the next two fiscal years.
• Current unsecured property tax revenues ($16.8 millionbudgeted in fiscal year 2012) are forecasted based on trendsand available information at the time the budget isdeveloped. A decline of 3.2% is budgeted for fiscal year 2012over the fiscal year 2011 adopted budget.
• Property taxes in lieu of vehicle license fees (VLF) comprises31.3% (an estimated $302.2 million) of budgeted generalpurpose revenue in fiscal year 2012. This revenue source wasestablished by the State in fiscal year 2005 to replace theprevious distribution of vehicle license fees to localgovernments. Growth in this revenue source is based on thegrowth in the County's gross taxable assessed value. Thecertified rate of increase for 2012 is 0.33%. Similar to currentsecured property tax revenue, no growth is expected for fiscalyear 2013.
• Teeter revenues represent 3.4% (an estimated $32.9 million)of budgeted general purpose revenue. In fiscal year 1994, theCounty adopted the alternative method of secured propertytax apportionment available under Chapter 3, Part 8, Division1, of the Revenue and Taxation Code of the State of California(also known as the “Teeter Plan”). Under this plan, the Countyadvances funds to these entities to cover the unpaid(delinquent) taxes (the “Teetered Taxes”). The County'sgeneral fund benefits from this plan by being entitled tofuture collections of penalties and interest that are also dueonce the delinquent taxes are paid. A legal requirement of theTeeter Plan requires the County to maintain a tax loss reservefund to cover losses that may occur if delinquent taxes are notpaid and the property goes into default and is sold for lessthan the outstanding taxes and assessments. Throughout theyear, all interest and penalties collected on Teetered securedand supplemental property taxes are first deposited into theTeeter Tax Loss Reserve Fund. Any excess amounts above 25%of the total delinquent secured taxes and assessments may betransferred to the general fund. For fiscal year 2012,
32
Comprehensive Annual Financial Report for the Year Ended June 30, 2011 ~ County of San Diego
Management’s Discussion and Analysis
collections from previous years' receivables are budgeted todecrease by $4.8 million based on the size of the outstandingannual receivables and based on anticipated collection trendsand market conditions. In fiscal year 2012, excess amountsfrom the Teeter Tax Loss Reserve Fund decrease from the$21.5 million that was budgeted in fiscal year 2011 to $19.0million budgeted in fiscal year 2012, based on the change inthe expected level of Teetered taxes. These revenues areexpected to decrease by $1.2 million in fiscal year 2013.
• Sales and use tax revenue and in lieu local sales and use tax($21.7 million in fiscal year 2012) represents about 2.3% ofbudgeted general purpose revenue. These revenues arederived from taxable sales by retailers who sell or renttangible personal property in unincorporated areas of thecounty or from use taxes from consumers who purchasetangible personal property from out of state. Use taxes arealso imposed on the storage, use, lease or other consumptionof tangible personal property at any time a sales tax has notbeen paid by the retailer. The growth in this funding source isgenerally impacted by population growth, new retail businessformation and consumer spending trends. The in lieu localsales and use tax revenue replaces regular sales and use taxrevenue with monies transferred from the EducationalRevenue Augmentation Fund (ERAF) under the provisions ofAB7 X1, one of the 2004 State budget bills. This legislationenabled the State to redirect one-quarter cent of the localsales and use tax to the state to repay up to $15 billion inbonds authorized by Proposition 57 (March 2004) to help theState refinance its past debt. In turn, the redirected local salesand use tax revenues are replaced on a dollar-for-dollar basiswith countywide property tax revenues shifted back from theERAF. This funding mechanism is known as the “triple flip.”
• Sales and Use Tax revenue grew moderately from fiscal year2006 through fiscal year 2008 in concert with populationgrowth and new retail business formation in theunincorporated area. However, the recent economicvolatility, housing market declines, and unemployment trendshave impacted retail sales at the statewide, southernCalifornia and San Diego regional levels. Sales tax revenuesimproved in all four quarters of 2010 compared to 2009 andthis trend has continued into 2011. The amount of budgetedrevenue in fiscal year 2012 is approximately $1.7 million(8.5%) above the fiscal year 2011 budgeted revenue. Growthof $0.4 million or 2.0% is projected for fiscal year 2013.
• Intergovernmental Revenue ($40.8 million budgeted in fiscalyear 2012) is approximately 4.2% of the total GPR in fiscalyear 2012 and represents funding the County receives from
various intergovernmental sources including RedevelopmentAgencies, the City of San Diego (pursuant to a MemorandumOf Understanding related to the County's Central Jail), thefederal government (Payments in Lieu of Taxes (PILT) for tax-exempt federal lands administered by the Bureau of LandManagement, the National Park Service, and the U.S. Fish andWildlife Service), and the State of California (reimbursementto the County for the Homeowner's Property Tax Relief(HOPTR) program). The largest portion of this funding is fromredevelopment agencies based on the provisions of Article 16,Section 16 of the California Constitution, and Health andSafety Code Section 33670 which provides for the division ofcertain portions of property tax revenues betweenredevelopment projects and other taxing agencies. Theamount of budgeted revenue in fiscal year 2012 isapproximately $5.2 million (14.6%) above the fiscal year 2011budgeted revenue. The anticipated increase in Aid fromRedevelopment Agencies is primarily associated withadditional funding from the Redevelopment Agency of theCity of San Diego, Centre City Redevelopment Project.Pursuant to an agreement, the County will receive apercentage increase of total tax increment generated in theproject are upon meeting certain tax increment thresholds.Growth of $0.2 million or 0.4% is projected for fiscal year2013.
• Other revenues budgeted for fiscal year 2012 total $61.0million, and comprise 6.3% of budgeted general purposerevenue. The fiscal year 2012 amount represents a 3.2% or$1.9 million increase over the fiscal year 2011 AdoptedBudget total. Various revenue sources make up this categoryincluding Real Property Transfer Tax (RPTT), interest ondeposits, fines, fees and forfeitures, prior year property taxes,penalty and cost delinquency taxes, franchise revenue, cableand video licenses and other miscellaneous revenues.
The County's Operational Plan for fiscal year 2012 and for fiscalyear 2013 can be found on the internet at http://www.sdcounty.ca.gov/auditor/budinfo.html.
Requests for InformationThis financial report is designed to provide our citizens,taxpayers, customers, and investors and creditors with a generaloverview of the County's finances and to demonstrate theCounty's accountability for the money it receives. If you havequestions about this report or need additional financialinformation, please contact the Auditor and Controller's Office,County of San Diego, located at 1600 Pacific Highway, San Diego,California 92101.

Basic FinancialStatements
33

Basic Financial Statements
34 The notes to the financial statements are an integral part of this statement.
Comprehensive Annual Financial Report for the Year Ended June 30, 2011 ~ County of San Diego
Statement of Net Assets
STATEMENT OF NET ASSETSJune 30, 2011 (In Thousands)
Primary Government Component Unit
Governmental Activities
Business-Type Activities Total
First 5 Commission Fund
ASSETS
Pooled cash and investments $ 1,869,417 82,420 1,951,837 128,251
Cash with fiscal agents 20 20
Investments with fiscal agents 383,774 383,774 36,086
Receivables, net 579,090 5,808 584,898 6,326
Property taxes receivables, net 150,621 150,621
Internal balances (2,965) 2,965
Inventories 12,904 1 12,905
Deposits with others 15 15
Prepaid items 379 379 2
Deferred charges 13,396 13,396
Restricted assets:
Cash with fiscal agents 490 490 1,288
Investments with fiscal agents 68,082 68,082
Lease receivable 14,306 14,306
Capital assets:
Land, easements and construction in progress 485,857 24,152 510,009 Other capital assets, net of accumulated depreciation/
amortization 2,571,006 140,682 2,711,688
Total assets 6,146,392 256,028 6,402,420 171,953
LIABILITIES
Accounts payable 162,900 896 163,796 102,532
Accrued payroll 43,338 219 43,557
Accrued interest 25,473 25,473
Unearned revenue 270,760 49 270,809
Non-current liabilities:
Due within one year 144,090 430 144,520 55
Due in more than one year 1,929,618 1,564 1,931,182 19
Total liabilities 2,576,179 3,158 2,579,337 102,606
NET ASSETS
Invested in capital assets, net of related debt 2,675,240 163,268 2,838,508
Restricted for:
Creditors - Capital projects 24,550 24,550
Grantors - Housing assistance 76,504 76,504
Donations 3,363 3,363
Laws or regulations of other governments:
Future road improvements 121,180 121,180 Maintenance, operation and construction of criminal justice
facilities and courthouses 24,411 24,411
Defray administrative costs, other general restrictions 16,208 16,208
Teeter tax loss 22,264 22,264
Mental health 27,603 27,603
Vector control 13,227 13,227
Fingerprinting equipment purchase and operation 8,526 8,526
Improvement and maintenance of recorded document systems 14,300 14,300
Housing repairs and improvements 164 164
Other purposes 177,508 177,508
First 5 Commission 69,347
Unrestricted 365,165 89,602 454,767
Total net assets $ 3,570,213 252,870 3,823,083 69,347

The notes to the financial statements are an integral part of this statement. 35
Basic Financial Statements
County of San Diego ~ Comprehensive Annual Financial Report for the Year Ended June 30, 2011
Statement of Activities
Continued
STATEMENT OF ACTIVITIESFor the year ended June 30, 2011 (In Thousands)
Program Revenues Net (Expense) Revenue and Changes in Net Assets
Functions/Programs: ExpensesCharges for
Services
Operating Grants and
Contributions
Capital Grants and
Contributions
Primary GovernmentComponent
Unit
Governmental Activities
Business-Type Activities Total
First 5 Commission
Fund
Governmental Activities:
General government $ 229,767 92,085 40,043 22,822 (74,817) (74,817)
Public protection 1,128,967 235,913 383,097 40 (509,917) (509,917)
Public ways and facilities 130,239 21,022 80,672 2,074 (26,471) (26,471)
Health and sanitation 721,939 111,300 536,949 (73,690) (73,690)
Public assistance 1,191,559 19,105 1,168,204 (4,250) (4,250)
Education 35,734 1,064 2,337 393 (31,940) (31,940)
Recreation and cultural 36,699 7,576 644 (28,479) (28,479)
Interest expense 106,381 (106,381) (106,381)
Total governmental activities 3,581,285 488,065 2,211,946 25,329 (855,945) (855,945)
Business-type activities:
Airport 12,876 11,301 1,513 (62) (62)
Sanitation Districts 21,699 20,431 (1,268) (1,268)
Wastewater Management 5,806 6,509 31 734 734
Total business-type activities 40,381 38,241 1,544 (596) (596)
Total primary government 3,621,666 526,306 2,213,490 25,329 (855,945) (596) (856,541)
Component Unit:
First 5 Commission $ 144,550 35,289 (109,261)
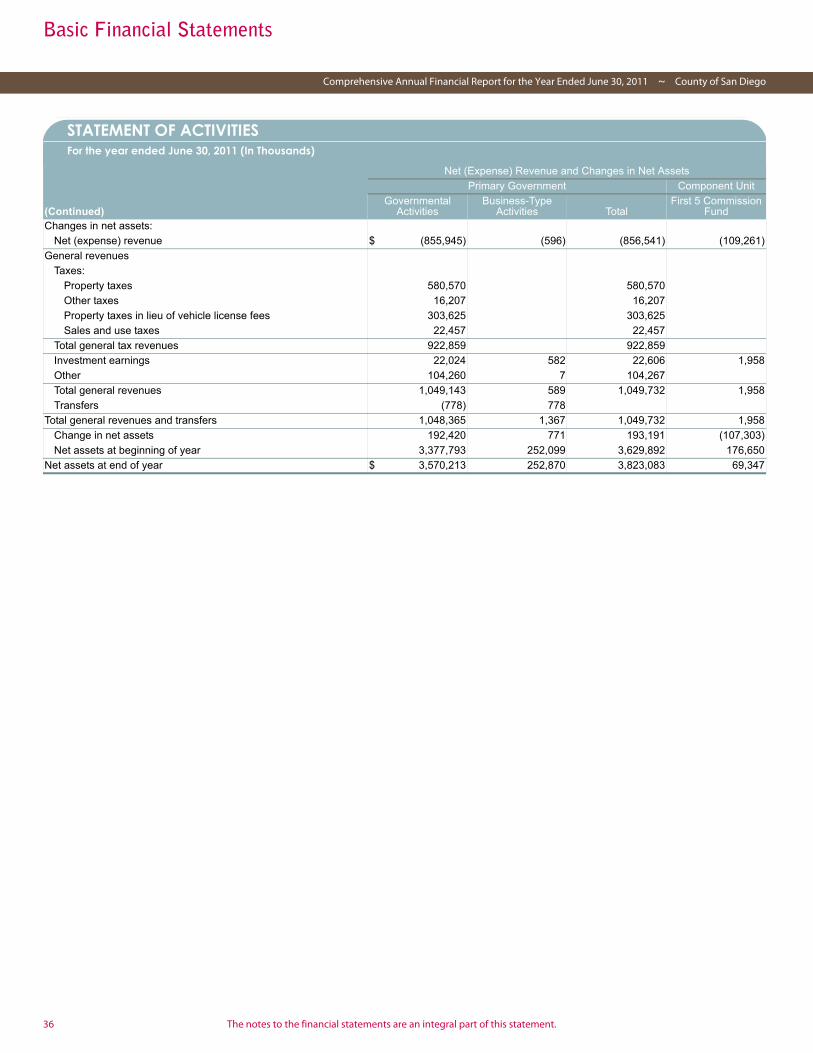
Basic Financial Statements
36 The notes to the financial statements are an integral part of this statement.
Comprehensive Annual Financial Report for the Year Ended June 30, 2011 ~ County of San Diego
STATEMENT OF ACTIVITIESFor the year ended June 30, 2011 (In Thousands)
Net (Expense) Revenue and Changes in Net Assets
Primary Government Component Unit
(Continued)Governmental
ActivitiesBusiness-Type
Activities TotalFirst 5 Commission
FundChanges in net assets:
Net (expense) revenue $ (855,945) (596) (856,541) (109,261)
General revenues
Taxes:
Property taxes 580,570 580,570
Other taxes 16,207 16,207
Property taxes in lieu of vehicle license fees 303,625 303,625
Sales and use taxes 22,457 22,457
Total general tax revenues 922,859 922,859
Investment earnings 22,024 582 22,606 1,958
Other 104,260 7 104,267
Total general revenues 1,049,143 589 1,049,732 1,958
Transfers (778) 778
Total general revenues and transfers 1,048,365 1,367 1,049,732 1,958
Change in net assets 192,420 771 193,191 (107,303)
Net assets at beginning of year 3,377,793 252,099 3,629,892 176,650
Net assets at end of year $ 3,570,213 252,870 3,823,083 69,347

The notes to the financial statements are an integral part of this statement. 37
Basic Financial Statements
County of San Diego ~ Comprehensive Annual Financial Report for the Year Ended June 30, 2011
Fund Financial Statements: Balance Sheet - Governmental Funds
BALANCE SHEETGOVERNMENTAL FUNDSJune 30, 2011 (In Thousands)
General FundPublic Safety
Fund
Tobacco Endowment
Fund
Other Governmental
Funds
Total Governmental
FundsASSETS
Pooled cash and investments $ 1,286,610 4,712 4,935 382,299 1,678,556
Cash with fiscal agents 20 20
Investments with fiscal agents 2 383,772 383,774
Receivables, net 465,866 36,214 4,873 68,272 575,225
Property taxes receivables, net 149,980 641 150,621
Due from other funds 34,625 21,545 56,170
Inventories 10,187 1,385 11,572
Deposits with others 15 15
Prepaid items 48 331 379
Restricted assets:
Cash with fiscal agents 156 334 490
Investments with fiscal agents 68,082 68,082
Lease receivable 6,299 8,007 14,306
Total assets 1,953,793 40,926 393,580 550,911 2,939,210
LIABILITIES AND FUND BALANCES
Liabilities
Accounts payable 101,157 33,007 134,164
Accrued payroll 39,890 2,363 42,253
Due to other funds 36,813 19,237 967 19,707 76,724
Deferred revenues 128,164 47,438 175,602
Unearned revenue 253,389 16,870 270,259
Total liabilities 559,413 19,237 967 119,385 699,002
Fund Balances
Nonspendable:
Not in spendable form:
Loans, due from other funds and prepaids 1,070 3,748 4,818
Inventories and deposits with others 10,187 1,400 11,587
Restricted for:
Creditors - Debt service 77,454 77,454
Creditors - Capital projects 24,550 24,550
Grantors - Housing assistance 55,338 21,166 76,504
Donations 3,363 3,363
Laws or regulations of other governments:
Future road improvements 118,781 118,781Maintenance, operation and construction of criminal justice
facilities and courthouses 24,411 24,411
Fund purpose 21,689 87,127 108,816
Other purposes 131,844 21,963 153,807
Committed to:
Realignment health, mental health and social services 69,297 69,297
Unforeseen catastrophic events 55,500 55,500
Capital projects' funding 353,165 6,971 360,136
Health 392,613 392,613
Other purposes 36,777 68,366 105,143
Assigned to:
Other purposes 40,614 40,614
Unassigned 612,814 612,814
Total fund balances 1,394,380 21,689 392,613 431,526 2,240,208
Total liabilities and fund balances $ 1,953,793 40,926 393,580 550,911 2,939,210

Basic Financial Statements
38 The notes to the financial statements are an integral part of this statement.
Comprehensive Annual Financial Report for the Year Ended June 30, 2011 ~ County of San Diego
Reconciliation of the Governmental Funds Balance Sheet to the Government-wide Statement of Net Assets
RECONCILIATION OF THE GOVERNMENTAL FUNDS BALANCE SHEET TO THE GOVERNMENT-WIDESTATEMENT OF NET ASSETS
June 30, 2011(In Thousands)
Total fund balances - governmental funds $ 2,240,208
Capital assets used in governmental activities (excluding internal service funds) are not current financial resources and, therefore, are not reported in the balance sheet. This amount represents capital assets net of accumulated depreciation. 2,995,149
Unamortized issuance costs - bonds, notes and loans payable deferred charges (to be amortized over the life of the debt). 13,396
Accrued interest on long-term debt. (25,469)
Other long-term assets are not available to pay for current period expenditures and, therefore, are deferred in the funds and recognized as revenue in the statement of activities. 175,602
Long-term liabilities, including bonds, notes, and loans payable, are not due and payable in the current period and, therefore, are not reported in the balance sheet. (1,931,002)
Internal service funds are used by management to charge the costs of information technology, vehicle operations and maintenance, employee benefits, public liability, road and communications services, materials and supplies (purchasing), and facilities services to individual funds; to make loans for start-up services for new and existing county service districts; and for the financing of clothing and personal sundry items for persons institutionalized at various county facilities. The assets and liabilities of the internal service funds are included in the governmental activities in the statement of net assets. 102,329
Net assets of governmental activities $ 3,570,213

The notes to the financial statements are an integral part of this statement. 39
Basic Financial Statements
County of San Diego ~ Comprehensive Annual Financial Report for the Year Ended June 30, 2011
Statement of Revenues, Expenditures, and Changes in Fund Balances - Governmental Funds
STATEMENT OF REVENUES, EXPENDITURES, AND CHANGES IN FUND BALANCES - GOVERNMENTAL FUNDSFor the Year Ended June 30, 2011 (In Thousands)
General FundPublic Safety
Fund
Tobacco Endowment
Fund
Other Governmental
Funds
Total Governmental
Funds
Revenues:
Taxes $ 894,222 40,515 934,737
Licenses, permits and franchise fees 42,643 8,501 51,144
Fines, forfeitures and penalties 51,826 2,441 54,267
Revenue from use of money and property 24,479 4,709 10,357 39,545
Aid from other governmental agencies:
State 904,749 202,809 84,843 1,192,401
Federal 818,217 126,951 945,168
Other 57,874 14,197 72,071
Charges for current services 320,966 38,273 359,239
Other revenue 51,542 38,944 90,486
Total revenues 3,166,518 202,809 4,709 365,022 3,739,058
Expenditures:
Current:
General government 209,293 171 13,826 223,290
Public protection 1,079,836 8,541 1,088,377
Public ways and facilities 5,543 56,424 61,967
Health and sanitation 671,276 42,746 714,022
Public assistance 1,055,530 129,102 1,184,632
Education 957 33,642 34,599
Recreation and cultural 30,637 2,417 33,054
Capital outlay 21,965 164,377 186,342
Debt service:
Principal 26,735 37,281 64,016
Interest and fiscal charges 15,044 82,246 97,290
Bond issuance costs 349 349
Payment to refunded bond escrow agent 3,437 3,437
Total expenditures 3,116,816 171 574,388 3,691,375
Excess (deficiency) of revenues over (under) expenditures 49,702 202,809 4,538 (209,366) 47,683
Other financing sources (uses):
Sale of capital assets 414 2,259 2,673
Issuance of bonds and loans:
Premium on issuance of refunding bonds 1,237 1,237
Refunding bonds issued 19,260 19,260
Payment to refunded bond escrow agent (18,774) (18,774)
Transfers in 274,448 152,163 426,611
Transfers out (151,061) (185,919) (24,200) (69,347) (430,527)
Total other financing sources (uses) 123,801 (185,919) (24,200) 86,798 480
Net change in fund balances 173,503 16,890 (19,662) (122,568) 48,163
Fund balances at beginning of year 1,220,108 4,799 412,275 554,221 2,191,403
Increase (decrease) in
Nonspendable inventories 769 (127) 642
Fund balances at end of year $ 1,394,380 21,689 392,613 431,526 2,240,208
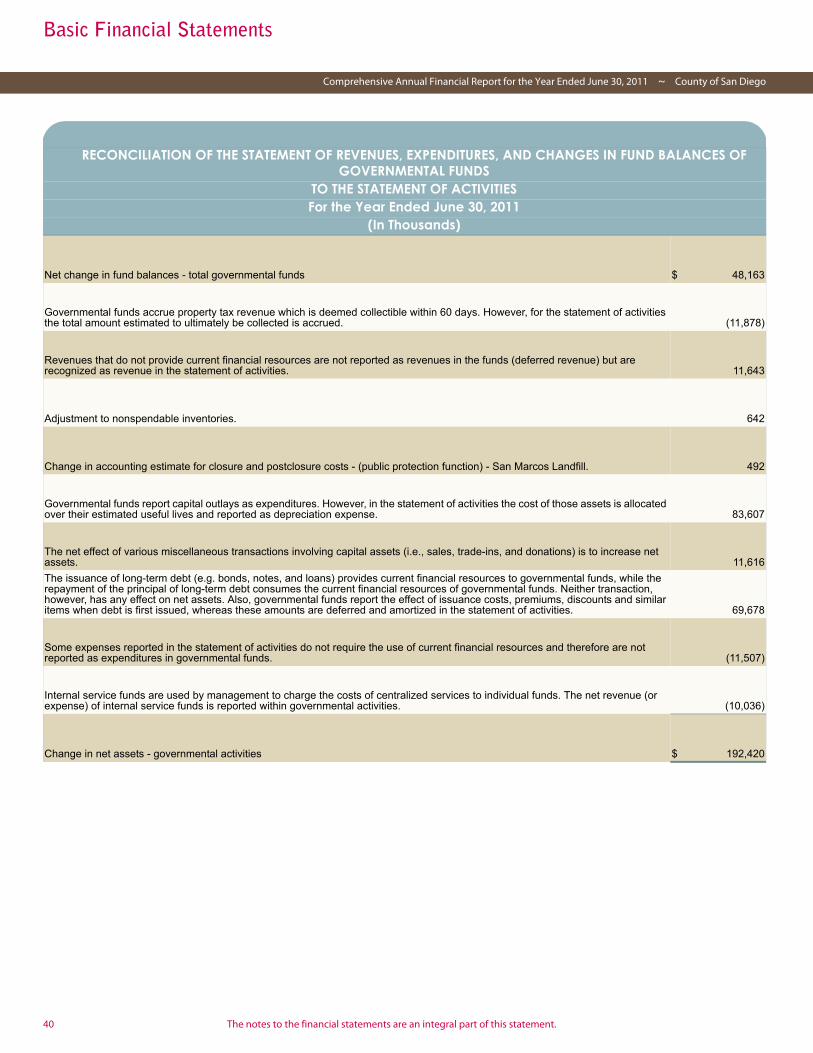
Basic Financial Statements
40 The notes to the financial statements are an integral part of this statement.
Comprehensive Annual Financial Report for the Year Ended June 30, 2011 ~ County of San Diego
Reconciliation of the Statement of Revenues, Expenditures, and Changes in Fund Balances of Governmental Funds to the Statement of Activities
RECONCILIATION OF THE STATEMENT OF REVENUES, EXPENDITURES, AND CHANGES IN FUND BALANCES OF GOVERNMENTAL FUNDS
TO THE STATEMENT OF ACTIVITIESFor the Year Ended June 30, 2011
(In Thousands)
Net change in fund balances - total governmental funds $ 48,163
Governmental funds accrue property tax revenue which is deemed collectible within 60 days. However, for the statement of activities the total amount estimated to ultimately be collected is accrued. (11,878)
Revenues that do not provide current financial resources are not reported as revenues in the funds (deferred revenue) but are recognized as revenue in the statement of activities. 11,643
Adjustment to nonspendable inventories. 642
Change in accounting estimate for closure and postclosure costs - (public protection function) - San Marcos Landfill. 492
Governmental funds report capital outlays as expenditures. However, in the statement of activities the cost of those assets is allocated over their estimated useful lives and reported as depreciation expense. 83,607
The net effect of various miscellaneous transactions involving capital assets (i.e., sales, trade-ins, and donations) is to increase net assets. 11,616
The issuance of long-term debt (e.g. bonds, notes, and loans) provides current financial resources to governmental funds, while the repayment of the principal of long-term debt consumes the current financial resources of governmental funds. Neither transaction, however, has any effect on net assets. Also, governmental funds report the effect of issuance costs, premiums, discounts and similar items when debt is first issued, whereas these amounts are deferred and amortized in the statement of activities. 69,678
Some expenses reported in the statement of activities do not require the use of current financial resources and therefore are not reported as expenditures in governmental funds. (11,507)
Internal service funds are used by management to charge the costs of centralized services to individual funds. The net revenue (or expense) of internal service funds is reported within governmental activities. (10,036)
Change in net assets - governmental activities $ 192,420

The notes to the financial statements are an integral part of this statement. 41
Basic Financial Statements
County of San Diego ~ Comprehensive Annual Financial Report for the Year Ended June 30, 2011
Statement of Net Assets - Proprietary Funds
STATEMENT OF NET ASSETSPROPRIETARY FUNDSJune 30, 2011 (In Thousands)
Business-Type Activities
Governmental Activities
Enterprise FundsInternal Service
FundsASSETS
Current assets:
Pooled cash and investments $ 82,420 190,861
Receivables, net 5,808 3,865
Due from other funds 259 22,871
Inventories 1 1,332
Total current assets 88,488 218,929
Noncurrent assets:
Due from other funds 3,363 60
Capital assets:
Land 11,565
Construction in progress 12,587
Buildings and improvements 114,787
Equipment 1,169 133,183
Software 67,137
Road infrastructure 6,445
Sewer infrastructure 85,764
Accumulated depreciation/amortization (67,483) (138,606)
Total noncurrent assets 168,197 61,774
Total assets 256,685 280,703
LIABILITIES
Current liabilities:
Accounts payable 896 28,736
Accrued payroll 219 1,085
Accrued interest 4
Due to other funds 1,055 4,944
Unearned revenue 49 501
Loans payable 254 855
Capital lease payable 27
Compensated absences 176 938
Claims and judgments 36,352
Total current liabilities 2,649 73,442
Noncurrent liabilities:
Loans payable 1,312 3,766
Capital lease payable 185
Compensated absences 252 1,336
Claims and judgments 99,247
Total noncurrent liabilities 1,564 104,534
Total liabilities 4,213 177,976
NET ASSETS
Invested in capital assets, net of related debt 163,268 61,502
Unrestricted net assets 89,204 41,225
Total net assets $ 252,472 102,727
Reconciliation between net assets - enterprise funds and net assets of business-type activities as reported in the government-wide statement of net assetsTotal net assets $ 252,472
Adjustment to reflect the consolidation of internal service fund activities related to enterprise funds 398
Net assets of business-type activities $ 252,870

Basic Financial Statements
42 The notes to the financial statements are an integral part of this statement.
Comprehensive Annual Financial Report for the Year Ended June 30, 2011 ~ County of San Diego
Statement of Revenues, Expenses, and Changes in Fund Net Assets - Proprietary Funds
STATEMENT OF REVENUES, EXPENSES, AND CHANGES IN FUND NET ASSETSPROPRIETARY FUNDSFor the Year Ended June 30, 2011 (In Thousands)
Business-Type Activities
Governmental Activities
Enterprise FundsInternal Service
FundsOperating revenues:
Charges for current services $ 38,241 300,321
Other revenue 7 4,764
Total operating revenues 38,248 305,085Operating expenses:
Salaries and employee benefits 7,043 35,342
Repairs and maintenance 6,982 30,225
Equipment rental 991 1,054
Sewage processing 13,517
Contracted services 4,151 151,279
Depreciation/amortization 5,377 15,899
Utilities 249 21,457
Cost of material 5,818
Claims and judgments 47,657
Fuel 2 11,614
Other 1,845 5,478
Total operating expenses 40,157 325,823
Operating income (loss) (1,909) (20,738)
Nonoperating revenues (expenses):
Grants 1,544 6,315
Investment earnings 582 810
Interest expense (102) (325)
Gain (loss) on disposal of assets (29) 265
Total nonoperating revenues (expenses) 1,995 7,065
Income (loss) before capital contributions and transfers 86 (13,673)
Capital contributions 406
Transfers in 1,109 6,759
Transfers out (331) (3,621)
Change in net assets 864 (10,129)
Net assets (deficits) at beginning of year 251,608 112,856
Net assets (deficits) at end of year $ 252,472 102,727
Reconciliation between changes in net assets - enterprise funds and changes in net assets of business-type activities as reported in the government-wide statement of activitiesChange in net assets $ 864
Adjustment to reflect the consolidation of internal service fund activities related to enterprise funds (93)
Change in net assets of business-type activities $ 771

The notes to the financial statements are an integral part of this statement. 43
Basic Financial Statements
County of San Diego ~ Comprehensive Annual Financial Report for the Year Ended June 30, 2011
Statement of Cash Flows - Proprietary Funds
STATEMENT OF CASH FLOWSPROPRIETARY FUNDSFor the Year Ended June 30, 2011 (In Thousands)
Business-Type Activities
Governmental Activities
Enterprise FundsInternal Service
FundsCash flows from operating activities:
Cash received from customers $ 31,586 12,052
Cash received from other funds 6,885 302,922
Cash payments to suppliers (27,396) (226,614)
Cash payments to employees (7,055) (35,193)
Cash payments to other funds (1,010) (13,566)
Cash paid for claims and judgments (30,157)
Net cash provided (used) by operating activities 3,010 9,444
Cash flows from noncapital financing activities:
Operating grants 9,173 7,055
Transfers from other funds 1,109 6,759
Transfers to other funds (331) (3,621)
Payments received on advances to other funds 47
Principal paid on long-term debt (767)
Interest paid on long-term debt (275)
Proceeds from loans 655
Net cash provided (used) by noncapital financing activities 9,951 9,853
Cash flows from capital and related financing activities:
Capital contributions 3
Acquisition of capital assets (9,121) (9,433)
Proceeds from sale of assets 834
Principal paid on long-term debt (243)
Principal paid on capital lease (30)
Interest paid on long-term debt (102) (36)
Interest paid on capital lease (14)
Net cash provided (used) by capital and related financing activities (9,466) (8,676)
Cash flows from investing activities:
Investment earnings 628 872
Net increase (decrease) in cash and cash equivalents 4,123 11,493
Cash and cash equivalents - beginning of year 78,297 179,368
Cash and cash equivalents - end of year 82,420 190,861
Reconciliation of operating income (loss) to net cash provided (used) by operating activities:
Operating income (loss) (1,909) (20,738)
Adjustments to reconcile operating income (loss) to net cash provided (used) by operating activities:
Decrease (increase) in accounts receivables (121) (2,613)
Decrease (increase) in due from other funds 7 8,457
Decrease (increase) in inventory (1) 18
Increase (decrease) in accounts payable (695) (9,135)
Increase (decrease) in accrued payroll 20 118
Increase (decrease) in due to other funds 352 4
Increase (decrease) in unearned revenue 12 (140)
Increase (decrease) in compensated absences (32) 74
Increase (decrease) in claims and judgments 17,500
Depreciation/amortization 5,377 15,899
Total adjustments 4,919 30,182
Net cash provided (used) by operating activities 3,010 9,444
Non-cash investing and capital financing activities:
Capital acquisitions included in accounts payable 441 440
Governmental contributions of capital assets $ 403

Basic Financial Statements
44 The notes to the financial statements are an integral part of this statement.
Comprehensive Annual Financial Report for the Year Ended June 30, 2011 ~ County of San Diego
Statement of Fiduciary Net Assets - Fiduciary Funds
STATEMENT OF FIDUCIARY NET ASSETSFIDUCIARY FUNDSJune 30, 2011 (In Thousands)
Investment Trust Funds Agency Funds
ASSETS
Pooled cash and investments $ 3,425,355 355,515
Cash with fiscal agents 1,325
Investments with fiscal agents 353
Receivables:
Accounts receivable 3,144
Investment earnings receivable 5,243 7,354
Total assets 3,430,951 367,338
LIABILITIES
Accounts payable 21,763
Warrants outstanding 191,227
Accrued payroll 33
Due to other governments 154,315
Total liabilities 367,338
NET ASSETS
Held in trust for pool participants 3,430,597
Held in trust for individual investment accounts 354
Total held in trust $ 3,430,951

The notes to the financial statements are an integral part of this statement. 45
Basic Financial Statements
County of San Diego ~ Comprehensive Annual Financial Report for the Year Ended June 30, 2011
Statement of Changes in Fiduciary Net Assets - Fiduciary Funds
STATEMENT OF CHANGES IN FIDUCIARY NET ASSETSFIDUCIARY FUNDSFor the Year Ended June 30, 2011 (In Thousands)
Investment Trust Funds
ADDITIONSContributions:
Contributions to investments $ 6,122,777
Total contributions 6,122,777Investment earnings:
Net increase (decrease) in fair value of investments (5,467)
Investment earnings 24,913
Total investment earnings 19,446
Total additions 6,142,223
DEDUCTIONS
Distributions from investments 5,856,824
Total deductions 5,856,824
Change in net assets 285,399
Net assets at beginning of year 3,145,552
Net assets at end of year $ 3,430,951
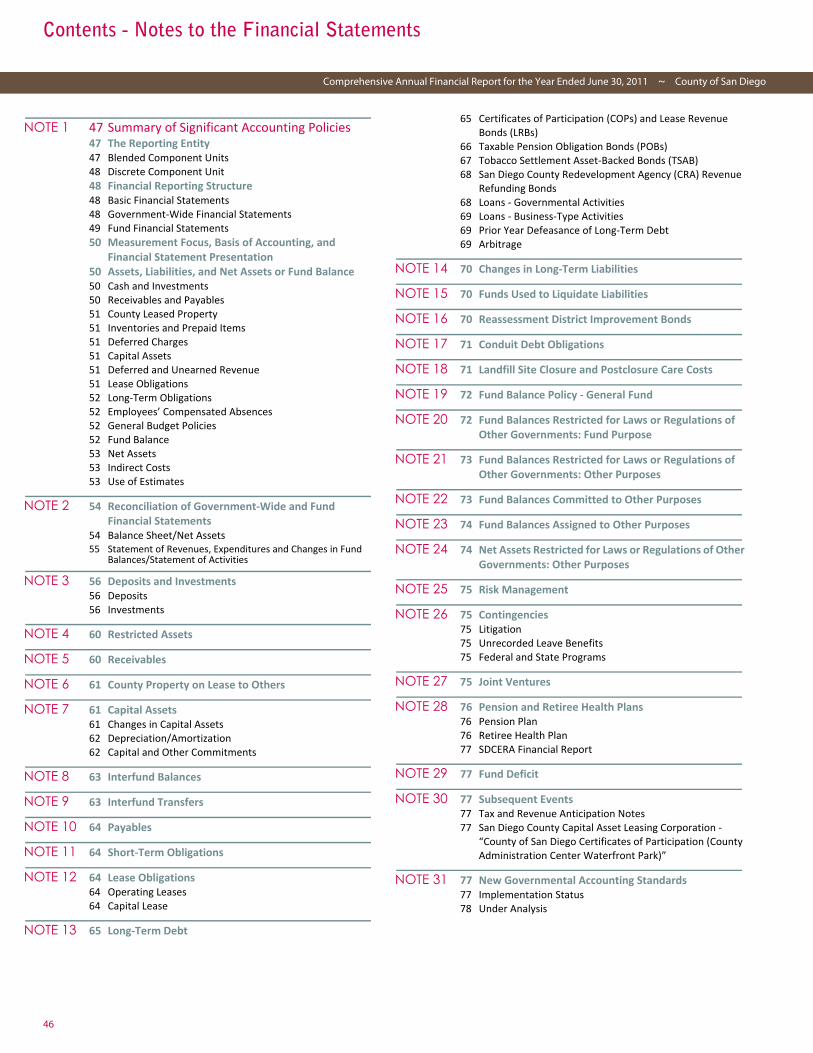
46
Contents - Notes to the Financial Statements
Comprehensive Annual Financial Report for the Year Ended June 30, 2011 ~ County of San Diego
NOTE 1 47 Summary of Significant Accounting Policies47 The Reporting Entity47 Blended Component Units48 Discrete Component Unit48 Financial Reporting Structure48 Basic Financial Statements48 Government-Wide Financial Statements49 Fund Financial Statements50 Measurement Focus, Basis of Accounting, and
Financial Statement Presentation50 Assets, Liabilities, and Net Assets or Fund Balance50 Cash and Investments50 Receivables and Payables51 County Leased Property51 Inventories and Prepaid Items51 Deferred Charges51 Capital Assets51 Deferred and Unearned Revenue51 Lease Obligations52 Long-Term Obligations52 Employees’ Compensated Absences52 General Budget Policies52 Fund Balance53 Net Assets53 Indirect Costs53 Use of Estimates
NOTE 2 54 Reconciliation of Government-Wide and Fund Financial Statements
54 Balance Sheet/Net Assets55 Statement of Revenues, Expenditures and Changes in Fund
Balances/Statement of Activities
NOTE 3 56 Deposits and Investments56 Deposits56 Investments
NOTE 4 60 Restricted Assets
NOTE 5 60 Receivables
NOTE 6 61 County Property on Lease to Others
NOTE 7 61 Capital Assets61 Changes in Capital Assets62 Depreciation/Amortization62 Capital and Other Commitments
NOTE 8 63 Interfund Balances
NOTE 9 63 Interfund Transfers
NOTE 10 64 Payables
NOTE 11 64 Short-Term Obligations
NOTE 12 64 Lease Obligations64 Operating Leases64 Capital Lease
NOTE 13 65 Long-Term Debt
65 Certificates of Participation (COPs) and Lease Revenue Bonds (LRBs)
66 Taxable Pension Obligation Bonds (POBs)67 Tobacco Settlement Asset-Backed Bonds (TSAB)68 San Diego County Redevelopment Agency (CRA) Revenue
Refunding Bonds68 Loans - Governmental Activities69 Loans - Business-Type Activities69 Prior Year Defeasance of Long-Term Debt69 Arbitrage
NOTE 14 70 Changes in Long-Term Liabilities
NOTE 15 70 Funds Used to Liquidate Liabilities
NOTE 16 70 Reassessment District Improvement Bonds
NOTE 17 71 Conduit Debt Obligations
NOTE 18 71 Landfill Site Closure and Postclosure Care Costs
NOTE 19 72 Fund Balance Policy - General Fund
NOTE 20 72 Fund Balances Restricted for Laws or Regulations of Other Governments: Fund Purpose
NOTE 21 73 Fund Balances Restricted for Laws or Regulations of Other Governments: Other Purposes
NOTE 22 73 Fund Balances Committed to Other Purposes
NOTE 23 74 Fund Balances Assigned to Other Purposes
NOTE 24 74 Net Assets Restricted for Laws or Regulations of Other Governments: Other Purposes
NOTE 25 75 Risk Management
NOTE 26 75 Contingencies75 Litigation75 Unrecorded Leave Benefits75 Federal and State Programs
NOTE 27 75 Joint Ventures
NOTE 28 76 Pension and Retiree Health Plans76 Pension Plan76 Retiree Health Plan77 SDCERA Financial Report
NOTE 29 77 Fund Deficit
NOTE 30 77 Subsequent Events77 Tax and Revenue Anticipation Notes77 San Diego County Capital Asset Leasing Corporation -
“County of San Diego Certificates of Participation (County Administration Center Waterfront Park)”
NOTE 31 77 New Governmental Accounting Standards77 Implementation Status78 Under Analysis

47
County of San Diego ~ Comprehensive Annual Financial Report for the Year Ended June 30, 2011
Notes to the Financial Statements(Amounts Expressed in Thousands Unless Otherwise Noted)
NOTE 1Summary of Significant Accounting Policies The Reporting EntityThe County of San Diego (the “County” or “CoSD”), is a politicalsubdivision of the State of California (the “State”) and as such canexercise the powers specified by the Constitution and laws of theState of California. The County operates under a charter and isgoverned by an elected five-member Board of Supervisors (the“Board”).
The County provides a full range of general government servicesincluding police protection, detention and correction, publicassistance, health and sanitation, recreation, library, floodcontrol, public ways and facilities, inactive waste management,airport management and general financial and administrativesupport.
The County reporting entity includes all significant organizations,departments, and agencies over which the County is consideredto be financially accountable. The component units discussedbelow are included in the County’s reporting entity because ofthe significance of their operational and financial relationshipswith the County. As required by generally accepted accountingprinciples in the United States of America (GAAP), the financialstatements present the financial position of the County and itscomponent units (entities for which the County is considered tobe financially responsible).
Blended component units, although legally separate entities are,in substance, part of the County's operations and data fromthese component units are combined with the data from theprimary government.
A discretely presented component unit is reported in a separatecolumn in the government-wide financial statements toemphasize that it is legally separate from the County.
Blended Component UnitsThe blended component units listed below are agencies andspecial districts whose governing board is the County Board ofSupervisors. These component units are fiscally dependent onthe County and as such financial actions including the setting ofrates, issuance of debt and the adoption of the annual budgetremain with the County.
Air Pollution Control District (APCD) - The APCD was establishedto protect the people and the environment from the harmfuleffects of air pollution. Air quality is continuously monitoredthroughout the San Diego Air Basin, and programs are developedto bring about the emission reductions necessary to achieveclean air. The APCD issues permits to limit air pollution, ensuresthat air pollution control laws are followed, and administersfunding that is used to reduce regional mobile source emissions.APCD is reported as a special revenue fund.
County of San Diego In-Home Supportive Services Public Authority(IHSSPA) - The IHSSPA was established to assist eligible low-income elderly and persons with disabilities in San Diego County
to live high quality lives in their own homes. The IHSSPA programis mandated by the State. As the employer of record, IHSSPArecruits, screens, and trains home care workers who are availableto assist eligible consumers in their own homes. IHSSPA isreported as a special revenue fund. County Service Area Districts (CSAD) - The CSADs wereestablished to provide authorized services such as road, park, fireprotection and ambulance to specific areas in the County. Theyare financed by ad valorem property taxes in the area benefitedor by special assessments levied on specific properties. TheCSADs are reported as special revenue funds.
Flood Control District (FCD) - The FCD was established to provideflood control in the County’s unincorporated area. It is financedprimarily by ad valorem property taxes and charges to propertyowners. The FCD is reported as a special revenue fund.
Lighting Maintenance District (LMD) - The LMD was establishedto provide street and road lighting services to specified areas ofthe County. Revenue sources include ad valorem taxes, benefitfees, state funding and charges to property owners. The LMD isreported as a special revenue fund.
San Diego County Housing Authority (SDCHA) - The SDCHA wasestablished to provide decent housing in a suitable environmentfor individuals who cannot afford standard private housing.Contracts with the U.S. Department of Housing and UrbanDevelopment provide the major funding sources. SDCHA isreported as a special revenue fund.
San Diego County Redevelopment Agency (SDCRA) - SDCRA wasestablished to provide a method of eliminating slums andblighted areas, improving housing, expanding employmentopportunities, and providing an environment for the social,economic and psychological growth, and well-being of all citizensof the County. SDCRA financial activities are reported in a specialrevenue fund and a debt service fund.
Sanitation Districts (SD) - The SDs were established to construct,operate and maintain reliable and sustainable sanitary sewersystems. Revenue sources include charges to property ownersand grants. The SDs are reported as enterprise funds.
Blended component units governed by boards other than theCoSD Board of Supervisors are listed below. These componentunits are, in substance, part of the County’s operations due totheir relationship with the County and the nature of theiroperations. Specifically, the CoSD Board appoints either all or amajority of their board members and the services they providesolely benefit the County.
San Diego County Capital Asset Leasing Corporation (SANCAL) -SANCAL was established to finance the acquisition of Countybuildings and equipment. It is a nonprofit corporation governedby a five-member Board of Directors, which is appointed by theCoSD Board. SANCAL financial activities are reported in a debtservice fund.
San Diego County Tobacco Asset Securitization Corporation(SDCTASC)) - The SDCTASC was created under the CaliforniaNonprofit Public Benefit Corporation Law and was established to

48
Notes to the Financial Statements(Amounts Expressed in Thousands Unless Otherwise Noted)
Comprehensive Annual Financial Report for the Year Ended June 30, 2011 ~ County of San Diego
purchase tobacco settlement payments allocated to the Countyfrom the State of California, pursuant to a Tobacco MasterSettlement Agreement.
SDCTASC is governed by a Board of Directors consisting of threemembers, two of which are employees of the County and oneindependent director who is not an employee of the County. TheSDCTASC is reported as a special revenue fund.
San Diego Regional Building Authority (SDRBA) - The SDRBA wasestablished under the Mark-Roos Local Bond Pooling Act of 1985and authorized to issue bonds for the purpose of acquiring andconstructing public capital improvements and to lease them to itsmembers, the County and the San Diego Metropolitan TransitDevelopment Board (MTDB). The services provided by the SDRBAto the MTDB are insignificant.
The SDRBA is governed by a Commission consisting of threemembers, two of which are County Supervisors appointed by theCounty Board of Supervisors and concurrently serve on the Boardof Directors of the San Diego Trolley, Inc and the Board ofDirectors of MTDB. The third Commissioner is a member ofMTDB and is appointed by the MTDB Board. The SDRBA’sfinancial activities are reported in a debt service fund and acapital projects fund.
The Tobacco Securitization Joint Powers Authority of SouthernCalifornia (TSJPA) - The TSJPA was created by a joint exercise ofpowers agreement between the County and the County ofSacramento pursuant to Government Code Sections 6500 et seq.The TSJPA's purpose is to finance a loan to the San Diego CountyTobacco Asset Securitization Corporation (the Corporation) viathe sale of tobacco asset-backed bonds. The Corporation in turnuses the loan proceeds to purchase the County’s future tobaccosettlement revenues under a purchase and sale agreement. TheTSJPA is administered by a Board of Directors consisting of threemembers, two members who are appointed by the CoSD Boardand the third member is appointed by the Sacramento CountyBoard of Supervisors. The TSJPA is reported as a special revenuefund.
Separately issued financial reports of the County's blendedcomponent units can be obtained from the County Auditor andController's Office located at 1600 Pacific Highway, Room 166,San Diego, California 92101.
Discrete Component UnitThe First 5 Commission of San Diego (Commission) wasestablished by the Board as a separate legal entity under theauthority of the California Children and Families First Act andSections 130100 et seq. of the Health and Safety Code. Itadministers the County's share of tobacco taxes levied by theState for the purpose of implementing early childhooddevelopment programs. The County appoints all of theCommission's board and can remove appointed members at will.
The Commission is discretely presented because its Board is notsubstantively the same as the County's and it does not provideservices entirely or almost entirely to the County. A separatelyissued financial report can be obtained by writing to The First 5Commission, 1495 Pacific Highway, Suite 201, (MS-A211), San
Diego, CA, 92101-6466.
Financial Reporting StructureBasic Financial StatementsThe basic financial statements include both government-widefinancial statements and fund financial statements. The reportingmodel, based on GASB Statement No. 34, “Basic FinancialStatements - and Management’s Discussion and Analysis - forState and Local Governments,” focuses on the County as a wholein the government-wide financial statements and majorindividual funds in the fund financial statements.
Government-Wide Financial StatementsThe government-wide financial statements (statement of netassets and statement of activities) display information about theCounty as a whole and the change in aggregate financial positionresulting from the activities of the fiscal period, except for itsfiduciary activities. These statements include separate columnsfor the governmental and business-type activities of the County(including its blended component units) as well as its discretelypresented component unit. In the statement of net assets, boththe governmental and business-type activities columns arepresented on a consolidated basis by column and are reflectedon a full accrual, economic resource basis, which incorporatescapital assets as well as long-term debt and obligations.
As a general rule, the effect of interfund activity has beeneliminated from the government-wide financial statements.However, interfund services provided and used are noteliminated in the process of consolidation. All internal balances inthe statement of net assets have been eliminated, with theexception of those representing balances between thegovernmental activities and the business-type activities, whichare presented as internal balances and eliminated in the primarygovernment total column. The statement of activities presentsfunction revenue and expenses of governmental activities andbusiness-type activities. Governmental activities, which normallyare supported by taxes and intergovernmental revenues, arereported separately from business-type activities, which rely to asignificant extent on fees and charges for support. In thestatement of activities, internal service funds' revenue andexpenses related to interfund services have been eliminated.Revenue and expenses related to services provided to externalcustomers have not been eliminated and are presented withingovernmental activities.
The government-wide financial statements distinguish functionsof the County that are principally supported by taxes andintergovernmental revenues (governmental activities) fromother functions that are intended to recover all or a significantportion of their costs through user fees and charges (business-type activities). The governmental activities of the County includegeneral government, public protection, public ways and facilities,health and sanitation, public assistance, education, andrecreation and cultural activities. The business type activities ofthe County include airport, sanitation, and wastewatermanagement.
49
Notes to the Financial Statements(Amounts Expressed in Thousands Unless Otherwise Noted)
County of San Diego ~ Comprehensive Annual Financial Report for the Year Ended June 30, 2011
The statement of activities demonstrates the degree to which thedirect expenses of a given function are offset by programrevenues. Direct expenses are those that are clearly identifiablewith a specific function. Program revenues include (1) charges tocustomers or applicants who purchase, use, or directly benefitfrom goods, services, or privileges provided by a given functionand (2) grants and contributions that are restricted to meetingthe operational or capital requirements of a particular function.Taxes and other items not properly included among programrevenues are reported instead as general revenues.
Fund Financial StatementsThe fund financial statements are presented after thegovernment-wide financial statements. They display informationabout major funds individually and in the aggregate forgovernmental and proprietary funds. In governmental andfiduciary funds, assets and liabilities are presented in order ofrelative liquidity. In proprietary funds, assets and liabilities arepresented in a classified format that distinguishes between allcurrent and noncurrent assets and liabilities. Current assets inthe classified format are those considered available to generateor use cash within twelve months of the end of the fiscal period.Examples include cash, various receivables and short-terminvestments. All other assets are considered noncurrent. Currentliabilities are obligations to be paid within the next fiscal year.Examples include payables and the current portion of long-termliabilities.
Major individual governmental funds are reported as separatecolumns in the fund financial statements and are presented on acurrent financial resources and modified accrual basis ofaccounting. Separate fund financial statements are provided forgovernmental funds, proprietary funds and fiduciary funds, eventhough the latter are excluded from the government-widefinancial statements.
The County reports the following major governmental funds:
The General Fund is the County's primary operating fund. Itaccounts for and reports all financial resources of the County notaccounted for and reported in another fund. Revenues areprimarily derived from taxes; licenses, permits and franchises;fines, forfeitures and penalties; use of money and property;intergovernmental revenues; charges for services; and otherrevenues. Expenditures are expended for functions of generalgovernment, public protection, public ways and facilities, healthand sanitation, public assistance, education, and recreation andcultural activities. Expenditures also include capital outlay anddebt service.
The Public Safety Special Revenue Fund accounts for Proposition172 half-cent sales taxes collected and apportioned to theCounty by the State Board of Equalization and are restricted forfunding public safety activities. Per Government Code Section30052, a “maintenance of effort” (pre-Proposition 172 publicsafety funding level) must be maintained by the County tocomply with the statute’s spending requirements. In accordancewith the Code, these funds are allocated to the Sheriff, DistrictAttorney and Probation departments. Transfers out of this fund
subsidize the following types of public safety activities: juveniledetention services; facilities maintenance and support; capitalprojects, equipment and other one-time expenditures; on-goingtechnology initiatives; and various region-wide services.
The Tobacco Endowment Special Revenue Fund accounts fortobacco settlement payments allocated to the County from theState of California, pursuant to the Master SettlementAgreement concluded on November 23, 1998 between the majortobacco companies and 46 states (including California), theDistrict of Columbia and four U.S. Territories. According to Boardof Supervisors Policy E-14, tobacco settlement monies are to beused for healthcare-based programs.
The County reports the following additional funds and fundtypes:
Enterprise Funds account for airport, sanitation district andwastewater management activities, including operations andmaintenance, sewage collection and treatment services.
Internal Service Funds account for the financing of public worksand communications equipment; the financing of materials andsupplies (purchasing); start up services for new and existingCounty service districts; the County's public liability andemployee benefits activities; the financing of fleet services;facilities management activities; the financing of informationtechnology services; and the financing of clothing and personalsundry items for persons institutionalized at various countyfacilities. Goods or services provided by servicing Countydepartments are paid for on a cost reimbursement basis byreceiving departments.
The following fiduciary funds account for resources that are heldby the County as a trustee or agent for outside parties andcannot be used to support the County's programs.
Agency Funds are custodial in nature, do not involvemeasurement of results of operations and account for assetsheld by the County as an agent for various local governments,organizations and individuals. Included are funds for childsupport payments; payroll taxes; public administrator and publicguardian accounts; and apportioned taxes for other localgovernments.
Investment Trust Funds account for two types of investmentactivities on behalf of external entities and include: the portion ofthe County Treasurer's investment pool applicable to externalentities (Pool Investments- Investment Trust Fund); and the totalamount of individual investment accounts held on behalf ofexternal entities by the Treasurer (Specific Investments -Investment Trust Fund). In general, external entities includeschool districts, independent special districts and various othergovernments. The Specific Investments - Investment Trust Fundaccounts for individual external entities investments which areoffered as an alternative to a pooled position.
50
Notes to the Financial Statements(Amounts Expressed in Thousands Unless Otherwise Noted)
Comprehensive Annual Financial Report for the Year Ended June 30, 2011 ~ County of San Diego
Measurement Focus, Basis of Accounting, and Financial Statement PresentationThe government-wide financial statements are reported usingthe economic resources measurement focus and the accrualbasis of accounting, as are the proprietary fund and fiduciaryfund financial statements. Revenues are recorded when earnedand expenses are recorded when a liability is incurred, regardlessof the timing of related cash flows. Property taxes are recognizedas revenues in the fiscal year for which they are levied. Grantsand similar items are recognized as revenue as soon as alleligibility requirements imposed by the provider have been met.
Governmental Funds are reported using the current financialresources measurement focus and the modified accrual basis ofaccounting. Under this method, revenues are susceptible toaccrual when measurable and available. Sales taxes, investmentearnings, state and federal grants, and charges for services areaccrued when their receipt occurs within 180 days following theend of the fiscal year. Property taxes are accrued if they arecollectible within 60 days after the end of the accounting period.Expenditures are generally recorded when a liability is incurred,as under accrual accounting. However, debt serviceexpenditures, as well as expenditures related to compensatedabsences, claims, and judgments, are recorded only whenpayment is due. General capital assets acquisitions and generalprincipal payments are reported as expenditures ingovernmental funds. Proceeds of general long-term debt andcapital leases are reported as other financing sources.
Proprietary Funds distinguish operating revenues and expensesfrom nonoperating items. Operating revenues and expensesgenerally result from providing services and producing anddelivering goods in connection with a proprietary fund's principalongoing operations. The principal operating revenues of theCounty's enterprise funds and internal service funds are chargesto customers for services. Operating expenses for enterprisefunds and internal service funds include the cost of services,administrative expenses, and depreciation on capital assets. Allrevenues and expenses not meeting this definition are reportedas nonoperating revenues and expenses.
For government-wide (governmental and business-typeactivities) and proprietary fund activities, the County applies allapplicable Governmental Accounting Standards Board (GASB)pronouncements as well as any applicable pronouncements ofthe Financial Accounting Standards Board (FASB), the AccountingPrinciples Board, or any Accounting Research Bulletins issued onor before November 30, 1989 unless those pronouncementsconflict with or contradict GASB pronouncements. The Countyhas elected not to apply the FASB standards issued subsequent toNovember 30, 1989 for business-type activities and proprietaryfunds. The GASB periodically updates its codification of theexisting Governmental Accounting and Financial ReportingStandards, which, along with subsequent GASB pronouncements(Statements and Interpretations), constitutes GAAP forgovernmental users.
When both restricted and unrestricted resources are available foruse, it is the County's policy to use restricted resources first, thenunrestricted resources as they are needed.
Assets, Liabilities, and Net Assets or Fund BalanceCash and InvestmentsThe County's cash and cash equivalents for cash flow reportingpurposes are considered to be cash on hand, demand deposits,restricted cash, and investments held in the County's Pool.
The Pool is available for use by all funds. Each fund type’s portionof the Pool is displayed on the statements of net assets/balancesheets as “pooled cash and investments.” The share of eachfund’s pooled cash and investments account is separatelyaccounted for and interest earned, net of related expenses, isapportioned quarterly based on the fund’s average daily balancein proportion to the total pooled cash and investments based onamortized cost. In accordance with Government Code Section53647, apportionments applicable to certain agency funds accrueto the benefit of the General Fund.
Investments are stated at fair value. The fair value of investmentsis determined monthly and is based on quoted market prices.
Receivables and PayablesThe major receivables for governmental and business-typeactivities are taxes, due from other governmental agencies andloans. All property taxes and accounts receivable are shown netof an allowance for uncollectibles ($10.597 million and $1.369million, respectively). Activities between funds that representlending/borrowing arrangements outstanding at the end of thefiscal year are interfund loans. All other outstanding balancesbetween funds are reported as “due to/from other funds.” Anyresidual balances outstanding between the governmentalactivities and business-type activities are reported in thegovernment-wide financial statements as “internal balances.”
Noncurrent interfund receivables between funds are reported asa nonspendable fund balance account in applicablegovernmental funds to indicate they are not available forappropriation and are not expendable financial resources.
Secured property taxes are levied based upon the assessedvaluation as of the previous January 1st, (lien date) and the taxlevy is recorded on July 1st (levy date). They are payable in twoequal installments due on November 1st and February 1st andare considered delinquent with ten percent penalties afterDecember 10th and April 10th, respectively. An additionalpenalty of one and one-half percent per month begins to accrueon July 1st and November 1st on delinquent secured propertytaxes. Unsecured property taxes are due as of the January 1stlien date and become delinquent, with 10 percent penalties,after August 31st. An additional penalty of one and one-halfpercent per month begins to accrue on October 31st ondelinquent unsecured property taxes.
Governmental funds’ property tax revenues are recognized in thefiscal year for which they are levied, provided they are due withinthe fiscal year and collected within 60 days after the fiscal year

51
Notes to the Financial Statements(Amounts Expressed in Thousands Unless Otherwise Noted)
County of San Diego ~ Comprehensive Annual Financial Report for the Year Ended June 30, 2011
end. Property tax revenues are also recognized for unsecuredand supplemental property taxes that are due at year end, andare collected within 60 days after the fiscal year end, but will notbe apportioned until the next fiscal year due to the timing of thetax apportionment schedule.
County Leased PropertyThe County and its blended component units lease real propertyto the private sector and other governmental agencies. Directfinancing lease receivables are shown as restricted assets on thegovernment-wide statement of net assets - governmentalactivities and governmental funds balance sheets. Revenue fromdirect financing and non-cancelable operating leases is reportedin the applicable government-wide statement of activities -governmental activities, governmental funds statements ofrevenues, expenditures, and changes in fund balances andproprietary funds, statements of revenues, expenses, andchanges in fund net assets, as applicable.
Inventories and Prepaid ItemsInventories include both inventories on hand for sale andconsumable inventories. Inventories are valued at average cost.They are accounted for as expenditures at the time of purchaseand reported in governmental funds as an asset with anoffsetting nonspendable amount. Proprietary fund types arecarried at average cost and are expended when consumed.Prepaid items reflect payments for costs applicable to futureaccounting periods and are recorded as prepaid items in both thegovernment-wide and fund financial statements, withexpenditures recorded when consumed. Inventories and prepaiditems recorded in the governmental funds do not reflect currentappropriable resources and thus, an equivalent portion of fundbalance is reported as nonspendable.
Deferred ChargesBond issuance costs are deferred and amortized over the life ofthe bonds using the straight-line method. In the government-wide financial statements, deferred charges are reported asassets in the governmental activities.
Capital Assets Capital assets are of a long-term character and include: land,buildings and improvements, construction in progress,equipment, infrastructure, software and easements.
Infrastructure assets include roads, bridges and sewers.
Capital assets are recorded at historical cost if purchased orconstructed. Donated capital assets are recorded at estimatedfair value at the date of donation. Capital assets with original unitcosts equal to or greater than the capitalization thresholdsshown in Table 1 are reported in the applicable governmentalactivities or business-type activities columns in the government-wide financial statements.
Depreciation and amortization are charged over the capitalassets’ estimated useful lives using the straight-line method forproprietary and governmental fund types. Governmental fundtype depreciation and amortization are only shown in thestatement of activities. Proprietary fund type depreciation andamortization are shown both in the fund statements and thestatement of activities. Estimated useful lives are shown in Table2.
Deferred and Unearned RevenueUnder both the accrual and the modified accrual basis ofaccounting, revenue may be recognized only when it is earned. Ifassets are recognized in connection with a transaction before theearnings process is complete, those assets must be offset by acorresponding liability for unearned revenue. Unearned revenuecan be found in government-wide financial reporting as well as ingovernmental fund, proprietary fund, and fiduciary fund financialstatements.
Under the modified accrual basis of accounting, it is not enoughthat revenue has been earned if it is to be recognized as revenueof the current period. Revenue must also be susceptible toaccrual, it must be both measurable and available to financeexpenditures of the current fiscal period. If assets are recognizedin connection with a transaction, but those assets are not yetavailable to finance expenditures of the current fiscal period,then the assets must be offset by a corresponding liability fordeferred revenue. This type of deferred revenue is unique togovernmental funds, since it is tied to the modified accrual basisof accounting, which is used only in connection withgovernmental funds.
Lease ObligationsThe County leases various assets under both operating andcapital lease agreements. In the government-wide andproprietary funds financial statements, capital lease obligationsare reported as liabilities in the applicable governmentalactivities, business-type activities or proprietary funds statementof net assets.
Table 1
Capitalization ThresholdsLand $ 0
Buildings and improvements 50
Infrastructure 25-50
Equipment 5
Software 50-100
Easements 50
Table 2
Estimated Useful LivesBuildings and improvements 10-50 years
Infrastructure 10-50 years
Equipment 5-20 years
Software 3-10 years

52
Notes to the Financial Statements(Amounts Expressed in Thousands Unless Otherwise Noted)
Comprehensive Annual Financial Report for the Year Ended June 30, 2011 ~ County of San Diego
Long-Term ObligationsLong-term liabilities reported in the statement of net assetsinclude the amount due in one year (current) and the amountdue in more than one year (noncurrent).
General long-term liabilities consist of the noncurrent portion ofclaims and judgments, compensated absences, landfill closureand post closure and other noncurrent liabilities. General long-term liabilities are not reported as liabilities in governmentalfunds but are reported in the governmental activities column inthe government-wide statement of net assets. General long-termdebt is not limited to liabilities arising from debt issuances butmay also include noncurrent liabilities on other commitmentsthat are not current liabilities properly recorded in governmentalfunds.
Debt may be issued at par (face) value, with a premium(applicable to debt issued in excess of face value) or at a discount(applicable to debt issued at amounts less than the face value).Occasionally, the County also refunds some of its existing debt.When this occurs, the difference between the funds required toretire (reacquisition price of) the refunded debt and the netcarrying amount of refunded debt results in a deferred amounton refunding.
In the government-wide financial statements and proprietaryfund financial statements, bond premiums and discounts, as wellas issuance costs, are deferred and amortized over the life of thebonds using the straight-line method. Bonds payable arereported net of the applicable bond premium or discount.Deferred issuance costs are reported as deferred charges andamortized over the term of the debt.
In the governmental fund financial statements, bond premiumsand discounts, as well as bond issuance costs, are recognizedduring the current period. The face amount of the debt issuedand premiums are reported as other financing sources whilediscounts on debt issuances are reported as other financing uses.Issuance costs, whether or not withheld from the actual debtproceeds received, are reported as debt service expenditures.
Capital Appreciation Bonds (CABs) issued by the Countyrepresent bonds that are issued at a deep discount, pay nocurrent interest but accrete or compound in value from the dateof issuance to the date of maturity. CABs are presented at theirmaturity value less the unaccreted appreciation. Unaccretedappreciation represents the difference between the maturityvalue of the debt and their par (face) value. The unaccretedappreciation is accreted as interest over the life of the CABs.
Employees’ Compensated AbsencesThe County's policy is to permit employees to accumulate earnedbut unused vacation, compensatory time, holiday and sick leavebenefits. Each of these benefits is subject to certain limits basedon employee class, except for sick leave and compensatory timethat is subject to Fair Labor Standands Act (FLSA) rules or theCalifornia Labor Code. All vacation pay and a certain portion ofcompensatory and sick pay for specified employee classes isaccrued in the government-wide and proprietary funds financialstatements. Except for specified employee classes, there is no
liability for unpaid accumulated sick leave since the County doesnot cash out unused sick leave when employees separate fromservice with the County. However, employees eligible forretirement benefits that meet minimum balance requirementsmay apply unused sick leave toward determining their length ofservice for the purpose of calculating retirement benefits.
Accumulated leave benefits including vacation, sick leave, andcompensatory time worked are recorded in the government-wide statement of net assets. Amounts recorded as accumulatedleave benefits include the employer’s share of Social Security andMedicare taxes. These amounts would not be expected to beliquidated from expendable available financial resources, butwould be expected to be liquidated in future years as employeeselect to use these benefits as prescribed by Civil Service rules andregulations.
County employees in the unclassified service and certainemployees hired prior to 1979 may receive up to 50% and 25%,respectively, of the cash value of all or a portion of their sickleave balances upon termination or retirement. The cash value ofthese benefits is included in the accumulated leave benefitsnoted above. This liability has been recorded in the current andlong-term portion of compensated absences in the appropriateproprietary funds and government-wide statement of net assets.
California Labor Code Section 4850 entitles safety officers whomeet certain criteria to receive full salary in lieu of temporarydisability payments for the period of disability, not exceeding 365days, or until such earlier date as he or she is retired onpermanent disability pension. This liability is accrued in thecurrent and long-term portion of compensated absences.
All County employees who have completed at least five years ofcontinuous service in the County retirement system, and have asick leave balance of at least one hundred hours, may convert, atretirement, all or a portion of their sick leave balance toretirement service credits on a hour-for-hour basis. Theconversion of these balances to retirement service credits isincluded in the County's actuarial accrued liability, as part of theannual actuarial valuation which includes assumptions regardingemployee terminations, retirement, death, etc.
General Budget PoliciesAn operating budget is adopted each fiscal year by the Board ofSupervisors for the governmental funds. The annual resolutionadopts the budget at the object level of expenditures withindepartments. Annual budgets are not required to be adopted forthe Tobacco Securitization Joint Special Revenue Fund; and theDebt Service and Capital Projects Funds (other governmentalfunds). Please refer to the notes to required supplementaryinformation for more details regarding the County's generalbudget policies.
Fund BalanceIn the fund financial statements, governmental funds report fundbalance in classifications that comprise a hierarchy basedprimarily on the extent to which the County is bound to honorconstraints on the specific purposes for which amounts in thosefunds can be spent. These classifications include: nonspendable;

53
Notes to the Financial Statements(Amounts Expressed in Thousands Unless Otherwise Noted)
County of San Diego ~ Comprehensive Annual Financial Report for the Year Ended June 30, 2011
restricted; and the unrestricted classifications of committed,assigned and unassigned. When both restricted and unrestrictedresources are available for use, fund balance is generallydepleted by restricted resources first, followed by unrestrictedresources in the following order: committed, assigned andunassigned. The fund balance classifications are defined asfollows:
Nonspendable fund balance - amounts that cannot be spentbecause they are either (a) not in spendable form or (b) legally orcontractually required to be maintained intact. The “not inspendable form” criterion includes items that are not expectedto be converted to cash, for example, inventories and prepaidamounts.
Restricted fund balance - amounts with constraints placed ontheir use that are either (a) externally imposed by creditors (suchas through debt covenants), grantors, contributors, or laws orregulations of other governments; or (b) imposed by law throughconstitutional provisions or enabling legislation.
Committed fund balance - amounts that can only be used forspecific purposes pursuant to constraints imposed by formalaction of the government's highest level of decision-makingauthority (the Board of Supervisors). Those committed amountscannot be used for any other purpose unless the County removesor changes the specified use by taking the same type of action itemployed to previously commit those amounts. The Board ofSupervisors establishes, modifies or rescinds fund balancecommitments by passage of an ordinance, resolution, or bytaking actions via minute orders. This is accomplished throughadoption of the County's operational plan and subsequentbudget amendments that occur throughout the year asnecessary.
Assigned fund balance - amounts that are constrained by theCounty's intent to be used for specific purposes, but are neitherrestricted nor committed. Intent should be expressed by thehighest level of decision making authority (the Board ofSupervisors), or by a body or official to which the governing bodyhas delegated the authority to assign amounts to be used forspecific purposes. In the County, the intent is generally expressedby the Board of Supervisors.
Unassigned fund balance - the residual classification for theGeneral Fund. This classification represents fund balance that hasnot been assigned to other funds and that has not beenrestricted, committed, or assigned to specific purposes within theGeneral Fund. The General Fund should be the only fund thatreports a positive unassigned fund balance amount. In othergovernmental funds, if expenditures incurred for specificpurposes exceeded the amounts restricted, committed, orassigned to those purposes, it may be necessary to report anegative unassigned fund balance
Net AssetsInvested in capital assets, net of related debt consists of capitalassets net of accumulated depreciation reduced by theoutstanding principal of capital related debt (adjusted by anyunamortized premiums, discounts, deferred amounts on
refundings, and unspent proceeds related to debt), incurred bythe County to buy or construct capital assets shown in thestatement of net assets. Capital assets cannot readily be sold andconverted to cash.
The County reports net assets as restricted when constraintsplaced on net assets are externally imposed by creditors,grantors, contributors or laws or regulations of othergovernments or imposed by law through constitutionalprovisions or enabling legislation. Enabling legislation authorizesthe government to assess, levy, charge or otherwise mandatepayment of resources (from external resource providers) andincludes a legally enforceable requirement that those resourcesbe used only for the specific purposes stipulated in thelegislation.
Unrestricted net assets consist of net assets that do not meet thedefinition of invested in capital assets, net of related debt orrestricted net assets.
Indirect CostsCounty indirect costs are allocated to benefiting departmentsand are included in the program expense reported for individualfunctions and activities. Cost allocations are based on the annualCounty-wide Cost Allocation Plan which is prepared inaccordance with Federal Office of Management and BudgetCircular A-87.
Use of EstimatesThe preparation of the basic financial statements in conformitywith generally accepted accounting principles requiresmanagement to make estimates and assumptions that affect theamounts reported in the basic financial statements andaccompanying notes. Actual results could differ from thoseestimates. Significant estimates made in preparing the financialstatements are described in the applicable notes.

54
Notes to the Financial Statements(Amounts Expressed in Thousands Unless Otherwise Noted)
Comprehensive Annual Financial Report for the Year Ended June 30, 2011 ~ County of San Diego
NOTE 2Reconciliation of Government-Wide and Fund Financial StatementsBalance Sheet/Net AssetsExplanations of certain differences between the governmental funds balance sheet and the government-wide statement of net assetsare detailed below:
Table 3
Governmental Funds Balance Sheet / Government-Wide Statement of Net Assets ReconciliationAt June 30, 2011Long-term liabilities, including bonds payable, are not due and payable in the current period and therefore are not reported in the funds. The details of this $(1,931,002) difference are as follows:
Bonds, notes and loans payable
Certificates of participation and lease revenue bonds $ (392,100)
Taxable pension obligation bonds (841,337)
Tobacco settlement asset-backed bonds (575,482)
San Diego County Redevelopment Agency revenue refunding bonds (14,280)
Loans - non-internal service funds (2,541)
Subtotal (1,825,740)
Unamortized issuance premiums (14,793)
Unamortized issuance discounts (to be amortized as interest expense) 15,055
Unamortized deferred amounts on refundings:
Beginning balance - Unamortized deferred amounts on refundings 16,502
Remaining unamortized cost of issuance on refunded debt 371
Remaining unamortized premium on refunded debt (778)Deferred amount on refunding attributable to reacquisition price of new debt in excess of outstanding debt refunded 96
Amortization of deferred amount on refunding (as shown on Table 4) (5,364)
Ending balance - Unamortized deferred amounts on refundings (to be amortized as interest expense) 10,827
Arbitrage (220)
Compensated absences (excluding Internal Service Funds) (95,706)
Landfill closure and postclosure - San Marcos landfill (20,425)
Net adjustment to reduce fund balance - total governmental funds to arrive at net assets - governmental activities $ (1,931,002)
Internal Service Funds. The assets and liabilities of internal service funds are included in governmental activities in the statement of net assets. The details of this $102,329 difference are as follows:
Net assets of the internal service funds $ 102,727
Less: Internal payable representing charges in excess of cost to business-type activities - prior years (491)
Add: Internal payable representing charges in excess of cost to business-type activities - current year 93Net adjustment to increase fund balance - total governmental funds to arrive at net assets - governmental activities $ 102,329

55
Notes to the Financial Statements(Amounts Expressed in Thousands Unless Otherwise Noted)
County of San Diego ~ Comprehensive Annual Financial Report for the Year Ended June 30, 2011
Statement of Revenues, Expenditures and Changes in Fund Balances/Statement of ActivitiesExplanations of certain differences between the governmental fund statement of revenues, expenditures, and changes in fund bal-ances and the government-wide statement of activities are detailed below:
Table 4
Governmental Funds Statement of Revenues, Expenditures, and Changes in Fund Balancesand the Government-Wide Statement of Activities Reconciliation
For the Year Ended June 30, 2011Governmental funds report capital outlays as expenditures. However, in the statement of activities the cost of those assets is allocated over their estimated useful lives and reported as depreciation expense. The details of this $83,607 difference are as follows:
Capital outlay $ 186,342
Depreciation/amortization expense (102,735)Net adjustment to increase net changes in fund balances - total governmental funds to arrive at changes in net assets - governmental activities $ 83,607
The net effect of various miscellaneous transactions involving capital assets (i.e., sales, trade-ins, and donations) is to increase net assets. The details of this $11,616 difference are as follows:
The proceeds from the sale of capital assets provide current financial resources but have no effect on net assets $ (2,673)
The gain on the disposal of capital assets does not affect current financial resources but increases net assets 2,699
Donations of assets to the County do not provide current financial resources but resources increase net assets 11,590Net adjustment to increase net changes in fund balances - total governmental funds to arrive at changes in net assets - governmental activities $ 11,616
The issuance of long-term debt (e.g. bonds, notes, and loans) provides current financial resources to governmental funds, while the repayment of the principal of long-term debt consumes the current financial resources of governmental funds. Neither transaction, however, has any effect on net assets. Also, governmental funds report the effect of issuance costs, premiums, discounts, and similar items when debt is first issued, whereas these amounts are deferred and amortized in the statement of activities. The details of this $69,678 difference are as follows:
Debt issued or incurred:
Refunding bonds issued $ (19,260)
Plus: Premiums (1,237)
Less: Issuance costs 349
Payment to refunded bond escrow agent 22,211
Principal repayments 64,016
Accreted interest paid 3,364
Arbitrage 235Net adjustment to increase net changes in fund balances - total governmental funds to arrive at changes in net assets - governmental activities $ 69,678
Some expenses reported in the statement of activities do not require the use of current financial resources and therefore are not reported as expenditures in governmental funds. The details of this $(11,507) difference are as follows:
Compensated absences $ 2,060
Accrued interest 817
Accretion of capital appreciation bonds (7,911)
Amortization of premiums 1,165
Amortization of discounts (1,071)
Amortization of deferred amounts on refundings (5,364)
Amortization of issuance costs (1,203)Net adjustment to decrease net changes in fund balances - total governmental funds to arrive at changes in net assets - governmental activities $ (11,507)
Internal Service Funds. The net revenue of certain activities of internal service funds is reported with governmental activities. The details of this $(10,036) difference are as follows:
Change in net assets of the internal service funds $ (10,129)
Add: Gain from charges to business activities 93Net adjustment to decrease net changes in fund balances - total governmental funds to arrive at changes in net assets - governmental activities $ (10,036)
56
Notes to the Financial Statements(Amounts Expressed in Thousands Unless Otherwise Noted)
Comprehensive Annual Financial Report for the Year Ended June 30, 2011 ~ County of San Diego
NOTE 3Deposits and InvestmentsThe Treasurer is responsible for authorizing all County bankaccounts and pursuant to Government Code Sections 27000.1 -27000.5, 27130 - 27137, and 53600 - 53686 is responsible forconducting County investment activities of the County’sinvestment pool (the Pool) as well as various individualinvestment accounts outside of the Pool. Additionally, theTreasurer has oversight responsibilities for investments withfiscal agents.
The Pool is a County sponsored “external investment pool”wherein moneys of the County and other legally separateexternal entities, which are not part of the County ReportingEntity, are commingled (pooled) and invested on the participants'behalf.
Pursuant to Sections 27130-27137 of the California GovernmentCode, the Board of Supervisors has established the Treasurer’sOversight Committee (“TOC”) that monitors and reviews theInvestment Policy. The TOC consists of members appointed fromthe districts or offices that they represent, and up to fivemembers of the public, having expertise in, or an academicbackground in public finance. This Committee requires a financialaudit to be conducted annually on a fiscal year basis, whichincludes limited tests of compliance with laws and regulations.The Investment Pool is not registered with the Securities andExchange Commission (“SEC”) as an investment company. TheInvestment Pool does not have any legally binding guarantees ofshare values.
A separately issued annual financial report for the Pool can beobtained from the Treasurer-Tax Collector at 1600 PacificHighway, Room 162, San Diego, California, 92101 and can also beaccessed at http:// www.sdtreastax.com.
Total pooled cash and investments totaled $5,860,958 consistingof: $5,856,303 investments in the County pool; $3.007 million indemand deposits; $1.125 million of collections in transit; and,$523 thousand in imprest cash.
DepositsGovernment Code Section 53652 et. seq. and the Treasurer’sPool Investment Policy (Pool Policy) prescribe the amount ofcollateral that is required to secure the deposit of public funds.
Federal Depository Insurance (FDIC) is available for fundsdeposited at any one financial institution up to a maximum of$250,000 for demand deposits, time and savings deposits. Theaforementioned Government Code and Pool Policy require thatdepositories collateralize public funds with securities having amarket value of at least 10% in excess of the total amount of thedeposits. These securities shall be placed in the institution'spooled collateral account and monitored by the State Treasurerof California or a mutually agreed upon third party custodianbank.
Custodial Credit Risk - Deposits
The custodial credit risk for deposits is the risk that the Countywill not be able to recover deposits that are in the possession ofan outside party. Deposits are exposed to custodial credit risk ifthey are not insured or collateralized.
The Investment Pool does not have a formal policy regardingsweep (deposit) accounts, but the practice is to utilize national orstate chartered banks where the excess over FDIC insurance isinvested in repurchase agreements that are collateralized by U.S.Treasury and Federal Agency securities equal to or greater thanthe deposit amount in accordance with California GovernmentCode.
California Government Code Section 53652 et. seq. requires thata financial institution secure deposits made by state or localgovernment units by pledging securities in an undividedcollateral pool held by a depository regulated under state law. AtJune 30, 2011, the County’s deposits were not exposed tocustodial credit risk as these deposits were either covered byFDIC insurance or collateralized with securities held by a namedagent depository as noted below:
a. Cash in banks is defined as short-term, highly liquid depositswith an original maturity of three months or less. At year-end,the carrying amount of the Investment Pool’s deposits was$3.007 million, and the bank balance at June 30, 2011 was $6.92million, consisting of demand deposits with various financialinstitutions. The difference between the carrying amount and thebank balance includes temporary reconciling items such as cashon hand, outstanding checks, and deposits in transit. Of the bankbalance, $431 thousand was covered by federal depositinsurance and $6.489 million was collateralized with securitiesheld by a named agent depository on behalf of the InvestmentPool as required by California Government Code Section 53656.The market value of the pledged securities in the collateral poolmust equal at least 110% of the total amount deposited by thepublic agencies.
b. The carrying amount of demand deposits with Fiscal Agents(outside of the Pool) was $1.835 million and the bank balance pervarious financial institutions was $2.308 million. Of the total bankbalance, $540 thousand was covered by federal depositinsurance and $1.768 million was collateralized by a named agentdepository.
InvestmentsGovernment Code Section 53601 governs the types ofinvestments that may be purchased and makes certainrestrictions on investment maturity, maximum portfoliopercentages, term, value, credit quality and timing to minimizethe risk of loss.
Permitted types of investments and financial instrumentsinclude: U.S. treasuries, Federal agencies, and local agencyobligations; banker’s acceptances; commercial paper; negotiablecertificates of deposit; repurchase agreements; reverserepurchase agreements; medium-term notes; collateralizedcertificates of deposit; money market mutual funds; mortgagepass-through securities; mortgage backed securities; and

57
Notes to the Financial Statements(Amounts Expressed in Thousands Unless Otherwise Noted)
County of San Diego ~ Comprehensive Annual Financial Report for the Year Ended June 30, 2011
mortgage collateralized obligations.
Investments in the Investment Pool are stated at fair value.Securities, which are traded on a national exchange, are valuedat the last reported sales price at current exchange rates. The fairvalue of investments is determined monthly and is provided bythe custodian bank. Repurchase agreements and institutionalmoney market funds are carried at portfolio book value (carryingcost). Open-end institutional money market funds are notcategorized as to custodial credit risk because the investment inthese funds is not evidenced by specific securities. All purchasesof investments are accounted for on a trade-date basis.Unrealized gains or losses of securities are determined by takingthe difference between amortized cost and the fair value ofinvestments. Realized gains and losses on investments that wereheld in more than one fiscal year and sold in the current yearwere included as a change in the fair value of investmentsreported in the prior year(s) and the current year.
In addition to the above, the Board annually adopts a PooledMoney Fund Investment Policy. This policy is based on thecriteria in Government Code Section 53601 but adds furtherspecificity and restrictions to permitted investments.
No policies have been established for investments with fiscalagents, however, moneys held by trustees on behalf of theCounty may generally only be invested in permitted investmentsspecified in trustee or indenture agreements.
In conjunction with the discussion below concerning investmentrisks, please refer to Tables 7 and 8 respectively, which providedetails on pooled investments and those held with fiscal agentsat fiscal year-end. Additionally, Table 9 provides a comparison ofInvestment Pool policy restrictions with Government CodeSection 53601 requirements.
Interest Rate Risk - Investments
This is the risk that changes in interest rates will adversely affectthe fair value of an investment.
Declines in the fair value of investments are managed by limitingthe length of the maturity of securities. In general, the maximummaturity allowed is five years unless the Board has grantedexpress authority either specifically or as part of an investmentprogram. The policy related to the maturity structure of theInvestment Pool requires at least 25 percent of securities tomature within 90 days, and at least 50 percent of securities tomature within one year. In addition, the Investment Pool limitsthe maximum effective duration of the portfolio to 18 months. Asof June 30, 2011, the Investment Pool was in full compliance withits own more restrictive Investment Policy, and therefore wasalso in compliance with California Government Code. Actualweighted average days to maturity by investment type ispresented in Table 7.
Generally, investments with fiscal agents are structured in such away that securities mature at the times and in the amounts thatare necessary to meet scheduled expenditures and withdrawals.
Credit Risk - Investments
This is the risk that an issuer or other counterparty to aninvestment may not fulfill its obligations.
The Investment Pool’s Investment Policy, which is morerestrictive than the Government Code, places a minimumstandard on the ratings of investments held in the InvestmentPool. Investments in securities other than those guaranteed bythe U.S. Treasury or Government Sponsored Enterprises musthave a credit rating of no less than “A” for long -term or “A1” forshort term investments. Non-rated securities include sweepaccounts, collateralized certificates of deposit and repurchaseagreements. Sweep accounts and collateralized certificates ofdeposit must be FDIC insured or collateralized with securitiesheld by a named agent of the depository. Repurchaseagreements are collateralized by securities, authorized byCalifornia Government Code section 53601, having a fair marketvalue of at least 102% of the amount of the repurchaseagreement. Credit quality based on Standard and Poor’s FundCredit Quality Rating is noted below:
Concentration of Credit Risk - Investments
This is the risk of loss attributed to the magnitude of agovernment’s investment in a single issuer.
The Investment Policy limits the amount of exposure to any onesingle issuer to the percentages listed in Table 9. As noted inTable 9, the Investment Pool’s Investment Policy is morerestrictive, in most cases, than the California Government Code.As of June 30, 2011, all Pool investments were in compliance withState law and with the Investment Policy.
The Investment Pool's investment in the securities of the FederalHome Loan Mortgage Corporation (FHLMC) and Federal NationalMortgage Association (FNMA) are issued by agencies that remainunder conservatorship by the Director of the Federal HousingAgency. The U.S. government does not guarantee, directly orindirectly, the securities of the FHLMC, Federal Home Loan Bank(FHLB), FNMA, or Federal Farm Credit Bank (FFCB). TheInvestment Pool's investments in FHLMC, FHLB, FNMA and FFCBsecurities as of June 30, 2011 comprised 15%, 9%, 24%, and 8% ofthe total County Investment Pool's investments, respectively.
Table 5
S & P Investment Rating
Investment PoolInvestments with
Fiscal Agents
Overall credit rating AAAf/S1
Short-term A-1
Long-term A

58
Notes to the Financial Statements(Amounts Expressed in Thousands Unless Otherwise Noted)
Comprehensive Annual Financial Report for the Year Ended June 30, 2011 ~ County of San Diego
No general policies have been established to limit the amount ofexposure to any one single issuer, however, moneys held bytrustees on behalf of the County may generally only be investedin permitted investments specified in trustee or indentureagreements. Instruments in any one issuer that represent 5% ormore of the County investments with fiscal agents by individualmajor fund or nonmajor funds in the aggregate at June 30, 2011are shown in Table 6.
Custodial Credit Risk - Investments
This is the risk that, in the event of the failure of the counterpartyto a transaction, a government will not be able to recover thevalue of the investment or collateral securities that are in thepossession of outside party.
The investment policy does not permit investments in uninsuredand unregistered securities not held by the County. The Countyof San Diego utilizes third party delivery versus paymentcustodian which mitigates any custodial credit risk. Securitiespurchased by the County Investment Pool are held by a third-party custodian, the Bank of New York Mellon Corporation, intheir trust department to mitigate custodial credit risk.
Foreign Currency Risk - Investments
This is the risk that investments are exposed to foreign currencyrisk.
The County’s investments do not have any foreign currency riskas all investments are in U.S. dollar-denominated assets.
Table 6
Concentration of Credit Risk -Investment With Fiscal Agents
Issuer
Tobacco Endowment
Fund Percent
Nonmajor Governmental
Funds Percent
BlackRock MuniFund $ 25,970 7Abbey National North America LLC $ 34,152 50Federal national mortgage association 15,055 22Federated treasury obligation 14,069 21
Table 7
Pooled InvestmentsAt June 30, 2011
Fair ValueAmortized
CostInterest Rate
RangeMaturity Range
Weighted Average
Maturity (days) S&P Rating% of
Portfolio
US government agencies:Federal home loan mortgage corporation notes $ 874,677 872,216 0.12% - 5.50% 7/11 - 3/16 399 AAA 14.94%
Federal home loan bank notes 554,345 550,692 0.25% - 5.75% 8/11 - 3/16 936 AAA 9.47%
Federal national mortgage association notes 1,407,919 1,404,907 0.11% - 5.00% 9/11 - 5/16 763 AAA 24.04%
Federal farm credit bank notes 768,243 767,404 0.20% - 4.45% 8/11 - 11/15 385 AAA 13.12%
US treasury notes 284,271 275,417 1.00% - 4.88% 7/11 - 11/15 647 AAA 4.85%
Commercial paper 1,411,418 1,411,569 0.02% - 0.18% 7/11 - 8/11 17 A-1/A-1+ 24.10%
Corporate medium-term notes 25,770 25,177 4.38% - 5.88% 2/12 - 3/12 237 AA+ 0.44%
Repurchase agreements collateralized by:
Government securities 774 774 0.05% 7/11 1 N/A 0.01%
Money market mutual funds 58,585 58,585 0.01% 7/11 17 AAA 1.00%
Certificates of deposit 435,161 435,161 0.11% - 1.00% 7/11 - 5/12 47 N/A 7.43%
Bond funds 35,140 35,000 0.53% 1/13 577 AA 0.60%
Total investments $ 5,856,303 5,836,902 425 100.00%
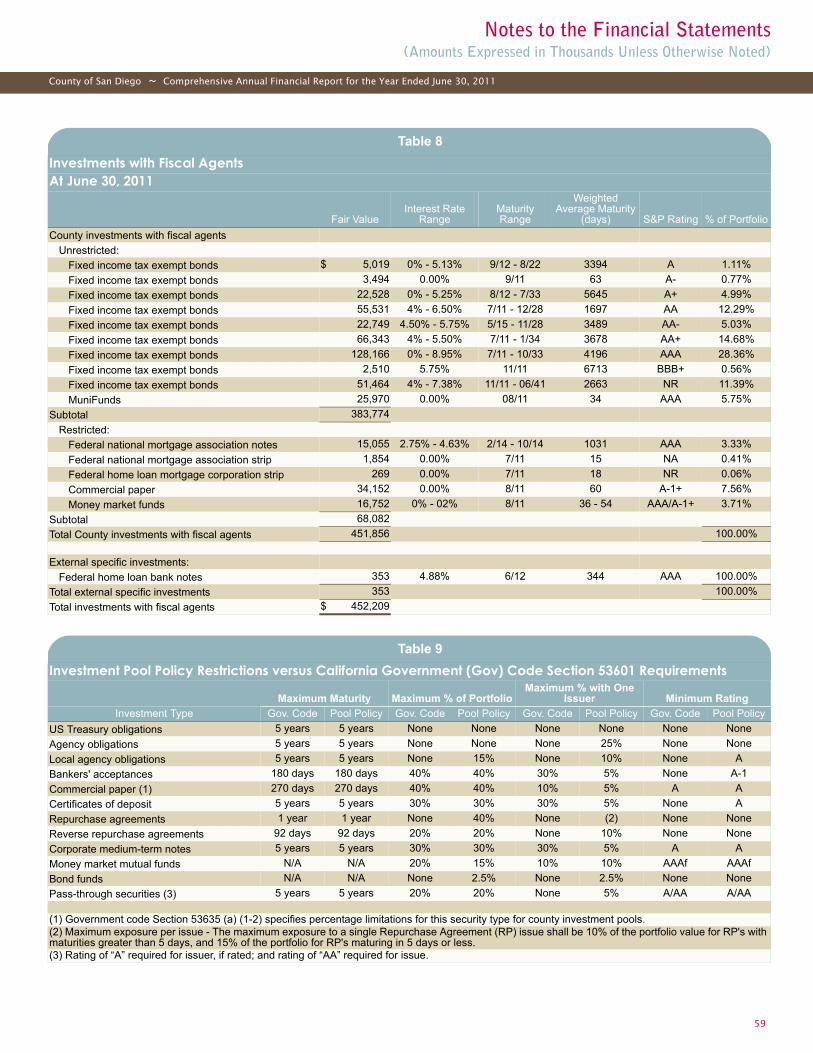
59
Notes to the Financial Statements(Amounts Expressed in Thousands Unless Otherwise Noted)
County of San Diego ~ Comprehensive Annual Financial Report for the Year Ended June 30, 2011
Table 8
Investments with Fiscal AgentsAt June 30, 2011
Fair ValueInterest Rate
RangeMaturity Range
Weighted Average Maturity
(days) S&P Rating % of Portfolio
County investments with fiscal agents
Unrestricted:
Fixed income tax exempt bonds $ 5,019 0% - 5.13% 9/12 - 8/22 3394 A 1.11%
Fixed income tax exempt bonds 3,494 0.00% 9/11 63 A- 0.77%
Fixed income tax exempt bonds 22,528 0% - 5.25% 8/12 - 7/33 5645 A+ 4.99%
Fixed income tax exempt bonds 55,531 4% - 6.50% 7/11 - 12/28 1697 AA 12.29%
Fixed income tax exempt bonds 22,749 4.50% - 5.75% 5/15 - 11/28 3489 AA- 5.03%
Fixed income tax exempt bonds 66,343 4% - 5.50% 7/11 - 1/34 3678 AA+ 14.68%
Fixed income tax exempt bonds 128,166 0% - 8.95% 7/11 - 10/33 4196 AAA 28.36%
Fixed income tax exempt bonds 2,510 5.75% 11/11 6713 BBB+ 0.56%
Fixed income tax exempt bonds 51,464 4% - 7.38% 11/11 - 06/41 2663 NR 11.39%
MuniFunds 25,970 0.00% 08/11 34 AAA 5.75%
Subtotal 383,774
Restricted:
Federal national mortgage association notes 15,055 2.75% - 4.63% 2/14 - 10/14 1031 AAA 3.33%
Federal national mortgage association strip 1,854 0.00% 7/11 15 NA 0.41%
Federal home loan mortgage corporation strip 269 0.00% 7/11 18 NR 0.06%
Commercial paper 34,152 0.00% 8/11 60 A-1+ 7.56%
Money market funds 16,752 0% - 02% 8/11 36 - 54 AAA/A-1+ 3.71%
Subtotal 68,082
Total County investments with fiscal agents 451,856 100.00%
External specific investments:
Federal home loan bank notes 353 4.88% 6/12 344 AAA 100.00%
Total external specific investments 353 100.00%
Total investments with fiscal agents $ 452,209
Table 9
Investment Pool Policy Restrictions versus California Government (Gov) Code Section 53601 Requirements
Maximum Maturity Maximum % of PortfolioMaximum % with One
Issuer Minimum Rating
Investment Type Gov. Code Pool Policy Gov. Code Pool Policy Gov. Code Pool Policy Gov. Code Pool Policy
US Treasury obligations 5 years 5 years None None None None None None
Agency obligations 5 years 5 years None None None 25% None None
Local agency obligations 5 years 5 years None 15% None 10% None A
Bankers' acceptances 180 days 180 days 40% 40% 30% 5% None A-1
Commercial paper (1) 270 days 270 days 40% 40% 10% 5% A A
Certificates of deposit 5 years 5 years 30% 30% 30% 5% None A
Repurchase agreements 1 year 1 year None 40% None (2) None None
Reverse repurchase agreements 92 days 92 days 20% 20% None 10% None None
Corporate medium-term notes 5 years 5 years 30% 30% 30% 5% A A
Money market mutual funds N/A N/A 20% 15% 10% 10% AAAf AAAf
Bond funds N/A N/A None 2.5% None 2.5% None None
Pass-through securities (3) 5 years 5 years 20% 20% None 5% A/AA A/AA
(1) Government code Section 53635 (a) (1-2) specifies percentage limitations for this security type for county investment pools.(2) Maximum exposure per issue - The maximum exposure to a single Repurchase Agreement (RP) issue shall be 10% of the portfolio value for RP's with maturities greater than 5 days, and 15% of the portfolio for RP's maturing in 5 days or less.(3) Rating of “A” required for issuer, if rated; and rating of “AA” required for issue.

60
Notes to the Financial Statements(Amounts Expressed in Thousands Unless Otherwise Noted)
Comprehensive Annual Financial Report for the Year Ended June 30, 2011 ~ County of San Diego
NOTE 4Restricted AssetsRestricted assets include monies or other resources required tobe set aside to repay principal and interest under debtcovenants; and to comply with other legal or contractualrequirements. For fiscal year 2011 restricted assets were asfollows:
NOTE 5ReceivablesDetails of receivables reported in the government-wideStatement of Net Assets are presented in Table 11. Amountsthat are not expected to be collected within the next fiscal yearare identified below:
Due from Other Governmental Agencies - Governmentalactivities - $61.496 million.
This amount represents Senate Bill (SB) 90 cost reimbursementsdue the County for the provision of State mandated programsand services mostly for fiscal years prior to 2004. The StateConstitution requires reimbursement for these costs and interestwill accrue on the reimbursement claims until they are paidaccording to Government Code Section 17617 over a period notmore than 15 years beginning in fiscal year 2007. The State beganto reimburse the County for these programs and services in fiscalyear 2007, but has not budgeted appropriations in the currentyear.
Loans - Governmental activities- $68.477 million
This amount includes: $40.374 million in housing rehabilitationloan programs for low-income or special need residents, loans forlow income housing downpayments, and redevelopmentagencies; and $28.103 million in community development blockgrant loans.
Loans- Business-type activities- $3.559 million
This amount represents Airport Enterprise Fund (AEF) loans toAirport lessees for the purchase of AEF reversionary interests inleasehold improvements existing at the expiration of previousleases.
Table 10
Restricted Assets
Fund
Legal or Contractual
RequirementsDebt
Covenants
General Fund $ 156 $ 6,299
Nonmajor Governmental Funds
Housing Authority Special Revenue Fund 580Tobacco Securitization Joint Special Revenue Fund 47,065Pension Obligation Bonds Debt Service Fund 2Redevelopment Agency Debt Service Fund 1,155San Diego Regional Building Authority Debt Service Fund 22,837
SANCAL Debt Service Fund 4,784
Table 11
ReceivablesPrimary Government and Discretely Presented Component UnitAt June 30, 2011
AccountsInvestment
Income
Due From Other
Government Agencies Loans Other
Total Receivables
Allowance For Doubtful
AccountsReceivables
Net
Governmental activities:
General Fund $ 4,981 1,937 403,715 56,458 144 467,235 (1,369) 465,866
Public Safety Special Revenue Fund 36,214 36,214 36,214
Tobacco Endowment Fund 4,873 4,873 4,873
Other Governmental Funds 18,254 959 36,870 12,019 170 68,272 68,272
Internal Service Funds 2,364 221 1,271 9 3,865 3,865
Total governmental activities $ 25,599 7,990 478,070 68,477 323 580,459 (1,369) 579,090
Business-type activities:
Enterprise Funds $ 395 111 1,743 3,559 5,808 5,808
Component Unit:
First 5 Commission $ 527 5,760 39 6,326 6,326

61
Notes to the Financial Statements(Amounts Expressed in Thousands Unless Otherwise Noted)
County of San Diego ~ Comprehensive Annual Financial Report for the Year Ended June 30, 2011
NOTE 6County Property on Lease to OthersThe County's blended component unit - SDRBA has a directfinancing lease with the San Miguel Consolidated Fire ProtectionDistrict (District) for two District fire stations. Additionally, theCounty has a sublease of a share of the Metropolitan TransitSystem (MTS) Towers. The share of the County's property underthe MTS Towers’ sub lease is an estimated $12.74 million instructures and improvements with accumulated depreciation of$5.76 million at June 30, 2011. The lease revenue received by theSDRBA and the County for the year ended June 30, 2011 wasapproximately $864 thousand and $891 thousand, respectively.
The County also has noncancelable operating leases for certainproperties which are not material to the County's governmentaloperations. Additionally, the Airport Enterprise Fund derives asubstantial portion of its revenues from noncancelable operatingleases with air carriers and concessionaires. The AirportEnterprise Fund's property under operating leases includes anestimated $2.46 million in land at June 30, 2011.
Lease revenue from noncancelable operating leases for the yearended June 30, 2011 was approximately $16.7 million. Futureminimum lease payments to be received under the directfinancing and noncancelable operating leases are noted in Table12.
NOTE 7Capital AssetsChanges in Capital AssetsIncreases and decreases in the County’s capital assets forgovernmental and business-type activities during the fiscal yearwere as follows:
Table 12
Lease RevenueCounty Property Leased To Others
Fiscal YearDirect Financing
Leases Operating Leases
2012 $ 1,621 $ 16,725
2013 1,640 16,132
2014 1,626 15,370
2015 1,637 11,055
2016 1,624 9,602
2017-2021 6,158 42,049
2022-2026 37,633
2027-2031 35,306
2032-2036 26,814
2037-2041 16,560
2042-2046 10,680
2047-2051 6,829
2052-2056 4,934
2057-2061 1,614
2062-2064 393
Total $ 14,306 $ 251,696
Table 13
Capital Assets - Governmental ActivitiesBeginning Balance at
July 1, 2010 Increases Decreases
Ending Balance at June 30,
2011Capital assets, not being depreciated/amortized:
Land $ 322,085 19,678 (71) $ 341,692
Easements 4,581 1,059 5,640Construction in progress 236,436 127,098 (225,009) 138,525
Total capital assets, not being depreciated/amortized 563,102 147,835 (225,080) 485,857Capital assets, being depreciated/amortized:
Buildings and improvements 1,147,962 213,661 (4,107) 1,357,516
Software 74,833 8,757 (400) 83,190
Equipment 241,205 19,729 (9,584) 251,350
Road infrastructure 2,417,546 36,982 2,454,528
Bridge infrastructure 60,781 6,253 (6) 67,028Total capital assets, being depreciated/amortized 3,942,327 285,382 (14,097) 4,213,612Less accumulated depreciation/amortization for:
Buildings and improvements (328,367) (23,845) 3,755 (348,457)
Software (61,829) (5,569) 233 (67,165)
Equipment (130,561) (21,552) 8,516 (143,597)
Road infrastructure (999,123) (66,494) (1,065,617)
Bridge infrastructure (16,596) (1,174) (17,770)Total accumulated depreciation/amortization (1,536,476) (118,634) 12,504 (1,642,606)Total capital assets, being depreciated/amortized, net 2,405,851 166,748 (1,593) 2,571,006Governmental activities capital assets, net $ 2,968,953 314,583 (226,673) $ 3,056,863

62
Notes to the Financial Statements(Amounts Expressed in Thousands Unless Otherwise Noted)
Comprehensive Annual Financial Report for the Year Ended June 30, 2011 ~ County of San Diego
Depreciation/AmortizationDepreciation/amortization expense was charged togovernmental activities and business-type activities as shownbelow.
Capital and Other CommitmentsEncumbrances represent commitments related to unperformedcontracts for goods or services. Encumbrance accounting is usedin the governmental funds. Encumbrances outstanding at yearend do not constitute expenditures or liabilities because thecommitments will be honored during the subsequent year oryears. Encumbered amounts for specific purposes for whichamounts have not been previously restricted, committed, orassigned are included within committed or assigned fundbalance, as appropriate. At June 30, 2011, the County GeneralFund's outstanding encumbrances totaled $399.793 million whilethe Public Safety Fund's outstanding encumbrances totaled$3.605 million. Non-major governmental funds' outstandingencumbrances totaled $31.240 million.
At June 30, 2011, major contracts entered into for structures andimprovements and other commitments within governmental andbusiness-type activities were as follows:
Table 14
Capital Assets - Business-type ActivitiesBeginning Balance at July 1,
2010 Increases Decreases
Ending Balance at June 30,
2011Capital assets, not being depreciated:
Land $ 11,565 $ 11,565
Construction in progress 21,186 3,533 (12,132) 12,587Total capital assets, not being depreciated 32,751 3,533 (12,132) 24,152Capital assets, being depreciated:
Buildings and improvements (1) 102,942 11,845 114,787
Equipment (1) 1,239 124 (194) 1,169
Road infrastructure 6,362 83 6,445
Sewer infrastructure 85,632 132 85,764Total capital assets, being depreciated 196,175 12,184 (194) 208,165Less accumulated depreciation for:
Buildings and improvements (1) (27,412) (3,500) (30,912)
Equipment (1) (1,057) (33) 166 (924)
Road infrastructure (27) (167) (194)
Sewer infrastructure (33,776) (1,677) (35,453)Total accumulated depreciation (62,272) (5,377) 166 (67,483)Total capital assets, being depreciated, net 133,903 6,807 (28) 140,682Business-type activities capital assets, net $ 166,654 10,340 (12,160) $ 164,834
(1) Beginning balances recast to present $68 thousand of Buildings and Improvements formerly reported as Equipment.
Table 15
Depreciation/Amortization Expense - Governmental Activities
General government $ 2,815
Public protection 22,154
Public ways and facilities 66,945
Health and sanitation 5,709
Public assistance 1,193
Education 795
Recreation and cultural 3,124
Internal Service Funds 15,899
Total $ 118,634
Table 16
Depreciation Expense - Business-type ActivitiesAirport Fund $ 3,595
Sanitation Districts Fund 1,765
Wastewater Management Fund 17
Total $ 5,377
Table 17
Capital CommitmentsAt June 30, 2011
Remaining Commitments
Governmental Activities
Other Governmental Funds:
Construction of County Operations Center $ 58,082
Construction of South Santa Fe Ave. 10,987
Upgrade of Oracle Enterprise Resources 10,664
Construction of Roadway Asset replacement 3,752
Construction of Jamacha Blvd. 3,647
Construction of San Pasqual Academy Housing 3,547
Construction of Women's Detention Facility 2,495Acquisition of Automated Fingerprinting Identification System 2,420
Construction of Spring Valley Traffic Signal 2,261Acquisition of Records MGT & Field Reprinting Software 1,605
Acquisition of Software AG License Agreement 1,091
Subtotal 100,551
Business-type Activities
Enterprise Funds:Construction of Rancho Del Campo Wastewater Treatment 750
Subtotal 750
Total $ 101,301

63
Notes to the Financial Statements(Amounts Expressed in Thousands Unless Otherwise Noted)
County of San Diego ~ Comprehensive Annual Financial Report for the Year Ended June 30, 2011
NOTE 8Interfund BalancesInterfund balances at fiscal year-end consisted of the following amounts:
Descriptions of amounts not due to be repaid in the subsequentyear are discussed below:
a. $1.022 million is due to the General Fund from theRedevelopment Agency Special Revenue Fund (Upper San DiegoRiver Project) as a result of a loan to provide funding for Projectimprovements. $929 thousand of this balance is not scheduled tobe collected in the subsequent year.
b. $3.363 million is due from the Redevelopment Agency SpecialRevenue Fund to the Airport Enterprise Fund as a result of a loanto fund airport projects. Loans repayments are based on thecondition that the collection of property tax revenue per Healthand Safety Code Section 33670 is sufficient to allow the paymentof the loan. $3.363 million of the balance is not scheduled to be
collected in the subsequent year.
c. $98 thousand is due to the Special District Loans InternalService Fund from the County Service District Special RevenueFunds as a result of a loan to improve and maintain County roads.Loan repayments are made from property tax collections. $60thousand of the balance is not scheduled to be collected in thesubsequent year.
All remaining balances resulted from the time lag between thedates that 1) interfund goods and services are provided orreimbursable expenditures occur; 2) transactions are recorded inthe accounting system; and 3) payments between funds aremade.
NOTE 9Interfund TransfersInterfund transfers at fiscal year-end consisted of the following amounts:
In general, transfers are used to: (1) move revenues from the fund that statute or budget requires to collect them to the fund that stat-ute or budget requires to expend them; (2) move receipts restricted to debt service from the funds collecting the receipts to the debtservice fund as debt service payments become due; and (3) use unrestricted revenues collected in the General Fund to finance pro-grams accounted for in other funds in accordance with budgetary authorizations.
Transfers made in fiscal year 2011 for purposes other than those described above included a one-time $49.878 million transfer to theGeneral Fund to close out the remaining activities of the Housing and Community Development Fund. The Housing and CommunityDevelopment Fund is no longer in operation.
Table 18
Interfund BalancesAt June 30, 2011
DUE FROM
General Fund Public SafetyTobacco
EndowmentNonmajor
GovernmentalNonmajor Enterprise
Internal Service Total
DU
E T
O
General Fund $ 19,237 967 10,156 93 4,172 $ 34,625
Nonmajor Governmental 16,345 4,521 645 34 21,545
Nonmajor Enterprise 32 3,366 224 3,622
Internal Service 20,436 1,664 93 738 22,931
Total $ 36,813 19,237 967 19,707 1,055 4,944 $ 82,723
Table 19
Transfers In/Transfers OutAt June 30, 2011
TRANSFERS OUT
General Fund Public SafetyTobacco
EndowmentNonmajor
GovernmentalNonmajor Enterprise
Internal Service Total
TR
AN
SF
ER
S IN General Fund $ 185,919 24,200 63,612 717 $ 274,448
Nonmajor Governmental 143,299 5,629 331 2,904 152,163
Nonmajor Enterprise 1,059 50 1,109
Internal Service 6,703 56 6,759
Total $ 151,061 185,919 24,200 69,347 331 3,621 $ 434,479

64
Notes to the Financial Statements(Amounts Expressed in Thousands Unless Otherwise Noted)
Comprehensive Annual Financial Report for the Year Ended June 30, 2011 ~ County of San Diego
NOTE 10PayablesF. Payables
The County's payables at fiscal year-end are shown below for theGeneral Fund, other governmental funds, internal service funds,business-type activities funds, and the discrete component unit:
NOTE 11Short-Term Obligations The County issues tax anticipation notes in advance of propertytax collections, depositing the proceeds in the General Fund.These notes are necessary to fund the County's annual cash flowneeds. The majority of property tax collections are received inDecember and April.
Short-term debt activity for the fiscal year was as follows:
NOTE 12Lease ObligationsOperating LeasesReal Property
The County has obligations under long-term operating leaseagreements through fiscal year 2022 (Table 22). The County isthe lessee under the terms of several non-cancelable operatingleases for real property used to house certain County operations.The total rental expense for all real property leases for the yearended June 30, 2011 was approximately $31.35 million, including$22.9 million for non-cancelable leases.
The future minimum lease payments for these non-cancelableleases are as follows:
Personal Property
The County has also entered into operating leases for personalproperty, a large portion of which represents duplicating andheavy duty construction equipment. Many of these leases aresubject to annual adjustment based upon negotiations.Management expects that in the normal course of business,leases that expire will be renewed or replaced by other leases.Total rental expense for these operating leases for the yearended June 30, 2011, was approximately $2.3 million.
Capital LeaseMinimum Lease Payments
Equipment has been leased from the Bowe Bell and HowellCompany. The present value of the minimum lease obligation hasbeen capitalized in the Facilities Management internal servicefund statement of net assets; and is reflected as a liability inthose statements. The County assumes responsibility for allmaintenance and repair of the equipment under the terms of thelease agreement. Future minimum lease payments under thecapital lease are as follows:
Table 20
PayablesAt June 30, 2011
Vendors
Due to Other Government
Agencies OtherTotal
Payables
Governmental Activities:
General Fund $ 56,804 39,586 4,767 $ 101,157
Other Governmental Funds 30,602 1,625 780 33,007
Internal Service Funds 27,592 1,144 28,736
Total governmental activities $ 114,998 42,355 5,547 $ 162,900
Business-type activities:
Enterprise Funds $ 894 1 1 $ 896
Component Unit:
First 5 Commission $ 4,682 97,673 177 $ 102,532
Table 21
Short-Term ObligationsBeginning Balance at
July 1, 2010 Issued Redeemed
Ending Balance at
June 30, 2011Tax and revenue anticipation notes $ 140,000 140,000 $
Table 22
Lease Commitments - Real PropertyFiscal Year Minimum Lease Payments
2012 $ 21,616
2013 15,556
2014 12,486
2015 8,600
2016 5,876
2017-2021 17,455
2022 1,644
Total $ 83,233
Table 23
Capital Leases - Future Minimum Lease PaymentsFiscal Year Amount
2012 $ 37
2013 40
2014 40
2015 40
2016 40
2017-2018 54
Total minimum lease payments 251
Less: Amount representing interest (39)
Net lease payments $ 212
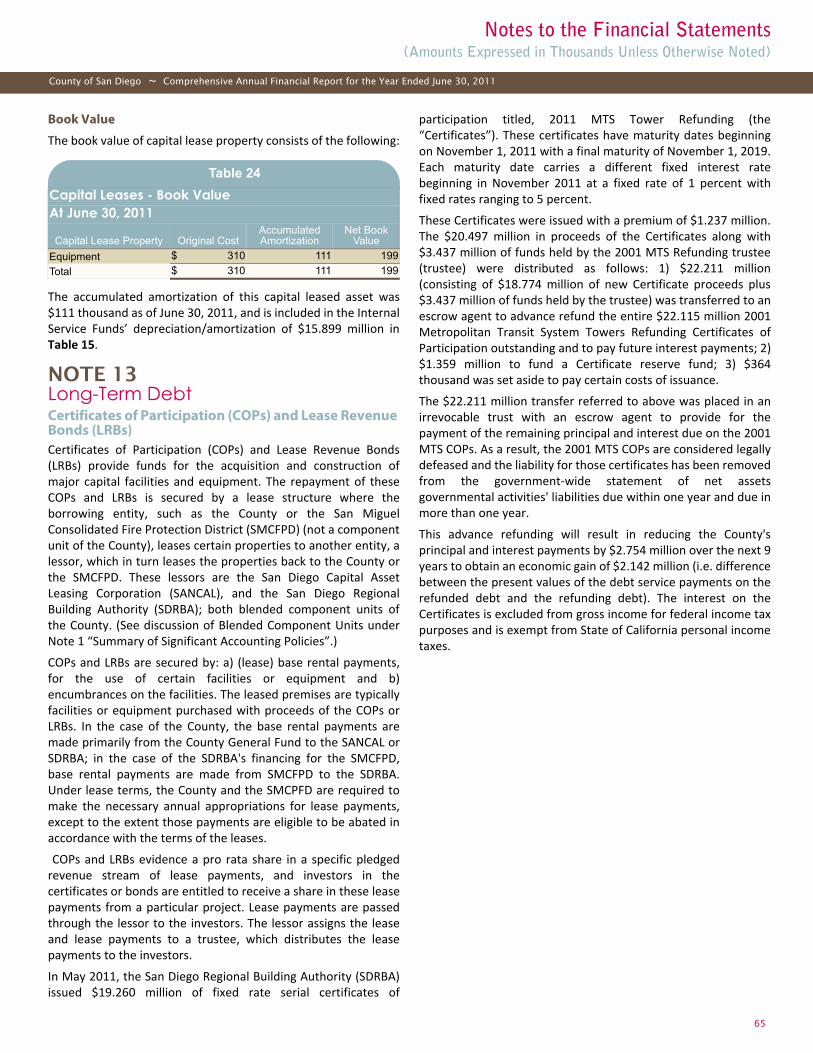
65
Notes to the Financial Statements(Amounts Expressed in Thousands Unless Otherwise Noted)
County of San Diego ~ Comprehensive Annual Financial Report for the Year Ended June 30, 2011
Book Value
The book value of capital lease property consists of the following:
The accumulated amortization of this capital leased asset was$111 thousand as of June 30, 2011, and is included in the InternalService Funds’ depreciation/amortization of $15.899 million inTable 15.
NOTE 13Long-Term DebtCertificates of Participation (COPs) and Lease Revenue Bonds (LRBs)Certificates of Participation (COPs) and Lease Revenue Bonds(LRBs) provide funds for the acquisition and construction ofmajor capital facilities and equipment. The repayment of theseCOPs and LRBs is secured by a lease structure where theborrowing entity, such as the County or the San MiguelConsolidated Fire Protection District (SMCFPD) (not a componentunit of the County), leases certain properties to another entity, alessor, which in turn leases the properties back to the County orthe SMCFPD. These lessors are the San Diego Capital AssetLeasing Corporation (SANCAL), and the San Diego RegionalBuilding Authority (SDRBA); both blended component units ofthe County. (See discussion of Blended Component Units underNote 1 “Summary of Significant Accounting Policies”.)
COPs and LRBs are secured by: a) (lease) base rental payments,for the use of certain facilities or equipment and b)encumbrances on the facilities. The leased premises are typicallyfacilities or equipment purchased with proceeds of the COPs orLRBs. In the case of the County, the base rental payments aremade primarily from the County General Fund to the SANCAL orSDRBA; in the case of the SDRBA's financing for the SMCFPD,base rental payments are made from SMCFPD to the SDRBA.Under lease terms, the County and the SMCPFD are required tomake the necessary annual appropriations for lease payments,except to the extent those payments are eligible to be abated inaccordance with the terms of the leases.
COPs and LRBs evidence a pro rata share in a specific pledgedrevenue stream of lease payments, and investors in thecertificates or bonds are entitled to receive a share in these leasepayments from a particular project. Lease payments are passedthrough the lessor to the investors. The lessor assigns the leaseand lease payments to a trustee, which distributes the leasepayments to the investors.
In May 2011, the San Diego Regional Building Authority (SDRBA)issued $19.260 million of fixed rate serial certificates of
participation titled, 2011 MTS Tower Refunding (the“Certificates”). These certificates have maturity dates beginningon November 1, 2011 with a final maturity of November 1, 2019.Each maturity date carries a different fixed interest ratebeginning in November 2011 at a fixed rate of 1 percent withfixed rates ranging to 5 percent.
These Certificates were issued with a premium of $1.237 million.The $20.497 million in proceeds of the Certificates along with$3.437 million of funds held by the 2001 MTS Refunding trustee(trustee) were distributed as follows: 1) $22.211 million(consisting of $18.774 million of new Certificate proceeds plus$3.437 million of funds held by the trustee) was transferred to anescrow agent to advance refund the entire $22.115 million 2001Metropolitan Transit System Towers Refunding Certificates ofParticipation outstanding and to pay future interest payments; 2)$1.359 million to fund a Certificate reserve fund; 3) $364thousand was set aside to pay certain costs of issuance.
The $22.211 million transfer referred to above was placed in anirrevocable trust with an escrow agent to provide for thepayment of the remaining principal and interest due on the 2001MTS COPs. As a result, the 2001 MTS COPs are considered legallydefeased and the liability for those certificates has been removedfrom the government-wide statement of net assetsgovernmental activities' liabilities due within one year and due inmore than one year.
This advance refunding will result in reducing the County'sprincipal and interest payments by $2.754 million over the next 9years to obtain an economic gain of $2.142 million (i.e. differencebetween the present values of the debt service payments on therefunded debt and the refunding debt). The interest on theCertificates is excluded from gross income for federal income taxpurposes and is exempt from State of California personal incometaxes.
Table 24
Capital Leases - Book ValueAt June 30, 2011
Capital Lease Property Original CostAccumulated Amortization
Net Book Value
Equipment $ 310 111 199
Total $ 310 111 199
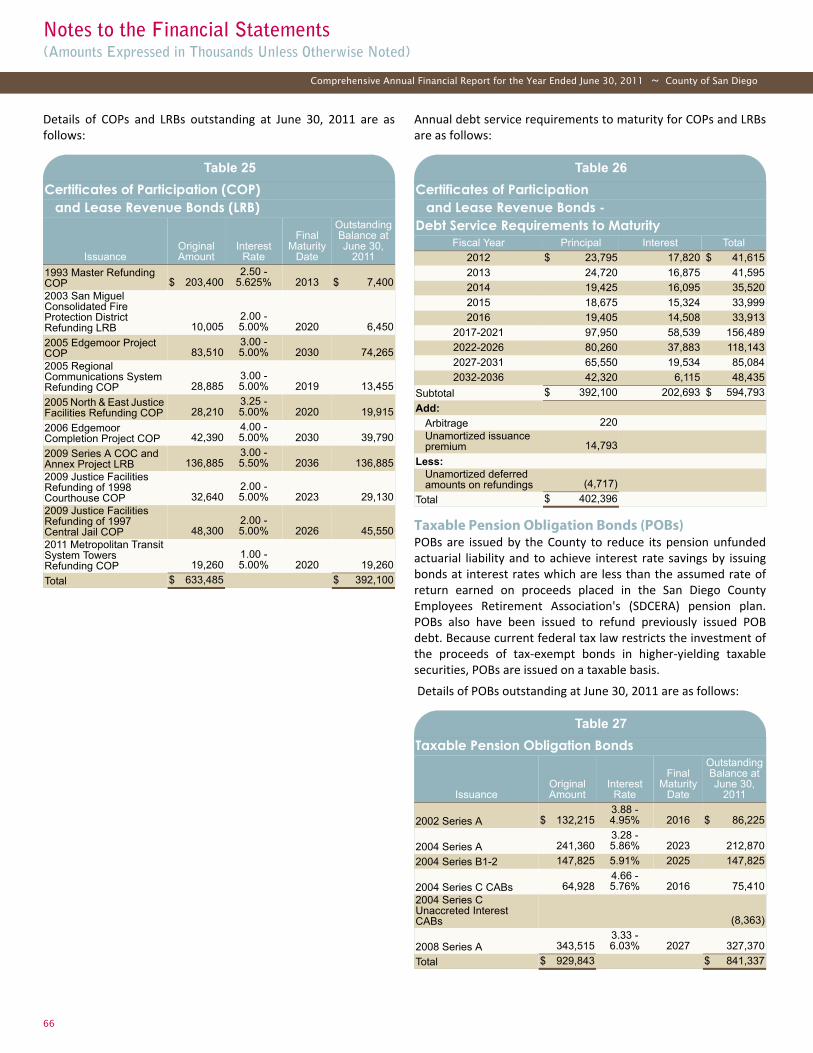
66
Notes to the Financial Statements(Amounts Expressed in Thousands Unless Otherwise Noted)
Comprehensive Annual Financial Report for the Year Ended June 30, 2011 ~ County of San Diego
Details of COPs and LRBs outstanding at June 30, 2011 are asfollows:
Annual debt service requirements to maturity for COPs and LRBsare as follows:
Taxable Pension Obligation Bonds (POBs)POBs are issued by the County to reduce its pension unfundedactuarial liability and to achieve interest rate savings by issuingbonds at interest rates which are less than the assumed rate ofreturn earned on proceeds placed in the San Diego CountyEmployees Retirement Association's (SDCERA) pension plan.POBs also have been issued to refund previously issued POBdebt. Because current federal tax law restricts the investment ofthe proceeds of tax-exempt bonds in higher-yielding taxablesecurities, POBs are issued on a taxable basis.
Details of POBs outstanding at June 30, 2011 are as follows:
Table 25
Certificates of Participation (COP)and Lease Revenue Bonds (LRB)
IssuanceOriginal Amount
Interest Rate
Final Maturity
Date
Outstanding Balance at June 30,
2011
1993 Master Refunding COP $ 203,400
2.50 - 5.625% 2013 $ 7,400
2003 San Miguel Consolidated Fire Protection District Refunding LRB 10,005
2.00 - 5.00% 2020 6,450
2005 Edgemoor Project COP 83,510
3.00 - 5.00% 2030 74,265
2005 Regional Communications System Refunding COP 28,885
3.00 - 5.00% 2019 13,455
2005 North & East Justice Facilities Refunding COP 28,210
3.25 - 5.00% 2020 19,915
2006 Edgemoor Completion Project COP 42,390
4.00 - 5.00% 2030 39,790
2009 Series A COC and Annex Project LRB 136,885
3.00 - 5.50% 2036 136,885
2009 Justice Facilities Refunding of 1998 Courthouse COP 32,640
2.00 - 5.00% 2023 29,130
2009 Justice Facilities Refunding of 1997 Central Jail COP 48,300
2.00 - 5.00% 2026 45,550
2011 Metropolitan Transit System Towers Refunding COP 19,260
1.00 -5.00% 2020 19,260
Total $ 633,485 $ 392,100
Table 26
Certificates of Participationand Lease Revenue Bonds -
Debt Service Requirements to MaturityFiscal Year Principal Interest Total
2012 $ 23,795 17,820 $ 41,615
2013 24,720 16,875 41,595
2014 19,425 16,095 35,520
2015 18,675 15,324 33,999
2016 19,405 14,508 33,913
2017-2021 97,950 58,539 156,489
2022-2026 80,260 37,883 118,143
2027-2031 65,550 19,534 85,084
2032-2036 42,320 6,115 48,435
Subtotal $ 392,100 202,693 $ 594,793
Add:
Arbitrage 220Unamortized issuance premium 14,793
Less:Unamortized deferred amounts on refundings (4,717)
Total $ 402,396
Table 27
Taxable Pension Obligation Bonds
IssuanceOriginal Amount
Interest Rate
Final Maturity
Date
Outstanding Balance at June 30,
2011
2002 Series A $ 132,2153.88 - 4.95% 2016 $ 86,225
2004 Series A 241,3603.28 - 5.86% 2023 212,870
2004 Series B1-2 147,825 5.91% 2025 147,825
2004 Series C CABs 64,9284.66 - 5.76% 2016 75,410
2004 Series C Unaccreted Interest CABs (8,363)
2008 Series A 343,5153.33 - 6.03% 2027 327,370
Total $ 929,843 $ 841,337
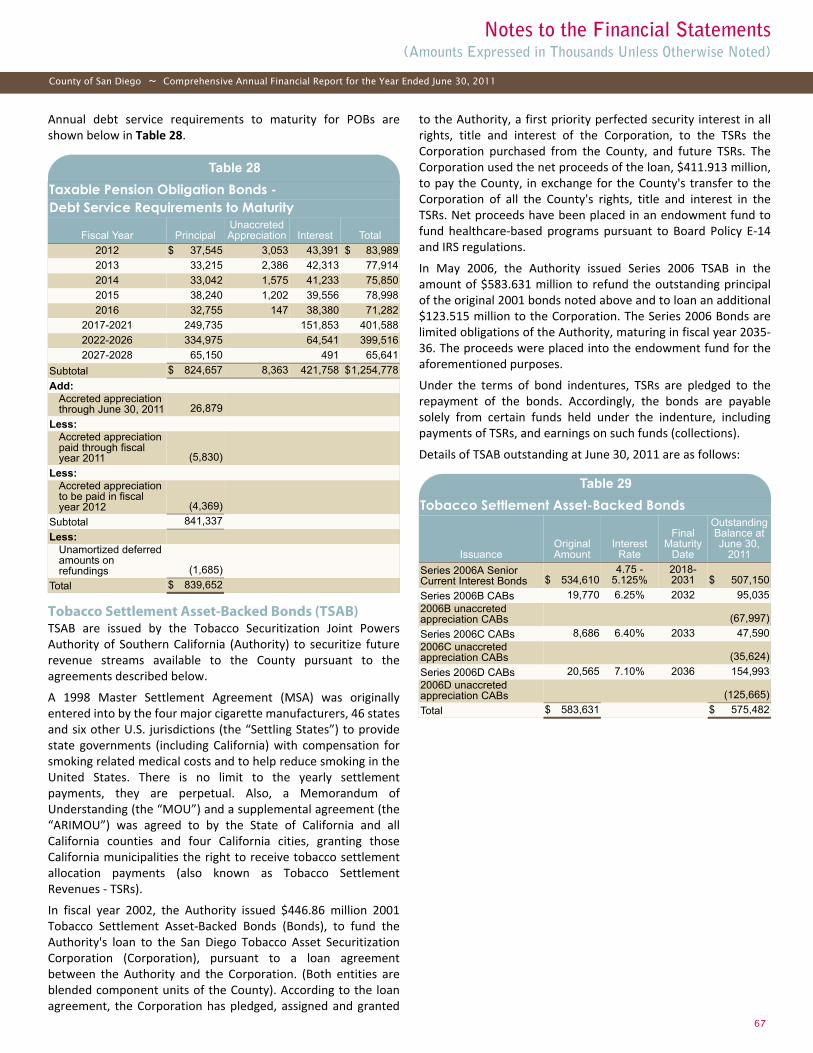
67
Notes to the Financial Statements(Amounts Expressed in Thousands Unless Otherwise Noted)
County of San Diego ~ Comprehensive Annual Financial Report for the Year Ended June 30, 2011
Annual debt service requirements to maturity for POBs areshown below in Table 28.
Tobacco Settlement Asset-Backed Bonds (TSAB)TSAB are issued by the Tobacco Securitization Joint PowersAuthority of Southern California (Authority) to securitize futurerevenue streams available to the County pursuant to theagreements described below.
A 1998 Master Settlement Agreement (MSA) was originallyentered into by the four major cigarette manufacturers, 46 statesand six other U.S. jurisdictions (the “Settling States”) to providestate governments (including California) with compensation forsmoking related medical costs and to help reduce smoking in theUnited States. There is no limit to the yearly settlementpayments, they are perpetual. Also, a Memorandum ofUnderstanding (the “MOU”) and a supplemental agreement (the“ARIMOU”) was agreed to by the State of California and allCalifornia counties and four California cities, granting thoseCalifornia municipalities the right to receive tobacco settlementallocation payments (also known as Tobacco SettlementRevenues - TSRs).
In fiscal year 2002, the Authority issued $446.86 million 2001Tobacco Settlement Asset-Backed Bonds (Bonds), to fund theAuthority's loan to the San Diego Tobacco Asset SecuritizationCorporation (Corporation), pursuant to a loan agreementbetween the Authority and the Corporation. (Both entities areblended component units of the County). According to the loanagreement, the Corporation has pledged, assigned and granted
to the Authority, a first priority perfected security interest in allrights, title and interest of the Corporation, to the TSRs theCorporation purchased from the County, and future TSRs. TheCorporation used the net proceeds of the loan, $411.913 million,to pay the County, in exchange for the County's transfer to theCorporation of all the County's rights, title and interest in theTSRs. Net proceeds have been placed in an endowment fund tofund healthcare-based programs pursuant to Board Policy E-14and IRS regulations.
In May 2006, the Authority issued Series 2006 TSAB in theamount of $583.631 million to refund the outstanding principalof the original 2001 bonds noted above and to loan an additional$123.515 million to the Corporation. The Series 2006 Bonds arelimited obligations of the Authority, maturing in fiscal year 2035-36. The proceeds were placed into the endowment fund for theaforementioned purposes.
Under the terms of bond indentures, TSRs are pledged to therepayment of the bonds. Accordingly, the bonds are payablesolely from certain funds held under the indenture, includingpayments of TSRs, and earnings on such funds (collections).
Details of TSAB outstanding at June 30, 2011 are as follows:
Table 28
Taxable Pension Obligation Bonds -Debt Service Requirements to Maturity
Fiscal Year PrincipalUnaccreted Appreciation Interest Total
2012 $ 37,545 3,053 43,391 $ 83,989
2013 33,215 2,386 42,313 77,914
2014 33,042 1,575 41,233 75,850
2015 38,240 1,202 39,556 78,998
2016 32,755 147 38,380 71,282
2017-2021 249,735 151,853 401,588
2022-2026 334,975 64,541 399,516
2027-2028 65,150 491 65,641
Subtotal $ 824,657 8,363 421,758 $1,254,778
Add:Accreted appreciation through June 30, 2011 26,879
Less:Accreted appreciation paid through fiscal year 2011 (5,830)
Less:Accreted appreciation to be paid in fiscal year 2012 (4,369)
Subtotal 841,337
Less:Unamortized deferred amounts on refundings (1,685)
Total $ 839,652
Table 29
Tobacco Settlement Asset-Backed Bonds
IssuanceOriginal Amount
Interest Rate
Final Maturity
Date
Outstanding Balance at June 30,
2011
Series 2006A Senior Current Interest Bonds $ 534,610
4.75 - 5.125%
2018-2031 $ 507,150
Series 2006B CABs 19,770 6.25% 2032 95,0352006B unaccreted appreciation CABs (67,997)
Series 2006C CABs 8,686 6.40% 2033 47,5902006C unaccreted appreciation CABs (35,624)
Series 2006D CABs 20,565 7.10% 2036 154,9932006D unaccreted appreciation CABs (125,665)
Total $ 583,631 $ 575,482

68
Notes to the Financial Statements(Amounts Expressed in Thousands Unless Otherwise Noted)
Comprehensive Annual Financial Report for the Year Ended June 30, 2011 ~ County of San Diego
Annual debt service requirements to maturity for TSAB are asfollows:
TSAB pledged revenue for the year ended June 30, 2011 was asfollows:
San Diego County Redevelopment Agency (CRA) Revenue Refunding BondsIn December 2005, the San Diego County Redevelopment Agency(CRA) issued $16 million Revenue Refunding Bonds Series 2005Athat mature in fiscal year 2033. The CRA has pledged property taxincrement revenues generated within the Gillespie Field ProjectArea to pay for the bonds. Gillespie Field Airport revenues mayalso be used to fund debt service payments if there areinsufficient property tax increment revenues to cover a particularfiscal year's debt service requirement. Bonds are also payablefrom funds held under the indenture, including earnings on suchfunds.
CRA revenue refunding bonds outstanding at June 30, 2011 werethe following:
Annual debt service requirements to maturity for CRA bonds areas follows:
CRA pledged revenue for the year ended June 30, 2011 was asfollows:
Loans - Governmental Activities Loans for various governmental activities included a UnitedStates Department of Agriculture Farmers Home Administrationloan for the construction of low income housing; and CaliforniaEnergy Commission loans to fund various projects in Countyfacilities to increase energy efficiency.
As of June 30, 2011, the County has received $2.565 million fromthe California Energy Commission (CEC Loan 3) from an existingauthorized loan amount of $3 million. The loan amount of $2.565million represents costs to fund multiple energy efficient projects
Table 30
Tobacco Settlement Asset-Backed Bonds -Debt Service Requirements to Maturity
Fiscal Year PrincipalUnaccreted Appreciation Interest Total
2012 $ 10,360 4,613 25,401 $ 40,374
2013 11,265 4,926 24,905 41,096
2014 12,195 5,260 24,366 41,821
2015 13,165 5,617 23,783 42,565
2016 14,245 5,998 23,154 43,397
2017-2021 100,660 36,674 103,370 240,704
2022-2026 149,410 50,938 73,228 273,576
2027-2031 205,686 70,540 29,352 305,578
2032-2036 39,185 44,721 83,906
Subtotal $ 556,171 229,287 327,559 $ 1,113,017
Add:Accreted appreciation through June 30, 2011 19,311
Subtotal 575,482
Less:Unamortized issuance discount (15,018)Unamortized deferred amounts on refundings (4,425)
Total $ 556,039
Table 31
Tobacco Settlement Asset-Backed Bonds -Pledged Revenues
Fiscal Year 2011
Debt Pledged
Final Maturity
Date
Pledged Revenue To
Maturity
Debt Principal & Interest
Paid
Pledged Revenue Received
Series 2006 Tobacco Settlement Asset-Backed Bonds 2036 $ 1,132,328 $ 28,579 $ 26,818
Table 32
CRA Revenue Refunding Bonds
IssuanceOriginal Amount
Interest Rate
Final Maturity
Date
Outstanding Balance at June 30,
2011
Revenue Refunding Bonds Series 2005A $ 16,000
3.65 - 5.75% 2033 $ 14,280
Total $ 16,000 $ 14,280
Table 33
CRA Revenue Refunding Bonds -Debt Service Requirements to Maturity
Fiscal Year Principal Interest Total
2012 $ 375 766 $ 1,141
2013 395 748 1,143
2014 415 728 1,143
2015 430 708 1,138
2016 455 686 1,141
2017-2021 2,635 3,046 5,681
2022-2026 3,405 2,247 5,652
2027-2031 4,475 1,138 5,613
2032-2033 1,695 91 1,786
Total $ 14,280 10,158 $ 24,438
Less:Unamortized issuance discount (37)
Total $ 14,243
Table 34
CRA Revenue Refunding Bonds -Pledged Revenues
Fiscal Year 2011
Debt Pledged
Final Maturity
Date
Pledged Revenue To
Maturity
Debt Principal & Interest
Paid
Pledged Revenue Received
Series 2005A Revenue Refunding Bonds 2033 $ 24,438 $ 1,143 $ 1,063

69
Notes to the Financial Statements(Amounts Expressed in Thousands Unless Otherwise Noted)
County of San Diego ~ Comprehensive Annual Financial Report for the Year Ended June 30, 2011
in County facilities incurred as of the authorized date ofcompletion of June 30, 2010. Semi-annual interest and principalpayments will be made in twenty equal installments at a fixedinterest rate of 4.50% with the first loan repayment havingoccurred on December 22, 2010 and every June 22 andDecember 22 thereafter.
Details of loans outstanding at June 30, 2011 for governmentalactivities are as follows:
Annual debt service requirements to maturity for loans -governmental activities are as follows:
Loans - Business-Type ActivitiesLoans for business-type activities included California Departmentof Transportation loans for the construction of a sewer line andthe installation of a control tower at the Ramona Airport.
Details of loans outstanding at June 30, 2011 for business-typeactivities are as follows:
Annual debt service requirements to maturity for loans -business-type activities are as follows:
Prior Year Defeasance of Long-Term DebtIn prior years, the County defeased TSAB by placing the proceedsof the original issue plus additional County contributions in anirrevocable trust to provide for all future debt service paymentson the old obligation. Accordingly, the trust account assets andthe liability for the defeased obligation are not included in theCounty's financial statements. At June 30, 2011, $412.535 millionof bonds were legally defeased and remain outstanding.
ArbitrageIn compliance with the Tax Reform Act of 1986 and subsequentU.S. Treasury Regulations, the County performed arbitragerebate calculations via a third party to determine probableamounts due to the Federal government. At June 30, 2011, $220of arbitrage rebate liability has been included in the statement ofnet assets.
Table 35
Loans - Governmental Activities
IssuanceOriginal Amount
Interest Rate
Final Maturity
Date
Outstanding Balance at June 30,
2011Loans - non internal service funds (ISF)
Firebird Manor $ 4,486 1.00% 2028 $ 2,541
Total loans - non-ISF 4,486 2,541
Loans - ISFCalifornia Energy Comm Loan 1 (Facilities ISF) 1,977 4.00% 2015 769California Energy Comm Loan 2 (Facilities ISF) 3,001 3.95% 2016 1,511California Energy Comm Loan 3 (Facilities ISF) 2,565 4.50% 2018 2,341
Total loans - ISF 7,543 4,621
Total $ 12,029 $ 7,162
Table 36
Loans - Governmental ActivitiesDebt Service Requirements to Maturity
Fiscal Year Principal Interest Total
2012 $ 994 212 $ 1,206
2013 1,034 174 1,208
2014 1,071 136 1,207
2015 993 95 1,088
2016 493 65 558
2017-2021 1,491 126 1,617
2022-2026 784 38 822
2027-2028 302 4 306
Total $ 7,162 850 $ 8,012
Table 37
Loans - Business-type Activities
LoanOriginal Amount
Interest Rate
Final Maturity
Date
Outstanding Balance at June 30,
20112001 Airport Development Loan - Ramona Sewer Line $ 2,388 5.63% 2017 $ 1,0432001 Airport Development Loan - Ramona Control Tower 1,196 5.63% 2017 523
Total $ 3,584 $ 1,566
Table 38
Loans - Business-type ActivitiesDebt Service Requirements to Maturity
Fiscal Year Principal Interest Total
2012 $ 254 88 $ 342
2013 267 74 341
2014 279 59 338
2015 292 43 335
2016 304 27 331
2017 170 10 180
Total $ 1,566 301 $ 1,867

70
Notes to the Financial Statements(Amounts Expressed in Thousands Unless Otherwise Noted)
Comprehensive Annual Financial Report for the Year Ended June 30, 2011 ~ County of San Diego
NOTE 14Changes in Long-Term LiabilitiesLong-term liability activities for the year ended June 30, 2011 were as follows:
NOTE 15Funds Used to Liquidate LiabilitiesThe following funds presented in Table 40 below have typicallybeen used to liquidate other long-term obligations in prior years:
NOTE 16Reassessment District Improvement BondsIn July of 1991, the County issued $28.804 million of 4-S Ranchbonds to finance the acquisition and construction of variouspublic improvements required for the development of landlocated in north San Diego County west of Interstate 15 and thecommunity of Rancho Bernardo. In July of 1997 the 4-S Ranchbonds were refunded. The County Treasurer-Tax Collector acts asan agent for property owners and bondholders in collecting andforwarding special assessment monies. The County is notobligated to pay for any special assessment bonds. Specialassessment debt is solely the obligation of various separategovernmental agencies. The County has covenanted to initiatejudicial foreclosure in the event of a delinquency in the paymentof reassessments. The amount of the 4-S Ranch specialassessment debt outstanding for which the County is a fiduciaryis $3.885 million at June 30, 2011.
Table 39
Changes in Long-Term LiabilitiesBeginning Balance at
July 1, 2010 Additions ReductionsAccreted Interest
Ending Balance at
June 30, 2011
Amounts Due Within One
Year
Governmental Activities:
COPs, bonds & loansCertificates of participation and lease revenue bonds $ 422,260 19,260 (49,420) 392,100 $ 23,795
Taxable pension obligation bonds 874,336 (36,590) 3,591 841,337 37,545
Tobacco settlement asset-backed bonds 574,157 (2,995) 4,320 575,482 10,360
CRA revenue refunding bonds 14,640 (360) 14,280 375
Loans - non-internal service funds 2,671 (130) 2,541 139
Loans - internal service funds (ISF) 4,733 655 (767) 4,621 855
Arbitrage 455 220 (455) 220 220
Unamortized issuance premiums 15,499 1,237 (1,943) 14,793 1,139
Unamortized issuance discounts (16,126) 1,071 (15,055) (1,071)
Unamortized deferred amounts on refundings (16,502) (49) 5,724 (10,827) (4,931)
Total COPs, bonds & loans 1,876,123 21,323 (85,865) 7,911 1,819,492 68,426
Other long-term liabilities:
Capital Leases - ISF $ 242 (30) 212 $ 27
Claims and judgments - ISF 118,099 47,657 (30,157) 135,599 36,352
Compensated absences -non-ISF 97,766 66,930 (68,990) 95,706 37,708
Compensated absences - ISF 2,200 1,704 (1,630) 2,274 938
Landfill closure and postclosure 20,917 (492) 20,425 639
Total Other long-term liabilities 239,224 116,291 (101,299) 254,216 75,664
Total Governmental Activities $ 2,115,347 137,614 (187,164) 7,911 2,073,708 $ 144,090
Business-type activities:
Loans $ 1,809 (243) 1,566 $ 254
Compensated absences 460 321 (353) 428 176
Total Business-type Activities $ 2,269 321 (596) 1,994 $ 430
Table 40
Liquidated LiabilitiesLiability Fund(s) Used to Liquidate in Prior Years
Claims & Judgments
Internal Service Funds - Employee Benefits Fund and Public Liability Insurance Fund
Compensated Absences
General Fund; Special Revenue Funds - County Library, Road, and Air Pollution; Internal Service Funds - Facilities Management, Fleet Services and Purchasing; and, Enterprise Funds - Airport and Wastewater Management
Landfill Closure and Postclosure General Fund

71
Notes to the Financial Statements(Amounts Expressed in Thousands Unless Otherwise Noted)
County of San Diego ~ Comprehensive Annual Financial Report for the Year Ended June 30, 2011
NOTE 17Conduit Debt ObligationsFrom time to time, the County has issued tax-exempt conduitdebt under the authority of Chapter 7 of Part 5 of Division 3 ofthe Health and Safety Code of the State of California on behalf ofqualified borrowers to provide financial assistance for projectsdeemed to be of public interest.
Conduit debt consisted of the following: a) fourteen certificatesof participation (COPs) for the acquisition, construction, capitalimprovement and equipping of various facilities and b) fourmortgage revenue bonds for the construction and permanentfinancing of multi-family residential rental projects located in theCounty to be partially occupied by persons of low or moderateincomes. Conduit debt is secured by the property that is financedand is payable from the respective COPs' base rentals; andunderlying payments on mortgage loans. Upon repayment of thedebt, ownership of the acquired facilities transfers to the private-sector entity served by the debt issuance.
The County is not obligated in any manner for repayment of thisdebt. Accordingly, the debt is not reported as liabilities in theaccompanying financial statements.
As of June 30, 2011, the aggregate conduit debt principal amountoutstanding was $323.176 million.
NOTE 18Landfill Site Closure and Postclosure Care Costs State laws and regulations require the placement of final coverson all landfill sites that stopped accepting solid waste afterOctober 9, 1991 and the performance of certain maintenanceand monitoring functions at these sites for a minimum of 30years after closure. Closure and postclosure care costs are paidnear or after the date a landfill stops accepting waste. The SanMarcos Landfill is the sole waste disposal site owned by theCounty that is subject to these regulations. It was operationaland accepted solid waste from 1979 until March 11, 1997. Formalclosure of this landfill spanned from July 2004 through March2007. Post closure maintenance began in April 2007.
The projected landfill closure and postclosure care liability atJune 30, 2011 for the San Marcos Landfill was $20.425 million.This estimated amount is based on what it would cost to performall closure and postclosure care in calendar year 2011 dollars andis subject to change as a result of such factors including but notlimited to: inflation; deflation; advancements in technology; andamendments to laws and regulations.
In addition to the above, state regulations require that landfillclosure and postclosure maintenance costs be fully funded at thetime of closure, unless a landfill owner/operator candemonstrate financial responsibility towards these activities byusing other approved financial assurance alternatives. A pledgeof revenue is one of various alternatives allowed to fundestimated postclosure costs. Under this alternative, the Board ofSupervisors, on February 3, 1998, approved Minute Order No. 5
“Postclosure Maintenance Funding for the San Marcos Landfill”,wherein the County entered into a pledge of revenue agreementwith the California Integrated Waste Management Board(CIWMB). Pursuant to Resolution No. 98-24, adopted underMinute Order No. 5, the Board directed that the amount ofpledged revenue shall be equal to $790 thousand per year for the30 year period of postclosure maintenance commencing uponcompletion of the final closure of the San Marcos Landfill. Thepledged amount is a promise of existing funds rather than futurerevenues and may increase or decrease to match any adjustmentto identified cost estimates that are mutually agreed to by theCounty and the CIWMB.
As of June 30, 2011, $24.885 million has been spent on closurecosts, including revegetation. As part of final closurerequirements, the County was required to vegetate the coversurface of the landfill. As of June 30, 2011 the work wassubstantially complete, however, $835 thousand of net assets ofthe government-wide statement of net assets has beenrestricted for potential remaining closure costs of the San MarcosLandfill until the Notice of Completion is considered final by allinterested entities.
Regulations governing solid waste management are promulgatedby government agencies on the federal and state levels. Theseregulations address the design, construction, operation,maintenance, closure and postclosure maintenance of varioustypes of facilities; acceptable and prohibited waste types; andinspection, permitting, environmental monitoring and solidwaste recycling requirements. Regulations at both the state andfederal levels could impose retroactive liability, particularly withrespect to cleanup activities relating to any landfill site everoperated by the County, whether or not owned by the County.Thus, the County has potential liability with respect to everylandfill ever owned, operated, contracted to be operated, or intowhich the County disposed waste. Compliance with theseregulations may be costly, and, as more stringent standards aredeveloped to protect the environment, these costs couldincrease.
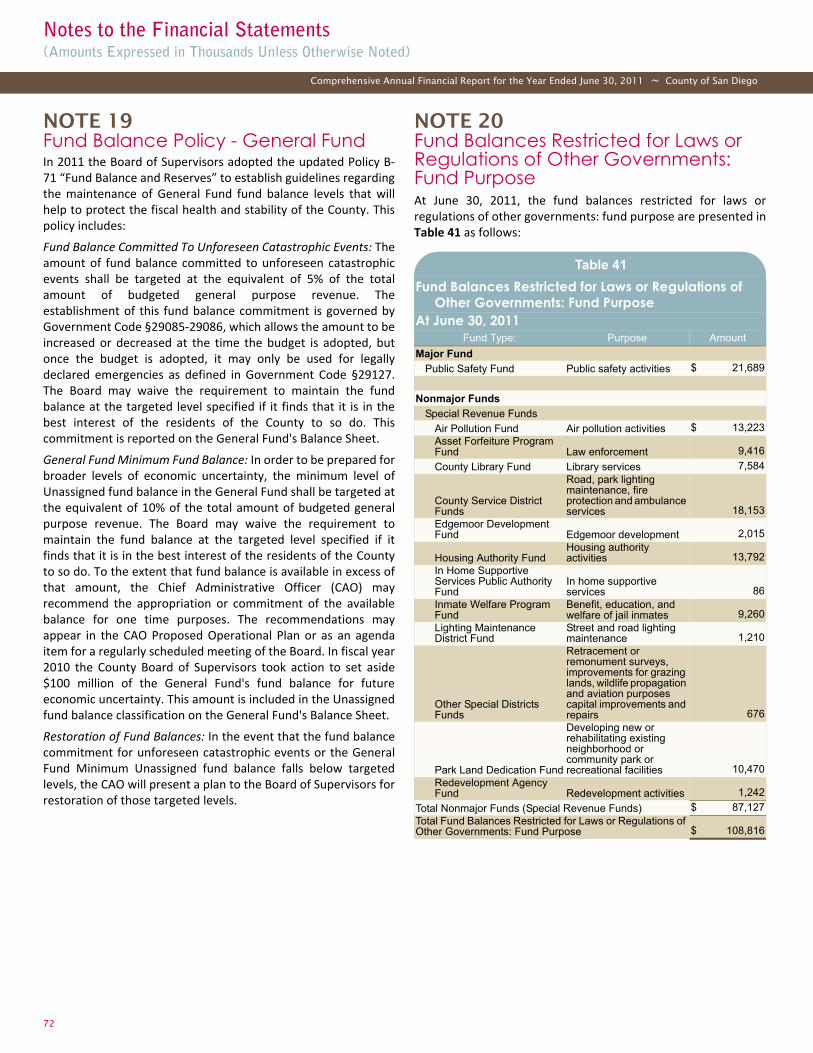
72
Notes to the Financial Statements(Amounts Expressed in Thousands Unless Otherwise Noted)
Comprehensive Annual Financial Report for the Year Ended June 30, 2011 ~ County of San Diego
NOTE 19Fund Balance Policy - General Fund In 2011 the Board of Supervisors adopted the updated Policy B-71 “Fund Balance and Reserves” to establish guidelines regardingthe maintenance of General Fund fund balance levels that willhelp to protect the fiscal health and stability of the County. Thispolicy includes:
Fund Balance Committed To Unforeseen Catastrophic Events: Theamount of fund balance committed to unforeseen catastrophicevents shall be targeted at the equivalent of 5% of the totalamount of budgeted general purpose revenue. Theestablishment of this fund balance commitment is governed byGovernment Code §29085-29086, which allows the amount to beincreased or decreased at the time the budget is adopted, butonce the budget is adopted, it may only be used for legallydeclared emergencies as defined in Government Code §29127.The Board may waive the requirement to maintain the fundbalance at the targeted level specified if it finds that it is in thebest interest of the residents of the County to so do. Thiscommitment is reported on the General Fund's Balance Sheet.
General Fund Minimum Fund Balance: In order to be prepared forbroader levels of economic uncertainty, the minimum level ofUnassigned fund balance in the General Fund shall be targeted atthe equivalent of 10% of the total amount of budgeted generalpurpose revenue. The Board may waive the requirement tomaintain the fund balance at the targeted level specified if itfinds that it is in the best interest of the residents of the Countyto so do. To the extent that fund balance is available in excess ofthat amount, the Chief Administrative Officer (CAO) mayrecommend the appropriation or commitment of the availablebalance for one time purposes. The recommendations mayappear in the CAO Proposed Operational Plan or as an agendaitem for a regularly scheduled meeting of the Board. In fiscal year2010 the County Board of Supervisors took action to set aside$100 million of the General Fund's fund balance for futureeconomic uncertainty. This amount is included in the Unassignedfund balance classification on the General Fund's Balance Sheet.
Restoration of Fund Balances: In the event that the fund balancecommitment for unforeseen catastrophic events or the GeneralFund Minimum Unassigned fund balance falls below targetedlevels, the CAO will present a plan to the Board of Supervisors forrestoration of those targeted levels.
NOTE 20Fund Balances Restricted for Laws or Regulations of Other Governments: Fund Purpose At June 30, 2011, the fund balances restricted for laws orregulations of other governments: fund purpose are presented inTable 41 as follows:
Table 41
Fund Balances Restricted for Laws or Regulations of Other Governments: Fund Purpose
At June 30, 2011Fund Type: Purpose Amount
Major Fund
Public Safety Fund Public safety activities $ 21,689
Nonmajor Funds
Special Revenue Funds
Air Pollution Fund Air pollution activities $ 13,223Asset Forfeiture Program Fund Law enforcement 9,416
County Library Fund Library services 7,584
County Service District Funds
Road, park lighting maintenance, fire protection and ambulance services 18,153
Edgemoor Development Fund Edgemoor development 2,015
Housing Authority FundHousing authority activities 13,792
In Home Supportive Services Public Authority Fund
In home supportive services 86
Inmate Welfare Program Fund
Benefit, education, and welfare of jail inmates 9,260
Lighting Maintenance District Fund
Street and road lighting maintenance 1,210
Other Special Districts Funds
Retracement or remonument surveys, improvements for grazing lands, wildlife propagation and aviation purposes capital improvements and repairs 676
Park Land Dedication Fund
Developing new or rehabilitating existing neighborhood or community park or recreational facilities 10,470
Redevelopment Agency Fund Redevelopment activities 1,242
Total Nonmajor Funds (Special Revenue Funds) $ 87,127Total Fund Balances Restricted for Laws or Regulations of Other Governments: Fund Purpose $ 108,816

73
Notes to the Financial Statements(Amounts Expressed in Thousands Unless Otherwise Noted)
County of San Diego ~ Comprehensive Annual Financial Report for the Year Ended June 30, 2011
NOTE 21Fund Balances Restricted for Laws or Regulations of Other Governments: Other PurposesAt June 30, 2011, the fund balances restricted for laws orregulations of other governments: other purposes are presentedin Table 42 as follows:
NOTE 22Fund Balances Committed to Other PurposesAt June 30, 2011, the fund balances committed to other purposesare presented in Table 43 as follows:
Table 42
Fund Balances Restricted for Laws or Regulations of Other Governments: Other Purposes
At June 30, 2011Major Fund
General Fund
Teeter tax loss $ 22,264
Justice, health, social and other facilities 19,654
Defray administrative costs, other general restrictions 16,208Improvement and maintenance of recorded document systems 14,300
Vector control 13,227
Mental health 16,793
Fingerprinting equipment purchase and operation 8,526
Sheriff automated warrant system 5,170
Public Defender defense of indigent cases 3,922Emergency medical services, various construction costs 3,307
Domestic violence and child abuse prevention 2,905
Sheriff vehicle maintenance and replacement 1,501
Real estate fraud prosecution 1,464Equipment replacement/system enhancement Caller ID Remote Access Network 1,163
Landfill closure costs 835Administration, operation and conservation of trails, paths or other facilities for off-highway motor vehicles 504
Social Services child safety education 101
Total General Fund $ 131,844
Nonmajor Funds
Special Revenue Funds
Flood Control District Fund
Flood control future drainage improvements $ 21,799
Housing Authority Fund
Housing repairs and improvements 164
Total Special Revenue Funds $ 21,963Total Fund Balances Restricted for Laws or Regulations of Other Governments: Other Purposes $ 153,807
Table 43
Fund Balances Committed To Other PurposesAt June 30, 2011Major Fund
General FundRegional communication system infrastructure enhancements $ 15,221
Health based programs reducing adult/youth smoking 8,084
Sheriff Department future capital expenditures 4,000
Sheriff Department helicopter replacement 2,674
Registrar of Voters services 1,260
Future lease payments 1,250
Department of Environmental Health services 1,170
Landfill closure, postclosure and landfill maintenance 857
Department of Planning and Land Use services 659
Management of conduit financing programs 531
Registrar of Voters equipment acquisition 445
Future replacement of HHSA public health clinic 275
Assessor/Recorder/County Clerk services 111
Parks and Recreation land acquisition 84
South County Shelter capital improvements 60
Housing Authority future lease payments 41Senior Volunteer Patrols Program in the unincorporated communities 38
Capital Improvement 12
Clerk of the Board services 5
Total General Fund $ 36,777
Nonmajor Funds
Special Revenue Funds
Inactive Wastesites FundLandfill closure, postclosure and landfill maintenance $ 68,366
Total Special Revenue Funds $ 68,366
Total Fund Balances Committed to Other Purposes $ 105,143

74
Notes to the Financial Statements(Amounts Expressed in Thousands Unless Otherwise Noted)
Comprehensive Annual Financial Report for the Year Ended June 30, 2011 ~ County of San Diego
NOTE 23Fund Balances Assigned to Other PurposesAt June 30, 2011, the fund balances assigned to other purposesare presented in Table 44 as follows:
NOTE 24Net Assets Restricted for Laws or Regulations of Other Governments: Other PurposesAt June 30, 2011, the net assets restricted for laws or regulationsof other governments: other purposes are presented in Table 45as follows:Table 44
Fund Balances Assigned to Other PurposesAt June 30, 2011Major Fund
General Fund
Health, mental health and social services $ 10,503Law enforcement, detention, legal and other protection services 8,476
Legislative and administrative services 7,186
Park and Recreation services 3,532Planning, land use, agriculture, watershed and other public services 3,170
Assessor/Recorder/County Clerk services 2,633
Fire protection 2,304
Maintenance 1,307
Treasurer-Tax Collector services 945
Registrar of Voters services 280
Animal Services 278
Total General Fund $ 40,614
Table 45
Net Assets Restricted for Laws or Regulations of Other Governments: Other Purposes
At June 30, 2011Flood control future drainage improvements $ 21,799
Public safety activities 21,689
Justice, health, social and other facilities 19,654Road, park lighting maintenance, fire protection and ambulance services 18,153
Housing Authority activities 13,792
Air pollution activities 13,223Developing new or rehabilitating existing neighborhood or community park or recreational facilities 10,470
Law enforcement 9,416
Benefit, education, and welfare of jail inmates 9,260
Edgemoor development 8,382
Library services 7,584
Sheriff automated warrant system 5,170
Public Defender defense of indigent cases 3,922
Emergency medical services, various construction costs 3,307
Domestic violence and child abuse prevention 2,905
Sheriff vehicle maintenance and replacement 1,501
Real estate fraud prosecution 1,464
Redevelopment activities 1,242
Street and road lighting maintenance 1,210Equipment replacement/system enhancement Caller ID Remote Access Network 1,163
Landfill closure costs 835Retracement or remonument surveys, improvements for grazing lands, wildlife propagation and aviation purpose capital improvements and repairs 676Administration, operation and conservation of trails, paths or other facilities for off-highway motor vehicles 504
Social services child safety education 101
In home supportive services 86Total Net Assets Restricted for Laws or Regulations of Other Governments: Other Purposes $ 177,508

75
Notes to the Financial Statements(Amounts Expressed in Thousands Unless Otherwise Noted)
County of San Diego ~ Comprehensive Annual Financial Report for the Year Ended June 30, 2011
NOTE 25Risk ManagementThe County operates a Risk Management Program, whereby it isself-insured for general liability (California Government CodeSection 990), medical malpractice (California Government CodeSection 990.9), automobile liability (California Vehicle CodeSection 16020(b)(4)) and workers’ compensation (California Codeof Regulations, Title 8, Section 15203.4). The County purchasesinsurance coverage for all risk property losses, government crimeinsurance, including employee dishonesty and faithfulperformance, airport comprehensive liability, and aircraft hulland liability insurance. Settlements in the areas covered have notexceeded insurance coverage for each of the past three fiscalyears.
The County's Employee Benefits and Public Liability InsuranceInternal Service Funds (ISF) are used to report all of its uninsuredrisk management activities. Risk management liabilities arereported when it is probable that a loss has occurred and theamount of that loss can be reasonably estimated. Actuarialevaluations were obtained which determine estimates of knownand projected public liability and workers compensation claimliabilities. These evaluations include estimates for claims incurredbut not reported; allocated and unallocated loss adjustmentexpenses; and amounts for incremental claim adjustmentexpenses related to specific claims and other claim adjustmentexpenses regardless of whether allocated to specific claims.
At June 30, 2011, these liabilities discounted for anticipatedinvestment return (public liability of 1% and workers’compensation of 3%), totaled $135.6 million, including $29million in public liability and $106.6 million in workers'compensation. Changes in the balances of claim liabilities forfiscal year 2011 and 2010 are shown below:
NOTE 26ContingenciesLitigationThe County has a potential liability of $15.7 million that couldresult if unfavorable final decisions are rendered in numerouslawsuits to which the County is a named defendant.
Appropriations are budgeted annually for those portions ofobligations coming due that fiscal year.
Unrecorded Leave BenefitsCounty employees have unrecorded accumulated benefits ofapproximately $173.96 million in sick leave, holiday andcompensatory time. With the exception of sick leave for eligibleemployees, these benefits are not payable to employees upontermination and are normally liquidated at year end or asemployees elect to use their benefits per Civil Service rules andregulations. Accumulated vacation, sick leave, and compensatorytime-off for which employees are eligible for payment uponseparation have been recorded as liabilities in the appropriateproprietary funds and the statement of net assets.
Federal and State ProgramsAmounts received or receivable from grantor agencies aresubject to audit and adjustment by grantor agencies, principallythe federal government. Any disallowed claims, includingamounts already collected, may constitute a liability of theapplicable funds. The amount, if any, of expenditures that maybe disallowed by the grantor cannot be determined at this time,although the County expects such amounts, if any, to beimmaterial.
NOTE 27Joint Ventures The San Diego Geographic Information Source (SanGIS) wascreated in July 1997 as a joint powers agreement between theCity of San Diego and the County of San Diego. SanGIS objectivesare to create and maintain a geographic information system;marketing and licensing compiled digital geographic data andsoftware; providing technical services; and publishing geographicand land related information for the City and the County, otherpublic agencies, and the private sector. It is governed by a Boardof Directors consisting of the Chief Operating Officer and theChief Administrative Officer. SanGIS relies mostly on an annualbudget of $1.3 million shared equally by the City and the Countyto supplement its operating revenues. In its latest report, SanGISreported a decrease in net assets of $1 thousand and ending netassets of $149 thousand for the fiscal year ended June 30, 2010.The financial report may be obtained by writing to SanGIS at5201 Ruffin Road, Suite E, San Diego CA 92123 or by calling (858)874-7000 or by e-mail at [email protected].
The County is a participant with eighteen incorporated cities tooperate the Unified San Diego County Emergency ServicesOrganization for the purpose of providing regional planning andmutual assistance in the event of an emergency in the regionincluding accidents involving hazardous waste. The organizationis governed by the Unified Disaster Council (UDC) with one votingmember from San Diego County Board of Supervisors who servesas Chair of the Council, and a representative from each of the 18incorporated cities. The County of San Diego Office of EmergencyServices (OES) serves as staff to the UDC. OES is a liaison betweenthe incorporated cities, the State Office of Emergency Services,the Federal Emergency Management Agency, and the American
Table 46
Risk Management - Changes in Claim Liabilities2011 2010
Employee Benefits Fund
Unpaid claims, July 1 $ 94,973 $ 88,563
Incurred claims 32,707 26,376
Claim payments (21,117) (19,966)
Unpaid claims, June 30 $ 106,563 $ 94,973
Public Liability Insurance Fund
Unpaid claims, July 1 $ 23,126 $ 19,965
Incurred claims 14,950 4,175
Claim payments (9,040) (1,014)
Unpaid claims, June 30 $ 29,036 $ 23,126

76
Notes to the Financial Statements(Amounts Expressed in Thousands Unless Otherwise Noted)
Comprehensive Annual Financial Report for the Year Ended June 30, 2011 ~ County of San Diego
Red Cross. A contractual agreement requires that the cities andthe County provide the total required funding each year; one halffrom the cities and the other half from the County. In its latestreport, the organization reported a decrease in net assets of $72thousand and ending net assets of $306 thousand for the fiscalyear ended June 30, 2010. Separate financial statements may beobtained from the Operational Area Emergency OperationsCenter, 5555 Overland Avenue, Suite 1911, San Diego CA 92123or by calling (858) 565-3490.
The City of San Diego and the County of San Diego jointly formeda Consortium under the Workforce Investment Act of 1998 toprovide regional employment and training services. TheConsortium is governed by a five member board consisting oftwo members designated from the County Board of Supervisors,two members designated from the San Diego City Council andone member from the Board of Directors of United Way, acharitable organization. The board assigned the San DiegoWorkforce Partnership, Inc. as the grant recipient and theadministrative entity to operate the San Diego Consortium. TheCity and the County agreed to share equally any debt or liabilityincurred with respect to State and Federal grants. For the yearended June 30, 2010, the Partnership reported an increase in netassets of $73 thousand and ending net assets of $182 thousand.Complete financial reports may be obtained by writing to the SanDiego Workforce Partnership, 3910 University Avenue, Suite 400,San Diego CA 92105-1326 or by calling (619) 228-2900.
NOTE 28Pension and Retiree Health Plans Pension Plan Plan Description
The County contributes to the San Diego County EmployeesRetirement Association pension plan, (SDCERA-PP), a cost-sharing multiple-employer defined benefit pension plan that isadministered by SDCERA. The SDCERA-PP has four Tiers andprovides retirement, disability, death and survivor benefits to itsGeneral and Safety members. Tier B is the current open system.Tier I and Tier A are closed to new entrants but have activemembers and Tier II was eliminated for active members. TheRetirement Act, (also referred to as the Retirement Law of 1937and Government Code Section 31450 et.seq.) assigns the CountyBoard of Supervisors, the authority to establish and amendbenefit provisions and assigns the SDCERA Board of Retirementthe authority to approve retiree members and beneficiaries cost-of-living increases. (See note below regarding SDCERA FinancialReport information.)
Funding Policy
The Retirement Act requires that County and membercontributions be actuarially determined to provide a specific levelof benefit. Contribution rates are expressed as a percentage ofcovered payroll and member rates vary according to age at entry,benefit tier level and certain negotiated contracts that providefor the County to pay a portion of members' contributions.California Government Code Section 31454 requires the Board of
Supervisors to adjust the rates of the San Diego County employerand employee retirement contributions in accordance with therecommendations of the Board of Retirement of SDCERA.
The actuarially determined rates adopted by SDCERA establishedthe average member contribution rate at 10.28% for allcategories combined (General Tier I, General Tier A, General TierB, Safety Tier A and Safety Tier B members) and set the employercontribution rate for all categories combined at 20.46%.However, the Board of Supervisors chose to adopt employercontribution rates at a level higher than the levels recommendedby the actuary in order to accelerate the pay down of theunfunded actuarial accrued liability (UAAL) of the retirementfund and to help position the County and other memberemployers for an expected further increase in rates in Fiscal Year2011-12. The average employer contribution rate for allcategories combined adopted by the Board of Supervisors was23.5%.
CoSD employer contributions to SDCERA-PP for the three yearsended June 30, 2011, which equaled or exceeded the requiredcontributions, were the following:
Retiree Health PlanPlan Description
Effective July 1, 2007, the County commenced contributing to theSDCERA retiree health plan, (SDCERA-RHP) a cost-sharingmultiple-employer defined benefit health plan administered bySDCERA. The Retirement Act assigns the authority to establishand amend health allowance benefits to the SDCERA Board ofRetirement. The retiree health plan provides a non-taxablehealth insurance allowance to Tier I and Tier II retirees. Healthinsurance allowances range from $200 per month to $400 permonth based on members’ service credits. (See note belowregarding SDCERA Financial Report information.)
Funding Policy
The SDCERA-RHP was established and is administered as anInternal Revenue Code Section 401(h) account within the definedbenefit pension plan under the authority granted by theRetirement Act to the SDCERA Board of Retirement. The SDCERA-RHP is funded by employer contributions that are based on anactuarially determined 20 year level dollar amortizationschedule. The health insurance allowance is not a vested benefitand may be reduced or discontinued at any time by the SDCERABoard of Retirement. Additionally, the total amount of employercontributions are limited by the provisions of 401(h).
Table 47
CoSD Employer Contributions - SDCERA - PP
Fiscal Year Ended June 30
Annual Required
Contribution (ARC)
Contributions Made
Percentage of ARC
Contributed
2011 $ 186,979 $ 214,978 115.0%
2010 172,453 176,243 102.2%
2009 200,146 200,146 100.0%

77
Notes to the Financial Statements(Amounts Expressed in Thousands Unless Otherwise Noted)
County of San Diego ~ Comprehensive Annual Financial Report for the Year Ended June 30, 2011
CoSD’s employer contributions to SDCERA-RHP for the threeyears ended June 30, 2011, which equaled or exceeded therequired contributions, were the following:
SDCERA Financial ReportSDCERA issues a publicly available financial report that includesfinancial statements and required supplementary information forthe SDCERA-PP and the SDCERA-RHP. The financial report may beobtained by writing to San Diego County Employees RetirementAssociation, 2275 Rio Bonito Way, Suite 200, San Diego,California 92108-1685 or by calling (619) 515-6800.
NOTE 29Fund Deficit
The Employee Benefits Fund deficit of $6.8 million resulted fromthe accrual of the estimated liability and costs associated withthe reported and unreported workers' compensation claims asprepared by an actuary for the reporting period ending June 30,2011. The liability increased to $106.5 million from the prioryear's estimate of $95.0 million. The County intends to reducethe deficit through increased premium rate charges to Countydepartments by $1.7 million per year in excess of projectedoperating expenses beginning in fiscal year 2012.
NOTE 30Subsequent EventsTax and Revenue Anticipation NotesIn July 2011, the County issued tax and revenue anticipationnotes (TRANS) totaling $50 million due June 29, 2012 at a couponrate of 2.00% and a yield of 0.26%. Proceeds from the notes willbe used to meet fiscal year 2012 cash flow requirements. Fiscalyear 2012 unrestricted revenues collateralize the notes.
San Diego County Capital Asset Leasing Corporation - “County of San Diego Certificates of Participation (County Administration Center Waterfront Park)”In August 2011, the San Diego County Capital Asset LeasingCorporation issued $32.665 million of fixed rate Certificate ofParticipation titled “County of San Diego Certificates ofParticipation (County Administration Center Waterfront Park (the
Series 2011 Certificates)”. The Series 2011 Certificates wereissued at fixed interest rates ranging from 3.00% to 5.125% withmaturity dates ranging from February 1, 2013 to February 1,2042.
These Certificates were issued with a discount of $182 thousand.Certificate proceeds of $32.483 million along with the County’scontribution of $14.2 million were distributed as follows:1) $30.004 million was transferred to the construction fund usedto pay construction costs on the County Administration CenterWaterfront Park project; 2) $14.2 million was transferred to theCounty’s capital project fund; 3) $2.094 million of proceeds wereused to fund the Certificates’ debt service reserve fund; 4) $151thousand was used to pay the underwriter’s discount; and 5)$234 thousand was set aside to pay certain costs of issuance.
NOTE 31New Governmental Accounting Standards Implementation StatusIn December 2009, the GASB issued Statement No. 57, OPEBMeasurements by Agent Employers and Agent Multiple-EmployerPlans. The objective of this Statement is to address issues relatedto the use of the alternative measurement method and thefrequency and timing of measurements by employers thatparticipate in agent multiple-employer other postemploymentbenefit (OPEB) plans (that is, agent employers).
This Statement amends Statement No. 45, Accounting andFinancial Reporting by Employers for Postemployment BenefitsOther Than Pensions, to permit an agent employer that has anindividual-employer OPEB plan with fewer than 100 total planmembers to use the alternative measurement method, at itsoption, regardless of the number of total plan members in theagent multiple-employer OPEB plan in which it participates.Consistent with this change to the employer-reportingrequirements, this Statement also amends a Statement No. 43,Financial Reporting for Postemployment Benefit Plans Other ThanPension Plans, requirement that a defined benefit OPEB planobtain an actuarial valuation. The amendment permits therequirement to be satisfied for an agent multiple-employer OPEBplan by reporting an aggregation of results of actuarial valuationsof the individual-employer OPEB plans or measurementsresulting from use of the alternative measurement method forindividual-employer OPEB plans that are eligible.
In addition, this Statement clarifies that when actuariallydetermined OPEB measures are reported by an agent multiple-employer OPEB plan and its participating employers, thosemeasures should be determined as of a common date and at aminimum frequency to satisfy the agent multiple-employer OPEBplan's financial reporting requirements.
The provisions of Statement No. 57 related to the use andreporting of the alternative measurement method are effectiveimmediately. The provisions related to the frequency and timingof measurements are effective for actuarial valuations first usedto report funded status information in OPEB plan financial
Table 48
COSD Employer Contributions - SDCERA-RHP
Fiscal Year Ended June 30
Annual Required
Contribution (ARC)
Contributions Made
Percentage of ARC
Contributed
2011 $ 16,239 $ 16,239 100.0%
2010 16,886 16,886 100.0%
2009 20,838 20,838 100.0%
Table 49
Fund DeficitAt June 30, 2011Internal Service Fund:
Employee Benefits Fund $ (6,821)
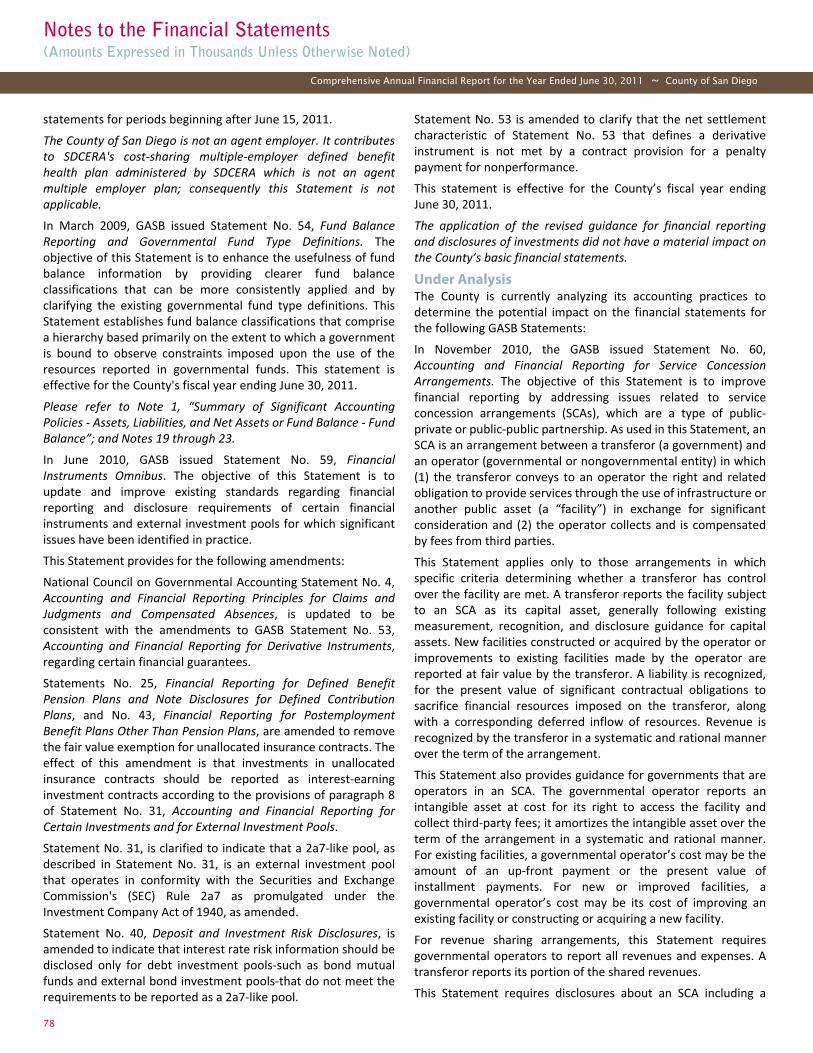
78
Notes to the Financial Statements(Amounts Expressed in Thousands Unless Otherwise Noted)
Comprehensive Annual Financial Report for the Year Ended June 30, 2011 ~ County of San Diego
statements for periods beginning after June 15, 2011.
The County of San Diego is not an agent employer. It contributesto SDCERA's cost-sharing multiple-employer defined benefithealth plan administered by SDCERA which is not an agentmultiple employer plan; consequently this Statement is notapplicable.In March 2009, GASB issued Statement No. 54, Fund BalanceReporting and Governmental Fund Type Definitions. Theobjective of this Statement is to enhance the usefulness of fundbalance information by providing clearer fund balanceclassifications that can be more consistently applied and byclarifying the existing governmental fund type definitions. ThisStatement establishes fund balance classifications that comprisea hierarchy based primarily on the extent to which a governmentis bound to observe constraints imposed upon the use of theresources reported in governmental funds. This statement iseffective for the County's fiscal year ending June 30, 2011.
Please refer to Note 1, “Summary of Significant AccountingPolicies - Assets, Liabilities, and Net Assets or Fund Balance - FundBalance”; and Notes 19 through 23.In June 2010, GASB issued Statement No. 59, FinancialInstruments Omnibus. The objective of this Statement is toupdate and improve existing standards regarding financialreporting and disclosure requirements of certain financialinstruments and external investment pools for which significantissues have been identified in practice.
This Statement provides for the following amendments:
National Council on Governmental Accounting Statement No. 4,Accounting and Financial Reporting Principles for Claims andJudgments and Compensated Absences, is updated to beconsistent with the amendments to GASB Statement No. 53,Accounting and Financial Reporting for Derivative Instruments,regarding certain financial guarantees.
Statements No. 25, Financial Reporting for Defined BenefitPension Plans and Note Disclosures for Defined ContributionPlans, and No. 43, Financial Reporting for PostemploymentBenefit Plans Other Than Pension Plans, are amended to removethe fair value exemption for unallocated insurance contracts. Theeffect of this amendment is that investments in unallocatedinsurance contracts should be reported as interest-earninginvestment contracts according to the provisions of paragraph 8of Statement No. 31, Accounting and Financial Reporting forCertain Investments and for External Investment Pools.
Statement No. 31, is clarified to indicate that a 2a7-like pool, asdescribed in Statement No. 31, is an external investment poolthat operates in conformity with the Securities and ExchangeCommission's (SEC) Rule 2a7 as promulgated under theInvestment Company Act of 1940, as amended.
Statement No. 40, Deposit and Investment Risk Disclosures, isamended to indicate that interest rate risk information should bedisclosed only for debt investment pools-such as bond mutualfunds and external bond investment pools-that do not meet therequirements to be reported as a 2a7-like pool.
Statement No. 53 is amended to clarify that the net settlementcharacteristic of Statement No. 53 that defines a derivativeinstrument is not met by a contract provision for a penaltypayment for nonperformance.
This statement is effective for the County’s fiscal year endingJune 30, 2011.
The application of the revised guidance for financial reportingand disclosures of investments did not have a material impact onthe County’s basic financial statements.
Under AnalysisThe County is currently analyzing its accounting practices todetermine the potential impact on the financial statements forthe following GASB Statements:
In November 2010, the GASB issued Statement No. 60,Accounting and Financial Reporting for Service ConcessionArrangements. The objective of this Statement is to improvefinancial reporting by addressing issues related to serviceconcession arrangements (SCAs), which are a type of public-private or public-public partnership. As used in this Statement, anSCA is an arrangement between a transferor (a government) andan operator (governmental or nongovernmental entity) in which(1) the transferor conveys to an operator the right and relatedobligation to provide services through the use of infrastructure oranother public asset (a “facility”) in exchange for significantconsideration and (2) the operator collects and is compensatedby fees from third parties.
This Statement applies only to those arrangements in whichspecific criteria determining whether a transferor has controlover the facility are met. A transferor reports the facility subjectto an SCA as its capital asset, generally following existingmeasurement, recognition, and disclosure guidance for capitalassets. New facilities constructed or acquired by the operator orimprovements to existing facilities made by the operator arereported at fair value by the transferor. A liability is recognized,for the present value of significant contractual obligations tosacrifice financial resources imposed on the transferor, alongwith a corresponding deferred inflow of resources. Revenue isrecognized by the transferor in a systematic and rational mannerover the term of the arrangement.
This Statement also provides guidance for governments that areoperators in an SCA. The governmental operator reports anintangible asset at cost for its right to access the facility andcollect third-party fees; it amortizes the intangible asset over theterm of the arrangement in a systematic and rational manner.For existing facilities, a governmental operator’s cost may be theamount of an up-front payment or the present value ofinstallment payments. For new or improved facilities, agovernmental operator’s cost may be its cost of improving anexisting facility or constructing or acquiring a new facility.
For revenue sharing arrangements, this Statement requiresgovernmental operators to report all revenues and expenses. Atransferor reports its portion of the shared revenues.
This Statement requires disclosures about an SCA including a

79
Notes to the Financial Statements(Amounts Expressed in Thousands Unless Otherwise Noted)
County of San Diego ~ Comprehensive Annual Financial Report for the Year Ended June 30, 2011
general description of the arrangement and information aboutthe associated assets, liabilities, and deferred inflows, the rightsgranted and retained, and guarantees and commitments.
This Statement is effective for periods beginning after December15, 2011.
In November 2010, the GASB issued Statement No. 61, TheFinancial Reporting Entity: Omnibus, an amendment of GASBStatements No. 14 and No. 34. The objective of this Statement isto improve financial reporting for a governmental financialreporting entity. The requirements of Statement No. 14, TheFinancial Reporting Entity, and the related financial reportingrequirements of Statement No. 34, Basic Financial Statements-and Management's Discussion and Analysis-for State and LocalGovernments, were amended to better meet user needs and toaddress reporting entity issues that have arisen since theissuance of those Statements.
This Statement modifies certain requirements for inclusion ofcomponent units in the financial reporting entity. Fororganizations that previously were required to be included ascomponent units by meeting the fiscal dependency criterion, afinancial benefit or burden relationship also would need to bepresent between the primary government and that organizationfor it to be included in the reporting entity as a component unit.Further, for organizations that do not meet the financialaccountability criteria for inclusion as component units but that,nevertheless, should be included because the primarygovernment's management determines that it would bemisleading to exclude them, this Statement clarifies the mannerin which that determination should be made and the types ofrelationships that generally should be considered in making thedetermination.
This Statement also amends the criteria for reporting componentunits as if they were part of the primary government (that is,blending) in certain circumstances. For component units thatcurrently are blended based on the “substantively the samegoverning body” criterion, it additionally requires that (1) theprimary government and the component unit have a financialbenefit or burden relationship or (2) management (below thelevel of the elected officials) of the primary government haveoperational responsibility (as defined in paragraph 8a) for theactivities of the component unit. New criteria also are added torequire blending of component units whose total debtoutstanding is expected to be repaid entirely or almost entirelywith resources of the primary government. The blendingprovisions are amended to clarify that funds of a blendedcomponent unit have the same financial reporting requirementsas a fund of the primary government. Lastly, additional reportingguidance is provided for blending a component unit if theprimary government is a business-type activity that uses a singlecolumn presentation for financial reporting.
This Statement also clarifies the reporting of equity interests inlegally separate organizations. It requires a primary governmentto report its equity interest in a component unit as an asset.
The provisions of this Statement are effective for financial
statements for periods beginning after June 15, 2012.
In December 2010, GASB issued Statement No. 62, Codification ofAccounting and Financial Reporting Guidance Contained in Pre-November 30, 1989 FASB and AICPA PronouncementsThe objective of this Statement is to incorporate into the GASB’sauthoritative literature certain accounting and financial reportingguidance that is included in the following pronouncementsissued on or before November 30, 1989, which does not conflictwith or contradict GASB pronouncements:
Financial Accounting Standards Board (FASB) Statements andInterpretations
Accounting Principles Board Opinions
Accounting Research Bulletins of the American Institute ofCertified Public Accountants’ (AICPA) Committee on AccountingProcedure.
Hereinafter, these pronouncements collectively are referred toas the “FASB and AICPA pronouncements.”
This Statement also supersedes Statement No. 20, Accountingand Financial Reporting for Proprietary Funds and OtherGovernmental Entities That Use Proprietary Fund Accounting,thereby eliminating the election provided in paragraph 7 of thatStatement for enterprise funds and business-type activities toapply post-November 30, 1989 FASB Statements andInterpretations that do not conflict with or contradict GASBpronouncements. However, those entities can continue to apply,as other accounting literature, post-November 30, 1989 FASBpronouncements that do not conflict with or contradict GASBpronouncements, including this Statement.
The requirements of this Statement are effective for financialstatements for periods beginning after December 15, 2011.
In June 2011, GASB issued Statement No. 63: Financial Reportingof Deferred Outflows of Resources, Deferred Inflows of Resources,and Net PositionThis Statement provides financial reporting guidance for deferredoutflows of resources and deferred inflows of resources.Concepts Statement No. 4, Elements of Financial Statements,introduced and defined those elements as a consumption of netassets by the government that is applicable to a future reportingperiod, and an acquisition of net assets by the government that isapplicable to a future reporting period, respectively. Previousfinancial reporting standards do not include guidance forreporting those financial statement elements, which are distinctfrom assets and liabilities.
Concepts Statement 4 also identifies net position as the residualof all other elements presented in a statement of financialposition. This Statement amends the net asset reportingrequirements in Statement No. 34, Basic Financial Statements—and Management’s Discussion and Analysis—for State and LocalGovernments, and other pronouncements by incorporatingdeferred outflows of resources and deferred inflows of resourcesinto the definitions of the required components of the residualmeasure and by renaming that measure as net position, rather
80
Notes to the Financial Statements(Amounts Expressed in Thousands Unless Otherwise Noted)
Comprehensive Annual Financial Report for the Year Ended June 30, 2011 ~ County of San Diego
than net assets.
The provisions of this Statement are effective for financialstatements for periods beginning after December 15, 2011.
In June 2011, GASB issued Statement No. 64, DerivativeInstruments: Application of Hedge Accounting TerminationProvisions—an amendment of GASB Statement No. 53 Some governments have entered into interest rate swapagreements and commodity swap agreements in which a swapcounterparty, or the swap counterparty’s credit supportprovider, commits or experiences either an act of default or atermination event as both are described in the swap agreement.Many of those governments have replaced their swapcounterparty, or swap counterparty’s credit support providers,either by amending existing swap agreements or by entering intonew swap agreements. When these swap agreements have beenreported as hedging instruments, questions have arisen
regarding the application of the termination of hedge accountingprovisions in Statement No. 53, Accounting and FinancialReporting for Derivative Instruments. Those provisions require agovernment to cease hedge accounting upon the termination ofthe hedging derivative instrument, resulting in the immediaterecognition of the deferred outflows of resources or deferredinflows of resources as a component of investment income.
The objective of this Statement is to clarify whether an effectivehedging relationship continues after the replacement of a swapcounterparty or a swap counterparty’s credit support provider.This Statement sets forth criteria that establish when theeffective hedging relationship continues and hedge accountingshould continue to be applied.
The provisions of this Statement are effective for financialstatements for periods beginning after June 15, 2011.

81
Required Supplementary
Information

82 See notes to required supplementary information.
Required Supplementary Information
Comprehensive Annual Financial Report for the Year Ended June 30, 2011 ~ County of San Diego
Schedule of Revenues, Expenditures, and Changes in Fund Balance - Budget and Actual: General Fund
Continued
SCHEDULE OF REVENUES, EXPENDITURES, AND CHANGES IN FUND BALANCE - BUDGET AND ACTUALGeneral FundFor the Year Ended June 30, 2011 (In Thousands)
Original Budget Final Budget Actual
Revenues:
Taxes $ 880,811 880,811 894,222Licenses, permits and franchise fees 40,189 40,189 42,643Fines, forfeitures and penalties 58,133 58,773 51,826Revenue from use of money and property 17,269 17,269 24,479Aid from other governmental agencies:
State 940,930 940,711 904,749Federal 880,153 919,504 818,217Other 99,507 58,460 57,874
Charges for current services 290,769 323,194 320,966Other revenue 39,734 41,356 51,542Total revenues 3,247,495 3,280,267 3,166,518
Expenditures:
Current:General government:
Assessor/recorder/county clerk - finance 34,166 34,155 32,368Auditor and controller 26,691 26,794 23,781Auditor and controller - information technology management services 6,031 5,917 4,813Board of supervisors district #1 1,254 1,454 1,192Board of supervisors district #2 1,256 1,256 1,137Board of supervisors district #3 1,230 1,245 1,191Board of supervisors district #4 1,174 1,374 1,211Board of supervisors district #5 1,355 1,555 1,204Board of supervisors general office 1,075 1,076 1,024CAC major maintenance 1,138 1,138 624Chief administrative office - legislative and administrative 4,330 4,330 3,991Civil service commission 536 536 521Clerk of the board of supervisors - legislative and administrative 3,037 3,037 2,898Clerk of the board of supervisors - property management 3,292 3,389 2,836Community enhancement 2,751 2,751 2,724Community projects 6,847 6,219 5,509Community services 8,892 7,905 2,519County communications office 2,550 2,549 2,371County counsel 21,877 21,877 20,438County technology office 11,730 11,729 8,184Countywide general expense 45,668 45,668 3,713Finance and general government - legislative and administrative 3,517 3,516 Finance and general government - other general 76,011 77,529 24,818Health and human services - legislative and administrative 425 425 417Human resources - other general government 4,343 4,343 4,114Human resources - personnel 18,365 18,359 14,581Land use and environment - legislative and administrative 4,075 4,524 3,791Public safety - legislative and administrative 7,582 7,582 5,479Registrar of voters 19,991 19,991 14,929Treasurer-tax collector 19,705 19,705 16,915Total general government $ 340,894 341,928 209,293

See notes to required supplementary information. 83
Required Supplementary Information
County of San Diego ~ Comprehensive Annual Financial Report for the Year Ended June 30, 2011
Continued
SCHEDULE OF REVENUES, EXPENDITURES, AND CHANGES IN FUND BALANCE - BUDGET AND ACTUALGeneral FundFor the Year Ended June 30, 2011 (In Thousands)
(Continued) Original Budget Final Budget ActualPublic protection:
Agriculture weights and measures $ 15,973 16,286 13,893Agriculture weights and measures - sealer 3,012 2,975 3,002Assessor/recorder/county clerk - other protection 18,687 18,675 14,839Child support 48,878 48,878 45,826Citizens law enforcement review board 538 538 484Contributions for trial courts 72,113 72,113 70,263Department of animal services 14,244 14,244 13,694District attorney-judicial 136,730 140,560 128,912Grand jury 578 578 529LAFCO administration 342 342 342Medical examiner 8,304 8,422 7,996Office of emergency services 8,698 12,718 6,452Planning and land use - fire protection 30,534 2,762 2,681Planning and land use - other protection 32,630 35,607 23,815Probation - adult detention 2,824 2,824 3,111Probation - detention and correction 107,157 106,610 100,141Probation - juvenile detention 44,236 44,236 42,544Probation - police protection 944 944 555Public defender 74,560 65,284 61,960Public safety - fire protection 28,745 15,241Public works, flood control, soil and water, general 14,185 14,705 8,198Public works, general - other protection 1,077 1,099 142Sheriff - adult detention 191,089 189,387 177,769Sheriff - other protection 2,586 1,604 1,359Sheriff - police protection 352,980 371,863 336,088Total public protection 1,182,899 1,201,999 1,079,836
Public ways and facilities:Public Works, dept of gen 4,752 4,953 4,171Public works, general - public ways 2,151 2,026 1,372Total public ways and facilities 6,903 6,979 5,543
Health and sanitation:Environmental health 49,330 49,426 36,278Health and human services agency - drug and alcohol abuse services 44,591 44,591 38,096Health and human services agency - health 105,038 104,975 99,454Health and human services agency - health administration 53,875 53,388 33,414Health and human services agency - medical care 143,453 165,354 166,717Health and human services agency - mental health 326,555 326,555 297,107Public works, general - sanitation 1,189 439 210Total health and sanitation 724,031 744,728 671,276
Public assistance:Health and human services agency - other assistance 322,316 301,128 293,369Health and human services agency - social administration 803,817 803,087 731,353Health and human services agency - veterans' services 908 908 834Housing authority 26,205 40,374 18,925Probation - care of court wards 9,661 10,489 11,049Total public assistance 1,162,907 1,155,986 1,055,530
Education:Agriculture weights and measures 934 940 957Total education 934 940 957
Recreation and cultural:Parks and recreation 37,135 37,248 30,637Total recreation and cultural $ 37,135 37,248 30,637
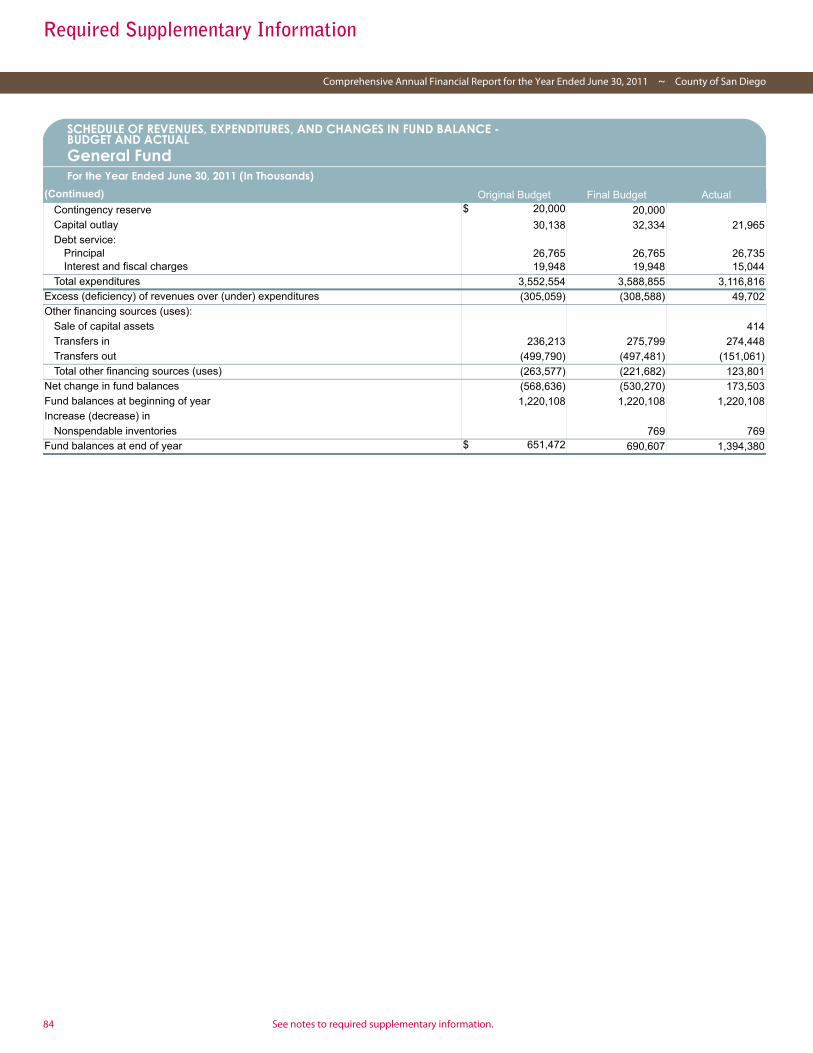
84 See notes to required supplementary information.
Required Supplementary Information
Comprehensive Annual Financial Report for the Year Ended June 30, 2011 ~ County of San Diego
SCHEDULE OF REVENUES, EXPENDITURES, AND CHANGES IN FUND BALANCE - BUDGET AND ACTUALGeneral FundFor the Year Ended June 30, 2011 (In Thousands)
(Continued) Original Budget Final Budget Actual
Contingency reserve $ 20,000 20,000
Capital outlay 30,138 32,334 21,965Debt service:
Principal 26,765 26,765 26,735Interest and fiscal charges 19,948 19,948 15,044
Total expenditures 3,552,554 3,588,855 3,116,816Excess (deficiency) of revenues over (under) expenditures (305,059) (308,588) 49,702Other financing sources (uses):
Sale of capital assets 414Transfers in 236,213 275,799 274,448Transfers out (499,790) (497,481) (151,061)Total other financing sources (uses) (263,577) (221,682) 123,801
Net change in fund balances (568,636) (530,270) 173,503Fund balances at beginning of year 1,220,108 1,220,108 1,220,108Increase (decrease) in
Nonspendable inventories 769 769Fund balances at end of year $ 651,472 690,607 1,394,380
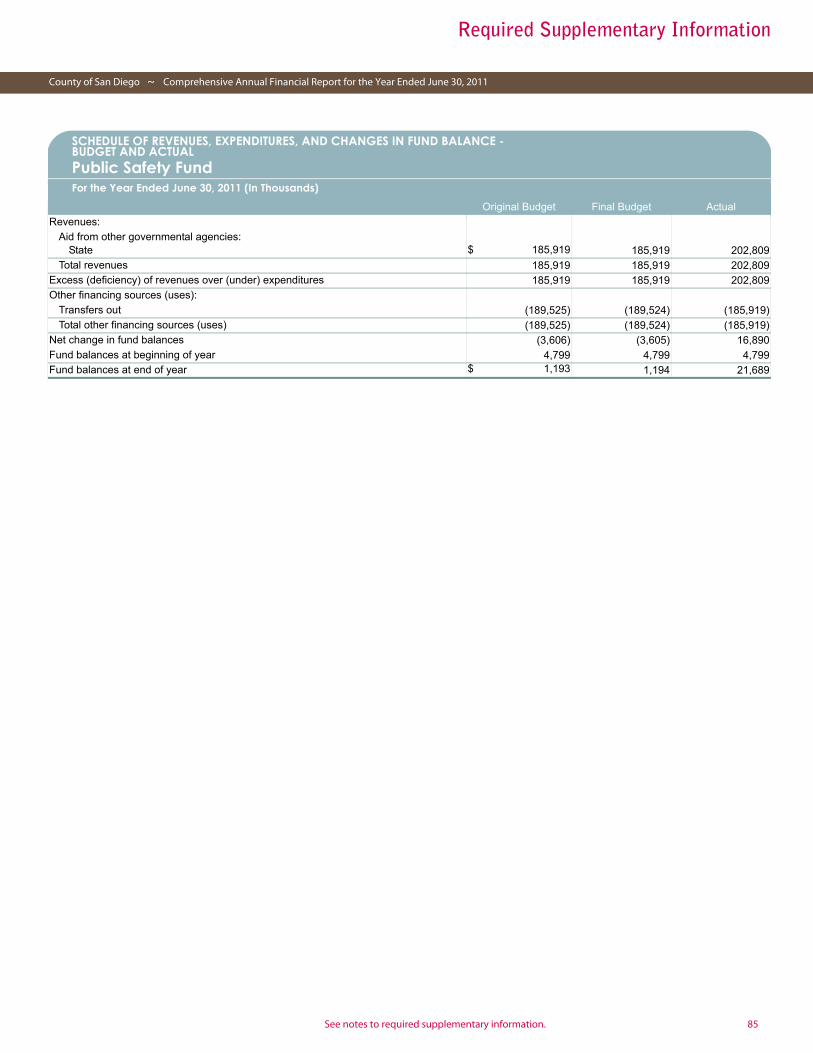
See notes to required supplementary information. 85
Required Supplementary Information
County of San Diego ~ Comprehensive Annual Financial Report for the Year Ended June 30, 2011
Public Safety Fund
SCHEDULE OF REVENUES, EXPENDITURES, AND CHANGES IN FUND BALANCE - BUDGET AND ACTUALPublic Safety FundFor the Year Ended June 30, 2011 (In Thousands)
Original Budget Final Budget Actual
Revenues:
Aid from other governmental agencies:State $ 185,919 185,919 202,809
Total revenues 185,919 185,919 202,809Excess (deficiency) of revenues over (under) expenditures 185,919 185,919 202,809Other financing sources (uses):
Transfers out (189,525) (189,524) (185,919)Total other financing sources (uses) (189,525) (189,524) (185,919)
Net change in fund balances (3,606) (3,605) 16,890Fund balances at beginning of year 4,799 4,799 4,799Fund balances at end of year $ 1,193 1,194 21,689
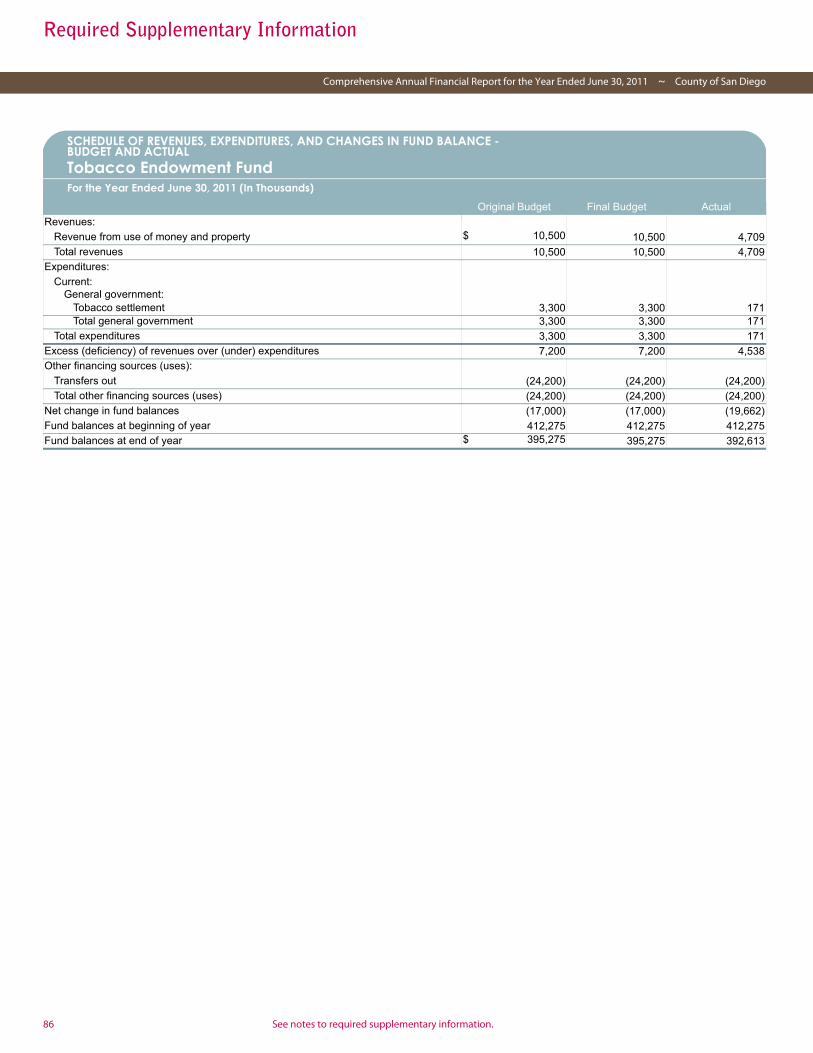
86 See notes to required supplementary information.
Required Supplementary Information
Comprehensive Annual Financial Report for the Year Ended June 30, 2011 ~ County of San Diego
Tobacco Endowment Fund
SCHEDULE OF REVENUES, EXPENDITURES, AND CHANGES IN FUND BALANCE - BUDGET AND ACTUALTobacco Endowment FundFor the Year Ended June 30, 2011 (In Thousands)
Original Budget Final Budget Actual
Revenues:
Revenue from use of money and property $ 10,500 10,500 4,709Total revenues 10,500 10,500 4,709
Expenditures:
Current:General government:
Tobacco settlement 3,300 3,300 171Total general government 3,300 3,300 171
Total expenditures 3,300 3,300 171Excess (deficiency) of revenues over (under) expenditures 7,200 7,200 4,538Other financing sources (uses):
Transfers out (24,200) (24,200) (24,200)Total other financing sources (uses) (24,200) (24,200) (24,200)
Net change in fund balances (17,000) (17,000) (19,662)Fund balances at beginning of year 412,275 412,275 412,275Fund balances at end of year $ 395,275 395,275 392,613
87
County of San Diego ~ Comprehensive Annual Financial Report for the Year Ended June 30, 2011
Budgetary InformationGeneral Budget PoliciesAn operating budget is adopted each fiscal year by the Board ofSupervisors for the governmental funds. The annual resolutionadopts the budget at the object level of expenditures withindepartments. Annual budgets are not required to be adopted forthe Tobacco Securitization Joint Special Revenue Fund; and theDebt Service and Capital Projects Funds (other governmentalfunds). Certain annual appropriations are budgeted on a projector program basis. If such projects or programs are not completedat the end of the fiscal year, unexpended appropriations,including encumbered funds, are carried forward to the followingyear with the approval of the Board of Supervisors.
Appropriations may also be adjusted during the year with theapproval of the Board of Supervisors. Additionally, the ChiefFinancial Officer is authorized to approve certain transfers andrevisions of appropriations within a department. Suchadjustments are reflected in the final budgetary data.Accordingly, the legal level of budgetary control by the Board ofSupervisors is the department level.
The schedule of revenues, expenditures, and changes in fundbalance - budget and actual for the General Fund, Public SafetyFund and the Tobacco Endowment Fund that is presented asRequired Supplementary Information was prepared inaccordance with generally accepted accounting principles(GAAP).
The Original Budget consists of the adopted budget plus thebudget carried forward from the prior fiscal year. Accordingly,encumbrances that are subject to automatic re-appropriation areincluded as part of the original budget. The County adopts itsbudget subsequent to the start of the each new fiscal year bymid-August. The final budget includes the original budget plusamended budget changes occurring during the fiscal year.
The Actual column represents the actual amounts of revenue andexpenditures reported on a GAAP basis which is the same basisthat is used to present the aforementioned original and finalbudget.
Notes to Required Supplementary Information - Budgetary Information
Notes to Required Supplementary Information

88

89
Combining & Individual Fund
Information and Other
Supplementary Information

90
Combining Financial Statements/Schedules -Nonmajor Governmental Funds
Comprehensive Annual Financial Report for the Year Ended June 30, 2011 ~ County of San Diego
NONMAJOR GOVERNMENTAL FUNDSSPECIAL REVENUE FUNDSSpecial revenue funds are used to account for and report theproceeds of specific revenue sources that are restricted orcommitted to expenditure for specified purposes other than debtservice or capital projects.
Air Pollution FundThis fund was established to provide for control of air pollutionfrom motor vehicles and other sources in order to attain healthbased air quality standards. Revenue sources include license andpermit fees, fines, state and federal funds, charges to propertyowners and vehicle registration fees. This fund is restricted for airpollution activities.
Asset Forfeiture Program FundThis fund was established to account for assets which have beenseized by law enforcement agencies during the investigation ofcriminal activities. These monies and the investment incomederived therefrom are used for the prevention, investigation,apprehension and prosecution of drug and other criminal lawviolators. This fund is restricted for law enforcement activities.
County Library FundThis fund was established to provide library services for theunincorporated area as well as 11 of the incorporated citieswithin the county. Property taxes provide most of the fund’srevenues; aid from other governmental agencies, grants andrevenues from library services provide the remaining principalrevenues. This fund is restricted for library services.
County Service District FundsThese special district funds were established to provideauthorized services such as road, park, lighting maintenance, fireprotection or ambulance service to specific areas in the county.They are financed by ad valorem property taxes in the areabenefited or by special assessments levied on specific properties.They also derive revenue from cities and from services providedto property owners. This fund is restricted for Road, park lightingmaintenance, fire protection and ambulance services.
Edgemoor Development FundThis fund was established pursuant to Board Policy F-38, whichprovides guidelines for the use, development and disposition ofthe County's 326 acres of property located in the City of Santee,known as the Edgemoor Property. Future development plans ofthe Edgemoor Property may include parks, a library, housing, afire station, post office and others. Revenues are derived fromthe sale or lease of land within the Edgemoor property, and theserevenues are to be used for the reconstruction of the EdgemoorSkilled Nursing Facility. A portion of these reconstruction costs
include an annual transfer to reimburse the General Fund forannual lease payments associated with two series of certificatesof participation, one sold in 2005 and the other in 2006, to fundthe redevelopment of the Edgemoor Skilled Nursing Facility,which was completed in 2009. The federal reimbursements withthe SB 1128 program are also deposited into this fund. This fundis restricted for Edgemoor development.
Flood Control District FundThis fund was established to account for revenues andexpenditures related to providing flood control in the county. It isfinanced primarily by ad valorem property taxes. This fund isrestricted for flood control future drainage improvements.
Housing Authority FundThis fund was established to account for revenues andexpenditures related to providing decent housing in a suitableenvironment for individuals who cannot afford standard privatehousing. Contracts with the U.S. Department of Housing andUrban Development provide the major funding sources. Thisfund is restricted for Housing Authority activities.
Housing and Community Development FundThe Housing and Community Development Fund was establishedto receive federal community development block grants as wellas state grants. Expenditures are for special projects related tovarious housing programs within the county. This fund wasclosed at the end of fiscal year 2010-11 and its activities will beaccounted for in the General Fund going forward.
In Home Supportive Services Public AuthorityFund (IHSSPA)This authority was established for the administration of theIHSSPA registry, investigation of the qualifications andbackground of potential registry personnel, referral of registrypersonnel to IHSSPA recipients and the provision for training ofproviders and recipients. The authority is funded by the State'ssocial services realignment fund, federal and state programs. Themonies are initially deposited into the County's General Fund,and transferred to the IHSSPA fund. This fund is restricted for inhome supportive services.
Inactive Wastesites FundThis fund was established to receive one-time homeownerassociation deposits and residual funds from the sale of theCounty’s Solid Waste System. Expenditures include repairs,maintenance and care for the County’s inactive landfill sites inaccordance with all applicable governmental regulations, lawsand guidelines. This fund is committed to landfill closure,postclosure and inactive landfill maintenance.
91
Combining Financial Statements/Schedules -Nonmajor Governmental Funds
County of San Diego ~ Comprehensive Annual Financial Report for the Year Ended June 30, 2011
Inmate Welfare Program FundThis fund was established to receive telephone and othervending commissions and profits from stores operated inconnection with the county jail and probation facilities. Fundexpenditures, by law, must be solely for the benefit, educationand welfare of confined inmates. This fund is restricted for thebenefit, education, and welfare of jail inmates.
Lighting Maintenance District FundThis fund was established to provide street and road lightingservices to specified areas of the County. Revenue sourcesinclude ad valorem taxes, benefit fees, state funding and chargesto property owners. This fund is restricted for street and roadlighting maintenance
Other Special Districts FundsThese funds were established to receive user fees, land leaserevenues and fines. The activities (expenditures) of this fund arerestricted for retracement or remonument surveys,improvements for grazing lands, wildlife propagation andaviation purpose capital improvements and repairs.
Park Land Dedication FundThis fund was established to receive and expend special park landdedication fees to developers of land as a condition for approvalof any development. The fees are then used for the purchase ofland and the development of land for park or recreationalfacilities. These facilities serve the future residents of suchdevelopments. In lieu of the payment of these fees, thedeveloper may dedicate land for park or recreational facilities.This fund is restricted for developing new or rehabilitatingexisting neighborhood or community park or recreationalfacilities
Redevelopment Agency FundThis fund was established to account for the financial resourcesobtained and used for pass-through payments to taxing entitieslocated in the Gillespie Field and Upper San Diego River projectareas. Mandatory payments of the twenty percent set-aside tothe Gillespie Field and Upper San Diego River Housing funds aremade through interfund operating transfers. The interfundactivity is eliminated to minimize the doubling effect betweenthe funds. Revenues primarily consist of incremental propertytaxes collected within the project areas. Financial resourcesreceived are also used to make operating transfers to theRedevelopment Agency - Debt Service Fund for payment ofprincipal and interest on revenue bonds. This fund is restrictedfor redevelopment activities.
Road FundThis fund was established to provide for maintenance andconstruction of roadways and for specialized engineeringservices to other governmental units and the public. Revenuesconsist primarily of the County’s share of state highway usertaxes and are supplemented by federal funds, vehicle code fines,and fees and reimbursements for engineering services provided.This fund is restricted for future road improvements.
Tobacco Securitization Joint Special RevenueFundThe Tobacco Securitization Joint Special Revenue Fund accountsfor the transactions of the San Diego County Tobacco AssetSecuritization Corporation and Tobacco Securitization Authorityof Southern California, two component units, that are blendedinto the County’s financial statements. This fund is funded byrestricted tobacco settlement revenues.
DEBT SERVICE FUNDSDebt service funds are used to account for and report financialresources that are restricted, committed, or assigned toexpenditure for principal and interest. Debt service funds shouldbe used to report resources if legally mandated.
Pension Obligation Bonds FundThis fund receives payments from the County and other agenciesfor payment of principal and interest due on taxable pensionobligation bonds. The debt issue was used to satisfy the County’srequirement to amortize the unfunded actuarial accrued liabilitywith respect to retirement benefits accruing to members of theSan Diego County Employees Retirement Association. This fund isrestricted for debt service.
Redevelopment Agency FundThis fund's primary source of income are operating transfersfrom the Redevelopment Agency - Special Revenue Fund andinvestment income based on a trust agreement between theagency and a trustee bank for payment of principal and interestdue on revenue bonds. Pledged installments from the countyairport system are deposited with a trustee and are available iftaxes and investment income are insufficient to pay debt servicepayments. In addition to the pledged amounts, a bond reservewas funded with bond proceeds. This fund is restricted for debtservice.
San Diego Regional Building Authority FundThis fund receives rental payments based on the lease purchaseagreement from the San Miguel Consolidated Fire ProtectionDistrict (SMCFPD) for payment of principal and interest due onlease revenue bonds issued for the SMCFPD; secured by the leasepurchase payments. This fund also receives interest on moniesinvested in permissible investments as directed by each San

92
Combining Financial Statements/Schedules -Nonmajor Governmental Funds
Comprehensive Annual Financial Report for the Year Ended June 30, 2011 ~ County of San Diego
Diego Regional Building Authority (SDRBA) financing’s Trustindenture. Debt service payments made in this fund also includepayments not accounted for in the County’s General Fund relatedto SDRBA debt issuances; and are secured by interest earnings onthe aforementioned permissible investments. This fund isrestricted for debt service.
SANCAL FundThis fund receives interest on monies invested in permissibleinvestments as directed by each San Diego County Capital AssetLeasing Corporation (SANCAL) financing’s Trust indenture. Debtservice payments made in this fund are secured by theaforementioned interest earnings and represent payments notaccounted for in the County’s General Fund related to SANCALdebt issuances. This fund is restricted for debt service.
CAPITAL PROJECTS FUNDSCapital projects funds are used to account for and reportfinancial resources that are restricted, committed, or assigned toexpenditure for capital outlays, including the acquisition orconstruction of capital facilities and other capital assets. Capitalprojects funds exclude those types of capital-related outflowsfinanced by proprietary funds or for assets that will be held intrust for individuals, private organizations, or other governments.
Capital Outlay FundThis fund is used exclusively to finance the acquisition,construction and completion of permanent public improvementsincluding public buildings and for the costs of acquiring land andpermanent improvements. Revenues are obtained from the saleof fixed assets, from lease or rental of county-owned facilities,and from other funds such as grants and contributions whenallocated by the Board of Supervisors to the fund. This fund iscommitted to capital projects.
San Diego Regional Building Authority FundThis fund is used to account for the expenditures of the proceedsfrom the sale of certificates of participation and lease revenuebonds of the San Diego Regional Building Authority used for theacquisition and construction of permanent buildings by theCounty. This fund is restricted for capital projects per variousdebt covenants.
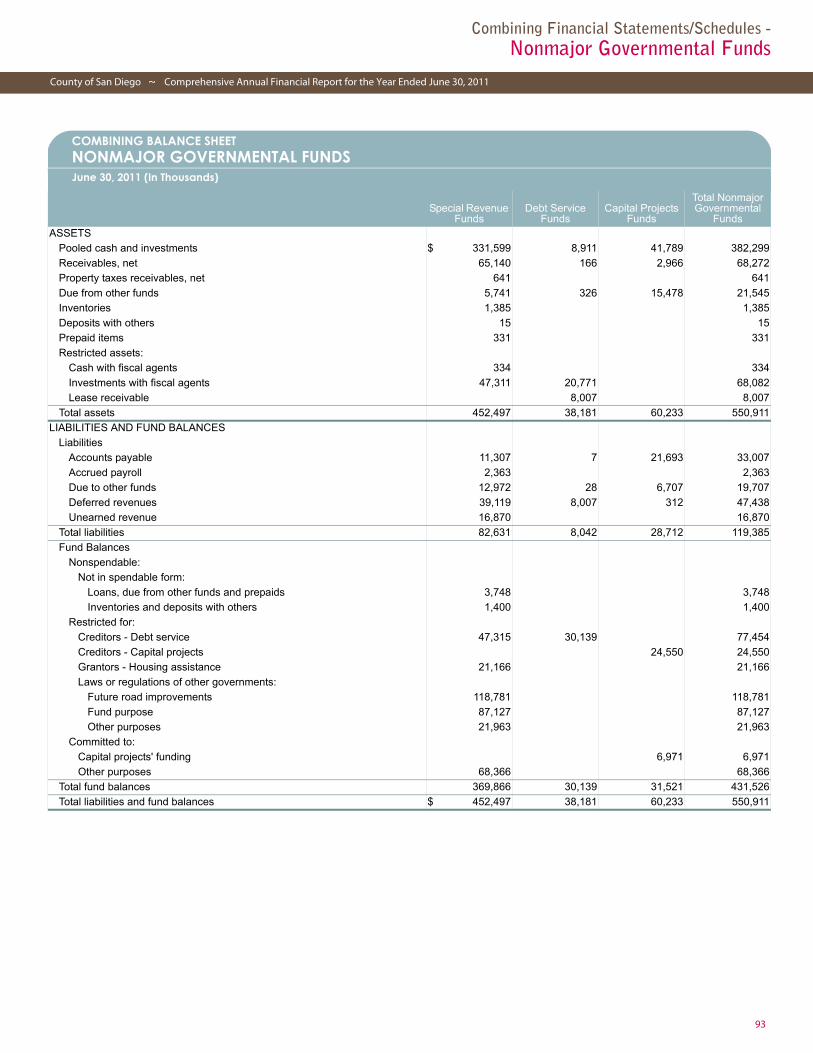
93
Combining Financial Statements/Schedules -Nonmajor Governmental Funds
County of San Diego ~ Comprehensive Annual Financial Report for the Year Ended June 30, 2011
Combining Balance Sheet: Nonmajor Governmental Funds
COMBINING BALANCE SHEETNONMAJOR GOVERNMENTAL FUNDSJune 30, 2011 (In Thousands)
Special Revenue Funds
Debt Service Funds
Capital Projects Funds
Total Nonmajor Governmental
FundsASSETS
Pooled cash and investments $ 331,599 8,911 41,789 382,299
Receivables, net 65,140 166 2,966 68,272
Property taxes receivables, net 641 641
Due from other funds 5,741 326 15,478 21,545
Inventories 1,385 1,385
Deposits with others 15 15
Prepaid items 331 331
Restricted assets:
Cash with fiscal agents 334 334
Investments with fiscal agents 47,311 20,771 68,082
Lease receivable 8,007 8,007
Total assets 452,497 38,181 60,233 550,911
LIABILITIES AND FUND BALANCES
Liabilities
Accounts payable 11,307 7 21,693 33,007
Accrued payroll 2,363 2,363
Due to other funds 12,972 28 6,707 19,707
Deferred revenues 39,119 8,007 312 47,438
Unearned revenue 16,870 16,870
Total liabilities 82,631 8,042 28,712 119,385
Fund Balances
Nonspendable:
Not in spendable form:
Loans, due from other funds and prepaids 3,748 3,748
Inventories and deposits with others 1,400 1,400
Restricted for:
Creditors - Debt service 47,315 30,139 77,454
Creditors - Capital projects 24,550 24,550
Grantors - Housing assistance 21,166 21,166
Laws or regulations of other governments:
Future road improvements 118,781 118,781
Fund purpose 87,127 87,127
Other purposes 21,963 21,963
Committed to:
Capital projects' funding 6,971 6,971
Other purposes 68,366 68,366
Total fund balances 369,866 30,139 31,521 431,526
Total liabilities and fund balances $ 452,497 38,181 60,233 550,911

94
Combining Financial Statements/Schedules -Nonmajor Governmental Funds
Comprehensive Annual Financial Report for the Year Ended June 30, 2011 ~ County of San Diego
Special Revenue Funds
Continued
COMBINING BALANCE SHEETNONMAJOR GOVERNMENTAL FUNDSSpecial Revenue FundsJune 30, 2011 (In Thousands)
Air Pollution FundAsset Forfeiture Program Fund
County Library Fund
County Service District Funds
Edgemoor Development
FundFlood Control District Fund
ASSETS
Pooled cash and investments $ 23,734 9,718 9,341 19,957 2,067 22,249
Receivables, net 1,582 13 598 127 10,654 32
Property taxes receivables, net 355 52 47
Due from other funds 8 77 4 50 47
Inventories 251 77 50 29
Deposits with others
Prepaid items
Restricted assets:
Cash with fiscal agents
Investments with fiscal agents
Total assets 25,575 9,885 10,348 20,215 12,721 22,375
LIABILITIES AND FUND BALANCES
Liabilities
Accounts payable 1,690 41 512 1,231 17 223
Accrued payroll 433 619
Due to other funds 324 351 804 699 38 249
Deferred revenues 355 48 10,651 43
Unearned revenue 9,654 424 55 61
Total liabilities 12,101 392 2,714 2,033 10,706 576
Fund Balances
Nonspendable:
Not in spendable form: Loans, due from other funds and
prepaids
Inventories and deposits with others 251 77 50 29
Restricted for:
Creditors - Debt service
Grantors - Housing assistance
Laws or regulations of other governments:
Future road improvements
Fund purpose 13,223 9,416 7,584 18,153 2,015
Other purposes 21,799
Committed to:
Other purposes
Total fund balances 13,474 9,493 7,634 18,182 2,015 21,799
Total liabilities and fund balances $ 25,575 9,885 10,348 20,215 12,721 22,375

95
Combining Financial Statements/Schedules -Nonmajor Governmental Funds
County of San Diego ~ Comprehensive Annual Financial Report for the Year Ended June 30, 2011
Continued
COMBINING BALANCE SHEETNONMAJOR GOVERNMENTAL FUNDSSpecial Revenue FundsJune 30, 2011 (In Thousands)
(Continued)Housing Authority
Fund
In Home Supportive
Services Public Authority Fund
Inactive Wastesites Fund
Inmate Welfare Program Fund
Lighting Maintenance District Fund
ASSETS
Pooled cash and investments $ 32,877 301 69,323 10,025 1,365
Receivables, net 9,854 1 540 284 2
Property taxes receivables, net 15
Due from other funds 50 67 53 3
Inventories 132 6
Deposits with others 15
Prepaid items 1
Restricted assets:
Cash with fiscal agents 334
Investments with fiscal agents 246
Total assets 43,377 369 69,916 10,444 1,388
LIABILITIES AND FUND BALANCES
Liabilities
Accounts payable 972 73 325 438 125
Accrued payroll 46
Due to other funds 1,132 210 80 614 18
Deferred revenues 1,155 40 14
Unearned revenue 4,730 1,059 15
Total liabilities 7,989 283 1,550 1,052 172
Fund Balances
Nonspendable:
Not in spendable form:
Loans, due from other funds and prepaids 1
Inventories and deposits with others 15 132 6
Restricted for:
Creditors - Debt service 250
Grantors - Housing assistance 21,166
Laws or regulations of other governments:
Future road improvements
Fund purpose 13,792 86 9,260 1,210
Other purposes 164
Committed to:
Other purposes 68,366
Total fund balances 35,388 86 68,366 9,392 1,216
Total liabilities and fund balances $ 43,377 369 69,916 10,444 1,388

96
Combining Financial Statements/Schedules -Nonmajor Governmental Funds
Comprehensive Annual Financial Report for the Year Ended June 30, 2011 ~ County of San Diego
COMBINING BALANCE SHEETNONMAJOR GOVERNMENTAL FUNDSSpecial Revenue FundsJune 30, 2011 (In Thousands)
(Continued)Other Special
Districts FundsPark Land
Dedication FundRedevelopment
Agency Fund Road Fund
Tobacco Securitization Joint Special
Revenue Fund
Total Special Revenue
Funds
ASSETS
Pooled cash and investments $ 681 10,465 6,237 113,259 331,599
Receivables, net 1 14 3,772 21,537 16,129 65,140
Property taxes receivables, net 172 641
Due from other funds 5,382 5,741
Inventories 840 1,385
Deposits with others 15
Prepaid items 330 331
Restricted assets:
Cash with fiscal agents 334
Investments with fiscal agents 47,065 47,311
Total assets 682 10,479 10,511 141,018 63,194 452,497
LIABILITIES AND FUND BALANCES
Liabilities
Accounts payable 8 611 5,041 11,307
Accrued payroll 1,265 2,363
Due to other funds 6 1 4,388 4,058 12,972
Deferred revenues 474 10,210 16,129 39,119
Unearned revenue 49 823 16,870
Total liabilities 6 9 5,522 21,397 16,129 82,631
Fund Balances
Nonspendable:
Not in spendable form: Loans, due from other funds and
prepaids 3,747 3,748
Inventories and deposits with others 840 1,400
Restricted for:
Creditors - Debt service 47,065 47,315
Grantors - Housing assistance 21,166
Laws or regulations of other governments:
Future road improvements 118,781 118,781
Fund purpose 676 10,470 1,242 87,127
Other purposes 21,963
Committed to:
Other purposes 68,366
Total fund balances 676 10,470 4,989 119,621 47,065 369,866
Total liabilities and fund balances $ 682 10,479 10,511 141,018 63,194 452,497

97
Combining Financial Statements/Schedules -Nonmajor Governmental Funds
County of San Diego ~ Comprehensive Annual Financial Report for the Year Ended June 30, 2011
Debt Service Funds
COMBINING BALANCE SHEETNONMAJOR GOVERNMENTAL FUNDSDebt Service FundsJune 30, 2011 (In Thousands)
Pension Obligation Bonds Fund
Redevelopment Agency Fund
San Diego Regional Building
Authority Fund SANCAL FundTotal Debt Service
Funds
ASSETS
Pooled cash and investments $ 1,814 216 6,881 8,911
Receivables, net 3 111 52 166
Due from other funds 326 326Restricted assets:
Investments with fiscal agents 2 1,155 14,830 4,784 20,771
Lease receivable 8,007 8,007
Total assets 2,145 1,155 23,164 11,717 38,181
LIABILITIES AND FUND BALANCES
Liabilities
Accounts payable 2 5 7
Due to other funds 28 28
Deferred revenues 8,007 8,007
Total liabilities 28 8,009 5 8,042
Fund Balances
Restricted for:
Creditors - Debt service 2,117 1,155 15,155 11,712 30,139
Total fund balances 2,117 1,155 15,155 11,712 30,139
Total liabilities and fund balances $ 2,145 1,155 23,164 11,717 38,181

98
Combining Financial Statements/Schedules -Nonmajor Governmental Funds
Comprehensive Annual Financial Report for the Year Ended June 30, 2011 ~ County of San Diego
Capital Projects Fund
COMBINING BALANCE SHEETNONMAJOR GOVERNMENTAL FUNDSCapital Projects FundsJune 30, 2011 (In Thousands)
Capital Outlay FundSan Diego Regional
Building Authority FundTotal Capital Projects
FundsASSETS
Pooled cash and investments $ 6,348 35,441 41,789
Receivables, net 2,910 56 2,966
Due from other funds 15,478 15,478
Total assets 24,736 35,497 60,233LIABILITIES AND FUND BALANCES
Liabilities
Accounts payable 11,718 9,975 21,693
Due to other funds 5,735 972 6,707
Deferred revenues 312 312
Total liabilities 17,765 10,947 28,712
Fund Balances
Restricted for:
Creditors - Capital projects 24,550 24,550
Committed to:
Capital projects' funding 6,971 6,971
Total fund balances 6,971 24,550 31,521
Total liabilities and fund balances $ 24,736 35,497 60,233
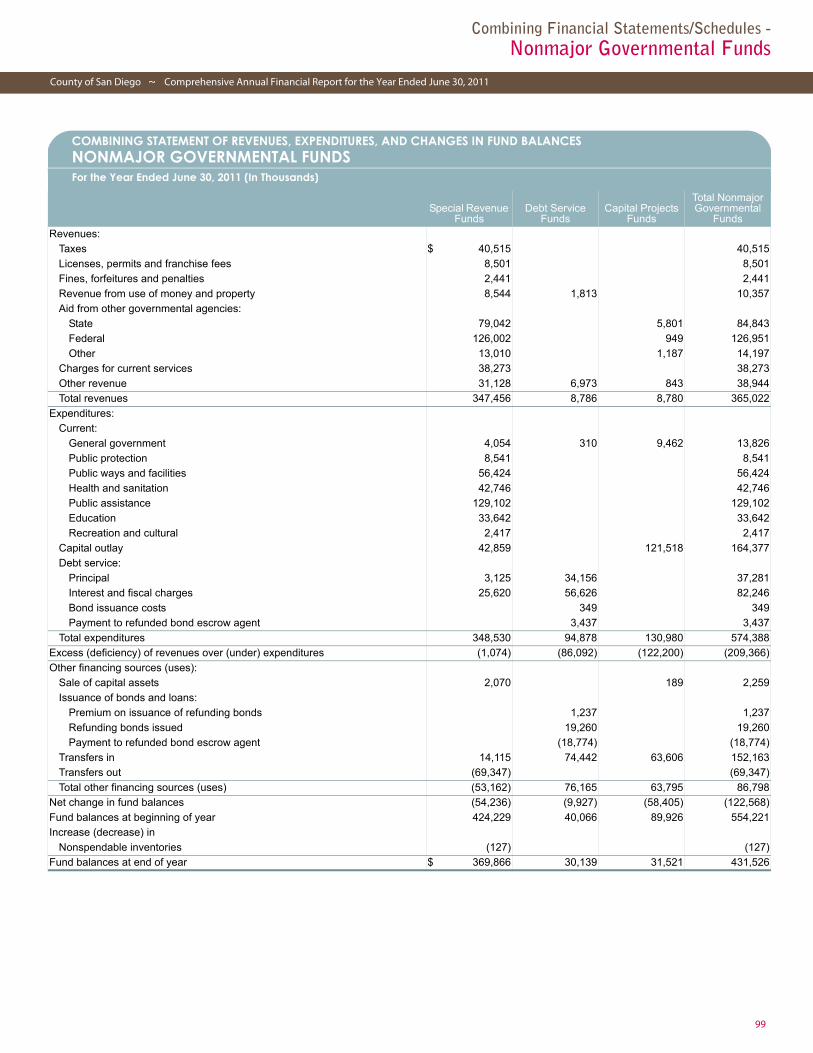
99
Combining Financial Statements/Schedules -Nonmajor Governmental Funds
County of San Diego ~ Comprehensive Annual Financial Report for the Year Ended June 30, 2011
Combining Statement of Revenues, Expenditures, and Changes in Fund Balances: Nonmajor Governmental Funds
COMBINING STATEMENT OF REVENUES, EXPENDITURES, AND CHANGES IN FUND BALANCESNONMAJOR GOVERNMENTAL FUNDSFor the Year Ended June 30, 2011 (In Thousands)
Special Revenue Funds
Debt Service Funds
Capital Projects Funds
Total Nonmajor Governmental
Funds
Revenues:
Taxes $ 40,515 40,515
Licenses, permits and franchise fees 8,501 8,501
Fines, forfeitures and penalties 2,441 2,441
Revenue from use of money and property 8,544 1,813 10,357
Aid from other governmental agencies:
State 79,042 5,801 84,843
Federal 126,002 949 126,951
Other 13,010 1,187 14,197
Charges for current services 38,273 38,273
Other revenue 31,128 6,973 843 38,944
Total revenues 347,456 8,786 8,780 365,022
Expenditures:
Current:
General government 4,054 310 9,462 13,826
Public protection 8,541 8,541
Public ways and facilities 56,424 56,424
Health and sanitation 42,746 42,746
Public assistance 129,102 129,102
Education 33,642 33,642
Recreation and cultural 2,417 2,417
Capital outlay 42,859 121,518 164,377
Debt service:
Principal 3,125 34,156 37,281
Interest and fiscal charges 25,620 56,626 82,246
Bond issuance costs 349 349
Payment to refunded bond escrow agent 3,437 3,437
Total expenditures 348,530 94,878 130,980 574,388
Excess (deficiency) of revenues over (under) expenditures (1,074) (86,092) (122,200) (209,366)
Other financing sources (uses):
Sale of capital assets 2,070 189 2,259
Issuance of bonds and loans:
Premium on issuance of refunding bonds 1,237 1,237
Refunding bonds issued 19,260 19,260
Payment to refunded bond escrow agent (18,774) (18,774)
Transfers in 14,115 74,442 63,606 152,163
Transfers out (69,347) (69,347)
Total other financing sources (uses) (53,162) 76,165 63,795 86,798
Net change in fund balances (54,236) (9,927) (58,405) (122,568)
Fund balances at beginning of year 424,229 40,066 89,926 554,221
Increase (decrease) in
Nonspendable inventories (127) (127)
Fund balances at end of year $ 369,866 30,139 31,521 431,526
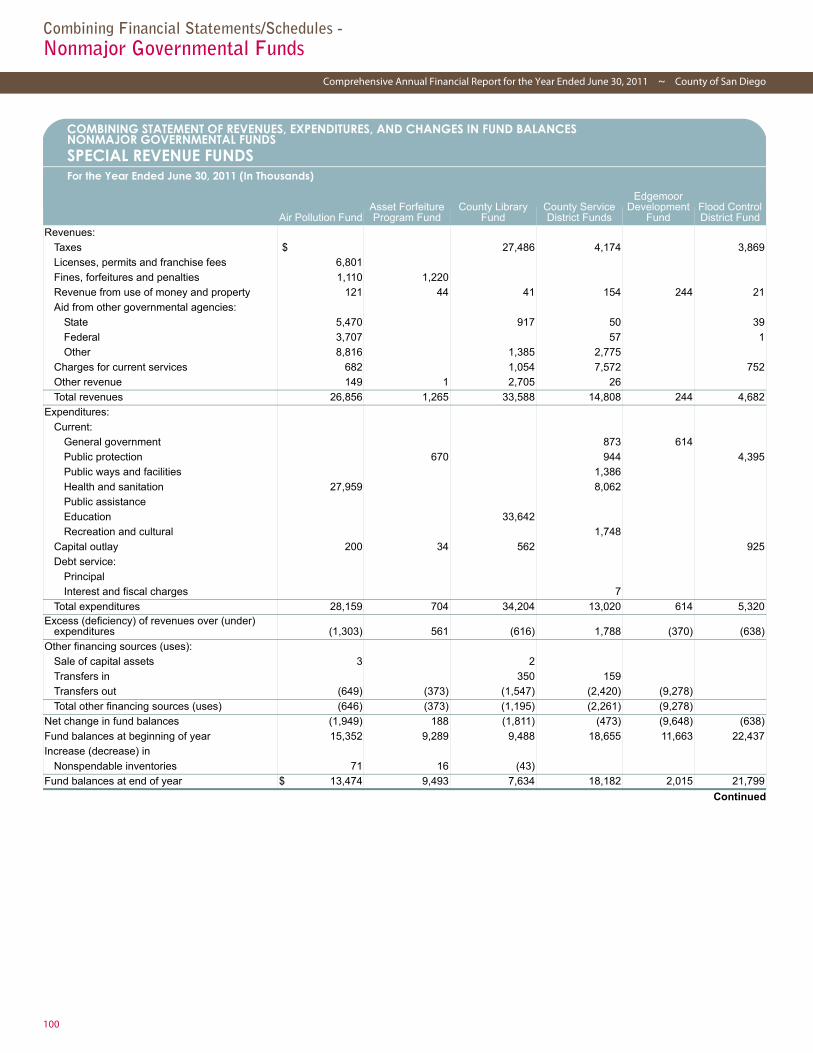
100
Combining Financial Statements/Schedules -Nonmajor Governmental Funds
Comprehensive Annual Financial Report for the Year Ended June 30, 2011 ~ County of San Diego
Special Revenue Funds
Continued
COMBINING STATEMENT OF REVENUES, EXPENDITURES, AND CHANGES IN FUND BALANCESNONMAJOR GOVERNMENTAL FUNDS SPECIAL REVENUE FUNDSFor the Year Ended June 30, 2011 (In Thousands)
Air Pollution FundAsset Forfeiture Program Fund
County Library Fund
County Service District Funds
Edgemoor Development
FundFlood Control District Fund
Revenues:
Taxes $ 27,486 4,174 3,869
Licenses, permits and franchise fees 6,801
Fines, forfeitures and penalties 1,110 1,220
Revenue from use of money and property 121 44 41 154 244 21
Aid from other governmental agencies:
State 5,470 917 50 39
Federal 3,707 57 1
Other 8,816 1,385 2,775
Charges for current services 682 1,054 7,572 752
Other revenue 149 1 2,705 26
Total revenues 26,856 1,265 33,588 14,808 244 4,682
Expenditures:
Current:
General government 873 614
Public protection 670 944 4,395
Public ways and facilities 1,386
Health and sanitation 27,959 8,062
Public assistance
Education 33,642
Recreation and cultural 1,748
Capital outlay 200 34 562 925
Debt service:
Principal
Interest and fiscal charges 7
Total expenditures 28,159 704 34,204 13,020 614 5,320Excess (deficiency) of revenues over (under)
expenditures (1,303) 561 (616) 1,788 (370) (638)
Other financing sources (uses):
Sale of capital assets 3 2
Transfers in 350 159
Transfers out (649) (373) (1,547) (2,420) (9,278)
Total other financing sources (uses) (646) (373) (1,195) (2,261) (9,278)
Net change in fund balances (1,949) 188 (1,811) (473) (9,648) (638)
Fund balances at beginning of year 15,352 9,289 9,488 18,655 11,663 22,437
Increase (decrease) in
Nonspendable inventories 71 16 (43)
Fund balances at end of year $ 13,474 9,493 7,634 18,182 2,015 21,799

101
Combining Financial Statements/Schedules -Nonmajor Governmental Funds
County of San Diego ~ Comprehensive Annual Financial Report for the Year Ended June 30, 2011
Continued
COMBINING STATEMENT OF REVENUES, EXPENDITURES, AND CHANGES IN FUND BALANCESNONMAJOR GOVERNMENTAL FUNDS SPECIAL REVENUE FUNDSFor the Year Ended June 30, 2011 (In Thousands)
(Continued)Housing
Authority Fund
Housing and Community
Development Fund
In Home Supportive
Services Public Authority Fund
Inactive Wastesites Fund
Inmate Welfare
Program Fund
Lighting Maintenance District Fund
Revenues:
Taxes $ 919
Licenses, permits and franchise fees
Fines, forfeitures and penalties 102
Revenue from use of money and property 1,133 11 654 3,606 7
Aid from other governmental agencies:
State 758 11 9
Federal 115,943
Other 34
Charges for current services 3,391 4,377 725
Other revenue 235 4 825
Total revenues 120,736 11 5,895 4,442 1,660
Expenditures:
Current:
General government
Public protection 2,433
Public ways and facilities 1,568
Health and sanitation 6,725
Public assistance 116,505 254 12,343
Education
Recreation and cultural
Capital outlay 34
Debt service:
Principal 130
Interest and fiscal charges 25
Total expenditures 116,660 254 12,343 6,725 2,467 1,568Excess (deficiency) of revenues over (under)
expenditures 4,076 (254) (12,332) (830) 1,975 92
Other financing sources (uses):
Sale of capital assets
Transfers in 12,331 1,275
Transfers out (49,878) (77) (1,779)
Total other financing sources (uses) (49,878) 12,331 (77) (504)
Net change in fund balances 4,076 (50,132) (1) (907) 1,471 92
Fund balances at beginning of year 31,312 50,132 87 69,273 7,867 1,118
Increase (decrease) in
Nonspendable inventories 54 6
Fund balances at end of year $ 35,388 86 68,366 9,392 1,216
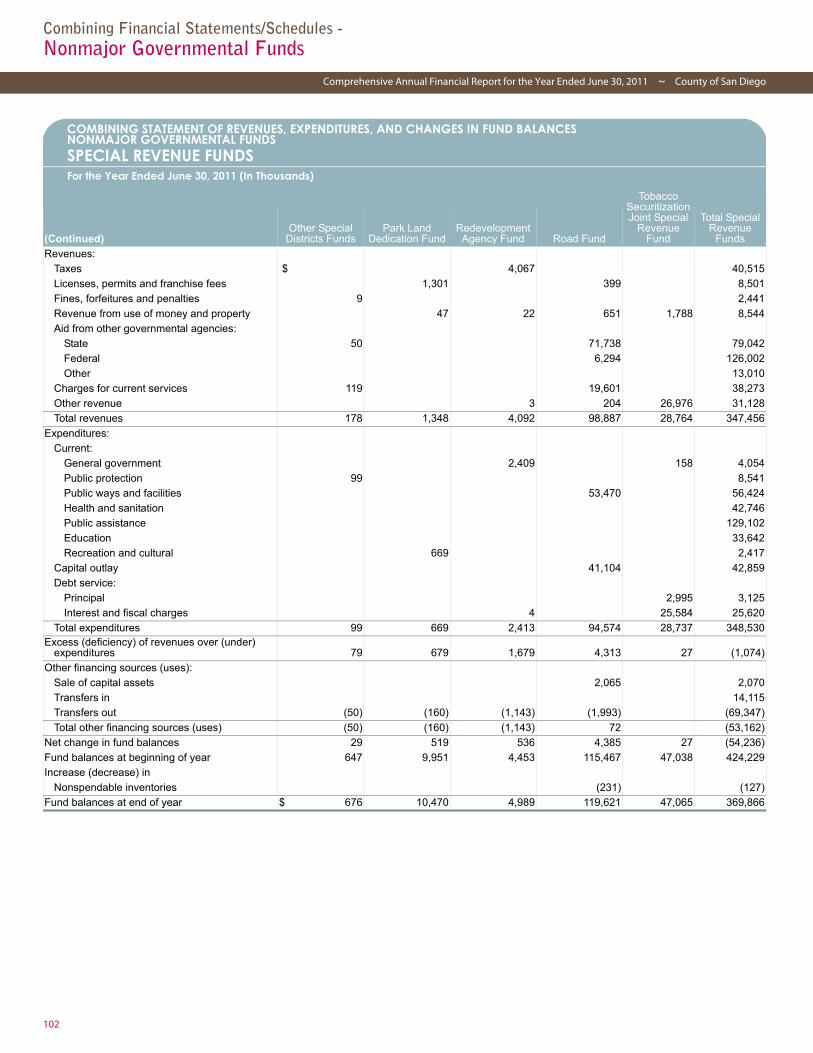
102
Combining Financial Statements/Schedules -Nonmajor Governmental Funds
Comprehensive Annual Financial Report for the Year Ended June 30, 2011 ~ County of San Diego
COMBINING STATEMENT OF REVENUES, EXPENDITURES, AND CHANGES IN FUND BALANCESNONMAJOR GOVERNMENTAL FUNDS SPECIAL REVENUE FUNDSFor the Year Ended June 30, 2011 (In Thousands)
(Continued)Other Special
Districts FundsPark Land
Dedication FundRedevelopment
Agency Fund Road Fund
Tobacco Securitization Joint Special
Revenue Fund
Total Special Revenue
Funds
Revenues:
Taxes $ 4,067 40,515
Licenses, permits and franchise fees 1,301 399 8,501
Fines, forfeitures and penalties 9 2,441
Revenue from use of money and property 47 22 651 1,788 8,544
Aid from other governmental agencies:
State 50 71,738 79,042
Federal 6,294 126,002
Other 13,010
Charges for current services 119 19,601 38,273
Other revenue 3 204 26,976 31,128
Total revenues 178 1,348 4,092 98,887 28,764 347,456
Expenditures:
Current:
General government 2,409 158 4,054
Public protection 99 8,541
Public ways and facilities 53,470 56,424
Health and sanitation 42,746
Public assistance 129,102
Education 33,642
Recreation and cultural 669 2,417
Capital outlay 41,104 42,859
Debt service:
Principal 2,995 3,125
Interest and fiscal charges 4 25,584 25,620
Total expenditures 99 669 2,413 94,574 28,737 348,530Excess (deficiency) of revenues over (under)
expenditures 79 679 1,679 4,313 27 (1,074)
Other financing sources (uses):
Sale of capital assets 2,065 2,070
Transfers in 14,115
Transfers out (50) (160) (1,143) (1,993) (69,347)
Total other financing sources (uses) (50) (160) (1,143) 72 (53,162)
Net change in fund balances 29 519 536 4,385 27 (54,236)
Fund balances at beginning of year 647 9,951 4,453 115,467 47,038 424,229
Increase (decrease) in
Nonspendable inventories (231) (127)
Fund balances at end of year $ 676 10,470 4,989 119,621 47,065 369,866

103
Combining Financial Statements/Schedules -Nonmajor Governmental Funds
County of San Diego ~ Comprehensive Annual Financial Report for the Year Ended June 30, 2011
Debt Service Funds
COMBINING STATEMENT OF REVENUES, EXPENDITURES, AND CHANGES IN FUND BALANCESNONMAJOR GOVERNMENTAL FUNDSDEBT SERVICE FUNDSFor the Year Ended June 30, 2011 (In Thousands)
Pension Obligation Bonds Fund
Redevelopment Agency Fund
San Diego Regional Building
Authority Fund SANCAL FundTotal Debt Service
Funds
Revenues:
Revenue from use of money and property $ 1,564 249 1,813
Other revenue 6,973 6,973
Total revenues 6,973 1,564 249 8,786
Expenditures:
Current:
General government 297 13 310
Debt service:
Principal 33,226 360 570 34,156
Interest and fiscal charges 48,225 783 7,098 520 56,626
Bond issuance costs 349 349
Payment to refunded bond escrow agent 3,437 3,437
Total expenditures 81,451 1,143 11,751 533 94,878Excess (deficiency) of revenues over (under)
expenditures (74,478) (1,143) (10,187) (284) (86,092)
Other financing sources (uses):
Issuance of bonds and loans:
Premium on issuance of refunding bonds 1,237 1,237
Refunding bonds issued 19,260 19,260
Payment to refunded bond escrow agent (18,774) (18,774)
Transfers in 73,231 1,143 23 45 74,442
Total other financing sources (uses) 73,231 1,143 1,746 45 76,165
Net change in fund balances (1,247) (8,441) (239) (9,927)
Fund balances at beginning of year 3,364 1,155 23,596 11,951 40,066
Fund balances at end of year $ 2,117 1,155 15,155 11,712 30,139

104
Combining Financial Statements/Schedules -Nonmajor Governmental Funds
Comprehensive Annual Financial Report for the Year Ended June 30, 2011 ~ County of San Diego
Capital Projects Fund
COMBINING STATEMENT OF REVENUES, EXPENDITURES, AND CHANGES IN FUND BALANCESNONMAJOR GOVERNMENTAL FUNDSCAPITAL PROJECTS FUNDSFor the Year Ended June 30, 2011 (In Thousands)
Capital Outlay FundSan Diego Regional
Building Authority FundTotal Capital Projects
Funds
Revenues:
Aid from other governmental agencies:
State $ 5,801 5,801
Federal 949 949
Other 1,187 1,187
Other revenue 843 843
Total revenues 8,780 8,780
Expenditures:
Current:
General government 9,462 9,462
Capital outlay 67,082 54,436 121,518
Total expenditures 67,082 63,898 130,980
Excess (deficiency) of revenues over (under) expenditures (58,302) (63,898) (122,200)
Other financing sources (uses):
Sale of capital assets 189 189
Transfers in 63,606 63,606
Total other financing sources (uses) 63,795 63,795
Net change in fund balances 5,493 (63,898) (58,405)
Fund balances at beginning of year 1,478 88,448 89,926
Fund balances at end of year $ 6,971 24,550 31,521

105
Combining Financial Statements/Schedules -Nonmajor Governmental Funds
County of San Diego ~ Comprehensive Annual Financial Report for the Year Ended June 30, 2011
Schedule of Revenues, Expenditures, and Changes in Fund Balance - Budget and Actual: Air Pollution Fund
SCHEDULE OF REVENUES, EXPENDITURES, AND CHANGES IN FUND BALANCE -BUDGET AND ACTUALAir Pollution FundFor the Year Ended June 30, 2011 (In Thousands)
Original Budget Final Budget ActualRevenues:
Licenses, permits and franchise fees $ 8,280 7,580 6,801
Fines, forfeitures and penalties 900 900 1,110
Revenue from use of money and property 50 50 121Aid from other governmental agencies:
State 11,442 17,222 5,470
Federal 4,044 4,519 3,707
Other 10,000 10,000 8,816
Charges for current services 353 353 682
Other revenue 158 158 149
Total revenues 35,227 40,782 26,856
Expenditures:
Current:
Health and sanitation:
Air pollution control 18,471 19,540 17,750
Air pollution control, air quality GMER program early grant 370 370 370
Air pollution control, air quality Proposition 1B GMER program 4,631 6,576 5,229
Air pollution control, air quality State LESB program 5,600 5,447 313
Air pollution control, GMERP match fund 580 580 151
Air pollution control, improvement trust 4,410 4,144 269
Air pollution control, moyer program 4,634 8,106 1,655
Air pollution control, power general mitigation 2,371 2,371 1,082
Air pollution control, school bus program 1,741 1,741 1,140
Total health and sanitation 42,808 48,875 27,959
Capital outlay 242 242 200
Total expenditures 43,050 49,117 28,159
Excess (deficiency) of revenues over (under) expenditures (7,823) (8,335) (1,303)
Other financing sources (uses):
Sale of capital assets 3
Transfers in 6,225 328
Transfers out (7,290) (1,393) (649)
Total other financing sources (uses) (1,065) (1,065) (646)
Net change in fund balances (8,888) (9,400) (1,949)
Fund balances at beginning of year 15,352 15,352 15,352
Increase (decrease) in
Nonspendable inventories 71 71
Fund balances at end of year $ 6,464 6,023 13,474
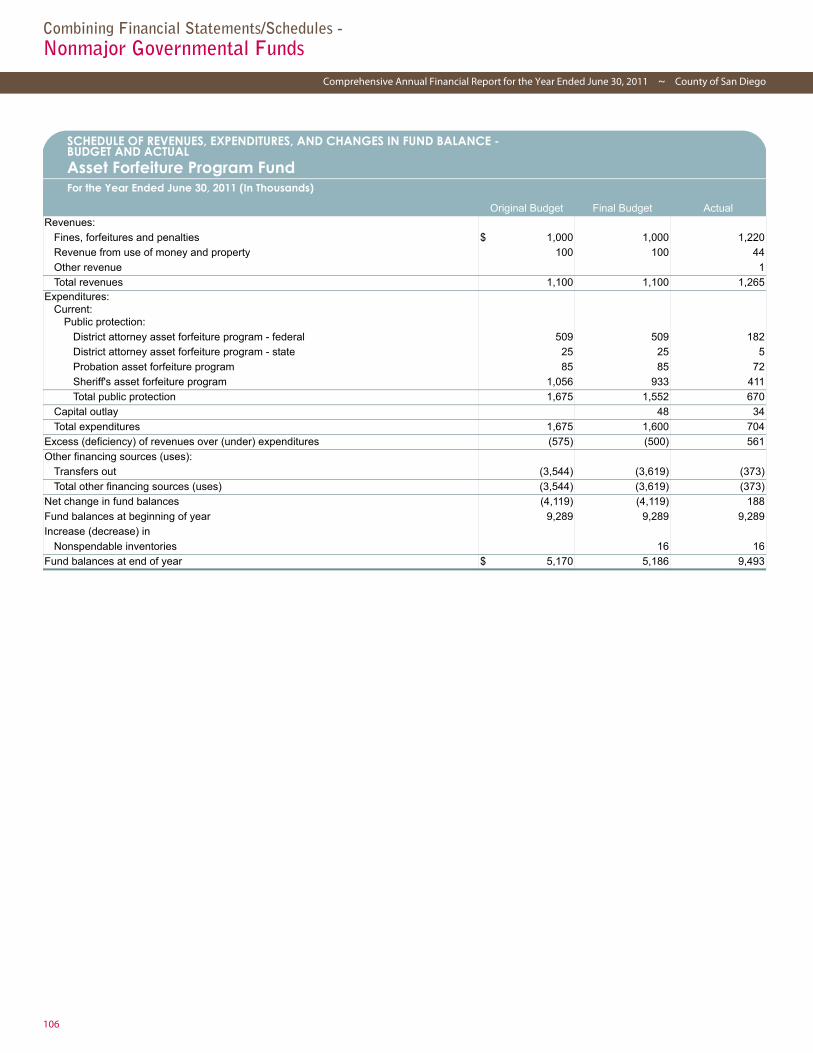
106
Combining Financial Statements/Schedules -Nonmajor Governmental Funds
Comprehensive Annual Financial Report for the Year Ended June 30, 2011 ~ County of San Diego
Asset Forfeiture Program Fund
SCHEDULE OF REVENUES, EXPENDITURES, AND CHANGES IN FUND BALANCE -BUDGET AND ACTUALAsset Forfeiture Program FundFor the Year Ended June 30, 2011 (In Thousands)
Original Budget Final Budget ActualRevenues:
Fines, forfeitures and penalties $ 1,000 1,000 1,220
Revenue from use of money and property 100 100 44
Other revenue 1
Total revenues 1,100 1,100 1,265Expenditures:
Current:Public protection:
District attorney asset forfeiture program - federal 509 509 182
District attorney asset forfeiture program - state 25 25 5
Probation asset forfeiture program 85 85 72
Sheriff's asset forfeiture program 1,056 933 411
Total public protection 1,675 1,552 670
Capital outlay 48 34
Total expenditures 1,675 1,600 704
Excess (deficiency) of revenues over (under) expenditures (575) (500) 561
Other financing sources (uses):
Transfers out (3,544) (3,619) (373)
Total other financing sources (uses) (3,544) (3,619) (373)
Net change in fund balances (4,119) (4,119) 188
Fund balances at beginning of year 9,289 9,289 9,289
Increase (decrease) in
Nonspendable inventories 16 16
Fund balances at end of year $ 5,170 5,186 9,493
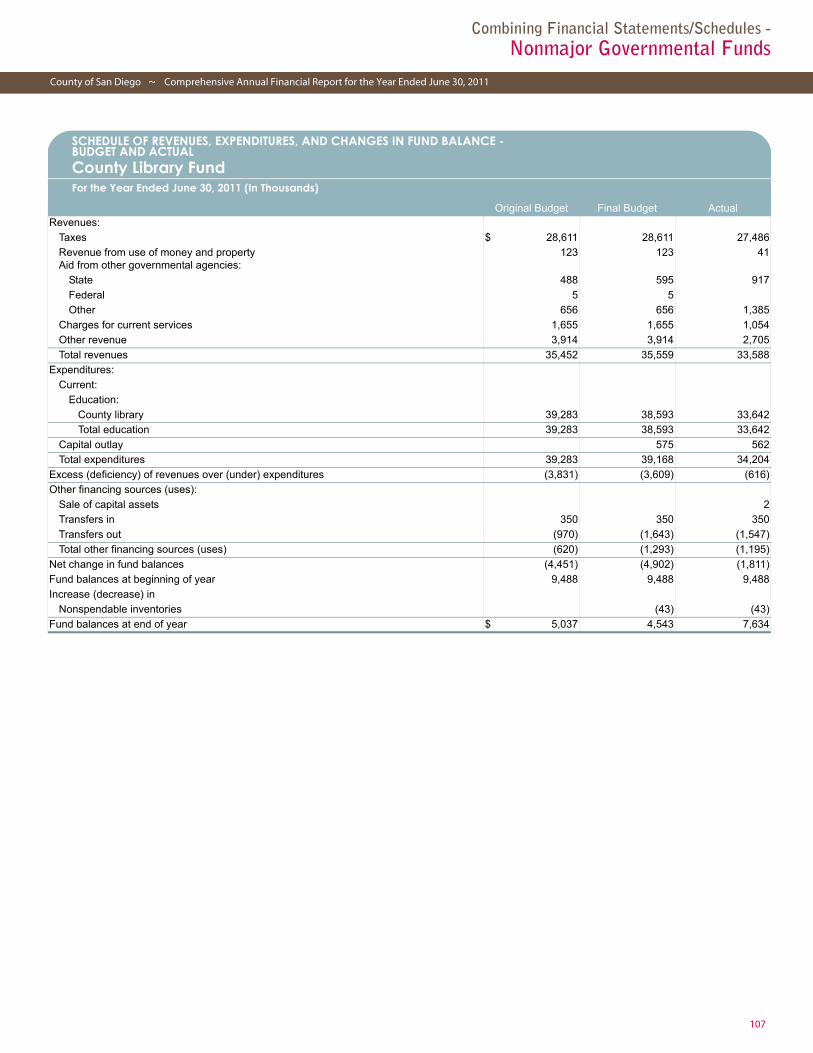
107
Combining Financial Statements/Schedules -Nonmajor Governmental Funds
County of San Diego ~ Comprehensive Annual Financial Report for the Year Ended June 30, 2011
County Library Fund
SCHEDULE OF REVENUES, EXPENDITURES, AND CHANGES IN FUND BALANCE -BUDGET AND ACTUALCounty Library FundFor the Year Ended June 30, 2011 (In Thousands)
Original Budget Final Budget ActualRevenues:
Taxes $ 28,611 28,611 27,486
Revenue from use of money and property 123 123 41Aid from other governmental agencies:
State 488 595 917
Federal 5 5
Other 656 656 1,385
Charges for current services 1,655 1,655 1,054
Other revenue 3,914 3,914 2,705
Total revenues 35,452 35,559 33,588
Expenditures:
Current:
Education:
County library 39,283 38,593 33,642
Total education 39,283 38,593 33,642
Capital outlay 575 562
Total expenditures 39,283 39,168 34,204
Excess (deficiency) of revenues over (under) expenditures (3,831) (3,609) (616)
Other financing sources (uses):
Sale of capital assets 2
Transfers in 350 350 350
Transfers out (970) (1,643) (1,547)
Total other financing sources (uses) (620) (1,293) (1,195)
Net change in fund balances (4,451) (4,902) (1,811)
Fund balances at beginning of year 9,488 9,488 9,488
Increase (decrease) in
Nonspendable inventories (43) (43)
Fund balances at end of year $ 5,037 4,543 7,634
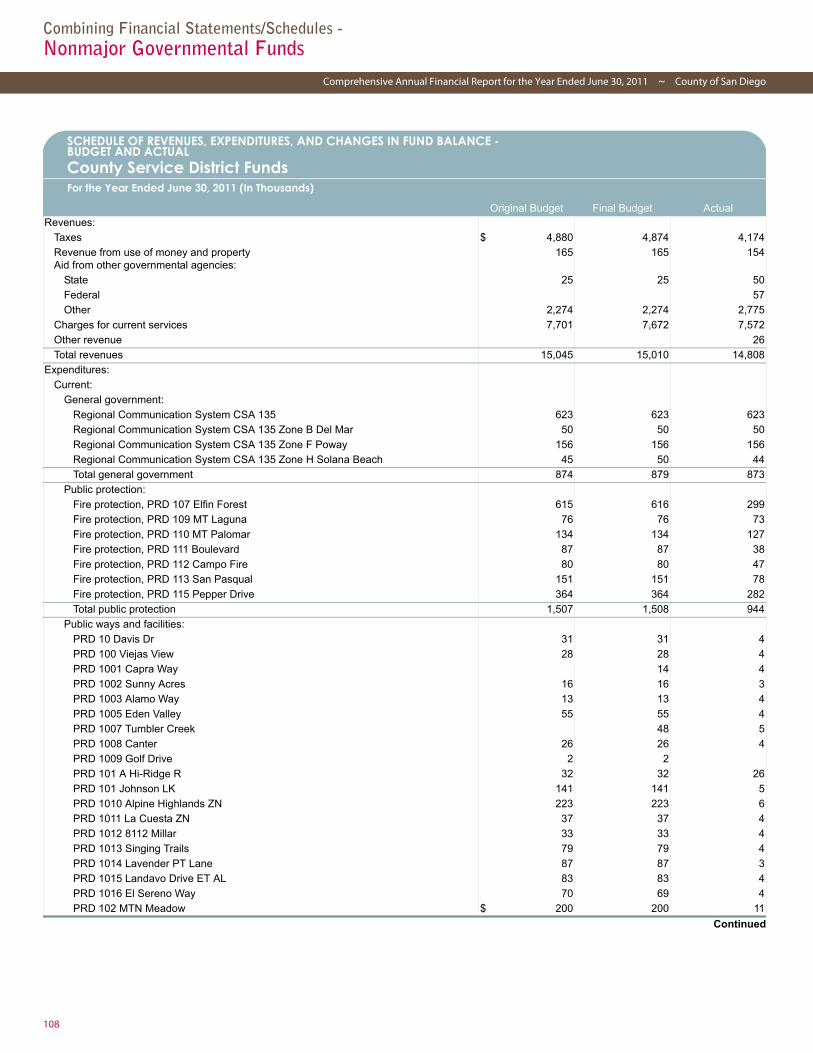
108
Combining Financial Statements/Schedules -Nonmajor Governmental Funds
Comprehensive Annual Financial Report for the Year Ended June 30, 2011 ~ County of San Diego
County Service District Funds
Continued
SCHEDULE OF REVENUES, EXPENDITURES, AND CHANGES IN FUND BALANCE - BUDGET AND ACTUALCounty Service District FundsFor the Year Ended June 30, 2011 (In Thousands)
Original Budget Final Budget ActualRevenues:
Taxes $ 4,880 4,874 4,174
Revenue from use of money and property 165 165 154Aid from other governmental agencies:
State 25 25 50
Federal 57
Other 2,274 2,274 2,775
Charges for current services 7,701 7,672 7,572
Other revenue 26
Total revenues 15,045 15,010 14,808
Expenditures:
Current:
General government:
Regional Communication System CSA 135 623 623 623
Regional Communication System CSA 135 Zone B Del Mar 50 50 50
Regional Communication System CSA 135 Zone F Poway 156 156 156
Regional Communication System CSA 135 Zone H Solana Beach 45 50 44
Total general government 874 879 873
Public protection:
Fire protection, PRD 107 Elfin Forest 615 616 299
Fire protection, PRD 109 MT Laguna 76 76 73
Fire protection, PRD 110 MT Palomar 134 134 127
Fire protection, PRD 111 Boulevard 87 87 38
Fire protection, PRD 112 Campo Fire 80 80 47
Fire protection, PRD 113 San Pasqual 151 151 78
Fire protection, PRD 115 Pepper Drive 364 364 282
Total public protection 1,507 1,508 944
Public ways and facilities:
PRD 10 Davis Dr 31 31 4
PRD 100 Viejas View 28 28 4
PRD 1001 Capra Way 14 4
PRD 1002 Sunny Acres 16 16 3
PRD 1003 Alamo Way 13 13 4
PRD 1005 Eden Valley 55 55 4
PRD 1007 Tumbler Creek 48 5
PRD 1008 Canter 26 26 4
PRD 1009 Golf Drive 2 2
PRD 101 A Hi-Ridge R 32 32 26
PRD 101 Johnson LK 141 141 5
PRD 1010 Alpine Highlands ZN 223 223 6
PRD 1011 La Cuesta ZN 37 37 4
PRD 1012 8112 Millar 33 33 4
PRD 1013 Singing Trails 79 79 4
PRD 1014 Lavender PT Lane 87 87 3
PRD 1015 Landavo Drive ET AL 83 83 4
PRD 1016 El Sereno Way 70 69 4
PRD 102 MTN Meadow $ 200 200 11

109
Combining Financial Statements/Schedules -Nonmajor Governmental Funds
County of San Diego ~ Comprehensive Annual Financial Report for the Year Ended June 30, 2011
Continued
SCHEDULE OF REVENUES, EXPENDITURES, AND CHANGES IN FUND BALANCE - BUDGET AND ACTUALCounty Service District FundsFor the Year Ended June 30, 2011 (In Thousands)
(Continued) Original Budget Final Budget Actual
PRD 103 Alto Drive $ 253 253 9
PRD 104 Artesian RO 92 92 5
PRD 105 A Alta Loma D 79 79 4
PRD 105 Alta Loma D 61 61 4
PRD 106 Garrison Ay 88 88 4
PRD 11 A Bernardo RD 36 36 4
PRD 11 C Bernardo RD 29 29 4
PRD 11 D Bernardo RD 28 28 4
PRD 117 Legend Rock 17 17 9
PRD 12 Lomair 240 240 11
PRD 123 Mizpah Lane 54 54 4
PRD 125 Wrightwood 68 68 4
PRD 126 Sandhurst W 35 35 4
PRD 127 Singing Trails 48 48 4
PRD 13 A Pala Mesa 313 313 45
PRD 13 B Stewart Canyon 43 43 12
PRD 130 Wilkes Road 131 131 13
PRD 133 Rnch Creek Rd 77 77 7
PRD 134 Kenora Lane 52 52 3
PRD 14 Rancho Diego 1 1
PRD 16 Wynola 113 113 6
PRD 18 Harrison Park 282 282 15
PRD 20 Daily Road 807 807 584
PRD 21 Pauma Heights 431 431 374
PRD 22 W Dougherty St 19 19 3
PRD 23 Rock Terrce RD 11 11 4
PRD 24 MT Whitney RD 52 52 4
PRD 30 Royal Oaks-CAR 43 43 5
PRD 38 Gay Rio Terrace 79 79 6
PRD 39 Sunbeam Lane 14 14 3
PRD 45 Rincon Springs 51 51 4
PRD 46 Rocoso Road 52 52 10
PRD 49 Sunset Knls RD 44 44 4
PRD 50 Knoll Park LN 125 125 4
PRD 53 Knoll Park LN EX 238 238 4
PRD 54 MT Helix 143 143 5
PRD 55 Rainbow Crest 187 187 7
PRD 6 Pauma Valley 287 287 7
PRD 60 River Drive 109 109 4
PRD 61 GRN Meadow Way 187 187 4
PRD 63 Hillview Road $ 263 262 4

110
Combining Financial Statements/Schedules -Nonmajor Governmental Funds
Comprehensive Annual Financial Report for the Year Ended June 30, 2011 ~ County of San Diego
SCHEDULE OF REVENUES, EXPENDITURES, AND CHANGES IN FUND BALANCE - BUDGET AND ACTUALCounty Service District FundsFor the Year Ended June 30, 2011 (In Thousands)
(Continued) Original Budget Final Budget Actual
PRD 64 Lila Lane $ 3 3
PRD 70 El Camino Cort 53 53 4
PRD 75 A Gay Rio Drive 151 151 8
PRD 75 B Gay Rio Drive 361 361 4
PRD 76 Kingford CT 28 28 4
PRD 77 Montiel TRK TR 219 219 5
PRD 78 Gardena Ay 41 41 3
PRD 8 Magee RD-PAL 137 137 9
PRD 80 Harris TRK TRL 257 257 5
PRD 88 East Fifth St 67 67 3
PRD 9 B Santa Fe 91 91 5
PRD 90 South Cordov 48 48 4
PRD 94 Roble Grnde 463 463 4
PRD 95 Valle Del Sol 242 242 4
PRD 99 Via Allndra 47 47 6
Total public ways and facilities 8,646 8,706 1,386
Health and sanitation:
CSA 17 San Dieguito Ambulance 2,708 2,708 2,643
CSA 69 Heartland Paramedics 5,497 5,497 5,380
PRD 122 Otay Mesa East 38 38 23
PRD 136 Sundance Detention Basin 49 49 16
Total health and sanitation 8,292 8,292 8,062
Recreation and cultural:
CSA 128 San Miguel Park 432 449 409
CSA 26 LMD Zone 2 Julian 35 35 33
CSA 26 Rancho San Diego 60 60 58
CSA 26 San Diego landscape maintenance 91 146 142
CSA 81 Fallbrook Park 225 225 213
CSA 83 San Dieguito 494 494 342
CSA 83A 4S Ranch Park 298 298 298
PRD 26 A Cottonwood Village 155 155 86
PRD 26 B Monte Vista 351 352 167
Total recreation and cultural 2,141 2,214 1,748
Capital outlay 56
Debt service:
Principal 48 50
Interest and fiscal charges 8 8 7
Total expenditures 21,572 21,657 13,020
Excess (deficiency) of revenues over (under) expenditures (6,527) (6,647) 1,788
Other financing sources (uses):
Transfers in 191 161 159
Transfers out (2,700) (2,711) (2,420)
Total other financing sources (uses) (2,509) (2,550) (2,261)
Net change in fund balances (9,036) (9,197) (473)
Fund balances at beginning of year 18,655 18,655 18,655
Fund balances at end of year $ 9,619 9,458 18,182

111
Combining Financial Statements/Schedules -Nonmajor Governmental Funds
County of San Diego ~ Comprehensive Annual Financial Report for the Year Ended June 30, 2011
Edgemoor Development Fund
SCHEDULE OF REVENUES, EXPENDITURES, AND CHANGES IN FUND BALANCE -BUDGET AND ACTUALEdgemoor Development FundFor the Year Ended June 30, 2011 (In Thousands)
Original Budget Final Budget ActualRevenues:
Revenue from use of money and property $ 430 430 244
Aid from other governmental agencies:
Federal 5,709 5,709
Total revenues 6,139 6,139 244Expenditures:
Current:General government:
Edgemoor development fund 949 949 614
Total general government 949 949 614
Total expenditures 949 949 614
Excess (deficiency) of revenues over (under) expenditures 5,190 5,190 (370)
Other financing sources (uses):
Transfers out (9,285) (9,285) (9,278)
Total other financing sources (uses) (9,285) (9,285) (9,278)
Net change in fund balances (4,095) (4,095) (9,648)
Fund balances at beginning of year 11,663 11,663 11,663
Fund balances at end of year $ 7,568 7,568 2,015
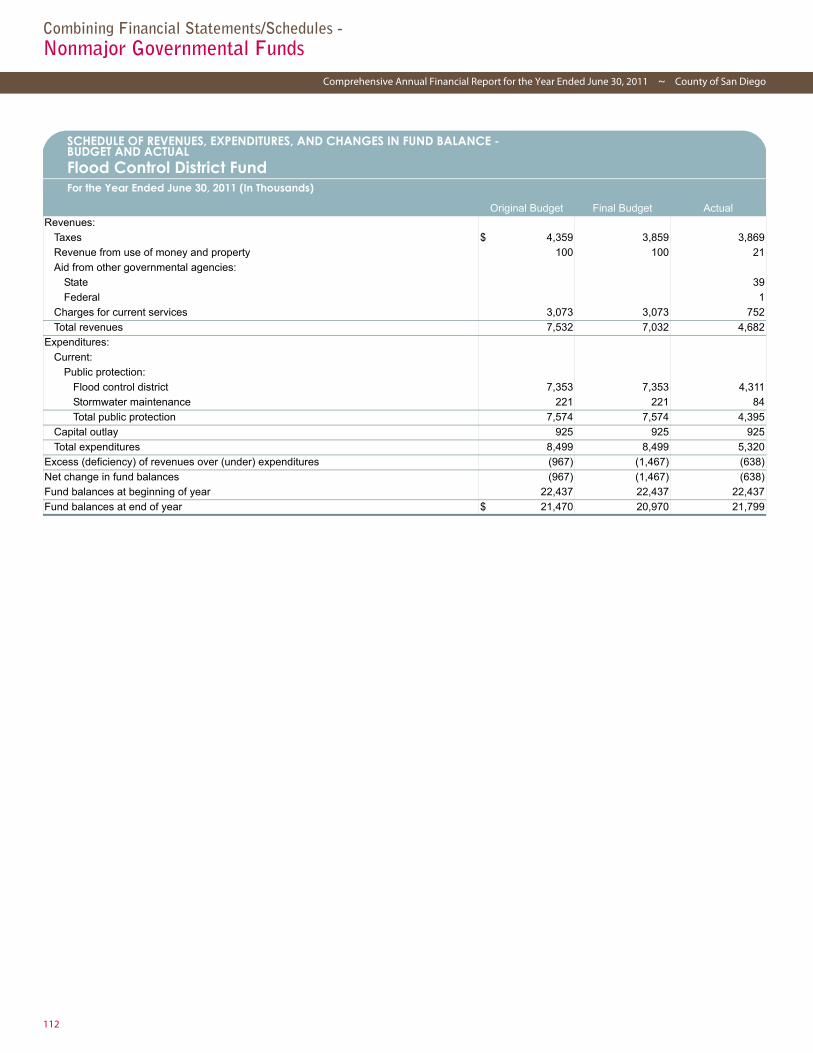
112
Combining Financial Statements/Schedules -Nonmajor Governmental Funds
Comprehensive Annual Financial Report for the Year Ended June 30, 2011 ~ County of San Diego
Flood Control District Fund
SCHEDULE OF REVENUES, EXPENDITURES, AND CHANGES IN FUND BALANCE -BUDGET AND ACTUALFlood Control District FundFor the Year Ended June 30, 2011 (In Thousands)
Original Budget Final Budget ActualRevenues:
Taxes $ 4,359 3,859 3,869
Revenue from use of money and property 100 100 21
Aid from other governmental agencies:
State 39
Federal 1
Charges for current services 3,073 3,073 752
Total revenues 7,532 7,032 4,682
Expenditures:
Current:
Public protection:
Flood control district 7,353 7,353 4,311
Stormwater maintenance 221 221 84
Total public protection 7,574 7,574 4,395
Capital outlay 925 925 925
Total expenditures 8,499 8,499 5,320
Excess (deficiency) of revenues over (under) expenditures (967) (1,467) (638)
Net change in fund balances (967) (1,467) (638)
Fund balances at beginning of year 22,437 22,437 22,437
Fund balances at end of year $ 21,470 20,970 21,799
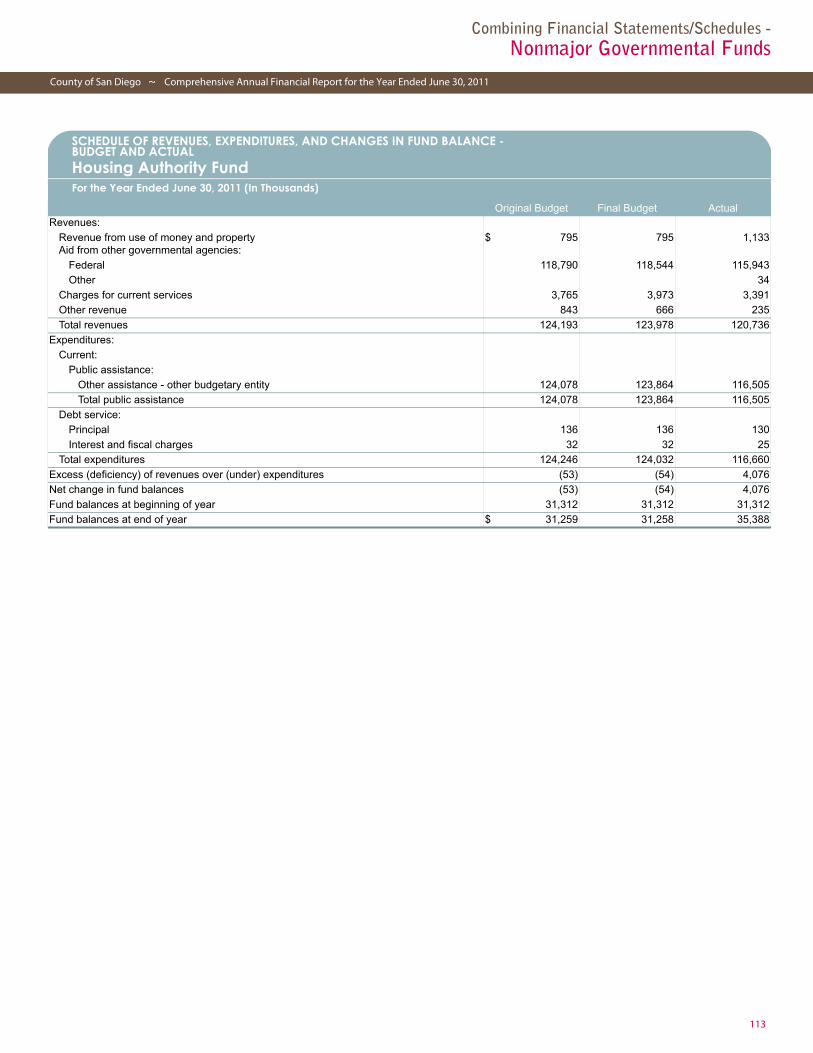
113
Combining Financial Statements/Schedules -Nonmajor Governmental Funds
County of San Diego ~ Comprehensive Annual Financial Report for the Year Ended June 30, 2011
Housing Authority Fund
SCHEDULE OF REVENUES, EXPENDITURES, AND CHANGES IN FUND BALANCE -BUDGET AND ACTUALHousing Authority FundFor the Year Ended June 30, 2011 (In Thousands)
Original Budget Final Budget ActualRevenues:
Revenue from use of money and property $ 795 795 1,133Aid from other governmental agencies:
Federal 118,790 118,544 115,943
Other 34
Charges for current services 3,765 3,973 3,391
Other revenue 843 666 235
Total revenues 124,193 123,978 120,736
Expenditures:
Current:
Public assistance:
Other assistance - other budgetary entity 124,078 123,864 116,505
Total public assistance 124,078 123,864 116,505
Debt service:
Principal 136 136 130
Interest and fiscal charges 32 32 25
Total expenditures 124,246 124,032 116,660
Excess (deficiency) of revenues over (under) expenditures (53) (54) 4,076
Net change in fund balances (53) (54) 4,076
Fund balances at beginning of year 31,312 31,312 31,312
Fund balances at end of year $ 31,259 31,258 35,388
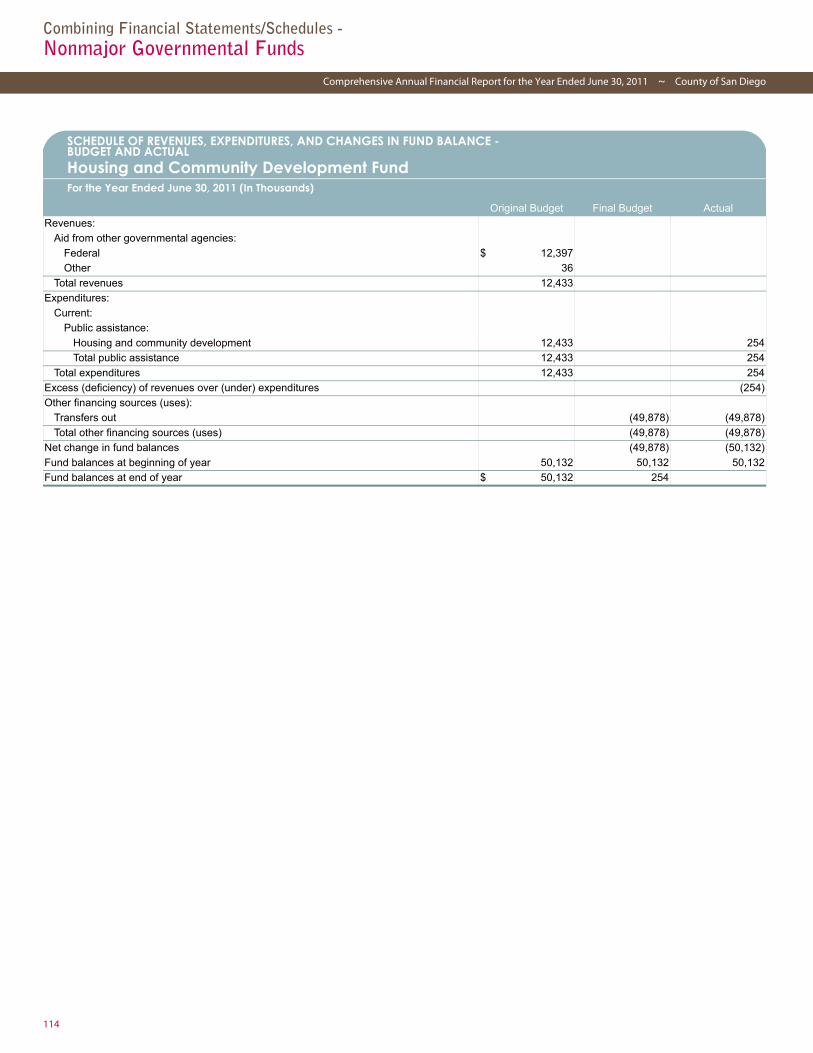
114
Combining Financial Statements/Schedules -Nonmajor Governmental Funds
Comprehensive Annual Financial Report for the Year Ended June 30, 2011 ~ County of San Diego
Housing and Community Development Fund
SCHEDULE OF REVENUES, EXPENDITURES, AND CHANGES IN FUND BALANCE -BUDGET AND ACTUALHousing and Community Development FundFor the Year Ended June 30, 2011 (In Thousands)
Original Budget Final Budget Actual
Revenues:
Aid from other governmental agencies:
Federal $ 12,397
Other 36
Total revenues 12,433
Expenditures:
Current:
Public assistance:
Housing and community development 12,433 254
Total public assistance 12,433 254
Total expenditures 12,433 254
Excess (deficiency) of revenues over (under) expenditures (254)
Other financing sources (uses):
Transfers out (49,878) (49,878)
Total other financing sources (uses) (49,878) (49,878)
Net change in fund balances (49,878) (50,132)
Fund balances at beginning of year 50,132 50,132 50,132
Fund balances at end of year $ 50,132 254
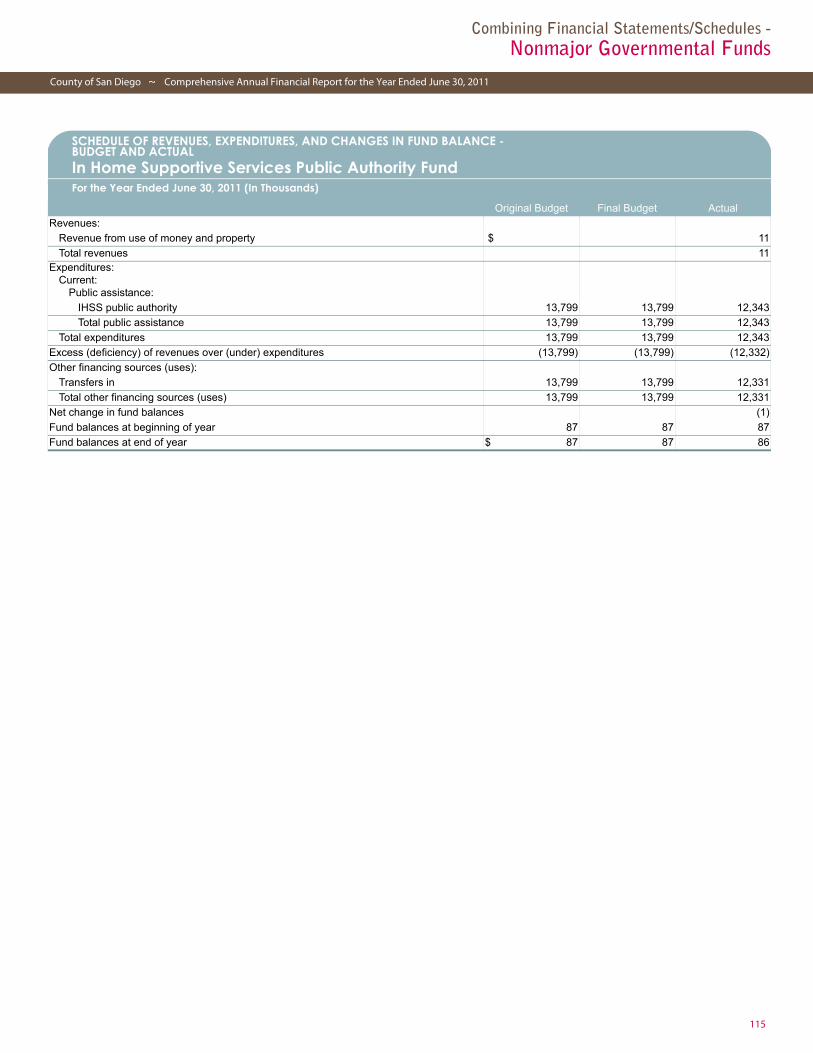
115
Combining Financial Statements/Schedules -Nonmajor Governmental Funds
County of San Diego ~ Comprehensive Annual Financial Report for the Year Ended June 30, 2011
In Home Supportive Services Public Authority Fund
SCHEDULE OF REVENUES, EXPENDITURES, AND CHANGES IN FUND BALANCE -BUDGET AND ACTUALIn Home Supportive Services Public Authority FundFor the Year Ended June 30, 2011 (In Thousands)
Original Budget Final Budget Actual
Revenues:
Revenue from use of money and property $ 11
Total revenues 11Expenditures:
Current:Public assistance:
IHSS public authority 13,799 13,799 12,343
Total public assistance 13,799 13,799 12,343
Total expenditures 13,799 13,799 12,343
Excess (deficiency) of revenues over (under) expenditures (13,799) (13,799) (12,332)
Other financing sources (uses):
Transfers in 13,799 13,799 12,331
Total other financing sources (uses) 13,799 13,799 12,331
Net change in fund balances (1)
Fund balances at beginning of year 87 87 87
Fund balances at end of year $ 87 87 86

116
Combining Financial Statements/Schedules -Nonmajor Governmental Funds
Comprehensive Annual Financial Report for the Year Ended June 30, 2011 ~ County of San Diego
Inactive Wastesites Fund
SCHEDULE OF REVENUES, EXPENDITURES, AND CHANGES IN FUND BALANCE -BUDGET AND ACTUALInactive Wastesites FundFor the Year Ended June 30, 2011 (In Thousands)
Original Budget Final Budget Actual
Revenues:
Fines, forfeitures and penalties $ 102
Revenue from use of money and property 414 414 654Aid from other governmental agencies:
State 525 794 758
Charges for current services 5,556 5,357 4,377
Other revenue 4
Total revenues 6,495 6,565 5,895
Expenditures:
Current:
Health and sanitation:
Duck pond landfill cleanup 16 16 11
Hillsborough maintenance 103 207 145
Inactive waste site management 7,003 7,450 6,569
Total health and sanitation 7,122 7,673 6,725
Total expenditures 7,122 7,673 6,725
Excess (deficiency) of revenues over (under) expenditures (627) (1,108) (830)
Other financing sources (uses):
Transfers out (87) (87) (77)
Total other financing sources (uses) (87) (87) (77)
Net change in fund balances (714) (1,195) (907)
Fund balances at beginning of year 69,273 69,273 69,273
Fund balances at end of year $ 68,559 68,078 68,366

117
Combining Financial Statements/Schedules -Nonmajor Governmental Funds
County of San Diego ~ Comprehensive Annual Financial Report for the Year Ended June 30, 2011
Inmate Welfare Program Fund
SCHEDULE OF REVENUES, EXPENDITURES, AND CHANGES IN FUND BALANCE -BUDGET AND ACTUALInmate Welfare Program FundFor the Year Ended June 30, 2011 (In Thousands)
Original Budget Final Budget ActualRevenues:
Revenue from use of money and property $ 3,195 3,195 3,606Aid from other governmental agencies:
State 29 29 11
Other revenue 150 150 825
Total revenues 3,374 3,374 4,442Expenditures:
Current:Public protection:
Probation inmate welfare 95 95 60
Sheriff's inmate welfare - adult detention 2,746 2,754 2,372
Sheriff's inmate welfare - police protection 14 14 1
Total public protection 2,855 2,863 2,433
Capital outlay 410 402 34
Total expenditures 3,265 3,265 2,467
Excess (deficiency) of revenues over (under) expenditures 109 109 1,975
Other financing sources (uses):
Transfers in 1,700 1,700 1,275
Transfers out (1,841) (1,841) (1,779)
Total other financing sources (uses) (141) (141) (504)
Net change in fund balances (32) (32) 1,471
Fund balances at beginning of year 7,867 7,867 7,867
Increase (decrease) in
Nonspendable inventories 54 54
Fund balances at end of year $ 7,835 7,889 9,392

118
Combining Financial Statements/Schedules -Nonmajor Governmental Funds
Comprehensive Annual Financial Report for the Year Ended June 30, 2011 ~ County of San Diego
Lighting Maintenance District Fund
SCHEDULE OF REVENUES, EXPENDITURES, AND CHANGES IN FUND BALANCE -BUDGET AND ACTUALLighting Maintenance District FundFor the Year Ended June 30, 2011 (In Thousands)
Original Budget Final Budget ActualRevenues:
Taxes $ 1,034 1,034 919
Revenue from use of money and property 9 9 7Aid from other governmental agencies:
State 5 5 9
Charges for current services 616 616 725
Total revenues 1,664 1,664 1,660Expenditures:
Current:Public ways and facilities:
San Diego lighting maintenance 1,679 1,679 1,568
Total public ways and facilities 1,679 1,679 1,568
Total expenditures 1,679 1,679 1,568
Excess (deficiency) of revenues over (under) expenditures (15) (15) 92
Net change in fund balances (15) (15) 92
Fund balances at beginning of year 1,118 1,118 1,118
Increase (decrease) in
Nonspendable inventories 6 6
Fund balances at end of year $ 1,103 1,109 1,216
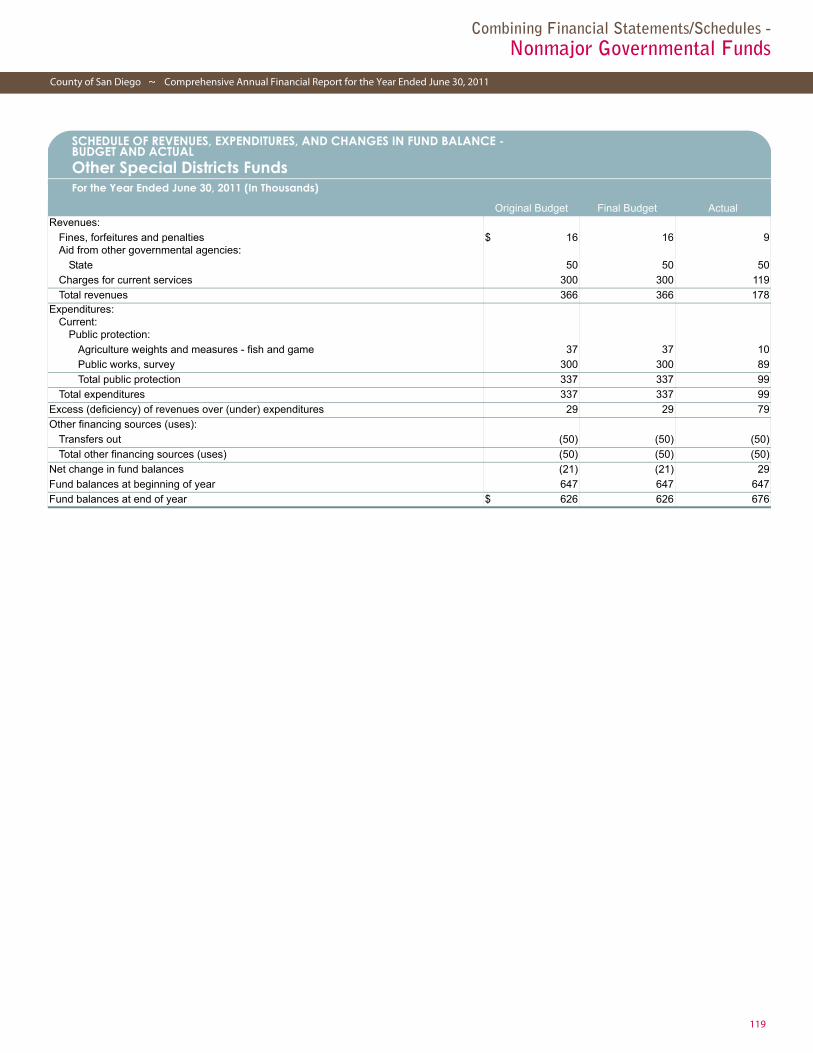
119
Combining Financial Statements/Schedules -Nonmajor Governmental Funds
County of San Diego ~ Comprehensive Annual Financial Report for the Year Ended June 30, 2011
Other Special Districts Funds
SCHEDULE OF REVENUES, EXPENDITURES, AND CHANGES IN FUND BALANCE -BUDGET AND ACTUALOther Special Districts FundsFor the Year Ended June 30, 2011 (In Thousands)
Original Budget Final Budget ActualRevenues:
Fines, forfeitures and penalties $ 16 16 9Aid from other governmental agencies:
State 50 50 50
Charges for current services 300 300 119
Total revenues 366 366 178Expenditures:
Current:Public protection:
Agriculture weights and measures - fish and game 37 37 10
Public works, survey 300 300 89
Total public protection 337 337 99
Total expenditures 337 337 99
Excess (deficiency) of revenues over (under) expenditures 29 29 79
Other financing sources (uses):
Transfers out (50) (50) (50)
Total other financing sources (uses) (50) (50) (50)
Net change in fund balances (21) (21) 29
Fund balances at beginning of year 647 647 647
Fund balances at end of year $ 626 626 676

120
Combining Financial Statements/Schedules -Nonmajor Governmental Funds
Comprehensive Annual Financial Report for the Year Ended June 30, 2011 ~ County of San Diego
Park Land Dedication Fund
SCHEDULE OF REVENUES, EXPENDITURES, AND CHANGES IN FUND BALANCE -BUDGET AND ACTUALPark Land Dedication FundFor the Year Ended June 30, 2011 (In Thousands)
Original Budget Final Budget ActualRevenues:
Licenses, permits and franchise fees $ 479 479 1,301
Revenue from use of money and property 85 85 47
Total revenues 564 564 1,348Expenditures:
Current:Recreation and cultural:
Local Park Planning Area 15 Sweetwater 10 10 4
Local Park Planning Area 16 Otay 2 2
Local Park Planning Area 19 Jamul 26 26
Local Park Planning Area 20 Spring Valley 5 5 5
Local Park Planning Area 25 Lakeside 24 69 60
Local Park Planning Area 26 Crest 11 11
Local Park Planning Area 27 Alpine 17 17 2
Local Park Planning Area 28 Ramona 44 194 2
Local Park Planning Area 29 Escondido 33 33
Local Park Planning Area 30 San Marcos 8 8
Local Park Planning Area 31 San Dieguito 135 135 9
Local Park Planning Area 32 Carlsbad 1 1
Local Park Planning Area 35 Fallbrook 104 104 19
Local Park Planning Area 36 Bonsall 23 23
Local Park Planning Area 37 Vista 22 22 1
Local Park Planning Area 38 Valley Center 305 570 527
Local Park Planning Area 39 Pauma 14 14
Local Park Planning Area 4 Lincoln Acres 5 5
Local Park Planning Area 40 Palomar-Julian 15 55 32
Local Park Planning Area 41 Mount Empire 7 7 4
Local Park Planning Area 42 Anza-Borrego 5 5 3
Local Park Planning Central Mountain 7 7
Local Park Planning Oceanside 1 1
Local Park Planning Valle de Oro 26 26 1
Total recreation and cultural 850 1,350 669
Total expenditures 850 1,350 669
Excess (deficiency) of revenues over (under) expenditures (286) (786) 679
Other financing sources (uses):
Transfers out (796) (996) (160)
Total other financing sources (uses) (796) (996) (160)
Net change in fund balances (1,082) (1,782) 519
Fund balances at beginning of year 9,951 9,951 9,951
Fund balances at end of year $ 8,869 8,169 10,470
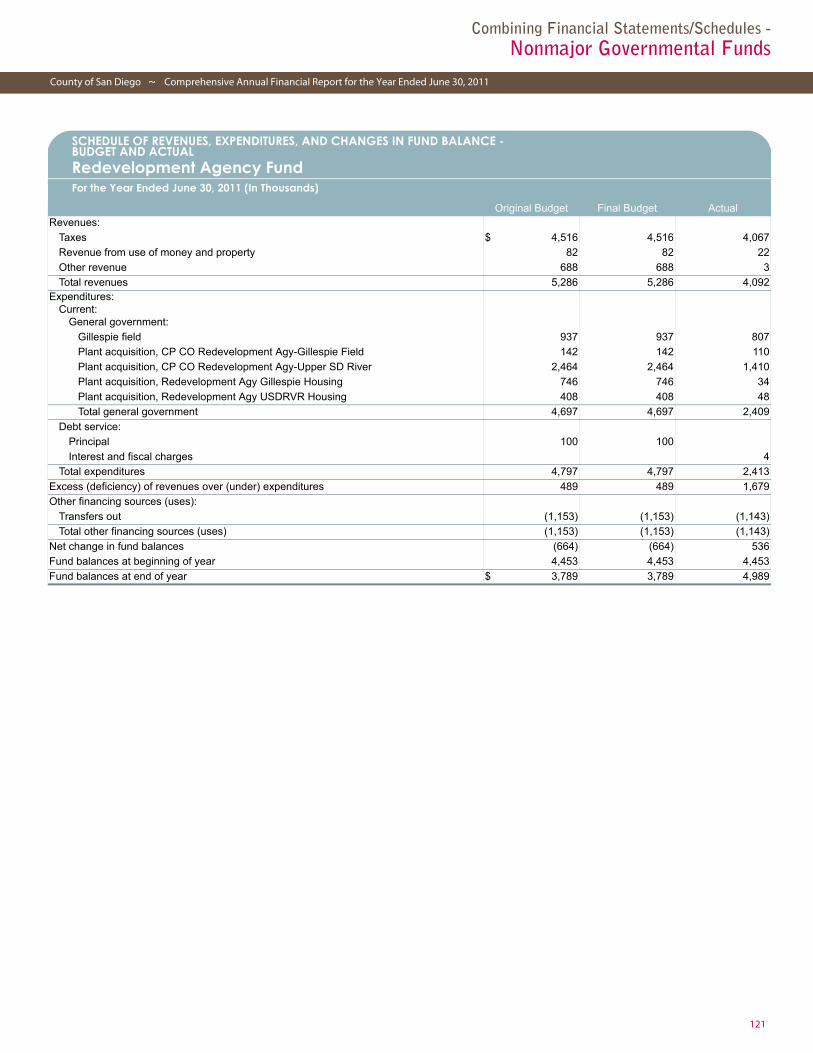
121
Combining Financial Statements/Schedules -Nonmajor Governmental Funds
County of San Diego ~ Comprehensive Annual Financial Report for the Year Ended June 30, 2011
Redevelopment Agency Fund
SCHEDULE OF REVENUES, EXPENDITURES, AND CHANGES IN FUND BALANCE - BUDGET AND ACTUALRedevelopment Agency FundFor the Year Ended June 30, 2011 (In Thousands)
Original Budget Final Budget ActualRevenues:
Taxes $ 4,516 4,516 4,067
Revenue from use of money and property 82 82 22
Other revenue 688 688 3
Total revenues 5,286 5,286 4,092Expenditures:
Current:General government:
Gillespie field 937 937 807
Plant acquisition, CP CO Redevelopment Agy-Gillespie Field 142 142 110
Plant acquisition, CP CO Redevelopment Agy-Upper SD River 2,464 2,464 1,410
Plant acquisition, Redevelopment Agy Gillespie Housing 746 746 34
Plant acquisition, Redevelopment Agy USDRVR Housing 408 408 48
Total general government 4,697 4,697 2,409
Debt service:
Principal 100 100
Interest and fiscal charges 4
Total expenditures 4,797 4,797 2,413
Excess (deficiency) of revenues over (under) expenditures 489 489 1,679
Other financing sources (uses):
Transfers out (1,153) (1,153) (1,143)
Total other financing sources (uses) (1,153) (1,153) (1,143)
Net change in fund balances (664) (664) 536
Fund balances at beginning of year 4,453 4,453 4,453
Fund balances at end of year $ 3,789 3,789 4,989

122
Combining Financial Statements/Schedules -Nonmajor Governmental Funds
Comprehensive Annual Financial Report for the Year Ended June 30, 2011 ~ County of San Diego
Road Fund
SCHEDULE OF REVENUES, EXPENDITURES, AND CHANGES IN FUND BALANCE -BUDGET AND ACTUALRoad FundFor the Year Ended June 30, 2011 (In Thousands)
Original Budget Final Budget ActualRevenues:
Licenses, permits and franchise fees $ 56 56 399
Revenue from use of money and property 642 642 651Aid from other governmental agencies:
State 88,646 87,884 71,738
Federal 8,381 12,131 6,294
Charges for current services 19,883 19,883 19,601
Other revenue 3,623 4,048 204
Total revenues 121,231 124,644 98,887
Expenditures:
Current:
Public ways and facilities:
Public works, road 125,024 128,470 53,470
Total public ways and facilities 125,024 128,470 53,470
Capital outlay 41,111 41,130 41,104
Total expenditures 166,135 169,600 94,574
Excess (deficiency) of revenues over (under) expenditures (44,904) (44,956) 4,313
Other financing sources (uses):
Sale of capital assets 2,065
Transfers out (2,597) (2,597) (1,993)
Total other financing sources (uses) (2,597) (2,597) 72
Net change in fund balances (47,501) (47,553) 4,385
Fund balances at beginning of year 115,467 115,467 115,467
Increase (decrease) in
Nonspendable inventories (231) (231)
Fund balances at end of year $ 67,966 67,683 119,621

123
County of San Diego ~ Comprehensive Annual Financial Report for the Year Ended June 30, 2011
Combining Financial Statements -Nonmajor Enterprise Funds
Combining Financial Statements - Nonmajor Enterprise Funds
ENTERPRISE FUNDSEnterprise funds are used to account for operations that are financed and operated in a manner similar to private business enterpriseswhere the intent of the governing body is that the costs of providing goods or services to the general public on a continuing basis befinanced or recovered primarily through user charges; or where the governing body has decided that periodic determination of netincome is appropriate for accountability purposes.
Airport FundThis fund is used to account for the maintenance, operations and development of County airports. A major objective of the airportprogram is to purchase and develop airport property in order to create tax revenues and create jobs in the private sector.
Sanitation Districts FundThis fund is used to account for the activities of all individual sanitation districts governed by the County Board of Supervisors.
Wastewater Management FundThis fund is used to account for operational services and support provided to sanitation districts governed by the County Board ofSupervisors.
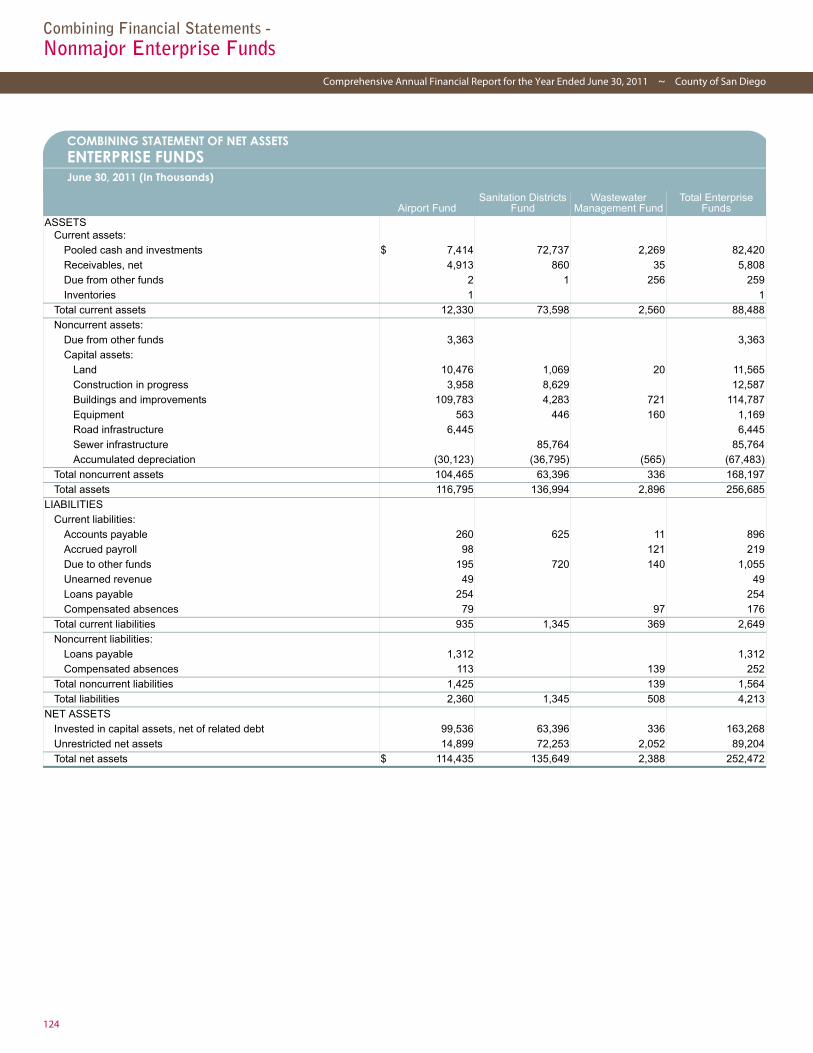
124
Combining Financial Statements -Nonmajor Enterprise Funds
Comprehensive Annual Financial Report for the Year Ended June 30, 2011 ~ County of San Diego
Combining Statement of Net Assets
COMBINING STATEMENT OF NET ASSETSENTERPRISE FUNDSJune 30, 2011 (In Thousands)
Airport FundSanitation Districts
FundWastewater
Management FundTotal Enterprise
FundsASSETS
Current assets:
Pooled cash and investments $ 7,414 72,737 2,269 82,420
Receivables, net 4,913 860 35 5,808
Due from other funds 2 1 256 259
Inventories 1 1
Total current assets 12,330 73,598 2,560 88,488
Noncurrent assets:
Due from other funds 3,363 3,363
Capital assets:
Land 10,476 1,069 20 11,565
Construction in progress 3,958 8,629 12,587
Buildings and improvements 109,783 4,283 721 114,787
Equipment 563 446 160 1,169
Road infrastructure 6,445 6,445
Sewer infrastructure 85,764 85,764
Accumulated depreciation (30,123) (36,795) (565) (67,483)
Total noncurrent assets 104,465 63,396 336 168,197
Total assets 116,795 136,994 2,896 256,685
LIABILITIES
Current liabilities:
Accounts payable 260 625 11 896
Accrued payroll 98 121 219
Due to other funds 195 720 140 1,055
Unearned revenue 49 49
Loans payable 254 254
Compensated absences 79 97 176
Total current liabilities 935 1,345 369 2,649
Noncurrent liabilities:
Loans payable 1,312 1,312
Compensated absences 113 139 252
Total noncurrent liabilities 1,425 139 1,564
Total liabilities 2,360 1,345 508 4,213
NET ASSETS
Invested in capital assets, net of related debt 99,536 63,396 336 163,268
Unrestricted net assets 14,899 72,253 2,052 89,204
Total net assets $ 114,435 135,649 2,388 252,472

125
County of San Diego ~ Comprehensive Annual Financial Report for the Year Ended June 30, 2011
Combining Financial Statements -Nonmajor Enterprise Funds
Combining Statement of Revenues, Expenses, and Changes in Fund Net Assets
COMBINING STATEMENT OF REVENUES, EXPENSES, AND CHANGES IN FUND NET ASSETSENTERPRISE FUNDSFor the Year Ended June 30, 2011 (In Thousands)
Airport FundSanitation Districts
FundWastewater
Management FundTotal Enterprise
FundsOperating revenues:
Charges for current services $ 11,301 20,431 6,509 38,241
Other revenue 1 6 7
Total operating revenues 11,302 20,431 6,515 38,248
Operating expenses:
Salaries and employee benefits 3,208 3,835 7,043
Repairs and maintenance 1,618 5,346 18 6,982
Equipment rental 445 546 991
Sewage processing 13,517 13,517
Contracted services 3,064 1,087 4,151
Depreciation 3,595 1,765 17 5,377
Utilities 236 13 249
Fuel 2 2
Other 558 1,003 284 1,845
Total operating expenses 12,726 21,631 5,800 40,157
Operating income (loss) (1,424) (1,200) 715 (1,909)
Nonoperating revenues (expenses):
Grants 1,513 31 1,544
Investment earnings 257 313 12 582
Interest expense (102) (102)
Gain (loss) on disposal of assets (6) (18) (5) (29)
Total nonoperating revenues (expenses) 1,662 295 38 1,995
Income (loss) before capital contributions and transfers 238 (905) 753 86
Transfers in 50 1,059 1,109
Transfers out (154) (177) (331)
Change in net assets 134 154 576 864
Net assets (deficits) at beginning of year 114,301 135,495 1,812 251,608
Net assets (deficits) at end of year $ 114,435 135,649 2,388 252,472
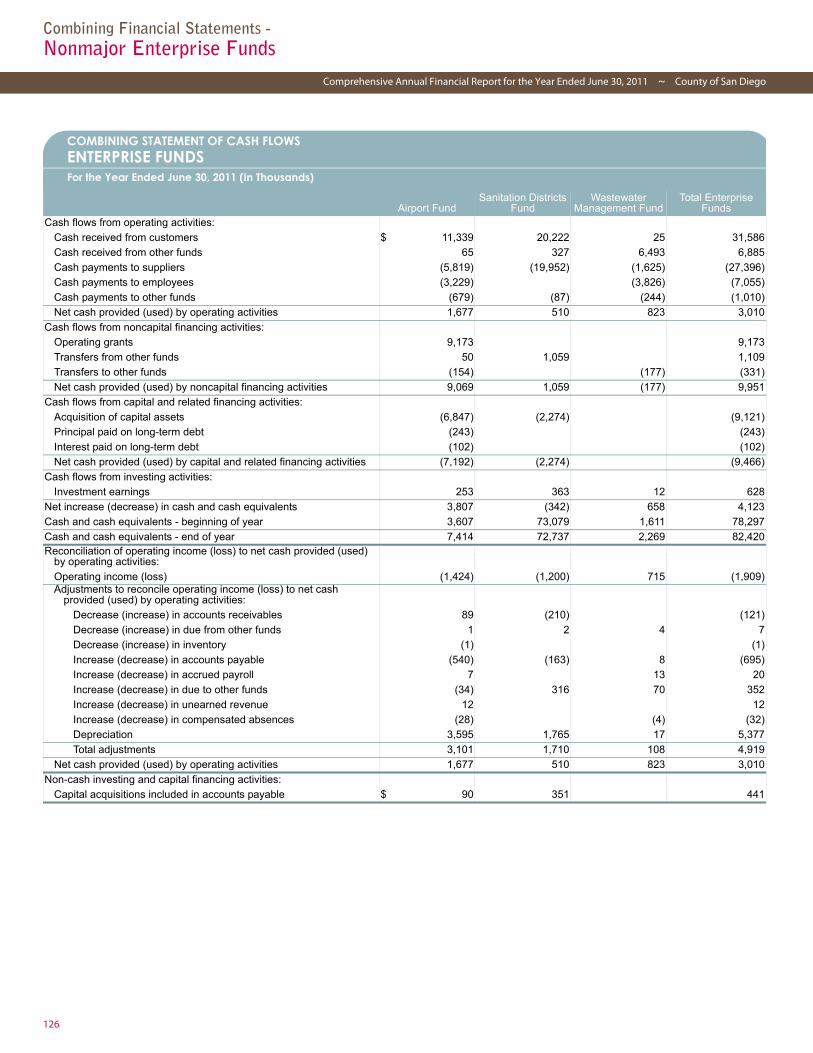
126
Combining Financial Statements -Nonmajor Enterprise Funds
Comprehensive Annual Financial Report for the Year Ended June 30, 2011 ~ County of San Diego
Combining Statement of Cash Flows
COMBINING STATEMENT OF CASH FLOWSENTERPRISE FUNDSFor the Year Ended June 30, 2011 (In Thousands)
Airport FundSanitation Districts
FundWastewater
Management FundTotal Enterprise
FundsCash flows from operating activities:
Cash received from customers $ 11,339 20,222 25 31,586
Cash received from other funds 65 327 6,493 6,885
Cash payments to suppliers (5,819) (19,952) (1,625) (27,396)
Cash payments to employees (3,229) (3,826) (7,055)
Cash payments to other funds (679) (87) (244) (1,010)
Net cash provided (used) by operating activities 1,677 510 823 3,010
Cash flows from noncapital financing activities:
Operating grants 9,173 9,173
Transfers from other funds 50 1,059 1,109
Transfers to other funds (154) (177) (331)
Net cash provided (used) by noncapital financing activities 9,069 1,059 (177) 9,951
Cash flows from capital and related financing activities:
Acquisition of capital assets (6,847) (2,274) (9,121)
Principal paid on long-term debt (243) (243)
Interest paid on long-term debt (102) (102)
Net cash provided (used) by capital and related financing activities (7,192) (2,274) (9,466)
Cash flows from investing activities:
Investment earnings 253 363 12 628
Net increase (decrease) in cash and cash equivalents 3,807 (342) 658 4,123
Cash and cash equivalents - beginning of year 3,607 73,079 1,611 78,297
Cash and cash equivalents - end of year 7,414 72,737 2,269 82,420Reconciliation of operating income (loss) to net cash provided (used)
by operating activities:
Operating income (loss) (1,424) (1,200) 715 (1,909)Adjustments to reconcile operating income (loss) to net cash
provided (used) by operating activities:
Decrease (increase) in accounts receivables 89 (210) (121)
Decrease (increase) in due from other funds 1 2 4 7
Decrease (increase) in inventory (1) (1)
Increase (decrease) in accounts payable (540) (163) 8 (695)
Increase (decrease) in accrued payroll 7 13 20
Increase (decrease) in due to other funds (34) 316 70 352
Increase (decrease) in unearned revenue 12 12
Increase (decrease) in compensated absences (28) (4) (32)
Depreciation 3,595 1,765 17 5,377
Total adjustments 3,101 1,710 108 4,919
Net cash provided (used) by operating activities 1,677 510 823 3,010
Non-cash investing and capital financing activities:
Capital acquisitions included in accounts payable $ 90 351 441
127
County of San Diego ~ Comprehensive Annual Financial Report for the Year Ended June 30, 2011
Combining Financial Statements -Internal Service Funds
First Page
Combining Financial Statements - Internal Service Funds
INTERNAL SERVICE FUNDSInternal service funds are established to account for servicesfurnished to other County departments and are financedprimarily by these service charges. Because they are exemptfrom budgetary control, they are free to employ commercialaccounting techniques, and are often used in situations where amore accurate determination of operating results is desired.
Employee Benefits FundThis fund was established to account for the County’s workers’compensation, unemployment insurance and medical insuranceactivities.
Facilities Management FundThis fund was established to account for the financing of publicservice utilities, property management, architectural andengineering services and mail services provided to other Countydepartments on a cost reimbursement basis.
Fleet Services FundThis fund was established to account for the financing of GeneralServices’ Fleet vehicles provided to other County departments ona cost reimbursement basis.
Information Technology FundThis fund was established to account for the financing ofsoftware applications for human resources, payroll, and financialsystems as well as telecommunications services provided toother County departments on a cost reimbursement basis.
Other Miscellaneous Internal Service FundsThis fund was established to provide for the financing of clothingand personal sundry items for persons institutionalized at variousCounty facilities.
Public Liability Insurance FundThis fund was established to account for all of the County’s publicliability claims and related expenses in compliance with theapplicable provisions of the law.
Purchasing FundThis fund accounts for the financing of materials and suppliesprovided to County departments and provides record storageservices; all on a cost reimbursement basis.
Road and Communication Equipment FundThis fund was established to account for the financing of publicworks and communications equipment provided to other Countydepartments on a cost reimbursement basis.
Special District Loans FundThis fund was established to provide financing for start upservices for new and existing County Service Districts on a costreimbursement basis.
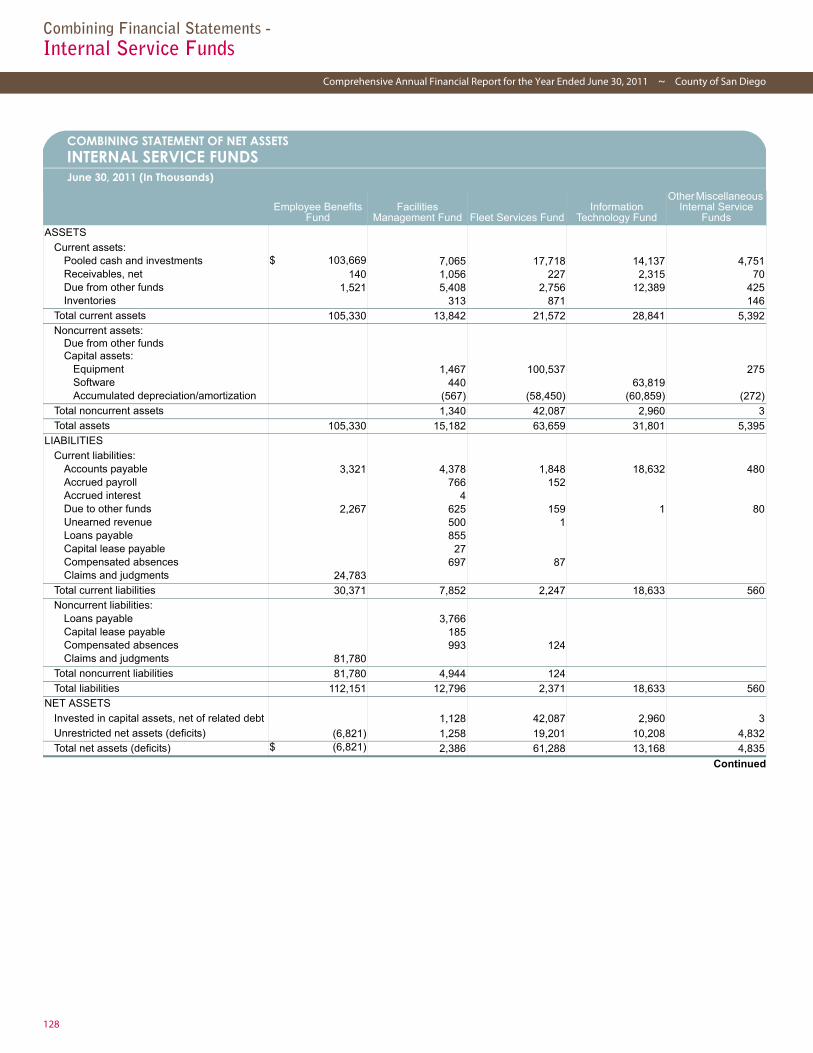
128
Combining Financial Statements -Internal Service Funds
Comprehensive Annual Financial Report for the Year Ended June 30, 2011 ~ County of San Diego
Combining Statement of Net Assets
Continued
COMBINING STATEMENT OF NET ASSETSINTERNAL SERVICE FUNDSJune 30, 2011 (In Thousands)
Employee Benefits Fund
Facilities Management Fund Fleet Services Fund
Information Technology Fund
Other Miscellaneous Internal Service
Funds
ASSETS
Current assets:Pooled cash and investments $ 103,669 7,065 17,718 14,137 4,751Receivables, net 140 1,056 227 2,315 70Due from other funds 1,521 5,408 2,756 12,389 425Inventories 313 871 146
Total current assets 105,330 13,842 21,572 28,841 5,392Noncurrent assets:
Due from other funds Capital assets:
Equipment 1,467 100,537 275Software 440 63,819 Accumulated depreciation/amortization (567) (58,450) (60,859) (272)
Total noncurrent assets 1,340 42,087 2,960 3Total assets 105,330 15,182 63,659 31,801 5,395
LIABILITIES
Current liabilities:Accounts payable 3,321 4,378 1,848 18,632 480Accrued payroll 766 152 Accrued interest 4 Due to other funds 2,267 625 159 1 80Unearned revenue 500 1 Loans payable 855 Capital lease payable 27 Compensated absences 697 87 Claims and judgments 24,783
Total current liabilities 30,371 7,852 2,247 18,633 560Noncurrent liabilities:
Loans payable 3,766 Capital lease payable 185 Compensated absences 993 124 Claims and judgments 81,780
Total noncurrent liabilities 81,780 4,944 124
Total liabilities 112,151 12,796 2,371 18,633 560NET ASSETS
Invested in capital assets, net of related debt 1,128 42,087 2,960 3Unrestricted net assets (deficits) (6,821) 1,258 19,201 10,208 4,832Total net assets (deficits) $ (6,821) 2,386 61,288 13,168 4,835
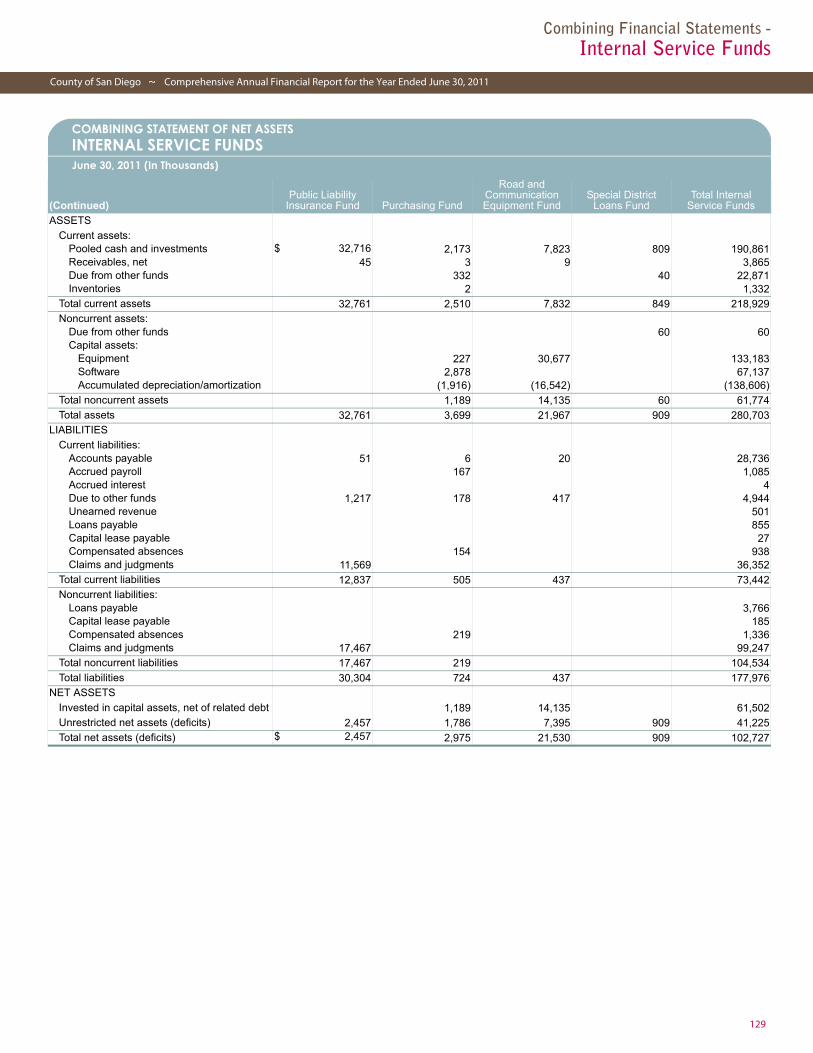
129
County of San Diego ~ Comprehensive Annual Financial Report for the Year Ended June 30, 2011
Combining Financial Statements -Internal Service Funds
COMBINING STATEMENT OF NET ASSETSINTERNAL SERVICE FUNDSJune 30, 2011 (In Thousands)
(Continued)Public Liability
Insurance Fund Purchasing Fund
Road and Communication Equipment Fund
Special District Loans Fund
Total Internal Service Funds
ASSETS
Current assets:Pooled cash and investments $ 32,716 2,173 7,823 809 190,861Receivables, net 45 3 9 3,865Due from other funds 332 40 22,871Inventories 2 1,332
Total current assets 32,761 2,510 7,832 849 218,929Noncurrent assets:
Due from other funds 60 60Capital assets:
Equipment 227 30,677 133,183Software 2,878 67,137Accumulated depreciation/amortization (1,916) (16,542) (138,606)
Total noncurrent assets 1,189 14,135 60 61,774Total assets 32,761 3,699 21,967 909 280,703
LIABILITIES
Current liabilities: Accounts payable 51 6 20 28,736Accrued payroll 167 1,085Accrued interest 4Due to other funds 1,217 178 417 4,944Unearned revenue 501Loans payable 855Capital lease payable 27Compensated absences 154 938Claims and judgments 11,569 36,352
Total current liabilities 12,837 505 437 73,442Noncurrent liabilities:
Loans payable 3,766Capital lease payable 185Compensated absences 219 1,336Claims and judgments 17,467 99,247
Total noncurrent liabilities 17,467 219 104,534Total liabilities 30,304 724 437 177,976
NET ASSETS
Invested in capital assets, net of related debt 1,189 14,135 61,502Unrestricted net assets (deficits) 2,457 1,786 7,395 909 41,225Total net assets (deficits) $ 2,457 2,975 21,530 909 102,727

130
Combining Financial Statements -Internal Service Funds
Comprehensive Annual Financial Report for the Year Ended June 30, 2011 ~ County of San Diego
Combining Statement of Revenues, Expenses, and Changes in Fund Net Assets
Continued
COMBINING STATEMENT OF REVENUES, EXPENSES, AND CHANGES IN FUND NET ASSETSINTERNAL SERVICE FUNDSFor the Year Ended June 30, 2011 (In Thousands)
Employee Benefits Fund
Facilities Management Fund Fleet Services Fund
Information Technology Fund
Other Miscellaneous Internal Service
Funds
Operating revenues:
Charges for current services $ 31,831 87,859 33,734 114,950 4,163Other revenue 133 1,248 280 380 2,031Total operating revenues 31,964 89,107 34,014 115,330 6,194
Operating expenses:
Salaries and employee benefits 25,044 4,891
Repairs and maintenance 20,296 6,826 6Equipment rental 61 91
Contracted services 8,757 18,734 900 111,761 1,988Depreciation/amortization 98 10,094 2,420
Utilities 21,118 331
Cost of material 3,998 122 1,697Claims and judgments 32,707
Fuel 298 10,012 2Other 3,611 896 86Total operating expenses 41,464 93,258 34,163 114,181 3,779
Operating income (loss) (9,500) (4,151) (149) 1,149 2,415Nonoperating revenues (expenses):
Grants 6,314
Investment earnings 491 114
Interest expense (289) (36)
Gain (loss) on disposal of assets 2 396
Total nonoperating revenues (expenses) 491 6,027 510 (36)
Income (loss) before capital contributions and transfers (9,009) 1,876 361 1,113 2,415
Capital contributions 403 3
Transfers in 258 1,415 1,322 1,998
Transfers out (1,153) (215) (1,992)Change in net assets (8,751) 2,541 1,471 3,111 423Net assets (deficits) at beginning of year 1,930 (155) 59,817 10,057 4,412
Net assets (deficits) at end of year $ (6,821) 2,386 61,288 13,168 4,835
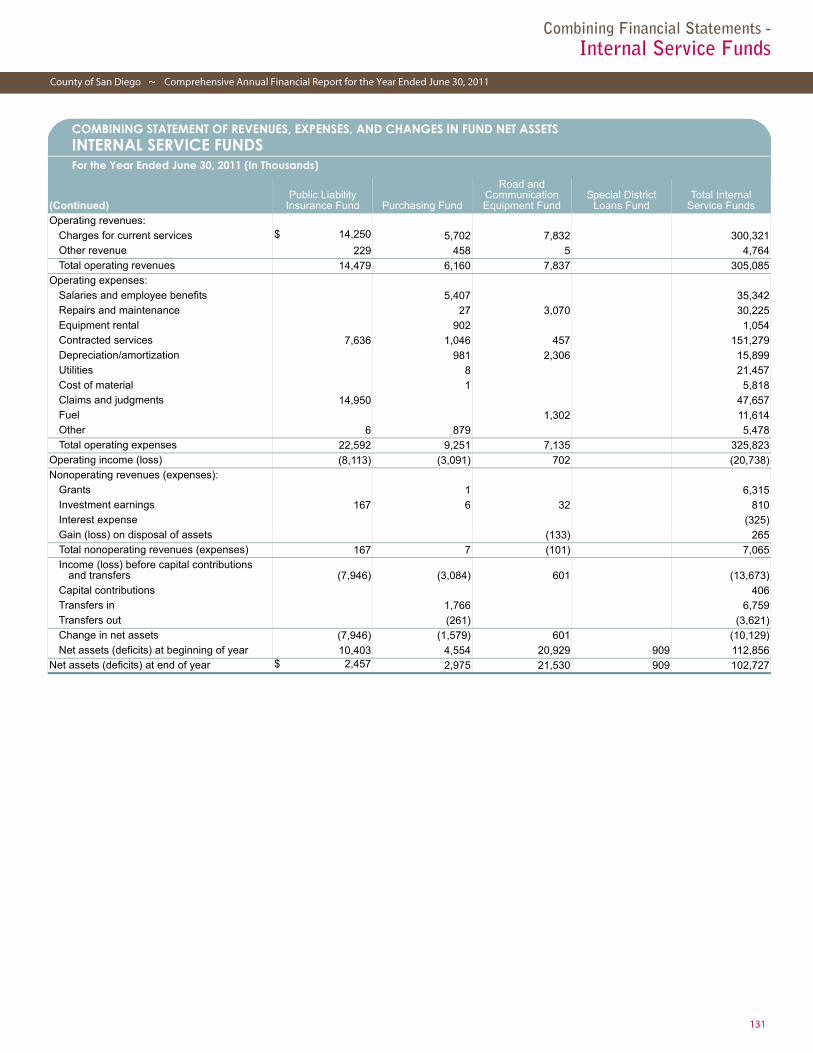
131
County of San Diego ~ Comprehensive Annual Financial Report for the Year Ended June 30, 2011
Combining Financial Statements -Internal Service Funds
COMBINING STATEMENT OF REVENUES, EXPENSES, AND CHANGES IN FUND NET ASSETSINTERNAL SERVICE FUNDSFor the Year Ended June 30, 2011 (In Thousands)
(Continued)Public Liability
Insurance Fund Purchasing Fund
Road and Communication Equipment Fund
Special District Loans Fund
Total Internal Service Funds
Operating revenues:
Charges for current services $ 14,250 5,702 7,832 300,321Other revenue 229 458 5 4,764Total operating revenues 14,479 6,160 7,837 305,085
Operating expenses:
Salaries and employee benefits 5,407 35,342Repairs and maintenance 27 3,070 30,225Equipment rental 902 1,054Contracted services 7,636 1,046 457 151,279Depreciation/amortization 981 2,306 15,899Utilities 8 21,457Cost of material 1 5,818Claims and judgments 14,950 47,657Fuel 1,302 11,614Other 6 879 5,478Total operating expenses 22,592 9,251 7,135 325,823
Operating income (loss) (8,113) (3,091) 702 (20,738)Nonoperating revenues (expenses):
Grants 1 6,315Investment earnings 167 6 32 810Interest expense (325)Gain (loss) on disposal of assets (133) 265Total nonoperating revenues (expenses) 167 7 (101) 7,065Income (loss) before capital contributions
and transfers (7,946) (3,084) 601
(13,673)Capital contributions 406Transfers in 1,766 6,759Transfers out (261) (3,621)Change in net assets (7,946) (1,579) 601 (10,129)Net assets (deficits) at beginning of year 10,403 4,554 20,929 909 112,856
Net assets (deficits) at end of year $ 2,457 2,975 21,530 909 102,727

132
Combining Financial Statements -Internal Service Funds
Comprehensive Annual Financial Report for the Year Ended June 30, 2011 ~ County of San Diego
Combining Statement of Cash Flows
Continued
COMBINING STATEMENT OF CASH FLOWSINTERNAL SERVICE FUNDSFor the Year Ended June 30, 2011 (In Thousands)
Employee Benefits Fund
Facilities Management
FundFleet Services
FundInformation
Technology Fund
Other Miscellaneous
Internal Service Funds
Cash flows from operating activities:
Cash received from customers $ 132 2,961 1,188 897 6,183Cash received from other funds 33,514 87,720 32,087 120,892 38Cash payments to suppliers (8,829) (65,449) (16,721) (122,555) (3,745)Cash payments to employees (24,899) (4,849)
Cash payments to other funds (4,266) (1,874) (1,259) (97)Cash paid for claims and judgments (21,117)
Net cash provided (used) by operating activities 3,700 (3,933) 9,831 (2,025) 2,379Cash flows from noncapital financing activities:
Operating grants 7,054
Transfers from other funds 258 1,415 1,322 1,998
Transfers to other funds (1,153) (215) (1,992)Payments received on advances to other funds
Principal paid on long-term debt (767)
Interest paid on long-term debt (275)
Proceeds from loans 655
Net cash provided (used) by noncapital financing activities 258 6,929 1,107 1,998 (1,992)
Cash flows from capital and related financing activities:
Capital contributions 3
Acquisition of capital assets (99) (8,166)
Proceeds from sale of assets 2 729
Principal paid on capital lease (30)
Interest paid on long-term debt (36)
Interest paid on capital lease (14)
Net cash provided (used) by capital and related financing activities
(141) (7,434) (36)
Cash flows from investing activities:
Investment earnings 550 88
Net increase (decrease) in cash and cash equivalents 4,508 2,855 3,592 (63) 387Cash and cash equivalents - beginning of year 99,161 4,210 14,126 14,200 4,364Cash and cash equivalents - end of year 103,669 7,065 17,718 14,137 4,751Reconciliation of operating income (loss) to net cash
provided (used) by operating activities:
Operating income (loss) (9,500) (4,151) (149) 1,149 2,415Adjustments to reconcile operating income (loss) to net
cash provided (used) by operating activities:
Decrease (increase) in accounts receivables (455) (55) (2,091) (12)Decrease (increase) in due from other funds 33 2,168 (682) 6,446 38Decrease (increase) in inventory (3) 19 2Increase (decrease) in accounts payable (73) (745) 555 (8,690) 24Increase (decrease) in accrued payroll 72 36 Increase (decrease) in due to other funds 1,650 (876) 5 (1,259) (88)Increase (decrease) in unearned revenue (140) Increase (decrease) in compensated absences 99 8 Increase (decrease) in claims and judgments 11,590 Depreciation/amortization 98 10,094 2,420 Total adjustments 13,200 218 9,980 (3,174) (36)
Net cash provided (used) by operating activities 3,700 (3,933) 9,831 (2,025) 2,379Non-cash investing and capital financing activities:
Capital acquisitions included in accounts payable 425
Governmental contributions of capital assets $ 403

133
County of San Diego ~ Comprehensive Annual Financial Report for the Year Ended June 30, 2011
Combining Financial Statements -Internal Service Funds
COMBINING STATEMENT OF CASH FLOWSINTERNAL SERVICE FUNDSFor the Year Ended June 30, 2011 (In Thousands)
(Continued)Public Liability
Insurance Fund Purchasing Fund
Road and Communication Equipment Fund
Special District Loans Fund
Total Internal Service Funds
Cash flows from operating activities:
Cash received from customers $ 228 458 5 12,052Cash received from other funds 14,685 5,929 8,057 302,922Cash payments to suppliers (7,720) (1,443) (152) (226,614)Cash payments to employees (5,445) (35,193)Cash payments to other funds (1,333) (4,737) (13,566)Cash paid for claims and judgments (9,040) (30,157)Net cash provided (used) by operating activities (1,847) (1,834) 3,173 9,444
Cash flows from noncapital financing activities:
Operating grants 1 7,055Transfers from other funds 1,766 6,759Transfers to other funds (261) (3,621)Payments received on advances to other funds 47 47Principal paid on long-term debt (767)Interest paid on long-term debt (275)Proceeds from loans 655Net cash provided (used) by noncapital financing
activities
1,506
47 9,853Cash flows from capital and related financing activities:
Capital contributions 3Acquisition of capital assets (1,168) (9,433)Proceeds from sale of assets 103 834Principal paid on capital lease (30)Interest paid on long-term debt (36)Interest paid on capital lease (14)Net cash provided (used) by capital and related
financing activities
(1,065)
(8,676)Cash flows from investing activities:
Investment earnings 193 8 33 872Net increase (decrease) in cash and cash equivalents (1,654) (320) 2,141 47 11,493Cash and cash equivalents - beginning of year 34,370 2,493 5,682 762 179,368Cash and cash equivalents - end of year 32,716 2,173 7,823 809 190,861Reconciliation of operating income (loss) to net cash
provided (used) by operating activities:
Operating income (loss) (8,113) (3,091) 702 (20,738)Adjustments to reconcile operating income (loss) to net
cash provided (used) by operating activities:
Decrease (increase) in accounts receivables (2,613)Decrease (increase) in due from other funds 229 225 8,457Decrease (increase) in inventory 18Increase (decrease) in accounts payable (79) 1 (128) (9,135)Increase (decrease) in accrued payroll 10 118Increase (decrease) in due to other funds 435 69 68 4Increase (decrease) in unearned revenue (140)Increase (decrease) in compensated absences (33) 74Increase (decrease) in claims and judgments 5,910 17,500Depreciation/amortization 981 2,306 15,899Total adjustments 6,266 1,257 2,471 30,182
Net cash provided (used) by operating activities (1,847) (1,834) 3,173 9,444Non-cash investing and capital financing activities:
Capital acquisitions included in accounts payable 15 440Governmental contributions of capital assets $ 403

134

135
County of San Diego ~ Comprehensive Annual Financial Report for the Year Ended June 30, 2011
Combining Financial Statements -Investment Trust Funds
Combining Financial Statements - Investment Trust Funds
INVESTMENT TRUST FUNDSInvestment trust funds are used to account for investments held on behalf of external entities in either the County pool or specificinvestments. These assets are held in a fiduciary capacity and accordingly, net assets reported in the Investment Trust funds are heldin trust for pool participants and individual investment accounts.
Pooled Investments - Investment Trust Fund
This fund was established to account for the external portion of the County Treasurer's investment pool in which the County, its com-ponent units and legally separate governments commingle or pool their resources in an investment pool.
Specific Investments - Investment Trust Fund
This fund was created for the purpose of reporting individual investments which are offered as an alternative to a pooled position. Itincludes specific investments for external entities.
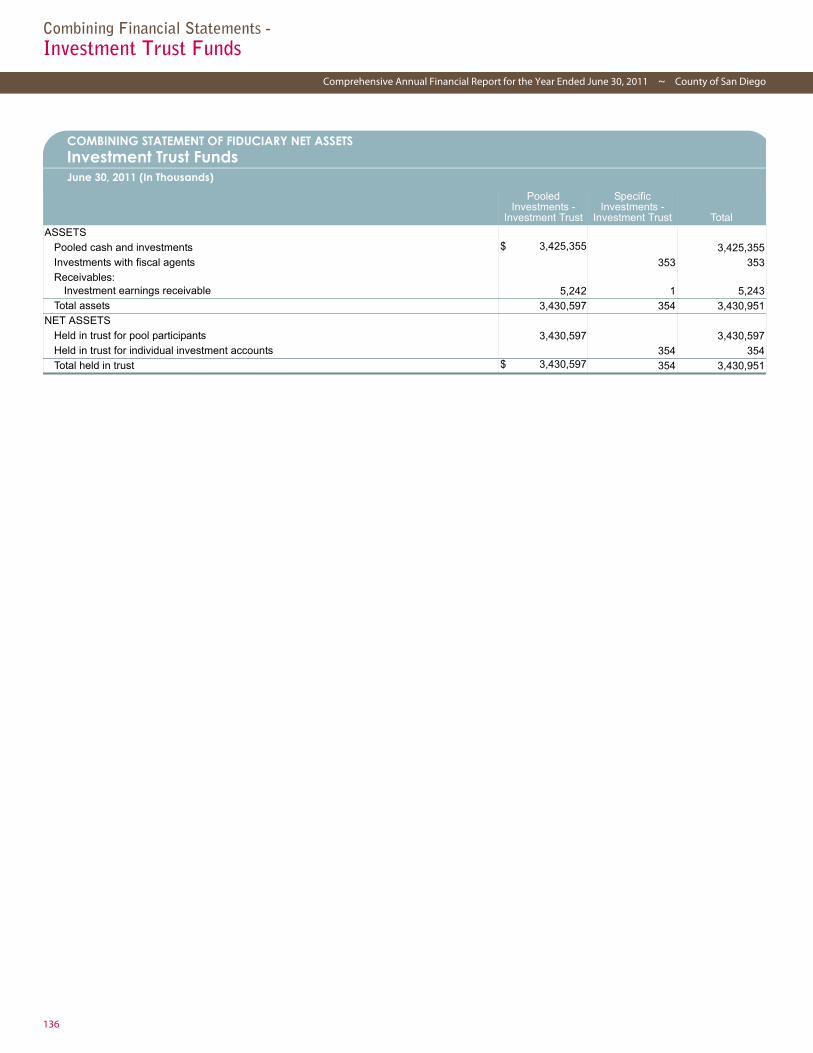
136
Combining Financial Statements -Investment Trust Funds
Comprehensive Annual Financial Report for the Year Ended June 30, 2011 ~ County of San Diego
Combining Statement of Fiduciary Net Assets
COMBINING STATEMENT OF FIDUCIARY NET ASSETSInvestment Trust FundsJune 30, 2011 (In Thousands)
Pooled Investments -
Investment Trust
Specific Investments -
Investment Trust Total
ASSETS
Pooled cash and investments $ 3,425,355 3,425,355Investments with fiscal agents 353 353Receivables:
Investment earnings receivable 5,242 1 5,243Total assets 3,430,597 354 3,430,951
NET ASSETS
Held in trust for pool participants 3,430,597 3,430,597Held in trust for individual investment accounts 354 354Total held in trust $ 3,430,597 354 3,430,951
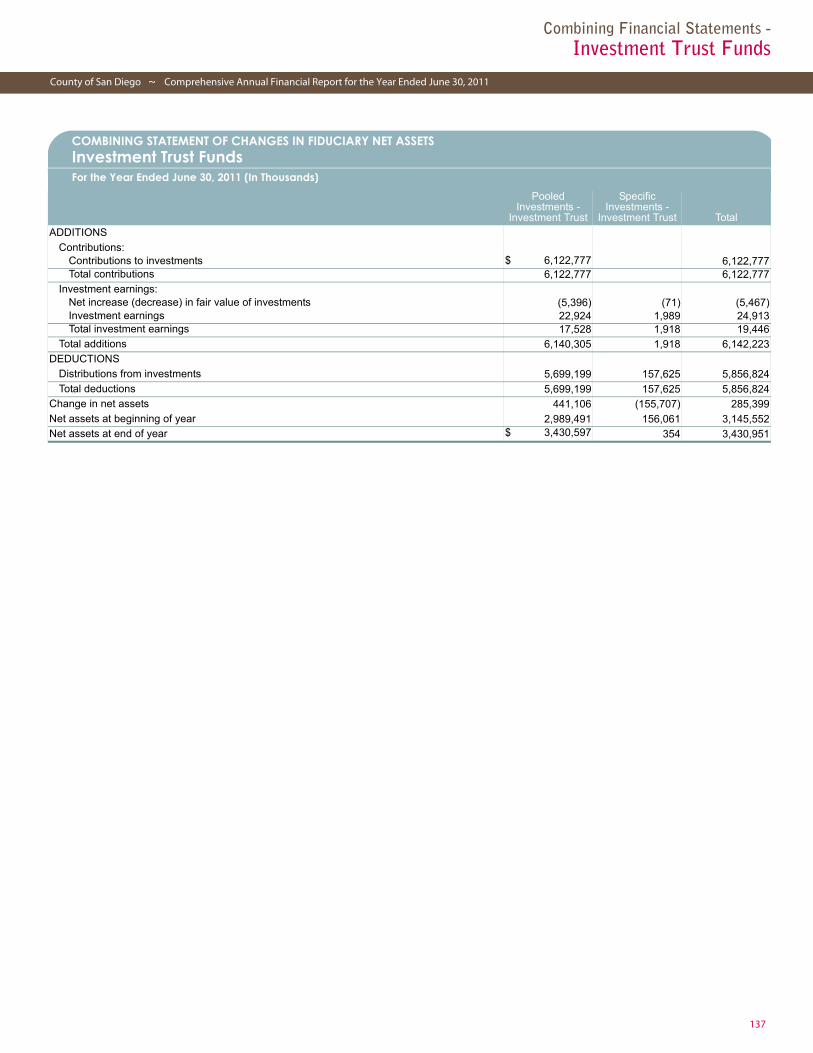
137
County of San Diego ~ Comprehensive Annual Financial Report for the Year Ended June 30, 2011
Combining Financial Statements -Investment Trust Funds
Combining Statement of Changes in Fiduciary Net Assets
COMBINING STATEMENT OF CHANGES IN FIDUCIARY NET ASSETSInvestment Trust FundsFor the Year Ended June 30, 2011 (In Thousands)
Pooled Investments -
Investment Trust
Specific Investments -
Investment Trust Total
ADDITIONS
Contributions: Contributions to investments $ 6,122,777 6,122,777Total contributions 6,122,777 6,122,777
Investment earnings:Net increase (decrease) in fair value of investments (5,396) (71) (5,467)Investment earnings 22,924 1,989 24,913Total investment earnings 17,528 1,918 19,446
Total additions 6,140,305 1,918 6,142,223DEDUCTIONS
Distributions from investments 5,699,199 157,625 5,856,824Total deductions 5,699,199 157,625 5,856,824
Change in net assets 441,106 (155,707) 285,399Net assets at beginning of year 2,989,491 156,061 3,145,552Net assets at end of year $ 3,430,597 354 3,430,951

138

139
County of San Diego ~ Comprehensive Annual Financial Report for the Year Ended June 30, 2011
Combining Financial Statements -Agency Funds
Combining Financial Statements - Agency Funds
AGENCY FUNDSAgency funds are used to account for situations where the County’s role is purely custodial, such as the receipt, temporary investment,and remittance of fiduciary resources to individuals, private organizations, or other governments. Accordingly, assets reported in theagency funds are offset by a liability to the party on whose behalf they are held.
Property Tax Collection FundsThese funds are used for recording the collection and distribution of property taxes.
Other Agency FundsThese funds maintain assets held in an agent capacity for other governments, organizations and individuals. These assets do notsupport the County’s programs or services. Any portion of agency fund assets held at fiscal year end for other funds are reported inthose funds rather than in the agency funds.
Combining Statement of Changes in Assets and Liabilities
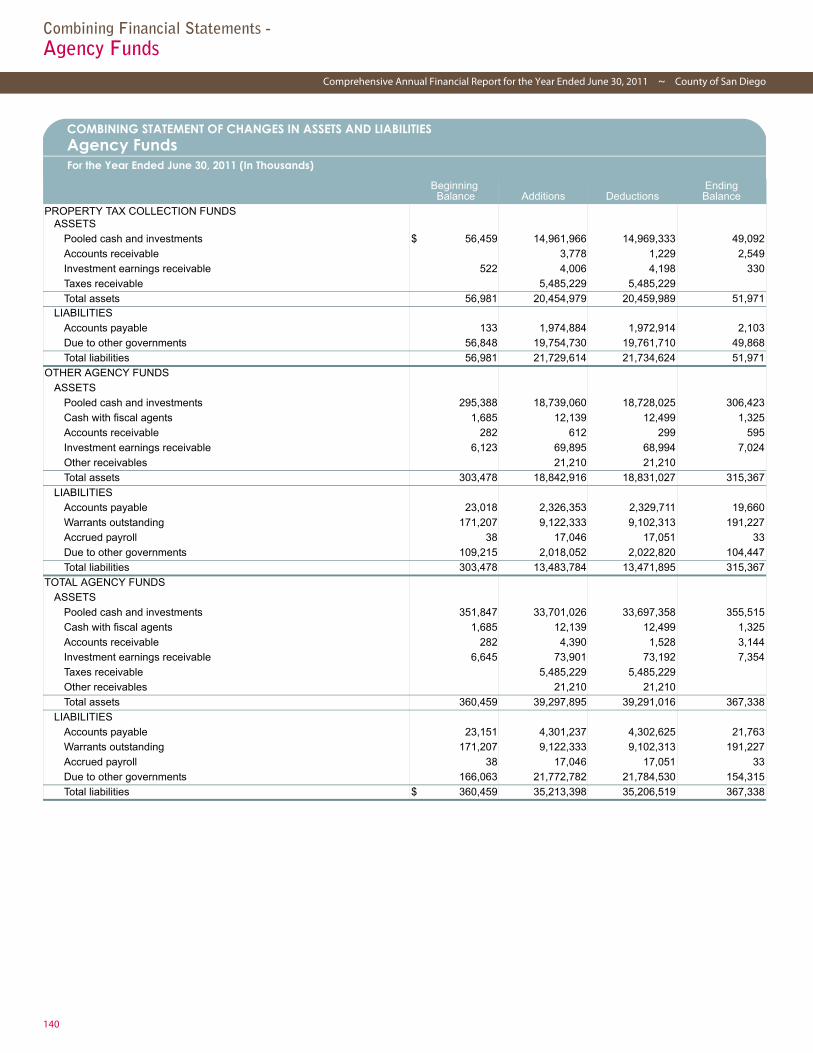
140
Combining Financial Statements -Agency Funds
Comprehensive Annual Financial Report for the Year Ended June 30, 2011 ~ County of San Diego
COMBINING STATEMENT OF CHANGES IN ASSETS AND LIABILITIESAgency FundsFor the Year Ended June 30, 2011 (In Thousands)
Beginning Balance Additions Deductions
Ending Balance
PROPERTY TAX COLLECTION FUNDSASSETS
Pooled cash and investments $ 56,459 14,961,966 14,969,333 49,092
Accounts receivable 3,778 1,229 2,549
Investment earnings receivable 522 4,006 4,198 330
Taxes receivable 5,485,229 5,485,229
Total assets 56,981 20,454,979 20,459,989 51,971LIABILITIES
Accounts payable 133 1,974,884 1,972,914 2,103
Due to other governments 56,848 19,754,730 19,761,710 49,868
Total liabilities 56,981 21,729,614 21,734,624 51,971
OTHER AGENCY FUNDS
ASSETS
Pooled cash and investments 295,388 18,739,060 18,728,025 306,423
Cash with fiscal agents 1,685 12,139 12,499 1,325
Accounts receivable 282 612 299 595
Investment earnings receivable 6,123 69,895 68,994 7,024
Other receivables 21,210 21,210
Total assets 303,478 18,842,916 18,831,027 315,367
LIABILITIES
Accounts payable 23,018 2,326,353 2,329,711 19,660
Warrants outstanding 171,207 9,122,333 9,102,313 191,227
Accrued payroll 38 17,046 17,051 33
Due to other governments 109,215 2,018,052 2,022,820 104,447
Total liabilities 303,478 13,483,784 13,471,895 315,367
TOTAL AGENCY FUNDS
ASSETS
Pooled cash and investments 351,847 33,701,026 33,697,358 355,515
Cash with fiscal agents 1,685 12,139 12,499 1,325
Accounts receivable 282 4,390 1,528 3,144
Investment earnings receivable 6,645 73,901 73,192 7,354
Taxes receivable 5,485,229 5,485,229
Other receivables 21,210 21,210
Total assets 360,459 39,297,895 39,291,016 367,338
LIABILITIES
Accounts payable 23,151 4,301,237 4,302,625 21,763
Warrants outstanding 171,207 9,122,333 9,102,313 191,227
Accrued payroll 38 17,046 17,051 33
Due to other governments 166,063 21,772,782 21,784,530 154,315
Total liabilities $ 360,459 35,213,398 35,206,519 367,338


141
County of San Diego ~ Comprehensive Annual Financial Report for the Year Ended June 30, 2011
Statistical Section
INTRODUCTIONGovernment Accounting Standards Board (GASB) Statement 44 “Economic Condition Reporting: The Statistical Section (anamendment of NCGA Statement 1)” requires that certain detailed statistical information be presented in this section, typically in ten-year trends, to assist users in utilizing the basic financial statements, notes to the financial statements, and required supplementaryinformation in order to assess the economic condition of the County. Provisions of this Statement require that governments preparingthis statistical section are encouraged but not required, to report all years of information retroactively.
Statistical Section
In this regard, when available, ten year trend information has been provided. When accounting data or other information isunavailable, statistical tables are footnoted to indicate as such. Generally, information was unavailable due to the following:
• Accounting data used in the preparation of the Comprehensive Annual Financial Reports prior to the County's implementation of changes in accounting and presentation called for in GASB Statement 34 “Basic Financial Statements-and Management's Discussion and Analysis-for State and Local Governments,” (implemented by the County in Fiscal Year 2002) was not archived in such a manner to enable a retroactive restatement of previous years accounting data.
• Non-accounting trend data called for by Statement 44 which was significantly different than data reported in previous fiscal years' statistical tables was either not available from external sources in the format required or was not available in internal archived data.
Financial Trends ....................................................................................................................... 142These Tables contain information to help the reader understand how the County’s financial performance and well-being have changed over time.
Revenue Capacity ................................................................................................................. 147These Tables contain information to help the reader assess the County’s most significant local revenue source, theproperty tax.
Debt Capacity ........................................................................................................................ 151These Tables present information to help the reader assess the affordability of the County’s current levels ofoutstanding debt and the County’s ability to issue additional debt in the future.
Demographic and Economic Information .......................................................................... 155These Tables offer demographic and economic indicators to help the reader understand the environment within whichthe County’s financial activities take place.
Operating Information............................................................................................................ 157These Tables contain service and infrastructure data to help the reader understand how the information in theCounty’s financial report relates to the services the County provides and the activities it performs.
Sources: Unless otherwise noted, the information in the following tables is derived from the comprehensive annual financial reportsfor the relevant year.
Introduction

142
Statistical Section
Comprehensive Annual Financial Report for the Year Ended June 30, 2011 ~ County of San Diego
et Assets by Component
Table 1
County of San DiegoNet Assets by Component
Last Ten Fiscal Years(Accrual Basis of Accounting)
(In Thousands)Fiscal Year
2002 2003 2004 2005 2006
Net assets
Governmental activities
Invested in capital assets, net of related debt $ 2,178,892 2,261,697 2,324,806 2,341,126 2,367,442
Restricted 148,489 243,815 169,983 223,565 224,635
Unrestricted 271,909 (317,357) (668,868) (541,048) (197,916)
Total governmental activities net assets 2,599,290 2,188,155 1,825,921 2,023,643 2,394,161
Business-type activities
Invested in capital assets, net of related debt 66,026 71,293 78,485 84,416 97,212
Restricted 34,151 15
Unrestricted 44,495 80,359 79,358 76,310 81,125
Total business-type activities net assets 144,672 151,667 157,843 160,726 178,337
Primary government
Invested in capital assets, net of related debt 2,244,918 2,332,990 2,403,291 2,425,542 2,464,654
Restricted 182,640 243,830 169,983 223,565 224,635
Unrestricted 316,404 (236,998) (589,510) (464,738) (116,791)
Total primary government net assets $ 2,743,962 2,339,822 1,983,764 2,184,369 2,572,498
2007 2008 2009 2010 2011
Net assets
Governmental activities
Invested in capital assets, net of related debt $ 2,409,050 2,468,142 2,582,854 2,595,105 2,675,240
Restricted 162,318 181,198 314,107 247,585 529,808
Unrestricted 178,231 351,326 319,669 535,103 365,165
Total governmental activities net assets 2,749,599 3,000,666 3,216,630 3,377,793 3,570,213
Business-type activities
Invested in capital assets, net of related debt 112,549 126,237 148,146 164,845 163,268
Restricted
Unrestricted 84,779 92,686 88,909 87,254 89,602
Total business-type activities net assets 197,328 218,923 237,055 252,099 252,870
Primary government
Invested in capital assets, net of related debt 2,521,599 2,594,379 2,731,000 2,759,950 2,838,508
Restricted 162,318 181,198 314,107 247,585 529,808
Unrestricted 263,010 444,012 408,578 622,357 454,767
Total primary government net assets $ 2,946,927 3,219,589 3,453,685 3,629,892 3,823,083

143
Statistical Section
County of San Diego ~ Comprehensive Annual Financial Report for the Year Ended June 30, 2011
Changes in Net Assets
Table 2
County of San DiegoChanges in Net Assets
For the Last Ten Fiscal Years(Accrual Basis of Accounting)
(In Thousands)Fiscal Year
2002 2003 2004 2005 2006 2007 2008 2009 2010 2011
Expenses
Governmental activities
General government $ 170,908 234,062 234,759 232,826 240,158 249,993 298,607 275,508 304,305 229,767
Public protection 823,520 1,140,484 1,173,532 960,227 1,021,464 1,079,320 1,180,114 1,158,162 1,091,910 1,128,967
Public ways and facilities 168,202 142,356 160,344 122,797 128,268 133,148 144,452 151,125 131,982 130,239
Health and sanitation 547,200 598,189 564,796 545,805 559,709 580,384 638,869 678,217 681,448 721,939
Public assistance 825,028 1,035,065 1,052,911 972,592 1,015,481 1,043,454 1,114,453 1,177,320 1,171,603 1,191,559
Education 24,119 30,850 31,722 27,394 32,488 33,223 36,355 42,424 39,165 35,734
Recreation and cultural 18,021 23,520 26,493 21,405 23,376 28,469 33,941 34,542 33,629 36,699
Interest on long-term debt 68,771 87,627 91,897 106,612 116,692 146,997 119,138 118,927 111,942 106,381
Total governmental activities expenses 2,645,769 3,292,153 3,336,454 2,989,658 3,137,636 3,294,988 3,565,929 3,636,225 3,565,984 3,581,285
Business-type activities
Airport 7,973 7,125 7,373 8,117 7,699 8,209 8,848 10,614 12,389 12,876
Wastewater Management 3,808 4,357 4,005 5,076 4,733 4,422 5,320 16,666 5,523 5,806
Transit (1) 17,085
Sanitation Districts 15,306 15,216 15,828 20,564 15,133 15,620 17,574 5,794 18,831 21,699
Total business-type activities expenses 44,172 26,698 27,206 33,757 27,565 28,251 31,742 33,074 36,743 40,381
Total primary government expenses 2,689,941 3,318,851 3,363,660 3,023,415 3,165,201 3,323,239 3,597,671 3,669,299 3,602,727 3,621,666
Program revenues
Governmental activities
Charges for services:
General government 94,805 121,070 93,143 84,769 99,083 98,365 130,645 93,939 90,503 92,085
Public protection 166,900 170,221 206,679 229,150 202,941 201,332 217,953 215,343 204,405 235,913
Other activities 119,291 117,569 122,139 100,465 153,535 153,717 137,020 133,834 150,461 160,067
Operating grants and contributions 1,724,847 1,873,493 1,914,614 1,867,829 2,067,803 2,113,585 2,152,380 2,181,366 2,192,591 2,211,946
Capital grants and contributions 30,128 40,587 67,357 32,303 5,283 7,559 24,474 60,703 33,246 25,329
Total governmental activities program revenues 2,135,971 2,322,940 2,403,932 2,314,516 2,528,645 2,574,558 2,662,472 2,685,185 2,671,206 2,725,340
Business-type activities
Charges for services:
Airport 5,479 7,396 6,734 8,345 7,433 9,367 16,097 9,397 9,299 11,301
Wastewater management 4,106 4,496 5,447 5,357 4,322 4,662 5,318 6,567 6,616 6,509
Transit (1) 17,047
Sanitation districts 15,713 15,444 15,765 16,949 17,251 17,995 20,060 20,114 19,823 20,431
Operating grants and contributions 5,763 3,769 4,153 3,700 9,994 8,257 7,725 12,974 15,330 1,544
Capital grants and contributions 501 839 1,539 1,036 58 464
Total business-type program revenues 48,609 31,944 33,638 35,387 39,058 40,745 49,200 49,052 51,068 39,785
Total primary government program revenues 2,184,580 2,354,884 2,437,570 2,349,903 2,567,703 2,615,303 2,711,672 2,734,237 2,722,274 2,765,125
Net (Expense) Revenue
Governmental activities (509,798) (969,213) (932,522) (675,142) (608,991) (720,430) (903,457) (951,040) (894,778) (855,945)
Business-type activities 4,437 5,246 6,432 1,630 11,493 12,494 17,458 15,978 14,325 (596)
Total primary government net (expense) revenue $ (505,361) (963,967) (926,090) (673,512) (597,498) (707,936) (885,999) (935,062) (880,453) (856,541)
(Continued)

144
Statistical Section
Comprehensive Annual Financial Report for the Year Ended June 30, 2011 ~ County of San Diego
Table 2
County of San DiegoChanges in Net Assets
For the Last Ten Fiscal Years(Accrual Basis of Accounting)
(In Thousands)(Continued)
Fiscal Year
2002 2003 2004 2005 2006 2007 2008 2009 2010 2011
General revenues and other changes in net assets
Governmental activities
Taxes:
Property taxes $ 412,400 459,340 496,917 441,716 516,569 559,726 637,491 618,048 593,553 580,570
Other taxes 5,011 3,964 4,200 96,927 34,219 26,760 20,374 15,167 15,991 16,207
Intergovernmental unrestricted:
Property taxes in lieu of VLF (2) 203,788 261,695 277,930 303,348 316,925 308,842 303,625
Sales and use taxes 48,414 50,898 50,046 8,524 23,475 26,534 24,872 22,435 20,576 22,457
Investment earnings 38,166 30,213 18,452 38,066 63,810 88,974 87,554 57,859 30,941 22,024
Other general revenues 83,079 78,651 95,343 80,804 118,929 85,693 104,260
Total governmental general revenues 503,991 544,415 569,615 872,100 978,419 1,075,267 1,154,443 1,149,363 1,055,596 1,049,143Special Item: gain or loss on sale of properties 1,054 474
Transfers 359 (160) 673 764 1,090 601 81 151 345 (778)
Total governmental activities 505,404 544,729 570,288 872,864 979,509 1,075,868 1,154,524 1,149,514 1,055,941 1,048,365
Business-type activities
Investment earnings 2,694 1,437 417 1,730 7,048 4,189 4,113 2,237 1,046 582
Other general revenues 27 287 160 2,909 105 68 18 7
Total business-type general revenues 2,694 1,464 417 2,017 7,208 7,098 4,218 2,305 1,064 589Special Item: gain or loss on sale of properties (5,145)
Transfers (359) 160 (673) (764) (1,090) (601) (81) (151) (345) 778
Total business-type activities (2,810) 1,624 (256) 1,253 6,118 6,497 4,137 2,154 719 1,367
Total primary government 502,594 546,353 570,032 874,117 985,627 1,082,365 1,158,661 1,151,668 1,056,660 1,049,732
Change in net assets
Governmental activities (4,394) (424,484) (362,234) 197,722 370,518 355,438 251,067 198,474 161,163 192,420
Business-type activities 1,627 6,870 6,176 2,883 17,611 18,991 21,595 18,132 15,044 771
Total change in net assets $ (2,767) (417,614) (356,058) 200,605 388,129 374,429 272,662 216,606 176,207 193,191
(1) County Transit System was divested on June 28, 2002 to the San Diego Metropolitan Transit Development Board
(2) In 2005, the County's share of vehicle license fee (VLF) was eliminated and replaced with property tax revenue

145
Statistical Section
County of San Diego ~ Comprehensive Annual Financial Report for the Year Ended June 30, 2011
Fund Balances Governmental Funds
Table 3
County of San DiegoFund Balances Governmental Funds
Last Ten Fiscal Years(In Thousands)
Fiscal Year
2002 2003 2004 2005 2006
General Fund
Reserved $ 215,197 210,277 213,292 291,832 $ 272,936
Unreserved 355,155 388,384 337,708 375,626 625,949
Total general fund 570,352 598,661 551,000 667,458 898,885
All Other Governmental Funds
Reserved 251,704 294,793 208,900 284,316 278,878
Unreserved, reported in:
Special Revenue Funds (1) 485,565 447,612 523,399 481,792 633,430
Capital Projects Funds 14,418 9,771 10,864 84,389 65,452
Total other governmental funds $ 751,687 752,176 743,163 850,497 $ 977,760
Fiscal Year
2007 2008 2009 2010 2011
General Fund
Reserved $ 410,244 273,231 266,434 162,257
Unreserved 744,838 947,235 923,604 1,057,851
Nonspendable(2) 11,257
Restricted (2) 214,956
Committed (2) 514,739
Assigned (2) 40,614
Unassigned (2) 612,814
Total general fund 1,155,082 1,220,466 1,190,038 1,220,108 1,394,380
All Other Governmental Funds
Reserved 274,024 199,472 213,984 175,900
Unreserved, reported in:
Special Revenue Funds 624,996 672,652 668,626 705,469
Capital Projects Funds 73,923 30,210 157,221 89,926
Nonspendable (2) 5,148
Restricted (2) 372,730
Committed (2) 467,950
Total other governmental funds $ 972,943 902,334 1,039,831 971,295 845,828
(1) The increase in the unreserved fund balance of special revenue funds was principally due to the proceeds received from the issuance of San Diego County Tobacco Securitization Corporation Series Tobacco Settlement Asset Backed Bonds in 2002 and 2006.
(2) Beginning in fiscal year 2011, governmental fund balances are required to be reported as nonspendable, restricted, committed, assigned, and unassigned.

146
Statistical Section
Comprehensive Annual Financial Report for the Year Ended June 30, 2011 ~ County of San Diego
Changes in Fund Balances Governmental Funds
Table 4
County of San DiegoChanges in Fund Balances Governmental Funds
Last Ten Fiscal Years(Modified Accrual Basis of Accounting)
(In Thousands)Fiscal Year
2002 2003 2004 2005 2006 2007 2008 2009 2010 2011
Revenues:
Taxes $ 409,969 446,835 497,178 717,174 1,102,032 1,146,937 971,616 973,899 946,324 934,737
Licenses, permits and franchise fees 37,808 39,335 42,252 42,954 41,824 43,807 45,257 49,990 47,578 51,144
Fines, forfeitures and penalties 39,691 41,236 46,495 55,538 60,071 58,355 63,014 59,348 57,869 54,267Revenue from use of money and property 45,567 40,733 25,867 50,811 76,608 93,246 137,963 70,911 46,100 39,545
Aid from other governmental agencies:
State 1,139,344 1,231,904 1,201,278 1,080,663 867,063 927,850 1,169,642 1,161,312 1,136,756 1,192,401
Federal 574,002 632,241 701,057 729,725 793,039 820,851 908,582 858,066 963,285 945,168
Other 57,777 66,116 69,860 74,272 94,866 100,323 79,066 144,205 102,708 72,071
Charges for current services 251,018 266,574 277,637 286,631 314,021 325,049 312,018 316,214 318,283 359,239
Other revenue 70,203 70,065 65,913 84,410 67,419 76,680 73,745 111,431 81,219 90,486
Total revenues 2,625,379 2,835,039 2,927,537 3,122,178 3,416,943 3,593,098 3,760,903 3,745,376 3,700,122 3,739,058
Expenditures:
General government 156,517 209,874 216,183 211,521 199,349 233,471 277,286 249,324 205,456 223,290
Public protection 809,185 1,145,171 1,216,276 939,070 1,014,653 1,065,984 1,145,807 1,133,843 1,063,890 1,088,377
Public ways and facilities 95,936 123,202 115,426 84,560 67,145 74,319 80,051 85,802 66,393 61,967
Health and sanitation 548,627 600,525 562,657 541,921 556,165 577,389 633,382 669,725 675,256 714,022
Public assistance 827,229 1,037,467 1,053,545 970,208 1,011,315 1,043,293 1,111,701 1,172,400 1,169,287 1,184,632
Education 24,005 31,013 31,308 27,119 32,043 32,961 35,569 41,461 37,422 34,599
Recreation and cultural 16,514 20,805 24,702 19,614 22,964 26,774 32,042 32,561 29,982 33,054
Total CAFR Governmental functions 2,478,013 3,168,057 3,220,097 2,794,013 2,903,634 3,054,191 3,315,838 3,385,116 3,247,686 3,339,941
Capital outlay 72,341 83,748 54,958 54,157 109,897 138,017 157,818 179,662 205,512 186,342
Debt service:
Principal 101,538 88,846 69,839 60,849 57,245 73,816 184,614 112,275 169,059 64,016
Interest and fiscal charges 67,773 73,747 92,503 94,556 109,491 116,095 107,631 103,831 101,036 97,290
Bond issuance costs 4,095 1,915 6,172 885 3,959 739 349Payment to refunded bond escrow agent 24,256 15,377 3,437
Total expenditures 2,719,665 3,414,398 3,441,492 3,005,490 3,210,695 3,383,004 3,765,901 3,784,843 3,739,409 3,691,375
Excess (deficiency) of revenues over (under) expenditures (94,286) (579,359) (513,955) 116,688 206,248 210,094 (4,998) (39,467) (39,287) 47,683
Other financing sources (uses)
Sale of capital assets 2,230 474 4,044 18,400 12,355 1,601 68 31 365 2,673
Issuance of bonds and loans:
Face value of bonds issued 83,510 166,611 42,390 136,885
Face value of loans issued 160 462
Discount on issuance of bonds (20,501)
Premium on issuance of bonds 5,960 1,308 606 1,175 7,803 1,237
Long-term debt proceeds 411,913 560,886 454,179
Refunding bonds issued 65,319 176,890 28,885 461,230 443,515 80,940 19,260Payment to refunded bond escrow agent (66,254) (176,890) (31,633) (467,458) (441,038) (83,173) (18,774)
Transfers in 1,188,505 768,997 776,167 819,490 867,973 512,386 594,512 525,424 452,018 426,611
Transfers (out) (1,196,995) (773,145) (777,180) (819,627) (868,908) (514,680) (594,882) (525,689) (457,683) (430,527)
Total other financing sources (uses) 404,718 557,212 457,210 105,145 152,610 42,765 (302) 140,303 270 480
Net change in fund balances $ 310,432 (22,147) (56,745) 221,833 358,858 252,859 (5,300) 100,836 (39,017) 48,163
Debt service as a percentage of noncapital expenditures 6.40% 4.88% 4.79% 5.27% 5.38% 5.85% 8.10% 5.99% 7.64% 4.60%
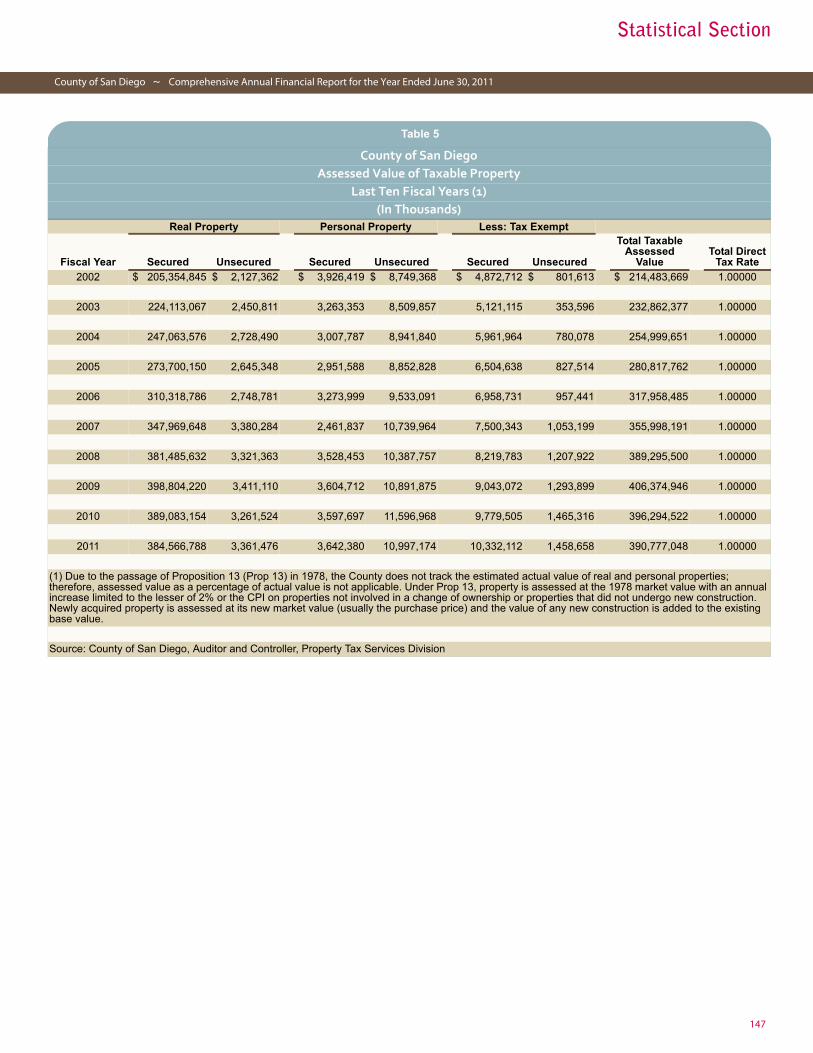
147
Statistical Section
County of San Diego ~ Comprehensive Annual Financial Report for the Year Ended June 30, 2011
Assessed Value of Taxable Property
Table 5
County of San DiegoAssessed Value of Taxable Property
Last Ten Fiscal Years (1)(In Thousands)
Real Property Personal Property Less: Tax Exempt
Fiscal Year Secured Unsecured Secured Unsecured Secured Unsecured
Total Taxable Assessed
ValueTotal Direct
Tax Rate
2002 $ 205,354,845 $ 2,127,362 $ 3,926,419 $ 8,749,368 $ 4,872,712 $ 801,613 $ 214,483,669 1.00000
2003 224,113,067 2,450,811 3,263,353 8,509,857 5,121,115 353,596 232,862,377 1.00000
2004 247,063,576 2,728,490 3,007,787 8,941,840 5,961,964 780,078 254,999,651 1.00000
2005 273,700,150 2,645,348 2,951,588 8,852,828 6,504,638 827,514 280,817,762 1.00000
2006 310,318,786 2,748,781 3,273,999 9,533,091 6,958,731 957,441 317,958,485 1.00000
2007 347,969,648 3,380,284 2,461,837 10,739,964 7,500,343 1,053,199 355,998,191 1.00000
2008 381,485,632 3,321,363 3,528,453 10,387,757 8,219,783 1,207,922 389,295,500 1.00000
2009 398,804,220 3,411,110 3,604,712 10,891,875 9,043,072 1,293,899 406,374,946 1.00000
2010 389,083,154 3,261,524 3,597,697 11,596,968 9,779,505 1,465,316 396,294,522 1.00000
2011 384,566,788 3,361,476 3,642,380 10,997,174 10,332,112 1,458,658 390,777,048 1.00000
(1) Due to the passage of Proposition 13 (Prop 13) in 1978, the County does not track the estimated actual value of real and personal properties; therefore, assessed value as a percentage of actual value is not applicable. Under Prop 13, property is assessed at the 1978 market value with an annual increase limited to the lesser of 2% or the CPI on properties not involved in a change of ownership or properties that did not undergo new construction. Newly acquired property is assessed at its new market value (usually the purchase price) and the value of any new construction is added to the existing base value.
Source: County of San Diego, Auditor and Controller, Property Tax Services Division

148
Statistical Section
Comprehensive Annual Financial Report for the Year Ended June 30, 2011 ~ County of San Diego
Property Tax Rates - Direct and Overlapping Governments
Table 6
County of San DiegoProperty Tax Rates
Direct and Overlapping GovernmentsLast Ten Fiscal Years
Overlapping Rates(2)
Fiscal YearCounty of San Diego
(1) Cities Schools Special DistrictsTotal Direct &
Overlapping Rates
2002 1.000 0.004 0.048 0.009 1.061
2003 1.000 0.004 0.054 0.008 1.066
2004 1.000 0.003 0.062 0.007 1.072
2005 1.000 0.004 0.062 0.006 1.072
2006 1.000 0.004 0.059 0.008 1.071
2007 1.000 0.005 0.055 0.009 1.069
2008 1.000 0.005 0.058 0.009 1.072
2009 1.000 0.004 0.050 0.007 1.061
2010 1.000 0.004 0.063 0.008 1.075
2011 1.000 0.004 0.066 0.008 1.078
(1) The $1.00 per $100 of Assessed Value (Proposition 13) tax rate beginning in Fiscal Year 1979 is distributed according to State Law on a percentage basis to each of the eligible taxing agencies in the County.
(2) Overlapping rates for cities, schools and special districts are chargeable to property owners within their respective tax rate areas (TRA). Overlapping rates do not apply to all property owners (e.g., the rates for special districts apply only to property owners whose property is located within the geographic boundary (TRA) of the special district).
Source: County of San Diego, Auditor and Controller, Property Tax Services Division

149
Statistical Section
County of San Diego ~ Comprehensive Annual Financial Report for the Year Ended June 30, 2011
Principal Property Taxpayers
Table 7
County of San DiegoPrincipal Property Taxpayers
June 30, 2011(In Thousands)
2011 2002
Taxpayer
Secured Taxable
Assessed Value Rank
Percentage of Total Secured
Taxable Assessed Value
Secured Taxable
Assessed Value Rank
Percentage of Total Secured
Taxable Assessed Value
San Diego Gas & Electric Company $ 4,909,449 1 1.30% $ 2,546,874 1 1.25%
Southern California Edison Co. 2,217,581 2 0.59% 1,244,408 3 0.61%
Irvine Co. 1,567,992 3 0.41%
Kilroy Realty LLP 1,436,577 4 0.38% 539,637 4 0.26%
San Diego Family Housing LLC 1,349,732 5 0.36% 319,510 7 0.16%
Qualcomm Inc 1,201,871 6 0.32% 465,566 6 0.23%
Camp Pendleton & Quantico Housing 1,099,420 7 0.29%
Arden Realty LLP 785,373 8 0.21%
Pacific Bell Telephone Company 744,525 9 0.20% 1,290,726 2 0.63%
O C/S D Holdings LLC 602,274 10 0.16%
Fashion Valley Mall LLC 530,665 5 0.26%
L-O Coronado Holding II Inc 308,912 8 0.15%
Cabrillo Power I LLC 305,158 9 0.15%
Sea World Inc 280,063 10 0.14%
Totals $ 15,914,794 4.22% $ 7,831,519 3.84%
Source: County of San Diego, Auditor and Controller, Property Tax Services Division

150
Statistical Section
Comprehensive Annual Financial Report for the Year Ended June 30, 2011 ~ County of San Diego
Property Tax Levies and Collections
Table 8
County of San DiegoProperty Tax Levies and Collections
Last Ten Fiscal Years(In Thousands)
Collections within the Fiscal Year of the Levy Total Collections to Date
Fiscal YearTotal Tax Levy
for Fiscal Year (1) AmountPercentage
of LevyCollections in
Subsequent Years AmountPercentage
of Levy
2002 $ 2,144,837 $ 2,110,686 98.41% $ 27,611 $ 2,138,297 99.70%
2003 2,328,624 2,291,331 98.40% 27,585 2,318,916 99.58%
2004 2,549,997 2,512,209 98.52% 28,018 2,540,227 99.62%
2005 2,808,178 2,759,201 98.26% 41,255 2,800,456 99.73%
2006 3,179,585 3,110,799 97.84% 61,036 3,171,835 99.76%
2007 3,559,982 3,454,709 97.04% 92,739 3,547,448 99.65%
2008 3,892,955 3,739,090 96.05% 130,042 3,869,132 99.39%
2009 4,063,749 3,903,633 96.06% 115,279 4,018,912 98.90%
2010 3,962,945 3,821,278 96.43% 68,877 3,890,155 98.16%
2011 3,907,770 3,795,900 97.14% N/A 3,795,900 97.14%
(1) Includes secured, unsecured and unitary tax levy for the County and school districts, cities and special districts under the supervision of independent governing boards.
Source: County of San Diego, Auditor and Controller, Property Tax Services Division

151
Statistical Section
County of San Diego ~ Comprehensive Annual Financial Report for the Year Ended June 30, 2011
Ratios of Outstanding Debt by Type
Table 9
County of San DiegoRatios of Outstanding Debt by Type
Last Ten Fiscal Years(In Thousands, Except Per Capita Amount)
Fiscal Year
2002 2003 2004 2005 2006
Governmental Activities:Certificates of Participation & Lease Revenue Bonds $ 433,790 395,285 344,365 393,395 356,690
Redevelopment Agency 4,655 4,530 4,400 4,260 16,000
Tobacco 403,868 449,235 440,305 430,350 583,904
Pension Obligation Bonds 282,900 824,395 1,268,878 1,252,243 1,238,405
Capital and retrofit loans 4,277 7,088 5,750 7,316 8,098
Capitalized Leases 46,604 40,860 37,346 34,625 31,894
Business-Type Activities:
Capital Loans 2,998 2,926 2,745
Sanitation Loans 200 195 195
Capitalized LeasesTotal Primary Government $ 1,176,294 1,721,588 2,104,237 2,125,115 2,237,736
Percentage of Personal Income (1) 1.17% 1.65% 1.86% 1.79% 1.77%
Per Capita (1) $ 405 589 717 722 759
Fiscal Year
2007 2008 2009 2010 2011
Governmental Activities:Certificates of Participation & Lease Revenue Bonds $ 364,355 330,055 469,970 422,260 392,100
Redevelopment Agency 15,640 15,320 14,985 14,640 14,280
Tobacco 584,137 580,820 574,610 574,157 575,482
Pension Obligation Bonds 1,206,887 1,068,200 1,005,955 874,336 841,337
Capital and retrofit loans 7,920 7,043 7,043 7,404 7,162
Capitalized Leases 29,623 27,590 242 212
Business-Type Activities:
Capital Loans 2,551 2,255 2,038 1,809 1,566
Total Primary Government $ 2,211,113 2,031,283 2,074,601 1,894,848 1,832,139
Percentage of Personal Income (1) 1.66% 1.41% 1.54% 1.38% 1.21%
Per Capita (1) $ 743 646 651 588 587
(1) See Table 13 Demographic and Economic Statistics
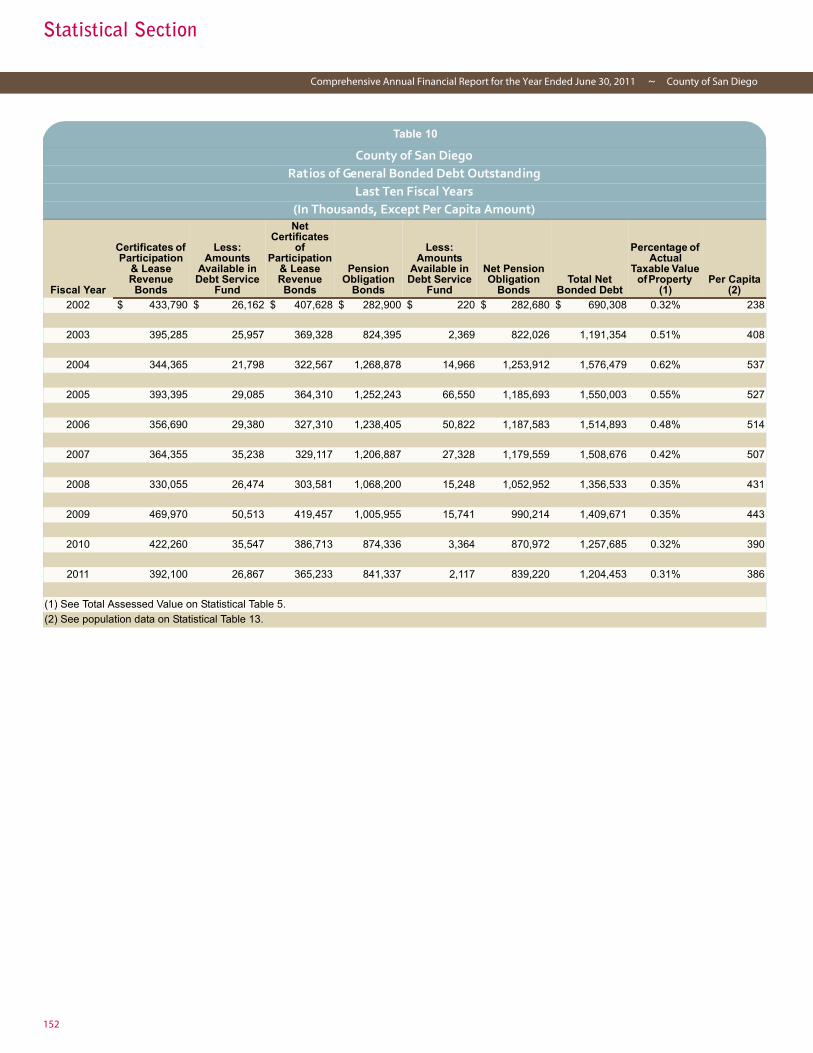
152
Statistical Section
Comprehensive Annual Financial Report for the Year Ended June 30, 2011 ~ County of San Diego
Ratios of General Bonded Debt Outstanding
Table 10
County of San DiegoRatios of General Bonded Debt Outstanding
Last Ten Fiscal Years(In Thousands, Except Per Capita Amount)
Fiscal Year
Certificates of Participation
& Lease Revenue Bonds
Less: Amounts
Available in Debt Service
Fund
Net Certificates
of Participation
& Lease Revenue Bonds
Pension Obligation
Bonds
Less: Amounts
Available in Debt Service
Fund
Net Pension Obligation
BondsTotal Net
Bonded Debt
Percentage of Actual
Taxable Value of Property
(1)Per Capita
(2)
2002 $ 433,790 $ 26,162 $ 407,628 $ 282,900 $ 220 $ 282,680 $ 690,308 0.32% 238
2003 395,285 25,957 369,328 824,395 2,369 822,026 1,191,354 0.51% 408
2004 344,365 21,798 322,567 1,268,878 14,966 1,253,912 1,576,479 0.62% 537
2005 393,395 29,085 364,310 1,252,243 66,550 1,185,693 1,550,003 0.55% 527
2006 356,690 29,380 327,310 1,238,405 50,822 1,187,583 1,514,893 0.48% 514
2007 364,355 35,238 329,117 1,206,887 27,328 1,179,559 1,508,676 0.42% 507
2008 330,055 26,474 303,581 1,068,200 15,248 1,052,952 1,356,533 0.35% 431
2009 469,970 50,513 419,457 1,005,955 15,741 990,214 1,409,671 0.35% 443
2010 422,260 35,547 386,713 874,336 3,364 870,972 1,257,685 0.32% 390
2011 392,100 26,867 365,233 841,337 2,117 839,220 1,204,453 0.31% 386
(1) See Total Assessed Value on Statistical Table 5.
(2) See population data on Statistical Table 13.

153
Statistical Section
County of San Diego ~ Comprehensive Annual Financial Report for the Year Ended June 30, 2011
Legal Debt Margin Information
Table 11
County of San DiegoLegal Debt Margin Information
Last Ten Fiscal Years(In Thousands)
Fiscal Year Debt Limit
Total Net DebtApplicable to
Limit (1) Legal Debt MarginLegal Debt Margin/
Debt Limit
2002 $ 2,681,046 $ 2,681,046 100%
2003 2,910,780 2,910,780 100%
2004 3,187,496 3,187,496 100%
2005 3,510,222 3,510,222 100%
2006 3,974,481 3,974,481 100%
2007 4,449,977 4,449,977 100%
2008 4,866,194 4,866,194 100%
2009 5,079,687 5,079,687 100%
2010 4,953,682 4,953,682 100%
2011 4,884,713 4,884,713 100%
Legal Debt Margin Calculation for Fiscal Year 2010-2011
Assessed value $ 390,777,048
Debt limit (1.25% of total assessed value) (2) 4,884,713
Debt applicable to limit:
General obligation bondsLess: Amount set aside for repayment of general obligation debt
Total net debt applicable to limitLegal debt margin $ 4,884,713
(1) For the fiscal years presented, the County had no debt that qualified as indebtedness subject to the bonded debt limit under the California Constitution.
(2) Under California State law, the total amount of bonded indebtedness shall not at any time exceed 1.25% of the taxable property of the County as shown by the last equalized assessment roll.

154
Statistical Section
Comprehensive Annual Financial Report for the Year Ended June 30, 2011 ~ County of San Diego
Pledged-Revenue Coverage
Table 12
County of San DiegoPledged-Revenue Coverage
Last Ten Fiscal Years(In Thousands)
Tobacco Settlement Asset-Backed Bonds (1)
Fiscal Year
Tobacco Settlement Revenues
Less: Operating
Expenses (3)Net Available
Revenue Principal (2) Interest Coverage
2002 $ 26,205 $ 50 $ 26,155 $ 8,045 $ 18,160 1.00
2003 35,444 113 35,331 9,560 25,351 1.01
2004 29,961 131 29,830 8,930 24,830 0.88
2005 30,415 172 30,243 9,955 24,446 0.88
2006 27,915 173 27,742 1,550 11,975 2.05
2007 29,219 164 29,055 3,100 26,820 0.97
2008 31,106 146 30,960 6,865 26,599 0.93
2009 34,181 156 34,025 10,000 26,273 0.94
2010 28,503 151 28,352 4,500 25,798 0.94
2011 26,976 158 26,818 2,995 25,584 0.94
Redevelopment Agency Refunding Bonds (Gillespie Field Series Bonds)
Fiscal Year
Property Tax Incremental Revenues
Less: Operating
Expenses (3)Net Available
Revenue Principal Interest Coverage
2002 $ 2,129 $ 668 $ 1,461 $ 115 $ 305 3.48
2003 2,237 958 1,279 125 299 3.02
2004 3,133 2,129 1,004 130 292 2.38
2005 2,135 1,262 873 140 284 2.06
2006 2,089 5,485 (3,396) 150 513 (5.12)
2007 1,976 791 1,185 360 837 0.99
2008 2,181 1,123 1,058 320 825 0.92
2009 2,281 1,105 1,176 335 812 1.03
2010 2,750 1,957 793 345 798 0.69
2011 2,521 1,458 1,063 360 783 0.93
(1) Data for fiscal years 2002-2006 applies to the Series 2001 Tobacco Asset-Backed bonds that were issued in 2002. In May 2006, the Series 2001 Tobacco bonds were refunded and the Series 2006 Tobacco Asset-Backed bonds were issued.
(2) Tobacco Principal Debt Service requirements include Turbo Principal payments.
(3) Operating expenses do not include interest.

155
Statistical Section
County of San Diego ~ Comprehensive Annual Financial Report for the Year Ended June 30, 2011
Demographic and Economic Statistics
Table 13
County of San DiegoDemographic and Economic Statistics
Last Ten Years
Year Population (1)Personal Income(in thousands) (2)
Per Capita Personal Income
(in dollars) (2)School
Enrollment (3)Unemployment
Rate (4)
2002 2,901,719 $ 100,655,726 $ 34,688 494,588 5.3
2003 2,921,810 104,630,453 35,810 499,750 5.7
2004 2,933,929 113,062,259 38,536 499,356 5.1
2005 2,941,658 118,793,000 40,383 498,186 4.5
2006 2,948,362 126,194,000 42,801 495,228 4.2
2007 2,974,861 133,369,000 44,832 496,699 4.6
2008 3,146,274 143,873,000 45,728 494,016 6.0
2009 3,185,462 134,696,000 42,285 496,702 10.2
2010 3,224,432 137,525,000 42,651 496,995 11.0
2011 3,118,876 151,539,000 48,588 498,243 10.4
Sources:
Primary(1) DOF - The California Department of Finance(2) LAEDC- Los Angeles County Economic Development Corporation, the Kyser Center for Economic Research(3) California Department of Education & Education Data Partnership(4) U.S. Department of Labor, Bureau of Labor Statistics
Secondary(1) BEA - Bureau of Economic Analysis, U.S. Department of Commerce

156
Statistical Section
Comprehensive Annual Financial Report for the Year Ended June 30, 2011 ~ County of San Diego
Principal Employers
Table 14
County of San DiegoPrincipal Employers
Current Year and Nine Years Ago2011 2002
Employer Employees (1) Rank
Percentage of Total County
Employment (2) Employees (1) Rank
Percentage of Total County
Employment (3)
Federal Government 46,300 1 3.30% 40,600 1 2.95%
State of California 45,500 2 3.24% 38,500 2 2.80%
University of California, San Diego 27,393 3 1.95% 21,266 4 1.55%
County of San Diego (4) 15,842 4 1.13% 16,894 5 1.23%
Sharp HealthCare 14,969 5 1.07% 12,167 8 0.88%
Scripps Health 13,830 6 0.99% 10,435 9 0.76%
San Diego Unified School District 13,730 7 0.98% 24,240 3 1.76%
Qualcomm Inc. 10,509 8 0.75%
City of San Diego 10,211 9 0.73% 12,656 6 0.92%
Kaiser Permanente 8,200 10 0.58%
U.S. Postal Service, San Diego District 12,336 7 0.90%
SBC Pacific Bell 6,988 10 0.51%
Total 206,484 14.72% 196,082 14.26%
Sources:
(1) San Diego Business Journal
(2) California Labor MarketInfo Percentage is calculated by dividing employees by total employment of 1,402,900 as of June 2011
(3) California Labor MarketInfoPercentage is calculated by dividing employees by total employment of 1,375,600 as of June 2002
(4) County of San Diego 2011 and 2002 Adopted Operational Plans

157
Statistical Section
County of San Diego ~ Comprehensive Annual Financial Report for the Year Ended June 30, 2011
Full-time Equivalent County Government Employees by Function
Table 15
County of San DiegoFull-time Equivalent County Government Employees by Function
Last Ten Fiscal YearsFiscal Years
Function 2002 2003 2004 2005 2006
General 1,567 1,605 1,578 1,495 1,486
Public protection 7,910 8,006 7,667 7,506 7,673
Public ways and facilities 373 380 351 350 366
Health and sanitation 2,287 2,315 2,250 2,130 2,127
Public assistance 4,141 4,027 3,737 3,567 3,761
Education 278 281 265 265 275
Recreation and cultural 143 145 154 154 158
Total 16,699 16,759 16,002 15,467 15,846
Fiscal Years
Function 2007 2008 2009 2010 2011
General 1,505 1,538 1,515 1,487 1,477
Public protection 7,804 8,027 7,879 7,575 7,362
Public ways and facilities 373 393 405 390 374
Health and sanitation 2,188 2,242 2,222 2,136 2,088
Public assistance 3,659 3,781 3,659 3,497 3,321
Education 295 297 312 293 277
Recreation and cultural 168 180 176 173 169
Total 15,992 16,458 16,168 15,551 15,068
Source: County of San Diego, Auditor and Controller, Central Payroll Division

158
Statistical Section
Comprehensive Annual Financial Report for the Year Ended June 30, 2011 ~ County of San Diego
Operating Indicators by Function
Table 16
County of San DiegoOperating Indicators by Function
Last Eight Fiscal Years (1)Fiscal Year
Function 2004 2005 2006 2007 2008 2009 2010 2011
GeneralRegistrar of Voters: Percent of total mail ballots tallied by the Monday after Election Day (2) 74.00% 96.10% 94.50% 99.80% 94.00% 93.00% 94.00%Assessor/Recorder/County Clerk: Percent of mandated assessments completed by close of annual tax roll (2) (2) 100.00% 100.00% 100.00% 100.00% 100.00% 100.00%Treasurer-Tax Collector: Secured taxes collected (% of total) (2) 99.00% 98.00% 97.20% 96.00% 96.30% 97.00% 98.00%
Public protectionChild support services: Percent of current support collected (federal performance measure #3) 41.00% 42.10% 49.00% 50.00% 51.00% 50.00% 53.00% 59.00%
Sheriff: Deputy Initiated Actions (DIA) (2) 221,732 215,346 243,118 263,626 270,666 333,924 322,753
Sheriff: Number of jail bookings 139,019 145,180 144,727 146,566 142,357 144,756 139,314 136,451
Sheriff: Daily average – number of inmates 5,009 5,102 5,184 5,118 5,209 5,141 4,751 4,622
District Attorney: Felony defendants received 30,108 31,150 31,182 30,357 27,849 28,150 27,744 26,619
District attorney: Misdemeanor defendants received 27,575 25,443 28,068 28,081 28,458 29,512 28,896 28,926Planning and land use: Percent of building inspections completed next day 100.00% 100.00% 100.00% 100.00% 100.00% 100.00% 100.00% 100.00%Animal services: Percentage euthanized animals that were treatable (2) 12.90% 12.90% 13.80% 15.80% 15.90% 24.00% 26.40%
Public ways and facilitiesPublic works: Protect water quality through DPW roads/ drainage waste debris removal (cubic yards removed) (2) 42,000 51,287 28,700 29,580 29,180 28,802 27,680
Health and sanitationRegional Operations: Children age 0-4 years receive age-appropriate vaccines (2) (2) (2) (2) (2) (2) 99.00% 99.00%Regional Operations: Children age 11-18 years receive age-appropriate vaccines (2) (2) (2) (2) (2) (2) 97.00% 97.00%Behavioral Health Services: Wait time for children's mental health outpatient treatment 9 days 5 days 4 days 4 days 4 days 7 days 5 days 5 days
Public assistanceStrategic Planning and Operational Support: Welfare to work participants have paid employment (2) (2) (2) (2) (2) (2) 26.45% 16.00%Strategic Planning and Operational Support: Welfare to work participants participating in work activities (2) (2) (2) (2) (2) (2) 42.00% 24.00%Aging & Independence Services: Face-to-face adult protective services investigations within 10 days 93.00% 94.00% 96.00% 96.00% 95.00% 96.00% 95.00% 96.00%Child Welfare Services: Foster children in 12th grade who achieve high school completion (diploma, certificate or equiv.) 74.00% 76.00% 79.00% 83.00% 86.00% 87.00% 85.20% 82.00%
Education
County library: Annual average circulation per Item (2) 2.51 2.57 3.08 3.10 5.44 6.46 9.95
Recreation and culturalParks and Recreation: Number of parkland acres owned and managed 37,326 40,000 40,600 41,100 41,500 45,043 44,616 45,187Parks and Recreation: Number of miles of trails managed in the county trails program (2) (2) 275 305 315 320 325 326
(1) 10 year trend data is unavailable, see explanatory information contained in Introduction to Statistical Section
(2) Trend data not available
Source: Various County departments
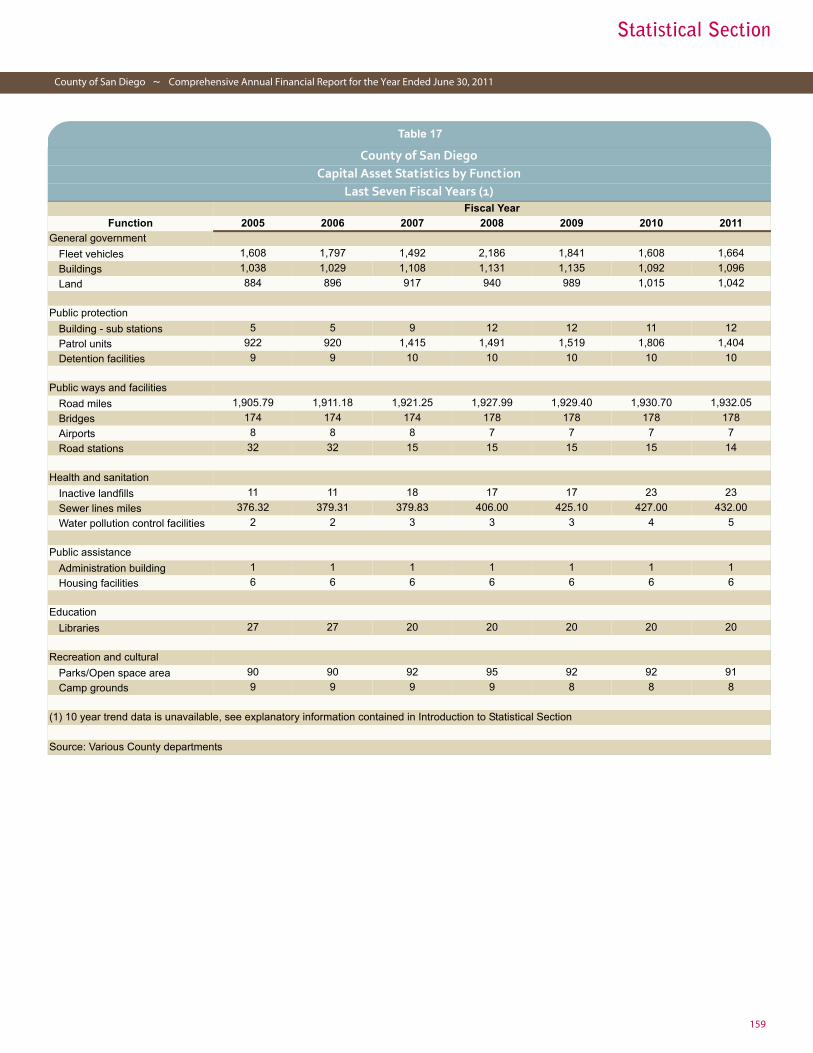
159
Statistical Section
County of San Diego ~ Comprehensive Annual Financial Report for the Year Ended June 30, 2011
Capital Asset Statistics by Function
Table 17
County of San DiegoCapital Asset Statistics by Function
Last Seven Fiscal Years (1)Fiscal Year
Function 2005 2006 2007 2008 2009 2010 2011
General government
Fleet vehicles 1,608 1,797 1,492 2,186 1,841 1,608 1,664
Buildings 1,038 1,029 1,108 1,131 1,135 1,092 1,096
Land 884 896 917 940 989 1,015 1,042
Public protection
Building - sub stations 5 5 9 12 12 11 12
Patrol units 922 920 1,415 1,491 1,519 1,806 1,404
Detention facilities 9 9 10 10 10 10 10
Public ways and facilities
Road miles 1,905.79 1,911.18 1,921.25 1,927.99 1,929.40 1,930.70 1,932.05
Bridges 174 174 174 178 178 178 178
Airports 8 8 8 7 7 7 7
Road stations 32 32 15 15 15 15 14
Health and sanitation
Inactive landfills 11 11 18 17 17 23 23
Sewer lines miles 376.32 379.31 379.83 406.00 425.10 427.00 432.00
Water pollution control facilities 2 2 3 3 3 4 5
Public assistance
Administration building 1 1 1 1 1 1 1
Housing facilities 6 6 6 6 6 6 6
Education
Libraries 27 27 20 20 20 20 20
Recreation and cultural
Parks/Open space area 90 90 92 95 92 92 91
Camp grounds 9 9 9 9 8 8 8
(1) 10 year trend data is unavailable, see explanatory information contained in Introduction to Statistical Section
Source: Various County departments

160

Photo Credits: Page 12: Marina Ivanova/Shutterstock.com(Sutherland Reservoir)Page 33:Chee-Onn Leong/Shutterstock.com(Palm trees along Coronado FerryLanding)
Page 81:Steve Minkler/Shutterstock.com(Downtown San Diego skyline)Page 88Travis Houston/Shutterstock.com(Aerial view to the ocean, bay andsuburbs)Page 89James M. House/Shutterstock.com(Torrey Pines State Park)
Page 134:aceshot1/Shutterstock.com(cliffs of La Jolla)Page 138:Nathalie Speliers Ufermann/Shutterstock.com(Light house at Cabrillo National Monument)Page 160:Sebastien Burel/Shutterstock.com(beach in San Diego)

County of San Diego1600 Pacific Highway, San Diego, CA 92101www.sdcounty.ca.gov