county of franklin, virginia comprehensive annual financial ...
Upload
khangminh22Category
view
0download
0

Prepared by the Finance Department
WASHTENAW COUNTY, MICHIGAN
COMPREHENSIVE ANNUAL FINANCIAL REPORT
YEAR ENDED DECEMBER 31, 2010

ON THE COVER
The Washtenaw County Landmark Photo Contest was conducted in 2008. Submissions of local landscapes from anyone who worked or lived in Washtenaw County were considered.
All of the entries featured many of Washtenaw County's cherished, beautiful and memorable sights. Some of these photos from the contest are displayed on the cover of this publication,
representing some of the local units of government within Washtenaw County. We would like to thank all of the artists for participating.
Below is a list of the artists for the pictures shown on the Comprehensive Annual Financial Report Year Ended December 31, 2010 cover:
Island Park Gazebo, Ann Arbor – Photo by: Mary C. Kirby
Michigan Firehouse Museum, Ypsilanti – Photo by: Jeff Hudson Lurie Tower with Flowers, University of Michigan, Ann Arbor – Photo by: Michael Thiel
Parker Mill, Ann Arbor Township – Photo by: Ann O’Hagan Classic Barn Scene, Saline – Photo by: Marcel Santiz

WASHTENAW COUNTY
COMPREHENSIVE ANNUAL FINANCIAL REPORT
YEAR ENDED DECEMBER 31, 2010
BOARD OF COMMISSIONERS
Rolland Sizemore Jr., Chair
Barbara Levin Bergman
Leah Gunn
Jeff Irwin
Kristin Judge
Mark Ouimet
Ronnie Peterson
Jessica Ping
Wesley Prater
Ken Schwartz
Conan Smith
COUNTY ADMINISTRATOR
Verna J. McDaniel
DEPUTY COUNTY ADMINISTRATOR
William H. Reynolds
FINANCE DIRECTOR
Kelly L. Belknap
INDEPENDENT AUDITORS
Rehmann Robson

WASHTENAW COUNTY COMPREHENSIVE ANNUAL FINANCIAL REPORT
YEAR ENDED DECEMBER 31, 2010
TABLE OF CONTENTS
Page
INTRODUCTORY SECTION Letter of Transmittal .................................................................................................................. i-ix GFOA Certificate of Achievement ............................................................................................ x Organizational Chart .................................................................................................................. xi List of Elected and Appointed Officials .................................................................................... xii
FINANCIAL SECTION
Independent Auditors’ Report .................................................................................................... 1-2 Management’s Discussion and Analysis .................................................................................... 3-16 Basic Financial Statements: Government-wide Financial Statements: Statement of Net Assets ....................................................................................................... 17 Statement of Activities ........................................................................................................ 18-19 Fund Financial Statements: Balance Sheet – Governmental Funds ................................................................................. 20-21 Reconciliation of Fund Balances on the Balance Sheet for Governmental Funds to Net Assets of Governmental Activities on the Statement of Net Assets ...................... 22 Statement of Revenues, Expenditures, and Changes in Fund Balances – Governmental Funds ........................................................................................................ 23-24 Reconciliation of the Statement of Revenues, Expenditures, and Changes in Fund Balances of Governmental Funds to the Statement of Activities ....................... 25 Statements of Revenues, Expenditures, and Changes in Fund Balance – Budget and Actual: General Fund ................................................................................................................. 26-27 Community Support & Treatment Services Fund ......................................................... 28 Parks and Recreation Fund ........................................................................................... 29 Revenue Sharing Reserve Fund .................................................................................... 30 Enhanced Emergency Communication System ............................................................ 31 Statement of Net Assets – Proprietary Funds ...................................................................... 32 Statement of Revenues, Expenses, and Changes in Fund Net Assets – Proprietary Funds ............................................................................................................. 33 Statement of Cash Flows – Proprietary Funds ................................................................... 34-35 Statement of Fiduciary Net Assets – Fiduciary Funds ........................................................ 36 Statement of Changes in Fiduciary Net Assets – Pension and Other Employee Benefit Trust Funds ......................................................................................... 37 Combining Statement of Net Assets – Component Units ................................................... 38 Combining Statement of Activities – Component Units ..................................................... 39
Notes to the Basic Financial Statements ................................................................................. 40-89

Page Required Supplementary Information: Employees Retirement System – Schedules of Funding Progress and Employer Contributions ............................................. 90 Voluntary Employees Beneficiary Association – Schedules of Funding Progress and Employer Contributions ............................................. 91 Municipal Employees’ Retirement System of Michigan Schedules of Funding Progress and Employer Contributions ............................................. 92 Supplementary Information: Combining and Individual Fund Financial Statements and Schedules:
Combining Balance Sheet – Nonmajor Governmental Funds ............................................. 93-96 Combining Statement of Revenues, Expenditures, and Changes in
Fund Balances – Nonmajor Governmental Funds ........................................................... 97-100 Combining Statement of Revenues, Expenditures, and Changes in Fund Balances – Final Budget and Actual – Nonmajor Special Revenue Funds ........................................ 101-113 Combining Statement of Net Assets – Nonmajor Enterprise Funds ................................... 114 Combining Statement of Revenues, Expenses, and Changes in Fund Net Assets – Nonmajor Enterprise Funds ........................................................... 115 Combining Statement of Cash Flows – Nonmajor Enterprise Funds .................................. 116 Combining Statement of Net Assets – Internal Service Funds ............................................ 117-118 Combining Statement of Revenues, Expenses, and Changes in Fund Net Assets – Internal Service Funds ................................................................... 119-120 Combining Statement of Cash Flows – Internal Service Funds .......................................... 121-122 Combining Statement of Fiduciary Net Assets – Pension and Other Employee Benefit Trust Funds .......................................................... 123-124 Combining Statement of Changes in Fiduciary Net Assets – Pension and Other Employee Benefit Trust Funds .......................................................... 125-126 Combining Statement of Changes in Assets and Liabilities – Agency Funds .................... 127
STATISTICAL SECTION Net Assets by Component .......................................................................................................... 128-129 Changes in Net Assets ............................................................................................................... 130-133 Fund Balances – Governmental Funds ...................................................................................... 134-135 Changes in Fund Balances – Governmental Funds.................................................................... 136-137 Changes in Fund Balances – General Fund ............................................................................... 138-139 Changes in Fund Balances – General Fund (Expenditures by Category) .................................. 140-141 Assessed and Actual Values of Taxable Property ...................................................................... 142 Direct and Overlapping Property Tax Rates ............................................................................. 143 Principal Property Tax Payers ................................................................................................... 144 Property Tax Levies and Collections ......................................................................................... 145 Ratios of Outstanding Debt by Type ......................................................................................... 146 Ratios of Net General Bonded Debt Outstanding ...................................................................... 147 Computation of Net Direct and Overlapping Debt .................................................................... 148 Legal Debt Margin ..................................................................................................................... 149 Demographic and Economic Statistics ...................................................................................... 150 Principal Employers ................................................................................................................... 151 Full-Time Equivalents ............................................................................................................... 152 Operating Indicators ................................................................................................................... 153 Capital Asset Statistics ............................................................................................................... 154 Schedule of Insurance ................................................................................................................ 155-156

Introductory Section

-i-
COUNTY ADMINISTRATOR 220 NORTH MAIN STREET, P.O. BOX 8645
ANN ARBOR, MICHIGAN 48107-8645 (734) 222-6850
FAX (734) 222-6715 http://www.ewashtenaw.org
March 18, 2011 To the Board of Commissioners and the Citizens of Washtenaw County: The Comprehensive Annual Financial Report (CAFR) of Washtenaw County for the year ended December 31, 2010, is submitted herewith. It was prepared by staff in the Finance Department with assistance from the accounting personnel in the Treasurer's Office, Water Resources Commissioner's Office, Public Works, Road Commission, Community Support and Treatment Services, Public Health, and other County departments. Responsibility for both the accuracy of the presented data and the completeness and fairness of the presentation, including all disclosures, rests with the County.
State law requires that every general-purpose local government publish within six months of the close of each fiscal year a complete set of audited financial statements. This report is published to fulfill that requirement for the fiscal year ended December 31, 2010. Management assumes full responsibility for the completeness and reliability of the information contained in this report, based upon a comprehensive framework of internal control that it has established for this purpose. Because the cost of internal control should not exceed anticipated benefits, the objective is to provide reasonable, rather than absolute, assurance that the financial statements are free of any material misstatement. Rehmann Robson, Certified Public Accountants, have issued an unqualified (“clean”) opinion on Washtenaw County’s financial statements for the year ended December 31, 2010. The independent auditor’s report is located at the front of the financial section of this report. Management’s discussion and analysis (MD&A) immediately follows the independent auditors’ report and provides a narrative introduction, overview, and analysis of the basic financial statements. MD&A complements this letter of transmittal and should be read in conjunction with it.

-ii-
PROFILE OF THE GOVERNMENT Washtenaw County, incorporated in 1827, is located in the southeast region of Michigan's Lower Peninsula, approximately 40 miles west of Detroit. The County encompasses 28 cities, villages and townships, settings range from urban to rural and small town to suburban. It is the sixth largest county in the State of Michigan, with an estimated 2010 population of 347,699. Sixty-three percent of the County’s population resides in four main areas. Its major cities are Ann Arbor and Ypsilanti, with estimated populations of 109,346 and 19,419, respectively. The County’s two largest townships are Ypsilanti and Pittsfield, with estimated populations of 53,037 and 37,224, respectively. It covers an area of approximately 710 square miles. The County seat is located in the City of Ann Arbor. Washtenaw County is empowered to levy a property tax, the primary source of funding, on both real and personal property located within its boundaries. The governmental structure of Washtenaw County is based upon the State Constitution and the general laws of the State of Michigan. The County's legislative body, and its administrative body for many functions, is the County Board of Commissioners. The Board consists of eleven commissioners elected by direct vote from single-member districts every two years. In addition to the Board of Commissioners, there are fifteen elected officials serving the County in judicial, administrative, or staff officer roles. An organization chart depicting the County structure is shown on the page following this letter. Washtenaw County provides a full range of services in the following service area groups (formerly known as communities of interest): civic infrastructure, economic development, emergency preparedness and response, health and human services, land use and environment, public safety and justice, and support services. The County is responsible for the management and financing of these operations. Other services are provided through legally separate entities. The Washtenaw County Building Authority, although legally separate, functions as a department because its sole purpose is to finance and construct the County’s public buildings, and therefore has been included as an integral part of the County’s financial statements. Washtenaw County is also financially accountable for five legally separate component units: Department of Public Works Projects, Water Resources Commissioner, Hazardous Material Response Team Authority, Brownfield Redevelopment Authority and Road Commission, all of which are reported separately within the County’s financial statements. Additional information on all of these legally separate entities can be found in the notes to the financial statements (See Note I.A.). The Board of Commissioners is required to adopt a final operating budget prior to the beginning of each fiscal year. This annual budget serves as the foundation for Washtenaw County’s financial planning and control. The budget is approved and budgetary control is exercised at the department level. Expenditures may not exceed budgeted appropriations at the department level. Departments are authorized to make budget adjustments up to $10,000 within established categories of their budget. The County Administrator is authorized to make budget adjustments within and between categories of budgets up to $100,000 or 10% of the budget, whichever is less. Budget adjustments greater than this amount must be approved by the Board of Commissioners. Transfers from the Capital Reserve Fund must be approved solely by the Board of Commissioners for any amount.

-iii-
Local Economy Washtenaw County’s vibrant economy is centered on eight business sectors. Major industries located within the government’s boundaries or in close proximity include alternative energies, automotive research, development and manufacturing, homeland security and defense, information technology, life sciences and health care, optics and sensors, and printing and publishing. In addition, many high quality educational institutions, most notably the University of Michigan and Eastern Michigan University, and healthcare facilities are located within our borders. The County also is a significant economic presence thanks to the vast array of services provided by over 1,300 employees. The innovative-based economy in the County is thriving. Because of its location in a region with a varied economic base, unemployment has been consistently below the state average, currently at 13.1 percent, and is also below the national average, currently at 9.6 percent. During the last decade, the unemployment rate has increased from a decade low of 2.9 percent (2001). Although Washtenaw County has one of the healthiest economies in the state, manufacturing layoffs and job losses in trade, transportation, and utilities, as well as pharmaceutical research and development affected the local unemployment rate. Since 2001, the unemployment rate steadily rose to a decade high of 8.8 percent in 2009 and has leveled downward slightly to the current rate of 8.6 percent (2010). Unemployment is expected to remain below both the state and national averages. As the State of Michigan’s economic crisis adjusts to the challenges of a rapidly globalizing economy, community and business leaders have come together like never before to respond. Economic development officials implemented an aggressive strategy for business growth and expansion within the region offering numerous programs and resources to match businesses with financing opportunities, incentives, location and site selection, networking and educational forums, and a talented workforce. Not only are new businesses being recruited to the region, but existing businesses are being offered information and services to continue operating through the economic crisis. As existing businesses face the uncertainties and risks in the current recession, there is assistance available to face the challenges at hand. A number of Washtenaw County organizations have teamed up to provide programs that can help businesses develop, diversify, find efficiencies, locate financing, attract talent and pursue tax incentives. One of the most important things to be done to help the community is by helping employers thrive during tough economic times. Washtenaw County has maintained strong population growth over the past two decades. This growth is expected to continue in the foreseeable future. Our 2000 Census population was 322,770. The estimated 2035 population is 380,170. The median age for the County is younger compared to the State of Michigan. In 2000, Washtenaw County had a median age of 32.9, while Michigan had a 35.5 median age. In 2010, the County is estimated to have a median age of 33.2, while Michigan is estimated to have a median age of 38.5. The low median age assures that the future will hold a broad pool from which employers can select skilled candidates for work in various business sectors.

-iv-
Over 48% of our residents 25 years and older have completed four or more years of college. The median household income (as of 2008) of our residents is over 22% higher than that of the State of Michigan and over 13% higher than the United States as a whole. Personal income figures for our citizens have risen significantly over the last decade, over 16% since 2001. This indicates a healthy local economy and a higher standard of living for our residents. Washtenaw County’s total equalized value of taxable property has increased by more than 33% over the last ten years. The equalized value of taxable property has realized an average 8.0% increase in growth per year for the period of 2001 through 2007. The County’s total equalized value of taxable property for 2010 was approximately $16.3 billion, a decrease over the prior year of $1.2 billion, or roughly 7.2%. Even though other statistics indicate a strong local economy, the economic base of the County has decreased for the third consecutive year, and current information from the Washtenaw County Equalization Division projects that the 2011 total equalized value of taxable property will continue to decline even more, estimated to be up to an eight percent loss. The County remains in good financial condition, as is demonstrated by the financial statements and schedules included in this report. Total governmental activities expenses have increased 53 percent over the past decade. From a ten year low of $128.1 million in 2001, total expenses increased an average of 4.9 percent per year and reached an all time high of $196.2 million. During 2010, total expenses increased 1.7 percent over the prior year. Governmental activities expenses for public safety, health, social services and judicial functions have made-up over 80.0 percent of total expenses for the past ten years. Judicial and health expenses decreased slightly (just over one percent) over the prior year. Judicial expenses were at their lowest levels in five years, making-up 12.2 percent of the total for the year. Although health expenses decreased over the prior year, they have consistently averaged 22.5 percent of total expenses for the past decade. Public Safety expenses have increased in amount each year since 2001, and have consistently remained within two percent of their category of total expenses (a ten-year average of 27.5 percent). Social services expenses have increased in amount each year since 2003, and made-up 21.5 percent of total expenses during 2010 (the decade average is17.3 percent). General government expenses have averaged 12.6 percent of total expenditures over the past decade. Between 2001 and 2008 expenses fluctuated within two percent of their category of total expenses. During 2009, expenses decreased 18.6 percent (due to streamlining operations through organizational structure changes and reorganizations) over 2008. During 2010, expenses decreased over the prior year, as savings continued to be realized from the changes that took place during 2009, and currently makeup 9.4 percent of total governmental expenses. The growth in culture and recreation expenses over the past ten years reflects an increase in park recreational activities and programs, as well as major land acquisitions under the Natural Areas Preservation program and development of the 35-mile Border-to-Border Trail, a non-motorized multi-use trail connecting to Livingston County in the north and Wayne County in the southeast. Even though expenses have increased each year, the category has averaged 4.6 percent of total governmental expenses.

-v-
The remaining expenditure categories (legislative, public works and interest expense activities) currently makeup less than 3.0 percent of total expenses. During the past ten years, the government’s interest expenses have fluctuated in amount because of the required and scheduled payment amounts due on long-term debt each year. During 2010, the interest expense decreased 6.3 percent over the prior year. Both legislative and public works expense categories decreased over the prior year and have remained constant as a percent of total expenses for the past decade (a ten year average of 1.0 percent). The consistency from year to year in these categories is a result of consistent operational expenses and minimal changes to the program areas. Total governmental revenues have increased 52.6 percent over the past decade. From a decade low of $135.3 million in 2001, total revenues increased an average of 4.9 percent per year. Revenues increased 4.1 percent over the prior year and reached an all time high of $206.5 million during 2010. Governmental activities revenue for property taxes, operating grants and contributions, and charges for services currently makeup over ninety-five percent of total revenues. Property tax revenue not only increased in amount ($44.8 million) between 2001 and 2006, but also as a percentage of total revenue (a five year average of 41.8 percent), to approximately 49.2 percent of the revenue collected during 2006. During 2007, property taxes decreased by approximately $8.7 million (9.2 percent) from 2006. This decrease was attributed to being the first year, in the previous four years, that no shift in property tax collections occurred. During the prior three years (2004-2006), property tax collections shifted from a December to a July levy, an additional one-third of the levy was collected each year until the transition was complete. The accelerated revenue recognition, pursuant to Public Act 357 of 2004, has and will continue to provide funding, until 2013, that serves as a substitute for state revenue sharing payments. Property taxes continued to decrease during 2008 through 2010 (due to taxable value declines). During 2010, property taxes decreased (4.0 percent) over prior year and currently makeup 38.4 percent of total revenues. Operating grants and contributions increased in amount (a ten year increase of 99.2 percent), but have consistently been approximately 32.1 percent (average) of total revenues between 2001 and 2007. Between 2008 and 2010, operating grants and contributions increased both in amount and as a percent of total revenues (36.8 percent, 38.6 percent and 40.7 percent, respectively) as awards and additional resources have supplemented programs in health, social services, judicial and public safety activities. During the past decade, charges for services increased in amount, but decreased in the percent of total revenues. In 2001, charges for services were $27.7 million and 20.4 percent of total revenues. In 2010, charges for services were approximately $31.1 million and 15.1 percent of total revenues. To explain the increase in amount, user fees and charges may fluctuate based on usage of a service and as fee increases and/or new fees are implemented, but are not intended to recoup the full costs of providing services. The remaining revenue categories (transfers, accommodation taxes, unrestricted grants and contributions, capital grants and contributions and investment earnings) currently makeup approximately 5.7 percent of total revenues at the end of 2010. Transfers are the net of other financing sources/uses (transfers in have exceeded transfers out for the past decade) for governmental activities. Accommodation taxes are revenues from the use of hotel and convention facilities and are restricted for tourism programs. Unrestricted grants and contributions are other revenues that are not restricted to specific programs and may be used for any purpose. Capital grants and contributions are primarily used for public safety activities for

-vi-
domestic preparedness and homeland security programs. Investment income has declined to its lowest levels in a decade due the economic realities of the current recession and the stock market declines. Long-Term Financial Planning Total fund balance in the general fund (16.2 percent of total general fund expenditures and transfers out) falls within policy guidelines set by the Board of Commissioners for budgetary and planning purposes. The Board has continued its commitment to plan future budgets to meet the goal of a reserve for subsequent years representing at least 8.0% of general fund expenditures and transfers out. The Board of Commissioners has committed to ensure the long-term fiscal stability of the County. The County completes long-term projections of at least two budget cycles (four years), and updates them frequently to ensure that the full impact of decisions are understood. The County has worked diligently over the years making long-term fiscal stability a top priority, which has resulted in higher bond ratings, reasonable levels of debt, reserves in line with policy and annual surpluses. However, not since the Great Depression more than 70 years ago have we experienced such profound economic loss. The County’s projections on property taxes will be tested, once again, come April of 2011 when the 2011 Equalization Report is published. The budget is a set of complex and interrelated assumptions, but nobody can predict the future. The projections for the next few years still remain with a long-term structural deficit. Projections are developed with an attempt to balance the short-term with the long-term, both from a fiscal perspective and community impact perspective. On the revenue side, the major assumption is that property taxes will continue to decline. A reduction of 5.0 percent in 2012 and 2.0 percent in 2013 have been estimated as a gradual recovery from the steeper decline projected for 2011 (8.5 percent). Other revenues including fees and fines are estimated to remain relatively flat. The County continues to operate with a great uncertainty as the State of Michigan struggles to find solutions to balance a billion dollar deficit. An impact on the County is certain. The question becomes the timing and severity. The most pressing concern comes in 2013 when the County’s Revenue Sharing Reserve fund is depleted. Long-term projections assume the State of Michigan will reinstate the County revenue sharing as originally promised when the reserve funds were established. However, the County must proceed in developing options if this does not occur.

-vii-
For expenditures, the assumptions take into consideration conservative wage adjustments but with growing fringe rates based on trends. Other operating costs are projected to be relatively neutral as it is assumed the organization will continue to operate with a constant pressure to contain costs as much as possible. Next to personnel costs, the largest portion of the general fund budget comes through its appropriations to programs outside the general fund. The projections are built on a revised policy to no longer automatically provide appropriations increases for personnel cost growth except where required by statute. This is a significant policy adjustment given these economic times. It has helped to reduce the projected deficit within the general fund, and yet this shift in approach may be difficult to realize if these non-general fund programs are faced with drastic service reductions if the general fund does not provide additional support. This scenario which may be upon us in the next couple of years only highlights the necessity for clear priorities and direction for the organization. The 2011 budget and the 2012 and 2013 projections are intended to first “stop the bleeding” from the economic downturn so that we can move forward in a strategic way to develop a long-term path to fiscal wellness. However, property tax revenues for each fiscal year are not known now until four months into the fiscal year. The budget is based on a set of assumptions using known information during the time of development. It will be critical to closely monitor these assumptions as new information from the emerging economy continues to become available. The challenge will continue into the future as the County is projecting sizable deficits in 2012 and 2013. The County has already begun planning for the 2012 and 2013 budgets. The strategies for long-term fiscal stability revolve around revenue growth and reform through strategic leveraging and economic stabilization; minimizing the growth of personnel costs through innovative solutions, employee cost-sharing and partnerships with labor units; organizational restructurings for efficiency and determination of core services; community collaborations to bring forth consolidations with reduced costs of doing business; and evaluating cost allocation of indirect services and maintaining an investment in infrastructure and reserves. The desire is for 2011 to be a strategic planning year to determine that desired long-term path to fiscal stability and to re-define Washtenaw County government. Relevant Financial Policies As a means to save state funding, legislation (Public Act 357 of 2004) was passed that shifted the timing of property tax payments to create a revenue stream that, for the next three years or so, will offset the reduction in state revenue sharing. The measure gradually moved up property tax collections from the winter to the summer over three years. Counties annually transfer from this pool the exact amount of funding that would have been available through state revenue sharing. Each year the State publishes the allowable spending amount that can be transferred from the reserve fund. The allowable spending amount is calculated using the growth in the U.S. Consumer Price Index from the State’s 2008 and 2009 fiscal years. The inflation rate used for fiscal year 2010 was -0.3% and will be 2.1% for 2011.

-viii-
Many changes occurred when the State passed the law to shift the County’s tax levy from December to July. One consequence was on the cash flow of the general fund, as the property tax revenue used to be received early in the year to sustain expenditures throughout the entire fiscal year. Now, costs begin to be incurred as of January 1, however the property tax revenue (over 70% of the general fund revenue) is not collected until the second half of the year. This potentially creates a negative cash balance in the general fund. The law allows for the use of the revenue sharing reserve fund cash to be moved into the general fund if such an issue arises. It was necessary for this to be the County’s practice for 2009 and beyond until the revenue sharing reserve fund is depleted. Interest levels have and will continue to decline from previous levels as the level of cash declines through the use of the revenue sharing reserve fund. It is a significant long-term issue with a need to identify a permanent solution to the general fund cash flow shortage, as it is projected that the revenue sharing reserve fund will not be available after 2013. Major Initiatives The County has been in a mode of reducing the cost of doing business for many years. The magnitude of the economic downturn resulted in budget reductions for the biennial (2010 and 2011) budget. Attempts were made to be as strategic as possible rather than implementing across the board reductions. A balance was desired between the short-term and long-term needs of the community and the organization. It was desired that the County hold true to its role as the “safety net” for vulnerable citizens, while at the same time strategically invest in the community for long-term fiscal stability. This is a challenge with limited and declining resources, and with the demand for services growing. Information sharing with the Board of Commissioners resulted in several focus areas used to manage the budget reductions. The priorities included preserve services and jobs, equity in process, review serviceability of mandate, evaluate non-mandated programs, and invest in the community. In an attempt to carry out these priorities several budget reduction principles were laid out for the organization and used during budget discussions: revenue growth and reform – pursue opportunities to maximize revenues to return to long-term fiscal stability; reduce the cost of doing business – demonstrate that we are operating programs as efficiently as possible; community collaboration – work with private, non-profit and public organizations to maintain services to our residents; organization structure by core business – determine the best organizational structure, including level of management to carry out our business; and employee compensation and benefits – work with our union partners to identify ways to reduce the County costs for personnel. This year we have made significant progress in carrying out the objectives set forth by the Board of Commissioners. Our work has been primarily focused on ensuring the continuation of fiscal stability for this organization and managing significant organizational change. We have a very difficult road ahead as we address the projected $20 million deficit for 2012/2013. As difficult as this road is, it’s also an opportunity to truly evaluate this organization and determine the best options for moving forward. This organization will change; it must change. We can no longer be everything to everyone; rather we must have a targeted approach for making the greatest positive impact on this community and I’m looking forward to using my role as County Administrator to do just that.

-ix-
AWARDS AND ACKNOWLEDGEMENTS The Government Finance Officers Association (GFOA) awarded a Certificate of Achievement for Excellence in Financial Reporting to Washtenaw County, Michigan for its comprehensive annual financial report (CAFR) for the fiscal year ended December 31, 2009. This was the 20th consecutive year that the County has achieved this prestigious award. In order to be awarded a Certificate of Achievement, the County must publish an easily readable and efficiently organized CAFR that satisfied both generally accepted accounting principles and applicable legal requirements. A Certificate of Achievement is valid for a period of one year only. We believe that our current CAFR continues to meet the Certificate of Achievement Program’s requirements, and we are submitting it to the GFOA to determine its eligibility for another certificate. In addition to the Certificate of Achievement, the County also received the GFOA’s Distinguished Budget Presentation Award for its budget for the biennium period beginning January 1, 2010. In order to qualify for the Distinguished Budget Presentation Award, the County's budget document was judged as a policy document, a financial plan, an operations guide, and a communication device. Finally, Washtenaw County is the proud recipient of the GFOA award for its Popular Annual Financial Report (PAFR). The fiscal year 2009 PAFR was the County’s fourth citation. Washtenaw County is one of four counties in the State of Michigan that holds all three of the GFOA awards simultaneously. The preparation of this report on a timely basis was made possible by the dedicated service of Finance Department accounting staff and the accounting personnel from the Treasurer's Office, Water Resources Commissioner's Office, Public Works, Road Commission, Community Support and Treatment Services, Public Health and other County departments, as well as advice from Rehmann Robson. I wish to express my appreciation and acknowledge those who assisted and contributed to the preparation of this report: Dan Ackerman Roberta Allen Terry Ballantyne Don Bilbey
Sue Bos Jennifer Brassow Peter Collinson Janet Egeler
Tina Gavalier Janet Gilkey Marie Irwin Kirsten Osborn
Stefanie Thacker Xiaohong Wu
Credit also must be given to the Board of Commissioners for their unfailing support for maintaining the highest standards of professionalism in the management of Washtenaw County’s finances. Sincerely,
Verna J. McDaniel County Administrator/Controller

-x-

-xi-

-xii-
WASHTENAW COUNTY
PRINCIPAL OFFICIALS
At December 31, 2010
Board of Commissioners
Rolland Sizemore Jr., Chair Barbara Levin Bergman Ronnie Peterson Leah Gunn Jessica Ping Jeff Irwin Wesley Prater Kristin Judge Ken Schwartz Mark Ouimet Conan Smith
District Court Judges Richard E. Conlin J. Cedric Simpson Kirk W. Tabbey
Trial Court Judges Archie C. Brown Darlene A. O’Brien Timothy P. Connors Donald E. Shelton Nancy C. Francis David S. Swartz Melinda Morris
Water Resources Clerk/Register of Deeds Commissioner Prosecuting Attorney Lawrence Kestenbaum Janis A. Bobrin Brian Mackie Sheriff Treasurer Jerry L. Clayton Catherine McClary
County Administrator
Verna J. McDaniel

Financial Section

Rehmann Robson
675 Robinson Rd. Jackson, MI 49203 Ph: 517.787.6503 Fx: 517.788.8111
www.rehmann.com
-1-
INDEPENDENT AUDITORS’ REPORT
March 18, 2011 To the Board of Commissioners of Washtenaw County Ann Arbor, Michigan We have audited the accompanying financial statements of the governmental activities, the business-type activities, the aggregate discretely presented component units, each major fund, and the aggregate remaining fund information of WASHTENAW COUNTY, MICHIGAN as of and for the year ended December 31, 2010, which collectively comprise the County’s basic financial statements as listed in the table of contents. These financial statements are the responsibility of Washtenaw County’s management. Our responsibility is to express opinions on these financial statements based on our audit. We did not audit the financial statements of the Employment Training and Community Services Fund, which represents 7.8% of the assets and 24.3% of the revenues of the aggregate remaining fund information and 0.4% of the assets and 7.6% of the revenues of the governmental activities. Also, we did not audit the financial statements of the Washtenaw County Road Commission, which represents 76.8% of the assets and 79.4% of the revenues of the aggregate discretely presented component units. Those financial statements were audited by other auditors whose reports were furnished to us, and our opinion, insofar as it relates to the amounts included for the Employment Training and Community Services Fund and Washtenaw County Road Commission, is based solely on the reports of the other auditors. We conducted our audit in accordance with auditing standards generally accepted in the United States of America and the standards applicable to financial audits contained in Government Auditing Standards, issued by the Comptroller General of the United States. Those standards require that we plan and perform the audit to obtain reasonable assurance about whether the financial statements are free of material misstatement. An audit includes examining, on a test basis, evidence supporting the amounts and disclosures in the financial statements. An audit also includes assessing the accounting principles used and significant estimates made by management, as well as evaluating the overall financial statement presentation. We believe that our audit and the reports of other auditors provide a reasonable basis for our opinions.

-2-
In our opinion, based on our audit and the reports of other auditors, the financial statements referred to above present fairly, in all material respects, the respective financial position of the governmental activities, the business-type activities, the aggregate discretely presented component units, each major fund, and the aggregate remaining fund information of Washtenaw County, Michigan, as of December 31, 2010, and the respective changes in financial position and cash flows, where applicable, thereof and the respective budgetary comparisons for the general fund and major special revenue funds for the year then ended in conformity with accounting principles generally accepted in the United States of America. In accordance with Government Auditing Standards, we have also issued our report dated March 18, 2011, on our consideration of Washtenaw County, Michigan’s internal controls over financial reporting and on our tests of its compliance with certain provisions of laws, regulations, contracts, and grant agreements and other matters. The purpose of that report is to describe the scope of our testing of internal control over financial reporting and compliance and the results of that testing, and not to provide an opinion on the internal control over financial reporting or on compliance. That report is an integral part of an audit performed in accordance with Government Auditing Standards and should be considered in assessing the results of our audit. The Management’s Discussion and Analysis on pages 3-16 and the pension and other postemployment benefits information on pages 90-92 are not a required part of the basic financial statements but are supplementary information required by the Governmental Accounting Standards Board. We have applied certain limited procedures, which consisted principally of inquiries of management regarding the methods of measurement and presentation of the supplementary information. However, we did not audit the information and express no opinion on it. Our audit was conducted for the purpose of forming opinions on the financial statements that collectively comprise Washtenaw County’s basic financial statements. The introductory section, combining and individual fund financial statements and schedules, and statistical section are presented for purposes of additional analysis and are not a required part of the basic financial statements. The combining and individual fund financial statements and schedules have been subjected to the auditing procedures applied by us and the other auditors in the audit of the basic financial statements and, in our opinion, based upon our audit and the reports of other auditors, are fairly presented, in all material respects, in relation to the basic financial statements taken as a whole. The introductory and statistical sections have not been subjected to the auditing procedures applied by us and the other auditors in the audit of the basic financial statements and, accordingly, we express no opinion on them.

Management’s Discussion and Analysis

-3-
MANAGEMENT’S DISCUSSION AND ANALYSIS
As management of Washtenaw County, Michigan we offer readers of the County’s financial statements this narrative overview and analysis of the financial activities of the County for the fiscal year ended December 31, 2010. We encourage readers to consider the information presented here in conjunction with additional information that we have furnished in our letter of transmittal, which can be found on pages i–ix of this report, and the accompanying basic financial statements. Financial Highlights
The assets of the County exceeded its liabilities at the close of the most recent fiscal year by
$215,297,082 (net assets). Of this amount, $83,805,934 (unrestricted net assets) may be used to meet the government’s ongoing obligations to citizens and creditors.
The County’s total net assets increased by $10,602,588 during 2010. This increase is
attributable to total revenues exceeding total expenses. As of the close of the current fiscal year, the County’s governmental funds (this includes the
general, special revenue, debt service and capital projects funds) reported combined ending fund balances of $88,498,970, a decrease of $12,717,424 in comparison with the prior year. Eighty-three percent of the ending fund balances are subject to the underlying limitations applicable to the particular special revenue, debt service and capital project funds. Approximately seventeen percent of this total amount, $15,310,490, is available for spending at the government’s discretion only (general fund unreserved, undesignated fund balance).
The general fund had a surplus of $5,544,098 for 2010. This planned surplus will be carried
forward and used to balance the 2011 budget. At the end of the year, total fund balance for the general fund was $15,317,157, or approximately 16.2 percent of total general fund expenditures and transfers out.
The County’s investment in capital assets increased by $16,345,393 during 2010. The County’s total bonded debt, excluding delinquent tax notes, decreased by $7,360,000
during the current fiscal year. Using this Annual Report This annual report consists of a series of financial statements. The statement of net assets and the statement of activities provide information about the activities of the County as a whole (government-wide financial statements) and present a longer-term view of the County’s finances. Fund financial statements tell how these services were financed in the short-term as well as what remains for future spending. Fund financial statements also report the County’s operations in more detail than the government-wide statements by providing information about the County’s most significant funds.

-4-
The remaining statements provide financial information about activities for which the County acts solely as a trustee or agent for the benefit of those outside of the government. The notes to the financial statements provide additional information that is essential to a full understanding of the data provided in the government-wide and fund financial statements. In addition to the basic financial statements and accompanying notes, this report also presents required supplementary information. This is limited to schedules concerning the County’s progress in funding its obligation to provide pension and other postemployment benefits to certain employees. Reporting the County as a Whole The Statement of Net Assets and the Statement of Activities. One of the most important questions asked about the County’s finances is, “Is the County as a whole better off or worse off as a result of this year’s activities?” The statement of net assets and the statement of activities report information about the County as a whole and about its activities in a way that helps answer this question. These statements include all assets and liabilities using the accrual basis of accounting, which is similar to the accounting used by most private-sector companies. All of the current year’s revenues and expenses are taken into account regardless of when cash is received or paid. These two statements report the County’s net assets and changes in them. One can think of the County’s net assets – the difference between assets and liabilities – as one way to measure the County’s financial health, or financial position. Over time, increases or decreases in the County’s net assets are one indicator of whether its financial health is improving or deteriorating. During 2010, the net assets of the County increased by $10.6 million. The statement of net assets and the statement of activities present information about the following: Governmental Activities. All of the County’s basic services are considered to be governmental activities, including legislative, judicial, general government, public safety, public works, health, social services, culture and recreation, and interest on debt. Property taxes, intergovernmental revenue for operating grants and contributions, and charges for services finance most of these activities. Business-type Activities. Other functions of the County that are intended to recover all or a significant portion of their costs through user fees and charges are considered to be business-type activities. These include delinquent tax collections and property foreclosures.
Component Units. The County includes five legally separate entities in its financial statements: the Washtenaw County Department of Public Works Projects, the Washtenaw County Water Resources Commissioner, the Washtenaw County Hazardous Materials Response Authority, the Washtenaw County Road Commission and the Washtenaw County Brownfield Redevelopment Authority. Although legally separate, these component units are important because the County is financially accountable for them. Financial information for these component units are reported separately from the financial information presented for the primary government itself. The Washtenaw County Building Authority, although also legally separate, functions for all practical purposes as a department of the County, and therefore has been included as an integral part of the primary government. The government-wide financial statements can be found on pages 17-19 of this report.

-5-
Reporting the County’s Most Significant Funds Fund Financial Statements. The fund financial statements provide detailed information about the most significant funds, not the County as a whole. Some funds are required to be established by State law and by bond covenants. However, the County establishes many other funds to help it control and manage money for particular purposes or to show that it is meeting legal responsibilities for using certain taxes, grants, and other money. The County’s two primary kinds of funds – governmental and proprietary – use different accounting approaches. Governmental funds. Most of the County’s basic services are reported in governmental funds, which focus on how money flows into and out of those funds and the balances left at year-end that are available for spending. These funds are reported using an accounting method called the modified accrual basis of accounting, which measures cash and all other financial assets that can readily be converted to cash. The governmental fund statements provide a detailed short-term view of the County’s general governmental operations and the basic services it provides. Governmental fund information helps one determine whether there are more or fewer financial resources that can be spent in the near future to finance the County’s programs. Because the focus of governmental funds is narrower than that of the government-wide financial statements, it is useful to compare the information presented for governmental funds with similar information presented for governmental activities in the government-wide financial statements. By doing so, readers may better understand the long-term impact of the government’s near-term financing decisions. Both the governmental fund balance sheet and the governmental fund statement of revenues, expenditures and changes in fund balances provide a reconciliation to facilitate this comparison between governmental funds and governmental activities. The County maintains 35 individual governmental funds. Information is presented separately in the governmental fund balance sheet and in the governmental fund statement of revenues, expenditures, and changes in fund balances for the general, community support and treatment services, parks and recreation, revenue sharing reserve, enhanced emergency communication system millage, and county capital project funds, each of which are considered to be major funds. Data from the other 29 governmental funds are combined into a single, aggregated presentation. Individual fund data for each of these nonmajor governmental funds is provided in the form of combining statements elsewhere in this report. The basic governmental fund financial statements can be found on pages 20-31 of this report. Proprietary funds. The County maintains two different types of proprietary funds. Enterprise funds are used to report the same functions presented as business-type activities in the government-wide financial statements. The County uses enterprise funds to account for delinquent tax operations and property foreclosures. Internal service funds are an accounting device used to accumulate and allocate costs internally among the County’s various functions. The County uses internal service funds to account for support services provided to other departments, which includes phone services, fleet, facilities management, insurance, duplicating and copier replacement, mail services and payroll fringe benefits. Because these services predominantly benefit governmental rather than business-type functions, they have been included within governmental activities in the government-wide financial statements.

-6-
Proprietary funds provide the same type of information as the government-wide financial statements, only in more detail. The proprietary fund financial statements provide separate information for the delinquent tax operations and other enterprise funds. Conversely, all internal service funds are combined into a single, aggregated presentation in the proprietary fund financial statements. Individual fund data for the internal service funds is provided in the form of combining statements elsewhere in this report. The basic proprietary fund financial statements can be found on pages 32-35 of this report. Reporting the County’s Fiduciary Responsibilities The County is the trustee, or fiduciary, for certain amounts held on behalf of others. Fiduciary funds are used to account for resources held for the benefit of parties outside the government. Fiduciary funds are not reflected in the government-wide financial statements because the resources of those funds are not available to support the County’s own programs. The County’s fiduciary activities are reported in separate statements of fiduciary net assets and changes in fiduciary net assets. The accounting used for fiduciary funds is much like that used for proprietary funds. The County is responsible for ensuring that the assets reported in these funds are used for their intended purposes. The basic fiduciary fund financial statements can be found on pages 36-37 of this report. Additional Information Notes to the Financial Statements. The notes provide additional information that is essential to a full understanding of the data provided in the government-wide and fund financial statements. The notes to the financial statements can be found on pages 40-89 of this report. Other Information. In addition to the basic financial statements and accompanying notes, this report also presents certain required supplementary information. This is limited to schedules concerning the County’s progress in funding its obligation to provide pension and other postemployment benefits to certain employees. Required supplementary information can be found on pages 90-92 of this report. The combining statements referred to earlier in connection with nonmajor governmental funds and internal service funds are presented immediately following the required supplementary information. Combining and individual fund statements and schedules can be found on pages 93-127 of this report. Financial Analysis of the County as a Whole The government-wide financial analysis focuses on the net assets and changes in net assets of the County’s governmental and business-type activities. As noted earlier, net assets may serve over time as a useful indicator of a government’s financial position. As the following table demonstrates, the County’s assets exceeded its liabilities by $215,297,082 at December 31, 2010.

-7-
Washtenaw County's Net Assets
Governmental activities Business-type activities Total
2010 2009 2010 2009 2010 2009
Current and other assets 134,032,416$ 145,863,226$ 43,188,648$ 41,877,466$ 177,221,064$ 187,740,692$
Capital assets 195,448,456 179,094,407 19,779 28,435 195,468,235 179,122,842
Total assets 329,480,872 324,957,633 43,208,427 41,905,901 372,689,299 366,863,534
Long-term liabilities 90,462,773 97,435,978 26,027,267 25,021,714 116,490,040 122,457,692
Other liabilities 40,856,962 39,661,772 45,215 49,576 40,902,177 39,711,348
Total liabilities 131,319,735 137,097,750 26,072,482 25,071,290 157,392,217 162,169,040
Net assets:
Invested in capital assets,
net of related debt 122,722,958 113,135,214 19,779 28,435 122,742,737 113,163,649
Restricted 8,748,411 6,804,739 - - 8,748,411 6,804,739
Unrestricted 66,689,768 67,919,930 17,116,166 16,806,176 83,805,934 84,726,106
Total net assets 198,161,137$ 187,859,883$ 17,135,945$ 16,834,611$ 215,297,082$ 204,694,494$
By far, the largest portion of the County’s net assets, $122,742,737 (57.0 percent), is its investment in capital assets (i.e., land, buildings, vehicles and equipment), net of any related debt used to acquire those assets that is still outstanding. The County uses these capital assets to provide services to citizens; consequently, these assets are not available for future spending. Although the County’s investment in its capital assets is reported net of related debt, it should be noted that the resources needed to repay this debt must be provided from other sources, since the capital assets themselves cannot be used to liquidate these liabilities. An additional portion of the County’s net assets, $83,805,934 (39.0 percent), unrestricted net assets, may be used to meet the government’s ongoing obligations to citizens and creditors. The remaining balance of $8,748,411 (4.0 percent) represents resources that are subject to external restrictions on how they may be used. At the end of the current fiscal year, the County is able to report positive balances in all three categories of net assets (unrestricted, restricted and invested in capital assets, net of related debt), both for the government as a whole, as well as for its separate governmental and business-type activities. The same situation held true for the prior year.

-8-
Washtenaw County's Changes in Net Assets
Governmental activities Business-type activities Total2010 2009 2010 2009 2010 2009
RevenueProgram revenue:
Charges for services 31,130,459$ 30,821,038$ 7,296,651$ 7,393,803$ 38,427,110$ 38,214,841$ Operating grants and contributions 84,101,904 76,525,122 - - 84,101,904 76,525,122
Capital grants and contributions 557,446 1,118,781 - - 557,446 1,118,781
General revenue:
Property taxes 79,314,216 82,635,161 - - 79,314,216 82,635,161
Accommodation taxes restricted
for tourism programs 3,539,013 3,039,774 - - 3,539,013 3,039,774
Grants and contributions notrestricted to specific programs 1,245,565 428,646 - - 1,245,565 428,646
Other 474,069 898,316 132,538 84,974 606,607 983,290
Gain on sale of capital assets 181,341 - - - 181,341 -
Total revenue 200,544,013 195,466,838 7,429,189 7,478,777 207,973,202 202,945,615
ExpensesLegislative 526,142 593,756 - - 526,142 593,756
Judicial 23,900,492 24,261,496 - - 23,900,492 24,261,496
General government 18,483,213 19,155,496 - - 18,483,213 19,155,496
Public safety 54,263,600 52,567,442 - - 54,263,600 52,567,442
Public works 844,588 982,745 - - 844,588 982,745
Health 43,899,534 44,486,741 - - 43,899,534 44,486,741
Social services 41,959,629 37,914,200 - - 41,959,629 37,914,200 Culture and recreation 8,981,545 9,312,142 - - 8,981,545 9,312,142
Interest on long-term debt 3,322,673 3,544,774 - - 3,322,673 3,544,774
Delinquent tax collections
and related activities - - 1,394,780 1,417,752 1,394,780 1,417,752
Total expenses 196,181,416 192,818,792 1,394,780 1,417,752 197,576,196 194,236,544
Increase in net assets before transfers 4,362,597 2,648,046 6,034,409 6,061,025 10,397,006 8,709,071
Transfers 5,938,657 2,918,000 (5,733,075) (2,208,624) 205,582 709,376
Increase in net assets 10,301,254 5,566,046 301,334 3,852,401 10,602,588 9,418,447
Net assets - beginning 187,859,883 182,293,837 16,834,611 12,982,210 204,694,494 195,276,047
Net assets - ending 198,161,137$ 187,859,883$ 17,135,945$ 16,834,611$ 215,297,082$ 204,694,494$
The County’s net assets increased by $10.6 million during the current fiscal year; approximately $10.3 million increase for governmental activities and $0.3 million increase for business-type activities. Governmental Activities. Overall, total revenues and transfers exceeded total expenses by over $10.3 million, thereby accounting for 97.2 percent of the total growth in the net assets during 2010. Total revenues for governmental activities were $5.1 more than the prior year. Key elements of the increase are as follows: Operating grants and contributions for governmental activities increased by $7.6 million (9.9
percent) during the year. Grant awards and contributions furnished additional resources to supplement programs in the areas of social services, health and public safety activities.
Transfers increased $3.0 million (more than doubled) over 2009, as other financing sources were more than uses. This was a result of a transfer from the business-type activities to the governmental activities.

-9-
Other increases in revenues took place over the prior year. Accommodation taxes increased by $0.5 million (16.4 percent) due to increased hotel and convention use. Charges for services increased by $0.3 million (1.0 percent) due to user fees for health activities. Grants and contributions not restricted to specific programs increased by $0.8 million (190.6 percent) for revenue reimbursements for servicers provided for general government, judicial and public safety activities. Finally, the gain on the sale of capital assets increased $0.2 million (100 percent) due to the retirement of leased equipment.
Property taxes in 2010 decreased by approximately $3.3 million (4.0 percent). This resulted
from continued taxable value declines due to decreased housing values and the economic downturn.
Other decreases in revenues also took place in comparison to 2009. Capital grants and
contributions decreased by $0.6 million (50.2 percent). There were less public safety grant awards for capital equipment purchases for emergency management and domestic preparedness initiatives. The other general revenue category decreased by $0.4 million (47.2 percent) due to a decline in unrestricted investment earnings over the prior year.
Overall, total expenses for governmental activities increased $3.4 million (1.7 percent) during the year. The functional areas that comprise this increase are social services ($4.0 million) for community development’s homeless and housing programs and public safety ($1.7 million) for sheriff services due to the jail expansion.

-10-
In addition, some costs decreased by $672,283 for general government activities as savings from organizational structure changes and reorganizations implemented to streamline operations continued to be realized during 2010 in response to projected budget shortfalls for 2012 and 2013, $587,207 for health initiatives for community support and treatment services and public health, $361,004 for judicial activities for court services, $330,597 for culture and recreation for park programs and operations, $222,101 for interest on long-term debt, $138,157 for public works projects and $67,614 for Board of Commissioners’ legislative functions.

-11-
Business-type Activities. Business-type activities increased the County’s net assets by approximately $0.3 million. Key elements of the current year increase are as follows:
Charges for services revenue for business-type activities decreased $97,152 (1.3 percent) in
comparison to the prior year due to lower delinquent tax and property foreclosure activity during 2010. Expenditures decreased by $22,972 (1.6 percent) due to expenditure reductions for collection operations.
The other general revenue category decreased by $47,564 (56.0 percent) during the year due
to a decline in investment earnings.
$0
$2,000,000
$4,000,000
$6,000,000
$8,000,000
Delinquent tax collections Property foreclosure
2010 & 2009 Expenses and Program Revenues - Business-type Activities
2010 expenses 2010 program revenue 2009 expenses 2009 program revenue
Financial Analysis of the County’s Funds As noted earlier, Washtenaw County uses fund accounting to ensure and demonstrate compliance with finance-related legal requirements. Governmental funds. The focus of the County’s governmental funds is to provide information on near-term inflows, outflows, and balances of spendable resources. Such information is useful in assessing the County’s financing requirements. In particular, unreserved fund balance may serve as a useful measure of a government’s net resources available for spending at the end of the fiscal year. As of the end of the current fiscal year, the County’s governmental funds reported combined ending fund balances of $88,498,970, a decrease of $12,717,424 in comparison with the prior year. Eighty-three percent of the ending fund balances are subject to the underlying limitations applicable to the particular special revenue, debt service and capital project funds. The other seventeen percent of this total amount, $15,310,490, is available for spending at the government’s discretion only (general fund unreserved, undesignated fund balance). The remainder of fund balance is reserved to indicate that it is not available for new spending because it has already been committed for community support and treatment services’ activities, land acquisition under the natural area preservation program, parks and recreation activities, replacement for state revenue sharing, enhancements to emergency communication systems and for improvements to existing assets and new construction for capital projects, as well as for long-term advances and prepaid items.

-12-
The general fund is the chief operating fund of the County. At the end of the current fiscal year, total fund balance of the general fund was $15,317,157, of which $6,667 is reserved for prepaid items. As a measure of the general fund’s liquidity, it may be useful to compare fund balance to total fund expenditures. Fund balance represents 16.2 percent of total general fund expenditures and transfers out. This level of fund balance in the general fund meets the Board of Commissioners formal adopted policy. The fund balance of the general fund increased by $5,544,098 during the current fiscal year because revenues and other sources were higher than expenditures and other uses. The 2010 approved budget included the planned surplus to be carried forward and used to balance the 2011 fiscal year budget. During 2010 the financial position of the community support and treatment services fund remained the same as the prior year. Total fund balance at the end of the year is $346,464. The parks and recreation fund had a total fund balance of $29,023,633, which increased $2.0 million in the current year. This increase was due to a voter-approved millage to fund parks and recreation program and activities. Fund balance will be used in subsequent years for park and recreation operations and as the land acquisitions are completed under the natural areas preservation program. The revenue sharing reserve fund had a total fund balance of $17,499,929, a decrease of $6.5 million during 2010. This fund is mandated by the State of Michigan and accounts for accelerated property tax collections that substitute state revenue sharing payments. Annual tax payments, each equal to 1/3 of the annual property tax levy, were placed in this fund over three years, 2004-2006. Beginning in 2004 the County started withdrawing monies from this fund equal to the fiscal 2004 state revenue sharing payments adjusted for inflation. The County will continue drawing down revenue sharing from the reserve fund using an inflationary factor over the prior year amount. This fund will decline just over $6.5 million per year in the future until the fund balance is exhausted. The enhanced emergency communication system millage fund had a fund balance of $2,389,765, an increase of $278,400 for the year. This fund accounts for the resources, including a voter-approved millage beginning in 2007, accumulated and payments made for principal and interest on long-term general obligation debt that will finance acquisition, construction, renovation, maintenance and operations of an upgrade to the County’s communication system. The county capital projects fund accounts for renovations and modifications of existing facilities, new capital construction projects and the purchase of capital equipment. The county capital projects fund has a total fund balance of $17,031,962. In addition, maintenance to existing facilities such as replacement of roof systems, carpeting, and other interior finishes are also funded by the county capital projects fund. The net decrease in fund balance during the current year in the county capital projects fund was $14,299,667 and is attributable to expenditures for the construction of the jail expansion and improvements, as well as a new district court at the County Service Center. Proprietary funds. The County’s proprietary funds provide the same type of information found in the government-wide financial statements, but in more detail.
Unrestricted net assets of the delinquent tax, other enterprise activities and internal service funds at the end of the year amounted to $15,869,042, $1,247,124 and $3,603,953, respectively. The delinquent tax fund had a decrease in net assets for the year of $53,256, whereas the other enterprise activities had an increase of $354,590 and the internal service funds had an increase of $509,047. Other factors concerning the finances of the delinquent tax fund have already been addressed in the discussion of the County’s business-type activities.

-13-
General Fund Budgetary Highlights There was a net increase of $303,629 (.31%) to general fund revenues (including transfers in) from the original to the final budget. Intergovernmental revenues increased $579,894 (11.1%). Most of this ($325,270) was for contributions from local entities in support of Medicaid ICA (Indigent Care Arrangements) - based DSH (Disproportionate Share Hospital) payments to area hospitals. These funds are leveraged to increase indigent health care funding in the community. A corresponding adjustment was also made to transfers out for the Medicaid disproportionate share hospital (DSH) payments. The remaining $254,624 increase was for state liquor tax and local reimbursements for information technology, human resources and water resources commissioner services provided to local entities, and other anticipated community reimbursements. The budget for transfers in increased $177,000 (2.3%) for anticipated reimbursement for personnel services for delinquent tax activities and E-911 revenues. There was a slight increase in taxes ($100,000 or .15%) due to property tax revenue outlook improving, over the prior year estimate, as more information became available during the year. Other revenues increased $55,143 (3.1%) for reimbursements of attorney fees for circuit court cases. Finally, the above increases were offset by a decrease in charges for services revenue in the amount of $608,408 (3.1%) for sheriff’s services as local entities have reduced the number of public safety units contracted with the Washtenaw County Sheriff’s Office the for road patrol services. Other small increases and decreases in revenue budgets also took place. There was a corresponding $303,629 net increase (.31%) between the original and final amended expenditure budget (including transfers out and the planned increase to fund balance to build reserves for subsequent year’s budget). There was a $1,250,427 (33.4%) budget increase in the other unallocated expenditure category because of personnel adjustments. The savings from furlough, banked days off and premium sharing for medical benefits was less than planned because not all employee groups voted to approve the union contracts at the level of concessions requested from management. The planned net change in fund balance was increased by $921,338 during the year. There was also a budget increase of $825,205 (5.22%) for judicial activities for court functions and public defender activities. In addition, there was a $1.6 million (8.5%) decrease in the other financial uses budget for transfers out which partially offset the needed budget increases discussed above. The reduction in the level of general fund support to non-general fund departments through appropriation decreases were absorbed through position vacancies, revenue adjustments or other budget savings primarily in County health programs. The budget amount for public safety activities decreased $815,928 (1.7%) for personnel services for sheriff department and prosecuting attorney activities. There was a net budget decrease of $324,350 (4.7%) for general government activities. Clerk/register, finance, water resources commissioner, and treasurer activities all had various decreases to their budgets. General government activities that had various increases to their budgets that offset the decreases included corporation counsel, human resources, administrative and information technology functions. Other small increases and decreases in expenditure budgets also took place. Overall, actual general fund revenues, including other financing sources, were more than the final budget. Actual general fund expenditures, including other financing uses, were more than the final budget. Actual revenues were higher than actual expenditures. This resulted in an increase in the actual fund balance of $5,544,098, which was $545,240 less than the final amended budget amount.

-14-
Capital Asset and Debt Administration Capital Assets. The County’s investment in capital assets for its governmental activities as of December 31, 2010, amounted to $195,448,456 (net of accumulated depreciation). This investment in capital assets includes land, buildings, easement property, improvements, and machinery and equipment. The total increase in the County’s investment in capital assets for the current fiscal year was 9.1 percent. The County’s business-type activities have a nominal investment in capital assets in the amount of $19,779 (net of accumulated depreciation) as of December 31, 2010. Major capital asset events during the current fiscal year included the following: Construction in progress at year end amounted to $92,370. The $42.7 million decrease was a
result of County capital projects completed during the year that included construction of a new district court building, jail improvements and expansion, as well as enhancements to the emergency communications system, and a new fiber network link.
Parks and recreation acquired land in the amount of $1.8 million under the Natural Areas
Preservation Program.
Other capital improvements, including infrastructure for the emergency communications system, the fiber network link project as well as landscaping and parking lot improvements, increased capital assets by $19.3 million.
Buildings and easements additions/improvements were completed during the year resulting
in an increase to capital assets of $31.7 million as the new 14A-1 District Court and Jail expansion was completed at the Washtenaw County Service Center.
Machinery and equipment as of the close of the fiscal year had a balance of $10.8 million.
An increase of $6.3 million from the prior year is a result of a new emergency communications system equipment, information and technology equipment, copiers and vehicles.
Washtenaw County’s Capital Assets (net of depreciation)
Governmental activities Business-type activities Total
2010 2009 2010 2009 2010 2009
Land 37,839,053$ 35,994,778$ -$ -$ 37,839,053$ 35,994,778$
Construction in progress 92,370 42,810,188 - - 92,370 42,810,188
Buildings and easement property 114,637,754 82,915,667 - - 114,637,754 82,915,667
Improvements other than buildings 32,036,141 12,782,711 - - 32,036,141 12,782,711
Machinery and equipment 10,843,138 4,591,063 19,779 28,435 10,862,917 4,619,498
Total 195,448,456$ 179,094,407$ 19,779$ 28,435$ 195,468,235$ 179,122,842$
Additional information on the County’s capital assets can be found in note III.C on pages 61-64 of this report.

-15-
Long-term Debt. At the end of the current fiscal year, the County had total bonded debt outstanding of $101,765,000. This entire amount comprises debt backed by the full faith and credit of the County.
Washtenaw County’s Outstanding Debt General Obligation
Governmental activities Business-type activities Total
2010 2009 2010 2009 2010 2009
General obligation bonds 75,765,000$ 83,125,000$ -$ -$ 75,765,000$ 83,125,000$
Delinquent tax notes - - 26,000,000 25,000,000 26,000,000 25,000,000
Total 75,765,000$ 83,125,000$ 26,000,000$ 25,000,000$ 101,765,000$ 108,125,000$
The County’s total debt decreased by $6,360,000 (5.9 percent) during the current fiscal year. The County retired debt of $7,360,000 in general obligation bonds and $28,000,000 in delinquent tax notes during 2010. The only new borrowing during the year was $29,000,000 in delinquent tax notes for business-type activities. Debt service requirements for general obligation bonds of $6,835,000 and interest of $2,471,087 are payable during 2011. The principal payment for delinquent tax notes of $26,000,000 and an interest payment of $205,667 are due during 2011. The County has an “Aa2” rating for both general obligation bonds and tax notes from Moody’s. The County has an “AA+” rating for both general obligation bonds and tax notes from Standard & Poor’s. Finally, the County has a “F1+” rating for general obligation tax notes and AA- for general obligation bonds from Fitch. State statutes limit the amount of general obligation debt a governmental entity may issue to 10 percent of its total assessed valuation (i.e., State Equalized Value). The current debt limitation for the County is $1,626,350,827 which is significantly in excess of the County’s outstanding general obligation debt. Additional information on the County’s long-term debt can be found in note III.G on pages 68-73 of this report. Economic Factors and Next Year’s Budget and Rates The Michigan economic downturn, housing market and stock market declines have a continuing impact on the County’s fiscal operations. The following factors were considered in preparing the County’s budget for 2011: The County completed labor negotiations regarding economic concessions for wage and
benefit modifications for 2010 and 2011. The partnership agreements cancelled across-the-board salary increases, eliminated pay for performance, implemented eight furlough days each year, and some of the union bargaining units and nonunion employees have approved premium sharing and increased co-pays for medical benefits.

-16-
To limit the County’s liability to the defined benefit retirement system, a cost-sharing model was negotiated capping the employer rate at 10%. This assisted with the potential cost increases within the pension system for 2011.
The unemployment rate for the County is currently 8.6%, slightly lower than a year ago.
This compares favorably to the state’s average unemployment rate of 13.1% and the national average rate of 9.6%.
Michigan has two constitutional laws that limit property tax growth to the rate of inflation
or a maximum allowable increase in an assessment of 5.0%, whichever is smaller. For 2010 the applicable inflation rate was -0.3%. Therefore, due to the laws that limit growth, the economy and housing market decline, as well as the shutdown of operations by two of the largest taxpayers in the County, property tax revenues are budgeted to decline by 8.5% in 2011.
The State of Michigan has been dealing with projected budgetary shortfalls for the past
seven years and is projected to continue into the future. The State has passed legislation that provides a funding mechanism to serve as a substitute for state revenue sharing payments. Annually, the County may make use of amounts equal to 2009/10 State revenue sharing payments adjusted for inflation. The budget assumes a flat level of revenue for 2011.
The County has committed to maintaining a general fund balance that is at least 8.0% of operating expenditures. The 2010 actual increase in fund balance was planned (budgeted for); this surplus will be carried forward and used to balance the 2011 fiscal year budget.
Financial trends in the region compare favorably to national indices. Analysis of revenue,
expenditure, operating position, debt structure, unfunded liabilities, condition of capital plant, and community needs and resources indicators are examined across time to provide a framework for objective investigation.
Contacting the County’s Financial Management This financial report is designed to provide a general overview of the County’s finances for all those with an interest in the government’s finances. Questions concerning any of the information provided in this report or requests for additional financial information should be addressed to Washtenaw County Finance Department, 220 North Main Street, P.O. Box 8645, Ann Arbor, Michigan 48107-8645.

Basic Financial Statements

Government-wide Financial Statements

-17-
WASHTENAW COUNTYStatement of Net Assets
December 31, 2010
Primary GovernmentGovernmental Business-type Component
Activities Activities Total Units
AssetsCash and pooled investments 95,545,914$ 12,262,894$ 107,808,808$ 17,906,511$ Receivables, net 36,039,395 30,925,754 66,965,149 42,546,232 Prepaid items and other assets 2,447,107 - 2,447,107 2,121,385 Capital assets not being depreciated 37,931,423 - 37,931,423 34,151,845 Capital assets being depreciated, net 157,517,033 19,779 157,536,812 242,547,842
Total assets 329,480,872 43,208,427 372,689,299 339,273,815
LiabilitiesAccounts payable and accrued expenses 20,502,139 11,006 20,513,145 7,250,445 Accrued interest payable 668,941 34,209 703,150 323,328 Unearned revenue 14,633,819 - 14,633,819 - Long-term liabilities:
Due within one year 8,731,109 21,002,492 29,733,601 3,506,518 Due in more than one year 81,731,664 5,024,775 86,756,439 40,874,221
Other noncurrent liability - net otherpostemployment benefit liability 5,052,063 - 5,052,063 307,522
Total liabilities 131,319,735 26,072,482 157,392,217 52,262,034
Net assetsInvested in capital assets, net of related debt 122,722,958 19,779 122,742,737 265,740,421 Restricted for:
Debt service 2,390,238 - 2,390,238 965,344 Capital projects 5,659,995 - 5,659,995 6,706,234 Other purposes 698,178 - 698,178 -
Unrestricted 66,689,768 17,116,166 83,805,934 13,599,782
Total net assets 198,161,137$ 17,135,945$ 215,297,082$ 287,011,781$
The accompanying notes are an integral part of these financial statements.

-18-
WASHTENAW COUNTYStatement of Activities
Year Ended December 31, 2010
Program RevenuesOperating Capital
Charges for Grants and Grants and Net (Expense)Functions/Programs Expenses Services Contributions Contributions Revenue
Primary governmentGovernmental activities:
Legislative 526,142$ -$ -$ -$ (526,142)$ Judicial 23,900,492 3,521,234 6,038,969 - (14,340,289) General government 18,483,213 4,900,363 3,358,242 - (10,224,608) Public safety 54,263,600 15,149,724 3,751,259 557,446 (34,805,171) Public works 844,588 69,883 651,007 - (123,698) Health 43,899,534 3,715,892 37,990,037 - (2,193,605) Social services 41,959,629 542,702 31,891,381 - (9,525,546) Culture and recreation 8,981,545 3,230,661 421,009 - (5,329,875) Interest on long-term debt 3,322,673 - - - (3,322,673)
Total governmental activities 196,181,416 31,130,459 84,101,904 557,446 (80,391,607)
Business-type activities:Delinquent tax collection 596,092 5,989,201 - - 5,393,109 Property foreclosure 794,981 1,291,039 - - 496,058 Principal residence exemption 3,707 16,411 - - 12,704
Total business-type activities 1,394,780 7,296,651 - - 5,901,871
Total primary government 197,576,196$ 38,427,110$ 84,101,904$ 557,446$ (74,489,736)$
Component unitsDepartment of Public Works Projects 1,954,117$ -$ -$ 1,419,482$ (534,635)$ Water Resources Commissioner 1,833,518 163,434 - 6,153,919 4,483,835 Hazardous Materials Response Authority 58,801 44,023 28,832 - 14,054 Road Commission 30,444,130 - 34,415,761 - 3,971,631 Brownfield Redevelopment Authority 1,072,807 - - - (1,072,807)
Total component units 35,363,373$ 207,457$ 34,444,593$ 7,573,401$ 6,862,078$
Continued…

-19-
WASHTENAW COUNTYStatement of Activities (Concluded)
Year Ended December 31, 2010
Primary Government
Governmental Business-type ComponentActivities Activities Total Units
Changes in net assetsNet (expense) revenue (80,391,607)$ 5,901,871$ (74,489,736)$ 6,862,078$
General revenues:Property taxes 79,314,216 - 79,314,216 1,103,569 Accommodation taxes restricted
for tourism programs 3,539,013 - 3,539,013 - Grants and contributions not
restricted to specific programs 1,245,565 - 1,245,565 - Unrestricted investment earnings 474,069 132,538 606,607 91,694 Gain on sale of capital assets 181,341 - 181,341 45,307
Transfers - internal activities 5,938,657 (5,733,075) 205,582 -
Total general revenuesand transfers 90,692,861 (5,600,537) 85,092,324 1,240,570
Change in net assets 10,301,254 301,334 10,602,588 8,102,648
Net assets, beginning of year 187,859,883 16,834,611 204,694,494 278,909,133
Net assets, end of year 198,161,137$ 17,135,945$ 215,297,082$ 287,011,781$
The accompanying notes are an integral part of these financial statements.

Fund Financial Statements

-20-
WASHTENAW COUNTYBalance Sheet - Governmental Funds
December 31, 2010
Community EnhancedSupport & Revenue EmergencyTreatment Parks and Sharing Communication
General Services Recreation Reserve System Millage
ASSETSAssets
Cash and pooled investments 10,640,569$ 738,643$ 30,860,425$ 17,499,929$ 2,769,876$ Receivables:
Taxes - current 2,986,255 - 8,749,520 - 2,454,628 Taxes - delinquent 253,351 - - - - Accounts 1,232,724 1,122,893 - - -
Interfund receivable - - - - - Due from other governments 2,954,761 19,324 - - - Notes receivable - - - - - Advances to other funds - - - - - Prepaid items 6,667 990 - - -
TOTAL ASSETS 18,074,327$ 1,881,850$ 39,609,945$ 17,499,929$ 5,224,504$
LIABILITIES AND FUND BALANCES
LiabilitiesAccounts payable 472,664$ 354,903$ 362,291$ -$ -$ Accrued liabilities 2,040,926 1,180,483 113,490 - - Due to other governments - - - - - Interfund payable - - - - - Deferred revenue 243,580 - 10,110,531 - 2,834,739 Advances from other governments - - - - -
Total liabilities 2,757,170 1,535,386 10,586,312 - 2,834,739
Fund balancesReserved:
Reserved for land acquisition - - 5,659,995 - - Reserved for long-term advances - - - - - Reserved for prepaid items 6,667 990 - - -
Unreserved:Undesignated 15,310,490 345,474 23,363,638 17,499,929 2,389,765 Undesignated, reported in nonmajor:
Special revenue funds - - - - - Debt service funds - - - - -
Total fund balances 15,317,157 346,464 29,023,633 17,499,929 2,389,765
LIABILITIES ANDFUND BALANCES 18,074,327$ 1,881,850$ 39,609,945$ 17,499,929$ 5,224,504$
The accompanying notes are an integral part of these financial statements.

-21-
County Other TotalCapital Governmental GovernmentalProjects Funds Funds
13,894,577$ 5,887,196$ 82,291,215$
- 834,573 15,024,976 - - 253,351
164,522 1,175,687 3,695,826 3,912,956 - 3,912,956
- 8,140,615 11,114,700 - 45,271 45,271
21,724 - 21,724 - 35,550 43,207
17,993,779$ 16,118,892$ 116,403,226$
950,681$ 1,705,486$ 3,846,025$ 11,136 1,071,839 4,417,874
- 1,015,582 1,015,582 - 3,912,956 3,912,956 - 1,444,969 14,633,819 - 78,000 78,000
961,817 9,228,832 27,904,256
- - 5,659,995 21,724 - 21,724
- 35,550 43,207
17,010,238 - 75,919,534
- 6,853,382 6,853,382 - 1,128 1,128
17,031,962 6,890,060 88,498,970
17,993,779$ 16,118,892$ 116,403,226$

-22-
WASHTENAW COUNTYReconciliation of Fund Balances on the Balance Sheet
for Governmental Funds to Net Assets ofGovernmental Activities on the Statement of Net Assets
December 31, 2010
Fund balances - total governmental funds 88,498,970$
Amounts reported for governmental activities in the statement of net assetsare different because:
Capital assets used in governmental activities are not financial resourcesand therefore are not reported in the funds.
Add - capital assets 246,306,707 Deduct - accumulated depreciation (54,057,904)
Other long-term assets are not available to pay for current-periodexpenditures and therefore are not recorded in the funds. 5,370,279
Discounts and premiums on bonds are reported as other financing uses orsources in the governmental funds, whereas they are capitalized and amortizedfor net assets (and netted against bonds payable).
Add - bond discounts 46,074 Deduct - bond premiums (352,289)
Deferred charges for bond issuance costs are currently expended in thegovernmental funds, whereas they are capitalized and amortized for net assets. 1,139,921
Losses on refunding are not reported in the governmental funds, whereas theyare capitalized and amortized for net assets (and netted against bonds payable). 676,071
Internal service funds are used by management to charge the costs of certainactivities such as insurance, worker's compensation, and building occupancyand maintenance. The assets and liabilities of the internal service funds areincluded in governmental activities in the statement of net assets. 6,803,606
Certain liabilities, such as bonds payable, are not due and payable in the currentperiod and therefore are not reported in the funds.
Deduct - bonds, notes and capital leases payable (76,651,401) Deduct - accrued interest on bonds payable (668,941) Deduct - other postemployment benefit obligation (5,052,063) Deduct - accrued compensated absences and other long-term liabilities (13,897,893)
Net assets of governmental activities 198,161,137$
The accompanying notes are an integral part of these financial statements.

-23-
WASHTENAW COUNTYStatement of Revenues, Expenditures and Changes in Fund Balances
Governmental FundsYear Ended December 31, 2010
Community EnhancedSupport & Revenue EmergencyTreatment Parks and Sharing Communication
General Services Recreation Reserve System Millage
RevenuesProperty taxes 64,703,053$ -$ 10,661,254$ -$ 2,977,329$ Accommodation taxes - - - - - Licenses and permits 205,407 - - - - Intergovernmental 5,871,026 26,863,959 - - - Charges for services 18,008,529 723,587 3,230,661 - 7,500 Fines and forfeits 933,663 - - - - Investment income 129,650 - 158,008 - 16,006 Other 1,781,630 594,347 242,207 - -
Total revenues 91,632,958 28,181,893 14,292,130 - 3,000,835
ExpendituresCurrent:
Legislative 522,093 - - - - Judicial 16,869,266 - - - - General government 5,068,342 - - - - Public safety 46,659,680 - - - 15,257 Public works 237,100 - - - - Health - 28,639,320 - - - Social services 419,048 - - - - Culture and recreation 649,794 - 12,303,008 - - Other 5,442,086 - - - -
Debt service:Principal 273,554 - - - - Interest and fiscal charges 44,246 - - - -
Capital outlay - - - - -
Total expenditures 76,185,209 28,639,320 12,303,008 - 15,257
Revenues over (under) expenditures 15,447,749 (457,427) 1,989,122 - 2,985,578
Other financing sources (uses)Capital leases 494,924 - - - - Transfers in 7,916,188 457,427 - - - Transfers out (18,314,763) - - (6,537,969) (2,707,178)
Total other sources (uses) (9,903,651) 457,427 - (6,537,969) (2,707,178)
Net change in fund balances 5,544,098 - 1,989,122 (6,537,969) 278,400
Fund balances:Beginning of year 9,773,059 346,464 27,034,511 24,037,898 2,111,365
End of year 15,317,157$ 346,464$ 29,023,633$ 17,499,929$ 2,389,765$
The accompanying notes are an integral part of these financial statements.

-24-
County Other TotalCapital Governmental GovernmentalProjects Funds Funds
-$ 972,580$ 79,314,216$ - 3,539,013 3,539,013 - 1,957,148 2,162,555
136,833 47,736,113 80,607,931 1,035,339 4,369,739 27,375,355
- 116,184 1,049,847 77,940 17,261 398,865
349,840 3,495,774 6,463,798
1,599,952 62,203,812 200,911,580
- - 522,093 - 5,758,090 22,627,356 - 4,720,983 9,789,325 - 6,272,887 52,947,824 - 614,870 851,970 - 15,248,537 43,887,857 - 40,215,412 40,634,460 - 145,636 13,098,438 - - 5,442,086
33,142 7,379,476 7,686,172 7,637 3,186,741 3,238,624
19,670,031 4,060 19,674,091
19,710,810 83,546,692 220,400,296
(18,110,858) (21,342,880) (19,488,716)
31,753 - 526,677 10,999,410 23,068,554 42,441,579 (7,219,972) (1,417,082) (36,196,964)
3,811,191 21,651,472 6,771,292
(14,299,667) 308,592 (12,717,424)
31,331,629 6,581,468 101,216,394
17,031,962$ 6,890,060$ 88,498,970$

-25-
WASHTENAW COUNTYReconciliation of the Statement of Revenues, Expenditures
and Changes in Fund Balances of Governmental Fundsto the Statement of Activities
Year Ended December 31, 2010
Net change in fund balances - total governmental funds (12,717,424)$
Amounts reported for governmental activities in the statement of activities aredifferent because:
Governmental funds report capital outlays as expenditures. However, in the statementof activities the cost of those assets is allocated over their estimated useful lives andreported as depreciation expense.
Add - capital outlay 23,419,947 Deduct - depreciation expense (5,484,241) Deduct - loss on disposal of capital assets (2,082,620) Add - gain on sale of capital assets 181,341
Revenues in the statement of activities that do not provide current resources are notreported as revenues in the funds. (548,928)
Bond proceeds provide current financial resources to governmental funds in the periodissued, but issuing bonds increases long-term liabilities in the statement of net assets.Repayment of bond principal is an expenditure in the governmental funds, but therepayment reduces long-term liabilities in the statement of net assets.
Add - principal payments on long-term liabilities 7,379,476 Add - principal payments on capital leases 306,696 Deduct - capital lease proceeds (526,677)
Accrued interest expense on bonds and the amortization of bond issuance costs,discounts, premiums and deferred losses are not recorded by governmental funds,but are reported under interest and fiscal charges for purposes of net assets:
Add - accrued interest expense 62,421 Deduct - amortization of bond issuance costs (120,940) Deduct - amortization of discount on bonds (4,760) Add - amortization of premium on bonds 55,443 Deduct - amortization of deferred loss on refunding (120,458)
Internal service funds are used by management to charge the costs of certain activitiessuch as insurance, workers' compensation, and building occupancy and maintenanceto individual governmental funds. The net revenue (expense) attributable to those fundsis reported with governmental activities.
Add - net operating income from governmental activities in internal service funds 737,254 Add - interest revenue from governmental internal service funds 75,204 Add - net gain on disposal of capital assets in governmental internal service funds 2,547 Deduct - net transfer from governmental internal service fund to capital project fund (305,958)
Some expenses reported in the statement of activities do not require the use of currentfinancial resources and therefore are not reported as expenditures in the funds.
Add - decrease in other postemployment benefit obligation 363,113 Decuct - increase in accrual for accrued compensated absences (370,182)
Change in net assets of governmental activities 10,301,254$
The accompanying notes are an integral part of these financial statements.

-26-
WASHTENAW COUNTYStatement of Revenues, Expenditures and
Changes in Fund Balance - Budget and ActualGeneral Fund
Year Ended December 31, 2010
Variance withFinal Budget -
Budget PositiveOriginal Final Actual (Negative)
RevenuesTaxes 62,925,468$ 63,025,468$ 64,703,053$ 1,677,585$ Licenses and permits 220,700 220,700 205,407 (15,293) Intergovernmental 5,243,849 5,823,743 5,871,026 47,283 Charges for services 19,318,003 18,709,595 18,008,529 (701,066) Fines and forfeits 1,232,100 1,232,100 933,663 (298,437) Investment income 668,800 668,800 129,650 (539,150) Other 1,802,281 1,857,424 1,781,630 (75,794)
Total revenues 91,411,201 91,537,830 91,632,958 95,128
ExpendituresLegislative -
Board of commissioners 507,855 532,855 522,093 10,762
Judicial:Circuit court 3,400,276 4,390,414 4,404,318 (13,904) District court 5,080,168 5,152,711 5,381,804 (229,093) Probate court 1,311,611 1,276,268 1,282,644 (6,376) Probate court - juvenile 3,211,328 2,903,144 2,894,091 9,053 Probation department 219,695 219,695 205,270 14,425 Public defender 2,607,138 2,713,189 2,701,139 12,050
Total judicial 15,830,216 16,655,421 16,869,266 (213,845)
General government:Information technology 5,107,712 5,158,896 5,195,552 (36,656) Building authority 7,085 7,085 5,260 1,825 Clerk / Register 4,470,490 4,082,059 3,859,574 222,485 Human resources 1,115,813 1,173,759 1,088,734 85,025 Drain commissioner 2,682,843 2,615,311 2,442,921 172,390 Equalization 1,500,516 1,466,050 1,461,759 4,291 Finance 2,728,078 2,525,108 2,378,800 146,308 Corporation counsel 195,503 294,713 298,014 (3,301) Treasurer 1,397,583 1,383,692 1,349,441 34,251 Administrator 739,728 795,317 779,447 15,870 Allocated to other departments (13,079,974) (12,960,963) (13,791,160) 830,197
Total general government 6,865,377 6,541,027 5,068,342 1,472,685
Continued…

-27-
WASHTENAW COUNTYStatement of Revenues, Expenditures and
Changes in Fund Balance - Budget and Actual (Concluded)General Fund
Year Ended December 31, 2010
Variance withFinal Budget -
Budget PositiveOriginal Final Actual (Negative)
Public safety:Emergency management 514,148$ 521,800$ 512,187$ 9,613$ Sheriff 40,948,090 40,171,751 40,695,134 (523,383) Prosecuting attorney 5,495,747 5,448,506 5,452,359 (3,853)
Total public safety 46,957,985 46,142,057 46,659,680 (517,623)
Public works 201,376 239,752 237,100 2,652
Social services:Children's services - - 17,115 (17,115) Veterans counselor 469,971 458,595 401,933 56,662
Total social services 469,971 458,595 419,048 39,547
Culture - county extension 639,155 631,761 649,794 (18,033)
Other unallocated expenditures 3,745,072 4,995,499 5,442,086 (446,587)
Debt service:Principal - - 273,554 (273,554) Interest and fiscal charges - - 44,246 (44,246)
Total debt service - - 317,800 (317,800)
Total expenditures 75,217,007 76,196,967 76,185,209 11,758
Revenues over expenditures 16,194,194 15,340,863 15,447,749 106,886
Other financing sources (uses)Capital leases - - 494,924 494,924 Transfers in 7,781,508 7,958,508 7,916,188 (42,320) Transfers out (18,807,702) (17,210,033) (18,314,763) (1,104,730)
Total other financing uses (11,026,194) (9,251,525) (9,903,651) (652,126)
Net change in fund balance 5,168,000 6,089,338 5,544,098 (545,240)
Fund balance, beginning of year 9,773,059 9,773,059 9,773,059 -
Fund balance, end of year 14,941,059$ 15,862,397$ 15,317,157$ (545,240)$
The accompanying notes are an integral part of these financial statements

-28-
WASHTENAW COUNTYStatement of Revenues, Expenditures and
Changes in Fund Balance - Budget and ActualCommunity Support & Treatment Services Special Revenue Fund
Year Ended September 30, 2010
Variance withFinal Budget -
Budget PositiveOriginal Final Actual (Negative)
RevenuesIntergovernmental 28,694,485$ 27,829,010$ 26,863,959$ (965,051)$ Charges for services 748,468 748,468 723,587 (24,881) Other 528,585 528,585 594,347 65,762
Total revenues 29,971,538 29,106,063 28,181,893 (924,170)
ExpendituresHealth 30,362,725 29,485,510 28,639,320 846,190
Revenues under expenditures (391,187) (379,447) (457,427) (77,980)
Other financing sourcesTransfers in 391,187 379,447 457,427 77,980
Net change in fund balance - - - -
Fund balance, beginning of year 346,464 346,464 346,464 -
Fund balance, end of year 346,464$ 346,464$ 346,464$ -$
The accompanying notes are an integral part of these financial statements.

-29-
WASHTENAW COUNTYStatement of Revenues, Expenditures and
Changes in Fund Balance - Budget and ActualParks and Recreation Special Revenue Fund
Year Ended December 31, 2010
Variance withFinal Budget -
Budget PositiveOriginal Final Actual (Negative)
RevenuesTaxes 10,190,089$ 10,190,089$ 10,661,254$ 471,165$ Charges for services 2,644,000 2,644,000 3,230,661 586,661 Investment income 400,000 400,000 158,008 (241,992) Other 182,000 182,000 242,207 60,207
Total revenues 13,416,089 13,416,089 14,292,130 876,041
ExpendituresCulture and recreation 18,413,801 18,413,801 12,303,008 6,110,793
Net change in fund balance (4,997,712) (4,997,712) 1,989,122 6,986,834
Fund balance, beginning of year 27,034,511 27,034,511 27,034,511 -
Fund balance, end of year 22,036,799$ 22,036,799$ 29,023,633$ 6,986,834$
The accompanying notes are an integral part of these financial statements.

-30-
WASHTENAW COUNTYStatement of Revenues, Expenditures and
Changes in Fund Balance - Budget and ActualRevenue Sharing Reserve Special Revenue Fund
Year Ended December 31, 2010
Variance withFinal Budget -
Budget PositiveOriginal Final Actual (Negative)
Other financing (uses)Transfers out (6,557,642)$ (6,557,642)$ (6,537,969)$ 19,673$
Fund balance, beginning of year 24,037,898 24,037,898 24,037,898 -
Fund balance, end of year 17,480,256$ 17,480,256$ 17,499,929$ 19,673$
The accompanying notes are an integral part of these financial statements.

-31-
WASHTENAW COUNTYStatement of Revenues, Expenditures and
Changes in Fund Balance - Budget and ActualEnhanced Emergency Communication System Millage
Special Revenue FundYear Ended December 31, 2010
Variance withFinal Budget -
Budget PositiveOriginal Final Actual (Negative)
RevenuesTaxes -$ 2,998,758$ 2,977,329$ (21,429)$ Charges for services - 7,500 7,500 - Investment income - - 16,006 16,006
Total revenues - 3,006,258 3,000,835 (5,423)
ExpendituresPublic safety - - 15,257 (15,257)
Revenues over expenditures - 3,006,258 2,985,578 9,834
Other financing (uses)Transfers out - (3,006,258) (2,707,178) 299,080
Net change in fund balance - - 278,400 308,914
Fund balance, beginning of year 2,111,365 2,111,365 2,111,365 -
Fund balance, end of year 2,111,365$ 2,111,365$ 2,389,765$ 308,914$
The accompanying notes are an integral part of these financial statements.

-32-
WASHTENAW COUNTYStatement of Net Assets
Proprietary FundsDecember 31, 2010
Business-type Activities - Enterprise Funds GovernmentalDelinquent Other Activities -
Tax Enterprise InternalRevolving Funds Total Service Funds
AssetsCurrent assets:
Cash and pooled investments 12,032,085$ 230,809$ 12,262,894$ 13,254,699$ Receivables:
Delinquent taxes 24,285,954 - 24,285,954 - Interest and collection fees 5,554,212 - 5,554,212 - Accounts - - - 170,845
Due from other governments - 1,054,588 1,054,588 364,147 Due from component units 31,000 - 31,000 - Inventories - - - 32,706 Prepaid items - - - 1,231,273
Total current assets 41,903,251 1,285,397 43,188,648 15,053,670
Noncurrent assets - capital assets, net - 19,779 19,779 3,199,653
Total assets 41,903,251 1,305,176 43,208,427 18,253,323
LiabilitiesCurrent liabilities:
Accounts payable - - - 7,819,919 Accrued liabilities - 11,006 11,006 87,739 Interest payable 34,209 - 34,209 - Current portion of:
Accrued compensated absences - 2,492 2,492 15,064 Claims payable - - - 2,271,950 General obligation notes payable 21,000,000 - 21,000,000 - Total current liabilities 21,034,209 13,498 21,047,707 10,194,672
Long-term liabilities:Accrued compensated absences - 24,775 24,775 268,271 Claims payable - - - 965,050 General obligation notes payable 5,000,000 - 5,000,000 - Advances from other funds - - - 21,724
Total long-term liabilities 5,000,000 24,775 5,024,775 1,255,045
Total liabilities 26,034,209 38,273 26,072,482 11,449,717
Net assetsInvested in capital assets - 19,779 19,779 3,199,653 Unrestricted 15,869,042 1,247,124 17,116,166 3,603,953
Total net assets 15,869,042$ 1,266,903$ 17,135,945$ 6,803,606$
The accompanying notes are an integral part of these financial statements.

-33-
WASHTENAW COUNTYStatement of Revenues, Expenses and
Changes in Net AssetsProprietary Funds
Year Ended December 31, 2010
Business-type Activities - Enterprise Funds GovernmentalDelinquent Other Activities -
Tax Enterprise InternalRevolving Funds Total Service Funds
Operating revenuesCharges for services -$ 1,291,039$ 1,291,039$ 45,574,475$ Interest charges 4,328,711 16,411 4,345,122 - Collection fees on taxes 1,660,490 - 1,660,490 -
Total operating revenues 5,989,201 1,307,450 7,296,651 45,574,475
Operating expensesPersonnel services - 362,836 362,836 2,546,707 Contractual services 70,569 72,548 143,117 1,122,241 Supplies - 108,324 108,324 1,499,824 Occupancy - - - 2,501,703 Telephone - 755 755 767,644 Equipment repair and rental - 1,914 1,914 682,938 Building repair and rental - - - 175,032 Benefits and insurance premiums - - - 26,227,667 Other - 243,655 243,655 8,267,534 Depreciation - 8,656 8,656 1,045,931
Total operating expenses 70,569 798,688 869,257 44,837,221
Operating income 5,918,632 508,762 6,427,394 737,254
Nonoperating income (expense)Investment earnings 127,592 4,946 132,538 75,204 Interest expense and fiscal charges (525,523) - (525,523) - Gain on sale of equipment - - - 2,547
Total nonoperating income (expense) (397,931) 4,946 (392,985) 77,751
Income before transfers 5,520,701 513,708 6,034,409 815,005
Transfers out (5,573,957) (159,118) (5,733,075) (305,958)
Change in net assets (53,256) 354,590 301,334 509,047
Net assets, beginning of year 15,922,298 912,313 16,834,611 6,294,559
Net assets, end of year 15,869,042$ 1,266,903$ 17,135,945$ 6,803,606$
The accompanying notes are an integral part of these financial statements.

WASHTENAW COUNTYStatement of Cash Flows
Proprietary FundsYear Ended December 31, 2010
Business-type Activities - Enterprise Funds GovernmentalDelinquent Other Activities -
Tax Enterprise InternalRevolving Funds Total Service Funds
Cash flows from operating activitiesCash received from customers 42,386,730$ 252,862$ 42,639,592$ -$ Cash received from interfund services - - - 45,597,545 Cash payments for delinquent taxes (34,968,259) - (34,968,259) - Cash payments to employees - (357,089) (357,089) (4,457,976) Cash payments to suppliers (70,569) (426,193) (496,762) (34,551,826) Cash payments for interfund services - - - (32,329)
Net cash provided (used) by operating activities 7,347,902 (530,420) 6,817,482 6,555,414
Cash flows from noncapital financing activitiesTransfers out (5,573,957) (159,118) (5,733,075) (305,958) Advances from other funds - - - (59,742) Proceeds from issuing long term debt 29,000,000 - 29,000,000 - Principal paid on long term debt (28,000,000) - (28,000,000) - Interest paid on long term debt (531,081) - (531,081) -
Net cash used by noncapital financing activities (5,105,038) (159,118) (5,264,156) (365,700)
Cash flows from capital and related financing activitiesProceeds from sale of equipment - - - 142,426 Payments for equipment acquisitions - - - (1,686,773)
Net cash used by capital and related financing activities - - - (1,544,347)
Cash flows from investing activitiesInvestment income (loss) 127,592 4,946 132,538 75,204
Net increase (decrease) in cash and cash equivalents 2,370,456 (684,592) 1,685,864 4,720,571
Cash and cash equivalents, beginning of year 9,661,629 915,401 10,577,030 8,534,128
Cash and cash equivalents, end of year 12,032,085$ 230,809$ 12,262,894$ 13,254,699$
Continued…
-34-

WASHTENAW COUNTYStatement of Cash Flows (Concluded)
Proprietary FundsYear Ended December 31, 2010
Business-type Activities - Enterprise Funds GovernmentalDelinquent Other Activities -
Tax Enterprise InternalRevolving Funds Total Service Funds
Reconciliation of operating income to net cash provided (used) by operating activities:
Operating income 5,918,632$ 508,762$ 6,427,394$ 737,254$ Adjustments to reconcile operating income to net cash provided (used) by operating activities:
Depreciation - 8,656 8,656 1,045,931 Changes in assets and liabilities:
Receivables 1,285,270 - 1,285,270 (1,608) Due from other governments - (1,054,588) (1,054,588) 24,678 Due from component units 144,000 - 144,000 - Inventories - - - 6,436 Prepaid items - - - (26,619) Accounts payable - - - 4,557,611 Accrued liabilities - 1,197 1,197 (2,952,944) Claims payable - - - 3,237,000 Accrued compensated absences - 5,553 5,553 (72,325)
Net cash provided (used) by operating activities 7,347,902$ (530,420)$ 6,817,482$ 6,555,414$
The accompanying notes are an integral part of these financial statements
-35-

-36-
WASHTENAW COUNTYStatement of Fiduciary Net Assets
Fiduciary FundsDecember 31, 2010
Pension andOther Employee
Benefit AgencyTrust Funds Fund
AssetsCash and pooled investments 781,478$ 21,840,699$ Investments, at fair value:
Equities 136,984,161 - United States treasuries 3,546,094 - United States treasury strips 11,445,575 - United States agencies 23,399,458 - Corporate securities 18,806,615 - Multi-strategy limited partnership 4,512,325 - Real estate limited partnership 728,560 Real estate investment trusts 13,803,854 - Mutual funds 41,257,121 - Money market funds 7,795,242 -
Accounts receivable 65,894 - Contributions receivable 7,157,900 - Accrued interest and dividends 373,169 -
Total assets 270,657,446 21,840,699$
LiabilitiesAccounts payable 315,440 -$ Accrued liabilities 471,915 - Undistributed receipts - 21,840,699
Total liabilities 787,355 21,840,699$
Net assetsHeld in trust for pension and other employee benefits 269,870,091$
The accompanying notes are an integral part of these financial statements.

-37-
WASHTENAW COUNTYStatement of Changes in Fiduciary Net Assets
Pension and Other Employee Benefit Trust FundsYear Ended December 31, 2010
AdditionsInvestment income (loss)
From investing activities:Net appreciation in fair value of investments 24,111,218$ Interest and dividends 5,729,441 Investment management fees (1,142,676)
Net income from investing activities 28,697,983
From securities lending activities:Gross earnings 51,596 Borrower rebates 2,355 Securities fees (25,116)
Net income from securities lending activities 28,835
Total net investment income 28,726,818
ContributionsEmployer 20,006,362 Employees 5,610,926 On behalf - federal Medicare Part D subsidy 505,309
Total contributions 26,122,597
Other additions:Other 1,609
Total additions 54,851,024
DeductionsParticipant benefits 25,001,248 Payments to terminated participants 926,980 Administrative expenses 600,361 Participant refunds 649,889
Total deductions 27,178,478
Net additions (deductions) to net assets held in trust Employees' pension benefits 15,962,871$ Postemployment healthcare benefits 11,908,805 Other employee benefits (199,130)
Total net additions to net assets held in trust 27,672,546
Net assets held in trust for benefits, beginning of year 242,197,545
Net assets held in trust for benefits, end of year Restricted for employees' pension benefits 206,403,925 Restricted for employees' postemployment healthcare benefits 63,078,224 Restricted for other employees' benefits 387,942
Total net assets held in trust for benefits, end of year 269,870,091$
The accompanying notes are an integral part of these financial statements.

-38-
WASHTENAW COUNTYCombining Statement of Net Assets
Component UnitsDecember 31, 2010
HazardousDepartment of Water Materials BrownfieldPublic Works Resources Response Road Redevelopment
Projects Commissioner Authority Commission Authority Total
AssetsCash and pooled investments 1,003,112$ 9,834,720$ 82,847$ 6,954,059$ 31,773$ 17,906,511$ Receivables, net 30,637,879 7,789,169 - 4,119,184 - 42,546,232 Prepaid items and other assets 524,232 218,106 - 1,379,047 - 2,121,385 Capital assets not being depreciated - 7,811,197 - 26,340,648 - 34,151,845 Capital assets being depreciated, net - 20,774,575 - 221,773,267 - 242,547,842
Total assets 32,165,223 46,427,767 82,847 260,566,205 31,773 339,273,815
LiabilitiesAccounts payable / accrued expenses 75,056 4,504,432 - 2,670,957 - 7,250,445 Accrued interest payable 199,734 90,370 - 33,224 - 323,328 Long-term liabilities:
Due within one year 1,890,000 807,754 - 808,764 - 3,506,518 Due in more than one year 27,807,266 10,518,385 - 2,548,570 - 40,874,221
Other noncurrent liability - net otherpostemployment benefit liability - - - 307,522 - 307,522
Total liabilities 29,972,056 15,920,941 - 6,369,037 - 52,262,034
Net assetsInvested in capital assets, net
of related debt - 17,259,633 - 248,480,788 - 265,740,421 Restricted for:
Debt service 26,158 939,186 - - - 965,344 Capital projects 2,167,009 4,539,225 - - - 6,706,234
Unrestricted - 7,768,782 82,847 5,716,380 31,773 13,599,782
Total net assets 2,193,167$ 30,506,826$ 82,847$ 254,197,168$ 31,773$ 287,011,781$
The accompanying notes are an integral part of these financial statements.

-39-
WASHTENAW COUNTYCombining Statement of Activities
Component UnitsYear Ended December 31, 2010
HazardousDepartment of Water Materials BrownfieldPublic Works Resources Response Road Redevelopment
Projects Commissioner Authority Commission Authority Total
ExpensesPublic safety -$ -$ 58,801$ -$ -$ 58,801$ Public works 1,954,117 1,833,518 - - 1,072,807 4,860,442 Highways and streets - - - 30,444,130 - 30,444,130
Total expenses 1,954,117 1,833,518 58,801 30,444,130 1,072,807 35,363,373
Program revenuesCharges for services - 163,434 44,023 - - 207,457 Operating grants and contributions - - 28,832 34,415,761 - 34,444,593 Capital grants and contributions 1,419,482 6,153,919 - - - 7,573,401
Total program revenues 1,419,482 6,317,353 72,855 34,415,761 - 42,225,451
Net program (expense) revenue (534,635) 4,483,835 14,054 3,971,631 (1,072,807) 6,862,078
General revenuesProperty taxes - - - - 1,103,569 1,103,569 Unrestricted investment earnings 6,232 45,098 338 39,522 504 91,694 Gain on sale of capital assets - - - 45,307 - 45,307
Total general revenues 6,232 45,098 338 84,829 1,104,073 1,240,570
Change in net assets (528,403) 4,528,933 14,392 4,056,460 31,266 8,102,648
Net assets, beginning of year 2,721,570 25,977,893 68,455 250,140,708 507 278,909,133
Net assets, end of year 2,193,167$ 30,506,826$ 82,847$ 254,197,168$ 31,773$ 287,011,781$
The accompanying notes are an integral part of these financial statements.

Notes to the Basic Financial Statements

WASHTENAW COUNTY
NOTES TO FINANCIAL STATEMENTS
-40-
INDEX
PAGE I. SUMMARY OF SIGNIFICANT ACCOUNTING POLICIES
A. Reporting Entity ......................................................................................................... 41 B. Government-wide and Fund Financial Statements ..................................................... 43 C. Measurement Focus, Basis of Accounting and Financial
Statement Presentation ............................................................................................ 43 D. Assets, Liabilities and Net Assets or Equity............................................................... 46
II. STEWARDSHIP, COMPLIANCE AND ACCOUNTABILITY
A. Budgetary Information ............................................................................................... 49 B. Excess of Expenditures over Appropriations ............................................................. 49
III. DETAILED NOTES ON ALL FUNDS
A. Deposits, Investments and Securities Lending ........................................................... 51 B. Receivables ................................................................................................................. 60 C. Capital Assets ............................................................................................................. 61 D. Payables ...................................................................................................................... 65 E. Interfund Receivables, Payables and Transfers .......................................................... 65 F. Leases ......................................................................................................................... 66 G. Long-term Debt .......................................................................................................... 68
IV. OTHER INFORMATION
A. Risk Management ....................................................................................................... 73 B. Contingent Liabilities ................................................................................................. 74 C. Property Taxes ............................................................................................................ 75 D. Joint Venture .............................................................................................................. 75 E. Jointly Governed Organizations ................................................................................. 76 F. Pension and Other Postemployment Benefits ............................................................ 78

WASHTENAW COUNTY
NOTES TO FINANCIAL STATEMENTS
-41-
I. SUMMARY OF SIGNIFICANT ACCOUNTING POLICIES The basic financial statements of Washtenaw County, Michigan (the “County” or “government”) have been prepared in conformity with generally accepted accounting principles (GAAP) as applied to governmental units. The Governmental Accounting Standards Board (GASB) is the accepted standard-setting body for establishing governmental accounting and financial reporting principles. The more significant of the County’s accounting policies are described below. A. Reporting Entity Washtenaw County is a municipal corporation governed by an 11-member commission and administered by an appointed county administrator. The accompanying financial statements present the government and its component units, entities for which the government is considered to be financially accountable. Blended component units, although legally separate entities, are in substance, part of the government’s operations. Discretely presented component units are reported in a separate column in the government-wide financial statements to emphasize that they are legally separate from the government. The blended and discretely presented component units have December 31 year ends. Blended Component Unit The Washtenaw County Building Authority is governed by a five-member board appointed by the Board of Commissioners. The Building Authority is reported as if it was part of the primary government because its sole purpose is to finance and construct the County’s public buildings. Discretely Presented Component Units The Washtenaw County Department of Public Works Projects is managed by the Board of Public Works, a seven-member board appointed by the County Board of Commissioners. The Board of Public Works is responsible for administering various public works construction projects and the associated debt service funds on behalf of local units of government within the County under the provisions of Act 185, Public Acts of 1957, as amended. All of the Board of Public Works’ contractual agreements including bond issuances require County Board of Commissioners approval. The full faith and credit of the County is given for the long-term debt of these projects. Each of the drainage districts included in the financial statements of the Washtenaw County Water Resources Commissioner are separate legal entities with the power to contract; to sue and to be sued; and to hold, manage and dispose of real and personal property. The Statutory Drain Board consists of the Water Resources Commissioner, the Chair of the County Board of Commissioners, and one other member of the Board of Commissioners. The Water Resources Commissioner is responsible for the construction and maintenance of storm drains within the County. The full faith and credit of the County is often given for the long-term debt of the drainage districts.

WASHTENAW COUNTY
NOTES TO FINANCIAL STATEMENTS
-42-
The Washtenaw County Hazardous Materials Response Team Authority (WCHMRTA) is managed by an 11-member board composed of a representative from each of the five enabling jurisdictions (Washtenaw County, City of Ann Arbor, City of Ypsilanti, Pittsfield Township and Ypsilanti Township) appointed by their governing bodies, three representatives appointed by the Mutual Aid Association, and one member each from the Criminal Justice Association, Washtenaw County Public Health Department, and Huron Valley Ambulance. A Technical Advisory Committee supports the Board. The WCHMRTA was formed to develop and manage a county wide hazardous material response team. The Washtenaw County Board of Commissioners approves the operating budget and the Authority has delegated fiscal powers to the County. The Washtenaw County Brownfield Redevelopment Authority (WCBRA) is governed by a nine-member board appointed by the Washtenaw County Board of Commissioners. Its purpose is to encourage and support the redevelopment of under-utilized and environmentally contaminated properties in partnership with member communities in Washtenaw County. The WCBRA is currently administered by the Economic Development and Energy Department. The County Board of Commissioners approves the Economic Development and Energy Department’s Budget. No separate financial report was issued. Financial statements are included here within, under the supplementary information section. The Washtenaw County Road Commission is responsible for the maintenance and construction of the county road system in Washtenaw County. It is governed by a three-member board appointed by the County Board of Commissioners. The Road Commission may not issue debt or levy a tax without the approval of the County Board of Commissioners. The Road Commission deposits its receipts with and has investments through the County. Complete financial statements for each of the discretely presented component units can be obtained directly from their respective administrative offices, as follows: Department of Public Works or Water Resources Commissioner WCHMRTA Road Commission 705 North Zeeb Road 220 North Main Street 555 North Zeeb Road Ann Arbor, MI 48107 Ann Arbor, MI 48107 Ann Arbor, MI 48106 Funds with Another Year End The Community Support & Treatment Services Fund and Public Health Fund (special revenue funds of the County) are reported on a September 30 year end in order to enhance the value of this document to certain readers and users.

WASHTENAW COUNTY
NOTES TO FINANCIAL STATEMENTS
-43-
B. Government-wide and Fund Financial Statements The government-wide financial statements (i.e., the statement of net assets and the statement of activities) report information on all of the nonfiduciary activities of the primary government and its component units. For the most part, the effect of interfund activity has been removed from these statements. Governmental activities, which normally are supported by taxes and intergovernmental revenues, are reported separately from business-type activities, which rely to a significant extent on fees and charges for support. Likewise, the primary government is reported separately from certain legally separate component units for which the primary government is financially accountable. The statement of activities demonstrates the degree to which the direct expenses of a given function or segment is offset by program revenues. Direct expenses are those that are clearly identifiable with a specific function or segment. Program revenues include: 1) charges to customers or applicants who purchase, use, or directly benefit from goods, services, or privileges provided by a given function or segment, and 2) grants and contributions that are restricted to meeting the operational or capital requirements of a particular function or segment. Taxes and other items not properly included among program revenues are reported instead as general revenues. Separate financial statements are provided for governmental funds, proprietary funds, and fiduciary funds, even though the latter are excluded from the government-wide financial statements. Major individual governmental funds and major individual enterprise funds are reported as separate columns in the fund financial statements. C. Measurement Focus, Basis of Accounting, and Financial Statement Presentation
The government-wide financial statements are reported using the economic resources measurement focus and the accrual basis of accounting, as are the proprietary fund and fiduciary fund financial statements. Revenues are recorded when earned and expenses are recorded when a liability is incurred, regardless of the timing of related cash flows. Property taxes are recognized as revenues in the year for which they are levied. Grants and similar items are recognized as revenue as soon as all eligibility requirements imposed by the provider have been met. Agency funds, a type of fiduciary fund, are unlike all other types of funds, reporting only assets and liabilities. So agency funds cannot be said to have a measurement focus. They do, however, use the accrual basis of accounting to recognize receivables and payables. Governmental fund financial statements are reported using the current financial resources measurement focus and the modified accrual basis of accounting. Revenues are recognized as soon as they are both measurable and available. Revenues are considered to be available when they are collectible within the current period or soon enough thereafter to pay liabilities of the current period. For this purpose, the government considers revenues to be available if they are collected within 60 days of the end of the current fiscal period, except for reimbursement-based grants which use one year. Expenditures generally are recorded when a liability is incurred, as under accrual accounting. However, debt service expenditures, as well as expenditures related to compensated absences and claims and judgments, are recorded only when payment is due.

WASHTENAW COUNTY
NOTES TO FINANCIAL STATEMENTS
-44-
Property taxes, state revenue, licenses, and interest associated with the current fiscal period are all considered to be susceptible to accrual and so have been recognized as revenues of the current fiscal period. Only the portion of special assessments receivable due within the current fiscal period is considered to be susceptible to accrual as revenue of the current period. All other revenue items are considered to be measurable and available only when cash is received by the government.
The County reports the following major governmental funds:
The general fund is the government’s primary operating fund. It accounts for all financial resources of the general government, except those required to be accounted for in another fund. The community support and treatment services fund accounts for the activities of delivering an array of mental health services to residents. The parks and recreation fund accounts for the operations of the County-owned parks and recreational facilities and for the millage approved by County voters for the purchase of natural areas within the County. The revenue sharing reserve fund is mandated by the State of Michigan and accounts for property tax collections to serve as a substitute to state revenue sharing payments. This substitute funding mechanism involves a gradual shift of County property tax millage from a winter tax levy to a summer tax levy. The collections shift was completed during 2007 when the entire tax levy was assessed in July. The enhanced emergency communication system millage fund accounts for the resources, including a voter-approved millage that began in 2007, accumulated and payments made for principal and interest on long-term general obligation debt that finances acquisition, construction, renovation, maintenance and operation of an upgrade to the County’s communication system.
The county capital projects fund accounts for renovation/small construction projects performed on County facilities and the purchase of capital equipment.
The government reports the following major proprietary fund:
The delinquent tax revolving fund accounts for the County’s annual purchase of delinquent real property taxes from each of the local taxing units within the County and the ultimate collection from the property owners of the delinquent taxes with penalty and interest. The fund also accounts for the County’s issuance of debt (to provide cash flow for the purchase of the taxes) and for the resulting debt service payments.

WASHTENAW COUNTY
NOTES TO FINANCIAL STATEMENTS
-45-
Additionally, the government reports the following fund types: The special revenue funds account for revenue sources that are legally restricted to expenditures for specific purposes not including major capital projects. The debt service funds account for the resources accumulated and payments made for principal and interest on long-term general obligation debt of governmental funds not being financed by proprietary funds. The capital projects fund accounts for financial resources to be used for the acquisition of capital equipment or construction of major capital facilities. The enterprise funds account for those operations that are financed and operated in a manner similar to private business or where the County has decided that the determination of revenues earned, costs incurred and/or net income is necessary for management accountability. The internal service funds account for operations that provide services (such as the County’s telephone system, building repair and maintenance, self-insurance, fleet and equipment management) to other departments or agencies of the County, or to other governments, on a cost-reimbursement basis. The agency fund accounts for assets held by the County in agency capacity for other governments and entities. Primarily this includes undistributed collections and withholdings such as state education taxes, current property taxes, state jail booking fees, state real estate transfer taxes, soil erosion inspections, library penal fines and state payroll withholding taxes. The pension and other employee benefit trust funds account for the activities of the Employees Retirement System, Money Purchase Pension Plan, and Voluntary Employees Beneficiary Association, which accumulate resources for pension and health benefit payments for qualified employees. The trust funds also include the Unemployment and Severance funds, which accumulate resources for unemployment and severance benefit payments, respectively, to qualified employees.
Private-sector standards of accounting and financial reporting issued prior to December 1, 1989, generally are followed in both the government-wide and proprietary fund financial statements to the extent that those standards do not conflict with or contradict guidance of the Governmental Accounting Standards Board. Governments also have the option of following subsequent private-sector guidance for their business-type activities and enterprise funds, subject to this same limitation. The government has elected not to follow subsequent private-sector guidance. As a general rule the effect of interfund activity has been eliminated from the government-wide financial statements. Exceptions to this general rule are payments-in-lieu of taxes and various other functions of the government. Elimination of these charges would distort the direct costs and program revenues reported for the various functions concerned.

WASHTENAW COUNTY
NOTES TO FINANCIAL STATEMENTS
-46-
Amounts reported as program revenues include: 1) charges to customers or applicants for goods, services, or privileges provided; 2) operating grants and contributions; and 3) capital grants and contributions, including special assessments. Internally dedicated resources are reported as general revenues rather than as program revenues. Likewise, general revenues include all taxes. Proprietary funds distinguish operating revenues and expenses from non-operating items. Operating revenues and expenses generally result from providing services and producing and delivering goods in connection with a proprietary fund’s principal ongoing operations. The principal operating revenues of the delinquent tax fund and of the government’s internal service funds are charges to customers for sales and services. Operating expenses for enterprise funds and internal service funds include the cost of sales and services, administrative expenses, and depreciation on capital assets. All revenues and expenses not meeting this definition are reported as non-operating revenues and expenses. When both restricted and unrestricted resources are available for use, it is the government’s policy to use restricted resources first, then unrestricted resources as they are needed. D. Assets, Liabilities and Net Assets or Equity 1. Deposits and Investments The County Treasurer maintains a cash management pool that is used by all funds and component units of the government, except for the pension and other employee benefit trust funds. In addition to their participation in the cash management pool, certain funds and component units also have separate checking accounts. The cash management pool has the general characteristics of a demand deposit account in that deposits and withdrawals may be made at any time without prior notice or penalty. Accordingly, each fund’s portion of this pool, along with any amounts in separate demand deposit accounts, is reported as “cash and pooled investments.” The government’s cash and cash equivalents are considered to be cash on hand, demand deposits and short-term investments with original maturities of three months or less. Investments are stated at fair value, which is determined as follows: (a) short-term investments are reported at cost, which approximates fair value; (b) securities traded on a national or international exchange are valued at the last reported sales price at current exchange rates; (c) investments that do not have established market values are reported at estimated fair value; and (d) cash deposits are reported at carrying amounts which reasonably approximates fair value. State statutes authorize the County to deposit in the accounts of federally insured banks, credit unions, and savings and loan associations, and to invest in obligations of the U.S. Treasury, certain commercial paper, repurchase agreements, bankers acceptances, and mutual funds composed of otherwise legal investments (except those with a fluctuating per share value). State statutes authorize pension and other employee benefit plans to invest in stocks, government and corporate securities, mortgages, real estate, and various other investment instruments, subject to certain limitations.

WASHTENAW COUNTY
NOTES TO FINANCIAL STATEMENTS
-47-
2. Receivables and Payables Activity between funds that are representative of lending/borrowing arrangements outstanding at the end of the fiscal year are referred to as either “interfund receivables/payables” (i.e., the current portion of interfund loans) or “advances to/from other funds” (i.e., the non-current portion of interfund loans). All other outstanding balances between funds are reported as “due to/from other funds.” Any residual balances outstanding between the governmental activities and business-type activities are reported in the government-wide financial statements as “internal balances.” Advances between funds, as reported in the fund financial statements, are offset by a fund balance reserve account in applicable governmental funds to indicate they are not available for appropriation and are not expendable available financial resources. All trade receivables are shown net of an allowance for uncollectibles. 3. Inventories and Prepaid Items
Inventories in the proprietary funds are stated at the lower of cost or market. Cost is determined by the first-in, first-out method. Certain payments to vendors reflect costs applicable to future accounting periods and are recorded as prepaid items in both government-wide and fund financial statements. For the Road Commission component unit, inventory is valued at average cost. 4. Capital Assets Capital assets, which include property, plant, equipment and infrastructure assets (e.g., roads, bridges, sidewalks and similar items), are reported in the applicable governmental or business-type activities columns in the government-wide financial statements. For the County, infrastructure exists in the Water Resources Commissioner and Road Commission component units. Capital assets are defined by the County as assets with an initial, individual cost of more than $5,000 and an estimated useful life in excess of two years. Capital assets are defined by the Road Commission as assets with an initial, individual cost of more than $500 and an estimated useful life in excess of one year. Such assets are recorded at historical cost or estimated historical cost if purchased or constructed. Donated capital assets are recorded at estimated fair value at the date of donation. The costs of normal maintenance and repairs that do not add to the value of the asset or materially extend assets lives are not capitalized. Major outlays for capital assets and improvements are capitalized as projects are constructed. Capital assets of the primary government and component units, except for the Road Commission, are depreciated using the straight-line method over the useful life of the assets as follows:
Buildings and improvements 50 years Drain infrastructure 50 years Equipment (computer, office and vehicles) 2.5 to 10 years

WASHTENAW COUNTY
NOTES TO FINANCIAL STATEMENTS
-48-
For the Road Commission component unit, capital assets are depreciated using the straight-line method over the following useful lives:
Buildings 40 to 60 years Machinery and equipment 5 to 20 years Roads 5 to 30 years
Other Infrastructure 12 to 50 years 5. Compensated Absences The County’s policy is to permit employees to accumulate earned but unused vacation and sick pay benefits. All vacation pay and 50 percent of sick pay are accrued when incurred in the government-wide and proprietary funds financial statements. A liability is reported in governmental funds only if these amounts have matured, for example, as a result of employee resignations or retirements. 6. Long-Term Obligations In the government-wide financial statements and proprietary fund types in the fund financial statements, long-term debt and other long-term obligations are reported as liabilities in the applicable governmental activities, business-type activities, or proprietary fund type statement of net assets. Bond premiums and discounts, as well as issuance costs, are deferred and amortized over the life of the bonds using the effective interest method. Bonds payable are reported net of the applicable bond premium or discount. Bond issuance costs are reported as deferred charges and amortized over the term of the related debt. In the fund financial statements, governmental fund types recognize bond premiums and discounts, as well as bond issuance costs, during the current period. The face amount of debt issued is reported as other financing sources. Premiums received on debt issuances are reported as other financing sources while discounts on debt issuances are reported as other financing uses. Issuance costs, whether or not withheld from the actual debt proceeds received, are reported as debt service expenditures. 7. Fund Equity In the fund financial statements, governmental funds report reservations of fund balance for amounts that are not available for appropriation or are legally restricted by outside parties for use for a specific purpose. Designations of fund balance represent tentative management plans that are subject to change.

WASHTENAW COUNTY
NOTES TO FINANCIAL STATEMENTS
-49-
II. STEWARDSHIP, COMPLIANCE AND ACCOUNTABILITY A. Budgetary Information Annual budgets are adopted on a basis consistent with generally accepted accounting principles for the general and special revenue funds. Budgets are not required for debt service and capital projects funds. All annual appropriations lapse at year-end. The County utilizes a biennial budget to improve the efficiency of the overall budgeting process. The first year of the biennial budget is prepared for approval and adoption, and the second year is based on information currently available. The second year budget is amended during the first year to reflect necessary revisions as economic conditions warrant. Necessary changes are brought back to the Board of Commissioners prior to the beginning of the fiscal year for final adoption. The County Administrator submits a proposed budget to the Board of Commissioners before September 15. The budget includes proposed expenditures and the means of financing them. Public hearings are held to obtain taxpayer comments. The budget is adopted no later than December 31 through a Board of Commissioners resolution. The appropriated budget is prepared by fund, function and department. The County’s department heads may make limited transfers of appropriations within a department. Transfers of appropriations between departments require approval by the Board of Commissioners or County Administrator, depending on the dollar value of the transfers. The legal level of budgetary control (i.e., the level at which expenditures may not legally exceed appropriations) is the department level for the General Fund and the function level for special revenue funds. Supplemental budgetary appropriations were made during the year, but were not material for purposes of these disclosures. Encumbrance accounting, under which purchase orders, contracts and other commitments for the expenditure of funds are recorded in order to reserve that portion of the applicable appropriation, is employed as an extension of formal budgetary integration in the governmental funds. Encumbrances are recorded in the amount of the outstanding purchase orders and contracts at the time the purchase orders and contracts are issued. The encumbrances are liquidated when the goods or services are received. Unliquidated encumbrances at the end of the year are not carried forward to the next year.
B. Excess of Expenditures over Appropriations State statutes provide that a local unit shall not incur expenditures in excess of the amount appropriated. The approved budgets of the County were adopted on a department level basis for the general fund and the function level for the special revenue funds.

WASHTENAW COUNTY
NOTES TO FINANCIAL STATEMENTS
-50-
Excess of expenditures over appropriations in individual funds are as follows:
Budget Actual ExcessGeneral fund Judicial: Circuit court 4,390,414$ 4,404,318$ 13,904$ District court 5,152,711 5,381,804 229,093 Probate court 1,276,268 1,282,644 6,376 General government: Information technology 5,158,896 5,195,552 36,656 Corporation counsel 294,713 298,014 3,301 Public safety: Sheriff 40,171,751 40,695,134 523,383 Prosecuting attorney 5,448,506 5,452,359 3,853 Social services - children's services - 17,115 17,115 Culture - county extension 631,761 649,794 18,033 Other unallocated expenditures 4,995,499 5,442,086 446,587 Debt service: Principal - 273,554 273,554 Interest and fiscal charges - 44,246 44,246 Transfers out 17,210,033 18,314,763 1,104,730
Enhanced emergency communication system fund Public safety - 15,257 15,257
Nonmajor special revenue funds Aerial photo - general government 110,000 183,376 73,376 E-911 - public safety 1,236,793 1,242,538 5,745 E-911 - transfers out 1,008,054 1,187,662 179,608 Inmate concessions - public safety 270,972 480,041 209,069 Other special revenue - transfers out 140,000 180,896 40,896 Public works solid waste program - public works 413,200 440,408 27,208 Sheriff's grants - transfers out - 9,624 9,624 Veterans' trust - transfers out - 3,000 3,000 Water resources commissioner grants - public works 108,457 174,462 66,005
These over-expenditures were funded by available fund balance.

WASHTENAW COUNTY
NOTES TO FINANCIAL STATEMENTS
-51-
III. DETAILED NOTES ON ALL FUNDS A. Deposits, Investments and Securities Lending Following is a reconciliation of deposits and investments as of December 31, 2010:
Primary Component Government Units Total
Statement of Net Assets:
Cash and pooled investments $ 107,808,808 $ 17,906,511 $ 125,715,319 Statement of Fiduciary Net Assets:
Cash and pooled investments 22,622,177 - 22,622,177 Investments 262,279,005 - 262,279,005
Total $ 392,709,990 $ 17,906,511 $ 410,616,501
Deposits and Investments: Bank deposits (checking accounts and certificates of deposit) $ 17,012,033 Investments in securities, mutual funds and similar vehicles: Treasurer’s investment pool 131,794,925 Employees retirement system 205,177,594 Money purchase pension plan 1,168,919 Voluntary employees beneficiary association 55,932,492 Cash on hand 41,181 Net effect of funds with different fiscal year ends (510,643) Total $ 410,616,501
Bank Deposits and Treasurer’s Investment Pool Custodial Credit Risk - Deposits. Deposits are exposed to custodial credit risk if they are not covered by depository insurance. The Federal Government provides $250,000 of FDIC insurance per customer and unlimited coverage on non-interest bearing checking accounts. The County had $5,455,468 of insured deposits through this coverage. At December 31, 2010, of the County’s total bank balance of $18,185,560 (total book balance was $17,012,033), $12,730,092 was exposed to custodial credit risk as it was uninsured and uncollateralized. In accordance with the County’s investment policy and State law, all deposits are uncollateralized, held in the County’s name, and evidenced by a safekeeping receipt. Due to the dollar amounts of cash deposits and the limits of FDIC insurance, the County believes it is impractical to obtain FDIC insurance for all bank deposits. The County evaluates each financial institution and assesses the level of risk of each institution; only those institutions with an acceptable estimated risk level are used as depositories.

WASHTENAW COUNTY
NOTES TO FINANCIAL STATEMENTS
-52-
Custodial Credit Risk - Investments. Following is a summary of the County’s investments as of December 31, 2010:
U.S. treasuries $ 4,998,500 U.S. agencies 30,753,350 Michigan municipal bonds and notes 17,823,811 Commercial paper 27,978,970 Money market funds 50,240,294 Total $ 131,794,925
Investments are exposed to custodial credit risk if the securities are uninsured, unregistered or held by a counterparty or its agent but not in the government’s name. In accordance with the County’s investment policy, all investments are held in the name of the County and are evidenced by a safekeeping receipt confirmation, and thus not exposed to custodial credit risk. Credit Risk. Credit risk is the risk that an issuer or other counterparty to an investment will not fulfill its obligations. The County’s investment policy and State law require that commercial paper be rated in the top two ratings by at least two nationally recognized statistical rating organizations (NRSRO); investments in local government tax notes must be rated in the top two ratings by one NRSRO. Ratings are not required for U.S. treasuries or certain money market funds. As of December 31, 2010, all of the County’s investments in securities of U.S. agencies were rated AAA by Standard & Poor’s (S&P) and Aaa by Moody’s. The County’s holdings in commercial paper were rated either A1 or A2 by S&P and either P1 or P2 by Moody’s. Of the County’s investments in money market funds, $43,457,324 was rated AAAm by S&P, and the remaining $6,782,970 was not rated. The County’s investment in Michigan municipal bonds and notes are rated in the top tier by at least one rating agency. Concentration of Credit Risk. Concentration of credit risk is the risk of loss attributed to the magnitude of a government’s investment in a single issuer. The County’s investment policy requires diversification by security type and institution, but does not place a fixed percentage limit for any one issuer. At December 31, 2010, the County had greater than 5% of its total investment portfolio concentrated as follows:
% of Investment Type Issuer Portfolio U.S. agencies Federal Home Loan Mortgage Company 17.99%Municipal tax notes Genesee County LTGO 2010 5.41%

WASHTENAW COUNTY
NOTES TO FINANCIAL STATEMENTS
-53-
Interest Rate Risk. Interest rate risk is the risk that changes in market interest rates will adversely affect the fair value of investments. The County’s investment policy does not limit investment maturities as a means of managing its exposure to fair value losses arising from increasing interest rates. However, it is the practice of the County to manage this risk by purchasing a mix of short and long term investments. This laddering approach also matches investment maturities to projected cash flow needs. As of December 31, 2010, maturities of the County’s debt securities were as follows:
Investment maturities (fair value by years)Fair Value Less Than 1 1 - 5 6 - 10 Over 10
U.S. treasuries 4,998,500$ 4,998,500$ -$ -$ -$ U.S. agencies 30,753,350 26,702,740 4,050,610 - - Michigan municipal
bonds and notes 17,823,811 - 17,823,811 - - Commercial paper 27,978,970 27,978,970 - - -
81,554,631$ 59,680,210$ 21,874,421$ -$ -$
Employees’ Retirement System Investments
The Michigan Public Employee Retirement System Investment Act, Public Act 314 of 1965, as amended, authorizes the Employees’ Retirement System to invest in stocks, government and corporate securities, mortgages, real estate, and various other investment instruments, subject to certain limitations. The System’s investments are primarily held in a bank-administered trust fund. Following is a summary of the System’s investments as of December 31, 2010: (investments at fair value, as determined by quoted market price)
Equities: Not on securities loan $ 99,078,705 On securities loan 9,495,738 U.S. treasuries 3,546,094 U.S. treasury strips 11,445,575 U.S. agencies: Not on securities loan 20,735,142 On securities loan 2,572,961 Corporate securities 18,412,881 Real estate investment trusts 13,803,854 Mutual funds 22,234,267 Money market funds 3,852,377 Total investments $ 205,177,594

WASHTENAW COUNTY
NOTES TO FINANCIAL STATEMENTS
-54-
Credit Risk. Credit risk is the risk that an issuer or other counterparty to an investment will not fulfill its obligations. The System’s investment policy provides that 90% of each manager’s investments in fixed income securities be limited to those rated BAA or better by a nationally recognized statistical rating organization, except for United States treasury securities which are explicitly guaranteed by the U.S. government and not considered to have credit risk. As of December 31, the System’s investments in securities of U.S. agencies that are implicitly guaranteed ($2,834,399 of U.S. agencies are explicitly guaranteed) by the U.S. government were rated AAA by Standard & Poor’s, except for $150,636 which were rated A. The System’s investments in corporate securities were rated by Standard & Poor’s as follows:
2010
AAA 5,747,705$ AA 2,306,283 A 5,041,873 BBB 3,335,483 BB 305,230 CCC 240,910 CC 30,835 Not rated 1,404,562
18,412,881$
The System’s investments in money market funds and real estate investment trusts were not rated. The System does not invest in bond mutual funds. Custodial Credit Risk. For investments, custodial credit risk is the risk that, in the event of the failure of the counterparty to a transaction, the System will not be able to recover the value of its investments or collateral securities that are in the possession of an outside party. The System’s investment policy requires that securities be held in trust by a third-party institution in the System’s name or its nominee custodian’s name or in bearer form. Although uninsured and unregistered, the System’s investments are not exposed to custodial credit risk since the securities are held by the counterparty’s trust department or agent in the System’s name. Short-term investments in money market funds and open-end mutual funds are not exposed to custodial credit risk because their existence is not evidenced by securities that exist in physical or book form.

WASHTENAW COUNTY
NOTES TO FINANCIAL STATEMENTS
-55-
Concentration of Credit Risk. Concentration of credit risk is the risk of loss attributed to the magnitude of the System’s investment in a single issuer. The System’s investment policy requires that no more than: 35% of its assets be invested in large cap equities, 15% in mid cap equities, 15% in small cap equities, 15% in international equities, 10% in real estate and 35% in fixed income securities. At December 31, 2010, the System’s investment portfolio was concentrated as follows: Interest Rate Risk. Interest rate risk is the risk that changes in interest rates will adversely affect the fair value of an investment. The System’s investment policy requires a maximum term to maturity of 30 years for any single fixed income security. The System’s investment policy does not address weighted average portfolio maturities. As of December 31, 2010, maturities of the System’s debt securities were as follows:
Investment Maturities (fair value by years)Less More
Fair Value Than 1 1-5 6-10 Than 10
U.S. treasuries 3,546,094$ 55,583$ 441,224$ 1,994,982$ 1,054,305$ U.S. treasury strips 11,445,575 - 7,288,961 3,765,668 390,946 U.S. agencies 23,308,103 152,292 968,755 4,531,492 17,655,564 Corporate securities 18,412,881 675,140 5,769,509 4,505,956 7,462,276
56,712,653$ 883,015$ 14,468,449$ 14,798,098$ 26,563,091$
Of the above balances, $8,649,654 of the U.S. agencies and $13,496,871 of corporate securities are callable.
% of Investment Type Issuer Portfolio Large cap equities D. E. Shaw Group Limited Partnership 30.4% Fixed income Federal National Mortgage Association 6.5%

WASHTENAW COUNTY
NOTES TO FINANCIAL STATEMENTS
-56-
The System’s portfolio of U.S. agencies and corporate securities includes certain collateralized mortgage obligations (with interest-only and principal-only strips), mortgage pass-through asset-backed securities, variable-rate securities, and inverse variable-rate securities. The fair value of these investments was summarized as follows at December 31: Collateralized mortgage obligations: Interest-only strips $ 1,435,209 Principal-only strips 2,317,667 Mortgage pass-through asset-backed securities 5,956,825 Variable-rate securities 2,000,932 Inverse variable-rate securities 2,617,104 The System invests in interest-only strips, in part, to maximize yields and as protection against a rise in interest rates. These securities are based on cash flows from interest payments on underlying mortgages. Therefore, they are sensitive to increased prepayments by mortgagees, which may result from a decline in interest rates. If interest rates decline, the value of interest-only strips declines. If interest rates increase, the value of interest-only strips increases. The System invests in principal-only strips to reduce the price sensitivity of its fixed-income portfolio to changes in interest rates. These principal-only strips are sensitive to decreased mortgage prepayments that may result from rising interest rates. If interest rates increase, the value of principal-only strips declines. If interest rates decrease, the value of principal-only strips increases. The System invests in mortgage pass-through asset-backed securities issued by Fannie Mae (Federal National Mortgage Association), Ginnie Mae (Government National Mortgage Association), and Freddie Mac (Federal Home Loan Mortgage Corporation), in order to reduce the fair value sensitivity of its fixed-income portfolio to changes in interest rates. These securities are sensitive to increased mortgage prepayments that may result from declining interest rates, thus decreasing the fair value of these investments. A variable-rate investment’s coupon amount enhances or amplifies the effects of interest rate changes by greater than a one-to-one basis. The multiplier makes the fair value of these investments highly sensitive to interest rate changes. As of December 31, 2010, the System holds 32 variable-rate investments with a fair value of $2,000,932. The coupon rates for these investments range from 0.0% to 6.68%; the benchmark indexes include one-month, three-month, six-month, and twelve-month LIBOR, 11th District Monthly Weighted Average Cost of Funds Index (San Francisco), and Federal Reserve US H.15 Treasury Note Constant Maturity One Year, and one-year treasury rate; the reset frequency is monthly, quarterly, semi-annually, or annually; the coupon payment frequency is monthly or quarterly; and coupon multipliers range from 1.0 to 44.8 times the benchmark index, minus 268.8% to plus 2.246%, with a cap ranging from 6.75% to 20.4% and a floor ranging from 0.0% to 3.20%.

WASHTENAW COUNTY
NOTES TO FINANCIAL STATEMENTS
-57-
As of December 31, 2010, the System holds 76 inverse variable-rate investments with a fair value of $2,617,104. With inverse variable-rate securities, coupon payments decline as interest rates increase. The coupon rates for these investments range from 8.76% to 1,153.49%; the benchmark indexes include one-month LIBOR, 11th District Monthly Weighted Average Cost of Funds Index (San Francisco), and three-month treasury rate; the reset and coupon payment frequency is monthly; and coupon multipliers range from negative 1,500 to negative .889 times the benchmark index, plus 5.05% to 15,573.50%, with a cap ranging from 5.05% to 15,573.50% and a floor ranging from 0.0% to 11.0%. Securities Lending. A contract approved by the System’s Board of Directors, permits the System to lend its securities to broker-dealers and other entities (borrowers) for collateral that will be returned for the same securities in the future. The System’s custodial bank manages the securities lending program and receives securities or irrevocable bank letters of credit as collateral. The collateral securities cannot be pledged or sold by the System unless the borrower defaults. Collateral securities and letters of credit are initially pledged at 102 percent of the market value of the securities lent, and may not fall below 100 percent during the term of the loan. There are no restrictions on the amount of securities that can be loaned. Securities on loan at year-end are classified in the preceding schedule of custodial credit risk according to the category for the collateral received on the securities lent. At year end, the System has no credit risk exposure to borrowers because the amounts the System owes the borrowers exceed the amounts the borrowers owe the System. The contract with the System’s custodian requires it to indemnify the System if the borrowers fail to return the securities (and if the collateral is inadequate to replace the securities lent) or fail to pay the System for income distributions by the securities’ issuers while the securities are on loan. Money Purchase Pension Plan Investments The Michigan Public Employee Retirement System Investment Act, Public Act 314 of 1965, as amended, authorizes the Money Purchase Pension Plan to invest in stocks, government and corporate securities, mortgages, real estate, and various other investment instruments including mutual funds, subject to certain limitations. The Plan’s investments are held by its trustee, a third-party financial institution. The management agreement between the Plan and the trustee requires 13 separate mutual funds, including ten stock funds, one balanced fund, one bond fund, and one guaranteed interest fund. Participants select the particular funds into which their contributions and the related County matching contributions are made. All of the Plan’s investments totaling $1,168,919 are in mutual funds. Credit Risk. Credit risk is the risk that an issuer or other counterparty to an investment will not fulfill its obligations. At December 31, 2010 the Plan’s bond mutual fund was not rated by a nationally recognized statistical rating organization. The Plan’s investment policy does not address credit risk.

WASHTENAW COUNTY
NOTES TO FINANCIAL STATEMENTS
-58-
Custodial Credit Risk. For investments, custodial credit risk is the risk that, in the event of the failure of the counterparty to a transaction, the Plan will not be able to recover the value of its investments or collateral securities that are in the possession of an outside party. Short-term investments in money market funds and open-end mutual funds are not exposed to custodial credit risk because their existence is not evidenced by securities that exist in physical or book form. At year end, the Plan’s bond mutual fund was an open-end mutual fund. Accordingly, the Plan’s investments were not exposed to custodial credit risk. The Plan’s investment policy does not address custodial credit risk. Interest Rate Risk. Interest rate risk is the risk that changes in interest rates will adversely affect the fair value of an investment. At December 31, 2010, the effective maturity of the Plan’s bond mutual fund was 7.12 years. The Plan’s investment policy does not address interest rate risk. Voluntary Employees Beneficiary Association (VEBA) Investments The Michigan Public Employee Retirement System Investment Act, Public Act 314 of 1965, as amended, authorizes the VEBA to invest in stocks, government and corporate securities, mortgages, real estate, and various other investment instruments, subject to certain limitations. The VEBA’s investments are held by an independent investment management company. Following is a summary of its investments as of December 31, 2010: Investments at fair value, as determined by quoted market prices: Equities $ 28,409,718 United States agencies 91,355 Corporate securities 393,734 Multi-strategy limited partnership 4,512,325 Real estate limited partnership 728,560 Bond mutual fund 17,853,935 Money market funds 3,942,865 Total investments $ 55,932,492 Credit Risk. Credit risk is the risk that an issuer or other counterparty to an investment will not fulfill its obligations. The VEBA’s investment policy provides that all of its investments in fixed income securities be rated A+ or better by a nationally recognized statistical rating organization, except for United States treasury securities which are explicitly guaranteed by the U.S. government and not considered to have credit risk.

WASHTENAW COUNTY
NOTES TO FINANCIAL STATEMENTS
-59-
As of December 31, 2010, the VEBA’s investments in money market funds and securities of U.S. agencies were rated AAA by Standard & Poor’s. The VEBA’s investment in its bond mutual fund was not rated at December 31, 2010. The VEBA’s investments in corporate securities were rated by Standard & Poor’s as follows: Custodial Credit Risk. For investments, custodial credit risk is the risk that, in the event of the failure of the counterparty to a transaction, the VEBA will not be able to recover the value of its investments or collateral securities that are in the possession of an outside party. The VEBA’s investment policy does not address custodial credit risk. Although uninsured and unregistered, the VEBA’s investments are not exposed to custodial credit risk since the securities are held by the counterparty’s trust department in the VEBA’s name. Short-term investments in money market funds and open-end mutual funds are not exposed to custodial credit risk because their existence is not evidenced by securities that exist in physical or book form. Concentration of Credit Risk. Concentration of credit risk is the risk of loss attributed to the magnitude of the VEBA’s investment in a single issuer. The VEBA’s investment policy requires that no more than ten percent of its assets be invested in money market funds or short-term U.S. treasuries, no more than five percent in any one issuer, and no more than 20% in any one industry. At December 31, 2010, the VEBA’s investment portfolio was not exposed to concentration credit risk. Interest Rate Risk. Interest rate risk is the risk that changes in interest rates will adversely affect the fair value of an investment. The VEBA’s investment policy provides that the weighted average maturity of its fixed income portfolio may not exceed 10 years. At year-end, maturities of debt securities are as follows:
BBB+ $ 57,150 B+ 36,700 B 90,600 CCC 24,650 CCC- 47,700 Not rated 136,934
$ 393,734

WASHTENAW COUNTY
NOTES TO FINANCIAL STATEMENTS
-60-
Investment Maturities (fair value by years)Less More
Fair Value Than 1 1-5 6-10 Than 10
U.S. agencies 91,355$ -$ -$ 20,242$ 71,113$ Corporate securities 393,734 - 104,850 - 288,884
485,089$ -$ 104,850$ 20,242$ 359,997$
Money market funds had a rolling maturity date of less than 60 days as of December 31, 2010. One of the bond mutual funds had a weighted average maturity of 5.41 years as of December 31, 2010; the other had a weighted average maturity of 4.45 years. Of the above balances, $31,015 of the U.S. agencies and $288,884 of the corporate securities were callable as of December 31, 2010. B. Receivables Receivables in the governmental activities, of which $4,955,804 of leases receivable are not expected to be collected within one year, are as follows:
Taxes 15,278,327$ Accounts 4,422,370 Leases 5,415,550 Intergovernmental 11,478,848 Less: allowance for uncollectible accounts (555,700)
36,039,395$
Receivables for the business-type activities are composed entirely of amounts due from taxpayers for delinquent taxes and related interest and collection fees. Component unit receivables totaling $42.5 million are comprised of leases receivable (70.23 percent), special assessments receivable (19.86 percent), accounts receivable (9.90 percent) and due from other governments (.01 percent). Governmental funds report deferred revenue in connection with receivables that are not available to liquidate liabilities of the current period (unavailable) and/or for resources that have been received, but not earned or that are intended to finance a future period (unearned). At year-end, the components of deferred revenue and unearned revenue reported in the governmental funds were as follows:

WASHTENAW COUNTY
NOTES TO FINANCIAL STATEMENTS
-61-
Unearned Unavailable Property taxes receivable:
General fund $ 243,580 $ -Parks and recreation fund 10,110,531 -
Enhanced emergency communication system 2,834,739 -
Nonmajor governmental funds 963,811 -
Grant drawdowns prior to meeting all eligibility requirements 481,158 -
$ 14,633,819 $ - C. Capital Assets
Primary Government - Capital asset activity for the year ended December 31, 2010 was as follows: Beginning Ending Balance Increases Decreases BalanceGovernmental activities
Capital assets, not being depreciated:
Land $ 35,994,778 $ 1,844,275 $ - $ 37,839,053
Construction in progress 42,810,188 92,370 (42,810,188) 92,370
Total capital assets, not being depreciated 78,804,966 1,936,645 (42,810,188) 37,931,423
Capital assets, being depreciated:
Buildings and easements 121,576,595 36,862,719 (3,462,113) 154,977,201
Improvement other than buildings 18,205,744 20,456,092 (63,894) 38,597,942
Machinery and equipment 14,992,819 8,661,452 (2,101,650) 21,552,621
Total capital assets being depreciated 154,775,158 65,980,263 (5,627,657) 215,127,764
Less accumulated depreciation for:
Buildings and easements (38,660,928) (3,119,623) 1,441,104 (40,339,447)
Improvements other than buildings (5,423,033) (1,179,920) 41,152 (6,561,801)
Machinery and equipment (10,401,756) (2,230,629) 1,922,902 (10,709,483)Total accumulated depreciation (54,485,717) (6,530,172) 3,405,158 (57,610,731)
Total capital assets being depreciated, net 100,289,441 59,450,091 (2,222,499) 157,517,033 Governmental activities capital assets, net $ 179,094,407 $ 61,386,736 $ (45,032,687) $ 195,448,456

WASHTENAW COUNTY
NOTES TO FINANCIAL STATEMENTS
-62-
Beginning Ending Balance Increases Decreases Balance Business type activities
Capital assets, being depreciated - Machinery and equipment $ 46,643 $ - $ - $ 46,643
Less accumulated depreciation for - Machinery and equipment (18,208) (8,656) - (26,864) Business type activities capital assets, net $ 28,435 $ (8,656) $ - $ 19,779 Depreciation and amortization expenses were charged to activities of the primary government as follows:
Governmental activities
Legislative $ 5,439
Judicial 935,756
General government 1,048,715
Public safety 1,666,470
Health 315,791
Social services 418,148
Culture and recreation 1,093,922
Capital assets held by the government’s internal service funds are charged
to the various functions based on their usage of the assets 1,045,931
Total depreciation expense - governmental activities $ 6,530,172
Business type activities $ 8,656

WASHTENAW COUNTY
NOTES TO FINANCIAL STATEMENTS
-63-
Discretely Presented Component Units Water Resources Commissioner. Capital asset activity for the Water Resources Commissioner for the year ended December 31, 2010 was as follows:
Beginning Ending
Balance Increases Decreases Balance
Capital assets, not being depreciated -
Construction in progress $ 3,888,171 $ 6,352,790 $ (2,429,764) $ 7,811,197
Capital assets, being depreciated:
Infrastructure 26,475,446 2,429,764 - 28,905,210
Machinery and equipment 363,649x - - 363,649x
Total capital assets being depreciated 26,839,095x 2,429,764 - 29,268,859x
Less accumulated depreciation for:
Infrastructure (7,846,809) (529,507) - (8,376,316)
Machinery and equipment (70,526) (47,442) - (117,968)
Total accumulated depreciation (7,917,335) (576,949) - (8,494,284)
Total capital assets being depreciated, net 18,921,760 1,852,815 - 20,774,575
Water Resources Commissioner capital assets, net $ 22,809,931 $ 8,205,605 $ (2,429,764) $ 28,585,772
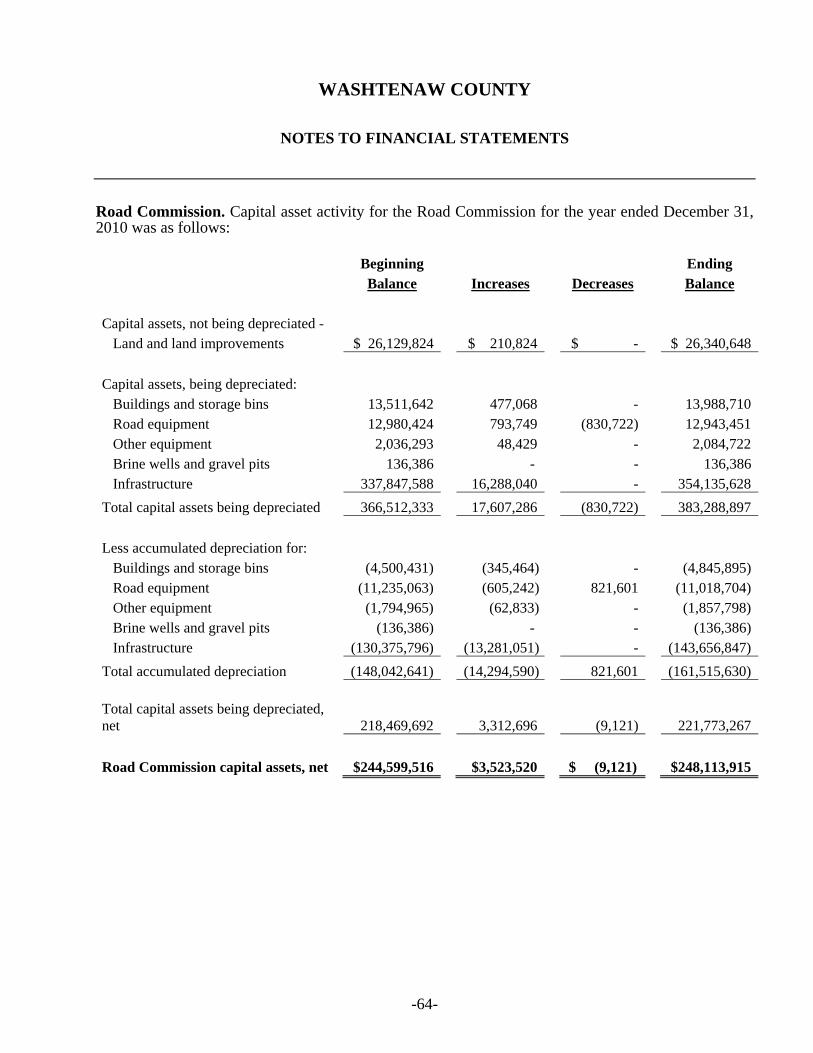
WASHTENAW COUNTY
NOTES TO FINANCIAL STATEMENTS
-64-
Road Commission. Capital asset activity for the Road Commission for the year ended December 31, 2010 was as follows: Beginning Ending Balance Increases Decreases Balance Capital assets, not being depreciated - Land and land improvements $ 26,129,824 $ 210,824 $ - $ 26,340,648
Capital assets, being depreciated: Buildings and storage bins 13,511,642 477,068 - 13,988,710 Road equipment 12,980,424 793,749 (830,722) 12,943,451 Other equipment 2,036,293 48,429 - 2,084,722 Brine wells and gravel pits 136,386 - - 136,386 Infrastructure 337,847,588 16,288,040 - 354,135,628
Total capital assets being depreciated 366,512,333 17,607,286 (830,722) 383,288,897
Less accumulated depreciation for: Buildings and storage bins (4,500,431) (345,464) - (4,845,895) Road equipment (11,235,063) (605,242) 821,601 (11,018,704) Other equipment (1,794,965) (62,833) - (1,857,798) Brine wells and gravel pits (136,386) - - (136,386) Infrastructure (130,375,796) (13,281,051) - (143,656,847)
Total accumulated depreciation (148,042,641) (14,294,590) 821,601 (161,515,630)
Total capital assets being depreciated, net 218,469,692 3,312,696 (9,121) 221,773,267
Road Commission capital assets, net $244,599,516 $3,523,520 $ (9,121) $248,113,915

WASHTENAW COUNTY
NOTES TO FINANCIAL STATEMENTS
-65-
D. Payables Accounts payable and accrued liabilities in the governmental activities are as follows: E. Interfund Receivables, Payables and Transfers The composition of interfund balances as of December 31, 2010, is as follows:
Receivable Payable Advances to/from other funds County capital projects fund $ 21,724 $ - Internal service funds - 21,724
Total $ 21,724 $ 21,724
Receivable Payable Interfund receivable/payable County capital projects fund $ 3,912,956 $ - Nonmajor governmental funds - 3,912,956
Total $ 3,912,956 $ 3,912,956 Outstanding advances between funds relate to working capital loans made to certain internal service funds, none of which is scheduled to be repaid in the subsequent year. Interfund receivables/payables represent short-term working capital loans for funds with negative cash balances in the County’s cash and investment pool as of year end.
Accounts $ 11,665,945
Wages, fringe benefits and other accrued liabilities 7,742,612
Intergovernmental 1,093,582
$ 20,502,139

WASHTENAW COUNTY
NOTES TO FINANCIAL STATEMENTS
-66-
A summary of interfund transfers for the year ended December 31, 2010, is as follows:
Interfund transfers Transfer In Transfer Out General fund 7,916,188$ 18,314,763$ Community support & treatment services 457,427 - Revenue sharing reserve - 6,537,969 Enhanced emergency communication system - 2,707,178 County capital projects 10,999,410 7,219,972 Nonmajor governmental funds 23,068,554 1,417,082 Delinquent tax revolving - 5,573,957 Property tax foreclosure - 159,118 Internal service funds - 305,958 Total per financial statements 42,441,579$ 42,235,997$ Adjustments for September 30 year end - 205,582 Total 42,441,579$ 42,441,579$
Transfers are used to: (1) move unrestricted revenues collected in the general fund to finance various programs accounted for in other funds in accordance with budgetary authorizations; (2) move revenues from the fund that is required to collect them to the fund that is required or allowed to expend them; and (3) move receipts restricted to or allowed for debt service from the funds collecting the receipts to the debt service funds as debt service payments become due. Total transfers in for the primary government as shown in the accompanying financial statements were $42,441,579 and total transfers out were $42,235,997. The difference between these amounts, $205,582, is attributable to transactions with the public health and community support & treatment services funds, which are reported on a September 30 year-end. As such, this is reported as an uneliminated internal balance in the statement of activities. F. Leases Capital Leases – During 2010 and prior years, the County entered into lease agreements as lessee for financing the acquisition of information and technology computer equipment. These lease agreements qualify as capital leases for accounting purposes and, therefore, have been recorded at the present value of their future minimum lease payments as of the inception date.

WASHTENAW COUNTY
NOTES TO FINANCIAL STATEMENTS
-67-
The assets acquired through capital leases in governmental activities are as follows:
Machinery and equipment $ 956,794 Less accumulated depreciation (396,543)
Total $ 560,251
The net present value of future minimum lease payments as of December 31, 2010, were as follows:
2011 $ 387,996 2012 387,996
Total minimum lease payments 775,992
Less: amount representing interest (64,871) Present value of minimum lease payments $ 711,121
Operating Leases - The County has commitments under operating lease agreements which provide for minimum annual lease payments as follows:
2011 $ 1,092,910
2012 706,007
2013 708,682 2014 566,739 2015 366,322 2016 373,822 2017 373,822 2018 117,622
Total $ 4,305,926
Rental expense for all operating leases aggregated $1,232,896 for the year ended December 31, 2010. In addition, for the year ended December 31, 2010, the County leased 350 spaces for employee parking that cost $350,000; this is not included above or in the aforementioned cost for the year since the County is reimbursed by the employees through payroll deductions. Lessor Leases – The County has leased the building located at 750 Towner Street to the Washtenaw Community Health Organization (WCHO). WCHO has commitments under the lease which provides for annual minimum lease payments of $67,591 during 2010 and continuing for the next 10 years.

WASHTENAW COUNTY
NOTES TO FINANCIAL STATEMENTS
-68-
G. Long-term Debt Primary Government The County issues general obligation bonds to provide funds for the acquisition and construction of major capital facilities. General obligation bonds have been issued for governmental activities. The original amount of general obligation bonds issued in prior years was $104.9 million. The County issues general obligation notes to provide monies for the purchase of the delinquent taxes receivable from local units of government. The original amount of general obligation notes was $58.0 million issued in prior years. During the year general obligation tax notes totaling $29 million were issued. General obligation bonds and notes are direct obligations and pledge the full faith and credit of the government. Bonds are generally issued as 15 to 20-year serial bonds with varying amounts of principal maturing each year. Notes are generally issued with a nine-month due maturity. General obligation bonds and notes currently outstanding are as follows:
Purpose Interest Rates Amount
Governmental activities 2.0 – 4.75% $ 61,485,000
Governmental activities - refunding 1.75 - 4.75% 14,280,000
Business-type activities 1.2 – 2.0% 26,000,000
$ 101,765,000
Annual debt service requirements to maturity for general obligation bonds and notes are as follows:
Year Ending Governmental Activities Business-type Activities
December 31 Principal Interest Principal Interest
2011 $ 6,835,000 $ 2,471,087 $ 21,000,000 $ 205,667
2012 8,295,000 2,696,378 5,000,000 36,458
2013 8,760,000 2,397,784 - -
2014 7,220,000 2,077,435 - -
2015 7,660,000 1,802,346 - -
2016-2020 19,865,000 5,656,144 - -
2021-2025 11,865,000 2,600,528 - -
2026-2028 5,265,000 354,811 - -
Total $ 75,765,000 $ 20,056,513 $ 26,000,000 $ 242,125

WASHTENAW COUNTY
NOTES TO FINANCIAL STATEMENTS
-69-
In addition to general obligation bonds and notes, the County has an interest-free loan from the Michigan Economic Development Corporation in the original amount of $292,133. The borrowed monies were used in conjunction with funds received under a federal Community Development Block Grant to fund renovation work in Hanger 1 at Willow Run Airport. The loan will be repaid in 60 quarterly installments of $4,869 beginning in the first quarter of 2005 and ending in the fourth quarter of 2019. The total remaining amount outstanding at December 31, 2010 is $175,280. Willow Run Airport Authority will be reimbursing the County for the debt service payments made by the County. Component Units Department of Public Works Projects. General obligation bonds are issued by the County to finance construction projects managed and administered by the Department of Public Works for governmental activities. The original amount of general obligation bonds issued in prior years was $44,411,593. During the year, the Department issued $12,870,000 of refunding bonds. All of these bonds are direct obligations, and pledge the full faith and credit, of the County and the associated municipalities and/or authorities. The bonds are issued as 10 to 20-year serial bonds with varying amounts of principal maturing each year through June 1, 2028 and bear interest at varying rates from 1.625% to 5.000%. Such bonds currently outstanding are summarized as follows:
Purpose Interest Rates Amount
Governmental activities 1.625 - 5.0% $ 13,497,279
Governmental activities - refunding 2.0 - 4.25% 16,385,000
$ 29,882,279 Annual debt service requirements to maturity for general obligation bonds are as follows:
Year Ending Governmental ActivitiesDecember 31 Principal Interest
2011 $ 1,890,000 $ 1,023,551
2012 1,950,000 939,717
2013 1,950,000 872,797
2014 2,640,000 797,968
2015 2,635,000 713,313
2016-2020 11,247,279 2,305,459
2021-2025 5,950,000 782,461
2026-2028 1,620,000 35,194
Total $ 29,882,279 $ 7,470,460

WASHTENAW COUNTY
NOTES TO FINANCIAL STATEMENTS
-70-
During the year, the Department defeased certain bonds by placing the proceeds of refunding bonds in irrevocable trusts for the purpose of generating resources for all future debt service payments on the refunded debt. As a result, the refunded bonds are considered to be defeased and the related liabilities have been removed from the statement of net assets. This included the following two issues where:
The Department issued $9,775,000 to defease $9,400,000 of bonds. The reacquisition price exceeded the carrying amount of the old debt by $264,309. The refunding extended the debt repayment period by four years and resulted in an economic gain of $300,966, but increased future debt service payments by $1,192,765.
The Department issued $3,095,000 to defease $3,050,000 of bonds. The carrying amount of
the old debt exceeded the reacquisition price by $865. The refunding extended the debt repayment period by five years and resulted in an economic gain of $67,233, but increased future debt service payments by $126,138.
Water Resources Commissioner. General obligation drain improvement bonds and notes are issued by the County to finance certain drainage district construction projects. The original amount of general obligation bonds and notes issued in prior years was $13,085,227. During the year, general obligation bonds of $3,730,213 and notes totaling $524,500 were issued. Installment obligations of $216,512 outstanding (for drain maintenance equipment) are due in annual installments of $46,079 to $150,000 through June 1, 2013 with interest of 4.75%. These direct obligations pledge the full faith and credit of the County and the respective drainage districts. The bonds are generally issued as 10 to 20-year serial bonds with varying amounts of principal maturing each year. General obligations currently outstanding are as follows:
Purpose Interest Rates Amount
Governmental activities 1.625 - 6.5% $11,388,989

WASHTENAW COUNTY
NOTES TO FINANCIAL STATEMENTS
-71-
Annual debt service requirements to maturity for general obligation bonds, notes and installment obligations are as follows:
Year Ending Governmental ActivitiesDecember 31 Principal Interest
2011 $ 807,754 $ 359,557
2012 935,721 391,416
2013 1,045,671 353,192
2014 815,216 315,959
2015 689,950 288,956
2016-2020 3,074,750 1,165,303
2021-2025 3,250,000 693,958
2026-2030 2,585,962 215,267
2031 230,000 2,876
13,435,024 3,786,484
Less available amount to draw (2,046,035) -
Total $ 11,388,989 $ 3,786,484
Road Commission. The Road Commission has a lease payable to the Washtenaw County Building Authority for the debt service costs related to bonds that were sold for the construction of Yard 2. The lease agreement terminates with the retirement of the bond issue in September 2013. The annual lease payment is equal to the related bond principal and interest. In addition, transportation fund notes were issued in accordance with the statutory requirements of Michigan Public Act 143 of 1943, as amended. The monies from these notes were used to fund improvements on county highways in Scio Township and Ypsilanti Township. Following is a summary of debt currently outstanding:
Purpose Interest Rates Amount
Governmental activities 2.0 - 4.5% $ 2,496,000

WASHTENAW COUNTY
NOTES TO FINANCIAL STATEMENTS
-72-
Annual principal and interest maturities as of December 31, 2010 are as follows:
Year Ending Governmental Activities
December 31 Principal Interest
2011 $ 750,000 $ 88,175
2012 780,000 61,019
2013 511,000 31,276
2014 70,000 13,872
2015 70,000 11,785
2016-2020 315,000 25,440
Total $ 2,496,000 $ 231,567
Changes in Long-Term Debt Long-term liability activity for the year ended December 31, 2010, was as follows:
Beginning Ending Due Within
Balance Additions Deductions Balance One Year Primary Government
Governmental activities:
Loan from State of Michigan $ 194,756 $ - $ (19,476) $ 175,280 $ 19,476
Capital leases 672,480 526,677 (488,036) 711,121 345,192
General obligation bonds 83,125,000 - (7,360,000) 75,765,000 6,835,000
Less deferred amounts for:
Issuance discounts (50,834) - 4,760 (46,074) -
Issuance premiums 407,732 - (55,443) 352,289 -
Refunding loss (796,529) - 120,458 (676,071) -
Compensated absences 13,883,371 8,574,534 (8,276,677) 14,181,228 1,531,441
$ 97,435,976 $ 9,101,211 $ (16,074,414) $ 90,462,773 $ 8,731,109
Business-type activities:
Delinquent tax revolving -
General obligation notes $ 25,000,000 $ 29,000,000 $ (28,000,000) $ 26,000,000 $21,000,000
Compensated absences 21,714 19,777 (14,224) 27,267 2,492
$ 25,021,714 $ 29,019,777 $ (28,014,224) $ 26,027,267 $21,002,492
The above deductions to capital leases of $488,036 includes a noncash reduction of $181,340 in the amount payable due to an adjustment of the lease agreement.

WASHTENAW COUNTY
NOTES TO FINANCIAL STATEMENTS
-73-
Beginning Ending Due WithinBalance Additions Deductions Balance One Year
Department of Public Works Projects: General obligation bonds 31,772,279$ 12,870,000$ (14,760,000)$ 29,882,279$ 1,890,000$ Less deferred amounts for: Issuance discounts (140,337) - 79,138 (61,199) - Issuance premiums 51,308 178,567 (20,477) 209,398 - Refunding gain - 865 (79) 786 - Refunding loss (102,880) (264,309) 33,191 (333,998) -
31,580,370$ 12,785,123$ (14,668,227)$ 29,697,266$ 1,890,000$
Water Resources Commissioner: General obligation bonds 6,894,714$ 3,730,213$ (560,000)$ 10,064,927$ 544,000$ Notes payable 1,829,267 524,500 (1,246,217) 1,107,550 227,950 Installment obligation 250,694 - (34,182) 216,512 35,804 Less deferred amounts for issuance discounts (54,232) (12,750) 4,132 (62,850) -
8,920,443$ 4,241,963$ (1,836,267)$ 11,326,139$ 807,754$
Road Commission: Michigan transportation fund notes 900,000$ $ - (300,000)$ 600,000$ 300,000$ Special assessment 320,000 349,000 (18,000) 651,000 55,000 Lease payable 1,620,000 - (375,000) 1,245,000 395,000 Less deferred amounts for refunding loss (54,188) - 13,547 (40,641) - Compensated absences 930,980 751,023 (780,028) 901,975 58,764
3,716,792$ 1,100,023$ (1,459,481)$ 3,357,334$ 808,764$
Component Units
Internal service funds predominantly serve the governmental funds; accordingly, long-term liabilities for those funds are included as part of the above totals for governmental activities. At year end, $283,335 of internal service funds compensated absences are included in the above amounts. Also, for the governmental activities, compensated absences and net pension and other postemployment benefits obligations are generally liquidated by the general fund. IV. OTHER INFORMATION A. Risk Management
The County is exposed to various risks of loss related to torts; theft of, damage to, and destruction of assets; errors and omissions; injuries to employees; and natural disasters. The County has established internal service funds to account for and finance its uninsured risks of loss. Under this program, the internal service funds provide coverage up to a maximum of $350,000 for each general liability, police liability or property claim, with no loss fund. The internal service funds also provide coverage up to $350,000 for any settlement, with all attorney fees being covered under the insurance policy for public officials and employee liability claims, up to $400,000 for each worker’s compensation claim, and up to $250,000 for each professional liability claim. The County purchases commercial insurance for claims in excess of coverage provided by the funds and for all other risks of loss.

WASHTENAW COUNTY
NOTES TO FINANCIAL STATEMENTS
-74-
All funds of the County participate in the program and make payments to the internal service funds based on rates established to fund estimated actual liabilities. The total claims liability of $3,237,000 reported in the funds at December 31, 2010, is based on the requirements of Governmental Accounting Standards Board Statement No. 10, as amended, which requires that a liability for claims be reported if information prior to the issuance of the financial statements indicates that it is probable that a liability has been incurred at the date of the financial statements and the amount of the loss can be reasonably estimated. The County has estimated its ultimate liability based upon estimates of known claims and actuarial based computations of incurred but not reported claims. The claims liability is presented at its net present value using an annual discount rate of 6%. Changes in the funds’ claims liability amount for the past two years were:
2010 2009
Balance at beginning of year $ 2,958,000 $ 2,813,000
Current year claims and changes
in estimates 22,662,979 25,333,500
Claims paid (22,383,979) (25,188,500)
Balance at end of year $ 3,237,000 $ 2,958,000
Component units participate in the County’s self-insurance program, except for the Road Commission, which purchases commercial insurance for health care claims and participates in the Michigan County Road Commission Self-Insurance Pool for claims relating to property loss, torts, and errors and omissions. The Michigan County Road Commission Self-Insurance Pool program operates as a common risk-sharing management program for local units of government in Michigan; member premiums are used to purchase commercial excess insurance coverage and to pay member claims in excess of deductible amounts. Settled claims relating to commercial insurance have not exceeded the amount of insurance coverage in any of the past three fiscal years. B. Contingent Liabilities Amounts received or receivable from grantor agencies are subject to audit and adjustment by those agencies, principally the federal government. Any disallowed claims, including amounts already collected, may constitute a liability of the applicable funds. The amount, if any, of expenditures which may be disallowed by grantor agencies cannot be determined at this time although the County expects such amounts, if any, to be immaterial. The County is a defendant in various lawsuits. Although the outcome of these lawsuits is not presently determinable, it is the opinion of the County’s counsel that resolution of these matters will not have a material adverse effect on the financial condition of the County.

WASHTENAW COUNTY
NOTES TO FINANCIAL STATEMENTS
-75-
C. Property Taxes County property taxes are levied annually on July 1 (the lien date) to fund operations for the current year. The property taxes are due in full within nine months (prior to March 1), at which time uncollected taxes became delinquent. The assessed value of real and personal property is established by the local units, accepted by the County and equalized under State statute at approximately 50% of the current estimated market value. In March 1994, Michigan voters approved Proposal A, which limits annual increases in assessed values to the lesser of 5% or the rate of inflation with assessed value reverting to 50% of true cash value when the property is sold. Property taxes are levied based on the taxable value of the property (as defined under Proposal A). Taxable value is determined by using such factors as equalized, assessed and capped values, along with a value change multiplier. The taxable value of real and personal property for the July 1, 2010 general operating levy was $14.5 billion. The general operating tax rate for this levy was at the maximum rate of 4.5493 mills, as adjusted by the Headlee Amendment to the State of Michigan Constitution. The County also had voter approved taxes of 0.4720 mills for parks and recreation purposes, 0.2409 mills for purchase of selected natural areas in the County, and 0.2000 mills for enhancements to emergency communications system, as well as Board of Commissioner approved levies of 0.0250 mills for veterans relief purposes and .0430 mills to promote the agricultural, industrial and tourist advantages of Washtenaw County pursuant to Public Act 88 of 1913 (MCLA 46.161), on the December 1, 2010 voter-approved levy. By agreement with various taxing authorities, the County purchases at face value the real property taxes returned delinquent each March 1 and records a corresponding delinquent taxes receivable. These receivables ($22.9 million at December 31, 2010, not including accrued interest and collection fees) are pledged to a bank for payment of the notes payable and subsequent collection of the receivables, interest and collection fees thereon, and investment earnings are used to extinguish the debt.
D. Joint Venture In 1999, the County entered into an agreement with the University of Michigan (the “University”) to form the Washtenaw Community Health Organization (WCHO) for the purpose of establishing an integrated health care delivery system to provide mental health, substance abuse, and primary and specialty health care to Medicaid, low income and indigent consumers as defined by the Michigan Mental Health Code and Medicaid eligibility guidelines. WCHO is governed by a 12-member board; both the County and University appoint six members each. Under the agreement, WCHO replaced the County as the contractor for the mental health and substance abuse managed care contracts with the State of Michigan. This change was effective October 1, 2000, and currently provides the primary source of funding for WCHO.

WASHTENAW COUNTY
NOTES TO FINANCIAL STATEMENTS
-76-
The agreement also provides that the County and University will share equally in any gains or losses generated by WCHO, subject to certain limitations. However, because the agreement prohibits the distribution of any assets until WCHO is terminated and/or dissolved (and there are specific restrictions on the use of gains under the managed care contracts with the State of Michigan), WCHO is deemed to be a “joint venture with no equity interest.” Accordingly, no amounts are reported in the accompanying financial statements for the County’s equity in WCHO. WCHO has a September 30 fiscal year end. Financial information may be obtained by writing to WCHO at P.O. Box 917, Ypsilanti, Michigan 48197. E. Jointly Governed Organizations The Aerotropolis Development Corporation (ADC) was created by an intergovernmental agreement under the Urban Cooperation Act (P.A. 7 of 1967). The creation of the ADC is an exciting initiative being implemented by Washtenaw County, Detroit Renaissance, Wayne County, Wayne County Airport Authority, leading business executives in Michigan, and the following seven local communities surrounding Detroit Metropolitan and Willow Run airports: the cities of Belleville, Romulus and Ypsilanti, and the townships of Huron, Taylor, Van Buren and Ypsilanti. The Aerotropolis is a proposed airport city encompassing approximately 60,000 acres of land in Wayne and Washtenaw counties. The airport city concept involves the clustering of air-commerce linked business adjacent to and surrounding the airports. As vested stakeholders, all participating entities have embraced the regional collaboration necessary for member governments to work as partners to attract businesses, to create jobs, to master plan, and to work cooperatively to build a better future for the region and the State of Michigan. The County has no significant influence over the management of the ADC. The agreement includes financial support from local governments and businesses. Therefore, the ADC is not included in the County’s financial report. Separate financial statements for the ADC may be obtained by writing to the Aerotropolis Development Corporation, 600 Randolph, Third Floor, Detroit, Michigan 48226. The Livingston and Washtenaw Narcotics Enforcement Team (LAWNET) was organized to create a cooperative team of narcotics investigators made up of personnel from municipal, county, state, and federal law enforcement agencies within Livingston and Washtenaw counties for the purpose of combining their efforts toward the enforcement of narcotic and controlled substance laws in the State of Michigan. The participating entities include the Michigan Department of State Police, Livingston County, Washtenaw County, City of Ann Arbor, City of Brighton, City of Fowlerville, City of Howell, City of Milan, City of Saline, City of Ypsilanti, Eastern Michigan University, Green Oak Township, Northfield Township and Pittsfield Township. Participating entities are required to make an annual contribution or else assign a qualified law enforcement officer to LAWNET. Washtenaw County serves as the fiduciary for LAWNET monies. The LAWNET Command Board is made up of the administrative heads, or their representatives, of the police agencies of the participating entities and the prosecuting attorneys from Washtenaw and Livingston counties.

WASHTENAW COUNTY
NOTES TO FINANCIAL STATEMENTS
-77-
Separate financial statements for LAWNET may be obtained by writing to the Washtenaw County Finance Department, 220 North Main Street, Ann Arbor, Michigan 48104 or by calling (734) 222-6750. The Washtenaw Central Dispatch and Technology Authority (WCDTA) was originally established to provide centralized public safety dispatching for law enforcement, fire and emergency medical services to the Sheriff’s Department, the Michigan State Police, Northfield Township Police, Huron Valley Ambulance, the townships of Ann Arbor, Augusta, Manchester, Northfield, Salem, Scio and Superior, and Dexter Area Fire Department. The organization is governed by a 12-member board. There was no financial activity for the Authority for the year ended December 31, 2010. Public safety dispatching services for the Sheriff’s Department, Northfield Township Police and the Michigan State Police were provided by the County during 2010. The County has no significant influence over the management of WCDTA. Therefore, WCDTA is not included in the County’s financial report. The Washtenaw County 800 MHz Communications Consortium (the Consortium) was formed to provide for the governance and management of a public safety/public service communications system that delivers reliable, interoperable wireless communications throughout Washtenaw County. The County and the cities of Ann Arbor, Saline, and Milan are charter members of the Consortium. The Consortium is governed by a board made up of representatives from all member agencies. The County has no significant influence over the management of the Consortium. Financial accountability is limited to the extent of any appropriated operating grant. Therefore, the Consortium is not included in the County’s financial report. Separate financial statements for the Consortium may be obtained by writing to the Washtenaw County Finance Department, 220 North Main Street, Ann Arbor, Michigan 48107 or by calling (734) 222-6750. The Washtenaw Educational Telecommunications System Consortium (the Consortium) was formed by an agreement between Washtenaw County, Eastern Michigan University, Merit Networks and Fiber Link LLC. The purpose of the Consortium is to share telecommunications resources related to the County’s fiber network construction and the sharing of recurring costs related to the ongoing maintenance and repair of the fiber network. The Consortium agreement is for a period of five years with the option to renew, and also permits other governmental partners to be included in the future, which may further reduce operating and maintenance costs. The Consortium agreement holds no monetary value. However, this agreement will enable the County and its partners to recognize reductions in operational costs for shared and common areas.

WASHTENAW COUNTY
NOTES TO FINANCIAL STATEMENTS
-78-
The Washtenaw Urban County was created by a formal cooperation agreement between the County, City of Ann Arbor, City of Ypsilanti and the following townships: Ann Arbor, Bridgewater, Northfield, Pittsfield, Salem, Scio, Superior, York and Ypsilanti. The Urban County jurisdictions receive HOME (Home Investment Partnership Program) funds, CDBG (Community Development Block Grant), CDBG NSP (Neighborhood Stabilization Program), CDBG-R (Community Development Block Grant – Recovery), and ESG (Emergency Shelter Grant) funds for use in those jurisdictions to address community development, human services, housing and homelessness needs. The chairperson of the Washtenaw County Board of Commissioners and the chief elected officials of the eleven jurisdictions participating in the Urban County have joined together to form the Urban County Executive Committee. The Urban County Executive Committee serves as the decision-making body for those funds. As a recipient of HOME, CDBG and ESG funds, the Washtenaw Urban County is required to submit a 5-year Consolidated Plan as well as an Annual Action Plan to the U.S. Department of Housing and Urban Development. Financial information may be obtained by writing to the Washtenaw County Finance Department, 220 North Main Street, Ann Arbor, Michigan 48107 or by calling (734) 222-6750. F. Pension and Other Postemployment Benefits The County provides pension and postemployment health care benefits to eligible employees through three County administered plans – the Employees’ Retirement System (ERS), Money Purchase Pension Plan (MPPP), and Voluntary Employees’ Beneficiary Association (VEBA) – and a separate plan through the Municipal Employees’ Retirement System of Michigan (MERS) The County issues publicly available financial reports for ERS, MPPP and VEBA that include financial statements and required supplementary information, as applicable. These financial reports may be obtained by writing to Washtenaw County Finance Department, 220 North Main Street, Ann Arbor, Michigan 48107 or by calling (734) 222-6750. Information regarding the aforementioned plans is presented below. County Administered Plans – Plan Descriptions, Funding Policies and Other Disclosures Employees’ Retirement System (ERS). The County has a single-employer defined benefit retirement plan which provides pension benefits to all full-time, regular employees. County Ordinances assign the authority to establish and amend benefit provisions and contribution requirements to the County Board of Commissioners, subject to the terms of collective bargaining agreements. Sheriff and non-Sheriff department Plan members are required to contribute 7.5% and 8.0%, respectively, of their annual compensation to the System for pension benefits. The County’s contribution for the Sheriff and non-Sheriff department Plan members for the year ended December 31, 2010, represents 987.60% and 8.70%, respectively, of annual covered payroll.

WASHTENAW COUNTY
NOTES TO FINANCIAL STATEMENTS
-79-
The County’s annual pension cost and net pension obligation for the current year are as follows:
Annual required contribution / retirement benefit cost $ 6,516,006
Contributions made 6,516,006
Increase (decrease) in net retirement benefit obligation -
Net retirement benefit obligation, beginning of year -
Net retirement benefit obligation, end of year $ -
The annual required contribution for the current year was determined as part of the December 31, 2008, actuarial valuation using the aggregate cost actuarial funding method, which does not identify or separately amortize unfunded actuarial liabilities.
Three-Year Trend Information
Annual
Pension Percentage Net
Cost of APC Pension
Year Ended (APC) Contributed Obligation
12/31/08 $ 5,359,824 100% $ -
12/31/09 6,752,093 100 -
12/31/10 6,516,006 100 - Funded Status and Funding Progress. The funded status of the System as of December 31, 2009, the date of the most recent actuarial valuation, is as follows:
Actuarial accrued liability (AAL) (1) 271,514,028$ Actuarial value of assets (2) 201,112,644 Unfunded AAL (UAAL) (3) 70,401,384$ (1) - (2)
Funded ratio (4) 74.1% (2) / (1)
Covered payroll (5) 58,041,444$
UAAL as % of covered payroll (6) 121.3% (3) / (5)

WASHTENAW COUNTY
NOTES TO FINANCIAL STATEMENTS
-80-
Actuarial valuations of an ongoing plan involve estimates of the value of reported amounts and assumptions about the probability of occurrence of events far into the future. Examples include assumptions about future employment and mortality. Actuarially determined amounts are subject to continual revision as actual results are compared with past expectations and new estimates are made about the future. The schedule of funding progress, presented as required supplementary information following the notes to the financial statements, presents multiyear trend information about whether the actuarial values of trust assets are increasing or decreasing over time relative to the actuarial accrued liabilities for benefits. For purposes of the schedule of funding progress, the actuarial accrued liability value as shown above is determined using the entry age actuarial cost method. However, for purposes of calculating the annual required contribution (ARC), the System uses the aggregate cost actuarial funding method, which does not identify or separately amortize unfunded actuarial liabilities.
The accompanying schedule of employer contributions presents trend information about the amounts contributed to the System by the employer in comparison to the ARC (annual required contribution), an amount that is actuarially determined in accordance with the parameters of GASB Statement No. 27. The ARC represents a level of funding that, if paid on an ongoing basis, is projected to cover normal cost for each year and amortize any unfunded actuarial liabilities (or funding excess) over a period not to exceed 30 years. Actuarial Methods and Assumptions. Projections of benefits for financial reporting purposes are based on the substantive plan (the plan understood by the employer and plan members) and include the types of benefits provided at the time of each valuation and the historical pattern of sharing of benefit costs between the employer and plan members to that point. The actuarial methods and assumptions used include techniques that are designed to reduce the effects of short-term volatility in actuarial accrued liabilities and the actuarial value of assets, consistent with a long-term perspective. Additional information as of the latest actuarial valuation includes:
Valuation date 12/31/09 Actuarial cost method Aggregate cost method for Sheriff’s division; Entry-age normal cost for General division Amortization method General Division liabilities funded as a level percent of payroll over 29 years. Sheriff’s division liabilities were amortized over nine years using level dollar method. Asset valuation method Market value with 5-year smoothing of gains and losses Actuarial assumptions: Investment rate of return 7.75% Projected salary increases 4.5% to 11.9% (including inflation of 4.5%) Cost-of-Living Adjustments None

WASHTENAW COUNTY
NOTES TO FINANCIAL STATEMENTS
-81-
Money Purchase Pension Plan. The Washtenaw County Money Purchase Pension Plan (MPPP; the “Plan”) is a defined contribution pension plan established and administered by Washtenaw County to provide benefits at retirement to all regular County employees hired on or after January 1, 1989; however, most Plan members were required to withdraw from MPPP during 2008 and 2009 and enroll in ERS. Accordingly, MPPP member account balances were transferred to ERS. Plan members are required to contribute 6% or 7.5% of covered salary depending on the particular collective bargaining unit to which they belong. The County is required to match the plan member contributions. Plan provisions and contribution requirements are established and may be amended by the Washtenaw County Board of Commissioners, subject to the County’s various collective bargaining agreements. The employer and employee contributions totaled $17,271 each for the year ended December 31, 2010. At December 31, 2010, there were twelve members. Voluntary Employees’ Beneficiary Association. The Washtenaw County Voluntary Employees’ Beneficiary Association (VEBA; the “Plan”) is a single-employer defined benefit post-employment healthcare plan established and administered by Washtenaw County to provide medical and healthcare benefits for retirees and their beneficiaries. Eligible participants include any retirees who receive pension benefits under one of the County’s pension plans. Plan provisions are established and may be amended by the Washtenaw County Board of Commissioners, subject to the County’s various collective bargaining agreements. The Plan is funded by a trust agreement established pursuant to Section 501(c)(9) of the Internal Revenue Code which allows for the formation of a VEBA. Subject to certain age and length of service requirements, eligible participants receive the same or comparable medical insurance coverage under the Plan as was in effect at the time of their employment. At such time that participants become Medicare eligible, the benefits under the Plan change to Medicare Supplemental coverage. Employer contributions to fund the Plan are currently on a pay-as-you-go basis with additional contributions intended to build the fund for purposes of paying future benefits. Employer contributions for the year ended December 31, 2010 were $12,579,185. Although an actuarial valuation of the Plan was completed during 2009, the County has determined that it will establish an annual employer contribution rate using the actuarial valuation as a reference, but not as a definitive requirement. Employees were not required to contribute to the Plan. As of December 31, 2010, 730 members received healthcare benefits under the Plan, and the cost of those benefits amounted to $6,563,154. Annual OPEB Cost and Net OPEB Obligation. The County’s annual other postemployment benefits (OPEB) cost is calculated based on the annual required contribution (ARC) of the employer, an amount actuarially determined in accordance with the parameters of GASB Statement No. 45. The ARC represents a level of funding that, if paid on an ongoing basis, is projected to cover normal cost each year and amortize any unfunded actuarial liabilities over a period not to exceed 30 years.

WASHTENAW COUNTY
NOTES TO FINANCIAL STATEMENTS
-82-
The following table shows the components of the County’s annual OPEB cost for the year, the amount actually contributed to the Plan, and changes in the County’s net OPEB obligation to the Plan:
Annual required contribution 12,073,876$ Interest on net OPEB obligation 406,138 Adjustment to annual required contribution (263,942) Annual OPEB cost 12,216,072$ Contributions made (12,579,185) Decrease in net OPEB obligation (363,113) Net OPEB obligation, beginning of year 5,415,176 Net OPEB obligation, end of year 5,052,063$
The County’s annual OPEB cost, the percentage of annual OPEB cost contributed to the Plan, and the net OPEB obligation as of December 31, 2010, and the two preceding years, were as follows:
Fiscal Percentage of NetYear Annual Annual OPEB OPEB
Ended OPEB Cost Cost Contributed Obligation
12/31/08 13,387,907$ 81.9% 4,736,456$ 12/31/09 10,946,582 93.8% 5,415,176 12/31/10 12,216,072 103.0% 5,052,063
Funded Status and Funding Progress. The funded status of the Plan as of December 31, 2009, the date of the most recent actuarial valuation, is as follows:
Actuarial accrued liability (AAL) (1) 192,041,852$ Actuarial value of assets (2) 52,375,567 Unfunded AAL (UAAL) (3) 139,666,285$ (1) - (2)
Funded ratio (4) 27.3% (2) / (1)
Covered payroll (5) 75,950,342$
UAAL as % of covered payroll (6) 183.9% (3) / (5)

WASHTENAW COUNTY
NOTES TO FINANCIAL STATEMENTS
-83-
Actuarial valuations of an ongoing plan involve estimates of the value of reported amounts and assumptions about the probability of occurrence of events far into the future. Examples include assumptions about future employment, mortality, and the healthcare cost trend. Amounts determined regarding the funded status of the trust and the annual required contributions of the employer are subject to continual revision as actual results are compared with past expectations and new estimates are made about the future. The schedule of funding progress, presented as required supplementary information following the notes to the financial statements, presents multiyear trend information about whether the actuarial values of trust assets are increasing or decreasing over time relative to the actuarial accrued liabilities for benefits. The accompanying schedule of employer contributions presents trend information about the amounts contributed to the Plan by the employer in comparison to the ARC (annual required contribution), an amount that is actuarially determined in accordance with the parameters of GASB Statement No. 45. The ARC represents a level of funding that, if paid on an ongoing basis, is projected to cover normal cost for each year and amortize any unfunded actuarial liabilities (or funding excess) over a period not to exceed 30 years. Actuarial Methods and Assumptions. Projections of benefits for financial reporting purposes are based on the substantive plan (the plan as understood by the employer and the plan members) and include the types of benefits provided at the time of each valuation and the historical pattern of sharing of benefit costs between the employer and plan members to that point. The actuarial methods and assumptions used include techniques that are designed to reduce the effects of short-term volatility in actuarial accrued liabilities and the actuarial value of assets, consistent with the long-term perspective of the calculations. Additional information as of the latest actuarial valuation includes:
Valuation date 12/31/09 Actuarial cost method Entry age Amortization method Level percentage of pay, closed Remaining amortization period 28 years Asset valuation method 5-year smoothed market Actuarial assumptions: Investment rate of return 7.5% Projected salary increases 5.0% Healthcare cost trend rate 9% initial; 5% ultimate
A publicly available financial report that includes financial statements and required supplementary information for the VEBA may be obtained by writing to the Washtenaw County Human Resources Department, 220 North Main Street, Ann Arbor, Michigan 48107 or by calling (734) 222-6800.

WASHTENAW COUNTY
NOTES TO FINANCIAL STATEMENTS
-84-
County Administered Plans – Summary of Significant Accounting Policies The financial statements of ERS, MPPP and VEBA are prepared using the accrual basis of accounting. Plan member contributions are recognized in the period in which the contributions are due. The County’s contributions are recognized when due and a formal commitment to provide the contributions has been made. Benefits and refunds are recognized when due and payable in accordance with the terms of the plans. Plan investments are reported at fair value. Short-term investments are reported at cost, which approximates fair value. Securities traded on a national or international exchange are valued at the last reported sales price at current exchange rates. Investments that do not have an established market are reported at estimated fair values. Municipal Employees’ Retirement System of Michigan The County participates in the Municipal Employees’ Retirement System of Michigan (MERS), an agent multiple-employer defined benefit pension plan providing retirement, death and disability benefits for certain full-time Washtenaw County Sheriff Department employees. The System is administered by the MERS Retirement Board. Act No. 427 of the Public Acts of 1984, as amended, establishes and amends the benefit provisions of the participants in MERS. A publicly available financial report that includes financial statements and required supplementary information for MERS may be obtained by writing to the Municipal Employees Retirement System of Michigan, 1134 Municipal Way, Lansing, Michigan 48917 or by calling (800) 767-6377. The County is required to contribute at an actuarially determined rate; the current rates are 10.29% for the Police Officers Association of Michigan (POAM) and 13.48% for the Command Officers Association of Michigan (COAM), of their annual covered payrolls. The POAM and COAM employees are required to contribute 8.50% of their annual covered payrolls. The contribution requirements of the County are established and may be amended by the MERS Retirement Board. The contribution requirements of plan members are established and may be amended by the County, subject to collective bargaining agreements and depending on the MERS contribution program adopted by the County. The County’s annual pension cost and net pension obligation for the current year are as follows:
Annual required contribution / retirement benefit cost $ 2,169,087
Contributions made 2,169,087
Increase (decrease) in net retirement benefit obligation -
Net retirement benefit obligation, beginning of year -
Net retirement benefit obligation, end of year $ -

WASHTENAW COUNTY
NOTES TO FINANCIAL STATEMENTS
-85-
The required contribution was determined as part of the December 31, 2008 actuarial valuation using the entry age normal cost method. The actuarial assumptions included: (a) a rate of return on the investment of present and future assets of 8.0%; (b) projected salary increases of 4.5% per year compounded annually, attributable to inflation; and (c) additional projected salary increases of 0.0% to 8.4% per year, depending on age, attributable to seniority/merit. The actuarial value of MERS assets was determined on the basis of a valuation method that assumes the fund earns the expected rate of return and includes an adjustment to reflect fair value. The County’s unfunded actuarial accrued liability is being amortized as a level percentage of projected payroll on an open basis. The remaining amortization period is 28 years.
Three-Year Trend Information
Annual
Pension Percentage Net
Cost of APC Pension
Year Ended (APC) Contributed Obligation
12/31/08 $ 1,317,421 100% $ -
12/31/09 1,546,281 100 -
12/31/10 2,169,087 100 - Funded Status and Funding Progress. The funded status of the MERS as of December 31, 2009, the date of the most recent actuarial valuation, is as follows:
Actuarial accrued liability (AAL) (1) 43,001,103$ Actuarial value of assets (2) 38,243,998 Unfunded AAL (UAAL) (3) 4,757,105$ (1) - (2)
Funded ratio (4) 88.9% (2) / (1)
Covered payroll (5) 17,808,892$
UAAL as % of covered payroll (6) 26.7% (3) / (5)
A schedule of funding progress presents multiyear trend information about whether the actuarial values of trust assets are increasing or decreasing over time relative to the actuarial accrued liabilities for benefits. The accompanying schedule of employer contributions presents trend information about the amounts contributed to the System by the employer in comparison to the ARC.

WASHTENAW COUNTY
NOTES TO FINANCIAL STATEMENTS
-86-
Projections of benefits for financial reporting purposes are based on the substantive plan (the plan understood by the employer and plan members) and include the types of benefits provided at the time of each valuation and the historical pattern of sharing of benefit costs between the employer and plan members to that point. The actuarial methods and assumptions used include techniques that are designed to reduce the effects of short-term volatility in actuarial accrued liabilities and the actuarial value of assets, consistent with the long-term perspective of the calculations. Additional information as of the latest actuarial valuation includes:
Valuation date 12/31/09 Actuarial cost method Entry age normal cost Amortization method Level percent of pay (open); for divisions that are closed, a 30-year level dollar method is used Asset valuation method 10-year smoothed market Actuarial assumptions: Investment rate of return 8.0% Projected salary increases 2.0% to 12.9% (including 2.0% inflation) Cost-of-living adjustments None
Component Unit – Pension Plan The Road Commission participates in MERS, an agent multiple-employer defined benefit pension
plan that covers nearly all employees of the Road Commission. The Road Commission’s MERS plan is separate from that of the County’s. The system provides retirement, disability, and death benefits to plan members and their beneficiaries. MERS issues a publicly available financial report that includes financial statements and required supplementary information for the system. That report may be obtained by writing to the system at 1134 Municipal Way, Lansing, Michigan 48917.
The obligation to contribute to and maintain the system for these employees was established by
resolution of the Road Commission Board. For the year ended December 31, 2010, the Road Commission’s annual pension cost of $1,081,091 for
the plan was equal to the Road Commission’s actual contribution which was determined as part of an actuarial valuation at December 31, 2008, using the entry age normal cost method. Significant actuarial assumptions used include: (a) an 8.0% investment rate of return; (b) projected salary increases of 4.5% to 12.9% per year, which includes an inflation component of 4.5%; and (c) no post retirement benefit increases. The actuarial value of assets was determined using techniques that smooth the effects of short-term volatility over a four-year period. The unfunded actuarial liability is being amortized as a level percentage of payroll on a closed basis. The amortization period is 28 years. Employees are required to contribute 5.0% of their annual covered payroll.

WASHTENAW COUNTY
NOTES TO FINANCIAL STATEMENTS
-87-
The valuation’s computed contributions and actual funding are summarized as follows:
Annual required contribution $ 1,081,091
Amounts contributed/pension cost 1,081,091
Increase (decrease) in net pension obligation -
Net pension obligation, beginning of year -
Net pension obligation, end of year $ -
Funded Status and Funding Progress. The funded status of the MERS as of December 31, 2009, the date of the most recent actuarial valuation, is as follows:
Actuarial accrued liability (AAL) (1) 45,511,537$ Actuarial value of assets (2) 32,212,344 Unfunded AAL (UAAL) (3) 13,299,193$ (1) - (2)
Funded ratio (4) 70.8% (2) / (1)
Covered payroll (5) 7,459,083$
UAAL as % of covered payroll (6) 178.3% (3) / (5)
Complete disclosures regarding the Road commission’s MERS plan are presented in the Road Commission’s financial report (see page 42 for contact information).
Component Unit – Other Postemployment Benefit Plan The Road Commission also participates in an agent multiple-employer defined benefit health care plan through MERS that covers all full time employees of the Road Commission. The Road Commission’s MERS health care plan is separate from that of the County’s. The system provides health care, dental, and death benefits to all full time employees upon retirement. MERS issues a publicly available financial report that includes financial statements and required supplementary information for the system. That report may be obtained by writing to the system at 1134 Municipal Way, Lansing, Michigan 48917. The Road Commission has no obligation to make contributions in advance of when the insurance premiums are due for payment (in other words, this may be financed on a “pay-as-you-go” basis). However, as shown below, the Road Commission has made contributions to advance-fund these benefits, as determined by the Board of Commissioners through annual budget resolutions.

WASHTENAW COUNTY
NOTES TO FINANCIAL STATEMENTS
-88-
Annual OPEB Cost and Net OPEB Obligation. The Road Commission’s annual OPEB cost is calculated based on the annual required contribution of the employer, an amount actuarially determined in accordance with the parameters of GASB Statement No. 45. The ARC represents a level of funding that, if paid on an ongoing basis, is projected to cover normal cost each year and amortize any unfunded actuarial liabilities over a period not to exceed 30 years. The following table shows the components of the Road Commission’s annual OPEB cost for the year, the amount actually contributed to the system, and changes in the Road Commission’s net OPEB obligation to the system:
Annual required contribution 1,847,498$ Interest on net OPEB obligation 21,004 Adjustment to annual required contribution - Annual OPEB cost (expense) 1,868,502$ Contributions: Payments of current premiums (1,181,951) Advance funding (641,585) Increase in net OPEB obligation 44,966 Net OPEB obligation, beginning of year 262,556 Net OPEB obligation, end of year 307,522$
The Road Commission’s annual OPEB cost, the percentage of annual OPEB cost contributed to the system, and the net OPEB obligation as of December 31, 2010, were as follows:
Fiscal Percentage of NetYear Annual Annual OPEB OPEB
Ended OPEB Cost Cost Contributed Obligation
12/31/08 1,570,073$ 93.10% 261,546$ 12/31/09 1,761,559 99.94% 262,556 12/31/10 1,868,502 97.59% 307,522

WASHTENAW COUNTY
NOTES TO FINANCIAL STATEMENTS
-89-
Funded Status and Funding Progress. The funded status of the system as of December 31, 2008, the date of the most recent actuarial valuation, is as follows:
Actuarial accrued liability (AAL(1) 25,209,139$ Actuarial value of assets (2) 1,729,732 Unfunded AAL (UAAL) (3) 23,479,407$
Funded ratio (4) 6.86%
Covered payroll (5) 7,459,083$
UAAL as % of covered payroll (6) 314.78%
Complete disclosures regarding the Road Commission’s OPEB plan are presented in the Road Commission’s financial report (see page 42 for contact information).
* * * * *

Required Supplementary Information

-90-
WASHTENAW COUNTYEmployees' Retirement System
Required Supplementary Information
Schedule of Funding Progress - Pension Only
(1) (2) (3) (4) (5) (6)Actuarial UAAL as a
Actuarial Accrued Unfunded % ofValuation Actuarial Liability AAL Funded Covered
Date Value of (AAL) (UAAL) Ratio Covered PayrollDecember 31 Assets Entry Age (2-1) (1/2) Payroll (3/5)
2000 156,959,460$ 152,942,076$ (4,017,384)$ 102.6% 11,589,561$ -34.7%2001 163,564,179 166,381,778 2,817,599 98.3% 13,843,557 20.4%2002 157,473,610 169,389,000 11,915,390 93.0% 12,836,355 92.8%2003 157,237,691 173,989,111 16,751,420 90.4% 12,332,026 135.8%2004 150,576,655 177,524,551 26,947,896 84.8% 12,134,962 222.1%2005 145,093,140 177,684,410 32,591,270 81.7% 11,076,300 294.2%2006 145,235,953 181,591,924 36,355,971 80.0% 10,243,828 354.9%2007 150,229,089 190,725,826 40,496,737 78.8% 9,354,679 432.9%
2007* 210,446,657 265,463,304 55,016,647 79.3% 57,943,478 94.9%2008 209,556,482 270,299,282 60,742,800 77.5% 61,746,106 98.4%2009 201,112,644 271,514,028 70,401,384 74.1% 58,041,444 121.3%
Note:
*
Schedule of Employer Contributions
Year Annual AnnualEnded Required Actual Percentage
December 31 Contribution Contribution Contributed
2001 1,449,631$ 1,449,631$ 100.0%2002 1,456,780 1,456,780 100.0%2003 1,651,416 1,651,416 100.0%2004 2,451,764 2,451,764 100.0%
2005 2,700,525 2,700,525 100.0%
2006 3,845,384 3,845,384 100.0%
2007 4,827,249 4,827,249 100.0%
2008 5,359,824 5,359,824 100.0%
2009 6,752,093 6,752,093 100.0%
2010 6,516,006 6,516,006 100.0%
For purposes of the Schedule of Funding Progress, the actuarial accrued liability values as shown are determinedusing the entry age actuarial cost method. However, for purposes of calculating the ARC, the System uses theaggregate cost actuarial funding method, which does not identify or separately amortize unfunded actuarialliabilities.
Includes General division employees from the County's defined contribution plan (MPPP).

-91-
WASHTENAW COUNTYVoluntary Employees Beneficiary Association
Required Supplementary Information
SCHEDULE OF FUNDING PROGRESS
(1) (2) (3) (4) (5) (6)Actuarial UAAL asAccrued Unfunded a % of
Actuarial Actuarial Liability AAL Funded CoveredValuation Value of (AAL) - (UAAL) Ratio Covered Payroll
Date Assets Entry Age (2-1) (1/2) Payroll (3/5)
12/31/04 30,159,739$ 150,053,560$ 119,893,821$ 20.1% 69,804,470$ 171.8%12/31/05 31,646,289 149,890,222 118,243,933 21.1% 71,477,954 165.4%12/31/06 37,653,565 183,743,134 146,089,569 20.5% 75,492,444 193.5%12/31/07 44,747,254 164,107,793 119,360,539 27.3% 76,546,962 155.9%12/31/08 48,980,535 194,580,255 145,599,720 25.2% 79,802,651 182.4%12/31/09 52,375,567 192,041,852 139,666,285 27.3% 75,950,342 183.9%
SCHEDULE OF CONTRIBUTIONS FROM THEEMPLOYER AND OTHER CONTRIBUTING ENTITY
Annual AnnualYear Required Actual Percentage Net OPEB
Ended Contribution Contribution Contributed Obligation
2006 12,013,367$ 8,035,887$ 66.9% -$ 2007 11,952,578 9,640,671 80.7% 2,311,907 2008 13,329,469 10,963,355 82.2% 4,736,456 2009 10,807,274 10,267,862 95.0% 5,415,176 2010 12,073,876 12,579,185 104.2% 5,052,063

-92-
WASHTENAW COUNTYMunicipal Employees' Retirement System of Michigan
Required Supplementary Information
Schedule of Funding Progress - Pension Only
(1) (2) (3) (4) (5) (6)Actuarial UAAL as a
Actuarial Accrued Unfunded % ofValuation Actuarial Liability AAL Funded Covered
Date Value of (AAL) (UAAL) Ratio Covered PayrollDecember 31 Assets Entry Age (2-1) (1/2) Payroll (3/5)
2000 8,825,067$ 10,626,535$ 1,801,468$ 83.0% 9,571,961$ 18.8%2001 10,576,339 12,361,200 1,784,861 85.6% 11,020,092 16.2%2002 12,389,117 15,438,644 3,049,527 80.2% 13,046,728 23.4%2003 15,087,281 18,117,442 3,030,161 83.3% 14,256,334 21.3%2004 17,732,213 22,080,360 4,348,147 80.3% 15,616,254 27.8%2005 20,743,229 25,523,316 4,780,087 81.3% 15,716,990 30.4%2006 24,068,415 33,442,555 9,374,140 72.0% 17,188,529 54.5%2007 28,502,361 39,234,595 10,732,234 72.6% 18,526,314 57.9%2008 32,923,716 45,653,463 12,729,747 72.1% 18,192,992 70.0%2009 38,243,998 43,001,103 4,757,105 88.9% 17,808,892 26.7%
Schedule of Employer Contributions
Year Annual AnnualEnded Required Actual Percentage
December 31 Contribution Contribution Contributed
2001 650,166$ 650,166$ 100.0%2002 783,326 783,326 100.0%2003 774,093 774,093 100.0%2004 956,387 956,387 100.0%
2005 972,278 972,278 100.0%
2006 1,187,154 1,187,154 100.0%
2007 1,264,818 1,264,818 100.0%
2008 1,317,421 1,317,421 100.0%
2009 1,546,281 1,546,281 100.0%
2010 2,169,087 2,169,087 100.0%

Supplementary Information

-93-
WASHTENAW COUNTYCombining Balance Sheet - Nonmajor Governmental Funds
December 31, 2010
Special Revenue Funds
AccommodationOrdinance Aerial Building Community Community
Tax Photo Services Child Care Corrections DevelopmentASSETS
AssetsCash and pooled investments 560,391$ 123,605$ 66,694$ 158,871$ 127,825$ -$ Receivables:
Taxes - current - - - - - - Accounts 190,772 - - - 604 -
Due from other governments - - 372 631,273 96,240 2,348,034 Notes receivable - - - - - - Prepaid items - - - - - -
TOTAL ASSETS 751,163$ 123,605$ 67,066$ 790,144$ 224,669$ 2,348,034$
LIABILITIESAND FUND BALANCES
LiabilitiesAccounts payable 427,322$ -$ -$ 47,736$ 40,237$ 138,281$ Accrued liabilities 1,082 - 15,207 151,969 16,365 31,722 Due to other governments - - - - - - Interfund payable - - - - - 2,100,712 Deferred revenue - - - - - - Advances from other governments - - - - - -
Total liabilities 428,404 - 15,207 199,705 56,602 2,270,715
Fund balancesReserved for prepaid items - - - - - - Unreserved, undesignated 322,759 123,605 51,859 590,439 168,067 77,319
Total fund balances 322,759 123,605 51,859 590,439 168,067 77,319
TOTAL LIABILITIESAND FUND BALANCES 751,163$ 123,605$ 67,066$ 790,144$ 224,669$ 2,348,034$

-94-
Special Revenue Funds
Economic EmploymentDepartment Development Economic Training and Environ- Friendof Human and Development Community mental of the Head HIDTAServices E-911 Energy Millage Services Health Court Start Grant
37,462$ 50,379$ 20,381$ 161,705$ 23,222$ 496,351$ -$ 90,229$ -$
- - - 527,745 - - - - - - 466,805 - - - 36,126 - - -
80,194 137,447 - - 1,199,366 16,679 1,485,405 184,790 445,543 - - - - - - - - - - - - - 35,550 - - - -
117,656$ 654,631$ 20,381$ 689,450$ 1,258,138$ 549,156$ 1,485,405$ 275,019$ 445,543$
-$ 263,702$ -$ -$ 399,857$ -$ 2,940$ 62,555$ 119,066$ - 3,626 10,779 4,986 76,472 92,801 155,038 62,734 19,936 - - - - - - 1,822 - - - - - - - - 1,325,605 - 306,541 - - - 609,469 328,630 - - - -
78,000 - - - - - - - -
78,000 267,328 10,779 614,455 804,959 92,801 1,485,405 125,289 445,543
- - - - 35,550 - - - - 39,656 387,303 9,602 74,995 417,629 456,355 - 149,730 -
39,656 387,303 9,602 74,995 453,179 456,355 - 149,730 -
117,656$ 654,631$ 20,381$ 689,450$ 1,258,138$ 549,156$ 1,485,405$ 275,019$ 445,543$
Continued…

-95-
WASHTENAW COUNTYCombining Balance Sheet - Nonmajor Governmental Funds (Concluded)
December 31, 2010
Special Revenue Funds
OtherHomeland Special ProsecutingSecurity Inmate Juvenile Revenue Attorney PublicGrants Concessions Grants Funds Grants Health
ASSETS
AssetsCash and pooled investments -$ 215,240$ -$ 531,478$ 256,407$ 1,861,365$ Receivables:
Taxes - current - - - - - - Accounts - - - - - 250,903
Due from other governments 100,786 - 169,516 295,202 118,607 392,149 Notes receivable - - - 45,271 - - Prepaid items - - - - - -
TOTAL ASSETS 100,786$ 215,240$ 169,516$ 871,951$ 375,014$ 2,504,417$
LIABILITIESAND FUND BALANCES
LiabilitiesAccounts payable -$ -$ 590$ 6,660$ -$ 147,947$ Accrued liabilities 4,359 - 4,477 70,182 17,102 312,376 Due to other governments - - - - 250 1,010,349 Interfund payable 73,866 - 106,232 - - - Deferred revenue - - 2,476 11,377 - 121,000 Advances from other governments - - - - - -
Total liabilities 78,225 - 113,775 88,219 17,352 1,591,672
Fund balancesReserved for prepaid items - - - - - - Unreserved, undesignated 22,561 215,240 55,741 783,732 357,662 912,745
Total fund balances 22,561 215,240 55,741 783,732 357,662 912,745
TOTAL LIABILITIESAND FUND BALANCES 100,786$ 215,240$ 169,516$ 871,951$ 375,014$ 2,504,417$

-96-
Capital
Special Revenue Funds Debt Service Projects
Water TotalPublic Works Resources OtherSolid Waste Sheriff's Veterans' Commissioner Building Building Governmental
Program Grants Trust Grants County Authority Authority Funds
95,280$ 617,919$ 237,618$ 153,646$ 655$ 473$ -$ 5,887,196$
- - 306,828 - - - - 834,573 163,524 - - 66,953 - - - 1,175,687
- 439,012 - - - - - 8,140,615 - - - - - - - 45,271 - - - - - - - 35,550
258,804$ 1,056,931$ 544,446$ 220,599$ 655$ 473$ -$ 16,118,892$
1,455$ 30,849$ -$ 16,289$ -$ -$ -$ 1,705,486$ 7,267 13,013 140 206 - - - 1,071,839
- 3,161 - - - - - 1,015,582 - - - - - - - 3,912,956 - 7,562 354,342 10,113 - - - 1,444,969 - - - - - - - 78,000
8,722 54,585 354,482 26,608 - - - 9,228,832
- - - - - - - 35,550 250,082 1,002,346 189,964 193,991 655 473 - 6,854,510
250,082 1,002,346 189,964 193,991 655 473 - 6,890,060
258,804$ 1,056,931$ 544,446$ 220,599$ 655$ 473$ -$ 16,118,892$

-97-
WASHTENAW COUNTYCombining Statement of Revenues, Expenditures and
Changes in Fund Balance - Nonmajor Governmental FundsYear Ended December 31, 2010
Special Revenue Funds
AccommodationOrdinance Aerial Building Community Community
Tax Photo Services Child Care Corrections Development
RevenuesTaxes 3,539,013$ -$ -$ -$ -$ -$ Licenses and permits - - 565,228 - - - Intergovernmental - - - 3,978,343 391,977 6,576,812 Charges for services - 25,917 266 - 234,184 - Fines and forfeits 25,032 - - - - - Investment income (loss) 811 755 140 - - - Other 9,367 - - 542,701 23,996 928,946
Total revenues 3,574,223 26,672 565,634 4,521,044 650,157 7,505,758
ExpendituresCurrent:
Judicial - - - - - - General government 3,251,464 183,376 - - - - Public safety - - 513,836 - 836,698 - Public works - - - - - - Health - - - - - - Social services - - - 9,745,889 - 8,634,955 Culture and recreation - - - - - -
Debt service:Principal - - - - - - Interest and fiscal charges - - - - - -
Capital outlay - - - - - -
Total expenditures 3,251,464 183,376 513,836 9,745,889 836,698 8,634,955
Revenues over (under) expenditures 322,759 (156,704) 51,798 (5,224,845) (186,541) (1,129,197)
Other financing sources (uses)Transfers in - - - 4,620,559 200,715 1,178,015 Transfers out - - - (1,548) - -
Total other sources (uses) - - - 4,619,011 200,715 1,178,015
Net change in fund balances 322,759 (156,704) 51,798 (605,834) 14,174 48,818
Fund balances, beginning of year - 280,309 61 1,196,273 153,893 28,501
Fund balances, end of year 322,759$ 123,605$ 51,859$ 590,439$ 168,067$ 77,319$

-98-
Special Revenue Funds
Economic EmploymentDepartment Development Economic Training and Environ- Friendof Human and Development Community mental of the Head HIDTAServices E-911 Energy Millage Service Health Court Start Grant
-$ -$ -$ 599,539$ -$ -$ -$ -$ -$ - - - - - 1,391,920 - - -
605,213 - - - 14,780,159 1,296,215 3,813,389 3,974,410 1,362,470 - 2,337,845 47,999 - - 538 220,685 - - - - - - - 5,669 2,064 - -
(2) 2,853 (1) - - - - - - - 39,061 26 - 346,644 6,375 1,212 399,344 -
605,211 2,379,759 48,024 599,539 15,126,803 2,700,717 4,037,350 4,373,754 1,362,470
- - - - - - 5,747,028 - - - - 458,146 524,544 - - - - - - 1,242,538 - - - - - - 1,362,470 - - - - - - - - - - - - - - 3,111,892 - - -
626,461 - - - 15,308,091 - - 5,057,767 - - - - - - - - - -
- - - - - - - - - - - - - - - - - - - - - - - - - - -
626,461 1,242,538 458,146 524,544 15,308,091 3,111,892 5,747,028 5,057,767 1,362,470
(21,250) 1,137,221 (410,122) 74,995 (181,288) (411,175) (1,709,678) (684,013) -
53,646 118,487 419,724 - 181,288 605,947 1,275,429 677,977 - - (1,187,662) - - - - - - -
53,646 (1,069,175) 419,724 - 181,288 605,947 1,275,429 677,977 -
32,396 68,046 9,602 74,995 - 194,772 (434,249) (6,036) -
7,260 319,257 - - 453,179 261,583 434,249 155,766 -
39,656$ 387,303$ 9,602$ 74,995$ 453,179$ 456,355$ -$ 149,730$ -$
Continued…

-99-
WASHTENAW COUNTYCombining Statement of Revenues, Expenditures and
Changes in Fund Balance - Nonmajor Governmental Funds (Concluded)Year Ended December 31, 2010
Special Revenue Funds
OtherHomeland Special ProsecutingSecurity Inmate Juvenile Revenue Attorney PublicGrants Concessions Grants Funds Grants Health
RevenuesTaxes -$ -$ -$ -$ -$ -$ Licenses and permits - - - - - - Intergovernmental 551,773 - 276,889 370,767 495,535 6,924,008 Charges for services - - - 139,910 - 1,286,816 Fines and forfeits - - - 8,500 9,914 - Investment income (loss) - 2,048 (1) 4,469 1 - Other - 320,610 8,800 153,304 - 111,761
Total revenues 551,773 322,658 285,688 676,950 505,450 8,322,585
ExpendituresCurrent:
Judicial - - - 11,062 - - General government - - - 303,453 - - Public safety 551,773 480,041 - - 674,880 - Public works - - - - - - Health - - - - - 12,136,645 Social services - - 282,212 257,459 - - Culture and recreation - - - 145,636 - -
Debt service:Principal - - - - - - Interest and fiscal charges - - - - - -
Capital outlay - - - - - -
Total expenditures 551,773 480,041 282,212 717,610 674,880 12,136,645
Revenues over (under) expenditures - (157,383) 3,476 (40,660) (169,430) (3,814,060)
Other financing sources (uses)Transfers in - - 1,547 125,641 157,242 4,283,352 Transfers out - - - (180,896) - -
Total other sources (uses) - - 1,547 (55,255) 157,242 4,283,352
Net change in fund balances - (157,383) 5,023 (95,915) (12,188) 469,292
Fund balances, beginning of year 22,561 372,623 50,718 879,647 369,850 443,453
Fund balances, end of year 22,561$ 215,240$ 55,741$ 783,732$ 357,662$ 912,745$

-100-
Capital
Special Revenue Funds Debt Service Projects
Water TotalPublic Works Resources OtherSolid Waste Sheriff's Veterans' Commissioner Building Building Governmental
Program Grants Trust Grants County Authority Authority Funds
-$ -$ 373,041$ -$ -$ -$ -$ 4,511,593$ - - - - - - - 1,957,148
22,380 723,987 3,880 76,392 1,511,514 - - 47,736,113 - 75,579 - - - - - 4,369,739 - 65,005 - - - - - 116,184
352 3,668 1,479 597 83 16 (7) 17,261 598,627 5,000 - - - - - 3,495,774
621,359 873,239 378,400 76,989 1,511,597 16 (7) 62,203,812
- - - - - - - 5,758,090 - - - - - - - 4,720,983 - 610,651 - - - - - 6,272,887
440,408 - - 174,462 - - - 614,870 - - - - - - - 15,248,537 - - 302,578 - - - - 40,215,412 - - - - - - - 145,636
- - - - 6,279,476 1,100,000 - 7,379,476 - - - - 2,971,853 214,888 - 3,186,741 - - - - - - 4,060 4,060
440,408 610,651 302,578 174,462 9,251,329 1,314,888 4,060 83,546,692
180,951 262,588 75,822 (97,473) (7,739,732) (1,314,872) (4,067) (21,342,880)
- - 3,000 111,286 7,739,447 1,315,252 - 23,068,554 - (9,624) (3,000) (17,000) - (14,111) (3,241) (1,417,082)
- (9,624) - 94,286 7,739,447 1,301,141 (3,241) 21,651,472
180,951 252,964 75,822 (3,187) (285) (13,731) (7,308) 308,592
69,131 749,382 114,142 197,178 940 14,204 7,308 6,581,468
250,082$ 1,002,346$ 189,964$ 193,991$ 655$ 473$ -$ 6,890,060$

-101-
WASHTENAW COUNTYCombining Schedule of Revenues, Expenditures and Changes in Fund Balance -
Final Budget and Actual - Nonmajor Special Revenue FundsYear Ended December 31, 2010
Variance with Variance with Final Final Budget Final Final Budget
Budget Actual + (-) Budget Actual + (-)
RevenuesTaxes 3,400,000$ 3,539,013$ 139,013$ -$ -$ -$ Licenses and permits - - - - - - Intergovernmental - - - - - - Charges for services - - - 39,000 25,917 (13,083) Fines and forfeits 25,000 25,032 32 - - - Investment income (loss) - 811 811 - 755 755 Other - 9,367 9,367 - - -
Total revenues 3,425,000 3,574,223 149,223 39,000 26,672 (12,328)
ExpendituresCurrent:
Judicial - - - - - - General government 3,425,000 3,251,464 173,536 110,000 183,376 (73,376) Public safety - - - - - - Public works - - - - - - Health - - - - - - Social services - - - - - - Culture and recreation - - - - - -
Total expenditures 3,425,000 3,251,464 173,536 110,000 183,376 (73,376)
Revenues over (under) expenditures - 322,759 322,759 (71,000) (156,704) (85,704)
Other financing sources (usesTransfers in - - - - - - Transfers out - - - - - -
Total other sources (uses) - - - - - -
Net change in fund balances - 322,759 322,759 (71,000) (156,704) (85,704)
Fund balances, beginning of year - - - 280,309 280,309 -
Fund balances, end of year -$ 322,759$ 322,759$ 209,309$ 123,605$ (85,704)$
Aerial PhotoAccomodation Ordinance Tax

-102-
WASHTENAW COUNTYCombining Schedule of Revenues, Expenditures and Changes in Fund Balance -
Final Budget and Actual - Nonmajor Special Revenue Funds (Continued)Year Ended December 31, 2010
Variance with Variance with Final Final Budget Final Final Budget
Budget Actual + (-) Budget Actual + (-)
RevenuesTaxes -$ -$ -$ -$ -$ -$ Licenses and permits 555,889 565,228 9,339 - - - Intergovernmental - - - 4,720,279 3,978,343 (741,936) Charges for services - 266 266 - - - Fines and forfeits - - - - - - Investment income (loss) - 140 140 - - - Other - - - 574,000 542,701 (31,299)
Total revenues 555,889 565,634 9,745 5,294,279 4,521,044 (773,235)
ExpendituresCurrent:
Judicial - - - - - - General government - - - - - - Public safety 555,889 513,836 42,053 - - - Public works - - - - - - Health - - - - - - Social services - - - 10,340,631 9,745,889 594,742 Culture and recreation - - - - - -
Total expenditures 555,889 513,836 42,053 10,340,631 9,745,889 594,742
Revenues over (under) expenditures - 51,798 51,798 (5,046,352) (5,224,845) (178,493)
Other financing sources (usesTransfers in - - - 5,055,894 4,620,559 (435,335) Transfers out - - - (9,200) (1,548) 7,652
Total other sources (uses) - - - 5,046,694 4,619,011 (427,683)
Net change in fund balances - 51,798 51,798 342 (605,834) (606,176)
Fund balances, beginning of year 61 61 - 1,196,273 1,196,273 -
Fund balances, end of year 61$ 51,859$ 51,798$ 1,196,615$ 590,439$ (606,176)$
Building Services Child Care

-103-
WASHTENAW COUNTYCombining Schedule of Revenues, Expenditures and Changes in Fund Balance -
Final Budget and Actual - Nonmajor Special Revenue Funds (Continued)Year Ended December 31, 2010
Variance with Variance with Final Final Budget Final Final Budget
Budget Actual + (-) Budget Actual + (-)
RevenuesTaxes -$ -$ -$ -$ -$ -$ Licenses and permits - - - - - - Intergovernmental 393,756 391,977 (1,779) 7,107,811 6,576,812 (530,999) Charges for services 290,589 234,184 (56,405) - - - Fines and forfeits - - - - - - Investment income (loss) - - - - - - Other 5,301 23,996 18,695 519,159 928,946 409,787
Total revenues 689,646 650,157 (39,489) 7,626,970 7,505,758 (121,212)
ExpendituresCurrent:
Judicial - - - - - - General government - - - - - - Public safety 890,361 836,698 53,663 - - - Public works - - - - - - Health - - - - - - Social services - - - 9,312,156 8,634,955 677,201 Culture and recreation - - - - - -
Total expenditures 890,361 836,698 53,663 9,312,156 8,634,955 677,201
Revenues over (under) expenditures (200,715) (186,541) 14,174 (1,685,186) (1,129,197) 555,989
Other financing sources (usesTransfers in 200,715 200,715 - 1,685,186 1,178,015 (507,171) Transfers out - - - - - -
Total other sources (uses) 200,715 200,715 - 1,685,186 1,178,015 (507,171)
Net change in fund balances - 14,174 14,174 - 48,818 48,818
Fund balances, beginning of year 153,893 153,893 - 28,501 28,501 -
Fund balances, end of year 153,893$ 168,067$ 14,174$ 28,501$ 77,319$ 48,818$
Community Corrections Community Development

-104-
WASHTENAW COUNTYCombining Schedule of Revenues, Expenditures and Changes in Fund Balance -
Final Budget and Actual - Nonmajor Special Revenue Funds (Continued)Year Ended December 31, 2010
Variance with Variance with Final Final Budget Final Final Budget
Budget Actual + (-) Budget Actual + (-)
RevenuesTaxes -$ -$ -$ -$ -$ -$ Licenses and permits - - - - - - Intergovernmental 800,000 605,213 (194,787) - - - Charges for services - - - 2,100,000 2,337,845 237,845 Fines and forfeits - - - - - - Investment income (loss) - (2) (2) - 2,853 2,853 Other - - - 36,000 39,061 3,061
Total revenues 800,000 605,211 (194,789) 2,136,000 2,379,759 243,759
ExpendituresCurrent:
Judicial - - - - - - General government - - - - - - Public safety - - - 1,236,793 1,242,538 (5,745) Public works - - - - - - Health - - - - - - Social services 854,109 626,461 227,648 - - - Culture and recreation - - - - - -
Total expenditures 854,109 626,461 227,648 1,236,793 1,242,538 (5,745)
Revenues over (under) expenditures (54,109) (21,250) 32,859 899,207 1,137,221 238,014
Other financing sources (usesTransfers in 54,109 53,646 (463) (108,847) 118,487 227,334 Transfers out - - - (1,008,054) (1,187,662) (179,608)
Total other sources (uses) 54,109 53,646 (463) (1,116,901) (1,069,175) 47,726
Net change in fund balances - 32,396 32,396 (217,694) 68,046 285,740
Fund balances, beginning of year 7,260 7,260 - 319,257 319,257 -
Fund balances, end of year 7,260$ 39,656$ 32,396$ 101,563$ 387,303$ 285,740$
Department of Human Services E-911

-105-
WASHTENAW COUNTYCombining Schedule of Revenues, Expenditures and Changes in Fund Balance -
Final Budget and Actual - Nonmajor Special Revenue Funds (Continued)Year Ended December 31, 2010
Variance with Variance with Final Final Budget Final Final Budget
Budget Actual + (-) Budget Actual + (-)
RevenuesTaxes -$ -$ -$ 603,000$ 599,539$ (3,461)$ Licenses and permits - - - - - - Intergovernmental - - - - - - Charges for services 35,000 47,999 12,999 - - - Fines and forfeits - - - - - - Investment income (loss) - (1) (1) - - - Other - 26 26 - - -
Total revenues 35,000 48,024 13,024 603,000 599,539 (3,461)
ExpendituresCurrent:
Judicial - - - - - - General government 491,881 458,146 33,735 603,000 524,544 78,456 Public safety - - - - - - Public works - - - - - - Health - - - - - - Social services - - - - - - Culture and recreation - - - - - -
Total expenditures 491,881 458,146 33,735 603,000 524,544 78,456
Revenues over (under) expenditures (456,881) (410,122) 46,759 - 74,995 74,995
Other financing sources (usesTransfers in 456,881 419,724 (37,157) - - - Transfers out - - - - - -
Total other sources (uses) 456,881 419,724 (37,157) - - -
Net change in fund balances - 9,602 9,602 - 74,995 74,995
Fund balances, beginning of year - - - - - -
Fund balances, end of year -$ 9,602$ 9,602$ -$ 74,995$ 74,995$
Economic Development and Energy Economic Development Millage

-106-
WASHTENAW COUNTYCombining Schedule of Revenues, Expenditures and Changes in Fund Balance -
Final Budget and Actual - Nonmajor Special Revenue Funds (Continued)Year Ended December 31, 2010
Variance with Variance with Final Final Budget Final Final Budget
Budget Actual + (-) Budget Actual + (-)
RevenuesTaxes -$ -$ -$ -$ -$ -$ Licenses and permits - - - 1,546,804 1,391,920 (154,884) Intergovernmental 16,819,514 14,780,159 (2,039,355) 782,458 1,296,215 513,757 Charges for services - - - 3,500 538 (2,962) Fines and forfeits - - - 10,174 5,669 (4,505) Investment income (loss) - - - - - - Other 175,625 346,644 171,019 7,360 6,375 (985)
Total revenues 16,995,139 15,126,803 (1,868,336) 2,350,296 2,700,717 350,421
ExpendituresCurrent:
Judicial - - - - - - General government - - - - - - Public safety - - - - - - Public works - - - - - - Health - - - 3,348,841 3,111,892 236,949 Social services 17,176,427 15,308,091 1,868,336 - - - Culture and recreation - - - - - -
Total expenditures 17,176,427 15,308,091 1,868,336 3,348,841 3,111,892 236,949
Revenues over (under) expenditures (181,288) (181,288) - (998,545) (411,175) 587,370
Other financing sources (usesTransfers in 181,288 181,288 - 998,545 605,947 (392,598) Transfers out - - - - - -
Total other sources (uses) 181,288 181,288 - 998,545 605,947 (392,598)
Net change in fund balances - - - - 194,772 194,772
Fund balances, beginning of year 453,179 453,179 - 261,583 261,583 -
Fund balances, end of year 453,179$ 453,179$ -$ 261,583$ 456,355$ 194,772$
Community ServicesEmployment Training and
Environmental Health

-107-
WASHTENAW COUNTYCombining Schedule of Revenues, Expenditures and Changes in Fund Balance -
Final Budget and Actual - Nonmajor Special Revenue Funds (Continued)Year Ended December 31, 2010
Variance with Variance with Final Final Budget Final Final Budget
Budget Actual + (-) Budget Actual + (-)
RevenuesTaxes -$ -$ -$ -$ -$ -$ Licenses and permits - - - - - - Intergovernmental 4,641,710 3,813,389 (828,321) 4,247,522 3,974,410 (273,112) Charges for services 230,682 220,685 (9,997) - - - Fines and forfeits - 2,064 2,064 - - - Investment income (loss) - - - - - - Other - 1,212 1,212 546,137 399,344 (146,793)
Total revenues 4,872,392 4,037,350 (835,042) 4,793,659 4,373,754 (419,905)
ExpendituresCurrent:
Judicial 6,776,092 5,747,028 1,029,064 - - - General government - - - - - - Public safety - - - - - - Public works - - - - - - Health - - - - - - Social services - - - 5,353,836 5,057,767 296,069 Culture and recreation - - - - - -
Total expenditures 6,776,092 5,747,028 1,029,064 5,353,836 5,057,767 296,069
Revenues over (under) expenditures (1,903,700) (1,709,678) 194,022 (560,177) (684,013) (123,836)
Other financing sources (usesTransfers in 1,903,700 1,275,429 (628,271) 700,260 677,977 (22,283) Transfers out - - - (140,083) - 140,083
Total other sources (uses) 1,903,700 1,275,429 (628,271) 560,177 677,977 117,800
Net change in fund balances - (434,249) (434,249) - (6,036) (6,036)
Fund balances, beginning of year 434,249 434,249 - 155,766 155,766 -
Fund balances, end of year 434,249$ -$ (434,249)$ 155,766$ 149,730$ (6,036)$
Friend of the Court Head Start

-108-
WASHTENAW COUNTYCombining Schedule of Revenues, Expenditures and Changes in Fund Balance -
Final Budget and Actual - Nonmajor Special Revenue Funds (Continued)Year Ended December 31, 2010
Variance with Variance with Final Final Budget Final Final Budget
Budget Actual + (-) Budget Actual + (-)
RevenuesTaxes -$ -$ -$ -$ -$ -$ Licenses and permits - - - - - - Intergovernmental 1,535,221 1,362,470 (172,751) 1,258,450 551,773 (706,677) Charges for services - - - - - - Fines and forfeits - - - - - - Investment income (loss) - - - - - - Other - - - - - -
Total revenues 1,535,221 1,362,470 (172,751) 1,258,450 551,773 (706,677)
ExpendituresCurrent:
Judicial - - - - - - General government - - - - - - Public safety 1,535,221 1,362,470 172,751 1,258,450 551,773 706,677 Public works - - - - - - Health - - - - - - Social services - - - - - - Culture and recreation - - - - - -
Total expenditures 1,535,221 1,362,470 172,751 1,258,450 551,773 706,677
Revenues over (under) expenditures - - - - - -
Other financing sources (usesTransfers in - - - - - - Transfers out - - - - - -
Total other sources (uses) - - - - - -
Net change in fund balances - - - - - -
Fund balances, beginning of year - - - 22,561 22,561 -
Fund balances, end of year -$ -$ -$ 22,561$ 22,561$ -$
HIDTA Grant Homeland Security Grants

-109-
WASHTENAW COUNTYCombining Schedule of Revenues, Expenditures and Changes in Fund Balance -
Final Budget and Actual - Nonmajor Special Revenue Funds (Continued)Year Ended December 31, 2010
Variance with Variance with Final Final Budget Final Final Budget
Budget Actual + (-) Budget Actual + (-)
RevenuesTaxes -$ -$ -$ -$ -$ -$ Licenses and permits - - - - - - Intergovernmental - - - 361,187 276,889 (84,298) Charges for services - - - - - - Fines and forfeits - - - - - - Investment income (loss) - 2,048 2,048 - (1) (1) Other 270,972 320,610 49,638 20,000 8,800 (11,200)
Total revenues 270,972 322,658 51,686 381,187 285,688 (95,499)
ExpendituresCurrent:
Judicial - - - - - - General government - - - - - - Public safety 270,972 480,041 (209,069) - - - Public works - - - - - - Health - - - - - - Social services - - - 403,728 282,212 121,516 Culture and recreation - - - - - -
Total expenditures 270,972 480,041 (209,069) 403,728 282,212 121,516
Revenues over (under) expenditures - (157,383) (157,383) (22,541) 3,476 26,017
Other financing sources (usesTransfers in - - - 22,541 1,547 (20,994) Transfers out - - - - - -
Total other sources (uses) - - - 22,541 1,547 (20,994)
Net change in fund balances - (157,383) (157,383) - 5,023 5,023
Fund balances, beginning of year 372,623 372,623 - 50,718 50,718 -
Fund balances, end of year 372,623$ 215,240$ (157,383)$ 50,718$ 55,741$ 5,023$
Inmate Concessions Juvenile Grants

-110-
WASHTENAW COUNTYCombining Schedule of Revenues, Expenditures and Changes in Fund Balance -
Final Budget and Actual - Nonmajor Special Revenue Funds (Continued)Year Ended December 31, 2010
Variance with Variance with Final Final Budget Final Final Budget
Budget Actual + (-) Budget Actual + (-)
RevenuesTaxes -$ -$ -$ -$ -$ -$ Licenses and permits - - - - - - Intergovernmental 969,837 370,767 (599,070) 743,759 495,535 (248,224) Charges for services 140,000 139,910 (90) - - - Fines and forfeits 8,500 8,500 - - 9,914 9,914 Investment income (loss) - 4,469 4,469 - 1 1 Other 109,993 153,304 43,311 - - -
Total revenues 1,228,330 676,950 (551,380) 743,759 505,450 (238,309)
ExpendituresCurrent:
Judicial 20,900 11,062 9,838 - - - General government 920,757 303,453 617,304 - - - Public safety - - - 920,897 674,880 246,017 Public works - - - - - - Health - - - - - - Social services 360,000 257,459 102,541 - - - Culture and recreation 171,392 145,636 25,756 - - -
Total expenditures 1,473,049 717,610 755,439 920,897 674,880 246,017
Revenues over (under) expenditures (244,719) (40,660) 204,059 (177,138) (169,430) 7,708
Other financing sources (usesTransfers in 172,400 125,641 (46,759) 177,138 157,242 (19,896) Transfers out (140,000) (180,896) (40,896) - - -
Total other sources (uses) 32,400 (55,255) (87,655) 177,138 157,242 (19,896)
Net change in fund balances (212,319) (95,915) 116,404 - (12,188) (12,188)
Fund balances, beginning of year 879,647 879,647 - 369,850 369,850 -
Fund balances, end of year 667,328$ 783,732$ 116,404$ 369,850$ 357,662$ (12,188)$
Other Special Revenue Funds Prosecuting Attorney Grants

-111-
WASHTENAW COUNTYCombining Schedule of Revenues, Expenditures and Changes in Fund Balance -
Final Budget and Actual - Nonmajor Special Revenue Funds (Continued)Year Ended December 31, 2010
Variance with Variance with Final Final Budget Final Final Budget
Budget Actual + (-) Budget Actual + (-)
RevenuesTaxes -$ -$ -$ -$ -$ -$ Licenses and permits - - - - - - Intergovernmental 7,017,786 6,924,008 (93,778) 10,000 22,380 12,380 Charges for services 1,256,116 1,286,816 30,700 - - - Fines and forfeits - - - - - - Investment income (loss) - - - 200 352 152 Other 124,982 111,761 (13,221) 382,175 598,627 216,452
Total revenues 8,398,884 8,322,585 (76,299) 392,375 621,359 228,984
ExpendituresCurrent:
Judicial - - - - - - General government - - - - - - Public safety - - - - - - Public works - - - 413,200 440,408 (27,208) Health 12,670,019 12,136,645 533,374 - - - Social services - - - - - - Culture and recreation - - - - - -
Total expenditures 12,670,019 12,136,645 533,374 413,200 440,408 (27,208)
Revenues over (under) expenditures (4,271,135) (3,814,060) 457,075 (20,825) 180,951 201,776
Other financing sources (usesTransfers in 4,271,135 4,283,352 12,217 20,000 - (20,000) Transfers out - - - - - -
Total other sources (uses) 4,271,135 4,283,352 12,217 20,000 - (20,000)
Net change in fund balances - 469,292 469,292 (825) 180,951 181,776
Fund balances, beginning of year 443,453 443,453 - 69,131 69,131 -
Fund balances, end of year 443,453$ 912,745$ 469,292$ 68,306$ 250,082$ 181,776$
Public Health Public Works Solid Waste Program

-112-
WASHTENAW COUNTYCombining Schedule of Revenues, Expenditures and Changes in Fund Balance -
Final Budget and Actual - Nonmajor Special Revenue Funds (Continued)Year Ended December 31, 2010
Variance with Variance with Final Final Budget Final Final Budget
Budget Actual + (-) Budget Actual + (-)
RevenuesTaxes -$ -$ -$ 393,616$ 373,041$ (20,575)$ Licenses and permits - - - - - - Intergovernmental 1,031,395 723,987 (307,408) 29,264 3,880 (25,384) Charges for services 48,000 75,579 27,579 - - - Fines and forfeits - 65,005 65,005 - - - Investment income (loss) - 3,668 3,668 - 1,479 1,479 Other - 5,000 5,000 - - -
Total revenues 1,079,395 873,239 (206,156) 422,880 378,400 (44,480)
ExpendituresCurrent:
Judicial - - - - - - General government - - - - - - Public safety 1,079,395 610,651 468,744 - - - Public works - - - - - - Health - - - - - - Social services - - - 422,880 302,578 120,302 Culture and recreation - - - - - -
Total expenditures 1,079,395 610,651 468,744 422,880 302,578 120,302
Revenues over (under) expenditures - 262,588 262,588 - 75,822 75,822
Other financing sources (usesTransfers in - - - - 3,000 3,000 Transfers out - (9,624) (9,624) - (3,000) (3,000)
Total other sources (uses) - (9,624) (9,624) - - -
Net change in fund balances - 252,964 252,964 - 75,822 75,822
Fund balances, beginning of year 749,382 749,382 - 114,142 114,142 -
Fund balances, end of year 749,382$ 1,002,346$ 252,964$ 114,142$ 189,964$ 75,822$
Sheriff's Grants Veterans' Trust

-113-
WASHTENAW COUNTYCombining Schedule of Revenues, Expenditures and Changes in Fund Balance -
Final Budget and Actual - Nonmajor Special Revenue Funds (Concluded)Year Ended December 31, 2010
Water Resources Commissioner GrantVariance with
Final Final BudgetBudget Actual + (-)
RevenuesTaxes -$ -$ -$ Licenses and permits - - - Intergovernmental - 76,392 76,392 Charges for services 10,000 - (10,000) Fines and forfeits - - - Investment income (loss) - 597 597 Other - - -
Total revenues 10,000 76,989 66,989
ExpendituresCurrent:
Judicial - - - General government - - - Public safety - - - Public works 108,457 174,462 (66,005) Health - - - Social services - - - Culture and recreation - - -
Total expenditures 108,457 174,462 (66,005)
Revenues over (under) expenditures (98,457) (97,473) 984
Other financing sources (usesTransfers in 115,457 111,286 (4,171) Transfers out (17,000) (17,000) -
Total other sources (uses) 98,457 94,286 (4,171)
Net change in fund balances - (3,187) (3,187)
Fund balances, beginning of year 197,178 197,178 -
Fund balances, end of year 197,178$ 193,991$ (3,187)$

-114-
WASHTENAW COUNTYCombining Statement of Net Assets
Nonmajor Enterprise FundsDecember 31, 2010
PrincipalProperty Residence
Foreclosure Exemption Total
AssetsCurrent assets -
Cash and pooled investments 205,603$ 25,206$ 230,809$ Due from other governments 1,054,588 - 1,054,588
Total assets 1,260,191 25,206 1,285,397
Noncurrent assets -Capital assets, net 19,779 - 19,779
Total assets 1,279,970 25,206 1,305,176
LiabilitiesCurrent liabilities:
Accrued liabilities 9,592 1,414 11,006 Accrued compensated absences,
current portion 2,492 - 2,492
Total current liabilities 12,084 1,414 13,498
Long-term liabilities -Accrued compensated absences 24,775 - 24,775
Total liabilities 36,859 1,414 38,273
Net assetsInvested in capital assets 19,779 - 19,779 Unrestricted 1,223,332 23,792 1,247,124
Total net assets 1,243,111$ 23,792$ 1,266,903$

-115-
WASHTENAW COUNTYCombining Statement of Revenues, Expenses
and Changes in Net AssetsNonmajor Enterprise Funds
Year Ended December 31, 2010
PrincipalProperty Residence
Foreclosure Exemption Total
Operating revenuesCharges for services 1,291,039$ -$ 1,291,039$ Interest charges - 16,411 16,411
Total operating revenues 1,291,039 16,411 1,307,450
Operating expensesPersonnel services 359,791 3,045 362,836 Contractual services 72,548 - 72,548 Supplies 108,324 - 108,324 Telephone 755 - 755 Equipment repair and rental 1,914 - 1,914 Other 242,993 662 243,655 Depreciation 8,656 - 8,656
Total operating expenses 794,981 3,707 798,688
Operating income 496,058 12,704 508,762
Non-operating incomeInvestment income (loss) 4,967 (21) 4,946
Income before transfers 501,025 12,683 513,708
Transfers out (159,118) - (159,118)
Change in net assets 341,907 12,683 354,590
Net assets, beginning of year 901,204 11,109 912,313
Net assets, end of year 1,243,111$ 23,792$ 1,266,903$

-116-
WASHTENAW COUNTYCombining Statement of Cash Flows
Nonmajor Enterprise FundsYear Ended December 31, 2010
PrincipalProperty Residence
Foreclosure Exemption Total
Cash flows from operating activitiesCash received from customers 236,451$ 16,411$ 252,862$ Cash payments to employees (354,238) (2,851) (357,089) Cash payments to suppliers (425,531) (662) (426,193)
Net cash provided (used) by operating activities (543,318) 12,898 (530,420)
Cash flows from noncapital financing activitiesTransfers out to other funds (159,118) - (159,118)
Cash flows from investing activitiesInvestment loss 4,967 (21) 4,946
Net increase (decrease) in cash and cash equivalents (697,469) 12,877 (684,592)
Cash and cash equivalents, beginning of year 903,072 12,329 915,401
Cash and cash equivalents, end of year 205,603$ 25,206$ 230,809$
Reconciliation of operating income to net cash provided (used) by operating activities:
Operating income 496,058$ 12,704$ 508,762$ Adjustments to reconcile operating income to net cash provided (used) by operating activities:
Depreciation 8,656 - 8,656 Changes in assets and liabilities:
Due from other governments (1,054,588) - (1,054,588) Accrued liabilities 1,003 194 1,197 Accrued compensated absences 5,553 - 5,553
Net cash provided (used) by operating activities (543,318)$ 12,898$ (530,420)$

-117-
WASHTENAW COUNTYCombining Statement of Net Assets
Internal Service FundsDecember 31, 2010
Facilities Fleet Fringe GeneralManagement Management Benefit Services
Revolving Revolving Revolving Revolving
AssetsCurrent assets:
Cash and pooled investments 948,336$ 497,684$ 495,628$ 183,445$ Accounts receivable 22,045 - 34,000 - Due from other governments - - 1,034 1,492 Inventories - - - 32,706 Prepaid items - - - -
Total current assets 970,381 497,684 530,662 217,643
Noncurrent assets:Capital assets, net - 2,831,430 - 345,189
Total assets 970,381 3,329,114 530,662 562,832
LiabilitiesCurrent liabilities:
Accounts payable 209,919 - 164,042 73,010 Accrued liabilities 58,700 3,679 17,285 - Current portion of:
Compensated absences 11,950 455 - - Claims payable - - 22,500 -
Total current liabilities 280,569 4,134 203,827 73,010
Long-term liabilities:Compensated absences , net 243,438 8,944 - - Claims payable, net - - - - Advances from other funds - - - -
Total long-term liabilities 243,438 8,944 - -
Total liabilities 524,007 13,078 203,827 73,010
Net assetsInvested in capital assets - 2,831,430 - 345,189 Unrestricted (deficit) 446,374 484,606 326,835 144,633
Total net assets 446,374$ 3,316,036$ 326,835$ 489,822$

-118-
Medical Worker'sInsurance Insurance Telephone Compensation RetireeRevolving Revolving Revolving Revolving Health Total
1,822,735$ 1,766,812$ 38,607$ 782,850$ 6,718,602$ 13,254,699$ - - - 114,800 - 170,845 - 361,621 - - - 364,147 - - - - - 32,706
791,975 - - - 439,298 1,231,273
2,614,710 2,128,433 38,607 897,650 7,157,900 15,053,670
- - 23,034 - - 3,199,653
2,614,710 2,128,433 61,641 897,650 7,157,900 18,253,323
154,440 - 39,917 20,691 7,157,900 7,819,919 7,220 - - 855 - 87,739
2,659 - - - - 15,064 499,750 1,369,000 - 380,700 - 2,271,950
664,069 1,369,000 39,917 402,246 7,157,900 10,194,672
15,889 - - - - 268,271 499,750 - - 465,300 - 965,050
- - 21,724 - - 21,724
515,639 - 21,724 465,300 - 1,255,045
1,179,708 1,369,000 61,641 867,546 7,157,900 11,449,717
- - 23,034 - - 3,199,653 1,435,002 759,433 (23,034) 30,104 - 3,603,953
1,435,002$ 759,433$ -$ 30,104$ -$ 6,803,606$

-119-
WASHTENAW COUNTYCombining Statement of Revenues,Expenses and Changes in Net Assets
Internal Service FundsYear Ended December 31, 2010
Facilities Fleet Fringe GeneralManagement Management Benefit Services
Revolving Revolving Revolving Revolving
Operating revenuesCharges for services 6,246,620$ 2,334,188$ 4,364,336$ 681,023$
Operating expensesPersonnel services 2,003,060 112,270 - 20,312 Contractual services 136,809 7,907 56,386 - Supplies 529,199 615,424 - 354,076 Occupancy 2,238,815 237,775 - - Telephone 29,833 1,433 - - Equipment repair and rental 203,963 333,667 - 145,308 Building repair and rental 175,032 - - - Benefit payments and insurance premiums - - 4,005,233 - Other 967,393 334 139,489 - Depreciation - 925,862 - 103,776
Total operating expenses 6,284,104 2,234,672 4,201,108 623,472
Operating income (loss) (37,484) 99,516 163,228 57,551
Non-operating revenues (expenses)Investment income 8,018 3,631 3,061 537 Gain (loss) on sale of capital assets - 4,196 - (1,649)
Total non-operating revenues (expenses) 8,018 7,827 3,061 (1,112)
Income (loss) before transfers (29,466) 107,343 166,289 56,439
Transfers out (305,958) - - -
Change in net assets (335,424) 107,343 166,289 56,439
Net assets, beginning of year 781,798 3,208,693 160,546 433,383
Net assets, end of year 446,374$ 3,316,036$ 326,835$ 489,822$

-120-
Medical Worker'sInsurance Insurance Telephone Compensation RetireeRevolving Revolving Revolving Revolving Health Total
2,488,677$ 20,823,003$ 751,608$ 759,344$ 7,125,676$ 45,574,475$
302,575 - - 108,490 - 2,546,707 880,574 - - 40,565 - 1,122,241
520 - - 605 - 1,499,824 25,113 - - - - 2,501,703 1,063 - 735,315 - - 767,644
- - - - - 682,938 - - - - - 175,032
1,426,508 20,093,428 - 702,498 - 26,227,667 2,418 - - - 7,157,900 8,267,534
- - 16,293 - - 1,045,931
2,638,771 20,093,428 751,608 852,158 7,157,900 44,837,221
(150,094) 729,575 - (92,814) (32,224) 737,254
10,530 13,262 - 3,941 32,224 75,204 - - - - - 2,547
10,530 13,262 - 3,941 32,224 77,751
(139,564) 742,837 - (88,873) - 815,005
- - - - - (305,958)
(139,564) 742,837 - (88,873) - 509,047
1,574,566 16,596 - 118,977 - 6,294,559
1,435,002$ 759,433$ -$ 30,104$ -$ 6,803,606$

-121-
WASHTENAW COUNTYCombining Statement of Cash Flows
Internal Service FundsYear Ended December 31, 2010
Facilities Fleet FringeManagement Management Benefit
Revolving Revolving RevolvingCash flows from operating activities
Cash received from interfund services 6,244,886$ 2,334,188$ 4,364,333$ Cash payments to employees (2,091,826) (108,404) (105,630) Cash payments to suppliers (4,189,632) (1,195,107) (4,175,480) Cash payments for interfund services (29,833) (1,433) -
Net cash provided (used) by operating activities (66,405) 1,029,244 83,223
Cash flows from noncapital financing activitiesTransfers out (305,958) - - Advances from other funds - - -
Net cash used by noncapital financing activities (305,958) - -
Cash flows from capital and related financing activitiesProceeds from sale of equipment - 142,426 - Payments for equipment acquisitions - (1,502,204) -
Net cash used by capital and related financing activities - (1,359,778) -
Cash flows from investing activitiesInvestment income 8,018 3,631 3,061
Net increase (decrease) in cash and pooled investments (364,345) (326,903) 86,284
Cash and pooled investments, beginning of year 1,312,681 824,587 409,344
Cash and pooled investments, end of year 948,336$ 497,684$ 495,628$
Reconciliation of operating income (loss) to net cash provided (used) by operating activities:
Operating income (loss) (37,484)$ 99,516$ 163,228$ Adjustments to reconcile operating income (loss) to net cash provided (used) by operating activities:
Depreciation - 925,862 - Changes in assets and liabilities:
Accounts receivable (1,734) - 126 Due from other governments - - (129) Inventories - - - Prepaid items - - - Accounts payable 61,579 - 3,128 Accrued liabilities (952) 2,088 (105,630) Claims payable - - 22,500 Accrued compensated absences (87,814) 1,778 -
Net cash provided (used) by operating activities (66,405)$ 1,029,244$ 83,223$

-122-
General Medical Worker'sServices Insurance Insurance Telephone Compensation Retiree
Revolving Revolving Revolving Revolving Revolving Health Total
682,889$ 2,500,475$ 20,834,146$ 751,608$ 759,344$ 7,125,676$ 45,597,545$ (20,312) (1,232,169) - - (899,635) - (4,457,976)
(444,624) (1,247,042) (19,838,428) (723,140) 20,297 (2,758,670) (34,551,826) - (1,063) - - - - (32,329)
217,953 20,201 995,718 28,468 (119,994) 4,367,006 6,555,414
- - - - - - (305,958) - - - (59,742) - - (59,742)
- - - (59,742) - - (365,700)
- - - - - - 142,426 (184,569) - - - - - (1,686,773)
(184,569) - - - - - (1,544,347)
537 10,530 13,262 - 3,941 32,224 75,204
33,921 30,731 1,008,980 (31,274) (116,053) 4,399,230 4,720,571
149,524 1,792,004 757,832 69,881 898,903 2,319,372 8,534,128
183,445$ 1,822,735$ 1,766,812$ 38,607$ 782,850$ 6,718,602$ 13,254,699$
57,551$ (150,094)$ 729,575$ -$ (92,814)$ (32,224)$ 737,254$
103,776 - - 16,293 - - 1,045,931
- - - - - - (1,608) 1,866 11,798 11,143 - - - 24,678 6,436 - - - - - 6,436
- (26,619) - - - - (26,619) 48,324 115,210 - 12,175 (82,035) 4,399,230 4,557,611
- (943,305) (1,114,000) - (791,145) - (2,952,944) - 999,500 1,369,000 - 846,000 - 3,237,000 - 13,711 - - - - (72,325)
217,953$ 20,201$ 995,718$ 28,468$ (119,994)$ 4,367,006$ 6,555,414$

-123-
WASHTENAW COUNTYCombining Statement of Fiduciary Net Assets
Pension and Other Employee Benefit Trust FundsDecember 31, 2010
Money VoluntaryEmployees' Purchase EmployeesRetirement Pension Beneficiary Severance
System Plan Association Benefits
AssetsCash and cash equivalents -$ -$ -$ 414,202$ Investments:
Equities 108,574,443 - 28,409,718 - United States treasuries 3,546,094 - - - United States treasury strips 11,445,575 - - - United States agencies 23,308,103 - 91,355 - Corporate securities 18,412,881 - 393,734 - Multi-strategy limited partnership - - 4,512,325 - Real estate limited partnership - - 728,560 - Real estate investment trusts 13,803,854 - - - Mutual funds 22,234,267 1,168,919 17,853,935 - Money market funds 3,852,377 - 3,942,865 -
Accounts receivable - - 65,894 - Contributions receivable - - 7,157,900 - Accrued interest and dividends 372,852 - - 173
Total assets 205,550,446 1,168,919 63,156,286 414,375
Liabilities Accounts payable 315,440 - - - Accrued liabilities - - 78,062 32,471
Total liabilities 315,440 - 78,062 32,471
Net assets held in trust for pension and other employee benefits 205,235,006$ 1,168,919$ 63,078,224$ 381,904$

-124-
UnemploymentBenefits Total
367,276$ 781,478$
- 136,984,161 - 3,546,094 - 11,445,575 - 23,399,458 - 18,806,615 - 4,512,325 - 728,560 - 13,803,854 - 41,257,121 - 7,795,242 - 65,894 - 7,157,900
144 373,169
367,420 270,657,446
- 315,440 361,382 471,915
361,382 787,355
6,038$ 269,870,091$

-125-
WASHTENAW COUNTYCombining Statement of Changes in Fiduciary Net Assets
Pension and Other Employee Benefit Trust FundsYear Ended December 31, 2010
Money Voluntary
Employees' Purchase Employees
Retirement Pension Beneficiary Severance
System Plan Association Benefits
Additions
Investment income (loss):
From investing activities:
Net appreciation in fair value of investments 18,814,308$ 128,708$ 5,168,202$ -$
Interest and dividends 4,509,652 34,879 1,181,715 1,657
Investment management fees (904,453) - (238,223) -
Net income from investing activities 22,419,507 163,587 6,111,694 1,657
From securities lending activities:
Gross earnings 51,596 - - -
Borrower rebates 2,355 - - -
Securities fees (25,116) - - -
Net income from securities lending activities 28,835 - - -
Total net investment income 22,448,342 163,587 6,111,694 1,657
Contributions:
Employer 6,516,006 17,271 12,073,876 1,108,684
Employees 5,593,655 17,271 - -
On behalf - federal Medicare Part D subsidy - - 505,309 -
Total contributions 12,109,661 34,542 12,579,185 1,108,684
Other additions:
Other 1,609 - - -
Total additions 34,559,612 198,129 18,690,879 1,110,341
Deductions
Participant benefits 16,836,560 - 6,563,154 1,240,152
Payments to terminated participants - 926,980 - -
Administrative expenses 381,409 32 218,920 -
Participant refunds 649,889 - - -
Total deductions 17,867,858 927,012 6,782,074 1,240,152
Net additions (deductions) to net assets
held in trust 16,691,754 (728,883) 11,908,805 (129,811)
Net assets held in trust for benefits:
Beginning of year 188,543,252 1,897,802 51,169,419 511,715
End of year 205,235,006$ 1,168,919$ 63,078,224$ 381,904$

-126-
Unemployment
Benefits Total
-$ 24,111,218$
1,538 5,729,441
- (1,142,676)
1,538 28,697,983
- 51,596
- 2,355
- (25,116)
- 28,835
1,538 28,726,818
290,525 20,006,362
- 5,610,926
- 505,309
290,525 26,122,597
- 1,609
292,063 54,851,024
361,382 25,001,248
- 926,980
- 600,361
- 649,889
361,382 27,178,478
(69,319) 27,672,546
75,357 242,197,545
6,038$ 269,870,091$

-127-
WASHTENAW COUNTYCombining Statement of Changes in Assets and Liabilities
Agency FundYear Ended December 31, 2010
Balance BalanceJanuary 1, December 31,
2010 Additions (Deductions) 2010
Agency Fund
AssetsCash and pooled investments 16,431,556$ 363,304,051$ (357,894,908)$ 21,840,699$
LiabilitiesUndistributed receipts 16,431,556$ 363,304,051$ (357,894,908)$ 21,840,699$

Statistical Section

This part of Washtenaw County's comprehensive annual financial report presents detailed information
as a context for understanding what the information in the financial statements, note disclosures, and
required supplementary information says about the government's overall financial health
Contents Page
Financial Trends (schedules 1 thru 5) 128
These schedules contain trend information to help the reader understand
how the government's financial performance and well-being have changed
over time.
Revenue Capacity (schedules 6 thru 9) 142
These schedules contain information to help the reader assess the govern-
ment's most significant local revenue source, the property tax.
Debt Capacity (schedules 10 thru 12) 146
These schedules present information to help the reader assess the afforda-
bility of the government's current levels of outstanding debt and the gov-
ernment's ability to issue additional debt in the future.
Demographic and Economic Information (schedules 13 and 14) 150
These schedules offer demographic and economic indicators to help the
reader understand the environment within which the government's finan-
cial activities take place.
Operating Information (schedules 15 thru 18) 152
These schedules contain service and infrastructure data to help the reader
understand how the information in the government's financial report re-
lates to the services the government provides and the activities it performs.
Source: Unless otherwise noted, the information in these schedules is derived from the comprehensive annual
financial reports for the relevant year.
STATISTICAL SECTION

-128-
WASHTENAW COUNTYNet Assets by Component
Last Ten Years(accrual basis of accounting)
2001 2002 2003 2004 2005
Governmental activitiesInvested in capital assets, net
of related debt 49,634,365$ 53,104,933$ 71,844,722$ 70,895,205$ 80,296,301$ Restricted 9,488,701 13,190,358 5,063,594 6,228,085 6,676,094 Unrestricted 23,994,559 25,598,647 23,447,913 51,600,695 67,250,358
Total governmental activities net assets 83,117,625$ 91,893,938$ 100,356,229$ 128,723,985$ 154,222,753$
Business-type activitiesInvested in capital assets, net
of related debt -$ -$ -$ -$ -$ Restricted 6,000,000 6,000,000 9,000,000 - - Unrestricted 3,182,698 4,002,441 1,283,817 9,615,484 9,722,818
Total business-type activities net assets 9,182,698$ 10,002,441$ 10,283,817$ 9,615,484$ 9,722,818$
Primary governmentInvested in capital assets, net
of related debt 49,634,365$ 53,104,933$ 71,844,722$ 70,895,205$ 80,296,301$ Restricted 15,488,701 19,190,358 14,063,594 6,228,085 6,676,094 Unrestricted 27,177,257 29,601,088 24,731,730 61,216,179 76,973,176
Total primary government net assets 92,300,323$ 101,896,379$ 110,640,046$ 138,339,469$ 163,945,571$
Source: Washtenaw County Finance Department

-129-
Schedule 1UNAUDITED
2006 2007 2008 2009 2010
90,342,374$ 96,616,753$ 110,931,643$ 113,135,214$ 122,722,958$ 6,812,864 11,110,530 8,152,803 6,804,739 8,748,411
78,187,728 71,500,619 63,686,238 67,919,930 66,689,768 175,342,966$ 179,227,902$ 182,770,684$ 187,859,883$ 198,161,137$
-$ 17,841$ 37,090$ 28,435$ 19,779$ - - - - -
10,085,873 11,611,001 12,945,120 16,806,176 17,116,166 10,085,873$ 11,628,842$ 12,982,210$ 16,834,611$ 17,135,945$
90,342,374$ 96,634,594$ 110,968,733$ 113,163,649$ 122,742,737$ 6,812,864 11,110,530 8,152,803 6,804,739 8,748,411
88,273,601 83,111,620 76,631,358 84,726,106 83,805,934 185,428,839$ 190,856,744$ 195,752,894$ 204,694,494$ 215,297,082$

-130-
WASHTENAW COUNTYChanges in Net Assets
Last Ten Years (accrual basis of accounting)
2001 2002 2003 2004 2005ExpensesGovernmental activities:
Legislative 588,623$ 638,162$ 597,651$ 647,373$ 722,185$ Judicial 16,940,482 18,074,212 19,584,218 21,443,309 22,588,152 General government 19,110,899 21,288,509 23,723,024 20,459,640 24,431,995 Public safety 34,060,565 36,228,288 40,927,414 42,748,613 45,341,263 Public works 1,154,023 1,413,125 2,246,625 611,126 608,029 Health 29,462,897 31,477,846 30,669,892 31,869,261 35,694,857 Social services 20,944,476 22,484,108 21,672,601 22,006,150 26,681,106 Culture and recreation 5,605,340 6,382,489 6,634,291 7,064,861 6,891,231 Interest on long-term debt 1,485,302 1,791,363 1,643,952 1,273,833 1,027,653
Total governmental activities expenses 129,352,607 139,778,102 147,699,668 148,124,166 163,986,471
Business-type activities:Delinquent tax collection 456,868 489,348 180,046 241,083 591,362 Property foreclosure 456,868 - 228,598 189,756 314,439 Brownfield revolving loan - - - - - Principal residence exemption - - - - -
Total business-type activities expenses 913,736 489,348 408,644 430,839 905,801
Total primary government expenses 130,266,343 140,267,450 148,108,312 148,555,005 164,892,272
Program revenuesGovernmental activities:
Charges for services:Judicial 3,305,460 3,176,945 3,352,989 3,613,380 3,763,939 General government 5,365,352 5,995,338 7,406,625 6,992,302 7,572,808 Public safety 10,363,234 11,449,421 11,049,685 12,141,274 12,110,959 Public works 650,755 1,025,351 187,780 169,811 167,094 Health 4,260,570 3,627,541 3,279,950 3,504,205 4,716,287 Social services 507,997 1,219,687 359,584 1,195,278 1,031,688 Culture and recreation 2,564,996 2,601,704 2,958,441 2,823,269 3,253,314 Other activities 636,161 724,019 145,126 148,876 150,676
Operating grants and contributions 42,221,235 46,297,193 52,695,000 53,642,415 60,027,293 Capital grants and contributions 1,218,521 1,091,143 3,473,175 960,689 211,159
Total governmental activities program revenues 71,094,281 77,208,342 84,908,355 85,191,499 93,005,217
Business-type activities:Charges for services:
Delinquent tax collection 2,600,927 3,435,482 2,563,993 2,398,603 2,636,271 Property foreclosure - - 646,920 284,980 412,680 Principal residence exemption - - - - -
Operating grants and contributions - - - - 27,424 Total business-type activities program revenues 2,600,927 3,435,482 3,210,913 2,683,583 3,076,375
Total primary government program revenues 73,695,208 80,643,824 88,119,268 87,875,082 96,081,592
Net (Expense)/RevenueGovernment activities (58,177,368) (62,559,900) (62,791,313) (62,932,667) (70,981,254) Business-type activities 2,144,059 2,946,134 2,802,269 2,252,744 2,170,574
Total primary government net expense (56,033,309) (59,613,766) (59,989,044) (60,679,923) (68,810,680)

-131-
Schedule 2UNAUDITED
2006 2007 2008 2009 2010
539,323$ 576,094$ 606,763$ 593,756$ 526,142$ 24,021,026 25,458,987 25,161,986 24,261,496 23,900,492 20,346,898 24,111,811 25,003,419 19,155,496 18,483,213 46,937,810 51,217,621 52,060,983 52,567,442 54,263,600
869,372 757,558 789,934 982,745 844,588 40,868,460 41,041,193 43,139,351 44,486,741 43,899,534 31,099,614 31,556,019 34,413,953 37,914,200 41,959,629 7,998,879 8,995,250 9,057,274 9,312,142 8,981,545 1,375,511 2,878,426 3,295,572 3,544,774 3,322,673
174,056,893 186,592,959 193,529,235 192,818,792 196,181,416
908,669 1,356,027 1,159,047 605,375 596,092 288,376 408,209 442,955 801,048 794,981
11,960 - - - - 9,968 29,259 10,265 11,329 3,707
1,218,973 1,793,495 1,612,267 1,417,752 1,394,780
175,275,866 188,386,454 195,141,502 194,236,544 197,576,196
4,074,640 4,391,210 4,094,645 3,583,580 3,521,234 5,821,567 5,271,252 4,314,215 4,859,331 4,900,363
12,021,420 12,470,668 14,734,612 15,680,018 15,149,724 184,188 - - 46,464 69,883
3,227,343 3,872,437 3,797,174 3,084,865 3,715,892 1,042,936 625,262 759,804 590,521 542,702 3,225,036 3,228,112 3,101,561 2,976,259 3,230,661
141,646 - - - - 61,329,306 63,759,215 71,865,991 76,525,122 84,101,904
76,441 428,017 562,620 1,118,781 557,446 91,144,523 94,046,173 103,230,622 108,464,941 115,789,809
2,896,431 3,722,455 5,216,222 6,764,664 5,989,201 660,333 449,036 382,509 616,929 1,291,039
9,425 13,923 18,253 12,210 16,411 11,960 - - - -
3,578,149 4,185,414 5,616,984 7,393,803 7,296,651
94,722,672 98,231,587 108,847,606 115,858,744 123,086,460
(82,912,370) (92,546,786) (90,298,613) (84,353,851) (80,391,607) 2,359,176 2,391,919 4,004,717 5,976,051 5,901,871
(80,553,194) (90,154,867) (86,293,896) (78,377,800) (74,489,736) Continued…

-132-
WASHTENAW COUNTYChanges in Net Assets (Concluded)
Last Ten Years (accrual basis of accounting)
2001 2002 2003 2004 2005General RevenuesGovernmental activities:
Property taxes 50,424,580$ 56,462,144$ 60,406,712$ 82,991,160$ 87,864,506$ Accommodation taxes 1,244,845 1,259,747 1,205,356 1,277,988 1,334,932 Unrestricted grants and contributions 7,709,801 7,503,237 6,538,510 3,003,251 457,637 Investment earnings 4,381,595 2,387,051 1,640,730 1,512,323 2,558,336 Gain on sale of capital assets - - - - - Transfers 1,711,915 3,733,894 2,462,465 2,515,704 2,546,616
Total governmental activities 65,472,736 71,346,073 72,253,773 91,300,426 94,762,027
Business-type activities:Investment earnings 430,304 1,611,591 (74,699) (515,993) (141,666) Transfers (1,739,824) (3,737,982) (2,446,194) (2,405,084) (1,921,574)
Total business-type activities (1,309,520) (2,126,391) (2,520,893) (2,921,077) (2,063,240)
Total primary government 64,163,216 69,219,682 69,732,880 88,379,349 92,698,787
Change in Net AssetsGovernment activities 7,295,368 8,786,173 9,462,460 28,367,759 23,780,773 Business-type activities 834,539 819,743 281,376 (668,333) 107,334
Total primary government 8,129,907$ 9,605,916$ 9,743,836$ 27,699,426$ 23,888,107$
Source: Washtenaw County Finance Department

-133-
Schedule 2UNAUDITED
2006 2007 2008 2009 2010
95,271,757$ 86,549,856$ 84,291,171$ 82,635,161$ 79,314,216$ 1,405,408 1,494,702 1,476,545 3,039,774 3,539,013
366,250 544,946 1,050,991 428,646 1,245,565 4,150,209 6,575,702 4,332,145 898,316 474,069
- - - - 181,341 2,838,959 1,622,955 2,555,369 2,918,000 5,938,657
104,032,583 96,788,161 93,706,221 89,919,897 90,692,861
763,766 825,864 603,510 84,974 132,538 (2,759,887) (1,674,814) (3,254,859) (2,208,624) (5,733,075) (1,996,121) (848,950) (2,651,349) (2,123,650) (5,600,537)
102,036,462 95,939,211 91,054,872 87,796,247 85,092,324
21,120,213 4,241,375 3,407,608 5,566,046 10,301,254 363,055 1,542,969 1,353,368 3,852,401 301,334
21,483,268$ 5,784,344$ 4,760,976$ 9,418,447$ 10,602,588$

-134-
WASHTENAW COUNTYFund Balances - Governmental Funds
Last Ten Years(modified accrual basis of accounting)
2001 2002 2003 2004 2005
General FundReserved 1,687,275$ 2,647,421$ 1,140,757$ 966,852$ 881,264$ Unreserved 5,759,252 6,290,358 6,323,675 6,940,364 7,465,485
Total general fund 7,446,527$ 8,937,779$ 7,464,432$ 7,907,216$ 8,346,749$
All Other Governmental FundsReserved 15,779$ 1,429,691$ 2,435,812$ 3,950,573$ 6,207,220$ Unreserved, reported in:
Special revenue funds 8,853,103 10,007,784 12,312,220 33,461,825 48,621,711 Debt service funds 13,391 12,595 12,676 12,976 15,591 Capital projects funds 27,960,615 22,933,029 16,016,182 21,568,510 14,753,918
Total all other governmental funds 36,842,888$ 34,383,099$ 30,776,890$ 58,993,884$ 69,598,440$
Source: Washtenaw County Finance Department

-135-
Schedule 3UNAUDITED
2006 2007 2008 2009 2010
141,069$ 1,176,336$ 64,335$ -$ 6,667$ 8,352,216 7,481,045 9,123,996 9,773,059 15,310,490
8,493,285$ 8,657,381$ 9,188,331$ 9,773,059$ 15,317,157$
5,046,822$ 8,095,327$ 5,024,720$ 4,427,403$ 5,718,259$
63,011,160 60,419,597 56,539,750 55,743,317 50,452,188 14,815 14,040 15,863 15,144 1,128
38,482,509 59,428,860 68,833,507 31,257,471 17,010,238
106,555,306$ 127,957,824$ 130,413,840$ 91,443,335$ 73,181,813$

-136-
WASHTENAW COUNTYChanges in Fund Balances - Governmental Funds
Last Ten Years(modified accrual basis of accounting)
2001 2002 2003 2004 2005Revenues
Property taxes 50,424,580$ 56,462,144$ 60,406,712$ 82,991,160$ 87,864,506$ Accommodation taxes 1,244,845 1,259,747 1,205,356 1,277,988 1,334,932 Licenses and permits 3,062,605 3,489,426 3,417,281 3,582,066 3,413,829 Intergovernmental 51,149,556 55,289,575 55,515,317 53,442,839 56,934,231 Charges for services 19,605,316 20,917,283 23,770,669 23,964,870 27,153,376 Fines and forfeits 1,212,956 1,043,636 1,192,646 1,846,181 1,167,872 Investment income 4,098,437 2,208,254 1,498,295 1,380,964 2,282,039 Other revenues 4,190,175 4,347,661 7,927,593 5,588,048 5,187,022
Total revenues 134,988,470 145,017,726 154,933,869 174,074,116 185,337,807
ExpendituresLegislative 576,886 630,172 578,996 639,574 642,291 Judicial 16,525,671 17,711,346 19,154,639 20,414,926 21,176,406 General government 12,388,575 13,547,020 15,910,534 12,929,577 14,270,733 Public safety 33,799,524 36,324,964 39,767,190 41,600,021 44,163,259 Public works 1,146,764 1,410,098 2,291,765 613,201 600,718 Health 29,038,088 31,222,165 30,148,915 31,486,496 35,254,194 Social services 20,796,935 22,350,481 21,963,095 22,412,894 26,238,219 Culture and recreation 9,190,778 9,474,501 11,120,549 10,234,930 12,382,181 Other activities 2,386,345 2,204,195 3,634,853 4,223,737 4,473,369 Capital outlay 16,120,377 13,540,717 13,085,312 5,105,824 11,795,834 Debt service Principal 2,760,000 2,985,000 3,605,000 3,475,000 3,449,476 Interest and fiscal charges 1,994,044 1,865,201 1,632,341 1,309,370 1,059,088 Bond issuance costs - - 146,459 294,511 235,176
Total expenditures 146,723,987 153,265,860 163,039,648 154,740,061 175,740,944
Revenues over (under) expenditures (11,735,517) (8,248,134) (8,105,779) 19,334,055 9,596,863
Other financing sources (uses)Issuance of bonds - 3,000,000 - 6,365,000 - Issuance of refunding bonds - - 8,705,000 7,835,000 11,475,000 Discount on bonds (52,500) - - - Premium on bonds - - - - - Premium on refunding bonds - - 151,271 79,167 95,406 Payment to refunding escrow agent - - (8,748,421) (7,857,903) (11,336,730) Capital leases - - - - - Transfers in 23,380,841 26,079,580 24,406,361 39,613,259 44,521,956 Transfers out (20,642,934) (21,747,483) (21,173,427) (36,708,800) (43,308,404)
Total other financing sources (uses) 2,737,907 7,279,597 3,340,784 9,325,723 1,447,228
Net changes in fund balances (8,997,610)$ (968,537)$ (4,764,995)$ 28,659,778$ 11,044,091$
Debt services as a percentage of noncapital expenditures 3.7% 3.5% 3.7% 3.4% 2.9%
Source: Washtenaw County Finance Department

-137-
Schedule 4UNAUDITED
2006 2007 2008 2009 2010
95,271,757$ 86,549,856$ 84,291,171$ 82,635,161$ 79,314,216$ 1,405,408 1,494,702 1,476,545 3,039,774 3,539,013 2,837,341 2,553,918 2,316,048 2,137,762 2,162,555
57,906,931 60,185,360 68,574,831 73,925,405 80,607,931 24,673,031 25,474,636 26,473,441 27,024,216 27,375,355
1,185,468 1,205,125 1,252,718 1,068,539 1,049,847 3,759,219 6,334,119 4,077,008 828,910 398,865 5,319,978 5,798,659 6,104,802 5,995,242 6,463,798
192,359,133 189,596,375 194,566,564 196,655,009 200,911,580
527,328 560,972 597,886 592,975 522,093 22,898,849 24,263,382 24,133,352 23,574,691 22,627,356 13,443,983 16,059,495 13,589,970 11,096,546 9,789,325 45,998,323 49,495,839 50,947,419 52,112,759 52,947,824
832,179 743,454 785,662 908,992 851,970 37,820,725 39,238,401 42,181,982 44,195,428 43,887,857 29,687,409 30,124,778 32,409,404 36,144,867 40,634,460 13,839,071 11,462,934 17,744,932 11,808,558 13,098,438 4,506,919 5,873,564 6,293,261 7,141,652 5,442,086 7,203,937 6,911,345 18,335,258 39,663,808 19,674,091
2,984,476 4,224,476 5,894,476 7,235,185 7,686,172 1,200,251 2,603,594 2,947,632 3,436,595 3,238,624
183,585 521,544 365,355 - -
181,127,035 192,083,778 216,226,589 237,912,056 220,400,296
11,232,098 (2,487,403) (21,660,025) (41,257,047) (19,488,716)
23,750,000 21,675,000 22,120,000 - - - - - - - - - (22,855) - -
236,004 125,147 - - - - - - - - - - - - - - 695,122 - 430,117 526,677
48,305,876 41,145,222 44,464,023 45,197,410 42,441,579 (46,165,148) (39,512,668) (41,914,177) (42,279,410) (36,196,964)
26,126,732 24,127,823 24,646,991 3,348,117 6,771,292
37,358,830$ 21,640,420$ 2,986,966$ (37,908,930)$ (12,717,424)$
2.6% 4.0% 4.8% 5.4% 5.6%

-138-
WASHTENAW COUNTYChanges in Fund Balances - General Fund
Last Ten Years(modified accrual basis of accounting)
2001 2002 2003 2004 2005Revenues
Property taxes 45,683,776$ 48,813,596$ 52,227,354$ 54,883,846$ 59,645,096$ Licenses and permits 129,816 111,912 169,388 171,524 161,907 Intergovernmental 11,578,947 11,714,821 10,563,759 7,758,214 5,641,139 Charges for services 13,421,880 14,974,369 16,262,412 16,165,713 17,521,139 Fines and forfeits 1,191,936 1,003,693 1,125,425 1,226,872 1,106,638 Investment income 1,185,820 824,979 612,244 544,005 628,154 Other revenues 1,003,157 790,671 1,084,307 941,153 1,032,874
Total revenues 74,195,332 78,234,041 82,044,889 81,691,327 85,736,947
ExpendituresLegislative 576,886 630,172 578,996 639,574 642,291 Judicial 11,681,080 12,657,027 13,602,187 14,235,820 14,916,715 General government 10,869,970 11,910,251 13,284,578 9,619,781 10,553,533 Public safety 28,509,433 30,810,238 33,285,150 36,535,457 38,948,971 Public works 274,615 406,286 402,840 - - Health 1,691,809 1,732,474 - - - Social services 1,001,111 1,100,806 1,243,477 1,178,913 1,263,782 Culture and recreation 674,524 709,564 718,738 820,124 628,307 Other activities 2,386,345 2,204,195 3,634,853 4,223,737 4,473,369 Debt service:
Principal - - - - - Interest and fiscal changes - - - - -
Total expenditures 57,665,773 62,161,013 66,750,819 67,253,406 71,426,968
Revenues over (under) expenditures 16,529,559 16,073,028 15,294,070 14,437,921 14,309,979
Other financing sources (uses)Capital leases - - - - - Transfers in - 1,028,662 925,501 4,620,356 6,611,427 Transfers out (16,223,931) (16,837,786) (16,150,909) (18,615,493) (20,481,873)
Total other financing sources (uses) (16,223,931) (15,809,124) (15,225,408) (13,995,137) (13,870,446)
Net changes in fund balances 305,628$ 263,904$ 68,662$ 442,784$ 439,533$
Source: Washtenaw County Finance Department

-139-
Schedule 5UNAUDITED
2006 2007 2008 2009 2010
66,237,030$ 72,803,650$ 70,205,639$ 68,211,292$ 64,703,053$ 174,530 271,202 178,489 173,367 205,407
5,308,246 5,524,930 5,848,199 5,743,226 5,871,026 16,911,965 17,331,774 18,041,878 18,581,479 18,008,529 1,118,938 1,141,280 1,045,732 983,940 933,663 1,145,749 1,429,478 785,074 185,483 129,650
917,865 974,130 1,467,791 1,668,811 1,781,630
91,814,323 99,476,444 97,572,802 95,547,598 91,632,958
527,328 560,972 597,886 592,975 522,093 16,216,012 17,316,916 17,246,115 17,229,218 16,869,266 11,648,323 14,244,201 10,812,812 7,878,754 5,068,342 40,911,096 43,786,137 45,051,719 45,095,753 46,659,680
- - - 326,863 237,100 - - - - -
1,574,522 1,519,638 1,803,863 1,525,431 419,048 654,343 667,590 809,009 819,549 649,794
4,506,919 5,873,564 6,293,261 7,141,652 5,442,086
- - - 225,709 273,554 - - - 26,129 44,246
76,038,543 83,969,018 82,614,665 80,862,033 76,185,209
15,775,780 15,507,426 14,958,137 14,685,565 15,447,749
- 695,122 - 430,117 494,924 6,958,254 7,390,700 8,678,199 8,401,218 7,916,188
(22,332,075) (23,355,340) (23,105,386) (22,932,172) (18,314,763)
(15,373,821) (15,269,518) (14,427,187) (14,100,837) (9,903,651)
401,959$ 237,908$ 530,950$ 584,728$ 5,544,098$

-140-
WASHTENAW COUNTYChanges in Fund Balances - General Fund
(Expenditures by Category)Last Ten Years
(modified accrual basis of accounting)
2001 2002 2003 2004 2005Revenues
Property taxes 45,683,776$ 48,813,596$ 52,227,354$ 54,883,846$ 59,645,096$ Licenses and permits 129,816 111,912 169,388 171,524 161,907 Intergovernmental 11,578,947 11,714,821 10,563,759 7,758,214 5,641,139 Charges for services 13,421,880 14,974,369 16,262,412 16,165,713 17,521,139 Fines and forfeits 1,191,936 1,003,693 1,125,425 1,226,872 1,106,638 Investment income 1,185,820 824,979 612,244 544,005 628,154 Other revenues 1,003,157 790,671 1,084,307 941,153 1,032,874
Total revenues 74,195,332 78,234,041 82,044,889 81,691,327 85,736,947
ExpendituresPersonal services 42,046,204 45,912,603 49,903,278 51,764,737 55,129,899 Supplies 1,308,329 1,588,845 1,452,823 1,627,031 1,528,967 Other services and charges 11,499,887 12,457,044 13,118,819 12,179,677 13,345,666 Internal service charges 2,778,308 2,171,613 2,222,890 1,645,145 1,410,187 Capital outlay 33,046 30,908 53,009 36,816 12,248 Debt service - - - - -
Total expenditures 57,665,773 62,161,013 66,750,819 67,253,406 71,426,968
Revenues over (under) expenditures 16,529,559 16,073,028 15,294,070 14,437,921 14,309,979
Other financing sources (uses)Capital leases - - - - - Transfers in - 1,028,662 925,501 4,620,356 6,611,427 Transfers out (16,223,931) (16,837,786) (16,150,909) (18,615,493) (20,481,873)
Total other financing sources (uses) (16,223,931) (15,809,124) (15,225,408) (13,995,137) (13,870,446)
Net changes in fund balances 305,628$ 263,904$ 68,662$ 442,784$ 439,533$
Source: Washtenaw County Finance Department

-141-
Schedule 5AUNAUDITED
2006 2007 2008 2009 2010
66,237,030$ 72,803,650$ 70,205,639$ 68,211,292$ 64,703,053$ 174,530 271,202 178,489 173,367 205,407
5,308,246 5,524,930 5,848,199 5,743,226 5,871,026 16,911,965 17,331,774 18,041,878 18,581,479 18,008,529
1,118,938 1,141,280 1,045,732 983,940 933,663 1,145,749 1,429,478 785,074 185,483 129,650
917,865 974,130 1,467,791 1,668,811 1,781,630
91,814,323 99,476,444 97,572,802 95,547,598 91,632,958
58,424,800 63,324,954 63,221,173 61,607,795 60,772,335 1,696,147 1,603,767 1,596,407 1,601,385 1,703,731
14,240,236 16,377,624 15,920,395 16,182,001 12,514,061 1,676,520 2,650,264 1,602,137 779,808 302,685
840 12,409 274,553 439,206 574,597 - - - 251,838 317,800
76,038,543 83,969,018 82,614,665 80,862,033 76,185,209
15,775,780 15,507,426 14,958,137 14,685,565 15,447,749
- 695,122 - 430,117 494,924 6,958,254 7,390,700 8,678,199 8,401,218 7,916,188
(22,332,075) (23,355,340) (23,105,386) (22,932,172) (18,314,763)
(15,373,821) (15,269,518) (14,427,187) (14,100,837) (9,903,651)
401,959$ 237,908$ 530,950$ 584,728$ 5,544,098$

-142-
Schedule 6UNAUDITED
WASHTENAW COUNTYAssessed and Actual Value of Taxable Property
Last Ten Years(in thousands of dollars)
Total TotalResidential Commercial Industrial Personal Assessed Actual Total Direct
Year Property Property Property Other Property Value Value Tax Rate
2001 7,947,075$ 2,164,528$ 641,354$ 352,969$ 1,085,093$ 12,191,019$ 24,472,414$ 5.4759 2002 8,983,153 2,382,889 757,346 433,528 1,145,185 13,702,101 27,492,263 5.6772 2003 10,017,580 2,652,147 804,851 478,542 1,092,571 15,045,691 30,196,516 5.6186 2004 11,016,278 2,820,335 848,380 533,236 1,096,757 16,314,986 32,758,847 5.5819 2005 11,886,410 3,106,081 885,397 564,140 1,092,596 17,534,624 35,184,135 5.5493 2006 12,712,166 3,278,326 912,147 559,299 1,083,615 18,545,553 37,208,917 5.5024 2007 13,180,822 3,454,744 955,905 589,064 1,150,417 19,330,952 38,961,637 5.6768 2008 12,377,703 3,681,923 882,304 595,774 1,227,324 18,765,028 37,678,729 5.7018 2009 11,260,432 3,692,630 834,222 578,251 1,163,963 17,529,498 35,263,130 5.7418 2010 10,619,743 3,541,601 523,123 534,906 1,044,135 16,263,508 32,711,793 5.7448
Note: Residential, commercial and industrial values are calculated without tax-exempt values
Source: County Equalization Department figures, exclusive of Industrial and Commercial Facility Tax and prior to any Board of Review actions.

-143-
Schedule 7UNAUDITED
WASHTENAW COUNTYDirect and Overlapping Property Tax Rates
Last Ten Years(rate per $1,000 of taxable value)
2001 2002 2003 2004 2005 2006 2007 2008 2009 2010
County direct ratesOperation 4.76 4.72 4.67 4.64 4.61 4.57 4.55 4.55 4.55 4.55 County imposed and debt - - 0.49 - - - - - - - Special voted 0.72 0.96 0.46 0.94 0.94 0.93 1.13 1.13 1.19 1.20
Total direct rate 5.48 5.68 5.62 5.58 5.55 5.50 5.68 5.68 5.74 5.74
Overlapping ratesCities:
Ann Arbor 17.13 17.00 16.87 16.90 16.90 16.82 16.78 16.78 16.80 16.82 Chelsea (1) - - - - - 13.21 15.05 15.05 14.96 13.16 Milan 15.75 15.75 15.75 15.75 15.75 15.75 15.50 15.50 15.50 14.40 Saline 10.00 9.96 10.96 12.95 13.72 15.53 15.53 15.53 15.53 15.53 Ypsilanti 24.46 27.37 27.41 28.28 27.92 29.03 29.58 30.60 30.86 31.53
Townships (average) (A) 2.62 2.72 2.80 2.77 2.97 3.07 3.22 3.19 3.40 3.16
Villages (average) (B) 13.46 13.29 13.23 13.18 12.95 9.77 9.54 9.56 9.62 9.62
School districts (average) (C) 30.15 30.16 30.15 29.39 30.22 29.77 29.55 29.54 30.91 31.04
Intermediate school district 3.13 3.11 3.07 3.46 4.04 4.00 3.97 3.97 3.97 3.97
Community college 3.99 3.97 3.86 3.83 3.77 3.72 3.70 3.69 3.69 3.69
(A) - Rates range from: Low 0.00 0.00 0.00 0.00 0.00 0.00 0.00 0.00 0.00 0.00High 9.75 9.75 10.12 9.66 10.53 10.40 10.40 10.40 10.40 10.40
(B) - Rates range from:Low 10.00 10.00 10.00 10.00 10.00 10.00 10.00 10.00 10.00 10.00 High 15.74 15.30 15.67 15.27 15.28 15.39 14.59 14.59 14.92 14.92
(C) - Rates range from:Low 25.29 25.93 25.26 24.17 23.38 25.26 25.40 25.40 25.36 25.36 High 38.76 41.35 34.30 32.65 33.65 36.48 35.69 35.69 34.59 34.59
Source: Washtenaw County Finance Department(1) - Chelsea became a city in 2006; previously it was reported with the Villages

-144-
Schedule 8UNAUDITED
WASHTENAW COUNTYPrincipal Property Tax Payers
Current Year and Nine Years Ago
2010 2001Percentage Percentage
of Total of TotalCounty County
Taxable Taxable Taxable TaxableAssessed Assessed Assessed Assessed
Taxpayer Value Rank Value Value Rank Value
Detroit Edison 149,466,515$ 1 1.03% 130,381,948$ 4 1.25%McKinley Associates 139,357,335 2 0.96% - - - Toyota Motor 117,606,544 3 0.81% 33,345,835 10 0.32%Michigan Consolidated Gas 99,728,148 4 0.69% 70,942,562 5 0.68%Ford Motor 97,497,327 5 0.67% - - -
Briarwood Complex 73,699,051 6 0.51% 62,973,388 6 0.60%Domino's Farm 69,107,175 7 0.48% 45,751,823 7 0.44%Hyundai 37,299,989 8 0.26% - - - Daimler Chrysler 34,479,913 9 0.24% 37,363,412 8 0.36%Mav Development 33,666,845 10 0.23% - - -
Arborland LLC 32,520,896 11 0.22% 18,839,028 15 0.18%Meijer Incorporated 30,988,186 12 0.21% 24,118,526 12 0.23%Comcast 30,230,787 13 0.21% 29,809,635 11 0.29%Ann Arbor Campus Housing 26,907,819 14 0.19% - - - Consumers Energy 26,391,347 15 0.18% - - -
998,947,877$ 6.89% 453,526,157$ 4.34%
Source: Washtenaw County Equalization Department.

-145-
Schedule 9UNAUDITED
WASHTENAW COUNTYProperty Tax Levies and Collections
Last Ten Years
Taxes Levied Subsequent Total Collections to Datefor the % of Years % of
Year Fiscal Year Amount Levy Collections Amount Levy
2001 52,181,561$ 49,523,726$ 94.91% 2,350,685$ 51,874,411$ 99.41%
2002 58,269,004 55,501,885 95.25% 2,417,213 57,919,098 99.40%
2003 62,459,717 59,400,607 95.10% 2,586,635 61,987,242 99.24%
2004 65,676,479 62,650,121 95.39% 2,622,050 65,272,171 99.38%
2005 69,669,724 66,173,312 94.98% 3,031,443 69,204,755 99.33%
2006 73,894,038 70,780,578 95.79% 2,852,695 73,633,273 99.65%
2007 81,570,687 78,257,648 95.94% 3,112,051 81,369,699 99.75%
2008 86,208,920 82,652,655 95.87% 3,359,451 86,012,106 99.77%
2009 86,755,826 82,908,257 95.57% 3,596,050 86,504,307 99.71%
2010 85,172,555 81,368,255 95.53% 3,550,949 84,919,204 99.70%
Source: Washtenaw County Treasurer's Office
Collected within theFiscal Year of the Levy

-146-
Schedule 10Unaudited
WASHTENAW COUNTYRatios of Outstanding Debt by Type
Last Ten Fiscal Years
2001 2002 2003 2004 2005 2006 2007 2008 2009 2010
Governmental activitiesGeneral obligation bonds 38,160,000$ 37,690,000$ 35,035,000$ 38,120,000$ 35,615,000$ 56,400,000$ 73,870,000$ 90,115,000$ 83,125,000$ 75,765,000$ Capital leases - 685,608 346,319 136,872 461,948 309,424 829,132 468,072 672,480 711,121 Loans 292,133 292,133 292,133 292,133 272,658 253,182 233,707 214,231 194,756 175,280
Total outstanding debt 38,452,133$ 38,667,741$ 35,673,452$ 38,549,005$ 36,349,606$ 56,962,606$ 74,932,839$ 90,797,303$ 83,992,236$ 76,651,401$
Total taxable value (000's) 12,191,019$ 13,702,101$ 15,045,691$ 16,314,986$ 17,534,624$ 18,545,553$ 19,330,952$ 18,765,028$ 17,529,498$ 16,263,508$
Ratio of total debt totaxable value 0.32% 0.28% 0.24% 0.24% 0.21% 0.31% 0.39% 0.48% 0.48% 0.47%
Total population 329,308 334,351 338,562 338,782 342,124 347,792 347,969 344,767 347,563 347,563
Total debt per capita 116.77$ 115.65$ 105.37$ 113.79$ 106.25$ 163.78$ 215.34$ 263.36$ 241.66$ 220.54$
% of personal income 0.33% 0.32% 0.28% 0.29% 0.27% 0.41% 0.53% 0.67% 0.62% 0.57%
Source: Washtenaw County Finance Department
Further details regarding the County's debt can be found in the notes to the financial statements.

-147-
Schedule 10AUNAUDITED
WASHTENAW COUNTYRatios of Net General Bonded Debt Outstanding
Last Ten Years
General Bonded Debt OutstandingLess: % of
Amounts ActualGeneral Restricted % of Taxable
Obligation to Repaying Personal Value of PerYear Bonds Principal Total Income Property Capita
2001 38,160,000$ -$ 38,160,000$ 0.32% 0.31% 115.88$
2002 37,690,000 - 37,690,000 0.31% 0.28% 112.73
2003 35,035,000 - 35,035,000 0.27% 0.23% 103.48
2004 38,120,000 - 38,120,000 0.28% 0.23% 112.52
2005 35,615,000 - 35,615,000 0.26% 0.20% 104.10
2006 56,400,000 - 56,400,000 0.41% 0.30% 162.17
2007 73,870,000 - 73,870,000 0.52% 0.38% 212.29
2008 90,115,000 - 90,115,000 0.67% 0.48% 261.38
2009 83,125,000 - 83,125,000 0.62% 0.47% 239.17
2010 75,765,000 - 75,765,000 0.56% 0.47% 217.99
Source: Washtenaw County Finance Department

-148-
Schedule 11UNAUDITED
WASHTENAW COUNTYComputation of Net Direct and Overlapping Debt
As of December 31, 2010
Self-SupportingGross or Paid Net
Amount by Benefited AmountOutstanding Entity Outstanding
Direct debtGeneral obligation tax notes 26,000,000$ 26,000,000$ -$ Building authority bonds 75,765,000 - 75,765,000 Notes payable 175,280 - 175,280 Water Resources bonds and notes 11,388,989 10,874,968 514,021 Public Works water and sewer debt 29,882,279 29,882,279 - Road Commission debt 1,251,000 1,251,000 -
Net direct debt 144,462,548$ 68,008,247$ 76,454,301
Overlapping debtSchool districts 930,798,549 Cities 215,738,257 Townships 78,761,819 Villages 9,197,000 Intermediate school district 307,318 Community colleges 38,142,623 Library 25,760,772
Net overlapping debt 1,298,706,338
Net direct and overlapping debt 1,375,160,639$
Source: Washtenaw County Finance Department and Municipal Advisory Council of Michigan.

-149-
Schedule 12UNAUDITED
WASHTENAW COUNTYLegal Debt Margin
Last Ten Years
Legal Debt Margin Calculation for 2010
Assessed value 16,263,508,267$
Debt limit (10% of assessed value) 1,626,350,827$
Debt applicable to limit - general obligation bonds 144,462,548
Legal debt margin 1,481,888,279$
TotalNet Debt
Total ApplicableNet Debt to Limit as a
Debt Applicable Legal Percentage ofLimit to Limit Debt Margin Debt Limit
2001 1,219,101,814$ 93,087,172$ 1,126,014,642$ 7.64%
2002 1,370,210,183 100,449,507 1,269,760,676 7.33%
2003 1,504,569,055 95,545,110 1,409,023,945 6.35%
2004 1,631,498,572 101,955,812 1,529,542,760 6.25%
2005 1,753,462,361 93,014,742 1,660,447,619 5.30%
2006 1,854,553,316 115,193,717 1,739,359,599 6.21%
2007 1,933,095,190 136,468,517 1,796,626,673 7.06%
2008 1,876,502,686 161,117,364 1,715,385,322 8.59%
2009 1,752,949,726 150,036,016 1,602,913,710 8.56%
2010 1,626,350,827 144,462,548 1,481,888,279 8.24%
Source: Washtenaw County Finance Department

-150-
Schedule 13UNAUDITED
WASHTENAW COUNTYDemographic and Economic Statistics
Last Ten Years
PersonalIncome Per Capita
(thousands Personal UnemploymentYear Population of dollars) Income Rate
2001 329,308 11,774,476$ 35,867$ 2.9%
2002 334,351 12,232,147 36,794 3.6%
2003 338,562 12,869,105 38,323 4.1%
2004 338,782 13,391,280 39,528 4.2%
2005 342,124 13,578,433 39,689 4.2%
2006 347,792 13,874,107 39,892 4.6%
2007 347,969 14,233,752 40,905 4.7%
2008 344,767 13,482,692 39,107 7.3%
2009 347,563 (a) 13,482,692 (a) 39,107 (a) 8.6%
2010 347,563 (a) 13,482,692 (a) 39,107 (a) 6.6% (b)
(a) Census Data not available at the time of publication.(b) Preliminary reported as of December 31, 2010
Sources: Bureau of Economic Analysis - http://bea.gov/regional/bearfacts/action.cfmEconomic Time Series - http://www.economagic.com/em-cgi/data.exe/blsla
Michigan Economic Development Corporation

-151-
Schedule 14UNAUDITED
WASHTENAW COUNTYPrincipal Employers
Current Year and Nine Years Ago
2010 2001% of % of
Total County Total CountyEmployer Employees Rank Employment Employees Rank Employment
University of Michigan 26,423 1 15.51% 14,804 1 7.95%Trinity Health 5,255 2 3.09% 4,243 5 - Ann Arbor Public Schools 3,579 3 2.10% 1,900 9 1.02%U.S. Government 2,621 4 1.54% 2,585 6 1.39%Eastern Michigan University 1,956 5 1.15% 2,223 7 1.19%
Thomson Reuters 1,773 6 1.04% - - 0.00%State of Michigan 1,569 7 0.92% 2,054 8 1.10%Washtenaw County 1,324 8 0.78% 1,300 11 0.70%Borders Group 895 9 0.53% 1,800 10 0.97%Ford Motor Company 823 10 0.48% 5,638 4 3.03%
City of Ann Arbor 745 11 0.44% 1,000 13 0.54%Ypsilanti Public Schools 643 12 0.38% 699 15 0.38%General Motors 625 13 0.37% 5,870 3 - DTE Energy Co. 618 14 0.36% - - - U.S. Postal Service 610 15 0.36% 551 19 -
Washtenaw Community College 590 16 0.35% - - 0.00%Lincoln Consolidated Schools 523 17 0.31% - - 0.00%Domino's Pizza Inc. 520 18 0.31% 550 20 0.30%IHA 502 19 0.29% - - - Chelsea School District 437 20 0.26% 862 14 0.46%
52,031 30.55% 46,079 19.03%
Source: Crain's Detroit Business

-152-
Schedule 15UNAUDITED
WASHTENAW COUNTYFull-Time Equivalent County Government Employees by Function/Program
Last Eight Years
Function/Program 2003 2004 2005 2006 2007 2008 2009 2010
LegislativeBoard of Commissioners 11.0 11.0 11.0 11.0 11.0 11.0 11.0 11.0
JudicialTrial Court-Civil/Criminal 30.9 28.7 28.7 26.7 26.7 26.7 26.7 26.7 Trial Court Clerk Services - - - - - - - 19.0 District Court 44.6 44.0 44.0 47.0 48.0 51.0 49.0 51.0 Trial Court-Probate 9.0 11.0 10.0 11.0 11.0 11.0 12.0 12.0 Trial Court-Juvenile Center 31.4 25.3 28.3 25.5 26.0 27.0 23.8 24.8 Trial Court-Friend of the Court 59.0 60.0 60.0 60.0 60.0 60.0 60.0 60.0 Community Corrections 7.0 9.0 9.0 9.0 8.0 8.0 8.0 7.0 Public Defender 22.0 22.0 21.0 21.0 22.0 22.0 18.0 16.0
General GovernmentCounty Administration 5.0 4.0 4.0 4.0 6.0 6.0 5.5 3.5 Corporation Counsel 1.8 1.5 1.5 1.5 1.5 1.5 1.0 1.0 Budget - 4.0 4.0 5.0 5.0 5.0 4.0 4.5 Finance 27.0 20.0 20.0 20.0 20.0 18.3 16.2 16.0 Information & Tech Systems 45.0 35.0 34.0 34.0 27.8 27.3 24.6 24.5 Equalization 14.0 14.0 13.0 14.0 14.0 14.0 13.0 13.0 Human Resources 13.0 8.0 8.0 8.0 7.0 9.8 9.0 7.0 Organizational Development - 4.0 5.0 5.0 3.0 1.0 1.0 - Clerk/Register 51.5 51.5 50.5 51.5 51.5 49.5 48.5 23.0 Treasurer 13.5 13.8 12.8 12.8 14.5 14.5 15.5 16.5 Drain/Water Resources Commissioner 21.0 22.0 21.0 21.0 18.0 20.0 20.0 19.0 Economic Development & energy - - - - - - - 4.0 WSC Customer Support Unit - - 5.3 5.3 5.3 - - - Office of Strategic Planning - - - - - - 7.0 - Risk Management 3.0 0.5 0.5 0.5 0.5 0.5 1.0 2.0 Facilities Management 38.0 30.0 31.0 31.0 28.5 27.5 22.0 22.5 Support Services - Fleet 3.0 3.0 3.0 3.0 3.0 2.5 1.0 0.5 Support Services - Project Management - - - - 3.8 3.8 3.0 1.0 Support Services - Strategic Planning 2.0 2.0 - - 7.0 5.0 4.0 -
Public SafetyProsecuting Attorney 39.9 41.9 41.9 42.9 43.9 42.9 41.9 41.9 Prosecuting Attorney - CRP 7.2 7.2 7.2 7.2 7.2 6.4 6.3 6.2 Prosecuting Attorney - Domestic Violence 24.0 8.0 7.0 2.0 2.0 2.0 2.0 2.0 Sheriff 296.0 289.0 282.5 284.5 288.0 282.0 283.8 285.8 Building Inspection/Services 25.0 15.0 13.3 13.3 28.9 9.5 9.6 5.0 Emergency Management 3.0 4.0 4.0 5.0 5.0 5.0 5.0 2.0 E-911 - Administration 1.0 1.0 1.0 1.0 1.0 1.0 1.0 1.0 HIDTA - 3.0 3.0 3.0 3.0 5.0 3.0 3.0
Public WorksPublic Works 16.6 12.5 11.1 11.1 12.2 12.7 2.0 1.0 Solid Waste 1.8 1.8 1.0 1.8 1.8 1.8 1.8 1.8
HealthEnvironmental Health 43.0 42.0 38.5 38.5 35.6 30.6 29.6 28.6 Public Health 86.2 69.6 70.8 70.8 72.9 74.8 72.4 68.4 Community Support & Treatment Services 271.1 235.5 251.8 265.4 276.5 281.5 308.0 301.0 Washtenaw Community Health Organization 50.1 63.2 65.2 78.1 80.1 78.1 73.1 63.3
Social ServicesChild Care - Trial Court/Juvenile Center 15.2 13.9 13.9 15.9 15.9 17.6 17.6 17.6 Child Care - Detention 29.6 30.2 30.2 30.0 29.9 28.9 28.2 30.6 Children Services 12.0 11.4 11.4 11.6 11.6 9.7 9.4 5.0 Veterans Services 5.0 5.0 5.0 5.0 5.0 5.0 5.0 5.0 Employment Training & Community Services 22.1 19.4 19.4 19.4 19.4 19.4 18.9 18.9 Head Start 36.5 36.5 36.5 37.0 37.3 37.3 37.3 36.3 Community Development - - 4.0 5.0 6.5 5.7 9.0 10.0
Culture & RecreationParks & Recreation 36.0 31.0 33.0 35.0 35.0 40.0 42.0 39.0 Library 7.0 6.0 6.0 7.0 7.0 5.5 - - County Extension 6.0 5.0 1.0 1.0 1.0 4.0 3.8 2.7
Total 1,486.8 1,376.1 1,383.9 1,418.8 1,455.5 1,428.8 1,415.1 1,361.3
Source: Washtenaw County Finance Department - 2010/11 budget summary listing of authorized active positionsOnly eight years of data readily available.

-153-
Schedule 16UNAUDITED
WASHTENAW COUNTYOperating Indicators by Function/Program
Last Ten Years
Function/Program 2001 2002 2003 2004 2005 2006 2007 2008 2009 2010
Public SafetySheriff:
Number of incidents 61,433 56,942 54,644 53,266 52,479 53,279 51,191 60,449 61,563 63,825 Number of crash reports 7,499 4,656 4,703 4,339 4,273 6,611 3,259 4,118 2,803 2,876 Number of arrests 2,921 2,900 2,648 2,509 2,306 1,127 2,108 3,876 6,980 2,388 Number of bookings 7,833 8,419 8,093 7,135 6,969 6,993 7,084 7,433 7,176 7,152
Public WorksCenterline miles of road maintained 1,580 1,582 1,594 1,603 1,612 1,624 1,634 1,647 1,650 1,652
HealthPublic Health:
Vaccines administered 37,535 41,642 44,971 40,410 54,143 46,454 53,409 49,688 46,600 57,522 Number of monthly participants 4,125 4,522 4,559 4,667 4,580 4,660 4,712 4,920 5,000 5,700
Culture & RecreationParks & Recreation:
Recreation center participation 368,221 395,190 414,354 363,709 367,581 370,696 346,298 317,029 341,078 338,148 Aquatic center participation 88,409 89,343 77,195 75,127 107,403 104,453 111,183 104,172 92,062 113,635 Rounds of Golf 43,273 40,816 39,249 39,169 37,591 37,049 33,580 31,120 35,880 33,316 Boat Rental 744 904 541 652 734 602 590 822 731 792
Source: Washtenaw County Finance Department

-154-
Schedule 17UNAUDITED
WASHTENAW COUNTYCapital Asset Statistics by Function/Program
Last Ten Years
Function/Program 2001 2002 2003 2004 2005 2006 2007 2008 2009 2010
SheriffVehicle patrol units:
Police service automobiles 60 82 82 85 85 85 90 90 89 87 Animal control - 1 1 2 2 2 2 2 2 2 Marine safety - 2 6 2 2 2 3 3 3 3 Jail - 16 16 17 17 17 17 17 18 17 Motorcycles - 5 12 12 12 12 2 - - -
Parks and recreationParks:
County 13 13 13 13 13 13 13 13 13 13 Natural areas - - 6 6 6 10 12 20 17 19
Park acreage:Parkland 1,376 1,376 1,438 1,438 1,647 1,762 1,834 1,903 1,943 1,943 Natural areas - - 438 715 780 980 1,079 1,659 1,767 2,044
Picnic areas 12 19 19 19 19 19 19 19 19 19 Historic sites 2 2 2 2 2 2 2 2 2 2 Buildings:
Log cabins - - - - 1 1 1 1 1 1 County recreation center 1 1 1 1 1 1 1 1 1 1 Fishing structures 4 3 3 3 3 3 3 3 3 3 Pavilions 6 11 11 12 12 12 12 12 12 13 Concession - - - 3 3 3 3 3 3 3 Multi-purpose - - - 2 2 2 2 2 2 2 Nature cabin 1 1 1 1 1 1 1 1 1 1
Swimming beach areas 2 2 2 2 1 1 1 1 1 1 Swimming pools (in/out) - 2 2 2 1 1 1 1 1 1 Golf Courses:
18 hole course 1 1 1 1 1 1 1 1 1 1 18 hole disc course - - - 1 1 1 1 1 2 2
Trails:Nature 13 7 7 9 9 9 10 10 11 12 Exercise 1 1 1 1 1 1 1 1 1 1 Multiuse 1 8 8 8 8 8 8 8 8 8
Playgrounds - 6 6 6 6 7 7 7 7 6 Water Areas:
Water parks 1 1 1 1 1 1 1 1 1 1 Spray play feature 1 3 3 3 3 3 3 3 3 3 Lazy river ride - - - 1 1 1 1 1 1 1
Public worksCenterline miles of county roads:
Federal and State 180 180 180 180 576 576 580 580 580 580 Primary 529 529 529 542 586 587 588 588 589 589 Local 758 758 756 743 703 704 706 706 705 705 Subdivision 282 282 296 308 323 333 340 353 356 357
Source: Washtenaw County Finance Department

-155-
Schedule 18UNAUDITED
WASHTENAW COUNTYSchedule of Insurance
As of December 31, 2010
Type of CoverageName of Company Policy Period Premium Description
Genesis Insurance 10/1/10-10/1/11 743,252$ Auto, general and police legal liability of the Company County for bodily injury, property damage and
personal injury. Limit $10,000,000 per occurrenceand $5,000,000 aggregate. Occurrence form;$400,000 self insured retention.
Buildings and Contents 10/1/10-10/1/11 117,542 All risk coverage on buildings and contents at CHUBB Insurance Co. replacement cost. $185,000,000 limit $250,000
deductible per occurrence (includes burglary).Includes perils from flood and earthquake.
Inland Marine Coverage 10/1/10-10/1/11 Included Covers scheduled portable equipment consisting of radio and video equipment, boats and trailers, etc.All risk coverage.
Data Processing Coverage 10/1/10-10/1/11 Included Covers data processing equipment, media andextra expense. Limit $500,000 per occurrence.
Employee Benefit Liability 10/1/10-10/1/11 Included Policy limit $1,000,000 covers employees, prospective employees, former employees, or theirbeneficiaries, for damages sustained in the administrationof employee benefits programs.
Great American Ins. Co. 10/1/10-10/1/11 11,764 Covers loss to the County caused by dishonesty orfraudulent act of an employee or failure tofaithfully perform the duties or the position. Limit$5,000,000 with $10,000 loss deductible. All Countyemployees covered. Public Employee Blanket Bond.
Public Officials 10/1/10-10/1/11 Included Policy limit $10,000,000 subject to $400,000 deductibleGenesis Insurance covers liability for wrongful acts, claims madeCompany form, duty to defend.
Professional Liability 10/1/10-10/1/11 130,235 Covers Public Health and Mental Health operationsHudson Insurance Co. (includes doctors) $1,000,000/$3,000,000 each medical incident.
Deductible of $250,000 does not include defense costs.
Boiler Machinery Policy 10/1/10-10/1/11 Included Covers boilers and air conditioning units, broadform basis (except cast iron), including repair and/or replacement on most objects. $1,000 deductible.
Lawyers Professional 10/1/10-10/1/11 1,730 Covers Employee related issues in Public Defender's Office. Lloyds/National Legal 3/1/10-3/1/11 15,307 Professional liability limit $1,000,000. Aid and Defender Disciplinary proceedings limit $5,000.Association Also covers Labor Relation Attorney and Corp Counsel.
Personal injury $1,000,000/1,000,000. Disciplinaryproceeding $10,000. Subject to deductible.
Continued…

-156-
Schedule 18UNAUDITED
WASHTENAW COUNTYSchedule of Insurance
As of December 31, 2010
Type of CoverageName of Company Policy Period Premium Description
Short-Term Bond 12/01/10-03/31/11 25,610$ Bond was based on 40% of the tax levy for the County,Burnham & Flower of schools and SET (State Education Tax). County isMichigan The Hartford reimbursed for approximately 95% of the cost of the bond.
Judicial Liability 10/1/10-10/1/11 35,315 Covers 20 Judges, Magistrates and referees Complete $1,000,000 liability coverage per claim. Equity Market $2,500 deductible.
Federal Insurance 10/1/10-10/1/11 11,550 Fiduciary Liability Policy for Washtenaw County covering theCompanies VEBA, MPPP and WCERS Systems with limits of $3,000,000.
United States Liability 10/1/10-10/1/11 4,726 Liquor Liability Insurance Policy for Pierce Lake Golf Course
Workers' Compensation 02/01/09-02/01/10 41,935 TPA for Claims Service.BROADSPIRE
Safety National 02/01/09-02/01/10 52,218 Statutory specific excess insurance above a $400,000 retention.
Long-Term Disability Monthly Varies Covers all full-time regular employees.Unum Provident Choice of coverage is 50%, 60%, or 66 and 2/3% of monthly
salary with varying elimination periods. Also covers part-time MNA employees basic coverage only
Dental Monthly Varies 100% basic dental, 50% other services, 50%Delta Dental Prosthondontics and Orthodontic services, $750 annual Core Plan limit.
Dental Monthly Varies 100% basic dental, 50% other services, 50%Delta Dental Prosthondontics, no Orthodontic services, $750 annual limit Retiree Plan
Dental Monthly Varies 100% basic dental, 80% other services, including sealants,Delta Dental 50% Orthodontics services, $1,000 annual limit and $1,750 Premier Plan for those in lifetime for Orthodontics.Flex Benefits who choosethis option
Life Insurance Monthly Varies Covers death of employee and/or AD&D. All full-timeUnum Provident employees with choice of coverage equal to 1 X annual
salary up to 50K, 2 X annual salary up to 100K, or 3 X annual salary up to 150K. MNA Employee basiccoverage (coverage up to 50K or 1 X annual salary)
Vision Care Monthly Varies Vision Care option pays for certain vision care Blue Cross/Blue Shied/ tests and supplies when obtained from a Vision Service Plan (VSP) participating provider after County employee pays
the provider the required co-payment amount.

Copyright © 2022 FDOKUMEN