City of Bowling Green Comprehensive Annual Financial ...
148
City of Bowling Green Comprehensive Annual Financial Report For the Fiscal Year Ended June 30, 2013 Issued by the Department of Finance
-
Upload
khangminh22 -
Category
Documents
-
view
4 -
download
0
Transcript of City of Bowling Green Comprehensive Annual Financial ...

City of Bowling Green
Comprehensive Annual Financial Report
For the Fiscal Year Ended June 30, 2013
Issued by theDepartment of Finance

City of Bowling Green, Kentucky
Table of ContentsYear Ended June 30, 2013
Page
INTRODUCTORY SECTIONLetter of Transmittal.................................................................................................................1-6GFOA Certificate of Achievement for Excellence in Financial Reporting....................................7Organizational Chart...................................................................................................................8Directory - Principal Officials.......................................................................................................9
FINANCIAL SECTION
Independent Auditor's Report ..........................................................................................10-12
Management's Discussion and Analysis ........................................................................13-24
Basic Financial Statements
Government Wide Financial StatementsStatement of Net Position...................................................................................................25Statement of Activities ........................................................................................................26
Fund Financial StatementsGovernmental Fund Financial Statements
Balance Sheet – Governmental Funds............................................................................27Reconciliation of the Balance Sheet of Governmental Funds to
the Statement of Net Position.......................................................................................28Statement of Revenues, Expenditures and Changes in Fund Balances -
Governmental Funds....................................................................................................29Reconciliation of the Statement of Revenues, Expenditures and Changes
in Fund Balances of Governmental Funds to the Statement of Activities .....................30
Proprietary Fund Financial StatementsStatement of Net Position - Proprietary Funds ................................................................31Statement of Revenues, Expenses and Changes in Net
Position - Proprietary Funds .........................................................................................32Statement of Cash Flows - Proprietary Funds.................................................................33
Fiduciary Fund Financial StatementsStatement of Fiduciary Net Position ................................................................................34Statement of Changes in Fiduciary Net Position .............................................................35
Component Units Financial StatementsStatement of Net Position................................................................................................36Statement of Activities .....................................................................................................37

City of Bowling Green, Kentucky
Table of ContentsYear Ended June 30, 2013
Notes to Financial Statements ...................................................................................38-66
Required Supplementary Information
Budgetary Comparison Schedule General Fund ................................................................................................................67-68Notes to Required Supplementary Information on Budgetary Accounting and Control.......69
Pension SchedulesSchedule of Funding Progress – Policemen and Firemen’s Retirement Fund....................70Schedule of Employer Contributions – Policemen and Firemen’s Retirement Fund...........70
Modified Approach for City Streets Infrastructure Capital Assets.............................71-73
Combining and Individual Fund Statements and Schedules
Nonmajor Governmental FundsCombining Balance Sheet - Nonmajor Governmental Funds.............................................78Combining Balance Sheet - Nonmajor Special Revenue Funds ...................................79-80Combining Balance Sheet - Nonmajor Capital Projects Funds......................................81-82Combining Statement of Revenues, Expenditures and Changes in
Fund Balances - Nonmajor Governmental Funds ...........................................................83Combining Statement of Revenues, Expenditures and Changes in
Fund Balances - Nonmajor Special Revenue Funds..................................................84-85Combining Statement of Revenues, Expenditures and Changes in
Fund Balances - Nonmajor Capital Projects Funds....................................................86-87Budgetary Comparison Schedules:
Debt Service Fund...........................................................................................................88WKU Athletics Debt Service Fund...................................................................................89ITA Bond Debt Service Fund...........................................................................................90TIF District Bond Debt Service Fund ...............................................................................91Community Development Special Revenue Fund...........................................................92Fire Improvement Special Revenue Fund .......................................................................93Municipal Aid Special Revenue Fund..............................................................................94Job Development Incentive Special Revenue Fund ........................................................95Parks Development Special Revenue Fund....................................................................96Landfill Closure Special Revenue Fund...........................................................................97Local Law Enforcement Block Grant Special Revenue Fund ..........................................98Trunking Operation Special Revenue Fund.....................................................................99Police Improvement Special Revenue Fund..................................................................100Lampkin Park Special Revenue Fund ...........................................................................101Homeland Security Special Revenue Fund...................................................................102Riverfront Development Capital Projects Fund..............................................................103

City of Bowling Green, Kentucky
Table of ContentsYear Ended June 30, 2013
Nonmajor Governmental Funds (Continued)
Equipment Replacement Capital Projects Fund ............................................................104Road Construction Capital Projects Fund......................................................................105Hennessey Way Construction Capital Projects Fund ....................................................106Heritage Trail Construction Capital Projects Fund.........................................................107Sidewalk Replacement Capital Projects Fund...............................................................108Stormwater Infrastructure Improvement Capital Projects Fund .....................................109Municipal Facilities Capital Projects Fund .....................................................................110800 Trunking Radio Systems Capital Projects Fund .....................................................111Technology Capital Improvements Projects Fund .........................................................112
Internal Service FundsCombining Statement of Net Position...............................................................................114Combining Statement of Revenues, Expenses and Changes in
Net Position...................................................................................................................115Combining Statement of Cash Flows ...............................................................................116
Fiduciary FundsCombining Statement of Changes in Assets and Liabilities - Agency Funds.............118-119
Bowling Green Municipal UtilitiesCombining Statement of Net Position...............................................................................120Combining Statement of Activities....................................................................................121
STATISTICAL SECTIONNarrative Introduction .............................................................................................................122Net Position by Component....................................................................................................123Changes in Net Position..................................................................................................124-125Fund Balances, Governmental Funds ....................................................................................126Changes in Fund Balances, Governmental Funds ..........................................................127-128Wage Withholding Fees .........................................................................................................129Direct Occupational License Tax Rates..................................................................................130Principal Occupational Withholdings Fees Payers .................................................................131Ratios of Outstanding Debt by Type.......................................................................................132Ratios of General Bonded Debt Outstanding .........................................................................132Direct and Overlapping Governmental Activities Debt............................................................134Legal Debt Margin Information ...............................................................................................135Pledged Revenue Coverage ..................................................................................................136Demographic and Economic Statistics ...................................................................................137Principal Employers................................................................................................................138Full-time Equivalent City Governmental Employees by Function/Program.............................139Operating Indicators by Function/Program.............................................................................140Capital Asset Statistics by Function/Program.........................................................................141

JEFFERY B. MEISEL, CPA DAVID L. LYNEChief Financial Officer Occupational License [email protected] [email protected]
WILMA B. [email protected]
DEPARTMENT OF FINANCEPhone: 270-393-3000 Web Site: www.bgky.org Fax: 270-393-3047
December 9, 2013
Honorable Mayor Bruce WilkersonMembers of the City CommissionCitizens of Bowling Green
Dear Mayor, City Commissioners, and Citizens of Bowling Green:
We are pleased to submit the Comprehensive Annual Financial Report (CAFR) of the City of Bowling Green (City) for the fiscal year ended June 30, 2013. The CAFR was prepared in conformance with Generally Accepted Accounting Principles (GAAP) and the reporting standards of the Governmental Accounting Standards Board (GASB). The CAFR includes all funds of the City and the component units.
Management of the City is responsible for the accuracy of the data presented as well as the completeness and fairness of the presentation of this information. To provide a reasonable basis for making these representations, the City has established a comprehensive internal control framework that is designed to protect the City’s assets from loss, theft, or misuse and to compile sufficient reliable information for the preparation of the City’s financial statements in conformity with GAAP. The internal control structure is designed to provide reasonable, but not absolute, assurance that these objectives are met. The concept of reasonable assurance recognizes that the cost of internal controls should not exceed the benefits likely to be derived from their use and that such cost-benefit evaluation requires estimates and judgment by management.
To the best of our knowledge and belief, this financial report is complete and reliable in all material respects and fairly presents the financial position and results of the operations of the City. All disclosures necessary to enable the reader to gain an understanding of the City’s financial activities have been included in this report.
The independent accounting firm of Mountjoy Chilton Medley LLP, Certified Public Accountants, has audited the City’s financial statements. The goal of the independent audit was to provide reasonable assurance that the financial statements of the City for the fiscal year ended June 30, 2013 are free of any material misstatement.
CITY HALL ANNEX 1017 COLLEGE STREET P. O. BOX 430 BOWLING GREEN, KY 42102-0430

2
The independent audit involved examining, on a test basis, evidence supporting the amounts and disclosures in the financial statements; assessing the accounting principles used and significant estimates made by the City; and evaluating the overall financial statement presentation. The independent auditor rendered an unmodified (“clean”) opinion that the City’s financial statements for the fiscal year ended June 30, 2013 are fairly presented in all material respects in conformity with GAAP. Their report is the first component in the Financial Section of this report.
Additionally, Mountjoy Chilton Medley LLP included an audit of federal grants in order to meet the requirements of federal grantor agencies as outlined by the federal Single Audit Act of 1984, the Single Audit Act Amendment of 1996, and related OMB Circular A-133. These standards require the auditor to report not only on the fairness of the representation of the financial statements, but also on the internal controls and compliance with legal requirements of the federal awards. These reports are published separately. Requests for a copy of the Single Audit Report should be directed to the City’s Chief Financial Officer.
PROFILE OF THE CITY
Bowling Green, the “Park City” of Kentucky, was established in 1798, and is located in the south-central part of the state. The City occupies a land area of 38.7 square miles, has a population estimated at 60,600 and serves as the retail, educational, medical, commercial, and social hub for south-central Kentucky and northern Tennessee. The labor market area, which measures employable workers that are 18 years and older, is measured at approximately 470,000 for the area encompassing a sixty minute drive from the City with an additional 25,500 workers being of age in the next two years.
The City operates under the City Manager form of government, one of the alternative forms of municipal government established under Kentucky Statutes. Under this form of government, a Mayor, who is elected for a term of four years, and four City Commissioners, who serve two years each, are all voted into office in non-partisan elections. The Mayor and the City Commissioners comprise the Board of Commissioners (Board), in which all legislative and executive authority of the City is vested. As such, the Board is responsible, among other things, for passing ordinances, adopting the budget, appointing committees, and hiring all City staff. The Board appoints a City Manager, who serves as the Chief Administrative Officer of the City and enforces City ordinances and policy as well as carrying out day-to-day operations. The City’s workforce as of June 30, 2013, was comprised of 441 authorized full-time positions, with 61% of the employees dedicated to public safety.
The City provides a full range of municipal services, including police and fire protection, engineering and inspection services, construction and maintenance of streets and other infrastructure, recreational activities and cultural events, and general administrative services. As required by GAAP, the financial statements of the City also include certain other agencies called component units. A component unit is generally a legally separate entity for which the City is financially accountable. The City is financially accountable for a legally separate organization if City officials appoint a voting majority of the board and it is either able to impose its will on that organization or there is potential for the organization to provide the City specific financial benefits, or impose specific financial burdens on the City.
In accordance with GASB Statement No. 39, “The Financial Reporting Entity”, and based on the foregoing criteria, the City has presented the Bowling Green Police and Firefighters’ Retirement Fund, the Convention Center Corporation and the Bowling Green Municipal Projects Corporation as blended component units within the City’s basic financial statements because the component unit’s governing

3
body is substantially the same as the governing body of the City, or the component unit provides services almost entirely to the City. Bowling Green Municipal Utilities is included as a discretely presented component unit because the City is financially accountable and is able to impose its will on the organization or the component unit provides specific financial benefits or imposes specific financial burdens on the City. The Bowling Green - Warren County Airport, Bowling Green Independent School District, Housing Authority of Bowling Green, and other various related organizations providing services within the City do not meet the financial accountability criteria discussed above and, therefore, are excluded from this report.
The annual budget serves as the foundation for the City’s financial planning and control. The City Manager submits a proposed budget to the City Commission in June. Under state statute, this budget must be balanced for each fund and total available funds must equal or exceed total anticipated expenditures. The Commission then conducts a series of public hearings on the proposed budget. Prior to July 1, the budget is legally enacted through passage of an ordinance. The Chief Financial Officer is authorized to transfer budgeted amounts between departments within any fund. However, the City Commission must approve any revisions that alter the total expenditures of any fund. During this fiscal year, there were four such budget amendments.
FACTORS AFFECTING FINANCIAL CONDITION
The following is a brief discussion of factors affecting the financial condition of the City. Additional detailed information can be found in the Management’s Discussion and Analysis (MD&A), in the Financial Section of this report.
Local EconomyThe local economy is made up of a well-balanced blend of service, manufacturing, retail and other industries that support the City’s main revenue source, the Employee Withholdings tax. Bowling Green is the home of Western Kentucky University, the City’s largest employer with over 4,700 employees and is a prime catalyst for the local economy. The University’s total enrollment for the Fall 2012 semester was 21,124, which was the 15th consecutive year of enrollment gains. Other major employers include the General Motors Corvette Assembly plant and two regional hospitals. In addition, countless local businesses have been started and have continued to prosper in the community. The entrepreneurial spirit is alive and well in the region.
Aggressive cooperative strategies are in place between the local governments, the Chamber of Commerce and the Economic Development Authority that continue to attract business and jobs to the community. The City consistently scores high in national rankings of preferred business location and favorable environments for the creation and development of businesses due to its rich economic, social and cultural environments. Sperling’s Best Places, an online site dedicated to the analysis of people and places, rankedBowling Green 13th in emerging metropolitan areas due to the City’s reported median home price of $138,000 coupled with the most recent valuation appreciation of +2.9%. In September of 2013, Convention South magazine named Bowling Green as one of the 15 hip and historic college towns citing the historic Van Meter Hall on Western Kentucky University’s campus and the beloved Fountain Squarelocated in the heart of downtown. Additionally, Forbes has ranked Bowling Green as 25th of 200 locations for “Best Small Places for Business and Careers” and as 46th for projected job growth through 2013. The positive ranking are a result of the City’s low cost of living, which is 11.6% below national average, coupled with projected job growth of +2.4% and current job growth of +2.7%.

4
Bowling Green began to show signs of economic recovery during fiscal years 2011 and 2012 as revenues rebounded and positive growth returned. Fiscal year 2013 continued with this trend as total revenue collections outperformed the previous year by +1.8%. No significant layoffs occurred in the City and wages grew at a faster pace than the previous fiscal year. The payroll tax base posted a gain of approximately $60.6 million, which increased employee withholding fees by $1,121,000 or +3.6% over fiscal year 2012, contributing to total withholding receipts of $32 million. This revenue category, employee withholding, has increased by an average of 4.0% over the prior three years, which is an improvement from the short period of decline from 2008-09. The City’s other important revenue source, net profit revenues, gained $821,000 or +13.1% during fiscal year 2013 over the prior year and contributed to a total collection of $7,079,000. New business licenses issued during the fiscal year totaled 785.
Bowling Green’s average unemployment rate during the past fiscal year decreased by -0.7% and ended the year below the state and slightly above the national rate. Bowling Green began fiscal year 2013 with an unemployment rate of 7.5%, versus 8.6% for the state and 8.2% nationally. By the end of the fiscal twelve months, June 2013, the City’s unemployment rate was 8.2%, versus 8.9% for the state and 7.6% for the nation. Bowling Green’s unemployment rate during fiscal year 2013 averaged 7.2%.
Management is optimistic that the future of the local economy is bright and the economic recovery that began in late 2011 will be sustainable by the continuing efforts to attract jobs to the area. The City plans to continue its commitment of offering incentives to new businesses locating in the area and to encouragethe expansions of existing businesses to grow the existing job base. Furthermore, Western Kentucky University will remain to be a stabilizing force for the local economy along with the continued diversification of industries forming the local tax base.
Long-term Financial Planning The City’s budget team, which is composed of the City Manager, Assistant City Manager, Human Resources Director, Comptroller, Senior Staff Accountant and Chief Financial Officer, is primarily responsible for the long-term financial planning for the City. Long-term fiscal sustainability is the top focus of the budget team. The Chief Financial Officer prepares the revenue forecast for the budget each year and budgeted expenditures are matched to revenue projections. Great emphasis is placed on current year operating revenues equaling or exceeding current year operating expenditures. Conservatism is used when preparing the annual revenue projection in order to avert budget shortfalls and to help encourage fiscal responsibility on the expenditure side. The use of fund balance is reserved for one-time capital expenditures. The City continues to make progress in reducing and eliminating debt and takes advantage of available debt refinancing opportunities.
Relevant Financial PoliciesThe City has an adopted Financial Policies and Procedures document that addresses various areas of operations such as revenue collection, banking services, investments, debt management, budget management, and fund balance reserves. The Fund Balance policy is included in the document and dictates that the General Fund minimum reserve balance will be 20% of adopted General Fund revenues. Prior to fiscal year 2012, the minimum reserve balance was targeted at 15% of adopted revenues. Segregation of duties and internal controls are a common theme to achieve sound financial operations in the sections covering accounting, accounts payable, revenue collections, payroll, cash management, investments, fixed assets, and procurement card guidelines.

5
Major Initiatives The City continues to emphasize delivery of focused public services in a way that provides maximum efficiency, effectiveness, and value to the citizens of Bowling Green. The City’s major initiatives during the year are discussed below.
Recent historic flooding in Bowling Green demonstrated the continued need to direct resources to the City's stormwater efforts. The fiscal year 2013 budget continued the increased commitment to the stormwater improvement effort, which is a significant undertaking that will take a number of years to fully implement. The Public Works Department has identified numerous drainage improvement projects of varying size and scope throughout the City. The fiscal year 2013 budget for stormwater totaled $500,000. Projects range from deepening an existing basin, to constructing new retention basins on vacant parcels, to any number of smaller projects. Costs depend greatly upon the conditions, such as rock, level of protection desired (75-year storm, 100-year storm), and market conditions for bids.
The City completed the seventh year of participation in the sidewalk program in fiscal year 2013. The sidewalk program is designed to construct over 5,000 linear feet of new sidewalks and improve existing sidewalks. The program is funded with available reserves on a year-to-year basis with no debt being issued. Funds totaling $400,000 were available during fiscal year 2013 for this program and an additional $400,000 will be contributed in fiscal year 2014.
The Parks and Recreation department continued and completed several projects during fiscal year 2013. The Parker-Bennett Community Center construction was completed and included center improvements, an additional playground, a picnic shelter, and a renovated playing court including lighting and fencing. The Lovers Lane Soccer Complex project to construct a new building to house restrooms, storage and office space was well underway at the end of fiscal year with over $100,000 spent. Lampkin Park was allotted General Fund monies to provide funding for numerous improvements, including new dug-outs, backstops, field lighting, fencing, field improvements and irrigation. The Fitness Center budget included $95,000 for the renovation of participant locker rooms. The City Golf courses purchased new equipment and underwent improvements during fiscal year 2013, including replacement of the greens at the Paul Walker course.
The Smallhouse/Cave Mill Road Realignment road construction project began in 2012 and was completed during fiscal year 2013. This realignment project has been a long-range transportation improvement goal of the City’s. The preliminary design was completed in 2009 and $500,000 was budgeted and expensed in fiscal year 2012 to provide final design, utility realignment, and property acquisition. Construction costs of $2,150,000 were funded 50/50 by the City and Warren County during fiscal year 2013.

6
AWARDS AND ACKNOWLEDGEMENTS
The Government Finance Officers Association of the United States and Canada (GFOA) awarded a Certificate of Achievement for Excellence in Financial Reporting to the City of Bowling for its Comprehensive Annual Financial Report for the fiscal year ended June 30, 2012. In order to be awarded a Certificate of Achievement, a government must publish an easily readable and efficiently organized comprehensive annual financial report. This report must satisfy both generally accepted accounting principles and applicable legal requirements.
The GFOA has also given an Award for Outstanding Achievement in Financial Reporting to the City of Bowling Green for its Popular Annual Financial Report for the fiscal year ended June 30, 2012. The Award for Outstanding Achievement in Popular Annual Financial Reporting is a prestigious national award recognizing conformance with the highest standards for preparation of state and local government popular reports. In order to receive an Award for Outstanding Achievement in Popular Annual Financial Reporting, a government must publish a Popular Annual Financial Report, whose contents conform to program standards of creativity, presentation, understandability and reader appeal.
A Certificate of Achievement for Excellence in Financial Reporting and an Award for Outstanding Achievement in Popular Financial Reporting are valid for a period of one year only. We believe our current reports continue to conform to the reporting requirements, and we are submitting to the GFOA.
Acknowledgements. The preparation of this report could not have been accomplished without the dedicated services of the entire staff in the Department of Finance. We wish to express our sincere appreciation to all members of the department for their assistance, with special thanks to Wilma Brown, Comptroller; Erin Ballou, Senior Staff Accountant; Sean Weeks, Staff Accountant; and to the staff of Mountjoy Chilton Medley LLP, CPA’s.
Respectfully submitted,
Jeff Meisel, CPAChief Financial Officer

7

8
C I T Y O F B O W L I N G G R E E N
PurchasingAgent
AssistantCity Manager/
City Clerk
Public Information
Internal Auditor
TreasuryLicense
Accounting
Payroll
Finance
Personnel ManagementBenefits and Insurance
Safety and Training
Employee Development
HumanResources/
Risk
Management
Paralegal
Law
OperationsMaintenance
InformationTechnology
RecordsCriminal Investigations
Traffic and Patrol
Communications
Police
AdministrationSuppression
Prevention
Training
Fire
Facilities ManagementFleet Management
Operations
Landfills
Public Works
AthleticsRecreation
Golf Courses
Cemetery/Landscaping
Parksand
Recreation
InspectionHousing Assistance
Code Enforcement
City Cent/Neighbrhd Act
Neighborhoodand
Community
Service
City Manager
Mayor and Commissioners
Citizens ofBowling Green

9
City of Bowling Green, KentuckyDirectory – Principal Officials
Mayor and Commissioners
Bruce Wilkerson MayorMelinda Hill Mayor Pro TemBill Waltrip CommissionerJoe Denning CommissionerRick Williams Commissioner
KEVIN D. DEFEBBO – CITY MANAGER
Administration:Katie Schaller Assistant City Manager/
City ClerkMarilyn Parrigin Purchasing AgentDeborah Jenkins Internal Auditor
Finance:Jeff Meisel, CPA Chief Financial OfficerWilma Brown Comptroller
Human Resources:Michael Grubbs Director
Law:H. Eugene Harmon City Attorney
Information Technology:Lynn Hartley Chief Information Officer
Public Safety:Doug Hawkins Police ChiefGreg Johnson Fire Chief
Public Works:Jeff Lashlee Director
Parks and Recreation:Brent Belcher Director
Neighborhood and Community Services:Brent Childers Director

Independent Auditor’s Report
Honorable Bruce Wilkerson, Mayor and the Board of Commissioners City of Bowling Green Bowling Green, Kentucky Report on the Financial Statements
We have audited the accompanying financial statements of the governmental activities, the business-type activities, the aggregate discretely presented component units, each major fund, and the aggregate remaining fund information of the City of Bowling Green, Kentucky (the Government) as of and for the year ended June 30, 2013, and the related notes to the financial statements, which collectively comprise the City’s basic financial statements as listed in the table of contents.
Management’s Responsibility for the Financial Statements
Management is responsible for the preparation and fair presentation of these financial statements in accordance with accounting principles generally accepted in the United States of America; this includes the design, implementation, and maintenance of internal control relevant to the preparation and fair presentation of financial statements that are free from material misstatement, whether due to fraud or error.
Auditor’s Responsibility
Our responsibility is to express opinions on these financial statements based on our audit. We did not audit the financial statements of the Policemen and Firemen's Retirement Fund which reflects total assets of $7,130,353 and total additions of $1,030,239 for the year ended June 30, 2013. We did not audit the financial statements of Bowling Green Municipal Utilities which represents all of the assets and the revenues as of and for the year ended June 30, 2013 of the discretely presented component units. Those financial statements were audited by other auditors whose reports thereon have been furnished to us, and our opinion, insofar as it relates to the amounts included for the Policemen and Firemen's Retirement Fund and Bowling Green Municipal Utilities is based solely on the reports of the other auditors. We conducted our audit in accordance with auditing standards generally accepted in the United States of America and the standards applicable to financial audits contained in Government Auditing Standards, issued by the Comptroller General of the United States. Those standards require that we plan and perform the audit to obtain reasonable assurance about whether the financial statements are free from material misstatement.
An audit involves performing procedures to obtain audit evidence about the amounts and disclosures in the financial statements. The procedures selected depend on the auditor’s judgment, including the assessment of the risks of material misstatement of the financial statements, whether due to fraud or error. In making those risk assessments, the auditor considers internal control relevant to the entity’s preparation and fair presentation of the financial statements in order to design audit procedures that are appropriate in the circumstances, but not for the purpose of expressing an opinion on the effectiveness of the entity’s internal control. Accordingly, we express no such opinion. An audit also includes evaluating the appropriateness of accounting policies used and the reasonableness of significant accounting estimates made by management, as well as evaluating the overall presentation of the financial statements.

11
Independent Auditor’s Report (Continued)
We believe that the audit evidence we have obtained is sufficient and appropriate to provide a basis for our audit opinions.
Opinions
In our opinion, based on our audit and the report of other auditors, the financial statements referred to above present fairly, in all material respects, the respective financial position of the governmental activities, the business-type activities, the aggregate discretely presented component units, each major fund, and the aggregate remaining fund information of the City of Bowling Green as of June 30, 2013, and the respective changes in financial position and, where applicable, cash flows thereof for the year then ended in accordance with accounting principles generally accepted in the United States of America.
Other Matters
Required Supplementary Information
Accounting principles generally accepted in the United States of America require that the management’s discussion and analysis and budgetary comparison information on pages 13 through 24 and pages 67through 69 be presented to supplement the basic financial statements. Such information, although not a part of the basic financial statements, is required by the Governmental Accounting Standards Board, who considers it to be an essential part of financial reporting for placing the basic financial statements in an appropriate operational, economic, or historical context. We have applied certain limited procedures to the required supplementary information in accordance with auditing standards generally accepted in the United States of America, which consisted of inquiries of management about the methods of preparing the information and comparing the information for consistency with management’s responses to our inquiries, the basic financial statements, and other knowledge we obtained during our audit of the basic financial statements. We do not express an opinion or provide any assurance on the information because the limited procedures do not provide us with sufficient evidence to express an opinion or provide any assurance.
Other Information
Our audit was conducted for the purpose of forming opinions on the financial statements that collectively comprise the City’s basic financial statements. The introductory section on pages 1 through 9, combining and individual funds statements and schedules on pages 78 through 121, and the statistical section on pages 122 through 141 are presented for purposes of additional analysis and are not a required part of the basic financial statements.
The combining and individual nonmajor fund financial statements are the responsibility of management and were derived from and relate directly to the underlying accounting and other records used to prepare the financial statements. Such information has been subjected to the auditing procedures applied in the audit of the basic financial statements and certain additional procedures, including comparing and reconciling such information directly to the underlying accounting and other records used to prepare thebasic financial statements or to the basic financial statements themselves, and other additional procedures in accordance with auditing standards generally accepted in the United States of America. In our opinion, the information is fairly stated in all material respects in relation to the basic financial statements as a whole.

12
Independent Auditor’s Report (Continued)
The introductory section and statistical tables have not been subjected to the auditing procedures applied by us and the other auditors in the audit of the basic financial statements and, accordingly, we express no opinion or provide any assurance on them.
Other Reporting Required by Government Auditing Standards
In accordance with Government Auditing Standards, we have also issued our report dated December 9, 2013 on our consideration of the Government’s internal control over financial reporting and on our tests of its compliance with certain provisions of laws, regulations, contracts, and grant agreements and other matters. The purpose of that report is to describe the scope of our testing of internal control over financial reporting and compliance and the results of that testing, and not to provide an opinion on internal control over financial reporting or on compliance. That report is an integral part of an audit performed in accordance with Government Auditing Standards in considering Government’s internal control over financial reporting and compliance.
Lexington, KentuckyDecember 9, 2013

13
MANAGEMENT’S DISCUSSION AND ANALYSIS
The Management Discussion and Analysis (MD&A) offers readers of the financial statements an overview and analysis of the financial position and activities of the City of Bowling Green (“the City”) for the fiscal year ended June 30, 2013. The information presented here should be read in conjunction with the Letter of Transmittal and the financial statements immediately following this analysis.
Financial Highlights
The City’s assets exceeded liabilities at the close of the fiscal year by $183.9 million (net position). This amount includes $9.8 million of resources that are restricted to specific projects by laws, regulations or contractual agreements. A total of $29.3 million of resources are unrestricted and are available to fund the City’s outstanding obligations and future programs.
The City’s total net position increased $12.9 million this year. Net position of governmental activities increased $11.7 million and net position of business-type activities increased by $1.2 million.
As of June 30, 2013, the City’s governmental funds reported combined ending fund balances of $51.4 million, an increase of $1.4 million from the prior year. Of this amount, $4.1 million in the General Fund was unassigned and available for spending. The City’s General Fund minimum reserve policy is 20% of the adopted revenue budget, or $10.5 million for FY13, and is reflected in the committed fund balance.
The City’s governmental activities total debt decreased by $9.2 million due to the payment of principal on outstanding debt. Business-type activity debt decreased by $1.0 million due to the payment of principal on outstanding debt.
Overview of Financial Statements
This report was published under the standards for governmental financial reporting prescribed by the Governmental Accounting Standards Board in Statement No. 34 (GASB 34). This reporting format consists of a series of financial statements that provide an overview of all services provided by or supported by the City (the government-wide statements) and provides more detailed information about major programs of the City (the fund statements).
The GASB 34 reporting model is designed to provide improved information to the reader. The statements present a financial picture of the City as a whole through the use of a consolidated statement of all funds, eliminating interfund transfers. In addition, the values of fixed assets of governmental-type operations are presented. Under prior reporting standards, the infrastructure assets for governmental type funds were not reported or depreciated.

14
Government-Wide Financial Statements
Government-wide financial statements include the Statement of Net Position and the Statement of Activities. The statements include all assets and liabilities using the accrual basis of accounting, which is similar to the accounting used by most private-sector companies. In accrual accounting, revenues earned and expenses incurred in the fiscal year are taken into account in the financial statements regardless of when cash is actually received or paid.
The Statement of Net Position presents information on all the City’s assets and liabilities as of June 30, 2013. Net position is the difference between assets and liabilities. Over time, increases or decreases in net position are one indicator of whether financial health is improving or deteriorating. Information on other factors, such as changes in the revenue structure and the condition of the City’s assets, is also needed to assess the overall financial situation of the City.
The Statement of Activities presents the City's annual revenues and expenses, as well as other transactions that increase or reduce net position. Program revenues are offset by program expenses in order to provide better information as to the net program costs that are financed by general government revenues.
The government-wide statements divide the various City functions into three kinds of activities:
Governmental activities - Most of the City's basic services are reported here, including police, fire, public works, parks, community development and general administration. Occupational license fees, property taxes and service charges finance most activities.
Business-type activities - Activities primarily paid for from the charges and fees to cover the cost of services are reported here. This includes golf programs, the aquatics program and the operations of the Sloan Convention Center.
Component units - The City includes one separate legal entity as component units: Bowling Green Municipal Utilities. Although legally separate, component units are important because the City is financially accountable.
Fund Financial Statements
Fund financial statements report the City's operations in more detail than the government-wide statements by providing information about the City's most significant funds. Some funds are required to be established by local law or by bond covenants. However, many other funds are established to help control and manage money for a particular purpose. Two types of funds are presented in the fund financial statements: governmental funds and proprietary funds.
Governmental funds - Most of the City's basic services are reported in governmental funds. The statements provide a short-term view of general government operations and show how services are financed as well as the balances left at year end that are available for future spending. Funds are reported using the modified accrual basis of accounting, which measures cash and all other financial assets that can be readily converted to cash. The relationship between the governmental activities (reported in the Statement of Net Position and Statement of Activities) and the governmental funds is described in a reconciliation, which is presented immediately following the

15
fund financial statements. Under accounting guidelines, the City considers the General Fund, WKU Athletics Fund, Debt Service Fund, and ITA Bond Fund to be major governmental funds.
Proprietary funds - When the City charges fees for services that are intended to cover the majority of the cost of providing the services - whether to outside customers or to other units of the City -the services are generally reported in proprietary funds. The subcategories of the funds include enterprise funds, which are business-type activities, and internal service funds that report services provided to internal units of government. The proprietary funds are reported in the same way that all activities are reported in the government-wide statements, but the fund statements provide more detail. The City considers the Golf Fund, the Aquatics Fund, and the Convention Center Fund to be major proprietary funds.
The City as Trustee
The City is trustee, or fiduciary, for the closed Policeman and Fireman’s Retirement Fund. The City is also responsible for other assets that, due to a trust arrangement, can be used only for trust beneficiaries. All the City's fiduciary activities are reported separately after the Proprietary Fund Statements. The activities are excluded from the other government-wide and fund statements since the City cannot use these assets to finance operations.
Government-wide Financial Analysis
NET POSITION
The following table summarizes the City’s financial position as of June 30, 2013. The City reported assets greater than liabilities by $183.9 million, an increase of $12.9 million over last year. The gain in net position is primarily a result of increased cash from revenue collections in addition to expenditure reductions. Of the $183.9 million increase in net position, $144.9 million or 78.8% was net investment in capital assets and $29.3 million or 15.9% was unrestricted. The net position of governmental activity funds totaled $170.1 million, with $138.0 million or 81.1% net investment in capital assets and $22.4million or 13.2% unrestricted. The unrestricted net position of governmental funds includes fund balances of the General Fund and various special revenue funds. Unrestricted net position may be used to meet the City’s ongoing obligations to citizens and creditors in the future.

16
Net PositionJune 30, 2013(In Millions)
Governmental Activities
Business-type Activities
Total Primary Government
2013 2012 2013 2012 2013 2012Current and other assets $105.2 $105.7 $7.2 $6.1 $112.3 $111.8Capital assets 183.1 180.2 13.6 14.4 196.8 194.6 Total assets 288.3 285.9 20.8 20.5 309.1 306.4Long-term liabilities 106.2 115.3 5.8 6.7 112.0 122.0Other liabilities 12.0 12.1 1.2 1.3 13.2 13.4 Total liabilities 118.2 127.4 7.0 8.0 125.2 135.4 Net position:Net Investment in capital assets 138.0 135.4 6.8 6.7 144.9 142.1Restricted for: Capital Projects 7.2 6.1 0.0 0.0 7.2 6.1 Debt Service 0.0 0.0 0.0 0.0 0.0 0.0 Community Development 1.6 1.4 0.0 0.0 1.6 1.4 Perpetual Care 0.9 0.8 0.0 0.0 0.9 0.8Unrestricted 22.4 14.8 7.0 5.9 29.3 20.6 Total net position $170.1 $158.5 $13.8 $12.6 $183.9 $171.0*Numbers may not total due to rounding.
The net position of the City's business-type activities totaled $13.8 million. Of the net position total, $6.8 million (49%) was net investment in capital assets and $7.0 million (51%) was unrestricted.
Analysis of City Operations
The following table summarizes City operations for the fiscal year ended June 30, 2013. Governmental activities increased the City of Bowling Green’s net position by $11.7 million, accounting for 91% of the total increase. As mentioned earlier, this is due to an increase in assets, particularly cash, as a result of improved revenue collections and expenditure reductions. Business-type activities increased the City’s net position by $1.2 million, which was 9% of the total increase. Likewise, the increase in business-type net position is related to growth in assets through reductions in spending at the golf courses.

17
Statement of ActivitiesFor the Year Ended June 30, 2013
(In millions)
Governmental Activities
Business-type Activities
Total Primary Government
Revenues 2013 2012 2013 2012 2013 2012Program Revenues:
Charges for services $5.3 $4.4 $2.1 $2.3 $7.4 $6.7 Operating grants and contributions 9.5 7.3 0.0 0.0 9.5 7.3 Capital grants and contributions 5.2 13.5 0.0 0.0 5.2 13.5General revenue: Property taxes 11.8 11.4 0.0 0.0 11.8 11.4 Insurance premium taxes 3.3 3.2 0.0 0.0 3.3 3.2 Transient room taxes 0.0 0.0 0.4 0.4 0.4 0.4 Wages and net profits taxes 41.4 39.5 0.0 0.0 41.4 39.5 Other general revenues 0.9 1.1 0.0 0.2 0.9 1.3Total revenues 77.4 80.3 2.5 2.9 79.9 83.2Program expenses General government 16.3 15.3 0.0 0.0 16.3 15.3 Public safety 23.1 22.3 0.0 0.0 23.1 22.3 Public works 6.2 7.6 0.0 0.0 6.2 7.6 Parks and recreation 5.3 5.0 0.0 0.0 5.3 5.0 Neighborhood & community services 4.8 5.2 0.0 0.0 4.8 5.2 Community services 1.1 1.3 0.0 0.0 1.1 1.3 Interest on long-term debt 6.6 6.5 0.0 0.0 6.6 6.5 Golf 0.0 0.0 2.0 2.8 2.0 2.8 Aquatics 0.0 0.0 0.9 0.9 0.9 0.9 Convention Center 0.0 0.0 0.7 0.9 0.7 0.9Total expenses 63.4 63.2 3.6 4.6 67.0 67.8Increase/decrease in net position before transfers
14.0 17.1 (1.1) (1.7) 12.9 15.4
Transfers (2.4) (2.5) 2.4 2.5 0.0 0.0Change in net positions 11.6 14.6 1.2 0.8 12.9 15.4Net position, beginning of year, 158.5 143.9 12.6 11.7 171.0 155.6Net position end of year *Numbers may not total due to rounding
$170.1 $158.5 $13.8 $12.6 $183.9 $171.0
Total revenues for the City’s governmental activities totaled $77.4 million at June 30, 2013, compared to $80.3 million in the prior year. The decrease in revenue is due to a reduction of contributed capital infrastructure from private development. The City’s largest source of revenue, wage and net profits taxes, totaled $41.4 million or 53.5% of revenue and includes other related occupational license fees during FY2013. The second largest category of governmental revenues was operating and capital grants and contributions, which accounted for $14.7 million, or 18.9% of total revenue.

18
Other revenue sources include property taxes ($11.8 million), charges for services ($5.3 million) and insurance premium taxes ($3.3 million).
Governmental Funds Revenue Sources
Wages and net profits taxes
Property Taxes
Grants
Charges for services
Insurance premium taxes
All other
Current year total expenses of the City’s governmental activities totaled $63.4 million, compared to $63.2million in the prior year. The increase in expenses was a result of public safety and general government spending and increased interest expenses. The City’s expense category, public safety, had expenses totaling $23.1 million or 36.4% of total expenses during FY2013. The second largest category of expenses was general government, which totaled $16.3 million or 25.7% of expenses. Other expense categories include interest expense ($6.6 million), public works ($6.2 million), parks and recreation ($5.3 million) and neighborhood and community services ($4.8 million).
Business-type Activities
Revenues for business-type activities totaled $2.5 million during fiscal year 2013 compared to $2.9 million reported last year. The decrease in revenue is the result of rainy and unseasonably cool weather during the spring and summer months that reduced participation at City golf courses and the aquatics center. Of this, $2.1 million or 84.0% was from charges for services. Expenses for business-type activities totaled $3.6 million during FY2013. The largest program was the operation of three municipal golf courses that account for 55.6% of business-type expenses. The Russell Sims Aquatic Center accounted for
Governmental Funds Expenditure Categories
Public Safety
General Government
Public Works
Interest Expense
Parks & Recreation
Neighborhood & Community Services
All Other

19
25.0% of business-type expenses and the operation of the Sloan Convention Center accounted for remaining 19.4% of expenses in business-type activities.
0
0.5
1
1.5
2
2.5
$ M
illio
ns
Golf Conv Cntr Aquatics
City Enterprise Funds
Revenues
Expenses
Funds of the City of Bowling Green
The City's governmental funds for the year ended June 30, 2013 reflected a combined ending total fund balance of $51.4 million, an increase of $1.4 million from the prior year. The increase in fund balance is a result of cash savings from under-spending set aside for future capital projects. Of the $51.4 million total fund balance, $4.1 million was unassigned in the General Fund and available for spending at the City's discretion. The remaining balance is comprised of non-spendable, assigned, committed, or restricted amounts; indicating that the funds were not available for spending, or whose spending was otherwise restricted by state statute or by City ordinance, or had been dedicated to pay outstanding contracts or purchase orders, or to make future debt service payments, or intended to be used for specific purposes, respectfully.
At the end of the fiscal year, the total fund balance in the General Fund was $18.8 million, which represents an increase of $0.3 million over the prior year. The increase in fund balance is a result of controlled spending on operating expenditures, personnel attrition with holding of vacancies, and an increase in occupational tax withholding revenue collections. Of the $18.8 million total fund balance; unassigned fund balance was $4.1 million and reflected 7.5% of General Fund revenues, representing residual net resources that have not been restricted, committed or assigned to specific purposes. Committed fund balance contains the minimum reserve of 20% of budgeted revenues, or $10.5 million. Assigned fund balance totaled $4.1 million or 7.6% of General Fund revenues; non-spendable fundbalance was $102,000 and restricted totaled $0. The fund balances for these categories represent prepaid items, spending restricted to specific purposes, and funds reserved to pay contracts and purchase orders outstanding as of June 30, 2013.
The WKU Athletics Fund is used to account for the revenues and expenditures associated with the City’s $29,580,000 General Obligation Refunding Bonds, Series 2010 and Series 2011 as well as $2,045,000 of the City’s General Obligation Refunding Bonds, Series 2002B and 2002C. The refunding bond proceeds were utilized to refinance $27,595,000 of the Series 2002B and 2002C. The original bond issuance was utilized to improve and increase public use of athletic and parking facilities belonging to Western Kentucky University. The University pays the City for the total annual debt service on the bonds each year through student athletic fees. This payment structure results in an offsetting payable and receivable with no fund balance.

20
The final major governmental fund, the Inter-Modal Transportation Authority, Inc. (ITA) Bond Fund, is used to account for the revenues and expenditures related to the refunding of the ITA mortgage-backed bond issues that funded the acquisition and construction of the Kentucky Transpark. Total fund balance in the ITA Bond Fund is $13.0 million as of June 30, 2013, compared to $13.7 million in the prior fiscal year. Of the $13.0 million total fund balance, $11.5 million is restricted and $1.5 million is assigned. The slight decrease in fund balance is due to the payment of debt service obligations with escrowed funds held in fund balance.
The City's proprietary funds statements provide the same type of information found in the government-wide financial statements, but in more detail. Total net position in the proprietary funds equal $13.8 million as of June 30, 2013, compared to $12.6 million last year.
The Golf Fund reported total net position of $3.6 million for FY2013, compared to $3.5 million in FY2012, a slight increase of $0.1 million. The increase in net position is a result of a reduction in personnel and supply and repair costs. Of the total net position, $3.1 million was Net Investment in Capital Assets and Unrestricted net position was $0.5 million.
The Aquatics Fund ended the year with total net position of $1.3 million, an increase of $0.1 million overlast year. The increase can be attributed to decreased repairs and supply costs. Of the total net position, unrestricted net position was $1.3 million.
The Convention Center Fund had total net position of $8.9 million, an increase of $1.1 million over last year. The gain in Convention Center fund net position is related to the increase in cash due to greater interest receipts throughout the year and reduced repairs and maintenance costs. Of the total net position, $3.7 million was net investment in capital assets, and $5.2 million was unrestricted.
General Fund Budgetary Highlights
Over the course of the fiscal year, the City Commission approved revisions of the General Fund’s budget four times in order to make adjustments for additional revenues collected and to add projects that were not anticipated when the budget was initially adopted. In all, the revenue budget was increased by $172,000 or +0.3%. The changes are briefly summarized below.
Original revenue estimates were changed by the following:
Grants $ 73,500Employee Withholdings 4,500Contributions & Donations 76,000Judgments and Settlements 18,000
The comparison of actual revenue to the final amended revenue budget yields significant budgetary variances for employee withholdings (+$1.1 million), net profits (+$0.7 million), and motor vehicle and boat taxes (+$0.1 million). An optimistic approach was used when projecting the FY2013 employee withholdings and growth of +5.3% was assumed in the budget process. During the fiscal year, employee

21
withholdings realized actual collections of +3.6% over the previous year and future budget projections were updated accordingly. Net profits rebounded impressively in FY13 and resulted in $658,000 of excess collections above the estimated budget, which was +$820,000 over the prior year’s actual receipts. The increased collections posted in motor vehicle and boat tax were due to omitted receipts from the state and higher property value assessments.
The total expenditure budget decreased by $346,250 (-0.8%) during the year. The decrease was primarily due to the reclassification of personnel appropriations, which resulted from under-spending, to transfer-out appropriations to fund capital projects in the Smallhouse/Cavemill Intersection Fund, Municipal Facilities Fund, 800 Trunking Radio Improvement Fund, Technology and Equipment Funds ($412,250). Other major changes were due to the following:
General Government $ (11,250)Parks and Recreation (94,500)Neighborhood & Community Services (129,500)Other Community Services (93,750)Public Works 395,000
The comparison of actual expenditures to the final amended expenditure budget results in significant budgetary variances in the following activities: Community Services ($0.2 million), Public Works ($0.3 million), and General Government ($0.2 million). The positive variances are a result of unspent budgeted projects, disciplined under-spending and budget cuts made during fiscal year 2013.
Capital Assets
The City's investment in capital assets totaled $196.7 million as of June 30, 2013, which represented an increase of $2.1 million over last year. This investment includes land, buildings, infrastructure, improvements, vehicles, equipment and intangible assets. For governmental activities, investments totaled $183.1 million, an increase of $2.9 million over FY12.
This year's major capital additions included the following:
Replacement of 8 police cruisers at $25,710 each $ 205,680Lampkin Park ballfield improvements 122,519Voice Over Internet Protocol phone system 101,370
Parks and Recreation locker room renovation 95,629Case Backhoe vehicle 95,400In-car camera equipment and storage system 60,180Parker Bennett Community Center improvements 50,501Paul Walker Golf Course greens improvements 45,534

22
The following table summarizes the changes in net capital assets:
(Net of Depreciation, Stated in Millions)
Governmental Activities
Business-type Activities
Total Primary Government
2013 2012 2013 2012 2013 2012Land (including Restricted Land) $17.6 $17.6 $2.7 $2.7 $20.3 $20.3Infrastructure 114.1 110.2 0.0 0.0 114.1 110.2Buildings 28.2 29.1 6.6 7.0 34.8 36.1Improvements other than buildings 15.3 15.9 3.8 4.2 19.1 20.1Vehicles, equipment, and furniture 3.8 4.4 0.3 0.3 4.1 4.7Construction in progress 1.5 0.3 0.0 0.0 1.5 0.3Intangibles 2.6 2.7 0.0 0.0 2.6 2.7Property held under capital lease 0.0 0.0 0.2 0.2 0.2 0.2 Total* $183.1 $180.2 $13.6 $14.4 $196.7 $194.6
*Numbers may not total due to rounding.
The City has elected to apply the Modified Approach to accounting for street and sidewalk infrastructure systems as set forth in GASB 34. With this approach, the City uses an overall condition index (OCI) to assess the surface condition of individual pavement segments. The City’s policy is to consider streets and sidewalks in need when the OCI rating falls below minimum functional classification values. The City’s most recent assessment in 2013 found that 98% of streets and 94% of sidewalks met or exceeded this goal, which is 1% higher and 2% higher than FY12, respectively. The estimated amount needed to maintain City streets at the specified levels for FY14 is $900,000 and $100,000 for sidewalks, which is included in the upcoming budget. Additional information on the City's capital assets activity can be found in note 3C.
Debt Administration
Bowling Green was the first City in the state to begin issuing general obligation (GO) bonds in fiscal year 1999 as a result of changes in state law that had previously precluded this type of financing. Since GO bonds are backed by the full faith and credit of the City, the bonds carry a higher credit rating than other forms of debt and have lower interest rates. Consequently, the majority of the future debt issuance of the City will be GO debt.
Prior to the issuance of GO bonds, mortgage revenue bonds were issued through various public corporations in order to finance public projects. For mortgage revenue bonds, the City entered into automatically annually renewable lease agreements with the corporations whereby lease payments from the City, combined with revenues generated by the operation of the facilities, were sufficient to meet debt service obligations. The underlying security for the bonds was the annually renewable lease agreements and the underlying mortgages on the property. Revenue bonds, where only the revenues from the operation of the facilities are pledged as security for the bonds, are now issued primarily to finance improvements to the sanitary sewer system. For additional detail on the City’s debt transactions, please refer to note 3F of this report.

23
At the end of the Fiscal Year, the City had $121.2 million in bonds and notes outstanding net of bond discounts and premiums. During FY2013, the City issued $4,200,000 in General Obligation Refunding Bonds, Series 2013 for the purpose of refinancing $2,305,000 of the Series 2002 and $1,900,000 of the Series 2004B bonds.
The following table is a summary of the changes in the City’s outstanding long-term debt obligations, which are further explained in Note 3E.
Long-term Obligation at Year End(Stated in Millions)
Governmental Activities
Business-type Activities
Total Primary Government
2013 2012 2013 2012 2013 2012General obligation & revenue bonds $110.5 $119.4 $7.3 $8.3 $117.8 $127.7
Notes & lease purchase agreements 2.9 3.4 0.0 0.0 2.9 3.4
Compensated absences 1.7 1.6 0.0 0.0 1.7 1.6
Landfill post-closure costs 1.3 1.0 0.0 0.0 1.3 1.0
Bond premium/discount and refunding loss
(2.0) (2.4) (0.5) (0.6) (2.5) (3.0)
Total $114.4 $123.0 $6.8 $7.8 $121.2 $130.8
*Numbers may not total due to rounding.
The City maintains bond ratings of “Aa2” from Moody's and “AA-” from Standard & Poors. Despite the provisions for the issuance of GO debt already discussed, legal limits remain on the total amount of GO indebtedness that may be incurred. The Kentucky Constitution provides that the total principal amount of City net indebtedness, which excludes self-supporting obligations, revenue bonds, special assessment debt, and non-tax supported debt, cannot exceed 10% of the value of taxable property in the City. Therefore, the City’s debt margin is $494.2 million.
Next Year’s Budget
During the budget planning for FY2014, revenue growth projections were kept conservative to avoid budget shortfall and constrain spending. However, there were adjustments made in certain revenue lines to align with what was shaping up with the FY2013 actuals at the time, particularly in the occupational license fee revenues. The FY2014 adopted General Fund budget utilizes $300,000 of unassigned fund balance to provide for capital project funding.
The FY2014 adopted expenditure budget for all funds increased by 4.3% over the FY2013 original budget and includes a 1.7% cost of living (COLA) adjustments for all employees and average step adjustments of an additional 1.28% for most employees. The FY2014 budget also allows for increases in debt service requirements and capital improvement spending. There is $22.3 million budgeted for Capital Improvement Projects, which includes debt service. This is a 16.3% increase over the $18.6 million CIP budget in FY2013. The FY2014 budget also continues funding in committed fund balance equal to 20%

24
of adopted general fund revenue budget or $10.7 million. The committed fund balance acts as the City’s ‘rainy day’ account and can be accessed by a majority Board of Commissioners vote.
Improvements in community livability, traffic and roads, parks and golf courses, and a continued investment in technology are some of the highlights of the capital budget in FY2014. The City also plans to continue to honor existing commitments in FY2014, including: funding existing programs, providing financial assistance to contract agencies that provide community services, paying debt service, and providing a fair and equitable pay structure to City employees.
Requests for Information
This financial report is designed to provide a general overview of the City of Bowling Green's finances for all those interested. Questions concerning any of the information provided in this report or requests for additional information should be addressed to Jeffery B. Meisel, Chief Financial Officer, PO Box 430, Bowling Green, Kentucky, 42102-0430 or can be e-mailed to [email protected].

See accompanying notes 25
City of Bowling Green, KentuckyStatement of Net PositionJune 30, 2013
Primary Government
Governmental Business-Type Component
Activities Activities Total UnitsASSETS
Pooled cash and cash equivalents 28,278,988$ -$ 28,278,988$ -$
Non-pooled cash and cash equivalents 1,390,289 3,970,143 5,360,432 9,519,323
Investments 19,049,051 3,065,436 22,114,487 100,000
Receivables (net):
Accounts 94,278 54,570 148,848 9,467,294
Other 285,191 - 285,191 6,810,451
Accrued interest 59,628 - 59,628 -
Due from other governmental units 328,756 - 328,756 -
Due from Western Kentucky University 28,790,000 - 28,790,000 -
Deferred charges 934,714 - 934,714 -
Prepaid items 425,022 - 425,022 565,742
Prepaid rent 13,029,090 - 13,029,090 -
Inventories 154,492 92,778 247,270 1,367,840
Other assets - - - 323,127
Restricted assets:
Non-pooled cash and cash equivalents 12,369,145 - 12,369,145 -
Restricted cash - TVA - - - 469,571
Investments - - - 6,162,432
Capital assets, net of accumulated depreciation:
Non-depreciable 122,321,776 2,744,198 125,065,974 74,487,833
Depreciable 60,823,067 10,874,479 71,697,546 125,321,342
Total assets 288,333,487 20,801,604 309,135,091 234,594,955
LIABILITIES
Vouchers and accounts payable 902,020 62,075 964,095 9,045,056
Accrued payroll 1,313,476 85,585 1,399,061 -
Accrued interest payable 766,067 22,727 788,794 1,197,353
Insurance claims payable 191,417 - 191,417 -
Other current liabilities 989 - 989 2,555,091
Unearned revenue 206,455 - 206,455 -
Deposits 485,021 - 485,021 4,117,440
Noncurrent liabilities:
Due within one year
Compensated absences 923,489 30,805 954,294 707,939
Bonds payable 6,705,779 1,013,429 7,719,208 4,312,491
Notes and capital lease obligations 412,231 4,308 416,539 40,234
Landfill closure and post closure costs 41,007 - 41,007 -
Due in more than one year
Bonds payable 101,795,931 5,739,130 107,535,061 86,916,131
Notes and capital lease obligations 2,459,272 30,082 2,489,354 127,106
Compensated absences 765,206 15,077 780,283 379,618
Landfill closure and post closure costs 1,226,734 - 1,226,734 -
Advances from customers and TVA - - - 56,861
Total liabilities 118,195,094 7,003,218 125,198,312 109,455,320
NET POSITION
Net investment in capital assets 138,027,516 6,831,728 144,859,244 108,791,580
Restricted for:
Debt service - - - 5,653,386
Capital projects 7,219,041 - 7,219,041 -
Community development 1,649,286 - 1,649,286 -
Perpetual care (nonexpendable) 887,315 - 887,315 -
Unrestricted 22,355,235 6,966,658 29,321,893 10,694,669
Total net position 170,138,393$ 13,798,386$ 183,936,779$ 125,139,635$

See accompanying notes 26
City of Bowling Green, KentuckyStatement of ActivitiesYear Ended June 30, 2013
Expenses
Charges for
Services
Operating Grants
and Contributions
Capital Grants and
Contributions
Governmental
Activities
Business-Type
Activities Total Component Units
PRIMARY GOVERNMENT
Governmental activities:
General government 16,265,264$ 4,650,906$ 4,927,012$ 2,445,539$ (4,241,807)$ -$ (4,241,807)$ -$
Public safety 23,180,539 252,181 1,326,436 1,801,121 (19,800,801) - (19,800,801) -
Public works 6,207,967 - - 815,930 (5,392,037) - (5,392,037) -
Parks and recreation 5,280,474 380,360 - - (4,900,114) - (4,900,114) -
Neighborhood and comm. services 4,787,160 - 3,285,020 106,516 (1,395,624) - (1,395,624) -
Community services 1,070,544 - - - (1,070,544) - (1,070,544) -
Interest expense 6,634,088 - - - (6,634,088) - (6,634,088) -
Total governmental activities 63,426,036 5,283,447 9,538,468 5,169,106 (43,435,015) - (43,435,015) -
Business-type activities:
Golf course 2,066,604 1,368,727 - - - (697,877) (697,877) -
Aquatics 885,993 477,508 - - - (408,485) (408,485) -
Convention center 673,102 212,823 - - - (460,279) (460,279) -
Total business-type activities 3,625,699 2,059,058 - - - (1,566,641) (1,566,641) -
Total primary goverrnment 67,051,735$ 7,342,505$ 9,538,468$ 5,169,106$ (43,435,015) (1,566,641) (45,001,656) -
COMPONENT UNITS
Bowling Green Municipal Utilities 104,170,516$ 107,798,765$ -$ 403,985$ - - - 4,032,234
Total component units 104,170,516$ 107,798,765$ -$ 403,985$ - - - 4,032,234
General revenues:
Property taxes 11,763,153 - 11,763,153 -
Insurance premium taxes 3,342,087 - 3,342,087 -
Transient room taxes - 460,640 460,640 -
Wages and net profits taxes 41,392,272 - 41,392,272 -
Investment income 644,577 6 644,583 184,247
Gain on sale of capital assets 53,678 - 53,678 -
Miscellaneous 251,083 - 251,083 791,864
Total general revenues 57,446,850 460,646 57,907,496 976,111
Transfers (2,351,760) 2,351,760 - -
55,095,090 2,812,406 57,907,496 976,111
Change in net position 11,660,075 1,245,765 12,905,840 5,008,345
Net position, beginning of year 158,478,318 12,552,621 171,030,939 120,131,290
Net position, end of year 170,138,393$ 13,798,386$ 183,936,779$ 125,139,635$
Function/Programs
Program Revenues
Primary Government
Changes in Net Position

See accompanying notes 27
City of Bowling Green, KentuckyBalance Sheet – Governmental FundsJune 30, 2013
General WKU Athletics Debt Service ITA Bond
Other Governmental
Funds
Total Governmental
Funds
ASSETS
Pooled cash and cash equivalents 10,191,932$ -$ -$ 1,472,055$ 13,720,855$ 25,384,842$
Non-pooled cash and cash equivalents 126,401 - - - 1,263,888 1,390,289
Investments 10,538,539 - - - 3,773,064 14,311,603
Receivables (net of allowances for uncollectibles):
Accounts 44,045 - - - 20,233 64,278
Western Kentucky University - 28,790,000 - - - 28,790,000
Interest 43,632 - - - 5,243 48,875
Due (to) from other funds 9,203 - (9,203) - - -
Due from other governmental units 116,046 - - - 212,710 328,756
Prepaid items 102,022 - - - - 102,022
Restricted assets:
Non-pooled cash and cash equivalents - - 9,203 11,543,320 816,622 12,369,145
Total assets 21,171,820$ 28,790,000$ -$ 13,015,375$ 19,812,615$ 82,789,810$
LIABILITIES AND FUND BALANCES
Liabilities
Vouchers and accounts payable 401,107$ -$ -$ -$ 261,364$ 662,471$
Accrued payroll 1,268,998 - - - 21,588 1,290,586
Deferred revenue 206,455 28,790,000 - - 989 28,997,444
Security deposits 485,021 - - - - 485,021
Total liabilities 2,361,581 28,790,000 - - 283,941 31,435,522
Fund Balances
Non-spendable
Prepaid items 102,022 - - - - 102,022
Restricted for:
Cemetery perpetual - - - - 816,622 816,622
Community services - - - - 1,036,554 1,036,554
Public works - - - - 2,159,485 2,159,485
Public safety - - - - 1,866,579 1,866,579
Debt service reserve - - - 11,543,321 - 11,543,321
Parks and recreation - - - - 22,563 22,563
Committed to:
Economic stabilzation 10,476,400 - - - 331,586 10,807,986
Public safety - - - - 1,628,023 1,628,023
Public works - - - - 2,133,831 2,133,831
Assigned to:
Capital projects 2,516,695 - - - 6,806,225 9,322,920
Debt service - - - 1,472,054 2,367,645 3,839,699
General government 190,825 - - - - 190,825
Public safety 91,128 - - - - 91,128
Public works 366,786 - - - - 366,786
Neighborhood and community service 27,888 - - - 288,867 316,755
Parks and recreation 471,483 - - - - 471,483
Other purposes 482,885 - - - 70,694 553,579
Unassigned 4,084,127 - - - - 4,084,127
Total fund balances 18,810,239 - - 13,015,375 19,528,674 51,354,288
Total liabilities and fund balances 21,171,820$ 28,790,000$ -$ 13,015,375$ 19,812,615$ 82,789,810$

28
City of Bowling Green, KentuckyReconciliation of the Balance Sheet of Governmental Funds
To the Statement of Net PositionJune 30, 2013
Fund balances - total governmental funds 51,354,288$
Amounts reported for governmental activities in the statement of
net position are different because:
Capital assets used in governmental activities are not financial
resources and, therefore, are not reported in the funds.
Governmental capital assets 222,178,442
Less accumulated depreciation (39,163,076) 183,015,366
Internal service funds are used by management to charge the costs of
certain activities, such as insurance and fleet maintenance, to
individual funds. The assets and liabilities of the internal service
funds are included in governmental activities in the
statement of net position. 7,807,932
Other long term assets, including the City's receivables from
a former employee and WKU, are not available to pay for
current period expenditures and, therefore, are deferred
in the funds. 29,075,191
Prepaid rent, which represents amounts due from the Inter-Modal
Transit Authority, is a noncurrent asset which is not available to pay
current period expenditures. 13,029,090
Long-term liabilities, including bonds payable and accrued interest
payable, are not due and payable in the current period and, therefore,
are not reported in the funds.
General obligation and revenue bonds (110,499,806)
Premiums, deferred charges and discounts on bond obligations 1,998,096
Deferred charges for issuance costs (to be amortized
over the life of debt) 934,711
Notes and lease purchase agreements (2,871,503)
Accrued interest payable (766,067)
Accrued compensated absences (1,671,164)
Landfill postclosure care (1,267,741) (114,143,474)
Total net position 170,138,393$

See accompanying notes 29
City of Bowling Green, KentuckyStatement of Revenues, Expenditures and Changes in Fund Balances – Government FundsYear Ended June 30, 2013
General WKU Athletics Debt Service ITA Bond
Other Governmental
Funds
Total Governmental
Funds
REVENUES
Property taxes 11,237,164$ -$ -$ -$ 405,093$ 11,642,257$
Insurance premium taxes 1,450,842 - - - 1,891,245 3,342,087
Wages and net profits taxes 39,138,971 - - - 2,253,301 41,392,272
Licenses and permits 1,196,829 - - - - 1,196,829
Intergovernmental 139,131 2,389,433 - - 7,170,920 9,699,484
Investment income 98,600 - - 433,673 64,961 597,234
Charges for services 577,827 - - - 77,453 655,280
Parks and recreation 345,951 - - - - 345,951
Rent income - - - 3,698,284 - 3,698,284
Miscellaneous 213,766 - - - 1,831,322 2,045,088
Total Revenues 54,399,081 2,389,433 - 4,131,957 13,694,295 74,614,766
EXPENDITURES
Current:
General government 5,749,885 - - - 179,806 5,929,691
Public safety 23,581,829 - - - 2,571,489 26,153,318
Public works 5,859,889 - - - 1,751,341 7,611,230
Parks and recreation 5,733,383 - - - - 5,733,383
Neighborhod and community services 1,456,207 - - - 3,523,091 4,979,298
Community services 423,326 - - - - 423,326
Capital Outlay - - - - 3,883,548 3,883,548
Debt Service:
Principal - 1,410,000 3,651,355 4,580,500 490,000 10,131,855
Interest and fiscal charges - 979,433 1,660,750 1,553,206 1,122,587 5,315,976
Total Expenditures 42,804,519 2,389,433 5,312,105 6,133,706 13,521,862 70,161,625
Excess (deficiency) of revenues over (under)
expenditures 11,594,562 - (5,312,105) (2,001,749) 172,433 4,453,141
Other financing sources (uses):
Transfers in 30,000 - 5,312,107 1,327,790 5,877,333 12,547,230
Transfers out (11,321,072) - - - (4,311,651) (15,632,723)
Issuance of refunding debt - - 4,099,807 - - 4,099,807
Premium from bond refunding - - 170,747 - - 170,747
Payment to refunded debt escrow agent - - (4,281,161) - - (4,281,161)
Proceeds from the sale of capital assets 19,731 - - - - 19,731
Total other financing sources (uses) (11,271,341) - 5,301,500 1,327,790 1,565,682 (3,076,369)
Net change in fund balances 323,221 - (10,605) (673,959) 1,738,115 1,376,772
Fund balances, beginning 18,487,018 - 10,605 13,689,334 17,790,559 49,977,516
Fund balances, ending 18,810,239$ -$ -$ 13,015,375$ 19,528,674$ 51,354,288$

See accompanying notes 30
City of Bowling Green, KentuckyReconciliation of the Statement of Revenues, Expenditures and Changes in Fund Balances
of the Governmental Funds to the Statement of ActivitiesYear Ended June 30, 2013
Net change in fund balances - total governmental funds 1,376,772$
Amounts reported for governmental activities in the statement of activities are difference because:
Capital asset additions 6,774,908
Depreciation expense (3,589,779)
Sales of capital assets 33,947 3,219,076
Certain long term receivables are not available for the payment of current
expenditures and therefore are not reported in the governmental funds.
Payments on these receivables are recorded as revenue in the governmental
funds and reduction of the receivable in the statement of net position. (1,424,073)
while the repayment of the principal long-term debt consumes the current financial resources of
government funds. Neither transaction, however, has any effect on net position. Also governmental
funds report the effect of issuance costs, premiums, discounts and similar items when debt is first
issued, whereas these amounts are deferred and amortized in the statement of activities. This amount
is the net effect of these differences in the treatment of long-term and related items. 8,838,371
230,828
37,791
Compensated absences payable (133,496)
Landfill postclosure care (228,421)
(256,773)
Change in net position of governmental activities 11,660,075$
Some expenses reported in the statement of activities do not require the use of current financial
resources and, therefore are not reported as expenditures in governmental funds:
Principal and interest payments made in relation to refunded ITA debt are current expenditures in the
governmental funds. These items are recorded as prepaids in the statement of activities as they
represent a long term lease agreement.
The internal service funds used by management to charge the costs of insurance and fleet
maintenance to individual funds are not reported in the entity-wide statement of activities.
Governmental fund expenditures and related internal fund revenues are eliminated.
Governmental funds report capital outlays as expenditures; however, in the statement of activities, the
cost of those assets is allocated over their estimated useful lives as depreciation expense.
Governmental funds also report only the proceeds from sales of fixed assets while the net gain or loss
is reported in the statement of activities. In addition, infrastructure assets donated to the city are not
recorded on the governmental funds but are donated capital on the statement of activities:
The issuance of long-term debt provides current financial resources to governmental funds
Accrued interest expense on long-term debt is reported in the statement of activities, but does not
require the use of current financial resources; therefore, accrued interest expense is not reported as
expenditures in governmental funds.

See accompanying notes 31
City of Bowling Green, KentuckyStatement of Net Position – Proprietary FundsJune 30, 2013
Governmental
Activities
Golf Aquatics
Convention
Center Total
Internal Service
Funds
ASSETS
Current Assets
Pooled cash and cash equivalents -$ -$ -$ -$ 2,894,146$
Non-pooled cash and cash equivalents 640,501 1,121,714 2,207,928 3,970,143 -
Investments - 267,356 2,798,080 3,065,436 4,737,448
Accounts receivable 7,331 316 46,923 54,570 30,000
Interest receivable - - - - 10,753
- - 23,082 23,082 -
Inventories 92,778 - - 92,778 154,492
Prepaid items - - - - 323,000
Total current assets 740,610 1,389,386 5,076,013 7,206,009 8,149,839
- - 140,787 140,787 -
Capital assets
Land 248,543 200,991 2,290,764 2,740,298 -
Construction in progress 3,900 - - 3,900 -
Buildings 1,734,994 210,684 10,562,775 12,508,453 200,986
Improvements other than buildings - 5,647,802 - 5,647,802 -
Golf course improvements 4,816,473 - - 4,816,473 -
Machinery and equipment 793,157 31,516 1,422,984 2,247,657 281,427
Property held under capital lease 306,633 - - 306,633 -
7,903,700 6,090,993 14,276,523 28,271,216 482,413
Less accumulated depreciation (4,269,692) (3,769,822) (6,613,025) (14,652,539) (352,936)
Capital assets, net 3,634,008 2,321,171 7,663,498 13,618,677 129,477
Total noncurrent assets 3,634,008 2,321,171 7,804,285 13,759,464 129,477
Total assets 4,374,618$ 3,710,557$ 12,880,298$ 20,965,473$ 8,279,316$
LIABILITIES
Current liabilities
Vouchers and accounts payable 32,011$ 10,063$ 20,001$ 62,075$ 239,546$
Accrued payroll 45,864 39,164 557 85,585 22,890
Accrued interest payable 1,648 8,305 12,774 22,727 -
Insurance claims payable - - - - 191,417
Current portion of compensated absences 30,080 725 - 30,805 12,863
Current portion of capital lease obligations 4,308 - - 4,308 -
23,082 - - 23,082 -
Current portion of bond obligations 38,429 345,000 630,000 1,013,429 -
175,422 403,257 663,332 1,242,011 466,716
Noncurrent liabilities
Noncurrent portion of compensated absences 12,144 2,933 - 15,077 4,668
Noncurrent portion of capital lease obligations 30,082 - - 30,082 -
component units 140,787 - - 140,787 -
Noncurrent portion of bond obligations 442,592 2,029,563 3,266,975 5,739,130 -
Total noncurrent liabilities 625,605 2,032,496 3,266,975 5,925,076 4,668
Total liabilities 801,027 2,435,753 3,930,307 7,167,087 471,384
NET POSITION
Net investment in capital assets 3,118,597 (53,392) 3,766,523 6,831,728 129,477
Unrestricted 454,994 1,328,196 5,183,468 6,966,658 7,678,455
Total net position 3,573,591$ 1,274,804$ 8,949,991$ 13,798,386$ 7,807,932$
Capital lease due to component unit
Noncurrent portion of capital lease due to
Enterprise Funds
Business-Type Activities
Noncurrent portion of lease receivable from
component unit
Lease receivable from component unit

See accompanying notes 32
City of Bowling Green, KentuckyStatement of Revenues, Expenses and Changes in Net Position – Proprietary FundsYear Ended June 30, 2013
Golf Aquatics
Convention
Center Total
OPERATING REVENUES
Transient room taxes -$ -$ 460,640 460,640$ -$
Charges for services 1,124,505 374,821 212,823 1,712,149 2,002,638
Sales of merchandise and concessions 244,222 102,670 - 346,892 -
Insurance premiums - - - - 4,897,050
Judgements and settlements - 17 - 17 22,132
Contributions and donations - - - - 2,748
Miscellaneous - - - - 2,772
Total operating revenues 1,368,727 477,508 673,463 2,519,698 6,927,340
OPERATING EXPENSES
Cost of sales 172,711 52,217 - 224,928 -
Personnel services 1,020,353 232,258 13,298 1,265,909 587,586
Contractual services 156,739 10,198 42,995 209,932 407,166
Supplies 271,821 64,793 - 336,614 1,232,542
Utilities 88,926 78,544 - 167,470 31,750
Repairs and maintenance 68,784 26,592 36,562 131,938 251,318
Insurance premiums and claims - - - - 5,425,962
Depreciation 226,742 289,580 347,508 863,830 13,966
Miscellaneous 35,102 574 24 35,700 14,898
Total operating expenses 2,041,178 754,756 440,387 3,236,321 7,965,188
Operating income (loss) (672,451) (277,248) 233,076 (716,623) (1,037,848)
NONOPERATING REVENUES (EXPENSES)
Interest income 181 2,272 (2,447) 6 47,342
Gain/(loss) on disposal of assets - (3,740) - (3,740) -
Interest expense (24,565) (108,878) (163,851) (297,294) -
Amortization (861) (18,619) (68,864) (88,344) -
Total nonoperating revenues (expenses) (25,245) (128,965) (235,162) (389,372) 47,342
Income (loss) before transfers (697,696) (406,213) (2,086) (1,105,995) (990,506)
Transfers in 739,772 514,191 1,097,797 2,351,760 833,733
Transfers out - - - - (100,000)
Change in net position 42,076 107,978 1,095,711 1,245,765 (256,773)
Net position, beginning 3,531,515 1,166,826 7,854,280 12,552,621 8,064,705
Net position, ending 3,573,591$ 1,274,804$ 8,949,991$ 13,798,386$ 7,807,932$
Governmental
Activities
Internal Service
Funds
Business-type Activities -
Enterprise Funds

See accompanying notes 33
City of Bowling Green, KentuckyStatement of Cash Flows – Proprietary FundsYear Ended June 30, 2013
Golf Aquatics Convention Center TotalCASH FLOWS FROM OPERATING ACTIVITIES
Cash received from customers 1,361,396$ 477,192$ 202,264$ 2,040,852$ 6,905,747$
Other cash receipts - - 460,640 460,640 -
Cash payments to employees (1,203,087) (280,815) (13,279) (1,497,181) (585,211)
Cash payments to suppliers (622,216) (191,888) (81,430) (895,534) (1,813,605)
Claims paid - - - - (5,451,440)
Net cash provided by (used in) operating activities (463,907) 4,489 568,195 108,777 (944,509)
CASH FLOWS FROM NONCAPITAL FINANCING ACTIVTIES
Transfers in (out) 739,772 514,191 1,097,797 2,351,760 733,733
Net cash provided by noncapital financing activities 739,772 514,191 1,097,797 2,351,760 733,733
Purchase of capital assets (62,372) - - (62,372) -
Principal paid on bond obligations (36,465) (335,800) (640,000) (1,012,265) -
Principal proceeds paid on component unit lease, net (23,082) - - (23,082) -
Principal paid on capital leases (15,867) - - (15,867) -
Interest paid on debt obligations (25,340) (109,728) (163,851) (298,919) -
Net cash used in capital and related financing activities (163,126) (445,528) (803,851) (1,412,505) -
CASH FLOWS FROM INVESTING ACTIVITIES
Interest received 181 2,272 (2,447) 6 51,883
Purchase of investments - - (617,564) (617,564) -
Proceeds from sale of investments - 7,588 - 7,588 540,124
Cash received from lease property - - 23,082 23,082 -
Net cash provided by (used in) investing activities 181 9,860 (596,929) (586,888) 592,007
Net increase (decrease) in cash and cash equivalents 112,920 83,012 265,212 461,144 381,231
Cash and cash equivalents, beginning of year 527,581 1,038,702 1,942,716 3,508,999 2,512,915
Cash and cash equivalents, end of year 640,501$ 1,121,714$ 2,207,928$ 3,970,143$ 2,894,146$
Operating income (loss) $ (672,451) $ (277,248) 233,076$ (716,623)$ (1,037,848)$
Depreciation 226,742 289,580 347,508 863,830 13,966 Change in assets and liabilities
Accounts receivable (7,331) (316) (10,559) (18,206) (21,593) Inventories 9,395 - - 9,395 21,383 Accounts payable (10,239) (11,187) (1,849) (23,275) 102,686 Compensated absences (5,721) 172 - (5,549) 1,590 Accrued payroll (4,302) 3,488 19 (795) 785 Insurance claims payable - - - - (25,478)
Net cash provided by (used in) operating activities (463,907)$ 4,489$ 568,195$ 108,777$ (944,509)$
Reconciliation of operating income (loss) to net cash provided by operating activities
Adjustments to reconcile operating income (loss) to net cash provided by (used in) operating activities
CASH FLOWS FROM CAPITAL AND RELATED FINANCING
ACTIVITIES
Governmental Activities -
Internal Service Funds
Business-type Activities -
Enterprise Funds

See accompanying notes 34
City of Bowling Green, KentuckyStatement of Fiduciary Net Position June 30, 2013
ASSETS
Pooled cash and cash equivalents -$ 106,385$
Non-pooled cash and cash equivalents 245,029 1,696,208
Accrued interest receivable 32,600 -
Investments
Corporate securities 1,864,552 -
Mutual funds 3,282,056 -
Kentucky local municipal bonds 1,606,662 -
United States government securities 99,454 -
Total investments at fair value 6,852,724 -
Total assets 7,130,353$ 1,802,593$
LIABILITIES
Accounts payable and accrued expenses 1,993$ -$
Due to other governmental units - 106,385
Other liabilities - 1,696,208
Total liabilities 1,993 1,802,593$
NET POSITION
Held in trust for pension benefits 7,128,360$
Pension Trust - Police &
Firemen's Retirement Agency Funds

See accompanying notes 35
City of Bowling Green, KentuckyStatement of Changes in Fiduciary Net PositionYear Ended June 30, 2013
ADDITIONS
Contributions
Employer 400,000$
Investment income
Net appreciation in fair value of investments 414,972
Interest 152,466
Dividends 62,801
Total investment earnings 630,239
Total additions 1,030,239
DEDUCTIONS
Benefit payments 951,864
Administrative expenses 19,774
Total deductions 971,638
Change in net position 58,601
Net position, beginning of year 7,069,759
Net position, end of year 7,128,360$
Pension Trust - Police &
Firemen's Retirement

See accompanying notes 36
City of Bowling Green, KentuckyStatement of Net PositionComponent UnitsJune 30, 2013
Bowling Green
Municipal
Utilities
ASSETS
Non-pooled cash and cash equivalents 9,519,323$
Investments 100,000
Receivables (net):
Accounts 9,467,294
Other 6,810,451
Inventories 1,367,840
Prepaid items 565,742
Restricted assets:
Restricted cash - TVA 469,571
Investments 6,162,432
Other assets 323,127
Capital assets, net of accumulated depreciation:
Non-depreciable 74,487,833
Depreciable 125,321,342
Total assets 234,594,955$
LIABILITIES
Vouchers and accounts payable 9,045,056$
Compensated absences payable 707,939
Accrued interest payable 1,197,353
Other current liabilities 2,555,091
Customer advances 56,861
Security deposits 4,117,440
Compensated absences payable, noncurrent 379,618
Noncurrent liabilities
Due within one year 4,352,725
Due in more than one year 87,043,237
Total liabilities 109,455,320
NET POSITION
Net investment in capital assets 108,791,580
Restricted for capital activities and debt service 5,653,386
Unrestricted 10,694,669
Total net position 125,139,635$

See accompanying notes 37
City of Bowling Green, Kentucky
Statement of ActivitiesComponent UnitsYear Ended June 30, 2013
Net (expense)
Revenue and
Changes in Net Position
Expenses Charges for
Services Operating
Contributions Capital
Contributions Bowling Green Municipal
Utilities
Bowling Green Municipal Utilities 104,170,516$ 107,798,765$ -$ 403,985$ 4,032,234$
General revenues:
Investment income 184,247
Miscellaneous 791,864
Total general revenues 976,111
Change in net position 5,008,345
Net position, beginning of year 120,131,290
Net position, end of year 125,139,635$
Function/Programs
Program Revenues

CITY OF BOWLING GREEN, KENTUCKY
NOTES TO FINANCIAL STATEMENTS
INDEX
NOTE 1. SUMMARY OF SIGNIFICANT ACCOUNTING POLICIES ................................................... 38A. Reporting Entity ............................................................................................................. 38B. Related Organization ..................................................................................................... 39C. Joint Venture .................................................................................................................. 39D. Basic Financial Statements ........................................................................................... 39E. Basis of Presentation .................................................................................................... 41F. Assets, Liabilities, and Fund Equity................................................................................ 42G. Revenues, Expenditures and Expenses ........................................................................ 45H. Estimates........................................................................................................................ 45
NOTE 2. STEWARDSHIP, COMPLIANCE AND ACCOUNTABILITY .................................................... 45A. Compliance with Finance Related Legal and Contractual Provisions............................ 45
NOTE 3. DETAIL NOTES ON ALL FUNDS ........................................................................................... 46A. Cash and Investments ................................................................................................... 46B. Restricted Assets ........................................................................................................... 49C. Capital Assets ................................................................................................................ 49D. Interfund Transfers......................................................................................................... 51E. Long-term Debt.............................................................................................................. 52F. Net Position.................................................................................................................... 60
NOTE 4. RISK MANAGEMENT ............................................................................................................. 60
NOTE 5. COMMITMENTS AND CONTINGENCIES.............................................................................. 61A. Litigation ......................................................................................................................... 61B. Bowling Green Municipal Utilities................................................................................... 61C. Construction Commitments............................................................................................ 61D. Contingencies................................................................................................................. 61E. Liens and Encumbrances............................................................................................... 61F. Conduit Debt .................................................................................................................. 62G. Lease Commitments ...................................................................................................... 62
NOTE 6. THE SINGLE AUDIT ACT........................................................................................................ 62
NOTE 7. DEFINED BENEFIT PENSION PLANS .................................................................................. 63A. Plan Descriptions .......................................................................................................... 63B. Summary of Significant Accounting Policies and Plan Asset Matters ........................... 63C. Funded Status and Funding Progress ........................................................................... 64D. The County Employees' Retirement System ................................................................. 64E. Deferred Compensation Plan ......................................................................................... 65
NOTE 8. SUBSEQUENT EVENTS ........................................................................................................ 65
NOTE 9. IMPLEMENTATION OF GASB 63 ........................................................................................... 66
NOTE 10. IMPLEMENTATION OF GASB 65 ........................................................................................... 66

City of Bowling Green, KentuckyNotes to Financial StatementsJune 30, 2013
38
NOTE 1. SUMMARY OF SIGNIFICANT ACCOUNTING POLICIES
The financial statements of the City of Bowling Green (the City) have been prepared in accordance with generally accepted accounting principles (GAAP) as applied to governmental units. The Governmental Accounting Standards Board (GASB) is the standard-setting body for government accounting and financial reporting. The GASB periodically updates its codification of the existing Governmental Accounting and Financial Reporting Standards which, along with subsequent GASB pronouncements (Statements and Interpretations), constitutes GAAP for governmental units. The more significant of these accounting policies are described below and, where appropriate, subsequent pronouncements will be referenced.
A. Reporting Entity - The accompanying financial statements present the City and its component units (traditionally separate reporting entities), for which the City is considered to be financially accountable. The City (the primary government) is financially accountable if it appoints a voting majority of the organization’s governing board and (1) is able to impose its will on the organization or (2) there is a potential for the organization to provide specific financial benefit to or impose specific financial burden on the City. Additionally, the City is required to consider other organizations for which the nature and significance of their relationship with the City are such that exclusion would cause the City’s financial statements to be misleading or incomplete. The financial statements are formatted to allow the user to clearly distinguish between the primary government and its component units.
1. Blended Component Units - The agencies and organizations listed below are, in substance, the same as the City, despite being legally separate from the City. Therefore, they are reported as part of the primary government. They have a governing body that is substantially the same as the governing body of the City; provide services entirely, or almost entirely, to the City; or otherwise exclusively, or almost exclusively, benefit the City even though they do not provide services directly to the City.
Governmental Fund Type
City of Bowling Green Policemen and Firemen's Retirement Fund. Retired or disabled City public safety employees participate in the Policemen and Firemen's Retirement Fund. The Fund functions for the benefit of these employees and surviving spouses and is administered by a Board of Trustees consisting of the Mayor, City Chief Financial Officer and representatives of the police and fire departments.
The City contributes amounts to fund current service costs and interest on unfunded past service costs based upon actuarial valuations. Plan benefit levels are determined by Kentucky Revised Statues.
Bowling Green Municipal Projects Corporation. The non-profit corporation was organized as an agency and instrumentality of the City to facilitate the financing of public capital projects. The corporation's articles of incorporation contain provisions for the City's governing body to retain organizational and supervisory control over the corporation's activities as a constituted authority of the City. The corporation issues revenue bonds to finance construction of public projects and leases the facilities to the City in accordance with lease agreements providing for initial one-year lease terms with annual renewal options at rental amounts sufficient to cover principal and interest maturities within that year.
The non-profit corporation's debt service transactions are reported as part of the City's Debt Service Fund.
Proprietary Fund Type
The Convention Center Corporation. The non-profit corporation was organized as an agency, instrumentality and constituted authority of the City for the express purpose of planning, financing and constructing a municipal convention center and trade show facility and Crosswinds golf course pro shop facility.

City of Bowling Green, KentuckyNotes to Financial Statements (Continued)June 30, 2013
39
NOTE 1. SUMMARY OF SIGNIFICANT ACCOUNTING POLICIES (Continued)
The Board of Directors consists of the Mayor, City Commissioners and Warren County Judge-Executive. Special taxing districts have been created by the City and County in the Hartland Planned Community for Convention Center Corporation operations. Bond issuance is approved by the City Commission. The Corporation is reported as an enterprise fund.
2. Discretely Presented Component Units - The agencies described below are included in the City's reporting entity because the City appoints the governing body and the agencies are fiscally dependent on the City. All of these agencies are reported as discretely presented component units because the primary government is financially accountable and is able to impose its will on the organization or the component unit provides specific financial benefits or imposes specific financial burdens on the primary government.
Proprietary Fund Type Bowling Green Municipal Utilities (BGMU). Board member appointments are made by the City Commission. The Electric Division is a distributor of electrical power under the authority of the Federal Energy Regulatory Commission and the Tennessee Valley Authority and provides service to customers primarily in the City. The Electric Division has erected various street lighting systems for the City for which monthly rental amounts are paid to the utility by the City based on a percentage of total unamortized investment.
The Water-Sewer Division operates the water treatment and the waste-water treatment facilities serving customers primarily in the City. The rates for user charges and bond issuance authorization are approved by the City Commission.
The General Services Division operates the fiber optic network in the City.
B. Related Organization - City officials are also responsible for appointing the members of boards of other organizations but the City's accountability for these organizations does not extend beyond making the appointments.
C. Joint Venture - The Inter-Modal Transportation Authority, Inc. (ITA) is a non-profit corporation organized for the purpose of acquiring and financing public projects and public facilities as an agent for the City and the County of Warren, Kentucky, jointly. In the year ended June 30, 2008, the City approved the issuance of General Obligation bonds (Series 2007 B & C) in the amount of $27,415,000 to refinance the ITA's mortgage-backed bonds that were outstanding. The City entered into a ground lease with the Authority, providing for the City’s acquisition of a leasehold estate in the project. The City, Warren County, and the Authority entered into a Contract, Lease & Option agreement in which the Authority and County shall lease back the project from the City in consideration of rental payments to be utilized by the City in support of the payment of principal and interest on the general obligation bonds. The City and Warren County have each pledged to evenly share any shortfalls towards payment of debt service on the outstanding bonds. In 2013, the ITA and Warren County made rental payments of $1,352,784. In addition, land sale proceeds totaling $2,345,500 were used to retire a portion of the Series 2007B and 2007C debt. The City was required to fund an additional $1,302,784 related to the required debt service payments. The separately audited financial statements of the ITA can be obtained from the finance department of the City.
D. Basic Financial Statements
Government-wide and Fund Financial Statements
The basic financial statements include both government-wide and fund financial statements. The reporting model focus is either on the City as a whole or on major individual funds. The government-wide financial statements report information on all of the non-fiduciary activities of the City and its component units. Both the government-wide and fund financial statements categorize primary activities as either governmental or business-type.

City of Bowling Green, KentuckyNotes to Financial Statements (Continued)June 30, 2013
40
NOTE 1. SUMMARY OF SIGNIFICANT ACCOUNTING POLICIES (Continued)
Governmental activities normally are supported by taxes and intergovernmental revenues. Business-type activities rely to a significant extent on fees and charges for support. In the Government-wide Statement of Net Position, both the governmental and business-type activities are presented on a consolidated basis by column.
The Government-wide Statement of Activities demonstrates the degree to which the direct expenses of a function are offset by program revenues. Direct expenses (including depreciation) are those that are clearly identifiable with a specific function. Program revenues are directly associated with the function and include charges for services and grants and contributions that are restricted to meeting the operational or capital requirements of a particular function. Operating grants include operating-specific and discretionary (either operating or capital) grants while capital grants are capital-specific. Occupational license fees applied to gross wages and net profits, other license fees and permits, taxes, interest income and other revenues not properly included in program revenues are reported as general revenues.
Separate financial statements are provided for governmental funds, proprietary funds, and fiduciary funds, even though fiduciary funds are excluded from the government-wide financial statements. Major individual governmental and enterprise funds are reported as separate columns in the fund financial statements. Non-major funds (by category) are summarized into a single column.
Basis of Accounting and Financial Statement Presentation
The government-wide financial statements are reported using the economic resources measurement focus and the accrual basis of accounting as are the proprietary fund and fiduciary financial statements. With this measurement focus, all assets and all liabilities including long-term assets as well as long-term debt and obligations, are included in the Statement of Net Position. Revenues are recorded when earned and expenses are recorded when a liability is incurred, regardless of the timing of related cash flows.
Governmental fund financial statements are reported using the current financial resources measurement focus and the modified accrual basis of accounting. Revenues are recognized when they are both measurable and available. "Available" means collectible within the current period or soon enough thereafter to be used to pay liabilities of the current period. For the City, available means expected to be received within sixty days of year end. Major revenue sources not susceptible to accrual include charges for services, penalties and fines, and miscellaneous revenues. Such revenues are recorded as revenues when received because they are generally not measurable or available until actually received. Intergovernmental revenues received for specific purposes or projects are recognized when the applicable eligibility requirements are met. Revenues received before the eligibility requirements are met are reported as deferred revenue. Expenditures are recorded when the liability is incurred except: (1) principal and interest on long-term debt is recorded when due and (2) compensated absences are accounted for as expenditures in the period used.
Since the Government fund statements are presented on a different measurement focus and basis of accounting than the Government-wide statements’ governmental column, a reconciliation is presented on the page following each statement which briefly explains the adjustments necessary to transform the fund based financial statements into the Governmental column of the Government-wide presentation.
Internal service funds provide services primarily to other funds of the City and are presented in summary form as part of the proprietary fund statements. Since the principal users of the internal services are the City’s governmental activities, the internal service funds’ financial statements are consolidated into the Governmental column in the Government-wide statements. Governmental funds reimburse the Employee Health Care, Workers Compensation, Fleet Maintenance funds and property and Casualty for employer insurance and fleet maintenance expenses; these revenues and expenses are eliminated upon consolidation. Direct expenses of the internal service funds are not eliminated.

City of Bowling Green, KentuckyNotes to Financial Statements (Continued)June 30, 2013
41
NOTE 1. SUMMARY OF SIGNIFICANT ACCOUNTING POLICIES (Continued)
The City’s fiduciary funds are presented in the fund financial statements by type (pension and agency). Since these assets are being held for the benefit of a third party (private parties, pension participants, etc.) and cannot be used for activities or obligations of the City, these funds are not incorporated into the Government-wide statements.
E. Basis of Presentation
The financial statements of the City are recorded in individual funds. Each fund is accounted for by providing a separate set of self-balancing accounts that is comprised of its assets, liabilities, reserves, fund equity, revenues, and expenditures or expenses, as appropriate. The various funds are reported by generic classification within the financial statements.
In accordance with GASB Statement No. 34, major funds are determined by the percentage of the assets, liabilities, revenues or expenditures/expenses of either fund category or the governmental and enterprise combined. Any other governmental or enterprise funds that the City believes is particularly important to financial statement users may also be reported as major. The non-major funds are combined in a column in the fund financial statements and detailed in the combining section.
The focus of governmental fund measurement (in the fund financial statements) is on the determination of financial position and changes in financial position (sources, uses, and balances of financial resources) rather than on net income. The balance sheets generally contain only current assets and liabilities. The reported fund balance (net current assets) is a measure of “available spendable resources”. The City reports the following major governmental funds:
The General Fund is the primary operating unit of the City and accounts for the revenues and expenditures not specifically provided for in other funds. Most of the essential governmental services such as police and fire protection, community services and general administration are reported in this fund.
The WKU Athletics Debt Service Fund is used to account for revenues received from Western Kentucky University (WKU) consisting of student athletic fees and suite rentals collected by WKU and remitted to the City pursuant to the Memorandum of Agreement between the City, WKU and the Hilltopper Athletic Foundation. The student athletic fees and suite rentals are to be paid to the City each year in sufficient amounts to pay debt services on the City's $27,775,000 General Obligation and Special Revenue Bonds, Series 2010 and $1,805,000 General Obligation and Special Revenues Bonds, Series 2011 as well as $2,045,000 on the City’s General Obligation and Special Revenues Bonds, Series 2002B and 2002C.
The ITA Bond Debt Service Fund is used to account for revenues received from lease payments made by the ITA and Warren County and expenditures related to the 2007A and 2007B bond issues that were used for refinancing the Kentucky Transpark.
The Debt Service Fund is used to account for the accumulation of resources and payments made for principal and interest on long-term general obligation debt in the governmental funds.
The focus of proprietary fund measurement is upon the determination of operating income, changes in net position, financial position, and cash flows, which is similar to businesses. All assets and all liabilities associated with the operation of these funds are included on the balance sheet. The City reports the following major proprietary funds:
The Golf Course Fund is used to account for the operations of the City's public golf courses.
The Aquatics Fund is used to account for the operations of the City's public pool and water park.
The Convention Center Fund is used to account for the operations of the City's Sloan Convention Center.

City of Bowling Green, KentuckyNotes to Financial Statements (Continued)June 30, 2013
42
NOTE 1. SUMMARY OF SIGNIFICANT ACCOUNTING POLICIES (Continued)
Internal Service Funds are used to account for the financing of goods and services provided by one department or agency to other departments or agencies of the City on a user charge basis. Internal Service Funds include the Fleet Maintenance Fund, Employee Health Care Fund, Workers Compensation Fund and Property and Casualty Fund.
Fiduciary Funds are used to account for assets held on behalf of outside parties, including other governments, or on behalf of other funds within the City. Trust funds account for assets held by the City under the terms of a formal trust agreement. Agency funds generally are used to account for assets that the City holds on behalf of others as their agent, are custodial in nature (assets equal liabilities) and do not involve measurement of results of operations. Fiduciary funds are as follows:
The City of Bowling Green Policemen and Firemen's Retirement Fund, a pension trust fund, is used to account for the accumulation of resources to be used for retirement annuity payments for retired or disabledpublic safety employees.
Agency Funds
Claims Fund is an imprest paying agent for all government funds.
Payroll Fund is an imprest paying agent for City payroll.
Tourist and Convention Fund is used to account for the collection of 4% transient room tax and payment to the Bowling Green Area Convention and Visitors Bureau and the Convention Center Corporation.
Tax Distribution Fund is used to account for property tax collections and disbursements to the General Fund and the Bowling Green Independent School System for property taxes billed and collected by the City on its behalf.
Treasurer's Distribution Fund is used to account for collection of miscellaneous receipts requiring disbursement to other outside agencies.
F. Assets, Liabilities and Fund Equity
Deposits and Investments - The City's cash and cash equivalents are considered to be cash on hand, demand deposits, and short-term investments with original maturities of three months or less from the date of acquisition. Some of the cash resources of the individual funds are combined to form a pool of cash for cash management purposes. Interest income earned as a result of pooling is distributed to the appropriate funds based on the ending monthly balance of pooled cash in each fund. Funds that incur a negative balance in pooled cash during the year are not charged interest. No reclassification has been made at year end for negative balances of pooled cash.
Investments for the government, as well as its component units, are reported at fair value.
Receivables - Receivables are amounts due representing revenues earned or accrued in the current period.
Property taxes attach as an enforceable lien on property as of January 1 each year. Property values are assessed on January 1 of each year, taxes are levied annually by ordinance, and are payable on December 31. The City bills and collects its own property taxes and also collects for the Bowling Green Independent School District. Collections of the City school taxes and remittance to the District are accounted for in the Tax Distribution Fund. City property tax revenues are recognized when levied to the extent that they are both measurable and available.
A receivable is reported for uncollected property taxes. Since these taxes are all at least six months delinquent at June 30 an allowance for uncollectible accounts has been established for the entire amount.

City of Bowling Green, KentuckyNotes to Financial Statements (Continued)June 30, 2013
43
NOTE 1. SUMMARY OF SIGNIFICANT ACCOUNTING POLICIES (Continued)
Interfund Receivables - During the course of its operations, the City has numerous transactions between funds to finance operations, provide services, construct assets, and service debt. To the extent that certain transactions between funds had not been paid or received as of June 30, 2013, balances of interfund amounts receivable or payable have been recorded as “due to/from other funds”. Any residual balances outstanding between the governmental activities and business-type activities are reported in the Government-wide financial statements as “internal balances”.
Inventories - Inventories are valued at cost, which approximate market, using the first-in/first-out (FIFO) method. The costs of inventory items are recognized as expenditures or expenses when used.
Prepaid Items - Certain payments to vendors reflect costs applicable to future accounting periods and are recorded as prepaid items in both Government-wide and fund financial statements. Prepaid rent consists of payments made by the City in relation to a leasehold estate in the Inter-Modal Transit Authority project, net of current year amortization of rent expense.
Restricted Assets - Certain proceeds of bonds, as well as certain resources set aside for their payment, are classified as restricted assets on the balance sheet since their use is limited by applicable bond indentures. Construction fund accounts are used to report proceeds of general obligation and revenue bonds and notes that are restricted for use in construction and capital acquisitions. Depreciation and Maintenance accounts are the resources set aside to provide reasonable reserves for renewals, replacements, improvements, extensions, extraordinary major repairs and contingencies related to bond obligation projects. Sinking Fund accounts are the resources accumulated for debt service payments.
Capital Assets – Capital assets, which include property, plant, equipment and infrastructure assets (e.g. roads, bridges, traffic signals, and similar items), are reported in the applicable governmental or business-type activities columns in the Government-wide financial statements. Land, building, and improvements expenditures for items having a useful life greater than two years and having a cost greater than $25,000 are capitalized. Machinery and equipment expenditures for items having a useful life greater than two years and having a cost greater than $5,000 are capitalized. Such assets are recorded at historical cost or estimated historical cost if purchased or constructed.Donated capital assets are recorded at estimated fair market value and recorded as donations at the date received. The costs of normal maintenance and repairs that do not add to the value of the asset or materially extend asset lives are not capitalized.
Property, plant, and equipment of the City are depreciated using the straight-line method over the following estimated useful lives:
Description
Governmental Activities Estimated
Lives
Business-Type Activities Estimated
Lives
Buildings and improvements 40 years 30 - 50 years
Improvements other than buildings 10 - 40 years 10 - 35 years
Infrastructure - drainage 30 - 100 years N/A
Machinery and equipment 3 - 7 years 3 - 10 years
Vehicles 5 - 7 years 5 - 7 years
Intangible assets 10 years – infinite N/A
The City's infrastructure consists of the street and storm sewers systems. The street system consists of streets, right of ways, sidewalks, and curbs. The storm sewers system consists of gutters and storm sewers. The City elected to use the Modified Approach as defined by GASB Statement No. 34 for infrastructure reporting of its street system. Using this approach, the City capitalizes the costs of its street system but does not report depreciation expense for those assets. Instead, the City reports all street system maintenance as expenditures in the period incurred unless those expenditures improve on those streets original condition or add to its capacity. These additions or improvements are not expensed but added to the historical cost of the assets. The City uses an asset

City of Bowling Green, KentuckyNotes to Financial Statements (Continued)June 30, 2013
44
NOTE 1. SUMMARY OF SIGNIFICANT ACCOUNTING POLICIES (Continued)
management system to provide an up-to-date inventory of its streets, perform condition assessments on the street pavement at least once every three years, and estimate an annual amount needed to maintain the streets at a specified condition level. The asset management system is discussed in the detail in Required Supplemental Information, immediately following these notes.
Compensated Absences - It is the City's policy to permit employees to accumulate earned but unused vacation and sick pay benefits. Vacation leave is earned based on working days for each month of credited service. For most classified employees, earning rates increase at 10, 15 and 20 years of credited service. Accumulated vacation time shall not exceed the amount of time which an employee may earn in 2 years.
Sick leave for most classified employees is earned on the basis of one working day or eight hours per month of service. Sick leave for Fire Department personnel working 24 hours on/48 hours off is earned on the basis of 12 hours per month of service. Earned sick leave may be accumulated up to a maximum of 180 days; thereafter, employees are compensated monthly for days accumulated in excess of 180 days in an amount equal to one-half of the base rate straight-time value. For retiring employees who are participating members of CERS, the City will purchase service credit for up to six months (120 days) of unused sick leave at the time of retirement. Employees who retire with more than 120 accrued sick days may receive cash payment for the number of days over 120 in the amount of $25/day.
All vacation pay is accrued when incurred in the government-wide, proprietary and fiduciary fund financial statements. A liability for these amounts is reported in governmental funds only if they have matured, for example, as a result of employee resignations and retirements.
Long-Term Obligations – In the Government-wide and proprietary fund financial statements, long-term debt and obligations are reported as liabilities in the applicable governmental activities, business-type activities, or proprietary fund Statement of Net Position. The discounts, premiums and issuance costs related to bonds and notes issued are deferred and amortized over the life of the bond or note using the straight-line method. Bonds and notes payable are reported net of the applicable bond premium or discount. Issuance costs are reported as deferred charges and amortized over the term of the related debt.
In the fund financial statements, governmental fund types recognize bond premiums and discounts, as well as bond issuance costs, during the current period. The face amount of debt issued is reported as other financing sources. Premiums on debt issuances are reported as other financing sources while discounts are reported as other financing uses. Issuance costs are reported as debt service expenditures.
Extraordinary losses, the difference between the re-acquisition price (new debt) and the net carrying value of the old debt on refunded debt are amortized as a component of interest expense over the life of the old or new bonds, whichever is shorter, using the straight-line method. The deferred amount is offset against the new liability.
Long-term liabilities include the following:
• Principal outstanding on general obligation bonds, notes and capital lease obligations.
• Landfill closure and postclosure care liability is the estimated total current cost to place a final cover on the City’s landfill sites and to perform certain maintenance and monitoring functions after closure.
Unearned Revenues – The City defers revenue recognition in connection with resources that have been received but not yet earned. At the end of fiscal year 2013, licenses and permits paid in advance of $206,455 have been deferred as these amounts have not yet been earned.

City of Bowling Green, KentuckyNotes to Financial Statements (Continued)June 30, 2013
45
NOTE 1. SUMMARY OF SIGNIFICANT ACCOUNTING POLICIES (Continued)
Fund Equity –The following classifications describe the relative strength of the spending constraints placed on the purposes for which resources can be used:
Nonspendable fund balance – amounts that are not in a spendable form (such as inventory) or are required to be maintained intact;
Restricted fund balance – amounts constrained to specific purposes by their providers (such as grantors, bondholders and higher levels of government), through constitutional provisions, or enabling legislation;
Committed fund balance – amounts constrained to specific purposes by the City itself, by Ordinance approved by the Board of Commissioners; to be reported as committed, amounts cannot be used for any other purpose unless the City takes action to remove or change the constraint;
Assigned fund balance – amounts the City intends to use for a specific purpose (such as encumbrances); intent can be expressed by the City or the City Manager, Assistant City Manager, and/or Chief Financial Officer or body to which the City delegates authority as established by the City’s Fund Balance Policyincluded in the City’s Financial Policies approved the Board of Commissioners.
Unassigned fund balance – amounts that are available for any purpose; positive amounts are reported only in the General Fund.
When both restricted and unrestricted funds are available for expenditure, restricted funds are spent first unless legal requirements disallow it. When committed, assigned and unassigned funds are available for expenditure, committed funds are spent first, assigned funds second, and unassigned funds last.
G. Revenues, Expenditures and Expenses
Operating revenues and expenses for proprietary funds are those that result from providing services and producing and delivering goods and/or services. It also includes all revenue and expenses not related to capital and related financing, non-capital financing or investing activities.
Interfund transactions that would be treated as revenues or expenditures/expenses if they involved organizations external to the City are similarly treated when involving funds of the City. Transactions that constitute reimbursements to a fund for expenditures/expenses initially made from it that are properly applicable to another fund are recorded as expenditures/expenses in the reimbursing fund and as reductions of expenditures/expenses in the reimbursed fund. Transfers from funds receiving revenues to funds through which the resources are to be expended and operating subsidies are classified as interfund transfers. Transfers between governmental and proprietary funds are netted as part of the reconciliation to the Government-wide columnar presentation.
H. Estimates
The preparation of financial statements in conformity with accounting principles generally accepted in the United States requires management to make estimates and assumptions that affect the reported amounts of assets and liabilities and disclosure of contingent assets and liabilities at the date of the financial statements and the reported amounts of revenues and expenses during the reporting period. Actual results could differ from those estimates.
NOTE 2. STEWARDSHIP, COMPLIANCE AND ACCOUNTABILITY
A. Compliance with Finance Related Legal and Contractual Provisions
The City has no material violations of finance related legal and contractual provisions.

City of Bowling Green, KentuckyNotes to Financial Statements (Continued)June 30, 2013
46
NOTE 3. DETAIL NOTES ON ALL FUNDS
A. Cash and Investments
Primary GovernmentThe Government's bank balances at June 30, 2013 are entirely insured or collateralized with securities held by the City's agent in the City's name. In accordance with Kentucky Revised Statutes (KRS) 66.480 and the Government's investment policy, the Government is allowed to invest in obligations of the U.S. Treasury and U.S. agencies and instruments, repurchase agreements, bankers' acceptances, commercial paper, obligations of the Commonwealth of Kentucky and its agencies and instrumentalities, shares of mutual funds or interest bearing deposits of insured national or state banks. In addition, the Fiduciary Funds are allowed to invest in equity securities, corporate bonds and international stocks listed as American Depository Receipts (ADR). Investments of the City as of June 30, 2013 are summarized and categorized below in the following table:
Investment Type Fair ValueWeighted Average
Maturity
Certificate of Deposit $ 17,131,353 1.816
Tax Free Mutual Funds 2,709,722 1.527
U.S. Agencies CMO 1,068,294 0.041
U.S. Agencies Bonds 754,658 0.416
Municipal Bonds 450,460 0.164
$ 22,114,487
Primary Government (except Fiduciary Funds)
Interest Rate Risk - The Government has adopted an investment policy that recommends controlling interest rate risk through maturity diversification. To the extent possible, the Government will attempt to match its investments with anticipated cash flow requirements.
Credit Risk - The Government has no policy related to credit risk.
Concentration of Credit Risk - To limit credit risk, the government has adopted an investment policy to limit investments held at one financial institution to no more than 25% of total investments, excluding money market mutual funds, unless they are fully insured or fully collateralized or they are authorized investment pools.
Component UnitsBowling Green Municipal UtilitiesThe Bowling Green Municipal Utilities may legally invest in direct obligations of and other obligations guaranteed as to principal by the U. S. Treasury and U. S. Agencies and instrumentalities, Kentucky bonds and certificates of indebtedness, highly-rated securities issued by a state or local government in the United States and certain other investments more fully described in the Kentucky Revised Statutes. Investments of each division of the utility as of June 30, 2013 are summarized and categorized in the following tables:
Maturities in YearsInvestment Type Fair Value Less than 1
U.S. Agencies obligations 1,613,499$ 1,613,499$ U.S. Treasury mutual fund 937,425 937,425
2,550,924$ 2,550,924$
Bowling Green Municipal Utilities Water-Sewer Division

City of Bowling Green, KentuckyNotes to Financial Statements (Continued)June 30, 2013
47
NOTE 3. DETAIL NOTES ON ALL FUNDS (Continued)
The carrying value of deposits and investments shown above are included in the Combining Statement of Net Position - Component Units - Bowling Green Municipal Utilities for the Water-Sewer Division as follows:
Carrying Value Deposits 4,184,810$
Investments 2,550,924
6,735,734$
Included in the following captions:
Non-pooled cash and cash equivalents 1,848,457$
Investments and restricted funds 4,887,277
6,735,734$
Maturities in Years
Investment Type Fair Value Less than 1U.S. Agencies obligations 671,696$ 671,696$
Bowling Green Municipal Utilities Electric Division
The carrying value of deposits and investments are included in the Combining Statement of Net Position -Component Units - Bowling Green Municipal Utilities for the Electric Division as follows:
Carrying Value Deposits $ 8,217,069
Investments 671,696 $ 8,888,765
Included in the following captions:
Cash and cash equivalents $ 7,513,610
Noncurrent cash, cash equivalents andinvestments 1,375,155
$ 8,888,765
Interest Rate Risk – Investment rate risk is the risk that changes in market interest rates will adversely affect the value of an investment The U.S. Treasury mutual funds are presented as an investment with a maturity of less than one year because it is redeemable in full immediately. The Municipal Utilities does not have a formal investment policy that limits its interest rate risk.
Credit Risk - Credit risk is the risk that the issuer or other counterparty to an investment will not fulfill its obligations. At June 30, 2013, the Utility's investments in U.S. agencies obligations not directly guaranteed by the U.S. government were rated by Standard & Poor's and by Moody's Investors Services as AAA.
Custodial Credit Risk - For an investment, custodial credit risk is the risk that, in the event of the failure of the counterparty, the Utility will not be able to recover the value of its investment or collateral securities that are in the possession of an outside party. As of June 30, 2013 the Municipal Utilities were not exposed to custodial credit risk.

City of Bowling Green, KentuckyNotes to Financial Statements (Continued)June 30, 2013
48
NOTE 3. DETAIL NOTES ON ALL FUNDS (Continued)
Concentration of Credit Risk - The Utility places no limit on the amount that may be invested in any one issuer. At June 30, 2013, the Water-Sewer Division's investment in Federal Home Loan Bank obligations constituted approximately 60% of its total investments. At June 30, 2013, the Electric Division's investment in Federal National Mortgage Corporation, Federal Home Loan Bank and Federal National Mortgage Association obligations constituted 74%, 16% and 10% of its total investments, respectively.
Policemen and Firefighters’ Retirement FundApproximately 9% of the net assets held in trust for pension benefits are invested in bonds of the U.S. Government and its instrumentalities. The Fund has no investments in the stocks or bonds of any commercial or industrial organization whose market value exceeds five percent of the net assets available for benefits.
The retirement fund's investments are all categorized as either insured or registered. The securities are held by the retirement fund, or by its agent, in the name of City of Bowling Green Policemen and Firefighter's Retirement Fund.
Investment Maturities(In Years)
Investment Type Fair Value Less than 1 1-5 6-10 More than 10U.S. Government 99,454$ -$ -$ 675$ 98,779$
Corporate Securities 1,864,552 397,238 575,567 359,403 532,344
Kentucky Municipal Bonds 1,606,662 - 197,221 720,119 689,322
Mutual Funds 3,282,056 3,282,056 - - -
Total 6,852,724$ 3,679,294$ 772,788$ 1,080,197$ 1,320,445$
Debt Securities Investments at Fair Value
Quality Ratings 2013AAA 102,603$ AA3 1,032,815 AA2 346,111 A1 311,436 A2 153,604 A3 161,411
BAA1 110,128 BAA2 105,298 NR 1,147,808
Total Credit Risk Debt Securities 3,471,214
U.S. Government Agencies 99,454
Total Debt Securities 3,570,668$
Custodial Credit Risk – For an investment, custodial credit risk is the risk that, in the event of the failure of the financial institution, the fund will not be able to recover the value of its cash equivalents. At June 30, 2013, the Fund's carrying amounts for cash investments were uninsured, but held in the Fund by the corresponding bank’s trust department.

City of Bowling Green, KentuckyNotes to Financial Statements (Continued)June 30, 2013
49
NOTE 3. DETAIL NOTES ON ALL FUNDS (Continued)
B. Restricted Assets
Governmental Activities
Cemetery Perpetual Fund - Assets totaling $816,623 are reported in the Cemetery Perpetual Fund as these assets are restricted for cemetery maintenance.
2007B & C General Obligation Bonds - For the 2007B and C bonds, various accounts were established for the payment of outstanding Inter-Model Transportation Authority mortgage-backed bonds as they come due. The balance of these funds at June 30, 2013 is $11,543,320.
2004A & B General Obligation Bonds - For the 2004A and B bonds, accounts were established related to the partial refunding in FY 2012. The balance of these funds at June 30, 2013 is $9,203.
Unrestricted Assets represent unrestricted liquid assets. While Government management may have categorized and segmented portions for various purposes, the Commission has the unrestricted authority to revisit or alter these management decisions.
C. Capital Assets
Capital asset activity for the year ended June 30, 2013 was as follows:Balance Balance
June 30, 2012 Increases Decreases June 30, 2013
Primary Government
Governmental activities:
Capital assets, not being depreciated:
Land 17,628,270$ -$ -$ 17,628,270$
Infrastructure 99,160,050 4,255,316 (207,159) 103,208,207
Construction in progress 309,466 1,383,055 (207,222) 1,485,299
Total capital assets, not being depreciated 117,097,786 5,638,371 (414,381) 122,321,776
Capital assets, being depreciated:
Stormwater Infrastructure 12,478,705 154,483 - 12,633,188
Buildings 41,073,157 157,681 (17,500) 41,213,338
Improvements other than buildings 20,882,639 173,020 - 21,055,659
Intangibles 2,949,975 14,066 - 2,964,041
Vehicles, equipment and furniture 21,913,935 866,030 (307,112) 22,472,853
Total capital assets, being depreciated 99,298,411 1,365,280 (324,612) 100,339,079
Less accumulated depreciation:
Stormwater Infrastructure (1,488,900) (230,701) - (1,719,601)
Buildings (11,963,865) (1,029,126) 17,500 (12,975,491)
Improvements (5,035,185) (726,611) - (5,761,796)
Intangibles (252,783) (105,461) - (358,244)
Vehicles, equipment and furniture (17,490,184) (1,511,846) 301,150 (18,700,880)
Total accumulated depreciation (36,230,917) (3,603,745) 318,650 (39,516,012)
Total capital assets, being depreciated, net 63,067,494 (2,238,465) (5,962) 60,823,067
Governmental activities, capital assets, net 180,165,280$ 3,399,906$ (420,343)$ 183,144,843$

City of Bowling Green, KentuckyNotes to Financial Statements (Continued)June 30, 2013
50
NOTE 3. DETAIL NOTES ON ALL FUNDS (Continued)
Balance Balance
June 30, 2012 Increases Decreases June 30, 2013
Business-type assets:
Capital assets, not being depreciated:
Land 2,740,298$ -$ -$ 2,740,298$
Construction in progress - 3,900 - 3,900
Total capital assets, not being depreciated 2,740,298 3,900 - 2,744,198
Capital assets, being depreciated:
Buildings 12,508,453 - - 12,508,453
Improvements other than buildings 10,418,741 45,534 - 10,464,275
Vehicles, equipment and furniture 2,245,552 12,938 (10,833) 2,247,657
Property held under capital lease 306,633 - - 306,633
Total capital assets, being depreciated 25,479,379 58,472 (10,833) 25,527,018
Less accumulated depreciation:
Buildings (5,545,564) (349,304) - (5,894,868)
Improvements (6,268,299) (423,402) - (6,691,701)
Vehicles, equipment and furniture (1,826,331) (83,693) 7,093 (1,902,931)
Property held under capital lease (155,608) (7,431) - (163,039)
Total accumulated depreciation (13,795,802) (863,830) 7,093 (14,652,539)
Total capital assets, being depreciated, net 11,683,577 (805,358) (3,740) 10,874,479
Business-type activities, capital assets, net 14,423,875$ (801,458)$ (3,740)$ 13,618,677$
Depreciation expense was charged to functions/programs of the primary government as follows:
Governmental activities
General government 467,310$
Public safety 1,618,697
Public works 619,740
Parks and recreation 740,570
Housing and community development 157,428
Total depreciation expense - governmental activities 3,603,745$
Business-type activties
Golf course 226,742$
Aquatics 289,580
Convention Center 347,508
Total depreciation expense - business-type activities 863,830$

City of Bowling Green, KentuckyNotes to Financial Statements (Continued)June 30, 2013
51
NOTE 3. DETAIL NOTES ON ALL FUNDS (Continued)
Component unit capital asset activity for the year ended June 30, 2013 was as follows:
Balance Balance
June 30, 2012 Increases Decreases June 30, 2013
Bowling Green Municipal Utilities
Capital assets, not being depreciated:
Construction in progress 61,409,688$ 13,078,145$ -$ 74,487,833$
Capital assets, being depreciated:
Transmission plant 2,089,023 - (1,075) 2,087,948
Distribution plant 72,169,314 2,538,002 (580,731) 74,126,585
Structures and improvements, nodes 265,840 2,930 - 268,770
General plant 13,841,290 443,616 (2,363,216) 11,921,690
Water plant 74,320,598 192,731 - 74,513,329
Sewer plant 55,648,079 1,704,475 (126,500) 57,226,054
Equipment 4,849,104 538,594 - 5,387,698
Overhead conductors and devices 4,980,811 143,072 - 5,123,883
Trucks and autos 1,922,847 45,487 - 1,968,334
Office equipment 1,567,732 43,979 - 1,611,711
Office additions 65,716 - - 65,716
Total capital assets, being depreciated 231,720,354 5,652,886 (3,071,522) 234,301,718
Less accumulated depreciation (104,830,476) (7,474,386) 3,324,486 (108,980,376)
Total capital assets, being depreciated, net126,889,878 (1,821,500) 252,964 125,321,342
Bowling Green Municipal Utilities, capital
assets, net 188,299,566$ 11,256,645$ 252,964$ 199,809,175$
D. Interfund Transfers
Transfers are used to (1) move revenues from the fund that statute or budget requires to collect them to the fund that statutes or budget requires to expend them, (2) move receipts restricted to debt service from the funds collecting the receipts to the Debt Service Fund as debt service payments become due and (3) use unrestricted revenues collected in the General Fund to finance various programs accounted for in other funds in accordance with budgetary authorizations.

City of Bowling Green, KentuckyNotes to Financial Statements (Continued)June 30, 2013
52
NOTE 3. DETAIL NOTES ON ALL FUNDS (Continued)
The following schedule briefly summarizes the City’s transfer activity:
Transfers In
Within the primary Non-Major Internal
government: General Governmental Service Total
General -$ 30,000$ -$ 30,000$
ITA Bond 1,327,790 - - 1,327,790
Debt Service 3,101,553 2,210,554 - 5,312,107
Golf 230,000 509,772 - 739,772
Aquatics 68,663 445,528 - 514,191
Convention Center - 1,097,797 - 1,097,797
Internal Service 733,733 - 100,000 833,733
Non-major governmental 5,859,333 18,000 - 5,877,333
Totals 11,321,072$ 4,311,651$ 100,000$ 15,732,723$
Transfers Out
E. Long-term Debt
Revenue bonds and other directly related long-term liabilities, which are intended to be paid from proprietary funds, are included in the accounts of such funds. All other long-term indebtedness is accounted for in the Governmental column of the Government-wide Statement of Net Position.
Primary Government:Original Interest Final Amount
Purpose of Issue Issue Rate Maturity OutstandingGovernmental Activities
General Obligation and Revenue Bonds
General Obligation Bond, Series 2004A
Parks Community Center, Police Dept.
Headquarters, Public Works Renovations,
Parks & Cemetery Improvements 12,626,000$ 2.422% - 4.792% June 30, 2017 598,259$ General Obligation Bond, Series 2004B Real Properties 2,025,000 3.0% - 5.050% June 30, 2024 95,000
General Obligation Bond, Series 2007A
Lovers Lane Utilities, Park Community
Center Expansion, Circus Square,
Downtown Signalization, SkyPAC land
acquisition, various road projects,
Southwest Parkway property acquisition,
Broadway Curve Straightening, Fields Drive
and Skate Park 14,905,000 4.0% - 5.0% June 30, 2033 12,515,000
General Obligation Bond, Series 2007B
Inter-Modal Transportation Authority, Inc.
refinancing 20,615,000 3.375% - 4.625% September 1, 2023 16,765,775
General Obligation Bond, Series 2007C
Inter-Modal Transportation Authority, Inc.
refinancing 6,800,000 5.60% September 1, 2023 3,683,725 General Obligation Bond, Series 2008A Baseball Stadium construction 24,835,000 3.50% - 5.00% June 1, 2038 22,975,000
General Obligation Bond, Series 2008B
Fire stations at Greenwood, Airport and Fire
Headquarters 6,585,000 3.50% - 4.75% June 1, 2028 5,330,000 General Obligation Bond, Series 2009 Refinance prior year bond obligations 12,119,800 3.00% - 4.50% June 1, 2020 8,373,750 General Obligation Bond, Series 2010/ 2011 Refinance prior year bond obligations 29,580,000 0.5% - 3.75% June 1, 2026 28,790,000 General Obligation Bond, Series 2012A Refinance GO Series 2004A 5,965,448 2.0% - 3.0% June 1, 2024 5,927,692 General Obligation Bond, Series 2012B Refinance GO Series 2004B 1,400,000 1.0% - 3.3% June 1, 2024 1,375,000
General Obligation Bond, Series 2013 Refinancing of GO Series 2002A & 2004A 4,090,605 2.00% December 1, 2017 4,070,605 110,499,806
Premiums, deferred charges and discounts on
bond obligations (1,998,096) Total General Obligation and Revenue Bonds 108,501,710$

City of Bowling Green, KentuckyNotes to Financial Statements (Continued)June 30, 2013
53
NOTE 3. DETAIL NOTES ON ALL FUNDS (Continued)
Original Interest Final Amount
Purpose of Issue Issue Rate Maturity OutstandingNotes and Lease Purchase AgreementsNational City Bank 2004 fire truck ladder 713,000 Prime - 1.67% December 5, 2013 71,100
BB&T
Relocation of operations division &
realignment of 14th Avenue 1,630,000 10 yr. LIBOR July 2, 2025 838,848US Bank Depot project 1,000,000 5.02% June 7, 2018 352,658Chase Bank 2007 Fire Pumper and Quint 1,019,193 3.97% August 1, 2018 534,631Chase Bank 2010 Fire Aerial & Pumper Trucks 1,309,391 2.66% October 1, 2020 1,074,266Total Notes Payable and Capital Leases 2,871,503 Other Long-Term LiabilitiesCompensated Absences 1,688,695Landfill 1,267,741
2,956,436
Total long-term governmental liabilities 114,329,649$
Original Interest Final Amount Purpose of Issue Issue Rate Maturity Outstanding
Business-Type ActivitiesGeneral Obligation Bonds
General Obligation Bond, Series 2003 Crosswinds Pro Shop/Conv. Cntr Facility 8,585,000 2.0% - 3.7% June 30, 2018 4,270,000$
General Obligation Bond, Series 2004A
Hobson Golf Pro Shop and maintenance
facility 749,000 3.8% - 5.050% June 30, 2024 31,742 General Obligation Bond, Series 2009 Refinance prior year bond obligations 3,620,200 3.00% - 4.50% June 1, 2020 2,501,250 General Obligation Bond, Series 2012A Refinance GO Series 2004A 354,552 2.0% - 3.0% June 1, 2024 352,052 General Obligation Bond, Series 2013 Refinancing of GO Series 2004A 109,395 2.00% June 2, 2024 109,395
7,264,439 Premiums, deferred changes and discounts
on bond obligations (511,880) Total General Obligation Bonds 6,752,559
Notes Payable and Capital LeasesBB&T Greens Roller lease 24,820 3.71% February 1, 2015 10,644
BB&T John Deere bed knife grinder & reel grinder 38,674 2.74% June 15, 2016 23,746Total Notes Payable and Capital Leases 34,390
Other Long-Term LiabilitiesCompensated Absences 45,882 Total long-term business-type liabilities 6,832,831$

City of Bowling Green, KentuckyNotes to Financial Statements (Continued)June 30, 2013
54
NOTE 3. DETAIL NOTES ON ALL FUNDS (Continued)
Changes in Long-term Liabilities
Long-term liability activity for the year ended June 30, 2013, was as follows:
Balance Balance Amounts Due
June 30, 2012 Increases Decreases June 30, 2013 In One Year
Governmental Activities:
General obligation and revenue bonds 119,438,352$ 4,090,605$ (13,029,151)$ 110,499,806$ 6,705,779$
Notes and lease purchase agreements 3,412,034 - (540,531) 2,871,503 412,232
Adjustments for deferred amounts:
Discount on bonds payable (124,731) - 12,069 (112,662) -
Premium on bonds payable 1,012,860 170,747 (56,903) 1,126,704 -
Loss on refunding (3,296,103) - 283,965 (3,012,138) -
Total bonds, notes, leases payable 120,442,412 4,261,352 (13,330,551) 111,373,213 7,118,011
Compensated absences 1,553,609 1,174,071 (1,038,985) 1,688,695 923,489
Landfill postclosure care 1,039,320 228,421 - 1,267,741 41,007
Total governmental activities 123,035,341 5,663,844 (14,369,536) 114,329,649 8,082,507
Business Type Activities
General obligation and revenue bonds 8,274,155 109,395 (1,119,111) 7,264,439 1,013,429
Notes and lease purchase agreements 50,258 - (15,868) 34,390 4,308
Compensated absences 51,431 15,825 (21,374) 45,882 30,805
Less: unamortized bond discount and
deferred amount from refunding (597,665) - 85,785 (511,880) -
Total business-type activities 7,778,179 125,220 (1,070,568) 6,832,831 1,048,542
Total governmental and
business-type activities 130,813,520$ 5,789,064$ (15,440,104)$ 121,162,480$ 9,131,049$
Balance Balance Amounts Due
June 30, 2012 Increases Decreases June 30, 2013 In One Year
Component Units
Bowling Green Municipal Utilities
Water-Sewer Division
Notes payable 78,238,372$ 4,428,675$ (3,313,373)$ 79,353,674$ 4,052,491$
Electric Division .
Revenue bonds 8,300,000 - (1,040,000) 7,260,000 260,000
General Services Division
Notes payable 5,000,000 - - 5,000,000 -
Capital lease obligation - 210,577 (43,237) 167,340 40,234
Less: unamortized bond discount (433,270) - 48,218 (385,052) -
91,105,102$ 4,639,252$ (4,348,392)$ 91,395,962$ 4,352,725$

City of Bowling Green, KentuckyNotes to Financial Statements (Continued)June 30, 2013
55
NOTE 3. DETAIL NOTES ON ALL FUNDS (Continued)
Internal service funds predominately serve the governmental funds. Accordingly, long-term liabilities for them are included as part of the above totals for governmental activities. At year end, $17,531 of internal service fund compensated absences is included in the above amounts. Landfill postclosure liabilities are liquidated by the Landfill Closure special revenue fund and governmental compensated absences are generally liquidated by the general fund.
Debt service requirements (principal and interest) to maturity for the Primary Government’s bonds and notes are as follows:
Fiscal Year Interest Principal Interest Principal Interest Principal Interest Principal
2014 4,465,705$ 6,705,779$ 102,550$ 412,232$ 252,362$ 1,013,429$ 1,039$ 4,308$
2015 4,241,202 7,153,115 87,110 348,278 215,906 1,081,886 637 13,238
2016 4,003,866 7,364,034 72,905 355,824 176,023 1,085,966 223 16,844
2017 3,739,666 7,570,772 60,008 363,577 135,587 1,049,229 - -
2018 3,462,832 7,883,031 46,888 371,542 95,247 1,146,969 - -
2019-2023 12,843,210 38,124,856 96,130 854,488 84,473 1,730,092 - -
2024-2028 6,051,484 19,033,219 8,968 165,562 1,155 156,868 - -
2029-2033 3,026,910 9,690,000 - - - - - -
2034-2038 1,080,000 6,975,000 - - - - - -
42,914,875$ 110,499,806$ 474,559$ 2,871,503$ 960,753$ 7,264,439$ 1,899$ 34,390$
Governmental Activities Business-Type Activities
General Obligation and Revenue
Bonds
Notes and Lease Purchase
Agreements
General Obligation and
Revenue Bonds
Notes and Lease
Purchase Agreements
Component Units
Principal requirements for component units' debt are as follows:
Fiscal Year
Bowling Green Municipal Utilities
Water-Sewer Division
Bowling Green Municipal Utilities General Services
Division
Bowling Green Municipal Utilities Electric Division Total
2014 4,052,491$ -$ 260,000$ 4,312,491$ 2015 4,020,444 5,000,000 265,000 9,285,444 2016 4,085,395 - 280,000 4,365,395 2017 4,151,038 - 290,000 4,441,038 2018 4,217,146 - 305,000 4,522,146
2019 - 2023 22,109,963 - 1,225,000 23,334,963 2024 - 2028 20,782,889 - 1,495,000 22,277,889 2029 - 2033 15,934,308 - 1,840,000 17,774,308
- - 1,300,000 1,300,000 Total 79,353,674$ 5,000,000$ 7,260,000$ 91,613,674$
General Description of the City's General Obligation and Revenue Bonds
General Obligation and Revenue Bonds - The City issues general obligation and revenue bonds to provide funds for the acquisition and construction of capital assets. The general obligation bonds are secured by an irrevocable pledge of the full faith, credit and taxing power of the City. The City has issued the following general obligation and revenue bonds:

City of Bowling Green, KentuckyNotes to Financial Statements (Continued)June 30, 2013
56
NOTE 3. DETAIL NOTES ON ALL FUNDS (Continued)
1. $13,375,000 general obligation bonds, Series 2004A, portion of proceeds (94.4%) used to provide funds for the demolition and reconstruction of the Parks Community Center, renovation and expansion of the Police Department headquarters, property acquisition for a relocated Public Works operations facility, improvements to parks and cemetery facilities, and various road improvements.
The remainder of the proceeds (5.6%) serviced by the Golf Enterprise Fund and used for the construction of the Hobson Grove golf course pro shop and maintenance facility.
In April 2012, this bond was partially refunded by Series 2012. The remaining portion was refunded in January 2013.
2. $2,025,000 general obligation bonds, Series 2004B, issued to finance the City's cost of acquisition and clearing of real properties in the Historic Bowling Green Revitalization Project Target area. In April 2012, this bond was partially refunded by Series 2012.
3. $14,905,000 general obligation bonds, Series 2007A, issued to finance costs for construction of public park improvements, construction of utilities, design and construction of a skate park, Circus Square acquisition and construction, land acquisition, construction of public roads, and installation of downtown signalization upgrades.
4. $27,415,000 general obligation bonds, Series 2007 B & C, issued for the purpose of refinancing the existing mortgage-backed bond issues that were used for acquisition and construction of the Kentucky Transpark. Series B is comprised of $20,615,000 tax-exempt bonds, and Series C is comprised of $6,800,000 taxable bonds.
5. $24,835,000 general obligation bonds, Series 2008A, issued for the purpose of constructing a baseball park and related infrastructure for the Bowling Green Hot Rods, a single A baseball team.
6. $6,585,000 general obligation bonds, Series 2008B, issued for the purpose of constructing the Greenwood Fire Station and the expansions and renovations of the Headquarters and Airport fire stations.
7. $15,740,000 general obligation bonds, Series 2009, issued for the purpose of refinancing the 1995 Bowling Green Municipal Projects Corporation Lease Revenue Bonds, the 1998 City of Bowling Green General Obligation Bonds, Series A and the 2000 City of Bowling Green General Obligation bonds.
8. $29,580,000 general obligation and special revenue refunding bonds, Series 2010 and Series 2011, issued for the purpose of refinancing the series 2002B and series 2002C general obligation and special revenue bonds.
9. $6,320,000 general obligation bonds, Series 2012A, issued for the purpose of refinancing Series 2004A, general obligation bonds. 94.4% of the proceeds were recorded in the Debt Service Fund and 5.6% were recorded in the Golf Enterprise Fund.
10. $1,400,000 general obligation bonds, Series 2012B, issued for the purpose of refinancing Series 2004B, general obligation bonds.
11. $4,090,605 general obligation bonds, Series 2013, issued for the purpose of refinancing Series 2002A and 2004A general obligation bonds. The remaining principal of the 2002A bonds of $2,395,000 was paid off. In addition, approximately $2,000,000 was transferred to an escrow account for the purpose of generating resources for future debt service payments of the 2004A bonds. As a result, the refunded portion of the bonds are considered to be defeased and the liability has been removed from the governmental activities column of the statement of net position. The refunding was undertaken to reduce total debt service payments and resulted in a net present value savings of $310,821.

City of Bowling Green, KentuckyNotes to Financial Statements (Continued)June 30, 2013
57
NOTE 3. DETAIL NOTES ON ALL FUNDS (Continued)
Memorandum of Agreement/WKU Project Financing
In June 2002 the City issued $30,115,000 General Obligation and Special Revenue Bonds, Series 2002B and $1,800,000 General Obligation and Special Revenue Bonds, Series 2002C to finance the renovation, improvement and equipping of certain WKU athletic and parking facilities, including the renovation and improvement of E. A.Diddle Arena. The Series 2002C Bonds were issued to finance costs allocated to certain private use facilities (luxury suites) in E. A. Diddle Arena, as renovated, not financed by the 2002B bonds.
Pursuant to a Memorandum of Agreement dated April 15, 2002 and amended by Supplement No. 1 dated June 1, 2002, between the City, WKU and the Hilltopper Athletic Foundation (HAF), WKU and HAF, respectively, pledge to impose and charge student athletic fees and suite rentals during the term of the respective series of bonds sufficient, when transferred to the City, for the payment of principal and interest on the bonds. WKU pledges the student athletic fees to the City for the payment of principal and interest on the Series 2002B bonds and, on a subordinated basis, the Series 2002C bonds, and HAF and WKU pledge the suite rentals (defined as annual luxury suite rentals minus HAF contributions of $7,500 per suite) to the City for the payment of principal and interest on the Series 2002C bonds. Payments from collected student athletic fees and suite rentals are to be made to the City on or before March 1 and September 1 of each year in amounts sufficient to pay debt service on the Series 2002B bonds and Series 2002C bonds, respectively, to the extent funds are not otherwise provided in the form of capitalized interest and interest earnings in the Series 2002B bond fund and the Series 2002C bond fund. No suite rentals shall be available or used for payment of debt service on the Series 2002B bonds.
In fiscal year 2011, the City issued general obligation and special revenue refunding bonds Series 2010 and Series 2011 for $29,580,000 for the purpose of refinancing $27,595,000 of the Series 2002B and Series 2002C bonds.
The following is a schedule, by year, of future amounts to be provided by WKU pursuant to the Memorandum of Agreement for the retirement of general long-term debt of the City, applicable to the issuance of the $30,115,000 General Obligation and Special Revenue Bonds, Series 2002B, $1,800,000 General Obligation and Special Revenue Bonds, Series 2002C, and $29,580,000 General Obligation and Special Revenue Refunding Bonds, Series 2010 and Series 2011 for the WKU Project:
Year Ending Principal Interest
June 30, 2010/2011 2010/2011 Total
2014 1,540,000$ 930,690$ 2,470,690$
2015 1,650,000 905,980 2,555,980
2016 1,775,000 872,980 2,647,980
2017 1,915,000 828,605 2,743,605
2018 2,045,000 771,155 2,816,155
2019-2023 11,965,000 2,795,300 14,760,300
2024-2026 7,900,000 618,206 8,518,206
28,790,000$ 7,722,916$ 36,512,916$
As of June 30, 2013 the City has recorded a receivable from WKU and deferred revenue of $28,790,000 in the WKU Athletics Special Revenue Fund applicable to future revenues to be received from WKU related to the above agreement.
Fund Depository and Administration Agreement/WKU Project Financing
On June 1, 2002, the City entered into a Fund Depository and Administration Agreement with the Finance and Administration Cabinet of the Commonwealth of Kentucky (FAC) applicable to the WKU project. The WKU project is and will be the property of the Commonwealth of Kentucky for the benefit of WKU and all contracts for the construction, acquisition and installation of the project are awarded, administered and carried out by the FAC through its Department for Facilities Management and its Office of Financial Management as a State-administered capital construction project.

City of Bowling Green, KentuckyNotes to Financial Statements (Continued)June 30, 2013
58
NOTE 3. DETAIL NOTES ON ALL FUNDS (Continued)
On June 28, 2002 (bond closing date) the City, pursuant to Fund Depository and Administration Agreement, transferred to the State Treasurer the net proceeds of the 2002B bonds ($28,235,432) and 2002C bonds ($1,670,716) for deposit to FAC-administered capital construction accounts. The transfers to the State of Series 2002B and 2002C bond net proceeds totaling $29,906,148 were accounted for as expenditures in the WKU Athletic Special Revenue Fund in fiscal year 2002.
In fiscal years subsequent to the transfer of bond net proceeds to the State, the City will not account for construction expenditures of the project and will not include State-administered construction accounts as assets of the City. The WKU project will be property of the Commonwealth of Kentucky for the benefit of WKU.
TIF District
In August 2007, the City approved the establishment of a downtown development area Tax Incremental Financing (TIF) district, which was later amended and expanded in October 2008. With the establishment of the district, the City pledged 80% of new incremental growth in property tax, withholding tax, and net profit fee revenues produced within the boundaries of the district to the Warren County Downtown Economic Development Authority (the Authority), a Chapter 58 agency designated to administer and oversee the project. These incremental revenues are to be used for purposes of debt service on the project. The State also pledged 80% of incremental revenues within the district under the condition that the project reached $200 million in eligible projects, which was later amended to $150 million by the State General Assembly in June 2009.
During FY09, the City issued $25 million in general obligation bonds to fund the construction of a ballpark for a single A team in Bowling Green located inside the TIF district. The bond proceeds included funding for infrastructure and capitalized interest and were placed into a construction fund account. The construction of the ballpark, including the bidding of the project and all construction oversight, was performed by the Authority. Drawstotaling $23 million for construction were requested through the City from the bond construction account and distributed to the contractor monthly. The other $2 million was set aside for capitalized interest and cost of issuance.
Title to the ballpark is held by the Authority who sold the ballpark to a Single Purpose Entity (SPE) which will provide new market tax credits in return for additional borrowings to fund other TIF construction. At the end of the bond term (30 years) the city will receive title to the ballpark. The City is entitled to the net revenue generated from the ballpark.
Prior Year Defeasance of Debt
In a prior year the City defeased certain general obligation bonds by placing the proceeds of new bonds in an irrevocable trust to provide for all future debt service payments on the old bonds. Accordingly, the trust account assets and the liability for the defeased bonds are not included in the City's financial statements. At June 30, 2013, $49,785,000 of bonds outstanding is considered defeased.
Landfill Closure and Postclosure Care Cost
Landfill closure and post-closure costs are accounted for in the Landfill Closure Special Revenue Fund. As of June 30, 2013, the cash, investments and due from other governments available totaled $1,420,614.
In fiscal year 2005, the Environmental and Public Protection Cabinet announced a program under which the commonwealth might assume responsibility for many aspects of landfill closure currently funded by local jurisdictions. However, under the provisions of the enabling legislation (HB 174 Kentucky Pride Fund, KRS 224.43-505) it appears that jurisdictions may well retain the bulk of costs to maintain landfill sites (e.g. sampling, pumping, transportation and disposal of leachate, erosion control, mowing, etc.). Until the full impact of KRS 224.43-505 is felt, it is prudent to assume annual outlays at all three Bowling Green landfill sites will continue, to some extent, in perpetuity. Under current assumptions and projections the Landfill Closure Special Revenue Fund is sufficiently capitalized through 2025, beyond which the city will need an alternate source of funds to maintain landfill sites.

City of Bowling Green, KentuckyNotes to Financial Statements (Continued)June 30, 2013
59
NOTE 3. DETAIL NOTES ON ALL FUNDS (Continued)
The estimate of present value of remaining closure and post-closure care liabilities for all three landfill sites as of June 30, 2013 is $1,267,741. The actual cost may differ due to inflation, changes in technology or applicable laws and regulations, the extent of any damage to landfill caps caused by weather and erosion, the magnitude of site improvements or corrections required by state inspectors to achieve closure, or other unforeseeable circumstances (e.g. acts of nature).
Glen Lily Road Landfill
The City's Glen Lily Road landfill was closed in 1981. On March 30, 1990, the City and Commonwealth of Kentucky Natural Resources and Environmental Protection Cabinet (the Cabinet) entered into an agreed order stipulating remedial measures to be taken by the City. To finance the Glen Lily Road landfill closure and post-closure costs, the City issued $2,950,000 Bowling Green Municipal Project Corporation Lease Revenue Bonds, Series 1991, dated April 1, 1991. Landfill closure cap construction is complete and the City performs annual monitoring, testing and reporting.
The City has submitted a closure application for Glen Lily which has not been approved to date, owing to the EPPC backlog of active landfill oversight responsibilities. The City continues to monitor and care for the landfill, submit required reports, and assume the city will incur landfill maintenance costs at least through 2034. A two year post-closure care period will follow the date upon which the City receives acceptance of any closure application, if the application is processed in accordance with precedent.
Butler County Landfill
The City submitted a closure plan for its Butler County landfill in May 1991. The site ceased receiving solid waste in June 1992. The closure plan was approved by the state in 1996. The facility met closure standards for a residential landfill rather than a contained landfill. Drawing upon funds from the Landfill Closure Special Revenue Fund, established from proceeds of the 1991 bond issue, the City added a leachate collection system and a passive methane gas venting system. Neither system was required by residential landfill standards. However, the systems were added to reduce the likelihood of discharge of unacceptable leachate in the future. Construction of the landfill cap was completed in fiscal year 1995. The City received a permit for closure construction in 1996. A quality assurance/quality control report was submitted on November 15, 1996. The original closure permit expired in July 1997, and a new permit extending to 2002 was issued. The City submitted quarterly and annual inspections and reports to the cabinet. In 2004, consultants Kamp, Dresser and McKee were engaged to assist in development of a plan to effect final closure of the landfill. In 2005, the City completed the third year of a three-year closure care period. However, the state has not granted final closure to date. Consequently, the City continues to monitor and care for the landfill, submit required reports, and assume the city will incur landfill maintenance costs at least through 2034.
Old Louisville Road
Landfill closure cap construction is complete and the City performs annual monitoring, testing and reporting. The Greenways Commission is considering a project for some compatible recreational use of the landfill area with which EPPC agrees in principle, but for which they will not agree in particular without review of such development plans as Greenways may offer for consideration.
Responding to Cabinet directives, in September 2000, the City awarded a project to install a leachate collection system at the Old Louisville Road landfill. The project cost was $521,955 and was completed in December 2001. The City anticipated a decision from the Cabinet on the closure application in July 2002. However, the Cabinet has not acted on the application. Consequently, the City continues to monitor and care for the landfill, submit required reports, and assume the city will incur landfill maintenance costs at least through 2034. A two year post-closure period will follow the date upon which the state should grant closure if the closure application is processed in accordance with precedent.

City of Bowling Green, KentuckyNotes to Financial Statements (Continued)June 30, 2013
60
NOTE 3. DETAIL NOTES ON ALL FUNDS (Continued)
F. Net Position
The Government-wide and business type fund financial statements utilize a net position presentation. Net position is categorized as investment in capital assets (net of related debt), restricted and unrestricted.
Invested in Capital Assets (net of related debt) is intended to reflect the portion of net position which are associated with non-liquid, capital assets less outstanding capital asset related debt. The net related debt is the debt less the unspent proceeds and any associated unamortized cost.
NOTE 4. RISK MANAGEMENT
The City is exposed to various risks of loss related to torts; theft of, damage to, and destruction of assets; errors and omissions; injuries to employees; and natural disasters. During fiscal year 1995, the City established the Employee Health Care Fund (EHCF) (an internal service fund) to account for and finance employee medical costs relating to the City's employee self-insured medical benefit plan. The EHCF provides coverage for up to $75,000 for each health insurance claim. The City purchases commercial insurance for claims in excess of coverage provided.
In July 1996, the City established the Workers Compensation Fund (WCF) (an internal service fund) to account for and finance its participation in the Kentucky League of Cities Workers' Compensation Trust (The "Trust"), a public entity risk pool currently operating as a common risk management and insurance program for Kentucky cities, municipal boards, agencies and authorities. The City pays an annual premium to the Trust for its workers' compensation, general liability and auto insurance coverages. The Trust Participation Agreement provides that the Trust will be self-sustaining through member premiums. The Trust reinsures through commercial companies at various limits, depending on the type of coverage. The WCF provides coverage of up to $10,000 for each worker's compensation occurrence.
Beginning fiscal year 2012, the City established the Property & Casualty (P&C) Fund to account for and finance its participation in the Kentucky League of Cities Insurance Services (KLCIS) General Insurance Trust. The P&C fund provides payment for premiums for all insurance coverage types except workers’ compensation. The fund was also established to make payment on any claim that falls within a City selected per occurrence deductible. KLCIS provides coverage for losses exceeding the chosen deductible level and reinsures through commercial companies at various higher limits. In FY13, the City selected a $15,000 deductible for General Liability, a $1,000 deductible for Buildings and Contents Coverage, and a $0 deductible for Law Enforcement Liability. Additionally, the City has chosen to self-insure a majority of its fleet for auto physical damage.
The City carries all-lines of insurance coverage through the Kentucky League of Cities for other risks of loss, including property loss and public officials. The City also carries commercial insurance for special risks coverage. Settled claims resulting from these risks have not exceeded insurance coverage in any of the past three years.
All funds of the City participate in the program and make payments to the EHCF and WCF based on historical cost information of the amounts needed to pay prior and current year claims. Claim liabilities are reported when it is probable that a loss has occurred and the amount of loss can be reasonably estimated. Liabilities include an amount for claims that have been incurred but not reported based on historical experience.

City of Bowling Green, KentuckyNotes to Financial Statements (Continued)June 30, 2013
61
NOTE 4. RISK MANAGEMENT (Continued)
Changes in the balances of claims liabilities during fiscal years 2013 and 2012 were as follows:
Health CareWorkers
CompensationProperty and
CasualtyLiability at June 30, 2011 128,672$ 120,428$ -$ Claims and changes in estimates - FY 2012 3,835,935 301,952 30,438 Claims paid FY 2012 (3,868,140) (301,952) (30,438) Liability at June 30, 2012 96,467 120,428 - Claims and changes in estimates FY 2013 3,176,647 (34,603) (12,331) Claims paid FY 2013 (3,103,937) (63,585) 12,331 Liability at June 30, 2013 169,177$ 22,240$ -$
NOTE 5. COMMITMENTS AND CONTINGENCIES
A. Litigation - The City of Bowling Green is party to numerous legal proceedings, many of which normally occur in government operations and will not involve any potential liability to the City.
B. Bowling Green Municipal Utilities - Bowling Green Municipal Utilities has erected various street lighting systems for the City, which represents a total unamortized investment by the Utility at June 30, 2013 of $4,442,873. For rental and maintenance of these systems, the City has agreed to pay Bowling Green Municipal Utilities eleven percent per annum on the total street light investments. The City must pay $488,716 per year on a recurring basis. One-twelfth of the annual charge is billed to the City monthly along with the charge for electric service. Similar arrangements were in effect in prior years.
C. Construction Commitments - The City has active construction projects as of June 30, 2013. At year end, the City had the following commitments on construction contracts:
ProjectRemaining
Commitment
Sidewalk Improvement Project $228,124 Lover’s Lane Soccer Complex Restroom/Storage Building Construction 144,235 Lover’s Lane Soccer Complex Field #16 Construction 15,610 City Hall Annex and Neighborhood & Community Services Building Renovations 66,290 HP Thomas Restroom & Shelter Construction 195,000 CrossWinds Intake Structure Bank Stabilization 37,900 Butler County Landfill Improvement Design Services 55,913 Traffic Signal Improvements 27,190 Street Resurfacing Project 897,437
D. Contingencies – The City participates in numerous State and Federal grant programs, which are governed by various rules and regulations of the grantor agencies. Costs charged to the respective grant programs are subject to audit and adjustments by the grantor agencies; therefore, to the extent that the City complied with the rules and regulations governing the grants, refunds of any money received may be required and the collectability of any related receivable at June 30, 2013 may be impaired. In the opinion of the City, there are no significant contingent liabilities relating to compliance with the rules and regulations governing the respective grants; therefore, no provision has been recorded in the accompanying financial statements for such contingencies.
E. Liens and Encumbrances - While the City does have satisfactory title to all owned assets, there may be some liens and encumbrances on such assets for matters other than related to bond issues. Only a complete accurate title search of all properties would disclose such liens and encumbrances.

City of Bowling Green, KentuckyNotes to Financial Statements (Continued)June 30, 2013
62
NOTE 5. COMMITMENTS AND CONTINGENCIES
F. Conduit Debt - The City has issued Industrial Revenue Bonds to provide financial assistance to private sector and nonprofit entities for the acquisition and construction of industrial and commercial facilities deemed to be in the public interest. The bonds are secured by the property financed and are payable solely from payments received on the underlying mortgage loans. Upon repayment of the bonds, ownership of the acquired facilities transfers to the private sector or nonprofit entity served by the bond issue. The City is not obligated in any manner for repayment of the bonds. Accordingly, the bonds are not reported as liabilities in the accompanying financial statements.
The City has also issued special assessment bonds to finance various residential improvement projects. The bonds are repaid from amounts levied against the property owners benefited by the improvements. Neither the faith and credit nor the general taxing power of the City has been pledged to the payment of the bonds and the City has no obligation for the payment of the bonds in the case of default. Accordingly, the bonds are not reported as liabilities in the accompanying financial statements.
As of June 30, 2013, there were four series of industrial revenue bonds and six series of special assessment bonds outstanding with an aggregate principal balance of $68,590,000 and $1,468,000, respectively.
G. Lease Commitments - The Golf Enterprise Fund leases approximately 53 acres of real estate from the Bowling Green-Warren County Airport Board. This lease provides for future minimum lease payments as of June 30, 2013 as follows:
Year Ended
2014 6,226$
2015 6,226
2016 6,226
2017 6,226 24,904$
In addition, the Golf Enterprise Fund leases the Crosswinds municipal golf course pro shop facility from The Convention Center Corporation, a component unit. The buildings, furnishings and equipment elements of this lease are classified as capital leases and included in the long-term debt footnote. The land element of this lease is classified as an operating lease. Rental payments are based on 7.62% of the total annual debt service of Mortgage Revenue Bonds, Series 1993. Rental payments attributed to the golf pro shop facility is based upon the facility’s original cost ($660,000) as a percentage of total project costs financed by Bonds ($8,660,000). The following is a schedule by years of minimum future rentals of the land element of the golf pro shop facility lease as of June 30, 2013:
Year Ending June 30, 2014 $ 30,597 2015 33,0712016 31,6702017 30,2682018 31,067
Thereafter 31,036
Total $ 187,709
NOTE 6. THE SINGLE AUDIT ACT
The U.S. Office of Management and Budget's Circular No. A-133 for Audits of States, Local Governments and Non-Profit Organizations requires non-federal entities that expend $500,000 or more a year in federal awards to have an audit performed in accordance with the provisions of the Circular. A separate supplemental report will be issued on active grant programs of the City of Bowling Green in accordance with applicable provisions of the Single Audit Act of 1984, P.L. 98-502 and the Single Audit Act Amendments of 1996, P.L. 104-156.

City of Bowling Green, KentuckyNotes to Financial Statements (Continued)June 30, 2013
63
NOTE 7. DEFINED BENEFIT PENSION PLANS
The Policemen and Firemen's Retirement Fund (PFRF)
A. Plan Descriptions
The PFRF is a single-employer defined benefit pension plan administered by a Board of Trustees consisting of the Mayor, City Chief Financial Officer, and two retirees from the Police and Fire Departments. PFRF was established to provide retirement and disability benefits for retiring, disabled, or deceased personnel and their surviving spouse. Benefits are determined by Kentucky Revised Statutes sections 95.851 to 95.884. On August 1, 1988 the plan was closed to new entrants and current active duty police and firemen of the City were given the choice of remaining in this plan or transferring into the County Employees Retirement System (CERS). The PFRF issues a publicly available financial report that includes financial statements and required supplementary information for the PFRF. That report may be obtained from the City's Chief Financial Officer, City Hall, Bowling Green, Kentucky.
B. Summary of Significant Accounting Policies and Plan Asset Matters
Basis of Accounting - The accrual basis of accounting if followed by the PFRF with reserve accounts maintained in accordance with legal and accounting requirements imposed by Kentucky Revised Statutes (KRS). Employer contributions to the fund are recognized when due and the employer has made a formal commitment to provide the contributions. Benefits and refunds are recognized when due and payable in accordance with the terms of the plan. The financial statements are presented in accordance with generally accepted accounting principles as promulgated by the Government Accounting Standards Board.
Investments – As required by GASB Statement No. 25, plan investments are presented at fair value, which is the amount at which financial instruments could be exchanged in a current transaction between willing parties. Short-term investments are carried at cost, which approximates fair value. Securities traded on a national exchange are valued at the last reported sales price at current exchange rates. Other investments not having an established market are reported at estimated fair value. All fair values are determined by external consultants.
Funding Policy and Annual Pension Cost - The contribution requirements of plan members and the City are established and may be amended by the Board of Trustees. Covered employees were required by statute to contribute eight percent of their annual covered salary. As there are no longer any active members, members made no contributions for the year ended June 30, 2013.
The City contributes amounts to amortize the unfunded actuarial accrued liability (AAL) and interest on unfunded AAL costs as determined by actuarial valuations in compliance with Kentucky Revised Statutes. Administrative costs of the PFRF are financed through investment earnings. The City is not required to make an annual contribution. At June 30, 2013, 2012 and 2011, the Net Pension Obligation was estimated to be zero. For 2010-2011 the City made a contribution of $450,000, which included a 2.7% cost of living increase and payment towards the unfunded liability. For 2011-2012 the City made a contribution of $400,000, which included a 2.5% cost of living increase and payment towards the unfunded liability. For 2012-2013 the City made a contribution of $400,000, which included a 2.0% cost of living increase and payment towards the unfunded liability

City of Bowling Green, KentuckyNotes to Financial Statements (Continued)June 30, 2013
64
NOTE 7. DEFINED BENEFIT PENSION PLANS (Continued)
C. Funded Status and Funding Progress
ActuarialActuarial
ValueActuarial Accrued
Liability (AAL) Unfunded AAL Funded Covered UAAL as a % ofValuation of Assets - Entry Age (UAAL) Ratio Payroll Covered Payroll
Date (a) (b) (b-a) (a/b) (c) (b-a)/(c)
1/1/2013 7,296,133$ 8,543,490$ 1,247,357$ 85.40% N/A N/A
1/1/2013 7,296,133$ 10,608,154$ 3,312,021$ 68.80% N/A N/A
Assumes no Future Cost of Living Increase
Assumes Future Cost-of-Living Increase of 3% per Year
The schedule of funding progress, presented as required supplemental information (RSI) following the notes to the financial statements, present multi-year trend information about whether the actuarial values of plan assets are increasing or decreasing over time relative to the AALs for benefits.
Information as of the latest actuarial valuation is presented in the following table:
Valuation date January 1, 2013
Actuarial cost method Entry Age Normal
Amortization method
N/A - no method has been adopted.Due to this being a closed plan, the
City has adopted the minimum statutory requirements
Amortization periodN/A - no period has been adopted. Due to this being a closed plan, the
City has adopted the minimum statutory requirements
Asset valuation method Fair Market Value
Actuarial assumptions:
Investment rate of return 6.0%
Projected salary increases N/A - closed plan
Inflation rate None
Cost of living adjustment 0% or 3%
D. The County Employees' Retirement System
Plan Description - The City, as well as employees for Bowling Green Municipal Utilities Electric, Water-Sewer, and General Services Divisions, and Bowling Green Public Library, are participants in the Commonwealth of Kentucky's County Employees' Retirement System (CERS). CERS is a cost-sharing multi-employer public employee retirement system. Funding for the Plan is provided through payroll withholdings (5% for non-hazardous and 8% for hazardous) and participating employers are required to contribute at an actuarially determined rate. Any employee entering the program after September 1, 2008 is required to contribute an additional 1%. The rates for the year ended June 30, 2013 were 19.55% for non-hazardous and 36.70% for hazardous employees of the employee's total compensation subject to contribution.

City of Bowling Green, KentuckyNotes to Financial Statements (Continued)June 30, 2013
65
NOTE 7. DEFINED BENEFIT PENSION PLANS (Continued)
The Kentucky Retirement System issues a publicly available financial report that includes financial statements and required supplementary information for CERS. That report may be obtained by writing to Kentucky Retirement Systems, Perimeter Park West, 1260 Louisville Road, Frankfort, KY 40601.
The contribution requirements for CERS for the years ended June 30, 2013, 2012 and 2011 were $7,997,969, $7,468,607, and $6,803,029, respectively. These amounts consisted of $6,499,081, $6,021,529, and $5,396,617from the City and $1,498,888, $1,447,078, and $1,406,412 from the employees, respectively.
Benefits under the plans will vary based on final compensation, years of service and other factors as fully described in the Plan documents.
The City also offers employees the option to participate in a Section 457 Deferred Compensation plan or in the Kentucky Public Employees 401(k) Deferred Compensation Plan.
E. Deferred Compensation Plan
On December 5, 1995, the City Commission adopted Municipal Order No. 95-268 extending participation in ICMA Retirement Corporation's Section 457 deferred compensation plan to all eligible City employees as a voluntary retirement supplement. The ICMA plan provides for retirement, disability and death benefits based upon the total value of each participant's contributions plus accrued investment returns. The ICMA plan offers both a 457 option and a 457 Roth option.
Investments are managed by ICMA Retirement Corporation, plan administrator, with various investment options. The choice of the investment option(s) is made by the participants. Participating employees can contribute to the Plan based on either a percentage of compensation or a fixed dollar amount per pay period. The limits for the plan are up to $17,000 per year for regular contributions and $5,500 for catch-up contributions. The limits for the Roth plan are up to $5,000 per year for regular contributions and $1,000 for catch-up contributions. During the fiscal year ended June 30, 2013, employee contributions for both plans totaled $245,369.
On December 5, 1995, the City Commission also adopted Municipal Order 95-269 authorizing participation in the Kentucky Public Employees 401(k) Deferred Compensation Plan. During the year ended June 30, 2009, the City also began offering a Roth 401(k) option. The Plans are administered by the Kentucky Public Employees Deferred Compensation Authority and are offered to all eligible City employees as a voluntary retirement supplement. Participating employees can defer a maximum of $17,000 for regular contributions and $5,500 for catch-up contributions for the 401(k) and $5,000 for regular contributions and $1,000 dollars for the Roth. Benefits are available upon termination of employment, retirement, death or for hardship withdrawal. Employee contributions for both plans totaled $279,187 for the fiscal year ended June 30, 2013.
NOTE 8. SUBSEQUENT EVENTS
Subsequent to year end, the City passed an ordinance authorizing the issuance of City of Bowling Green, Kentucky General Obligation Refunding Bonds, Series 2013C in an aggregate principal amount not to exceed $3,800,000 for the purpose of currently refunding the outstanding City of Bowling Green, Kentucky General Obligation Bonds, Series 2003.

City of Bowling Green, KentuckyNotes to Financial Statements (Continued)June 30, 2013
66
NOTE 9. IMPLEMENTATION OF GASB 63
In June 2011, the GASB issued Statement No. 63, Financial Reporting of Deferred Outflows of Resources, Deferred Inflows of Resources, and Net Position. GASB Statement No. 63 provides financial reporting guidance relative to deferred outflows of resources, a consumption of net assets by the entity that is applicable to a future reporting period, and deferred inflows of resources, an acquisition of net assets by the entity that is applicable to a future reporting period. GASB Statement No. 63 incorporates deferred outflows and inflows of resources into the definitions of the required components of the residual measure, renaming such measure as net position, rather than net assets. The provisions of GASB Statement No. 63 are effective for fiscal periods beginning after December 15, 2011 (the fiscal year ended June 30, 2013 for the District). The City adopted GASB 63 for the year ended June 30, 2013, the adoption of this standard did not have an impact on the City’s financial position, results of operations, and/or cash flows.
NOTE 10. IMPLEMENTATION OF GASB 65
In March 2012, the GASB issued Statement No. 65, Items Previously Reported as Assets and Liabilities. GASB Statement No. 65 establishes accounting and financial reporting standards that reclassify, as deferred outflows of resources or deferred inflows of resources, certain items that were previously reported as assets and liabilities and recognizes, as outflows of resources or inflows of resources, certain items that were previously reported as assets and liabilities.
Concepts Statement No. 4, Elements of Financial Statements, introduced and defined the elements included in financial statements, including deferred outflows of resources and deferred inflows of resources. In addition, Concepts Statement 4 provides that reporting a deferred outflow of resources or a deferred inflow of resources should be limited to those instances identified by the Board in authoritative pronouncements that are established after applicable due process. Prior to the issuance of this Statement, only two such pronouncements have been issued. Statement No. 53, Accounting and Financial Reporting for Derivative Instruments, requires the reporting of a deferred outflow of resources or a deferred inflow of resources for the changes in fair value of hedging derivative instruments, and Statement No. 60, Accounting and Financial Reporting for Service Concession Arrangements, requires a deferred inflow of resources to be reported by a transferor government in a qualifying service concession arrangement. This Statement amends the financial statement element classification of certain items previously reported as assets and liabilities to be consistent with the definitions in Concepts Statement 4.
This Statement also provides other financial reporting guidance related to the impact of the financial statement elements deferred outflows of resources and deferred inflows of resources, such as changes in the determination of the major fund calculations and limiting the use of the term deferred in financial statement presentations.
The provisions of this Statement are effective for financial statements for periods beginning after December 15, 2012. The City has not yet determined the impact on the City’s financial position, results of operations and/or cash flows during the year of implementation.

REQUIRED SUPPLEMENTARY INFORMATION(Other than Management’s Discussion and Analysis)

See accompanying independent auditor’s report67
City of Bowling Green, KentuckyBudgetary Comparison ScheduleGeneral FundYear Ended June 30, 2013
Original Final Actual
REVENUES
Property taxes
Real estate 7,379,000$ 7,379,000$ 7,395,414$ 16,414$
Personal property 1,500,000 1,500,000 1,586,950 86,950
Insurance premium 1,450,000 1,450,000 1,450,842 842
Motor vehicle and boat 740,000 740,000 841,042 101,042
Payment in lieu of taxes 200,000 200,000 201,688 1,688
Franchise 1,155,000 1,155,000 1,118,608 (36,392)
Other taxes 16,000 16,000 15,387 (613)
Penalties and Interest 84,000 84,000 78,075 (5,925)
Total taxes 12,524,000 12,524,000 12,688,006 164,006
Licenses and permits
Occupational:
Employees' withholding 30,931,000 30,935,500 32,060,326 1,124,826
Net profits 6,421,000 6,421,000 7,078,645 657,645
Other fees 242,000 242,000 258,093 16,093
Special licenses 230,000 230,000 244,325 14,325
Permits 673,500 673,500 694,411 20,911
Total licenses and permits 38,497,500 38,502,000 40,335,800 1,833,800
Intergovernmental
Federal grants 38,000 108,329 65,030 (43,299)
State grants - 3,076 12,665 9,589
Local grants 62,000 62,000 61,436 (564)
Total intergovernmental 100,000 173,405 139,131 (34,274)
Charges for services
School tax collection fees 181,000 181,000 187,079 6,079
Other general government fees 6,500 6,500 7,405 905
Public safety fees 50,500 50,500 63,802 13,302
Cemetery lot sales 94,000 94,000 106,080 12,080
Cemetery fees 146,500 146,500 153,694 7,194
Other 71,000 71,000 59,767 (11,233)
Total charges for services 549,500 549,500 577,827 28,327
Parks and recreation 377,500 377,500 345,951 (31,549)
Miscellaneous
Interest income 156,000 156,000 98,600 (57,400)
ABC and parking violations fees 21,500 21,500 26,280 4,780
Contributions and donations 37,500 113,530 84,647 (28,883)
Judgements and settlements 40,500 58,510 39,179 (19,331)
Other 54,000 54,000 63,660 9,660
Total miscellaneous 309,500 403,540 312,366 (91,174)
Total revenues 52,358,000$ 52,529,945$ 54,399,081$ 1,869,136$
Budgeted AmountsVariance with Final
Budget - Positive
(Negative)

See accompanying independent auditor’s report68
City of Bowling Green, KentuckyBudgetary Comparison Schedule General Fund (Continued)Year Ended June 30, 2013
Original Final Actual
EXPENDITURES
General government
Legislative 155,380$ 141,503$ 146,459$ (4,956)$
Executive 883,382 913,170 843,731 69,439
Finance 1,384,633 1,334,687 1,332,653 2,034
Human resources 894,420 761,387 741,032 20,355
Law 308,082 297,187 276,416 20,771
Information technology 1,544,775 1,602,706 1,524,609 78,097
Administrative services 777,474 886,209 884,985 1,224
Total general government 5,948,146 5,936,849 5,749,885 186,964
Public safety
Police 12,894,081 12,625,349 12,575,676 49,673
Fire 11,168,289 11,024,813 11,006,153 18,660
Total public safety 24,062,370 23,650,162 23,581,829 68,333
Public works
Public works administration 1,224,365 1,463,124 1,269,702 193,422
Highway and streets 2,265,425 2,238,552 2,228,477 10,075
Building and plant 1,962,608 2,186,182 2,082,173 104,009
Transportation 319,995 279,540 279,537 3
Total public works 5,772,393 6,167,398 5,859,889 307,509
Parks and recreation
Parks 2,049,089 1,829,502 1,822,846 6,656
Recreation 622,581 615,430 591,136 24,294
Athletics 877,350 1,070,185 1,016,042 54,143
Community centers 970,642 951,973 932,725 19,248
Other parks 1,429,097 1,387,308 1,370,634 16,674
Total parks and recreation 5,948,759 5,854,398 5,733,383 121,015
Neighborhood & Community Services 1,636,244 1,506,582 1,456,207 50,375
Community services
Community services 263,342 355,389 262,380 93,009
Intergovernmental 432,000 246,258 160,946 85,312
Total community services 695,342 601,647 423,326 178,321
Total Expenditures 44,063,254 43,717,036 42,804,519 912,517
Excess of revenues over expenditures 8,294,746 8,812,909 11,594,562 2,781,653
Other financing sources (uses):
Transfers in - 30,000 30,000 -
Transfers out (9,068,746) (14,282,961) (11,321,072) 2,961,889
Proceeds from sale of capital assets 24,000 24,000 19,731 (4,269)
Total other financing sources (uses) (9,044,746) (14,228,961) (11,271,341) 2,957,620
Net change in fund balances (750,000) (5,416,052) 323,221 5,739,273
Fund balances, beginning 18,487,018 18,487,018 18,487,018 -
Fund balances, ending 17,737,018$ 13,070,966$ 18,810,239$ 5,739,273$
Variance with Final
Budget - Positive
(Negative)
Budgeted Amounts

See accompanying independent auditor’s report69
City of Bowling Green, KentuckyNotes to Required Supplementary Information on Budgetary Accounting and ControlYear Ended June 30, 2013
Budget Policy - Budgets are adopted on a basis consistent with generally accepted accounting principles. Annual appropriated budgets are adopted for the general, special revenue, debt service and capital projects funds. The City adopts an annual appropriation budget for four Debt Service Funds covering all government debt service activities. A budget is not prepared for the City's permanent fund.
Legal Compliance – All departments submit requests for the appropriations to the Budget Team. The Budget Team meets with each department head and reviews the new budget year requests. The budget is prepared by fund, function and activity and includes information of the prior year, current year and requested appropriations for the next fiscal year.
It is the City Manager’s responsibility to prepare a budget proposal and message, which must be submitted to the Board of Commissioners at least 30 days prior to July 1
st. The budget message explains revenue changes and
expenditure goals, any significant changes in program goals and appropriations, and any important budget features or major changes in financial policy. Following its submission to the Board, the City Manager presents the recommended budget at a public meeting. The budget is legally enacted through passage of an ordinance by June 30
th.
The Assistant City Manager is authorized to transfer budget amounts between departments within any fund. The Comptroller is authorized to prepare periodic budget amendments throughout the fiscal year that are passed by an ordinance of the Board of Commissioners. The budget amendments provide supplementary appropriations as necessary to ensure expenditures do not exceed budget appropriations at the activity level.
Encumbrances - Encumbrances represent commitments related to unperformed contracts for goods or services. Encumbrance accounting, under which purchase orders, contracts and other commitments for the expenditures of resources are recorded to reserve that portion of the applicable appropriation, is utilized in the governmental funds. Encumbrances outstanding at year end are included within the appropriate fund balances in the governmental funds and are not reported separately on the financial statements. Encumbrances do not constitute expenditures or liabilities because the commitments will be honored during the subsequent year. Encumbrances are not recorded in the financial statements for proprietary, internal service and fiduciary fund types.
The following funds had purchase orders outstanding at June 30, 2013 as follows:
General fund 520,869$
Golf 47,927
Convention Center 24,690
Aquatics 5,531
Nonmajor governmental 1,778,650
Internal Service 41,063
2,418,730$

See accompanying independent auditor’s report70
City of Bowling Green, KentuckyPolice and Firemen’s Retirement FundYear Ended June 30, 2013
ActuarialActuarial
Value
Actuarial Accrued
Liability (AAL)Unfunded
AAL Funded Covered UAAL as a % ofValuation of Assets - Entry Age (UAAL) Ratio Payroll Covered Payroll
Date (a) (b) (b-a) (a/b) (c) (b-a)/(c)
1/1/2013 7,296,133$ 8,543,490$ 1,247,357$ 85.4% N/A N/A1/1/2012 7,202,376 8,810,728 1,608,352 81.7% N/A N/A1/1/2011 7,471,464 8,891,254 1,419,790 84.0% N/A N/A1/1/2010 7,425,235 9,419,690 1,994,455 78.8% N/A N/A
1/1/2013 7,296,133$ 10,608,154$ 3,312,021$ 68.8% N/A N/A1/1/2012 7,202,376 11,005,995 3,803,619 65.4% N/A N/A1/1/2011 7,471,464 11,174,666 3,703,202 66.9% N/A N/A1/1/2010 7,425,235 11,877,751 4,452,516 62.5% N/A N/A
Schedule of Funding Progress
Assumes No Future Cost of Living Increase
Assumes Future Cost-of-Living Increase of 3% per Year
Schedule of Employer Contributions
Year Ended June 30
Annual Pension Cost
Amount Contributed
2001 48,781$ 48,781$ 2002 88,514 88,514 2003 108,000 108,000 2004 108,000 108,000 2005 209,000 209,000 2006 209,000 209,000 2007 328,000 328,000 2008 328,000 328,000 2009 384,000 384,000 2010 410,000 410,000 2011 450,000 450,000 2012 400,000 400,000 2013 400,000 400,000

See accompanying independent auditor’s report71
City of Bowling Green, KentuckyModified Approach for City Streets Infrastructure Capital Assets
Year Ended June 30, 2013
As allowed by GASB Statement No. 34, Basic Financial Statements - and Management's Discussion and Analysis -for State and Local Governments, the City has adopted an alternative process for recording depreciation expense on selected infrastructure assets. Under this alternative method, referred to as the modified approach, the City expenses certain maintenance and preservation costs and does not report depreciation expense.
In order to utilize the modified approach, the City is required to:
Maintain an asset management system that includes an up-to-date inventory of eligible infrastructure assets.
Perform condition assessments of eligible assets and summarize the results using a measurement scale. Estimate each year the annual amount to maintain and preserve the assets at the condition level
established and disclosed by the City. Document that the assets are being preserved approximately at, or above, the established condition level.
Roads
The City began using its computerized pavement management system in 1997. Surface distress and ride comfort assessments are conducted on all segments. Street assessments are conducted annually, and all segments are assessed within a three year cycle. The most recent assessment was conducted in the summer of 2013.
Upon completion of the assessment, an overall condition index (OCI) is calculated to assess individual pavement segments. Streets are rated on a 0 to 100 scale. An OCI of 100 would correspond to a pavement with proper engineering design and construction at the beginning of its life cycle.
The following pavement quality conditions have been defined:
Condition OCI Rating
Excellent 88.0 - 100.00Good 76.0 - 87.99Fair 64.0 - 75.99Poor 50.0 - 63.99Bad 0.0 - 49.99

See accompanying independent auditor’s report72
City of Bowling Green, KentuckyModified Approach for City Streets Infrastructure Capital Assets (Continued)
Year Ended June 30, 2013
Established Condition Level
The City’s policy is to consider streets in need when the OCI rating falls below minimum vales. These values are as follows:
Functional Classification Minimum OCILocal 67.0Collector 69.0Arterial 72.0
Segments considered to be in need are quantitatively prioritized for rehabilitation based on OCI, traffic, functional class and other factors.
Assessed Conditions
The following table reports the percentage of streets meeting the minimum acceptable conditions or above:
Year Percentage 2013 98% 2012 97% 2011 95% 2010 94% 2009 90% 2008 90%
2007 85%2006 85%
Budgeted and Estimated Costs to Maintain
The following table presents the City's estimate of spending necessary to preserve and maintain the Street infrastructure at, or above, the "Established Condition Levels" cited above, and the actual amount spent during the past six fiscal years (in thousands):
Fiscal Year Estimated Spending Actual Spending2013-2014 $900 $2012-2013 $850 $5722011-2012 $850 $1,0902010-2011 $811 $4312009-2010 $850 $8102008-2009 $915 $9152007-2008 $842 $8352006-2007 $1,192 $8422005-2006 $842 $8422004-2005 $875 $920
The budgeting process utilized by the City results in spending in one fiscal year from amounts that were budgeted in a previous year(s). Therefore, this timing difference does not allow a true comparison of amounts budgeted and spent within a given year. The table demonstrates that over the past five years, the City spending has been in line with the budgeted amounts and the other tables contained within this narrative demonstrate that the City has met its desired condition levels.

See accompanying independent auditor’s report73
City of Bowling Green, KentuckyModified Approach for City Streets Infrastructure Capital Assets (Continued)
Year Ended June 30, 2013
SidewalksThe City utilizes a computerized sidewalk management system. Condition assessments are visually performed on all sidewalks segments, ratings are based on the presence of cracking, heaving, holes, settling and spalling. These assessments were conducted on the entire sidewalk network on a three year cycle. The most recent assessment was completed in the Spring of 2010 and will be reassessed in the Winter of 2013.
Upon completion of the assessment, an overall condition index (OCI) is calculated to assess individual pavement segments. Segments are rated on a 0 to 100 scale. An OCI of 100 would correspond to a sidewalk with proper engineering design and construction at the beginning of its life cycle.
The following overall condition index for sidewalks has been defined as follows:
Condition OCI Rating
Excellent 88.0 - 100.00Good 76.0 - 87.99Fair 64.0 - 75.99Poor 50.0 - 63.99Bad 0.0 - 49.99
Established Condition Level (same as streets with new software)The City’s policy is to achieve a rating of 76.0 for all sidewalks, which is a good rating. This rating allows minor cracking and raveling of the sidewalk along with minor roughness that could be noticeable to pedestrians.
Assessed Conditions
The sidewalk management system indicates that 94% of city maintained sidewalks had an OCI value greater than or equal to the minimum rating of 76.0 as of June 30, 2013.
Budgeted and Estimated Costs to Maintain
The following table presents the City’s estimate of spending necessary to preserve and maintain the Sidewalk infrastructure at, or above, the “Established Condition Levels” cited above, and the actual amount spent during the past five fiscal years (in thousands):
Fiscal Year Estimated Spending Actual Spending2013-2014 $100 $2012-2013 $100 $412011-2012 $100 $412010-2011 $100 $ 1332009-2010 $100 $02008-2009 $100 $1002007-2008 $100 $602006-2007 $100 $52005-2006 $100 $113
The budgeting process utilized by the City results in spending in one fiscal year from amounts that were budgeted in a previous fiscal year(s). Therefore, this timing difference does not allow a true comparison of amounts budgeted and spent within a given year.

COMBINING AND INDIVIDUAL FUND STATEMENTS AND SCHEDULES

74
NONMAJOR GOVERNMENTAL FUNDS
SPECIAL REVENUE FUNDS
Special revenue funds are used to account for specific revenues that are legally restricted to expenditure for particular purposes.
Community Development FundThis fund is used to account for revenues and expenditures of the federal community development programs.
Fire Improvement FundThis fund is used to account for capital outlays of the fire department. Funding is provided by fire insurance premium license fees.
Municipal Aid FundsThese funds are used to account for revenues and expenditures of Kentucky public safety, public works and economic development grants, liquid fuel tax, mineral and coal severance tax receipts, and law enforcement special pay programs.
Job Development FundThis fund is used to account for job development incentive payments to business prospects within City boundaries to provide incentives for the creation of new jobs. Employee withholdings generated by new jobs are deposited to the fund to reduce incentive payment obligations payable in annual installments not to exceed five years.
Parks Development FundThis fund is used to account for expenditures of certain parks projects. Funding is provided by property tax receipts and occupational fees from the Hartland Development area.
Landfill Closure FundThis fund is used to account for revenues and expenditures applicable to government landfill closure and postclosure care.
Local Law Enforcement Block Grant FundThis fund is used to account for a Serious Habitual Offender/Criminal Apprehension Program (SHOCAP) Grant which targets habitual juvenile offenders for intense supervision with the assistance of the courts, social services and the local schools.
Trunking Operation FundThis fund is used to account for the joint operations of an 800 MHZ radio system by the City of Bowling Green, Warren County Government, the Medical Center at Bowling Green, and Western Kentucky University.
Police Improvement FundThis fund is used to account for revenue received from citations. The citations revenue will be collected and appropriated for capital expenditures for the Police Department.
Lampkin Park Trust FundThis fund is used to account for the receipt of one-seventh of the net income from C.W. Lampkin Charitable Trust. The money shall be used for the maintenance, improvement, and development of Lampkin Park in Bowling Green, Kentucky, as long as the park bears the name Lampkin Park.
Homeland Security FundThis fund is used to account for expenditures funded indirectly through the U.S. Department of Homeland Security. The City of Bowling Green acts as the lead agency for regional projects to purchase mobile data terminals and associated hardware and software for seventeen agencies.

75
NONMAJOR GOVERNMENTAL FUNDS
CAPITAL PROJECTS FUNDS
Capital projects funds are used to account for the acquisition and construction of major capital facilities other than those financed by proprietary funds and trust funds.
Riverfront Development FundThis fund was previously utilized to account for the revenues and expenditures in the development of a riverfront park between College and State Streets adjacent to the Barren River. This fund currently provides funds and expenditures for the construction of greenway trails throughout the City.
Equipment Replacement FundThis fund is used to account for the short-term financing of general government capital outlays forvehicles and equipment. Financing for this fund is provided by the General Fund.
Road Construction FundThis fund was previously used to account for costs associated with the purchase of land and construction of three road projects, Bale Boulevard, Turner Court, and Houston Court. This fund currently tracks expenditures related to the Smallhouse/Cavemil Road intersection realignment project. Funding for the new projects has been made available through the General Fund.
Hennessey Way Construction FundThe Hennessey Way Construction Fund will account for costs related to the Hennessey Way construction project. The project will be funded by the General Fund.
Heritage Trail Construction FundThis fund is used to account for the revenue and expenditures associated with the construction of the Heritage Trail. The trail will ultimately run from Fountain Square Park to Riverfront Park. Funding has been provided by donations and subsidies from the General Fund and the Renaissance Alliance Fund.
Sidewalk Improvement FundThis fund is used to account for costs associated with the improvement of existing and construction of new sidewalks throughout the City. Funding has been made available through subsidies from the General Fund and the Coal Mineral Tax Fund.
Stormwater Infrastructure Improvement FundThis fund tracks expenditures related to the improvement of existing storm drainage pipes located throughout the City of Bowling Green. Funding has been provided through a General Fund subsidy.
Municipal Facilities FundThis fund is used to monitor costs associated with the study and renovation of City buildings. Funding for this project has been made available from General Fund subsidies.
Technology Capital Improvement FundThis fund is used to account for expenditures associated with the City’s information technology program. Funding is mainly provided by transfers from other funds.
800 Trucking Radio Systems Improvement FundThis fund will be used to track revenues and expenditures associated with the replacement and improvement of the existing 800 Trucking Radio System. Funding has currently been provided from the General Fund and other local governmental agencies, such as Warren County.

76
NONMAJOR GOVERNMENTAL FUNDS
DEBT SERVICE FUNDS
TIF DistrictThis fund is used to account for debt service payments for the General Bond Obligation, Series 2008A. The bond issue provided funding for the construction of Bowling Green’s Single A baseball park.

77
NONMAJOR GOVERNMENTAL FUNDS
PERMANENT FUNDS
Permanent funds are used to report resources that are legally restricted to allow only the earnings and not the principal, to be used for the prescribed purposes.
Cemetery Perpetual Trust FundThis fund is used to account for monies provided by private donors and from the sale of cemetery lots. The principal amount is to be maintained intact and invested. Investment earnings are used for cemetery maintenance.

See accompanying independent auditor’s report78
City of Bowling Green, KentuckyCombining Balance Sheet – Nonmajor Governmental FundsJune 30, 2013
Nonmajor Special
Revenue Funds
Nonmajor Capital
Projects Funds
Nonmajor Debt
Service Fund - TIF
District
Nonmajor
Permanent Fund -
Cemetery
Perpetual
Total Nonmajor
Governmental
Funds
ASSETS
Pooled cash and cash
equivalents 4,005,120$ 7,277,397$ 2,367,645$ 70,693$ 13,720,855$
Non-pooled cash and
cash equivalents 1,263,888 - - - 1,263,888
Investments 3,773,064 - - - 3,773,064
Receivables (net of allowances
for uncollectibles):
Accounts 17,133 3,100 - - 20,233
Interest 5,243 - - - 5,243
Due from other governmental units 209,251 3,459 - - 212,710
Restricted assets:
Non-pooled cash and
cash equivalents - - - 816,622 816,622
Total assets 9,273,699$ 7,283,956$ 2,367,645$ 887,315$ 19,812,615$
LIABILITIES AND FUND BALANCES
Liabilities
Vouchers and accounts
payable 196,449$ 64,915$ -$ -$ 261,364$
Accrued payroll 21,588 - - - 21,588
Deferred revenue 989 - - - 989
Total liabilities 219,026 64,915 - - 283,941
Fund Balances
Assigned - 7,095,094 2,367,645 70,692 9,533,431
Committed 4,093,440 - - - 4,093,440
Restricted 4,961,233 123,947 - 816,623 5,901,803
Total fund balances 9,054,673 7,219,041 2,367,645 887,315 19,528,674
Total liabilities and
fund balances 9,273,699$ 7,283,956$ 2,367,645$ 887,315$ 19,812,615$

See accompanying independent auditor’s report79
City of Bowling Green, KentuckyCombining Balance SheetNonmajor Special Revenue FundsJune 30, 2013
Community
Development Fire Improvement Municipal Aid
Job Development
Incentive
Parks
Development Landfill Closure
ASSETS
Pooled cash and cash equivalents -$ 383,980$ 2,464,881$ 331,588$ 36,657$ 291,470$
Non-pooled cash and cash equivalents 1,145,213 118,675 - - - -
Investments 500,000 733,132 1,425,636 - - 1,114,296
Receivables (net of allowances for uncollectibles)
Accounts 16,785 - 348 - - -
Interest 226 3,973 804 - - 240
Due from other governmental units 29,167 - 164,996 - - 14,608
Total assets 1,691,391$ 1,239,760$ 4,056,665$ 331,588$ 36,657$ 1,420,614$
LIABILITIES AND FUND BALANCES
Liabilities
Vouchers and accounts payable 30,349$ 34,258$ 71,722$ -$ 36,657$ 23,463$
Accrued payroll 11,756 - 9,832 - - -
Deferred revenue - - 989 - - -
Total liabilities 42,105 34,258 82,543 - 36,657 23,463
Fund Balances
Committed 736,680 1,192,626 87,596 331,588 - 1,397,151
Restricted 912,606 12,876 3,886,526 - - -
Total fund balances 1,649,286 1,205,502 3,974,122 331,588 - 1,397,151
Total liabilities and fund balances 1,691,391$ 1,239,760$ 4,056,665$ 331,588$ 36,657$ 1,420,614$

See accompanying independent auditor’s report80
City of Bowling Green, KentuckyCombining Balance SheetNonmajor Special Revenue Funds (Continued)June 30, 2013
Local Law
Enforcement
Block Grant
Trunking
Operation
Police
Improvement
Lampkin Park
Trust
Homeland
Security
Total Nonmajor
Special Revenue
Funds
ASSETS
Pooled cash and cash equivalents -$ 126,661$ 347,799$ 22,564$ (480)$ 4,005,120$
Non-pooled cash and cash equivalents - - - - - 1,263,888
Investments - - - - - 3,773,064
Receivables (net of allowances for uncollectibles)
Accounts - - - - - 17,133
Interest - - - - - 5,243
Due from other governmental units - - - - 480 209,251
Total assets -$ 126,661$ 347,799$ 22,564$ -$ 9,273,699$
LIABILITIES AND FUND BALANCES
Liabilities
Vouchers and accounts payable -$ -$ -$ -$ -$ 196,449$
Accrued payroll - - - - - 21,588
Deferred revenue - - - - - 989
Total liabilities - - - - - 219,026
Fund Balances
Committed - - 347,799 - - 4,093,440
Restricted - 126,661 - 22,564 - 4,961,233
Total fund balances - 126,661 347,799 22,564 - 9,054,673
Total liabilities and fund balances -$ 126,661$ 347,799$ 22,564$ -$ 9,273,699$

See accompanying independent auditor’s report81
City of Bowling Green, KentuckyCombining Balance SheetNonmajor Capital Projects FundsJune 30, 2013
Riverfront
Development
Equipment
Replacement
Road
Construction
Hennessey Way
Construction
Heritage Trail
Construction
Sidewalk
Improvement
Stormwater
Infrastructure
Improvement
ASSETS
Pooled cash and cash equivalents 212,654$ 854,239$ 223,200$ 262,000$ 196,702$ 882,275$ 655,684$
Due from other governmental units 3,459 - - - - - -
Receivables, net
Accounts - - - - - - -
Total assets 216,113$ 854,239$ 223,200$ 262,000$ 196,702$ 882,275$ 655,684$
LIABILITIES AND FUND BALANCES
Liabilities
Vouchers and accounts payable -$ -$ -$ -$ -$ 23,229$ -$
Total liabilities - - - - - 23,229 -
Fund Balances
Assigned 208,834 854,239 223,200 262,000 80,034 859,046 655,684
Restricted 7,279 - - - 116,668 - -
Total fund balances 216,113 854,239 223,200 262,000 196,702 859,046 655,684
Total liabilities and fund balances 216,113$ 854,239$ 223,200$ 262,000$ 196,702$ 882,275$ 655,684$

See accompanying independent auditor’s report82
City of Bowling Green, KentuckyCombining Balance SheetNonmajor Capital Projects Funds (Continued)June 30, 2013
Municipal
Facilities
Technology
Capital
Improvement
800 Trunking
Radio Systems
Improvements
Total Nonmajor
Capital Project
Funds
ASSETS
Pooled cash and cash equivalents 1,102,998$ 708,325$ 2,179,320$ 7,277,397$
Due from other governmental units - - - 3,459
Receivables, net
Accounts - - 3,100 3,100
Total assets 1,102,998$ 708,325$ 2,182,420$ 7,283,956$
LIABILITIES AND FUND BALANCES
Liabilities
Vouchers and accounts payable 4,560$ 30,927$ 6,199$ 64,915$
Total liabilities 4,560 30,927 6,199 64,915
Fund Balances
Assigned 1,098,438 677,398 2,176,221 7,095,094
Restricted - - - 123,947
Total fund balances 1,098,438 677,398 2,176,221 7,219,041
Total liabilities and fund balances 1,102,998$ 708,325$ 2,182,420$ 7,283,956$

See accompanying independent auditor’s report83
City of Bowling Green, KentuckyCombining Statement of Revenues, Expenditures, and Changes in Fund Balances Nonmajor Governmental FundsYear Ended June 30, 2013
Nonmajor
Special
Revenue
Funds
Nonmajor
Capital
Projects
Funds
Nonmajor Debt
Service Fund -
TIF District
Nonmajor
Permanent Fund -
Cemetery
Perpetual
Total
Nonmajor
Governmental
Funds
REVENUES
Property taxes 405,093$ -$ -$ -$ 405,093$
Insurance premium taxes 1,891,245 - - - 1,891,245
Wages and net profits taxes 2,253,301 - - - 2,253,301
Judgements and settlements 13,598 - - - 13,598
Intergovernmental 7,063,675 107,245 - - 7,170,920
Investment income 19,380 - - 45,581 64,961
Charges for services 77,453 - - - 77,453
Contributions and donations 71,068 1,359,930 - - 1,430,998
Miscellaneous 360,541 - - 26,185 386,726
Total Revenues 12,155,354 1,467,175 - 71,766 13,694,295
EXPENDITURES
Current:
General government - 179,806 - - 179,806
Public safety 1,971,116 600,373 - - 2,571,489
Public works 1,737,452 3,888 - 10,001 1,751,341
Neighborhood and community services 3,419,305 103,786 - - 3,523,091
Capital Outlay 256,833 3,626,715 - - 3,883,548 Debt service:
Principal - - 490,000 - 490,000
Interest - - 1,122,587 - 1,122,587
Total Expenditures 7,384,706 4,514,568 1,612,587 10,001 13,521,862
Excess (deficiency) of revenues over
(under) expenditures 4,770,648 (3,047,393) (1,612,587) 61,765 172,433
Other financing sources (uses):
Transfers in 51,233 4,213,500 1,612,600 - 5,877,333
Transfers out (4,311,651) - - - (4,311,651)
Total other financing sources (uses) (4,260,418) 4,213,500 1,612,600 - 1,565,682
Net change in fund balances 510,230 1,166,107 13 61,765 1,738,115
Fund balances, beginning 8,544,443 6,052,934 2,367,632 825,550 17,790,559
Fund balances, ending 9,054,673$ 7,219,041$ 2,367,645$ 887,315$ 19,528,674$

See accompanying independent auditor’s report84
City of Bowling Green, KentuckyCombining Statement of Revenues, Expenditures, and Changes in Fund Balances – Nonmajor Special Revenue FundsYear Ended June 30, 2013
Community
Development
Fire
Improvement Municipal Aid
Job
Development
Incentive
Parks
Development
Landfill
Closure
Local Law
Enforcement
Block Grant
Trunking
Operation
REVENUES
Property taxes -$ -$ -$ -$ 405,093$ -$ -$ -$
Insurance premium taxes - 1,891,245 - - - - - -
Wages and net profits taxes - - - 1,050,826 1,202,475 - - -
Judgments and settlements - 13,598 - - - - - -
Intergovernmental 3,388,077 44,150 3,481,922 - - - 37,996 32,100
Investment income 903 4,599 4,125 1,217 - 8,536 - -
Charges for services - - - - - - - -
Contributions and donations - - - - - 59,209 - -
Miscellaneous 249,615 - 68,364 - - - - -
Total Revenues 3,638,595 1,953,592 3,554,411 1,052,043 1,607,568 67,745 37,996 32,100
EXPENDITURES
Current:
Public safety - 263,293 1,548,915 - - - 48,322 -
Public works - - 1,579,422 - - 118,534 - 39,496
Neighborhood and community services 3,419,305 - - - - - - -
Capital outlay 15,326 105,203 89,918 - - - 46,386 -
Total Expenditures 3,434,631 368,496 3,218,255 - - 118,534 94,708 39,496
Excess (deficiency) of revenues over
(under) expenditures 203,964 1,585,096 336,156 1,052,043 1,607,568 (50,789) (56,712) (7,396)
Other financing sources (uses):
Transfers in - - 26,233 - - - - 25,000
Transfers out - (1,462,918) (18,000) (1,193,165) (1,607,568) - - -
Total other financing sources (uses) - (1,462,918) 8,233 (1,193,165) (1,607,568) - - 25,000
Net change in fund balances 203,964 122,178 344,389 (141,122) - (50,789) (56,712) 17,604
Fund balances, beginning 1,445,322 1,083,324 3,629,733 472,710 - 1,447,940 56,712 109,057
Fund balances, ending 1,649,286$ 1,205,502$ 3,974,122$ 331,588$ -$ 1,397,151$ -$ 126,661$

See accompanying independent auditor’s report85
City of Bowling Green, KentuckyCombining Statement of Revenues, Expenditures, and Changes in Fund Balances – Nonmajor Special Revenue Funds (Continued)Year Ended June 30, 2013
Police
Improvement Lampkin Park
Homeland
Security
Total Special
Revenue Funds
REVENUES
Property taxes -$ -$ -$ 405,093$
Insurance premium taxes - - - 1,891,245
Wages and net profits taxes - - - 2,253,301
Judgments and settlements - - - 13,598
Intergovernmental - - 79,430 7,063,675
Investment income - - - 19,380
Charges for services 77,453 - - 77,453
Contributions and donations - 11,859 - 71,068
Miscellaneous 42,562 - - 360,541
Total Revenues 120,015 11,859 79,430 12,155,354
EXPENDITURES
Current:
Public safety 31,156 - 79,430 1,971,116
Public works - - - 1,737,452
Neighborhood and community services - - - 3,419,305
Capital outlay - - - 256,833
Total Expenditures 31,156 - 79,430 7,384,706
Excess (deficiency) of revenues over
(under) expenditures 88,859 11,859 - 4,770,648
Other financing sources (uses):
Transfers in - - - 51,233
Transfers out - (30,000) - (4,311,651)
Total other financing sources (uses) - (30,000) - (4,260,418)
Net change in fund balances 88,859 (18,141) - 510,230
Fund balances, beginning 258,940 40,705 - 8,544,443
Fund balances, ending 347,799$ 22,564$ -$ 9,054,673$

See accompanying independent auditor’s report86
City of Bowling Green, KentuckyCombining Statement of Revenues, Expenditures and Changes in Fund Balance – Nonmajor Capital Projects FundsYear Ended June 30, 2013
Riverfront
Development
Equipment
Replacement Road Construction
Hennessey Way
Construction
Heritage Trail
Construction
Sidewalk
Improvement
Stormwater
Infrastructure
Improvement
REVENUES
Intergovernmental 107,245$ -$ -$ -$ -$ -$ -$
Contributions and donations - - 1,075,000 - - - -
Total Revenues 107,245 - 1,075,000 - - - -
EXPENDITURES
Current:
General Government - 39,758 - - - - -
Public safety - - - - - - -
Public works - - - - - 3,727 161
Neighborhood and community services 103,786 - - - - - -
Capital outlay 3,459 391,957 2,151,800 - - 252,865 293,473
Total Expenditures 107,245 431,715 2,151,800 - - 256,592 293,634
Excess (deficiency) of revenues over
(under) expenditures - (431,715) (1,076,800) - - (256,592) (293,634)
Other financing sources (uses):
Transfers in - 495,500 800,000 250,000 - 400,000 500,000
Total other financing sources (uses) - 495,500 800,000 250,000 - 400,000 500,000
Net change in fund balances - 63,785 (276,800) 250,000 - 143,408 206,366
Fund balances, beginning 216,113 790,454 500,000 12,000 196,702 715,638 449,318
Fund balances, ending 216,113$ 854,239$ 223,200$ 262,000$ 196,702$ 859,046$ 655,684$

See accompanying independent auditor’s report87
City of Bowling Green, KentuckyCombining Statement of Revenues, Expenditures and Changes in Fund Balance – Nonmajor Capital Projects Funds (Continued)Year Ended June 30, 2013
Municipal
Facilities
Technology
Capital
Improvement
800 Trucking
Radio
Systems
Improvements
Total
Nonmajor
Capital Project
Funds
REVENUES
Intergovernmental -$ -$ -$ 107,245$
Contributions and donations - - 284,930 1,359,930
Total Revenues - - 284,930 1,467,175
EXPENDITURES
Current:
Public safety - 140,048 - 179,806
Public safety - - 600,373 600,373
Public works - - - 3,888
Neighborhood and community services - - - 103,786
Capital outlay 21,374 511,787 - 3,626,715
Total Expenditures 21,374 651,835 600,373 4,514,568
Excess (deficiency) of revenues over
(under) expenditures (21,374) (651,835) (315,443) (3,047,393)
Other financing sources (uses):
Transfers in 718,000 450,000 600,000 4,213,500
Total other financing sources (uses) 718,000 450,000 600,000 4,213,500
Net change in fund balances 696,626 (201,835) 284,557 1,166,107
Fund balances, beginning 401,812 879,233 1,891,664 6,052,934
Fund balances, ending 1,098,438$ 677,398$ 2,176,221$ 7,219,041$

See accompanying independent auditor’s report88
City of Bowling Green, KentuckyBudgetary Comparison ScheduleDebt Service FundYear Ended June 30, 2013
Original Final Actual
EXPENDITURES
Principal 3,452,830$ 3,714,316$ 3,651,355$ 62,961$
Interest and fiscal charges 1,716,430 1,706,944 1,660,750 46,194
Total expenditures 5,169,260 5,421,260 5,312,105 109,155
Excess (deficiency) of revenues over
(under) expenditures (5,169,260) (5,421,260) (5,312,105) 109,155
Other financing sources (uses):
Proceeds from bond refunding - 4,385,000 4,099,807 (285,193)
Premium from bond refunding - - 170,747 170,747
Payment to refunded debt escrow agent - (4,385,000) (4,281,161) 103,839
Transfers in 5,169,260 5,421,260 5,312,107 (109,153)
Total other financing sources 5,169,260 5,421,260 5,301,500 (119,760)
Net change in fund balances - - (10,605) (10,605)
Fund balances, beginning - - 10,605 10,605
Fund balances, ending -$ -$ -$ -$
Variance with Final
Budget - Positive
(Negative)
Budgeted Amounts

See accompanying independent auditor’s report89
City of Bowling Green, KentuckyBudgetary Comparison ScheduleWKU Athletics Debt Service FundYear Ended June 30, 2013
Original Final Actual
REVENUES
Intergovernmental 2,389,433$ 2,389,433$ 2,389,433$ -$
Total revenues 2,389,433 2,389,433 2,389,433 -
EXPENDITURES
Debt Service
Principal 1,410,000 1,410,000 1,410,000 -
Interest 979,433 979,433 979,433 -
Total expenditures 2,389,433 2,389,433 2,389,433 -
Excess (deficiency) of revenues over
(under) expenditures - - - -
Fund balances, beginning - - - -
Fund balances, ending -$ -$ -$ -$
Variance with
Final Budget -
Positive
(Negative)
Budgeted Amounts

See accompanying independent auditor’s report90
City of Bowling Green, KentuckyBudgetary Comparison ScheduleITA Bond Debt Service FundYear Ended June 30, 2013
Original Final Actual
REVENUES
Rent Income -$ 2,345,500$ 2,345,500$ -$
Investment income - - 433,673 433,673
Contributions and donations 1,327,790 1,327,790 1,352,784 24,994
Total revenues 1,327,790 3,673,290 4,131,957 458,667
EXPENDITURES
Debt Service:
Principal 2,235,000 4,580,500 4,580,500 -
Interest 1,553,220 1,553,220 1,553,206 14
Total expenditures 3,788,220 6,133,720 6,133,706 14
Excess (deficiency) of revenues over
(under) expenditures (2,460,430) (2,460,430) (2,001,749) 458,681
Other financing sources (uses):
Transfers In 1,327,790 1,327,790 1,327,790 -
Total other financing sources (uses) 1,327,790 1,327,790 1,327,790 -
Net change in fund balances (1,132,640) (1,132,640) (673,959) 458,681
Fund balances, beginning 13,689,334 13,689,334 13,689,334 -
Fund balances, ending 12,556,694$ 12,556,694$ 13,015,375$ 458,681$
Variance with Final
Budget - Positive
(Negative)
Budgeted Amounts

See accompanying independent auditor’s report91
City of Bowling Green, KentuckyBudgetary Comparison ScheduleTIF District Debt Service FundYear Ended June 30, 2013
Original Final Actual
EXPENDITURES
Principal 490,000$ 490,000$ 490,000$ -$
Interest and fiscal charges 1,122,600 1,122,600 1,122,587 13
Total expenditures 1,612,600 1,612,600 1,612,587 13
Excess (deficiency) of revenues over
(under) expenditures (1,612,600) (1,612,600) (1,612,587) 13
Other financing sources (uses):
Transfers in 1,612,600 1,612,600 1,612,600 -
Total other financing sources 1,612,600 1,612,600 1,612,600 -
Net change in fund balances - - 13 13
Fund balances, beginning - - 2,367,632 2,367,632
Fund balances, ending -$ -$ 2,367,645$ 2,367,645$
Budgeted AmountsVariance with Final
Budget - Positive
(Negative)

See accompanying independent auditor’s report92
City of Bowling Green, KentuckyBudgetary Comparison ScheduleCommunity Development Special Revenue FundYear Ended June 30, 2013
Original Final Actual
REVENUES
Intergovernmental 3,531,721$ 3,835,478$ 3,388,077$ (447,401)$
Investment income 1,400 1,400 903 (497)
Miscellaneous 71,670 236,670 249,615 12,945
Total revenues 3,604,791 4,073,548 3,638,595 (434,953)
EXPENDITURES
Current:
Neighborhood and community services 3,572,621 4,060,130 3,419,305 640,825
Capital outlay - 15,326 15,326 -
Total expenditures 3,572,621 4,075,456 3,434,631 640,825
Excess (deficiency) of revenues over
(under) expenditures 32,170 (1,908) 203,964 205,872
Other financing sources (uses):
Transfers in - - - -
Transfers out - - - -
Total other financing sources (uses) - - - -
Net change in fund balances 32,170 (1,908) 203,964 205,872
Fund balances, beginning 1,445,322 1,445,322 1,445,322 -
Fund balances, ending 1,477,492$ 1,443,414$ 1,649,286$ 205,872$
Variance with Final
Budget - Positive
(Negative)
Budgeted Amounts

See accompanying independent auditor’s report93
City of Bowling Green, KentuckyBudgetary Comparison ScheduleFire Improvement Special Revenue FundYear Ended June 30, 2013
Original Final Actual
REVENUES
Insurance premium taxes 1,700,000$ 1,700,000$ 1,891,245$ 191,245$
Judgments and settlements 15,500 15,500 13,598 (1,902)
Intergovernmental - 47,520 44,150 (3,370)
Investment income 11,600 11,600 4,599 (7,001)
Contributions and donations - - - -
Total revenues 1,727,100 1,774,620 1,953,592 178,972
EXPENDITURES
Current:
Public safety 331,515 381,899 263,293 118,606
Capital outlay 91,792 294,254 105,203 189,051
Total expenditures 423,307 676,153 368,496 307,657
Excess (deficiency) of revenues over
(under) expenditures 1,303,793 1,098,467 1,585,096 486,629
Other financing sources (uses):
Transfers out (1,464,200) (1,464,200) (1,462,918) 1,282
Transfers in - - - -
Proceeds from capital lease obligation - - - -
Proceeds from sale of capital assets - - - -
Total other financing sources (uses) (1,464,200) (1,464,200) (1,462,918) 1,282
Net change in fund balances (160,407) (365,733) 122,178 487,911
Fund balances, beginning 1,083,324 1,083,324 1,083,324 -
Fund balances, ending 922,917$ 717,591$ 1,205,502$ 487,911$
Variance with Final
Budget - Positive
(Negative)
Budgeted Amounts

See accompanying independent auditor’s report94
City of Bowling Green, KentuckyBudgetary Comparison ScheduleMunicipal Aid Special Revenue FundYear Ended June 30, 2013
Original Final Actual
REVENUES
Intergovernmental 3,609,500$ 4,002,548$ 3,481,922$ (520,626)$
Investment income 18,000 18,000 4,125 (13,875)
Miscellaneous 12,500 12,500 68,364 55,864
Total revenues 3,640,000 4,033,048 3,554,411 (478,637)
EXPENDITURES
Current:
Public safety 1,888,017 1,691,471 1,548,915 142,556
Public works 2,029,500 2,333,258 1,579,422 753,836
Capital outlay 78,500 133,779 89,918 43,861
Total expenditures 3,996,017 4,158,508 3,218,255 940,253
Excess (deficiency) of revenues over
(under) expenditures (356,017) (125,460) 336,156 461,616
Other financing sources (uses):
Transfers in 28,665 28,665 26,233 (2,432)
Transfers out (18,000) (18,000) (18,000) -
Total other financing sources (uses) 10,665 10,665 8,233 (2,432)
Net change in fund balances (345,352) (114,795) 344,389 459,184
Fund balances, beginning 3,629,733 3,629,733 3,629,733 -
Fund balances, ending 3,284,381$ 3,514,938$ 3,974,122$ 459,184$
Variance with Final
Budget - Positive
(Negative)
Budgeted Amounts

See accompanying independent auditor’s report95
City of Bowling Green, KentuckyBudgetary Comparison ScheduleJob Development Incentive Special Revenue FundYear Ended June 30, 2013
Original Final Actual
REVENUES
Wages and net profits taxes 1,091,000$ 1,091,000$ 1,050,826$ (40,174)$
Investment income 2,000 2,000 1,217 (783)
Total revenues 1,093,000 1,093,000 1,052,043 (40,957)
EXPENSES
Capital outlay - - - -
Excess of revenues over
expenditures 1,093,000 1,093,000 1,052,043 (40,957)
Other financing sources (uses):
Transfers in - 300,000 - (300,000)
Transfers out (1,215,495) (1,215,495) (1,193,165) 22,330
Total other financing sources (uses) (1,215,495) (915,495) (1,193,165) (277,670)
Net change in fund balances (122,495) 177,505 (141,122) (318,627)
Fund balances, beginning 472,710 472,710 472,710 -
Fund balances, ending 350,215$ 650,215$ 331,588$ (318,627)$
Variance with Final
Budget - Positive
(Negative)
Budgeted Amounts

See accompanying independent auditor’s report96
City of Bowling Green, KentuckyBudgetary Comparison ScheduleParks Development Special Revenue FundYear Ended June 30, 2013
Original Final Actual
REVENUES
Property taxes 404,750$ 404,750$ 405,093$ 343$
Wages and net profits taxes 1,059,000 1,209,000 1,202,475 (6,525)
Total revenues 1,463,750 1,613,750 1,607,568 (6,182)
Other financing sources (uses):
Transfers in - - - -
Transfers out (1,463,750) (1,613,750) (1,607,568) 6,182
Total other financing sources (uses) (1,463,750) (1,613,750) (1,607,568) 6,182
Net change in fund balances - - - -
Fund balances, beginning - - - -
Fund balances, ending -$ -$ -$ -$
Variance with Final
Budget - Positive
(Negative)
Budgeted Amounts

See accompanying independent auditor’s report97
City of Bowling Green, KentuckyBudgetary Comparison ScheduleLandfill Closure Special Revenue FundYear Ended June 30, 2013
Original Final Actual
REVENUES
Interest income 42,000$ 42,000$ 8,536$ (33,464)$
Contributions and donations - 102,015 59,209 (42,806)
Total revenues 42,000 144,015 67,745 (76,270)
EXPENDITURES
Current:
Public works 94,320 231,911 118,534 113,377
Total expenditures 94,320 231,911 118,534 113,377
Net change in fund balances (52,320) (87,896) (50,789) 37,107
Fund balances, beginning 1,447,940 1,447,940 1,447,940 -
Fund balances, ending 1,395,620$ 1,360,044$ 1,397,151$ 37,107$
Variance with Final
Budget - Positive
(Negative)
Budgeted Amounts

See accompanying independent auditor’s report98
City of Bowling Green, KentuckyBudgetary Comparison ScheduleLocal Law Enforcement Block Grant Special Revenue FundYear Ended June 30, 2013
Original Final Actual
REVENUES
Intergovernmental -$ 55,207$ 37,996$ (17,211)$
EXPENDITURES
Current:
Public safety - 34,300 48,322 (14,022)
Capital Outlay - 77,619 46,386 31,233
Total expenditures - 111,919 94,708 17,211
Net change in fund balances - (56,712) (56,712) -
Fund balances, beginning 56,712 56,712 56,712 -
Fund balances, ending 56,712$ -$ -$ -$
Variance with Final
Budget - Positive
(Negative)
Budgeted Amounts

See accompanying independent auditor’s report99
City of Bowling Green, KentuckyBudgetary Comparison ScheduleTrunking Operation Special Revenue FundYear Ended June 30, 2013
Original Final Actual
REVENUES
Intergovernmental 25,000$ 25,000$ 32,100$ 7,100$
Investment Income - - - -
Contributions and donations 7,100 7,100 - (7,100)
Total revenues 32,100 32,100 32,100 -
EXPENDITURES
Current:
Public works 49,850 49,850 39,496 10,354
Capital outlay 7,000 7,000 - 7,000
Total expenditures 56,850 56,850 39,496 17,354
Excess (deficiency) of revenues over
(under) expenditures (24,750) (24,750) (7,396) 17,354
Other financing sources (uses):
Transfers in 25,000 25,000 25,000 -
Total other financing sources (uses) 25,000 25,000 25,000 -
Net change in fund balances 250 250 17,604 17,354
Fund balances, beginning 109,057 109,057 109,057 -
Fund balances, ending 109,307$ 109,307$ 126,661$ 17,354$
Variance with Final
Budget - Positive
(Negative)
Budgeted Amounts

See accompanying independent auditor’s report100
City of Bowling Green, KentuckyBudgetary Comparison SchedulePolice Improvement Special Revenue FundYear Ended June 30, 2013
Original Final Actual
REVENUES
Charges for services 83,000$ 83,000$ 77,453$ (5,547)$
Investment income - - - -
Contributions and donations - - - -
Miscellaneous 52,500 52,500 42,562 (9,938)
Total revenues 135,500 135,500 120,015 (15,485)
EXPENDITURES
Public safety - 3,721 31,156 (27,435)
Capital outlay 35,600 34,036 - 34,036
Total expenses 35,600 37,757 31,156 6,601
Excess (deficiency) of revenues over
(under) expenditures 99,900 97,743 88,859 (8,884)
Other financing sources (uses):
Proceeds from sale of capital assets - - - -
Transfers in - - - -
Transfers out - - - -
Total other financing sources (uses) - - - -
Net change in fund balances 99,900 97,743 88,859 (8,884)
Fund balances, beginning 258,940 258,940 258,940 -
Fund balances, ending 358,840$ 356,683$ 347,799$ (8,884)$
Variance with Final
Budget - Positive
(Negative)
Budgeted Amounts

See accompanying independent auditor’s report101
City of Bowling Green, KentuckyBudgetary Comparison ScheduleLampkin Park Special Revenue FundYear Ended June 30, 2013
Original Final Actual
REVENUES
Contributions and donations 5,000$ 5,000$ 11,859$ 6,859$
Total revenues 5,000 5,000 11,859 6,859
Other financing sources (uses):
Transfers out - (30,000) (30,000) -
Net change in fund balances 5,000 (25,000) (18,141) 6,859
Fund balances, beginning 40,705 40,705 40,705 -
Fund balances, ending 45,705$ 15,705$ 22,564$ 6,859$
Variance with Final
Budget - Positive
(Negative)
Budgeted Amounts

See accompanying independent auditor’s report102
City of Bowling Green, KentuckyBudgetary Comparison ScheduleHomeland Security Special Revenue FundYear Ended June 30, 2013
Original Final Actual
REVENUES
Intergovernmental -$ 81,607$ 79,430 (2,177)$
Contributions and donations - - - -
Total revenues - 81,607 79,430 (2,177)
EXPENDITURES
Current:
Public safety - 81,607 79,430 2,177
Total expenditures - 81,607 79,430 2,177
Excess (deficiency) of revenues over
(under) expenditures - - - -
Other financing sources (uses):
Transfers in - - - -
Total other financing sources (uses) - - - -
Net change in fund balances - - - -
Fund balances, beginning - - - -
Fund balances, ending -$ -$ -$ -$
Variance with Final
Budget - Positive
(Negative)
Budgeted Amounts

See accompanying independent auditor’s report103
City of Bowling Green, KentuckyBudgetary Comparison ScheduleRiverfront Development Capital Projects FundYear Ended June 30, 2013
Original Final Actual
REVENUES
Intergovernmental -$ 258,958$ 107,245$ (151,713)$
Contributions and donations - - - -
Total revenues - 258,958 107,245 (151,713)
EXPENDITURES
Current:
Neighborhood and community services - 103,786 103,786 -
Capital outlay - 264,213 3,459 260,754
Total expenditures - 367,999 107,245 260,754
Excess (deficiency) of revenues over
(under) expenditures - (109,041) - 109,041
Other financing sources (uses):
Transfers out - - - -
Total other financing sources (uses) - - - -
Net change in fund balances - (109,041) - 109,041
Fund balances, beginning 216,113 216,113 216,113 -
Fund balances, ending 216,113$ 107,072$ 216,113$ 109,041$
Variance with Final
Budget - Positive
(Negative)
Budgeted Amounts

See accompanying independent auditor’s report104
City of Bowling Green, KentuckyBudgetary Comparison ScheduleEquipment Replacement Capital Projects FundYear Ended June 30, 2013
Original Final Actual
REVENUES
Intergovernmental -$ -$ -$ -$
Miscellaneous - - - -
Total revenues - - - -
EXPENDITURES
General Government - 55,712 39,758 15,954
Capital outlay 641,000 609,777 391,957 217,820
Total expenditures 641,000 665,489 431,715 233,774
Excess (deficiency) of revenues over
(under) expenditures (641,000) (665,489) (431,715) 233,774
Other financing sources (uses):
Transfers out (20,000) - - -
Transfers in 150,000 1,328,695 495,500 (833,195)
Net change in fund balances (511,000) 663,206 63,785 (599,421)
Fund balances, beginning 790,454 790,454 790,454 -
Fund balances, ending 279,454$ 1,453,660$ 854,239$ (599,421)$
Variance with Final
Budget - Positive
(Negative)
Budgeted Amounts

See accompanying independent auditor’s report105
City of Bowling Green, KentuckyBudgetary Comparison ScheduleRoad Construction Capital Projects FundYear Ended June 30, 2013
Original Final Actual
REVENUES
Contributions and donations -$ 1,075,000$ 1,075,000$ -$
Total revenues - 1,075,000 1,075,000 -
EXPENDITURES
Capital outlay 500,000 2,151,800 2,151,800 -
Total expenditures 500,000 2,151,800 2,151,800 -
Excess (deficiency) of revenues over
(under) expenditures (500,000) (1,076,800) (1,076,800)
Other financing sources (uses):
Transfers in 500,000 800,000 800,000 -
Transfers out - (223,200) - 223,200
Total other financing sources (uses) 500,000 576,800 800,000 223,200
Net change in fund balances - (500,000) (276,800) 223,200
Fund balances, beginning 500,000 500,000 500,000 -
Fund balances, ending 500,000$ -$ 223,200$ 223,200$
Variance with Final
Budget - Positive
(Negative)
Budgeted Amounts

See accompanying independent auditor’s report106
City of Bowling Green, KentuckyBudgetary Comparison ScheduleHennessey Way Construction Capital Projects FundYear Ended June 30, 2013
Original Final Actual
REVENUES
Contributions -$ -$ -$ -$
Miscellaneous - - - -
Total revenues - - - -
EXPENDITURES
Capital outlay 250,000 485,200 - 485,200
Total expenditures 250,000 485,200 - 485,200
Other financing sources (uses):
Transfer in 250,000 473,200 250,000
Net change in fund balances - (12,000) 250,000 262,000
Fund balances, beginning 12,000 12,000 12,000 -
Fund balances, ending 12,000$ -$ 262,000$ 262,000$
Variance with Final
Budget - Positive
(Negative)
Budgeted Amounts

See accompanying independent auditor’s report107
City of Bowling Green, KentuckyBudgetary Comparison ScheduleHeritage Trail Construction Capital Projects FundYear Ended June 30, 2013
Original Final Actual
REVENUES
Contributions and donations -$ -$ -$ -$
EXPENDITURES
Capital outlay - - - -
Net change in fund balances - - - -
Fund balances, beginning 196,702 196,702 196,702 -
Fund balances, ending 196,702$ 196,702$ 196,702$ -$
Variance with Final Budget - Positive
(Negative)
Budgeted Amounts

See accompanying independent auditor’s report108
City of Bowling Green, KentuckyBudgetary Comparison ScheduleSidewalk Replacement Capital Projects FundYear Ended June 30, 2013
Original Final Actual
EXPENDITURES
Current:
Public works -$ 27,703$ 3,727$ 23,976$
Capital outlay 400,000 855,010 252,865 602,145
Total expenditures 400,000 882,713 256,592 626,121
Other financing sources (uses):
Transfers in 400,000 400,000 400,000 -
Total other financing sources (uses) 400,000 400,000 400,000 -
Net change in fund balances - (482,713) 143,408 626,121
Fund balances, beginning 715,638 715,638 715,638 -
Fund balances, ending 715,638$ 232,925$ 859,046$ 626,121$
Variance with Final
Budget - Positive
(Negative)
Budgeted Amounts

See accompanying independent auditor’s report109
City of Bowling Green, KentuckyBudgetary Comparison ScheduleStormwater Infrastructure Improvement Capital Projects FundYear Ended June 30, 2013
Original Final Actual
EXPENDITURES
Current:
Public Works -$ 14,202$ 161$ 14,041$
Capital Outlay 500,000 935,116 293,473 641,643
Total expenditures (500,000) (949,318) (293,634) 655,684
Other financing sources (uses):
Transfers in 500,000 500,000 500,000 -
Net change in fund balances - (449,318) 206,366 655,684
Fund balances, beginning 449,318 449,318 449,318 -
Fund balances, ending 449,318$ -$ 655,684$ 655,684$
Variance with Final
Budget - Positive
(Negative)
Budgeted Amounts

See accompanying independent auditor’s report110
City of Bowling Green, KentuckyBudgetary Comparison ScheduleMunicipal Facilities Capital Projects FundYear Ended June 30, 2013
Original Final Actual
EXPENDITURES
Capital outlay 18,000$ 1,887,022$ 21,374$ 1,865,648$
Deficiency of revenues under expenditures (18,000) (1,887,022) (21,374) 1,865,648
Other financing sources (uses):
Transfers in 18,000 2,251,500 718,000 (1,533,500)
Net change in fund balances - 364,478 696,626 332,148
Fund balances, beginning 401,812 401,812 401,812 -
Fund balances, ending 401,812$ 766,290$ 1,098,438$ 332,148$
Variance with Final
Budget - Positive
(Negative)
Budgeted Amounts

See accompanying independent auditor’s report111
City of Bowling Green, KentuckyBudgetary Comparison Schedule800 Trunking Radio Systems Capital Projects FundYear Ended June 30, 2013
Original Final Actual
REVENUES
Contrubutions and donations -$ 285,000$ 284,930$ (70)$
Total revenues - 285,000 284,930 (70)
EXPENDITURES
Public Safety - 861,663 600,373 261,290
Total expenditures - 861,663 600,373 261,290
Other financing sources (uses):
Transfers in - 600,000 600,000 -
Total other financing sources (uses) - 600,000 600,000 -
Net change in fund balances - 23,337 284,557 261,220
Fund balances, beginning 1,891,664 1,891,664 1,891,664 -
Fund balances, ending 1,891,664$ 1,915,001$ 2,176,221$ 261,220$
Variance with Final
Budget - Positive
(Negative)
Budgeted Amounts
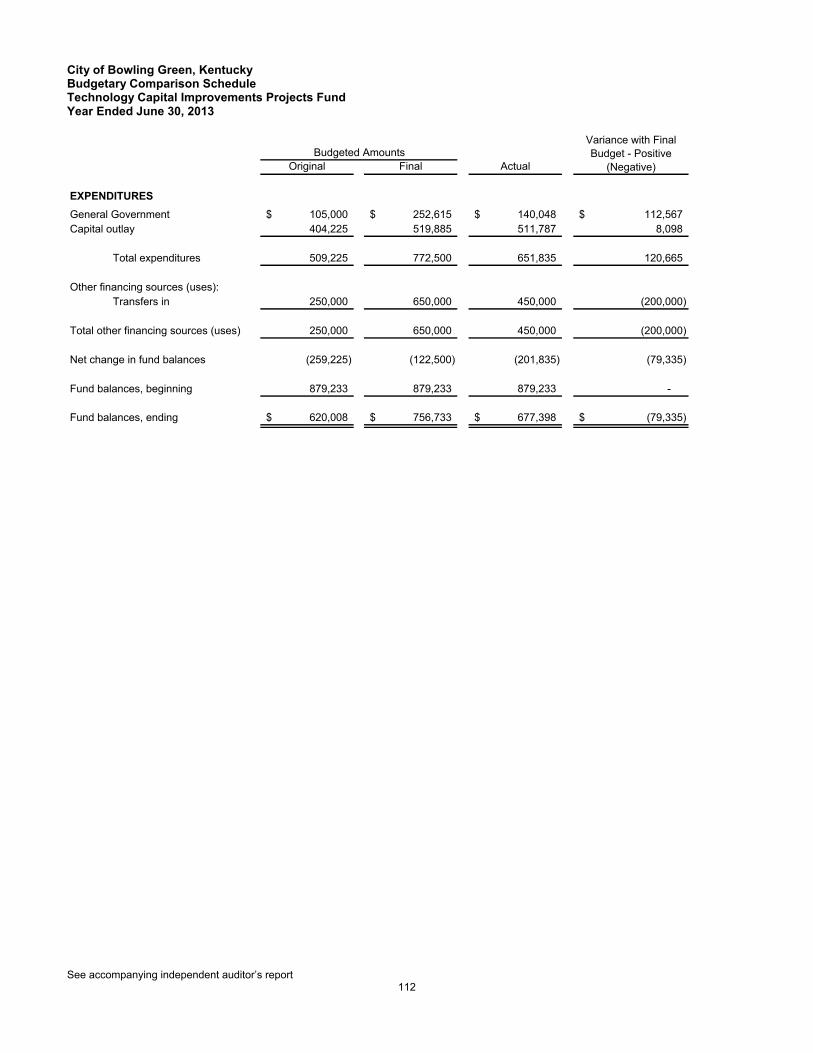
See accompanying independent auditor’s report112
City of Bowling Green, KentuckyBudgetary Comparison ScheduleTechnology Capital Improvements Projects FundYear Ended June 30, 2013
Original Final Actual
EXPENDITURES
General Government 105,000$ 252,615$ 140,048$ 112,567$
Capital outlay 404,225 519,885 511,787 8,098
Total expenditures 509,225 772,500 651,835 120,665
Other financing sources (uses):
Transfers in 250,000 650,000 450,000 (200,000)
Total other financing sources (uses) 250,000 650,000 450,000 (200,000)
Net change in fund balances (259,225) (122,500) (201,835) (79,335)
Fund balances, beginning 879,233 879,233 879,233 -
Fund balances, ending 620,008$ 756,733$ 677,398$ (79,335)$
Variance with Final
Budget - Positive
(Negative)
Budgeted Amounts

See accompanying independent auditor’s report113
NONMAJOR GOVERNMENTAL FUNDS
INTERNAL SERVICE FUNDS
Internal service funds are used to account for the financing of goods or services provided by one department or agency to other departments or agencies of the City and to other governmental units, on a cost reimbursement basis.
Fleet Maintenance FundThis fund is used to account for the operating costs of centralized maintenance of automotive equipment used by other City departments. Department billings are on a cost reimbursement basis.
Employee Health Care FundThis fund is used to account for the accumulation of resources for the purpose of funding medical costs of City employees and dependents.
Workers Compensation FundThis fund is used to account for the accumulation of resources for the purpose of funding workers compensation costs of City employees.
Property and Casualty FundThis fund is used to account for the accumulation of resources for the purpose of funding property and casualty costs of the City.

See accompanying independent auditor’s report
114
City of Bowling Green, KentuckyCombining Statement of Net Position – Internal Service FundsJune 30, 2013
Fleet Employee Workers Properly
Maintenance Health Care Compensation and Casualty Total
ASSETS
Current assets
Pooled cash and cash equivalents 502,598$ 670,365$ 597,894$ 1,123,289$ 2,894,146$
Investments - 3,576,269 1,161,179 - 4,737,448
Accounts receivable 30,000 - - - 30,000
Interest receivable - 10,563 190 - 10,753
Inventories 154,492 - - - 154,492
Prepaid items - 323,000 - - 323,000
Total current assets 687,090 4,580,197 1,759,263 1,123,289 8,149,839
Noncurrent assets
Capital assets
Building 200,986 - - - 200,986
Machinery and equipment 241,082 - 40,345 - 281,427
442,068 - 40,345 - 482,413
Less accumulated depreciation (314,664) - (38,272) - (352,936)
Total capital assets, net of accumulated depreciation 127,404 - 2,073 - 129,477
Total noncurrent assets 127,404 - 2,073 - 129,477
Total assets 814,494$ 4,580,197$ 1,761,336$ 1,123,289$ 8,279,316$
LIABILITIES
Current liabilities
Vouchers and accounts payable 78,150$ 134,173$ 23,140$ 4,083$ 239,546$
Accrued payroll 21,996 - 894 - 22,890
Insurance claims payable - 169,177 22,240 - 191,417
Current portion of compensated absences payable 12,863 - - - 12,863
Total current liabilities 113,009 303,350 46,274 4,083 466,716
Noncurrent liabilities
Compensated absences payable, net of current portion 4,668 - - - 4,668
Total liabilities 117,677 303,350 46,274 4,083 471,384
NET POSITION
Net investment in capital assets 127,404 - 2,073 - 129,477
Unrestricted 569,413 4,276,847 1,712,989 1,119,206 7,678,455
Total net position 696,817$ 4,276,847$ 1,715,062$ 1,119,206$ 7,807,932$

See accompanying independent auditor’s report
115
City of Bowling Green, KentuckyCombining Statement of Revenues, Expenses and Changes in Net Position – Internal Service FundsYear Ended June 30, 2013
Fleet Employee Workers Property
Maintenance Health Care Compensation and Casualty Total
OPERATING REVENUES
Charges for services 2,002,638$ -$ -$ -$ 2,002,638$
Insurance premiums - 4,288,905 608,145 - 4,897,050
Judgments and settlements 513 - - 21,619 22,132
Contributions and donations - - 2,748 - 2,748
Miscellaneous 2,666 106 - - 2,772
Total operating revenues 2,005,817 4,289,011 610,893 21,619 6,927,340
OPERATING EXPENSES
Personnel services 565,841 - 21,745 - 587,586
Contractual services 1,503 347,896 57,767 - 407,166
Supplies 1,206,958 7,819 947 16,818 1,232,542
Utilities 31,750 - - - 31,750
Repairs and maintenance 214,946 - 20,837 15,535 251,318
Insurance premiums and claims - 4,566,162 198,869 660,931 5,425,962
Depreciation 10,740 - 3,226 - 13,966
Miscellaneous 5,145 8,475 195 1,083 14,898
Total operating expenses 2,036,883 4,930,352 303,586 694,367 7,965,188
Operating income (loss) (31,066) (641,341) 307,307 (672,748) (1,037,848)
NONOPERATING REVENUES (EXPENSES)
Interest income - 38,086 9,256 - 47,342
Total nonoperating revenues - 38,086 9,256 - 47,342
Income (loss) before transfers (31,066) (603,255) 316,563 (672,748) (990,506)
Transfer in 33,733 - - 800,000 833,733
Transfers out - - (100,000) - (100,000)
Change in net position 2,667 (603,255) 216,563 127,252 (256,773)
Net position, beginning 694,150 4,880,102 1,498,499 991,954 8,064,705
Net position, ending 696,817$ 4,276,847$ 1,715,062$ 1,119,206$ 7,807,932$

See accompanying independent auditor’s report
116
City of Bowling Green, KentuckyCombining Statement of Cash Flows – Internal Service FundsYear Ended June 30, 2013
Fleet Employee Workers Property
Maintenance Health Care Compensation and Casualty Total
CASH FLOWS FROM OPERATING ACTIVITIES
Cash received from customers 1,976,764$ 4,296,360$ 611,004$ 21,619$ 6,905,747$
Payments to employees (563,043) - (22,168) - (585,211)
Payments to suppliers (1,424,870) (282,557) (73,132) (33,046) (1,813,605)
Insurance premiums and claims paid - (4,493,452) (297,057) (660,931) (5,451,440)
Net cash (used in) provided by operating activities (11,149) (479,649) 218,647 (672,358) (944,509)
CASH FLOWS FROM NONCAPITAL FINANCING ACTIVTIES
Transfers in (out) 33,733 - (100,000) 800,000 733,733
Net cash provided by (used in) noncapital financing activities 33,733 - (100,000) 800,000 733,733
CASH FLOWS FROM INVESTING ACTIVITIES
Interest received - 42,817 9,066 - 51,883
Sale of investments - 273,709 266,415 - 540,124
Net cash provided by investing activities - 316,526 275,481 - 592,007
Net increase (decrease) in cash and cash equivalents 22,584 (163,123) 394,128 127,642 381,231
Cash and cash equivalents, beginning of year 480,014 833,488 203,766 995,647 2,512,915
Cash and cash equivalents, end of year 502,598$ 670,365$ 597,894$ 1,123,289$ 2,894,146$
cash provided by operating activities
Operating income (loss) (31,066)$ (641,341)$ 307,307$ (672,748)$ (1,037,848)$
Adjustments to reconcile operating income (loss) to net cash
provided by (used in) operating activities:
Depreciation 10,740 - 3,226 - 13,966
Change in assets and liabilities
Accounts receivable (29,053) 7,349 111 - (21,593)
Inventories 21,383 - - - 21,383
Accounts payable 14,049 81,633 6,614 390 102,686
Compensated absences 1,590 - - - 1,590
Accrued payroll 1,208 - (423) - 785
Insurance claims payable - 72,710 (98,188) - (25,478)
Net cash provided by (used in) operating activities (11,149)$ (479,649)$ 218,647$ (672,358)$ (944,509)$
Reconciliation of operating income to net

117
NONMAJOR GOVERNMENTAL FUNDS
AGENCY FUNDS
Agency funds are used to account for assets held by the City as an agent for individuals, private organizations, other governments and/or other funds.
Claims FundImprest vendor paying agent for all government funds.
Payroll FundImprest paying agent for City payroll.
Tourist & Convention FundThis fund is used to account for the collection of a 4% hotel, motel transient room tax and payment to the Bowling Green Area Convention and Visitors Bureau and the Convention Center Corporation.
Tax Distribution FundThis fund is used to account for property tax collections and disbursement to General Fund and the Bowling Green Independent School System for property taxes billed and collected by the City on its behalf.
Treasurer’s Distribution FundThis fund is used to account for collection of miscellaneous receipts requiring disbursement to other outside agencies.

See accompanying independent auditor’s report118
City of Bowling Green, KentuckyCombining Statement of Changes in Assets and Liabilities – Agency FundsYear Ended June 30, 2013
Balance Balance
July 1, 2012 Additions Deductions June 30, 2013
CLAIMS FUND
Assets
Non-pooled cash and cash equivalents 1,629,855$ 106,264,466$ 106,213,193$ 1,681,128$
Liabilities
Other liabilities 1,629,855$ 106,264,466$ 106,213,193$ 1,681,128$
PAYROLL FUND
Assets
Non-pooled cash and cash equivalents 22,413$ 35,064,085$ 35,071,418$ 15,080$
Liabilities
Other liabilities 22,413$ 35,064,085$ 35,071,418$ 15,080$
TOURIST & CONVENTION FUND
Assets
Pooled cash and cash equivalents -$ 1,475,786$ 1,475,786$ -$
Liabilities
Due to Tourist Commission -$ 1,106,839$ 1,106,839$ -$
Due to Convention Center Corp. - 368,947 368,947 -
Total liabilities -$ 1,475,786$ 1,475,786$ -$
TAX DISTRIBUTION FUND
Assets
Pooled cash and cash equivalents -$ 19,504,718$ 19,504,718$ -$
Liabilities
Due to other funds -$ 9,527,581$ 9,527,581$ -$
Due to other taxing units - School Board - 9,353,943 9,353,943 -
Other liabilities - 623,194 623,194 -
Total liabilities -$ 19,504,718$ 19,504,718$ -$

See accompanying independent auditor’s report119
City of Bowling Green, KentuckyCombining Statement of Changes in Assets and Liabilities – Agency Funds (Continued)Year Ended June 30, 2013
Balance Balance
July 1, 2012 Additions Deductions June 30, 2013
TREASURER'S DISTRIBUTION FUND
Assets
Pooled cash and cash equivalents 109,715$ 191,835$ 195,165$ 106,385$
Liabilities
Due to other governmental units 109,715$ 191,835$ 195,165$ 106,385$
TOTALS - ALL AGENCY FUNDS
Assets
Pooled cash and cash equivalents 109,715$ 21,172,339$ 21,175,669$ 106,385$
Non-pooled cash and cash equivalents 1,652,268 141,328,551 141,284,611 1,696,208
Total assets 1,761,983$ 162,500,890$ 162,460,280$ 1,802,593$
Liabilities
Due to other funds -$ 9,527,581$ 9,527,581$ -$
Due to Tourist Commission - 1,106,839 1,106,839 -
Due to Convention Center Corp. - 368,947 368,947 -
Due to other taxing units - School Board - 9,353,943 9,353,943 -
Due to other governmental units 109,715 191,835 195,165 106,385
Other liabilities 1,652,268 141,951,745 141,907,805 1,696,208
Total liabilities 1,761,983$ 162,500,890$ 162,460,280$ 1,802,593$

See accompanying independent auditor’s report120
City of Bowling Green, KentuckyCombining Statement of Net Position – Component Units – Bowling Green Municipal UtilitiesJune 30, 2013
Electric Water-Sewer General Services
Division Division Division Total
ASSETS
Non-pooled cash and cash equivalents 7,513,610$ 1,848,457$ 157,256$ 9,519,323$
Receivables (net):
Accounts 8,104,886 1,320,818 41,590 9,467,294
Other 126,686 174,568 - 301,254
Inventories 1,053,703 175,415 138,722 1,367,840
Prepaid items 392,524 155,557 17,661 565,742
Long-term investments 100,000 - - 100,000
Prepayment to TVA 469,571 - - 469,571
Investments and restricted funds 1,275,155 4,887,277 - 6,162,432
Due from component units 26,181 6,406,391 76,625 6,509,197
Capital assets, net of accumulated depreciation:
Non-depreciable 5,339,524 69,046,601 101,708 74,487,833
Depreciable 47,760,736 73,145,644 4,414,962 125,321,342
Other assets 68,571 53,978 200,578 323,127
Total assets 72,231,147 157,214,706 5,149,102 234,594,955
LIABILITIES
Vouchers and accounts payable 7,848,999 1,099,407 96,650 9,045,056
Compensated absences payable 463,526 244,413 - 707,939
Accrued interest payable 1,079,985 117,368 - 1,197,353
Due to component unit 708,016 - 775,000 1,483,016
Security deposits 4,117,440 - - 4,117,440
Other current liabilities 766,118 219,166 86,791 1,072,075
Compensated absences payable, noncurrent 249,527 130,091 - 379,618
56,861 - - 56,861
Noncurrent liabilities:
Due within one year 260,000 4,052,491 40,234 4,352,725
Due in more than one year 6,871,808 75,044,323 127,106 82,043,237
Due to component unit - - 5,000,000 5,000,000
Total liabilities 22,422,280 80,907,259 6,125,781 109,455,320
NET POSITION
Net investment in capital assets 45,968,452 63,473,798 (650,670) 108,791,580
Restricted 1,375,155 4,278,231 - 5,653,386
Unrestricted 2,465,260 8,555,418 (326,009) 10,694,669
Total net position 49,808,867$ 76,307,447$ (976,679)$ 125,139,635$
Customer advances
Bowling Green Municipal Utilities

See accompanying independent auditor’s report121
City of Bowling Green, KentuckyCombining Statement of Revenues, Expenses and Changes in Net Position – Component Units – Bowling Green Municipal UtilitiesYear Ended June 30, 2013
Expenses
Charges for
Services
Operating
Contributions
Capital
Contributions Electric System
Water and
Sewer System
Fiber Optic
System Totals
Electric Division 84,451,189$ 85,820,286$ -$ -$ 1,369,097$ -$ -$ 1,369,097$
Water-Sewer Division 17,729,319 19,568,158 - 403,985 - 2,242,824 - 2,242,824
General Services Division 1,990,008 2,410,321 - - - - 420,313 420,313
Total component units 104,170,516$ 107,798,765$ -$ 403,985$ 1,369,097 2,242,824 420,313 4,032,234
General revenues:
Investment income 69,718 114,529 - 184,247
Merchandising revenues, net 44,865 - 3,641 48,506
Miscellaneous - 760,570 (17,212) 743,358
Total general revenues 114,583 875,099 (13,571) 976,111
Change in net position 1,483,680 3,117,923 406,742 5,008,345
Net position beginning of year 48,325,187 73,189,524 (1,383,421) 120,131,290
Net position end of year 49,808,867$ 76,307,447$ (976,679)$ 125,139,635$
Bowling Green Municipal Utilities
Program Revenues Net (Expense) Revenue and Changes in Net Position

122
STATISTICAL SECTION
The Statistical Section of the City of Bowling Green's comprehensive annual financial report presents detailed information as a context for understanding what the information in the financial statements, note disclosures, and required supplementary information says about the government's overall financial health.
Financial Trends: Tables 1 - 4
These schedules contain trend information to help the reader understand how the government's financial performance and well-being have changed over time.
Revenue Capacity: Tables 5 - 7
These schedules contain information to help the reader assess the government's most significant local revenue sources.
Debt Capacity: Tables 8 - 12
These schedules present information to help the reader assess the affordability of the government's current levels of outstanding debt and ability to issue additional debt in the future.
Demographic and Economic Information: Tables 13 - 14
These schedules offer demographic and economic indicators to help the reader understand the environment within which the government's financial activities take place.
Operating Information: Tables 15 -17
These schedules contain service and infrastructure data to help the reader understand how the information in the government's financial report relates to the services the government provides and the activities it performs.

See accompanying independent auditor’s report123
Schedule 1
City of Bowling Green
Net Position by Component
Last Ten Fiscal Years
(accrual basis of accounting)
2013 2012 2011 2010 2009 2008 2007 2006 2005 2004
Governmental activities
Net investment in capital assets 138,027,516$ 135,364,894$ 124,378,964$ 115,406,434$ 110,124,978$ 95,299,980$ 70,506,798$ 61,920,839$ 48,982,175$ 47,421,777$
Restricted 9,755,642 8,334,411 7,678,890 8,489,209 12,648,978 13,706,589 16,471,139 7,114,135 8,614,231 2,697,480
Unrestricted 22,355,235 14,779,013 11,861,503 10,322,628 3,791,321 30,702,914 35,938,960 32,220,951 24,642,192 14,287,360
Total governmental activities net position 170,138,393$ 158,478,318$ 143,919,357$ 134,218,271$ 126,565,277$ 139,709,483$ 122,916,897$ 101,255,925$ 82,238,598$ 64,406,617$
Business-type activities
Net investment in capital assets 6,831,728$ 6,697,127$ 6,601,646$ 6,073,639$ 5,673,876$ 4,914,526$ 4,536,514$ 4,391,188$ 4,007,468$ 4,148,183$
Restricted - 0 - - - - - - 533 16,967
Unrestricted 6,966,658 5,855,494 5,109,640 4,408,480 3,763,476 2,954,021 2,723,849 1,908,071 1,503,788 1,618,039
Total business-type activities net position 13,798,386$ 12,552,621$ 11,711,286$ 10,482,119$ 9,437,352$ 7,868,547$ 7,260,363$ 6,299,259$ 5,511,789$ 5,783,189$
Primary government
Net investment in capital assets 144,859,244$ 142,062,021$ 130,980,610$ 121,480,073$ 115,798,854$ 100,214,506$ 75,043,312$ 66,312,027$ 52,989,643$ 51,569,960$
Restricted 9,755,642 8,334,411 7,678,890 8,489,209 12,648,978 13,706,589 16,471,139 7,114,135 8,614,764 2,714,447
Unrestricted 29,321,893 20,634,507 16,971,143 14,731,108 7,554,797 33,656,935 38,662,809 34,129,022 26,145,980 15,905,399
Total primary government net position 183,936,779$ 171,030,939$ 155,630,643$ 144,700,390$ 136,002,629$ 147,578,030$ 130,177,260$ 107,555,184$ 87,750,387$ 70,189,806$
Fiscal Year

See accompanying independent auditor’s report124
Schedule 2
City of Bowling GreenChanges in Net Position, Last Ten Fiscal Years
(accrual basis of accounting)
2013 2012 2011 2010 2009 2008 2007 2006 2005 2004Expenses
Governmental activities: General government 16,265,264$ 15,273,247$ 15,155,819$ 12,874,758$ 14,240,674$ 14,963,398$ 11,585,397$ 10,620,708$ 9,839,358$ 5,895,705$ Public safety 23,180,539 22,297,308 21,843,704 22,477,932 20,629,290 20,888,002 18,477,954 17,028,198 16,864,958 16,260,982
Public works 6,207,967 7,576,164 6,700,923 7,782,325 6,276,210 6,445,139 8,024,218 6,407,082 6,126,248 5,144,685 Parks and recreation 5,280,474 5,011,216 5,478,404 4,895,725 4,715,430 4,643,176 4,579,136 4,318,574 4,056,394 3,989,799
Neighborhood and comm. services 4,787,160 5,158,144 4,948,826 4,739,011 5,562,852 4,533,189 5,891,219 5,221,716 4,170,122 3,716,744 Community services 1,070,544 1,341,318 1,238,015 2,446,270 24,078,708 4,087,698 3,016,601 2,585,297 2,445,889 2,406,986 Miscellaneous - - - - - - - - 5,595 280,874
Interest expense 6,634,088 6,498,659 5,670,703 6,789,892 7,033,869 4,380,214 3,501,788 3,478,617 3,470,870 2,991,536 Total governmental activities expenses 63,426,036$ 63,156,056$ 61,036,394$ 62,005,913$ 82,537,033$ 59,940,816$ 55,076,313$ 49,660,192$ 46,979,434$ 40,687,311$
Business-type activities: Golf course 2,066,604$ 2,759,341$ 2,366,430$ 2,323,270$ 2,342,624$ 2,379,799$ 2,375,208$ 2,316,855$ 2,251,191$ 2,116,158$
Aquatics 885,993 919,636 871,429 849,210 848,501 1,231,201 862,409 877,479 1,039,779 991,237 Convention center 673,102 904,908 607,015 823,333 742,829 850,659 682,734 897,524 1,087,721 1,136,688
Total business-type activities expenses 3,625,699 4,583,885 3,844,874 3,995,813 3,933,954 4,461,659 3,920,351 4,091,858 4,378,691 4,244,083
Total primary government expenses 67,051,735$ 67,739,941$ 64,881,268$ 66,001,726$ 86,470,987$ 64,402,475$ 58,996,664$ 53,752,050$ 51,358,125$ 44,931,394$
Program Revenues
Governmental activities Charges for services:
General government 4,650,906$ 3,728,986$ 3,415,888$ 3,095,600$ 3,545,304$ 2,234,584$ 2,124,151$ 1,072,180$ 1,248,536$ 603,853$ Public safety 252,181 269,502 187,098 187,228 250,696 294,866 191,964 199,137 572,295 113,112 Public works - - - - - - - - 668,347
Parks and recreation 380,360 389,486 398,333 421,798 390,693 382,818 323,999 361,444 351,497 591,871 Operating grants and contributions 9,538,468 7,308,403 8,425,923 8,986,469 7,311,410 7,544,586 6,445,180 5,614,030 5,242,315 5,570,258
Capital grants and contributions 5,169,106 13,461,928 9,941,334 8,339,284 7,689,270 14,582,910 17,335,681 7,856,470 4,185,783 2,847,325 Total governmental activities program revenues 19,991,021$ 25,158,305$ 22,368,576$ 21,030,379$ 19,187,373$ 25,039,764$ 26,420,975$ 15,103,261$ 11,600,426$ 10,394,766$
Business-type activities:
Charges for services: Golf course 1,368,727$ 1,438,517$ 1,275,821$ 1,316,218$ 1,429,946$ 1,416,483$ 1,430,200$ 1,369,313$ 1,326,003$ 1,388,009$
Aquatics 477,508 649,347 578,532 518,834 511,395 475,673 421,185 461,381 460,480 490,405 Convention center 212,823 205,503 216,665 214,459 223,958 203,324 194,675 312,682 570,517 287,876 Operating grants and contributions - - - - - - - - - -
Capital grants and contributions - - - - - - - - - - Total business-type activities 2,059,058 2,293,367 2,071,018 2,049,511 2,165,299 2,095,480 2,046,060 2,143,376 2,357,000 2,166,290
Total primary government program revenues 22,050,079$ 27,451,672$ 24,439,594$ 23,079,890$ 21,352,672$ 27,135,244$ 28,467,035$ 17,246,637$ 13,957,426$ 12,561,056$
Net (Expense)/Revenue
Governmental activities (43,435,015)$ (37,997,751)$ (38,667,818)$ (40,975,534)$ (63,349,660)$ (34,901,052)$ (28,655,338)$ (34,556,931)$ (35,379,008)$ (30,292,545)$Business-type activities (1,566,641) (2,290,518) (1,773,856) (1,946,302) (1,768,655) (2,366,179) (1,874,291) (1,948,482) (2,021,691) (2,077,793)
Total primary government net expense (45,001,656)$ (40,288,269)$ (40,441,674)$ (42,921,836)$ (65,118,315)$ (37,267,231)$ (30,529,629)$ (36,505,413)$ (37,400,699)$ (32,370,338)$
Fiscal Year

See accompanying independent auditor’s report125
2013 2012 2011 2010 2009 2008 2007 2006 2005 2004General Revenues and Other Changes in Net Assets
Governmental activities: Taxes
Property taxes 11,763,153$ 11,377,484$ 11,220,959$ 11,346,706$ 10,824,938$ 11,871,893$ 10,835,879$ 13,163,115$ 10,797,549$ 10,401,190$
Insurance premium taxes a
3,342,087 3,156,411 3,087,621 3,140,598 3,100,377 3,154,521 3,097,857 - - - Wages and net profits taxes 41,392,272 39,490,949 37,220,689 35,502,869 36,016,500 36,502,625 37,247,653 37,285,158 35,711,658 29,965,370 Gain (loss) on sale of capital assets 53,678 - (1,839,170) - - - (872,410) 44,519 6,107 (226,900)
Judgements and settlements - - - - - - - 730,458 427,363 - Investment income 644,577 815,700 886,084 1,031,911 2,435,228 2,351,828 2,253,732 1,787,940 957,679 588,707
Miscellaneous 251,083 262,868 270,561 144,527 696,997 327,802 159,972 148,603 1,302,587 1,235,134 Transfers (2,351,760) (2,546,700) (2,477,840) (2,538,083) (2,868,586) (2,515,031) (2,406,373) (2,318,501) (1,651,859) (1,613,157) Total governmental activities 55,095,090$ 52,556,712$ 48,368,904$ 48,628,528$ 50,205,454$ 51,693,638$ 50,316,310$ 50,841,292$ 47,551,084$ 40,350,344$
Business-type activities:
Taxes Property taxes -$ -$ -$ -$ -$ -$ -$ -$ -$ 512,710$
Transient room taxes 460,640 432,158 420,300 382,340 396,518 398,381 369,162 373,236 379,571 - Gain (loss) on sale of capital assets - - - - - - - (10,854) 10,386 (777) Judgements and settlements - - - - - - - - - 16,162
Investment income 6 152,995 84,510 70,646 72,356 60,951 59,860 55,069 39,089 11,987 Miscellaneous - - 20,373 - - - - - 17,542 -
Transfers 2,351,760 2,546,700 2,477,840 2,538,083 2,868,586 2,515,031 2,406,373 2,318,501 1,651,859 1,613,157 Total business-type activities 2,812,406 3,131,853 3,003,023 2,991,069 3,337,460 2,974,363 2,835,395 2,735,952 2,098,447 2,153,239 Total primary government 57,907,496$ 55,688,565$ 51,371,927$ 51,619,597$ 53,542,914$ 54,668,001$ 53,151,705$ 53,577,244$ 49,649,531$ 42,503,583$
Changes in Net Position
Governmental activities 11,660,075$ 14,558,961$ 9,701,086$ 7,652,994$ (13,144,206)$ 16,792,586$ 21,660,972$ 16,284,361$ 12,172,076$ 10,057,799$ Business-type activities 1,245,765 841,335 1,229,167 1,044,767 1,568,805 608,184 961,104 787,470 76,756 75,446
Total primary government 12,905,840$ 15,400,296$ 10,930,253$ 8,697,761$ (11,575,401)$ 17,400,770$ 22,622,076$ 17,071,831$ 12,248,832$ 10,133,245$
Note: (a) Insurance premium taxes were previously reported in the property tax line.
Fiscal Year

See accompanying independent auditor’s report126
Schedule 3City of Bowling GreenFund Balances, Governmental FundsLast Ten Fiscal Years(modified accrual basis of accounting)
2013 2012 2011 2010 2009 2008 2007 2006 2005 2004
General FundNonspendable 102,022$ 110,067$ 116,591$ -$ -$ -$ -$ -$ -$ -$ Reserved - - - 580,258 1,843,259 2,175,158 853,653 681,409 573,802 991,825 Restricted - - 28,381 - - - - - - - Committed 10,476,400 10,142,001 7,153,358 - - - - - - - Assigned 4,147,690 3,946,030 2,350,558 - - - - - - - Unassigned 4,084,127 4,288,920 8,083,626 - - - - - - - Unreserved - - - 16,393,728 13,888,739 15,328,742 20,593,019 21,042,696 16,742,378 10,721,868
Total General Fund 18,810,239$ 18,487,018$ 17,732,514$ 16,973,986$ 15,731,998$ 17,503,900$ 21,446,672$ 21,724,105$ 17,316,180$ 11,713,693$
All Other Governmental FundsRestricted 17,445,124 17,804,417 20,223,543 4,992,442$ 3,672,061$ 6,198,535$ 6,364,120$ 4,340,670$ 3,348,334$ 5,115,715$ Committed 4,093,440 3,875,464 - - - - - - - - Assigned 11,005,485 9,810,617 11,382,712 - - - - - - - Unassigned - - - - - - - - - - Unreserved, reported in: - - - - - - - - - -
Special Revenue funds - - - 25,691,575 27,562,694 24,465,839 7,658,317 8,367,593 7,091,740 5,305,482 Capital Projects funds - - - 3,285,091 8,778,626 8,619,293 13,733,273 2,747,696 4,887,593 6,722,685
Debt Service funds - - - - - 47,702 104,610 105,116 104,949 a
- Permanent fund - - - 36,806 93,736 67,610 47,988 32,288 541,276 104,014
Total all other governmental funds 32,544,049$ 31,490,498$ 31,606,255$ 34,005,914$ 40,107,117$ 39,398,979$ 27,908,308$ 15,593,363$ 15,973,892$ 17,247,896$
Note: (a) FY2005 was the first year Debt Service funds reported a fund balance.
Implementation of GASB Statement 54 resulted in the following new governmental fund balance classifications: NonspendableCommittedAssignedUnassigned
Effective with FY2011, the unrestricted governmental fund balance is eliminated.
Fiscal Year

See accompanying independent auditor’s report127
Schedule 4
City of Bowling GreenChanges in Fund Balances, Governmental FundsLast Ten Fiscal Years(modified accrual basis of accounting)
2013 2012 2011 2010 2009 2008 2007 2006 2005 2004
Revenues
Taxes 11,642,257$ 11,233,161$ 11,094,132$ 11,174,838$ 10,633,642$ 11,743,169$ 10,835,879$ a
13,163,115$ 10,797,549$ 10,401,190$
Insurance premium taxes 3,342,087 3,131,426 3,087,621 3,140,598 3,100,377 3,154,521 3,097,857 a
- - -
Wage and net profit taxes 41,392,272 39,490,949 37,218,764 35,502,869 36,111,281 36,681,744 37,406,227 b
37,285,157 35,711,658 31,085,066
Licenses and permits 1,196,829 1,225,876 1,008,531 1,164,737 898,603 945,383 735,949 b
- - - Intergovernmental 9,699,484 10,282,887 10,490,457 12,457,418 9,836,174 10,453,862 11,392,786 9,868,433 9,428,098 8,417,583
Investment income 597,234 709,096 774,589 940,504 2,236,555 2,099,729 2,017,219 c
- - - Charges for services 655,280 617,189 572,038 616,196 481,491 547,340 595,021 571,009 572,295 451,453 Parks and recreation 345,951 352,727 379,821 410,111 380,317 372,484 323,999 361,444 351,497 383,879 Rental Income 3,698,284 1,418,056 1,410,533 976,868 1,685,901 - - - - - Miscellaneous 2,045,088 678,284 1,007,904 492,125 954,532 591,109 965,356 3,050,865 2,188,073 1,813,668
Total revenues 74,614,766 69,139,651 67,044,390 66,876,264 66,318,873 66,589,341 67,370,293 64,300,023 59,049,170 52,552,839
Expenditures
General government 5,929,691 6,416,600 6,319,543 6,753,844 6,899,349 8,512,371 7,018,903 6,490,388 6,034,350 5,721,598
Public safety 26,153,318 24,472,880 23,911,824 24,774,100 23,200,660 23,276,993 21,382,962 19,849,913 17,481,667 15,716,344 Public works 7,611,230 7,879,907 7,330,975 7,590,188 7,862,753 6,885,983 7,369,126 7,518,741 6,504,418 5,204,488 Parks and recreation 5,733,383 5,298,687 5,591,502 4,986,858 5,412,954 5,758,676 5,107,121 4,274,028 3,913,462 3,722,246
Neighborhood & Community Services 4,979,298 5,756,566 5,194,215 6,937,549 27,800,163 6,062,010 6,652,290 5,298,730 4,253,515 3,784,107 Community services 423,326 625,098 461,995 751,278 1,066,412 3,116,912 3,016,601 2,576,613 2,437,205 2,373,892 Miscellaneous - - - - - - - - 5,595 285,827 Capital outlay 3,883,548 2,491,802 5,879,013 5,675,679 12,407,497 10,561,509 9,324,923 6,254,064 9,846,885 10,198,474 Debt service:
Principal 10,131,855 7,391,770 6,798,046 5,489,095 5,009,606 4,201,347 4,757,074 3,506,898 2,648,501 2,172,095 Interest and fiscal charges 5,315,976 5,632,984 6,145,566 6,655,188 7,277,785 4,500,337 3,403,076 3,403,726 3,576,060 3,206,406
Total Expenditures 70,161,625 65,966,294 67,632,679 69,613,779 96,937,179 72,876,138 68,032,076 59,173,101 56,701,658 52,385,477
Excess (deficiency) of revenues over (under) expenditures 4,453,141 3,173,357 (588,289) (2,737,515) (30,618,306) (6,286,797) (661,783) 5,126,922 2,347,512 167,362
Fiscal Year

See accompanying independent auditor’s report128
Other Financing Sources (Uses)
Transfers in 12,547,232 13,721,906 10,727,493 14,823,177 19,275,432 14,236,314 12,653,038 9,202,125 9,336,999 6,640,294 Transfers out (15,632,723) (16,452,014) (13,105,332) (17,011,260) (22,144,018) (16,816,345) (15,186,551) (11,448,126) (10,893,858) (8,148,010) Issuance of debt - - - - 31,420,000 - - - 1,630,000 14,658,705 Premium on general obligation bonds - - - - 667,110 - 83,038 - - 237,204 Discount on general obligation bonds - - - - (8,009) - - - - (1,643) Capital lease proceeds - - 1,309,391 - - - - - 1,708,594 212,000 General Obligation note proceeds - - - - - - - - - 1,730,000 General Obligation bond proceeds - - - - - - 14,682,962 - - - Issuance of refunding debt 4,099,807 7,409,463 29,627,561 - 12,119,800 30,443,095 - - - - Payment to refunded bonds redeemed 170,747 - - - (2,147,888) - - - - - Payments to refunded debt escrow agent (4,281,161) (7,718,497) (29,627,561) - (9,971,912) (13,803,815) - - - - Premium from bond refunding 19,731 319,639 - - - - - - - - Other financing costs - - - - (319,653) - - - - Sale of capital assets - 184,893 15,604 66,383 344,027 95,100 466,807 1,146,475 199,236 213,637
Total other financing sources (uses) (3,076,367) (2,534,610) (1,052,844) (2,121,700) 29,554,542 13,834,696 12,699,294 (1,099,526) 1,980,971 15,542,187
Net Change in fund balances 1,376,774$ 638,747$ (1,641,133)$ (4,859,215)$ (1,063,764)$ 7,547,899$ 12,037,511$ 4,027,396$ 4,328,483$ 15,709,549$
Debt service as a percentage of noncapital expenditures 24.37% 24.37% 22.78% 21.03% 15.55% 21.74% 18.28% 13.41% 12.75% 12.04%
(a) Insurance Premium Taxes were previously reported as Property Tax Revenue.
(b) Licenses and Permits were previously reported under Wage and Net Profit Taxes.
(c) Investment Income was previously reported as Miscellaneous Revenue.
(d) Neighborhood & Community Services was previously known as Community Development.

See accompanying independent auditor’s report129
Schedule 5City of Bowling GreenWage Withholding Fees Last Ten Fiscal Years
Fiscal Year
Ended June 30, Total Gross Wages
Occupational
Withholding Fees
Total Direct
Tax Rate2004 1,128,756,300$ 22,575,126$ 2.00%2005 1,271,473,750 25,429,475 2.00%2006 1,369,273,450 27,385,469 2.00%
2007 1,437,833,982 28,103,464 1.85% a
2008 1,528,058,865 28,269,089 1.85%
2009 1,506,249,500 27,865,616 1.85%
2010 1,517,902,824 28,081,202 1.85%2011 1,559,791,267 28,856,139 1.85%2012 1,672,226,810 30,936,196 1.85%2013 1,732,990,595 32,060,326 1.85%
Source: City of Bowling Green, Department of Finance
Note: Prior to fiscal year 1997, all businesses paid occupational withholding fees on a quarterly basis. Due to a change in City code, large employersbegan paying employee withholdings on a monthly basis.
a The new tax rate of 1.85% began on January 1, 2007, returns were based on this rate beginning in February 2007.

See accompanying independent auditor’s report130
Schedule 6City of Bowling GreenDirect Occupational License Tax Rates,Last Ten Fiscal Years
Fiscal Year
City of Bowling
Green Direct Rate Total Direct2004 2.00% 2.00%2005 2.00% 2.00%2006 2.00% 2.00%2007 1.85% 1.85%2008 1.85% 1.85%2009 1.85% 1.85%2010 1.85% 1.85%2011 1.85% 1.85%2012 1.85% 1.85%2013 1.85% 1.85%
Source: City of Bowling Green, Department of Finance
Note: (a) Occupational License Tax Rates include the Net Profit Fees and WageWithholding fees.
(b) The new tax rate of 1.85% began January 1, 2007, returns were based on this rate beginning February of 2007.

See accompanying independent auditor’s report131
Schedule 7City of Bowling GreenPrincipal Occupational Withholdings Fees PayersCurrent Year and Nine Years Ago
2013 2004Bowling Green Independent Schools Bowling Green Independent SchoolsBowling Green Metalforming LLC City of Bowling GreenCommonwealth of Kentucky Commonwealth of Kentucky
Country Oven Bakery County Oven BakeryGeneral Motors Corporation Desa Heating LLCSun Products Corporation General Motors CorporationThe Medical Center at BG The Medical Center at BGUnion Underwear Co. LLC Union Underwear Co. LLCWarren County Board of Education Warren County Board of EducationWestern Kentucky University Western Kentucky University
Source: City of Bowling Green, Department of Finance
Note: Taxpayer information is listed alphabetically.
General Motors previously was listed as NAO Comp Oper-North American Oper.
Taxpayer

See accompanying independent auditor’s report132
Schedule 8City of Bowling GreenRatios of Oustanding Debt by TypeLast Ten Fiscal Years
Fiscal
Year
General
Obligation
Bonds
Lease
Revenue
Bonds
Special
Assessment
Bonds (a)
Notes
Payable and
Capital
Leases
General
Obligation
Bonds
Lease
Revenue
Bonds
Notes
Payable and
Capital
Leases
Total
Primary
Government
Percentage
of Personal
Income (b)
Per
Capita (b)
2004 66,537,320$ 3,240,000$ 160,241$ 7,542,796$ 15,969,295$ -$ 405,894$ 93,855,546$ 3.77% 1,805
2005 65,738,223 2,805,000 153,331 9,630,041 14,408,408 - 318,668 93,053,671 3.52% 1,789
2006 64,175,565 2,350,000 148,250 8,129,023 13,427,668 - 233,686 88,464,192 3.25% 1,701
2007 77,134,277 1,350,000 143,167 6,106,234 13,385,722 - 153,352 98,272,752 3.34% 1,890
2008 102,042,174 1,230,000 136,590 5,577,154 12,287,828 - 98,893 121,372,639 3.98% 2,248
2009 132,181,377 - 131,906 4,510,477 11,288,624 - 60,698 148,173,082 4.64% 2,694
2010 128,561,433 - 125,229 3,241,585 10,073,568 - 47,544 142,049,359 4.17% 2,492
2011 124,964,655 - 118,419 3,944,088 9,165,353 - 28,925 138,221,440 4.02% 2,383
2012 119,325,846 - 112,506 3,412,034 8,274,155 - 50,256 131,174,797 3.90% 2,223
2013 108,501,710 - - 2,871,504 6,752,559 - 34,390 118,160,163 3.19% 1,950
Note: Details regarding the city's outstanding debt can be found In the notes to the financial statements.
(a) Warren County Water District bonds.
(b) See Schedule 13 for personal income and population data. The ratios are calculated using personal income and population for the
prior calendar year.
Governmental Activities Business-Type Activities

See accompanying independent auditor’s report133
Schedule 9City of Bowling GreenRatios of General Bonded Debt Outstanding
Last Ten Fiscal Years
2013 2012 2011 2010 2009 2008 2007 2006 2005 2004
General bonded debt outstandingGeneral obligation bonds 108,501,710$ 119,325,846$ 124,964,655$ 128,561,433$ 132,181,377$ 102,042,174$ 77,134,277$ 64,175,565$ 65,738,223$ 66,537,320$ Lease revenue bonds - - - - - 1,230,000 1,350,000 2,350,000 2,805,000 3,240,000 Special Assessment bonds - 112,506 118,419 125,229 131,906 136,590 143,167 148,250 153,331 160,241
Total 108,501,710$ 119,438,352$ 125,083,074$ 128,686,662 132,313,283 103,408,764 78,627,444 66,673,815 68,696,554 69,937,561
Less: Amounts set aside to repay general debt - - - - - (47,702) (104,610) (105,116) (105,482) (106,397)
Net general bonded debt 108,501,710$ 119,438,352$ 125,083,074$ 128,686,662$ 132,313,283$ 103,361,062$ 78,522,834$ 66,568,699$ 68,591,072$ 69,831,164$
Property Values 4,941,833,867$ 4,725,859,276$ 4,565,229,850$ 4,551,808,439$ 4,489,771,784$ 4,394,868,241$ 4,094,335,746$ 3,394,130,088$ 3,117,333,952$ 2,942,526,746$
Percentage of estimated
actual taxable value of property 2.20% 2.53% 2.74% 2.83% 2.95% 2.35% 1.92% 1.96% 2.20% 2.37%
Per capita (a) 1,790 2,024 2,194 2,258 2,406 1,914 1,510 1,280 1,319 1,343
Note: Details regarding the city's outstanding debt can be found in the notes to financial statements.
(a) Population data can be found in Schedule 13.
Fiscal Year

See accompanying independent auditor’s report134
Schedule 10City of Bowling GreenDirect and Overlapping Governmental Activities DebtAs of June 30, 2013
Governmental Unit
Debt
Outstanding
(1)
Estimated
Percentage
Applicable
(2)
Estimated Share of
Overlapping Debt
Bowling Green Independent Schools 36,122,000$ 100.00% 36,122,000$
Warren County 78,375,000 57.68% 45,203,625
Warren County Schools 135,031,235 49.80% 67,243,854
Bowling Green Municipal Utilities 96,963,674 100.00% 96,963,674
Subtotal, overlapping debt 245,533,153
City direct debt 118,194,553
Total direct and overlapping debt 363,727,706$
Notes:
(1) Gross governmental debt, less reserves.
(2) Determined by ratio of assessed valuation of property subject to taxation in overlapping unit to valuation of property subject to taxation in the City of Bowling Green.(Warren County ratio = City + Annex/All Districts; Warren County Schools = Annex/County
+ Annex)
Sources:
Bowling Green Municipal Utilities Bowling Green Board of Education Warren County Treasurer Warren County Board of Education

See accompanying independent auditor’s report135
Schedule 11City of Bowling Green
Legal Debt Margin Information Assessed value 4,941,833,867
Last Ten Fiscal Years Debt Limit (10% of assessed value) 494,183,387 Debt applicable to limit:
General Obligation bonds 115,254,269 Notes and Capital Leases payable 2,905,894 Less: Amount set aside for
repayment of general
obligation debt - Less: Non tax-supported debt 34,390
Total net debt applicable to limit 118,194,553
Legal debt margin 375,988,834$
2013 2012 2011 2010 2009 2008 2007 2006 2005 2004
Debt Limit 494,183,387$ 472,585,927$ 456,522,985$ 455,180,844$ 448,977,178$ 439,486,824$ 409,433,575$ 339,413,009$ 311,733,395$ 321,124,611$
Total net debt applicable to limit 118,194,553 129,153,378 135,935,233 140,594,305 145,580,339 117,768,696 94,166,847 80,217,030 85,646,789 93,892,441
Legal Debt Margin 375,988,834$ $343,432,549 320,587,752$ 314,586,539$ 303,396,839$ 321,718,128$ 315,266,728$ 259,195,979$ 226,086,606$ 227,232,170$
Total net debt applicable to limitas a percentage of debt limit 23.92% 27.33% 29.78% 30.89% 32.42% 26.80% 23.00% 23.63% 27.47% 29.24%
Note: (a) Under Section 158 of the Consitutition of Commonwealth of Kentucky, the city's outstanding debt is not to exceed 10 percent of total assessed property value.
Fiscal Year
Legal Debt Margin Calculation for Fiscal Year 2013

See accompanying independent auditor’s report136
Schedule 12City of Bowling GreenPledged-Revenue CoverageLast Ten Fiscal Years
Principal Interest Principal Interest Principal Interest
2004 92,565$ 16,000$ 71,596$ 1.06 26,575$ 5,000$ 19,575$ 1.08
2005 115,120 24,000 86,151 1.05 26,238 5,000 19,238 1.08
2006 114,776 25,000 84,808 1.05 25,900 5,000 18,900 1.08
2007 112,572 29,000 81,468 1.02 29,997 10,000 18,563 1.05
2008 111,571 29,000 83,125 1.00 29,513 10,000 17,888 1.06 16,150 6,273 9,877 1.00
2009 117,482 33,000 85,712 0.99 29,238 10,000 19,213 1.00 16,150 6,577 9,574 1.00
2010 126,701 34,000 83,840 1.08 29,632 10,000 18,538 1.04 15,581 6,896 9,255 0.96
2011 107,345 40,000 82,560 0.88 28,003 10,000 17,863 1.01 15,385 7,229 8,921 0.95
2012 131,031 42,000 74,643 1.12 27,112 10,000 17,188 1.00 16,247 7,579 8,571 1.01
2013 122,336 42,000 77,580 1.02 26,210 10,000 16,513 0.99 15,387 7,946 8,204 0.95
Notes: (a) The Stonehenge Sections I-V and Cedar Grove Section IX Special Assessment revenues
are collected from property owners in each district to fund the development of the subdivisions
and to provide amentities such as sidewalk infrastructure.
(b) Lovers Lane Special Assessment revenues are collected from property owners to fund the development of underground utilities. This special assessment is new for fiscal year 2008.
Lovers Lane (b)
Special
Assessment
Collections
Debt Service
Coverage
Stonehenge Sections I-V (a) Cedar Grove Section IX (a)
Coverage
Fiscal
Year
Special
Assessment
Collections
Debt Service
Coverage
Special
Assessment
Collections
Debt Service

See accompanying independent auditor’s report137
Schedule 13City of Bowling GreenDemographic and Economic StatisticsLast Ten Calendar Years
Year Population (a) Personal Income (b)
Per Capita Personal
Income (c)Median Age (d)
School Enrollment (e)
Percentage of Workforce
Unemployed (f)
2004 52,000 2,489,642,000$ 26,056$ 29 15,944 4.3%2005 52,000 2,644,620,000 27,218 29 15,469 5.5%2006 52,000 2,723,959,000 28,035 29 15,791 5.2%2007 52,000 2,941,885,397 29,737 29 16,502 4.6%2008 54,000 3,051,745,000 29,849 29 16,251 4.6%2009 55,000 3,195,505,000 30,802 29 16,107 8.0%2010 57,000 3,410,173,000 31,993 29 17,917 9.9%2011 58,000 3,438,236,000 31,640 28 18,157 9.0%2012 59,000 3,359,422,000 29,426 28 18,128 7.9%2013 60,600 3,699,388,000 32,025 28 18,957 7.2%
Sources: (a) Estimated population statistics obtained from the U.S Census Bureau (http://quickfacts.census.gov/qfd/states/21/2108902.html).
(c) Personal Income data obtained from www.bea.gov (Bureau of Economic Analysis).
(c) Income Per Capita obtained from www.bea.gov (Bureau of Economic Analysis).
(d) U.S. Department of the Census American FactFinder (2010 Census)(http://factfinder2.census.gov).
(e) Refer to www.education.ky.gov for public school information and www.greatschools.orgfor private school information. Schools included are Bowling Green Board of Education, Warren County Board of Education, and private schools. Western Kentucky University is excluded.
(f) Bureau of Labor Statistics (www.bls.gov), figures not seasonally adjusted, average for fiscal year.
Note: (1) Personal and Per Capita Income correspond to the full calendar year prior to fiscal year end. Vaules are derived from Warren County population statistics.

See accompanying independent auditor’s report138
Schedule 14City of Bowling GreenPrincipal EmployersCurrent Year and Nine Years Ago
Employer Employees Rank
Percentage of Total City Employment Employees Rank
Percentage of Total City Employment
Western Kentucky University 4,741 1 7.54% 3,979 1 7.21%The Medical Center at BG 2,145 2 3.41% 1,630 2 2.95%Union Underwear Co. LLC 1,610 3 2.56% 837 3 1.52%Sun Products 975 4 1.55% ---- ---- ----Warren County Board of Education 941 5 1.50% 680 5 1.23%Express Services Inc 878 6 1.40% ---- ---- ----Wal-Mart Associates Inc. 851 7 1.35% 593 9 1.07%Houchens Food Group Inc. 816 8 1.30% 703 4 1.27%BG Metalforming LLC 755 9 1.20% ---- ---- ----Commonwealth of Kentucky 700 10 1.11% ---- ---- ----Bowling Green Independent Schools ---- ---- ---- 553 10 1.00%Desa International Inc. ---- ---- ---- 623 7 1.13%City of Bowling Green ---- ---- ---- 610 8 1.11%Eagle Industries LLC & Subs ---- ---- ---- 644 6 1.17%
Total 14,412 22.91% 10,852 19.66%
Sources: City of Bowling Green, Department of FinanceBowling Green Area Chamber of Commerce Bureau of Labor and Statistics (www.bls.gov)
Note: North America Operations (NAO Comp Oper) is now listed as General Motors Corporation
2013 2004

See accompanying independent auditor’s report139
Schedule 15City of Bowling GreenFull-time Equivalent City Government Employees by Function/ProgramLast Ten Fiscal Years
2013 2012 2011 2010 2009 2008 2007 2006 2005 2004Function/Program
General government 41 41 42 41 45 45 44 44 46 46 Administration 7 7 7 7 6 6 6 4 4 4 Citizen's Assistance - - - 6 7 7 9 9 9 Finance 17 18 18 18 18 17 17 17 19 20 Human Resources 6 5 6 6 5 6 6 6 6 6 Legal 2 2 2 2 2 2 2 2 2 2 Information Technology 9 9 9 8 8 7 6 6 6 5
Public Safety 267 266 269 263 276 265 260 257 247 239 Police
Officers 110 109 110 104 114 111 107 103 97 95 Civilians 37 35 38 38 40 38 35 35 34 31
FireFirefighters and officers 117 118 117 117 118 112 115 115 112 109 Civilians 3 4 4 4 4 4 3 4 4 4
Public Works 53 52 50 51 57 58 60 60 57 58
Parks and Recreation 57 58 57 61 60 60 58 60 60 58
Neighborhood & Community Services 23 23 21 21 22 22 26 24 22 23
Total 441 440 439 437 460 450 448 445 432 424
Source: City of Bowling Green Department of Finance
Note: Neighborhood & Community Services was previously known as Community Development.
Fiscal Year

See accompanying independent auditor’s report140
Schedule 16City of Bowling GreenOperating Indicators by Function/ProgramLast Ten Fiscal Years
2013 2012 2011 2010 2009 2008 2007 2006 2005 2004
Function/Program
Citizen's Information
Anti-Litter presentations/events - 2 7 8 7 28 50 23 10 d
-
Neighborhood Meetings conducted 63 71 71 72 91 97 84 91 70 65
Finance
Tax bills sent 21,703 21,495 21,405 21,372 21,238 20,946 20,444 20,330 19,714 19,555
Business registrations received 923 801 835 819 776 967 1,072 1,134 1,351 1,193
Human Resources
Job applicants 1,299 1,394 1,346 1,137 1,938 1,567 2,505 1,386 942 611
Position filled 234 216 216 178 204 224 147 185 132 122
Police
911 Service calls 61,859 a
67,842 65,440 54,754 60,013 59,041 54,294 55,730 53,226 50,789
Animal control calls 2,027 3,203 3,176 3,202 3,283 3,615 3,990 4,900 4,867 e
524
Traffic stops 11,897 13,476 15,650 15,777 17,356 13,021 14,066 3,237 3,367 3,281
Fire
Accident runs 5,523 5,049 4,836 4,517 4,586 4,552 2,475 2,292 2,741 3,161
Fire runs 278 300 285 258 294 499 534 405 578 648
Fires investigated 61 b
71 2,845 3,373 3,838 2,761 937 134 2,183 1,136
Public Works
Street resurfacing (miles) 7 12 5 5 4 5 18 17 14 14
Potholes repaired 772 392 478 466 385 408 294 349 625 567
Parks and Recreation
Fitness & Athletic participants 859,614 927,403 765,462 878,035 871,724 842,043 845,618 821,759 729,967 705,271
Visits to Community Center 267,813 269,596 271,722 214,184 223,628 176,998 298,315 110,929 109,599 120,000 f
Neighborhood & Community Services c
Households receiving asst 725 726 723 765 791 688 579 663 616 628 Bldg/Electrical & Code inspections 12,170 9,912 8,804 15,631 12,302 13,038 15,460 16,001 13,935 9,032
Notes: (a) Beginning in 2012, Public Safety became the answering point for both landline and cell phone 911 calls in Warren County.(b) Effective in 2012, the Fire Department began tracking fires investigations rather than fire inspections.
(c) Neighborhood & Community Services was previously Community Development
(d) The Anti-Litter program was established in 2005.
(e) Animal Control Program was developed in 2005, calls had previously been forwarded to the Sheriff's Department.
(f) Community Action volume is no longer tracked at the Bowling Green Community Center.
Source: Citizens Information & Assistance department compliled information from various City of Bowling Green departments.
Fiscal Year

See accompanying independent auditor’s report141
Schedule 17City of Bowling GreenCapital Asset Statistics by Function/ProgramLast Ten Fiscal Years
2013 2012 2011 2010 2009 2008 2007 2006 2005 2004Function/Program
PolicePolice Stations 1 1 1 1 1 1 1 1 1 3 Substations 2 2 2 2 2 2 2 2 2 -
Fire Fire stations 7 7 7 7 6 5 5 5 5 5 Training centers 1 1 1 1 1 1 1 1 1 1
Public WorksStreets (miles) 258 266 265 257 247 242 241 235 230 221 Sidewalks (miles) 112 109 104 95 94 90 88 106 106 207 Alleys (miles) 19 19 17 17 17 15 4 4 4 3
Parks and recreationNumber of Parks 20 25 25 25 25 25 25 25 24 24
Number of Facilities 7 a
- - - - - - - - - Acreage 972 972 970 970 970 970 970 944 886 886 Playgrounds 22 22 22 22 22 22 19 19 17 17 Baseball/Softball diamonds 11 11 11 11 11 11 11 11 11 11 Soccer fields 13 13 13 13 13 13 13 13 13 13 Community Centers 3 3 3 3 3 2 2 2 2 2
Community DevelopmentBuilding Permits Issued 1,868 1,609 1,515 1,571 1,523 2,082 2,400 2,787 2,765 2,488
Notes: (a) Effective with FY2013, parks and facilities are categorized separately.
Source: Various City of Bowling Green Departments
Fiscal Year