Open Space Preservation Comprehensive Plan Maryland ...
265
Land Use Law Center Gaining Ground Information Database Topic: Healthy Communities; Open Space Preservation Resource Type: Comprehensive Plan State: Maryland Jurisdiction Type: Municipal Municipality: Baltimore Year (adopted, written, etc.): 2007 Community Type – applicable to: Urban Title: Transforming Vacant Properties Document Last Updated in Database: April 19, 2018 Abstract Baltimore has a vacant property reclamation project termed “Project 5000.” The purpose of the project is to purchase vacant properties in “competitive, emerging, and stable” neighborhoods, but the most recent Master Plan calls for an extension of this project to “transitional and distressed” areas. Further, the plan calls for offering interest groups the chance to convert or purchase the vacant lots for conversion into community gardens, among other uses. In combination with Project 5000, the Master Plan calls for support of a Community Garden Land Trust. The trust is designed to ensure that public open spaces are maintained, protected, and sustainable. The land trust will further ensure that the time, labor, and money invested by residents to create these green spaces will be protected; the community- managed open spaces will complement the extensive network of parks and trails and place no additional responsibility on the Department of Recreation and Parks. Resource Baltimore Master Plan Project 5000 has been and will continue to be a successful program for addressing the disposition of vacant properties in Competitive, Emerging, and Stable neighborhoods as defined in Housing Typology (See Appendix M); this important initiative should continue. Additionally, an aggressive vacant housing reclamation strategy should be developed in Transitional and Distressed areas that considers the following: development of a database that inventories and tracks vacant and abandoned buildings and land parcels; buildings that are vacant/abandoned for more than 6 months must register and pay an annual sliding fee; abandoned property owners should be required to carry minimum insurance on property in case of damage to neighboring homes from collapse and/or fire; RFP’s offered to CDC’s, community organizations, and other interest groups to convert and/or purchase vacant lots and buildings into community gardens, parks, recreation areas, etc.
-
Upload
khangminh22 -
Category
Documents
-
view
3 -
download
0
Transcript of Open Space Preservation Comprehensive Plan Maryland ...

Land Use Law Center Gaining Ground Information Database
Topic: Healthy Communities; Open Space
Preservation Resource Type: Comprehensive Plan State: Maryland Jurisdiction Type: Municipal Municipality: Baltimore Year (adopted, written, etc.): 2007 Community Type – applicable to: Urban Title: Transforming Vacant Properties Document Last Updated in Database: April 19, 2018
Abstract Baltimore has a vacant property reclamation project termed “Project 5000.” The purpose of the project is to purchase vacant properties in “competitive, emerging, and stable” neighborhoods, but the most recent Master Plan calls for an extension of this project to “transitional and distressed” areas. Further, the plan calls for offering interest groups the chance to convert or purchase the vacant lots for conversion into community gardens, among other uses. In combination with Project 5000, the Master Plan calls for support of a Community Garden Land Trust. The trust is designed to ensure that public open spaces are maintained, protected, and sustainable. The land trust will further ensure that the time, labor, and money invested by residents to create these green spaces will be protected; the community-managed open spaces will complement the extensive network of parks and trails and place no additional responsibility on the Department of Recreation and Parks.
Resource Baltimore Master Plan Project 5000 has been and will continue to be a successful program for addressing the disposition of vacant properties in Competitive, Emerging, and Stable neighborhoods as defined in Housing Typology (See Appendix M); this important initiative should continue. Additionally, an aggressive vacant housing reclamation strategy should be developed in Transitional and Distressed areas that considers the following: development of a database that inventories and tracks vacant and abandoned buildings and land parcels; buildings that are vacant/abandoned for more than 6 months must register and pay an annual sliding fee; abandoned property owners should be required to carry minimum insurance on property in case of damage to neighboring homes from collapse and/or fire; RFP’s offered to CDC’s, community organizations, and other interest groups to convert and/or purchase vacant lots and buildings into community gardens, parks, recreation areas, etc.

[Type text]
Supporting a Community Garden Land Trust will help to ensure that public open spaces are maintained, protected, and sustainable. Healthy, well-maintained neighborhood green spaces help to strengthen neighborhood social, economic, and environmental health. Facilitating a network of community-managed open spaces will complement Baltimore’s extensive network of parks and trails, while placing no additional responsibility on the Department of Recreation and Parks. Moreover, many neighborhood residents invest significant amounts of time, labor, and money to transform vacant lots into community gardens and parks, yet they are at risk of losing their investment absent a land trust that can hold title to these properties. Without attention and stewardship from neighborhood residents, these lots would otherwise be eyesores and havens for illicit activity that decrease property values and detract from neighborhood quality of life. The full Baltimore Comprehensive Plan can be found here: https://planning.baltimorecity.gov/master-plans

Planning Commission Adoption • June 15, 2006Mayor and City Council • November 21, 2006Revised • July 9, 2009


Dear Baltimore:
During the creation of this comprehensive plan, the Baltimore City Planning Commis-sion wanted to make sure that this document was not just shelved, never read, and never truly implemented. My predecessors on the Commission emphasized including actionable strategies that would effectively achieve the goals of the plan. So LIVE, EARN, PLAY, LEARN was drafted in a business plan format, to provide clear goals and objectives to direct the City’s capital investment in order to use public resources more effectively; create zoning strategies which will match the zoning code to 21st century land uses and patterns of economic and demographic development; and develop a public policy approach that can be adopted and implemented by all segments of Baltimore.
Every good, well-intentioned plan needs to be monitored and evaluated to see if it’s being implemented, and if not, why not. Results from our 2008 Evaluation Report show that over 50% of the strategies in the plan have been completed, are now adopted City policy, or are on-going efforts being made in partnership with non-profit and private entities. An additional 38% of the strategies are in progress or have been initiated and are expected to be accomplished within the six-year time frame of the Comprehensive Master Plan. This level of success reflects commitment and effective cooperation on the part of the various City agencies and community stakeholders responsible for implementing LIVE EARN PLAY LEARN.
The other big accomplishment since adoption of the plan is that every single one of our CIP projects is now linked to one or more of the comprehensive plan’s goals and/or strategies. We can show very clearly that we are spending capital dollars in a way that ensures that we will achieve that collective vision set forth in the plan.
On behalf of the Planning Commission, I am committed to ensuring that all of us who are charged with implementing this plan are both diligent and vigilant to achieving its goals.
Wilbur “Bill” Cunningham
President
Baltimore City Planning Commission
Dear Baltimore,
When LIVE, EARN, PLAY, LEARN, the City’s Comprehensive Master Plan, was ad-opted by the Mayor and City Council in November 2006, it became the first time in over 35 years that the City of Baltimore had a plan in place that reflected our common vision of making BaltiMORE THAN EVER. Today, we here in the Department of Planning are able to implement this common vision when making decisions on how to spend taxpayer dollars on capital improvement projects, how to work with neighborhood groups to plan for the future of our communities, and how to rewrite our zoning code to allow for the type of lifestyle we all want to have in a 21st century Baltimore.
This 2009 Midpoint Update incorporates two critical accomplishments since the plan was passed 3 years ago. First, it incorporates a Water Resources Element that comprehen-sively shows how the City is protecting one of our most precious resources. Second, it incorporates the City’s newly-adopted Sustainability Plan which outlines a plan for us to live today and ensure environmental health for future generations.
Many of you have been involved in some or all of the past years’ planning processes, and collaborating with you and others has resulted in better, stronger outcomes. I urge you to continue to be involved in those efforts that are aimed at realizing the vision set out in the plan. Join us during the TransForm Baltimore process (http://www.ci.baltimore.md.us/government/planning/transformBaltimore.php), which is the City’s comprehensive rezon-ing project to produce a new zoning ordinance for the City; this is a once-in-a-generation effort that will have lasting impact and your voice in the process is valued and critical.
Sincerely,
Thomas J. Stosur
Thomas J. Stosur
Director
City of Baltimore Department of Planning

WaterResourcesElement Z. WaterandWastewaterSupplyandCapacity 236 AA. WastewaterTreatmentandPointSource 236 PollutionPrevention BB. StormwaterRun-OffandNon-PointSource 236 PollutionPrevention CC. WaterResourcesMaps 240
PlansandMaps DD. RedlineCommunityCompact 243 EE. CompletedandAdoptedNeighborhood 243
Plans,UrbanRenewalPlansandPlannedUnitDevelopments
FF. PublicInstitutions 255 GG. Parks,WaterwaysandTrails 256 HH. Floodplain 257 II. MTA/MDOTFacilities 258 JJ. DPWFacilities 259
I Introduction 6
II ExecutiveSummary 17
III HistoryofBaltimore 25
IV KeyTrends 48
V LIVE 60
VI EARN 90
VII PLAY 116
VIII LEARN 142
IX PlanImplementation 161
X ManagementandPersonnel 170
XI Financial 174
XII Conclusion 178
XIII GlossaryofTermsandAcronyms 182
XIV Appendices 190
PoliciesandStrategies A. FulfillmentofCityandStateGuidelines 190 B. SustainabilityPlan 205 C. BWIBTargetedIndustryStrategy 205 D. 2008ComprehensiveEconomicDevelopment Strategy(CEDS) 209 E. TODStrategy 209
LandUsePlanElements F. IndustrialLandUseStudy 212 G. RetailAssessmentSurvey 212 H. CommercialLandStudy 219 I. MaritimeIndustrialZoningOverlayDistrict 219
(MIZOD)2009Ordinance J. HeritageAreaManagementActionPlan 219 K. CharlesStreetScenicBywayManagementPlan 220 L. BaltimoreDrilldown 220 M. HousingTypology 220 N. HoldingCapacity 224
TransportationPlanElements O. BaltimoreRegionalRailPlan 229 P. WaterTaxiStops 230 Q. BicycleMasterPlan 230 R. TransportationPlan 230
SensitiveAreasElements S. SensitiveAreaPlan 230 T. All-HazardsPlan 231 U. CriticalAreaPlan 231 V. TenYearSolidWasteManagementPlan 232
CommunityFacilitiesElement W. EducationalFacilitiesMasterPlan 232 X. LandPreservationandRecreationPlan 232 Y. ListofContractandCommunitySchools 233
XV Authors 260
TableofContents

� City of Baltimore Comprehensive Master Plan
The Planning Commission in its current form dates back to a revision of the City Charter in 1947. Article VII, § 70 of the City Charter creates a Depart-ment of Planning, the head of which is the Planning Commission. Article VII, § 71 stipulates that the Commission shall be a nine-member board composed of six citizens appointed by the Mayor, the Director of the Department of Public Works or his designee, a member of the City Council, and the Mayor or his representative.
The City Charter, Article VII, § 72, also defines the key responsibilities of the Commission as:
• Developing and maintaining a Comprehensive Master Plan for the City;
• Preparing and updating plans showing the physical development of the City;
• Developing a capital budget and six-year capital development program for consideration of the Board of Estimates;
• Reviewing all proposals for the subdivision of land within the City for con-formance to specified standards; and
• Reviewing all proposed amendments to the City’s Zoning Ordinance and making recommendations to the City Council.
Introduction

Introduction �
INTR
OD
UC
TION
SU
MM
AR
Y H
ISTO
RY
KE
Y TR
EN
DS
LIVE
EA
RN
PLAY
LEA
RN
IMP
LEM
EN
TATION
MA
NA
GE
ME
NT FIN
AN
CIA
L CO
NC
LUS
ION
GLO
SS
AR
Y A
PP
EN
DIC
ES
The Planning Commission directs its staff, the Department of Planning, to accomplish these mandates, as well as to carry out new and expanded re-sponsibilities the Commission has assumed over the years. The Department’s mission is to provide the highest level services and leadership in urban and strategic planning, historical and architectural preservation, zoning, design, development, and capital budgeting to promote the sustained economic, so-cial, and community development of the City of Baltimore.
In pursuit of achieving the afore-mentioned mission, and in adherence to Ar-ticle VII, § 74, of the City Charter, the Commission has completed LIVE • EARN • PLAY • LEARN: The City of Baltimore Comprehensive Master Plan (CMP). Though drafted in a non-traditional business plan format, the CMP, both in text and graphic components, painstakingly meets the requirements of both the City Charter, as well as Article 66B of the Maryland Annotated Code. A matrix at the conclusion of this plan (see Appendix A) provides you with a point by point reference citing how and where we comply with Article VII and Article 66B requirements.
THE PLAN
LIVE • EARN • PLAY • LEARN: The City of Baltimore Comprehensive Master Plan (CMP) is a plan that was eight years in the making! The planning process began in 1997. The objective was to create the first new comprehensive plan for Baltimore in over 30 years. While the process was led by the Planning Commission and the Department of Planning, the Fannie Mae Foundation and the Annie E. Casey Foundation partnered with the City, supporting out-reach efforts which helped to ensure intergenerational input to this important plan. More than 2,000 citizens participated in a dozen meetings and work-shops to provide input into the plan and a draft of the PlanBaltimore docu-ment was released in April 1999. Hundreds of additional citizens provided comments on PlanBaltimore through letters, e-mail and at two public review sessions. While the draft was greatly enhanced, it primarily provided policy recommendations instead of concise goals and strategies to move the City of Baltimore forward. Although not formally adopted, PlanBaltimore created the framework for what Baltimoreans want Baltimore to be: a world-class city. LIVE • EARN • PLAY • LEARN updates that vision, and focuses on imple-mentation steps needed to make that vision a reality. The Live, Earn, Play, and Learn categories focus the CMP on discrete, attainable goals.
LIVE
LIVE creates the plan that will guide Baltimore as it readjusts its residential land use to account for the changing population, the growing commuter mar-ket, the expanding market for condominiums, the impending regional growth over the next 15 years, and the aging housing stock. The need for affordable and moderately priced, quality housing to retain socio-economically diverse current citizens of Baltimore; and attracting new households is a central goal of the CMP. Aided by the wonderful mix of architecture, lifestyles, and neigh-borhoods that already make Baltimore a premier place to live, LIVE sets forth an implementation strategy for how the City can begin to capture the 172,200 individuals that Baltimore has the holding capacity to comfortably absorb. It sets an ambitious goal of adding 10,000 new households over the next 6 years! Furthermore, LIVE highlights the potential for growth and increased investment in Growth Promotion Areas, beyond those neighborhoods that are already experiencing renovation, rehabilitation, and new development.
Introduction

� City of Baltimore Comprehensive Master Plan
EARN
EARN sets forth strategies to meet the employment needs of residents and local businesses and cultivate seven (7) vital growth sectors: Bioscience; Business Services; Construction; Computer, Internet and Data and Software-Related Services (CIDS); Healthcare and Social Assistance; Hospitality and Tourism; and Port and Port-Related Services. The strategy will aim to capture and en-courage biotech job opportunities; plan and implement transportation infra-structure improvements to support port related economic development; create larger tracts of land for commercial or industrial development near transpor-tation centers; and connect residents to available employment opportunities. EARN examines the zoning code and the capital budget to determine how they can be retooled to better meet today’s and tomorrow’s market demands.
PLAY
PLAY guides Baltimore as it enhances our rich cultural, entertainment, and natural resource amenities. Consistently, in bond questions submitted to vot-ers, park and cultural requests get the highest votes. Based on this interest and demand, PLAY proposes strategies to make these resources accessible to more of our residents and to introduce these amenities to increasing numbers of visitors from the region, state, country and world. PLAY also highlights strate-gies to increase funding for parks and recreation, and proposes a strategy to tie together heritage tourism, nightlife, parks, trails and other amenities to move us closer to our vision of a 24 hour world-class city.
LEARN
LEARN creates a plan to turn our schools and libraries into community re-sources, strengthen the connection between communities and their schools and libraries, upgrade and restructure our school facilities to meet the educa-tional needs of today’s population, plan and build an additional three (3) an-chor libraries in Southwest, Northwest, and Northeast Baltimore (Southeast is currently under construction), and use school dollars efficiently. Furthermore, LEARN provides strategies to capitalize on the untapped potential that four-teen colleges and universities provide for Baltimore. LEARN focuses on con-sistent improvements of our schools and on the expansion of higher education opportunities as tools for human, community, and economic development.
Fulfillment of State Guidelines
As Maryland’s largest city, growth and development in the City of Baltimore greatly influence and shape overall growth statewide. The two major initia-tives taken by the Maryland General Assembly are the Planning Act of 1992, which was intended to establish interjurisdictional consistency in land use policies by setting forth eight visions for each local area to follow, and the Smart Growth Initiative of 1997, which established priority funding in desig-nated Priority Funding Areas (PFA). Given the city’s strategic location and existing infrastructure, the entire City of Baltimore was designated as a state PFA. LIVE • EARN • PLAY • LEARN both conforms to the visions of the 1992 Plan-ning Act and is aligned with the 1997 Smart Growth Initiatives.

Introduction �
INTR
OD
UC
TION
SU
MM
AR
Y H
ISTO
RY
KE
Y TR
EN
DS
LIVE
EA
RN
PLAY
LEA
RN
IMP
LEM
EN
TATION
MA
NA
GE
ME
NT FIN
AN
CIA
L CO
NC
LUS
ION
GLO
SS
AR
Y A
PP
EN
DIC
ES
Baltimore City’s Visions:
Vision 1 Development shall be concentrated in suitable areas
This Plan reinforces this vision with policies and strategies that encourage development, infill and redevelopment that is transit oriented, brings back va-cant areas into productive use, located in Growth Promotion Areas (GPA) and the Central Business District yet preserves and respects our City’s historic character. These efforts will involve local visioning through targeted Area Master Plans and emphasize mixed uses, nodal activity centers and access to multiple modes of transit. Vision 2 Sensitive areas shall be protected
This Plan highlights updates to the City’s resource inventories, protection measures and implementation of plan recommendations and sets forth a pri-mary policy to protect sensitive areas with appropriate utilization. The Balti-more City Planning Commission adopted the Baltimore City Sensitive Areas Plan on June 12, 1997. Baltimore City’s sensitive areas are protected primar-ily through the Forests Conservation Act, the Critical Area Management Plan and the Floodplain Management Regulations. Additional regulations such as the City’s tree protection ordinance and a proposed landscape ordinance are expected to add to these protections. Vision 3 In rural areas, growth shall be directed to existing population cen-ters and resource areas shall be protected
While the City itself no longer has any rural areas, this Plan aims to protect rural areas in surrounding jurisdictions by absorbing the metropolitan growth anticipated to occur in the short- and long-term. The Plan aims to increase the City’s population by 10,000 households in the next 6 years through the development of Growth Promotion Areas and marketing of the City to poten-tial residents and employers. Vision 4 Stewardship of the Chesapeake Bay and the land shall be a universal ethic
This Plan addresses this vision with several strategies to improve water qual-ity and protect the Chesapeake Bay. Recommendations for adopting and implementing Comprehensive Land and Water Sanitation Plans, an Urban Forest Management Plan, and a Comprehensive Water and Wastewater Plan as well as adopting new storm water regulations and watershed plans that include stream stabilization all serve to reduce pollution into and degradation of the Bay and its tributaries. All of these recommendations are consistent with and enhance the region’s Reservoir Watershed Management Agreement of 2005. This Plan also recommends appropriate development of recreational trails and greenways in stream buffers and floodplains for residents to experi-ence, enjoy and excercise stewardship over open space in the City.Vision 5 Conservation of resources, including a reduction in resource con-sumption, shall be practiced
This Plan address this vision by ensuring access to alternative modes of trans-portation through support of the Baltimore Regional Rail Plan, adoption of the Bicycle Master Plan, and recommendations for developing a Comprehensive Pedestrian Plan to facilitate walkability throughout the City. Conservation of energy also underlies several green infrastructure recommendations for new development as well as the rehabilitation of private and public structures. Protection and reuse of historic structures in the City also serves to reduce resource consumption.

10 City of Baltimore Comprehensive Master Plan
Vision 6 To encourage the achievement of paragraphs (1) through (5) of this subsection, economic growth shall be encouraged and regulatory mecha-nisms shall be streamlined
This Plan encourages economic growth in port- and defense-related industries as well as six burgeoning employment sectors identified by the Baltimore Workforce Investment Board by better articulating the development process and ensuring development compatibility in all parts of the City. The integral role of transportation planning in promoting economic development is also recognized. Importantly, the Plan aims to ensure that the residents of Balti-more are well-equipped to assume existing and future positions by providing better access to educational and job training facilities and programs. Vision 7 Adequate public facilities and infrastructure under the control of the County or Municipal Corporation are available or planned in areas where growth is to occur
This vision is addressed in the Plan with specific recommendations to main-tain and improve public schools and libraries, historic and cultural landmarks, and recreational and park facilities. City resources will be leveraged with private funds to ensure access to well-managed resources for all residents and visitors. Vision 8 Funding mechanisms shall be addressed to achieve this policy
Capital investment decisions for public facilities, infrastructure and services will be consistent with the recommendations in the Plan. Additionally, sus-tainable funding sources will be identified to ensure affordable housing, ad-equate park land and priority development projects.
Public Participation
An essential component in the creation of a comprehensive master plan is the role of civic input. This plan is a result of building on the public’s vision gathered during the late 1990s PlanBaltimore effort. The input from the over 2,000 participants from the PlanBaltimore effort provided the Department of Planning with a wealth of information and the foundation for the LIVE • EARN • PLAY • LEARN themes. With these themes in place, we returned to the community in 2005 to continue to craft concise strategies for improv-ing how current and future Baltimoreans LIVE, EARN, PLAY, and LEARN. The Department of Planning pursued a number of steps to insure that the citizens it serves helped to shape this document. Below is a concise summary of this effort, highlighting the many ways in which residents, community leaders, neighborhood associations, government agencies, and others contributed to a shared vision of Baltimore’s future.
Advertisement Summary
During the summer of 2005, the Department of Planning launched a large-scale community effort to inform residents about the Comprehensive Master Planning process and to solicit citizen input regarding land use in their neigh-borhood. This was achieved through community mailings, e-mail notifica-tion, and local advertisements. Specifically:
June 27, 2005 Mailing to the 935 associations in Community Association Directory
June 30, 2005 City Paper – Full Page Ad (page 2)
June 30, 2005 Baltimore Messenger – Full Page Ad (back page)

Introduction 11
INTR
OD
UC
TION
SU
MM
AR
Y H
ISTO
RY
KE
Y TR
EN
DS
LIVE
EA
RN
PLAY
LEA
RN
IMP
LEM
EN
TATION
MA
NA
GE
ME
NT FIN
AN
CIA
L CO
NC
LUS
ION
GLO
SS
AR
Y A
PP
EN
DIC
ES
July 1, 2005 Baltimore Jewish Times – Full Page Ad (page 17)
July 1, 2005 Baltimore Times – Full Page Ad (page 19)
July 2, 2005 Baltimore Afro American – Full Page Ad (page 2)
July 22, 2005 Mayor’s Neighborhood Newsflash
Land Use Survey
A returnable survey intended to solicit data regarding neighborhood-level land use was integrated with the CMP Overview advertisement. Over one hundred forty (140) responses were received from citizens in the commu-nity, representing over 50 neighborhoods, on how the City should use avail-able vacant or underutilized land. The survey was released to an expansive list of community groups, was advertised in the above mentioned media spots, and available on the Baltimorecity.gov website. The data was col-lected and incorporated into the CMP (if applicable), and shared with the appropriate neighborhood planner.
Stakeholder/Advisory Meetings
Throughout the Comprehensive Planning process, stakeholders and advi-sors consistently contributed to this major effort. Multiple meetings were held and valuable contributions gathered from a wide range of leaders dur-ing 2005. These meetings were typically organized by the LIVE, EARN, PLAY, and LEARN Team Leaders, who invited representatives from major city in-stitutions and organizations to express what priorities the city must take as it moves forward and comment on early draft products produced by the four teams. These meetings informed all steps in the Plan’s formation. Brief-ings to relevant government agencies and City leaders also occurred on an incremental basis.
Open House Events
The Open House Events that occurred during late October 2005 were one of the most important components of the CMP Outreach process. This setting gave citizens and constituents a glimpse of the project’s progression, and an opportunity to provide guided feedback. Attendees were also encouraged to write questions, comments, or suggestions directly on the teams’ displays. The three events took place on: Monday, October 17th from 4-7pm at War Memorial, Saturday, October 22nd from 9am-noon at Poly High School, and on Tuesday, October 25th from 6-8pm at City College High School. To solicit broad based attendance, the Department pursued an extremely thorough noti-fication strategy. This included:
• E-mail, list-serv, and newsletter submissions
• Postering government buildings and all library branches
• Attending special Events like the Book Festival and the Farmer’s Market
• Mailed flyers to the 935 community associations in the Directory
• Posted to the City, Department of Planning, LIVEBaltimore, Baltimore Housing, Coloquio, and BaltimoreFunGuide websites

12 City of Baltimore Comprehensive Master Plan
Comprehensive Plan Survey
A survey was written to solicit comments related to the topic matter for each of the LIVE • EARN • PLAY • LEARN Teams. These surveys were avail-able at the Open House events and could also be completed online. The re-sults helped to shape the objectives and strategies developed for the Plan. In addition, the data collected will be used towards recommendations at the neighborhood level, assisting the efforts of the planners assigned to the City’s nine planning districts.
Distributing the Preliminary Plan
Beginning February 21st, 2006, the Planning Commission hosted nine Plan-ning Commission Hearings across the City to review the draft version of the Plan and gather reactions and feedback from citizens. These meetings occurred in each of the nine planning districts to maximize the opportunity to hear from neighborhoods. Copies of the draft were available in every Enoch Pratt Free Library branch, and downloadable from the City of Baltimore website(http://www.ci.baltimore.md.us/government/planning/compplan/masterplan.php). There was an extensive publicity campaign undertaken to ensure that residents and other important City stakeholders were aware of the release of the draft and the opportunities for comment. This outreach campaign utilized the same techniques used to publicize the Open Houses in October along with additional resources to increase awareness of this important document.Per Maryland Code: Article 66B: “The Planning Commission shall make a preliminary report and hold at least one public hearing on the preliminary report before submitting the final report.” The Planning Commission submit-ted a preliminary (draft) plan on February 2, 2006. Far exceeding Maryland requirements, the Planning Commission allowed for over three months of public participation, comment and feedback. This CMP reflects the comments received and presented at a public hearing to the Planning Commission on June 15, 2006. The adopted plan will then be submitted to the City Council for review and adoption.
TransForm Baltimore: The Comprehensive Rezoning Project
After the CMP was adopted by the City Council, the Mayor and the Plan-ning Commission began directing the Department of Planning to rewrite our antiquated zoning code. In Baltimore, our zoning framework dates back to the 1970’s. Because our zoning code is outdated, we have used other tools, such as urban renewal plans and planned unit development overlay zones, to accommodate modern land use needs. The first task of comprehensive rezon-ing was to define the scope and magnitude of the many lifestyle and other changes since 1971 that affect the Zoning Code. These changes include:
• Redevelopment of the waterfront for tourism, office residential and mixed uses;
• Increase in the importance of service, technology, higher education, and health-related industries;
• Decline in heavy industry;
• Suburbanization of retail development;
• Increasing dependence upon the automobile;

Introduction 13
INTR
OD
UC
TION
SU
MM
AR
Y H
ISTO
RY
KE
Y TR
EN
DS
LIVE
EA
RN
PLAY
LEA
RN
IMP
LEM
EN
TATION
MA
NA
GE
ME
NT FIN
AN
CIA
L CO
NC
LUS
ION
GLO
SS
AR
Y A
PP
EN
DIC
ES
• Growing interest in historic preservation, adaptive reuse of older build-ings, and conservation of community character;
• Increasing interest in mixed use neighborhoods;
• Increasing desire to protect neighborhoods against adverse influences;
• De-institutionalization and increase in the numbers of group homes;
• Passage of federal and state legislation affecting planning and land use regulation, including the Federal Fair Housing, Americans with Disabili-ties, and Religious Land Use and Institutionalized Persons Acts, and the State Smart Growth Law;
• Increased use of technology in communications, increasing emphasis on timeliness, and a need to streamline the development process.
Each of the above changes has implications for the Zoning Code. Some re-quire relatively simple code revisions; others affect multiple code sections and necessitate considerable research and review. The best way at achieving an overall more useful code is to rewrite it in its entirety with the following objectives:
• Streamlining of zoning and development procedures
• Consistency of zoning with existing land use, community character, City plans and projects, and City economic development goals
• Conformance to applicable state and federal law
• Utilization of state-of-the-art planning and zoning practice and proce-dures
The Department of Planning began updating discrete sections of the zoning code in 2004. The Maritime Industrial Overlay Zoning District and a first phase of changes to night life provisions have been enacted. In 2005, provi-sions related to locating supportive group homes and treatment facilities were proposed and not enacted – but are still under discussion. Throughout 2006, the Department of Planning will propose updates to the City’s Industrial Zon-ing, zoning in the Southeast District, and begin the total rewrite of the exist-ing code, which will include a proposed transit oriented development overlay zone; a university district overlay zone; mixed-use categories; and a new park zoning classification.
As part of the comprehensive planning process, the Department of Planning solicited ideas about how land could be better used. Additionally, we com-missioned commercial and industrial land use studies. The Department also worked with The Reinvestment Fund and the Baltimore City Department of Housing and Community Development to achieve a comprehensive residen-tial land use study resulting in the 2005 Housing Typologies. The results of these combined efforts helped to generate the generalized proposed land use map found in the CMP. The results of the study and analysis, and the proposed land use map, will allow us to move to the immediate next step of compre-hensive rezoning for the City of Baltimore. Steps toward the completion of the comprehensive rezoning are listed below, but the time schedule for imple-mentation of this comprehensive rezoning depends on two factors:

14 City of Baltimore Comprehensive Master Plan
• The size of the annual funding commitment / staff available, and
• The extent to which time-consuming individual Zoning Code amend-ments are implemented in advance of full comprehensive Code revision
TransForm Baltimore/Comprehensive Rezoning Work Program
Task I: Initial Investigation (completed through the CMP process)Initial assessment of zoning issues.
Task II. Technical Review/ Code Diagnosis was completed in Septem-ber 2008A. Technical Review of Existing Zoning Text1. Continue the technical review begun in 2001:
• Review existing zoning ordinance and other relevant documents and pro-cedures
• Conduct interviews/focus groups with relevant persons• Tour affected city neighborhoods• Review professional literature• Investigate zoning practice in comparable cities
2. Review and analyze existing code as to what works and what doesn’t Product: a Technical Report that will:
• Review existing text for revisions• Identify new and innovative zoning strategies that could be appropriately
utilized in Baltimore City • Summarize each recommended change, including definition of the prob-
lem, proposed text changes, and rationale for the change.
B. Technical Review of Zoning Map
1. Assist the Department of Planning in reviewing the existing zoning map for various neighborhoods and sections of the city, utilizing the existing land use maps prepared as part of the comprehensive rezoning project, and neigh-borhood land use and/or urban renewal plans. For each neighborhood/sec-tion, assess any differences between existing land use and existing zoning, proposed projects that may affect land use, City economic development plans, and neighborhood desires. Utilize existing or proposed urban renewal plans; to the extent they are up-to-date.
Technical review of the zoning map will be conducted in cooperation with the Department of Planning’s Comprehensive Planning Division, which will be responsible for neighborhood land use planning and neighborhood liaison. Product: map identifying areas of potential zoning change.
2. Assist in the review of neighborhood land use plans and zoning maps with affected agencies and neighborhood and civic groups.

Introduction 15
INTR
OD
UC
TION
SU
MM
AR
Y H
ISTO
RY
KE
Y TR
EN
DS
LIVE
EA
RN
PLAY
LEA
RN
IMP
LEM
EN
TATION
MA
NA
GE
ME
NT FIN
AN
CIA
L CO
NC
LUS
ION
GLO
SS
AR
Y A
PP
EN
DIC
ES
C. Establish Zoning Advisory Committee Present findings to the Zoning Advisory Committee
• Committee to be appointed at the end of the Technical Review Process
• ZAC consists of 30 citizens including City Staff who meet monthly
• Purpose: lend expertise; oversee the comprehensive rezoning project; represent community groups, land use professionals, developers, and other stakeholders; make recommendations to the Planning Commission on comprehensive rezoning
2. Revise Technical Report as per comments of the Zoning Advisory Com mittee.
Task III. First Draft Zoning Text and MapA. Annotated Outline1. Prepare annotated outline of the recommended new zoning text, incor-
porating changes proposed in the Technical Report.2. Present to Zoning Advisory Committee for review and comment. 3. Revise outline as appropriate.B. First Draft Zoning Text1. Draft new zoning ordinance in sections, utilizing the outline and tech-
nical review of issues prepared above2. Consult with the City Law Department and affected agencies and
groups, as appropriate.3. Present sections to Zoning Advisory Committee for review and com-
ment, as completed.4. Revise sections as appropriate.5. For those issues that can be resolved independently of the entire ordi
nance, propose immediate zoning amendments.C. First Draft Zoning Map1. Continue technical review of the zoning map begun in Task II.2. Based on neighborhood concepts and plans, assist the Planning De-
partment Community Planning Division in preparation of draft zoning maps for neighborhoods. The Community Planning Division will be responsible for neighborhood land use planning and community liai-son.
3. Assist in the review of plans and zoning maps with affected agencies, neighborhood and civic groups, and the Zoning Advisory Committee.
4. Revise as appropriate.

1� City of Baltimore Comprehensive Master Plan
Task IV. Final Draft Zoning Text And Map A. Final Draft Zoning Text1. Present the complete revised first draft zoning text to the Planning
Commission.2. Hold several public hearing(s) to review proposed zoning ordinance
text.3. In consultation with the City Law Department, revise as appropriate.B. Final Draft Zoning Map1. Present the complete revised first draft zoning map to the Planning
Commission.2. Hold a public hearing(s) to review proposed zoning ordinance map.3. Revise as appropriate.
Task V. Adoption1. Submit proposed final zoning ordinance text and map to City Council
for review and adoption.2. Attend committee meetings and public hearing(s); make presentation(s)
as appropriate.3. Revise zoning text and map as required prior to adoption.
Visit the Website: http://www.ci.baltimore.md.us/government/planning/ transformBaltimore.php
The City of Baltimore’s Comprehensive Master Plan: 2007 - 2012
LIVE • EARN • PLAY • LEARN: The City of Baltimore Comprehensive Mas-ter Plan, supersedes the 1971 Master Plan and amendments and sets forth a citywide comprehensive six-year strategy. Different from comprehensive plans of the past, this planning effort sought to merge a business plan and a comprehensive urban development plan into one document. The Baltimore City Planning Commission thought it imperative that this document not be a plan for the shelves, never read, and never truly implemented. Instead, drafted in a business plan format, the CMP seeks to provide clear goals and objectives to direct the City’s capital investment, zoning strategies, and public policy in a way that can be read, understood, and implemented by all segments of Baltimore. While realistically, not every goal or policy in this plan will be accomplished within the specific six-year time frame, Baltimore’s citizenry must direct elected officials to prioritize and balance many desirable actions with available resources, legal constraints and market conditions. The CMP will support those seeking grants to carry out its purposes, provide protection of and encouragement for private investment, and give greater predictability and certainty to the City’s future. The administration, City Council and ap-pointed boards, commissions and committees, as well as the general public, and other City agencies will give and receive guidance from this document and recommend amendments as needed.

PB City of Baltimore Comprehensive Master Plan Executive Summary 17
INTR
OD
UC
TION
SU
MM
AR
Y H
ISTO
RY
KE
Y TR
EN
DS
LIVE
EA
RN
PLAY
LEA
RN
IMP
LEM
EN
TATION
MA
NA
GE
ME
NT FIN
AN
CIA
L CO
NC
LUS
ION
GLO
SS
AR
Y A
PP
EN
DIC
ES
LIVE • EARN • PLAY • LEARN The City of Baltimore Comprehensive Mas-ter Plan is a plan that was eight years in the making! The planning process began in 1997. The objective was to create the first new comprehensive plan for Baltimore in over 30 years. While the process was led by the Department of Planning, the Fannie Mae Foundation and the Annie E. Casey Foundation partnered with the City, supporting outreach efforts which helped to ensure representative and intergenerational input to this important plan. More than 2,000 citizens participated in a dozen meetings and workshops to provide input into the plan and a draft of the PlanBaltimore document was released in April 1999. Hundreds more citizens provided comments on PlanBaltimore through letters, e-mail and input at two public review sessions. While the draft was greatly enhanced, it primarily provided policy recommendations instead of concise goals and strategies to move the City of Baltimore forward. PlanBaltimore created the framework for what Baltimoreans want Baltimore to be: a world-class city.
LIVE • EARN • PLAY • LEARN updates that vision and focuses on imple-mentation steps needed to make that vision a reality. The Live, Earn, Play and Learn categories focus this Comprehensive Plan into discrete, attainable goals in order to respond to residents’ needs and visions for the future of Baltimore. This plan also contains all of the required elements and visions as prescribed by the governing State Code (Article 66B, § 1.02 & 1.03) and City Charter (Article VII, § 72 & 74).
Executive Summary

18 City of Baltimore Comprehensive Master Plan Executive Summary 1918 City of Baltimore Comprehensive Master Plan Executive Summary 19
Summary of Goals Developed for this Plan
LIVE
LIVE creates the plan that will guide Baltimore as it readjusts its residential land use to account for the changing population, the growing commuter mar-ket, the expanding market for condominiums, the impending regional growth over the next 15 years, and the aging housing stock. The goals outlined in this plan aim to maintain and improve upon existing affordable housing opportuni-ties for all Baltimore residents. It also aims to make moderately priced, quality housing available to diverse households in an attempt to strengthen and build Baltimore’s middle class. Finally, it seeks to maintain the wonderful mix of architecture, lifestyles, and neighborhoods in order to maximize the City’s po-tential to be an outstanding place to LIVE.
LIVE:
Goal 1: Build Human and Social Capital by Strengthening Neighbor-hoods
Goal 2: Elevate the Design and Quality of the City’s Built Environment
Goal 3: Improve Transportation Access and Choice for City Residents
Some of the strategies identified in LIVE to achieve these goals include:
• implement an inclusionary housing plan
• modernize zoning codes to meet current needs
• adopt a landscape ordinance
• provide rehabilitation loans for low income families in locally designated historic districts
• improve water quality and protect the Chesapeake Bay
• create a pedestrian plan city-wide
• create intermodal transit hubs in areas of low automobile ownership
EARN
EARN sets forth strategies to meet the employment needs of residents and local businesses and cultivate seven (7) vital growth sectors: Port-Related Services; Healthcare and Social Assistance; Bioscience; Business Services; Construc-tion; Computer, Internet and Data and Software-Related Services (CIDS); and Hospitality and Tourism.
The following goals will support and foster economic development and maxi-mize the City’s potential to be a competitive place to EARN:
Goal 1: Strengthen Identified Growth Sectors
Goal 2: Improve Labor Force Participation Rate Among City Residents
Goal 3: Improve Access to Jobs and Transportation Linkages between Businesses

18 City of Baltimore Comprehensive Master Plan Executive Summary 1918 City of Baltimore Comprehensive Master Plan Executive Summary 19
INTR
OD
UC
TION
SU
MM
AR
Y H
ISTO
RY
KE
Y TR
EN
DS
LIVE
EA
RN
PLAY
LEA
RN
IMP
LEM
EN
TATION
MA
NA
GE
ME
NT FIN
AN
CIA
L CO
NC
LUS
ION
GLO
SS
AR
Y A
PP
EN
DIC
ES
Some of the strategies identified in EARN to achieve these goals include:
• establish microenterprise loans for start-up businesses specifically in the growth sectors
• preserve and enhance CBD office space
• provide wireless technology in public areas throughout the City
• install environmental and aesthetic improvements around tourist areas
• expand outreach to encourage use of One-Stop Employment Centers
• expand the number of participants in the Commuter Choice program
• create Transit-Oriented Development zoning and incentive programs for transit nodes throughout the City
PLAY
PLAY guides Baltimore as it enhances our rich cultural, entertainment, and natural resource amenities. Based on the interest and demand for these unique aspects of urban life, the following goals aim to make these resources accessible to more of our residents, introduce these amenities to increasing numbers of visitors from the region, state, country and world and maximize the City’s potential as a premier place to PLAY:
Goal 1: Enhance the Enjoyment, Appreciation, and Stewardship of Baltimore’s Historical and Cultural Resources
Goal 2: Improve Night Life, Entertainment, and Recreation Experi-ences for Residents and Visitors
Goal 3: Increase the Attractiveness of Baltimore’s Natural Resources and Open Spaces
Some of the strategies identified in PLAY to achieve these goals include:
• develop new visitor centers and enhance existing visitor centers
• teach American History using Baltimore’s history museums
• enhance and reuse under-utilized historic structures
• designate Main Street areas as local and/or national historic districts
• implement Bicycle Master Plan to provide recreational opportunities for residents
• locate dedicated funding sources for parks and cultural assets
• develop a plan to reduce trash within Baltimore’s parks and open space
• complete the Harbor Promenade and Middle Branch park/trail systems

20 City of Baltimore Comprehensive Master Plan Executive Summary 2120 City of Baltimore Comprehensive Master Plan Executive Summary 21
LEARN
LEARN recognizes the potential of a robust educational network that pro-vides a wide range of services to a diverse market both locally and beyond. By viewing the City’s libraries, schools and higher educational institutions as community resources, LEARN aims to strengthen the connection between communities and their educational resources, and upgrade and restructure our school and library facilities to meet the educational needs of today’s popula-tion. The purpose of the goals outlined in this section is to not only prepare Baltimoreans for 21st Century social and economic opportunities but also create a culture of learning within families and communities and maximize the City’s potential as an engaging place to LEARN.
Goal 1: Improve Public Schools and Libraies
Goal 2: Capitalize on Untapped Potential of Higher Education Institu-tions
Goal 3: Encourage a Culture of Learning by Enhancing Educational and Vocational Opportunities for all Baltimoreans
Goal 4: Ensure Safe and Convenient Transportation to and from Edu-cational Facilities
Some of the strategies identified in LEARN to achieve these goals include:
• eliminate poor building conditions within school facilities
• develop a Community Schools Policy to facilitate the use of school build-ings beyond the school day
• create and adopt campus master plans
• build tot lots at schools
• broaden access to job training centers and professional development op-portunities
• implement “Safe Routes to School” program at schools
• make reduced fare transit programs available to all college students
• improve access to quality library services for all age groups
Implementing Strategies
LIVE • EARN • PLAY • LEARN, The City of Baltimore Comprehensive Mas-ter Plan, supersedes the 1971 Master Plan and amendments and sets forth a citywide comprehensive six-year strategy. Different from comprehensive plans of the past, this planning effort sought to merge a business plan and a comprehensive urban development plan into one document. The Baltimore City Planning Commission thought it imperative that this document not be a plan for the shelves, never read, and never truly implemented. Instead, drafted in a business plan format, LIVE • EARN • PLAY • LEARN seeks to provide clear goals and objectives to do the following:

20 City of Baltimore Comprehensive Master Plan Executive Summary 2120 City of Baltimore Comprehensive Master Plan Executive Summary 21
INTR
OD
UC
TION
SU
MM
AR
Y H
ISTO
RY
KE
Y TR
EN
DS
LIVE
EA
RN
PLAY
LEA
RN
IMP
LEM
EN
TATION
MA
NA
GE
ME
NT FIN
AN
CIA
L CO
NC
LUS
ION
GLO
SS
AR
Y A
PP
EN
DIC
ES
• Direct the City’s capital investment to more effectively use public resources
• Create zoning strategies which will match the zoning code to 21st Century land uses and patterns of economic and demographic de-velopment
• Develop a public policy approach that can be adopted and imple-mented by all segments of Baltimore.
Implementing Bodies and Agencies
The Mayor, the Mayor’s Cabinet and the City Council comprise the man-agement level key to implementing the plan. Of the Cabinet, the Directors of Planning, Finance, Housing, Health, Transportation, Public Works, Rec-reation and Parks, and the Mayor’s Office of Employment Development are most important to the successful implementation of the Plan. Two quasi-city agencies, the Baltimore Development Corporation (BDC) and the Baltimore Area Convention and Visitors Association (BACVA) are critical to imple-menting the City’s economic development strategy.
The Baltimore City Public School System (BCPSS) is the one agency that is critical to the success of the plan that is NOT entirely governed by the Mayor and City Council. This agency has been integral to the development of the plan, however, and the school system’s Facilities Master Plan is required by law to be adopted as part of this Comprehensive Plan.
Other management entities of the Plan that are substantially influenced by the State through the budget process are the Maryland Transit Administration (MTA) and funding for substance abuse treatment. Note that the strategy for Growth Promotion Areas (GPA) is largely dependent on additional State dol-lars to direct future State growth into City areas with high levels of vacancy.
Are you part of the Plan…?
The most crucial stakeholders for the success and sustainability of this Plan include ALL residents, employers and employees in the City of Baltimore. Baltimore’s citizenry must direct elected officials to prioritize and balance many desirable actions with available resources, legal constraints and market conditions. The plan will support those seeking grants to carry out its pur-poses, provide protection of and encouragement for private investment, and give greater predictability and certainty to the City’s future. Many of these key stakeholders are organized and represented by the following groups who were identified as having a vital impact on the implementation of this Plan:
Municipal Agencies:Baltimore Convention CenterBaltimore Office of Promotion & the ArtsGeneral Services, Department of (DGS)Mayor’s Office of Cable and CommunicationsMayor’s Office of Community & Human Development Mayor’s Office of Criminal Justice Mayor’s Office of Employment Development

22 City of Baltimore Comprehensive Master Plan Executive Summary 2322 City of Baltimore Comprehensive Master Plan Executive Summary 23
Mayor’s Office of Information Technology Mayor’s Office of International & Immigrant AffairsMayor’s Office of Minority & Women-Owned Business DevelopmentMayor’s Office of Neighborhood & Economic Development Mayor’s Office of NeighborhoodsMayor’s Office of SustainabilityFinance, Department ofFire DepartmentHealth DepartmentBaltimore Heritage Area, Office of the Mayor
Baltimore Housing (Dept. of Housing & Community Development/Housing Authority of Baltimore City)Human Resources, Department of Law Department Labor Commissioner Legislative Reference, Department of Planning, Department ofPolice Department Public Works, Department of Recreation and Parks, Department of Employees Retirement SystemElected Officials Retirement SystemFire and Police Retirement SystemTransportation, Department of
Maryland State AgenciesDepartment of PlanningDepartment of the Environment Department of TransportationDepartment of Natural ResourcesMaryland Historical TrustState Highway AdministrationMaryland Transit AdministrationCritical Area CommissionMaryland Port Administration
Boards and CommissionsPlanning CommissionCivilian Review BoardCommission on Aging and Retirement Education (CARE)Commission for Historical and Architectural Preservation (CHAP)Mayor’s Commission on Disabilities (MCD)Baltimore Community Relations CommissionBoard of Municipal & Zoning Appeals (BMZA)Board of Estimates of the Mayor & City Council Environmental Control Board

22 City of Baltimore Comprehensive Master Plan Executive Summary 2322 City of Baltimore Comprehensive Master Plan Executive Summary 23
INTR
OD
UC
TION
SU
MM
AR
Y H
ISTO
RY
KE
Y TR
EN
DS
LIVE
EA
RN
PLAY
LEA
RN
IMP
LEM
EN
TATION
MA
NA
GE
ME
NT FIN
AN
CIA
L CO
NC
LUS
ION
GLO
SS
AR
Y A
PP
EN
DIC
ES
Quasi-Government & Advisory CommitteesBaltimore City Parking Authority Baltimore City Public School System (BCPSS)Baltimore Area Convention & Visitors Association (BACVA)Baltimore Development Corporation (BDC)Baltimore Neighborhood Indicators Alliance (BNIA) Baltimore Regional Council (BMC) Regional Planning DirectorsBaltimore Rising, Inc. Comprehensive Economic Development Strategy CommitteeDowntown Partnership of BaltimoreEast Baltimore Development, Inc. (EBDI)Enoch Pratt Free Library (EPFL)Maryland Stadium AuthorityPolice Athletic League
Non-profits, Foundations, Private IndustryAbell FoundationAmerican Institute of Architects (AIA)Alliance for the Chesapeake BayAnnie E. Casey FoundationBaltimore Alliance for Great Urban ParksBaltimore City Chamber of CommerceBaltimore Community FoundationBaltimore Ecosystem Study/CUEREBeyond the BoundariesBOOST (Baltimore’s Out Of School Time Initiative)Citizens Planning & Housing Association (CPHA)Collegetown NetworkConcierge AssociationCount Program (Trade Apprenticeship)Creative AllianceEnterprise FoundationFund for Educational ExcellenceGreater Baltimore CommitteeGreater Baltimore Cultural AllianceHarry and Jeanette Weinberg FoundationLiveBaltimoreMaryland Association of Counties (MACO)Marina/Harbor Master, Department of Real EstateMain Streets ProgramMunicipal MarketsNational Trust for Historic PreservationNeighborhood Design CenterParks & People FoundationProjects for Public SpacesRestaurant Association of MarylandSafe and SoundU.S. Green Building Council-Baltimore ChapterUrban Leadership Institute (ULI)Westside Skills Center

24 City of Baltimore Comprehensive Master Plan Executive Summary PB
Colleges & UniversitiesBaltimore City Community CollegeBaltimore Hebrew UniversityBaltimore International CollegeCoppin State UniversityThe Johns Hopkins UniversityLoyola College in MarylandMaryland Institute College of Art (MICA)Morgan State UniversitySojourner Douglass CollegeUniversity of BaltimoreUniversity of Maryland, BaltimoreCollege of Notre Dame of MarylandSt. Mary’s Seminary
Timeline for Adoption of LIVE • EARN • PLAY • LEARN: The City of Baltimore Comprehensive Plan
1999 Final Draft of PlanBaltimore issued
July 2004 Official kick-off of Comprehensive Plan effort
March 2005 Team-based staff work begins on new Comprehensive Plan Draft
August-December 2005 Staff teams hold meetings with stakeholder groups to assess key issues and possible approaches for draft
October 2005 Open houses held to gather community input during drafting process, Comprehensive Plan Surveys released
February 2, 2006 First Draft of LIVE • EARN • PLAY • LEARN released to the public
February-April 2006 Special Planning Commission hearings held to receive reaction to Draft Comprehensive Plan
April 17, 2006 End of the comment period on the first draft of LIVE • EARN • PLAY • LEARN
May 22, 2006 Second draft of LIVE • EARN • PLAY • LEARN released to the public, incorporating comments from the public, City agencies and other stakeholders
June 15, 2006 Adoption of Comprehensive Plan by Planning Commission
July 10, 2006 Introduction of resolution to adopt Comprehensive Plan to Baltimore City Council
November 21, 2006 Adoption of LIVE • EARN • PLAY • LEARN as the City’s official Comprehensive Plan by Baltimore City Council
May 2009 Mid-Point Update

PB City of Baltimore Comprehensive Master Plan The History of Baltimore 25
INTR
OD
UC
TION
SU
MM
AR
Y H
ISTO
RY
KE
Y TR
EN
DS
LIVE
EA
RN
PLAY
LEA
RN
IMP
LEM
EN
TATION
MA
NA
GE
ME
NT FIN
AN
CIA
L CO
NC
LUS
ION
GLO
SS
AR
Y A
PP
EN
DIC
ES
Four centuries of decisions made by millions of people have created Balti-more City. Sometimes, these decisions – local, national, or global in scale – have challenged the very existence of Baltimore City. At other times, these decisions have created opportunities for Baltimore to grow, transform, and thrive.
Within this continual sea of decision making, Baltimoreans have success-fully steered their City through global turmoil, economic booms and busts, political and social upheaval, and the extraordinary consequences of techno-logical change. Throughout Baltimore’s history, its leadership responded to a number of seemingly insurmountable challenges by reinventing the City many times: brilliant Baltimoreans have invented and improved upon a vast range of technologies; shrewd businessmen have seized mercantile advan-tages; philanthropists have dramatically improved the lives of people within Baltimore and across the globe; and civic-minded citizens have organized and re-organized local government and the City’s civic institutions. The next few pages will chronicle moments in Baltimore’s history when hard, culture-defining choices had to be made. These choices reveal the tenacity, ingenuity, and genius of Baltimore and its residents.
In 1752 John Moale sketched a rough drawing of Baltimore Town as seen from Federal Hill. In 1817 Edward Johnson Coale repainted this view, adding picturesque embellishments.
The History of Baltimore

26 City of Baltimore Comprehensive Master Plan The History of Baltimore 2726 City of Baltimore Comprehensive Master Plan The History of Baltimore 27
1729 to 1752 – The Beginning
There was nothing unusual in 1729 when several wealthy Marylanders pushed through the State Leg-islature a town charter for Baltimore. Town charters were issued routinely across the State in those times. In 1730, Baltimore Town was established with sixty lots, one-acre each, and located on the north side of the Inner Basin of the Patapsco River (now the Inner Harbor). These lots were squeezed in between a shal-low harbor on the south; the Jones Falls River and marsh on the east; a bluff and woods on the north; and large gullies on the west. In 1745, Jonestown, a small settlement just east of the Jones Falls, was merged into Baltimore, adding twenty more lots to the town. By 1752, only twenty-five buildings had been con-
structed in Baltimore– a rate of approximately one building per year. Shortly after 1752, the pace changed.
1752 to 1773 – Seizing the Geography
The rise of Baltimore from a sleepy town trading in tobacco to a city rival-ing Philadelphia, Boston, and New York began when Dr. John Stevenson, a prominent Baltimore physician and merchant, began shipping flour to Ire-land. The success of this seemingly insignificant venture opened the eyes of many Baltimoreans to the City’s most extraordinary advantage– a port nestled alongside a vast wheat growing countryside, significantly closer to this rich farm land than Philadelphia.
The town exploded with energy, and Baltimoreans restructured the City’s economy based on flour. Trails heading west were transformed into roads; flour mills were built along the Jones Falls, Gwynns Falls, and Patapsco Riv-er; and merchants built warehouses on thousand-foot long wharves that ex-tended into the harbor. Soon, the roads from Baltimore extended all the way to Frederick County and southern Pennsylvania, and Baltimore ships sailed beyond Ireland to ports in Europe, the Caribbean, and South America.
The City’s widening reach was also apparent in the foreign-born populations it attracted. In 1756 a group of nine hundred Acadians, French-speaking Cath-olics from Nova Scotia, made what homes they could in an undeveloped tract along the waterfront. This pattern would be repeated by numerous groups over subsequent decades and centuries: entry into Baltimore’s harbor, a scramble for housing near the centers of commerce, and a dispersion throughout the city as much as space, means and sometimes stigma would allow. But not all newcomers started at a disadvantage. During this period, Irish, Scottish and German families with experience and capital gained from milling in other parts of the region took advantage of the City’s growth economy.
1773 to 1827 – Improving on the Geography
During the Revolutionary War, Baltimore contributed an essential ingredient for victory: naval superiority. By the 1770s, Baltimore had built the most ma-neuverable ships in the world. These ships penetrated British blockades and
Map showing Baltimore and Jonestown in the mid-18th Century.

26 City of Baltimore Comprehensive Master Plan The History of Baltimore 2726 City of Baltimore Comprehensive Master Plan The History of Baltimore 27
INTR
OD
UC
TION
SU
MM
AR
Y H
ISTO
RY
KE
Y TR
EN
DS
LIVE
EA
RN
PLAY
LEA
RN
IMP
LEM
EN
TATION
MA
NA
GE
ME
NT FIN
AN
CIA
L CO
NC
LUS
ION
GLO
SS
AR
Y A
PP
EN
DIC
ES
outran pirates, privateers, and the Royal British Navy. The agility and speed of these ships allowed Baltimore merchants to continue trading during the Revolutionary War, which in turn helped to win the war and to propel Balti-more’s growth from 564 houses in 1774 to 3,000 houses in the mid 1790s.
From the late 1770s through the 1790s, Baltimore was loaded with boom-town energy. Baltimore’s Town Commissioners implemented a number of critical public works projects and legislative actions to guide this energy: Fells Point merged with Baltimore (1773); a Street Commission was cre-ated to lay-out and pave streets (1782); and a Board of Port Wardens was created to survey the harbor and dredge a main shipping channel (1783). Street lighting followed in 1784 along with the establishment of “Marsh Market,” and the straightening of the Jones Falls. In 1797 Baltimore was officially incorporated as a city, which allowed local officials to create and pass laws. In 1798 George Washington described Baltimore as the “rising-est town in America” (A.T. Morison, George Washington).
Baltimore City at the beginning of the 19th century overcame many ob-stacles to growth. The northern shoreline of the Inner Harbor was ex-tended two blocks south (Water Street marks the original location of the
This engraving of Baltimore was published in Paris and New York around 1834. Since 1752, Federal Hill has been the vantage point from which to view Baltimore.

28 City of Baltimore Comprehensive Master Plan The History of Baltimore 2928 City of Baltimore Comprehensive Master Plan The History of Baltimore 29
shoreline) and devel-opment expanded in all directions, usually following the turnpike roads that led from Baltimore’s harbor to the rural hinterlands. In 1816, when the population reached 46,000 residents, Bal-timore expanded its boundaries, increas-ing its size from three to ten square miles. Shortly thereafter, land surveyor Thomas Poppleton was hired to map the City and prepare a plan to con-
trol future street extensions. His plan consisted of a gridiron street pattern that created a hierarchy of streets: main streets, side streets and small alleys. This set in motion Baltimore’s basic development pattern of various-sized rowhouses built on a hierarchical street grid. Catering to several economic classes, the larger streets held larger houses; the smaller cross streets held smaller houses; and the alleys held tiny houses for immigrants and laborers.
As Baltimore’s port grew, its trade routes were extended to the Ohio Valley. In 1806 the Federal Government authorized the building of the National Road from the Ohio River to Cumberland, Maryland. In turn, Baltimore businessmen
built turnpike roads from Baltimore to Cumberland, effectively complet-ing the Maryland portion of the Na-tional Road. The Road quickly be-came Baltimore’s economic lifeline to the fertile lands of the Ohio Val-ley. By 1827 Baltimore became the country’s fastest growing city and the largest flour market in the world.
At the same time, other economic forces were taking hold. Many mills along Jones Falls were converted to or built as textile mills. In 1808 the Union Manufacturing Company, built in the Mount Washington area, became one of America’s first tex-tile mills. Nearly twenty years later,
mills along the Jones Falls were producing over 80% of the cotton duck (sail cloth) in the country. In addition, 60 flour and grist mills, 57 saw mills, 13 spinning and paper mills, 6 foundries, and 3 powder mills were located on streams near the City, and shipyards, brick kilns, copper and iron works, and glass factories were built along the shoreline of the harbor.
This 1865 view of Fort McHenry was published by E. Sachse and Company. Fort McHenry was the military post for Baltimore in the Civil War as well as a jail for Confederate prisoners.
Fairview Inn was located on the Old Frederick Road. The inn, known as the “three mile house,” catered to farmers bringing wheat, flour, and produce to Baltimore. This image was painted by Thomas Coke Ruckle around 1829.

28 City of Baltimore Comprehensive Master Plan The History of Baltimore 2928 City of Baltimore Comprehensive Master Plan The History of Baltimore 29
INTR
OD
UC
TION
SU
MM
AR
Y H
ISTO
RY
KE
Y TR
EN
DS
LIVE
EA
RN
PLAY
LEA
RN
IMP
LEM
EN
TATION
MA
NA
GE
ME
NT FIN
AN
CIA
L CO
NC
LUS
ION
GLO
SS
AR
Y A
PP
EN
DIC
ES
Baltimore also played a key role in the War of 1812. Privateers, essen-tially pirates supported by the U.S. government, played a decisive role in winning the War. At this time Bal-timore shipbuilders built the fast-est, most maneuverable ships in the world. Known as the “Baltimore Clipper,” these ships allowed Balti-more ship captains to wreak havoc on England’s maritime trade. Captain W.F. Wise of the Royal Navy said “In England we cannot build such vessels as your ‘Baltimore Clippers.’ We have no such models, and even if we had them they would be of no service to us, for we could never sail them as you do.” Of the 2,000 Eng-lish ships lost during the war, Balti-more privateers had captured 476 or almost 25% of them.
The British described Baltimore as ‘a nest of pirates,’ and the City soon be-came a military target. After the British burned Washington, DC, they sailed to Baltimore. The City, left to defend itself, looked to Revolutionary War hero General Samuel Smith to coordinate its defense. Following Smith’s direction, every able-bodied man toiled for days, building a formidable defense at Hamp-stead Hill (now Patterson Park) and making preparations at Fort McHenry. A contemporary of Smith quipped “Washington saved his Country and Smith saved his City.”
The Battle of Baltimore has been immortalized by not one but two American treasures. The Battle Monument erected between 1815 and 1825 was the first public war memorial in the country and the first memorial since antiquity to commemorate the common soldier. It lists every ordinary citizen who died in the battle. In addition, Francis Scott Key, who was being held prisoner on a British ship, observed the battle and recorded the event in a poem, which he set to the tune of an old drink-ing song. The Star Spangled Banner premiered in Baltimore in 1814 and became our National Anthem in the early 20th century.
As Baltimore grew in size and popu-lation, many social and cultural in-stitutions were founded. As early as 1773, a theater opened in an old warehouse near current-day Power Plant Live. By 1800 there were three theaters and several theater compa-nies. In 1797, directly across from the current-day City Hall, the Balti-more Dance Club built the New As-sembly Room featuring a ball room
The Washington Monument in 1835 sat on the grounds of “Howard’s Woods.” Baltimore’s developed area ended a block south on Charles Street.
In 1829, the Baltimore & Ohio (B&O) Railroad built the Mount Clare Station. By 1900 it was a sprawling complex of 32 buildings. This building, the Mount Clare Passenger Car Shop, built in 1884, became the B&O Railroad Museum’s principal building in 1953.

30 City of Baltimore Comprehensive Master Plan The History of Baltimore 3130 City of Baltimore Comprehensive Master Plan The History of Baltimore 31
and a subscription library. In 1814, Rembrandt Peale built the first purpose-built museum building in the Western Hemisphere and the second in modern history. The Peale Museum exhibited paintings, sculpture, and the bones of a mastodon excavated in upstate New York. During the first half of the 19th century, Baltimore’s cultural activities grew as literary, science and social clubs were formed.
The early 19th century was a great time for Baltimore. It seemed to be Amer-ica’s perennial boom town. It kept growing. It had energy. It was a city full of merchants of all kinds. Its sailing ships were the fastest, swiftest force on the world’s oceans. In the 1830 national census, with its population of 80,000, Bal-timore had become the second largest city in the United States. German settlers now made up a substantial part of this population (possibly some ten percent as early as 1796). Substantial numbers of Scotch-Irish moved overland from Pennsylvania while boatloads of newcomers from Ireland, Scotland and France were received as well. A number of the new French-speaking arrivals came by way of the Caribbean from Santo Domingo (present-day Haiti), displaced by a massive and ultimately successful slave revolt. The blacks among them may have added as much as 30% to the “colored” population of the town.
1827 to 1850 – The Looming Economic Downturn
In 1825, one boat completed a journey that indirectly shaped Baltimore’s his-tory for the next 100 years. The packet boat, Seneca Chief, operated by New York Governor Dewitt Clinton, journeyed from the eastern end of Lake Erie to New York City, thereby inaugurating the Erie Canal. A year later, 19,000 boats had transported goods to and from the Midwest and New York. The new freight rates from Buffalo to New York were $10 per ton by canal, compared to the cost of $100 per ton by road. The canal became by far the most efficient and affordable way to transport goods from the Midwest to the Atlantic Ocean.
As trade on the canal began to usurp trade on the National Road, Baltimoreans foresaw the City’s economic power eroding. Baltimore’s business leaders were on the verge of panic. They discussed all sorts of wild schemes and alternative canal locations, but Baltimore’s geography prevented any of these schemes from becoming reality.
At this point, the luck and stubbornness of Baltimoreans began a course of events that reinvented the world, even making its arch nemesis, the Erie Canal, obsolete. Baltimore merchant Philip Evan Thomas while in England became convinced that England’s “short railroads,” which hauled coal from the mines to the canals, had long-distance potential. On February 12, 1827, Thomas and 25 other Baltimore merchants met “to take into consideration the best means of restoring to the City of Baltimore that portion of the western trade which has lately been diverted from it by the introduction of steam navigation [on the Mississippi] and by other causes [the Erie Canal].” Four days later, the men resolved “that immediate application be made to the legislature of Maryland for an act incorporating a joint stock company, to be named the Baltimore & Ohio Railway Company.” Twelve days later, the Act of Incorporation for the company was approved.
Over a year later, on July 4, 1828, with $4,000,000 of capital stock already raised, Charles Carroll of Carrollton laid the “first stone” of the B&O Rail-road. On May 22, 1830, the B&O Railroad began running operations from Baltimore to Ellicott’s Mills, a distance of 13 1/2 miles. Finally, on December
Portrait of Frederick Douglass. Douglass spent his early years in Baltimore where he learned to read and write. In the late 1830s, Douglass escaped to freedom while impersonating a sailor.

30 City of Baltimore Comprehensive Master Plan The History of Baltimore 3130 City of Baltimore Comprehensive Master Plan The History of Baltimore 31
INTR
OD
UC
TION
SU
MM
AR
Y H
ISTO
RY
KE
Y TR
EN
DS
LIVE
EA
RN
PLAY
LEA
RN
IMP
LEM
EN
TATION
MA
NA
GE
ME
NT FIN
AN
CIA
L CO
NC
LUS
ION
GLO
SS
AR
Y A
PP
EN
DIC
ES
24, 1852, the last spike was driv-en in Wheeling, Virginia (now West Virginia), a distance of 379 miles.
In those few years, Baltimore citizens had decided how far apart the rails should be (4 feet 8 1/2 inches), had completely re-engineered the steam engine, and in fact had created the world’s first long distance railroad, the world’s first passenger railroad, and the world’s first railroad that climbed over mountain tops. At the B&O railroad shops in West Baltimore, ingenious innovators perfected passenger and freight car design, continuously im-proved the steam locomotive de-sign, and fabricated bridges for the growing railroad. Baltimor-eans unleashed “mighty forces that were to revolutionize land transportation, alter the course of trade, make and unmake great cities, and transform the face of the country” (J. Wallace Brown).
The B&O Railroad shops triggered technological innovation in architecture and engineering. Wendel Bollman, after working as an engineer for the B&O Railroad, developed the first cast-iron bridge system in the country. In 1850, the Hayward, Bartlett & Company, iron fabricators, moved next to the B&O Railroad shops and began producing much of the nation’s cast-iron architec-tural components.
The telegraph became intertwined with the development and success of the B&O Railroad. In 1844, a telegraph line was completed from Baltimore to Washington, DC along the B&O Railroad tracks. First the telegraph lines were buried, but the lines kept failing. Finally, they were strung on poles, effectively bringing into existence the telephone pole. Later, the railroads and the telegraph, together, helped to implement standard time zones through-out the Country. Standard time zones were essential for railroads to safely schedule their trains, and the telegraph allowed cities across the country to synchronize their clocks.
The railroad’s first year of operation coincided with a spike in immigration. The port’s intake of foreigners doubled in 1830 and again in 1832, from 2,000 to 4,000 to 8,000 per year. Bavarian Jews, for example, settled in Oldtown on High, Lombard, Exeter and Aisquith streets.
1850 to 1866 – Baltimore at Mid-Century
Between 1850 and the Civil War, extraordinary changes spread through Bal-timore’s landscape. Cast-iron building technology transformed Baltimore’s downtown. In 1851 the construction of the Sun Iron Building introduced
An 1848 image of the Washington Monument from Charles and Hamilton streets. The squares were first laid out as simple lawns.

32 City of Baltimore Comprehensive Master Plan The History of Baltimore 3332 City of Baltimore Comprehensive Master Plan The History of Baltimore 33
cast-iron architecture to Baltimore and the nation. Its five-story cast-iron fa-çade, iron post-and-beam construction, and sculptural detailing were copied throughout cities worldwide. Back in Baltimore, 18 months after the Sun Building opened, 22 new downtown buildings incorporated cast iron into their construction. In 1857 the Baltimore Sun noted, “literally, the City of yesterday is not the city of today… The dingy edifices that for half a century have stood…are one by one being removed, and in their places new and im-posing fronts of brown stone or iron present themselves.”
Baltimore was also remarkable during this time for the size and achieve-ments of its African-American community. In 1820 it was the largest in the nation. Slave or free, no greater number of blacks could be found anywhere in the nation. By the time the Civil War erupted, the City contained 26,000 free blacks and approximately 2,000 slaves. Even more remarkable, during that same period Maryland alone accounted for one out of every five free blacks in the country.
African Americans struggled for a piece of Baltimore’s economic activities. Prior to emancipation, it was common for slaves in the City to rent their skills and services for wages, part of which went to their masters and part of which could be used for food, accommodation and amusement. At the same time racism handicapped free blacks while competing with whites for skilled and unskilled jobs in the port economy. During times of recession, white working men sometimes resorted to violence to keep jobs among themselves.
An 1850s-era view of Mount Vernon Place in relation with downtown Baltimore.

32 City of Baltimore Comprehensive Master Plan The History of Baltimore 3332 City of Baltimore Comprehensive Master Plan The History of Baltimore 33
INTR
OD
UC
TION
SU
MM
AR
Y H
ISTO
RY
KE
Y TR
EN
DS
LIVE
EA
RN
PLAY
LEA
RN
IMP
LEM
EN
TATION
MA
NA
GE
ME
NT FIN
AN
CIA
L CO
NC
LUS
ION
GLO
SS
AR
Y A
PP
EN
DIC
ES
1866 to 1899– Heading Towards Modernity
After the war, the City’s industry gathered momentum. The advent of steam power in the 1820s released Baltimore’s industry from its stream valleys, and new larger-scale industries were built close to the harbor. Baltimore’s connec-tions to the Bay’s fishing industry and the fertile farm land around the Chesa-peake Bay helped to concentrate canning factories around the harbor’s edge. In fact, by the 1880s, Baltimore had become the world’s largest oyster sup-plier and America’s leader in canned fruits and vegetables. Complementing the canning industry was the fertilizer industry. Baltimore became the number one importer of guano, centuries-old bird droppings scraped off Pacific Coast islands near South America. Mixed with phosphates, guano became the most important fertilizer for the farms lining the Chesapeake Bay. By 1880, Balti-more had 27 fertilizer factories producing 280,000 tons of fertilizer per year.
Baltimore was also becoming a leader in other manufacturing sectors. By the 20th century, the City was a world leader in manufacturing chrome, copper, and steel products. In 1887, Sparrow’s Point was developed by Pennsylvania Steel Company. This location brought Cuban iron ore and Western Maryland coal together, creating a company that helped to shape Baltimore’s economy for over a hundred years. In addition, Baltimore was America’s ready-made
Immigrants waiting to debark at Locust Point. Close to two million immigrants arrived in Baltimore throughout the 19th and early 20th centuries. (Courtesy of the Maryland Historical Society, Baltimore, Maryland)

34 City of Baltimore Comprehensive Master Plan The History of Baltimore 3534 City of Baltimore Comprehensive Master Plan The History of Baltimore 35
garment manufacturing center and the world’s largest producer of umbrellas. Baltimore grew on its manufacturing strength, and indus-try expanded along the shorelines of Fairfield, Brooklyn, and Curtis Bay.
From 1850 to 1900 Baltimore’s population grew from 169,000 to 508,957. Baltimore’s vibrant and diverse neighborhoods evolved to accommodate a constant influx of immigrants searching for opportu-nity. More than two million immi-grants landed first in Fells Point and then in Locust Point, making the City second only to New York as an immigrant port-of-entry. Most new arrivals promptly boarded the B&O Railroad and headed west, but many stayed in the City to work in
the burgeoning industries or start their own businesses. Irish, German, East-ern European, Greek and Italian immigrants added their customs, religions and talents to Baltimore’s colorful tapestry of neighborhoods and industries.
This growth, however, placed great pressure on Baltimore’s physical infra-structure, and City officials responded. To accommodate this growth, Balti-more expanded its size from ten to thirty square miles in 1888. Prior to this annexation, the City influenced the suburban regions through the Baltimore City Water Works and the development of the horsecar.
In 1853, the Baltimore City government purchased the Baltimore Water Com-pany. With Baltimore’s water supply clearly a government responsibility, ambitious plans were implemented. Between 1858 and 1864, the Hampden Reservoir, Lake Roland and Druid Lake were created. This water system used the Jones Falls as its source; however, in 1874 the City passed an ordinance to create another water system with the Gunpowder River as its main source. By 1888, Baltimore had created Loch Raven Reservoir and a seven-mile tunnel that connected Loch Raven to Lake Montebello.
In addition, horsecar railway companies began laying track along Baltimore streets in 1859. Many horsecar railway lines followed old turnpike roads, effectively opening up suburban areas for development. In a matter of years Baltimore’s neighborhoods and its suburban villages were tied together by a comprehensive system of horsecar railway lines. In the 1890s, Baltimore replaced horsecars with the electric streetcar, which opened up even more suburban areas to development, and by 1900 over 100 suburban villages surrounded Baltimore.
While horsecars expanded Baltimore’s physical reach, steamships and rail-roads tied Baltimore to the global economy. The B&O Railroad connected Baltimore to the West; the Philadelphia, Wilmington and Baltimore Railroad connected the City to Philadelphia; and the Maryland and Potomac Railroad
Baltimore Harbor image of Locust Point and Canton around 1860. Images of Camden Station (left) and the old Calvert Street Station (right) are located in the upper corners of the picture.

34 City of Baltimore Comprehensive Master Plan The History of Baltimore 3534 City of Baltimore Comprehensive Master Plan The History of Baltimore 35
INTR
OD
UC
TION
SU
MM
AR
Y H
ISTO
RY
KE
Y TR
EN
DS
LIVE
EA
RN
PLAY
LEA
RN
IMP
LEM
EN
TATION
MA
NA
GE
ME
NT FIN
AN
CIA
L CO
NC
LUS
ION
GLO
SS
AR
Y A
PP
EN
DIC
ES
connected Baltimore to the South. As early as 1851, Baltimore steamship companies connected the City to points along the shoreline of the Chesapeake Bay. In 1869, Baltimore and Bremen businessmen opened the Baltimore Bremen Line, which began regular runs between Baltimore and Germany. Samuel Shoemaker, an enterprising Baltimorean, seized the opportunity that Baltimore’s transportation hub offered. He helped to organize the Adams Ex-press Company that prided itself on delivering anything, anywhere. This ser-vice helped to open and settle the West. By the 1880s the company employed over 50,000 people.
Closer to home, Mayor Swann agreed to allow horsecar companies to lay track on public streets in exchange for 20% of their gross proceeds to fund a park system. In 1860 Baltimore created its first park board and opened Druid Hill Park. By 1900, the Park board had added eight major parks to Baltimore. All these parks were incorporated into Baltimore’s major park plan of 1904.
As of 1893, Baltimore had more millionaire philanthropists than any other city in America; moreover, through the benevolence of four Baltimoreans, modern philanthropy began. In 1866 the Peabody Institute opened with a mu-sic school, an art gallery, a lyceum, and a library more comprehensive than the Library of Congress. Picking up on these themes, Enoch Pratt founded the City’s library system; William and Henry Walters founded the Walters Art Gallery; and Johns Hopkins founded Johns Hopkins University and Hos-pital. During one memorable dinner, John Work Garrett remembers George Peabody telling Johns Hopkins, “I began to find out it was pleasanter to give money away than it was to make it.”
A lithograph of City Hall in 1875 by A. Hoen Company.

36 City of Baltimore Comprehensive Master Plan The History of Baltimore 3736 City of Baltimore Comprehensive Master Plan The History of Baltimore 37
“My library,” Mr. Pratt said, “shall be for all, rich and poor without distinction of race or color, who, when properly accredited, can take out the books if they will handle them carefully and return them.” In 1886 with the opening of the central library and four branch libraries, the Enoch Pratt Free Library became the first city-wide library system in the country. The Johns Hopkins Univer-sity opened in 1876 as America’s first research-oriented university modeled after the German university system. The university attracted some of the best minds of the late 19th century: philosophers Josiah Royce and Charles Sand-ers Pierce; medical doctor William Osler and chemist Ira Remsen; histori-ans Frederick Jackson Turner and Herbert Baxter Adams (father of Political Science); and ambassador Theodore Marburg and future President Woodrow Wilson.
At the same time, Charles Joseph Bonaparte (future U.S. Attorney Gen-eral under Theodore Roosevelt), Cardinal Gibbons, Baptist minister Henry Wharton, Reverend Hiram Vrooman of the New Jerusalem Church, and oth-ers formed the Baltimore Reform League to reform the election process in Baltimore. By 1900, the League had managed to significantly reduce the level of voting fraud and elect politicians not beholden to Baltimore’s infa-mous Democratic Machine.
As the 20th century loomed over Baltimore, major economic, physical and technological changes were taking place. Family-owned businesses began to give way to corporations. Between 1895 and 1900, Baltimore found itself fully integrated into the national economy. In 1881 there were 39 corporations in Baltimore; by 1895 there were over 200 corporations.
During this same period, the City saw the beginnings of a Polish immigra-tion that began around 1870 and continued until World War I. The first fami-lies settled in Fells Point before moving east and northeast of the water. The City also became home to a small number of Lithuanians fleeing assimilation and service in the Russian army in the 1880s. They settled in East Baltimore and eventually formed communities along Paca and Saratoga streets. Italians, fleeing drought and poverty, entered Baltimore around the same time. Today’s Little Italy neighborhood didn’t become Italian until it had seen a succession of Germans, Irish and Jews.

36 City of Baltimore Comprehensive Master Plan The History of Baltimore 3736 City of Baltimore Comprehensive Master Plan The History of Baltimore 37
INTR
OD
UC
TION
SU
MM
AR
Y H
ISTO
RY
KE
Y TR
EN
DS
LIVE
EA
RN
PLAY
LEA
RN
IMP
LEM
EN
TATION
MA
NA
GE
ME
NT FIN
AN
CIA
L CO
NC
LUS
ION
GLO
SS
AR
Y A
PP
EN
DIC
ES
By the turn of the century the wealth and success of many Jewish families was evident in the size and diversity of the community’s synagogues, some orthodox, some reform. The wealthier sections of the population were becom-ing increasingly mobile, able to move northwest out of Oldtown.
African Americans, too, were in need of new and better homes. An influx of African American rural migrants in the 1870s and 1890s worsened already crowded conditions in many Baltimore neighborhoods, but discrimination meant that little to no new housing would be designated for them.
1900 to 1939 – Keeping up with Technology
At the dawn of the 20th century, Baltimore’s population reached over half a million. Hundreds of passenger trains were funneled through its five railroad stations; 13 trust companies controlled large areas of Baltimore manufac-turing; 21 national banks and 9 local banks controlled Baltimore’s financial interests; 13 steamship companies were engaged in coastal trading; and 6 steamship companies connected Baltimore to foreign ports. Technological progress, economic restructuring, and an increasing population placed great pressure on Baltimore’s urban fabric.
To confront these immense changes, the Baltimore Municipal Art Society was formed around 1899 and soon became the voice that directed Baltimore’s physical development. The society’s initial goals were inspired by the Na-tional City Beautiful Movement. They commissioned artists to create several monuments and hired the Olmsted Brothers’ Landscape Architects to create the 1904 Baltimore City park plan. They advocated successfully for a com-prehensive sewer system (1914), for annexation (1918), and for a comprehen-sive zoning ordinance (1923).
Baltimore’s biggest challenge, however, began in 1904. On Sunday, Febru-ary 7, 1904, Baltimore’s downtown vanished. On that morning, smoke rose from the basement of a dry goods store on the corner of German (now Red-wood) and Liberty streets. Shortly before 11:00 a.m., the building exploded, spreading flames and debris to nearby structures. Driven by a strong wind,
Panoramic view of the destruction left by the Great Baltimore Fire of 1904. This view is looking west from near Baltimore and Gay streets.

38 City of Baltimore Comprehensive Master Plan The History of Baltimore 3938 City of Baltimore Comprehensive Master Plan The History of Baltimore 39
the blaze moved east and then south. Approximately 30 hours later, firemen from Baltimore and other cities along the East Coast as far away as New York stopped the blaze at the Jones Falls. The downtown smoldered for weeks. The fire consumed 140 acres, destroyed 1,526 buildings, and burned out 2,500 companies.
Baltimore quickly began rebuilding, and dozens of buildings were being constructed a year later. Ten years after the fire, Baltimore’s downtown was completely rebuilt. In all, the fire made way for several significant improve-ments to the downtown: twelve streets were widened, utilities were moved underground, a plaza was established, and wharves were rebuilt and became publicly owned. The fire also led to stricter fire codes for Baltimore and na-tional standardization of fire hydrants and fire-hose connectors.
World War I imposed hardships on Baltimore as well as presented economic opportunities. In 1917, when the U.S. declared war on Germany, Baltimore swelled with anti-German feelings. German Street was renamed Redwood Street after Lt. George B. Redwood, Maryland’s first casualty in the War. The German-American Bank was renamed the American Bank. Worse, thousands of German immigrants were classified as enemy aliens, even if they had lived in Baltimore for years. The War cut off the flow of European immigrants.
Baltimore’s population swelled from 558,485 in 1910 to 733,826 in 1920 as unemployed rural southerners flocked to Baltimore. Even though the number of workers increased by a third, labor shortages were still pervasive. This
Memorial Day Parade June 2, 1919. Here the 808th Infantry, an African American unit, headed south on Holliday Street, a half-block from City Hall.

38 City of Baltimore Comprehensive Master Plan The History of Baltimore 3938 City of Baltimore Comprehensive Master Plan The History of Baltimore 39
INTR
OD
UC
TION
SU
MM
AR
Y H
ISTO
RY
KE
Y TR
EN
DS
LIVE
EA
RN
PLAY
LEA
RN
IMP
LEM
EN
TATION
MA
NA
GE
ME
NT FIN
AN
CIA
L CO
NC
LUS
ION
GLO
SS
AR
Y A
PP
EN
DIC
ES
worker-friendly environment helped to bring the eight-hour day to Baltimore, opened up jobs for women, and provided more skilled jobs for African Ameri-cans.
In 1918, Baltimore completed a major annexation, instantly enlarging its size from 30 square miles to almost 90 square miles. In contrast to Baltimore’s old rowhouse model, the annexed area was developed with bungalows and other types of suburban-style houses. Street patterns in the annexed area dif-fered from the older, inner-city area of Baltimore. Alleys disappeared, and the urban grid softened into irregular and curved patterns. City government retooled and reorganized in order to thoughtfully develop the annexed area. The City Plan Committee was appointed in 1918. In addition, Baltimore City passed the 1923 Zoning Ordinance, and the Board of Municipal and Zoning Appeals was created. Other bureaucratic reorganization occurred: the Bureau of Highways was formed (1920s); Bureau of Plans and Survey was created (1926); and several departments were consolidated into the Department of Public Works (1926). The Major Street Plan for the annexed area was adopted in 1923, and from the beginning it was under extreme development pressure. In an unprecedented effort Baltimore bureaucrats and legislators “adopted a policy of refusing to extend paving or underground utilities in any street the location of which had not been approved by the City Plan Committee, and all sub-division plans were submitted to it.”
In turn, developers adapted to the changes in the bureaucratic approval process as well as changes in finance, real estate, and building technology.
The weekly step-scrubbing ritual, 1938. Baltimore is famous for its ubiquitous white marble steps lining the streets of many of its rowhouse neighborhoods.

40 City of Baltimore Comprehensive Master Plan The History of Baltimore 4140 City of Baltimore Comprehensive Master Plan The History of Baltimore 41
Developers began to consolidate their development process. They bought large estates, subdivided them, laid out the roads and underground utilities, built the houses, set-up building and loan associations (sometimes on site), and marketed their new neighborhoods. Prior to the 20th century, many of these steps were done separately. The results were extraordinary: E.J. Gal-lagher, Ephraim Macht, and Frank Novak built over fifty thousand houses in Baltimore. Other developers, including George R. Morris, Henry Kolbe, and Kennard and Company, partnered with longtime residents of suburban areas and formed real estate corporations. The rate of development was extraordi-nary: in Northeast Baltimore alone between 1900 and 1939 the number of housing units grew from 279 units to over 14,000 units.
Most African Americans, however, were left out of this suburban expansion. Three times before World War I the City Council passed ordinances forbid-ding them from moving into white neighborhoods. Each was overturned, but unfortunately they represented only the most formal and overt of numerous racist tactics. With the newest offerings within the expanding housing stock largely off limits, many blacks bought and rented secondhand. After another large rural influx in 1900, by 1904, half of the City’s black population had taken up residence in Old West Baltimore as the area’s German community branched out further north. Within this single area could be found a rich di-versity of African American life.
Corporations, more than individuals, reshaped the downtown and surrounding areas along the shoreline. National corporations built industrial parks, not just industrial buildings. Western Electric, Standard Oil, and Crown Cork & Seal each had an industrial complex encompassing more than 125 acres. Standard Oil also located its regional office headquarters on St. Paul Place. Baltimore found a comfortable position in the new world of national corporations.
By the 1930s, most of our venerable cultural institutions had been created: the Baltimore Museum of Art, the Walters Art Gallery, the Peale Museum re-opened as Baltimore’s history museum, Lyric Opera House, and more than a hundred movie theaters were built throughout Baltimore neighborhoods. Oth-er institutions were thriving: the Maryland Institute College of Art, Goucher College, Morgan College (now Morgan State University), Coppin Teachers College (now Coppin State University), and the University of Maryland at Baltimore.
By 1931 the Depression hit Baltimore hard. On September 31, 1931, the Bal-timore Trust Company closed its thirty-two-story skyscraper; by 1933, the Governor closed all banks to try and prevent mass bank withdrawals. For the next six years Baltimore spiraled deeper into despair; 29,000 Baltimoreans were officially unemployed in 1934. Federal resources during the latter half of the 1930s kept Baltimore afloat. Civil engineer Abel Wolman coordinated the Civil Works Administration (CWA) in Baltimore, which put thousands of people back to work. The Works Progress Administration (WPA) followed the CWA, providing work for many more Baltimoreans. But it took another war to pull Baltimore and the nation out of its doldrums. By 1939, Baltimore industries began retooling their factories for war.

40 City of Baltimore Comprehensive Master Plan The History of Baltimore 4140 City of Baltimore Comprehensive Master Plan The History of Baltimore 41
INTR
OD
UC
TION
SU
MM
AR
Y H
ISTO
RY
KE
Y TR
EN
DS
LIVE
EA
RN
PLAY
LEA
RN
IMP
LEM
EN
TATION
MA
NA
GE
ME
NT FIN
AN
CIA
L CO
NC
LUS
ION
GLO
SS
AR
Y A
PP
EN
DIC
ES
1939 to 1946 – World War II: Baltimore Comes Through
Baltimore geared up for World War II in a big way. Even before America’s entrance into the War, many Baltimore factories were refitted to make every-thing that the war effort required. Dining room table-cover manufacturers began making the heavy cloth parts for gas masks; automobile makers began building tanks and jeeps; and the Martin Aircraft Corporation began mak-ing B-26 and B-29 Superfortress bombers. At the end of World War II, one Baltimore business, Martin-Marietta, was turning out thousands of airplanes a year, and at the Curtis Bay and Fairfield shipyards an ocean freighter a day slid into the water.
Migrants from the rural south, looking for work, overwhelmed Baltimore. Many grand Baltimore houses were cut up into small apartments to house the population. Rooms in many South Baltimore rowhouses were fitted with multiple beds. Each bed may have slept one man during each 8 hour shift.
1946 to 1968 – Suburbanization without End / Charles Center invented / Historic Preservation Begins
After World War II, Baltimore City found itself in the middle of tremen-dous physical and social changes. With the return of soldiers eager to raise families, suburbanization accelerated and spread past the City limits into the
S.S. Maritime Victory Launching, photograph by A. Aubrey Bodine, May 1945. (Courtesy of the Maryland Historical Society, Baltimore, Maryland)

42 City of Baltimore Comprehensive Master Plan The History of Baltimore 4342 City of Baltimore Comprehensive Master Plan The History of Baltimore 43
surrounding counties. By the 1950s, 7,000 to 8,000 houses a year were being constructed in the counties surrounding Baltimore. The popula-tion within the City boundaries be-gan a slow, continual decline: the City lost 10,000 people in the 1950s and 35,000 in the 1960s. During the 1960s the bulk of the retail activ-ity in Baltimore’s downtown shop-ping district and neighborhood main streets followed their customers and moved to the suburbs into shopping centers built around four-leaf-clover exit ramps of the newly completed beltway (1962). Industry, too, fol-lowed their employees. The City’s old, multi-story brick factories were vacated as sprawling, new industrial parks with quick access to the newly designed highway system were de-veloped.
The federal government subsidized much of the development of the suburbs. Federal subsidies, such as new housing-oriented FHA loans, the 1956 Highway act, and tax incentives for industrial development, were instrumental in restructuring the City and the region.
Many Baltimoreans, however, were forced to move. In the City, the rate of demolition rose from 600 households a year throughout the 1950s to 800 in the early 1960s. The number reached 2,600 per annum in the late 1960s, as sites were cleared for expressways, new schools, and public housing projects. Poor and African American populations were disproportionately affected. At the same time, blockbusting reached its peak with the population turnover in Edmondson Village. Over a period of ten years (1955 –1965) most of the area’s white residents were replaced by African-Americans. In situations such as this, “investors” could buy low by capitalizing on white residents’ fears of a worsening neighborhood and sell high to African American families desper-ate for a chance at homeownership.
A great deal of attention was focused on the City center. Very few new office buildings, large or small, had been built since the Baltimore Trust building in 1929. Baltimore citizens decided to act. In 1958, the Greater Baltimore Com-mittee, a regional organization of business leaders, in cooperation with City Government, unveiled a report that called for the transformation of 22 acres in the heart of downtown Baltimore. To implement the plan, the City created a public-private corporation known as the Charles Center Management Corpo-ration. The plan mostly consisted of office buildings surrounding three urban plazas. Underground parking was constructed under each of the plazas and some of the buildings. While the new buildings were to be unabashedly mod-ern, four existing office buildings were incorporated into the plan. The three plazas and most of the office buildings that surrounded them were linked by an overhead walkway system that crossed over several busy streets and in-cluded escalators connecting the elevated walkway to city sidewalks below.
An image from the initial Charles Center Plan published by the Greater Baltimore Committee in 1958. A photograph of the model of Charles Center was superimposed on an aerial photograph of downtown, creating an illusion of a completed project.

42 City of Baltimore Comprehensive Master Plan The History of Baltimore 4342 City of Baltimore Comprehensive Master Plan The History of Baltimore 43
INTR
OD
UC
TION
SU
MM
AR
Y H
ISTO
RY
KE
Y TR
EN
DS
LIVE
EA
RN
PLAY
LEA
RN
IMP
LEM
EN
TATION
MA
NA
GE
ME
NT FIN
AN
CIA
L CO
NC
LUS
ION
GLO
SS
AR
Y A
PP
EN
DIC
ES
In addition to the office buildings, a hotel, several residential towers, some ground floor retail establishments, and the Mechanic Theater were incorpo-rated into the complex. At the time, Fortune Magazine wrote of the Charles Center Plan, “It looks as if it were designed by people who like the City.”
In 1962, the construction of One Charles Center, located between Center Plaza and Charles Street, was completed. The 24-story, dark bronze-colored, metal-and-glass office building was designed by Mies van der Rohe, a very important International Style architect. Fortune Magazine called this building one of the nation’s “ten buildings that point to the future.” For many years, the American Heritage Dictionary included a thumbnail illustration of this building adjacent to the architect’s entry.
The Commission for Historical and Architectural Preservation (CHAP) was created in 1964 to administer design review for the new Mount Vernon local historic district. Concurrent with the creation of CHAP was the Mount Vernon Urban Renewal Ordinance, the first of its kind written to restore, not demolish the historic mansions that made up the area. Today, Baltimore has more than 50 National Register Historic Districts and 30 Local Historic Districts. Balti-more has a total of 56,000 structures listed on local and national registers.
1969 to 1999 – Suburbanization Continues / Inner Harbor: A Magical Invention
In 1956, the Federal Government passed the National Highway Act, which provided 90% of funding for interstate highway construction. In 1960, the Planning Commission published a study for the East-West Expressway, which chronicled eight major proposals to build highways through Baltimore. I-95 would have sliced through Federal Hill and included a bridge to Little Italy. These proposals would have effectively destroyed all harbor-front neighbor-hoods as well as pedestrian access to the harbor. Between 1965 and 1967, the City began condemning property along the proposed highway corridors. Throughout this process, Baltimoreans organized to oppose the destruction of the harbor-front neighborhoods. In 1969, Fells Point became a National Reg-ister historic district, and in 1970 Federal Hill followed suit. Shortly thereafter, I-95 was rerouted south of Locust Point, and a bridge would span the harbor, connecting Locust Point to Lazaretto Point. In 1975, the bridge concept was replaced with the Fort McHenry Tunnel in order to preserve Fort McHenry. In the 1970s, I-83 was proposed to be built underground in order to preserve Fells Point, but the idea fizzled out as construction costs became prohibitive. In the end, Baltimore lost over two hundred historic properties and hundreds of others sat vacant after being condemned for highway construction. It was the tenacity of Baltimoreans that prevented the highway from obliterating not only the harbor-front neighborhoods but the Inner Harbor itself.
By 1975, 108 houses in the Otterbein neighborhood had been scheduled for demolition as part of the Inner Harbor West Urban Renewal Plan. Instead, these houses were sold to “homesteaders” for one dollar. In turn, homestead-ers would restore the houses and live in them for at least five years. 3,000 potential homesteaders visited Otterbein, proving that there was immense de-mand for downtown living. Homesteading and historic preservation, follow-ing the Otterbein example, spread to other neighborhoods, including Ridgley’s Delight, Barre Circle, and Washington Hill. More importantly, however, the

44 City of Baltimore Comprehensive Master Plan The History of Baltimore 4544 City of Baltimore Comprehensive Master Plan The History of Baltimore 45
internationally recognized success of homesteading proved that Baltimore was a place in which people wanted to live. Baltimoreans were beginning to reinvent their City as a collection of restored and rebuilt neighborhoods.
The roaring success of Charles Center empowered Baltimore officials to ex-pand the reinvention of Downtown. The Charles Center Management Corpo-ration was renamed the Charles Center Inner Harbor Management Corpora-tion, and its staff began to work with the Philadelphia consultants, Wallace, McHarg, Roberts, and Todd to define the next stage of the Downtown trans-formation. In 1964, the City and the Consultants came up with a vision: the harbor should be encircled by a ring of new public spaces all connected to-gether by a public, waterfront promenade. They envisioned museums, office buildings, hotels, amphitheaters, marinas and piers for visiting ships, parks and playgrounds, and a new kind of shopping center, the festival market-place.
Using Federal Urban Renewal funds, the City demolished almost all of the buildings within the project area and constructed an entirely new infrastruc-ture of piers, bulkheads, roads, utilities, and parks. A new brick pedestrian promenade was constructed around the harbor’s edge. The State of Maryland erected the World Trade Center (1973), a pentagonal concrete-and-glass office building designed by the architect I. M. Pei. One of its columns symbolically emerges from the water, straddles the promenade, and hovers over the harbor. The United States Fidelity and Guarantee Company, the City’s largest insur-ance company, consolidated its downtown offices and built its new 40-story headquarters (1970-73), which became the City’s largest office building.
During the 1960s, the Inner Harbor looked like a wide open pool of black wa-
A 1959 rendition of one of several interstate highway plans that would have connected I-95 to an East West Expressway and the Jones Falls Expressway. Baltimoreans fought for over twenty years to prevent a highway from destroying their historic neighborhoods.

44 City of Baltimore Comprehensive Master Plan The History of Baltimore 4544 City of Baltimore Comprehensive Master Plan The History of Baltimore 45
INTR
OD
UC
TION
SU
MM
AR
Y H
ISTO
RY
KE
Y TR
EN
DS
LIVE
EA
RN
PLAY
LEA
RN
IMP
LEM
EN
TATION
MA
NA
GE
ME
NT FIN
AN
CIA
L CO
NC
LUS
ION
GLO
SS
AR
Y A
PP
EN
DIC
ES
ter surrounded by a prairie crisscrossed by streets. Those early days are just a memory now. The Inner Harbor, year by year, was sculpted with a world-class collection of uses and attractions: the National Aquarium, the Power Plant, the Gallery, the Hyatt Regency Hotel, the Maryland Science Center, Harbor Court apartments and hotel, Rash Field, Harbor Place, the USS Constellation, Scarlet Place, McKeldin Square and Meyerhoff Fountain, and the brand new Baltimore Visitors Center.
In its first year, Harborplace (1981) drew more tourists than Disneyland. The Inner Harbor has become an intricate, exciting people-place that changes all the time. It is a playground, a front yard, and a main street for the entire City. It is a place for the City to look at itself and a place for Baltimore to show off some of its wonders to the outside world.
Perhaps, the Inner Harbor is Baltimore’s most important invention since the railroad. Elected officials, economic developers, and city planners arrive monthly from all over the world to see and learn from this magical place. It was invention by meticulous deliberation. The Inner Harbor was put together brick by brick, building by building, and block by block. The Inner Harbor’s success can be attributed, in part, to the following features: well-developed architectural and urban design guidelines; major new attractions every five years; attractions for all ages and groups; high quality building materials; easy access to the water; uniformed policemen and other measures that cre-ate a feeling of safety; quality events; gardens and flowers; and high quality maintenance.
1999 to the Present: BaltiMORE THAN EVER
From 1999 to the present, dramatic progress has been made in creating a safer, cleaner city; a better place for children; and a more attractive place
View of the Inner Harbor today.

46 City of Baltimore Comprehensive Master Plan The History of Baltimore 4746 City of Baltimore Comprehensive Master Plan The History of Baltimore 47
for investment. Nevertheless, stubborn urban ills still plague Baltimore. During the past six years, the City has addressed these challenges in new and innovative ways.
In 1999, Baltimore was the most violent city in America. Now Baltimore leads big cities in reducing violence through a three-pronged approach: more and better drug treatment, youth intervention, and more effective po-licing. Overall, violent crime is down 40% - to its lowest level since the 1960s.
Baltimore has also been plagued with diseases that fester in poor urban en-vironments. Throughout the 1990s the City was the most drug addicted city in America – a fact that defined Baltimore for the rest of America. Today, we have doubled the number of people able to receive drug treatment from 11,000 to 25,000. Health officials now point to Baltimore as having the best drug treatment system in the nation. In addition, Baltimore was infamous for the high numbers of deaths caused by sexually transmitted diseases, tuberculosis, AIDS and lead poisoning. Baltimore has reduced these deaths dramatically. For example, the City has reduced the number of children with serious lead poisoning by 45% in just three years. In 2003, the City achieved the lowest infant mortality rate in its history.
For many years Baltimore public schools have been underperforming and providing second-rate education. The trend is changing, however, and for the last five years, the City has seen real improvement in its educational system. Our first and second graders are scoring above the national average in reading and math for the first time in 30 years. All grades are improving faster than the state average on the Maryland School Assessments, and Bal-timore ranks ahead of cities like New York, Chicago, Boston, Philadelphia and Los Angeles on state assessment tests. In addition, three of our high schools are ranked among the State’s top ten, and each year more students are graduating from our high schools.
Baltimore’s astonishing progress in the last six years is the result of deliber-ate and comprehensive changes in the City’s bureaucracy. Through the Ci-tiStat program, Baltimore is moving from a traditional spoils-based system of local government to a new results-based system of government. CitiStat is an accountability tool that tracks the activities of City agencies. CitiStat has won Harvard’s Innovation in Government Award, and Neal Pierce, a columnist on urban affairs, said that CitiStat “may represent the most sig-nificant local government innovation of this decade.”
In addition, the City established the 311 system to allow residents to report non-emergency problems in the city. Residents can now report problems and track responses to complaints, such as potholes, housing code viola-tions, and broken lights. For its 311 system, Baltimore is the first govern-ment entity to win the Gartner Award for customer relationship manage-ment.
Cities that are diverse, cities that nurture creativity, cities that are culturally alive and preserve their history are cities that thrive– because they create a better quality of life; they create new businesses; they create living neigh-borhoods; they retain and attract members of a growing creative class.

46 City of Baltimore Comprehensive Master Plan The History of Baltimore 4746 City of Baltimore Comprehensive Master Plan The History of Baltimore 47
INTR
OD
UC
TION
SU
MM
AR
Y H
ISTO
RY
KE
Y TR
EN
DS
LIVE
EA
RN
PLAY
LEA
RN
IMP
LEM
EN
TATION
MA
NA
GE
ME
NT FIN
AN
CIA
L CO
NC
LUS
ION
GLO
SS
AR
Y A
PP
EN
DIC
ES
Baltimore is simmering with creativity and entrepreneurs, musicians, artists, architects, engineers, researchers, and scientists are already moving our lo-cal economy forward. World-renowned medical research institutions, most notably Johns Hopkins and the University of Maryland, are potent engines for the future of Baltimore’s economy. Both of the City’s arts districts are gaining momentum. This year, Entrepreneur Magazine reported that Balti-more moved from 30th to12th on their list of best cities for entrepreneurs, and we’re number two in the East.
Qualities embedded in the urban fabric are attracting new residents to Bal-timore: pedestrian-friendly environments promote less driving; historic architecture and streetscapes provide tangible connections to the past; res-taurants, coffee shops, and pubs just a walk away offer social places where basic human connections are made; and cultural institutions produce char-acter-defining activities that are enjoyed by all.
Baltimore has been scorched by devastating fires, real and figurative, but from these ashes, Baltimore, once again, is rising. The City’s spirit thrives on beating the odds and achieving what others thought was unachievable. Baltimoreans have learned from our past, a past whose buildings, monu-ments, and diverse cultures still stands strong.
Making bold decisions in times of extraordinary change leads to reinven-tion. Thus, this is probably Baltimore’s latest reinvention: today’s willing-ness to change City Government and to tackle the chronic results of pov-erty. Baltimore’s history also tells us something more: cities never cease to change, and unknown reinventions will be part of providing our children’s children with a place to live, earn, play and learn in Baltimore.
View of downtown Baltimore and the Inner Harbor at dusk.

48 City of Baltimore Comprehensive Master Plan
Key TrendsFrom the outset, it is important to recognize that trends themselves are not necessarily positive or negative, rather a reflection of a constantly changing urban landscape. All change presents both challenges and opportunities. Whether Baltimore becomes overwhelmed by the hazards of change or seizes the opportunities for a better quality of life is largely within our control as residents, leaders and policymakers. LIVE • EARN • PLAY • LEARN focuses on the opportunities.
Many of the changes Baltimore has experienced over the past 50 years have also happened in other older urban areas. The growth of population and jobs in suburbs around big cities has been a key trend nationwide over the last 60 years. Manufacturing jobs have been replaced by white collar and service-oriented jobs not only in Baltimore, but in nearly all of the older cities of the Northeast and Midwest.
Nevertheless, Baltimore is still uniquely Baltimore, and the City’s trends need to be seen in the light of our own history of growth, expansion and dispersion. Baltimore has been decompressing and spreading out to its sub-urbs for more than a century, ever since horse drawn street cars, and later electric railways, allowed people to live beyond walking distance of their jobs. The Baltimore Region has never stopped growing, but growth has increasingly happened outside the core City limits. Baltimore City’s popu-lation is projected to stabilize and increase slightly over the next twenty-five years, while the region’s population is projected to grow by a quarter of a million people during the same timeframe. As we move into the next

Key Trends 49
INTR
OD
UC
TION
SU
MM
AR
Y H
ISTO
RY
KE
Y TR
EN
DS
LIVE
EA
RN
PLAY
LEA
RN
IMP
LEM
EN
TATION
MA
NA
GE
ME
NT FIN
AN
CIA
L CO
NC
LUS
ION
GLO
SS
AR
Y A
PP
EN
DIC
ES
Key Trends
millennium, current and emerging trends provide cause for optimism that Baltimore can position itself for a future of growth and prosperity.
Conditions in America’s Cities: Changes & Challenges
The following trends reflect the state of America’s cities, both in the progress that they have made and the challenges they continue to face. Five reports: The State of the Cities 1999 (U.S. Department of Housing & Urban Devel-opment (HUD)); The State of America’s Cities: 2005 (National League of Cities); Income, Poverty, and Health Insurance Coverage in the United States: 2004 (U.S. Census Bureau); Living Cities (the Brookings Institu-tion); and HUD’s State of the Cities Data System, contributed to the follow-ing indicators of urban conditions.
Population
During the 1980s and 1990s, many West Coast and Southwest cities gained population: Phoenix, AZ (68 percent), San Antonio, TX (45 percent), and Portland, OR (44 percent). Some of the increase was due to annexation of surrounding jurisdictions; Baltimore has not been able to annex land since 1918. However, Baltimore, like many other Mid-Atlantic and Midwest cit-ies continued to lose population. In 2000, Baltimore was the 17th largest city in the nation.
Baltimore Philadelphia Cleveland Washington, DC
Population Change, 1980 to 2000
-17.2% -10.1% -16.6% -10.4%
Housing
In 2000, in Baltimore City, the homeownership rate was 50.2 percent, up from 48.6 percent in 1990. The U.S. homeownership rate was 66.2 percent; in the 100 largest cities, the homeownership rate was 52.8 percent. In Baltimore City, 40.0 percent of renters paid more than 30 percent of their income on rent, which is about average for American cities (average from sample of 23 cities is 40.2 percent). However, Baltimore had significantly fewer renters in the low-middle income range ($20,000-$35,000) paying more than 30 per-cent of their income for rent than most other American cities (Baltimore 25.1 percent, average from sample of 23 cities is 42.6 percent).
Baltimore Philadelphia Cleveland Washington, DC
Homeownership Rate 50.3% 59.3% 48.5% 40.8%
Paying more than 30% on rent
40.0% 42.5% 40.7% 35.2%
Income $20,000 to 35,000, paying more than 30% on rent
25.1% 35.1% 20.0% 35.4%
Income and Poverty
Baltimore ranks 87 out of the 100 largest U.S. cities in terms of median house-hold income. Approximately 2 in 10 Baltimore City residents live below the poverty line (22.9 percent) and approximately 4 in 10 families with children

50 City of Baltimore Comprehensive Master Plan
live below 150 percent of the poverty line (39.5 percent). Nationally, an average of 1 in 10 residents live below the poverty line (12.4 percent) and approximately 3 in 10 families with children live below 150 percent of the poverty line (29.3 percent).
Baltimore Philadelphia Cleveland Washington, DC
Median Household Income, 2000
$30,078 $30,746 $25,928 $40,127
Percent Change Median Income, 1990 to 2000
-6.9% -7.0% 8.3% -2.8%
Poverty rate 22.9% 22.9% 26.3% 20.2%
Families with children under 150 percent poverty rate
39.5% 38.0% 47.8% 35.2%
Employment
In 2000, Baltimore’s labor force participation rate (56.6 percent) ranked 95th out of the 100 largest U.S. cities (average 63 percent). Baltimore’s unemploy-ment rate (8 percent) ranked 80th (average 5.4 percent).
Baltimore Philadelphia Cleveland Washington, DC
Labor Force Partici-pation Rate
56.6% 55.9% 57.4% 63.6%
U n e m p l o y m e n t Rate
8.0% 7.5% 8.3% 6.4%
Commuting Patterns
Approximately 6 in 10 Baltimore City residents work in Baltimore City (61.9 percent). Nationally, an average of 7 in 10 residents of a center city also work in the center city (70.4 percent). Less than 1 in 3 residents of the Bal-timore Region work in Baltimore City (28.7 percent).
Baltimore Philadelphia Cleveland Washington, DC
Central city to cen-tral city
13.4 19.0 12.5 11.7
Central city to suburb
7.4 5.9 9.1 4.1
Suburb to central city
15.3 9.9 18.3 20.9
Suburb to suburb 51.2 57.4 55.4 59.1
Outside metro area 12.7 7.8 4.7 4.2

Key Trends 51
INTR
OD
UC
TION
SU
MM
AR
Y H
ISTO
RY
KE
Y TR
EN
DS
LIVE
EA
RN
PLAY
LEA
RN
IMP
LEM
EN
TATION
MA
NA
GE
ME
NT FIN
AN
CIA
L CO
NC
LUS
ION
GLO
SS
AR
Y A
PP
EN
DIC
ES
Baltimore: From Mid-Century to TodayPopulation
In the 1950’s, Baltimore was a city in the midst of a post-war economic boom. Fueled by plentiful jobs and a climate of opportunity, the City’s population swelled to nearly 950,000. The population declined over the next half century to 651,154 in 2000 - a loss of approximately 30 percent from our peak popula-tion in 1950. Since 2000, annual population estimates indicate a leveling off of population decline and a slight future increase in population, based on popula-tion forecasts completed by the Baltimore Metropolitan Council with the sup-port of the Baltimore City Department of Planning.
Households
The characteristics of Baltimore households have changed significantly since 1940. The number and size of City households decreased over the last five de-cades. In 2000, the average household size was 2.42 people compared to 3.41 people in 1950, which reflects a dramatic change in the composition of city households. In 2000, only 27 percent of households were headed by married couples compared to a vast majority in 1940. Today, a majority of house-holds are either headed by a single parent or contain a single person. Age
Baltimore of the 1950’s and 1960’s was a youthful city. The Baby Boom was in full swing. Children under the age of 14 comprised the largest single age group in 1960, and City policies favored school construction. The el-derly were a small proportion of the population, and made relatively few demands on City services. Only one in every 14 Baltimore residents was older than 65. Baltimore also has a slightly higher percentage of senior residents than the state, with 17 per-cent of City residents currently over the age of 60, versus 14 percent statewide.
In 2000, Baltimore’s population was less youthful than during the post World War II Baby Boom. The number and proportion of City youth have declined steadily since 1950. In particular, the population under 5 years of age decreased by nearly 30 percent between 1990 and 2000. In contrast, today residents over the age of 65 account for 13.2 percent of the population compared to 7.3 percent in 1950. In the last
6
Baltimore Region Population Trends & Projections 1950-2035
Source: U.S. Census Bureau & Round 7 Cooperative Forecast from the Baltimore Metropolitan Council, 2007
807 , 94 9
95 7 ,50 9
4 1 0,6 3 7
45 1,1 5 6
007 ,84 6
0 02 ,9 56
004,9 66
00 8,5 7 6
00 9, 18 6
0 09,5 86
00 0, 68 6
07 3 ,7 33 ,1
07 6, 07 0,2
07 1 ,2 83 ,2
983,515,2
00 6, 43 6 ,2
004,147,2
0 06 ,0 28 ,2
005 , 178 , 2
002,809 ,2
00 9,93 9,2
00 5,859,2
0
500,000
1,000,000
1,500,000
2,000,000
2,500,000
3,000,000
3,500,000
1950 1970 1990 2000 2005 2010 2015 2020 2025 2030 2035
Baltimore City Baltimore Region
Baltimore City Population & Household Change 1950 - 2000
949,708 939,024905,759
786,775736,014
651,154
268,096 275,597 289,349 281,414 275,977 257,996
0
200,000
400,000
600,000
800,000
1,000,000
1950 1960 1970 1980 1990 2000
Population Households
Source: U.S. Bureau of Census
Baltimore City Population & Household Change 1950 - 2000
8 07,9 49
4 20,9 39
957, 50 9577,687
410 ,63 7
4 51,156
6 90,8 62
7 95,5 72
943, 98 2
414 ,182
7 79,5 72
699,752
0
200,000
400,000
600,000
800,000
1,000,000
195019601970198019902000
PopulationHouseholds
Source: U.S. Bureau of Census
Baltimore City Population & Household Change 1950 - 2000
807, 949
42 0, 93 9
95 7 ,5 09
577,687
4 10, 637
45 1,156
69 0,86 2
79 5 ,57 2
9 43,9 82
414,18 2
779, 57 2
699 ,752
0
200,000
400,000
600,000
800,000
1,000,000
1950 1960 1970 1980 1990 2000
Population Households
Source: U.S. Bureau of Census

52 City of Baltimore Comprehensive Master Plan
decade, the number of seniors decreased. However, the number of residents between 45 and 64, the Baby Boom generation, increased dramatically. Over the next twen-ty-five years, these aging Baby Boomers are anticipated to cause a great increase in the size of the City’s senior population, with a 31 percent increase in the number of senior citizens living in the City expected.
Race
Baltimore’s racial composition has changed signifi-cantly since 1950. In the last half century, racial change in the City has been defined by a decline in the White population offset by a large increase in Black popula-tion. From 1950 to 2000, the Black population nearly doubled, from 225,000 to 420,000. During the same time span, the White population declined by more than 500,000. By 2000, 65 percent of Baltimore’s popula-tion was Black compared to less than a quarter of the population in 1950.
Between 1990 and 2000, for the first time in half a cen-tury, the Black population also started to decline. In a single decade, the City lost almost 17,000 Black resi-dents. In the same decade, the proportion of residents who reported themselves as “Other Race” doubled, rep-resenting an increase in diversity.
Housing
The percentage of owner-occupied homes fell between 1950 and 1990, but increased slightly in 2000, from 48.6 percent in 1990 to 50.3 percent in 2000. Although hom-eownership increased slightly during the 1990s, vacan-cies due to uninhabitable conditions more than doubled, from 6,049 in 1900 to 13,846 in 2000. The spike in the number of vacancies is partially due to improved moni-toring and reporting, but it also reflects severe disinvest-ment in some areas. The number of vacant and aban-doned houses increased gradually from 1995 to 2002 and has since leveled off.
In a break from the past, substantial new development has occurred in the last five years. Since 2000, approxi-mately 6,600 new and converted housing units have been built in Baltimore. The recent housing investment is dominated by construction of rental properties, which may result in a slight decrease in the homeownership rate.
During the 1950’s, Baltimore City and suburban households had about the same median earnings. By the end of the century, however, the median family income of City households had fallen considerably in relation to incomes in the suburbs. As more affluent households moved to the suburbs, poor resi-dents became increasingly concentrated in the City. In 2000, about one in
Household Types,Baltimore City, 1940
One Person
Households
7.22%
Other
Households
18.84% Married
Couples
73.94%
Baltimore City Population Distribution by Age 1950-2000
0%
20%
40%
60%
80%
100%
1950 1960 1970 1980 1990 2000
65+
45-64
35-44
20-34
5-19
0-4
Source: U.S. Census Bureau
Household TypesBaltimore City, 2000
Single Female Head
25.0%
Single Male Head5.4%
Married Couple
Households26.7%
Nonfamily Households
8.0%
Single Person
Households34.9%
Source: U.S. Census 2000
US Census Bureau
US Census Bureau
US Census Bureau

Key Trends 53
INTR
OD
UC
TION
SU
MM
AR
Y H
ISTO
RY
KE
Y TR
EN
DS
LIVE
EA
RN
PLAY
LEA
RN
IMP
LEM
EN
TATION
MA
NA
GE
ME
NT FIN
AN
CIA
L CO
NC
LUS
ION
GLO
SS
AR
Y A
PP
EN
DIC
ES
Baltimore City Racial Composition 2000
White 31.6%
Black64.3%
Two or More Races1.5%
Asian1.6%
Other Race0.7%Native
American0.3%
Source: U.S. Census 2000
every five Baltimore residents lived below the poverty line. From 1990 to 2000, there was an 8 percent decrease in the number of individuals living in poverty.
Education
While the education level of Baltimore residents has im-proved over the last few decades, the City lags behind surrounding counties in terms of adult educational attain-ment. In 2000, more than 30 percent of City adults had not completed high school, double the average rate for the surrounding counties. Only 22 percent of Baltimore residents have a college degree compared to 36 percent in Baltimore County and 59 percent in Howard County.
Economy & Employment
Driven by a huge demand for durable goods during World War II and immediately thereafter, Baltimore’s economy prospered in the 1950s. About one-third of all employees in the City worked in manufacturing. Good wages enabled most Baltimore workers to support an entire family on the salary of a single wage earner. In the next half century, blue collar manufacturing jobs were replaced by white collar service jobs.
Unlike other industrial cities, Baltimore’s manufactur-ing base was not dominated by a single industry – as was Pittsburgh with steel or Detroit with automobiles.
A booming service sector, including health care, technol-ogy, higher education, legal and accounting services, has enabled the City of Baltimore to remain the dominant economic center of the re-gion. In 2000, the vast majority of City residents worked in services or related jobs sectors such as finance, insurance, real estate and information. Among the biggest growth sectors for service jobs are health care, educational services, and accounting.
Employment opportunities in Bal-timore have been projected to grow slowly through 2030. However, jobs in the whole region are expected to in-crease at a faster rate, effectively de-creasing the City’s share of jobs in the region.
The Maryland Office of Planning de-fines the Baltimore Region as Balti-more City and the surrounding counties of Anne Arundel, Baltimore, Car-roll, Harford, and Howard. (The US Census Bureau also includes Queen Anne’s County in their regional statistics.)
Vacant & Abandoned Housing in Baltimore 1970 - 2004
6,2296,302 6,0499,247 10,54311,35511,89012,46413,84613,72315,19015,75315,8640
2,0004,0006,0008,000
10,00012,00014,00016,00018,000
1970 1980 1990 1995 1996 1997 1998 1999 2000 2001 2002 2003 2004
Source: Baltimore City Department of Housing & Community Development
1970 20040
2000
4000
6000
8000
10000
12000
14000
16000
18000
1970 1980 1990 1995 2000 2001 2002 2003 2004 2005 2006 2007 2008 2009
Vacant & Abandoned Housing in Baltimore1970-2009

54 City of Baltimore Comprehensive Master Plan
Three aspects of the Baltimore region are especially noteworthy: its access to water and related port activities; its proximity to Washington, DC; and its geographic position in the middle of the huge megalopolis extending from Boston to Richmond.
The Greater Baltimore State of the Region Report compares 20 regional economies: Atlanta, Austin, Baltimore, Boston, Charlotte, Cleveland, Dal-las, Denver, Indianapolis, Minneapo-lis, Philadelphia, Pittsburgh, Raleigh, Richmond, San Diego, Seattle, St. Louis, Tampa and Washington, DC.
The Baltimore Region Compared to Other Regions Across the U.S.
In December 2005, the Greater Balti-more Committee and the Greater Bal-timore Alliance jointly released the Greater Baltimore State of the Region Report about our metropolitan area. The report compared the Baltimore region to a benchmark group of met-ropolitan areas in the U.S. on numer-ous indicators of economic and social health.
The findings confirm that our region has both strengths to build on and challenges to address. The Greater Baltimore region is relatively affluent with a strong relationship to the Wash-ington, DC region. We offer top-notch health care, transportation and cultural assets, and quality higher education institutions. However, our competi-tiveness as a region is hindered by low employment growth and a relatively less diverse economic structure than Washington, DC.
Baltimore Region’s Population
The Baltimore Region’s population has remained relatively stable com-pared to the twenty benchmark regions in the State of the Region report with a low rate of growth between 2000 and 2004. Our region ranks fifteenth with 3.4 percent growth.
Persons in Poverty in Baltimore Region 2000
47,603 (6.3%)
24,335 (5%)
10,695 (4.9%)
5,617 (3.7%)
9,491 (3.8%)
143,514 (22%)
0 50,000 100,000 150,000
Baltimore City
Baltimore County
Anne Arundel Cnty
Harford County
Howard County
Carroll County
Source: U.S. Census 2000
Adult Educational Attainment in Baltimore Region, 2000
0%
10%
20%
30%
40%
50%
60%
70%
80%
90%
100%
AnneArundel
Co.
BaltimoreCounty
CarrollCounty
HarfordCounty
HowardCounty
BaltimoreCity
Graduate Degree
Bachelor Degree
Associate Degree
H.S. Grad
Not H.S. Grad
Source: U.S. Census 2000
Baltimore Region Median Family Income 1950-2000
$2,098$5,659 $8,815
$15,721
$28,217$35,440
$2,159$6,199
$10,577
$59,324
$21,826$42,206
$0
$10,000
$20,000
$30,000
$40,000
$50,000
$60,000
1950 1960 1970 1980 1990 2000
Baltimore City Baltimore Region
Source: U.S. Census Bureau
US Census Bureau
US Census Bureau
,
US Census Bureau

Key Trends 55
INTR
OD
UC
TION
SU
MM
AR
Y H
ISTO
RY
KE
Y TR
EN
DS
LIVE
EA
RN
PLAY
LEA
RN
IMP
LEM
EN
TATION
MA
NA
GE
ME
NT FIN
AN
CIA
L CO
NC
LUS
ION
GLO
SS
AR
Y A
PP
EN
DIC
ES
Baltimore Region’s Economy and Workforce
Trends in the Baltimore Region’s economy indicate strengths, as well as signs of slow growth. The region remains relatively affluent and above the national average for income mea-sures. Among the 20 benchmark re-gions, it ranks 4th in recent per capita income growth and 11th in effective buying income. Baltimore was the only region among the twenty where regional per capita income increased during the economic downturn that affected the nation after 2001.
While income trends are encourag-ing, the Baltimore Region’s economy has remained stagnant in recent years. The region has suffered in terms of employment, seeing its unemploy-ment rate decline only slightly, from 4.9 percent to 4.8 percent between 2002 and 2004. The Baltimore region now ranks 10th among the benchmark regions in the rate of unemployment.
The Baltimore/ Washington, DC Region
Baltimore’s Relationship to Washington, DC
The Baltimore Region’s population and economic trends are better under-stood within the context of the larger Baltimore–Washington, DC Region, which represents the functional eco-nomic region for Baltimore. Our close economic relationship with the Washington, DC metropolitan area presents both benefits and challenges to our regional economy.
Baltimore’s income and population growth can be partially accredited to the migration of affluent residents from Washington, DC to Baltimore. However, this same trend has con-tributed to the recent rise in the cost of living. The Baltimore Region rose from 3rd least expensive benchmark region to 5th most expensive bench-mark region between 2003 and 2005.
Note: 1997 is the latest year for which comparable data on job sectors is avail-
Baltimore City Jobs by Sector
11,416
33,340
19,624
17,051
40,027
28,029
146,330
17,632
89,415
28,102
24,870
58,730
30,987
79,665
0 50,000 100,000 150,000 200,000
Construction
Manufacturing
Transp & Utility
Wholesale Trade
Retail Trade
F.I.R.E.
Services
1974
1997
* Finance, Insurance, and Real Estate
Source: U.S. Census Bureau
Baltimore City Resident Employment by Sector 2000
12,939
20,082
6,911
22,881
14,285
8,218
17,453
152,978
0 40,000 80,000 120,000 160,000
Construction
Manufacturing
Wholesale Trade
Retail Trade
Transportation & Utilities
Information
F.I.R.E*
Services
* Finance, Insurance, and Real EstateSource: U.S. Census 2000
Baltimore Region Job Estimates & Projections 2000- 2030
450,940 431,880 436,110 440,210 444,170 447,990 451,6601,530,040 1,622,055 1,740,260 1,858,085 1,975,460 2,092,2552,218,410
0
500,000
1,000,000
1,500,000
2,000,000
2,500,000
2000 2005 2010 2015 2020 2025 2030
Baltimore City Baltimore Region
Source: Woods & Poole 2005 State Profile Forecasts
US Census Bureau
US Census Bureau
Baltimore City Jobs by Sector, 1974 and 1997
Baltimore City Resident Employment by Sector, 2000
Baltimore Region Job Estimates & Projections, 2000-2030

56 City of Baltimore Comprehensive Master Plan
Per Capita Personal Income Percentage Change2003–2005 vs. 2001–2003
Cur. Per. Rank Region
2003-2005 Average Annual Percent Change
Ear. Per. Rank
2001-2003 Average Annual Percent Change
1 San Diego 6.6% 3 2.9%
2 Baltimore 6.3% 4 2.6%
3 Washington, DC 5.7% 9 1.6%
4 Pittsburgh 5.3% 5 2.4%
5 Charlotte 5.1% 13 1.1%
6 Boston 5.1% 14 0.5%
7 Austin 5.0% 19 -1.3%
8 Philadelphia 5.0% 2 3.0%
9 Tampa 4.9% 10 1.6%
10 Richmond 4.9% 6 2.2%
11 Denver 4.8% 17 -1.0%
U.S. 4.8% 1.5%
12 Dallas 4.5% 16 -0.2%
13 Cleveland 4.4% 11 1.2%
14 Portland 4.3% 15 0.5%
15 Minneapolis 4.2% 7 1.9%
16 Indianapolis 4.2% 8 1.7%
17 Seattle 3.8% 12 1.2%
18 Raleigh 3.8% 20 -1.4%
19 Atlanta 3.4% 18 -1.1%
20 St. Louis 3.2% 1 3.1%
Source: Bureau of Economic Analysis
Population Growth2000–2003 vs. 2003–2006
2003–2006Rank Region
Average Annual
Growth Rate 2003–2006
2000–2003Rank
Average Annual
Growth Rate 2000–2003
1 Raleigh 4.0% 1 3.8%
2 Charlotte 3.4% 5 2.7%
3 Austin 3.3% 3 3.4%
4 Atlanta 3.2% 2 3.4%
5 Dallas 2.5% 4 2.7%
6 Tampa 2.2% 9 1.8%
7 Richmond 1.6% 11 1.3%
8 Portland 1.6% 7 1.9%
9 Denver 1.6% 8 1.8%
10 Indianapolis 1.4% 10 1.6%
11 Seattle 1.3% 15 1.1%
12 Washington, DC 1.2% 6 2.1%
13 Minneapolis 1.0% 13 1.3%
U.S. 1.0% 1.1%
14 St. Louis 0.6% 16 0.6%
15 Baltimore 0.4% 15 0.9%
16 Philadelphia 0.4% 18 0.4%
17 San Diego 0.2% 12 1.3%
18 Boston 0.0% 17 0.5%
19 Cleveland -0.4% 19 -0.1%
20 Pittsburgh -0.5% 20 -0.3%
Source: Bureau of the Census, 2007
region to 5th most expensive benchmark region between 2003 and 2005. This shift reflects increasing home pric-es in the region, a factor influenced by the discovery of the Baltimore Region’s housing bargains by families previously living in the Washington, DC area, which has the second highest cost of living in the nation.
The Baltimore Region benefits from proximity to the larger Washington, DC retail market. When compared to the largest commercial markets in the United States, Baltimore ranks 19th in size and 18th for effective buy-ing income. While the Baltimore and Washington, DC regions are no longer combined for statistical purposes, our region does benefit from the buying power of the Washington Region, which ranks 4th nationally.
Baltimore Region’s Quality of LifeThe Baltimore Region also benefits from its proximity to Washington, DC amenities; Baltimore, however, as a distinct and unique community, offers a wealth of cul-tural resources that are unmatched by many other re-gions across the country. Our region ranked 19th in the 2004 national arts ranking.

Key Trends 57
INTR
OD
UC
TION
SU
MM
AR
Y H
ISTO
RY
KE
Y TR
EN
DS
LIVE
EA
RN
PLAY
LEA
RN
IMP
LEM
EN
TATION
MA
NA
GE
ME
NT FIN
AN
CIA
L CO
NC
LUS
ION
GLO
SS
AR
Y A
PP
EN
DIC
ES
Our crime rates declined at a faster rate than most other benchmark regions. Between 2002 and 2005, Baltimore’s rate of violent crime decreased by an annual average of 7 percent, making it the fourth highest rate of decrease. However, Baltimore remains near the bottom in the rankings for the incidents of violent crime, indicating crime and public safety remain challenges in the region and specifically in the City of Baltimore.
Median Household Effective Buying Income2006
Rank Region Median IncomeMargin of Error
(+/-)
1 Washington, DC $78,978 784
2 Boston $64,144 926
3 Minneapolis $62,223 464
4 Baltimore $61,010 842
5 Seattle $60,663 506
6 San Diego $59,591 1284
7 Raleigh $56,150 1358
8 Philadelphia $55,593 463
9 Atlanta $55,552 743
10 Denver $54,994 980
11 Richmond $53,416 1298
12 Austin $52,882 1107
13 Portland $52,480 770
14 Dallas $52,001 483
15 Indianapolis $50,841 754
16 Charlotte $50,367 859
17 St. Louis $49,765 699
U.S. $48,451
18 Cleveland $45,925 686
19 Tampa $43,742 707
20 Pittsburgh $43,260 745
Source: U.S. Bureau of the Census, American Community Survey
Cost of Living2007 Q2 and 2005 Q2
2007Rank Region
100%Composite Index,
20072005Rank
100%Composite Index,
2005
1 Charlotte 88.2 2 93.1
2 Dallas 90.9 5 94.4
3 St. Louis 91.0 6 96.8
4 Indianapolis 94.5 1 91.2
5 Austin 95.1 7 97.1
6 Atlanta 95.7 8 97.3
7 Tampa 98.6 9 98.8
8 Pittsburgh 99.5 3 93.2
9 Cleveland 99.6 10 102.0
10 Raleigh 100.4 4 93.3
11 Denver 103.7 11 103.0
12 Richmond 104.1 12 105.2
13 Baltimore 117.6 15 118.5
14 Portland 120.3 13 115.6
15 Seattle 120.4 14 116.4
16 Philadelphia 124.0 16 125.4
17 Boston 135.9 17 137.4
18 Washington, DC 137.0 18 141.4
19 San Diego 140.6 19 152.1
Minneapolis NA NA
Source: ACCRA Cost of Living Index

58 City of Baltimore Comprehensive Master Plan
Twenty Largest U.S. Markets
Median Household Effective Buying
Income 2006Rank RegionPopulation 2006
(000s)Retail Sales 2007
(millions)
1 Washington, DC 5,290.4 $78,978 $70,745
2 Boston 4,455.2 $64,144 $ 65,681
3 Minneapolis 3,175.0 $62,223 $ 48,549
4 Baltimore 2,658.4 $61,010 $35,635
5 Seattle 3,263.5 $60,663 $47,063
6 San Diego 2,941.4 $59,591 $39,582
7 Raleigh 994.5 $56,150 $14,352
8 Philadelphia 5,826.7 $55,593 $ 80,681
9 Atlanta 5,138.2 $55,552 $74,597
10 Denver 2,408.7 $54,994 $35,908
11 Richmond 1,194.0 $53,416 $16,171
12 Austin 1,513.5 $52,882 $21,043
13 Portland 2,137.5 $52,480 $ 32,280
14 Dallas 6,003.9 $52,001 $89,840
15 Indianapolis 1,666.0 $50,841 $25,036
16 Charlotte 1,583.0 $50,367 $ 22,722
17 St. Louis 2,796.3 $49,765 $38,425
18 Cleveland 2,114.1 $45,925 $31,440
19 Tampa 2,697.7 $43,742 $36,872
20 Pittsburgh 2,370.7 $43,260 $32,070
Source: Greater Baltimore State of the Region Report, 2007, Demographic & Market Characteristics

Key Trends 59
INTR
OD
UC
TION
SU
MM
AR
Y H
ISTO
RY
KE
Y TR
EN
DS
LIVE
EA
RN
PLAY
LEA
RN
IMP
LEM
EN
TATION
MA
NA
GE
ME
NT FIN
AN
CIA
L CO
NC
LUS
ION
GLO
SS
AR
Y A
PP
EN
DIC
ES
Arts Destinations 2007
National Rankings
Pittsburgh 1
Washington, DC 2
Seattle 3
Atlanta 3
Boston 5
Austin 6
Philadelphia 7
Portland 8
Minneapolis 8
Baltimore 10
San Diego 11
Denver 12
Dallas 13
Cleveland 14
Charlotte 15
St. Louis 16
Indianapolis 17
Tampa 17
Source: Greater Baltimore State of the Region Report, 2007
Regional Change in Violent Crime 2004-2006
% Annual
Average Change
1 Richmond -6.2%
2 Tampa -4.9%
3 Baltimore -3.5%
4 Austin -2.6%
5 Portland -2.6%
6 Dallas -1.9%
7 Pittsburgh -1.2%
8 San Diego -1.0%
9 Denver -0.7%
10 Boston (1) -0.5%
11 Minneapolis (2) 0.0%
12 Atlanta 0.5%
U.S. 0.9%
13 Indianapolis 1.3%
14 Seattle 2.1%
15 Washington, DC 3.5%
16 Philadelphia 4..1%
17 Raleigh 4.4%
18 St. Louis 7.7%
19 Charlotte (1) 9.7%
Cleveland NA
Source: Greater Baltimore State of the Region Re-port, 2007
(1) Change is from 2004 to 2005
(2) Data is from 2004
Rank

60 City of Baltimore Comprehensive Master Plan LIVE 6160 City of Baltimore Comprehensive Master Plan LIVE 61
LIVEA. The Industry
Baltimore’s market for living consists of the City’s diverse housing stock and aesthetic built environment, social and human services, and urban ame-nities and attractions. The City’s strength relies on the positive interaction between these major components of urban living. To ensure a healthy qual-ity of life for Baltimore residents, a strong and affordable housing market must be complemented with adequate City and human services and acces-sibility to urban amenities.
The core products of Baltimore’s market for living include the following:
1. A housing unit, or a residence, is a basic necessity for living in the City. Baltimore has a diverse range of housing products at all levels of afford-ability. The most common housing type is the single family row house, which makes up more than 50% of the city’s housing stock.
2. When customers buy a house in Baltimore, they also purchase municipal and human services such as public schools, police and life safety, sanita-tion services, parks and a range of social services.
3. Amenities of urban living include diverse neighborhoods, density and the accessibility of services, retail, and public transportation.

60 City of Baltimore Comprehensive Master Plan LIVE 6160 City of Baltimore Comprehensive Master Plan LIVE 61
INTR
OD
UC
TION
SU
MM
AR
Y H
ISTO
RY
KE
Y TR
EN
DS
LIVE
EA
RN
PLAY
LEA
RN
IMP
LEM
EN
TATION
MA
NA
GE
ME
NT FIN
AN
CIA
L CO
NC
LUS
ION
GLO
SS
AR
Y A
PP
EN
DIC
ES
LIVEB. Customers
According to the 2000 Census, Baltimore residents have a median family in-come of $35,440 compared to $59,324 in the Baltimore region; therefore, the City’s median family income is approximately 60 percent of the surrounding region. Also, 22 percent of households were in poverty, which is a signifi-cantly higher figure than any of the surrounding jurisdictions and the met-ropolitan area as a whole. There are also approximately 3,000 persons in Baltimore without permanent homes.
The most common income calculation used as a way of determining income eligibility for various housing programs is called the Area Median Income (AMI). AMI is calculated every year by the U.S. Department of Housing and Urban Development (HUD) for every county and metropolitan area. The 2005 Area Median Income in the entire Baltimore metropolitan area for a family of four was $72,188. Families of four with incomes below 80% of AMI, or $57,750 in 2005, are categorized as being low-income by HUD and are eligible for special housing programs and benefits.

62 City of Baltimore Comprehensive Master Plan LIVE 6362 City of Baltimore Comprehensive Master Plan LIVE 63
As a result of increasingly concentrated poverty within the City, the City has a substantial population that relies on Baltimore’s stock of affordable hous-ing and human services. As the following charts indicate, the City has a markedly different distribution of household types than other jurisdictions in Maryland, with fewer married couple households and higher percentages of single person households and households headed by single females. Between 1995 and 2000, Baltimore lost nearly four times as many family households with school-age children than it gained. As a result of this loss, the City has a smaller proportion of middle-income residents in comparison to the sur-rounding jurisdictions. Having a stable middle class population in the City will raise the quality of life for all residents and perception of the City as a viable place to live and raise children.
The proportion of City residents over 60 has grown to comprise 17 percent of the population. Even more prominently, 38 percent of the City’s hom-eowners are over the age of 60. This may cause a need for new construction or adaptation of existing properties to accommodate the physical challenges rowhouses present to seniors due to their multistory layouts.
City residents have varying expectations on what city living should provide based on their personal or family situations. As such, which city amenities or services are most important to residents may vary greatly from household to household. The amenities and services most valued by all groups of City residents include the following: quality affordable housing; quality of public education; quality and access to human services; public safety and crime; access to transit and transportation networks; parks and open space; historic and cultural amenities; aesthetic landscaping and streetscaping; and access to jobs, retail and recreation.
While attracting potential migrants to the City, Baltimore needs to achieve a balance between supporting the needs of the new higher and middle income residents while providing additional quality affordable housing, municipal services and social assistance to the existing population living in poverty. Po-
2005 AMI Distribution
AMI (4-person house-
hold)
% of Baltimore residents in each
category*
Affordable Sales Price (3-bedroom
unit)
Affordable Rent (3-bedroom unit)
Typical Occupations
30% AMI $21,656 27% $66,009 $541
Home Health Aide, Fast Food Clerk,
Dishwasher, Store Cashier, Parking Lot Attendant
80% AMI $57,750 39% $176,189 $1,444
Teachers, School Counselors, Police
Officers, Physi-cians’ Assistants, Insurance Claims
Adjuster
120% AMI $86,625 18% $264,284 $2,166First Year Lawyer,
Assistant Professor
120% Above **** 17% **** ****
*Median Income of 4-person households in Baltimore is approximately 60% of AMI. Based on 2000 Census income distribu-tion.

62 City of Baltimore Comprehensive Master Plan LIVE 6362 City of Baltimore Comprehensive Master Plan LIVE 63
INTR
OD
UC
TION
SU
MM
AR
Y H
ISTO
RY
KE
Y TR
EN
DS
LIVE
EA
RN
PLAY
LEA
RN
IMP
LEM
EN
TATION
MA
NA
GE
ME
NT FIN
AN
CIA
L CO
NC
LUS
ION
GLO
SS
AR
Y A
PP
EN
DIC
ES
tential residents include both those who currently live within the Balti-more region and those who reside in other regions of the United States as well as other countries. While Bal-timore has a recent history of losing population because of out-migration, the City gains residents from the Mid-Atlantic region as well as oth-er regions of the country and other countries. In fact, Baltimore had a positive net gain of residents from Washington, DC and New England between 1995 and 2000.
Potential residents come from many demographic backgrounds and are described below by what attracts them to Baltimore.
1. Employment Mobility
Potential residents who are attracted by local employment opportunities will likely work in the professional or service sectors, broadly defined, as well as construction. These customers desire a variety of housing types both to rent and to own in stable, vibrant neighborhoods with easy access to their place of employment, shopping and entertainment.
2. Regional Affordability
Potential residents who are attracted by Baltimore’s affordability and location within the region but who work elsewhere also desire housing choice in stable neighborhoods. Access, using both transit and private automobiles, to regional destinations including Washington, DC and suburban employment centers is crucial to attracting these potential residents. A relatively small stock of single family detached homes, approximately 13% of total stock, may serve as an obstacle to attracting this group of customers, since these customers are often more price-oriented than urban living-oriented.
3. City Choice Potential residents who are attracted by urban amenities and an urban lifestyle will seek housing in key City neighborhoods. These customers are potential residents of choice who, in the recent past, have tended to be relatively af-fluent. These potential residents may choose to live in Baltimore regardless of the location of their job within the region, and may, in some cases, be the source of new business locations within the City. This group generally de-sires rowhouses, condominiums, and high quality historic homes unique to the City. These customers are focused on the City’s top-tier neighborhoods near the waterfront and in historic single-family neighborhoods with access to cultural amenities, upscale retail opportunities and transit connections.
C. Market Size and Trends
Recent population estimates for Baltimore indicate a slowing in the rate of population loss since the 2000 Census enumeration. Projections indicate that the City population is expected to stabilize and slightly increase through the year 2020. This positive shift in the population trend indicates renewed
Population Change for Maryland and the Baltimore Region 1990 - 2000
736,014 692,134427,239
123,372 182,132 187,328
4,781,468
651,154 754,292489,656
150,897 218,590 247,842
5,296,486
641,943780,821
508,572166,159 235,594 266,738
5,558,058
0
1,000,000
2,000,000
3,000,000
4,000,000
5,000,000
6,000,000
BaltimoreCity
BaltimoreCounty
AnneArundel
County
CarrollCounty
HarfordCounty
HowardCounty
Maryland
1990
2000
2004 Estimate
2005 AMI Distribution
AMI (4-person house-
hold)
% of Baltimore residents in each
category*
Affordable Sales Price (3-bedroom
unit)
Affordable Rent (3-bedroom unit)
Typical Occupations
30% AMI $21,656 27% $66,009 $541
Home Health Aide, Fast Food Clerk,
Dishwasher, Store Cashier, Parking Lot Attendant
80% AMI $57,750 39% $176,189 $1,444
Teachers, School Counselors, Police
Officers, Physi-cians’ Assistants, Insurance Claims
Adjuster
120% AMI $86,625 18% $264,284 $2,166First Year Lawyer,
Assistant Professor
120% Above **** 17% **** ****
*Median Income of 4-person households in Baltimore is approximately 60% of AMI. Based on 2000 Census income distribu-tion.

64 City of Baltimore Comprehensive Master Plan LIVE 6564 City of Baltimore Comprehensive Master Plan LIVE 65
interest in Baltimore as a place to live and presents opportunities to attract potential residents from all walks of life. While population loss has clearly slowed, this positive trend could be somewhat offset by the steady decline in the average household size. Rather than focusing solely on population gain, increasing the number of City households and quality housing units is crucial to stabilizing population and increasing the tax base. A strategy of encourag-ing density in strategic and specific areas with the infrastructure to handle increased growth and sustain a healthy quality of life must be undertaken.The Baltimore Region gained 164,212 people from 1990 to 2000 while the City continued to lose population. While the City’s rapid population loss has largely ended, there continues to be a net out-migration to the surrounding counties. Baltimore gained 30,052 residents from the surrounding counties while seeing a net loss of 103,183 citizens to the region as a whole. However, the City is in the unique position within the region as being the only jurisdic-tion welcoming large-scale residential development and population growth. The City needs to position itself as a place that is ready to claim its share of regional growth. If the City were to gain its share of projected state popula-tion growth between 2005 and 2020, it would result in a 2020 population of 734,501, a net gain of over 83,000 residents.A recent increase in the price of homes indicates greater demand for living in Baltimore. While the median single family home price increased 14.3% for Baltimore from 1999 to 2000, with greater increases in appreciation in specific neighborhoods, the City remains relatively affordable within the Bal-timore region, which saw an average increase of 59.7% in the price of single family homes. In the third quarter of 2005, the City posted the strongest gain in home sales prices of any jurisdiction within the Baltimore region.
B altimore Hous ing Unit T ypes by P erc entage, 2005
High R is e Apartments ,
5.1%
G arden Apartments ,
19.3%
S ingle F amily Attached,
58.2%
S ingle F amily Detached,
13.0%
S ingle F amily S emi-Detached,
4.4%

64 City of Baltimore Comprehensive Master Plan LIVE 6564 City of Baltimore Comprehensive Master Plan LIVE 65
INTR
OD
UC
TION
SU
MM
AR
Y H
ISTO
RY
KE
Y TR
EN
DS
LIVE
EA
RN
PLAY
LEA
RN
IMP
LEM
EN
TATION
MA
NA
GE
ME
NT FIN
AN
CIA
L CO
NC
LUS
ION
GLO
SS
AR
Y A
PP
EN
DIC
ES
D. Location
Baltimore’s location combines its housing affordability and strong urban fab-ric into a range of products attractive to a diverse market. Baltimore is well situated near the nation’s capital, Washington DC, as well as centrally located among other East Coast metropolitan areas, to attract and retain residents. The City is connected by both commuter and long distance rail to Washing-ton, DC, Philadelphia, New York, Boston and other northeastern destinations. Within the region, Baltimore is the focus of the public transportation system with a high level of access in and out of downtown and many other City neighborhoods.
E. Competition
Baltimore’s chief competitors are other jurisdictions in the Baltimore region, Washington, DC and its suburbs as well as other Mid-Atlantic Cities, especial-ly Philadelphia. Baltimore is competitive within the Baltimore-Washington Region as a place to live, which is evidenced by the positive population gain from Washington, DC and the relatively slight losses to suburban Washington and other Maryland counties. Baltimore showed a net population gain from Northeast states between 1995 and 2000, showing its growing strength in the larger region. While it is important to capitalize on our affordability, urban appeal and ease of access to Washington, DC, Baltimore City must become more competitive within the Baltimore Region and the State of Maryland. Both the state and the region continue to experience population gain, and our success as a market for potential and existing residents relies on our ability to capture a greater share of this growth. Baltimore must address struggling neighborhoods, an aging infrastructure, and weaknesses of City schools in order to change the trends of the past. Focusing on our products and services as our strengths, as well as on the needed strategies for improvement, is the key to increasing our resident market.

66 City of Baltimore Comprehensive Master Plan LIVE 6766 City of Baltimore Comprehensive Master Plan LIVE 67
A. Products and Services Specific Products and Services Sold
Choosing to LIVE in Baltimore requires considering three layers of products and services: housing units, the neighborhoods in which housing units are located, and the amenities that enhance the value of housing and neighbor-hoods, such as shopping, transportation, local parks, public libraries, com-munity centers and schools. These products and services make Baltimore a desirable place to LIVE, potentially drawing a range of new residents into city living while enhancing the lives of existing residents.
Baltimore City Housing Profile
Housing Owner-occupied Rental Total
No. of Units 129,870 128,125 257,995
% of Units in City 50.3% 49.7% 100%
Vacancy Rate 3.6% 7.6% 5.6%
Avg. Household Size 2.57 2.27 2.42
Source: U.S. Census 2000
The core product offered for living in Baltimore is the housing unit. Housing is offered at a broad range of types, sizes and prices. The types of housing offered include single-family houses -- both attached and detached -- multi-family units such as apartments and condominiums, as well as niche-ori-ented products such as loft buildings and live-work spaces. As can be seen in the chart above, these housing products are offered as rentals and owner-occupied products in nearly equal proportions. Baltimore’s specific mix of products includes a heavy orientation towards single-family attached units, usually referred to as rowhouses or townhouses. Rowhouses comprise 58.2 percent of the City’s housing units. By contrast, single-family detached units represent only 13 percent of the housing stock. Apartments, both high-rise and garden style, represent nearly a quarter of the housing avail-able in the City of Baltimore. This product mix represents both a strength and weakness of the City’s housing market. While the Baltimore rowhouse offers energy efficiency, neighborly contact, wise use of space and classic design, the rowhouse offers neither the multiplier effects resulting from the density of high-rise living nor the personal space offered by the detached house. As will be seen below, this product mix creates very specific strate-gies that must be taken to position the City in relation to its competitors.
Beyond the housing unit, another core product for living in Baltimore is the neighborhoods in which the housing units are located. Baltimore has 271 neighborhoods, each with its own distinct identity that contributes to the over-all identity of the City. These neighborhoods, each with their distinct mix of housing types, neighborhood retail, parks and recreational facilities, and institutions such as schools and churches, offer a strong local context within the setting of a much larger city. The character of these neighborhoods cannot be matched by the newer tract developments that comprise the majority of the surrounding jurisdictions’ residential settings. The quality of these neighbor-

66 City of Baltimore Comprehensive Master Plan LIVE 6766 City of Baltimore Comprehensive Master Plan LIVE 67
INTR
OD
UC
TION
SU
MM
AR
Y H
ISTO
RY
KE
Y TR
EN
DS
LIVE
EA
RN
PLAY
LEA
RN
IMP
LEM
EN
TATION
MA
NA
GE
ME
NT FIN
AN
CIA
L CO
NC
LUS
ION
GLO
SS
AR
Y A
PP
EN
DIC
ES
hoods is enhanced by the amenities that are available within or near each neigh-borhood. Strong neighborhood retail strengthens the neighborhood’s identity and makes the area more usable. Similarly, access to transportation makes a neighborhood much more easily connected to the city. Lastly, for several neighborhoods, location near major attractions visited by residents throughout the City and region can make an area especially attractive and place a premium on housing values.
Baltimore offers a range of services that can enhance the housing market through incentives to encourage investment where it might not otherwise occur. These incentives include loans, loan guarantees, Payment In Lieu Of Taxes (PI-LOT) agreements, and Tax Increment Financing (TIF). The City government also works to aid the housing market through activities such as plans review, permitting, inspections, and code enforcement. The combined effect of these actions is to foster high quality redevelopment of the City’s residential market, enhance housing values, and stabilize the City’s residential areas.
Baltimore’s services for living also include a number of programs to inter-vene in the housing market to improve living conditions for residents with special needs, such as elderly or disabled residents, homeowners who are cost-burdened, and renters in properties with environmental hazards such as lead. These programs are instrumental in maintaining the best possible quality of life for City residents while contributing to neighborhood quality and improving the overall condition of the City’s housing stock. As Baltimore’s population ages, many of these programs will need to be strengthened to meet the demands of a growing senior citizen segment.
B. Competitive Advantage
Housing affordability and the dominance of rowhouses are unique to Baltimore City, compared to other options in the region. Beyond these factors, Balti-more’s competitive advantage comes from the City’s location and convenience within the metropolitan area. Baltimore has a wealth of cultural, sporting, en-tertainment and recreation amenities that are not available in the surrounding jurisdictions. These amenities make the City attractive as a residential destina-tion and add value to residential units that are located near them.
Another unique feature is the large supply of historic structures in the City. Some of Baltimore’s best housing is located within designated historic districts, a status which can offer access to financial incentives, rewards for restoration, and incentives for conversion of industrial buildings to residences. There are no jurisdictions within the United States with as many historic districts as Bal-timore, and the number of historic properties designated in Baltimore equals the number of properties designated in New York City and Washington, DC combined. Absent a spurt of historic designation activity in other East Coast cities, Baltimore has and will keep a commanding position in the marketplace for historic housing.
The Inner Harbor, with its rapidly developing residential market, is another unique Baltimore feature. This area carries the Baltimore brand perhaps more strongly than any other area of the City. To leverage this position as much as possible, the City needs to capitalize on the desire to live in this area by creat-ing the type of dense urban living arrangement that is served by shopping and entertainment activities.
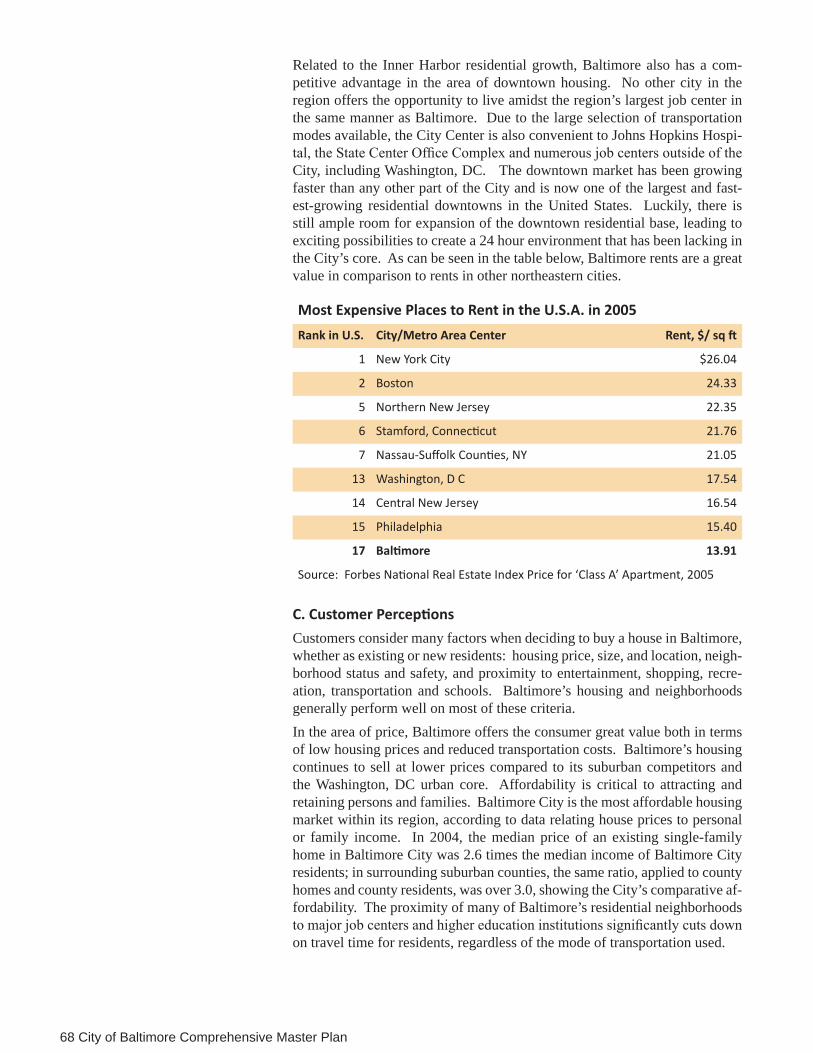
68 City of Baltimore Comprehensive Master Plan LIVE 6968 City of Baltimore Comprehensive Master Plan LIVE 69
Related to the Inner Harbor residential growth, Baltimore also has a com-petitive advantage in the area of downtown housing. No other city in the region offers the opportunity to live amidst the region’s largest job center in the same manner as Baltimore. Due to the large selection of transportation modes available, the City Center is also convenient to Johns Hopkins Hospi-tal, the State Center Office Complex and numerous job centers outside of the City, including Washington, DC. The downtown market has been growing faster than any other part of the City and is now one of the largest and fast-est-growing residential downtowns in the United States. Luckily, there is still ample room for expansion of the downtown residential base, leading to exciting possibilities to create a 24 hour environment that has been lacking in the City’s core. As can be seen in the table below, Baltimore rents are a great value in comparison to rents in other northeastern cities.
Most Expensive Places to Rent in the U.S.A. in 2005
Rank in U.S. City/Metro Area Center Rent, $/ sq ft
1 New York City $26.04
2 Boston 24.33
5 Northern New Jersey 22.35
6 Stamford, Connecticut 21.76
7 Nassau-Suffolk Counties, NY 21.05
13 Washington, D C 17.54
14 Central New Jersey 16.54
15 Philadelphia 15.40
17 Baltimore 13.91
Source: Forbes National Real Estate Index Price for ‘Class A’ Apartment, 2005
C. Customer Perceptions
Customers consider many factors when deciding to buy a house in Baltimore, whether as existing or new residents: housing price, size, and location, neigh-borhood status and safety, and proximity to entertainment, shopping, recre-ation, transportation and schools. Baltimore’s housing and neighborhoods generally perform well on most of these criteria. In the area of price, Baltimore offers the consumer great value both in terms of low housing prices and reduced transportation costs. Baltimore’s housing continues to sell at lower prices compared to its suburban competitors and the Washington, DC urban core. Affordability is critical to attracting and retaining persons and families. Baltimore City is the most affordable housing market within its region, according to data relating house prices to personal or family income. In 2004, the median price of an existing single-family home in Baltimore City was 2.6 times the median income of Baltimore City residents; in surrounding suburban counties, the same ratio, applied to county homes and county residents, was over 3.0, showing the City’s comparative af-fordability. The proximity of many of Baltimore’s residential neighborhoods to major job centers and higher education institutions significantly cuts down on travel time for residents, regardless of the mode of transportation used.

68 City of Baltimore Comprehensive Master Plan LIVE 6968 City of Baltimore Comprehensive Master Plan LIVE 69
INTR
OD
UC
TION
SU
MM
AR
Y H
ISTO
RY
KE
Y TR
EN
DS
LIVE
EA
RN
PLAY
LEA
RN
IMP
LEM
EN
TATION
MA
NA
GE
ME
NT FIN
AN
CIA
L CO
NC
LUS
ION
GLO
SS
AR
Y A
PP
EN
DIC
ES
Housing Affordability by Baltimore Regional Jurisdiction, 2005
JurisdictionAffordability index (median
sale price: median family in-come)
Median single-family home price increase 1999
– 2004
Baltimore City 2.6 14.3%
Anne Arundel County
3.6 78.5%
Baltimore County 3.2 61.3%
Carroll County 3.8 69.9%
Harford County 2.9 53.0%
Howard County 3.7 81.4
Sources: U.S. Census Bureau; Maryland Department of Planning; Maryland As-sociation of Realtors ®
Despite the continued affordability of Baltimore housing, City housing prices have recently risen much faster than those of suburban jurisdictions. This trend threatens to diminish one of the City’s greatest assets, if it causes resi-dences in safe, well-located neighborhoods to no longer be affordable.
In the area of convenience, Baltimore offers a traditional urban setting with convenient accessibility to neighborhood retail and parks. Additionally, many neighborhoods in Baltimore offer access to large employment centers, such as downtown, major hospitals, and universities.
Status measures the desirability of a product. In many cases, Baltimore’s houses and neighborhoods score well in this area, due to the high quality of Baltimore’s historic housing stock and the desirability of the many new residential units that have come on the market in recent years. Prestige of a neighborhood is best reflected in a few key indicators – price, low vacan-cy rate and length of time on the market. In recent years these indicators have improved dramatically, demonstrating both the increased strength of the City’s housing market and an increased interest in City living.
Safety is the one area where the City suffers from both a perceived and real inferiority to surrounding jurisdictions. Addressing what has been long been seen as a significant problem in the City, recent crime prevention efforts have paid off as violent and property crimes have dropped substantially since 1999. Despite this fact, overall rates of crime within Baltimore City are still substan-tially higher than those in competing markets, both locally and regionally.
D. Comparative Analysis
Compared to competing jurisdictions, Baltimore offers a radically different housing product. The rowhouse, which accounts for over 58 percent of the City’s residential units, is the product that dominates the City market and provides a clear alternative to single family subdivisions in pod-and-collec-tor street arrangements. The rowhouse offers substantial savings over other housing types in terms of its heating and air conditioning costs per square foot.

70 City of Baltimore Comprehensive Master Plan LIVE 7170 City of Baltimore Comprehensive Master Plan LIVE 71
The rowhouse is also adaptable to the growing taste for larger houses. Many rowhouse renovations have involved adding to the original structure through vertical and rearward expansions. The rowhouse has shown its versatility in its ability to be augmented with new features such as roof decks.
Baltimore is also the only location in the region with an ample supply of newly-constructed, high-density housing, much of it on or very near the wa-terfront. This new housing is designed primarily for persons and couples without school-age children, as it provides little or no play areas. The rec-reational amenities associated with this housing are mostly water-oriented, such as marinas for berthing recreational boats. This is in sharp contrast to suburban Anne Arundel County, where most of the waterfront land is occu-pied by single-family detached housing with extremely high waterfront real estate prices, and Baltimore County, where many of the waterfront areas are undergoing a piecemeal transition from “shore shacks” to million-dollar wa-terfront homes.
New housing needs to be marketed based on three specific criteria: location, convenience to regional amenities, and price. These three factors are the City’s chief competitive factors in the regional housing market and should be capitalized upon whenever possible.
As part of its larger, City-wide response to market forces, Baltimore will work with individual neighborhoods to stabilize localized real estate markets. This will focus City resources and services on retaining existing residents while attracting new residents. Tailoring City action to the particular needs of each community will efficiently and effectively cut the constraints which can hin-der neighborhood stability, allowing more Baltimore neighborhoods to com-pete with their suburban alternatives.
Overall, the City of Baltimore’s combination of location, historic housing stock, affordable prices, distinctive neighborhood character, convenience and accessibility makes the City an attractive place to live. Future efforts should focus on expanding the base of successful neighborhoods to include well-lo-cated or amenity-rich areas that have been underperforming due to the condi-tion of the housing stock or a lack of coordinated investment in recent years.
Baltimore will remain competitive in the housing market because of its his-tory, cultural and recreational amenities, diversity, and all the opportunities with which a cosmopolitan city is endowed. Baltimore offers lower prices, a wider range of options, and more extensive opportunities for new construc-tion, rehabilitation and conversion than competing jurisdictions. Baltimore also offers a variety of places to live, unmatched by its suburban neighbors in terms of quantity and quality of options and amenities. Improving and tar-geting City services will protect the values of residences and neighborhoods. This will improve the quality of City life, strengthen the housing market, and ensure that the City retains its competitive advantage as a place to live into the future.
70 City of Baltimore Comprehensive Master Plan LIVE 7170 City of Baltimore Comprehensive Master Plan LIVE 71
INTR
OD
UC
TION
SU
MM
AR
Y H
ISTO
RY
KE
Y TR
EN
DS
LIVE
EA
RN
PLAY
LEA
RN
IMP
LEM
EN
TATION
MA
NA
GE
ME
NT FIN
AN
CIA
L CO
NC
LUS
ION
GLO
SS
AR
Y A
PP
EN
DIC
ES
LIVE
Goals, Objectives and Strategies
Like many other urban areas across the United States, in the past 40 years the City of Baltimore has suffered the consequences of rapid population loss and concentrated poverty. However, in the last decade, the City has proactively persevered to stave off these trends and has experienced not only the end of population loss but also a resurgence in the housing market and a rise in civic engagement regarding all aspects of urban life. The goals outlined in this plan aim to make the most of these positive developments and maximize the City’s potential to be an outstanding place to LIVE:
Goal 1: Build Human and Social Capital by Strengthening Neighbor-hoods
Goal 2: Elevate the Design and Quality of the City’s Built Environment
Goal 3: Improve transportation access and choice for City residents
The objectives and strategies that follow are designed to provide guidance to City agencies and officials as they attempt to improve the City. While the following section details the main methods by which the City will become an even better place to LIVE, the recommendations are closely related to recommendations in the EARN, PLAY and LEARN sections, as well as the recommendations referenced in the appendices.

72 City of Baltimore Comprehensive Master Plan LIVE 7372 City of Baltimore Comprehensive Master Plan LIVE 73
LIVE
Goal 1: Build Human and Social Capital by Strengthening Neighborhoods
Objective 1: Expand Housing Choices for all Residents
• Develop and implement City- wide inclusionary housing plan• Ensure that at least 300 more housing units per year are affordable to seniors,
people with disabilities, low- and fixed income households• Expand eviction prevention services to help households retain their housing• Ensure households that are involuntarily displaced from housing receive pref-
erence for public housing and Section 8 vouchers• Target homeownership and rehabilitation loans as well as financial counseling
using Housing Typology• Create and preserve mixed-income neighborhoods in Competitive, Emerging
and Stable neighborhoods with targeted disposition of City properties• Eliminate homelessness City-wide
Objective 2: Strategically Redevelop Vacant Properties Throughout the City
• Establish a multi-tiered property tax to encourage development of vacant property and parcels
• Develop a vacant housing reclamation strategy for Transitional and Dis-tressed neighborhoods
• Support creation of a Community Garden Land Trust(s) to hold title to com-munity-managed open spaces and gardens (See also PLAY, Goal 3, Objective 2)
Objective 3: Maintain and Create Safe, Clean, & Healthy Neighbor-hoods
• Implement Crime Prevention Through Environmental Design (CPTED) stan-dards
• Target housing and sanitation code enforcement using the Housing Typology• Create a comprehensive City-wide sanitation plan• Eliminate childhood lead poisoning• Increase Substance Abuse Treatment City-wide• Adopt and implement an Urban Forest Management Plan
Objective 4: Target Neighborhood Planning to Leverage Investment
• Create Area Master Plans in a targeted manner• Leverage CIP resources in targeted areas using the neighborhood plans
Objective 5: Increase the City’s Population by 10,000 Households in 6 Years
• Develop Growth Promotion Areas (GPAs) to absorb future population growth in the region.
• Market the City to surrounding jurisdictions and Washington DC
Objective 6: Improve neighborhood schools (See LEARN, Goal 1)

72 City of Baltimore Comprehensive Master Plan LIVE 7372 City of Baltimore Comprehensive Master Plan LIVE 73
INTR
OD
UC
TION
SU
MM
AR
Y H
ISTO
RY
KE
Y TR
EN
DS
LIVE
EA
RN
PLAY
LEA
RN
IMP
LEM
EN
TATION
MA
NA
GE
ME
NT FIN
AN
CIA
L CO
NC
LUS
ION
GLO
SS
AR
Y A
PP
EN
DIC
ES
Goal 2: Elevate the Design and Quality of the City’s Built Environment.
Objective 1: Improve Design Quality of Baltimore’s Built Environ-ment
• Develop design guidelines to respond to the unique character of Baltimore City
• Create and adopt a City-wide landscape ordinance• Update building code to promote sustainable, universal or high perfor-
mance buildings through incentives and regulations• Create standards for hiring design professionals to foster the design of high
quality city projects
Objective 2: Streamline and Strengthen the Development Process
• Modernize zoning codes to meet current needs• Improve efficiency of One-Stop Shop permitting center• Increase number of zoning code enforcers• Create a task force on interagency coordination for web-based, real time
access to development projects
Objective 3: Promote Transit Oriented Development (TOD) and Mixed-use Development to Reinforce Neighborhood Centers and Main Streets
• Implement a Transit Oriented Development (TOD) strategy to foster stron-ger neighborhood centers
• Provide preferential capital funding for TOD projects• Create mixed-use with residential zoning category• Ensure all residents are within 1.5 miles of quality groceries and neighbor-
hood services
Objective 4: Protect and Enhance the Preservation of Baltimore’s Historic Buildings and Neighborhoods
• Update City-wide historic preservation guidelines• Promote use of Maryland Building Rehabilitation Code• Simplify, and actively pursue the local historic district designation process
for Baltimore neighborhoods• Create, expand and promote the historic structure tax credit programs for
local historic districts and landmarks• Strengthen CHAP ordinance enforcement by providing dedicated staff to
proactively enforce CHAP guidelines• Implement a program that physically demarcates the City’s locally desig-
nated historic districts• Create a fund/program that provides rehabilitation loans for low income
families in locally designated historic districts

74 City of Baltimore Comprehensive Master Plan LIVE 7574 City of Baltimore Comprehensive Master Plan LIVE 75
Objective 5: Improve Water Quality and the Environmental Sustain-ability of the Chesapeake Bay
• Adopt and implement the Comprehensive Water and Wastewater Plan• Reduce pollutants in streams, rivers and reservoirs to meet Total Maximum
Daily Load (TMDL) for each body of water
Goal 3: Improve Transportation Access, Accessibility and Choice for City Residents
Objective 1: Create a Comprehensive Transportation Plan to Im-prove Mobility, Accessibility and Choice
• Create a City-wide pedestrian plan• Implement Bicycle Master Plan to create a complete bikeway system• Implement Transportation System Management (TSM) techniques to im-
prove the efficiency and safety of existing roadway system• Create traffic- calming policies and procedures• Target Pavement Maintenance Management System (PMMS) funding to
bus routes and surface rail crossings
Objective 2: Facilitate Movement throughout the Region
• Create a regional authority to manage public transit and paratransit ser-vices throughout the metropolitan area
• Support efforts to implement the Baltimore Regional Rail Plan and its Red and Green Line priority segments
• Protect and create Rights-of-Way along existing and proposed rail lines• Create intermodal transit hubs in areas of low automobile ownership• Establish a development mitigation program to reduce congestion effects
of new development
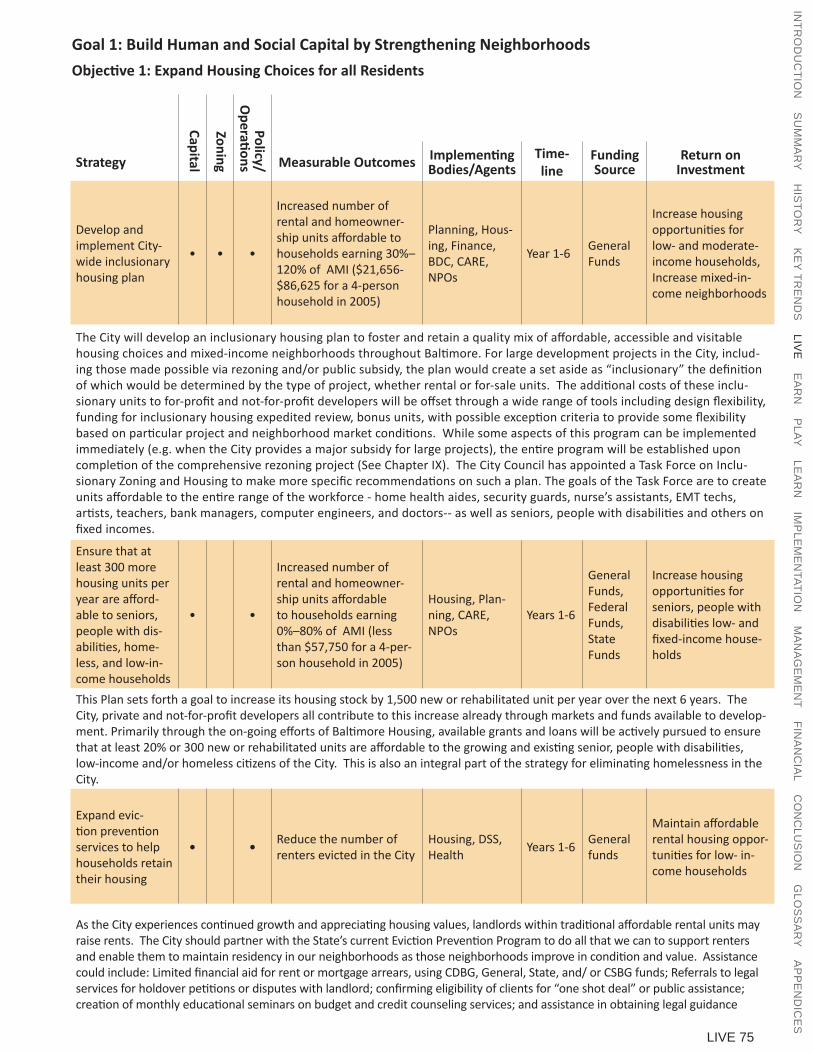
74 City of Baltimore Comprehensive Master Plan LIVE 7574 City of Baltimore Comprehensive Master Plan LIVE 75
INTR
OD
UC
TION
SU
MM
AR
Y H
ISTO
RY
KE
Y TR
EN
DS
LIVE
EA
RN
PLAY
LEA
RN
IMP
LEM
EN
TATION
MA
NA
GE
ME
NT FIN
AN
CIA
L CO
NC
LUS
ION
GLO
SS
AR
Y A
PP
EN
DIC
ES
Strategy Measurable Outcomes Implementing Bodies/Agents
Time-line
Funding Source
Return on Investment
Develop and implement City- wide inclusionary housing plan
• • •
Increased number of rental and homeowner-ship units affordable to households earning 30%–120% of AMI ($21,656-$86,625 for a 4-person household in 2005)
Planning, Hous-ing, Finance, BDC, CARE, NPOs
Year 1-6General Funds
Increase housing opportunities for low- and moderate-income households, Increase mixed-in-come neighborhoods
The City will develop an inclusionary housing plan to foster and retain a quality mix of affordable, accessible and visitable housing choices and mixed-income neighborhoods throughout Baltimore. For large development projects in the City, includ-ing those made possible via rezoning and/or public subsidy, the plan would create a set aside as “inclusionary” the definition of which would be determined by the type of project, whether rental or for-sale units. The additional costs of these inclu-sionary units to for-profit and not-for-profit developers will be offset through a wide range of tools including design flexibility, funding for inclusionary housing expedited review, bonus units, with possible exception criteria to provide some flexibility based on particular project and neighborhood market conditions. While some aspects of this program can be implemented immediately (e.g. when the City provides a major subsidy for large projects), the entire program will be established upon completion of the comprehensive rezoning project (See Chapter IX). The City Council has appointed a Task Force on Inclu-sionary Zoning and Housing to make more specific recommendations on such a plan. The goals of the Task Force are to create units affordable to the entire range of the workforce - home health aides, security guards, nurse’s assistants, EMT techs, artists, teachers, bank managers, computer engineers, and doctors-- as well as seniors, people with disabilities and others on fixed incomes.
Ensure that at least 300 more housing units per year are afford-able to seniors, people with dis-abilities, home-less, and low-in-come households
• •
Increased number of rental and homeowner-ship units affordable to households earning 0%–80% of AMI (less than $57,750 for a 4-per-son household in 2005)
Housing, Plan-ning, CARE, NPOs
Years 1-6
General Funds, Federal Funds, State Funds
Increase housing opportunities for seniors, people with disabilities low- and fixed-income house-holds
This Plan sets forth a goal to increase its housing stock by 1,500 new or rehabilitated unit per year over the next 6 years. The City, private and not-for-profit developers all contribute to this increase already through markets and funds available to develop-ment. Primarily through the on-going efforts of Baltimore Housing, available grants and loans will be actively pursued to ensure that at least 20% or 300 new or rehabilitated units are affordable to the growing and existing senior, people with disabilities, low-income and/or homeless citizens of the City. This is also an integral part of the strategy for eliminating homelessness in the City.
Expand evic-tion prevention services to help households retain their housing
• •Reduce the number of renters evicted in the City
Housing, DSS, Health
Years 1-6General funds
Maintain affordable rental housing oppor-tunities for low- in-come households
As the City experiences continued growth and appreciating housing values, landlords within traditional affordable rental units may raise rents. The City should partner with the State’s current Eviction Prevention Program to do all that we can to support renters and enable them to maintain residency in our neighborhoods as those neighborhoods improve in condition and value. Assistance could include: Limited financial aid for rent or mortgage arrears, using CDBG, General, State, and/ or CSBG funds; Referrals to legal services for holdover petitions or disputes with landlord; confirming eligibility of clients for “one shot deal” or public assistance; creation of monthly educational seminars on budget and credit counseling services; and assistance in obtaining legal guidance
Capital
Zoning
Policy/ O
perations
Goal 1: Build Human and Social Capital by Strengthening Neighborhoods
Objective 1: Expand Housing Choices for all Residents

76 City of Baltimore Comprehensive Master Plan LIVE 7776 City of Baltimore Comprehensive Master Plan LIVE 77
Strategy Measurable Outcomes Implementing Bodies/Agents
Time-line
Funding Source
Return on Investment
Ensure house-holds that are involuntarily displaced from housing receive preference for public housing and Section 8 vouchers
• •Reduce the number of homeless individuals in Baltimore
Housing Year 1-6Federal Funds
Maintain affordable rental housing oppor-tunities for low- in-come households
This existing policy of Baltimore Housing should remain in place and be available to all persons who are involuntarily displaced from their homes due to natural disaster, public action, or due to intimidation stemming from either witnessing or being a victim of a crime.
Target homeown-ership and reha-bilitation loans as well as financial counseling using Housing Typology
• •
Increased homeowner-ship rate, decreased turnover, decrease in mortgage defaults
Planning, Housing, NPOs
Year 1
Federal Grants, GO Bonds, General Funds
Increased personal equity and greater stability in transi-tional and emerging neighborhoods
The Department of Planning, Baltimore Housing and The Reinvestment Fund have jointly developed a Housing Typology (see Appendix M). The primary purpose of the typology is to assist the City government and the non-profit organizations operating in the City to develop neighborhood strategies that better match available public resources to neighborhood housing market condi-tions. In addition, the typology can inform neighborhood planning efforts by helping neighborhood residents understand the housing market forces impacting their communities. Using the Housing Typology, Baltimore Housing and the many non-profit housing programs will have greater insight about where to target homeownership and loan products such as second mortgages, which will foster stability in neighborhoods, eliminate duplication of resources, and increase homeownership (see Appendix M). Financial counseling will also be conducted to inform residents of safeguards already in place to protect homeowners against excessive tax increases due in part to the rise in property values due to proximate development.
Create and preserve mixed-income neighbor-hoods in Compet-itive, Emerging and Stable neighborhoods with targeted disposition of City properties
• •
Increased number of rental and homeowner-ship units affordable to households earning 30%–120% of AMI ($21,656-$86,625 for a 4-person household in 2005)
Planning, Housing, BDC, BCPSS, DPW, CARE, DGS
Years 1-6General Funds
Increase middle-in-come housing op-portunities, Increase mixed-income neigh-borhoods
City-held properties in Competitive and Emerging neighborhoods would be disposed of in a way that ensures retention and/or creation of mixed-income communities.
Eliminate home-lessness City-wide
• •Decreased number of residents without a per-manent home
Health, Hous-ing, MOED, Planning
Years 1-6General Funds
More stable neigh-borhoods, Greater access to social servicess
The City will create a 10-year plan to end homelessness with annual benchmarks to measure outcomes. Targeted and increased access to job-training, quality affordable housing, and healthcare are all necessary aspects of eliminating homelessness city-wide.
Capital
Zoning
Policy/ O
perations

76 City of Baltimore Comprehensive Master Plan LIVE 7776 City of Baltimore Comprehensive Master Plan LIVE 77
INTR
OD
UC
TION
SU
MM
AR
Y H
ISTO
RY
KE
Y TR
EN
DS
LIVE
EA
RN
PLAY
LEA
RN
IMP
LEM
EN
TATION
MA
NA
GE
ME
NT FIN
AN
CIA
L CO
NC
LUS
ION
GLO
SS
AR
Y A
PP
EN
DIC
ES
Objective 2: Strategically Redevelop Vacant Properties Throughout the City
Strategy Measurable OutcomesImplementing Bodies/Agents
Time-line
Funding Source
Return on Investment
Establish a multi-tiered property tax to encourage development of vacant property and parcels.
•Adoption of State en-abling legislation, Fewer vacant properties
Planning, Housing, BDC, Finance, Mary-land General Assembly
Year 2-3General Funds
Increased develop-ment activity, Stron-ger neighborhoods and commercial centers
Currently, the City has a single tax rate for all properties based on assessed value. To encourage rehabilitation and redevelop-ment of vacant properties and discourage speculative holding, the City will create a more equitable property tax structure. The tax rate for properties that are vacant or have received Vacant House Notices will be higher to stimulate rehabilitation and redevelopment. To achieve this, the City will pursue State enabling legislation to alter the current structure, up to, and including a potential amendment to the Maryland Constitution.
Develop a vacant housing reclama-tion strategy for Transitional and Distressed neigh-borhoods
•Fewer vacant residential properties
Housing, Plan-ning, Law, Rec & Parks, Finance
Year 2General Funds
Increased residential development activity, Stronger neighbor-hoods
Project 5000 has been and will continue to be a successful program for addressing the disposition of vacant properties in Com-petitive, Emerging, and Stable neighborhoods as defined in Housing Typology (See Appendix M); this important initiative should continue. Additionally, an aggressive vacant housing reclamation strategy should be developed in Transitional and Distressed areas that considers the following: development of a database that inventories and tracks vacant and abandoned buildings and land parcels; buildings that are vacant/abandoned for more than 6 months must register and pay an annual sliding fee; aban-doned property owners should be required to carry minimum insurance on property in case of damage to neighboring homes from collapse and/or fire; RFP’s offered to CDC’s, community organizations, and other interest groups to convert and/or pur-chase vacant lots and buildings into community gardens, parks, recreation areas, etc. Capital
Zoning
Policy/ O
perations
Support creation of a Commu-nity garden Land Trust(s) to hold title to commu-nity-managed open spaces and gardens (See also PLAY, Goal 3, Objective 2)
• •
Legislation that creates mechanism for transfer-ring land owned by the City or available by tax sale to a non-profit land trust entity; improved management of vacant lands not under manage-ment of Recreation and Parks or DPW; increased number of community-managed open spaces and gardens
Planning, Law, HCD, MCC, CARE, Public Works
Years 1-2
Program Open Space; Com-munity Develop-ment Block Grants
Higher prop-erty values; lower number of unin-tended vacant lots throughout the city; ensure that time and labor invested by neigh-borhood residents to transform and improve their communities is protected; stron-ger social ties among neighbor-hood residents
Supporting a Community Garden Land Trust will help to ensure that public open spaces are maintained, protected, and sustainable. Healthy, well-maintained neighborhood green spaces help to strengthen neighborhood social, economic, and environmental health. Facilitating a network of community-managed open spaces will complement Baltimore’s extensive network of parks and trails, while placing no additional responsibility on the Department of Recreation and Parks. Moreover, many neighborhood residents invest significant amounts of time, labor, and money to transform vacant lots into community gardens and parks, yet they are at risk of losing their investment absent a land trust that can hold title to these properties. Without attention and stewardship from neighborhood residents, these lots would otherwise be eyesores and havens for illicit activity that decrease property values and detract from neighborhood quality of life.

78 City of Baltimore Comprehensive Master Plan LIVE 7978 City of Baltimore Comprehensive Master Plan LIVE 79
Objective 3: Maintain and Create Safe, Clean, & Healthy Neighborhoods
Strategy Measurable Outcomes Implementing Bodies/Agents
Time-line
Funding Source
Return on Investment
Implement Crime Preven-tion Through Environmental Design (CPTED) standards
•
Standards added to De-velopment Guidebook, In-creased number of plans reviewed using CPTED standards, decreased crime rates
Planning, Hous-ing, Police, Transportation
Year 1General Funds
Lower expenditures for police response, higher property values
The City will implement CPTED design standards to create safer public spaces by reducing opportunities for crime. By creating ‘defensible spaces’ through measures such as activating ground floor areas, and improving lighting and pedestrian areas, the City will create public spaces that are safer and more utilized.
Target housing and sanitation code enforce-ment using the Housing Typology
• •
Decreased number of vacant house notices, increased prosecutions, increased compliance with violation notices, increased CO’S
Planning/Hous-ing/DPW, DGS
Years 1-6General funds
Reduction of blight and Greater stability in neighborhoods
Nearly 16,000 vacant or abandoned structures exist within the City of Baltimore. These properties have a detrimental effect on the neighborhoods in which they are located. The City already utilizes geographic data in enforcement activities to which the Housing Typology (See Appendix M) will enhance the targeted enforcement approach to return these properties to a productive use.
Create a compre-hensive City-wide sanitation plan
• • •
Decreased number of 311 sanitation calls, De-creased litter throughout the city and Harbor
MCC, Health, Planning, DPW, MOIT
Years 2-3General funds
Cleaner streets and water; more efficient sanitation proce-dures
The streets, alleys, and sidewalks of Baltimore City are valued parts of the city’s public infrastructure. Keeping these areas clean is vital to creating a positive image of the City and improving water quality. A comprehensive sanitation plan which includes such strategies as developing modern sanitation management practices, optimizing locations of trash cans, educating residents on how to help keep the city clean with an anti-dumping, anti-littering, and anti-polluting campaign, and investments in street cleaning, and sanitation equipment such as street sweepers, mobile vacuums, brooms, and shovels for sanitation personnel will improve the physical environment throughout the City. One of the goals of the plan will be a measureable reduction of non-re-cycled waste within the City.
Eliminate child-hood lead poison-ing
• • •Decreased number of lead poisoning cases
Health, Hous-ing, Planning, DGS
Year 1-6
Federal Grants, State Grants, General Funds
Improved public health for City chil-dren
While redeveloping and rehabilitating residential and non-residential structures, as well as while improving school facilities, the potential exposure to lead must be addressed and mitigated. Safeguards should be in place to protect all residents, particularly children, from exposure to lead.
Capital
Zoning
Policy/ O
perations

78 City of Baltimore Comprehensive Master Plan LIVE 7978 City of Baltimore Comprehensive Master Plan LIVE 79
INTR
OD
UC
TION
SU
MM
AR
Y H
ISTO
RY
KE
Y TR
EN
DS
LIVE
EA
RN
PLAY
LEA
RN
IMP
LEM
EN
TATION
MA
NA
GE
ME
NT FIN
AN
CIA
L CO
NC
LUS
ION
GLO
SS
AR
Y A
PP
EN
DIC
ES
Strategy Measurable Outcomes Implementing Bodies/Agents
Time-line
Funding Source
Return on Investment
Increase Sub-stance Abuse Treatment City-wide
• • •
Decreased relapse rate, Reduced drug treatment waiting list, Reduced rate of drug-related crimes
Health, DSS, State Dept of Health and Mental Hy-giene, non-profit and for-profit treatment facilities
Years 1-6
Federal Grants, State Grants, General Funds
Reduced chemical dependency, reduced drug-related crime, increased productiv-ity of residents
An estimated 60 thousand individuals in Baltimore are addicted to drugs and/or alcohol. Increasing the availability of effective drug treatment will save lives, reduce crime and rebuild families and neighborhoods. One of the City’s top priorities is to reduce substance abuse and drug-related crime. Expanding the capacity of the public system will enable all city residents to have rapid access to high quality treatment services resulting in improved health and well-being for them, and their families and communi-ties.
Adopt and imple-ment an Urban Forest Manage-ment Plan
• •Increased number of street trees, Increased longevity of trees
Rec & Parks/ Forestry/ Plan-ning/ DPW/ Transportation/MD DNR/USFS/Private Sector, DGS
Years 2-6
MVR, General funds, GO Bonds
Higher property values, lower energy costs.Improved air and water quality
Planting trees and creating new standards for tree maintenance will help to ensure that public areas and public resources are aesthetic, protected, and sustainable. Baltimore will review and adopt an Urban Forest Management Plan that will increase efficiency of tree management and maintenance systems, improve the coordination between city agencies, and increase the survival rate and longevity of trees ( see Appendix BB).
Objective 4: Target Neighborhood Planning to Leverage Investment
Create Area Master Plans in a targeted manner
•Adopted plans; Plan implementation strate-gies within the CIP
Planning, BDC, Housing, CARE
Years 1-6
General and CDBG funds
Positive neighbor-hood change through targeted planning
The city has 271 neighborhoods; currently 40% of the city is covered by an adopted SAP, SNAP, or AMP (See Appendix EE). The goal is for every area in the city to have an adopted area master plan that is consistent with the CMP within 10 years. The process for developing these plans needs to be done in a targeted manner. Prioritization will be determined by a process which involves elected officials, assesses the ability to leverage public and private resources, and accounts for the likelihood of the plan to effect positive change and achieve comprehensive planning goals
Leverage CIP resources in tar-geted areas using the neighbor-hood plans
• • Increased tax revenuePlanning, Housing, MCC, DGS
Years 1-6
General Funds, GO Bonds, Revenue Bonds, Federal and state grants
Increased private investment
Through the development of Area Master Plans, the City will develop neighborhood-specific strategies to target Capital Im-provement dollars as well as leverage other resources to maximize investment and stabilize neighborhood real estate markets.
Capital
Zoning
Policy/ O
perations

80 City of Baltimore Comprehensive Master Plan LIVE 8180 City of Baltimore Comprehensive Master Plan LIVE 81
Strategy Measurable Outcomes Implementing Bodies/Agents
Time-line
Funding Source
Return on Investment
Develop Growth Promotion Areas (GPAs) to absorb future population growth in the region.
• • •Increased opportunity for development in targeted areas
Planning, Hous-ing
Imple-ment 1 yr, ongo-ing
General Funds, GO Bonds, federal and state funds
More vibrant urban lifestyle, Increased number of develop-ments
The City has the infrastructure, transit and school capacity for a significant increase in residents and the City will strategically attract additional resources and capital to capture a substantial part of future State growth. We welcome new residential de-velopment throughout the City and encourage a variety of new housing products to be built There are areas with high holding capacity, but which require significant infrastructure improvements, more efficient transportation options and capital resource allocations to attract redevelopment. The Planning Department will develop Growth Promotion Areas (See Chapter IX) in order to attract additional population and investment.
Market the City to surrounding jurisdictions and Washington DC
• • Increased populationLiveBaltimore, BOPA, Housing, BDC
Year 1-6More vibrant urban lifestyle, Increased property tax revenue
Growth in Washington DC has become a significant driver of the growth in Baltimore’s housing market. The City will continue marketing to potential residents and work with MTA to expand both the number of MARC cars and days of service to improve access to and from Washington for Baltimore residents.
Objective 6: Improve neighborhood schools (See LEARN, Goal 1)
Goal 2: Elevate the Design and Quality of the City’s Built Environment.
Objective 1: Improve Design Quality of Baltimore’s Built Environment
Develop design guidelines to respond to the unique character of Baltimore City
•Increased number of plans using design guide-lines
Planning, Housing
Years 2-6General funds
More predictable and transparent design review process
Current design guidelines are inefficient and outdated. Different types of design guidelines are necessary for different types of buildings and areas throughout the City.
Create and adopt a City-wide land-scape ordinance
•
Improved air and water quality, Development projects that enhance surrounding communi-ties, Reduction in imper-vious surfaces
DOP, BDC, Housing, Trans-portation, DPW, & Rec. & Parks Private Interest, DGS
Year 1General Funds
Improved water qual-ity and air quality; negative influences converted to assets; increase in property values
Landscapes in Baltimore City range from forest and naturalized open space to residential developments of varying densities, of-ten bordered by commercial corridors, urban streets, industrial and commercial centers. Institutions, such as schools, colleges, and houses of worship, also contribute to the varied landscape. Creating and adopting a landscape ordinance citywide will be a public process and would enhance the appearance of the City by establishing minimum design standards, currently not in place, which would further improve the design quality of the City’s existing landscapes and streets. Development of these standards should encourage the use of native, non-invasive plants, trees and shrubs and encourage the reduction of chemical pesticides.
Capital
Zoning
Policy/ O
perations
Objective 5: Increase the City’s Population by 10,000 Households in 6 Years

80 City of Baltimore Comprehensive Master Plan LIVE 8180 City of Baltimore Comprehensive Master Plan LIVE 81
INTR
OD
UC
TION
SU
MM
AR
Y H
ISTO
RY
KE
Y TR
EN
DS
LIVE
EA
RN
PLAY
LEA
RN
IMP
LEM
EN
TATION
MA
NA
GE
ME
NT FIN
AN
CIA
L CO
NC
LUS
ION
GLO
SS
AR
Y A
PP
EN
DIC
ES
Strategy Measurable Outcomes Implementing Bodies/Agents
Time-line
Funding Source
Return on Investment
Update building code to promote sustainable, universal or high performance buildings through incentives and regulations
•
Updated building codes to include sustainable performance regulations and incentives
Planning, Housing, DPW, BCPSS, BDC, DGS
Years 2-4General funds
Increase in sustain-able development, decreased demand on City Infrastructure
Translating current development activity into a lasting, quality built environment means promoting higher quality buildings and more sustainable and universal designs. Producing buildings which have greater longevity starts by building with materi-als which will stand the test of time and meet ADA requirements. Equally important is encouraging “green” or environmentally sensitive construction which will reduce demands for expensive utility infrastructure, help preserve the region’s delicate environ-ment, and create more healthy living environments. Baltimore City’s Green Building Task Force released the final report with recommendations for policies and programs to promote building in compliance with Green Building (LEED) standards for new and rehabilitated private and public commercial and residential structures.
Create standards for hiring design professionals to foster the design of high quality city projects
•
Increased number of hir-ings made using the new process, Updated A&E board procedures, poli-cies and appointments
All city agencies Year 2-4General funds
Higher quality design and construction
Promoting high quality design should start with our city sponsored civic projects. We only need look to the past, at our great schools and courthouses to see the legacy of good civic design. By implementing “Design Excellence” we can utilize top design talent to design our civic projects to promote high quality architecture. Such a program would not necessitate spending more on more expensive buildings, but rather would simply match better designers with city projects to be more creative with our city’s built legacy. The public will benefit from improved spaces and buildings that will foster more involvement from the public in their local government.
Objective 2: Streamline and Strengthen the Development Process
Modernize zoning codes to meet current needs
•Decreased number of zoning variances
Planning, BMZA, Housing, Law, MCC
Years 2-3General funds
More predictable and transparent develop-ment process
Current zoning policies are not flexible enough to accommodate current and future development (See Chapter IX for Future Zon-ing Recommendations). Existing zoning segregates uses, especially in commercial and industrial zoned areas. Flexibility should be the key factor to consider when revising the zoning code. To assist the development process, general building design and streetscape/landscape guidelines need to be adopted for the City as a whole. Design standards for residential and mixed-use areas should produce more consistent development patterns that also meet ADA requirements than those that have been devel-oped to date. These patterns should reflect and respect historic patterns in Baltimore while providing flexibility for contempo-rary development and design solutions. There should be transparency in the design review process.
Capital
Zoning
Policy/ O
perations

82 City of Baltimore Comprehensive Master Plan LIVE 8382 City of Baltimore Comprehensive Master Plan LIVE 83
Strategy Measurable Outcomes Implementing Bodies/Agents
Time-line
Funding Source
Return on Investment
Improve efficien-cy of One-Stop Shop permitting center
•Fewer 311 calls for permit violations
Housing, Plan-ning, DPW, Transportation, DGS
Years 2-6General Funds
Increased accuracy in permitting process
In order to improve the efficiency and accuracy of permits issued through the One-Stop Shop permitting center, the City will automate the referrals process for agency approval so that it’s mandatory and not permission-based. This will require increased coordination among City agencies and more accurate databases for allowed development in different parts of the City.
Increase number of zoning code enforcers
• Fewer zoning violations Housing Year 1General Funds
Greater consistency in zoning code ap-plication
The purpose of zoning is to guide development in the City by setting density and use restrictions within the different categories in the code. In order to enforce existing and proposed zoning regulations, the City needs sufficient resources and code enforcers to monitor development and implement the comprehensive rezoning project (See Chapter IX).
Create a task force on inter-agency coordina-tion for web-based, real time access to devel-opment projects
• Creation of Task Force
MOIT, Planning, Housing, DPW, Transportation, BDC, DGS
Year 1General funds
Easier access to de-velopment informa-tion City-wide
City agencies must continue to work together to link databases in real time so that development projects are easily accessible to city government, developers, businesses and residents. Create map-based Web site to effectively market redevelopment sites including property information, and applicable development incentives. Interagency coordination is needed to ensure non-pri-vate information pertaining to development projects is comprehensive. This information would also be used to annually moni-tor the City’s development (holding) capacity (See Appendix N).
Objective 3: Promote Transit Oriented Development (TOD) and Mixed-use Development to Reinforce Neighborhood Centers and Main Streets
Implement a Transit Oriented Development (TOD) strategy to foster stronger neighborhood centers
• •
Reduced number of car trips, increased mass transit ridership, increased pedestrian activity
Planning/BMZA/Hous-ing/Law/ Mayor and City Coun-cil/Transporta-tion, CARE
Years 2-4General funds
Increased develop-ment and property values near transit stations
Baltimore will focus on implementing a set of related policies that allow for and encourage increased development near exist-ing and proposed transit stations in the City (See Appendix E). One of the broad objectives of TOD is to enhance the character, safety and sense of place in neighborhoods near transit stations, and promote a broad range of housing choices. In order to pur-sue these objectives, land use strategies are necessary including a TOD station area zone district, a coordinated land acquisition plan that reflects economic development goals, and regulatory incentives that encourage intensified development near transit.
Capital
Zoning
Policy/ O
perations

82 City of Baltimore Comprehensive Master Plan LIVE 8382 City of Baltimore Comprehensive Master Plan LIVE 83
INTR
OD
UC
TION
SU
MM
AR
Y H
ISTO
RY
KE
Y TR
EN
DS
LIVE
EA
RN
PLAY
LEA
RN
IMP
LEM
EN
TATION
MA
NA
GE
ME
NT FIN
AN
CIA
L CO
NC
LUS
ION
GLO
SS
AR
Y A
PP
EN
DIC
ES
Strategy Measurable Outcomes Implementing Bodies/Agents
Time-line
Funding Source
Return on Investment
Provide pref-erential capital funding for TOD projects
• •Increased development in TOD areas
All city agencies Years 2-4
General Funds, GO Bonds, federal and state funds, other
Increased tax base and density
Utilize the City’s Capital Improvement Program (CIP) to encourage residential and commercial development that adheres to TOD principles and guidelines in close proximity to transit areas (See Appendix E). Projects that meet these factors will receive high priority when used to determine which projects are financed using CIP funding.
Create mixed-use with residential zoning category
• •
Decreased number of variances for mixed-use and fewer URP’s, Increased mixed-use in neighborhood centers
Planning/BMZA/Hous-ing/Law/ Mayor and City Council
Years 2-4General funds
Increased tax base and density
Many of the City’s older neighborhoods were developed at a time when mixed-use development was the norm. However, most of the City’s current zoning districts are single use, effectively zoning out the development of new mixed-use areas. Within the existing code, “Business” and “Office-Residential” zoning districts permit a mixture of uses, but they are not designed to produce residential areas with core neighborhood services. Mixed-use with residential zoning would allow the preservation and replica-tion of the best of Baltimore City’s historic neighborhoods and facilitate the creation of new models of mixed-use development to accommodate modern ways of living and working in an urban environment. Such zoning would allow mixed-use development by right, avoiding the time-consuming urban renewal and planned unit development processes that today are used to achieve mixed-use development in many areas of the City (See Chapter IX for Future Zoning Recommendations).
Ensure all resi-dents are within 1.5 miles of qual-ity groceries and neighborhood services
•Increased number of gro-cery stores and neighbor-hood services
Health, BDC, Planning, CARE
Years 1-6General funds
Greater access to quality foods and ser-vices, Better public health
It is imperative that every city resident has access to and is aware of quality, fresh food and daily services. For many years, resi-dents have not had easy, proximate access to quality food, in particular. Since 2000, the city has attracted at least 19 supermar-kets and grocery stores through the City’s Grocery Store Initiative. The city needs to market itself to show that it already has the demographics and density to support these businesses. Residents will also be made aware of healthy food options and other neighborhood services in the area.
Capital
Zoning
Policy/ O
perations

84 City of Baltimore Comprehensive Master Plan LIVE 8584 City of Baltimore Comprehensive Master Plan LIVE 85
Objective 4: Protect and Enhance the Preservation of Baltimore’s Historic Buildings and Neighborhoods
Strategy Measurable Outcomes Implementing Bodies/Agents
Time-line
Funding Source
Return on Investment
Update City-wide historic preserva-tion guidelines
•
New guidelines ad-opted for each district, increased number of permits in each district
Planning, CHAP, Housing
Year 2-6General funds
Expedited and higher quality new develop-ment
The guidelines for new construction and rehabilitation in local historic districts will assist developers in the design and mainte-nance of buildings located in the City’s local historic districts. The guidelines will be tailored to reflect the diverse architectural character and historical significance of all districts in the City. The updated guidelines will be user-friendly and provide predict-ability for developers and property owners at all levels of experience in preservation.
Promote use of Maryland Build-ing Rehabilitation Code
•Increased number of rehabilitation of historic structures
Housing, Planning, DGS
Year 1-6General funds
Quality rehabilita-tion of historic areas, Return of vacant structures to produc-tive use
In 2001, the State of Maryland adopted the Maryland Rehabilitation Code, which became effective throughout the State, includ-ing the City of Baltimore. Since then, the Code has facilitated the rehabilitation of a number of older and historic buildings in the city. However, many older buildings sitting vacant or underutilized could benefit from the Code.
Simplify, and actively pursue the local historic district designa-tion process for Baltimore neigh-borhoods
•Increase the number of districts
CHAP, Planning Commission, Planning
Year 1-6General funds
Increase property tax revenue and assess-ment and increase rehabilitations with tax credits
CHAP will revise the local designation process in order to shorten the time for local designation to nine months on average. Also, Planning staff will actively pursue historic designation in areas where documentation and research regarding historic signifi-cance has already been compiled.
Create, expand and promote the historic structure tax credit pro-grams for local historic districts and and land-marks
•
Increased tax credit ap-plications, Increased as-sessed values, increased number of rehab permits, increased new/infill con-structions
Planning, CHAP, MCC, Finance
Years 1-6
His-toric tax credits, General Funds
Increased investment in historic properties and neighborhoods
City Council and the Department of Finance will create a new tax credit that will be targeted to locally designated historic prop-erties. The City will also actively promote the availability and use of existing tax credits. A focus on locally designated properties will bring more investment to Baltimore’s historic resources and increase the number of properties designated under the protec-tion of local historic designation.
Capital
Zoning
Policy/ O
perations

84 City of Baltimore Comprehensive Master Plan LIVE 8584 City of Baltimore Comprehensive Master Plan LIVE 85
INTR
OD
UC
TION
SU
MM
AR
Y H
ISTO
RY
KE
Y TR
EN
DS
LIVE
EA
RN
PLAY
LEA
RN
IMP
LEM
EN
TATION
MA
NA
GE
ME
NT FIN
AN
CIA
L CO
NC
LUS
ION
GLO
SS
AR
Y A
PP
EN
DIC
ES
Strategy Measurable Outcomes Implementing Bodies/Agents
Time-line
Funding Source
Return on Investment
Strengthen CHAP ordinance en-forcement by pro-viding dedicated staff to proactive-ly enforce CHAP guidelines
•
Increased number of vio-lation notices issued, stop work orders and court cases enforcing the CHAP ordinance
Planning, CHAP, Housing, Law
Years 1-6General funds
More structures within historic dis-tricts that adhere to preservation guide-lines
There are over 8,000 buildings in local CHAP districts that require proactive enforcement of the CHAP ordinance. This strategy aims to ensure that there are is a dedicated staff of code enforcement officers and construction and building inspectors who are well-trained to specifically enforce the CHAP guidelines. All CHAP enforcers and inspectors will need specialized education and training on the CHAP ordinance and CHAP areas in the City.
Implement a program that physically demar-cates the City’s locally designated historic districts
• •
Increased number of physical improvements in local historic districts, In-creased number of locally designated districts
Planning, CHAP, DPW, Rec. and Parks, Transpor-tation, Libraries, Housing, BCPSS, BDC
Years 1-6MVR, General Funds
More attractive local districts
Baltimore’s locally designated districts are spread throughout the City, but some are not identified by markers to demarcate a neighborhood as a historic district. Appropriate signage, lighting and gateway signage will make the areas stand out to local residents and visitors.
Create a fund/program that pro-vides rehabilita-tion loans for low income families in locally desig-nated historic districts
• •Number of houses reha-bilitated made possible by the loans
Planning, CHAP, Finance, Hous-ing
Years 1-6
General funds, GO Bonds, federal and state grants
More attractive mixed income com-munities which at-tract investment
The creation of a program that provides rehabilitation loans for low income individuals and families to complete exterior renova-tions according to CHAP guidelines in locally designated historic districts will promote investment, reduce blight, and ensure that longtime residents will not be forced out of their homes by gentrification. Historic properties within local historic districts and within distressed, transitional, and stable neighborhoods as identified by the Baltimore City’s Housing Market Typology will be eligible for this program. Housing and CHAP will administer the program.
Capital
Zoning
Policy/ O
perations

86 City of Baltimore Comprehensive Master Plan LIVE 8786 City of Baltimore Comprehensive Master Plan LIVE 87
Objective 5: Improve Water Quality and the Environmental Sustainability of the Chesapeake Bay
Strategy Measurable Outcomes Implementing Bodies/Agents
Time-line
Funding Source
Return on Investment
Adopt and imple-ment the Com-prehensive Water and Wastewater Plan
• •Reduced nutrient loading in drinking water, Less discharge into the Bay
DPW, Planning, Transportation
Year 1General funds
Clean drinking water for entire Baltimore region, Less pollution in the Bay
The objective of the City’s 2006 Comprehensive Water and Wastewater Plan is to guide the development of the ultimate water and wastewater systems consistent with population growth, comprehensive planning, and economic development so that an ample supply of water may be collected, treated and delivered to points where needed and so that collected wastewaters may be treated and disposed of to prevent or minimize adverse effects on legitimate water uses.
Reduce pollutants in streams, rivers and reservoirs to meet Total Maxi-mum Daily Load (TMDL) for each body of water
• •TMDL requirement met for area streams, rivers and reservoirs
DPW, Planning, MDE, DNR, DGS
Years 1-6
MVR, General Funds, GO Bonds
Clean drinking water for entire Baltimore region, Less pollution in the Bay
A TMDL (Total Maximum Daily Load) establishes the maximum amount of an impairing substance that can enter a body of water and still meet meet water quality standards. Total Maximum Daily Loads (TMDLs) are a requirement, found in §303(d), of the federal Clean Water Act (CWA) that became law in 1972 and are a tool for implementing State water quality standards. They are based on the relationship between pollution sources and in-stream water quality conditions. Non-point source controls may be established by implementing Best Management Practices (BMPs, See PLAY, Goal 3, Objective 2, Strategy 2) through voluntary or mandatory programs for enforcement, technical assistance, financial assistance, education, training, technology transfer, and demonstration projects.
Goal 3: Improve Transportation Access, Accessibility and Choice for City Residents
Objective 1: Create a Comprehensive Transportation Plan to Improve Mobility, Accessibility and Choice
Create a City-wide pedestrian plan
• •
Increased pedestrian level of service, decreased pedestrian-involved ac-cidents
Transportation, DPW, Planning, DGS
Years 1-6
Federal DOT, GO Bonds, General funds, MVR
Improved environ-ment for walkabil-ity, Connectivity be-tween destinations, Increased pedestrian safety, Improved public health
This element will be an integral part of the comprehensive transportation plan. In order to ensure pedestrian safety and overall walkability within and among the City’s neighborhoods, the City will develop a pedestrian plan to target sidewalk, crosswalk, lighting and signal improvements and deploy modern and accessible pedestrian safety technologies near and between neighbor-hood centers, schools, business and transit areas. This strategy will provide safer trips for residents and tourists in our neigh-borhoods and business centers. This will improve connections between schools, transit areas and neighborhoods. Enhancing pedestrian facilities around transit stops would also make use of public transportation more attractive and viable.
Capital
Zoning
Policy/ O
perations

86 City of Baltimore Comprehensive Master Plan LIVE 8786 City of Baltimore Comprehensive Master Plan LIVE 87
INTR
OD
UC
TION
SU
MM
AR
Y H
ISTO
RY
KE
Y TR
EN
DS
LIVE
EA
RN
PLAY
LEA
RN
IMP
LEM
EN
TATION
MA
NA
GE
ME
NT FIN
AN
CIA
L CO
NC
LUS
ION
GLO
SS
AR
Y A
PP
EN
DIC
ES
Strategy Measurable Outcomes Implementing Bodies/Agents
Time-line
Funding Source
Return on Investment
Implement Bicy-cle Master Plan to create a complete bikeway system
• •Increased number of bike lane miles, Increased bike use
Planning, Trans-portation, Rec & Parks
Years 1-3
GO Bonds, General funds, MVR
Less air pollution alert days,
Improved public health
This element will be an integral part of the comprehensive transportation plan. Create dedicated bikeways for safety and mobil-ity by incorporating bicycle–friendly elements in all major renovations and new construction as outlined in the Bicycle Master Plan. Ensuring connectivity of the bikeways in accordance with the Bicycle Master Plan will let more people use bikeways for commuting, errands or recreation. This would create alternatives to vehicular trips, which create air pollution, cause congestion and threaten pedestrian safety
Implement Trans-portation System Management (TSM) techniques to improve the efficiency and safety of existing roadway system
• •
Reduced traffic violations, reduced traffic-related ac-cidents, reduced conges-tion, reduced air pollution
Planning, Transportation, MDOT, BMC, SHA
Years 1-6General funds, MVR
More efficient road-way system
The City has a well-established roadway system that needs to be maintained and improved to ensure safety and efficiency of movement. Transportation System Management techniques include traffic signal enhancements and intersection improve-ments. These efforts will be coordinated with Baltimore and Anne Arundel counties to ensure seamless integration of the roadway networks.
Create traffic- calming policies and procedures
• •Increased traffic calming measures, speed reduc-tion in residential areas
Planning Transportation
Years 1-6
GO Bonds, General funds, MVR
Reduced accidents; Increased real estate values; Decreased impacts from traffic
Speed humps, bump-outs, and other traffic-calming devices will reduce the speed and impact of traffic, improving the quality and safety of City neighborhoods and the urban environment. The policy will spell out what traffic calming measures are avail-able, where they are appropriate, and how they can be requested. Some measures, notably speed humps and rumble strips, are done in-house. Other measures such as islands and “chokers” are capital improvements. A traffic-calming program will be initiated with CIP funds.
Target Pavement Maintenance Management System (PMMS) funding to bicycle and bus routes and surface rail crossings
• •Increased number of miles resurfaced on tran-sit routes
Transportation Years 1-6
GO Bonds, General funds, MVR
Less capital costs to maintain roads, im-proved road surfaces
The Pavement Maintenance Management System was started a year ago by Baltimore City Department of Transportation. The program preserves and prolongs the lifespan of road surfaces by maintaining them before they deteriorate. Priority will be given to bicycle and bus routes to support public transportation and maximize the potential number of people who benefit.
Capital
Zoning
Policy/ O
perations

88 City of Baltimore Comprehensive Master Plan LIVE 8988 City of Baltimore Comprehensive Master Plan LIVE 89
Objective 2: Facilitate Movement throughout the Region
Strategy Measurable Outcomes Implementing Bodies/Agents
Time-line
Funding Source
Return on Investment
Create a regional authority to man-age public transit and paratransit services through-out the metro-politan area
•Creation of regional board, increased ridership
MTA, BRTB, MDOT, Trans-portation, Mayor’s Office, Maryland Gen-eral Assembly, Governor’s Office
Years 2-6General funds
Better and more responsive transit service
Transit systems are generally controlled by the areas that they serve. It ties the responsibility, responsiveness and control of transit to those who most directly use and benefit from it. Currently, the State of Maryland controls the Baltimore region’s tran-sit system. This situation is highly unusual, existing only in a handful of other transit systems. This strategy aims to develop an authority with city, regional, and state partners that integrates and improves public transit and paratransit services throughout the region.
Support efforts to implement the Baltimore Regional Rail Plan and its Red and Green Line prior-ity segments
• •
Increased number of Pas-senger Rail Lines in the region, Increase in “tran-sit mode share” (share of all trips made via public transportation) for people who either live or work in the City, Increased number of households and jobs 1/3-mile from existing and future rapid transit stops in City
MTA, BMC, MDOT, Trans-portation, Housing, Plan-ning, DGS
Years 1-6
FTA New Starts, MVR, CTP, MDOT and MTA
Transit Investments boost local economy and enhance compet-itiveness in attracting new business.
The Baltimore Region Rail Plan as developed in 2002 is moving forward with portions of the Red and Green Lines as top pri-orities (See Appendix O). To realize these projects, City agencies will work with surrounding businesses and communities to explore and plan for the most appropriate economic development and related infrastructure (e.g. street improvements, traffic signals, safe pedestrian pathways) along these priority lines. The City will also collaborate with surrounding communities and businesses, other local jurisdictions, and the Maryland Transit Administration (MTA) to provide advice on preferred alignments, station locations, technologies, and system features. Those recommendations will be geared toward helping the City realize its transit-oriented development strategy and neighborhood revitalization goals and also toward making the project competitive for federal transportation funds. In addition, the City will work with City, State, and federal elected officials to develop viable fund-ing strategies for construction of new transit lines and related economic development.
Protect and cre-ate Rights-of-Way along existing and proposed rail lines
• • Increased rail milesBDC, Housing, DPW, DGS, Transportation
Years 1-6General funds
Improved transit options
In order to realize an expanded transit system of either MARC or Amtrak such as the one detailed in the Baltimore Regional Rail Plan (See Appendix O), the Rights-of-way (ROW) needed for alignments identified for proposed transit and highspeed rail (MAG-LEV) need to be preserved.
Capital
Zoning
Policy/ O
perations

88 City of Baltimore Comprehensive Master Plan LIVE 8988 City of Baltimore Comprehensive Master Plan LIVE 89
INTR
OD
UC
TION
SU
MM
AR
Y H
ISTO
RY
KE
Y TR
EN
DS
LIVE
EA
RN
PLAY
LEA
RN
IMP
LEM
EN
TATION
MA
NA
GE
ME
NT FIN
AN
CIA
L CO
NC
LUS
ION
GLO
SS
AR
Y A
PP
EN
DIC
ES
Strategy Measurable Outcomes Implementing Bodies/Agents
Time-line
Funding Source
Return on Investment
Create intermo-dal transit hubs in areas of low automobile own-ership
• • Increased transit ridershipMTA, Planning, Housing, Trans-portation
Years 1-6
GO Bonds, General funds, MVR
Improved transporta-tion accessibility and employability
Over 30% of City residents have no cars; it is the City’s priority to provide and support transit service for residents who choose not or can’t afford to own cars. In order for Baltimore City to realize its potential as an employment center for the 21st century, the City must partner with public and private entities to expand and enhance transportation options in the region. Creating transit hubs in areas of low automobile ownership as well as connecting these hubs to destinations (e.g. work, school, recre-ation, daily activities) will increase the efficiency of transit usage for city residents.
Establish a devel-opment mitiga-tion program to reduce conges-tion effects of new develop-ment.
•Creation of Traffic Reduc-tion Ordinance
Planning/
Transportation/ BDC/ Finance/ Housing/ MCC
Year 1General funds
Reduced impact on congestion of new development
Strengthen traffic impact study (TIS) requirements and explore development impact fees to ensure that new development in the City’s congested neighborhoods is adequately supported by transportation infrastructure and services.
Capital
Zoning
Policy/ O
perations
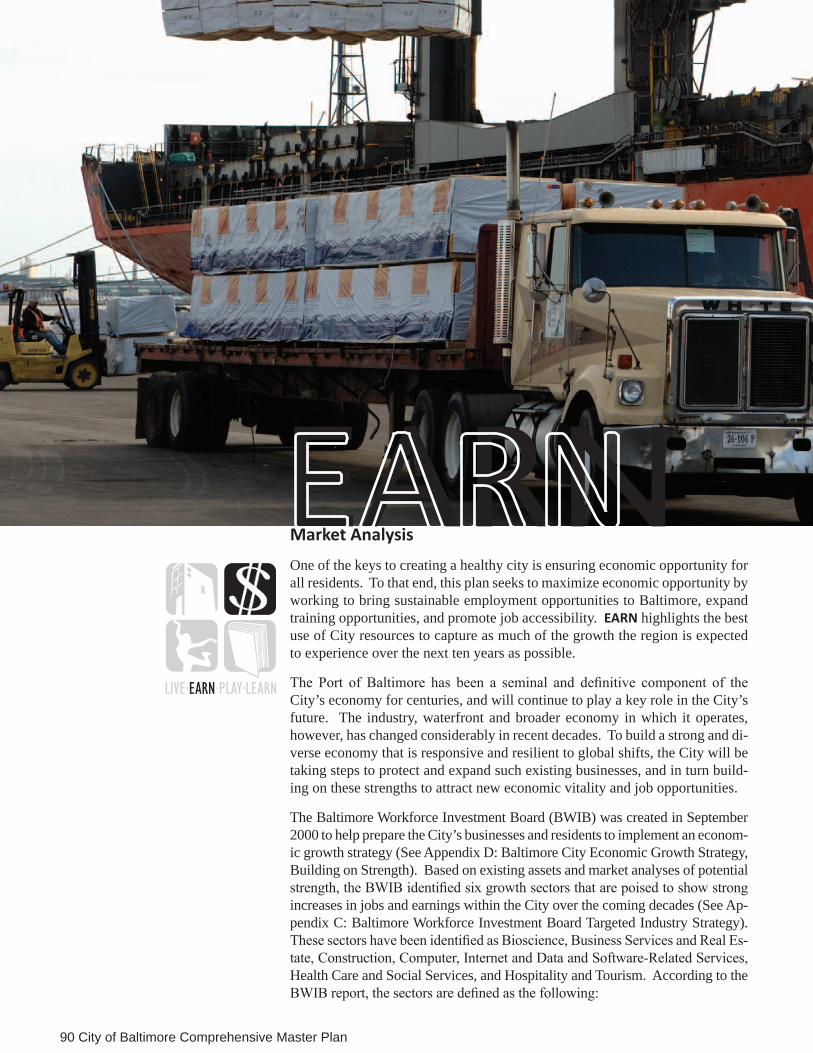
90 City of Baltimore Comprehensive Master Plan EARN 9190 City of Baltimore Comprehensive Master Plan EARN 91
Market Analysis
One of the keys to creating a healthy city is ensuring economic opportunity for all residents. To that end, this plan seeks to maximize economic opportunity by working to bring sustainable employment opportunities to Baltimore, expand training opportunities, and promote job accessibility. EARN highlights the best use of City resources to capture as much of the growth the region is expected to experience over the next ten years as possible.
The Port of Baltimore has been a seminal and definitive component of the City’s economy for centuries, and will continue to play a key role in the City’s future. The industry, waterfront and broader economy in which it operates, however, has changed considerably in recent decades. To build a strong and di-verse economy that is responsive and resilient to global shifts, the City will be taking steps to protect and expand such existing businesses, and in turn build-ing on these strengths to attract new economic vitality and job opportunities.
The Baltimore Workforce Investment Board (BWIB) was created in September 2000 to help prepare the City’s businesses and residents to implement an econom-ic growth strategy (See Appendix D: Baltimore City Economic Growth Strategy, Building on Strength). Based on existing assets and market analyses of potential strength, the BWIB identified six growth sectors that are poised to show strong increases in jobs and earnings within the City over the coming decades (See Ap-pendix C: Baltimore Workforce Investment Board Targeted Industry Strategy). These sectors have been identified as Bioscience, Business Services and Real Es-tate, Construction, Computer, Internet and Data and Software-Related Services, Health Care and Social Services, and Hospitality and Tourism. According to the BWIB report, the sectors are defined as the following:

90 City of Baltimore Comprehensive Master Plan EARN 9190 City of Baltimore Comprehensive Master Plan EARN 91
INTR
OD
UC
TION
SU
MM
AR
Y H
ISTO
RY
KE
Y TR
EN
DS
LIVE
EA
RN
PLAY
LEA
RN
IMP
LEM
EN
TATION
MA
NA
GE
ME
NT FIN
AN
CIA
L CO
NC
LUS
ION
GLO
SS
AR
Y A
PP
EN
DIC
ES
Bioscience
The Bioscience industry cluster includes not only research and development, but manufacturing in such fields as pharmaceuticals and medical supplies, analytical laboratory instrumentation and testing, and environmental, bio-technology and life sciences.
Business Services and Real Estate
The Business Services and Real Estate sector includes the following indus-tries: accounting, tax preparation, bookkeeping, and payroll; management and management consulting; advertising; administrative and office support; and real estate brokering, mortgaging and titling.
Construction
The Construction sector is comprised of establishments primarily engaged in the construction of buildings or engineering projects.
Computer, Internet and Data and Software-Related Services (CIDS)
The Computer, Internet and Data Services related industries include: inter-net publishing and broadcasting; internet service providers and web search portals; data processing services; and computer facilities management.
Healthcare and Social Assistance
The Health Care and Social Assistance sector consists of establishments pro-viding health care and social assistance for individuals. Trained professionals

92 City of Baltimore Comprehensive Master Plan EARN 9392 City of Baltimore Comprehensive Master Plan EARN 93
deliver the services provided by establishments in this sector. Many of the industries in the sector are defined based on the educational degree held by the practitioners included in the industry.
Hospitality and Tourism
The Hospitality and Tourism sector includes the following industries: ac-commodation industries; food services and drinking places; convention and visitors bureaus; scenic and sightseeing transportation; performing arts and spectator sports; and retail trade and stores.
Over the next ten years, employment in these sectors is projected to grow by 50% in the Baltimore region. In order for the City to position itself to capture its share of this growth, the City needs to attract employers in these sectors and ensure that the labor force within the City has the appropriate skills to meet the new job demand.
This chapter will investigate the market for each of these growth sectors, the workforce available to serve these sectors, and the transportation options available to serve both the industry and the workforce. By exploring how the City can best build on its strengths, we will set a firm foundation and strategy for future growth.
A. The Industry
Baltimore’s economy has changed dramatically in recent decades. The City once could rely on a robust manufacturing sector as the major source of em-ployment for residents. However, the global and national economies have greatly transformed since the 1970s, and the domestic manufacturing sector has declined considerably. To succeed in transitioning to the new and emer-gent economy, the City must continue to diversify and re-tool its economic engines. For Baltimore’s economy to be truly successful, it must be viable both regionally and globally for businesses and firms to “buy Baltimore” and meet the employment needs of all types of City residents.
As contending waterfront uses gain in popularity, the challenge has also be-come one of ensuring that land use regulations preserve the viability of our important port infrastructure, and that steps are taken to strengthen this key element of the local economy.
Percentage of Jobs by Sector by Jurisdiction, 2004
% of Total Employment,
Professional and Business Services
% Total Employment, Construction
% Total Employment,
CIDS
%Total Employ-ment, Educa-
tion and Health Services
% Total Em-ployment, Hospitality
and Tourism
% of Total Em-ployment, Finan-
cial Activities
Baltimore City 13.1% 3.2% 1.9% 24.9% 7.4% 7.1%
Anne Arundel County
14.7% 7.2% 2.0% 9.7% 11.3% 5.3%
Baltimore County
13.5% 6.7% 1.7% 15.5% 8.8% 8.3%
Harford County 12.7% 8.4% 0.8% 10.0% 9.2% 4.4%
Source: Maryland Department of Labor and Licensing Regulation, 2004

92 City of Baltimore Comprehensive Master Plan EARN 9392 City of Baltimore Comprehensive Master Plan EARN 93
INTR
OD
UC
TION
SU
MM
AR
Y H
ISTO
RY
KE
Y TR
EN
DS
LIVE
EA
RN
PLAY
LEA
RN
IMP
LEM
EN
TATION
MA
NA
GE
ME
NT FIN
AN
CIA
L CO
NC
LUS
ION
GLO
SS
AR
Y A
PP
EN
DIC
ES
For both the existing port industries and the emergent growth sectors, the aim is first and foremost to help strengthen the existing businesses, while encour-aging new business growth and entrepreneurship.
B. Customers
The customers for the City’s economic products fall into two general catego-ries: employers and workers. Within these categories there are subcategories. For employers there are business owners, managers, and entrepeneurs. For employees there are City residents of employment age as well as residents of other jurisdictions who commute to the City for employment purposes.
Employers
Employers fuel the City’s growth and are key to helping the City build on its existing and emergent assets. These include not only the port and port-related industries that have been a mainstay of the economy for centuries, but also new industries that have demonstrated potential for growth in the area, including Bioscience, Business Services/Real Estate, Construction, CIDS, Healthcare/Social Assistance, and Hospitality and Tourism. When business entities look to locate or expand in an area, they consider numerous variables, including land costs, incentives, networks of supply and transportation (air, rail, and road), access to markets, and availability of an appropriate pool of employees. Research has demonstrated that cities have more success when they selectively strategize around clusters of industries, rather than try to meet all potential needs of all potential business investors. Because these business groups in turn support and sustain other business growth, this plan focuses on the Port and the six emergent growth sectors.
Business owners, executives, and entrepeneurs are those individuals who have the power to positively impact the City through locating, expanding or starting their business in Baltimore. The final decision to locate and expand a business in an area often lies with the upper level executives once the ground work of identifying and presenting options has been completed. These indi-viduals could potentially impact the City negatively by moving their business away from the City or declining to expand or locate their business within the City.
Small businesses are an integral part of the City’s economy. Entrepreneurs are independent business owners who provide the majority of neighborhood amenities and are the cornerstone of neighborhood shopping districts. The small business owner works in many industries and provides a multitude of services ranging from the professional spectrum of real estate businesses, medical services, and legal offices to the service spectrum of restaurants, beauty and wellness services, and entertainment establishments.
Entrepreneurs not only provide sources of employment, but they also support the six targeted growth sectors by providing professional business services and as a cornerstone for furthering research and advancing technologies in the Healthcare, Biotechnology and CIDS fields in particular. Many small businesses operate in cooperation with larger institutions, foundations and corporations. Their role, for example, could include refining patented drugs, procedures and technologies, and providing the basis from which these ad-vancements come to the broader public. Entrepreneurship is important not only to the vitality of our ports and the advancement of growth sectors, but to the overall health, growth and diversification of the City’s economy.
Percentage of Jobs by Sector by Jurisdiction, 2004
% of Total Employment,
Professional and Business Services
% Total Employment, Construction
% Total Employment,
CIDS
%Total Employ-ment, Educa-
tion and Health Services
% Total Em-ployment, Hospitality
and Tourism
% of Total Em-ployment, Finan-
cial Activities
Baltimore City 13.1% 3.2% 1.9% 24.9% 7.4% 7.1%
Anne Arundel County
14.7% 7.2% 2.0% 9.7% 11.3% 5.3%
Baltimore County
13.5% 6.7% 1.7% 15.5% 8.8% 8.3%
Harford County 12.7% 8.4% 0.8% 10.0% 9.2% 4.4%
Source: Maryland Department of Labor and Licensing Regulation, 2004

94 City of Baltimore Comprehensive Master Plan EARN 9594 City of Baltimore Comprehensive Master Plan EARN 95
Employees
City’s residents represent a critical source of human capital that businesses depend upon for the success of their ventures. This factor also figures largely in business leaders’ decisions as to where they should locate. To promote the City as a place to establish new businesses and relocate or expand existing ones, it is important that the City retain and create an employment base with appropriate skill sets.
Currently, the City’s labor force participation rate is 56 percent, the lowest in the region. As of September 2005, the City of Baltimore experienced a 7.1 per-cent unemployment rate, much higher than the 4.2 percent figure in the metro area. Within these percentages are both highly trained professionals as well as skilled and unskilled workers that need job training and additional skills de-velopment for career advancement. It is crucial to provide a workforce that is prepared to participate in the growing industries at all levels of employment.
One of the keys to creating a healthy city is ensuring economic opportunity for all residents. To that end, the EARN component of this plan seeks to maximize economic opportunity by working to bring the right jobs to the City, expand training opportunities, and promote job accessibility.
City residents as customers include both existing City residents as well as those that will move permanently into the City. These potential customers include those who look for jobs in the Baltimore region or those who are selecting from multiple job prospects including one or more within the city or region. For these people, Baltimore may be judged as a possibility for both employment and residency in terms of the quality of the job prospects as well as the quality of life the city and region will offer.
Outside of employment, the factors that contribute to the City’s attractiveness and quality of life are being addressed in the LIVE and PLAY sections. These qualities are highly important to out-of-town job seekers that are an integral part of maintaining and growing the City’s economic base.
While the plan’s goal is to enhance opportunities for Baltimore City residents, it should be recognized that a portion of the City’s employment base comes from surrounding counties and neighboring states. These commuters must be recognized as helping to build the economy of Baltimore at all levels of the workforce from unskilled workers to professionals.
Baltimore’s Labor Force
In 2005, Baltimore’s labor force consisted of roughly 249,000 people aged 16 and older. Baltimore’s labor force can be combined with external resi-dents to include not only the 154,463 workers who reside and work in Bal-timore City, but also 94,910 workers who reside in Baltimore City, but work outside the City; 187,535 workers who reside outside Baltimore City, but work in Baltimore City.
Because all employees, whether they live inside or outside the City, must com-mute to work (whether by car or other means), improving overall job access and transportation is a critical component of planning for this City’s future. This will include planning for enhanced mass-transit options, as well as non-motorized options such as walking and bicycling.

94 City of Baltimore Comprehensive Master Plan EARN 9594 City of Baltimore Comprehensive Master Plan EARN 95
INTR
OD
UC
TION
SU
MM
AR
Y H
ISTO
RY
KE
Y TR
EN
DS
LIVE
EA
RN
PLAY
LEA
RN
IMP
LEM
EN
TATION
MA
NA
GE
ME
NT FIN
AN
CIA
L CO
NC
LUS
ION
GLO
SS
AR
Y A
PP
EN
DIC
ES
Percentage of Employed Residents Who Work in Own
County
Percentage of County Jobs Held by Residents
Baltimore City 61.90% 45.20%
Anne Arundel County 56.30% 64.00%
Baltimore County 52.70% 57.60%
Harford County 51.90% 76.50%
C. Market Size and Trends
While the economy of metropolitan Baltimore has grown greatly over the last few decades, the City’s economic growth has not kept pace. Like many other struggling cities, Baltimore has been losing ground to its suburban competitors in terms of its share of regional job growth. The City must work to strengthen its position as the core of the region’s economy. Part of the reason for this trend is the fact that as middle-class City residents fled to the suburbs, employ-ers often moved to be closer to the workers. This has led to a situation where many City residents (and even the most mobile of them), are often forced to work outside city limits. In 2005, it was estimated that 154,463 workers were living and working in Baltimore City, while 94,910 City residents worked out-side the City. Current projections also suggest that the Baltimore region may well increase its employment totals by 50% by 2030. If the City, however, does not capture a more proportionate share of this regional growth, it will be in the unenviable position of having most of its residents forced to commute outside of the City limits to earn an income.
The port has been an enduring source of strength in this job market, supply-ing roughly 15,700 direct jobs with an average wage of $59,000 in 2002. In addition, the Port supported an estimated 83,000 induced jobs in trades and services sustained by spending of the direct employees, and 8,900 indirect jobs sustained by the business purchases of direct employers in the Port. The total 33,000 direct, indirect and induced employees generated roughly $216 million in State and local taxes in 2002. Faced with increasing competition for other desired uses along the waterfront the City has been and must continue taking action to preserve and enhance this major driving force in our economy.
To further strengthen the City’s eco-nomic role in the regional economy, the City has targeted six growth ar-eas, in addition to our existing port-related services, in strengthening our overall economy. These “growth sectors” were identified on the basis of their a) wage potential, b) appro-priateness for Baltimore’s workforce, and c) relation to existing strengths
JurisdictionAverage Travel
Time to Work (in minutes)
Residents Who Work in Own
County
Workers Com-muting Into the
County
Workers Com-muting Out of
the County
Net Workers Com-muting Into/Out
of the County
Baltimore City 31.1 154,463 187,535 94,910 92,625
Anne Arundel County 28.9 144,033 81,082 111,825 -30,743
Baltimore County 27.6 196,917 144,759 176,579 -31,820
Harford County 31.6 57,973 17,793 53,731 -35,938
Source: US Census
Source: Maryland Department of Plan-

96 City of Baltimore Comprehensive Master Plan EARN 9796 City of Baltimore Comprehensive Master Plan EARN 97
and identified growth potential in the broader state and national contexts. This focused strategy will supplement the existing strength that resides in our port infrastructure, to build a more viable future for the current and future citizens of Baltimore.
D. Location
Baltimore’s location along the Eastern Seaboard in the Mid-Atlantic region is a tremendous asset to the City’s economy. The advantages of Baltimore’s location are heightened by the extensive transportation network that serves the City, including a water, road and rail transportation network in which the Port again plays an integral role. This infrastructure, combined with the location, make the area important for manufacturing, warehousing and dis-tribution businesses across the Mid-Atlantic and East Coast states. Inter-state 95, for example, which stretches from Canada to Miami, helps connect the City to most other major Cities of the East Coast, while we also have strong connections West, via Interstate 70. In addition, the City is served by a major international airport, an extensive freight rail network as well as Amtrak passenger rail service.
Within the region, Baltimore remains the core location for business activity, as it has the area’s downtown as well as many important shipping terminals. However, Baltimore’s preeminence has been challenged by the trend of de-centralization of employment that has been ongoing over a period of more than 50 years. This decentralization can be seen in the fact that in many of the area’s suburban counties, workers are more likely to work in their home county or adjacent counties than to commute into the central city.
Beyond transportation advantages, Baltimore’s waterfront location is also beneficial in that it provides a natural feature around which new business ac-tivities still have numerous opportunities to locate. The fact that Baltimore’s waterfront remains a “frontier” that has yet to be fully utilized leaves room for future business innovation as the waterfront redevelops and its image is remade.
E. Competition
1. National and International - Baltimore’s main competitors at the larger geographic scale are the other East Coast ports (Halifax, Boston, New York, Philadelphia, Norfolk, Savannah, Jacksonville, and Miami); the world’s major medical and biotechnology centers, tourist destinations as well as other places that specialize in the industries in which Baltimore hopes to compete.
The Port of Baltimore is a major player at the national and international level, and has been designated number one in the nation (in the early years of 2000) for roll on/roll off cargo. This includes a broad array of construc-tion and farm machinery, as well as trucks and automobiles. Among North Atlantic Coast ports the Port also ranked second in the import of forest products, and third in overall import and export of automobiles.
2. Regional - At the regional level, Baltimore completes with many other met-ropolitan areas of similar size in the mid-Atlantic Region, stretching from Norfolk to New York City. Baltimore’s relatively low cost for office space

96 City of Baltimore Comprehensive Master Plan EARN 9796 City of Baltimore Comprehensive Master Plan EARN 97
INTR
OD
UC
TION
SU
MM
AR
Y H
ISTO
RY
KE
Y TR
EN
DS
LIVE
EA
RN
PLAY
LEA
RN
IMP
LEM
EN
TATION
MA
NA
GE
ME
NT FIN
AN
CIA
L CO
NC
LUS
ION
GLO
SS
AR
Y A
PP
EN
DIC
ES
makes it competitive with most urban areas in the region. Downtown office spaces in Washington, DC, Philadelphia, Boston, and New York typically sell for $600 to $700 per square foot. Similar quality downtown office space in Baltimore trades at $200 to $300 per square foot. Additionally, for prospective resident-employees, our relatively low cost of living and hous-ing makes it competitive with most of the cities in the region, especially the ones that can offer similar mixes of urban amenities, educational training and locational advantages as those that are offered within the City.
3. Local - Within the Baltimore-Washington region, Baltimore’s position has shrunk from being the major economic engine to being a node in a com-plex web of regional economic actors in which suburban edge cities are often able to attract major sources of employment away from traditional downtown settings. Regionally, these areas include Maryland counties of Baltimore County, Montgomery County, Anne Arundel County, Howard County, and Virginia jurisdictions of Arlington, Fairfax, and Alexandria. The high levels of population and employment growth in these areas has led to increased development cost, making the city competitive with these suburban employment centers. The City also often offers superior transpor-tation options for employers and employees and access to urban amenities not available in suburban and outlying areas.
Conclusion
The City of Baltimore offers unique opportunities for employers to run suc-cessful businesses and employees to earn a comfortable income. Baltimore’s emerging and established industries have access to business-friendly trans-portation options, a vital and vibrant port, and a concentrated population with many of the skills necessary for serving these industries, and a local govern-ment ready and willing to foster partnerships that grow industry.

98 City of Baltimore Comprehensive Master Plan EARN 9998 City of Baltimore Comprehensive Master Plan EARN 99
Products and Services
Baltimore possesses unique and specific resources that define how people EARN in the City. The key factors - or “products” - that the City controls and contributes in this market are land and labor. The services offered include the unique financing tools offered by the City to acquire land and continuing edu-cation and job training for workers. By aligning how we make our products and services available to employers and employees, Baltimore will be better equipped to meet the challenges of the 21st Century and successfully compete in the global marketplace.
A. Products and Services Offered
Products
The core physical products pertaining to how Baltimore EARNs are land and labor. Baltimore has ample land that is - or could be made - developable for newer and more productive uses in the new economy. The land is relatively well served by existing infrastructure investments in roads, rail, transit, water and sewer lines, etc. This existing investment presents an enormous oppor-tunity and potential cost savings for the development and lease of property, increasing the range of choices for Baltimore businesses to grow, and for more businesses to relocate to or expand into the City. The City’s built environ-ment includes a diverse mix of buildings and urban fabrics to sustain a broad range of economic niches, and is supported by a strong network of non-profit, educational, and institutional entities, as well as port, tourism, and recreational amenities. These assets are key strengths to build from in both retaining and attracting business in the City.
The City’s workforce is also a key product that defines Baltimore for business-es, at not only the local, but regional, national and international level. Busi-nesses seeking to locate or grow within the City will require a ready supply of skilled and educated workers, and a pool of candidates that can be trained or cross-trained into new fields. Baltimore residents, on the other hand, need the support and training required to enable them to fill these jobs, and to access jobs outside of the City as needed.
Services
Financing and assembling land for employers and training the City’s work-force are key pieces of the overall EARN strategy. The interaction and capacity to leverage such key factors against other key assets and City products (land, infrastructure, etc.) must be carefully managed and marketed as a foundation for growing jobs, salaries, and profits in the City.
The City has considerable business development and property tax incentive tools at its disposal, from which to help recruit and build businesses, invest in residents and ensure growth. The One Maryland Fund is a State program com-prised of a set of targeted tax incentives for business start-ups and expansion

98 City of Baltimore Comprehensive Master Plan EARN 9998 City of Baltimore Comprehensive Master Plan EARN 99
INTR
OD
UC
TION
SU
MM
AR
Y H
ISTO
RY
KE
Y TR
EN
DS
LIVE
EA
RN
PLAY
LEA
RN
IMP
LEM
EN
TATION
MA
NA
GE
ME
NT FIN
AN
CIA
L CO
NC
LUS
ION
GLO
SS
AR
Y A
PP
EN
DIC
ES
that can provide tax credits of up to $500,000 for firms to furnish and equip new facilities. Tax Increment Financing (TIF) is a tool for financing public sector costs associated with private development without creating new demands on scarce tax revenues. The Enterprise Zone (EZ) Property Tax Credit is a ten-year program that waives 80% of the property tax on non-residential properties for the first five years. Payment in Lieu of Taxes (PILOT) is a strategy that can provide economic incentive for job growth and physical development. The Brownfields Property Tax Credit allows developers to waive up to 70% of the increase in tax assessment over five years for most brownfields projects, or ten years if the business is within an Enterprise Zone. Historic Preservation credits can be applied to renovation projects worth at least 25% of the property’s full cash value. Income Tax Credits can be tailored to specific projects, each with its own set of requirements and restrictions. These are the types of financing services that Baltimore provides to help businesses EARN.
Creating education and job training programs to prepare or cross-train resi-dents for jobs, particularly to meet needs in the port and growth industries, is essential. It is important that these opportunities in training and education be planned to ensure employees can achieve upward mobility in their fields. There are several formal educational institutions and other job training venues within the City that allow workers to receive new or additional training in a wide variety of skills. This provides a continuous supply of trained workers and the improvement-in-place of current workers. Aside from the general mar-ket that Baltimore enjoys, there are several specific incentives available to help Baltimore compete successfully for new businesses and jobs.
The Mayor’s Office of Employment Development’s (MOED) regional ca-reer and youth centers served over 18,000 jobseekers last year. Additionally, MOED’s digital learning labs, GED classes, and the YouthWorks summer jobs program placed up to 5,500 youth 14-21 in 400 job sites across the city. Each of the City’s strategically-located One-Stop Career Centers is staffed with pro-fessionals from MOED and partner agencies to provide direct and compre-hensive services onsite for persons who are unemployed, underemployed or employed and for targeted populations such as veterans, ex-offenders, people with disabilities, senior citizens and youth.
B. Competitive Advantage
The key proprietary positions and market strengths that Baltimore City must leverage include its vital and historic port industries, its strong convenient con-nections to Washington D.C., its Central Business District, and its strategic location between northern and southern cities of the Eastern seaboard.
With more than 16,000,000 square feet of office space in 111 downtown build-ings, over half of it Class A, Downtown Baltimore is the largest office market in the Baltimore metropolitan area, and one of the largest in the consolidated Baltimore-Washington region. The appeal and convenience of our central city and the amenities it offers should be leveraged to give the City competitive ad-vantage over the smaller areas that contend with us in attracting businesses.
The existing institutional, infrastructural, and locational advantages of the City, as well as its current labor force characteristics, were taken into close consideration by the Baltimore Workforce Investment Board (BWIB) in strategizing for growth in the emergent economy. The Board consid-ered such City-specific assets and opportunities, relative to national and

100 City of Baltimore Comprehensive Master Plan EARN 101100 City of Baltimore Comprehensive Master Plan EARN 101
state-wide trends in job and wage growth, as a basis from which to identify six growth sectors as a focus for targeted intervention: Construction, Com-puter, Internet and Data and Software-Related Services, Hospitality and Tourism, Healthcare and Social Assistance, Business Services, and Biosci-ence. While City agencies continue to work for the retention and growth of all current City industries, they will also pursue a more targeted investment strategy by building infrastructure and amenities to support and attract firms in these specific industry clusters. By focusing our resources, the strategy will help expand City employment opportunities in general, while helping maximize the earning potential of City residents.
C. Customer Perceptions
Baltimore offers convenience and access to a broad range of workers, en-trepreneurs and other customers in the regional market place. Domesti-cally, Baltimore is in a prime location to access the large urban markets of the Northeast; with three of the five largest metropolitan areas in the United States within 200 miles of downtown. No other location in Central Maryland is more reachable than Downtown Baltimore, which is easily accessible by national and regional rail, metro subway, light rail, commuter and local buses, and private automobile. Potential customers also benefit from the size of downtown Baltimore, which has achieved the critical mass of businesses re-quired to provide a wide array of amenities in a localized area. The proximity of numerous business support services will aid businesses in operating in the most efficient manner possible.
Affordability is another one of Baltimore’s great assets, with asking rents comparable to those of the suburban office markets, and much less than other major east coast urban centers. The City also has a number of office ar-eas away from downtown with even more affordable rents that are ideal for young businesses not needing to be located in premier office space. The Port of Baltimore provides an affordable option for businesses dealing in cargo shipment. Baltimore’s inland location on the Chesapeake Bay makes Bal-timore the most proximate major port city to the Midwest market, allowing importers and exporters who ship through Baltimore to reduce costs associ-ated with surface transportation.
The City of Baltimore provides numerous tools to businesses and jobseekers to enhance employment through the Mayor’s Office of Employment Devel-opment (MOED) and the Baltimore Workforce Investment Board (BWIB). While many municipalities and states, including Maryland, provide some degree of service with respect to matching employers with potential employ-ees, MOED and BWIB are particularly notable for offering the “Employer Toolkit,” which connects employers with more than 500 services available through over 200 public and nonprofit agencies. MOED also provides ad-ditional services such as customized training, employee pre-screening, and assistance in helping large employers support employees affected by mass layoffs.
Downtown Baltimore still reigns as one of the Northeast’s major urban cen-ters and the premier business address in Central Maryland. The traditional significance of the downtown and the recent resurgence of Baltimore’s resi-dential and retail sectors leave the City well positioned to gain a unique place and new prominence in the national market.

100 City of Baltimore Comprehensive Master Plan EARN 101100 City of Baltimore Comprehensive Master Plan EARN 101
INTR
OD
UC
TION
SU
MM
AR
Y H
ISTO
RY
KE
Y TR
EN
DS
LIVE
EA
RN
PLAY
LEA
RN
IMP
LEM
EN
TATION
MA
NA
GE
ME
NT FIN
AN
CIA
L CO
NC
LUS
ION
GLO
SS
AR
Y A
PP
EN
DIC
ES
D. Comparative Analysis
While many of the products and services offered by Baltimore are similar to those in other urban and suburban areas, Baltimore can leverage its unique combination of assets to bolster investment in the identified growth industry sectors. As an integral and central part of the broader interstate, railway and port networks of the East Coast, Baltimore’s locational strength can be seen as a pivotal point connecting major cities of the North (Boston, New York, and Philadelphia) to cities of the South (D.C., Richmond, Atlanta). This key position could be strengthened, leveraged and marketed in connecting large markets around the nation, and the world.
One of Baltimore’s greatest competitive advantages is its (generally) lower land values, development costs, and rents. The City’s cost of development is significantly lower than that of many of its urban and suburban competitors. Lease rates of existing buildings are also generally lower: While downtown office spaces in cities like Washington, DC, Philadelphia, Boston, and New York sell for $600 to $700 per square foot on average, office space in down-town Baltimore trades at $200 to $300 per square foot. Compared to regional competitors like Philadelphia or New York, and local competitors like Wash-ington, DC, Montgomery and Baltimore counties, Baltimore City has more vacant residential and industrial buildings appropriate for redevelopment, and can offer them at lower cost.
Baltimore also has significant water, sewer, mass transit, building stock, fi-ber optic, and road network infrastructure appropriate to new and expanding commercial development. In essence, Baltimore is a “built-out” city, with infrastructure completed in most of the buildable areas. The availability, age, and quality of this infrastructure are on par with that of other regional urban competitors like Washington, DC, New York, and Philadelphia, and in great-er abundance and capacity than in suburban or rural areas. Commercial-re-lated activities like transporting goods and people, manufacturing, shipping, and warehousing tend to be more cost-efficient in Baltimore, making it very competitive for expanding or relocating businesses in the targeted growth industries as well as the port –related and commercial sectors. Suburban com-petitors, however, present a challenge by offering “green field” development opportunities where new state-of-the-art infrastructure can be built to desired specifications.
Baltimore is well-served by freight and passenger rail lines, making it com-petitive with regional competitors along the Northeast and Southeast cor-ridors. Amtrak service provides strong connections for the area not only to DC and the North, but also (via transfers) to such points further West as Cleveland and Chicago. Amtrak’s Acela Express line provides high-speed passenger service along the Northeast corridor, connecting Baltimore to business travelers from Washington to Boston. The MARC regional pas-senger lines not only connect Baltimore to Washington DC and its suburbs but also are part of a broader network connecting to Martinsburg WV and Frederick MD to the West. Freight lines include CSX and Conrail and serve Baltimore’s numerous industrial zones.

102 City of Baltimore Comprehensive Master Plan EARN 103102 City of Baltimore Comprehensive Master Plan EARN 103
In terms of mass transit, the City of Baltimore falls behind its closest competi-tor of similar size, Washington, DC. Washington and its suburbs have an ad-vanced transit system that moves over 700,000 commuters, tourists, and resi-dents each day. Baltimore, on the other hand, has struggled to build an effective transit network. Although 30% to 40% of Baltimore City’s population is transit dependent, many complain that the City’s transit lines do not adequately con-nect to employment centers in and around the metropolitan area. The Maryland Transit Administration controls the operations, maintenance, and capital bud-gets of Baltimore’s and other Maryland jurisdictions’ rail and bus lines, requir-ing the City to compete with suburban areas for transit resources. In order to promote transit and transit-oriented development, Baltimore is developing transit supportive neighborhood master plans and recommending changes to zoning policies that will increase residential and commercial densities near transit stations.
The City of Baltimore’s workforce may be its greatest challenge as it competes with other cities for commercial investment. The national transformation from a manufacturing-based economy to a service-and-information-based economy has left many Baltimore residents with skills that are not transferable to high paying jobs in emerging sectors. According to a study by the Brookings Insti-tution, Baltimore lags behind other cities in the proportion of residents with college degrees, despite Baltimore’s high percentage of jobs in health care, education, social, and business services which generally require advanced skills. Metropolitan areas like Washington, DC and New York have been able to attract a highly educated workforce and have fared much better in attracting business services, information technology, and biotechnology jobs. However, Baltimore is home to 14 institutions of higher learning, including the number one health care and biotechnology research institution in the nation, The Johns Hopkins University. By enhancing residents’ access to the educational resourc-es available within the City, attracting highly educated workers from other cit-ies with higher costs of living, and retaining graduates of these institutions, the City of Baltimore will build a more viable workforce in the coming years.
102 City of Baltimore Comprehensive Master Plan EARN 103102 City of Baltimore Comprehensive Master Plan EARN 103
INTR
OD
UC
TION
SU
MM
AR
Y H
ISTO
RY
KE
Y TR
EN
DS
LIVE
EA
RN
PLAY
LEA
RN
IMP
LEM
EN
TATION
MA
NA
GE
ME
NT FIN
AN
CIA
L CO
NC
LUS
ION
GLO
SS
AR
Y A
PP
EN
DIC
ES
Earn Goals, Objectives, and Strategies
In 2000 the Baltimore Workforce Investment Board (BWIB) identified six in-dustry sectors that are expected to grow in the metropolitan region: Bioscience; Business Services; Construction; Computer, Internet and Data and Software-Related Services (CIDS); Healthcare and Social Assistance; and Hospitality and Tourism. Additionally, the Port of Baltimore has been a seminal and de-finitive component of the City’s economy for centuries, and will continue to play a key role in the City’s future. In order to attract and retain businesses in the fastest growing employment sectors as well as capture our share of pro-jected employment growth in Central Maryland, Baltimore needs to lever-age its many proven assets. The following three goals will support and foster economic development and maximize the City’s potential to be a competitive place to EARN:
Goal 1: Strengthen Identified Growth Sectors
Goal 2: Improve Labor Force Participation Rate among City Residents
Goal 3: Improve Access to Jobs and Transportation Linkages Between Busi-nesses
These three goals and their subsequent objectives and strategies are the frame-work by which the City can utilize its capital budget, land use controls, and policy to guide economic development and transportation to support the City’s workforce. By linking a highly qualified trained workforce with a diverse range of specialized private firms, nonprofit organizations and public agencies, Baltimore will become a leading source of innovation, productivity and global competitiveness. Endorsing policy decisions in conjunction with strategically placed Capital Improvement dollars favorable to the six growth sectors as well as port-related industries will help facilitate growth of local businesses as well as help the City be competitive in attracting new businesses and their employ-ees. This plan will poise the City to take advantage of our assets and capitalize on our federal and state appropriations and local investment.

104 City of Baltimore Comprehensive Master Plan EARN 105104 City of Baltimore Comprehensive Master Plan EARN 105
EARN Goals, Objectives and Strategies
Goal 1: Strengthen Identified Growth Sectors
Objective 1: Retain and Attract Businesses in all Growth Sectors (See also LEARN, Goal 2, Objective 2)
• Create an industrial mixed-use zoning district
• Create a light industrial mixed-use zoning district
• Establish microenterprise loans for start up businesses specifically in the growth sectors
• Work with growth sector employers to identify training needs
• Preserve use of eminent domain for underutilized and/or contaminated parcels of commercial and industrial land
Objective 2: Retain and Attract Business in Bioscience
• Create a Bioscience Development District
• Create incubator space around biotechnology areas
Objective 3: Retain and Attract Business in Business Support Ser-vices
• Identify and rezone nodes in the city that can support high-density, mixed-use commercial properties
• Preserve and enhance CBD office space
Objective 4: Retain and Attract Business in Computer, Internet, Data and Software (CIDS) Related Services
• Develop a master plan for the City’s current and future CIDS infrastructure
• Provide Wireless Technology Zones in public areas throughout the City
Objective 5: Retain and Attract Business in Construction
• Create, tailor and market programs that assist and encourage construc-tion entrepreneurs in acquiring low-cost bonding
Objective 6: Retain and Attract Business in Healthcare and Social Assistance.
• Create a mechanism to adopt health care facility master plans to provide institutions with predictability in the development review process
• Amend the zoning code to broaden the definition of Health Clinics to include non-residential substance abuse treatment centers
Objective 7: Retain and Attract Business in Hospitality and Tourism.
• Create a Strategic Convention Center Area Master Plan
• Install environmental and aesthetic improvements around tourist areas
Objective 8: Retain and Attract Port-Related Services (See EARN Goal 1, Objective 1, Strategy 2 and EARN Goal 3, Objective 2, Strat-egy 3)

104 City of Baltimore Comprehensive Master Plan EARN 105104 City of Baltimore Comprehensive Master Plan EARN 105
INTR
OD
UC
TION
SU
MM
AR
Y H
ISTO
RY
KE
Y TR
EN
DS
LIVE
EA
RN
PLAY
LEA
RN
IMP
LEM
EN
TATION
MA
NA
GE
ME
NT FIN
AN
CIA
L CO
NC
LUS
ION
GLO
SS
AR
Y A
PP
EN
DIC
ES
Goal 2: Improve Labor Force Participation Rate Among City Residents
Objective 1: Align Employers with Job Seekers and Training Resources
• Create a Strategic Plan for MOED that links employers to job seekers
• Monitor and enforce First Source Hiring program.
• Expand outreach to encourage use of One-Stop Employment Centers
• Target MOED resources to under- and un-employed populations to better connect job seekers and employers.
• Prioritize drug treatment program access for job seekers working with MOED pro-grams.
• Give preference for City-subsidized contracts to contractors with active apprenticeship programs
Objective 2: Increase Qualifications/Skill Sets of City Residents (See LEARN, GOAL 3, Objective 3)
Goal 3: Improve Access to Jobs and Transportation Linkages between Businesses
Objective 1: Enhance Transportation Options to Provide Workers with Commuting Options and Mitigate Traffic Congestion
• Expand the number of participants in the Commuter Choice program throughout the Baltimore Region
• Support efforts to implement the Baltimore Regional Rail Plan and its Red and Green Line priority segments
• Implement Transportation Demand Management (TDM) strategies with large employ-ers and institutions
• Implement Bicycle Master Plan
• Increase number of water taxi stops catering to commuters
Objective 2: Promote Economic Development Throughout the City by Improv-ing Business-to-business Connectivity via Transportation Linkages
• Restore and increase on-street parking in mixed-use and business districts
• Create Transit-Oriented Development zoning and incentive programs for transit nodes throughout the City (i.e. State Center, West Baltimore MARC)
• Integrate land use and transportation planning to ensure movement of freight into and throughout the City
• Capture share of regional growth in defense-related industries due to BRAC

106 City of Baltimore Comprehensive Master Plan EARN 107106 City of Baltimore Comprehensive Master Plan EARN 107
Strategy Measurable Outcomes Implementing Bodies/Agents
Time-line
Funding Source
Return on Investment
Create an indus-trial mixed-use zoning district
• •
Decreased number of variances for mixed use and less URP’s. Increased mixed-use in industrial areas
Planning, BMZA, Housing, Law, MCC
Years 2-4 General Funds
Increased tax base and density
Currently, our Zoning Code does not include all types of office uses in industrially zoned land (M-1 through M-3), and, where it is permitted, it requires approval by the Board of Municipal and Zoning Appeals (BMZA) at a public hearing. At the same time, our business districts that allow offices of all types as permitted uses do not allow for industrial uses. In today’s indus-trial market, a need for mixed-use developments has emerged. Baltimore will need to accommodate this need for a mixture of industrial and commercial uses by providing land with a zoning category that permits all of these uses under one roof that a modern industrial operator requires (See Chapter IX for Future Zoning Recommendations).
Create a light industrial mixed-use zoning district
• •
Decreased number of variances for mixed-use and less URP’s. Increased mixed-use in commercial areas
Planning/BMZA/Housing/Law/ MCC
Years 2-4
GO Bonds, General funds, state
Increased tax base and density
Businesses in this sector have demonstrated a preference for flex office space, which has the lowest vacancy rate in the City. Creation of a mixed-use commercial district would also allow for “green” light-industrial users to locate in commercial parks where their non-commercial uses will not negatively impact the other commercial uses in the immediate area. This particu-lar zoning district would serve as an appropriate, non-residential buffer for the MIZOD (See Appendix I). City agencies should address this growing demand through the review/renovation of select existing buildings, and by amending the Zoning Code to provide for this kind of office product (See Chapter IX for Future Zoning Recommendations).
Establish micro-enterprise loans for start up busi-nesses specifically in the growth sectors
• •Increased number of start up businesses
BDC, Finance Year 2
GO Bonds, State Grants, General Funds
Increased jobs and businesses in growth sectors
Remove barriers to start up companies by providing microenterprise loans to entrepreneurs in the growth sectors. Loan ap-plications will be processed through the City’s Small Business Resource Center.
Work with growth sector employers to identify train-ing needs
• • •
Recommendations on how City can support internal and external organizations to most effectively utilize training resources
BWIB, MOED, BDC, Planning, Housing
Years 1-6
General Funds, Grants, Lever-aged MOED budget
Stronger training programs, better equipped work-force, improved workforce, in-creased tax base, reduced depen-dency on social subsidies
Focusing training resources on preparation for employment in the six identified growth sectors as well as port-related industries will assist in providing a workforce that is qualified and enticing to growth sector businesses looking to expand or relocate.
Capital
Zoning
Policy/ O
perations
Goal 1: Strengthen Identified Growth Sectors
Objective 1: Retain and Attract Businesses in all Growth Sectors (See also LEARN, Goal 2, Objective 2)

106 City of Baltimore Comprehensive Master Plan EARN 107106 City of Baltimore Comprehensive Master Plan EARN 107
INTR
OD
UC
TION
SU
MM
AR
Y H
ISTO
RY
KE
Y TR
EN
DS
LIVE
EA
RN
PLAY
LEA
RN
IMP
LEM
EN
TATION
MA
NA
GE
ME
NT FIN
AN
CIA
L CO
NC
LUS
ION
GLO
SS
AR
Y A
PP
EN
DIC
ES
StrategyMeasurable Outcomes
Implementing Bodies/Agents Timeline Funding
SourceReturn on
Investment
Preserve use of eminent domain for underutilized and/or contami-nated parcels of commercial and industrial land
• • •
Return of underuti-lized and/or con-taminated parcels to productive use
Planning, BDC, Housing, Law, MCC
Years 1-6GO Bonds, Federal Grants
Increase in property taxes and revenue
Underutilized and/or contaminated commercial and industrial parcels are a legacy of Baltimore’s past. Often these parcels are in areas where they are now incompatible uses or are vacant properties. Eminent domain is often the only tool to take these properties and return them to the market for development. Prior to the use of eminent domain, a site specific plan will be developed that is consistent with any Area Master Plan (See LIVE, Goal 1, Objective 4, Strategy 1) and the City’s Com-prehensive Plan.
Objective 2: Retain and Attract Business in Bioscience.
Create a Biosci-ence Develop-ment District
• • Amended zoning codePlanning, BMZA, Housing, Law, MCC
Years 2-4 General Funds
More jobs, predictability of development
Currently, two major universities are working to build bio-parks and additional lab space, but a special Bioscience Develop-ment District would allow for broader areas around the primary facility to benefit from the same mixture of uses. This type of district would allow property owners in the area to sell, lease, and retrofit buildings that would support both the research and manufacturing components of the biotechnology industry, giving them preference over other uses that are not Biosci-ence-related. This effort would be achieved through the establishment and creation of a new zoning district that would allow for the mixed-use development of business, office, lab research, production space, and other bioscience uses. The Biotechnology Development District would disallow certain uses that would lead to encroachment of non-contributing uses or increase property values in a way so that smaller biotechnology businesses or support structures could not afford to per-form business. Currently, there is a great need to have space for biotechnology manufacturing as well as research.
Create incuba-tor space around biotechnology areas
• •Increased square foot-age available for bio start-up businesses
MOED, BDC, Planning
Years 2-6
GO Bonds, General Funds, Fed-eral Grants
Provides for start-up space near existing Biotech activi-ties.
While the Baltimore Development Corporation operates some incubator space for small businesses, many of the small business clients within the biotech field already have patents and/or research that is being supported through partnerships with major institutions and corporations but need a start-up space that is fully equipped with laboratory, and other specific needs, in close proximity to other biotech activities.
Objective 3: Retain and Attract Business in Business Support Services
Identify and rezone nodes in the city that can support high-density, mixed-use commercial properties.
• • •Increased renova-tion of office space in targeted nodes.
BDC, Housing, Planning, MCC
Years 2-4
Gen-eral Funds, MVR, GO Bonds
More supply of new quality office space and mixed-uses that meets demand and curtails vacancy.
The Department of Planning will work closely with Housing and BDC to identify key sites/opportunities for targeted mixed-use nodes. By providing increased density and the option for form-based designs, the renovation and adaptive reuse of office space will be directed to the targeted nodes.
Capital
Zoning
Policy/ O
perations

108 City of Baltimore Comprehensive Master Plan EARN 109108 City of Baltimore Comprehensive Master Plan EARN 109
StrategyMeasurable Outcomes
Implementing Bodies/Agents Timeline Funding
SourceReturn on
Investment
Preserve and en-hance CBD office space
• •Decreased vacancy rates downtown
BDC, Planning, Downtown Part-nership, DGS
Years 2-4
General Funds, State Grants, Historic Tax Credits
Maintaining downtown as the commercial center of the city
The majority of support services and other office uses should be located in the CBD. The greatest demand is for small of-fice, large class A office, and flex office space. Vacancies are most extensive among midsized buildings between 50,000 to 100,000 sq.ft. Renovations in heating ventilation, air conditioning and telecommunications are major factors determining the vacancy rate in older buildings.
Objective 4: Retain and Attract Business in Computer, Internet, Data and Software (CIDS) Related Services
Develop a master plan for the City’s current and future CIDS infrastructure.
• •Development of the plan. Increased CIDS-related employment.
Planning, BDC, DPW, Mayor’s Office, DOT, Fiber Optic Installation Firms
Years 2-5
Gen-eral Funds, MVR, GO Bonds, Fed-eral DOT, Homeland Security
New CIDS busi-nesses locate and expand into the City.
The City has a unique position in that the entire underground conduit system is controlled by a franchise agreement pro-gram. This allows the City to require projects that add conduit or capacity underground to include space for the City’s use, at the cost of the project developer. This can then be used to market Baltimore as a “Connected City” with “High Tech Zones.” However, the system is not comprehensive, is near capacity, and is expensive to improve. A master plan should be developed to positively identify the system capacities, occupancy, and specific needs. The City of Baltimore will then increase its opportunity to retain and attract CIDS businesses by offering quality infrastructure through increased bandwidth and telecommunication capabilities (fiber optics, wireless connectivity). Areas of the city where new underground systems are being built need to include similar infrastructure for CIDS support, and should be included as a policy for new construc-tion projects.
Provide Wireless Technology Zones in public areas throughout the City.
• •Increased number of wireless locations
Planning, BDC, MOIT, Cable & Communications
Years 2-5
GO Bonds, General Funds, Fed-eral DOT
Increased tax base and incen-tives
While the City of Baltimore is enhancing a lot of its CIDS efforts on homeland security with video and surveillance cameras, the City should also capitalize on this initiative by marketing safe areas that can be used as wireless office spaces, cafés, parks, neighborhoods, schools, libraries, and commercial areas. Baltimore currently ranks 24th as the most-wired City. Development of wireless technology zones has great potential for significant public spaces at key locations such as along the I-95 corridor, MARC train stations, Montgomery Park, the Inner Harbor, Patterson Park, the Middle Branch, and the Howard Street corridor.
Capital
Zoning
Policy/ O
perations

108 City of Baltimore Comprehensive Master Plan EARN 109108 City of Baltimore Comprehensive Master Plan EARN 109
INTR
OD
UC
TION
SU
MM
AR
Y H
ISTO
RY
KE
Y TR
EN
DS
LIVE
EA
RN
PLAY
LEA
RN
IMP
LEM
EN
TATION
MA
NA
GE
ME
NT FIN
AN
CIA
L CO
NC
LUS
ION
GLO
SS
AR
Y A
PP
EN
DIC
ES
StrategyMeasurable Outcomes
Implementing Bodies/Agents Timeline Funding
SourceReturn on
Investment
Create, tailor and market pro-grams that assist and encourage construction entrepreneurs in acquiring low-cost bonding
• •Increased number of new construction businesses
BDC, Finance, SBRC, DBED, MOED
Years 2-6General Funds, GO Bonds
More work-ers living close to jobs, More businesses to provide workers and residents goods and ser-vices, Increased property taxes, Increased in-come taxes
Bonding and finding employees are two of the biggest hurdles for new construction companies. The City should provide resources to companies that make an effort to employ City residents and ex-offenders.
Objective 6: Retain and Attract Business in Healthcare and Social Assistance.
Create a mecha-nism to adopt health care facility master plans to provide institutions with predictability in the development review process
• •
Increased number of approved mas-ter plans, improved speed of development review, predictability in the development review process
Hospital and Health Care Facilities, Plan-ning, Planning Commission
Years 2-3Hospitals, General Fund
Improved rela-tions between neighborhoods and Hospital institutions in terms of facility expansion.
All health care institutions are encouraged to develop master plans for long-term growth. The City will develop a process to adopt master plans to provide institutions greater predictability during the development review process. By having the City participate in the development of facility master plans and formally adopt the plans, the City will be better prepared to support the recommendations in the plan, ranging from streetscape improvements to land acquisition. The intent is to ensure a better correlation between the City’s Master Plan and the development/expansion of hospital campuses through-out Baltimore. A typical master plan should include a ten year physical plan as well as an economic impact statement, design guidelines, pedestrian safety standards, transportation/alternative commuting strategies, LEED-based environmental design objectives, etc. The master plan should also include strategies to reduce single occupancy vehicle trips to campus by discouraging parking, encouraging transit and carpooling, and providing on or near hospital residential opportunities for staff and family of long-term patients.
Amend the zoning code to broaden the defi-nition of Health Clinics to include non-residential substance abuse treatment centers
• • Compliance with ADAPlanning, BMZA, MCC
Year 1 General Fund
Facilities will be able to locate with reduced time and expenses required, encouraging the growth of this portion of the healthcare sector.
This change will bring our Zoning Code into compliance with the Americans with Disabilities Act (ADA), which will reduce liability for the City due to legal challenges.
Objective 5: Retain and Attract Business in Construction.
Capital
Zoning
Policy/ O
perations

110 City of Baltimore Comprehensive Master Plan EARN 111110 City of Baltimore Comprehensive Master Plan EARN 111
StrategyMeasurable Outcomes
Implementing Bodies/Agents Timeline Funding
SourceReturn on
Investment
Create a Strategic Con-vention Center Area Master Plan.
• • Adoption of plan
Planning, Trans-portation, BDC, MTA, BACVA, Convention Cen-ter, DGS
Year 3General Funds
Expanded Job, Profit and Rev-enue Potential for the City
The Department of Planning will work closely with City agencies to review and improve pedestrian amenities, transit access, and to pursue business/rehabilitation opportunities to create greater synergies between new facilities and the adjacent area. Job and business opportunities in the Tourism sector are generally available for: hotel workers, food industry work-ers (producing, selling, serving), waiters and waitresses, bartenders, cooks, security guards, musicians and singers, actors and performers (including re-enactors of historic events), tour guides and escorts, amusement and recreation attendants, landscaping and groundskeepers, janitors, cleaners and maintenance workers, producers and tour organizers, recreation workers, producers, general and operations managers, recreation workers, travel agents, reservation & transportation ticket agents, meeting planners, and spa- and health club operators. The plan should also address the City’s need for a modern, larger seating capacity, multi-use arena for concerts, circuses, present and potential sport professional franchise teams, col-lege playoffs.
Install environmental and aesthetic improve-ments around tourist areas
•
Increased number and quality of lights, Increased pedes-trian activity in tourist areas
Planning, BACVA, BDC, Downtown Partnership, Transportation, DGS, Rec & Parks
Years 2-4
General Funds, GO Bonds, Hotel Tax
Increased Hotel Tax Revenues. Improved per-ception of City of Baltimore by visitors
This will be an integral part of the City’s pedestrian plan (See LIVE, Goal 3, Objective 1, Strategy 1). By improving the lighting and aesthetic environment around the City’s tourist areas, we can successfully combat perceived safety issues. Hospitable areas will attract more visitors to the City, encourage exploration of City attractions and surroundings, and foster longer stays.
Objective 8: Retain and Attract Port-Related Industries (See EARN Goal 1, Objective 1, Strategy 2 and EARN Goal 3, Objective 2, Strategy 3)
Goal 2: Improve Labor Force Participation Rate Among City Residents
Objective 1: Align Employers with Job Seekers and Training Resources
Create a Strategic Plan for MOED that links employers to job seekers
•Increased work-force participa-tion rate.
MOED, BWIB, BDC, Housing, BCPSS, BCCC, Planning, and other training programs.
Years 2-3General Funds
Higher per capita income in the city, fewer recipients of social assistance
By creating a strategic plan for MOED services, the city will be able to better manage all City-funded workforce development programs, increase and improve workforce development training opportunities, particularly apprenticeship programs, for targeted sectors. By making Baltimore City attractive to these businesses, the City can capture its share of the predicted employment growth in the greater Baltimore region.
Capital
Zoning
Policy/ O
perations
Objective 7: Retain and Attract Business in Hospitality and Tourism.

110 City of Baltimore Comprehensive Master Plan EARN 111110 City of Baltimore Comprehensive Master Plan EARN 111
INTR
OD
UC
TION
SU
MM
AR
Y H
ISTO
RY
KE
Y TR
EN
DS
LIVE
EA
RN
PLAY
LEA
RN
IMP
LEM
EN
TATION
MA
NA
GE
ME
NT FIN
AN
CIA
L CO
NC
LUS
ION
GLO
SS
AR
Y A
PP
EN
DIC
ES
StrategyMeasurable Outcomes
Implementing Bodies/Agents Timeline Funding
SourceReturn on
Investment
Monitor and enforce Baltimore City Resi-dents First program.
•
Increased rate of use of Balti-more residents in the local workforce.
All city agencies Years 1-6
General funds, also tie to con-tract money for indiv. projects
Involves more City residents in the local workforce. Re-duction in City funding export-ed from City, more successful businesses and higher tax base
Monitoring First Source Hiring by contractors for City-funded development will help ensure that City dollars employ City residents. By enacting legislation or issuing an executive order for a reporting mechanism that links the program payout to compliance, the City can ensure that City dollars contribute to the local economy and improve the lives of employable Bal-timoreans. Currently, the program is operated on a voluntary compliance basis, and there is no way of enforcing local labor use pledges once money is awarded. By incorporating a better method of review and ensuring compliance, the investments for the use of local labor will go to those companies and projects that actually use local labor – not just those that make a promise to do so. Funding for MOED will need to be increased to meet this new requirement.
Expand outreach to encourage use of One-Stop Employment Centers
•
Increased num-ber of residents using One-Stop Centers
BWIB/MOED Years 2-5
General Funds, Foundation support
Increased labor force participa-tion rate, de-creased unem-ployment rate, increased tax base, reduced dependency on social subsidies.
Increase outreach to communities with high rates of unemployment and/or low rates of labor force participation in order to remind City residents that resources are available and encourage them to use available assistance to become more employ-able and/or gain employment. Offer a mix of programs available at each site by transferring oversight and coordination of all City-funded employment and improvement programs to MOED. Provide sufficient funding and staffing levels to ensure provision of adequate service and coordination.
Ensure targeted resources are available to under- and un-employed populations to better connect job seekers and employers.
•
Increased num-ber of ex-of-fenders utilizing MOED resourc-es, increased placement rate for ex-offenders in program
BWIB/MOED Years 1-6General, Foundation grants
Reduced recidi-vism, reduced crime, safer communities, increased prop-erty values.
Targeting MOED programs to specific populations will help reduce barriers for connecting job seekers with potential employ-ers. For example, MOED’s Ex-Offender initiative seeks to break down those barriers and help ex-offenders gain long-term employment. Employment studies have shown that this is a key element in reducing recidivism. The City should embark on a potential study of incentives including insurance guarantees and tax credits to encourage private employers to employ ex-offenders.
Capital
Zoning
Policy/ O
perations
Objective 7: Retain and Attract Business in Hospitality and Tourism.

112 City of Baltimore Comprehensive Master Plan EARN 113112 City of Baltimore Comprehensive Master Plan EARN 113
Strategy Measurable Outcomes Implementing Bodies/Agents
Time-line
Funding Source
Return on Investment
Prioritize drug treatment pro-gram access for job seekers work-ing with MOED programs.
•
Increase the quality of worker by minimizing the chance for relapse, and therefore loss of invest-ment.
Health, BSAS, MOED
Years 2-4
Ensures that programs are coordinated and that the likeli-hood of success for participating individuals is increased.
Intervention with drug treatment programs is not necessarily sufficient on its own to get addicts to become productive members of the workforce. By coordinating drug treatment programs with job training programs, it is much more likely that a positive change in lifestyle will become permanent and increase the cumulative effect of this investment in the quality of Baltimore workforce members.
Give preference for City-subsi-dized contracts to contractors with active apprentice-ship programs
•
Increased number of apprenticeship programs, increasingly skilled work-force
All city agencies Years 1-6No direct cost
Wider range of training op-portunities, Higher number of City residents qualified to work “good jobs”
Giving preference to contractors with active apprenticeship programs will help support the expansion and utilization of ap-prenticeship programs, encourage the use of training opportunities, and, in the long run, provide more City residents with opportunities to work professional jobs that pay much more than minimum wage.
Objective 2: Increase Qualifications/Skill Sets of City Residents (See LEARN, GOAL 3, Objective 3)
Goal 3: Improve Access to Jobs and Transportation Linkages between Businesses
Objective 1: Enhance Transportation Options to Provide Workers with Commuting Options and Miti-gate Traffic Congestion
Expand the number of par-ticipants in the Commuter Choice program through-out the Baltimore Region
•
Increased number of employees and employ-ers who participate in the Commuter Choice Program
Baltimore Metropolitan Council, Mary-land Transit Administration, Transportation
Years 1-6General Funds
Cost savings to employers and employees, less congestion
Federal law states that employers can provide up to $100 per month per employee in tax free benefits to reward transit ridership. The Commuter Choice program allows employers and employees to benefit from these tax savings through payroll deduction for transit passes. In 2005, the MTA estimates that roughly 300 companies and over 12,000 employees were participating in the program. It is in the City’s best interest to work with public and private partners to expand transit and paratransit ridership, provide cost savings to residents, and bolster our competitiveness for further transit funding.
Capital
Zoning
Policy/ O
perations

112 City of Baltimore Comprehensive Master Plan EARN 113112 City of Baltimore Comprehensive Master Plan EARN 113
INTR
OD
UC
TION
SU
MM
AR
Y H
ISTO
RY
KE
Y TR
EN
DS
LIVE
EA
RN
PLAY
LEA
RN
IMP
LEM
EN
TATION
MA
NA
GE
ME
NT FIN
AN
CIA
L CO
NC
LUS
ION
GLO
SS
AR
Y A
PP
EN
DIC
ES
Strategy Measurable Outcomes Implementing Bodies/Agents
Time-line
Funding Source
Return on Investment
Support efforts to implement the Baltimore Regional Rail Plan and its Red and Green Line prior-ity segments
• •
Increased number of Pas-senger Rail Lines in the region, Increase in “transit mode share” (share of all trips made via public transportation) for people who either live or work in the City, Increased number of households and jobs 1/3-mile from existing and future rapid transit stops in City
MTA, BMC, MDOT, Trans-portation, Housing, Plan-ning
Years 1-6General Funds
Cost savings to employers and employees, less congestion
The Baltimore Region Rail System Plan as developed in 2002 is moving forward with portions of the Red and Green Lines as top priorities (See Appendix O). To realize these projects, City agencies will work with surrounding businesses and commu-nities to explore and plan for the most appropriate economic development and related infrastructure (e.g. street improve-ments, traffic signals, safe pedestrian pathways) along these priority lines. The City will also collaborate with surrounding communities and businesses, other local jurisdictions, and the Maryland Transit Administration (MTA) to provide advice on preferred alignments, station locations, technologies, and system features. Those recommendations will be geared toward helping the City realize its transit-oriented development strategy and neighborhood revitalization goals and also toward making the project competitive for federal transportation funds. In addition, the City will work with City, State, and federal elected officials to develop viable funding strategies for construction of new transit lines and related economic development.
Implement Transportation Demand Manage-ment (TDM) strat-egies with large employers and institutions
•
Reduced or managed traffic, increased car- and vanpooling, increased bus ridership, adoption of a traffic reduction ordinance, creation of transportation management associations
BDC, BMC Transportation, MTA, Planning
Years 2-4General Funds
Cost savings to all city residents and developers through more efficient use of road and park-ing resources.
A full Transportation Demand Management (TDM) Program will include an aggressive publicity campaign, partnerships with large employers and alternatives to single-occupancy vehicles, including promoting employer-subsidized transit passes. Alternative parking requirements will be encouraged to help reduce the demand for single automobile use. Other TDM strategies, such as a traffic reduction ordinance to minimize single occupancy vehicles will be studied. In addition, alterna-tive parking policies at parking facilities will be promoted to help reduce the demand for single automobile uses, including preferential parking for carpool vehicles.
Implement Bi-cycle Master Plan
• •Increased number of bike lanes and bike racks at employment centers.
Planning, Transportation, DPW, Private Partners.
Years 1-3
MVR, Federal Grants, General Funds
Improved Air Quality, Cost savings to City, employers and employees in terms of auto use, parking infrastructure, etc. Land use efficiencies that can translate into enhanced property values.
Recognizing the health, quality of life, and cost saving benefits of bicycle ridership, the City has developed a Bicycle Master Plan that will heighten the safety and attractiveness of bicycling to work as a commuting option for City residents. Imple-mentation of the Bicycle Master Plan provides a platform from which to encourage bicycling as a viable commuting option.
Capital
Zoning
Policy/ O
perations

114 City of Baltimore Comprehensive Master Plan EARN 115114 City of Baltimore Comprehensive Master Plan EARN 115
StrategyMeasurable Outcomes
Implementing Bodies/Agents Timeline Funding
SourceReturn on
Investment
Increase number of water taxi stops near employment locations
• •
Increased number of water taxis, Increased number of water taxi passengers
Planning, Transportation, Maryland Transit Administration, BDC, Water Taxi Service, National Historic Seaport of Baltimore
Years 1-6
MVR, Fed-eral grants, General Funds
Land and time efficiencies and cost savings related to park-ing.
The water taxi and the harbor present a unique alternate transportation opportunity which could be expanded to accommo-date commuter traffic. In addition, the water taxi could be expanded into the Middle Branch to accommodate new devel-opment. The City will seek available federal funds for expanded water-bourne passenger services, which will lead to less dependence on vehicles and will, therefore, reduce vehicle trips.
Objective 2: Promote Economic Development Throughout the City by Improving Business-to-Business Connectivity via Transportation Linkages
Restore and increase on-street parking in mixed-use and busi-ness districts
• •
Increased on-street, high-turnover park-ing, Increased store-front occupancy
Transportation/Planning, Parking Authority
Years 1-6GO Bonds, General Funds, MVR
Greater ac-cessibility to neighborhood businesses and retail
Expanding use of the new short-term, high-turnover meter parking technologies in mixed-use and neighborhood business centers will give merchants more customer traffic and improve their trade. In appropriate areas curb lanes, now used for through-traffic, can be restored to on-street parking and increase angled parking conversions where appropriate. This also creates an important psychological barrier between pedestrians and moving vehicles, increasing pedestrians’ sense of safety while shopping or walking in the area.
Create Transit-Oriented Development zoning and incentive pro-grams for transit nodes throughout the City (i.e. State Center, West Baltimore MARC)
• • •
Increased number of jobs within ½ mile radius of transit stations, Im-proved pedes-trian access to stations
BDC, MDOT, Housing, Planning, BMZA, Law/, MCC, Transportation
Years 2-4General Funds
Increased de-velopment and property values near transit sta-tions
In order to increase non-automobile accessibility to City businesses, the City will create zoning changes and develop in-centive programs to promote Transit-Oriented Development around transit hubs. This approach has been demonstrated to improve land use efficiencies and property values in most cases across the United States. Transit-supportive land use strategies can be expected to yield return on investment for the City in terms of: reduced development and service costs, consumer transportation cost savings, and support for economic activities such as the key growth sector of tourism. High quality transit service would help provide cost savings and efficiencies to businesses and consumers, which would in turn increase productivity, expenditures on local goods, local business activity and employment. The City has already been pursuing projects and partnerships to bolster awareness and use of land near existing transit stations. Pilot projects being pursued with public and private partners at State Center, for example, will in turn be used to better market the City’s transit assets for potential development and infill. By building principles of Transit-Oriented Development into RFPs and RFQs for publicly owned property, and into the site plan and design review, City agencies will help developers achieve better products that support ridership and augment profitability.
Capital
Zoning
Policy/ O
perations Strategy
Measurable Outcomes
Implementing Bodies/Agents Timeline Funding
SourceReturn on
Investment
Integrate land use and transportation plan-ning to ensure move-ment of freight into and throughout the City
• •Integrated land use and trans-portation plan
Planning, BDC, Transportation, MDOT, Port Authority
Years 2-4General Funds
Stronger indus-trial and com-mercial activity, fewer land use and transporta-tion conflicts
The City has a mature and functioning industry that is sustained by adequate port, rail, and truck access. By integrating land use and transportation planning, critical linkages in the transportation system will not be choked off by development.
Capture share of regional growth in defense-related indus-tries due to BRAC
• •
Increased defense-re-lated industries, Increased rate of employment
BDC, MCC, Plan-ning
Years 2-6General Funds
Stronger overall economy, Greater employ-ment base
The base realignment and closure (BRAC) recommendations took effect on November 9, 2005, and involve more than 800 installations. Maryland is one of very few states slated to experience a significant net gain, primarily at the Aberdeen Proving Ground (APG), Andrews Air Force Base (AFB), Fort Meade, and the Bethesda National Naval Medical Center (NNMC). The DOD has until September 15, 2007 to begin the indicated closings, which must be completed by September 15, 2011. The City is strategically located both proximate to the nation’s capital, Washington DC, and among Maryland receiving areas with the implementation of BRAC. The City will capture office market and defense-related growth through strategic marketing and expansion of transit services to surround base installations.

114 City of Baltimore Comprehensive Master Plan EARN 115114 City of Baltimore Comprehensive Master Plan EARN 115
INTR
OD
UC
TION
SU
MM
AR
Y H
ISTO
RY
KE
Y TR
EN
DS
LIVE
EA
RN
PLAY
LEA
RN
IMP
LEM
EN
TATION
MA
NA
GE
ME
NT FIN
AN
CIA
L CO
NC
LUS
ION
GLO
SS
AR
Y A
PP
EN
DIC
ES
StrategyMeasurable Outcomes
Implementing Bodies/Agents Timeline Funding
SourceReturn on
Investment
Integrate land use and transportation plan-ning to ensure move-ment of freight into and throughout the City
• •Integrated land use and trans-portation plan
Planning, BDC, Transportation, MDOT, Port Authority
Years 2-4General Funds
Stronger indus-trial and com-mercial activity, fewer land use and transporta-tion conflicts
The City has a mature and functioning industry that is sustained by adequate port, rail, and truck access. By integrating land use and transportation planning, critical linkages in the transportation system will not be choked off by development.
Capture share of regional growth in defense-related indus-tries due to BRAC
• •
Increased defense-re-lated industries, Increased rate of employment
BDC, MCC, Plan-ning
Years 2-6General Funds
Stronger overall economy, Greater employ-ment base
The base realignment and closure (BRAC) recommendations took effect on November 9, 2005, and involve more than 800 installations. Maryland is one of very few states slated to experience a significant net gain, primarily at the Aberdeen Proving Ground (APG), Andrews Air Force Base (AFB), Fort Meade, and the Bethesda National Naval Medical Center (NNMC). The DOD has until September 15, 2007 to begin the indicated closings, which must be completed by September 15, 2011. The City is strategically located both proximate to the nation’s capital, Washington DC, and among Maryland receiving areas with the implementation of BRAC. The City will capture office market and defense-related growth through strategic marketing and expansion of transit services to surround base installations.
Capital
Zoning
Policy/ O
perations

116 City of Baltimore Comprehensive Master Plan PLAY 117116 City of Baltimore Comprehensive Master Plan PLAY 117
Market Analysis
A. The IndustryBaltimore’s cultural, entertainment, and natural amenities provide Baltimore City residents and millions of visitors with unique opportunities to PLAY. 650,000 City residents, 11.79 million visitors from outside the Baltimore re-gion and 3.97 million visitors living in the Baltimore region, but outside Bal-timore City, explored the many attractions our City has to offer (D.K. Shifflet & Associates, Ltd. 2004 DKS&A). These amenities provide activities for all segments of the population, from youth and families to the elderly. The fol-lowing identifies the market for Baltimore’s cultural, entertainment, and natu-ral amenities, with emphasis on our customer base, market size, and trends.
Historical and Cultural ResourcesBaltimore’s historic/cultural industry provides place-based, unique experien-tial products that range from large world-renowned attractions to small, local-ly celebrated activities. These amenities fall within three broad areas: visual arts-based products such as museums, galleries, art studios and architecture-related events; performing arts-based attractions such as theater, cinema, mu-sic and dance; and historic/cultural-based products such as history museums, libraries, literary events, bus and walking tours, and historic districts. These resources provide life-enriching experiences that are attracting an increas-ing number of visitors from all walks of life. Baltimore’s cultural industry continues to expand, branching out to include a broader range of products
PLAY

116 City of Baltimore Comprehensive Master Plan PLAY 117116 City of Baltimore Comprehensive Master Plan PLAY 117
INTR
OD
UC
TION
SU
MM
AR
Y H
ISTO
RY
KE
Y TR
EN
DS
LIVE
EA
RN
PLAY
LEA
RN
IMP
LEM
EN
TATION
MA
NA
GE
ME
NT FIN
AN
CIA
L CO
NC
LUS
ION
GLO
SS
AR
Y A
PP
EN
DIC
ES
such as more African American-oriented resources, which is a great source of untapped potential. In addition, the City’s many historic neighborhoods are taking steps to preserve and enhance their historic character and consequently attracting more visitors. Several uncontrollable factors affect the health of his-toric and cultural tourism. These range from local trends to global economic factors, such as financial health of individual historic/cultural attractions, acts of terrorism and nature, and national and global economic trends.
Nightlife, Entertainment and SportsThe nightlife, entertainment and sports industry encompasses a broad range of businesses and activities. Business establishments range from restaurants, bars and taverns, and nightclubs to movie theaters, bowling alleys, and even roller-disco. The sports segment can be divided into the participatory and spectator categories. Participatory sports include intramural play, privately organized leagues such as Baltimore Sports and Social Club (BSSC) or South Baltimore Sports (SOBO), leagues sponsored by the City’s Department of Recreation and Parks, and leagues sponsored through the public school sys-tem. Spectator sports include the City’s major and minor league teams, as well as collegiate teams. This sector is critical to Baltimore’s health in a num-ber of ways – to complement the burgeoning tourism industry, to satisfy the leisure pursuits of residents, and to add to the City’s jobs and tax base.
PLAY

118 City of Baltimore Comprehensive Master Plan PLAY 119118 City of Baltimore Comprehensive Master Plan PLAY 119
Natural Resources and Open SpacesBaltimore’s natural resource industry includes parks and open spaces, rec-reation centers, natural habitats such as forests, streams and estuaries. The City’s parks and natural resource system includes over 6,000 acres of land on over 400 different properties ranging in size from the magnificent 700-acre forest in Leakin Park to small sub-acre lots in the inner city. Baltimore’s most famous natural resource is the Inner Harbor, an international tourist destina-tion. Our parks, natural resources, stream valleys, and open spaces offer great diversity. Residents can play tennis in Druid Hill Park, hike in the forests of Cylburn Arboretum or navigate the Inner Harbor in a paddle boat. Our large parks and stream valleys feature scenic vistas that rival those of other great cities across the globe. The importance of our natural resources also extends beyond political boundaries to include water quality issues, drinking water supply and air quality. Our natural and recreational amenities are described and analyzed regularly through a state-mandated planning document, the Land Preservation and Recreation Plan (LPRP, See Appendix X), updated in conjunction with this Comprehensive Master Plan. The LPRP gives lo-cal planners an opportunity to review and compare local and state planning goals and objectives for open space land use categories of special interest to the Maryland Department of Planning: recreation, agriculture and natural resources.
B. Customers
Historic/cultural resources target a customer base that includes regional resi-dents as well as national and international tourists. The main consumers of the City’s historic/cultural attractions are:• The Historic/Cultural Traveler is usually middle-aged and college-educat-
ed. Approximately 15% of this group is retired and 45% have grown chil-dren (D.K. Shifflett & Associates, Profile of Travelers Who Participate in Historic and Cultural Activities, American Demographics, October 1997). These travelers tend to travel in groups, fly to their destination, and shop in addition to sightseeing. Historic/cultural travelers spend more than other tourists, spending on average $623 per trip vs. $457 (Travel Industry Asso-ciation, The Historic/Cultural Traveler, 2003 Edition). Remarkably, 81% of adults, or 118 million, who traveled in 2003 are considered historic/cul-tural travelers (TIA). These travelers visited historic or cultural activities on almost 217 million person-trips last year (a person-trip is one person on one trip, traveling 50 miles or more from home). This staggering number is up 13% from 192 million in 1996 (TIA). In addition, historic/cultural trips are more likely to be seven nights or longer in length of time and include air travel and hotel stays (TIA). Four out of ten travelers extended their trip to include a historic/cultural activity (TIA).
Segments Tracked Business Travelers 3.92 million visitors in 2004
Leisure Travelers 7.88 million visitors in 2004
Broken out by: Overnight 3.87 million visitors in 2004
Day trip 7.92 million visitors in 2004

118 City of Baltimore Comprehensive Master Plan PLAY 119118 City of Baltimore Comprehensive Master Plan PLAY 119
INTR
OD
UC
TION
SU
MM
AR
Y H
ISTO
RY
KE
Y TR
EN
DS
LIVE
EA
RN
PLAY
LEA
RN
IMP
LEM
EN
TATION
MA
NA
GE
ME
NT FIN
AN
CIA
L CO
NC
LUS
ION
GLO
SS
AR
Y A
PP
EN
DIC
ES
• School Children and Families of Baltimore’s region also include six school districts that take advantage of Baltimore’s historic/cultural attractions. These school districts provide Baltimore’s historic/cultural attractions with fall, winter, and springtime customers. Area private and parochial schools also utilize these resources in their educational programs. Additionally, families within the region also bring children to these attractions, both to expose them to special children’s programming and to enrich their cultural learning.
• Local Visitors are typically highly educated, usually in their forties or older, and many have high levels of disposable income. They are usually mem-bers of one or more historical or cultural institutions. Due to their high incomes, this group also supports historic/cultural institutions in a substan-tial but indirect manner through the payment of income and property taxes. Most local visitors live in Baltimore City or in the older neighborhoods in the surrounding counties. They are the regular customers of these attrac-tions and are frequently the advocates for culture in Baltimore.
The nightlife, entertainment, and sports sectors appeal to many groups within the overall population. This can be attributed in part to the extended hours of operation. Generally speaking, those most likely to take advantage of night-life and entertainment include college students, childless young profession-als, tourists and business travelers. Sports are likely to be enjoyed by the same groups and children and families. Also, sports enthusiasts tend to be skewed more toward males. The consumers of nightlife, entertainment, and sports are:• College Students. The college student population in Baltimore has not de-
creased at the same rate as the general population has decreased. Census figures indicate that in the year 2000, there were 48,736 individuals in Bal-timore City enrolled in college, graduate, or professional schools. This is very close to the 50,325 enrolled in 1990. Additionally, there are 32,500 college students at four year colleges in Baltimore County. Many of these students were attracted to these institutions based on the entertainment amenities a large city offers.
• Childless Young Professionals. The number of childless young profession-als has grown in the City, a demographic trend that is echoed in many of the nation’s urban centers. Attracting and retaining these individuals could be an essential component in laying the foundation for the City’s future economic health.
• Tourists and Business Travelers. 15.77 million tourists and business travel-ers visited Baltimore with a predominance of trips made for leisure rather than business, according to a 2004 study of tourism (DKS&A). The top ori-gin states for overnight leisure visitors include Pennsylvania (17%), New York (15%), New Jersey (10%), Virginia (9%), California (9%), Maryland (6%), North Carolina (5%), and Florida (4%). The top reasons for visiting include family or friends, special events, general weekend trips, and general vacation trips. Top activities that people pursue include dining, sightseeing, entertainment, and shopping. The number of day-trippers versus overnight-ers indicates that the City should be doing more to entice people to make longer visits. In addition to Leisure travelers, 3.92 million Business travel-ers visited Baltimore in 2004 (DKS&A). Average daily spending for the overnight Business traveler was $226.78 (DKS&A). Major decision fac-tors for meeting planners when choosing a destination to host their meeting
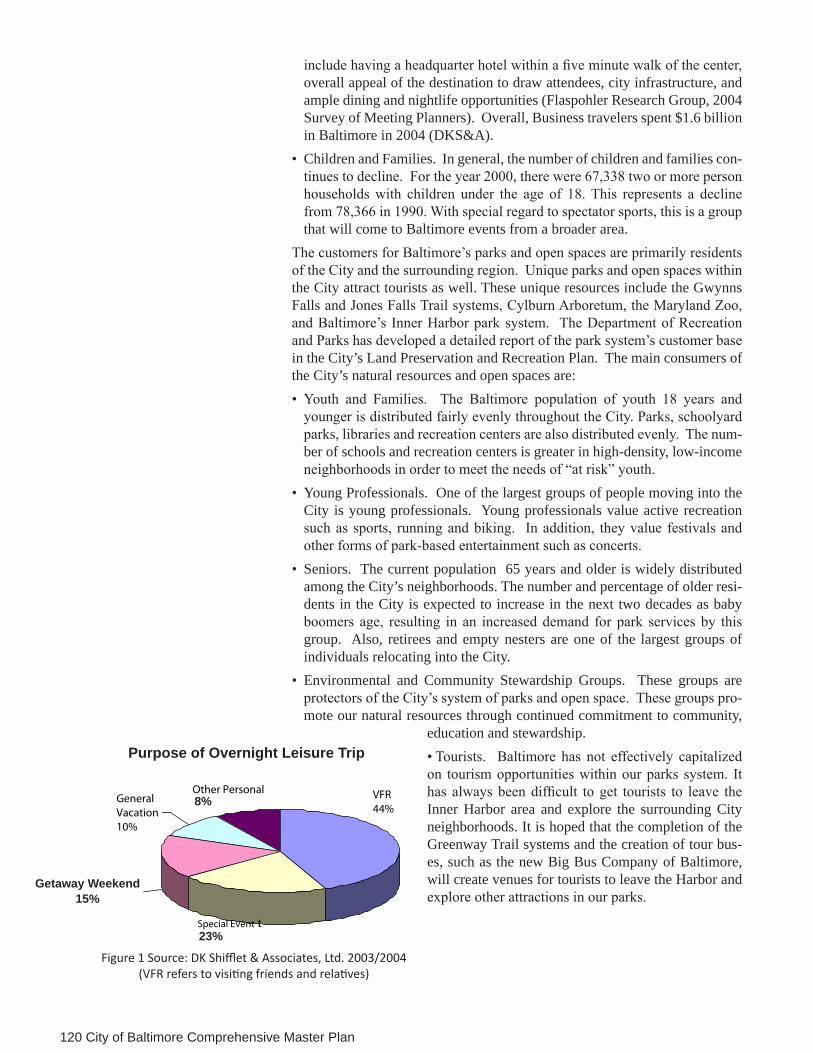
120 City of Baltimore Comprehensive Master Plan PLAY 121120 City of Baltimore Comprehensive Master Plan PLAY 121
include having a headquarter hotel within a five minute walk of the center, overall appeal of the destination to draw attendees, city infrastructure, and ample dining and nightlife opportunities (Flaspohler Research Group, 2004 Survey of Meeting Planners). Overall, Business travelers spent $1.6 billion in Baltimore in 2004 (DKS&A).
• Children and Families. In general, the number of children and families con-tinues to decline. For the year 2000, there were 67,338 two or more person households with children under the age of 18. This represents a decline from 78,366 in 1990. With special regard to spectator sports, this is a group that will come to Baltimore events from a broader area.
The customers for Baltimore’s parks and open spaces are primarily residents of the City and the surrounding region. Unique parks and open spaces within the City attract tourists as well. These unique resources include the Gwynns Falls and Jones Falls Trail systems, Cylburn Arboretum, the Maryland Zoo, and Baltimore’s Inner Harbor park system. The Department of Recreation and Parks has developed a detailed report of the park system’s customer base in the City’s Land Preservation and Recreation Plan. The main consumers of the City’s natural resources and open spaces are:• Youth and Families. The Baltimore population of youth 18 years and
younger is distributed fairly evenly throughout the City. Parks, schoolyard parks, libraries and recreation centers are also distributed evenly. The num-ber of schools and recreation centers is greater in high-density, low-income neighborhoods in order to meet the needs of “at risk” youth.
• Young Professionals. One of the largest groups of people moving into the City is young professionals. Young professionals value active recreation such as sports, running and biking. In addition, they value festivals and other forms of park-based entertainment such as concerts.
• Seniors. The current population 65 years and older is widely distributed among the City’s neighborhoods. The number and percentage of older resi-dents in the City is expected to increase in the next two decades as baby boomers age, resulting in an increased demand for park services by this group. Also, retirees and empty nesters are one of the largest groups of individuals relocating into the City.
• Environmental and Community Stewardship Groups. These groups are protectors of the City’s system of parks and open space. These groups pro-mote our natural resources through continued commitment to community,
education and stewardship.• Tourists. Baltimore has not effectively capitalized on tourism opportunities within our parks system. It has always been difficult to get tourists to leave the Inner Harbor area and explore the surrounding City neighborhoods. It is hoped that the completion of the Greenway Trail systems and the creation of tour bus-es, such as the new Big Bus Company of Baltimore, will create venues for tourists to leave the Harbor and explore other attractions in our parks.
Purpose of Leisure Trip
General Vacation10%
Weekend17%
VFR44%
Special Event20%
Other Personal9%
Figure 1 Source: DK Shifflet & Associates, Ltd. 2003/2004 (VFR refers to visiting friends and relatives)
Purpose of Overnight Leisure Trip
8%
15%Getaway Weekend
15%
t23%

120 City of Baltimore Comprehensive Master Plan PLAY 121120 City of Baltimore Comprehensive Master Plan PLAY 121
INTR
OD
UC
TION
SU
MM
AR
Y H
ISTO
RY
KE
Y TR
EN
DS
LIVE
EA
RN
PLAY
LEA
RN
IMP
LEM
EN
TATION
MA
NA
GE
ME
NT FIN
AN
CIA
L CO
NC
LUS
ION
GLO
SS
AR
Y A
PP
EN
DIC
ES
C. Market Size and Trends
In 2004, a total of 15.77 million customers visited Baltimore and cumulative-ly spent $2.9 billion. The tourism industry has become the third largest em-ployer in the City. D.K. Shifflet & Associates conducts a monthly nationally syndicated travel survey to determine domestic travel and spending. Their clients for this research program include Baltimore, many other destinations and states, as well as the Travel Industry Association of America. The travel industry defines a visitor as someone who travels to a destination and stays overnight, or takes a day-trip 50 miles or more one-way from their home, outside of normal activities such as commuting to work. Based on this defini-tion, Baltimore welcomed 11.79 million visitors. Since a good portion of the Washington, DC market falls within the 50-mile radius of Baltimore, BACVA commissioned D.K. Shifflet & Associates to begin a separate tracking study to look at day-trip travel originating within 50 miles of the Baltimore area; generally, the Baltimore Beltway is used as mile 0. The study found that in 2004, there were 3.97 million visitors from within 50 miles who took a day-trip to Baltimore. Specific trends are not as easy to glean for the nightlife, entertainment, and sports market segment. This is an industry that is subject to changes in market conditions, as it relies heavily on people’s discretionary incomes. It is also subject to demographic trends because new businesses will arise to meet the demand of growing populations. Lastly, it is subject to overall trends in the tourism industry in Baltimore.The market for Baltimore’s park and open space system is difficult to define. There is a wide variation in the types of parks and open spaces offered and multitudes of possible uses within the parks and open space system. No recent, quantifiable data has been collected by the City to identify the quantities and types of users within the parks. While some parks, or park facilities, appear to receive a great deal of use, many others appear to be virtually empty. Overall, it is difficult to define whether our parks and recreational areas are receiving adequate usage. Data is needed to clearly identify existing park and recreation user patterns. The data should be combined with City census data to develop a clear picture of our market for our parks and open space system.
D. Location
Historic and cultural attractions are located throughout Baltimore City, with many concentrated in the Baltimore City Heritage Area (BCHA). The BCHA features a rich variety of historic sites and cultural experiences. These attrac-tions are convenient to highway, rail and air service. In addition, Baltimore is part of the Washington, DC metropolitan area and can attract visitors based upon that proximity. The growing recognition of the Baltimore City Heritage Area, and its related trail system, will dramatically increase visitation within the next five years.Throughout the City there are a number of nightlife, arts and entertainment “districts” that include: the Inner Harbor, the Stadium Area, Fells Point, Can-ton, Federal Hill, Mount Vernon, Station North, Highlandtown, Belvedere Square, 36th Street, West Side, The Block, Little Italy, and Pennsylvania Av-enue. Most entertainment areas enjoy public transit access, particularly the large sports venues which are linked regionally through the light rail system.

122 City of Baltimore Comprehensive Master Plan PLAY 123122 City of Baltimore Comprehensive Master Plan PLAY 123
Baltimore’s largest park and open space systems are distributed throughout the City. There are also many neighborhood parks, public fields, and recre-ation areas on school properties. Baltimore’s college campuses also function as informal open space areas for surrounding neighborhoods.
E. Competition
Baltimore’s historical and cultural tourism industry struggles from a market standpoint because it is in the midst of three first-tier competitors: New York City, Philadelphia, and Washington, DC. Each of these competitors aggressively markets to the same visitor-base that Baltimore seeks to at-tract. In addition, their marketing campaigns are funded with profoundly greater resources. The key competitors for tourism visits originating within the Baltimore re-gion are the Eastern Shore and beach attractions, Atlantic City, Washington, DC, and Annapolis. Competition for nightlife, entertainment, and sports comes from a number of sources, most typically, the Washington, DC area. This is because people are not willing to travel too far for a dining or entertainment experience not involving an overnight stay. Baltimore enjoys little competition for spectator sports within the Baltimore region. However, Baltimore does compete for its share of the sports dollar with the Washington, DC area and Annapolis.Baltimore’s competition for parks and natural resources is not with the first-tier northeastern cities as identified above for historic and cultural resourc-es. Baltimore’s competition for parks and natural resources is with other local activities available to our citizens. The City’s recreation resources have serious competition from facilities, leagues and associations originat-ing in surrounding counties. The City must maintain parks in a clean and safe manner to assure that they are utilized and adopted by the surround-ing populace. Baltimore has an excellent natural resource and park system with which to work. Our natural resources and parks are available to both our local population and regional and national tourists. The best example of capitalizing on unique natural resources for tourism within the City is the revitalization of the Inner Harbor. Baltimore Harbor is different from other waterfront cities because it is well protected, affords unique views and pedestrian connectivity around the water’s edge, and functions as a year-round, working seaport. Our parks and stream valley system also offer similar opportunities that have not been fully capitalized upon. The Green-way Trail systems are a good first step in this direction.

122 City of Baltimore Comprehensive Master Plan PLAY 123122 City of Baltimore Comprehensive Master Plan PLAY 123
INTR
OD
UC
TION
SU
MM
AR
Y H
ISTO
RY
KE
Y TR
EN
DS
LIVE
EA
RN
PLAY
LEA
RN
IMP
LEM
EN
TATION
MA
NA
GE
ME
NT FIN
AN
CIA
L CO
NC
LUS
ION
GLO
SS
AR
Y A
PP
EN
DIC
ES
PLAY
Products and Services Successful cities offer high quality, life-enhancing environments. Cities un-derstand that strengthening and diversifying historic/cultural amenities, en-tertainment, and natural resources are critical to improving the City’s vitality. These amenities play a critical role in lowering the “barrier to entry” for new-comers, especially where these amenities intersect to create a unique sense of place. Baltimore offers unparallel, diverse visitor experiences that are the
foundation of a successful, healthy city. Every Baltimore resident and visitor participates in Baltimore’s his-toric/cultural, entertainment, and nat-ural resource amenities in one form or another. From watching a football game at a corner pub, shopping on a main street, or attending an opening at the Baltimore Museum of Art, op-portunities abound for everyone. There are more than 200 historical and cultural organizations in Balti-more. More than half of these orga-nizations fall into the categories of vi-sual art, music, historical and cultural heritage, and theater and dance (Ran-dall Gross/Development Economics, Opportunity Audit for Cultural, Rec-reational, Retail and Entertainment Amenities, 2003).
A. Products and Services Offered
Visual ArtsThere are approximately 54 visual arts organizations in Baltimore. These organizations include museums, galleries, artist studios, community arts/re-source centers, associations, graphic design and architectural firms, commer-cial art dealers, colleges, art exhibits, and shows. Many of these venues are nationally and internationally recognized such as the Walters Art Museum,
1. B a ltim o re C u ltu ra l O rg a n iz a tio n s by T y peS ourc e: G reater B altimore C ultural Allianc e
V is ual A rt22%
Mus ic18%
His tory13%
Theater9%
Educ9%
Danc e7%
Film5%
Literary5%
Multi5%
Info5%
A ttrac tion2%
Education

124 City of Baltimore Comprehensive Master Plan PLAY 125124 City of Baltimore Comprehensive Master Plan PLAY 125
the Baltimore Museum of Art and the Visionary Arts Museum. In addition, Baltimore houses one of the most prestigious art schools in the country, the Maryland Institute College of Art (MICA). Overall, Baltimore’s visual arts are thriving and in many ways inspiring revitalization of whole neighborhoods like the Station North Arts District.
MusicBaltimore’s music scene, too, is nationally recognized. Baltimore’s leading classical music venues are the world-renowned Peabody Institute, Baltimore Symphony Orchestra and the Opera Company. In addition, there are at least eleven other classical music organizations in the City, including the Baltimore Chamber Orchestra, Baltimore Choral Arts Society and the Hopkins Symphony Orchestra. The Eubie Blake Institute is preserving and enhancing Baltimore’s love for jazz. The Institute celebrates Baltimore’s jazz greats such as Eubie Blake, Cab Calloway, Chick Webb, Billie Holiday, Dennis Chambers, Carl Fili-piak, and Gary Bartz. There are several additional organizations that support live jazz in Baltimore, including the Baltimore Chamber Jazz Society and Pea-body Institute. Business establishments such as Bertha’s, New Haven Lounge, Sascha’s and An die Musik regularly hold live jazz performances.
History and CultureBaltimore’s rich historical and cultural heritage defines the City as a world re-nowned tourist destination. Baltimore’s historic/cultural attractions range from over seventy historic districts to nationally recognized history museums: Fort McHenry; Mt. Vernon Place, a National Historic Landmark District; the B&O Railroad Museum; USS Constellation; Edgar Allan Poe house museum; Mount Clare Mansion; the Maryland Historical Society; Reginald L. Lewis African American Museum; and many others. Other organizations hold lectures, con-ferences, walking tours, and other events. In addition, many walking and driv-ing trails are being created that will have signage interpreting Baltimore history and culture.
Theater/DanceBaltimore has several large live theater venues and many small theater venues and companies. Baltimore’s theater options range from several small theater companies to large traveling shows at the Hippodrome, Lyric and Meyerhoff. Additionally, the area’s colleges and universities host theatre and dance produc-tions as well as performances by traveling companies.
Nightlife, Entertainment and SportsBaltimore has an active nightlife. From casual dining to luxurious gourmet restaurants, Baltimore has more than three hundred restaurants that can satisfy anyone’s culinary delights. There are at least a dozen nightlife and entertain-ment “districts” throughout the City. Additionally, it is important to note that many of these districts serve as local shopping destinations as well. Much of the City’s shopping, dining, and entertainment can be found in centrally-managed centers and mixed-use complexes, or in neighborhood commercial districts. Several of these commercial districts have strong identities and are marketed by an organized business association. Sports facilities are concentrated close to downtown, making patronage of other entertainment experiences possible. There are local social leagues, recreational centers, and other facilities scattered throughout the City, providing local com-munities with opportunities to participate in a wide variety of activities.

124 City of Baltimore Comprehensive Master Plan PLAY 125124 City of Baltimore Comprehensive Master Plan PLAY 125
INTR
OD
UC
TION
SU
MM
AR
Y H
ISTO
RY
KE
Y TR
EN
DS
LIVE
EA
RN
PLAY
LEA
RN
IMP
LEM
EN
TATION
MA
NA
GE
ME
NT FIN
AN
CIA
L CO
NC
LUS
ION
GLO
SS
AR
Y A
PP
EN
DIC
ES
Some of the major products and services provided for Baltimore City custom-ers in nightlife, entertainment, and sports include:
• Individually operated bars & nightclubs – Baltimore has an abundance of bars and nightclubs that contribute to the City’s highly individual character, often featuring local and national entertainment.
• Nightclub entertainment complexes – Power Plant Live! is managed as a nightclub complex. In addition, Fells Point, Canton, and Federal Hill business districts belong in this category because the sheer number of busi-nesses locating in close proximity creates a highly visited area that caters to night time leisure activities.
• Large concert venues—These include the Pier Six Pavilion, Ram’s Head Live and other facilities that are larger in size than the typical nightclub.
• Chain entertainment – This category includes places such as the ESPN Zone or Hard Rock Café. These are geared more toward tourists and visi-tors who are in the City for sporting events, conventions and concerts.
• Formal dining – Baltimore has several upscale restaurants ranging from traditional to contemporary, most of them located near the Inner Harbor or the City’s numerous cultural institutions.
• Casual dining – These restaurants have been especially attractive to tourists as innovative new restaurants have helped raise the City’s dining profile.
• Professional sports venues – Includes M&T Bank Stadium, Oriole Park at Camden Yards, 1st Mariner Arena, and Pimlico Racecourse.
• Recreation centers – The City has 45 recreation centers in the Recreation & Parks system, including facilities attached to schools.
• Other recreational facilities include venues such as DuBurns Arena, Meyers Pavilion, YMCA locations, golf courses and marinas.
Natural ResourcesBaltimore also provides great opportunities for leading an active lifestyle. From a leisurely stroll along one of the City’s many trailways, streams and waterfront promenades to a game of touch football in a local park, there are many activities from which to choose. Baltimore offers all of these recreation opportunities even though the City’s land area is more developed than any other comparable region in the State. The City has preserved some important areas that add value to the environment of the City. Aside from their recreation benefits, parks and natural land function to moderate the microclimatic condi-tions in the City. The trees, fields and natural stream valleys offer an aesthetic alternative to a continuous landscape of roads and buildings. These areas also provide habitat for many species of animals and plants, including migratory woodland birds and waterfowl. As the City is redeveloped in the next decade, some acquisition will be important both for protection of Baltimore’s natural resources and for the general ecological health of the region. The City will continue to monitor trends in land use and land sales to watch for opportunities to enhance the current park system and protect areas of special habitat. Priority will be given to land parcels that directly support the mission and goals of the Department of Recreation and Parks: land that has high environmental/habitat

126 City of Baltimore Comprehensive Master Plan PLAY 127126 City of Baltimore Comprehensive Master Plan PLAY 127
value, historic or cultural values, or can complement recreation facilities by expanding existing parks or linking existing parks and open space in the gre-enway network.
B. Competitive Advantage
Culture isn’t just about organizations and institutions; it is about what makes Baltimore undeniably Baltimore. Baltimore is a unique place because of its physical character, neighborhoods, institutions, and history. Baltimore enjoys its own, unique dialect, with several distinctive pronunciations and catch phras-es. The Chesapeake Bay and the seafood it yields contribute to local culinary identity. Baltimore, too, is celebrated through a large list of icons and celebri-ties. These icons and celebrities define Baltimore, ranging from built trade-marks such as the Washington Monument, rowhouses, formstone and marble steps to Historic sites commemorating local figures such as H.L. Mencken, Thurgood Marshall, Billie Holliday and Babe Ruth to the presence of contem-porary popular figures such as Cal Ripken and John Waters. This wealth of local trademarks and “only here” cultural goods makes Baltimore a place with a distinct, strong local identity.While offering the full range of nightlife, entertainment, and sports products one would expect from a large city, Baltimore has its own unique character that can attract visitors and enhance the experience of people who are visiting for other reasons. Among the many products that are uniquely Baltimore are such things as rowhouse bars, crab houses, lacrosse games, public markets, snow-balls and other features that make the City enjoyable for visitors.Baltimore’s nightlife, entertainment, and sports products also have the advan-tage of being reasonably priced. The low cost of many products in this category is often able to keep local dollars in the area and attract visitors who are looking for an affordable alternative to comparable areas elsewhere on the East Coast.Baltimore’s parks and open spaces offer more distinct identities and amenities than many similar properties in surrounding areas. Some outstanding examples of historic park buildings include Clifton Mansion, Mount Clare, Druid Hill Conservatory, Cylburn Mansion, Patterson Park Pagoda and numerous other monuments and park pavilions. Because of these historic structures, the City parks have a built-in advantage over the more strictly functional parks in neigh-boring jurisdictions.
C. Customer Perceptions
Residents and visitors perceive many factors when deciding to visit and live in Baltimore. A combination of convenience, cost, services, proximity to other venues, and safety all play a role in one’s decision to PLAY in the City. For historic/cultural resources, most of the attractions have admission fees rang-ing from the nominal to over ten dollars. These prices are usually reasonable but can be surprising to tourists that may have recently been to free museums in the Washington, DC area. Performing arts tickets can be considerably more expen-sive, but are generally cheaper than those found in other northeastern cities. Convenience is a factor that can be both an asset and liability for Baltimore area historic/cultural resources. While there is a strong concentration of cultural attractions along the Charles Street corridor, many of the attractions outside of this area are not readily accessible without a car. In the area of nightlife, entertainment, and sports, customers’ choices are deter-mined by the safety of the location, the quality of the service as well as conve-

126 City of Baltimore Comprehensive Master Plan PLAY 127126 City of Baltimore Comprehensive Master Plan PLAY 127
INTR
OD
UC
TION
SU
MM
AR
Y H
ISTO
RY
KE
Y TR
EN
DS
LIVE
EA
RN
PLAY
LEA
RN
IMP
LEM
EN
TATION
MA
NA
GE
ME
NT FIN
AN
CIA
L CO
NC
LUS
ION
GLO
SS
AR
Y A
PP
EN
DIC
ES
nience. Many of the entertainment options are located in the downtown area, which is well populated during the day. However, the downtown area’s busi-ness focus can mean areas not near the harbor seem dead at night, discouraging pedestrian exploration of the areas around the entertainment attractions. The sense of pedestrian safety and interconnectedness of nightlife and entertain-ment activities needs to be improved to strengthen the nightlife and entertain-ment performance of downtown as a whole. Access to nightlife spots away from the Inner Harbor area has not been devel-oped as much as it could be. Tourists may not yet have awareness of how many of the City’s nightlife and entertainment areas are located in close proximity to one another. The links between the Inner Harbor and nearby areas have not been developed to the fullest. These links could be better developed through enhanced signage, tourist maps, shuttle routes and better publicity of the broad-er area surrounding Downtown and the many amenities offered nearby. The City’s parks often score highly in terms of convenience due to their prox-imity to large population centers within the City. Certain parks should be upgraded in order to improve safety, both real and perceived. With safety upgrades, the status of the City’s parks would be improved, leading to stron-ger participation in friends groups and utilization of rentable park facilities. Deferred maintenance of buildings and ball fields also needs to be addressed to improve the usage and prestige of the parks.
D. Comparative Analysis
Baltimore City’s historic/cultural, entertainment, and natural resource ameni-ties are for the most part healthy and vibrant. In 2004, the Baltimore region hosted 15.77 million visitors, including nearly 4 million day-trippers from close-in markets, especially Washington, DC area (DKS&A). Visitors gener-ated an estimated $3 billion in direct spending, and Baltimore was ranked one of Frommer’s up-and-coming top 10 summer destinations in 2005. Baltimore offers a neighborhood orientation with deeper roots to its local heri-tage than nearby Washington, DC, which has a weaker local identity due to the predominance of a transplant population in both the district and its suburbs. Compared to both Philadelphia and Washington, DC, Baltimore nightlife, din-ing, sports and entertainment activities are often considerably more affordable. Despite the lower prices, Baltimore has several nightlife spots and restaurants that have attracted positive reviews from out-of-town publications, proving that lower-priced entertainment does not necessarily imply second-rate.Historic and cultural resources in the City are distinguished by their local orientation, as opposed to the national orientation found in Washington, DC. However, since Baltimore resources are not part of the Smithsonian Institution, admission is not free. This may have the effect of discouraging museum visits from travelers visiting from the Capital region.Baltimore’s parks and open spaces are distinctive in comparison to those in neighboring jurisdictions. The City’s parks are unique; its historic features, architecture and natural resources are found only in Baltimore such as the In-ner Harbor. In many cases the classic design of the parks themselves is distinct from suburban counterparts. As Baltimore continues to be an important cultural hub, there is more that can be done to maximize the potential for cultural amenities and attract visitors to the City.

128 City of Baltimore Comprehensive Master Plan PLAY 129128 City of Baltimore Comprehensive Master Plan PLAY 129
PLAY
Goals, Objectives and StrategiesBaltimore is the region’s cultural, entertainment and leisure center, as well as a world-renowned tourist destination. The City provides a wide array of leisure and social activities for tourists and citizens alike, many of which are in close proximity to jobs, neighborhoods, schools and transportation. There are, however, several areas to improve upon in order to provide more fulfill-ing recreational experiences for the visitor and resident. The following three goals will guide efforts to maximize the City’s potential as a premier place to PLAY:
Goal 1: Enhance the Enjoyment, Appreciation, and Stewardship of Balti-more’s Historical and Cultural Resources
Goal 2: Improve Night Life, Entertainment, and Recreation Experiences for Residents and Visitors
Goal 3: Increase the Attractiveness of Baltimore’s Natural Resources and Open Spaces for Recreation and to Improve Water Quality
The objectives and strategies that follow are designed to provide a blueprint to City agencies and officials as they implement this plan. PLAY’s recom-mendations, in addition to enhancing the leisure experience, will strengthen Baltimore’s attractiveness as a place to live, work and learn. PLAY’s goals, objectives and strategies complement those of LIVE, EARN and LEARN.

128 City of Baltimore Comprehensive Master Plan PLAY 129128 City of Baltimore Comprehensive Master Plan PLAY 129
INTR
OD
UC
TION
SU
MM
AR
Y H
ISTO
RY
KE
Y TR
EN
DS
LIVE
EA
RN
PLAY
LEA
RN
IMP
LEM
EN
TATION
MA
NA
GE
ME
NT FIN
AN
CIA
L CO
NC
LUS
ION
GLO
SS
AR
Y A
PP
EN
DIC
ES
PLAY
Goal 1: Enhance the Enjoyment, Appreciation, and Steward-ship of Baltimore’s Historical and Cultural Resources
Objective 1: Market, Develop, and Promote Visitor Attractions in Baltimore City
• Market and promote the City through increased funding for BACVA and BCHA
• Develop new visitor centers and enhance existing visitor centers
• Complete pedestrian and automobile-oriented wayfinding system to help visitors navigate Baltimore’s Heritage Area attractions
• Pursue designation of Baltimore as a National Heritage Area
• Prepare for the bicentennial anniversary of the War of 1812
Objective 2: Increase Everyday Historical and Cultural Encounters for Baltimore City Residents
• Implement Heritage trails in historic areas of the City
• Teach American History using Baltimore’s history museums, establishing links to the City’s public and private school curriculums
• Support special events and festivals by improving festival space and infra-structure throughout the City
Objective 3: Enhance Accessibility to Historical and Cultural Re-sources through Transportation Improvements
• Develop plans for and implement Charles Street Trolley Line
• Implement Charles Street Scenic Byway Plan
Objective 4: Strengthen Stewardship of Historical and Cultural Resources
• Expand “Authentic Baltimore” program and link to Baltimore City Historic landmark program
• Create more effective management agreements by completing inventory of city-owned historic/cultural sites and attractions
• Implement a feasibility study to enhance and reuse under-utilized historic structures
Objective 5: Establish Baltimore City as the Region’s Center of Cul-ture and Entertainment
• Establish regional policy to increase regional funding resources for cul-tural activities within Baltimore City
Goal 2: Improve Nightlife, Entertainment, and Recreation Ex-periences for Residents and Visitors
Objective 1: Expand Access to Nightlife
• Create mixed-use zoning categories that allow nightlife and extended closing hours where appropriate

130 City of Baltimore Comprehensive Master Plan PLAY 131130 City of Baltimore Comprehensive Master Plan PLAY 131
Objective 2: Promote Unique Retail Venues as Shopping and Tourist Destinations
• Reinstate the “Shuttle Bug” system along main streets and shopping dis-tricts within the City
• Designate Main Street areas as local and/or national historic districts in order to access tax credits
• Increase retail space downtown by 400,000 sq. ft. to one million sq. ft.
• Designate and support Arts and Entertainment Districts
Objective 3: Improve Local Participation in City Recreational Activi-ties
• Develop a strategic recreational plan that will target recreational opportu-nities to address the City’s needs
• Implement the Bicycle Master Plan to provide recreational opportunities for residents
Goal 3: Increase the Health of Baltimore’s Natural Resources and Open Spaces for Recreation and to Improve Water Quality and to Improve Neighborhood Social, Economic, and Environ-mental Well-Being
Objective 1: Maintain a Well-managed System of Parks & Open Spaces
• Draft and adopt a City-wide plan for parks and open space
• Locate dedicated, sustainable funding sources for our parks and cultural assets
• Create park and open space zone in the Zoning Code
• Improve park stewardship and safety by expanding current parks partner-ship program
Objective 2: Protect and Enhance Baltimore’s Natural Habitat and Environmental Resources
• Meet the goals and requirements of the Chesapeake Bay Program, the City’s National Pollution Discharge Elimination Permit (NPDES) and Tribu-tary Strategies
• Develop a Waterway Trash Management Plan to ensure compliance with the National Pollutant Discharge Elimination Permit
• Construct one ultra-urban Best Management Practices (BMP) per year as identified in the Watershed 263 Plan
• Restore and protect at least one mile per year of streams and river banks in floodplains and stream valleys
• Target sidewalk, lighting and signal improvements near parks and open space
• Develop a plan to reduce trash within and along Baltimore’s parks and open space
• Complete plans for and creation of Greenway Trail system
• Increase Baltimore’s green infrastructure by increasing the number of trees and tree canopy size (See LIVE, GOAL 1, Objective 3, Strategy 6)
Objective 3: Ensure Public Access to the Waterfront
• Complete the Harbor Promenade and Middle Branch park/trail systems

130 City of Baltimore Comprehensive Master Plan PLAY 131130 City of Baltimore Comprehensive Master Plan PLAY 131
INTR
OD
UC
TION
SU
MM
AR
Y H
ISTO
RY
KE
Y TR
EN
DS
LIVE
EA
RN
PLAY
LEA
RN
IMP
LEM
EN
TATION
MA
NA
GE
ME
NT FIN
AN
CIA
L CO
NC
LUS
ION
GLO
SS
AR
Y A
PP
EN
DIC
ES
StrategyMeasurable Outcomes
Implementing Bodies/Agents
Time-line
Funding Source
Return on Investment
Market and promote the City through increased funding for BACVA and BCHA
•
Increased number of at-tendees at local attractions.
BACVA, BCHA Years 1-6
Increase BACVA’s share of Occupancy Tax by 20%. In-crease BCHA funding through general funds
More tourist dol-lars
Positive perception of Baltimore
Several recent reports conclude that BACVA is severely outspent by its competitors from a leisure marketing perspective. In or-der for Baltimore City to become a first-tier market, BACVA must be adequately funded to launch market campaigns in first-tier feeder markets. Additionally, the Travel Industry Association of America (TIA) estimates that minority tourists make up a $90 billion travel market. Baltimore City historic/cultural tourism is poised to capture a significantly greater portion of this market by developing and promoting the rich African American history in Baltimore.
Develop new visi-tor centers and enhance existing visitor centers
• •
Increased number of visitor centers, increased use of centers
BCHA, Planning, BACVA, BDC, DGS, Public Works
Years 1-6GO Bond, general funds, hotel tax
Greater aware-ness and increased spending by tour-ists in a broader area, longer visitor stays
Visitors Centers are an essential component to Baltimore’s Tourism. Between July of 2004 and June of 2005, 382,404 visitors stopped into the Inner Harbor Visitor Center. This number exceeded expectations. Developing an integrated system of acces-sible visitor centers throughout Baltimore’s prime tourism areas would provide a more coherent tourism experience.
Complete pedestrian and automobile-ori-ented wayfinding system to help visitors navi-gate Baltimore’s Heritage Area attractions.
• •Implemented wayfinding system
BCHA, Planning, DPW, Transpor-tation.
Years 1-6BCHA, Planning, DPW, Transportation
Increased tourism in areas beyond the Inner Harbor
This strategy will be an integral part of a City-wide pedestrian plan (See LIVE, Goal 3, Objective 1, Strategy 1). A systematic, fully developed way finding system for pedestrians as well as automobile users will help visitors navigate the City and explore a wide range of areas and attractions.
Pursue designa-tion of Baltimore as a National Heritage Area
•
Awarding of National Heritage Area Designation
BCHA, BACVA, Planning, DPW, Transporta-tion, BOPA, Rec & Parks, CHAP, Maryland Historical Trust, National Park Service, Mary-land Historical Society, tourism industry, DGS
Years 1-2 General fundsIncreased promi-nence of Baltimore tourism
BCHA is completing a feasibility study for Baltimore to pursue National Heritage Area designation. Agency heads throughout city government must become engaged in this feasibility study in order for the City to obtain National Heritage area status.
Capital
Zoning
Policy/ O
perations
Goal 1: Enhance the Enjoyment, Appreciation, and Stewardship of Baltimore’s Historical and Cultural ResourcesObjective 1: Market, Develop and Promote Visitor Attractions in Baltimore City

132 City of Baltimore Comprehensive Master Plan PLAY 133132 City of Baltimore Comprehensive Master Plan PLAY 133
StrategyMeasurable Outcomes
Implementing Bodies/Agents
Time-line
Funding Source
Return on Investment
Prepare for the bicentennial an-niversary of the War of 1812
•Anniversary celebra-tion
BCHA, BACVA, Planning, DPW, Transportation, BOPA, DGS, Rec & Parks, CHAP, Maryland Historical Trust, National Park Service, Mary-land Historical Society, Public Libraries, tourism industry
Years 1-6 General Funds
Increased prominence of Baltimore tour-ism
During the War of 1812, Baltimore saved the United States from imminent defeat. This legacy is celebrated at the Fort McHenry National Monument and Historic Shrine. The Bicentennial celebration of the War of 1812, especially the Battle of Baltimore, will be a national celebration, and Baltimore should take the lead. A task-force of Baltimore City agency heads must be formed to guide the three-year-long celebration of the War of 1812. The BCHA should manage this task-force, hire consultants and provide the initial celebration planning.
Implement Heritage trails in historic areas of the city
• •
Trails are completed and are part of the City trail system.In-creased use of trails
BCHA, BACVA, CHAP, Transpor-tation
Years 1-6GO Bonds-General Funds
More tour-ist dollars, andgreater awareness of Baltimore be-yond the Inner harbor.
Heritage trails are designed for guided and self-guided walking tours that lead visitors from the Inner Harbor to surrounding historic neighborhoods, such as Federal Hill/Sharp Leadenhall, Fells Point, West Baltimore, the Pennsylvania Avenue corridor, and Seton Hill area. These trails highlight the heritage and culture of Baltimore and lead tourists to shops, restaurants, muse-ums and other historic attractions that are located beyond the Inner Harbor. The trail system is composed of interpretive and wayfinding signage, seasonal tour guides, maps, brochures, and disks that are embedded in the sidewalk that mark the trail. Improvements to the trails will be an integral part of a pedestrian plan (See LIVE, Goal 3, Objective 1, Strategy 1)
Teach American History using Baltimore’s his-tory museums, establishing links to the City’s public and private school curricu-lums
•
Increased visitation to City museums by City school children.Created specific line item for bus trips to attractions
BCHA, Greater Baltimore His-tory Alliance, and BC public and private Schools, BOPA
Years 1-6General Funds
Appreciation of Baltimore City history and culture by chil-dren and future adults
Currently, City school students cannot attend Baltimore’s historic/cultural attractions because of insufficient transportation funds. Earmarked funding would enable students to go on field trips to these attractions. The suggested funding would pro-vide each student the opportunity to take approximately 3 field trips per year. A strengthened relationship between BCPSS and the Baltimore City Heritage Area will also enhance stewardship and curriculum development at Baltimore’s historic and cultural attractions.
Capital
Zoning
Policy/ O
perations
Objective 2: Increase Everyday Historical and Cultural Encounters for Baltimore City Residents

132 City of Baltimore Comprehensive Master Plan PLAY 133132 City of Baltimore Comprehensive Master Plan PLAY 133
INTR
OD
UC
TION
SU
MM
AR
Y H
ISTO
RY
KE
Y TR
EN
DS
LIVE
EA
RN
PLAY
LEA
RN
IMP
LEM
EN
TATION
MA
NA
GE
ME
NT FIN
AN
CIA
L CO
NC
LUS
ION
GLO
SS
AR
Y A
PP
EN
DIC
ES
Develop plans for and implement Charles Street Trolley Line
• •Increased number of tourist visitations out-side of Inner Harbor
Transportation, BDC
Years 1-6Private Funding, State Funds
Connection of attractions along Charles Street
A trolley line linking the Inner Harbor tourist attractions to Johns Hopkins University will connect many of the City’s historic and cultural venues together, such as Peabody Institute, Walters Art Museum, and Baltimore Museum of Art. This line will also connect the Central Business District to Penn Station and spur economic development all along the line. Transit-Ori-ented Development principles (See Appendix E) will be promoted at selected planned stops along the line.
Implement Charles Street Scenic Byway Plan
• •Increased tourist visitation to Baltimore City
Planning, CHAP, Transportation, BCHA,
Years 1-6
Fed DOT, State funds, private grants, MVR, GO Bond
Increased tourism along Charles Street corridor
BCHA requires immediate funding and staffing to implement this timely and important endeavor. Charles Street Scenic Byway runs from the southern tip of South Baltimore to Lutherville in Baltimore County. Charles Street exhibits hundreds of historic, architectural and cultural treasures. This scenic byway will provide visual and physical links between the Inner Harbor and nearby neighborhoods to neighborhoods throughout northern Baltimore. This linkage further promotes region-alism and economic development (See Appendix K).
Objective 3: Enhance Accessibility to Historical and Cultural Resources through Transportation Improvements.
StrategyMeasurable Outcomes
Implementing Bodies/Agents
Time-line
Funding Source
Return on Investment
Support special events and festi-vals by improving festival space and infrastructure throughout the City
• •
Increased visitation to historical and cultural attractions by city residents.
BOPA, Rec & Parks, DGS, Transportation
Years 2-3
Private spon-sor (corporate sponsorship) General Funds (BOPA) Rec & Parks sustain-able funding
Increased ap-peal of festivals
Baltimore’s tourism industry in partnership with Baltimore City agencies should plan multiple activities and events that di-rectly benefit Baltimore residents. These attractions and events may include ‘Be a Tourist in Your Own City Day,’ the New City Fair, discount weekends at the Inner Harbor attractions, local restaurants, museums, etc. Festival space needs to be improved to become more hospitable and accessible to the visitors the City intends to attract.
Capital
Zoning
Policy/ O
perations

134 City of Baltimore Comprehensive Master Plan PLAY 135134 City of Baltimore Comprehensive Master Plan PLAY 135
StrategyMeasurable Outcomes
Implementing Bodies/Agents
Time-line
Funding Source
Return on Investment
Expand “Authen-tic Baltimore” program and link to Baltimore City Historic landmark program
• •
Increased number of participating organiza-tions and City historic Landmarks
BCHA, CHAP Years 1-6 General Funds
More tourist dollars, Positive perception of Baltimore
The Baltimore City Heritage Area created the “Authentic Baltimore” program to help identify restaurants, hotels, museums and events that authentically convey the heritage of Baltimore. This program provides participating establishments and events with the Authentic Baltimore logo that alerts customers that they are experiencing a piece of the “real” Baltimore. In order to participate in the Authentic Baltimore program, establishments must provide historical information that documents the building, establishment or event. In turn, the Baltimore City Landmark Program is administered by CHAP and provides legally-binding protection for the preservation of a historic resource. Landmark designation reports provide “authentic” well-documented history of historic properties. These reports may serve as the basis for the historical information needed in the Authentic Baltimore application.
Create more effective manage-ment agreements by completing inventory of city-owned historic/cultural sites and attractions
• •
Decreased number of vacant, City-owned structures in Balti-more
BCHA, Planning, Rec. & Parks, Housing, Mary-land Historical Trust, MOIT, DGS
Data-base: Years 1-2 Manage-ment Plan: Years 2-6
GO Bonds, General Funds, Private sponsorship
Improved stew-ardship of city-owned historic properties
The City owns very prominent historic structures (e.g. Peale, Mencken, PS 103) that need to be inventoried and better man-aged. By creating a database and management plan for these structures for which management agreements exist and enter into new management agreements with partner organizations for high-priority properties, the City will be better able to maintain and maximize the use of these properties.
Implement a feasibility study to enhance and reuse under-utilized historic structures
• • •Increased number of well-maintained historic buildings
DPW, MCC, Planning, BCPSS, Housing, BCHA, Rec & Parks, DGS
Years 1-6
General funds, GO Bonds, Gen-eral Funds, state grants
1-Increased number of taxable proper-ties. 2-Positive perception of Baltimore City
Many of Baltimore’s historic structures are owned by Baltimore City; many of these structures are vacant or underuti-lized. The reuse of these structures can increase the number of taxable properties, add commercial and civic activities to communities, and enhance the maintenance and stewardship of these properties. New zoning categories may need to be created as well as active promotion of local, state, and federal preservation tax credit programs to facilitate reuse.
Capital
Zoning
Policy/ O
perations
Objective 4: Strengthen Stewardship of Historical and Cultural Resources.

134 City of Baltimore Comprehensive Master Plan PLAY 135134 City of Baltimore Comprehensive Master Plan PLAY 135
INTR
OD
UC
TION
SU
MM
AR
Y H
ISTO
RY
KE
Y TR
EN
DS
LIVE
EA
RN
PLAY
LEA
RN
IMP
LEM
EN
TATION
MA
NA
GE
ME
NT FIN
AN
CIA
L CO
NC
LUS
ION
GLO
SS
AR
Y A
PP
EN
DIC
ES
Create Mixed-use zoning categories that allow night-life and extended closing hours where appropri-ate
•
Decreased number of variances and URPs for mixed-use, and increased nightlife in appropriate mixed-use zones
Planning/BMZA/Housing/Law/ MCC
Years 2-4 General Funds
Increased tax base and den-sity
During the comprehensive rezoning process (See Chapter IX), the City will work with residents, businesses and employees to develop mixed-use zoning categories that include options for live music and extended hours (4 am bar closing). Zoning changes would be district-specific. The new zones will use the work of the Night-Life Task Force and definitions added to the Zoning Code in 2004 to develop coherent categories for all restaurant and entertainment uses.
Objective 2: Promote Unique Retail Venues as Shopping and Tourist Destinations.
Reinstate the “Shuttle Bug” system along main streets and shopping districts within the City
•Ridership; Increased retail sales receipts
MTA; DOT, Planning, BDC, Downtown Part-nership
Years 1-3
Federal Transporta-tion, State, General Funds
Greater acces-sibility to retail
A shopping shuttle could provide direct connections around residential neighborhoods and shopping hubs. These could operate in the evening hours, on weekends, and for extended hours during holiday periods. Funding for this service would be a joint effort with the City paying one-third of the cost and the State paying two-thirds of the cost.
Designate Main Street areas as local and/or national historic districts in order to access tax credits
•
Increased number of designated Main Streets. Lower reha-bilitation costs
BDC, Planning, CHAP
Years 1-6General funds
Sales tax col-lected; greater occupancy in commercial districts
Baltimore offers specialty retail unique to the local, if not, regional market. In particular, some businesses carry products that are not available at other places on the East Coast. Much of the City’s shopping, dining, and entertainment can be found in centrally-managed centers and mixed-use complexes, or in neighborhood commercial districts. As the City con-tinues to grow, supporting the creation and expansion of local businesses and retail venues will provide an opportunity for enhancing the City’s overall quality of life.
Objective 5: Establish Baltimore City as the Region’s Center of Culture and Entertainment
StrategyMeasurable Outcomes
Implementing Bodies/Agents
Time-line
Funding Source
Return on Investment
Establish regional policy to increase regional fund-ing resources for cultural activities within Baltimore City
•
Increased funding by county jurisdictions for Baltimore City’s historic and cultural attractions
Greater Balti-more Cultural Alliance, BCHA, Baltimore city and regional county govern-ments.
Years 1-6 General Funds
Greater funding for historical and cultural at-tractions
Increased regional funding will provide better stewardship of Baltimore City’s regional historical and cultural attractions. Partnerships with the surrounding county governments will enhance revenue and State support for local attractions. Regional cooperation will be to everyone’s benefit.
Capital
Zoning
Policy/ O
perations
Goal 2: Improve Nightlife, Entertainment, and Recreation Experiences for Residents and Visitors
Objective 1: Expand Access to Nightlife

136 City of Baltimore Comprehensive Master Plan PLAY 137136 City of Baltimore Comprehensive Master Plan PLAY 137
StrategyMeasurable Outcomes
Implementing Bodies/Agents Timeline Funding
SourceReturn on
Investment
Increase retail space downtown by 400,000 sq.ft. to 1 million sq. ft.
•Increased retail square footage down-town
MTA; Planning, BDC, Downtown Partnership, Parking Author-ity
Years 1-3General Funds
Greater acces-sibility to retail
According to the Downtown Retail Study, the downtown area now has a substantial residential population that can sustain a viable retail market within a one-mile radius of the intersection of Pratt & Light streets. The area will be marketed to retail-ers in order to provide necessary goods and services to downtown residents.
Designate and support Arts and Entertainment Districts
• • •
Increased Arts and Entertainment venues in designated sections of the City
BOPA, BCHA Years 1-6GO Bonds-General Funds
Sales tax col-lected. Greater occupancy and activity in Arts and Entertain-ment districts.
Arts and Entertainment Districts are well-recognized, labeled, mixed-used areas of a city in which a high concentration of arts and cultural facilities serve as the anchor attraction. The State of Maryland has implemented a state-wide Arts and Entertainment program that provides various tax benefits to artists and businesses within a district. Station North and Highlandtown are two of Baltimore’s Arts and Entertainment Districts. The City should designate other areas of the City and continue to enhance the current arts and entertainment districts.
Objective 3: Improve Local Participation in City Recreational Activities
Develop a strategic recreational plan that will target recreational opportunities to address the City’s needs
• •Increased participa-tion in recreational programs
Rec & Parks, Planning, Com-munity Organiza-tions
Year 2Service/Use Fee, Gen-eral Funds
Recreation programs that improve lives of City residents by providing resources and opportunities they desire
Baltimore’s residents vary in age, income levels, and the neighborhoods in which they live. Recreational services that the City provides should creatively reflect the needs of the unique and diverse populations within the City. Currently, many City residents go to neighboring jurisdictions for recreational programs not offered in the City, and many County residents are heavy users of facilities such as the Du Burns and Myers Arenas. Baltimore needs to review the recreational models of other jurisdictions, such as Baltimore County, to develop the best model for the City. The recreational model should include staff-ing, volunteer training and recruiting, partnership programs and use of non-profit organizations. The model must consider the needs of Baltimore residents first and strike a balance between public and private uses of land- and water-based recre-ational facilities. The fee structure for use of recreational facilities and fields should be a sliding scale with the lowest fees to groups serving City youth. Many of our recreational facilities, such as fields, gymnasiums, marinas and indoor soccer arenas, are not well used by City residents. In many cases, lack of use is due to poor condition lack of accessibility and/or safety concerns. All facilities need to be in good condition with adequate and updated necessities such as bathrooms, lighting and equipment. Visitors and citizens are more likely to participate and support these facilities if they are in good repair. Having more active community resources will also enhance community identity and cohesion. Public and private water uses are governed by the 2003 Maritime Master Plan, to which slight amendments have been made in conjunction with this plan.
Capital
Zoning
Policy/ O
perations

136 City of Baltimore Comprehensive Master Plan PLAY 137136 City of Baltimore Comprehensive Master Plan PLAY 137
INTR
OD
UC
TION
SU
MM
AR
Y H
ISTO
RY
KE
Y TR
EN
DS
LIVE
EA
RN
PLAY
LEA
RN
IMP
LEM
EN
TATION
MA
NA
GE
ME
NT FIN
AN
CIA
L CO
NC
LUS
ION
GLO
SS
AR
Y A
PP
EN
DIC
ES
Draft and adopt a City-wide plan for parks and open space
• An adopted plan
Rec. & Parks, Planning, Transportation, Housing, DPW, DGS
Years 1-2General Funds
An integrated system of parks and open space throughout the City
The City will draft and adopt a City-wide plan in order to provide a well-maintained, accessible, and well-utilized system of parks and open space in Baltimore. This plan will set priorities for expanding the current park system by following recom-mendations in the LPRP (See Appendix X) for developing plans to acquire land that has high environmental, historic or cultural value, or can complement recreation facilities by expanding existing parks or linking existing parks and open space in the greenway network. This concept first originated from the Olmsted Brothers Landscape Architects 1904 Report Upon the Development of Public Grounds for Greater Baltimore, in which the Olmsted Brothers sought to create a comprehensive park system that connected parks and open spaces to one another, tying the City together with a web of green spaces. A modern update of this vision (One-Park) has been developed by the Parks and People Foundation. Wherever possible, incorporate City’s stormwater management goals to meet the legal requirements in the National Pollutant Discharge Elimination Permit (NPDES). This can be done by the practice of “greening” paved areas- unnecessary paved surfaces are removed at parks, schools, vacant lots and then planted with grass and native species. This reduction in paved surface helps the City meet Federal, State and local requirements and specifically meet the water pollution loading limits imposed under various Total Maximum Daily Loads (TMDL).
Locate dedicated, sustainable fund-ing sources for our parks and cultural assets
•
Increased num-ber of dedicated funding sources in place
Rec. & Parks, Planning, Fi-nance, Alliance for Great Urban Parks, DGS
Years 1-2General Funds
More predictable and sustainable park funds
The City’s park system is an important asset to residents of Baltimore. Properly maintained parks enhance property values. Baltimore City’s Department of Recreation and Parks has $138 million of deferred maintenance. In addition, the dollars spent per capita for parks and recreation maintenance is one of the lowest in the nation. It is necessary to find sustainable funding sources for the Department of Recreation & Parks in order to restore and maintain a viable park and recreation sys-tem similar to Chicago’s Gateway Green Initiative.
Goal 3: Increase the Health of Baltimore’s Natural Resources and Open Spaces for Recreation and to Improve Water Quality and to Improve Neighborhood Social, Economic, and Environ-mental Well-Being
Objective 1: Maintain a Well-managed System of Parks & Open Spaces
StrategyMeasurable Outcomes
Implementing Bodies/Agents
Time-line
Funding Source
Return on Investment
Implement Bicycle Master Plan to provide recreational op-portunities for residents
• •Increased number of cyclists, Increased number of bikeways
Rec. & Parks, Transportation, Planning, DPW
Years 1-3Federal DOT, State, MVR
Improved air quality and Improved public health
Most major cities have well developed bicycle and greenway trail networks, including Philadelphia, Chicago, Seattle and Washington, DC. To enhance and promote bicycling as a means of recreation and transportation, the City of Baltimore is creating a Bicycle Master Plan. Implementing the recommendations of the Plan will make bicycle transportation safe and ac-cessible for the largest number of people.
Capital
Zoning
Policy/ O
perations

138 City of Baltimore Comprehensive Master Plan PLAY 139138 City of Baltimore Comprehensive Master Plan PLAY 139
Meet the goals and requirements of the Chesa-peake Bay Pro-gram, the City’s National Pollution Discharge Elimi-nation Permit (NPDES) and Tributary Strate-gies
• • •
Reduced nutri-ents flowing into streams, rivers and the Bay. Im-proved fish health (reduced fish and crab consump-tion advisories for citizens). Reduced toxic pollutants.Reduction in bacterial contami-nation
Planning, DPW Years 1-6MVR, Bonds
Swimable and fishable rivers, streams and Bay by 2020
The Chesapeake Bay Program is a collaborative multi-state effort to restore and sustain the ecological health of the Chesa-peake Bay and its tributaries. This includes Baltimore Harbor, the Patapsco and Back Rivers, the streams that feed them and the contributing land area. Restoration involves treating urban runoff with management practices, restoring stream and other natural habitats and changing our lifestyle to minimize our impact on the environment. This is necessary for a sustain-able healthy community and Chesapeake Bay Ecosystem. The Tributary Strategy is also an important tool for helping the City meet these goals. Tributary strategies are detailed implementation plans to achieve the nutrient and sediment cap load allocations and are developed in cooperation with local watershed stakeholders. The City’s NPDES permit for stormwater is mandated by the Clean Water Act and requires the City to clean its waterways to improve and sustain their ecological health. Like the Chesapeake Bay Program, this is done through the treatment of stormwater with best management practices, restor-ing stream and natural habitats and changing our lifestyles to minimize our impact on the environment.
Objective 2: Protect and Enhance Baltimore’s Natural Habitat and Environmental Resources
Create park and open space zone in the Zoning Code
•
Decreased num-ber of variances and URP’s for mixed-use, In-creased mixed-use in neighborhood centers
Planning, BMZA, HCD, Law, MCC
Years 2-4
Increased tax base and density
Baltimore’s parks are currently zoned residential. This zoning designation leads to confusion, permitting developers to perceive the land is available for development. Furthermore, none of the permitted uses in residential zones are appro-priate for parks. A discrete park and open space zone should be established and park master plans should be created to better protect parkland and open space to allow for uses that are appropriate as well as for phasing of capital improvement funding.
Improve park stewardship and safety by expand-ing current parks partnership program
•
Legal language that permits Rec-reation & Parks to allow private enti-ties to lease park land, Increased number of groups adopting parks
Rec. & Parks Law, Planning
Years 1-2General Funds
Greater flexibility for Rec. & Parks in the management of parks, greater funds from leases; Reduced costs for parks maintenance through cooperative partnerships
The Baltimore City Department of Recreation and Parks currently has 34 official partnerships with organizations through-out the City. However, the Baltimore City Charter limits the ability of the Department of Recreation and Parks to enter into partnerships with private partners to lease park property. A charter amendment would provide greater flexibility for more creative partnerships, facilitate stronger private connections and allow organizations to take the lead in keeping neighborhood parks attractive, clean, safe and programmed with structured activities.
StrategyMeasurable Out-
comesImplementing Bodies/Agents
Time-line
Funding Source
Return on Investment
Capital
Zoning
Policy/ O
perations

138 City of Baltimore Comprehensive Master Plan PLAY 139138 City of Baltimore Comprehensive Master Plan PLAY 139
INTR
OD
UC
TION
SU
MM
AR
Y H
ISTO
RY
KE
Y TR
EN
DS
LIVE
EA
RN
PLAY
LEA
RN
IMP
LEM
EN
TATION
MA
NA
GE
ME
NT FIN
AN
CIA
L CO
NC
LUS
ION
GLO
SS
AR
Y A
PP
EN
DIC
ES
Develop a Waterway Trash Management Plan to ensure compliance with the National Pol-lutant Discharge Elimination Permit
• •
Improve wa-ter quality and reduce trash in Baltimore’s bodies of water
Planning, BDC, USACE, Water-shed Associa-tions
Years 2-5
MVR, Fed-eral USACE funds, Private funds
Improved water quality and reduction of trash in bodies of water
Floatable trash is a major problem impacting Baltimore’s harbor and waterways. Trash is washed off of the street system into the storm drains and deposited into streams and eventually the harbor. Floatable trash is unsightly; it smothers wet-lands and wildlife habitat, carries bacteria, and damages the engines of recreational vessels. A plan is needed to identify methods for trash reduction, such as educating the public about the impacts of trash, improving infrastructure (optimizing locations of trash cans, recycling, etc.), waste reduction, clean-up campaigns and building trash interceptors at storm drain outfalls and catching trash before it enters streams. The National Pollutant Discharge Elimination Permit for Stormwater requires the City to remove contaminants from our waterways by managing or controlling stormwater runoff from ten percent of the City’s impervious area every five year permit cycle.
Construct one ultra-urban Best Management Practices (BMP) per year as identi-fied in the Water-shed 263 Plan
• •
Creation of the BMPs, Less storm-water pollution runoff
Planning, DPW, Transportation, Housing, DGS
Years 1-6 MVREnhanced open space, Cleaner streams and Bay
BMPs (such rain gardens, bioretention areas, dry and wet swales) are identified in the Watershed 263 Plan to aid in reducing storm water pollution run-off. The premise behind Watershed 263 is to improve the environmental quality and in doing so improve the quality of life. Trash and litter are among the quality of life issues to be addressed through government action (e.g., street sweeping) and neighborhood stewardship. One of the goals of the project is to improve the aesthetics of the area by cleaning and greening the numerous vacant lots. Studies have shown that introducing “natural” green-scapes into blighted urban areas improves neighborhood “cleanliness” and overall sense of “well-being”. The Watershed 263 Project is the test-ing-ground for the integration of environmental and sustainable community objectives across governmental agencies. The Department of Public Works has developed a plan that identifies best management practices to meet the water quality goal of the project and helps the City meet its NPDES permit requirement.
Restore and pro-tect at least one mile per year of streams and river banks in flood-plains and stream valleys
• •
Increase in miles of restored buffers and acreage of protected flood-plains. Improved water quality
DPW, Planning, Rec & Parks
Years 1-5
MVR funds, CA offset fees, State funds (mitigation projects)
Increased water qual-ity/better flood con-trol/better habitat
Stream restoration projects protect floodplains and stream valleys and improve water quality by reducing erosion and im-proving natural habitat. They also help the City comply with its NPDES requirement to restore 10 percent of its impervious area every 10 years. Managing water storage areas for flood water stabilizes property boundaries by reducing flood damage and preventing loss of structures. In addition, restored streams provide active and passive recreational opportunities, such as picnicking, sightseeing, fishing and swimming. Many people also enjoy camping, hiking, jogging, or bicycling near a stream.
StrategyMeasurable Outcomes
Implementing Bodies/Agents Timeline Funding
SourceReturn on
Investment
Capital
Zoning
Policy/ O
perations

140 City of Baltimore Comprehensive Master Plan PLAY 141140 City of Baltimore Comprehensive Master Plan PLAY 141
StrategyMeasurable Outcomes
Implementing Bodies/Agents
Time-line
Funding Source
Return on Investment
Target sidewalk, lighting and signal improvements near parks and open space
•
Increased num-ber and quality of lights, In-creased pedes-trian activity in tourist areas
Planning, BACVA, BDC, Downtown Partnership, Transportation, DGS, Public Works
Years 2-4General Funds, GO Bonds, Hotel Tax
Increased Hotel Tax Revenues. Improved Percep-tion of City of Baltimore by visitors
This will be an integral part of the City’s pedestrian plan (See LIVE, Goal 3, Objective 1, Strategy 1). Improving the access and physical environment around the City’s parks and open space will allow residents, particularly children, to enjoy both neigh-borhood parks and City-wide open spaces.
Develop a plan to reduce trash within and along Baltimore’s parks and open space
• •Decreased vol-ume of trash in public spaces
DPW, Planning, Watershed Associations
Year 3MVR funds, Federal Private funds
More attractive, cleaner neighbor-hoods, parks and streets, better water quality and habitat
Create a comprehensive City-wide sanitation plan (See LIVE, GOAL 1, OBJECTIVE 3, STRATEGY 3).
Complete plans for and creation of Greenway Trail system
• •
Increased num-ber of complet-ed trail miles, Increased con-tiguous land and habitat areas
Rec & Parks, Transportation, Planning
Years 1-6MVR, GO Bonds, General Funds, Federal
Improved envi-ronmental qual-ity and Access to recreation
Restoring green spaces and protecting riparian buffers in stream valleys improve water quality and provide habitat for wildlife. The City will plan and complete the Jones Falls and Herring Run Greenway Trails and connect them to the In-ner Harbor Promenade.
Increase Balti-more’s green infrastructure by increasing the number of trees and tree canopy size (See LIVE, GOAL 1, Objec-tive 3, Strategy 6)
• •
Increased number of street trees, Increased lon-gevity of trees, Increased con-tiguous land and habitat areas
Rec & Parks, Forestry, Plan-ning, DPW, Transportation, MD DNR, USFS, Private Sector, DGS
Years 2-6MVR funds, General Funds, GO Bonds
Higher prop-erty values, lower energy costs.Improved air and water quality
Trees are an important part of the City’s infrastructure. Trees provide shade and cool the air, lowering temperatures through-out the City. They filter pollution and particulates, cleaning both our water and air. The presence of trees has been shown to have positive psychological benefits--reducing stress and improving health. Some studies even link trees to reduced crime rates. However, Baltimore’s tree population is in decline. The City is setting Urban Tree Canopy Goals for the area and creating a Comprehensive Forestry Management Plan to help Baltimore meet the tree canopy goals (See Appendix BB).
Capital
Zoning
Policy/ O
perations

140 City of Baltimore Comprehensive Master Plan PLAY 141140 City of Baltimore Comprehensive Master Plan PLAY 141
INTR
OD
UC
TION
SU
MM
AR
Y H
ISTO
RY
KE
Y TR
EN
DS
LIVE
EA
RN
PLAY
LEA
RN
IMP
LEM
EN
TATION
MA
NA
GE
ME
NT FIN
AN
CIA
L CO
NC
LUS
ION
GLO
SS
AR
Y A
PP
EN
DIC
ES
StrategyMeasurable Outcomes
Implementing Bodies/Agents
Time-line
Funding Source
Return on Investment
Complete the Harbor Prome-nade and Middle Branch park/trail systems
• •
Completion of seven mile promenade along Harbor waterfront.Completion of public water-front access along entire shoreline of Middle Branch
Planning, Rec. & Parks, Trans-portation, BDC, Inner Harbor Task Force
Years 1-6GO Bonds, General funds, state funds, federal funds
Greater access to Baltimore’s waterfront
Baltimore’s waterfront is one of its greatest natural assets and should be available for all to enjoy. The City must protect public access to the waterfront. Access to waterfront resources should be available and accessible to everyone. At comple-tion, the Inner Harbor Promenade will extend from Canton Crossing to the Museum of Industry.
Capital
Zoning
Policy/ O
perations
Objective 3: Ensure Public Access to the Waterfront

142 City of Baltimore Comprehensive Master Plan LEARN 143142 City of Baltimore Comprehensive Master Plan LEARN 143
LEARNMarket AnalysisA. The Industry
The Baltimore learning industry encompasses all opportunities to enhance the education of city residents and other potential consumers. Learning products are available for all ages and education levels. The City’s learning resources are valuable both to enhance the education of City residents as well as to at-tract new residents to the City. The products that are necessary to accomplish these goals include:
1. Public and private schools, from kindergarten through high school
2. Higher education, including two and four year undergraduate curriculums, post graduate studies and continuing education
3. Lifelong learning, designed to improve the employment prospects, school readiness, and/or societal and political participation of those not served by traditional K-16 schools.
B. Customers
The customers for learning activities are widely varied, with different markets for each of the main products. For each of the target customer groups, the key issues in selecting educational resources are the quality of the product, both real and perceived, the cost of the product and its convenience. Public schools are probably the most important product in the City’s overall education market and contribute heavily to the overall health of the City. For public schools, the customers are the parents of school-age children as well as the students themselves. Other important target markets include the parents

142 City of Baltimore Comprehensive Master Plan LEARN 143142 City of Baltimore Comprehensive Master Plan LEARN 143
INTR
OD
UC
TION
SU
MM
AR
Y H
ISTO
RY
KE
Y TR
EN
DS
LIVE
EA
RN
PLAY
LEA
RN
IMP
LEM
EN
TATION
MA
NA
GE
ME
NT FIN
AN
CIA
L CO
NC
LUS
ION
GLO
SS
AR
Y A
PP
EN
DIC
ES
of students approaching school age, as well as parents with children who are in the process of making a school enrollment or relocation decision. Perceptions of specific school options available in a neighborhood, as well as perceptions of the school system as a whole, greatly influence attendance patterns.For higher education programs, the consumers are the students as well as the par-ents of prospective students who are often minors at the time of the enrollment decision. The primary considerations made by these customers are quality of the educational institution, availability of desired programs, and the value of the pro-gram or institution in terms of both cost and prestige. Location is also a factor in selecting higher education goods, both for local residents choosing from nearby institutions as well as for regional, national and international consumers. Con-sumers are drawn to the quality of many of the City’s offerings as well as the amenities and convenience offered by a program’s location in Baltimore and the mid-Atlantic region.For lifelong learning programs, the target customers include people with a specific education goal, such as those who want to improve their literacy and other basic skills, earning potential, or English language skills, as well as people with more general interests, such as those who want to utilize school readiness programs or personal enrichment programs. In addition to these elective participants in com-munity education, important target customers include prisoners reentering civilian life, of which the City has the largest share in the state.For each of these target markets, the quality of the educational products the City offers is an important factor in getting customers to utilize the products. The qual-ity of the products can also assist in attracting new residents to the City and suc-cessfully creating and retaining lifelong learners.

144 City of Baltimore Comprehensive Master Plan LEARN 145144 City of Baltimore Comprehensive Master Plan LEARN 145
C. Market Size and Trends
Elementary and Secondary Education
For public education in the City, the number of potential consumers has shrunk as the City’s overall population has declined. To a certain extent, the quality, perceived and real, of the public education institutions in the City has negative-ly affected both public school enrollment and the market size, as reflected by the number of school age children living in the City. As the number of school-age children in the City has declined to 141,515, the public school system en-rollment has shrunk to 86,300 at the present time. Of the remaining 55,000 school-aged children, more than 17,000 are enrolled in the City’s private/pa-rochial schools, many are home-schooled, and some are not yet enrolled in early-learning programs. However, the largest percentage of non school-going children is between the ages of 16 and 19 who are unable or have chosen not to continue their high school education. Many strategies in EARN are specifically geared to ensuring these children have job-readiness skills necessary for future employment. Statistics and data on all schools within the Baltimore City Public School Sys-tem (BCPSS) can be found in the Comprehensive Educational Facilities Master Plan (CEFMP) required by the State. The master plan is developed by the Balti-more City Public School System and must be submitted by July 1 of each year. The plan must include goals, standards, guidelines, community analysis includ-ing trends and projections and facility needs analysis. The CEFMP includes detailed data on facilities, projections on enrollment as well as community analysis. The CEFMP is referenced in this plan (See Appendix W). The State also requires a five year Capital Improvement Program. In the medium-range future, the City is not expected to generate additional demand for public school facilities through population growth. Despite this fact, there may develop sub-markets within the City that will grow significantly over the next few decades, causing localized strains on facilities, even as City-wide enrollment remains stable. Within this overall stable enrollment, there may also be the need for the expansion of certain programs such as English as a Second Language as the City’s population changes through increased immigration.
Higher Education
The market for Baltimore’s higher education products is truly international in nature. However, several products within the market have a tighter local or regional focus. The overall enrollment in the City’s higher education institu-tions was 48,736 in 2000. Additionally, there are two large state universities and two smaller private colleges in Baltimore County totaling approximately 33,000 students. Despite their locations outside the City limits, these institu-tions are active contributors to Baltimore’s intellectual life and economy. The market demand for higher education in Baltimore is increasing as competition for entry into many of Maryland’s public and private colleges and universities has grown. If this trend continues and enrollment capacity is not increased, students may be forced to leave the state to pursue higher education and some may be discouraged from entering higher education altogether.
Lifelong Learning
The market for lifelong learning programs is affected by several key variables: the number of individuals needing and desiring adult education or skills train-ing, the level of immigration into the City, the number of convicts returning to society and the number of children between 0-5 years of age. The market could fluctuate widely according to demographic changes and efforts to mobilize and

144 City of Baltimore Comprehensive Master Plan LEARN 145144 City of Baltimore Comprehensive Master Plan LEARN 145
INTR
OD
UC
TION
SU
MM
AR
Y H
ISTO
RY
KE
Y TR
EN
DS
LIVE
EA
RN
PLAY
LEA
RN
IMP
LEM
EN
TATION
MA
NA
GE
ME
NT FIN
AN
CIA
L CO
NC
LUS
ION
GLO
SS
AR
Y A
PP
EN
DIC
ES
motivate target populations. Although there is an extremely high potential for demand, utilization is largely determined by accessibility and awareness of the programs offered.
D. Location
Population shifts over the last fifty years have created a situation whereby Bal-timore’s public school locations do not match current demographic patterns. The population shifts created uneven utilization of facilities, resulting in both overcrowded and underutilized school buildings. A Facilities Master Plan has been adopted by the BCPSS Board of Commissioners that attempts to better match school facilities with student populations. Additionally, the school build-ings to be selected for future use should be in locations where neighborhood quality can be enhanced. To make the location process the most effective, the transportation and bike/pedestrian routes to the school locations should have maximum accessibility and safety. For higher education institutions, being located in the Baltimore region as well as the heavily populated eastern seaboard presents a competitive advan-tage over institutions in less populated or less accessible locations. Similarly, the proximity of higher education institutions to both the local job market as well as other major employment centers, such as Washington, DC and Phila-delphia, presents an opportunity for the schools to market their Baltimore location as an advantage over many competitors. Additionally, because Bal-timore is part of a large metropolitan region, the City also benefits from the nearby presence of several institutions of higher education readily accessed by City and regional residents.Lifelong learning opportunities are located throughout the City, in non-prof-its, churches, schools, licensed and unlicensed private homes, and City service centers. A major gateway to lifelong learning opportunities and a source of access to information needed for formal and informal education support is the Enoch Pratt Free Library (EPFL), the city’s public library system with twenty-two agencies, two bookmobiles, two kiosks and multiple deposit collections throughout the city. It is important that these programs are located near or are otherwise easily accessible to those most in need of basic education and skills training. These facilities should be located so that they are readily accessible by public transportation as well as near places of employment and residence for these learners.
E. Competition
For public schools, the main competitors are public school districts in sur-rounding counties as well as private schools within and near the City. The per-ceived quality of the surrounding districts and the private schools may reduce the City’s public school enrollment. However, in the case of private schools, these schools allow people to remain in the City who might otherwise move to another jurisdiction because they do not want to send their children to Balti-more’s public schools. Furthermore, in some cases, the excellent reputation of Baltimore’s private schools may be the motivating factor that causes parents of school children to choose to reside within the City. Despite not sending their children to public schools, the parents of private school children make indirect contributions to the school system’s budget through their property taxes. The more immediate competitors are public school districts in the surrounding ju-risdictions. To improve their position in relation to these competitors, and to improve the City’s overall competitiveness as a place to live, the Baltimore City Public Schools will have to better market their existing strengths while improving performance system-wide.

146 City of Baltimore Comprehensive Master Plan LEARN 147146 City of Baltimore Comprehensive Master Plan LEARN 147
For the City’s higher education institutions, the competition is defined in relation to the niche market of each school. Baltimore has a diverse array of schools, each of which competes with its peers. In some cases peers are defined by geography, such as competition among State institutions or other institutions in the Mid-Atlantic region. In other cases, peers are defined by program, such as liberal arts program, law school, medical school, arts program, community college, etc. Peers are also defined by price, prestige, demographics, religious affiliation, etc. Regardless of their different market niches, all institutions located in Baltimore have a built-in advantage over non-metropolitan institutions due to their proximity to the cultural, enter-tainment and other amenities a big city offers. Enhancements made to the residential and business areas surrounding the schools can further increase these schools’ attractiveness and can assist in promoting Baltimore as a top college destination. As mentioned above, Baltimore, unlike many competi-tors, is near several employment centers, which students can take advantage of both during and after their educational experiences. Lifelong learning programs, provided by non-profits and city agencies, often compete with for-profit programs offering similar products. For the most needy customers, the cost of for-profit programs leads them to seek public or non-profit providers of these services. Lifelong learning programs must also compete with barriers in the lives of the customer. For example, exist-ing income pressures can push an individual to take a second job instead of participating in a training opportunity.
Products & ServicesA. Products and Services Offfered
The educational products and services offered in Baltimore City fall into three categories: Elementary/Secondary Education, Higher Education and Continu-ing Education/Lifelong Learning programs. These three areas comprise the majority of educational products and services available in Baltimore.
Elementary/Secondary Education includes Pre-Kindergarten through 12th grade. This level of schooling is expected to provide the skills training and general knowledge necessary to be a competitive member of America’s soci-ety and economy. According to the U.S. Census, sixty-five percent of school age children in Baltimore are enrolled in the Baltimore City Public School System. Approximately 86,000students are enrolled at the city’s 192 schools: 122 elementary or elementary-middle schools, 23 middle schools and 34 high schools. These schools offer a combination of general and specialized edu-cational programs that focus on general proficiency. The City also has nu-merous options available for private or religious-based schooling. Private schools vary by type, size, cost, gender, etc. There are 117 private and paro-chial schools attended by a total of 17,523 students. These enrollment figures include substantial numbers of students who reside outside the City limits. (See Appendix Y)
Higher Education in Baltimore includes products ranging from Certificate and Associate degree programs to advanced professional and research de-gree offerings. The City has 14 institutions of higher education enrolling over 47,000 students. The range of institutions available in the City includes public universities, a major private research university, Catholic and Hebrew colleges and universities, schools for the visual arts and music, historically

146 City of Baltimore Comprehensive Master Plan LEARN 147146 City of Baltimore Comprehensive Master Plan LEARN 147
INTR
OD
UC
TION
SU
MM
AR
Y H
ISTO
RY
KE
Y TR
EN
DS
LIVE
EA
RN
PLAY
LEA
RN
IMP
LEM
EN
TATION
MA
NA
GE
ME
NT FIN
AN
CIA
L CO
NC
LUS
ION
GLO
SS
AR
Y A
PP
EN
DIC
ES
black colleges and universities and a culinary college. While the majority of the students at the City’s higher education institutions are enrolled in undergradu-ate programs, several institutions have graduate offerings as well. Additionally, many of Baltimore’s colleges and universities offer enrollment on a part-time basis, making these programs attractive to individuals looking to improve their career opportunities or otherwise expand their knowledge.
Continuing Education/Lifelong Learning includes offerings not fitting into the elementary, secondary or higher education markets. These programs include English as a Second Language, early childhood education, prisoner re-entry ser-vices, workforce readiness training, personal enrichment classes, and summer youth programs.
B. Competitive Advantage
The City has several unique market positions in its educational products and service offerings. These positions help distinguish the City of Baltimore from surrounding jurisdictions as well as regional, national and international competi-tion, depending on the market for the specific product offered.
In the elementary and secondary education segment, both public and private schools offer distinctive products that contribute to Baltimore’s position in re-lation to its competitors. Baltimore is developing a unique high school system in which students entering high school have a choice among numerous differ-ent programs ranging from technical education to small specialized programs and college preparatory programs. In addition, four Baltimore City public high schools are among the top ten ranked schools in the state of Maryland: Balti-more City College, Baltimore Polytechnic Institute, Western High School, and Baltimore School for the Arts. These schools are a strong factor in attracting and retaining City residents with children in or nearing their high school years. In addition to the typical public/private split, there is an emerging sector being created by the development of charter schools within the City. These schools of-fer specialized curricula or teaching approaches that, if successful, could attract new residents to neighborhoods that were less marketable due to problems with the perception of school quality.
Proprietary positions held by the private schools are mostly based on the avail-ability of specialized curricula, selective admissions, programs focused on spe-cial needs students and schools affiliated with religious sects. These schools add tremendous range to Baltimore’s educational market. In many cases the avail-ability of private schools places Baltimore at a competitive advantage among families who prefer these specialized and prestigious programs.
Local higher education institutions have proprietary positions based on their quality and unique programs. Baltimore is home to the only law, medical, and public health schools in Maryland. The Johns Hopkins Schools of Medicine and Public Health have few peers in the United States or internationally.
Continuing Education/Lifelong Learning programs in Baltimore City, as in most metropolitan areas, are very diverse in order to serve a wide variety of populations with programs tailored to that population. These programs are often located in proximity to the population that they serve. The variety and specificity of these offerings make Baltimore stand out from surrounding counties.

148 City of Baltimore Comprehensive Master Plan LEARN 149148 City of Baltimore Comprehensive Master Plan LEARN 149
C. Customer Perceptions
Perception of Baltimore’s public education products varies widely. The public school system is perceived positively in terms of convenience, cost, and the quality of some of the specialized program offerings. However, overall perfor-mance, safety, and the physical condition of the schools are perceived as nega-tive factors. The private schools in the City perform well in terms of prestige, performance, and safety. However, since these schools are few in number and are essentially luxury goods, they are perceived less well in the categories of convenience, value and accessibility. The overall product of higher education in the City is too varied to be sum-marized by broad generalizations. Because of the City’s large range of higher education products, the overall perception is that there are suitable selections to fit all desired price levels, convenience and program needs. Selection of a Continuing Education/Lifelong Learning product is most influ-enced by accessibility. Accessibility includes physical access and proximity, cultural relativity, and individual perceptions. Additionally, neighborhood pub-lic library branches serve as information centers and a “people’s university” for the segment of the population unaffiliated with higher learning institutions.
D. Comparative Analysis
Baltimore’s education market position in relation to its competitors is gener-ally strong, but is dependent on the specific product or service offered. By far, the weakest position is that of the Baltimore City Public School System when compared against surrounding jurisdictions on a system-by-system basis. Over-all, BCPSS is weaker both in terms of performance on standardized tests and the condition of school facilities. However, the City schools fare better when considering special programs, such as the citywide magnet high schools. De-spite this fact, the education that the average and below-average student receives within the City schools remains a significant weakness in the Baltimore educa-tional product.
Higher education in the City is highly competitive on the basis of individual in-stitutions and programs. The City further distinguishes itself from the competi-tors through the combined effect of having numerous colleges and universities in close proximity to one another in an urban setting. The Baltimore Collegetown Network (BCN) adds to this value by bringing area colleges and universities to-gether with government, business and community leaders to develop and market Baltimore as a vibrant place to live and learn. This collaboration was initiated to address the lack of public transportation options available to the area’s college students. As the BCN continues to grow, the organization works to strengthen the links among the city’s educational, cultural and community institutions to maximize the creative energy they represent.
The City has an advantage in providing lifelong learning due to the proximity of City residents and workers to community education facilities. Similarly, for programs offered through non-profit organizations, Baltimore has been the locus for the vast majority of non-profit organizations for a long period of time. While surrounding jurisdictions may be ahead of the City in terms of the quality of of-ferings in some areas—especially better funded suburban community colleges in comparison to Baltimore City Community College—the overall offerings of the City are tailored to a wider audience of education-seekers.

148 City of Baltimore Comprehensive Master Plan LEARN 149148 City of Baltimore Comprehensive Master Plan LEARN 149
INTR
OD
UC
TION
SU
MM
AR
Y H
ISTO
RY
KE
Y TR
EN
DS
LIVE
EA
RN
PLAY
LEA
RN
IMP
LEM
EN
TATION
MA
NA
GE
ME
NT FIN
AN
CIA
L CO
NC
LUS
ION
GLO
SS
AR
Y A
PP
EN
DIC
ES
LEARN
Goals and Objectives
One of the greatest benefits of being at the center of a major metropolitan area is the availability of a robust educational network that provides a wide range of services to a diverse market both locally and beyond. The components of this network - BCPSS, private schools, public libraries, Colleges and Univer-sities, and Lifelong Learning opportunities - must be accessible to existing and potential customers in order to not only prepare Baltimoreans for 21st Century social and economic realities, but also create a culture of learning within families and communities. The goals outlined in this section have been developed to respond to the needs of all learners in the City and maxi-mize the City’s potential as an engaging place to LEARN:
Goal 1: Improve Public Schools and Libraries
Goal 2: Capitalize on Untapped Potential of Higher Education Institutions
Goal 3: Encourage a Culture of Learning by Enhancing Educational and Vo-cational Opportunities for all Baltimoreans
Goal 4: Ensure Safe and Convenient Transportation to and from Education-al Facilities
The major deficits in our educational network include aging and outdated public school facilities, underutilized resources of a rich higher education network, lack of support for lifelong learning providers with a rising need for their services, and inadequate, unsafe access to these resources. We need to address these deficits to create more opportunities, highlight education as worthwhile, and foster a culture of learning for all citizens of Baltimore.

150 City of Baltimore Comprehensive Master Plan LEARN 151150 City of Baltimore Comprehensive Master Plan LEARN 151
LEARN
Goal 1: Improve Public Schools and Libraries
Objective 1: Adopt Facilities Master Plan to Better Utilize School Facilities
• Eliminate poor building conditions within school facilities
• Create school facilities that effectively support learning, teaching, and community activities
• Develop and implement menu of options for greening school facilities
Objective 2: Enhance Schools and Libraries as Neighborhood Assets
• Develop a Community Schools Policy to facilitate the use of school build-ings beyond the school day
• Create a dozen community school centers, with dedicated space for com-munity uses
• Ensure access to public library services for all residents
• Ensure reuse of surplus school facilities is timely and compatible with sur-rounding neighborhoods
Goal 2: Capitalize on Untapped Potential of Higher Education Institutions
Objective 1: Attract and Retain College Students and Recent Graduates
• Market Baltimore as a higher education hub and a great place to live and work after college
• Increase funding for internships, service learning, fellowships, and men-toring for students pursuing higher education
Objective 2: Encourage Partnerships between and among Universi-ties and the City (See also EARN, Goal 1, Objective 1)
• Establish a City liaison to integrate higher education institutions into the City’s economic development program
• Create a mechanism to adopt campus master plans
Objective 3: Improve the Physical Relationship Between Campuses and Adjacent Neighborhoods
• Develop a new zoning district that encompasses mixed-use development related to residential neighborhoods, college, and universities

150 City of Baltimore Comprehensive Master Plan LEARN 151150 City of Baltimore Comprehensive Master Plan LEARN 151
INTR
OD
UC
TION
SU
MM
AR
Y H
ISTO
RY
KE
Y TR
EN
DS
LIVE
EA
RN
PLAY
LEA
RN
IMP
LEM
EN
TATION
MA
NA
GE
ME
NT FIN
AN
CIA
L CO
NC
LUS
ION
GLO
SS
AR
Y A
PP
EN
DIC
ES
Goal 3: Encourage a Culture of Learning by Enhancing Educational and Vocational Opportunities for all Baltimoreans
Objective 1: Improve and Expand School Readiness Opportunities for Baltimoreans 5 Years Old and Younger
• Prioritize City funding for school readiness related activities
• Increase opportunities to locate school readiness programs and support services in public schools, such as ‘Judy Centers’
• Co-locate tot lots at schools
Objective 2: Improve and Expand Workforce Development and Job Readiness through Education and Job Training (See EARN, Goal 2, Objective 1)
Objective 3: Improve and Expand Learning Opportunities for all Balti-moreans to Create Active and Well-educated Citizens
• Create a coordinating entity for lifelong learning service providers
• Create opportunities for continuing education programs to locate in Balti-more
• Broaden access to job training centers and increase awareness of profes-sional development opportunities
Goal 4: Ensure Safe and Convenient Transportation to and from Educational Facilities
Objective 1: Improve Pedestrian and Bicycle Access to Schools and Libraries
• Implement “Safe Routes to School” Program at schools.
• Implement physical improvements near educational facilities to ensure safe access
• Coordinate implementation of Bicycle Master Plan with school facilities plan.
Objective 2: Encourage the use of public transit to travel to schools
• Develop transit routes, schedules and amenities to provide reliable trans-portation to schools
• Integrate college-based shuttle services with public transit
• Make reduced fare transit programs available to all college students

152 City of Baltimore Comprehensive Master Plan LEARN 153152 City of Baltimore Comprehensive Master Plan LEARN 153
StrategyMeasurable Outcomes
Implementing Bodies/Agents
Time-line
Funding Source
Return on Investment
Eliminate poor building condi-tions within school facilities.
• •
Increased percentage of children attending facili-ties that meet standards
MCC, BCPSS, Planning, State Department of Education, Public Works
Years 1-6GO Bonds, Federal and State Grants, General Funds
Better learning environments and more efficient operations
Many schools are currently in poor condition, which means that building systems are at the end of their useful life. Typically, the entire building is in need of major repair. New roofs, windows, interior finishes, cabinetry, floors, ceilings, electrical up-grades, ADA improvement, and other modifications are needed. Through the Facilities Master Plan, the school system will con-sider community input, building condition, school design, age of buildings, current and projected enrollment, school accessibili-ty (especially by foot and transit) and historical significance in formulating a master plan to outline renovation, replacement and new construction for all school property. Based on anticipated savings in operating and maintenance costs by reducing square footage, the master plan will allow the system to eliminate the poor conditions that exist in many of the schools. Baltimore City’s Green Building Task Force released the final report with recommendations for policies and programs to promote building in compliance with Green Building (LEED) standards for new and rehabilitated private and public commercial and residential structures.
Create school facilities that ef-fectively support learning, teach-ing, and commu-nity activities.
• •
Increased per-centage of chil-dren attend-ing facilities designed for their academic programs
BCPSS, Plan-ning, State Department of Education
Years 1-6GO Bonds, Federal and State Grants, General Funds
Better facilities for all educational programs
Academic programs have changed significantly in the past decade, and school facilities need to be aligned with these changes, as well as with community preferences. It is likely that interior reconfiguration of space will be required to meet program standards. During the 1970’s, many open space classrooms were built, and in most cases, the school community now wants to eliminate open space classrooms. Advances in technology mean that schools need to be equipped with computer labs and internet connections. The high school reform movement proposes smaller high schools, which means buildings need to be retrofitted. Opportunities for career technology education should be increased, which means creating specialized classroom spaces to allow students hands-on education experiences.
Develop and implement menu of options for greening at least 3 school facilities per year.
•Better design and lower util-ity costs
BCPSS with assistance from other City agen-cies, such as Rec & Parks
Years 1-6 General Funds
Environmentally friendly and more aesthetically at-tractive buildings
Recognizing the large amount of land devoted to schools, the City needs to update existing school facilities to current environ-mental standards and techniques. This could include LEED standards, removal of impervious surfaces, green roofs, alternative parking lots, natural landscaping and solar panels. Baltimore City’s Green Building Task Force released the final report with recommendations for policies and programs to promote building in compliance with Green Building (LEED) standards for new and rehabilitated private and public commercial and residential structures. In many neighborhoods, school facilities offer the greatest opportunity to provide public open spaces as both a recreational and natural resource for the community.
Capital
Zoning
Policy/ O
perations
Goal 1: Improve Public Schools and Library FacilitiesObjective 1: Adopt Facilities Master Plan to Better Utilize School Facilities
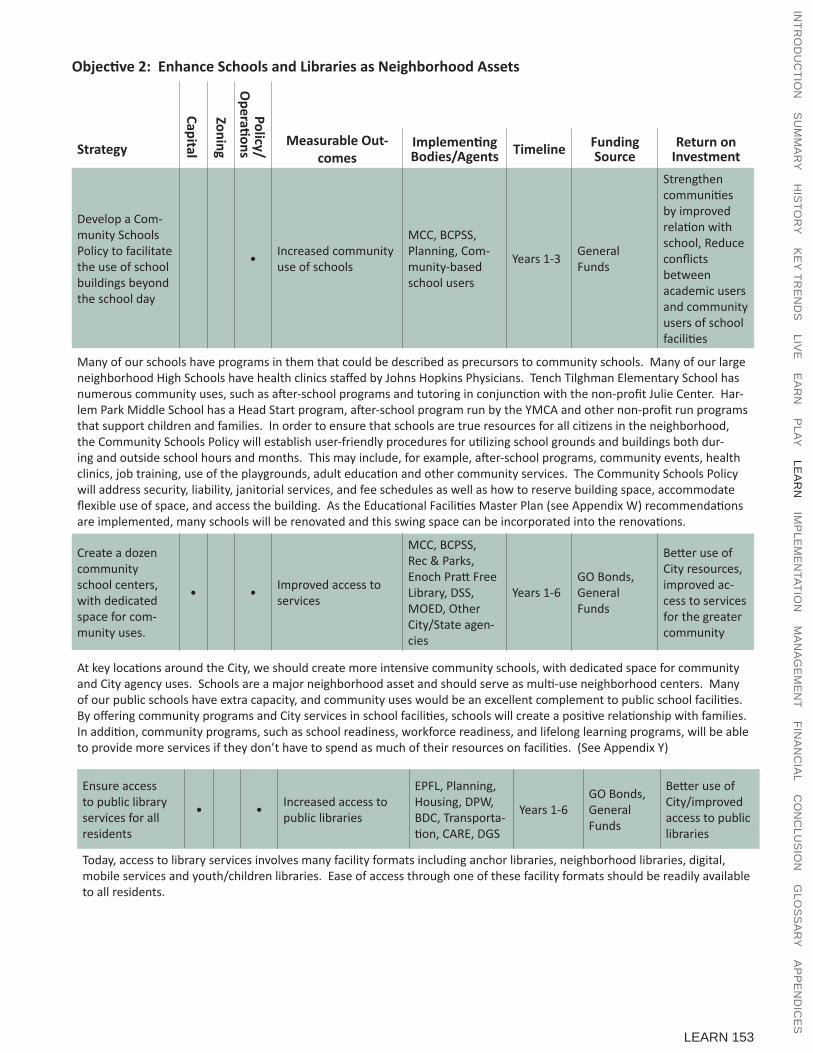
152 City of Baltimore Comprehensive Master Plan LEARN 153152 City of Baltimore Comprehensive Master Plan LEARN 153
INTR
OD
UC
TION
SU
MM
AR
Y H
ISTO
RY
KE
Y TR
EN
DS
LIVE
EA
RN
PLAY
LEA
RN
IMP
LEM
EN
TATION
MA
NA
GE
ME
NT FIN
AN
CIA
L CO
NC
LUS
ION
GLO
SS
AR
Y A
PP
EN
DIC
ES
StrategyMeasurable Out-
comesImplementing Bodies/Agents Timeline Funding
SourceReturn on
Investment
Develop a Com-munity Schools Policy to facilitate the use of school buildings beyond the school day
•Increased community use of schools
MCC, BCPSS, Planning, Com-munity-based school users
Years 1-3General Funds
Strengthen communities by improved relation with school, Reduce conflicts between academic users and community users of school facilities
Many of our schools have programs in them that could be described as precursors to community schools. Many of our large neighborhood High Schools have health clinics staffed by Johns Hopkins Physicians. Tench Tilghman Elementary School has numerous community uses, such as after-school programs and tutoring in conjunction with the non-profit Julie Center. Har-lem Park Middle School has a Head Start program, after-school program run by the YMCA and other non-profit run programs that support children and families. In order to ensure that schools are true resources for all citizens in the neighborhood, the Community Schools Policy will establish user-friendly procedures for utilizing school grounds and buildings both dur-ing and outside school hours and months. This may include, for example, after-school programs, community events, health clinics, job training, use of the playgrounds, adult education and other community services. The Community Schools Policy will address security, liability, janitorial services, and fee schedules as well as how to reserve building space, accommodate flexible use of space, and access the building. As the Educational Facilities Master Plan (see Appendix W) recommendations are implemented, many schools will be renovated and this swing space can be incorporated into the renovations.
Create a dozen community school centers, with dedicated space for com-munity uses.
• •Improved access to services
MCC, BCPSS, Rec & Parks, Enoch Pratt Free Library, DSS, MOED, Other City/State agen-cies
Years 1-6GO Bonds, General Funds
Better use of City resources, improved ac-cess to services for the greater community
At key locations around the City, we should create more intensive community schools, with dedicated space for community and City agency uses. Schools are a major neighborhood asset and should serve as multi-use neighborhood centers. Many of our public schools have extra capacity, and community uses would be an excellent complement to public school facilities. By offering community programs and City services in school facilities, schools will create a positive relationship with families. In addition, community programs, such as school readiness, workforce readiness, and lifelong learning programs, will be able to provide more services if they don’t have to spend as much of their resources on facilities. (See Appendix Y)
Ensure access to public library services for all residents
• •Increased access to public libraries
EPFL, Planning, Housing, DPW, BDC, Transporta-tion, CARE, DGS
Years 1-6GO Bonds, General Funds
Better use of City/improved access to public libraries
Today, access to library services involves many facility formats including anchor libraries, neighborhood libraries, digital, mobile services and youth/children libraries. Ease of access through one of these facility formats should be readily available to all residents.
Capital
Zoning
Policy/ O
perations
Objective 2: Enhance Schools and Libraries as Neighborhood Assets

154 City of Baltimore Comprehensive Master Plan LEARN 155154 City of Baltimore Comprehensive Master Plan LEARN 155
Ensure reuse of surplus school facilities is timely and compatible with surrounding neighborhoods
•
No vacant, boarded school buildings (minimal time build-ing is idle)
Planning, Hous-ing, BDC, BCPSS, DGS
Years 1-6
General Funds, BCPSS Real Estate sales revenue
Strengthen communities by positively reusing former school prop-erty. Reused buildings are an asset to their neighborhood.
Understanding that the facilities plan is likely to recommend the closing of some schools, it is vitally important that the City have plans in place for the disposition and reuse of surplus facilities to ensure that reuse is appropriate for and compatible with the surrounding neighborhood. Baltimore City has a long history of successfully reusing former schools. Schools often lend themselves to residential reuse, because a classroom is approximately the size of a small apartment. Some relatively recent examples of school reuse are the former Louisa May Alcott School at Reistertown and Keyworth, a very attractive se-nior housing building. The former Park Heights Elementary School was redeveloped by Magna Corporation for a job training facility. The former Luther Craven Mitchell School at 1731 East Chase Street is offices and community space for a non-profit development corporation. In addition, the timeline for reuse must be streamlined. The plan should identify disposition be-fore the closing of a school, so that the school will not remain vacant. Furthermore, when a school is proposed to be closed any existing community programs in the school should be relocated along with the students as much as possible.
Goal 2: Capitalize on Untapped Potential of Higher Education Institutions
Objective 1: Attract & Retain College Students & Recent Graduates
Market Baltimore as a higher educa-tion hub and a great place to live and work after college.
•
Increased number of out of state students attending college in Baltimore, Increased number of students remaining in Balti-more after college
BACVA, Down-town Partner-ship, Mayor’s Office of Neigh-borhoods, Collegetown, Live Baltimore, Greater Balti-more Committee and Universities
Years 1-6General Funds
Increase in the number of new students and young people staying in Baltimore after college
Build off the success of the Baltimore Collegetown Network’s marketing campaign to attract, engage, and retain outstanding students. The campaign would attract students to Baltimore, get them engaged in the community, and retain them once they have finished their education. The program should focus on attracting high school juniors and their parents to colleges in the city; engaging current students in arts and culture, internships, and volunteer positions to help them learn about Baltimore; and retaining college seniors and graduate students looking for jobs and housing. These programs should build on BCN’s work and also look to the successful efforts of Live Baltimore and their campaign geared toward Washington, DC residents.
Increase funding for internships, service learning, fellowships, and mentoring for students pursuing higher education.
•
Increased number of participants, Increased number of programs
MCC, Profession-al schools, and Employers/vari-ous agencies
Years 1-6General Funds
Source of future city workers
Build off the success of the Mayor’s Fellows program by increasing funding for additional programs that provide college stu-dents with networks that will encourage them to stay in Baltimore after they graduate.

154 City of Baltimore Comprehensive Master Plan LEARN 155154 City of Baltimore Comprehensive Master Plan LEARN 155
INTR
OD
UC
TION
SU
MM
AR
Y H
ISTO
RY
KE
Y TR
EN
DS
LIVE
EA
RN
PLAY
LEA
RN
IMP
LEM
EN
TATION
MA
NA
GE
ME
NT FIN
AN
CIA
L CO
NC
LUS
ION
GLO
SS
AR
Y A
PP
EN
DIC
ES
Establish a City li-aison to integrate higher education institutions into the City’s eco-nomic develop-ment program
•
Creation of liaison position, number of universities participat-ing
MCC, Colleges and Universities, Collegetown
Years1-3 General Funds
Greater in-tegration of universities into economic development framework
The liaison will advocate for education as a major economic development engine and work with higher education institu-tions and private schools to make sure that their collective and individual concerns are addressed by the appropriate City agencies. The liaison will work with the Collegetown Network and higher education institutions to create and implement a common education development agenda. Educational institutions recognize their strength in working together on a variety of issues, including transportation, joint scholarship programs, and programs to expose K-12 students to colleges. To more effectively work together, the liaison can staff a joint task force to advocate for policies and identify common projects.
Create a mecha-nism to adopt campus master plans
• •
Increased number of approved mas-ter plans, improved speed of develop-ment review
Universities and Colleges, Plan-ning, Planning Commission, and State govern-ment and neigh-borhoods
Years 2-3
Colleges fund master plans; Gen-eral Funds
Provide institu-tions with predictability in the develop-ment review process. Im-proved relation-ships between neighborhoods and academic institutions in terms of cam-pus expansion.
All higher education institutions develop master plans for long-term growth. The City will develop a process to adopt master plans to provide institutions greater predictability during the development review process. By having the City participate in the development of campus master plans and formally adopt the plans, the City will be better prepared to support the recommendations in the plan, ranging from streetscape improvements to land acquisition. The intent is to ensure a better correlation between the City’s Master Plan and the development/expansion of campuses throughout Baltimore. A typical master plan should include a ten year physical plan as well as economic impact statement, design guidelines, pedestrian safety and transportation/alternative commuting strategies, and LEED-based environmental design requirements. The mas-ter plan should also include strategies to reduce single occupancy vehicle trips to campus by discouraging parking, encourag-ing transit and carpooling, and providing on or near campus housing and shuttles.
Objective 2: Encourage Partnerships between and among Universities and the City (See also EARN, Goal 1, Objective 1)

156 City of Baltimore Comprehensive Master Plan LEARN 157156 City of Baltimore Comprehensive Master Plan LEARN 157
Develop a new zoning district that encom-passes mixed-use development related to resi-dential neighbor-hoods, college, and universities.
• •
Decreased number of variances and URPs for mixed-use, increased mixed-use in university areas
Planning, BMZA, HCD, Law, MCC
Years 2-4 General Funds
Increased density and tax base
Given the level of existing student populations at and surrounding higher education institutions, these areas can support entertainment, coffee shops, restaurants, and general shopping opportunities. Although the market exists for these types of uses, and these uses would benefit both the campus and the surrounding neighborhoods, in many cases the current zoning prohibits this type of mixed-use development. Working with neighborhoods and higher education institutions, we can create a mixed-use zoning district to allow this type of development adjacent to campuses (See Chapter IX for Future Zoning Recommendations).
Goal 3: Encourage a Culture of Learning by Enhancing Educational and Vocational Opportunities for all Baltimoreans
Objective 1: Improve and Expand School Readiness Opportunities for Baltimoreans 5 Years Old and Younger
Prioritize City funding for school readiness related activities.
•
Increased number of participants in school readiness programs, increased kindergarteners’ rating on Maryland State Department of Education (MSDE) work sampling system (WSS) to evaluate school readiness.
Family League of Baltimore City, Safe and Sound, Health, BCPSS
Years 1-6General Funds
Improved family-school relationships, comfort with school systems
Support Baltimore Leadership in Action Project (BLAP), a coalition which provides leadership to early childhood service providers in Baltimore. They have developed a strategic plan to enhance early childhood education, which uses a broad and innovative range of partners and is supportive of kids and their families. Resources and policy decisions should be made that assist in the implementation of their plan.
Increase oppor-tunities to locate school readiness programs and support services in public schools, such as ‘Judy Centers’.
• •
Increased number of school-based school readiness programs, increased number of ‘community schools’ coordinators.
BCPSS, BLAP, Judy Centers
Years 1-6
GO Bonds, Federal and State Grants, General Funds
Reducing oper-ating costs for school readi-ness programs, improve access to school readi-ness for citizens
Schools are a major neighborhood asset and should serve as multi-use neighborhood centers. Many of our public schools have extra capacity and school readiness programs are an excellent complement to public school facilities. By offering school readiness programs in school facilities, schools will create an early positive relationship with families. In addition, school readiness service providers will be able to provide more services if they don’t have to spend as much of their resourc-es on facilities. The school facilities solutions master plan will identify opportunities for community use of schools.
Objective 3: Improve the Physical Relationship Between Campuses and Adjacent Neighborhoods

156 City of Baltimore Comprehensive Master Plan LEARN 157156 City of Baltimore Comprehensive Master Plan LEARN 157
INTR
OD
UC
TION
SU
MM
AR
Y H
ISTO
RY
KE
Y TR
EN
DS
LIVE
EA
RN
PLAY
LEA
RN
IMP
LEM
EN
TATION
MA
NA
GE
ME
NT FIN
AN
CIA
L CO
NC
LUS
ION
GLO
SS
AR
Y A
PP
EN
DIC
ES
Co-locate tot lots at schools. • •
Increased number of tot lots at schools.
Rec & Parks, BCPSS, BLAP
Years 1- 6
General Funds, Go Bonds, Federal and State Grants
Positive early exposure to school facili-ties.
Tot lots are playgrounds specifically designed to provide a fun learning experience for children 0-5 years old. These children are too small to use a regular playground. Co-locating tot lots on school grounds makes the most of limited resources and exposes children and their parents to school facilities before the child enrolls in school. Creating an early positive relation-ship with school is a key factor in a student’s success in school. Additionally, increasing physical activity at an early age assists in the prevention of obesity later in life.
Objective 2: Improve and Expand Workforce Development and Job Readiness through Education and Job Training. (See Earn, Goal 2, Objective 1)
Objective 3: Improve and Expand Learning Opportunities for all Baltimoreans to Create Active and Well-educated Citizens
Create a coordi-nating entity for lifelong learning service providers.
•
Increase number of participants in lifelong learning programs. Creation of coordinat-ing entity
MCC, BCPSS, BCCC
Year 2General Funds
Coordinated approach to Baltimore’s life-long learning needs
Lifelong learning opportunities include GED, adult literacy, computer literacy, English as a second language, personal enrichment, citizenship, summer youth programs, etc. The Mayor’s Office of Community Investment will assist in conven-ing service providers and higher education institutions to create a coordinating entity for these services. The coordinating entity will provide leadership and craft an action plan that identifies resources and policy decisions to enhance service delivery. In preparing their action plan, the group should consider services that are targeted to specific needs and popula-tions as well as services that cross demographic boundaries (such as the growing senior and immigrant populations). It is important that this group be a coalition of service providers and not become a service provider itself, so that it can help coordinate services without competing for resources. One of the strategies that the group should explore is promoting a culture of learning through a marketing campaign using a broad and innovative range of messengers.
Create opportuni-ties for continuing education pro-grams to locate in Baltimore
• •
Increased number of lifelong and higher education programs located in the City
Colleges and uni-versities, BCPSS, BDC, CARE
Years 1-6
GO Bonds, General Funds, State Grants
Reducing oper-ating costs for lifelong learn-ing programs, improve access to lifelong learning and continuing education in the City
The City can expand available continuing education offerings by providing multi-tenant education centers. These centers could be located in buildings such as former city schools. These centers would provide convenient access to continuing edu-cation programs in an off-campus setting.

158 City of Baltimore Comprehensive Master Plan LEARN 159158 City of Baltimore Comprehensive Master Plan LEARN 159
Broaden access to job training centers and in-crease awareness of professional development op-portunities.
• • •Number of persons enrolled in job train-ing programs
BWIB/MOED, BCPSS, BCCC, CARE, Other training pro-grams
Years 1-6Grants, Leveraged budgets
More acces-sible training programs, lower unem-ployment, higher labor force participa-tion
Reducing restrictions on where training centers can locate and improving accessibility via transit to these centers will enable residents to tap into important job training resources, increasing the likelihood of residents engaging in training and profes-sional development. Through a combination of Capital Improvement, rezoning, and policy/operational actions, the City can reduce barriers to training access.
Goal 4: Ensure Safe and Convenient Transportation to and from Educational Facilities
Objective 1: Improve Pedestrian and Bicycle Access to Schools and Libraries
Implement “Safe Routes to School” Program at schools.
• •
Increased number of schools participating in program (goal: 10% in first 2 years), reduc-tion in child injuries traveling to school
BCPSS, PTO/PTA, Transportation, Planning, Health, DGS
Years 1-6
General Funds, Fed-eral DOT funds, MVR
Improves physi-cal health of students
The City of Baltimore, in cooperation with federal agencies, state partners, the school system, and community groups will work to establish a ‘Safe Routes to School’ program. A successful Safe Routes to School (SR2S) program integrates health, fitness, traffic relief, environmental awareness, and safety under one program. SR2S funds can be used for both infrastructure projects and non-infrastructure activities. The legislation also requires each state to have a Safe Routes to School Coordinator to serve as a central point of contact for the state. In order to maximize the federal assistance, the City will establish a Citywide Coordi-nator, similar to the state coordinator, to serve as a single point of contact. The federal SR2S program provides funds that can be used for “Planning, design, and construction of infrastructure-related projects that will substantially improve the ability of students to walk and bicycle to school, on any public road or any bicycle or pedestrian pathway or trail within approximately 2 miles of a primary or middle school” and “non infrastructure-related activities to encourage walking and bicycling to school, including public awareness campaigns and outreach to press and community leaders, traffic education and enforcement, stu-dent training, and funding for training, volunteers, and managers of SR2S programs.”
Implement physical improvements near educational facili-ties to ensure safe access.
•Increased number of physical improve-ments installed
BCPSS, Transpor-tation, Planning, DGS
Years 1-6
GO Bonds, Gen-eral Funds, Federal and State grants, MVR
Safety improve-ments at school facilities
This will be an integral part of the city-wide pedestrian plan (see LIVE Goal 3, Objective 1, Strategy 1). Physical improvements could include crosswalks, traffic signal, signs, and other traffic calming measures. Funding should be set aside specifically for improving pedestrian/traffic safety conditions as identified as a part of the “Safe Routes to School” Program.
StrategyMeasurable Outcomes
Implementing Bodies/Agents
TimelineFunding Source
Return on Investment
Capital
Zoning
Policy/ O
perations

158 City of Baltimore Comprehensive Master Plan LEARN 159158 City of Baltimore Comprehensive Master Plan LEARN 159
INTR
OD
UC
TION
SU
MM
AR
Y H
ISTO
RY
KE
Y TR
EN
DS
LIVE
EA
RN
PLAY
LEA
RN
IMP
LEM
EN
TATION
MA
NA
GE
ME
NT FIN
AN
CIA
L CO
NC
LUS
ION
GLO
SS
AR
Y A
PP
EN
DIC
ES
StrategyMeasurable Outcomes
Implementing Bodies/Agents
TimelineFunding Source
Return on Investment
Coordinate imple-mentation of Bicycle Master Plan with school facilities plan.
• •
Increased percentage of students walk-ing/biking to school (survey school stu-dent travel modes), Increased number of schools with bike racks, Increased num-ber of busses with bike racks
Transporta-tion, Planning, Mayor’s Bicycle Advisory Com-mittee, Colleg-etown , BCPSS, MTA
Years 1-3
GO Bonds, Gen-eral Funds, Federal and State grants, MVR
Student health improvements, Reduction in single occu-pancy vehicle travel, air pollu-tion, road wear and tear.
The Baltimore City Planning Commission has adopted the Departments of Transportation and Planning’s Bicycle Master Plan. Over three years, we will create a complete bike network. To complete the full network, bicycle facilities and standards will be incorporated into all transportation projects. To encourage bicycling to elementary, middle, high school and colleges, bike parking and safe bicycle routes should be established at these facilities. The plan includes a Collegetown Bike Route Network providing access to the major colleges and universities in Baltimore City. Colleges are encouraged to provide bike parking. Bike racks should be installed on all MTA busses.
Objective 2: Encourage the use of public transit to travel to schools.
Develop transit routes, schedules and amenities to provide reliable transportation to schools
•
Decreased travel time to and from school, Decreased complaints from neighbors of school
MCC, BCPSS, MTA, Transporta-tion, Planning
Years 1-3General Funds
Better access to educational facilities, Im-proved neigh-borhood-school relations
Most students in grades 6-12 utilize public transportation to travel to school. The degree to which the public transportation system serves the needs of the students is uneven. In many cases, the MTA can add busses to existing lines to serve the school. In other situations, the routes do not accommodate the students’ needs. As a principal funder of public transporta-tion systems, the Federal Transit Administration places limitations on the MTA’s use of busses for school transportation. The MTA and BCPSS need to work together to develop routes that meet FTA guidelines while still serving students and the gen-eral public. In conjunction with bus route improvements, MTA, BCPSS and DOT will work together to improve other school transportation logistics such as pedestrian safety, dismissal policies and bus stop locations.
Integrate college based shuttle ser-vices with public transit.
•
Increased percentage of college students utilizing Collegetown and other school sup-ported shuttles and MTA
Individual Col-lege Shuttles, Collegetown Network, MTA
Years 1-6General Funds
Less conges-tion on roads, Better access to educational and other facili-ties for college students.
The individual shuttle systems operated by local colleges and universities and the Collegetown Network shuttle should be better integrated with the MTA routes. Shuttle routes should supplement MTA routes rather than duplicate them. MTA routes should be revamped in order to better meet the needs of the City’s student population.
StrategyMeasurable Outcomes
Implementing Bodies/Agents
TimelineFunding Source
Return on Investment
Capital
Zoning
Policy/ O
perations

160 City of Baltimore Comprehensive Master Plan LEARN PB
Make reduced fare transit pro-grams available to all college students.
•
Increased percentage of students utilizing public transportation, decreased percentage of students driving to school, reduced capi-tal costs for parking facilities
MTA, colleges, universities
Years 1-3 State DOT
Reduction in traffic, less money/land used for park-ing
MTA and higher education institutions currently offer a reduced fare program for college students. Each school receives a finite number of reduced fare passes, and this limitation should be removed. In addition, students, faculty, and staff at State schools should be eligible to receive the same free MTA pass that State employees receive. Using State funds to support transit use will save State funds for parking facilities.

PB City of Baltimore Comprehensive Master Plan Plan Implementation 161
INTR
OD
UC
TION
SU
MM
AR
Y H
ISTO
RY
KE
Y TR
EN
DS
LIVE
EA
RN
PLAY
LEA
RN
IMP
LEM
EN
TATION
MA
NA
GE
ME
NT FIN
AN
CIA
L CO
NC
LUS
ION
GLO
SS
AR
Y A
PP
EN
DIC
ES
Plan ImplementationSummary of Zoning and Land Use Recommendations
Baltimore City’s Zoning Code was adopted in 1971 and has become increas-ingly outmoded in the 35 years since that time. Because our zoning code is outdated, we have used other tools such as urban renewal plans (URP) and planned unit development (PUD) overlay zones to accommodate modern land use needs. Although numerous amendments have been made over the years to address specific problems, important issues can only be addressed by an in-depth review and update of the entire zoning code.
The Department of Planning began updating discrete sections of the zoning code in 2004. The Maritime Industrial Overlay Zoning District and a first phase of changes to live entertainment provisions have been enacted. In 2005, provisions related to locating supportive group homes and treatment facilities were proposed and not enacted – but are still under discussion. After Plan-ning Commission and City Council adoption of the CMP, the Department of Planning will propose updates to the City’s Industrial Zoning, zoning in the Southeast District, and begin the total rewrite of the existing code, which will include a proposed transit oriented development overlay zone; a university district overlay zone; mixed-use categories; and a new park zoning classifica-tion.
Zoning Recommendations
This Comprehensive Plan has identified numerous goals to be addressed during the subsequent Comprehensive Rezoning process. The following is a summary of the overarching goals followed by some of the specific frame-work and categories:

162 City of Baltimore Comprehensive Master Plan Plan Implementation 163162 City of Baltimore Comprehensive Master Plan Plan Implementation 163
Ease of use – A new zoning code should be as brief and user-friendly as possible and should work seamlessly with the new electronic zoning maps.
Flexibility – Flexibility should be the key factor to consider when revising the zoning code in order to reflect and respect historic patterns in Baltimore while providing flexibility for contemporary development and design solu-tions.
Use categories updated – The use categories and their definitions need to be reviewed to meet modern spatial requirements, new and emerging land uses, residential needs and economic changes.
Design standards – A new Zoning Code should include form-based ap-proaches and design standards that offer opportunities to neighborhoods and reflect the variety of existing building types.
Parking standards – Parking standards need to be completely rewritten to encourage transit oriented developments and reduce auto dependency.
Residential Districts
Residential zoning covers large portions of the City, including everything from detached houses on half-acre lots to high-rise apartment buildings. These cat-egories need to be reviewed and revised to include urban design considerations such as setback and lot area requirements. In addition, the residential zones have a minimum dwelling width of sixteen feet. This causes over 75 % of the rowhouses in the R-8 district to be non-conforming structures because the lots are less than sixteen feet wide. At the same time, the current code has no design standards for major or minor additions to an existing rowhouse. This has caused a 400% increase in appeals to the Board of Municipal and Zoning Appeals (BMZA) for variances. About half of these appeals would not need BMZA hearings were it not for the structures’ non-complying width.
Mixed-Use Zones with Residential
A. Commercial Mixed Use Nodes
Our existing business districts, which are inherently mixed use, need to be reviewed to ensure that they encourage the development of commercial nodes that meet the needs of our business and residential users. The updating of these districts will include a review of density, FAR, parking and design standards.
B. Office-Residence
The existing OR Districts will be retained and will be included in the mixed-use with residential category, instead of remaining separate. It will be retained because it provides high density office and residential with retail limited to the internally-accessed shops which are either accessory uses in multi-unit build-ings with fifty or more units, or in a building that contains more than 20,000 square feet of gross floor area is devoted to business and professional office use.
C. Neighborhood District
This district will be used principally in the row house neighborhoods, and will provide an accounting for existing nonconforming uses which are located based on historic use patterns. It will allow a variety of by-right commercial uses that

162 City of Baltimore Comprehensive Master Plan Plan Implementation 163162 City of Baltimore Comprehensive Master Plan Plan Implementation 163
INTR
OD
UC
TION
SU
MM
AR
Y H
ISTO
RY
KE
Y TR
EN
DS
LIVE
EA
RN
PLAY
LEA
RN
IMP
LEM
EN
TATION
MA
NA
GE
ME
NT FIN
AN
CIA
L CO
NC
LUS
ION
GLO
SS
AR
Y A
PP
EN
DIC
ES
exist presently as nonconforming uses throughout the City. The benefit is that this district will provide a stable and predictable mixed-use district that does not require a public hearing or BMZA approval for each change in use, as is currently required for lawfully established nonconforming uses. It will encourage moving commercial uses within residential areas to appropriately planned and designed portions of the neighborhood instead of perpetuating existing nonconforming uses, as those locations are presently the only oppor-tunity to have commercial uses in our neighborhoods.
D. Bioscience/University/Hospital Districts
Bioscience areas, universities and hospitals tend to be large land owners with complex, interrelated buildings and functions that districts need to be created to manage, zone and develop them. The Zoning Code should provide a tool for adoption of the campus and hospital master plans. A district master plan directs expansion so that property owners can continue to invest in the area with some assurance of stability. This can trade flexibility in uses, design, parking and review process with comprehensive planning with public input. The communities surrounding these areas and institutions provide a unique opportunity for housing and retail support for the area and the surrounding neighborhoods. This category should support the mix of use (biotechnol-ogy companies, medical offices, educational institutions, retail, and housing) that can support both the institutions and neighborhoods. This district will be different from the other mixed use categories based on the use mix, and the general purpose statements that will guide development in this district.
F. Transit Oriented Development (TOD)
The working definition for TOD set out by the Maryland Department of Transportation (MDOT) in 2000 is the following: “A place of relatively higher density that includes a mixture of residential, employment, shopping, and civic uses and types, located within an easy walk of a bus or transit cen-ter.” (TOD Task Force, MDOT, 2000). It is important to stress that Transit Oriented Development is an approach, rather than a pre-determined program of development, the object of which is to create pedestrian-friendly activity zones near transit stations. The resulting densities around transit hubs can and will vary around the city to reflect the needs and form of surrounding areas (See Appendix E for more details).
Mixed-Use Zones Without Residential
Business and Industrial mixed-use zones are intended to be non-residen-tial in order to protect the business and industrial users from residential conflict as well as land speculation that would put undue pressure on busi-ness and industry through increasing the cost of land and being out-com-peted for key properties.
A. Industrial Mixed-Use
According to the Industrial Land Use Analysis from the Baltimore Develop-ment Corporation (January 2004), the current requirements of industrial users no longer fit into the strictly industrial models in our present Zoning Code. Today’s industrial users have a mix of office and other supporting uses that are not traditionally industrial in nature, but are necessary to include within the same buildings. Likewise, the forms of the structures that are desired for modern industrial applications are very different from the older stock of

164 City of Baltimore Comprehensive Master Plan Plan Implementation 165164 City of Baltimore Comprehensive Master Plan Plan Implementation 165
buildings that exist in our older industrial areas within Baltimore. This new model of mixed-use district will include design guidelines that will encourage an industrial park feel within the district, while providing the mix of industrial with supporting commercial uses that are needed. One of the fundamental purposes for our existing industrial districts is to protect the industrial uses by intrusion from other uses. The commercial uses allowed in this mixed-use district will have to be carefully controlled so as not to allow them to overrun the industrial uses that are not able to afford the same property prices, else they will be out-competed and will moot the mixed-use district.
B. Light Industrial Mixed-Use
This district is the inverse of the Industrial Mixed-Use District, in that there are currently clean industrial uses that are able to perform well with and ben-efit from commercial activity that supports these industries. In some cases, some M-2 uses in the current zoning code can be managed well enough to fit within this proposed district. The design guidelines and performance stan-dards will ensure that this degree of flexibility is provided, while adding a measure of security that the industrial uses allowed will not create otherwise typical negative externalities on surrounding properties.
C. Industrial
These districts will be essentially our existing exclusively industrial and man-ufacturing zones. They need to be reviewed and updated to ensure that the needs of our industrial users are met. This will also provide protection, as they are not able to afford the same property prices as business and residential uses. Without this protection, industrial uses can be out-competed and will leave the City in a shortage of consolidated industrial core areas. This review will include a review of density, FAR, parking and design standards.
D. Maritime Industrial (MIZOD)
The Maritime Industrial Overlay Zoning District is intended to protect the City’s maritime shipping industries associated with the Port of Baltimore by reducing development pressure of the City’s waterfront areas due to new mixed-use residential development. The district protects maritime uses in deep-water areas, which are to be reserved for industrial use. The current overlay, which was enacted in 2004, prohibits incompatible developments in the overlay area such as Planned Unit Developments (PUDs are currently the principal method of accomplishing conversion from industrial to mixed use. PUDs in industrial zones may include any use allowed in business zones, in-cluding office, residential, etc.); offices, business and professional, other than accessory; hotels and motels; restaurants, other than accessory; live entertain-ment or dancing in accessory restaurants; taverns.
Park and Open Space (PO)
The proposed Park and Open Space Zoning District is intended to protect parks and critical open space resources against development pressures. Cur-rently, Baltimore’s public parks and environmentally sensitive lands are lo-cated in a variety of residential and business districts, permitting them to be perceived as available for development. In addition, it would implement more flexible use of land within parks and open space than the current zoning does. More appropriate regulations will improve the quality of park environments and protect the integrity of natural resources.

164 City of Baltimore Comprehensive Master Plan Plan Implementation 165164 City of Baltimore Comprehensive Master Plan Plan Implementation 165
INTR
OD
UC
TION
SU
MM
AR
Y H
ISTO
RY
KE
Y TR
EN
DS
LIVE
EA
RN
PLAY
LEA
RN
IMP
LEM
EN
TATION
MA
NA
GE
ME
NT FIN
AN
CIA
L CO
NC
LUS
ION
GLO
SS
AR
Y A
PP
EN
DIC
ES
2008 Generalized Existing Land Uses (Map)

166 City of Baltimore Comprehensive Master Plan Plan Implementation 167166 City of Baltimore Comprehensive Master Plan Plan Implementation 167
Proposed Future Land Uses

166 City of Baltimore Comprehensive Master Plan Plan Implementation 167166 City of Baltimore Comprehensive Master Plan Plan Implementation 167
INTR
OD
UC
TION
SU
MM
AR
Y H
ISTO
RY
KE
Y TR
EN
DS
LIVE
EA
RN
PLAY
LEA
RN
IMP
LEM
EN
TATION
MA
NA
GE
ME
NT FIN
AN
CIA
L CO
NC
LUS
ION
GLO
SS
AR
Y A
PP
EN
DIC
ES
Growth Promotion Areas
Based on initiatives set out by the State of Maryland’s Smart Growth Pro-gram, the entire City of Baltimore has been designated a Priority Funding Area (PFA). This means the City has the infrastructure, transit and school capacity for a significant increase in residents. We welcome new residential development throughout the City and encourage a variety of new housing products to be built.
While it is our goal to promote the entire City, there are many areas with naturally strong markets where development moves forward with only lim-ited City intervention. However, there are other areas where the City needs substantially more resources to effect lasting change to the real estate mar-ket. This Plan recommends further refining the City by designating Growth Promotion Areas (GPA) to provide us with specific areas within the City to strategically attract additional resources and capital to capture a substantial part of future State growth.
The Growth Promotion Areas are areas of Baltimore City where:
1. Existing roads, utilities and other infrastructure and services can accom-modate growth while minimizing environmental impacts;
2. There is significant growth capacity as evident in the significant amount (20% or greater) of vacant housing stock and/or land;
3. The market has failed to spur sustainable economic and community de-velopment;
4. The ability to leverage or generate significant private investment to an area is dependent on state resources above existing allocations;
5. Planning efforts have been adopted that are designed to achieve market stability;
6. Transit Oriented Development provides 1) economic efficiency and growth; 2) expanded transportation choice; 3) efficient land use; and 4) measurable neighborhood benefits.
Analysis of all block groups in the City shows that the following neighbor-hoods had some portion of their land meeting the first 3 criteria (has existing infrastructure, has capacity for significant growth, and has a distressed hous-ing market based on the Housing Typology). Choosing the City’s GPAs from the initial list required further consideration of existing and proposed transit stops and current neighborhood planning areas. This led to the identifica-tion of 13 GPAs for the City (see Table below). Further development of the 13 will be achieved during the comprehensive rezoning process as planning initiatives and funding availability are assembled as well as consensus among several stakeholders. Below is a table and map showing the neighborhoods that meet the first 3 GPA criteria and the ones that were chosen based on the last 3 criteria.

168 City of Baltimore Comprehensive Master Plan Plan Implementation 169168 City of Baltimore Comprehensive Master Plan Plan Implementation 169
(X
(X
(X
(X
(X(X(X
(X(X(X(X(X
(X
(X
(X
(X
(X
(X
(X
(X
(X(X(X
(X(X
(X
(X
(X
(X
(X
(X
(X
(X
(X
(X(X (X (X (X
(X(X
(X
(X(X
(X
(X(X(X (X (X
(X (X (X
(X
(XCENTRAL
PARKHEIGHTS
SANDTOWN-WINCHESTER
FRANKLINSQUARE
DRUIDHEIGHTSPENN
NORTH
BARCLAY
SOUTHCLIFTON
PARK
OLIVER BROADWAYEAST
MIDDLEEAST
BOYD-BOOTHPOPPLETON
UPTON
N
GrowthPromotion Areas
GPA Neighborhoods
GPA Qualified Block Groups
Overlapping Area Master Plans
(X Existing Transit Stop
(X Proposed Transit Stop
Sheila DixonMayor
Thomas J. StosurDirector of Planning
Growth Promotion Areas

168 City of Baltimore Comprehensive Master Plan Plan Implementation 169168 City of Baltimore Comprehensive Master Plan Plan Implementation 169
INTR
OD
UC
TION
SU
MM
AR
Y H
ISTO
RY
KE
Y TR
EN
DS
LIVE
EA
RN
PLAY
LEA
RN
IMP
LEM
EN
TATION
MA
NA
GE
ME
NT FIN
AN
CIA
L CO
NC
LUS
ION
GLO
SS
AR
Y A
PP
EN
DIC
ES
Neighborhood Existing Infrastruc-ture
Growth capacity
Distressed Housing Market
% of neighbor-hood covered by qualifying block groups
Existing or Proposed transit station within ½ mile of any quali-fying block group in neighborhood
Neighbor-hood cov-ered within existing SNAP, SAP or AMP
Boyd-Booth • • • 86.53% Existing
Penn North • • • 77.65% Existing Y
Poppleton • • • 76.18% Both Y
Druid Heights • • • 68.53% Existing
Middle East • • • 64.88% Both Y
Broadway East • • • 64.61% Both
Berea • • • 62.73%
South Clifton Park • • • 60.42% Proposed
Oliver • • • 59.36% Proposed Y
Milton-Montford • • • 58.77%
Franklin Square • • • 54.54% Both
Upton • • • 52.62% Both Y
McElderry Park • • • 45.20% Y
Sandtown- Winchester
• • • 43.00% Both
Central Park Heights • • • 42.80% Existing Y
Barclay • • • 40.69% Existing Y
Carrollton Ridge • • • 40.40%
Johnston Square • • • 38.25% Proposed Y
Greenspring • • • 36.49% Y
Midtown-Edmondson • • • 35.47% Existing Y
New Southwest/ Mount Clare
• • • 31.53%
Northwest Community Action
• • • 31.20% Y
Gay Street • • • 28.25% Both Y
Greenmount West • • • 26.77% Both
Biddle Street • • • 21.52%
Madison East End • • • 21.16%
Harlem Park • • • 21.04% Both
East Baltimore Midway • • • 17.56%
Edmondson Village • • • 16.93% Y
Patterson Place • • • 16.78%
Coldstream Homestead Montebello
• • • 16.06% Y
Walbrook • • • 13.95% Y
Towanda-Grantley • • • 13.01% Existing Y
Better Waverly • • • 12.18%
Park Circle • • • 10.16% Y
Mondawmin • • • 6.44% Both Y
Penrose/Fayette Street Outreach
• • • 6.36% Existing

170 City of Baltimore Comprehensive Master Plan Management and Personnel 171170 City of Baltimore Comprehensive Master Plan Management and Personnel 171
Management and Personnel Who are the owners and key management personnel of the business?
The Mayor and City Council are the legal owners of the City of Baltimore mu-nicipal corporation. They are democratically elected by the citizens of the City. The Mayor, the Mayor’s Cabinet and the City Council would comprise the man-agement level key to implementing the plan. Of the Cabinet, the Directors of Planning, Finance, Housing, Health, Transportation, Public Works, Recreation and Parks, and the Mayor’s Office of Employment Development are most im-portant to the successful implementation of the Plan. Two quasi-city agencies, the Baltimore Development Corporation and the Baltimore Area Convention and Visitor’s Association (BACVA) are critical to implementing the City’s economic development strategy.
The Baltimore City Public School System (BCPSS) is the one agency that is criti-cal to the success of the plan that is NOT governed by the Mayor and City Coun-cil. BCPSS is solely governed by an unpaid Board of Commissioners that are jointly appointed by the Governor and the Mayor. This agency has been integral to the development of the plan, however, and the school system’s Facilities Master Plan is required by law to be adopted as part of this Comprehensive Plan.
Other management entities of the CMP that are substantially influenced by the State through the budget process are the Maryland Transit Administration and funding for substance abuse treatment. Note that the strategy for Priority Funding Areas is largely dependent on additional State dollars to direct future State growth into City areas with high levels of vacancy.
What are the key functions each will perform?

170 City of Baltimore Comprehensive Master Plan Management and Personnel 171170 City of Baltimore Comprehensive Master Plan Management and Personnel 171
INTR
OD
UC
TION
SU
MM
AR
Y H
ISTO
RY
KE
Y TR
EN
DS
LIVE
EA
RN
PLAY
LEA
RN
IMP
LEM
EN
TATION
MA
NA
GE
ME
NT FIN
AN
CIA
L CO
NC
LUS
ION
GLO
SS
AR
Y A
PP
EN
DIC
ES
Management and Personnel
Department of Planning
• Develop inclusionary housing plan;• Implement crime prevention through environmental design;• Apply housing typology to neighborhood planning;• Create landscape ordinance and develop new system of design guidelines;• Target MVR funds to schools and transit-orientated areas;• Implement strategies to increase and enhance Local Historic Districts;• Develop a management plan for City-owned historic buildings;• Modernize the Zoning Code to address Transit-Orientated Development,
mixed use, campus, substance abuse treatment and park zoning districts; and• Assist with the planning of re-use school facilities.
Department of Housing and Community Development
• Target loan, counseling, and code enforcement products based upon the hous-ing typology;
• Update building code to address sustainable design;• Designate five new code enforcement positions for Local Historic Districts;
and• Administer loan & grant programs to low income households in Local His-
toric Districts.
Department of Transportation
• Target sidewalk, lighting, and signal improvement funds to schools, transit areas, and tourist areas;
• Restore and increase on-street parking for mixed-use and business areas;• Implement bicycle master plan;• Create traffic-calming policies and procedures;• Target Pavement Maintenance Management to transit lines;• Implement Charles Street trolley;• Complete pedestrian and automobile way-finding system for Heritage Areas;
and• Institute a Transportation Demand Management model that includes develop-
ment mitigation and alternatives to single-occupancy vehicles.
Department of Public Works
• Create new standards for hiring design professionals for public building proj-ects;
• Develop a Waterway Trash Management Plan to ensure compliance with the National Pollutant Discharge Elimination Permit; and
• Complete a comprehensive City-wide sanitation plan.
Department of Recreation and Parks
• Create system to enhance ability to lease land and buildings to improve stew-ardship of parks, park structures and open space;

172 City of Baltimore Comprehensive Master Plan Management and Personnel 173172 City of Baltimore Comprehensive Master Plan Management and Personnel 173
• Complete stream valley and trail system;• Implement urban forestry management plan;• Develop a strategic recreation plan to target public resources; and• Identify sustainable funding strategy.
Department of Finance
• Identify sustainable funding strategy
Baltimore Development Corporation
• Establishment of micro-enterprise loan program for start-up businesses in growth sectors;
• Identify employer training needs;• Establish higher education liaison;• Assemble and market development sites for construction-related business-
es;• Maintain the CBD as the city’s concentration of office space;• Create bioscience incubator space and development districts; and• Develop wireless zones in public areas.
The Mayor’s Office of Employment Development is responsible for the following:
• Creating a strategic plan that links job seekers to employers that targets resources to the under and unemployed; and
• Develop systems to monitor first-source hiring and apprenticeship pro-grams.
The Baltimore Area Convention and Visitor’s Agency is respon-sible for the following:
• A master plan for the Convention Center area.
The Baltimore City Public School System (BCPSS) is responsible for the following:
• Improving building conditions;• Implementing “green” building principles;• Developing Community Schools Policy;• Creating twelve community school centers; and• Developing timely re-use options.
The Health Department, with substantial State help, is respon-sible for the following:
• Increased drug treatment targeted to those seeking employment.
The Maryland Transit Administration is responsible for the fol-lowing:
• Implementing the Baltimore Regional Transit Plan.

172 City of Baltimore Comprehensive Master Plan Management and Personnel 173172 City of Baltimore Comprehensive Master Plan Management and Personnel 173
INTR
OD
UC
TION
SU
MM
AR
Y H
ISTO
RY
KE
Y TR
EN
DS
LIVE
EA
RN
PLAY
LEA
RN
IMP
LEM
EN
TATION
MA
NA
GE
ME
NT FIN
AN
CIA
L CO
NC
LUS
ION
GLO
SS
AR
Y A
PP
EN
DIC
ES
The Office of the Mayor, Baltimore City Heritage Area
• Develop new visitor centers and enhance existing centers• Complete wayfinding systems• Establish a National Heritage Area• Prepare for the Bicentennial of the War of 1812• Implement heritage trail system• Teach American history using Baltimore’s history museums• Implement the Charles Street Scenic Byway Corridor Management Plan
The City’s political representatives are responsible for the fol-lowing:
• Establishing a regional authority to manage public transit.The staff of the Comprehensive Planning Division will be responsible for monitoring the recommendations of the plan through their responsibility for developing the City’s Capital Improvement Program. The Capital Improve-ment Program is a six year budget for all City agencies (see Chapter XI) administered by the Department of Planning. As part of the Comprehensive Planning process, the Department has added an accountant position to its staff and will be incorporating the capital budget into the Citistat process. This will ensure careful tracking and timely completion of all projects.
The success of the Plan warrants the inclusion of planners in the adminis-tration of each agency, similar to the way fiscal staff are employed by each agency. Several agencies, such as the Baltimore Development Corporation or the Department of Transportation, now include professional planning staff in the management team of the agency. For other agencies’, the Department of Planning acts as those agencies planning staff, for example, the Depart-ments of Education, Housing and Community Development and Recreation and Parks. It is recommended that the Departments of Health and Public Works, Mayor’s Office of Employment Development and Baltimore Area Convention and Visitors Association adopt one of these models.

174 City of Baltimore Comprehensive Master Plan Financial 175174 City of Baltimore Comprehensive Master Plan Financial 175
The City of Baltimore draws from a variety of sources to fund its Capital and Operational budgets. The Operational budget draws on property taxes, in-come taxes, federal grants, charges for service, state grants, state shared taxes, other local taxes, and other sources. The Capital budget’s funding sources include Revenue Bonds, General Obligation Bonds, Motor Vehicle Revenue funds, federal and state grants, and other sources such as Water and Waste-water Utility Revenue funds. For Fiscal Year 2006, the City of Baltimore’s Capital and Operating Budgets totaled $2.318 billion dollars.
General Fund is the central fund into which most of the City’s tax and unre-stricted revenues are budgeted to support basic City operations and pay-as-you-go capital projects.
Motor Vehicle Revenue funds are revenues distributed to the City of Bal-timore by the State of Maryland. Funds must be used for the construction, reconstruction, or maintenance of the streets and highways in the City.
Revenue Bonds and General Obligation Bonds are borrowed funds whose redemption and payment of interest is guaranteed by the faith, credit, and tax-ing power of the City. General Obligation Bonds are approved at referendum every two years.
Community Development Block Grant monies are federal funds distrib-uted to the City of Baltimore to be used at the discretion of the City for broad community development programs and initiatives.
Financial

174 City of Baltimore Comprehensive Master Plan Financial 175174 City of Baltimore Comprehensive Master Plan Financial 175
INTR
OD
UC
TION
SU
MM
AR
Y H
ISTO
RY
KE
Y TR
EN
DS
LIVE
EA
RN
PLAY
LEA
RN
IMP
LEM
EN
TATION
MA
NA
GE
ME
NT FIN
AN
CIA
L CO
NC
LUS
ION
GLO
SS
AR
Y A
PP
EN
DIC
ES
Water and Wastewater Utility funds are two funds established to budget for the operating and capital expense of the City’s water supply system and wastewater facilities.
Capital Improvement Programming
One of the most important ways the City of Baltimore implements the poli-cies and projects envisioned in the Comprehensive Master Plan is through the Capital Improvement Program (CIP). The City Charter requires the Plan-ning Commission to prepare annually a six-year recommendation for capi-tal improvement programming (Art. IV Sec.4(b)). The CIP adopted by the Planning Commission is a complete listing of physical improvements that the Commission believes the City should fund during the six- year period covered by the program. The program is developed by the Department of Planning after soliciting and reviewing requests of the various City agencies. The Department of Planning, through careful, deliberate analysis of the sub-missions, and detailed discussion with the submitting agencies, either adds or deletes projects, so that the CIP will be in keeping with the directions set forth in the Comprehensive Master Plan. These decisions are made to ensure that the expenditures are in line with the overall City vision, the needs of the citizens, and meet the necessary funding requirements. This comprehensive approach to programming these projects allows the City to deliver a more efficient product, reducing unnecessary duplication, avoiding conflicts, and maximizing cost sharing with state and federal resources.
The CIP process for each fiscal year (from July 1 to June 30) begins in the pre-ceding September with requests to City agencies to submit program requests for the upcoming six-year CIP. The agency is provided targeted amounts from each available funding source. The agency provides a brief description, justi-fication, and detailed cost estimate of the project being proposed. The agency also lists its appropriation requests, by fund source, for the six-year program. The agencies must submit their requests to the Planning Commission on or before December 1.
The Planning Commission is charged with reviewing each agency submis-sion and with developing a recommended CIP program on or before March 1. The Department of Planning staff works with the Commission and the sub-mitting agencies to develop recommendations on each of the requests. The Department’s staff reviews each project to ensure it best matches the needs of the City of Baltimore. Some of the criteria to which a project must answer include:
• The relationship of the requested project to the Comprehensive Master Plan and major policy initiatives of the City;
• The degree and availability of coordination between projects, including tim-ing and shared resources;
• Constituent support; and
• Availability of financing from City and non-City sources, including antici-pated impact to the overall City budget.
While the Department of Planning, in consultation with the Department of Fi-nance, develops target funding amounts for each submitting agency, there are occasions when the number and/or cost of projects that are deemed to meet the criteria stated above exceed the available funding. In these instances, the

176 City of Baltimore Comprehensive Master Plan Financial 177176 City of Baltimore Comprehensive Master Plan Financial 177
Department of Planning staff must prioritize the project requests. In consider-ing this prioritization, Planning staff look to maximize the impact of the proj-ect toward achieving the goals set forth in the Comprehensive Master Plan. The Department of Planning staff in consultation with the Planning Commis-sion develops recommendations for the CIP.
As part of the Planning Commission’s deliberations over approving the rec-ommended CIP, each agency is invited to brief the Commission on their pro-gram requests. After weighing all considerations, the Commission adopts a six-year CIP program, which is then presented to the Board of Estimates. The Board of Estimates (BOE) then forwards the CIP to the Director of Finance and the Board of Finance for review and recommendations. Upon receiv-ing a favorable recommendation from the Director and Board of Finance, the Board of Estimates officially adopts the CIP six-year program. This does not legally bind the City to appropriate the funds for the six years. The City Council’s approval of the first year of the CIP as part of the Ordinance of Esti-mates (City budget) actually commits the City to financing the project for the first of the six years. However, because the Board of Estimates is composed of the Mayor, the President of the City Council, and the Comptroller, adoption of the six year program by the BOE indicates a serious commitment on part of the City to implement the six-year program.
General Obligation Bonding Authority
As a major source of Capital budget, General Obligations Bonds are pro-grammed in a similar manner to the CIP. Beginning nearly two full years prior to the fiscal years they become available, City agencies are invited to submit to the Planning Commission requests for the General Obligation (GO) Bonds programming. These bonds are subject to approval by the constituency in the November election preceding the fiscal year in which these monies would be available. This program is for two years’ worth of bonds and is repeated every two years to coincide with even-year general elections. Similar to the CIP, City agencies are asked to submit their two year GO Bond requests for specific projects, series of projects, or funding for other agency needs. City agencies are asked to submit these requests 14 months prior to the General Election to which they will be subject (22 months prior to the fiscal year in which the monies will be available). The requests are typically well matched with agencies’ CIP request as the cyclical pattern of each of these programs allows for good coordination in long range forecasting. As with the CIP, the Department of Planning, in conjunction with the Department of Finance, establishes target funding levels for the agency’s requests. The Planning Commission, along with the Department of Planning staff, re-views the GO Bond request through a similar process as the CIP programming in order to ensure that the GO Bond request is well matched to the priorities set forth in the Comprehensive Master Plan. Upon approval by the Planning Commission, the GO Bond program is forwarded to the Board of Estimates for approval. The approved program is presented to the City’s state represen-tatives. The City Delegation to Annapolis introduces authorizing legislation enabling the GO Bond program to be placed on the November ballot. Once approved by the state legislature, the City Council introduces legislation to place the program on the November ballot for approval by the constituency. If and when the ballot issues are approved by the voters, the bonds are sold and the funds made available for the subsequent fiscal year.

176 City of Baltimore Comprehensive Master Plan Financial 177176 City of Baltimore Comprehensive Master Plan Financial 177
INTR
OD
UC
TION
SU
MM
AR
Y H
ISTO
RY
KE
Y TR
EN
DS
LIVE
EA
RN
PLAY
LEA
RN
IMP
LEM
EN
TATION
MA
NA
GE
ME
NT FIN
AN
CIA
L CO
NC
LUS
ION
GLO
SS
AR
Y A
PP
EN
DIC
ES
Park Funding Strategy
The Baltimore City Department of Recreation and Parks manages almost 6,000 acres of parkland, developed in part by the renowned Olmsted broth-ers. The park system attracts visitors from near and far, and provides a wealth of benefits to city residents and visitors, including opportunities to rest and recreate, improved air and water quality, and economic benefits such as in-creased property values in areas near certain parks and open space. The De-partment also manages urban horticultural and forestry operations, as well as facilities such as swimming pools, senior centers, soccer arenas, ice rinks and therapeutic recreation facilities. The Department also offers indoor recreation programs at 46 neighborhood recreation centers.
Over the past few decades, the condition of Department of Recreation & Parks grounds and facilities has been steadily declining due to under-funding. Fis-cal constraints have prevented the Department from meeting its broad goals and from functioning at optimal levels. The Department’s operating budget and size of maintenance crews have been reduced in the last decade while park acreage has remained constant. While the total number of recreation centers operated by the Department has also decreased, the repair demands have remained steady. The demand for capital improvements and operating funds continues to outweigh available funds. There is a gap between the pub-lic’s needs and desires and the ability of the Department to provide expected services. As great cities are known for their great parks, no city park system can survive without sufficient funding. Creating a sustainable funding source would enable the City to achieve its goals for improved park and recreation opportunities for its residents and visitors.
In 2004, the Trust for Public Land (TPL) prepared a feasibility study on Park and Open Space Funding Options that discussed several finance mechanisms to be considered for funding parks and open space in Baltimore. These mech-anisms include city-wide, regional, and local area finance strategies. The city-wide funding option consists of raising or dedicating specific city taxes or issuing general obligation bonds. Regional funding options call for the cre-ation of a regional parks and recreation district that would include surround-ing counties, and could be funded by the property tax, sales tax, or utility fees. Local area funding options include creating special tax districts, community benefits districts, and tax increment financing (TIF). National research shows a number of these same financing options have been utilized to fund parks and open space preservation areas throughout the United States.
Among the finance options presented in the Trust for Public Land report, city-wide options and local area options seem the most feasible for Baltimore City. These options will require further investigation to gauge support for parks and recreation in relation to other City priorities, and a general willingness to commit additional public funds for this purpose. To date, a comprehensive parks and recreation needs assessment has been prepared by the Department of Recreation and Parks and a task force has been formed to further evaluate the feasibility of sustainable funding for city parks and recreation needs. With continued support from leadership, great partnerships, and proper funding the Baltimore City Department of Recreation and Parks can further enhance its parks system and make it the world-class park system it once was.

178 City of Baltimore Comprehensive Master Plan Conclusion 179178 City of Baltimore Comprehensive Master Plan Conclusion 179
ConclusionLIVE • EARN • PLAY • LEARN: The City of Baltimore Comprehensive Master Plan (CMP) provides the City of Baltimore with 13 Goals and over 100 specific strategies to direct its capital expenditures for the next 6 years and beyond. Focusing on capital investments, zoning, and public policy, the CMP provides a roadmap to help continue the City’s journey on the road to-ward success. That journey involves our current citizens and those who will soon come to reside in Charm City. It involves the young and the old, those with great wealth and those with little. It involves those citizens who weath-ered the storm during Baltimore’s roughest times and those new to this great City. The citizens of Baltimore helped craft the draft CMP that was released on February 2, 2006. The Department of Planning extensively distributed the plan to as many residents, community groups, and implementing agencies as possible. Hard copies of the draft were distributed to the following locations throughout the City:
Distribution
• Fourteen State Agencies • All Branches of the Enoch Pratt Free Library System• All City Public and Private High Schools • All Fourteen Local Colleges and Universities • City Council

178 City of Baltimore Comprehensive Master Plan Conclusion 179178 City of Baltimore Comprehensive Master Plan Conclusion 179
INTR
OD
UC
TION
SU
MM
AR
Y HIS
TOR
Y KE
Y TRE
ND
S LIV
E E
AR
N P
LAY LEA
RN
IMP
LEM
EN
TATION
MA
NA
GE
ME
NT FIN
AN
CIA
L CO
NC
LUS
ION
GLO
SS
AR
Y AP
PE
ND
ICE
S
• City’s State Delegation • City’s Federal Delegation • Commission for Historical and Architectural Preservation Commissioners• All Department Heads • Planning Directors in surrounding jurisdictions • Community Organizations • All City Senior Centers • Public Housing Resident Leadership
In addition, information about the strategies in the plan was disseminated using a variety of media in order to reach all segments of Baltimore’s popula-tion. Thousands of dollars were spend all to inform and get feedback from as many people and interests groups in the City as were willing to participate. This includes: • Article in the Baltimore Sun, January 26th - Draft of first city master plan
in 30 years looks to 2012, by Eric Siegel -- Urban Chronicles. • Mayor’s Press Conference on February 2, 2006• Planning Commission Hearing, February 2nd 1:30p.m. • Dedicated website www.LiveEarnPlayLearn.com – went live February 2nd• Mayor’s Neighborhood News Flash • President Dixon Report• Eye on Baltimore to Discuss the Master Plan• Ongoing Program on TV25 • Discussion on WEAA • Discussion on WOLB • WYPR 88.1 Mark Steiner Show – 2 programs• Discussion on Heaven 600AM • Postings at various downtown garages • Benton Building Banner • Ads on and inside 50 MTA Buses – February 21st – April 1st • Mobile Billboard through the nine planning districts –
March 8th – April 1st • Article in Baltimore Sun, February 3rd - City seeks comment on master
plan. Public hearings are to begin Feb. 21, by John Fritze • Sent print media to area Baltimore city grocery store merchants – February
14th • Blast email to all City employees – February 17th • Full page ad in the Baltimore Jewish Times – February 17th • Full page ad in the Afro-American Newspaper – March 10th • Community Calendars – City Paper and Sun paper

180 City of Baltimore Comprehensive Master Plan Conclusion 181180 City of Baltimore Comprehensive Master Plan Conclusion 181
The purpose of distributing the plan and disseminating information about its contents was to receive feedback on what residents, employers, employees, city officials and implementing bodies wanted to see retained, deleted, revised and/or added. And hundreds of comments were received from a variety of sources (citizens, community groups, business and non-profit organizations, neighborhood associations, ministries, hospitals, foundations, etc) regarding all aspects of the plan. All comments were recorded and reviewed by the De-partment of Planning. Thanks to all who took the time to respond via email, letter, or telephone.
However, the most important means of discussing the plan were the Planning Commission Community Hearings held in all 9 planning districts in the City at which people’s testimonies were recorded and transcribed (transcriptions are available in hard copy in the Department of Planning’s office at 417 E. Fayette St, 8th floor, or online at http://www.ci.baltimore.md.us/govern-ment/planning/compplan). Over 550 people came to these meetings and offered comments on the draft.
Many of the comments received both during and outside these meetings were directly incorporated into this revised version of the plan. All new and signifi-cantly revised strategies in the CMP have been flagged at the beginning of each section. An emphasis on affordable housing, comprehensive transportation, and environmental protection was clearly a top priority for many who pro-vided feedback. The LIVE section has been greatly modified with 30 new or revised objectives and strategies to address concerns about affordable housing, improving water quality and protecting the Chesapeake Bay, enforcing zoning regulations, streamlining the development process, and enhancing walkability throughout the City. Recreation, access to open space and a comprehensive plan for parks in the City were equally important; many of the new and revised strategies in PLAY aim to integrate the park system and protect natural areas within the City.
Next Steps According to Article 66B of the Maryland Annotated Code, comprehensive plans need to be implemented, monitored and updated every 6 years. This helps
District Date of Meeting Location Attendance
Northwest Tuesday 2.21.06 Pimlico Middle School 65
East Tuesday 2.28.06 Harford Heights 49
South Tuesday 3.7.06 Southside Academy 51
North Sunday 3.12.06 Western High School 42
Central Monday 3.13.06 War Memorial Bldg 45
Southwest Monday 3.20.06 Edmonson High School 75
Southeast Saturday 3.25.06 Hampton Hill Academy 72
Northeast Tuesday 3.28.06 Baltimore City College 89
West Saturday 4.1.06 Frederick Douglass High School 78

180 City of Baltimore Comprehensive Master Plan Conclusion 181180 City of Baltimore Comprehensive Master Plan Conclusion 181
INTR
OD
UC
TION
SU
MM
AR
Y HIS
TOR
Y KE
Y TRE
ND
S LIV
E E
AR
N P
LAY LEA
RN
IMP
LEM
EN
TATION
MA
NA
GE
ME
NT FIN
AN
CIA
L CO
NC
LUS
ION
GLO
SS
AR
Y AP
PE
ND
ICE
S
ensure that the City continually assesses the ability of this guiding document for the vision of Baltimore to effectively achieve the stated returns on invest-ment. The goal of ongoing monitoring of CIP funds distributed according to strategies in the CMP is to gauge which ones achieved results and which ones did not. Future updates will benefit from the track-record of the imple-mentation of this plan. Also, future plans can address some concerns voiced during the public comment period that were not incorporated in this plan. Many people wanted to see a greater focus on regionalism and greater coop-eration with surrounding jurisdictions particularly with respect to transporta-tion and environmental protection. While interjurisdictional coordination is only a suggested element according to Article 66B, Baltimoreans recognize that regional planning is necessary for alleviating traffic congestion, ensuring everyone has access to potable water, and open spaces throughout the region are preserved.
How can you continue to be part of the plan…?
LIVE • EARN • PLAY • LEARN: The City of Baltimore Comprehensive Master Plan is a plan for all Baltimoreans, current and future residents alike. Therefore, it should be part of a ‘living’ process where the public can continue participating in its implementation. There are 5 main areas through which residents, employers and employees can help ensure that the strategies set out in this plan are realized:
1. Comprehensive Rezoning—This Comprehensive Plan has identified nu-merous goals to be addressed during the subsequent Comprehensive Rezon-ing process. The City will work with residents, businesses and employees to develop new zoning categories and update the zoning code.
2. Area Master Plans—In LIVE, a strategy set out a goal for every area in the city to have an adopted area master plan within 10 years. These plans are in-tense visioning and planning processes that involve residents, neighborhood groups, businesses and city agencies in the future of a smaller area in the City. These plans should be consistent with the goals set out in the CMP.
3. Planning Commission meetings—The Planning Commission is charged with reviewing all development projects, zoning changes and subdivisions of land as well as developing a comprehensive plan for the City. The Com-mission meets regularly throughout the year, and its meetings are open to the public.
4. Capital Improvement Program (CIP)—The Planning Commission is charged with reviewing each agency submission and with developing a rec-ommended CIP program on or before March 1. The public is welcome to provide testimony.
5. Voting—The power of this plan, whether or not it gets implemented, rests in you. Elected City, State, and Federal officials, as well as their appointees, are vital to ensuring that this plan is implemented and enforced. Your vote counts towards ensuring your elected officials facilitate this vision for the City.

182 City of Baltimore Comprehensive Master Plan Glossary of Terms and Acronyms 183182 City of Baltimore Comprehensive Master Plan Glossary of Terms and Acronyms 183
AffordableHousing Housingcapableofbeingpurchasedorrentedbyahouseholdwithlowormoderateincome,basedonahousehold’sabilitytomakemonthlypaymentsnecessaryto obtain housing and defined by Area Median Income (AMI). Housing is considered affordable when a householdpayslessthan30percentofitsgrossmonthlyincome (GMI) for housing including utilities
Americans with Disability Act (ADA) A federal law that prohibits discrimination against peoplewithphysicalormentaldisabilitiesinemployment,publicservicesandplacesofpublicaccommodation,suchasrestaurants,hotelsandtheaters
AssistedLiving Asupportivehousingfacilitydesignedforthosewhoneedextrahelpintheirday-to-daylivesbutwhodonotrequirethe24-hourskillednursingcarefoundintraditionalnursinghomes
Area Median Income (AMI) A way of determining income eligibility for various housing programs. AMI is calculated every year by the U.S. Department of Housing and Urban Development (“HUD”) for every county and metropolitan area. The 2003 Area Median Income in the Baltimore area for a family of four is $67,300. Families with incomes below 80% of AMI, or $53,850, are categorized as being low-incomebyHUDandareeligibleforspecialprogramsand benefits.
Glossary of Terms and Acronyms

182 City of Baltimore Comprehensive Master Plan Glossary of Terms and Acronyms 183182 City of Baltimore Comprehensive Master Plan Glossary of Terms and Acronyms 183
INTR
OD
UC
TION
SU
MM
AR
Y H
ISTO
RY
KE
Y TR
EN
DS
LIVE
EA
RN
PLAY
LEA
RN
IMP
LEM
EN
TATION
MA
NA
GE
ME
NT FIN
AN
CIA
L CO
NC
LUS
ION
GLO
SS
AR
Y A
PP
EN
DIC
ES
Baltimore Area Convention and Visitors Association http://www.baltimore.org/ (BACVA)
Baltimore Heritage Area http://www.ci.baltimore.md.us/government/heritage/
Baltimore Development Corporation (BDC) http://www.baltimoredevelopment.com/
Baltimore Housing Baltimore Housing represents the combined efforts of the Department of Housing and Community Development and the Housing Authority of Baltimore City. www.baltimorehousing.org/
Baltimore Metropolitan Council (BMC) http://www.baltometro.org/
Baltimore Region Baltimore City, Baltimore County, Carroll County, Harford County, Howard County, Anne Arundel County
Baltimore Regional Transit Plan (BRTP) http://www.baltimoreregiontransitplan.com/
Baltimore Workforce Investment Board (BWIB) http://www.baltoworkforce.com/
Baltimore City Community College (BCCC) http://www.bccc.edu/
Baltimore City Public School System (BCPSS) http://www.bcps.k12.md.us/
Baltimore Department of Transportation (BDOT) http://www.ci.baltimore.md.us/government/transportation/index.html
Baltimore Leadership in Action Program (BLAP) http://www.readyatfive.org//images/worddocs/distinguished%20performance%20award-text.doc
Board of Municipal and Zoning Appeals (BMZA) http://www.ci.baltimore.md.us/government/zoning/index.html
Brownfields Property Tax Credit There is a Brownfields property tax credit of 50 percent against the increased property tax liability of qualified Brownfields sites. The credits apply for a certain number ofyearsaftercompletionofavoluntarycleanuporcorrective action plan and revaluation of the qualified Brownfields site.
Baltimore Substance Abuse Systems (BSAS) http://www.bsasinc.org/
Baltimore Sports and Social Club (BSSC) http://www.baltssc.com/
Base Realignment and Closure (BRAC) The BRAC recommendations took effect on November 9, 2005, and involve more than 800 installations. Maryland is one of very few states slated to experience a significant net gain, primarily at the Aberdeen Proving Ground (APG), Andrews Air Force Base (AFB), Fort Meade, and the Bethesda National Naval Medical Center (NNMC). The DOD has until September 15, 2007 to begintheindicatedclosings,whichmustbecompletedby September 15, 2011.
Central Business District (CBD) The major commercial downtown center of a community.

184 City of Baltimore Comprehensive Master Plan Glossary of Terms and Acronyms 185184 City of Baltimore Comprehensive Master Plan Glossary of Terms and Acronyms 185
Capital Improvement Program (CIP) A program, administered by a city or county government andreviewedbyitsplanningcommission,whichschedulespermanentimprovements,usuallyforaminimum of five years in the future, to fit the projected fiscal capability of the local jurisdiction. The program generallyisreviewedannually,forconformancetoandconsistencywiththegeneralplan
Certificate of Occupancy (CO’S) A certificate issued by a local building department to a builderorrenovator,indicatingthatthebuildingisinproperconditiontobeoccupied
Collegetown http://www.baltimorecollegetown.org/asp/home.asp
Commission for Historical and Architectural Preservation http://www.ci.baltimore.md.us/government/historic/
Community Association Directory A comprehensive listing of community associations in Baltimore City, including citywide non-profits, umbrella organizations, community associations, business associations, and block groups. The Directory includes associationnames,contactinformation,boundarydescriptions,andcitywide,umbrella,anddistrictdesignations.
Commuter Choice Program http://www.mdot.state.md.us/CommuterChoice/commuterchoice
Comprehensive Forestry Management Plan A practical, detail-oriented plan for taking care of Baltimore’s trees and forests and increasing Baltimore’s Tree Canopy. Included will be new policies and procedures,standards,andanynecessaryrevisionsforour current Tree and Forest Ordinances, as well as new strategies for both private and public lands.
Comprehensive Master Plan (CMP) http://www.liveearnplaylearn.com/
Comprehensive Educational Facilities Master Plan The State of Maryland requires all local jurisdictions to (CEFMP) annually submit a Comprehensive Educational Facilities
Master Plan and a five year Capital Improvement. Program. The master plan must be submitted by July 1 of each year. The plan must include goals, standards, guidelines,communityanalysisincludingtrendsandprojections and facility needs analysis
Convention Center http://bccenter.org/
The Crime Prevention Through Environmental Design the proper design and effective use of the built environ (CPTED) ment that can lead to a reduction in the fear and
incidenceofcrimeandanimprovementinthequalityoflife
Department of Business and Economic Development http://www.choosemaryland.org/ (DBED)

184 City of Baltimore Comprehensive Master Plan Glossary of Terms and Acronyms 185184 City of Baltimore Comprehensive Master Plan Glossary of Terms and Acronyms 185
INTR
OD
UC
TION
SU
MM
AR
Y H
ISTO
RY
KE
Y TR
EN
DS
LIVE
EA
RN
PLAY
LEA
RN
IMP
LEM
EN
TATION
MA
NA
GE
ME
NT FIN
AN
CIA
L CO
NC
LUS
ION
GLO
SS
AR
Y A
PP
EN
DIC
ES
Defensible spaces Open spaces, entry points, and pathways configured to provide maximum opportunities to rightful users and/or residentstodefendthemselvesagainstintrudersandcriminalactivity
Department of Finance http://www.ci.baltimore.md.us/government/finance/index.html
Department of Social Services (DSS) http://www.dhr.state.md.us/baltocity.htm
Design Excellence Buildings that express the vision, leadership, and commitmentofthegovernmenttoservingthepublicandthevaluesofthenation
Baltimore City Department of Transportation (DOT) http://www.ci.baltimore.md.us/government/transportation/index.html
Downtown Partnership (Downtown Partnership of Baltimore) http://www.godowntownbaltimore.com
Baltimore City Department of Public Works (DPW) http://www.ci.baltimore.md.us/government/dpw/
Enoch Pratt Free Library (EPFL) http://www.pratt.lib.md.us/
Enterprise Zone (EZ) Property Tax Credit http://www.choosemaryland.org/businessservices/taxincentives/enterprisezone.html
Fair Housing Act http://www.usdoj.gov/crt/housing/housing_coverage.htm
Family League of Baltimore City http://www.flbcinc.org/
Federal Housing Administration loans (FHA Loans) FHA loan is a mortgage loan in the United States insured by the Federal Housing Administration. The loan may be issued by federally-qualified lenders.
First Source Hiring program Promotes the hiring of qualified unemployed or under-employed residents of East Baltimore. The program encouragesconstructioncontractorsandsubcontractorsto give first consideration to qualified residents of East Baltimore
Form-based (code) designs A code based primarily on building or neighborhood forms, rather than based primarily on land use. Form basedcodestypicallyfocusondesignissuesdealingwiththerelationshipofbuildingstoeachother,tostreetsand to open spaces.
FTA New Starts The Federal Transit Administration’s (FTA) New Starts programprovidescapitalfundingforthedevelopmentof new fixed guideway transit systems and extensions to existingsystems
General Obligation Bonds (GO Bonds) GO Bonds are a form of long-term borrowing in which thestateissuesmunicipalsecuritiesandpledgesitsfullfaithandcredittotheirrepayment
Greater Baltimore Committee http://www.gbc.org/

186 City of Baltimore Comprehensive Master Plan Glossary of Terms and Acronyms 187186 City of Baltimore Comprehensive Master Plan Glossary of Terms and Acronyms 187
Greater Baltimore History Alliance http://www.baltimoremuseums.org/index.htm
Greater Baltimore State of the Region Report www.gbc.org/reports/GBCSOR2007.pdf
Baltimore City Health Department http://www.ci.baltimore.md.us/government/health/
Historic Preservation credits Available to Baltimore City property owners in designated historic districts (local and National), or owners of individually designated Baltimore City or National Register Landmark structures, who significantly improve, or restore, or rehabilitate their historic property. Work performed must be compatible with the Commission for Historical and Architectural Preservation’s (CHAP) standards, must have been approved prior to work beginning, and certified at the time of completion by CHAP. The life of the credit (annual deduction) is ten years; tax credit value is determined by the State Department of Assessments and Taxation
Housing Typology A classification of Baltimore City’s Housing Market using eight data about housing combined by the City’s 710 census block groups. Statistical analysis was used tocombinethegroupsthatweremostsimilartogether
Judy Centers Early childhood and family learning centers. They typicallyoperateserviceprogramsforyoungchildrenand their families - 7-12 hours a day and year around. Judy Centers are unique because they promote school readinessthroughcollaborationamongcommunity-based agencies and organizations located within each Judy Center.
Law http://www.ci.baltimore.md.us/government/law/index.html
Leadership in Energy and Environmental Design (LEED) A voluntary, consensus-based national standard for developinghigh-performance,sustainablebuildings
Live Baltimore http://www.livebaltimore.com/home/
Local Historic Districts http://www.ci.baltimore.md.us/government/historic/districts.html
Magnetically Levitated Trains (MAGLEV) http://www.bwmaglev.com/
Maryland Rail Commuter Service (MARC) http://www.mtamaryland.com/services/marc/
Maritime Industrial Zoning Overlay District (MIZOD) The Maritime Industrial Overlay zoning district is intended to reduce increasing conflicts in the City’s waterfrontareasbetweennewmixed-usedevelopmentand maritime shipping associated with the Port of Baltimore
Mayor’s Fellows program http://www.ci.baltimore.md.us/fellows/

186 City of Baltimore Comprehensive Master Plan Glossary of Terms and Acronyms 187186 City of Baltimore Comprehensive Master Plan Glossary of Terms and Acronyms 187
INTR
OD
UC
TION
SU
MM
AR
Y H
ISTO
RY
KE
Y TR
EN
DS
LIVE
EA
RN
PLAY
LEA
RN
IMP
LEM
EN
TATION
MA
NA
GE
ME
NT FIN
AN
CIA
L CO
NC
LUS
ION
GLO
SS
AR
Y A
PP
EN
DIC
ES
Mayor’s Neighborhood Newsflash http://www.ci.baltimore.md.us/neighborhoods/nnf/index.html
Mayor’s Office and City Council (MCC) http://www.ci.baltimore.md.us/mayor/http://www.baltimorecitycouncil.com
Mayor’s Office of Employment Development (MOED) http://www.oedworks.com/
Maryland Department of Natural Resources (MD DNR) http://www.dnr.state.md.us/
Mixed-Use Developments Mixed use refers to the combining of retail/commercial and/or service uses with residential or office use in the samebuildingoronthesamesite
Mayors Office of Information Technology (MOIT) http://www.ci.baltimore.md.us/government/moit/
Maryland Transit Administration (MTA) http://www.mtamaryland.com/
Motor Vehicle Revenue (MVR) Motor Vehicle Revenue funds are revenues distributed to the City of Baltimore by the State of Maryland. Funds mustbeusedfortheconstruction,reconstruction,ormaintenance of the streets and highways in the City.
National Heritage Area http://www.nps.gov/history/heritageareas/
National Register Historic Districts The official list, established by the National Historic Preservation Act, of sites, districts, buildings, structures, and objects significant in the nation’s history or whose artisticorarchitecturalvalueisunique
Non-Profit Organizations (NPO) A nonprofit organization is formed for the purpose of serving a public or mutual benefit other than the pursuit or accumulation of profits for owners or investors
One-Stop (Career) Centers http://www.dllr.state.md.us/county/bacity/
Parks & Rec http://www.ci.baltimore.md.us/government/recnparks/ (Baltimore City Department of Recreation and Parks)
Department of Planning http://www.ci.baltimore.md.us/government/planning/
Promenade A public area set aside as a pedestrian walk
PTO/PTA Parent Teacher Organizations/Associations
Rec and Parks (Baltimore City Department of Recreation and Parks) http://www.ci.baltimore.md.us/government/recnparks/
Red and Green Line http://www.baltimoreregiontransitplan.com/pages/prjt_redover.htm
Request For Proposals RFPs
Request For Qualifications RFQs
Safe and Sound (Baltimore’s Safe and Sound Campaign) http://www.safeandsound.org/site/index.php
Small Business Resource Center (SBRC) http://www.sbrcbaltimore.com/

188 City of Baltimore Comprehensive Master Plan Glossary of Terms and Acronyms 189188 City of Baltimore Comprehensive Master Plan Glossary of Terms and Acronyms 189
State Department of Education (Maryland) http://www.marylandpublicschools.org/msde
State Dept of Health and Mental Hygiene (Maryland Department of…) http://www.dhmh.state.md.us/
Tax Credits/Incentives A program under Federal IRS regulations (Low Income Housing Tax Credit Program) which provides tax credits inreturnforinvestmentinhousingdevelopmentswherea portion of the units are subject to rent limits for tenants who meet income eligibility requirements.
Tax Increment Financing (TIF) Tax Increment Financing is used to publicly finance needed public improvements and enhanced infrastructure in a defined area. The cost of improvementstotheareaisrepaidbythecontributionsoffuturetaxrevenuesbyeachparticipatingtaxingunitthat levies taxes against the property. The intended purposeistopromotetheviabilityofexistingbusinesses, and attract new commercial enterprises.
The Reinvestment Fund http://www.trfund.com/
Tot Lot A playground for toddlers
Traffic- Calming Traffic management measures specifically designed toreducevehicularspeedalongroutesorthroughareas. Usually associated with improving the local environmentandreducingroadaccidents
Transit-Oriented Development (TOD) Land uses that are sited, designed and combined to maximize transit, particularly rail, ridership
Transportation Demand Management (TDM) A strategy for reducing demand on the road system by reducing the number of vehicles using the roadways and/or increasing the number of persons per vehicle. TDM attemptstoreducethenumberofpersonswhodrivealoneontheroadwayduringthecommuteperiodandtoincreasethenumberincarpools,vanpools,busesandtrains, walking, and biking. TDM can be an element of TSM (see below).
Transportation System Management (TSM) Techniques that maintain and improve efficiency and safety of an existing road-way system. Examples include traffic signal enhancements and intersection improvements
Tree Canopy The leaves and branches of a tree or trees. If you look down from the sky and see leaves, it’s tree canopy. For TreeBaltimore, it is a satellite that will be looking down, andwheretheimagefromthesatelliteshowstrees,it’stree canopy.

188 City of Baltimore Comprehensive Master Plan Glossary of Terms and Acronyms 189188 City of Baltimore Comprehensive Master Plan Glossary of Terms and Acronyms 189
INTR
OD
UC
TION
SU
MM
AR
Y H
ISTO
RY
KE
Y TR
EN
DS
LIVE
EA
RN
PLAY
LEA
RN
IMP
LEM
EN
TATION
MA
NA
GE
ME
NT FIN
AN
CIA
L CO
NC
LUS
ION
GLO
SS
AR
Y A
PP
EN
DIC
ES
Urban Tree Canopy Goal 20% of Baltimore City’s land area is currently covered by tree canopy. Our goal is to double that, to 40%, within30years
Urban Renewal Plans (URPs) An Urban Renewal Plan represents the City’s vision, sharedwithoneormorecommunities,ofwhatanexisting [geographic] area of the City of Baltimore should become over several decades. Urban Renewal Plans generally are in force for 20 to 40 years, as specified in each plan, and empower and direct the City, usually acting through its Department of Housing and Community Development, to intervene directly in some specific cases and/or locations to bring about desiredchangesorimprovementsintheareacoveredbythe Plan. Urban Renewal Plans can be, and often are, amendedovertimetotakeadvantageofprivatesectorinvestmentpossibilitieswhichwereunforeseenwhenthePlan was first enacted.
United States Forest Service (USFS) http://www.fs.fed.us/
Zoning Code http://cityservices.baltimorecity.gov/charterandcodes/Code/Art%2000%20-%20Zoning.pdf

190 City of Baltimore Comprehensive Master Plan Appendices 191190 City of Baltimore Comprehensive Master Plan Appendices 191
AppendicesComprehensive Master Plan RequirementsARTICLE VII, § 74(a), (b) of the Baltimore City Charter
PurposeThe Master Plan shall be made for the general purpose of guiding and ac-complishing a coordinated, adjusted and harmonious development of Bal-timore City to promote the health, order, security, safety, and morals of its inhabitants, and to preserve and enhance the aesthetic and natural environ-ment of the City.ScopeThe Master Plan may consist of a series of component plans. It shall show, among other things, the future general location and extent of all public im-provements and enterprises, including among other things, the general loca-tion and extent of streets, highways, boulevards, viaducts, bridges, subways, tunnels and all uses of land for purposes of public transportation, and also the general location and extent of piers, wharves, docks and bulkheads, and buildings or structures thereon, whether publicly or privately owned or oper-ated, and also the general location and extent of publicly owned places of recreation, such as playgrounds, squares, and parks, and all public buildings and other public property, including school buildings, and all existing and proposed zoning areas or districts, and all public utilities, services and termi-nals, such as water, gas, electricity, sewerage, telephone, telegraph and trans-portation, whether privately or publicly owned or operated.
A. Fulfillment of City and State Guidelines
The City’s interactive map of neighborhood statistical areas, building footprints and parcel boundaries can be found at http://maps.baltimorecity.gov/imap/

190 City of Baltimore Comprehensive Master Plan Appendices 191190 City of Baltimore Comprehensive Master Plan Appendices 191
INTR
OD
UC
TION
SU
MM
AR
Y H
ISTO
RY
KE
Y TR
EN
DS
LIVE
EA
RN
PLAY
LEA
RN
IMP
LEM
EN
TATION
MA
NA
GE
ME
NT FIN
AN
CIA
L CO
NC
LUS
ION
GLO
SS
AR
Y A
PP
EN
DIC
ES
ARTICLE 66B of the Maryland Annotated CodeBasic Requirements(1) Include and implement the Eight Visions (see below) through the Compre-
hensive Plan;(2) Prepare a Sensitive Areas Element for the Comprehensive Plan;(3) Encourageregulatorystreamlining,innovation,andflexibilityintheplan;(4) Comply with the two “consistency” requirements: implementation regu-
lations must be consistent with the Comprehensive Master Plan and state and federal funds may be used only for projects that are consistent with the Plan.
Required Elements:(1) Statement of Goals and Policies(2) Land Use Plan Element(3) Transportation Plan Element(4) Community Facilities Element(5) Mineral Resources Element (if available)(6) Sensitive Areas Element(7) Inter-jurisdictional Coordination (suggested, not required)(8) Plan Implementation ElementEight Visions:(1) Development shall be concentrated in suitable areas;(2) Sensitive areas shall be protected;(3) In rural areas, growth shall be directed to existing population centers and
resource areas shall be protected;(4) Stewardship of the Chesapeake Bay and the land shall be a universal ethic;(5) Conservation of resources, including a reduction in resource consumption,
shall be practiced; (6) To encourage the achievement of paragraphs (1) through (5) of this subsec-
tion, economic growth shall be encouraged and regulatory mechanisms shall be streamlined;
(7) Adequate public facilities and infrastructure under the control of the County or Municipal Corporation are available or planned in areas where growth is to occur; and
(8) Funding mechanisms shall be addressed to achieve this policy.
Policies and Strategies

192 City of Baltimore Comprehensive Master Plan Appendices 193192 City of Baltimore Comprehensive Master Plan Appendices 193
C1C2
Expa
nd e
victi
on p
reve
ntion
ser
vice
s to
hel
p ho
useh
olds
re
tain
thei
r ho
usin
g
V1 V2 V3 V4 V5 V6 V7 V8 E1 E2 E3 E4 E5 E6 E7 E8 C1 C2
dddd
Obj
ectiv
e 1:
Exp
and
and
Prot
ect H
ousi
ng
Dev
elop
and
impl
emen
t City
-wid
e in
clus
iona
ry
Ensu
re th
at a
tleas
t 300
hou
sing
uni
ts p
er y
ear
are
Ensu
re h
ouse
hold
s th
at a
re in
volu
ntar
ily d
ispl
aced
Wat
er R
esou
rces
Ele
men
t

192 City of Baltimore Comprehensive Master Plan Appendices 193192 City of Baltimore Comprehensive Master Plan Appendices 193
INTR
OD
UC
TION
SU
MM
AR
Y H
ISTO
RY
KE
Y TR
EN
DS
LIVE
EA
RN
PLAY
LEA
RN
IMP
LEM
EN
TATION
MA
NA
GE
ME
NT FIN
AN
CIA
L CO
NC
LUS
ION
GLO
SS
AR
Y A
PP
EN
DIC
ES
Policies and Strategies
Dev
elop
a v
acan
t hou
sing
recl
amati
on re
clam
ation
str
at-
egy
for
Tran
sitio
nal a
nd D
istr
esse
d ne
ighb
orho
ods
Supp
ort c
reati
on o
f a C
omm
unity
Gar
den
Land
Tru
st(s
) to
hol
d tit
le to
com
mun
ity-m
anag
ed o
pen
spac
es a
nd
gard
ens
(See
als
o PL
AY, G
oal 3
, Obj
ectiv
e 2)
Targ
et h
omeo
wne
rshi
p an
d re
habi
litati
on lo
ans
as
Crea
te a
nd p
rese
rve
mix
ed-in
com
e ne
ighb
orho
od
Dev
elop
a c
ompr
ehen
sive
pla
n to
elim
inat
e ho
me-
Obj
ectiv
e 2:
Str
ateg
ical
ly R
edev
elop
Vac
ant P
rope
r-
Esta
blis
h a
mul
ti-tie
red
prop
erty
tax
to e
ncou
rage
Obj
ectiv
e 3:
Mai
ntai
n an
d Cr
eate
Saf
e, C
lean
, &
Obj
ectiv
e 6:
Incr
ease
the
City
’s p
opul
ation
by
Elim
inat
e ch
ildho
od le
ad p
oiso
ning
Dev
elop
Gro
wth
Pro
moti
on A
reas
(GPA
s) to
Mar
ket t
he C
ity to
sur
roun
ding
juri
sdic
tions
and

194 City of Baltimore Comprehensive Master Plan Appendices 195194 City of Baltimore Comprehensive Master Plan Appendices 195
Pro
mot
e us
e of
Mar
ylan
d Bu
ildin
g Re
habi
litati
on C
ode
Obj
ectiv
e 2:
Str
eam
line
and
Stre
ngth
en th
e D
evel
-
Impr
ove
effici
ency
of O
ne-S
top
Shop
for
perm
itting
Incr
ease
num
ber
of z
onin
g co
de e
nfor
cers
Crea
te a
task
forc
e on
inte
rage
ncy
coor
dina
tion
for
Ensu
re a
ll re
side
nts
are
with
in 1
.5 m
iles
of q
ualit
y
Upd
ate
City
-wid
e hi
stor
ic p
rese
rvati
on g
uide
lines
Sim
plify
and
acti
vely
pur
sue
the
loca
l his
tori
c
Stre
ngth
en C
HA
P or
dina
nce
enfo
rcem
ent b
y

194 City of Baltimore Comprehensive Master Plan Appendices 195194 City of Baltimore Comprehensive Master Plan Appendices 195
INTR
OD
UC
TION
SU
MM
AR
Y H
ISTO
RY
KE
Y TR
EN
DS
LIVE
EA
RN
PLAY
LEA
RN
IMP
LEM
EN
TATION
MA
NA
GE
ME
NT FIN
AN
CIA
L CO
NC
LUS
ION
GLO
SS
AR
Y A
PP
EN
DIC
ES
Policies and Strategies
Obj
ectiv
e 5:
Impr
ove
Wat
er Q
ualit
y an
d th
e En
vi-
Ado
pt a
nd im
plem
ent t
he C
ompr
ehen
sive
Wat
er
Redu
ce p
ollu
tant
s in
str
eam
s, r
iver
s an
d re
serv
oirs
Obj
ectiv
e 1:
Cre
ate
a Co
mpr
ehen
sive
Tra
nspo
r-
Crea
te a
City
-wid
e pe
dest
rian
pla
n
Impl
emen
t Tra
nspo
rtati
on S
yste
m M
anag
emen
t
Crea
te a
regi
onal
aut
hori
ty to
man
age
publ
ic
Supp
ort e
ffort
s to
impl
emen
t the
Bal
timor
e
Prot
ect a
nd c
reat
e Ri
ghts
-of-
Way
alo
ng e
xisti
ng a
nd

196 City of Baltimore Comprehensive Master Plan Appendices 197196 City of Baltimore Comprehensive Master Plan Appendices 197
Pres
erve
use
of e
min
ent d
omai
n fo
r un
deru
tiliz
ed

196 City of Baltimore Comprehensive Master Plan Appendices 197196 City of Baltimore Comprehensive Master Plan Appendices 197
INTR
OD
UC
TION
SU
MM
AR
Y H
ISTO
RY
KE
Y TR
EN
DS
LIVE
EA
RN
PLAY
LEA
RN
IMP
LEM
EN
TATION
MA
NA
GE
ME
NT FIN
AN
CIA
L CO
NC
LUS
ION
GLO
SS
AR
Y A
PP
EN
DIC
ES
Policies and Strategies
Obj
ectiv
e 8:
Ret
ain
and
Attra
ct P
ort-
Rela
ted
Indu
s-

198 City of Baltimore Comprehensive Master Plan Appendices 199198 City of Baltimore Comprehensive Master Plan Appendices 199
Capt
ure
shar
e of
regi
onal
gro
wth
in d
efen
se-r
elat
ed
Purs
ue d
esig
natio
n of
Bal
timor
e as
a N
ation
al
Prep
are
for
the
bice
nten
nial
ann
iver
sary
of t
he W
ar

198 City of Baltimore Comprehensive Master Plan Appendices 199198 City of Baltimore Comprehensive Master Plan Appendices 199
INTR
OD
UC
TION
SU
MM
AR
Y H
ISTO
RY
KE
Y TR
EN
DS
LIVE
EA
RN
PLAY
LEA
RN
IMP
LEM
EN
TATION
MA
NA
GE
ME
NT FIN
AN
CIA
L CO
NC
LUS
ION
GLO
SS
AR
Y A
PP
EN
DIC
ES
Des
igna
te a
nd s
uppo
rt A
rt a
nd E
nter
tain
men
t Dis
tric
ts
Policies and Strategies

200 City of Baltimore Comprehensive Master Plan Appendices 201200 City of Baltimore Comprehensive Master Plan Appendices 201
Dra
ft a
nd a
dopt
a C
ity-w
ide
plan
for
park
s an
d op
en s
pace
Mee
t goa
ls a
nd re
quire
men
ts o
f the
Che
sape
ake
Bay
Dev
elop
a W
ater
way
Tra
sh M
anag
emen
t Pla
n to
Cons
truc
t 1 u
ltra-
urba
n Be
st M
anag
emen
t Pra
ctice
s
Goa
l 1: I
mpr
ove
Publ
ic S
choo
ls a
nd L
ibra
ries

200 City of Baltimore Comprehensive Master Plan Appendices 201200 City of Baltimore Comprehensive Master Plan Appendices 201
INTR
OD
UC
TION
SU
MM
AR
Y H
ISTO
RY
KE
Y TR
EN
DS
LIVE
EA
RN
PLAY
LEA
RN
IMP
LEM
EN
TATION
MA
NA
GE
ME
NT FIN
AN
CIA
L CO
NC
LUS
ION
GLO
SS
AR
Y A
PP
EN
DIC
ES
Ensu
re a
cces
s to
pub
lic li
brar
y se
rvic
es fo
r al
l res
iden
ts.
Policies and Strategies

202 City of Baltimore Comprehensive Master Plan Appendices 203202 City of Baltimore Comprehensive Master Plan Appendices 203

202 City of Baltimore Comprehensive Master Plan Appendices 203202 City of Baltimore Comprehensive Master Plan Appendices 203
INTR
OD
UC
TION
SU
MM
AR
Y H
ISTO
RY
KE
Y TR
EN
DS
LIVE
EA
RN
PLAY
LEA
RN
IMP
LEM
EN
TATION
MA
NA
GE
ME
NT FIN
AN
CIA
L CO
NC
LUS
ION
GLO
SS
AR
Y A
PP
EN
DIC
ES
Policies and Strategies
X.

204 City of Baltimore Comprehensive Master Plan Appendices 205204 City of Baltimore Comprehensive Master Plan Appendices 205
DPW
Fac
iliti
es

204 City of Baltimore Comprehensive Master Plan Appendices 205204 City of Baltimore Comprehensive Master Plan Appendices 205
INTR
OD
UC
TION
SU
MM
AR
Y H
ISTO
RY
KE
Y TR
EN
DS
LIVE
EA
RN
PLAY
LEA
RN
IMP
LEM
EN
TATION
MA
NA
GE
ME
NT FIN
AN
CIA
L CO
NC
LUS
ION
GLO
SS
AR
Y A
PP
EN
DIC
ES
http://www.baltimorecity.gov/government/planning/sustainability/down-loads/0509/051509_BCS-001SustainabilityReport.pdf
Baltimore Workforce Investment Board Targeted Industry StrategyPresentation to Sectoral Advancement Strategies SubcommitteeMarch 10, 2004I. INTRODUCTIONIn the summer of 2001, the Planning Committee of the Baltimore Workforce InvestmentBoard(BWIB)begantheprocessofchoosingspecificindustrysec-tors for targeted workforce development strategies in the Baltimore Metropoli-tanregion.Basedontheselectionprocessdescribedbelow,thefollowingfiveindustries were chosen by the BWIB in April of 2002 for targeted workforce development strategies:Required Elements:• Business Services • Construction• Health Care/Life Sciences• Hospitality/Tourism • Information Technology and Computer Related ServicesIn the Fall of 2003, the Committee recommended that Health Care and Life Sciences be broken into two distinct industries because of their unique work-force development planning needs. Information Technology was also renamed to be more precise. This resulted in a total of six targeted BWIB industries in alphabetical order as follows:• Bioscience • Business Services • Computer, Internet and Data Services• Construction• Health Care and Social Assistance• Hospitality/Tourism II. DEFINITIONS OF TARGETED INDUSTRIESBioscienceThe Bioscience sector includes industries that are “biology driven, and their activity substantially involves research, development or manufacture of the following: 1) Biologically active molecules, 2) Devices that employ or affect biological processes, and 3) Biological information resources”. Within this broaddefinition,thetargetsectorincludesthefollowingemployers:1)Privatesector (Bioscience companies- R&D, Service and Manufacturing, Testing labs such as Quest Diagnostics, and Hospital Labs such as University of Maryland Medical Center); 2) Higher Education (University research labs); 3) Federal Labs (such as National Institutes of Health); and 4) Research Institutes.
Business ServicesThe Business Services sector includes the following industries: 1) Accounting, Tax Preparation, Bookkeeping, and Payroll Services; 2) Management Consult-ing Services, 3) Advertising and Related Services, 4) Management of Compa-nies and Enterprises (except government establishments) that administer, over-see, and manage establishments of the company or enterprise and that normally undertake the strategic or organizational planning and decision-making role of the company or enterprise and 5) Administrative and Support Services.
B. Sustainability Plan
Policies and Strategies
C. BWIB Targeted Industry Strategy

206 City of Baltimore Comprehensive Master Plan Appendices 207206 City of Baltimore Comprehensive Master Plan Appendices 207
Computer, Internet and Data ServicesThe Computer, Internet and Data Services related industries include: 1) In-ternet Publishing and Broadcasting, 2) Internet Service Providers and Web Search Portals, and Data Processing Services; 3) Computer Facilities Man-agement Services (including establishments primarily engaged in providing on-site management and operation of clients’ computer systems and/or data processing facilities as well as establishments providing computer systems or data processing facilities support services).
ConstructionThe Construction sector comprises establishments primarily engaged in the construction of buildings or engineering projects. Construction work done may include new work, additions, alterations, or maintenance and repairs. Activitiesoftheseestablishmentsgenerallyaremanagedatafixedplaceofbusiness, but they usually perform construction activities at multiple project sites. Production responsibilities for establishments in this sector are usually specifiedin(1)contractswiththeownersofconstructionprojects(primecon-tracts) or (2) contracts with other construction establishments (subcontracts).
Health Care and Social AssistanceThe Health Care and Social Assistance sector comprises establishments pro-viding health care and social assistance for individuals. Trained professionals deliver the services provided by establishments in this sector. Many of the industriesinthesectoraredefinedbasedontheeducationaldegreeheldbythe practitioners included in the industry.
Hospitality and TourismThe Hospitality and Tourism sector includes the following industries: 1) Retail Trade; 2) Food and Beverage; 3) Clothing and Clothing Accessories Stores; 4) Sporting Goods, Hobby, Book, and Music Stores; 5) General Merchandise Stores; 5) Miscellaneous Store Retailers (Does not include motor vehicles and parts; new furniture and house furnishings; new appliances and electronic products; new building materials; and garden equipment and supplies; food and beverages; health and personal care goods; gasoline; new clothing and accessories; and new sporting goods, hobby goods, books, and music), 6) Scenic and Sightseeing Transportation, 7) Convention and Visitors Bureaus, 8) Convention and Trade Show Organizers, 9) Performing Arts, Spectator Sports, and Related Industries, 10) Accommodation Industries and 11) Food Services and Drinking Places (Including full-service restaurants; limited-ser-vice eating places; special food services, such as food service contractors, caterers, and mobile food services; and drinking places).
III. DATA REVIEWEDThe following criteria and types of information were reviewed:(1) CurrentNeedbyIndustry •EmployerRecruitmentDifficulty • Projected Openings Availability of Entry-level Jobs • Vacancy Rates(2) CurrentHumanandFinancialResourcesbyIndustry • Total local Employment • BWIB Financial Resources • Total Number of Graduate degrees in a Year by Area of Study • Economic Development/Political Strategies

206 City of Baltimore Comprehensive Master Plan Appendices 207206 City of Baltimore Comprehensive Master Plan Appendices 207
INTR
OD
UC
TION
SU
MM
AR
Y H
ISTO
RY
KE
Y TR
EN
DS
LIVE
EA
RN
PLAY
LEA
RN
IMP
LEM
EN
TATION
MA
NA
GE
ME
NT FIN
AN
CIA
L CO
NC
LUS
ION
GLO
SS
AR
Y A
PP
EN
DIC
ES
(3) WagesbyIndustry • Wage Ranges • Wage Changes over time (1 and 10 year time span)(4) ChangesinEmploymentOverTimebyIndustry • Past Employment Growth (1 and 10 year time span) • Projected Employment Growth (5) PotentialforCareerLaddersbyIndustry •LocallyidentifiedcareerLadders •Nationallyidentifiedcareerladders(6) OpportunitiesforLow-SkillWorkers •IdentifiedIndustriesWithEntry-LevelJobOpportunitiesand“Good
Wages” •Identifiedoccupationswithgrowthpotentialinthelocalarea
IV. SUMMARYBusinessServicesSector is the second largest employment industry sector in Baltimore City, employing 45,000 people or 12% of the workforce in July 2003. From 1990 to 2002, this employment sector grew 9.3% in Baltimore City.Wageshaveincreased50.9%afterinflationinMaryland.Careerladdersappear to be less obvious in this industry and need further exploration. There are six high growth occupations in this industry projected through 2006. There are high-demand, low skill/education jobs with good wages in this industry.Construction In July 2003, there were 12,300 and 74,200 construction related jobs in Baltimore Cty and the Baltimore Metro area, respectively. The Con-struction industry represents 3% and 5.3% of Baltimore City and Baltimore Metro Area’s total employment, respectively. In 2000 the Construction indus-try in Baltimore City represented 16% and 8.6% of the total Construction in-dustry in the Baltimore Metro area and Maryland, respectively. Baltimore’s share of Maryland’s Construction industry decreased by 2% between 1990 and 2000. Maryland average weekly wages in this industry are very good and have shown an increase of 46% between 1990 and 1999. This industry is particularly important to job seekers with low educational attainment. There are many low education, high-demand, jobs with good wages in this industry. Most of the training is done through on-the-job experience. HealthCare/LifeSciencesSector is the largest employment industry sector in Baltimore City. The Health Care and Social Assistance sector employs 67,200 alone or 17.34% of the workforce. In Maryland, the industry grew 23.3% from 1990-1999. The industry is one of only three Baltimore city sectors to grow (9.3%) from 1990 to 2002. The industry has high vacancy rates. From 1990 to 1999,wagesinthisindustryhavegrown32%afterinflation(26%).ThereareeasilyidentifiablecareerladdersinthisindustryandlocalBaltimoreemployershave been receptive to further development of career pipeline strategies. There are high-demand, low skill/education jobs with good wages in this industry.Hospitality/Tourism In July 2003, there were 30,300 jobs in the Hospitality/Tourism industry in Baltimore City. However, this is probably an underestimate of the whole tourism industry that includes many retail shops not counted in thisfigure.Thissectorrepresents8%ofBaltimoreCityemployment.Between1990 and 2002, this industry decreased by 8.2% . Some of this may be due to terrorist activities and a lagging economy in 2001 and 2002; however employ-ment before the events of 9-11, in 2000, was just 27,400; a drop of 6.4% from
Policies and Strategies

208 City of Baltimore Comprehensive Master Plan Appendices 209208 City of Baltimore Comprehensive Master Plan Appendices 209
1990 employment. Nevertheless, this industry boasts 11 occupations listed among the 50-projected growth occupations in Baltimore City through 2006. Wages in this industry are relatively low but have increased 36% from 1990 to1999inMaryland,afteradjustingforinflation.Therearemanyentry-leveljobs for low skill workers in this industry. Career ladders have been devel-oped and local employers have shown interest in developing them further.Information Technology and Computer Related Services This sector employed 21,296 Core IT workers in the Baltimore Metro Region in 2001. Updatedfiguresarenoteasilyavailable.Between1991and1999thisemploy-ment sector grew by 10% in Maryland. Of all industries in Baltimore, this employment sector pays the highest weekly wages. In addition, wages have increasedby47%inMarylandafteradjustingforinflation.Sixoccupationswithin this industry have been projected to experience high growth through 2006 in Baltimore. While the future rate of continued employment growth in this industry is debatable, national studies have shown that there are more computer-related jobs across all industries than there are within the Informa-tion Technology industry itself. Put another way, the skills associated with this industry have broad applicability across the workforce. Career ladders havebeen established in this industry.Twooccupationswere identified ashigh-demand, low skill/education jobs with good wages in this industry.V. OTHER MARYLAND ENTITIES’ TARGETED INDUSTRIES
A. Governor’s Workforce Investment Board Vital Industries for Maryland Purpose: Identify industries vital to workforce and economic development • Construction • Health Care • Hospitality and Tourism • Education • High Technology B. Department of Business and Economic Development (DBED)
Maryland’s Most Competitive IndustriesPurpose: Focus limited resources on high-impact projects with best chance to win
Baltimore City Growth Industries1
Maryland Growth Industries2
Vacancy Rates
Baltimore Jobs3
Industry Specific Maryland Graduates 20004
Baltimore Average Weekly Wages5
Maryland Wage Growth 1990-1999
Business Services +8.3% +13.9% 10%6 45,000 7214 $550 +43.4%
Health Care & Soc. Ass. +9.3% +44.7% 13.9%7 67,200 6487 $588 +32.4%
Information Technology N/A +10.2% 12.1%8 21,2969 4371 $962 +47.2%
Construction -32.6% +5.7% N/A 12,300 N/A $680 +31.6%
Hospitality/Tourism -8.19% +17.4% N/A 30,300 N/A $404 +35.6%

208 City of Baltimore Comprehensive Master Plan Appendices 209208 City of Baltimore Comprehensive Master Plan Appendices 209
INTR
OD
UC
TION
SU
MM
AR
Y H
ISTO
RY
KE
Y TR
EN
DS
LIVE
EA
RN
PLAY
LEA
RN
IMP
LEM
EN
TATION
MA
NA
GE
ME
NT FIN
AN
CIA
L CO
NC
LUS
ION
GLO
SS
AR
Y A
PP
EN
DIC
ES
MostCompetitiveBiotech (Core in Rockville to Frederick area):• Diagnostics • Commercial Research• Biological ProductsTelcom • Space vehicles• Communication services• Search and Navigation EquipmentIT Services• Systems Integration • Computer ProgrammingFIRE• Credit Institutions• Real Estate Investment Trusts• Commercial Banks• Savings Institutions
http://www.baltimorecity.gov/government/planning/ceds/downloads/2008%20Baltimore%20City%20CEDS.pdf
TransitOrientedDevelopment(TOD)StrategyThe State of Maryland’s TOD Task Force developed the following working definitionforTransitOrientedDevelopment in2000: “Aplaceofrelativelyhigher density that includes a mixture of residential, employment, shopping, and civic uses and types, located within an easy walk of a bus or transit center.” (TOD Task Force, MDOT, 2000). Baltimore City’s Department of Planning hastakenthisdefinitionasapointofdepartureindevelopingtransit-supportiveland use strategies for the City. In this effort, the City emphasizes Transit Ori-ented Development as an approach, rather than a pre-determined architectural product, the object of which is to create compact, pedestrian-friendly activity zones near transit stations. As such, bringing TOD principles to any given sta-tion area will imply very different outcomes in terms of the character, density and mix of uses implied, depending on the needs, opportunities and existing character of surrounding neighborhoods (ranging from Downtown districts to residential centers). Benefits and Purpose of Transit Oriented DevelopmentTheTODapproachseeks topromoteactive,well-definedplacesnear transitstations so as to create amenities for existing transit riders, to generate new rid-ership through housing and destinations, and to leverage transit investments to achieve community goals. The approach is a critical component of the broader land use strategy which seeks to accommodate growth while enhancing livabil-ity by promoting appropriate infrastructure and land use mixes in station areas. By making it easier for residents to access shopping, work and neighborhood services by either walking or transit, the approach can help reduce auto-depen-dency. Given heightening fuel and energy costs, and the large share of house-hold incomes generally devoted to meeting auto-travel expenses, we expect thestrategytoyieldsignificantcostsavingsforarearesidentsandbusinesses,while attracting new investment and interest to Baltimore City.
D. 2008 Comprehensive Economic Development Strategy (CEDS)
E. TOD Strategy
Policies and Strategies

210 City of Baltimore Comprehensive Master Plan Appendices 211210 City of Baltimore Comprehensive Master Plan Appendices 211
GuidingObjectivesforTODPlanningandPolicy:The Planning Department in conjunction with the Departments of Housing, Transportation, and the Baltimore Development Corporation, has developed a list of overarching objectives as a guide for transit-oriented development in Baltimore. It is intended that these objectives would be more formally adopted to provide the focus for our zoning and incentive programs for transit-oriented development: Economic Efficacy and Growth Maximizetransitassetsforpublicbenefitandleveragetheseinvestmentsto-wards the realization of broader economic development goals. TransportationChoicesExpand transportation choices by enhancing the quality of bicycle, pedestrian and transit access, and managing the use of the automobile. Efficient Land Use Guide future development into compact mixed-use activity centers near transit thatpromoteefficientlanduseandprovideconvenientaccesstojobsanddailyservices. Neighborhood Benefits Enhance character, safety and sense of place in neighborhoods near transit sta-tions, and promote a broad range of housing choices.
Since 2004, the Baltimore City Department of Planning has embarked on a two-part strategy to bring the principles of Transit Oriented Development into City land use policy and practice. This strategy has entailed two key elements: Pilot projects and policy review to enhance existing station areas, and TOD planning for proposed extensions of the mass transit system.
I. Existing StationAreas:TOD Pilot Projects and Development Guide-lines
- TOD Pilot Projects In 2004, the Department conducted a comprehensive review of existing transit stations to identify promising pilot projects. The analysis resulted in Depart-mental negotiations with MDP and MDOT to move forward in 3 existing sta-tion areas: State Center, West Baltimore MARC and Reisterstown Plaza. Of thesetheStateCenterproject,whichincorporatesallthreeoftheCity’sfixedmasstransitmodeswasidentifiedasatoppriority.The process of TOD planning for State Center entailed working with State agencies and their consultants to conduct market research, land use analysis and stakeholder outreach in the half mile radius of the existing State Center Metrostation.InJanuary2005,afivedaycharrettewasheldtobeginoutlininga vision of the potential for the area to be redeveloped along TOD principles. Results of this process were documented in a Draft State Center Transit Ori-ented Development Strategy (March 2005), which became a basis for further planning in the area, and informed the State’s decision to issue an RFQ for all state-owned properties in the area (roughly 25 acres) in September 2005.
While detailed policy lessons have yet to be drawn, the project has provided insights into constraints and possibilities of partnering for TOD projects in the Baltimore context. It has also provided a basis from which City and State will

210 City of Baltimore Comprehensive Master Plan Appendices 211210 City of Baltimore Comprehensive Master Plan Appendices 211
INTR
OD
UC
TION
SU
MM
AR
Y H
ISTO
RY
KE
Y TR
EN
DS
LIVE
EA
RN
PLAY
LEA
RN
IMP
LEM
EN
TATION
MA
NA
GE
ME
NT FIN
AN
CIA
L CO
NC
LUS
ION
GLO
SS
AR
Y A
PP
EN
DIC
ES
continue to work together, to promote public-private partnerships and plan-ningprocessesforTODinsuchotheridentifiedplanningareasastheWestBaltimore MARC and Reisterstown Plaza Metro stations, which we expect to move forward in the coming year.
The Department has meanwhile continued investigation of other station area planning and redevelopment opportunities (including Westport, Shot Tower, and Penn North), and put in place a checklist of concerns to be addressed in the development review of station area projects.
- TOD Development Guidelines: In 2005, the Department of Planning developed and implemented a checklist to guide the site plan and design review of projects within a half mile radius of transit stations. This list of principles or ‘checklist’, which have been in-cluded in the City’s Development Guidebook, is intended to ensure the fol-lowing principles are addressed:
• Higher density development in relation to the surrounding community• A mix of land uses, horizontally and vertically• Compact pedestrian-oriented design and streetscapes• Building design and orientation to the street and transit facilities• Connected street pattern without super-blocks and cul-de-sacs• A system of quality open space and amenities • Limited and managed automobile parking
II:PlanningforFutureTransitStationAreasThe City has also partnered with MDOT, MTA and Baltimore County to in-vestigate transit-supportive land use policies as part of the current Red Line study. In the primary instance this has entailed bringing Transit Oriented De-velopment principles to bear on alignment decisions, to ensure that planning for transit takes existing land use challenges and opportunities adequately into account.
Preliminary market research for station areas at Edmondson Village Shopping Center, West Baltimore MARC, and Canton Crossing Stations has been con-ducted. As the Red Line planning process moves forward, we expect to see community involvement in more in-depth station area planning. This process will include outreach activities, land use and zoning analysis, and station area planning to help extend and integrate Baltimore’s transit system and to lever-age transit investments towards achieving community goals.
The Department intends to create a TOD zoning district to more directly regu-late and incentivize development near transit stations to ensure that land uses are transit-supportive. The Proposed Future Land Use Map (See Chapter IX) shows where TOD projects are being pursued at existing stations (e.g. State Center and Rogers Avenue) as well as potential TOD areas for proposed tran-sit stations (e.g. Poppleton).
Policies and Strategies

212 City of Baltimore Comprehensive Master Plan Appendices 213212 City of Baltimore Comprehensive Master Plan Appendices 213
www.liveearnplaylearn.com/publications/cmp/appendix/industrial_land_use_analysis.pdf
RetailAssessmentSummaryForBaltimoreCityOctober5,2005The Baltimore Development Corporation (BDC), Downtown Partnership of Baltimore, Inc. (Downtown Partnership), Baltimore City Department of Plan-ning (DOP), and the Charles Street Development Corporation have formed a Strategy Team to develop a comprehensive retail strategy and marketing pro-gram for the City of Baltimore, focusing primarily on downtown and select neighborhood retail districts. To develop the report, the Strategy Team re-quires a comprehensive understanding of the national retail marketplace and Baltimore’s position to take advantage of it. This retail market assessment is designed to serve as the foundation for the retail strategy, enabling intelligent and creative decisions based on data, information and market realities.KeyTakeawaysThe U.S. Urban Retail Market• Demographics Drive Retail Location Decisions: While retailers consider a
wide variety of factors in making location decisions, decisions are driven primarily by demographics –population, employment and income. If the demographic data and trends in a location do not meet predetermined re-quirements, retailers are not as likely to give the location or its other traits further consideration.
• Different Location Factors for Different Retail Types: Within cities, high-end retailers are typically attracted to areas in and near downtown since this is where the greatest number of high-income residents, employees and visitors are on a day-to-day basis. However, when mid-level and big box retailers, such as Target, Marshalls, and Home Depot, locate in cities, they tend to locate outside the center city in less expensive areas that offer easy access to a broad range of residents. These areas often offer easy parking or are near major public transportation stations. Home Depot, Toys ‘R’ Us, and Target (among others) have opened prototype stores in Manhattan, however, this is more of an urban experiment than a trend.
• National Retail is Limited in Center Cities: Typical location models for major national retail chains do not favor center cities. Suburban areas continue to be the preferred location of choice for most national retail chains. While the argument could be made that many major cities are ‘under-retailed’ by national chains based on population, most cities do not have the other critical demographic criteria and attributes that retailers believe they need to be successful.
Of the 40 national chains studied for this project, about half have locations in the top8retailcities identifiedbelow. Forcitiesbelowthe top8, thepresence of high-end and other national chains is much more limited. The mid-tier cities that have some national chains tend to have stores such as Gap, Banana Republic, Talbots, Barnes & Noble, Borders and perhaps one department store.
• National Retailers Cluster Together: Whether in suburban or central city areas, national retailers cluster near one another and other high-end local
F. Industrial Land Use Study
G. Retail Assessment Study

212 City of Baltimore Comprehensive Master Plan Appendices 213212 City of Baltimore Comprehensive Master Plan Appendices 213
INTR
OD
UC
TION
SU
MM
AR
Y H
ISTO
RY
KE
Y TR
EN
DS
LIVE
EA
RN
PLAY
LEA
RN
IMP
LEM
EN
TATION
MA
NA
GE
ME
NT FIN
AN
CIA
L CO
NC
LUS
ION
GLO
SS
AR
Y A
PP
EN
DIC
ES
Land Use Elements
retailers in enclosed malls, open air malls, or designated shopping districts. Many national retailers have a pre-determined list of retailers with whom they prefer to co-locate.
• Changing Urban Malls: While most cities in the top 25 metro areas have a major shopping mall of 400,000 square feet or more, many of these are in decline, such as Philadelphia’s Gallery (1 million square feet) and St. Louis City Centre (900,000 square feet). Many of the newest developments in cen-tral cities are quite different including: mixed-use facilities, open-air malls, and street-level storefronts in neighborhood shopping districts. Louisville recently opened up the former Galleria Mall into an outdoor Urban Entertain-ment Center similar to Baltimore’s Power Plant. Examples of newer urban shopping districts or open-air malls include Philadelphia’s Walnut Street, Minneapolis’ Nicollet Mall and Atlanta’s Atlantic Station (a 138-acre mixed-use project on the site of a former midtown steel mill).
• Top U.S. Retail Cities: Among major U.S. metro areas, there are only about 8 strong retail center cities. They are New York, Chicago, San Francisco, Bos-ton, Seattle, Washington, D.C., Philadelphia and Portland, OR. The selection of these cities as top tier retail centers was based on high retail sales, high consumer spending, high retail employment and/or a large presence of major national chains in the center city. While other cities, such as Minneapolis, Denver and San Diego, are improving their retail bases, most cities in the top 25 metro areas are struggling to retain and attract national retail chains.
• What Top Cities Have in Common: Most of the cities listed above have a number of common traits. They have: 1) large metro area populations; 2) high center city population densities; 3) high center city daytime employ-ment; 4) high center city average incomes; 5) at least one large mall or shop-ping district (400,000 to 1.5 million square feet) in the center city; 6) good public transportation; 7) good public safety either real or perceived. It is the combination of all of these traits together in a core area that seems to drive success, as opposed to having only one or two traits.
• Experience and Authenticity: In urban areas, national retail (and high-end locally-owned stores) tends to locate in neighborhoods or areas that offer a unique experience relative to typical suburban neighborhoods. This includes the presence of small parks and squares, sidewalk cafes, clustered amenities and a pedestrian-friendly non auto-dominated environment that encourages people to linger. Urban areas are also capitalizing on their authenticity – us-ing historic assets, architecture, cultural offerings, and unique urban settings to create a desirable environment for residents, employers and visitors. Rit-tenhouseSquare(Philadelphia),MagnificentMile(Chicago),andNewburyStreet/Public Garden (Boston) provide examples of urban areas that pull most of these traits together.
• Department Stores: With retail trends favoring big box stores, low-price warehouses, and open-air, ‘main street’ malls, department stores have been losing their long-held ‘anchor’ position in the retail market. Department stores are being forced to re-invent themselves (Sears, JC Penney), consoli-date with other stores (e.g., the Federated takeover of May), eliminate stores (Federated, Lord & Taylor) or go out of business (Wards, Bradlees, Caldor). However, among the 25 largest metro areas, 18 have at least one department store in or near downtown. Six of the eight top tier retail cities listed above have at least 4 or more department stores, with only Philadelphia (2 stores) and Washington, D.C. (1 store) lagging the group. The department stores that

214 City of Baltimore Comprehensive Master Plan Appendices 215214 City of Baltimore Comprehensive Master Plan Appendices 215
are located in these center cities tend to be higher-end, including Nordstrom, Neiman Marcus, Macy’s, Saks Fifth Avenue, Barney’s, Lord & Taylor and Bloomingdales.
•Pittsburghprovidesasoberingexampleofthedifficultyintryingtosecuredepartment stores to spur high-end retail growth. The city was successful in using incentives to lure high-end Lazarus and Lord & Taylor stores to serve as anchors for a planned high-end shopping avenue. However, both storesclosedwithin2yearsofopening,citingsalesfiguresthatfellbelow50% of projections.
• Incentives: While a handful of cities have created incentive programs to at-tract retail, researchon thisprojectwasunable tofindanysignificantandsuccessful retail incentive programs in major cities. Pittsburgh, as discussed above, provided $50 million for new Lazarus and Lord & Taylor stores, only to see both downtown stores close within two years of opening. The city is now responsible for paying off that debt. Washington, D.C. has enabled TIF legislation for retail, however, it has produced no favorable results. Only one small store has taken advantage of Detroit’s retail grants incentive. Buffalo usedsignificantstateandlocalgrantstoattractBassProShopstoanchoradowntown redevelopment project, however, this is viewed largely as an act of desperation by a city in need of an economic spark.
Most articles reviewed for this project, and representatives of other cities, conclude that incentives for retail are bad policy not only because they tend to be risky, but also because they do not seem to produce desired results. The best incentive for retail appears to be the creation of a city environment that supports retail through infrastructure, amenities, government support and in-centives targeted to the project developer for the overall project, as opposed to potential project tenants.
• Retail as Economic Development Effort: Historically, most cities have taken the position that retail is a follower of other economic activity. Therefore, cities and regions have not considered attracting and supporting retail to be an economic development priority. However, recent trends, such as renewal of center cities and the quest for improved amenities, have driven a new focus on retail as a key amenity in supporting quality of life.
Few cities, however, have placed much in the way of resources towards a retail attraction and support effort. Some cities have created retail incentives (see above) with minimal results; San Jose, Austin and Portland have each developed retail strategies; and Philadelphia has pieced together highly pro-fessional marketing materials to promote its retail neighborhoods. But none of these cities has a program, staff or organization that is dedicated to retail attraction and support.
• Transportation and Parking: While parking for retail is viewed as a must in the suburbs, it plays a different role in urban centers. The top 8 retail cities identifiedeachhavegoodpublictransportationsystems(includingsubwayand light rail) and a daytime population base that is already downtown on a daily basis for other reasons (e.g., residents, employees, visitors). Philadel-phia representatives stated that their retailers do not complain about the lack of parking nearby because they recognize that their business will come from people who are in town for other reasons and will shop while they are there. If people do come downtown to shop, it is for the experience or a unique item, not for convenience. This is why the existing demographics are so

214 City of Baltimore Comprehensive Master Plan Appendices 215214 City of Baltimore Comprehensive Master Plan Appendices 215
INTR
OD
UC
TION
SU
MM
AR
Y H
ISTO
RY
KE
Y TR
EN
DS
LIVE
EA
RN
PLAY
LEA
RN
IMP
LEM
EN
TATION
MA
NA
GE
ME
NT FIN
AN
CIA
L CO
NC
LUS
ION
GLO
SS
AR
Y A
PP
EN
DIC
ES
important. Cheap, easy parking is not typically a necessary part of the suc-cessful urban retail district.
• General Retail Development Trends: Current retail developments tend to revolve around mixed-use, ‘lifestyle’ centers (often open-air ‘main street’ malls), and urban entertainment centers (UEC). Few traditional enclosed malls are being developed today, although many argue the existing ones still have a place in the market.
Mixed-usedevelopmentsarethosethatincludeoffice,retailandresidentialspace. They often entail pedestrian friendly environments, lifestyle-ori-ented merchandising, main street ambience, convenient access, and scaled-down big-box stores.
AccordingtoICSC,lifestylecenterstypicallyhaveanopen-airconfigura-tion and 150,000 to 500,000 square feet of retail space, with at least 50,000 square feet occupied by upscale national chains. The tenant types are typi-cally apparel, home goods, and books and music. Restaurants, entertain-ment and design ambience (including sidewalk cafes, open space and other desirable settings) also make the complex a destination for more than just shopping. Many of these ‘main street’ projects are anchored by mega-plex movie theaters and offer outdoor dining, fountains and park benches de-signed to replicate the environment of old time city shopping districts.
Urban Entertainment Centers (UEC) are developments that mix destination, entertainment and retail. These projects bring together unique tenants and sense of place to encourage visitors to extend their stay. They are often ‘over the top’, with one developer describing them as, “Disneyland without the rides”. To become successful, UECs require a strong tourist and local market. They also need some type of over-arching idea. The Cordish Com-pany in Baltimore has become a signature developer of downtown UECs, with Baltimore’s Power Plant, Louisville’s 4th Street Live, Kansas City’s Power and Light District and projects in Orlando, Norfolk and other cities.
TheBaltimoreCityMarketandRetailPotential• Demographic Power in 1-Mile Radius of Core: Baltimore arguably has one
of the nation’s top center cities. The mix of residents, employers, tourists and amenities in the core of the city supports Baltimore’s emergence as a top tier downtown. Among the top 25 U.S. metro areas, Baltimore ranks 8th for population (36,980) within a 1-mile radius of the city center and 8th for number of households earning $75,000+ in the same radius.
• Demographic Decline in 3- and 5-Mile Radius: Like many major U.S. cit-ies, Baltimore has a solid core city, surrounded by struggling areas. While Baltimore’s population in a 3- and 5-mile radius remains among the top 10 cities nationally, income, growth and other critical measures fall-off dramatically. Like Baltimore, most major metro areas used to resemble a ‘doughnut’, with the entire city in decline and the surrounding suburbs showing great strength and growth. Today, large metro areas are starting to resemble ‘bullseyes’, with redevelopment and a rising middle- and up-per-class demographic in the core and in suburban areas, but with continued decline in other city areas and the inner ring suburbs.
• Underserved by National Retail Chains? Yes and No: Given its improving demographics in the city center and in demographic comparison with city
Land Use Elements

216 City of Baltimore Comprehensive Master Plan Appendices 217216 City of Baltimore Comprehensive Master Plan Appendices 217
centers in other metro areas, it could be argued that Baltimore is underserved by national retail chains. However, like most cities, Baltimore’s city center still does not fare well when compared to surrounding suburban jurisdictions giventheirstrongdemographics,flexiblerealestate,andparkingaccess.Theoverall retail market in Greater Baltimore and nearby Washington is very well served by national retail chains.
Of the 40 national retail chains evaluated for this project, only 8 have loca-tions within 1 mile of Baltimore’s city center. They are: Banana Repub-lic,Barnes&Noble,ESPNZone,Gap,OfficeDepot,Safeway,Talbots,andWhole Foods. Most of the other chains have multiple locations in suburban Maryland, however, some have no Maryland locations, including Barney’s, Cole Haan, Marshall Fields, Neiman Marcus, and West Elm.
• Characterized by Small, Local Retail: While the presence of high-end na-tional chains is fairly limited in Baltimore’s center city, the City does have a large number of small, street-level, local retailers. Among the top 25 markets reviewed, Baltimore City is among the top 10 for number of retail establish-ments and has the lowest average employment per establishment. This con-tributes to the City’s authenticity, however, the existing building footprints and frontage are not suitable for attracting national retail chains.
• What’s Been Holding Baltimore Back?: Baltimore’s effort to attract national retail chains has been held back by: 1) demographics that have only recently begun to become attractive to retailers; 2) downtown daytime employment that is well-below top markets; 3) no large, clustered shopping district or mall in or near downtown; 4) lack of adequate space to group retailers together and provide desired footprints and store frontage; 5) stiff competition from Columbia and wealthy surrounding suburbs; 6) easy access to high-end urban shopping experiences in New York, Philadelphia and Washington, D.C.; 7) inadequate and poorly connected public transportation system; 8) the percep-tion of crime; 9) lack of comprehensive information on the Baltimore market and how it compares to other cities and suburban markets.
• Reasons for Optimism in Baltimore: Baltimore has a number of reasons to be optimistic about its position to attract and support a strong retail base. The City: 1) is arguably one of the nation’s top downtowns given its dense clustering of residents, businesses, visitors, institutions, sports facilities and events; 2) meets many factors that are driving national retail chain locations in top tier cities; 3) has high population density; 4) has a high number of high income earners in the city center; 5) is realizing a booming demand for high-end residential units; 6) has a high hotel occupancy rate with many new hotels in the pipeline; and 7) has the authenticity (architecture, culture, distinct neighborhoods, diverse populations) that is driving urban renewal in many major markets.
• Suburbs Win Demographic Battle with City: While Baltimore and nearby Washington, D.C. are performing fairly well against other central cities for desired demographic attributes, the surrounding Maryland suburbs perform much better. Using a 5-mile radius geography, Washington, Silver Spring, Baltimore and Bethesda have by far the highest populations and employment levels in the region. However, growth, incomes and consumer spending are much higher in the suburban towns than in Baltimore. The median household income within a 5-mile radius of downtown Baltimore is only $31,976, while it is over $80,000 in Columbia and Bethesda. All other jurisdictions, includ-ing Washington, D.C., average over $50,000. Combine these demographic

216 City of Baltimore Comprehensive Master Plan Appendices 217216 City of Baltimore Comprehensive Master Plan Appendices 217
INTR
OD
UC
TION
SU
MM
AR
Y H
ISTO
RY
KE
Y TR
EN
DS
LIVE
EA
RN
PLAY
LEA
RN
IMP
LEM
EN
TATION
MA
NA
GE
ME
NT FIN
AN
CIA
L CO
NC
LUS
ION
GLO
SS
AR
Y A
PP
EN
DIC
ES
factors with other key factors considered in retail location models, such as available land, parking, and public safety, and it is easy to see why retailers tend to cluster in suburban areas.
• Light Street to Canton is Strongest City Area: Among the Baltimore City neighborhoods reviewed, the areas around the Inner Harbor from the corner of Light and Pratt Streets, through Harbor East, to Canton show the greatest potential for attracting national retail. Federal Hill possesses fairly strong demographics and provides possibilities, however, it is not as central to the business and tourism core as the other areas and does not have large buildings or parcels to meet national retail needs. Incomes and household growth would likely deter high-end national chains from considering Mt. Vernon, the East Side/JHU, and the West Side/UMMS, even though these neighborhoods have the largest populations within a 1-mile radius. These neighborhoods should be considered for local, boutique, and small national or regional retail chains.
PrimaryImplicationsofFindingsforBaltimore• If Demographics Rule: Then, in efforts to attract high-end national retail
chains, Baltimore must focus on the neighborhoods within a 1-mile radius of the core downtown area. These are the only areas in the City that be-gin to provide the demographics and attributes that are proving attractive to high-end chains in other cities. Baltimore must also begin to produce demographics and marketing materials based on the entire city center (e.g., 1-mileradius)andnotalimiteddefinitionofwhatconstitutes‘downtown’.If Baltimore doesn’t put its best foot forward in attempting to attract national retail, it is much less likely to be successful.
• If Cities Don’t Fit Retail Models: Then Baltimore must creatively package and market itself to desired retailers guided by a well-conceived plan. Other-wise, the existing models will serve to pass the City by. Baltimore must also identify ways to differentiate itself from surrounding suburbs.
• If National Retailers Cluster; If All Successful Cities Have Dedicated Shop-ping Districts and/or Malls: Then Baltimore must identify and promote areas where retailers can co-locate and cluster together in large numbers.
• If Retailers Want Certain Footprints and Frontage: Then Baltimore must ei-therwork tofindspace thatmeets retailermodelsorworkcreativelywithretailers to help them adapt their models to unique urban environments.
• If Authenticity Matters: Then Baltimore must preserve and leverage its unique neighborhoods, markets and architecture.
• If The Experience Matters: Then Baltimore must consider sidewalk cafes, parks/squares, and places to linger which are not dominated by automobiles when determining where retail will thrive.
• If Access Matters; If Top Tier Retail Cities Don’t Prioritize Easy Parking: Then Baltimore must consider retail access in housing, transportation, and other growth planning. The City must also ensure its designated shopping districts are pedestrian friendly since most urban shoppers arrive on foot.
• If Department Stores Aren’t Anchors Anymore, but Part of the Mix; If Most Downtown Department Stores are High End: Then Baltimore should con-tinue to explore the possibilities department stores may provide to the overall retail environment and mix downtown, but attraction of a department store should not be viewed as a panacea that will move the City ahead by itself.
Land Use Elements

218 City of Baltimore Comprehensive Master Plan Appendices 219218 City of Baltimore Comprehensive Master Plan Appendices 219
The City should focus downtown efforts on higher-end department stores.• If Retail Incentives Aren’t Effective: Then Baltimore must consider the entire
set of factors that are proving to drive attraction of targeted national retail chains, as opposed to looking for an incentive that will serve as a silver bullet. The City must also focus on attracting and working with experienced devel-opers that have the proven ability to attract desired retail to their projects.
•IfBaltimorehasaStrong,DiversifiedCenterCity,buthasLimitedPresenceof National Retail: Then Baltimore has the opportunity to move into the top tier of U.S. downtowns for retail if it markets and manages its assets well.
• If Most Cities Don’t Have Dedicated Retail Marketing Programs: Then Balti-morehastheopportunitytoachievesuccessandbeafirst-moveramongmid-tier markets, given its dedicated retail staff at Downtown Partnership, focus on commercial revitalization at BDC (including Main Streets) and existing center city attributes and demographics.
• If Site Selection for Retail Varies by Size and Type: Then Baltimore must address the strategy to meet the different needs of primary retail types: 1) high-end national chains; 2) mid-level national chains; and 3) smaller, lo-cal retailers. High-end retail must focus primarily on the high-income core (1-mile radius); mid-level retail (e.g., Target, Kohls, Marshalls) must focus on neighborhoods that provide lower cost, easy access to a wide variety of residents; and smaller, local retail must focus primarily on the City’s many unique neighborhoods.
Background:ProjectApproachTo develop a successful assessment and strategy, the Team wanted to under-stand: how retail location decisions are being made; the key factors involved in the location process; how Baltimore and other places compare given these key factors; current and future retail trends; and the recent experiences of other cities. To attain this understanding, the Team approached the project from a variety of different angles. They are:• Understanding Retail Location Decisions: Forty national retailers were evalu-
ated to determine where they have actually located stores and how they make location decisions. The 40 retailers represent a cross section of retail types including department, grocery, specialty, and big box stores.
• Comparing Center Cities in the Top 25 Metro Areas: Each of the top 25 U.S. metro areas and their core cities were evaluated to determine their demograph-ics. The cities were also studied to determine which national retail chains are located in or near downtown.
• Determining Retail Trends: A wide variety of articles and reports were re-viewed to determine the latest retail trends.
• Comparing Baltimore and Its Surrounding Suburbs: Baltimore City was com-pared to surrounding suburban towns to determine the difference in demo-graphic characteristics and other factors most critical to retail location.
• Comparing Baltimore Center City Neighborhoods: Key demographics were evaluated using a 1-mile radius of 7 different neighborhoods in or near down-town. The areas studied include: Canton, East Side/JHU, Federal Hill, Har-bor East, Mt. Vernon, Pratt & Light Streets, and the West Side/UMMS.
• Visiting a Top Retail City: Members of the project team visited Philadelphia foroneday tomeetwith localofficials and toexperience theCity’s retailshoppingdistrictsandassociatedneighborhoodsfirsthand.

218 City of Baltimore Comprehensive Master Plan Appendices 219218 City of Baltimore Comprehensive Master Plan Appendices 219
INTR
OD
UC
TION
SU
MM
AR
Y H
ISTO
RY
KE
Y TR
EN
DS
LIVE
EA
RN
PLAY
LEA
RN
IMP
LEM
EN
TATION
MA
NA
GE
ME
NT FIN
AN
CIA
L CO
NC
LUS
ION
GLO
SS
AR
Y A
PP
EN
DIC
ES
CityComparisons:ApplesandOrangesThe problem in comparing cities is that they are political jurisdictions that are very different in size (land area) so the information obtained does not provide for apples-to-apples comparisons. For example, Phoenix has a city population of 1.39 million and Baltimore City has a population of 643,000. So it is commonly assumed that Phoenix (6th largest U.S. city) is over twice as big as Baltimore City (18th largest). However, Phoenix City has a land area of about 475 square miles, whereas Baltimore City has only 81 square miles. Baltimore City actually has a population density three times greater than Phoenix. Even downtowns are difficult to compare. TheTeamwasable to uncover some studies that compared ‘downtown’ areas in many cities, however, most of the data was self-reported and the downtowns also varied insizeanddefinition.Therefore, instead of using the top 25 cities for comparison, the Team decided to start by identifying the 25 largest metro areas, which represent true mar-kets. Then, to ensure apples-to-apples comparisons of city centers, Claritas software was used to collect demographic data for a 1-, 3- and 5- mile radius from each city center. Using this data, Baltimore actually ranks 8th among the top 25 U.S. metros for population within a 1-mile radius of the city center, while Phoenix ranks only 17th. This approach more accurately portrays how national retailers make location decisionsandhelpstoexplainwhyPhoenix,inspiteofofficiallybeingthenation’s 6th largest city, has limited retail downtown. It also more accurately reveals the true strength of Baltimore’s downtown and nearby areas. PopulationandHouseholdsIt is important to recognize the importance of household growth, in addi-tion to monitoring population trends, in evaluating a market. In Baltimore’s case, while population in certain neighborhoods has declined, the number of households in them actually increased. Incomes are also rising in many city neighborhoods. In neighborhoods in and around downtown and the In-ner Harbor, homes that used to house lower-income families of 5, are now middle- to upper-class households of one or two people. The City is also real-izingsignificantinfilldevelopment.So,populationmaydecline,butnumberof households, median household incomes, property values, and tax revenues in many neighborhoods are going up.
www.liveearnplaylearn.com/publications/cmp/appendix/commercial_land_study.pdf
http://www.baltimorecity.gov/government/planning/compplan/appen-dix.phphttp://legistar.baltimorecitycouncil.com/attachments/4366.pdf
www.liveearnplaylearn.com/publications/cmp/appendix/heritage_area_management_action_plan.pdf
H. Commercial Land Study
I. Maritime Industrial Zoning Overlay District (MIZOD) 2009 Ordinance
J. Heritage Area Management Action Plan
Land Use Elements

220 City of Baltimore Comprehensive Master Plan Appendices 221220 City of Baltimore Comprehensive Master Plan Appendices 221
http://www.baltimorecity.gov/government/heritage/charlesBwyMgt-Plan.php
K. Charles Scenic Byway Management Plan
L. Baltimore Drilldown http://www.ubalt.edu/bnia/drilldown/
BaltimoreCity’s2008HousingMarketTypology
The typology was developed to assist the City strategically match available public resources to neighborhood housing market conditions. It informs neighborhood planning efforts by helping neighborhood residents understand thehousingmarketforces impacting theircommunities. Thefinancialandresource tools the City uses to intervene in the housing market are applied appropriately to the conditions in the neighborhoods. Some tools, such as demolition, may be necessary in distressed markets to bring about change in whole blocks yet may be applied more selectively in stable markets on prop-erties that may lead to destabilization in the future.
Thetypologyisahousingmarketclassificationschemebasedonquantitativedata using a statistical process called “Cluster Analysis.” Cluster analysis is a statistical technique that can be applied to data that exhibit “natural” group-ings. Cluster analysis sorts through the raw data and groups them into clus-ters. A cluster is a group of relatively similar cases or observations. Objects in a cluster are relatively similar to each other while collectively being dis-similar to objects outside the cluster, particularly objects in other clusters. The eight variables about the City’s housing market (see below) were aggregated to the census block group level, allowing for a detailed analysis within the traditional City neighborhoods.
This 2008 update of the City’s typology was jointly developed by the Bal-timore City Planning Department, The Reinvestment Fund and Baltimore’s Comprehensive Economic Development Strategy (CEDS) Committee, which is funded by the US Economic Development Agency (EDA). We tested a variety of variables about the City’s housing market. The following variables were selected to best represent housing market conditions at the individual property level:
Percent Foreclosure Percent Single Family Homes
Percent Home Ownership Percent Commercial Land
Percent Vacant Homes Percent Rental Subsides
Percent Vacant Lots Median Home Value Sales
The typology development was an iterative process – the number of classes wasbasedonthe“fit”ofthedataandtheneedforanumberthatwouldbeusefulforpractitioners(5-9classes).Wealsoconductedfieldverificationofthe results as well as a peer review process. The result is a snapshot of the city’s housing market in 2008.
M. Housing Typology

220 City of Baltimore Comprehensive Master Plan Appendices 221220 City of Baltimore Comprehensive Master Plan Appendices 221
INTR
OD
UC
TION
SU
MM
AR
Y H
ISTO
RY
KE
Y TR
EN
DS
LIVE
EA
RN
PLAY
LEA
RN
IMP
LEM
EN
TATION
MA
NA
GE
ME
NT FIN
AN
CIA
L CO
NC
LUS
ION
GLO
SS
AR
Y A
PP
EN
DIC
ES
Land Use Elements
Hou
sing
Mar
ket
Typo
logy

222 City of Baltimore Comprehensive Master Plan Appendices 223222 City of Baltimore Comprehensive Master Plan Appendices 223
I 95
I 95
I 695
I 895
PARKHEIGHTS
AVE
FREDERICK AVE
HIL
LEN
RO
AD
NORTHERN PKWY
FALLS
RO
AD
MONUMENT ST
PATAPSCO AVE
YOR
KR
OA
D
FRANKLIN STBALTIMORE ST
FAYETTE ST
LIGH
TST
GR
EEN
MO
UN
TAV
E
MO
NR
OE
ST
HA
NO
VERST
LOCH
RAVE
NBL
VD
FAYETTE ST
REISTERSTOWN ROAD
EDMONDSON AVE
I 395
W NORTH AVE
WILKENS AVE
CAT
ON
AVE
BR
OA
DW
AY
ERDMAN AVE
HO
WA
RD
ST
EASTERN AVE
PULASKI HWY
HARB
ORTU
N
RUSSELL ST
LIBERTY HEIGHTS AVE
HARFORD
ROAD
HILTO
NST
PENN
ING
TON
AVE
BELAIRROAD
I83
I 895
BOSTON STI 83
I 95
BOSTON ST
I295
CH
AR
LESST
November 2008
Baltimore City's 2008Housing Market Typology
Stable
Transitional
Distressed
Emerging
Competitive
Downtown Multi-Family
Outer City Multi-Family
Non-Residential
Parks
Parcels > 20% Vacant Lots
Ü
Developed in partnership between the Baltimore CityPlanning Department, The Reinvestment Fund,
and Baltimore Housing.
Paul T. GrazianoCommissioner
TheReinvestment
Fund
Sheila DixonMayor
Thomas J. StosurDirector of Planning

222 City of Baltimore Comprehensive Master Plan Appendices 223222 City of Baltimore Comprehensive Master Plan Appendices 223
INTR
OD
UC
TION
SU
MM
AR
Y H
ISTO
RY
KE
Y TR
EN
DS
LIVE
EA
RN
PLAY
LEA
RN
IMP
LEM
EN
TATION
MA
NA
GE
ME
NT FIN
AN
CIA
L CO
NC
LUS
ION
GLO
SS
AR
Y A
PP
EN
DIC
ES
ClusterDescriptionsandPotentialCityResourceAllocation
CompetitiveNeighborhoods in this category, like Federal Hill, Canton and Homeland, have robust housing markets with high owner-occupancy rates and high prop-erty values. Foreclosure, vacancy and abandonment rates are all very low. Most direct market interventions are not necessary in the Competitive market. Basic municipal services such as street maintenance are essential to maintain-ing these markets. While densities do vary single family detached homes predominate and these areas typically don’t have a mix of housing types.
Emerging Neighborhoods in the “Emerging” category, such as Abell, Hampden and Mt. Vernon, have robust housing markets but with homeownership rates slightly below the citywide average; this category appeals to property owners inter-ested in tapping into a strong rental market. Median sales price is above $244,000. Additional incentives for development and investment in the Emerging market would recognize its potential for growth. There is more variety in housing types and more commercial areas than in the competitive cluster.
Stable This cluster includes neighborhoods such as Reservoir Hill, Lauraville and Violetville. Median sale price is around $160,000 and the rate of foreclosure is just below the City average of 5%. In Stable markets, the City should con-sider stabilizing and marketing any vacant houses. Traditional housing code enforcement is also essential to maintain the existing housing stock. Hom-eownershipisstillsignificantat55%.
Transitional Neighborhoods in the “Transitional” category, such as Allendale, Belair Edi-son and Kenilworth Park, are found typically at the inner edge of the stable neighborhoods. These neighborhoods have moderate real estate values with median sale prices between $80,000-$100,000, with higher median sales in areas with commercial land uses. Foreclosure rates are slightly higher than average, but occupancy rates are still higher than average. This cluster also has the highest rate of rental subsidy. The City should support homeowners who may be facing economic hardships due to the national economy.
Distressed These neighborhoods, which include Middle East, Penn North and Westport, have nearly 4 times the levels of vacant homes and vacant lots as found in other categories. Sale prices typically range from $36,000 - $40,000. Dis-tressed markets tend to rely on comprehensive housing market inventions, suchassiteassemblyandtaxincrementfinancing.Oneofthesixcriteriafor identifying the Growth Promotion Areas includes neighborhoods located in distressed markets. Demolitions in the Distressed markets should be clus-tered to create potential for greater public safety as well as marketability. The housing type here is predominately rowhouse.
Land Use Elements

224 City of Baltimore Comprehensive Master Plan Appendices 225224 City of Baltimore Comprehensive Master Plan Appendices 225
N. Holding Capacity
Framework for Use
The typology is to be used to make sense of a volatile and variable housing market. By using census block groups as the geography we have captured relatively small geographic variations in the market. In some rare cases, the shapes of the block groups run cross a broad spectrum of market conditions. For this reason, it should be considered an approximation. Since it is an ap-proximation and a snapshot of the market, it should always be used with ad-ditional data.
Thetypologyisavailabletobothgovernmentandnon-profitformarketanal-ysis. There are two broad ways the typology will be used: comprehensive planning and taxonomic. Comprehensive planning uses include aggregating and reporting data by typology, using it as one factor in directing grants and using it as criteria in managing capital program spending. Taxonomic usages include its use in a toolkit – tailoring market intervention tools and strategies as appropriate to each market cluster.
Holding(Development)CapacityfortheCityofBaltimoreIntroduction: What is “Holding Capacity?” Holding capacity is the potential number of future housing units that could be built on vacant and underutilized land based on current zoning, additional land use regulations and policies, and housing markets. Given assumptions about local land-use policies, growth trends, typical densities, and holding capacity, the number of future housing units can be projected under various growth scenarios. The Need for Holding Capacity DataTheconceptofestimatingholdingcapacityinMarylandwasfirstdevelopedby the Maryland Department of Planning. Its purpose was to support the state’s Smart Growth objective of directing development to Priority Funding Areas. Not only is it important to know how much land there is, but also what areas of the City are suitable for new development and ripe for redevelop-ment. Capacity analyses were developed for the metropolitan counties surrounding Baltimore City. Baltimore City has developed this holding capacity estimate in collaboration with the Baltimore Metropolitan Council (BMC) and the Maryland Department of Planning. The effort was partially funded through theBMCsUnifiedPlanningWorkProgramfunds.Holdingcapacityestimatesare useful for a number of planning purposes. Baltimore City has determined its holding capacity as a means to support population forecasting, transporta-tion initiatives, and public and private housing development. Methodology for Determining Holding CapacityThe overall methodology used for estimating the City’s holding capacity is described in the Maryland Department of Planning’s guidebook Estimating Residential Development Capacity, August 2005, which ensures uniformity in analysis and implementation for all jurisdictions in the state. In order to applythegeneralguidelinestotheCityofBaltimore,specificcriteriawereestablishedtoidentifydevelopableland,classifiedaseithervacantorunde-rutilized properties. All analyses were done at the parcel level. “Vacant” properties include parcels with no existing physical improvements on the site whereas “underutilized” properties consist of parcels that fall into one

224 City of Baltimore Comprehensive Master Plan Appendices 225224 City of Baltimore Comprehensive Master Plan Appendices 225
INTR
OD
UC
TION
SU
MM
AR
Y H
ISTO
RY
KE
Y TR
EN
DS
LIVE
EA
RN
PLAY
LEA
RN
IMP
LEM
EN
TATION
MA
NA
GE
ME
NT FIN
AN
CIA
L CO
NC
LUS
ION
GLO
SS
AR
Y A
PP
EN
DIC
ES
Land Use Elements
or more of the following categories:1. Properties with a Vacant House Notice (VHN)2. Downtown properties with potential for residential conversion 3. Off street surface parking lots in the Central Business District (CBD)4. Properties that meet the ‘Quick Take’ criteria5. Rezoned properties approved by Planning Commission in 2004-2005Data SourcesIn order to identify residentially developable land, 3 main criteria were used:1. Allowable by zoning, which in the City of Baltimore are all zones except
industrial zones2. Allowable by ownership (excluded City owned, university owned, etc.)3. Allowablebyenvironment(excludedfloodways,steepslopes,etc.)
In order to classify a parcel as vacant, 4 sources of data were used and cross-referenced to check for consistency. 1. Tax Assessment
State Department of Assesment and Taxation, Improvement valuation2. Building foot print
Mayor’s Office of Information Technology (MOIT), Planimetric GIS data3. Vacant by demolition
Baltimore Housing, Parcels with demolition recordation4. Aerial Imagery
MOIT, Pictometry ImageryAs shown in the table below, the City of Baltimore does have many parcels thatwereclassifiedas‘vacant’accordingtothedatasourcesdetailedabove(11,198 parcels). However, much of the development that occurs in the City is actually redevelopment of underutilized parcels. Identifying parcels as ‘underutilized’requiredanestimationofinfilldevelopmentand/orredevelop-ment of existing land. The methodology adopted for this estimation attempt-ed to model how and where future growth in the City can be accommodated. The following data sources were used to classify underutilized properties:Vacant House Notice (VHN)
Baltimore Housing, VHNs are generated when a property is abandoned and open to casual entry.
Residential conversion survey in CBD Downtown Partnership of Baltimore, survey of properties with potential for conversion to residential use.
Off street surface parking lots in CBD Various sources, surface parking is not highest and best use in CBD.
‘Quick Take’ blocks Baltimore Housing, criteria include block faces with more than 70% vacant lots and vacant houses combined.
Rezonings approved by Planning Commission in 2004-2005 Planning Commission, zoning changes that allow higher residential den-sity or change from Industrial zoning
226 City of Baltimore Comprehensive Master Plan Appendices 227226 City of Baltimore Comprehensive Master Plan Appendices 227
Identifying Development Capacity Oncethenetsupplyofvacantandunderutilizedparcelswereidentifiedbasedon the methodology described (total for the city is 25,498 parcels), the capac-ity (number of units) was calculated using the underlying zoning for each parcel. For zoning categories with a single level of density (R1 through R4), the number of units on each parcel is set to capacity. For example, for R-1 and R-2 the unadjusted yield is 5.97 units per acre and R-3 and R-4 the unadjusted yield is 8.72 units per acre. For zoning categories with multiple levels of density (R5 through R10, OR, B1 through B4), the mostly likely (modal) density was used to calculate ca-pacity. In R-5, for example, the allowable yields (depending on unit type) range from 8.72 units per acre for single family detached to 14.53 units per acre for multi-family attached, the modal density was set at 14.53 units per acre.
Revisions and Updates to Holding Capacity for Baltimore CityPer the State of Maryland’s Guidelines, the City’s Holding Capacity Analysis is included as an appendix in the City’s Comprehensive Plan. It is important to note, given that thousands of building permits are generated in the region each year, the most intense effort to measure available land will still only generate a snapshot of the region’s holding capacity. Thus, it is necessary not only to determine current holding capacity, but also to develop a system that will continually monitor land use and holding capacity so that it can be known at any given time. Therefore, regular updates to the analysis will be completed as the City updates the Comprehensive Plan itself (every 6 years per Article 66B of the State Code). In the interim, the City will prepare An-nual Development Reports which track approved development plans within the City, actual development yields, and any updates to the City’s Housing Typology (See Appendix M).Future analyses should take into account criteria for determining capacity onparcels thatarepartiallyvacantandinventoryingarea-specificdensitychanges to the zoning code imposed by the City’s URPs and PUDs (See Appendix BB).

226 City of Baltimore Comprehensive Master Plan Appendices 227226 City of Baltimore Comprehensive Master Plan Appendices 227
INTR
OD
UC
TION
SU
MM
AR
Y H
ISTO
RY
KE
Y TR
EN
DS
LIVE
EA
RN
PLAY
LEA
RN
IMP
LEM
EN
TATION
MA
NA
GE
ME
NT FIN
AN
CIA
L CO
NC
LUS
ION
GLO
SS
AR
Y A
PP
EN
DIC
ES
Development Capacity Summary Report Baltimore City
Results Process Acres Parcels Capacity
Total Acres in Parcelsand Lots
41,053 224,816
Subtract land zoned for nonresidential use (industrial only)
13,706 5,708
Residentially ZonedAcres
28,804 201,226
Vacant land 1,042 10,219 22,914
Underutilized land 600 16,596 25,220
Office-Residentially Zoned Acres
1,104 1,930
Vacant land 10 74 641
Underutilized land 13 180 1,707
Commercially ZonedAcres
4,934 17,088
Vacant land 103 1,210 4,503
Underutilized land 136 1,450 19,134
Acres and Parcels with Capacity
Vacant land 1,138 11,455 28,059
Underutilized land 745 18,202 46,062
Total capacity 1,884 29,657 74,1221
Subsets of the Analysis of Interest* (these are not additive)
Acres and Parcels with capacity associ-ated with Competi-tive Housing Mar-kets
Improved (Under-utilized) Parcels
22 172 1,488
Vacant Parcels 192 435 2,727
Acres and Parcels with capacity associ-ated with Emerging Housing Markets
Improved (Under-utilized) Parcels
28 403 2,622
Vacant Parcels 146 589 2,924
Acres and Parcels with capacity as-sociated with Stable Housing Markets
Improved (Under-utilized) Parcels
99 1,187 5,545
Vacant Parcels 241 1,620 4,318
Acres and Parcels with capacity associ-ated with Transition-al Housing Markets
Improved (Under-utilized) Parcels
136 2,553 4,273
Vacant Parcels 289 2,035 6,870
Acres and Parcels with capacity associ-ated with Distressed Housing Markets
Improved (Under-utilized) Parcels
440 13,692 20,489
Vacant Parcels 283 6,804 12,313
*2005 Housing Typology for the City of Baltimore
Land Use Elements

228 City of Baltimore Comprehensive Master Plan Appendices 229228 City of Baltimore Comprehensive Master Plan Appendices 229
Holding Capacity

228 City of Baltimore Comprehensive Master Plan Appendices 229228 City of Baltimore Comprehensive Master Plan Appendices 229
INTR
OD
UC
TION
SU
MM
AR
Y H
ISTO
RY
KE
Y TR
EN
DS
LIVE
EA
RN
PLAY
LEA
RN
IMP
LEM
EN
TATION
MA
NA
GE
ME
NT FIN
AN
CIA
L CO
NC
LUS
ION
GLO
SS
AR
Y A
PP
EN
DIC
ES
http://www.baltimorerailplan.com/linked_files/brreportfinal.pdfO. Baltimore Regional Rail Plan
Regional Rail Map
Transportation Plan Elements

230 City of Baltimore Comprehensive Master Plan Appendices 231230 City of Baltimore Comprehensive Master Plan Appendices 231
P. Water Taxi Stops
http://www.baltimorecity.gov/government/planning/bikeplan.php
http://baltimorecity.gov/government/transportation/images/StratTrans-portationPlan2003.pdf
BackgroundThe Baltimore City Planning Commission adopted the Baltimore City Sen-sitive Areas Plan on June 12, 1997. Since that time there have been some minor changes to the City’s resource inventories, protection measures and implementation of plan recommendations. A primary policy of the plan is to protect sensitive areas with appropriate utilization in the urban context in which they area found. ChangestoInventoryDataSince the adoption of the plan, there have been several improvements in the City’s resource inventories, primarily as a result of improvements in our Geo-graphic Information Systems (GIS) data. The Department of Public Works has developed a detailed stream database that includes a stream centerline and data on perennial and ephemeral streams channels. This data has been used
Q. Bicycle Master Plan
R. Transportation Plan
S. Sensitive Area Plan

230 City of Baltimore Comprehensive Master Plan Appendices 231230 City of Baltimore Comprehensive Master Plan Appendices 231
INTR
OD
UC
TION
SU
MM
AR
Y H
ISTO
RY
KE
Y TR
EN
DS
LIVE
EA
RN
PLAY
LEA
RN
IMP
LEM
EN
TATION
MA
NA
GE
ME
NT FIN
AN
CIA
L CO
NC
LUS
ION
GLO
SS
AR
Y A
PP
EN
DIC
ES
primarily by the City’s Water Quality Division in watershed planning. In 2001, satellite imagery was collected and the City’s tree canopy was delin-eated. Planning and Rec & Parks have used this data for planning for the City’s urban forest. TheCityhasacquiredthedetaileddigitalelevationdatathatallowsafinerde-lineation of the steep slopes. The Planning Department has secured funding toconductnewfloodstudiesandredelineateareasthatwillnotundergonewstudies. This work is expected to be completed in 2007. The MD Department of Natural Resources’ latest inventory of “Rare, Threatened and Endangered Species” has been amended since the plan was adopted. Five plant species, mostly sedges, have been dropped from the listing for Baltimore City.ChangesinProtectionsBaltimore City’s sensitive areas are protected primarily through the Forests Conservation Act, the Critical Area Management Plan and the Floodplain ManagementRegulations.Therehavebeennosignificantchangestotheseprotections since the adoption of the SAP in 1997. Additional regulations such as the City’s tree protection ordinance and a proposed landscape ordi-nance are expected to add to the protections.ChangestoPlansGoals,ObjectivesandRecommendationsSeveral changes in City policy and regulations have been made since the plan wasadopted.TheCityhasadoptednewstormwaterregulationsthatreflectcurrent available technology and resources. The Water Quality Division of DPW has developed watershed plans that include stream stabilization. Bal-timore has been aggressive in developing appropriate recreational trails and greenwaysinstreambuffersandfloodplains.Andlastly,BaltimoreCity,withgrant support from MD DNR, will develop a tree canopy plan to increase the urban tree canopy.
http://www.baltimorecity.gov/government/planning/compplan/down-loads/current_version/appendicies/Sensitive%20Areas%20Plan.pdf
The All-Hazards Mitigation Plan for the City of Baltimore provides a blue-print for theCity tomitigate risks fromhazards likeflooding,highwinds,and extreme heat. Required by the Federal Emergency Management Agency to reduce the damages associated with natural hazards, the All-Hazards Miti-gation Plan makes the City of Baltimore eligible for pre- and post-disaster hazard mitigation grants. Hazard mitigation is any action to reduce or elimi-nate the loss of life and property damage resulting from natural hazards. The hazard mitigation planning process entails engaging community resources for research, expertise, and input; assessing the potential losses hazards may inflict upon the community; developing strategies to address the identifiedrisks; and implementing the plan. The Baltimore City Department of Plan-ning adopted the All-Hazard Mitigation Plan in November 2004 and revised it in September 2005 based on recommendations by the Maryland Emergency Management Agency.
http://baltimorecity.gov/government/planning/images/042006_All_Hazard_%20Plan.pdf
h t tp : / /www.c i .ba l t imore .md.us /government /p lanning/ images /criticalarea.pdf
T. All Hazards Plan
U. Critical Area Plan
Transportation Plan and Sensitive Areas Elements
232 City of Baltimore Comprehensive Master Plan Appendices 233232 City of Baltimore Comprehensive Master Plan Appendices 233
http://www.baltimorecity.gov/government/dpw/waste.php
Baltimore City Public Schools System (BCPSS) is required to submit to the State a Master Plan annually by July 1st of each year. The plan must include goals, standards and guidelines for schools including their organizational patterns, inventory and analysis of all facilities, enrollment data and ten year projections, and a facilities needs analysis. This plan should also include a community analysis based on an adopted comprehensive plan for the jurisdiction. BCPSS has completed the process of completely overhauling their current facilities plan. This planning process was completed in March 2006, and adopted by the Board of School Commissioners March 28, 2006. It will be submitted to the State by July 1, 2006.http://www.baltimorecityschools.org/Departments/Facilities/Index.asphttp://www.baltimorecityschools.org/Departments/Facilities/PDF/adopted_3-28-06.pdf
State Program Open Space Law requires the 23 Counties and Baltimore City to prepare local Parks, Recreation and Land Preservation Plans (LPRP) every six years. These plans are incorporated into a State- wide plan that guides the use and allocation of State Program Open Space (POS) funds. Local LPRP’s must show that they meet minimum State guidelines for parkland, recreation-al programming and natural resource protection. Baltimore’s LPRP is in the finalstagesofapproval,andwasfinalizedinwinter2006.Baltimore’sLPRPnotesthatthereisasufficientamountofparklandoveralltoserveourpopula-tion and meet the State’s goals. Baltimore is in need of funds for maintenance and operation of our parkland and recreation facilities, and proposes to use the POS funds for this purpose.
V. Ten Year Solid Waste Management Plan
W. Educational Facilities Master Plan
X. Land Preservation and Recreation Plan
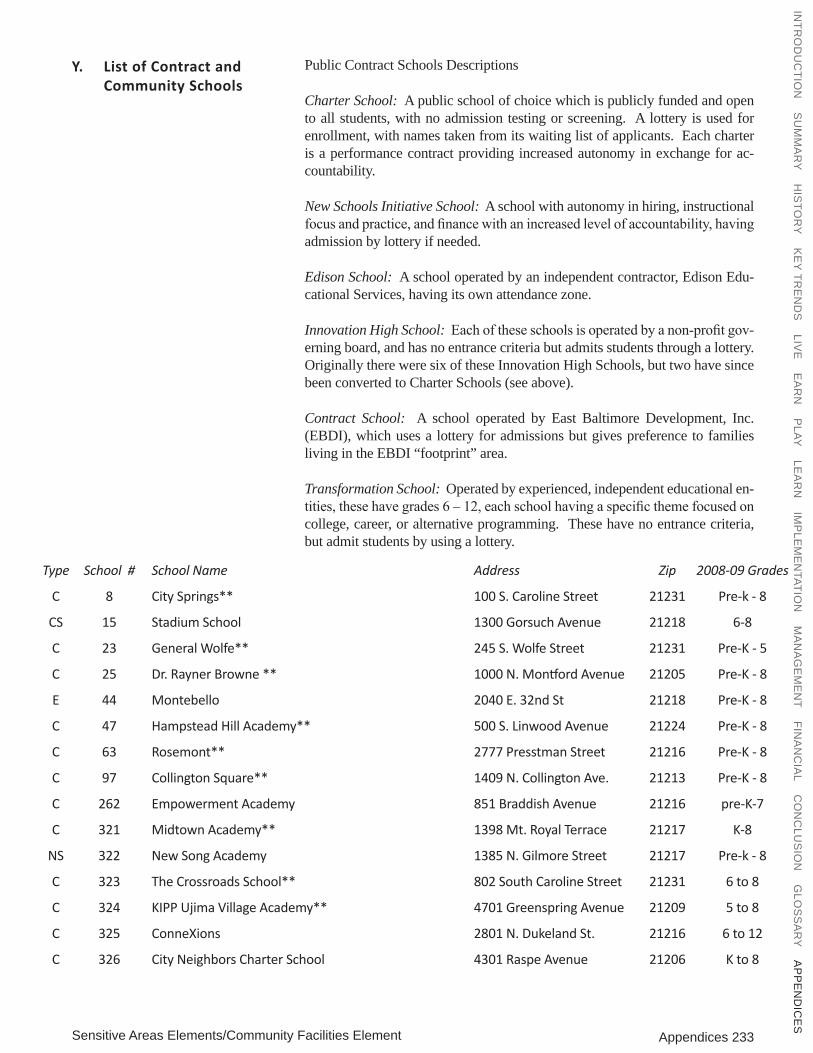
232 City of Baltimore Comprehensive Master Plan Appendices 233232 City of Baltimore Comprehensive Master Plan Appendices 233
INTR
OD
UC
TION
SU
MM
AR
Y H
ISTO
RY
KE
Y TR
EN
DS
LIVE
EA
RN
PLAY
LEA
RN
IMP
LEM
EN
TATION
MA
NA
GE
ME
NT FIN
AN
CIA
L CO
NC
LUS
ION
GLO
SS
AR
Y A
PP
EN
DIC
ES
Y. List of Contract and Community Schools
Public Contract Schools Descriptions
Charter School: A public school of choice which is publicly funded and open to all students, with no admission testing or screening. A lottery is used for enrollment, with names taken from its waiting list of applicants. Each charter is a performance contract providing increased autonomy in exchange for ac-countability.
New Schools Initiative School: A school with autonomy in hiring, instructional focusandpractice,andfinancewithanincreasedlevelofaccountability,havingadmission by lottery if needed.
Edison School: A school operated by an independent contractor, Edison Edu-cational Services, having its own attendance zone.
Innovation High School:Eachoftheseschoolsisoperatedbyanon-profitgov-erning board, and has no entrance criteria but admits students through a lottery. Originally there were six of these Innovation High Schools, but two have since been converted to Charter Schools (see above).
Contract School: A school operated by East Baltimore Development, Inc. (EBDI), which uses a lottery for admissions but gives preference to families living in the EBDI “footprint” area.
Transformation School: Operated by experienced, independent educational en-tities,thesehavegrades6–12,eachschoolhavingaspecificthemefocusedoncollege, career, or alternative programming. These have no entrance criteria, but admit students by using a lottery.
Address
100 S. Caroline Street
1300 Gorsuch Avenue
245 S. Wolfe Street
1000 N. Montford Avenue
2040 E. 32nd St
500 S. Linwood Avenue
2777 Presstman Street
1409 N. Collington Ave.
851 Braddish Avenue
1398 Mt. Royal Terrace
1385 N. Gilmore Street
802 South Caroline Street
4701 Greenspring Avenue
2801 N. Dukeland St.
4301 Raspe Avenue
Zip
21231
21218
21231
21205
21218
21224
21216
21213
21216
21217
21217
21231
21209
21216
21206
2008-09 Grades
Pre-k - 8
6-8
Pre-K - 5
Pre-K - 8
Pre-K - 8
Pre-K - 8
Pre-K - 8
Pre-K - 8
pre-K-7
K-8
Pre-k - 8
6 to 8
5 to 8
6 to 12
K to 8
Type
C
CS
C
C
E
C
C
C
C
C
NS
C
C
C
C
School #
8
15
23
25
44
47
63
97
262
321
322
323
324
325
326
School Name
City Springs**
Stadium School
General Wolfe**
Dr. Rayner Browne **
Montebello
Hampstead Hill Academy**
Rosemont**
Collington Square**
Empowerment Academy
Midtown Academy**
New Song Academy
The Crossroads School**
KIPP Ujima Village Academy**
ConneXions
City Neighbors Charter School
Sensitive Areas Elements/Community Facilities Element

234 City of Baltimore Comprehensive Master Plan Appendices 235234 City of Baltimore Comprehensive Master Plan Appendices 235
C
C
C
C
C
C
C
C
C
IH
C
IH
IH
C
IH
C
C
TS
TS
TS
Type
TS
TS
C
C
TS
TS
TS
TS
TS
TS
CS
327
328
329
330
331
332
333
334
335
422
423
427
428
432
433
336
337
338
339
341
School #
342
343
346
347
348
349
364
365
366
367
368
27 North Lakewood Avenue
31 S. Schroeder Street
200 N. Central Avenue
4417 Loch Raven Boulevard
4701 Greenspring Avenue
2800 Brendan Avenue
1250 W. 36th Street
1130 N. Caroline Street
3501 Taylor Ave
2700 Seamon Avenue
101 S. Caroline Street
1300 W.36th Street
1500 Harlem Avenue
2500 W. North Avenue
1301 McCulloh Street
1600 Guilford Ave.
2800 Brendan Avenue
801 S. Highland Avenue
2500 E. Northern Parkway
6820 Fait Avenue
Address
201 Northbend Road
4701 Greenspring Avenue
5609 Sefton Avenue
2810 Shirley Ave.
TBD
2500 E. Northern Parkway
1300 Herkimer Street
2801 N Dukeland Street
2555 Harford Road
6820 Fait Avenue
1101 N. Wolfe Street
21224
21223
21202
21212
21209
21213
21211
21213
21236
21225
21231
21211
21217
21217
21217
21202
21213
21224
21214
21224
Zip
21229
21209
21214
21215
21214
21213
21216
21218
21224
21213
K to 8
K to 5
K to 7
K to 5
6 to 11
K to 5
9-12
6-8
K-7
9 to 12
6-12
9 to 12
9 to 12
9 to 12
9 to 12
Pre-K to 5
6-7
6-7 & 9-10
6-7 & 9-10
6-7 & 9-10
2008-09 Grades
6-7 & 9-10
6-7 & 9-10
K-3
K
6
6 & 9
6
ages 15-21
ages 15-21 (9th grade)
ages 14-21 (6th and 9th)
K, 1 & 5
Patterson Park Public Charter
Southwest Baltimore Charter
Inner Harbor East Academy
Northwood Appold Community Academy
Maryland Academy of Technology & Health Sciences
The Green School
Independence School Local I
Bluford Drew Jemison MST Academy
Baltimore International Academy
New Era Academy
Baltimore Freedom Academy**
Academy for College and Career Exploration (ACCE)
Baltimore Talent Development
Coppin Academy**
Renaissance
Baltimore Montessori Public Charter School
Afya Public Charter School
Friendship Academy of Science & Technology
Friendship Academy of Engineering & Technology
REACH
School Name
KASA
CIVITAS
City Neighbors Hamilton
KIPP Harmony
Baltimore Leadership School for Young Women (BLSYW)
NACA Freedom and Democracy Academy II
Bluford Drew Jemison STEM Academy West
Baltimore Liberation Diploma Plus High School
Baltimore Antioch Diploma Plus High School
Baltimore Community School
East Baltimore Community School
KEY:
C Charter School
NS New Schools Initiative
E Edison School
IH Innovation High School
CS Contract School
TS Transformation School
** Conversion Charter Schools

234 City of Baltimore Comprehensive Master Plan Appendices 235234 City of Baltimore Comprehensive Master Plan Appendices 235
INTR
OD
UC
TION
SU
MM
AR
Y H
ISTO
RY
KE
Y TR
EN
DS
LIVE
EA
RN
PLAY
LEA
RN
IMP
LEM
EN
TATION
MA
NA
GE
ME
NT FIN
AN
CIA
L CO
NC
LUS
ION
GLO
SS
AR
Y A
PP
EN
DIC
ES
At key locations around the City, we should create more intensive community schools, with dedicated space for community and City agency uses. Schools are a major neighborhood asset and should serve as multi-use neighbor-hood centers. Many of our public schools have extra capacity, and community uses would be an excellent comple-ment to public school facilities. By offering community programs and City services in school facilities, schools will create a positive relationship with families. In addition, community programs, such as school readiness, workforce readiness, and lifelong learning programs, will be able to provide more services if they don’t have to spend as much of their resources on facilities.
Community School Name Coordinating Partner
Barclay Elementary/Middle Greater Homewood Community Corporation
Masonville Cove Community Academy SWCOS University of Maryland School of Social Work
Chinquapin Middle YMCA of Central Maryland
Collington Square School Baltimore Curriculum Project
Dallas F. Nicholas Sr. Elementary Greater Homewood Community Corporation
George G. Kelson Elementary Druid Heights Community Development Corporation
Frederick Douglass High Druid Heights Community Development Corporation
George Washington Elementary YMCA of Central Maryland
Guilford Elementary/Middle Greater Homewood Community Corporation
Lake Clifton Campus Doris M. Johnson High Heritage High School Safe Healing Foundation, Inc.
Northern Campus Reginald F. Lewis High W.E.B. DuBois High School YMCA of Central Maryland
Northwestern High Partners in Progress
Patterson High YMCA of Central Maryland
Patterson Park Public Charter School Patterson Park Public Charter
Paul Laurence Dunbar Middle YMCA of Central Maryland
Pimilico Elementary/Middle Druid Heights Community Development Corporation
Dr. Raynor Browne YMCA of Central Maryland
Rognel Heights Elementary Partners in Progress
Tench Tilghman Elementary Julie Community Center
Violetville Elementary/Middle HOPE, International
Walbrook Campus Homeland Security High Institute of Business and Entrepreneurship YMCA of Central Maryland
Waverly Elementary/Middle Franciscan Youth Center
Wolfe Street Academy YMCA of Central Maryland
Community Facilities Element

236 City of Baltimore Comprehensive Master Plan Appendices 237236 City of Baltimore Comprehensive Master Plan Appendices 237
Z. Water and Wastewater Supply and Capacity
BaltimoreCityWaterResourcesElementhttp://www.baltimorecity.gov/government/planning/waterelement/index.php
2006WaterWastewaterMasterPlan,AdoptedNovember2006http://www.baltimorecity.gov/government/planning/compplan/down loads/0709/2006_CompW&WWplan.pdf
AA. Wastewater Treatment and Point Source Pollution Prevention
BaltimoreCityConsentDecreehttp://www.baltimorecity.gov/government/dpw/water/ConsentDecree/
NationalPollutantDischargeEliminationSystemPermit(NPDES)http://www.mde.state.md.us/assets/document/sedimentStormwater/MSSPer-mit/bc_permit_appendix.pdf
MunicipalSeparateStormWaterSystems(MS4)Permithttp://cfpub.epa.gov/npdes/stormwater/munic.cfm
ApprovedTotalMaximumDailyLoads(TMDLs)forBaltimoreCitywww.mde.state.md.us/Programs/WaterPrograms/TMDL/ApprovedFinalT-MDL/index.asp
BB. Stormwater Run-Off and Non-Point Pollution Prevention
WaterResourcesPlanningAssessmentNutrient loadingsImpervious cover is one of the key determinants for estimating nutrient loadings from urban areas and is the basis for prescribing restoration mea-sures under the National Pollutant Discharge Elimination System Permit (NPDES) for stormwater. Under the City’s permit the Department of Public Works determined the City’s impervious cover to be 23,373 acres which is 45.1 percent of the total 51,790 acreage of the City. A copy of the methodol-ogy is attached. Over the past two permit cycles, the City has been required to provide some degree of restoration or “treatment” for 20 percent of the impervious cover or 4674.6 acres. The City will be issued a new 5-year NPDES permit in January 2010 that will include a requirement to restore an additional 20 percent of the impervious area for a total of 9349.2 acres. The Center for Watershed Protection’s Short-cut Method is one of the most widely accepted methods in the country for estimating contaminant loading rates from urban areas. This method has been incorporated into spreadsheet format and is referred to as the watershed treatment model. The computa-tions and loading estimates for total nitrogen and phosphorus for the entire cityarealsoprovidedintheattachedfileandsummarizedbelow.The total nutrient loadings for the City are:• TN Load = 640,335 pounds per year• TP Load = 55,520.5 pounds per yearNutrientreductionsviaretrofitting:Whiletherearenoguidelinesforthedefinitionofrestorationor“treatment”,the City assumes this to mean the equivalent nutrient load reduction that would occur if 100 percent of the runoff from the impervious area drain to state-of-the-art best management practices. BasedonestimatesofBMPefficienciesfromseveraldocumentsincludingthe Maryland Stormwater Design Manual and Center for Watershed Protec-

236 City of Baltimore Comprehensive Master Plan Appendices 237236 City of Baltimore Comprehensive Master Plan Appendices 237
INTR
OD
UC
TION
SU
MM
AR
Y H
ISTO
RY
KE
Y TR
EN
DS
LIVE
EA
RN
PLAY
LEA
RN
IMP
LEM
EN
TATION
MA
NA
GE
ME
NT FIN
AN
CIA
L CO
NC
LUS
ION
GLO
SS
AR
Y A
PP
EN
DIC
ES
tion,weassumethattypicalnutrientreductionefficienciesforurbanBMP’sare30 percent for total nitrogen (TN) and 40 percent for total phosphorus (TP). The projected load reduction as a result of projects implemented under the NPDES permit through 2009 is 31,245 pounds per year for total nitrogen and 3,666 pounds per year for total phosphorus which equates to 4.9 percent and 6.5 percent of the total nitrogen and phosphorus loadings. Several projects are under design and the City has committed to meet the full 20 percent under the existing NPDES permit in addition to another 20 percent reduction over the nextfiveyearpermitcycleforatotalloadreductionby2015of:• Total TN reduction = 76,840 # per year (12 percent of total)• Total TP reduction = 9016 # per year (16 percent of total)Note as of this point in time, the nutrient TMDL reductions projected for NPS’s for the City and County are 15 percent. This will undoubtedly increase when the load allocations for the Chesapeake Bay nutrient TMDL are developed. While the next NPDES (2010) Permit for stormwater will most likely require a schedule for meeting the load allocations, it is unlikely that the City and County will meet the targeted reductions by 2015.Nutrient reductions via redevelopment:Unfortunately, the City’s Stormwater Management Program did not keep track of the amount of development that occurred during the 10 year permit period corresponding to when the restoration began under the NPDES Program. The existing stormwater management requirement is that redevelopment sites have to reduce runoff or provide treatment for 20 percent of the site’s impervious area. This requirement was initiated in October, 2000 and was recently modi-fiedundertheStormwaterManagementactof2007.Thenewregulationsincrease the amount of impervious area that has to be treated to 50 percent and will go into effect in May 2010 when local ordinances are required to be adopted.Therefore, for the sake of this assessment it is safe to say that any projected growth over the 6 year comprehensive planning period (or next 5 year permit cycle) will have to control 50 percent of the existing impervious cover. We also assumethatBMPefficiencieswillremainat30percentforTNand40percentfor TP however the new regulations specify that environmental site design be usedtomeettherequirementswhichcouldsubstantiallyincreasetheseeffi-ciencies.The 6 year comprehensive plan makes the following assumptions regarding additional growth.• approximately 10,000 additional households are planned• an average lot size would be 0.025 acres • the average impervious cover is 45 percent• the additional 10,000 households would equate to approximately 112.5 acres of impervious cover• since these are redevelopment projects no additional nutrient load ings are anticipated
Water Resources Element

238 City of Baltimore Comprehensive Master Plan Appendices 239238 City of Baltimore Comprehensive Master Plan Appendices 239
Using the CWP’s short cut method described above, 112.5 acres of impervi-ous cover generates the following loadings from the expected redevelop-ment over the planning period:• TN= 3068 #/yr• TP= 271.3 #/yr.Given the new stormwater requirement of treating 50 percent of this amount andassumingthereductionefficienciesofstate-of-the-artpracticestobeapproximately 30 percent for TN and 40 percent for TP.• TN load reductions from redevelopment = 920.4 #/yr• TP load reductions from redevelopment = 108.5 #/yrTherefore the combined 6 year projected load reductions from the NPDES Permit and Stormwater Management regulations are:• TN= 77,760 #/yr• TP= 9,287 #/yrIn addition, Baltimore City is spending considerable resources to monitor nutrient loading from our 3 stream systems. In subsequent analyses, we will attempt to apply the watershed treatment model to the watersheds draining these streams. We will then compare the modeling results to the monitoring data to determine the accuracy of the model.Also, we have a monitoring program to determine the effectiveness of urban BMP’s.Inthefuture,ratherthanusinggrossassumptionsonBMP’seffi-ciencies, we hope to provide more accurate estimates for stream restoration.
TargetedAreaImperviousnessSummary:http://www.baltimorecity.gov/government/planning/compplan/down-loads/0709/072809_Targeted_Area_Imperviousness_Summary.pdf
ReservoirWatershedManagementAggreementhttp://www.baltometro.org/RWP/ReservoirAgreement2005.pdf
ReservoirForestManagementPlanhttp://www.baltimorecity.gov/government/dpw/water/rnrs/index.php
BaltimoreCity/BaltimoreCountyWatershedAgreementhttp://www.baltimorecountymd.gov/Agencies/environment/watershedagree-ment/index.html
Urban Canopy GoalsTreeBaltimore: Doubling Baltimore’s Tree CoverTrees are an important part of Baltimore. They provide shade and cool the air,loweringtemperaturesthroughouttheCity.Theyfilterpollutionandpar-ticulates, cleaning our water and air. The presence of trees has been shown to havepositivepsychologicalbenefits-reducingstressandimprovinghealth.Somestudiesevenlinktreestoreducedratesincrime.Treeshelpdefinethepersonality of our City; they provide much of what is unique and attractive in our communities, offering a sense of stability and place.On March 30, 2006, Baltimore set a goal to double its tree canopy from 20% to 40%. More precisely, Baltimore’s goal is to reach 39.6% tree cover within 30 years. To facilitate this increase in tree canopy, the Departments of Plan-ning and Recreation & Parks will lead an inter-departmental cabinet and a

238 City of Baltimore Comprehensive Master Plan Appendices 239238 City of Baltimore Comprehensive Master Plan Appendices 239
INTR
OD
UC
TION
SU
MM
AR
Y H
ISTO
RY
KE
Y TR
EN
DS
LIVE
EA
RN
PLAY
LEA
RN
IMP
LEM
EN
TATION
MA
NA
GE
ME
NT FIN
AN
CIA
L CO
NC
LUS
ION
GLO
SS
AR
Y A
PP
EN
DIC
ES
citizens’ panel in drafting Baltimore’s Urban Forest Management Plan: Tree-Baltimore. The plan will include:• Needed changes to policies, procedures, guidelines, regulations, and ordi-
nances, including a new Landscape Ordinance and amendments to the Criti-cal Area Management Program and the Forest Conservation Program.
• New tree planting standards for new development• New tree planting standards for existing locations• New tree-related standards for construction, reconstruction, repair and
maintenance• New standards for increased and better targeted maintenance of trees• Strategies for riparian and coastal buffers enhancement • Strategies for revitalizing Baltimore’s natural forested areas• Strategies and incentives for reforesting private property• Increased participation in the maintenance and management of urban tree coverbyresidents,businesses,non-profitsandnon-traditionalpartners
• Analyze and develop best management plan for utilization of Baltimore’s wood waste
• Revised recommended tree species lists•Costandbenefitsanalysisofproposedstrategies• Identifiedpotentialfundingsourcestoimplementstrategieswithintheman-
agement planThe plan will be completed by March 31, 2007, and then will be introduced to the Planning Commission and the City Council. Outcomes will include:• Increased survival rate and longevity of trees•Increasedefficiencyoftreemanagement&maintenancesystems• Improved coordination between City agencies.
CIPWaterProjectshttp://www.baltimorecity.gov/government/planning/compplan/down-
loads/0709/072109_2010CIP_Water_Projects.pdf
Water Resources Element

240 City of Baltimore Comprehensive Master Plan Appendices 241240 City of Baltimore Comprehensive Master Plan Appendices 241
CC. Water Resources Maps
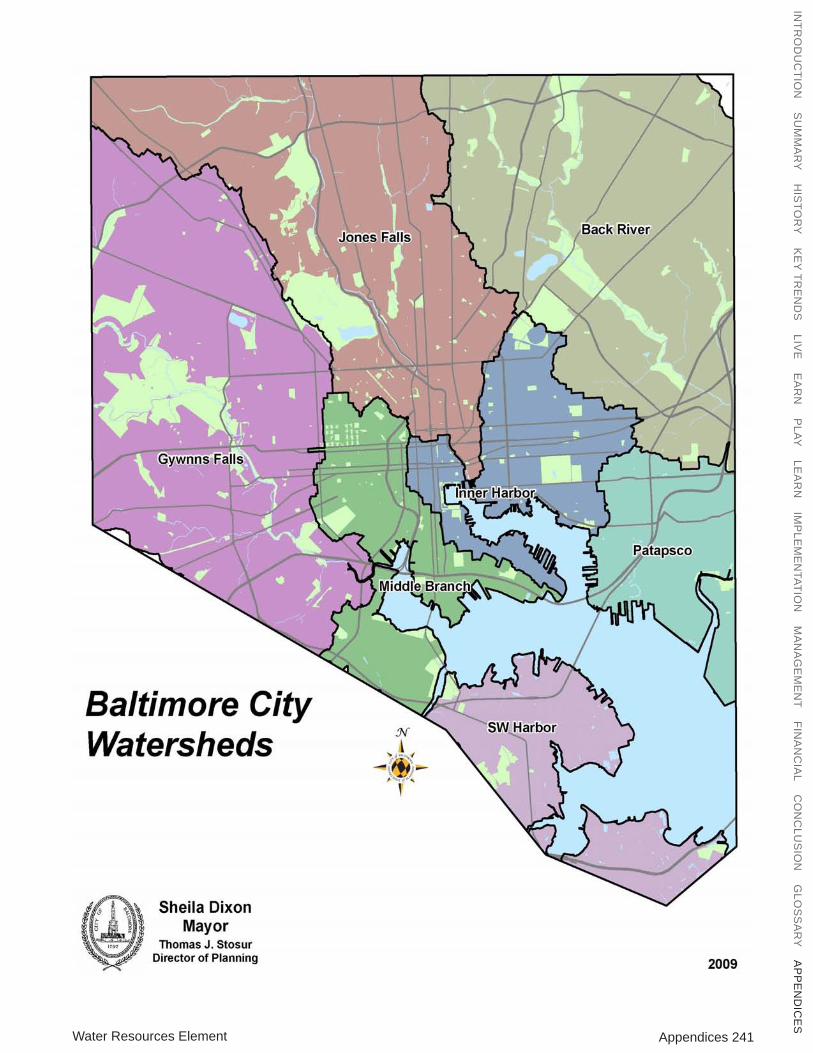
240 City of Baltimore Comprehensive Master Plan Appendices 241240 City of Baltimore Comprehensive Master Plan Appendices 241
INTR
OD
UC
TION
SU
MM
AR
Y H
ISTO
RY
KE
Y TR
EN
DS
LIVE
EA
RN
PLAY
LEA
RN
IMP
LEM
EN
TATION
MA
NA
GE
ME
NT FIN
AN
CIA
L CO
NC
LUS
ION
GLO
SS
AR
Y A
PP
EN
DIC
ES
Water Resources Element

242 City of Baltimore Comprehensive Master Plan Appendices 243242 City of Baltimore Comprehensive Master Plan Appendices 243

242 City of Baltimore Comprehensive Master Plan Appendices 243242 City of Baltimore Comprehensive Master Plan Appendices 243
INTR
OD
UC
TION
SU
MM
AR
Y H
ISTO
RY
KE
Y TR
EN
DS
LIVE
EA
RN
PLAY
LEA
RN
IMP
LEM
EN
TATION
MA
NA
GE
ME
NT FIN
AN
CIA
L CO
NC
LUS
ION
GLO
SS
AR
Y A
PP
EN
DIC
ES
An Urban Renewal Plan represents the City’s vision, shared with one or more communities, of what an existing [geographic] area of the City of Baltimore should become over several decades. Urban Renewal Plans generally are in forcefor20to40years,asspecifiedineachplan,andempoweranddirectthe City, usually acting through its Department of Housing and Community Development, to intervenedirectly in some specificcases and/or locationsto bring about desired changes or improvements in the area covered by the Plan. Urban Renewal Plans can be, and often are, amended over time to take advantage of private sector investment possibilities which were unforeseen whenthePlanwasfirstenacted.
Brooklyn and Curtis Bay Coalition
Cherry Hill
Coldstream Homestead Montebello (CHM)
Edmondson Village
Farring - Baybrook Park
Greater Northwest Community Coalition (GNCC)
Key Highway Waterfront
Locust Point
Middle Branch
Monument-McElderry-Fayette
Northwest Community Planning Forum
Operation ReachOut Southwest (OROSW)
Park Heights
Pen Lucy
Penn North
Sharp – Leadenhall
Southeastern Neighborhoods Development (SEND)
Upton
West Baltimore MARC
Westport Mount Winans Lakeland
York Road Community
All Area Master Plans already adopted by the Planning Commission as of 2006 are grand-fathered. All new plans and amendments to adopted plans shall be consistent with this Comprehensive Master Plan. Plans listed below are on the Planning Department web-site: http://baltimorec-ity.gov/government/planning/PlansMapPublications.php
EE. Completed and Adopted Neighborhood Plans, Urban Renewal Plans and Planned Unit Developments.
DD. Red Line Community Compact
http://gobaltimoreredline.com/compact.asp
Water Resources Element/Plans and Maps

244 City of Baltimore Comprehensive Master Plan Appendices 245244 City of Baltimore Comprehensive Master Plan Appendices 245
Baltimore City Urban Renewal Plans in Force in 2009
Urban Renewal Plan Name Original Adoption Date
Barclay 12/13/1978
Belair-Erdman Business Area 7/10/1991
Broadway East 7/6/1988
Brooklyn and Curtis Bay Business Area 12/21/1982
Camden Station Area 12/1/1983
Canton Industrial Area 6/20/1990
Canton Waterfront 6/5/1984
Carroll Camden 3/6/2002
Caton/95 7/2/1981
Central Business District 5/25/2001
Charles/North Revitalization Area 10/25/1982
Charles-25th 12/19/2001
Coldspring Neighborhood Development Program (NDP)
1/8/1973
Coldstream Homestead Montebello 2/28/1977
Druid Heights 6/28/1977
East Baltimore Midway 6/20/1979
East Highlandtown Business Area 7/10/1991
Fairfield 10/6/2004
Fells Point Waterfront 2007
Franklin Square 7/19/1978
Gay Street I 12/2/1967
Greenmount West 4/17/1978
Hamilton Business Area 11/30/1979
Hampden Business Area 2/17/1977
Harlem Park Project II 7/6/1960
Highlandtown Business Area 10/25/1977
Hilton North Business Area 12/4/1987
Howard Park Business Area 11/21/1979
Inner Harbor East 11/19/1971
Inner Harbor Project I 6/15/1967
Inner Harbor Project I-A 5/12/1978
Inner Harbor West 3/15/1971
Johnston Square 6/27/1977
Jonestown 12/14/1978
Key Highway 3/12/1986
Key Highway East Industrial Plan 6/29/1987
Lauraville Business District 10/28/2003
Liberty-Garrison Business Area 6/20/1990
Madison Park North 4/16/1963

244 City of Baltimore Comprehensive Master Plan Appendices 245244 City of Baltimore Comprehensive Master Plan Appendices 245
INTR
OD
UC
TION
SU
MM
AR
Y H
ISTO
RY
KE
Y TR
EN
DS
LIVE
EA
RN
PLAY
LEA
RN
IMP
LEM
EN
TATION
MA
NA
GE
ME
NT FIN
AN
CIA
L CO
NC
LUS
ION
GLO
SS
AR
Y A
PP
EN
DIC
ES
Urban Renewal Plan Name Original Adoption Date
Notice: if there is any discrepancy between information contained in this table and an Urban Renewal ordinance, provisions of theordinance are and shall be controlling.
Madison Park South 7/3/1961
Market Center 11/16/1977
Middle Branch 7/27/1979
Middle East 11/30/1979
Montgomery 5/14/1979
Mount Clare 5/30/1974
Mount Washington Village Business Area 12/9/1976
Oldtown 4/7/1970
Oliver Neighborhood Dev. Program (NDP) 5/17/1971
Orchard-Biddle NDP 5/17/1971
Park Heights 12/11/2008
Penn North Transit Station 7/10/1978
Poppleton 3/31/1975
Port Covington 10/22/1987
Reisterstown Plaza Transit Station 7/2/1981
Reservoir Hill 4/10/1972
Ridgely’s Delight 3/31/1975
Rogers Avenue Transit Station 4/5/1983
Rosemont 4/3/2003
Sandtown-Winchester 4/17/1978
Sharp-Leadenhall 4/19/1974
South Baltimore Business Area 6/24/1975)
Uplands 12/6/2004
Upton 5/22/1970
Walbrook Shopping Center 6/30/1976
Washington Village 6/27/1979
Waterview 5/13/1982
Waverly Business Area 5/24/1979
West Coldspring Transit Station 5/21/1981
York-Woodbourne Business Area 6/13/1974
Plans and Maps

246 City of Baltimore Comprehensive Master Plan Appendices 247246 City of Baltimore Comprehensive Master Plan Appendices 247
ST
ST
AVE
ST
AVE
WASHBURN
ST
RD
ST
ST
WAL
LAC
E AVE
RIVERVIEW
BECKLEY
OAK
OAK
B
ST
ST
ST ST
ST
CHEMICAL
RD
ST
ST
ST
ST
WEST
BAY
TOMPKINS
ST. M
ARG
ARET
CHERRY
ST
ST
CEREAL
ASPEN
ST
6TH
CO
ALPEIR
RD
DOCK
RD
RDRD
COVE
RD
DRUIDON
NIMITZ
ST
KEITH
AVE
NEW
VAIL BRO
E NIN
G
AVEOAK
AVE
AVE
ST
PARNELL
TR I B UTARY
1ST
ST
ST4TH
NO
RTH
ST
C
F
FRANKCH IL DS
AVE
E. PATAPSCO
CHESAPEAKE
SHELL
E. JEFFREY
STOLLGRETNA
SIXTH
CT
MAR
IBAN
OLMSTEAD
LOCUST
PLUM
CARBON
WEEDO
NST
NORTHBRIDGE
AVE
AVE
PRU
DE
NC
E
6TH
HAZEL
AVE
ST
AVE
BLOSSOM
OPEN
AVEPEN
NIN
GTO
N
ORDNANCE
RD
FORTSM
ALLWO
OD
HAWKINS POINT
ST
McCOMAS
ANDR
EST E. FORT PORT
RD
ST
PLHALS
EY
DR
LEAHY
ST
ST
LELAND
AVE
MERTENS
S.HIG
HLAN
D
ST
VALE
NEWGATE
ST
VAND
EMAN
AVE
ST
RD
AVE
EDGEWATERRALLS ST
AVEPINE
AVE
AVE
AVE
CEN
TRAL
MAPLE
DETROIT
CLEVELAND
COLGATE
RALLS
AVE
ST.HELENA AVE
AVE AVE
BALTIMOREAVE
HIGHWAY
BERTH
RD
ST
ST
ST
ST
3RD
ST3RD
ST
6TH
7TH
5TH
SERV
ICE
SERV
ICE
SOUT
H
RD
ST
ST
CHIL
DS
AVE
FRANKFURST
BALTICAVE
ST
AVE
CHESAPEAKE
ST
CH
ILD
AVE
ST
ST.V
ICTO
R
AVE
ST7TH
8TH
ST
ST
PONTIAC
ST
ST
WES
TBA
Y
AVE
AVE
CAMBRIAST
HAGUE
AVE
AVE
DUANECT
CT
ELARTON
CT
WES
TBA
YCT
JACK
9TH
REMLEY
AVEAVE
BRADY
TATE
SUN
FAIRFIELD
AVE
EVERETT
FAIRH
AVEN
ST
PENN
ING
TON
SPRUCE
ST
STPOPLAND
CU
RTIS
CT
ED W IGHT
CT
ST
GR
ACE
AVEVIRGINIA
ST
CHURCH
CHARELESTON AVER
OSAB
ELL
FILBERT
ELMTREE
CYPRESS ST
ST
AVE
ST
ST
AVE
CEDDOX
AVEBENHILL
BENHILL
STBIRCH
NORA
ST
ST
ST
AVE
I 695 SI 695 N
RD
HAWKINS POINT
RDBUNGALOW
AVE
ARUN
DEL
COVE
AVE
COAS
TG
UAR
DYA
RD
RD
I 695 N
I 695 S
QUA
RAN
TINE
QUARANTINE
FORT
ARMIS
TEAD
I 695 S
I 695 N
HAWKINSPOINT
RD
RD
BRIDGE
FRANCIS
SCOTT KEY
RD
AVEST
ASPHALT
LEO
ST
CANNERY
AVE4TH
AVE
ASIATIC
RD
DR
RD
RDLN
MARJORIE
TAMWORTH
CORDING
HARWOODRD
RD JOBS
RD
LA McCABE
RD
NO
RW
OO
D
PL
CATOR
WINSTON
AVE
DR
LOM
BAR
DY
AVE
WAY
LN
KERN
WO
OD
PKWY
RD
DR
DR
RD
DR
PUR
DU
E RD
SAGR
A HAMILTONAVE
PIO
NEE
R
LATONA
RD
GOODWOOD
AVE
RD
RD
RD
HAMILTON
WISTERIA
CLOVILLE
AVE
AVE
RD
RD
AVE
MAINFIELD
AVE
ALAM
EDA
RD
RD
RD
RD
RD
RD
AVE
RD
AVE AVE
BAYONNE
AVE
WOODLEA
WO
OD
LEA AVE
PARK
PL
ARIO
N
AVE
HILLTO
P
AVE
AVE
SQ
AVE
AVE
AVE
POWELL
AVE
GRANITE
AVE
AVE
AVE
AVE
AVE
AVE
BAGLEY AVE
DECKERTS
AVE
AVE
KENWOOD
AVE
AVE
AVE
AVE
AVE
AVE
AVE
RD
AVE
AVE
LINWOOD
PARKWOOD CEMETERY
GLE
NOAK
AVE
AVE
AVE
AVE
AVE
PINEWOOD
AVE
CHESLEY
GLEN
OAK
KOLB
GLENMORE
AVE
WHITE
BENT
ONAVE
AVEEDGAR
REMMELL
AVE
AVE
RDAVE
RDST
AVE
AVE
RD
AVE
DR
PRESTON
ELMORA
AVE
DR
WAY
MORAVIA
AVE
RD
RD
DR
OD
ELL
EDEW
ING
CT
MORAVIA
AVEAVE
AVE
RD
RD
AVE
AVE
RD
OMAHA
CHESTERFIELD
AVE
WAY
ST
RD
INTE
RST
ATE
95
AVE
ST
AVE
STST
ST AVEAVE
ST
AVE
ST
ST
ST
TOONE
ST
HIG
HW
AY
ST
AVE
AVE
AVE
GR
UN
DY
FAGLEY
AVE
ST
TOLN
A
KANE
ST
BROWN
MARNE
ST
ST
HWY
TRAVISH
AVE
ST
HARPER
AVE
RD
RD
WAY
WHITE
CAR
TER
EAST
ERN
ALTA
AVE
AVE
AVE
AVE
WIL
MAR
Y
RIDGEMEDE
GR
EENLE
AF
BOXH
ILL
LAWN
DALE
PINEH
UR
ST
N. C
HAR
LES
ALLENWOOD
NO
RW
OO
D
RICHNOR ALAM
EDA
FEN
WIC
K
NASC
O
RD
AVE
EVERGREEN
AVE
MO
YER
AVE
PLAINFIELD
AVE
RD
ST
N.M
ACO
N
N. KR
ESSON
ST
AVE
CARDIFF
EASTBOURNE
W. LAKE
H U
NTC
LUB
LA
AVE
BELLEMORE
DROHOMER
STON
YR
UN
GR
EENLE
AF
BOXH
ILL
RD
PKWY
RO
LAND
WO
OD
LAW
N
AMBERLY
FRIEN
DS
OLDBARNUPNOR
LA
TUNBRIDGE
ENFIELD
CHURCHWARDENS
MAYPOLE
CLU
B
RD
ST. JOHNS
LN
SUM
MIT
RD
GLADSTONE AVE WILM
SLO
W
AVE
ELMHURST
CARL
OW
E
RD
LA
LA
CHURCH
LA
ROLAND
SCH
ENLEY
KENDALL
BL YTHEW
OOD
ST
SHADO
W
BOULDER
HO
LLYWO
OD
LALO
NG
MAYN
ADIER
HAW
T HO
RN
RD
WILM
SLOW
WO
OD
LAWN
RD
RD
RD
AVEDEW
EY
KITTERY
RD
LINKW
OO
D
ST.PAUL
GREENWAYNORTHWAY
UN
DE
RWO
OD
RD
KERNEWAY
RADNOR RADNOR
OAKLAND
RD
ALHAM
BRA
AVE
RD
RICHWOODST
READ
Y
ROSSITER
AVE
NO
RW
OO
D
AVE
LANE
NUTHATCH
WAY
ALH
AMBR
A
WOODAN
AVE
RD
WAY
PUTNEY
LATW
ILIGH
TPURLIN
GTO
N
LA
RD
COW
SL IP
SPRING
LAKE
RD
CLEAR
SPRIN
G
PKWY
E. BELVEDERE
RD
CEDARCROFT
RD
AVE
YOR
K
BLACKBU
RN
HOLLEN
KENNETHAVE
EVESHAM
WALKER
WEIDNER
WOODSON
DR
RD
RUSHBROOK
AVE
NORTHWO
OD
MARLAU
D
AR
TMOUTH
RDGITTINGS
SHERWOOD
MAR
LOR
A
ALHAM
BRA
AVE
RD
RD
ST DUNSTANS
RDRDRD
RD
SHERIDAN
KIT M ORE
AVE
IVAN
HO
E
IVAN
HO
E
ALH
AMBR
A
AVE
STG
EO
RG
ES
KENILW
OR
TH
AVECROFTON
THE
AVE
WR
ENW
OO
D
IVAN
HO
EAV
E
SPRINGFIELD
AVE
KEN
ILW
OR
TH
DE
EPWOOD
SOUTHVIEW
RD
RD
RD
E. ARLINGTON
RD
RD
RD
WE
LBO
UR
NE
RD
RD
DR
KINGSWAY
RD
WINFORD
HILLENWOOD
AVE
AVE
HILLEN
RD
PL
RAMBLEWOOD
WALTERWOODWAY
WAL
K
MERIDENE
GITTINGS
LOCH
RAVEN
AVE
RD
LOC
HM
EDA
PERRING
E. NORTHERN
PRAGUE
AVE
GLENOAK
AVE
AVE
WAVEWORTH
CRESTVIEW
RAMBLEWOOD
PLYM
OU
TH
AVE
PLYM
OU
TH
GIBBONS
AVE
ALBIONHER RIN
GR
UN
AVE
CATA
LPHA
AVE
MO
RELL
O
GILR
AY
MO
NTE
BELLO
PILG
RIM
HALCYON
ELSRODE
AVE
AVE
IVY
ARGON NE
RD
RD
LERCH
EUGENE
CA RTER
GIBBONS
ROSELAWN
AVE
HARF
ORD
BEECHLAND
LAURELT
ON
FER
NBAN
K
OLD
HAR
FOR
D
FLEETWOOD
LOUISE
ROSELAWN
FLEETWOOD
ELSR
ODE
PENTLAND DR
WELLBRIDGE
AVE AVE
RD
ALVARADO
MILTON AVE
LA
EUN
ICE
ROYSTON
BERT
RAM H
ILLTOPAVE
AVE
AVE
AVE
AVE
BELLEVIS
TA
LILLY
AN
HAMILTON
BIDDISON
AVE
MARX
BELAIR
GREENHILL
AVE
ADLEIGHCOOK
AVE
FURLEY
AVE
BIDDISON
FRANKFORD
AVE
FR A NCONIAAVE
SHAMROCK
AVE
GUNTHER
LA
BOELEYS
AVE
BOW
LEYS
LA
CRENSHAW
KENYON SHANNON
AVE
RAYMONN
ROBE
RTON
BREHMS
AVE
DRIVE
OLIV
ERERDMAN
AVE
HORN
ERS
ST
AVE
N. N
EWKIR
K
WRIGHT
ST
ALRICKS
PULASKI
HEWITT
E. MONUMENT
E. FAYETTE
E. FAIRMONT
E. LOMBARD
ST
AVE
ST
FLEET
DR BANK
UM
BRA
PON
CA
ST
ST
S. MAC
ON ST
HUDSON
HW
Y
ELRIN
O
BROWN
AVE
POR
T
A L
NO
ME
BRENTWOOD
AVE
AVE
ST
AVEAVE
DELBERT
ELLIOTT
ST
IMLA
E. PRATT
ST
C ONLEYGOU GH
EA STBROOK
E. BALT
IMORE
QU
INTO
N
ST
QUAD
QUAD
RD
MORAVIA
BOWLEYS
PROC
TMAN
ST62ND
ST
AVE
62ND
62ND
HILLTOP AVE
GRE
ENCR
EST
MID
LINE
SARRIL
FRAN
KFOR
DAVE
WAY
AVE
CALUMET
CRENSHAWAVE
AVE
MAYVIEW
LANE
DENVIEW
RD
SCHERING
DA
RIEN
SEWARD
AVE
UTRE
CHT
RD
TOD
D
AVE
HAZEL WOOD
AVE
AVE
DUNCREST
PLUM
ER
POWELL
GRE
ENHI
LL
GL ENARM
MAR
LUTH
BA
YONNE
AVE
PA
R KMONT AVE
CED
ON
IA
AVE
AVE
AVEFL EETWOOD
ASHL
EY
AVE
AVE
BIRCHVIEW
AVE
FRED
KERT
LA
AYRES
AVE
AVE
AVE
VICTO
RY
LA
RD
PL
W. NORTHERN
KENM
OR
E
W. MELROSE
RD
CASTLEWOOD
RD
AVE
ROLAND
LA
BOXW
OO
DRD
MO
SSWAY
MEADOWO
ODR
D
RD
BELLEMOR E
E. MELROSE
RD
BLEN
HEI
MR
D
BELLON
A
LA
RD
SYCA
MO
RE
TAPLOW
RDROSEBANKSE.NORTHERN
STALBANS
ST. DUNSTANS
RDWITHERSPOON
RDCROYDON
LA
RD
ORKNEY
RD
HOMELAND
RD
AVE
LA
BLYTHEW
OO
DAVE
CH
UR
CH
RD
UPLAND
LONG
AVE
KESWIC
KEASTH
AWTH
OR
N
WYNDHURST
BEECHDALERD
LN
PADDINGTO N
OAKDALE
LA
KENWOOD
LA
ELMAVE
AVE
RD
LA
W. UNIVERSITY
RD
NORTHFIELDPL
RD
OVERHIL L
SOMERSET
LALA
WINGATE
RD
LA
RD
RD
RD
MEAD
OW
RD
WIC
KFORD
ST
OAK
E. HIGHFIELD
ST
RD
RD
WHITFI
EL
DPATH
WESTWAY
LA
NEIGHBORS
RESERVOIR
RD
EASTWAY
RD
E. 43RD
WEN
DO
VER
AVE
AVEE. OLD COLDSPRINGLA WILLOW
OLD
YOR
K
AVE
AVEW
ILSBY
STE. 41ST
AVE
RD
RD
NOTRE DAME
CR
OW
SO
N
LA BEAUMONT
AVE
AVE
SOU
THFIELD
PLACE ST
CHATEAU
AVE
AVE
AVE
WH
ITEFOR
D
AVE
AVE
PL
AVE
MID
WO
OD
MILLBR
OO
K
GLENWOOD
WOODBURNE
AVE
MID
WO
ODAVE
AVE
WAY
RDBROXTON
TILBURY
RDTHORNHILL
AVE
BENNINGHAUS
BRADHURST
ST DUNSTANS
AVE
BRO
ADM
OOR
TUNBRIDGE
RD
ST. DUNSTANS
RD
RD
GILPIN
AVE
SCHWARTZ
AVE
GITTINGS
N.C
HAR
LES AVE RD
SQUARE
LANE
YORKSHIRE
DR
DR
CEDARCROFT
AVE
AVE
E. NORTHERN
REVERDY
HO LLENRD
HOLLEN
RD
LIMIT
THE
ALAME
DAWALKER
NO
RTH
WO
OD
GITTINGS
LEIT
H
WAL
K
RD CEDARCROFT
RD
DU
NR
OM
ING
ELBANK
RD AVE
GLENEAGLE
THE
ALAM
EDA
GLE
NN
OR
RD
RAM B LEWOOD RD
GLENHAVEN
FALK
IRK
RD
AVE
RD
FALKIRK
RD
PKWY
WA Y
FENWICK
ME R IDENE
AVE
FALK
IRK
LEIT
H
E. BELVEDERE
RD
WAVERLY
WAK
EHU
RST
BLVD
WAY
YORKWOOD
WADSWORTH
RD
AVE WOODBOURNE
AVE
WALTER S
UPNORRD
THE
COCHRAN LEIT HHARWOODAVE
AVE
HOLLEN RDCEDARCROFT
CHINQ
UAPIN
AVE
PK W Y
RD
GLE
NKIR
K
WO
OD
MO
NT
RD
LOCHNER
NORTHBOURNE
BURNWOOD
LOC
HR
AV EN
FENW
ICK
RD
RD
TUNBRIDGE
AVE
SHERIDAN AVE
SILVERTHORNERD
AVE
AVE
RD
DR
RADNOR
LINWORTH AVE
AVE
AVE
HARTSDALE
RD
FENW
ICK
INGRAM
AVE
HARTSDALE
RD
RD
HEATHFIELD
WINSTON
AVE
BEA U MONT
KELWAY
RD
MAR
BLE
HAL
L
ST
RD
PENTWOODSTONEWOOD
RD
RDPENTRIDGE
WINSTON
AVE
AVEFE
NW
ICK
AVE
RD
HILLEN
E. COLD SPRINGLA
AVE
CR
ADD
OC
K
THE
ALAM
EDA
NORTHHILL
RD
RD
PORTAG
E
AVE
AVEADRIAN
HAVENWOODRD
AVE
BLVD
RALWORTH
SHADYSIDE
AVE
TIVO
LY
NORTHGATE
NORTHWICK
LOCHWOOD
MARBLE
RD
HALL
RD
SHEFFIELD
RD
LA
AVE
CEDARHURST
AVERICH
ARD
ROSEKEMP
ARAB
IA
AVE
ROSS
DRAVE
AILSA
AVE
OVER
LAND
AVEWEITZEL
MO
NTE
BE
LLO
TER
ELSRODE
DR OVERLAND
TR
WALTHERMONTEBELLO
AVE
AVE
AVE
TEREDGAR
AVE
GRINDON
AVE
EUGENE
RD
AVEGRENTON
WO
OD
SDALE
MAINFIELD
RUECKERT
AVE
AVE
BATAVIAAVE
AVE
AVE
AVE
DR
SOUTHERN
RD
RD
TRAM
OR
E
HERMOSA
PILGRIM
RD
ALISA
GRINDON
LIST
RUECKERT
AVE
ELSR
ODEEL
SRODE
RD
AVE
AVE
ECHODALE
AVE
AVE
PKWY
AVE
RD
MORELLOAV
E
HAMLET
RD
SWANSEA
PKWY
RD
AVE
E BELVEDERE
AVE
RD
LYDONLEAWAY
EDG
EPA
RK
RD
RD
CAT
ALPH
A
WALSHIRE
LAU
RELT
ONAVE
HEMLOCKAVE
RD
CORBIN RD
GR
IND
ON
ESTRATHMORE
AVE
ROSELAWN
DR
PILG
RIM
BLVD
RD
McC
LEAN
AVE
BIRC
HWO
OD
FAIR
OAK
HAM
LET
AVE
AVE
AVECHRISTOPHER
AVEAVE
LOUISE
RD
PLYMOUTH
RD
GLENMORE
MARY
RD
MAR
IETT
A
LOUISE
PER
RIN
G
WESTFIELD
AVE
HILLEN
E. NORTHERN
PERRING
PINEWOOD
AVE
PINEWOOD
AVEJUBILEE CT
DR
MC
LEANBLVD
AVE
DR
FLEETWOOD
CHESLEY
AVE
BRIDGEHAMPTONRD
HAM
LET
MOORE
AVE
PKWY
AVE
FLEETWOOD
AVE
INGLEWOOD
KILDAIRE
WOODHOMECHESLEY
BERWICK
NORTHWAY
WOODRING
MO
YER
ORLANDO
BAUERNWOOD
ROSALIE
OLD
HAR
FORD
AVE
AVE
PARK
GLENCOE
RD DR
RD
CREIGHTON
LINWOOD
RD
AVE
AVE
WESTFIELD
ELSR
ODE
PINEWOOD
WILDPARK AVE
CHAMBER SHARVIEW
AVE
GLENDALE
AVE
AVE
AVE
ROSALIE
AVE
OAKCREST
GLENDALE
OAKCREST
AVE
CLEARVIEW
AVE
CLEARVIEW
HARVIEW
RD
TAYLOR
WILSON
DANIELS
AVE
AVE
ORLANDO
FAIRD
EL
AVE
DR
HARF
ORD
RD
AVE
PKW
Y
AVE
SYLVAN
AVE
AVE
GLENMORE
AVE
AVEEUNIC
E
AVE
RICHARD
AVE
ARAB
IA
AVE
AVE
BELL
VIST
AHI
LLTO
P
AVE
AVE
SEFT
ON
AVE
AVEDR
AVE
FAIR
DEL
AVEBELLEVALE
WAL
THER
AVE
AVE
GIBBONS
WISTERIA
AVE
SEFTON
EDN
A
BURG
ESS
AVE
MARY
AVE
THEO
DORE
AVE
GLENARM
AVE
BAYONNE
AVE
EVERGREEN
WIN
TH
ROPEKEENEHAMILTON
TWIN
OAK
AVE
AVE
AVE
EASTERN
PKWY
AVE
WALTHER
FAIR
WO
OD
AVEBELLE VISTA
AVE
AVE
AVE
WHITE
AVE
AVE
ELIN
OR
E
AVE
AVE
AVEBIDDISONAV
EAV
EHILLBURN
FRANKFORD
PEMBROKE
AVE
FAIR
DEL
INA AVE
RID
GEV
IEW
E VERALL
MAYBERRYAVE
BRO
OK
AVE
AVE
MARY
AVE
KAVON AV
E
AVE
AVE
SCHLEY
SIMMS
AVECROSSWOOD
AVE
TER
AVEM
ARX
AVEWILHOME
AVE
AVE
SOUTH
ERN
AVE
AVE
AILSA
REMMELL
PARKWOOD
AVEBELW
OOD
CHESMONT
AVE
GRENTON
LUERSSEN
WILLSHIRE
LASALLE
AVEVALLEY VIEW
RID
GEC
RO
FT
AVE
AVEFO
RRESTER
MONTANA
AVE
AVEAVE
BELAIR
AVE
WO
ODLEA
AVE
AVEBARBARA
AVE
AVE
AVE
GOODNOW
AVESHELDON
AVE
KAVON
RAYMAR
MARX
WILKE
AVE
SOUTHERNAVE
GREENH
ILL
RD
KAVON
RDAV
E
ST THOMAS
AVE
AVE
SIPP
LE
DR
AVE
NICHOLAS
AVE
KNELL
SEIFERT
AVE AVE
AVEBARBARA
AVE
ASBURY
AVE
STANWOODSEIDEL
FINDLA
Y
LANE
AVE
MANNASOTA
AVEHOMESDALE
AVE
CHATFORD
AVEELISON
LYNDALE
JUNEWAY
AVEARDLEY
AVE
EASTBURY
RD
SINCLAIR
AVEBALFERN
AVEAVE
EASTMO
NT
AVE
CLAREW
AY
AVELORELLY
RD
MORAVIA
AVE
CLAYBURY
TRUESDALE
AVEBOWLANDABERDEEN
AVE
LANE
WEST
RDSOUTHCLARE
FEDERALST
HOFFMAN
ST
E. EAGER
ST
N. M
ACO
N
STN. JAN
NEY
N. IR
IS
ASHLANDAVE
ST ERDMAN
AVEMAPLETON
EAGER
STSERVICE
DR
ARMISTEAD
WAY
QUAN
TRIL
WAY
LANEAVE
W
A Y
PULASKI
N.JAN
NEY
ST
AVE
ST
E. LOMBARD OLD
HAM
AVE
ST
ST
PL
ST
ALPHACOMMONS
ST
ST
FOSTER
SH
AVEN
EASTERN
BANK
ST
STS.NEW
KIRK
GOUGH
S.MAC
ON
S. LEHIG
H
BALT
IMO
RE
HAR
BOR
RAPPALLO
TUN
NEL
FAIT
AVEFAIT
ST
ST
KRESSO
N
O'DONNELLST
ST
MAS O N
ST
AVE
ST
STBO
NSA
L AVE
S.NEW
KIRK
ST
ST CUT-OFF
O'DONNELL
ANG
LESEA
BON
SAL
BRO
ENIN
G
ST
QU
AIL
ST
CHANDLERY
ST
AVERAILW
AY
AVE
ROBERTS
AVE
ST
BRO
ENIN
G
AVE
BESSEMER
DANVILLE
AVE
HAR TWAIT
AVEAVE
DANVILLE
AVE
AVE
BESSEMERAVEYOUNGSTOWNBOSTON
GU
SRYAN
ST
ELRIN
OW
AY
GARY AVEGARY
STEELTON
AVE
BETHLEHEM
DULUTH
AVE
GRACELANDO'DONNELL
FAIT
ST
STBUSHEY
STJO
PLIN
HUDSON
ST
FLEET
DUNDALK
BLVD
STE. PRATT
E. PRATT ST
KANE
DR
EWST
STC
OR
NW
ALL
ELRIN
O STFO
LCR
OFT
GU
SRYAN
HO
RN
ELST
ST
ST
JOPLIN
ST
EASTERN
ST
BANK
ST
AVE ST
ST
AVE
NORTHPOINT
RD
LANE
BOW
LEYS
FR ANKFORD
AVE
AVEENTERPRISE
AVESUPPLY
HWY
LANE
SCHEELER
AVE
AVE
EB
OU
ND
ARY
AVE
LN
FORCE
RD
RDRELCREST
RD
RD
AVE
AVE
ST.REG
ISR
D
RDST. REGIS
CEDGATE
AVE
DAYWALT
AVE
AVE
DAYWALT
LASALLE
AVE
AVEG
AR
DEN
WO
OD
CEDELLA
GERLAND
SUMMERFIELD
CEDONIA
MO
ORES
RUN
DR
RDW
HITW
OO
D
ARIZONA
BUCKNELL
WH ITBY
AVE
AVE
AVE
AVE
RITT
ER
AVE
NEWHOLME
AVEBURLAND
ARIZONA
BERGER
AVE
BENTON
HEIGHTS
AVE
AVE
SEYM
OUR
AVE
AVE
AVE
GARDENVILLEAVE
ANTHONY
VALI
QU
ETAV
E
WH
ITE
SUNBROOKAVE
AVE
AVE
AVE AVE
AVE
HAZELWOOD
HELLWIG
AVE
PLAI
NFI
ELD
AVE
AVE
RD
CENTURY
RASPE AVE
FOREST VIEW
MAR
LUTH
AVE
SPRINGWOOD EUR
ITH
BELMAR
MAN
NIN
GTO
N
AVE
AVE
RO
SEMO
NT
AVE
BRO
OK
AVE
PKWYCEDO
NIA
OVERLEA
WALNUT
AVE
PINEWOOD
AVE
AVE
AVE
CT
TAYLOR
AVE
EVER
ALL
AVE
AVE
WESTFIELD
RADECKE
WAY
ST
ST
RD
HICKORY
CAN
TERB
UR
Y
BAY
DR
ST
ST
ST ST
STAVE
AVE
AVE
ST
RUTTERMASON JOHN
MOSHER
DOLPHIN
ST
RD
RD
ST
AVE
ST
ST
RD
STST
MAC
E
ST
AVE
MATHEW
S
ST
22 1/2
ST
ST
PL
ST
MORRIS
AVE
BREVARD
ST
AISQ
UITH
LA
ST
STPAU
L
HIL
LEN
IRO
N
STST
MAYFIELD
E. 20TH
ST
BLVD
RD
UPSHIRE
ST
AVE
BLVD
ROBB
ST
CECIL
AVE
ASQUITH
ROBB
ST
N.R
EGES
TER
N. C
HAPEL
ST
N. SPR
ING
ST
STN
DU
RH
AM
ST
LA
ELMLEY
KENTU
CK
Y
PELHAM
WOODSTO
CK
ST
PERLM
AN
STN
. WO
LFE
ST
AVE
N. LAK
EWO
OD
STSTST
PL
AVEST
N. GAY
CROSSLAND
AVE
PL
WALTHER
AVE
AVE
EIERMAN
DR
BRENDAN
AVE LA
AVE
MANNASOTA
AVEKENTUCKY
BRENDAN
AVE
LAKE
AVE
STC
LOU
D
AVE
FEDERAL
DUNCANWOOD
LAKE
DR
CURRAN
WHIT
MAN
DR
RD
E. MADISON
.
.
ST
ALBEMARLE
.
ST
ST
RUSSELL
ST
HAINES
KEY
ST
GEORGE
ST
ST
STOLER
ST
ST
ST
ST
ST
McELDERRY
ST
BUSH
SEVERN
RIDGELY
ST
W. WEST
S.SHARP
ST
BATTERY
S. GAY
ST
EAST
ST
ST
STW
EBSTER
EAST
FOR
RE
ST
WLA
NVALE
AVE
E GITTINGS
ST
ST
S. BELN
OR
D
ST
ST STST
STST STST
ST
BEASON
STST
ST
LOW
MAN
ST
KEY
AVE
ST
ST
PARK
ST
HULL
ST
DUKER
ST
S.PATTERSO
NPAR
K
ST
ST
ORLEANS
ST
ST
LA
E. FAIRMOUNT
ST
ST
STEV
ENSO
N
DECA
TUR
ANDR
E
RICH
ARDS
ON
ST
MARRIOTT
ST
DO
YLE
ST
S. CLIN
TON
S. DU
NC
AN
WALLACE
S.DU
RH
AM
AVE
ST
ST
E. PRATT
AVE
S.BO
ULD
IN
ST
ST
ST
FORSTER
ST
ST
AVE
INVERNESS
AVE
WINDER
RD
AVE
ST
ST
RD
RD
AVE
ST
ST
AVE
ST
CH
ERR
YH
ILL
ERIC
K
WENBURN
SIDN
EY
S.H
ANO
VER
AVE
LARUESQ
E.
RAC
E
W. CROMWELL
AVE
AVE
RD
RD
GOULD
ST
RUTH
ST
CROW
THER
ROLAND
ST
KESWIC
K
CH
ESTNU
T
ST
RD
W.35 TH
W.34 THST
HUBNER
POWERS
DR
W. 31ST
LOVEG
RO
VE
HANLON
ST
W. 28TH
AVE
BRO
OKFIELD
ST
AVE
ST LENNOX
PRESSTMAN
ST
ST
JENKINS
TIFFANYDRUID
HILL
ETTING
MADISON
ST
AL
ST
N.SC
HR
OED
ER
STN.STO
CKTO
N
BORN
AVEN
.POPPLETO
N
PARK
IN
FOUNDRY
CT
ST
ST
ST
ST
WARDCLE
VELAND
W. HAMBURG
WICOMIC
O
WORCESTER
ALLUVION
ST
I
BLOO
MFIELD
AVE
FOREST HILL
AVE
WILMINGTON
TRANSIT
ATCO
AVESPONSON
BROHAWN
BANGER
TRANSIT
CARROLL
AVE
RIDGLE
Y
HURON
ST
ST
WIC O
MIC
O
AVE
RD
ST
NIE
MAN
AV
E
RD
NORTHSHIRE
ANN
APO
LIS
RD
ENGLISH
CONSUL
BALTIMO
RE
BOO
KER
T
BETHUNE
ST
WA
T
ERVIEW
WATERVIEW
AVE
AVE
VERONICA
RO
UN
D
RDSE
AB
URY
S.HANO
VER
POTE
E
SEAGULL
REED
BIRD
ST
WYANOKE
GR
EENM
OU
NT
DUMBARTON AVE
ELLERSLIE
RD
CH ANCERY
AVE
REXM
ERE
RD
MONTEREY
ROUNDHILL
RD
OAKRIDGE
AVE
KENNEWICK
HARCOURT
IONA
TERD
R
HARRIS
AVE
RICHMOND
GREEN
WAY
SOUTHWAY
BREN
TWO
OD
ST
HOMESTEAD
ST
RDBELLE TERRE AVE
GORSUCH
GORSUCH
ST
ST
ABBOTSTON
E. 30TH
AVE
HAR
GR
OVE
RD
E. 35TH
AVE
W. 24TH
ST
ST
ST
W. 25TH
E. 25_1
ROBB
E 20TH
AVE
TYLE
R
ST
AIKEN
BONAPARTE DARLEY
HOLY CROSS
MAR
YLAND
ST
W. LAFAYETTE
N.C
HAR
LES
AL
BIDDLE
E. OLIVER
WILC
OXGU
ILFOR
D
ST
ST
W. REDWOOD
S.GR
EENE
MARION
W. MADISON ST
STST
MO
RTON
ST
EARECKSON
E. LANVALE
STST. PA
UL
ST
ST
HARFO
RD
RD
AVE
ERDMAN
AVE
HILLTO
P
HIL
L EN
FEN
WIC
K
N. BO
ND
ST
ELLSWORTH
SPARK
THAMES
DOCK
ST
ST
ST
HILLM
AN
ST
AVEN
. DU
RH
AM
N. C
HAPEL
ST
AVE
N.C
ASTLE
N. C
HESTER
N. C
OLLIN
GTO
NDU
NC
AN
ST
E. LANVALE
N.PO
RT
E. BIDDLE
MURA
N.KEN
HILL
N. KEN
WO
OD
N. LIN
WO
OD
N. PO
TOM
AC
N. W
ASHIN
GTO
N
ST
E. EAGER
E. READ
ST
ST
W. MULBERRY
ST
ST
ST
TYSO
N
ST
ST
BATH
ST
N.PIN
E
N. PEAR
L
GU
ILFOR
D
ST E.BALTIMORE
ST
S.FRED
ERIC
K ST
AISQ
UITH
N. D
UN
CAN
ST
ST
N.BO
ULD
IN
N. EAST
STPL
HW
Y
ST
ST
N.D
ALLAS
ST
S. LUZER
NE
S. RO
SEAVE
ST
ST
ST
EASTERN
AVE
BANK
AVE
THE
FALLS
W
AY
ST
ST
E. BALTIMORE S.REG
ESTER
ST
ST
ST
AL
STST
CO
VING
TON
S. LIGH
T
W. CAMDEN
KEYW. HILL
PEACH
RACE
CHURCHILL
AVE
RIVER
SIDE
ST
E. OSTEND
CLAR
KSON
ST
ST
ST
ST
ST
E. FORT
STHARVEY
ST
BRO
OKL
YN
S.H
ANO
VER
ST
BRISTOL
ST
POTEE
AVE
ST
AVEEASTBOURNE
CT
ST
ELLIOTTST
HUDSON
ST
S.LINW
OO
D
51/2
EATON
HARFORD
DR
N.D
ALLAS
LA
HEAVER
ST
ENSO
R
HUNTINGDON
W. PRESTO
N
RED
SARAH ANN
ST
ST
KOPP
ERS
AVE
RD
RIVERSIDE
AUDREY
CAMBRIA
STBYR
D
ST
COLVIN
.W. EAGER
E. HOFFMAN
JUNIPER
AVE
ST
RD
DR
ST
ST
ST
CAMBRIDGE
STAVE
AVE
ST
ST
AVE
E LOMBARD
ST
E. HOFFMAN
ST
AVE
CLIF TMONT
AVE
AVE
EASTW
OOD
CHESTERFIED
AVE
ST
ST
S.BOU
LDIN
ST
LAELMC
AIRN
ES
CO
ND
UIT
AVE
AVE
BEECHPLEA
SANT
UNIONAVE
AVE
W. 37THST
ST
W. 37THST
LA
W. 39TH ST
STW. 38TH
TUD
OR
ARM
SAVE
SAN
MARTIN
DR
ST
ST
BERRY
ST
POO
LE
PL
BERRY STST
WELLINGTONST
ST
ST
ST
JONESFALLS
EXPW
W. 33RD
W.32RD
KESWIC
KR
D
HARDINGPL
ST
ST
ST
PACIFIC
WYMAN PARK
EASTDR
RD
DR
W. 29T
H
ST
LIND
ENJORDAN
EUTAW
LA
AVE
LAKEVIEW
CALLO
W
DRUID PARK LAKEDR
RESERVOIR ST
NEWINGTON
PARK
AVE
STDUCATEL
MORRIS
WHITELOCK
EUTAW
AVE
MADISON
ST
MORRIS
W. NORTH
STODDARDBRUNT
BLOOM
ST BOLTONST
STAVE
ST
JORDAN
WALTEMEYER
MCMECHEN
TIFFANY
ST
ST
ST
ST
ARGYLE
MOSHER
SMALL
ST
ST
W. LANVALE
ST
N.AR
LING
TON
AVESHIELDS
ST
PLST
UPTON
DOLPHIN
STST
W. FRANKLIN
BENNETT ST
AVE
BRU
NEST
W. HOFFMAN
ST
AVE
AVE
N. MLK
JR.
BLVD
ST
AVE
AL
VINE
N. FREM
ONT
AVE AVE
STVINE
N.C
ARO
LLTON
N. AM
ITY
S. MLK
JR.
N.
CAR
LTON
ST
ST
BOOTHST
ST
BOYD
CALLE
ND
AR
SCO
TT
ST
ST
RAMSAY ST
ST
HERKIMER
ST
GLYNDON
AVE
JAMES
SARGEANT
S.ARLI N
GT O
N
STST
W. OSTENDST
ST
ST
NANTICOKE
S. CAREY
ST
ST
RYAN ST
ST
CARROLL
MC HENRY ST
W.BAR
RE
WASHINGTON
ST
AV E
WCROSS
CARROLL
WOODWARDST
DEXTER
S.PACAW HAMBURG
ST ST
ST
ST
ST
DENVER
ST
W OSTEND
STOCKHOLMST
ST
ST
WARNER
ST
CLARE
ST
ST
S. GRANTLEY
STRD
S. EDG
EWO
OD
AVE
RD
RDVERO
ST
AVE
I
RD
RD
AVE
GLOSTER
CLARINDA
PARKMAN
GEORG
ETOW
N
HERKIMER
ST CASADEL
DELMONT
AVE
LETITIA ST
JAMES
AVE
WICKES
AVE
DEERING
HERKIMER
ST
JAMES
AVE
AVE
WASHINGTON
JAMESW. PATAPSCO
DR
DR
AVE
AVE
AVE
INVERNESS
AVEWHITTI NGTON
RD
AVE
PARKSLEYAVE
TOLL
EY
ST
AVE
GRIFFIS
ST
WHISTLER
HARMAN
AVE
BLVD
BREITWERT
AVESEVERN
ST
ST
L A NGLEY
ST
HARMAN
ST
S. PACA
AVE
ST
PUGET
PIERPONT
RDST
MAISELCT
ST
KENT
ST
MAISEL
NEVA
DA
ST
STWES
TPOR
T
AVE
WATERVIEW
NORF
OLK
KLO
MAN
ST
MANOKINST
STAV
E
RD
KENT
ST
ANNA
P0LI
S
CEDL
EY
ST
KLO
MAN
ST
AVE
ARBUTON ST
PUGE
T
STGABLE
AVE
LORE
NA
SMITH
AVE
POLA
R
GEBHAVE
AVE
JANI
CE
MARBOURNE
HARRIET
ST
AVE
SOUTHDENE
PUG
ET
W. PATAPSCO
ANN
APO
LIS
STR
AND
EN
SAVO
Y
FRANK
HO
LLIN
SFE
RR
Y
AVE
AVE
WEGWORTH LN
RDAVE
NORLAND
AVE
MALLVIEW
RD
LNWEGWORTH
AVE
RITTENHOUSE
AVE
AVE
DR
VIONA
MAGNOLIA
AVE AVE
CT
MARMEN
CO
ST
AVE
SEAGULL
RD
RD
CT
DEACOHILL
RO U ND VIEW
RD
AVE
AVE
SOUTHLAND
AVE
RD
SEAMON
CHERRY HILL
RD
TERRAFIRM
A
JOSEPH
AVE
DR
ROUN
DSHELLBANKS
WOODVIEW
RD
BRIDGEVIE
W
GILES
RD
BLYD
EN RDBEREA
RD
GILES
RD
AVE W. PATAPSCO
DORIS
TOWNSEND
AVE
AVE
ST
HILLCREST
5TH
AVE
ST
AVE
AVE
6TH
3RD
HIGHLANDST
5TH
STST
6TH
4TH
CALVERTFRANKLE
2ND
JACK
ST
ST
CHART
BALTIC
FREEMANPONTIAC
WASHBURN
E. GARRETTRD
E. JEFFREY
POTE
E
E. TALBOTTST
HORT
ON
ST
ANNABEL AVE
2ND
ST
FRANKFURST
ST
ST
MAUDEST
CHESAPEAKE ARSAN
ST
HELM
STET
TER
DR
INSU
LATO
R
ST
E. McCOMASST
ST
E CROMWELL
ST
W. McCOMAS
ST
W. DICKMAN
RD
ST. PAUL
W 39TH
RD
CLO
VERH
ILL
ST. MARTINS
RD
E. 39TH
KEMBLE
ARGONNEAVE
EDN
ORSTE. 38TH
RD
HILLCHESTNUTAVE
ELKAD
ER
KIMBLE
YOLAN
DO
HILLCHESTNUT
WBISHOPS
FOX
E. 36TH
ABELL
RDHOMEWOODTR
AVE
PKWY
BARC
LAY
E. 34TH
ST
ST
AVE
ELLERSLIE
AVE
VENABLE
SUFFOLK
ST.PAU
L
ST
E. 32ND
E. 31ST
HU
NTER
ST
E. 29TH
ST
WYMAN
PARK
SISSON
W. 30TH
ST
AVECRESM
ONT
ST
W. 26TH
W. 27TH
W. 28TH ST
MAR
YLAND
N.
HO
WAR
D
MO
RTON
LOVEG
RO
VE
STN.C
HAR
LES
W. 26TH
AVE
W. 23RD
HAM
PD
ENAVE
LOVEG
RO
VE
ST
E. 23 RD
ST E. 24 TH
W. 22ND
W. 21ST
ST
RD
W. 20TH
AVE
AVE
W. M
OUNTROYAL
AVE
ST
PARK
AVE
ST
W. LANVALE
ST
ST
ST
ST
AVE
N.H
OW
ARD
ST
W. TRENTONJONES FALLS
EXPWLAW. OLIVER
ST
HAR
GR
OVE
E. NORTH
E. LANVALEST
AVE
LIND
EN
AVEH
UN
TERST
ST
ST
HAR
GR
OVE
TYSO
N PARK
CAMPST
WHITRIDGE
ILCHESTER
BARC
LAY
E. 26THST
ST
ST
STBAR
CLAY ST
LOCH
RAVEN
BARTLETT
BOO
NE
ST
HOMEWOOD
AVE
CURTAIN
AVE
ST
AVEG
REEN
MO
UN
T
ST
AVE
KIRK
ST
ST
E.25 TH
AVEBR
ENTW
OO
D
AVE
STST
ST
ST
MC ALLISTERSTG
UILFO
RD
LATRO
BE
E. FEDERALFEDERAL
E. OLIVER
HO
LBRO
OK
VALLEY
LOVEG
RO
VE
E.EAGER
E. CHASE
HO
MEW
OO
D
GR
EENM
OU
NT
AVE
ST E. PRESTON ST
ST
ST
E. BIDDLE
E. EAGER
ST N. C
ENTR
AL
ST
ST
ST
N. PAC
AJASPE
R
ST
E. CENTREST
N.C
ALVERRT
STN
.EUTAW
STST
W. MONUMENT
POLY
AVE
ST
ST
HIGHST
ST
E. MONUMENT
THE
FA LL SW
AY
ST
W. READLIN
DEN
ST E. FRANKLIN
ST
PLEASANT
N.G
REEN
EST
E. LEXINGTON
W. REDWOOD
ST ST
W. CLAY
ST
AVE
ST
W. FAIRMOUNTAVE ST
ST
W. LOMBARDPENN
ST
PORTLANDST
BLVD
RU
SSELL
STW. LEE
ST
STW
ARNER
BLVD
McKEWIN
MELVILLE
FRISBY
ST
E. 37TH STGREYSTONE
RD RD
RD
E. 36TH
AVE
E. 33RD
ST
EXETER HALL
INDE
PEND
ENCE
ST
ST
FRIS
EY
MONTPELIER
AVE
ELLE
RSLI
E
E. 30 TH
AVE
VINEYA
RD
ST
MONTPELIER
FILLMORE
ST
FRIENDSHIP
ST
AVE
ST STAV
E
E. 29TH
ST LO
E.28 TH
THE
CHILTON
AVECARSWELL
STAVE
AVE
CEC
ILKENNEDY
GARRETT
AVE
ST
STST
AVE
SHERWOOD
AVE
AVE
ST
CLOUGH
POLK
ST
AVE
ST
N. BROADWAY
AVEDARLEY
CLIFTVIEW AVE
ST LO
ST
LA
AISQUIT
H
AISQ
UITH
ST
ST
N. ED
EN
ST
LAFAYETTEE.
N.BO
ND
N. BETH
EL
PL
ST
DAVIS
ST
N.LIBERTY
ST E. SA RATOGA
ST.PAUL
E.REDWOOD
ST
STWATER
SOU
TH
ST E. LOMBARD
N.C
HAR
LES
E. PRATT
ST
S.CALVER
T
ST ST STN.G
A YST
ST
ST
E. LEXINGTON
CO
MM
ER
CE
AVE
E. FAYETTE
ST
MAR
KET
PLST
S. EUTAW
ST
CONWAY ST
ST
HW
ST
ST
HUGHES ST
MONTGOMERY ST
ST
S.HAN
OV
ER
ST
S.LEADENHALL
S.CH
ARLES
S.SHARP
CROSS
WEST ST
DU
RST
HEN
RY
GRINDALL
ST
WILLIAMWARREN
ST
ST
FORTAVE BELT
STE BARNEY
BARNEY
ST
ST
STAVEST
OLIVE
PATAPSCO
MAR
SHALL
ST
E. CLEMENT
ST
KEY
HW
STST
RANDALLST
HEATH ST
JOH
NSO
N
ELKIN
S
WELLS ST
STST
HWY
ST
WO
OD
ALLHW
Y
REYN
OLD
S
ST
HAUB
ERT
ST
E. CLEMENT
COO
KSIE
AVE
TOW
SON
CUBA
ST
ST
ST
STBOYL
E
E.HEATH
ST
HYSON
ST
ST
ST
FELL
ST
THAMESST
STST
ST
LANCASTER
ST
ST
AVE
ALICEANNA
AVEFLEET
LANCASTER
FALLS
ST
ST
CTEASTERN
FAWNBANK
S.EXETER
S. SPR
ING
S.D
ALLAS
GR
IFFIN
CT
SWAN
CT
PRESIDENTST
TEMPLE
WATSON
ST
S.BO
ND
ST
N.C
ARO
LINE
ST
S. EDEN
AVES. C
ENTR
AL
E. PRATT
ST
GOUGH
CT
ST
E. FAIRMOUNT
ORLEANS
S.WO
LFES. C
HAPEL
S. CASTLE
S. ANN
E. FAYETTE
JEFFERSON
N.W
OLFE
PORTUGALST
ST
STMULLIKIN
N.BO
ND
S. BETH
EL
ST
S. BRO
ADW
AY
S. CAR
OLIN
E
ST
RD
KENNEWICK
TIVOLY
THE
ALAMED
A
STE. 36TH
RD
RD
LAKESIDE AVE
RD
WINDEMERE
E. 35TH ST
RD
LOC
HR
AVEN
TIVOLY
E. 31ST
E. 32ND ST
ST
E. 31ST
ST
HARFORD
RD
ERDMAN
DR
MAYFIELD
AVE
AVE
AVE
KENTUCKY
PEHLAMCHESTERFIELD
HARFORD
WHITMANDR
RD
DOBLER
AVE
WEAVER
AVE TR
RD
BERKSHIRE
RD
RDTYNDALE
JUNEAU
RD
AVE
HARCOURT
AVE
DILLER
PARKSIDE
CAN
FIEL
D
DR
AVE
NR
OSE
INDIAN HEAD
ELMORA
RAVENWOOD
ST
BELAIR
LYNDALE
AVE
AVE
AVE
AVE
AVELO
NG
VIE
W
AVE
N.
ELLW
OO
D
RD
NORMANAVE
AVE
AVEAV
E
AVE
AVE
HARWELL
CLARENCE
PARKLA
WN
AVEAVE
PELHAM
AVE
AVE
JUNEWAY
ERDMAN
AVE
AVE
AVE
BREN
DAN
CLIFTMONT
BREHMS
RAVENWOOD
ELMLEY
LYNDALE
ELMORA
ED
ISON
DR
LA
WNVIEW
BONVIEWSINCLAIR
AVE
LN ST
N.ELLW
OO
DAVE
N. ELLW
OO
D ST
ST
AVE
ST
ST
AVE
AVE
N. PATTE
RSO
NPAR
K
N.
MILTO
N
STN.M
ON
TFOR
D
N. BR
ADFO
RD
SINCLAIR
AVEN
. RU
TLAND
E. NORTH
N.W
ASHIN
GTO
N
N. W
OLFE
ST
AVE
ST
FEDERALN.C
OLLIN
GTO
N
STE. OLIVER
ST
ST
STE. HOFFMAN
E. PRESTON
RU
TLAND
ST
ST
MURA ST
N.C
ASTLE
AVE
N.LU
ZER
NE
GROGAN
STN
.POR
TST
AVEBERYL
ST
AVEN
. PATTER
SON
ST
N. C
HESTER
ST
ST
STST
E. MONUMENT
ASHLANDST
E. MADISON
SOM
ERSET
ASHLAND
ST
ST
ST
ST ST
ST
AVE
N. EXETER
HILLEN
LOW
ST
STN. GAY
ENSO
R
S. HIG
H
STILES
CRTWALDO
McELDERRY
ST
N. BR
ADFO
RD
N. M
ON
TFOR
DN
. POR
T
N. LU
ZER
NE
AVE
N.
STR
EEPER
ST
N.
BELN
OR
D
N. LIN
WO
OD
N. ELLW
OO
D
AVE
N. PO
TOM
ACST
ST JEFFERSON
N.
CU
RLEY
E. FAYETTEPULASKI
AVE
AVE ST
AVE
AVE ST
AVE
N. D
ECKER
N. PO
TOM
AC
HWY
ST
N.D
ECKER
ST
E. MADISON
N.C
LINTO
NST
ST STN
. DEAN
CO
NKLIN
G
ST
N.H
IGH
LAND
N. R
OBIN
SON
ESTHERAVE
LON
EYS
NOBLEAVE
N.EAST
ST
E. BALTIMORE
AVES. ELLW
OO
D
S. EAST
S. RO
BINSO
N
N. D
EAN
GOUGH
LEVERTON AVE
ST STFAG
LEY
BAYLIS
CHESTLE
BENEFIT ST
STS.D
EAN
MARSHALL CRT
MUELLER
S.HIG
HLAN
DST
S. CLIN
TON
BAYLAS
HARMONY
FLEET ST
FOSTER
AVE
S. GLO
VER
DILLON
ST
FAIT
STSTS. M
ILTON
ST
AVE
HUDSON
S.MO
NTFO
RD
S. POR
T
FOSTER
AVE
ST
S.LAKEWO
OD
AVEAVE
BINN
EY
S. POTO
MAC
ST
S.DEC
KER
S. CU
RLEY
S. STREEPER
S. KEN
WO
OD
AVE
ESSEXBOSTON
ST
S. LAKEW
OODAV
E
AVE
ST
TOONE
STAVE
AVE
BOSTON
CARDIFF
AVE
ST
AVE
ST
ST
O'DONNELL ST
ST
AVE
ST
S.MAD
IERA
ST
ST
AVE
AVE
S. CO
LLING
TON
STC
TH
AMP
STEAD
ST E. 32ND
ALAMEDA
GU
ILFOR
D
N.C
ALVERT
E. 30TH
ST E. 27TH
AVE
ST
WORSLEY
OAKH
ILL
AVE
AVE
AVE
E. 33RD
E. 34TH
ST
CR
ITTENTO
N
PL
RD
HAMPDEN
AVE
MILES
AVE
REMINGTON
W. NORTH
MADISON
ST
AVE
ST
ST
ST
N.STO
CKTO
N
ST
ST
ST.MARY
ORCHARD
ST
ST
S.HO
WAR
D
ST
JORDAN
N. FREM
ONT
MYRTLE
W.CHASE
CATHEDRAL
AVES. SH
ARP
LEE
ST
ST
ELLICOTT
ST
ST
RD
ST
ST
ST
LEMMON
ST
AVE
ST
ST
ST
ST
ST
ST
ST
ST
WILSO
ST
ST
ST
LA
WILLARD
S.MO
UN
T
N. PAR
RISH
STSTST
AVE
ST
N.M
OU
NT
AVE
ST
ELLI
CO
TT
MULBERRY
ST
N.PU
LASKI
AVE
EMERSON
S MONROE
AVE
ST
ST
ST
KINGSLEY
DR
RIGGS
RD
RAYNER
N.ED
GEW
OO
D
W. LANVALE
W. LEXINGTON
ST
W. BALTIMORE
LOHRS
STAFFORD
STRICKLAND
ST
AVE
ST
CATHERINE EAGLEASHTON
ST
CHRISTIAN
SS
MALLW
OO
D
ST
W. PRATT
BOYD STHOLLINS
ST
W. PRATT
RD
S.ADD
ISON
ST
ST
PAYSON
RDW. BALTIMOREST
VINE
W FAYETTE
AVE
AVE
HARLEM
W. LANVALE
WH
ITMO
RE
NO
RR
IS
N. C
ALHO
UN
N. M
OU
NT
ST
ST
ST
HOLLINS
ST
ST
S.PARR
ISH
BELMONT
NORMOUNT
WESTMONT
AVE
AVE
RO
SED
ALE
N.D
UKE
LAN
D
WINCHESTER
AVE
PROSPECT ST
N.D
UKELAN
DST
HARLEMARUNAH
EDMONDSON
AVE
NLO
NG
WO
OD
ST
AVE
AVE
ST
BERNARD
DR ST
ST
SPENCESEXTON
MOSHER
ST
AVE
CALVERTON HEIGHTS AVE
ST
HARLEM
N.W
ARW
ICK
WH
EELER
MOSHER ST
RIGGS AVE
ST
AVE
AVE
ARUNAH
AVE
LAURETTA
AVE
AVE
EDMONDSON
N.VIN
CEN
T
ST
ST
LAURETTA AVE
N.FU
LTON
B RA
DD
I SH
W.LAFAYETTE
STST
W. FRANKLIN
ST
ST
S.CATO
N
AVE
ST. BENEDICT
ST
AVE
S.LON
GW
OO
D
WILMINGTON
COWAN
AVEBENSON
AVE
AVE
PARKSLEY
WHISTLER
AVE
WILM ARCO
AVE
WASHINGTO
N
WESTERN
ST
MONTEREYMAISEL
WILKENS
AVE
COLE
AVE
PARK
SLEYAVE
FON
THIL
LAV
E
STST
WE
LLESLEY
AV E
MASSACHUSETTS
AVE
FREDERICK
S. CATON
BENKERTAV
E
LA
MOUNT
OL IVET
PHELPS
LA
ELBERT
ST
STST
GW
YNN
AVE
AVE
DENISO
NST
HILTO
N
PKWY
RD
N FRANKLINTOWN
ST AVE
W. SARATOGA
PENROSEAVE
W. FAIRMOUNT AVE
STBOOTH
STBOOTH
W BALTIMORE
W. FAIRMONTAVE
WAR
WIC
K
N CALVERTON
W. LEXINGTON ST
N.BEN
TALOU
TOWANDA
RED RDAVE
PIMLICODR
AVE
ST
STST
ST
DR
AVE
ST
RD
RD
RUPP
BRIGHTON
AVE
MULLIN
DIVISION
AVE
GIRARD
ST
CHOWAN
POPLAR
AVE
RUSKIN
WABASH
AVE
DORITHANYOSEMITE
PALLM
ALL
KEYWORTH
RD
AVE
AVE
RALAND
VIEW
AVE
LOYOLA
SPRINGHILLRD
AVE
BARRINGTON
LYNC
HES
TER
RD
RD
VIOLET
N. DU
KE LA ND
DRUI
D
PARK
AVE
EVERG
REEN
RO
SEDALE
TERR
KOKO
LA
AVE
ST
AVE
AVE
THO
MAS
N. LO
NG
WO
OD AVE
AVEGRAYSON
AVE
ST
AVE
BAKER
SLING
LUFF
PRESSTMAN
GE
RTR
UD
E
ST
PKWY
BRIGHTON
APPLETON
AVE
KAVANAUGHST
ST
N. CAREY
ST
AVE
LAURENS
LORMAN
N.STR
ICKER
WH
ATCO
AT
N. G
ILMO
RN. STOCKTON
ST
N.SM
ALLWO
OD
ST
N.PU
LASKI
PARKWAY
SWANN
DR
DRUID PARK
DR
FOREST D R
POPLA R D R
AVEROCKROSE
SENEC
AST
RD
UNION
AVE
HOO
PER
BUENAVISTA
WELDON
ASH
EXPW
BEECHWOODLAKE DR
LA K E DR
RD
GROVE
CUT OFF DR
OCALA
AVE
HENDLER
BOARMAN
GRANTLEYWABASH
RD
CEDA
RDA
LE
RD
EDGEWOOD
BAREVA
RD
DORITHAN
RD
RD
AVE
RD
RD
AVE
GALLWAY A VE
PARKHEIGHTS
QUANTICOTOWANDA
AVE
RD
SHIRLEY
CO
TTAG
E
AVE
SOUTHWAY
GREENSPRIN
G
AVE
RD
AVE
AVE
WICHITA
AVE
AVE
AVE
RD
ROSE
DAL
E
DENN
LYN
ELLA
MO
NT
RD
RD
AVE
AVE
HILT
ON
EDG
EWO
OD
DENI
SON
AVE
TITON
BU RLEIT
H
DEN
ISON
N. H
ILTON
AVE
N. LONG
WO
OD
ELGIN
N.ELLAM
ON
T
POPLAR
GR
OVE
WINDSOR
ST
ASHBU
RTO
NAVE
ST
N.W
ARW
ICK
HERBERT STWALBROOK
W. NORTH
HILTON
WESTWOOD
BLOOMINGDALE
ST
ST
STEPHEN
ST
AVE
ST
DU
KELAND
ST
AVEM
OR
ELAND
ST
N.ED
GEW
OO
D
ST
ST
ST
N.C
AREYST
AVE
ST
STST
PRESSTMAN
WALBROOK
HERBERT ST
RU
XTON
DANIELLE
WESTWOOD
PRESBURY
N.BEN
TALOU
WIN DSOR
AVE
WH
EELER
BAKER
GOLD
ST
ST
N.BR
UC
EST
ST
ST
N.M
OU
NT
N. PAYSO
N
ETTINGMC
KEAN
AVE
CALHOUN
RET
REA
T
PENNSYLVANIA
FRANCISAVECLIFTON
RD
STMCCULLOH
STODDARD
AL
N. MONROE
AVE
RD
WOODBROOK
DR
AVE
CRO
WS
NES
T
RD
PRO
SPE CT
SPRING D R
DR
RDCLIPPER
W. 36THST
RD
ST
CLIPPERM
ILL
AVE
CLIPPER
JONES
FALLS
AVE
W. 41ST
SMITH
RD
WAY
AVE
MIDVALE
RD
AVE
RID
GED
ALE
LA
RD RD
AVE
BRAMBLETON
GR
EENSPR
ING
REISTERSTOWN
SOUTH
RD
KEN OAK
DELAWAR
E
RD
AVE
AVE
W. NORTHERN
DR
AVE
AVE
AVE
AVE
AVE
MAT
TFE
LDT
RD
PWKY
LN
RD
LANE
IVYMOUNT
AVE
GERNAND
RD
PIMLIC
OAVE
AVE
RD
LANIER
AVE
AVE
FINN
EY
RD
FAIRBANK
DIXO
N
WINDING
DEEPDENE
RD
BUCHANANG
RAND
VIEW
LAPLATA
QUEENSBERRY
AVEAVE
AVE
AVE
CYLBURN
AVE
OAKLEY
THO
RN
DALE
AVE
RD
OLN
EY
AVEPO
E
RUSCOMBE
AVE
AVEWILERN
AVEAVE
AVE
ROSALANDWOODLAND
DUPONT
AVELAU
REL
AVE
SUNSET
EDGECOMBECIR
AVE
HANWAY
ROGENEPKWY
NORTHCLIF FDR
RD
WESTERN RUNDR
DR BON
NI EVIEW
DR
BLVD
SAREVA
DR
KELLY
CREST
GREENSPRING
RD
ARDEN
CRO
SSCO
UN
TRY
CHILHAM
RD
RD
BRIARWOOD
RD
RUSK
AVE
PKWY
W. NORTHERN
W. ROGERS
BLVD
AVE
STUAR
T
AVE
AVE
EVERTON
RD
RDSULGRAVE
ENSLOW
AVE
RD
RD
AVE
PRE
AKN
ESS
WAY
RD
KEN OAK
AVE
LANIER
AVE
PALLM
ALL
EDGEMEREAVE
AVE
DUPO
NT
VIR
GIN
IA
AVE
NORTHWAY
OAKFORDW. COLD SPRING
RD
TAM
ARIN
D
GLEN
RD
TAMAR
IND
LANE
W.O
LDCO
LDSP
RING
AVE
GREENBERRY
RDAVE
WILDWOOD
LN
SOU
THBEN
D
RD
WE
XFOR
D
LOCHLEA
RDAVE
SMITHAVE
AVE
FALLSSTANTO
NAPPLEBY
AVE
ASBURYRD
KELLY
RD
JONES
FALLSEXPW
Y
POPLAR
H I LL
BELLE MORE
SUNNY
RD
RD
INDIA
N
LN
EDGEVALE
PLOVER
W COLDSPRING
FALLS
HILLSIDE
LNIVY
LASU
NN
Y
AVE
NEWPO
RT
AVE
AVE
ROLAND HEIGHTS
AVE
MEDFIELD
CLYD
ESDA
LEAV
E
LNAVE
YELLOW
WO
OD
PARKHEIGHTS
WYL
IE
LOYOLA
PARKHEIGHTS
AVE
WALLIS
RD
CLARIN
TH
DR
WABASH
AVE
AVE
ST
MARNAT
RD
AVE
LA
RD
RD
DR
WINNER
REDCEDAR
RD
RD
AVERD
DR
TRAINOR
AVE
CORDELIA
AVE
RD
AVE
AVE
RD
DR
RD
AVE
AVE
AVE
MANHATTAN
W.BELV
EDER
E
GIS T
BARTWOOD
RD
AVERD
LA
VINCENT
FORDS
BELLE
AVE
EMMART
MORTIMER
FAIRLAWN
REISTERSTOWN TIPPET
RD
RUBIN
TANE
Y
AVE
AVE
AVE
HIGH
GATE
W. STRATHMORE
ELRAY
GREEN
L INC
OLN
BERKELEY
AVE
MERVILLE
SIMM
ONDS
ROCKWOOD
AVE
INGLESIDE
ETHELBERT
CUTHBERT
NELSON
AVE
AVE
BEAUFORT
AVE
SPAULDING
ELEANORA
GR
ANAD
A
ELDO
RAD
O
MAPLE
SLADE
AVE
CHARLESWORTH
RD
TEAKWOOD
DR
HATTO
N
RD
SHELBURNE
LABYR
INTH
RD
WESTBROOK
BONFIELD
RD
NERAK
RD
RD
SEVENMILE
LANEBROOKCRESTWY
GLENGYLE
AVE
DAVIS
AVE
BONNIE
RD
CLAR
AN RD
AVE
BOXFORD
AVE
OLYMPIA
RD
SZOLD
RD
FALLSTAFF
RD
LABYRIN
TH
RD
SUR REYREISTERSTOWN
NADINE
LABYRIN
TH
BROOKHILL
BROOKHILL
EBERLE
DR
RD
AVE
RIDGE
PARSONS
AVE
BRIGHTON
AVEAVE
PARRARMSTRONG
AVE
DRMETRO
DR
DR
W. NORTHERN
PKWY
AVE
HAYWARD
WESTERN RUN
CROSS COUNTRY
BLVD
CLARKS
LN
WILLOWGLEN DR
CHESWOLDE RD
DR
KIM
FALLSTAFF
BENHURST
DR
AVE
ST
VIN
CEN
TSD
R
DR
WILLIAMSON
RD
AVE
RDTANEY
RUSK
AVE
PL
AVE
HANSON
BARTOL
AVE STUART
AVE
WALLISAVE
RD
FIELDCREST
HOPETON
WALLIS
GIST
AVE
BILTMORE
AVE
BAYWO
ODAVE
STEELE
WESTERN RUNCROSS COUNTRY
DR
KE
Y
PKWY
AVE
BLA
ND
SULGRAVE
AVE
RD
DEV
ONS
HIRE
AVE WINNER
PARKINGTON
PATTERSON
AMOS
AVE
PINKNEY
AVE
JONQUIL
AVE
PRIMROSE
AVEGLE
N
AVE
WIR
T
AVE
LEW
ISTON
KENNISON AVE
AVE
ELDERON AVE
KENSHAW
MANHATTAN
AVE
AVE
GROVELAND
WILVAN
AVE
AVE
YELL
MENLO
AVE
AVE
NELSONARBUTUS
AVE
AVE
W. B
ELVED
ERE
OAKLEAF
AVE
FORDLE
IGH
AVE
DR
AVONDALE
LITCHFIELD
AVE
MT.HOPE
MAR
IAM
DR
SETO
N
AVE
ETHELBERT
AVE
DEN
MORE
HILLSD
ALE
RD
LYNVIEW
AVE
ROSECREST
RD
LUDGATE
AVE
MIDHEIG
HTS
PEARCE
W. S
TRAT
HMORE
RD
BERKELEY
W. G
ARRI
SON
RD
RD
RD
AVE
RD
RD
RD
RD
LA
AVE
AVE
AVE
CLIFTON
OAKLAWN
AVE
AVE
AVE
AVE
AVE
DR
RD
AVE
RD
DR
AVE
AVE
TERRRD
ALTO
CHESHOLMAVE
ELMDALE
BERW
YN
AVE
PA
RKV IEW
PEERLESS
FERNPARK
BOS WO RTH
AVE
HADDON
AVE
AVE
MAR
MO
NFE
RNDA
LE
N. ROG
ERS
AVE
AVE
HADDON
RDAV
E
PENHURST
RD
WENTWORTH
AVE
FENDALL
AVE
P U RN
ELL
DR
GATEHOUSE DR
NORFOLK
WAKEFIELD
HUTTO N AVE
HUTTON
RD
WHEATLEY
CHALLEDON
TUCKER
SEKO
TS RD
DIC KEY HILL
MOSBY
WINDSOR MILL
CLIFTON
N. FORES
T
N. FRANKLINTOWN
WINTERBOURNE
CHELSEA
AVE
RD
TALBOT
CH
ELSEA
MT. H
OLLY
LYNDHURST
RD
BONNER
AVE
LAWINA
WO
LCOTT
OAKFIELD
FAIRFA
X
BATEMAN
ELSINO
RE
GWYNNS FALLS
RO
SLYN
ST
ALTO
GRAN
ADA
AYDA
LE
RD
EGERTON
GARRISON
AVEAR
AGO
N
ARYD
ALE
AVE
GAR
RIS
ON
BELLE
W. N
ORT
HER
N
LIBERTY
HEIGHTS
AVE
POW
DER
MIL
L WAYNE
AVE
BOW
ERS
N.RO
GER
S
OAK
ROYAL OAKGWYNNDALE
BEETHOVEN
BOW
ERS
AVE
CHANDLER
CHRYSLER
AVE
AVE
AVE
AVE
FORD
NEY
LA
WAYN
E
GWYNN
MAR
MON
AVE
AVE
FERNDAL
E
RIDGEWOOD
OAKFORD
AVE
AVE
MIL
FORD
PLAT
EAU W
OO
DBI
NE
GW
YNN
OAK
MAINE
HILL
SDAL
EM
OHA
WK
GW
YNN
OAK
AVE
W. COLD SPRING
FERNDALE
AVE
RD
HOW
ARD
PARK
SPRINGDALEKATHLAND
NORWOOD
CALIFORNIA
AVE
BLVD
AVEBRIG
HTWO
OD
AUBURN
MILFO
RD
ETHLAND
CARLEVIEW
AVE
AVE
AVE
DORCHESTER
AVEROLLINSAVE
CHATHAM
OAK
HILL
RD
AVEAVE
AVE
PURNELLD
R
PICKWICKRD
HILL
SDAL
E
N. FOREST PARK
RD
AVE
OAK
FIEL
D
AVEGRA
NAD
A
AVE
WET H E R ED
SVIL
LE
RDFO
RE
STGLEN
BONNERFAIRVIEW
RD
AVE
AVELYNDH
URST
CHELSEA
AVE AVE
RD
AVE
AVE
BLVD
AVE
WOODHAVEN
CARLISLE
WESTCHESTER
RD
AVE
RD
CR
IMEA
RD
LA
AVE
RD
AVE
CARMINE
AVE
OVERCREST
AVE
NORTH
AVE
PARK
MUTH
WETH
ERED
SV
I LLE
RDRDWIND SOR MILL
RD
NORTONIA
RD
RD
RDTE
R
AVEAVE
AVE
CLIFT
ON PIEDMONT
MONDAWMIN
AVECARLISLE
DUVALL
ALLEND
ALE
AVE
W. FOREST PARK
RD
FAIRVIEW
AVE
COLUMBUS
AVEAVE
BOARMANAVE
YOSEMITESEQUOIA
BARRINGTON CAR
SDALE
AVE
RD
AVECOOKS
DR
RD
AVE
AVEN. CHAPELGATE
KINGSTON
LA
WALRAD
ST
ST
RD
RD
COOLIDGE
AVE
ST
RD
AVE
LYND
HO
LLY
RD
AVE
MAR
DR
EW
MANORV
IEW
RD
LA
AVE
ST
ST
RD
MELBOURNE
WESTHILLS
LINDSAY
RD
STONECROFT
COLLEEN
NOTTINGH
AM
HU
NTING PL
RDW
INAN
S BRIARCLIFT
WEDGEWOOD
RD
RD
GLE
N ALLEN
BRIA
RCLIFT
GREENW
ICH
RD
WESTGATE
LA
RD
OLD FREDERICK
S. ROCK GLEN
RD
RD
BOSW
ELL
FREDCREST
RANS
OM
TAYLOR
BEEC
HFIE
LD
S. WIC
KHAMQU
EENSGAT
EC
HARRAWAY
BRISBANE
DEVON
SHIRE
RD RDD
ORC
HESTER
ELDO NE
BEECH
FIELD
COLC
HEST
ER
BLVD
RD
HINELIN
E
WEDDEL
RD
MAR
YDE
LL
TERSO
RR
EN
TO
AVE
S. MO
NASTER
Y
IRVIN
G
AVE
POTTER
YALEAVE
RD
CO
BBER
N.BEE
CH
FIELD
WOODRID
GE
W. SARATOGA
ST
AVE
HARLEM
RD
ALLEND
ALE
LYND
HU
RST
MT. H
OLLY
WICKLOW
N. AUGU
STA
NW
OODINGTO
N
RD
LA
STAMFORDRD
NOTTINGHAM
RDBROOKWOOD
BALTIMORE NATIONAL
BRAESIDE
RD
WOODSID
E
AVE
PIKE
AVE
OLD
OR
CH
ARD
RD
RD
UPLAN
DS
WAY
EDMONDSON
RD
RD
DR
ROKE BY
WAY
DRYDE
N DR
KEVIN
SEMINOLE
AVESW
ANNCOLEHERNE
RD
WALNUT
GELSTO
N
N.ATH
OLEDSDALE
MAN
OR
DE
NE
RD
NORTH BEND
RDR
D
GARTH
E. MEDW
ICK
WE
STOW
NE
RD
AVE
FREDERICK
MAL
LOW
HILL
RD
N. ROCK GLEN RD
STAMFORD
RD
RD
DRURY
EDMONDSON
RD
LA
PKWY
RD S.
WIC
KH
AM
ATHOLGATE
LA PEN LUCY
N.TR
EMO
NT
RDR
D
AVE
MO
UNT
VIEW
AVE
RD
AVE
N. W
OO
DIN
GTO
N
AVECONNECTICUT
MASSACHUSETTS
AVE
S.AUG
USTA
AVE
S. CO
LLINS
AVEC
OLLIN
SAVE
S. LOU
DO
NRD
S. CHAPELGATE
LA
S. CHAPELGATE
AVEHAZ
LETT
OVERTONWILLISTON
RD
RD
RD
CEDARGARDEN
AVEAIRY HILL
PARKTON
YALERD
SOUTH COLLEGE RD
RD
GIBSON
AVE
AVE
MAR
TIN
GAL
E
FREDERICK
ADELLE
HAVERHILL
AVERO
CKH
ILL
W. PATAPSCO
MACTAVISH
AVE
AVE
ARION
PARKRD
WILKENS RD
COLBORNE
RD
CRANSTON
FLOW
ERTON
RD
WILD
WO
OD
STOKES
DR
RD
AVE
RDLA
PKWY
N. LO
UD
EN
W. MULBERRY
W. FRANKLIN
ST
STST
AVE
RD
AVE
AVE
RD
PIMLICO
GR
EE NS PR
ING
BERKELEY
AVE
AVE
AVE
WROGERS
BEAUFORT
DOLFIELD
RIDGEWOOD
SPRINGDALE
AVE
DORCHESTER
POWHATAN
BLVD
CLIFTON
RD
N. GRANTLE
Y
ST
AVE
ST
N. DENIS
ON
N. EDGEW
OOD
ST
ST
S. KOSSUTH
S.M
OR
LEY
COOLIDGE
AVE
CLARENELL
FRANKLINTOWN
ST
ST
ST
ST
RIGGS
McKEAN
MOSHER
N.PAYSO
NST
W. LANVALE
APPLETON
ST
N. M
ON
RO
E
ST
N. C
ALHO
UN
AVE
CR
AWFO
RD
AVE
AVECADILLAC
AVE BELVIEU
AVE
FERNHILL
AVE
AVE
LARED
O
BELVIEU
WOODLA
ND
RD
AVE
OSWEGO
TER
AVE
AVE
ELSA
ST
ASHBU
RTO
N
ST
ELLICOTT ST
N.BR
UC
EST
SARAH ANNST
ST
ST
AVE
ST
ST
ST
S.GILM
OR
FUR
RO
W
SB
ENTALO
U
S. FULTO
N
SMALLW
OO
D
W. MULBERR Y
ST
ST
S.CATH
ERIN
E
RDBOYD ST
McHENRY
RAMSEYWILHELM
ST
ST
W. LOMBARD
STS.BR
UC
E
ST
ST
ST
SP
ULASKI
STN
. VINC
ENT
S. VINC
ENT
ST
ST
STS. PAYSO
NLE
HMAN
DULANY
MILLINGTON
STCOLE
AVE
EAGLE
ST
HAMLET HILLCT
PALMER
BELLEVILLEWESLEY
AVE
AVEROCKROSE
AVENORFOLKULMAN
AVE
HILDALE
AVE
AVESUFFOLK AVEAVE PAR
KH
EIGH
TS
AVEPARK
AVE
ST
W FOREST
TIO
GA
ARTABAN
PL
REISTERSTOWN
PKWY
BRYANT
AVE
ST
DRUIDHILL
BRAD
DISH
AVE
N. FULT
ON
ST
N.FU
LTON
ST
AVE
N. W
OO
DYEAR
S. DUKELAND
AVE
WHITNEY
AVE
PEMBRIDGE
CHALGROVE
DENMOREAV
E
COPL
EYAVE
GRA
NTL
EY
DENI
SON
RD
AVE
RD
PRESBURY
LIN
NAR
D
ST
ST
S. CULV
ER
S. MONASTE
RY
RD
PINE
HEIGH
TS
AVE
AVE
RD
GREENVALE
BENSON
SOUT
HWES
TERN
DESOTO
ST
BLVD
ST
STST
AVE
ST
ST
AVE
HARLEM
W. LAFAYETTE
AVE
N.C
ARR
OLLTO
N
ST
ISLAMIC
LAURENS
AVE
MADISO
N
CLIPPER MIL L
W.36TH
SWEET
AIR
AVE
STBERRY
RDFALLS
AVE
W 40TH
W. 38TH
RD
EVANS
CHAPEL
RD
RD
LONGWOOD
NO
RM
AND
YPL PL
ST. GEORGES
RD
LENTON
AVE
AVEAVE
AVE
STAVE
AVE
AVE
ST
ORCHARD
O'DONNELL
AVE
ST
AVE
STS.DEAN
ST
N.H
AVEN
AVE
FREEDOMWAY
A V E
AVEAVE
DUDLEY
KENYON
SHANNON
AVE
RAMONA
AVE
MORAVIA
RD
HOLDER
RDMO
RAVIA
PARKVIEW
TR
AVE
HAMPNET
T
BEVERLYARGONNEDR
AVE
RD
WENDOVER
N.C
HAR
LES
GR
E ENW
AY
STRATFORDRD
TUSCANY
ST
ST
W 40TH
KITTERYST
W. 42ND
PIMLICO
AVELAPORTE
STLA
OAKFORD
AVE
BEEH
LER
AVE
AVE
AVE
SMITHSON
AVE
MC
. DO
NO
GH
ST
N. GAY
E. CHASE
N.M
ADEIR
A
N.
GLO
VER
N. R
OSE
ST AVE
AVE
HOLABIRD
RAPPO
LLO
AVE
ST
HOLLINS FERRY
DR
WILMARCO
AVE
E. PATAPSCO
Market Center Central Business District
Inner Harbor West
Inner HarborProject I
Inner HarborProject I-A
Oldtown
Inner Harbor East
Key Highway
Key Highway East Industrial
South BaltimoreBusiness Area
Montgomery
Sharp-Leadenhall
Ridgely's Delight
Reisterstown Plaza Transit Station
Rogers Avenue Transit Station
Park Heights
Howard Park
Liberty-Garrison Business Area
W. Cold Spring LaneTransit Station
Coldspring
York-Woodbourne
Mt. Washington Village
Hamilton Business Business Area
Lauraville Business District
HampdenWaverly Business
Coldstream Homestead Montebello
Belair-Erdman
East Baltimore MidwayBarclay
Charles/25th
Reservoir Hill
Penn North
MondawminTransit Station
Walbrook Shopping Center
Hilton/North Business Area
Rosemont
Sandtown-Winchester
Druid Heights
Madison ParkNorth
Madison ParkSouth
Upton Mount Vernon
GreenmountWest
OliverBroadway East
Middle EastGay Street I
Johnston Square
East Highlandtown
Highlandtown Business
Jonestown
Orchard-Biddle
Poppleton
Harlem Park II
Franklin Square
Uplands
Irvington Business Area
Mount Clare
Washington Village
CamdenStation
Fells Point WaterfrontCanton Waterfront
Canton Industrial Area
Carroll-Camden Industrial Area
Caton/95
Mount Winans
Waterview
Middle Branch
Port Covington
Fairfield Industrial Area
Brooklyn/Curtis Bay
Charles North
2009
UrbanRenewalPlans
N
One Inch Equals 1,500 FeetPlanning Department
Baltimore Development
Agency Responsible
Corporation
Sheila DixonMayor
Thomas J. StosurDirector of Planning
Sheila DixonMayor
Thomas J. StosurDirector of Planning

246 City of Baltimore Comprehensive Master Plan Appendices 247246 City of Baltimore Comprehensive Master Plan Appendices 247
INTR
OD
UC
TION
SU
MM
AR
Y H
ISTO
RY
KE
Y TR
EN
DS
LIVE
EA
RN
PLAY
LEA
RN
IMP
LEM
EN
TATION
MA
NA
GE
ME
NT FIN
AN
CIA
L CO
NC
LUS
ION
GLO
SS
AR
Y A
PP
EN
DIC
ES
For large pieces of land or assembled parcels, a developer proposes a Planned Unit Development (PUD) specifying expected development types. PUDs are used to obtain zoning flexibility thatwould not be possible if the landwasbrought in for development on a parcel by parcel basis. Via PUDs, the City more actively participates in the design of a large area in the City. Approval of a PUD or any major PUD amendments requires a City Council Ordinance. Minor amendments to an established PUD are done through Planning Commission.
BALTIMORE CITY’S PLANNED UNIT DEVELOPMENTS (PUD)
PUD Name Location (Street & Street/Neighborhood)
Adoption Date
Salvation Army Patapsco & Gable Avenues 12/2/1971
Village of Cross Keys Falls Road below Northern Parkway
4/24/1972
Loch Raven Shopping Ctr. l.k.a. Loch Raven (or Loch Raven -- Northern Parkway)
Loch Raven Boulevard & Northern Parkway & 6101 Fenwick Avenue
1/23/1973
6317 Park Heights Avenue 6317 Park Heights Avenue 6/4/1973
Fallstaff & Benhurst / Benhurst Park
Clarks Lane, Fallstaff & Ben-hurst Roads area
7/11/1973
Roland Park -- Coldspring Lane l.k.a. Roland Springs
Roland Avenue & Coldspring Lane
2/8/1974
Union Memorial Hospital Calvert & 33rd Streets 2/24/1974
Russell T. Baker/ Caton-Joh Caton & Joh Avenues at I-95 3/1/1974
North Charles General Hosp./ now Homewood Hospital Ctr. (name change per Ord. 88-211)
N. Charles & 28th - 27th Streets, 2600 block N. Charles Street
12/6/1974
Marimar Company/ York Road & E. Belvedere Avenue now Belvedere Square (name change per Ord. 84-187)
York Road & Belvedere Avenue
12/17/1974
First United Church of Jesus Christ Apostolic
W. Coldspring Lane & Cal-loway & Dolfield Avenues
10/27/1975
Mondawmin Mall (Business) formerly Mondawmin Mass Transit Station
Gwynns Falls & Tioga Park-ways
Replacement: 6/14/2006
Original: 6/22/1977
Northwood Company Loch Raven Blvd. & Argonne Drive
9/1/1977
Northwest Plaza Northern Parkway & Wa-bash Avenue
6/23/1978
John J. Germenko/ Patapsco Avenue
Patapsco & Magnolia/ Viona Aves.
10/31/1978
Plans and Maps
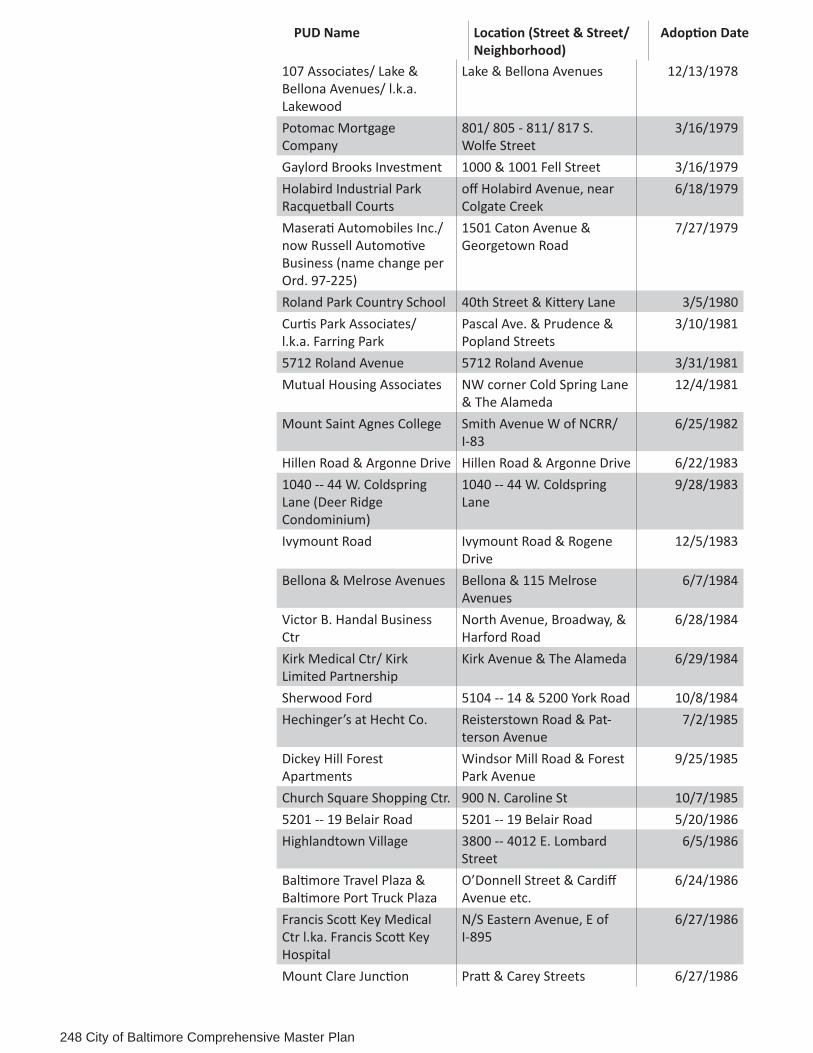
248 City of Baltimore Comprehensive Master Plan Appendices 249248 City of Baltimore Comprehensive Master Plan Appendices 249
107 Associates/ Lake & Bellona Avenues/ l.k.a. Lakewood
Lake & Bellona Avenues 12/13/1978
Potomac Mortgage Company
801/ 805 - 811/ 817 S. Wolfe Street
3/16/1979
Gaylord Brooks Investment 1000 & 1001 Fell Street 3/16/1979
Holabird Industrial Park Racquetball Courts
off Holabird Avenue, near Colgate Creek
6/18/1979
Maserati Automobiles Inc./ now Russell Automotive Business (name change per Ord. 97-225)
1501 Caton Avenue & Georgetown Road
7/27/1979
Roland Park Country School 40th Street & Kittery Lane 3/5/1980
Curtis Park Associates/ l.k.a. Farring Park
Pascal Ave. & Prudence & Popland Streets
3/10/1981
5712 Roland Avenue 5712 Roland Avenue 3/31/1981
Mutual Housing Associates NW corner Cold Spring Lane & The Alameda
12/4/1981
Mount Saint Agnes College Smith Avenue W of NCRR/ I-83
6/25/1982
Hillen Road & Argonne Drive Hillen Road & Argonne Drive 6/22/1983
1040 -- 44 W. Coldspring Lane (Deer Ridge Condominium)
1040 -- 44 W. Coldspring Lane
9/28/1983
Ivymount Road Ivymount Road & Rogene Drive
12/5/1983
Bellona & Melrose Avenues Bellona & 115 Melrose Avenues
6/7/1984
Victor B. Handal Business Ctr
North Avenue, Broadway, & Harford Road
6/28/1984
Kirk Medical Ctr/ Kirk Limited Partnership
Kirk Avenue & The Alameda 6/29/1984
Sherwood Ford 5104 -- 14 & 5200 York Road 10/8/1984
Hechinger’s at Hecht Co. Reisterstown Road & Pat-terson Avenue
7/2/1985
Dickey Hill Forest Apartments
Windsor Mill Road & Forest Park Avenue
9/25/1985
Church Square Shopping Ctr. 900 N. Caroline St 10/7/1985
5201 -- 19 Belair Road 5201 -- 19 Belair Road 5/20/1986
Highlandtown Village 3800 -- 4012 E. Lombard Street
6/5/1986
Baltimore Travel Plaza & Baltimore Port Truck Plaza
O’Donnell Street & Cardiff Avenue etc.
6/24/1986
Francis Scott Key Medical Ctr l.ka. Francis Scott Key Hospital
N/S Eastern Avenue, E of I-895
6/27/1986
Mount Clare Junction Pratt & Carey Streets 6/27/1986
PUD Name Location (Street & Street/Neighborhood)
Adoption Date
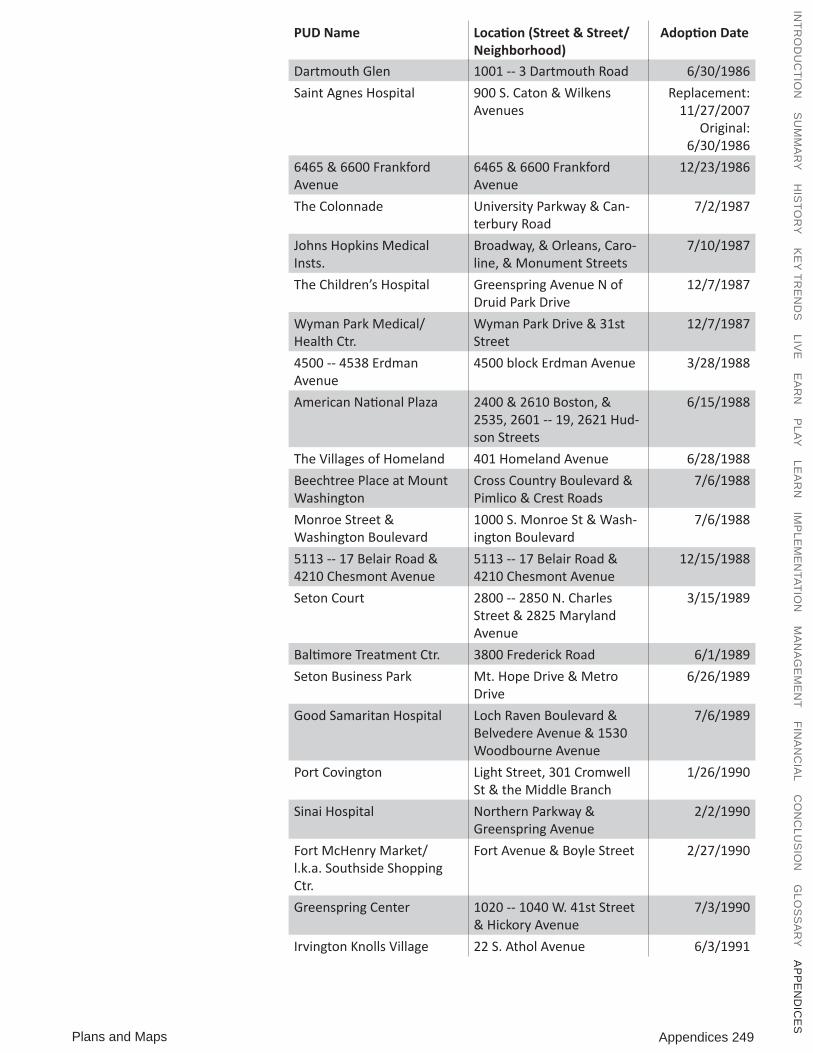
248 City of Baltimore Comprehensive Master Plan Appendices 249248 City of Baltimore Comprehensive Master Plan Appendices 249
INTR
OD
UC
TION
SU
MM
AR
Y H
ISTO
RY
KE
Y TR
EN
DS
LIVE
EA
RN
PLAY
LEA
RN
IMP
LEM
EN
TATION
MA
NA
GE
ME
NT FIN
AN
CIA
L CO
NC
LUS
ION
GLO
SS
AR
Y A
PP
EN
DIC
ES
PUD Name Location (Street & Street/
Neighborhood)Adoption Date
Dartmouth Glen 1001 -- 3 Dartmouth Road 6/30/1986
Saint Agnes Hospital 900 S. Caton & Wilkens Avenues
Replacement: 11/27/2007
Original: 6/30/1986
6465 & 6600 Frankford Avenue
6465 & 6600 Frankford Avenue
12/23/1986
The Colonnade University Parkway & Can-terbury Road
7/2/1987
Johns Hopkins Medical Insts.
Broadway, & Orleans, Caro-line, & Monument Streets
7/10/1987
The Children’s Hospital Greenspring Avenue N of Druid Park Drive
12/7/1987
Wyman Park Medical/ Health Ctr.
Wyman Park Drive & 31st Street
12/7/1987
4500 -- 4538 Erdman Avenue
4500 block Erdman Avenue 3/28/1988
American National Plaza 2400 & 2610 Boston, & 2535, 2601 -- 19, 2621 Hud-son Streets
6/15/1988
The Villages of Homeland 401 Homeland Avenue 6/28/1988
Beechtree Place at Mount Washington
Cross Country Boulevard & Pimlico & Crest Roads
7/6/1988
Monroe Street & Washington Boulevard
1000 S. Monroe St & Wash-ington Boulevard
7/6/1988
5113 -- 17 Belair Road & 4210 Chesmont Avenue
5113 -- 17 Belair Road & 4210 Chesmont Avenue
12/15/1988
Seton Court 2800 -- 2850 N. Charles Street & 2825 Maryland Avenue
3/15/1989
Baltimore Treatment Ctr. 3800 Frederick Road 6/1/1989
Seton Business Park Mt. Hope Drive & Metro Drive
6/26/1989
Good Samaritan Hospital Loch Raven Boulevard & Belvedere Avenue & 1530 Woodbourne Avenue
7/6/1989
Port Covington Light Street, 301 Cromwell St & the Middle Branch
1/26/1990
Sinai Hospital Northern Parkway & Greenspring Avenue
2/2/1990
Fort McHenry Market/ l.k.a. Southside Shopping Ctr.
Fort Avenue & Boyle Street 2/27/1990
Greenspring Center 1020 -- 1040 W. 41st Street & Hickory Avenue
7/3/1990
Irvington Knolls Village 22 S. Athol Avenue 6/3/1991
Plans and Maps
PUD Name Location (Street & Street/Neighborhood)
Adoption Date

250 City of Baltimore Comprehensive Master Plan Appendices 251250 City of Baltimore Comprehensive Master Plan Appendices 251
1401 -- 15 E. Coldspring Lane
1401 -- 15 E. Coldspring Lane
6/21/1991
The Jenkins Memorial 1100 S. Caton & 3230 Ben-son Avs
6/21/1991
Gundry/ Glass Properties 2 N. Wickham & Frederick Roads
6/21/1991
York & Orkney Roads 5835 & 5837 -- 43 York Road
12/2/1991
Mount Washington Mill Smith Avenue between I-83 & the Jones Falls
7/1/1992
Cylburn Hills N end of Coldspring New Town bordering Cylburn Arboretum
10/27/1993
The James Lawrence Kernan Hospital, Inc.
Forest Park Avenue & Wind-sor Mill Road
1/4/1994
1700 block of N. Gay Street 1700 -- 28 & 1701 -- 29 N. Gay & 1632 - 34 N. Gay Street
2/17/1994
New Lafayette Courts Orleans, E. Fayette, & Ais-quith Streets
2/10/1995
Ashburton Square Elderly Residence
Ashburton Street & Rayner & Braddish Avenues
6/6/1995
4801 Tamarind Road 4801 Tamarind Rd 7/27/1995
Eastern High School Site S side of 33rd Street from Ellerslie Avenue to Loch Raven Boulevard
12/4/1995
Frankford Avenue & Belair Rd.
4206 -- 24 Frankford Av & Belair Rd
12/4/1995
New Lexington Terrace N. Poppleton St, Fremont Ave, W. Saratoga & W. Mul-berry Streets
6/14/1996
North Charles Village 3000 blk. N. Charles St., 3100 & 3200 & 3300 blks. St. Paul St., 3 - 5 E. 33rd St., 3200 blk Hargrove & 3200 blk. Lovegrove Streets
6/14/1996
Wyndholme Village 5241 & 5205 Frederick & 100 S. Rock Glen Roads & block 8139-J, lot 18/53
12/5/1996
Baltimore Inner Harbor East Business Planned Developm’t.
East Falls Lane & Fleet Street
12/17/1997
Nome/ Dundalk/ Hartwait 1708 -- 10 -- 12 Dundalk Ave., 1717 -- 26 Nome & 6613 Hartwait Streets
6/22/1998
BARC 6151 Metro Drive 12/21/1998
Ruppert Landscaping Co. 6020 Marian Drive 12/21/1998
4300 Shannon Drive 4300 Shannon Drive 4/16/1999
PUD Name Location (Street & Street/Neighborhood)
Adoption Date

250 City of Baltimore Comprehensive Master Plan Appendices 251250 City of Baltimore Comprehensive Master Plan Appendices 251
INTR
OD
UC
TION
SU
MM
AR
Y H
ISTO
RY
KE
Y TR
EN
DS
LIVE
EA
RN
PLAY
LEA
RN
IMP
LEM
EN
TATION
MA
NA
GE
ME
NT FIN
AN
CIA
L CO
NC
LUS
ION
GLO
SS
AR
Y A
PP
EN
DIC
ES
PUD Name Location (Street & Street/
Neighborhood)Adoption Date
New George B. Murphy Homes & Emerson Julian Gardens l.k.a. Heritage Crossing
Franklin Street & Fremont & Edmondson Avenues
6/30/1999
Whetstone Point 1422 Nicholson, 1113, 1116, 1134 - 44 Hull, part of 1450 Beason, & 1.852 ac. N of Marriott & Cuba Streets & E of Hull, Cooksie, & Towson Streets
6/30/1999
Patterson Village 4101 -- 4109 -- 4173 Patter-son Avenue
11/11/1999
New Shiloh Baptist Church 2100 -- 2300 blocks of Mon-roe St
11/18/1999
4221 Shannon Drive 4221 Shannon Drive 12/6/1999
Patapsco -- Hollins Ferry Dev.
2306 - 10 - 12- 14 - 16 W Patapsco 3100, 3104, 3110 Hollins Ferry Road & block 7531, lots 11 -- 17
6/26/2000
Stadium Place E. 33rd Street & Ellerslie Avenue
12/20/2000
Constellation Property Dock & Caroline & Thames Sts
12/20/2000
Brewers Hill 3601 & 3701 Dillon, 3701 O’Donnell, 1200, 1211, & 1301 S. Conkling Streets, & 2 lots & 2 RR RoWs, 4001 Hudson Street
12/20/2000
801 Key Highway 801 Key Highway 12/20/2000
Rehoboth Square 700 Poplar Grove St., 2922 Arunah Avenue, 802 -- 820 N. Franklintown Road
5/14/2001
Broadway Homes HOPE VI 6 & 100 N. Broadway, 1501 E. Fayette St., 1500 - 14 E Fairmount Avenue, 29 - 35 & 41 - 43 N. Caroline St., 102 - 12 N. Dallas St., roadbed of Dallas Street from E. Fayette Street to E Fairmount Avenue
6/5/2001
Canton Crossing Boston, Clinton, & Haven Streets
6/21/2001
Eastern Plaza 6500 Eastern Ave 9/25/2001
The Home Depot at Reisterstown Plaza
6500 block Reisterstown Road
12/19/2001
Flag House Court HOPE VI 900 block E. Baltimore & 900 block E. Lombard Streets
3/6/2002
Plans and Maps
PUD Name Location (Street & Street/Neighborhood)
Adoption Date

252 City of Baltimore Comprehensive Master Plan Appendices 253252 City of Baltimore Comprehensive Master Plan Appendices 253
Union Wharf 901 & 905 S. Wolfe Street 3/20/2002
Loyola Athletic Complex E side Greenspring & S side Coldspring Avenues
6/10/2002
Inner Harbor East II 800 & 801 Aliceanna Street 6/13/2002
Hampden Village Center 3355 Keswick Road 7/1/2002
701 Washington Boulevard 701 Washington Boulevard 12/23/2002
Johns Hopkins S of Orleans 201 & 301 N. Broadway 2/6/2003
Swann’s Wharf 935 S. Wolfe Street & 947 - 951 Fell Street
3/18/2003
921 Fort Avenue 921 Fort Avenue 4/23/2003
Greenmount West Arts & Entertainment District
1501 -- 17, 1601, 1611, 1639 Guilford Ave, 301 - 9 E. Lanvale St, 325/35, 401/3, 405/13, 415/17, 419/33 E. Oliver Street, 1418 & 1446 E. Belvidere Street
5/5/2003
3500 Clipper Road 3500 Clipper Road, 3501 Parkdale, & block 3390-B, lots 52 & 52A, & 2001 -- 3 Druid Park Drive
6/9/2003
UMB Biomedical Research Park
800 -- 946 W Baltimore Street, 3 -- 15 & 6 -- 16 N Poppleton Street, 4 --12 N Fremont Street, 803 -- 927 & 802 -- 12 W Fairmount Avenue, 801 W Fayette Street, 3 -- 11 N Schroeder, & 3 -- 15 N Amity Street
10/28/2003
Silo Point II 1800 Fort Av & 1700 Beason Street & Clement Street
7/14/2004
1901 & 1921 Light Street, bed of Johnson Street & block 1947, lot 1
1901 - 21 Light Street & Johnson Street & block - lot 1947-1
11/23/2004
3100 Waterview Avenue & Ward 25, Sec. 5, block 7610, lot 19
3100 Waterview Avenue 11/29/2004
1950 & 1951 E. Fayette Street & 1921 -- 39 Orleans Street
1950 & 1951 E. Fayette & 1921 -- 39 Orleans Streets
12/2/2004
East Baltimore Development, Inc.
1700 - 1900 blocks E. Madi-son Street, Ashland Avenue, & Eager Street
1/10/2005
Kennedy Krieger Institute 801 N. Broadway 5/5/2005
Inner Harbor East--Parcel “D”
Aliceanne & President Streets
10/20/2005
5910 Moravia Road 5910 Moravia Road 12/15/2005
PUD Name Location (Street & Street/Neighborhood)
Adoption Date

252 City of Baltimore Comprehensive Master Plan Appendices 253252 City of Baltimore Comprehensive Master Plan Appendices 253
INTR
OD
UC
TION
SU
MM
AR
Y H
ISTO
RY
KE
Y TR
EN
DS
LIVE
EA
RN
PLAY
LEA
RN
IMP
LEM
EN
TATION
MA
NA
GE
ME
NT FIN
AN
CIA
L CO
NC
LUS
ION
GLO
SS
AR
Y A
PP
EN
DIC
ES
PUD Name Location (Street & Street/
Neighborhood)Adoption Date
Harbor Point formerly Allied & Related Sites
Replacement: Block & Caroline Streets @ water-front Original: 100 Wills, 1400 - 01 - 10 - 12 - 31 Block, 1423 Dock, 1404 Thames, 902 - 05 S. Caro-line, & 1401 Philpot Streets
Replacement: 5/10/2004
Original: 8/10/1993
Lighthouse Point formerly Baltimore International Yachting Ctr.
2701 -- 45 Boston Street & 1222 & 1210 S. Lakewood Avenue
Replacement: 6/15/1995
Original: 12/71987
Liberty Heights Avenue & Reisterstown Road
2600 Liberty Heights Ave Replacement: 3/3/1999;
Original: 4/15/1982
Maryland Jockey Club of Baltimore City, Inc./ formerly Maryland Jockey Club/ Pimlico Race Track
W. Northern Parkway, W. Rogers Avenue, & Pimlico Road (Pimlico Race Track & adjacent properties)
Replacement: 3/31/2004
Original: 8/14/1975
Greektown Redevelopment
820 Oldham Street, 4601 Foster & 4700 Fait Avenues, & 4618-4624 O’Donnell Street
3/15/2006
1100 Wicomico Street 1100 Wicomico Street 5/1/2006Chesapeake Paperboard 1500 Woodall Street &
1605-1801 Key Highway5/17/2007
Westport Waterfront 2001-2417 Kloman Street
11/27/2007
Gateway South 1501-1645 Warner, 2110 & 2119 Haines, 1501-1551 Russell, 2102 Oler, & 2104 Worcester Streets
5/12/2008
State Center Transit Oriented Business
Martin Luther King Jr. Boulevard @ Madison Ave. & Howard Street, & Madison Avenue @ Dolphin Street
12/11/2008
Plans and Maps
PUD Name Location (Street & Street/Neighborhood)
Adoption Date

254 City of Baltimore Comprehensive Master Plan Appendices 255254 City of Baltimore Comprehensive Master Plan Appendices 255
State Center
Port Covington
Sinai Hospital/Levindale
Canton Crossing
Mondawmin
Westport Waterfront
Village of Cross Keys
Loyola Athletic Complex
Lighthouse Point
Francis Scott Key Medical Ctr
Brewers Hill
BARC
Stadium Place
Harbor Point
Good Samaritan Hospital
Northwest Plaza
Fallstaff & Benhurst / Benhurst Park
Monroe Street & Washington Boulevard
Cylburn Hills
The James LawrenceKernan Hospital, Inc.
Greektown
Maryland Jockey Clubof Baltimore City, Inc.
WyndholmeVillage
Silo Point IIThe JenkinsMemorial
Mount Clare Junction
New LafayetteCourts
Parkside Associates
4300Shannon Dr
New Lexington Terrace
EBDI
Eastern High School Site
Gundry/ GlassProperties
Mount Saint Agnes College
The Children'sHospital
GatewaySouth
Whetstone Point
Russell T. Baker/Caton-Joh
Holy Cityof Zion
3500 Clipper Road
Flag House CourtHOPE VI
NorthCharlesVillage
4801 Tamarind Road
Dickey HillForest Apartments
Irvington KnollsVillage
Hechinger'sat Hecht Co.
Union Wharf
5712 Roland Avenue
Johns HopkinsMedical Insts.
Eastern Plaza
801 KeyHighway
Saint Joseph's Monastery
NorthwoodCompany
New George B. MurphyHomes & Emerson Julian
Gardens/Heritage Crossing
Liberty Heights Avenue & Reisterstown Road
Saint AgnesHospital
ConstellationProperty
Broadway HomesHOPE VI
GreenspringCenter
ChesapeakePaperboard
AmericanNational
Plaza
Baltimore Travel & Port Truck Plaza
John J. Germenko/Patapsco Avenue
Mutual HousingAssociates
Ivymount Road
5910 Moravia Rd
Loch Raven Shopping Ctr.
Dartmouth Glen
UnionMemorialHospital
Hillen Road &Argonne Drive
New ShilohBaptist Church
Roland Park -- ColdspringLane/Roland Springs
6317 ParkHeights Avenue
Roland ParkCountry School
Home Depot atReisterstown Plaza
921 Fort Avenue
MountWashington
Mill
Wyman ParkMedical
Johns HopkinsS of Orleans
4221Shannon Dr
Beechtree Place atMount Washington
RuppertLandscaping Co.
Salvation Army
Joh-Caton Title Holding Corp.
Highlandtown Village
SouthsideShopping Ctr.
1950 & 1951 E. Fayette Street &1921 -- 39 Orleans Street
Marketplaceat Fells Point
York & Orkney Roads
Seton Court
Bellona & MelroseAvenues
Nome/Dundalk/Hartwait
The Colonnade
3100 Waterview Avenue &Ward 25, Sec. 5,
block 7610, lot 19
Russell AutomotiveBusiness
BelvedereSquare
UMB Biomedical Research Park
Ashburton SquareElderly Residence
5113 -- 17 Belair Road &4210 Chesmont Avenue
1100 Wicomico St
6465 & 6600Frankford Avenue
4500 -- 4538Erdman Avenue
Kennedy KriegerInstitute
Frankford Avenue & Belair Rd.
SetonBusiness
Park
Rehoboth Square
5201 -- 19 Belair Road
1901 & 1921 Light Street,bed of Johnson Street &
block 1947, lot 1
First United Churchof Jesus Christ Apostolic
Greenmount WestArts & Entertainment District
107 Associates/Lake & Bellona Avenues/
Lakewood
PotomacMortgageCompany
Patapsco-Hollins Ferry Dev.
701 Washington Boulevard
1700 block ofN. Gay Street
Deer RidgeCondominium
HampdenVillage Center
Sherwood FordThe Villagesof Homeland
Victor B. HandalBusiness Ctr
HomewoodHospital Ctr
Gaylord BrooksInvestment
Holabird Industrial ParkRacquetball Courts
Kirk Medical Ctr
1401 -- 15 E.Coldspring Lane
Curtis Park Associates/Farring Park
Swann'sWharf
Patterson Village
Inner HarborEast
Church SquareShopping Ctr.
Planned UnitDevelopments
N
One Inch Equals 1,500 Feet
2009
Sheila DixonMayor
Thomas J. StosurDirector of Planning
Sheila DixonMayor
Thomas J. StosurDirector of Planning

254 City of Baltimore Comprehensive Master Plan Appendices 255254 City of Baltimore Comprehensive Master Plan Appendices 255
INTR
OD
UC
TION
SU
MM
AR
Y H
ISTO
RY
KE
Y TR
EN
DS
LIVE
EA
RN
PLAY
LEA
RN
IMP
LEM
EN
TATION
MA
NA
GE
ME
NT FIN
AN
CIA
L CO
NC
LUS
ION
GLO
SS
AR
Y A
PP
EN
DIC
ES
FF. Public Institutions
Sheila DixonMayor
Thomas J. StosurDirector of Planning
Plans and Maps
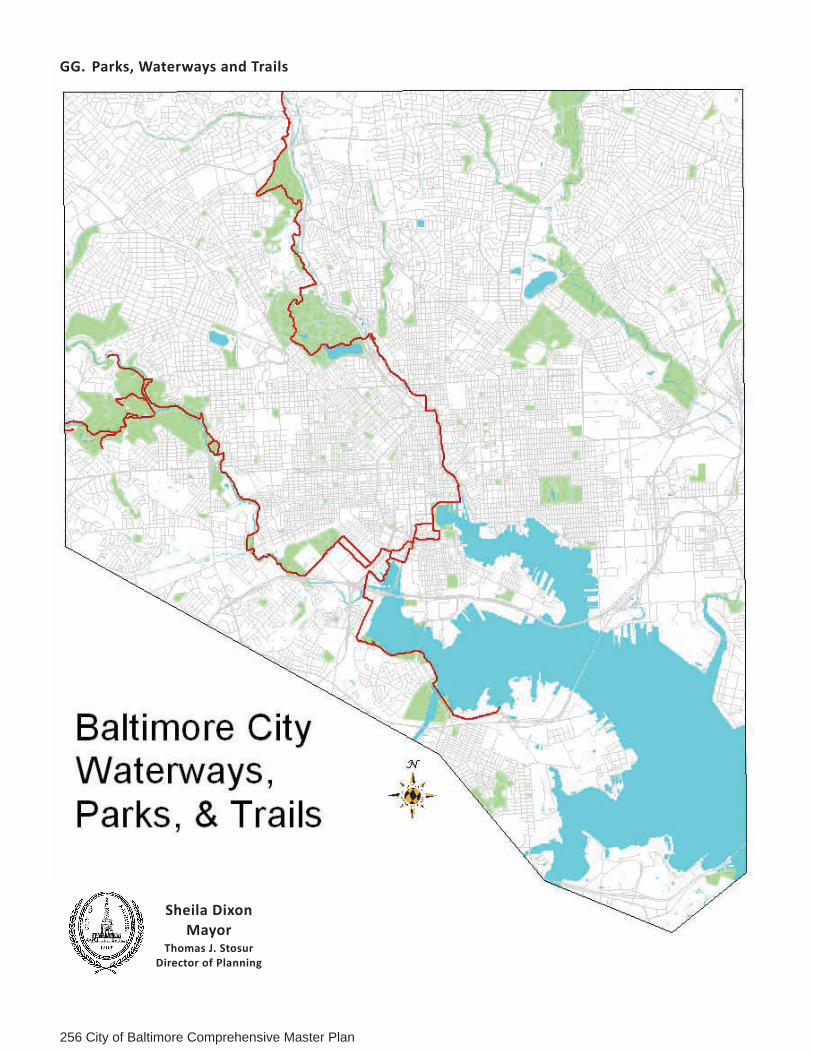
256 City of Baltimore Comprehensive Master Plan Appendices 257256 City of Baltimore Comprehensive Master Plan Appendices 257
GG. Parks, Waterways and Trails
Sheila DixonMayor
Thomas J. StosurDirector of Planning

256 City of Baltimore Comprehensive Master Plan Appendices 257256 City of Baltimore Comprehensive Master Plan Appendices 257
INTR
OD
UC
TION
SU
MM
AR
Y H
ISTO
RY
KE
Y TR
EN
DS
LIVE
EA
RN
PLAY
LEA
RN
IMP
LEM
EN
TATION
MA
NA
GE
ME
NT FIN
AN
CIA
L CO
NC
LUS
ION
GLO
SS
AR
Y A
PP
EN
DIC
ES
Plans and Maps
Sheila DixonMayor
Thomas J. StosurDirector of Planning
HH. Floodplain

258 City of Baltimore Comprehensive Master Plan Appendices 259258 City of Baltimore Comprehensive Master Plan Appendices 259
II. MTA/MDOT Facilities
Sheila DixonMayor
Thomas J. StosurDirector of Planning

258 City of Baltimore Comprehensive Master Plan Appendices 259258 City of Baltimore Comprehensive Master Plan Appendices 259
INTR
OD
UC
TION
SU
MM
AR
Y H
ISTO
RY
KE
Y TR
EN
DS
LIVE
EA
RN
PLAY
LEA
RN
IMP
LEM
EN
TATION
MA
NA
GE
ME
NT FIN
AN
CIA
L CO
NC
LUS
ION
GLO
SS
AR
Y A
PP
EN
DIC
ES
Plans and Maps
JJ. DPW Facilities
Sheila DixonMayor
Thomas J. StosurDirector of Planning

260 City of Baltimore Comprehensive Master Plan Appendices 261260 City of Baltimore Comprehensive Master Plan Appendices 261
President
Mayor’s Representative
Citizen Representative
President & Citizen Representative
Citizen Representative
Citizen Representative
Citizen Representative
Dept. of Public Works Representative
City Council Representative
President & Citizen Representative
Wilber E. Cunningham
Elaine Garven
Robert Hopkins
Hector Torres
Victor Bonaparte
Darlene Kennedy
Benjamin Glenn
Ben Meli
Rochelle Spector
Peter E. Auchincloss
Mayor’s Representative Clarence Bishop
Citizen Representative Javier Bustamante
Citizen Representative Rita Church
Vice President & Citizen Representative Douglas McCoach
Citizen Representative Regina Clay Drake
City Council Representative Rochelle Spector
DPW Director’s Representative Shirley Williams
Citizen Representative Matthews Wright
Authors:
The Citizens of Baltimore
Mayor and City Council
Planning Commission 2009
Department of Planning Staff
Planning Commission 2006
Division Chief - Land Use & Urban Design Wolde Ararsa
City Planner II Natasha Becker
Environmental Planner Brett Buikema
Design Planner II Anthony Cataldo
Personnel Assistant I Lisa Chalk
Deputy Director of Planning Gary Cole
Special Assistant to the Director Alyssa Commander
City Planner II William Doane, Jr
City Planner III Kate Edwards
Division Chief - Comprehensive Planning Laurie Feinberg, AICP
City Planner III Brigitte Fessenden
City Planner III Brenton Flickinger
City Planner II Martin French
City Planner II Jamie Gerhart

260 City of Baltimore Comprehensive Master Plan Appendices 261260 City of Baltimore Comprehensive Master Plan Appendices 261
INTR
OD
UC
TION
SU
MM
AR
Y H
ISTO
RY
KE
Y TR
EN
DS
LIVE
EA
RN
PLAY
LEA
RN
IMP
LEM
EN
TATION
MA
NA
GE
ME
NT FIN
AN
CIA
L CO
NC
LUS
ION
GLO
SS
AR
Y A
PP
EN
DIC
ES
Authors
City Planner I Melvin Hicks
City Planner I Alexandra Hoffman
City Planner II Eric Holcomb
City Planner I Andrea Houseman
City Planner II Kenneth Hranicky
Division Chief - Research & Strategic Planning Seema Iyer, Ph.D.
Poe Museum Curator Jeffrey Jerome
Division Chief - Historical & Architectural Preservation Kathleen Kotarba
GIS Technician Anna Krzystyniak-Sobiewska
City Planner III Kyle Leggs
City Planner II Jill Lemke
City Planner II W. Eddie Leon
Environmental Planner Gary Letteron
Secretary III Tiffany Lowery
City Planner III Ervin McDaniel
City Planner II Carmen Morosan
City Planner I Lisa Morris
City Planner III Sara Paranilam
Real Estate Agent Supervisor Ivor Quashie
Design Planner II Robert Quilter
Accountant II Ulanda Robinson
Director of Planning Thomas J. Stosur
Manager - Office of Sustainability Beth Strommen
City Planner III Duncan Stuart, AICP
City Planner II Eric Tiso
Planning Assistant - Land Use & Urban Design Jennyffer Vargas
Administrative Officer III Gloria Wayman
Capital Planning Analyst Tommy Williams
City Planner III Tamara Woods
Sustainability Coordinator Sarah Zaleski
City Planner II Martha G. Baker, Ph.D
City Planner II Paul Barrett, AICP
Design Planner II Keia Butts
City Planner II Jerome Chou
City Planner II Tarita Coles, AICP
City Planner III Peter Conrad
City Planner II Peggy Drake
Planning Intern Ben Duda
Graphic Artist II Gerald Elkins
Contributing Former Staff
Department of Planning Staff (continued)

262 City of Baltimore Comprehensive Master Plan Appendices 263262 City of Baltimore Comprehensive Master Plan Appendices 263
Annie E. Casey Foundation
Fannie Mae Foundation
The PlanBaltimore Team 1997-1999
Jay L. Baker
Design
Jack Young, GraphicJack.com
Photography
Led by Charles Graves III and Amy Hasson
Executive Assistant Theresa Edwards
Personnel Assistant Drusilla Elias
Special Assistant Lionel Foster
City Planner II David Fowler, AICP
City Planner I Carley Francis
City Planner II Tranell Guthrie
City Planner III James Hall, AICP
City Planner II Andrea Limauro
Administrative Officer III Karen Miller
Architect II Thor Nelson
City Planner III Theo Ngongang
Contractual Zoning Specialist Ellen Nutter
City Planner I Tara Penders
City Planner I Kevin Quinn
Director of Planning Otis Rolley, III
Planning Assistant Terry Royce
Division Chief - Comprehensive Planning D. Christopher Ryer
Real Estate Agent Supervisor Timothy Schneid
City Planner III Fred Shoken
City Planner II Kristin Smith, AICP
City Planner III Thomas Stosur
Planning Assistant David Strathy
Planning Assistant Hieu Truong
Planning Assistant Louella White
Division Chief - Research & Strategic Planning Shari Wilson, Esq.
Contributing Former Staff (continued)

417 East Fayette Street • 8th Floor • Baltimore, MD • 21202 • 410 396 PLAN •
http://baltimorecity.gov/government/planning/compplan/
Wilbur E. Cunningham, President
Thomas J. Stosur, Executive Secretary
Elaine Garven, Mayor’s Office Representative
Rochelle “Rikki” Spector, City Council Representative
Ben Meli, Department of Public Works Representative
Robert Hopkins, Citizen Representative
Hector Torres, Citizen Representative
Victor Bonaparte, Citizen Representative
Darlene Kennedy, Citizen Representative
Benjamin Glenn, Citizen Representative
Baltimore City Planning Commission