Parks and Recreation Comprehensive Master Plan
157
G LENWOOD S PRINGS , C OLORADO Parks and Recreation Comprehensive Master Plan N OVEMBER 2006
-
Upload
khangminh22 -
Category
Documents
-
view
2 -
download
0
Transcript of Parks and Recreation Comprehensive Master Plan

GLENWOOD SPRINGS, COLORADO Parks and Recreation Comprehensive Master Plan
NOVEMBER 2006

Glenwood Springs, Colorado Parks and Recreation Comprehensive Master Plan page i
Acknowledgements CITY OF GLENWOOD SPRINGS LEADERSHIP:
The Honorable Mayor Bruce Christensen, Ward 4
CITY COUNCIL MEMBERS: Dave Johnson, At Large Joe O’Donnell, At Large Larry Beckwith, Ward 1 Kristen Chadwick, Ward 2 Chris McGovern, Ward 3 David Merritt, Ward 5
PARKS AND RECREATION COMMISSION MEMBERS: M. Susan Cashel - Chair Nancy Hess Rick Tadus Bill Coleman Laura Ayers Nikki Vogt Joan Bates Savanna Cochran Donni Cochran Dave Johnson, Council Liaison
CITY OF GLENWOOD SPRINGS ADMINISTRATION:
Jeff Hecksel, City Manager City Attorney – Vacant Robin Unsworth, City Clerk Andrew McGregor, Director of Community Development Robin Millyard, Director of Public Works Terry Wilson, Director of Public Saftey/Police Chief Michael Piper, Fire Chief Mike Harman, Director of Finance Sebrina Hoffmeister, Human Services Director Bruce Munroe, Director of Information Systems
PARKS AND RECREATION DEPARTMENT Director of Parks and Recreation - Vacant Eric Brendlinger, Youth Coordinator (Acting Director) Cristi Newton, Facility Coordinator Lew Grant, Ice Rink Coordinator Vacant, Aquatics Coordinator Karla Scholz, Fitness and Senior Coordinator Matthew Kraemer, Athletics Coordinator Barb Park, Kidcare/Preschool Coordinator Mike Cain, Maintenance Foreman Administrative Assistant – Vacant
SPECIAL THANKS TO THE COMMUNITY, CIVIC ORGANIZATIONS, STAKEHOLDERS, SCHOOL DISTRICT AND GARFIELD COUNTY CONSULTANTS:
GreenPlay, LLC Design Concepts Geowest Western Slope Consulting. LLC ETC Institute Leisure Visio
For more information about this document contact Karon Badalamenti, CPRP, Principal, GreenPlay, LLC
3050 Industrial Lane, Suite 200, Broomfield, CO 80020
Telephone: (303) 439-8369 Fax: (303) 439-0628 E-mail: [email protected] Web: www.GreenPlayLLC.com


Glenwood Springs, Colorado Parks and Recreation Comprehensive Master Plan page iii
Table of Contents Foreword ..................................................................................................................................................................................................................................................................................................................................................................................ix I. Executive Summary.............................................................................................................................................................................................................................................................................................................................................................1 II. Past, Present and Future – The Master Planning Context ............................................................................................................................................................................................................................................................................................3
A. Vision and Mission .....................................................................................................................................................................................................................................................................................................................................................3 Glenwood Springs Vision Statement .......................................................................................................................................................................................................................................................................................................................3 Community Goals.......................................................................................................................................................................................................................................................................................................................................................3 Department Mission Statement ................................................................................................................................................................................................................................................................................................................................3 Community Center Mission Statement....................................................................................................................................................................................................................................................................................................................3 Project Vision...............................................................................................................................................................................................................................................................................................................................................................3 Background..................................................................................................................................................................................................................................................................................................................................................................3 Process & Timeline .....................................................................................................................................................................................................................................................................................................................................................3
B. Purpose of this Plan ....................................................................................................................................................................................................................................................................................................................................................3 Project Description......................................................................................................................................................................................................................................................................................................................................................3 Current Conditions.....................................................................................................................................................................................................................................................................................................................................................4 Services Required........................................................................................................................................................................................................................................................................................................................................................4 Schedule .......................................................................................................................................................................................................................................................................................................................................................................4 Project Team ................................................................................................................................................................................................................................................................................................................................................................4
C. History of Parks and Recreation ...............................................................................................................................................................................................................................................................................................................................4 Glenwood Springs History ........................................................................................................................................................................................................................................................................................................................................4
D. Organizational Overview ..........................................................................................................................................................................................................................................................................................................................................5 City Governance and Organization..........................................................................................................................................................................................................................................................................................................................5
E. Related Planning Efforts and Integration ................................................................................................................................................................................................................................................................................................................5 F. Relationship to the Previous Master Plan ...............................................................................................................................................................................................................................................................................................................5
Park, Recreation, Open Space, Greenway and Pathway Master Plan.................................................................................................................................................................................................................................................................5 G. Methodology of this Planning Process ....................................................................................................................................................................................................................................................................................................................6
The Approach to the Scope of Work ........................................................................................................................................................................................................................................................................................................................6 III. What We Want - Our Community and Identified Needs............................................................................................................................................................................................................................................................................................8
A. Community Profile and Demographic Study.........................................................................................................................................................................................................................................................................................................8 Market Analysis ..........................................................................................................................................................................................................................................................................................................................................................8 Population, Age Ranges, and Family Information.................................................................................................................................................................................................................................................................................................8 Health and Obesity ...................................................................................................................................................................................................................................................................................................................................................11 Population Forecasts.................................................................................................................................................................................................................................................................................................................................................11
B. Current Trends ..........................................................................................................................................................................................................................................................................................................................................................11 National Trends.........................................................................................................................................................................................................................................................................................................................................................11 Colorado Mountain Town Trends..........................................................................................................................................................................................................................................................................................................................11
C. Community and Stakeholder Input .......................................................................................................................................................................................................................................................................................................................12 Users and Stakeholders............................................................................................................................................................................................................................................................................................................................................12 Focus Group Results.................................................................................................................................................................................................................................................................................................................................................12 Stakeholder Input - Youth Sports Associations....................................................................................................................................................................................................................................................................................................12 Stakeholder Input - Local Businesses, Chamber of Commerce and Downtown Business Association .......................................................................................................................................................................................................12 Stakeholder Input - Regarding Opportunities......................................................................................................................................................................................................................................................................................................13 Stakeholder Input - Regarding Funding Considerations....................................................................................................................................................................................................................................................................................13

page iv Glenwood Springs, Colorado Parks and Recreation Comprehensive Master Plan
Previous Survey - A Glenwood Springs Park and Recreation Survey of Public Opinion..............................................................................................................................................................................................................................13 Results from Glenwood Springs GRASP® Survey ...............................................................................................................................................................................................................................................................................................13 Statistacally Valid Survey ........................................................................................................................................................................................................................................................................................................................................13 Key Survey Findings ................................................................................................................................................................................................................................................................................................................................................14 Survey Questions National Benchmarking ...........................................................................................................................................................................................................................................................................................................17
IV. What We Have Now – An Analysis of Public Programs and Spaces .....................................................................................................................................................................................................................................................................18 A. Community Recreation Programs ..........................................................................................................................................................................................................................................................................................................................18
City of Glenwood Springs - Park and Recreation Events ...................................................................................................................................................................................................................................................................................18 Youth Non-Profit Sports Associations ...................................................................................................................................................................................................................................................................................................................18 City of Glenwood Springs - Park and Recreation Services .................................................................................................................................................................................................................................................................................18
B. Indoor Recreation Facilities .....................................................................................................................................................................................................................................................................................................................................20 City of Glenwood Springs Park and Recreation Facilities ..................................................................................................................................................................................................................................................................................20 Partnership with the Public Golf Course...............................................................................................................................................................................................................................................................................................................21 Partnership with the Glenwood Springs RE-1 School District ...........................................................................................................................................................................................................................................................................21 City of Glenwood Springs - Alternative Providers of Various Recreation Services .......................................................................................................................................................................................................................................21
C. Opportunities to Improve Indoor Facilities and Programs ................................................................................................................................................................................................................................................................................22 Enclosing the Skating Rink......................................................................................................................................................................................................................................................................................................................................23 Parks and Community Center Room Rentals .......................................................................................................................................................................................................................................................................................................23
D. Outdoor Active Facilities and Sports .....................................................................................................................................................................................................................................................................................................................23 Whitewater Park and River Opportunities ...........................................................................................................................................................................................................................................................................................................23
E. Parks and Natural Resources Facilities..................................................................................................................................................................................................................................................................................................................24 F. Opportunities to Improve Outdoor Facilities, Parks and Natural Areas..........................................................................................................................................................................................................................................................24 G. Current Level of Service – The GRASP® Analysis ...............................................................................................................................................................................................................................................................................................24
Inventory Process and Method ...............................................................................................................................................................................................................................................................................................................................24 V. How We Manage – Analysis of Findings and Oversight ...........................................................................................................................................................................................................................................................................................25
A. Administration, Management and Organizational Development.....................................................................................................................................................................................................................................................................25 Parks and Recreation Department Structure ........................................................................................................................................................................................................................................................................................................25 Organizational Chart................................................................................................................................................................................................................................................................................................................................................25 Budget ........................................................................................................................................................................................................................................................................................................................................................................25 Economic Development ...........................................................................................................................................................................................................................................................................................................................................26 Place at the table........................................................................................................................................................................................................................................................................................................................................................26 Resource Allocation ..................................................................................................................................................................................................................................................................................................................................................26 Use of Volunteers......................................................................................................................................................................................................................................................................................................................................................26
B. Benchmarking - Administrative .............................................................................................................................................................................................................................................................................................................................27 C. Benchmarking - Fees and Charges .........................................................................................................................................................................................................................................................................................................................29 D. Planning and Design ................................................................................................................................................................................................................................................................................................................................................32 E. Marketing and Communications............................................................................................................................................................................................................................................................................................................................32 F. Information Technology ..........................................................................................................................................................................................................................................................................................................................................33 G. Park Maintenance .....................................................................................................................................................................................................................................................................................................................................................33
Open Space, Parks, and Trail Systems ...................................................................................................................................................................................................................................................................................................................33 Parks, Athletic Fields, Undeveloped Lands ..........................................................................................................................................................................................................................................................................................................33 Trails ........................................................................................................................................................................................................................................................................................................................................................................33 Contracted Services ..................................................................................................................................................................................................................................................................................................................................................33 Budget Levels ............................................................................................................................................................................................................................................................................................................................................................33

Glenwood Springs, Colorado Parks and Recreation Comprehensive Master Plan page v
Revenues ....................................................................................................................................................................................................................................................................................................................................................................34 Cost Per Maintenance Task .....................................................................................................................................................................................................................................................................................................................................34 Staffing Levels ...........................................................................................................................................................................................................................................................................................................................................................34 Maintenance Scheduling..........................................................................................................................................................................................................................................................................................................................................34 Irrigation.....................................................................................................................................................................................................................................................................................................................................................................34 Equipment..................................................................................................................................................................................................................................................................................................................................................................34 Park Maintenance Primary Concerns ....................................................................................................................................................................................................................................................................................................................34 Trends in Parks, Open Space and Trail Maintenance Practices .........................................................................................................................................................................................................................................................................34
H. Recreation...................................................................................................................................................................................................................................................................................................................................................................36 Contracted Services ..................................................................................................................................................................................................................................................................................................................................................36 Budget Levels ............................................................................................................................................................................................................................................................................................................................................................36 Staffing Levels - Paid ................................................................................................................................................................................................................................................................................................................................................36 Training ......................................................................................................................................................................................................................................................................................................................................................................36 Revenues ....................................................................................................................................................................................................................................................................................................................................................................36
I. Finances and Traditional Funding..........................................................................................................................................................................................................................................................................................................................37 J. Alternative Funding .................................................................................................................................................................................................................................................................................................................................................37 K. Partnerships ...............................................................................................................................................................................................................................................................................................................................................................37 L. Summary of Key Findings .......................................................................................................................................................................................................................................................................................................................................37
VI. Great Things to Come - Recommendations and Action Plans..................................................................................................................................................................................................................................................................................38 A. Grand Challenges and Opportunities....................................................................................................................................................................................................................................................................................................................38 B. Analysis of Priorities ................................................................................................................................................................................................................................................................................................................................................39
Parks and Recreation Valued Equally....................................................................................................................................................................................................................................................................................................................39 The Role of the Local Parks and Recreation Agency ...........................................................................................................................................................................................................................................................................................39
Analysis of Financial Planning and Recommendations for Funding Strategies ....................................................................................................................................................................................................................................................40 Traditional Funding Mechanisms ..........................................................................................................................................................................................................................................................................................................................40 Park and Recreation Capital Development ..........................................................................................................................................................................................................................................................................................................40 Recreation Programming and Admissions ...........................................................................................................................................................................................................................................................................................................40 Specific Recommendations ......................................................................................................................................................................................................................................................................................................................................40 Overall fees and Charges .........................................................................................................................................................................................................................................................................................................................................41
Alternative Funding Methods .......................................................................................................................................................................................................................................................................................................................................42 Park and Recreation Capital Development, Operations and Maintenance: ...................................................................................................................................................................................................................................................42
Financial and Funding Opportunities ..........................................................................................................................................................................................................................................................................................................................45 Opportunities for the City of Glenwood Springs - Fees and Charges:..............................................................................................................................................................................................................................................................45 Opportunities for the City of Glenwood Springs - Grants..................................................................................................................................................................................................................................................................................45 Opportunities for the City of Glenwood Springs - Corporate Sponsorships, Naming Rights, and Advertising Sales .............................................................................................................................................................................45 Opportunities for the City of Glenwood Springs - Permitting...........................................................................................................................................................................................................................................................................45 Opportunities for the City of Glenwood Springs - Partnerships .......................................................................................................................................................................................................................................................................45 Opportunities for the City of Glenwood Springs - Policies ................................................................................................................................................................................................................................................................................45 Analysis of Staffing Issues .......................................................................................................................................................................................................................................................................................................................................45 Analysis of IT Issues .................................................................................................................................................................................................................................................................................................................................................46 Analysis of Expanded Programming.....................................................................................................................................................................................................................................................................................................................46 GRASP® Map Analysis Process ..............................................................................................................................................................................................................................................................................................................................46 Level of Service Analysis .........................................................................................................................................................................................................................................................................................................................................47 The GRASP® Maps....................................................................................................................................................................................................................................................................................................................................................47

page vi Glenwood Springs, Colorado Parks and Recreation Comprehensive Master Plan
Analysis of Crime Prevention Designing ..............................................................................................................................................................................................................................................................................................................49 Analysis of Park Maintenance Issues.....................................................................................................................................................................................................................................................................................................................49
C. Implementation and Action Plans..........................................................................................................................................................................................................................................................................................................................50 Guiding Themes........................................................................................................................................................................................................................................................................................................................................................50 Action Theme One - Maintain and Finish What Was Started ............................................................................................................................................................................................................................................................................51 Action Theme Two - Connectivity..........................................................................................................................................................................................................................................................................................................................52 Action Theme Three – Organizational Management...........................................................................................................................................................................................................................................................................................52 Action Theme Four: Cost Recovery and Funding................................................................................................................................................................................................................................................................................................53 Action Theme Five - Expansion ..............................................................................................................................................................................................................................................................................................................................54 Action Plans – What Happens Next.......................................................................................................................................................................................................................................................................................................................55
VII. Appendices.....................................................................................................................................................................................................................................................................................................................................................................61 Appendix A. National Trends ......................................................................................................................................................................................................................................................................................................................................61 Appendix B. Colorado Mountain Towns - Trends ....................................................................................................................................................................................................................................................................................................68 Appendix C. Public Process Presentation ...................................................................................................................................................................................................................................................................................................................76 Appendix D. Youth Sports Association Analysis ......................................................................................................................................................................................................................................................................................................81 Appendix E. Results from Glenwood Springs GRASP® Survey..............................................................................................................................................................................................................................................................................84 Appendix F. Statistically Valid Survey - Executive Summary.................................................................................................................................................................................................................................................................................89 Appendix G. GRASP® Inventory Spreadsheet .........................................................................................................................................................................................................................................................................................................101 Appendix H. Cost Recovery Pyramid Methodology ..............................................................................................................................................................................................................................................................................................105 Appendix I. Private Grant and Philanthropic Agencies .........................................................................................................................................................................................................................................................................................108 Appendix J Sponsorship Market Analysis of Fees and Charges ...........................................................................................................................................................................................................................................................................113 Appendix K. Sample Sponsorship Policy .................................................................................................................................................................................................................................................................................................................114 Appendix L. Sample Partnership Policy ...................................................................................................................................................................................................................................................................................................................120 Appendix M. Sample Field Use Policy......................................................................................................................................................................................................................................................................................................................127 Appendix N. Capacities LOS Table ...........................................................................................................................................................................................................................................................................................................................131 Appendix O. GRASP® Scoring Methodology...........................................................................................................................................................................................................................................................................................................132 Appendix P. GRASP® Perspectives - Inventory.......................................................................................................................................................................................................................................................................................................133 Appendix Q. GRASP® Perspectives - Analysis Areas .............................................................................................................................................................................................................................................................................................135 Appendix R. GRASP® Perspectives - Access to All Components..........................................................................................................................................................................................................................................................................137 Appendix S. GRASP® Perspectives - Trails, Bike Lanes and Public Transportation ..........................................................................................................................................................................................................................................139 Appendix T. GRASP® Perspectives - Access to All Components with Proposed Improvements ....................................................................................................................................................................................................................141 Appendix U. GRASP® LOS Summary Table for All Components - Based on the GRASP® Perspective - Access to All Components GRASP® Analysis Map .............................................................................................................143 Appendix V. GRASP® LOS Summary Table for All Components - Based on the GRASP® Perspective - Access to All Components With Proposed Improvements GRASP® Analysis Map .......................................................144
List of Tables Table 1: Race Comparisons for 2005......................................................................................................................................................................................................................................................................................................................................9 Table 2: Educational Attainment – 18 Years and Older (2000) ..........................................................................................................................................................................................................................................................................................9 Table 3: Housing Units (2005) ..............................................................................................................................................................................................................................................................................................................................................10 Table 4: Survey National Benchmarking - Needed Facilities ..........................................................................................................................................................................................................................................................................................17 Table 5: Survey National Benchmarking - Important Facilities ......................................................................................................................................................................................................................................................................................17 Table 6: KidKare Annual Attendance 2003 to 2005...........................................................................................................................................................................................................................................................................................................18 Table 7: KidKare January to May Attendance 2005/2006................................................................................................................................................................................................................................................................................................18 Table 8: KidKare Year to Date 2006 and 2005 Actual Cost Recovery .............................................................................................................................................................................................................................................................................19

Glenwood Springs, Colorado Parks and Recreation Comprehensive Master Plan page vii
Table 9: KidKare Suppositional Cost Recovery .................................................................................................................................................................................................................................................................................................................19 Table 10: SWOT Analysis on KidKare ................................................................................................................................................................................................................................................................................................................................20 Table 11: KidKamp Attendance 2004/2005........................................................................................................................................................................................................................................................................................................................20 Table 12: KidKamp Suppositional Cost Recovery.............................................................................................................................................................................................................................................................................................................20 Table 13: Youth Scholarship Program Participation and Expenses ................................................................................................................................................................................................................................................................................20 Table 14: 2003-2006 Parks and Recreation Department Operating Budgets .................................................................................................................................................................................................................................................................25 Table 15: 2003-2006 Divisional Operating Budgets ...........................................................................................................................................................................................................................................................................................................25 Table 16: Administrative Benchmarking Table: Glenwood Springs, CO.......................................................................................................................................................................................................................................................................28 Table 17: Recreation Fees Comparison - Daily Admission ..............................................................................................................................................................................................................................................................................................30 Table 18: Recreation Fee Comparison - Annual Pass........................................................................................................................................................................................................................................................................................................30 Table 19: Recreation Fee Comparison - Child Care...........................................................................................................................................................................................................................................................................................................32 Table 20: Public Works Operations Division - Park Maintenance Budget ....................................................................................................................................................................................................................................................................33 Table 21: Seasonal/Part Time Labor Hours .......................................................................................................................................................................................................................................................................................................................34 Table 22: Labor Ratios for Selected Community Services Maintenance Activities.......................................................................................................................................................................................................................................................35 Table 23: LWCF Listing of Grants for the City of Glenwood Springs, CO ....................................................................................................................................................................................................................................................................43 Table 24: GRASP® LOS Summary Table for All Components.........................................................................................................................................................................................................................................................................................48 Table 25: GRASP® LOS Summary Table for All Components with Proposed Improvements (Also in Appendix V). ...........................................................................................................................................................................................51 Table 26: Glenwood Springs Parks and Recreation Master Plan Action Themes Implementation Table................................................................................................................................................................................................................56 Table 27: Glenwood Springs Parks and Recreation Master Plan - Summary Table for CIP – Park Components ..................................................................................................................................................................................................58 Table 28: Top Ten Activities Ranked by Total Participation for National Recreation Participation in 2004 ............................................................................................................................................................................................................61 Table 29: National Recreation Participation in 2004 of Selected Sports Ranked by Percent Change from 1999 to 2004.........................................................................................................................................................................................61 Table 30: National Youth Participation in Selected Sports Comparison by Age Group 2004 vs. 1994......................................................................................................................................................................................................................62 Table 31: National Recreation Participation of Women in Selected Sports Comparison 2004 vs. 1999.....................................................................................................................................................................................................................62 Table 32: Recreation Activities for Adults 55 and Older Based on Frequent Participation 2002...............................................................................................................................................................................................................................63
List of Figures Figure 1: Population Breakdown – Glenwood Springs, CO (2005)..................................................................................................................................................................................................................................................................................8 Figure 2: Population Comparisons – City of Glenwood Springs, State of Colorado and United States (2005)..........................................................................................................................................................................................................9 Figure 3: Households by Income – City of Glenwood Springs compared to the State of Colorado and the US (2005).........................................................................................................................................................................................10 Figure 4: Population Projections 2000 to 2010....................................................................................................................................................................................................................................................................................................................11 Figure 5: Rating of Physical Condition of the Parks .........................................................................................................................................................................................................................................................................................................14 Figure 6: Number of Households Needing Most Desired Facilities...............................................................................................................................................................................................................................................................................14 Figure 7: Households Having Un-Met Needs by Type of Facilities ...............................................................................................................................................................................................................................................................................15 Figure 8: Households Needing Various Recreation Programs........................................................................................................................................................................................................................................................................................15 Figure 9: Households Having Un-Met Needs by Type of Programs .............................................................................................................................................................................................................................................................................15 Figure 10: Likelihood of Using a 500-700 Seat Theater.....................................................................................................................................................................................................................................................................................................16 Figure 11: Ways to Fund Parks and Recreation Improvements ......................................................................................................................................................................................................................................................................................16 Figure 12: Should Glenwood Springs Create a Special Parks and Recreation District ................................................................................................................................................................................................................................................16


Glenwood Springs, Colorado Parks and Recreation Comprehensive Master Plan page ix
Foreword
The Glenwood Springs area is blessed with a multitude of recreation and leisure possibilities. The City of Glenwood Springs has vibrant Park and Recreation programs. Community members as well as staff members continually seek to improve and increase available programs and facilities. A formal Master Plan gives framework and suggested priority lists for the future direction of the Parks and Recreation Department as well acknowledges our current situation and the opinions of citizens on recreational and park activities. It is the mission of the Glenwood Springs Parks and Recreation Commission to improve the quality of life for the citizens and guest of Glenwood Springs by guiding future land use plans for parks and recreational facilities; by pursuing recreational and cultural opportunities that promote social, economic and environmental prosperity; and by providing recreational infrastructure and space which promotes civic activity. The Parks and Recreation Commission and the Parks and Recreation staff worked with the well respected firm, Greenplay LLC, to help develop the current Master Plan. The document was citizen opinion generated, base on a statistically valid survey of 439 households within the city limits of Glenwood Springs. The document is fully supported by the Parks and Recreation Commission, Community Center staff, and the staff and management of the Parks & Recreation Department. We are impressed with the work of Greenplay LLC and are pleased to present their comprehensive Master Plan for City Council’s consideration, adoption as a resolution, and future implementation.
The Parks and Recreation Commission M. Susan Cashel, Chair Laura Ayers Joan Bates Donni Cochran Savanna Cochran Bill Coleman Nancy Hess Rick Tadus Nikki Vogt Dave Johnson, Council Liaison


Glenwood Springs, Colorado Parks and Recreation Comprehensive Master Plan page 1
I. Executive Summary This Parks Master Plan was created to:
• provide both a vision for parks, recreation and open space, and an action plan for implementing this vision through a potential separate revenue initiative;
• survey of the needs of residents; • involve a comprehensive review of the existing inventory of
land, recreation facilities, programs, services and opportunities;
• research and develop recommendations for all aspects of the City’s recreational service area, including staffing needs, operation and maintenance funding needs, and recreational programming needs;
• develop a strategic set of goals, objectives, and actions for the next five years;
• identify land needs for future parks and open space acquisition;
• provide a capital improvement schedule, and review of existing finance strategies; and
• develop recommendations to fund improvements.
Findings and Analysis were compiled through a detailed process involving:
• public meetings and focus groups; • stakeholder meetings and staff input; • a statistically-valid survey sent randomly to 2,000 homes; • analysis of demographics and trends; • a complete inventory of all parks, open space, facilities,
programs, services, partners and alternative providers; • SWOT analysis; and • GRASP® Analysis of current and future Levels of Service for
the parks, facilities and their components.
Purpose of these recommendations: • To identify key focus areas for improvement for the
immediate future, short term goals within 1-2 years, and long term goals within the next 5 years.
• To identify priorities and costs and funding mechanisms for improvements, expansions, further study, and conceptual capital projects.
• To plan to update this master plan every 5 years.
General Themes for Improvement Include: • Maintain and finish what we started • Connectivity • Organizational management • Cost recovery and funding • Expansion
Key Components The following were identified as the most important for consideration within the next 5 years.
• Trails and Connectivity • Skatepark • Capital Improvements Plan • Wage Study • Create Policies • Improve Cost Recovery • Coordinate Efforts • Performing Arts, Indoor Ice Arena, and Sports Complex
Feasibility Studies Understanding the Priorities: The Findings and Analysis Compilation completed in July 2006 identified the Access to All Inventory and Components and the current level of service for the City of Glenwood Springs. Strive towards a goal of available recreation programs, services, and parks with key components that are walkable (within 1/3 mile - 10 minutes). Minimum key components consist of three amenities or features like open turf area, playground, or shelter, and connectivity to other parts of Glenwood Springs, a trail system or loop. #1 – Maintain and Finish What We Started
• Complete the Community Center landscape plan • Improve the skatepark at Two Rivers Park • Increase Level of Service (LOS) throughout the Park System • Implement the recommended Capital Improvement Projects
(CIP)
#2 – Connectivity • Complete the trail system and connect the community
#3 – Organizational Management • Create policies • Track labor hours and equipment usage • Engage and educate Sports Associations to assist in
minimizing their impact on parks and athletic fields • Pay attention to design • Coordinate planning efforts • Coordinate volunteer efforts • Plan for the future • Encourage, enhance and maximize relationships and
partnerships opportunities • Resolve outstanding management issues
#4 – Cost Recovery and Funding
• Establish life cycle costing assessments • Conduct a wage study • Implement a 5-year master planning schedule with annual
updates • Establish a 501 (c) 3 Park and Recreation Foundation • Pursue grant opportunities • Institute volunteer opportunities • Create a cost recovery policy • Establish an equipment replacement fund • Explore new Parks and Recreation dedicated tax revenues
#5 – Expansion
• Conduct a performing arts complex feasibility study • Conduct an indoor ice rink feasibility study • Conduct a sports complex feasibility study • Conduct a cost benefit study on privatizing or improving the
cemeteries

page 2 Glenwood Springs, Colorado Parks and Recreation Comprehensive Master Plan
Total Costs for All Recommendations:
Recommendations Estimated Implementation Costs
#1 – Maintain and Finish What We Started
Staff time, $1,346,250 in CIP costs over 5 years, plus
Community Center landscaping
#2 – Connectivity Staff time, included in CIP #1
#3 – Organizational Management Staff time
#4 – Cost Recovery and Funding Staff time, $65,000-$80,000; volunteer time
#5 – Expansion Staff time, $140,000-$200,000
Total $1,375,250 - 1,576,250 + undetermined projects
CIP Chart Recommendations
Immediate Needs - as soon as possible Estimated CIP Costs
Design and install landscaping at Community Center TBD
Design and add loop walk to Gregory Park $104,000
Design and add benches, increase plantings and add small shelter to Sister Lucy Downy Park
$23,250
Design and add trees and picnic tables to Sopris Park $13,000
Plan and design an addition to Oasis Creek Park (loop walk, shelter and seating area). This parcel adjoins a large piece of land owned by the City with undetermined future use/development; coordinate construction costs with future plans for both parcels.
$50,000
Immediate Needs - as soon as possible Estimated CIP Costs
Plan and design improvements to Vogelaar (loop walk, shade trees, picnic shelter/area and public art)
$50,000
Plan and design official seating/observation area to White Water Park; coordinate installation and funding with current construction efforts/ project
TBD
Total $240,250 Short Term - within 1-2 years Estimated CIP Costs
Construct planned improvements for Vogelaar $170,000
Design/add small shelter to Centennial Park $20,000
Improve directional signage to Two Rivers Park TBD
Coordinate the replacement of the Skatepark at Two Rivers Park - see Recommendation #1
$500,000
Add loop walk to Sopris Park $104,000
Total $794,000 Long Term - within the next 5 years Estimated CIP Costs
Improve the aesthetics of O'Leary Park add improved fencing, 2 small shelters, improved surfacing
$40,000
Long Term - within the next 5 years Estimated CIP Costs
Design and add a small shelter, benches and a loop walk to Glenwood Park
$127,000
Create a Master Plan for the Rodeo Grounds $50,000
Create a Master Plans to guide future improvements for Axtell Park and Two Rivers Park
$30,000
Conduct a Master Plan/Feasibility study for Sayre Park (relocate the tennis courts expand ballfield to accommodate 90’ baselines and outfield appropriate for pre-high school little league baseball games)
$25,000
Continued Ballfield study $15,000
Other Tennis Court considerations - next 10 years $10,000
Veltus Park traffic issues $15,000
Total $312,000 Total CIP Estimated CIP Costs
Total CIP to the year 2010 $1,346,250 Note: Unless noted as being in an existing park, all construction and CIP costs include support space development and total land costs.

Glenwood Springs, Colorado Parks and Recreation Comprehensive Master Plan page 3
II. Past, Present and Future – The Master Planning Context
A. Vision and Mission
Glenwood Springs Vision Statement The City of Glenwood Springs desires to maintain its small town character and preserve it’s cultural and natural resources by implementing a proactive plan to achieve directed and balanced growth, social and economic diversity, and address its transportation needs.
Community Goals The goals of the community, as voiced by citizens who participated in the comprehensive planning process for the 1998 City Comprehensive Plan include:
• Maintain small town character • Preserve natural resources • Balance development • Achieve economic diversity • Preserve cultural resources • Direct development • Achieve social diversity • Address transportation needs
Department Mission Statement The Glenwood Springs Parks and Recreation Department is dedicated to improving the quality of life for the residents and guests of the City of Glenwood Springs by providing and maintaining a variety of recreation programs, facilities, parks and open space that respond to the needs of the community and promote social, economic and environmental prosperity. The goals of the Mission and Department include:
• Enhance the quality of life for all residents through the coordination of public recreation programs and services;
• Maintain and develop park areas and recreational facilities to meet the present and future demands of the City’s residents;
• Ensure sufficient passive and active parkland to meet the leisure needs of present and future populations;
• Maintain park areas and facilities that are clean, safe, and aesthetically pleasing;
• Effectively administer the revenues and expenditures of the Parks and Recreation budgets;
• Effectively market the Department’s services, and to contribute to the economic growth of the City of Glenwood Springs; and
• Provide of a variety of passive and active recreation programs for all age groups in cooperation with schools and other community organizations.
Community Center Mission Statement The mission of the Glenwood Community Center is to provide a variety of quality, fun, and safe opportunities for all people of all ages. We are a service-based organization to promote community unity and the health and well-being of the public in an efficient and sustainable manner.
Project Vision The City of Glenwood Springs sought to hire consultants to prepare a Parks and Recreation Comprehensive Master Plan. The plan expands and updates the 1998 Parks & Recreation Master Plan. The plan provides both a vision for parks, recreation and open space, and an action plan for implementing this vision through a potential separate revenue initiative. The plan is comprehensive in that it involved implementation of a direct mail-out citizen voter survey to determine and prioritize planning and development of future recreational and park property amenities. The Master Plan also includes research and development of recommendations for all aspects of the City’s recreational service area, including capital project needs, land acquisition needs, staffing needs, operation and maintenance funding needs, and recreational programming needs. The consultants worked closely with the City of Glenwood Springs staff, in particular the Parks and Recreation Director and the Public Works and Community Development Director. They also be worked and communicated closely with the Parks & Recreation Commission and the Parks and Recreation Department staff. Background Nestled in a beautiful mountainous valley, Glenwood Springs sits on the western slope of Colorado as a hub to the Roaring Fork and Colorado River Valleys, Aspen, (40 minutes south), Vail (45 minutes
east), and Grand Junction (90 minutes west). The city is a popular tourist attraction offering an array of private and public, passive and active recreational opportunities for all seasons. The current City Parks and Recreation Master Plan was completed in 1998. Since then, the City has built a 68,000 sq. ft. Community Center and pool, a partially enclosed regulation ice rink, two regulation Little League Baseball fields at Sopris Elementary School, three tennis courts at the Community Center, and replaced play equipment in all but one of City neighborhood parks. The current plan has valid recommendations yet to complete, however a steady and guaranteed funding source is not available.
Process & Timeline The six month project was awarded on March 9, 2006 with a completion date of September 15, 2006. B. Purpose of this Plan
Project Description The purpose of the updated Parks and Recreation Comprehensive Master Plan is to provide a framework for decision-making over a multi-year planning period. The plan looked at changing community demographics, natural resources, parkland and facilities, recreation programming, and Community Center operations. In addition, the comprehensive plan set short-range and long-range goals, explored various funding mechanisms and prioritized spending. Additional goals included:
• Providing a long-range vision for parks, recreation and open space.
• Defining the role of parks and recreation in its contribution to community livability and quality of life.
• Defining the role of parks and recreation programs and services in contributing to community economic development.
• Defined individual and community value; matching both community and individual citizen needs in regard to parks and recreation programs and services.

page 4 Glenwood Springs, Colorado Parks and Recreation Comprehensive Master Plan
Current Conditions The biggest issue facing the City is transportation. State highway 82 to Aspen runs through the downtown was approximately 27,000 vehicle trips per day (this number should be verified with CDOT). Commuter traffic, along with tourists and locals create incredible hardship for the City to establish and maintain a City center. State highway 82 and its associated high traffic volumes serve to physically divided Glenwood Springs. Relocation of traffic on this highway has been a topic of discussion for many years. There is no easy fix for this problem due to steep terrain and a limited availability of options. How the parks and recreation trails system interacts with and compliments the resolution of this enormous issue and is paramount to forward focusing. Many separate groups are tackling various components to complete or provide linkages in the trail system. This plan seeks to identify all plans or groups to encourage cooperative and coordinated planning and implementation efforts. Another major factor is the financial sustainability of not only the Parks and Recreation Department, but the City as a whole. Much needed sales tax revenue relief is occurring due to development of Glenwood Meadows, a new commercial development. A considerable amount of debt service is being paid back, and reserves, fund balances, and inter-fund loans from enterprise funds are being used to balance the general fund operating deficits. All loan obligations need to be repaid, and reserves brought back up to mandated and desired levels. Some of this deficit exists from the operation and maintenance of the Community Center over the last few years when sales tax revenues were not yet increasing the revenues in the general fund. Public perception is that the City is flush with new sales tax revenues without the understanding that repayment of these loans and bringing back reserves are the City’s number one priority; along with a long-term solution to funding the transportation problem. It is suggested that the City consider a series of town hall meetings to inform the citizens of Glenwood Springs about what the short and long term financial goals are, and where the tax revenues are going, as well as the City’s overall prioritized needs, and where each department’s master plan recommendations fit into the future projects in the phased and fiscally responsible comprehensive planning and implementation effort.
It is also suggested that given the demographic and economic changes, it is time for the City to review, and perhaps update its Comprehensive Plan.
Services Required The City desires that this plan address:
• the budgetary sustainability for the Department; • the Department’s current cost recovery of facilities, programs
and services, identifying efficiencies and recommendations for improvements;
• the prioritized list of capital, operations and maintenance recommendations;
• the provision of a framework to encompass all groups and other planning efforts;
• and the identification of critical relationships with county and school districts as well as other potential partners within the community.
Schedule The project began in March 2006 and was scheduled to be completed within seven to eight months
Project Team The team consisted of GreenPlay, LLC as the lead with Design Concepts and Geowest as the GRASP® Level of Service Analysis Team, ETC Institute Leisure Vision as the surveying firm, and Western Slope Consulting, LLC for local expertise. C. History of Parks and Recreation
Glenwood Springs History The following information was taken from the Glenwood Springs Chamber of Commerce 2006-2007 Publication. They came via the mining towns of Leadville and Aspen seeking their fortunes. There were three such prospectors who gave Glenwood Springs its first name: Defiance. Searching the Flat Tops for ore they could mine, they found deposits of lead carbonate and quartzite. Without regard for the Ute Indians, who used the area part of the year, or the harsh winters, the three men built Fort Defiance, a log outpost to protect themselves from both problems. While the Indians posed no known threat, it was Mother Nature
who drove the men and the town site of Defiance to the valley floor where the climate was more hospitable. Built in 1883, Defiance soon became a rough-hewn town of tents and shanties, bars and brothels, populated with gamblers, gunslingers, miners and madams. The town retained its rebellious moniker only a brief two years. In 1885, Mrs. Sarah Cooper, wife of founding father, Isaac Cooper, having difficulty adjusting to his less-than-perfect lifestyle, renamed the town Glenwood Springs after her home town in Glenwood, Iowa. Although Isaac Cooper had visions of transforming the area’s natural hot springs into a magnate for real estate development, he never saw those dreams realized. He was, however, instrumental in bringing the railroad to Glenwood Springs. On October 5, 1886, the first D&RGW train arrived through Glenwood Canyon on tracks that cost $2 million, an astronomical sum in those days. It wasn’t until after Cooper’s death in 1887 that his dreams of transforming the hot springs into a world-class health resort and spa became a reality. It was Walter Devereux, an East Coast-educated mining engineer with deep pockets, who embarked on building a Spa in the Rockies that would cater to the world’s privileged classes. He re-channeled the Colorado River away from the hot springs, oversaw the construction of the stone pool, built the Natatorium (now a health club and administrative office), developed the vapor caves and built the Hotel Colorado. To add to the opulence, Devereux also installed a polo field and formed the Glenwood Polo Association. It wasn’t long before word got out that Glenwood Springs rivaled the best health resorts on Europe. Soon presidents, historical figures, movie stars and even wealthy gangsters signed the hotel’s guest books. One of the hotel’s most famous guests was President Theodore Roosevelt. The President came to the area to hunt big game, including deer, elk and bear. Legend has it that after an unsuccessful bear hunt, several of the hotel’s maids decided to cheer up the disappointed President. They created a stuffed miniature bear made from fabric scraps. Some believe Glenwood Springs is the birthplace of the beloved “Teddy Bear.”

Glenwood Springs, Colorado Parks and Recreation Comprehensive Master Plan page 5
Some historical fact and local legend notes that in 1887, Doc Holliday made his way to the Hotel Glenwood, near the hot springs, hoping to take advantage of the reputed curative power of the waters (to cure his tuberculosis after fleeing Leadville suffering the effects of the high altitude and deteriorating health.) However, the sulfurous fumes from the spring may have done his lungs more harm than good, and Holliday eventually died in his hotel room, after being nearly bedridden for two months. Doc Holliday’s grave is in Linwood Cemetery. D. Organizational Overview
City Governance and Organization The City governance is under a Mayoral, Council and City Manager administration with a City Council of seven members representing five voting wards, with two at large positions. The Executive or Senior level management consists of six department directors, the Police Chief, The Fire Chief (although it operates as a special District), and City Clerk. There are also Legal Counsel and a Municipal Court System. Departments or business units in the City’s comprehensive services plan include Finance; Information Systems; Parks and Recreation that includes, a Cemetery division; Resources including Personnel and Risk Management divisions; Police; Community Development with Planning and Zoning, and Building Official divisions; Public Works which includes the City’s enterprise businesses of Electric, Water/Wastewater, and Landfill. The City has several boards and commissions made up of committed and caring citizens. They include among others:
• River Commission • Parks and Recreation Commission • Planning and Zoning Commission • Downtown Development Commission • Historic Preservation Commission
E. Related Planning Efforts and Integration The following documents were used as background information and supporting studies:
• Glenwood Springs Comprehensive Plan, A Framework for Decision-Making, adopted by Resolution No. 98-3 by City Council on February 19, 1998
• Glenwood Springs Park, Recreation, Open Space, Greenway and Pathway Master Plan, adopted by Resolution No. 98-6 by City Council on April 2, 1998
• Glenwood Springs Community Center Marketing Plan • Glenwood Springs Combined Strategy Files - draft • Glenwood Springs Land Use Plan 1996-2010, an element of
the comprehensive plan, adopted by Resolution 96-6 on April 4, 1996 and revised by City Council on February 19, 1998
• Directory of Youth Organizations Serving the Roaring Fork Valley by the Aspen Foundation
• A Glenwood Springs Park and Recreation District - A Survey of Public Opinion, October 21, 1997
• 2006-2007 Glenwood Springs Official Guide, a Glenwood Springs Chamber of Commerce publication
• Parks and Recreation Internship Manual • Downtown Plan - Spring 1999 • RiverTrails Plan • State of Colorado Small Community Parks and Recreation
Planning Standards - Department of Local Affairs funded study by Rural Planning Institute Consulting, Inc. (RPI)
This Parks and Recreation Comprehensive Master Plan is intended to provide relative and current information which will support the planned update to the City’s Comprehensive Plan. It also provides a framework for decision-making, project prioritization and resource allocation. F. Relationship to the Previous Master Plan
Park, Recreation, Open Space, Greenway and Pathway Master Plan The previous Departmental Master Plan was adopted in 1998. Many conditions have changed in the last eight years. The City’s demographics have dramatically changed along with its commercial development. World events have contributed to a down turned economy (this was true in 2001 but presently the local economy has turned around and is booming again) and growth in commuter traffic has created a transportation crisis. This Parks and Recreation Comprehensive Master Plan is an update to the 1998 plan. Some of the recommendations from the previous planning efforts of 1975 and 1998 have been addressed:
• The operations and maintenance of parks, recreation, open space, trails and pathways elements have been combined within one department (it also includes cemeteries);
• The City has developed a park land dedication requirement with a fee in-lieu of dedication provisions which is City Code 070.030.150 Dedications;
• Land was acquired in South Glenwood (now referred to as South Canyon Area) and the Wulfsohn Ranch areas;
• The Community Center has been built along with an aquatics component in the last five years; and
• Other recommended facilities have been built. Many of the recommendations are still issues today: Positioning the Parks and Recreation Department as a major service for the City continues to be developed through its recognized contribution to the economic development of the City as well as a partner in prevention;
• Securing “equitable” funding is a continued concern in light of ever increasing demands for regional service, rising cost of service provision, and a general fund with many obligations;
• Acquiring land and the ability to develop it is still a challenge;
• Some recommended facilities are yet to be built; and • The master plan for South Canyon parkland is yet to be
completed. Additionally, the provision of dedicated funding source for ongoing operation, maintenance and capital repair and replacement is still under debate. This Parks and Recreation Comprehensive Master Plan will re-evaluate the previous recommendations for relevance today based on the needs assessment; GRASP® analysis; current and projected demographics, trends and market analysis; Strengths, Weaknesses, Opportunities, and Threats (SWOT) analysis; financial viability and sustainability.

page 6 Glenwood Springs, Colorado Parks and Recreation Comprehensive Master Plan
G. Methodology of this Planning Process
The Approach to the Scope of Work Community Input - Public Involvement We created an in-depth, efficient, open, and citizen-focused community process as part of the public project. We assured policy makers, staff, user groups, associations, and other stakeholders that they were provided an opportunity to participate in the development of this plan through an appropriate number of meetings. We conducted:
• One orientation meeting with the project staff. • Three public focus group meetings with various Citizen
representatives that included those from, but not limited to, persons associated with existing programs and activities, members of organized sports leagues, and any other groups or associations identified by City staff or through a publicly advertised notification process
• One additional public involvement meeting to provide broad-based community input where the findings were presented.
• Ten meetings or interviews with stakeholders to provide opportunity for discussion and address pertinent issues.
• Five project team meetings to review tasks status. • Two public hearings and/or presentations with the Parks
and Recreation Commission, and/or City Council will be held for the presentation of the draft and final documents of the Parks and Recreation Comprehensive Master Plan.
Needs Assessment - Statistically-Valid Survey A statistically-valid survey is crucial in getting reliable information from the residents of the community to establish a baseline for setting realistic and achievable goals in the Parks and Recreation Comprehensive Master Plan. It is the only method that gives us statistically valid information, not only from the users, but from the non-users who are also taxpayers and voters. Based on the population of the City of Glenwood Springs being roughly 8500 according to the US Census projections, a sample of 2000 households was used and provided a cost effective statistically valid survey. GreenPlay worked with Leisure Vision to administer the survey completing 439 household surveys with relatively equal distribution among the five (5) voting wards and based on the estimated
population of the community. The survey was administered by mail. Questions on the survey were developed in partnership with GreenPlay project staff, the Parks and Recreation Commission, and the City’s Project Team. The survey instrument was administered at a timeline within the project where the information is best be used to help break down barriers and build consensus. Overall results for the entire survey of the 400 households have a 95% level of confidence with a margin of error of +/- 5% overall. The survey instrument was 6 pages in length. This allowed for 23 questions to be asked, with many of the questions having multiple components. Spanish translation was also available. National Benchmarking Benchmarking “National Averages” have been developed for numerous strategically important recreation planning and management issues including: customer satisfaction and usage of recreation programs; methods for receiving marketing information regarding recreation programs; reasons that prevent members of households from using recreation programs and facilities more often; priority recreation programs, outdoor and indoor recreation facilities to improve or develop; priority programming spaces to have in planned community centers and aquatic facilities; etc. This information was provided as compared to survey findings from the City of Glenwood Springs to aid in the planning process and 80 consensus development. Demographic and Trends Analysis We identified the constituency of the City of Glenwood Springs through a demographic analysis and market profile. We compiled all information available from previous planning efforts including the City’s past and current planning efforts, the U.S. Census Bureau, and other national and local sources. The analysis used approved methods to evaluate current and future users of recreation facilities, programs and services. Inventory and Assessment of Existing Recreation and Park Facilities We developed a comprehensive assessment of each of the City’s services including parks, recreation, open space and special use facilities to determine current conditions, use patterns, environmental issues and economic impacts. In addition, we
included those services provided by other agencies that may impact the City. The inventory also included an analysis of best possible providers of community and recreation services, and recommendations for minimizing duplication and/or enhancing possibilities for collaborative partnerships where appropriate. The inventory was compiled and analyzed to provide complete information. The textual assessment included a comparative analysis to agencies of similar size and density, both regionally and statewide, using nationally accepted standards and Geo-Referenced Amenities Standards Program (GRASP®) technology. Specific park types were clearly defined. The inventory identified areas of parkland needed and provided a verifiable basis for acquisition opportunities along with future parkland development priorities. All mapping of facilities and open spaces were incorporated into the dynamic digital database that becomes property of the City upon completion of the project. Analysis of Standards and Demands for Service Level of Service (LOS) Analysis - GRASP® Methodology The traditional and historical practices for calculating Level of Service (LOS), often called the NRPA (National Recreation and Parks Association) standards method, is typically based on providing “X” number of acres or “X” number of facilities per 1,000 population (or “capacity analysis”). This methodology was developed in the 1970’s and 80’s, and the methodology is not accurate for the majority of public agency usage. Even most NRPA officials are now calling this standards methodology “obsolete”. In order to create a way to standardize that is accurate, can be implemented, can be benchmarked, and is unique to the community, we adapted these practices to a slightly different approach using a “composite values analysis.” The composite values analysis methodology we used is proprietary. This methodology builds on the traditional capacity analysis, but can track not only the quantity (or capacity), but quality of components of an entire parks, recreation, and/or open space system.

Glenwood Springs, Colorado Parks and Recreation Comprehensive Master Plan page 7
As a general summary, the following gives some specific outcomes of our GRASP® approach.
• While we still use the traditional methods for comparisons, we are moving away from capacity analysis that relies on the broad and often ambiguous categorization of facilities per thousand and have developed a system that looks at individual components of service, such as ballfields, picnic shelters, trailheads, parking, wetlands, playgrounds, location-based programs, recreational amenities, etc., and then measures the service that each component provides to the community.
• We use GIS to provide a better way of analyzing how any specific location, home or business is being served by amenities.
• We bring a qualitative component into the measurement of service. Traditional capacity methods of LOS analysis are lacking in this respect.
• We evaluate the components and easily graphically display them, quickly identifying gaps in service on a neighborhood, community, regional and/or community-wide basis. This also allows us to combine a population density factor into the traditional LOS equations.
Assessment of Current Recreation Programs and Park Maintenance Services - SWOT Analysis & Program Evaluation We provided an assessment of the City’s current level of recreation and Community Center programs. An analysis of the best possible providers of programs and services were developed to discern possible competition or duplication of services through other public and private program providers, along with recommendations for minimizing duplication and/or enhancing possibilities for collaborative partnerships where appropriate. To develop a short term and long term strategy for the future planning of facilities and the provision of programs and services we conducted a SWOT Analysis of the organization. A SWOT Analysis is an effective and realistic way of identifying the market Strengths and internal and external Weaknesses, and of examining the
Opportunities and Threats faced by the organization in the provision of parks, recreation and open space facilities and services. Financial Analysis - Finance and Administration (Capital Improvement Plan) We conducted an analysis of the existing budget procedures, resources, capital improvement plans, cost recovery, traditional and alternative funding, pricing methodology, and, where appropriate, potential fee adjustments or increases. A twenty year Capital Improvement Plan was developed that was proposed in five year increments reflective of the alternatives proposed in the draft Parks and Recreation Comprehensive Master Plan. We also provided recommendations to address the potential development an efficient and responsive parks and recreation system for the City of Glenwood Springs. Funding Options - Pricing and Cost Recovery We explained and documented the “Pricing & Cost Recovery Pyramid” methodology, and evaluated the agency’s current and potential methods for fair pricing that helps with increased cost recovery using this method. Alternative Funding and Partnerships There is a trend for agencies to look outside the traditional funding mechanisms towards the use of partnerships to fund improvements and future programming and use of public spaces. Alternative Funding typically includes grants, donor programs and/or partnerships. This may include partnerships with other business, governmental (federal, state, school, nearby agencies, etc.), and/or non-profit agencies, along with creation of policies and evaluation processes to help determine if they might be a “good fit”.
• We identified key partners in the area that are identified through this planning process, and analyzed those potentially viable community partnerships for the City.
• We identified strategies to address Public and Private Partnership opportunities, facilitate the partnerships and minimize risk.
• We provided recommendations and sample documents that can be utilized to formulate a Partnership Policy that can be approved and implemented to help minimize risk and streamline the partnership opportunities.
Recommendations and Action Plan - Future Programs, Services, Parks, Open Space, and Trails The Parks and Recreation Comprehensive Master Plan is intended as a living document that changes as conditions in Glenwood Springs change every five (5) years. The recommendations and action plan comprise the following elements:
• Prioritized recommended new capital construction or facility renovation projects and costs prioritized over the next five years.
• Proposed improvements to the City’s existing recreational facilities and parks
• Developed a strategic funding plan to finance recommended program additions and facility construction over a five year period through a prioritization schedule and analysis of current and projected City financial information.
• Identified possible land purchases that fulfill the deficiencies for parks and open space.
• Recommended a best first and second option for financing new capital construction, land acquisition, and future facility improvement projects.
• Identified the potential use of currently developed and undeveloped City properties.
• Identified prospects for the creation of greenways to establish appropriate linkages through the community.
• Developed suggestions for the acquisition and renovation of properties that would satisfy the recommendations developed for the Parks and Recreation Comprehensive Master Plan.
• Identified potential partnerships to develop key relationships for future land and facility development and improvements to the overall benefit of the Glenwood Springs community.

page 8 Glenwood Springs, Colorado Parks and Recreation Comprehensive Master Plan
III. What We Want - Our Community and Identified Needs A. Community Profile and Demographic Study
Market Analysis Service Area and Population The primary service area for this analysis is the City of Glenwood Springs, Colorado. For this study, ESRI Business Information Solutions was examined to determine current and future population projections. The most current population estimate for the City of Glenwood Springs was 8,825 for 2005 based on information from ESRI Business Information Solutions.
Population, Age Ranges, and Family Information Age Distribution The following age breakdown is used to separate the population into age-sensitive user groups and to retain the ability to adjust to future age-sensitive trends. Population distribution by age for the City of Glenwood Springs is demonstrated in Figure 1.
• Under 5 years: This group represents users of preschool and
tot programs and facilities, and as trails and open space users, are often in strollers. These individuals are the future participants in youth activities.
• 5 to 14 years: This group represents current youth program
participants. • 15 to 24 years: This group represents teen/young adult
program participants moving out of the youth programs and into adult programs. Members of this age group are often seasonal employment seekers.
• 25 to 34 years: This group represents involvement in adult
programming with characteristics of beginning long-term relationships and establishing families.
• 35 to 54 years: This group represents users of a wide range of
adult programming and park facilities. Their characteristics extend from having children using preschool and youth programs to becoming empty nesters.
• 55 to 64 years: This group represents users of older adult programming exhibiting the characteristics of approaching
retirement or already retired and typically enjoying grandchildren.
• 65 years plus: This group will be doubling in 14 years.
Programming for this group should positively impact the health of older adults through networking, training and technical assistance, and fundraising. Recreation Centers, senior centers and other senior programs can be a significant link in the health care system. This group generally also ranges from very healthy, active seniors to more physically inactive seniors.
Figure 1: Population Breakdown – Glenwood Springs, CO (2005)
6.2%
11.7%14.0% 15.4%
33.3%
10.5% 9.1%
0.0%
5.0%
10.0%
15.0%
20.0%
25.0%
30.0%
35.0%
Under5
years
5 to 14years
15 to24
years
25 to34
years
35 to54
years
55 to64
years
65yearsplus
Source: ESRI Business Information Solutions Population Comparisons According to ESRI Business Information Solutions, the State of Colorado is within two percentage points of national population percentages in all categories. The population of the City of Glenwood Springs is within two percentage points of the State of Colorado, however, it varies in the categories 35 to 54 and 65 years plus when compared to the Nation. The proportion of population in the category 35 to 54 is 4% greater than the Nation and the proportion of population in the category 65 years plus is 3% fewer than the Nation. This is graphically represented in Figure 2. Interestingly, the 2005 median age in 2005 for the City of Glenwood Springs was 37 which was older than the median for the State of Colorado (35.3) and the Nation (36.3).

Glenwood Springs, Colorado Parks and Recreation Comprehensive Master Plan page 9
Figure 2: Population Comparisons – City of Glenwood Springs, State of Colorado and United States (2005)
Source: ESRI Business Information Solutions
Gender The 2005 population estimate for the City of Glenwood Springs consists of 50.8% male and 49.2% female. The State of Colorado consists of 50.3% male and 49.7% female, and the United States consists of 49.2% male and 50.8% female. Race (2005) Statistics gathered from ESRI Business Solutions provide the race breakdown for the City of Glenwood Springs. As shown in Table 1, the race with the largest population is white (87.5%) while the second largest category is some other race alone with 8.2% of the population. Those of Hispanic Origin of any race make up 18.5% of the total population.
Table 1: Race Comparisons for 2005
Race City of
Glenwood Springs
State of Colorado
United States
White Alone 87.5% 80.2% 71.5%
Black Alone 0.2% 3.9% 12.7%
American Indian Alone 0.6% 1.0% 0.9%
Asian Alone or Pacific Islander Alone 1.2% 3.1% 4.8%
Some Other Race Alone 8.2% 8.8% 7.1%
Two or More Races 2.2% 3.1% 3.0%
Hispanic Origin (Any Race) 18.5% 20.8% 16.4%
Source: ESRI Business Information Solutions Education According to ESRI Business Information Solutions, 33.1% of the population has either a Bachelor’s or a Master’s degree. 32.7% of the population in the State of Colorado and 24.4% of the population in the US has a Bachelor’s or a Master’s degree. The educational attainment breakdown is shown in Table 2. Table 2: Educational Attainment – 18 Years and Older (2000)
Degree City of
Glenwood Springs
State of Colorado
United States
Less than 9th Grade 5.8% 4.8% 7.5%
9th-12th Grade, No Diploma 7.4% 8.2% 12.1%
High School Graduate 20.4% 23.2% 28.6%
Some College, No Diploma 25.6% 24.0% 21.0%
Associate 7.8% 7.0% 6.3%
Bachelor’s 24.0% 21.6% 15.5%
Master’s/Prof/Doctorate 9.1% 11.1% 8.9%
Source: ESRI Business Information Solutions
0%
5%
10%
15%
20%
25%
30%
35%
Under 5 years 5 to 14 years 15 to 24 years 25 to 34 years 35 to 54 years 55 to 64 years 65 years plus
Glenwood SpringsColoradoUS

page 10 Glenwood Springs, Colorado Parks and Recreation Comprehensive Master Plan
Household Income According to ESRI Business Information Solutions, the estimated 2005 median household income for the City of Glenwood Springs is $45,516. Per capita income was $26,400. The median household income for the State of Colorado was $55,698 and the US was $49,747. The per capita income for the State was $29,014 and the US was $26,228. Figure 3 shows households by income. Figure 3: Households by Income – City of Glenwood Springs compared to the State of Colorado and the US (2005) Source: ESRI Business Information Solutions
The largest share of households (22.7%) earns $50,000 to $74,999, followed next by those earning $35,000 to $49,999 (18.0%). The smallest percentage of the population (9.3%) earns less than $25,000-$34,999. The State of Colorado is within two percentage points of national household income earnings in all categories except $15,000 or less where the State has 3% fewer population and $100,000 or more where the State has 3% more population. The City of Glenwood Springs is within two percentage points of the State in the categories $0 to $24,999 and $50,000 to $99,999, but it differs significantly in the
categories $25,000 to $49,999 and $100,000 or more. The proportion of population earning $25,000 to $49,999 is 3% greater than the State. The proportion of population earning $100,000 or more is 6% less than the State. Household Size and Units The 2005 average household size in the City of Glenwood Springs is 2.39 people. Nationally, the average size is 2.59 and in the State of Colorado it is 2.54. Table 3 shows that a significantly larger percentage of housing units in Glenwood are rented when compared to the State and the Nation. Table 3: Housing Units (2005)
Degree City of
Glenwood Springs
State of Colorado
United States
Owner Occupied Housing Units 55.7% 63.3% 61.5%
Renter Occupied Housing Units 40.6% 27.7% 28.9%
Vacant Housing Units 3.7% 9.0% 9.6%
Source: ESRI Business Information Solutions Employment The estimated 2005 employed work force in the City of Glenwood Springs is 1,664 or 64%of the population 16 years and over (ESRI Business Information Solutions). The employed work force in the State of Colorado is 57% and the Nation is 46% of the population 16 years and over. Of the employed work force in the City of Glenwood Springs, 62.4% are engaged in White Collar professions such as management, business, financial and sales and the balance of the work force is engaged in service (15.3%) and blue collar (22.37%) professions. These percentages are within 2% points when compared to the State with slightly more proportion of population working blue collar jobs and slightly less proportion of population working white collar jobs in the City of Glenwood Springs.
0%
5%
10%
15%
20%
25%
< $15,000 $15,000 -$24,999
$25,000 -$34,999
$35,000 -$49,999
$50,000 -$74,999
$75,000 -$99,999
$100,000 ormore
Glenwood SpringsColoradoUS

Glenwood Springs, Colorado Parks and Recreation Comprehensive Master Plan page 11
Health and Obesity The United Health Foundation has ranked Colorado 17th in its 2005 State Health Rankings. It was 13th in 2004. The State’s biggest strengths include:
• low prevalence of obesity • a low rate of cardiovascular deaths • a low percentage of children in poverty • a low rate of cancer deaths
Some of the challenges the State faces include:
• low per capita public health spending • limited access to adequate prenatal care • low immunization coverage
Source: http://www.unitedhealthfoundation.org/shr2005/states/Colorado.html
Population Forecasts Although we can never know the future with certainty, it is helpful to make assumptions about it for economic reasons. Figure 4 shows the 2000 population as 7,736 which is from the 2000 US Census. The estimated population of 8,825 in 2005 and the 10,020 projected for 2010 for the City of Glenwood Springs were derived from ESRI Business Information Solutions. Figure 4: Population Projections 2000 to 2010
Source: ESRI Business Information Solutions B. Current Trends
National Trends Various data sources convey national trends which can influence the City of Glenwood Springs. The National Sporting Goods Association (NSGA) survey on sports participation revealed several
activities pertinent to the City are currently very popular or growing in popularity. These include various aquatics related activities, sports, walking and exercising with equipment. A detailed narrative on related trends can be found in Appendix A. Selected activities pertinent to the City are highlighted below.
• Swimming - experienced a 2.2% increase in total participation from 2003 to 2004
• Skateboarding - participation has increased 48.6% from 1999 to 2004
• Exercising with equipment - had a 15.4% increase in total participation from 1999 to 2004
• Volleyball - has increased 4% from 1999 to 2004 for females • Aerobic exercise - saw an increase of 12.2% in total
population from 1999-20034 • Exercise walking and running/jogging boasted well over 7
million participants 55 years of age in 2002 according to the Superstudy of Sports Participation conducted by American Sports Data, Inc. in January 2002.
Other relevant recreational trends noted in the NSGA’s 2003 study:
• Snowboarding had 6.3 million participants in 2003. It continued on a 12.9% increase from 2002. This popular sport has most likely impacted alpine skiing, which has had a continual percentage decrease over the last five years (-11.8% from 1998 to 2003).
• Ice hockey has had an overall increase of 9.4% since 1993, and participation by children ages 7- 11 years old has increased 59.7% in the last ten years. However, as a total percentage it is still fairly low.
• Skateboarding continues a steady increase in popularity, and now includes 9 million participants.
• Exercise walking continues to be the number one sport in American participation, with 79.5 million participants.
• Yoga and Tai Chi were introduced to the survey in 2002 and included in the 2003 survey. Total participation was 5.6 million, with women comprising 83.3% of that total.
• Martial Arts is the largest percent change from 2002 to 2003 with a 15% increase and 4.8 million participants.
Colorado Mountain Town Trends The complete Colorado Mountain Towns trends document can be found in Appendix B. The primary focus area includes five Colorado counties in the central mountains of the state. These counties are: Eagle, Garfield, Pitkin, Routt and Summit. In some
cases data from other mountain counties were used when relevant information was available; these counties include Archuleta, Grand, Gunnison, LaPlata and San Miguel. Counties were included because of data availability restrictions in certain circumstances. Within these five counties are several municipalities that were considered in the analysis. The communities of focus that were selected are: City of Aspen, Town of Breckenridge, Town of Dillon, Town of Grand Lake, City of Glenwood Springs, City of Steamboat Springs and Town of Vail. As with county information, additional communities were reviewed and information from these communities was included when relevant. Other communities considered are: Avon, Basalt, Crested Butte, Durango, Eagle, Frisco, Silverthorne, Snowmass Village and Telluride. Communities and counties were selected based on their recreational amenities that make them communities attractive to visitors from Colorado and outside of the state as well. The approach was to identify common themes between communities and/or counties to ascertain whether certain trends could be identified in the areas of parks, recreation, open space and tourism. The following is a summary of common themes:
• Visiting friends and relatives continues to be one of the main reasons for an overnight vacation in Colorado, with one in four trips originating in Colorado.
• Outdoor trips remain popular with visitors, accounting for more than 2.2 million visitors in 2004.
• An increasing number (44%) of vacationers are using the internet to plan their vacation.
• Residents in mountain communities tend to prefer individual activities such as walking, skiing, and mountain biking versus group activities.
• The use of some tax mechanism to finance recreation and park activities is being done in mountain communities.
• Communities have room for improvement in the area of arts and culture as a visitor attraction and for community residents.
• Mountain communities are increasingly interested in land preservation and open space.
01,0002,0003,0004,0005,0006,0007,0008,0009,000
10,00011,00012,000
2000 2005 2010
Glenwood Springs

page 12 Glenwood Springs, Colorado Parks and Recreation Comprehensive Master Plan
State of Colorado Small Community Parks and Recreation Planning Standards The Department of Local Affairs (DOLA) funded this 2003 study by Rural Planning Institute Consulting, Inc. (RPI) to assist small communities in their planning efforts. This project presents parks and recreation planning standards specifically for small communities in Colorado. For the purposes of this study, a small community means any jurisdiction with roughly 10,000 residents or less. The parks standards presented in this report were intended to replace (for small communities) those standards established by National Parks and Recreation Association (NPRA). According to the study, NPRA standards are based on urban and metropolitan models and are largely inappropriate for smaller communities. The study included a statewide survey with direct citizen input from small communities to ascertain specifically what types of park and recreation facilities were desired and used the most in these small Colorado communities. Developed from the study were recommended standards or level of service based on the obtained citizen input for:
• Park Land and Dedication • Open Space and Trails • Sport Fields and Courts • Outdoor Recreation • Leisure and Other Recreation Facilities
The 2003 study cites national trends for sports participation. Specifically it states that in the last twenty years or so, there has been decreased participation in many of the traditional competitive team sports including baseball, softball, volleyball, and tennis; with the exceptions of soccer and ice hockey, which have experienced healthy growth. Kayaking, and whitewater activities, use of climbing walls, skateboarding and inline skating, mountain biking and trail running are the up and coming national trends for sports activities. Through a pilot survey of Garfield and eleven other Colorado counties, baseball, softball, and little league have the highest participation rates with approximately one player for every two households. This information was used to evaluate the demand for field sports.
The Colorado Small Town Parks Demand Survey conducted by RPI indicated that relaxing in a park and gathering with friends and family, as well as festivals and fairs are highly valued in small communities. According to RPI, “the park planning standards simply represent the demand for, and capacity of, parks and recreation facilities for Colorado’s small communities. They are a general statement of the minimum facilities that small communities should provide residents. Clearly, every community will have unique needs (e.g. softball may be a popular activity in one community, whereas fishing, or picnicking is more so in another), nevertheless, the system of standards provides two important numbers (demand and capacity) for small communities parks planning.” The study does suggest conducting a local validation survey to test these recommended standards against a community’s interests and priorities. C. Community and Stakeholder Input
Users and Stakeholders During the week April 4-6, 2006, several meetings were conducted with public focus groups, various stakeholder, and the Parks and Recreation Commission. In addition, staff interviews and subsequent follow up telephone conference calls and emailed questionnaires were conducted with other stakeholders.
Focus Group Results The next steps were to use the information gained from the stakeholders and public focus groups to shape the needs assessment, citizen opinion/satisifaction survey instrument. This allowed the testing of what was heard from the users against the citizens of Glenwood Springs as an entire community, hearing from both the users and the non-users. A statistacally valid random survey which represents the community’s desires as a voting community was then developed. The results were summarized for the Department, the Parks and Recreation Commission and members of City Council. The compiled results can be found in Appendix C, Focus Group Results.
Stakeholder Input - Youth Sports Associations In general, many of the sport associations that provided input on the athletic field needs in the City expressed a concern about the lack of field space due to competition among the users. Overall, they are somewhat satisfied with the quality and condition of the fields depending on the sport. There was a general suggestion to build a spots complex. For a complete analysis of each youth sports association, please refer to Appendix D, Youth Sports Association Analysis.
Stakeholder Input - Local Businesses, Chamber of Commerce and Downtown Business Association The primary issues facing the City of Glenwood Springs include:
• Commuter and local traffic, and affordable housing • Preservation of downtown and historic core with public
spaces downtown where people will congregate • Connectivity • Preserving the sense of community
The Glenwood Springs economy is built on tourism so the City must meet the needs of the Front Range visitors, and do things right to attract tourism so that citizens can enjoy the amenities too. If we improve on what we have, it will draw tourists. We should better utilize the shoulder seasons (April/May and September) to attract more tourist activities. The master plan must maximize opportunities that currently exist as well as:
• Unify all planning efforts together • Tie the River system trails with downtown • Take into account tourism impact but provide a balance
between tourism and local needs • Maintain, overhaul and renovate what we have; then develop
a wish list of new facilities and services • Protect future opportunities because there isn’t a lot of
available land • Connect the trail system and create more playgrounds and
neighborhood amenities • Increase traffic calming measures to make it safer for bikes
and pedestrians

Glenwood Springs, Colorado Parks and Recreation Comprehensive Master Plan page 13
Stakeholder Input - Regarding Opportunities There was general interest in a performing arts center with more meeting and convention space, and the potential use of the airport land. Developing the South Canyon area and the 198 acres near the community center were often discussed. Necessary infrastructure improvements include the dog park and skate park; increasing funding and staffing for general park and facility maintenance; better community communication and use of volunteers; adding more or consolidating athletic fields, tennis courts, whitewater activities, a driving range and a sledding hill.
Stakeholder Input - Regarding Funding Considerations All stakeholder groups were asked:
“On average, what portion of the City’s ongoing operations and maintenance of parks and recreation services should be funded by taxes (understanding that the unfunded portion would be supported mainly by fees and charges)?”
The responses generally ranged between 50% to greater than 60%. All stakeholder groups were asked if they thought residents would support the following funding methodologies to improve, build and operate parks and facilities desired by the community:
• A property tax increase, operating levy, or bond issue - the overwhelming response was no. It was felt that property tax is too high.
• It was also felt that the sales tax is already too high. • An admission/amusement tax or sales tax - the
overwhelming response was yes. • A special parks and recreation open space tax - the
overwhelming response was yes.
Previous Survey - A Glenwood Springs Park and Recreation Survey of Public Opinion The last public opinion survey was presented in October 1997 with the focus toward the creation of a community recreation center, and including questions about the establishment of a special district. The survey firm interviewed 350 registered voters with an overall margin of error of +/- 5.2%.
At that time, the major finding was 49% support for the community establishing a special park and recreation district but only 32% were willing to fund the special district with a property tax. There was concern expressed over paying both commercial and residential property tax. A performing art center was ranked high on the list of desired facilities.
Results from Glenwood Springs GRASP® Survey During the public meetings held in Glenwood Springs in early April 2006, a survey was handed out to aid in the GRASP® analysis. The survey included three questions that measure residents’ desire to have outdoor recreation facilities and cultural and entertainment events within walking distance of their homes. The third question asked specifically about features that make a park a more pleasant place to be. Final tabulated data and chart results can be found in Appendix E. Respondents were asked to indicate the top five outdoor facilities that they would like to have within walking distance from their home. They were then asked to indicate how far they would be willing to walk to each of the facilities. The same question was asked about cultural and entertainment events. The following facilities were used in the survey: baseball field, softball field, soccer field, lacrosse, playground, tennis courts, volleyball, picnic facilities, disc golf, fitness course, open grass, walking loop/track, skate park, recreational trail, outdoor pool, community garden, nature park, in-line rink, and amphitheater. Cultural and entertainment events that were listed included: performing arts, visual arts, historic preservation, and cultural/ethnic. The last questions asked respondents to rank a list of 10 comfort and convenience features found in parks according to importance. These items included: shade, benches, mature landscaping, natural areas, open water, variety of topography, good street access, shelters, restrooms, and drinking fountains. About 100 surveys were collected during the three days of meetings. The results of the surveys show interests consistent with those of other western communities the size of Glenwood Springs, however the results also show interest in features not common in similar communities.
Outdoor recreation facilities Specifically, participants showed a high degree of interest in being able to walk to recreational trails, open grass, playgrounds and amphitheaters. The last item in this list represents a desire specific to Glenwood Springs. It is not uncommon to see a high level of interest in trails, playground and grass, but amphitheaters do not usually rank in the top five. This could indicate a need for better or more centrally located amphitheater facilities in Glenwood Springs. The walking tolerance for getting to outdoor recreation facilities is generally around 10-20 minutes. For 14 of the 20 items listed, 30-40% of residents would walk 10-20 minutes. Items that respondents would like to have within a 10-minute walk from their homes include playgrounds, tennis courts, picnic facilities, open grass, and recreational trails. Several things stand out as items that residents would not walk to. These things include lacrosse fields, disc golf, and in-line hockey rinks. Cultural and entertainment events and facilities The residents responding to this survey are overwhelmingly interested in being able to walk to performing arts events and facilities included in the question. This matches well with their desire to be able to walk to an amphitheater as shown in the outdoor recreation facilities preference. In addition, most people would be willing to walk up to 20 minutes to these facilities and events. Residents ranked the other categories in the following order of importance: visual arts, historic, and cultural/ethnic. For each of these things people would walk 10-20 minutes or not at all. Park features As in many communities, shade ranked as the most important feature to have in a park. The second most preferred comfort and convenience feature is restrooms. Respondents evenly ranked other features, although variety of topography and open water rank slightly less desirable than other features on the list. It is possible that due to the mountainous location of Glenwood Springs, a lack of variety in topography would rank highly as flat areas are hard to find but are needed for many park activities.
Statistacally Valid Survey The City of Glenwood Springs conducted a Community Attitude and Interest Survey during May and June of 2006 as part of a Parks, Recreation, and Open Space Master Plan Study to set priorities for the future development of facilities, programs and services in the

page 14 Glenwood Springs, Colorado Parks and Recreation Comprehensive Master Plan
community. The survey was designed to obtain statistically valid results from households throughout the City of Glenwood Springs. The survey was administered by mail. Leisure Vision worked extensively with City of Glenwood Springs officials, as well as members of the GreenPlay LLC project team in the development of the survey questionnaire. This work allowed the survey to be tailored to issues of strategic importance to effectively plan the future system. The goal was to obtain a total of at least 400 completed surveys, with at least 60 surveys coming from each of the five City of Glenwood Springs voting wards. These goals were accomplished, with a total of 439 surveys having been completed, including at least 80 from each of the five voting wards. The number of completed surveys from each voting ward is listed below: Ward 1 – 83 surveys (19%) Ward 2 – 93 surveys (21%) Ward 3 – 80 surveys (18%) Ward 4 – 87 surveys (20%) Ward 5 – 96 surveys (22%) The overall results of the random sample of 439 households have a 95% level of confidence with a precision of at least +/-4.7%. The complete survey results Executive Summary cam be found in Appendix F.
Key Survey Findings Of the 94% of respondents that have visited City of Glenwood Springs parks during the past year, 77% rated the physical condition of all the parks they have visited as either excellent (14%) or good (63%). This is demonstrated in Figure 5.
Figure 5: Rating of Physical Condition of the Parks
Six of the 27 parks and recreation facilities had over 50% of respondent households indicate they have a need for it. These six facilities include: walking and biking trails (89%), open grassy area (76%), picnic shelters/areas (71%), indoor fitness and exercise areas (58%), performing art venue (56%), and nature parks (56%). Figure 6 shows the estimated number of households in the City of Glenwood Springs that have a need for various parks and recreation facilities, based on 3,216 households in the City. Figure 6: Number of Households Needing Most Desired Facilities

Glenwood Springs, Colorado Parks and Recreation Comprehensive Master Plan page 15
From the list of 27 parks and recreation facilities, respondent households that have a need for facilities were asked to indicate how well those facilities meet their needs. Figure 7 shows the estimated number of households in the City of Glenwood Springs whose needs for facilities are only being 50% met or less, based on 3,216 households in the City. Figure 7: Households Having Un-Met Needs by Type of Facilities
From a list of 18 recreation programs, respondent households that have a need for programs were asked to indicate which ones they or household members have a need for. Four of the 18 recreation programs had over 50% of respondent households indicate they have a need for them. These four programs include: art, dance, music, performing arts (65%), community special events (64%), fitness and wellness programs (60%), and visual arts programs (51%). Figure 8 shows the number of households the percentage represents. Figure 8: Households Needing Various Recreation Programs
From the same list of 18 recreation programs, respondent households that have a need for programs were asked to indicate how well those programs meet their needs. Figure 9 shows the estimated number of households in the City of Glenwood Springs whose needs for programs are only being 50% met or less, based on 3,216 households in the City. Figure 9: Households Having Un-Met Needs by Type of Programs

page 16 Glenwood Springs, Colorado Parks and Recreation Comprehensive Master Plan
Respondents were asked to indicate how likely they would be to use a 500-750 seat performing arts center for music, dance, theater, etc. Figure 10 graphically demonstrates the results. The following summarizes key findings: Seventy-two percent (72%) of respondents indicated they are either very likely (51%) or somewhat likely (21%) to use the performing arts center. In addition, 14% of respondents indicated they are not likely to use the performing arts center, and 11% indicated “not sure.” Figure 10: Likelihood of Using a 500-700 Seat Theater
From the list of 12 options, respondents were asked to select the three improvements they feel would add the most value to City of Glenwood Springs parks. Based on the sum of their top three choices, respondents selected walking trials (45%) as the improvement that would add the most value to City of Glenwood Springs parks. The other improvements that respondents feel would add the most value to parks include: restrooms (40%), shade (38%), and natural areas (27%). It should also be noted that walking trails had the highest percentage of respondents select it as their first choice as the improvement that would add the most value to parks.
From a list of 11 various parks and recreation services provided by the City of Glenwood Springs, respondents were asked to rate their level of satisfaction with each one. Three of the 11 parks and recreation services had over 60% of respondents indicate being either very satisfied or somewhat satisfied with them. These three services include maintenance of the Glenwood Springs parks (66%), quality of indoor swimming pools (64%), and the number of Glenwood Springs parks (61%). Respondents were asked to indicate how important parks and recreation services are compared to other priorities for the Glenwood Springs community, such as law enforcement, fire, and streets. Ninety percent (90%) of respondents indicated that parks and recreation services are either very important (52%) or somewhat important (38%) compared to other priorities for the Glenwood Springs community. From a list of four options, respondents were asked to indicate which way they most prefer to fund improvements to parks and recreation facilities or the construction of new facilities. Twenty-six percent (26%) of respondents indicated an amusement/admission/attraction tax as their preferred way of funding improvements or new facilities. In addition, 19% of respondents indicated a parks and recreation tax, 10% indicated a sales tax increase, and 10% indicated a property tax mill levy. Figure 11 graphically represents the results of the responses to this question. One clear means is not indicated although this shows there is support for some method of tax support. Further research is necessary to determine the best method or combination of methods.
Figure 11: Ways to Fund Parks and Recreation Improvements
Respondents were asked to indicate if the City of Glenwood Springs should consider creating a special parks and recreation district including the surrounding areas to be funded with a dedicated property tax. Only thirty-five percent (35%) of respondents indicated that the City of Glenwood Springs should consider creating a special parks and recreation district. See Figure 12. Figure 12: Should Glenwood Springs Create a Special Parks and Recreation District

Glenwood Springs, Colorado Parks and Recreation Comprehensive Master Plan page 17
Survey Questions National Benchmarking When compared to other cities completing similar surveys, the City of Glenwood Springs rates: Quality of Parks Excellent Good Fair Poor Glenwood Springs 14% 63% 20% 2% National Average 30% 53% 13% 2% When compared to other cities, the City of Glenwood Springs rates lower than the national average on the need for nature center/nature trails, outdoor aquatic facilities, youth baseball fields and adult softball fields. Most other facilities are rated as being needed higher than the national average. Table 4 indicates the benchmarked responses. Table 4: Survey National Benchmarking - Needed Facilities
Need of Facilities National Average
Glenwood Springs
Paved Walking/Biking Trails 67% 89%
Open play areas NA 76%
Picnic Facilities 55% 71%
Indoor Exercise and Fitness Facility 46% 58%
Nature Center/Nature Trails 58% 56%
Performing Arts Center 39% 56%
Outdoor Amphitheater NA 50%
Community/Recreation Centers 42% 49%
Indoor Aquatic Facilities 45% 46%
Playgrounds for Children 43% 44%
Outdoor Aquatic Facilities 43% 39%
Indoor Ice-Skating Rinks 25% 38%
Indoor running/jogging track NA 34%
Golf Driving Range NA 32%
Community Gardens NA 31%
Multi-Purpose Sports Complexes 19% 31%
Need of Facilities National Average
Glenwood Springs
Off-leash dog parks 24% 30%
Tennis Courts 24% 26%
Climbing wall area NA 25%
Shooting range for archery and firearms NA 18%
Volleyball courts 17% 17%
Skateboarding Area 14% 15%
Youth Baseball Fields 21% 15%
Gymnastics Center NA 14%
Ultimate Frisbee/Disc Golf 12% 14%
Adult Softball Fields 16% 13%
BMX Bicycle Course 9% 9% When compared to other cities, the City of Glenwood Springs rates dramatically lower than the national average on the importance of playgrounds for children, indoor and outdoor aquatic facilities, and somewhat lower on community/recreation centers and adult softball fields. This is probably due to those facilities are provided in adequate quantity in the community. Most other facilities are rated as being more important higher than the national average; specifically paved walking/biking trails, picnic facilities, performing arts center, indoor fitness facility and a natural resources park. Table 5 indicates the benchmarked responses. Table 5: Survey National Benchmarking - Important Facilities
Most Important Facilities National Average
Glenwood Springs
Paved Walking/Biking Trails 41% 59%
Open Play Areas NA 30%
Picnic Facilities 20% 26%
Performing Arts Center 13% 25%
Indoor Fitness Facility 19% 22%
Most Important Facilities National Average
Glenwood Springs
Natural Resource Parks 15% 19%
Playgrounds for Children 23% 17%
Golf Driving Range NA 13%
Indoor Aquatic Facilities 17% 12%
Outdoor Amphitheater NA 12%
Community/Recreation Centers 13% 11%
Multi-Purpose Sports Complexes 11% 11%
Off-Leash Dog Park 11% 10%
Outdoor Aquatic Facilities 17% 10%
Tennis Courts 7% 8%
Community Gardens NA 7%
Indoor Ice-Skating Rinks 6% 7%
Shooting range for archery and firearms NA 7%
Youth Baseball Fields 7% 6%
Indoor walking/jogging track NA 5%
Climbing wall area NA 4%
Adult Softball Fields 5% 3%
Skateboarding Area 3% 3%
Ultimate Frisbee/Disc Golf 2% 3%
Gymnastics NA 2%
Volleyball Courts 3% 2%
BMX Bicycle Course 2% 1%

page 18 Glenwood Springs, Colorado Parks and Recreation Comprehensive Master Plan
IV. What We Have Now – An Analysis of Public Programs and Spaces A. Community Recreation Programs
City of Glenwood Springs - Park and Recreation Events The City of Glenwood Springs offers the following special events in whole or in support of other organizations throughout the summer months. Events run by the City: Halloween Easter Egg Hunt Daddy Daughter Dance Events run by others: Strawberry Days - Summer Summer of Jazz Symphony in the Valley - Year round Fall Arts Festival Linwood (pioneer) Cemetery Ghost Walks - October Oktoberfest at the Caverns A Community Christmas Sunlight Mountain Ski Spree Festivities Glenwood Springs Canter for the Arts Community Theater
• The Defiance Players • Colorado Mountain College Theater • Rock the Boat Theater Company • Thunder River Theatre Company
Youth Non-Profit Sports Associations The following youth sports associations and organizations serve the recreational athletic needs of Glenwood Springs’ school age children.
• Glenwood Springs Soccer Club (youth soccer) • Three Rivers Little League (youth baseball) • Triple Crown Sports (youth and adult softball) • Hockey (youth hockey)
The top priority for all the organizations is not enough fields or space to meet the growing demand for play. A dedicated sports complex is desired.
City of Glenwood Springs - Park and Recreation Services Senior Programs The Yampah Yahoos program is a partnership between the Community Center and Valley View Hospital. Programs include fitness, strength training, social functions and community health and safety classes. The Adult/Senior and Fitness Coordinator at the community center schedules fun and educational trips for seniors at least once a month. There are also swim programs for seniors, which include water aerobics, swim lessons and lap swimming. Other optional programs are ice skating, dancing, tennis, yoga, spinning classes and the running/walking track. Teen and Adult Programs Program offerings for teens are sports, the outdoor club, hiking and climbing programs, explorer programs, tennis, skating, swimming, basketball and baseball. They also offer the Nature Talk series, which is in partnership with the White River National Forest. Adult sports programs are drop-in volleyball and basketball, soccer, baseball, hockey, volleyball and basketball leagues. All Community Center drop in activities and classes are also available for both teens and adults. Youth Programs Programs for children ages six (6) years and under include T-Ball, soccer, pre-school crafts, toddler time, KidKare, skating lessons, swim lessons and special events. Programs for youth ages seven (7) to thirteen (13) years old include spring break and summer KidKamp, Youth Hoops, baseball, soccer, tennis lessons, swim lessons, scuba diving, track, cheerleading and special sports skills development programs. Child Care KidKare is the onsite childcare program located at the Community Center. It provides a safe and stimulating environment for children ages one (1) years or walking to age seven (7) years. The program includes interactive activities enabling child to learn through play. Crafts, songs, stories, and games are just a few activities that keep the children happy and engaged while the parent uses the community center, its amenities and programs. Kidkare employs
several childcare trained individuals all trained in CPR and First Aid. The program aims to facilitate growth and development in the children who participate. KidKare is available on a first come, first served basis for a maximum of two (2) hours. KidKare is included with the family or youth memberships and there is a daily fee for those who wish to drop-in and do not have a membership. Multi-visit punch passes are also available. Table 6 shows the annual attendance for 2003-2005 and projected 2006 based on year through May monthly average attendances. Table 6: KidKare Annual Attendance 2003 to 2005 KidKare 2005 Participants % change
2003 2,601
2004 3,927 51% increase
2005 8,608 54% increase
2006 January to May
5,190
The average per month projects the annual attendance as 10,380;
predicting a 20% increase for 2006 Table 7 shows the year to date attendance for KidKare compared to last year. Table 7: KidKare January to May Attendance 2005/2006 KidKare 2005 Participants 2006 Participants % change
January 645 841 30% increase
February 669 729 9% increase
March 725 949 31% increase
April 703 877 25% increase
May 711 909 28% increase
June 736 885 20% increase Although very successful and well attended, this program is labor intensive and very expensive to operate. Current hours of operation

Glenwood Springs, Colorado Parks and Recreation Comprehensive Master Plan page 19
necessitate staffing KidKare with a minimum of one (1) staff for forty-one (41) hours per week, year round except for any facility closures or the equivalent of one (1) FTE position. If we assume the $4 per hour fee was paid for each participant, the maximum potential revenue would reflect over $15,000 in 2004 and over $23,500 for 2005. If part time staff were scheduled for forty-one (41) hours per week for fifty (50) weeks per year, this equals 2050 annual hours of operation. Multiply this times the hourly rate of $12 per hour for the Supervisor position using a 1 to 7 or 10 instructor: participant ratio (depending on the ages of the kids). The annual hourly salary is $24,600 plus personnel costs of social security and Medicare at 7.65% of earnings. A $9 per hour Leader is added as warranted to keep the desired ratios. There appears to be no formal mandate regarding full or partial direct cost recovery for programs or facilities. Table 8 shows current actual drop in revenue. Table 8: KidKare Year to Date 2006 and 2005 Actual Cost Recovery
KidKare Revenue
Actual Drop-In Resident $4
Actual Drop-In Non-Resident
$6
Number of visits at drop in
fees
Jan. to May 2006 $711 $186 209
2005 $1,695 $696 540 Table 9 shows the maximum potential cost recovery without the additional expense of programs supplies if everyone paid the drop in rate. However; the maximum potential revenue projection is not achievable as most participants do not pay a fee but use this service as included in the cost of their family memberships. This is only a graphic illustration because in order to see the actual cost recovery, either the attributable revenues would have to be transferred to the KidKare budget and shown as revenue there; or the expenses for KidKare would need to be attributed to the Community Center; or an additional fee for the child care option to a pass would need to be shown in the KidCare budget along with the drop in revenues. Also, the expenses are not accurately reflected in the graphic illustration; they are too low because peak times of utilization
centered on scheduled classes and instructor: participant ratios necessitate multiple staff members at high demand times. Table 9: KidKare Suppositional Cost Recovery
KidKare Annual Participants
2004 Maximum Potential Revenue (all participants at $4
drop in rate)
2004 Projected Expense 1 staff
Cost Recovery (if everyone
paid the drop in rate)
3,927 Average 1.9
children/hour of operation
$15,708 $26,482 59%
2005 Maximum Potential Revenue (all participants at $4 drop
in rate)
2005 Projected Expense 1 staff
Cost Recovery (if everyone
paid the drop in rate)
5,912 Average 2.9
children/hour of operation
$23,648 $26,482 89%
Projected 2005 Revenue
(actual drop in fees and $50 x 277 memberships
allocations)
2005 Projected Expense 1 staff
Cost Recovery (from
projections and allocations
above)
5,912 Average 2.9
children/hour of operation
$16,241 $26,482 61%
The percentage of current family memberships to the Community Center that have used the KidKare services year to date is roughly 23%. Of the 1,216 people attached to family memberships, 277 children are within the age category to use KidKare. The 1,216 people represent 403 different families. If we multiple the 23% of current family memberships to the Community Center by the 403 number of different families this serves, then roughly 93 families are taking advantage of the KidKare service. Creating an additional cost for these families could result in a potential loss of over $58,125
annually due to dropped family memberships at a rate of $625 each. And while this revenue may go away, the expenses would too. If we subtract the drop in visits from the total visits in 2005, then the total family membership visits equal 5,372 for 2005. That means that each of the 277 family membership pass holder’s children are using KidKare an average 19 times each in 2005. The financial benefit of 19 visits at the resident rate of $4 per visit equals $76 per year per child using the family membership for KidKare. A SWOT analysis identifies the strengths, weaknesses, opportunities and threats that exist for a program. Table 10 below indicates that KidKare is a well used and established service for those who take advantage of the program. If the service is considered a membership benefit and as a cost of operating the center, then the program costs should be added to the overall facility expenses to evaluate the true cost recovery of the community center including this service. If it is to be considered a stand alone program or service, then requiring pre-registration for limited spaces may assist with adjusting the staffing levels as necessary to maintain the desired participant to leader ratios. The staff feels that this could reduce attendance and create a challenge for finding staff who are willing to change their hours only days in advance. An analysis of fees is found in Chapter 3, Section C Benchmarking Fees and Charges of this report.

page 20 Glenwood Springs, Colorado Parks and Recreation Comprehensive Master Plan
Table 10: SWOT Analysis on KidKare Strengths Weaknesses Opportunities Threats
• High utilization of service
• Good space for activities
• Safe and fun • Well liked by
users • Promotes
family membership
• Reduces number of unattended children with in the facility
• Socialization for children and parents promotes betterment of community.
• Expensive to operate
• Difficult to find staff for few guaranteed hours of work (city issue)
• Ramping up and down of staffing levels
• As a stand alone program or service, it is subsidized by the general fund
• Facility or room capacity
• Value of service may not be actualizing revenue potential
• As a amenity or service component of the community center’s overall operating expenses, it decreases the center’s cost recovery which is currently at 63%
• Shrinking general fund to subsidize programs and services
• Charging for this added value may result in less family member-ships sold
• May also reduce class participation
KidKamp is the full day camp program offered when school is not in session during the summer and spring breaks. In Summer 2005 the program was based at two (2) locations, Glenwood Spring Elementary and Sopris Elementary with the first two weeks in August held at the community center. The full day camp is full of planned activities and special events. Children are grouped by age. Activities include swimming, arts and crafts, games, nature and science, free time, movies, and gym activities. Pre-registration is necessary. Table 11 shows attendance for KidKamp for 2004 compared to 2005.
Table 11: KidKamp Attendance 2004/2005
Camps 2004 Participants
2005 Participants % change
KidKamp - Summer 132 170
29% increase
KidKamp - Spring Break 15 24
6% increase
Expenses for 2004 totaled $22,468. In 2005, the budgeted expense rose to $31,500, and the 2006 budget is $35,500. The Department does not track revenues against expenditures to determine cost recovery per program. If we assume that all the participants paid the full resident fee per week and attended every week (which is highly unlikely because of vacations and many participants attend partial weeks) then the maximum potential revenue generation compared with the actual or budgeted expenses, and subsequent maximum potential cost recovery would look like Table 12. As you can see, even at half of the maximum potential revenue based on actual participation numbers, this program produces excess revenue over expenditures. Table 12: KidKamp Suppositional Cost Recovery
Camps 2004 Maximum
Potential Revenue
2004 Actual Expense
Maximum Potential Cost
Recovery
KidKamp - Summer only $148,500 $20,584 721%
At ½ revenue $74,250 360%
2005 Maximum
Potential Revenue
2005 Budgeted Expense
Maximum Potential Cost
Recovery
KidKamp - Summer only $191,250 $30,000 637%
At ½ revenue $95,625 318% Youth Scholarship Program The Parks & Recreation Scholarship Fund is designed to assist the youth of Glenwood Springs to participate in recreational activities offered through the Parks & Recreation Department. The scholarship is based on need, the applicant’s desire to participate,
and the potential beneficial outcome for the participant directly related to their involvement with the program. Funds are not to be used for adult programs, team fees, or in some sub-contracted programs. The applicant is required to write a brief essay explaining their need for an ”All Kids Included” scholarship. The essay is to explain the applicant’s personal reasons why he or she wants to take this particular class or program. The essay is to also cover what the applicant expects to achieve or gain through their participation in the program. This service allows youth up to $35 per person per brochure cycle or season with a family maximum of $70, and it is a budgeted line item expense. Table 13 shows participation for years 2004 and 2005, and budgeted expenses for the youth scholarship program for 2004 through 2006. Table 13: Youth Scholarship Program Participation and Expenses Scholarships 2004 2005 2006
Participants 11 35 n/a
Expenses $412
(actual) $1,700
(budget) $1,700
(budget) B. Indoor Recreation Facilities
City of Glenwood Springs Park and Recreation Facilities The Community Center The Community Center is 38,000 square feet in total and was opened in November, 2001. The community center provides a central focal point for both individual and family activities and programs. It also has rental space for meetings, clubs, special events, and social functions. Activities for all age groups include volleyball, basketball, indoor soccer, tennis and tennis lessons, dance classes, fitness and yoga classes, spinning classes and child care. The running track, cardio deck and free weight area allow individual choices for fitness and the climbing wall challenges the rock climbing enthusiast’s skills.

Glenwood Springs, Colorado Parks and Recreation Comprehensive Master Plan page 21
Aquatic Center The 11,000 square foot aquatic center is an attached component of the community center which opened in November, 2004. It offers a 25 yard or 25 meter eight-lane lap and competition pool with starting blocks, pace clocks and a Colorado Timing System; children’s play pool with zero to three foot depth water, tumble buckets, play and spray features; body flume water slide; one (1) meter diving board; and whirlpool for ten (10) persons. All three pools are handicapped accessible and the lap pool has a movable pool floor to accommodate swimmers who wish to swim either meters or yards. Programs include public swimming lessons, aqua aerobics, open kayak, scuba lessons, lifeguard training, special events, and group and party rentals. The aquatic center also accommodates the high school swim team and the Barracudas (the local year round swim club) for swim practice sessions and meets. The Skating Rink The 17,000 square foot Skating Rink is adjacent to the community/aquatics center. It is open as an ice rink from November through March and provides for public skating, skating lessons, youth and adult hockey, family skate night and special events. Skate rentals and concessions are also available. Summer use includes in-line hockey and rentals for large parties and special events.
Partnership with the Public Golf Course In 1988, the City of Glenwood Springs entered into a twenty (20) year lease agreement with the Glenwood Springs Golf Club, Inc. to ensure the status of a public golf course. Per Resolution Number 88-22 the City pays $10 per year to the management group and the agreement is up December 31, 2007. Since this agreement is coming to an end, its time to consider renewal. It has been brought up that the organization may wish to sell its interests and perhaps the City might wish to investigate this opportunity. The City needs to evaluate its interest in ensuring public golf within the Glenwood Springs area and its economic impact.
Partnership with the Glenwood Springs RE-1 School District The City of Glenwood Springs does provide pool space for both practice time and swim meets for the Glenwood Springs High School Men’s Swim Team, Women’s Swimming and Diving Team through an agreement for the purchase of pool use restricted memberships at reduced fees.
City of Glenwood Springs - Alternative Providers of Various Recreation Services While some alternative and complementary services exist within the service area, regional forecasted population growth, the demand for indoor aquatics and recreation facilities and the obesity epidemic demonstrate a continued need for all public, private and non-profit venues. Often, existing providers are operating at or near capacity during peak operating hours. A general overview of the services provided by these facilities is listed subsequently. This information is relevant in defining the facility and program components of a Parks and Recreation Comprehensive Master Plan. It also provides awareness of the alternative providers and their distinct differences, insight regarding the market opportunities in an area, how new facilities could provide services in an underserved market, and how partnerships and open communication with various agencies could help limit duplication of services. Creating synergy based on expanded program offerings, and collaborative efforts can be beneficial to all providers as interest grows and people gravitate to the type of facility and programs that best suit their recreational needs and schedules. However, while competition provides choice for the consumer it will be important for an agency to track program offerings at other facilities. This will help reduce potential duplication and/or saturation of program offerings and identify where deficiencies are occurring in the market. The facilities listed on the following pages offer a wide variety of indoor fitness, aquatics and recreation programming. Alternative Providers, Public, Private and Non-Profit The following is a list of alternative recreation, fitness, gym, cultural arts, ice and swimming providers. Specific information was obtained through the consultant’s site tours and stakeholder interviews, the Directory of Youth Organizations Serving the Roaring Fork Valley, the Chamber of Commerce, DexOnline, Glenwood Springs’ telephone yellow pages and various websites.
Art and Dance Glenwood Springs Arts Council Glenwood Springs Center for the Arts 601 East 6th Glenwood Springs (970) 945-2414 Glenwood Dance Academy 100 Midland Avenue Glenwood Springs (970) 945-2717 Exercise and Fitness Curves 504 21st Street Glenwood Springs (970) 945-0660 Fitrose Pilates Glenwood Springs (970) 948-2661 Hot Springs Athletic Club 401 North River Street Glenwood Springs (970) 945-7428 La Province Spa and Fitness - The Gym and Spa 526 Pine - Hotel Colorado Glenwood Springs (970) 945-5783 Golf Glenwood Springs Golf Club - public 0193 Sunny Acres Road Glenwood Springs (970) 945-7086 Ironbridge Club - private 430 Ironbridge Drive Glenwood Springs (970) 384-0630

page 22 Glenwood Springs, Colorado Parks and Recreation Comprehensive Master Plan
Gymnastics Glenwood Gymnastics Academy 1524 Polo Road Glenwood Springs (970) 945-7898 Kidsplex Gymnastics 100 Midland Avenue, Suite #250 Glenwood Springs (970) 945-0606 Recreation Epic Adventure Inc. 3768 Highway 82 Glenwood Springs (970) 945-8697 Hideout Cabins and Campgrounds 1293 CR 117 Glenwood Springs (970) 945-5621 Senior Services Aging Services Network 1402 Blake Avenue Glenwood Springs (970) 945-9118 Swimming Hot Springs Lodge and Pool 401 North River Street Glenwood Springs (970) 945-7131 Yoga Bikrams Yoga College of India 182 CR 160 Glenwood Springs (970) 945-9642 Glenwood Yoga Glenwood Springs (970) 309-3276
Youth Organizations Asistencia Para Latinos - Latino Network Council 1512 Grand Avenue, Suite 110 Glenwood Springs (970) 945-4060 Defiance Youth Volleyball Club (970) 963-6363 Colorado West Regional Mental Health Center 6916 Highway 82 Glenwood Springs Garfield County Department of Social Services 109 8th Street Glenwood Springs (970) 945-9191 Garfield-Pitkin 4-H Program 109 8th Street Glenwood Springs (970) 945-7437 Glenwood Springs Soccer Club, Inc. (970) 945-6091 Mountain Valley Development Services 700 Mt. Sopris Drive Glenwood Springs (970) 945-2306 Sopris Barracuda Swim Team (970) 945-8659 Sunlight Ski Club (970) 945-0319 Three Rivers Tackle Football 3rd through 5th grade (970) 948-9109
Valley View Youth Recovery Center 1906 Blake Avenue Glenwood Springs (970) 945-3440 Youth for Christ (970) 945-7552 YouthZone - Garfield Youth Services - Coalition for Families 803 School Street Glenwood Springs (970) 945-9300 Partnerships Opportunities with the City - Non-Profit and Profit Organizations Other current and potential partners may include:
Colorado Mountain College Valley View Hospital Town of Gypsum Western Eagle County Metropolitan Recreation District Town of Carbondale Sunlight Ski Area Glenwood Caverns White River National Forest
C. Opportunities to Improve Indoor Facilities and
Programs Great Outdoors Colorado (GOCO) In 1992, Coloradoans took a major step toward preserving their state’s outdoor heritage by voting to create the GOCO Trust Fund, which now forms Article XXVII of the Colorado Constitution. GOCO receives 50% of the proceeds from the Colorado Lottery, its only source of funding. The funding is capped at $35 million a year adjusted for inflation. If GOCO’s share exceeds that amount, the remainder goes into the State Public School fund. The amendment dedicates a portion of state lottery proceeds to projects that preserve, protect and enhance Colorado’s wildlife, parks, rivers, trails and open spaces. GOCO is required to allocate its proceeds to four areas in substantially equal portions over time:
• Investments in the wildlife resources of Colorado through the Colorado Division of Wildlife (DOW), including the protection and restoration of crucial wildlife habitats, appropriate programs for maintaining Colorado’s diverse
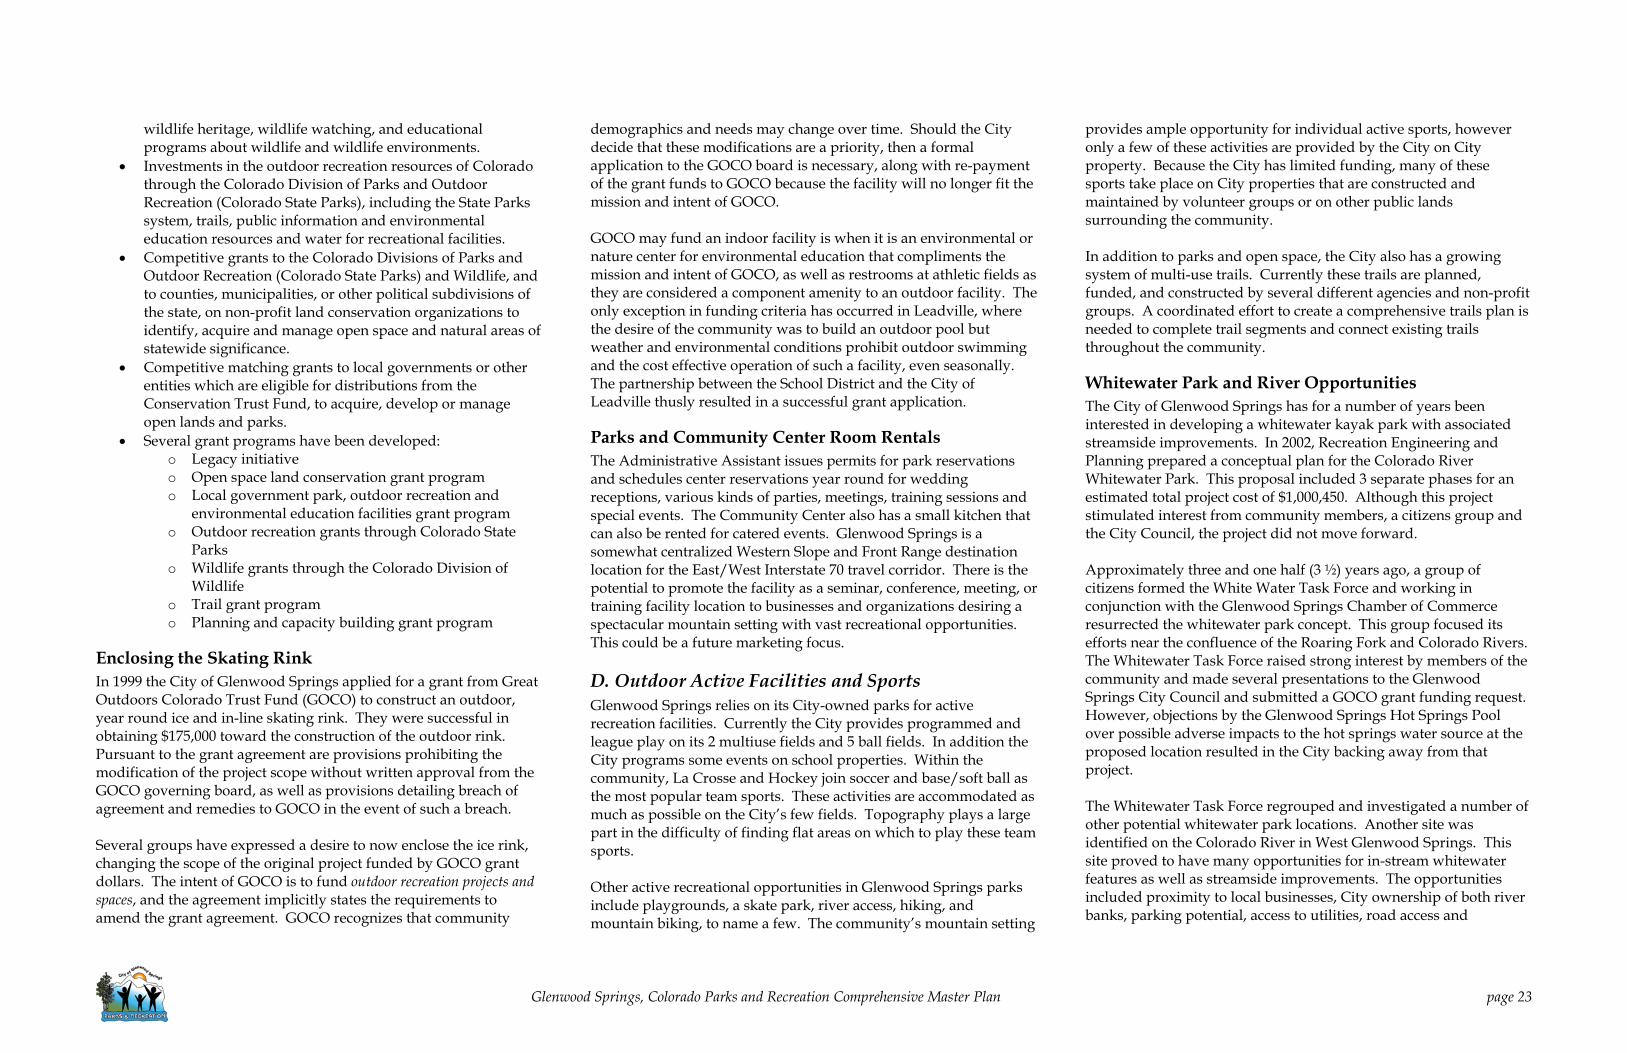
Glenwood Springs, Colorado Parks and Recreation Comprehensive Master Plan page 23
wildlife heritage, wildlife watching, and educational programs about wildlife and wildlife environments.
• Investments in the outdoor recreation resources of Colorado through the Colorado Division of Parks and Outdoor Recreation (Colorado State Parks), including the State Parks system, trails, public information and environmental education resources and water for recreational facilities.
• Competitive grants to the Colorado Divisions of Parks and Outdoor Recreation (Colorado State Parks) and Wildlife, and to counties, municipalities, or other political subdivisions of the state, on non-profit land conservation organizations to identify, acquire and manage open space and natural areas of statewide significance.
• Competitive matching grants to local governments or other entities which are eligible for distributions from the Conservation Trust Fund, to acquire, develop or manage open lands and parks.
• Several grant programs have been developed: o Legacy initiative o Open space land conservation grant program o Local government park, outdoor recreation and
environmental education facilities grant program o Outdoor recreation grants through Colorado State
Parks o Wildlife grants through the Colorado Division of
Wildlife o Trail grant program o Planning and capacity building grant program
Enclosing the Skating Rink In 1999 the City of Glenwood Springs applied for a grant from Great Outdoors Colorado Trust Fund (GOCO) to construct an outdoor, year round ice and in-line skating rink. They were successful in obtaining $175,000 toward the construction of the outdoor rink. Pursuant to the grant agreement are provisions prohibiting the modification of the project scope without written approval from the GOCO governing board, as well as provisions detailing breach of agreement and remedies to GOCO in the event of such a breach. Several groups have expressed a desire to now enclose the ice rink, changing the scope of the original project funded by GOCO grant dollars. The intent of GOCO is to fund outdoor recreation projects and spaces, and the agreement implicitly states the requirements to amend the grant agreement. GOCO recognizes that community
demographics and needs may change over time. Should the City decide that these modifications are a priority, then a formal application to the GOCO board is necessary, along with re-payment of the grant funds to GOCO because the facility will no longer fit the mission and intent of GOCO. GOCO may fund an indoor facility is when it is an environmental or nature center for environmental education that compliments the mission and intent of GOCO, as well as restrooms at athletic fields as they are considered a component amenity to an outdoor facility. The only exception in funding criteria has occurred in Leadville, where the desire of the community was to build an outdoor pool but weather and environmental conditions prohibit outdoor swimming and the cost effective operation of such a facility, even seasonally. The partnership between the School District and the City of Leadville thusly resulted in a successful grant application.
Parks and Community Center Room Rentals The Administrative Assistant issues permits for park reservations and schedules center reservations year round for wedding receptions, various kinds of parties, meetings, training sessions and special events. The Community Center also has a small kitchen that can also be rented for catered events. Glenwood Springs is a somewhat centralized Western Slope and Front Range destination location for the East/West Interstate 70 travel corridor. There is the potential to promote the facility as a seminar, conference, meeting, or training facility location to businesses and organizations desiring a spectacular mountain setting with vast recreational opportunities. This could be a future marketing focus. D. Outdoor Active Facilities and Sports Glenwood Springs relies on its City-owned parks for active recreation facilities. Currently the City provides programmed and league play on its 2 multiuse fields and 5 ball fields. In addition the City programs some events on school properties. Within the community, La Crosse and Hockey join soccer and base/soft ball as the most popular team sports. These activities are accommodated as much as possible on the City’s few fields. Topography plays a large part in the difficulty of finding flat areas on which to play these team sports. Other active recreational opportunities in Glenwood Springs parks include playgrounds, a skate park, river access, hiking, and mountain biking, to name a few. The community’s mountain setting
provides ample opportunity for individual active sports, however only a few of these activities are provided by the City on City property. Because the City has limited funding, many of these sports take place on City properties that are constructed and maintained by volunteer groups or on other public lands surrounding the community. In addition to parks and open space, the City also has a growing system of multi-use trails. Currently these trails are planned, funded, and constructed by several different agencies and non-profit groups. A coordinated effort to create a comprehensive trails plan is needed to complete trail segments and connect existing trails throughout the community.
Whitewater Park and River Opportunities The City of Glenwood Springs has for a number of years been interested in developing a whitewater kayak park with associated streamside improvements. In 2002, Recreation Engineering and Planning prepared a conceptual plan for the Colorado River Whitewater Park. This proposal included 3 separate phases for an estimated total project cost of $1,000,450. Although this project stimulated interest from community members, a citizens group and the City Council, the project did not move forward. Approximately three and one half (3 ½) years ago, a group of citizens formed the White Water Task Force and working in conjunction with the Glenwood Springs Chamber of Commerce resurrected the whitewater park concept. This group focused its efforts near the confluence of the Roaring Fork and Colorado Rivers. The Whitewater Task Force raised strong interest by members of the community and made several presentations to the Glenwood Springs City Council and submitted a GOCO grant funding request. However, objections by the Glenwood Springs Hot Springs Pool over possible adverse impacts to the hot springs water source at the proposed location resulted in the City backing away from that project. The Whitewater Task Force regrouped and investigated a number of other potential whitewater park locations. Another site was identified on the Colorado River in West Glenwood Springs. This site proved to have many opportunities for in-stream whitewater features as well as streamside improvements. The opportunities included proximity to local businesses, City ownership of both river banks, parking potential, access to utilities, road access and

page 24 Glenwood Springs, Colorado Parks and Recreation Comprehensive Master Plan
opportunities for trail connections. Most importantly, this location was supported by the Hot Springs Pool, City Council, the Glenwood Springs River Commission and a variety of citizens groups. In April 2006, the Glenwood Springs City Council advertised for appointed members to the Whitewater Park Ad Hoc Advisory Group. This nine-member group was given defined duties by the City Council and directed to move forward with park development. At the same time, the City hired the team of River Restoration and Hydraulic Design Group to develop concept designs for the Whitewater Park. The Ad Hoc Advisory Group is currently evaluating the designs with the goal of selecting a design to pursue in more detail. The group, in conjunction with the City, intends to make application for another GOCO grant and request a budget appropriation in the 2007 Glenwood Springs Municipal Budget. Simultaneously, the Ad Hoc Advisory Group and the consultants will be developing final designs and pursuing applications for the required agency permits. It is anticipated that construction of the park will commence in early 2007 during low water flows on the Colorado River. There has been very strong support by the City Council and strong momentum by the citizens group for this project. Obviously, the Council has not committed 2007 funds for the project but all indications to the group have been favorable for funding. The final project is not yet approved, but the Ad Hoc committee has the authority and the approval to appropriate funds for engineering design work and to proceed with a GOCO application in August. As river recreation instruction programs rank in the top five (5) most important programs that Glenwood Springs households have a need for (representing 41% or 1,312 households); and it ranks 3rd for households not having their needs met 50% or less; and it is ranked 7th out of eighteen (18) programs that are most important with 16% of the accumulative 1st-4th important votes; it is clear this is well supported through the survey. This project should be considered among all the recommendations for capital projects through this report with the statistically valid survey cited as support and validation of where it falls among the recommendations. E. Parks and Natural Resources Facilities
The City of Glenwood Springs has the unique ability to incorporate a “natural” setting in many of its urban city parks, in addition, the City owns several large parcels of land that are undeveloped for recreational use but that provide open space to the City and constitute a land bank from which the community can draw as needed. Both the City parks and these large undeveloped lands provide beautiful settings for passive recreation. F. Opportunities to Improve Outdoor Facilities,
Parks and Natural Areas There are several major opportunities in Glenwood Springs to improve the outdoor facilities and natural areas in the community. Currently volunteer groups in the community are very active in the design, management, and construction of facilities in the City’s parks. These volunteer efforts, while effective, are unorganized. There is great opportunity to harness the work force found in these volunteers to improve the existing facilities according to the long-term planning efforts of the Department. Other opportunities exist in the expansion of the park system as the development of existing lands becomes focused and funded. Unfortunately this expansion may not include room for more sports fields as land currently held by the City is generally too steep to reasonably develop as fields. However these lands could be developed for passive uses and activities such as educational programs, hiking, biking and group gatherings. G. Current Level of Service – The GRASP® Analysis
Inventory Process and Method The inventory compilation is a three-step process: preliminary data collection, site visits, and data review and compilation. In the first step, the planning team prepared a preliminary inventory using a geo-referenced black and white aerial photo obtained from USGS (flight date unknown). In addition, the team referenced the color aerial available from the Glenwood Springs website on-line mapping application. The preliminary inventory included components as identified in the aerial photo and as listed in the Department’s recreation activity guide. Each of the components was given a GIS point and a name. Using the preliminary inventory the planning team visited each City property in late April 2006.
For the second step, the team visited Glenwood Springs and conducted staff interviews and site visits. Based on staff input, a standard of service was established that is provided to the community by Glenwood Springs. This standard of care forms the basis on which the component rating system was based. While on site, the inventory team used the following three-tier rating system to evaluate the City’s facilities:
B = Below Expectations (1), M = Meets Expectations (2,) and E = Exceeds Expectations (3)
During the site visits the following information was collected:
• Component type • Component location • Evaluation of component condition - record of comfort and
convenience features • Evaluation of comfort and convenience features • Evaluation of park design and ambience • Site photos • General comments
Components were evaluated from two perspectives: first, the value of the component in serving the immediate neighborhood, and second, its value to the entire community. In addition to the components’ scores, each park site or facility was given a set of scores to rate its comfort, convenience, and ambient qualities. These scores were used as modifiers that affect the scores of the components within the park or facility during the GRASP® analysis. Each component was given a score to indicate how well it met expectations for its intended function. The scores were based on both the condition and ability of the component to meet the needs of the users of the park.
To complete the inventory, GIS and CAD data was obtained from Glenwood Springs. Information collected during the site visit was then compiled and corrections and comparisons made to GIS. In addition all parcels and GIS were checked for accuracy and area information was gathered. Following the comparisons and compilation, the inventory was sent to the City staff for corrections and comments. The compiled inventory data can be found in Appendix G for the inventory spreadsheet and in Appendix P for the GRASP® Inventory Map.

Glenwood Springs, Colorado Parks and Recreation Comprehensive Master Plan page 25
V. How We Manage – Analysis of Findings and Oversight A. Administration, Management and Organizational
Development
Parks and Recreation Department Structure The City of Glenwood Springs Parks and Recreation Department has a nine member Parks and Recreation Commission acting in an advisory capacity. One member of the City Council sits on the committee as a City Council liaison. The Parks and Recreation Department is comprised of two divisions; Recreation and Parks. The Recreation Division provides a variety of programs, special events, classes, and athletics for residents and guests of all ages. The Parks Division provides maintenance and care of all park and recreational facilities as well as cemeteries. In the Recreation Division, eight full time Coordinators oversee various programming areas including:
• Aquatics • Facility • Youth Programs • Adult Athletics • Fitness and Seniors • Skate Rink Programs • Preschool and Daycare programs • Administrative Assistant and Room Rental
There is also a full time Building Maintenance Foreman. The Parks and Cemetery Division is managed by one fulltime Superintendent. These ten full time positions are a direct report to the Department Director.
Organizational Chart
Budget The Parks and Recreation Department’s annual operations and maintenance budget was anticipated to improve its cost recovery by 10% in fiscal 2005 over 2004 actual and almost 5% in 2006 over the 2005 budget. Table 14 details the revenues, expenditures, net loss and percent of cost recovery through fees and charges. Table 14: 2003-2006 Parks and Recreation Department Operating Budgets
2003
Actual 2004
Actual 2005
Budget 2006
Approved
Revenue $628,139 $629,436 $926,000 $1,180,000
Expense $1,878,316 $1,928,871 $2,181,216 $2,492,250
Net <$1,250,177> <$1,299,435> <$1,255,216> <$1,312,250>
% Cost Recovery 33.4% 32.6% 42.5% 47.3%
As indicated, the overall cost recovery for the Department is projected to continues to improve. Table 15 details the various divisional operating budgets for the Center, Recreation Programs, and Parks and Cemeteries. Table 15: 2003-2006 Divisional Operating Budgets
2003
Actual 2004
Actual 2005
Budget 2006
Approved
Community Center
Revenue (Community Center Fees)
$434,033 $427,231* $625,000 $875,000
Expense $767,343 $787,318
** $912,068
*** $1,130,322
****
Net <$333,310> <$360,087> <$287,038> <$255,322>
% Cost Recovery 56.6% 54.3% 68.5% 77.4%
Recreation Programs
Revenue (Recreation Fees)
$153,006 $159,610 $260,000 $263,000
Expense $413,463 $454,931 $564,938 $613,623
Net <$260,457> <$295,321> <$304,938> <$350,623>
% Cost Recovery 37% 35.1% 46% 42.9%
Parks and Cemeteries
Revenue (Park User Fees)
$28,894 $26,251 $25,000 $27,000
Revenue (Cemetery Fees)
$12,206 $16,344 $16,000 $15,000

page 26 Glenwood Springs, Colorado Parks and Recreation Comprehensive Master Plan
2003
Actual 2004
Actual 2005
Budget 2006
Approved
Total Revenue $41,100 $42,595 $41,000 $42,000
Expense $697,510 $686,622 $704,210 $748,305
Net <$656,410> <$644,027> <$663,210> <$706,305>
% Cost Recovery 5.9% 6.2% 5.8% 5.6%
* 2004 actual revenue was down $148,004 over budget ** 2004 actual expense was over $24,918 over budget ($16,770 in Personnel Services and 48,147 in Current Expenses) *** 2005 expenses included a capital outlay of $5000 for the climbing wall safety flooring **** 2006 expenses do not include any capital outlay
Economic Development People move to Garfield County and Glenwood Springs for the quality of life. It provides the ultimate venue for the “Colorado outdoor” experience. In the 1998 City Comprehensive Plan, the encouragement of more parks lands and facilities was vital to addressing the transportation needs at that time. The importance of Parks and Recreation as a factor in providing for a high quality of life was discussed in the 1998 Master Plan. In addition, the role of Parks and Recreation in the City’s economic development and tourism industry can no longer be ignored. With the influx of younger families moving to the area, the Parks and Recreation Department’s facilities, programs and services fulfill a vital regional need and expectation. While the City relies on tourism to fuel the economic engine, it’s the City’s services that enhance and supplement the tourist experience, as well as provide quality of life expectations for the working citizens and attract additional commercial businesses which contribute to the fiscal health of the City through sales tax. The tourism industry, while acting as a catalyst for local businesses sustainability, contributes property tax revenues only for venues in the City boundaries, or sales tax revenue on the sale of merchandise. The attractions help sustain the hotel/motel industry whose sales tax revenue is dedicated to promotion of the tourism industry.
Place at the table Parks and Recreation facilities, programs and services are the vivid descriptor of the community’s vision. They paint the picture of a strong municipal economy, provide opportunities for healthy partnerships in the provision of services, and express the government’s commitment to the quality of life for all its citizens. Parks provide the necessary buffer from traffic, noise, and overcrowding. They preserve natural resources and protect a community from uncontrolled development. The Parks and Recreation facilities, programs and services provide a balance necessary for a sustainable community and an outlet to celebrate and explore diversity. The Department must be recognized as a partner in the prevention, health and environment movement. It is a critical player in the solution to the transportation issue. It provides life long learning, leisure and wellness opportunities, employment and volunteer opportunities, and is the “green infrastructure” of a city. Parks and Recreation is an investment in the vitality and quality of a community.
Resource Allocation The Parks Division consists of 14 developed parks totaling over 40 acres and over 4,000 acres of open space. The Division maintains and schedules five athletic fields, a skate park, outdoor theater, six lighted tennis courts, rodeo grounds, two sand volleyball courts, 12 picnic pavilions, 6 miles of groomed trails, and a boat ramp. The Division also provides the perpetual care of both a municipal and historical cemetery. The newest facility is a large $10 million Community Center featuring a covered ice rink, climbing wall, internet lab, banquet area, childcare, gymnasium, fitness center, outdoor tennis courts, dance studio and aquatic center with competitive swim lanes and an interactive play zone. The previous information was obtained from the Department’s Internship Manual
Use of Volunteers The City has a Release of Liability and Indemnification Agreement for volunteer activities administered through the Human Resources Department. The Parks and Recreation Department has also developed a comprehensive Internship Manual for use of young professional finishing a degree in the parks and recreation or related field. In fiscal year (FY) 2005, 906 hours of volunteer labor from 112 volunteers was utilized by the department. The Independent Sector is the leadership forum for charities, foundations, and corporate giving programs committed to advancing the common good in America and around the world. Since its founding in 1980, they have sponsored ground-breaking research, fought for public policies that support a dynamic, independent sector, and created unparalleled resources so staff, boards, and volunteers can improve their organizations and better serve their communities. According to the Independent Sector’s website (www.independentsector.org/ programs/research/ volunteer_time.html), the value of volunteer time is based on the average hourly earnings of all production and non-supervisory workers on private non-farm payrolls (as determined by the Bureau of Labor Statistics). The Independent Sector takes this figure and increases it by 12 percent to estimate for fringe benefits. The estimated dollar value of volunteer time in Colorado is $18.02 per hour for 2004 (the most recent year of available data). The 2005 value of volunteer time has not yet been posted; it is scheduled for spring 2006 following the release of relevant data from the federal Bureau of Labor Statistics. Using this $18.02 per hour figure, volunteer hours in Glenwood Springs equates to over $16,326 in saved labor costs in FY2005. The City does not have a formal volunteer recruitment and training program, a dedicated volunteer coordinator, volunteer manual, job description or application process that details the rights and responsibilities of its volunteers. The potential is there for the City to greatly expand this program. The savings actualized in volunteer labor would offset the cost of a full time volunteer coordinator position to recruit, train, and schedule, track hours, monitor, evaluate and recognize a volunteer workforce. This position would work in concert with the Human

Glenwood Springs, Colorado Parks and Recreation Comprehensive Master Plan page 27
Resources Department, conducting the program on behalf of the entire Parks and Recreation Department. Another benefit to formalizing this program is the ability to track the use of volunteers and the value of the in-kind support to grant funded programs and events. Many grant applications ask for community support and agency in-kind contributions or a match. B. Benchmarking - Administrative Limits of Comparative Data and Analysis Benchmarking is an important tool that allows the comparison of certain attributes of the City’s management of Public Spaces (parks, recreation, arts and cultural and related services) with other similar communities. For this Plan, the City of Glenwood Springs was compared to five other communities from the State of Colorado including Carbondale, Cortez, Durango, Pagosa Springs and Silverthorne. Tables 16 through 18 detail the results of the administrative benchmarking. It is very difficult to find exact comparable communities because each has its own unique identity, its own way of conducting business and differences in what populations they serve. While many park and recreation departments serve primarily residents, other serve a large portion of non-residents as is the case with the City of Glenwood Springs. Additionally, organizations typically don’t break down the expenditures of maintainable park acreage versus natural areas and open spaces or type of indoor recreation spaces they have in the same way. Available details are also limited due to the time involved in retrieving this information. This being said the benchmarking information presented here should be used as a catalyst for the City of Glenwood Springs to continue to research best practices for more specific areas when they are needed.
Benchmarking Data Sought The communities were chosen primarily due to the perceived similarities to the City of Glenwood Springs:
• Population • Household income levels • Bond ratings (Moody’s)
Moody's long-term obligation ratings are opinions of the relative credit risk of fixed-income obligations with an original maturity of one year or more. They address the possibility that a financial obligation will not be honored as promised. Such ratings reflect both the likelihood of default and any financial loss suffered in the event of default. The highest ratings are as follows Aaa (highest quality), Aa (high quality) and A (upper medium quality). Lower ratings such as Baa, Ba, B, Caa, etc. are considered more speculative and risky.
• Total full time equivalencies (FTE) • Managed indoor space • Total parks and open space acres • Total Parks budget • Total Recreation budget • Total Parks revenue • Total Recreation revenue • Cost recovery • City’s Park Dedication Requirements
Additionally benchmarking data looks to weigh pertinent data along with comparing against a “per thousand” population calculation in some cases.

page 28 Glenwood Springs, Colorado Parks and Recreation Comprehensive Master Plan
Table 16: Administrative Benchmarking Table: Glenwood Springs, CO
Location
Bond Rating
Population (2005 estimate)
Median Household Income
Total Parks FTE’s
Total Recreation FTE’s
Managed Indoor Space (sq ft)
Developed Parks/ Open Space Acreage
Undeveloped Parks/ Open Space Acreage
Developed Acres per 1000
Glenwood Springs, CO* AAA 8,825 $45,516 7 9 49,000 83*** TBD 9.4 Breckenridge, CO (see note below) AAA 2,456 $60,757 10 27 108,000 15 3,200 6.1 Carbondale, CO AAA 6,156 $60,381 3 3 0** 44 43 7.1 Cortez, CO AAA 8,374 $34,050 2 7 46,000 156 100 18.6 Durango, CO AAA 15,025 $42,966 8 15 103,000 199 904 13.2 Pagosa Springs, CO AAA 2,110 $43,561 2 1 6,000 24 137 11.3 Silverthorne, CO BAA 3,390 $73,590 3 18 72,000 33 32 9.7
*2005 Budget Figures **13,400 With new recreation center ***Park acreage may be adjusted when GIS information is received from the City TBD - The remaining parcels of undeveloped land have not yet been designated as open space acreage or slated to be developed. Table 16: Administrative Benchmarking Table: Glenwood Springs, CO - continued
Location Total Parks Budget
Parks Budget per Developed Acre
Total Recreation Budget
Total P & R Budget
Expenditure per 1000 Population
Glenwood Springs, CO $ 704,210 $ 8,484 $1,477,006 $2,181,216 $ 247,865 Breckenridge, CO $ 608,602 $40,573 $4,125,819 $5,343,023 $2,175,497 Carbondale. CO $ 431,963 $ 9,817 $ 381,855 $ 813,818 $ 132,199 Cortez, CO $ 391,376 $ 2,508 $1,090,677 $1,482,053 $ 176,982 Durango, CO $1,114,066 $ 5,598 $2,868,717 $3,800,783 $ 252,963 Pagosa Springs, CO $ 143,124 $ 5,963 $ 179,582 $ 322,706 $ 152,941 Silverthorne, CO $ 247,000 $ 7,484 $2,295,931 $2,542,931 $ 750,127
Table 16: Administrative Benchmarking Table: Glenwood Springs, CO - continued
Location Total Parks Revenues
Total Recreation Revenue Cost Recovery
Parkland Dedication
Glenwood Springs, CO 0 $1,078,824 49% 0.0070 acres per resident or 7 acres per 1000 residents Breckenridge, CO $30,000 $2,679,747 65% No Standards Set Carbondale. CO 0 $ 137,450 17% 15% Underlying Zones/25% PUD Cortez, CO 0 $ 658,409 44% 5% of Gross Land Area Durango, CO $41,854 $2,165,695 56% Negotiated Pagosa Springs, CO $33,000 $ 51,000 26% 0 acres Silverthorne, CO $ 1,750 $1,522,782 60% 6 acres per 1000 residents
Note: The Town of Breckenridge has the second lowest population but has the highest total parks and recreation budget in the cities and towns that were compared to Glenwood Springs. This high parks and recreation
budget can be attributed to the tourist destination venues it operates such as the recreation center, indoor ice rink and Nordic center. The operational costs associated with these venues along with other park and recreation facilities and program offerings provide a very high level of service for permanent residents of the community.

Glenwood Springs, Colorado Parks and Recreation Comprehensive Master Plan page 29
Analysis of Benchmarking The City of Glenwood Spring is a growing community as are the areas that surround it. However due to its location available spaces to expand residential development are becoming rare. The City of Glenwood Springs is a unique community and depends heavily on tourists dollars to help sustain it. With that in mind, the City of Glenwood Springs should use this Benchmarking against itself today and over time in order to maximize the park and recreation offerings it has and continue to maintain the high level of resident satisfaction. Items of Note:
• The City of Glenwood Springs is the forth highest in Expenditures per 1,000 people. This figure should be noted as the City has the second highest population of the comparable Cities.
• The City of Glenwood Springs is fifth lowest in acres per 1,000 people. This figure is not surprising due to the geological location of the City and the demand for development to support the growing population.
• The Cost Recovery of 49% for Parks and Recreation is the forth highest behind the Town of Breckenridge, Silverthorne and the City of Durango. There is a trend for increasing cost recovery throughout the U.S. John Crompton from Texas A & M, a leading educator and researcher on the benefits and economic impact of leisure services indicates that the national average is around 34% cost recovery, conversely indicating an average of around 66% subsidy. The City of Glenwood Springs is well above the national average with its cost recovery. As operation and maintenance costs continue to rise, it will be difficult to match these increases with new tax dollars as both property and sale tax levels are already high. It will be important to for the City to manage its fee structure to assist in covering additional costs and seek to be unique in its program offerings in order to grow its customer base. Additionally, it will be prudent to examine alternative funding mechanisms in order to maintain current costs recovery levels.
• Park Full Time Employees – The City of Glenwood Springs has 1 FTE dedicated to parks maintenance for every 11.9 acres of park land. This is the 3rd lowest staff to developed park acreage ratio.
• Parks Budget Per Acre – The City of Glenwood Springs spends approximately $8,484 in maintenance dollars for each acre of athletic fields and park land it owns and operates.
However it should be noted the some of these dollars go to trail maintenance and support services for special events. This ranks second among the cities that were benchmarked.
• Park Dedication Requirements –There seems to be no discernable trend in park dedication requirements within the Cities that were benchmarked. The public process that took place as part of this plan showed that residents of the City along with those living outside the City limits enjoy all the outdoor activities that are available to them. National trends also show steady growth in participation for many outdoor activities such as walking and biking and team sports such as soccer, football and lacrosse. It will be important for the City to work strategically with developers to maximize new park development as the inventory of available lands continues to dwindle.
C. Benchmarking - Fees and Charges Four Colorado cities were solicited to participate in the fees and charges benchmarking that were comparable:
• Breckenridge • Cortez • Durango • Silverthorne
Areas benchmarked included Resident and Non-Resident Annual Pass fees for Family, Adult, Youth, Child, Senior and Corporate categories; Resident and Non-Resident Daily Admission fees for Adult, Youth, Child, Senior and Family categories; and details regarding child care. Tables 19 through 21 shows the comparisons in a matrix. Benchmarking – Recreation Centers The type and size of the Glenwood Springs Community Center programming components such as an aquatics area, gymnasium and fitness area are comparable to many recreation centers in other communities in the State of Colorado. Recreation centers from the communities of Breckenridge, Cortez, Durango and Silverthorne were chosen for comparison due to their location in mountain and size of communities with a high volume of tourists that visit or travel through these cities and towns.

page 30 Glenwood Springs, Colorado Parks and Recreation Comprehensive Master Plan
Table 17: Recreation Fees Comparison - Daily Admission Recreation Fees Comparision Glenwood Springs Breckenridge Cortez Durango Silverthorne
Daily Admission Res/Non Res Res/Non Res Res/Non Res Res/Non Res Res/Non ResAdult $8.00/$9.00 $10.00/$10.00 $4.00/$4.00 $4.50/$4.50 $9.00/$9.00 (18+)Youth $6.00/$7.00 $6.00/$6.00 $3.00/$3.00 $3.50/$3.50 $6.50/$6.50Child Free (3yrs & younger) $5.00/$5.00 $2.00/$2.00 Free $5.50/$5.50Senior $6.00/$7.00 $6.00/$6.00 $3.00/$3.00 $3.50/$3.50 Free (70+ and Resident)Family $25.00/$25.00 N/A N/A N/A N/A Table 18: Recreation Fee Comparison - Annual Pass Recreation Fees Comparision Glenwood Springs Breckenridge Cortez Durango Silverthorne
Annual Pass
Family Res - $625Non Res - $750
Res - $817Non Res - $961
(Up to 2 Children)
2 people-$300,3 people-$360,4+people-$420
$500Up to 5 people
Res - $620.50County Res - $768.50
Non Res - $808.50
AdultRes - $380
Non Res - $435(18yrs to 59yrs)
Res - $367Non Res - $448(18yrs to 59yrs)
$300(19yrs to 59yrs)
$300(18yrs to 59yrs)
Res - $301.25County Res - $371.75
Non Res - $406.75(18yrs to 59yrs)
YouthRes - $275
Non Res - $315(4yrs to 17yrs)
Res - $219Non Res - $264(13yrs to 17yrs)
$180 (13yrs to 18yrs)
$180(4yrs to 17yrs)
Res - $181.50County Res - $227.50
Non Res - $239(12yrs to 17yrs)
Child N/A,(3yrs & younger)
N/A, (12yrs & younger)
$120(5yrs to 12yrs)
N/A(3yrs & younger)
Res - $181.50County Res - $227.50
Non Res - $239(4yrs to 11yrs)
SeniorRes - $275
Non Res - $315(60+ Years)
Res - $219Non Res - $264
(60+ Years)
$180(60+ Years)
$180(60+ Years)
Res - $247.50County Res - $319.00
Non Res - N/A(60+ Years)
Corporate $75 Application Fee then 10% Discount N/A N/A N/A N/A

Glenwood Springs, Colorado Parks and Recreation Comprehensive Master Plan page 31
Memberships and Fees Several different types of memberships were researched to see how the Glenwood Springs Community Center compares to other facilities. Findings on fees and memberships are summarized below. Resident Fees The Glenwood Springs Community Center has:
• The third highest family annual residents membership fees behind Breckenridge and Silverthorne
• The highest adult annual resident membership fee • The third highest adult daily resident rate. • The highest youth annual resident membership fee. • The second highest youth daily resident fee • The highest senior annual resident membership fee • The highest senior daily resident fee.
Non-Resident Fees Of the four recreation centers that were compared to the Glenwood Springs Community Center, only Breckenridge and Silverthorne have non-resident fees. Centers in Cortez and Durango do not have non-resident fees. Non-resident fees charged by the Glenwood Springs Community Center are:
• The third highest for family annual memberships • The second highest for adult annual memberships and daily
fees • The highest for youth and senior annual memberships and
daily fees Corporate Fees The Glenwood Springs Community Center is the only center that promotes a corporate rate that offers discounts to employees after an application fee is paid.
Child Care Child care opportunities for recreation center visitors were also researched at each of the selected sites (see Table 21). Child care is defined as a place where parents can drop of children in order to participate in an activity inside the recreation center. Cost, hours of operation, inclusions and restrictions were determined and compared against the Glenwood Springs Community Center. In summary the Glenwood Springs Community Center:
• Is the only center of those contacted that includes child care with the purchase of an annual pass
• The Glenwood Springs Community Center has the third highest hourly rate for child care

page 32 Glenwood Springs, Colorado Parks and Recreation Comprehensive Master Plan
Table 19: Recreation Fee Comparison - Child Care Recreation Fees Comparision Glenwood Springs Breckenridge Cortez Durango Silverthorne
Child Care
Included in Addmission or Annual Pass
Family and Youth Annual Pass No No No No
Drop in Fees Res - $4.00/hr Non Res - $6.00/hr $5.00/hr $2.00/hr $2.00/hr
$4.50.hr (Pass Holders)$5.50/hr (Non Pass
Holders)
Min Age 1 yr 3 months 2yr & Toliet Trained None 6 months
Max Age 7 yrs 6 yrs 8yr None 6 yrsMax # of Hours 2 hrs 2.5 2 2 2
Operating Hours
M-Th 8am to 11:30am & 3pm to 8pm
F-Sat 8am to 11:30amSun - Closed
M - F 9:30am to Noon
M-F 8:00am to 1:00pm & 4:00pm to 8:00pm
Sat 8:00am to noonSun Closed
M-F 8:00am to 1:00pm & 4:00pm to 8:00pm
Sat 8:00am to noonSun Closed
M-F 8:30am to 11:30am & 5pm to 7:30pm
Sat 9am to 11:30amSun - Closed
D. Planning and Design The primary planning issues facing the City of Glenwood Springs have to do more with transportation issues than anything else. Trying to establish additional vehicle routes through town for cargo trucks and commuters while maintaining the vital tourist traffic is a tremendous challenge for the City.
Another major transportation planning issue facing the City is coordinating the master planning of the City’s trails system. There are two major trail systems, one that runs east and west along the Colorado River and the other that runs north and south along the Roaring Fork River. Many sections along both trail corridors are not connected. The River Trails Commission is the primary planning entity that assists the City in determining priorities for trail development along the river corridors and is made up of appointed volunteers. The enormity if this project probably requires a separate coordinator position. This position would also oversee development of secondary trails throughout the City.
E. Marketing and Communications There is not a formal division or position dedicated to marketing, communication or public relations for the Parks and Recreation Department. A Marketing Plan was created for the Community Center designed around the idea of using a minimal marketing budget. The plan’s key goals are to:
• Increase awareness and interest of programs and activities • Increase program enrollment and promote memberships • Gather feedback • Reach visitors or tourists and other target markets • Promote employment opportunities
The Department contracts the design and development of an activity guide three times per year. Testimonials and photos are included in the guide. The “Community Center Activities Guide - Parks and Recreation” is produced through a collaborative arrangement with the Glenwood Springs Arts Council Center. The Arts Center also promotes their arts and dance classes, exhibits and events in this guide that is direct mailed to every household in the City of Glenwood Springs.
Flyers are distributed to students through the schools, at the community center and at events. The local government television channel, radio station and newspaper run public service announcements or press releases on upcoming activities and events. Monthly emails are sent to those with memberships. Signs and banners are displayed where possible. The Parks and Recreation Department is promoted through the Chamber of Commerce’s publications (including its magazine and trail map) and has a link from both its website (where tourism is promoted) and the City’s website to the Department’s own site. A variety of information regarding the Department, the Community Center, activities, shelter rentals, park amenities and locations, schedules and employment opportunities are available. The site has an active recreation interest survey that doesn’t yield much result, and the current “Community Center Activities Guide - Parks and Recreation” can be downloaded.

Glenwood Springs, Colorado Parks and Recreation Comprehensive Master Plan page 33
F. Information Technology
The Information Systems Department is currently down to two (2) full time staff (last year they had three (3) full time staff and were also contracting services). According to the Department’s Director, they should be operating with the equivalent of four (4) full time staff. As you increase the Parks and Recreation Department’s services and facility responsibilities, the need for technology also increases. Ideally, you should increase the support services to deal with technology demands. Without good tracking, management, and integration processes, the use of available technological information for sound decision making is limited. The Parks and Recreation Department has been allowed to research, suggest and implement the software systems they feel best suits its needs. Presently, they use RecTrac. G. Park Maintenance
Open Space, Parks, and Trail Systems The City of Glenwood Springs, Parks Maintenance Division manages a diverse number of facilities that include parks, athletic fields and cemeteries. Additionally the City manages a trail system that primarily runs east and west along the Colorado River and north and south along the Roaring Fork River. The Parks Maintenance Division also oversees the maintenance of city tennis courts, city basketball courts, playgrounds and park structures such as picnic shelters. All of these facilities and properties provide recreational opportunities for residents of the City, residents of the surrounding communities and tourist that visit throughout the year.
Parks, Athletic Fields, Undeveloped Lands The Maintenance Division oversees approximately 83 acres of park land and athletic fields, a yet to be determined number of acres of undeveloped lands, two cemeteries (one active and the Doc Holiday historical cemetery site), medians and streetscapes. Turf and athletic field maintenance is done primarily from March thru October. The Parks Maintenance Division is also responsible for maintenance of trees on City properties.
Maintenance duties include:
• Turf care – sports fields • Turf care – open turf areas • Fertilization • Irrigation • Litter control • Pruning • Disease and pest control • Lighting • Other surfaces (sweeping and cleaning) • Inspection (play structures, buildings and surfaces) • Repairs (play structures, buildings, fences and surfaces) • Restroom servicing (does not include portable toilets) • Special features (drinking fountains, BBQ grills, etc.) • Trial corridors • Natural areas and greenways • Tree, plant or shrub replacement
It is the Parks Maintenance Division’s desire to maintain all landscapes, parks and recreation facilities in good condition. The Department feels that current budget levels are sufficient to maintain this standard. However staffing levels are strained due the difficulty in filling positions at the wages being offered, (higher wages are available at local resorts). There are a number of undeveloped areas in the City but they only receive minor maintenance such as weed and litter control. The Department would like to see some to these lands developed into additional parks, both active and passive, but feels it would have trouble maintaining them at current budget levels. Athletic fields receive a higher level of maintenance through an increase in frequency in mowing and fertilization. Athletic Fields and Capacity Issues Many of the sport associations that provided input on the athletic field needs in the City expressed a concern about the lack of field availability. The Department understands this need and would like to provide more. However the Department also points out the many of these associations only want to use fields Monday thru Thursday after 5:00pm. The Department feels that some capacity issues could be eliminated if sport associations would schedule more practice and game times during non peak hours such as Friday evenings, weekends or before 5:00pm Monday through Thursday.
Trails There are two major concrete trails systems located within the City and maintained by the Parks Maintenance Division. The concrete trails systems run east and west along the Colorado River and North and South along the Roaring Fork River. However there are many sections of these trails that are not continuously connected. The Department monitors these trails for safety issues and plows them during the winter months. There are also numerous soft trail systems located on City properties used for hiking and biking. The Department relies heavily on volunteer groups to help monitor and maintain these trails for their use.
Contracted Services All park maintenance tasks are handled primarily internally by the Department with the exception of tree maintenance that is contracted out from time to time depending on workload. Installation and maintenance of portable toilets are contracted out to a private company.
Budget Levels Budget levels for the Department have hovered around the $660,000 to $705,000 level for 2003 to 2005. The Department has seen an increase of over $40,000 in 2006. Table 22 below shows the expenditures associated with the park maintenance operations. Table 20: Public Works Operations Division - Park Maintenance Budget
Expenditures 2003
Actual 2004
Actual 2005
Budget 2006
Projected
Personnel • Fulltime • Part Time • Benefits
$222,132 $ 77,289 $ 89,788
$232,840 $ 65,000 $ 89,765
$246,051 $ 68,000 $103,909
$248,908 $ 68,000 $145,947
Materials & Services $318,244 $278,250 $286,250 $285,450
Capital Outlay $ 0 $ 0 $ 0 $ 0
Total $697,410 $665,855 $704,210 $748,305

page 34 Glenwood Springs, Colorado Parks and Recreation Comprehensive Master Plan
Revenues The only revenue the Department generates is from rental of picnic shelters. This revenue goes directly into the general fund. Other opportunities that exist to generate more funds for maintenance would be to institute player use fees or team fees from sports providers that use City fields. These funds could be designated as “field maintenance fees” and used solely for the purpose.
Cost Per Maintenance Task The Department currently does not track maintenance cost per task. It is not high priority for the superintendent to develop a system that tracks maintenance cost per task but it is realized that it may be necessary in order to justify ongoing budgets levels or increased budget levels.
Staffing Levels Currently maintenance duties for parks and recreation facilities are handled by seven (7) full time equivalent (FTE) positions including the Department Manager supplemented by seasonal employees. Seasonal or part time employees currently make up around 10% of the Department’s overall budget depending on the fiscal year’s budget. Seasonal or part time labor hours for the last 4 years can found below in Table 23. Table 21: Seasonal/Part Time Labor Hours Year # of Hours Time Period
2003 7,149 4/6/03 to 11/29/03
2004 6,099 3/21/04 to 11/27/04
2005 3,910* 3/6/05 to 11/26/04
*Decease in hours was due to the inability to find enough candidates to fill the seasonal positions.
Maintenance Scheduling The Department does not have a park maintenance program with a schedule for all maintenance tasks throughout the calendar year. The exception is that park maintenance crews have a weekly mowing and irrigation schedule during the growing season. Most other park maintenance tasks such as fertilization, weed and insect control, over-seeding and aeration are performed on an as needed basis and also as staffing availability allows.
Irrigation All developed parks are irrigated and are on automatic onsite systems. The cemetery is not on an automatic irrigation system. Improvements to the irrigation infrastructure that would assist in more efficient use of water and staff time would be the installation of centralized control station and the addition of an automatic system at the cemetery.
Equipment Turf and field maintenance equipment such as mowers, edgers and blowers are primarily purchased rather than leased. A preventive maintenance program is in place to maximize equipment lifespan. Lifecycle assessments and costing is not used to project future equipment need and costs.
Park Maintenance Primary Concerns It is the Parks Maintenance Division’s goal to maintain all facilities in good condition. It is a concern of the superintendent that the number responsibilities being handed by this department has stretched his time and ability to effectively and properly manage. The addition of qualified staff could help alleviate this to some degree but current wages being offered are not attracting suitable candidates. Until June of 2006 two maintenance staffing positions remained unfilled hampering the Department’s effort in maintaining parks, athletic fields and trails. Other top Department concerns focus around:
• The lack of an equipment replacement schedule for both park amenities, such as playgrounds, and maintenance equipment, such as mower and vehicles, creates uncertainty about the quality of ongoing service the Department can provide. The tremendous use that both park amenities and maintenance equipment receive demands regular repair and replacement programs in order to keep up with the expectations of the community.
• Improvement to parks restrooms. Many park restrooms are in need of updating and in some cases also need to be made available year around.
• Updating skate park components. Current skate park components are getting old and risk falling into disrepair.
• Better parks signage, identification and wayfinding system. The geographical location of the City does not necessarily lend itself to large tracks of open spaces to easily identify
park locations. Many parks are “tucked away” and difficult to find. Improvements to signage and the development of a park location brochure would help the community and visitors find locations to participate in outdoor activities.
• Vandalism is an ongoing concern. As with communities in Colorado and across the country, vandalism of park amenities is an ongoing issue in the City of Glenwood Springs. Vandalism creates unplanned expenses that put strains on budgets and manpower. Adopt a Park programs that organize community activism in reporting these instances and monitoring use of parks may help in reducing vandalism.
• The need for more sun protection. Temperatures in the City can reach 90 to 100 degrees regularly during the summer months making uncovered playground equipment unusable for a good part of the day. The addition of shade structures in the most utilized parks would be a benefit to the community.
Trends in Parks, Open Space and Trail Maintenance Practices Park Maintenance Staffing Standards Very limited information exists regarding standards for labor ratios for park maintenance activities. In his book, Municipal Benchmarks Assessing Local Performance and Establishing Community Standards, David N. Ammons reports that “although every municipality may wish to design its own standards to reflect local preferences and conditions, it need not start from scratch.” He further suggests that the following labor ratio guidelines devised by the National Recreation and Park Association (NRPA) may be useful to a community deciding on its own standards, procedures, and resource requirements. Table 24 which follows describes the labor rates from NRPA.

Glenwood Springs, Colorado Parks and Recreation Comprehensive Master Plan page 35
Table 22: Labor Ratios for Selected Community Services Maintenance Activities Labor Ratios for Selected Community Services Maintenance Activities
Task Labor Hours
Mowing 1 Acre, Flat Medium Terrain at Medium Speed
20” walking 2.8 per acre
24” walking 2.2 per acre
30” riding 2.0 per acre
72” (6-foot) riding 0.35 per acre
Bush hog 0.5 per acre
Trim
Gas powered (weedeater) 1.0 per 1,000 linear ft.
Planting Grass
Cut and plant sod by hand (1.5’ strips) 1.0 per 1,000 sq. ft.
Cut and plant sprigs by hand (not watered) 10.9 per 1,000 linear ft.
Seed, by hand 0.5 per 1,000 sq. ft.
Overseeding, Reconditioning 0.8 per acre
Fertilize Turf
24”: sifter spreader 0.16 per 1,000 sq. ft.
Hand push spreader 36” 2.96 per acre
Tractor towed spreader 12” 0.43 per acre
Weed Control
Spraying herbicide w/fence line truck, tank sprayer 2 ft. wide (1” either side of fence)
0.45 per 1,000 sq. ft.
Labor Ratios for Selected Community Services Maintenance Activities
Task Labor Hours
Leaf Removal
Hand rake leaves 0.42 per 1,000 sq. ft.
Vacuum 30” 0.08 per 1,000 sq. ft.
Planting Trees
Plant tree 5-6 ft. ht. 0.44 per tree
Plan tree 2-3.5” dia. 1.0 per tree
Tree Removal
Street tree removal 13.0 per tree
Street tree stump removal 3.5 per tree
Park tree removal 5.0 per tree
Park tree stump removal 2.0 per tree
Ammons also indicated that a report “prepared by a management analysis team in Pasadena, California, concluded that a ratio of one park maintenance employee for every 7-10 acres should produce ‘A-Level’ service—in other words, ‘a high-frequency maintenance service’ (City of Pasadena [CA] Management Audit Team, 1986, p. 9.4).” However, he was quick to point out that “standards of the maintenance-employee-per-park-acreage variety and corresponding statistics reported by individual cities, are complicated by the question of developed versus undeveloped park acreage … and therefore should be interpreted cautiously.” Among ten cities he examined, ratios of 10.6 to 84.7 acres maintained per maintenance employee were reported. Currently the City has one fulltime employee for every 11.7 acres of developed parklands and athletic fields. The City has 7 fulltime employees for every 83 acres of developed and undeveloped park acreage. With such variables in reporting from different communities, it is less important to measure this aspect of operations against other communities and more important to establish a benchmark for the
City of Glenwood Springs against citizen expectation and satisfaction levels. Parks Maintenance Budgets Park maintenance budgets have shrunk over the past years. For instance, in 1998 the City of Denver Parks budget allowed approximately $6,300 per urban park acre. In 2004 the City of Denver Parks budget was reduced to approximately $5,000 per urban park acre. In Boulder, Colorado between the years of 1992 – 1994 the budgeted cost per acre to maintain an urban park acre was approximately $4,000 and in 2004 the budgeted cost per acre to maintain an urban park acre was approximately $4,100 representing only a $100 an acre increase in the parks maintenance budget in 10 years. Using a 3% annual inflation rate, budgeted park maintenance per park acre would have increased by $1,591 from 1994 to 2004 to a total of $5,520 per acre. At a 4% annual inflation rate the budgeted park maintenance per park acre would be approximately $6,100. Athletic Field Maintenance A survey of five Colorado community Parks and Recreation Departments was conducted to develop a realistic perspective of current annual maintenance costs for athletic fields. The costs for maintenance of athletic fields in park settings ranged between $2,500 per acre and $6,000 per acre, with three of the five communities projecting between $5,000 per acre and $5,500 per acre. The costs for maintenance of athletic fields in complex settings ranged between $5,000 per acre and $12,000 per acre. The average maintenance cost for athletic fields in complex settings is projected to be between $6,500 per acre and $7,000 per acre. These estimates are based on 2005 budget schedules and actual expenditures for fiscal year 2004. The maintenance cost figures per acre include mowing operations, fertilization applications, aeration, weed and insect control, over seeding, topdressing, irrigation expenses (includes water where applicable), lining and striping, infield preparation, lighting, restroom cleaning, and trash removal. A yearly cost for maintaining athletic fields in park settings is projected to be $5,500 per acre. This cost includes the normal costs associated with the typical park maintenance operations (generally projected at $4,000 to $5,000 per acre) plus increased costs for additional fertilization, aeration, infield preparation, lining and striping, top dressing, etc. A yearly cost for maintaining athletic fields in a complex setting is projected to be $7,000 per acre. This cost includes the normal costs

page 36 Glenwood Springs, Colorado Parks and Recreation Comprehensive Master Plan
associated with the typical park maintenance operations (generally projected at $4,000 to $5,000 per acre) plus increased costs for additional fertilization, aeration, infield preparation, lining and striping, top dressing, field lighting, restroom maintenance, etc. To project the annual maintenance costs for the existing athletic field facilities, the following categories have been established with size assumptions and proposed uses:
• Baseball/softball fields in park setting 1.2 to 2.0 acres @ $5,500 per acre = $6,600 to $11,000
• Baseball/softball fields in complex setting 2.0 to 2.5 acres @ $7,000 per acre = $14,000 to $17,500
• Multi-use turf fields in park setting 1.5 to 2.0 acres @ $5,500 per acre = $8,250 to $11,000
• Multi-use turf fields in a complex setting 1.5 to 2.0 acres @ $7,000 per acre = $10,500 to $14,000 (Multi-use turf fields include soccer, football, lacrosse, rugby, etc.)
H. Recreation
Contracted Services The Recreation Division contracts the following services:
• Brochure development and graphic design • Heating, ventilation, and air conditioning servicing • Dance instruction • KidKamp programming • Buses and bus drivers • Learn to ski and snowboard programming
Budget Levels The Recreation Division does not do program or activity based budgeting and most back up detail is unavailable. The definition of direct and indirect costs is not uniformly applied. Revenues are not easily tracked; nor are they compared to cost to provide the program or service. Program area or facility cost recovery percentages are not available.
Staffing Levels - Paid The Recreation Division’s full time staff includes six (6) Recreation Coordinators, one (1) Building Maintenance Foreman, and one (1) Administrative Assistant. Peak seasonal part time staff totals 125. The Aquatics Coordinator is a certified Aquatics Facility Operator (AFO).
The Division has part time staffing level limitations dictated by general fund spending constraints. Through a detailed activity-based budgeting, the Division would be better able to match staffing levels to operational and programmatic needs. The struggle to attract and retain qualified aquatics staff has caused pool closures. The current hourly salary range is $8-12 per hour and competition for lifeguards is fierce. To be competitive, the starting hourly rate may need to increase.
Training The Aquatics Division has an extensive new employee orientation and training program as well as a detailed and thorough aquatics center procedural manual. The Division attempts to recruit staff and train them through a feeder program for lifeguards and instructors. Teens 12-14 years participate in a junior lifeguard training or swim instructor course for up to six (6) weeks. The Junior Lifeguard training program follows the Jeff Ellis & Associates guidelines. Water Safety Instructor and Lifeguard Training courses are also offered for older teens. The Department also has a well developed internship manual. This guide provides background information concerning the policies and procedures for students wishing to intern with the City of Glenwood Springs Parks & Recreation Department. The principle purpose of the intern program is to assist students in making an effective transition from the classroom to the professional world. It is designed to give students the opportunity to explore the recreation field and discover in which areas their interests lie. The Department’s goal is to assist the intern in becoming a professional capable of securing, through practical experience, a permanent position in the parks and recreation field. The Department does not have a detailed emergency action plan. And the facility does not have an operational procedure manual.
Revenues Recreation non-tax subsidized revenues come from fees and charges for the community/aquatics center and skating rink admission fees and memberships; facility and equipment rental fees; park reservations; program fees; grants and donations.
Community/Aquatics Center and Skating Fees The daily drop in fees include use of the pool, water and floor aerobics, public skating (November through March), climbing wall, tennis without reservations, gymnasium, running track, ongoing fitness classes and fitness center. KidKare is an additional fee. There is a separate Ice Rink only daily admission fee for public skating if there is no desire to use the other amenities at the community center. And there is a tennis court reservation fee for non-members. Memberships are available for 10-punch card, monthly, six (6) months and one (1) year. Youth, Adult, Seniors age 60 years and up and Family Resident and Non-Resident rates apply. Facility and fitness program benefits are the same as are included in the daily drop-in fee but at a significant savings. KidKare is included in the Youth and Family Memberships. Corporate memberships are also available and require a $75 application fee. Employees and their family members are then granted a 10% discount off of all types of yearly resident memberships. Facility Rentals Community rooms and the skating rink are available to rent by the hour or by the day. Non-profit/government and general rates apply. Tables and chairs are included in the fees, as well as set up and tear down services. Audio Visual equipment is also available for an additional fee. Program Fees The City doesn’t have a formal fees and charges policy. However, it is understood by staff that fees are based on direct cost recovery but this is not uniformly applied. Currently fees are evaluated every three years; however, the City is going to a two year budget cycle, so fees will need to be evaluated bi-annually. There is not a structured or formalized advertisement or sponsorship policy.

Glenwood Springs, Colorado Parks and Recreation Comprehensive Master Plan page 37
I. Finances and Traditional Funding The primary sources of traditional funding for parks maintenance and recreation operations come from the General Fund. The General Fund is primarily made up of property and some sales taxes. Other sources of funding include cash in lieu of land dedication that is used for capital projects. The overall City budget includes a variety of funds supported through voter approved tax, fees, charges and other revenue streams, grants and other alternative funding sources. Currently, the City’s sales tax rate is 3.7% Acquisitions and Improvements (AI) Fund
• This fund is one (1) cent of 3.7 cents sales tax; • Revenues are bonded to MOC (maintenance, fleet, public
work), city hall and community center, and water line debt servicing;
• $3.9 million in revenue: $2.3 million is debt service; $1.6 million remainder;
• Of the remaining $1.6 million, $500,000 is allocated to the RiverTrails; $100,000 is discretionary funding in the community for civic, cultural, senior, meals on wheels, programs and other projects through an application process; $136,000 is for economic incentive rebates (for Glenwood Meadows or other commercial developments); $164,000 for cost allocation; $60,000 is miscellaneous expenses; $700,000 remaining for fund balance deficits; these funds also support the arts center and the museums.
Capital Projects Fund
• This fund is a ½ cent sales tax for infrastructure needs; its balance is under $2 million; for 2007 $1.6 million spoken for; goal is to raise water and sewer rates in May of 2006 in the enterprise fund and use that for infrastructure funding; then the Capital Projects Fund can be used for rolling stock.
• Capital needs for Community Center and City Hall will eventually come from the capital projects plan in several years. Emergencies are tapping into the AI Fund now.
Special Revenue Funds
• Street Maintenance has its own fund with a dedicated ½ cent tax.
• Other Special Revenue Funds include a tourism or accommodations tax for tourism promotion which is contracted to the Chamber of Commerce; VALE fund which is victims assistance; Conservation Trust fund; bus tax fund which is 2/10 of cent for the new free bus service balanced with grants
• The City might be able to include additional cost allocation for these funds
• Recreation grants would go into General Fund, AI Fund, or into the Capital Fund if the project is capital in nature with separate line items to account for expenses.
Fund Balance Each fund has fund balance - the General Fund is 10-15% of the annual budget; and there is a contingency reserve in General Fund of 10%; the Enterprise Funds have no guidelines for fund balance nor does the CIP or Special Revenue Funds. Equipment Replacement Funding There is not an established Equipment Replacement Fund. The Finance Director hopes to establish a sinking fund in 2007. It will probably be seeded through the existing capital funds then ongoing funding through annual allocations from each fund. Park Development/Land Dedication Funds Park Development or Land Dedication Funds are established by city ordinance 070.030.150. As of November 2005, there is $27, 775 in the capital projects fund. These funds can not be used to offset operations and maintenance costs. The General Fund The General Fund is mostly property tax supported. The net mil levy is 4.863%. These mils are distributed as follows:
• IGA with rural fire protection district - 1.602 • General Fund levy 2.603 mils - generates $402, 800
• 1.061 mil for capital expenditures for fire • Commercial property tax
J. Alternative Funding Sponsorships with local businesses are used for underwriting various special events. There is currently not a formal policy regarding sponsorships nor is there a central repository for Department-wide prioritized and strategic solicitation. Grants are researched and used for capital funding shortfalls and program underwriting. In the past the Department has received grants from WalMart, Environmental Foundation of the Aspen Skiing Company, White River National Forest Association, Rotary and Great Outdoors Colorado (GOCO). In addition, the Barracudas Swim Club was instrumental in raising donations to partially fund the new aquatics center. The group solicited both corporate and private donations for the construction project. The total pledge amount has changed to $1,699,000 and the amount given to the City to date as of July 27, 2006 is $563,789. Total amount collected is $1,424,000. This included a $750,000 allocation from the city and $100,000 from a DOLA Grant. K. Partnerships The City has a programmatic partnership with the White River National Forest; and a strategic partnership with the school district for reciprocal use of their facilities for the after school and summer camp programs. L. Summary of Key Findings The citizens of Glenwood Springs indicate that their highest priorities for facilities are trails, grassy and picnic areas, indoor fitness and performing arts. The highest need for programs is performing and visual arts, special events, fitness, and river instruction.

page 38 Glenwood Springs, Colorado Parks and Recreation Comprehensive Master Plan
VI. Great Things to Come - Recommendations and Action Plans A. Grand Challenges and Opportunities The Advocacy Update in the January 2006 issue of the National Recreation and Park Association’s magazine contains an article entitled “Top Ten Reasons Parks are Important.” Authors Richard J. Dolesh, Monica Hobbs Vinluan and Michael Phillips discuss the values of public parks and recreation in America. In no particular order, the list of values encompasses the essence of why we agree with the authors that “public parks and recreation are an essential part of our national heritage.” 1. “Public parks provide millions of Americans with the
opportunity to be physically active. Physical activity is an essential part of an individual’s efforts to stay healthy, fight obesity and prevent chronic conditions that lead to coronary disease, high blood pressure and diabetes. Having close-to-home access to places where one can recreate is one of the most important factors linking whether people will become active and stay that way.”
2. “Parks have true economic benefits. Proximity to a developed state, regional or community park improves property value. The economic benefits of park and recreation areas are manifold, but one of the most significant is the increase in value of private land adjacent or near protected public land. The proximity of parks to residential areas leads to increased value of private land, a higher tax base and ultimately many economic benefits to a community including increased local and regional revenue from heritage tourism, steady jobs, and numerous small business benefits. Park and recreation areas are economic engines that improve the quality of life and make communities livable and desirable for businesses and owners.”
3. “Parks provide vital green space in a fast-developing American landscape, and provide vegetative buffers to construction and development, thus reducing the effects of sprawl. More importantly, parks and public lands also provide groundwater recharge areas, floodplain protection, natural sound barriers, storm water protection from wetlands, reductions in heat island effects, and carbon uptake from abundant trees and vegetation. Parks keep our living environment healthy.”
4. “Parks preserve critical wildlife habitat. As our nation develops and our rural, agricultural and forest landscape is being lost, open space and wildlife habitats are disappearing at an alarming rate. The connected network of local, regional, state and national parks from across our country provide permanently protected wildlife habitat corridors for thousands of indigenous and migratory wildlife species. In addition, stream valley parks and community parks allow natural wildlife to co-exist with people while providing enjoyment for children and families.”
5. “Parks and recreation facilitate social interactions that are critical to maintaining community cohesion and pride. Parks provide a meeting place where community members can develop social ties, and where healthy behavior is modeled and admired. People gather to share experiences, socialize and build community bonds in common green spaces. These public commons are often the glue that holds the community together and the means to maintaining and improving future positive social interactions.”
6. “Leisure activities in parks improve moods, reduce stress and enhance a sense of wellness. In an increasingly complex world, more and more people are placing a high value on achieving the feelings of relaxation and peacefulness that contact with nature, recreation and exposure to natural open spaces bring. People go to the park to get in a better mood, to reinvigorate themselves and to decrease the anxieties of daily life.”
7. “Recreational programs provide organized, structured, enjoyable activities for all ages. The diverse range of recreational programs offered by public parks and recreation agencies offer all Americans the opportunity to develop the skills necessary to successfully and confidently engage in sports, dance, crafts and other social activities. Public recreation leagues and classes offer seniors, adults and children alike the opportunity to interact with coaches and teachers who often turn into mentors and role models. Quality recreational programs facilitate safety, good sportsmanship and community participation.”
8. “Community recreation services provide a refuge of safety for at-risk youth. Many parents are rightfully concerned with the dangers of unstructured ‘hanging-out’ or unsupervised after-school activities. Community recreation programs at public park and recreation facilities provide children with a safe refuge and a place to play, which are important in reducing at-risk behavior such as drug use and gang involvement. Recreational programs led by trained leaders offer children healthy role models and give valuable life lessons to help steer youth to a future of promise and opportunity for success.”
9. “Therapeutic recreation is an outlet that individuals with disabilities have to be physically active, socially engaged and cognitively stimulated. A goal of all public recreation agencies is to provide access to all people. Public park and recreation agencies are the largest providers in America of high-quality, life-enhancing, therapeutic recreation programs and interventions. Such programs prevent the on-set of secondary conditions due to inactivity, improve physical, social, emotional and cognitive functioning, and slow the onset of regressive conditions.”
10. “Public parks embody the American tradition of preserving public lands for the benefit and use of all. Since the creation of the first national park in the early 1900’s and the subsequent development and growth of state, regional and local park systems in virtually every part of our nation, Americans have had a special relationship with their parks and public lands. A love of parks is one of the defining characteristics of our national identity. Americans love their parks, historic sites, national monuments, recreation areas and public open spaces because they bring such joy and pleasure to all people. In addition, the American public has shown time after time that they are willing to care for their parks, protect them, and pay for them.”
Richard J. Dolesh is acting director of NRPA’s Public Policy Division. Monica Hobbs Vinluan is the senior policy associate for health and wellness issues. Michael Phillips is policy and advocacy specialist for the Division. For more information, go to www.NRPA,org.

Glenwood Springs, Colorado Parks and Recreation Comprehensive Master Plan page 39
B. Analysis of Priorities
Parks and Recreation Valued Equally The Research Update in the January 2006 issue of the National Recreation and Park Association’s magazine contains an article entitled “Components of Urban Park System.” Authors Chan Chung Shing and Lawal M. Marafa adapt information from Peter Harnik’s “The excellent park system” The United States: The Trust for Public Land, Harnik, P (2003), regarding the seven broad measures of an excellent city park system. Theses measures include:
Measure Key Questions (Extracts)
A clear expression of purpose
√ Does your agency have, and make available to the public, a written legislative mandate? A written mission statement? A written set of defined core services?
√ Does your agency publish a publicly available annual report? Does it provide hard, numerical information on outcome? Does it provide useful budget numbers?
Ongoing planning and community involvement
√ Is your park and recreation plan integrated into the full city-wide comprehensive plan?
√ Does the agency have an official citizen advisory board or similar community involvement mechanism that meets regularly?
Sufficient assets in land, staffing and equipment to meet the systems’ goals
√ What was your agency’ total actual revenue in the most recent completed fiscal year, including both operating funds and capital funds?
√ How many natural resources professionals - horticulturists, foresters and landscape architects - do you have on staff?
Measure Key Questions (Extracts)
√ How much did your agency spend in the past fiscal year, including maintenance, programming, capital construction and land acquisition?
Equitable access √ Do you know the distance from every residence to its nearest park? If so, what percentage of city residents are located more than one-quarter mile from a park of at least one acre in size?
√ Is there a formal disability advisory group to assist in meeting the physical and programming mission of your park system?
User satisfaction √ Is there at least one full-time person in the park agency devoted to surveying park users and non-users, and analyzing the surveys?
Safety form physical hazards and crime
√ How many uniformed park personnel does your agency have or contract with?
√ Do you systematically collect data on crimes that occur in parks?
Benefits for the city beyond boundaries of the parks
√ Does your city systematically collect data comparing property values near parks with those farther from parks, and repot on the findings?
Source: Adapted from Harnik (2003)
The Role of the Local Parks and Recreation Agency Contribution to the Community’s Economic Health The Glenwood Springs Parks and Recreation Department acts as a major employer for the City’s economy and plays an important role in the tourism industry that is an economic driver for the City.
Contribution to the Community’s Physical Health Below is a news release on a policy statement appearing in the May 2006 issue of Pediatrics, the peer-reviewed, scientific journal of the American Academy of Pediatrics (AAP). Active Healthy Living: Prevention of Childhood Obesity through Increased Physical Activity Physicians and health care professionals can help prevent and curb childhood obesity by working with families and communities to improve nutrition and encourage physical activity, especially through in-school programs, according to a new American Academy of Pediatrics (AAP) policy statement. According to the 1999-2000 National Health and Nutrition Examination Survey, the prevalence of overweight or obese children in the U.S. has tripled since the 1960s to more than 15 percent. The policy statement, “Active Healthy Living: Prevention of Childhood Obesity through Increased Physical Activity,” recommends that physicians regularly assess a child’s weight, diet, and level of physical activity. Physicians should work with families to identify possible barriers to healthy living and suggest positive changes when necessary. Parents also should be encouraged to serve as role models of healthy living through their diet and exercise regimens, and encourage their children to participate in sports and other physical activities. The policy recommends that physicians and health care professionals aggressively advocate for:
• School and community recreation programs that encourage physical activity;
• School curriculums that foster better nutrition; • The creation of school wellness councils that include
physician representation; • The reinstatement of compulsory, quality, daily physical
education programs; • The protection of school recess time; • The creation of safe recreational facilities, parks,
playgrounds, bicycle paths, sidewalks and crosswalks; • More funding for quality research in the prevention of
childhood obesity; and • Social marketing that promotes physical activity.
Clearly, community park and recreation agencies play a vital role in the health and welfare of our children; both as a direct provider of

page 40 Glenwood Springs, Colorado Parks and Recreation Comprehensive Master Plan
services, programs and facilities, and as a partner with the health profession and educational system. Contribution to the Community’s Quality of Life The National Recreation and Park Association has twenty-four (24) policy statements that advocate the breadth of benefits these services and facilities contribute to and provide for the overall economic vitality, health and quality of life within a community. These policy statements include:
1. Childcare, “Latchkey” Children and Recreation 2. Recreation and Fees 3. Recreation Access 4. The Environment and Recreation 5. Fiscal Resources 6. Fiscal Resources for Recreation and Park Capital Investment 7. International Affairs 8. Limited Purpose Accounts, Funds and Trusts 9. Medicaid Reform and Community-based Services 10. National Institution for Policy and Program 11. Recreation and Health 12. Recreation, Health and Fitness 13. Recreation and Older Americans 14. Restoration of Recreation and Park Infrastructure 15. Recreation Youth Development 16. Renewing the Urban Community 17. Savings and Loan Properties 18. Scenic Byways 19. School-Age Children and Recreation 20. Volunteer Protection 21. Water-based Recreation 22. Gender and Equity 23. Fiscal Resources 2 24. Unfair Competition
According to the NRPA website, on July 11, 2005 bill number ACR 77 was introduced in the California State Assembly that "would recognize the importance of local recreation and park agencies in the effort to reverse negative trends in inactivity, obesity, diabetes, and other health problems among Californians and encourages the state to utilize and partner with local recreation and park providers to create a healthier state".
Analysis and Recommendations Regarding Management Issues This master planning document recognizes that the current management system has many things to be proud of as well as several opportunities for improvement. Adequate planning is essential at this critical time in Glenwood’s history, for the future of all current and future residents. Although agreements with other entities are in place for the provision of certain services, these agreements are in some cases lacking important components and need to be formally reviewed on an annual basis.
Analysis of Financial Planning and Recommendations for Funding Strategies The City of Glenwood Springs uses a number of options for funding parks and recreation services including traditional funding such as local sales and property taxes, to name a few. The City has the ability to use these and other funding mechanisms to enhance the quality of life in Glenwood Springs and expand recreation and park services to the community.
Traditional Funding Mechanisms Park and Recreation Capital Development In the past the City has funded capital development through cash-in-lieu of land dedication, sales tax funded debt service, and revenue bonds, along with alternative funding mechanisms discussed later. The City is experiencing moderate growth. Cash–in-lieu of land dedication for future annexation areas is not typically considered due to the lack of land for park purposes. The topography of the area and lack of available land, coupled with the current limited inventory, provides little development opportunity. The purchase of existing commercial properties and re-zoning efforts may be a viable option. However, this will require dedicated development funding such as bonding or a tax appropriation. Debt Service, Loans and Bonding: The City is currently paying down debt service for the community center and aquatics addition. Dedicated Tax: The City doesn’t presently have a dedicated tax or special parks and recreation taxing district to fund park and recreation infrastructure improvements. The survey results indicate that citizens would prefer park and recreation facilities, programs and services provided by the City rather than creating a special district funded through additional property taxes. The City could
consider a dedicated sales or utility tax to fund parks, recreation and open space needs. Park and Recreation Operations, Maintenance and Equipment Repair/Replacement: The City doesn’t presently dedicate a portion of sales tax revenue to Parks and Recreation facilities and services but rather the Department’s budget competes for tax subsidization support through the general fund with all other departments. The City could consider a dedicated admission or sales tax to Parks and Recreation needs. Recreation Programming and Admissions Research indicates that there is not a detailed computerized tracking or budget monitoring system in place on the programmatic level. Because the present budgetary system doesn’t combine revenues with expenses, it is difficult to determine the cost recovery and subsidy level of each program and facility or if they are meeting desired cost recovery levels. This Study has indicated that the City of Glenwood Springs Parks and Recreation Department is well positioned in its target market. Its fees and charges should be community-benefit based and market-driven based considering both public and private facilities. The potential outcome of revenue generation is consistent with City of Glenwood Springs’ desire for a self-sustaining program, market-driven pricing, niche and market share.
Specific Recommendations The City should use zero-based line item budgeting for every program and service and track expenditures and revenues to establish current cost recovery. After creating a cost recovery policy, the City should annually evaluate fees and charges during budget preparation based on its cost recovery policy. Cost Recovery Pyramid Methodology, developed by GreenPlay, LLC is discussed in Appendix H. KidKare Financial records indicate that the KidKare program may not be generating adequate revenue to cover all the direct expenses associated with offering this service. The City could lessen the expenses related to providing the KidKare program and evaluate potential revenue generation opportunities like fee increases, pursuing grants and donations, or limit the hours available to the

Glenwood Springs, Colorado Parks and Recreation Comprehensive Master Plan page 41
peak demand periods. This could reduce or offset the cost of providing this highly individualized service and minimize or eliminate subsidization of this service. Options to be considered individually or in tandem include:
• Create a more accurate cost recovery picture: o Absorb the cost of providing KidKare into the facility
budget and consider this a direct cost of the facility. o Allocate a percentage or amount of the family pass
revenue to the KidKare program as the offsetting revenue stream.
• Increase fee for program users: o Consider an extra fee for this service based on actual
direct costs to provide 100% cost recovery. The dilemma is the publics’ perception of an additional service or “perk” to those roughly 93 families (both resident and non-resident) with children utilizing this highly individualized service that are paying the same amount as a family who has no need for this service. A service which does not benefit the community as a whole and according to the “Pyramid Methodology” should at least break even in cost recovery.
As indicated through the fee benchmarking analysis, no other agency offered this highly individualized service as a benefit to annual pass holders. The daily fee is on the high end of those benchmarked but there is room to increase it. However, most people taking advantage of this service do so through the annual pass.
• Reduce program expenses: o Offer the service only during peak fitness/exercise
times to concentrate the staffing and use o Require pre-registration for reserved spaces with a
cancellation fee for no shows. Daily Admission and Pass Fees The fee benchmarking analysis indicates that the City of Glenwood Springs’ daily admission and pass fees are on the high end, but less than some other comparable facilities. While there may be room to increase, the high cost of living in the City and surrounding area
makes increasing these fees an undesirable consideration for both residents and non-residents. Corporate Fees A more aggressive marketing approach to increase the number corporate pass holders may be considered, but no other agency benchmarked in the fee analysis offers a corporate fee program. Fee increases are neither advised nor warranted but rather a targeting marketing effort capitalizing on this as a benefit to working, living and playing in Glenwood Springs should be pursued.
Overall fees and Charges The City of Glenwood should consider structuring most if not all programs to generate a minimum of 100% cost recovery for direct costs (except fulltime program staff) so that the program effort is sustainable. This will also create opportunities to generate excess revenue over direct expenses to support the indirect costs of each program, other community center costs, and the recommended fund balance to support an equipment replacement program. It is recommended that The City of Glenwood Springs develop a subsidy/cost recovery philosophy and policy to guide the Department’s current efforts to increase the level of cost recovery and sustainability. Developing and implementing a Subsidy/Cost Recovery Philosophy based on the Department’s mission will provide the foundation for revising fees and charges as necessary. This will include the adoption of a pricing policy and strategy that fine-tunes the existing pricing practices to provide expanded detail in guiding management decisions. Steps to accomplish this include:
Tracking Costs Direct and indirect costs will need to be defined and tracked to specific facilities or programs in order to understand costs versus revenues. Direct costs: includes all the specific, identifiable expenses associated with providing a service. A few examples include wages and benefits, contracted services, rental of facility and equipment directly related to the service, and purchased equipment and supplies. Indirect costs: encompasses facility overhead including the administrative costs of the Department, debt service, contractual services, and various other appropriate costs.
Identify City-wide Participant Categories The next step is to identify or review the various participant categories that should be used for all programs, services and facilities. Participant category examples include resident and non-resident, age, partners identified through various inter-governmental agreements, non-profit organizations, and private organizations, as well as many others. Determine Fee Schedule and Subsidy Levels Based on the Pyramid Pricing Model for each program/activity and facility, determine the subsidy/cost recovery level incorporating participant categories. Partial Cost Fee: recovers something less than full cost. This partial cost fee could be set at a percentage of direct costs, all direct costs, all direct costs plus a percentage of indirect costs, or some combination. Full Cost Fee: recovers the total cost of a service including all direct and all indirect costs. Market Rate Fee: based on demand for a service or facility. Determine the market rate by identifying all providers of an identical service (e.g., private sector providers, other municipalities, etc.) and setting the fee at the highest level the market will sustain. Expand the Current Scholarship Program to Implement Ability to Pay and Fee Reduction/Waiver Policy Since park and recreation services exist to benefit the community as a whole, ability to pay can be an issue for all age groups and all persons of varying ability or participation levels. The fee reduction/waiver policy could be designed to follow the free and reduced school lunch program guidelines utilizing annual household income thresholds to determine eligibility. It is recommended that the fee reduction policy include all persons facing difficulties with ability to pay. A simple application procedure along with consistent and fair proof of eligibility should be implemented. Eligibility requirements might include proof of Medicare or Social Security beneficiary with a per year maximum benefit per person or household. Other criteria can include income verification although this is often not a reliable indicator of ability to pay for retired persons.

page 42 Glenwood Springs, Colorado Parks and Recreation Comprehensive Master Plan
Enhance Financial Tracking and Analysis Relative to the City’s budget, the overall monthly, quarterly, and annual tracking systems should be expanded by the Parks and Recreation Department to provide information relative to management decisions.
Alternative Funding Methods Park and Recreation Capital Development, Operations and Maintenance: In the past, the City of Glenwood Springs has used alternative funding sources like Land and Water Conservation Grants to fund Riverside Park, and Roaring Fork River Access. The City has also used GOCO funds for the Outdoor Ice Skating Rink, other grant funding for programs, and a capital fundraising campaign for the aquatics addition. The following subsections summarize research findings on potential funding sources that could enhance capital expenditures for capital repair, renovation and new construction and operating budgets for the Department. This report does not represent any particular funding strategy over another. The economic conditions within the City of Glenwood Springs vary with time and the City should explore the best means of achieving its goals towards the operations of the Department and the Glenwood Springs Community Center on an ongoing basis. Philanthropic Defined as the concept of voluntary giving by an individual or group to promote the common good and improve the quality of life. Philanthropy generally takes the form of donor programs, capital campaigns, and volunteers/in-kind services. The time commitment to initiate a philanthropic campaign can be significant. Current City resources that could be dedicated to such a venture are limited. If this option is deemed possible by City decision-makers, it is recommended that the City outsource most of this task to a non-profit or private agency experienced in seeking funding of this type. To manage a volunteer program, typically an agency dedicates a staff member to oversee the program for the entire Parks and Recreation Department. This staff member would then work closely with the Human Resources Department as volunteers are another
form of staffing a program, facility or event. Relevant methods are discussed below: Friends Associations: These groups are formed to raise money typically for a single focus purpose that could include a park facility or program that will better the community as a whole and its special interest. Volunteers/In-Kind Services: This revenue source is an indirect revenue source in that persons donate time to assist the department in providing a product or service on an hourly basis. This reduces the City’s cost in providing the service plus it builds advocacy for the system. Grants Grants are used primarily as a way to supplement or match funding already received. For example, grants can be used for program purposes, planning, design, and seed money. Due to their infrequent nature, grants are normally looked at as a way to fund a specific venture and should not be used as a continuous source of funding. General Purpose or Operating Grants: When a grant maker gives your organization an operating grant, you can use it to support the general expenses of operating your organization. An operating grant means the fund provider supports your organization’s overall mission and trusts you to make good use of the money. Program or Support Grants: A program or support grant is given to support a specific, connected set of activities, with a beginning and an end, specific objectives and predetermined costs. Listed below are some of the most common types of program or support grants: Planning Grants—When planning a major new program, you may need to spend a good deal of time and money conducting research. You may need to investigate the needs of your constituents, consult with experts in the field, or conduct other planning activities. A planning grant supports this initial project development work. Facilities and Equipment Grants—These grants help organizations buy long-lasting physical assets, such as a building. The applicant organization must make the case that the new acquisition will help
serve its clients better. Fund providers considering these requests will not only be interested in the applicant’s current activities and financial health, but will also inquire to the financial and program plans for the next several years. Fund providers do not want to help an organization or program, only to see it shut down in a few years because of poor management. Matching Grants—Many grant makers will provide funding only on the condition that your organization can raise an amount equal to the size of the grant from other sources. This type of grant is another means by which foundations can determine the viability of an organization or program. Seed Money or Start-up Grants—These grants help a new organization or program in its first few years. The idea is to give the new effort a strong push forward, so it can devote its energy early on to setting up programs without worrying constantly about raising money. Such grants are often for more than one year, and frequently decrease in amount each year. Management or Technical Assistance Grants—Unlike most project grants, a technical assistance grant does not directly support the mission-related activities of the organization. Instead, it supports the organization’s management or administration and the fundraising, marketing, financial management, etc. Program-Related Investments (PRIs)—In addition to grants, the Internal Revenue Service allows foundations to make loans—called Program-Related Investments (PRIs)—to nonprofits. PRIs must be for projects that would be eligible for grant support. They are usually made at low or zero interest. PRIs must be paid back to the grant maker. PRIs are often made to organizations involved in building projects. Types of Grants Available: Federal Sources:
• Information on current and archived Federal Register Grant Announcements can be accessed from The Grantsmanship Center (TGCI) on the Internet at: www.tgci.com/funding/fedTodayAR.asp.
• For information on government product news and procurement visit GovPro at www.govpro.com.

Glenwood Springs, Colorado Parks and Recreation Comprehensive Master Plan page 43
• Another resource is the Foundation Center's RFP Bulletin Grants Page on Health at: www.fdncenter.org/pnd/rfp/index.jhtml.
• Safe Routes to Schools Initiatives at: www.saferoutesinfo.org. “This national movement creates safe, convenient and fun opportunities for children to bicycle and walk to school.” According to the June 2006 issue of Parks and Recreation , the official magazine of the National Recreation and Park Association, “Local park and recreation agencies often own or manage much of the land surrounding local schools and connecting local neighborhoods.”
• Research www.eCivis.com for a contract provider of a web-based Grants Locator system for government and foundation grants specifically designed for local government.
• Next Generation of Service Grants • Cooperative Agreements for the Comprehensive Community • Mental Health Services Program for Children and their
Families • Adolescent Family Life Grants • AmeriCorps Resources • Governors' Grants for Drug and Violence Prevention • Community Services Block Grant Program • Urban and Community Forestry for and with Minority and
Underserved Populations • Land and Water Conservation Fund (LWCF)
(www.nps.gov/lwcf) The Land and Water Conservation Fund grant program provides up to 50% reimbursement assistance for state and local government subdivisions (towns, villages, cities, counties, park districts, joint recreation districts, and conservancy districts) for the acquisition, development, and rehabilitation of recreational areas. Funding is issued to the state and it is at the state’s discretion how much of that funding will be made available for local government. Proposed funding for LWCF is determined by Congress. The federal government provides up to 50 % reimbursement for a public outdoor recreation project through each LWCF grant, while the local agency is responsible for the remainder. Federal funds supporting the LWCF program are derived from offshore oil lease revenues and other non-tax sources. The FY 2006 Department of the Interior appropriations bill (P.L. 109-55) appropriated $27,994,976 for LWCF state grants after two across-the-board reductions.
The allocation for each State and Territory is determined by formula based on law and subsequent approval of a "certificate of apportionment" by the Secretary of the Interior. The FY 2006 certificate was approved by the Secretary on January 27th and each State and Territory was notified by letter of its annual share. Table 25 shows the City of Glenwood Springs’ project allocation since 1966. Table 23: LWCF Listing of Grants for the City of Glenwood Springs, CO Park/Facility Amount Start Completion
Riverside Park $ 8,000 12/13/1966 12/31/1969
Roaring Fork Rive r Access $20,000 1/25/1989 9/30/1993
Total Funding Received $28,000
How States Plan and Select Projects To be eligible for grants, every State must prepare and regularly update a statewide recreation plan (sometimes called a SCORP). Most SCORPS address the demand for and supply of recreation resources (local, state and federal) within a state, identify needs and new opportunities for recreation improvements, and set forth an implementation program to meet the goals identified by its citizens and elected leaders. When a State's current plan has been approved by the appropriate field office of the National Park Service, all grant applications submitted must be in accord with the priorities listed in its action plan. To make the connection between the SCORP and concrete project proposals, each State also develops an Open Project Selection Process which contains:
• a set of project-ranking selection criteria that allow scoring of each project proposal according to how well it meets the needs and priorities published in the State recreation plan; and,
• a process (usually scheduled annually) to ensure that all eligible applicants can be notified of funding availability, application deadlines and selection criteria when a new project selection cycle starts.
In most years, all States receive individual allocations (apportionments) of LWCF grant funds based on a national formula (with state population being the most influential factor). Then States
initiate a statewide competition for the amount available (including the new year allocation, any previous year allocations, and any amounts “recovered” due to cost under-runs on earlier projects funded). Applications are received by a State up to its specified deadline date. Then they are scored and ranked according to the project selection criteria so that only the top-ranked projects (up to the total amount available that year) are chosen for funding. "Winning" applications are then forwarded to the National Park Service for formal approval and obligation of federal grant monies. Because each State has its own priorities and selection criteria (tailored to its own particular needs and unique opportunities), and because individual States make the decisions, in effect, about which projects will receive LWCF grants, the first step for potential applicants is to contact the cooperating State office to find out about local application deadlines, state priorities and selection criteria, and what kinds of documentation are required to justify a grant award. Interested applicants should call or write the appropriate state agency to request application information. State Sources: In Colorado, the LWCF’s annual apportionments have ranged from $0 (1996-1999) to nearly $5.4 million in 1979. In recent years, Colorado’s annual allocation has been approximately $1.5 million. The state matching grants program is administered by Colorado State Parks. The current policy of the Colorado Board of Parks and Outdoor Recreation is to divide the annual Colorado apportionment 50/50 between projects sponsored by eligible local governments and projects sponsored by Colorado State Parks. Contact: Deputy Director, Colorado State Parks 1313 Sherman Street, Room 618, Denver, CO 80203 Telephone: (303)866-3203 http://parks.state.co.us Private Grant and Philanthropic Agencies: The foundations and charitable organizations listed in Appendix I* appear to generally fit with the City of Glenwood Springs’ potential park and recreation partnership opportunities, programming and services. A more thorough investigation and further research is necessary to assure mutually compatible interests and current status of available funding.

page 44 Glenwood Springs, Colorado Parks and Recreation Comprehensive Master Plan
Local Sources: Aspen Community Foundation - (970) 920-9319 The Aspen Community Foundation supports an early childhood initiative which is in year three (3) of a five (5) year $1.2 million funding commitment. While the ultimate goal is to create of support programs that will eventually become sustaining through other means, there is funding available for the following types of programs:
• Kids First • Non-profit preschools • Human Service Organizations
Corporate Sponsorships, Naming Rights and Advertising Sales This revenue-funding source allows corporations to invest in the development or enhancement of new or existing facilities in a park and recreation system. Sponsorships are also highly used for programs and events. Corporate Sponsorships: A market analysis of fees and charges from various national companies is found in Appendix J. The following web sites are provided and were explored for an analysis of various fees and charges:
www.sportsplexwest.com/Sponsorship_Real_Estate.htms www.plexindoorsports.com/pdfs/plexx-misc-
PlexSponsorshipProspectus.pdf www.rexplex.com/sponsors/
There may be opportunities for sponsorships within the Community Center facility. Comparable rates and limited advertising opportunities strengthen the City’s market share and make this a viable alternative funding resource. Naming Rights: Many cities, towns and counties throughout the country have successfully sold the naming rights for newly constructed facilities or when renovating existing buildings. Additionally, newly developed and renovated parks have also been successfully funded through the sales of naming rights. Generally the cost for naming rights offsets the development costs associated with the improvement. People incorrectly assume that selling the naming rights for facilities is reserved for professional stadiums and other high profile team sport venues. This trend has expanded in the
recent years to include public recreation centers and facilities as viable naming rights sales opportunities. Naming rights can be a one-time payment or spread out with a fixed payment schedule over a defined period of time. During this time the sponsor retains the “rights” to have the building named for them. Also during this time, all publications, advertisements, events, and activities could have the sponsoring group’s name as the venue. Naming rights negotiations need to be developed by professionals so as to ensure a proper agreement that benefits all agents in the contractual obligation and provides remedies to change or cancel the arrangements at any time during the agreement period. Advertising Sales: Advertising sales is a viable opportunity for revenue through the sale of tasteful and appropriate advertising on park and recreation related items such as in the program guides, on scoreboards, dasher boards and other visible products or services that are consumable or permanent that exposes the product or service to many people. The current Sign Code should be reviewed for conflicts and necessary revisions. Other Fees and Charges Recreation Service Fee: The Recreation Service Fee is a dedicated user fee that can be established by a local ordinance or other government procedures for the purpose of constructing and maintaining recreation facilities. The fee can apply to all organized activities, which require a reservation of some type, or other purposes as defined by the governing agency. Examples of such generally accepted activities that are assigned a service fee include adult basketball, volleyball, and softball leagues, youth baseball, soccer, and softball leagues, and special interest classes. The fee allows participants an opportunity to contribute toward the maintenance of the facilities being used. Capital Improvement Fees: These fees are on top of the set user rate for accessing facilities such as golf, recreation centers and pools to support capital improvements that benefit the user of the facility. Contractual Services Private Concessionaires: Contracts can be developed with private businesses to provide and operate desirable recreational activities financed, constructed, and
operated by the private sector or non-profit organization with additional compensation paid to the City. Concession Management: Concession management is the retail sales or rental of soft goods, hard goods, or consumable items. The City can either contract for the service or receives a percentage of the gross sales or the net revenue dollars from the profits after expenses are paid. Merchandising Sales or Services: This revenue source comes from the public or private sector on resale items from gift shops and pro shops for either all of the sales or a defined percentage of the gross sales. Cell Towers and Wi-Fi: Cell towers attached to existing or new light poles in game field complexes is another source of revenue the City could seek in helping support the system. Another type of revenue for a facility or complex can come from providing sites for supporting Wi-Fi technology. Wi-Fi, or Wireless Fidelity, allows individuals to connect to the Internet without wires, similar to cell phone technology. Wi-Fi enabled computers send and receive data indoors and out; anywhere within the range of a base station. The connection and data transfer time is several times faster than the fastest cable modem connection. In California the State Park System is providing wireless internet access and are charging $7.95 for 24 hours of connectivity (approximately $.33 per hour) within their service area. They are connecting 85 state parks with SBC Communications. For more information contact California State Parks at www.parks.ca.gov. Permitting Permits (Special Use Permits): These special permits allow individuals to use specific park property for financial gain. The City either receives a set amount of money or a percentage of the gross service that is being provided. Catering Permits and Services: This is a license to allow caterers to work in the park system on a permit basis with a set fee or percentage of food sales returning to the City. Also many cities have their own catering service and receive a percentage of dollars off the sale of the food sales.
Glenwood Springs, Colorado Parks and Recreation Comprehensive Master Plan page 45
Partnerships Partnerships are joint development funding sources or operational funding sources between two separate agencies, such as two government entities, a non-profit and a government department, or a private business and a government agency. Two partners jointly develop revenue producing park and recreation facilities and share risk, operational costs, responsibilities, and asset management based on the strengths and weaknesses of each partner. Positive Cash Flow Depending on how aggressive the marketing and management strategies are pursued there may be a positive fund balance at the end of each year; especially if a new sports complex is built. While current projections and fee policies do not anticipate a positive cash flow the climate can change. The ending positive balance could be used to, for example, establish a maintenance endowment for recreation facilities, set aside funds for capital replacement and/or repair, or generate a fund balance for contingency or new programming opportunities. It is suggested that the Department be challenged to generate a fund balance and it not be returned to the City’s general fund.
Financial and Funding Opportunities
Opportunities for the City of Glenwood Springs - Fees and Charges: The City of Glenwood should consider structuring most if not all programs to generate 100% cost recovery for direct costs (except fulltime program staff) so that the programs are sustainable at a minimum. This will also create opportunities to generate excess revenue over direct expenses to support the indirect costs of the department, subsidy of the community center, and the recommended fund balance to support an equipment replacement program.
Opportunities for the City of Glenwood Springs - Grants The seeking of philanthropic dollars to augment funding for the development of the facility would be a large task. But seeking grants to fund programs, to act as seed money, or to provide matching funds is a better time investment.
Many communities have had success in seeking grants for programs and community quality of life. It is recommended that the City of Glenwood Springs evaluate what types of grant programs would best match the opportunities to be provided by future facilities and seek funds either internally or through an associated non-profit. Grants should not be a priority goal when seeking dollars to initially develop facilities. Most grants that could contribute substantial dollars towards parks and recreation ventures are normally tied to land acquisition and preservation ventures (EPA, Land Water Conservation Fund, Trust for Public Lands, etc.). Many communities have had success in seeking grants for programs and community quality of life. It is recommended that the City evaluate what types of grant programs would best match the opportunities to be provided by the facility and seek funds either internally or through an associated non-profit.
Opportunities for the City of Glenwood Springs - Corporate Sponsorships, Naming Rights, and Advertising Sales The City of Glenwood Springs could create and adopt a sponsorship policy that would allow the agency to target individuals, groups, and companies that may have an interest in having naming rights on a portion of, or the entire Glenwood Springs Community Center or a new sports complex in the future. The policy would stipulate all types of sponsorship opportunities and could be structured to provide remedy for the City to cancel agreements if they were deemed unsuitable for the agency. The use of securing a named sponsor for an entire facility, sponsorships and naming portions of the facility, and advertising sales are all valid considerations. Please refer to the recommended Sponsorship Policy in Appendix K for more information.
Opportunities for the City of Glenwood Springs - Permitting The City will need to be proactive in the promotion and securing of rental reservation and permitting income to balance the overall operating budget. Consideration will need to be given to balanced opportunities for the community with outside users, priority use given to the community and the City of Glenwood Springs Parks
and Recreation Department’s program offerings, and should be reviewed annually.
Opportunities for the City of Glenwood Springs - Partnerships It is suggested that the City actively research expanding the partnership opportunities with the School District, any private and charter schools, local non-profit agencies, and the local businesses. The City might also consider a partnership with the more competitive non-profit sports associations. If preferred, rental opportunities may be more advantageous for these types of partners which should also be reviewed annually.
Opportunities for the City of Glenwood Springs - Policies Sponsorship Policy It is suggested that the City of Glenwood Springs create a sponsorship policy. Please see Appendix K for a sample policy, levels of sponsorship tiers and benefits, and a glossary of terms. Partnership Policy It is suggested that the City of Glenwood Springs create a partnership policy. Please see Appendix L for a sample policy, a partnering process, an evaluation process and an outline format. Field Use Policy It is suggested that the City of Glenwood Springs create a field use policy. Please see Appendix M for a sample policy and a facility/responsibility inventory sheet. Forming a Parks and Recreation Independent Taxing District Previously there have been discussions regarding the formation of an independent Park and Recreation District with taxing authority. The citizen’s survey showed that this was not a viable option for the City.
Analysis of Staffing Issues The City of Glenwood Springs has too many staff reporting directly to the Director. Directors lead and establish the vision; Managers manage the day to day operation. The City should consider a re-organization effort to create a mid-level Manager of Recreation position as a direct report to the Director.

page 46 Glenwood Springs, Colorado Parks and Recreation Comprehensive Master Plan
Additionally, keeping part time staff is difficult as the Glenwood Springs employment market is competitive. A wage survey and an evaluation of pay rates is warranted.
Analysis of IT Issues A potential exists for the City to pursue the charging for wireless internet access in the parks.
Analysis of Expanded Programming It is clear form the survey and needs assessment that the community is pleased with what the City offers for recreation and leisure programming. To expand programming, the City should continue to establish partnerships with alternative providers to utilize available and unused spaces for additional recreation programming. Include all direct costs in the establishment of fees and charges for these programs following the Pyramid Methodology (please refer to Appendix H for details on the methodology.)
GRASP® Map Analysis Process System wide analysis For the purposes of the planning process, several methods have been employed to analyze the current facilities in relationship to the growing needs of the community. Each of these methods provides a different look at the community and addresses different aspects of the parks, trails, and open space system. Level of Service (LOS) is then determined for the community. When the results of each analysis are combined, a full view of the system and the LOS that is provided to the City of Glenwood Springs is created on which recommendations can be formed. The three analysis methods that have been used in this report include: GRASP® scoring, GRASP® mapping, and Capacities LOS. The following information outlines each method and describes the resulting conclusions from applying each method. Levels of Service Analysis An analysis of the existing parks, open space, trails and recreation system was conducted in order to determine how the system is serving the public. Level of Service (LOS) is typically defined in parks and recreation master plans as the capacity of the various components and facilities that make up the system to meet the needs of the public. The traditional means of measuring Levels of Service (LOS), often called the NRPA (National Recreation and Parks Association) Standards method, was typically based on providing X number of facilities or acres per 1,000 population (or “capacity”).
This methodology was developed in the 1970s and 80s and is not completely accurate for the majority of public agency usage, particularly urban jurisdictions. Even NRPA officials are now calling this standards methodology “obsolete.” It has been, however, used extensively, and therefore we provide these historic comparisons as part of this plan. GRASP® Methods and Technologies In order to find a way to standardize LOS that is accurate, implementable, and can be benchmarked, this plan includes an enhanced approach using the Geo-Referenced Amenities Standards Program (GRASP®). This new methodology gives much better results, more useful information, and better quality comparative data. This methodology would have been very difficult in years past, but given the capabilities of modern technology and GIS products, it is now achievable and reliable. This methodology builds on the traditional NRPA standards incorporating capacity, but can track not only the quantity, but quality of amenities and components of an entire parks, recreation, and/or open space system. After years of research on many public projects by three key firms: GreenPlay, LLC, Design Concepts and Geowest, this new Level of Service methodology has emerged that is being accepted nationally as a better methodology for analysis. Level of Service showing how well the community is served by the relevant components is depicted by evaluating individual park GRASP® scores, visually portraying graphics, and using a quantified measurement spreadsheet (as presented in the Capacities LOS Table Appendix N.) This quantification system provides a benchmark against which a community can determine how it is doing in providing services in relation to the community’s goals, presently and over time. GRASP® technology applies to individual components, such as basketball courts, as well as to overall facilities such as neighborhood and community parks. It replaces the traditional classification of parks with a classification of the individual components within parks and open space according to their functions to create a component based system. By thinking of the components within the parks, trails, and recreational facility system as an integrated whole that provides a service to residents, it is possible to measure and quantify the net Level of Service provided.
In the GRASP® methodology, capacity of individual components is only part of the LOS equation. Other factors are brought into consideration, including quality, condition, location, comfort, convenience, and ambience. To do this, parks, trails, recreation, and open space are looked at as part of an overall infrastructure made up of various components, such as playgrounds, multi-purpose fields, and passive areas. The Level of Service provided by the components within the parkland infrastructure depends primarily upon several characteristics of the components. Some components depend more on one characteristic than others. The objective is to see that the correct balance of these characteristics exists within the community.
• The range of features and facilities available to meet the desires of the population: i.e., a combination of courts, athletic fields, and other active recreation facilities, along with passive features such as benches, picnic tables, etc.
• The quantity and capacities of the various features within the system
• The quality of the features • The location and distribution of features within the community
The ways in which the characteristics listed above affect the amount of service provided by the components of the system are explained in the following text. Quality – The service provided by anything, whether it is a playground, soccer field, or swimming pool is determined in part by its quality. A playground with a variety of features, such as climbers, slides, and swings provides a higher degree of service than one with nothing but an old teeter-totter and some “monkey-bars”. Condition – The condition of a component within the park system also affects the amount of service it provides. A playground in disrepair with unsafe equipment does not offer the same service as one in good condition. Similarly, a soccer field with a smooth surface of well-maintained grass certainly offers a higher degree of service than one that is full of weeds, ruts, and other hazards. Location – To be served by something, you need to be able to get to it. The typical park playground is of more service to people who live within easy reach of it than it is to someone living all the way across town. Therefore, service is dependent upon proximity and access.

Glenwood Springs, Colorado Parks and Recreation Comprehensive Master Plan page 47
Comfort – The service provided by a component, such as a playground, is increased by having amenities such as shade, seating, and a restroom nearby. Comfort enhances the experience of using a component. Convenience – Convenience encourages people to use a component, which increased the amount of service that it offers. Easy access and the availability of trash receptacles, bike rack, or nearby parking are examples of conveniences that enhance the service provided by a component. Ambience – Simple observation will prove that people are drawn to places that “feel” good. This includes a sense of safety and security, as well as pleasant surroundings, attractive views, and a sense of place. A well-designed park is preferable to poorly-designed one, and this enhances the degree of service provided by the components within it. Process In the methodology used for Glenwood Springs’s Level of Service analysis, each of the various components found within the Parks and Recreation Department was evaluated for its quality and condition. The geographic location of the component was also recorded. Capacity also is part of the LOS analysis, due to the fact that the quantity of each component is recorded as well. The methodology uses comfort, convenience and ambience as characteristics that are part of the context and setting of a component. They are not characteristics of the component itself, but when they exist in proximity to a component they enhance the value of the component. This will be explained further in the next section. By combining and analyzing the value of each component, it is possible to measure the service provided by the entire park system from a variety of perspectives and for any given location. This was done for Glenwood Springs, and the results are presented in a series of maps and tables that make up the GRASP® analysis of the study area. Using the compiled inventory, three analyses were conducted – GRASP® score analysis, GRASP® mapping and the Capacities LOS. GRASP® Score analysis The numbers collected during the inventory are not used as raw scores but are modified based on public input. Scoring
Methodology (Appendix O) explains the scoring methodology used to determine the modified scores for Glenwood Springs. By applying the formula as described, each park receives a score that represents a complete picture of the LOS that is being provided to the community by the component. In the GRASP® mapping analysis, this formula is applied to each component and is then given a buffer that is mapped. Prior to applying these scores graphically, an analysis can be done with the scores as they are combined as a complete park score. The scoring methodology takes into consideration alternate providers such as schools, and discounts their scores based on availability. To establish a benchmark for comparison, parks providing varying levels of service were scored using the methodology that was applied to the inventory of Glenwood Springs. From these scores, a “base” score was derived that represents the minimum score that a park can receive and still provide adequate LOS to the community. Individual park GRASP® scores can be compared to the “base” score and thus prioritized for improvements. Several categories were established in this method.
Level of Service Analysis Using the GRASP® methodology, (Geo-Referenced Amenities Standards Program) the current level of service (LOS) was analyzed and measured for both quantitative and qualitative aspects for every component part of the system. The plan explores opportunities to improve the current level of service to neighborhood access to all components and access to trails, bike lanes, and public transportation.
The GRASP® Maps By combining and analyzing the value of each component, it is possible to measure the service provided by the entire park system from a variety of perspectives and for any given location. This was done for The City of Glenwood Springs, and the results are presented in a series of maps and tables that make up the GRASP® analysis of the study area.
The included maps in Appendices P through T for this Plan’s analyses are:
• GRASP® Perspective - Inventory • GRASP® Perspective - Analysis Areas • GRASP® Perspective - Access to All Components • GRASP® Perspective - Trails, Bike Lanes and Public
Transportation • GRASP® Perspective - Access to All Components with
Proposed Improvements For each map, each inventoried component has been assigned a service radius. This is the distance from which getting to the component can be accomplished within a reasonable time frame. For analyzing levels of service from a neighborhood perspective, a 1/3 mile service radius based upon a 10-minute walk was used for each component and the resulting area has been shaded according to the component’s score from the compiled inventory. Schools are included in the level of service analysis but have discounted scores based on reduced availability and lack of control of maintenance levels. Appendix O describes in detail the scoring methodology that was used in the mapping. The shade or darkness of each component’s service area varies according to its score. A darker shade indicates a higher score for that component. When the service areas for multiple components are plotted on a map, a picture emerges that represents the cumulative service provided by that set of components upon the geographic area. Where service areas for multiple components overlap, a darker shade results from the overlap. Darker shades indicate locations that are “served” by more and/or higher-quality components. The shades all have numeric values associated with them, which means that for any given location on a GRASP® map, there is a numeric GRASP® Level of Service score for that location and that particular set of components. The legend on each map shows the range of GRASP® scores for each map. Because the ranges are different for each map, GRASP® colors are not comparable between maps. The maps can be used to determine levels of service throughout the City from a variety of perspectives. It is not necessary for all parts of the City to score equally in the analyses. The desired level of service for any particular location will depend on the type of service being analyzed, and the characteristics of the particular location. Commercial and industrial areas might reasonably be expected to

page 48 Glenwood Springs, Colorado Parks and Recreation Comprehensive Master Plan
have lower levels of service in many cases than residential areas. Levels of service for high-density residential areas might be different than those for lower-density areas. If current levels of service are not appropriate in any given location, or changes are needed in specific locations to achieve a desired level of service, opportunities can be explored to add amenities to those locations where additional amenities are needed. In some areas, it may be that the level of service exceeds targets, and decisions can be made as to whether or not components should be repaired or replaced as they become obsolete. If service levels for a given location are exceedingly high, it may be that funds that would be normally used to replace components there can be diverted to other locations with deficiencies or higher needs. GRASP® Map Analysis GRASP® Inventory Map Please refer to Appendix P for the GRASP® inventory map. Shown on this map are the locations of all public recreation facilities including the community center, schools, and the bike routes. Also shown on the map are all City owned parcels and undeveloped parks. The key at the left shows the symbols that were used. The legend on the left describes the symbols used to show the individual components within the City. As referenced in Chapter IV. What We Have Now – An Analysis of Public Programs and Spaces, Section G. Current Level of Service – The GRASP® Analysis, the City has a diverse inventory of recreation components and several large land holdings in the mountains surrounding the town. Accompanying the inventory map is a chart showing the complete list. This chart is located in Appendix G. Neighborhood Access to All Components See Appendix R for the GRASP® Perspective - Neighborhood Access to All Components. The purpose of this map is to show how well Glenwood Springs is served by park and recreation components within easy reach of residential neighborhoods. As described previously, a 1/3 mile buffer has been applied to each recreational component which demonstrates the walkability of the recreation services. Walking access has been used for this analysis instead of automobile access because the relatively small size of Glenwood Springs makes virtually all of the components within the city accessible within a ten (10) minute drive. Not everyone can drive, but most people can walk (or use a wheelchair). Encouraging people
to walk instead of driving also enhances the livability of the community and the health of its residents. This map shows that the highest level of service is southwest of the confluence of the Colorado and Roaring Fork Rivers, around Sayre Park and around Sopris Park. Gaps in service occur north of the Colorado River, at the eastern-most edge of town, and between Sayre Park and Three Mile Park. Additional information has been obtained from this map and is presented in the GRASP® LOS Summary Table 26 for All Components (Also in Appendix U). Major barriers to pedestrian access have been identified and used to create areas for LOS comparison. The identified barriers are I-70, the Colorado River, and the Roaring Fork River. The table shows comparative data for the following areas:
• Area 1 - between I-70 and the Colorado River • Area 2 - south and west of the Colorado and Roaring Fork
Rivers • Area 3 - south and east of the Colorado and Roaring Fork
Rivers • Area 4 - north of I-70 • City owned properties outside of the city limits
Table 24: GRASP® LOS Summary Table for All Components GRASP™ LOS Summary Table for All ComponentsThis table is based on the GRASP Perspective - Access to All Components GRASP™ Analysis Map
Analysis Area Tota
l Acr
es
Acre
s. w
/LOS
% o
f Tot
al w
/LOS
Av
g. L
OS S
core
per
Acr
e Se
rved
Acre
s <1
9
Acre
s 19
+
% o
f Tot
al A
rea
<19
% o
f Tot
al A
rea
19+
% o
f Ser
ved
Area
<19
% o
f Ser
ved
Area
19+
Area 1 121.85 121.85 100% 28.60 74.33 47.52 61% 39% 61% 39%Area 2 1477.98 1413.52 96% 43.56 779.08 634.44 53% 43% 55% 45%Area 3 811.71 811.66 100% 32.88 405.72 405.94 50% 50% 50% 50%Area 4 1021.64 916.53 90% 9.10 853.62 62.91 84% 6% 93% 7%
Unincorporated Park Area (South Canyon, Lookout Mountain) 3057.22 3057.22 100% 9.79 3057.22 0.00 100% 0% 100% 0%
Entire Glenwood Springs (Excluding Surface Water) 3433.18 3263.56 95% 30.67 2112.75 1150.81 62% 34% 65% 35%
DefinitionsTotal Acres: Total area within the designated analysis area as calculated from the GISAcres With LOS: Area within each analysis area that has some service (LOS = 1 or Greater).Percent of Total with LOS: Percentage of the designated analysis area that has some service (LOS = 1 or Greater).Average LOS per Acre Served: The average GRASP™ score for any given acre within the designated analysis area.Percent of Total Area <19: The percentage of the area within each analysis area that has a GRASP™ score of less than 19 points.Percent of Total Area 19+: The percentage of the area within each analysis area that has a GRASP™ score of 19 points or more.Percent of Served Area <19: Of the area that has some service, the percentage of the served area that has a GRASP™ score of less than 19 points.Percent of Served Area 19+: Of the area that has some service, the percentage of the served area that has a GRASP™ score of 19 points or more.
This information includes the total acres within each area, and the number of acres that experience at least some service according to the map. Service is measured according to a point value that accrues to any given location as a result of the combined service areas within which it lies. This is a point value, or score, that relates to the darkness of the shading on the map. Areas with darker shades experience a higher point value, and hence a higher Level of Service (LOS) than areas with lighter shades. An average point value per acre is given for each of the areas on the table, and this is further broken down into brackets of “less than 19 points” and “nineteen (19) points or higher.” The score of nineteen (19) points represents the score for a location that falls within the service areas of a basic set of components that could include a playground, an open turf area, a shelter or covered area, a picnic area and a recreational trail or path. This represents an “ideal minimum” set of components for neighborhood service, but a score of nineteen (19) points could be obtained from some other set of components. In some cases this might be desirable, as different people have different interests, so any area with a score of nineteen (19) points is considered to have service with the “ideal minimum” set of components. The table shows that Glenwood Springs currently has at least some service for 95% of its 3,433 acres located within the city limits. This means that 95% of the City lies within walking access of at least one component of recreation. The table also shows that of the 95% of Glenwood Springs that has service, 35% of this area scores at or above the target of nineteen (19) points. The average score per acre for the area with service is 30.67 points. Please see Appendix Q for a map of the areas. Area 1 is the smallest area in acres because it is sandwiched between the Colorado River and I-70 and has few residents. However it does have 100% LOS coverage, in part, due to Two Rivers Park which provides a high level of service. Area 2 makes up the southwest part of the community and has the highest average LOS. The high level of service can be attributed to the location of the community center and the parks located in the southern most part of town. Although this area has the highest average LOS it does not have 100% coverage and presents some significant gaps in service in the area between O’Leary Park and Rosebud cemetery and western most parts of the study area. These

Glenwood Springs, Colorado Parks and Recreation Comprehensive Master Plan page 49
areas are of lower concern because they are either undeveloped (the west) or have few residents and little opportunity for the addition of parks (central). Area 3 has an average LOS that is relatively high, has 100% coverage, and no significant gaps in service, making the lowest concern for improvements and park additions. Area 4 has only 90% coverage and by far the lowest average LOS of the entire community, yet it supports a significant population that has very little access to the parks in other parts of the community because of the barriers presented by I-70, the Colorado River, and traffic along Highway 82. The information presented above points to a need to increase the LOS in several of the areas of Glenwood Springs with special attention to the area north of the interstate. Trails, Bike Lanes, and Public Transportation See Appendix S for the GRASP® Perspective - Trails, Bike Lanes, and Public Transportation. This map shows the LOS provided to the community by trails, bike routes, and bus routes. According to the citizens’ survey, walking and biking trails rank as the highest need in the City. The trails and bike routes have been scored based on their appropriateness for recreational use, therefore bike routes such as bike lanes are single-use routes are not appropriate for recreational use and their scores have been discounted. This analysis shows that most residents have access to at least one trail or bike route. However, because recreational uses are such a priority in the community is important to consider the system without the bike routes. When only considering trails, the system is disconnected and incomplete. Major gaps in service occur between the end of the Roaring Fork River Trail and Glenwood Park and connecting the Glenwood Canyon trail to the center of town and on to the west and north.
Analysis of Crime Prevention Designing Designing Against Crime In areas of rapid growth crime prevention in parks has become a major issue. It is known that quality parks and trails increase surrounding property values, however there is also a fear that these types of facilities can also bring undesirable activities into surrounding neighborhood. The term Crime Prevention Through Environmental Design (CPTED) (C. Ray Jeffreys, 1971) is defined as
the “proper design and effective use of the built environment that can lead to a reduction in the fear and the incidence of crime, and an improvement in the quality of life.” There are four main principles to CPTED:
1. Natural Surveillance: the environment is maintained so that people can be easily seen by others
2. Natural Access Control: the natural access is controlled by some means
3. Territoriality: distinguishing between public and private spaces
4. Maintenance: Parks and Recreation Departments should only build what they can maintain
The City of Glenwood Springs should investigate CPTED design standards and incorporate them into any future park development or new improvements. Resources for CPTED include:
• Designing Safer Communities: Handbook by the National Crime Prevention Handbook
• Crime Prevention Through Environmental Design, Second Edition, by Timothy Crowe
• Virginia CPTED Guidelines: www.vcpa.org • Trees and Crime: The role of Landscapes in Crime
Prevention: www1.brcc.edu/murrary/research/cpted
Analysis of Park Maintenance Issues Improvements to Maintenance Polices and Procedures Development of Park Maintenance Standards The Parks Maintenance Division should seek to develop formalized park maintenance standards to create the basis for which tasks could be tracked in order to support the standard. These standards would recommend timeframes for standard turf care and responding to maintenance concerns such as lighting, restroom servicing and repairs to playgrounds. Using the standards as a guide will help in providing necessary yearly budget estimates based on actual recorded costs. Determine cost per acre for maintenance task Although the Department does not track costs for maintenance tasks there is a need for this information for more accurate budget projections and understanding what maintenance costs would be involved in any new park development. Tasks that should be tracked for both labor and equipment use might include:
• Training • Inspection • Meetings • Fertilizing • Mowing • Pruning/Tree Maintenance • Edging/Weed-eating • Trash Removal • Marking/Striping • Infield Preparation • Irrigation • Irrigation maintenance and repairs • Weed control • Spraying (pesticides, shrubs and trees) • Trail Maintenance
Benefits of Tracking Costs • Accurate estimating of costs for new park acreage
As new facilities come online, having a cost for each maintenance task that would be required including staffing, supplies and equipment will allow the City to accurately estimate future maintenance costs.
• Improved scheduling of maintenance activities
Understanding how many hours it takes to complete maintenance tasks will allow for better time management for maintenance staff. This in turn should allow for more efficient operations and maximizing use of staff and equipment.
• Safer conditions
More efficient park and athletic field maintenance operations will lead to better maintenance practices therefore improving conditions for user.
• Improved ability to apply maintenance cost to
programming fees Understanding costs associated with maintenance, especially athletic field maintenance, will allow the City to potentially recoup these costs (if deemed appropriate) by applying some or all maintenance costs to programming and/or field rental and/or player use fees.

page 50 Glenwood Springs, Colorado Parks and Recreation Comprehensive Master Plan
Develop a Life Cycle Costing Assessment Program for Park Amenities The goals of this assessment would be to gain a better understanding of deferred maintenance needs that have not been met and to develop a strategy for renovating or replacing facilities. The life cycle cost would include a review of field conditions, picnic shelters, all site furnishings, field turf, fencing, comfort, athletic courts and lights, athletic field lights and other site furnishings. Roads, parking lots, and other infrastructure systems could also be analyzed. Historical replacement data and manufacturing specifications can be used as a guide in developing life cycle assessments. Benefits of Implementing Life-Cycle Costing Tracking Systems
• Creates a better estimating system for developing the annual capital budget and a five-year Capital Improvements Plan (CIP).
• Provides a mechanism for making budget adjustments when necessary capital funds are unavailable by providing cost and lifecycle inventory for all facility types.
• Will be a valuable tool for facility analysis, and will aid in deciding which facilities will not be replaced due to the high cost of duplicate facilities and high operating cost of facilities.
Develop a Life Cycle Costing Assessment Program for Park Maintenance Equipment As with park amenities, park maintenance equipment also requires a life cycle costing assessment program to assist in future budget requirements to replace aging equipment. Based on anticipated hours of use (see development of park maintenance standards) and manufacturing specifications park maintenance equipment would be budgeted for replacement in the appropriate year. Conduct a Wage Study One issue the Department faces is maintaining a quality workforce to meet the needs for parks and trails maintenance. Partly this is due to competition for labor from surrounding resort areas. Conducting a wage study to determine if Glenwood Springs is offering a competitive wages to its park maintenance employees will determine if adjustments are necessary in order to attract qualified long term staff to the Department. Athletic Fields User Training Programs There is limited athletic field space in the City and high demand for practice and game time slots. Sport Associations often loose sight of
when or when not an athletic field should be used based on the limited resources available. It is important for users to understand under what conditions fields should be practiced or played on, and when they should rest or be serviced. Using athletic fields when conditions are poor can cause excessive damage and create an even bigger maintenance concern in the future. Developing mandatory training program to help user groups understand under what conditions fields should not be used, how to alternate use patterns to reduce impact, now to identify and report safety concerns and scheduling strategies (use during non peak times i.e. before 5:00 pm on weekdays and Fridays) will help keep the fields maintained to the desired level of service.
Volunteer Programs
• Adopt a Park/Trail The Department currently relies on volunteer groups to help support the maintenance needs of the non-paved trails in the City. This support is mainly based on the type of use group using the trails such as those with running or mountain biking interests. These groups provide a tremendous benefit to the Department but the effort is not fully organized. City sponsored programs, such as adopt-a-park or adopt a trail should be created with and supported by the residents, businesses, and/or organizations. These programs allow volunteers to actively assist in improving and maintaining trials, parks, related facilities, and the community in which they live.
• Neighborhood Park Watch As a way to reduce cost associated with vandalism and other crimes against property, the City should develop a neighborhood park watch program. This program would develop community ownership of the City’s facilities.
C. Implementation and Action Plans The City of Glenwood Springs is doing many things well related to providing quality parks and limited recreation opportunities to the community. The 2006 Citizen Survey showed satisfaction levels from the community are high for the quality of parks and selected programs. The survey also indicated that its time for the department to become a full service department to meet the demands of the growing community. The primary challenge in the coming years will be to meet the desired level of service throughout the
community in the immediate future while adjusting to continued population growth, increased demand for programming and facilities, and the changing economics and demographics.
Guiding Themes Throughout this planning process, five primary themes emerged to address current needs, future goals, and guide the action and implementation plan. Maintain and Finish what was Started: Improvements to the existing parks and facilities offered by the City, ongoing maintenance, as well as the completion of what has already been promised are desired and expected by the community in order to meet and maintain current and expected levels of satisfaction. Connectivity: The coordination of all planning efforts for the development of additional trails to provide connectivity are desired and expected by the community in order to meet and maintain current and expected levels of satisfaction. Organizational Management: The creation of policies and procedures that will further define how to operate, facilitate data collection and provide for increased financial sustainability is paramount. The importance of the role of public input and the leadership in the decision making process can not be disregarded. The importance of creating an equal place at the table as a vital and essential service for the community and an economic driver for the Department throughout the organization is imperative. Cost Recovery and Funding: It is important for the City of Glenwood to develop a Pricing and Cost Recovery Philosophy that reflects the values of the community and the responsibility it has to the community. This philosophy will be especially important if the City moves forward in the development of new programs, additional and/or expanded facilities, design and development of the Wolfshon, South Canyon and any new land acquisitions for a new sports complex, and as it strives for sustainability and determines how much it is willing to subsidize operations. Future Expansion: The growing demand for leisure and recreation services has created the need for the City of Glenwood to maximize use of its resources through leveraging its partnerships and assets. Continued relationship development between the City of Glenwood the Garfield County, the School District, alternative providers and

Glenwood Springs, Colorado Parks and Recreation Comprehensive Master Plan page 51
stakeholders will help provide additional resources for the City to leverage space for expanded recreational programming. New facilities and programs may be possible in the future through partnerships, alternative funding mechanisms and new revenue streams.
Action Theme One - Maintain and Finish What Was Started There is strong documented community satisfaction with the current level of programming and active recreation spaces such as the community center; walking, hiking and biking; fitness, weight and cardiovascular areas; cultural and performing art spaces, fields, and indoor/outdoor leisure aquatics. There is also solid rationale for improvements to the existing programs, facilities and services. Recommendation 1.1 – Complete the Community Center Landscape Plan The City has a landscape plan from the construction documents for the Community Center that it needs to complete. Recommendation 1.2 – Improve the Skatepark at Two Rivers Park The GRASP® analysis, survey and public focus groups indicated that the existing skatepark is a well used and desired facility. The Two Rivers Skatepark is aging and nearing the end of its useful life. The City should pursue efforts to create a citizen directed teen advisory board which contains users and fundraisers alike. This board would be responsible for determining the specific needs and desires of the community regarding upgrades to the skatepark facility, should participate in the design process and spearhead the fundraising efforts. Improving the skatepark should be considered for the Short-Term needs and is included in the CIP list. Assuming a park of 15,000 to 25,000 square feet with in-ground pools and street elements, a cost of $500,000 should be budgeted for this item. Recommendation 1.3 – Increased LOS throughout the Park System – GRASP® Perspective: -Access to All Components Proposed Improvements See Appendix V for this map which shows the increased Level of Service to the City of Glenwood Springs if the improvements recommended in this plan are completed. The GRASP® LOS Summary Table 27 for All Components with Proposed Improvements shows the break down LOS for each area. In each
area except the area outside the city limits (no improvements were made) the LOS is increased and the average LOS for the entire community is increased by sixteen (16) points. Table 25: GRASP® LOS Summary Table for All Components with Proposed Improvements (Also in Appendix V). GRASP™ LOS Summary Table for All Components
This table is based on the GRASP Perspective - Access to All Components With Proposed Improvements GRASP™ Analysis Map
Analysis Area Tota
l Acr
es
Acre
s. w
/LOS
% o
f Tot
al w
/LOS
Av
g. L
OS S
core
per
Acr
e Se
rved
Acre
s <1
9
Acre
s 19
+
% o
f Tot
al A
rea
<19
% o
f Tot
al A
rea
19+
% o
f Ser
ved
Area
<19
% o
f Ser
ved
Area
19+
Area 1 121.85 121.85 100% 30.83 74.33 47.52 61% 39% 61% 39%Area 2 1477.98 1413.52 96% 55.13 725.01 688.52 49% 47% 51% 49%Area 3 811.71 811.66 100% 41.08 380.48 431.20 47% 53% 47% 53%Area 4 1021.64 916.53 90% 16.65 568.53 347.99 56% 34% 62% 38%
Unincorporated Park Area (South Canyon, Lookout Mountain) 3057.22 3057.22 100% 9.79 3057.22 0.00 100% 0% 100% 0%
Entire Glenwood Springs (Excluding Surface Water) 3433.18 3263.56 95% 46.66 1748.35 1515.23 51% 44% 54% 46%
DefinitionsTotal Acres: Total area within the designated analysis area as calculated from the GISAcres With LOS: Area within each analysis area that has some service (LOS = 1 or Greater).Percent of Total with LOS: Percentage of the designated analysis area that has some service (LOS = 1 or Greater).Average LOS per Acre Served: The average GRASP™ score for any given acre within the designated analysis area.Percent of Total Area <19: The percentage of the area within each analysis area that has a GRASP™ score of less than 19 points.Percent of Total Area 19+: The percentage of the area within each analysis area that has a GRASP™ score of 19 points or more.
Percent of Served Area <19: Of the area that has some service, the percentage of the served area that has a GRASP™ score of less than 19 points.
Percent of Served Area 19+: Of the area that has some service, the percentage of the served area that has a GRASP™ score of 19 points or more. The improvements that are represented on this map are detailed in Recommendation 1.4. In addition to these capital improvements, the proposed improvements also reflect general design and aesthetic improvements as outlined in Recommendation 3.4 and bring the design and ambiance scores up in all parks to “meets expectations.” Area 4 still has an average LOS below the “ideal minimum” of nineteen (19) points. The City should continue to work to acquire land and improve access to service in this area. Recommendation 1.4– Summary Table for CIP – Park Components The Capacities LOS Table Appendix N provides an analysis of the current ratios of key components to population for the City of Glenwood Springs. This allows projections to be made for adding future components as the population grows. By comparing the existing quantity of each component to the current population, ratios are generated that can then be used to calculate the number of new
components needed to maintain these same ratios as the City of Glenwood Springs grows. Because the existing ratio for any given component may or may not suit the actual need, data from the statistically-valid survey has been used to adjust the ratios up or down to fit the priorities of the people. Suggested ratios for each component have been placed into the chart. Ratios for components with low unmet need have been left unadjusted or rounded to an approximate number. Ratios for components with a high unmet need have been adjusted upward. The amount of adjustment was based on the judgment of the consultants, and experience with other communities. The results provide an estimate of the number of each component that should be added to meet the needs of Glenwood Springs’ population in the year 2010. The costs for providing these facilities have been incorporated into The Summary Table for CIP – Park Components Table 29. The Importance-Unmet Need Assessment Matrix for City of Glenwood Springs Parks and Recreation Facilities has been used to prioritize the sequencing of these additions to the park system. Components with a high importance and high unmet need on the matrix have been prioritized for immediate implementation. Those with lower importance but high unmet need, and the ones with higher importance but low unmet need have been assigned to short-term implementation, and those with lower importance and low unmet need have been assigned a longer range implementation. The Summary Table for CIP – Park Components Table 29 shows the estimated timing and costs for the capital improvements recommended within this plan. These have been broken down by the Immediate, Short-Term, and Long-Term categories described previously. Immediate Needs have been defined as within the next year. These include the improvement of parks in Area 4 (north of the interstate), the design and installation of landscaping at the Community center and planning for future improvements. Unknown costs in this category include design and installation fees for the landscaping at the community center. Short-Term Needs have been defined as within the next one (1) to two (2) years. These improvements include planning improvements to
page 52 Glenwood Springs, Colorado Parks and Recreation Comprehensive Master Plan
Two Rivers Skatepark; directional signage to Two Rivers; and additional park improvements to Vogelaar Park and Sopris Park. Long-Term Needs are defined as those to be completed before 2010. Included in this group are improvements to Glenwood Park and O’Leary Park as well as significant planning efforts for the larger parks in town, Rodeo Grounds, ballfield and tennis considerations. Total costs for the CIP through year 2010, amount to a total of $1,346,250. Annual costs on the same items are estimated to be $79,000 after all of the improvements are in place. The City should pursue dedicated capital tax funding as well as grant funds as soon as possible; and concurrently with or immediately after the establishment of a 501 (c) 3 foundation. The costs shown in this CIP are in current dollars, and may need to be adjusted for inflation. All of the costs estimated for this CIP have included within them a 1% amount for public art. The 1% figure is commensurate with what other communities, as well as the Federal government, typically allocate. Summary Table for CIP – Park Components Table 29 details the recommended improvements or additions to the City of Glenwood Springs parks system for the immediate future, short and long term.
Action Theme Two - Connectivity Recommendation 2.1 –Complete the Trail System and Connect the Community As with most communities surveyed around the country, the most important recreational need is walking and biking trails, which rank the highest as the most important need in the 2006 Citizen Survey. Connectivity is vital to the Glenwood Springs Community. In addition, Glenwood Springs has several organizations and groups that act a organizers, advocates, and builders of trails throughout the community. It is essential that these groups be coordinated through a council or through the City offices so that their efforts can mesh with the goals of the City and be a part of official planning efforts. There a variety of methods that can be used to develop trails in the community. The City should continue working with volunteer groups and non-profits to create new trails as well as work with Public Works to improve existing sidewalk bike routes. Widening or converting existing routes to grade separated trails should occur wherever possible. The GRASP Perspective – Access to All Components – with Proposed Improvements map located in
Appendix T shows the suggested locations of future connecting trails as well as proposed locations of improved pedestrian bridges. The trail improvements shown on this map should be evaluated on a case-by-case basis for feasibility and cost.
Action Theme Three – Organizational Management A strong dedication to providing quality facilities and programs resonates throughout every level of the City of Glenwood Springs’ staff. The following recommendations and strategies can help to clarify operations and continues to ensure that the Parks and Recreation Department equally contributes to the overall City organization. Recommendation 3.1 – Create Policies The Parks and Recreation Department should create the following policies to assist it in the provision of services for the Glenwood Springs Community:
• Cost Recovery and Pricing Policy • Sponsorship Policy • Partnership Policy • Field Use Policy • Fee Reduction or Scholarship Policy
Recommendation 3.2 –Tracking Labor Hours and Equipment Use for Parks’ and Athletic Fields’ Maintenance Tasks The importance of understanding how maintenance dollars are being spent cannot be understated. Developing systems to track labor and equipment costs will require a change in operational philosophy and discipline in order to gather accurate maintenance data. Tracking labor costs and equipment costs for maintenance tasks will allow for:
• More accurate estimating of associated maintenance costs for new parks and athletic fields;
• Establishing true costs for maintenance; and • Greater understanding of the impacts of maintenance
budgets Recommendation 3.3 - Engage and Educate Sports Associations to Assist in Minimizing their Impact on Parks and Athletic Fields There is great demand for City athletic fields by the local youth sports associations. Because of this demand, youth sports providers may use fields when, because of conditions, they shouldn’t. The City needs to develop an annual training program that educates youth sports associations as to when fields should and should not be
used. This training program would also allow sports providers to identify potential safety issues and potential future maintenance issues and report them to the Parks Maintenance Division. Recommendation 3.4 – Pay Attention to Design The City should work with professional designers to create master plans for all parks, trails, and open space properties. Designs can be created with in-house design staff if available or through design consultants. Each master plan should include locations of walks, plantings, recreation components, passive areas and seating areas. Some parks may include other components as needed. Special attention should be paid to create a variety of spaces and use indigenous and specialty materials in park design and construction. Master plans should also include details for site furnishings and lighting. System wide design standards including shelter, lighting, signage and site furnishing details should also be developed to create a unique look and identity for City of Glenwood Springs Parks. Recommendation 3.5 – Coordinate Planning Efforts At this time, several major planning efforts are taking place in Glenwood Springs. Some of these planning efforts, both formal and informal, include an overall transportation plan, river trails, and development of the south canyon area and the 198 acres in the Wolfshon area. Care should be taken within the city to coordinate all efforts to ensure compatibility and reduce duplication of planning efforts. The Parks and Recreation Department should strive to take an active role in city-wide planning efforts to coordinate park and recreation improvements and be an advocate for parks in the community. Recommendation 3.6 – Coordinate Volunteer Efforts The City of Glenwood Springs has a myriad of volunteers and volunteer groups that aid in park and trail construction. The Parks and Recreation Department needs to take an active role in the coordination of these groups and efforts. All volunteer groups that wish to build or plan a park or recreation project in the City should have an understanding of this document and be able to speak to how their project meets the goals of the parks master plan. In doing this the City can better guide volunteer efforts and direct energies to where they are needed most.

Glenwood Springs, Colorado Parks and Recreation Comprehensive Master Plan page 53
Recommendation 3.7 – Planning for the Future The City of Glenwood Springs currently owns several large parcels of open space land both within and outside of the city limits. Input from public process and the statistically valid survey show that residents feel strongly that the City should focus on maintaining and improving current facilities rather than developing new ones. Because of this input this recommendation focuses on planning efforts rather than development plans for these large land holdings. Over the next five (5) years the City should engage in planning efforts for South Canyon Park, Red Mountain Park and Lookout Mountain Parks. It is essential that these planning efforts include public input and a complete master plan that closely follows the mission of the Parks and Recreation Department as well as the funding capability and public interest of the community. Recommendation 3.8 – Encourage, Enhance and Maximize Relationships and Partnerships Opportunities Continue to facilitate and improve collaborative relationships and partnerships with all stakeholders including non-profit organizations, other governmental agencies, homeowner associations, etc. Where possible, provide liaisons to other boards, councils or commissions; encourage participation and involvement with the Parks and Recreation Commission; exchange information and facilitate collaborative brainstorming, problem solving and decision making for the greater benefit for the citizens of the City of Glenwood Springs. Recommendation 3.9 – Resolution of Outstanding Management Issues Two management issues are looming in the near future:
• Who will manage the Whitewater Park? • What is the disposition of the private/public golf course?
Opportunities may exist for the City to own and operate these facilities. The City could add a driving range to the golf course (it scored high on the survey), or re-purpose the site if golf is not needed in the valley.
Action Theme Four: Cost Recovery and Funding All indications point to the City of Glenwood Springs needing to focus on sustainability for parks, leisure and recreation programs, facilities and services for the community.
Recommendation 4.1 - Establish Life Cycle Costing Assessments The goals of this assessment would be to gain a better understanding of deferred maintenance needs that have not been met, develop a strategy for renovating or replacing facilities, and assist in future budget requirements to replace equipment. A condition value for park components has been established and can be found in the Capacities LOS Table Appendix N. Recommendation 4.2 - Conduct a Wage Study to Ensure Competitiveness Attracting qualified recreation staff (lifeguards), park and trails maintenance staff is an issue due to competition for staff from surrounding resorts. Identifying if Glenwood Springs is offering competitive wages to its park maintenance employees will determine if adjustments are necessary in order to attract qualified long term staff to the Department. Recommendation 4.3 – Implement a 5-Year Master Planning Schedule as well as Annual Updates to the Plan This Master Plan represents a comprehensive update to the existing Master Plan for the City of Glenwood Springs Parks and Recreation Department since the Community Center was built. While some agencies attempt to adopt Master Plans for more than five years it is very difficult to plan accurately more than five years in advance. Technological advancement, along with changes in needs and trends, alter greatly over short periods of time. Current programs and facilities have been developed in a “reactive” manner, due primarily to citizen demand. In order to allow for a more proactive and managed approach, and knowing that the process is detailed and involves extensive public outreach, it is recommended that the City schedule annual updates and a major update every five years by allocating resources starting in 2011. Since this Parks and Recreation Master Plan has been created using dynamic land management tools (including GRASP® and GIS), the next update should be easier and less time-consuming, but will still require stakeholder involvement (which should include a statistically valid survey) and needs assessment, along with reexamination of management practices and the future cost recovery and budget realities.
Recommendation 4.4 – Establish a 501 (c) 3 Park and Recreation Foundation To facilitate the receipt of grant funds and other fundraising activities, the City of Glenwood Springs should establish a 501 (c) 3 Foundation. Recommendation 4.5 – Pursue Grant Opportunities It has been several years since the City has pursued Land and Water Conservation Grant funding. The Trust for Public Lands may be another resource for future acquisitions. In addition, there may be opportunities to pursue grant funds through the United States Tennis Association for tennis court development or seed money. Also, the City should pursue the Safe Routes to Schools Initiatives for trail connection funding. Recommendation 4.6– Institute Volunteer Opportunities The City should establish an Adopt a Park Program, Adopt a Trail Program, and a Neighborhood Park Watch Program. Consideration should be given to creating a full time dedicated position in the future to manage these programs as they grow. Recommendation 4.7 - Create a Cost Recovery Policy It is recommended that the City of Glenwood Springs develop a subsidy/cost recovery philosophy and policy. Refer to Appendix H for the Cost Recovery Pyramid Methodology developed by GreenPlay, LLC. This philosophy allows you to establish core services, determine current and target cost recovery percentages, and allocate resources and use of subsidy. The City should plan to adjust fees as necessary, and research and utilize alternative funding methods. The City should specifically look at peak and off peak fees for field use; user fee boundaries of resident and non-resident (or perhaps a three-tiered system for City residents, County residents, and visitors); KidKare cost: benefit of free with memberships (versus $2 per hour with a 2 hour maximum), reduce expenditures, limit hours or operation, or absorb expenses into the facility budget as another amenity. Recommendation 4.8 - Establish an Equipment Replacement Fund Through the use of available revenues, establish an on-going sinking fund to plan for routine equipment replacement and repairs for the Community Center.

page 54 Glenwood Springs, Colorado Parks and Recreation Comprehensive Master Plan
Recommendation 4.9 - Explore New Park and Recreation Dedicated Tax Revenues The survey indicated initial support for a dedicated tax to support the operations and maintenance of what the City currently has, to finish what was started, and to provide desired facilities, parks, trails, programs and services. It was not clear what type of tax support is the most desirable, but there is support for an Attractions/Admission Tax, Sales Tax or perhaps a Utility Tax.
Action Theme Five - Expansion As new funding becomes available or opportunities present themselves which allow for additional operations and maintenance funding in addition to capital construction funding, the City should conduct feasibility studies and develop master plans for the available sites. The plans should consider the survey results. This includes the Wolfshon area’s 198 acres behind the community center; the South Canyon area; improvements to the Red Mountain Park; or opportunities for the Lookout Mountain Park outside of the City limits. Recommendation 5.1 – Conduct a Performing Arts Complex Feasibility Study The 2006 Citizen Survey documented performing art programs and a venue as very important programs and facilities. The City should provide a liaison from the Parks and Recreation Commission to the newly established Ad Hoc Committee that is studying this issue. A feasibility study should be conducted to determine the construction cost and operation costs based on most needed and relevant performing art spaces. Additional elements of this study would typically include:
• Performing Arts Venue program analysis and conceptual design
• Pricing and cost recovery projections • Staffing projections • Market analysis • Potential partners • Impact on the City’s economic development • Financial implications for construction and operational cost
Recommendation 5.2 – Conduct a Indoor Ice Rink Feasibility Study Pursuant to the desires expressed through the focus groups, conduct a feasibility study to determine the cost benefit and financially viability of enclosing the current outdoor multi-season ice/roller rink. This study would not only involve detailed construction and operations costs and other elements as typical (and outlined in Recommendation 5.2); it would also include an extensive citizen participation process, establishment of an advisory committee, and a cost benefit analysis of the conversion to include the GOCO grant repayment. If at least sustainable to the current level of financial subsidy or improved sustainability, then establish an Advisory/Fundraising group to either, repay the GOCO funds and enclose the outdoor facility, or build a new indoor, year round ice rink. Recommendation 5.3 – Conduct a Sports Complex Feasibility Study Because the City’s fields are located in various neighborhood parks, the City should conduct a feasibility study to locate all game fields in a sports complex and re-purpose the neighborhood park fields to be local practice fields. This would require an available large parcel of land of around 30-50 acres and would have a positive impact on the parking and congestion of the neighborhood parks from spectators and player’s families during games. Additionally, light spillage into the neighborhood could be reduced by concentrating the fields in one complex. This study could include several components in one complex, like multi-purpose fields and baseball fields, a destination playground, and tennis courts. Additional elements of this study would typically include:
• Complex program analysis and conceptual design • Pricing and cost recovery projections • Staffing projections • Market analysis • Potential partners • Impact on the City’s economic development • Financial implications for construction and operational cost
Recommendation 5.4 – Conduct a Cost Benefit Study on Privatizing or Improving the Cemeteries. The City needs to decide the relative importance of the Doc Holliday Cemetery to the tourism industry. If determined to be important, then improvements need to be made. The City should conduct a cost benefit analysis on all cemeteries to determine if privatizing all or part of the operations and maintenance may be warranted.

Glenwood Springs, Colorado Parks and Recreation Comprehensive Master Plan page 55
Action Plans – What Happens Next The City of Glenwood Springs is continually striving to keep up with the expectations and needs of the community. The current facility is heavily used and most programs have high participation rates. The City athletic fields are also in great demand. All organizations supplying leisure and recreation programs have numerous positive impacts including encouraging healthy lifestyles, promoting social well-being, providing opportunities and facilities for enjoyment, and enhancing the quality of life. This Parks and Recreation Master Plan endeavors to provide a guiding mechanism for continuing to meet existing and future community needs, and expanding the positive impacts of this portion of the City of Glenwood Springs’ services. The strengths of this report stems from the extensive research, community involvement, analysis of needs, and public review that form the basis for the recommendations it contains. The recommendations of this Plan are designed to create goals cultivating:
• Focus on consistently meeting and exceeding citizen expectations;
• Use of innovative ideas and methods to successfully meet challenges posed by budgetary, facility and staffing limitations;
• A system that benefits residents by increasing services to all age groups and providing diverse opportunities;
• A service agency that sees itself as a viable partner in providing community services;
• A stewardship approach to providing high-quality facilities, existing and future, through judicious use of public funds;
• Cooperation and partnerships among the City, Public Schools, other non-profit organizations and the private sector in providing recreational services and facilities;
• A proactive planning process guided by community needs and executable strategies; and a process for reviewing and updating this document annually.
Ultimately, this plan is designed to serve as a decision-making tool for the City of Glenwood Springs. Action Strategies are needed to carry out the Parks and Recreation Master Plan recommendations. The following chart has been developed which summarizes the recommendations including actions, funding where appropriate, and timing. Timing This plan is intended to be a 5-year Plan. The following Action Themes Implementation Table 28 indicates timing based on the start of implementation:
• Immediate: immediately or within one- year • Short-Term: within one-two years • Long-term: within the five years • Ongoing

page 56 Glenwood Springs, Colorado Parks and Recreation Comprehensive Master Plan
Table 26: Glenwood Springs Parks and Recreation Master Plan Action Themes Implementation Table Recommendations Timing Responsibility Financial Impact
Action Theme One – Maintain and Finish What Was Started
Recommendation 1.1 – Complete the Community Center Landscape Plan Short Term Parks and Recreation Department or Contract Staff time; Obtain bid
Recommendation 1.2 – Improve the Skate Park at Two Rivers Park Short Term Parks and Recreation Department or Contract Staff time; See Summary Table for CIP - Park Improvements
Recommendation 1.3 – Increased LOS throughout the Park System – GRASP® Perspective -Access to All Components Proposed Improvements Immediate Parks and Recreation Department or Contract Staff time; See Summary Table for CIP - Park Improvements
Recommendation 1.4– Summary Table for CIP – Park Components (see the Community Recreation Components Summary Table 29)
Immediate Parks and Recreation Department or Contract Staff time; See Summary Table for CIP - Park Improvements - $240,250
Recommendation 1.4– Summary Table for CIP – Park Components (see the Community Recreation Components Summary Table 29)
Short Term Parks and Recreation Department or Contract Staff time; See Summary Table for CIP - Park Improvements - $794,000
Recommendation 1.4– Summary Table for CIP – Park Components (see the Community Recreation Components Summary Table 29)
Long Term Parks and Recreation Department or Contract Staff time; See Summary Table for CIP - Park Improvements - $312,000
Action Theme Two – Connectivity
Recommendation 2.1 –Complete the Trail System and Connect the Community
Immediate Short Term Long Term
Parks and Recreation Department or Contract Staff time; See Summary Table for CIP - Park Improvements
Action Theme Three – Operational Management
Recommendation 3.1 – Create Policies Immediate Parks and Recreation Department Staff time
Recommendation 3.2 –Tracking Labor Hours and Equipment Use for Parks’ and Athletic Fields’ Maintenance Tasks Short Term Parks Maintenance Division Staff time/Software Costs
Recommendation 3.3 - Engage and Educate Sports Associations to Assist in Minimizing their Impact on Parks and Athletic Fields Short Term Parks Maintenance Division / Sport Association /
Parks and Recreation Department Staff time
Recommendation 3.4 – Pay Attention to Design Ongoing Parks and Recreation Department/Planning Department Initial Consultant or Planner to develop design; costs TBD
Recommendation 3.5 – Coordinate Planning Efforts Ongoing Parks and Recreation Department/Planning Department Staff time
Recommendation 3.6 – Coordinate Volunteer Efforts Ongoing Parks and Recreation Department Staff time
Recommendation 3.7 – Planning for the Future Short Term Parks and Recreation Department/Planning Department Staff time
Recommendation 3.8 – Encourage, Enhance and Maximize Relationships and Partnerships Opportunities Immediate Parks and Recreation Department Staff time
Recommendation 3.9 – Resolution of Outstanding Management Issues Immediate Parks and Recreation Department/Planning Department
Staff time; investment funds if golf course is purchased from the private owners

Glenwood Springs, Colorado Parks and Recreation Comprehensive Master Plan page 57
Recommendations Timing Responsibility Financial Impact
Action Theme Four – Cost Recovery and Funding
Recommendation 4.1 - Establish Life Cycle Costing Assessments Short Term Parks Maintenance Division Staff time
Recommendation 4.2 - Conduct a Wage Study to Ensure Competitiveness Short Term Human Resource Department Staff time
Recommendation 4.3 – Implement a 5-Year Master Planning Schedule as well as Annual Updates to the Plan Long Term Parks and Recreation Department/Consultant Staff time; $45-55,000
Recommendation 4.4 – Establish a 501 (c) 3 Park and Recreation Foundation Short Term Parks and Recreation Department Staff time
Recommendation 4.5 – Pursue Grant Opportunities Immediate Parks and Recreation Department Staff time; full time staff position - salaried with benefits to handle alternative funding, grants and volunteer program
Recommendation 4.6– Institute Volunteer Opportunities Immediate Parks and Recreation Department Staff time; full time staff position - salaried with benefits to handle alternative funding, grants and volunteer program
Recommendation 4.7 - Create a Cost Recovery Policy Immediate Parks and Recreation Department Staff time; consultant $20,000-25,000
Recommendation 4.8 - Establish an Equipment Replacement Fund Immediate Parks and Recreation Department/Finance Department Staff time; allocation of starting balance
Recommendation 4.9 - Explore New Park and Recreation Dedicated Tax Revenues Immediate Parks and Recreation Department/Finance
Department Staff time
Action Theme Five - Expansion
Recommendation 5.1 – Conduct a Performing Arts Complex Feasibility Study Short Term Parks and Recreation Department; Consultant Staff time; $35,000-$50,000
Recommendation 5.2 – Conduct a Indoor Ice Rink Feasibility Study Long Term Parks and Recreation Department; Consultant Staff time; $35,000-$50,000
Recommendation 5.3 – Conduct a Sports Complex Feasibility Study Long Term Parks and Recreation Department; Consultant Staff time; $35,000-$50,000
Recommendation 5.4 – Conduct a Cost Benefit Study on Privatizing or Improving the Cemeteries. Long Term Parks and Recreation Department; Consultant Staff time; $35,000-$50,000

page 58 Glenwood Springs, Colorado Parks and Recreation Comprehensive Master Plan
Table 27: Glenwood Springs Parks and Recreation Master Plan - Summary Table for CIP – Park Components Prepared by Design Concepts, September/October 2006 Immediate Needs - as soon as possible
Recommendation Notes: CIP costs (construction costs assuming new land and including support space) broken out CIP Total Cost LCC - broken out Total Annual Life
Cycle Costs Priority
1 Design and install landscaping at Community Center undetermined amount undetermined undetermined high
2 Design and add loop walk to Gregory Park $104,000 $15,000 low
3 Design and add benches, increase plantings and add small shelter to Sister Lucy Downy Park 3 @ $750 + $1000 + $20,000 $23,250 $300 + $500 + $5000
= $5800 $6,000 high
4 Design and add trees and picnic tables to Sopris Park 20 @ $350 + 5 @ $1200 $13,000 $3,000 med
5
Plan and design an addition to Oasis Creek Park to include a loop walk, shelter and seating areas. This parcel adjoins a large piece of land owned by the City with undetermined future use/development. Construction costs should coordinate with future plans for both parcels.
$50,000 $0 high
6 Plan and design improvements to Vogelaar Park to include a loop walk, shade trees a picnic shelter, picnic area and public art
$50,000 $0 med
7 Plan and design official seating and observation area to White Water Park and coordinate installation with current construction efforts and fund through that project
undetermined $0 high
TOTALS $240,250 $24,000

Glenwood Springs, Colorado Parks and Recreation Comprehensive Master Plan page 59
Short-Term Needs - in the next 1-2 years
Recommendation Notes: CIP costs (construction costs assuming new land and including support space) broken out CIP Total Cost LCC - broken out Total Annual Life
Cycle Costs Priority
1 Construct planned improvements for Vogelaar $104,000 + 20 @ 300 + $30,000 + $1500 +$28,000 $170,000 $15,000 + $5,000 + $500 + $7600 $28,000 high
2 Design and add small shelter to Centennial Park 1 @ $20,000 $20,000 $4,000 med
3 Improve directional signage to Two Rivers Park undetermined amount undetermined undetermined high
4 Coordinate the replacement of the Skatepark at Two Rivers Park - see Recommendation 1.2 undetermined amount $500,000 undetermined high
5 Add loop walk to Sopris Park $104,000 $15,000 med
TOTALS $794,000 $47,000
* unless noted as being in an existing park, all construction and CIP costs include support space development and total land costs.
Long-Term Needs - by 2010 (or beyond)
Recommendation Notes: CIP costs (construction costs assuming new land and including support space) broken out CIP Total Cost LCC - broken out Total Annual Life
Cycle Costs Priority
1 Improve the aesthetics of O'Leary Park by designing and adding improved fencing, 2 small shelters and improved surfacing.
2 @ $20,000 + unknown $40,000 $4,000 med
2 Design and add a small shelter, benches and a loop walk to Glenwood Park $20,000 + 3 @ $750 + $104,000 $127,000 $4,000 high
3
Create a Master Plan for the Rodeo Grounds. Use public process to determine the most appropriate use of the property and create a master plan possibly including multi-use fields and ballfields for construction in 10 years (2016)
$50,000 $0 high
4 Create Master Plans to guide future improvements for Axtell Park, and Two Rivers Park 2 @ $15,000 each $30,000 $0 high

page 60 Glenwood Springs, Colorado Parks and Recreation Comprehensive Master Plan
Long-Term Needs - by 2010 (or beyond)
Recommendation Notes: CIP costs (construction costs assuming new land and including support space) broken out CIP Total Cost LCC - broken out Total Annual Life
Cycle Costs Priority
5
Conduct a Master Plan and Feasibility study for Sayre Park to include exploring the options for relocating the tennis courts so that the ballfield could be expanded to accommodate 90’ baselines and an outfield appropriate for pre-high school little league baseball games.
Address construction methods for the tennis courts that would provide maximum cost effectiveness for long term play (i.e. determine the initial costs of post-tension courts and maintenance savings vs. the initial costs and maintenance for asphalt courts)
$25,000 $0 med
6 Continued Ballfield study
Currently the City has enough fields to accommodate softball, however there is a need for a field that would accommodate 90’ baselines and an outfield appropriate for pre-high school little league baseball games. Two studies should be conducted to determine the feasibility of locating a baseball field in the community. See Long Term Recommendations 3 - Create a Master Plan for Rodeo Grounds and 5 – Create a Master Plan and Feasibility study for Sayre Park.
$15,000 $0 med
7 Other Tennis Court considerations - over the next ten (10) years
Repair and plan for long term use of the tennis court at Veltus Park. Continue regular maintenance on the tennis court and design and plan for continued use at the court. Consider installing a post-tension slab tennis court in future renovations to extend the life and reduce maintenance of the court
$10,000 undetermined med
8 Veltus Park traffic issues
Conduct a study to investigate traffic patterns at Veltus Park. Currently the layout of Veltus Park does not provide adequate ingress and egress for the amount of visitors that use the park. The majority of the problems occurs as park visitors are looking for parking and traveling between the two parking lots. Topography is prohibitive for widening the entrance drive or reconfiguring the parking lots. However the proposed study should include: reconfiguring the parking lots and entrance drives and providing satellite parking and improving pedestrian connections to the park
$15,000 undetermined med
TOTALS $312,000 $8,000
* unless noted as being in an existing park, all construction and CIP costs include support space development and total land costs.
CIP TOTALS TO THE YEAR 2010 $1,346,250 $79,000

Glenwood Springs, Colorado Parks and Recreation Comprehensive Master Plan page 61
VII. Appendices Appendix A. National Trends Recreation and Leisure Trends In this fast paced, modern society it has become essential to stay on top of current trends impacting the field of parks and recreation. The recreational provider is faced with the challenge of meeting and exceeding user expectations. Part of this task involves comprehension about what participants want now, studying what they wanted in the past, and developing an idea of what they will look for in future activities. Statistical data presented by the National Sporting Goods Association 2003 Survey on sports participation is one primary tool to understanding user trends. The following information was gathered by a mail panel resource of more than 20,000 pre-recruited households. Through a self-administered questionnaire, male and female heads of household and up to two other household members who were at least seven years of age were asked to indicate the sports they participated in 2003, along with the frequency of participation in 2003. For this study, a participant is defined as an individual seven years of age or older who participates in a sport more than once a year. There are seven sports that required participation to be defined as six times or more a year: aerobic exercise, bicycle riding, exercise walking, exercising with equipment, running/jogging, step aerobics, swimming, and weightlifting. The following tables illustrate the results of this study. Activities are listed in descending order by total participation. Table 28: Top Ten Activities Ranked by Total Participation for National Recreation Participation in 2004
Sport Total Participation (in Millions)
Percent Change From 2003
Exercise Walking 84.7 3.8% Camping (vacation/overnight) 55.3 3.5% Swimming 53.4 2.2% Exercising with Equipment 52.2 3.9% Bowling 43.8 4.6% Fishing 41.2 -3.6% Bicycle Riding 40.3 5.3% Billiards/Pool 34.2 3.7% Workout at Club 31.8 8.0% Aerobic Exercising 29.5 5.1%
Source: National Sporting Goods Association
Table 29: National Recreation Participation in 2004 of Selected Sports Ranked by Percent Change from 1999 to 2004
Sport Total Participation (in Millions) 2004
Total Participation (in Millions) 1999
Percent Change 1999 to 2004
Skateboarding 10.3 7.0 48.6% Workout at Club 31.8 24.1 32.0% Hockey (ice) 2.4 1.9 28.9% Mountain Biking 8.0 6.8 18.2% Exercising w/ Equipment 52.2 45.2 15.4%
Aerobic Exercising 29.5 26.2 12.2% Running/Jogging 24.7 22.4 10.3% Exercise Walking 84.7 80.8 4.9% Hiking 28.3 28.1 0.9% Soccer 13.3 13.2 0.9% Baseball 15.9 16.3 -2.9% Bicycle Riding 40.3 42.4 -4.9% Basketball 27.8 29.6 -6.0% Swimming 53.4 57.9 -7.7% Volleyball 10.8 11.7 -7.9%
Martial Arts 4.7 5.1 -8.7% Golf 24.5 27.0 -9.4% Tennis 9.6 10.9 -11.9% Football (touch) 9.6 11.1 -14.1% Softball 12.5 14.7 -15.0% In-Line Roller Skating 11.7 24.1 -51.5%
Source: National Sporting Goods Association

page 62 Glenwood Springs, Colorado Parks and Recreation Comprehensive Master Plan
Table 30: National Youth Participation in Selected Sports Comparison by Age Group 2004 vs. 1994
Sport Total Percent Change 1994 – 2004 (Ages 7-17)
Total Percent Change 1994 – 2004 (Ages 7-11)
Total Percent Change 1994 – 2004 (Ages 12-17)
Baseball -11.6 4.7 15.8 Basketball -.04 5.6 -9.8 Bicycle Riding -.22.4 -19.4 -17.0 Golf 37.5 53.3 31.9 Ice Hockey .05 -24.7 33.3 In-line Skating -69.8 -52.7 -25.8 Skateboarding 97.6 82.4 111.8 Soccer -.01 -1.5 1.2
Source: National Sporting Goods Association Table 31: National Recreation Participation of Women in Selected Sports Comparison 2004 vs. 1999
Sport Total Participation (in Millions) 2004
Total Female Participation (in Millions)
2004
Total Female Participation (in Millions)
1999
Percent Change 1999 to 2004
Aerobic Exercising 29.5 21.7 19.6 -0.7
Baseball 15.9 3.5 3.5 0.5 Basketball 27.8 8.7 8.6 2.1 Bicycle Riding 40.3 18.7 18.9 2.0 Exercise Walking 84.7 52.4 50.0 -0.1
Exercising with Equipment 52.2 28.0 23.1 2.6
Football (touch) 9.6 2.2 2.0 4.8 Golf 24.5 5.7 5.6 2.4 Hiking 28.3 13.7 12.8 2.8 Hockey (ice) 2.4 0.6 0.5 0.0 In-Line Roller Skating 11.7 5.9 12.2 -0.4
Martial Arts 4.7 1.6 2.0 -4.8 Mountain Biking 8.0 2.7 2.1 3.0
Running/ Jogging 24.7 11.5 10.1 1.4
Skateboarding 10.3 2.6 1.2 7.5
Sport Total Participation (in Millions) 2004
Total Female Participation (in Millions)
2004
Total Female Participation (in Millions)
1999
Percent Change 1999 to 2004
Soccer 13.3 5.5 4.8 5.0 Softball 12.5 6.5 6.9 5.0 Swimming 53.4 28.6 30.8 0.4 Tennis 9.6 5.1 5.0 6.8 Volleyball 10.8 6.3 6.4 4.0 Workout at Club 31.8 17.8 12.9 2.3
Source: National Sporting Goods Association Other miscellaneous recreational trends noted in the NSGA’s 2003 study:
• Snowboarding had 6.3 million participants in 2003. It continued on a 12.9% increase from 2002. This popular sport has most likely impacted alpine skiing, which has had a continual percentage decrease over the last five years (-11.8% from 1998 to 2003).
• Ice hockey has had an overall increase of 9.4% since 1993, and participation by children ages 7- 11 years old has increased 59.7% in the last ten years. However, as a total percentage it is still fairly low.
• Skateboarding continues a steady increase in popularity, and now includes 9 million participants. • Exercise walking continues to be the number one sport in American participation, with 79.5 million
participants. • Yoga and Tai Chi were introduced to the survey in 2002 and included in the 2003 survey. Total
participation was 5.6 million, with women comprising 83.3% of that total. • Martial Arts is the largest percent change from 2002 to 2003 with a 15% increase and 4.8 million
participants. Demographic Changes: The greatest trend found in recreation is not a particular sport but rather a sport participant. Baby boomers, defined as anyone born between 1946 and 1964, consist of 77 million people. By 2005 an estimated 42 percent of baby boomers will be over 50 years of age. Below are statistical data on boomers and implications on recreational services for this influential group. Information for this report was gathered by NRPA, AARP, SGMA, and GreenPlay LLC. Demographics of Baby Boomers
• Median income level is $51,700 • 68% of boomers are married • Most boomers are well educated, with 50% having at least two years of college • An estimated 23% of boomers will not be financially prepared for retirement

Glenwood Springs, Colorado Parks and Recreation Comprehensive Master Plan page 63
• With an almost 20 year age gap, it should be noted that baby boomers are a diverse group with regards to social behavior and attitudes
Lifestyle of Baby Boomers
• Known to work hard, play hard, and spend hard • Place value on exercise and fitness • Time viewed as a precious commodity • Less interest in civic engagement (low rate of volunteerism) • Do not associate with being “old” • Retirement viewed as “mid-life” • Tend to participate in more individualized activities rather than group events • Highest volunteerism rate at 34.5%(Annual Bureau of Labor Statistics survey "Volunteering in the
United States" found that the highest rates of volunteering are among persons 35-44 http://www.bls.gov/news.release/pdf/volun.pdf)
Implications of Baby Boomer Trends for Recreation
• Increased demand for well-equipped fitness centers • Movement away from “senior” related programs such as bridge and shuffleboard since many
boomers associate these with being “old” • Swimming pools better utilized by programs like water walking, water aerobics, and active lap
swimming • Increased demand for on-going educational classes to create life-long hobbies • Increased interest in computer courses from basic application to Web site design • Length and timing of programs should be compressed • Workshops preferable to six- or eight- week classes, weekend and night classes popular • Increased interest in outdoor recreation and maintaining parks and open space • Continued interest in arts and entertainment
Business of Baby Boomers It is important to realize that baby boomers have no intention of “slowing down” in retirement. Many will work part-time, change careers, or create new businesses during this time. Recreation services offered to this age group must be customized to suit each individual need for:
• Self-fulfillment • Healthy pleasure • Nostalgic youthfulness • Individual escapes
Table 32: Recreation Activities for Adults 55 and Older Based on Frequent Participation 2002 Activity Days Per Year Participants
Fitness Walking 100 + 6,515,000
Stretching 100 + 4,107,000
Treadmill Exercise 100 + 3,887, 000
Activity Days Per Year Participants
Golf 25 + 3,646,000
Freshwater Fishing 15 + 1,903,000
R.V. Camping 15 + 1,736,000
Lifting Free Weights 100 + 1,735,000
Bowling 25 + 1,725,000
Day Hiking 15 + 1,545,000
Weight/Resistance Machines 100 + 1,513,000
Stationary Cycling 100 + 1,298,000
Running/Jogging 100 + 870,000
Source: American Sports Data, Inc. The above information was taken from the Superstudy of Sports Participation conducted by American Sports Data, Inc. in January 2002. Information was gathered by a mail panel resource of 25,000 households with a 58.7% response rate and reprinted by the Sporting Goods Manufacturers Association. Other Age Cohorts and Their Impact on Leisure Services in the United States Matures Source: The Center for Generational Studies This generation consists of those born prior to 1946. For this age group, survival was a way of life as many grew up during World War II. Sayings such as “a penny saved is a penny earned” and “an honest day’s work for an honest day’s pay” are firmly implanted in their approach to life and they enter jobs with very strong beliefs about hard work and ethics. This era was a man’s economy, women had limited positions in the workplace and their place was “in the home.” This generation returned from WWII to produce the Baby Boom and began building a new peace-time economy. Lifestyle of Matures:
• They are dedicated to a job once they take it • They are respectful of authority, even if it sometimes frustrates them • They place duty before pleasure • Patience is a virtue. They are willing to wait for the delayed reward • Honor and integrity are critical parts of their being • They are reluctant to challenge the system • They are resistant to change and will tend to avoid it

page 64 Glenwood Springs, Colorado Parks and Recreation Comprehensive Master Plan
Generation X Source: The Center for Generational Studies People in this generation were born between 1965 and 1980. They learned resourcefulness at an early age as most grew up in a house where both parents had careers. Gen-Xers entered a world with social turmoil with the assassination of JFK, anti-war protests, Watergate, inflation, and massive layoffs. As a result of this they have become a generation skeptical of traditional practices and beliefs. With their ability to deal with uncertainty and an emphasis on working to live, rather than living to work, they will continue to transform the way business is done. Lifestyle of Generation X:
• Gen-Xers work to live rather than live to work • Jobs are viewed within the context of a contract, not a lifetime commitment • Clear and consistent expectations are essential • Providing the opportunity to grow will lengthen tenure • A sense of contribution while having fun will keep an Gen-Xer productive • Earning money is only one part of a larger equation which includes contribution to the whole • To them, versatility of skills & experiences ensures employability
The Millennials Source: The Center for Generational Studies Those in this generation were born between 1981 and 1999. With 81 million, Millennials are the largest generational group in U.S. History. Millennials have grown up in a world where beliefs about family and society have been compromised. Media has taught them that they can challenge every convention and individual. They are growing up in a time of unprecedented growth in the U.S. economy and development of technology. They are born into cell phones, pagers, and the Internet. Many enter jobs with what employers are calling a disturbing lack of basic skills, yet they are able to navigate software programs that intimidate those in their 40’s. As Millennials continue to grow up in this new world of terrorism, technology, and situational ethics, they will bring to the table new expectations and perceptions that older generations never dreamed possible. Lifestyle of Millennials:
• They have been conditioned to live in the moment • They are used to the immediacy of technology and expect everything with it • Clear and consistent expectations are essential to ensure productivity • They earn money for the purpose of immediate consumption • They will demonstrate respect only after they have been treated with respect • They have grown up learning to question everything • As a generation, they are astoundingly diverse demographically
Overview of Regional and National Trends in Parks and Recreation Lifestyle Practices:
• Outside the home, more women than men participate in fitness programs. According to IHRSA, women accounted for 53% of all health club memberships in 2003, an increase of 130.8% from 1987.
• Baby boomers have no intention of “slowing down” in retirement. Many will work part-time, change careers, or create new businesses during this time. According to IHRSA, baby boomers claim 37.6% of all health club memberships in 2003.
• Americans have less leisure time than 5 years ago, but recognize the intrinsic and extrinsic value of recreation and leisure more than ever before.
• The greater the household income, the more likely that members started a new recreational activity in the last year, and patronized public parks and recreation services.
• Participation in structured programmed activities has decreased. • Action sports (in-line skating, snowboarding, skateboarding, etc.) are the strongest area of growth
in the sporting goods industry. • Americans are participating in less of a variety of activities. • American’s feel a majority of their free time occurs during the weekdays - weekends are jammed
with chores that are put off during the week. • Currently, opportunities for park and recreation participation are greater in mid-sized cities, as
opposed to smaller or larger cities. • Americans spend more than $300 billion on recreation annually. • The average recreation fee that people are willing to pay is slightly over $12. However, the more
satisfied they are with the experience, the more they are willing to pay. • Choices for recreational activities continue to grow with malls, school activities, entertainment
centers (Dave and Buster’s, Adventure Golf, etc.), movie complexes, IMAX, skate parks, etc. • Many homes today are designed as central entertainment centers with televisions, computers, home
fitness equipment, workshop and hobby areas, etc. • On average, Americans watch more than four hours of television a day (NRPA, 2001). • 77% of personal computer owners come out from behind their monitors for some time outdoors at
least once a month. • Young adults and Americans with annual household incomes of $50,000 or more are more inclined
than the total public to engage in outdoor activity frequently. • Frequency of outdoor activity appears to increase as household income increases, the most socially
and politically active group in the nation are the most recreationally active. • 62% of families in which both spouses work find time to balance the responsibilities of two jobs and
the home and still make time for an outing at least once a month. • According to IHRSA (2003), 8 out of 10 Millennials and almost 9 out of 10 Generation Xers feel the
need to take measures to make sure their health will be good when they get older. • According to IHRSA (2003), 91% of Boomers feel the need to take measures to ensure their future
health. • The top four free-time activities for all Americans for the last decade have been and remain: watching
television, reading, socializing with friends and family, and shopping. Swimming and walking are the only two physical activities that make the top-ten list.

Glenwood Springs, Colorado Parks and Recreation Comprehensive Master Plan page 65
Recreation Programming: (from various NRPA lectures and recreation literature) • People have less unstructured time, so length of programs and sessions should be reduced. • Activities are moving towards unstructured, individual, and drop-in programs. • Increasing demand for self-directed activities, with less reliance on instructors and more flexible
timing. • Adults are moving away from teams to more individual activities. • According to IHRSA, unmarried adults head 47% of the country’s households, and there are now
more households headed by people living alone (26%) than households headed by married couples with children (24%). These singletons are looking for clubs that create an environment that fosters a sense of community, as well as create programs and events that they can join without a partner. They want a place they have friends in addition to a place to go for a workout.
• Increased demand for family programs and more programs for girls and women. • Information technologies allow for the design and customizing of recreation and fitness activities
(reducing the need for a “standard package”). • Increased pressure to open traditional male sports to females. • More activities are being adapted for disabled participants. Programs should strive to be
“universally” accessible. • Fitness and wellness are viewed as a lifestyle that stresses the integration of mental, physical, and
spiritual well-being. • Programs need to encompass a whole “experience,” as people look to add quality to the basic
recreation activity with depth, self-fulfillment, and self-expression. • People desire quality over quantity - a first class experience in the form of excellent customer
service, programs, and facilities. • According to SGMA (Sporting Goods Manufacturers Association) International, 6 of the 15 most
popular activities for children are team sports. • According to IHRSA, health clubs have significant opportunities and could play a key role in
providing the missing fitness and exercise in students’ lives. Organized, after-school activities, club sports and programs targeted to school-age children in communities around the country could fill the fitness void that is growing wider in U.S. schools.
• According to IDEA Health and Fitness Association 2004 Fitness Programs and Equipment Survey, several programming trends emerged. Fitness programs that are growing include personal training (one-on-one), pilates, core-conditioning classes, strength training (individual, non-group), stretching and/or flexibility, personal training and pilates or yoga, yoga, stability, ball-based, strength training, and group with background music; programming that is staying stable includes step aerobics, fitness assessment, mixed-impact aerobics, low-impact aerobics; and programming that is declining includes high-impact aerobics and boxing-based/kickboxing.
• According to IDEA Health and Fitness Association there have been changes in fitness programs from 1998 to 2004. What clients wanted in 1998 is not necessarily what they want today. Programs that have increased in popularity since 1998 include Pilates, stability/ball-based, personal training (two clients share), post-rehab, kids-specific fitness, sport-specific training. Programming that has decreased since 1998 includes dance (ballroom, ballet, etc.), abdominals, health fairs, sports clinics, high-impact aerobics, mixed-impact aerobics, step aerobics, stress-management classes, weight-management classes, lifestyle classes (managing your money, book club), and low-impact aerobics.
Recreation Facilities: • The current national trend is toward a “one-stop” facility to serve all ages. Large, multi purpose
regional centers help increase cost recovery, promote retention, and encourage cross-use. • Agencies across the U.S. are increasing revenue production and cost recovery • Amenities that are becoming “typical” as opposed to alternative: • Multi-purpose, large regional centers (65,000 to 125,000+ sq. ft.) for all ages/abilities with all
amenities in one place. This design saves on staff costs, encourages retention and participation, and saves on operating expenses due to economies of scale.
• Leisure and therapeutic pools • Interactive game rooms • Nature centers/outdoor recreation and education centers • Regional playground for all ages of youth • In-line hockey and skate parks • Partnerships with private providers or other government agencies • Indoor walking tracks • Themed décor • Amenities that are still considered “alternative” but increasing in popularity:
○ Climbing walls ○ BMX tracks and Indoor Soccer ○ Cultural art facilities
• Green design techniques and certifications such as Leadership in Energy and Environmental Design (LEED). A recent BCA survey indicated that 52% of the recreation-industry survey respondents indicated they were willing to pay more for green design knowing that it would significantly reduce or eliminate the negative impact of buildings on the environment and occupants.
Recreation and Park Administration:
• Level of subsidy for programs is lessening and more “enterprise” activities are being developed, thereby allowing subsidy to be used where deemed appropriate.
• Agencies are hiring consultants for master planning, feasibility, and strategic/policy plans. • Recreation programmers and administrators are being involved at the beginning of the planning
process. • Information technology allows for tracking and reporting. • Pricing is often done by peak, off-peak, and off-season rates. • More agencies are partnering with private, public, and non-profit groups. • Organization is structured away from specific geographic units into agency-wide sections for
athletics, youth/teen sports, seniors, facilities, parks, planning, etc. Master Planning Processes:
• Most parks and recreation master planning and other long-range planning processes consider a 20 year, or longer, horizon to assure an adequate vision to move from existing conditions to a desired future. However, the plan itself is most often written for a 5 year period requiring a major update at that time interval. In this age of information, mobility, and ever changing advancements in technology, it is impossible with any acceptable degree of reliability to predict demographics,

page 66 Glenwood Springs, Colorado Parks and Recreation Comprehensive Master Plan
interests, and how technology will change the way we live work and play, much beyond the 5 year timeframe. The 5 year timeframe also coincides with a typical timeframe for an agency’s Capital Improvement Program (CIP).
• Most parks and recreation master planning and other long-range planning processes rely on the mission and vision statements developed as a result of the development of the plan and its public process to guide and drive the facilities, programs and operation of the organization.
• Traditional master planning efforts relied heavily on national level of service standards for the provision of parks and facilities (number of acres or number of facilities/1000 population). Due to unique circumstances in most communities, including but not limited to things such as climate, other providers, exposure to trends, demographics, etc.), today’s master planning efforts rely much less on pre-determined standards, and much more on fresh citizen input, often through community surveys that reach current users, as well as non-users of park and recreation systems, supplemented by community open houses, focus groups and stakeholder interviews.
• Early master planning efforts did a good job identifying the initial one-time costs associated with capital improvements. Today’s master plans consider the ongoing operating costs and potential revenue generation of equal importance. In addition, plans are identifying traditional and alternative funding sources for projects.
Environmental Stewardship
• People seek natural environments and open space as an antidote to the constant reminder of technology and over-civilization.
• Most studies reveal that access to open space is one of the keys to a satisfactory quality of life. • There is a shift in how many people view natural resources. It is changing from domination to
stewardship, consumption to sustainability, from rights to responsibilities, from surviving to thriving so that the well being of people, the economy and nature are all in balance.
• Many businesses are moving their focus from money-driven objectives to implementing more environmentally sound practices for their customers.
Urban Communities:
• Cities are moving from public to private space; creating less of a community environment and loss of social capital.
• Civic life requires settings in which people meet as equals; the most significant amenity that a city can offer potential residents is a public realm where people can meet.
• Property values are typically higher for property near parks and open spaces. • In a study done by Amy Zlot for the American Journal of Health Promotion, it was determined that,
“the number of route choices a community provides – a mix – the relative percentage of housing, retail, work and recreational opportunities in a community – appear to be important, independent predictors of walking and bicycling.”
• The Role of Physical Activity and its Effect on Health Trends: • Regular moderate sports playing add 1.25 years to the life expectancy of a 45 -54 year old man. • One study found that the U.S. could save $20 billion a year in health care costs if every sedentary
American walked an hour a day.
• It is estimated that nearly 250,000 deaths per year in the United States are attributed to lack of exercise.
• In 2002, research showed that 64 percent of the adult population is overweight with 30 percent being obese (Center for Disease Control).
• In 2002, an estimated 15% of children and adolescents age 6-19 were over weight (Center for Disease Control).
• Overall, regular physical exercise is considered to be the “best medicine” since it is inexpensive, has no side effects, can be shared with others and is health promoting as well as disease preventing.
• Some research has demonstrated exercise to be more effective than a tranquilizer drug, and a number of studies of trait anxiety found a meaningful difference between the effectiveness of exercise and other forms of treatment on anxiety levels.
• Physical activity has been linked to slowing of the onset of HIV-related symptoms, including decrement of natural killer cells.
• Kaiser Permanente partners with HealthCare Dimensions Incorporated to offer the Silver Sneakers Fitness Program for seniors to promote an active lifestyle and reduce healthcare costs. The program is beneficial for the following reasons:
○ Participation: Senior-friendly programming is designed to reduce barriers to participation and engage seniors in physical activity
○ Risk Reduction: Increasing the physical activity in seniors reduces their risk for higher claims costs
○ Heath Status: Regular physical activity improves measures of independence and functional health status among seniors
○ Claims Impact: Reducing risk and improving health through increased physical activity and social interactions reduces pharmaceutical and medical claims costs
o (Source: www.silversneakers.com) • Each additional mile walked or run by a sedentary person would give him/her and extra 21
minutes of life and save society an average of 34 cents in medical and other costs. Partnerships
• Recreation agencies are forming strategic alliances with health, social services, and educational agencies to offer more comprehensive health and wellness assistance.
• A survey of park and recreation directors and administrators in Illinois showed that: ○ A majority of respondents (72 percent) agree that they would prefer a partnership with a
professional health care provider. ○ An overwhelming majority of respondents (83%) agree that they would consider developing
a partnership to increase membership and programs. Fewer than half (39%) currently have a professional partnership with another agency.
○ Of the participants who would consider developing a partnership, a large majority (72%) would prefer a partnership with a professional health care provider such as a hospital.
○ More than half (64%) would partner with a non-profit organization such as the YMCA, municipality or school.
○ More than a third (38%) would consider partnering with a professional management corporation.

Glenwood Springs, Colorado Parks and Recreation Comprehensive Master Plan page 67
○ More than three-quarters (81%) would want to remain in control of the management of the facility when developing a professional partnership with another agency.
Programming for Pre-School Age Youngsters
• Local park and recreation agencies are reportedly finding great success in programming for the pre-school age child by responding to parent feedback and desires. The requests tend to center around opportunities to expose a child to a variety of activities to learn the child’s interests, and opportunities for interaction outside the child’s own home. Popular requests include:
○ Family programming for tots, starting at age 9 months, with an adult, are increasingly popular (in particular: swimming, gymnastics, cooking, music, art, story time, special one time holiday classes such as Father’s Day gift or card making)
○ Daytime activities for “at home” parents ○ Activities for families to support home-schooling ○ Activities for child only from 24-36 months (art, music, story time) ○ Little tot sports for ages 4-5 (soccer is popular)
• A British medical study found that although the average three year old is consuming more calories a day than 25 years ago, physical activity has decreased, resulting in 200 extra “unburned” calories per day.
• A Kaiser Family Foundation study found that “according to their parents, children age 6 and under spend an average of two hours a day with screen media (TV, DVDs, videos, computers, video games) – about the same amount of time they spend outside.”
Employment Practices
• Researchers found that adherence to a work-based physical activity program increased as a result of an incentive based intervention. In addition there were significant improvements in cardiovascular efficiency and work capacity.
• Of the City of Boulder, Colorado’s 1,200 employees, 600 are members of their employee wellness program. Program data show that members of the program have reduced their blood pressure, heart rate, body weight, and body fat, and have increased their morale, strength, and flexibility. The number of workplace injuries has gone down significantly since the program began. The program is a cooperative effort between the Human Resources and Parks and Recreation Departments, making use of the Parks and Recreation facilities and programs.
Bibliography Atilano, D., Health and Wellness Partnership Secrets: A survey by Burnidge Cassell Associates Inc., reveals some keys to successful partnerships with healthcare providers and local governments, Chicago, Illinois, Illinois Parks and Recreation, September/ October 2000. Brown, D. (2004, June 28). Extreme Bonding The Denver Post DeGraaf, D., S. Lankford, and J. Lankford, The New Urbanism: Managing Urban Sprawl, Tampa, Florida, National Recreation and Parks Association National Congress, 2002 From Ricky & Lucy to Beavis & Butthead, The Center for Generational Studies, Aurora, CO 2002, 4pp
Human Powered Outdoor Recreation: State of the Industry Report, The Trade Association of the Outdoor Industry, Boulder, CO, 2000, 25pp Kennedy, Summer. “Personnel & Risk Management”. Ideas in Action: A Guide to Local Government Innovation Vo.9 Winter (2003) Paulson, S. “Not All Fun and Games.” Press Publications February 10, 1999 The Benefits Catalogue, Canadian Parks/Recreation Association, Gloucester, ON, 1997, 222 pp www.cdc.gov “Trends in Obesity” 08/23/04 www.silversneakers.com “Program Impact” 06/21/04 www.zerotothree.org “Active Bodies, Healthy Children” 06/30/04 Younger, Leon. Presentation at NRPA Annual Conference, 2000 Other Sources: SGMA NRPA FLOW Consulting, LLC Leon Younger and Pros Roper Research NSGA Leisure Vision John Crompton Publications EDAW, Inc. Athletic Business IDEA Health and Fitness Association Recreation Management Center for Disease Control. “Overweight Prevalence” http://www.cdc.gov/nchs/fastats/overwt.htm Harvard School of Public Health. “Study finds increased consumption of sugar-sweetened beverages promotes childhood obesity.” Feb. 15, 2001. http://www.hsph.harvard.edu/press/releases/press02152001.html Ziegler, Jaffrey. “Recreation Retirement: How will baby boomers reshape leisure in their 60’s?” http://nrpa.org/story.cfm?story_id=1222&departmentID=18&publicationID=11. 6/13/2003 pp 1-4. NRPA. “Life without TV: Filling those four hours with more satisfying leisure” http://nrpa.org/story.cfm?story_id=1277&departmentID=18&publicationID11. 6/13/2003 pp 1-6 McNeil, C. (ed.) IHRSA (The International Health, Racquet & Sportsclub Association) (July and October 2004). “IHRSA Trend Report”. Zlot, Amy (2005). “Urban green space linked to walking, cycling levels” www.medicalnewstoday.com/medicalnews.php?newsid=20455.

page 68 Glenwood Springs, Colorado Parks and Recreation Comprehensive Master Plan
Appendix B. Colorado Mountain Towns - Trends
Colorado Mountain Communities
June 2006
Prepared for GreenPlay, LLC Broomfield, Colorado
Prepared by: Leslie T. Jones Regional Solutions LLC
Montrose, Colorado
Introduction Colorado is blessed with a natural environment that includes desert, mountains, valleys, rivers, lakes and streams. Colorado is home to four National Parks and two National Recreation areas. In addition, much of the landscape resides in one of eight National Forests. This, combined with numerous State and local parks, truly makes Colorado an outdoor playground. The Rocky Mountains in Colorado are one of the State’s biggest attractions. This was true in the past as settlers came to Colorado looking for precious metals and for ranching. Today people come to the mountains for the variety of recreational opportunities that abound in Colorado’s high country. Nestled in the mountains of Colorado are unique communities and places that have been inspired by dreams, and seek today to fulfill dreams. These communities, large and small, are the focus of this analysis of Colorado Mountain Communities. Approach The primary focus area includes five Colorado counties in the central mountains of the state. These counties are: Eagle, Garfield, Pitkin, Routt and Summit. In some cases data from other mountain counties will be used when relevant information is available; these counties include Archuleta, Grand, Gunnison, LaPlata and San Miguel. Counties are included because of data availability restrictions in certain circumstances. Within these five counties are several municipalities that have been considered in the analysis. The communities of focus that have been selected are: City of Aspen, Town of Breckenridge, Town of Dillon, Town of Grand Lake, City of Glenwood Springs, City of Steamboat Springs and Town of Vail. As with county information, additional communities were reviewed and information from these communities is included when relevant. Other communities considered are: Avon, Basalt, Crested Butte, Durango, Eagle, Frisco, Silverthorne, Snowmass Village and Telluride. Communities and counties were selected based on their recreational amenities that make them communities attractive to visitors from Colorado and outside of the state as well. The approach was to identify common themes between communities and/or counties to ascertain whether certain trends could be identified in the areas of parks, recreation, open space and tourism. Counties Eagle, Garfield and Summit Counties all straddle the Interstate 70 Mountain Corridor. This is a significant factor in the fabric and nature of these counties compared to other mountain counties. The I-70 corridor provides interstate access to several communities in these counties. In addition, the corridor connects through the City and County of Denver to Denver International Airport. Eagle and Garfield Counties are the largest with populations of more than 40,000 based on the 2000 Census. Pitkin and Routt Counties had a 2000 Census population of between 10,000 and 20,000 people.

Glenwood Springs, Colorado Parks and Recreation Comprehensive Master Plan page 69
Similarly sized counties include: Grand and Gunnison. Summit County had a population of a little more than 20,000 in 2000. Table 1: Population by County 2000 Census 2004 Estimate 2010 Projection Eagle County 41,659 47,990 57,881 Garfield County 43,791 49,325 63,625 Pitkin County 14,872 16,421 17,588 Routt County 19,690 21,366 24,690 Summit County 23,548 27,443 31,765 Source: Colorado Department of Local Affairs, Demography Section, Preliminary Population Forecast by County 2000-2035, May 2006 Between 2000 and 2001, all five counties experienced significant population increases according to the population estimates prepared by the State Demography office. The average annual percent changes were: 7.6% in Eagle County, 5.4% in Garfield County, 8.9% in Pitkin County, 4.4% in Routt County and 11.9% in Summit County. Since then, the average annual rates have fallen to more modest levels ranging from 1.2% to 2.3% between 2003 and 2004. During this same time period the average annual rate in Pitkin County decreased 0.9%. You can see from the table above that Eagle and Garfield Counties will experience the most significant population growth of the five Counties by 2010. Cities & Towns Of the focus communities selected, Glenwood Springs, Aspen and Steamboat Springs are considered cities, and the remainder are classified as towns according to standard definitions in the State of Colorado. Of note is that all of the cities and towns selected operate under a Home Rule Charter with the exception of Grand Lake which is a statutory town. Each community can be considered a “resort” community, defined as a popular place for vacations. Each community has a different past from which the community’s character is derived and established. This character can be influential in terms of recreational amenities offered in and around the community. The City of Glenwood Springs (7,736) and the City of Steamboat Springs (9,815) are the largest communities and also serve as regional service centers or anchor communities for the surrounding areas. These cities provide the majority of residential services including shopping, health services and government services. The City of Aspen is the smallest of the cities considered with a population of 5,914 in 2000. The Cities of Steamboat Springs and Glenwood Springs were established and became popular due to the hot springs in the area. The City of Aspen was a mining community. The Town of Breckenridge also has its roots as a mining community. The Towns of Dillon and Grand Lake rank among some of the earliest resort communities in the state. The relative newcomer is the Town of Vail, which has become an internationally known winter resort.
Table 2: Municipal Population Selected Communities 2000 Census 2004 estimate 2003 – 2004 % Change City of Aspen 5,914 6,368 -1.3 Town of Breckenridge 2,408 3,296 3.0 Town of Dillon 802 819 2.2 Town of Grand Lake 447 482 -0.4 City of Glenwood Springs 7,736 8,517 1.3
City of Steamboat Springs 9,815 10,742 1.3
Town of Vail 4,531 4,806 0.0 Source: Colorado Department of Local Affairs, Demography Section, Population for Colorado Counties & Municipalities, October 2005 The population in municipalities is also increasing. The table above shows that City of Steamboat Springs was the fastest growing municipality between 2000 and 2004, followed by the Town of Breckenridge and the City of Glenwood Springs, respectively. Between 2003 and 2004 Breckenridge continued to increase in population while the City of Aspen and the Town of Grand Lake showed slight decreases. Transportation Regional airports are located in Eagle, Pitkin and Routt Counties and provide commercial service to Denver and other destinations throughout the United States. Many of these communities have transit systems that serve both residents and visitors. The following transit systems are operating in the counties and communities selected:
• Roaring Fork Transit (RFTA) serving Pitkin County and portions of Eagle and Garfield Counties. • Eagle County Transit provides regional connections to communities in Eagle County. • Summit Stage provides community connections in Summit County. • Eagle County resort systems include the Avon/Beaver Creek and Town of Vail transit systems. • Breckenridge Ski Area provides transit services in the Town of Breckenridge. • The City of Glenwood Springs’ “Ride Glenwood Springs” transit system operates in the city and
provides connections to the Roaring Fork Transit system. • Steamboat Springs Transit is operated by the City of Steamboat Springs.
In some cases the transit systems are supported by a Mass Transit Tax which is charged with sales and use taxes, but dedicated to the provision of transportation services. Other services are provided by local governments or ski areas. Amtrak passenger rail service is available in the City of Glenwood Springs and Town of Winter Park. The State Highway system connects the City of Aspen, the City of Steamboat Springs, and the Towns of Grand Lake and Breckenridge to the Interstate 70 corridor.

page 70 Glenwood Springs, Colorado Parks and Recreation Comprehensive Master Plan
Community Amenities Hot Springs Colorado is home to 93 hot springs according to the USGS. Of those 93 springs, fewer than three dozen welcome visitors. These hot springs come with a variety of facilities and may range from primitive and rustic to more fully developed springs and spas. Many of the hot springs in the state are privately owned but are open to the public. Visitors are attracted to hot springs, with the most well-known springs found in Glenwood Springs and Steamboat Springs. Lesser-known springs can be found in or near Pagosa Springs, Hot Sulfur Springs, Ouray, and Durango. Ski Areas Colorado is home to twenty-five ski areas. According to Colorado Ski Country USA, Vail, Aspen Mountain, Breckenridge and Steamboat ski areas rank in the top ten ski areas in North America. Vail is the largest ski mountain in North America. It is estimated the ski industry contributes $2 to $2.5 billon dollars annually to Colorado’s economy. Colorado has more acres (39,000) of skiable terrain than anywhere else in North America. Many of Colorado ski areas are diversifying their mountains with the installation of snowboarding parks that include pipes, tables and rails. Golf Courses Colorado is home to 247 golf courses according to the Official Guide to the Golf Courses of Colorado. Courses listed in the guide are described as Private, Semi-private, Public and Resort. The Guide does include Par 3 courses. Table 3: Golf Courses by Type for Selected Counties Resort Public Private Semi-Private Eagle County 6 5 4 1 Garfield County 0 7 1 0 Pitkin County 0 1 2 1 Routt County 1 2 0 1 Summit County 3 1 0 1 Source: Official Guide to the Golf Courses of Colorado, 2006 Arts & Culture Arts and cultural activities are increasingly becoming part of the attraction of visitors to a community. The communities of Vail, Aspen, Steamboat, and Breckenridge all have performing arts venues large enough to host nationally recognized events and performances. Outdoor amphitheaters are also popular in mountain communities such as Dillon and Vail. Some small communities have local performing arts groups that perform for both residents and visitors.
Visual arts including galleries are found throughout Colorado mountain communities. Public art programs are also increasing in popularity. Colorado’s rich history inspires museums of all types from local history museums to the specialized museums like Colorado Ski and Snowboard Hall of Fame in Vail. People The largest age group in the selected municipalities is those age 25 to 44 years. This is indicative of the active lifestyles of persons residing in mountain communities. The median age in Colorado in 2000 was 34.30 years. Table 4: Population by Age Group
Median Age Under 15 Age
15 to 24 Age
25 to 44 Age
45 to 64 Age 65+ Total
Population
City of Aspen 36.70 649 706 2,490 1,634 435 5,914 Town of Breckenridge 29.40 228 588 1,091 451 50 2,408 Town of Dillon 36.70 107 104 314 205 72 802 City of Glenwood Springs 36.20 1,441 1,078 2,577 1,926 714 7,736 Town of Grand Lake 44.30 61 42 131 159 54 447 City of Steamboat Springs 32.40 1,510 1,679 3,932 2,266 428 9,815 Town of Vail 31.90 387 734 2,172 1,024 214 4,531 Source: 2000 Census Pitkin County has the oldest median age of the five counties at 38 years, compared to 30 to 34 years in the other focus counties in 2000. Table 5: Population by Age & Gender
Median Age Under 15 Age 15 to 24 Age 25 to 44 Age 45 to 64 Age 65+
M F M F M F M F M F M F
Aspen 35.1 38.6 337 312 401 305 1,377 1,113 817 817 233 202 Breckenridge 28.5 30.9 133 95 385 203 691 400 249 202 27 23 Dillon 36.4 37.4 58 49 54 50 180 134 113 92 38 34 Glenwood Springs 34.6 37.9 756 685 572 506 1,334 1,243 1,000 926 273 441 Grand Lake 44.3 44.5 31 30 26 16 76 55 91 68 24 30 Steamboat Springs 31.4 34.1 775 735 1,004 675 2,262 1,670 1,195 1,071 189 239 Vail 31.2 32.8 200 187 461 273 1,318 854 549 475 116 98 Source: Population by Age Group and Gender Colorado Municipalities, 2000 Census The relative number of males and females in each age category remains fairly balanced with a couple of exceptions, the first being that there are significantly more males than females age 25 to 44 living in the selected communities. The second exception is the age 65+ group where there is a tendency to see more females than males, which is consistent with the life expectancy rate.

Glenwood Springs, Colorado Parks and Recreation Comprehensive Master Plan page 71
Colorado has the seventh fastest growing aging population in the U.S. In the year 2010, there will be more than 770,000 seniors age 60 and over in Colorado. From the years 2000 - 2010, the numbers of these seniors will increase 39%. Currently, there are about 600 Coloradans 100 years old or older. In 2010, there will be approximately 700 Coloradans 100 years or older. The Census Bureau changed how data is reported for race and ethnicity in 2000. There are two Hispanic-origin categories – Hispanic or Latino and Not Hispanic or Latino. Under the current classification system, Race and Hispanic Origin are two separate and distinct categories. Therefore, Hispanics may be of any race or races. People in each race group may be either Hispanic or Not Hispanic. Each person has two attributes, their race or races and whether or not they are Hispanic. Table 6: Population by Race & Hispanic Origin Non-Hispanic
County Total Population White
Black/ African
American
American Indian & Alaska Native
Asian/ Pacific
Islander
Other Race
Two or More Races
TOTAL
Hispanic Origin (of any race)
Aspen 5,914 90.8% 0.4% 0.2% 1.5% 0.1% 0.8% 6.1% Breckenridge 2,408 91.3% 0.4% 0.2% 1.0% 0.2% 1.5% 5.4% Dillon 802 87.5% 0.9% 0.6% 0.1% 0.0% 0.5% 10.3% Glenwood Springs 7,736 83.8% 0.2% 0.6% 0.9% 0.1% 1.2% 13.3%
Grand Lake 447 94.4% 0.7% 0.9% 0.2% 0.0% 1.1% 2.7% Steamboat Springs 9,815 94.7% 0.1% 0.3% 0.6% 0.1% 1.1% 3.1%
Vail 4,531 89.7% 0.3% 0.4% 1.7% 0.2% 1.5% 6.2% Source: U.S Census Bureau, 2000 Census Tourism Most Colorado mountain communities rely on Tourism as their major economic industry. Tourism remains one of Colorado’s largest industries. For several years the Colorado Tourism Office has contracted with Longwoods International to conduct surveys regarding Colorado’s market share and a visitor profile. In 2004, Longwoods International again conducted a survey of American households using a random sample from the Ipsos-NPD consumer panel (comprised of 450,000 households) and Travel USA, Longwoods’ annual syndicated survey of the travel market (comprised of 200,000 households). The study yielded a sample of 2,551 travelers to Colorado in 2004. There was a 59% response rate. This study examines overnight trips and does not include day trips. In 2004, Colorado welcomed 25.8 million domestic U.S. visitors on overnight trips. Of the more than 25.8 million visitors, 22.3 million were people on leisure trips versus business trips. Ski Trips, Touring Trips and Outdoor Trips are the top types of trip for Colorado’s market.
Table 7: Number of Visitors by Type of Trip Type of Trip Number of Visitors
Touring Trip 2,240,000
Outdoor Trip 2,210,000
Special Events 1,650,000
Skiing Trips 1,500,000
Source: Longwoods International, 2004 Colorado is perceived as a dream destination and ranks in the top ten places people “would really like visiting,” behind Florida, California, Hawaii and New York. The largest factor for the recognition of Colorado as a destination is Colorado skiing. In 2004 Colorado was the top ski destination in the United States, commanding 18% of the market share and ranked number one for overnight ski vacations. The two trip types studied are Business and Leisure Trips. Leisure trips to Colorado were up 5% over 2003 with most trips associated with visiting friends and relatives in Colorado. Colorado residents account for one in four of the state’s overnight vacations. However, there is not a corresponding increase in “marketable” trips – trips where visitors stay in paid accommodations, and spend more in restaurants, on attractions and the like. Business travel to Colorado has continued to decline, reaching what is believed to be at an all time low having dropped 18% since 2000. Of the marketable trips, there is an increase in the “business with pleasure” trips, casino trips and city and country resort trips and fewer touring and outdoor trips according to this study. Because of the nature of travel to Colorado, visitors are more likely than the national norm to use the internet for trip planning. In fact, 44% of the survey respondents used the internet for planning overnight pleasure trips. Six in ten vacations to Colorado occurred in the spring and summer months (April to September) according to the survey. Primary motivators in determining where to vacation include:
• excitement and sense of adventure offered by the destination • suitability for adults and couples • family atmosphere with plenty for the kids to do
Opportunities for sports and recreational activities ranks lower on the list of motivators. Compared to the competition, Colorado is similar in winter vacation appeal and the availability of good resorts. Colorado is also viewed as a good place for families and is seen as relatively affordable. In addition, Colorado’s largest interest areas in terms of Sports and Recreation are: hiking/backpacking 83%, mountain climbing 85%, camping and mountain biking 76%, rafting 73%, hunting 72%, fishing 66% and walking/strolling 61%.

page 72 Glenwood Springs, Colorado Parks and Recreation Comprehensive Master Plan
For skiing, Colorado far outpaces the competition in terms of excellent skiing/snowboarding overall, well groomed slopes, slopes not too crowed, wide variety of ski areas, and excellent snow conditions. In studying Colorado’s image, respondents perceive Colorado for its: skiing (85%), sports & recreation (61%), adult atmosphere (76%), and excitement (67%). Other strengths in Colorado’s image include:
• popular with vacationers • excellent value for the money • interesting festivals/fairs • good weather in summer
Colorado is viewed less favorably for boating and water sports, canoeing and kayaking, mountain biking/off-road bicycling, rafting, theater and the arts and having lots to see and do. In terms of people’s image of sightseeing in Colorado, the largest interest areas are: beautiful scenery 86%, beautiful gardens and parks 71%, wildlife/birds 75%, and interesting small towns and villages 66%. Heritage Tourism Colorado recently established the Colorado Heritage Tourism program with the Colorado Tourism Office. This program has completed a strategic plan for Heritage Tourism in the state. Heritage Tourism according to the National Trust for Historic Preservation is “traveling to experience the places and activities that authentically represent the stories and people of the past and present. Tourism at the Local Level The Colorado State Demographer, in cooperation with county and municipal governments, has been working for several years to develop a methodology that will help communities better understand the importance of tourism to the local economy. This has resulted in the Local Economic Information and Forecasting Assistance (LEIFA) program. This program and its analysis examine tourism as a basic industry in the overall economy similar to what is traditionally thought as a basic industry like mining and manufacturing. The premise of the analysis is to identify outside sources of money coming into a local economy. Tourism is not identified as a standard industrial classification in the North American Industrial Classification System, and detailed analysis of both jobs and income is conducted at the local level to determine the make up of the tourism segment of the local economy. This make up includes resorts, second homes, tourist services and tourism transportation. When Income is considered, Summit County outpaces the other four counties with more than 55% of the basic economy attributed to tourism-related activities. Tourism-related activities in Garfield County represent 13% of the basic economy. This indicates that other factors are influencing the local economy in Garfield County.
Table 8: Tourism-Related Economic Factors by County (% of Income)
County Resorts Second Homes Tourist Services
Tourism Transportation
Total Percent Basic
Eagle County 21.5 19.8 7.9 .9 51.1 Garfield County 4.9 6.2 1.6 .5 13.4 Pitkin County 24.6 18 4.5 1.6 49.2 Routt County 17.5 18.9 3.7 1.9 42.4 Summit County 26.4 18.5 8.1 1.7 55.3 Source: Department of Local Affairs, Demography Section, 2003 Jobs & Income Summary by Base Industry Group Grand and San Miguel Counties also derive more that 50% of their basic economy from tourism- related activities, while Gunnison, LaPlata and Archuleta Counties derive a little more than 20% of their income from tourism. The resort areas of Aspen, Vail, Breckenridge and Steamboat Springs exhibit a mixture of amenities which accommodate the seasons and offer diverse experiences and opportunities for the visitor. This obviously includes ski areas but also includes other winter amenities such as skating rinks, cross-country skiing, snowmobiling, and sleigh rides. Summer activities include hiking, mountain biking, festivals, sporting events, golf, rafting and fishing, to name a few. This allows these communities to attract visitors on a year-round basis. Other communities exhibit a tendency toward one season or another and struggle to develop shoulder season (fall and spring) economies. Often times, communities have a successful winter season due to skiing and then a successful summer season due to special events, festivals and other activities. This is the case in communities like Crested Butte and Telluride. Still other communities have what is viewed primarily as either a winter or a summer visitor season. This is true of communities like Ouray, Lake City, Silverton and Pagosa Springs. Some communities have an amenity that is a particular attraction for visitors to come to the community. These communities build around this amenity to strengthen both the seasonal and year-round nature of visitor experience. Examples of these types of communities include Glenwood Springs (Hot Springs Pool), Durango (Durango & Silverton Narrow Gauge Railroad), Cortez (Mesa Verde National Park), and Silverthorne (Outlet Stores). Natural Environment Colorado is an outdoor recreation playground. The natural features, including mountains, rivers, and lakes, provide the backdrop for a host of outdoor pursuits such as skiing, hiking, fishing, boating, hunting, mountain biking, watching wildlife, and camping. The natural environment contributes to a community’s sense of place. Several communities are taking an active role in the preservation of land and maintaining open space, in part due to population growth driving a demand for property development. Several communities have an open space or land preservation strategy. Coordination of this strategy occurs either as a component of
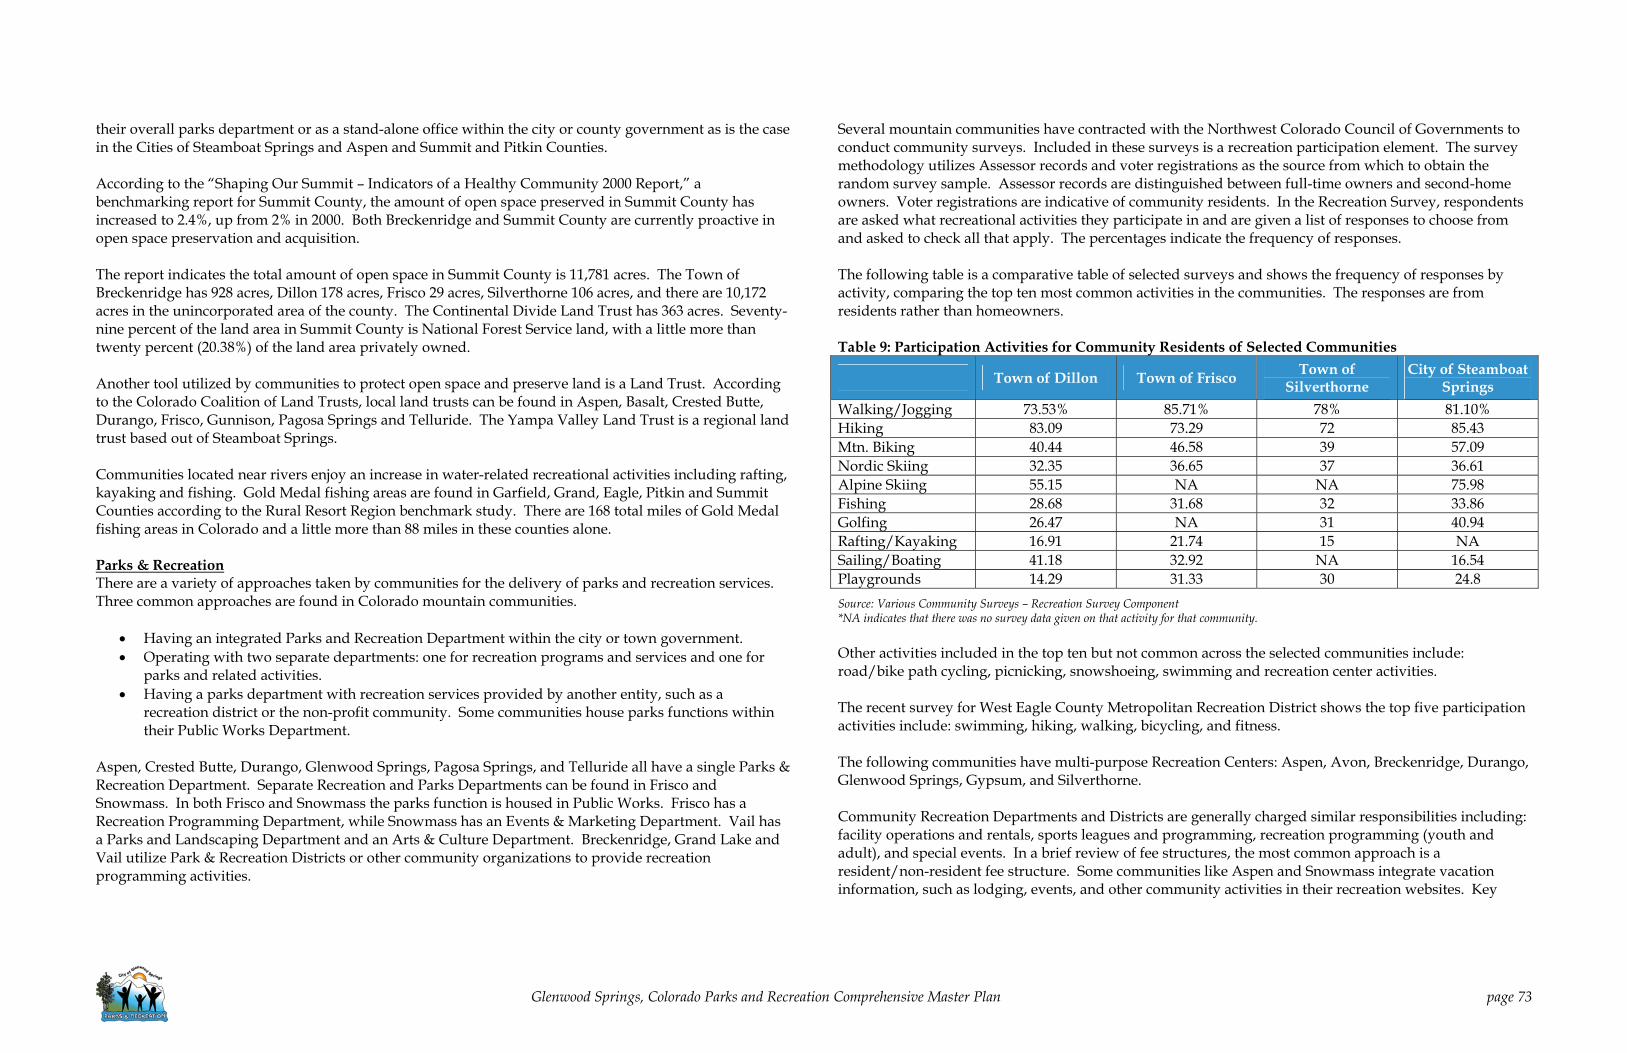
Glenwood Springs, Colorado Parks and Recreation Comprehensive Master Plan page 73
their overall parks department or as a stand-alone office within the city or county government as is the case in the Cities of Steamboat Springs and Aspen and Summit and Pitkin Counties. According to the “Shaping Our Summit – Indicators of a Healthy Community 2000 Report,” a benchmarking report for Summit County, the amount of open space preserved in Summit County has increased to 2.4%, up from 2% in 2000. Both Breckenridge and Summit County are currently proactive in open space preservation and acquisition. The report indicates the total amount of open space in Summit County is 11,781 acres. The Town of Breckenridge has 928 acres, Dillon 178 acres, Frisco 29 acres, Silverthorne 106 acres, and there are 10,172 acres in the unincorporated area of the county. The Continental Divide Land Trust has 363 acres. Seventy-nine percent of the land area in Summit County is National Forest Service land, with a little more than twenty percent (20.38%) of the land area privately owned. Another tool utilized by communities to protect open space and preserve land is a Land Trust. According to the Colorado Coalition of Land Trusts, local land trusts can be found in Aspen, Basalt, Crested Butte, Durango, Frisco, Gunnison, Pagosa Springs and Telluride. The Yampa Valley Land Trust is a regional land trust based out of Steamboat Springs. Communities located near rivers enjoy an increase in water-related recreational activities including rafting, kayaking and fishing. Gold Medal fishing areas are found in Garfield, Grand, Eagle, Pitkin and Summit Counties according to the Rural Resort Region benchmark study. There are 168 total miles of Gold Medal fishing areas in Colorado and a little more than 88 miles in these counties alone. Parks & Recreation There are a variety of approaches taken by communities for the delivery of parks and recreation services. Three common approaches are found in Colorado mountain communities.
• Having an integrated Parks and Recreation Department within the city or town government. • Operating with two separate departments: one for recreation programs and services and one for
parks and related activities. • Having a parks department with recreation services provided by another entity, such as a
recreation district or the non-profit community. Some communities house parks functions within their Public Works Department.
Aspen, Crested Butte, Durango, Glenwood Springs, Pagosa Springs, and Telluride all have a single Parks & Recreation Department. Separate Recreation and Parks Departments can be found in Frisco and Snowmass. In both Frisco and Snowmass the parks function is housed in Public Works. Frisco has a Recreation Programming Department, while Snowmass has an Events & Marketing Department. Vail has a Parks and Landscaping Department and an Arts & Culture Department. Breckenridge, Grand Lake and Vail utilize Park & Recreation Districts or other community organizations to provide recreation programming activities.
Several mountain communities have contracted with the Northwest Colorado Council of Governments to conduct community surveys. Included in these surveys is a recreation participation element. The survey methodology utilizes Assessor records and voter registrations as the source from which to obtain the random survey sample. Assessor records are distinguished between full-time owners and second-home owners. Voter registrations are indicative of community residents. In the Recreation Survey, respondents are asked what recreational activities they participate in and are given a list of responses to choose from and asked to check all that apply. The percentages indicate the frequency of responses. The following table is a comparative table of selected surveys and shows the frequency of responses by activity, comparing the top ten most common activities in the communities. The responses are from residents rather than homeowners. Table 9: Participation Activities for Community Residents of Selected Communities
Town of Dillon Town of Frisco Town of Silverthorne
City of Steamboat Springs
Walking/Jogging 73.53% 85.71% 78% 81.10% Hiking 83.09 73.29 72 85.43 Mtn. Biking 40.44 46.58 39 57.09 Nordic Skiing 32.35 36.65 37 36.61 Alpine Skiing 55.15 NA NA 75.98 Fishing 28.68 31.68 32 33.86 Golfing 26.47 NA 31 40.94 Rafting/Kayaking 16.91 21.74 15 NA Sailing/Boating 41.18 32.92 NA 16.54 Playgrounds 14.29 31.33 30 24.8 Source: Various Community Surveys – Recreation Survey Component *NA indicates that there was no survey data given on that activity for that community. Other activities included in the top ten but not common across the selected communities include: road/bike path cycling, picnicking, snowshoeing, swimming and recreation center activities. The recent survey for West Eagle County Metropolitan Recreation District shows the top five participation activities include: swimming, hiking, walking, bicycling, and fitness. The following communities have multi-purpose Recreation Centers: Aspen, Avon, Breckenridge, Durango, Glenwood Springs, Gypsum, and Silverthorne. Community Recreation Departments and Districts are generally charged similar responsibilities including: facility operations and rentals, sports leagues and programming, recreation programming (youth and adult), and special events. In a brief review of fee structures, the most common approach is a resident/non-resident fee structure. Some communities like Aspen and Snowmass integrate vacation information, such as lodging, events, and other community activities in their recreation websites. Key

page 74 Glenwood Springs, Colorado Parks and Recreation Comprehensive Master Plan
visitor links are also included. Some Recreation Department websites reveal the importance of visitors in the mission of the organization. Park Departments or divisions within Public Works perform a variety of responsibilities including: maintenance of parks, public facilities, and public buildings (City Hall for example), maintenance and preparation of athletic fields, and landscape maintenance. Other responsibilities include: trail and open space maintenance, snow removal, and in some cases the design and development of parks. Community Financing Lodging & Accommodation Tax According to the Department of Revenue, the following mountain counties have a Lodging Tax in place: Clear Creek, San Juan, San Miguel (excluding Mountain Village), Archuleta, Hinsdale, Lake, La Plata (excluding Durango), Grand (excluding Winter Park) and Gunnison. Table 10: County Lodging Tax Rates Tax Rate Archuleta County 1.9 Clear Creek County 2.0 Grand County 1.8 Gunnison County 4.0 Hinsdale County 1.9 Lake County 1.9 LaPlata County 1.9 San Juan County 2.0 San Miguel County 2.0
Source: Colorado Department of Revenue, Publication DR1002, 1/13/06 These taxes are on lodging services including hotels, motels, condominiums and camping spaces. Lodging tax funds are generally used for marketing and other promotional types of activities. Local lodging taxes are in place in Dillon, Eagle, Glenwood Springs, Steamboat Springs and Vail. Local Marketing Districts Local Marketing Districts are also used to finance the promotion of communities. According to the Department of Revenue, the following communities have Local Marketing Districts. Town of Vail has a 1.4% tax on lodging services, including hotels, motels, condominiums and camping spaces. The City of Steamboat Springs has a 2% marketing district tax. Sales & Use Taxes Sales and Use Taxes are also used for parks, recreation and open space activities. Aspen, Breckenridge, Carbondale, Durango, Ridgway and Snowmass have dedicated a portion of the sales and/or use tax for these types of activities. Telluride and Mountain Village have dedicated a portion to support the Airline Guarantee program.
Sales & Use Tax rates in mountain communities range from 2.0% to 5.0%. County sales tax rates for Eagle, Garfield, Pitkin, Routt and Summit Counties range from 1.0% to 2.75% According to the Property Tax Annual Report for 2005, Eagle, Pitkin, Routt and Summit Counties are using property tax revenue to support expenditures in the Recreation Services category for one or more of these activities: library, TV translator, museum, community center board, library capital reserve, recreation, fair, conservation trust, home rule charter, open space and public lands. Summit and Eagle Counties are showing revenues in this category of more than $3 million, while Pitkin County is showing revenue of more than $7 million, and Routt County lists less than $500,000.00. Special Districts Special taxing districts can be found throughout Colorado and may include districts for cemeteries, libraries, parks and recreation, water and sanitation, hospitals, and health services. Metropolitan Districts provide any two or more of the following services: fire protection, mosquito control, parks & recreation, safety, protection, sanitation, solid waste disposal and collection, street improvements, television translator and relay, transportation, and water. Parks & Recreation Districts are established to provide park and recreation facilities or programs. Both Eagle and Garfield Counties have Parks &Recreation Districts. Eagle County has four Parks & Recreation Districts with a range of property tax mil levies from 1.000 to 3.650. The Parachute/Battlement Mesa Parks and Recreation District has a mil levy of 3.080 in Garfield County. Other counties with Parks and Recreation Districts include Grand County (2), Gunnison County (1), LaPlata County (1), and San Miguel County(1). Table 11: Cemetery & Library Districts Cemetery Districts Library Districts Archuleta County 1 Eagle County 3 2 Grand County 0 1 Gunnison County 1 0 LaPlata County 2 2 Pitkin County 0 2 Routt County 4 3 San Miguel County 1 2 Source: 2005 Annual Report, Division of Property Taxation, Department of Local Affairs, 2005 Hospital or Health Service Districts can be found in Eagle County (Health Service and Ambulance), Pitkin County (Ambulance & Hospital), Routt County (Hospital), and Summit County (Hospital). Other counties with these types of districts include: Archuleta (Health Service), Grand (Hospital), and San Miguel (Health Services).

Glenwood Springs, Colorado Parks and Recreation Comprehensive Master Plan page 75
Summary • Visiting friends and relatives continues to be one of the main reasons for an overnight vacation in
Colorado, with one in four trips originating in Colorado. • Outdoor trips remain popular with visitors, accounting for more than 2.2 million visitors in 2004. • An increasing number (44%) of vacationers are using the internet to plan their vacation. • Residents in mountain communities tend to prefer individual activities such as walking, skiing, and
mountain biking versus group activities. • The use of some tax mechanism to finance recreation and park activities is being done in mountain
communities. • Communities have room for improvement in the area of arts and culture as a visitor attraction and
for community residents. • Mountain communities are increasingly interested in land preservation and open space.
Bibliography AAA Publishing, Colorado & Utah Tour Book, 2005 Edition, AAA Publishing, Heathrow, FL, 2005. “A Strategic Plan for Colorado Heritage Tourism Enhancement Executive Summary”, Colorado Tourism
Office, Heritage Tourism Program, Denver, CO, 2006 Colorado Coalition of Land Trusts. http://www.cclt.org
Colorado Golf - The Official Guide to the Golf Courses of Colorado 2006, Colorado Activity Centers, Frisco, CO,
2006. Colorado Ski Country USA. http://www.media-coloradoski.com Dex Directories, Dex Media, Inc., 2005/06. Division of Local Government, Demography Section, “Final Colorado Population Estimates by Region and
County, 2000-2004”, State of Colorado, Department of Local Affairs, Denver, CO, October 2005. “Local Economic Information and Forecasting Assistance”, State of Colorado, Department of Local Affairs,
Denver, CO, April 2005 “Population by Age Group - Colorado Municipalities”, State of Colorado, Department of Local Affairs,
Denver, CO, 2000. “Population by Age Group and Gender – Colorado Municipalities”, State of Colorado, Department of
Local Affairs, Denver, CO, 2000. “Population for Colorado Counties & Municipalities”, State of Colorado, Department of Local Affairs,
Denver, CO, October 2005.
“Preliminary Population Forecasts by County 2000-2035”, State of Colorado, Department of Local Affairs, Denver, CO, May 2006
Division of Property Taxation, “2005 Annual Report”, State of Colorado, Department of Local Affairs,
Property Tax Division, Denver, CO, 2005. Division of Taxpayer Services, “Colorado Sales/Use Tax Rates” State of Colorado, Department of Revenue,
Denver, CO, January 2006. Felsburg Holt & Ullevig, “Intermountain 2030 Regional Transportation Plan” Intermountain
Transportation Planning Region, October 2004.
Frazier, Deborah, Colorado Hot Springs, Pruett Publishing Company, Boulder, CO, 1996. Longwoods International, “Colorado Travel Year 2004 Final Report”, Colorado Tourism Office, 2005. “Municipal Debt/Multiple-Fiscal Year Obligation Issues on 1993-2005 Ballots”, Colorado Municipal
League, Denver, CO, 2006. “Rural Resort Region 2005 Benchmark Report, Northwest Colorado Council of Governments, Silverthorne,
CO, 2005, page 27.
Shaping Our Summit, “2004 Community Report (an update to Indicators of a Healthy Community: Measuring Summit County’s Quality of Life 2000), Summit County Colorado, 2004
URS Corporation, et al., “Northwest 2030 Regional Transportation Plan”, Northwest Colorado Regional Planning Commission, October 2004.
Venturoni, Linda, “2003 Dillon Community Survey”, Northwest Colorado Council of Governments,
Silverthorne, CO, October 2003. “2003 Frisco Community Survey”, Northwest Colorado Council of Governments, Silverthorne, CO,
September 2003. “Town of Silverthorne 2005 Community Survey”, Northwest Colorado Council of Governments,
Silverthorne, CO, February 2006. “2005 City of Steamboat Springs Community Survey”, Northwest Colorado Council of Governments,
Silverthorne, CO, September 2005. “2006 Western Eagle County Metropolitan Recreation District Survey”, Northwest Colorado Council of
Governments, Silverthorne, CO, March 2006 Other: Various local government and parks and recreation department websites

page 76 Glenwood Springs, Colorado Parks and Recreation Comprehensive Master Plan
Appendix C. Public Process PresentationFocus Group Results
3 evening groups; 32 citizens April 4-6, 2006
1) How long have you been a resident of Glenwood Springs? 1 <5 years 9 20+ years 9 5-9 years 1 Not a city resident, but use programs and services 12 10-19 years 2) What are the key issues and values in the Glenwood Springs community that need to be
considered while developing this master plan? – Charted • Family • Fitness • Environment and Appearance – plants greenery • Image • Natural beauty • Neighborhood • Cleanliness • Access for children • Quiet?? • Social Consciousness • User friendly • Tourist friendly • Community • Ability to participate – diverse access • Recreational opportunities • Public participation • Health of community is judged by it’s parks • Safe community • Partnerships/collaborations • Glenwood Unique – unique natural area • Balance of leisure and work • Affordability • User friendly • Family Friendly • Age friendly; appropriate • Natural beauty • Ability friendly
• Affordability - reasonable • Diversity
3) Where do you go to recreate indoors? What providers do you use?,
• Glenwood Springs Recreation Center -17 • Neighboring communities - 5 • YMCA/YWCA – 1 Denver • Churches - 12 • Recreation programs in Schools - 12 • Private Fitness Club - 18 • University/College - 5 • Hot Springs Pool and other private providers - 25 • Don’t use indoor facilities - 0 • Other –
o Glenwood center-1 o Center for the Arts – 11 o Home –- 1
4) What are the City’s strengths when it comes to parks, recreation, trails and open space that should
be continued over the next ten years? • Organize use of parks • cleanliness – parks and trails • make children’s programs priority • very helpful in maintenance issues • variety of options • responsive to concerns – good communication • KidKare • Lunch bunch program • Community center vitality • Service to people with disabilities –mountain valley • Outdoor parks system • Continue public input • Bike/ pedestrian trail system – keep finishing it • Consider cemetery in plan • Maintaining landscaping downtown • Maintaining fields • Bike paths and trails; parks

Glenwood Springs, Colorado Parks and Recreation Comprehensive Master Plan page 77
• Care and maintenance of facilities • Continue to move around the whole facility • The Recreation Center and pool • Summer adult programs - softball • Winter programs at center • Summer jazz series • Tennis courts • Adult only use of gym at certain times
5) On a scale of 1-5, how satisfied are you with the quality of current programs offered?
And why? (1 = Not At All Satisfied - 5 = Very Satisfied) 1- = 0 2- = 0 3- = 15 4- = 8 5- = 6
6) What additional programs or activities do you feel the City should offer that are currently not
available? – Charted • White water • Competitive children’s gymnastics • Adult master swim • Gardening • Spinning • Adopt a park • Pre school • Senior programs • Outdoor volleyball league • Special need programs • Special events • Fitness classes during kid care hours • Outdoor winter activities: snowshoeing, cross-country skiing, sledding, family oriented • Have a clearing house/resource center for activities for all groups • Define clear course of sports progression • Clean-up program for river • Wrestling • Other concerts with variety of music • More cultural events - downtown • Theater in the park • Movies in the park • Summer playground and inter-park play • Pet Olympics • Busker programs - juggling
• Kid’s carnival
7) Are there any parks, programs or facilities currently available that should be eliminated? If so, which ones and why? • More efficient use of resources • Stop expanding • More collaboration inside and inside the community
8) On a scale of 1 to 5, how satisfied are you with the quality of the existing City parks and recreation
facilities and level of maintenance provided by the City? And why? (1 = Not At All Satisfied - 5 = Very Satisfied)
1- = 0 2- = 2 3- = 15 4- = 10 5- = 4
9) What improvements are needed in existing parks and recreation facilities or maintenance? Please
identify the location and specifics of any maintenance concerns. Where are these improvements needed? • Rocks falling on canyon trail – Who is responsible? • Enforcement of dog laws (leash and poop), more doggy stations, move dogs to dog park, dog
ranger • Maintenance needs to be more timely • Restroom maintenance needs to be better, new restrooms • Safety issues • Trash pickup • BBQ in Sayre Park • Update playground equipment • Some portion of hotel tax should be put to up keep and cleanliness • Beautification of parks and gateway, plenty of room for improvement • Environmental responsibility • Pedestrian walk along Deverau • Finish the trail system to Hunter Park • Locker rooms for hockey • Enclosed hockey • Soft trails to hard surface trails • Connectivity of trails • Outdoor pool or spray ground • Tennis is spread out • Better utilization of rodeo ground • Use South Canyon • Park landscaping of parks, more vegetation, more trees, better maintenance, asphalt in two
rivers park

page 78 Glenwood Springs, Colorado Parks and Recreation Comprehensive Master Plan
• Beautification of trails especially trees (shade) • Trails connectivity • Side screens between new courts at the recreation center • Paved trails and accessible trails • Parking for access • 2 River and Roaring Fork; and through Veltus Park - lighting; real dark on trail and in park • Improve general maintenance • Landscaping at park entryways and parking lots • Better lighting in darker places • Tamarisk • Bear-proofed containers at parks (Two Rivers) • Centennial Park is dysfunctional and needs a facelift; perhaps patio • Year round restroom facilities • Veltus park needs fire clean up mitigation maintenance • Signage; wayfinding and distances; directional; kiosks; pamphlets; historic • Two Rivers Park is dark
10) What NEW recreation facilities or amenities would you like to see the City provide? - Charted • Fishing Lake/pond • Fitness trail • Community garden • Small amphitheater 100 seat • Purchasing Nelly’s Duffy property • Sledding hill – winter activities • Driving range • Natural xericscape • Bike trails behind Glenwood meadows single track • Bike trails along Midland Ave. • Bike trails south of Ski Bridge • White water park/feature • Trail along Glenwood ditch • Beautify river • Performing arts theater • Trail along Attikinson’s ditch • Joint facilities for efficiency • BMX course • Trail from red mountain to south canyon - partner • Developed Dog Park • Additional bridges across the river; and Main Street • Urban Park System; plaza space • Botanic Garden - Wolfshon
11) Are there any portions of the community that are underserved? Please explain (i.e., what market segment needs more attention, like age groups, geographic locations, special interest groups, etc.). - Charted • Seniors • Preschoolers • Latino population • Working poor • People in developments without facilities • Teenager activities after 9:00pm • Teens activities • Soft trail users • West Glenwood • Tennis courts aren’t being used • Non-competitive sports for youth • Skaters • South Glenwood • Tourists • Newcomers • CMC students • Singles • Seniors • Teenager • Special Needs • Downtown - social spaces • Historical advocates
12) On a scale of 1 to 5, how would you rate the quality of customer service provided by the City?
Please elaborate. (1 = Poor - 5 = Excellent) Park and Recreation City 1- = 0 1- = 6 2- = 2 2- = 0 3- = 15 3- = 3 4- = 3 4- = 6 5- = 1 5- = 1 13) On a scale of 1 to 5, how effective is the City in seeking feedback from the community and users
on improving its performance? (1 = Not At All Effective - 5 = Very Effective) 1- = 5 2- = 10 3- = 8 4- = 2 5- = 1

Glenwood Springs, Colorado Parks and Recreation Comprehensive Master Plan page 79
14) On average, what portion of the City’s ongoing operations and maintenance of parks and recreation services should be funded by taxes (understanding that the unfunded portion would be supported mainly by fees and charges?) - Charted
<40% = 0 50% = 6 60% = 16 >60% = 6
It should be established as to what the standard is and then decide portion of taxes/fees needed 15) Do you think residents would support a property tax increase, operating levy, or bond issue to
improve, build and operate parks and facilities desired by the community? Yes - 3 No – 5 Need specific ideas Yes - 1 No - all others Yes - 1 No - 3
16) Do you think residents would support an admission/amusement tax or sales tax to improve, build
and operate parks and facilities desired by the community? Yes - 8 No – 0 Yes - 10 No - none, one maybe Yes - 11 No - 0
17) Do you think residents would support a special parks and recreation open space tax to improve,
build and operate parks and facilities desired by the community? Yes - 2 No – 7
• When you say recreation and open space you will lose • 2 think it is good • Would like a recreation district to tax both residents and non-residents, it is the only fair way to
go, will address the future development • Demographics are shifting and it would be good to bring it up again • Look at a portion of accommodations tax
Yes - 7 No - 3
18) Who are the key partners and stakeholders we need to speak with to create the best possible master
plan for the community? - Charted • Kids • Seniors • Latinos • Business that promote tourism • People who live here • School district • Hotels and motels • Civic groups • Sport groups • Chamber of commerce • Police department • Small business not member of the chamber, non-profits – churches – youth zone – hospital • RTFA and Ride Glenwood • Garfield County commissioners • City employees • CMC • Other special districts – fire and sanitation, Colorado Water Conservation District • CDOT • Scouts • LoVa • Roaring Fork Outdoor Volunteers • Historical societies • Newspapers and media • Developers • BLM, USFS, USWS • Petroleum industry • Mountain Valley Developmental Services • Mountain Valley Hospital • Teens • Fire and Police • Singles • Churches • Environmental groups • Dog Park Committee • Aspen Valley Land Trust (AVLT)

page 80 Glenwood Springs, Colorado Parks and Recreation Comprehensive Master Plan
19) Are there any sensitivities we should be aware of that could impact the success of the Park and Recreation Commission’s and City’s master planning efforts? - Charted • Taxed to death – no tolerance • Some tolerance for taxes • Latino involvement in community – diversity issues • Economic diversity • Language • Lack of community involvement • People don’t respond until plan is made • Under paid parks & recreation staff • Non-resident user • KidKare charges • “everybody’s neighborhood” • Town old time character • Silent majority (non resident -users, ) • Funders • Protectionism from private providers and special interest • Inter-governmental relations or lack there of… • Downtown system is very fragile; bad decisions can ruin downtown • Lack of inter-governmental relations • Government decision-makers not listening; disenfranchised citizens • Continuation of family friendly; affordable
20) During the next ten years, what should be the top priorities for the City? - Charted
• More park space • Take care of what we have now • Connectivity of trails • Connect recreation center to two rivers park • Make Ted O’leary park bigger • Full usage of land we own • Children programs • Bi-lingual communication • White water park • Maintain what we have • Trails on Wilson Mountain • Environmental focus
Other issues are competing for the same dollars – esp transportation and affordable housing
• Want to get results – implement the plan and make the plan implementable • IGA with school and county • Golf driving range • Keep things affordable • Define needs of the tourist
• Environmental degradation needs to have integration and collaboration • Regional planning • Carrying capacity in relationship to qualitiy of life • Revenue enhancement programs • Would like to see the downtown area in the park master plan as park • Communication and education • Volunteer programs • Golf course 18 holes • Develop Dog Park • Performing Arts Theater • Expanded opportunities for persons with disabilities
21) Where do you get information on parks and recreation services? Are there any cost-effective
methods the City should use to distribute information about parks, open space, trails, and recreation services? • Paper • Community center • Brochure • Newspaper mailer • More newspaper • Newspaper • Program guide /brochure • Website • Word of mouth • Mountain parent magazine • Photos of parks and events on web and kiosk • Newspapers • Mailings • Chamber • More on city channel 12 • Website • Word of mouth
Please complete the GRASP® questionnaire on park amenities, cultural, historic and other programs and services, and walk time. Thank you for your time and participation!

Glenwood Springs, Colorado Parks and Recreation Comprehensive Master Plan page 81
Appendix D. Youth Sports Association Analysis Glenwood Springs Soccer Club P.O. Box 4 Glenwood Springs, CO 81602 Ph: 970-945-6091 Email: [email protected] Web: www.glenwoodsoccer.com Primary Contact: Denise Hussain Activities Provided The Glenwood Springs Soccer Club provides both recreational and competitive soccer opportunities for boys and girls ages 10 to 14 years. Additionally the club offers soccer camps and tournaments. Two seasons are offered, one in the spring and one in the fall. Youth with special needs also participate from time to time. Length of Season Season start dates and length of seasons are dictated by state (Colorado Youth Soccer Association) and national (USA Soccer) governing bodies for youth soccer. Participation The Club serves almost 400 youths in the fall and 175 youths in the spring at the recreational level and 166 youths annually at the completive level. This season the Club had to turn away late registrations as all the teams were full. Satisfaction Levels The City of Glenwood Springs athletic fields are somewhat meeting the needs of the organizations. There is a lot of competition for field space during the year and the number of fields that have been available during the spring are now being lost to other activities. The Club is very satisfied with the condition of the fields and appreciates the job the City does in trying to accommodated its needs. Top Concerns The top concern of the Club is that there are not enough fields to accommodate all sport groups. Three Rivers Little League 46089 Highway 6 & 24 Glenwood Springs, CO 81601 Ph: 907-319-7401 or 970-947-9212 Email: [email protected] Web: www.trll.org Primary Contact Rick Ullom
Activities Provided The Three Rivers Little League is a competitive baseball league that serves boys from 9 to 14 year of age. Length of Season There two things that dictate the starting and ending dates for the league. The first being the National Little League Organization and the second being the availability of baseball fields in the City of Glenwood Springs. Participation The league currently serves 240 youths during its season. At this time the league has had to turn away seven boys due to teams being full. Additionally there has been a great interest in starting a girl’s softball league but due the lack of fields the league cannot accommodate this request. The league estimates that it could serve 180 girls if fields were available. Satisfaction Levels The league feels that City if somewhat meeting its needs for athletic fields. There is only one field (Sopris West) the can accommodated the 13-14 years old participants that need the equivalent of a high school size field. Condition of the fields is also a concern of the leagues as the infields do not drain properly causing the cancellation and rescheduling of many games during the season. The league provided additional funding to the City to address this issue but more is needed. Top Concerns The top concern of the league is the need for an increase in adequate fields to play on. One suggestion would be a four field complex with permanent mounds (on three of the fields) along with a concession area to be used a way to raise funds to assist in maintenance issues. Triple Crown Sports PO Box 2232 Glenwood Springs, CO Ph: 970-945-0627 Email: [email protected] Web Site: www.triplecrownsports.com Primary Contact: Stacy Sorensen Activities Provided Triple Crown Sport organizes and hosts adult softball and youth baseball tournaments at the competitive level. Length of Season Length of season is determined solely by the organization.

page 82 Glenwood Springs, Colorado Parks and Recreation Comprehensive Master Plan
Participation The organization averages 2 tournaments a years and can have between 30 and 80 teams for each event. Many of these teams travel from outside the Glenwood Springs area and also require overnight accommodations during these tournaments. Satisfaction levels The organization feels the City if somewhat meeting their needs in regards to athletic fields. Maintenance levels are rated as fair. Concerns range from the everyday aspect of field maintenance to cleanliness of the fields Top Concerns The organization feels the City is not always willing to work with the organization. One of the primary goals of the organizations is to have a healthy relationship with the City and to be a positive economic opportunity by bringing people into the community for sporting events. As with the Little League the organization seeks a baseball/softball complex to hold its tournaments. Glenwood Youth Hockey Association 526 Pine Street Glenwood Springs, CO 81601 Ph: 970-640-9112 or 970-285-7724 Email: [email protected] Web Site: www.GlenwoodYouthHockey.com Primary Contact Person: Larry McDonald – President Activities Provided The Glenwood Youth Hockey Association (GYHA) provides both recreational and competitive ice hockey for boys and girls ages 8 to 16 years. The GYHA also provides learn to skate and play hockey programs along with traveling teams, tournaments and practices. Length of Season Primarily the length of the hockey season is determined by GYHA. The length of the season is also dictated by weather condition as the home ice arena for the GYHA is an outdoor venue. Participation The GYHA currently serves 208 youths during its season (18 girls and 190 boys). Of those youths, a little more that half (113) play at the recreational level and the balance (95) play at the competitive level. The association currently does not have waiting lists for youths wanting to participate. Satisfaction Levels The GYHA feels the City if somewhat meeting their needs in regards to the ice arena and the amount ice time that is available. Since the GYHA is essentially the main tenant of the ice arena they would like to see it enclosed; that will in turn allow for longer seasons and additional participation growth of the association.
Additionally, an enclosed rink would allow for summer hockey camps, more tournaments and expanded programming. The GYHA rates condition of the ice arena as fair. This is mainly due the fact that it is an outdoor venue and therefore lacks amenities available for visiting teams, players, coaches and spectators. Top Concerns The top concerns of the GYHA center on having the current ice arena enclosed. An enclosed venue would allow for year around involvement in GYHA offerings and increase participation levels. Other concerns include:
• Having a separate youth locker room so younger players are not exposed to adult conversations, profanity and nudeness;
• Better crowd control for less distractions to coaches and players; • Better spectator viewing areas; • Being allowed by the City to sell dasher board sponsorships/advertising as a way to raise funds;
and • Better support by the City by allowing the GYHA to hang championship banners, team
photographs and display trophies. Additional Comments by the Glenwood Youth Hockey Association The following information was provided by the Glenwood Springs Youth Hockey Association for a reference point of various aspects of the association and its operational goals. This handout is intended to offer members of The Glenwood Springs Parks and Recreation to have additional insight into our association and its membership. Our Mission Statement It is the philosophy of the Glenwood Springs Youth Hockey Association to provide an opportunity for ice hockey players in the vicinity of the Roaring Fork Valley to participate in a recreational and competitive hockey program. This program will promote sportsmanship and team play, and will work to build self-esteem and character. Glenwood Youth Hockey will field a team in each age division at which it can be competitive. Our Association Goals
1. To facilitate the youth hockey program in the Valley for kids of all ages and at all skill levels. 2. To offer year round programs for youth hockey and develop our membership base. 3. To offer in house programs and offer skill base camps to our membership to advance their level of
play. 4. To build an all girls league, offering a girls hockey league outside of the current co-ed programs. 5. To provide a year round sports alternative for young people who desire to pursue hockey to its
highest level. 6. To provide our players the foundation of opportunities for collegiate scholarships. 7. To have players reach the collegiate level and beyond. 8. To have our graduating players recycle through our program as coaches, and board members.

Glenwood Springs, Colorado Parks and Recreation Comprehensive Master Plan page 83
Why an Enclosed Rink? • An enclosed ice arena operates more efficiently at all levels; un-enclosed facility is considered an
uncontrolled environment in the arena industry. Enclosed arenas are said to operate in some cases 60% more energy efficient than a seasonal open arena, saving thousands of operational costs monthly and tens of thousands annually.
• Glenwood Youth Hockey Association spent $12,836.00 on ice rental in Aspen and Eagle combined from August 2005 until the Glenwood Ice Arena opened in November for our association member’s local use.
• Currently Glenwood Youth Hockey has two retired NHL players desiring additional ice time for camps at our facility and both of these individuals as involved with player development within our association.
• In season and off season skill camps. Currently Glenwood Youth Hockey Members spend over $26,000.00 out of the city, and out of state on skill base summer camps. This figure does not include the influx into the local economy for lodging, restaurants and retail revenues. This is a low average, based upon our players at each level heading to hockey summer camps this year, Aspen, Vail, Eagle, Denver and Colorado Springs.
• Additional flexibility in scheduling for additional programs and driving additional interest for public use, in house development programs, learn to play hockey, a venue for young people when parents are shopping at the new Meadows Shopping facility. Parents shop & kids skate, or kids shop and parents skate.
• Tournament Play: Both Western and Eastern Slope Teams would like to come to Glenwood rather than Vail, Aspen, Steamboat, Summit due to the lower cost and easy access; as well as local attractions, and costs of lodging, and the ability of combining vacations with hockey tournaments. Two and three day tournaments guarantee an overnight stay and influx of revenue streams into the local economy.
• Spring and summer drop in hockey for youth programs; the majority of kids playing drop in hockey last summer in Aspen were made up of Glenwood Youth Hockey players, some traveled as far as Grand Junction.
• A year round ice arena would support other Community Center activities and draw vacationers to the facility with additional options for locals as well.
• This is not only a Glenwood Ice Arena; we have 110 kids in the program over the past 4 years and they come from Glenwood and surrounding areas; as far as Grand Junction, Fruita, Avon, Vail and Marble; and all points in between.
• An indoor facility would continue our mission; it's been a great opportunity to keep our kids working hard, team building and staying off the streets. That is a plus in society book!

page 84 Glenwood Springs, Colorado Parks and Recreation Comprehensive Master Plan
Appendix E. Results from Glenwood Springs GRASP® Survey Rank facilities based on what is most important to have within walking distance of your home. Facility Total number of times rankedBaseball field 16Softball field 9Soccer 15La Crosse 5Playground 31Tennis courts 20Volleyball 6Picnic facilities 20Disc Golf 7Fitness course 12Open grass 38Walking loop /Track 20Skate park 21Recreational Trail 47Outdoor pool 17Community garden 16Nature Park 25In-line Rink 8Amphitheater 31Ice arena 15Other (see below)Theatre 3Music program 1Sandcourt volleyball 1Botanic garden 1River access 3Community event space 1Dog park 4Downtown plaza/park 1Basketball courts 1Outdoor climbing boulders 3
Glenwood Springs Outdoor Falilities Ranking Based on Walking Distance from Home
0
5
10
15
20
25
30
35
40
45
50
Baseb
all fie
ldSoft
ball f
ield
Socce
rLa
Cros
sePlay
groun
dTen
nis co
urts
Volley
ball
Picnic
facilit
iesDisc
Golf
Fitnes
s cou
rseOpe
n gras
s
Walk
ing lo
op /T
rack
Skate
park
Recrea
tiona
l Trai
lOutd
oor p
ool
Commun
ity ga
rden
Nature
ParkIn-
line R
inkAmph
ithea
terIce
aren
a
Components
Tim
es ra
nked
in th
e to
p 5
mos
t im
port
ant

Glenwood Springs, Colorado Parks and Recreation Comprehensive Master Plan page 85
Rank facilities based on what is most important to have from your home.
0-10MIN 10-20MIN 20-30MIN NOT AT ALL% % % %
Baseball field 24.5% 31.6% 6.12% 37.76%Softball field 23.4% 26.6% 6.38% 43.62%Soccer 23.2% 26.3% 9.47% 41.05%La Crosse 17.2% 12.9% 4.30% 65.59%Playground 38.1% 29.9% 11.34% 20.62%Tennis courts 28.3% 28.3% 14.14% 29.29%Volleyball 21.9% 26.0% 11.46% 40.63%Picnic facilities 35.4% 36.4% 15.15% 13.13%Disc Golf 20.0% 21.1% 8.42% 50.53%Fitness course 23.5% 43.9% 14.29% 18.37%Open grass 38.1% 30.9% 21.65% 9.28%Walking loop /Track 21.4% 37.8% 20.41% 20.41%Skate park 17.9% 24.2% 12.63% 45.26%Recreational Trail 32.3% 29.3% 26.26% 12.12%Outdoor pool 15.8% 41.1% 17.89% 25.26%Community garden 18.9% 43.2% 18.95% 18.95%Nature Park 19.4% 42.9% 24.49% 13.27%In-line Rink 18.3% 16.1% 11.83% 53.76%Amphitheater 18.5% 38.0% 29.35% 14.13%Ice arena 23.2% 22.2% 15.15% 39.39%Other (see below)Theatre 0.0% 0.0% 100.00% 0.00%Music programSandcourt volleyballBotanic garden 0.00%River access 75.00%Community event space 0.00%Dog park 0.00%Downtown plaza/park 0.00%Basketball courtsOutdoor climbing boulders 100.00%
Glenwood Springs Walking Tolerance to Outdoor Facilities
0.0%
10.0%
20.0%
30.0%
40.0%
50.0%
60.0%
70.0%
Baseb
all fie
ldSoft
ball f
ield
Socce
rLa
Cros
sePlay
groun
dTen
nis co
urts
Volley
ball
Picnic
facilit
iesDisc
Golf
Fitnes
s cou
rseOpe
n gras
s
Walking
loop
/Trac
kSka
te pa
rk
Recrea
tiona
l Trai
lOutd
oor p
ool
Commun
ity ga
rden
Nature
ParkIn-
line R
inkAmph
ithea
terIce
aren
a
Components
Perc
enta
ge o
f Res
pond
ants
0-10MIN %10-20MIN %20-30MIN %NOT AT ALL %

page 86 Glenwood Springs, Colorado Parks and Recreation Comprehensive Master Plan
Rank park features based on what adds the most value to a park.
Feature
Priority for adding the
most value to a park
percentage ranked 1-3
Number of times ranked 4-
6
percentage ranked 4-6
percentage ranked 7-10
Shade 63.8% 25 26.6% 9.6%Benches 33.3% 29 34.5% 32.1%Mature Landscaping 30.0% 31 38.8% 31.3%
Natural Areas 38.0% 22 27.8% 34.2%Open Water 26.5% 12 17.6% 55.9%Variety of topography 20.3% 17 24.6% 55.1%
Good street access 25.0% 24 31.6% 43.4%
Shelters 25.9% 40 47.1% 27.1%Restrooms 55.4% 29 31.5% 13.0%Drinking Fountain 47.0% 23 27.7% 25.3%
Glenwood Springs Important Park Features Ranking
0.0%
10.0%
20.0%
30.0%
40.0%
50.0%
60.0%
70.0%
percentage ranked 1-3 percentage ranked 4-6 percentage ranked 7-10
ShadeBenchesMature LandscapingNatural AreasOpen WaterVariety of topographyGood street accessSheltersRestroomsDrinking Fountain

Glenwood Springs, Colorado Parks and Recreation Comprehensive Master Plan page 87
Rank cultural events and facilities most important to have.
Feature Rank Tally
1 2 3 4 5 T
Performing Arts 29 7 2 1 4 43Visual arts 4 14 10 10 2 40Historic Preservation 7 11 12 7 2 39Cultural/Ethnic 2 4 13 12 2 33Other (see below) 0
Dog Park 1Summer Music 1Climbing/Bike trails 1Farmer's MarketWater access at River 1Ballfields 1
Glenwood Springs Importance of Cultural and Entertainment Features
0
5
10
15
20
25
30
35
1 2 3 4 5
Rank
Tim
es R
anke
d Performing ArtsVisual artsHistoric PreservationCultural/EthnicOther (see below)

page 88 Glenwood Springs, Colorado Parks and Recreation Comprehensive Master Plan
Rank cultural events and facilities most important to have within walking distance of your home.
Feature 0-10MIN 10-20MIN 20-30MIN NOT AT ALL
% % % %Performing Arts 12.2% 42.2% 28.89% 16.67%Visual arts 10.3% 35.6% 19.54% 34.48%Historic Preservation 14.9% 41.4% 17.24% 26.44%Cultural/Ethnic 12.0% 34.9% 20.48% 32.53%Other (see below)
Dog ParkSummer MusicClimbing/Bike trailsFarmer's Market 0.0% 0.0% 100.00% 0.00%Water access at RiverBallfields
Glenwood Springs Walking Tolerance to Cultural and Entertainment Features
0.0%
5.0%
10.0%
15.0%
20.0%
25.0%
30.0%
35.0%
40.0%
45.0%
% % % %
0-10MIN 10-20MIN 20-30MIN NOT AT ALL
Performing ArtsVisual artsHistoric PreservationCultural/Ethnic

Glenwood Springs, Colorado Parks and Recreation Comprehensive Master Plan page 89
Appendix F. Statistically Valid Survey - Executive Summary
Community Attitude and Interest Survey
Executive Summary of Citizen Survey Results
Overview of the Methodology The City of Glenwood Springs conducted a Community Attitude and Interest Survey during May and June of 2006 as part of a Parks, Recreation, and Open Space Master Plan Study to set priorities for the future development of facilities, programs and services in the community. The survey was designed to obtain statistically valid results from households throughout the City of Glenwood Springs. The survey was administered by mail. Leisure Vision worked extensively with City of Glenwood Springs officials, as well as members of the GreenPlay LLC project team in the development of the survey questionnaire. This work allowed the survey to be tailored to issues of strategic importance to effectively plan the future system. The goal was to obtain a total of at least 400 completed surveys, with at least 60 surveys coming from each of the five City of Glenwood Springs voting wards. These goals were accomplished, with a total of 439 surveys having been completed, including at least 80 from each of the five voting wards. The number of completed surveys from each voting ward is listed below:
• Ward 1 – 83 surveys (19%) • Ward 2 – 93 surveys (21%) • Ward 3 – 80 surveys (18%) • Ward 4 – 87 surveys (20%) • Ward 5 – 96 surveys (22%)
The overall results of the random sample of 439 households have a 95% level of confidence with a precision of at least +/-4.7%. The following pages summarize major survey findings:
Visitation of Parks During the Past Year Respondents were asked if they or members of their household have visited any City of Glenwood Springs parks during the past year. The following summarizes key findings:
• Ninety-four percent (94%) of respondent households have visited City of Glenwood Springs parks during the past year.

page 90 Glenwood Springs, Colorado Parks and Recreation Comprehensive Master Plan
Physical Condition of Parks Respondent households that have visited City of Glenwood Springs parks during the past year were asked to rate the physical condition of all the parks they have visited. The following summarizes key findings:
• Of the 94% of respondents that have visited City of Glenwood Springs parks during the past year, 77% rated the physical condition of all the parks they have visited as either excellent (14%) or good (63%). An additional 20% of respondents rated the parks as fair, and 2% rated them as poor. The remaining 1% of respondents indicated “don’t know”.
Organizations Used for Parks and Recreation Programs and Services From a list of 10 options, respondent households were asked to select all of the organizations they use for parks and recreation programs and services. The following summarizes key findings:
• The City of Glenwood Springs (48%) is the organization used by the highest percentage of respondent households. There are two other organizations used by over 30% of respondent households, including: attractions/amusements (44%) and private or public schools (31%).

Glenwood Springs, Colorado Parks and Recreation Comprehensive Master Plan page 91
Reasons Preventing the Use of Parks and Recreation Facilities More Often
From a list of 19 reasons, respondents were asked to select all of the ones that prevent them and members of their household from using parks and recreation facilities in the City of Glenwood Springs more often. The following summarizes key findings:
• “We are too busy or not interested” (20%) is the reason preventing the highest percentage of respondent households from using parks and recreation facilities of the City of Glenwood Springs more often. The other most frequently mentioned reasons preventing respondents from using parks and recreation facilities more often include: “fees are too high” (19%) and “program times are not convenient” (18%).
Need for Parks and Recreation Facilities
From a list of 27 various parks and recreation facilities, respondents were asked to indicate which ones they and members of their household have a need for. The following summarizes key findings:
• Six of the 27 parks and recreation facilities had over 50% of respondent households indicate they
have a need for it. These six facilities include: walking and biking trails (89%), open grassy area (76%), picnic shelters/areas (71%), indoor fitness and exercise areas (58%), performing art venue (56%), and nature parks (56%).

page 92 Glenwood Springs, Colorado Parks and Recreation Comprehensive Master Plan
Need For Parks and Recreation Facilities in Glenwood Springs
From the list of 27 parks and recreation facilities, respondents were asked to indicate which ones they and members of their household have a need for. The graph below shows the estimated number of households in the City of Glenwood Springs that have a need for various parks and recreation facilities, based on 3,216 households in the City.
How Well Parks and Recreation Facilities Meet Needs
From the list of 27 parks and recreation facilities, respondent households that have a need for facilities were asked to indicate how well those facilities meet their needs. The following summarizes key findings:
• For all 27 facilities, less than 45% of respondents indicated the facility completely meets the
needs of their household.

Glenwood Springs, Colorado Parks and Recreation Comprehensive Master Plan page 93
Glenwood Springs Households with Facility Needs Being 50% Met or Less
From the list of 27 parks and recreation facilities, respondent households that have a need for facilities were asked to indicate how well those facilities meet their needs. The graph below shows the estimated number of households in the City of Glenwood Springs whose needs for facilities are only being 50% met or less, based on 3,216 households in the City.
Most Important Parks and Recreation Facilities From the list of 27 parks and recreation facilities, respondents were asked to select the four facilities that are most important to them and members of their household. The following summarizes key findings:
• Based on the sum of their top four choices, respondents selected walking and biking trails (59%) as the most important facility. The other facilities respondents selected as the most important include: open grassy area (30%), picnic shelters/areas (26%) and performing art venue (25%). It should also be noted that walking and biking trails had the highest percentage of respondents select it as their first choice as the most important facility.

page 94 Glenwood Springs, Colorado Parks and Recreation Comprehensive Master Plan
Willingness to Walk to Use Various Parks and Recreation Facilities
From the list of 27 various parks and recreation facilities, respondents were asked to indicate the maximum amount of time they would be willing to walk to use each of the facilities. The following summarizes key findings:
• Six of the 27 parks and recreation facilities had over 60% of respondents indicate they would
walk to use them. These six facilities include: walking and biking trails (87%), open grassy area (82%), picnic shelters/areas (72%), nature parks (67%), amphitheater (63%), and indoor fitness and exercise facilities (62%).
Need for Recreation Programs
From a list of 18 recreation programs, respondents were asked to indicate which ones they and members of their household have a need for. The following summarizes key findings:
• Four of the 18 recreation programs had over 50% of respondent households indicate they have a
need for them. These four programs include: art, dance, music, performing arts (65%), community special events (64%), fitness and wellness programs (60%), and visual arts programs (51%).

Glenwood Springs, Colorado Parks and Recreation Comprehensive Master Plan page 95
Need For Recreation Programs in Glenwood Springs
From the list of 18 recreation programs, respondents were asked to indicate which ones they and members of their household have a need for. The graph below shows the estimated number of households in the City of Glenwood Springs that have a need for various recreation programs, based on 3,216 households in the City.
How Well Recreation Programs Meet Needs
From the list of 18 recreation programs, respondent households that have a need for programs were asked to indicate how well those programs meet their needs. The following summarizes key findings:
• For all 18 programs, less than 20% of respondents indicated the program completely meets the
needs of their household.

page 96 Glenwood Springs, Colorado Parks and Recreation Comprehensive Master Plan
Glenwood Springs Households with Program Needs Being 50% Met or Less
From the list of 18 recreation programs, respondent households that have a need for programs were asked to indicate how well those programs meet their needs. The graph below shows the estimated number of households in the City of Glenwood Springs whose needs for programs are only being 50% met or less, based on 3,216 households in the City.
Most Important Recreation Programs From the list of 16 recreation programs, respondents were asked to select the four that are most important to them and members of their household. The following summarizes key findings:
• Based on the sum of their top four choices, respondents selected art, dance, music, performing arts (37%) as the most important programs. The other programs respondents selected as the most important include: fitness and wellness programs (36%), community special events (33%) and visual arts programs (25%). It should also be noted that fitness and wellness programs had the highest percentage of respondents select it as their first choice as the most important program.

Glenwood Springs, Colorado Parks and Recreation Comprehensive Master Plan page 97
Likelihood of Using a 500-750 Seat Performing Arts Center Respondents were asked to indicate how likely they would be to use a 500-750 seat performing arts center for music, dance, theater, etc. The following summarizes key findings:
• Seventy-two percent (72%) of respondents indicated they are either very likely (51%) or somewhat likely (21%) to use the performing arts center. In addition, 14% of respondents indicated they are not likely to use the performing arts center, and 11% indicated “not sure”.
Potential Improvements to City of Glenwood Springs Parks From a list of 12 options, respondents were asked to indicate all of the improvements they would most like to have made to City of Glenwood Springs parks. The following summarizes key findings:
• There are four improvements that over 50% respondents would like to have made to City of Glenwood Springs parks. These four improvements include: restrooms (69%), walking trails (65%), shade (60%), and drinking fountains (57%).

page 98 Glenwood Springs, Colorado Parks and Recreation Comprehensive Master Plan
Improvements That Add the Most Value to Parks From the list of 12 options, respondents were asked to select the three improvements they feel would add the most value to City of Glenwood Springs parks. The following summarizes key findings:
• Based on the sum of their top three choices, respondents selected walking trials (45%) as the improvement that would add the most value to City of Glenwood Springs parks. The other improvements that respondents feel would add the most value to parks include: restrooms (40%), shade (38%), and natural areas (27%). It should also be noted that walking trails had the highest percentage of respondents select it as their first choice as the improvement that would add the most value to parks.
Level of Satisfaction with Various Parks and Recreation Services From a list of 11 various parks and recreation services provided by the City of Glenwood Springs, respondents were asked to rate their level of satisfaction with each one. The following summarizes key findings:
• Three of the 11 parks and recreation services had over 60% of respondents indicate being either very satisfied or somewhat satisfied with them. These three services include maintenance of Glenwood Springs parks (66%), quality of indoor swimming pools (64%), and number of Glenwood Springs parks (61%).

Glenwood Springs, Colorado Parks and Recreation Comprehensive Master Plan page 99
Importance of Parks and Recreation Services Compared to Other Priorities Respondents were asked to indicate how important parks and recreation services are compared to other priorities for the Glenwood Springs community, such as law enforcement, fire, and streets. The following summarizes key findings:
• Ninety percent (90%) of respondents indicated that parks and recreation services are either very important (52%) or somewhat important (38%) compared to other priorities for the Glenwood Springs community. Only 5% of respondents indicated that parks and recreation services are not important, 4% indicated “not sure”, and 1% did not provide a response.
Funding the Operations and Maintenance of Parks and Recreation Services with Taxes From a list of four options, respondents were asked to indicate what portion of the City’s ongoing operations and maintenance of parks and recreation services should be funded by taxes. The following summarizes key findings:
• Thirty percent (30%) of respondents indicated that the City’s ongoing operations and maintenance of parks and recreation services should be funded 40% or less by taxes. In addition, 27% of respondents feel the operations and maintenance should be funded 50% by taxes, 16% feel they should be funded 60% by taxes, and 17% feel they should be funded more than 60% by taxes.

page 100 Glenwood Springs, Colorado Parks and Recreation Comprehensive Master Plan
Ways to Fund Improvements to Parks and Recreation Facilities From a list of four options, respondents were asked to indicate which way they most prefer to fund improvements to parks and recreation facilities or the construction of new facilities. The following summarizes key findings:
• Twenty-six percent (26%) of respondents indicated an amusement/admission/attraction tax as their preferred way of funding improvements or new facilities. In addition, 19% of respondents indicated a parks and recreation tax, 10% indicated a sales tax increase, and 10% indicated a property tax mill levy.
Creating a Special Parks and Recreation District Respondents were asked to indicate if the City of Glenwood Springs should consider creating a special parks and recreation district including the surrounding areas to be funded with a dedicated property tax. The following summarizes key findings:
• Thirty-five percent (35%) of respondents indicated that the City of Glenwood Springs should consider creating a special parks and recreation district.

Glenwood Springs, Colorado Parks and Recreation Comprehensive Master Plan page 101
GRASP® InventoryGlenwood Springs Parks and RecreationCompiled 2006
Boat
Ram
p
Com
petit
ive
Trac
k
Amph
ithea
ter
Aren
a (R
odeo
)
Ballf
ield
*
Bask
etba
ll
PARK NAMEAcreage - Geowest
GIS Dri
nkin
g Fo
unta
ins
Ben
ches
BB
Q G
rills
Dog
Sta
tion
Sec
urity
Lig
htin
g
Loop
Wal
k
Res
troo
ms
w/ P
lum
bing
Sha
de T
rees
Trai
l Con
nect
ions
Par
k A
cces
s
Par
king
Sea
sona
l Pla
ntin
gs
Pic
nic
Tabl
es
Des
ign/
ambi
ance
Comfort And Convenience Rating
Boat
Ram
p
Com
petit
ive
Trac
k
Amph
ithea
ter
Aren
a (R
odeo
)
Ballf
ield
*
Bask
etba
ll
Qua
ntity
Scor
e N
Scor
e C
Qua
ntity
Scor
e N
Scor
e C
Qua
ntity
Scor
e N
Scor
e C
Qua
ntity
Scor
e N
Scor
e C
Qua
ntity
Scor
e N
Scor
e C
Qua
ntity
Scor
e N
Scor
e C
Axtell Park 0.23 2 2 2 2 3 2 2 2Centennial Park 0.17 2 2 2 2 2 2 2 2 2Glenwood Park 3.78 2 2 2 2 2 2 2 2 2 1.0 2.0 2.0Glenwood Springs Community Center Grounds 38.39 2 2 1 2 2 1 2Glenwood Springs Conservancy/Cardiff Park 1.51 2 2 3 1 2 2Glenwood Springs Whitewater Park 1.20 2 2 2 2 2Gregory Park 2.85 2 2 2 2 2 2 3Lookout Mountain Park (Undeveloped) 43.15 1 2Oasis Creek/Gracie Park 0.17 1 2 3 2O'Leary Park 1.81 2 2 1 3 1 1 1 2 1Red Mountain Park (Undeveloped) 376.52 3 2 2Rodeo Grounds 2 2 1 1 1.0 1.0 1.0Sayre Park 5.97 2 2 2 2 2 2 2 2 2 2 1 2 2 1.0 2.0 2.0 1.0 2.0 2.0Sister Lucy Downey Park 0.67 2 2 1 2 2 2 1Sopris Park 6.28 2 2 2 1 2 2.0 2.0 2.0South Canyon Park Lands (Undeveloped) 3014.07 2 2 3Three Mile Park 9.90 2 2 3 2 2 3Two Rivers 23.39 2 2 2 2 2 2 2 2 2 1 2 2 2 1.0 2.0 3.0 1.0 2.0 2.0 1.0 2.0 3.0Veltus Park 8.21 2 2 2 2 2 2 2 3 1 2 2 2 1.0 1.0 1.0Vogelaar Park 4.21 2 2 2 2 2 1 1.0 2.0 2.0Glenwood Elementary 1 2Glenwood High School 1 2 1.0 2.0Glenwood Springs Middle School 1 2 1.0 2.0 1.0 2.0 2.0 1.0 2.0Sopris Elementary 1 2
Totals 3542.48 1.0 1.0 6.0 4.0 1.0 2.0
*One Dedicated Baseball Field At Sopris Park
Comfort And Convenience Rating
Appendix G. GRASP® Inventory Spreadsheet

page 102 Glenwood Springs, Colorado Parks and Recreation Comprehensive Master Plan
GRASP® InventoryGlenwood Springs Parks and RecreationCompiled 2006
Dog
Park
Fitn
ess
Path
(Com
fort
&
Conv
enie
nce)
Foot
ball
Fiel
d
Gol
f
Gra
ndst
and
Gro
up S
helte
r
Hors
esho
e Co
urt
Ice
Rink
Lacr
osse
Fie
ld
Hist
oric
Ele
men
ts
PARK NAME Dog
Park
Fitn
ess
Path
(Com
fort
&
Conv
enie
nce)
Foot
ball
Fiel
d
Gol
f
Gra
ndst
and
Gro
up S
helte
r
Hors
esho
e Co
urt
Ice
Rink
Lacr
osse
Fie
ld
Hist
oric
Ele
men
ts
Qua
ntity
Scor
e N
Scor
e C
Qua
ntity
Scor
e N
Scor
e C
Qua
ntity
Scor
e N
Scor
e C
Qua
ntity
Scor
e N
Scor
e C
Qua
ntity
Scor
e N
Scor
e C
Qua
ntity
Scor
e N
Scor
e C
Qua
ntity
Scor
e N
Scor
e C
Qua
ntity
Scor
e N
Scor
e C
Qua
ntity
Scor
e N
Scor
e C
Qua
ntity
Scor
e N
Scor
e C
Axtell ParkCentennial ParkGlenwood ParkGlenwood Springs Community Center Grounds 1.0 2.0 3.0Glenwood Springs Conservancy/Cardiff ParkGlenwood Springs Whitewater ParkGregory Park 1.0 2.0 2.0 1.0 2.0 1.0Lookout Mountain Park (Undeveloped)Oasis Creek/Gracie ParkO'Leary Park 1.0 2.0 1.0 1.0 2.0 1.0Red Mountain Park (Undeveloped)Rodeo GroundsSayre Park 2.0 1.5 1.5 1.0 2.0 2.0Sister Lucy Downey ParkSopris ParkSouth Canyon Park Lands (Undeveloped) 1.0 1.0 1.0Three Mile ParkTwo Rivers 2.0 2.0 2.0 1.0 2.0 2.0Veltus Park 4.0 2.0 2.0 1.0 2.0 2.0Vogelaar ParkGlenwood ElementaryGlenwood High School 1.0 2.0 2.0 1.0 1.0Glenwood Springs Middle SchoolSopris Elementary
Totals 1.0 0.0 1.0 0.0 1.0 9.0 1.0 4.0 1.0 1.0
*One Dedicated Baseball Field At Sopris Park
Appendix G. GRASP® Inventory Spreadsheet – continued

Glenwood Springs, Colorado Parks and Recreation Comprehensive Master Plan page 103
GRASP® InventoryGlenwood Springs Parks and RecreationCompiled 2006
Shoo
ting
Rang
e Pr
ivat
e
Rive
r Ove
rlook
Shel
ter
Ope
n Tu
rf
Play
grou
nd
Play
Pad
Publ
ic A
rt/M
emor
ial
Gar
den
Mul
tipur
pose
/Soc
cer
Fiel
d
Nativ
e Co
mpo
nent
PARK NAME Skat
e Pa
rk
Shoo
ting
Rang
e Pr
ivat
e
Rive
r Ove
rlook
Shel
ter
Ope
n Tu
rf
Play
grou
nd
Play
Pad
Publ
ic A
rt/M
emor
ial
Gar
den
Mul
tipur
pose
/Soc
cer
Fiel
d
Nativ
e Co
mpo
nent
Qua
ntity
Scor
e N
Scor
e C
Qua
ntity
Scor
e N
Scor
e C
Qua
ntity
Scor
e N
Scor
e C
Qua
ntity
Scor
e N
Scor
e C
Qua
ntity
Scor
e N
Scor
e C
Qua
ntity
Scor
e N
Scor
e C
Qua
ntity
Scor
e N
Scor
e C
Qua
ntity
Scor
e N
Scor
e C
Qua
ntity
Scor
e N
Scor
e C
Qua
ntity
Scor
e N
Scor
e C
Axtell Park 1.0 2.0 0.0Centennial ParkGlenwood Park 1.0 2.0 2.0Glenwood Springs Community Center Grounds 1.0 1.0 2.0 1.0 2.0 1.0 2.0 3.0Glenwood Springs Conservancy/Cardiff Park 1.0 1.0 2.0 1.0 3.0 2.0Glenwood Springs Whitewater ParkGregory Park 1.0 3.0 1.0 1.0 2.0 1.0Lookout Mountain Park (Undeveloped) 1.0 1.0 3.0Oasis Creek/Gracie Park 1.0 2.0O'Leary ParkRed Mountain Park (Undeveloped) 1.0 1.0 3.0Rodeo GroundsSayre Park 2.0 2.0 2.0 1.0 3.0 2.0Sister Lucy Downey Park 1.0 2.0 1.0Sopris Park 1.0 2.0 2.0South Canyon Park Lands (Undeveloped) 1.0 1.0 3.0 1.0 1.0 1.0Three Mile Park 2.0 3.0 1.0 1.0 3.0 1.0Two Rivers 2.0 2.0 3.0 1.0 2.0 2.0 1.0 2.0 2.0 1.0 2.0 2.0 1.0 1.0 2.0Veltus Park 2.0 3.0 3.0 1.0 2.0 1.0 2.0 2.0 2.0 1.0 2.0 3.0Vogelaar Park 1.0 2.0 2.0 1.0 2.0Glenwood Elementary 2.0 2.0 1.0 1.0Glenwood High School 1.0 2.0 2.0Glenwood Springs Middle School 1.0 2.0 2.0 1.0 1.0Sopris Elementary 1.0 2.0
Totals 6.0 10.0 7.0 12.0 2.0 2.0 1.0 1.0 1.0 1.0
*One Dedicated Baseball Field At Sopris Park
Appendix G. GRASP® Inventory Spreadsheet - continued

page 104 Glenwood Springs, Colorado Parks and Recreation Comprehensive Master Plan
GRASP® InventoryGlenwood Springs Parks and RecreationCompiled 2006
Volle
ybal
l
Volle
ybal
l - S
and
Xeris
cape
Gar
den
Whi
tew
ater
Par
k
Tenn
is C
ourts
Soun
d G
arde
n
Stru
ctur
e
PARK NAME Volle
ybal
l
Volle
ybal
l - S
and
Xeris
cape
Gar
den
Whi
tew
ater
Par
k
Tenn
is C
ourts
Soun
d G
arde
n
Stru
ctur
e
Qua
ntity
Scor
e N
Scor
e C
Qua
ntity
Scor
e N
Scor
e C
Qua
ntity
Scor
e N
Scor
e C
Qua
ntity
Scor
e N
Scor
e C
Qua
ntity
Scor
e N
Scor
e C
Qua
ntity
Scor
e N
Scor
e C
Qua
ntity
Scor
e N
Scor
e C
Axtell ParkCentennial ParkGlenwood ParkGlenwood Springs Community Center Grounds 1.0 2.0 2.0 3.0 2.0 3.0 1.0Glenwood Springs Conservancy/Cardiff ParkGlenwood Springs Whitewater Park 1.0 2.0 3.0Gregory ParkLookout Mountain Park (Undeveloped)Oasis Creek/Gracie ParkO'Leary Park 1.0 1.0 1.0Red Mountain Park (Undeveloped)Rodeo GroundsSayre Park 2.0 2.0 2.0 2.0 2.0 2.0 1.0 2.0 2.0Sister Lucy Downey ParkSopris ParkSouth Canyon Park Lands (Undeveloped)Three Mile Park 1.0 2.0 2.0Two RiversVeltus Park 1.0 2.0 2.0 1.0 2.0 2.0Vogelaar ParkGlenwood ElementaryGlenwood High SchoolGlenwood Springs Middle School 1.0 2.0 2.0Sopris Elementary
Totals 1.0 2.0 6.0 2.0 2.0 1.0 2.0
*One Dedicated Baseball Field At Sopris Park
Appendix G. GRASP® Inventory Spreadsheet - continued

Glenwood Springs, Colorado Parks and Recreation Comprehensive Master Plan page 105
Appendix H. Cost Recovery Pyramid Methodology
Cost Recovery Pyramid Methodology
The creation of a cost recovery philosophy and policy is a key component to maintaining financial control, equitably pricing offerings, and identifying core programs, facilities and services for an agency.
Critical to this philosophical undertaking is the support and buy-in of elected officials and advisory boards, staff and ultimately of citizens. Whether or not significant changes are called for, the organization wants to be certain that it is philosophically aligned with its constituents. The development of the cost recovery philosophy and policy is built upon a very logical foundation, using the understanding of who is benefiting from the parks and recreation service to determine how that service should be paid for.
The development of the cost recovery philosophy can be broken down into the following steps: Step 1 – Building on Your Mission - What is Your Mission?
The entire premise for this process is to fulfill the Community mission. It is important that organizational values are reflected in the mission. Often mission statements are a starting point and further work needs to occur to create a more detailed common understanding of the interpretation of the mission. This is accomplished by involving staff in a discussion of a variety of Filter. Step 2 – Understanding Filters and the Pyramid
Filters are a series of continuums covering different ways of viewing service provision. The Primary Filters influence the final positioning of services as they relate to each other and are summarized below. The Benefits Filter, however, forms the foundation of the Pyramid Model and is used in this discussion to illustrate a cost recovery philosophy and policies for parks and recreation organizations. The other filters are explained later.
Filter Definition
Benefit Who receives the benefit of the service? (Skill development, education, physical health, mental health, safety)
Commitment What is the intensity of the program? Trends Is it tried and true or a fad?
Obligation Is it our role to provide? (Is it legally mandated, e.g. ADA) Market What is the effect of the program in attracting customers
Relative Cost to Provide What is the cost per participant? Environmental Impact What is the impact to the resource or other visitors?
Political What out of our control? Who We Serve Are we targeting certain populations?
The Benefits Filter The principal foundation of all the filters is the Benefits Filter. It is shown first as a continuum and then applied to the Cost Recovery Pyramid model.
Conceptually, the base level of the pyramid represents the mainstay of a public parks and recreation program. Programs appropriate to higher levels of the pyramid should only be offered when the preceding levels below are full enough to provide a foundation for the next level. This foundation and upward progression is intended to represent the public parks and recreation core mission, while also reflecting the growth and maturity of an organization as it enhances its program and facility offerings.
It is often easier to integrate the values of the organization with its mission if they can be visualized. An ideal philosophical model for this purpose is the pyramid. In addition to a physical structure, pyramid is defined by Webster’s Dictionary as “an immaterial structure built on a broad supporting base and narrowing gradually to an apex.”
Parks and recreation programs are built with a broad supporting base of core services, enhanced with more specialized services as resources allow. Envision a pyramid sectioned horizontally into five levels.
COMMUNITY Benefit
The foundational level of the pyramid is the largest, and includes those programs, facilities and services that benefit the COMMUNITY as a whole. These programs, facilities and services can increase property values, provide safety, address social needs, and enhance quality of life for residents. The community (made up of residents of the State of Arizona) generally pays for these basic services and facilities through taxes. These services are offered to residents at minimal or no fee. A large percentage of the tax support of the agency would fund this level of the pyramid.
Examples of these services could include the existence of the community parks and recreation system, the ability for youth to visit and enjoy facilities on an informal basis, development and distribution of marketing brochures, low-income or scholarship programs, park and facility planning and design, park maintenance, and research, or others.
NOTE: All examples are generic - your programs and services may be very different based on your agencies mission, demographics, goals, etc.
COMMUNITY / INDIVIDUAL Benefit
The second and a smaller level of the pyramid represents programs, facilities and services that promote individual physical and mental well-being, and provide recreation skill development. They are generally the more traditionally expected services and beginner instructional levels. These programs, services and facilities are typically assigned fees based on a specified percentage of direct and indirect costs. These costs are partially offset by both a tax subsidy to account for the COMMUNITY Benefit and participant fees to account for the INDIVIDUAL Benefit.
Examples of these services could include the ability of teens and adults to visit facilities on an informal basis, ranger led interpretive programs, and beginning level instructional programs and classes, etc.
INDIVIDUAL / COMMUNITY Benefit
The third and even, yet smaller level of the pyramid represents services that promote individual physical and mental well-being, and provide an intermediate level of recreational skill development. This level provides more INDIVIDUAL Benefit and less COMMUNITY Benefit and should be priced to reflect this. The individual fee is higher than for programs and services that fall within the lower levels of the pyramid.

page 106 Glenwood Springs, Colorado Parks and Recreation Comprehensive Master Plan
Examples of these services could include summer recreational day camp, summer sports leagues, year-round swim team, etc.
MOSTLY INDIVIDUAL Benefit
The fourth and even smaller level of the pyramid represents specialized services generally for specific groups, and may have a competitive focus. In this level, programs and services may be priced to recover full cost, including all direct and indirect costs.
Examples of these services might include specialty classes, golf, and outdoor adventure programs. Examples of these facilities might include camp sites with power hook-ups.
HIGHLY INDIVIDUAL Benefit
Stretching to the top, the fifth and smallest level of the pyramid represents activities that have a profit center potential, and may even fall outside of the core mission. In this level, programs and services should be priced to recover full cost plus a designated profit percentage.
Examples of these activities could include elite diving teams, golf lessons, food concessions, company picnic rentals and other facility rentals, such as for weddings, or other services.
Step 3 – Sorting Services
It is critical that this sorting step be done with staff, and with governing bodies and citizens in mind. This is where ownership is created for the philosophy, while participants discover the current and possibly varied operating histories, cultures, missions and values of the organization. It is the time to develop consensus and get everyone on the same page, the page you write together. Remember, as well, this effort must reflect the community and must align with the thinking of policy makers.
Sample Policy Language:
XXX community brought together staff from across the department to sort existing programs into each level of the pyramid. This was a challenging step. It was facilitated by an objective and impartial facilitator in order to hear all viewpoints. It generated discussion and debate as participants discovered what different staff members had to say about serving culturally and economically different parts of the community; about historic versus recreational parks; about adults versus youth versus seniors; about weddings and interpretive programs; and the list goes on. It was important to push through the “what” to the “why” to find common ground. This is what discovering the philosophy is all about.
Step 4 – Understanding the Other Filters
Inherent in sorting programs into the pyramid model using the benefits filter is the realization that other filters come into play. This can result in decisions to place programs in other levels than might first be thought. These filters also follow a continuum form however do not necessarily follow the five levels like the benefits filter. In other words, the continuum may fall totally within the first two levels of the pyramid. These filters can aid in determining core programs versus ancillary programs. These filters represent a layering effect and should be used to make adjustments to an initial placement in the pyramid.
THE MARKETING FILTER: What is the effect of the program in attracting customers?
Loss Leader Popular – High Willingness to Pay
THE COMMITMENT FILTER: What is the intensity of the program, what is the commitment of the participant?
Drop-In
Opportunities Instructional –
Basic Instructional – Intermediate
Competitive – Not Recreational Specialized
THE TRENDS FILTER: Is the program or service tried and true, or is it a fad?
Basic Traditionally Expected
Staying Current with Trends Cool, Cutting Edge Far Out
THE OBLIGATION FILTER: Is it our role to provide? Is it legally mandated?
Must Do – Legal Obligation
Traditionally Expected To Do
Should Do –No Other Way To
Provide
Could Do – Someone Else Could Provide
Highly Questionable – Someone Else Is
Providing THE RELATIVE COST TO PROVIDE FILTER: what is the cost per participant?
Low Cost per
Participant Medium Cost per Participant High Cost per
Participant THE ENVIRONMENTAL IMPACT FILTER: what is the impact to the resource or other visitors?
Low Impact to
Resource or Others High Impact to Resource or Others
Exceeds Park Capacity
WHO WE SERVE: Are we targeting certain populations?
Children and
Families Local Residents County Residents Regional Residents Non-residents of the Community

Glenwood Springs, Colorado Parks and Recreation Comprehensive Master Plan page 107
THE POLITICAL FILTER: What is out of our control? This filter does not operate on a continuum, but is a reality, and will dictate from time to time where certain programs fit in the pyramid. Step 5 – Determining Current Subsidy/Cost Recovery Levels
Subsidy and cost recovery are complementary. If a program is subsidized at 75%, it has a 25% cost recovery, and vice-versa. It is more powerful to work through this exercise thinking about where the tax subsidy is used rather than what is the cost recovery. When it is complete, you can reverse thinking to articulate the cost recovery philosophy, as necessary.
The overall subsidy/cost recovery level is comprised of the average of everything in all of the levels together as a whole. Determine what the current subsidy level is for the programs sorted into each level. There may be quite a range in each level, and some programs could overlap with other levels of the pyramid. This will be rectified in the final steps.
Step 6 – Assigning Desired Subsidy/Cost Recovery Levels
Ask these questions: Who benefits? Who pays? Now you have the answer; who benefits – pays! The tax subsidy is used in greater amounts at the bottom levels of the pyramid, reflecting the benefit to the Community as a whole. As the pyramid is climbed, the percentage of tax subsidy decreases, and at the top levels it may not be used at all, reflecting the Individual benefit. So, what is the right percentage of tax subsidy for each level? It would be appropriate to keep some range within each level; however, the ranges should not overlap from level to level.
Again, this effort must reflect your community and must align with the thinking of your policy makers. In addition, pricing must also reflect what your community thinks is reasonable, as well as the value of the offering.
Examples
Many times categories at the bottom level will be completely or mostly subsidized, but you may have a small cost recovery to convey value for the experience. The range for subsidy may be 90-100% - but it may be higher, depending on your overall goals.
The top level may range from 0% subsidy to 50% excess revenues above all costs, or more. Or, your organization may not have any activities or services in the top level.
Step 7 – Adjust Fees to Reflect Your Comprehensive Cost Recovery Philosophy
Across the country, ranges in overall cost recovery levels can vary from less than 10% to over 100%. Your organization sets your target based on your mission, stakeholder input, funding, and/or other circumstances. This exercise may have been completed to determine present cost recovery level. Or, you may have needed to increase your cost recovery from where you are currently to meet budget targets. Sometimes just implementing the policy equitably to existing programs is enough, without a concerted effort to increase fees. Now that this information is apparent, the organization can articulate where it has been and where it is going – by pyramid level and overall, and fees can be adjusted accordingly.
Step 8 – Use Your Efforts to Your Advantage in the Future
The results of this exercise may be used: To articulate your comprehensive cost recovery philosophy; To train staff at all levels as to why and how things are priced the way they are; To shift subsidy to where is it most appropriately needed; To recommend program or service cuts to meet budget subsidy targets, or show how revenues can be
increased as an alternative; and, To justify the pricing of new programs.
This Sample Cost Recovery Philosophy and Policy Outline is provided by:
GreenPlay, LLC, 3050 Industrial Lane, Suite 200, Broomfield, CO 80020 (303) 439-8369; Toll-free: 1-866-849-9959; [email protected]; www.GreenPlayLLC.com
All Rights Reserved. Please contact GreenPlay for more information.

page 108 Glenwood Springs, Colorado Parks and Recreation Comprehensive Master Plan
Appendix I. Private Grant and Philanthropic Agencies A listing of grants can be found on the web-site of AGS Publishing. A-Z Grants - AGS Funding Center at http://www.agsnet.com/grants. Anneberg Foundation The Annenberg Foundation provides support for projects within its grant-making interests of education, culture, the arts, and community and civic life. It generally limits funding to programs likely to produce beneficent change on a large scale. http://www.whanneberg.org AOL Timewarner Foundation The AOL Time Warner Foundation is dedicated to using the power of media, communications and information technology to serve the public interest and strengthen society. http://www.aoltimewarnerfoundation.org/grants/grants.html#exclusion AT&T Foundation The AT&T Foundation supports initiatives that focus technology and innovation on improving the quality of life in communities served by AT&T. Support covers three primary areas: Education, Civic & Community Service, and Arts & Culture. http://www.att.com/foundation/ General Mills Foundation General Mills invests in the people, neighborhoods and education of the communities in which we live and work. Since the General Mills Foundation was created, it has awarded over $270 million to General Mills communities. In fiscal 2001, the Foundation contributed $15 million in the focus areas of family life, education, nutrition and arts and culture. Beyond the financial resources we provide, we support our grants with volunteers and mentors who share their expertise. http://www.generalmills.com/corporate/commitment/community/default_old.asp GM Foundation GM's targeted areas of focus are: education, health, community relations, public policy, arts and culture, and environment and energy, with a strong commitment to diversity in all areas. http://www.gm.com/company/gmability/philanthropy/guidelines Pentair Foundation The mission of The Pentair Foundation is to enrich and advance the communities in which Pentair operates by funding local programs that promote education, vocational readiness, cultural understanding, self-sufficiency, and general well-being so that people in these communities benefit by our presence. http://www.pentair.com/foundation.html Positive Youth Development Foundation In 1999, Philip Morris U.S.A. launched a grant making initiative focused on Positive Youth Development (PYD). In the first three years of this initiative, we have made nearly 600 grants in 40 states -- plus Washington D.C. and Puerto Rico -- to support after-school programs, summer programs, and food
expenditures for youth programs. Our Positive Youth Development grant making initiative is a long-term commitment. http://www.philipmorrisusa.com RGK Foundation This Foundation includes three main components: Educational, Medical, and Community. Grants in these areas include support for research and conferences as well as support for programs that promote academic excellence in institutions of higher learning; programs that raise literacy levels; programs that attract minority and women students into the fields of math, science, and technology; and programs that promote the health and well being of children. http://www.rgkfoundation.org Starbucks Foundation Success through literacy. We call them Opportunity Grants because our mission is to create opportunity in the communities where Starbucks lives and works. Being literate is necessary to succeed in our society, and by ensuring our youth learn to read and write, we are opening a world of opportunity to them. http://www.starbucks.com/aboutus/foundation.asp W. K. Kellogg Foundation Goal: Support healthy infant, child, and youth development by mobilizing, strengthening, and aligning systems that affect children’s learning. Strategy 1: Mobilize youth, families, and communities to influence institutions and policies that impact learning and achievement for vulnerable children and youth. Strategy 2: Forge partnerships between education institutions and communities to promote learning, academic performance, and workforce preparation among vulnerable young people. http://www.wkkf.org Westinghouse Charitable Giving Program The program serves as the principle funding entity for the company's social investments. The Program makes charitable contributions to nonprofit organizations in Southwestern Pennsylvania and other communities throughout the United States where Westinghouse has a local presence. Areas of emphasis are: Health and welfare, education and civic and social. http://www.westinghouse.com Windhover Foundation Windhover Foundation funds organizations focused on meeting a pressing, unfilled need, whether social, educational, cultural or otherwise. The foundation also funds upstart groups of maverick intent, providing seed money to set their work into motion. http://www.qg.com/whoarewe/windhover.html Other grants from other sources: Special Olympics Healthy Athletes Grants Program Special Olympics has announced its new Healthy Athletes Grants Program with the following three grant categories: Healthy Athletes Capacity Grants, Pilot Health Promotion Grants, and Lions Clubs International Opening Eyes Grants. The Healthy Athletes Capacity Grants competition may be used for one or more games and competitions in which there will be a Healthy Athletes venue. For more information, contact Dr. Mark L. Wagner, by e-mail at [email protected].

Glenwood Springs, Colorado Parks and Recreation Comprehensive Master Plan page 109
The Pilot Health Promotion Grants identify and develop community-based and athlete-focused health and fitness programs that go beyond the training and competition environment. This is a two-step grant submission process beginning with a letter of intent, followed by a proposal if Special Olympics likes your idea. Contact Dr. Mark L. Wagner, by e-mail at [email protected] for more information. Pew Charitable Trusts Grants The Trusts make grants in the following program areas:
• Health and Human Services program is designed to promote the health and well-being of the American people and to strengthen disadvantaged communities.
• The Public Policy program advances and helps sustain improvements in America's democratic life by strengthening the foundations of civic engagement and rebuilding Americans' confidence in government and the basic democratic process, primarily elections.
You should first review the information about the program whose interests most closely match those of your organization. The guidelines lay out concisely each program's goals and objectives and the kinds of activities it will and will not consider. The Trusts will respond to all specific letters of inquiry but not to general solicitations for funds. Go to http://www.pewtrusts.com/grants for more information on the letter of inquiry requirements. Grants with Federal and State Programs Grants.gov: Grants.gov allows organizations to electronically find and apply for more than $400 billion in Federal grants. Grants.gov is THE single access point for over 1000 grant programs offered by all Federal grant-making agencies. The US Department of Health and Human Services is proud to be the managing partner for Grants.gov, an initiative that is having an unparalleled impact on the grant community. http://www.grants.gov Centers for Disease Control and Prevention: Steps to a HealthierUS: A Community- Focused Initiative To Reduce the Burden of Asthma, Diabetes, and Obesity To enable communities to reduce the burden of chronic disease, including: Preventing diabetes among populations with pre-diabetes; increasing the likelihood that persons with undiagnosed diabetes are diagnosed; reducing complications of diabetes; preventing overweight and obesity; reducing overweight and obesity; and reducing the complications of asthma. STEPS will achieve these outcomes by improving nutrition; increasing physical activity; preventing tobacco use and exposure, targeting adults who are diabetic or who live with persons with asthma; increasing tobacco cessation, targeting adults who are diabetic or who live with persons with asthma; increasing use of appropriate health care services; improving the quality of care; and increasing effective self-management of chronic diseases and associated risk factors. The key to the success of STEPS will be community-focused programs that include the full engagement of schools, businesses, faith- communities, health care purchasers, health plans, health care providers, academic institutions, senior centers, and many other community sectors working together to promote health and prevent chronic disease. STEPS programs need to build on, but not duplicate current and prior HHS programs and coordinate fully with existing programs and resources in the community. Please consult with agencies listed in the Federal Register announcement http://www.tgci.com/fedrgtxt/03-10986.txt to apply for this grant.
The Corporation for National and Community Service: Grants support public safety, public health, and disaster preparedness and relief The Corporation for National and Community Service awarded a total of $10.3 million in competitive grants to 43 non-profit and public organizations in 26 states and the District of Columbia. These groups will support recruitment of volunteers for local efforts to develop disaster response plans, expand Neighborhood Watch and Community Emergency Response Teams, establish Medical Reserve Corps, train youth to cope with disasters, disseminate information on bioterrorism, and assist ham radio operators and volunteer pilots in responding to disasters. Find out if the grantees can help your disaster preparedness and monitoring efforts by visiting http://www.nationalservice.org/about/hs/grantees.html. For more information on corps grant awards to states that you can access, please contact your state commissioner, go to http://www.nationalservice.gov/home/site_map/index.asp. Centers for Disease Prevention and Control: Exemplary State Programs to Prevent Chronic Disease and Promote Health CDC supports a variety of programs to improve the nation's health by preventing chronic diseases and their risk factors. The CDC gives states guidelines, recommendations and resources, helping state health and education agencies promote healthy behaviors. Park and recreation agencies can contract with public health and education agencies to provide these services. For more information on this program, go to http://www.cdc.gov/nccdphp/programs.htm. To contact your state chronic disease director, go to: http://www.chronicdisease.org/members.html. Department of Health and Human Services: Preventive Health and Health Services Block Grant The PHHS Block Grant is the primary source of flexible funding that provides states the latitude to fund any of 265 national health objectives available in the nation's Healthy People 2010 health improvement plan. States invest their PHHS block grant dollars in a variety of public health areas. PHHS block grant dollars are used to support existing programs, implement new programs, and respond to unexpected emergencies. For a listing of Healthy People 2010 health improvement plans in your state, go to http://www.cdc.gov/nccdphp/blockgrant/stateselection.html. Send an email to: [email protected] to find out whom to contact in your state to become involved in these plans. Department of Health and Human Services: Social Services Block Grant Program Funding uses are flexible, but must be used to provide services directed toward one of the following five goals specified in the law: (1) preventing, reducing or eliminating dependency; (2) achieving or maintaining self-sufficiency; (3) preventing neglect, child abuse, or exploitation of children and adults; (4) preventing or reducing inappropriate institutional care; and (5) securing admission or referral for institutional care when other forms of care are not appropriate. SSBG services directed toward the program goals include but are not limited to, child care services, protective services for children and adults, services for children and adults in foster care, services related to the management and maintenance of home, day care services for adults, transportation services, family planning services, training and related services, employment services, information, referral, and counseling services, the preparation and delivery

page 110 Glenwood Springs, Colorado Parks and Recreation Comprehensive Master Plan
of meals, health support services, and appropriate combinations of services designed to meet the needs of children, the aged, the mentally retarded, the blind, the emotionally disturbed, the physically handicapped, alcoholics and drug addicts. Each State receives a block grant and has the flexibility to determine what services will be provided, who is eligible to receive services, and how funds are distributed among various services within the State. States and/or local agencies (i.e., county, city, and regional offices) may provide services directly or purchase them from qualified providers. Each year States must submit a report on the intended use of funds under this Block Grant. Prior to December 1 of each fiscal year, states are notified of their allocation in order to facilitate state planning and preparation of their required report. Funds are sent to states on a quarterly basis. Potential Partners include: Community-based organizations, public and private social service agencies, faith-based organizations, community groups, and public and private child care organizations. For more information, go to: http://www.acf.dhhs.gov/programs/ocs/ssbg/ or call (202) 401-5281. Department of Housing and Urban Development: Community Development Block Grant Entitlement Programs Grants to develop viable urban communities, by providing decent housing and a suitable living environment, and by expanding economic opportunities, principally for persons of low and moderate income. Eligible entities include cities or urban counties. There are field offices in most states, cities or urban counties that accept these applications. There is also a state program that handles smaller communities. Each urban area is allocated a formula-derived amount of funds and must submit a consolidated plan to the field office. Contact your local government for information on how to be included in the plan. http://www.hud.gov/offices/cpd/communitydevelopment/programs/ For more information, go to: http://www.hud.gov/grants/index.cfm or call: (202) 708- 1112. Environmental Protection Agency: Children's Health Protection The EPA offers this grant program to enhance public outreach and communication; assist families in evaluating risks to children and in making informed consumer choices; build partnerships that increase a community's long-term capacity to advance protection of children's environmental health and safety; leverage private and public investments to enhance environmental quality by enabling community efforts to continue past EPA's ability to provide assistance to communities; and to promote protection of children from environmental threats. Eligible applicants include community groups, public nonprofit institutions/organizations, tribal governments, specialized groups, profit organizations, private nonprofit institutions/ organizations, municipal and local governments. There is no deadline. For more information, please go to Catalog of Federal Domestic Assistance at http://12.46.245.173/cfda/cfda.html. Environmental Protection Agency: Environmental Justice Through Pollution Prevention Grants These funds are to be used to augment a variety of environmental, environmental justice, academic, tribal, community-based, and grass-roots groups for projects that address environmental justice concerns and use pollution prevention as the proposed solution. This grant program is designed to fund projects that have a direct impact on affected communities.
Eligible applicants include non-profit organizations, State and local governments, and academic institutions; but preferences will be given to nonprofit, community-based/grass-roots organizations and State and federally recognized tribal organizations. Applications are usually due in April each year. Awardees are generally notified in September of each year. For more information, please see: Catalog of Federal Domestic Assistance at http://12.46.245.173/cfda/cfda.html. Health Resources and Services Administration: Community Health Centers Grant Program Grants support the development and operation of community health centers that provide preventive and primary health care services, supplemental health and support services and environmental health services to medically underserved areas/populations. The program's priorities included providing services in the most medically underserved areas and maintaining existing centers that are serving high priority populations. Grants have been used to fund health centers, health networks to support systems of care, community health programs and planning activities. Public agencies, nonprofit private organizations, and a limited number of state and local governments are eligible to apply. The applicant must assume part of the project costs determined on a case-by-case basis. For more information on how to partner with health care agencies for this grant, please contact state primary care offices or associations, a list is available on the website: http://www.bphc.hrsa.gov, or for more information, call: (301) 594-4300. Corporation for National Service: AmeriCorps Program Resources: AmeriCorps seeks to strengthen communities through projects that address education, public safety, the environment, and other unmet human needs. Learn more about how to start a program in your community at http://www.americorps.gov/home/site_map/index.asp. Deadlines vary. Governor's Grants for Drug and Violence Prevention Activities This program provides support to governors for a variety of drug and violence prevention activities focused primarily on school-age youths. Governors use their program funds to provide support to parent groups, community-based organizations, and other public and private nonprofit entities for drug and violence prevention activities that complement the state education agency (SEA) and local education agency (LEA) portion of the Safe and Drug-Free Schools and Communities Program. Deadlines vary. For more information, contact your governor's office or the U.S. Department of Education at (202) 260- 3354. Foundation Grants: Beaumont Foundation of America Grants of Toshiba branded equipment will be administered to support digital inclusion for underserved individuals. The Foundation will grant $350 million over 5 years in all 50 states and the District of Columbia. Contact: P.O. Box 1855, Beaumont, TX 77701, 1-866-546-2667 (toll-free) http://www.bmtfoundation.com. Bridgestone/Firestone Trust Fund Founded in 1952, the Bridgestone Firestone Trust Fund proudly supports a wide variety of important charities in the United States, particularly in those markets it calls home. While contributions are made to

Glenwood Springs, Colorado Parks and Recreation Comprehensive Master Plan page 111
nearly a hundred organizations each year, the Trust Fund focuses on organizations with missions supporting: 1) education, 2) environment and conservation, 3) children’s programs. Including national and local charities, the Trust Fund has donated more than $20 Million in the past 5 years. Giving for education (including employee matching gifts), health and welfare, civic and community, and culture and the arts especially in areas of major company operations: AR, CO, CT, FL, IA, IL, IN, KY, LA, MI, NC, OH, OK, PA, SC, TN, TX, UT, and WI. http://www.bridgestone-firestone.com/about/index_citizen.asp?id=trust_main ConAgra Foods Foundation, Inc. Our mission is to improve the quality of life in communities where ConAgra Foods employees work and live. We focus our resources in these areas: Arts and Culture; Civic and Community Betterment; Education; Health and Human Services; Hunger, Nutrition and Food Safety. ConAgra Foods is a multi-faceted company operating in many communities across the United States. A listing of all locations is not available. To find out if your organization has a ConAgra Foods facility nearby, please consult your local phone directory or contact your Chamber of Commerce. Because of ConAgra Foods' major commitment to fighting child hunger in America, there is limited funding available for other new initiatives. Grant proposals will be accepted, however, from organizations meeting these criteria:
• Organization must have IRS 501(c)3 tax-exempt status. • Organization must have been in existence for at least one year. • Organization or project must provide a solution for specific community needs. • Organization must be well-managed, fiscally responsible and demonstrate success in meeting goals.
http://www.conagrafoods.com/company/corporate_responsibility/foundation/community_guidelines.jsp Cooper Industries Foundation Contributions to local charities, the United Way, education, civic and community affairs, health services, and cultural programs where company's operations are located. Giving in Houston, TX, and other communities of company operations in AL, AR, CA, CO, CT, FL, GA, IL, ME, MI, MO, MS, NC, NV, NY, OH, OR, PA, SC, TX, and WI. Contact: (713) 209-8464 http://www.cooperindustries.com, or http://www.cooperindustries.com/common/sustainability/old/socialResponsibility.cfm Eastman Chemical Company Foundation, Inc. Giving for children/youth services. Contact: (423) 229-1413, P.O. Box 511, Kingsport, TN 37662-5075. Energizer Charitable Trust Emphasis on giving for youth services. Contact application address: Energizer Trust Fund, 533 Maryville University Dr., St. Louis, MO 63141. Enterprise Rent-A-Car Foundation Support primarily for education and community funds; grants also for social service and youth programs, including services for children with disabilities, and cultural affairs. Giving limited to organizations with
which employees, their families, and customers are involved, with some emphasis on MO. Contact: 600 Corporate Park Dr., St. Louis, MO 63105-4211, (314) 512-2754. Charles P. Ferro Foundation Giving primarily for health related causes and children's services. Contact: 25 Bayview St., Burlington, VT 05401, (802) 660-2765. Samuel J. & Connie Frankino Charitable Foundation Giving primarily for education and for health and human services; children and youth, services. Contact: P.O. Box 250, Richland, NJ 08350, (856) 697-8766. Charles A. Frueauff Foundation, Inc. Contact: 3 Financial Ctr., 900 S. Shakleford, Ste. 300, Little Rock, AR 72211 (501) 219-1410. Heineman Foundation for Research, Educational, Charitable and Scientific Purposes, Inc. Giving for programs for children and youth services. Contact: c/o Brown Brothers Harriman Trust Co., 63 Wall St., New York, NY 10005. Tommy Hilfiger Corporate Foundation, Inc. Giving primarily for educational youth organizations; support also for health, environment, human services, and the arts. Contact: 25 W. 39th St., 11th Fl., New York, NY 10018, Telephone: (212) 840-8888. The Janus Foundation Giving primarily for at-risk youth through education, community service and volunteerism, and cultural institutions in the Denver, Colorado metropolitan area. Contact: 100 Fillmore St., Ste. 300, Denver, CO 80206-4923, (720) 210-1265. http://www.janusfoundation.org. Johnson Controls Foundation Grants for higher education; health and hospitals; community funds; social services, including aid to the disabled, care of children, and the aged. Contact: Foundation Coordinator; 5757 N. Green Bay Ave., P.O. Box 591, M.S. X-46, Milwaukee, WI 53201 (414) 524-2296, http://www.johnsoncontrols.com/corpvalues/foundation.htm. Liatis Foundation Giving to arts education; children/youth services; education; museums. Contact: President; 2707 Kipling, Houston, TX 77098, (713) 520-7600. M & T Foundation Giving for athletics/sports, Olympics; athletics/sports, training; Big Brothers/Big Sisters; children/youth, services; health care; health organizations; higher education; hospitals (general); military/veterans' organizations; recreation. Contact: President; P.O. Box 676370, Rancho Santa Fe, CA 92067-6370, (858) 756-1154.

page 112 Glenwood Springs, Colorado Parks and Recreation Comprehensive Master Plan
Richard E. & Nancy P. Marriott Foundation, Inc. Giving to education; youth development; adult & child programs. Contact: 10400 Fernwood Rd., Dept. 901, Bethesda, MD 20817. Newman's Own Foundation, Inc. Giving for children's health & human services. Contact: 246 Post Rd. E., Westport, CT 06880-3615. http://www.newmansown.com. The Pepsi Bottling Group Foundation, Inc. Giving for arts, youth, services, human services. Company offices in Redding, CA; Denver, CO; Mesquite, TX. Contact: c/o The Pepsi Bottling Group, Inc., 1 Pepsi Way, Somers, NY 10589-2201 (914) 767-7472. Susan R. & John W. Sullivan Foundation Giving primarily for educational support, health care, and human services. Contact: President; 851 S.E. Monterey Commons Blvd., Stuart, FL 34996 (561) 283-3838. The Textron Charitable Trust Giving primarily for community funds, higher education, including scholarship programs, and hospitals and health agencies; support also for youth clubs, urban programs, minorities, and cultural programs. Contact: Contributions Coordinator; P.O. Box 1861, Providence, RI 02901, (401) 457-2430. Timken Foundation of Canton Promoting broad civic betterment by capital fund grants; support largely for colleges, schools, hospitals, cultural centers, social services and recreation, and other charitable institutions. Contact: Program Director; 200 Market Ave. N., Ste. 210, Canton, OH 44702, (330) 452-1144. Toy Industry Foundation The TIF focuses its grant making and other charitable activities on organizations that provide goods or services to children who are homeless in the U.S. and Canada, specifically targeting organizations that are currently bringing and/or planning to bring play and/or a recreational element to their program. http://www.toy-tia.org/Content/NavigationMenu/Toy_Industy_Foundation/Toy_Industy_Foundation.htm. The Woods Foundation Giving primarily for wildlife conservation, the arts and cultural programs, higher education, health care, and youth services. Contact: President; c/o Bessemer Trust Co., N.A., Tax Dept., 630 5th Ave., New York, NY 10111.
Grant Facilitation Organizations: These organizations facilitate but don’t provide grants directly. They may assist you if your goals meet with the goals of these organizations. Foundation Grants: Parks and recreation agencies are not 501(c)(3) organizations, but donations to them are tax deductible. If a foundation insists that your agency have 501(c)(3) status, consider forming a "friends of parks and recreation" non-profit organization. Information on this process can be found at The Grantsmanship Center: http://www.tgci.com. If a foundation or its company's offices reside in your city submit a letter of inquiry. Assistance with grant proposal writing can be found at Non-profit Guides: http://www.npguides.org/. The Nature Conservancy The Nature Conservancy works with conservation supporters and partner organizations to create funding for conservation worldwide using a variety of creative methods. We seek to create market incentives for conservation, such as debt for nature swaps. We also strive to increase funding for public land acquisition and management through appropriations and public finance campaigns. http://www.nature.org The Trust for Public Lands The Trust for Public Land (TPL) is a national, nonprofit, land conservation organization that conserves land for people to enjoy as parks, community gardens, historic sites, rural lands, and other natural places, ensuring livable communities for generations to come. If possible, the TPL prefers to get paid for their services. http://www.tlp.org

Glenwood Springs, Colorado Parks and Recreation Comprehensive Master Plan page 113
Appendix J Sponsorship Market Analysis of Fees and Charges Sponsorship Opportunity SportsPlex West Plex Indoor Sports
Premium Facility (3 banners +)
n/a $8,000 first year $7,000 per year for multi-years
Facility (1 banner +)
n/a $5,000 first year $4,500 per year for multi-years
Climbing Gym $12,000 – 5 year
Field $10,000 – 5 year Varies
Scoreboard ¼ panel $2,500 – 3 year ½ panel $4,200 – 3 year
2, ½ panels $8,000 – 3 year
$12,000 first year $5,000 per year (max. 3 yr. total)
Entire scoreboard
Field/Court Banner (4’x7’)
$1,000 – 1 year $1,800 – 2 year $2,600 – 3 year
n/a
Batting Cage Banner (4’x7’)
$500 – 1 year $900 – 2 year
$1,700 – 3 year
n/a
Signage (4’x8’)
n/a $3,500 first year $3,000 per year for multi-years
Media Partners n/a Varies
Dasherboards n/a n/a
Billboards n/a n/a
Rooftop n/a n/a
Skatepark elements n/a n/a The following web sites were explored for an analysis of various fees and charges: www.sportsplexwest.com/Sponsorship_Real_Estate.htms www.plexindoorsports.com/pdfs/plexx-misc-PlexSponsorshipProspectus.pdf www.rexplex.com/sponsors/ Some costs were not available and only two of the three sites provided web pricing.
Sponsorships may include any or all of the following amenities: • web site recognition • brochure advertisement recognition • complimentary team sport registration • memberships • discounted fees • complimentary passes • discount tickets for spectators • room rentals

page 114 Glenwood Springs, Colorado Parks and Recreation Comprehensive Master Plan
Appendix K. Sample Sponsorship Policy
SAMPLE
XX Parks & Recreation
Department
Sponsorship Policy
Draft © 2003
Created for XX by:
3050 Industrial Lane, Suite 200 Broomfield, CO 80020
(303) 439-8369 FAX: (303) 439-0628
www.greenplayllc.com
© 2003 GreenPlay, LLC Sample Parks & Recreation Department – DRAFT Sponsorship Policy
XX Parks & Recreation Department
Sponsorship Policy Introduction The following guidelines in this Sponsorship Policy have been specifically designed for the XX Parks & Recreation Department, while considering that these guidelines may be later adapted and implemented on a city-wide basis. Some assumptions regarding this policy are:
• Partnerships for recreation and parks facilities and program development may be pursued based on the XX Partnership Policy, encouraging the development of partnerships for the benefit of the city, its citizens, and potential partners. Sponsorships are one type of partnership, and one avenue of procurement for alternative funding resources. The Sponsorship Policy may evolve as the needs of new projects and other City departments are incorporated into its usage.
• Broad guidelines are offered in this policy to delineate primarily which types of sponsors and approval levels are currently acceptable for the XX Parks & Recreation Department.
• The policy should ensure that the definition of potential sponsors may include non-commercial community organizations (for example: YMCA’s and Universities), but does not include a forum for non-commercial speech or advertising.
• Sponsorships are clearly defined and are different from advertisements. Advertisements are one type of benefit that may be offered to a sponsor in exchange for cash or in-kind sponsorship.
• The difference between sponsors and donors must be clarified, as some staff and the public often confuse and misuse these terms.
Structure Part A of this document gives the Sponsorship Policy Part B gives the Levels of Sponsorship Tiers and Benefits Part C provides the vocabulary and Glossary of Sponsorship Terms

Glenwood Springs, Colorado Parks and Recreation Comprehensive Master Plan page 115
Part A.
Sponsorship Policy XX Parks & Recreation Department
I. Purpose
In an effort to utilize and maximize the community’s resources, it is in the best interest of the City’s Parks & Recreation Department to create and enhance relationship-based sponsorships. This may be accomplished by providing local, regional, and national commercial businesses and non-profit groups a method for becoming involved with the many opportunities provided by the Parks & Recreation Department. The Department delivers quality, life-enriching activities to the broadest base of the community. This translates into exceptional visibility for sponsors and supporters. It is the goal of the Department to create relationships and partnerships with sponsors for the financial benefit of the Department.
Sponsorships Vs. Donations
It is important to note that there is a difference between a sponsorship and a donation. Basically, sponsorships are cash or in-kind products and services offered by sponsors with the clear expectation that an obligation is created. The recipient is obliged to return something of value to the sponsor. The value is typically public recognition and publicity or advertising highlighting the contribution of the sponsor and/or the sponsor’s name, logo, message, products or services. The Sponsor usually has clear marketing objectives that they are trying to achieve, including but not limited to the ability to drive sales directly based on the sponsorship, and/or quite often, the right to be the exclusive sponsor in a specific category of sales. The arrangement is typically consummated by a letter of agreement or contractual arrangement that details the particulars of the exchange.
In contrast, a donation comes with no restrictions on how the money or in-kind resources are used. This policy specifically addresses sponsorships, the agreements for the procurement of the resources, and the benefits provided in return for securing those resources. Since donations or gifts come with no restrictions or expected benefits for the donor, a policy is generally not needed.
II. Guidelines for Acceptable Sponsorships Sponsors should be businesses, non-profit groups, or individuals that promote mutually beneficial relationships for the Parks & Recreation Department. All potentially sponsored properties (facilities, events or programs) should be reviewed in terms of creating synergistic working relationships with
regards to benefits, community contributions, knowledge, and political sensitivity. All sponsored properties should promote the goals and mission of the Parks & Recreation Department as follows: NEED SPECIFIC MISSION STATEMENT Sample XX Parks & Recreation Mission Statement: NEED SPECIFIC GOALS Sample Goals of the Park & Recreation Department: III. Sponsorship Selection Criteria
A. Relationship of Sponsorship to Mission and Goals The first major criterion is the appropriate relationship of a sponsorship to the above outlined Parks & Recreation Department’s Mission and Goals. While objective analysis is ideal, the appropriateness of a relationship may sometimes be necessarily subjective. This policy addresses this necessity by including Approval Levels from various levels of City management staff and elected officials, outlined in Section B, to help assist with decisions involving larger amounts and benefits for sponsorship.
The following questions are the major guiding components of this policy and should be addressed prior to soliciting potential sponsors:
• Is the sponsorship reasonably related to the purpose of the facility or programs as exemplified by the Mission Statement and Goals of the Department?
• Will the sponsorship help generate more revenue and/or less cost per participant than the City can provide without it?
• What are the real costs, including staff time, for procuring the amount of cash or in-kind resources that come with the generation of the sponsorship?
Sponsorships which shall NOT be considered are those which: • Promote environmental, work, or other practices that, if they took place in the City, would violate U.S.
or state law (i.e., dumping of hazardous waste, exploitation of child labor, etc.), or promote drugs, alcohol, or tobacco, or that constitute violations of law.
• Duplicate or mimic the identity or programs of the Parks & Recreation Department or any of its divisions.
• Exploit participants or staff members of the Department. • Offer benefits which may violate other accepted policies or the Sign Code. DO YOU HAVE A SIGN
CODE?

page 116 Glenwood Springs, Colorado Parks and Recreation Comprehensive Master Plan
B. Sponsorship Plan and Approval Levels Each project or program that involves solicitation of Sponsors should, PRIOR to procurement, create a Sponsorship Plan specific to that project or program that is in line with the Sponsorship Levels given in Part B. This plan needs to be approved by the Management Team Members supervising the project and in accordance to City Partnership, Sponsorship and Sign Code policies. In addition, each sponsorship will need separate approval if they exceed pre-specified limits. The Approval Levels are outlined below:
Under $1,000 The program or project staff may approve this level of
Agreement, with review by their supervising Management Team Member.
$1,001 to $10,000 The Agreement needs approval of a Management Team Member.
$10,001 to $25,000 The Agreement needs approval of the entire Senior Management Team and Department Director
Over $25,000 The Agreement needs approval of the City Supervisor (the City Supervisor may recommend a City Council or Board of Trustees review).
C. No Non-Commercial Forum is Permitted
This criterion deals with the commercial character of a sponsorship message. The City intends to create a limited forum, focused on advertisements incidental to commercial sponsorships of Parks & Recreation facilities and programs. While non-commercial community organizations or individuals may wish to sponsor Department activities or facilities for various reasons, no non-commercial speech is permitted in the limited forum created by this policy:
Advertisements incidental to commercial sponsorship must primarily propose a commercial transaction, either directly, through the text, or indirectly, through the association of the sponsor’s name with the commercial transaction of purchasing the commercial goods or services which the sponsor sells.
The reasons for this portion of the Policy include:
(1) The desirability of avoiding non-commercial proselytizing of a “captive audience” of event spectators and participants;
(2) The constitutional prohibition on any view-point related decisions about permitted advertising coupled with the danger that the City and the Parks & Recreation Department would be associated with advertising anyway;
(3) The desire of the City to maximize income from sponsorship, weighed against the likelihood that commercial sponsors would be dissuaded from using the same forum commonly used by persons wishing to communicate non-commercial messages, some of which could be offensive to the public;
(4) The desire of the City to maintain a position of neutrality on political and religious issues;
(5) In the case of religious advertising and political advertising, specific concerns about the danger of “excessive entanglement” with religion (and resultant constitutional violations) and the danger of election campaign law violations, respectively.
Guidelines for calculating the Levels of Sponsorship Tiers and Benefits are outlined in Part B. IV. Additional Guidelines for Implementation A. Equitable Offerings
It is important that all sponsorships of equal levels across divisions within Parks & Recreation yield the same value of benefits for potential sponsors.
B. Sponsorship Contact Database A designated staff person or representative of the Parks & Recreation Department will keep an updated list of all current sponsors, sponsored activities, and contacts related to sponsorship. Purpose of Maintaining the Database: • Limit duplicate solicitations of one sponsor • Allow management to make decisions based on most appropriate solicitations and levels of benefits
offered • Keep a current list of all Department supporters and contacts • Help provide leads for new sponsorships, if appropriate For staff below Management Team level, access to the database will be limited to printouts of listings of names of sponsors and their sponsored events. This limited access will provide information to help limit duplicated solicitations, and will also protect existing sponsor relationships, while allowing the evaluation of future sponsorships to occur at a management level. If a potential sponsor is already listed, staff should not pursue a sponsorship without researching the sponsor’s history with the most recently sponsored division. If more than one division wishes to pursue sponsorship by the same company, the Management Team shall make a decision based on several variables, including but not limited to:
• History of sponsorship, relationships, and types of sponsorship needed • Amount of funding available • Best use of funding based on departmental priorities. C. Sponsorship Committee A committee consisting of the supervisors of each program using sponsorships and other management team designees shall meet twice per year to review the database, exchange current contract samples, and recommend adjusting benefit levels and policy as needed. Changes shall not take effect before approval by the Management Team.

Glenwood Springs, Colorado Parks and Recreation Comprehensive Master Plan page 117
Part B.
Levels of Sponsorship Tiers and Benefits The following tiers are presented as a guideline for types of benefits that may be presented as opportunities for potential sponsors. Each sponsorship will most likely need to be individually negotiated. One purpose for these guidelines is to create equity in exchanges across sponsorship arrangements. While for the sake of ease the examples given for levels are based on amount of sponsorship requested, the level of approval needed from City staff is really based on the amount of benefits exchanged for the resources. The levels of approval are necessary because the costs and values for different levels of benefits may vary, depending on the sponsorship. It is important to note that these values may be very different. Sponsors typically will not offer to contribute resources that cost them more than the value of resources that they will gain and, typically, seek at least a 2-1 return on their investment. Likewise, the City should not pursue sponsorships unless the total value the City receives is greater than the Township’s real costs. A hierarchy of Sponsors for events, programs or facilities with more than one sponsor is listed below from the highest level to the lowest. Not all Levels will necessarily be used in each Sponsorship Plan. Note that the hierarchy is not dependent on specific levels or amounts of sponsorship. Specific levels and amounts should be designed for each property before sponsorships are procured within the approved Sponsorship Plan. Complete definitions of terms are included in Part C.
Heirarchy of Sponsorship Levels (highest to lowest)
Parks and Recreation Department-Wide Sponsor ⇒
Facility/Park Title or Primary Sponsor ⇒
Event/Program Title or Primary Sponsor ⇒
Presenting Sponsor (Facility, Event or Program) ⇒
Facility/Park Sponsor ⇒
Program/Event Sponsor ⇒ Media Sponsor ⇒ Official Supplier ⇒
Co-sponsor
This hierarchy will help decide the amounts to ask various sponsors for, and determine what levels of benefits to provide. It is important to build flexibility and choice into each level so that sponsors can have the ability to choose options that will best fit their objectives. Note that the benefits listed under each level are examples of value. The listing does not mean that all of the benefits should be offered. It is a menu of options for possible benefits, depending on the circumstances. These are listed primarily as a guideline for maximum benefit values. It is recommended that each project create a project-specific Sponsorship Plan for approval in advance of Sponsorship procurement, based on the benefits available and the values specific to the project. I. Sponsorship Assets and Related Benefits Inventory
TO BE DETERMINED FOR EACH AGENCY BASED ON OFFERINGS
(PROPERTIES), VALUATION, AND DETERMINED BENEFITS
A tiered structure of actual values and approval levels should be determined as part of a Sponsorship Plan.
Part C.
Glossary of Sponsorship Terms
Activation The marketing activity a company conducts to promote its sponsorship. Money spent on activation is over and above the rights fee paid to the sponsored property. Also known as leverage.
Advertising The direct sale of print or some other types of City communication medium to provide access to a select target market.
Ambush Marketing A promotional strategy whereby a non-sponsor attempts to capitalize on the popularity/prestige of a property by giving the false impression that it is a sponsor. Often employed by the competitors of a property’s official sponsors.
Audio Mention The mention of a sponsor during a TV or radio broadcast.
Business-to-Business Sponsorship Programs intended to influence corporate purchase/awareness, as opposed to individual consumers.

page 118 Glenwood Springs, Colorado Parks and Recreation Comprehensive Master Plan
Category Exclusivity The right of a sponsor to be the only company within its product or service category associated with the sponsored property.
Cause Marketing Promotional strategy that links a company’s sales campaign directly to a nonprofit organization. Generally includes an offer by the sponsor to make a donation to the cause with purchase of its product or service. Unlike philanthropy, money spent on cause marketing is a business expense, not a donation, and is expected to show a return on investment.
Cosponsors Sponsors of the same property.
CPM (Cost Per Thousand) The cost to deliver an ad message to a thousand people.
Cross-Promotions A joint marketing effort conducted by to or more cosponsors using the sponsored property as the central theme.
Donations Cash or in-kind gifts that do not include any additional negotiated conditions in return. Synonyms: Philanthropy, Patronage.
Editorial Coverage Exposure that is generated by media coverage of the sponsored property that includes mention of the sponsor.
Emblem A graphic symbol unique to a property. Also called a mark.
Escalator An annual percentage increase built into the sponsorship fee for multi-year contracts. Escalators are typically tied to inflation.
Exclusive Rights A company pays a premium or provides economic benefit in exchange for the right to be the sole advertised provider, at the most competitive prices, of goods purchased by consumers within Parks & Recreation Department facilities and parks.
Fulfillment The delivery of benefits promised to the sponsor in the contract.
Hospitality Hosting key customers, clients, government officials, employees and other VIPs at an event or facility. Usually involves tickets, parking, dining and other amenities, often in a specially designated area, and may include interaction with athletes.
In-Kind Sponsorship Payment (full or partial) of sponsorship fee in goods or services rather than cash.
Licensed Merchandise Goods produced by a manufacturer (the licensee) who has obtained a license to produce and distribute the official Marks on products such as clothing and souvenirs.
Licensee Manufacturer which has obtained a license to produce and distribute Licensed Merchandise.
Licensing Right to use a property’s logos and terminology on products for retail sale. Note: While a sponsor will typically receive the right to include a property’s marks on its packaging and advertising, sponsors are not automatically licensees.
Mark Any official visual representation of a property, including emblems and mascots.
Mascot A graphic illustration of a character, usually a cartoon figure, used to promote the identity of a property.
Media Equivalencies Measuring the exposure value of a sponsorship by adding up all the coverage it generated and calculating what it would have cost to buy a like amount of ad time or space in those outlets based on media rate cards.
Media Sponsor TV and radio stations, print media and outdoor advertising companies that provide either cash, or more frequently advertising time or space, to a property in exchange for official designation.
Municipal Marketing Promotional strategy linking a company to community services and activities (sponsorship of parks and recreation programs, libraries, etc.)
Option to Renew Contractual right to renew a sponsorship on specified terms. Philanthropy Support for a nonprofit property where no commercial advantage is expected. Synonym: Patronage.

Glenwood Springs, Colorado Parks and Recreation Comprehensive Master Plan page 119
Perimeter Advertising Stationary advertising around the perimeter of an arena or event site, often reserved for sponsors.
Premiums Souvenir merchandise, produced to promote a sponsor’s involvement with a property (customized with the names/logos of the sponsor and the property).
Presenting Sponsor The sponsor that has its name presented just below that of the sponsored property. In presenting arrangements, the event/facility name and the sponsor name are not fully integrated since the word(s) “presents” or “presented by” always come between them.
Primary Sponsor The sponsor paying the largest fee and receiving the most prominent identification (Would be naming rights or title sponsor if sponsored property sold name or title).
Property A unique, commercially exploitable entity (could be a facility, site, event, or program) Synonyms: sponsee, rightsholder, seller.
Right of First Refusal Contractual right granting a sponsor the right to match any offer the property receives during a specific period of time in the sponsor’s product category.
Selling Rights The ability of a sponsor to earn back some, or all, of its sponsorship fee by selling its product or service to the property, its attendees, or members.
Signage Banners, billboards, electronic messages, decals, etc., displayed on-site and containing sponsors ID.
Sole Sponsor A company that has paid to be the only sponsor of a property.
Sponsee A property available for sponsorship.
Sponsor An entity that pays a property for the right to promote itself and its products or services in association with the property.
Sponsor ID Visual and audio recognition of sponsor in property’s publications and advertising; public-address and on-air broadcast mentions.
Sponsorship The relationship between a sponsor and a property, in which the sponsor pays a cash or in-kind fee in return for access to the commercial potential associated with the property.
Sponsorship Agency A firm which specializes in advising on, managing, brokering or organizing sponsored properties. The agency may be employed by either the sponsor or property.
Sponsorship Fee Payment made by a sponsor to a property.
Sports Marketing Promotional strategy linking a company to sports (sponsorship of competitions, teams, leagues, etc.).
Supplier Official provider of goods or services in exchange for designated recognition. This level is below official sponsor, and the benefits provided are limited accordingly.
Title Sponsor The sponsor that has its name incorporated into the name of the sponsored property.
Venue Marketing Promotional strategy linking a sponsor to a physical site (sponsorship of stadiums, arenas, auditoriums, amphitheaters, racetracks, fairgrounds, etc.)
Web Sponsorship The purchase (in cash or trade) of the right to utilize the commercial potential associated with a site on the World Wide Web, including integrated relationship building and branding. © 2003 GreenPlay, LLC Sample Parks & Recreation Department – DRAFT Sponsorship Policy

page 120 Glenwood Springs, Colorado Parks and Recreation Comprehensive Master Plan
Appendix L. Sample Partnership Policy
Sample Partnership Policy
and Proposal Format
Created By:
www.greenplayllc.com 3050 Industrial Lane, Suite 200
Broomfield, CO 80020 303-439-8369
Fax: 303-439-0628
Partnership Policy – © 2001 GreenPlay, LLC
XX Partnership Policy And Proposal Format
Table of Contents Part One Page I. The XX Partnership Policy
A. Purpose 3 B. Background and Assumptions 4 C. Partnership Definition 5 D. Possible Types of Partners 6 E. Sponsorships 7 F. Limited Decision-Making Partnerships 7 G. Benefits of Partnerships 8
II. The Partnering Process 9 III. The Partnership Evaluation Process A. Mission and Goals 10 B. Other Considerations 11 C. Selection Criteria 12 D. Additional Assistance 14 Part Two The “Proposed Partnership Outline Format” 15

Glenwood Springs, Colorado Parks and Recreation Comprehensive Master Plan page 121
I. XX Partnership Policy A. Purpose This policy is designed to guide the process for XX in their desire to partner with other private, non-profit, or other governmental entities for the development, design, construction and operation of possibly partnered recreational or related facilities and/or program partnerships that may occur on Agency property. XX would like to identify for-profit, non-profit, and governmental entities that are interested in proposing to partner with the Agency to develop recreational and related facilities and/or programs. A major component in exploring any potential partnership will be to identify additional collaborating partners that may help provide a synergistic working relationship in terms of resources, community contributions, knowledge, and political sensitivity. These partnerships should be mutually beneficial for all proposing partners including the Agency, as well as for the citizens of the community. This policy document is designed to: • Provide essential background information, • Provide parameters for gathering information regarding the needs and contributions of potential
partners, and • Identify how the partnerships will benefit XX and the community. Part Two, The “Proposed Partnership Outline Format”, provides a format that is intended to help guide Proposing Partners in creating a proposal for review with XX staff. B. Background and Assumptions Partnerships are being used across the nation by governmental agencies in order to utilize additional resources for their community’s benefit. Examples of partnerships abound, and encompass a broad spectrum of agreements and implementation. The most commonly described partnership is between a public and a private entity, but partnerships also occur between public entities and non-profit organizations and/or other governmental agencies.
Note on Privatization: This application is specific for proposed partnering for new facilities or programs. This information does not intend to address the issue of privatization, or transferring existing Agency functions to a non-Township entity for improved efficiency and/or competitive cost concerns. An example of privatization would be a contract for a landscaping company to provide mowing services in a park. The Agency is always open to suggestions for improving services and cost savings through contractual arrangements. If you have an idea for privatization of current Agency functions, please call or outline your ideas in a letter for the Agency’s consideration. In order for partnerships to be successful, research has shown that the following elements should be in place prior to partnership procurement: There must be support for the concept and process of partnering from the very highest organizational
level – i.e.: the Board or Trustees, City Council, and/or Department Head. The most successful agencies have high-ranking officials that believe that they owe it to their citizens to
explore partnering opportunities whenever presented, those communities both solicit partners and consider partnering requests brought to them.
It is very important to have a Partnership Policy in place before partner procurement begins. This
allows the agency to be proactive rather than reactive when presented with a partnership opportunity. It also sets a “level playing field” for all potential partners, so that they can know and understand in advance the parameters and selection criteria for a proposed partnership.
A partnership policy and process should set development priorities and incorporate multiple points for
go/no-go decisions. The partnership creation process should be a public process, with both Partners and the Partnering
Agency well aware in advance of the upcoming steps. C. Partnership Definition For purposes of this document and policy, a Proposed Partnership is defined as: "An identified idea or concept involving XX and for-profit, non-profit, and/or governmental entities, outlining the application of combined resources to develop facilities, programs, and/or amenities for the Agency and its citizens." A partnership is a cooperative venture between two or more parties with a common goal, who combine complementary resources to establish a mutual direction or complete a mutually beneficial project. Partnerships can be facility-based or program-specific. The main goal for XX partnerships is enhancing public offerings to meet the mission and goals of the Agency. XX is interested in promoting partnerships which involve cooperation among many partners, bringing resources together to accomplish goals in a synergistic manner. Proposals that incorporate such collaborative efforts will receive priority status.

page 122 Glenwood Springs, Colorado Parks and Recreation Comprehensive Master Plan
Partnerships can accomplish tasks with limited resources, respond to compelling issues, encourage cooperative interaction and conflict resolution, involve outside interests, and serve as an education and outreach tool. Partnerships broaden ownership in various projects and increase public support for community recreation goals. Partners often have flexibility to obtain and invest resources/dollars on products or activities where municipal government may be limited. Partnerships can take the form of (1) cash gifts and donor programs, (2) improved access to alternative funding, (3) property investments, (4) charitable trust funds, (5) labor, (6) materials, (7) equipment, (8) sponsorships, (9) technical skills and/or management skills, and other forms of value. The effective use of volunteers also can figure significantly into developing partnerships. Some partnerships involve active decision making, while in others, certain partners take a more passive role. The following schematic shows the types of possible partnerships discussed in this policy:
D. Possible Types of Active Partnerships XX is interested in promoting collaborative partnerships among multiple community organizations. Types of agreements for Proposed “Active” Partnerships may include leases, contracts, sponsorship agreements, marketing agreements, management agreements, joint-use agreements, inter-governmental agreements, or a combination of these. An innovative and mutually beneficial partnership that does not fit into any of the following categories may also be considered. Proposed partnerships will be considered for facility, service, operations, and/or program development including associated needs, such as parking, paving, fencing, drainage systems, signage, outdoor restrooms, lighting, utility infrastructure, etc. The following examples are provided only to illustrate possible types of partnerships. They are not necessarily examples that would be approved and/or implemented.
Examples of Public/Private Partnerships • A private business seeing the need for more/different community fitness and wellness activities wants
to build a facility on Agency land, negotiate a management contract, provide the needed programs, and make a profit.
• A private group interested in environmental conservation obtains a grant from a foundation to build an
educational kiosk, providing all materials and labor, and needs a spot to place it. • Several neighboring businesses see the need for a place for their employees to work out during the
work day. They group together to fund initial facilities and an operating subsidy and give the facility to the Agency to operate for additional public users.
• A biking club wants to fund the building of a racecourse through a park. The races would be held one
night per week, but otherwise the path would be open for public biking and in-line skating. • A large corporate community relations office wants to provide a skatepark, but doesn't want to run it.
They give a check to the Agency in exchange for publicizing their underwriting of the park's cost. • A private restaurant operator sees the need for a concessions stand in a park and funds the building of
one, operates it, and provides a share of revenue back to the Agency. • A garden club wants land to build unique butterfly gardens. They will tend the gardens and just need
a location and irrigation water. Examples of Public/Non-Profit Partnerships • A group of participants for a particular sport or hobby sees a need for more playing space and forms a
non-profit entity to raise funds for a facility for their priority use that is open to the public during other hours.
• A non-profit baseball association needs fields for community programs and wants to obtain grants for
the building of the fields. They would get priority use of the fields, which would be open for the Agency to schedule use during other times.
• A museum funds and constructs a new building, dedicating some space and time for community
meetings and paying a portion of revenues to the Agency to lease the land. Examples of Public/Public Partnerships • Two governmental public safety agencies see the need for more physical training space for their
employees. They jointly build two gyms adjacent to Agency facilities to share for their training during the day. The gyms would be open for the Agency to schedule for other users at night.
Active Partnerships Management Agreements
Program Partnerships Facility Leases
Intergovernmental Agreements (IGAs)
Marketing Partnerships
Semi-Limited Decision Making Partnerships
Sponsorships
Limited Decision Making Partnerships
Grant Programs Donor Programs
Volunteer Programs
Types of Partnerships

Glenwood Springs, Colorado Parks and Recreation Comprehensive Master Plan page 123
• A school district sees the need for a climbing wall for their athletes. The district funds the wall and subsidizes operating costs, and the Agency manages and maintains the wall to provide public use during off hours.
• A university needs meeting rooms. They fund a multi-use building on Agency land that can be used
for Agency community programs at night.
E. Sponsorships XX is interested in actively procuring sponsorships for facilities and programs as one type of beneficial partnership. Please see the XX Sponsorship Policy for more information.
F. Limited-Decision Making Partnerships: Donor, Volunteer, and Granting Programs While this policy document focuses on the parameters for more active types of partnerships, the Agency is interested in, and will be happy to discuss, a proposal for any of these types of partnerships, and may create specific plans for such in the future. G. Benefits of Partnerships with XX The Agency expects that any Proposed Partnership will have benefits for all involved parties. Some general expected benefits are: Benefits for the Agency and the Community: Merging of resources to create a higher level of service and facility availability for community
members. Making alternative funding sources available for public community amenities. Tapping into the dynamic and entrepreneurial traits of private industry. Delivering services and facilities more efficiently by allowing for collaborative business solutions to
public organizational challenges. Meeting the needs of specific groups of users through the availability of land for development and
community use. Benefits for the Partners: Land and/or facility availability at a subsidized level for specific facility and/or program needs. Sharing of the risk with an established stable governmental entity. Becoming part of a larger network of support for management and promotion of facilities and
programs. Availability of professional Agency recreation and planning experts to maximize the facilities and
programs that may result Availability of Agency staff facilitation to help streamline the planning and operational efforts.
II. The Partnering Process The steps for the creation of a partnership with the XX are as follows: A. XX will create a public notification process that will help inform any and all interested partners of the
availability of partnerships with the Agency. This will be done through notification in area newspapers, listing in the brochure, and through any other notification method that is feasible.
B. The proposing partner takes the first step to propose partnering with the Agency. To help in reviewing
both the partnerships proposed, and the project to be developed in partnership, the Agency asks for a Preliminary Proposal according to a specific format as outlined in Part Two - Proposed Partnership Outline Format.
C. If initial review of a Preliminary Proposal yields interest and appears to be mutually beneficial based
on the Agency Mission and Goals, and the Selection Criteria, an Agency staff or appointed representative will be assigned to work with potential partners.
D. The Agency representative is available to answer questions related to the creation of an initial proposal,
and after initial interest has been indicated, will work with the proposing partner to create a checklist of what actions need to take place next. Each project will have distinctive planning, design, review and support issues. The Agency representative will facilitate the process of determining how the partnership will address these issues. This representative can also facilitate approvals and input from any involved Agency departments, providing guidance for the partners as to necessary steps.
E. An additional focus at this point will be determining whether this project is appropriate for additional
collaborative partnering, and whether this project should prompt the Agency to seek a Request For Proposal (RFP) from competing/ collaborating organizations.
Request For Proposal (RFP) Trigger: In order to reduce concerns of unfair private competition, if a proposed project involves partnering with a private "for-profit" entity and a dollar amount greater than $5,000, and the Agency has not already undergone a public process for solicitation of that particular type of partnership, the Agency will request Partnership Proposals from other interested private entities for identical and/or complementary facilities, programs or services. A selection of appropriate partners will be part of the process.
F. For most projects, a Formal Proposal from the partners for their desired development project will need
to be presented for the Agency’s official development review processes and approvals. The project may require approval by the Legal, Planning, Fire and Safety, Finance and/or other Agency Departments, Parks and Recreation Advisory Board, Planning Board, The Board of Trustees, City Council and/or the Agency Supervisor’s Office, depending on project complexity and applicable Agency Charter provisions, ordinances or regulations. If these reviews are necessary, provision to reimburse the Agency for its costs incurred in having a representative facilitate the partnered project’s passage through Development Review should be included in the partnership proposal.

page 124 Glenwood Springs, Colorado Parks and Recreation Comprehensive Master Plan
G. Depending on project complexity and anticipated benefits, responsibilities for all action points are negotiable, within the framework established by law, to assure the most efficient and mutually beneficial outcome. Some projects may require that all technical and professional expertise and staff resources come from outside the Agency staff, while some projects may proceed most efficiently if the Agency contributes staff resources to the partnership.
H. The partnership must cover the costs the partnership incurs, regardless of how the partnered project is
staffed, and reflect those costs in its project proposal and budget. The proposal for the partnered project should also discuss how staffing and expertise will be provided, and what documents will be produced. If Agency staff resources are to be used by the partnership, those costs should be allocated to the partnered project and charged to it.
I. Specific Partnership Agreements appropriate to the project will be drafted jointly. There is no
specifically prescribed format for Partnership Agreements, which may take any of several forms depending on what will accomplish the desired relationships among partners. The agreements may be in the form of:
Lease Agreements Management and/or Operating Agreements Maintenance Agreements Intergovernmental Agreements (IGAs) Or a combination of these and/or other appropriate agreements
Proposed partnership agreements might include oversight of the development of the partnership, concept plans and project master plans, environmental assessments, architectural designs, development and design review, project management, and construction documents, inspections, contracting, monitoring, etc. Provision to fund the costs and for reimbursing the Agency for its costs incurred in creating the partnership, facilitating the project’s passage through the Development Review Processes, and completing the required documents should be considered.
J. If all is approved, the Partnership begins. The Agency is committed to upholding its responsibilities to
Partners from the initiation through the continuation of a partnership. Evaluation will be an integral component of all Partnerships. The agreements should outline who is responsible for evaluation, the types of measures used, and details on what will occur should the evaluations reveal Partners are not meeting their Partnership obligations.
III. The Partnership Evaluation Process A. Mission Statements and Goals All partnerships with XX should be in accord with the Agency’s and any specifically affected Department's Mission and Goals. For purposes of example for this policy, the following sections utilize the XX’s Parks &
Recreation Department’s Mission and Goals to represent how a proposed partnership for that Department would be preliminarily evaluated: NEED SPECIFIC MISSION STATEMENT Sample XX Parks & Recreation Mission Statement: The XX Parks & Recreation Department provides and cares for public park lands and creates opportunities for personal growth. We work with the citizens of the Agency to provide a broad spectrum of opportunities to renew, restore, refresh, and recreate, balancing often stressful life-styles. We encourage the participation of individuals and families to develop the highest possible level of physical and mental well-being. We believe that well-balanced, healthy people contribute to a productive and healthy community. NEED SPECIFIC GOALS Sample Goals of the Park & Recreation Department: • Promoting physical and mental health and fitness • Nourishing the development of children and youth • Helping to build strong communities and neighborhoods • Promoting environmental stewardship • Providing beautiful, safe, and functional parks and facilities that improve the lives of all citizens • Preserving cultural and historic features within the Agency’s parks and recreation systems • Providing a work environment for the Parks & Recreation Department staff that encourages initiative,
professional development, high morale, productivity, teamwork, innovation, and excellence in management
B. Other Considerations 1. Costs for the Proposal Approval Process For most proposed partnerships, there will be considerable staff time spent on the review and approval process once a project passes the initial review stage. This time includes discussions with Proposing Partners, exploration of synergistic partnering opportunities, possible RFP processes, facilitation of the approval process, assistance in writing and negotiating agreements, contracting, etc. There may also be costs for construction and planning documents, design work, and related needs and development review processes mandated by Agency ordinances. Successful Partnerships will take these costs into account and may plan for Agency recovery of some or all of these costs within the proposal framework. Some of these costs could be reimbursed through a negotiated agreement once operations begin, considered as construction expenses, or covered through some other creative means. 2. Land Use and/or Site Improvements Some proposed partnerships may include facility and/or land use. Necessary site improvements cannot be automatically assumed. Costs and responsibility for these improvements should be considered in any

Glenwood Springs, Colorado Parks and Recreation Comprehensive Master Plan page 125
Proposal. Some of the general and usual needs for public facilities that may not be included as Agency contributions and may need to be negotiated for a project include:
Any Facilities or non-existent Infrastructure Construction
Outdoor Restrooms Water Fountains
Roads or Street improvements Complementary uses of the Site Maintenance to Specified
Standards Staffing
Utility Improvements (phone, cable, storm drainage, electricity, water, gas, sewer, etc.)
Parking Custodial Services Snow Removal Trash Removal Lighting
3. Need The nature of provision of public services determines that certain activities will have a higher need than others. Some activities serve a relatively small number of users and have a high facility cost. Others serve a large number of users and are widely available from the private sector because they are profitable. The determination of need for facilities and programs is an ongoing discussion in public provision of programs and amenities. The project will be evaluated based on how the project fulfills a public need. Proposals should specifically explain how if they propose to be made available with a subsidy, as would be the case if a partnership is made through the dedication of public land or facilities as a lower than market value. 4. Funding Only when a Partnership Proposal demonstrates high unmet needs and high benefits for Agency citizens, will the Agency consider contributing resources at a below market value to a project. The Agency recommends that Proposing Partners consider sources of potential funding. The more successful partnerships will have funding secured in advance. In most cases, Proposing Partners should consider funding and cash flow for initial capital development, staffing, and ongoing operation and maintenance. The details of approved and pending funding sources should be clearly identified in a proposal. For many partners, especially small private user groups, non-profit groups, and governmental agencies, cash resources may be a limiting factor in the proposal. It may be a necessity for partners to utilize alternative funding sources for resources to complete a proposed project. Obtaining alternative funding often demands creativity, ingenuity, and persistence, but many forms of funding are available. Alternative funding can come from many sources, e.g. Sponsorships, Grants, and Donor Programs. A local librarian can help with foundation and grant resources. Developing a solid leadership team for a partnering organization will help find funding sources. In-kind contributions can in some cases add additional funding. All plans for using alternative funding should be clearly identified. The Agency has an established Sponsorship Policy, and partnered projects will be expected to adhere to the Policy. This includes the
necessity of having an Approved Sponsorship Plan in place prior to procurement of sponsorships for a Partnered Project. C. Selection Criteria In assessing a partnership opportunity to provide facilities and services, the Agency will consider (as appropriate) the following criteria. The Proposed Partnership Outline Format in Part Two gives a structure to use in creating a proposal. Agency staff and representatives will make an evaluation by attempting to answer each of the following Guiding Questions: • How does the project align with the Agency and affected Department’s Mission Statement and Goals? • How does the proposed facility fit into the current Agency and the affected Department’s Master Plan? • How does the facility/program meet the needs of Agency residents? • How will the project generate more revenue and/or less cost per participant than the Agency can
provide with its own staff or facilities? • What are the alternatives that currently exist, or have been considered, to serve the users identified in
this project? • How much of the existing need is now being met within the Agency borders and within adjacent
Townships? • What is the number and demographic profile of participants who will be served? • How can the proposing partner assure the Agency of the long-term stability of the proposed
partnership, both for operations and for maintenance standards? • How will the partnered project meet Americans with Disabilities Act and EEOC requirements? • How will the organization offer programs at reasonable and competitive costs for participants • What are the overall benefits for both the Agency and the Proposing Partners? Additional Assistance XX is aware that the partnership process does entail a great deal of background work on the part of the Proposing Partner. The following list of resources may be helpful in preparing a proposal: • Courses are available through local colleges and universities to help organizations develop a business
plan. • The Chamber of Commerce offers a variety of courses and assistance for business owners and for those
contemplating starting new ventures. • Reference Librarians at local libraries can be very helpful in identifying possible funding sources and
partners, including grants, foundations, financing, etc. • Relevant information including the XX Comprehensive and Master Plans, the Parks and Recreation
Master Plan, site maps, and other documents are available at the Agency Offices. These documents may be copied or reviewed, but may not be taken off-site.
• The XX Web Site (www.AgencyName.???) has additional information. • If additional help or information is needed, please call (123) 456-7890.

page 126 Glenwood Springs, Colorado Parks and Recreation Comprehensive Master Plan
Part Two Proposed Partnership Outline Format (Sample format to be used by the Parks & Recreation Department) Please provide as much information as possible in the following outline form. I. Description of Proposing Organization:
• Name of Organization • Purpose of Organization • Years in Existence • Services Provided
• Member/User/Customer Profiles • Contact Names, Mailing Address, Physical Address, Phone, Fax, E-mail • Accomplishments
• Legal Status II. Summary of Proposal (100 words or less) What is being proposed? III. Benefits to the Partnering Organization Why is your organization interested in partnering with the XX Parks & Recreation Department? Please individually list and discuss the benefits (monetary and non-monetary) for your organization. IV. Benefits to the XX Parks & Recreation Department Please individually list and discuss the benefits (monetary and non-monetary) for the XX Parks & Recreation Department and residents of the Township. V. Details (as currently known) The following page lists a series of Guiding Questions to help you address details that can help outline the benefits of a possible partnership. Please try to answer as many as possible with currently known information. Please include what your organization proposes to provide and what is requested of XX Parks & Recreation Department. Please include (as known) initial plans for your concept, operations, projected costs and revenues, staffing, and/or any scheduling or maintenance needs, etc.
Guiding Questions Meeting the Needs of our Community: In your experience, how does the project align with park and recreation goals? How does the proposed program or facility meet a need for Agency residents? Who will be the users? What is the projected number and profile of participants who will be served? What alternatives currently exist to serve the users identified in this project? How much of the existing need is now being met? What is the availability of similar programs
elsewhere in the community? Do the programs provide opportunities for entry-level, intermediate, and/or expert skill levels?
The Financial Aspect: Can the project generate more revenue and/or less cost per participant than the Township can provide
with its own staff or facilities? Will your organization offer programs at reasonable and competitive costs for participants? What are
the anticipated prices for participants? What resources are expected to come from the Parks & Recreation Department? Will there be a monetary benefit for the Agency, and if so, how and how much?
Logistics: How much space do you need? What type of space? What is your proposed timeline? What are your projected hours of operations? What are your initial staffing projections? Are there any mutually-beneficial cooperative marketing benefits? What types of insurance will be needed and who will be responsible for acquiring and paying
premiums on the policies? What is your organization's experience in providing this type of facility/program? How will your organization meet Americans with Disabilities Act and EEO requirements?
Agreements and Evaluation: How, by whom, and at what intervals should the project be evaluated? How can you assure the Agency of long-term stability of your organization? What types and length of agreements should be used for this project? What types of “exit strategies” should we include? What should be done if the project does not meet the conditions of the original agreements?

Glenwood Springs, Colorado Parks and Recreation Comprehensive Master Plan page 127
Appendix M. Sample Field Use Policy Sample Field Use Policy AGENCY NAME Parks and Recreation Sample Policies and Procedures (Items in red require modification or inclusion for relevance to the agency) Field and Court Assignments and Permits I. Permit Priority Rating Permits will be issued to users with the following priority rating: A. The AGENCY NAME Parks and Recreation and "Recognized" Independent Sports Organizations (I.S.O.) NOTE: Recognized I.S.O. serves the community at large and pays rental fees as established by AGENCY NAME. List I.S.O.’s The above listed organizations are only "Recognized" for their approved sport and season and are subject to listed procedures for adding additional activities. B. "Private Recognized" I.S.O. Note: Pays team/player/rental fees as established by AGENCY NAME C. Others - See "Field Rental Application" (Attachment) II. Guideline for "Recognizing" New I.S.O. for Field Permits The following factors will be considered as significant reasons to consider granting "Recognized" status to a new I.S.O. A. New organizations caused by a mandated split due to National or State Association bylaws of a current "recognized" I.S.O. 1. That organization shall notify the AGENCY NAME Parks and Recreation Staff Member in writing, documenting the mandate to split. 2. That organization must then provide the AGENCY NAME Parks and Recreation Staff Member with a written plan as to how the split will occur to include: a. Number of teams and participants which will be affiliated with each of the two new organizations. b. The AGENCY NAME will provide the two new organizations with a list of fields previously allocated to the original organization.
c. The two new organizations will then submit an agreed contract between them listing the fields or courts which will be assigned to each. In the event no agreement is reached, the AGENCY NAME Parks and Recreation will assign the fields. d. Neither of the two new organizations shall be allocated additional fields. e. Changing of boundaries and/or number of teams serviced may affect the number of fields permitted. B. A group of parents, community leaders, businesses, etc. request "recognition" of their newly formed youth organization. 1. The new organization must provide written documentation demonstrating a need for their organization. The following criteria will be considered when reviewing new organization's request for "Recognized" Status. a. Isolated Geographic Location - area has been part of AGENCY NAME or location, but may have only recently been developed or populated. b. Different Activity - sport that is NOT currently offered or can not be offered by an existing organization. Along with items(s) a or b, the new organization must also submit: (1) Rosters of a minimum of 40 participants. (2) Each team shall consist of minimum of 12 players. (3) 80% of the players must be residents of the AGENCY NAME. Residency verification is not necessary and the AGENCY NAME holds a lottery for teams. (4) 100% of the organization's games played in the AGENCY NAME must involve the AGENCY NAME teams. C. The AGENCY NAME Parks and Recreation Staff Member will give the organization written notice of their approval or rejection of "Recognized" status. 1. Appeals can be made to the AGENCY NAME Recreation Staff Member. 2. If ”Recognition” is granted, the new organization shall be subject to the ratio of "teams per fields". (See Section V of Policies and Procedures for Field and Court Assignments and Permits). a. If facilities and/or enough time are not available, The AGENCY NAME may re-allocate facilities and times assigned to existing "Recognized" organizations.

page 128 Glenwood Springs, Colorado Parks and Recreation Comprehensive Master Plan
III. Organization Requirements for Retaining "Recognized" Status A. Organizations must attend the regular annual meeting sponsored by the AGENCY NAME Parks and Recreation and keep on file the following information. (NOTE: Additional meetings may be scheduled as necessary). 1. A list of their officers naming: President, Vice President, Field Coordinator, and a contact person for general registration. Please list name, title, address, home and work numbers. 2. A statement of the organization's Philosophy and Goals. (Only needed as philosophy changes or as requested by the AGENCY NAME Parks and Recreation). 3. Age range(s) and skill levels the organization is offering. Items 1, 2, and 3 will not only give us a better understanding of your organization, but will enable us to pass that information on to the general public. B. Organizations must pay for their Field/Court Permits within 30 days after the effective date of the Permits. Please submit a summary sheet with payment (see attached “Use Agreement” form). C. Organization must demonstrate a willingness to adhere to the above guidelines. Failure to do so may result in revocation or suspension of "Recognized" status. IV. Request for Permits A. Organizations must submit written request (see attached "Use Agreement” form) for fields only during the seasonal request dates. (See below) B. Block permits will be issued to organizations. The AGENCY NAME Parks and Recreation will deal only with the "Field Coordinator" of these organizations. It is the responsibility of the organization to schedule games and practices and deal with individual coaches and parents. 1. Appeals can be made to the AGENCY NAME Parks and Recreation Staff Member.
FIELD ASSIGNMENTS: Practices and Games SEASON
REQUEST DUE PERMITS ISSUED APPROXIMATE SEASON LENGTHS
Spring (11 weeks)
November 14 December 1 1st week of March 1 - 3rd week of May
Summer (10-11 weeks)
November 14 (currently the same)
December 1 4th week of May 24 - 1st week of August
Fall (13 weeks)
May 15 June 1 3rd week of August - 2nd week of November
Winter No Permits Issued Applicants may submit one permit for all three/four seasons, or submit separate permits for each season. Exception dates will be noted on the permit or “Use Agreement” form. If an I.S.O.'s season overlaps another season by no more than 30 days, one request will be accepted for that season. FIELD ASSIGNMENTS: Tournaments and Special Events Requests for the following year are due in writing by August 15. Assignments for the year will be completed by September 10. After September 10, requests will be taken on a first come - first serve basis as fields are available and the allotted number of special events per field has not been reached. If an organization requests a special event that would exceed the allocated number of special events, consideration will be given to substitute a special event for their regularly scheduled day of games. V. Allocation of Fields A. The AGENCY NAME reserves the right to increase/decrease the number of fields assigned to an organization based upon enrollment changes; unavailability of fields due to maintenance; contractual agreements or priority scheduling; abusive usage and/or failure to use assigned fields; and failure to pay permit fee. B. Fields will be assigned to the organizations that have the greatest need for fields based on the previous year's ratio of the AGENCY NAME residents per field. Additional fields will be assigned as the fields become available for usage. C. Due to maintenance factors, the design of fields, geographical location, or because "new fields" become available or are upgraded, organizations may be assigned some different fields from season to season.

Glenwood Springs, Colorado Parks and Recreation Comprehensive Master Plan page 129
D. Fields that have been developed primarily through the efforts and financial investment of an I.S.O. shall be assigned to that I.S.O. on a "First Right of Refusal" basis. Documentation of the investment shall be provided to the AGENCY NAME to substantiate the assignment. In the event that circumstances change and demand from the public relating to the use of fields increases beyond the AGENCY NAME 's capacity to serve the needs of the community, this assignment will be reconsidered through discussion with the I.S.O. VI. Sport Seasons A. Permanent dates/seasons have been established for I.S.O.'s. This is done in order to prevent different seasonal sports from overlapping and causing field allocation problems as well as to not deprive youngsters the experience of participating in various sports. (See permit priority rating section above and listed ”Recognized” Independent Sports Organizations.) VII. General Hours of Operation AGENCY NAME Fields Monday - Friday 3:30 p.m. to dark Saturday & Sunday 8:00 a.m to dark VIII. Special Tournament Requests Any organization conducting a tournament that requires any of the following usage changes MUST fill out a “Field Rental Application” (attached) and submit it to the AGENCY NAME Parks and Recreation Staff Member a minimum of 30 days prior to the event. A. Dates and times of usage B. Additional portable toilets or portable toilet service. C. Additional structures, bleachers, tents, concessions, fences. D. Additional maintenance: lines, heavy drag, mowing, etc. Due to heavy weekend use of ballfields, it is recommended that requests be made by August 10th of the preceding year. Organizations MUST pay in full for any additional services required to conduct a tournament. See the field rental information sheet attached. IX. Field Maintenance A. The AGENCY NAME will "line" foul boundaries only on AGENCY NAME "game" fields twice per season. B. The AGENCY NAME will provide general maintenance (cut and water grass), and heavy drag infield only as needed to provide a "safe environment."
C. Organizations must "chalk" their boundary and foul lines, repack batter's box, pitchers mound and drag the infield with light-weight vehicle (no larger than a small truck). D. Any other request or permission to perform maintenance must be made in writing to the AGENCY NAME Parks and Recreation Staff Member. X. Maintenance Projects As authorized by the AGENCY NAME’ Council or Board each I.S.O. (see pages 1 & 2 Recognized & Private I.S.O.'s) pays a team/player/rental fee primarily to contribute to the direct expenses incurred in providing and maintaining AGENCY NAME game fields. Any surplus funds will be made available for special projects. It may be necessary to ask the organization(s) requesting projects to provide additional funds and/or materials in order to consider a project or complete it in a timelier manner. XI. Portable Toilets A. Portable units will be placed only at AGENCY NAME owned "GAME" locations. Costs of these units are covered by I.S.O. budget. Requests must be made at least 10 business days in advance. Contact the AGENCY NAME Athletics Office at (123) 456-7890. B. Additional units may be placed by individual I.S.O. Written permission must be obtained from the Staff Member, if a unit is to be placed on AGENCY NAME Park property. The AGENCY NAME Athletics Office will order any extra units and charge the I.S.O. the direct cost. C. Those parks with permanent toilet facilities will have them in operation from approximately May 1 - October 1. 1. Portable toilets will be available at other times, during the particular sports season in progress. XII. Concessions A. The AGENCY NAME concessionaire has exclusive rights to tournaments and league play at (list all applicable) Parks. The AGENCY NAME Concessionaire may waive their right to tournaments or special events in writing to the AGENCY NAME Staff Member. At that time permission may be granted by the Staff Member to another person/organization requesting to provide concessions. B. To set up concessions contact the AGENCY NAME Parks and Recreation Staff Member at (123) 456-7890.

page 130 Glenwood Springs, Colorado Parks and Recreation Comprehensive Master Plan
C. The following items are required. Each one is fairly easy to obtain and has a minimal or no fee. 1. A AGENCY NAME Sales Tax Permit. 2. A State of BLANK Sales Tax Permit. 3. A County Health Permit. XIII. Emergency Phone Numbers A. Fields owned by AGENCY NAME: Contact phone number and staff will contact appropriate person. Police Dispatch: phone number. B. Please follow-up ALL requests, complaints and compliments with a call or letter to: Athletic Office for AGENCY NAME 123 Mainstreet Anywhere, USA 88888-9999 Office: (123) 456-7890 FAX: (123) 456-7891
We hope this information will enable us to better serve your organization, coaches, parents, and most of all, the players.
Maintenance Scheduling
Facility Name Baseball
Softball Field
Baseball
Softball Field
List all facilities Select responsible party
AGENCY NAME or n/a AGENCY NAME or n/a
AGENCY NAME or n/a AGENCY NAME or n/a
AGENCY NAME or n/a AGENCY NAME or n/a
Maintenance Scheduling Facility Name
Soccer Field Soccer Field
List all facilities Select responsible party
AGENCY NAME or n/a AGENCY NAME or n/a
AGENCY NAME or n/a AGENCY NAME or n/a
AGENCY NAME or n/a AGENCY NAME or n/a

Glenwood Springs, Colorado Parks and Recreation Comprehensive Master Plan page 131
Appendix N. Capacities LOS Table Component Summary TableGlenwood Springs, Colorado Final: October 2006
Am
phith
eate
r
Bal
lfiel
d - B
aseb
all
Bal
lfiel
ds -
Softb
all
Bas
ketb
all
Boa
t Ram
p
Dog
Par
k
Foot
ball
field
Gar
den
- Xer
isca
pe
Hoc
key
- out
door
ic
e
Hor
sesh
oe P
its
Loop
Wal
k (2
000
lf.,
20' R
OW
@ 5
2' lf
.)
Mul
tipur
pose
/Soc
cer F
ield
s
Ope
n Tu
rf
Picn
ic S
helte
r -
smal
l (in
divi
dual
)
Picn
ic s
helte
r - la
rge
(gro
up)
Play
grou
nd
Shoo
ting
Ran
ge
Skat
e Pa
rk
Tenn
is C
ourt
s
Trac
k
Volle
ybal
l
Whi
te W
ater
Par
k
INVENTORY
City Components 1 1 4 3 1 1 0 1 1 1 6 4 7 1 9 9 1 6 0 2 1Schools 0 0 1 0 0 0 0 0 0 0 0 0 0 0 0 0 0 0 0 0 0 0Other 0 0 0 1 0 0 1 0 0 0 0 2 0 0 0 3 1 0 0 2 0 0TOTAL 1 1 5 4 1 1 1 1 1 1 6 6 7 1 9 12 1 1 6 2 2 1
CURRENT RATIO PER POPULATIONCURRENT POPULATION (2005) 8,825
Current Ratio per 1000 Population 0.11 0.11 0.57 0.45 0.11 0.11 0.11 0.11 0.11 0.11 0.68 0.68 0.79 0.11 1.02 1.36 0.11 0.11 0.68 0.23 0.23 0.11Population per component 8,825 8,825 1,765 2,206 8,825 8,825 8,825 8,825 8,825 8,825 1,471 1,471 1,261 8,825 981 735 8,825 8,825 1,471 4,413 4,413 8,825
PROJECTED POPULATION - YEAR 2010 10,020
Total # needed to maintain current ratio of all existing facilities at projected population
1 1 6 5 1 1 1 1 1 1 7 7 8 1 10 14 1 1 7 2 2 1
Number that should be added to achieve current ration at projected population 0 0 1 1 0 0 0 0 0 0 1 1 1 0 1 2 0 0 1 0 0 0
SUGGESTED RATIO PER POPULATION
Suggested Ratio per 1000 0.11 0.20 0.40 0.30 0.11 0.11 0.10 0.11 0.11 0.11 1.25 0.50 0.85 0.60 1.00 1.00 0.10 0.11 0.68 0.23 0.23 0.11Population per component 9,091 5,000 2,500 3,333 9,091 9,091 10,000 9,091 9,091 9,091 800 2,000 1,176 1,667 1,000 1,000 10,000 9,091 1,471 4,348 4,348 9,091
2010 NEED: Total # needed in place to attain suggested ratio in year 2010 1 2 4 3 1 1 1 1 1 1 13 5 9 6 10 10 1 1 7 2 2 1
Number that should be added to achieve suggested ration at 2010 population 0 1 0 0 0 0 0 0 0 0 7 1 2 5 0 1 0 0 1 0 0 0
ESTIMATED FUNDING BUDGET - (in 2006 dollars)
Number of components 0 1 0 0 0 0 0 0 0 0 7 1 2 5 0 1 0 0 1 0 0 0
Acres required for number of components needed 0 3 0 0 varies 0 0 varies varies 0 7 1 1 1.25 0 0.25 0 0 0.25 0 0 varies
Support space for number of components needed 0.00 4.50 0.00 0.00 0.00 0.00 0.00 63.00 1.50 0.52 0.64 0.00 0.13 0.00 0.00 0.13 0.00 0.00
Cost for constructing number of components needed $0 $400,000 $0 $0 $0 $0 $0 $728,000 $100,000 $50,000 $100,000 $0 $75,000 $0 $0 $45,000 $0 $0
Cost for developing support space $0 $787,500 $0 $0 $0 $0 $0 $63,000 $262,500 $25,758 $32,197 $0 $6,439 $0 $0 $6,439 $0 $0
Public art fund - 1% of construction costs $0 $11,875 $0 $0 $0 $0 $0 $7,910 $3,625 $758 $1,322 $0 $814 $0 $0 $514 $0 $0
TOTAL incl.- component construction, support space development, and public art $0 $1,199,375 $0 $0 $0 $0 $0 $798,910 $366,125 $76,515 $133,519 $0 $82,254 $0 $0 $51,954 $0 $0
Total $$ Needed $2,708,652ESTIMATED LIFE CYCLE COSTS - (in 2006 dollars)Life Cycle Cost per component per year $61,500 $68,667 $51,500 $5,542 varies $53,375 $27,167 varies varies $1,358 $15,080 $30,500 $6,375 $4,100 $9,225 $14,125 $14,125 $42,917 $11,475 $102,000 $12,750 variesUseful Life of component 20 15 15 15 10 15 15 20 10 20 20 20 12 30 15 20 20 10Life Cycle Costs through life of component $1,230,000 $1,030,000 $772,500 $83,125 $533,750 $407,500 $20,375 $301,600 $305,000 $127,500 $8,200 $18,450 $169,500 $423,750 $643,750 $229,500 $2,040,000 $127,500

page 132 Glenwood Springs, Colorado Parks and Recreation Comprehensive Master Plan
Appendix O. GRASP® Scoring Methodology Description of GRASP® scoring for the Glenwood Springs, CO Parks, Recreation, and Cemeteries Master Plan During the inventory the following information was gathered: Design and ambiance score: This score reflects the general impression of the park. It is based on comfort, aesthetics, convenience, design, and relationship to street among other things. Score range 1=low/poor, 2=average/good, 3=high/excellent. Total park component score: Each park component (including: ballfields, multi-purpose fields, playgrounds, picnic shelters or ramadas, trail access, natural/native components, passive areas, basketball courts, practice backstops, open turf areas, and other components as noted) was located and scored. The score (1=low/poor, 2=average/good, 3=high/excellent) was based on the quality, condition, location, and site appropriateness of the component. The total of all of these component scores makes the total park component score. Total modifier score: Several park features make up the “modifier” category. These features make the park a nicer place to be by providing comfort, convenience, and functionality. Components in this category include: drinking fountains, benches, BBQ grills, dog stations, security lighting, loop walks, shade trees,
open water, trail connections, access, parking, seasonal plantings, picnic tables, natural areas, and restrooms with plumbing. These components were given a score based on quality and appropriate quantity base on the size of the park with 1=low/poor, 2=average/good, 3=high/excellent. The total of all of these scores makes the total modifier score. Adjusted modifier score: The range of total modifier scores was divided into three groups and given an adjusted score based on where it falls in the range of scores, thus scores of 1 to 7 = 1.1, 8 to 14 = 1.2, and 15 to 21 = 1.3. Ownership modifier: The inventory includes facilities that fall under the following headings each with a modifier that represents the access and control the Lisle Parks District (LPD) has over the facility. This includes schools and properties owned by the school district. Owned, Managed and Maintained by the city - 100% School Properties – 50% Composite GRASP® score: To determine the composite GRASP® score of City owned parks the following formula was used: (total park component score) (adjusted modifier score) (park overall base score) (ownership modifier) = Composite GRASP® score

Glenwood Springs, Colorado Parks and Recreation Comprehensive Master Plan page 133
Appendix P. GRASP® Perspectives - Inventory


Glenwood Springs, Colorado Parks and Recreation Comprehensive Master Plan page 135
Appendix Q. GRASP® Perspectives - Analysis Areas


Glenwood Springs, Colorado Parks and Recreation Comprehensive Master Plan page 137
Appendix R. GRASP® Perspectives - Access to All Components


Glenwood Springs, Colorado Parks and Recreation Comprehensive Master Plan page 139
Appendix S. GRASP® Perspectives - Trails, Bike Lanes and Public Transportation


Glenwood Springs, Colorado Parks and Recreation Comprehensive Master Plan page 141
Appendix T. GRASP® Perspectives - Access to All Components with Proposed Improvements


Glenwood Springs, Colorado Parks and Recreation Comprehensive Master Plan page 143
Appendix U. GRASP® LOS Summary Table for All Components - Based on the GRASP® Perspective - Access to All Components GRASP® Analysis Map
GRASP™ LOS Summary Table for All ComponentsThis table is based on the GRASP Perspective - Access to All Components GRASP™ Analysis Map
Analysis Area Tota
l Acr
es
Acre
s. w
/LOS
% o
f Tot
al w
/LOS
Av
g. L
OS S
core
per
Acr
e Se
rved
Acre
s <1
9
Acre
s 19
+
% o
f Tot
al A
rea
<19
% o
f Tot
al A
rea
19+
% o
f Ser
ved
Area
<19
% o
f Ser
ved
Area
19+
Area 1 121.85 121.85 100% 28.60 74.33 47.52 61% 39% 61% 39%Area 2 1477.98 1413.52 96% 43.56 779.08 634.44 53% 43% 55% 45%Area 3 811.71 811.66 100% 32.88 405.72 405.94 50% 50% 50% 50%Area 4 1021.64 916.53 90% 9.10 853.62 62.91 84% 6% 93% 7%
Unincorporated Park Area (South Canyon, Lookout Mountain) 3057.22 3057.22 100% 9.79 3057.22 0.00 100% 0% 100% 0%
Entire Glenwood Springs (Excluding Surface Water) 3433.18 3263.56 95% 30.67 2112.75 1150.81 62% 34% 65% 35%
DefinitionsTotal Acres: Total area within the designated analysis area as calculated from the GISAcres With LOS: Area within each analysis area that has some service (LOS = 1 or Greater).Percent of Total with LOS: Percentage of the designated analysis area that has some service (LOS = 1 or Greater).Average LOS per Acre Served: The average GRASP™ score for any given acre within the designated analysis area.Percent of Total Area <19: The percentage of the area within each analysis area that has a GRASP™ score of less than 19 points.Percent of Total Area 19+: The percentage of the area within each analysis area that has a GRASP™ score of 19 points or more.Percent of Served Area <19: Of the area that has some service, the percentage of the served area that has a GRASP™ score of less than 19 points.Percent of Served Area 19+: Of the area that has some service, the percentage of the served area that has a GRASP™ score of 19 points or more.

page 144 Glenwood Springs, Colorado Parks and Recreation Comprehensive Master Plan
Appendix V. GRASP® LOS Summary Table for All Components - Based on the GRASP® Perspective - Access to All Components With Proposed Improvements GRASP® Analysis Map
GRASP™ LOS Summary Table for All Components
This table is based on the GRASP Perspective - Access to All Components With Proposed Improvements GRASP™ Analysis Map
Analysis Area Tota
l Acr
es
Acre
s. w
/LOS
% o
f Tot
al w
/LOS
Av
g. L
OS S
core
per
Acr
e Se
rved
Acre
s <1
9
Acre
s 19
+
% o
f Tot
al A
rea
<19
% o
f Tot
al A
rea
19+
% o
f Ser
ved
Area
<19
% o
f Ser
ved
Area
19+
Area 1 121.85 121.85 100% 30.83 74.33 47.52 61% 39% 61% 39%Area 2 1477.98 1413.52 96% 55.13 725.01 688.52 49% 47% 51% 49%Area 3 811.71 811.66 100% 41.08 380.48 431.20 47% 53% 47% 53%Area 4 1021.64 916.53 90% 16.65 568.53 347.99 56% 34% 62% 38%
Unincorporated Park Area (South Canyon, Lookout Mountain) 3057.22 3057.22 100% 9.79 3057.22 0.00 100% 0% 100% 0%
Entire Glenwood Springs (Excluding Surface Water) 3433.18 3263.56 95% 46.66 1748.35 1515.23 51% 44% 54% 46%
DefinitionsTotal Acres: Total area within the designated analysis area as calculated from the GISAcres With LOS: Area within each analysis area that has some service (LOS = 1 or Greater).Percent of Total with LOS: Percentage of the designated analysis area that has some service (LOS = 1 or Greater).Average LOS per Acre Served: The average GRASP™ score for any given acre within the designated analysis area.Percent of Total Area <19: The percentage of the area within each analysis area that has a GRASP™ score of less than 19 points.Percent of Total Area 19+: The percentage of the area within each analysis area that has a GRASP™ score of 19 points or more.
Percent of Served Area <19: Of the area that has some service, the percentage of the served area that has a GRASP™ score of less than 19 points.
Percent of Served Area 19+: Of the area that has some service, the percentage of the served area that has a GRASP™ score of 19 points or more.